Observations of hydrography and downflow of brine-enriched shelf water in the Storfjorden polynya,...
13
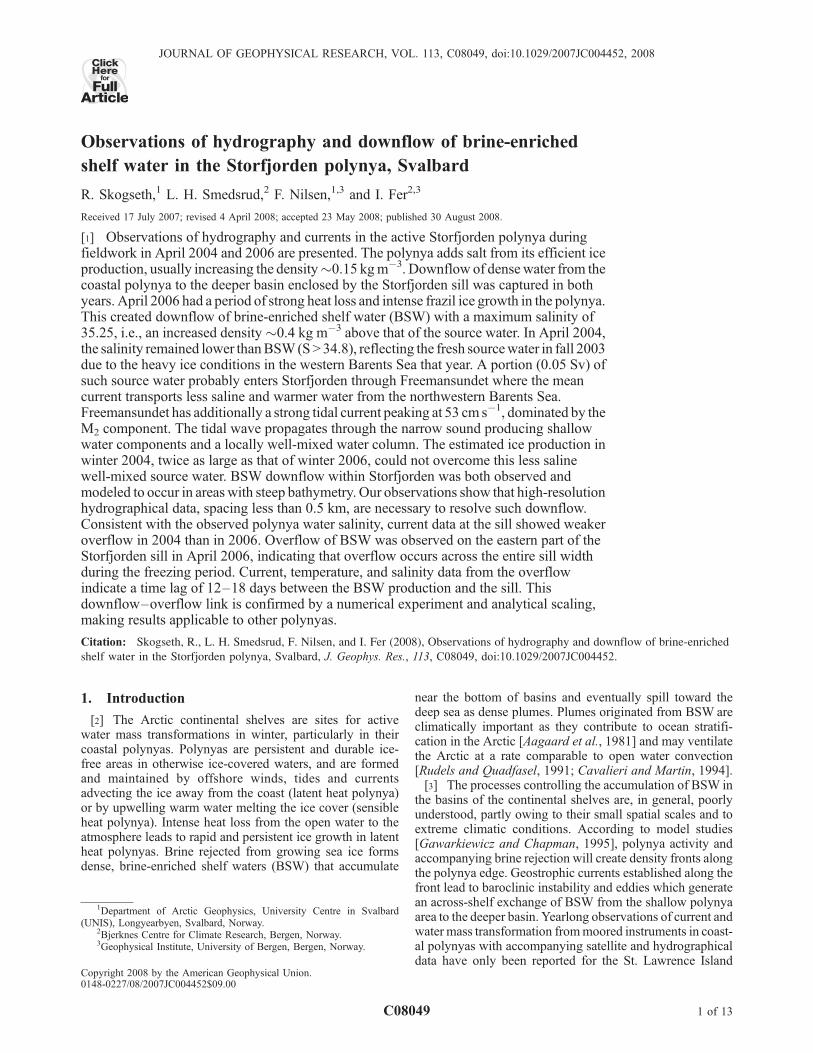
Observations of hydrography and downflow of brine-enriched shelf water in the Storfjorden polynya, Svalbard R. Skogseth, 1 L. H. Smedsrud, 2 F. Nilsen, 1,3 and I. Fer 2,3 Received 17 July 2007; revised 4 April 2008; accepted 23 May 2008; published 30 August 2008. [1] Observations of hydrography and currents in the active Storfjorden polynya during fieldwork in April 2004 and 2006 are presented. The polynya adds salt from its efficient ice production, usually increasing the density 0.15 kg m 3 . Downflow of dense water from the coastal polynya to the deeper basin enclosed by the Storfjorden sill was captured in both years. April 2006 had a period of strong heat loss and intense frazil ice growth in the polynya. This created downflow of brine-enriched shelf water (BSW) with a maximum salinity of 35.25, i.e., an increased density 0.4 kg m 3 above that of the source water. In April 2004, the salinity remained lower than BSW (S > 34.8), reflecting the fresh source water in fall 2003 due to the heavy ice conditions in the western Barents Sea that year. A portion (0.05 Sv) of such source water probably enters Storfjorden through Freemansundet where the mean current transports less saline and warmer water from the northwestern Barents Sea. Freemansundet has additionally a strong tidal current peaking at 53 cm s 1 , dominated by the M 2 component. The tidal wave propagates through the narrow sound producing shallow water components and a locally well-mixed water column. The estimated ice production in winter 2004, twice as large as that of winter 2006, could not overcome this less saline well-mixed source water. BSW downflow within Storfjorden was both observed and modeled to occur in areas with steep bathymetry. Our observations show that high-resolution hydrographical data, spacing less than 0.5 km, are necessary to resolve such downflow. Consistent with the observed polynya water salinity, current data at the sill showed weaker overflow in 2004 than in 2006. Overflow of BSW was observed on the eastern part of the Storfjorden sill in April 2006, indicating that overflow occurs across the entire sill width during the freezing period. Current, temperature, and salinity data from the overflow indicate a time lag of 12 – 18 days between the BSW production and the sill. This downflow – overflow link is confirmed by a numerical experiment and analytical scaling, making results applicable to other polynyas. Citation: Skogseth, R., L. H. Smedsrud, F. Nilsen, and I. Fer (2008), Observations of hydrography and downflow of brine-enriched shelf water in the Storfjorden polynya, Svalbard, J. Geophys. Res., 113, C08049, doi:10.1029/2007JC004452. 1. Introduction [2] The Arctic continental shelves are sites for active water mass transformations in winter, particularly in their coastal polynyas. Polynyas are persistent and durable ice- free areas in otherwise ice-covered waters, and are formed and maintained by offshore winds, tides and currents advecting the ice away from the coast (latent heat polynya) or by upwelling warm water melting the ice cover (sensible heat polynya). Intense heat loss from the open water to the atmosphere leads to rapid and persistent ice growth in latent heat polynyas. Brine rejected from growing sea ice forms dense, brine-enriched shelf waters (BSW) that accumulate near the bottom of basins and eventually spill toward the deep sea as dense plumes. Plumes originated from BSW are climatically important as they contribute to ocean stratifi- cation in the Arctic [Aagaard et al., 1981] and may ventilate the Arctic at a rate comparable to open water convection [Rudels and Quadfasel, 1991; Cavalieri and Martin, 1994]. [3] The processes controlling the accumulation of BSW in the basins of the continental shelves are, in general, poorly understood, partly owing to their small spatial scales and to extreme climatic conditions. According to model studies [Gawarkiewicz and Chapman, 1995], polynya activity and accompanying brine rejection will create density fronts along the polynya edge. Geostrophic currents established along the front lead to baroclinic instability and eddies which generate an across-shelf exchange of BSW from the shallow polynya area to the deeper basin. Yearlong observations of current and water mass transformation from moored instruments in coast- al polynyas with accompanying satellite and hydrographical data have only been reported for the St. Lawrence Island JOURNAL OF GEOPHYSICAL RESEARCH, VOL. 113, C08049, doi:10.1029/2007JC004452, 2008 Click Here for Full Articl e 1 Department of Arctic Geophysics, University Centre in Svalbard (UNIS), Longyearbyen, Svalbard, Norway. 2 Bjerknes Centre for Climate Research, Bergen, Norway. 3 Geophysical Institute, University of Bergen, Bergen, Norway. Copyright 2008 by the American Geophysical Union. 0148-0227/08/2007JC004452$09.00 C08049 1 of 13
-
Upload
independent -
Category
Documents
-
view
2 -
download
0
Transcript of Observations of hydrography and downflow of brine-enriched shelf water in the Storfjorden polynya,...
Observations of hydrography and downflow of brine-enriched
shelf water in the Storfjorden polynya, Svalbard
R. Skogseth,1 L. H. Smedsrud,2 F. Nilsen,1,3 and I. Fer2,3
Received 17 July 2007; revised 4 April 2008; accepted 23 May 2008; published 30 August 2008.
[1] Observations of hydrography and currents in the active Storfjorden polynya duringfieldwork in April 2004 and 2006 are presented. The polynya adds salt from its efficient iceproduction, usually increasing the density�0.15 kgm�3. Downflow of densewater from thecoastal polynya to the deeper basin enclosed by the Storfjorden sill was captured in bothyears. April 2006 had a period of strong heat loss and intense frazil ice growth in the polynya.This created downflow of brine-enriched shelf water (BSW) with a maximum salinity of35.25, i.e., an increased density �0.4 kg m�3 above that of the source water. In April 2004,the salinity remained lower thanBSW(S>34.8), reflecting the fresh sourcewater in fall 2003due to the heavy ice conditions in the western Barents Sea that year. A portion (0.05 Sv) ofsuch source water probably enters Storfjorden through Freemansundet where the meancurrent transports less saline and warmer water from the northwestern Barents Sea.Freemansundet has additionally a strong tidal current peaking at 53 cm s�1, dominated by theM2 component. The tidal wave propagates through the narrow sound producing shallowwater components and a locally well-mixed water column. The estimated ice production inwinter 2004, twice as large as that of winter 2006, could not overcome this less salinewell-mixed source water. BSW downflow within Storfjorden was both observed andmodeled to occur in areas with steep bathymetry. Our observations show that high-resolutionhydrographical data, spacing less than 0.5 km, are necessary to resolve such downflow.Consistent with the observed polynya water salinity, current data at the sill showed weakeroverflow in 2004 than in 2006. Overflow of BSW was observed on the eastern part of theStorfjorden sill in April 2006, indicating that overflow occurs across the entire sill widthduring the freezing period. Current, temperature, and salinity data from the overflowindicate a time lag of 12–18 days between the BSW production and the sill. Thisdownflow–overflow link is confirmed by a numerical experiment and analytical scaling,making results applicable to other polynyas.
Citation: Skogseth, R., L. H. Smedsrud, F. Nilsen, and I. Fer (2008), Observations of hydrography and downflow of brine-enriched
shelf water in the Storfjorden polynya, Svalbard, J. Geophys. Res., 113, C08049, doi:10.1029/2007JC004452.
1. Introduction
[2] The Arctic continental shelves are sites for activewater mass transformations in winter, particularly in theircoastal polynyas. Polynyas are persistent and durable ice-free areas in otherwise ice-covered waters, and are formedand maintained by offshore winds, tides and currentsadvecting the ice away from the coast (latent heat polynya)or by upwelling warm water melting the ice cover (sensibleheat polynya). Intense heat loss from the open water to theatmosphere leads to rapid and persistent ice growth in latentheat polynyas. Brine rejected from growing sea ice formsdense, brine-enriched shelf waters (BSW) that accumulate
near the bottom of basins and eventually spill toward thedeep sea as dense plumes. Plumes originated from BSW areclimatically important as they contribute to ocean stratifi-cation in the Arctic [Aagaard et al., 1981] and may ventilatethe Arctic at a rate comparable to open water convection[Rudels and Quadfasel, 1991; Cavalieri and Martin, 1994].[3] The processes controlling the accumulation of BSW in
the basins of the continental shelves are, in general, poorlyunderstood, partly owing to their small spatial scales and toextreme climatic conditions. According to model studies[Gawarkiewicz and Chapman, 1995], polynya activity andaccompanying brine rejection will create density fronts alongthe polynya edge. Geostrophic currents established along thefront lead to baroclinic instability and eddies which generatean across-shelf exchange of BSW from the shallow polynyaarea to the deeper basin. Yearlong observations of current andwater mass transformation frommoored instruments in coast-al polynyas with accompanying satellite and hydrographicaldata have only been reported for the St. Lawrence Island
JOURNAL OF GEOPHYSICAL RESEARCH, VOL. 113, C08049, doi:10.1029/2007JC004452, 2008ClickHere
for
FullArticle
1Department of Arctic Geophysics, University Centre in Svalbard(UNIS), Longyearbyen, Svalbard, Norway.
2Bjerknes Centre for Climate Research, Bergen, Norway.3Geophysical Institute, University of Bergen, Bergen, Norway.
Copyright 2008 by the American Geophysical Union.0148-0227/08/2007JC004452$09.00
C08049 1 of 13
polynya in the Bering Shelf [Drucker et al., 2003; Danielsonet al., 2006] and theNorthwestern polynya in theOkhotsk Sea[Shcherbina et al., 2004]. These studies showed that the twoshelf areas with different circulation and bathymetry,responded differently to the polynya activity. Despite brinerejection during ice growth and the accompanying BSWformation at both sites, no eddy activity was detected by the14 moorings in the St. Lawrence polynya [Danielson et al.,2006], whereas eddies due to baroclinic instability weresuggested to cause the across-shelf exchange of BSW in theNorthwestern polynya [Shcherbina et al., 2004]. Increasedknowledge on polynya processes and the ocean response topolynya activity on continental shelves in marginal seas iscrucial to estimate reliable bulk fluxes and to improve sea iceand ocean circulation models.[4] A recurring latent heat polynya is known to form
inside Storfjorden during northeasterly winds in winter[Haarpaintner et al., 2001; Skogseth et al., 2004] producingtypically 0.03–0.04 Sv of BSW annually [Skogseth et al.,2004, 2005a]. A sill at the mouth of Storfjorden separatesdense basin water from the adjacent shelf areas. We refer toBSW flow from shallow polynya to deeper part of the basinas ‘‘downflow’’ and that across the sill as ‘‘overflow.’’[5] Plumes of dense water originating at the Storfjorden
polynya have been frequently observed south of the silltoward the shelf break of the West Spitsbergen Shelf[Quadfasel et al., 1988; Anderson et al., 1988; Schauer,1995; Schauer and Fahrbach, 1999; Fer et al., 2003, 2004b;Fer, 2006]. If its density excess permits, the plume cascadesinto the deep Norwegian Sea and northward along the easternslope of Fram Strait toward the Arctic Ocean [Quadfasel etal., 1988]. Despite relatively constant BSW volume fluxfrom the polynya, the maximum observed BSW salinityvaries interannually by more than unity [Skogseth et al.,2005b]. The density of the overflow varies accordingly,affecting the penetration depth of the plume. The motivationof this study is to better understand the exchange between thepolynya and the Storfjorden basin, the downflow of BSWandpolynya dynamics-overflow relations and attempt to gener-alize the results for other polynya systems.[6] As a part of the Polar Ocean Climate Processes
(ProClim) project a fieldwork program was conducted inthe Storfjorden polynya in April 2004 and 2006 to study theice properties and processes inside a polynya, and the oceanresponse to polynya activity. Observations from 2004 onproperties of grease and thin ice were presented in Smedsrudand Skogseth [2006], and results from 2006 focusing on heatflux, frazil ice growth, and supercooling in (R. Skogseth etal., Observations of in-situ supercooled water in an Arcticpolynya, submitted to Journal of Glaciology, 2008). In thispaper, we present observations of the ocean response to anactive polynya, documenting rapid water transformation.Conditions during field experiments are described in section2. Results in section 3 describe wind and tidal influence onthe source water for BSW production in the polynya, as wellas areas for downflow, controlling mechanisms, and timescales on the downflow-overflow connection. Interannualvariability and effects of topography and eddies on downfloware discussed in section 4. A numerical experiment confirmsdownflow sites of BSW as well as the link and time delaybetween water transformation in the polynya, downflow andoverflow at the sill. We conclude our findings in section 5.
2. Experiments: Environmental Conditions andSampling
2.1. Storfjorden Polynya Overview
[7] Located on the eastern side of Svalbard, Storfjorden(Figure 1) is largely isolated from the heat transportedtoward the Arctic by the North Atlantic Current. The fjordis generally ice covered from December through June. Theprocesses taking place here are in many ways representativeof those in the Arctic shelf seas. Storfjorden has largeshallow areas where the temperature in winter is at thefreezing point over the entire water column, and further heatloss leads to ice production and brine release and increasethe bottom salinity. Variations in atmospheric forcing overthe polynya bring significant differences between wintersand their sea ice cover. An analytical polynya model[Skogseth et al., 2004] driven by atmospheric observationsand partially validated by remote sensing data, gives a meanwinter ice production between 1998 and 2001 of 40 km3
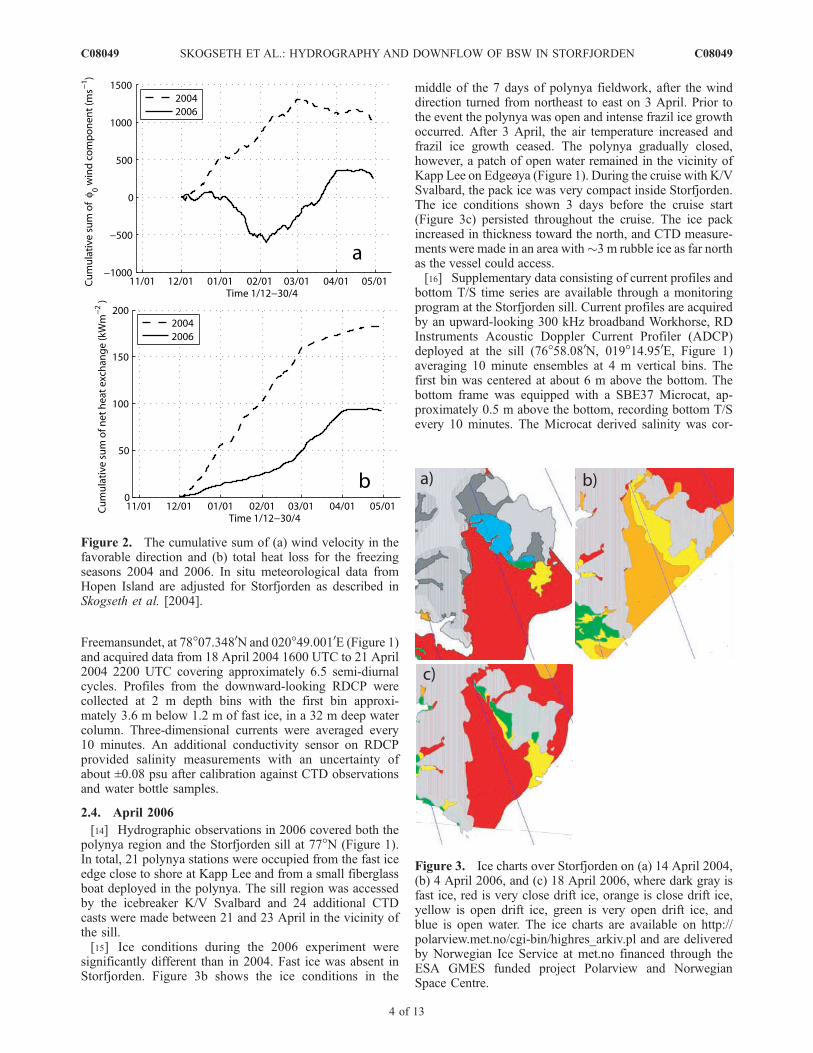
over a mean polynya area of 48 � 60 km2. Compared tothis, ice production in 2004 and 2006 was above (48.4 km3)and below (24.9 km3) the average, respectively.[8] This variability was caused by a more frequent wind
in direction favoring polynya opening (Figure 2a) and alarger net heat loss to the atmosphere (Figure 2b) in 2004compared to 2006. The main wind driven polynya activitydid not start until February in 2006, whereas the winterseason 2004 had an active polynya opening period fromDecember 2003 until March 2004. A steep rise in thecumulative sum of the wind component favorable for icetransport out of Storfjorden (80) in March 2006, combinedwith steep rise in the cumulative sum of net heat exchange,reflect the intense ice production and water mass transfor-mation observed this month. The heat loss to the atmo-sphere during the winter season 2006 is less than that in2004, owing to frequent (above normal) southerly windperiods bringing warm air over Svalbard. The dominance ofsoutherly winds is also seen by the wind component inFigure 2a showing a negative trend in the cumulative sumfrom the end of December until the beginning of February2006, a period with none or very little polynya activity.[9] March and April usually have comparable and signif-
icant total ice growth of 5–10 km3 [Skogseth et al., 2004],but the contribution from May is quite small. The polynyaarea (open water and thin ice) changes quickly through thewinter. Using a constant polynya length of 48 km, thepolynya width may increase with �80 km over a few daysdue to northerly winds [Smedsrud et al., 2006]. Conditionsduring our experiments in 2004 and 2006 were thus typicalcovering a large polynya and intense freezing, to a smalland closing one with nearly no freezing at all. Field experi-ments conducted in April 2004 and 2006 are describedseparately in the following.
2.2. Experimental Methods
[10] All CTD profiles (Figure 1) were obtained by aSeaBird Electronics SBE19 (unpumped) sonde. The sensorsuite was lowered and heaved at a speed in the range of0.3–1.0 m s�1, and the temperature (T) and conductivity(C) sensors were aligned in advance to pressure (P) accord-ing to the descent rate of each cast. The accuracy is0.14 dbar for P, 0.005�C for T and 0.0005 S m�1 for C.
C08049 SKOGSETH ET AL.: HYDROGRAPHY AND DOWNFLOW OF BSW IN STORFJORDEN
2 of 13
C08049

The CTD data are corrected against 15 and 11 watersamples taken in 2004 and 2006, respectively, from a 1.7liters Niskin bottle. The resulting uncertainty of the derivedsalinity is estimated to be 0.01. In order to avoid freezing ofthe sensors between stations, the CTD was kept in a heatedbox together with the Niskin bottle and the water samplebottles. The CTD sonde was first lowered to and maintainedat 5–10 m depth until the measurements stabilized, then itwas heaved to just below the surface ready for profiling.Both down- and up-casts were recorded.
2.3. April 2004
[11] Hydrographic observations were made close to KappLee in the Storfjorden polynya (Figure 1), between 16 and24 April 2004. In total, 15 CTD stations were occupiedfrom the fast ice edge along the polynya and through holesin the fast ice in Freemansundet accessed by a snowmobile.
[12] For the duration of the experiment, the Storfjordenpolynya consisted of mostly open water and some thin ice.Satellite inferred ice-chart shows the open water in Storf-jorden two days prior to the fieldwork (Figure 3a). Thewind, recorded on Hopen Island, was from the north andnortheast advecting the pack ice away from the fast ice innorthern Storfjorden and along the west coast of Edgeøya.This resulted in a confined polynya edge along the fast iceborder on the upwind end of the polynya, and a relativelydiffuse polynya border on the downwind end toward thepack ice. During the fieldwork period, the wind graduallyturned southeasterly, closing the polynya with growing thinice and pack ice, despite the increasing air temperature from�20�C toward 0�C.[13] The hydrographic observations were supplemented
by current measurements recorded by an Aanderaa Instru-ments Recording Doppler Current Profiler (RDCP). TheRDCP was deployed in the under-ice boundary layer in
Figure 1. Storfjorden surrounded by the islands Spitsbergen, Barentsya, and Edgeøya in the SvalbardArchipelago. Kapp Lee on Edgeøya is indicated, and the CTD stations are marked with blue (April 2004)and red (April 2006) dots and numbers. The dashed boxes on the large map indicate the borders of theclose-up maps. The meteorological station on Kapp Lee, the RDCP station in Freemansundet, and theADCP at the sill are indicated with a green star, a black star, and a red diamond, respectively. The depthcontours are in meters.
C08049 SKOGSETH ET AL.: HYDROGRAPHY AND DOWNFLOW OF BSW IN STORFJORDEN
3 of 13
C08049
Freemansundet, at 78�07.3480N and 020�49.0010E (Figure 1)and acquired data from 18 April 2004 1600 UTC to 21 April2004 2200 UTC covering approximately 6.5 semi-diurnalcycles. Profiles from the downward-looking RDCP werecollected at 2 m depth bins with the first bin approxi-mately 3.6 m below 1.2 m of fast ice, in a 32 m deep watercolumn. Three-dimensional currents were averaged every10 minutes. An additional conductivity sensor on RDCPprovided salinity measurements with an uncertainty ofabout ±0.08 psu after calibration against CTD observationsand water bottle samples.
2.4. April 2006
[14] Hydrographic observations in 2006 covered both thepolynya region and the Storfjorden sill at 77�N (Figure 1).In total, 21 polynya stations were occupied from the fast iceedge close to shore at Kapp Lee and from a small fiberglassboat deployed in the polynya. The sill region was accessedby the icebreaker K/V Svalbard and 24 additional CTDcasts were made between 21 and 23 April in the vicinity ofthe sill.[15] Ice conditions during the 2006 experiment were
significantly different than in 2004. Fast ice was absent inStorfjorden. Figure 3b shows the ice conditions in the
middle of the 7 days of polynya fieldwork, after the winddirection turned from northeast to east on 3 April. Prior tothe event the polynya was open and intense frazil ice growthoccurred. After 3 April, the air temperature increased andfrazil ice growth ceased. The polynya gradually closed,however, a patch of open water remained in the vicinity ofKapp Lee on Edgeøya (Figure 1). During the cruise with K/VSvalbard, the pack ice was very compact inside Storfjorden.The ice conditions shown 3 days before the cruise start(Figure 3c) persisted throughout the cruise. The ice packincreased in thickness toward the north, and CTD measure-ments were made in an area with�3 m rubble ice as far northas the vessel could access.[16] Supplementary data consisting of current profiles and
bottom T/S time series are available through a monitoringprogram at the Storfjorden sill. Current profiles are acquiredby an upward-looking 300 kHz broadband Workhorse, RDInstruments Acoustic Doppler Current Profiler (ADCP)deployed at the sill (76�58.080N, 019�14.950E, Figure 1)averaging 10 minute ensembles at 4 m vertical bins. Thefirst bin was centered at about 6 m above the bottom. Thebottom frame was equipped with a SBE37 Microcat, ap-proximately 0.5 m above the bottom, recording bottom T/Severy 10 minutes. The Microcat derived salinity was cor-
Figure 2. The cumulative sum of (a) wind velocity in thefavorable direction and (b) total heat loss for the freezingseasons 2004 and 2006. In situ meteorological data fromHopen Island are adjusted for Storfjorden as described inSkogseth et al. [2004].
Figure 3. Ice charts over Storfjorden on (a) 14 April 2004,(b) 4 April 2006, and (c) 18 April 2006, where dark gray isfast ice, red is very close drift ice, orange is close drift ice,yellow is open drift ice, green is very open drift ice, andblue is open water. The ice charts are available on http://polarview.met.no/cgi-bin/highres_arkiv.pl and are deliveredby Norwegian Ice Service at met.no financed through theESA GMES funded project Polarview and NorwegianSpace Centre.
C08049 SKOGSETH ET AL.: HYDROGRAPHY AND DOWNFLOW OF BSW IN STORFJORDEN
4 of 13
C08049

rected against available CTD casts collected at severaloccasions.
3. Results
3.1. Polynya
[17] Polynya waters are characterized by high-salinitydense water at freezing point temperature. A compositepotential temperature (q), salinity (S) diagram of all CTDdata collected during both field experiments exemplify thewinter-time water mass transformations in Storfjorden(Figure 4). Early into the experiment in April 2006,atmospheric conditions favored polynya activity, frazilice growth and brine release. During the first three days,the polynya water was supercooled with salinity reaching35.9. Following this event, the maximum salinity observed,S = 35.25, is about 0.6 higher than that in April 2004.Bottom-attached, polynya-origin water is detected in thecasts made in the vicinity of the Storfjorden sill in late April2006 (section 3.2). Diapycnal mixing lines can be recognizedin the qS diagram between polynya (or polynya origin) waterand relatively warmer, less saline ambient water, both in thepolynya area and at the sill, approximately 120 km down-stream (section 3.2).[18] Isopycnals derived from the section worked in 2004
along the fast ice edge, on the upwind side of the polynya,show evidence of dense water (sq ca. 27.86 kg m�3)downflow from the shallows (Figure 5). Denser polynyawater, observed in the deeper part of the section, is likelyconvected in a similar manner from the polynya, prior to theexperiment. Comparable downflow events are observed inApril 2006. Figure 6 shows the sections of isopycnalsobtained in the polynya, 4 days after the supercooling event.
Of the two sections worked from the shallows near KappLee toward the deeper basin (Figure 6, top and middle), thesection joining Stations 13–6 has the densest polynya water(sq = 28.32 kg m�3) spilling down the steep bathymetry.However, both sections show patches of polynya water,suggesting sluggish downflow in response to polynyaactivity. The doming of the isopycnals between Stations 8and 10 (Figure 6, middle) suggests an eddy-like feature. Thesection approximately along the 30-m isobath shows thedensification toward the polynya (Figure 6, bottom).[19] The shallow Storfjordbanken south of Edgeøya is
another candidate polynya site that could supply densewater into the basin. Figure 7 shows isopycnals along asection following the 60–80 m isobaths at the western flankof Storfjordbanken. Here near bottom density is about0.4 kg m�3 less than that in the polynya, and downflow ofdense water from the bank toward the deep trough is notdetected. Instead, a north-south density gradient is recordedacross the mouth of the fjord, with water in the basin beingdenser than that south of the sill. The sharpest density frontis located in the upper 30 m between Stations 37 and 36.
3.2. Sill
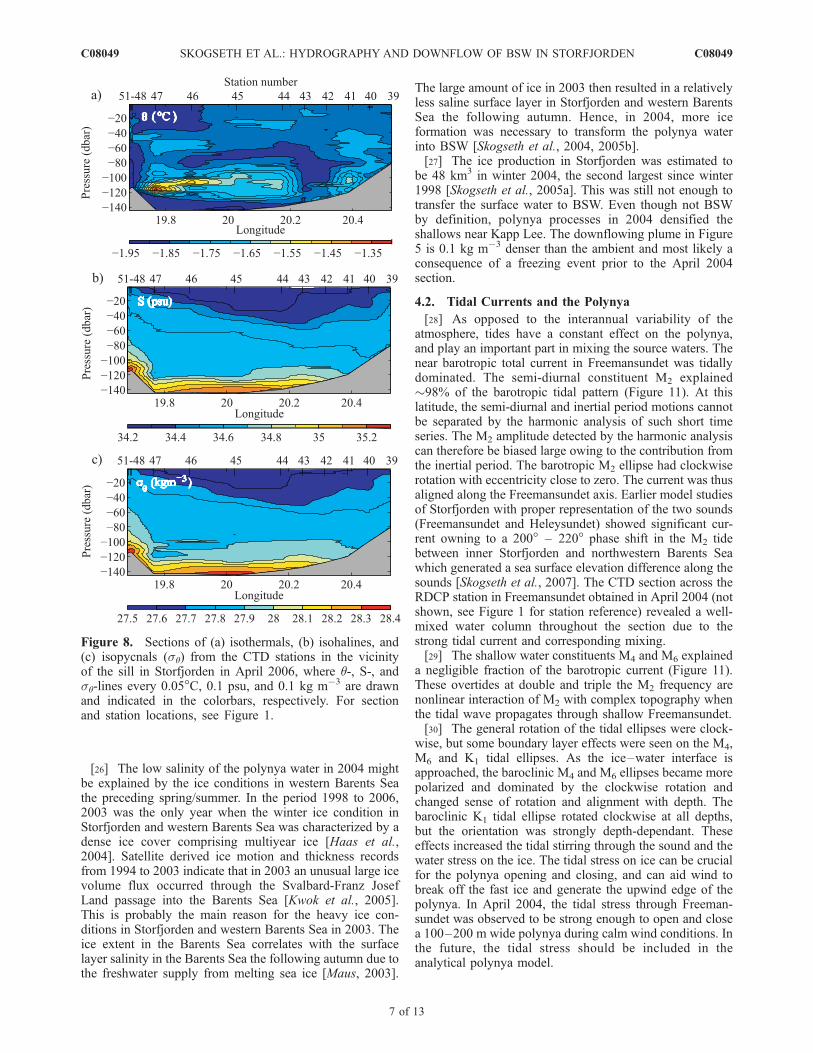
[20] The CTD section obtained in the vicinity of the sill inlate April 2006 shows a �30 m thick overflow of densewater between Stations 51 and 48 at the eastern part of thesill (Figure 8). Here the plume has salinity up to 35.2 andtemperature down to �1.95�C. An equally thick layer ofdense bottom-attached plume is present in the hollowsoutheast of the sill, between Stations 47 and 42. Hydro-graphic properties cover a wider range near the sill com-pared to the polynya. Additional isopycnal mixing lines andintrusive features can be seen between warmer ambientwater above the plume at the sill and cold Storfjorden waterin the basin (Figure 4).[21] Time series of current profiles at the sill (Figure 1)
together with the bottom temperature and salinity show asaline plume near freezing temperature flowing past themooring site (Figure 9). Bottom salinity gradually increasesthrough mid-March and mid-April. Cross-sill component ofthe velocity is bottom-enhanced, reaches 20 cm s�1 andoccasionally extends over 60 m from the bottom. Pulsing
Figure 4. Potential temperature and salinity plot of theCTD profiles in Storfjorden outside Kapp Lee in (blue)April 2004 and (red) March–April 2006, and (green) in thevicinity of the sill in April 2006. Density (sq) lines every0.2 kg m�3 are drawn, and the freezing point temperaturereferred to surface is indicated by the red stippled line.
Figure 5. Section of isopycnals (sq) from the CTDstations in Storfjorden outside Kapp Lee in April 2004.Contour interval is 0.02 kg m�3. For station locations, seeFigure 1.
C08049 SKOGSETH ET AL.: HYDROGRAPHY AND DOWNFLOW OF BSW IN STORFJORDEN
5 of 13
C08049

events associated with high bottom salinity are likely linkedto strong polynya activity and supercooling events.
3.3. Tides and Currents in Freemansundet
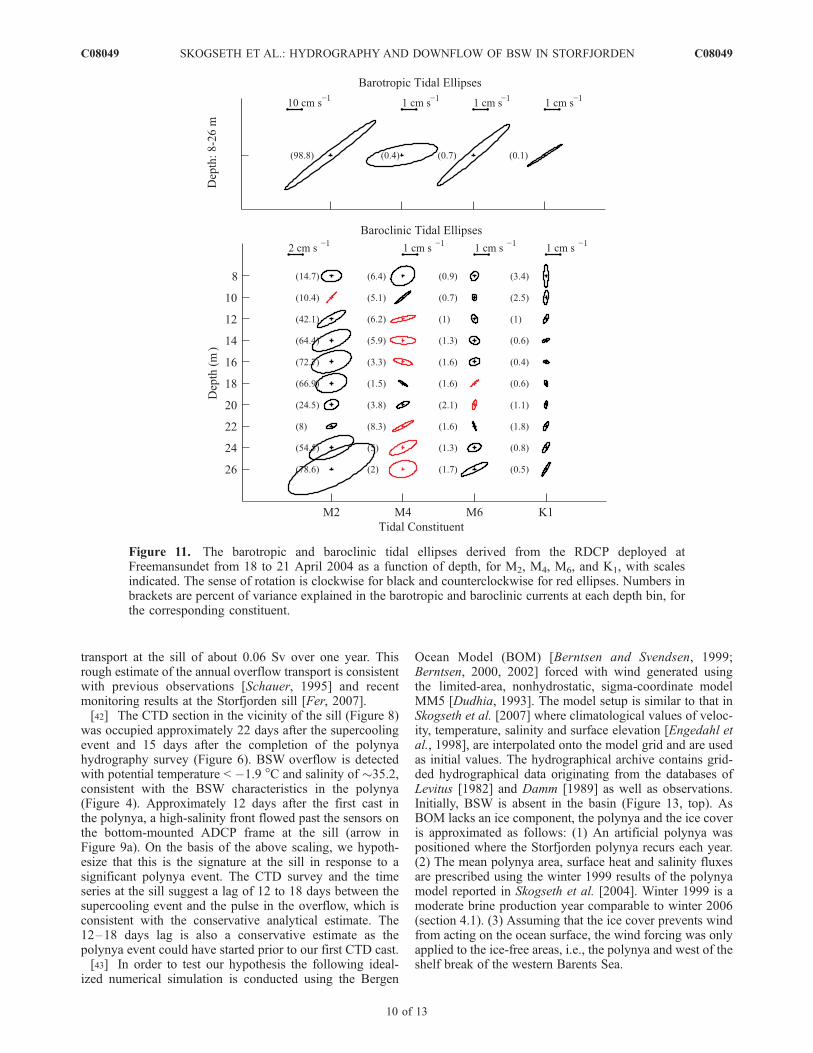
[22] The polynya is in close proximity to Freemansundet,characterized by strong currents and tides. This influencesthe polynya dynamics and water mass properties, throughboth mixing and advection. Time series of nearly full-depthcurrent profiles are analyzed with emphasize on tides andresidual currents. There is a nearly barotropic total currentthrough the sound with amplitude reaching 53 cm s�1. Thetidal ellipses for the most significant constituents, derivedusing the harmonic analysis of the barotropic and baroclinictime series [Pawlowicz et al., 2002] are shown in Figure 11.The dominant constituent is the semi-diurnal M2 withmaximum total (barotropic and baroclinic) amplitudes upto 47 cm s�1 at 26 m depth. The M2 tidal wave is nearlyrectilinear along the sound axis with marginal clockwiserotation. The higher tidal harmonics M4 and M6 are signif-icant with total amplitudes up to, respectively, 3.5 cm s�1
and 4.5 cm s�1 at 26 m depth. While the ellipse of the M6
tide behave like the M2 constituent, that of M4 is aligned ina more east-west direction (Figure 11). Furthermore, M4 isthe least unidirectional and the rotation of the baroclinicellipses become increasingly clockwise (counterclockwise)as the ice (bottom boundary) are approached.[23] Residual currents obtained by time averaging 25 h
low-passed horizontal velocity components are directed into
Storfjorden at all depths (Figure 12). The mean residualcurrent varies between 2.4 cm s�1 (at 20 m) and 1.5 cm s�1
(at 8 m), comparable to M4, M6, and K1 constituents. Themean residual current vectors rotate counterclockwise(clockwise) with depth above (below) about 18 m, suggest-ing boundary layers toward the ice-water interface and thebottom. The width of Freemansundet, at the current mea-surement site, is approximately 8 km with a mean depth ofabout 30 m. Using the depth averaged residual current of2.0 cm s�1, the net transport through the sound during themeasuring period is estimated to be 0.05 Sv, directed intoStorfjorden. This is comparable to the typical annual BSWproduction in Storfjorden polynya, and approximately halfthe annual overflow volume transport estimates at the sill.
4. Discussion
4.1. Interannual Variability
[24] Observations show large differences between April2004 and 2006 hydrography (Figure 4). In April 2004, thesalinity of the polynya water close to Kapp Lee was lessthan 34.7. This is by definition not BSW (S > 34.8 and T <�1.5 �C, [Schauer, 1995]). In April 2006, the maximumsalinity of the polynya water close to Kapp Lee was 35.9during frazil ice growth in supercooled water [Skogseth etal., 2007] and was 35.25 under atmospheric conditionscomparable to April 2004. The overflow salinity at the sillwas �35.2 in April 2006. Observations in Storfjordenreveal annual maximum BSW salinity of S = 35.20 ±0.26 (± one std) when averaged over 1981 to 2002 [Skogsethet al., 2005a, 2005b]. Compared to the averaged, brineproduction in 2004 is poor and that in 2006 is moderate.[25] The BSW production and its interannual variability
in the polynya have consequences for the overflow strengthand its variability at the sill (section 4.4). Mean profiles ofthe cross-sill velocity measured by the ADCP at the sill(Figure 10) show weaker overflow in April 2004 than thatin 2006. This is consistent with the observations in thepolynya, the inferred interannual variability and the strengthof the BSW production.
Figure 6. Sections of isopycnals (sq) from the CTDstations in Storfjorden outside Kapp Lee in April 2006.Contour interval is 0.02 kg m�3. For section and stationlocations, see Figure 1.
Figure 7. Section of isopycnals (sq) from the CTDstations off Storfjordbanken south of the sill in Storfjordenin April 2006. Contour interval is 0.02 kg m�3. For sectionand station locations, see Figure 1.
C08049 SKOGSETH ET AL.: HYDROGRAPHY AND DOWNFLOW OF BSW IN STORFJORDEN
6 of 13
C08049
[26] The low salinity of the polynya water in 2004 mightbe explained by the ice conditions in western Barents Seathe preceding spring/summer. In the period 1998 to 2006,2003 was the only year when the winter ice condition inStorfjorden and western Barents Sea was characterized by adense ice cover comprising multiyear ice [Haas et al.,2004]. Satellite derived ice motion and thickness recordsfrom 1994 to 2003 indicate that in 2003 an unusual large icevolume flux occurred through the Svalbard-Franz JosefLand passage into the Barents Sea [Kwok et al., 2005].This is probably the main reason for the heavy ice con-ditions in Storfjorden and western Barents Sea in 2003. Theice extent in the Barents Sea correlates with the surfacelayer salinity in the Barents Sea the following autumn due tothe freshwater supply from melting sea ice [Maus, 2003].
The large amount of ice in 2003 then resulted in a relativelyless saline surface layer in Storfjorden and western BarentsSea the following autumn. Hence, in 2004, more iceformation was necessary to transform the polynya waterinto BSW [Skogseth et al., 2004, 2005b].[27] The ice production in Storfjorden was estimated to
be 48 km3 in winter 2004, the second largest since winter1998 [Skogseth et al., 2005a]. This was still not enough totransfer the surface water to BSW. Even though not BSWby definition, polynya processes in 2004 densified theshallows near Kapp Lee. The downflowing plume in Figure5 is 0.1 kg m�3 denser than the ambient and most likely aconsequence of a freezing event prior to the April 2004section.
4.2. Tidal Currents and the Polynya
[28] As opposed to the interannual variability of theatmosphere, tides have a constant effect on the polynya,and play an important part in mixing the source waters. Thenear barotropic total current in Freemansundet was tidallydominated. The semi-diurnal constituent M2 explained�98% of the barotropic tidal pattern (Figure 11). At thislatitude, the semi-diurnal and inertial period motions cannotbe separated by the harmonic analysis of such short timeseries. The M2 amplitude detected by the harmonic analysiscan therefore be biased large owing to the contribution fromthe inertial period. The barotropic M2 ellipse had clockwiserotation with eccentricity close to zero. The current was thusaligned along the Freemansundet axis. Earlier model studiesof Storfjorden with proper representation of the two sounds(Freemansundet and Heleysundet) showed significant cur-rent owning to a 200� – 220� phase shift in the M2 tidebetween inner Storfjorden and northwestern Barents Seawhich generated a sea surface elevation difference along thesounds [Skogseth et al., 2007]. The CTD section across theRDCP station in Freemansundet obtained in April 2004 (notshown, see Figure 1 for station reference) revealed a well-mixed water column throughout the section due to thestrong tidal current and corresponding mixing.[29] The shallow water constituents M4 and M6 explained
a negligible fraction of the barotropic current (Figure 11).These overtides at double and triple the M2 frequency arenonlinear interaction of M2 with complex topography whenthe tidal wave propagates through shallow Freemansundet.[30] The general rotation of the tidal ellipses were clock-
wise, but some boundary layer effects were seen on the M4,M6 and K1 tidal ellipses. As the ice–water interface isapproached, the baroclinic M4 and M6 ellipses became morepolarized and dominated by the clockwise rotation andchanged sense of rotation and alignment with depth. Thebaroclinic K1 tidal ellipse rotated clockwise at all depths,but the orientation was strongly depth-dependant. Theseeffects increased the tidal stirring through the sound and thewater stress on the ice. The tidal stress on ice can be crucialfor the polynya opening and closing, and can aid wind tobreak off the fast ice and generate the upwind edge of thepolynya. In April 2004, the tidal stress through Freeman-sundet was observed to be strong enough to open and closea 100–200 m wide polynya during calm wind conditions. Inthe future, the tidal stress should be included in theanalytical polynya model.
Figure 8. Sections of (a) isothermals, (b) isohalines, and(c) isopycnals (sq) from the CTD stations in the vicinityof the sill in Storfjorden in April 2006, where q-, S-, andsq-lines every 0.05�C, 0.1 psu, and 0.1 kg m�3 are drawnand indicated in the colorbars, respectively. For sectionand station locations, see Figure 1.
C08049 SKOGSETH ET AL.: HYDROGRAPHY AND DOWNFLOW OF BSW IN STORFJORDEN
7 of 13
C08049

[31] The residual current (tidal oscillations removed)showed a net transport into Storfjorden through Freeman-sundet (Figure 12). The residual current veers to the righttoward the ice-water interface and the bottom consistentwith the boundary layer effects on the baroclinic M4, M6
and K1 ellipses (Figure 11). Hence the turning of theresidual current with depth probably was a nonlinear effectdue to the bathymetry and the jet-like tidal current throughthe sound.[32] The RDCP measured relatively higher salinity and
lower temperature when the total current was directedinto northwestern Barents Sea, than when directed intoStorfjorden (not shown). Saltier and colder water in innerStorfjorden is likely caused by the polynya and accompa-nying large heat fluxes, effective frazil ice growth and brinerelease. The increasing trend in temperature and a slightlydecreasing trend in salinity time series (not shown) reflectsthe direction of the mean residual current, transporting lesssaline and warmer water from the east. The water masstransformation in Storfjorden thus involves partly theinflowing water above the sill in the south and that throughFreemansundet.
4.3. Effects of Topography
[33] During winter, the downflow of BSW from theshallow nearshore areas gradually fills Storfjorden to thesill level [Skogseth et al., 2005a, 2005b]. Noticeably, 55%of the Storfjorden area is shallower than 70 m, and 16% ofthe area is deeper than the sill depth and occupies only 5%of the total volume [Skogseth et al., 2005b]. Although thepolynya length (normal to the coast line) is of order 50 kmon the average, the densification due to brine production islimited to the shallows with significantly less horizontalextend. Isopycnals for years 2004 and 2006 suggest a lengthscale of order 5 km where a large fraction of the watercolumn is densified and a lateral density gradient is estab-lished between the shallows and the adjacent water. It is thislateral density gradient that drives the downflow and flush-ing of the polynya waters. The effective discharge from thepolynya and total volume transport of BSW from theshallows are the sum of flushing events of such length scaleover about 50–60 km width (polynya width) along thecoast.[34] The mechanisms involved in dense water cascades
off the continental shelf, including initiation and develop-ment stages of downflow, were described in Shapiro et al.[2003]. In the Storfjorden polynya, although the polynya
Figure 9. Time series derived from the bottom-mounted ADCP and Microcat deployed at theStorfjorden sill (Figure 1). (a) Ten-minute sampled bottom (black) temperature and (red) salinity. Verticaldashed lines mark the time of the first and the last CTD cast when supercooling was observed. The arrowmarks the time of passage of the first high-salinity front after the supercooling event. (b) Cross-sillcomponent of the velocity recorded at the bottommost depth bin, 6-m height above bottom (hab).(c) Time-hab map of cross-sill component of velocity. Ten-minute current profiles are hourly averagedand 15-day low-pass filtered. White portions are times with poor data quality after screening, largely dueto lack of scatters. Noisy features away from the bottom are portions of data not sufficiently long enoughfor 15-day filtering.
C08049 SKOGSETH ET AL.: HYDROGRAPHY AND DOWNFLOW OF BSW IN STORFJORDEN
8 of 13
C08049

spans isobaths down to 100 m, the ice production and brinerejection are not homogenous, and densification is favoredin shallows. The lateral density contrast is either controlledby the ratio of the cumulative ice production in the shallowsto that in deeper portions of the polynya, or if this ratio isclose to unity, by the relative difference of the depth of theshallows and the halocline [Shapiro et al., 2003].[35] In the absence of along-slope gradients and lateral
diffusion, and assuming steady state with negligible cross-slope advection in the bottom boundary layer, Shapiro et al.[2003] suggest RH = (Drag)/rLf 2 < 1 for the existence ofa steady-state boundary layer solution, and RH > 1 foraccelerating events. Here Dr is the density differenceover the lateral distance L, and a is the bottom slope. In2006 from Figure 6 (middle), we estimate RH > 1 usingDr = 0.08 kg m�3 over 0.8 km and a bottom slope of about25 m per 0.8 km, suggesting an accelerating downslopeevent. In 2004 from Figure 5, we estimate RH < 1 usingDr = 0.06 kg m�3 over 2 km and a bottom slope of about30 m per 2 km.[36] Figures 1 and 6 show that BSW flowed along a
channel toward deeper basins (Section 20-26), but thatdownflow with denser BSW occurred at steeper bathymetry(Section 13-6). Through the depth-contour-following sec-tion (Section 20-13), the densest BSW was detected atStation 16 (78�04.40N, 020�36.30E), indicating favorablebathymetry for downflow at this site. The distance betweenthe CTD stations in the sections are �0.5–1 km. Clearly,high-resolution hydrographical sampling and bathymetricmaps are needed to resolve and predict the BSW downflowin areas with such complex bathymetry as Storfjorden.Bathymetric data of Storfjorden with a resolution of0.5 km � 0.5 km [Skogseth et al., 2005b] should be usedin future model studies.
4.4. Downflow–Overflow Link
[37] The polynya activity over shallow areas effectivelyfills the volume below the sill level with BSW. Skogseth etal. [2005a] infer a typical annual BSW production of aboutVBSW = 1012 m3 in the years 1998–2002, i.e., 0.06 Sv over afreezing period of 180 days. Here we show that the BSWinterface reached the sill level in about 25 days, which wasat the time of the experiment in April 2006. Subsequentevents with accompanying downflow that reach the inter-face will propagate to the sill in 1 to 3 days.[38] The effective polynya volume is VP = hLW = 7.5 �
109 m3, using a mean polynya depth h = 30 m, length L =5 km and width W = 50 km. During one freezing period, thepolynya flushes VBSW/VP � 130 times over a typicalfreezing period of 180 days. The buoyancy forcing due tofreezing between the polynya flushing events sets thedensity anomaly that triggers the subsequent flushing andits time scale t = L/
ffiffiffiffiffiffiffig0h
p[Fer et al., 2002], i.e., 7 hours for
a typical densification of Dr = 0.15 kg m�3. Over 130flushing events, this amounts to 20% of the freezing period.[39] In the initial stage of the downflow, before the
rotational control is established, the steady state downslopespeed of a plume with thickness hp is u =
ffiffiffiffiffiffiffiffiffiffiffiffiffiffiffiffiffiffiffiffiffiffiffiffiffiffiffiffiffiffig0hp sina=CDð Þ
p
[Fer et al., 2002]. Using a typical range for the dragcoefficient (CD = 2–5 � 10�3), Dr = 0.15 kg m�3, hp =10 m and a bottom slope of 2–5 � 10�3, u is in the range of10–20 cm s�1. Within 12 hours until rotational control isachieved, the plume will sink from the mean polynyadepth to the 38–75 m isobath. Consequently, the rotation-ally controlled plume moving along the slope with speedVNof = g0a/f = 0.03–0.05 m s�1 [Nof, 1983; Walin, 2004]will gently cross the isobaths due to friction. The descentrate is roughly 1/400 [Killworth, 2001], corresponding toan alongpath distance of 46–60 km, for the 115–152 mvertical descent to the 190 m deep basin. This translationwill be covered within 11–23 days.[40] A conservative estimate of the filling-time for the
Storfjorden basin can be obtained using the shortest path(46 km) and VNof = 0.05 m s�1. The volume below the sill is54 � 109 m3. In the absence of entrainment, the polynyaneeds to flush the shallows 7 times (54 � 109/7.5 � 109) tofill this volume. The BSW plume will increase in volumedue to entrainment along the path. Using Dr = 0.1 kg m�3
and thickness of about 15 m (i.e., allowed some dilution andincrease in thickness due to entrainment), a very crudeestimate of the Froude number (Fr = 0.25) will yield anentrainment coefficient of about E = 6 � 10�5 [Fernando,1991]. This will roughly double the plume volume over the11 days it takes to reach the deep basin, i.e., 4 times flushingwill suffice to account for the volume below the sill. Actingover the mean polynya width of 50 km, the total meanvolume flux (BSW plus the entrainment) yields a fillingtime of 14 days. We can then estimate about 25 days(downflow time plus the filling time) from the start of thefreezing period to the start of weak overflow at the sill. Asignificant polynya event will then cause a pulse which willpropagate as an interfacial wave and reach the sill in one tothree days.[41] Note that each of the 130 polynya flushing events
carried an approximate volume of 1.4 � 1010 m3 afterentrainment when it reached the deep basin. Removing 4events needed to fill the basin, this yields a total volume
Figure 10. Profiles of the cross-sill component of thevelocity measured at the Storfjorden sill. Profiles areaverages for (black) April 2004 and (red) April 2006.
C08049 SKOGSETH ET AL.: HYDROGRAPHY AND DOWNFLOW OF BSW IN STORFJORDEN
9 of 13
C08049
transport at the sill of about 0.06 Sv over one year. Thisrough estimate of the annual overflow transport is consistentwith previous observations [Schauer, 1995] and recentmonitoring results at the Storfjorden sill [Fer, 2007].[42] The CTD section in the vicinity of the sill (Figure 8)
was occupied approximately 22 days after the supercoolingevent and 15 days after the completion of the polynyahydrography survey (Figure 6). BSW overflow is detectedwith potential temperature < �1.9 �C and salinity of �35.2,consistent with the BSW characteristics in the polynya(Figure 4). Approximately 12 days after the first cast inthe polynya, a high-salinity front flowed past the sensors onthe bottom-mounted ADCP frame at the sill (arrow inFigure 9a). On the basis of the above scaling, we hypoth-esize that this is the signature at the sill in response to asignificant polynya event. The CTD survey and the timeseries at the sill suggest a lag of 12 to 18 days between thesupercooling event and the pulse in the overflow, which isconsistent with the conservative analytical estimate. The12–18 days lag is also a conservative estimate as thepolynya event could have started prior to our first CTD cast.[43] In order to test our hypothesis the following ideal-
ized numerical simulation is conducted using the Bergen
Ocean Model (BOM) [Berntsen and Svendsen, 1999;Berntsen, 2000, 2002] forced with wind generated usingthe limited-area, nonhydrostatic, sigma-coordinate modelMM5 [Dudhia, 1993]. The model setup is similar to that inSkogseth et al. [2007] where climatological values of veloc-ity, temperature, salinity and surface elevation [Engedahl etal., 1998], are interpolated onto the model grid and are usedas initial values. The hydrographical archive contains grid-ded hydrographical data originating from the databases ofLevitus [1982] and Damm [1989] as well as observations.Initially, BSW is absent in the basin (Figure 13, top). AsBOM lacks an ice component, the polynya and the ice coveris approximated as follows: (1) An artificial polynya waspositioned where the Storfjorden polynya recurs each year.(2) The mean polynya area, surface heat and salinity fluxesare prescribed using the winter 1999 results of the polynyamodel reported in Skogseth et al. [2004]. Winter 1999 is amoderate brine production year comparable to winter 2006(section 4.1). (3) Assuming that the ice cover prevents windfrom acting on the ocean surface, the wind forcing was onlyapplied to the ice-free areas, i.e., the polynya and west of theshelf break of the western Barents Sea.
Figure 11. The barotropic and baroclinic tidal ellipses derived from the RDCP deployed atFreemansundet from 18 to 21 April 2004 as a function of depth, for M2, M4, M6, and K1, with scalesindicated. The sense of rotation is clockwise for black and counterclockwise for red ellipses. Numbers inbrackets are percent of variance explained in the barotropic and baroclinic currents at each depth bin, forthe corresponding constituent.
C08049 SKOGSETH ET AL.: HYDROGRAPHY AND DOWNFLOW OF BSW IN STORFJORDEN
10 of 13
C08049

[44] Modeled downflow of dense polynya water startedon Day 8 as a tongue of dense water at about 77.5�N and20.5�E (64 km southwest of Station 16) underneath thedesignated polynya area (dark red color in Figure 13).Downflow was weaker in the observation site close to KappLee. The BSW downflow continued, concentrated at thesesites, growing broader and thicker, and eventually filled thebasin to the sill level by Day 29, initiating an overflow(Figure 13, middle). The signature of the dense BSWproduced in the polynya thus arrives in about 20 days tothe sill. This is comparable to the estimate from theobservations and the analytical analysis. The BSW produc-tion at the polynya exceeds the volume flux of the denseoverflow at the sill, which is possibly constrained byrotational effects, by Day 56, Storfjorden was filled to thesubmarine ridge level at 80 m depth (at about 77.25�N and18.5�E, see Figure 1 for location) and spilled across theridge.
4.5. Overflow Plume Width in Winter
[45] Two moorings situated �40 km downstream of thesill indicated an overflow width less than 15 km in 1992 and1994 [Schauer, 1995; Schauer and Fahrbach, 1999]. Exist-ing transport estimates of the overflow were therefore madeusing a typical plume width of 15 km. Observationsreported here suggest that this can be an underestimate inwinter. The CTD section in Figure 8 shows a BSW plumewith �30 m thickness at the eastern edge of the sill(Station 48). Under rotational control, the plume leanstoward the west wall of the sill looking downstream, hencewe conclude that the overflow most likely occurred acrossthe entire sill width of �40 km. CTD sections at the sill insummer and autumn from 1999 to 2002 have revealedoverflow of BSW remnants with a width of 15–20 kmfrom the western edge of the sill [Skogseth et al., 2005b;
Fer et al., 2004b]. Assuming that the overflow is indepen-dent of the tidal cycle, our observations indicate that theoverflow cross-section at the sill is larger in the freezingperiod than in summer and autumn.
4.6. Effects of Eddies
[46] The rise in the isopycnals observed between Stations 8and 10 (Figure 6, middle) is connected with the ongoing brinerelease and downflow, and it has the structure of a small eddy.
Figure 12. Mean residual current vectors in Freemansun-det estimated from the RDCP data from 18 to 21 April 2004at 2-m interval between 8.2- and 26.2-m depths. Numbersindicated close to the arrowheads are the respective depthsin meters. Tides are filtered.
Figure 13. Modeled isopycnals (sq) along the bottomfrom the BOM simulation forced with salt and heat fluxrepresenting the approximate effects of the Storfjordenpolynya in winter 1998/1999 after 8, 29, and 56 days ofsimulation. Isopycnals are drawn at 0.1 kg m�3 intervals.
C08049 SKOGSETH ET AL.: HYDROGRAPHY AND DOWNFLOW OF BSW IN STORFJORDEN
11 of 13
C08049

The dome covers about 60% of the 30 m water column andappears nearly uniform in density between 5 and 25 m. Thedome might be caused by processes including topographi-cally enhanced tidal currents, eddies caused by the conser-vation of potential energy over steep topography, eddiestriggered by instabilities along the polynya front, convergingtopographically steered currents, and spatial variability inwind stress. Numerical model [Gawarkiewicz and Chapman,1995] and laboratory studies [Cenedese et al., 2004] indicatethat eddy activity at the density front controls the downflowof dense water from the shallow shelves. Observations fromdensely spaced moorings in the St. Lawrence polynya havenot detected eddies that might lead to such cross-shelfexchange [Danielson et al., 2006]. Albeit inconclusive dueto undersampling and lack of current measurements, presentobservations of downflow of newly formed BSW fromthe shallow polynya area, following a supercooling event,indicate that the downflow was connected to a doming inthe pycnocline in the vicinity of the steepest topography(Figure 6), which might indicate eddy activity along thepolynya edge.
4.7. Storfjordbanken as a Site for BSW Productionand Downflow
[47] The shallow Storfjordbanken on the eastern slope ofthe fjord (Figure 1) is a potential candidate for BSWproduction and polynya activity, but observations arescarce. The CTD section off Storfjordbanken east of thesill (Figure 7) indicates no downflow of BSW from theshallow bank area south of the sill toward Storfjordrenna.CTD sections obtained in March 2003 from R.V. Polarsternalso lack BSW downflow in this area [Fer et al., 2004a].The only indication of BSW downflow from the shallowareas was found in the northernmost sections closest to thewest coast of Edgeøya. The most likely explanation is thatthe polynya activity is most frequent with longer durationalong the west coast of Edgeøya than around Tusenyane onStorfjordbanken south of Edgeøya. This is also consistentwith the results on persistent polynya areas during thewinter of 2000 [Smedsrud et al., 2006]. Earlier modelstudies revealed topographically enhanced tidal currents inan anticyclonic sense on Storfjordbanken [Skogseth et al.,2007], which might confine the dense water on the shallowbank.[48] The idealized model results also suggest that the
shallow polynya area south of Edgeøya near Storfjord-banken is not effective in BSW downflow despite the iceproduction (Figure 13). The topography guides the densewater effectively northward along the slope, consistent withlack of BSW downflow signature off Storfjordbanken inthis study (Figure 7) and for March 2003 [Fer et al., 2004a].Our model results thus complement the scarce data and weconclude that Storfjordenbanken is not an effective BSWdownflow site. The produced BSW is topographicallyconfined to the bank and advected into Storfjorden forfurther densification.
5. Summary and Conclusions
[49] During two field experiments in April 2004 and2006, hydrographical and current data were collected inthe active Storfjorden polynya. Production and downflow of
BSW from shallow areas to the deeper basin inside Storf-jorden is documented.[50] During period of strong heat loss and intense frazil
ice growth in the Storfjorden polynya in April 2006, theBSW salinity exceeded 35.3. The shallow nearshore areas inStorfjorden are effective and important brine productionsites, and are able to increase density locally by as much as0.5 kg m�3. Major portions of the BSW in April 2006 had asalinity of �35.1, comparable to earlier observations, andwas �0.15 kg m�3 denser than the local surface water.[51] Despite the large ice production in winter 2004
(twice that in 2006), and comparable densification of0.15 kg m�3, the BSW salinity was less than 34.8. This is aconsequence of relatively fresh source water. Anomalouslyfresh surface water existed in the western Barents Sea inspring and summer 2003, consistent with heavy ice condi-tions the previous winter.[52] Strong tides, offshore wind and currents keep the
polynya on the eastern shores of Storfjorden frequentlyopen, in contrast with the deeper areas of the fjord. TheBSW downflow close to Edgeøya was most significantwhere the bathymetry was steepest, confirming both theidealized numerical model study and analytical estimates ofsuch downflow. The model results suggest the strongestdownflow to be directly west of Edgeøya at 77�300N, whichis suggested here as a key area for monitoring the down-flow. Downflow of BSW from the shallow Storfjordbankenwas absent both in observations and the model results.[53] Inferred from observations, winter-time extent of the
BSW overflow plume covers the entire sill of about 40 km.This is much greater than 15 km which is typically used intransport calculations. Current, salinity, and temperaturedata in the core of the overflow at the sill indicate a timelag of 12–18 days from the observed maximum salinity anddownflow in the polynya area to overflow with similarcharacteristics at the sill. This downflow–overflow link isconfirmed by an idealized numerical model and theoreticalcalculations.[54] The BSW downflow is guided by the complex
bathymetry in Storfjorden. High-resolution hydrographicaldata are needed to capture the downflow, and model studieshave to implement fine-grid bathymetric data with resolu-tion of 0.5–1 km to properly resolve such flow. One of oursections inside the polynya indicates an eddy like feature of2 km width. Such eddies and instabilities in the polynyamay be an important signature of cascading and downflow.[55] Freemansundet influences the polynya dynamics.
Here strong currents up to 53 cm s�1 are dominated bythe M2 tidal wave. Shallow water tides (M4 and M6) areobserved and reflects the nonlinear interaction of M2 whenthe tidal wave propagates through the shallow sound. Thepresence of an ice cover and the shallow depth in Free-mansundet introduces boundary effects, whereby the resid-ual current veers to the right toward the upper (ice) andlower (bottom) boundaries. In April 2004 a net transport of0.05 Sv less saline and warmer water into Storfjorden fromthe northwestern Barents Sea was measured, probablycontrolled by the wind direction and corresponding Ekmantransport. The complex tidal pattern mixes such sourcewater effectively.[56] Storfjorden is one of the important BSW production
sites in the Arctic. In the same way as for other polynyas of
C08049 SKOGSETH ET AL.: HYDROGRAPHY AND DOWNFLOW OF BSW IN STORFJORDEN
12 of 13
C08049

the Arctic, the Storfjorden polynya release salt effectively,and makes the underlying water denser than the sourcewater in the range 0.15–0.5 kg m�3, depending on atmo-spheric forcing. Subsequent downflow depends on thisdensity increase and topography. The density and volumeof the final overflow reaching the deep ocean are thus alsodependant and sensitive to the source water.
[57] Acknowledgments. This work was conducted as a part of thePolar Ocean Climate Processes project (PROCLIM) funded by the Norwe-gian Research Council, through Grant 155923/7, and the IPY projectBipolar Atlantic Thermohaline Circulation (BIAC) through Grant176082/S30. Monitoring effort at the sill received funding through theDamocles project, financed by the European Union in the 6th FrameworkProgramme for Research and Development.
ReferencesAagaard, K., L. K. Coachman, and E. Carmack (1981), On the halocline ofthe Arctic Ocean, Deep-Sea Res., Part A, 28, 529–545.
Anderson, L. G., E. P. Jones, R. Lindegren, B. Rudels, and P.-I. Sehlstedt(1988), Nutrient regeneration in cold, high salinity bottom water of theArctic shelves, Cont. Shelf Res., 8, 1345–1355.
Berntsen, J. (2000), Users guide for a modesplit s-coordinate numericalocean model version 1.0. Report 135, Department of Applied Mathe-matics, Univ. of Bergen, Bergen, Norway.
Berntsen, J. (2002), Internal pressure errors in sigma-coordinate oceanmodels, J. Atmos. Oceanic Technol., 19, 1403–1414.
Berntsen, J., and E. Svendsen (1999), Using the Skagex dataset for evalua-tion of ocean model skills, J. Mar. Syst., 18, 313–331.
Cavalieri, D. J., and S. Martin (1994), The contribution of Alaskan, Siber-ian, and Canadian coastal polynyas to the cold halocline layer of theArctic Ocean, J. Geophys. Res., 99, 18,343–18,362.
Cenedese, C., J. Marshall, and J. A. Whitehead (2004), A laboratory modelof thermocline depth and exchange fluxes across circumpolar fronts,J. Phys. Oceanogr., 34, 656–667.
Damm, P. (1989), Klimatologischer Atlas des Salzgehaltes, der Temperaturund der Dichte in der Nordsee, 1968–1985, Tech. Rep. 89-6, Institut furMeereskunde, Hamburg.
Danielson, S., K. Aagaard, T. Weingartner, S. Marin, P. Winsor, andG. Gawarkiewicz (2006), The St. Lawrence polynya and the Bering shelfcirculation: New observations and a model comparison, J. Geophys. Res.,111, C09023, doi:10.1029/2005JC003268.
Drucker, R., S. Martin, and R. Moritz (2003), Observations of ice thicknessand frazil ice in the St. Lawrence Island polynya from satellite imagery,upward looking sonar, and salinity/temperature moorings, J. Geophys.Res., 108(C5), 3149, doi:10.1029/2001JC001213.
Dudhia, J. (1993), A nonhydrostatic version of the Penn State/NCARmesoscale model: Validation tests and simulation of an Atlantic cycloneand cold front, Mon. Weather Rev., 121, 1493–1513.
Engedahl, H., B. Adlandsvik, and E. Martinsen (1998), Production ofmonthly mean climatological archives for the Nordic Seas, J. Mar. Syst.,14, 1–26.
Fer, I. (2006), Scaling turbulent dissipation in an Arctic fjord, Deep-SeaRes., Part II, 53, 77–95.
Fer, I. (2007), Current measurements at the Storfjorden sill, 2004–2006,Tech. Rep. 1, Reports in Meteorology and Oceanography, GeophysicalInstitute, University of Bergen, Bergen, Norway.
Fer, I., U. Lemmin, and S. A. Thorpe (2002), Winter cascading of coldwater in Lake Geneva, J. Geophys. Res., 107(C6), 3060, doi:10.1029/2001JC000828.
Fer, I., R. Skogseth, P. M. Haugan, and P. Jaccard (2003), Observations ofthe Storfjorden overflow, Deep-Sea Res., Part I, 50, 1283–1303.
Fer, I., I. Harms, T. Martin, S. Pisarev, B. Rudels, U. Schauer, andA. Sirevaag (2004a), Water masses and circulation: Shelf convection inthe western Barents Sea and Atlantic water north of Svalbard, in TheExpedition ARKTIS XIX/1 a, b and XIX/2 of the Research Vessel‘‘POLARSTERN’’ in 2003, Berichte zur Polar- und Meeresforschung,vol. 481, edited by U. Schauer and G. Kattner, chap. 5, pp. 72–87,Alfred-Wegener-Institut fur Polar- und Meeresforschung, Bremerhaven,Bundesrepublik Deutschland.
Fer, I., R. Skogseth, and P. M. Haugan (2004b), Mixing of the Storfjorden(Svalbard Archipelago) overflow inferred from density overturns, J. Geo-phys. Res., 109, C01005, doi:10.1029/2003JC001968.
Fernando, H. J. S. (1991), Turbulent mixing in stratified flows, Annu. Rev.Fluid Mech., 23, 455–493.
Gawarkiewicz, G., and D. C. Chapman (1995), A numerical study of densewater formation and transport on a shallow, sloping continental shelf,J. Geophys. Res., 100, 4489–4508.
Haarpaintner, J., J. C. Gascard, and P. M. Haugan (2001), Ice productionand brine formation in Storfjorden, Svalbard, J. Geophys. Res., 106,14,001–14,013.
Haas, C., J. Lieser, J. Lobach, T. Martin, A. Pfaffling, S. Willmes,V. Alexandrov, and S. Kern (2004), Sea ice physics, in The ExpeditionARKTIS XIX/1 a, b and XIX/2 of the Research Vessel ‘‘POLARSTERN’’in 2003, Berichte zur Polar- und Meeresforschung, vol. 481, edited byU. Schauer and G. Kattner, chap. 3, pp. 13–46, Alfred-Wegener-Institutfur Polar- und Meeresforschung, Bremerhaven, BundesrepublikDeutschland.
Killworth, P. D. (2001), On the rate of descent of overflows, J. Geophys.Res., 106, 22,267–22,275.
Kwok, R., W. Maslowski, and S. W. Laxon (2005), On large outflows ofArctic sea ice into the Barents Sea, Geophys. Res. Lett., 32, L22503,doi:10.1029/2005GL024485.
Levitus, S. (1982), Climatological atlas of the world ocean, NOAA Prof.Pap., 13, 1–173.
Maus, S. (2003), Interannual variability of dense shelf water salinities in thenorth-western Barents Sea, Polar Res., 22, 59–66.
Nof, D. (1983), The translation of isolated cold eddies along a slopingbottom, Deep-Sea Res., 30, 171–182.
Pawlowicz, R., B. Beardsley, and S. Lentz (2002), Classical tidal harmonicanalysis including error estimates in MATLAB using T_TIDE, Comput.Geosci., 28, 929–937.
Quadfasel, D., B. Rudels, and K. Kurz (1988), Outflow of dense water froma Svalbard fjord into the Fram Strait, Deep-Sea Res., 35, 1143–1150.
Rudels, B., and D. Quadfasel (1991), Convection and deep water formationin the Arctic Ocean–Greenland Sea system, J. Mar. Syst., 2, 435–450.
Schauer, U. (1995), The release of brine-enriched shelf water from Storfjordinto the Norwegian Sea, J. Geophys. Res., 100, 16,015–16,028.
Schauer, U., and E. Fahrbach (1999), A dense bottom water plume in thewestern Barents Sea: Downstream modification and interannual variabil-ity, Deep-Sea Res., Part I, 46, 2095–2108.
Shapiro, G. I., J. M. Huthnance, and V. V. Ivanov (2003), Dense watercascading off the continental shelf, J. Geophys. Res., 108(C12), 3390,doi:10.1029/2002JC001610.
Shcherbina, A. Y., L. D. Talley, and D. L. Rudnick (2004), Dense waterformation on the northwestern shelf of the Okhotsk Sea: 1. Directobservations of brine rejection, J. Geophys. Res., 109, C09S08,doi:10.1029/2003JC002196.
Skogseth, R., P. M. Haugan, and J. Haarpaintner (2004), Ice and brineproduction in Storfjorden from four winters of satellite and in situobservations and modeling, J. Geophys. Res., 109, C10008,doi:10.1029/2004JC002384.
Skogseth, R., I. Fer, and P. M. Haugan (2005a), Dense-water productionand overflow from an Arctic coastal polynya in Storfjorden, in TheNordic Seas: An Integrated Perspective, Geophys. Monogr. Ser., vol.158, pp. 73–88, AGU, Washington, D. C.
Skogseth, R., P. M. Haugan, and M. Jakobsson (2005b), Watermass trans-formations in Storfjorden, Cont. Shelf Res., 25, 667–695.
Skogseth, R., A. L. Sandvik, and L. Asplin (2007), Wind and tidal forcingon the meso-scale circulation in Storfjorden, Svalbard, Cont. Shelf Res.,27, 208–227, doi:10.1016/j.csr.2006.10.001.
Smedsrud, L. H., and R. Skogseth (2006), Field measurements of Arcticgrease ice properties and processes, Cold Reg. Sci. Technol., 44, 171–183.
Smedsrud, L. H., W. P. Budgell, A. D. Jenkins, and B. Adlandsvik (2006),Fine scale sea ice modelling of the Storfjorden polynya, Ann. Glaciol.,44, 73–79.
Walin, A. K. (2004), Topographic advection of dense bottom water, J. FluidMech., 510, 95–104.
�����������������������I. Fer, Geophysical Institute, Allegaten 70, 5007 Bergen, Norway.
([email protected])F. Nilsen and R. Skogseth, Department of Arctic Geophysics, University
Centre in Svalbard (UNIS), P.O. Box 156, Longyearbyen, N-9171Svalvard, Norway. ([email protected]; [email protected])L. H. Smedsrud, Bjerknes Centre for Climate Research, Allegaten 55,
5007 Bergen, Norway. ([email protected])
C08049 SKOGSETH ET AL.: HYDROGRAPHY AND DOWNFLOW OF BSW IN STORFJORDEN
13 of 13
C08049