Livestock manure treatment for nutrients removal - AIR Unimi

XML-IS
Our reference: DSRII 2845 P-authorquery-vx
AUTHOR QUERY FORM
Journal: DSRII
Please e-mail or fax your responses and any corrections to:
Article Number: 2845
E-mail: [email protected]
Fax: (619) 699-6211 or (619) 699-6859
Dear Author,
Please check your proof carefully and mark all corrections at the appropriate place in the proof (e.g., by using on-screenannotation in the PDF file) or compile them in a separate list.
For correction or revision of any artwork, please consult http://www.elsevier.com/artworkinstructions.
Any queries or remarks that have arisen during the processing of your manuscript are listed below and highlighted by flags in the proof.
Click on the Q link to go to the location in the proof.
Location inarticle
Query / Remark: click on the Q link to go
Please insert your reply or correction at the corresponding line in the proof
Q1 Please supply keywords.
Thank you for your assistance.

1
3
5
7
9
11
13
15
17
19
21
23
25
27
29
31
33
35
37
39
41
43
45
47
49
51
53
55
57
59
61
63
65
Deep-Sea Research II ] (]]]]) ]]]–]]]
Contents lists available at ScienceDirect
Deep-Sea Research II
0967-06
doi:10.1
n Corr
E-m
Pleas2004
journal homepage: www.elsevier.com/locate/dsr2
The impact of equatorial Pacific tropical instability waves on hydrographyand nutrients: 2004-2005
Peter G. Strutton a,n, Artur P. Palacz b, Richard C. Dugdale c, Fei Chai b, Al Marchi c, Alex E. Parker c,Victoria Hogue c, Frances P. Wilkerson c
a Institute for Marine and Antarctic Studies, University of Tasmania, Private Bag 129, Hobart, Tas 7001, Australiab School of Marine Sciences, University of Maine, ME, USAc Romberg Tiburon Center for Environmental Studies, San Francisco State University, San Francisco, CA, USA
Q1
a r t i c l e i n f o
Article history:
Received 9 August 2010
Accepted 9 August 2010
67
45/$ - see front matter & 2010 Published by
016/j.dsr2.2010.08.015
esponding author. Tel.: +613 6226 8595.
ail address: [email protected] (P.G. S
e cite this article as: Strutton, P.G., et-2005. Deep-Sea Research II (2010),
a b s t r a c t
This paper documents the variability in physics and nutrients during two cruises spanning 1101W to
1401W in December 2004 and September 2005. The goal of this work is to set the hydrographic
framework for companion papers which quantify the role of iron, silicon and grazing in maintaining the
high nitrate, low chlorophyll (HNLC) conditions in the equatorial Pacific. The two cruises were
conducted almost a year apart, at different phases of the El Nino cycle, but during similarly intense
tropical instability wave (TIW) seasons. The higher phytoplankton biomass observed on the 2005 cruise
was due to a combination of time of year and a weakening El Nino. A general relationship between TIWs
and Si cycling is described. TIWs advect the equatorial upwelling plume alternately to the north and
south, and also generate localized enhanced upwelling. The distorted upwelling plume is a region
of enhanced biogenic silica production and export. Away from regions of active upwelling,
Si remineralization is enhanced and export is significantly reduced or absent.
& 2010 Published by Elsevier Ltd.
69
71
73
75
77
79
81
83
85
87
89
91
1. Introduction
The equatorial Pacific is a major component of global biogeo-chemical cycles. Upwelling driven by trade winds generates thecool tongue which spans one quarter of the Earth’s circumference(Wyrtki, 1981). This upwelled water contains modest concentra-tions of macro-nutrients (N, P, Si) and high dissolved inorganiccarbon (Chavez and Barber, 1987; Feely et al., 1987; Toggweilerand Carson, 1995). Primary and new production in the upwellingregion are low given the observed levels of macronutrients (Coaleet al., 1996a,b), but the province is vast and therefore accounts forapproximately 18% of global new production (Chavez andToggweiler, 1995). The partial pressure of carbon dioxide (pCO2)in upwelled waters is approximately 50 to 150 matm higher thanatmospheric pCO2 resulting in a flux to the atmosphere of 0.5 to1.1�1015 gC yr�1 (Takahashi et al., 2002; Feely et al., 2006). Thisflux represents the largest oceanic source of CO2 to the atmosphere,equivalent to about 10% of the total anthropogenic flux of6.5�1015 gC yr�1 (Marland et al., 2008).
The physics, biology and chemistry of the equatorial Pacific areperturbed by intraseasonal to interannual, meso- to basin-scaleprocesses. Westerly wind bursts over the western equatorialwarm pool generate downwelling Kelvin waves which propagate
93
95
Elsevier Ltd.
trutton).
al., The impact of equatoriadoi:10.1016/j.dsr2.2010.08
from west to east at about 200 km day�1. These waves have beenshown to decrease productivity in the central equatorial Pacific,by deepening the nutricline (Foley et al., 1997; Chavez et al.,1998). El Nino events occur every 3 to 7 years and arecharacterized by warmer sea surface temperatures (SSTs), weakor absent equatorial upwelling, reduced primary productivity anda smaller ocean to atmosphere CO2 flux (Chavez et al., 1999;McPhaden, 1999). El Nino events are often followed by La Ninaperiods of enhanced upwelling, ephemeral phytoplankton blooms(Ryan et al., 2006) and an active tropical instability wave season.Tropical instability waves (TIWs) have been described as havingtheir genesis in the shear between the westwards flowing SouthEquatorial Current (SEC) and the opposing countercurrents to thenorth (North Equatorial Countercurrent; NECC), south (SouthEquatorial Countercurrent; SECC) and beneath (equatorial under-current, EUC; Philander, 1978). TIWs distort the upwelling tongueinto a wavelike pattern that is visible in satellite images of bothchlorophyll a (chl) (Strutton et al., 2001) and SST (Chelton et al.,2001). The waves travel from east to west at approximately50 km day�1, have wavelengths of 1000 km and periods of 17 to33 days (Lyman et al., 2007). Other authors (Flament et al., 1996;Menkes et al., 2002) have preferred to characterize TIWs as trainsof off-equator vortices (tropical instability vortices, TIVs). Regard-less of how they are described, TIWs generate regions of enhancedupwelling and subduction that can lead to localized highproductivity and biomass accumulation, respectively (Yoderet al., 1994; Archer et al., 1997).
97
l Pacific tropical instability waves on hydrography and nutrients:.015

1
3
5
7
9
11
13
15
17
19
21
23
25
27
29
31
33
35
37
39
41
43
45
47
49
51
53
55
57
59
61
63
65
67
69
71
73
75
77
79
P.G. Strutton et al. / Deep-Sea Research II ] (]]]]) ]]]–]]]2
This paper documents the variability in physics and nutrientsduring two cruises spanning 1101W to 1401W in December 2004and September 2005. The goal of this work is to set thehydrographic framework for the biogeochemical papers in thisvolume, which in turn aim to carefully investigate the role of iron,silicon and grazing in maintaining the high nitrate, low chl (HNLC)conditions in the equatorial Pacific. Aspects of the data presentedin this paper hint at the existence of vortices (TIVs), but in theabsence of detailed 3D circulation data, and at the insistence of areviewer, we have refrained from attributing the observedpatterns to the existence of vortices. Instead, we relate thedistributions of physical properties and nutrients to TIW distor-tions of the upwelling tongue and localized upwelling andsubduction.
81
83
85
87
89
91
93
2. Methods
The in situ observations described here are from two cruises tothe equatorial Pacific aboard the R/V Revelle in December 2004(EB04) and September 2005 (EB05; EB refers to EquatorialBiocomplexity). Figs. 1 and 2 show satellite SST and chl mapswith the cruise tracks and station locations. EB04 commencedobservations at 51N, 1101W on 10 December 2004, headed southalong 1101W then west along the equator and completedobservations at 01 1401W on 29 December 2004. EB05 initiatedobservations at 41N 1401W on 08 September 2005, headed southalong 1401W, then east along approximately 0.51N to about
95
97
99
101
103
105
107
109
111
113
115
119
121
123
125
127
129
131
133Fig. 1. SST [1C] and chl [mg m�3] maps for EB04. (A) SST [1C] and (B) chl [mg m�3]
for the north to south transect, 10-18 December 2004. (C) SST [1C] and (D) chl
[mg m�3] for the west to east transect, 19-29 Decmber 2004.
Fig. 2. SST [1C] and chl [mg m�3] maps for EB05. (A) SST [1C] and (B) chl [mg m�3]
for the north to south transect, 8-17 Septemper 2005. (C) SST [1C] and (D) chl
[mg m�3] for the east to west transect, 18-24 September 2005.
Please cite this article as: Strutton, P.G., et al., The impact of equatoria2004-2005. Deep-Sea Research II (2010), doi:10.1016/j.dsr2.2010.08
1251W, completing observations on 24 September 2005. At thestation locations shown in Figs. 1 and 2, CTD profiles using eitherthe ship’s CTD rosette, or a trace metal clean rosette (TM rosette;Kaupp et al., this volume) were performed to at least 200 m.
The data presented here include density [sy, kg m�3] frominstruments on the CTD package, as well as dissolved nitrate,ammonium and silicic acid sampled from the bottles on therosette. Nutrient samples were collected in 20 ml polypropylenebottles. Nitrate was measured as NO3+NO2 with consistently lowNO2. Samples were stored at 4 1C until analysis within 12-24hours with a Bran and Luebbe AutoAnalyzer II (Whitledge et al.,1981; Bran and Luebbe, 1999). Ammonium samples in 60 mlpolycarbonate centrifuge tubes were treated with phenol reagentand held at 4 1C until analysis using a Hewlett Packard Model8452A diode array spectrophotometer equipped with a 10 cmcuvette (Solorzano, 1969).
Satellite data were obtained and processed to provide thelarge-scale context for the cruises. The SST data were optimallyinterpolated TMI/AMSR-E microwave data obtained from RemoteSensing Systems (www.remss.com) at 0.251 spatial resolution.These data are not cloud contaminated, and the small gapsbetween swaths are interpolated in time and space. The chl datawere 4 km resolution Level 3 Standard Mapped Image MODISAqua data obtained from NASA (oceancolor.gsfc.nasa.gov). Thesedata are cloud contaminated, so the number of observations forany given pixel in the image ranges from zero to the number ofdays taken to occupy the transect depicted in the image, typicallyless than 10 days.
l Pacific tropical instability waves on hydrography and nutrients:.015

1
3
5
7
9
11
13
15
17
19
21
23
25
27
29
31
33
35
37
39
41
43
45
47
49
51
53
55
57
59
61
63
65
67
69
71
73
75
77
79
81
83
85
87
89
91
93
95
97
99
101
103
105
107
P.G. Strutton et al. / Deep-Sea Research II ] (]]]]) ]]]–]]] 3
To quantify El Nino phase, the time series of the MultivariateENSO index (MEI; Wolter and Timlin, 1998) was downloadedfrom NOAA’s Climate Diagnostic Center (http://www.cdc.noaa.gov/people/klaus.wolter/MEI/table.html). The temporal variabilityof the MEI is almost identical to that of the southern oscillationindex (SOI). We prefer the MEI because its sign is more intuitive(positive for El Nino, same sign as the SST anomalies), it has amean of zero, a standard deviation of one and it is calculated fromSST, winds, atmospheric pressure, air temperature and cloudiness,not simply an atmospheric pressure gradient. To quantify theintensity of TIWs in the region of the cruises, a TIW index wascalculated from SST data at the 21N, 1401W TAO buoy, asdescribed by Evans et al. (2009). Briefly, the SST time series washigh-pass filtered using a LOESS smoother with a half-powerpoint of 66.6 days, the absolute value was taken and 30 day blockaverages were calculated. The resulting time series was thennormalized to its maximum value to produce an index that has avalue of 1 for periods of strong TIW activity and 0 for periods ofabsent TIWs. Data from north of the equator were chosen sinceTIWs are more intense and coherent there.
A filtered time series of equatorial satellite chl was constructedto emphasize the seasonal signal, with long term ENSO variabilityremoved. Monthly Sea-viewing Wide Field-of-view Sensor (Sea-WiFS) level 3, 9 km chl data were obtained from the SeaWiFSProject. A time series of mean monthly chl was extracted fromtwo geographical boxes centered on the 1251W and 1401W TAOlines. These boxes extended from 1.51N to 71N and 51 longitudeeast and west of the mooring line (so the box dimensions were5.51 in the meridional direction �101 in the zonal direction). Asfor the SST analysis, the focus of the chl time series analysis wasnorth of the equator because of the clearer TIW signal there. Thetime series of monthly average chl from 1251W and 1401W werehigh-pass filtered using a LOESS smoother with a half power pointof 20 months. This filtering removed the interannual ENSO trendand emphasized the seasonal cycle (Evans et al., 2009).
Hovmuller plots of zonal winds, SST, 20 1C isotherm depth(Z20 1C) and chl were created from in situ TAO data and MODISsatellite chl. Depending on the time period considered in each plot(see Results), the mean annual cycle was subtracted from the datato depict seasonal anomalies (Fig. 4), or not (Figs. 5 and 6). Whereit was employed, the mean annual cycle was calculated for the
1997 1998 1999 2000 2001 2002-2
-1
0
1
2
3
MEI
inde
x
a
1997 1998 1999 2000 2001 2002-0.05
0
0.05
0.1
chl a
nom
aly
[mg
m3 ]
b
(A)
(B)
Fig. 3. (A) Time series of the multivariate ENSO index (MEI; thin line with shading) and a
north of the equator at 1251W and 1401W. The time series span 1 January 1997 to 1 Ja
Please cite this article as: Strutton, P.G., et al., The impact of equatoria2004-2005. Deep-Sea Research II (2010), doi:10.1016/j.dsr2.2010.08
period 1999-2008 for TAO data and 2002-2008 for MODIS. Thewind, SST and isotherm data were daily observations from TAOmoorings at 21N, the equator and 21S at 1801, 1701W, 1551W,1401W, 1251W, 1101W and 951W. The data were averaged at eachlongitude and interpolated at 11 in the zonal direction. The MODISdata were from NASA’s 8 day, 4 km product, averaging all validpixels between 21N and 21S at each longitude.
3. Results
3.1. Large-scale context
The satellite-derived SST and chl fields for EB04 and EB05 areshown in Figs. 1 and 2. Each cruise is broken into two pairs offigures depicting SST and chl for the meridional and zonaltransects. In each case, the image is the mean of the daily imagesfor the time period taken to occupy the transect, described in thefigure legends and methods. The satellite images provide thelarge-scale context for the CTD observations that will be depictedas latitude-depth sections for the meridional transects andlongitude-depth sections for the zonal transects.
Fig. 3 provides the large-scale temporal context for thephysical conditions characterizing each of the two cruises. TheMEI is plotted in Fig. 3A. Positive and negative values indicate ElNino and La Nina conditions, respectively. The 1997-98 event isobvious at the beginning of the data set, followed by a rapid andintense transition to La Nina. From 1999 to 2002, there was agradual weakening of La Nina into the weak 2002-03 El Nino(McPhaden, 2004). Weak El Nino events also occurred in 2004-05(Lyon and Barnston, 2005) and 2006-07 (McPhaden, 2008). TheMEI (Fig. 3A) and other indicators such as the NINO 3.4 SSTanomaly show that the 2004-05 event was weaker than both the2002-03 and 2006-07 events, so much so that the event waspoorly predicted, and there is debate as to whether it should beconsidered an El Nino at all (Lyon and Barnston, 2005; McPhaden,2008). Fig. 3A also depicts a TIW index time series. The indexconfirms the particularly intense TIW season that occurred duringthe 1998 La Nina, and in general shows the seasonal cycle of TIWsincreased prevalence through the second half of the calendar yearand into the early part of the following year. Together, the MEI
109
111
113
115
119
121
123
125
127
129
131
133
2003 2004 2005 2006 2007 2008
0
0.2
0.4
0.6
0.8
1
TIW
inde
x
MEITIW
2003 2004 2005 2006 2007 2008
125W140W
n index of TIW activity. (B) Time series of high pass filtered SeaWiFS chl for regions
nuary 2008. Each figure has two vertical lines indicating the timing of the cruises.
l Pacific tropical instability waves on hydrography and nutrients:.015

1
3
5
7
9
11
13
15
17
19
21
23
25
27
29
31
33
35
37
39
41
43
45
47
49
51
53
55
57
59
61
63
65
67
69
71
P.G. Strutton et al. / Deep-Sea Research II ] (]]]]) ]]]–]]]4
and TIW indices show that the 2004 and 2005 cruises experiencedslightly different ENSO conditions - weak El Nino in 2004, ‘normal’in 2005 - but similar, moderate TIW intensity.
The combination of El Nino phase and TIW intensity impactsthe observed chl field. Here we use filtered time series (Fig. 3B)
Fig. 4. Time-longitude anomaly plots of (A) zonal wind vector [m s�1], (B) SST [1C], (C) d
represent the approximate time and space windows of the two cruises and the filled tr
from which data were obtained. The color palette is intended to emphasize the anomalie
respectively. For the zonal winds, positive anomalies correspond to weakened or rever
Fig. 5. Detailed view of the physical environment and chl concentrations for EB04. (A)
upwelling favorable), (B) SST [1C], (C) Depth of the 20 1C isotherm [m], a proxy for the
occurred in longitude-time space. To aid the viewer, stations 5, 10, 15, 20 and 25 are colo
Note that stations 1-3 were performed north of 21N and stations 11-12 were performe
Please cite this article as: Strutton, P.G., et al., The impact of equatoria2004-2005. Deep-Sea Research II (2010), doi:10.1016/j.dsr2.2010.08
and Hovmuller plots (Figs. 4–6) to quantify physical andbiological variability at seasonal and interannual time scales.Fig. 3B shows that, in general, there are two peaks in high-passfiltered chl each year, and that the peak in the second half of theyear, when TIWs are most prevalent, is lower than the peak in the
73
75
77
79
81
83
85
87
89
91
93
95
97
99
101
103
105
107
109
111
113
115
119
121
123
125
127
129
131
133
epth of the 20 1C isotherm [m] and (D) MODIS chl [mg m�3]. The rectangular boxes
iangles represent the longitudes of the TAO moorings at 21N, the equator and 21S
s: White is zero while blue and red correspond to negative and positive anomalies,
sed trades. For Z20 1C, positive anomalies indicate a deeper thermocline.
Zonal winds [m s�1], negative values indicate winds from the east (trade winds,
rmocline depth, and (D) MODIS surface chl [mg m�3]. Stations are shown as they
red white. The color data presented are means from 21N to 21S at a given longitude.
d south of 21S.
l Pacific tropical instability waves on hydrography and nutrients:.015

1
3
5
7
9
11
13
15
17
19
21
23
25
27
29
31
33
35
37
39
41
43
45
47
49
51
53
55
57
59
61
63
65
67
69
71
73
75
77
79
81
83
85
87
89
91
93
95
97
99
101
103
105
107
109
111
113
115
119
121
123
125
127
129
131
133
Fig. 6. As for Fig. 5, but for EB05. To aid the viewer, stations 5, 10, 15 and 20 are colored white. The color data presented are means from 21N to 21S at a given longitude.
Note that stations 1-3 were performed north of 21N and stations 15-16 were performed south of 21S.
P.G. Strutton et al. / Deep-Sea Research II ] (]]]]) ]]]–]]] 5
first half of the year, consistent with model analyses (Gorgueset al., 2005) and the combined ship and satellite observations ofEvans et al. (2009). In 2004 and 2005, the latter chl peaks were ofapproximately the same magnitude, but the slightly differenttime of year of the cruises (December 2004 versus September2005) means that the seasonal chl signal was in general higher forEB05 compared to EB04.
Hovmuller plots of zonal winds, SST, 20 1C isotherm depth (Z201C)and MODIS chl are shown in Fig. 4 for January 2004 to January 2006.Here the data are plotted as anomalies relative to the mean annualcycle, as described in the methods. The most obvious signal in thezonal winds is a series of westerly wind bursts (positive anomalies)in the western Pacific. Each one of these events (January 2004, April2004, July 2004, August/September 2004, October 2004, December2004 and February 2005) generated a downwelling, equatoriallytrapped Kelvin wave that propagated from west to east across thebasin, visible in the Z20 1C anomalies (Fig. 4C). Several of these wavesclearly generated negative anomalies in chl (in particular the January2004, April 2004, December 2004 and February 2005 events),consistent with previous work that has associated the deepening ofthe thermocline with decreased productivity (Chavez et al., 1998). Inour study area, during the peak of the 2004-05 El Nino event, SSTanomalies were about +1 1C, declining to near zero by the time of thesecond cruise in September 2005. The high-pass filtered chl timeseries (Fig. 3B) suggested that the differences in large-scale averagechl concentration observed between 2004 and 2005 were largely dueto the timing of the cruises (December versus September; see alsoFigs. 5 and 6D). In contrast, the Hovmuller plot (Fig. 4D) shows thatthe chl anomalies were more positive in the second half of 2005 cf
2004, although the signal is small, approximately 70.05 mg m�3 orless. That is, the two figures differ regarding the sign of the chlanomalies in late 2005, likely because of differences in the way inwhich the anomalies were calculated: Fig. 3B is a high-pass filteredtime series (interannual variability removed) of SeaWiFS chl fromtwo locations, whereas Fig. 4D represents the spatial and temporalvariability in MODIS chl with the mean annual cycle removed.
Please cite this article as: Strutton, P.G., et al., The impact of equatoria2004-2005. Deep-Sea Research II (2010), doi:10.1016/j.dsr2.2010.08
Regardless, comparison of Figs. 3B and 4D confirms that the EB04cruise took place during a local minimum in chl, while EB05 occurredvery close to a local chl maximum. Figs. 5 and 6 are again Hovmullerplots of winds, temperature, thermocline depth and chl, not plottedas anomalies. They provide greater detail on the 2004 and 2005cruises, respectively, including the dates and locations of stations.
3.2. Meridional section along 1101W, 2004
The meridional transect along 1101W in 2004 (Fig. 7) passedthrough the crest of a TIW (Fig. 1A). Note that here we use the terms‘crest’ and ‘trough’ to describe the shape of the northern TIW front, asdepicted in a satellite map, so ‘crest’ refers to the northwardsadvection of cool upwelled water from the equator. The CTD andsatellite data through this feature show a clear gradient from warm,low nutrient, low productivity water to the north, transitioning tocooler, moderate nutrient conditions near the equator. The surfaceexpression of upwelling, that would be centered on the equator inthe absence of TIWs, was observed at 11S, but the subsurfaceexpression of upwelling (doming of the isotherms in the vicinity of100 m, data not shown) was at about 0.51N. The offset was due to theshallow (o50 m), current between the equator and about 31S, whichadvected the surface expression of upwelling to the south (Fig. 7C).At about 11N, surface currents were close to zero, but at the northernend of the ADCP transect (2.751N, the other data extend to 51N),currents tended towards the north and west. Given the shape of theTIW crest observed in satellite data, we expect that currents turnedtowards the east near 51N. The pycnocline was between 50 and100 m over the entire transect, and the core of the EUC was clearlyvisible in the zonal velocity data between 50 and 150 m, 11N to 11S,and as a bulging in the nitrate and silicic acid isopleths (Fig. 7E and F).Surface nitrate concentrations were about 5 mmol m�3 at theequator, decreasing to almost 0 mmol m�3 at 51N, but increasingsouthward to about 10 mmol m�3, typical of the asymmetry thatcharacterizes the upwelling tongue, particularly in the east. The
l Pacific tropical instability waves on hydrography and nutrients:.015

1
3
5
7
9
11
13
15
17
19
21
23
25
27
29
31
33
35
37
39
41
43
45
47
49
51
53
55
57
59
61
63
65
67
69
71
73
75
77
79
81
83
85
87
89
91
93
95
97
99
101
103
105
107
109
111
113
115
119
121
123
125
127
Fig. 7. North to south transect along 1101W in December 2004 (EB04). In Figs. 7–10, the color scales for density and nutrients have been adjusted for maximum contrast in
the upper 100 m.
P.G. Strutton et al. / Deep-Sea Research II ] (]]]]) ]]]–]]]6
pattern for silicic acid was the same, but with concentrationsgenerally about 2 mmol m�3 lower. This led to the Si:N ratio beingo1 everywhere, except for the surface waters north of about 41N,where we observed excess Si relative to N. This could be due to (1)low diatom productivity as suggested by Krause et al. (this volume),who measured their lowest silicification rates for diatoms at 41N1401W, or (2) enhanced upwelling of Si relative to N due toasymmetry in the distributions of these nutrients about the equator(Dugdale et al., 2002b).
129
131
133
3.3. Zonal section along the equator, 2004
The ADCP data from 1151W to 1401W along the equator showthe core of the EUC at 125 m at 1401W, shoaling to about 100 m at1151W (Fig. 8). Closer to the surface, the currents are roughly
Please cite this article as: Strutton, P.G., et al., The impact of equatoria2004-2005. Deep-Sea Research II (2010), doi:10.1016/j.dsr2.2010.08
consistent with the location of TIW crests and troughs indicated inthe satellite data after taking into account some smearing due tothe 11-day averaging in Fig. 1C and D. The exact locations of wavefeatures are sometimes difficult to define because shear at theboundary with the NECC tends to smear the SST signal, but on theequator, TIW crests are indicated by northward advection of coolwater between 1151W and 1181W, and between 1351W and1301W. TIW troughs are indicated by southward currents at about1251W and 1381W, but the velocities appear weaker at the morewestern location where the TIWs are likely losing energy. Thecomparison between the wave patterns in the satellite images andthe CTD sections of nutrients does not always show thiscorrespondence, because the satellite data are an 11-day average,while the CTD data are not. Therefore, the satellite images oftenshow the TIW features displaced to the east of where they are seenin the CTD transect, for example the peak seen in satellite SST at
l Pacific tropical instability waves on hydrography and nutrients:.015

1
3
5
7
9
11
13
15
17
19
21
23
25
27
29
31
33
35
37
39
41
43
45
47
49
51
53
55
57
59
61
63
65
67
69
71
73
75
77
79
81
83
85
87
89
91
93
95
97
99
101
103
105
107
109
111
113
115
119
121
123
125
127
Fig. 8. East to west transect along the equator in December 2004 (EB04).
P.G. Strutton et al. / Deep-Sea Research II ] (]]]]) ]]]–]]] 7
1251W that was observed in the ADCP data at 1351W. Wave-likealternation of high and low nutrients is observed, but thecorrelation with TIW flow is not always clear. Warmer tempera-tures and lower nutrients might be expected where the flow issouthward (eg 1251W), but this is not always the case. Here‘nutrients’ refers mostly to nitrate and silicic acid; the distributionof ammonium is out of phase with nitrate and silicic acid. Elevatednitrate and silicic acid, or shallower penetration of high nutrientwaters from below, were observed at about 1151W, 1251W and1371W, with lower values in between. It is in the areas of lownitrate and silicic acid that elevated ammonium is observed.
129
131
133
3.4. Meridional section along 1401W, 2005
In 2005, the N-S section along 1401W (Fig. 9) transected theequatorial upwelling plume at a longitude where TIWs are weak, as
Please cite this article as: Strutton, P.G., et al., The impact of equatoria2004-2005. Deep-Sea Research II (2010), doi:10.1016/j.dsr2.2010.08
characterized by their amplitude, compared to further east at 1101W.At certain times during the TIW season, in particular at thislongitude, the peaks and troughs of TIWs can be symmetrical aboutthe equator (Chelton et al., 2001). This was the case for this transect.The satellite SST imagery shows that the CTD section sampled thewestern edge of two TIW cusps (Fig. 2A). Based on the polewardextent of cool SST, and from inspection of SST animations (notshown), the advection north of the equator was slightly more intenseor at least more obvious than its counterpart south of the equator.Doming of nitrate and silicic acid isopleths was more pronounced at21N, although this was likely due more to asymmetry in sourcewaters feeding the EUC (Dugdale et al., 2002b) than to asymmetry inthe isopycnals. In contrast to the zonal (along equator) section in2004, elevated nitrate and silicic acid co-occurred with elevatedammonium. Nitrate and silicic acid were both quite low in the upper50 m of the water column, with concentrations below about5 mmol m�3 and 3 mmol m�3, respectively.
l Pacific tropical instability waves on hydrography and nutrients:.015

1
3
5
7
9
11
13
15
17
19
21
23
25
27
29
31
33
35
37
39
41
43
45
47
49
51
53
55
57
59
61
63
65
67
69
71
73
75
77
79
81
83
85
87
89
91
93
95
97
99
101
103
105
107
109
111
113
115
119
121
123
125
127
129
131
133
Fig. 9. North to south transect along 1401W in September 2005 (EB05).
P.G. Strutton et al. / Deep-Sea Research II ] (]]]]) ]]]–]]]8
3.5. Zonal section along 0.51N, 2005
After the station at 3.251S, 1401W, the EB05 cruise steamed to01, 1341W and then performed a west-to-east section (shorterthan the 2004 equatorial section) along about 0.51N (Fig. 10). Thefocus of this transect was to sample through a TIW, and the finalstation at 1.751N, 1251W was an attempt to pinpoint localizedelevated upwelling as indicated by cool SST. Due to the rapidwestward advection of the TIW, it seems that this attempt wasnot successful (i.e. the station was not in the coolest, recentlyupwelled water; Fig. 6). The ADCP zonal current data show theEUC shoaling to the east (Fig. 10B), but this is more likely causedby TIW-related upwelling than the basin scale tilt to thethermocline since both the ADCP and density data show arelaxation of this tilt east of about 1261W. The meridional ADCP
Please cite this article as: Strutton, P.G., et al., The impact of equatoria2004-2005. Deep-Sea Research II (2010), doi:10.1016/j.dsr2.2010.08
data are completely consistent with the positions of wavesindicated by the satellite SST data (Fig. 2C). There are strongsouthward velocities of about 0.5 m s�1 near 1351W and 1251W,indicative of TIW troughs, and a TIW crest indicated by a region ofstrong poleward velocity at 1301W. Enhanced upwelling occurredat 1261W, indicated by shallow isopycnals and elevated near-surface nitrate and silicic acid. Our interpretation is that waterwas being upwelled at 1261W and advected horizontally, so the‘time since exposure to the surface’ increased towards the westand east moving away from this upwelling center. As for the 2004E-W transect, ammonium was somewhat out of phase withnitrate and silicic acid, in that very low values persisted wherenitrate and silicic acid were high. The highest ammoniumconcentrations occurred at the pycnocline, away from theupwelling center.
l Pacific tropical instability waves on hydrography and nutrients:.015

1
3
5
7
9
11
13
15
17
19
21
23
25
27
29
31
33
35
37
39
41
43
45
47
49
51
53
55
57
59
61
63
65
67
69
71
73
75
77
79
81
83
85
87
89
91
93
95
97
99
101
103
105
107
109
111
113
115
119
121
123
125
127
129
131
133
Fig. 10. West to east transect along approximately 0.51N in September 2005 (EB05).
P.G. Strutton et al. / Deep-Sea Research II ] (]]]]) ]]]–]]] 9
4. Discussion
4.1. TIW and ENSO conditions
Both cruises occurred during periods of active TIWs. Accordingto the time series of the TIW index (Fig. 3A), the intensity of TIWswas approximately equal in both years, but the 2005 cruisemostly occupied an area further west (around 1401W) where TIWactivity decreases, compared to the 2004 cruise. The intensity of aTIW season and its impact on biogeochemistry is superimposedon the El Nino-La Nina cycle. The time series of the MEI (Fig. 3A)shows that the 2004 cruise took place during weak-to-moderateEl Nino conditions while the 2005 cruise occurred during neutralconditions. This variability is reflected in the SST and chlanomalies (Fig. 4): Conditions were warmer and less productivein 2004 relative to 2005. Seasonal variability also contributes tothe physical and biological conditions observed. The time series of
Please cite this article as: Strutton, P.G., et al., The impact of equatoria2004-2005. Deep-Sea Research II (2010), doi:10.1016/j.dsr2.2010.08
high pass filtered chl (Fig. 3B) and Hovmuller plots (particularlyFig. 4d) show that this translated to higher observed chl levels in2005 cf 2004. The goal of this paper was to describe theenvironmental context - physics and nutrients - for the twocruises. In the following sections, the features observed in thesatellite and ship data presented here are compared with patternsin biological processes and other tracers from companion papersin this volume.
4.2. Al and Fe
Kaupp et al. (this volume) described the distribution of Al andFe for the 2004 cruise. The distribution of Al generally follows theisohalines and oxygen contours and is thus subject to redistribu-tion by physical processes such as TIWs. On the equator at 1151Win 2004, there was an oxygen minimum and a salinity maximumcoincident with a region of northward flow in the ADCP section
l Pacific tropical instability waves on hydrography and nutrients:.015

1
3
5
7
9
11
13
15
17
19
21
23
25
27
29
31
33
35
37
39
41
43
45
47
49
51
53
55
57
59
61
63
65
67
69
71
73
75
77
79
81
83
85
87
89
91
93
95
97
99
101
103
105
107
109
111
113
115
119
121
123
125
127
129
131
133
P.G. Strutton et al. / Deep-Sea Research II ] (]]]]) ]]]–]]]10
(Fig. 8). This salinity signature is commonly observed just south ofthe equator and is indicative of south Pacific water. In this case, itwas observed on the equator due to northward advection of theupper water column by TIWs. Flux budget results obtained from abox model revealed large spatial variability in vertical supply andnet scavenging of Al (Palacz et al., this volume). The zonaldistribution of these fluxes showed a wave pattern which could beattributed to TIWs. Adjacent flux maxima and minima werecaused by enhanced and suppressed upwelling, respectively,perhaps corresponding to contrasting phases of TIWs. Equator-ward meridional inflow also led to local minima in Al due toadvection of low Al waters from off-equator.
While Fe is commonly upwelled with Al from the EUC, the TIWpassage during EB04 and EB05 did not show any clear effect on thedissolved Fe concentration field. Kaupp et al. (this volume) discussedthe reasons for this in detail. In short, rapid biogeochemicalscavenging and intense surface remineralization of Fe dominatedany spatial variability due to physical processes alone. This does notmean that the TIW activity plays no role in changing the Fe supplyand thus the growth conditions for the eastern equatorial Pacificplankton community. The link between changing Fe supply due toTIW activity and primary productivity in the equatorial Pacific hasbeen recently demonstrated by Gorgues et al. (2005) and Vichi et al.(2008). Box model budget calculations (Palacz et al., this volume)showed zonal variability in macro-nutrient and trace metal verticalsupply rates. Areas of increased upwelling flux were reflected inenhanced net biological and chemical removal. In data fromDecember 2004, there was increased Fe upwelling in the areabetween 140 1W and 133 1W, possibly related to localized TIWupwelling (Fig. 1). Box model budget estimates of nitrate and silicicacid removal rates along the equator also expressed a wave patternthat may be an artifact of a passing TIW.
4.3. Si:N ratios
If the eastern equatorial Pacific behaves as a chemostat(Dugdale and Wilkerson, 1998; Dugdale et al., 2002a; 2007; thisvolume), then low Si:N ratios might indicate regions of Silimitation that constrain diatom growth rate and biomass. Highrates of silica production were measured at 1101W, between 11Nand 11S in 2004 (Krause et al., this volume), corresponding to aregion of very low Si:N ratio. This suggests that the biogenic silicaproduction depleted Si to low levels relative to N such that thesystem had become Si limited by the time it was sampled on the2004 cruise. Ignoring for a moment the Si:N ratio and focusingjust on the Si concentrations, they were sufficiently low(approximately 2 mmol m�3) at the surface in this region to limitdiatom Si uptake (Leynaert et al., 2001). Variability in the Si:Nratio of upwelling source waters can occur because the nitrate andsilicic acid isopleths are not at the same depth. Based on thesurface Si:N ratio, an example of freshly upwelled waters that hadnot yet experienced significant Si uptake was found between1151W and 1201W on the equator in 2004.
4.4. Biogenic silica: Stocks and production rates
During the equatorial Pacific Joint Global Ocean Flux Study, Yoderet al. (1994) observed extremely dense accumulations of Rhizosole-
nia at the convergent boundary along the northern edge of a TIW at1401W. This phenomenon was explained by subduction of thebuoyant diatom cells under the warmer, less dense waters to thenorth, and subsequent floating to the surface where they accumu-lated in a narrow ‘line in the sea’ of approximately 20 mg chl m�3. Inthis volume, Krause et al. (this volume); their Fig. 5 and Demarestet al. (this volume); their Fig. 2) measured less spectacular, but
Please cite this article as: Strutton, P.G., et al., The impact of equatoria2004-2005. Deep-Sea Research II (2010), doi:10.1016/j.dsr2.2010.08
significant variability in the spatial distribution of biogenic silica(bSiO2) and its production. The clearest example of these parametersbeing influenced by the upper ocean physics occurred along thezonal transect in 2005. Demarest et al. (this volume) measuredelevated net bSiO2 production in the upper 20 m from about 1301Wto 1251W. In fact, the maxima in bSiO2 production were at 1301Wand 1251W, with slightly lower production directly over theshallowest pycnocline, interpreted here as the location of strongestupwelling. Both Krause et al. (this volume) and Demarest et al. (thisvolume) showed that the maxima in [bSiO2] that were likelygenerated by this increased bSiO2 production, were found to the eastand west of the production maximum, consistent with horizontaladvection at the surface. As these waters are upwelled, there is somedelay in the response of the diatom community, so the highestproduction values occur to the east and west (downstream) of thepeak upwelling. The resulting bSiO2 maxima occur near theboundaries with less dense water masses, where the upwelling-induced bSiO2 production is potentially subducted. The moreobvious of the two [bSiO2] maxima occurs at about 1321W, whereTaylor et al. (this volume) observed the highest diatom concentra-tion from either of the EB cruises, and where our data show that theupwelled waters are subducted under less dense waters from thenorth and west (Figs. 2 and 10). As pointed out by Krause et al. (thisvolume), these data represent the first example of spatial coherencebetween variability in silicification rates and TIW activity.
Spatial variability in Si dynamics is dominated by TIW activityto the extent that any spatial patterns related to the zonal tilt ofthe thermocline (and nutriclines) is absent. This is particularlyevident in the long east-to-west transect from 2004, spanning1151W to 1401W, where minima and maxima in the biomass-specific uptake of Si occur at intervals consistent with thewavelength of TIWs (Krause et al., this volume). In addition todifferences in Si uptake associated with TIWs, Demarest et al. (thisvolume) argued that TIWs generate spatial variability in thecycling (or pumping) of Si. They observed stronger potential forsilica export in the region of strong upwelling and TIW activity,compared to more efficient recycling of Si off the equator or inregions of weak upwelling.
4.5. Summary of TIW-diatom interactions
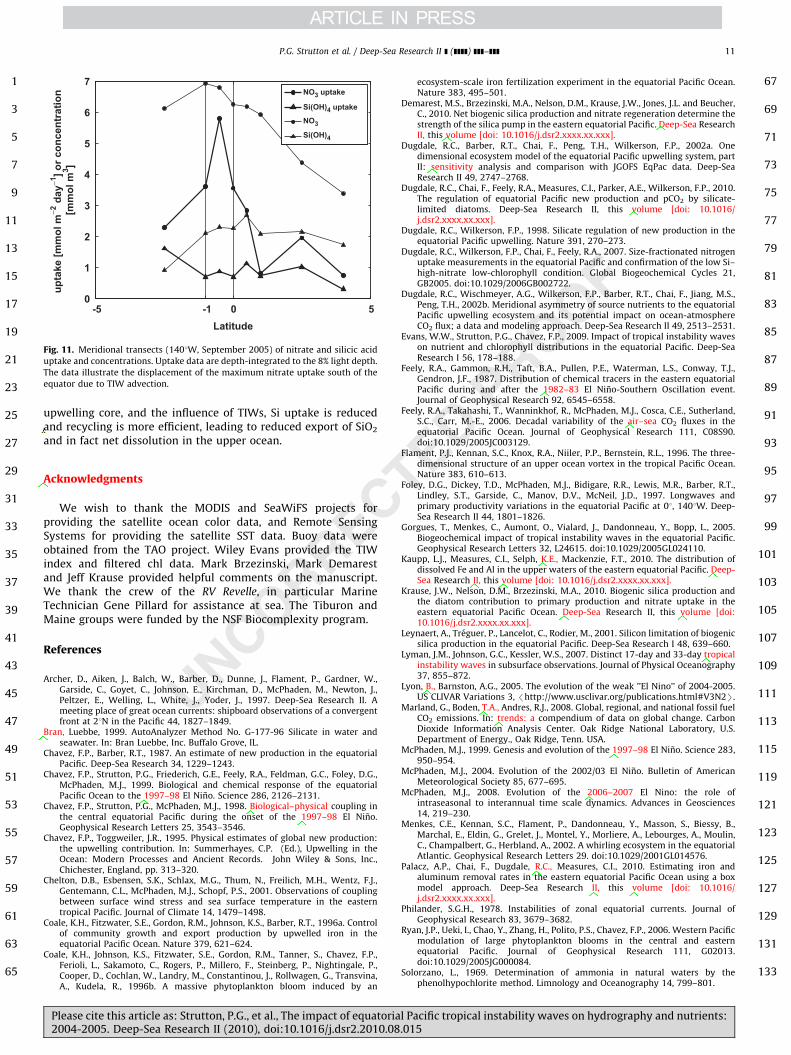
The following general mechanism for TIW influences on Siuptake, recycling and export could be proposed based on datapresented here, and in Krause et al. (this volume) and Demarestet al. (this volume). TIW generate regions of localized enhancedupwelling and subduction, while moving the band of equatorialupwelling north-south. The latter is clearly evident in our satelliteand ship data (particularly Figs. 1, 2 and 11) and in the rate andstanding stock measurements of other papers in this issue (e.g.Taylor et al., this volume). Si uptake is enhanced over theequatorial upwelling core, and even more so over strong localizedupwelling. That is, these represent favorable environments fordiatoms to make a greater contribution to new production.Likewise, Si export (or pumping; Demarest et al., this volume) ispotentially enhanced in the vicinity of the upwelling core, andparticularly so where strong subduction occurs (Yoder et al.,1994; Strutton et al., 2001). Comparing the zonal transects from2004 and 2005, which occurred at 01N and 0.51N, respectively, it isapparent that the north-south, wave-like advection of theequatorial upwelling tongue was the dominant source of spatialvariability in the 2004 biological measurements. In 2005, thespatial distributions of Si uptake and bSiO2 accumulation weredominated by localized upwelling, horizontal advection andaccumulation at a physical front. The meridional transects fromboth 2004 and 2005 show that away from the equatorial
l Pacific tropical instability waves on hydrography and nutrients:.015
1
3
5
7
9
11
13
15
17
19
21
23
25
27
29
31
33
35
37
39
41
43
45
47
49
51
53
55
57
59
61
63
65
67
69
71
73
75
77
79
81
83
85
87
89
91
93
-5 -1 0 50
1
2
3
4
5
6
7
Latitude
upta
ke [m
mol
m− 2
day
−1] o
r con
cent
ratio
n [m
mol
m3 ]
NO3 uptake
Si(OH)4 uptake
NO3
Si(OH)4
Fig. 11. Meridional transects (1401W, September 2005) of nitrate and silicic acid
uptake and concentrations. Uptake data are depth-integrated to the 8% light depth.
The data illustrate the displacement of the maximum nitrate uptake south of the
equator due to TIW advection.
P.G. Strutton et al. / Deep-Sea Research II ] (]]]]) ]]]–]]] 11
upwelling core, and the influence of TIWs, Si uptake is reducedand recycling is more efficient, leading to reduced export of SiO2
and in fact net dissolution in the upper ocean.
95
97
99
101
103
105
107
109
111
113
115
119
121
123
125
127
129
131
133
Acknowledgments
We wish to thank the MODIS and SeaWiFS projects forproviding the satellite ocean color data, and Remote SensingSystems for providing the satellite SST data. Buoy data wereobtained from the TAO project. Wiley Evans provided the TIWindex and filtered chl data. Mark Brzezinski, Mark Demarestand Jeff Krause provided helpful comments on the manuscript.We thank the crew of the RV Revelle, in particular MarineTechnician Gene Pillard for assistance at sea. The Tiburon andMaine groups were funded by the NSF Biocomplexity program.
References
Archer, D., Aiken, J., Balch, W., Barber, D., Dunne, J., Flament, P., Gardner, W.,Garside, C., Goyet, C., Johnson, E., Kirchman, D., McPhaden, M., Newton, J.,Peltzer, E., Welling, L., White, J., Yoder, J., 1997. Deep-Sea Research II. Ameeting place of great ocean currents: shipboard observations of a convergentfront at 21N in the Pacific 44, 1827–1849.
Bran, Luebbe, 1999. AutoAnalyzer Method No. G-177-96 Silicate in water andseawater. In: Bran Luebbe, Inc. Buffalo Grove, IL.
Chavez, F.P., Barber, R.T., 1987. An estimate of new production in the equatorialPacific. Deep-Sea Research 34, 1229–1243.
Chavez, F.P., Strutton, P.G., Friederich, G.E., Feely, R.A., Feldman, G.C., Foley, D.G.,McPhaden, M.J., 1999. Biological and chemical response of the equatorialPacific Ocean to the 1997–98 El Nino. Science 286, 2126–2131.
Chavez, F.P., Strutton, P.G., McPhaden, M.J., 1998. Biological–physical coupling inthe central equatorial Pacific during the onset of the 1997–98 El Nino.Geophysical Research Letters 25, 3543–3546.
Chavez, F.P., Toggweiler, J.R., 1995. Physical estimates of global new production:the upwelling contribution. In: Summerhayes, C.P. (Ed.), Upwelling in theOcean: Modern Processes and Ancient Records. John Wiley & Sons, Inc.,Chichester, England, pp. 313–320.
Chelton, D.B., Esbensen, S.K., Schlax, M.G., Thum, N., Freilich, M.H., Wentz, F.J.,Gentemann, C.L., McPhaden, M.J., Schopf, P.S., 2001. Observations of couplingbetween surface wind stress and sea surface temperature in the easterntropical Pacific. Journal of Climate 14, 1479–1498.
Coale, K.H., Fitzwater, S.E., Gordon, R.M., Johnson, K.S., Barber, R.T., 1996a. Controlof community growth and export production by upwelled iron in theequatorial Pacific Ocean. Nature 379, 621–624.
Coale, K.H., Johnson, K.S., Fitzwater, S.E., Gordon, R.M., Tanner, S., Chavez, F.P.,Ferioli, L., Sakamoto, C., Rogers, P., Millero, F., Steinberg, P., Nightingale, P.,Cooper, D., Cochlan, W., Landry, M., Constantinou, J., Rollwagen, G., Transvina,A., Kudela, R., 1996b. A massive phytoplankton bloom induced by an
Please cite this article as: Strutton, P.G., et al., The impact of equatoria2004-2005. Deep-Sea Research II (2010), doi:10.1016/j.dsr2.2010.08
ecosystem-scale iron fertilization experiment in the equatorial Pacific Ocean.Nature 383, 495–501.
Demarest, M.S., Brzezinski, M.A., Nelson, D.M., Krause, J.W., Jones, J.L. and Beucher,C., 2010. Net biogenic silica production and nitrate regeneration determine thestrength of the silica pump in the eastern equatorial Pacific. Deep-Sea ResearchII, this volume [doi: 10.1016/j.dsr2.xxxx.xx.xxx].
Dugdale, R.C., Barber, R.T., Chai, F., Peng, T.H., Wilkerson, F.P., 2002a. Onedimensional ecosystem model of the equatorial Pacific upwelling system, partII: sensitivity analysis and comparison with JGOFS EqPac data. Deep-SeaResearch II 49, 2747–2768.
Dugdale, R.C., Chai, F., Feely, R.A., Measures, C.I., Parker, A.E., Wilkerson, F.P., 2010.The regulation of equatorial Pacific new production and pCO2 by silicate-limited diatoms. Deep-Sea Research II, this volume [doi: 10.1016/j.dsr2.xxxx.xx.xxx].
Dugdale, R.C., Wilkerson, F.P., 1998. Silicate regulation of new production in theequatorial Pacific upwelling. Nature 391, 270–273.
Dugdale, R.C., Wilkerson, F.P., Chai, F., Feely, R.A., 2007. Size-fractionated nitrogenuptake measurements in the equatorial Pacific and confirmation of the low Si–high-nitrate low-chlorophyll condition. Global Biogeochemical Cycles 21,GB2005. doi:10.1029/2006GB002722.
Dugdale, R.C., Wischmeyer, A.G., Wilkerson, F.P., Barber, R.T., Chai, F., Jiang, M.S.,Peng, T.H., 2002b. Meridional asymmetry of source nutrients to the equatorialPacific upwelling ecosystem and its potential impact on ocean-atmosphereCO2 flux; a data and modeling approach. Deep-Sea Research II 49, 2513–2531.
Evans, W.W., Strutton, P.G., Chavez, F.P., 2009. Impact of tropical instability waveson nutrient and chlorophyll distributions in the equatorial Pacific. Deep-SeaResearch I 56, 178–188.
Feely, R.A., Gammon, R.H., Taft, B.A., Pullen, P.E., Waterman, L.S., Conway, T.J.,Gendron, J.F., 1987. Distribution of chemical tracers in the eastern equatorialPacific during and after the 1982–83 El Nino-Southern Oscillation event.Journal of Geophysical Research 92, 6545–6558.
Feely, R.A., Takahashi, T., Wanninkhof, R., McPhaden, M.J., Cosca, C.E., Sutherland,S.C., Carr, M.-E., 2006. Decadal variability of the air–sea CO2 fluxes in theequatorial Pacific Ocean. Journal of Geophysical Research 111, C08S90.doi:10.1029/2005JC003129.
Flament, P.J., Kennan, S.C., Knox, R.A., Niiler, P.P., Bernstein, R.L., 1996. The three-dimensional structure of an upper ocean vortex in the tropical Pacific Ocean.Nature 383, 610–613.
Foley, D.G., Dickey, T.D., McPhaden, M.J., Bidigare, R.R., Lewis, M.R., Barber, R.T.,Lindley, S.T., Garside, C., Manov, D.V., McNeil, J.D., 1997. Longwaves andprimary productivity variations in the equatorial Pacific at 01, 1401W. Deep-Sea Research II 44, 1801–1826.
Gorgues, T., Menkes, C., Aumont, O., Vialard, J., Dandonneau, Y., Bopp, L., 2005.Biogeochemical impact of tropical instability waves in the equatorial Pacific.Geophysical Research Letters 32, L24615. doi:10.1029/2005GL024110.
Kaupp, L.J., Measures, C.I., Selph, K.E., Mackenzie, F.T., 2010. The distribution ofdissolved Fe and Al in the upper waters of the eastern equatorial Pacific. Deep-Sea Research II, this volume [doi: 10.1016/j.dsr2.xxxx.xx.xxx].
Krause, J.W., Nelson, D.M., Brzezinski, M.A., 2010. Biogenic silica production andthe diatom contribution to primary production and nitrate uptake in theeastern equatorial Pacific Ocean. Deep-Sea Research II, this volume [doi:10.1016/j.dsr2.xxxx.xx.xxx].
Leynaert, A., Treguer, P., Lancelot, C., Rodier, M., 2001. Silicon limitation of biogenicsilica production in the equatorial Pacific. Deep-Sea Research I 48, 639–660.
Lyman, J.M., Johnson, G.C., Kessler, W.S., 2007. Distinct 17-day and 33-day tropicalinstability waves in subsurface observations. Journal of Physical Oceanography37, 855–872.
Lyon, B., Barnston, A.G., 2005. The evolution of the weak ’’El Nino’’ of 2004-2005.US CLIVAR Variations 3, /http://www.usclivar.org/publications.html#V3N2S.
Marland, G., Boden, T.A., Andres, R.J., 2008. Global, regional, and national fossil fuelCO2 emissions. In: trends: a compendium of data on global change. CarbonDioxide Information Analysis Center. Oak Ridge National Laboratory, U.S.Department of Energy., Oak Ridge, Tenn. USA.
McPhaden, M.J., 1999. Genesis and evolution of the 1997–98 El Nino. Science 283,950–954.
McPhaden, M.J., 2004. Evolution of the 2002/03 El Nino. Bulletin of AmericanMeteorological Society 85, 677–695.
McPhaden, M.J., 2008. Evolution of the 2006–2007 El Nino: the role ofintraseasonal to interannual time scale dynamics. Advances in Geosciences14, 219–230.
Menkes, C.E., Kennan, S.C., Flament, P., Dandonneau, Y., Masson, S., Biessy, B.,Marchal, E., Eldin, G., Grelet, J., Montel, Y., Morliere, A., Lebourges, A., Moulin,C., Champalbert, G., Herbland, A., 2002. A whirling ecosystem in the equatorialAtlantic. Geophysical Research Letters 29. doi:10.1029/2001GL014576.
Palacz, A.P., Chai, F., Dugdale, R.C., Measures, C.I., 2010. Estimating iron andaluminum removal rates in the eastern equatorial Pacific Ocean using a boxmodel approach. Deep-Sea Research II, this volume [doi: 10.1016/j.dsr2.xxxx.xx.xxx].
Philander, S.G.H., 1978. Instabilities of zonal equatorial currents. Journal ofGeophysical Research 83, 3679–3682.
Ryan, J.P., Ueki, I., Chao, Y., Zhang, H., Polito, P.S., Chavez, F.P., 2006. Western Pacificmodulation of large phytoplankton blooms in the central and easternequatorial Pacific. Journal of Geophysical Research 111, G02013.doi:10.1029/2005JG000084.
Solorzano, L., 1969. Determination of ammonia in natural waters by thephenolhypochlorite method. Limnology and Oceanography 14, 799–801.
l Pacific tropical instability waves on hydrography and nutrients:.015

1
3
5
7
9
11
13
15
17
19
21
23
P.G. Strutton et al. / Deep-Sea Research II ] (]]]]) ]]]–]]]12
Strutton, P.G., Ryan, J.P., Chavez, F.P., 2001. Enhanced chlorophyll associated withtropical instability waves in the equatorial Pacific. Geophysical ResearchLetters 28, 2005–2008.
Takahashi, T., Sutherland, S.C., Sweeney, C., Poisson, A., Metzl, N., Tilbrook, B.,Bates, N., Wanninkhof, R., Feely, R.A., Sabine, C., Olafsson, J., Nojiri, Y., 2002.Global sea–air CO2 flux based on climatological surface ocean pCO2, andseasonal biological and temperature effects. Deep-Sea Research II 49, 1601–1622.
Taylor, A.G., Landry, M.R., Selph, K.E., Yang, E.J., 2010. Biomass, size structureand depth distributions of the microbial community in the easternequatorial Pacific. Deep-Sea Research II, this volume [doi: 10.1016/j.dsr2.xxxx.xx.xxx].
Toggweiler, J.R., Carson, S., 1995. What are upwelling systems contributing toglobal nutrient and carbon budgets?. In: Summerhayes C.P. (Ed.), Upwelling
Please cite this article as: Strutton, P.G., et al., The impact of equatoria2004-2005. Deep-Sea Research II (2010), doi:10.1016/j.dsr2.2010.08
the Ocean: Modern Processes and Ancient Records. John Wiley & Sons, Inc.,Chichester, England pp..
Vichi, M., Masina, S., Nencioli, F., 2008. A process-oriented model study ofequatorial Pacific phytoplankton: the role of iron supply and tropicalinstability waves. Progress in Oceanography 78, 147–162.
Whitledge, T.E., Malloy, S., Patton, C.J., Wirick, C.D., 1981. Automated nutrientanalysis in seawater. Brookhaven National Laboratory Technical Report BNL51398, 226pp.
Wolter, K., Timlin, M.S., 1998. Measuring the strength of ENSO—how does 1997/98rank? Weather 53 315–324.
Wyrtki, K., 1981. An estimate of equatorial upwelling in the Pacific. Journal ofPhysical Oceanography 11, 1205–1214.
Yoder, J.A., Ackleson, S.G., Barber, R.T., Flament, P., Balch, W.M., 1994. A line in thesea. Nature 371, 689–692.
l Pacific tropical instability waves on hydrography and nutrients:.015
Copyright © 2022 FDOKUMEN