mass in passive solar buildings at equatorial high altitudes
245
ENERGY-EFFICIENCY AND COMFORT CONDITIONS THROUGH THERMAL MASS IN PASSIVE SOLAR BUILDINGS AT EQUATORIAL HIGH ALTITUDES By DAVID MWALE OGOLI A DISSERTATION PRESENTED TO THE GRADUATE SCHOOL OF THE UNIVERSITY OF FLORIDA IN PARTIAL FULFILLMENT OF THE REQUIREMENTS FOR THE DEGREE OF DOCTOR OF PHILOSOPHY UNIVERSITY OF FLORIDA 2000
-
Upload
khangminh22 -
Category
Documents
-
view
4 -
download
0
Transcript of mass in passive solar buildings at equatorial high altitudes
ENERGY-EFFICIENCY AND COMFORT CONDITIONS THROUGH THERMALMASS IN PASSIVE SOLAR BUILDINGS AT EQUATORIAL HIGH ALTITUDES
By
DAVID MWALE OGOLI
A DISSERTATION PRESENTED TO THE GRADUATE SCHOOLOF THE UNIVERSITY OF FLORIDA IN PARTIAL FULFILLMENT
OF THE REQUIREMENTS FOR THE DEGREE OFDOCTOR OF PHILOSOPHY
UNIVERSITY OF FLORIDA
2000

Copyright 2000
By
DAVID MWALE OGOLI

Dedicated to Roy and Sharon
ACKNOWLEDGMENTS
This project is by no means the effort of an individual. It represents the exemplary
effort and commitment of Professor Gary Walter Siebein (Department of Architecture)
without whose help this work would not be what it is now. He was very supportive and
he offered outstanding academic and professional guidance throughout my doctoral
studies. He always asked me the right questions and assisted me to frame the best course
of action. I wish to thank him most sincerely and will always emulate his example
throughout my career.
Professor Emeritus Bertram Y. Kinzey (Department of Architecture) gave me his
comments, criticisms and invaluable support for which I am utterly grateful. I extend my
utmost gratitude to Professor Ira H. Winarsky (Department of Architecture) for his
friendship, help and perpetual intellectual stimulation. I am fortunate to have worked
closely with Professor Martin A. Gold (Department of Architecture). We shared many
wonderful hoiu"s working together throughout my studies. I extend many special thanks
for the exemplary work of Professor D. Yogi Goswami (Department of Mechanical
Engineering) who enlightened me on current engineering principles.
I also extend my thanks to the JJ Fulbright Foundation (New York, NY) for
funding this program. I wish to thank the College of Architecture for continuously
providing me with a stimulating academic environment in which to realize my academic
goals. I am proud to have attended this distinguished institution where I interacted with
wonderful staff and students.
iv

Staff and students at Jomo Kenyatta University of Agriculture and Technology
(JKUAT) need commendation for granting me the basis to realize this academic venture.
Particularly, I wish to thank Professor P. G. Ngunjiri, Professor S. Ike Umenne, Mwangi
Maringa, C. O. A. Misiani, and S. Kigondu for their great academic and professional
inspiration. I extend my special gratitude to P. M. Wanderi, D. M. Saiva, Kenduiywo,
Mugambi, Shikanda, Murgor, Ojello and Osamu Yamada from JICA (Japan International
Cooperation Agency) for assistance in putting together the test houses at JKUAT.
I wish to express my sincere appreciation to my parents for their motivation and
moral support at home in Kaimosi, Kenya. They gave me the foundational basis to aim
high in life by reminding me that any goal is achievable through hard work. I am utterly
grateful to God for them. Last but not least, I wish to thank my wife Iris for her support,
patience and encouragement; I wish to thank our children Roy and Sharon. They stood
together with me throughout my studies.
V
TABLE OF CONTENTS
page
ACKNOWLEDGMENTS iv
LIST OF TABLES viii
LIST OF FIGURES ix
ABSTRACT xiii
1. INTRODUCTION 1
Goals and Objectives 7
Scope and Framework of the Study 9
Research Method 12
Importance of the Research 16
Definition of Thermal Mass 23
Major Theoretical Issues 24
Conclusions 37
2. EXPERIMENTAL STUDY ON THERMAL MASS 39
Introduction 39
Experimental Test Houses 46
Results 55
Analysis and Discussion 67
Conclusions from the Experimental Study 97
3. EFFECT OF CLIMATE ON THERMAL MASS 99Introduction 99Climate of Nairobi, Kenya 101
Psychrometric Analysis of the Climate of Nairobi, Kenya 123
Effect of Climate on Thermal Mass 126
Buildings in Kenya 130
Conclusion 133
4. THERMAL COMFORT AND THERMAL MASS 135Introduction 135Recent Studies in Thermal Comfort in Buildings 136Thermal Comfort and Thermal Mass 143Conclusions 148
vi
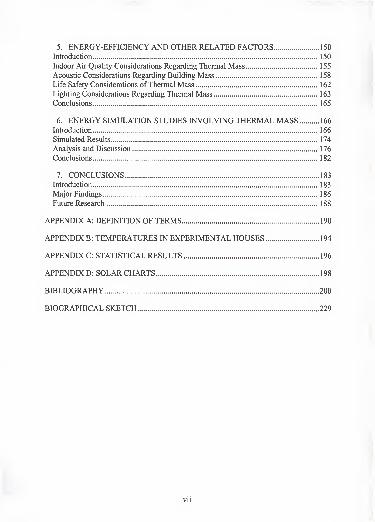
5 . ENERGY-EFFICIENCY AND OTHER RELATED FACTORS 1 50
Introduction 150
Indoor Air Quality Considerations Regarding Thermal Mass 155
Acoustic Considerations Regarding Building Mass 158
Life Safety Considerations of Thermal Mass 162
Lighting Considerations Regarding Thermal Mass 163
Conclusions 165
6. ENERGY SIMULATION STUDIES INVOLVING THERMAL MASS 166
Introduction 166
Simulated Results 174
Analysis and Discussion 176
Conclusions 182
7. CONCLUSIONS 183
Introduction 183
Major Findings 186
Future Research 188
APPENDIX A: DEFINITION OF TERMS 190
APPENDIX B: TEMPERATURES IN EXPERIMENTAL HOUSES 194
APPENDIX C: STATISTICAL RESULTS 196
APPENDIX D: SOLAR CHARTS 198
BIBLIOGRAPHY 200
BIOGRAPHICAL SKETCH 229
vii
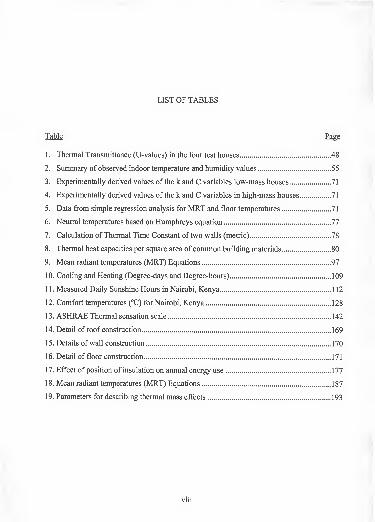
LIST OF TABLES
Table Page
1 . Thermal Transmittance (U-values) in the four test houses 48
2. Summary of observed indoor temperature and humidity values 55
3. Experimentally derived values of the k and C variables low-mass houses 71
4. Experimentally derived values of the k and C variables in high-mass houses 71
5. Data from simple regression analysis for MRT and floor temperatures 71
6. Neutral temperatures based on Humphreys equation 77
7. Calculation of Thermal Time Constant of two walls (metric) 78
8. Thermal heat capacities per square area ofcommon building materials 80
9. Mean radiant temperatures (MRT) Equations 97
10. Cooling and Heating (Degree-days and Degree-hours) 109
11. Measured Daily Sunshine Hours in Nairobi, Kenya 112
12. Comfort temperatures (°C) for Nairobi, Kenya 128
13. ASHRAE Thermal sensation scale 142
14. Detail of roof construction 169
15. Details of wall construction 170
16. Detail of floor construction 171
17. Effect of position of insulation on annual energy use 177
18. Mean radiant temperatures (MRT) Equations 187
19. Parameters for describing thermal mass effects 193
viii
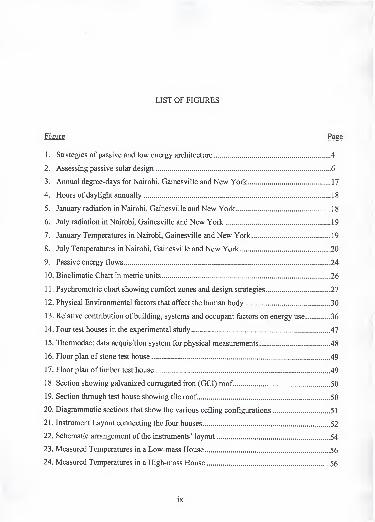
LIST OF FIGURES
Figure Page
1 . Strategies of passive and low energy architecture 4
2. Assessing passive solar design 6
3. Annual degree-days for Nairobi, Gainesville and New York 17
4. Hours of daylight annually 18
5. January radiation in Nairobi, Gainesville and New York 1
8
6. July radiation in Nairobi, Gainesville and New York 19
7. January Temperatures in Nairobi, Gainesville and New York 19
8. July Temperatures in Nairobi, Gainesville and New York .20
9. Passive energy flows 24
10. Bioclimatic Chart in metric units 26
11. Psychrometric chart showing comfort zones and design strategies 27
12. Physical Environmental factors that affect the human body 30
13. Relative contribution of building, systems and occupant factors on energy use 36
14. Four test houses in the experimental study 47
15. Thermodac: data acquisition system for physical measurements 48
16. Floor plan of stone test house 49
17. Floor plan of timber test house 49
18. Section showing galvanized corrugated iron (GCI) roof. 50
19. Section through test house showing tile roof. 50
20. Diagrammatic sections that show the various ceiling configurations 51
21. Instrument Layout connecting the four houses 52
22. Schematic arrangement of the instruments' layout 54
23. Measured Temperatures in a Low-mass House 56
24. Measured Temperatures in a High-mass House 56
ix
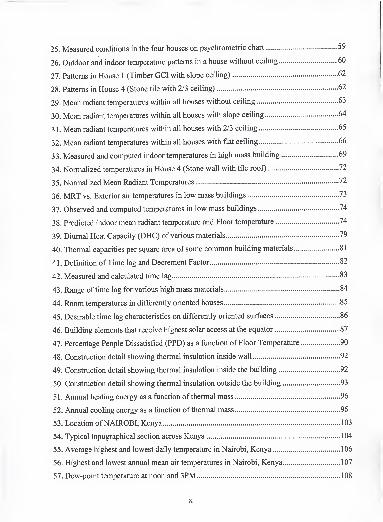
25. Measured conditions in the four houses on psychrometric chart 59
26. Outdoor and indoor temperature patterns in a house without ceiling 60
27. Patterns in House 1 (Timber GCI with slope ceiling) 62
28. Patterns in House 4 (Stone tile with 2/3 ceiling) 62
29. Mean radiant temperatures within all houses without ceiling 63
30. Mean radiant temperatures within all houses with slope ceiling 64
31. Mean radiant temperatures within all houses with 2/3 ceiling 65
32. Mean radiant temperatures within all houses with flat ceiling 66
33. Measured and computed indoor temperatures in high mass building 69
34. Normalized temperatures in House 4 (Stone wall with tile roof) 72
35. Normalized Mean Radiant Temperatures 72
36. MRT vs. Exterior air temperatures in low mass buildings 73
37. Observed and computed temperatures in low mass buildings 74
38. Predicted indoor mean radiant temperature and Floor temperature 74
39. Diurnal Heat Capacity (DHC) of various materials 79
40. Thermal capacities per square area of some common building materials 81
41. Definition ofTime lag and Decrement Factor 82
42. Measured and calculated time lag 83
43. Range of time lag for various high mass materials 84
44. Room temperatures in differently oriented houses 85
45. Desirable time lag characteristics on differently oriented surfaces 86
46. Building elements that receive highest solar access at the equator 87
47. Percentage People Dissatisfied (PPD) as a function of Floor Temperature 90
48. Construction detail showing thermal insulation inside wall 92
49. Construction detail showing thermal insulation inside the building 92
50. Construction detail showing thermal insulation outside the building 93
5 1 . Annual heating energy as a function of thermal mass 96
52. Annual cooling energy as a function of thermal mass 96
53. Location ofNAIROBI, Kenya 103
54. Typical topographical section across Kenya 104
55. Average highest and lowest daily temperature in Nairobi, Kenya 106
56. Highest and lowest annual mean air temperatures in Nairobi, Kenya 107
57. Dew-point temperature at noon and 3PM 108
X
58. Extreme annual temperatures (since 1955) 108
59. Number of hours for cooling, heating and comfort zone 109
60. Ratio of cooling, heating and comfort zone hours 1 10
61. Measured daily radiation on a horizontal surface Ill
62. Measured Daily Sunshine Hours 11
1
63. Definitions of solar angles 113
64. Measured and calculated solar radiation compared 116
65. Average solar radiation on 21*' day of every month 11
7
66. Daily solar radiation on vertical surfaces in January 118
67. Solar radiation as a fiinction of altitude angle 119
68. Solar altitude and Solar azimuth angles 120
69. Relative humidity at 6AM, Noon, and 3PM 121
70. Rainfall patterns in Nairobi, Kenya 122
71. Psychrometric chart defining climate-conditioning processes 123
72. Climatic zones as defined on the psychrometric chart 124
73. Annual average climate for Nairobi, Kenya, on psychrometric chart 125
74. Daily average temperature in January and July in Nairobi, Kenya 125
75. Hours for cooling, heating and comfort zone for Nairobi, Kenya 126
76. Comfort temperatures in Nairobi, Kenya 130
77. Plan of an African traditional round house 132
78. Residential units with solar access elements 133
79. Boundaries of acceptable conditions for still air 145
80. Thermal comfort limits as extended by natural ventilation 146
81. Boundaries and design strategies for thermal comfort 146
82. Annual energy use a function of air changes per hour 148
83. Energy consumption in Kenya by primary source in 1996 152
84. Sound paths through building mass 159
85. Schematic illustration of airborne sound attenuation in high mass walls 160
86. Transmission loss performance based on equal surface weight 161
87. Thermal storage effect in cooling load from lights 164
88. Thermal circuit showing thermal mass in a passive solar building 166
89. Electrical analogue of the thermal performance of a building element 167
90. Plan of a passive solar house 168
xi
91. Ranking strategies BEFORE applying insulation and thermal mass 172
92. Ranking strategies AFTER applying insulation and thermal mass 173
93. Monthly electric demand peaks 174
94. Annual energy use 175
95. Annual energy cost 175
96. Annual cooling energy for different shading orientations 177
97. Effect of position of insulation on annual energy 178
98. Energy consumption (kWh/m^) for houses 178
99. Simulated indoor temperatures for a building with walls 200mm thick 181
1 00. Degree-days at various equatorial altitudes 185
101. Annual degree-days for Nairobi, Tel Aviv, Sede Boqer and Los Angeles 1 85
102. Predicted indoor mean radiant temperatures in high mass building 187
1 03 . Design strategies for passive and low energy buildings 189
1 04. Outdoor and indoor temperature patterns in the timber houses 1 94
105. Outdoor and indoor temperature patterns in the stone houses 1 94
106. Mean radiant temperatures within all houses (without ceiling) 195
107. Sun path diagram at the Equator (0° N/S) 198
108. Sun path diagram at latitude 2° N 199
1 09. Sun path diagram at latitude 4° N 1 99
xii

Abstract of Dissertation Presented to the Graduate School
of the University of Florida in Partial Fulfillment of the
Requirements for the Degree of Doctor of Philosophy
ENERGY-EFFICIENCY AND COMFORT CONDITIONS THROUGH THERMALMASS IN PASSIVE SOLAR BUILDINGS AT EQUATORIAL HIGH ALTITUDES
By
David Mwale Ogoli
December 2000
Chairman: Professor Gary W. Siebein
Major Department: Architecture
This dissertation is based on the philosophy that architectural design should not
just be a function of aesthetics, but also of energy-efficiency, advanced technologies and
passive solar strategies. A lot of published literature is silent regarding buildings in
equatorial highland regions. This dissertation is part of the body of knowledge that
attempts to provide a study of energy in buildings using thermal mass.
The objectives were to establish (1) effect of equatorial high-altitude climate on
thermal mass, (2) effect of thermal mass on moderating indoor temperatures, (3) effect of
thermal mass in reducing heating and cooling energy, and (4) the amount of time lag and
decrement factor of thermal mass.
Evidence to analyze the effect of thermal mass issues came from three sources.
First, experimental physical models involving four houses were parametrically conducted
xiii
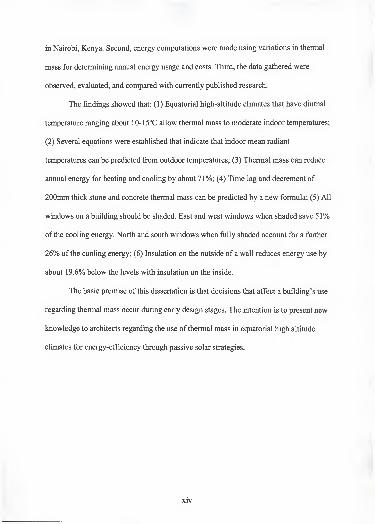
in Nairobi, Kenya. Second, energy computations were made using variations in thermal
mass for determining annual energy usage and costs. Third, the data gathered were
observed, evaluated, and compared with currently published research.
The findings showed that: (1) Equatorial high-altitude climates that have diurnal
temperature ranging about 10-15°C allow thermal mass to moderate indoor temperatures;
(2) Several equations were established that indicate that indoor mean radiant
temperatures can be predicted from outdoor temperatures; (3) Thermal mass can reduce
annual energy for heating and cooling by about 71%; (4) Time lag and decrement of
200mm thick stone and concrete thermal mass can be predicted by a new formula; (5) All
windows on a building should be shaded. East and west windows when shaded save 51%
of the cooling energy. North and south windows when fully shaded account for a further
26% of the cooling energy; (6) Insulation on the outside of a wall reduces energy use by
about 19.6% below the levels with insulation on the inside.
The basic premise of this dissertation is that decisions that affect a building's use
regarding thermal mass occur during early design stages. The intention is to present new
knowledge to architects regarding the use of thermal mass in equatorial high altitude
climates for energy-efficiency through passive solar strategies.
xiv
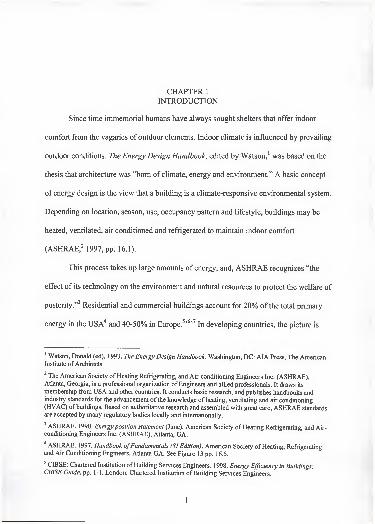
CHAPTER 1
INTRODUCTION
Since time immemorial humans have always sought shelters that offer indoor
comfort from the vagaries of outdoor elements. Indoor climate is influenced by prevailing
outdoor conditions. The Energy Design Handbook, edited by Watson,' was based on the
thesis that architecture was "bom of climate, energy and environment." A basic concept
of energy design is the view that a building is a climate-responsive environmental system.
Depending on location, season, use, occupancy pattern and lifestyle, buildings may be
heated, ventilated, air conditioned and refrigerated to maintain indoor comfort
(ASHRAE,^ 1997, pp. 16.1).
This process takes up large amounts of energy, and, ASHRAE recognizes "the
effect of its technology on the environment and natural resources to protect the welfare of
postenty." Residential and commercial buildings account for 20% of the total primary
energy in the USA'' and 40-50% in Europe.^'^'^ In developing countries, the picture is
' Watson, Donald (ed). 1993. The Energy Design Handbook. Washington, DC: AIA Press, The AmericanInstitute of Architects.
^ The American Society of Heating Refrigerating, and Air-conditioning Engineers Inc. (ASHRAE),Atlanta, Georgia, is a professional organization of Engineers and allied professionals. It draws its
membership from USA and other countries. It conducts basic research, and publishes handbooks andindustry standards for the advancement of the knowledge of heating, ventilating and air conditioning
(HVAC) of buildings. Based on authoritative research and assembled with great care, ASHRAE standards
are accepted by many regulatory bodies locally and internationally.
^ ASHRAE. 1990. Energy position statement (June). American Society of Heating Refrigerating, and Air-conditioning Engineers Inc. (ASHRAE), Atlanta, GA.
* ASHRAE. 1997. Handbook ofFundamentals (SI Edition). American Society of Heating, Refrigerating
and Air Conditioning Engineers, Atlanta GA. See Figure 13 pp. 16.5.
' CIBSE: Chartered Institution of Building Services Engineers. 1998. Energy Efficiency in Buildings:CIBSE Guide, pp. 1-1. London: Chartered Institution of Building Services Engineers.
1
more severe. For instance in Kenya, rural households make up about 80% of the
population and they use 59% of the total energy in the sector.^
The use of heating, ventilating and air-conditioning (HVAC) systems have risen
in recent years (Santamouris and Asimakopolous, 1996, pp. 12; Stein and Reynolds,
2000, pp. 9-12; Hinrichs, 1996, pp. 6), at the rate of almost 10% per year in USA. Today,
two thirds of all households have some form of air conditioning (40% have central air),
while 83% of all commercial space is air-conditioned.' In southeastern USA it is more
serious. In a typical Florida residential power bill 49.5% is required for space heating and
cooling. Water heating accounts for 22.9% of the energy expenses. Cooking, lighting and
appliances and other miscellaneous sources use the remaining 27.5%>.'*^ Chapter 34 of the
1999 ASHRAE Handbook ofApplications outlines different analysis techniques that may
be used to select an optimum system for energy management currently adopted in Kenya.
ASHRAE acknowledges "the energy requirements and fuel consumption of
HVAC systems have a direct impact on the cost of operating a building and an indirect
impact on the environment."" A primary objective of building energy analysis is
economic - to determine the most cost-effective method among available options. Many
* Santamouris, M., A. Argiriou, E. Dascalaki, C. A. Balaris and A. Gaglia. 1994. Energy characteristics andsavings potential in office buildings , in Solar Energy vol. 52 pp. 59-66. Amsterdam: Elsevier ScienceLimited.
' Lewis, J. Owen. 2000. Developing a low energv architecture for Europe in Architecture, City andEnvironment: Proceedings ofPLEA 2000, Cambridge, UK (July 2000) by Koen Steemers and SimosYannas (eds) pp. 10-15. James & James (Science Publishers) Ltd.
* Hankin, M. 1987. Renewable Energy in Kenya. Nairobi: Creative Motives, pp. 2.
' Hinrichs, Roger, A. 1996. Energy: Its use and the environment. New York: Saunders College Publishingpp. 137.
Florida Solar Energy Center (FSEC). 1992. Manual entitled: Energy-efficient Florida Home BuildingFSEC-GP-33-88 by Veira, Robin K., Kenneth G. Sheinkopf and Jeffrey K. Sonne at Florida Solar EnergyCenter (FSEC) Cape Canaveral, FL. pp. 2- 1
.
" ASHRAE. 1997. Handbook ofFundamentals (SI Edition). American Society of Heating, Refrigeratingand Air Conditioning Engineers, Atlanta GA. pp. 30.1.
developing countries cannot afford the rising costs of fossil fuels, and therefore, have to
develop renewable energy sources. Consequently, interest in the use of natural energies
as substitutes for conventional fiaels has been renewed and intensified. The local climate,
type of building, schedule of usage, equipment, appliances and the lifestyles of the users
influence energy consumption in buildings.
Buildings account for 40% of the materials and about one third of the energy
consumed by the world economy.'^ The world acknowledges that environmental
problems are associated with CFC refrigerants in HVAC systems that are causing ozone
depletion. Recent studies (ASHRAE,'^ Baker,'^ Santamouris,'^ UNCHS,'^ Dennison'^)
have shown that problems with indoor air quality and illness occur more frequently in
deep-plan buildings with air-conditioning than in those without air conditioning. "Sick
building syndrome," more commonly called "building-related illness," has focused
attention on the need to evaluate how buildings are designed, ventilated and
maintained.'^''' Watson,^" Santamouris,^' Givoni^^ and Goulding et alP suggested a
Rees, William, E. 1999. The built-environment and the ecosphere: a global perspective . BuildingResearch & Information, (1999) 27 (4/5), 206-220. London: E & FN Spon.
'Mbid. pp. 9.5.
''' Baker, N. V. 2000. We are all outdoor animals m Architecture, City and Environment: Proceedings ofPLEA 2000. Cambridge, UK (July 2000) by Koen Steemers and Simos Yannas (eds) pp. 553-555. James &James (Science Publishers) Ltd.
Santamouris, M. and D. Asimakopolous (ed). 1996. Passive Cooling ofBuildings. London: James &James (Science Publishers) Ltd. pp. 37.
UNCHS: United Nations Conference ofHuman Settlements (Habitat). 2000. Building Sustainable Cities
by Rainer Norberg and Conflicts Between the Construction Industry and the Environment by Bans Der-Petrossian at http://www.unchs.orp/unchs/english/hdv5n2/intro.htm .
" Dennison, Peter, J. 1994. An Examination and Analvsis of Sick Building Syndrome in Selected Librariesof Great Britain. Master's Thesis at Loughborough University, UK.
ASHRAE. 1997. Handbook ofFundamentals (SI Edition). American Society of Heating, Refrigeratingand Air Conditioning Engineers, Atlanta GA. pp. 13.5.
" Fitch, James Marston with William Bobenhausen. 1999. American Building: The Environmentalforcesthat shape it. New York: Oxford University Press pp. 90.
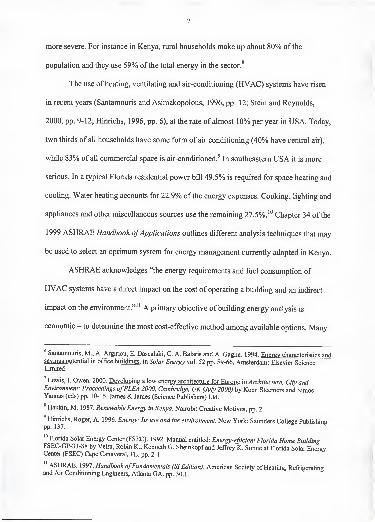
framework of considering passive and low energy architecture in the context of energy
conservation as prevention of excess heat, temperature modulation^'* and heat dissipation
through ventilation, a concept summarized in the figure below. Thermal mass is
commonly used in two broad strategies: passive cooling and passive heating.
Passive and Low Energy Architecture
I
Passive Cooling
1Passive Heating
Heat Prevention Heat Dissipation
— Microclimate
— Solar control
— Building form and layout
— Thermal insulation
— Lifestyles of occupants— Occupancy patterns
— Internal heat gain control
— Site design
1Heat IVIodulation
— Ventilation
— Ground cooling
- Evaporative cooling
- Radiative cooling
Use of thermal mass
— Direct gain
— Storage (Trombe) wall
— Wall convective loops
— Sun spaces
Figure 1 : Strategies of passive and low energy architecture
A recent study by Cook traced the evolution ofmodem office architecture in the
USA and showed that it was generally associated with air conditioning, artificial lighting
and the emergence of the high-rise typology, the skyscraper. Cook observed:
Watson, Donald (ed). 1993. The Energy Design Handbook. Washington, DC: AIA Press, The AmericanInstitute of Architects.
^' Santamouris, M. and D. Asimakopolous (ed). 1996. pp. 6.
Givoni, Baruch. 1998b. Climate Considerations In Building And Urban Design. Van Nostrand Reinhold,
New York, NY. pp. 149.
Goulding, J. R., J. Owen Lewis and T. C. Steemers (eds). 1992. Energy in Architecture, The EuropeanSolar Handbook, Commission of the European Communities, Brussels.
^* "Modulation" means the ability of the building to reduce, regulate or adjust the amplitude of daily indoor
temperature against daily outdoor temperature swings. The thermal mass of a building (typically containedin walls, floors and partitions, constructed of material with high heat capacity) absorbs heat during the dayand regulates the magnitude of indoor temperature swings, reduces peak cooling load and transfers part ofthe absorbed heat into the night hours (Santamouris and Asimakopolous, 1996. pp. 8).
Cook, Jeffrey. 2000. Evolution of American office architecture to 1950: Pollution vs. passive strategies
to design the work environment in Architecture, City and Environment: Proceedings ofPLEA 2000,Cambridge, UK (July 2000) by Koen Steemers and Simos Yannas (eds) pp. 16-21. James & James (SciencePublishers) Ltd.
5
Essentially, it took over a half a century, up to 1950 for true air
conditioning to shift the architectural paradigm and to free exterior form
from the restraints of daylighting and natural ventilation. Thereafter, it
took less than a quarter century to rediscover passively based architectural
design.
These shifts and the succession in architectural styles (International style to Post-
modernism) offer important lessons for developing countries. Daylighting and natural
ventilation required high floor-to-ceiling heights and high building heights. Radovic^*
highlighted environmental issues for offices. For passive solar strategies to be effective,
they should be evaluated continually throughout the design process. To use the words of
Balcomb, et al. (1996, pp. 37):
This is an iterative process - design, adjust the model, review, design,
adjust the building description, evaluate, design, adjust the building
description, review, etc. Each step along the way represents a different
design scheme.^'
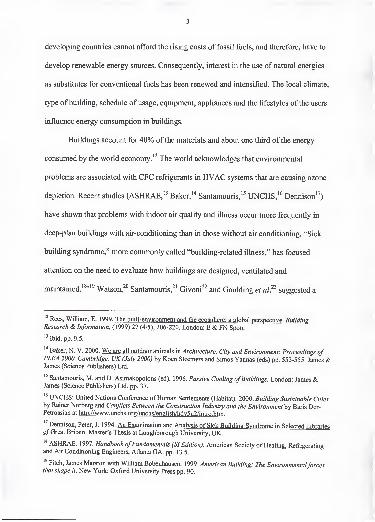
The Commission of European Communities (CEC)^^ said that "Architecture is a
process" and this idea is implied in a modeP' shown below in Figure 2. The idea
conveyed by this method is that the iterative nature of architecture should move forward
an backwards to test and re-test applicable solutions. This is true for establishing passive
solar strategies that are climate-responsive and appropriate for a given region.
Radovic, Darko. 2000. Green office building: Environmental issues and themes as seen by architects in
Architecture. City and Environment: Proceedings ofPLEA 2000, Cambridge, UK (July 2000) by KoenSteemers and Simos Yannas (eds) pp. 38-41. James & James (Science Publishers) Ltd.
Balcomb, J. Douglas. 1996. Designing low-energy buildings: Passive solar strategies and Energy-10Software. Developed in collaboration with Passive Solar Industries Council, National Renewable EnergyLaboratory, Lawrence Berkeley National Laboratory and US Department of Energy (DOE) pp. 37.
CEC: Commission of European Communities. 1990. Passive solar energy as afuel- 1990-2010.Executive Summary, Commission of European Communities, DGXH, pp. 29.
^' Ogoli, David Mwale. 2000. An assessment method for the performance of passive solar buildings at
equatorial high altitudes in Architecture, City and Environment: Proceedings ofPLEA 2000, Cambridge,
6
Assessment Procedure for Passive Solar Design
Project Start
Analyze the brief
Conceptual [
Preparation of initia
}esign Stagedesign from briefs
Adjust building designPefform energy caloiatons to evaluate passive cooling, twating and dayl^hting strategies
- Thermal mass- Natural ventilation
- Natural lighting
- Insulation
-Shading- Passive heating
- Passive cooling
Schematic Design StagePreparation of scheme design
Review Scheme DesignPerform energy calctiations to r»«\«luete paswe cooling, heating and daylighting strategies
- Themial mass- Natural ventilation
- Natural lighting
- Insulation
- Shading- Passive heating
- Passive cooling
Detailed Design StagePreparation of dataited working drawngs to support prewus design stages
Use models and simulationsReMew and evaluate performance goals of detailed design
-Consider high-efficient HVAC systems- Consider energy-efficient lighting
- Consider lighting controls and "intelligenr systems)- Review passive solar strategies
I- Value engineering and quality control
Bidding and Construction StageJob site si^ianlsion and observation by design team to insae that systems are buHt as designed
Adjust landscape and natural systemsEvaluate natural enwonmeital strategies
-Adjust landscaping
-Adjust for evaporative cooling
I— Adjust for environmental heat sinks
Project EndPost contractual mairtenance. occipancy evaluation to assess energy loads, comfort, indoor air quality and costs
Figure 2: Assessing passive solar design
UK (July 2000) by Koen Steemers and Siinos Yannas (eds) pp. 827-828. James & James (SciencePublishers) Ltd.
7
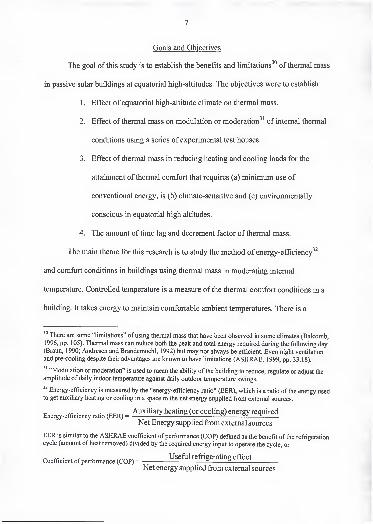
Goals and Objectives
The goal of this study is to establish the benefits and limitations'" of thermal mass
in passive solar buildings at equatorial high-altitudes. The objectives were to establish:
1 . Effect of equatorial high-altitude climate on thermal mass.
2. Effect of thermal mass on modulation or moderation of internal thermal
conditions using a series of experimental test houses.
3. Effect of thermal mass in reducing heating and cooling loads for the
attainment of thermal comfort that requires (a) minimum use of
conventional energy, is (b) climate-sensitive and (c) environmentally
conscious in equatorial high altitudes.
4. The amount of time lag and decrement factor of thermal mass.
The main theme for this research is to study the method of energy-efficiency'^
and comfort conditions in buildings using thermal mass in moderating internal
temperature. Controlled temperature is a measure of the thermal comfort conditions in a
building. It takes energy to maintain comfortable ambient temperatures. There is a
There are some "limitations" of using thermal mass that have been observed in some climates (Balcomb,
1996, pp. 105). Thermal mass can reduce both the peak and total energy required during the following day(Braun, 1990; Andresen and Brandemuehl, 1992) but may not always be efficient. Even night ventilation
and pre-cooling despite their advantages are known to have limitations (ASHRAE, 1999, pp. 33.18).
^' "Modulation or moderation" is used to mean the ability of the building to reduce, regulate or adjust the
amplitude of daily indoor temperature against daily outdoor temperature swings.
Energy-efficiency is measured by the "energy-efficiency ratio" (EER), which is a ratio of the energy usedto get auxiliary heating or cooling in a space to the net energy supplied from external sources.
Energy-efficiency ratio (EER) =Auxiliary heating (or cooling) energy required
Net Energy supplied from external sources
EER is similar to the ASHRAE coefficient of performance (COP) defined as the benefit of the refrigeration
cycle (amount of heat removed) divided by the required energy input to operate the cycle, or
„ . , . - Useful refrigerating effectCoefficient of performance (COP) = —
Net energy supplied from external sources
8
worldwide need to reduce the use of harmful systems^^ because of their impact on energy
usage.^"* The "Earth Summit" held in Rio de Janeiro in June 1992 and the "Kyoto
Protocol" held in Japan in December 1997 were efforts made to control adverse effects
on the environment and climate change caused by large energy demand due to rapid
human growth. Passive cooling and heating systems are climate-conscious solutions to
architectural design. This means that the size, capacity and energy input for
supplementary HVAC systems can be designed to the optimal level^^.
The theme of this research arises out of the need to optimize energy use in
buildings and to make intelligent use of the available resources to create a comfortable
and healthy built environment. The human population is rapidly urbanizing, leading
many observers to conclude that humans are leaving nature and the countryside
behind.''^' Up to 80% of the populations of high-income countries already live in cities
and towns, and 25% of the human population consumes 80% of the world's economic
(ASHRAE, 1997, pp. 1.3)
" Reduction of harmful systems were the reason that the Rio Earth Summit was held in June 1992 where118 heads of state stressed that one nation could longer do anything it wants with its environment without
regard to the impact on other countries. They established goals to stabilize carbon dioxide and other green
house gas emissions and set Agenda 21, an environmental action plan for the 21^' century that coveredsustainable development, etc.
Hinrichs, Roger, A. 1996. Energy: Its use and the environment. New York: Saunders College Publishing
pp. 25-28, 238-278.
" WorldWatch Paper 124, March 1995. Jane A. Peterson (ed). Building Revolution: How Ecology andHealth Concerns are Transforming Construction by David Malin and Roodman and Nicholas Lenssen.WorldWatch Institute, 1776 Massachusetts Ave., NW Washington DC 20036. Also found at
http://www.worldwatch.org/pubs/paper/124.html .
^* The term "Optimal level" is used to denote the best and correct sizing HVAC system that complementsthe positive contribution of passive systems.
" Rees, William, E. 1999. The built-environment and the ecosphere: a global perspective. Building
Research & Information, (1999) 27 (4/5), 206-220. London: E & FN Spon.
Baker, N. V. 2000. We are all outdoor animals in Architecture, City and Environment: Proceedings ofPLEA 2000. Cambridge, UK (July 2000) by Koen Steemers and Simos Yannas (eds) pp. 553-555. James &James (Science Publishers) Ltd.
9
output. In short, "half the people and three-quarters of the world's environmental
problems reside in cities."^" Cities have most buildings that are increasingly dependent on
mechanically controlled indoor climates. Yet low-energy design is still not widely
adopted (Yannas, 1994, pp. 23).
Large architectural design issues like building location, form, shape, orientation,
landscaping, envelope, daylighting, and doors and windows can control the effects of
solar radiation even when outdoor temperatures are too high or too low. A passive solar
building balances all aspects of energy use (lighting, cooling, heating and ventilation) by
focusing on whole building performance'*' (Balcomb, 1996, pp. 14). CEC*^ said:
Passive solar design uses building form and fabric to admit, distribute and
re-emit solar energy radiation, conduction and natural convection. Passive
systems obtain solar energy from glazing (direct gain), thermal mass
(indirect gain from solar energy, first absorbed by the thermal mass and
then radiated or convected as heat), or a separate storage system (isolated
gain, usually heat transferred from a thermal mass away from a thermal
mass away from the main building.
A passive solar building should be economical yet inspire human intelligence.
Scope and Framework of the Study
The dissertation provides observations on the role of thermal mass and does not
purport to answer every question regarding passive solar methods in general. The criteria
WCED. 1987. Our Common Future. Report of the (UN) World Commission on Environment andDevelopment, New York and Oxford: Oxford University Press.
Rees, William E. 1997. Is "sustainable citv" an oxymoron? Local Environment, 2 (2), 303-310. London-E & FN Spon.
Whole building performance derives its meaning from the principle that the whole is the sum of its parts.
For passive solar buildings it implies developing a design team early in the design process to develop thebuilding shell, the lighting systems, mechanical systems of that building for energy-efficiency.
CEC: Commission of European Communities. 1990. Passive solar energy as afuel - 1990-2010.Executive Summary, Commission of European Communities, DGXII, pp. 1 0.
10
used to comment on other methods are the degree to which they make thermal mass more
effective in moderating indoor temperature against outdoor temperature swings.
In general cases, most literature on architecture describes buildings in terms of
culture, regional context, language, proportion, balance, rhythm, color, texture and
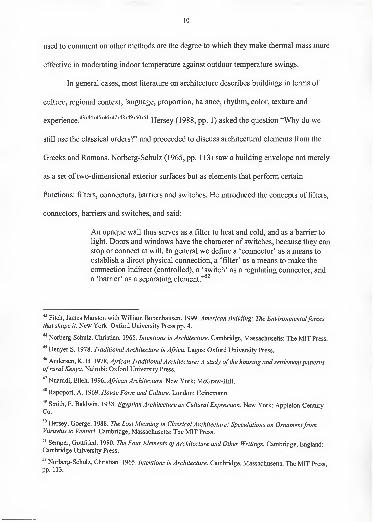
experience.''^'^'^^'^^"*^'''*'^^'^"'^' Hersey (1988, pp. 1) asked the question "Why do we
still use the classical orders?" and proceeded to discuss architectural elements from the
Greeks and Romans. Norberg-Schulz (1965, pp. 113) saw a building envelope not merely
as a set of two-dimensional exterior surfaces but as elements that perform certain
functions: filters, connectors, barriers and switches. He introduced the concepts of filters,
connectors, barriers and switches, and said:
An opaque wall thus serves as a filter to heat and cold, and as a barrier to
light. Doors and windows have the character of switches, because they can
stop or connect at will. In general we define a 'connector' as a means to
establish a direct physical connection, a 'filter' as a means to make the
connection indirect (controlled), a 'switch' as a regulating connector, and
a 'barrier' as a separating element."^^
Fitch, James Marston with WilHam Bobenhausen. 1999. American Building: The Environmentalforcesthat shape it. New York: Oxford University Press pp. 4.
Norberg-Schulz, Christian. 1965. Intentions in Architecture. Cambridge, Massachusetts: The MIT Press.
Denyer S. 1978. Traditional Architecture in Africa. Lagos: Oxford University Press.
Andersen, K. B. 1978. African Traditional Architecture: A study ofthe housing and settlement patterns
ofrural Kenya. Nairobi: Oxford University Press.
^'^Nnamdi, Elleh. 1996. African Architecture. New York: McGraw-Hill.
""^Rapoport, A. 1969. House Form and Culture. London: Heinemann.
Smith, E. Baldwin. 1938. Egyptian Architecture as Cultural Expression. New York: Appleton-CenturyCo.
Hersey, Goerge. 1 988. Tlie Lost Meaning in Classical Architecture: Speculations on OrnamentfromVitruvius to Venturi. Cambridge, Massachusetts: The MIT Press.
Semper, Gottfried. 1980. The Four Elements ofArchitecture and Other Writings. Cambridge, England:Cambridge University Press.
" Norberg-Schulz, Christian. 1965. Intentions in Architecture. Cambridge, Massachusetts: The MIT Press
pp.113.
11
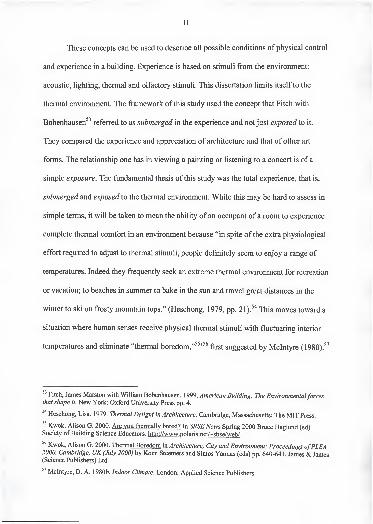
These concepts can be used to describe all possible conditions of physical control
and experience in a building. Experience is based on stimuli from the environment:
acoustic, lighting, thermal and olfactory stimuli. This dissertation limits itself to the
thermal environment. The framework of this study used the concept that Fitch with
Bobenhausen^^ referred to as submerged in the experience and not just exposed to it.
They compared the experience and appreciation of architecture and that of other art
forms. The relationship one has in viewing a painting or listening to a concert is of a
simple exposure. The fundamental thesis of this study was the total experience, that is,
submerged and exposed to the thermal environment. While this may be hard to assess in
simple terms, it will be taken to mean the ability of an occupant of a room to experience
complete thermal comfort in an environment because "in spite of the extra physiological
effort required to adjust to thermal stimuli, people definitely seem to enjoy a range of
temperatures. Indeed they frequently seek an extreme thermal environment for recreation
or vacation; to beaches in summer to bake in the sun and travel great distances in the
winter to ski on frosty mountain tops." (Heschong, 1979, pp. 21).^^* This moves toward a
situation where human senses receive physical thermal stimuli with fluctuating interior
temperatures and eliminate "thermal boredom,"^^'^^ first suggested by Mclntyre (1980)."
Fitch, James Marston with William Bobenhausen. 1999. American Building: The Environmentalforcesthat shape it. New York: Oxford University Press pp. 4.
Heschong, Lisa. 1979. Thermal Delight in Architecture. Cambridge, Massachusetts: The MIT Press.
" Kwok, Alison G. 2000. Are you thermally bored? In SBSE News Spring 2000 Bruce Haglund (ed).
Society of Building Science Educators, http://www.polaris.net/~sbse/web/
Kwok, Alison G. 2000. Thermal Boredom in Architecture. City and Environment: Proceedings ofPLEA2000, Cambridge, UK (July 2000) by Koen Steemers and Simos Yannas (eds) pp. 640-641. James & James(Science Publishers) Ltd.
" Mclntyre, D. A. 1980b. Indoor Climate. London: Applied Science Publishers.
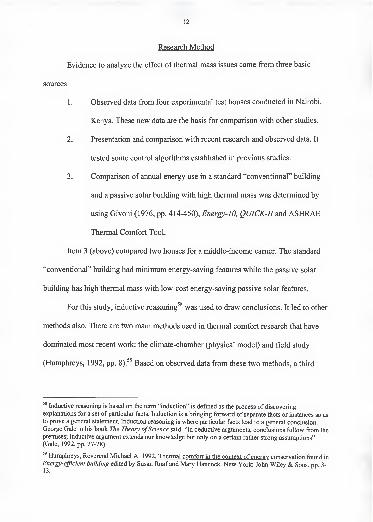
Research Method
Evidence to analyze the effect of thermal mass issues came from three basic
sources:
1. Observed data from four experimental test houses conducted in Nairobi,
Kenya. These new data are the basis for comparison with other studies.
2. Presentation and comparison with recent research and observed data. It
tested some control algorithms established in previous studies.
3. Comparison of annual energy use in a standard "conventional" building
and a passive solar building with high thermal mass was determined by
using Givoni (1976, pp. 414-450), Energy-] 0, QUICK-II and ASHRAE
Thermal Comfort Tool.
Item 3 (above) compared two houses for a middle-income earner. The standard
"conventional" building had minimum energy-saving features while the passive solar
building has high thermal mass with low-cost energy-saving passive solar features.
For this study, inductive reasoning^^ was used to draw conclusions. It led to other
methods also. There are two main methods used in thermal comfort research that have
dominated most recent work: the climate-chamber (physical model) and field study
(Humphreys, 1992, pp. 8).^^ Based on observed data from these two methods, a third
Inductive reasoning is based on the term "induction" is defined as the process of discoveringexplanations for a set of particular facts. Induction is a bringing forward of separate facts or instances so as
to prove a general statement. Induction reasoning is where particular facts lead to a general conclusion.
George Gale in his book The Theory ofScience said: "in deductive arguments, conclusions follow from the
premises; inductive argument extends our knowledge but only on a certain rather strong assumptions"(Gale, 1992, pp. 27-28).
Humphreys, Reverend Michael A. 1992. Thermal comfort in the context of energy conservation found in
Energy-efficient building edited by Susan Roaf and Mary Hancock. New York: John Wiley & Sons. pp. 3-
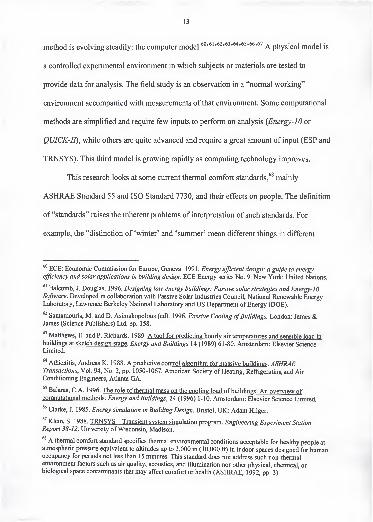
13
method is evolving steadily: the computer model.^"'"'"'"''^'"''""*" A physical model is
a controlled experimental environment in which subjects or materials are tested to
provide data for analysis. The field study is an observation in a "normal working"
environment accompanied with measurements of that enviromnent. Some computational
methods are simplified and require few inputs to perform an analysis (Energy-10 or
QUICK-II), while others are quite advanced and require a great amount of input (ESP and
TRNSYS). This third model is growing rapidly as computing technology improves.
fro
This research looks at some current thermal comfort standards, mainly
ASHRAE Standard 55 and ISO Standard 7730, and their effects on people. The definition
of "standards" raises the inherent problems of interpretation of such standards. For
example, the "distinction of 'winter' and 'summer' mean different things in different
ECE: Economic Commission for Europe, Geneva. 1991. Energy efficient design: a guide to energy
efficiency and solar applications in building design. ECE Energy series No. 9. New York: United Nations.
Balcomb, J. Douglas. 1 996. Designing low-energy buildings: Passive solar strategies and Energy- 10
Software. Developed in collaboration with Passive Solar Industries Council, National Renewable EnergyLaboratory, Lawrence Berkeley National Laboratory and US Department of Energy (DOE).
" Santamouris, M. and D. Asimakopolous (ed). 1 996. Passive Cooling ofBuildings. London: James &James (Science Publishers) Ltd. pp. 158.
" Matthews, E. and P. Richards. 1989. A tool for predicting hourly air temperatures and sensible load in
buildings at sketch design stage . Energy and Buildings 14 (1989) 61-80. Amsterdam: Elsevier Science
Limited.
^ Athienitis, Andreas K. 1988. A predictive control algorithm for massive buildings . ASHRAETransactions, Vol. 94, No. 2, pp. 1050-1067. American Society of Heating, Refrigerating and AirConditioning Engineers, Atlanta GA.
" Balaras, C.A. 1996. The role of thermal mass on the cooling load of buildings. An overview ofcomputational methods . Energy and Buildings, 24 (1996) 1-10. Amsterdam: Elsevier Science Limited.
Clarke, J. 1985. Energy simulation in Building Design. Bristol, UK: Adam Hilger.
Klein, S. 1988. TRNSYS - Transient system simulation program. Engineering Experiment Station
Report 38-12. University of Wisconsin, Madison.
A thermal comfort standard specifies thermal environmental conditions acceptable for healthy people at
atmospheric pressure equivalent to altitudes up to 3,000 m (10,000 ft) in indoor spaces designed for humanoccupancy for periods not less than 1 5 minutes. This standard does not address such non-thermalenvironment factors such as air quality, acoustics, and illumination nor other physical, chemical, or '
"
biological space contaminants that may affect comfort or health (ASHRAE, 1 992, pp. 3)
14
places. Winter in New York is different from winter in New Delhi or New Zealand."
Most equatorial regions have one long season marked by two rainy parts. This explains
why, from region to region, temperature or thermal comfort standards are being
established.^"'^'''^''^'^"'^^'^^ The dissertation questions why there should be the same
comfort zone universally; in fact many studies^^'^^'^' show it is not possible. Regarding
the adaptive approach to different comfort standards, Humphreys said:
Humphreys, Reverend M. A. 1995. Thermal comfort temperatures and the habits of hobbits: Comfort
temperatures and climate . Standardsfor Thermal Comfort: Indoor air temperaturesfor the 2r' century.
Edited by F. Nicol, M. Humphreys, O. Sykes and S. Roaf London: E & FN Spon pp. 3-13.
™ Sharpies, Steve and Shahin Heidari. 2000. A thermal comfort survey of courtyard housing in Iran in
Architecture, City and Environment: Proceedings ofPLEA 2000, Cambridge, UK (July 2000) by KoenSteemers and Simos Yannas (eds) pp. 224-228. James & James (Science Publishers) Ltd.
^' Sharpies, Steve and Albert Malama. 1997. A thermal comfort field survey in the cool season of Zambia .
Building and Environment, Vol. 32, No. 3, pp. 237 - 243, 1997. Amsterdam: Elsevier Science Limited.
Ahmed, Z. N. 1995. Temperature standards for the tropics? Standardsfor Thermal Comfort: Indoor air
temperaturesfor the 21" century. Edited by F. Nicol, M. Humphreys, O. Sykes and S. Roaf. London: E &FN Spon pp. 31-39.
Jokl, Miloslav V. 1995. New thermal comfort standards of the Czech Republic . Standardsfor Thermal
Comfort: Indoor air temperaturesfor the 21" century. Edited by F. Nicol, M. Humphreys, 0. Sykes and S.
Roaf London: E & FN Spon pp. 40-49.
Busch, John F. 1995. Thermal comfort in Thai air conditioned and naturally ventilated offices . Standards
for Thermal Comfort: Indoor air temperaturesfor the 21"' century. Edited by F. Nicol, M. Humphreys, O.
Sykes and S. Roaf London: E & FN Spon pp. 1 14-121.
De Dear, Richard J. 1995. Thermal comfort in air conditioned office buildings in the tropics . Standards
for Thermal Comfort: Indoor air temperaturesfor the 21" century. Edited by F. Nicol, M. Humphreys, O.
Sykes and S. Roaf London: E & FN Spon pp. 122-136.
Nicol, J. Fergus. 1995. Thermal comfort standards in Pakistan . Standardsfor Thermal Comfort: Indoor
air temperaturesfor the 21" century. Edited by F. Nicol, M. Humphreys, O. Sykes and S. Roaf London: E& FN Spon pp. 149-156.
Givoni, Baruch. 1998b. Climate Considerations In Building And Urban Design. New York: VanNostrand Reinhold, pp. 35-36.
Humphreys, Reverend Michael A. 1996. Thermal comfort temperatures world-wide - The current
position . Renewable Energy, Vol. 8 Issues 1-5 May 1996, ppl39-144. Amsterdam: Elsevier Science
Limited.
" Parsons, K. C. 1995. ISO Standards and thermal comfort: Recent developments . Standardsfor ThermalComfort: Indoor air temperaturesfor the 21" century. Edited by F. Nicol, M. Humphreys, O. Sykes and S.
Roaf London: E & FN Spon pp. 97-105.
Humphreys, Reverend M. A. 1995. Thermal comfort temperatures and the habits of hobbits: Comforttemperatures and climate . Standardsfor Thermal Comfort: Indoor air temperaturesfor the 21" century.
Edited by F. Nicol, M. Humphreys, O. Sykes and S. Roaf London: E & FN Spon pp. 3-13.
15
The Adaptive approach suggests that to some extent comfort standards
have the nature of self-fulfiUing prophecy. If a building is set regularly at,
say, 22° C, the occupants will choose their clothing so that they are
comfortable at that temperature. If enough buildings are controlled at this
temperature, it becomes a norm for that society at that period of its history,
and anything different is regarded as "uncomfortable," even though
another generation might have preferred to wear more clothing and have
cooler rooms, or to wear less clothing and have warmer rooms. Sothermally comfortable temperatures are socially and historically
conditioned.
A study^' was carried to field-validate ASHRAE Standard-55 comfort zone in a
tropical setting using a standardized questionnaire and laboratory-grade instrumentation.
It found that thermal "neutrality"^^ was approximately 1°C warmer than most acceptable
temperature (calculated at 23.5°C). While ASHRAE and ISO Standards are used widely
around the world, HVAC engineers usually have reservations when applying them to
other climates. ASHRAE Standard 55 was based on climate-chamber experiments using
North American and European university students in mid-latitude climatic zones. Some
studies question the relevance of using climate-chamber subjects for "real" people in real
life situations in the tropics.^^'*'*'^^ After acknowledging the fact that there is an apparent
discrepancy between subjective assessments of comfort in field studies and the comfort
criteria adopted by ISO 7730 and ASHRAE Standard 55 based on the work of Fanger,
De Dear, Richard J. 1995. Thermal comfort in air conditioned office buildings in the tropics . Standardsfor Thermal Comfort: Indoor air temperaturesfor the 21" century. Edited by F. Nicol, M. Humphreys, 0.Sykes and S. Roaf London: E & FN Spon pp. 1 22- 1 36.
Thermal neutrality is a term that refers to preferred temperature for most people; it is a temperature valuewhere at least 80% of the occupants of a room find it acceptable.
" Rohles, F. H. 1978. The empirical approach to thermal comfort . ASHRAE Transactions, Vol. 84 (1) pp.725-732. American Society of Heating, RefHgerating and Air Conditioning Engineers, Atlanta GA.
Mclntyre, D. A. 1982. Climate chamber - reductio ad absurdum? Energy and Buildings 5 (1982) 89-96.Amsterdam: Elsevier Science Limited.
Prins, G. 1992. Replv to comments on "On Condis and Coolth" Energy and Buildings 18 (1992) 267-268. Amsterdam: Elsevier Science Limited.
16
the European Community established the PASCOOL task force to study it further.
Before 1995, most countries in Europe used ISO Standard 7730 unmodified.
Technology and economic development play a major role in determining thermal
comfort standards because people tend to do what they want if they can afford it
(Humphreys, 1995, pp. 3-13; Leaman and Bordass, 1999, pp. 8; Oseland, 1993).
Humphreys argued that "it is technically possible to have warm indoor temperatures in
cold climates, and very cool temperatures in hot climates. It is costly and may deplete the
earth's resources and pollute its atmosphere." ' ' Local climate has a big influence on
the preferred comfort temperature. This is the essence of the importance of this research
because developing countries with limited energy resources and growing populations
should invest more resources establishing comfort-standards for energy-efficiency.
Importance of the Research
Equatorial Climate is Unique
A major reason for this study was the fact that an equatorial highland climate has
major points that are usually overlooked. Such items are translated into high-energy
design strategies and costs to cover unnecessary mechanical systems. For perspective, the
Standeven, M. A. and Nick V. Baker. 1995. Comfort conditions in PASCOOL surveys . StandardsforThermal Comfort: Indoor air temperaturesfor the 21" century. Edited by F. Nicol, M. Humphreys, O.Sykes and S. Roaf. London: E & FN Spon pp. 161-168.
" Humphreys, Reverend M. A. 1995. Thermal comfort temperatures and the habits of hobbits: Comforttemperatures and climate . Standardsfor Thermal Comfort: Indoor air temperaturesfor the 21" century.
Edited by F. Nicol, M. Humphreys, O. Sykes and S. Roaf London: E & FN Spon pp. 3-13.
Humphreys, Reverend Michael A. 1981. The dependence of comfortable temperature upon indoor andoutdoor climates. Bio-engineering, Physiology and Comfort. Amsterdam: Elsevier Science Limited.
Milne, G. R. 1995. The energy implications of a climate-based indoor air temperature standard .
Standardsfor Thermal Comfort: Indoor air temperaturesfor the 21" century. Edited by F. Nicol, M.Humphreys, O. Sykes and S. Roaf London: E & FN Spon pp. 182-189.
17
climate of Nairobi is compared with Gainesville, Florida (29.7°N) and New York, New
York (40°N) in USA in several graphs that follow.
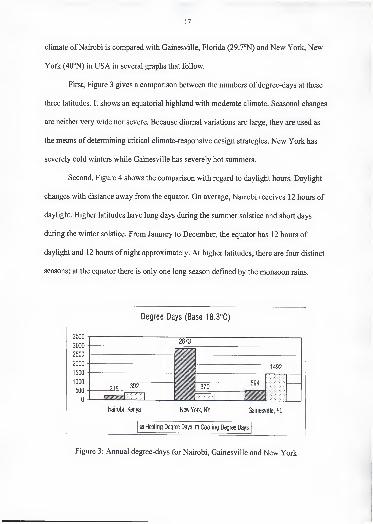
First, Figure 3 gives a comparison between the numbers of degree-days at these
three latitudes. It shows an equatorial highland with moderate climate. Seasonal changes
are neither very wide nor severe. Because diurnal variations are large, they are used as
the means of determining critical climate-responsive design strategies. New York has
severely cold winters while Gainesville has severely hot summers.
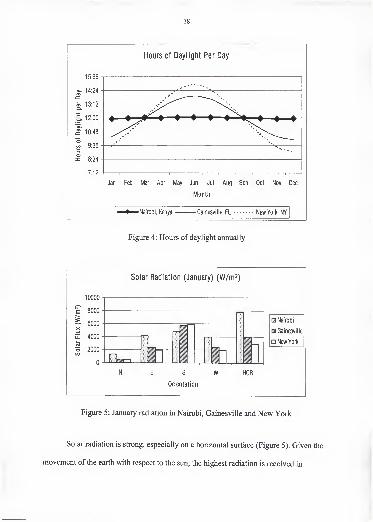
Second, Figure 4 shows the comparison with regard to daylight hours. Daylight
changes with distance away from the equator. On average, Nairobi receives 12 hours of
daylight. Higher latitudes have long days during the summer solstice and short days
during the winter solstice. From January to December, the equator has 12 hours of
daylight and 12 hours of night approximately. At higher latitudes, there are four distinct
seasons; at the equator there is only one long season defined by the monsoon rains.
Figure 3: Annual degree-days for Nairobi, Gainesville and New York
18
Hours of Daylight Per Day
15:36
>. 14:24
7:12 T 1 1 1 1 1 1 1 1 1 1 1
Jan Feb Mar Apr May Jun Jul Aug Sep Oct Nov Dec
Month
Nairobi, Kenya Gainesville, FL New York, NY
Figure 4: Hours of daylight annually
Solar Radiation (January) (W/m^)
10000
1 8000
^ 6000X
Z 4000
5 2000CO
w
Orientation
Nairobi
^ Gainesville
New York
HOR
Figure 5: January radiation in Nairobi, Gainesville and New York
Solar radiation is strong, especially on a horizontal surface (Figure 5). Given the
movement of the earth with respect to the sun, the highest radiation is received in
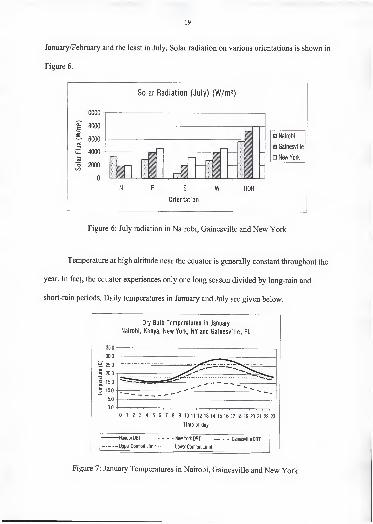
19
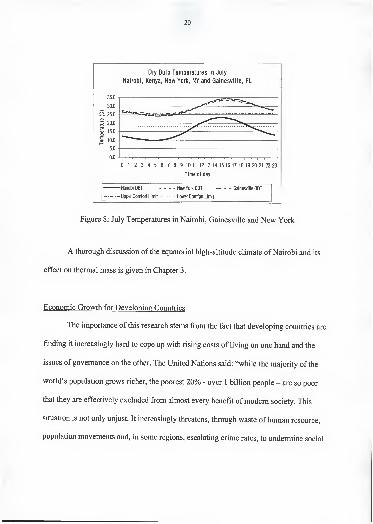
January/February and the least in July. Solar radiation on various orientations is shown in
Figure 6.
10000
I" 8000
— 6000X
;r 4000
o 200000
Solar Radiation (July) (W/m^)
Nairobi
Gainesville
New York
S W
Orientation
HOR
Figure 6: July radiation in Nairobi, Gainesville and New York
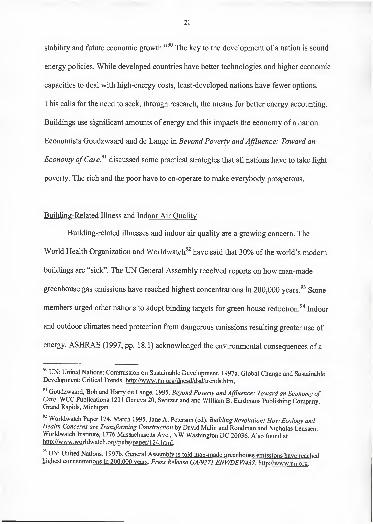
Temperature at high altitude near the equator is generally constant throughout the
year. In fact, the equator experiences only one long season divided by long-rain and
short-rain periods. Daily temperatures in January and July are given below.
Dry Bulb Temperatures in January
Nairobi, Kenya, New York, NY and Gainesville. FL
35.0 -i-
30.0 -B 25.0
3 20.0 -CO *S 15.0 -
i 10.0 -
5.0
0.0 I
0 1 2 3 4 5 6 7 8 9 10 11 12 13 14 15 16 17 18 19 20 21 22 23
Time of day— Nairobi DBT - - - - NewYoii< DBT — - - GainesvilieDBT
Uppef Comfort Limit Lower Comfort Limit
Figure 7: January Temperatures in Nairobi, Gainesville and New York
20
Dry Bulb Temperatures in July
Nairobi, Kenya, New Yorl<, NY and Gainesville, FL
5.0
0.0 I
0 1 2 3 4 5 6 7 8 9 10 11 12 13 14 15 16 17 18 19 20 21 22 23
Time of day
Nairobi DBT .... New York DBT — . . Gainesville DBT
Upper Comfort Limit Lower Comfort Limit
Figure 8: July Temperatures in Nairobi, Gainesville and New York
A thorough discussion of the equatorial high-altitude climate of Nairobi and its
effect on thermal mass is given in Chapter 3.
Economic Growth for Developing Countries
The importance of this research stems from the fact that developing countries are
finding it increasingly hard to cope up with rising costs of living on one hand and the
issues of governance on the other. The United Nations said: "while the majority of the
world's population grows richer, the poorest 20% - over 1 billion people - are so poor
that they are effectively excluded from almost every benefit ofmodem society. This
situation is not only unjust. It increasingly threatens, through waste ofhuman resource,
population movements and, in some regions, escalating crime rates, to undermine social
21
stability and future economic growth." The key to the development of a nation is sound
energy policies. While developed countries have better technologies and higher economic
capacities to deal with high-energy costs, least-developed nations have fewer options.
This calls for the need to seek, through research, the means for better energy accounting.
Buildings use significant amounts of energy and this impacts the economy of a nation.
Economists Goudzwaard and de Lange in Beyond Poverty and Affluence: Toward an
Economy ofCare^^ discussed some practical strategies that all nations have to take fight
poverty. The rich and the poor have to co-operate to make everybody prosperous.
Building-Related Illness and Indoor Air Quality
Building-related illnesses and indoor air quality are a growing concern. The
World Health Organization and Worldwatch^^ have said that 30% of the world's modem
buildings are "sick". The UN General Assembly received reports on how man-made
greenhouse gas emissions have reached highest concentrations in 200,000 years.'^ Some
members urged other nations to adopt binding targets for green house reduction.^'* Indoor
and outdoor climates need protection from dangerous emissions resulting greater use of
energy. ASHRAE (1997, pp. 18.1) acknowledged the environmental consequences of a
UN: United Nations: Commission on Sustainable Development. 1997a. Global Change and SustainableDevelopment: Critical Trends, http://www.un.org/dpcsd/dsd/trends.htm .
" Goudzwaard, Bob and Harry de Lange. 1 995. Beyond Poverty and Affluence: Toward an Economy ofCare. WCC Publications 1211 Geneva 20, Switzerland and William B. Eardmans Publishing Company,Grand Rapids, Michigan.
^ WorldWatch Paper 124, March 1995. Jane A. Peterson (ed). Building Revolution: How Ecology andHealth Concerns are Transforming Construction by David Malin and Roodman and Nicholas Lenssen.WorldWatch Institute, 1776 Massachusetts Ave., NW Washington DC 20036. Also found at
http://www.worldwatch.org/pubs/paper/124.html.
" UN: United Nations. 1997b. General Assembly is told man-made greenhouse emissions have reachedhighest concentrations in 200.000 vears . Press Release GA/9271 ENV/DEV/437. http://www.un.org .
22
refrigerant that leaks from a system because of the adverse effect on the depletion of the
ozone layer, which has worsened through the use ofCFC refrigerants in HVAC systems.
An effort made to acknowledge this problem was the formulation and signing in
1989 of the Montreal Protocol that controlled the production of ozone-depleting
substances.'^ Later, the Copenhagen Amendment, entered into force on June 14, 1994,
called for a complete cessation of the production of CFC's by January 1, 1996.
Air conditioning has a direct effect on indoor air quality. Refrigerants are the
working fluids in refrigeration, air conditioning, and heat pumping systems. They absorb
heat from one area, such as an air-conditioned space, and reject it into another, such as
outdoors, usually through evaporation and condensation respectively.'^ They affect
indoor air quality. Closely related to this, the US Environmental Protection Agency
(EPA'^) called indoor air quality (lAQ) one of the top environmental health risks. EPA
discussed many topics related to sick building syndrome,'^ and ventilation and indoor air
facts. The Worid Health Organization rule of thumb is that "a pollutant released indoors
is 1000 times more likely to reach people's lungs than a pollutant released indoors."'*'^
UN: United Nations. 1997c. Binding targets for greenhouse gas reduction must be adopted in Kyoto.Japan tells economic and financial committee . Press Release GA/EF/2788. http://www.un.org .
UN: United Nations. 1994. 1994 Report ofthe refrigeration, air conditioning, and heatpumps technicaloptions committee. United Nations Environmental Programme, Nairobi, Kenya.
ASHRAE. 1997. Handbook ofFundamentals (SI Edition). American Society of Heating, Refrigeratingand Air Conditioning Engineers, Atlanta GA. Chapter 18: Refrigerants.
EPA: Environmental Protection Agency http://www.epa.gov
EPA (Environmental Protection Agency). 1 99 1 . Indoor Air Facts No. 4 (Revised). Sick buildingsyndrome, (http://www.epa.gov/iaq/sbs.htmn .
" EPA: Environmental Protection Agency. Fact sheet: Ventilation and air quality in offices. EPA(Environmental Protection Agency). 1990. Fact Sheet. 402-F-94-003. Ventilation and Air Quality in
Offices, http://www.epa.gov/iaq/pubs/ventilat.htmi .
World Health Organization. 2000. Air Pollution. Fact Sheet No. 187 Revised September 2000 at
http://www.who.int/inf-fs/en/factl87.html .
23
Many building-related illnesses are constantly being reported with fatalities in
some cases. Researchers at Lawrence Berkeley National Laboratories '"^ suggested that
US companies can save as much as $58 billion annually by preventing building-related
illnesses and an extra $200 billion lAQ improvements for better worker performance.
Definition of Thermal Mass
Socrates, as a thinker, demanded that important words be defined prior to their
use in discussion. Consequently, a few key definitions are given in Appendix 1 . Thermal
mass is a term given to dense building materials used for walls, floors and roofs. These
materials such as stone, concrete and brick tend to have high density and heat capacity."'^
Therefore, thermal mass, by definition from ASHRAE, "should store significant amounts
of thermal energy. It can also delay heat transfer through a building component. This
delay leads to a slower response time that tends to moderate indoor temperature
fluctuations under outdoor temperature swings. Thermal mass can be used to move off-
peak energy demand" (ASHRAE, 1997, pp. 39.12). Besides creating a useful delay in
heat transfer, thermal mass also has a moderating effect since some absorbed heat energy
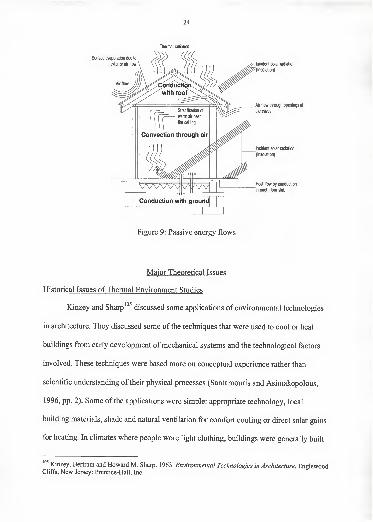
is not re-radiated. Figure 9 explains the passive energy flow through building mass.
Conlin, Michelle. 2000. Is your office killing vou? The dangers of sick buildings in Business WeekJme5, 2000 pp. 1 14 - 128. New York: McGraw-Hill Companies, www.businessweek.com .
'°^Ibid. pp. 118.
'"^ Cited by Gale, George. 1992. Theory ofScience. New York: John Wiley & Sons, in Chapter 3: Theoriesand Paradigms, pp. 55.
'"^ Lechner, N. 1991. Heating, Cooling, Lighting: Design Methodsfor Architects. New York- John Wiley& Sons, pp. 110.
24
Incident solar radiation
(Insolation)
Air flow \S\mgh openings at
ttie eaves
Incident solar radiation
(Insolation)
Heat flow by conduction
through floor slab
Major Theoretical Issues
Historical Issues ofThermal Environment Studies
Kinzey and Sharp'°^ discussed some applications of environmental technologies
in architecture. They discussed some of the techniques that v^ere used to cool or heat
buildings from early development of mechanical systems and the technological factors
involved. These techniques were based more on conceptual experience rather than
scientific understanding of their physical processes (Santamouris and Asimakopolous,
1996, pp. 2). Some of the applications were simple: appropriate technology, local
building materials, shade and natural ventilation for comfort cooling or direct solar gains
for heating. In climates where people wore light clothing, buildings were generally built
Kinzey, Bertram and Howard M. Sharp. 1963. Environmental Technologies in Architecture. EnglewoodCliffs, New Jersey: Prentice-Hall, Inc.
Thermal radiation
Conduction with ground
Figure 9: Passive energy flows
25
with light mass. Conversely, where people wore heavy clothing, the buildings tended to
be high mass.
This trend can be observed in many climates. In Thermal Delight in Architecture,
Lisa Heschong discusses ways in which people adapted to different climates. She refers
specifically to thermal mass and says:
Vernacular buildings all over the world display remarkably sophisticated
thermal adaptation. Primitive builders consistently used forms and
materials that effectively moderated prevailing climatic conditions. In the
desert the characteristic problem is extremely high daytimes coupled with
uncomfortably low temperatures at night. The ideal building material
would have a high heat capacity in order to absorb solar radiation during
the day and slowly reradiate it at night.
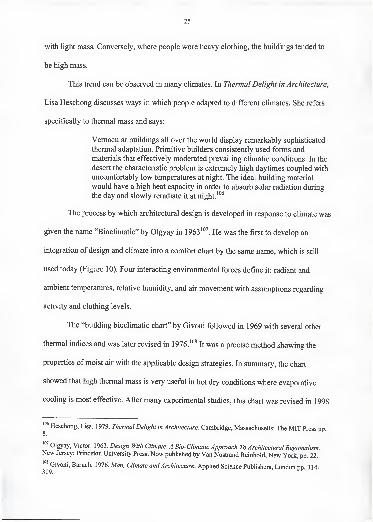
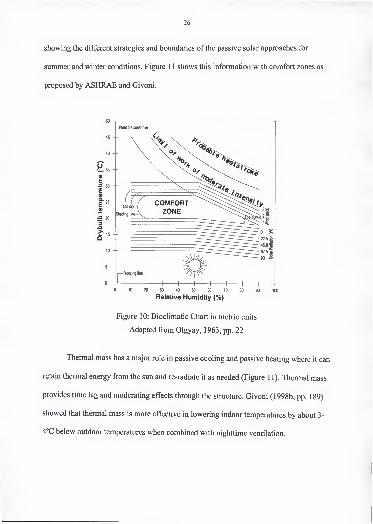
The process by which architectural design is developed in response to climate was
given the name "Bioclimatic" by Olgyay in 1963'°\ He was the first to develop an
integration of design and climate into a comfort chart by the same name, which is still
used today (Figure 10). Four interacting environmental forces define it: radiant and
ambient temperatures, relative humidity, and air movement with assumptions regarding
activity and clothing levels.
The "building bioclimatic chart" by Givoni followed in 1969 with several other
thermal indices and was later revised in 1976.'°^ It was a precise method showing the
properties of moist air with the applicable design strategies. In summary, the chart
showed that high thermal mass is very usefiil in hot dry conditions where evaporative
cooling is most effective. After many experimental studies, this chart was revised in 1998
'°* Heschong, Lisa. 1979. Thermal Delight in Architecture. Cambridge, Massachusetts: The MIT Press dd8.
^'
'"^ Olgyay, Victor. 1963. Design With Climate. A Bio-Climatic Approach To Architectural Regionalism.New Jersey: Princeton University Press. Now published by Van Nostrand Reinhold, New York, pp. 22.
Givoni, Baruch. 1976. Man. Climate and Architecture. Applied Science Publishers, London pp. 314-
26
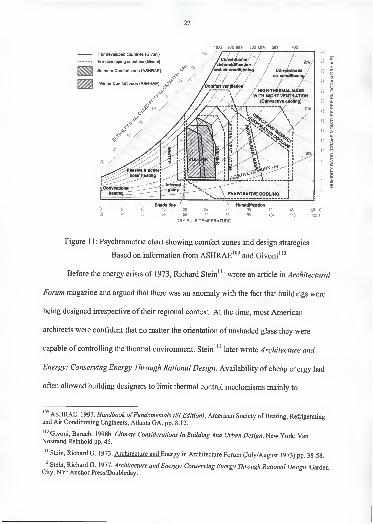
showing the different strategies and boundaries of the passive solar approaches for
summer and winter conditions. Figure 1 1 shows this information with comfort zones as
proposed by ASHRAE and Givoni.
50
45
40 --
Ii35a>k_
3 30
«
I-
£ 20
3
10 --
Probable sunstroke
Shading line-j
0 10 20 30 40 50 60 70 80 90 100
Relative Humidity (%)
Figure 10: Bioclimatic Chart in metric units
Adapted from Olgyay, 1963, pp. 22
Thermal mass has a major role in passive cooling and passive heating where it can
retain thermal energy from the sun and re-radiate it as needed (Figure 1 1). Thermal mass
provides time lag and moderating effects through the structure. Givoni (1998b, pp. 189)
showed that thermal mass is more effective in lowering indoor temperatures by about 3-
4°C below outdoor temperatures when combined with nighttime ventilation.
27
100% 90% 80% 70% 60% 50% 40%
DRY BULB TEMPERATURE
Figure 11: Psychrometric chart showing comfort zones and design strategies
Based on information from ASHRAE*"^ and Givoni""
Before the energy crisis of 1973, Richard Stein''
' wrote an article in Architectural
Forum magazine and argued that there was an anomaly with the fact that buildings were
being designed irrespective of their regional context. At the time, most American
architects were confident that no matter the orientation of unshaded glass they were
capable of controlling the thermal environment. Stein' '^later wrote Architecture and
Energy: Conserving Energy Through Rational Design. Availability of cheap energy had
often allowed building designers to limit thermal control mechanisms mainly to
'"^ ASHRAE. 1997. Handbook ofFundamentals (SI Edition). American Society of Heating, Refrigeratingand Air Conditioning Engineers, Atlanta GA. pp. 8.12.
"° Givoni, Baruch. 1998b. Climate Considerations In Building And Urban Design. New York: VanNostrand Reinhold pp. 45.
"' Stein, Richard G. 1973. Architecture and Energy in Architecture Forum (July/August 1973) pp. 38-58.
Stein, Richard G. 1977. Architecture and Energy: Conserving Energy Through Rational Design. GardenCity, NY: Anchor Press/Doubieday.
28
mechanical systems. Rather than develop some proven passive solar methods, many of
these methods were abandoned. As it appears, many people took immediate steps by
looking for answers upwards - to the sun. Resurgence of solar design has had an up-and-
down history this past century. Society may be served well by rediscovering the
connection of climate, environment and architecture. It has been said that envirormiental
forces shape architecture.
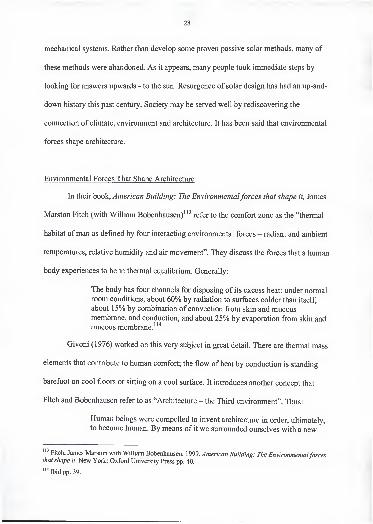
Environmental Forces That Shape Architecture
In their book, American Building: The Environmentalforces that shape it, James
Marston Fitch (with William Bobenhausen)"^ refer to the comfort zone as the "thermal
habitat ofman as defined by four interacting environmental forces - radiant and ambient
temperatures, relative humidity and air movement". They discuss the forces that a human
body experiences to be in thermal equilibrium. Generally:
The body has four channels for disposing of its excess heat: under normal
room conditions, about 60% by radiation to surfaces colder than itself,
about 15% by combination of convection from skin and mucousmembrane, and conduction, and about 25% by evaporation from skin andmucous membrane.""*
Givoni (1976) worked on this very subject in great detail. There are thermal mass
elements that contribute to human comfort; the flow of heat by conduction is standing
barefoot on cool floors or sitting on a cool surface. It introduces another concept that
Fitch and Bobenhausen refer to as "Architecture - the Third environment". Thus:
Human beings were compelled to invent architecture in order, ultimately,
to become human. By means of it we surrounded ourselves with a new
' Fitch, James Marston with William Bobenhausen. 1 999. American Building: The Environmentalforcesthat shape it. New York: Oxford University Press pp. 40.
"•"ibid pp. 39.
29
environment tailored to his specifications, interposed between the world
and ourselves."^
McCleary talked of nature, super nature and super-super nature. These ideas are
important in the way architecture is executed presently and also in future. Architecture is
a process. The art and science of design must adapt new forms of expression as
technology advances while at the same time not loose its real intention - human comfort.
Finally they suggest that:
The task of architecture, then, is not merely to abolish gross thermal
extremes (freezing to death, dying of heat prostration) but to provide the
optimal thermal environments for the whole spectrum ofmodem life. The
technology of heating and cooling aims not merely at introducing the
proper amount of heat into, or extracting the proper heat out of, the
building: but to do it in such a manner as to achieve a thermal steady state
across time - and a thermal equilibrium across space. Neither of these
criteria is easy to achieve, as radiant and ambient heat are very unstable
forms of energy."^
The idea of thermal equilibrium has been challenged by the concept of thermal
boredom (Heschong,1979; Kwok, 2000). Anecdotal evidence seems to suggest that
thermal mass can offer moderation for thermal environments conducive for long-term
human comfort. Fanger (1967,"^ 1970,"^ 1972"') and Fitch with Bobenhausen refer to
the physical environmental factors that affect thermal comfort as are summarized in the
figure below. The acoustic factors discussed by Siebein (1993) in Tutorial on
Architectural Acoustics are also included in the diagram summary.
'"Ibid. pp. 15.
Ibid. pp. 45.
Fanger, P. O. 1967. Calculation of thermal comfort: Introduction of a basic comfort equation . ASHRAETransactions 73 (2) pp. Ill 4. 1-4.20.
Fanger, P. O. 1 970. Thermal Comfort: Analysis and Applications in Environmental Engineering. NewYork: McGraw-Hill Book Company pp. 15.
30
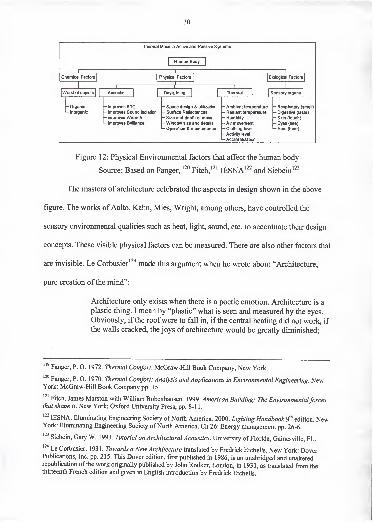
Thermal Mass in Active and Passive Systems
Human Body
Chemical Factors Physical Factors Biological Factors
World of objects Acoustic Daylighting Thermal Sensory organs
- Organic [— Improves STC- Inorganic - Improves Sound isolation
-improves Warmth-Improves Brilliance
Space design & utilization
Surface Reflectances
- Size and depth of mass-Window size and details
—Operation & maintenance
- Ambient temperature - Respiratory (smell)
- Radiant temperature
-Humidity
-Air movement- Clothing level
- Activity level
-Acclimatization
- Digestive (taste)
-Skin (touch)
Eyes (see)
- Ears (hear)
Figure 12: Physical Environmental factors that affect the human body
Source: Based on Fanger, Fitch,'^' IESNA'^^ and Siebein'"
The masters of architecture celebrated the aspects in design shown in the above
figure. The works of Aalto, Kahn, Mies, Wright, among others, have controlled the
sensory environmental qualities such as heat, light, sound, etc. to accentuate their design
concepts. These visible physical factors can be measured. There are also other factors that
are invisible. Le Corbusier'^'* made this argument when he wrote about "Architecture,
pure creation of the mind":
Architecture only exists when there is a poetic emotion. Architecture is a
plastic thing. I mean by "plastic" what is seen and measured by the eyes.
Obviously, if the roof were to fall in, if the central heating did not work, if
the walls cracked, the joys of architecture would be greatly diminished;
Fanger, P. O. 1972. Thermal Comfort. McGraw-Hill Book Company, New York.
Fanger, P. O. 1970. Thermal Comfort: Analysis and Applications in Environmental Engineering. NewYork: McGraw-Hill Book Company pp. 15.
Fitch, James Marston with William Bobenhausen. 1999. American Building: The Environmentalforcesthat shape it. New York: Oxford University Press, pp. 8-11.
'^^ lESNA: Illuminating Engineering Society of North America. 2000. Lighting Handbook 9* edition. NewYork: Illuminating Engineering Society of North America. Ch 26: Energy management pp. 26-6.
Siebein, Gary W. 1993. Tutorial on Architectural Acoustics. University of Florida, Gainesville, FL.
Le Corbusier. 1931. Towards a New Architecture translated by Fredrick Etchells, New York: DoverPublications, Inc. pp. 215. This Dover edition, first published in 1986, is an unabridged and unalteredrepublication of the work originally published by John Rodker, London, in 1931, as translated from thethirteenth French edition and given in English introduction by Fredrick Etchells.
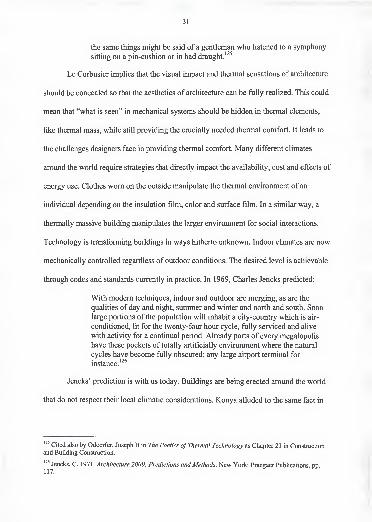
31
the same things might be said of a gentleman who listened to a symphony
sitting on a pin-cushion or in bad draught.'^^
Le Corbusier implies that the visual impact and thermal sensations of architecture
should be concealed so that the aesthetics of architecture can be fully realized. This could
mean that "what is seen" in mechanical systems should be hidden in thermal elements,
like thermal mass, while still providing the crucially needed thermal comfort. It leads to
the challenges designers face in providing thermal comfort. Many different climates
around the world require strategies that directly impact the availability, cost and effects of
energy use. Clothes worn on the outside manipulate the thermal environment of an
individual depending on the insulation film, color and surface film. In a similar way, a
thermally massive building manipulates the larger environment for social interactions.
Technology is transforming buildings in ways hitherto unknown. Indoor climates are now
mechanically controlled regardless of outdoor conditions. The desired level is achievable
through codes and standards currently in practice. In 1969, Charles Jencks predicted:
With modem techniques, indoor and outdoor are merging, as are the
qualities of day and night, summer and winter and north and south. Soon
large portions of the population will inhabit a city-country which is air-
conditioned, lit for the twenty-four hour cycle, fially serviced and alive
with activity for a continual period. Already parts of every megalopolis
have these pockets of totally artificially environment where the natural
cycles have become fully obscured: any large airport terminal for
instance.'^^
Jencks' prediction is with us today. Buildings are being erected around the world
that do not respect their local climatic considerations. Konya alluded to the same fact in
Cited also by Odoerfer, Joseph B in The Poetics ofThermal Technology as Chapter 21 in Construction
and Building Construction.
Jencks, C. 1971. Architecture 2000: Predictions and Methods. New York: Praegaer Publications, pp.117.
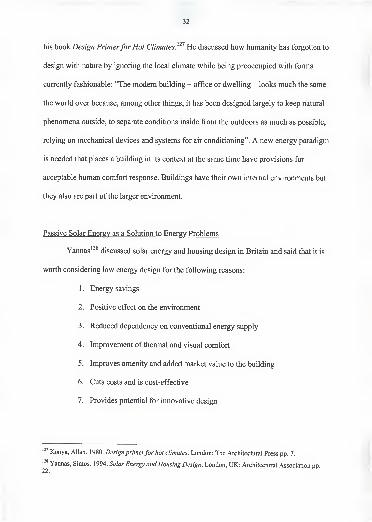
32
his book Design Primerfor Hot Climates He discussed how humanity has forgotten to
design with nature by ignoring the local climate while being preoccupied with forms
currently fashionable: "The modem building - office or dwelling - looks much the same
the world over because, among other things, it has been designed largely to keep natural
phenomena outside, to separate conditions inside from the outdoors as much as possible,
relying on mechanical devices and systems for air conditioning". A new energy paradigm
is needed that places a building in its context at the same time have provisions for
acceptable human comfort response. Buildings have their own internal environments but
they also are part of the larger environment.
Passive Solar Energy as a Solution to Energy Problems
1 28Yannas discussed solar energy and housing design in Britain and said that it is
worth considering low energy design for the following reasons:
1 . Energy savings
2. Positive effect on the envirormient
3. Reduced dependency on conventional energy supply
4. Improvement of thermal and visual comfort
5. Improves amenity and added market value to the building
6. Cuts costs and is cost-effective
7. Provides potential for iimovative design
Konya, Allan. 1980. Design primerfor hot climates. London: The Architectural Press pp. 7.
Yannas, Simos. 1994. Solar Energy and Housing Design. London, UK: Architectural Association op22.

Yannas went on to explain why low energy design is not more widely adopted
despite these tremendous benefits. They are:
1. Lack of design information: There is insufficient published information on
design principles and performance data.
2. Credibility and applicability: There is a mistaken belief that low-energy
design involves unusual, unconventional or unreliable devices.
3. Marketability: The potential market value is not yet widely recognized by
developers, even though surveys suggest a growing environmental
consciousness among buyers.
4. Lack of incentive: Low fuel prices and lack of positive incentives for
saving energy have acted as constraints.
5. Costs: There is a mistaken belief that the design process will take longer
and require more effort and that the building costs will be high.
6. Design quality: Few built examples have been of outstanding architectural
quality to act as exemplars. .
At the time of the oil crisis in 1973, many building regulations around the world
did not require that buildings incorporate thermal insulation. The ability to control the
thermal environment inside buildings was threatened because low cost energy for daily
social and economic life had been taken for granted for so long. This changed
immediately. By the 1990's, insulation alone was perceived to be the only energy-
efficient strategy needed. One of the lessons now being learnt is that climate-sensitive
design improves thermal comfort and environmental quality.
Ibid pp. 23.
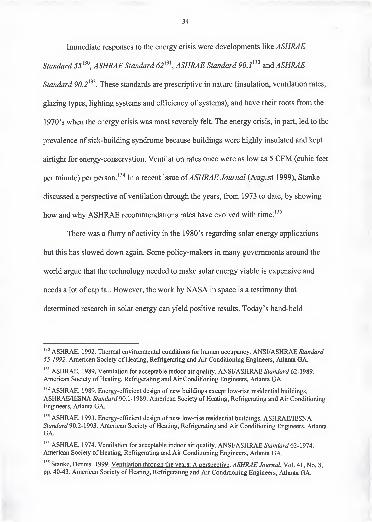
34
Immediate responses to the energy crisis were developments like ASHRAE
Standard 55^^\ ASHRAE Standard 62^^\ ASHRAE Standard 90.1^^^ and ASHRAE
Standard 90.2^^^. These standards are prescriptive in nature (insulation, ventilation rates,
glazing types, lighting systems and efficiency of systems), and have their roots from the
1970's when the energy crisis was most severely felt. The energy crisis, in part, led to the
prevalence of sick-building syndrome because buildings were highly insulated and kept
airtight for energy-conservation. Ventilation rates once were as low as 5 CFM (cubic feet
per minute) per person.''''' In a recent issue ofASHRAE Journal (August 1999), Stanke
discussed a perspective of ventilation through the years, from 1973 to date, by showing
how and why ASHRAE recommendations rates have evolved with time.'^^
There was a flurry of activity in the 1980's regarding solar energy applications
but this has slowed down again. Some policy-makers in many governments around the
world argue that the technology needed to make solar energy viable is expensive and
needs a lot of capital. However, the work by NASA in space is a testimony that
determined research in solar energy can yield positive results. Today's hand-held
ASHRAE. 1992. Thermal environmental conditions for human occupancy. ANSI/ASHRAE Standard
55-1992. American Society of Heating, Refrigerating and Air Conditioning Engineers, Atlanta GA.
ASHRAE. 1989. Ventilation for acceptable indoor air quality. ANSI/ASHRAE Standard 62-1989.
American Society of Heating, Refrigerating and Air Conditioning Engineers, Atlanta GA.
'^^ ASHRAE. 1989. Energy-efficient design of new buildings except low-rise residential buildings.
ASHRAE/IESNA Standard 90.1-1989. American Society of Heating, Refrigerating and Air Conditioning
Engineers, Atlanta GA.
ASHRAE. 1993. Energy-efficient design of new low-rise residential buildings. ASHRAE/IESNAStandard 90.2-1993. American Society of Heating, Refrigerating and Air Conditioning Engineers, Atlanta
GA.
ASHRAE. 1974. Ventilation for acceptable indoor air quality. ANSI/ASHRAE Standard 62-1974.
American Society of Heating, Refrigerating and Air Conditioning Engineers, Atlanta GA.
Stanke, Dennis. 1999. Ventilation through the years: A perspective . ASHRAE Journal, Vol. 41, No. 8,
pp. 40-43. American Society of Heating, Refrigerating and Air Conditioning Engineers, Atlanta GA.
35
calculator can use readily available solar energy; it is a product resulting from the need to
make high-performance computations using low levels of renewable energy.
Energy-conscious architecture has moved from just solar collectors on roofs to the
building itself While passive solar architecture does not have the fanfare of the 1980's, it
is still feasible in many places around the world. Dr. J. Douglas Balcomb at Los Alamos
National Laboratory and National Renewable Laboratories led research in Passive Solar
Buildings. The main theme from these studies was that architects must fully understand
local climate if energy-efficiency was to be achieved.
Although not directly related to thermal mass, emerging technologies such as
building-integrated photovoltaic designs are also growing steadily in communications,
rural site electrification, remote power, vaccine refrigeration, remote monitoring stations,
water pumping and battery charging.'^^''^^''^^''^^''^"''^'''^^''^^.
The use of thermal mass can be optimized using number of equations developed
from this study. Some studies'** show that passive systems (cooling, heating and lighting)
have a bigger influence on architectural form than active systems. Not all energy issues
'^^ 1999 ASHRAE Applications Handbook, Chapter 32, pp. 32.26.
2000 ASHRAE Systems and Equipment Handbook, Chapter 33 pp. 33.20.
Goswami, et al. 2000.
Solar Today. 1998. Vol. 12, No. 6. PV in Paradise by James Bing . pp. 26-29. Boulder, CO: The
American Solar Energy Society.
Solar Today. 1999. Vol. 13, No. 1. Solar energy in Europe by Pamela Murphy Kunz. pp. 28-31.
Boulder, CO: The American Solar Energy Society.
Solar Today. 1999. Vol. 13, No. 2. The ABC's of solar liying by David and Brenda Hriynak . pp. 34-37.
Boulder, CO: The American Solar Energy Society.
'"^ Solar Today. 1999. Vol. 13, No. 3. PV powers rural communities by Andre Verani. Chad Nielsen and
Philip Coyell . pp. 30-33. Boulder, CO: The American Solar Energy Society.
'"^ Solar Today. 1999. Vol. 13, No. 6. Electrifying the un-electrified by John Perlin Balcomb . pp. 26-29.
Boulder, CO: The American Solar Energy Society.
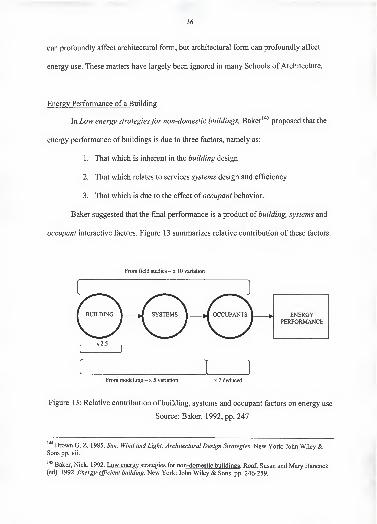
36
can profoundly affect architectural form, but architectural form can profoundly affect
energy use. These matters have largely been ignored in many Schools of Architecture.
Energy Performance of a Building
In Low energy strategiesfor non-domestic buildings, Baker'''^ proposed that the
energy performance of buildings is due to three factors, namely as:
1 . That which is inherent in the building design
2. That which relates to services systems design and efficiency
3. That which is due to the effect of occupant behavior.
Baker suggested that the final performance is a product of building, systems and
occupant interactive factors. Figure 13 summarizes relative contribution of these factors.
From field studies - x 10 variation
ENERGYPERFORMANCE
t 1
[ I ]From modelling - x 5 variation x 2 deduced
Figure 13: Relative contribution of building, systems and occupant factors on energy use
Source: Baker, 1992, pp. 247
Brown G. Z. 1985. Sun, Wind and Light: Architectural Design Strategies. New York: John Wiley &Sons pp. vii.
Baker, Nick. 1992. Low energy strategies for non-domestic buildings. Roaf, Susan and Mary Hancock
(ed). 1992. Energy-efficient building. New York: John Wiley & Sons, pp. 246-259.
37
Baker argued that a deep plan would result in certain building performance
demanding heating, cooling and lighting for an idealized occupant. The efficiency of
building systems plays a key role in the overall performance. Occupants (and
management) who operate building systems in a non-optimal fashion can decrease
performance.
Baker said that ifsystems and occupant factors are fixed, the range of energy use
due to building alone is unlikely to be greater than about 2.5 fold. When systems are
varied also, then the energy consumption range increases five fold, implying that
occupant factors account for a twofold variation. Efficient systems can replace older
systems even after a building is complete, and occupants can be educated to manage their
buildings better. Building factors are hard to adjust or alter after construction. Therefore,
building elements (particularly the use and location of thermal mass!) have profound
implications on architecture and energy performance. More emphasis is needed on the
systems/mass interaction, hence this study.
Conclusions
Architecture is a process'"*^ - from inception, through design development to
completion. Basic design decisions have energy consequences. Energy is used to run and
maintain buildings. Energy consumption in buildings is related to the local climate,
building systems, occupancy patterns and the thermal properties of the building materials.
Energy use is important concern because it affects (1) the choice of building materials
and methods (2) architectural form and layout planning (3) response to site and natural

38
features. Some building materials waste energy while others, such as those where thermal
mass is applicable, conserve cooling and heating energy. Not all energy issues can
profoundly affect architectural form, but architectural form can profoundly affect energy
use. Psychological expectations have a bearing on the use energy in buildings.
CEC: Commission of European Communities. 1990. Passive solar energy as afuel - 1990-2010.Executive Summary, Commission of European Communities, DGXII, pp. 29.
CHAPTER 2
EXPERIMENTAL STUDY ON THERMAL MASS
Introduction
This chapter discusses a model study carried out to test the effect of thermal mass
on comfort conditions. Specifically, the experiment tested the effectiveness of high
thermal mass in moderating indoor temperatures, and thus improving comfort conditions.
It was conducted in Nairobi, Kenya, which is an equatorial high altitude region.
Precisely, Nairobi is at 1.3° S latitude at an altitude of 1798m (5900 feet) above sea level.
This chapter is a presentation ofmeasurements taken in the four test houses and discusses
the work that has been done on this subject in other studies, principally by Baruch Givoni
and J. Douglas Balcomb. Lord Kelvin' ( 1 824- 1 907) said:
When you can measure what you are speaking about, and express it in
numbers, you know something about it; but when you cannot express it in
numbers, your knowledge is of a meager and unsatisfactory kind; it maybe the beginning of knowledge, but you have scarcely, in your thoughts,
advanced to the stage of science, whatever the matter may be.
Experiments on Thermal Mass: An Overview
The work by Givoni (1998a)^ is among the latest and probably the best on this
subject. He monitored buildings with different mass levels under different ventilation and
' Cited by lESNA: Illuminating Engineering Society of North America. 2000. Lighting Handbook 9^edition. New York: Illuminating Engineering Society of North America, pp. 2-1.
^ Givoni, Baruch. 1998a. Effectiveness Of Mass And Night Ventilation In Lowering Indoor DaytimeTemperatures. Part I: 1993 experimental periods. Energy and Buildings 28 (1998) 25-32. Amsterdam:Elsevier Science Limited.
39
40
shading conditions in the summer of 1993 in Pala in Southern CaHfomia in the USA. The
lowering of the daytime indoor temperatures was evaluated. Givoni found that night
ventilation was effective in lowering indoor temperature for a high mass building below
the outdoor maximum. He reported that on an extremely hot day with outdoor maximum
of 38°C (100"F), the indoor maximum temperature of the high mass building was only
24.5°C (76°F), which is well within the comfort zone for the humidity level of California.
While in Israel at Ben Gurion University of the Negev,^ Givoni conducted more
research on the performance of two full-size rooms (3 x 4m) (10' x 13' approximately)
with high mass. He used walls of200mm (8") concrete, insulated towards the external
side. The exterior color was off-white. He found that when buildings have white envelope
color, night ventilation lowered the maximum temperature by about 2°C as compared to a
dark building. These results were reported more precisely in 1998.'* Another study^ was
made using an insulated passive wall design to minimize building temperature swings.
Most recently, Givoni and Noguchi have studied and established some issues in outdoor
comfort research.^ Insulation decouples the mass from exterior temperatures. This affects
the behavior and location of thermal mass.
For many years, Balcomb has led a team of researchers at the Los Alamos
National Laboratories and the National Renewable Energy Laboratories in passive and
low energy architecture. They developed design software called Energy-10 that can
^ Givoni, Baruch. 1976. Man, Climate and Architecture. Applied Science Publishers, London, pp. 120-144.
'* Givoni, Baruch. 1998b. Climate Considerations In Building And Urban Design. New York: Van Nostrand
Reinhold,pp. 187-188.
' Duffin, R. J. 1984. A passive wall design to minimize building temperature swings . Solar Energy 33 (3/4)
(1984) 319-326. New York: Pergamon Press.
41
investigate design strategies like passive solar heating and daylighting. It assists pre-
design decisions such as when thermal mass is beneficial to the design. The following
recommendations are made regarding the benefits of the use of thermal mass:
Dense building materials with the right mix of thermal conductivity and
heat capacity, such as brick, concrete and concrete block, store and release
considerable amounts of energy when they rise and fall in temperature. ...
Thermal mass is particularly effective in regions where the outdoor air
temperature fluctuates daily above and below the building balance point
(the exterior temperature at which a building is in equilibrium with heat
gains equaling heat losses).'
Studies*'^''"'" show that the color of thermal mass is a significant factor in heat
transfer. Light-colored surfaces reflect most of the solar radiation while dark surfaces
absorb 70-90% of it (Balcomb 1996, pp. 106). The quantitative effect of the color of the
envelope on the indoor air temperature, and on the energy demand of a building, depends
on the thermal properties of the walls and roofs, climate, and ventilation conditions
(Givoni, 1998b, pp. 78). Thermal mass surfaces should be large enough to store adequate
heat and cold as required. In Sun, Wind and Light, Brown reported: "in order to be
effective thermal masses for storing heat or cold, buildings must have exposed surfaces
inside the space. Insulation, if needed, must be on the exterior side of the mass."'^
* Givoni, Baruch and Mikiko Noguchi. 2000. Issues in outdoor comfort research in Architecture, City andEnvironment: Proceedings ofPLEA 2000, Cambridge, UK (July 2000) by Koen Steemers and Simos
Yannas (eds) pp. 562-564. James & James (Science Publishers) Ltd.
^ Balcomb, J. Douglas. 1996. Designing low-energy buildings: Passive solar strategies and Energy-10
Software. Passive Solar Industries Council, National Renewable Energy Laboratory, Lawrence Berkeley
National Laboratory and US Department of Energy (DOE) pp. 105-1 10.
* Ibid. pp. 106.
' Givoni, Baruch. 1976. Man, Climate and Architecture. London: Applied Science Publishers, pp. 217.
Givoni, Baruch. 1 998b. Climate Considerations In Building And Urban Design. New York: VanNostrand Reinhold, pp. 74.
" Santamouris, M. and D. Asimakopolous (ed). 1996. Passive Cooling ofBuildings. London: James &James (Science Publishers) Ltd. pp. 192.
42
Thermal mass location, distribution, insulation and the role of ventilation are important
matters that must be addressed if full thermal mass benefits are to be realized.
Modeling Techniques Involving Thermal Mass
Experiments (using physical models) and field studies have been the two major
research methods of quantitatively and qualitatively studying various phenomena in
buildings. Proper criteria need to be established to determine the best method to answer a
research question. Experiments involving physical models and climate-chambers provide
data that show what happens in controlled environments; field studies, on the other hand,
provide data that show what happens in uncontrolled environments. Both methods have a
role in adding knowledge, although there are potential conflicts that could arise out of
conclusions drawn fi-om both methods.
Recently, with the advent of personal computers, simulation programs have been
developed using improved energy theory based on evidence from experiments and field
results. They are important as a means to test different alternatives that would otherwise
be difficult or expensive to study.
Victor Olgyay methodically documented the theoretical analysis of thermal
effects of thermal mass in 1963'\ Over the years, Givoni also made tremendous
contribution to the body of knowledge on this subject by using physical models in Israel
and in California. His book Man, Climate and Architecture, published originally in 1969
and revised in 1976, was a major research compilation of theoretical knowledge backed
Brown G. Z. 1985. Sun, Wind and Light: Architectural Design Strategies. New York: John Wiley &Sons pp. 124.
43
by enormous experimental evidence. The Florida Solar Energy Center (FSEC) in Cape
Canaveral, Florida has engaged in numerous studies using full-scale models. Their
publication in 1988 ofEnergy-efficient Florida Home Building,''^ among many others, is
the result of such studies. Other studies have reported major success using physical
models and climate-chamber experiments (Wilcox et al.;^^ De dear et a/.;'^''^ and Wu'^).
J. Douglas Balcomb at Los Alamos National Laboratory and National Renewable
Laboratories has led research in Designing Low-Energy Buildings^^ and measurement of
passive solar performance. Balcomb contributed very important knowledge in several
other key publications.^^'^' Recent studies by Givoni have examined the role of thermal
mass on indoor temperatures.'
Olgyay, Victor. 1963. Design With Climate. A Bio-Climatic Approach To Architectural Regionalism.
New Jersey: Princeton University Press. Now published by Van Nostrand Reinhold, New York. Chapter
10: Thermal Effects of Materials pp. 1 13-124.
Florida Solar Energy Center (FSEC). 1992. Manual entitled: Energy-efficient Florida Home Building byVeira, Robin K., Kenneth G. Sheinkopf and Jeffrey K. Sonne at Florida Solar Energy Center (FSEC) CapeCanaveral, FL.
" Wilcox, B. et al. 1985. The effects of thermal mass exterior walls on heating and cooling loads in
commercial buildings. Proceedings ofASHRAE Building Envelopes Conference. Atlanta GA: ASHRAE
De Dear, R., K. Leow, and A. Ameen. 1991. Thermal comfort in the humid tropics - Part I: Climate
Chamber experiments on thermal acceptability in Singapore ASHRAE Transactions 97 (1): 874-879.
American Society of Heating, Refrigerating and Air Conditioning Engineers, Atlanta GA.
De Dear, R., K. Leow, and A. Ameen. 1991. Thermal comfort in the humid tropics - Part II: Climate
Chamber experiments on thermal acceptability in Singapore ASHRAE Transactions 97 (1): 880-886.
American Society of Heating, Refrigerating and Air Conditioning Engineers, Atlanta GA.
Wu, H. 1996. The Effect of Thermal Mass On Indoor Comfort with Evaporative Cooling Systems In
Semi-Arid Climates . Proceedings Of The National Passive Solar Conference 1996; Vol 21 pp. 1 13-1 18.
" Balcomb, J. Douglas. 1996. Designing low-energy buildings: Passive solar strategies and Energy-10Software. Developed in collaboration with Passive Solar Industries Council, National Renewable EnergyLaboratory, Lawrence Berkeley National Laboratory and US Department of Energy (DOE).
Balcomb, J. Douglas. 1983. Heat storage and distribution inside passive solar buildings. Los AlamosNational Laboratory, New Mexico Report LA-9694-MS, available from the National Technical InformationService, 5285 Port Royal Road, Springfield, VA 22 1 6 1 , USA.
^' Balcomb, J. Douglas. 1 984. Passive Solar Design Handbook. New York: Van Nostrand Reinhold.
Givoni, Baruch. 1998a. Effectiveness Of Mass And Night Ventilation In Lowering Indoor DaytimeTemperatures. Part I: 1993 experimental periods. Energy and Buildings 28 (1998) 25-32. Amsterdam:Elsevier Science Limited.
44
Most current theoretical knowledge has been developed from physical model
experiments (controlled environments). As previously stated, the other major research
method used in many thermal comfort studies has been the field study. This technique
meets people in their normal environments, while performing their normal activities, and
seeks their opinion on-site. In this case the researcher measures the envirormient without
altering it. Humphreys^'* reported major results of this method in thermal comfort studies
after a series of previous studies in 1975,^^ 1976^^ and 1978^^.
Santamouris and Asimakopolous^^ reported a series of case studies involving
thermal mass; their studies have guided this literature search. Brown^^ monitored an
office building and compared data with simulations using variable levels of thermal mass
in similar buildings, and found that a ten-fold increase of thermal mass from 21 to 201
kg/m^ of floor area, in closed and in ventilated buildings, can reduce the peak indoor
temperature by approximately 1°C to 2°C. Ruud et al. evaluated the effect of building
thermal mass in offsetting cooling loads by conducting two experiments on the
Givoni, Baruch. 1998b. Climate Considerations In Building And Urban Design. New York: VanNostrand Reinhold.
Humphreys, Reverend Michael A. 1992. Thermal comfort in the context of energy conservation in
Energy-efficient building edited by Susan Roaf and Mary Hancok. New York: John Wiley & Sons, Inc. pp.
3-13.
Humphreys, Reverend Michael A. 1975. Field Studies of thermal comfort compared and applied .
Building Research Establishment, Current Paper. CP 76/75, Garston, Watford, UK.
Humphreys, Reverend Michael A. 1976. Field Studies of thermal comfort compared and applied.
Building Services Engineer, 44, pp. 5-27.
" Humphreys, Reverend Michael A. 1978. Outdoor temperatures and comfort indoors. Building Research
and Practice, 62, pp. 92-105.
Santamouris, M. and D. Asimakopolous (ed). 1996. Passive Cooling ofBuildings. London: James &James (Science Publishers) Ltd.
^' Brown, M. 1990. Optimization of thermal mass in commercial building applications. ASME Journal ofSolar Energy Engineering, 1 12 (1990) 273-279.
45
Independent Life Insurance building located in Jacksonville, Florida in USA. The results
showed an 18% reduction in cooling energy supplied during the daytime based on
nighttime ventilation on thermal mass.
Six test buildings were investigated by Burch et al?^ to test the effect of wall
mass on summer space cooling. The buildings were located at the US National Bureau of
Standards in Gaithersburg, MD. They found that for indoor temperature set at 24° C, high
mass buildings consumed less cooling energy than similar lightweight buildings with
similar thermal resistance. They also found that thermal mass was more effective when
positioned on the interior side of insulation. Burch et al. also studied the effect of
thermal mass on night-temperature setback savings and noticed a 40% reduction on
sensible heating and cooling loads.
Sunaga and Ito^^ tested the role of thermal mass on various passive systems and
noted the benefits of adobe buildings. Robertson presented specific recommendations on
how best to use thermal mass in residential and small commercial buildings, for
southwestern USA, in 1986.^"* These studies have provided important observations to
other studies involving thermal mass.
Ruud, M. D., J. W. Mitchell and S. A. Klein. 1990. Use of building thermal mass to offset cooling loads.
ASHRAE Transactions, 96 (2): 820-828. American Society of Heating, Refrigerating and Air Conditioning
Engineers, Atlanta GA.
Burch, D., S. Malcolm and K. Davis. 1984. The effect of wall mass on the summer space cooling of six
test buildings . ASHRAE Transactions, Vol. 90, No. 2B, pp. 5-21. American Society of Heating,
Refrigerating and Air Conditioning Engineers, Atlanta GA.
Burch, D., W. Johns, T. Jacobsen, G. Walton, and C. Reeve. 1984. The effect of thermal mass on night
temperature setback savings . ASHRAE Transactions, Vol. 90, No. 2A, pp. 184-206. American Society of
Heating, Refrigerating and Air Conditioning Engineers, Atlanta GA.
Sunaga, N. and N. Ito. 1985. Experimental analysis of thermal mass effect on the indoor climate in
passive solar heating system with test cells . Proceedings ofthe International Symposium on ThermalApplication ofSolar Energy, pp. 253-258, 7-10 April, Hakone, Japan.
" Robertson, D. 1986. The performance of adobe and other thermal mass materials in residential buildings .
Passive Solar Journal, 3 (1986) 387-417.
46
Today, computational simulations also play a major role in testing and modeling
techniques involving thermal mass. Ober and Wortman^^ ran a series of simulations of
three building types (a warehouse, low-rise office building and a retail building) in four
climatic zones in USA (Atlanta, Phoenix, New York and Minnesota). They reported that
the wall thermal mass is more effective in office and retail buildings than in warehouses
and buildings with high internal mass levels. These are some of the methods and results
from previous studies. This study used an experimental method with four test houses.
Experimental Test Houses
Experimental Set-up
Four buildings were built and monitored on a site in Nairobi, Kenya. Each house
measured 2.0m (6' 7") long by 2.0m (6' 7") wide and 2.0m (6' 7") high at wall plate level.
Two houses were built with timber walls while the other two had natural stonework.
Further more, the roof was made of galvanized corrugated iron (GCI) sheets and concrete
interlocking tiles. The timber buildings were considered as low mass while the stone
buildings as high mass. The heat loss coefficient (UA) was 120 W/°C (229 Btu/h °F) for
the low mass building and 85 W/ °C (162 Btu/h °F) for the high mass buildings.
Givoni (1998a)^^ monitored three buildings with the same heat loss coefficient
(96.5 W/ °C) (183 Btu/h °F) but with three different mass levels: a "low-mass" building
(conventional stud-wall construction), a "medium-mass" building, and a "high-mass"
" Ober, D. and D. Wortman. 1991. Effect o building type on wall thermal mass performance . ASHRAETransactions, Vol. 33, No. 1 1, pp. 18-21. American Society of Heating, Refrigerating and Air Conditioning
Engineers, Atlanta GA.
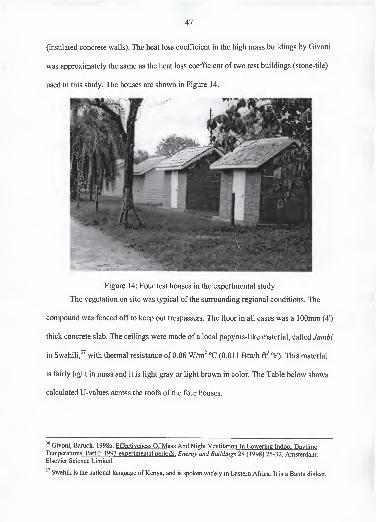
47
(insulated concrete walls). The heat loss coefficient in the high mass buildings by Givoni
was approximately the same as the heat loss coefficient of two test buildings (stone-tile)
used in this study. The houses are shown in Figure 14.
mFigure 14: Four test houses in the experimental study
The vegetation on site was typical of the surrounding regional conditions. The
compound was fenced off to keep out trespassers. The floor in all cases was a 100mm (4')
thick concrete slab. The ceilings were made of a local papyrus-like material, called Jambi
in Swahili with thermal resistance of 0.06 W/m^ °C (0.01 1 Btu/h ft^ °F). This material
is fairly light in mass and it is light gray or light brown in color. The Table below shows
calculated U-values across the roofs of the four houses.
Givoni, Baruch. 1998a. Effectiveness Of Mass And Night Ventilation In Lowering Indoor DaytimeTemperatures. Part I: 1993 experimental periods. Energy and Buildings 28 (1998) 25-32. Amsterdam:Elsevier Science Limited.
" Swahili is the national language of Kenya, and is spoken widely in Eastern Africa. It is a Bantu dialect.

48
Table 1 : Thermal Transmittance (U-values) in the four test houses
Ceiling configurationGCI sheet roof
W/m^ "C (Btu/hft^ T)Concrete tile roof
W/m^ °C (Btu/h ft^ °F)
Without ceiling 0.600 (0.106) 0.418(0.074)
Slope ceiling 0.581 (0.102) 0.408 (0.072)
2/3 ceiling 0.360 (0.063) 0.246 (0.043)
Flat ceiling 0.360 (0.063) 0.246 (0.043)
The main instrument for data acquisition was the thermodac (Figure 15). It is a
mobile measurement system that collects up to 60 parameters concurrently. The system
meets ANSI/ASHRAE 55-92^^ and ISO 7726^^ standards' specifications for accuracy and
response times. The instrument was in one house and cables were extended to all houses.
(a) Thermodac, Manual and Carrying Case (b) Top showing terminal points
Figure 15: Thermodac: data acquisition system for physical measurements
Plans and Sections of Experimental Test Houses
The layout for the houses is shown below. The test chamber in each case is shown
as dimensioned and annotated. The two types of walling materials of stone and timber are
shown. The other two types of roofing materials (galvanized corrugated iron sheets and
ASHRAE. 1992. Thermal environmental conditions for human occupancy. ANSI/ASHRAE Standard55-1992. American Society of Heating, Refrigerating and Air Conditioning Engineers, Atlanta GA.
^' ISO 7726. 1985. Thermal environments - Specifications relating to appliance and methods for measuringphysical characteristics of the environmental . ISO Standard 7726. Geneva: International StandardsOrganization.
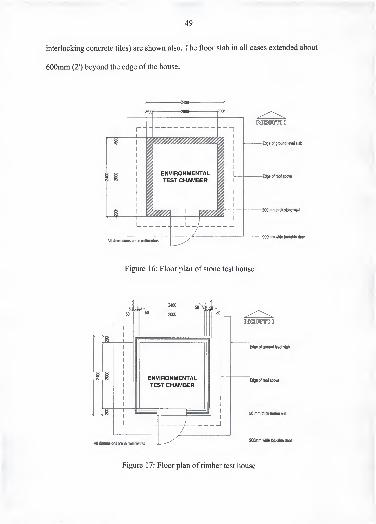
49
interlocking concrete tiles) are shown also. The floor slab in all cases extended about
600mm (2') beyond the edge of the house.
-240&
Edge of ground level slab
All dimensions are In millimetres
Edge of root atxwe
-200mm ttiick stone wall
^OOtnm wide loclable door
Figure 16: Floor plan of stone test house
s s
_5D_
r'
50
2400
2Q0Q
50
I
ENVIROhfMENTALTEST CHAMBER
All dimensions are In millimetres
50
0¥lCe)1^1f[Ml
Edge of ground level slab
Edge ot root above
50 mm mat timber wall
900mm wide locliabie door
Figure 17: Floor plan of timber test house
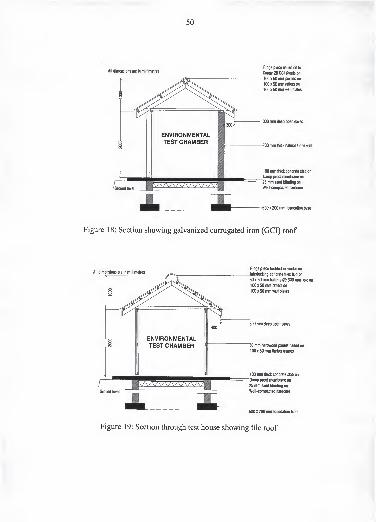
50
Ridge piece nailed on to
All dimensions ate in millimetresgj^ge 28 GCI sheets on
100x50 mm purlins on
100x50 mm rafters on
100 x 50 mm wall plates
-300 mm deep open eaves
-200 mm Hiick natural stone wall
100 mm tliicli concrete slab on
Damp proot membrane on
25 mm sand blinding on
Well-compacted hardcore
-600 x 200 mm foundation base
Figure 18: Section showing galvanized corrugated iron (GCI) roof
Figure 19: Section through test house showing tile roof
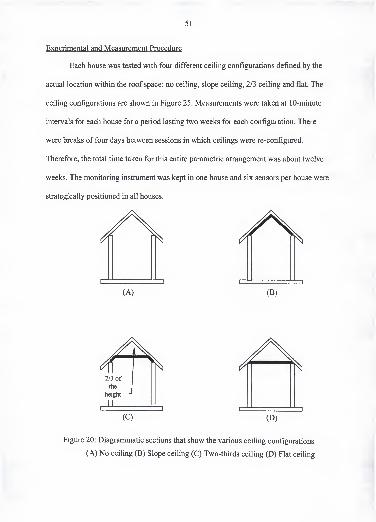
51
Experimental and Measurement Procedure
Each house was tested with four different ceiling configurations defined by the
actual location within the roof space: no ceiling, slope ceiling, 2/3 ceiling and flat. The
ceiling configurations are shown in Figure 25. Measurements were taken at 10-minute
intervals for each house for a period lasting two weeks for each configuration. There
were breaks of four days between sessions in which ceilings were re-configured.
Therefore, the total time taken for this entire parametric arrangement was about twelve
weeks. The monitoring instrument was kept in one house and six sensors per house were
strategically positioned in all houses.
I II
"
(A) (B)
Figure 20: Diagrammatic sections that show the various ceiling configurations
(A) No ceiling (B) Slope ceiling (C) Two-thirds ceiling (D) Flat ceiling
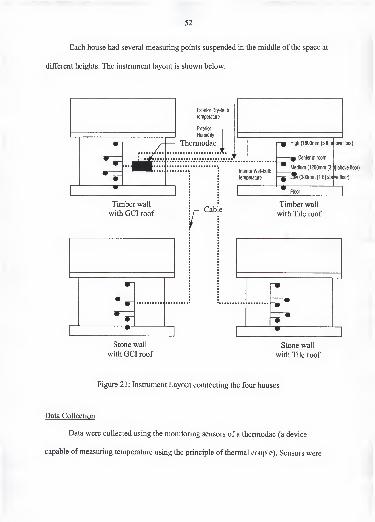
52
Each house had several measuring points suspended in the middle of the space at
different heights. The instrument layout is shown below.
Timber wall
with GCI roof
Stone wall
with GCI roof
Exterior Dry-bulb
temperature
Exterior
Humidity
Thermodac1.
Cable
Inte ior Wet-bulb
tem )erature
High {1800mm [5 ft] a DOve floor)
-p Center of room
f^edium (1200mm [3 It] above floor)
~Mi (300mm [1 ft] ab( ve floor)
Floor
Timber wall
with Tile roof
Stone wall
with Tile roof
Figure 21 : Instrument Layout connecting the four houses
Data Collection
Data were collected using the monitoring sensors of a thermodac (a device
capable of measuring temperature using the principle of thermal couple). Sensors were
53
attached to wall and floor surfaces, and also others were suspended in each house to take
data defining the room conditions. These sensors'*^ in each building measured:
(a) Mean radiant temperature (MRT) by globe thermometer (center of the room)
(b) High ( 1 800 mm [5 ft]) dry bulb temperature (DBT)
(c) Medium ( 1 200 mm [3 ft]) DBT
(d) Low (300 mm [1 ft]) DBT
(e) Floor (on the concrete slab) DBT
(f) Interior wet-bulb temperature (WBT)
(g) Exterior wet bulb temperature (WBT)"*'
(h) Exterior dry bulb temperature (DBT)''^
The wet bulb temperatures were used to calculate the relative humidity with
corresponding indoor and outdoor dry bulb temperatures. The globe thermometer gave
the Mean Radiant Temperatures. All the measured data were stored on data-loggers and
retrieved daily into a computer in the laboratory.
The other parts of the instruments, besides the main thermodac, included sensors
and data loggers appropriately positioned under the schematic representation shown in
Figure 27. Each sensor was positioned away direct solar radiation or the influence of
radiant surfaces.
The sensors were located at the distances indicated above the finished floor level.
Exterior value was measured only at one point for all houses.
Ditto.
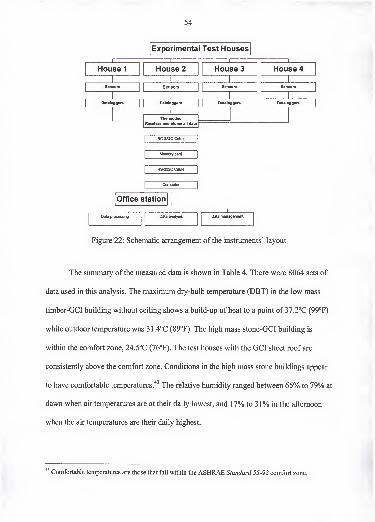
House 1
Sensor*
Dataloggers
54
Experimental Test Houses
XHouse 2
Sensors
Dataloggers
Thermodac
Receives and stores all data
RC-232C Cable
MerTxxy card
RS-232C Cable
Computer
Office station -
Data processing Data analysis
House 3
Sensor*
Dataloggers
1Data management
House 4
Sensors
Dataloggers
Figure 22: Schematic arrangement of the instruments' layout
The summary of the measured data is shown in Table 4. There were 8064 sets of
data used in this analysis. The maximum dry-bulb temperature (DBT) in the low mass
timber-GCI building without ceiling shows a build-up of heat to a point of 37.2°C (99°F)
while outdoor temperature was 3 1 .4°C (89°F). The high mass stone-GCI building is
within the comfort zone, 24.5°C (76°F). The test houses with the GCI sheet roof are
consistently above the comfort zone. Conditions in the high mass stone buildings appear
to have comfortable temperatures."^ The relative humidity ranged between 65% to 79% at
dawn when air temperatures are at their daily lowest, and 17% to 31% in the afternoon
when the air temperatures are their daily highest.
''^ Comfortable temperatures are those that fall within the ASHRAE Standard 55-92 comfort zone.
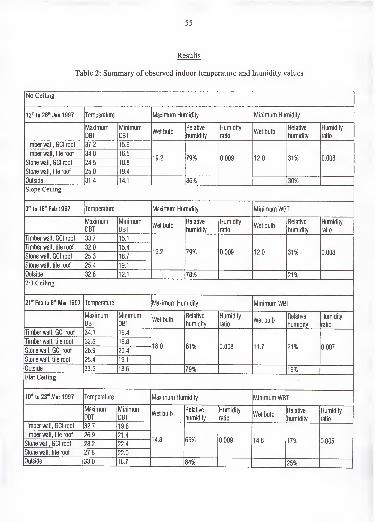
55
Results
Table 2: Summary of observed indoor temperature and humidity values
No Ceiling
13'" to 26'" Jan 1997 Temperature Maximum Humidity Minimum Humidity
f^ilaximum
DBT
Minimum
DBTWet bulb
Relative
humidity
Humidity
ratioWet bulb
Relative
humidity
Humidity
ratio
Timber wall, GCI roof 37,2 15,9
19.2 79% 0.009 12.0 31% 0,008Timber wall, tile roof 34,0 16,5
Stone wall, GCI roof 24,5 18.8
Stonewall, tile roof 25,0 19.4
Outside 31.4 14.1 86% 30%
Slope Ceiling
3'" to 16* Feb 1997 Temperature Maximum Humidity Minimum WBT
Maximum
DBT
Minimum
DBTWet bulb
Relative
humidity
Humidity
ratioWet bulb
Relative
humidity
Humidity
ratio
Timber wall, GCI roof 33,7 15.1
19.2 79% 0.009 12.0 31% 0,008Timber wall, tile roof 32,0 15.4
Stone wall, GCI roof 25,3 18.7
Stone wall, tile roof 25,4 19.1
Outside 32.8 12.1 78% 21%
2/3 Ceiling
21" Feb to 6'" Mar 1997 Temperature Maximum Humidity Minimum WBT
Maximum
DBT
Minimum
DBTWet bulb
Relative
humidity
Humidity
ratioWet bulb
Relative
humidity
Humidity
ratio
Timber wall, GCI roof 34,1 16.4
18.0 81% 0.008 11.7 21% 0.007
Timber wall, tile roof 32,6 16.8
Stone wall, GCI roof 26,9 20.4
Stone wall, tile roof 25.4 19.1
Outside 33,5 13.6 79% 19%
Flat Ceiling
10* to 23'" Mar 1997 Temperature Maximum Humidity Minimum WBT
Maximum
DBT
Minimum
DBTWet bulb
Relative
humidity
Humidity
ratioWet bulb
Relative
humidity
Humidity
ratio
Timber wall, GCI roof 32.7 19.6
14.8 65% 0.009 14.8 17% 0.005
Timber wall, tile roof 26.9 21.4
Stone wall, GCI roof 28.2 22.4
Stone wall, tile roof 27,8 22.0
Outside 33,0 16.7 84% 25%
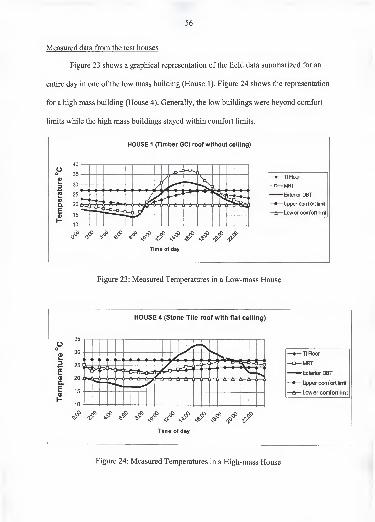
56
Measured data from the test houses
Figure 23 shows a graphical representation of the field data summarized for an
entire day in one of the low mass building (House 1). Figure 24 shows the representation
for a high mass building (House 4). Generally, the low buildings were beyond comfort
limits while the high mass buildings stayed within comfort limits.
HOUSE 1 (Timber GCI roof without ceiling)
tlirrit
Time of day
Figure 23: Measured Temperatures in a Low-mass House
Figure 24: Measured Temperatures in a High-mass House
57
First, the low mass building (timber wall) closely followed the outdoor
conditions. There was no significant moderation of temperatures. Second, the high mass
(stone) buildings showed a clear time delay and temperature moderation. The conditions
are firmly within the comfort zone. Third, floor temperatures are the most stable; they
have the smallest amplitude from mean values. More results are in Appendix B.
Criteria for Evaluating the Experimental Data
Since the main theme of this research was the effect of thermal mass on comfort
conditions (using indoor temperatures as an indicator of comfort), the main criterion
chosen for evaluating the performance of the buildings was borrowed from previous
experiments conducted by Givoni (1976, 1998a, 1998b). Basically, it meant examining
indoor maximum and minimum air temperature and its reduction below the outdoor
maximum.'*^ The effect of the various ceiling configurations is fully analyzed later. At
this stage, only the situations without ceiling and flat ceiling will be discussed.
This study also borrows the concepts of the thermal time constant (TTC),'*^ re-
developed by Givoni and Hoffman"*^ from previous work by Bruckmayer'*^ and
Raychoudhury,"* and diurnal heat capacity (DHC)"^ that was developed by Balcomb.^"
Expressed mathematically: (Outdoor - Indoor maxima) = (Slope) x (Outdoor temperature swing) +(Intercept)
*^ TTC was defined as "the heat stored in the wall per unit of heat transmitted through it" (Givoni, 1976,
pp. 435). TTC is a measure of the heat capacity.
Givoni, B. and M. E. Hoffman. 1968. Effect of building materials on internal temperature . ResearchReportfor the Ministry ofHousing, Building Research Station, Technion, Haifa, April 1968.
Cited by Givoni (1976, pp. 1 17).
Raychaudhury, B. C. and N. K. D. Chaudhury. 1961. Thermal performance of dwelling in the tropics .
Indian Construction News, December 1961, pp. 38-42. Cited by Givoni, 1976, pp. 1 17.
58
The patterns of indoor temperature are a measure of the DHC. Givoni^' (1998b, pp. 149-
183) discussed a mathematical model predicting the quantitative effect ofDHC on the
performance of direct gain and its application. The concept was carried here.
Effect of Thermal Mass on Temperatures in Experimental Buildings
Comparing the experiments by Givoni with the results of this study, there is a
clear pattern that show that indoor maxima follow the pattern of outdoor temperature
swings. Looking at indoor air temperatures in two main cases, the effect of thermal mass
was observed under these two main headings: Without-Ceiling and with Flat-Ceiling.
The psychrometric chart represents the initial observation made previously. It can
now be seen that thermal mass is clearly responsible for adjusting internal conditions to
remain within the narrow ASHRAE comfort zone. Many studies, by Givoni,^^
Humphreys,"'^'' Nicol,^^ Tanabe^^'", Leaman & Bordass^^ and Kwok^', have
DHC determines the capacity of the interior thermal mass to absorb solar energy penetrating through the
windows thus by-passing the modifying effect of the walls and the roof, and to release the absorbed heat
back into the interior air during the night hours.
Balcomb, J. Douglas. 1983. Heat storage and distribution inside passive solar buildings. ReportLA9694. Los Alamos National Laboratory, New Mexico: Los Alamos.
" Givoni, Baruch. 1998b. Climate Considerations In Building And Urban Design. Van Nostrand Reinhold,
New York. See Chapter 4: Passive Solar Heating Systems pi 49- 183.
" Givoni, Baruch. 1998b. Climate Considerations In Building And Urban Design. New York: VanNostrand Reinhold pp. 25.
" Humphreys, M. A. 1975. Field Studies of thermal comfort compared and applied. Building Research
Establishment, Current Paper. CP 76/75, Garston, Watford, UK^ Humphreys, Reverend Michael A. 1976. Field Studies of thermal comfort compared and applied.
Building Services Engineer, 44, pp. 5-27.
" Nicol, F., G. N. Jamy, O. Sykes, M. A. Humphreys, S. Roaf, and Hancock. 1994. Thermal Comfort in
Pakistan. UK: Oxford Brookes University, School of Architecture.
Tanabe, S. L, K. Kimura, and T. Hara. 1987. Thermal comfort requirements during the summer season in
Japan. ASHRAE Transactions 93 (1): 564-577. American Society of Heating, Refrigerating and AirConditioning Engineers, Atlanta GA.
" Tanabe, S. L 1988. Thermal Comfort in Japan . Waseda University, Tokyo, Japan.
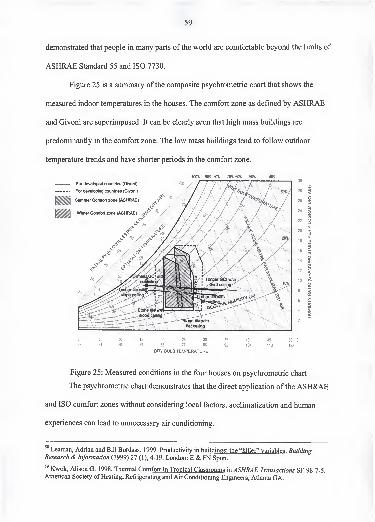
59
demonstrated that people in many parts of the world are comfortable beyond the limits of
ASHRAE Standard 55 and ISO 7730.
Figure 25 is a summary of the composite psychrometric chart that shows the
measured indoor temperatures in the houses. The comfort zone as defined by ASHRAE
and Givoni are superimposed. It can be clearly seen that high mass buildings are
predominantly in the comfort zone. The low mass buildings tend to follow outdoor
temperature trends and have shorter periods in the comfort zone.
100% 90% 80% 70% 60% 50% 40%
For developed countries (Givoni)
.... For developing countries (Givoni)
Summer Comfort zone (ASHRAE)
m ^ Winter Comlbrt zone (ASHRAE) ^
<>-
o:Q
<a.
o
a.3
os0)
s
oo
<
>
osDI
0 5 to 15 20 25 30 35 40 45 50 C
32 41 50 59 68 77 86 95 104 113 122 F
DRY BULB TEMPERATURE
Figure 25: Measured conditions in the four houses on psychrometric chart
The psychrometric chart demonstrates that the direct application of the ASHRAE
and ISO comfort zones without considering local factors, acclimatization and human
experiences can lead to unnecessary air conditioning.
58Leaman, Adrian and Bill Bordass. 1999. Productivity in buildings: the "killer" variables . Building
Research & Information (1999) 27 (1), 4-19. London: E & FN Spon.
Kwok, Alison G. 1998. Thermal Comfort In Tropical Classrooms in ASHRAE Transactions SF-98-7-5.American Society of Heating, Refrigerating and Air Conditioning Engineers, Atlanta GA.
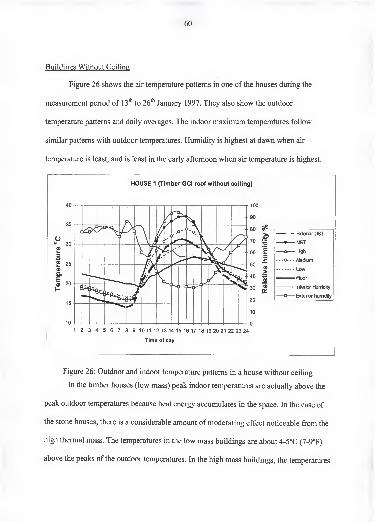
60
Buildings Without Ceiling
Figure 26 shows the air temperature patterns in one of the houses during the
measurement period of 13"^ to 26* January 1997. They also show the outdoor
temperature patterns and daily averages. The indoor maximum temperatures follow
similar patterns with outdoor temperatures. Humidity is highest at dawn when air
temperature is least, and is least in the early afternoon when air temperature is highest.
HOUSE 1 (Timber GCI roof without ceiling)
123456789 10 11 12 13 14 15 16 17 18 19 20 21 22 23 24
Time of day
Figure 26: Outdoor and indoor temperature patterns in a house without ceiling
In the timber houses (low mass) peak indoor temperatures are actually above the
peak outdoor temperatures because heat energy accumulates in the space. In the case of
the stone houses, there is a considerable amount of moderating effect noticeable from the
high thermal mass. The temperatures in the low mass buildings are about 4-5°C (7-9°F)
above the peaks of the outdoor temperatures. In the high mass buildings, the temperatures
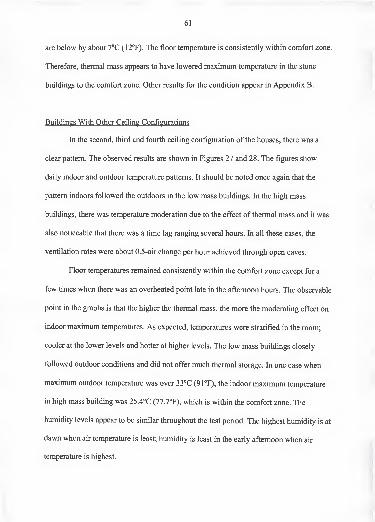
61.
are below by about 7°C (12°F). The floor temperature is consistently within comfort zone.
Therefore, thermal mass appears to have lowered maximum temperature in the stone
buildings to the comfort zone. Other results for the condition appear in Appendix B.
Buildings With Other Ceiling Configurations
In the second, third and fourth ceiling configuration of the houses, there was a
clear pattern. The observed results are shown in Figures 27 and 28. The figures show
daily indoor and outdoor temperature patterns. It should be noted once again that the
pattern indoors followed the outdoors in the low mass buildings. In the high mass
buildings, there was temperature moderation due to the effect of thermal mass and it was
also noticeable that there was a time lag ranging several hours. In all these cases, the
ventilation rates were about 0.5-air change per hour achieved through open eaves.
Floor temperatures remained consistently within the comfort zone except for a
few times when there was an overheated point late in the afternoon hours. The observable
point in the graphs is that the higher the thermal mass, the more the moderating effect on
indoor maximum temperatures. As expected, temperatures were stratified in the room;
cooler at the lower levels and hotter at higher levels. The low mass buildings closely
followed outdoor conditions and did not offer much thermal storage. In one case when
maximum outdoor temperature was over 33°C (9rF), the indoor maximum temperature
in high mass building was 25.4°C (77.7°F), which is within the comfort zone. The
humidity levels appear to be similar throughout the test period. The highest humidity is at
davm when air temperature is least; humidity is least in the early afternoon when air
temperature is highest.
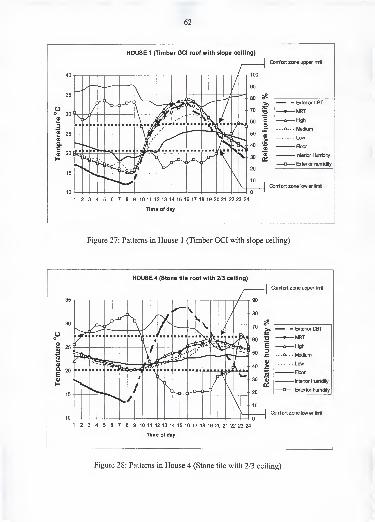
62
HOUSE 1 (Timber GCI roof with slope ceiling)
1 2 3 4 5 6 7 8 9 10 11 12 13 14 15 16 17 18 19 20 21 22 23 24
Time of day
Figure 27: Patterns in House 1 (Timber GCI with slope ceiling)
HOUSE 4 (Stone tile roof with 2/3 ceiling)
I
Corrfort zone upper Brrit
1 2 3 4 5 6 7 8 9 10 11 12 13 14 15 16 17 18 19 20 21 22 23 24
Time of day
Figure 28: Patterns in House 4 (Stone tile with 2/3 ceiling)
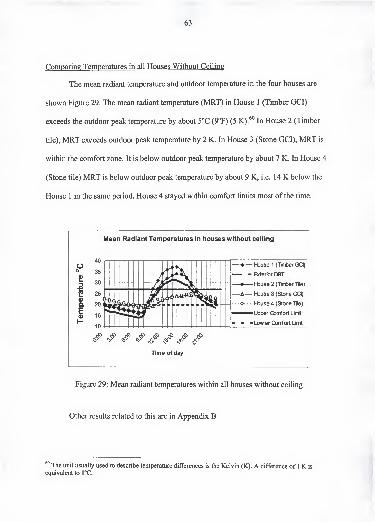
63
Comparing Temperatures in all Houses Without Ceiling
The mean radiant temperature and outdoor temperature in the four houses are
shown Figure 29. The mean radiant temperature (MRT) in House 1 (Timber GCI)
exceeds the outdoor peak temperature by about 5°C (9°F) (5 K).^° In House 2 (Timber
tile), MRT exceeds outdoor peak temperature by 2 K. In House 3 (Stone GCI), MRT is
within the comfort zone. It is below outdoor peak temperature by about 7 K. In House 4
(Stone tile) MRT is below outdoor peak temperature by about 9 K, i.e. 14 K below the
House 1 in the same period. House 4 stayed within comfort limits most of the time.
Mean Radiant Temperatures in houses without ceiling
Oo
S!
s«aE
I-
40
35
30
25
20
15
10
CS^ /Time of day
— House 1 (Tinker GO)— - Exterbr DBT
—•— House 2 (Tirtt»er Tile)
—^— House 3 (Stone GO!)
.. .o- - - House 4 (Stone Tile)
Upper Contfort Linnit
- - -Lower Confort Lirrit— -—
Figure 29: Mean radiant temperatures within all houses without ceiling
Other results related to this are in Appendix B
^ The unit usually used to describe temperature differences is the Kelvin (K). A difference of 1 K is
equivalent to 1°C.
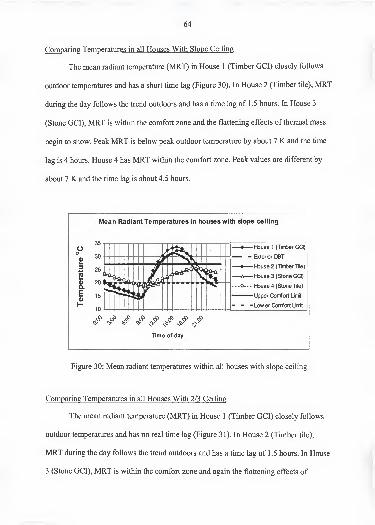
64
Comparing Temperatures in all Houses With Slope Ceiling
The mean radiant temperature (MRT) in House 1 (Timber GCI) closely follows
outdoor temperatures and has a short time lag (Figure 30). In House 2 (Timber tile), MRT
during the day follows the trend outdoors and has a time lag of 1.5 hours. In House 3
(Stone GCI), MRT is within the comfort zone and the flattening effects of thermal mass
begin to show. Peak MRT is below peak outdoor temperature by about 7 K and the time
lag is 4 hours. House 4 has MRT within the comfort zone. Peak values are different by
about 7 K and the time lag is about 4.5 hours.
Mean Radiant Temperatures in houses with slope ceiling
— House 1 (Timber GO)
- - Exterior DBT
•— House 2 (Timber Tile)
A— House 3 (Stone GO)
o- - - House 4 (Stone Tile)
Upper Comfort Limit
- - Low er Comfort Limit
Figure 30: Mean radiant temperatures within all houses with slope ceiling
Comparing Temperatures in all Houses With 2/3 Ceiling
The mean radiant temperature (MRT) in House 1 (Timber GCI) closely follows
outdoor temperatures and has no real time lag (Figure 31). In House 2 (Timber tile),
MRT during the day follows the trend outdoors and has a time lag of 1.5 hours. In House
3 (Stone GCI), MRT is within the comfort zone and again the flattening effects of
Time of day
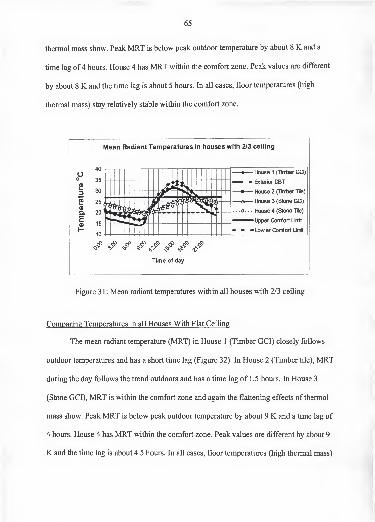
65
thermal mass show. Peak MRT is below peak outdoor temperature by about 8 K and a
time lag of 4 hours. House 4 has MRT within the comfort zone. Peak values are different
by about 8 K and the time lag is about 5 hours. In all cases, floor temperatures (high
thermal mass) stay relatively stable within the comfort zone.
Mean Radiant Temperatures in houses with 2/3 ceiling
House 1 (Timber GO)
- - Exterior DBT
• House 2 (Tinnber Tile)
A— House 3 (Stone GO)
o- - - House 4 (Stone Tile)
Upper Conrfort Linnit
- Low er Confort Lirrit
Figure 3 1 : Mean radiant temperatures within all houses with 2/3 ceiling
Comparing Temperatures in all Houses With Flat Ceiling
The mean radiant temperature (MRT) in House 1 (Timber GCI) closely follows
outdoor temperatures and has a short time lag (Figure 32). In House 2 (Timber tile), MRT
during the day follows the trend outdoors and has a time lag of 1.5 hours. In House 3
(Stone GCI), MRT is within the comfort zone and again the flattening effects of thermal
mass show. Peak MRT is below peak outdoor temperature by about 9 K and a time lag of
4 hours. House 4 has MRT within the comfort zone. Peak values are different by about 9
K and the time lag is about 4.5 hours. In all cases, floor temperatures (high thermal mass)
Time of day
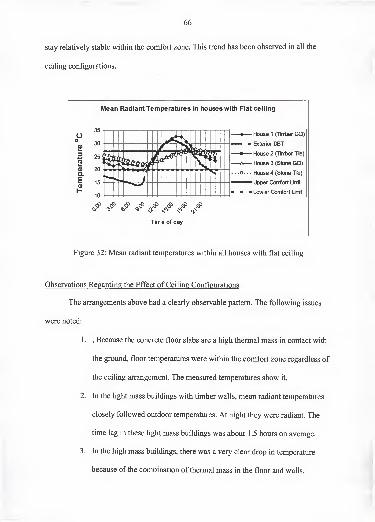
66
stay relatively stable within the comfort zone. This trend has been observed in all the
ceiling configurations.
Mean Radiant Temperatures in houses with Flat ceiling
Oo
£3
iSa>a.
Ea>
I-
<V <j K°
Time of day
— House 1 (Tirrber GCI)
- Exterior DBT
•— House 2 (Tirrber Tile)
House 3 (Stone GO)
o- - - House 4 (Stone Tile)
Upper Confort Linnit
- - -Lower Confort Lirnt
Figure 32: Mean radiant temperatures within all houses with flat ceiling
Observations Regarding the Effect of Ceiling Configurations
The arrangements above had a clearly observable pattern. The following issues
were noted:
1 . , Because the concrete floor slabs are a high thermal mass in contact with
the ground, floor temperatures were within the comfort zone regardless of
the ceiling arrangement. The measured temperatures show it.
2. In the light mass buildings with timber walls, mean radiant temperatures
closely followed outdoor temperatures. At night they were radiant. The
time lag in these light mass buildings was about 1.5 hours on average.
3. In the high mass buildings, there was a very clear drop in temperature
because of the combination of thermal mass in the floor and walls.
67
4. Sensors for MRT and "Medium" thermometers were at the same level. By
observing MRT, "Medium" and "High" temperatures, it is observable that
MRT is generally lower than "High" air temperature but higher than
"Medium" air temperature. This suggests that the roof is a more radiant
element than the walls and that thermal mass should be located on the roof
as well as the wall. Implicitly, the floor had a large stabilizing effect.
Taylor^' et al. (2000, pp. 343) in Pretoria, South Africa observed that roof
insulation altered indoor comfort conditions by about 4.5 K. This study showed that the
ceiling configuration had some influence on mean radiant temperatures, and this suggests
that they would affect thermal comfort of occupants of the space.
Analysis and Discussion ' ; , -
,
Formulae For Predicting Indoor Temperatures
A common feature noticed from the buildings with high thermal mass is the
tendency of correlation between the indoor maximum temperatures and the outdoor air
temperature patterns. Givoni also saw this observation consistently in several studies in
Califomia^^ and Israel^^ It formed the basis for the development of a predictive formula
for the expected indoor maximum temperatures, which were described fully in 1998^.
Taylor, P. B., E. H. Mathews, M. Kleingeld and G. W. Taljaard. 2000. The effect of ceiling insularion on
indoor comfort . Building and Environment 35 (2000) 339-346. London: Elsevier Science Ltd.
Givoni. Baruch. 1998a. Effectiveness Of Mass And Night Ventilation In Lowering Indoor Daytime
Temperatures. Part I: 1993 experimental periods. Energy and Buildings 28 (1998) 25-32. Amsterdam:
Elsevier Science Limited.
" Givoni, Baruch. 1976. Man, Climate and Architecture. Applied Science Publishers: London, UK. pp.137.
^ Givoni, Baruch. 1998b. Climate Considerations In Building And Urban Design. New York: VanNostrand Reinhold pp. 187-188.
68
His equation was used to predict for the same type of thermal mass used in this study and,
while the patterns look similar, the differences between the predicted and the observed
data are consistently about 2-3°C (4-6°F). The formula developed by Givoni was:
Tmax-in ~ Tmax-out ~ 0.31 X (Tmax-out ~ Tmin-out) 1«6
Where:
Tmax-in = Indoor maximum temperature;
Tmax-out = Outdoor maximum temperature;
Tmin-out ^ Outdoor minimum temperature.
Data from this experiment were examined closely to see the relationships and
phenomena that would offer useful explanations. Statistical analysis was conducted and
there was a correlation (0.905) (R^ = 0.63) between the drop of indoor maximum
temperature below the outdoor maximum and the daily outdoor swing. The new formula
was very close to that of Givoni. Full statistical summaries are in Appendix C.
The new regression analysis from this study for a high mass building was given
by:
Tmax-in Tmax-out 0.488 X (Tmax-out ~ Tmin-out) 2.44
(p-value = 0.01; = 0.63; Standard error ±0.68° C)
The two mathematical relationships (Givoni and this study) are close. The
differences in the gradient (slope) and the "constant" can be explained by the fact that
these studies have been done in different climates. The results of this study suggest that
the new equation can be used for high thermal mass buildings comprising 200mm (8")
thick stonewalls at equatorial high altitudes.
The new equation was applied to the published work by Givoni and generated the
results in Figure 33. The figure shows the measured data and computed data side by side
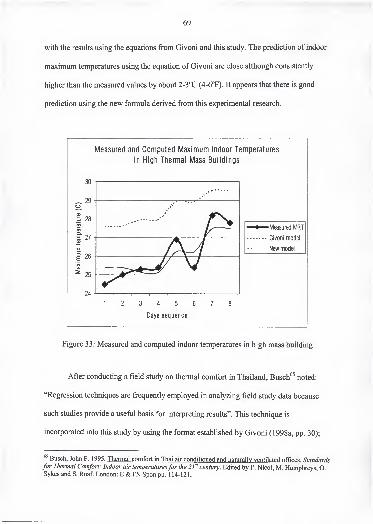
69
with the results using the equations from Givoni and this study. The prediction of indoor
maximum temperatures using the equation of Givoni are close although consistently
higher than the measured values by about 2-3°C (4-6°F). It appears that there is good
prediction using the new formula derived from this experimental research.
Measured and Computed Maximum Indoor Temperatures
in Higli Thermal Mass Buildings
30 11
^ 29o
24 -I 1 1
1 I1 1 1
1 2 3 4 5 6 7 8
Days sequence
Figure 33: Measured and computed indoor temperatures in high mass building
After conducting a field study on thermal comfort in Thailand, Busch*' noted:
"Regression techniques are frequently employed in analyzing field study data because
such studies provide a usefiil basis for interpreting results". This technique is
incorporated into this study by using the format established by Givoni (1998a, pp. 30);
Busch, John F. 1995. Thermal comfort in Thai air conditioned and naturally ventilated offices . Standardsfor Thermal Comfort: Indoor air temperaturesfor the 21" century. Edited by F. Nicol, M. Humphreys, O.Sykes and S. Roaf. London: E & FN Spon pp. 1 14-121.
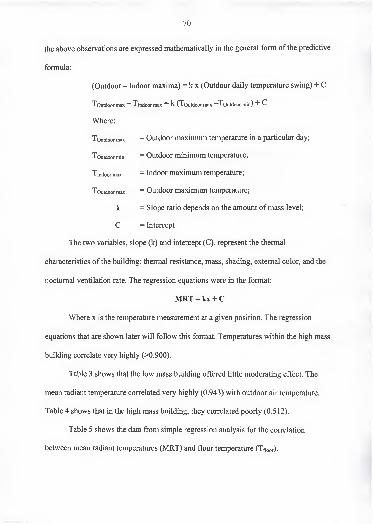
70
the above observations are expressed mathematically in the general form of the predictive
formula:
(Outdoor - Indoor maxima) = k x (Outdoor daily temperature swing) + C
Toutdoor max ~ Tjndoor max " k (Toutdoor max ~Toutdoor min) "'' C
Where:
Toutdoor max = Outdoor maximum temperature in a particular day;
Toutdoor min = Outdoor minimum temperature;
Tindoor max = Indoor maximum temperature;
Toutdoor max = Outdoor maximum temperature;
k = Slope ratio depends on the amount of mass level;
C = Intercept
The two variables, slope (k) and intercept (C), represent the thermal
characteristics of the building: thermal resistance, mass, shading, external color, and the
nocturnal ventilation rate. The regression equations were in the format:
MRT = kx + C
Where x is the temperature measurement at a given position. The regression
equations that are shown later will follow this format. Temperatures within the high mass
building correlate very highly (>0.900).
Table 3 shows that the low mass building offered little moderating effect. The
mean radiant temperature correlated very highly (0.943) with outdoor air temperature.
Table 4 shows that in the high mass building, they correlated poorly (0.512).
Table 5 shows the data from simple regression analysis for the correlation
between mean radiant temperatures (MRT) and floor temperature (Tnoor)-
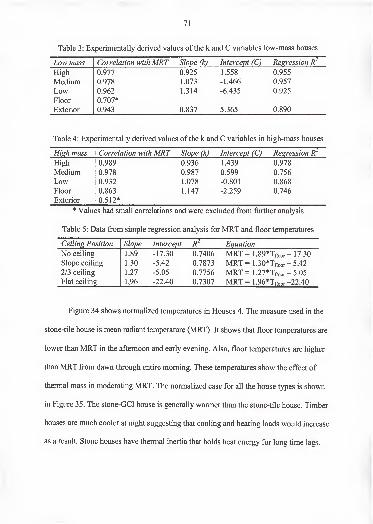
71
Table 3: Experimentally derived values of the k and C variables low-mass houses
Low mass Correlation with MRT Slope (k) Intercept (C) Regression R
High 0.977 0.925 1.558 0.955
Medium 0.978 1.073 -1.466 0.957
Low 0.962 1.314 -6.435 0 99S
Floor 0.707*
Exterior 0.943 0.837 5.365 0.890
Table 4: Experimentally derived values of the k and C variables in
High mass Correlation with MRT Slope (k) Intercept (C) Regression RHigh 0.989 0.936 1.439 0.978
Medium 0.978 0.987 0.599 0.756
Low 0.932 1.078 -0.801 0.868
Floor 0.863 1.147 -2.259 0.746
Exterior 0.512*
* Values had small correlations and were excluded from further analysis
Table 5: Data from simple regression analysis for MRT and floor temperatures
Ceiling Position Slope Intercept r' Equation
No ceiling 1.89 -17.30 0.7406 MRT =1.89*Tfloor - 17.30
Slope ceiling 1.30 -5.42 0.7873 MRT =1.30*Tfloor -5.42
2/3 ceiling 1.27 -5.05 0.7756 MRT =1.27*Tfloor -5.05
Flat ceiling 1,96 -22.40 0.7307 MRT =1.96*Tfloor -22.40
Figure 34 shows normalized temperatures in Houses 4. The measure used in the
stone-tile house is mean radiant temperature (MRT). It shows that floor temperatures are
lower than MRT in the afternoon and early evening. Also, floor temperatures are higher
than MRT from dawn through entire morning. These temperatures show the effect of
thermal mass in moderating MRT. The normalized case for all the house types is shown
in Figure 35. The stone-GCI house is generally warmer than the stone-tile house. Timber
houses are much cooler at night suggesting that cooling and heating loads would increase
as a result. Stone houses have thermal inertia that holds heat energy for long time lags.
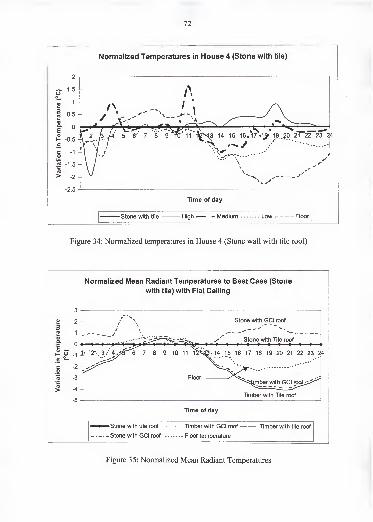
72
Normalized Temperatures in House 4 (Stone with tile)
Figure 34: Normalized temperatures in House 4 (Stone wall with tile roof)
Normalized Mean Radiant Temperatures to Best Case (Stone
with tile) with Flat Ceiling
i_
oQ.
EA) o-^
co
.2*cn>
3
2
1
0
-1
-2
-3
-4
-5
Stone with GCI roof
-'' ^ ^
Stone with Tile roof
2-. 3/ 4,>5^3 7 8 9 10 11 12^-.14 15 16 17 18 19 20 21 22 23 24
Floor
Timber with Tile roof
Time of day
•Stone with tile roof Tlmtier with GCI roof Tlmlaer with tiie roof
- Stone with GCI roof Floor temperature
Figure 35: Normalized Mean Radiant Temperatures
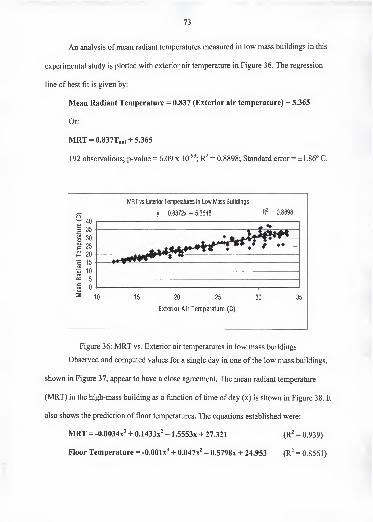
73
An analysis ofmean radiant temperatures measured in low mass buildings in this
experimental study is plotted with exterior air temperature in Figure 36. The regression
line of best fit is given by:
Mean Radiant Temperature = 0.837 (Exterior air temperature) + 5.365
Or:
MRT = 0.837To„, + 5.365
192 observations; p-value = 6.09 x 10"'^; = 0.8898; Standard error = ±1.86° C.
MRT vs Exterior Temperatures in Low Mass Buildings
y = 0,8372x + 5.3648 = 0.8898
I 0 ^ < : < <
^ 10 15 20 25 30 35
Exterior Air Temperature (C)
Figure 36: MRT vs. Exterior air temperatures in low mass buildings
Observed and computed values for a single day in one of the low mass buildings,
shown in Figure 37, appear to have a close agreement. The mean radiant temperature
(MRT) in the high-mass building as a function of time of day (x) is shown in Figure 38. It
also shows the prediction of floor temperatures. The equations established were:
MRT = -0.0034x^ + 0.1433x^ - 1.5553x + 27.321 (R^ = 0.939)
Floor Temperature = -O.OOlx^ + 0.047x^ - 0.5798x + 24.953 (R^ = 0.8561)
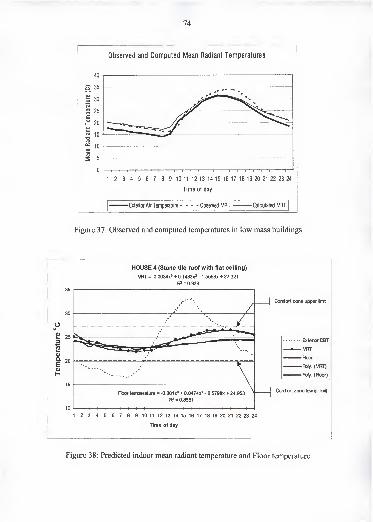
Observed and Computed Mean Radiant Temperatures
1 2 3 4 5 6 7 8 9 10 11 12 13 14 15 16 17 18 19 20 21 22 23 24
Time of day
Exterior Air Temperature - - - - Observed MRT Calculated MRT
Figure 37: Observed and computed temperatures in low mass buildings
35
15
10
HOUSE 4 (Stone tile roof with flat ceiling)
tjm = -0.0034x3 + 0.1433x2 - 1 .5553x + 27.321
= 0.939
Floor tennperature = -0.001 x^ + 0.0474x2 . o.5798x + 24.953
FC = 0.8561
1 2 3 4 5 6 7 8 9 10 11 12 13 14 15 16 17 18 19 20 21 22 23 24
Time of day
Confort zone upper liint
B(teror DBT
-VRT
•Floor
-Fbly. (MRT)
•Baly. (Floor)
Comfort zone low er llnit
Figure 38: Predicted indoor mean radiant temperature and Floor temperature
75
Comparisons with Previous Studies
Several theoretical and experimental methods have been developed to predict the
characteristics of internal temperatures. Givoni (1976, pp. 137) discussed some of these
methods. For high thermal mass materials, he said: "the indoor temperature is closely
related to the thickness of the walls and internal partitions". Mackey and Wright^^ used a
theoretical method and developed algorithms to determine the decrement and time lag
under natural external conditions, as functions of the thermal diffusivity and thickness of
the building components, and of the cycle period. This method was limited for use here
because it is only good for steady-state conditions (air conditioned spaces).
In Australia, Drysdale ' suggested the formula:
Tmax-in = T„,ax-out - 0.009W X (T^ax-out - 68) °F
Where:
Tmax-in = Indoor maximum temperature; ^,
Tmax-out= Outdoor maximum temperature
W = average weight per unit area of the external walls (Ib/ft^)
This formula assumes that the building is single storied and located in Australia
(latitude 30°S). In India (latitude 20°N), Raychaudhury and Chaudhury^' suggested this
formula:
Tmax-in = T^ax-out - 0.004W X (T„,ax-out - 60) T
Mackey, C. O. and L.T. Wright. 1946. Periodic heat flow - composite walls or roofs . Heat, Piping andAir Conditioning, June 1946. Cited by Givoni, 1976, pp. 138.
Drysdale, J. \9A%. Technical Study No. 27, Comm. Exp. Bldg. Station, Australia. Cited by Givoni, 1976pp. 141.
Drysdale, J. 1 96 1.Cooling the home. Symposium on the Functional Effect ofBuildings, Indian Concrete
News, CBRI, Roorkee, India, Nov. 1961, pp. 33-37. Cited by Givoni, 1976, pp. 141.
76
Where:
Tmax-in = Indoof maximum temperature;
Tmax-out = Outdoor maximum temperature
W = average weight of the whole structure, including roof, and the
external walls, per unit area of the whole external surface (Ib/ft^)
Much experimental research has been done and, as previously stated, according to
Givoni (1998b, 187), the formula for a 200mm-thick mass wall is given as:
Tmax-in ~ Tmax-out ~ 0.31 X (Tmax-out Tmin-out) "I" 1«6
Where:
Tmax-in = ludoor maximum tcmpcraturc; ' -
Tmax-out = Outdoor maximum temperature
Tmin-out - Outdoor minimum temperature
Results of the formulae determined in this study follow these previous works.
Predicting Thermal Sensation in Passive Solar Buildings
Humphreys^" reviewed 36 field studies of thermal comfort in "free-running"
passive solar buildings, totaling over 200,000 observations, and concluded that there is a
relationship between neutral (preferred) temperatures and the mean monthly external air
temperature. He found that:
Neutral Temperature = 0.534 (Average monthly exterior air temperature) + 1 1.9
Or, Tn = 0.534Tout + 11.9
Raychaudhury, B. C. and N. K. D. Chaudhury. 1961. Thermal performance of dwelling in the tropics .
Symposium on the Functional Efficiency ofBuildings, CBRI, November 1961, pp. 38-42. Cited by Givoni,
1976, pp. 138.
™ Humphreys, Reverend Michael A. 1975. Field Studies of thermal comfort compared and applied .
Building Research Establishment, Current Paper. CP 76/75, Garston, Watford, UK.
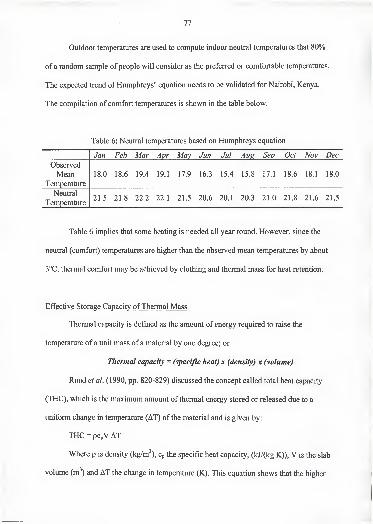
77
Outdoor temperatures are used to compute indoor neutral temperatures that 80%
of a random sample of people will consider as the preferred or comfortable temperatures.
The expected trend of Humphreys' equation needs to be validated for Nairobi, Kenya.
The compilation of comfort temperatures is shown in the table below.
Table 6: Neutral temperatures based on Humphreys equation
Jan Feb Mar Apr May Jun Jul Aug Sep Oct Nov Dec
Observed
Mean 18.0 18.6 19.4 19.1 17.9 16.3 15.4 15.8 17.1 18.6 18.1 18.0
Temperature
Neutral
Temperature21.5 21.8 22.2 22.1 21.5 20.6 20.1 20.3 21.0 21.8 21.6 21.5
Table 6 implies that some heating is needed all year round. However, since the
neutral (comfort) temperatures are higher than the observed mean temperatures by about
3°C, thermal comfort may be achieved by clothing and thermal mass for heat retention.
Effective Storage Capacity of Thermal Mass
Thermal capacity is defined as the amount of energy required to raise the
temperature of a unit mass of a material by one degree; or
Thermal capacity = (specific heat) x (density) x (volume)
Ruud et al. (1990, pp. 820-829) discussed the concept called total heat capacity
(THC), which is the maximum amount of thermal energy stored or released due to a
uniform change in temperature (AT) of the material and is given by:
THC = pCpVAT
Where p is density (kg/m^), Cp the specific heat capacity, (kJ/(kg K)), V is the slab
volume (m^) and AT the change in temperature (K). This equation shows that the higher
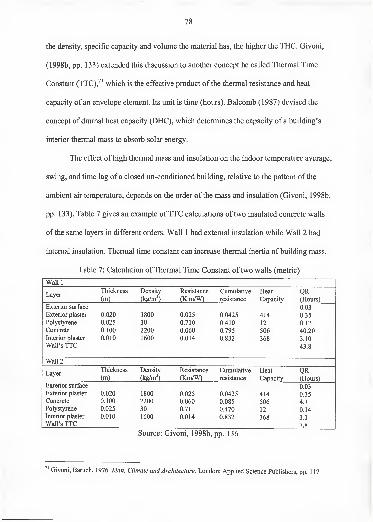
78
the density, specific capacity and volume the material has, the higher the THC. Givoni,
(1998b, pp. 133) extended this discussion to another concept he called Thermal Time
Constant (TTC),^' which is the effective product of the thermal resistance and heat
capacity of an envelope element. Its unit is time (hours). Balcomb (1987) devised the
concept of diurnal heat capacity (DHC), which determines the capacity of a building's
interior thermal mass to absorb solar energy.
The effect of high thermal mass and insulation on the indoor temperature average,
swing, and time lag of a closed un-conditioned building, relative to the pattern of the
ambient air temperature, depends on the order of the mass and insulation (Givoni, 1998b,
pp. 133). Table 7 gives an example ofTTC calculations of two insulated concrete walls
of the same layers in different orders. Wall 1 had external insulation while Wall 2 had
internal insulation. Thermal time constant can increase thermal inertia of building mass.
Table 7: Calculation of Thermal Time Constant of two walls (metric)
Wall 1
LayerThickness
(m)
Density
(kg/m')
Resistance
(K mAV)Cumulative
resistance
Heat
Capacity
QR(Hours)
Exterior surface 0.03
Exterior plaster 0.020 1800 0.025 0.0425 414 0.35
Polystyrene 0.025 30 0.710 0.410 12 0.12
Concrete 0.100 2200 0.060 0.795 506 40.20
Interior plaster 0.010 1600 0.014 0.832 368 3.10
Wall's TTC 43.8
Wall 2
LayerThickness
(m)
Density
(kg/m^)
Resistance
(Km/W)Cumulative
resistance
Heat
Capacity
QR(Hours)
Exterior surface 0.03
Exterior plaster 0.020 1800 0.025 0.0425 414 0.35
Concrete 0.100 2200 0.060 0.085 506 4.3
Polystyrene 0.025 30 0.71 0.470 12 0.14Interior plaster 0.010 1600 0.014 0.832 368 3.1
Wall's TTC 7.8
Source: Givoni, 1998b, pp. 136
^' Givoni, Baruch. 1976. Man, Climate and Architecture. London: Applied Science Publishers, pp. 1 17.
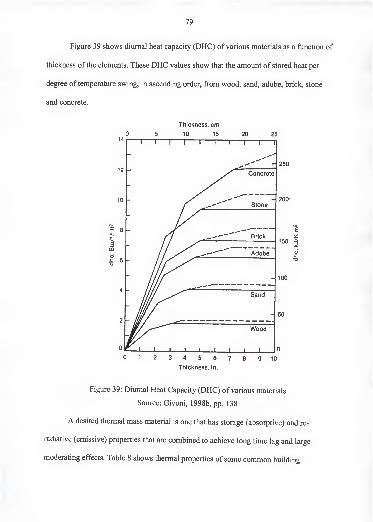
79
Figure 39 shows diumal heat capacity (DHC) of various materials as a function of
thickness of the elements. These DHC values show that the amount of stored heat per
degree of temperature swing, in ascending order, from wood, sand, adobe, brick, stone
and concrete.
Thickness, cm
10 15
T—
r
- 250
- 200
150
CM
E
ux:
- 100
3 4 5 6
Thickness, in.
Figure 39: Diumal Heat Capacity (DHC) of various materials
Source: Givoni, 1998b, pp. 138
A desired thermal mass material is one that has storage (absorptive) and re-
radiative (emissive) properties that are combined to achieve long time lag and large
moderating effects. Table 8 shows thermal properties of some common building
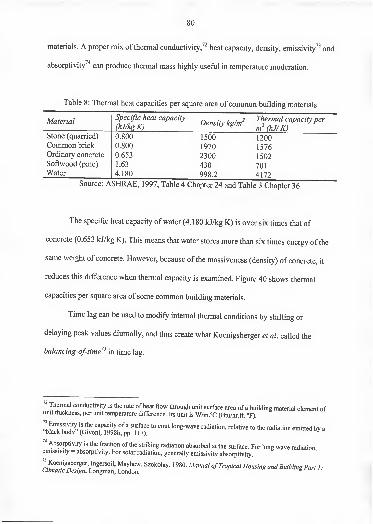
80
materials. A proper mix of thermal conductivity,^^ heat capacity, density, emissivity'^ and
absorptivity^'' can produce thermal mass highly useful in temperature moderation.
Table 8: Thermal heat capacities per square area of common building materials
MaterialSpecific heat capacity
(kJ/k^K)Density kg/m^
Thermal capacity per
(kJ/K)Stone (quarried) 0.800 1500 1200Common brick 0.800 1970 1576Ordinary concrete 0.653 2300 1502Softwood (pine) 1.63 430 701Water 4.180 998.2 4172
Source: ASHRAE, 1997, Table 4 Chapter 24 and Table 3 Chapter 36
The specific heat capacity of water (4.180 kJ/kg K) is over six times that of
concrete (0.653 kJ/kg K). This means that water stores more than six times energy of the
same weight of concrete. However, because of the massiveness (density) of concrete, it
reduces this difference when thermal capacity is examined. Figure 40 shows thermal
capacities per square area of some common building materials.
Time lag can be used to modify internal thermal conditions by shifting or
delaying peak values diumally, and thus create what Koenigsberger et al. called the
balancing-of-time^^ in time lag.
Thermal conductivity is the rate of heat flow through unit surface area of a building material element ofunit thickness, per unit temperature difference. Its unit is W/m.°C (Btu/hr.ft. °F).
"Kf"",! u'!!^.l*^'^^P?''^ ^ '"'^^'^^ '° ^""'^ long-wave radiation, relative to the radiation emitted by a
black body" (Givoni, 1 998b, pp. 11 7).^
Absorptivity is the fraction of the striking radiation absorbed at the surface. For long wave radiationemissivity = absorptivity. For solar radiation, generally emissivity absorptivity.
"Koenigsberger, Ingersoil, Mayhew, Szokolay. 1980. Manual ofTropical Housing and Building Part 1-Uimatic Design. Longman, honAon.
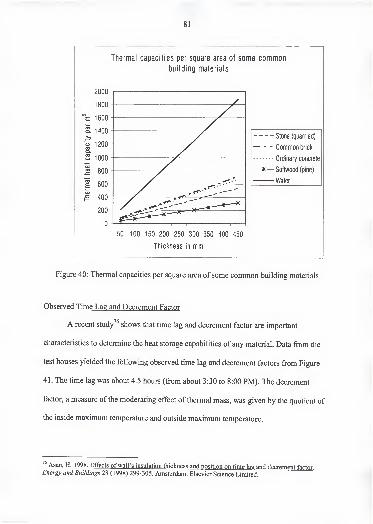
81
Thermal capacities per square area of some common
building materials
2000 11
50 100 150 200 250 300 350 400 450
Thickness in mm
Figure 40: Thermal capacities per square area of some common building materials
Observed Time Lag and Decrement Factor
A recent study^^ shows that time lag and decrement factor are important
characteristics to determine the heat storage capabilities of any material. Data from the
test houses yielded the following observed time lag and decrement factors from Figure
41. The time lag was about 4.5 hours (from about 3:30 to 8:00 PM). The decrement
factor, a measure of the moderating effect of thermal mass, was given by the quotient of
the inside maximum temperature and outside maximum temperature.
Asan, H. 1998. Effects of wall's insulation thickness and position on time lag and decrement factor .
Energy and Buildings 28 (1998) 299-305. Amsterdam: Elsevier Science Limited.
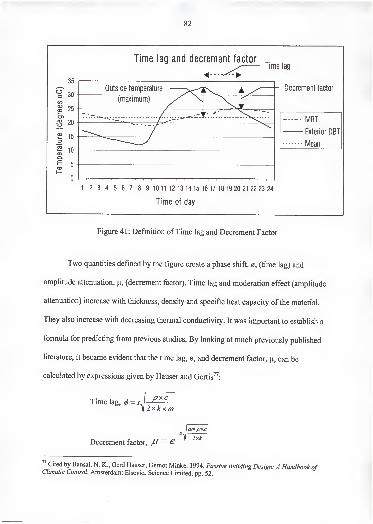
Figure 41 : Definition of Time lag and Decrement Factor
Two quantities defined by the figure create a phase shift, 0, (time lag) and
amplitude attenuation, \i, (decrement factor). Time lag and moderation effect (amplitude
attenuation) increase with thickness, density and specific heat capacity of the material.
They also increase with decreasing thermal conductivity. It was important to establish a
formula for predicting from previous studies. By looking at much previously published
literature, it became evident that the time lag, 0, and decrement factor, |i, can be
calculated by expressions given by Hauser and Gertis^':
Time lag, ^ = sJ\2xkx(v
ivxpxc
Decrement factor, JLl = e
" Cited by Bansal, N. K., Gerd Hauser, Gemot Minke. 1994. Passive Building Design: A Handbook ofClimatic Control. Amsterdam: Elsevier Science Limited, pp. 52.
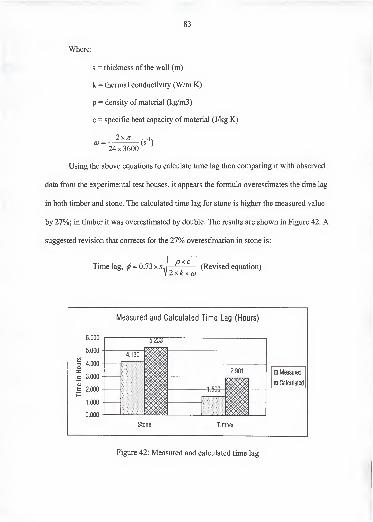
83
Where:
s = thickness of the wall (m)
k = thermal conductivity (W/m K)
p = density of material (kg/m3)
c = specific heat capacity of material (J/kg K)
£0 = (S )24x3600
Using the above equations to calculate time lag then comparing it with observed
data from the experimental test houses, it appears the formula overestimates the time lag
in both timber and stone. The calculated time lag for stone is higher the measured value
by 27%; in timber it was overestimated by double. The results are shown in Figure 42. A
suggested revision that corrects for the 27% overestimation in stone is:
Time lag, if>= 0.73 x s.\—^ (Revised equation)
Measured and Calculated Time Lag (Hours)
Measured
Q Calculated
Stone Timber
Figure 42: Measured and calculated time lag
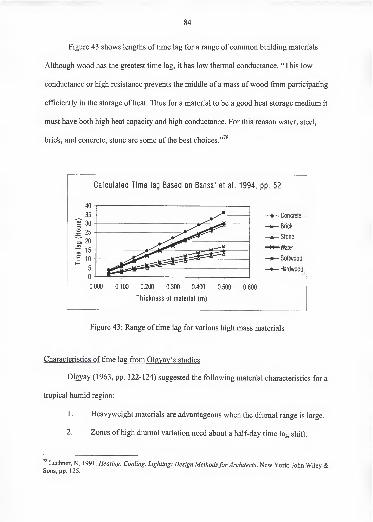
84
Figure 43 shows lengths of time lag for a range of common building materials.
Although wood has the greatest time lag, it has low thermal conductance. "This low
conductance or high resistance prevents the middle of a mass ofwood from participating
efficiently in the storage of heat. Thus for a material to be a good heat storage medium it
must have both high heat capacity and high conductance. For this reason water, steel,
brick, and concrete, stone are some of the best choices."^^
Calculated Time lag Based on Bansal et al. 1994, pp. 52
——Concrete
—B— Brick
—A— Stone
-N— Water
^it— Softwood
—•— Hardwood
Figure 43: Range of time lag for various high mass materials
Characteristics of time lag from Olgvav's studies
Olgyay (1963, pp. 122-124) suggested the following material characteristics for a
tropical humid region:
1. Heavyweight materials are advantageous when the diurnal range is large.
2. Zones of high diurnal variation need about a half-day time lag shift.
Lechner, N. 1991. Heating, Cooling, Lighting: Design Methodsfor Architects. New York: John Wiley &Sons, pp. 125.
0.000 0.100 0.200 0.300 0.400 0.500 0.600
Thickness of material (m)
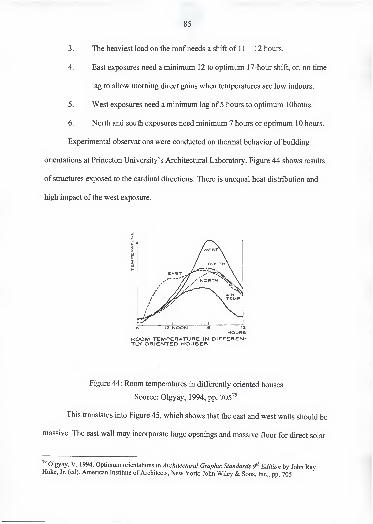
3. The heaviest load on the roof needs a shift of 1 1 - 12 hours.
4. East exposures need a minimum 12 to optimum 17-hour shift, or, no time
lag to allow morning direct gains when temperatures are low indoors.
5. West exposures need a minimum lag of 5 hours to optimum lOhours.
6. North and south exposures need minimum 7 hours or optimum 10 hours.
Experimental observations were conducted on thermal behavior of building
orientations at Princeton University's Architectural Laboratory. Figure 44 shows results
of structures exposed to the cardinal directions. There is unequal heat distribution and
high impact of the west exposure.
HOURSROOM TEMPERATURE IN DIFFEREN-TLY ORIENTED HOUSES
Figure 44: Room temperatures in differently oriented houses
Source: Olgyay, 1994, pp. 705^^
This translates into Figure 45, which shows that the east and west walls should be
massive. The east wall may incorporate large openings and massive floor for direct solar
Olgyay, V. 1994. Optimum orientations in Architectural Graphic Standards 9'* Edition by John RayHoke, Jr. (ed). American Institute of Architects, New York: John Wiley & Sons, Inc., pp. 705
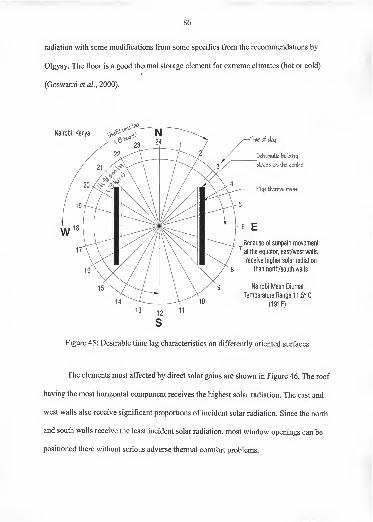
86
radiation with some modifications from some specifics from the recommendations by
Olgyay. The floor is a good thermal storage element for extreme climates (hot or cold)
(Goswami et al, 2000).
Nairobi
Time of dat)
5chem3i\c bulldinc|
placed at tlie centre
Hiqh tJiermal mass
Because of sunpatfi movement
^ at the equator, east/west wails
receive tiigher solar radiation
than north/south walls
Nairobi Mean Diurnal
Temperature Range 1 1 .5° C
(19° F)
Figure 45: Desirable time lag characteristics on differently oriented surfaces
The elements most affected by direct solar gains are shown in Figure 46. The roof
having the most horizontal component receives the highest solar radiation. The east and
west walls also receive significant proportions of incident solar radiation. Since the north
and south walls receive the least incident solar radiation, most window openings can be
positioned there without serious adverse thermal comfort problems.
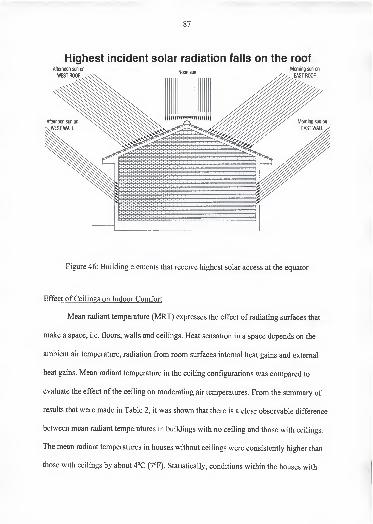
87
Highest incident solar radiation falls on the roof
Figure 46: Building elements that receive highest solar access at the equator
Effect of Ceilings on Indoor Comfort
Mean radiant temperature (MRT) expresses the effect of radiating surfaces that
make a space, i.e. floors, walls and ceilings. Heat sensation in a space depends on the
ambient air temperature, radiation from room surfaces internal heat gains and external
heat gains. Mean radiant temperature in the ceiling configurations was compared to
evaluate the effect of the ceiling on moderating air temperatures. From the summary of
results that were made in Table 2, it was shown that there is a clear observable difference
between mean radiant temperatures in buildings with no ceiling and those with ceilings.
The mean radiant temperatures in houses without ceilings were consistently higher than
those with ceilings by about 4°C (7°F). Statistically, conditions within the houses with
88
ceilings were within 1° to 2°C of each other. This suggests that a barrier can reduce
incoming solar heat gains through the roof before it is admitted within the structure.
The Florida Solar Energy Center conducted very extensive experimental research
and simulations on the effect of radiant barriers on thermal performance of buildings
(Chandra et al. 1986).^° Chandra et al. compared the cooling and heating energy when
materials with different thermal resistances are used in radiant barriers. The FSEC studies
had ceilings in all conditions. Some were with radiant barriers, and some were without
radiant barriers. These possibly created air space buffers that acted as insulators. Their
study concluded that adding a radiant barrier outperformed ordinary insulated roofs.
Radiant barriers are best applied to roofs on skin-load-dominated buildings in regions
with high solar radiation.
While this study did not incorporate radiant barriers, there is a clear observable
trend that shows that even a simple treatment of the ceiling surfaces has some effect on
mean radiant temperatures within the space. These are discussed in the next section.
Effect of Floor Temperatures
Floor temperature has a significant influence on the mean radiant temperature in a
room. Floor temperatures are themselves influenced by the presence of insulation, floor
heating or incident solar radiation. Many studies have shown that when floors are too
cold, people feel cold on their feet and they react by trying to raise the temperature of the
room (ASHRAE 1997, pp. 8.12). This increases energy consumption.
Chandra, S., P. W. Fairey, and M. M. Houston. 1986. Cooling with Ventilation. Solar Energy ResearchInstitute (SERI), Golden, Colorado. SERI/SP-273-2966, DE860 10701. Cape Canaveral, FL- Florida SolarEnergy Center (FSEC).
89
Olesen ( 1 977a, 1 977b ) studied the influence of floor temperature on foot
comfort. He did experimental studies and re-analyzed data from previous studies by
Nevins (1958,*^ 1964,^'' 1966^^). Olesen concluded that flooring material is very
important for people with bare feet in buildings. He suggested that the range of
temperature for concrete floors is 26 to 28.5° C.
Athienitis (1997, pp. 337-345)^^ investigated thermal performance of a passive
solar building with floor radiant heating and found that sufficient thermal mass can
ensure floor temperature limit remains 29° C.
Figure 47 shows the relationship between floor temperature and Percentage
People Dissatisfied (PPD). Comfort was assessed using the ASHRAE Thermal Comfort*
program with observed floor temperature as the input data. The program was adjusted to
assume subjects who were in thermal neutrality so that the percentage of people
dissatisfied is only related to thermal discomfort due to the thermal sensation on the feet.
Olesen, B. W. 1977a. Thermal comfort requirements for floors . Proceedings ofCommissions Bl, B2, Elof the IIR, Belgrade, p337-43.
Olesen, B. W. 1977b. Thermal comfort requirements for floors occupied by people with bare feet .
ASHRAE Transactions 83 (2).
" Nevins, R. G. K. B. Michaels and A. M. Feyerherm. 1964. The effect of floor surface temperatures oncomfort. Part I, College age males; Part II, College age females. ASHRAE Transactions 70:29.
Nevins, R. G. and A. 0. Flinner. 1958. Effect of heated-floor temperatures on comfort. ASHRAETransactions 64: 1 75.
" Nevins, R. G. F. H. Rohles, Jr., W. E. Springer, and A. M. Feyerherm. 1966. Temperature-humidity chart
for thermal comfort of seated persons. ASHRAE Transactions 72 (1): 283.
Athienitis, Andreas K. 1997. Investigation of thermal performance of a passive solar building with floor
radiant heating . Solar Energy Vol. 61, No. 6, pp. 337-345 1997. Amsterdam: Elsevier Science Limited.
Environmental Analytics (Berkeley, CA) developed a Thermal Comfort program for The AmericanSociety of Heating, Refrigeration, and Air-Conditioning Engineers. The program predicts human thermalresponse to the environment using several thermal comfort models, including PMV-PPD (Percentage MeanVote-Percentage People Dissatisfied) and ET-DISC (Effective Temperature-Thermal Discomfort). Thissoftware calculates the predicted thermal comfort for a human at a point in space.
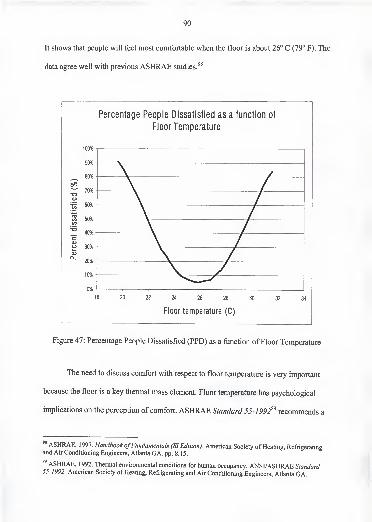
90
It shows that people will feel most comfortable when the floor is about 26° C (79° F). The
data agree well with previous ASHRAE studies.*^
100% ^
90% -
—V 80% ^
^ 70%aa>
1 ^^ 50%CO
^ 40% -
co 30% -
20%
10% -
n* -
Percentage People Dissatisfied as a function of
Floor Temperature
4
\ /
w 1 1 r I -I- 1 11
18 20 22 24 26 28 30 32 3
Floor temperature (C)
Figure 47: Percentage People Dissatisfied (PPD) as a function of Floor Temperature
The need to discuss comfort with respect to floor temperature is very important
because the floor is a key thermal mass element. Floor temperature has psychological
implications on the perception of comfort. ASHRAE Standard 55-1992^^ recommends a
ASHRAE. 1997. Handbook ofFundamentals (SI Edition). American Society of Heating, Refrigeratingand Air Conditioning Engineers, Atlanta GA. pp. 8.15.
ASHRAE. 1992. Thermal environmental conditions for human occupancy. ANSI/ASHRAE Standard55-1992. American Society of Heating, Refrigerating and Air Conditioning Engineers, Atlanta GA.
91
vertical air temperature difference between feet and heat of less than 3°C (5°F); a radiant
temperature asymmetry from a cold wall or window less than 10°C (18°F); a radiant
temperature asymmetry from a heated ceiling of less than 5°C (9°F); and a floor
temperature range of 18°C to 29°C (64°F to 84°F). This study has values that appear to be
within these limits.'"
Effect of Insulation in Walls
This study dealt mainly with non-insulated solar buildings. However, it borrows
some techniques from other studies with respect to insulation. There are numerous
studies that have shown that insulation on the internal side of a space lowers the thermal
mass effect of external walls (Givoni/' ECE,'^ Balcomb,'^ Balaras'"*). It reduces the
energy required to heat up the building but can lead to overheating during the warm
season.
Internal insulation impedes useful heat stored by thermal mass to be transmitted
indoors or internal thermal conditions to be modified by the thermal mass. External
insulation impedes solar radiation from causing rapid internal temperature swings but
once heated the building retains the internal heat for a long period. Generally, thicker
Olesen, Bjame W. 2000. Guidelines for comfort . ASHRAE Journal Vol. 42, No. 8, pp. 41-46. AmericanSociety of Heating, Refrigerating and Air Conditioning Engineers, Atlanta GA.
" Givoni, Baruch. 1976. Man, Climate and Architecture. London: Applied Science Publishers pl28.
ECE: Economic Commission for Europe, Geneva. 1991. Energy efficient design: a guide to energyefficiency and solar applications in building design. ECE Energy series No. 9. New York: United Nationsp55.
Balcomb, J. Douglas. 1 996. Designing low-energy buildings: Passive solar strategies and Energy-10Software. Developed in collaboration with Passive Solar Industries Council, National Renewable EnergyLaboratory, Lawrence Berkeley National Laboratory and US Department of Energy (DOE) p23-25.
Baiaras, C.A. 1996. The role of thermal mass on the cooling load of buildings. An overview ofcomputational methods. Energy and Buildings, 24 ( 1 996) 1 - 1 0. Amsterdam: Elsevier Science Limited.
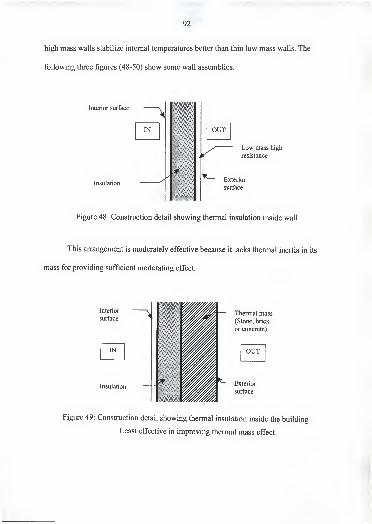
92
high mass walls stabilize internal temperatures better than thin low mass walls. The
following three figures (48-50) show some wall assemblies.
Interior surface
IN
Insulation
OUT
Low mass high
resistance
Exterior
surface
Figure 48: Construction detail showing thermal insulation inside wall
This arrangement is moderately effective because it lacks thermal inertia in its
mass for providing sufficient moderating effect.
Thermal mass
(Stone, brick
or concrete)
OUT
Exterior
surface
Figure 49: Construction detail showing thermal insulation inside the building
Least effective in improving thermal mass effect
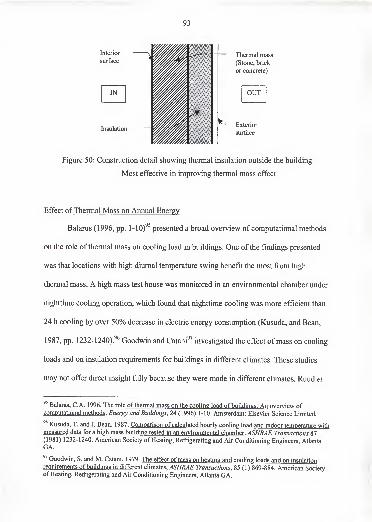
93
Thermal mass
(Stone, brick
or concrete)
OUT
Exterior
surface
Figure 50: Construction detail showing thermal insulation outside the building
Most effective in improving thermal mass effect
Effect of Thermal Mass on Annual Energy
Balarus (1996, pp. 1-10)'^ presented a broad overview of computational methods
on the role of thermal mass on cooling load in buildings. One of the findings presented
was that locations with high diurnal temperature swing benefit the most from high
thermal mass. A high mass test house was monitored in an envirormiental chamber under
nighttime cooling operation, which found that nighttime cooling was more efficient than
24 h cooling by over 50% decrease in electric energy consumption (Kusuda, and Bean,
1987, pp. 1232-1240).^^ Goodwin and Catani^^ investigated the effect of mass on cooling
loads and on insulation requirements for buildings in different climates. These studies
may not offer direct insight fully because they were made in different climates. Ruud et
Balaras, C.A. 1996. The role of thermal mass on the cooling load of buildings. An overview ofcomputational methods . Energy and Buildings, 24 (1996) 1-10. Amsterdam: Elsevier Science Limited.
Kusuda, T. and J. Bean. 1987. Comparison of calculated hourly cooling load and indoor temperature withmeasured data for a high mass building tested in an environmental chamber . ASHRAE Transactions 87(1981) 1232-1240. American Society of Heating, Refrigerating and Air Conditioning Engineers, Atlanta
GA.
Goodwin, S. and M. Catani. 1979. The effect of mass on heating and cooling loads and on insulation
requirements of buildings in different climates . ASHRAE Transactions, 85 (1) 869-884. American Societyof Heating, Refrigerating and Air Conditioning Engineers, Atlanta GA.

94
al. (1990, pp. 820-829)^^ evaluated the effect of thermal mass on cooling energy through
two experiments performed on the Independent Life Insurance building in Jacksonville,
FL. and results showed an 18% reduction in cooling energy supplied during daytime. The
study involved examining the reduction of energy demand in two experimental units with
air conditioning. The passive strategy involved in the testing method was achieved by
allowing nighttime pre-cooling of thermal mass. They used calculated and measured
values of energy storage and further showed that even carpet on the floor significantly
affected the effectiveness on energy demand.
Robertson (1986, pp. 387-417)^^ presented recommendations on how best to use
thermal mass in the southwest United States for residential and small commercial
buildings by strongly recommending dense and more conductive materials, such as high
mass adobe materials.
Calculating annual cooling and heating energy provided another test for the effect
of thickness of thermal mass. This was done using standard ASHRAE load calculation
principles'°°''°''^°^ and Energy-]0 program (Balcomb, 1996). High thermal mass was
simulated for a standard building in the climate of Nairobi, Kenya. Results were observed
imder what Balcomb noted:
Ruud, M. D., J. W. Mitchell and S. A. Klein. 1990. Use of building thermal mass to offset cooling loads .
ASHRAE Transactions, 96 (2): 820-828. American Society of Heating, Refrigerating and Air Conditioning
Engineers, Atlanta GA.
^ Robertson, D. 1986. The performance of adobe and other thermal mass materials in residential buildings .
Passive Solar Journal, 3 ( 1 986) 387-417.
'"^ ASHRAE. 1997. Handbook ofFundamentals (SI Edition). American Society of Heating, Refrigerating
and Air Conditioning Engineers, Atlanta GA. Chapters 27 and 28.
McQuiston, Faye C. and Jeffrey D. Spitler. 1 992. Cooling and Heating Load Calculation Manual.American Society of Heating, Refrigerating and Air Conditioning Engineers, Atlanta GA. pp. 8.1.
'"^ Pedersen, Curtis O., Daniel E. Fisher, Jeffrey D. Spitler, Richard J. Liesen. 1998. Cooling and HeatingLoad Calculation Principles. American Society of Heating, Refrigerating and Air Conditioning EngineersAtlanta GA.
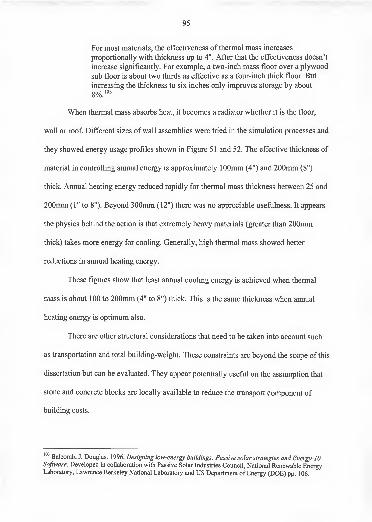
95
For most materials, the effectiveness of thermal mass increases
proportionally with thickness up to 4". After that the effectiveness doesn't
increase significantly. For example, a two-inch mass floor over a plywood
sub floor is about two thirds as effective as a four-inch thick floor. But
increasing the thickness to six inches only improves storage by about
When thermal mass absorbs heat, it becomes a radiator whether it is the floor,
wall or roof Different sizes of wall assemblies were tried in the simulation processes and
they showed energy usage profiles shown in Figure 5 1 and 52. The effective thickness of
material in controlling annual energy is approximately 100mm (4") and 200mm (8")
thick. Annual heating energy reduced rapidly for thermal mass thickness between 25 and
200mm (1" to 8"). Beyond 300mm (12") there was no appreciable usefixlness. It appears
the physics behind the action is that extremely heavy materials (greater than 200mm
thick) takes more energy for cooling. Generally, high thermal mass showed better
reductions in annual heating energy.
These figures show that least annual cooling energy is achieved when thermal
mass is about 100 to 200mm (4" to 8") thick. This is the same thickness when annual
heating energy is optimum also.
There are other structural considerations that need to be taken into account such
as transportation and total building-weight. These constraints are beyond the scope of this
dissertation but can be evaluated. They appear potentially usefiil on the assumption that
stone and concrete blocks are locally available to reduce the transport component of
building costs.
Balcomb, J. Douglas. 1 996. Designing low-energy buildings: Passive solar strategies and Energy-10Software. Developed in collaboration with Passive Solar Industries Council, National Renewable EnergyLaboratory, Lawrence Berkeley National Laboratory and US Department of Energy (DOE) pp. 106.
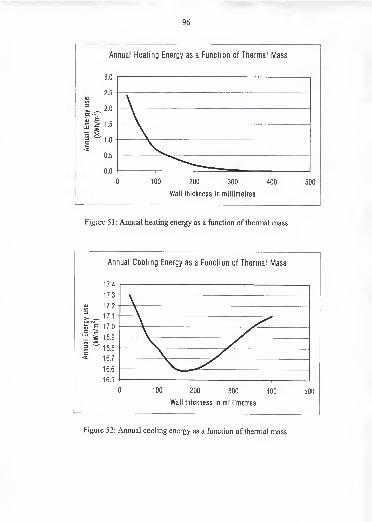
96
Annual Heating Energy as a Function of Thermal Mass
3.0 1
0 100 200 300 400 500
Wall thickness In millimetres
Figure 5 1 : Annual heating energy as a function of thermal mass
Figure 52: Annual cooling energy as a function of thermal mass
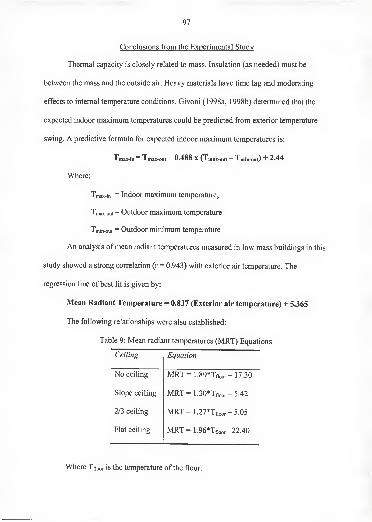
97
Conclusions from the Experimental Study
Thermal capacity is closely related to mass. Insulation (as needed) must be
between the mass and the outside air. Heavy materials have time lag and moderating
effects to internal temperature conditions. Givoni (1998a, 1998b) determined that the
expected indoor maximum temperatures could be predicted from exterior temperature
swing. A predictive formula for expected indoor maximum temperatures is:
Tmax-in ~ Tmax-out ~ 0.488 X (Tmax-out ~ Tmin-out) "'" 2.44
Where:
A max-in = Indoor maximum temperature;
Tmax-out = Outdoor maximum temperature
Tmin-out = Outdoor minimum temperature
An analysis ofmean radiant temperatures measured in low mass buildings in this
study showed a strong correlation (r = 0.943) with exterior air temperature. The
regression line of best fit is given by:
Mean Radiant Temperature = 0.837 (Exterior air temperature) + 5.365
The following relationships were also established:
Table 9: Mean radiant temperatures (MRT) Equations
Ceiling Equation
No ceiling MRT =1.89*Tfloor - 17.30
Slope ceiling MRT =1.30*Tfloor -5.42
2/3 ceiling MRT =1.27*Tfloor -5.05
Flat ceiling MRT =1.96*Tfloor -22.40
Where Tfloor is the temperature of the floor.
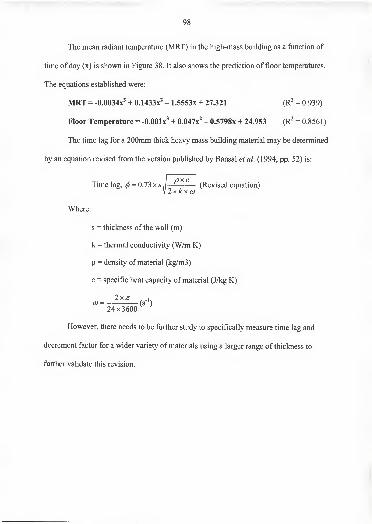
98
The mean radiant temperature (MRT) in the high-mass building as a function of
time of day (x) is shown in Figure 38. It also shows the prediction of floor temperatures.
The equations established were:
MRT = -0.0034x^ + 0.1433x^ - 1.5553x + 27.321 (R^ = 0.939)
Floor Temperature = -O.OOlx^ + 0.047x^ - 0.5798x + 24.953 (R^ = 0.8561)
The time lag for a 200mm thick heavy mass building material may be determined
by an equation revised from the version published by Bansal et al. (1994, pp. 52) is:
Time lag, ^ = 0.73 x s.\^- (Revised equation)V 2xA:x<y
Where:
s = thickness of the wall (m)
k = thermal conductivity (W/m K)
p - density of material (kg/m3)
c = specific heat capacity of material (J/kg K)
2x;r . .K0) = (s )
24x3600
However, there needs to be further study to specifically measure time lag and
decrement factor for a wider variety of materials using a larger range of thickness to
further validate this revision.
CHAPTER 3
EFFECT OF CLIMATE ON THERMAL MASS
Introduction
Climates directly affect architecture. Generally, hot climates require cooling, cool
climates require heating, humid climates need dry air movement, and dry climates require
moist air movement. This chapter discusses the climate of Nairobi, Kenya. Climate plays
a key role in the effectiveness of thermal mass for temperature moderation. Most data in
this chapter have been gathered by Kenya Meteorological Department' since 1955. The
data are presented graphically, including building bio-climatic charts, to highlight key
points relevant to this study.
Annually, Nairobi requires cooling 6% of the year, heating 60% of the year and it
is within the comfort zone 34% of the year. An equatorial region has high solar radiation
yet, as a recent study shows, air temperature drops with altitude at a rate of
approximately 5.9°C every 1000-metre rise (approximately 3.24°F every 1000-foot rise).
Another study was done on the impediments and opportunities of bio-climatic
building design techniques in Kenya. It suggested that agents and methods of promotion
' Kenya Meteorological Department. 1984. Climatological Statisticsfor Kenya. Dagoretti Comer, NgongRoad, Nairobi, Kenya, Ministry of Transport and Communications p60.
^ Ogoli, David Mwale. 2000. An assessment method for the performance of passive solar buildings at
equatorial high altitudes in Architecture, City and Environment: Proceedings ofPLEA 2000, Cambridge,UK (July 2000) by Koen Steemers and Simos Yannas (eds) pp. 827-828. James & James (Science
Publishers) Ltd.
^ Njuguna, Dafton G. 1997. Diffusion of Bio-climatic building design techniques in Kenya: Impedimentsand opportunities . Habitat International Vol. 21, No. 4 pp. 347-359, 1997. Amsterdam: Elsevier ScienceLimited.
99
100
be developed to improve passive design systems. When faced with limited budgets, many
developing countries more or less choose more critical national priorities such as health,
agriculture, education and transport.
Affordable housing is recognized as a means of attaining better productivity and
social order. One way of improving shelter is by providing a low-cost indoor thermal
environment, which is capable of acceptable levels of comfort, without a significant
increase in commercial energy consumption (Njuguna, 1996, pp. 348).
A study in 1991 by Adebayo'* drew attention to some aspects of urban
climatology that are relevant to design in Nairobi. Other studies by Meffert^ and Flatt^
gave detailed climatic site analysis for integrating into urban planning of the city of
Nairobi.
However, more research on passive solar designs applicable to the local climate is
needed. Historically, government in response to external and internal influences has
driven research and development in Kenya (Republic of Kenya, 1997b, pp. 174).
There are other forces that determine energy-usage. 75% of urban residential
energy for cooking and space heating comes from wood (O'keefe et al. 1984)^ and can be
reduced if climate-conscious passive solar heating and natural cooling design strategies
" Adebayo, Yinka R. 1991. On climatic reference points for some aspects of engineering design in Nairobi.Kenya. Energy and Buildings 15-16 (1990/91) 801-808. Amsterdam: Elsevier Science Limited.
' Meffert, Erich, E. 1991. The climate - site analysis in Climate and human settlements: Integrating climateinto urban planning and building design in Africa, by Yinka R. Adebayo (ed). Nairobi: United NationsEnvironmental Programme, pp. 1 1-14.
* Flatt, Derrick. 1991. Cooling and ventilation in Kenya: Some comments in Climate and humansettlements: Integrating climate into urban planning and building design in Africa, by Yinka R. Adebayo(ed). Nairobi: United Nations Environmental Programme, pp. 63-64.
^ O'Keefe, P. (ed). 1984. Energy and Development in Kenya. Scandinavian Institute of African Studies,Uppsala.
101
are implemented (UNHCS, 1984).^'^ Studies on climate and design have been done in
over 20 years and their importance continues to grow.'"'^'''^''^''''
Climate ofNairobi, Kenya
This chapter is more than just a basic study of the climate. There are three basic
approaches. First, it is a presentation of the climatic data. Second, it is an explanation of
the climatic data in terms of physical principles. Third, analyze benefits of climate to the
improvement of the effect of thermal mass on temperature moderation. Temperature is
important. Regarding temperature swing, Balcomb'^ said:
A common problem in passive solar design is not providing enough mass
in the building to store the solar gains. An effective way to determine if
there is enough mass is to calculate the temperature swing on a clear mid-
winter day under free-running conditions, that is without back-up heat. If
the swing is not excessive, then there is sufficient mass, and adequate
thermal comfort is assured. The temperature swing estimate is based on
the diurnal heat capacity (DHC) method (Balcomb, 1987).
UNCHS: United Nations Centre for Human Settlement. 1984. Energy conservation in the in the
construction and maintenance of buildings (1 : Use of solar energy and natural cooling in the design ofbuildings in the developing countries. Report CHS/49/84/E. UNCHS, Nairobi.
' Scandinavian Institute of African Studies, Uppsala, Sweden. 1984. Environment and Development in
Africa 6: Wood, energy and Households: Perspectives on Rural Kenya by Carolyn Barnes, Jean Ensringer
and Phil O'Keefe (eds.). The Beijer Institute, The Royal Swedish Academy of Sciences, Stockholm,Sweden.
'° United Nations. 1 97 1 . Climate and Housing Design 1 . United Nations, New York.
" Koenigsberger, Ingersoil, Mayhew, Szokolay. 1974. Manual ofTropical Housing and Building Part 1:
Climatic Design. London: Longman Limited.
UNCHS: United Nations Centre for Human Settlement. 1990. National design handbookprototype onpassive solar heating and natural cooling ofbuildings. Report CHS/1 82/89.E. UNCHS, Nairobi.
Bansal, N. K., Gerd Hauser, Gemot Minke. 1994. Passive Building Design: A Handbook ofClimaticControl. Amsterdam: Elsevier Science Limited.
Banham, Reyner. 1969. The Architecture ofthe Well-Tempered Environment. Chicago, IL: TheUniversity of Chicago Press.
Balcomb, J. Douglas. 1992. Passive solar building research in Advances in Solar Energy: An AnnualReview ofResearch and Development, by Karl W. Boer (ed) Vol. 7 1992, pp. 239-282. Boulder, Colorado:American Solar Energy Society, Inc.
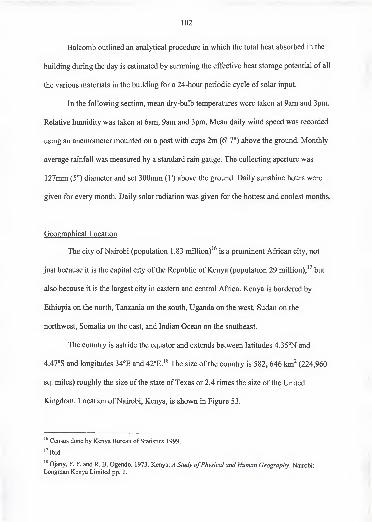
- s\
102
Balcomb outlined an analytical procedure in which the total heat absorbed in the
building during the day is estimated by summing the effective heat storage potential of all
the various materials in the building for a 24-hour periodic cycle of solar input.
In the following section, mean dry-bulb temperatures were taken at 9am and 3pm.
Relative humidity was taken at 6am, 9am and 3pm. Mean daily wind speed was recorded
using an anemometer mounted on a post with cups 2m (6' 7") above the ground. Monthly
average rainfall was measured by a standard rain gauge. The collecting aperture was
127mm (5") diameter and set 300mm (T) above the ground. Daily sunshine hours were
given for every month. Daily solar radiation was given for the hottest and coolest months.
Geographical Location
The city of Nairobi (population 1.83 million)'^ is a prominent African city, not
just because it is the capital city of the Republic of Kenya (population 29 million),'^ but
also because it is the largest city in eastern and central Africa. Kenya is bordered by
Ethiopia on the north, Tanzania on the south, Uganda on the west, Sudan on the
northwest, Somalia on the east, and Indian Ocean on the southeast.
The country is astride the equator and extends between latitudes 4.35°N and
4.47°S and longitudes 34°E and 42°E.'^ The size of the country is 582, 646 km^ (224,960
sq. miles) roughly the size of the state of Texas or 2.4 times the size of the United
Kingdom. Location of Nairobi, Kenya, is shown in Figure 53.
Census done by Kenya Bureau of Statistics 1999.
''Ibid.
Ojany, F. F. and R. B. Ogendo. 1 973. Kenya: A Study ofPhysical and Human Geography. Nairobi:
Longman Kenya Limited pp. 1
.
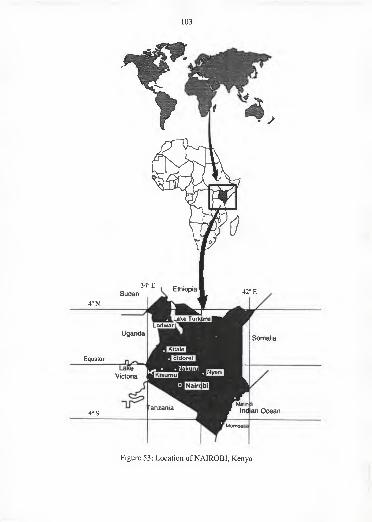
Figure 53: Location ofNAIROBI, Kenya
104
Topography, vegetation, lakes and strong air movements that are driven by the
monsoon winds across the Indian Ocean define climate in Kenya. This climate varies
from cool temperate-like features (at high altitudes) to hot dry areas (in low altitudes).
Topographv ofKenya
A typical section showing the topography of Kenya is summarized in Figure 54.
Mombasa is at sea level. The highest point is Mt Kenya at an altitude of 5199m (17058
feet) above sea level. The rift valley is a major feature occurring in the central highlands.
The ensuing climatic zones are affected by this topographical layout. Kenya experiences
strong seasonal winds that are responsible for the rainy seasons. Most people live at
altitudes between 1000 and 2500m (3048 and 8202 feet) above sea level.
Typical Topographical Section Across Kenya
3000 T——
-
Figure 54: Typical topographical section across Kenya
105
As Adebayo (1991, pp. 801) noted, the climate of Nairobi is influenced by the
interaction of altitude, three-dimensional human developments, other surface features,
topography and vegetation. The altitude of Nairobi taken at Dagoretti Comer is about
1798m (5900 feet) above sea level. Altitudes of other places in Nairobi are: Kabete
Observatory in the north is 1820m (5971 feet); Jomo Kenyatta International Airport in
the east is 1624m (5327 feet); Wilson Airport in the south is 1683m (5525 feet); and.
National Laboratories is 1737m (5700 feet). Nairobi's latitude is 1.3°S and the longitude
is 36.75°E. Local time is three hours ahead of Greenwich Mean Time (GMT + 3 hours).
Air Temperature
Average diurnal temperature variation is about 13.5°C (25°F). The highest
temperature occurs at about 4pm and the lowest temperature at about 6am (Figure 55).
The temperature range is uniform throughout the year. The highest temperature coincides
with the lowest humidity and the lowest temperature with the highest humidity. Average
daily temperatures rise as high as 28.9°C (84°?) at 4pm in February and they reduce as
low as 9.8°C (50°F) at 6am in July.
The annual mean maximum and minimum temperatures are 26.4°C (79.5°F) and
12.9°C (55.2°F) respectively (Figure 55). The annual mean temperature is 18.8°C
(65.8°F). The extreme highest and lowest temperatures on record are 30.6°C (87T) and
2.5°C (36.5T) respectively. Freezing has never been recorded in Nairobi. Some studies
(Ojany and Ogembo, 1971, pp. 66) have found that Eldama Ravine near Nakuru has
recorded absolute minimum temperature of-3.3°C (26T) while absolute maximum
temperature of 41.8°C (107°F) has been recorded at Magadi on the rift valley floor.
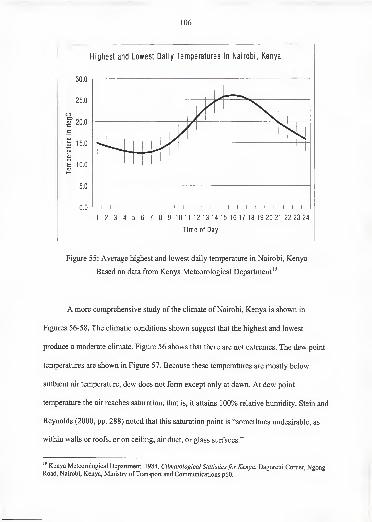
106
Highest and Lowest Daily Temperatures in Nairobi, Kenya
E 10.003
5.0
0.0 -I—^—t
—
\
—\
—\
—\
—\
—\
—^
—
\
—^
—
\
—^—I—^—^—I—I—I—I—I—I—^—
'
1 2 3 4 5 6 7 8 9 10 11 12 13 14 15 16 17 18 19 20 21 22 23 24
Time of Day
Figiire 55: Average highest and lowest daily temperature in Nairobi, Kenya
Based on data from Kenya Meteorological Department'^
A more comprehensive study of the climate of Nairobi, Kenya is shown in
Figures 56-58. The climatic conditions shown suggest that the highest and lowest
produce a moderate climate. Figure 56 shows that there are not extremes. The dew point
temperatures are shown in Figure 57. Because these temperatures are mostly below
ambient air temperature, dew does not form except only at dawn. At dew point
temperature the air reaches saturation, that is, it attains 100% relative humidity. Stein and
Reynolds (2000, pp. 288) noted that this saturation point is "sometimes undesirable, as
within walls or roofs, or on ceiling, air duct, or glass surfaces."
" Kenya Meteorological Department. 1984. Climatological Statisticsfor Kenya. Dagoretti Comer, NgongRoad, Nairobi, Kenya, Ministry of Transport and Communications p60.
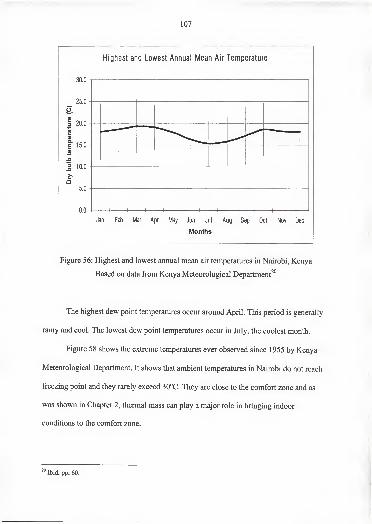
107
Highest and Lowest Annual Mean Air Temperature
30.0 n
25.0
= 10.0
o5.0
0.0 -I 1 1 \ \ \ \ 1 1 \ \ \
Jan Feb Mar Apr May Jun Jul Aug Sep Oct Nov Dec
Months
Figure 56: Highest and lowest annual mean air temperatures in Nairobi, Kenya
Based on data from Kenya Meteorological Department^°
The highest dew point temperatures occur around April. This period is generally
rainy and cool. The lowest dew point temperatures occur in July, the coolest month.
Figure 58 shows the extreme temperatures ever observed since 1955 by Kenya
Meteorological Department. It shows that ambient temperatures in Nairobi do not reach
freezing point and they rarely exceed 30°C. They are close to the comfort zone and as
was shown in Chapter 2, thermal mass can play a major role in bringing indoor
conditions to the comfort zone.
Ibid. pp. 60.
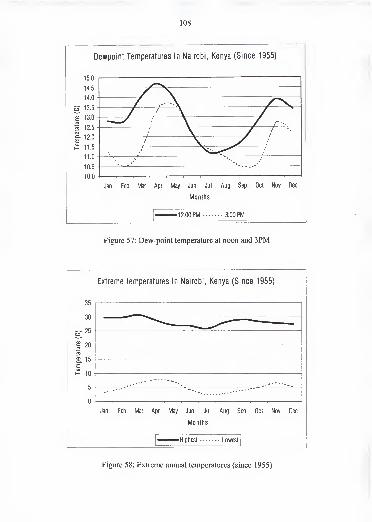
108
Dewpoint Temperatures in Nairobi, Kenya (Since 1955)
15.0
14.5-
14.0 -
o 13.5
13.0-
k_ 12.5-
a>a. 12.0
-
Ea>1— 11.5
-
11.0-
10.5-
10.0-
Jan Feb Mar Apr May Jun Jul Aug Sep Oct Nov Dec
Months
12:00 PM 3:00 PM
Figure 57: Dew-point temperature at noon and 3PM
Extreme temperatures in Nairobi, Kenya (Since 1955)
Figure 58: Extreme annual temperatures (since 1955)
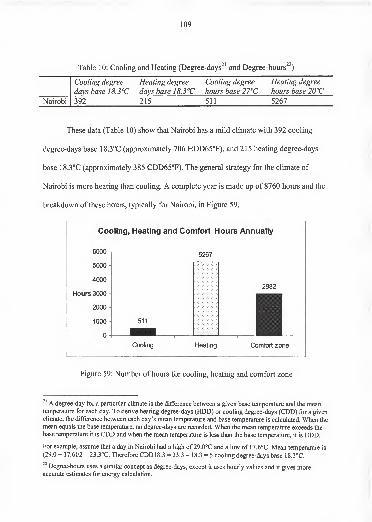
109
Table 10: Cooling and Heating (Degree-days^' and Degree-hours^^)
Cooling degree Heating degree Cooling degree Heating degree
days base 18.3°C days base ]8.3"C hours base 27°C hours base 20''C
Nairobi 392 215 511 5267
These data (Table 10) show that Nairobi has a mild climate with 392 cooling
degree-days base 18.3°C (approximately 706 HDD65°F), and 215 heating degree-days
base ISJ^C (approximately 385 CDD65°F). The general strategy for the climate of
Nairobi is more heating than cooling. A complete year is made up of 8760 hours and the
breakdown of these hours, typically for Nairobi, in Figure 59.
Cooling, Heating and Comfort Hours Annually
6000
5000
4000
Hours 3000
2000
1000
, 0
5267
2982
511
r
Cooling Heating Comfort zone
Figure 59: Number of hours for cooling, heating and comfort zone
^' A degree-day for a particular climate is the difference between a given base temperature and the meantemperature for each day. To derive heating degree-days (HDD) or cooling degree-days (CDD) for a given
climate, the difference between each day's mean temperature and base temperature is calculated. When the
mean equals the base temperature, no degree-days are recorded. When the mean temperature exceeds the
base temperature it is CDD and when the mean temperature is less than the base temperature, it is HDD.
For example, assume that a day in Nairobi had a high of 29.0°C and a low of 17.6°C. Mean temperature is
(29.0 + 17.6)/2 = 23.3°C. Therefore CDD18.3 = 23.3 - 18.3 = 5 cooling degree-days base 18.3°C.
Degree-hours uses a similar concept as degree-days, except it uses hourly values and it gives moreaccurate estimates for energy calculation.
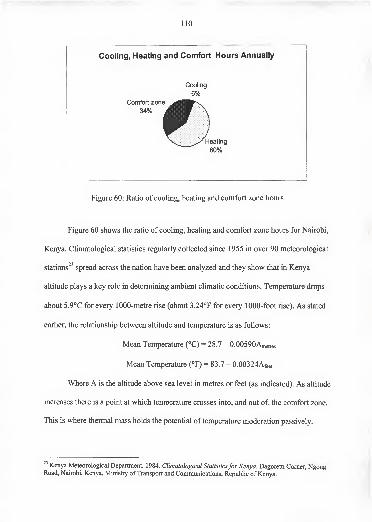
110
Cooling, Heating and Comfort Hours Annually
Cooling
6%Comfort zone
34% ,
Heating
60%
Figure 60: Ratio of cooling, heating and comfort zone hours
Figure 60 shows the ratio of cooling, heating and comfort zone hours for Nairobi,
Kenya. Climatological statistics regularly collected since 1955 in over 90 meteorological
stations^^ spread across the nation have been analyzed and they show that in Kenya
altitude plays a key role in determining ambient climatic conditions. Temperature drops
about 5.9°C for every 1000-metre rise (about 3.24°F for every 1000-foot rise). As stated
earlier, the relationship between altitude and temperature is as follows:
Where A is the altitude above sea level in metres or feet (as indicated). As altitude
increases there is a point at which temperature crosses into, and out of, the comfort zone.
This is where thermal mass holds the potential of temperature moderation passively.
Kenya Meteorological Department. 1984. Climatological Statisticsfor Kenya. Dagoretti Comer, NgongRoad, Nairobi, Kenya, Ministry of Transport and Communications, Republic of Kenya.
Mean Temperature (°C) = 28.7 - 0.00590A,metres
Mean Temperature (°F) = 83.7 - 0.00324Afereet
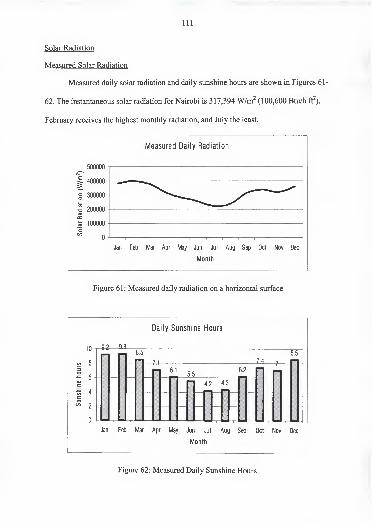
Ill
Solar Radiation
Measured Solar Radiation
Measured daily solar radiation and daily sunshine hours are shown in Figures 61-
62. The instantaneous solar radiation for Nairobi is 317,394wW (100,600 Btu/h ft^).
February receives the highest monthly radiation, and July the least.
Measured Daily Radiation
CO
500000
400000
300000
200000
J5 100000oto
Jan Feb Mar Apr May Jun Jul Aug Sep Oct Nov Dec
Month
Figure 61 : Measured daily radiation on a horizontal surface
Daily Sunshine Hours
10 -9,2 9J-
00 8Z3O-= 6VCI
^ 400 ^
=>
8.5 8.5
lA.
m 6^6.2
4,2 4.3
Jan Feb Mar Apr May Jun Jul Aug Sep Oct Nov Dec
Month
Figure 62: Measured Daily Sunshine Hours
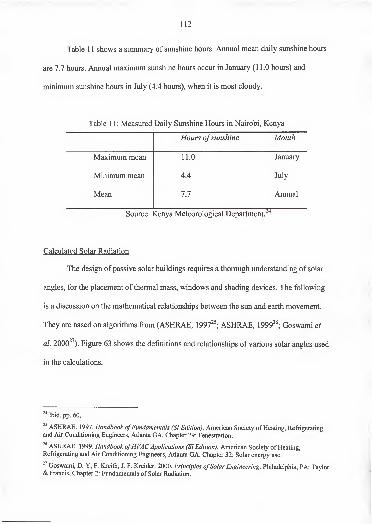
112
Table 1 1 shows a summary of sunshine hours. Annual mean daily sunshine hours
are 7.7 hours. Annual maximum sunshine hours occur in January (1 1.0 hours) and
minimum sunshine hours in July (4.4 hours), when it is most cloudy.
Table 1 1 : Measured Daily Sunshine Hours in Nairobi, Kenya
Hours ofsunshine Month
Maximum mean
Minimum mean
Mean
11.0 January
4.4 July
7.7 Annual
Source: ]Cenya Meteorological Department.
Calculated Solar Radiation
The design of passive solar buildings requires a thorough understanding of solar
angles, for the placement of thermal mass, windows and shading devices. The following
is a discussion on the mathematical relationships between the sun and earth movement.
They are based on algorithms from (ASHRAE, 1997^^ ASHRAE, 1999^^; Goswami et
27al. 2000 ). Figure 63 shows the definitions and relationships of various solar angles used
in the calculations.
Ibid. pp. 60.
" ASHRAE. 1997. Handbook ofFundamentals (SI Edition). American Society of Heating, Refrigerating
and Air Conditioning Engineers, Atlanta GA. Chapter 29: Fenestration.
ASHRAE. 1999. Handbook ofHVAC Applications (SI Edition). American Society of Heating,
Refrigerating and Air Conditioning Engineers, Atlanta GA. Chapter 32: Solar energy use.
" Goswami, D. Y, F. Kreith, J. F. Kreider. 2000. Principles ofSolar Engineering. Philadelphia, PA: Taylor& Francis, Chapter 2: Fundamentals of Solar Radiation.
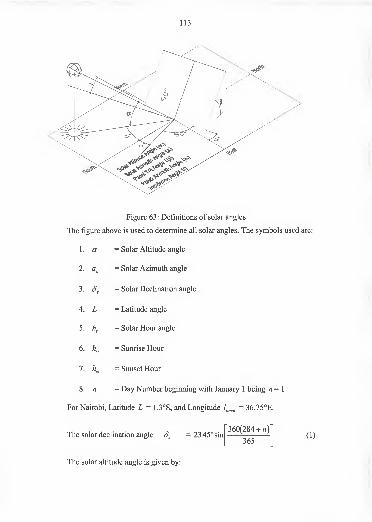
113
Figure 63: Definitions of solar angles
The figure above is used to determine all solar angles. The symbols used are:
= Solar Altitude angle
= Solar Azimuth angle
= Solar Declination angle
= Latitude angle
= Solar Hour angle
6. /i„ = Sunrise Hour
1. a
2.
3.
4. L
5. K
6. K
7. K
8. n Day Number beginning with January 1 being n - 1
For Nairobi, Latitude L = 1.3°S, and Longitude l,^^, =36.75°E.
'360(284 + «)^The solar declination angle = 23.45° sin
365(1)
The solar altitude angle is given by:
114
sina = sin Z sin + cos L cos cos (2)
, • . , • • , • cos <5", sin A, ...
The solar azimuth angle is given by: sin a, = ^ (3)cos<2r
At solar noon, h= 0; therefore, a = 90 - |L - 5s|, and as = 0. Sunrise and sunset
times can be estimated by finding the hour angle for or = 0. Substituting a = 0 in
equation 2 gives the hour angles for sunrise ( h^^ ) and sunset ( /z^ ) as:
K^'^Ks = ±cos"'[-tanZ,.tanf5"J (5)
Goswami et al. (2000, pp. 29) emphasize that equation 5 is "based on the center
of the sun being at the horizon. In practice, sunrise and sunset are defined as the times
when the upper limb of the sun is on the horizon. Because the radius of the sun is 16', the
sunrise would occur when a = -16'. Also, at lower solar elevations, the sun will appear
on the horizon when it is actually 34' below the horizon. Therefore, for apparent sunrise
or sunset, a = -50"'.
The Equation of Time, ET, is given by:
ET = 9.87sin2B - 7.53cosB - 1 .5sin B min (6)
Where B =— («-8l) (7)364 ^
^
Nairobi, Kenya, is in the East African Standard Time zone, where l^, = 30° E. The
solar angles above are for local solar time, which differs from the local standard time.
The relationship between the local solar time and the local standard time (LST) is:
LST = Solar Time - ET - (/^, - l,^^^, ). 4 minutes/degree. (8)
The amount of solar radiation falling on a surface normal to the rays of the sun
outside the atmosphere of the earth (extra-terrestrial) at mean Earth-sun distance is called
115
2 28 29the Solar Constant, Iq. Measurements indicate this constant as 1367 W/m .
' The
amount of solar radiation, (I), at a point on the earth is given by:
/ =/o{l +0.034cos(360n/365.25) (9)
As solar radiation / travels through the atmosphere, it is attenuated due to
absorption and scattering. According to Bouger's law and the work of Threlkeld and
Jordon, the beam normal solar radiation, h.N, for a solar altitude angle is given by:
h.N, =Cnle"''^" (10)
Where C„ is a parameter called clearness number and k is the local extinction
coefficient of the atmosphere. The total instantaneous solar radiation on a horizontal
surface, /c,a, is the sum of the direct solar radiation, 7/,,^, and the sky diffuse radiation, /</,*,:
=C„/e-*'^-""(C + sina) (11)
Solar radiation (4) on a tilted surface having a tilt angle of P from the horizontal
and an azimuth angle of (assumed + west of south) is the sum of the components of
beam (h.c) sky diffuse (ld.<^ and ground reflected solar radiation (/^.c). Therefore:
Ic =h.c + Id.c + Ir.c (12)
If / is the angle of incidence of the beam radiation on the tilted surface, then:
Ib.c =Ib.N cos i. (13)
From geometry it can be proved that:
cos / = cos a cos (Us - aw)sin^ + smacosjS (14)
ASHRAE. 1999. Handbook ofHVAC Applications (SI Edition). American Society of Heating,
Refrigerating and Air Conditioning Engineers, Atlanta GA. pp. 32.1.
^' Goswami, D. Y, F. Kreith, J. F. Kreider. 2000. Principles ofSolar Engineering. Philadelphia, PA: Taylor
& Francis, pp. 41.
Threlkeld, J. L. and R. C. Jordan. 1958. Direct radiation available on clear days . ASHRAE Transactions
64: 45. The American Society of Heating Refrigerating, and Air-conditioning Engineers Inc. (ASHRAE),Atlanta, GA.
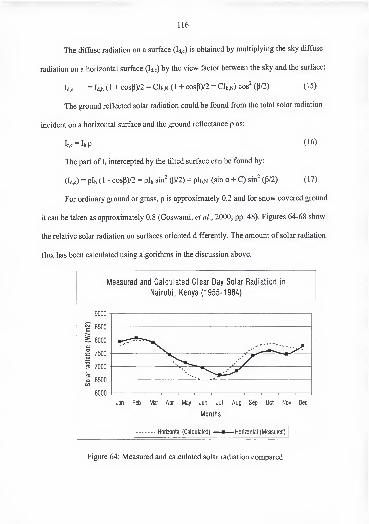
116
The diffuse radiation on a surface (Id,c) is obtained by multiplying the sky diffuse
radiation on a horizontal surface (ld,c) by the view factor between the sky and the surface:
Id.c = Id.h (1 + cosp)/2 = Clb,N (1 + cosp)/2 = Clb,N) cos^ (p/2) (15)
The ground reflected solar radiation could be found from the total solar radiation
incident on a horizontal surface and the ground reflectance p as:
Ir,c = IhP (16)
The part of Ir intercepted by the tilted surface can be found by:
(Id,c) = plh ( 1 - cosp)/2 = plh sin^ (p/2) - pIb,N (sin a + C) sin^ (p/2) ( 1 7)
For ordinary ground or grass, p is approximately 0.2 and for snow covered ground
it can be taken as approximately 0.8 (Goswami, et al, 2000, pp. 48). Figures 64-68 show
the relative solar radiation on surfaces oriented differently. The amount of solar radiation
flux has been calculated using algorithms in the discussion above.
Measured and Calculated Clear Day Solar Radiation in
Nairobi, Kenya (1955-1984)
9000
§ 8500
8000
~ 7500.2
2 7000
5 6500CO
6000 1 1 1 1 1 ^ 1 1 1 1 ^
Jan Feb Mar Apr May Jun Jul Aug Sep Oct Nov Dec
Months
Horizontal (Calculated) — — Horizontal (Measured)
Figure 64: Measured and calculated solar radiation compared
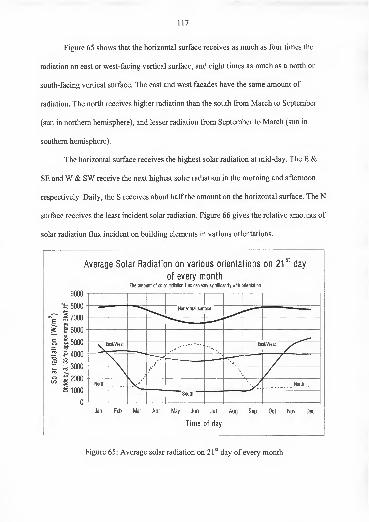
117
Figure 65 shows that the horizontal surface receives as much as four times the
radiation on east or west-facing vertical surface, and eight times as much as a north or
south-facing vertical surface. The east and west facades have the same amount of
radiation. The north receives higher radiation than the south from March to September
(sun in northern hemisphere), and lesser radiation from September to March (sun in
southern hemisphere).
The horizontal surface receives the highest solar radiation at mid-day. The E &
SE and W & SW receive the next highest solar radiation in the morning and afternoon
respectively. Daily, the S receives about half the amount on the horizontal surface. The N
surface receives the least incident solar radiation. Figure 66 gives the relative amounts of
solar radiation flux incident on building elements in various orientations.
Average Solar Radiation on various orientations on 21^' day
of every monthThe amount of solar radiation flux can vary significantly with orientation
9000 1 \ \ \ \ 1 \ \ \ \ \ r
0 -\ 1 \ \ \ \ \ \ \ 1 \ \
Jan Feb Mar Apr May Jun Jul Aug Sep Oct Nov Dec
Time of day
Figure 65: Average solar radiation on 21 day of every month
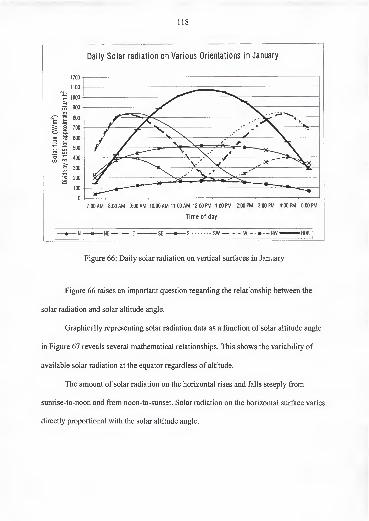
118
Daily Solar radiation on Various Orientations in January
1200 T
7:00AM 8:00AM 9:00 AM 10:00 AM 11:00 AM 12:00 PM 1:00PM 2:00PM 3:00PM 4:00PM 5:00 PM
Time of day
^— N
—
B— NE E SE— — S SW— - - W--3K--NW HOR
Figure 66: Daily solar radiation on vertical surfaces in January
Figure 66 raises an important question regarding the relationship between the
solar radiation and solar altitude angle.
Graphically representing solar radiation data as a function of solar altitude angle
in Figure 67 reveals several mathematical relationships. This shows the variability of
available solar radiation at the equator regardless of altitude.
The amount of solar radiation on the horizontal rises and falls steeply from
sunrise-to-noon and from noon-to-sunset. Solar radiation on the horizontal surface varies
directly proportional with the solar altitude angle.
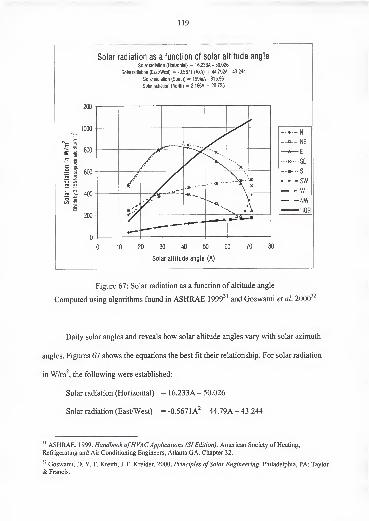
119
Solar radiation as a function of solar altitude angle
Solar radiation (Horizontal) = 16.233A - 50.026
Solar radiation (East/West) = -0.5671 (AxA) + 44.792A - 43.244
Solar radiation (South) = 199lnA - 315.96
Solar radiation (Nortfi) = 2.1 66A + 20.725
1200 1
0-1 \ \ \ \ \ \ \ 1
0 10 20 30 40 50 60 70 80
Solar altitude angle (A)
Figure 67: Solar radiation as a function of altitude angle
Computed using algorithms found in ASHRAE 1999^' and Goswami et al. 2000
Daily solar angles and reveals how solar altitude angles vary with solar azimuth
angles. Figures 67 shows the equations the best fit their relationship. For solar radiation
in wW, the following were established:
Solar radiation (Horizontal) = 16.233A - 50.026
Solar radiation (EastAVest) = -0.5671 A^ + 44.79A - 43.244
^' ASHRAE. 1999. Handbook ofHVAC Applications (SI Edition) . American Society of Heating,
Refrigerating and Air Conditioning Engineers, Atlanta GA. Chapter 32.
Goswami, D. Y, F. Kreith, J. F. Kreider. 2000. Principles ofSolar Engineering. Philadelphia, PA: Taylor
& Francis.
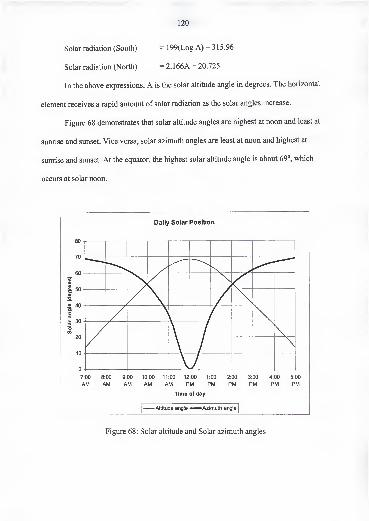
mSolar radiation (South) = 199(Log A) - 3 15.96
Solar radiation (North) - 2. 166A + 20.725
In the above expressions, A is the solar altitude angle in degrees. The horizontal
element receives a rapid amount of solar radiation as the solar angles increase.
Figure 68 demonstrates that solar altitude angles are highest at noon and least at
sunrise and sunset. Vice versa, solar azimuth angles are least at noon and highest at
sunrise and sunset. At the equator, the highest solar altitude angle is about 69°, which
occurs at solar noon.
Daily Solar Position
80
Time of day
Altitude angle Azimuth angle
Figure 68: Solar altitude and Solar azimuth angles
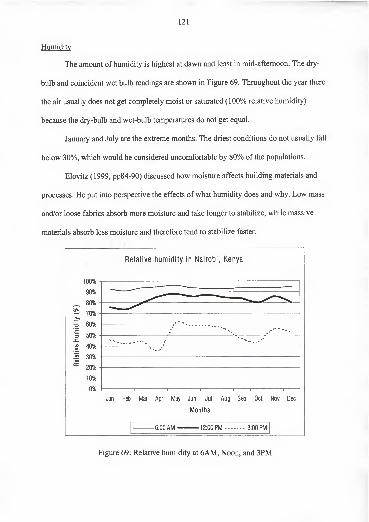
121
Humidity
The amount of humidity is highest at dawn and least in mid-afternoon. The dry-
bulb and coincident wet bulb readings are shown in Figure 69. Throughout the year there
the air usually does not get completely moist or saturated (100% relative humidity)
because the dry-bulb and wet-bulb temperatures do not get equal.
January and July are the extreme months. The driest conditions do not usually fall
below 30%, which would be considered uncomfortable by 80% of the populations.
Elovitz (1999, pp84-90) discussed how moisture affects building materials and
processes. He put into perspective the effects of what humidity does and why. Low mass
and/or loose fabrics absorb more moisture and take longer to stabilize, while massive
materials absorb less moisture and therefore tend to stabilize faster.
Relative humidity in Nairobi, Kenya
100%
90%
80%
70%
60%
'e50%
n:a>_>
40%
w 30%<ucc
20%
10%
0% -1 r-
Jan Feb Mar Apr May Jun Jul Aug Sep Oct Nov Dec
Months
6:00 AM •12:00 PM 3:00 PM
Figure 69: Relative humidity at 6AM, Noon, and 3PM
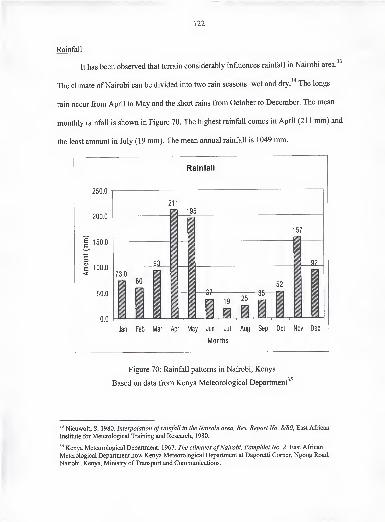
122
Rainfall
33
It has been observed that terrain considerably influences rainfall in Nairobi area.
The climate ofNairobi can be divided into two rain seasons: wet and dry.^'' The longs
rain occur from April to May and the short rains from October to December. The mean
monthly rainfall is shown in Figure 70. The highest rainfall comes in April (211 mm) and
the least amount in July (19 mm). The mean annual rainfall is 1049 mm.
Rainfall
250.0
200.0
150.0
1 100.0
50.0
0.0
211
93
73.0
I
60
m
195
m.
157
-3^
1925
52
-35
—
m
Jan Feb Mar Apr May Jun Jul Aug Sep Oct Nov Dec
Montlis
Figure 70: Rainfall patterns in Nairobi, Kenya
Based on data from Kenya Meteorological Department35
" Nieuwolt, S. 1980. Interpolation ofrainfall in the Nairobi area, Res. Report No. 8/80, East African
Institute for Meterological Training and Research, 1980.
Kenya Meteorological Department. 1967. The climates ofNairobi, Pamphlet No. 2. East African
Meterological Department now Kenya Meteorological Department at Dagoretti Comer, Ngong Road,
Nairobi, Kenya, Ministry of Transport and Communications.
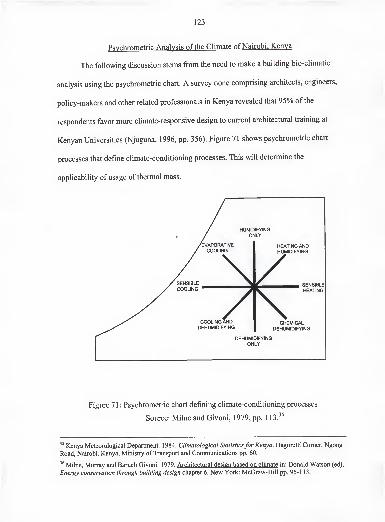
123
Psvchrometric Analysis of the Climate of Nairobi. Kenya
The following discussion stems from the need to make a building bio-climatic
analysis using the psychrometric chart. A suryey done comprising architects, engineers,
policy-makers and other related professionals in Kenya reyealed that 95% of the
respondents fayor more climate-responsiye design to current architectural training at
Kenyan Uniyersities (Njuguna, 1996, pp. 356). Figure 71 shows psychrometric chart
processes that define climate-conditioning processes. This will determine the
applicability of usage of thermal mass.
ONLY
Figure 71: Psychrometric chart defining climate-conditioning processes
Source: Milne and Giyoni, 1979, pp. 113.^^
Kenya Meteorological Department. 1984. Climatological Statisticsfor Kenya. Dagoretti Comer, Ngong
Road, Nairobi, Kenya, Ministry of Transport and Communications pp. 60.
Milne, Murray and Baruch Givoni. 1979. Architectural design based on climate in: Donald Watson (ed),
Energy conservation through building design chapter 6. New York: McGraw-Hill pp. 95-1 13.
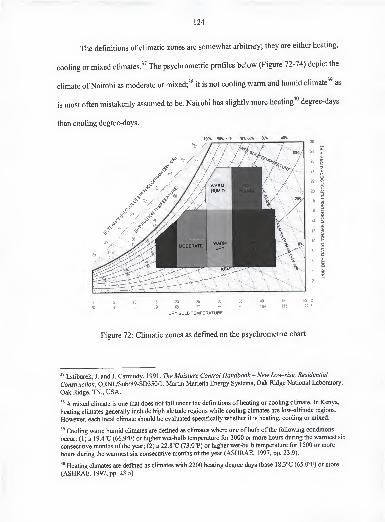
124
The definitions of climatic zones are somewhat arbitrary; they are either heating,
cooling or mixed climates." The psychrometric profiles below (Figure 72-74) depict the
climate of Nairobi as moderate or mixed;^^ it is not cooling warm and humid climate^^ as
is most often mistakenly assumed to be. Nairobi has slightly more heating^" degree-days
than cooling degree-days.
100% m 80% 70% 60% 50% 40%
0
32
10
50
15 20 25 30 35
59 66 77 86 95
DRY BULB TEMPERATURE
40
104
45
113
50 C
122 F
Figure 72: Climatic zones as defined on the psychrometric chart
" Lstiburek, J. and J. Carmody . 1 99 1 . The Moisture Control Handbook - New Low-rise, Residential
Construction, ORNL/Sub/89-SD350/l. Martin Marietta Energy Systems, Oak Ridge National Laboratory,
Oak Ridge, TN., USA.
A mixed climate is one that does not fall under the definitions of heating or cooling climate. In Kenya,
heating climates generally include high altitude regions while cooling climates are low-altitude regions.
However, each local climate should be evaluated specifically whether it is heating, cooling or mixed.
Cooling warm humid climates are defined as climates where one of both of the following conditions
occur: (1) a 19.4°C (66.9°F) or higher wet-bulb temperattire for 3000 or more hours during the warmest six
consecutive months of the year; (2) a 22.8°C (73.0°F) or higher wet-bulb temperature for 1500 or more
hours during the warmest six consecutive months of the year (ASHRAE, 1997, pp. 23.9).
Heating climates are defmed as climates with 2200 heating degree days (base 18.3°C (65.0°F) or more
(ASHRAE, 1997, pp. 23.5)
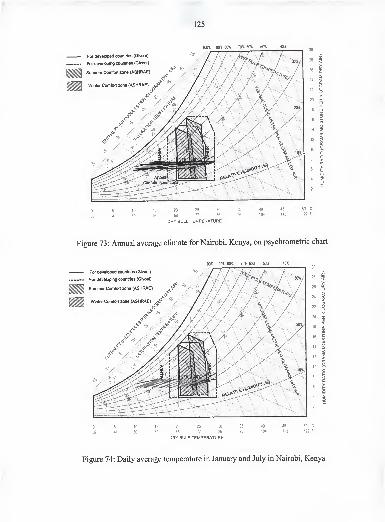
125
10 15 20 25 30 35 40 45
50 59 68 /7 86 95 104 113
DRY BULB TEMPERATURE
Figure 73: Annual average climate for Nairobi, Kenya, on psychrometric chart
0 5 10 15 20 25 30 35 40 45 50 C
32 41 50 59 68 U 86 95 104 113 122 F
DRY BULB TEMPERATURE
Figure 74: Daily average temperature in January and July in Nairobi, Kenya
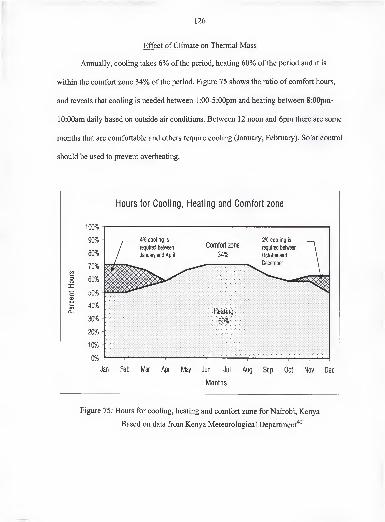
126
Effect of Climate on Thermal Mass
Annually, cooling takes 6% of the period, heating 60% of the period and it is
within the comfort zone 34% of the period. Figure 75 shows the ratio of comfort hours,
and reveals that cooling is needed between 1:00-5 :00pm and heating between 8:00pm-
10:00am daily based on outside air conditions. Between 12 noon and 6pm there are some
months that are comfortable and others require cooling (January, February). Solar control
should be used to prevent overheating.
Hours for Cooling, Heating and Comfort zone
Jan Feb Mar Apr May Jun Jul
Months
Aug Sep Oct Nov Dec
Figure 75: Hours for cooling, heating and comfort zone for Nairobi, Kenya
Based on data from Kenya Meteorological Department'*'
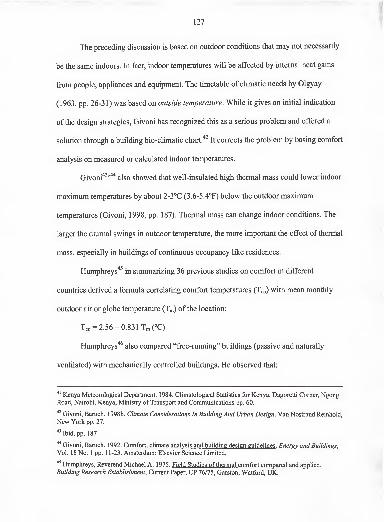
127
The preceding discussion is based on outdoor conditions that may not necessarily
be the same indoors. In fact, indoor temperatures will be affected by internal heat gains
from people, appliances and equipment. The timetable of climatic needs by Olgyay
(1963, pp. 26-3 1) was based on outside temperature. While it gives an initial indication
of the design strategies, Givoni has recognized this as a serious problem and offered a
solution through a building bio-climatic chart."*^ It corrects the problem by basing comfort
analysis on measured or calculated indoor temperatures.
Givoni''^'''^
also showed that well-insulated high thermal mass could lower indoor
maximum temperatures by about 2-3°C (3.6-5.4°F) below the outdoor maximum
temperatures (Givoni, 1998, pp. 187). Thermal mass can change indoor conditions. The
larger the diurnal swings in outdoor temperature, the more important the effect of thermal
mass, especially in buildings of continuous occupancy like residences.
Humphreys'*^ in summarizing 36 previous studies on comfort in different
countries derived a formula correlating comfort temperatures (Tco) with mean monthly
outdoor air or globe temperature (Tm) of the location:
Tco -2.56 + 0.831 Tm(°C)
Humphreys'** also compared "free-running" buildings (passive and naturally
ventilated) with mechanically controlled buildings. He observed that:
Kenya Meteorological Department. 1984. Climatological Statistics for Kenya. Dagoretti Comer, NgongRoad, Nairobi, Kenya, Ministry of Transport and Communications pp. 60.
Givoni, Baruch. 1998b. Climate Considerations In Building And Urban Design. Van Nostrand Reinhold,
New York pp. 27.
"^Ibid. pp. 187
Givoni, Baruch. 1992. Comfort, climate analvsis and building design guidelines . Energy and Buildings,
Vol. 18 No. 1 pp. 1 1-23. Amsterdam: Elsevier Science Limited.
Humphreys, Reverend Michael A. 1975. Field Studies of thermal comfort compared and applied .
Building Research Establishment, Current Paper. CP 76/75, Garston, Watford, UK.
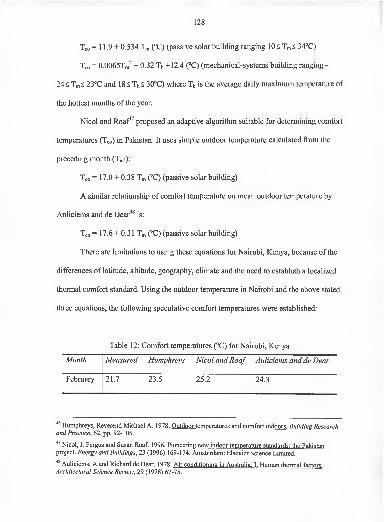
128
Tco = 1 1.9 + 0.534 Tm (°C) (passive solar building ranging 10< 34°C)
Tco = 0.0065Tm^ + 0.32 Th +12.4 (°C) (mechanical-systems building ranging -
24< Tm< 23°C and 18< Th< 30°C) where Th is the average daily maximum temperature of
the hottest months of the year.
Nicol and Roaf*' proposed an adaptive algorithm suitable for determining comfort
temperatures (Tco) in Pakistan. It uses simple outdoor temperature calculated from the
preceding month (Tm-):
Tco =17.0 + 0.38 Tm (°C) (passive solar building)
A similar relationship of comfort temperature on mean outdoor temperature by
Auliciems and de Dear'** is:
Tco = 17.6 + 0.31 Tm (°C) (passive solar building)
There are limitations to using these equations for Nairobi, Kenya, because of the
differences of latitude, altitude, geography, climate and the need to establish a localized
thermal comfort standard. Using the outdoor temperature in Nairobi and the above stated
three equations, the following speculative comfort temperatures were established:
Table 12: Comfort temperatures (°C) for Nairobi, Kenya
Month Measured Humphreys Nicol and Roaf Auliciems and de Dear
February 21.7 23.5 25.2 24.3
Humphreys, Reverend Michael A. 1978. Outdoor temperatures and comfort indoors . Building Researchand Practice, 62, pp. 92-105.
*^ Nicol, J. Fergus and Susan Roaf. 1996. Pioneering new indoor temperature standards: the Pakistan
project. Energy and Buildings, 23 (1996) 169-174. Amsterdam: Elsevier Science Limited.
Auliciems, A.and Richard de Dear. 1978. Air conditioning in Australia. I. Human thermal factors.
Architectural Science Review, 29 (1978) 67-75.
129
The above algorithms were made in studies done under "free-running", or natural
or passive solar conditions in various climates. There is therefore a limitation to which
they can be used, however, they provide an indication in other climates. In cooling and
heating load calculations, a reduced difference between indoor and outdoor temperatures
(AT) implies a reduction in energy use (Q = UA x AT).'*' Although the Pakistani climate
is different, the studies by Nicol and Roaf,^° and Nicol et al.^' provide the basis of the
Figure 76. The outdoor maximum, minimum and mean temperatures are plotted with the
indoor comfort temperatures. The mean comfort temperature is 23.7°C and this may be
achieved passively using thermal mass.
Applving the Results to Passive Solar Buildings
In Figure 76, the comfort temperature (23.7°C) is very close to the outdoor
maximum temperature. As a result, nighttime ventilation is likely to be effective in
lowering indoor temperatures that rise due to internal heat gains in the day. Passive solar
heating is useful in the morning hours when temperatures are still low. As in the Pakistan
study, since comfort temperatures are above the mean outdoor minimum temperatures,
the use of thermal mass with nighttime ventilation should enable comfort to be achieved
without mechanical cooling (Nicol and Roaf, 1996, pp. 173). This is a general
Q=UA X AT is standard heat loss/gain calculation where Q is the rate of heat flow (Btu/h or W), U is the
thermal transmittance (Btu/h fiP F or C) of the material through which is flowing and A (fP or m^)
the surface area of the face the heat is flowing. AT is the difference in temperature (°F or °C) between the
two sides of the material.
Nicol, J. Fergus and Susan Roaf 1996. Pioneering new indoor temperature standards: the Pakistan
project . Energy and Buildings, 23 (1996) 169-174. Amsterdam: Elsevier Science Limited.
" Nicol, J. Fergus, Iftikhar A. Raja, Arif Allaudin, Gul Najam Jamy. 1999. Climatic variations in
comfortable temperatures: the Pakistan projects.Energy and Buildings, 30 (1999) 261-279. Amsterdam:
Elsevier Science Limited.
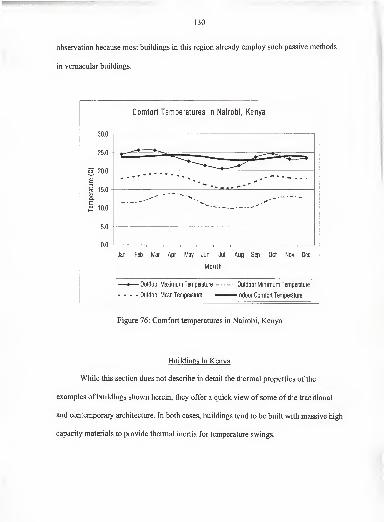
130
observation because most buildings in this region already employ such passive methods
in vernacular buildings.
30.0
Comfort Temperatures in Nairobi, Kenya
25.0
o 20.0
2 15.0a>a.
I 10.0
5.0
0.0
Jan Feb Mar Apr May Jun Jul Aug Sep Oct Nov Dec
Month
-•— Outdoor Maximum Temperature Outdoor Minimum Temperature
- - Outdoor Mean Temperature Indoor Comfort Temperature
Figure 76: Comfort temperatures in Nairobi, Kenya
Buildings in Kenya
While this section does not describe in detail the thermal properties of the
examples of buildings shovra herein, they offer a quick view of some of the traditional
and contemporary architecture. In both cases, buildings tend to be built with massive high
capacity materials to provide thermal inertia for temperature swings.
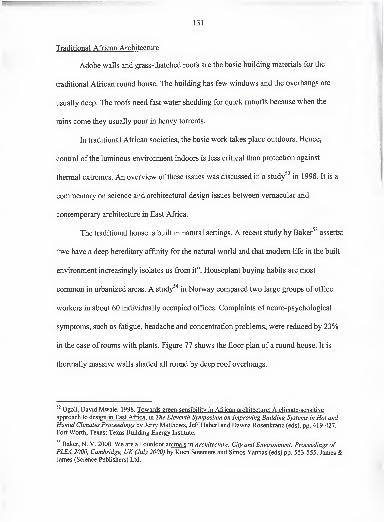
131
Traditional African Architecture
Adobe walls and grass-thatched roofs are the basic building materials for the
traditional African round house. The building has few windows and the overhangs are
usually deep. The roofs need fast water shedding for quick runoffs because when the
rains come they usually pour in heavy torrents.
In traditional African societies, the basic work takes place outdoors. Hence,
control of the luminous environment indoors is less critical than protection against
thermal extremes. An overview of these issues was discussed in a study m 1998. It is a
commentary on science and architectural design issues between vernacular and
contemporary architecture in East Africa.
The traditional house is built in natural settings. A recent study by Baker'^ asserts:
"we have a deep hereditary affinity for the natural world and that modem life in the built
environment increasingly isolates us from it". Houseplant buying habits are most
common in urbanized areas. A study^'* in Norway compared two large groups of office
workers in about 60 individually occupied offices. Complaints of neuro-psychological
symptoms, such as fatigue, headache and concentration problems, were reduced by 23%
in the case of rooms with plants. Figure 77 shows the floor plan of a round house. It is
thermally massive walls shaded all round by deep roof overhangs.
Ogoli, David Mwale. 1998. Towards green-sensibility in African architecture: A climate-sensitive
approach to design in East Africa, in The Eleventh Symposium on Improving Building Systems in Hot andHumid Climates Proceedings by Jerry Matthews, Jeff Haberl and Dawna Rosenkranz (eds), pp. 419-427.
Fort Worth, Texas: Texas Building Energy Institute.
Baker, N. V. 2000. We are all outdoor animals in Architecture, City and Environment: Proceedings ofPLEA 2000, Cambridge. UK (July 2000) by Koen Steemers and Simos Yannas (eds) pp. 553-555. James &James (Science Publishers) Ltd.
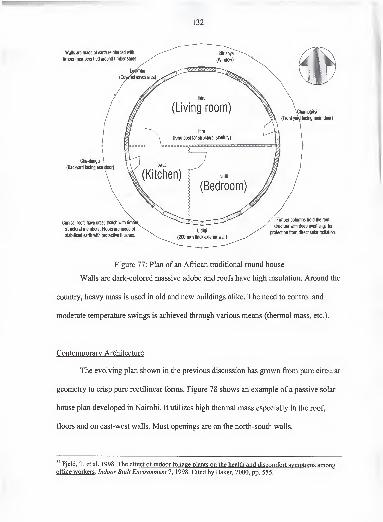
132
Figiire 77: Plan of an African traditional round house
Walls are dark-colored massive adobe and roofs have high insulation. Around the
country, heavy mass is used in old and new buildings alike. The need to control and
moderate temperature swings is achieved through various means (thermal mass, etc.).
Contemporary Architecture
The evolving plan shown in the previous discussion has grown from pure circular
geometry to crisp pure rectilinear forms. Figure 78 shows an example of a passive solar
house plan developed in Nairobi. It utilizes high thermal mass especially in the roof,
floors and on east-west walls. Most openings are on the north-south walls.
Fjeld, T. et al. 1998. The effect of indoor foliage plants on the health and discomfort symptoms amongoffice workers . Indoor Built Environment 7, 1998. Cited by Baker, 2000, pp. 555.
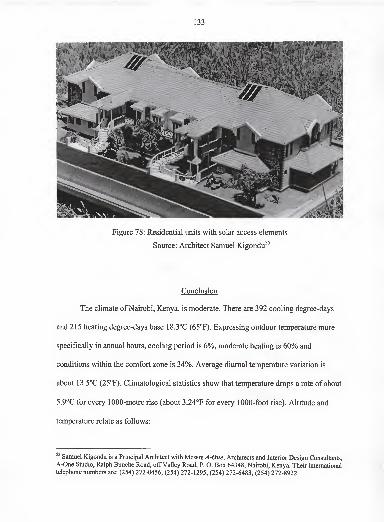
133
Conclusion
The climate of Nairobi, Kenya, is moderate. There are 392 cooling degree-days
and 215 heating degree-days base 18.3°C (65°F). Expressing outdoor temperature more
specifically in annual hours, cooling period is 6%, moderate heating is 60% and
conditions within the comfort zone is 34%. Average diurnal temperature variation is
about 13.5°C (25°F). Climatological statistics show that temperature drops a rate of about
5.9°C for every 1000-metre rise (about 3.24°F for every 1000-foot rise). Altitude and
temperature relate as follows:
Samuel Kigondu is a Principal Architect with Messrs A-One, Architects and Interior Design Consultants,
A-One Studio, Ralph Bunche Road, off Valley Road, P. O. Box 64348, Nairobi, Kenya. Their international
telephone numbers are: (254) 272-0456, (254) 272-1295, (254) 272-6483, (254) 272-8922.
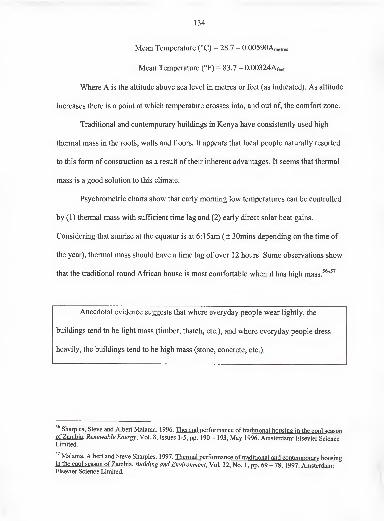
134
Mean Temperature (°C) = 28.7 - 0.00590An,etres
Mean Temperature (°F) = 83.7 - 0.00324Afeet
Where A is the altitude above sea level in metres or feet (as indicated). As altitude
increases there is a point at which temperature crosses into, and out of, the comfort zone.
Traditional and contemporary buildings in Kenya have consistently used high
thermal mass in the roofs, walls and floors. It appears that local people naturally resorted
to this form of construction as a result of their inherent advantages. It seems that thermal
mass is a good solution to this climate.
Psychrometric charts show that early morning low temperatures can be controlled
by (1) thermal mass with sufficient time lag and (2) early direct solar heat gains.
Considering that sunrise at the equator is at 6:15am (± 30mins depending on the time of
the year), thermal mass should have a time lag of over 12 hours. Some observations show
that the traditional round African house is most comfortable when it has high mass.^^'^^
Anecdotal evidence suggests that where everyday people wear lightly, the
buildings tend to be light mass (timber, thatch, etc.), and where everyday people dress
heavily, the buildings tend to be high mass (stone, concrete, etc.).
Sharpies, Steve and Albert Malama. 1996. Thermal performance of traditional housing in the cool seasonof Zambia. Renewable Energy, Vol. 8, Issues 1-5, pp. 190 - 193, May 1996. Amsterdam: Elsevier ScienceLimited.
" Malama, Albert and Steve Sharpies. 1997. Thermal performance of traditional and contemporary housingin the cool season of Zambia . Building and Environment, Vol. 32, No. 1, pp. 69 - 78, 1997. Amsterdam:Elsevier Science Limited.
CHAPTER 4
THERMAL COMFORT AND THERMAL MASS
Introduction
Thermal comfort requirements have been a topic ofmuch formal laboratory and
field research. Brager and de Dear' asked a very important question: What constitutes a
"comfortable" thermal environment? The answer to this deceptively simple question has
profound implications for the way buildings are designed and operated relative to the
amount of energy required to maintain long-term human survival. It is important to
understand the thermal interchanges between humans and their environment if the full
potential effects of thermal mass are to be experienced. This chapter is devoted to explain
this phenomenon through a survey of current literature on thermal comfort research.
Kenya is a country with limited energy resources yet there is a developing trend to
adopt high-energy air conditioning in new building projects largely because designers do
not examine all environmental design opportunities and constraints. The difference
between design indoor temperature and outdoor temperature is basic in HVAC load and
sizing calculations. International indoor temperature standards (ASHRAE Standard 55-
1992^ and ISO Standard 773&) are used in current sizing recommendations for HVAC
' Brager, Gail S. and Richard J. de Dear. 1998. Thermal adaptation in the built environment: a literature
review . Energy and Buildings 27 (1998) 83-96. London: Elsevier Science Ltd.
^ ASHRAE. 1992. Thermal environmental conditions for human occupancy. ANSI/ASHRAE Standard 55-
1992. American Society of Heating, Refrigerating and Air Conditioning Engineers, Atlanta GA.
^ International Standard Organization (ISO). 1994. Moderate thermal environment- Determination of the
PMV and PPD indices and Specification of the conditions for Thermal Comfort . ISO Standard 7730.
Geneva Switzerland.
135
136
systems in Kenya. However, these standards do not take into account climatic variation
and often have a very narrow temperature band that can only be met by air-conditioning.
Different criteria, indices and standards have been developed to assist architects and
engineers to design buildings that are comfortable. Human physiological factors like the
fundamental thermodynamic processes in heat exchange between the body and the
environment were not be dealt with since they were beyond the scope of this dissertation.
This chapter dwells on physical environmental indices: dry-bulb temperature,
mean radiant temperature, humidity, and air movement. It takes into cognizance the fact
that occupants of different building types in different climates in different parts of the
world seem to define comfort in different terms.
Recent Studies in Thermal Comfort in Buildings
Climate Chamber and Field studies
The "comfort zone" is an appropriate design goal for a deterministic mechanical
system but analysis ofmany international field studies by researchers has questioned its
relevance to passive solar buildings (Humphreys, 1975, 1976; Auliciems, 1986;''
Forwood, 1995, pp. 122-131;^ Baker and Standeven, 1996, pp. 175-186;^ Standeven and
Baker, 1995, pp. 161-168;' Milne, 1995, pp. 182-189^). Givoni revised his already
* Auliciems, A.and Richard de Dear. 1978. Air conditioning in Australia. I. Human thermal factors .
Architectural Science Review, 29 (1978) 67-75.
' Forwood, G. 1995. What is thermal comfort in a naturally ventilated building? in: Nicol. Humphreys.
Svkes. Roaf (eds.) Thermal Comfort. London: E and F. N. Spoon 1995, pp. 122-131.
* Baker, Nick and Mark Standeven. 1996. Thermal Comfort in Free-Running Buildings . Energy and
Buildings, 23 (1996) 175-182. Amsterdam: Elsevier Science Ltd.
^ Standeven, M. A. and Nick V. Baker. 1995. Comfort conditions in PASCOOL surveys . Standardsfor
Thermal Comfort: Indoor air temperaturesfor the 21"' century. Edited by F. Nicol, M. Humphreys, O.
Sykes and S. Roaf London: E & FN Spon pp. 161-168.
137
authoritative and notable work on the building bio-climatic chart having recognized this
new position.^ These revisions reflect a paradigm shift in thermal comfort for people
relative to their thermal environment.
There is mounting evidence'^'^'''^''^''"* that confirms that thermal perceptions are
affected by factors that are not recognized by current comfort standards. The factors
include thermal history, non-thermal stimuli and psychological expectations. These
perceptions are most noticeable in naturally ventilated buildings where expectations are
distinctly different from air-conditioned buildings. Mclntyre (1980a) stated that "a
person's reaction to a temperature which is less than perfect will depend very much on
his expectations, personality and what else he is doing at the time".'^ Brager and de Dear
(1998, pp. 87) added: "anecdotal evidence suggests that building occupants become
accustomed to levels of warmth prevailing within buildings on time scales of weeks to
months". They concluded that there is a distinction between thermal comfort responses in
* Milne, G. R. 1995. The energy implications of a climate-based indoor air temperature standard . Standards
for Thermal Comfort: Indoor air temperaturesfor the 21" century. Edited by F. Nicol, M. Humphreys, 0.
Sykes and S. Roaf. London: E & FN Spon pp. 182-189.
' Givoni, Baruch. 1998b. Climate Considerations In Building And Urban Design. Van Nostrand Reinhold,
New York pp. 45.
Humphreys, Reverend Michael A. 1976. Field Studies of thermal comfort compared and applied .
Building Services Engineer, 44, pp. 5-27.
" Humphreys, Reverend Michael A. 1996. Thermal comfort temperatures world-wide - The current
position . Renewable Energy, Vol. 8 Issues 1-5 May 1996, ppl39-144. Amsterdam: Elsevier Science Ltd.
Baker, Nick and Mark Standeven. 1996. Thermal Comfort in Free-Running Buildings . Energy and
Buildings, 23 (1996) 175-182. London: Elsevier Science Ltd.
Brager, Gail S. and Richard J. de Dear. 1998. Thermal adaptation in the built environment: a literature
review . Energy and Buildings 27 (1998) 83-96. Amsterdam: Elsevier Science Ltd.
Karyono, Tri Harso. 2000. Report on thermal comfort and building energy studies in Jakarta . Building
and Environment 35 (2000) 77-90. Amsterdam: Elsevier Science Limited.
" Mclntyre, D. A. 1980a. Design requirements for a comfortable environment , in: K. Cena, J. A. Clark
(eds). Bio-engineering, Thermal Physiology and Comfort. Amsterdam: Elsevier, pp. 157-168.

138
air-conditioned vs. naturally ventilated buildings.'^ It leads to another emerging
observation of psychological adaptation resulting from one's thermal experiences and
expectations (Baker and Standeven, 1996, pp. 180). Psychologically, a person's
perception of, or response to, the thermal experience appears altered. Paciuk'^ and
Williams'^ found that perceived degree of control is one of the strongest predictors of
thermal comfort. People who have greater control over their indoor environment are more
tolerant of wider ranges in temperature (Leaman and Bordass, 1999, pp. 4; Bunn, 1993,
pp. 25-27). These "adaptive errors" are the cause of discrepancy between observed
comfort temperatures from field studies and predicted comfort temperatures from climate
chamber experiments (Baker and Standeven, 1996, pp. 175).
Evidence from Environmental Psychological
Several studies'^'^" describe some aspects of thermal comfort research to which
environmental psychology makes a contribution. They suggest that a psychological
dependent variable such as thermal comfort should be decided on the basis of physical
and non-physical independent variables. They appear to support the view that thermal
comfort is wider than most technical "standards" demand; thermal comfort should
Brager, Gail S. and Richard J. de Dear. 1998. Thermal adaptation in the built environment: a literature
review . Energy and Buildings 27 (1998) 83-96. London: Elsevier Science Ltd.
" Paciuk, M. The role of personal control of the environment in thermal comfort and satisfaction at the
workplace. Coming of age . EDRA 21/1990, in: R. L Selby, K. H. Anthony, J. Choi, B. Orland (eds.).
Environmental Design Research Association, Oklahoma City, OK, 1990, pp. 303-312.
Williams, R. N. 1995. Field investigation of thermal comfort, environmental satisfaction and perceived
controls levels in UK office buildings .Healthy Buildings.
" Heijs, Wim and Peter Stringer. 1988. Research on residential thermal comfort: some contributions from
environmental psvchology . Journal ofEnvironmental Psychology (1988) 8, 235-247. New York: Academic
Press Limited.
139
include, alongside the measurement of physical variables (temperature, humidity, and
wind), "an important classificatory variables (gender, age, education, etc.), socio-cultural
(employment status, place of residence, background), psychological (knowledge,
experience, self-perceived cold-naturedness, the psychological effect of visual warmth by
a fireplace, for example) and contextual variables" (Heijs and Stringer, 1988, pp. 245).
Rohles (1980, pp. 541-551) reported a number of experiments in which he
investigated the psychological variables of thermal comfort. The idea was to establish
phenomenon that made subjects in an experiment to respond the way they did. Most
climate-chambers looked like cold stores and he felt this psychologically influenced
perceptions. When the room was clad with wood and given a carpet floor and made
homely with appropriate furniture, responses were more positive.
Rohles performed subsequent experiments where they placed in the room a large
thermometer that showed constant temperature even though in reality the temperature
was gradually lowered. The subjects recorded a cooling effect but they judged that the
environment was in thermal comfort.
A third experiment was repeated with heating and the results were similar.
Seemingly unrelated factors such as light, furnishing and knowledge of the temperature,
culture and experience have a role in thermal comfort. Rohles (1980, pp. 541-551)
concluded: "To deny or ignore the psychology involved in comfort measurement is not
21
only shortsighted, but treats the human subject as a machine, which it is not". Rohles
Rohles, F. H. 1980. Temperature or temperament: a psychologist looks at thermal comfort . ASHRAETransactions, 86, 541-551. American Society of Heating, Refrigerating and Air Conditioning Engineers,
Atlanta GA.
^' Rohles, F. H. 1981 . Thermal comfort and strategies for energy conservation . Journal ofSocial Issues, 37,
132-149.
140
also indicated that alongside control of physical variables (air temperature, mean radiant
temperature, humidity and air movement), adjustments in the amount of furnishing and in
space and lighting could probably provide a solution to improving thermal comfort.
In their book, Environmental Psychology, Heimstra and Mcfarling^^ described the
emerging importance and understanding of "the relationships between human behavior
and the physical environment". Psychologists and behavioral scientists agree that the
environment (thermal, visual, acoustic, olfactory, etc.) shapes human behavior.
Many major US corporations have cited daylighting systems as significantly
increasing worker productivity and reducing absenteeism.^^ These studies showed that
students in daylit schools outperform their counterparts in "conventional" schools when
assessed by a team of teachers and psychologists for a year in their regular learning
conditions (UC Berkeley Wellness Letter 1996; Psychology Today, 1994). The
results were seen to hold true when students were flip-flopped between the two
environments during one half of the testing period.
In a study on "Health and behavior of children in classrooms with and without
windows", KuUer and Lindsten^^ assessed the effects of light on the production of stress
hormones, classroom performance, body growth, and sick leave, of 90 school children in
their school environment for a duration of one year. The children were placed in four
classrooms differing in respect to the access of natural daylight and artificial light. They
Heimistra, Norman W. and Leslie H. McFarling. 1974. Environmental Psychology. Monterey, CA:
Brooks/Cole Publishing Company, pp. 5.
University of California, Berkeley, Wellness Letter February 1996 vl2 n5 pp. 8 (1)
Psychology Today March-April 1994 v27 n2 pp. 8 (2)
Kuller, Rikard and Carin Lindsten. 1992. Health and behavior of children in classrooms with and without
windows . Journal ofEnvironmental Psychology (1992) 12, 305-317. New York: Academic Press Limited.
141
concluded that windowless classrooms should be avoided for permanent use because
natural daylight contributes to better health and behavior of students.
In 1984, Ulrich^^ illustrated that natural daylight had an influence on surgical
patients in the recovery room. Ulrich found that surgical patients assigned to rooms with
natural light had shorter post-operative hospital stays, received fewer negative evaluative
comments in nurses' notes, and took fewer potent analgesics than matched patients in
similar rooms in windowless units or units with windows facing a brick building fafade.
Wilson^^ did a clinical research in 1972 by comparing surgical patients in an intensive
care unit without windows and with patients in an intensive care unit with windows. He
observed development of organic matter between the two cases and concluded that the
presence of windows was highly desirable for the prevention of sensory deprivation.
These examples show the long understood view that light has profound psychological and
physiological impact on humans (KuUer, 1981).
Research Methods in Thermal Comfort Studies
As previously stated, there are two methods currently used in thermal comfort
studies: experiments in climate-chambers and field studies. The climate chamber is based
on a heat-balance model whereby subjects in a carefully controlled environment are
subjected to different levels of physical environmental parameters and their "neutral"
heat balance point established. Pioneer thermal comfort work (ASHRAE, ISO, and
Ulrich, R. S. 1984. View through a window may influence recovery from surgery. Science, 224, 420-421.
^' Wilson, L. M. 1972. Intensive care delirium. The effect of outside deprivation in a windowless unit .
Archives ofInternal Medicine, 130, 225-226.
Kuller, R. 1981. Non-visual effects of light and color. Annotated bibliography. Document No. 15 .
Stockholm: Swedish Council for Building Research.
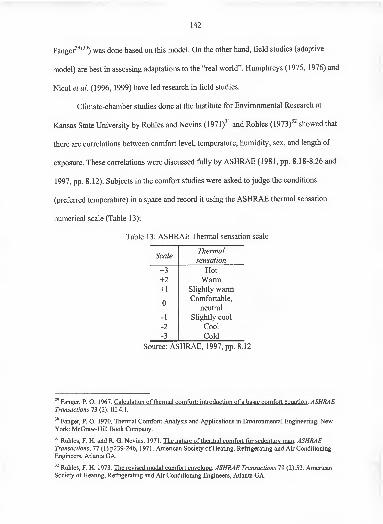
142
Fanger^^'^") was done based on this model. On the other hand, field studies (adaptive
model) are best in assessing adaptations to the "real world". Humphreys (1975, 1976) and
Nicol et al. (1996, 1999) have led research in field studies.
Climate-chamber studies done at the Institute for Environmental Research at
Kansas State University by Rohles and Nevins (1971)^' and Rohles (1973)^^ showed that
there are correlations between comfort level, temperature, humidity, sex, and length of
exposure. These correlations were discussed fiilly by ASHRAE (1981, pp. 8.18-8.26 and
1997, pp. 8.12). Subjects in the comfort studies were asked to judge the conditions
(preferred temperature) in a space and record it using the ASHRAE thermal sensation
numerical scale (Table 13):
Table 13: ASHRAE Thermal sensation scale
ScaleThermal
sensation
+3 Hot
+2 Warm+1 Slightly warm
0Comfortable,
neutral
-1 Slightly cool
-2 Cool
-3 Cold
Source: ASHRAE, 1997, pp. 8.12
Fanger, P. O. 1967. Calculation of thermal comfort: introduction of a basic comfort equation . ASHRAETransactions 73 (2): III.4.1.
Fanger, P. O. 1 970. Thermal Comfort: Analysis and Applications in Environmental Engineering. NewYork: McGraw-Hill Book Company.
Rohles, F. H. and R. G. Nevins. 1971. The nature of thermal comfort for sedentary man . ASHRAETransactions, 77 (1) p239-246, 1971. American Society of Heating, Refrigerating and Air Conditioning
Engineers, Atlanta GA.
Rohles, F. H. 1973. The revised modal comfort envelope . ASHRAE Transactions 79 (2):52. American
Society of Heating, Refrigerating and Air Conditioning Engineers, Atlanta GA.
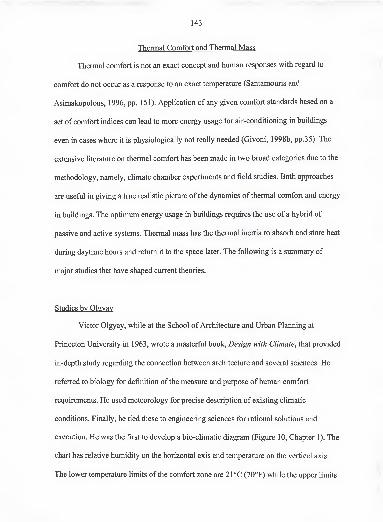
143
Thermal Comfort and Thermal Mass
Thermal comfort is not an exact concept and human responses with regard to
comfort do not occur as a response to an exact temperature (Santamouris and
Asimakopolous, 1996, pp. 151). Application of any given comfort standards based on a
set of comfort indices can lead to more energy usage for air-conditioning in buildings
even in cases where it is physiologically not really needed (Givoni, 1998b, pp.35). The
extensive literature on thermal comfort has been made in two broad categories due to the
methodology, namely, climate chamber experiments and field studies. Both approaches
are useful in giving a true realistic picture of the dynamics of thermal comfort and energy
in buildings. The optimum energy usage in buildings requires the use of a hybrid of
passive and active systems. Thermal mass has the thermal inertia to absorb and store heat
during daytime hours and return it to the space later. The following is a summary of
major studies that have shaped current theories.
Studies by Qlgvay
Victor Olgyay, while at the School of Architecture and Urban Planning at
Princeton University in 1963, wrote a masterful book. Design with Climate, that provided
in-depth study regarding the connection between architecture and several sciences. He
referred to biology for definition of the measure and purpose ofhuman comfort
requirements. He used meteorology for precise description of existing climatic
conditions. Finally, he tied these to engineering sciences for rational solutions and
execution. He was the first to develop a bio-climatic diagram (Figure 10, Chapter 1). The
chart has relative humidity on the horizontal axis and temperature on the vertical axis.
The lower temperature limits of the comfort zone are 21°C (70°F) while the upper limits
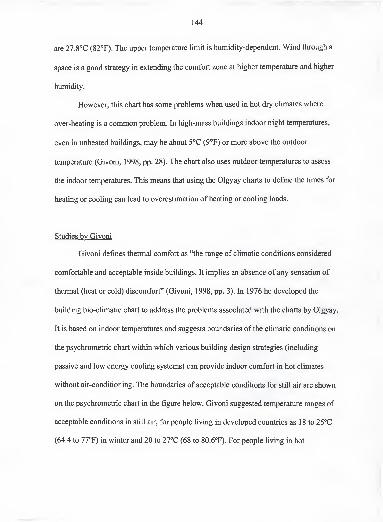
144
are 27.8°C (82°F). The upper temperature limit is humidity-dependent. Wind through a
space is a good strategy in extending the comfort zone at higher temperature and higher
humidity.
However, this chart has some problems when used in hot dry climates where
over-heating is a common problem. In high-mass buildings indoor night temperatures,
even in unheated buildings, may be about 5°C (9°F) or more above the outdoor
temperature (Givoni, 1998, pp. 28). The chart also uses outdoor temperatures to assess
the indoor temperatures. This means that using the Olgyay charts to define the times for
heating or cooling can lead to overestimation of heating or cooling loads.
Studies by Givoni
Givoni defines thermal comfort as "the range of climatic conditions considered
comfortable and acceptable inside buildings. It implies an absence of any sensation of
thermal (heat or cold) discomfort" (Givoni, 1998, pp. 3). In 1976 he developed the
building bio-climatic chart to address the problems associated with the charts by Olgyay,
It is based on indoor temperatures and suggests boundaries of the climatic conditions on
the psychrometric chart within which various building design strategies (including
passive and low energy cooling systems) can provide indoor comfort in hot climates
without air-conditioning. The boundaries of acceptable conditions for still air are shown
on the psychrometric chart in the figure below. Givoni suggested temperature ranges of
acceptable conditions in still air, for people living in developed countries as 18 to 25''C
(64.4 to 77°F) in winter and 20 to 27°C (68 to 80.6T). For people living in hot
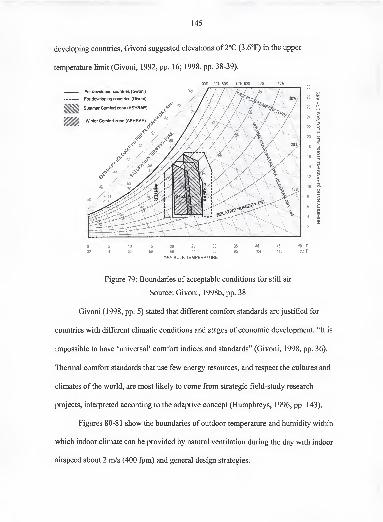
145
developing countries, Givoni suggested elevations of 2°C (3.6°F) in the upper
temperature limit (Givoni, 1992, pp. 16; 1998, pp. 38-39).
100% 90% 80% 70% 60% 50% 40%
0 5 10 15 20 25 30 35 40 45 50 C
32 41 50 59 68 77 86 95 104 113 122 F
DRY BULB TEMPERATURE
Figure 79: Boundaries of acceptable conditions for still air
Source: Givoni, 1998b, pp. 38
Givoni (1998, pp. 5) stated that different comfort standards are justified for
countries with different climatic conditions and stages of economic development. "It is
impossible to have 'universal' comfort indices and standards" (Givoni, 1998, pp. 36).
Thermal comfort standards that use few energy resources, and respect the cultures and
climates of the world, are most likely to come from strategic field-study research
projects, interpreted according to the adaptive concept (Humphreys, 1996, pp. 143).
Figures 80-81 show the boundaries of outdoor temperature and humidity within
which indoor climate can be provided by natural ventilation during the day with indoor
airspeed about 2 m/s (400 fpm) and general design strategies.
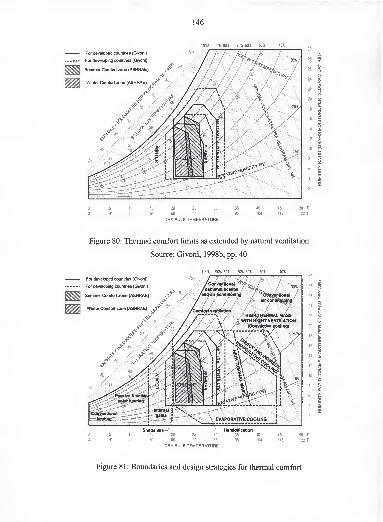
146
Figure 80: Thermal comfort limits as extended by natural ventilation
Source: Givoni, 1998b, pp. 40
100% 90% 80% 70% 60% 50% 40%
DRY BULB TEMPERATURE
Figure 8 1 : Boundaries and design strategies for thermal comfort
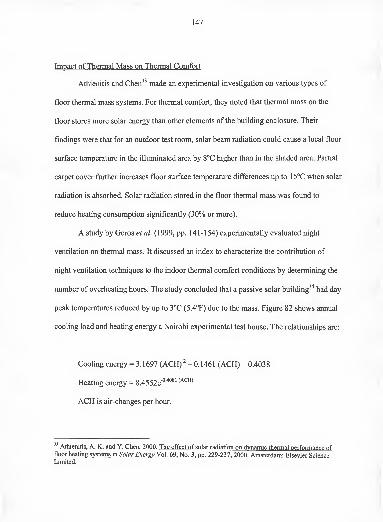
147
Impact of Thermal Mass on Thermal Comfort
Athienitis and Chen^^ made an experimental investigation on various types of
floor thermal mass systems. For thermal comfort, they noted that thermal mass on the
floor stores more solar energy than other elements of the building enclosure. Their
findings were that for an outdoor test room, solar beam radiation could cause a local floor
surface temperature in the illuminated area by 8°C higher than in the shaded area. Partial
carpet cover further increases floor surface temperature differences up to 1 5°C when solar
radiation is absorbed. Solar radiation stored in the floor thermal mass was found to
reduce heating consumption significantly (30% or more).
A study by Geros et al. (1999, pp. 141-154) experimentally evaluated night
ventilation on thermal mass. It discussed an index to characterize the contribution of
night ventilation techniques to the indoor thermal comfort conditions by determining the
number of overheating hours. The study concluded that a passive solar building^'* had day
peak temperatures reduced by up to 3°C (5.4°F) due to the mass. Figure 82 shows annual
cooling load and heating energy a Nairobi experimental test house. The relationships are:
Cooling energy - 3.1697 (ACH)^ - 0.1461 (ACH) - 0.4038
Heating energy = 8.4552e-°-^''^'^^^"^
ACH is air-changes per hour.
Athienitis, A. K. and Y. Chen. 2000. The effect of solar radiation on dynamic thermal performance offloor heating systems in Solar Energy Vol. 69, No. 3, pp. 229-237, 2000. Amsterdam: Elsevier ScienceLimited.
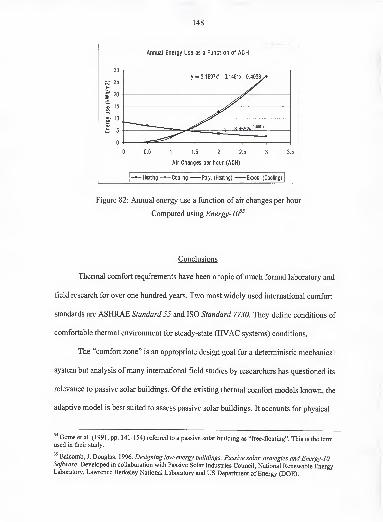
148
Annual Energy Use as a Function of ACH
0 0.5 1 1.5 2 2.5 3 3.5
Air Changes per hour (ACH)
Heating -^Cooling Poly. (Heating) Expon. (Cooling)
Figure 82: Annual energy use a function of air changes per hour
Computed using Energy-]0^^
Conclusions
Thermal comfort requirements have been a topic ofmuch formal laboratory and
field research for over one hundred years. Two most widely used international comfort
standards are ASHRAE Standard 55 and ISO Standard 7730. They define conditions of
comfortable thermal environment for steady-state (HVAC systems) conditions.
The "comfort zone" is an appropriate design goal for a deterministic mechanical
system but analysis ofmany international field studies by researchers has questioned its
relevance to passive solar buildings. Of the existing thermal comfort models known, the
adaptive model is best suited to assess passive solar buildings. It accounts for physical
Geros et al. (1991, pp. 141-154) referred to a passive solar building as "free-floating". This is the termused in their study.
Balcomb, J.Douglas. 1 996. Designing low-energy buildings: Passive solar strategies and Energy-]
0
Software. Developed in collaboration with Passive Solar Industries Council, National Renewable EnergyLaboratory, Lawrence Berkeley National Laboratory and US Department of Energy (DOE).
149
environmental parameters as well as personal and psychological adaptations. Thermal
mass has the thermal inertia to moderate and delay daytime temperature.
Night ventilation can extend the effectiveness of thermal mass. It can also have
other energy implications. Ventilation in the form of air changes per hour (ACH) can
extend the comfort zone. They also have an impact on energy use.
Annual cooling load and heating energy a Nairobi experimental test house has
produced the relationships:
Cooling energy = 3.1697 (ACH) ^ - 0.1461 (ACH) - 0.4038
Heating energy = 8.4552e-°'*°«'(^^")
Thermal comfort standards vary from climate to climate and are not uniform
everywhere. Comfort standards should be conscious of the local climate, culture,
economic capability and acclimatization of the people for them to be useful.
CHAPTER 5
ENERGY-EFFICIENCY AND OTHER RELATED FACTORS
Introduction
This chapter discusses energy-efficiency, environmental sustainability issues and
other matters that relate to thermal mass. It discusses some simplified design tools for
estimating the energy use, indoor temperatures and effects of natural ventilation in
buildings with thermal mass. It also briefly discusses non-thermal issues that have direct
impact on comfort in buildings including: indoor air quality, acoustics, and life safety
systems and lighting.
Solar energy holds the key to sustainable development for the future. A recent
study' discussed the necessity, speed and strategies to be taken for a transition from an
estimated US $ 8 trillion fossil fuel-based infrastructure to a sustainable worldwide
energy approach. The study said:
The world is on a path that is not sustainable. Ahead is our rapidly
expanding energy needs, a fundamental component of development;
behind follows the environmental destruction, a consequence of the very
energy system that brought it to this point.
Solar energy is often regarded as envirormientally friendly but at the same time as
not economical. A study published by American Solar Energy Society discussed the
' Nicklas, Michael. 1996. 40% renewable energy by 2020: An ISES goal, a global necessity in Advances in
Solar Energy: An Annual Review ofResearch and Development, by Karl W. Boer (ed) Vol. 1 1 1996, pp.415-460. Boulder, Colorado: American Solar Energy Society, Inc.
^ Scheer, H. 1994. The economy of solar energy in Advances in Solar Energy: An Annual Review ofResearch and Development, by Karl W. Boer (ed) Vol. 9 1994, pp. 307-338. Boulder, Colorado: AmericanSolar Energy Society, Inc.
150
151
economics of solar energy. It showed that renewable energy provides new jobs, has long-
term reduction in administrative and health costs associated with renewable energies,
and, is sustainable. On this note, many organizations'^''*'^ overall mission is to provide
support to governments to strengthen sustainable human development with aims such as:
1 . Elimination of poverty.
2. Creation ofjobs.
3. Regeneration of the natural environment.
Thermal mass as a passive strategy is sustainable. A look at renewable energy
sources, simplified simulation tools, acoustic and lighting issues provide a chance for the
proper integration of thermal mass in buildings to ensure a sustainable world.
Energy Research in Kenya: Overview
Renewable energy in the form solar, wind, geothermal and oceanic currents have
been used in Kenya in a long time (Walsh, 1969^ DuBois, 1970"^; Tole, 1996^ Ogoli,
1997^). However, Kenya's economy depends on three major sources, namely, wood fuel.
' UNDP: United Nations Development Programme. Poverty and Environmental Initiative (PEI), December2000 at http://www.undp.org/seed/pei/
World Bank. 2000b. A Brighter Future? Energy in Africa 's Development, December 2000 at
http://www.worldbank.org/html/fpd/energv/subenergv/energvinafrica.htm
^ International Finance Corporation. IPC Strategic Directions: Executive Summary, December, 2000 at
http://www.ifc.org/images/strategic_summarv.pdf
* Walsh, J. 1969. Mineral and thermal waters of Kenya in XXII International Geological Congress, 19, pp.105-110.
' DuBois, C. G.B. 1970. Minerals of Kenya . Geological Survey Kenya Bulletin 11, pp. 66. Nairobi:
Government Printers.
* Tole, Mwakio P. 1996. Geothermal energv research in Kenya: A review in Journal ofAfrican Earth
Sciences, Vol. 23, No. 4, pp. 565-575, 1996. New York: Pergamon Press.
' Ogoli, David Mwale. 1997. Energv in African architecture - Guidelines for Kenya in Horizon DAT, Vol.
1, No. 1, pp. 52-62, 1997. Nairobi, Kenya: ICIPE Science Press.
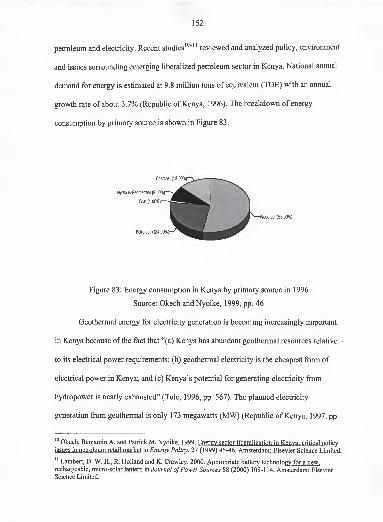
152
petroleum and electricity. Recent studies'^'" reviewed and analyzed policy, environment
and issues surrounding emerging liberalized petroleum sector in Kenya. National annual
demand for energy is estimated at 9.8 million tons of equivalent (TOE) with an annual
growth rate of about 3.7% (Republic of Kenya, 1996). The breakdown of energy
consumption by primary source is shown in Figure 83.
Figure 83: Energy consumption in Kenya by primary source in 1996
Source: Okech and Nyoike, 1999, pp. 46
Geothermal energy for electricity generation is becoming increasingly important
in Kenya because of the fact that "(a) Kenya has abundant geothermal resources relative -
to its electrical power requirements; (b) geothermal electricity is the cheapest form of
electrical power in Kenya; and (c) Kenya's potential for generating electricity from
hydropower is nearly exhausted" (Tole, 1996, pp. 567). The planned electricity
generation from geothermal is only 173 megawatts (MW) (Republic of Kenya, 1997, pp.
Okech, Benjamin A. and Patrick M. Nyoike. 1999. Energy sector liberalization in Kenya: critical policy
issues in petroleum retail market in Energy Policy, 27 (1999) 45-46. Amsterdam: Elsevier Science Limited.
" Lambert, D. W. H., R. Holland and K. Crawley. 2000. Appropriate battery technology for a new,rechargeable, micro-solar lantern in Journal ofPower Sources 88 (2000) 108-114. Amsterdam: Elseyier
Science Limited.
153
100). Based on studies'^ of the geothermal fields of Turkana, Bogoria, Eburru, Olkaria,
Magadi and Natron, the estimated heat flow in the Kenya rift valley is between 6,882 and
18,680 MW. Although definitive data are lacking, Kenya's geothermal potential is much
greater than current total installed electrical power system of 822 MW.
Energy is vital to economic development. Developed countries depend on large
amounts of energy to fuel their economy and keep industries running. According to the
World Bank:'^ "people in OECD countries spend only 2 to 3% of their income for
'energy', in the developing world, this share is 12% and in the case of the poor is even
more". The fact that poor people spend so much of their income on energy emphasizes
the importance of energy. Of the 650 million people in Africa, majority has limited
access to modem forms of energy. Lack of energy denies millions of people the ability to
reduce poverty because they cannot reap the fiiU benefits of their investment ofhuman
resources. Human energy is most prevalent in Africa and this hampers real economic
development. The World Bank''* acknowledges that energy is critical to development:
No country in the world has succeeded in shaking loose from a subsistence
economy without access to the services which modem energy provides.
The history of development identifies it as one of the prerequisites to
facilitate social development and fiiel growth. There is no evidence to the
contrary. There is, however, voluminous evidence ofhow lack of access
constrains social development and growth. A mark of the importance that
people in developing countries attach to energy is that they spend 12% of
their income on energy, compared with an average ofjust 2% in OECDcountries. As a 'revealed preference', to use the economic jargon, energy
is high on the agenda of those stmggling to escape poverty.
Crane, K. and S. O'Connell. 1983. The distribution and implications of heat flow from the Gregory rift in
Kenya in Tectonophysics, 94, pp. 253-275.
World Bank. 2000a. Perspectives on Energy Development.
http://www.worldbank.org/html/fpd/energv/energv_dev.htm
World Bank. 2000b. A Brighter Future? Energy in Africa 's Development, December 2000 at
http://www.worldbank.org/html/fpd/energv/subenergy/energvinafrica.htm

154
This dissertation is based on the thesis that if buildings use more passive solar
energy'^ then more active energy'^ will be available for other sectors of the economy in
poverty reduction.
A study^' funded by USAID was carried out to describe and catalogue renewable
energy systems in Kenya. Sources of conventional energy include renewable energies
(biomass, wind, hydropower and direct solar), and non-renewable (fossil fuels and
geothermal'^ power). Details of some the findings are summarized below. A study by
Hankin (1987, pp. 12) and other studies'^'^'' show that renewable energies are the most
appropriate for rural areas because:
1 . Renewable energies make use of local resources;
2. Renewable energies increase rural employment opportunities;
3. Renewable energies help to protect the environment;
4. Renewable energies save foreign exchange;
5. Renewable energies can meet demand scattered over large areas;
6. Renewable energies improve the standard of living.
Passive solar energy is generally diffuse, low flux and not concentrated. However, domestic applications
can be gainfully utilized for photovoltaic electricity, heating, cooling, and other low temperature heat
applications. This is renewable energy in the form of direct sun, wind, geothermal and ocean waves.
" Active energy is taken to mean concentrated and highly processed forms of non-renewable energy. They
includes fossil fiiels and nuclear energy.
Hankin, M. 1987. Renewable Energy in Kenya. Creative Motives, Nairobi, Kenya.
Geothermal energy is renewable energy but some people categorize it as non-renewable due to the
resources and capital required to maintain it.
" Flavin, Christopher and Molly 0;Meara. 1998. Financing solar home systems in developing countries:
Examples of new market strategies in Advances in Solar Energy: An Annual Review ofResearch andDevelopment, by Karl W. Boer (ed) Vol. 12 1998, pp. 123-148. Boulder, Colorado: American Solar Energy
Society, Inc.
World Bank. 2000b. A Brighter Future? Energy in Africa 's Development, December 2000 at
http://www.worldbank.org/html/fpd/energv/subenergv/energvinafrica.htm

155
Wood fuel, hydro and solar energy resources already meet major energy needs in
Kenya. More research in renewable energy is needed.
Indoor Air Quality Considerations Regarding Thermal Mass
The behavior of thermal mass is affected by considerations of indoor air quality
such as ventilation standards. The Kenya Building Code^' (1997a, by-law #150 pp. 54)
requires that every domestic building be provided with adequate means of ventilation and
have a sufficient number of windows suitably positioned for direct communication with
external air. This Code emphasizes natural ventilation and natural daylighting noting that
mechanical systems have indoor air quality (lAQ) problems.
Ventilation Standards
In Kenya, the Building Code is the ventilation standard. Other standards around
the world, however, have been developed to fully embrace the technology of air
conditioning. ASHRAE Standard 62-89^^ specifies minimum ventilation rates and indoor
air quality that will be acceptable to human occupants and are intended to minimize the
potential for adverse health effects. Ventilating systems designed and installed according
to ASHRAE Standard 62^^'^"^ should not cause conditions that conflict with the thermal
^' GK: Government of Kenya. 1997a. Building Code: Local Government (Adoptive By-Laws) (Building)
Order 1968 and The Local Government (Adoptive By-Laws) (Grade II Building) Order 1968. Nairobi:
Government Printer.
ASHRAE. 1989b. Ventilation for acceptable indoor air quality. ANSI/ASHRAE Standard 62-1989.
American Society of Heating, Refrigerating and Air Conditioning Engineers, Atlanta GA.
ASHRAE Standard 62-1999: Ventilationfor Acceptable Indoor Air Quality was released in October1999. It specifies minimum ventilation rates for nearly 100 different indoor spaces, including hospitals,
public assembly buildings and commercial and office buildings. The standard also references maximumacceptable levels of contaminants as set by cognizant organizations.
156
comfort ASHRAE Standard 55. In the United States of America, this usually means
resorting to mechanical systems.
In United Kingdom, two sources for designing natural ventilation are publications
by Chartered Institution of Building Services Engineers (CIBSE, 1997)^^ and the British
Standards Institution (BSI, 1991).^^ Even these two, however, have very high standards
so much so that to naturally ventilate a traditional African round house would have the
equivalent of a mechanical system operating as a wind tunnel to meet the same needs. In
Kenya, this fete is normally met adequately by "opening" the building by inexpensive
passive systems. Ventilation can affect the effect of thermal mass on indoor climate.
It is widely accepted that reducing ventilation and infiltration for thermal comfort
reasons and energy conservation measures can affect indoor air quality. Outdoor air that
flows through a building is often used to dilute and remove indoor air contaminants. The
size, position and number of windows have profound effect on the ability to use natural
ventilation.^^ Natural and/or artificial pressure differences drive natural ventilation,
infiltration^^ and exfiltration^'. Thermal mass, in turn, affects internal building loads.
ASHRAE. 1999b. Ventilation for acceptable indoor air quality. ANSI/ASHRAE Standard 62-1999.
American Society of Heating, Refrigerating and Air Conditioning Engineers, Atlanta GA.
CIBSE: Chartered Institution of Building Services Engineers. 1997. Natural ventilation in non-domestic
buildings in Applications Manual AMIO. London: Chartered Institution of Building Services Engineers.
BSI: British Standards Institution. 1991. fi5 5925: Code ofpracticefor ventilation principles anddesigningfor natural ventilation. London: British Standards Institution.
Natural ventilation is the intentional flow of air through open windows, doors, grilles, and other plannedbuilding envelope penetrations, and it is driven by natural and/or artificially produced pressure differentials
(ASHRAE Fundamentals Handbook 25.1)
Infiltration is the uncontrolled flow of outdoor air into a building through cracks and other unintentional
openings through the normal use of exterior doors for entrance and egress (ASHRAE FundamentalsHandbook 25. \).
Exfiltration is the leakage of the indoor air out of a building (ASHRAE Fundamentals Handbook 25.1).
157
Odor and Indoor Air Quality in Occupied Spaces
In the I980's, research^"'^''^^ showed that 80% of visitors to an occupied space
express odor satisfaction at an outdoor air ventilation rate of 15 cfm (7.5 L/s) per person,
while 80% of occupants express odor satisfaction at 5 cfm (2.5 L/s) per person. "Since
people adapt quickly to many odors, visitors odor acceptability within 15 seconds
after entering the space while occupants yvLdgQ acceptability 15 minutes or more after
entering the space" (Stanke, 1999, pp. 41). These studies confirmed the long established
people-odor minimum rate^^ and offered a rational explanation for the minimum rate of 5
cfm (2.5 L/s) per person used previously. In many cases, when ventilation is used to pre-
cool thermal mass, then also the implications of odors should be taken very seriously.
Some studies^'*'^^'^^ have shown that productivity of20% of office workers in the
USA was raised simply by improved indoor air quality. Rowe (1999) argued that
naturally ventilated buildings are the preferred enviroimients because they offer more
Berg-Munch, B., G. H. Clausen and P. O. Fanger. 1986. Ventilation requirements for the control ofbody
odor in spaces occupied by women . Environ. Int. 12:195-200.
^' Cain, W. S., et al. 1983. Ventilation requirements in buildings - 1. Control of occupancy odor and
tobacco smoke odor . Atmospheric Environment 17 (6): 1 183-1 197. Amsterdam: Elsevier Science Limited.
Fanger, P. O. and B. Berg-Munch. 1983. Ventilation and body odor . Proceedings ofan Engineering
Foundation Conference on Management ofAtmospheres in Tightly Enclosed Spaces, pp. 45-50. American
Society of Heating, Refrigerating and Air Conditioning Engineers, Atlanta GA.
" Yaglou, C. P., E. C. Riley and D. I. Coggins. 1936. Ventilation requirements . ASHRAE Transactions 42:
133-162. American Society of Heating, Refrigerating and Air Conditioning Engineers, Atlanta GA.
Lorsch, H. and O. Abdou. 1994a. The impact of the building indoor environment on occupant
productivity: Part 1 : recent studies, measures and costs . ASHRAE Transactions, 1994, pp. 741-749.
American Society of Heating, Refrigerating and Air Conditioning Engineers, Atlanta GA.
Lorsch, H. and O. Abdou. 1994b. The impact of the building indoor environment on occupant
productivity: Part 2: effects of temperature . ASHRAE Transactions, 1994, pp. 895-901. American Society
of Heating, Refrigerating and Air Conditioning Engineers, Atlanta GA.
Lorsch, H. and O. Abdou. 1994c. The impact of the building indoor environment on occupant
productivity: Part 2: effects of indoor air quality . ASHRAE Transactions, 1994, pp. 902-912. AmericanSociety of Heating, Refrigerating and Air Conditioning Engineers, Atlanta GA.
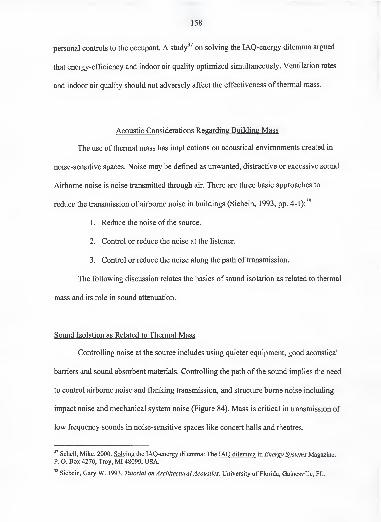
158
personal controls to the occupant. A study^^ on solving the lAQ-energy dilemma argued
that energy-efficiency and indoor air quality optimized simultaneously. Ventilation rates
and indoor air quality should not adversely affect the effectiveness of thermal mass.
Acoustic Considerations Regarding Building Mass
The use of thermal mass has implications on acoustical environments created in
noise-sensitive spaces. Noise may be defined as unwanted, distractive or excessive sound.
Airborne noise is noise transmitted through air. There are three basic approaches to
38reduce the transmission of airborne noise in buildings (Siebein, 1993, pp. 4-1):
1 . Reduce the noise of the source.
2. Control or reduce the noise at the listener.
3. Control or reduce the noise along the path of transmission.
The following discussion relates the basics of sound isolation as related to thermal
mass and its role in sound attenuation.
Sound Isolation as Related to Thermal Mass
Controlling noise at the source includes using quieter equipment, good acoustical
barriers and sound absorbent materials. Controlling the path of the sound implies the need
to control airborne noise and flanking transmission, and structure borne noise including
impact noise and mechanical system noise (Figure 84). Mass is critical in transmission of
low frequency sounds in noise-sensitive spaces like concert halls and theatres.
Schell, Mike. 2000. Solving the lAQ-energy dilemma: The lAQ dilemma in Energy Systems Magazine.
P. O. Box 4270, Troy, MI 48099, USA.
Siebein, Gary W. 1993. Tutorial on Architectural Acoustics. University of Florida, Gainesville, FL.
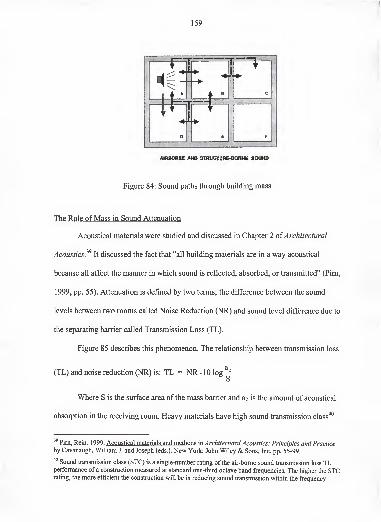
159
—*-J
r, 1
—c
E FI
AIRBORNE AND STRUCYUR&BQRNE SOUNP
Figure 84: Sound paths through building mass
The Role of Mass in Sound Attenuation
Acoustical materials were studied and discussed in Chapter 2 ofArchitectural
Acoustics. It discussed the fact that "all building materials are in a way acoustical
because all affect the manner in which sound is reflected, absorbed, or transmitted" (Pirn,
1999, pp. 55). Attenuation is defined by two terms; the difference between the sound
levels between two rooms called Noise Reduction (NR) and sound level difference due to
the separating barrier called Transmission Loss (TL).
Figure 85 describes this phenomenon. The relationship between transmission loss
(TL) and noise reduction (NR) is: TL = NR - 10 log—s
Where S is the surface area of the mass barrier and a2 is the amount of acoustical
absorption in the receiving room. Heavy materials have high sound transmission class"*"
^' Pirn, Rein. 1999. Acoustical materials and methods in Architectural Acoustics: Principles and Practice
by Cavanaugh, William J. and Joseph (eds.). New York: John Wiley & Sons, Inc. pp. 55-99.
Sound transmission class (STC) is a single-number rating of the air-borne sound transmission loss TLperformance of a construction measured at standard one-third octave band frequencies. The higher the STCrating, the more efficient the construction will be in reducing sound transmission within the frequency
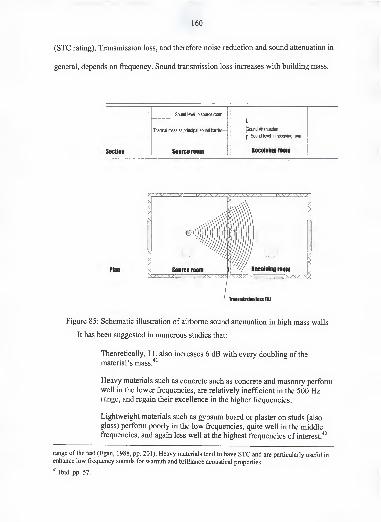
160 i
(STC rating). Transmission loss, and therefore noise reduction and sound attenuation in
general, depends on frequency. Sound transmission loss increases with building mass.
Section
Sound level in source room
Thermal mass as principal sound barrier-
Sourceroom
sound Attenuation
Sound level in receiving room
Receiving room
Pian
Trmsiiilssionb»s(TU
Figure 85: Schematic illustration of airborne sound attenuation in high mass walls
It has been suggested in numerous studies that:
Theoretically, TL also increases 6 dB with every doubling of the
material's mass41
Heavy materials such as concrete such as concrete and masonry perform
well in the lower frequencies, are relatively inefficient in the 500 Hzrange, and regain their excellence in the higher frequencies.
Lightweight materials such as gypsum board or plaster on studs (also
glass) perform poorly in the low frequencies, quite well in the middlefrequencies, and again less well at the highest frequencies of interest."*^
range of the test (Egan, 1988, pp. 201). Heavy materials tend to have STC and are particularly useful in
enhance low frequency sounds for warmth and brilliance acoustical properties.
Ibid. pp. 57.
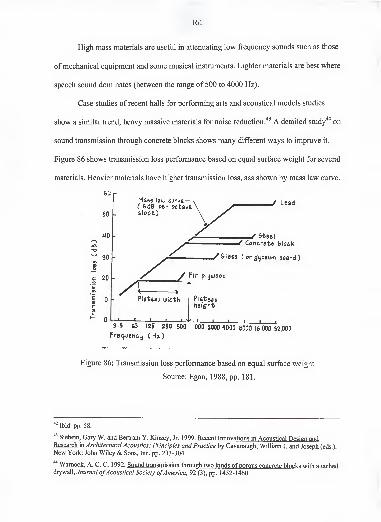
161
High mass materials are useful in attenuating low frequency sounds such as those
of mechanical equipment and some musical instruments. Lighter materials are best where
speech sound dominates (between the range of 500 to 4000 Hz).
Case studies of recent halls for performing arts and acoustical models studies
show a similar trend; heavy massive materials for noise reduction.''^ A detailed study"*^ on
sound transmission through concrete blocks shows many different ways to improve it.
Figure 86 shows transmission loss performance based on equal surface weight for several
materials. Heavier materials have higher transmission loss, ass shown by mass law curve.
6U
50
40 -
Mass law curve( 6dB per octaveslope)
/ Lead
/ steel
CO
inino
30
c 20o
Ewc
0 L,
^ Concrete block
^6l85S (or gypsum board)
/I^ Fir plyiuood
Plateau width Plateauheight
-I 1 1 1
31.5 fi3 125 250 500 1000 2000 mO 6000 16,000 32,000
Freq-uency (Hz)
Figure 86: Transmission loss performance based on equal surface weight
Source: Egan, 1988, pp. 181.
Ibid. pp. 58.
Siebein, Gary W. and Bertram Y. Kinzey, Jr. 1999. Recent Innovations in Acoustical Design andResearch in Architectural Acoustics: Principles and Practice by Cavanaugh, William J. and Joseph (eds.).
New York: John Wiley & Sons, Inc. pp. 233-304.
*^ Wamock, A. C. C. 1992. Sound transmission through two kinds of porous concrete blocks with attacheddrywall . Journal ofAcoustical Society ofAmerica, 92 (3), pp. 1452-1460.
162
Higher plateau levels and narrower plateau widths on the figure above indicate
better sound-isolating performance on an equivalent weight basis. Heavier masses have
relatively good acoustic properties. As Egan (1988, pp. 180/^ said: "The ideal sound
isolating construction would be heavy, limp, and airtight".
High building mass for noise control improves worker productivity
Leaman and Bordass'*^ did a study relating productivity in buildings with five
perceived control variables - heating, cooling, lighting, ventilation, and noise. They
concluded that noise is the most strongly associated with perceived productivity. Some of
the respondents to their survey said that noise has the most disturbing effect on work.
Building mass is an important consideration since it affects noise attenuation.
Life Safety Considerations of Thermal Mass
Thermal mass has a dual role in the attainment of thermal comfort and life safety.
Floors, walls and roofs affect the spread of fire, and consequently smoke management,
and should be chosen to improve life safety. Most high mass materials like concrete can
achieve higher fire rating than lightweight materials. One of the most efficient ways
known to limit the damage from a fire is to develop compartments (ASHRAE, 1999, pp.
51.1) thereby giving rise to thermal mass within the floors and partitions.
Life safety considerations depend on the type of occupancy of a building; office
buildings have different requirements from manufacturing facilities. Buildings need to be
Egan, M. David. 1988. Architectural Acoustics. New York: McGraw-Hill, Inc. pp. 180.
Leaman, Adrian and Bill Bordass. 1999. Productivity in buildings: the "killer" variables . BuildingResearch & Information (1999) 27 (1), 4-19. London: E & FN Spon.
163
protected against fires for life safety. Usually, smoke causes most deaths in fires. The US
Fire Protection Handbook (NFPA 1997)'*^ and Life Safety Handbook*^ contain details on
fire safety information. According to US National Fire Protection Administration (NFPA)
and ASHRAE ( 1 999, pp. 5 1 . 1 ), there are two approaches to fire protection:
1 . To protect fire ignition and
2. To manage fire impact.
Building occupants play a major role in protection against fire ignition. Managing
fire impact requires a carefijlly coordinated effort that includes the building design.
Lighting Considerations Regarding Thermal Mass
Heat load in the form of thermal radiation due to lighting requirements has a time
lag from the building mass. Figure 87 shows how this absorbed energy contributes to
space cooling load only after a time lag, with some part of such energy still present and
reradiating after the lights have been switched off.
Since light is a major space load component (ASHRAE, 1997, 28.7), an accurate
heat transfer mechanism is needed. Part of light energy is in the form of convective heat
but a major portion is in the form of radiation that gets absorbed by thermal mass (walls,
floors etc.). This absorbed energy is released slowly depending on the thermal properties
of the material. Therefore, lighting systems should be carefiiUy considered.
NFPA. 1997a. Fire Protection Handbook, 18* edition. Quincy, MA: National Fire ProtectionAdministration.
NFPA. 1997b. Life Safety Code. ANSI/NFPA Standard 101-94. Quincy, MA: National Fire ProtectionAdministration.
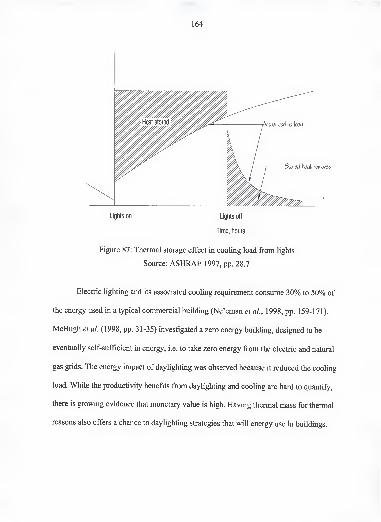
164
Lights on Lights off
Time, hours
Figure 87: Thermal storage effect in cooling load from lights
Source: ASHRAE 1997, pp. 28.7
Electric lighting and its associated cooling requirement consume 30% to 50% of
the energy used in a typical commercial building (Ne'eman et al, 1998, pp. 159-171).
McHugh et al. (1998, pp. 31-35) investigated a zero energy building, designed to be
eventually self-sufficient in energy, i.e. to take zero energy from the electric and natural
gas grids. The energy impact of daylighting was observed because it reduced the cooling
load. While the productivity benefits from daylighting and cooling are hard to quantify,
there is growing evidence that monetary value is high. Having thermal mass for thermal
reasons also offers a chance to daylighting strategies that will energy use in buildings.
165
Conclusions
People in developing countries spend over 12% of their income for "energy"; the
OECD countries spend only 2 to 3 % developing world. In the case of the poorest poor,
they spend even more than 12%. The fact that poor people spend so much of their income
on energy emphasizes the importance of energy in human society.
Thermal mass, the size, position and number of windows have profound effect on
the ability to use natural ventilation in passive solar buildings. Studies show that indoor
air quality raises the productivity of office workers in buildings.
Heavy materials such as concrete and masonry perform (1) well in the lower
frequencies, (2) are relatively inefficient in the 500 Hz range, and (3) regain their
excellence in the higher frequencies. High mass materials are extremely useful in
attenuating low frequency sounds such as those of mechanical equipment and some
musical instruments. Lighter materials are best useful where speech sound dominates
(between the range of 500 to 4000 Hz). The ideal sound isolating construction is heavy
building mass.
Floors, walls and roofs affect the spread of fire, and consequently smoke
management, and should be chosen to improve life safety. Most high mass materials like
concrete can achieve higher fire rating than lightweight materials. Building mass has
multiple roles in attainment of acoustic noise control, life safety, lighting efficiency and
thermal comfort.
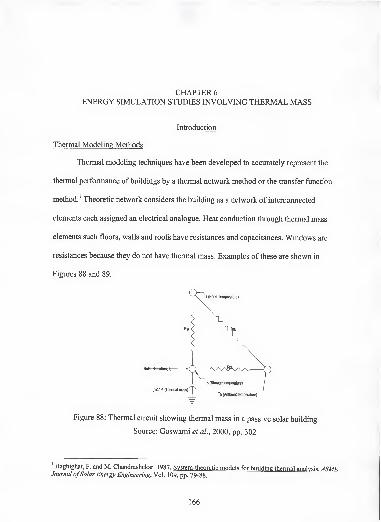
CHAPTER 6
ENERGY SIMULATION STUDIES INVOLVING THERMAL MASS
Introduction
Thermal Modeling Methods
Thermal modeling techniques have been developed to accurately represent the
thermal performance of buildings by a thermal network method or the transfer fiinction
method.' Theoretic network considers the building as a network of interconnected
elements each assigned an electrical analogue. Heat conduction through thermal mass
elements such floors, walls and roofs have resistances and capacitances. Windows are
resistances because they do not have thermal mass. Examples of these are shown in
Figures 88 and 89.
Figure 88: Thermal circuit showing thermal mass in a passive solar building
Source: Goswami et al, 2000, pp. 302
' Haghighat, F. and M. Chandrashekar. 1987. System-theoretic models for building thermal analysis . ASMEJournal ofSolar Energy Engineering, Vol. 1 09, pp. 79-88.
166
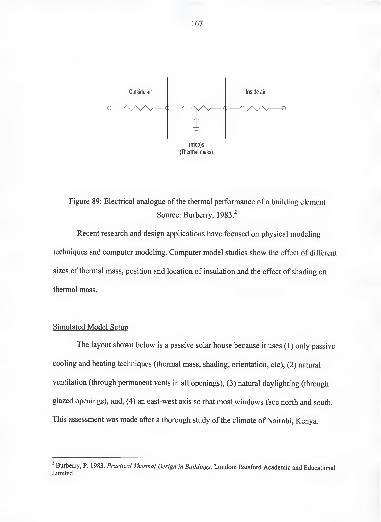
167
Figure 89: Electrical analogue of the thermal performance of a building element
Source: Burberry, 1983.^
Recent research and design applications have focused on physical modeling
techniques and computer modeling. Computer model studies show the effect of different
sizes of thermal mass, position and location of insulation and the effect of shading on
thermal mass.
Simulated Model Setup
The layout shown below is a passive solar house because it uses (1) only passive
cooling and heating techniques (thermal mass, shading, orientation, etc), (2) natural
ventilation (through permanent vents in all openings), (3) natural daylighting (through
glazed openings), and, (4) an east-west axis so that most windows face north and south.
This assessment was made after a thorough study of the climate ofNairobi, Kenya.
^ Burberry, P. 1983. Practical Thermal Design in Buildings. London: Batsford Academic and EducationalLimited.
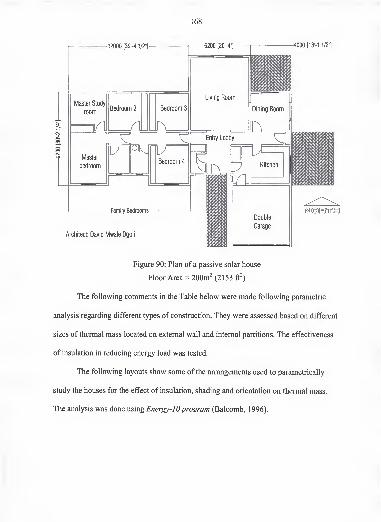
168
-12000 [39'-41/2" 4000[13'-1 1/2"!
Architect: David Mwale Ogoli
Figure 90: Plan of a passive solar house
Floor Area = 200m^ (2153 ft^)
The following comments in the Table below were made following parametric
analysis regarding different types of construction. They were assessed based on different
sizes of thermal mass located on external wall and internal partitions. The effectiveness
of insulation in reducing energy load was tested.
The following layouts show some ofthe arrangements used to parametrically
study the houses for the effect of insulation, shading and orientation on thermal mass.
The analysis was done using Energy-10program (Balcomb, 1996).
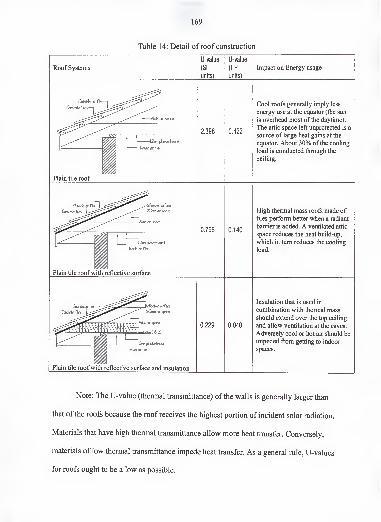
169
Table 14: Detail of roof construction
Roof Systems
U-value
(SI
units)
U-value
(l-P
units)
Impact on Energy usage
CUade air fill
Concreie f il(55-
——Attic air space
2.398 0.422
-12mm plastcrttaard
Inside air film
Cool roofs generally imply less
energy use at the equator (the sun
is overhead most of the daytime).
The attic space left unprotected is a
source of large heat gains at the
equator. About 30% of the cooling
load is conducted through the
ceiling.
Plain tile roof
CUsi
CoKre^ Tilei
SefiedJ^ surface
20im air space
^ttic ar space
0.796 0.140
I2im pJastertoa'd
Inside arf^
High thermal mass roofs made of
tiles perform better when a radiant
barrier is added. A ventilated attic
space reduces the heat build-up,
which in turn reduces the cooling
load.
Plain tile roof with reflective surface
Otei
CoKTcte f^es
0.229 0.040
=J«ulat<3n(R-2)
I2rmi plasterfaca'd
Inski? ar film
Insulation that is used in
combination with thermal mass
should extend over the top ceiling
and allow ventilation at the eaves.
Adversely cool or hot air should be
impeded from getting to indoor
spaces.
Plain tile roof with reflective surface and insulation
Note: The U-value (thermal transmittance) of the walls is generally larger than
that of the roofs because the roof receives the highest portion of incident solar radiation.
Materials that have high thermal transmittance allow more heat transfer. Conversely,
materials of low thermal transmittance impede heat transfer. As a general rule, U-values
for roofs ought to be a low as possible.
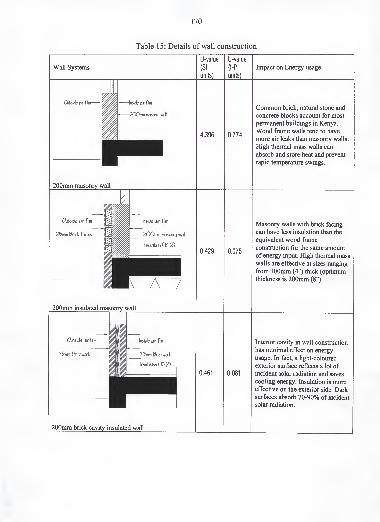
170
Table 15: Details of wall construction
Wall Systems
U-value
(SI
units)
U-value
(l-P
units)
Impact on Energy usage
Outside ar filnr- nslde air film
200mm mascmj wall
200mm masonry wall
4.396 0.774
Common brick, natural stone and
concrete blocks account for most
permanent buildings in Kenya.
Wood frame walls tend to have
more air leaks than masonry walls.
High thermal mass walls can
absorb and store heat and prevent
rapid temperature swings.
Cutside air film
25'mm I?rick facinq
Irside air film
200mm mascrrLi wall
0.429 0.075
Masonry walls with brick facing
can have less insulation than the
equivalent wood frame
construction for the same amount
of energy input. High thermal mass
walls are effective at sizes ranging
from 100mm (4") thick (optimum
thickness is 200mm (8").
200mm insulated masonry wall
Outside air film
7^mm brickwork
I
II
Inside air film
75mm Prickwork
Insulation ( R-2)
0.461 0.081
Interior cavity in wall construction
has minimal effect on energy
usage. In fact, a light-coloured
exterior surface reflects a lot of
incident solar radiation and saves
cooling energy. Insulation is moreeffective on the exterior side. Dark
surfaces absorb 70-90% of incident
solar radiation.
200mm brick cavity insulated wall
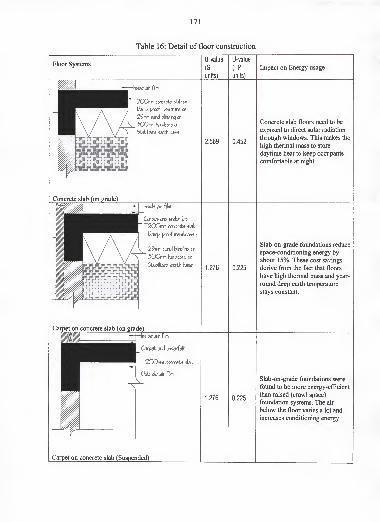
171
Table 16: Detail of floor construction
Floor SystemsU-value
(SI
units)
U-value
(l-P
units)
Impact on Energy usage
Insde air film
200rmi oricrete slab on
Vamp-prod membrane an
25mm sard Windinq on
500mm ha-dare on
Stabilized eartJi base
2.569 0.452
Concrete slab floors need to be
exposed to direct solar radiation
through windows. This makes the
high thermal mass to store
daytime heat to keep occupants
comfortable at night.
Concrete slab (on grade)
nslde air film
Cs«'p(A and undei-felt
200mm concrete slab
Pamp-proof membrane <
2^mm sand bllndinq on
JOOmm hardcore on
Stabilized earth base1.276 0.225
Slab-on-grade foundations reduce
space-conditioning energy by
about 15%. These cost savings
derive from the fact that floors
have high thermal mass and year-
round deep earth temperature
stays constant.
Caipet on concrete slab (on grade)
Inside air film
Carpet and underfelt
200mm (X)ncre!!£ slab
CUslde air film
1.276 0.225
Slab-on-grade foundations were
found to be more energy-efficient
than raised (crawl space)
foundation systems. The air
below the floor varies a lot and
increases conditioning energy.
Carpet on concrete slab (Suspended)
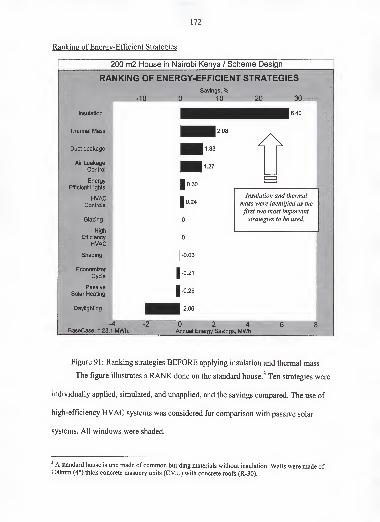
172
Ranking of Energy-Efficient Strategies
200 m2 House in Nairobi Kenya / Scheme Design
RANKING OF ENERGY-EFFICIENT STRATEGIESSavings, %
-10 0 10 20
Insulation
Thermal Mass
Duct Leakage
Air LeakageControl
Energy
Efficient Lights
HVACControls
Glazing
High
Efficiency
HVAC
Shading
Economizer
Cycle
Passive
Solar Heating
Daylighting
2.08
1.33
1.27
30
6.40
BaseCase = 23.1 MWh.
1 0.30
1 0.24
0
0
I
-0.03
I-0.21
I-0.25
I-2.06
Annual Energy Savings, MWh
Insulation and thermal
mass were identified as the
first two most important
strategies to be used.
Figure 91: Ranking strategies BEFORE applying insulation and thermal mass
The figure illustrates a RANK done on the standard house.^ Ten strategies were
individually applied, simulated, and unapplied, and the savings compared. The use of
high-efficiency HVAC systems was considered for comparison with passive solar
systems. All windows were shaded.
^ A standard house is one made ofcommon building materials without insulation. Walls were made of100mm (4") thick concrete masonry units (CMU) with concrete roofs (R-30).
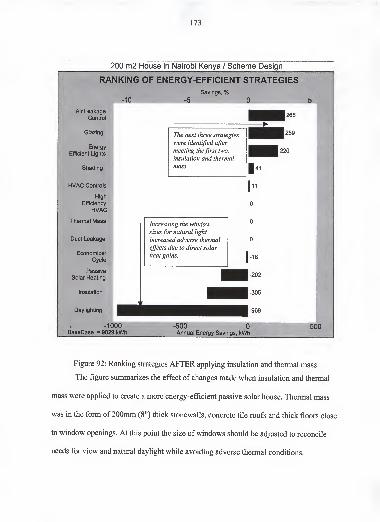
173
200 m2 House in Nairobi Kenya / Scheme Design
RANKING OF ENERGY-EFFICIENT STRATEGIESSavings, %
-10
Air Lealoge
Control
Glazing
Energy
Efficient Lights
Shading
HVAC Controls
High
Efficiency
HVAC
Thermal Mass
Duct Leakage
EconomizerCycle
Passive
Solar Heating
Insulation
Daylighting
-1000BaseCase =9029kWh.
-5
The next three strategies
were identified after
meeting thefirst two,
insulation and thermal
massI 41
11
Increasing the window
sizesfor natural light
increased adverse thermal
effects due to direct solar
heat gains. -16
-202
-305
-969
-500 0Annual Energy Savings, kWh
266
259
220
500
Figure 92: Ranking strategies AFTER applying insulation and thermal mass
The figure summarizes the effect of changes made when insulation and thermal
mass were applied to create a more energy-efficient passive solar house. Thermal mass
was in the form of200mm (8") thick stonewalls, concrete tile roofs and thick floors close
to window openings. At this point the size ofwindows should be adjusted to reconcile
needs for view and natural daylight while avoiding adverse thermal conditions.
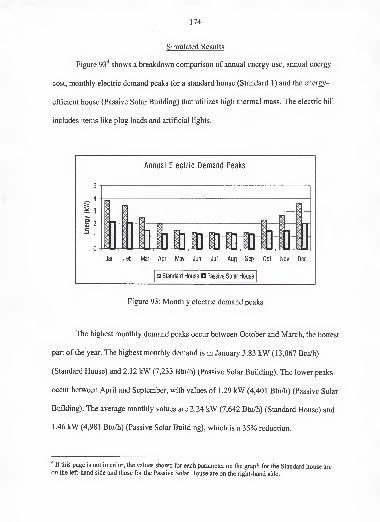
174
Simulated Results
Figure 93^ shows a breakdown comparison of annual energy use, annual energy
cost, monthly electric demand peaks for a standard house (Standard 1) and the energy-
efficient house (Passive Solar Building) that utilizes high thermal mass. The electric bill
includes items like plug loads and artificial lights.
Annual Electric Demand Peaks
Jan Feb Mar Apr May Jun Jul Aug Sep Oct Nov Dec
Q Standard House Passive Solar House
Figure 93: Monthly electric demand peaks
The highest monthly demand peaks occur between October and March, the hottest
part of the year. The highest monthly demand is in January 3.83 kW (13,067 Btu/h)
(Standard House) and 2.12 kW (7,233 Btu/h) (Passive Solar Building). The lower peaks
occur between April and September, with values of 1.29 kW (4,401 Btu/h) (Passive Solar
Building). The average monthly values are 2.24 kW (7,642 Btu/h) (Standard House) and
1.46 kW (4,981 Btu/h) (Passive Solar Building), which is a 35% reduction.
^ If this page is not in color, the values shown for each parameter on the graph for the Standard house areon the left-hand side and those for the Passive Solar House are on the right-hand side.
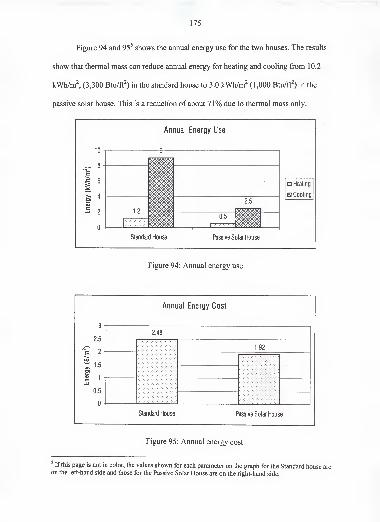
175
Figure 94 and 95^ shows the annual energy use for the two houses. The results
show that thermal mass can reduce annual energy for heating and cooling from 10.2
kWh/m^ (3,300 Btu/ft^) in the standard house to 3.0 kWh/m^ (1,000 Btu/ft^) in the
passive solar house. This is a reduction of about 71% due to thermal mass only.
10
^ 8CNJ
Ei 6
- 2
0
Annual Energy Use
2.5
0.5
Standard House Passive Solar House
Heating
s Cooling
Figure 94: Annual energy use
3
2.5
CM
E 2
1.5>.o>03C 1
0.5
0
Annual Energy Cost
2.48
1.92
Standard House Passive Solar House
Figure 95: Annual energy cost
' If this page is not in color, the values shown for each parameter on the graph for the Standard house areon the left-hand side and those for the Passive Solar House are on the right-hand side.
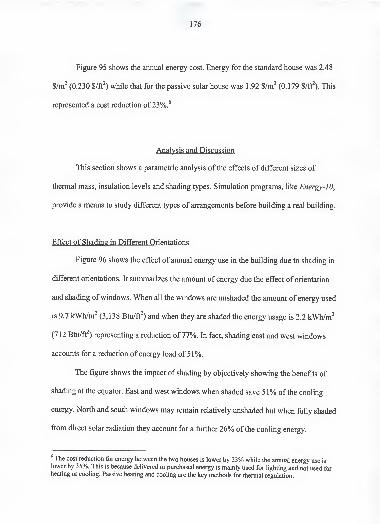
176
i
Figure 95 shows the annual energy cost. Energy for the standard house was 2.48
(0.230 $/ft^) while that for the passive solar house was 1 .92 $/m^ (0.179 $/ft^). This
represented a cost reduction of 23%.^
"'1
Analysis and Discussion
This section shows a parametric analysis of the effects of different sizes of
thermal mass, insulation levels and shading types. Simulation programs, like Energy-10,
provide a means to study different types of arrangements before building a real building.
Effect of Shading in Different Orientations
Figure 96 shows the effect of annual energy use in the building due to shading in
different orientations. It summarizes the amount of energy due the effect of orientation ^
and shading of windows. When all the windows are unshaded the amount of energy used
is 9.7 kWh/m^ (3,138 Btu/ft^) and when they are shaded the energy usage is 2.2 kWh/m^
(712 Btu/ft^) representing a reduction of 77%. In fact, shading east and west windows
accounts for a reduction of energy load of 5 1%.
The figure shows the impact of shading by objectively showing the benefits of
shading at the equator. East and west windows when shaded save 51% of the cooling 'i
energy. North and south windows may remain relatively unshaded but when fully shaded
from direct solar radiation they account for a further 26% of the cooling energy.
* The cost reduction for energy between the two houses is lower by 23% while the annual energy use is
'
lower by 35%. This is because delivered or purchased energy is mainly used for lighting and not used forheating or cooling. Passive heating and cooling are the key methods for thermal regulation.
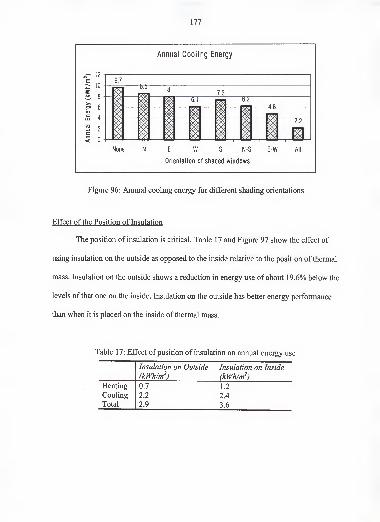
177
Annual Cooling Energy
None N E W S N-S E-W All
Orientation ot stiaded windows
Figure 96: Annual cooling energy for different shading orientations
Effect of the Position of Insulation
The position of insulation is critical. Table 17 and Figure 97 show the effect of
using insulation on the outside as opposed to the inside relative to the position of thermal
mass. Insulation on the outside shows a reduction in energy use of about 19.6% below the
levels of that one on the inside. Insulation on the outside has better energy performance
than when it is placed on the inside of thermal mass.
Table 17: Effect of position of insulation on annual energy use
Insulation on Outside Insulation on Inside
(kWh/m^) (kWh/m^)
Heating 0.7 1.2
Cooling 2.2 2.4
Total 2.9 3.6
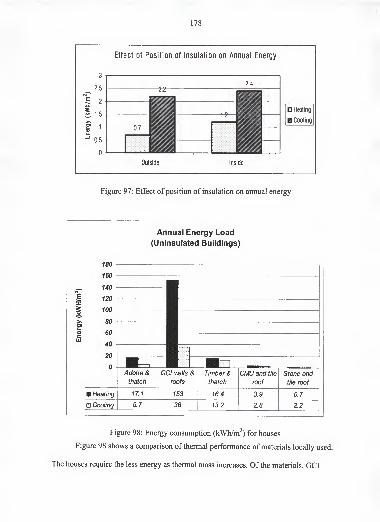
178
Effect of Position of Insulation on Annual Energy
3 1
2.5
CVJ
2XI
1.5
><O)
109c=LU
0.5
2.4
Heating
B Cooling
Outside Inside
Figure 97: Effect of position of insulation on annual energy
Annual Energy Load
(Uninsulated Buildings)
180
160
E
Adobe & GCI walis & Timber & CMU and tile Stone andthatcti roofs thatch roof tile roof
Heating 17.1 153 16.4 3.9 0.7
Cooling 5.7 36 13.2 2.8 2.2
Figure 98: Energy consumption (kWh/m^) for houses
Figure 98 shows a comparison of thermal performance of materials locally used.
The houses require the less energy as thermal mass increases. Of the materials, GCI
179
sheets lack thermal inertia that is necessary to reduce temperature swings. All the
assemblies did not have insulation except stone/tile option that was used to gauge the
impact of insulation beyond a standard CMU/tile house.
Comparison with Previous Studies
An extensive investigation of the effect of a window's orientation under various
conditions of shading was conducted by Givoni at the Building Research Station of the
Technion, in Haifa, Israel (Givoni, 1976, pp. 213-231).^ An experiment was setup
comprising four rotatable models of 1 x 1 x Im with walls 150mm thick of lightweight
concrete. One wall of the model had a window and the rear wall had a smaller opening
with an insulated shutter-board. The four models had windows that could be shaded and
were oriented in the four cardinal directions. Givoni (1998, pp. 65) noted following the
findings:
1 . Immediately at sunrise, as expected, showed a steep rise temperature.
2. The indoor maximum window in the model with the eastern window was
about 6°C (1 IT) above the outdoors' maximum.
3. In the western window model the indoor maximum temperature was 1 TC
(20°F) above the outdoor maximum temperature.
4. The models with unshaded southern and northern windows had roughly
similar patterns, with much lower elevation of their indoor maximum
temperature of about that of the outdoor.
' Givoni, Baruch. 1976. Man, Climate and Architecture. London: Applied Science Publishers. Chapter 11:Orientation and its effect on indoor climate.
180
5. With effective shading, and with even low ventilation rate, the effect of
the orientations of the windows almost disappeared.
6. With cross-ventilation, even when the windows are not shaded, the effect
of the orientations of the windows of the windows disappeared.
7. The quantitative effect of the envelope color on the indoor air temperature,
and on the energy demand of a building, depends on the thermal properties
of the walls and the roof, as well as on the ventilation conditions (Givoni,
1998, pp. 78).
Building orientation affects the indoor climate by determining the effect of solar
radiation and ventilation due to the prevailing winds. Thermal mass is the barrier that
receives the impact of these conditions.
Simulated indoor temperatures
QUICK II is a thermal analysis program that can simulate the thermal
performance and indoor comfort conditions in buildings. Mathews and Richards (1989,
pp. 61-80) developed it at the University of Pretoria in South Africa. It can simulate
hourly indoor temperatures in single zone although it does not offer temperature
stratification in a room, interior surfaces are considered to be at the same temperature and
it does not take into account wind effects (Balarus, 1996, pp. 5). QUICK II can predict
the effect of a building area with the ground contact or a raised intermediate floor.
Figure 99 shows the simulated indoor temperatures in a building with high mass
walls, 200mm (8) thick. Outdoor temperatures are also shown. It is clearly visible from
the chart that thermal mass can maintain thermal comfort conditions indoors.

181
TEMPERATURE SIMULATION FOR COLD DAY
I I I I I I I I I I I I I I I I I I I I t I I
I 3 5 7 9 11 13 15 17 19 21 23
Time of day
Cold day outdoors
' Cold day indoors
Comfort limit
Upp. Comfort Limit
TEMPERATURE SIMULATION FOR HOT DAY
40.0
35.0
30.0
25.0
20.0
15.0
10.0
5.0
0.0
~ Hot day outdoors
* Hot day indoors
'
" " Low. Comfort limit
Upp. Comfort Limit
I I I I I 1 ! I I I I 1 I I I I II II I II
1 3 5 7 9 11 13 15 17 19 21 23
Time of day
Figure 99: Simulated indoor temperatures for a building with walls 200mm thick
The "cold and hot" days are respective annual coolest day (July) and hottest day (February).
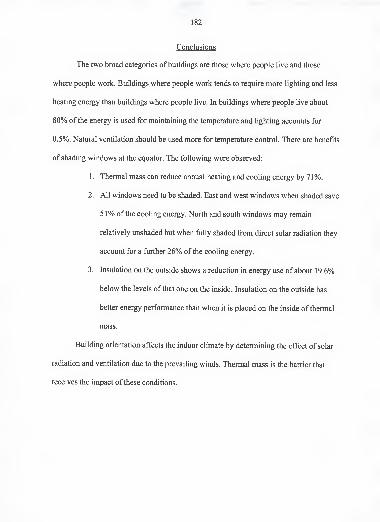
182
Conclusions
The two broad categories of buildings are those where people live and those
where people work. Buildings where people work tends to require more lighting and less
heating energy than buildings where people live. In buildings where people live about
80% of the energy is used for maintaining the temperature and lighting accounts for
0.5%. Natural ventilation should be used more for temperature control. There are benefits
of shading windows at the equator. The following were observed:
1. Thermal mass can reduce annual heating and cooling energy by 71%.
2. All windows need to be shaded. East and west windows when shaded save
51% of the cooling energy. North and south windows may remain
relatively unshaded but when fiilly shaded from direct solar radiation they
account for a further 26% of the cooling energy.
3. Insulation on the outside shows a reduction in energy use of about 19.6%
below the levels of that one on the inside. Insulation on the outside has
better energy performance than when it is placed on the inside of thermal
mass.
Building orientation affects the indoor climate by determining the effect of solar
radiation and ventilation due to the prevailing winds. Thermal mass is the barrier that
receives the impact of these conditions.
CHAPTER 7
CONCLUSIONS
Introduction
Architecture is a process' - from inception, through design development to
completion. Basic design decisions have energy consequences. Energy is used to run and
maintain buildings. Energy consumption in buildings is related to the local climate,
building systems, occupancy patterns and the thermal properties of the building materials.
Energy use is an important concern because it affects (1) the choice of building materials
and methods (2) architectural form and layout planning (3) response to site and natural
features. Some building materials waste energy while others, such as those where thermal
mass is applicable, conserve cooling and heating energy. Not all energy issues can
profoundly affect architectural form, but architectural form can profoundly affect energy
use. Psychological expectations have a bearing on the use of energy in buildings.
Traditional architecture around the world developed on a paradigm ofharmony
with local climate. Contemporary architecture has shifted to a new different paradigm:
"international style" that is based solely on technology without adapting design to local
climate. Charles Jencks predicted that air conditioning would merge indoor and outdoor
environments, day and night activities, summer and winter seasons, and north and south
orientations. This is largely true now that human activity is a twenty-four hour cycle.
However, some recent trends seem to indicate that dependence on mechanical systems
183
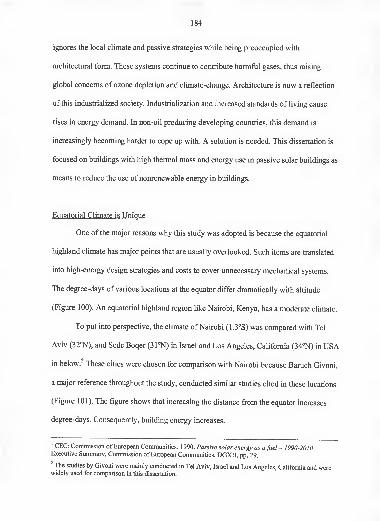
184
ignores the local climate and passive strategies while being preoccupied with
architectural form. These systems continue to contribute harmful gases, thus raising
global concerns of ozone depletion and climate-change. Architecture is now a reflection
of this industrialized society. Industrialization and increased standards of living cause
rises in energy demand. In non-oil producing developing countries, this demand is
increasingly becoming harder to cope up with. A solution is needed. This dissertation is
focused on buildings with high thermal mass and energy use in passive solar buildings as
means to reduce the use of nonrenewable energy in buildings.
Equatorial Climate is Unique
One of the major reasons why this study was adopted is because the equatorial
highland climate has major points that are usually overlooked. Such items are translated
into high-energy design strategies and costs to cover unnecessary mechanical systems.
The degree-days of various locations at the equator differ dramatically with altitude
(Figure 100). An equatorial highland region like Nairobi, Kenya, has a moderate climate.
To put into perspective, the climate of Nairobi (1.3°S) was compared with Tel
Aviv (32°N), and Sede Boqer (31°N) in Israel and Los Angeles, California (34°N) in USA
m below. These cities were chosen for comparison with Nairobi because Baruch Givoni,
a major reference throughout the study, conducted similar studies cited in these locations
(Figure 101). The figure shows that increasing the distance from the equator increases
degree-days. Consequently, building energy increases.
' CEC: Commission of European Communities. 1 990. Passive solar energy as afuel - 1990-2010.Executive Summary, Commission of European Communities, DGXII, pp. 29.
^ The studies by Givoni were mainly conducted in Tel Aviv, Israel and Los Angeles, California and werewidely used for comparison in this dissertation.
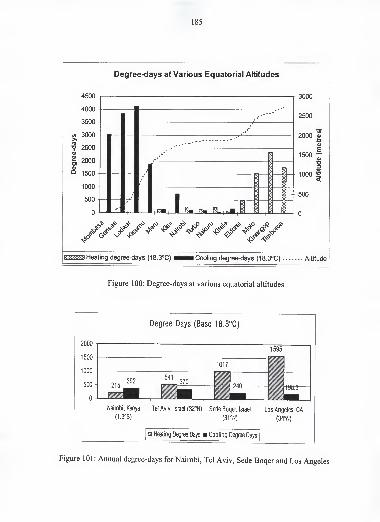
185
Degree-days at Various Equatorial Altitudes
4500
4000
3500
(0 3000
? 2500
£ 2000
Q 1500
1000
500
01
3000
2500
2000 2
ii>f>f>fMf>> Heating degree-days (18.3°C) I Cooling degree-days (18.3°C) Altitude
Figure 100: Degree-days at various equatorial altitudes
Degree Days (Base 18.3°C)
2000
1500
1000
500
1595
1017
.^r 392 ^370 -246 m3
—
Nairobi, Kenya Tel Aviv, Israel (32°N) Sede Boqer, Israel Los Angeles, CA
(1-3°S) (3rN) (34°N)
Heating Degree Days Cooling Degree Days
Figure 101:Annual degree-days for Nairobi, Tel Aviv, Sede Boqer and Los Angeles
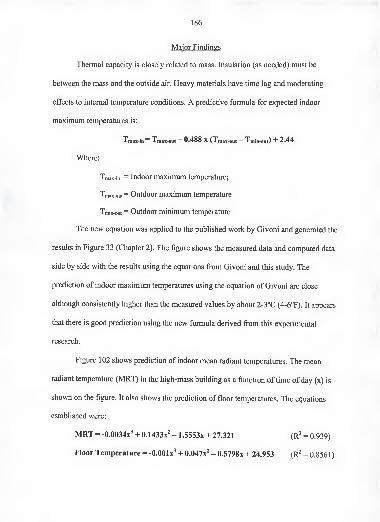
186
Major Findings
Thermal capacity is closely related to mass. Insulation (as needed) must be
between the mass and the outside air. Heavy materials have time lag and moderating
effects to internal temperature conditions. A predictive formula for expected indoor
maximum temperatures is:
T|n«x-in ~ Tmax^ut ~ 0.488 X (Tmax-out ~ Tmin^ut) 2.44
Where:
Tmax-in = Indoor maximum temperature;
Tmax-out = Outdoor maximum temperature
Tmin-out = Outdoor minimum temperature
The new equation was applied to the published work by Givoni and generated the
results in Figure 33 (Chapter 2). The figure shows the measured data and computed data
side by side with the results using the equations from Givoni and this study. The
prediction of indoor maximum temperatures using the equation of Givoni are close
although consistently higher than the measured values by about 2-3°C (4-6°F). It appears
that there is good prediction using the new formula derived from this experimental
research.
Figure 102 shows prediction of indoor mean radiant temperatures. The mean
radiant temperature (MRT) in the high-mass building as a function of time of day (x) is
shown on the figure. It also shows the prediction of floor temperatures. The equations
established were:
MRT = -0.0034x^ + 0.1433x^ - 1.5553x + 27.321 (R^ = 0.939)
Floor Temperature = -O.OOlx^ + 0.047x^ - 0.5798x + 24.953 (R^ = 0.8561)
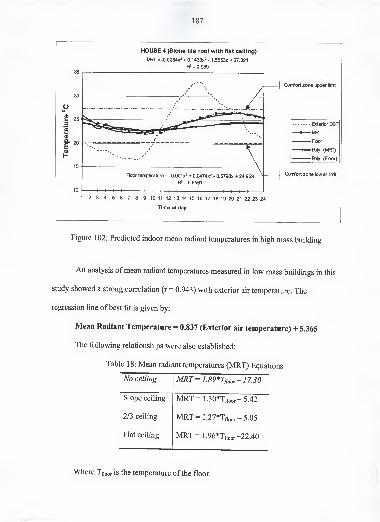
187
HOUSE 4 (Stone tile roof with flat ceiling)
MRT = -0.0034x3 + 0.1433x2 - 1 .5553x + 27.321
FP = 0.939
Connfort zone upper fin*
Exterior DBT
IVRT
Floor
Roly. (MFfT)
Fbly. (Floor)
Comfort zone low er limit
1 2 3 4 5 6 7 8 9 10 11 12 13 14 15 16 17 18 19 20 21 22 23 24
Time of day
Figure 102: Predicted indoor mean radiant temperatures in high mass building
An analysis ofmean radiant temperatures measured in low mass buildings in this
study showed a strong correlation (r = 0.943) with exterior air temperature. The
regression line of best fit is given by:
Mean Radiant Temperature = 0.837 (Exterior air temperature) + 5.365
The following relationships were also established:
Table 18: Mean radiant temperatures (MRT) Equations
No ceiling MRT =1.89*Tfloor -17.30
Slope ceiling MRT =1.30*Tfloor -5.42
2/3 ceiling MRT =1.27*Tfloor -5.05
Flat ceiling MRT =1.96*Tnoor -22.40
30
oo
S3+^2a>a.
E0)
C 25 I ^
20
15
10
Floor temperature = -O.OOIx' + 0.0474x2 - 0.5798x + 24.953
R2 = 0.8561
Where Tfloor is the temperature of the floor.
188
The time lag for a 200mm thick heavy mass building material may be determined
by an equation revised from the version published by Bansal et ul. (1994, pp. 52) is;
/ ny^ cTime lag, ^ = 0.73 xsA— (Revised equation)
Where:
s = thickness of the wall (m)
k = thermal conductivity (W/m K)
p = density of material (kg/m3)
c = specific heat capacity of material (J/kg K)
2x^ , .,.
co = (s )24x3600
Future Research
There are a number of subjects that have arisen from this study that require further
experimental climate chamber studies and field research. The outline is stated here below.
Establish Thermal Comfort Standard
Thermal comfort needs further study. The parameters of conditions that most
people consider to be comfortable need to be established. Two stages of this work should
include climate chamber experiments and field studies in "normal" working environment.
A recent study^ presented an assessment method summarized in Figure 103 in which
preventive and diagnostic aspects of work proposed further study might proceed.
^ Ogoli, David Mwale. 2000. An assessment method for the performance of passive solar buildings atequatorial high altitudes in Architecture, City and Environment: Proceedings ofPLEA 2000, CambridgeUK (July 2000) by Koen Steemers and Simos Yannas (eds) pp. 827-828. James & James (SciencePublishers) Ltd.
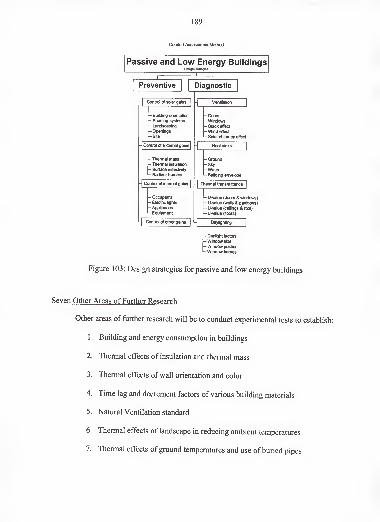
189
Comfort Assessment Metfiod
Passive and Low Energy BuildingsDesign Strategies
Preventive
- Control of solar gains
Diagnostic
- Building orientation
— Shading systems- Landscaping
— OpeningsLsite
Control of External gains
- Thermal mass- Thermal insulation
- Surface reflectivity
- Radiant barriers
Control of internal gains
Occupants- Electric lights
- Appliances
- Equipment
Control of other gains
Ventilation
Doors- WindowsStack effect
Wind effect
Solar chimney effect
Heat sinks
- Ground
-Sky- Water- Building envelope
- Thermal transmittance
- U-value (doors & windows)
U-value (walls & partitions)
• U-value (ceilings & roof)
• U-value (Hoors)
Daylighting
- Daylight factors
Window size
• Window postion
• Window frames
Figure 103: Design strategies for passive and low energy buildings
Seven Other Areas of Further Research
Other areas of further research will be to conduct experimental tests to establish:
1 . Building and energy consumption in buildings
2. Thermal effects of insulation and thermal mass
3. Thermal effects of wall orientation and color
4. Time lag and decrement factors of various building materials
5. Natural Ventilation standard
6. Thermal effects of landscape in reducing ambient temperatures
7. Thermal effects ofground temperatures and use of buried pipes

APPENDIX AAPPENDIX A: DEFINITION OF TERMS
The term thermal mass is commonly used to signify the ability of materials to
store significant amounts of thermal energy and delay heat transfer through a building
component. This delay leads to a slower response time that tends to moderate indoor
temperature fluctuations under outdoor temperature swings. Thermal mass can be used to
move off-peak energy demand. High thermal mass materials have high densities such as
natural stone (1500 kg/m3) and concrete (2240 kg/m3).
Passive cooling, heating and lighting systems are design methods that save
energy by inexpensively putting the energy-control function in the building itself through
active and passive systems. A passive solar building is one that integrates with the local
climate. It uses natural ventilation, natural daylighting, solar heat gains, appropriate
thermal mass, shading, windows (size, shape, location, framing, glazing type), building
orientation, insulation, and slab-on-grade foundation. Passive solar systems require little,
if any, nonrenewable energy to make them function.
Thermal comfort is that condition of mind that expresses satisfaction with the
thermal environment (ASHRAE 1997, pp. 8.1). Comfort is not a physiological condition
but a state ofmind (Fontain, et al. 1996, pp. 179-182). Thermal comfort has been defined
operationally as the range of climatic conditions considered comfortable and acceptable
inside buildings (Givoni, 1998b, pp. 3). Comfort is a state of well-being or relief or a
measure ofhuman acceptability of the physical environment (UN, 1991, pp. 16).
190
191
Temperature is a measure of hotness or coldness. Ambient temperature is the
temperature of the air surrounding the occupant and mean radiant temperature the
temperature of an imaginary isothermal black enclosure in which an occupant would
exchange the same amount of heat radiation as in the actual non-uniform environment.
In the article Understanding what humidity does and why, Elovitz' provides
several definitions for different measures of humidity. They are adapted and adopted for
this study:
Relative humidity is the ratio of the amount of water vapor in the air to
the amount of water vapor air can hold at that temperature. At 100%relative humidity, the dry bulb, wet bulb and dew point temperature are
equal. At 100% relative humidity, the air is saturated, which means it
cannot hold any more moisture.
Specific humidity is the amount of moisture in the air per unit mass.
Specific humidity is proportional to the enthalpy or total energy content ofthe moist air mixture.
Dew point is the temperature where moisture begins to condense out ofthe air. When air is cooled to its dew point, it reaches 100% relative
humidity or saturation.
Vapor pressure is the pressure exerted by free molecules at the surface ofa solid or liquid. For a given substance, vapor pressure is a function of
temperature.
Raising the temperature without changing the amount of moisture in the air
reduces the relative humidity. The relative humidity goes down because warmer air can
hold more moisture than cold air. Specific humidity changes when moisture is added or
removed. Changing temperature does not change specific humidity unless the air is
cooled below the dew point. Cooling the air any fiirther causes the water vapor in the air
to change to the liquid phase. Liquid water molecules accumulate, droplets form, and
' Elovitz, Kenneth M. 1999. Understanding what humidity does and whv . ASHRAE Journal Aoril 199984-90.
192
moisture condenses out of the air. As temperature increases, vapor pressure increases.
Vapor pressure is a measure of the affinity of a substance for itself If a substance has low
affinity for itself, it evaporates readily even at low temperature. The substance will have a
high vapor pressure.
Equatorial regions are tropical areas between latitude 10° N and 10° S. High
altitude areas are considered places that are above 915m (3000 feet) above sea level.^
These regions are generally categorized with high solar angles and usually experience a
two-season annual climatic cycle.
Energy is the capacity to do work. The use of concentrated energy (fuels), rather
than muscle power, is an important determining factor in industrial development. The
supply and use of energy has implications on many other human activities. Efficiency
increases the positive effect of energy. The following definitions are noteworthy:
Energy efficiency is the capacity to produce results with a minimumexpenditure of energy inputs. Waste energy is any energy in a system that
is not directly serving the system's functions. A system is thought of as
energy-efficient if its requirements are low in relation to the results
produced, and if energy is not wasted.^
Energy-efficient design embraces the design and building process, the
building as it is to be used, and the building as it is actually used. Energyefficient design therefore prioritizes energy efficiency for human factors,
the environment, economics, architecture, building elements, solar
applications and monitoring."
The Table below gives some of the parameters that describe thermal mass effects.
^ Ojany, F. F. and R. B. Ogendo. 1985. Kenya: A study ofphysical and human geography. Nairobi:Longman Kenya Limited pp. 38.
' ECE: Economic Commission for Europe, Geneva. 1991. Energy efficient design: a guide to energyefficiency and solar applications in building design. ECE Energy series No. 9. New York: United Nationsp6. This document was written as a United Nations Development Programme (UNDP) project. The purposewas to enhance the professional skills of practicing architects, engineers and town planners to designefficient buildings which reduce energy consumption and make greater use of passive solar heating andnatural cooling techniques, pp. 6.
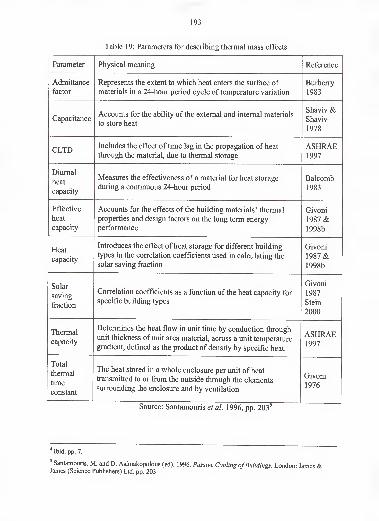
193
Table 19: Parameters for describing thermal mass effects
Parameter Physical meaning Reference
Admittance
factor
Represents the extent to which heat enters the surface of
materials in a 24-hour period cycle of temperature variation
Burberry
1983
CapacitanceAccounts for the ability of the external and internal materials
to store heat
Shaviv &Shaviv
1978
CLTDIncludes the effect of time lag in the propagation of heat
through the material, due to thermal storage
ASHRAE1997
Diurnal
heat
capacity
Measures the effectiveness of a material for heat storage
during a continuous 24-hour period
Balcomb
1983
Effective
heat
capacity
Accounts for the effects of the building materials' thermal
properties and design factors on the long term energy
performance
Givoni
1987 &1998b
Heat
capacity
Introduces the effect of heat storage for different building
types in the correlation coefficients used in calculating the
solar saving fraction
Givoni
1987 &1998b
Solar
saving
fraction
Correlation coefficients as a function of the heat capacity for
speciiic Duuamg types
Givoni
1987
Stein
2000
Thermal
capacity
Determines the heat flow in unit time by conduction through
unit thickness of unit area material, across a unit temperature
graaient, aennea as the product oi density by specific heat.
ASHRAE1997
Total
thermal
time
constant
The heat stored in a whole enclosure per unit of heattransmitted to or from the outside through the elements
surrounding the enclosure and by ventilation
Givoni
1976
Source: Santamouris et al. 1996, pp. 203^
" Ibid. pp. 7.
' Santamouris, M. and D. Asimakopolous (ed). 1996. Passive Cooling ofBuildings. London: James &James (Science Publishers) Ltd. pp. 203
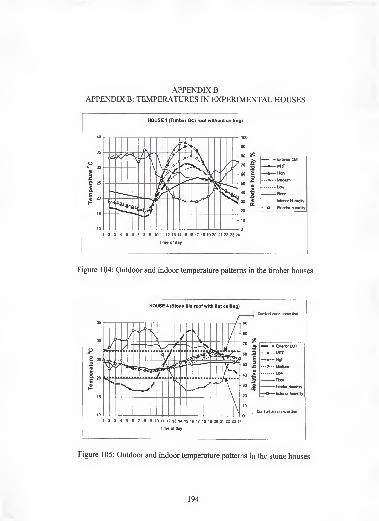
APPENDIX BAPPENDIX B: TEMPERATURES IN EXPERIMENTAL HOUSES
HOUSE 1 (Timber 6CI roof without ceiiing)
Figure 104: Outdoor and indoor temperature patterns in the timber houses
HOUSE 4 (Stone tiie roof with flat ceiiing)
1 2 3 4 5 6 7 8 9 10 11 12 13 14 15 16 17 18 19 20 21 22 23 24
Ttm0 of day
Figure 105: Outdoor and indoor temperature patterns in the stone houses
194
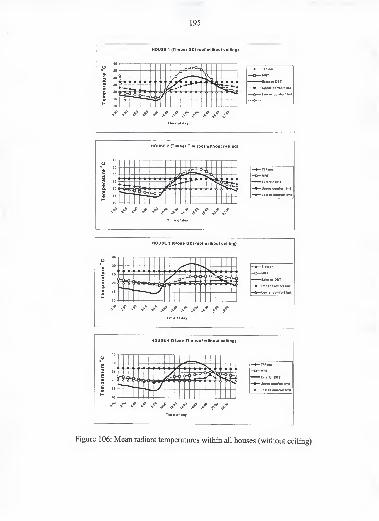
195
HOUSE 1 (TImbar OCI roof without calling)
O- V V «) * .0- A' >• .t^f s«
Tim • of day
-Tl Ftoof
-MRT
"Exleftor DBT
- Upper comfort 6r
- Low ar comfort i
aE
HOUSE 2 (Timber Tll« roof without celling)
t—
1
r-i
S^i' ^'^ ^S'"' K<P .SP^O' <V s*- K»' s*- a« *T- Ti,!.
Tim* of day
-Tl Floor
-MBT
Exteror DBT
- Uppor comfort limll
- Low or comfort Nmil
Oe
HOUSE 3 (Stan* GCI roof without colling)
jiP .oO o" .<?
s"" N*' ^*
Tim • of day
-Tl Floor
-MRT
•Ejclarlor DBT
-Upper comfort HmH
-Low or comfort HmH
3a
aE
HOUSE 4 (Ston* Til* roof without colling)
INN li
Tim a of day
-Tl Ftoor
-MRT
Exterior DBT
- Upper comforl hnX
- Low er comfort HmK
Figure 106: Mean radiant temperatures within all houses (without ceiling)
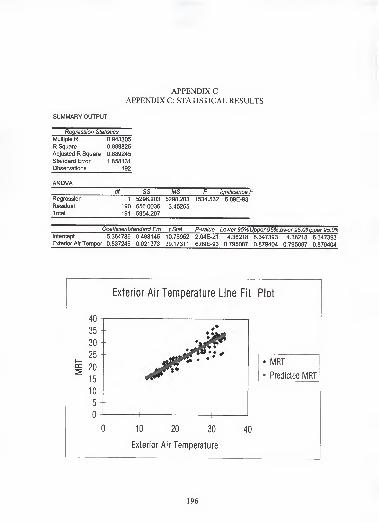
APPENDIX CAPPENDIX C: STATISTICAL RESULTS
SUMMARY OUTPUT
Regression Statistics
Multiple R 0.943305
R Square 0.889825
Adjusted R Square 0.889245
Standard Error 1.858131
Observations 192
ANOVAdf SS MS F ignificance 1
Regression 1 5298.203 5298.203 1534.532 6.09E-93
Residual 190 656.0036 3.45265
Total 191 5954.207
Coefficients'andard Ern tStat P-value Lower 95% Upper 95% ower 95.0°/lpper 95.0°/,
Intercept 5.364786 0.498145
Exterior Air Temper 0.837246 0.021373
10.76952
39.17311
2.04E-21
6.09E-93
4.38218 6.347393
0.795087 0.879404
4.38218 6.347393
0.795087 0.879404
Exterior Air Temperature Line Fit Plot
40
0 10 20 30 40
Exterior Air Temperature
196
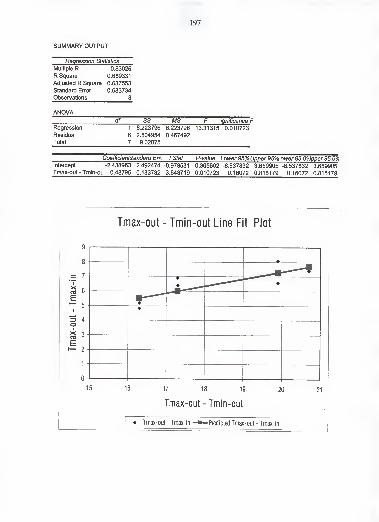
197
SUMMARY OUTPUT
Regression Statistics
Multiple R 0.83026
R Square 0.689331
Adjusted R Square 0.637553
Standard Error 0.683734
Observations 8
ANOVAdf SS MS F ignificance 1
Regression 1 6.223796 6.223796 13.31315 0.010723
Residual 6 2.804954 0.467492
Total 7 9.02875
Coefficients'andard Ern t Stat P-value Lower 95% Upper 95% ower 95. 0°/lpper 95. O'a
Intercept -2.438963 2.492474 -0.978531 0.365602 -8.537832 3.659905 -8.537832 3,659905Tmax-out - Tmin-oi 0.48795 0.133732 3.648719 0.010723 0.16072 0.815179 0.16072 0.815179
9 -
Tmax-out - Tmin-out Line Fit Plot
8 -
.E 7-
><fi
E5
A -r
c10-X
EI- 2 -
1 -
0 -
1 5 16 17 18 1
Tmax-out - Tmin-out
9 20 21
Tmax-out - Tmax-in -•— Predicted Tmax-out - Tmax-in
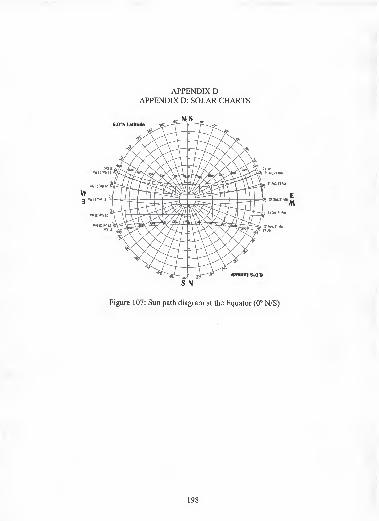
APPENDIX DAPPENDIX D: SOLAR CHARTS
S N
Figure 107: Sun path diagram at the Equator (0° N/S)
198
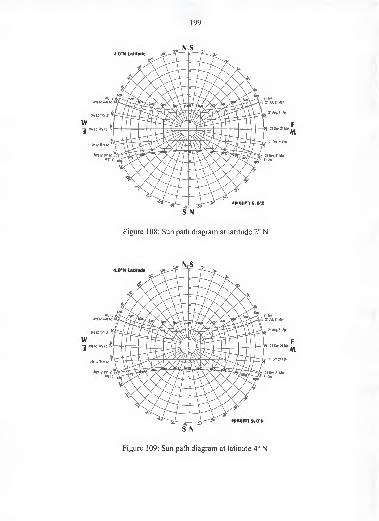
199
S N
Figure 108: Sun path diagram at latitude 2° N
S N
Figure 109: Sun path diagram at latitude 4° N
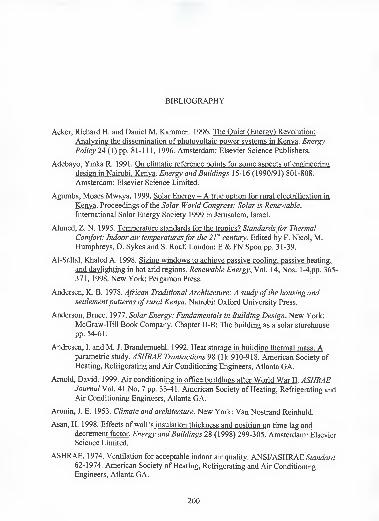
BIBLIOGRAPHY
Acker, Richard H. and Daniel M. Kammen. 1996. The Quiet (Energy) Revolution:
Analyzing the dissemination of photovoltaic power systems in Kenya . Energy
Policy 24 (1) pp. 81-1 1 1, 1996. Amsterdam: Elsevier Science Publishers.
Adebayo, Yinka R. 1991. On climatic reference points for some aspects of engineering
design in Nairobi. Kenya . Energy and Buildings 15-16 (1990/91) 801-808.
Amsterdam: Elsevier Science Limited.
Agumba, Moses Mwaya. 1999. Solar Energy - A true option for rural electrification in
Kenya.Proceedings of the Solar World Congress: Solar is Renewable.
International Solar Energy Society 1999 in Jerusalem, Israel.
Ahmed, Z. N. 1995. Temperature standards for the tropics? Standardsfor Thermal
Comfort: Indoor air temperaturesfor the 21^' century. Edited by F. Nicol, M.Humphreys, O. Sykes and S. Roaf London: E & FN Spon pp. 31-39.
Al-Sallal, Khaled A. 1998. Sizing windows to achieve passive cooling, passive heating,
and daylighting in hot arid regions . Renewable Energy, Vol. 14, Nos. l-4,pp. 365-
371, 1998. New York: Pergamon Press.
Andersen, K. B. 1978. African Traditional Architecture: A study ofthe housing andsettlement patterns ofrural Kenya. Nairobi: Oxford University Press.
Anderson, Bruce. 1977. Solar Energy: Fundamentals in Building Design. New York:
McGraw-Hill Book Company. Chapter II-B: The building as a solar storehouse
pp. 54-61.
Andresen, I. and M. J. Brandemuehl. 1992. Heat storage in building thermal mass: Aparametric study . ASHRAE Transactions 98 (1): 910-918. American Society of
Heating, Refrigerating and Air Conditioning Engineers, Atlanta GA.
Arnold, David. 1999. Air conditioning in office buildings after World War II . ASHRAEJournal Vol. 41 No. 7 pp. 33-41. American Society of Heating, Refrigerating andAir Conditioning Engineers, Atlanta GA.
Aronin, J. E. 1953. Climate and architecture. New York: Van Nostrand Reinhold.
Asan, H. 1998. Effects of wall's insulation thickness and position on time lag anddecrement factor . Energy and Buildings 28 (1998) 299-305. Amsterdam: Elsevier
Science Limited.
ASHRAE. 1974. Ventilation for acceptable indoor air quality. ANSI/ASHRAE Standard62-1974. American Society of Heating, Refrigerating and Air Conditioning
Engineers, Atlanta GA.
200
201
ASHRAE. 1981. Handbook ofFundamentals. American Society of Heating,
Refrigerating and Air Conditioning Engineers, Atlanta GA.
ASHRAE. 1989a. Energy-efficient design ofnew buildings except low-rise residential
buildings. ASHRAE/IESNA Standard 90. \-\9%9. American Society of Heating,
Refrigerating and Air Conditioning Engineers, Atlanta GA.
ASHRAE. 1989b. Ventilation for acceptable indoor air quality. ANSI/ASHRAEStandard 62-1989. American Society of Heating, Refrigerating and Air
Conditioning Engineers, Atlanta GA.
ASHRAE. 1990. Energy position statement (June). American Society of Heating
Refrigerating, and Air-conditioning Engineers Inc. (ASHRAE), Atlanta, GA.
ASHRAE. 1992. Thermal environmental conditions for human occupancy.
ANSI/ASHRAE Standard 55-1992. American Society of Heating, Refrigerating
and Air Conditioning Engineers, Atlanta GA.
ASHRAE. 1993. Energy-efficient design ofnew low-rise residential buildings.
ASHRAE/IESNA Standard 90.2-1993. American Society of Heating,
Refrigerating and Air Conditioning Engineers, Atlanta GA.
ASHRAE. 1994. Addendum 55a. ANSI/ASHRAE Standard 55-1992. American Society
of Heating, Refrigerating and Air Conditioning Engineers, Atlanta GA.
ASHRAE. 1996. Handbook ofHVAC Systems and Equipment (SI Edition). American
Society of Heating, Refrigerating and Air Conditioning Engineers, Atlanta GA.
ASHRAE. 1997. Handbook ofFundamentals (SI Edition). American Society of Heating,
Refrigerating and Air Conditioning Engineers, Atlanta GA.
ASHRAE. 1998. Handbook ofRefrigeration (IP Edition). American Society of Heating,
Refrigerating and Air Conditioning Engineers, Atlanta GA.
ASHRAE. 1999a. Handbook ofHVAC Applications (SI Edition). American Society of
Heating, Refrigerating and Air Conditioning Engineers, Atlanta GA.
ASHRAE. 1999b. Ventilation for acceptable indoor air quality. ANSI/ASHRAEStandard 62-1999. American Society of Heating, Refrigerating and Air
Conditioning Engineers, Atlanta GA.
ASHRAE. 2000. Handbook ofHVAC Systems and Equipment (IP Edition). AmericanSociety of Heating, Refrigerating and Air Conditioning Engineers, Atlanta GA.
Athienitis, A. K. and Y. Chen. 2000. The effect of solar radiation on dynamic thermal
performance of floor heating systems in Solar Energy Vol. 69, No. 3, pp. 229-
237, 2000. Amsterdam: Elsevier Science Limited.
Athienitis, Andreas K. 1988. A predictive control algorithm for massive buildings .
ASHRAE Transactions, Vol. 94, No. 2, pp. 1050-1067. American Society ofHeating, Refrigerating and Air Conditioning Engineers, Atlanta GA.
Athienitis, Andreas K. 1997. Investigation of thermal performance of a passive solar
building with floor radiant heating . Solar Energy Vol. 61, No. 6, pp. 337-3451997. Amsterdam: Elsevier Science Limited.

202
Auliciems, A.and Richard de Dear. 1978. Air conditioning in Australia. I. Human thermal
factors . Architectural Science Review, 29 (1978) 67-75.
Ayisi, Eric. 1979. An Introduction to the Study ofAfrican Culture. London: Heinemaim.
Baechler, M. C, D. L. Hadley, T. J. Marseille, R. D. Stenner. 1991. Sick Building
Syndrome: Sources, Health Effects, Mitigation. New Jersey: Noyes Data
Corporation. - -
Baker, N. V. 1987. Passive and Low Energy Designfor Tropical Island Climates.
London: The Commonwealth Secretariat.
Baker, N. V. 2000. We are all outdoor animals in Architecture, City and Environment:
Proceedings ofPLEA 2000, Cambridge, UK (July 2000) by Koen Steemers and
Simos Yannas (eds) pp. 553-555. James & James (Science Publishers) Ltd.
Baker, Nick and Mark Standeven. 1993. Comfort Criteria for Passively Cooled Buildings
- A PASCOOL Task . Proceedings ofthe Conference on Solar Energy
Architecture and Planning, Florence. The Martin Center for Architectural and
Urban Studies, Department of Architecture, University of Cambridge, U.K.
Baker, Nick and Mark Standeven. 1995. A behavioral approach to thermal comfort
assessment in naturallv ventilated buildings. Proceedings to CIBSE National
Conference, Eastbourne, pp. 76-S4.
Baker, Nick and Mark Standeven. 1996. Thermal Comfort in Free-Running Buildings .
Energy and Buildings, 23 (1996) 175-182. Amsterdam: Elsevier Science Limited.
Baker, Nick. 1992. Low energy strategies for non-domestic buildings . Roaf, Susan and
Mary Hancock (ed). 1992. Energy-efficient building. New York: John Wiley &Sons pp. 246-259.
Baker, Nick. 1996. The irritant occupant: recent developments in thermal comfort theory .
Architectural Research Quarterly, 2 (2) 84-90.
Balaras, C.A. 1996. The role of thermal mass on the cooling load of buildings. Anoverview of computational methods . Energy and Buildings, 24 (1996) 1-10,
Amsterdam: Elsevier Science Limited.
Balcomb, J. Douglas, Adrianne Curtner, Inger Andresen and Anne Crete Hestnes. 2000.
Multi-criteria decision-making process for buildings in Architecture, City andEnvironment: Proceedings ofPLEA 2000, Cambridge, UK (July 2000) by KoenSteemers and Simos Yannas (eds) pp. 719-724. James & James (Science
Publishers) Ltd.
Balcomb, J. Douglas. 1983. Heat storage and distribution inside passive solar buildings.
Los Alamos National Laboratory, New Mexico Report LA-9694-MS, available
from the National Technical Information Service, 5285 Port Royal Road,Springfield, VA 22161, USA.
Balcomb, J. Douglas. 1984. Passive Solar Design Handbook. New York: Van NostrandReinhold.
203
Balcomb, J. Douglas. 1992. Passive solar building research in Advances in Solar Energy:
An Annual Review ofResearch and Development, by Karl W. Boer (ed) Vol. 7
1992, pp. 239-282. Boulder, Colorado: American Solar Energy Society, Inc.
Balcomb, J. Douglas. 1996. Designing low-energy buildings: Passive solar strategies and
Energy-]0 Software. Developed in collaboration with Passive Solar Industries
Council, National Renewable Energy Laboratory, Lawrence Berkeley National
Laboratory and US Department of Energy (DOE).
Banham, Reyner. 1969. The Architecture ofthe Well-Tempered Environment. Chicago,
IL: The University of Chicago Press.
Bansal, N. K., Gerd Hauser, Gemot Minke. 1994. Passive Building Design: A Handbook
ofClimatic Control. Amsterdam: Elsevier Science Limited.
Bamhart, C. L. and Jess Stein (Eds). 1958. The American College Dictionary. New York:
Random House, Inc.
Bedford, T. 1964. Basic Principles of Ventilation and Heating. London: Lewis.
Benton, C. C. 1989. The Lockheed Building 157 MoniProiect. Phase II: The lighting
Control System - Final Report. Windows and Daylighting Group, Lawrence
Berkeley Laboratory, University of California. Berkeley: Lawrence Berkeley
National Laboratory.
Bergland, Larry G. 1998. Comfort and Humiditv in ASHRAE Journal August 1998 pp.
35-41. American Society of Heating, Refrigerating and Air Conditioning
Engineers, Atlanta GA.
Berg-Munch, B., G. H. Clausen and P. O. Fanger. 1986. Ventilation requirements for the
control of body odor in spaces occupied by women . Environ. Int. 12:195-200.
Berkovski, Boris. 1998. The involvement ofUNESCO to stimulate solar conversion in
Advances in Solar Energy: An Annual Review ofResearch and Development, by
Karl W. Boer (ed) Vol. 12 1998, pp. 1-66. Boulder, Colorado: American Solar
Energy Society, Inc.
Bowen, A. and Wagner. 1982. Passive Low Energy Alternatives. New York: PergamonPress.
Boyer, Ernest L. 1987. College: The Undergraduate Experience in America. New York:
Harper & Row.
Boyer, Ernest L. 1990. Scholarship Reconsidered: Prioritiesfor the Professoriate. ASpecial Report for The Carnegie Foundation for the Advancement of Teaching, 5
Ivy Lane, Princeton, New Jersey 08540.
Bradshaw, Vaughn. 1993. Building Control Systems. New York: John Wiley & Sons, Inc.
Brager, Gail S. and Richard J. de Dear. 1998. Thermal adaptation in the built
environment: a literature review . Energy and Buildings 27 (1998) 83-96.
Amsterdam: Elsevier Science Limited.
204
Brandemuehl, M. J., J. L. Lepore, and J. F. Kreider. 1990. Modeling and testing the
interacton of conditioned air with thermal mass . ASHRAE Transactions 96 (2):
871-75.
Braun, J. E. 1990. Reducing energy costs and peak electrical demand through optimal
control of building thermal storage . ASHRAE Transactions 96 (2): 876-888.
American Society of Heating, Refrigerating and Air Conditioning Engineers,
Atlanta GA.
Brown G. Z. 1985. Sun, Wind and Light: Architectural Design Strategies. New York:
John Wiley & Sons.
Brown, M. 1990. Optimization of thermal mass in commercial building applications.
ASME Journal ofSolar Energy Engineering, 1 12 (1990) 273-279.
BSI: British Standards Institution. 1991. 555925.- Code ofpracticefor ventilation
principles and designingfor natural ventilation. London: British Standards
Institution.
Building Science UC Berkeley. 2000. ASHRAE Investigation ofThermal Comfort at
High Humidities (Researchers: Edward Arens, Fred Bauman and Charles
Huizenga) www-archfp.ced.Berkeley.edu/bldsci/research/thermalcomfhtm .
Bunn, R. 1993. Fanger: Face to face . Building Services, June, 25-27.
Burberry, P. 1983. Practical Thermal Design in Buildings, London: Batsford Academicand Educational Ltd.
Burch, D., S. Malcolm and K. Davis. 1984. The effect of wall mass on the summer space
cooling of six test buildings . ASHRAE Transactions, Vol. 90, No. 2B, pp. 5-21.
American Society of Heating, Refrigerating and Air Conditioning Engineers,
Atlanta GA.
Burch, D., W. Johns, T. Jacobsen, G. Walton, and C. Reeve. 1984. The effect of thermal
mass on night temperature setback savings . ASHRAE Transactions, Vol. 90, No.2A, pp. 184-206. American Society of Heating, Refrigerating and Air
Conditioning Engineers, Atlanta GA.
Busch, John F. 1992. A tale of two populations: thermal comfort in air-conditioned andnaturally ventilated offices in Thailand . Energy and Buildings 18 (1992) 235-249.
Amsterdam: Elsevier Science Limited.
Busch, John F. 1995. Thermal comfort in Thai air conditioned and naturallv ventilated
offices . Standardsfor Thermal Comfort: Indoor air temperaturesfor the 2f'century. Edited by F. Nicol, M. Humphreys, O. Sykes and S. Roaf. London: E &FNSponpp. 114-121.
Cain, W. S., et al. 1983. Ventilation requirements in buildings - 1. Control of occupancyodor and tobacco smoke odor . Atmospheric Environment 17 (6): 1 183-1 197.
Amsterdam: Elsevier Science Limited.
Canada Public Works. 1987. Derivation ofthe tenant questionnaire survey assessmentmethod: office building occupant survey data analysis and User manual: tenant
205
questionnaire survey. Public Works Canada, Sir Charles Tupper Building,
Riverside Drive, Ottawa, Ontario KIA 0M2, Canada.
Cavanaugh, William J. and Joseph A. Wilkes (eds.). 1999. Architectural Acoustics:
Principles and Practice. New York: John Wiley & Sons, Inc.
CEC: Commission of European Communities. 1990. Passive solar energy as afuel -
1990-2010. Executive Summary, Commission of European Communities, DGXII.
Chandra, S., P. W. Fairey, and M. M. Houston. 1986. Cooling with Ventilation. Solar
Energy Research Institute (SERI), Golden, Colorado. SERI/SP-273-2966,
DE860 1 070 1 . Cape Canaveral, FL: Florida Solar Energy Center (FSEC).
CIBSE: Chartered Institution of Building Services Engineers. 1997. Natural ventilation in
non-domestic buildings in Applications Manual AMID. London: Chartered
Institution of Building Services Engineers.
CIBSE: Chartered Institution of Building Services Engineers. 1998. Energy Efficiency in
Buildings: CIBSE Guide, pp. 1-1. London: Chartered Institution of Building
Services Engineers.
Clarke, J. 1985. Energy simulation in Building Design. Bristol, UK: Adam Hilger.
Coad, William. 2000. Energv conservation is an ethic in ASHRAE Journal Vol. 42 No. 7,
pp. 16-21. American Society of Heating, Refrigerating and Air Conditioning
Engineers, Atlanta GA.
Conlin, Michelle. 2000. Is your office killing you? The dangers of sick buildings in
Business Week June 5, 2000 pp. 1 14 - 128. New York: McGraw-Hill Companies.
www.businessweek.com .
Jeffrey. 1990. The State of passive cooling research in Passive Cooling, Jeffrey
Cook (ed.) Chapter 7, pp. 539-569. Cambridge, Massachusetts: MIT Press.
Jeffrey. 2000. Evolution ofAmerican office architecture to 1950: Pollution vs.
passive strategies to design the work environment in Architecture, City andEnvironment: Proceedings ofPLEA 2000, Cambridge, UK (July 2000) by KoenSteemers and Simos Yannas (eds) pp. 16-21. James & James (Science Publishers)
Ltd.
Crane, K. and S. O'Connell. 1983. The distribution and implications of heat flow fromthe Gregory rift in Kenya in Tectonophysics, 94, pp. 253-275.
De Assis, Eleonora Sad and Anesia Barros Frota. 1999. Urban bioclimatic design
strategies for a tropical citv . Atmospheric Environment 33 (1999) 4135-4142.Amsterdam: Elsevier Science Limited.
De Dear, R. and Brager, G. S. 1998. Developing an adaptive model of thermal comfortand preference . ASHRAE Transactions 104 (1). American Society of Heating,Refrigerating and Air Conditioning Engineers, Atlanta GA.
De Dear, R. W. 1993. Afield study ofoccupant comfort and office thermal environmentsin a hot humid climate. ASHRAE RP-702 November 1993. American Society ofHeating, Refrigerating and Air Conditioning Engineers, Atlanta GA.
206
De Dear, R., K. Leow, and A. Ameen. 1991a. Thermal comfort in the humid tropics
Part I: Climate Chamber experiments on thermal acceptability in Singapore
ASHRAE Transactions 97 (1): 874-879. American Society of Heating,
Refrigerating and Air Conditioning Engineers, Atlanta GA.
De Dear, R., K. Leow, and A. Ameen. 1991b. Thermal comfort in the humid tropics -
Part II: Climate Chamber experiments on thermal acceptability in Singapore
ASHRAE Transactions 97 (1): 880-886. American Society of Heating,
Refrigerating and Air Conditioning Engineers, Atlanta GA.
De Dear, Richard J. 1995. Thermal comfort in air conditioned office buildings in the
tropics . Standardsfor Thermal Comfort: Indoor air temperaturesfor the 21^'
century. Edited by F. Nicol, M. Humphreys, O. Sykes and S. Roaf. London: E &FNSponpp. 122-136.
Dermison, Peter, J. 1994. An Examination and Analysis of Sick Building Syndrome in
Selected Libraries of Great Britain. Master's Thesis at Loughborough University,
UK. http://info.lut.ac.uk/departments/dils/te)/dennison.htm
Denyer S. 1978. Traditional Architecture in Africa. Lagos: Oxford University Press.
Drysdale, J. 194S. Technical Study No. 27, Comm. Exp. Bldg. Station, Australia. Cited byGivoni, 1976, pp. 141.
Drysdale, J. 1961 . Cooling the home . Symposium on the Functional Effect ofBuildings,Indian Concrete News, CBRI, Roorkee, India, Nov. 1961, pp. 33-37. Cited byGivoni, 1976, pp. 141.
DuBois, C. G.B. 1970. Minerals of Kenya . Geological Survey Kenya Bulletin 1 1, pp. 66.
Nairobi: Government Printers.
Duffm, R. J. 1984. A passive wall design to minimize building temperature swings . Solar
Energy 33 (3/4) (1984) 319-326. New York: Pergamon Press.
Dung, N. H. 1995. Discussions ofhuman thermal comfort in Vietnam . StandardsforThermal Comfort: Indoor air temperaturesfor the 21" century. Edited by F.
Nicol, M. Humphreys, O. Sykes and S. Roaf London: E & FN Spon pp. 143-148.
Dwivedi, Maneesh. 1997. Thermal comfort study of a heavy mass residence in Arizona.
Master of Science Thesis at Arizona State University.
ECE: Economic Commission for Europe, Geneva. 1991. Energy efficient design: a guideto energy efficiency and solar applications in building design. ECE Energy series
No. 9. New York: United Nations.
Echikson, William. 2000. Why the air and light are so much better in Paris in Business
Week June 5, 2000 pp. 124. New York: McGraw-Hill Companies.www.businessweek.com .
Egan, M. David. 1988. Architectural Acoustics. New York: McGraw-Hill, Inc.
Einstein, Albert. 1947. Out ofMy Earlier Years. London: Oxford University Press.
Elovitz, Kenneth M. 1999. Understanding what humidity does and why . ASHRAEJournal April 1999, pp. S4-90.
207
Environmental Analytics (Berkeley, CA). 1998. Thermal Comfortprogram for The
American Society of Heating, Refrigeration, and Air-Conditioning Engineers.
EPA (Environmental Protection Agency). 1990. Fact Sheet. 402-F-94-003. Ventilation
and Air Quality in Offices, http://www.epa.gov/iaq/pubs/ventilat.html .
EPA (Environmental Protection Agency). 1991 . Indoor Air Facts No. 4 (Revised). Sick
building syndrome, (http://www.epa.gov/iaq/sbs.html) .
Etzion, Y., D. Pearlmutter, E. Erell, I. A. Meir. Adaptive architecture: integrating low-
energy technologies for climate control in the desert . Automation in construction
6 (1997) 417-425. Amsterdam: Elsevier Science Limited.
Evans, B. 1989. Letting fresh air back into buildings found m Architecture, 73 (3),
March, pp. 72-77.
Evans, W. S. 1998. Ice storage cooling for campus expansion . ASHRAE Journal, Vol. 40
No. 4 pp. 66-68. American Society of Heating, Refrigerating and Air
Conditioning Engineers, Atlanta GA.
Fairey, Philip. 1984. Designing and Installing Radiant Barrier Systems. FSEC-DN-7-84.
Florida Solar Energy Center, Cape Canaveral, FL.
Fanger, P. O. 1967. Calculation of thermal comfort: introduction of a basic comfort
equation . ASHRAE Transactions 73 (2): III.4.1. American Society of Heating,
Refrigerating and Air Conditioning Engineers, Atlanta GA.
Fanger, P. O. 1970. Thermal Comfort: Analysis and Applications in Environmental
Engineering. New York: McGraw-Hill Book Company.
Fanger, P. O. 1972a. Thermal Comfort. New York: McGraw-Hill Book Company.
Fanger, P. O. 1972b. Biometeorology 2 (1972) 31-41.
Fanger, P. O. and B. Berg-Munch. 1983. Ventilation and body odor . Proceedings ofan
Engineering Foundation Conference on Management ofAtmospheres in Tightly
Enclosed Spaces, pp. 45-50. American Society of Heating, Refrigerating and Air
Conditioning Engineers, Atlanta GA.
Fathy, Hassan. 1973. Architecturefor the poor: An experiment in rural Egypt. Chicago:
University of Chicago press.
Fitch, James Marston with William Bobenhausen. 1999. American Building: The
Environmentalforces that shape it. New York: Oxford University Press.
Fjeld, T. et al. 1998. The effect of indoor foliage plants on the health and discomfort
symptoms among office workers . Indoor Built Environment 7, 1998. Cited byBaker, 2000, pp. 555.
Flavin, Christopher and Molly 0;Meara. 1998. Financing solar home systems in
developing countries: Examples ofnew market strategies in Advances in Solar
Energy: An Annual Review ofResearch and Development, by Karl W. Boer (ed)
Vol. 12 1998, pp. 123-148. Boulder, Colorado: American Solar Energy Society,
Inc.
208
Florida Solar Energy Center (FSEC). 1981. Manual entitled: Passive cooling and human
comfort FSEC-DN-5-81 by P. W. Fairey at Florida Solar Energy Center (FSEC)
Cape Canaveral, FL.
Florida Solar Energy Center (FSEC). 1984. Manual entitled: Designing and installing
radiant barrier systems FSEC-DN-7-84 by Philip Fairey at Florida Solar Energy
Center (FSEC) Cape Canaveral, FL.
Florida Solar Energy Center (FSEC). 1985. Manual entitled: Window treatmentfor
energy conservation FSEC-EN-4-80 by W. R. McCluney at Florida Solar Energy
Center (FSEC) Cape Canaveral, FL.
Florida Solar Energy Center (FSEC). 1986. Manual entitled: Dealing with heat and
humidity in Florida homes FSEC-EN- 14-86 by Robin Vieira at Florida Solar
Energy Center (FSEC) Cape Canaveral, FL.
Florida Solar Energy Center (FSEC). 1989. Manual entitled: Solar energy in Florida
FSEC-EN- 1-89 by Carolyn King Bums at Florida Solar Energy Center (FSEC)
Cape Canaveral, FL.
Florida Solar Energy Center (FSEC). 1992. Manual entitled: Energy-efficient Florida
Home Building FSEC-GP-33-88 by Veira, Robin K., Kenneth G. Sheinkopf and
Jeffrey K. Sonne at Florida Solar Energy Center (FSEC) Cape Canaveral, FL.
Ford, B. 1982. The evaluation of comfort in passive heated dw^ellings . Energy and
Buildings, 5 (1982): 97-102. Amsterdam: Elsevier Science Limited.
Fordham, M. 2000. Natural Ventilation . Renewable Energy 19 (2000) 17-37. Amsterdam:
Elsevier Science Limited.
Forwood, G. 1995. What is thermal comfort in a naturally ventilated building? Standards
for Thermal Comfort: Indoor air temperaturesfor the 2f' century. Edited by F.
Nicol, M. Humphreys, O. Sykes and S. Roaf London: E & FN Spon pp. 176-181.
Fountain, Marc, Gail S. Brager and Richard de Dear. 1996. Expectations of indoor
climate control . Energy an Buildings, 24 (1996) 179-182. Amsterdam: Elsevier
Science Limited.
Frank Lloyd Wright Foundation. 1958. The Natural House. Princeton University Press.
Gagge, A. P., J. Stolwijk and Y. Nishi. 1971. An effective temperature scale based on a
simple model ofhuman physiological regulatory response . ASHRAE Transactions
11 {\): 247-262. American Society of Heating, Refrigerating and Air
Conditioning Engineers, Atlanta GA.
Gale, George. 1992. Theory ofScience. New York: John Wiley & Sons.
Geros, V, M. Santamouris, A. Tsangrasoulis, G. Guarracino. 1999. Experimental
evaluation of night ventilation phenomena . Energy an Buildings, 29 (1999) 141-
154. Amsterdam: Elsevier Science Limited.
Givoni, B. and M. E. Hoffman. 1968. Effect of building materials on internal
temperature . Research Reportfor the Ministry ofHousing, Building Research
Station, Technion, Haifa, April 1968.
209
Givoni, Baruch and Leon Katz. 1985. Earth temperature and underground buildings .
Energy and Buildings, Vol. 8 pp. 15-25. Amsterdam: Elsevier Science Limited.
Givoni, Baruch and Mikiko Noguchi. 2000. Issues in outdoor comfort research in
Architecture, City and Environment: Proceedings ofPLEA 2000, Cambridge, UK(July 2000) by Koen Steemers and Simos Yannas (eds) pp. 562-564. James &James (Science Publishers) Ltd.
Givoni, Baruch. 1976. Man, Climate and Architecture. London: Applied Science
Publishers.
Givoni, Baruch. 1982. Passive indirect evaporative cooling by shaded roof ponds - a
mathematical model . Proceedings ofPassive and Low Energy Architecture
(PLEA) First International Conference, Bermuda, Pergamon, Oxford, 1982 pp.
13/1-13/7.
Givoni, Baruch. 1987. A generalized predictive model for direct gain . Passive Solar
Journal, Vol. 4 No. 1 pp. 5-24.
Givoni, Baruch. 1991. Performance and applicability of passive and low energy cooling
svstems . Energy and Buildings, 17 (1991) 177-199. Amsterdam: Elsevier Science
Limited.
Givoni, Baruch. 1992. Comfort, climate analysis and building design guidelines . Energy
and Buildings, 18 (1992) 1 1-23. Amsterdam: Elsevier Science Limited.
Givoni, Baruch. 1994. Passive and low energy cooling ofbuildings. New York: VanNostrand Reinhold.
Givoni, Baruch. 1998a. Effectiveness Of Mass And Night Ventilation In Lowering
Indoor Daytime Temperatures. Part I: 1993 experimental periods. Energy andBuildings 28 (1998) 25-32. Amsterdam: Elsevier Science Limited.
Givoni, Baruch. 1998b. Climate Considerations In BuildingAnd Urban Design. NewYork: Van Nostrand Reinhold.
Goodwin, S. and M. Catani. 1979. The effect of mass on heating and cooling loads and
on insulation requirements of buildings in different climates . ASHRAETransactions, 85 (1) 869-884. American Society of Heating, Refrigerating andAir Conditioning Engineers, Atlanta GA.
Gope, Gideon, Farhad Aghdasi and M. D. Dlamini. 1997. A review of the developmentof the photovoltaic industry and its development in Africa . Solar Energy, Vol. 59,
Nos. 4-6, pp. 217-225, 1997. New York: Pergamon (Elsevier Science Limited).
Goswami, D. Y, F. Kreith, J. F. Kreider. 2000. Principles ofSolar Engineering.
Philadelphia, PA: Taylor & Francis.
Goudzwaard, Bob and Harry de Lange. 1995. Beyond Poverty and Affluence: Toward anEconomy ofCare. WCC Publications 1211 Geneva 20, Switzerland and WilliamB. Eardmans Publishing Company, Grand Rapids, Michigan.
210
Goulding, J. R., J. Owen Lewis and T. C. Steemers (eds). 1992. Energy in Architecture,
The European Solar Handbook, Commission of the European Communities,
Brussels.
Grobler, L. J. and Vinod Singh. 1999. The green buildings for Africa programme .
Building Research & Information (1999), 27 (3), 183-193. London: E & F. Spon.
Guedes, Manuel Correia. 2000. Thermal Comfort and Passive Cooling in Southern
European Offices. Ph.D. Dissertation, University of Cambridge, UK. July 2000.
Gun, R. T. and G. M. Budd. 1995. Effects of thermal, personal and behavioral factors onthe physiological strain, thermal comfort and productivity of Australian shearers
in hot weather . Ergonomics; July 1995, v38, n7, pp. 1368 (17).
Haghighat, F. and M. Chandrashekar. 1987. System-theoretic models for buildine
thermal analysis . ASME Journal ofSolar Energy Engineering, Vol. 109, pp. 79-
88.
Hanel, A. 1999. The state of the art in building-integrated photovoltaics in EuropeanDirectory ofSustainable and Energy efficient building 1999: Components,
Services and Materials, by Owen Lewis and John Goulding (eds.) pp. 80-87.
London: James and James (Science Publishers).
Hankin, Mark 1987. Renewable Energy in Kenya. Creative Motives, Nairobi, Kenya.
Hankin, Mark. 1992. A profile of the Kenya solar electric industry in Regional Solar
Electric Training and Awareness Workshop by Muiruri J. Kimani (ed). Nairobi,
Kenya.
Hankin, Mark. 1994a. Photovoltaic Power to the People: The Kenya Case. Nairobi:
United Nations Development Programme (UNDP) and World Bank EnergySector Management Assistance Program.
Hankin, Mark. 1994b. Draft East and Southern Africa Wind and Solar Survey. Nairobi:
United Nations Industrial Development Organization.
Hankins, Mark. 2000. A case study on provision of photovoltaic systems in Kenya in
Energy and Development Report 2000: Energy Servicesfor the World's Poor bythe World Bank Group, pp. 92-99.
http://www.worldbank.org/html/fpd/esmap/energy report2000/chl 1 .pdf
Hastings, S. Robert. 1995. Myths in passive solar design. Solar Energy Vol. 55, No. 6,
pp. 445-45 1, 1995. Amsterdam: Elsevier Science Limited.
Hawkes, Dean and Janet Owers. 1982. The Architecture ofEnergy. London: LongmanGroup.
Hawkes, Dean. 2000. Sustainabilitv and architectural synthesis in Architecture. City andEnvironment: Proceedings ofPLEA 2000, Cambridge, UK (July 2000) by KoenSteemers and Simos Yannas (eds) pp. 3-9. James &. James (Science PubUshers)Ltd.
Heidigger, Martin. 1966. Discourse on Thinking. Translated by John M. Anderson and E.Hans Freund. New York: Harper & Row Publishers.
211
Heidigger, Martin. 1977. The Question Concerning Technology and Other Essays.
Translated by William Lovitt. New York: Harper & Row p285. The German text
appears in Martin Heidigger, Vortrage und Aufsatze (Pfullingen: Gunther NeskeVerlag, 1954), pi 3-44, and in the same publisher's "Opuscula" series under the
title, Die Technik und die Kehre (1962), pp. 5-36.
Heijs, Wim and Peter Stringer. 1988. Research on residential thermal comfort: Somecontributions from environmental psychology . Journal ofEnvironmental
Psychology (1988) 8, 235-247. New York: Academic Press Limited.
Heimistra, Norman W. and Leslie H. McFarling. 1974. Environmental Psychology.
Monterey, CA: Brooks/Cole Publishing Company.
Hersey, Goerge. 1988. The Lost Meaning in Classical Architecture: Speculations on
Ornamentfrom Vitruvius to Venturi. Cambridge, Massachusetts: The MIT Press.
Heschong, Lisa. 1979. Thermal Delight in Architecture. Cambridge, Massachusetts: TheMIT Press.
Hestnes, Anne Crete. 1999. "Building Integration of Solar Energy". Proceedings of the
Solar World Congress: Solar is Renewable. International Solar Energy Society
1999 in Jerusalem, Israel.
Hinrichs, Roger, A. 1996. Energy: Its use and the environment. New York: SaundersCollege Publishing.
Hopkins, V., G. Gross and D. Ellifritt. 1979. Comparing the thermal performances ofbuildings with high and low masses . ASHRAE Transactions, Vol. 85, No. 1, pp.885-902. American Society of Heating, Refrigerating and Air ConditioningEngineers, Atlanta GA.
Hopkinson, R. G. and J. Longmore. 1959. The Permanent supplementary artificial
lighting of interiors. Transactions ofthe Illuminating Engineering Society. 2 (No.
1): 17-27. New York: lESNA.
Howard, B. D. and D. H. Saunders. 1989. Building performance monitoring - TheThermal envelope perspective - Past, present and future . Thermal Performance ofthe Exterior Envelopes ofBuildings IV. American Society of Heating,Refrigerating and Air Conditioning Engineers, Atlanta GA.
Howard, B. D. and E. O. Pollock. 1982. Comparative report - Performance of passivesolar heating systems. Vitro Corp. US DOE National Solar Data Program. USTIC Box 62, Oak Ridge, TN 37829.
Humphreys, M. A. and J. Fergus Nicol. 1970. An investigation into the thermal comfortof office workers . Journal ofthe IHVE, Vol. 38, pp. 181-189.
Humphreys, Reverend M. A. 1995. Thermal comfort temperatures and the habits ofhobbits: Comfort temperatures and climate . Standardsfor Thermal Comfort:Indoor air temperaturesfor the 21" century. Edited by F. Nicol, M. Humphreys,O. Sykes and S. Roaf London: E & FN Spon pp. 3-13.
212
Humphreys, Reverend Michael A. 1975. Field Studies of thermal comfort compared and
applied . Building Research Establishment, Current Paper. CP 76/75, Garston,
Watford, UK.
Humphreys, Reverend Michael A. 1976. Field Studies of thermal comfort compared and
applied.Building Services Engineer, 44, pp. 5-27.
Humphreys, Reverend Michael A. 1978. Outdoor temperatures and comfort indoors .
Building Research and Practice, 62, pp. 92-105.
Humphreys, Reverend Michael A. 1981. The dependence of comfortable temperature
upon indoor and outdoor climates . Bio-engineering, Physiology and Comfort.
Amsterdam: Elsevier Science Limited.
Humphreys, Reverend Michael A. 1992. Thermal comfort in the context of energy
conservation found in Energy-efficient building edited by Susan Roaf and MaryHancock. New York: John Wiley & Sons pp. 3-13.
Humphreys, Reverend Michael A. 1996. Thermal comfort temperatures world-wide -
The current position . Renewable Energy, Vol. 8 Issues 1-5 May 1996, ppl39-144.
Amsterdam: Elsevier Science Limited.
lESNA: Illuminating Engineering Society ofNorth America. 2000. Lighting Handbook9"^ edition. New York: Illuminating Engineering Society ofNorth America.
International Finance Corporation. IFC Strategic Directions: Executive Summary,December, 2000 at http://www.ifc.org/images/strategic_summarv.pdf.
ISO 7726. 1985. Thermal environments - Specifications relating to appliance andmethods for measuring physical characteristics of the environmental . ISOStandard 7726. Geneva: International Standards Organization.
ISO 7730. 1994. Moderate thermal environment- Determination of the PMV and PPDindices and Specification of the conditions for Thermal Comfort . ISO Standard7730. Geneva: International Standards Organization.
Iwashita, Go and Hiroshi Akasaka. 1997. The effects of human behavior on natural
ventilation rate and indoor air environment in summer - a field study in southern
Japan . Energy and Buildings 25 (1997) 195-205. Amsterdam: Elsevier ScienceLimited.
Jencks, C. 1971. Architecture 2000: Predictions and Methods. New York: PraegaerPublications, pp. 117.
JKUAT. 1989. JKUAT Order ofJuly 1989. Nairobi: Jomo Kenyatta University ofAgriculture and Technology.
Jokl, Miloslav V. 1995. New thermal comfort standards of the Czech Republic .
Standardsfor Thermal Comfort: Indoor air temperaturesfor the 21" century.Edited by F. Nicol, M. Humphreys, O. Sykes and S. Roaf London: E & FN Sponpp. 40-49.
213
Kandjov, Iwajlo M. 2000. Thermal stability of the human body under environmental air
conditions . Journal ofThermal Biology, Vol. 23, No. 2,pp. 1 17-121, 1998. NewYork: Pergamon Press.
Karekezi, Stephen. 1994. Photovoltaics and solar water heaters in Kenya . Nairobi.
Karyono, Tri Harso. 2000. Report on thermal comfort and building energy studies in
Jakarta . Building and Environment 35 (2000) 77-90. Amsterdam: Elsevier
Science Limited.
Kenya Meteorological Department. 1984. Climatological Statisticsfor Kenya. Dagoretti
Comer, Ngong Road, Nairobi, Kenya, Ministry of Transport and
Communications, Republic of Kenya.
Kimura, K. and S. Tanabe. 1985. Design of Waseda University Environmental Test
Chamber and its Performance Characteristics in Clima 2000 Volume 4 Indoor
Climate edited by P. O. Fanger. Copenhagen: VVS Kongres -WS Messe pl21-
126.
Kinzey, Bertram and Howard M. Sharp. 1962. Environmental Technologies in
Architecture. Englewood Cliffs, New Jersey: Prentice-Hall, Inc.
Klassen, Winand. 1990. Architecture and Philosophy. Cebu City: University of San
Carlos. , . ,
Klein, S. 1988. TRNSYS - Transient system simulation program . Engineering
Experiment Station Report 38-12. University of Wisconsin, Madison.
Koenigsberger, Ingersoil, Mayhew, Szokolay. 1974. Manual of Tropical Housing and
Building Part 1: Climatic Design. London: Longman Limited.
Konya, Allan. 1980. Design primerfor hot climates. London: The Architectural Press.
Kosar, D. R., Witte, M. J., D. B. Shirey and R. L. Hedrick. 1998. Dehumidification issues
of Standard 62-1989 . ASHRAE Journal, Vol. 40 No. 3 pp. 71-75. American
Society of Heating, Refrigerating and Air Conditioning Engineers, Atlanta GA.
Kristesen, Poul E., Nick V. Baker, Koen Steemers, Katerina Parpairi, Marc Fontoynont
and Joe Clarke. 1998. Article entitled Daylight Europe in Sustainable and
Energy-efficient building. London, UK: James and James.
Kuhn, Thomas S. 1996. The Structure OfScientific Revolutions. Chicago, IL: TheUniversity of Chicago Press.
Kuller, R. 1981. Non-visual effects of light and color. Annotated bibliography. DocumentNo. 15 . Stockholm: Swedish Council for Building Research.
Kuller, Rikard and Carin Lindsten. 1992. Health and behavior of children in classrooms
with and without windows . Journal ofEnvironmental Psychology (1992) 12, 305-
317. New York: Academic Press Limited.
Kusuda, T. and J. Bean. 1987. Comparison of calculated hourly cooling load and indoor
temperature with measured data for a high mass building tested in an
environmental chamber . ASHRAE Transactions 87(1981) 1232-1 240. AmericanSociety of Heating, Refrigerating and Air Conditioning Engineers, Atlanta GA.
214
Kwok, Alison G. 1998. Thermal Comfort In Tropical Classrooms in ASHRAETransactions SF-98-7-5. American Society of Heating, Refrigerating and Air
Conditioning Engineers, Atlanta GA.
Kwok, Alison G. 2000. Are vou thermally bored? In SBSE News Spring 2000 by Bruce
Haglund (ed). Society of Building Science Educators.
http://www.polaris.net/~sbse/web/
Kwok, Alison G. 2000. Thermal Boredom in Architecture, City and Environment:
Proceedings ofPLEA 2000, Cambridge, UK (July 2000) by Koen Steemers and
Simos Yannas (eds) pp. 640-641. James & James (Science Publishers) Ltd.
Labaki, Lucila C. and Doris C. C. K. Kowaltowski. 1998. Bioclimatic and vernacular
design in urban settlements of Brazil . Building and Environment, Vol. 33 No. 1,
pp. 63-77, 1998. Amsterdam: Elsevier Science Limited.
Labs, Kenneth. \9S\ . Regional Analysis ofGround and Above Ground Climate. OakRidge, TN: Oak Ridge National Laboratory.
Lambert, D. W. H., R. Holland and K. Crawley. 2000. Appropriate battery technology for
a new, rechargeable, micro-solar lantern in Journal ofPower Sources 88 (2000)
108-1 14. Amsterdam: Elsevier Science Limited.
Le Corbusier. 1926. Urbanisme. Paris.
Le Corbusier. 1931. Towards a New Architecture translated by Fredrick Etchells, NewYork: Dover Publications, Inc. pp. 199. This Dover edition, first published in
1986, is an unabridged and unaltered republication of the work originally
published by John Rodker, London, in 193 1, as translated from the thirteenth
French edition and given in English introduction by Fredrick Etchells.
Leaman, Adrian and Bill Bordass. 1999. Productivity in buildings: the "killer" variables .
Building Research & Information (1999) 27 (1), 4-19. London: E «& FN Spon.
Lechner, N. 1991. Heating, Cooling, Lighting: Design Methodsfor Architects. NewYork: John Wiley & Sons.
Lewis, J. Owen. 2000. Developing a low energy architecture for Europe in Architecture,
City and Environment: Proceedings ofPLEA 2000, Cambridge, UK (July 2000)
by Koen Steemers and Simos Yannas (eds) pp. 10-15. James & James (Science
Publishers) Ltd.
Lorsch, H. and O. Abdou. 1994a. The impact of the building indoor environment onoccupant productivity: Part 1 : recent studies, measures and costs . ASHRAETransactions, 1994, pp. 741-749. American Society of Heating, Refrigerating andAir Conditioning Engineers, Atlanta GA.
Lorsch, H. and O. Abdou. 1994b. The impact of the building indoor environment onoccupant productivity: Part 2: effects of temperature . ASHRAE Transactions,
1994, pp. 895-901. American Society of Heating, Refrigerating and Air
Conditioning Engineers, Atlanta GA.
Lorsch, H. and O. Abdou. 1994c. The impact of the building indoor environment onoccupant productivity: Part 2: effects of indoor air quality . ASHRAE Transactions,
215
1994, pp. 902-912. American Society of Heating, Refrigerating and Air
Conditioning Engineers, Atlanta GA.
Lstiburek, J. and J. Carmody. 1991. The Moisture Control Handbook - New Low-rise,
Residential Construction, ORNL/Sub/89-SD350/l. Martin Marietta Energy
Systems, Oak Ridge National Laboratory, Oak Ridge, TN., USA.
Mackey, C. O. and L.T. Wright. 1946. Periodic heat flow - composite walls or roofs .
Heat, Piping and Air Conditioning, June 1946. Cited by Givoni, 1976, pp. 138.
Malama, Albert and Steve Sharpies. 1997. Thermal performance of traditional and
contemporary housing in the cool season of Zambia . Building and Environment,
Vol. 32, No. 1, pp. 69 - 78, 1997. Amsterdam: Elsevier Science Limited.
Markus, T. A. and E. N. Morris. 1980. Buildings, Climate And Energy. London: Pitman
Publishing Limited.
Masakhwe, J. K. 1993. The private sector in solar industry: the case of Kenya in Recent
Experiences in Research, Development, and Dissemination ofRenewable Energy
Technologies in Sub-Saharan Africa. Seminar Proceedings of the Conference of
on Renewable Energies held in Nairobi, Kenya.
Matthews, E. H. and P. G. Richards. 1989. A tool for predicting hourly air temperatures
and sensible load in buildings at sketch design stage. Energy and Buildings 14
(1989) 61-80. Amsterdam: Elsevier Science Limited.
Matthews, E. H. and P. G. Richards. 1993. An efficient tool for future building designs in
Building and Environment, Vol. 28, No. 4, pp. 409-417. New York: Pergamon.
Mazrui, Ali. 1986. The Triple Heritage. Boston: Little Brown.
McHugh, Jonathan, Patrick J. Bums and Douglas C. Hittle. 1998. The energy impact ofdavlighting . ASHRAE Journal, Vol. 40 No. 5 pp. 31-35. American Society ofHeating, Refrigerating and Air Conditioning Engineers, Atlanta GA.
Mclntyre, D. A. 1980a. Design requirements for a comfortable environment , in: K. Cena,J. A. Clark (eds). Bio-engineering, Thermal Physiology and Comfort. Amsterdam:Elsevier Science Limited, pp. 157-168.
Mclntyre, D. A. 1980b. Indoor Climate. London: Applied Science Publishers.
Mclntyre, D. A. 1982. Climate chamber - reductio ad absurdum? Energy and Buildings 5
(1982) 89-96. Amsterdam: Elsevier Science Limited.
Mcleary, Peter. 1997. An Introduction of Technology. University of Pennsylvania.
McQuiston, Faye C. and Jeffrey D. Spitler. 1992. Cooling and Heating Load CalculationManual. American Society of Heating, Refrigerating and Air ConditioningEngineers, Atlanta GA. pp. 8. 1
.
Medawar, P. B. 1967. The Art ofthe Soluble. London: Methuen & Co. Ltd.
Meffert, Erich, E. 1991. The climate - site analysis in Climate and human settlements:Integrating climate into urban planning and building design in Africa, by YinkaR. Adebayo (ed). Nairobi: United Nations Environmental Programme, pp. 1 1-14.
216
Meffert, Erich. 1979. Six Shadow Chartsfor Latitudes 4° North to 6° South:
Environmental Science Paper No. 2. Nairobi: University of Nairobi, Department
of Architecture.
Meier, A. K. 1990. Measured cooling savings from vegetative landscaping.Proceedings
ofthe American Councilfor an Energy-efficient Economy and Environment, 4
(1990) 133-143.
Meier, A. K. 1991. Strategic landscaping and air-conditioning savings: a literature
review . Energy and Buildings 15-16 (1991) 479-486. Amsterdam: Elsevier
Science Limited.
Mertens, Elke. 1999. Bioclimatic and city planning - open space planning.Atmospheric
Environment 33 (1999) 41 15-4123. Amsterdam: Elsevier Science Limited.
Miller, Robert K. 1989. The Informed Argument: A multi-disciplinary reader and guide.
San Diego: Harcourt Brace Jovanovich, Publishers.
Milne, G. R. 1995. The energy implications of a climate-based indoor air temperature
standard . Standardsfor Thermal Comfort: Indoor air temperaturesfor the 21^'
century. Edited by F. Nicol, M. Humphreys, O. Sykes and S. Roaf London: E &FNSponpp. 182-189.
Milne, Murray and Baruch Givoni. 1979. Architectural design based on climate in:
Donald Watson (ed). Energy conservation through building design chapter 6.
New York: McGraw-Hill pp. 95-1 13.
Minke, Gemot 2000. The building material earth and its application in modem ecological
and low energv architecture in Architecture, City and Environment: Proceedings
ofPLEA 2000, Cambridge, UK (July 2000) by Koen Steemers and Simos Yannas
(eds) pp. 239-242. James & James (Science Publishers) Ltd.
Moffat, A. and M. Schiller. \9^\ . Lanscape Design. How to save energy. New York:
William and Narrow Company.
Montgomery, R. D. 1998. Ice storage for school complex . ASHRAE Journal Vol. 40 No.
7 pp. 52-56. American Society of Heating, Refrigerating and Air Conditioning
Engineers, Atlanta GA.
Moore, Fuller. 1985. Concepts and Practice ofArchitectural Daylighting. New York:
McGraw-Hill.
Moore, Fuller. 1993. Environmental Control Systems: Heating, Cooling and Lighting.
New York: McGraw-Hill.
Morell, D. 1981. Energv conservation and public policv: if it's such a good idea, whydon't we do more of it? Journal ofSocial Issues, 37,8-30.
Morris, F. B., J. E. Braun, and S. J. Treado. 1994. Experimental and simulated
performance of optimal control of building thermal storage . ASHRAETransactions, 100 (1): 402-414. American Society of Heating, Refrigerating andAir Conditioning Engineers, Atlanta GA.
217
Mulugetta, Yacob, Tinashe Nhete and Tim Jackson. 2000. Photovoltaics in Zimbabwe:
lessons from the GEF Solar Project in Energy Policy 28 (2000) 1069-1080.
Amsterdam: Elsevier Science Limited.
Musinga, M., M. Hankins, D. Hirsch, and J. de Schutter. 1997. Kenya photo-voltaic rural
energy project (KENPREP): Results of the 1997 Market Survey.Report prepared
for DGIS, Ecotec Limited, the Netherlands.
Naumov, A. 1994. Comfort equation for calculating thermal mass and heating regimes .
Healthy Buildings - International conference 1994 vol. 1 p2 19-222.
Ne'eman, E. 1984. A comprehensive approach to the integration of daylight and electric
light in buildings.Energy and Buildings, Amsterdam: Elsevier Science Limited.
Ne'eman, E. 1998. Daylight availability database for energy efficient integration with
electric light . Journal ofthe Illuminating Engineering Society 11 (1998) 2: 59-66.
New York: lESNA.
Ne'eman, E. and R. G. Hopkinson. 1970. Critical minimum acceptable window size: a
study of window design and provision of view . Lighting Research and
Technology, 2 (No. 1): 17-27. New York: lESNA.
Ne'eman, E., G. Sweitzer and E.Vine. 1984. Office worker response to lighting and
daylighting issues in workplace environments: a pilot study . Energy andBuildings, 6 (1984) 159-171. New York: Elsevier Science Limited.
Nevins, R. G. and A. O. Flinner. 1958. Effect of heated-floor temperatures on comfort.
ASHRAE Transactions 64:175. American Society of Heating, Refrigerating and
Air Conditioning Engineers, Atlanta GA.
Nevins, R. G. F. H. Rohles, Jr., W. E. Springer, and A. M. Feyerherm. 1966.
Temperature-humidity chart for thermal comfort of seated persons. ASHRAETransactions 72 (1): 283. American Society of Heating, Refrigerating and Air
Conditioning Engineers, Atlanta GA.
Nevins, R. G., K. B. Michaels and A. M. Feyerherm. 1964. The effect of floor surface
temperatures on comfort. Part I, College age males; Part II, College age females.
ASHRAE Transactions 70:29. American Society of Heating, Refrigerating and Air
Conditioning Engineers, Atlanta GA.
Nevins, R. G., R. R. Gonzalez, Yasunobu Nishi, A. P. Gagge. 1975. Effect of changes in
ambient temperature and level of humidity on comfort and thermal sensations .
ASHRAE Transactions 81 (2): 169-182.
Newell, T. A. and M. E. Snyder. 1990. Cooling cost minimization using building massfor thermal storage . ASHRAE Transactions 96 (2).
Newsham, Guy R. 1997. Clothing as a thermal comfort moderator and the effect onenergy consumption
.Energy and Buildings, 26 (1997) 283-291. Amsterdam:
Elsevier Science Limited.
NFPA. 1997a. Fire Protection Handbook, 18* edition. Quincy, MA: National Fire
Protection Administration.
218
NFPA. 1997b. Life Safety Code. ANSI/NFPA Standard 101-94. Quincy, MA: National
Fire Protection Administration.
Ng'ang'a, John K. 1980. Climatological aspects ofair polluion dispersion in Nairobi.
Research Report No. 5/80 for East African Institute for Meteorological Training
and Research. Dagoretti Comer, Ngong Road, Nairobi, Kenya, Ministry of
Transport and Communications.
Nicklas, Michael. 1996. 40% renewable energy by 2020: An ISES goal, a global
necessity in Advances in Solar Energy: An Annual Review ofResearch and
Development, by Karl W. Boer (ed) Vol. 1 1 1996, pp. 415-460. Boulder,
Colorado: American Solar Energy Society, Inc.
Nicol, J. Fergus and M. Kessler. 1998. Perception of comfort in relation to weather and
indoor adaptive opportunities . ASHRAE Technical Data Bulletin, 14 (1).
American Society of Heating, Refrigerating and Air Conditioning Engineers,
Atlanta GA.
Nicol, J. Fergus and Susan Roaf. 1996. Pioneering new indoor temperature standards: the
Pakistan project . Energy and Buildings, 23 (1996) 169-174. Amsterdam: Elsevier
Science Limited.
Nicol, J. Fergus, G. N. Jamy, O. Sykes, M. A. Humphreys, S. Roaf, and Hancock. 1994.
Thermal Comfort in Pakistan. UK: Oxford Brookes University, School of
Architecture.
Nicol, J. Fergus, Iftikhar A. Raja, Arif Allaudin, Gul Najam Jamy. 1999. Climatic
variations in comfortable temperatures: the Pakistan projects.Energy and
Buildings, 30 (1999) 261-279. Amsterdam: Elsevier Science Limited.
Nicol, J. Fergus. 1993. Thermal Comfort- A Handbookfor Field Studies toward and
Adaptive Model. London: School of Architecture, University of East London.
Nicol, J. Fergus. 1995. Thermal comfort standards in Pakistan . Standardsfor Thermal
Comfort: Indoor air temperaturesfor the 21^' century. Edited by F. Nicol, M.Humphreys, O. Sykes and S. Roaf. London: E & FN Spon pp. 149-156.
Nieuwolt, S. 1980. Interpolation ofrainfall in the Nairobi area, Res. Report No. 8/80,
East African Institute for Meterological Training and Research, 1980.
Njuguna, Dafton G. 1997. Diffusion of Bio-climatic building design techniques in Kenya:
Impediments and opportunities . Habitat International Vol. 21, No. 4 pp. 347-359,
1997. Amsterdam: Elsevier Science Limited.
Nnamdi, Elleh. 1996. African Architecture. New York: McGraw-Hill.
Norberg-Schulz, Christian. 1965. Intentions in Architecture. Cambridge, Massachusetts:
The MIT Press.
Nyoike, P. M. 1993. National industrial energy conservation - Perspectives from Kenya ,
in Energy Optionsfor Africa: Environmentally Sustainable Alternatives byStephen Karekezi and Gordon A. Mackenzie (eds.), pp. 128-138. Nairobi: UNEPCollaborating Centre on Energy and Environment and London: Zed BooksLimited.
219
O'Keefe, P. (ed). 1984. Energy and development in Kenya. Scandinavian Institute of
African Studies, Uppsala.
Ober, D. and D. Wortman. 1991. Effect o building type on wall thermal mass
performance . ASHRAE Transactions, Vol. 33, No. 1 1, pp. 18-21. American
Society of Heating, Refrigerating and Air Conditioning Engineers, Atlanta GA.
Ogoli, David Mwale. 1994. Non-domestic buildings: Design for passive cooling in
Nairobi. Kenya . In Proceedings ofthe JJ''' Passive and Low Energy Architecture
(PLEA 1994), Dead Sea, Israel.
Ogoli, David Mwale. 1997. Energy in African architecture - Guidelines for Kenya . In
Horizon DAT, Vol. 1, No. 1, pp. 52-62, 1997. Nairobi, Kenya: ICIPE Science
Press.
Ogoli, David Mwale. 1998. Towards green-sensibility in African architecture: A climate-
sensitive approach to design in East Africa . In The Eleventh Symposium on
Improving Building Systems in Hot and Humid Climates Proceedings by Jerry
Matthews, Jeff Haberl and Dawna Rosenkranz (eds), pp. 419-427. Fort Worth,
Texas: Texas Building Energy Institute.
Ogoli, David Mwale. 2000. An assessment method for the performance of passive solar
buildings at equatorial high altitudes . In Architecture, City and Environment:
Proceedings ofPLEA 2000, Cambridge, UK (July 2000) by Koen Steemers and
Simos Yannas (eds) pp. 827-828. James & James (Science Publishers) Ltd.
Ojany, F. F. 1968. The geography of East Africa in Zamani: A survey ofEast African
History, Nairobi: East African Publishing House/Longman Kenya Limited.
Ojany, F. F. and R. B. Ogendo. 1985. Kenya: A study ofphysical and human geography.
Nairobi: Longman Kenya Limited.
Okech, Benjamin A. and Patrick M. Nyoike. 1999. Energy sector liberalization in Kenya:
critical policy issues in petroleum retail market in Energy Policy, 27 (1999) 45-
46. Amsterdam: Elsevier Science Limited.
Okoola, Raphael E. 1979. The Nairobi heat Island. Research Report No. 4/79 for East
African Institute for Meteorological Training and Research. Dagoretti Comer,
Ngong Road, Nairobi, Kenya, Ministry of Transport and Communications.
Olesen, B. W. 1977a. Thermal comfort requirements for floors . Proceedings ofCommissions Bl, B2, El ofthe IIR, Belgrade, Yugoslavia, pp. 337-343.
Olesen, B. W. 1977b. Thermal comfort requirements for floors occupied by people with
bare feet . ASHRAE Transactions 83 (2).
Olesen, Bjame W. 2000. Guidelines for comfort . ASHRAE Journal Vol. 42, No. 8, pp.41-46. American Society of Heating, Refrigerating and Air Conditioning
Engineers, Atlanta GA.
Olgyay, V. 1994. Optimum orientations m Architectural Graphic Standards 9** Edition
by John Ray Hoke, Jr. (ed). American Institute of Architects, New York: JohnWiley 8l Sons, Inc.
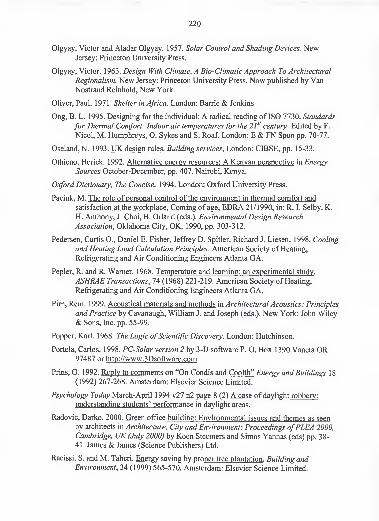
220
Olgyay, Victor and Aladar Olgyay. 1957. Solar Control and Shading Devices. NewJersey: Princeton University Press.
Olgyay, Victor. 1963. Design With Climate. A Bio-Climatic Approach To Architectural
Regionalism. New Jersey: Princeton University Press. Now published by VanNostrand Reinhold, New York.
Oliver, Paul. 1971. Shelter in Africa. London: Barrie & Jenkins.
Ong, B. L. 1995. Designing for the individual: A radical reading of ISO 7730 . Standards
for Thermal Comfort: Indoor air temperaturesfor the 2f' century. Edited by F.
Nicol, M. Humphreys, O. Sykes and S. Roaf. London: E & FN Spon pp. 70-77.
Oseland, N. 1993. UK design rules . Building services, London: CIBSE, pp. 15-33.
Othieno, Herick. 1992. Alternative energy resources: A Kenyan perspective in Energy
Sources October-December, pp. 407. Nairobi, Kenya.
Oxford Dictionary, The Concise. 1994. London: Oxford University Press.
Paciuk, M. The role of personal control of the environment in thermal comfort and
satisfaction at the workplace. Coming of age , EDRA 21/1990, in: R. I. Selby, K.
H. Anthony, J. Choi, B. Orland (eds.). Environmental Design Research
Association, Oklahoma City, OK, 1990, pp. 303-312.
Pedersen, Curtis O., Daniel E. Fisher, Jeffrey D. Spitler, Richard J. Liesen. 1998. Cooling
and Heating Load Calculation Principles. American Society of Heating,
Refrigerating and Air Conditioning Engineers Atlanta GA.
Pepler, R. and R. Warner. 1968. Temperature and learning: an experimental studv .
ASHRAE Transactions, 74 (1968) 221-219. American Society of Heating,
Refrigerating and Air Conditioning Engineers Atlanta GA.
Pirn, Rein. 1999. Acoustical materials and methods m Architectural Acoustics: Principles
and Practice by Cavanaugh, William J. and Joseph (eds.). New York: John Wiley
& Sons, Inc. pp. 55-99.
Popper, Karl. 1968. The Logic ofScientific Discovery. London: Hutchinson.
Portela, Carlos. 1998. PC-Solar version 2 by 3-D software P. O. Box 1390 Vaneta OR97487 or http://www.3Dsoftware.com
Prins, G. 1992. Reply to comments on "On Condis and Coolth" Energy and Buildings 18
(1992) 267-268. Amsterdam: Elsevier Science Limited.
Psychology Today March-April 1994 v27 n2 page 8 (2) A case of daylight robbery:
understanding students' performance in daylight areas .
Radovic, Darko. 2000. Green office building: Environmental issues and themes as seen
by architects in Architecture, City and Environment: Proceedings ofPLEA 2000,
Cambridge, UK (July 2000) by Koen Steemers and Simos Yannas (eds) pp. 38-
41. James & James (Science Publishers) Ltd.
Raeissi, S. and M. Taheri. Energy saving by proper tree plantation . Building andEnvironment, 34 (1999) 565-570. Amsterdam: Elsevier Science Limited.
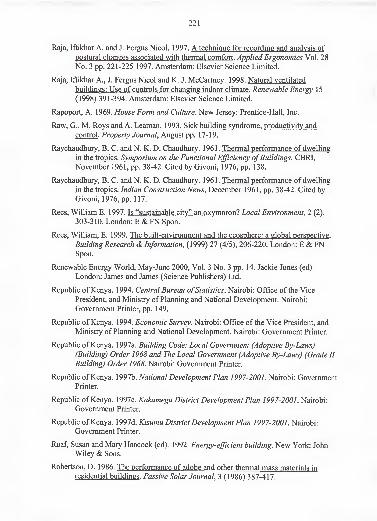
221
Raja, Iftikhar A. and J. Fergus Nicol. 1997. A technique for recording and analysis of
postural changes associated with thermal comfort . Applied Ergonomics Vol. 28
No. 3 pp. 221-225 1997. Amsterdam: Elsevier Science Limited.
Raja, Iftikhar A., J. Fergus Nicol and K. J. McCartney. 1998. Natural ventilated
buildings: Use of controls for changing indoor climate . Renewable Energy 1
5
(1998) 391-394. Amsterdam: Elsevier Science Limited.
Rapoport, A. 1969. House Form and Culture. New Jersey: Prentice-Hall, Inc.
Raw, G., M. Roys and A. Leaman. 1993. Sick building syndrome, productivity and
control . Property Journal, August pp. 17-19.
Raychaudhury, B. C. andN. K. D. Chaudhury. 1961. Thermal performance of dwelling
in the tropics. Symposium on the Functional Efficiency ofBuildings, CBRI,
November 1961, pp. 38-42. Cited by Givoni, 1976, pp. 138.
Raychaudhury, B. C. and N. K. D. Chaudhury. 1961. Thermal performance of dwelling
in the tropics . Indian Construction News, December 1961, pp. 38-42. Cited by
Givoni, 1976, pp. 117.
Rees, William E. 1997. Is "sustainable city" an oxymoron? Local Environment, 2 (2),
303-310. London: E «fe FN Spon.
Rees, William, E. 1999. The built-environment and the ecosphere: a global perspective .
Building Research & Information, (1999) 27 (4/5), 206-220. London: E & FNSpon.
Renewable Energy World, May-June 2000, Vol. 3 No. 3 pp. 14. Jackie Jones (ed)
London: James and James (Science Publishers) Ltd.
Republic of Kenya. 1994. Central Bureau ofStatistics. Nairobi: Office of the Vice
President, and Ministry of Planning and National Development. Nairobi:
Government Printer, pp. 149.
Republic of Kenya. 1994. Economic Survey. Nairobi: Office of the Vice President, and
Ministry of Planning and National Development. Nairobi: Government Printer.
Republic of Kenya. 1 997a. Building Code: Local Government (Adoptive By-Laws)
(Building) Order 1968 and The Local Government (Adoptive By-Laws) (Grade II
Building) Order 1968. Nairobi: Government Printer.
Republic of Kenya. 1997b. National Development Plan 1997-2001. Nairobi: GovernmentPrinter.
Republic of Kenya. 1997c. Kakamega District Development Plan 1997-2001. Nairobi:
, Government Printer.
Republic of Kenya. 1997d. Kisumu District Development Plan 1997-2001. Nairobi:
Government Printer.
Roaf, Susan and Mary Hancock (ed). 1992. Energy-efficient building. New York: JohnWiley & Sons.
Robertson, D. 1986. The performance of adobe and other thermal mass materials in
residential buildings . Passive Solar Journal, 3 (1986) 387-417.
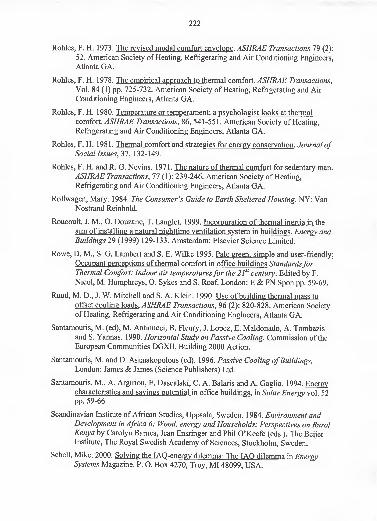
222
Rohles, F. H. 1973. The revised modal comfort envelope . ASHRAE Transactions 79 (2):
52. American Society of Heating, Refrigerating and Air Conditioning Engineers,
Atlanta GA.
Rohles, F. H. 1978. The empirical approach to thermal comfort . ASHRAE Transactions,
Vol. 84 (1) pp. 725-732. American Society of Heating, Refrigerating and Air
Conditioning Engineers, Atlanta GA.
Rohles, F. H. 1980. Temperature or temperament: a psychologist looks at thermal
comfort . ASHRAE Transactions, 86, 541-551. American Society of Heating,
Refrigerating and Air Conditioning Engineers, Atlanta GA.
Rohles, F. H. 1981. Thermal comfort and strategies for energy conservation . Journal ofSocial Issues, 37, 132-149.
Rohles, F. H. and R. G. Nevins. 1971. The nature of thermal comfort for sedentary man .
ASHRAE Transactions, 11 {\): 239-246. American Society of Heating,
Refrigerating and Air Conditioning Engineers, Atlanta GA.
Rollwagen, Mary. 1984. The Consumer's Guide to Earth Sheltered Housing. NY: VanNostrand Reinhold.
Roucoult, J. M., O. Douzane, T. Langlet. 1999. Incorporation of thermal inertia in the
aim of installing a natural nighttime ventilation system in buildings. Energy and
Buildings 29 (1999) 129-133. Amsterdam: Elsevier Science Limited.
Rowe, D. M., S. G. Lambert and S. E. Wilke 1995. Pale green, simple and user-friendlv:
Occupant perceptions of thermal comfort in office buildings Standardsfor
Thermal Comfort: Indoor air temperaturesfor the 2f century. Edited by F.
Nicol, M. Humphreys, O. Sykes and S. Roaf. London: E & FN Spon pp. 59-69.
Ruud, M. D., J. W. Mitchell and S. A. Klein. 1990. Use of building thermal mass to
offset cooling loads . ASHRAE Transactions, 96 (2): 820-828. American Society
of Heating, Refrigerating and Air Conditioning Engineers, Atlanta GA.
Santamouris, M. (ed), M. Antinucci, B. Fleury, J. Lopez, E. Maldonado, A. Tombazis
and S. Yannas. 1990. Horizontal Study on Passive Cooling. Commission of the
European Communities DGXII, Building 2000 Action.
Santamouris, M. and D. Asimakopolous (ed). 1996. Passive Cooling ofBuildings.
London: James & James (Science Publishers) Ltd.
Santamouris, M., A. Argiriou, E. Dascalaki, C. A. Balaris and A. Gaglia. 1994. Energycharacteristics and savings potential in office buildings , in Solar Energy vol. 52
pp. 59-66.
Scandinavian Institute of African Studies, Uppsala, Sweden. 1984. Environment andDevelopment in Africa 6: Wood, energy and Households: Perspectives on RuralKenya by Carolyn Barnes, Jean Ensringer and Phil O'Keefe (eds.). The Beijer
Institute, The Royal Swedish Academy of Sciences, Stockholm, Sweden.
Schell, Mike. 2000. Solving the lAQ-energy dilemma: The lAO dilemma in EnergySystems Magazine. P. O. Box 4270, Troy, MI 48099, USA.
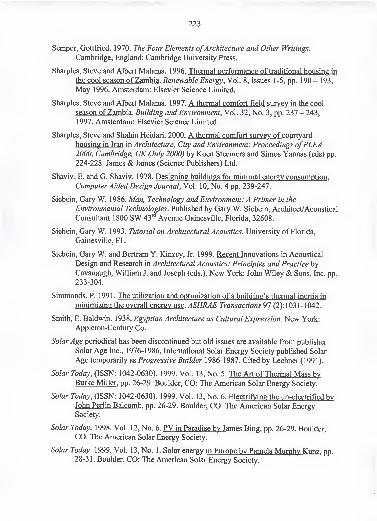
223
Semper, Gottfried. 1970. The Four Elements ofArchitecture and Other Writings.
Cambridge, England: Cambridge University Press.
Sharpies, Steve and Albert Malama. 1 996. Thermal performance of traditional housing in
the cool season of Zambia . Renewable Energy, Vol. 8, Issues 1-5, pp. 190 - 193,
May 1996. Amsterdam: Elsevier Science Limited.
Sharpies, Steve and Albert Malama. 1997. A thermal comfort field survey in the cool
season of Zambia . Building and Environment, Vol. 32, No. 3, pp. 237 - 243,
1997. Amsterdam: Elsevier Science Limited.
Sharpies, Steve and Shahin Heidari. 2000. A thermal comfort survey of courtyard
housing in Iran in Architecture, City and Environment: Proceedings ofPLEA2000, Cambridge, UK (July 2000) by Koen Steemers and Simos Yannas (eds) pp.
224-228. James & James (Science Publishers) Ltd.
Shaviv, E. and G. Shaviv. 1978. Designing buildings for minimal energy consumption .
Computer Aided Design Journal, Vol. 10, No. 4 pp. 239-247.
Siebein, Gary W. 1986. Man, Technology and Environment: A Primer in the
Environmental Technologies. Published by Gary W. Siebein, Architect/Acoustical
Consultant 1800 SW 43'^Avenue Gainesville, Florida, 32608.
Siebein, Gary W. 1993. Tutorial on Architectural Acoustics. University of Florida,
Gainesville, FL.
Siebein, Gary W. and Bertram Y. Kinzey, Jr. 1999. Recent Innovations in Acoustical
Design and Research in Architectural Acoustics: Principles and Practice by
Cavanaugh, William J. and Joseph (eds.). New York: John Wiley & Sons, Inc. pp.
233-304.
Simmonds, P. 1991. The utilization and optimization of a building's thermal inertia in
minimizing the overall energy use . ASHRAE Transactions 97 (2): 103 1-1042.
Smith, E. Baldwin. 1938. Egyptian Architecture as Cultural Expression. New York:
Appleton-Century Co.
Solar Age periodical has been discontinued but old issues are available from publisher
Solar Age Inc., 1976-1986. International Solar Energy Society published Solar
Age temporarily as Progressive Builder 1986-1987. Cited by Lechner (1991).
Solar Today, (ISSN: 1042-0630). 1999. Vol. 13, No. 5. The Art of Thermal Mass bv
Burke Miller, pp. 26-29. Boulder, CO: The American Solar Energy Society.
Solar Today, (ISSN: 1042-0630). 1999. Vol. 13, No. 6. Electrifying the un-electrified bvJohn Periin Balcomb . pp. 26-29. Boulder, CO: The American Solar EnergySociety.
Solar Today. 1998. Vol. 12, No. 6. PV in Paradise bv James Bing . pp. 26-29. Boulder,
CO: The American Solar Energy Society.
Solar Today. 1999. Vol. 13, No. 1. Solar energv in Europe bv Pamela Murphv Kunz . pp.28-31. Boulder, CO: The American Solar Energy Society.
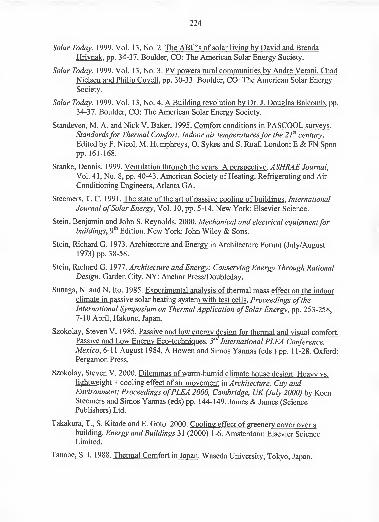
224
Solar Today. 1999. Vol. 13, No. 2. The ABC's of solar living bv David and Brenda
Hrivnak , pp. 34-37. Boulder, CO: The American Solar Energy Society.
Solar Today. 1999. Vol. 13, No. 3. PV powers rural communities by Andre Verani. Chad
Nielsen and Philip Covell , pp. 30-33. Boulder, CO: The American Solar Energy
Society.
Solar Today. 1999. Vol. 13, No. 4. A Building revolution by Dr. J. Douglas Balcomb . pp.
34-37. Boulder, CO: The American Solar Energy Society.
Standeven, M. A. and Nick V. Baker. 1995. Comfort conditions in PASCOOL surveys .
Standardsfor Thermal Comfort: Indoor air temperaturesfor the 2f century.
Edited by F. Nicol, M. Humphreys, O. Sykes and S. Roaf London: E & FN Spon
pp. 161-168.
Stanke, Dennis. 1999. Ventilation through the years: A perspective . ASHRAE Journal,
Vol. 41, No. 8, pp. 40-43. American Society of Heating, Refrigerating and Air
Conditioning Engineers, Atlanta GA.
Steemers, T. C. 1991. The state of the art of passive cooling of buildings . International
Journal ofSolar Energy, Vol. 10, pp. 5-14. New York: Elsevier Science.
Stein, Benjamin and John S. Reynolds. 2000. Mechanical and electrical equipmentforbuildings, 9"^ Edition. New York: John Wiley & Sons.
Stein, Richard G. 1973. Architecture and Energy in Architecture Forum (July/August
1973) pp. 38-58.
Stein, Richard G. 1977. Architecture and Energy: Conserving Energy Through Rational
Design. Garden City, NY: Anchor Press/Doubleday.
Sunaga, N. and N. Ito. 1985. Experimental analysis of thermal mass effect on the indoor
climate in passive solar heating system with test cells . Proceedings ofthe
International Symposium on Thermal Application ofSolar Energy, pp. 253-258,
7-10 April, Hakone, Japan.
Szokolay, Steven V. 1985. Passive and low energy design for thermal and visual comfort.
Passive and Low Energy Eco-techniques .
3''''International PLEA Conference,
Mexico, 6-1 1 August 1984, A Bowen and Simos Yannas (eds.) pp. 1 1-28. Oxford:
Pergamon Press.
Szokolay, Steven V. 2000. Dilemmas of warm-humid climate house design: Heavy vs.
lightweight + cooling effect of air movement in Architecture, City andEnvironment: Proceedings ofPLEA 2000, Cambridge, UK (July 2000) by KoenSteemers and Simos Yannas (eds) pp. 144-149. James & James (Science
Publishers) Ltd.
Takakura, T., S. Kitade and E. Goto. 2000. Cooling effect of greenery cover over a
building . Energy and Buildings 3 \ (2000) 1-6. Amsterdam: Elsevier Science
Limited.
Tanabe, S. L 1988. Thermal Comfort in Japan . Waseda University, Tokyo, Japan.
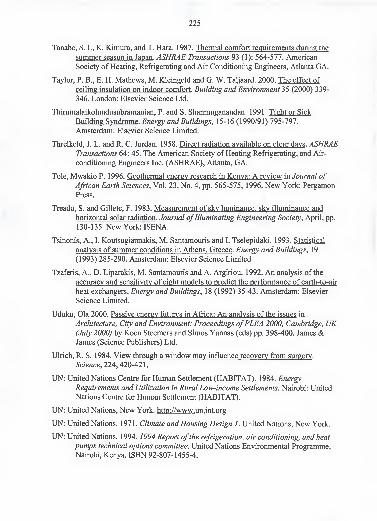
225
Tanabe, S. I., K. Kimura, and T. Hara. 1987. Thermal comfort requirements during the
summer season in Japan . ASHRAE Transactions 93 (1): 564-577. American
Society of Heating, Refrigerating and Air Conditioning Engineers, Atlanta GA.
Taylor, P. B., E. H. Mathews, M. Kleingeld and G. W. Taljaard. 2000. The effect of
ceiling insulation on indoor comfort . Building and Environment 35 (2000) 339-
346. London: Elsevier Science Ltd.
Thirumalaikolundusubramanian, P. and S. Shanmuganandan. 1991. Tight or Sick
Building Syndrome . Energy and Buildings, 15-16 (1990/91) 795-797.
Amsterdam: Elsevier Science Limited.
Threlkeld, J. L. and R. C. Jordan. 1958. Direct radiation available on clear days . ASHRAETransactions 64: 45. The American Society of Heating Refrigerating, and Air-
conditioning Engineers Inc. (ASHRAE), Atlanta, GA.
Tole, Mwakio P. 1996. Geothermal energy research in Kenya: A review in Journal of
African Earth Sciences, Vol. 23, No. 4, pp. 565-575, 1996. New York: Pergamon
Press.
Treado, S. and Gillete, F. 1983. Measurement of sky luminance, sky illuminance and
horizontal solar radiation . Journal ofIlluminating Engineering Society, April, pp.
130-135. New York: ISENA.
Tsinonis, A., I. Koutsogiannakis, M. Santamouris and I. Tselepidaki. 1993. Statistical
analysis of summer conditions in Athens, Greece . Energy and Buildings, 19
(1993) 285-290. Amsterdam: Elsevier Science Limited.
Tzaferis, A., D. Liparakis, M. Santamouris and A. Argiriou. 1992. An analysis of the
accuracy and sensitivity of eight models to predict the performance of earth-to-air
heat exchangers . Energy and Buildings, 18 (1992) 35-43. Amsterdam: Elsevier
Science Limited.
Uduku, Ola 2000. Passive energy futures in Africa: An analysis of the issues in
Architecture, City and Environment: Proceedings ofPLEA 2000, Cambridge, UK(July 2000) by Koen Steemers and Simos Yannas (eds) pp. 398-400. James &James (Science Publishers) Ltd.
Ulrich, R. S. 1984. View through a window may influence recovery from surgery .
Science, 224, 420-421.
UN: United Nations Centre for Human Settlement (HABITAT). 1984. Energy
Requirements and Utilization in Rural Low-income Settlements. Nairobi: United
Nations Centre for Human Settlement (HABITAT).
UN: United Nations, New York, http://www.un.int.org
UN: United Nations. 1971. Climate and Housing Design L United Nations, New York.
UN: United Nations. 1994. 1994 Report ofthe refrigeration, air conditioning, and heat
pumps technical options committee. United Nations Environmental Programme,Nairobi, Kenya. ISBN 92-807-1455-4.
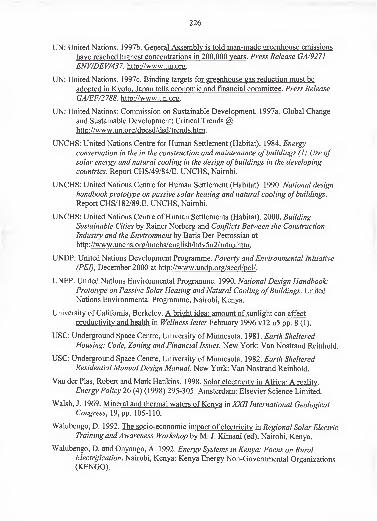
226
UN: United Nations. 1997b. General Assembly is told man-made greenhouse emissions
have reached highest concentrations in 200.000 years . Press Release GA/927
1
ENV/DEV/437. http://www.un.org .
UN: United Nations. 1997c. Binding targets for greenhouse gas reduction must be
adopted in Kyoto. Japan tells economic and financial committee . Press Release
GA/EF/2788. http://www.un.org .
UN: United Nations: Commission on Sustainable Development. 1997a. Global Change
and Sustainable Development: Critical Trends @http ://www un.org/dpcsd/dsd/trends .htm .
UNCHS: United Nations Centre for Human Settlement (Habitat). 1984. Energy
conservation in the in the construction and maintenance ofbuildings (1: Use ofsolar energy and natural cooling in the design ofbuildings in the developing
countries. Report CHS/49/84/E. UNCHS, Nairobi.
UNCHS: United Nations Centre for Human Settlement (Habitat). 1990. National design
handbookprototype on passive solar heating and natural cooling ofbuildings.
Report CHS/1 82/89.E. UNCHS, Nairobi.
UNCHS: United Nations Centre ofHuman Settlements (Habitat). 2000. Building
Sustainable Cities by Rainer Norberg and Conflicts Between the Construction
Industry and the Environment by Baris Der-Petrossian at
http://www.unchs.org/unchs/english/hdv5n2/intro.htm .
UNDP: United Nations Development Programme. Poverty and Environmental Initiative
(PEI), December 2000 at http://www.undp.org/seed/pei/ .
UNEP: United Nations Environmental Programme. 1990. National Design Handbook:Prototype on Passive Solar Heating and Natural Cooling ofBuildings. United
Nations Environmental Programme, Nairobi, Kenya.
University of California, Berkeley. A bright idea: amount of sunlight can affect
productivity and health in Wellness letter February 1996 vl2 n5 pp. 8 (1).
USC: Underground Space Centre, University of Minnesota. 1981. Earth Sheltered
Housing: Code, Zoning and Financial Issues. New York: Van Nostrand Reinhold.
USC: Underground Space Centre, University of Minnesota. 1982. Earth Sheltered
Residential Manual Design Manual. New York: Van Nostrand Reinhold.
Van der Plas, Robert and Mark Hankins. 1998. Solar electricity in Africa: A reality .
Energy Policy 26 (4) (1998) 295-305. Amsterdam: Elsevier Science Limited.
Walsh, J. 1969. Mineral and thermal waters of Kenya in XXII International Geological
Congress, 19, pp. 105-110.
Walubengo, D. 1992. The socio-economic impact of electricity in Regional Solar Electric
Training and Awareness Workshop by M. J. Kimani (ed). Nairobi, Kenya.
Walubengo, D. and Onyango, A. 1992. Energy Systems in Kenya: Focus on RuralElectrification. Nairobi, Kenya: Kenya Energy Non-Governmental Organizations
(KENGO).
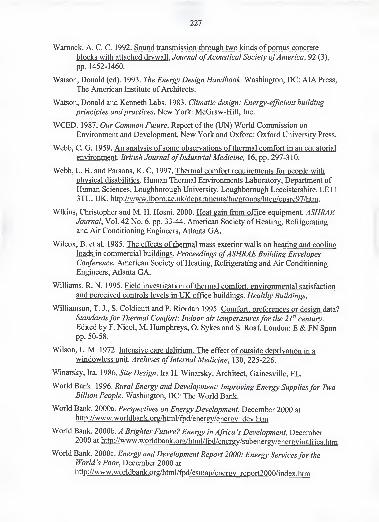
227
Wamock, A. C. C. 1992. Sound transmission through two kinds of porous concrete
blocks with attached drywall . Journal ofAcoustical Society ofAmerica, 92 (3),
pp. 1452-1460.
Watson, Donald (ed). 1993. The Energy Design Handbook. Washington, DC: AIA Press,
The American Institute of Architects.
Watson, Donald and Kenneth Labs. 1983. Climatic design: Energy-efficient building
principles and practices. New York: McGraw-Hill, Inc.
WCED. 1987. Our Common Future. Report of the (UN) World Commission on
Environment and Development, New York and Oxford: Oxford University Press.
Webb, C. G. 1959. An analysis of some observations of thermal comfort in an equatorial
environment . British Journal ofIndustrial Medicine, 16, pp. 297-310.
Webb, L. H. and Parsons, K. C. 1997. Thermal comfort requirements for people with
physical disabilities . Human Thermal Environments Laboratory, Department of
Human Sciences, Loughborough University, Loughborough Leceistershire. LEI 1
3TU. UK. http://www.lboro.ac.uk/departments/hu/groups/hteg/epsrc97/htm .
Wikins, Christopher and M. H. Hosni. 2000. Heat gain from office equipment . ASHRAEJournal, Vol. 42 No. 6, pp. 33-44. American Society of Heating, Refrigerating
and Air Conditioning Engineers, Atlanta GA.
Wilcox, B. et al. 1985. The effects of thermal mass exterior walls on heating and cooling
loads in commercial buildings. Proceedings ofASHRAE Building Envelopes
Conference. American Society of Heating, Refrigerating and Air Conditioning
Engineers, Atlanta GA.
Williams, R. N. 1995. Field investigation of thermal comfort, environmental satisfaction
and perceived controls levels in UK office buildings . Healthy Buildings.
Williamson, T. J., S. Coldicutt and P. Riordan 1995. Comfort, preferences or design data?
Standardsfor Thermal Comfort: Indoor air temperaturesfor the 21^' century.
Edited by F. Nicol, M. Humphreys, O. Sykes and S. Roaf London: E & FN Spon
pp. 50-58.
Wilson, L. M. 1972. Intensive care delirium. The effect of outside deprivation in a
windowless unit . Archives ofInternal Medicine, 130, 225-226.
Winarsky, Ira. 1986. Site Design. Ira H. Winarsky, Architect, Gainesville, FL.
World Bank. 1996. Rural Energy and Development: Improving Energy Suppliesfor TwoBillion People. Washington, DC: The World Bank.
World Bank. 2000a. Perspectives on Energy Development, December 2000 at
http://www.worldbank.org/html/fpd/energv/energv dev.htm
World Bank. 2000b. A Brighter Future? Energy in Africa 's Development, December2000 at http://www.worldbank.org/html/fpd/energv/subenergv/energvinafrica.htm
World Bank. 2000c. Energy and Development Report 2000: Energy Servicesfor the
World's Poor, December 2000 at
http://www.worldbank.org/html/fpd/esmap/energv report200Q/index.htm
228
World Solar Programme 1996-2005:
http://www.unesco.org/general/eng/programmes/science/wssp/index.htmK
http://www.unesco.org/general/fre/programmes/science/wssp/index.html
WorldWatch Paper 124, March 1995. Jane A. Peterson (ed). Building Revolution: HowEcology and Health Concerns are Transforming Construction by David Malin
and Roodman and Nicholas Lenssen. Worldwatch Institute, 1 776 Massachusetts
Ave., NW Washington DC 20036. Also found at
http://www.worldwatch.org/pubs/paper/124.html .
Wouters, Peter, David Ducarme, Jan Demeester and Luk Vandaele. 1998. Ventilation
requirements in nin-domestic buildings and energy efficiency.Energy and
Buildings 27 (1998) 257-261. Amsterdam: Elsevier Science Limited.
Wu, H. 1996. The Effect of Thermal Mass On Indoor Comfort with Evaporative Cooling
Systems In Semi-Arid Climates . America Solar Energy Society. Proceedings of
The National Passive Solar Conference 1996; Vol. 21 pp. 1 13-1 18.
Yaglou, C. P. 1947. A method for improving the effective temperature index . ASHVETransactions, Vol. 53,pp. 307. American Society of Heating, Refrigerating and
Air Conditioning Engineers, Atlanta GA.
Yaglou, C. P., E. C. Riley and D. I. Coggins. 1936. Ventilation requirements . ASHRAETransactions 42: 133-162. American Society of Heating, Refrigerating and Air
Conditioning Engineers, Atlanta GA.
Yannas, Simos. 1994. Solar Energy and Housing Design. London, UK: Architectural
Association. , h
Yellot, John I, D. Aiello, G. Rand and M. Y. King. 1976. Solar-oriented architecture .
Arizona State University Architecture Foundation, Tempe, AZ.
Yellot, John I. 1965. Drapery fabrics and their effectiveness in sun control. ASHRAETransactions 71 (1): 260-72. American Society of Heating, Refrigerating and AirConditioning Engineers, Atlanta GA.
Yellot, John I. 1974. Solar Energy Utilizationfor heating and cooling. Report preparedunder National Science Foundation for the American Society of Heating,Refrigerating and Air Conditioning Engineers, Atlanta GA.
Yellot, John I. 1977. Passive solar heating and cooling systems . ASHRAE Transactions
83 (2): 429-445. American Society of Heating, Refrigerating and AirConditioning Engineers, Atlanta GA.
BIOGRAPHICAL SKETCH
David Mwale Ogoli was bom in Kaimosi in Vihiga District, Kenya, on 9^
October 1962. He was bom fifth in a family of nine energetic children who offered a
challenging academic and social environment in the early days at Kaimosi. He pursued
Ordinary-level studies at Sigalagala Secondary Technical School near Kakamega and
Advanced-level studies at The Mombasa Polytechnic in Mombasa, Kenya.
He attended the University of Nairobi and graduated at the top of his class with
the degree of Bachelor of Architecture (First Class Honors) in June 1988. He was
awarded a British Chevening Scholarship to attend the University of Cambridge, UK, and
graduated with a Master of Philosophy degree in November 1994. He was awarded a J. J.
Fulbright Scholarship to attend the University of Florida, USA, where he graduated with
a Doctor of Philosophy degree in December 2000. He received several awards including
the University of Florida's ARCC King Student Medal for Excellence in Architectural
and Environmental Design Research, and he won the First Prize for the Witter's
Competition 2000. He was mentioned in the Jury's report of the Zephyr Competition
conducted by the European Commission in 1994.
He worked with several architectural firms in Kenya and became a Registered
Architect in 1990. In 1992, he was appointed as a Lecturer at Jomo Kenyatta University
of Agriculture and Technology (JKUAT) in Nairobi, Kenya. He has deep interest in
Building Science (Environmental Technology) and Energy issues in Architecture.
229

I certify that I have read this study and that in my opinion it conforms to
acceptable standards of scholarly presentation and is fiiUy adequate, in scope and quality,
as a dissertation for the degree of Doctor of Philosophy.
Gary W. S iebem, Chair
Pro^ssorjbf Architecture
I certify that I have read this study and that in my opinion it conforms to
acceptable standards of scholarly presentation and is fully adequate, in scope and quality,
as a dissertation for the degree of Doctor of Philosoph
Jertram Y. Kinzey,lji. y ^ji
'Emeritus Professor of Architecttlre
I certify that I have read this study and that in my opinion it conforms to
acceptable standards of scholarly presentation and is fully adequate, in scope and quality,
as a dissertation for the degree of Doctor of Philosophy.
Ira H. wmarsk
Professor of Architecture
I certify that I have read this study and that in my opinion it conforms to
acceptable standards of scholarly presentation and is fully adequate, in scope and/auality,
as a dissertation for the degree of Doctor of Philosopl
Assistant Professor of Architecture
I certify that I have read this study and that in my opinion it conforms to
acceptable standards of scholarly presentation and is fully adequate, in scope and quality,
as a dissertation for the degree of Doctor of Philosophy.
D. Yogi GoswamiProfessor of Mechanical Engineering

This dissertation was submitted to the Graduate Faculty of the College of Design,
Construction and Planning and to the Graduate School and was accepted as partial
fulfillment of the requirements for the degree of Doctor of Philosophy.
December 2000.
^anf^llege of Design, Construction
and Planning
i
Dean, Graduate School