Eastern Equatorial Pacific - Domain Name System (DNS ...
95
-
Upload
khangminh22 -
Category
Documents
-
view
0 -
download
0
Transcript of Eastern Equatorial Pacific - Domain Name System (DNS ...

Global International Waters Assessment
Regional assessments

Other reports in this series:
Russian Arctic – GIWA Regional assessment 1a
Caribbean Sea/Small Islands – GIWA Regional assessment 3a
Caribbean Islands – GIWA Regional assessment 4
Barents Sea – GIWA Regional assessment 11
Baltic Sea – GIWA Regional assessment 17
Caspian Sea – GIWA Regional assessment 23
Aral Sea – GIWA Regional assessment 24
Gulf of California/Colorado River Basin – GIWA Regional assessment 27
Sea of Okhotsk – GIWA Regional assessment 30
Oyashio Current – GIWA Regional assessment 31
Yellow Sea – GIWA Regional assessment 34
East China Sea – GIWA Regional assessment 36
Patagonian Shelf – GIWA Regional assessment 38
Brazil Current – GIWA Regional assessment 39
Amazon Basin – GIWA Regional assessment 40b
Canary Current – GIWA Regional assessment 41
Guinea Current – GIWA Regional assessment 42
Lake Chad Basin – GIWA Regional assessment 43
Benguela Current – GIWA Regional assessment 44
Indian Ocean Islands – GIWA Regional assessment 45b
East African Rift Valley Lakes – GIWA Regional assessment 47
South China Sea – GIWA Regional assessment 54
Mekong River – GIWA Regional assessment 55
Sulu-Celebes (Sulawesi) Sea – GIWA Regional assessment 56
Indonesian Seas – GIWA Regional assessment 57
Pacifi c Islands – GIWA Regional assessment 62
Humboldt Current – GIWA Regional assessment 64
Global International Waters Assessment
Regional assessment 65Eastern Equatorial Pacific
GIWA report production
Series editor: Ulla Li Zweifel
Editorial assistance: Kristin Bertilius,
Matthew Fortnam, Russell Arthurton
Maps & GIS: Rasmus Göransson
Design & graphics: Joakim Palmqvist

Global International Waters AssessmentEastern Equatorial Pacifi c, GIWA Regional assessment 65
Published by the University of Kalmar on behalf of United Nations Environment Programme
© 2006 United Nations Environment Programme
ISSN 1651-940X
University of KalmarSE-391 82 KalmarSweden
United Nations Environment ProgrammePO Box 30552,Nairobi, Kenya
This publication may be reproduced in whole or in part and in any form for educational or non-profi t purposes without special permission from the copyright holder, provided acknowledgement of the source is made. No use of this publication may be made for resale or for any other commercial purpose whatsoever without prior permission in writing from the United Nations Environment Programme.
CITATIONSWhen citing this report, please use:UNEP, 2006. Permanent Commission for the South Pacifi c (CPPS). Eastern Equatorial Pacifi c, GIWA Regional assessment 65. University of Kalmar, Kalmar, Sweden.
DISCLAIMERThe views expressed in this publication are those of the authors and do not necessarily refl ect those of UNEP. The designations employed and the presentations do not imply the expressions of any opinion whatsoever on the part of UNEP or cooperating agencies concerning the legal status of any country, territory, city or areas or its authority, or concerning the delimitation of its frontiers or boundaries.
This publication has been peer-reviewed and the information herein is believed to be reliable, but the publisher does not warrant its completeness or accuracy.
Publishing house: Kirjastusaktsiaselts MATS, Tallinn Printed in Estonia by Tallinna Raamatutrükikoda, 2006
CONTENTS
Contents
Executive summary 9Abbreviations and acronyms 13Regional defi nition 16Boundaries of the Eastern Equatorial Pacifi c region 16Physical characteristics 17Socio-economic characteristics 21Regional cooperation 24
Assessment 26Freshwater shortage 26Pollution 32Habitat and community modifi cation 40Unsustainable exploitation of fi sh and other living resources 42Global change 45Priority concerns for further analysis 47
Causal chain analysis 49Freshwater shortage 49Pollution 52Unsustainable exploitation of fi sh and other living resources 55
Policy options 57Southwest Mexico 57Central Equatorial Pacifi c sub-system 59Pacifi c Colombian sub-system 62
Conclusions and recommendations 64Southwest Mexico 64Central Equatorial Pacifi c sub-system 64Pacifi c Colombian sub-system 65
References 67Annexes 74Annex I List of contributing authors and organisations 74Annex II Detailed scoring tables 75Annex III Regional agreements, conventions and projects 78Annex IV Fee-and-rebate system (Southwest Mexico sub-system) 81
The Global International Waters Assessment iThe GIWA methodology vii
EXECUTIVE SUMMARY 9
Executive summary
the south and the Equatorial Counter-current from the west. The
interactions of these currents result in zones of upwelling with
productive fi sheries. There are extensive lakes in the region, notably in
Nicaragua. Two Guatemalean rivers discharge through neighbouring
countries – the Suchiate in Mexico and the Paz in El Salvador. In El
Salvador, transboundary rivers include the Paz, shared with Guatemala,
and the Gosgocaran, shared with Honduras. Honduras also shares
Nicaragua’s Negro River.
Agriculture is the main economic activity in the region, providing
employment for around half of the economically active population.
Coastal and artisanal fi sheries have a high socio-economic signifi cance,
employing around 500 000 fi shermen and processing plant operators.
Aquaculture, particularly of shrimps, is growing in the region, with 70% of
Central America’s total production coming from Honduras and Panama.
Tourism is also growing, accounting for some 30% of GDP, making it the
region’s second most important economic activity. Except in Colombia
and Mexico, industry is underdeveloped, contributing only 15% to
the regional GDP. There is intensive shipping throughout the region
including an intercontinental maritime route and, notably, the Panama
Canal. Mining of the region’s rich mineral resources produces signifi cant
proportions of the world’s totals, especially silver, lead and zinc.
Assessment of the Southwest Mexico sub-system
Pollution was considered to be the priority concern of this sub-
system. The enormous amount of untreated wastewater entering
the aquatic environment is deteriorating the environmental quality of
the sub-system’s water bodies. In Mexico, two thirds of wastewater is
discharged into the Pacifi c Ocean. Microbiological pollution on Mexican
beaches has been identifi ed as a priority by Mexican authorities due
to the potential eff ects on human health and tourism. Fertiliser use in
Mexico has increased considerably, causing eutrophication in many
water bodies, notably Lake Chapala where there is a proliferation of
Regional Defi nition
The GIWA Eastern Equatorial Pacifi c region extends along the west
coast of Central America from the Colombian-Ecuador border in the
south to northern Central Mexico. It includes El Salvador and the Pacifi c
coastal areas of seven other countries – Mexico, Guatemala, Honduras,
Nicaragua, Costa Rica, Panama and Colombia. The region was divided
into three sub-systems – Southwest Mexico, Central Equatorial Pacifi c
and Pacifi c Colombian. The GIWA assessment focuses predominantly
on the Central Equatorial Pacifi c sub-system as it includes most of the
signifi cant and reported transboundary issues.
The Southwest Mexico sub-system extends along 1 800 km of Mexico’s
Pacifi c coast from the border between the states of Nayarit and Sinaloa
in the north to the border with Guatemala in the south. The Central
Equatorial Pacifi c sub-system includes the western part of the Central
American isthmus and extends along 3 870 km of Pacifi c coast from
the Guatemala-Mexico border in the north to the Panama-Colombia
border in the south. The Pacifi c Colombian sub-system’s coast extends
for 1 300 km from Colombia’s border with Panama in the north to its
border with Ecuador.
The climate of the Southwest Mexico sub-system ranges from tropical
(in the lower-lying coastal areas) to warm temperate. The climate of
the Central Equatorial Pacifi c sub-system is tropical to temperate with
a winter dry period, when drought conditions occur in a corridor
extending from Guatemala to the northern part of Costa Rica; also
aff ecting parts of Panama. Drought conditions are intensifi ed during
El Niño events. The Pacifi c Colombian sub-system is wet tropical,
infl uenced by the Intertropical Convergence Zone, its proximity to the
ocean, and the El Niño climatic events.
The region’s marine area is infl uenced by three major current systems
– the California Current from the north, the Humboldt Current from
10 GIWA REGIONAL ASSESSMENT 65 EASTERN EQUATORIAL PACIFIC
algae and invasive aquatic weeds. Closed seasons during HAB events
have resulted in economic losses of 200 million USD to the fi sheries
industry. Mexico uses more pesticides than any other country in the
GIWA Eastern Equatorial Pacifi c region. However, DDT application has
decreased considerably since the 1960s. Heavy metal contamination
is particularly high in the Lerma River basin and Lake Chapala, causing
toxicological induced mutations in some fi sh species. The water bodies
of the sub-system carry large amounts of suspended solids which are
causing severe sedimentation in lakes and coastal wetlands.
Freshwater shortage was considered to be the second priority concern
of the Southwest Mexico sub-system. Although the rivers are highly
dynamic and characterised by signifi cant inter-annual fl uctuations,
discharges have shown a decreasing trend over the past 40 years, largely
due to increased abstraction. The availability of water suitable for human
consumption has declined due to contamination by the discharge of
untreated wastewater. The aquifers in the Lerma-Santiago-Pacifi co
basin have been overabstracted mainly to supply water for agriculture.
The depletion of groundwater supplies is concerning given that 70% of
the basin’s population obtain their water supply from aquifers.
Assessment of the Central Equatorial Pacifi c sub-system
Freshwater shortage was considered to be the priority aquatic concern.
Although water resources are abundant they are unevenly distributed,
some areas suff ering shortages during the dry season. Pollution,
deforestation and inappropriate soil management are adversely
aff ecting downstream transboundary aquatic ecosystems by changing
the dynamics of accretion and erosion, the supply of nutrients and the
patterns of fl ooding, as well as by reducing the availability and quality
of water resources. Areas defi cient in water are generally the more
densely populated with the greatest concentration of economic
activity. Continuing population growth and economic development
will increase the demand for water, increasing the extent and severity
of water shortages. Excessive groundwater abstraction is threatening
aquifers and resulting in acute water shortages for populations
dependent on groundwater. Global climate change will aff ect the
future availability of freshwater in the sub-system. Rainfall is expected
to become more intense during the rainy season and droughts more
severe during the dry season
Pollution was identifi ed as the second priority concern. In 2000,
approximately 22% of the population had no access to safe freshwater;
in rural areas half the population obtained water from polluted natural
water bodies. Wastewater discharged without treatment is the most
widespread pollution issue. Excepting Costa Rica, there is a low level of
sanitation coverage. In general, coverage of sanitation and drinking water
services has not matched population growth and urban development.
As a consequence, water-related diseases are increasingly prevalent.
Acute diarrheic disease is the main cause of morbidity and infant
mortality. Pesticides and fertilisers are used intensively in agriculture.
They are responsible, together with domestic wastewater, for causing
eutrophication in coastal areas, which is impacting the food security
of the coastal population. Pollution of groundwater, a major source of
water for coastal communities, is increasing; higher demand has led to
increased abstraction, leading to saline intrusion. Groundwater is also
being polluted by urban and agricultural run-off .
Assessment of the Pacifi c Colombian sub-system
The unsustainable exploitation of fi sh and other living resources was
the principal concern of the sub-system. Despite most of the fi sheries
in Colombia being small scale and/or subsistence, the current level of
exploitation is unsustainable; catches of some traditionally targeted
species such as mackerel and sharks have declined. Similarly, stocks
of freshwater commercial species are signifi cantly depleted. Although
there have been no studies of the level of by-catch in the Pacifi c
Colombian, based on studies in territories within close proximity of the
sub-system, it is believed that large quantities of fi sh are caught as by-
catch in the shrimp trawling industry and the majority are discarded.
Pollution was considered by the regional team to be the second
priority concern. The Pacifi c Colombian sub-system has the highest
rate of fertiliser consumption on the Pacifi c coast of South America
resulting in some areas, such as Tumaco and Buenaventura, having
eutrophic conditions. Variable concentrations of pesticides have been
found in water, sediment and organisms at diff erent sites in Colombia.
Concentrations of DDTs in surface sediments exceed international
and national standards. Extensive deforestation has exacerbated
erosion, increasing the amount of sediments entering the rivers.
Unplanned urban development has resulted in wastes being disposed
of inappropriately. Localised oil spills from exploitation, refi ning and
transport activities have been reported.
Causal chain analysis
In the Southwest Mexico sub-system, only a quarter of the population is
connected to wastewater treatment facilities. The sewage infrastructure
that does exist is commonly non-operational, with most wastewater
discharged directly into the ocean or inland waterways without
treatment. Coastal tourism development is increasing further the
pressure on sewer infrastructure. Regulatory agencies have achieved
increasing success in controlling large-volume industrial polluters
whose wastes fl ow into federal waterways. Pollution levels are still high,
however, due to a lack of direct control over municipal pollution sources
EXECUTIVE SUMMARY 11
and weak enforcement power to collect fi nes from municipalities who
exceed federal pollution limits. Local municipal governments lack
technical expertise and fi nancial capacity to create and maintain
wastewater treatment networks.
In the Central Equatorial Pacifi c sub-system, freshwater shortage
is being caused by the modifi cation of stream fl ow, pollution and
excessive abstraction of groundwater from aquifers. The demographic
trends of the last four decades have led to increasing demand for
freshwater resources for drinking water, agricultural production and
industrial processes. Urbanisation has intensifi ed and concentrated
demand in areas that have limited freshwater availability. The current
water distribution systems are obsolete and highly ineffi cient, but
countries lack the economic resources needed to adopt water-
effi cient technologies. The development of freshwater supply and
sanitation coverage is not keeping pace with population growth,
posing a growing risk for human health. Low tariff rates for water and
underinvestment in sanitation infrastructure are the principal causes
of the lack of basic sanitation services. Most countries have weak legal
and institutional frameworks for water management and there is a lack
of a transboundary approach to shared basins. Other shortcomings
are a lack of a multidisciplinary approach resulting in inter-institutional
confl icts and a lack of monitoring, control and surveillance for the
implementation of existing regulations. There is a dearth of knowledge
regarding water quality and the eff ects of pollutants on ecosystems and
their biota. There is also a lack of public awareness of water issues and
there is no culture of water conservation. Other than the consumptive
benefi ts of water, there is little recognition or valuation of the indirect
benefi ts that water provides through ecosystem goods and services.
On the Pacifi c Colombian coast, non-selective and destructive fi shing
gear is used to increase short-term profi ts at the detriment of fi sh stocks
and marine ecosystems. As the distribution of fi sh species has changed
and stocks of traditionally exploited species have declined, the fi shing
industry has began to exploit stocks which are further off shore using
new technologies. The fi sheries sector concentrates on certain valuable
species to supply the export, rather than domestic, fi sh market. Existing
laws related to the fi sheries are weakly enforced allowing domestic and
foreign fi shing fl eets to avoid legislation. There is lack of institutional
cooperation, fi sheries statistics and stakeholder participation to aid and
improve the eff ectiveness of decision making processes.
Policy options
Recommendations made by the GIWA regional experts of the Eastern
Equatorial Pacifi c region coincide with those of international fora on
water management and the Environmental Plan of Central America
(PARCA). The policy options discussed address a range of root causes
identifi ed during the Causal chain analysis:
Policy options for addressing microbiological pollution in the Southwest
Mexico sub-system:
Rehabilitate existing, and construct new, wastewater treatment
facilities;
Introduce a fee-and-rebate system for municipal wastewater;
Reduce excess water use;
Formulate and implement education and information strategies;
Publicly rate municipalities for their level of compliance with
wastewater treatment standards;
Create autonomous water districts; and
Reform the pollution-related legal framework.
Policy options for addressing freshwater shortage in the Central
Equatorial Pacifi c sub-system
Integrate territorial planning with water management;
Promote new development centres in rural areas;
Strengthen and establish further monitoring programmes;
Develop and implement environmental awareness programmes;
Reorganise the water sector; and
Finance the maintenance and expansion of water services by
introducing water rates.
Policy options for addressing microbiological pollution in the Central
Equatorial Pacifi c sub-system:
Invest in treatment infrastructure;
Adopt the polluter pays-principle;
Review and reform regional and national legal frameworks;
Strengthen the capacity of the agencies responsible for water
management;
Develop and implement environmental awareness programmes;
and
Strengthen information management.
Policy options for addressing overexploitation of the fi sheries in the
Pacifi c Colombian sub-system:
Transfer of sustainable technologies;
Enhance information management and education programmes;
Further implement integrated coastal zone management (ICZM);
and
Strengthen the self-regulation of coastal communities.
The countries of the Eastern Equatorial Pacifi c region are inextricably
linked by hydrological processes. Water is a vector transporting not
12 GIWA REGIONAL ASSESSMENT 65 EASTERN EQUATORIAL PACIFIC
only a wide variety of valuable resources but also problems from one
country to another. In the Southwest Mexico sub-system, increased
understanding of pollution issues, the establishment of communication
networks between the stakeholders of a river basin, the creation of
incentives as well as penalties for polluters, and greater civil legal
powers will shift the political situation in favour of environmental
protection. In order to address transboundary pollution and freshwater
scarcity in the Central Equatorial Pacifi c sub-system, a fi rst step would be
the implementation of regional instruments of cooperation such as the
Plan of Action for the Protection of the Marine Environment and Coastal
Areas of the North East Pacifi c. The regional experts recognise that the
institutional inadequacies of water management need to be addressed,
and recommended the development of environmental awareness
programmes and the reorganisation of the water sector. To address the
overexploitation of the fi sheries in the Pacifi c Colombian sub-system,
the regional experts recommended that the most feasible option would
be to enhance information management and education programmes
and to strengthen the self-regulations of local communities.
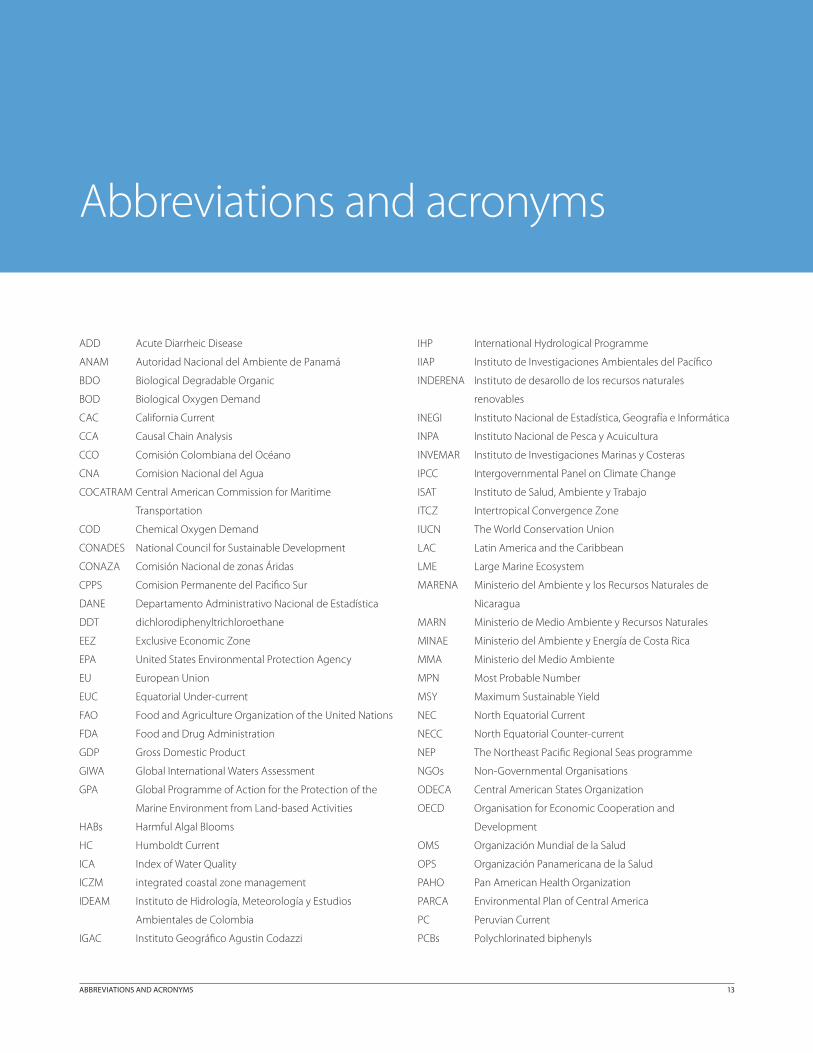
ABBREVIATIONS AND ACRONYMS 13
Abbreviations and acronyms
IHP International Hydrological Programme
IIAP Instituto de Investigaciones Ambientales del Pacífi co
INDERENA Instituto de desarollo de los recursos naturales
renovables
INEGI Instituto Nacional de Estadística, Geografía e Informática
INPA Instituto Nacional de Pesca y Acuicultura
INVEMAR Instituto de Investigaciones Marinas y Costeras
IPCC Intergovernmental Panel on Climate Change
ISAT Instituto de Salud, Ambiente y Trabajo
ITCZ Intertropical Convergence Zone
IUCN The World Conservation Union
LAC Latin America and the Caribbean
LME Large Marine Ecosystem
MARENA Ministerio del Ambiente y los Recursos Naturales de
Nicaragua
MARN Ministerio de Medio Ambiente y Recursos Naturales
MINAE Ministerio del Ambiente y Energía de Costa Rica
MMA Ministerio del Medio Ambiente
MPN Most Probable Number
MSY Maximum Sustainable Yield
NEC North Equatorial Current
NECC North Equatorial Counter-current
NEP The Northeast Pacifi c Regional Seas programme
NGOs Non-Governmental Organisations
ODECA Central American States Organization
OECD Organisation for Economic Cooperation and
Development
OMS Organización Mundial de la Salud
OPS Organización Panamericana de la Salud
PAHO Pan American Health Organization
PARCA Environmental Plan of Central America
PC Peruvian Current
PCBs Polychlorinated biphenyls
ADD Acute Diarrheic Disease
ANAM Autoridad Nacional del Ambiente de Panamá
BDO Biological Degradable Organic
BOD Biological Oxygen Demand
CAC California Current
CCA Causal Chain Analysis
CCO Comisión Colombiana del Océano
CNA Comision Nacional del Agua
COCATRAM Central American Commission for Maritime
Transportation
COD Chemical Oxygen Demand
CONADES National Council for Sustainable Development
CONAZA Comisión Nacional de zonas Áridas
CPPS Comision Permanente del Pacifi co Sur
DANE Departamento Administrativo Nacional de Estadística
DDT dichlorodiphenyltrichloroethane
EEZ Exclusive Economic Zone
EPA United States Environmental Protection Agency
EU European Union
EUC Equatorial Under-current
FAO Food and Agriculture Organization of the United Nations
FDA Food and Drug Administration
GDP Gross Domestic Product
GIWA Global International Waters Assessment
GPA Global Programme of Action for the Protection of the
Marine Environment from Land-based Activities
HABs Harmful Algal Blooms
HC Humboldt Current
ICA Index of Water Quality
ICZM integrated coastal zone management
IDEAM Instituto de Hidrología, Meteorología y Estudios
Ambientales de Colombia
IGAC Instituto Geográfi co Agustin Codazzi
14 GIWA REGIONAL ASSESSMENT 65 EASTERN EQUATORIAL PACIFIC
PNUD Programa de las Naciones Unidas para el Desarrollo
PNUMA Programa de Naciones Unidas para el Medio Ambiente
PSP Paralytic Shellfi sh Poisoning
SEC South Equatorial Current
SEMAR Ministry of the Navy
SEMARNAT Ministry of Environment and Natural Resources
SERNA Secretary of Natural Resources and Environment
SNET Servicio Nacional de Estudios Territoriales
TDSs Total Dissolved Solids
TEDs Turtle Exclusion Devices
UNEP United Nations Environmental Programme
UNESCO United Nations Educational, Scientifi c and Cultural
Organization
USD United States Dollar
WCMC World Conservation Monitoring Centre
WFP World Food Programme
ABBREVIATIONS AND ACRONYMS 15
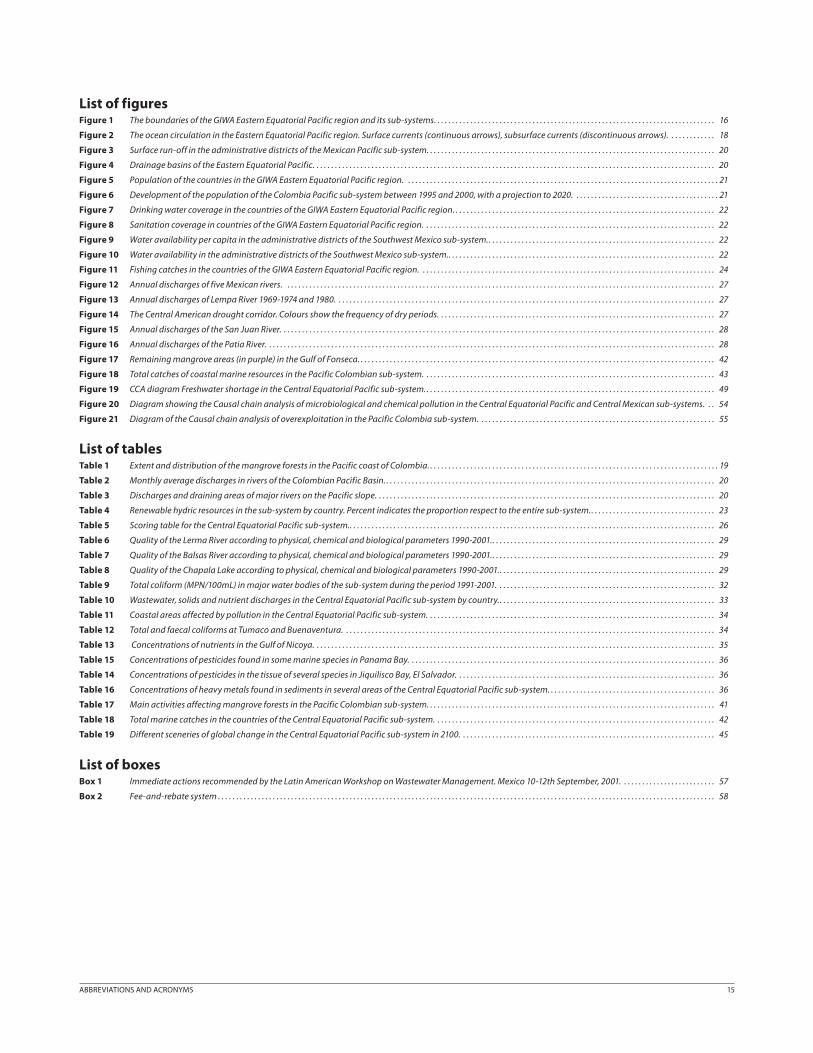
List of tablesTable 1 Extent and distribution of the mangrove forests in the Pacific coast of Colombia. . . . . . . . . . . . . . . . . . . . . . . . . . . . . . . . . . . . . . . . . . . . . . . . . . . . . . . . . . . . . . . . . . . . . . . . . . . . . . . . 19
Table 2 Monthly average discharges in rivers of the Colombian Pacific Basin. . . . . . . . . . . . . . . . . . . . . . . . . . . . . . . . . . . . . . . . . . . . . . . . . . . . . . . . . . . . . . . . . . . . . . . . . . . . . . . . . . . . . . . . . . . 20
Table 3 Discharges and draining areas of major rivers on the Pacific slope. . . . . . . . . . . . . . . . . . . . . . . . . . . . . . . . . . . . . . . . . . . . . . . . . . . . . . . . . . . . . . . . . . . . . . . . . . . . . . . . . . . . . . . . . . . . . 20
Table 4 Renewable hydric resources in the sub-system by country. Percent indicates the proportion respect to the entire sub-system.. . . . . . . . . . . . . . . . . . . . . . . . . . . . . . . . . . 23
Table 5 Scoring table for the Central Equatorial Pacific sub-system.. . . . . . . . . . . . . . . . . . . . . . . . . . . . . . . . . . . . . . . . . . . . . . . . . . . . . . . . . . . . . . . . . . . . . . . . . . . . . . . . . . . . . . . . . . . . . . . . . . . . 26
Table 6 Quality of the Lerma River according to physical, chemical and biological parameters 1990-2001.. . . . . . . . . . . . . . . . . . . . . . . . . . . . . . . . . . . . . . . . . . . . . . . . . . . . . . . . . . . . . 29
Table 7 Quality of the Balsas River according to physical, chemical and biological parameters 1990-2001.. . . . . . . . . . . . . . . . . . . . . . . . . . . . . . . . . . . . . . . . . . . . . . . . . . . . . . . . . . . . . 29
Table 8 Quality of the Chapala Lake according to physical, chemical and biological parameters 1990-2001.. . . . . . . . . . . . . . . . . . . . . . . . . . . . . . . . . . . . . . . . . . . . . . . . . . . . . . . . . . . 29
Table 9 Total coliform (MPN/100mL) in major water bodies of the sub-system during the period 1991-2001. . . . . . . . . . . . . . . . . . . . . . . . . . . . . . . . . . . . . . . . . . . . . . . . . . . . . . . . . . . . 32
Table 10 Wastewater, solids and nutrient discharges in the Central Equatorial Pacific sub-system by country.. . . . . . . . . . . . . . . . . . . . . . . . . . . . . . . . . . . . . . . . . . . . . . . . . . . . . . . . . . . 33
Table 11 Coastal areas affected by pollution in the Central Equatorial Pacific sub-system. . . . . . . . . . . . . . . . . . . . . . . . . . . . . . . . . . . . . . . . . . . . . . . . . . . . . . . . . . . . . . . . . . . . . . . . . . . . . . . 34
Table 12 Total and faecal coliforms at Tumaco and Buenaventura. . . . . . . . . . . . . . . . . . . . . . . . . . . . . . . . . . . . . . . . . . . . . . . . . . . . . . . . . . . . . . . . . . . . . . . . . . . . . . . . . . . . . . . . . . . . . . . . . . . . . . 34
Table 13 Concentrations of nutrients in the Gulf of Nicoya. . . . . . . . . . . . . . . . . . . . . . . . . . . . . . . . . . . . . . . . . . . . . . . . . . . . . . . . . . . . . . . . . . . . . . . . . . . . . . . . . . . . . . . . . . . . . . . . . . . . . . . . . . . . . . 35
Table 15 Concentrations of pesticides found in some marine species in Panama Bay. . . . . . . . . . . . . . . . . . . . . . . . . . . . . . . . . . . . . . . . . . . . . . . . . . . . . . . . . . . . . . . . . . . . . . . . . . . . . . . . . . . . 36
Table 14 Concentrations of pesticides in the tissue of several species in Jiquilisco Bay, El Salvador. . . . . . . . . . . . . . . . . . . . . . . . . . . . . . . . . . . . . . . . . . . . . . . . . . . . . . . . . . . . . . . . . . . . . . . 36
Table 16 Concentrations of heavy metals found in sediments in several areas of the Central Equatorial Pacific sub-system. . . . . . . . . . . . . . . . . . . . . . . . . . . . . . . . . . . . . . . . . . . . . . 36
Table 17 Main activities affecting mangrove forests in the Pacific Colombian sub-system. . . . . . . . . . . . . . . . . . . . . . . . . . . . . . . . . . . . . . . . . . . . . . . . . . . . . . . . . . . . . . . . . . . . . . . . . . . . . . . 41
Table 18 Total marine catches in the countries of the Central Equatorial Pacific sub-system. . . . . . . . . . . . . . . . . . . . . . . . . . . . . . . . . . . . . . . . . . . . . . . . . . . . . . . . . . . . . . . . . . . . . . . . . . . . . 42
Table 19 Different sceneries of global change in the Central Equatorial Pacific sub-system in 2100. . . . . . . . . . . . . . . . . . . . . . . . . . . . . . . . . . . . . . . . . . . . . . . . . . . . . . . . . . . . . . . . . . . . . . 45
List of boxesBox 1 Immediate actions recommended by the Latin American Workshop on Wastewater Management. Mexico 10-12th September, 2001. . . . . . . . . . . . . . . . . . . . . . . . . . 57
Box 2 Fee-and-rebate system . . . . . . . . . . . . . . . . . . . . . . . . . . . . . . . . . . . . . . . . . . . . . . . . . . . . . . . . . . . . . . . . . . . . . . . . . . . . . . . . . . . . . . . . . . . . . . . . . . . . . . . . . . . . . . . . . . . . . . . . . . . . . . . . . . . . . . . . 58
List of figuresFigure 1 The boundaries of the GIWA Eastern Equatorial Pacific region and its sub-systems. . . . . . . . . . . . . . . . . . . . . . . . . . . . . . . . . . . . . . . . . . . . . . . . . . . . . . . . . . . . . . . . . . . . . . . . . . . . . 16
Figure 2 The ocean circulation in the Eastern Equatorial Pacific region. Surface currents (continuous arrows), subsurface currents (discontinuous arrows). . . . . . . . . . . . . 18
Figure 3 Surface run-off in the administrative districts of the Mexican Pacific sub-system. . . . . . . . . . . . . . . . . . . . . . . . . . . . . . . . . . . . . . . . . . . . . . . . . . . . . . . . . . . . . . . . . . . . . . . . . . . . . . . 20
Figure 4 Drainage basins of the Eastern Equatorial Pacific. . . . . . . . . . . . . . . . . . . . . . . . . . . . . . . . . . . . . . . . . . . . . . . . . . . . . . . . . . . . . . . . . . . . . . . . . . . . . . . . . . . . . . . . . . . . . . . . . . . . . . . . . . . . . . 20
Figure 5 Population of the countries in the GIWA Eastern Equatorial Pacific region. . . . . . . . . . . . . . . . . . . . . . . . . . . . . . . . . . . . . . . . . . . . . . . . . . . . . . . . . . . . . . . . . . . . . . . . . . . . . . . . . . . . . . 21
Figure 6 Development of the population of the Colombia Pacific sub-system between 1995 and 2000, with a projection to 2020. . . . . . . . . . . . . . . . . . . . . . . . . . . . . . . . . . . . . . . . 21
Figure 7 Drinking water coverage in the countries of the GIWA Eastern Equatorial Pacific region. . . . . . . . . . . . . . . . . . . . . . . . . . . . . . . . . . . . . . . . . . . . . . . . . . . . . . . . . . . . . . . . . . . . . . . . 22
Figure 8 Sanitation coverage in countries of the GIWA Eastern Equatorial Pacific region. . . . . . . . . . . . . . . . . . . . . . . . . . . . . . . . . . . . . . . . . . . . . . . . . . . . . . . . . . . . . . . . . . . . . . . . . . . . . . . . 22
Figure 9 Water availability per capita in the administrative districts of the Southwest Mexico sub-system.. . . . . . . . . . . . . . . . . . . . . . . . . . . . . . . . . . . . . . . . . . . . . . . . . . . . . . . . . . . . . . 22
Figure 10 Water availability in the administrative districts of the Southwest Mexico sub-system.. . . . . . . . . . . . . . . . . . . . . . . . . . . . . . . . . . . . . . . . . . . . . . . . . . . . . . . . . . . . . . . . . . . . . . . . . 22
Figure 11 Fishing catches in the countries of the GIWA Eastern Equatorial Pacific region. . . . . . . . . . . . . . . . . . . . . . . . . . . . . . . . . . . . . . . . . . . . . . . . . . . . . . . . . . . . . . . . . . . . . . . . . . . . . . . . . 24
Figure 12 Annual discharges of five Mexican rivers. . . . . . . . . . . . . . . . . . . . . . . . . . . . . . . . . . . . . . . . . . . . . . . . . . . . . . . . . . . . . . . . . . . . . . . . . . . . . . . . . . . . . . . . . . . . . . . . . . . . . . . . . . . . . . . . . . . . . . 27
Figure 13 Annual discharges of Lempa River 1969-1974 and 1980. . . . . . . . . . . . . . . . . . . . . . . . . . . . . . . . . . . . . . . . . . . . . . . . . . . . . . . . . . . . . . . . . . . . . . . . . . . . . . . . . . . . . . . . . . . . . . . . . . . . . . . . 27
Figure 14 The Central American drought corridor. Colours show the frequency of dry periods. . . . . . . . . . . . . . . . . . . . . . . . . . . . . . . . . . . . . . . . . . . . . . . . . . . . . . . . . . . . . . . . . . . . . . . . . . . . 27
Figure 15 Annual discharges of the San Juan River. . . . . . . . . . . . . . . . . . . . . . . . . . . . . . . . . . . . . . . . . . . . . . . . . . . . . . . . . . . . . . . . . . . . . . . . . . . . . . . . . . . . . . . . . . . . . . . . . . . . . . . . . . . . . . . . . . . . . . . 28
Figure 16 Annual discharges of the Patia River. . . . . . . . . . . . . . . . . . . . . . . . . . . . . . . . . . . . . . . . . . . . . . . . . . . . . . . . . . . . . . . . . . . . . . . . . . . . . . . . . . . . . . . . . . . . . . . . . . . . . . . . . . . . . . . . . . . . . . . . . . . 28
Figure 17 Remaining mangrove areas (in purple) in the Gulf of Fonseca. . . . . . . . . . . . . . . . . . . . . . . . . . . . . . . . . . . . . . . . . . . . . . . . . . . . . . . . . . . . . . . . . . . . . . . . . . . . . . . . . . . . . . . . . . . . . . . . . . 42
Figure 18 Total catches of coastal marine resources in the Pacific Colombian sub-system. . . . . . . . . . . . . . . . . . . . . . . . . . . . . . . . . . . . . . . . . . . . . . . . . . . . . . . . . . . . . . . . . . . . . . . . . . . . . . . . 43
Figure 19 CCA diagram Freshwater shortage in the Central Equatorial Pacific sub-system.. . . . . . . . . . . . . . . . . . . . . . . . . . . . . . . . . . . . . . . . . . . . . . . . . . . . . . . . . . . . . . . . . . . . . . . . . . . . . . . 49
Figure 20 Diagram showing the Causal chain analysis of microbiological and chemical pollution in the Central Equatorial Pacific and Central Mexican sub-systems. . . 54
Figure 21 Diagram of the Causal chain analysis of overexploitation in the Pacific Colombia sub-system. . . . . . . . . . . . . . . . . . . . . . . . . . . . . . . . . . . . . . . . . . . . . . . . . . . . . . . . . . . . . . . . . 55
16 GIWA REGIONAL ASSESSMENT 65 EASTERN EQUATORIAL PACIFIC
Regional defi nition
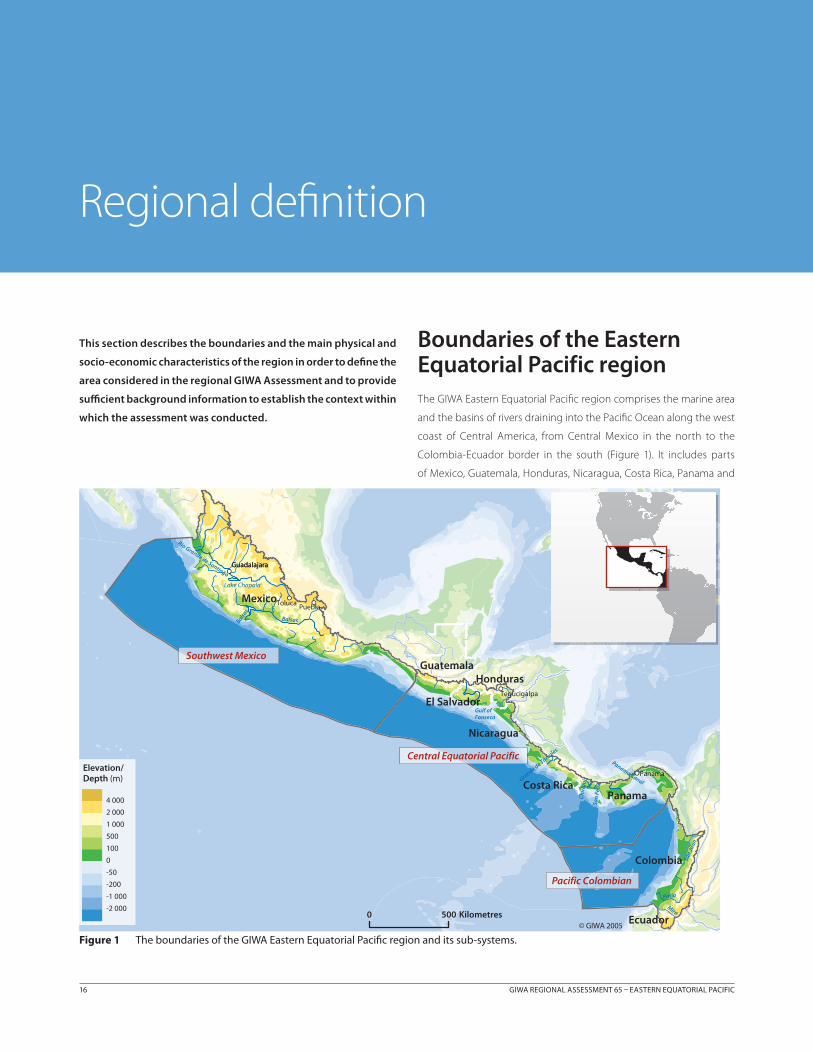
Boundaries of the Eastern Equatorial Pacific regionThe GIWA Eastern Equatorial Pacifi c region comprises the marine area
and the basins of rivers draining into the Pacifi c Ocean along the west
coast of Central America, from Central Mexico in the north to the
Colombia-Ecuador border in the south (Figure 1). It includes parts
of Mexico, Guatemala, Honduras, Nicaragua, Costa Rica, Panama and
This section describes the boundaries and the main physical and
socio-economic characteristics of the region in order to defi ne the
area considered in the regional GIWA Assessment and to provide
suffi cient background information to establish the context within
which the assessment was conducted.
San
Felix
Chir
iquíGra
nde de Tárcales
Mexico
Colombia
Nicaragua
Honduras
Ecuador
Guatemala
PanamaCosta Rica
El Salvador
BalsasBalsas
Rio Grande de Santiago
Patia
Mira
San
Juan
Panama Canal
Lake Chapala
Guadalajara
Panama
PueblaToluca
Tegucigalpa
Guadalajara
Southwest Mexico
Central Equatorial Pacific
Pacific Colombian
Gulf of Fonseca
Elevation/Depth (m)
4 000
2 000
1 000
500
100
0
-50
-200
-1 000
-2 0000 500 Kilometres
© GIWA 2005
Figure 1 The boundaries of the GIWA Eastern Equatorial Pacifi c region and its sub-systems.
REGIONAL DEFINITION 17
Colombia, and all of El Salvador. The marine area includes the Tres Marías
Islands at its northern limit. The marine boundary of the region is based
on the criteria used to defi ne the Large Marine Ecosystems (LME) of
the Equatorial Pacifi c – the Humboldt Current and California Current
(Sea Around Us Project 2002). The land boundary is mostly an arbitrary
line based on diff ering historical and economic development, and
population occupancy between the Caribbean and the Pacifi c zones
of the Central American countries (PNUD/EU 1998); in the southern part
of Colombia, it is taken as the west Andean mountain branch, which
physically divides that country. The Gulf of Fonseca is an important
transboundary feature of the region shared by three countries, El
Salvador, Honduras and Nicaragua. There are minor transboundary
rivers along the borders of several countries, as well as important
national rivers that have transboundary impacts in the coastal zone.
The environmental characteristics of the Central American countries
(Guatemala, Honduras, El Salvador, Nicaragua, Costa Rica and Panama)
are similar, and show distinct diff erences to Mexico and Colombia. For
example, Colombia is among the six countries that possess over half
of the global surface water resources (Tierramerica 2004), whereas
water is scarce in most Central American countries. The environmental
problems of Mexico and Colombia are also diff erent because of
their higher levels of industrialisation and urbanisation. Taking these
diff erences into account, the regional experts considered it appropriate
to divide the region into three sub-systems – the Mexican Southwest
Pacifi c, Central Equatorial Pacifi c, and Pacifi c Colombian sub-systems
(Figure 1). Because of the lack of signifi cant transboundary issues in
the Southwest Mexico and Pacifi c Colombian sub-systems, detailed
Assessment and Causal chain analysis have been focused more on the
Central Equatorial Pacifi c sub-system.
Physical characteristics
The countries of the Eastern Equatorial Pacifi c region have several
environmental features in common. These include extensive coastal
areas in the Pacifi c basin, unevenly distributed water resources and
vulnerability to recurrent and extreme natural events, such as hurricanes
and the El Niño phenomenon.
The Southwest Mexico sub-system includes seven coastal states
(Nayarit, Jalisco, Colima, Michoacan, Guerrero, Oaxaca and Chiapas)
along 1 800 km of the Pacifi c coast of Mexico. The sub-system stretches
from the border between the states of Nayarit and Sinaloa in the north
to the border with Guatemala in the south. It covers about 500 000 km2,
some 25% of Mexico’s total area. The marine area is infl uenced by the
cold California Current from the north and a branch of the warm
Equatorial Current from the south. The interaction of these currents
produces an active marine area. Major geographic features include the
Gulf and Ithmus of Tehuantepec in the south of the sub-system and the
Revillagigedo archipelago in the northwest.
The Central Equatorial sub-system includes the western part of the
Central American isthmus, which is fl anked to the east by the Caribbean
Sea and to the west by the Pacifi c Ocean. It includes the coastal and
marine areas of six countries (Costa Rica, El Salvador, Guatemala,
Honduras, Nicaragua and Panama) with 3 870 km of coastline. It
extends from the Guatemala-Mexico border in the north to the
Panama-Colombia border in the south (Figure 1). The total coastal area
infl uenced by the Pacifi c Ocean is estimated to be 150 300 km2 (PNUMA
2001). The sub-system’s continental area is characterised by a mountain
range with two orographic systems – an older range in Guatemala,
Honduras and Nicaragua and a younger one in Panama and Costa Rica,
extending through the southeastern part of Nicaragua.
The Pacifi c Colombian coast is fl anked by the Panama Bight in the
Eastern Tropical region of the Pacifi c Ocean (Steer et al. 1997). It
extends for 1 300 km from Colombia’s border with Panama at Jurado
in the north to its border with Equador near the outlet of the Mira River
at Cape Manglares in the south (Figure 1) (Prahl et al. 1990, Restrepo &
Kjerve 2000). It includes the islands of Gorgona, Gorgonilla and Malpelo
(Steer et al. 1997). Its land area is 23 500 km2 – around 2% of Colombian
territory. Its oceanic area is 339 500 km2.
ClimateThe climate of the Southwest Mexico sub-system is strongly infl uenced
by tropical anti-cyclones of the northern hemisphere. The area is sub-
humid to temperate sub-humid with temperatures higher than 26°C
along most of the coastal zone, dropping to between 18 and 21°C
during the coldest months (Amendola et al. 2005). The sub-system
receives over 800 mm of rainfall and even more in the southernmost
part in Chiapas, although it decreases steadily towards the highlands.
The rainy season is monsoonal in summer with convective rain.
The climate of the Central Equatorial Pacifi c sub-system is tropical to
temperate with a variable dry period during the winter (Ofi cina de
Coordinación Plan Puebla-Panama 2001). Conditions vary latitudinally.
There is a dry zone, named by the FAO as the drought corridor,
extending from Guatemala to the northern part of Costa Rica that
experiences drought for at least fi ve months of the year. There are also
dry areas in Panama – the dry arc of Azuero. There is a high humidity
18 GIWA REGIONAL ASSESSMENT 65 EASTERN EQUATORIAL PACIFIC
transition zone in Guatemala and a rainy zone in the south of Costa Rica
and Panama with dry periods of two months (Windevoxhel et al. 2000,
WFP/FAO 2002). Other vulnerable zones include the dry arc of the Gulf
of Fonseca on the Nicaraguan coast and some dry areas in the Paz River
basin of El Salvador. The region is vulnerable to El Niño events, when the
Pacifi c side of Central America receives abnormally little rainfall causing
intense drought conditions, whereas the Caribbean side experiences a
stronger rainy season (PNUD/EU 1998).
The Columbian Pacifi c sub-system is wet tropical and infl uenced
by the Intertropical Convergence Zone (ITCZ), its proximity to the
ocean and by climatic events such as the El Niño. The ITCZ is a zone
of low atmospheric pressure, where northeast and southeast trade
winds converge to create thermodynamic conditions that favour the
development of clouds and rain; southeast trade winds defl ect along
the coast and become western equatorial or westerly winds (INVEMAR
2003a). Heavy rainfall occurs throughout the year (INVEMAR 2003a).
Rainfall peaks twice – in April-June and September-November and is
lowest in January-March (INVEMAR 2003a).
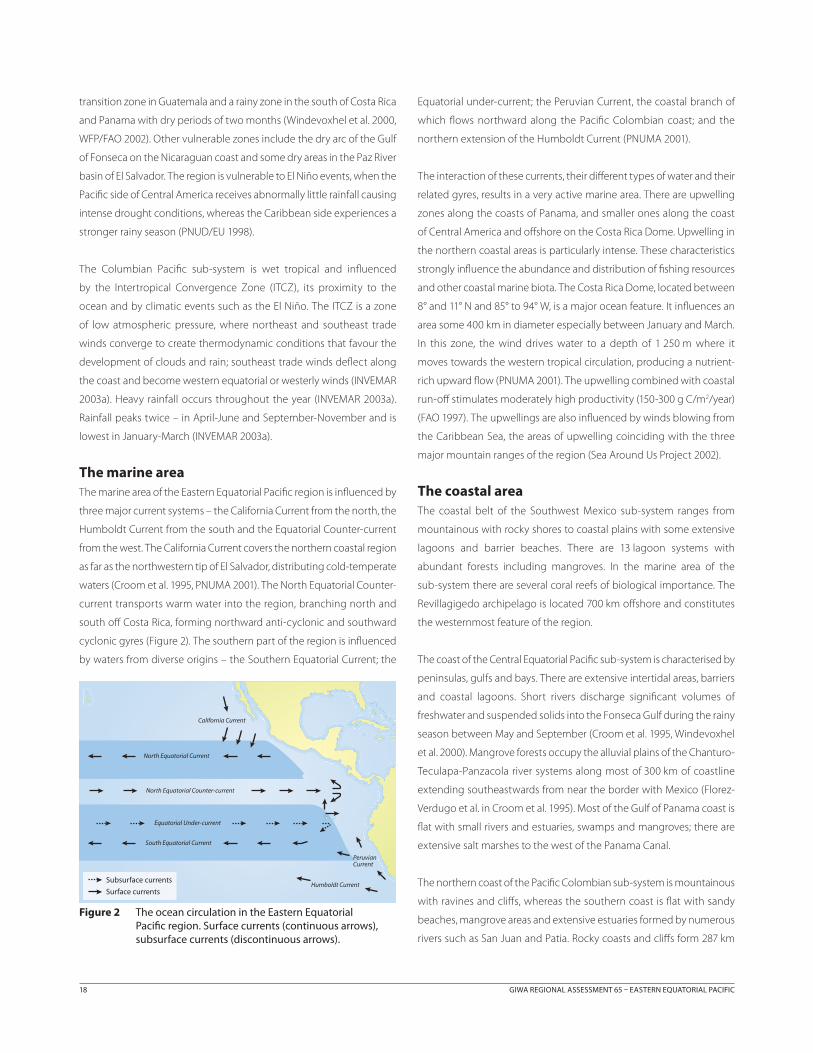
The marine areaThe marine area of the Eastern Equatorial Pacifi c region is infl uenced by
three major current systems – the California Current from the north, the
Humboldt Current from the south and the Equatorial Counter-current
from the west. The California Current covers the northern coastal region
as far as the northwestern tip of El Salvador, distributing cold-temperate
waters (Croom et al. 1995, PNUMA 2001). The North Equatorial Counter-
current transports warm water into the region, branching north and
south off Costa Rica, forming northward anti-cyclonic and southward
cyclonic gyres (Figure 2). The southern part of the region is infl uenced
by waters from diverse origins – the Southern Equatorial Current; the
Equatorial under-current; the Peruvian Current, the coastal branch of
which fl ows northward along the Pacifi c Colombian coast; and the
northern extension of the Humboldt Current (PNUMA 2001).
The interaction of these currents, their diff erent types of water and their
related gyres, results in a very active marine area. There are upwelling
zones along the coasts of Panama, and smaller ones along the coast
of Central America and off shore on the Costa Rica Dome. Upwelling in
the northern coastal areas is particularly intense. These characteristics
strongly infl uence the abundance and distribution of fi shing resources
and other coastal marine biota. The Costa Rica Dome, located between
8° and 11° N and 85° to 94° W, is a major ocean feature. It infl uences an
area some 400 km in diameter especially between January and March.
In this zone, the wind drives water to a depth of 1 250 m where it
moves towards the western tropical circulation, producing a nutrient-
rich upward fl ow (PNUMA 2001). The upwelling combined with coastal
run-off stimulates moderately high productivity (150-300 g C/m2/year)
(FAO 1997). The upwellings are also infl uenced by winds blowing from
the Caribbean Sea, the areas of upwelling coinciding with the three
major mountain ranges of the region (Sea Around Us Project 2002).
The coastal areaThe coastal belt of the Southwest Mexico sub-system ranges from
mountainous with rocky shores to coastal plains with some extensive
lagoons and barrier beaches. There are 13 lagoon systems with
abundant forests including mangroves. In the marine area of the
sub-system there are several coral reefs of biological importance. The
Revillagigedo archipelago is located 700 km off shore and constitutes
the westernmost feature of the region.
The coast of the Central Equatorial Pacifi c sub-system is characterised by
peninsulas, gulfs and bays. There are extensive intertidal areas, barriers
and coastal lagoons. Short rivers discharge signifi cant volumes of
freshwater and suspended solids into the Fonseca Gulf during the rainy
season between May and September (Croom et al. 1995, Windevoxhel
et al. 2000). Mangrove forests occupy the alluvial plains of the Chanturo-
Teculapa-Panzacola river systems along most of 300 km of coastline
extending southeastwards from near the border with Mexico (Florez-
Verdugo et al. in Croom et al. 1995). Most of the Gulf of Panama coast is
fl at with small rivers and estuaries, swamps and mangroves; there are
extensive salt marshes to the west of the Panama Canal.
The northern coast of the Pacifi c Colombian sub-system is mountainous
with ravines and cliff s, whereas the southern coast is fl at with sandy
beaches, mangrove areas and extensive estuaries formed by numerous
rivers such as San Juan and Patia. Rocky coasts and cliff s form 287 km
Surface currents
Subsurface currents
California Current
North Equatorial Current
North Equatorial Counter-current
Equatorial Under-current
South Equatorial Current
Humboldt Current
Peruvian Current
Figure 2 The ocean circulation in the Eastern Equatorial Pacifi c region. Surface currents (continuous arrows), subsurface currents (discontinuous arrows).

REGIONAL DEFINITION 19
of the northern coast at the foothills of the Baudo mountain range
(Martínez in INVEMAR 2003a). South of Cape Corrientes, cliff s are
discontinuous along the outlet of the San Juan River, Malaga Bay,
Buenaventura Bay and the Gulf of Tortugas (INVEMAR 2003a). There
are several sandy beaches on the northern coast, such as Solano Bay,
Humboldt, Aguacate, Coredo, Ardita, Nabuga and Guaca. On the
southern coast, beaches comprise sandy-muddy sediments originating
from river discharges, as at Baudo, San Juan, Dagua, Anchicayá, Naya,
Patía and Mira (Cantera & Arnaud 1995, Martínez in INVEMAR 2003a).
At the mouths of the major estuaries there are important low-lying
sandy islands (Martínez in INVEMAR 2003a). The main coastal lagoons
and estuaries are those formed by deltas of rivers, such as Jurado and
Partado, Catipre, Baudó, San Juan, San Juan de Micay, Guapí, Patía, and
bays, such as Tumaco, Málaga and Buenaventura.
BiodiversityCoastal upwelling inhibits the development of coral reefs (PNUMA/
IUCN 1988). The reefs that do occur are small and discontinuous, and
less abundant than those of the Caribbean coasts of Central America
(Glynn & Wellington 1983). Fifteen species of coral have been reported
as the most common in 42 important sites (PNUMA 2001), the greatest
diversity occurring in Mexico, Costa Rica and Colombia. On the
Colombian coast, small coral reefs include the corals Pocillopora sp.,
Pavona, Porites, Psammocora and Gardineroseris planulata. On some
isolated rocky shores (Capes Corrientes and Marzo) coral colonies
develop together with other sessile invertebrates, such as barnacles,
octocorals and sponges, although they do not form true coral reefs.
The presence of true coral reefs is directly determined by the availability
of hard substrates and clear waters, away from river discharges and
estuarine ecosystems with mangroves. According to their geographic
distribution in relation to the continent, these communities are classifi ed
in three groups – the barrier reefs of the continental coast of North
Choco (Utría Cove and Cupica Bay), the barrier reefs of the continental
Gorgona island, and the barrier reefs of the oceanic Malpelo island
(INVEMAR 2003a). The Central Equatorial Pacifi c sub-system’s coastal
waters and continental shelf include habitats for several species of
economically important crustaceans. Some of these species inhabit
muddy and sandy bottoms between 0 and 40 m depth, including
crabs (Callinectes arcuatus) and some species of shallow water shrimp
(Pineda-Polo 1992, Pineda et al. in INVEMAR 2003a).
There are 12 species of mangrove in the region. Mangroves are abundant
in protected areas, particularly in Mexico, Panama, Colombia and the
Gulf of Fonseca in Costa Rica (PNUMA 2001). Three countries, Colombia,
Panama and Mexico, account for about 80% of the total coverage. Using
radar images and air photos, Zambrano & Rubiano (1996) estimated
the area of mangrove cover on Colombia’s Pacifi c coast to be 2 930 ha
(Table 1) (Informe de República de Colombia et al. 2002).
There are 15 wetlands of international importance in the region,
together covering an area of 640 857 ha. Eleven of these are coastal
(PNUMA 2001). Costa Rica has seven Ramsar sites in its Pacifi c coastal
area (218 087 ha); Nicaragua, three (98 530 ha); Panama, two (94 570 ha);
and the remaining countries, one each – Mexico (144 866 ha), Guatemala
(13 500 ha), Honduras (13 850 ha) and El Salvador (1 517 ha). There are
numerous highly productive and biologically diverse estuaries and
lagoons in the region. El Salvador has more than 30 lagoons; Honduras
is characterised by lagoons no more than 5 m deep; and lagoons occur
also in Nicaragua and Costa Rica and in the south of Colombia (PNUMA
2001). There are few large islands in the region but over 180 small islands
(e.g. Coiba, Otoque and Perlas). Beaches, dunes and cliff s are common;
several beaches are important turtle nesting sites (Escobar 2005). In the
Pacifi c Colombian sub-system, there are three protected areas – the
National Parks of Sanquianga (80 000 ha); Gorgona (61 687 ha), which
includes the islands Gorgona and Gorgonilla and their surrounding
marine area; and Utria (54 300 ha), which includes a marine area of
12 000 ha (INVEMAR 2003a).
In the Pacifi c Colombian sub-system, there are several types of forest
community including Tropical Wet Forest, Tropical Highly Wet Forest,
Tropical Pluvial Forest, Pre-mountain Pluvial Forest, Low Mountain
Pluvial Forest and Low Mountain Highly Wet Forest (INVEMAR 2003a).
Hydrology The hydrology of the region has been described by UNEP (2001). In
the Southwest Mexico sub-system, the major river basins include the
Lerma-Santiago, Ameca and Balsas. Another basin, River Suchiate,
is shared with Guatemala. Rainfall between 1941 and 2000 showed
important seasonal variations among the diff erent administrative
districts on the southern Pacifi c slope (CNA 2002). In general, more
than three-quarters of the rainfall occurs over the fi ve months June to
October, with a noticeable dry period between February and April. The
South Border district has the highest rainfall, whereas Lerma-Santiago
Table 1 Extent and distribution of the mangrove forests in the Pacifi c coast of Colombia.
Region Department Area (ha) %
Pacific
Cauca 36 276.8 9.57
Choco 64 750.5 17.08
Nariño 149 735.8 39.50
Valle del Cauca 41 961.4 11.07
Subtotal 292 724.5 100.00
(Source: Zambrano and Rubiano, 1996; 1997, in: INVEMAR, 2003a)
20 GIWA REGIONAL ASSESSMENT 65 EASTERN EQUATORIAL PACIFIC
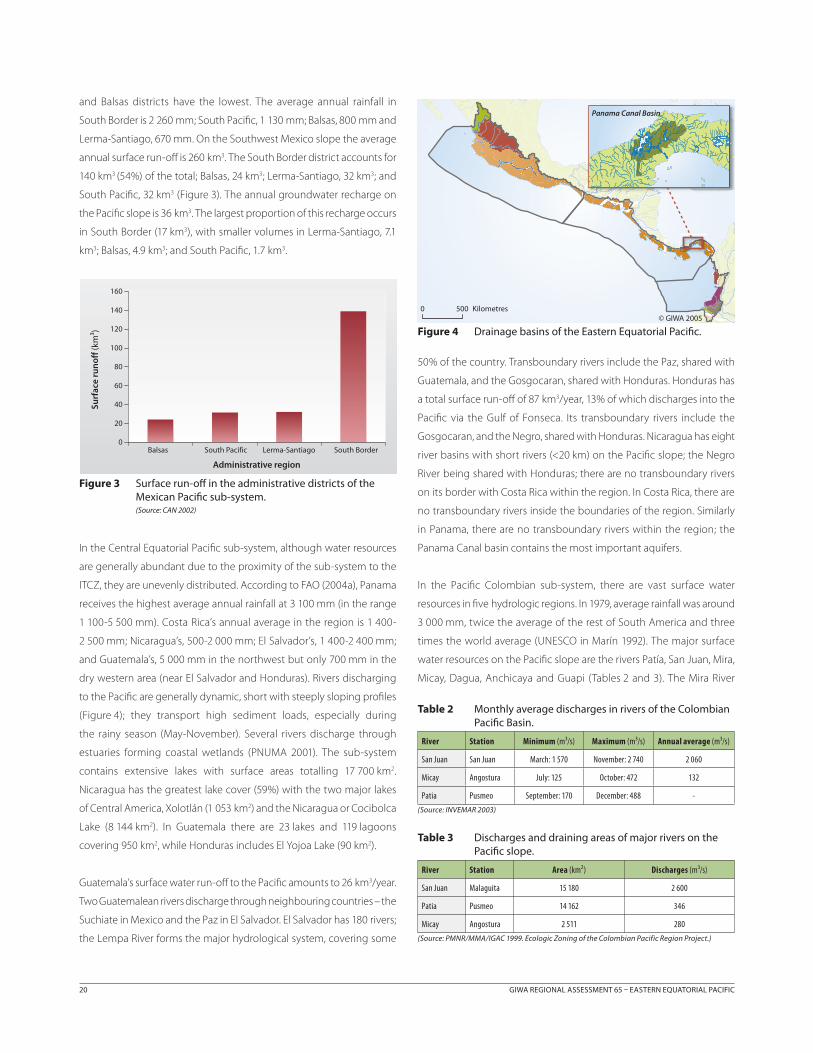
and Balsas districts have the lowest. The average annual rainfall in
South Border is 2 260 mm; South Pacifi c, 1 130 mm; Balsas, 800 mm and
Lerma-Santiago, 670 mm. On the Southwest Mexico slope the average
annual surface run-off is 260 km3. The South Border district accounts for
140 km3 (54%) of the total; Balsas, 24 km3; Lerma-Santiago, 32 km3; and
South Pacifi c, 32 km3 (Figure 3). The annual groundwater recharge on
the Pacifi c slope is 36 km3. The largest proportion of this recharge occurs
in South Border (17 km3), with smaller volumes in Lerma-Santiago, 7.1
km3; Balsas, 4.9 km3; and South Pacifi c, 1.7 km3.
In the Central Equatorial Pacifi c sub-system, although water resources
are generally abundant due to the proximity of the sub-system to the
ITCZ, they are unevenly distributed. According to FAO (2004a), Panama
receives the highest average annual rainfall at 3 100 mm (in the range
1 100-5 500 mm). Costa Rica’s annual average in the region is 1 400-
2 500 mm; Nicaragua’s, 500-2 000 mm; El Salvador’s, 1 400-2 400 mm;
and Guatemala’s, 5 000 mm in the northwest but only 700 mm in the
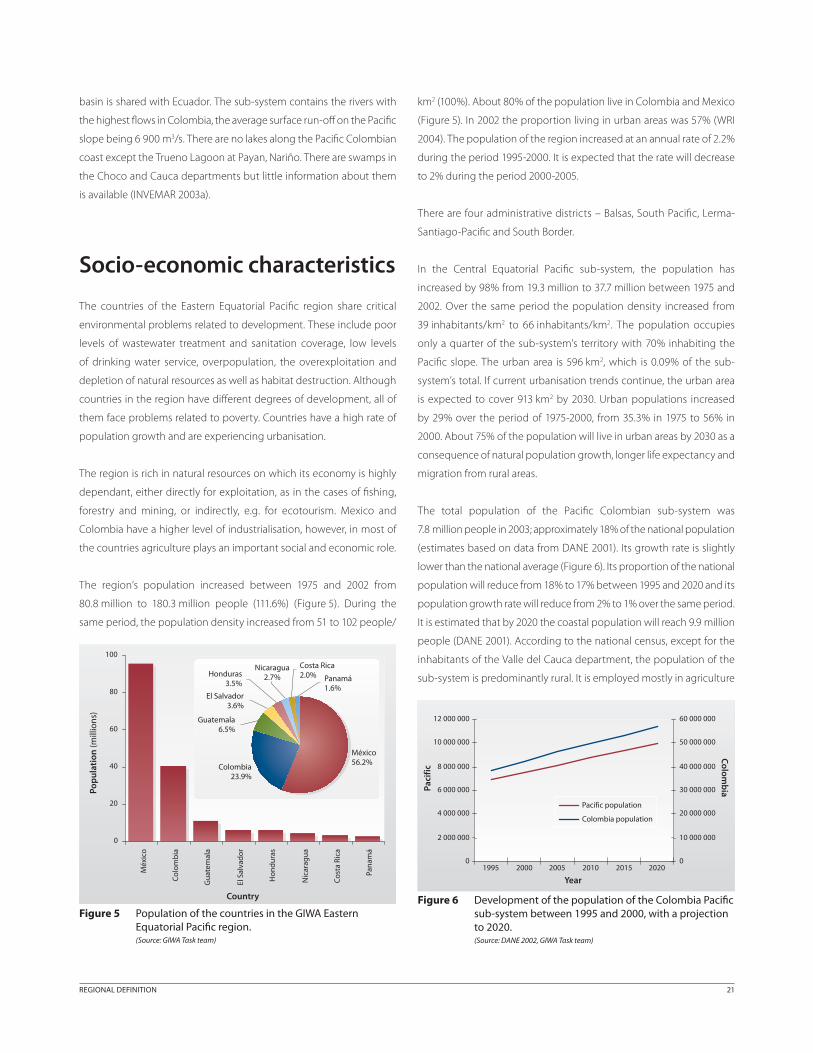
dry western area (near El Salvador and Honduras). Rivers discharging
to the Pacifi c are generally dynamic, short with steeply sloping profi les
(Figure 4); they transport high sediment loads, especially during
the rainy season (May-November). Several rivers discharge through
estuaries forming coastal wetlands (PNUMA 2001). The sub-system
contains extensive lakes with surface areas totalling 17 700 km2.
Nicaragua has the greatest lake cover (59%) with the two major lakes
of Central America, Xolotlán (1 053 km2) and the Nicaragua or Cocibolca
Lake (8 144 km2). In Guatemala there are 23 lakes and 119 lagoons
covering 950 km2, while Honduras includes El Yojoa Lake (90 km2).
Guatemala’s surface water run-off to the Pacifi c amounts to 26 km3/year.
Two Guatemalean rivers discharge through neighbouring countries – the
Suchiate in Mexico and the Paz in El Salvador. El Salvador has 180 rivers;
the Lempa River forms the major hydrological system, covering some
50% of the country. Transboundary rivers include the Paz, shared with
Guatemala, and the Gosgocaran, shared with Honduras. Honduras has
a total surface run-off of 87 km3/year, 13% of which discharges into the
Pacifi c via the Gulf of Fonseca. Its transboundary rivers include the
Gosgocaran, and the Negro, shared with Honduras. Nicaragua has eight
river basins with short rivers (<20 km) on the Pacifi c slope; the Negro
River being shared with Honduras; there are no transboundary rivers
on its border with Costa Rica within the region. In Costa Rica, there are
no transboundary rivers inside the boundaries of the region. Similarly
in Panama, there are no transboundary rivers within the region; the
Panama Canal basin contains the most important aquifers.
In the Pacifi c Colombian sub-system, there are vast surface water
resources in fi ve hydrologic regions. In 1979, average rainfall was around
3 000 mm, twice the average of the rest of South America and three
times the world average (UNESCO in Marín 1992). The major surface
water resources on the Pacifi c slope are the rivers Patía, San Juan, Mira,
Micay, Dagua, Anchicaya and Guapi (Tables 2 and 3). The Mira River
Surf
ace
run
off (
km³)
Balsas South Pacific Lerma-Santiago South Border0
20
40
60
80
100
120
140
160
Administrative region
Figure 3 Surface run-off in the administrative districts of the Mexican Pacifi c sub-system.(Source: CAN 2002)
0 500 Kilometres© GIWA 2005
Panama Canal Basin
Figure 4 Drainage basins of the Eastern Equatorial Pacifi c.
Table 2 Monthly average discharges in rivers of the Colombian Pacifi c Basin.
River Station Minimum (m³/s) Maximum (m³/s) Annual average (m³/s)
San Juan San Juan March: 1 570 November: 2 740 2 060
Micay Angostura July: 125 October: 472 132
Patia Pusmeo September: 170 December: 488 -
(Source: INVEMAR 2003)
Table 3 Discharges and draining areas of major rivers on the Pacifi c slope.
River Station Area (km²) Discharges (m³/s)
San Juan Malaguita 15 180 2 600
Patia Pusmeo 14 162 346
Micay Angostura 2 511 280
(Source: PMNR/MMA/IGAC 1999. Ecologic Zoning of the Colombian Pacific Region Project.)
REGIONAL DEFINITION 21
basin is shared with Ecuador. The sub-system contains the rivers with
the highest fl ows in Colombia, the average surface run-off on the Pacifi c
slope being 6 900 m3/s. There are no lakes along the Pacifi c Colombian
coast except the Trueno Lagoon at Payan, Nariño. There are swamps in
the Choco and Cauca departments but little information about them
is available (INVEMAR 2003a).
Socio-economic characteristics
The countries of the Eastern Equatorial Pacifi c region share critical
environmental problems related to development. These include poor
levels of wastewater treatment and sanitation coverage, low levels
of drinking water service, overpopulation, the overexploitation and
depletion of natural resources as well as habitat destruction. Although
countries in the region have diff erent degrees of development, all of
them face problems related to poverty. Countries have a high rate of
population growth and are experiencing urbanisation.
The region is rich in natural resources on which its economy is highly
dependant, either directly for exploitation, as in the cases of fi shing,
forestry and mining, or indirectly, e.g. for ecotourism. Mexico and
Colombia have a higher level of industrialisation, however, in most of
the countries agriculture plays an important social and economic role.
The region’s population increased between 1975 and 2002 from
80.8 million to 180.3 million people (111.6%) (Figure 5). During the
same period, the population density increased from 51 to 102 people/
km2 (100%). About 80% of the population live in Colombia and Mexico
(Figure 5). In 2002 the proportion living in urban areas was 57% (WRI
2004). The population of the region increased at an annual rate of 2.2%
during the period 1995-2000. It is expected that the rate will decrease
to 2% during the period 2000-2005.
There are four administrative districts – Balsas, South Pacifi c, Lerma-
Santiago-Pacifi c and South Border.
In the Central Equatorial Pacifi c sub-system, the population has
increased by 98% from 19.3 million to 37.7 million between 1975 and
2002. Over the same period the population density increased from
39 inhabitants/km2 to 66 inhabitants/km2. The population occupies
only a quarter of the sub-system’s territory with 70% inhabiting the
Pacifi c slope. The urban area is 596 km2, which is 0.09% of the sub-
system’s total. If current urbanisation trends continue, the urban area
is expected to cover 913 km2 by 2030. Urban populations increased
by 29% over the period of 1975-2000, from 35.3% in 1975 to 56% in
2000. About 75% of the population will live in urban areas by 2030 as a
consequence of natural population growth, longer life expectancy and
migration from rural areas.
The total population of the Pacifi c Colombian sub-system was
7.8 million people in 2003; approximately 18% of the national population
(estimates based on data from DANE 2001). Its growth rate is slightly
lower than the national average (Figure 6). Its proportion of the national
population will reduce from 18% to 17% between 1995 and 2020 and its
population growth rate will reduce from 2% to 1% over the same period.
It is estimated that by 2020 the coastal population will reach 9.9 million
people (DANE 2001). According to the national census, except for the
inhabitants of the Valle del Cauca department, the population of the
sub-system is predominantly rural. It is employed mostly in agriculture
Méx
ico
Col
omb
ia
Gua
tem
ala
El S
alva
dor
Hon
dura
s
Nic
arag
ua
Cos
ta R
ica
Pana
má
0
20
40
60
80
100
Pop
ulat
ion
(mill
ions
)
Country
México 56.2%Colombia
23.9%
Honduras 3.5%
Guatemala 6.5%
El Salvador 3.6%
Nicaragua 2.7%
Costa Rica 2.0% Panamá
1.6%
Figure 5 Population of the countries in the GIWA Eastern Equatorial Pacifi c region. (Source: GIWA Task team)
Figure 6 Development of the population of the Colombia Pacifi c sub-system between 1995 and 2000, with a projection to 2020. (Source: DANE 2002, GIWA Task team)
1995 2000 2005 2010 2015 2020
Paci
fic
0
10 000 000
20 000 000
30 000 000
40 000 000
50 000 000
60 000 000
Colom
bia
Year
Pacific population
Colombia population
0
12 000 000
10 000 000
8 000 000
6 000 000
4 000 000
2 000 000
22 GIWA REGIONAL ASSESSMENT 65 EASTERN EQUATORIAL PACIFIC
(22%), trading (15%) and manufacturing industries (10%). In the Choco
department, mining provides 23% of the employment, manufacturing
in the Valle del Cauca, 12%, and fi shing in the Nariño department, 2%.
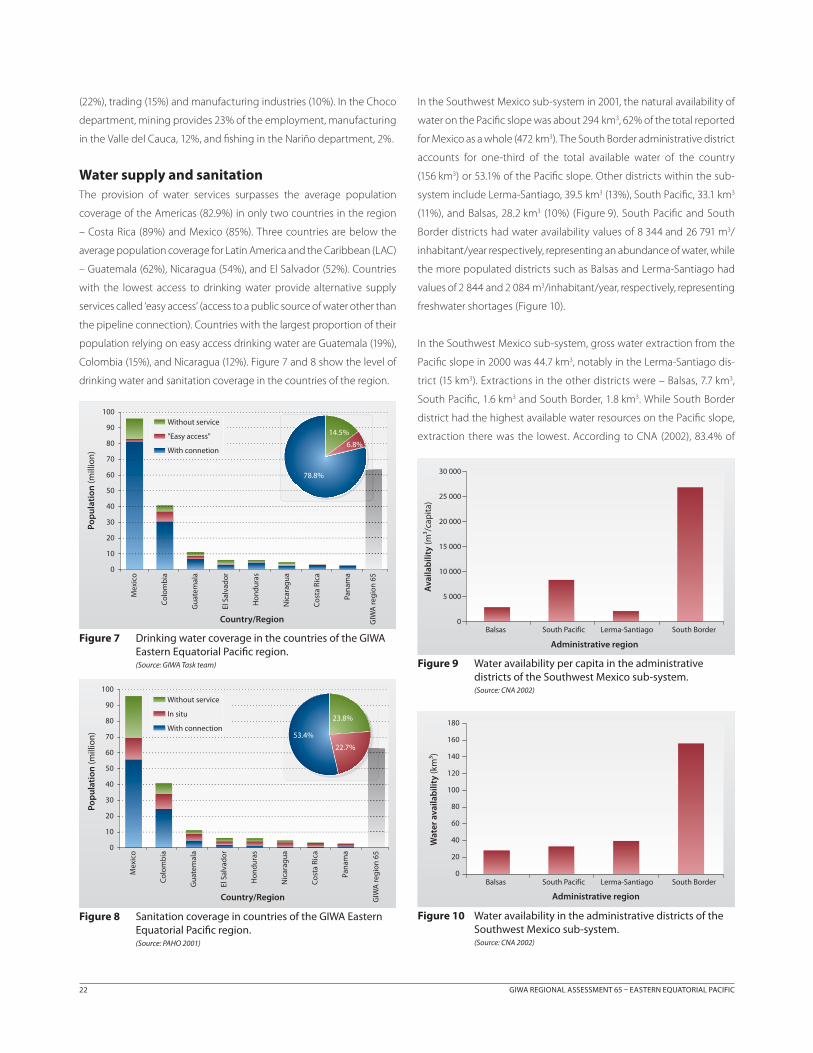
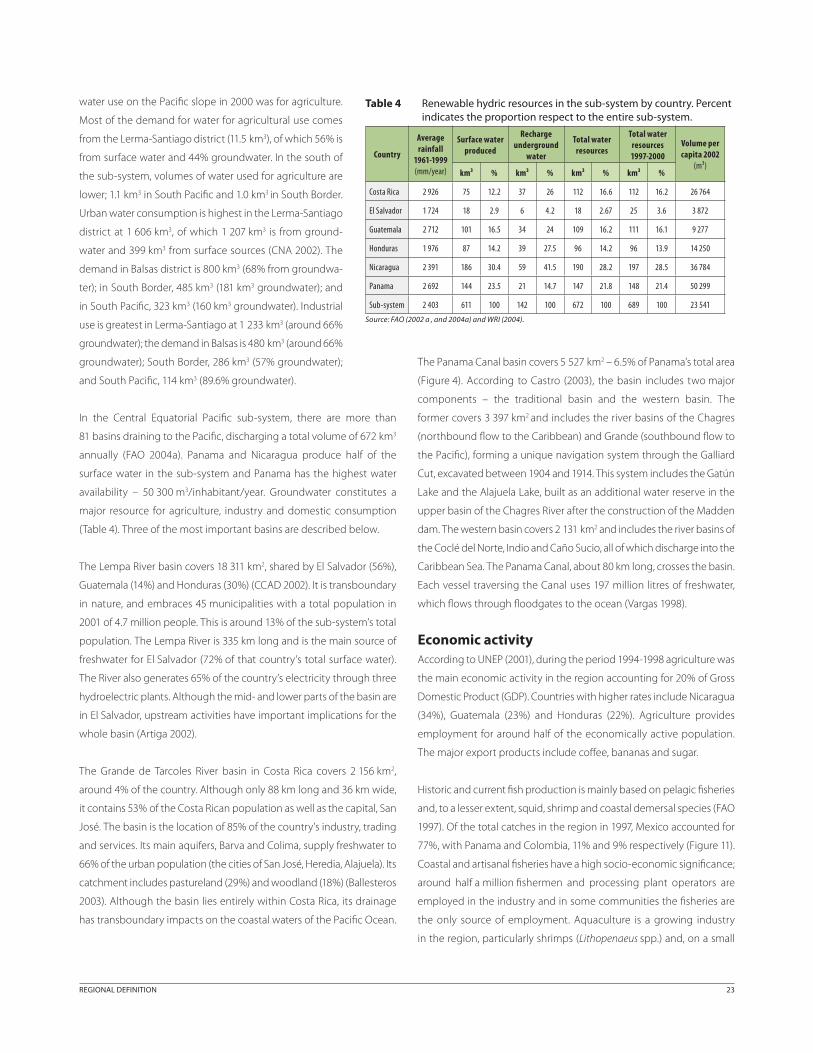
Water supply and sanitationThe provision of water services surpasses the average population
coverage of the Americas (82.9%) in only two countries in the region
– Costa Rica (89%) and Mexico (85%). Three countries are below the
average population coverage for Latin America and the Caribbean (LAC)
– Guatemala (62%), Nicaragua (54%), and El Salvador (52%). Countries
with the lowest access to drinking water provide alternative supply
services called ‘easy access’ (access to a public source of water other than
the pipeline connection). Countries with the largest proportion of their
population relying on easy access drinking water are Guatemala (19%),
Colombia (15%), and Nicaragua (12%). Figure 7 and 8 show the level of
drinking water and sanitation coverage in the countries of the region.
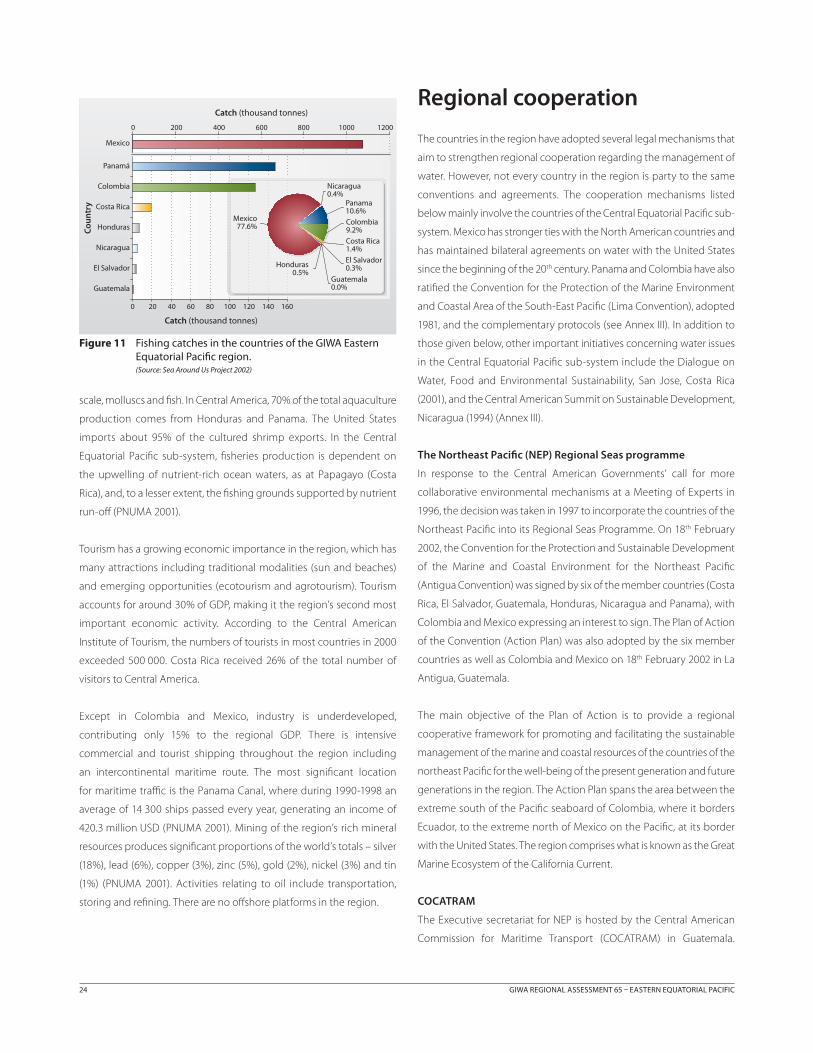
In the Southwest Mexico sub-system in 2001, the natural availability of
water on the Pacifi c slope was about 294 km3, 62% of the total reported
for Mexico as a whole (472 km3). The South Border administrative district
accounts for one-third of the total available water of the country
(156 km3) or 53.1% of the Pacifi c slope. Other districts within the sub-
system include Lerma-Santiago, 39.5 km3 (13%), South Pacifi c, 33.1 km3
(11%), and Balsas, 28.2 km3 (10%) (Figure 9). South Pacifi c and South
Border districts had water availability values of 8 344 and 26 791 m3/
inhabitant/year respectively, representing an abundance of water, while
the more populated districts such as Balsas and Lerma-Santiago had
values of 2 844 and 2 084 m3/inhabitant/year, respectively, representing
freshwater shortages (Figure 10).
In the Southwest Mexico sub-system, gross water extraction from the
Pacifi c slope in 2000 was 44.7 km3, notably in the Lerma-Santiago dis-
trict (15 km3). Extractions in the other districts were – Balsas, 7.7 km3,
South Pacifi c, 1.6 km3 and South Border, 1.8 km3. While South Border
district had the highest available water resources on the Pacifi c slope,
extraction there was the lowest. According to CNA (2002), 83.4% of
0
10
20
30
40
50
60
70
80
90
100
Pop
ulat
ion
(mill
ion)
Country/Region
Without service
"Easy access"
With connetion
Mex
ico
Col
omb
ia
Gua
tem
ala
El S
alva
dor
Hon
dura
s
Nic
arag
ua
Cos
ta R
ica
Pana
ma
GIW
A re
gion
65
78.8%
14.5%
6.8%
Figure 7 Drinking water coverage in the countries of the GIWA Eastern Equatorial Pacifi c region.(Source: GIWA Task team)
Pop
ulat
ion
(mill
ion)
Country/Region
Without service
In situ
With connection
0
10
20
30
40
50
60
70
80
90
100
Mex
ico
Col
omb
ia
Gua
tem
ala
El S
alva
dor
Hon
dura
s
Nic
arag
ua
Cos
ta R
ica
Pana
ma
GIW
A re
gion
65
22.7%
23.8%
53.4%
Figure 8 Sanitation coverage in countries of the GIWA Eastern Equatorial Pacifi c region.(Source: PAHO 2001)
Balsas South Pacific Lerma-Santiago South Border
Ava
ilab
ility
(m³/
cap
ita)
0
5 000
10 000
15 000
20 000
25 000
30 000
Administrative region
Figure 9 Water availability per capita in the administrative districts of the Southwest Mexico sub-system.(Source: CNA 2002)
Figure 10 Water availability in the administrative districts of the Southwest Mexico sub-system.(Source: CNA 2002)
Balsas South Pacific Lerma-Santiago South Border
Wat
er a
vaila
bili
ty (k
m³)
0
20
40
60
80
100
120
140
160
180
Administrative region
REGIONAL DEFINITION 23
water use on the Pacifi c slope in 2000 was for agriculture.
Most of the demand for water for agricultural use comes
from the Lerma-Santiago district (11.5 km3), of which 56% is
from surface water and 44% groundwater. In the south of
the sub-system, volumes of water used for agriculture are
lower; 1.1 km3 in South Pacifi c and 1.0 km3 in South Border.
Urban water consumption is highest in the Lerma-Santiago
district at 1 606 km3, of which 1 207 km3 is from ground-
water and 399 km3 from surface sources (CNA 2002). The
demand in Balsas district is 800 km3 (68% from groundwa-
ter); in South Border, 485 km3 (181 km3 groundwater); and
in South Pacifi c, 323 km3 (160 km3 groundwater). Industrial
use is greatest in Lerma-Santiago at 1 233 km3 (around 66%
groundwater); the demand in Balsas is 480 km3 (around 66%
groundwater); South Border, 286 km3 (57% groundwater);
and South Pacifi c, 114 km3 (89.6% groundwater).
In the Central Equatorial Pacifi c sub-system, there are more than
81 basins draining to the Pacifi c, discharging a total volume of 672 km3
annually (FAO 2004a). Panama and Nicaragua produce half of the
surface water in the sub-system and Panama has the highest water
availability – 50 300 m3/inhabitant/year. Groundwater constitutes a
major resource for agriculture, industry and domestic consumption
(Table 4). Three of the most important basins are described below.
The Lempa River basin covers 18 311 km2, shared by El Salvador (56%),
Guatemala (14%) and Honduras (30%) (CCAD 2002). It is transboundary
in nature, and embraces 45 municipalities with a total population in
2001 of 4.7 million people. This is around 13% of the sub-system’s total
population. The Lempa River is 335 km long and is the main source of
freshwater for El Salvador (72% of that country’s total surface water).
The River also generates 65% of the country’s electricity through three
hydroelectric plants. Although the mid- and lower parts of the basin are
in El Salvador, upstream activities have important implications for the
whole basin (Artiga 2002).
The Grande de Tarcoles River basin in Costa Rica covers 2 156 km2,
around 4% of the country. Although only 88 km long and 36 km wide,
it contains 53% of the Costa Rican population as well as the capital, San
José. The basin is the location of 85% of the country’s industry, trading
and services. Its main aquifers, Barva and Colima, supply freshwater to
66% of the urban population (the cities of San José, Heredia, Alajuela). Its
catchment includes pastureland (29%) and woodland (18%) (Ballesteros
2003). Although the basin lies entirely within Costa Rica, its drainage
has transboundary impacts on the coastal waters of the Pacifi c Ocean.
The Panama Canal basin covers 5 527 km2 – 6.5% of Panama’s total area
(Figure 4). According to Castro (2003), the basin includes two major
components – the traditional basin and the western basin. The
former covers 3 397 km2 and includes the river basins of the Chagres
(northbound fl ow to the Caribbean) and Grande (southbound fl ow to
the Pacifi c), forming a unique navigation system through the Galliard
Cut, excavated between 1904 and 1914. This system includes the Gatún
Lake and the Alajuela Lake, built as an additional water reserve in the
upper basin of the Chagres River after the construction of the Madden
dam. The western basin covers 2 131 km2 and includes the river basins of
the Coclé del Norte, Indio and Caño Sucio, all of which discharge into the
Caribbean Sea. The Panama Canal, about 80 km long, crosses the basin.
Each vessel traversing the Canal uses 197 million litres of freshwater,
which fl ows through fl oodgates to the ocean (Vargas 1998).
Economic activityAccording to UNEP (2001), during the period 1994-1998 agriculture was
the main economic activity in the region accounting for 20% of Gross
Domestic Product (GDP). Countries with higher rates include Nicaragua
(34%), Guatemala (23%) and Honduras (22%). Agriculture provides
employment for around half of the economically active population.
The major export products include coff ee, bananas and sugar.
Historic and current fi sh production is mainly based on pelagic fi sheries
and, to a lesser extent, squid, shrimp and coastal demersal species (FAO
1997). Of the total catches in the region in 1997, Mexico accounted for
77%, with Panama and Colombia, 11% and 9% respectively (Figure 11).
Coastal and artisanal fi sheries have a high socio-economic signifi cance;
around half a million fi shermen and processing plant operators are
employed in the industry and in some communities the fi sheries are
the only source of employment. Aquaculture is a growing industry
in the region, particularly shrimps (Lithopenaeus spp.) and, on a small
Table 4 Renewable hydric resources in the sub-system by country. Percent indicates the proportion respect to the entire sub-system.
Country
Average rainfall
1961-1999 (mm/year)
Surface water produced
Recharge underground
water
Total water resources
Total water resources 1997-2000
Volume per capita 2002
(m³)km³ % km³ % km³ % km³ %
Costa Rica 2 926 75 12.2 37 26 112 16.6 112 16.2 26 764
El Salvador 1 724 18 2.9 6 4.2 18 2.67 25 3.6 3 872
Guatemala 2 712 101 16.5 34 24 109 16.2 111 16.1 9 277
Honduras 1 976 87 14.2 39 27.5 96 14.2 96 13.9 14 250
Nicaragua 2 391 186 30.4 59 41.5 190 28.2 197 28.5 36 784
Panama 2 692 144 23.5 21 14.7 147 21.8 148 21.4 50 299
Sub-system 2 403 611 100 142 100 672 100 689 100 23 541
Source: FAO (2002 a , and 2004a) and WRI (2004).
24 GIWA REGIONAL ASSESSMENT 65 EASTERN EQUATORIAL PACIFIC
scale, molluscs and fi sh. In Central America, 70% of the total aquaculture
production comes from Honduras and Panama. The United States
imports about 95% of the cultured shrimp exports. In the Central
Equatorial Pacifi c sub-system, fi sheries production is dependent on
the upwelling of nutrient-rich ocean waters, as at Papagayo (Costa
Rica), and, to a lesser extent, the fi shing grounds supported by nutrient
run-off (PNUMA 2001).
Tourism has a growing economic importance in the region, which has
many attractions including traditional modalities (sun and beaches)
and emerging opportunities (ecotourism and agrotourism). Tourism
accounts for around 30% of GDP, making it the region’s second most
important economic activity. According to the Central American
Institute of Tourism, the numbers of tourists in most countries in 2000
exceeded 500 000. Costa Rica received 26% of the total number of
visitors to Central America.
Except in Colombia and Mexico, industry is underdeveloped,
contributing only 15% to the regional GDP. There is intensive
commercial and tourist shipping throughout the region including
an intercontinental maritime route. The most signifi cant location
for maritime traffi c is the Panama Canal, where during 1990-1998 an
average of 14 300 ships passed every year, generating an income of
420.3 million USD (PNUMA 2001). Mining of the region’s rich mineral
resources produces signifi cant proportions of the world’s totals – silver
(18%), lead (6%), copper (3%), zinc (5%), gold (2%), nickel (3%) and tin
(1%) (PNUMA 2001). Activities relating to oil include transportation,
storing and refi ning. There are no off shore platforms in the region.
Regional cooperation
The countries in the region have adopted several legal mechanisms that
aim to strengthen regional cooperation regarding the management of
water. However, not every country in the region is party to the same
conventions and agreements. The cooperation mechanisms listed
below mainly involve the countries of the Central Equatorial Pacifi c sub-
system. Mexico has stronger ties with the North American countries and
has maintained bilateral agreements on water with the United States
since the beginning of the 20th century. Panama and Colombia have also
ratifi ed the Convention for the Protection of the Marine Environment
and Coastal Area of the South-East Pacifi c (Lima Convention), adopted
1981, and the complementary protocols (see Annex III). In addition to
those given below, other important initiatives concerning water issues
in the Central Equatorial Pacifi c sub-system include the Dialogue on
Water, Food and Environmental Sustainability, San Jose, Costa Rica
(2001), and the Central American Summit on Sustainable Development,
Nicaragua (1994) (Annex III).
The Northeast Pacifi c (NEP) Regional Seas programme
In response to the Central American Governments’ call for more
collaborative environmental mechanisms at a Meeting of Experts in
1996, the decision was taken in 1997 to incorporate the countries of the
Northeast Pacifi c into its Regional Seas Programme. On 18th February
2002, the Convention for the Protection and Sustainable Development
of the Marine and Coastal Environment for the Northeast Pacifi c
(Antigua Convention) was signed by six of the member countries (Costa
Rica, El Salvador, Guatemala, Honduras, Nicaragua and Panama), with
Colombia and Mexico expressing an interest to sign. The Plan of Action
of the Convention (Action Plan) was also adopted by the six member
countries as well as Colombia and Mexico on 18th February 2002 in La
Antigua, Guatemala.
The main objective of the Plan of Action is to provide a regional
cooperative framework for promoting and facilitating the sustainable
management of the marine and coastal resources of the countries of the
northeast Pacifi c for the well-being of the present generation and future
generations in the region. The Action Plan spans the area between the
extreme south of the Pacifi c seaboard of Colombia, where it borders
Ecuador, to the extreme north of Mexico on the Pacifi c, at its border
with the United States. The region comprises what is known as the Great
Marine Ecosystem of the California Current.
COCATRAM
The Executive secretariat for NEP is hosted by the Central American
Commission for Maritime Transport (COCATRAM) in Guatemala.
0 200 400 600 800 1000 1200
Catch (thousand tonnes)
0 20 40 60 80 100 120 140 160
Catch (thousand tonnes)
Guatemala
El Salvador
Nicaragua
Honduras
Costa Rica
Colombia
Panamá
Mexico
Nicaragua 0.4%
Honduras 0.5%
Guatemala 0.0%
Mexico 77.6% Colombia
9.2%Costa Rica 1.4%El Salvador 0.3%
Panama 10.6%
Cou
ntr
y
Figure 11 Fishing catches in the countries of the GIWA Eastern Equatorial Pacifi c region. (Source: Sea Around Us Project 2002)
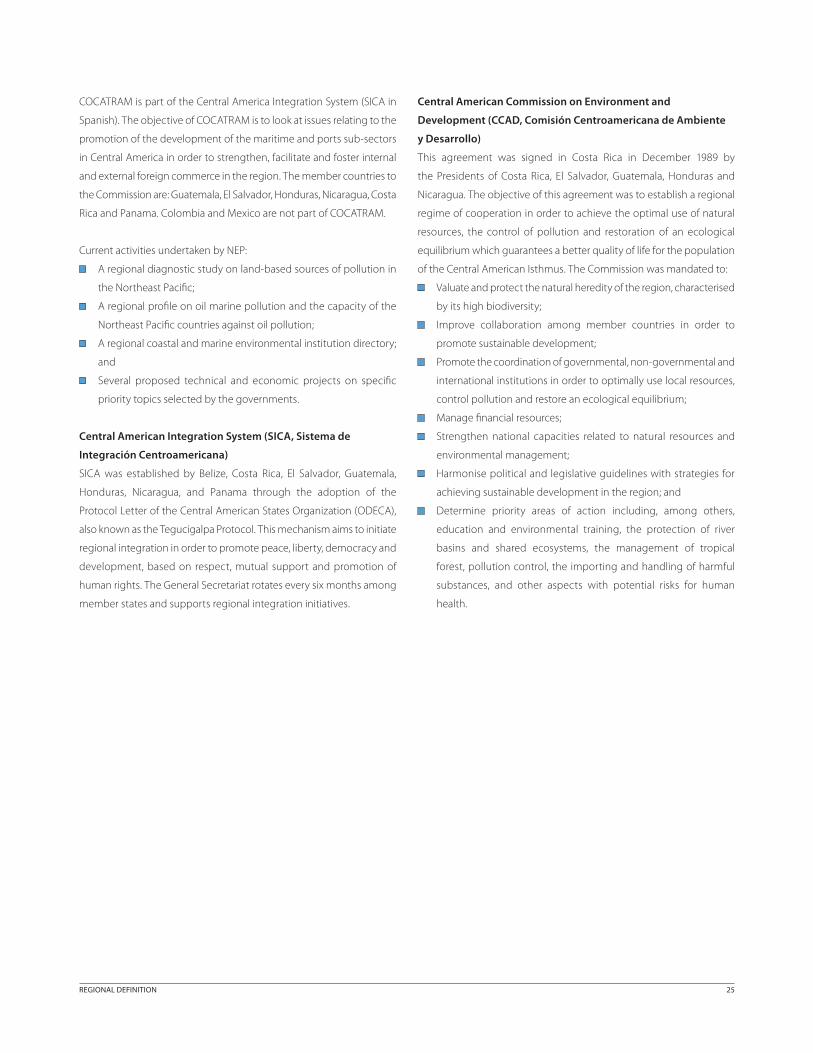
REGIONAL DEFINITION 25
COCATRAM is part of the Central America Integration System (SICA in
Spanish). The objective of COCATRAM is to look at issues relating to the
promotion of the development of the maritime and ports sub-sectors
in Central America in order to strengthen, facilitate and foster internal
and external foreign commerce in the region. The member countries to
the Commission are: Guatemala, El Salvador, Honduras, Nicaragua, Costa
Rica and Panama. Colombia and Mexico are not part of COCATRAM.
Current activities undertaken by NEP:
A regional diagnostic study on land-based sources of pollution in
the Northeast Pacifi c;
A regional profi le on oil marine pollution and the capacity of the
Northeast Pacifi c countries against oil pollution;
A regional coastal and marine environmental institution directory;
and
Several proposed technical and economic projects on specifi c
priority topics selected by the governments.
Central American Integration System (SICA, Sistema de
Integración Centroamericana)
SICA was established by Belize, Costa Rica, El Salvador, Guatemala,
Honduras, Nicaragua, and Panama through the adoption of the
Protocol Letter of the Central American States Organization (ODECA),
also known as the Tegucigalpa Protocol. This mechanism aims to initiate
regional integration in order to promote peace, liberty, democracy and
development, based on respect, mutual support and promotion of
human rights. The General Secretariat rotates every six months among
member states and supports regional integration initiatives.
Central American Commission on Environment and
Development (CCAD, Comisión Centroamericana de Ambiente
y Desarrollo)
This agreement was signed in Costa Rica in December 1989 by
the Presidents of Costa Rica, El Salvador, Guatemala, Honduras and
Nicaragua. The objective of this agreement was to establish a regional
regime of cooperation in order to achieve the optimal use of natural
resources, the control of pollution and restoration of an ecological
equilibrium which guarantees a better quality of life for the population
of the Central American Isthmus. The Commission was mandated to:
Valuate and protect the natural heredity of the region, characterised
by its high biodiversity;
Improve collaboration among member countries in order to
promote sustainable development;
Promote the coordination of governmental, non-governmental and
international institutions in order to optimally use local resources,
control pollution and restore an ecological equilibrium;
Manage fi nancial resources;
Strengthen national capacities related to natural resources and
environmental management;
Harmonise political and legislative guidelines with strategies for
achieving sustainable development in the region; and
Determine priority areas of action including, among others,
education and environmental training, the protection of river
basins and shared ecosystems, the management of tropical
forest, pollution control, the importing and handling of harmful
substances, and other aspects with potential risks for human
health.

26 GIWA REGIONAL ASSESSMENT 65 EASTERN EQUATORIAL PACIFIC
Assessment
Table 5 Scoring table for the Central Equatorial Pacifi c sub-system.
Envi
ronm
enta
l im
pact
s
Econ
omic
impa
cts
Heal
th im
pact
s
Othe
r com
mun
ity
impa
cts
Over
all S
core
**
Prio
rity*
**
Pollution
Unsustainable exploitation of fish
Global change
Freshwater shortage
Habitat and community modification
Modification of stream flow
Pollution of existing supplies
Changes in the water table
Microbiological pollution
Eutrophication
Chemical
Suspended solids
Solid wastes
Thermal
Radionuclides
Spills
Overexploitation
Excessive by-catch and discards
Destructive fishing practices
Decreased viability of stock
Impact on biological and genetic diversity
Changes in hydrological cycle
Sea level change
Increased UV-B radiation
Changes in ocean CO2 source/sink function
Loss of ecosystems
Modification of ecosystems
2
2
2
1
2
1
2
2
0
0
2
2*
2
2
2
0
0
2
1
0
0
2*
2*
2*
2
2
2*
2
2
2
3
2
2
0
2
2
0
2
2
0
2
2
2
4
3
1
5
1.6
1.9
2.2
1.6
2.2
Assessment of GIWA concerns and issues according to scoring criteria (see Methodology chapter)
No known impacts
Slight impacts
Moderate impacts
Severe impacts
IMPA
CT
0
IMPA
CT
1
IMPA
CT
3
IMPA
CT
2 Increased impact
No changes
Decreased impact
The arrow indicates the likely direction of future changes.
* This value represents an average weighted score of the environmental issues associated to the concern.
** This value represents the overall score including environmental, socio-economic and likely future impacts.
*** Priority refers to the ranking of GIWA concerns.
Central Equatorial Pacific sub-system
This section presents the results of the assessment of the impacts
of each of the fi ve predefi ned GIWA concerns i.e. Freshwater
shortage, Pollution, Habitat and community modifi cation,
Unsustainable exploitation of fi sh and other living resources,
Global change, and their constituent issues and the priorities
identifi ed during this process. The evaluation of severity of each
issue adheres to a set of predefi ned criteria as provided in the
chapter describing the GIWA methodology. In this section, the
scoring of GIWA concerns and issues is presented in Table 5.
Because of the lack of signifi cant transboundary issues in the Southwest
Mexico and Pacifi c Colombian sub-systems, detailed Assessment and
Causal chain analysis focuses mainly on the Central Equatorial Pacifi c
sub-system. In the Southwest Mexico sub-system there was a lack of
information on the only transboundary river, the Suchiate, and in the
Pacifi c Colombian sub-system there are no transboundary rivers. The
regional experts therefore included analysis of national aquatic concerns
which are believed to be aff ecting the pacifi c coastal zone of Mexico and
Colombia and their neighbouring countries. Only freshwater shortage and
pollution were assessed for the Southwest Mexico sub-system.
During the assessment process it was evident that several environmental
issues do not have quantitative indicators to allow them to be objectively
evaluated. They are therefore assessed using qualitative information and
may include a degree of subjectivity. The GIWA scoring table (Table 5)
shows the results for the Central Equatorial Pacifi c sub-system.
IMPA
CT Freshwater shortage
The assessment of freshwater shortage evaluates the environmental and
socio-economic impacts of three transboundary issues: modifi cation of
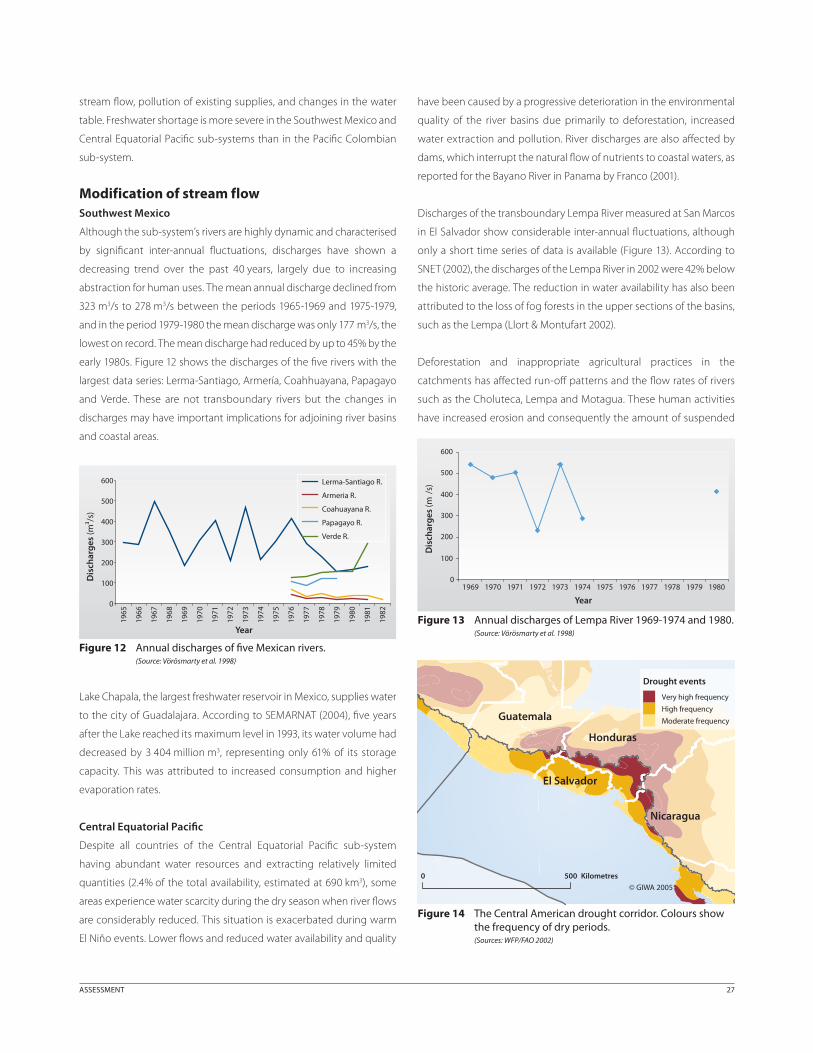
ASSESSMENT 27
stream fl ow, pollution of existing supplies, and changes in the water
table. Freshwater shortage is more severe in the Southwest Mexico and
Central Equatorial Pacifi c sub-systems than in the Pacifi c Colombian
sub-system.
Modification of stream flowSouthwest Mexico
Although the sub-system’s rivers are highly dynamic and characterised
by signifi cant inter-annual fl uctuations, discharges have shown a
decreasing trend over the past 40 years, largely due to increasing
abstraction for human uses. The mean annual discharge declined from
323 m3/s to 278 m3/s between the periods 1965-1969 and 1975-1979,
and in the period 1979-1980 the mean discharge was only 177 m3/s, the
lowest on record. The mean discharge had reduced by up to 45% by the
early 1980s. Figure 12 shows the discharges of the fi ve rivers with the
largest data series: Lerma-Santiago, Armería, Coahhuayana, Papagayo
and Verde. These are not transboundary rivers but the changes in
discharges may have important implications for adjoining river basins
and coastal areas.
Lake Chapala, the largest freshwater reservoir in Mexico, supplies water
to the city of Guadalajara. According to SEMARNAT (2004), fi ve years
after the Lake reached its maximum level in 1993, its water volume had
decreased by 3 404 million m3, representing only 61% of its storage
capacity. This was attributed to increased consumption and higher
evaporation rates.
Central Equatorial Pacifi c
Despite all countries of the Central Equatorial Pacifi c sub-system
having abundant water resources and extracting relatively limited
quantities (2.4% of the total availability, estimated at 690 km3), some
areas experience water scarcity during the dry season when river fl ows
are considerably reduced. This situation is exacerbated during warm
El Niño events. Lower fl ows and reduced water availability and quality
have been caused by a progressive deterioration in the environmental
quality of the river basins due primarily to deforestation, increased
water extraction and pollution. River discharges are also aff ected by
dams, which interrupt the natural fl ow of nutrients to coastal waters, as
reported for the Bayano River in Panama by Franco (2001).
Discharges of the transboundary Lempa River measured at San Marcos
in El Salvador show considerable inter-annual fl uctuations, although
only a short time series of data is available (Figure 13). According to
SNET (2002), the discharges of the Lempa River in 2002 were 42% below
the historic average. The reduction in water availability has also been
attributed to the loss of fog forests in the upper sections of the basins,
such as the Lempa (Llort & Montufart 2002).
Deforestation and inappropriate agricultural practices in the
catchments has aff ected run-off patterns and the fl ow rates of rivers
such as the Choluteca, Lempa and Motagua. These human activities
have increased erosion and consequently the amount of suspended
Dis
char
ges
(m³/
s)
Lerma-Santiago R.
Armeria R.
Coahuayana R.
Papagayo R.
Verde R.
0
100
200
300
400
500
600
1965
1966
1967
1968
1969
1970
1971
1972
1973
1974
1975
1976
1977
1978
1979
1980
1981
1982
Year
Figure 12 Annual discharges of fi ve Mexican rivers. (Source: Vörösmarty et al. 1998)
0
100
200
300
400
500
600
1969 1970 1971 1972 1973 1974 1975 1976 1977 1978 1979 1980
Dis
char
ges
(m /
s)
Year
Figure 13 Annual discharges of Lempa River 1969-1974 and 1980.(Source: Vörösmarty et al. 1998)
Nicaragua
Honduras
Guatemala
El Salvador
0 500 Kilometres
© GIWA 2005
Drought events
Very high frequency
High frequency
Moderate frequency
Figure 14 The Central American drought corridor. Colours show the frequency of dry periods. (Sources: WFP/FAO 2002)
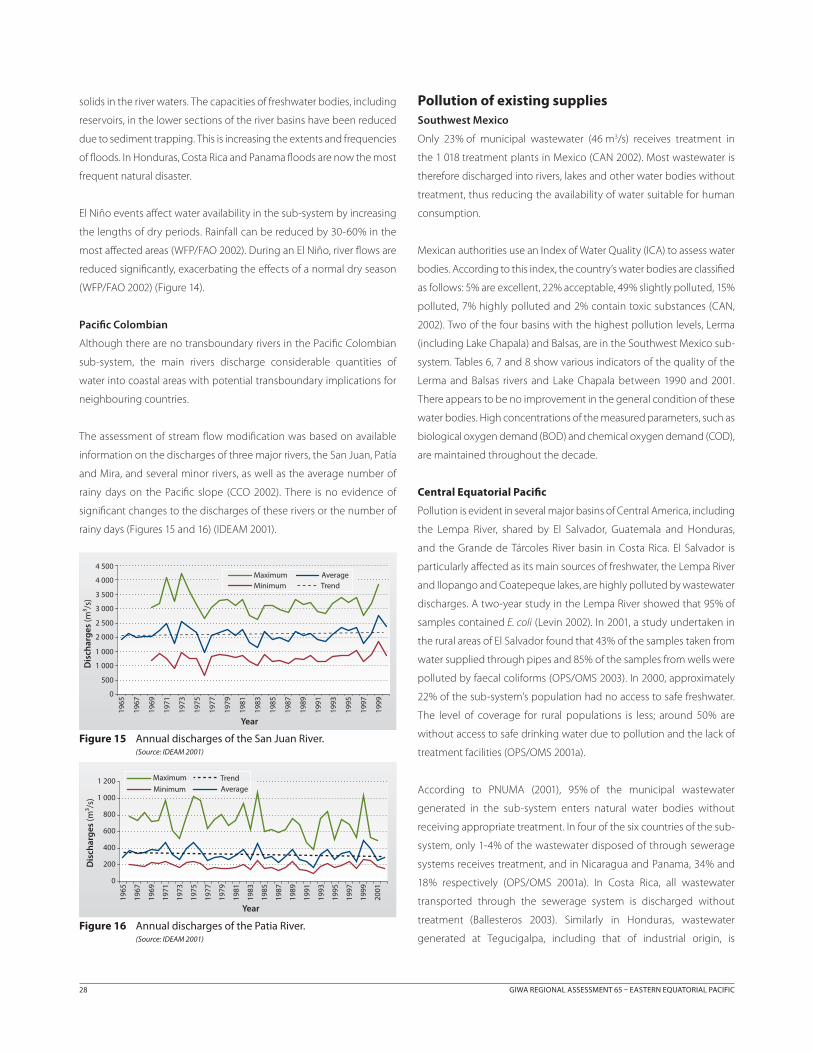
28 GIWA REGIONAL ASSESSMENT 65 EASTERN EQUATORIAL PACIFIC
solids in the river waters. The capacities of freshwater bodies, including
reservoirs, in the lower sections of the river basins have been reduced
due to sediment trapping. This is increasing the extents and frequencies
of fl oods. In Honduras, Costa Rica and Panama fl oods are now the most
frequent natural disaster.
El Niño events aff ect water availability in the sub-system by increasing
the lengths of dry periods. Rainfall can be reduced by 30-60% in the
most aff ected areas (WFP/FAO 2002). During an El Niño, river fl ows are
reduced signifi cantly, exacerbating the eff ects of a normal dry season
(WFP/FAO 2002) (Figure 14).
Pacifi c Colombian
Although there are no transboundary rivers in the Pacifi c Colombian
sub-system, the main rivers discharge considerable quantities of
water into coastal areas with potential transboundary implications for
neighbouring countries.
The assessment of stream fl ow modifi cation was based on available
information on the discharges of three major rivers, the San Juan, Patía
and Mira, and several minor rivers, as well as the average number of
rainy days on the Pacifi c slope (CCO 2002). There is no evidence of
signifi cant changes to the discharges of these rivers or the number of
rainy days (Figures 15 and 16) (IDEAM 2001).
Pollution of existing suppliesSouthwest Mexico
Only 23% of municipal wastewater (46 m3/s) receives treatment in
the 1 018 treatment plants in Mexico (CAN 2002). Most wastewater is
therefore discharged into rivers, lakes and other water bodies without
treatment, thus reducing the availability of water suitable for human
consumption.
Mexican authorities use an Index of Water Quality (ICA) to assess water
bodies. According to this index, the country’s water bodies are classifi ed
as follows: 5% are excellent, 22% acceptable, 49% slightly polluted, 15%
polluted, 7% highly polluted and 2% contain toxic substances (CAN,
2002). Two of the four basins with the highest pollution levels, Lerma
(including Lake Chapala) and Balsas, are in the Southwest Mexico sub-
system. Tables 6, 7 and 8 show various indicators of the quality of the
Lerma and Balsas rivers and Lake Chapala between 1990 and 2001.
There appears to be no improvement in the general condition of these
water bodies. High concentrations of the measured parameters, such as
biological oxygen demand (BOD) and chemical oxygen demand (COD),
are maintained throughout the decade.
Central Equatorial Pacifi c
Pollution is evident in several major basins of Central America, including
the Lempa River, shared by El Salvador, Guatemala and Honduras,
and the Grande de Tárcoles River basin in Costa Rica. El Salvador is
particularly aff ected as its main sources of freshwater, the Lempa River
and Ilopango and Coatepeque lakes, are highly polluted by wastewater
discharges. A two-year study in the Lempa River showed that 95% of
samples contained E. coli (Levin 2002). In 2001, a study undertaken in
the rural areas of El Salvador found that 43% of the samples taken from
water supplied through pipes and 85% of the samples from wells were
polluted by faecal coliforms (OPS/OMS 2003). In 2000, approximately
22% of the sub-system’s population had no access to safe freshwater.
The level of coverage for rural populations is less; around 50% are
without access to safe drinking water due to pollution and the lack of
treatment facilities (OPS/OMS 2001a).
According to PNUMA (2001), 95% of the municipal wastewater
generated in the sub-system enters natural water bodies without
receiving appropriate treatment. In four of the six countries of the sub-
system, only 1-4% of the wastewater disposed of through sewerage
systems receives treatment, and in Nicaragua and Panama, 34% and
18% respectively (OPS/OMS 2001a). In Costa Rica, all wastewater
transported through the sewerage system is discharged without
treatment (Ballesteros 2003). Similarly in Honduras, wastewater
generated at Tegucigalpa, including that of industrial origin, is
Dis
char
ges
(m³/
s)
Year
AverageTrend
MaximumMinimum
0
500
1 000
1 000
2 000
2 500
3 000
3 500
4 000
4 500
1965
1967
1969
1971
1973
1975
1977
1979
1981
1983
1985
1987
1989
1991
1993
1995
1997
1999
Figure 15 Annual discharges of the San Juan River. (Source: IDEAM 2001)
Figure 16 Annual discharges of the Patia River.(Source: IDEAM 2001)
1965
1967
1969
1971
1973
1975
1977
1979
1981
1983
1985
1987
1989
1991
1993
1995
1997
1999
2001
Year
Average
Maximum
MinimumTrend
0
200
400
600
800
1 000
1 200
Dis
char
ges
(m³/
s)

ASSESSMENT 29
discharged into Choluteca River without treatment. In Guatemala, only
15 out of 344 municipalities apply any treatment to their wastewaters
from urban areas. Thus, most of the pollution in the surface waters of
the sub-system originates in the lack of appropriate treatment.
Some coastal industries use large amounts of water which is later
discharged into the surrounding water bodies without treatment. In
Costa Rica, the coff ee industry is still a major source of pollution, despite
a programme to reduce pollutant discharges being established in 1989.
Today, approximately 45% of the pollution charge and BOD reaching
the Tárcoles River originates from the coff ee industry. Some studies
have shown that this industry may be responsible for up to 77% of the
pollutant load (Ballesteros 2003).
Higher water demand, driven largely by the expansion of the tourism
industry, has led to increased abstraction from aquifers, which are a
major source of water for coastal communities. This has led to saline
intrusion in aquifers used by 31% of fi ve communities monitored,
Table 7 Quality of the Balsas River according to physical, chemical and biological parameters 1990-2001.
Parameter Unit 1990 1991 1992 1993 1994 1995 1996 1997 1998 1999 2000 2001
Ammonium(NH₄) Mg/L 0.2
BOD (20°C, 5d) MPN/100mL 1.74 1. 3.4 1.46 1.47 2.34 2.43 1.7 3.68 2.29
COD (K₂Cr₂O₇) mgO₂/L 10.4 5.1 25.8 10.4 43.5 16
Nitrates (NO₃) mgO₂/L 0.11
Ortophosphates mg/L 0.064 0.067 0.06 0.065 0.11
Dissolved Oxygen mgO₂/L 6.38 6.26 7 5.97 3.7 5.2 3.26 6.43 6.69 6.66 2.9 6.06
Dissolved solids mg/L 128 74 174 233 170 182 177 235 40.8 2.76 148
Suspended solids mg/L 48 7.8 37.3 19 21 77.5 59 22.5
pH pH units 8.4 7.7 7.9 8 7.5 7.4 7.3
(Source: CAN 2002)
Table 8 Quality of the Chapala Lake according to physical, chemical and biological parameters 1990-2001.
Parameter Unit 1990 1991 1992 1994 1996 1997 1998 1999 2000 2001
Ammonium(NH₄) Mg/L 0.41 0.32 0.33 1.79 0.13 0.22 0.15 0.238 1.26
BOD (20°C, 5d) MPN/100mL 1.71 1.23 1.22 1.17 2.34 2.85 2.46 3.86 2 3.59
COD (K₂Cr₂O₇) mgO₂/L 30 31.61 41.29 31.1 39.6 42.4 47 58.43
Nitrates (NO₃) mgO₂/L 0.15 0.36 0.18 0.23 0.17 0.12 0.12 0.082 0.195
Ortophosphates mg/L 0.24 0.28 0.27 0.32 0.43 0.38 0.38 0.382 0.46 0.751
Dissolved Oxygen mgO₂/L 7.6 7.18 7.45 6.8 6.7 7.3 7.55 7.34 8.6 8.1
Dissolved solids mg/L 662 850 613 481.7 613.5 643.5 730.8 790 802 943
Suspended solids mg/L 52 40 37 35.7 25 44 61.6 66 66 89
pH pH units 8.92 8.59 7.59 8.55 8.80 9 9.2 8.75
(Source: CAN 2002)
Table 6 Quality of the Lerma River according to physical, chemical and biological parameters 1990-2001.
Parameter Unit 1990 1991 1992 1993 1994 1995 1996 1997 1998 1999 2000 2001
Ammonium(NH₄) Mg/L 0.39 0.59 1.3 3.34 1.35 18.45 0.75
BOD (20°C, 5d) MPN/100mL 13.5 2.9 15.3 16.1 9.58 17 12 92.33 11 30 7.31
COD (K₂Cr₂O₇) mgO₂/L 35 63.3 63.3 39 134 58 63.5 44.4
Nitrates (NO₃) mgO₂/L 0.44 0.55 1.17 1.7 0.49 0.78 0.3 0.82 0.26 0.55 1.27
Ortophosphates mg/L 0.39 0.55 1.65 2.6 5.63 2.83 2.83 1.01
Dissolved Oxygen mgO₂/L 2.4 4.35 3.17 3.97 5.7 5.76 3.52 0.7 6.6 2.21 6.04
Dissolved solids mg/L 223 487 782 634 7 500 418
Suspended solids mg/L 304 380 40.3 189 253 8.22 40 63.6
pH pH units 7.8 8 8 7.2 7.4 7.7 7.6 8 8.1 8.2 7.5 7.7
(Source: CAN 2002)
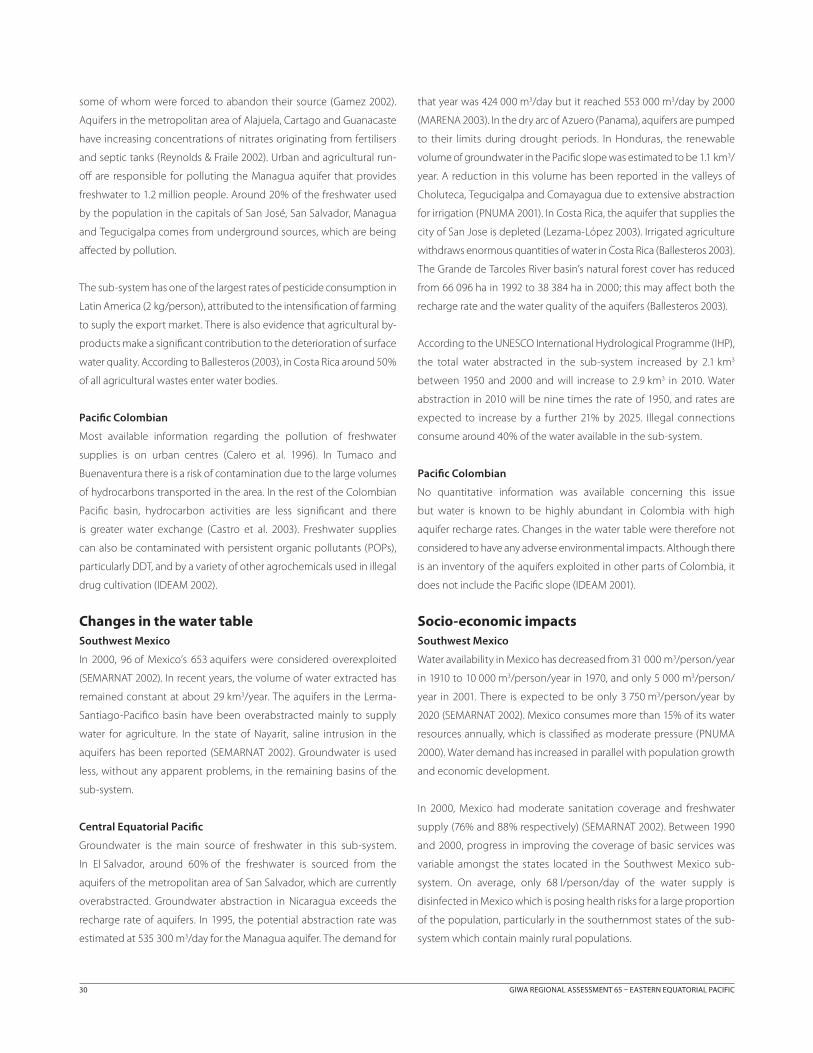
30 GIWA REGIONAL ASSESSMENT 65 EASTERN EQUATORIAL PACIFIC
some of whom were forced to abandon their source (Gamez 2002).
Aquifers in the metropolitan area of Alajuela, Cartago and Guanacaste
have increasing concentrations of nitrates originating from fertilisers
and septic tanks (Reynolds & Fraile 2002). Urban and agricultural run-
off are responsible for polluting the Managua aquifer that provides
freshwater to 1.2 million people. Around 20% of the freshwater used
by the population in the capitals of San José, San Salvador, Managua
and Tegucigalpa comes from underground sources, which are being
aff ected by pollution.
The sub-system has one of the largest rates of pesticide consumption in
Latin America (2 kg/person), attributed to the intensifi cation of farming
to suply the export market. There is also evidence that agricultural by-
products make a signifi cant contribution to the deterioration of surface
water quality. According to Ballesteros (2003), in Costa Rica around 50%
of all agricultural wastes enter water bodies.
Pacifi c Colombian
Most available information regarding the pollution of freshwater
supplies is on urban centres (Calero et al. 1996). In Tumaco and
Buenaventura there is a risk of contamination due to the large volumes
of hydrocarbons transported in the area. In the rest of the Colombian
Pacifi c basin, hydrocarbon activities are less signifi cant and there
is greater water exchange (Castro et al. 2003). Freshwater supplies
can also be contaminated with persistent organic pollutants (POPs),
particularly DDT, and by a variety of other agrochemicals used in illegal
drug cultivation (IDEAM 2002).
Changes in the water tableSouthwest Mexico
In 2000, 96 of Mexico’s 653 aquifers were considered overexploited
(SEMARNAT 2002). In recent years, the volume of water extracted has
remained constant at about 29 km3/year. The aquifers in the Lerma-
Santiago-Pacifi co basin have been overabstracted mainly to supply
water for agriculture. In the state of Nayarit, saline intrusion in the
aquifers has been reported (SEMARNAT 2002). Groundwater is used
less, without any apparent problems, in the remaining basins of the
sub-system.
Central Equatorial Pacifi c
Groundwater is the main source of freshwater in this sub-system.
In El Salvador, around 60% of the freshwater is sourced from the
aquifers of the metropolitan area of San Salvador, which are currently
overabstracted. Groundwater abstraction in Nicaragua exceeds the
recharge rate of aquifers. In 1995, the potential abstraction rate was
estimated at 535 300 m3/day for the Managua aquifer. The demand for
that year was 424 000 m3/day but it reached 553 000 m3/day by 2000
(MARENA 2003). In the dry arc of Azuero (Panama), aquifers are pumped
to their limits during drought periods. In Honduras, the renewable
volume of groundwater in the Pacifi c slope was estimated to be 1.1 km3/
year. A reduction in this volume has been reported in the valleys of
Choluteca, Tegucigalpa and Comayagua due to extensive abstraction
for irrigation (PNUMA 2001). In Costa Rica, the aquifer that supplies the
city of San Jose is depleted (Lezama-López 2003). Irrigated agriculture
withdraws enormous quantities of water in Costa Rica (Ballesteros 2003).
The Grande de Tarcoles River basin’s natural forest cover has reduced
from 66 096 ha in 1992 to 38 384 ha in 2000; this may aff ect both the
recharge rate and the water quality of the aquifers (Ballesteros 2003).
According to the UNESCO International Hydrological Programme (IHP),
the total water abstracted in the sub-system increased by 2.1 km3
between 1950 and 2000 and will increase to 2.9 km3 in 2010. Water
abstraction in 2010 will be nine times the rate of 1950, and rates are
expected to increase by a further 21% by 2025. Illegal connections
consume around 40% of the water available in the sub-system.
Pacifi c Colombian
No quantitative information was available concerning this issue
but water is known to be highly abundant in Colombia with high
aquifer recharge rates. Changes in the water table were therefore not
considered to have any adverse environmental impacts. Although there
is an inventory of the aquifers exploited in other parts of Colombia, it
does not include the Pacifi c slope (IDEAM 2001).
Socio-economic impactsSouthwest Mexico
Water availability in Mexico has decreased from 31 000 m3/person/year
in 1910 to 10 000 m3/person/year in 1970, and only 5 000 m3/person/
year in 2001. There is expected to be only 3 750 m3/person/year by
2020 (SEMARNAT 2002). Mexico consumes more than 15% of its water
resources annually, which is classifi ed as moderate pressure (PNUMA
2000). Water demand has increased in parallel with population growth
and economic development.
In 2000, Mexico had moderate sanitation coverage and freshwater
supply (76% and 88% respectively) (SEMARNAT 2002). Between 1990
and 2000, progress in improving the coverage of basic services was
variable amongst the states located in the Southwest Mexico sub-
system. On average, only 68 l/person/day of the water supply is
disinfected in Mexico which is posing health risks for a large proportion
of the population, particularly in the southernmost states of the sub-
system which contain mainly rural populations.

ASSESSMENT 31
The overexploitation of aquifers is also of concern given that 70% of the
freshwater supply is groundwater; 75 million people (55 million in cities
and 20 million in rural communities) obtain their water supply from
aquifers (SEMARNAT 2002). In future, it will be diffi cult to substantially
increase water supply coverage as there is already enormous pressure
on water resources in the Southwest Mexico sub-system.
Water confl icts have arisen in the past decade in Mexico. Sainz & Becera
(2005) reviewed 3 800 cases of confl ict related to water between 1990
and 2002. Most of these confl icts were concerning availability, tariff
increases, infrastructure improvements or aquifer related issues.
About 60% of these cases occurred in locations where aquifers are
overabstracted.
Central Equatorial Pacifi c
Although the availability of water per person is adequate, only 78% of
the population had access to drinking water services in 2000. The
Pan-American Health Organization classifi es the sub-system as level V
– low-coverage level (OPS/OMS 2001a). The level of coverage has not
increased at the same rate as population growth. In fact, the proportion
of the population without adequate sanitation and freshwater services
increases year by year. Poor water quality is posing health risks for the
population. In some rural areas where freshwater services are often
interrupted by technical failures there is higher prevalence of water-
related diseases, especially diarrhoea.
The contamination of several freshwater sources in the Central
Equatorial sub-system has increased the cost of treatment for drinking
water. Pollutant concentrations in water bodies increase when river
fl ows decrease during dry periods, increasing the risk of pathogenic
diseases and the rates of morbidity and mortality. Acute diarrhoea is
the main cause of infant mortality (children under fi ve years old). In
El Salvador, 12 000 children die annually due to water-borne diseases
and annual cases of diarrhoea and parasitism increased from 150 000 to
220 000 over a 10-year period (Levin 2002).
The Pan-American Health Organization has demonstrated that access
to water is directly related to poverty (OPS/OMS 2001b, 2001c), which
is more severe in rural areas. The Indian population, artisanal fi shermen
and small farmers have particularly limited access to safe water and are
vulnerable to water-borne diseases. In rural areas in El Salvador, 40% of
the population (around 200 000 people in 1999) use water from natural
sources. Poverty has increased as a result of water shortages, combined
with unemployment and reductions in food availability. The resultant
social insecurity has prompted migration from rural areas to cities.
The depletion and contamination of groundwater resources may
impede economic development in the sub-system. If this trend
continues, it is expected that by 2025 the sub-system will be developing
under conditions of increasing water shortage.
Water availability per capita declined by 62% between the 1950s and
the 1990s. Between 1995 and 2025, water availability is expected to
decrease from 8 580 m3/person to 1 780 m3/person in El Salvador and
from 33 810 m3/person to 4 830 m3/person in Guatemala (PNUD 2003).
Agriculture will be one of the sectors most aff ected by water shortages
because of the large amounts of water needed for export products.
Extension of agricultural areas will further reduce water availability,
particularly in El Salvador and Costa Rica (Pratt & Girot 1999). A large
proportion of the workforce is employed in the agricultural sector, thus
a decline in agricultural production due to decreased water availability
will increase unemployment. In drought prone areas, poverty will
increase resulting in social instability. Tourism, another large consumer
of water, would also suff er as a result of water shortages. Tourism
accounts for around 13% of the sub-system’s gross product and the
sector is expected to grow in the future (PNUMA 2001).
In the drought corridor, limited water availability and food insecurity
have forced people to gather food from the forest. Over 20% obtain
water from public or private wells. Small farmers do not own the land
and pay for its use with part of their harvest, but during dry years, when
harvests are reduced or lost, they struggle to pay the land owners. In
the drought corridor the eff ects of reduced rainfall during the El Niño
become most evident during the sowing and harvest seasons (May-
August and September-November), aff ecting around 8.6 million people
(WFP/FAO 2002).
Pacifi c Colombian
The most aff ected economic sectors include agriculture, industry and
public services (energy and water supply). The sectors demanding the
highest volumes of water are agriculture (48%), domestic use (36%)
and industry (7%) (MMA 2002c). The economic implications of water
shortages include (i) increased costs of extraction and (ii) increased
costs of water treatment and pollution control. In the Valle del Cauca
Department, for example, signifi cant investment has been required to
supply water to the agricultural sector. Water charges and retributive
rates have been introduced in many areas to control water pollution
(MMA 2002d).
According to DANE (2001), despite abundant water supplies on the
coast of Colombia, technical and fi nancial constraints as well as poor
management are responsible for the low level of freshwater supply
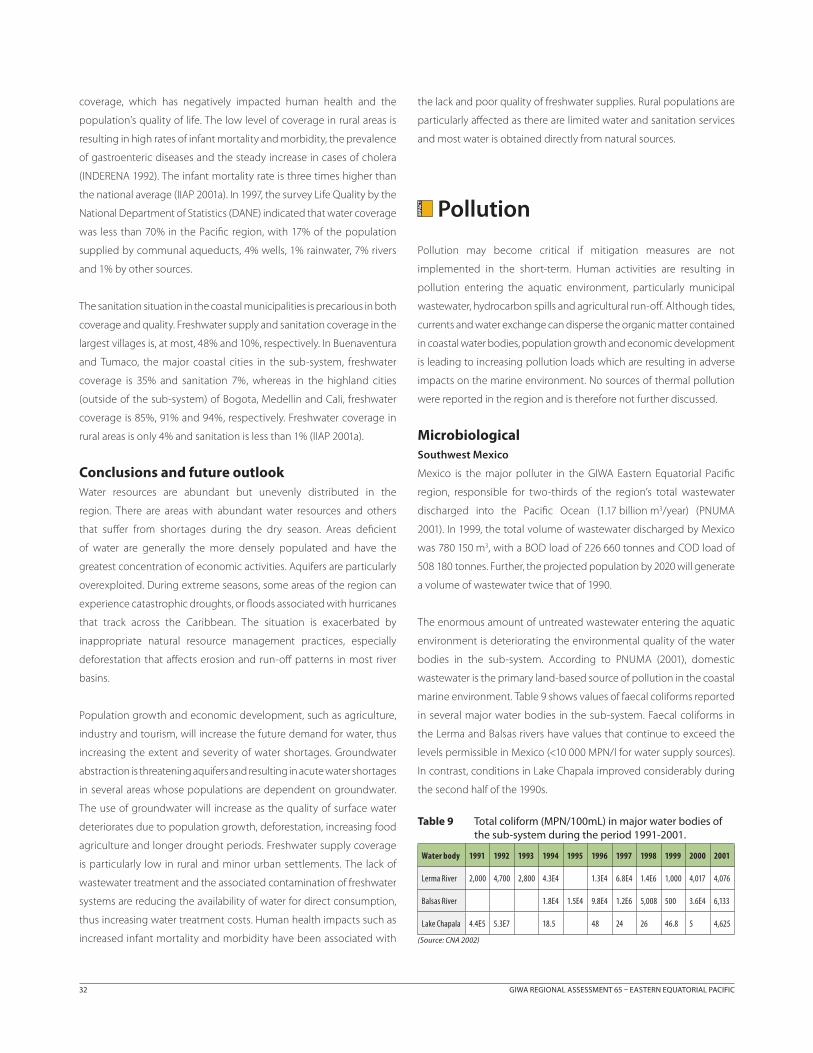
32 GIWA REGIONAL ASSESSMENT 65 EASTERN EQUATORIAL PACIFIC
coverage, which has negatively impacted human health and the
population’s quality of life. The low level of coverage in rural areas is
resulting in high rates of infant mortality and morbidity, the prevalence
of gastroenteric diseases and the steady increase in cases of cholera
(INDERENA 1992). The infant mortality rate is three times higher than
the national average (IIAP 2001a). In 1997, the survey Life Quality by the
National Department of Statistics (DANE) indicated that water coverage
was less than 70% in the Pacifi c region, with 17% of the population
supplied by communal aqueducts, 4% wells, 1% rainwater, 7% rivers
and 1% by other sources.
The sanitation situation in the coastal municipalities is precarious in both
coverage and quality. Freshwater supply and sanitation coverage in the
largest villages is, at most, 48% and 10%, respectively. In Buenaventura
and Tumaco, the major coastal cities in the sub-system, freshwater
coverage is 35% and sanitation 7%, whereas in the highland cities
(outside of the sub-system) of Bogota, Medellin and Cali, freshwater
coverage is 85%, 91% and 94%, respectively. Freshwater coverage in
rural areas is only 4% and sanitation is less than 1% (IIAP 2001a).
Conclusions and future outlookWater resources are abundant but unevenly distributed in the
region. There are areas with abundant water resources and others
that suff er from shortages during the dry season. Areas defi cient
of water are generally the more densely populated and have the
greatest concentration of economic activities. Aquifers are particularly
overexploited. During extreme seasons, some areas of the region can
experience catastrophic droughts, or fl oods associated with hurricanes
that track across the Caribbean. The situation is exacerbated by
inappropriate natural resource management practices, especially
deforestation that aff ects erosion and run-off patterns in most river
basins.
Population growth and economic development, such as agriculture,
industry and tourism, will increase the future demand for water, thus
increasing the extent and severity of water shortages. Groundwater
abstraction is threatening aquifers and resulting in acute water shortages
in several areas whose populations are dependent on groundwater.
The use of groundwater will increase as the quality of surface water
deteriorates due to population growth, deforestation, increasing food
agriculture and longer drought periods. Freshwater supply coverage
is particularly low in rural and minor urban settlements. The lack of
wastewater treatment and the associated contamination of freshwater
systems are reducing the availability of water for direct consumption,
thus increasing water treatment costs. Human health impacts such as
increased infant mortality and morbidity have been associated with
the lack and poor quality of freshwater supplies. Rural populations are
particularly aff ected as there are limited water and sanitation services
and most water is obtained directly from natural sources.
IMPA
CT Pollution
Pollution may become critical if mitigation measures are not
implemented in the short-term. Human activities are resulting in
pollution entering the aquatic environment, particularly municipal
wastewater, hydrocarbon spills and agricultural run-off . Although tides,
currents and water exchange can disperse the organic matter contained
in coastal water bodies, population growth and economic development
is leading to increasing pollution loads which are resulting in adverse
impacts on the marine environment. No sources of thermal pollution
were reported in the region and is therefore not further discussed.
MicrobiologicalSouthwest Mexico
Mexico is the major polluter in the GIWA Eastern Equatorial Pacifi c
region, responsible for two-thirds of the region’s total wastewater
discharged into the Pacifi c Ocean (1.17 billion m3/year) (PNUMA
2001). In 1999, the total volume of wastewater discharged by Mexico
was 780 150 m3, with a BOD load of 226 660 tonnes and COD load of
508 180 tonnes. Further, the projected population by 2020 will generate
a volume of wastewater twice that of 1990.
The enormous amount of untreated wastewater entering the aquatic
environment is deteriorating the environmental quality of the water
bodies in the sub-system. According to PNUMA (2001), domestic
wastewater is the primary land-based source of pollution in the coastal
marine environment. Table 9 shows values of faecal coliforms reported
in several major water bodies in the sub-system. Faecal coliforms in
the Lerma and Balsas rivers have values that continue to exceed the
levels permissible in Mexico (<10 000 MPN/l for water supply sources).
In contrast, conditions in Lake Chapala improved considerably during
the second half of the 1990s.
Table 9 Total coliform (MPN/100mL) in major water bodies of the sub-system during the period 1991-2001.
Water body 1991 1992 1993 1994 1995 1996 1997 1998 1999 2000 2001
Lerma River 2,000 4,700 2,800 4.3E4 1.3E4 6.8E4 1.4E6 1,000 4,017 4,076
Balsas River 1.8E4 1.5E4 9.8E4 1.2E6 5,008 500 3.6E4 6,133
Lake Chapala 4.4E5 5.3E7 18.5 48 24 26 46.8 5 4,625
(Source: CNA 2002)

ASSESSMENT 33
Microbiological pollution on Mexican beaches has been identifi ed
as a priority issue by Mexican authorities due to the potential eff ects
on human health and tourism. In 2002, the Ministries of Environment
and Natural Resources (SEMARNAT), Health (SS) and the Navy (SEMAR)
began conducting microbiological monitoring on beaches. This
study showed that the most important tourist beaches located in the
Southwest Mexico sub-system, such as Zihuatanejo, Acapulco, Bahía de
Banderas, Puerto Angel and Puerto Escondido, were among the most
polluted beaches in Mexico (SEMAR 2004).
A study carried out in Acapulco Bay over the period 1998-2000 shows
that water quality decreases seasonally at the beginning of the rainy
period in July due to increased run-off and tourism wastewater;
maximum values of between 100 000 and 10 million MPN/l are
recorded in July (Leal et al. 2000). During this study Vibrio cholerae and
Shigella sp. were detected in several locations.
Central Equatorial Pacifi c
The main source of microbiological pollution is the discharge of
untreated wastewater into the sewerage system or natural water
bodies. The failure to appropriately dispose of excrement and the use
of latrines and septic wells in porous soils is contributing signifi cant
loads of microbiological pollution. The total volume of wastewater
discharged into the sub-system was 367 billion m3 in 1999, with a BOD
load of 104 630 tonnes and a COD load of 234 350 tonnes (Table 10).
These total loads may be considered as minimum values and are likely
to represent only around 20-22% of the total wastes discharged in the
sub-system. The low levels of wastewater treatment in the sub-system
(10.3% on average) results in around 95% of wastewater reaching
the Pacifi c Ocean with a high load of organic matter, nutrients and
microbial pollutants (PNUMA 2001). Table 11 shows the main coastal
areas aff ected by pollution.
Signifi cant discharges are introduced through the basins of the rivers
Tárcoles, Tempisque and Barranca into the Gulf of Nicoya, Costa Rica
(León in Ramírez & Espejel 2001). If the current population growth
continues and the volumes of untreated discharges per head of
population are maintained, the total volume of discharges will double
in the next two decades. These discharges are directly responsible for
the presence of pathogenic microorganisms, such as coliforms, on the
beaches and in the coastal waters of Costa Rica, El Salvador, Nicaragua
and Panama. No information was available about the contribution
of livestock to the microbiological pollution of surface waters in the
sub-system. However, its impact may be signifi cant considering the
importance of livestock production to the regional economy.
High concentrations of pathogenic micro-organisms associated
with water pollution have been recorded in water bodies and on
beaches of the sub-system, posing health risks for the population and
aff ecting some economic activities. Concentrations of total coliforms
between 80 and 16 000 MPN/ml and faecal coliforms between
0 and 160 MPN/l were recorded in Panama Bay between 1985 and
1987 (CPPS 2000). The highest values coincided with wastewater
outfalls. In Puntarenas, Panama, concentrations of total coliforms
between 160 and 200 million MPN/l and faecal coliforms between
20 and 92 million MPN/l were recently reported (Acuña et al. in Wo-
Ching & Cordero 2001). All these concentrations exceed national and
international standards (EPA 1983).
Several rivers including Torres, Maria Aguilar, Tiribi, Virilla, Segundo and
tributaries of Grande de Tárcoles River have concentrations of total
coliforms above 100 million MPN/l and the surface aquifers of Barva
are unsafe due to high concentrations of coliforms (Ballesteros 2003).
In El Salvador, several beaches and coastal areas, such as Jiquilisco, El
Zapote and Don Diego, have concentrations of coliforms above national
and international standards. In the El Zapote estuary (Barra de Santiago),
Raquena & Miton (in Rubio 1994) found concentrations of faecal
coliforms between 600 and 5 000 MPN/l and, in Zanjones, La Danta and
Aguachapio, concentrations of between 3 000 and 240 000 MPN/l, and
total coliforms of around 240 000 MPN/l.
During the 1990s around 60% of the sub-system’s urban population
was connected to the sewerage network and 51% used some type
of in situ service. In contrast, the rural population was not served by a
sewerage network and all sanitation solutions were in situ. By the end
of the 1990s the sanitation coverage improved considerably, especially
in Nicaragua and Guatemala, where it had increased up to 80% by
2000. During the same period, El Salvador and Honduras increased
their level of coverage by only 8% (OPS/OMS 2001a), and Panama from
Table 10 Wastewater, solids and nutrient discharges in the Central Equatorial Pacifi c sub-system by country.
CountryWastewater (10³m³/year)
BOD(tonnes/
year)
COD(tonnes/
year)
Suspended solids
(tonnes/year)
TDS(tonnes/
year)
N (tonnes/
year)
P (tonnes/
year)
Panama 166 010.8 45 898.1 102 644.7 48 600.4 82 192.5 7 431.1 900.7
Costa Rica 30 366.1 8 257.9 18 451.6 8 499.0 15 136.2 1 368.50 165.9
Nicaragua 45 501.0 14 275.7 32 123.3 18 136.0 21 272.3 1 923.20 233.1
El Salvador 49 589.8 14 353.8 32 175.3 16 344.6 24 075.8 2 176.70 263.8
Honduras 59 888.1 17 030.3 38 141.1 18 874.7 29 300.9 2 649.10 321.1
Guatemala 15 964.0 4 814.2 10 812.9 5 810.9 7 607.3 687.8 83.4
Total 367 198.8 104 630.0 234 348.9 116 265.6 179 585 16 236.4 1968
(Source: PNUMA 2001)

34 GIWA REGIONAL ASSESSMENT 65 EASTERN EQUATORIAL PACIFIC
84% to 93%. The situation of Costa Rica was diff erent; during the early
1990s the coverage was 97% but a decade later it had decreased to
94%. Despite this, Costa Rica continues to have the highest level of
sanitation coverage in the sub-system. According to OPS/OMS (2001a),
the treatment of industrial effl uents is very low, 1-4% for most countries
though 34% in Nicaragua.
Pacifi c Colombian
A total of 87 200 m3/day of untreated wastewater is discharged into the
coastal waters of the Colombian Pacifi c, with a biological degradable
organic (BDO) charge equivalent to 16.5 tonnes/day (Garay et al.
2002). Most of this load (91.5%) is produced in the Valle del Cauca and
Nariño Departments, especially by the urban centres of Buenaventura
and Tumaco. Microbiological pollution has continued to exceed
permissible limits in the waters of both these cities. Table 12 shows
the concentrations of coliforms in the cities in the late 1980s. In 2002,
most of the monitored beaches located in the Nariño, Valle del Cauca
and Choco Departments surpassed the Colombian Permissible Limit
(2 000 MPN/l), especially during the rainy season (Vélez et al. 2003).
EutrophicationSouthwest Mexico
Wastewater discharges and agricultural run-off are the main sources
of nutrient enrichment in the aquatic environment of the Southwest
Mexico sub-system. Domestic discharges were estimated to introduce
a total of 34 200 tonnes of nitrogen and 4 150 tonnes of phosphorus
every year into the Pacifi c Ocean (PNUMA 2001). The major source
of nutrient enrichment in the coastal environment, however, is from
agricultural run-off . In Mexico, fertiliser application increased from
2.87 million tonnes in 1980 to 3.93 million tonnes in 2000 and use per
hectare increased over the same period from 110 kg/ha to 160 kg/ha
(Espinoza 2002). Contreras et al. (1995) analysed the water of 39 coastal
lagoons in Mexico, 20 of which are located in the Southwest Mexico
sub-system. They concluded that most of these water bodies are in
a permanent state of eutrophication. Some lagoons contained high
concentrations of nitrites and nitrates, whereas others in the states
of Oaxaca and Chiapas showed high concentrations of phosphorus.
In Lake Chapala, high levels of phosphorus (80 times higher than
permitted by international standards) and the proliferation of algae
and invasive aquatic weeds were clear indicators of eutrophication
(Living Lakes 2005).
Table 11 Coastal areas aff ected by pollution in the Central Equatorial Pacifi c sub-system.
Country Severe Severe/Moderate Moderate Slight
Costa Rica
Grande de Tarcoles Barranca Basin Gulf of Nicoya
Wastewater, Solid wastes, Sedimentation, Agrochemical
Puntarenas EstuaryWastewater, Solid wastes, Sedimentation, Habitat modification
Moín Limón Puerto Caldera
Wastewater, Agrochemicals, Oil
Golfito Agua Dulce
El Salvador
Estero Jaltepeque Lempa River basin, Sampuyo, Jalponga etc.
Wastewater, Solid wastes, Sedimentation, Agrochemical, Heavy metals
Bahía Jiquilisco Bahía La Unión Acajutla
Agrochemical, Heavy metals Wastewater, Oil
Guatemala
Puerto Quetzal Champerico
WastewaterOils, Solid wastes
Honduras
Gulf of Fonseca Agrochemicals, Nutrients, Aquaculture wastes
Amapala Cedeño San Lorenzo
Wastewater, Solid wastes, Oil
Nicaragua
Real Estuary Volcano-Pacific basin Negro River
Wastewater, Solid wastes, Pesticides, Sedimentation, Deforestation
Corinto Atoya-Sucio River (El Viejo-Chinandega- North Pacific) Chiquito River (Leon-South Pacific) Jesús Quisala River (San Rafael, Managua-South Pacific) Grande Carazo River (Jinotepe, Carazo-South Pacific)
Wastewater, Solid wastes, Pesticides, Sedimentation, Nutrients
Central zone, rivers Jesús-Quizada
Wastewater, Nutrients, Solid wastes
Panama Panama Bay (inner area)
Wastewater, Solid wastes, Pesticides, Eutrophication, Oil, Heavy metals
VacamonteSolid wastes, Oil
Gulf of Chiriqui Charco Azul
Sedimentation, Pesticides, Oil
Agua DulceNutrients, Oil
(Source: PNUMA 2001)
Table 12 Total and faecal coliforms at Tumaco and Buenaventura.
Year
Tumaco Buenaventura
Total coliforms (MPN/100 mL)
Faecal coliforms (MPN/100 mL)
Total coliforms (MPN/100 mL)
Faecal coliforms (MPN/100 mL)
Min Max Min Max Min Max Min Max
1986 91 11 000 36 11 000 40 11 000 200 4 600
1987 36 11 000 18 11 000 44 15 000 21 2 300
1988 17 43 000 20 3 300 210 110 000 93 46 000
1989 12 90 000 22 27 000 13 4 600 13 4 600
1990 33 66 000 19 22 000 80 9 200 79 5 400(Source: CPPS 2000)
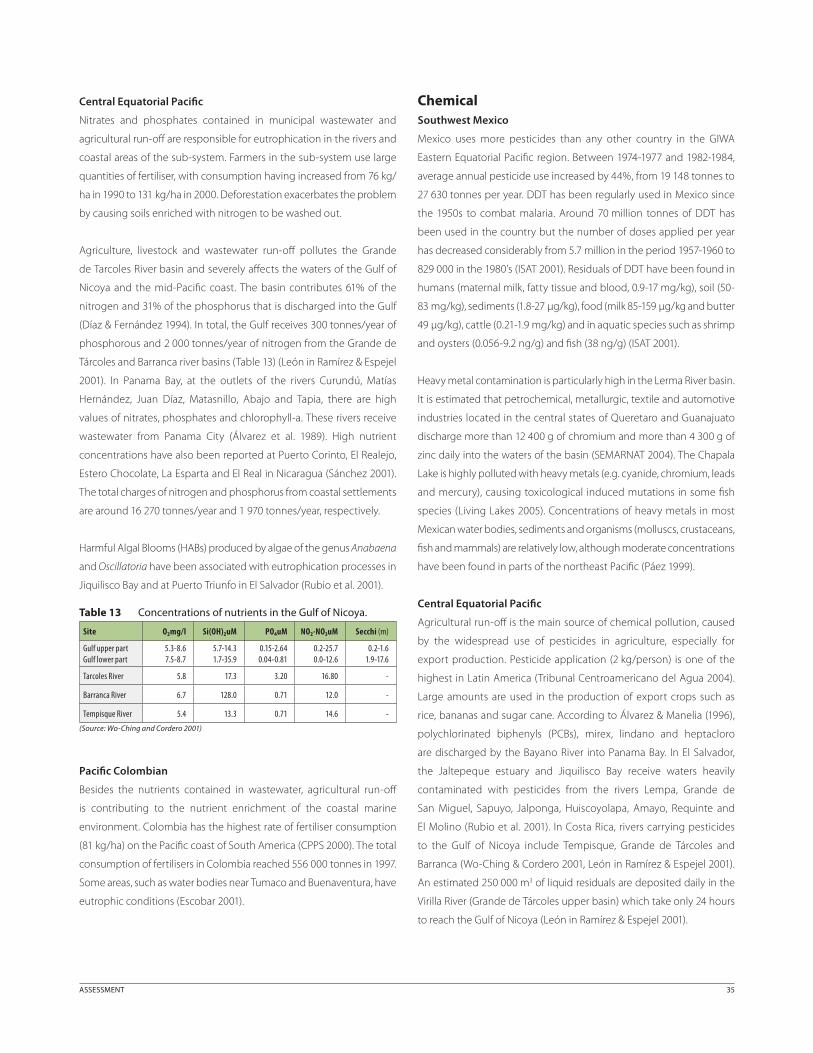
ASSESSMENT 35
Central Equatorial Pacifi c
Nitrates and phosphates contained in municipal wastewater and
agricultural run-off are responsible for eutrophication in the rivers and
coastal areas of the sub-system. Farmers in the sub-system use large
quantities of fertiliser, with consumption having increased from 76 kg/
ha in 1990 to 131 kg/ha in 2000. Deforestation exacerbates the problem
by causing soils enriched with nitrogen to be washed out.
Agriculture, livestock and wastewater run-off pollutes the Grande
de Tarcoles River basin and severely aff ects the waters of the Gulf of
Nicoya and the mid-Pacifi c coast. The basin contributes 61% of the
nitrogen and 31% of the phosphorus that is discharged into the Gulf
(Díaz & Fernández 1994). In total, the Gulf receives 300 tonnes/year of
phosphorous and 2 000 tonnes/year of nitrogen from the Grande de
Tárcoles and Barranca river basins (Table 13) (León in Ramírez & Espejel
2001). In Panama Bay, at the outlets of the rivers Curundú, Matías
Hernández, Juan Díaz, Matasnillo, Abajo and Tapia, there are high
values of nitrates, phosphates and chlorophyll-a. These rivers receive
wastewater from Panama City (Álvarez et al. 1989). High nutrient
concentrations have also been reported at Puerto Corinto, El Realejo,
Estero Chocolate, La Esparta and El Real in Nicaragua (Sánchez 2001).
The total charges of nitrogen and phosphorus from coastal settlements
are around 16 270 tonnes/year and 1 970 tonnes/year, respectively.
Harmful Algal Blooms (HABs) produced by algae of the genus Anabaena
and Oscillatoria have been associated with eutrophication processes in
Jiquilisco Bay and at Puerto Triunfo in El Salvador (Rubio et al. 2001).
Pacifi c Colombian
Besides the nutrients contained in wastewater, agricultural run-off
is contributing to the nutrient enrichment of the coastal marine
environment. Colombia has the highest rate of fertiliser consumption
(81 kg/ha) on the Pacifi c coast of South America (CPPS 2000). The total
consumption of fertilisers in Colombia reached 556 000 tonnes in 1997.
Some areas, such as water bodies near Tumaco and Buenaventura, have
eutrophic conditions (Escobar 2001).
ChemicalSouthwest Mexico
Mexico uses more pesticides than any other country in the GIWA
Eastern Equatorial Pacifi c region. Between 1974-1977 and 1982-1984,
average annual pesticide use increased by 44%, from 19 148 tonnes to
27 630 tonnes per year. DDT has been regularly used in Mexico since
the 1950s to combat malaria. Around 70 million tonnes of DDT has
been used in the country but the number of doses applied per year
has decreased considerably from 5.7 million in the period 1957-1960 to
829 000 in the 1980’s (ISAT 2001). Residuals of DDT have been found in
humans (maternal milk, fatty tissue and blood, 0.9-17 mg/kg), soil (50-
83 mg/kg), sediments (1.8-27 µg/kg), food (milk 85-159 µg/kg and butter
49 µg/kg), cattle (0.21-1.9 mg/kg) and in aquatic species such as shrimp
and oysters (0.056-9.2 ng/g) and fi sh (38 ng/g) (ISAT 2001).
Heavy metal contamination is particularly high in the Lerma River basin.
It is estimated that petrochemical, metallurgic, textile and automotive
industries located in the central states of Queretaro and Guanajuato
discharge more than 12 400 g of chromium and more than 4 300 g of
zinc daily into the waters of the basin (SEMARNAT 2004). The Chapala
Lake is highly polluted with heavy metals (e.g. cyanide, chromium, leads
and mercury), causing toxicological induced mutations in some fi sh
species (Living Lakes 2005). Concentrations of heavy metals in most
Mexican water bodies, sediments and organisms (molluscs, crustaceans,
fi sh and mammals) are relatively low, although moderate concentrations
have been found in parts of the northeast Pacifi c (Páez 1999).
Central Equatorial Pacifi c
Agricultural run-off is the main source of chemical pollution, caused
by the widespread use of pesticides in agriculture, especially for
export production. Pesticide application (2 kg/person) is one of the
highest in Latin America (Tribunal Centroamericano del Agua 2004).
Large amounts are used in the production of export crops such as
rice, bananas and sugar cane. According to Álvarez & Manelia (1996),
polychlorinated biphenyls (PCBs), mirex, lindano and heptacloro
are discharged by the Bayano River into Panama Bay. In El Salvador,
the Jaltepeque estuary and Jiquilisco Bay receive waters heavily
contaminated with pesticides from the rivers Lempa, Grande de
San Miguel, Sapuyo, Jalponga, Huiscoyolapa, Amayo, Requinte and
El Molino (Rubio et al. 2001). In Costa Rica, rivers carrying pesticides
to the Gulf of Nicoya include Tempisque, Grande de Tárcoles and
Barranca (Wo-Ching & Cordero 2001, León in Ramírez & Espejel 2001).
An estimated 250 000 m3 of liquid residuals are deposited daily in the
Virilla River (Grande de Tárcoles upper basin) which take only 24 hours
to reach the Gulf of Nicoya (León in Ramírez & Espejel 2001).
Table 13 Concentrations of nutrients in the Gulf of Nicoya.
Site O₂mg/l Si(OH)₂uM PO₄uM NO₂-NO₃uM Secchi (m)
Gulf upper partGulf lower part
5.3-8.67.5-8.7
5.7-14.31.7-35.9
0.15-2.640.04-0.81
0.2-25.70.0-12.6
0.2-1.61.9-17.6
Tarcoles River 5.8 17.3 3.20 16.80 -
Barranca River 6.7 128.0 0.71 12.0 -
Tempisque River 5.4 13.3 0.71 14.6 -
(Source: Wo-Ching and Cordero 2001)
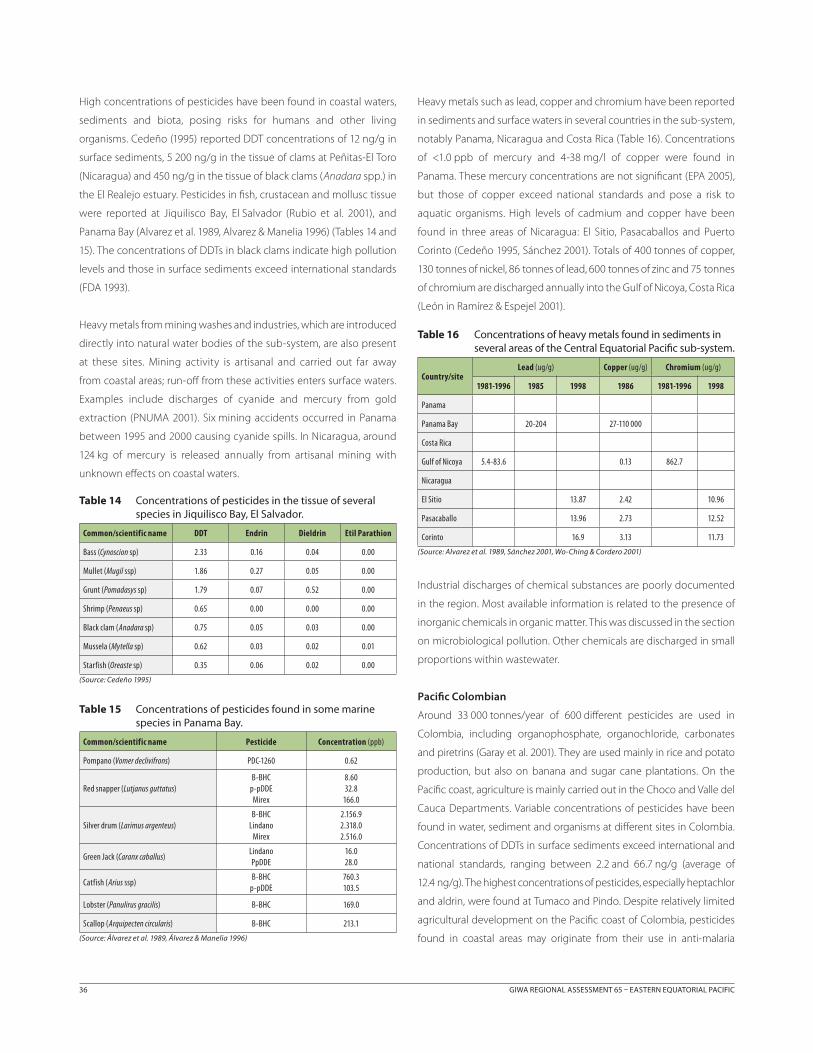
36 GIWA REGIONAL ASSESSMENT 65 EASTERN EQUATORIAL PACIFIC
High concentrations of pesticides have been found in coastal waters,
sediments and biota, posing risks for humans and other living
organisms. Cedeño (1995) reported DDT concentrations of 12 ng/g in
surface sediments, 5 200 ng/g in the tissue of clams at Peñitas-El Toro
(Nicaragua) and 450 ng/g in the tissue of black clams (Anadara spp.) in
the El Realejo estuary. Pesticides in fi sh, crustacean and mollusc tissue
were reported at Jiquilisco Bay, El Salvador (Rubio et al. 2001), and
Panama Bay (Alvarez et al. 1989, Alvarez & Manelia 1996) (Tables 14 and
15). The concentrations of DDTs in black clams indicate high pollution
levels and those in surface sediments exceed international standards
(FDA 1993).
Heavy metals from mining washes and industries, which are introduced
directly into natural water bodies of the sub-system, are also present
at these sites. Mining activity is artisanal and carried out far away
from coastal areas; run-off from these activities enters surface waters.
Examples include discharges of cyanide and mercury from gold
extraction (PNUMA 2001). Six mining accidents occurred in Panama
between 1995 and 2000 causing cyanide spills. In Nicaragua, around
124 kg of mercury is released annually from artisanal mining with
unknown eff ects on coastal waters.
Heavy metals such as lead, copper and chromium have been reported
in sediments and surface waters in several countries in the sub-system,
notably Panama, Nicaragua and Costa Rica (Table 16). Concentrations
of <1.0 ppb of mercury and 4-38 mg/l of copper were found in
Panama. These mercury concentrations are not signifi cant (EPA 2005),
but those of copper exceed national standards and pose a risk to
aquatic organisms. High levels of cadmium and copper have been
found in three areas of Nicaragua: El Sitio, Pasacaballos and Puerto
Corinto (Cedeño 1995, Sánchez 2001). Totals of 400 tonnes of copper,
130 tonnes of nickel, 86 tonnes of lead, 600 tonnes of zinc and 75 tonnes
of chromium are discharged annually into the Gulf of Nicoya, Costa Rica
(León in Ramírez & Espejel 2001).
Industrial discharges of chemical substances are poorly documented
in the region. Most available information is related to the presence of
inorganic chemicals in organic matter. This was discussed in the section
on microbiological pollution. Other chemicals are discharged in small
proportions within wastewater.
Pacifi c Colombian
Around 33 000 tonnes/year of 600 diff erent pesticides are used in
Colombia, including organophosphate, organochloride, carbonates
and piretrins (Garay et al. 2001). They are used mainly in rice and potato
production, but also on banana and sugar cane plantations. On the
Pacifi c coast, agriculture is mainly carried out in the Choco and Valle del
Cauca Departments. Variable concentrations of pesticides have been
found in water, sediment and organisms at diff erent sites in Colombia.
Concentrations of DDTs in surface sediments exceed international and
national standards, ranging between 2.2 and 66.7 ng/g (average of
12.4 ng/g). The highest concentrations of pesticides, especially heptachlor
and aldrin, were found at Tumaco and Pindo. Despite relatively limited
agricultural development on the Pacifi c coast of Colombia, pesticides
found in coastal areas may originate from their use in anti-malaria
Table 14 Concentrations of pesticides in the tissue of several species in Jiquilisco Bay, El Salvador.
Common/scientific name DDT Endrin Dieldrin Etil Parathion
Bass (Cynoscion sp) 2.33 0.16 0.04 0.00
Mullet (Mugil ssp) 1.86 0.27 0.05 0.00
Grunt (Pomadasys sp) 1.79 0.07 0.52 0.00
Shrimp (Penaeus sp) 0.65 0.00 0.00 0.00
Black clam (Anadara sp) 0.75 0.05 0.03 0.00
Mussela (Mytella sp) 0.62 0.03 0.02 0.01
Starfish (Oreaste sp) 0.35 0.06 0.02 0.00
(Source: Cedeño 1995)
Table 15 Concentrations of pesticides found in some marine species in Panama Bay.
Common/scientific name Pesticide Concentration (ppb)
Pompano (Vomer declivifrons) PDC-1260 0.62
Red snapper (Lutjanus guttatus)B-BHC
p-pDDEMirex
8.6032.8
166.0
Silver drum (Larimus argenteus)B-BHC
LindanoMirex
2.156.92.318.02.516.0
Green Jack (Caranx caballus)LindanoPpDDE
16.028.0
Catfish (Arius ssp)B-BHC
p-pDDE760.3103.5
Lobster (Panulirus gracilis) B-BHC 169.0
Scallop (Arquipecten circularis) B-BHC 213.1
(Source: Álvarez et al. 1989, Álvarez & Manelia 1996)
Table 16 Concentrations of heavy metals found in sediments in several areas of the Central Equatorial Pacifi c sub-system.
Country/siteLead (ug/g) Copper (ug/g) Chromium (ug/g)
1981-1996 1985 1998 1986 1981-1996 1998
Panama
Panama Bay 20-204 27-110 000
Costa Rica
Gulf of Nicoya 5.4-83.6 0.13 862.7
Nicaragua
El Sitio 13.87 2.42 10.96
Pasacaballo 13.96 2.73 12.52
Corinto 16.9 3.13 11.73
(Source: Alvarez et al. 1989, Sánchez 2001, Wo-Ching & Cordero 2001)
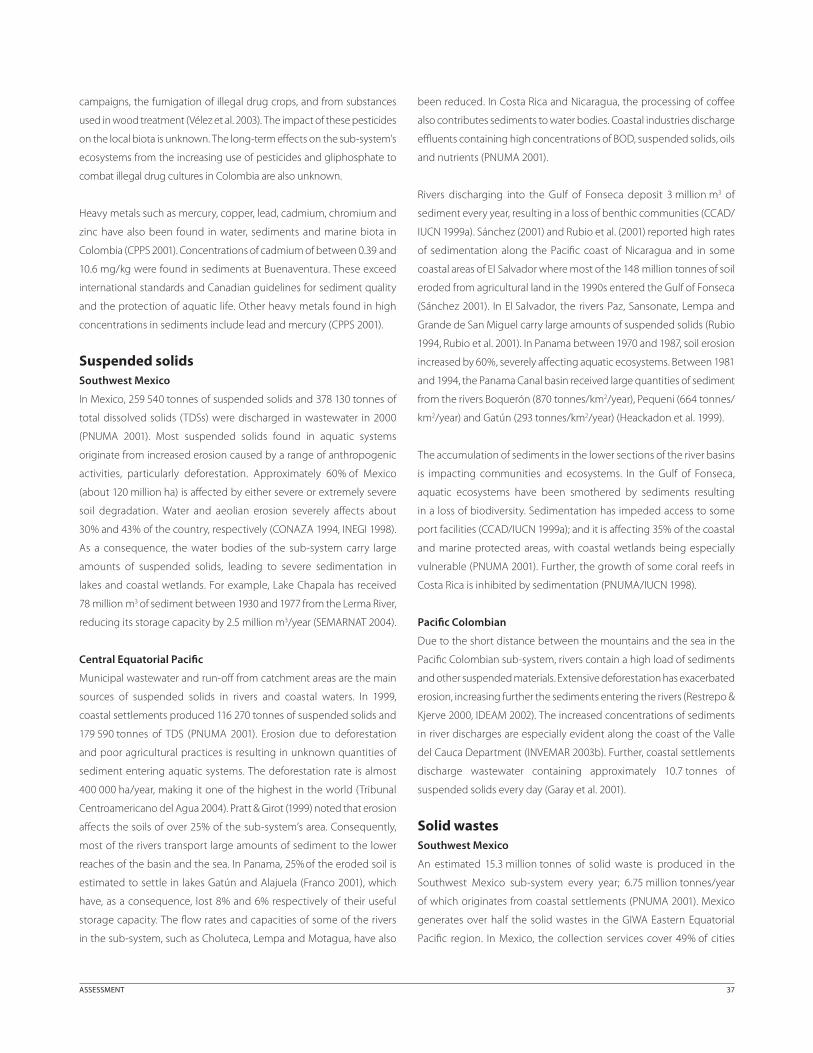
ASSESSMENT 37
campaigns, the fumigation of illegal drug crops, and from substances
used in wood treatment (Vélez et al. 2003). The impact of these pesticides
on the local biota is unknown. The long-term eff ects on the sub-system’s
ecosystems from the increasing use of pesticides and gliphosphate to
combat illegal drug cultures in Colombia are also unknown.
Heavy metals such as mercury, copper, lead, cadmium, chromium and
zinc have also been found in water, sediments and marine biota in
Colombia (CPPS 2001). Concentrations of cadmium of between 0.39 and
10.6 mg/kg were found in sediments at Buenaventura. These exceed
international standards and Canadian guidelines for sediment quality
and the protection of aquatic life. Other heavy metals found in high
concentrations in sediments include lead and mercury (CPPS 2001).
Suspended solidsSouthwest Mexico
In Mexico, 259 540 tonnes of suspended solids and 378 130 tonnes of
total dissolved solids (TDSs) were discharged in wastewater in 2000
(PNUMA 2001). Most suspended solids found in aquatic systems
originate from increased erosion caused by a range of anthropogenic
activities, particularly deforestation. Approximately 60% of Mexico
(about 120 million ha) is aff ected by either severe or extremely severe
soil degradation. Water and aeolian erosion severely aff ects about
30% and 43% of the country, respectively (CONAZA 1994, INEGI 1998).
As a consequence, the water bodies of the sub-system carry large
amounts of suspended solids, leading to severe sedimentation in
lakes and coastal wetlands. For example, Lake Chapala has received
78 million m3 of sediment between 1930 and 1977 from the Lerma River,
reducing its storage capacity by 2.5 million m3/year (SEMARNAT 2004).
Central Equatorial Pacifi c
Municipal wastewater and run-off from catchment areas are the main
sources of suspended solids in rivers and coastal waters. In 1999,
coastal settlements produced 116 270 tonnes of suspended solids and
179 590 tonnes of TDS (PNUMA 2001). Erosion due to deforestation
and poor agricultural practices is resulting in unknown quantities of
sediment entering aquatic systems. The deforestation rate is almost
400 000 ha/year, making it one of the highest in the world (Tribunal
Centroamericano del Agua 2004). Pratt & Girot (1999) noted that erosion
aff ects the soils of over 25% of the sub-system’s area. Consequently,
most of the rivers transport large amounts of sediment to the lower
reaches of the basin and the sea. In Panama, 25% of the eroded soil is
estimated to settle in lakes Gatún and Alajuela (Franco 2001), which
have, as a consequence, lost 8% and 6% respectively of their useful
storage capacity. The fl ow rates and capacities of some of the rivers
in the sub-system, such as Choluteca, Lempa and Motagua, have also
been reduced. In Costa Rica and Nicaragua, the processing of coff ee
also contributes sediments to water bodies. Coastal industries discharge
effl uents containing high concentrations of BOD, suspended solids, oils
and nutrients (PNUMA 2001).
Rivers discharging into the Gulf of Fonseca deposit 3 million m3 of
sediment every year, resulting in a loss of benthic communities (CCAD/
IUCN 1999a). Sánchez (2001) and Rubio et al. (2001) reported high rates
of sedimentation along the Pacifi c coast of Nicaragua and in some
coastal areas of El Salvador where most of the 148 million tonnes of soil
eroded from agricultural land in the 1990s entered the Gulf of Fonseca
(Sánchez 2001). In El Salvador, the rivers Paz, Sansonate, Lempa and
Grande de San Miguel carry large amounts of suspended solids (Rubio
1994, Rubio et al. 2001). In Panama between 1970 and 1987, soil erosion
increased by 60%, severely aff ecting aquatic ecosystems. Between 1981
and 1994, the Panama Canal basin received large quantities of sediment
from the rivers Boquerón (870 tonnes/km2/year), Pequeni (664 tonnes/
km2/year) and Gatún (293 tonnes/km2/year) (Heackadon et al. 1999).
The accumulation of sediments in the lower sections of the river basins
is impacting communities and ecosystems. In the Gulf of Fonseca,
aquatic ecosystems have been smothered by sediments resulting
in a loss of biodiversity. Sedimentation has impeded access to some
port facilities (CCAD/IUCN 1999a); and it is aff ecting 35% of the coastal
and marine protected areas, with coastal wetlands being especially
vulnerable (PNUMA 2001). Further, the growth of some coral reefs in
Costa Rica is inhibited by sedimentation (PNUMA/IUCN 1998).
Pacifi c Colombian
Due to the short distance between the mountains and the sea in the
Pacifi c Colombian sub-system, rivers contain a high load of sediments
and other suspended materials. Extensive deforestation has exacerbated
erosion, increasing further the sediments entering the rivers (Restrepo &
Kjerve 2000, IDEAM 2002). The increased concentrations of sediments
in river discharges are especially evident along the coast of the Valle
del Cauca Department (INVEMAR 2003b). Further, coastal settlements
discharge wastewater containing approximately 10.7 tonnes of
suspended solids every day (Garay et al. 2001).
Solid wastesSouthwest Mexico
An estimated 15.3 million tonnes of solid waste is produced in the
Southwest Mexico sub-system every year; 6.75 million tonnes/year
of which originates from coastal settlements (PNUMA 2001). Mexico
generates over half the solid wastes in the GIWA Eastern Equatorial
Pacifi c region. In Mexico, the collection services cover 49% of cities
38 GIWA REGIONAL ASSESSMENT 65 EASTERN EQUATORIAL PACIFIC
with more than 100 000 inhabitants. Most solid wastes reaching the
coasts of Mexico include organic matter of urban, agricultural and
industrial origin, which after oxidative processes become inorganic
stable compounds and can increase microbiological pollution (Páez
1999). In 2002, the Ministry of Navy (SEMAR) collected 58 000 tonnes of
solid waste from Mexican beaches.
Central Equatorial Pacifi c
The sub-system generates around 32 300 tonnes/day of solid waste
(Acurio et al. 1997). There is a lack of statistics on the coverage
of collection services, except for in the urban areas of Costa Rica
(66%), Honduras (20%) and Guatemala (47%) where the services are
concentrated. Overall, the level of coverage is believed to be low. Most
solid waste is disposed of inappropriately, some dumped directly into
water bodies. Wastes are not separated except, in some countries,
hospital wastes. Consequently, solid wastes accumulate in the outlets
of rivers such as Volcano-Pacifi c in Nicaragua, Virilla-Grande de Tárcoles
in Costa Rica (Wo-Ching & Cordero 2001), and the rivers discharging into
Panama Bay. In El Salvador, wastes are disposed of in open areas without
treatment, often obstructing port activities (Rubio et al. 2001).
There are several environmental impacts caused by solid wastes,
including increased BOD loads resulting from contained organic
matter. In sites receiving solid wastes, soils may become acidic and
leachates can contaminate aquifers. Improperly disposed solid wastes
also provide breeding environments for vermin, which may become
disease vectors. Debris can also harm wildlife through ingestion or
entanglement.
Pacifi c Colombian
The unplanned development of urban centres in the Pacifi c Colombian
sub-system has resulted in wastes being inappropriately disposed. As a
consequence, waste accumulates on beaches. In 1996, 320 tonnes/day
of solid waste was produced by communities along the Pacifi c coast of
Colombia (CPPS 2000). Buenaventura generated 250 tonnes/day (78%
of the total), 180 tonnes of which were collected and 70 tonnes were
disposed of in open dumps. In Tumaco, only 40% (70 tonnes/day) of its
solid waste is collected. Another major source of solid waste is the timber
industry which generates around 570 000 m3/year (CPPS 2000).
RadionuclidesThere are no reports of radionuclide pollution in the region. However,
there is a potential risk of nuclear pollution from the transport of
radioactive material through the Panama Canal (Gibbs in Escobar 2000).
It is estimated that 10 vessels per month carry radioactive loads through
the Canal, each holding 12-14 containers with 30-60 tonnes of nuclear
material. Most radioactive materials include 132I, 3H, material for industrial
purposes and non-destructive trials (192Ir, 60Co), as well as non-irradiated
fuel (a mixture of plutonium oxide or enriched uranium). In general,
loads passing through the Panama Canal are classifi ed as ‘type B’ or
as having a ‘mid to high level of activity’. The material most frequently
transported through the Canal is depleted uranium hexafl uoride (UF6),
the transportation of which is strictly controlled.
Radionuclides of natural and anthropogenic origin (40K and 137C) were
found in the Gulf of Nicoya, Costa Rica, with concentrations exceeding
international averages in the case of 40K (Loria et al. 2002). The source
of this isotope could be agricultural activities along the Grande de
Tárcoles River, whereas the presence of 137C is associated with nuclear
tests conducted elsewhere.
SpillsSouthwest Mexico
The majority of oil spills are caused by operational failures in ports, during
the shipment of oil and gasoline, and by pipeline damage. Minor con-
tamination is caused by oils and other hydrocarbons entering the sewer-
age system and then being discharged in coastal areas. These residuals
can originate from burned oil from cars, the maintenance of vessels in
dry docks, and motors used by industry. Polycyclic aromatic hydrocar-
bons are found in the sediments and coastal areas surrounding the port
of Salina Cruz (Oaxaca State in southern Mexico) where one of the most
signifi cant petrochemical industries is located (Botello et al. 1998).
Central Equatorial Pacifi c
Most oil spills in the sub-system occur in ports and at storage sites. The
1 900 vessels/year transiting the Panama Canal introduce approximately
200 tonnes of oil per year into the bay (Kiewcinsky 1986). Additionally,
spills totalling 384 m3 were reported in the ports Balboa, Cristóbal and
Vacamonte in 1999. Most discharges were of diesel, bunker or cesspool re-
siduals (PNUMA 2001). The trans-isthmus oil pipeline is another potential
source of oil pollution (PNUMA 1999). In Charco Azul, Gulf of Chiriqui, spills
of up to 800 m3 were reported in 1978 (CPPS 2000). In other areas of the
sub-system, oil spills total 600 m3/year. Spills total 28 m3/year in Guatemala
and El Salvador, and 32 m3/year in Honduras. Around 40-60% of the total
spills are caused by the fi shing fl eet (Escobar 2003), whereas spills result-
ing from shipping accidents are uncommon and of low impact.
Pacifi c Colombian
Several minor spills that occurred in 1976 and 1998 in Ecuador aff ected
the Colombian coasts of Nariño and Valle del Cauca, including Gorgona
Island and Tumaco (MMA 2002b). Exploitation, refi ning and transport
activities have resulted in chronic pollution, particularly around Tumaco
ASSESSMENT 39
(Vélez 2003). In the late 1990s, the average hydrocarbon concentrations
were recorded as 25 µg/l in coastal waters, 1.18 µg/g in sediments and
7.45 µg/g in mollusc bivalves (Garay et al. 2002). Between 1986 and 1999,
there were 654 acts of sabotage to the Colombian oil pipeline, which
caused the spillage of 336 420 m3 of oil into the environment, resulting
in remediation costs of 37.7 million USD (Vélez 2003).
Socio-economic impactsSouthwest Mexico
In Mexico, 74.5% of the population had access to sanitation services in
the form of a sewerage system (58.4%) or in situ solutions (14.1%) in 2000
(OPS/OMS 2001a). This means that a total of 26.4 million inhabitants
dispose their wastewater and excreta inappropriately. The proportion
of the population with sanitation services or in situ solutions in Mexico
is lower than the average for the LAC (79.2% and 30.6% respectively)
(OPS/OMS 2001a).
The economic impact of water pollution in Mexico has not been fully
examined. Qualitative evidence suggests that tourists are discouraged
from visiting polluted areas and are selecting alternative tourism desti-
nations (Muñoz-Pineda pers. comm.). Coastal water pollution negatively
aff ects diving and other forms of tourism, as well as the commercial fi sh-
eries, as it is degrading aquatic ecosystems, particularly coral reefs and
their associated living resources (Coral Reef Alliance 2003).
In Mexico, microbiological pollution in coastal waters poses health risks
for bathers as exposure can result in disease, including gastroenteritis,
acute febrile respiratory illness and hepatitis. Children, the elderly and
individuals with weak immune systems are particularly vulnerable;
even with treatment some of these diseases can be fatal (Hancock &
Gilmore 2004).
Digestive tract diseases related to the consumption of contaminated
water or shellfi sh include acute gastroenteritis, typhoid fever, hepati-
tis A and cholera. Nasal and pharyngeal diseases are also associated
with poor water quality. Gastroenteritis is the most common disease
aff ecting children, the poor and other vulnerable groups (CPPS 2001,
UNEP 2000). In general, gastrointestinal disorders are the main cause
of infant mortality.
Eutrophication may increase the frequency of HABs in Mexican Pacifi c
waters. Toxic HABs were reported in Mazatlan in 1979 and Oaxaca-
Chiapas in 1989 (Cortés et al. 1993). More than 300 cases of paralytic
shellfi sh poisoning (PSP) have occurred in Mexico with 17 mortalities.
Closed seasons during the HAB events have resulted in economic losses
of 200 million USD to the fi sheries industry (Schoijet 2002).
Central Equatorial Pacifi c
Untreated domestic and industrial wastewaters are major sources of
pollution in the sub-system and a signifi cant cause of enteric diseases.
As many as 12 diseases produced by pathogenic micro-organisms are
linked to polluted waters. They aff ect mainly the vulnerable groups
of the population, especially children (PNUMA 2001). Acute diarrheic
disease (ADD) is the main cause of infant mortality (children under fi ve
years old). In the past 30 years, 5 million children died from this disease,
although the mortality rate has decreased signifi cantly in recent years
(Tribunal Centroamericano del Agua 2004). ADD and other water-
related diseases are still the main cause of the high rates of morbidity
and mortality in the sub-system. The current infant mortality rate is
36‰, decreasing to a quarter of the rate in 1970 when it was 135‰.
In the case of Costa Rica, which has the highest living standards in the
sub-system, it was 16‰ in 1998. In Nicaragua, which has the lowest per
capita income, the rate decreased from 165‰ in 1970 to 48 ‰ in 1998.
Despite this progress, infant mortality rates remain comparably high,
even in Costa Rica (Ballesteros 2003).
Cholera is another disease aff ecting the population of the sub-system.
During the 1990s, the Pan-American Health Organization recorded
254 077 cases of cholera. Countries with the most cases are Guatemala,
33.9%; Nicaragua, 12.8%; and El Salvador, 12%. A total of 27 412 cases of
dengue fever were reported in 2001, of which 991 were hemorrhagic
dengue fever which killed 28 people (OPS/OMS 2004). Because
sanitation coverage is not increasing in line with population growth,
the prevalence of diseases will increase.
The economic costs of environmental degradation caused by pollution
in the sub-system have not been suffi ciently researched. The total cost
of pollution in the Gulf of Nicoya, Costa Rica, has been estimated at
203 million USD per year (Castro et al. 2000). These costs include the
treatment of wastewater and solid wastes of domestic and industrial
origin and the loss of revenues by productive activities such as tourism,
fi shing and farming. Every year between 1 000 and 2 000 persons in
Central America are poisoned by pesticides; the associated medical
costs are between 32 and 92 USD per person, depending on the type
of toxin (García 1998). Litter accumulation has reduced the aesthetic
value of coastal sites, thus aff ecting tourism and posing a permanent
risk for fi shing and maritime traffi c.
Pacifi c Colombian
The impact of pollution on human health in the Pacifi c Colombian
sub-system is considered as moderate to severe. Several private
enterprises that provide freshwater and sanitation services in the Valle
del Cauca Department have been charged retributive fees (pollution
40 GIWA REGIONAL ASSESSMENT 65 EASTERN EQUATORIAL PACIFIC
tax). Recently, the government institution Corporación Autónoma
Regional del Valle del Cauca began legal proceedings against four of
the fi ve enterprises operating in this department because they have
failed to pay the retributive fees since 1997. The fees are owed for the
discharge of 68 700 kg/day of pollutants into water bodies in the Cauca
River basin (El País 2004).
In terms of morbidity, the low sanitation coverage seriously aff ects the
health of the population. Between 5 and 10% of deaths are related to
the lack of sewerage services, the inappropriate disposal of wastes and
poor freshwater quality. About 50 000 people die annually from water
related disease in Colombia. The two major causes of infant mortality
are gastroenteric diseases and malnutrition, which also increase the vul-
nerability of children to other infectious diseases (INDERENA 1992). The
population in the Pacifi c region of Colombia has the highest risk of infant
morbidity and mortality (Yepes 1990). The infant mortality in the Choco
Department is 150‰, which is three times the national average, and the
life expectancy is 12 years lower than in Cali City (INDERENA 1992).
Conclusions and future outlookWastewater discharged without treatment through the sewerage
network or directly into water bodies is the most widespread pollution
issue. There is a low level of sanitation coverage in most of the countries
in the Eastern Equatorial Pacifi c region. In general, the coverage of
sanitation and drinking water services has not grown in line with
population growth and urban development. As a consequence, water-
related diseases are increasingly prevalent with acute diarrheic disease
the main cause of morbidity and infant mortality. Poorer communities,
children and the elderly are the most vulnerable groups.
Pesticides and fertilisers are used intensively in agriculture. They are
responsible, in combination with domestic wastewater, for causing
eutrophication and toxic pollution in coastal areas which is impacting
marine ecosystems and thus the food security of the coastal
population. Although there is a dearth of information regarding the
eff ects of pollutants in the coastal zone of the region, it is expected
that pesticides, heavy metals and other pollutants are accumulating
in coastal areas and are impacting marine biota. Pollution has a direct
impact on human health as a result of defi ciencies in freshwater supply,
sanitation and wastes collection services. Pollution is threatening
economic development, particularly tourism.
IMPA
CT Habitat and community
modificationHabitat and community modifi cation is being caused by a range
of human activities including deforestation, fi shing, tourism and
aquaculture. Lakes, rivers, mangroves, benthic ecosystems and coral
reefs have been degraded, but no quantitative data is available. Data
related to the loss of native species or changes in community structure
caused by alien species is similarly unavailable.
Habitat and community modifi cation was assessed for the Central
Equatorial Pacifi c and Pacifi c Colombian sub-systems.
Loss of ecosystemsCentral Equatorial Pacifi c
Aquatic ecosystems and habitats are severely aff ected by sedimentation,
particularly corals reefs at Punto Islotes and Agua Dulce in Costa Rica, as
well as some shallow water coral reefs at Baru and Chiriqui in Panama. At
Iguana Island (Panama) around 80% of the coral reef has been destroyed
by oil spills, whereas the coral reefs at Coiba and in the Gulf of Chiriquí
have been partly destroyed by trawlers (Escobar 1996). During the warm
phase of the El Niño events in 1982-1983 and 1997-1998, widespread
coral bleaching occurred in Panama (PNUMA 2001).
Wetlands and mangroves are impacted by solid wastes, such as in the
Volcano-Pacifi c basin in Nicaragua, La Unión Bay in the Gulf of Fonseca
and in the lower sections of the river basins of Matasnillo, Tapias,
Juan Díaz, Río Abajo, Chilibre and Chilibrillo in the Gulf of Panama.
An estimated 98% of estuaries in the sub-system are aff ected by
sedimentation, wastewater and agro-chemicals (PNUMA 2001).
Mangrove forests have been used for several purposes, including
aquaculture, agriculture, urbanisation, fi rewood, construction and
to obtain salts and tannins. In the Gulf of Fonseca, mangrove forests
have been cleared for shrimp ponds, and salt and tannin production.
In 1993, 89 200 m3 of fi rewood from mangrove forests was used for salt
extraction (1 tonnes of salt requires 3.5 tonnes of wood). The extent
of the mangrove area has been reduced from 104 911 ha in 1976 to
69 109 ha in 1997, while the shrimp farming area has increased from
8 000 ha in the 1980s to 29 370 ha in 1997 (CCAD/IUCN 1999a). By 1994,
Honduras had lost around 12% of its mangrove forest due to aquaculture
(Figure 17). Prior to the 1960s, there were 500 000 ha of mangrove in the
central provinces of Herrera, Los Santos and part of Cocle (Panama),
but by 1988 only 176 000 ha remained. In a 30-year period, 5 647 ha of
mangrove forest were cleared for agricultural purposes in Soná, 1 345 ha
in Veraguas province and 2 157 ha in Chiriqui (López et al. 1996). The

ASSESSMENT 41
consequences of mangrove destruction include increases in coastal
erosion, higher penetration of the saline wedge in some estuaries,
soil salinisation and, in particular, a decrease in biological productivity
which directly impacts the artisanal fi shery (PNUMA 2001).
Pacifi c Colombian
Mangrove and alluvial forests are the most aff ected ecosystems.
Between 1980 and 1990, agriculture expanded by 108 623 ha at the
expense of forests, while at the same time, the Andean forests were
reduced by 23 302 ha. Mangrove forests are unsustainably exploited
as they are valuable resources for humans (República de Colombia et
al. 2002). Mangroves have been destroyed mainly to build aquaculture
infrastructure (Conservación Internacional 2004), but also due to logging,
in-fi lling, construction, the accumulation of wastes and wastewater
contamination, among other threats (Table 17) (MMA 2002b).
Anthropogenic activities are also reducing biodiversity; for example,
the richness and abundance of coprophages beetles has declined
(Family Scarabaeidae, Subfamily Scarabaeinae) (República de Colom-
bia et al. 2002).
The forests in the river basins of the sub-system have been
extensively modifi ed; 22.1% (2.23 million ha) of the total surface area
of the sub-system has experienced moderate intervention and 12.3%
(1.24 million ha) is degraded (República de Colombia et al. 2002). The
deforestation rate in the region over the past 17 years has been around
110 000 ha/year, which has caused the loss of more than half of the sub-
system’s original forest (Conservation International 2004).
Modification of ecosystemsCentral Equatorial Pacifi c
Several aquatic environments and communities are aff ected by envi-
ronmental deterioration in the Central Equatorial Pacifi c sub-system.
Mangroves are the most impacted coastal ecosystem, especially at
Puntarenas, Costa Rica; in El Salvador between the outlets of the riv-
ers Paz and Jiquilisco; in the estuaries of El Zapote, San Diego and
Jaltepeque; and near Maculita Beach (Rubio et al. 2001). In Nicaragua,
the most impacted areas are the estuaries of El Realejo, Jiquilillo and
Chichigalpa (Sánchez 2001); mangrove forests in the lower basin of riv-
ers draining into Panama Bay (Franco 2001); and mangroves in the Gulf
of Fonseca (CCAD/IUCN 1999a). Among the measures adopted by the
governments of the region to protect their biodiversity is the creation
of protected areas. However, around 35% of the coastal and marine pro-
tected areas had deteriorated by 2001 due to a variety of causes, such as
sedimentation, mangrove clearing, pollution and overfi shing (PNUMA
2001). The status of mangrove forests on the Pacifi c coast is considered
to be vulnerable, in the Gulf of Fonseca and northern dry coast as en-
dangered, and in the southern part of the dry coast as critical. Only a
small proportion of the Pacifi c mangrove forests are relatively stable.
The modifi cation of mangrove and estuarine ecosystems has aff ected
important fi sh nursery and recruitment grounds. Further, trawling is al-
tering benthic habitats in coastal waters.
Pacifi c Colombian
Habitat modifi cation is evident in wetlands as well as natural forests
(IDEAM 2002). These ecosystems are degraded more than on the
plains as concessions have been granted to several enterprises to ex-
tract wood pulp from both wetlands and rainforests (Conservation
International 2004). Coastal ecosystems, in particular mangroves, are
considered fragile and vulnerable as a result of high rates of erosion and
habitat fragmentation. These issues raise concern about the sustainabil-
ity of the region and its resilience to the current rates of exploitation
(Conservation International 2004).
Although several alien species are known to have been introduced
into Colombian waters, there is limited information regarding their
distribution and impact on aquatic ecosystems. However, introduced
species of cichlids, gerrids and shrimps, among others, may be aff ecting
the biodiversity of the sub-system. In some cases, these species are
introduced by government institutions without consideration of
the environmental consequences (Conservation International 2004).
Acrostichum aureum, an alien fern species, has been detected in
deforested mangrove zones (MMA 2002b).
Socio-economic impactsThe economic impact of the loss and modifi cation of ecosystems is
insuffi ciently documented. According to the regional team, habitat
modifi cation has reduced income and investment opportunities. The
loss and degradation of mangrove forests has compromised their
Table 17 Main activities aff ecting mangrove forests in the Pacifi c Colombian sub-system.
Activities/causes Choco Valle Cauca Nariño
Sedimentation ✓ ✓ ✓
Roads, airports, maritime and port infrastructure ✓ ✓ ✓
Expansion of the urban frontier ✓ ✓
Expansion of agriculture and livestock frontier ✓ ✓ ✓
Eutrophication ✓ ✓
Logging, filling and construction ✓ ✓
Inappropriate forestry ✓ ✓ ✓ ✓
Pollution by hydrocarbons ✓ ✓ ✓
Shrimp farms ✓
Natural disasters ✓ ✓ ✓
(Source: MMA 2002c)

42 GIWA REGIONAL ASSESSMENT 65 EASTERN EQUATORIAL PACIFIC
ability to provide valuable resources for local communities. Around
820 000 people depend directly on the Gulf of Fonseca’s resources.
Despite the importance of mangroves in the Gulf as nursery and
recruitment areas for important commercial fi sheries, large areas
of forest have been destroyed by a variety of human activities (see
Figure 17). A study by CCAD/IUCN (1999a) showed that the number of
artisanal fi shermen has increased but fi sh production has decreased.
The resultant lower incomes from fi shing have led to extreme poverty in
some communities. The expansion of aquaculture in the Gulf of Fonseca
is creating social tensions as the farmers are restricting the access of
artisanal fi shermen to traditional fi shing areas (CCAD/IUCN 1999a).
No health impacts associated with habitat modifi cation have been re-
ported. The construction of dams and reservoirs for hydroelectric gen-
eration causes habitat fragmentation and increases the water surface
area where tropical disease vectors can develop. Habitat degradation
is eff ecting rural populations that depend on wetland and marine re-
sources for their subsistence. The social and community impacts are
expected to increase in severity due to the continued modifi cation of
ecosystems.
Conclusions and future outlookThe extent and structure of coastal ecosystems has changed as a result
of human activities. Mangrove and several other forest communities,
especially in fl ooding lowlands, have been overexploited since the sec-
ond half of the 20th century and they are now on the brink of collapse.
These ecosystems have lost the capacity to provide basic necessities
for human well-being. Increased sedimentation, primarily as a result of
deforestation, is modifying the aquatic ecosystems of the sub-system.
Loss of mangrove forest is the best documented case of habitat destruc-
tion in coastal areas. Urbanisation has also aff ected both mangrove and
other forests, and will continue to increase in signifi cance due to high
population growth rates, particularly in coastal areas. The future out-
look is uncertain and will depend on the success of current and future
conservation and sustainable initiatives.
IMPA
CT Unsustainable exploitation of
fish and other living resourcesThe unsustainable exploitation of fi sh and other living resources
was assessed in the Central Equatorial Pacifi c and Pacifi c Colombian
sub-systems. There has been an increase in fi shing eff ort in both the
industrial and artisanal sectors, particularly for high-value species such
as shrimp and tuna. Overfi shing and the use of destructive fi shing gear
have resulted in a decline in recruitment and the degradation of the
habitat of some commercial species.
Marine fi sheries account for 92% of the total catches in the sub-system
(FAO 2002b). Panama is the leading fi shing country with 77% of the
total volume, followed by Costa Rica with 11.6% (Table 18). The main
commercial fi sheries include tuna and small schooling fi sh, such as the
California sardine (Sardinops sagax) and anchovy (Engraulis spp.). There
is also an upwelling area off Panama where a locally important stock
of the Central Pacifi c anchovy (Cetengrauilis mysticetus) is exploited
(WCMC 1996).
Fishing is one of the main sources of income for inhabitants in the
coastal area of the Pacifi c Colombian sub-system. The major fi shing
ports on the Pacifi c coast are Tumaco, Guapi, Buenaventura, Nuqui
and Solano Bay (INDERENA 1992). The fi sheries industry is comprised
of three sectors: industrial, artisanal and aquaculture. The artisanal
and industrial sectors account for 53.9% and 46.1% of total catches,
respectively (INDERENA 1992).
G U L F O F F O N S E C A
P A C I F I CO
CE
AN
Mangrove© GIWA 2005
Figure 17 Remaining mangrove areas (in purple) in the Gulf of Fonseca.(Source: CCAD/IUCN 1999b)
Table 18 Total marine catches in the countries of the Central Equatorial Pacifi c sub-system.
CountryPacific Ocean (tonnes)
Average production (tonnes) %
1995 1997 1999 2001 1995-2001
Costa Rica 15 846 25 409 23 555 32 917 24 431 11.6
El Salvador 10 747 9 089 7 841 16 065 10 935 5.20
Guatemala 3 838 1 490 8 930 2 450 4 177 1.98
Honduras 864 4 002 1 702 3 044 2 403 1.14
Nicaragua 4 500 5 432 9 662 8 304 6 974 3.34
Panama 151 219 147 295 111 140 230 390 160 011 77
Total sub-system 187 014 192 717 162 830 293 170 208 931 100
(Source: FAO 2002b)

ASSESSMENT 43
OverexploitationCentral Equatorial Pacifi c
The increasingly large catches of fi sh have become unsustainable. In
Nicaragua, for example, annual catches increased from 4 235 tonnes in
1984 to 23 259 tonnes in 1998, and in Honduras they increased by 250%
over the same period (Pratt & Girot 1999). Coastal species such as lobster,
snail and sea urchin are considered depleted. The Central Pacifi c anchovy
is fully or overexploited in Panama (WCMC 1996). The increase in catches
of anchovy and the Californian sardine will lead to the collapse of these
fi sheries (FAO 1997). A signifi cant proportion of tuna production is by
foreign fl eets, such as those from South Korea, Japan, the United States
and Venezuela (Sea Around Us Project 2002).
Most shrimp populations in the sub-system are considered by the FAO to
be fully or overexploited. In Costa Rica, the majority of pelagic and coastal
benthic fi sh species are also overexploited. Catches of shark, marlin, sailfi sh
and some species of tuna have decreased steadily since the 1950s. Today,
some 85% of pelagic production is caught beyond the Economic Exclu-
sive Zone (EEZ) (Sinergia 69 unpublished).
In the Gulf of Fonseca, some molluscs and crustaceans associated with
mangrove and rocky ecosystems are overexploited by the artisanal
fi shery, and several others such as the oyster Ostrea iridescens, Green
lobster (Panulirus gracilis) and the crab Menipe frontalis are at their limit of
exploitation (CCAD/IUCN 1999a).
Pacifi c Colombian
According to FAO (2004c), catches of marine fi sh, crustaceans, molluscs
and other marine living resources decreased in Colombia between
1992 and 2000 (Figure 18). Catches of fi sh in the continental waters
of the Choco region have also steadily declined. The current rate of
exploitation of fi shing resources is considered unsustainable in the
sub-system.
The report on the State of Marine and Coastal Resources of Colombia
(INVEMAR 2003c) reported that catches of mackerel, snappers and sharks
decreased in 2001, whereas catches of tuna and other fi sh increased.
Catches of Blue crab (Cardisoma guanhumi) increased from 37 tonnes in
2000 to 716 tonnes in 2001. High-value resources such as jumbo shrimps
(Penaeus sp.) decreased from 2 686 tonnes in 1999 to 4 tonnes in 2001,
and other shrimps from 3 826 tonnes to 1 575 tonnes between 2000
and 2001. Mollusc production decreased from 864 tonnes to 7 tonnes
between 1997 and 2001. Squid catches decreased from 295 tonnes in
1996 to 76 tonnes in 2001 and clams decreased from 10 tonnes in 2000
to only 1 tonnes in 2001. Unfortunately, there is a lack of fi sheries data
to investigate the long-term trends of fi sh catches and stocks. A risk
analysis of the Pacifi c artisanal fi sheries concluded that several species
of fi sh, molluscs and crustaceans are at a high risk of overexploitation
(Rueda et al. 2003).
There are around 15 000 artisanal fi shermen along the Pacifi c coast of
Colombia. In recent years, there has been an increase in fi shing eff ort,
most likely caused by the high level of unemployment in rural areas.
There has been migration from rural inland areas to the coast in search
of food, security and an income (INPA 2000). The increased coastal
population puts further pressure on fi sheries resources which, in turn,
decreases the per capita supply of protein.
During the 1970s, the trade in marine turtle skins resulted in the death of
thousands of Olive Ridley turtles (Lepidochelys olivacea). The turtles were
caught mainly to the south of Buenaventura and towards the border
with Ecuador (MMA 2002a). From March until June during this period,
between 500 and 3 000 turtles were slaughtered every day (Olarte 1987
in MMA 2002a). Only a small part of the turtle was used (neck and pecto-
ral fi ns); only 7 kg of a 50 kg turtle (MMA 2002a). In 1996, the use of turtle
exclusion devices (TEDs) was made obligatory for the Pacifi c trawl fl eet
and the retention of captured turtles was prohibited (FAO 2003).
Excessive by-catch and discardsCentral Equatorial Pacifi c
The shrimp trawl fi shery has the highest rate of discards due to the use
of non-selective fi shing gear. The catching of shrimp larvae for shrimp
ponds is reducing the recruitment of several commercial species and
threatening the long-term sustainability of both aquaculture and artisanal
fi shing, as observed in the Gulf of Fonseca. Shrimp aquaculture requires
4 billion post-larvae annually; for every shrimp post-larvae caught,
nine larvae of other commercial species are discarded. Discards can
1992 1993 1994 1995 1996 1997 1998 1999 2000
Year
Cat
ch (t
onne
s)
0
20 000
40 000
60 000
80 000
100 000
120 000
140 000
Figure 18 Total catches of coastal marine resources in the Pacifi c Colombian sub-system.(Source: FAO 2004c).
44 GIWA REGIONAL ASSESSMENT 65 EASTERN EQUATORIAL PACIFIC
include larvae of up to 30 diff erent organisms (CCAD/IUCN 1999a). There
are no assessments of marine mammal by-catch, although Palacios &
Gerrodette (1996) suggest it is similar to other parts of the Pacifi c coast
of South America.
Several demersal species are caught as by-catch in the artisanal
fi shery of El Salvador and Guatemala. The depletion of these stocks is
extremely detrimental to the sharks that prey on them (Sea Around Us
Project 2002). In the Gulf of Fonseca, the shark fi shery is showing signs
of depletion, especially species of the genus Carcharrinus and Spyrna.
Other species at their exploitation limit include several species of the
families Lutjanidae, Scianidae, Centropomidae and Serranidae (CCAD/
IUCN 1999a).
Pacifi c Colombian
Shrimp trawling nets and gillnets are considered the main threat to
marine turtles in Colombian waters. Approximately 8 230 marine turtles
were captured by the trawling fl eet in 1998 (Duque-Goodman 1998 in
MMA 2002a), including the Olive Ridley turtle and Black turtle (Chelonia
agassizzi), 23-65% of which died (MMA 2002a). Some studies on by-catch
from the shrimp trawling fi shery in the Colombian Caribbean demon-
strated that the ratio of fi sh caught to shrimp is 10-12:1, with 75% of the
fi sh discarded (Santodomingo & Rueda 2003). Although similar studies
have not been carried out on the Pacifi c coast of Colombia, information
on shrimp trawling in Ecuador, south of Colombia, shows the same rate
of discards as on the Caribbean coast of Colombia (Little & Herrera 1991).
Purse seine gear, which was intensively used between 1985 and 1999,
was also found to have signifi cant by-catch; the target species account
for only 32% of the catch (Santodomingo & Rueda 2003).
Destructive fishing practicesCentral Equatorial Pacifi c
There is no quantitative information on the use of destructive fi shing
gear in the sub-system. Some national reports presented during the
preparatory meeting of the Plan of Action for the Protection of the
Marine Environment and Coastal Zones of the North East Pacifi c (2001)
provided information about the use of dynamite and barbasco (fi sh
poison from the roots of Lonchocarpus nicou) by artisanal fi shermen
in estuaries. The use of fi ne mesh nets for shrimp larvae is particularly
common in the Gulf of Fonseca (CCAD/IUCN 1999a). All these methods
are illegal and forbidden throughout the sub-system.
Pacifi c Colombian
There is no available information on destructive fi shing practices in
Colombia other than on trawl nets used by the shrimp trawl fl eet. In
2000, the Pacifi c trawl fl eet comprised 64 vessels operating in shallow
waters and 34 industrial vessels operating in deep waters (Ustate 2002).
The full eff ect of trawling nets on benthic communities is unknown.
Decreased viability of stocks through pollution and diseaseCentral Equatorial Pacifi c
Díaz & Fernández (1994) found that fi shing activity in the Gulf of Nicoya
(Costa Rica) has decreased by over 50% due to wastewater and other
pollutants discharged by the Grande de Tárcoles River basin. There
are no records in other areas of the sub-system of sickness in fi sh and
marine organisms caused by pollution. Decreased catches are mainly
attributed to overfi shing and the infl uence of El Niño events.
Pacifi c Colombian
Landings of shrimp have changed dramatically in the last fi ve years.
The viability of the stock is aff ected by both overfi shing and white spot
disease, a virus that has impacted shrimp farms since 1999 causing
a downturn in the profi tability of the aquaculture sector (González
2002).
Impact on biological and genetic diversityCentral Equatorial Pacifi c
Several alien species, notably cichlids, have been introduced for
freshwater aquaculture. In Nicaragua, the main species used in
aquaculture is Nile tilapia (Oreochromis niloticus). The Rainbow trout
(Oncorhynchus mykiss) is raised in El Salvador, Panama and Costa Rica.
In the Panama Canal basin, several alien species of fi sh, such as the
Common carp (Ciprinus carpio) and the Peacock bass (Cichla ocellaris),
are found in the Chagres River and several species of Tilapia have been
reported in Lake Gatún. Their impact on biological and genetic diversity
is inadequately documented. It is known, however, that several alien
species are highly adaptive and compete successfully with local fauna.
Various species of the genus Tilapia have become widespread in some
coastal areas. Fisheries authorities have established procedures for the
use of alien species in the aquaculture industry.
Pacifi c Colombian
The introduction of alien species either intentionally for farming or
unintentionally via ballast waters is poorly studied in Colombia. Around
96 species of fi sh are known to have been introduced into Colombian
waters, especially species of the families Salmonidae, Cyprinidae and
Cychlidae (Alvarado & Gutiérrez 2002).
Socio-economic impactsFishing is one of the most important economic activities on the coast,
providing a major source of employment and income. The depletion
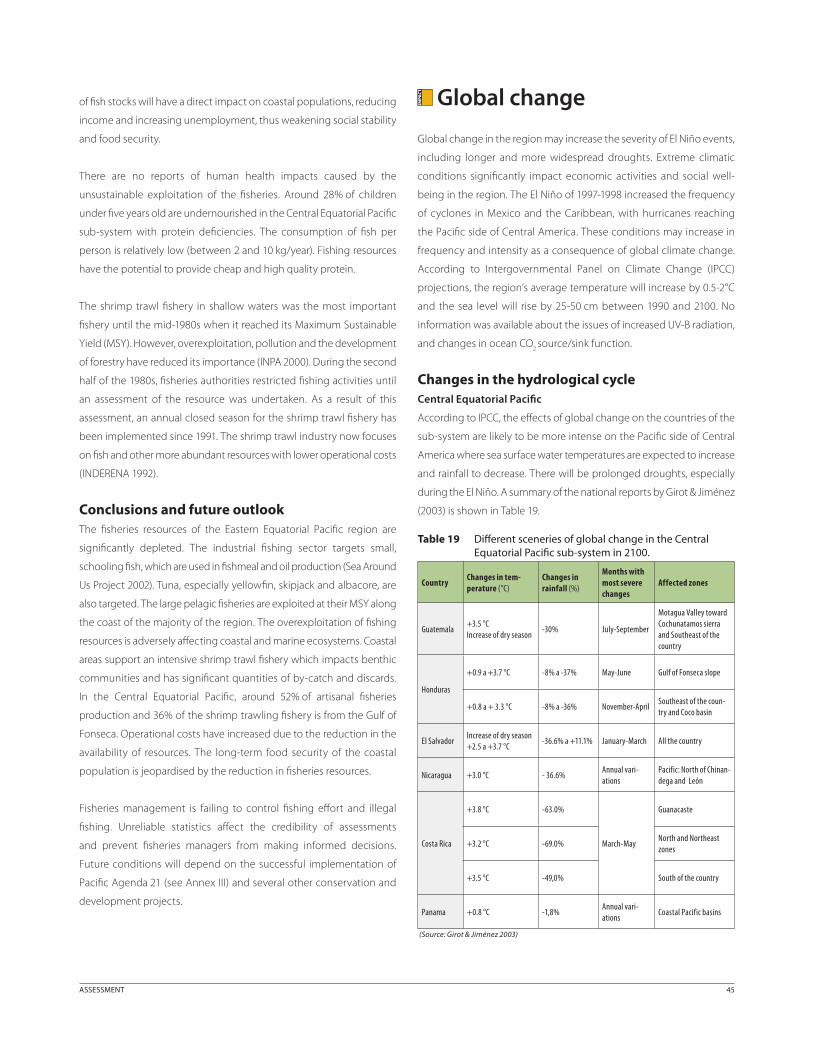
ASSESSMENT 45
of fi sh stocks will have a direct impact on coastal populations, reducing
income and increasing unemployment, thus weakening social stability
and food security.
There are no reports of human health impacts caused by the
unsustainable exploitation of the fi sheries. Around 28% of children
under fi ve years old are undernourished in the Central Equatorial Pacifi c
sub-system with protein defi ciencies. The consumption of fi sh per
person is relatively low (between 2 and 10 kg/year). Fishing resources
have the potential to provide cheap and high quality protein.
The shrimp trawl fi shery in shallow waters was the most important
fi shery until the mid-1980s when it reached its Maximum Sustainable
Yield (MSY). However, overexploitation, pollution and the development
of forestry have reduced its importance (INPA 2000). During the second
half of the 1980s, fi sheries authorities restricted fi shing activities until
an assessment of the resource was undertaken. As a result of this
assessment, an annual closed season for the shrimp trawl fi shery has
been implemented since 1991. The shrimp trawl industry now focuses
on fi sh and other more abundant resources with lower operational costs
(INDERENA 1992).
Conclusions and future outlookThe fi sheries resources of the Eastern Equatorial Pacifi c region are
signifi cantly depleted. The industrial fi shing sector targets small,
schooling fi sh, which are used in fi shmeal and oil production (Sea Around
Us Project 2002). Tuna, especially yellowfi n, skipjack and albacore, are
also targeted. The large pelagic fi sheries are exploited at their MSY along
the coast of the majority of the region. The overexploitation of fi shing
resources is adversely aff ecting coastal and marine ecosystems. Coastal
areas support an intensive shrimp trawl fi shery which impacts benthic
communities and has signifi cant quantities of by-catch and discards.
In the Central Equatorial Pacifi c, around 52% of artisanal fi sheries
production and 36% of the shrimp trawling fi shery is from the Gulf of
Fonseca. Operational costs have increased due to the reduction in the
availability of resources. The long-term food security of the coastal
population is jeopardised by the reduction in fi sheries resources.
Fisheries management is failing to control fi shing eff ort and illegal
fi shing. Unreliable statistics aff ect the credibility of assessments
and prevent fi sheries managers from making informed decisions.
Future conditions will depend on the successful implementation of
Pacifi c Agenda 21 (see Annex III) and several other conservation and
development projects.
IMPA
CT Global change
Global change in the region may increase the severity of El Niño events,
including longer and more widespread droughts. Extreme climatic
conditions signifi cantly impact economic activities and social well-
being in the region. The El Niño of 1997-1998 increased the frequency
of cyclones in Mexico and the Caribbean, with hurricanes reaching
the Pacifi c side of Central America. These conditions may increase in
frequency and intensity as a consequence of global climate change.
According to Intergovernmental Panel on Climate Change (IPCC)
projections, the region’s average temperature will increase by 0.5-2°C
and the sea level will rise by 25-50 cm between 1990 and 2100. No
information was available about the issues of increased UV-B radiation,
and changes in ocean CO2 source/sink function.
Changes in the hydrological cycleCentral Equatorial Pacifi c
According to IPCC, the eff ects of global change on the countries of the
sub-system are likely to be more intense on the Pacifi c side of Central
America where sea surface water temperatures are expected to increase
and rainfall to decrease. There will be prolonged droughts, especially
during the El Niño. A summary of the national reports by Girot & Jiménez
(2003) is shown in Table 19.
Table 19 Diff erent sceneries of global change in the Central Equatorial Pacifi c sub-system in 2100.
CountryChanges in tem-perature (°C)
Changes in rainfall (%)
Months with most severe changes
Affected zones
Guatemala +3.5 °CIncrease of dry season
-30% July-September
Motagua Valley toward Cochunatamos sierra and Southeast of the country
Honduras
+0.9 a +3.7 °C -8% a -37% May-June Gulf of Fonseca slope
+0.8 a + 3.3 °C -8% a -36% November-AprilSoutheast of the coun-try and Coco basin
El Salvador Increase of dry season+2.5 a +3.7 °C
-36.6% a +11.1% January-March All the country
Nicaragua +3.0 °C - 36.6%Annual vari-ations
Pacific: North of Chinan-dega and León
Costa Rica
+3.8 °C -63.0%
March-May
Guanacaste
+3.2 °C -69.0%North and Northeast zones
+3.5 °C -49,0% South of the country
Panama +0.8 °C -1,8%Annual vari-ations
Coastal Pacific basins
(Source: Girot & Jiménez 2003)

46 GIWA REGIONAL ASSESSMENT 65 EASTERN EQUATORIAL PACIFIC
In Nicaragua, the annual mean temperature will increase from 27-28°C
to 30-31°C in the Pacifi c areas of Chinandega and León, and rainfall will
decrease by 36.6%. Annual rainfall will be less than 500 mm in most of
the Central Equatorial Pacifi c and 800-1 000 mm in the south. By 2100,
cities on the Pacifi c slope will have a 25% water defi cit and a reduc-
tion in rainfall of 21% (Girot & Jiménez 2003). In Honduras, a vulner-
ability analysis of water resources shows a signifi cant reduction in the
discharges of the river basins of Choluteca and Humaya. For the Cho-
luteca River, under a scenario of a 1-2°C temperature increase and 10-
15% increase in rainfall, run-off during the rainy season will increase by
18-20%. In contrast, discharges will decrease by between 31% and 21%
if there is a reduction in rainfall of 10-15% and a temperature increase
of 1°C (SERNA in Girot & Jiménez 2003). In Guatemala, according to IPCC
scenarios, potential temperature and rainfall changes will have the larg-
est impact on an area containing 40% of the cloud forests, resulting in
increased river discharges (MARN Guatemala 2001). In El Salvador, the
forecasted intensifi cation of dry periods by 2100, in combination with
high population growth, could have severe impacts on the availability
of water for the country’s ecosystems and population (MARN in Girot
& Jiménez 2003).
Pacifi c Colombian
The average water availability in Colombia is estimated to be 57 000 m3/
person/year (IDEAM 2001) and average annual rainfall and surface run-
off is more than three and six times the global average, respectively.
It may, therefore, be inferred that global change has not signifi cantly
aff ected the hydrology of the Pacifi c Colombian sub-system. However,
Pérez et al. (2005) found positive trends in minimum and average
temperatures throughout Colombia and a reduction in the discharge
of the major river basins. This was linked to a shift in the annual cycles
of several climatic variables. Such fi ndings demonstrate that climatic
changes are beginning to aff ect the hydrological regime of the Pacifi c
Colombian sub-system.
It is unknown how changes in ocean circulation may infl uence the sub-
system but it is evident that ocean induced events such as the El Niño
and/or La Niña change the rainfall regime; such events are expected
to occur more frequently and intensely due to global warming (IPCC
2001).
Sea-level changeCentral Equatorial Pacifi c
Sea-level change will aff ect large areas of the sub-system. The estuar-
ies in Costa Rica, El Salvador, Honduras and Nicaragua are particularly
vulnerable. The shoreline and the intertidal zone will widen in these
areas. Some countries have estimated the impact of the sea-level rise
predicted under IPCC scenarios, presenting the results at the Fifth An-
nual Session of the Commission on Sustainable Development. In Costa
Rica, seawater will penetrate inland by 150 m at Puntarenas, fl ooding
105 ha (60% of the urban area). If the sea level rises by 1 m, the sea
will reach up to 500 m inland, fl ooding 300 ha (90% of the urban area)
(MINAE 2000). In El Salvador, it is estimated that around 10% (149 km2)
of its territory would be fl ooded if the sea level rises by 13 cm and up to
27.6% (401 km2) if it rises by 1.1 m (MARN El Salvador 2000). In Panama,
sea-level change will result in fl ooding, the displacement of wetlands,
increasing coastal erosion and the salinisation of estuaries and aquifers.
Storms will become more frequent, intertidal areas will increase in area
and sedimentation patterns will change resulting in the fl ooding of
low-lying areas (ANAM 1994). So far, there is no authoritative evidence
of sea level change in the sub-system.
Pacifi c Colombian
Recent studies have highlighted the vulnerability of the sub-system
to sea level rise (INVEMAR 2003a). Tumaco and Buenaventura are
considered at high risk. The annual rate of sea level rise is estimated to
be 2-5 mm (Lozano & Pabón 2005).
Socio-economic impactsThere are severe economic, health and social impacts associated with
natural disasters. They often result in migration, disease epidemics, a
loss of income and employment, human injuries and mortality, and
damage to property. There is no available data which links socio-
economic problems in the sub-system with global changes. However,
severe social and economic impacts are expected to result from the
increasing frequency and intensity of extreme climatic events.
Sea-level rise will impact coastal infrastructure and economic activities,
such as tourism. Global warming is expected to cause the tropicalisation
of the marine environment which will alter the distribution and
composition of marine resources, signifi cantly impacting the regional
fi sheries. The increased severity of El Niño periods will have disastrous
eff ects on the economy of the countries in the region. Higher surface
water temperatures will change the productivity of upwelling areas,
thus aff ecting the food web of the region’s ecosystems.
The sectors impacted by global change are thought to be agriculture,
fi shing and hydroelectricity, particularly during El Niño events. In 1992,
a drought period necessitated the restriction of electricity, which
confi rmed that El Niño can have major eff ects on the economy of the
region (Carvajal et al. 1997). Poveda & Rojas (1997) reported a signifi cant
increase in the cases of malaria and other endemic diseases during El
Niño events. This is attributed to higher temperatures, which shorten
ASSESSMENT 47
the larvae period of mosquitoes, and to a reduction in water fl ow, which
favours the formation of pools and small lagoons where mosquitoes
breed (Carvajal et al. 1997).
Diarrhoea, cholera, hepatitis and other diseases increase their
geographic distribution and prevalence following natural disasters.
OPS/OMS (1999) noted that following disasters, water-related diseases
become epidemics. For example, after Hurricane Mitch in 1998 there
were 1 451 cases of cholera in Nicaragua, with a mortality rate of 2.4%.
The hurricane severely disrupted the freshwater supply system. An
increase in diarrhoea, typhoid fever and other diseases also occurs
when sanitation problems increase during droughts, especially during
El Niño events (WFP/FAO 2002).
Conclusions and future outlookThe IPCC predicts that global climate change will increase rainfall
during the rainy season and prolong drought periods during the dry
season. The reduction of river discharges will increase the size of arid
zones. Coastal cities will experience greater water shortage. Climatic
change will increase the intensity and change the trajectory of storms
and hurricanes.
The governments of the region recognise the potential impact of
climate changes but actions to limit the vulnerability of their countries
to these changes are rarely implemented. They are yet to accurately
assess the impact of climate change on aquatic ecosystems under
diff erent scenarios. Aquatic productivity is expected to decrease as
it does during current El Niño events. Although there is insuffi cient
information about the potential changes in ocean circulation in the
region, it is known that during El Niño events upwellings collapse when
the thermocline sinks, resulting in extreme impacts on the productivity
of marine ecosystems and the fi sheries.
The sectors most aff ected by global change are expected to be agricul-
ture, fi shing and hydroelectric generation. Climate change may increase
the prevalence of malaria, which is already experienced during El Niño
events. According to IPCC projections, the eff ect of El Niño events on
ecosystems, the economy and human well-being will increase in the
future. The severity of the impacts will depend on the level of imple-
mentation of mitigatory programmes, which are still in their infancy.
Priority concerns for further analysisThe above assessment of the environmental and socio-economic
state of the region identifi ed the priority GIWA concerns based on
an integrated evaluation of the impacts. The priorities established by
the GIWA Task team constitute the basis of the Causal chain analysis
which led to the development of policy options which aim to address
and mitigate the causes of the environmental and socio-economic
impacts.
The assessment of the major concerns shows that the environmental
quality of the transboundary waters of the Eastern Equatorial Pacifi c
region is deteriorating. This situation is not expected to improve by
2020 due to rapid population growth and economic development. The
aquatic concerns are ranked below in priority order.
Southwest Mexico Pollution was considered by the regional team to be the priority
concern of the Southwest Mexico sub-system. In 2002, nearly one-
quarter of the beaches tested in Mexico failed to meet WHO standards.
SEMARNAT suspects that untreated municipal wastewater is responsible
for a signifi cant portion of coastal water pollution. Many municipalities
fail to treat, or under-treat, wastewater before discharging it into
Mexico’s inland and coastal waters. The tourism boom in Mexico’s
coastal regions benefi ts coastal economies while harming coastal
ecology. Coastal tourism development is outpacing the development
of both sewer infrastructure and wastewater treatment. The increase in
visitors and associated construction is increasing point and non-point
sources of pollution. In addition to harming bathers, coastal water
pollution negatively impacts commercial fi sheries, coral reefs, other
aquatic ecosystems, the quality of diving, and other forms of tourism.
The problem of beach pollution in Mexico is complicated by the fact
that there are many sources of pollution, and each of these sources
is subject to economic, technical and political constraints that will
determine the eff ectiveness of any particular intervention.
Central Equatorial PacificFreshwater shortage was selected as the Central Equatorial Pacifi c
sub-system’s priority concern. Water availability in the sub-system is
strongly infl uenced by climatic variability. The intensity and duration of
El Niño induced droughts and the size of the area aff ected is increasing.
Anthropogenic activities are also aff ecting water availability. The sub-
system has one of the highest deforestation rates in the world which
exacerbates erosion processes in river basins. As a result, rivers carry
large amounts of sediment downstream which is reducing the storage

48 GIWA REGIONAL ASSESSMENT 65 EASTERN EQUATORIAL PACIFIC
capacity of rivers and lakes, thus modifying stream fl ow and increasing
fl ooding. Population growth and urbanisation are increasing water
demand beyond sustainable limits. Water availability per capita has
reduced by almost 62% since the 1950s. Many of the major urban areas
of the sub-system depend on groundwater supplies which are already
overexploited. Higher aridity is predicted in the long-term, with the risk
of water shortages becoming severe.
Pollution is considered as the second priority concern. Around 95% of
municipal wastewaters released into the water bodies of the sub-system
are untreated, resulting in microbiological pollution downstream and in
coastal marine areas. Agricultural run-off containing agro-chemicals is
degrading freshwater ecosystems and causing eutrophication in coastal
waters. Wastewater from industries is also introducing organic matter,
suspended solids and nutrients (nitrates and phosphates). The low level
of sanitation coverage and the widespread use of latrines are leading to
the contamination of aquifers. Pollution is increasing the prevalence of
diarrhoeic diseases, the main cause of morbidity and infant mortality.
Global change will aff ect the availability of freshwater in the sub-
system. Rainfall is expected to be more intense during the rainy season
and droughts more severe during the dry season. The heavily populated
parts of the Pacifi c slope are the most vulnerable to droughts and
changes to river fl ows. However, global climate change is not studied in
the Casual chain analysis or Policy options analysis because the causes
are also global issues that can not be resolved through regional action in
the Eastern Equatorial Pacifi c alone but requires concerted eff orts by the
international community. The infl uence of future climate change on this
region is still poorly understood and requires further investigation.
Pacific Colombian Unsustainable exploitation of fi sh and other living resources was
selected as the priority concern of the Pacifi c Colombian sub-system.
Despite most of the fi sheries in Colombia being small scale and/or sub-
sistence, the current level of exploitation is unsustainable. Although
total catches have increased recently, catches of some traditionally tar-
geted species, such as mackerel and sharks, have declined (INVEMAR
2003c, FAO 2004c). The abundance of some coastal shellfi sh such as
clams, squid and snails has decreased signifi cantly. Similarly, stocks of
freshwater commercial species are signifi cantly depleted (IIAP 2001b).
Additionally, the uncontrolled exploitation of marine turtles contin-
ues. As stocks of traditional species become exhausted, fi shing eff ort
targets other more abundant species to maintain income levels and
food security. Although the aquatic living resources are unsustainably
exploited on the coast of the Colombian Pacifi c sub-system, the coast
is less populated than some areas of Colombia and therefore the en-
vironmental problems are mainly localised. It is therefore not too late
to implement mitigation measures in order to reduce the pressure on
fi sheries resources.
Pollution was identifi ed as the second priority concern. Pollution is
the principal cause of freshwater shortage in the sub-system. The main
sources of pollution are untreated domestic and industrial effl uents,
hydrocarbon spills and agricultural run-off (Calero et al. 1995, Peña
1995, IDEAM 2002). However, organic matter and other pollutants car-
ried by water bodies are rapidly dispersed due to the high rate of water
exchange (Calero et al. 1995, IDEAM 2002). Fees and fi nes have been
imposed on enterprises and the urban sector in order to reduce the
pollution load of water bodies.

CAUSAL CHAIN ANALYSIS 49
Causal chain analysis
Based on the results of the assessment (see priority concerns above),
the CCA of the Eastern Equatorial Pacifi c region was conducted for
the priority concerns of each sub-system. The analysis considered the
following sub-systems for each priority concern:
Freshwater shortage in the Central Equatorial Pacifi c sub-system
Pollution in the Central Equatorial Pacifi c and Southwest Mexico
sub-systems
Unsustainable exploitation of fi sh and other living resources in the
Pacifi c Colombian sub-system
Freshwater shortage
Although the Central Equatorial Pacifi c sub-system has abundant water
resources, they are unevenly distributed, with some countries having a
surplus and others having defi cient supplies. In 2002, the discharge of
This section aims to identify the root causes of the environmental
and socio-economic impacts resulting from those issues and
concerns that were prioritised during the assessment, so that
appropriate policy interventions can be developed and focused
where they will yield the greatest benefi ts for the region. In order
to achieve this aim, the analysis involved a step-by-step process
that identifi ed the most important causal links between the
environmental and socio-economic impacts, their immediate
causes, the responsible human activities and economic sectors
and, fi nally, the root causes that determine the behaviour of those
sectors. The GIWA Causal chain analysis (CCA) recognises that,
within each region, there is often enormous variation in capacity
and great social, cultural, political and environmental diversity.
The CCA uses a relatively simple and practical analytical model.
For further details of the methodology, please refer to the GIWA
methodology chapter.
Root causesSectors/ActivitiesImmediate causesIssueEnvironmental
impactsConcerns
Socio-economic impacts
Food insecurity
Freshwater shortage
Decreased river discharges
Increased erosion and sedimentation
Saline intrusion
Demography
Legal/institutional
Governance
Increased nitrate concentrations
Modification of stream flow
Untreated wastewater
Irrigation
Overabstraction of groundwater
Knowledge
Economy
Deterioration of surface water quality
Aquifer depletion
Increased health risks
High prevalence of water-borne
diseases
Increased cost of treatment
High infant mortality
Migration
Increased unemployment
Pollution of existing supplies
Changes in the water table
Forestry
Electricity production
Agriculture
Industry
Urbanisation
Tourism
Figure 19 CCA diagram Freshwater shortage in the Central Equatorial Pacifi c sub-system.
50 GIWA REGIONAL ASSESSMENT 65 EASTERN EQUATORIAL PACIFIC
the Lempa River – shared by El Salvador, Guatemala and Honduras – was
42% below the historic average (SNET 2002). Approximately 70% of the
total population and 80% of the economic activities are located in areas
with a shortage of freshwater. About one-quarter of the population in
the sub-system did not have access to safe freshwater in 2000.
During the Causal chain analysis, the issue of pollution of freshwater
supply is emphasised because it is the issue best documented in the
sub-system. The information regarding the other two issues is somewhat
limited, not current and tends to focus on specifi c localities and rivers.
Figures 19 and 20 show the causal links between the environmental
and socio-economic impacts of the freshwater and pollution concerns,
the immediate causes, the responsible economic sectors, and the root
causes that determine the behaviour of these sectors.
Immediate causes Climatic variability
Despite all countries of the Central Equatorial Pacifi c sub-system having
abundant water resources and extracting relatively limited quantities,
some areas experience water scarcity during the dry season when
river fl ows are considerably reduced. During the El Niño, river fl ows are
notably smaller, exacerbating the eff ects of a normal dry season.
Land-use changes and practices
Deforestation and inappropriate agricultural practices in the catchments
have aff ected run-off and river fl ow patterns. These practices have
increased sedimentation, reducing the capacity of freshwater bodies
including reservoirs, thus increasing the extent and frequency of fl oods.
The reduction in water availability has also been attributed to the loss
of fog forests in the upper sections of the basin. The removal of natural
forest cover may also be aff ecting both the recharge rate and water
quality of aquifers (Ballesteros 2003).
River diversion and groundwater abstraction
River discharges are aff ected by dams, which interrupt the natural
fl ow of nutrients to coastal waters. Groundwater is the main source
of freshwater in the sub-system and aquifers in most countries are
unsustainably exploited. For example, the aquifers that supply Managua
(Nicaragua), San José (Costa Rica) and San Salvador (El Salvador) are
overexploited (Lezama-López 2003). According to the International
Hydrological Programme of UNESCO, groundwater abstraction in
2010 is expected to be nine times the rate in 1950. Illegal connections
consume a large proportion of the water available for the cities of the
sub-system. Groundwater use will increase as the quality of surface
water deteriorates in the future.
Discharge of untreated wastewater
Freshwater supplies are contaminated in several major basins of Central
America, including the Lempa River and the Grande de Tárcoles River
basin. According to PNUMA (2001), 95% of the municipal wastewater
generated in the sub-system enters natural water bodies without
appropriate treatment. El Salvador is particularly aff ected as the
main sources of freshwater, the Lempa River and lakes Ilopango and
Coatepeque, are highly polluted by wastewater discharges. In the
Lempa River, a two-year study found that 95% of samples contained
E. coli (Levin 2002). Industries, particularly coff ee production, also
discharge large amounts of wastewater without treatment.
Agricultural run-off
The sub-system has one of the largest rates of pesticide consumption
in Latin America (2 kg/person), which contribute to the deterioration of
surface and ground water quality. Aquifers in the metropolitan area of
Alajuela, Cartago and Guanacaste contain increasing concentrations of
nitrates originating from fertilisers and septic tanks (Reynolds & Fraile
2002). Urban and agricultural run-off are responsible for polluting the
Managua aquifer that provides freshwater to 1.2 million people.
Root CausesDemography
The demographic trends of the last four decades have led to increasing
demand for freshwater resources for drinking water, agricultural
production and industrial processes, among other uses. Urbanisation
has intensifi ed and concentrated demand in areas that have limited
freshwater availability. The following demographic trends are driving
freshwater shortage issues in the sub-system:
Over the past 30 years, the population of the sub-system has
increased by 98%, from 19.3 million to over 37 million. The
population density increased over the same period from 39 to
66 inhabitants/km2. The population of the sub-system will continue
to grow rapidly, reaching 40 million within the next decade.
The population is concentrated in specifi c areas. In general, the
population occupies only a quarter of the sub-system’s territory
with 70% inhabiting the Pacifi c slope. The urban area is expected
to increase from 596 km2 to 913 km2 by 2030 if current urbanisation
trends continue.
Urban populations increased by 29% over the period of 1975-2000.
About 75% of the population will live in urban areas by 2030 as a
consequence of natural population growth, longer life expectancy
and migration from rural areas. Most rural populations are poor
and migrate for economic reasons, while others are environmental
refugees fl eeing from natural disasters (OPS/OMS 2001a). The larger
urban population will increase further the pressure on water and
CAUSAL CHAIN ANALYSIS 51
sanitation services. The infl ux of immigrants into urban areas has
created an illegal land market and the establishment of illegal
settlements which have no freshwater supply or sanitation services.
The Lempa River basin is the most densely populated and intensively
exploited area of the sub-system. Its population was 4.7 million
inhabitants in 2001, of which 3.9 million live in the Salvadorian part of
the basin. The population is expected to double in the next 25 years
(Granados in Llort & Montufar 2003). The majority of economic activity
and the two major urban centres (San Salvador and Santa Ana) of
El Salvador are located in the Lempa River Basin. These socio-economic
characteristics are exerting extreme pressure on the freshwater
resources of the basin.
Freshwater supply and sanitation services
The current water distribution systems are obsolete and highly
ineffi cient. The countries of the Central Equatorial Pacifi c sub-system lack
the economic resources needed to adopt water effi cient technologies.
Water supply and sanitation services are subsidised. As a consequence,
insuffi cient revenues are generated to maintain current and invest in
new technologies, and the population has no incentive to save water.
Most countries in the sub-system depend on foreign imports rather
than developing their own technologies that are culturally compatible
and suitable for their local environmental conditions. The Pan-American
Health Organization has stated that technical solutions used to solve
water supply problems in rural areas are not always appropriate for
either the local communities or the environment.
The development of both freshwater supply and sanitation coverage is
not keeping pace with population growth. The health of the increasing
number of people without access to these basic services is at risk. Some
urban areas such as the capitals of most countries in the sub-system (e.g.
Panama, San José, San Salvador, Managua and Tegucigalpa) have grown
in a disorganised manner. They are characterised by the occupation
of fringe urban areas by a rural migrating population or by people
displaced from neighbouring countries. In these cities, where public
services do not cover even the formal population, urban development
will increase pressure on the aquifers that are already depleted.
The average freshwater supply coverage in the sub-system was 78%
in 2000, of which 69% was through the network and 9% through easy
access (OPS/OMS 2001a), which, in most cases, increases human heath
risks. Besides the low level of coverage, several cities in the sub-system
have defi ciencies in treatment processes, forcing the population to
boil water for direct consumption. Only a small proportion of rural
communities apply chlorine to water for disinfection. In most countries,
water supply is not continuous (between 27% and 98% of the systems),
with a supply only available for 6-20 hours/day because of the poor
condition of the equipment. This is especially true in rural areas. Almost
40% of water systems have leaks due to the poor maintenance of the
network and the use of obsolete technology. In Costa Rica, only 50%
of the water abstracted is actually charged to users, with the other half
being consumed through illegal connections or wasted as a result of
dilapidated pipelines (Ballesteros 2003). Illegal connections increase the
costs of operation and maintenance, and create an additional problem
in quantifying water losses.
Economic
The assessments by OPS/OMS (2001a) for Latin American and the
Caribbean are also valid for this sub-system. Both reports highlighted
the diff ering situations facing the countries, but noted that they share
the following economic problems:
Substantial resources are required to improve the current
infrastructure and to improve the level of freshwater supply
coverage.
Service charges do not cover operational and maintenance costs.
As a consequence, governments subsidise water supplies.
Diffi culties estimating operational and maintenance costs as a result
of distortions introduced by governmental subsides, and ineffi cient
management and technical defi ciencies.
Subsidies do not benefi t the population directly but, instead, hide
operational and management ineffi ciencies.
The lack of realistic tariff rates and jurisdictional uncertainty
discourages private investment in sanitation and wastewater
treatment.
The privatisation of public services reduces the possibility of
improving the level of wastewater treatment coverage and the
introduction of integrated water resources management. In several
cases of privatisation, environmental costs are charged to users and
the government assume an intermediary role.
Management lacks an enterprise approach.
There is a vulnerability to political pressures.
Current statistics show that a high proportion of the population
use in situ sanitation solutions, which involve environmental risks.
For example, if latrines are located in porous soils, leachates may
contaminate aquifers.
Legal/Institutional
Most countries in the sub-system have a weak legal and institutional
framework for water management which results in overlapping
responsibilities and a duplication of eff ort. There is a lack of control
and surveillance during the implementation of current regulations

52 GIWA REGIONAL ASSESSMENT 65 EASTERN EQUATORIAL PACIFIC
(Dourojeanni 2001). Some regulations, particularly those regarding
permissible limits for individual substances or groups of substances,
have been modernised. Others are obsolete or incomplete (UNEP/
GPA 2001) as they do not include provisions for new approaches and
administration procedures, such as those necessary for a sustainable
development approach. The legislation considers water quantity
separately from water quality. They are also managed by diff erent
institutions, making it diffi cult to implement a holistic approach at
the institutional level (Escobar 2003). Environmental policies regarding
water management are predominantly sectorial and fail to take into
account the multiple uses of water.
Most water services in the sub-system are managed by centralised
governmental agencies which lack the capacity to maintain and up-
date the distribution networks and equipment, as well as to monitor
the quality of the water supplied. Incipient decentralisation processes
suff er from inadequate governmental support for the transfer
of responsibilities for water management to local governments.
Traditionally, local stakeholders were not consulted in the management
of water resources. The lack of a multidisciplinary approach leads to
inter-institutional confl icts. There is an absence of an integrated policy
for population distribution, urban development and the provision of
water services. An integrated river basin management approach to
shared river basins has not been suffi ciently adopted.
Knowledge
Countries in the sub-system lack water monitoring programmes and
environmental, social and economic impact assessment processes.
There is a dearth of knowledge regarding water quality and the eff ect of
pollutants on ecosystems and their biota. Most of the countries lack the
economic and technological resources necessary for strengthening the
territorial agencies responsible for undertaking studies on biophysical,
hydro-geological, meteorological and other environmental parameters.
The monitoring of water quality is inadequate as it only focuses on a
few indicators (Ramírez & Espejel 2001). These knowledge defi ciencies
are impeding the development of a better management framework
that incorporates the particularities of the sub-system’s environment.
The Workshop of Experts on Municipal Liquid Wastes in Latin America,
held in September 2001 in Mexico (UNEP/GPA 2001), identifi ed the
absence of monitoring and surveillance of water quality as a major
obstacle to combating pollution in the region and recommended the
standardisation of water quality criteria (Ballesteros 2003).
There is a lack of public awareness of water issues and the associated
socio-economic impacts, particularly regarding sanitation. There is no
culture of water conservation in the population of the sub-system. This
prognosis is evidenced by the use of inappropriate farming practices
which result in severe impacts on the water cycle, the lack of treatment
for industrial and domestic wastes, and the disregard by the public for
their impact on the environment. Other than the consumptive benefi ts
of water, there is little recognition or valuation of the indirect benefi ts
water provides through ecosystem goods and services.
Pollution
Microbiological contamination was considered to be the priority
pollution issue in the Central Equatorial Pacifi c and Southwest Mexico
sub-systems. In the Central Equatorial Pacifi c sub-system, chemical
pollution was also considered to be a priority.
Immediate causesDischarge of untreated municipal wastewater
The failure to appropriately dispose of excrement and the use of latrines
and septic wells in porous soils contribute signifi cantly to the load of
microbiological pollution. The low levels of wastewater treatment
in both sub-systems results in around 95% of wastewater reaching
the Pacifi c Ocean with a high load of organic matter, nutrients and
microbial pollutants (PNUMA 2001). Livestock production may also
contribute considerable microbiological pollution to the surface
waters of the Central Equatorial Pacifi c sub-system. High concentrations
of pathogenic micro-organisms associated with water pollution have
been recorded in water bodies and on beaches in the Central Equatorial
Pacifi c and Southwest Mexico sub-system. Many of these beaches are
important for the tourism industry; the pollution can discourage visitors
and cause health problems for bathers.
Agricultural run-off
Agricultural run-off is the main source of chemical pollution due to
the large-scale use of pesticides in agriculture, especially for export
production. High concentrations of pesticides have been found in
several coastal sites in water, sediments and biota, posing risks for
humans and other living organisms.
Industrial and mining run-off
Heavy metals are introduced into water bodies from mining washes
and industries. Other chemicals are discharged in small concentrations
within wastewater. Heavy metals, such as lead, copper and chromium,
have been reported in sediments and surface waters in several
countries in the Central Equatorial Pacifi c sub-system, particularly
Panama, Nicaragua and Costa Rica.
CAUSAL CHAIN ANALYSIS 53
Root causes Population demography and economic development
Today, half of the Central Equatorial Pacifi c sub-system’s population is
urban and by 2030 the proportion is expected to increase to three-
quarters. The coverage of sanitation services has not expanded
suffi ciently to cope with the increasing quantities of wastewater
produced by the swelling urban population. The growing population
and export market requires more food which is leading to the application
of more agro-chemicals and, thus, increased chemical pollution.
The tourism boom in Mexico’s coastal regions is benefi ting the
economy but harming coastal ecology. The growing numbers of visitors
and associated development are increasing the volume of point and
non-point sources of pollution (Rivera-Arriaga & Villalobos 2001) and
placing additional pressure on sewer infrastructure and wastewater
treatment facilities. The negative environmental impacts of untreated
wastewater are particularly apparent in and around the coastal tourist
cities of Acapulco, Ensenada, Veracruz, and Xihuatanejo (Ascencio
pers. comm.). In cities such as these, largely uncontrolled coastal
tourism development has put enormous pressure on the ability of the
ecosystems to absorb municipal waste.
Technology
The major cities in the Central Equatorial Pacifi c have dilapidated
wastewater treatment systems (OPS/OMS 2001a). In Guatemala, only
15 municipalities treat wastewater, and only 4 out of 16 plants in the
metropolitan zone are functioning (FAO 2004a). Design fl aws have
frequently led to new systems failing soon after installation.
Industrial processes often involve the use of antiquated technology.
Political will to force or encourage industry to adopt cleaner
technologies is lacking. Industry managers are also uninformed about
new technological alternatives and there is a lack of facilities for the
recycling of industrial wastes. Guidelines on agricultural best practice
including techniques to reduce the use of agro-chemicals and to
improve soil management are not disseminated to farmers.
Mexico’s water treatment infrastructure is signifi cantly less advanced than
that of other nations in the Organisation for Economic Cooperation and
Development (OECD), as well as other countries in Latin America. At least
20% of the existing treatment facilities in Mexico are non-operational
and a signifi cant percentage of those in operation are performing below
their capacity (OECD 2003). While over 76% of the Mexican population
is connected to sewer systems, only 26% is connected to wastewater
treatment facilities (OECD 2003); the wastewater is therefore discharged
directly into the ocean or inland waterways without treatment.
Economy
Low tariff rates for water and underinvestment in sanitation
infrastructure are the principal causes of the lack of basic sanitation
services in the Central Equatorial Pacifi c sub-system. In Panama, water
and sanitation services are subsidised resulting in the authorities
receiving insuffi cient revenues to invest in the expansion of sanitation
services. As a consequence, investment was limited to maintenance
during the 1990s. Privatisation of sanitation services has led to the
improvement of waste collection rather than sewage treatment or
water supply. In fact, there is no example of wastewater treatment
services being privatised. There is a lack of economic incentives to
encourage industries to adopt environmentally friendly technologies
and practices. In terms of disincentives, polluters are not taxed
appropriately for the environmental damage that their activities cause.
In the Southwest Mexico sub-system, federal authorities lack the
appropriated mechanisms to collect fi nes from local governments.
Such fi nes could be used for maintenance or for the construction of
new wastewater treatment plants.
Legal/Institutional
All countries in the sub-system are failing resolve their pollution
problems, in part due to fi nancial problems and in part due to the
unwillingness of governments to regulate economic activities for fear
of constraining development. There is a lack of common coastal and
marine policies with specifi c environmental objectives that address
pollution issues. This has resulted from an inappropriate institutional
framework and the application of freshwater criteria to marine
environmental legislation. The countries within the sub-system have
diff ering marine policies, except those related to maritime aspects
such as traffi c and national security. Institutional weaknesses and a
lack of coordination among the diff erent governmental sectors hinder
the implementation of legislation and environmental management
instruments (e.g. environmental impact assessments, management
plans and environmental auditing). Industries and agriculture are
regulated by a weak and uncoordinated legal framework. In most
countries, the institutions responsible for river basin management
only focus on water distribution and consumption, have overlapping
responsibilities and rarely encourage stakeholder participation in the
decision making process. The control and surveillance of pollution is
undertaken by a variety of institutions. River basins and the coastal zone
are managed autonomously by diff erent institutions (Escobar 2002).
The legal regime and the institutional organisation of several countries
in the Central Equatorial Pacifi c sub-system have been characterised
by Jouravlev (2001):

54 GIWA REGIONAL ASSESSMENT 65 EASTERN EQUATORIAL PACIFIC
In Costa Rica, legislation is disarticulate and, in part, obsolete
(Ballesteros 2003). In several cases, laws and decrees are confl icting
or are not implemented due to a lack of institutional capacity.
In El Salvador, the diversity of laws related to water resources
creates confusion in defi ning responsibilities. In fact, there are
numerous laws but few that have specifi c regulations needed for
implementation. To solve these problems a new Law of Waters is
being developed.
Guatemala does not have a general water law but secondary laws
partially regulate issues related to water, its use and conservation.
In Honduras, until recently, the responsibilities for implementing
regulations regarding water management were dispersed
between several institutions. However, important advances in
water management have been achieved, including the creation of
the National Council for Sustainable Development (CONADES) and
the Secretary of Natural Resources and Environment (SERNA). The
Framework Law of Waters, currently in development, will provide
a modern, legal, technical and institutional basis for the integrated
management of water resources.
In Nicaragua, the integrated management of water continues to be
fragmentary and lacking in coordination (MARENA in FAO 2002a).
In Panama, institutions in charge of water management do not have
an integrated legal framework. The lack of appropriate technical
knowledge and economic constraints impede the implementation
of current regulations.
In Southwest Mexico, SEMARNAT, Comision Nacional del Agua (CNA)
and other regulatory bodies have achieved increasing success in
controlling large volume industrial polluters whose wastes fl ow into
federal waterways. These agencies have direct jurisdiction over facilities
aff ecting federal waters and are able to enforce fi nes for exceeding
pollution targets. They have even shutdown the worst off enders. Despite
these improvements, pollution levels are still high due to a lack of direct
control over municipal pollution sources. Under the Mexican Constitution,
municipalities are responsible for the maintenance of their water
systems and are largely autonomous from state and federal authorities
(Constitucion Nacional de Mexico 1992). Therefore, attempts to regulate
municipal pollution have been largely ineff ective as the government has
little enforcement power to collect fi nes from municipalities who exceed
federal pollution limits, and no power to directly fi ne those who pump
their waste into these municipally controlled waters.
The Mexican federal government and several international NGOs have
invested in the construction of sewers and treatment facilities. However,
the strong legal provisions guaranteeing municipal autonomy prohibit
federal authorities from funding the ongoing maintenance and upkeep
of these investments. This means that in communities with limited
economic resources, funding of waste treatment services is often a low
priority. These aspects of municipal water control have resulted in the
breakdown of many recent environmental initiatives. While many state
and municipal governments have turned to outside contractors to run
their wastewater treatment operations (called operating agencies), major
sanitation-related decisions are often made by municipal offi cers. These
decisions are frequently based on political considerations that have little
relevance to the long-term water and sanitation needs of a community.
Many pollution problems impact downstream communities and
ecosystems, especially those on the coast. There is insuffi cient
investment in upstream sewage infrastructure which could reduce the
impact on the economy and public health of many other communities
sharing the same watershed. These problems are exacerbated by the
sheer number of municipal governments.
Root causesSectors/ActivitiesImmediate causesIssueEnvironmental
impactsConcerns
Socio-economic impacts
Increase of water-borne diseas
Pollution
Increased concentrations of microbiological
pollutants
Increased chemical concentrations
Increased heavy metal concentrations
in sediments
Economy
Governance
Technology
Education/ knowledge
Increased DDT concentrations
Microbiological
Agriculture run-off
Untreated wastewater
Discharge of animal waste
Discharge of effluents
Chemical release
Release from mining
Demography
Legal Increased health
risks particularly to indigenous people
Increased treatment costs
Loss of revenues
Increased risk of poisoning
Decreased aesthetic value
Chemical
Agriculture
Urbanisation
Industry
Mining
Figure 20 Diagram showing the Causal chain analysis of microbiological and chemical pollution in the Central Equatorial Pacifi c and Central Mexican sub-systems.

CAUSAL CHAIN ANALYSIS 55
Knowledge
In the Central Equatorial Pacifi c sub-system, available information is
dispersed, sparse and not current, which restricts the understanding
of the real situation. Limited research and technological development
hinders progress in addressing pollution issues. In the Southwest
Mexico sub-system, local municipal governments lack personnel with
the necessary technical expertise to create and maintain complex
wastewater treatment networks. Additionally, politicians poorly
understand wastewater and pollution issues and their eff ects on public
health and local economies. This often leads to political decisions that
do not recognise the environmental and social benefi ts that could be
obtained through investments in pollution control.
Unsustainable exploitation of fish and other living resources The unsustainable exploitation of fi sh and other living resources was
considered to be the priority concern in the Pacifi c Colombian sub-
system. The Causal chain analysis focuses on the issue of overexploitation
as it is having the most severe impacts, but also considers destructive
fi shing practices and excessive by-catch and discards.
Immediate causes Excessive fi shing eff ort
The current level of fi shing eff ort is unsustainable. According to FAO
(2004c), catches of marine fi sh, crustaceans, molluscs and other marine
living resources decreased in Colombia between 1992 and 2000.
Destructive fi shing practices
The use of destructive fi shing gear has resulted in a decline in
recruitment and the degradation of the habitat of some commercial
species. Today, shrimp trawling nets and gillnets are considered the
main threat to marine turtles in Colombian waters.
Excessive by-catch and discards
Although there have been no studies of the level of by-catch in the Pacifi c
Colombian, based on studies in territories within close proximity of the
sub-system, it is believed that large quantities of fi sh are caught as by-
catch in the shrimp trawling industry and the majority are discarded.
Root causes Technology
On the Colombian Pacifi c coast, non-selective and destructive fi shing
gear is employed in the artisanal and industrial fi sheries. Such gear is
used to increase short-term profi ts, but at the expense of the long-
term sustainability of fi sh stocks. As the distribution of fi sh species has
changed and stocks of traditionally exploited species have declined, the
fi shing industry has began to exploit stocks which are further off shore
using new technologies.
Economy
Investment in the fi sheries sector is aimed at increasing catches of
species valuable on the international market; there are few incentives
to supply local demand.
Legal/Institutional
There is a lack of harmonisation between national and international
fi sheries policies. Although Colombia has a legal framework for the
Sectors/ActivitiesIssuesConcern Immediate causes Root causes
Unsustainable exploitation of fish
Overexploitation
Increased effort
Shift in population distribution
Use of non-selective gear
Technology
Economy
Legal/Institutional
Knowledge
Habitat and community modification
Unsustainable harvest practices
Shift in populationdistribution
Decreased habitat
Fishery
Forestry
Governance
Figure 21 Diagram of the Causal chain analysis of overexploitation in the Pacifi c Colombia sub-system.
56 GIWA REGIONAL ASSESSMENT 65 EASTERN EQUATORIAL PACIFIC
management of natural resources, there is a lack of inter-institutional
coordination, resulting in the weak implementation of existing
environmental laws. Domestic and foreign fi shing fl eets are able
to avoid legislation due to weak enforcement. Limited stakeholder
participation in decision making processes often results in the
unsuccessful implementation of fi sheries policies.
Knowledge
There is a lack of detailed information about the exploitation and
status of fi shing resources in Colombia. Although recent data has
shown a decreasing trend in the catches of some important species,
the long-term eff ects on fi sh stocks are unknown. The fi sheries are
irregularly monitored and there is limited surveillance of aquatic
ecosystems (INVEMAR 2003c). The quantity and impact of by-catch
and discards produced by the fi shing industry in the sub-system, as
well as the distribution and infl uence of introduced species, has not
been studied.
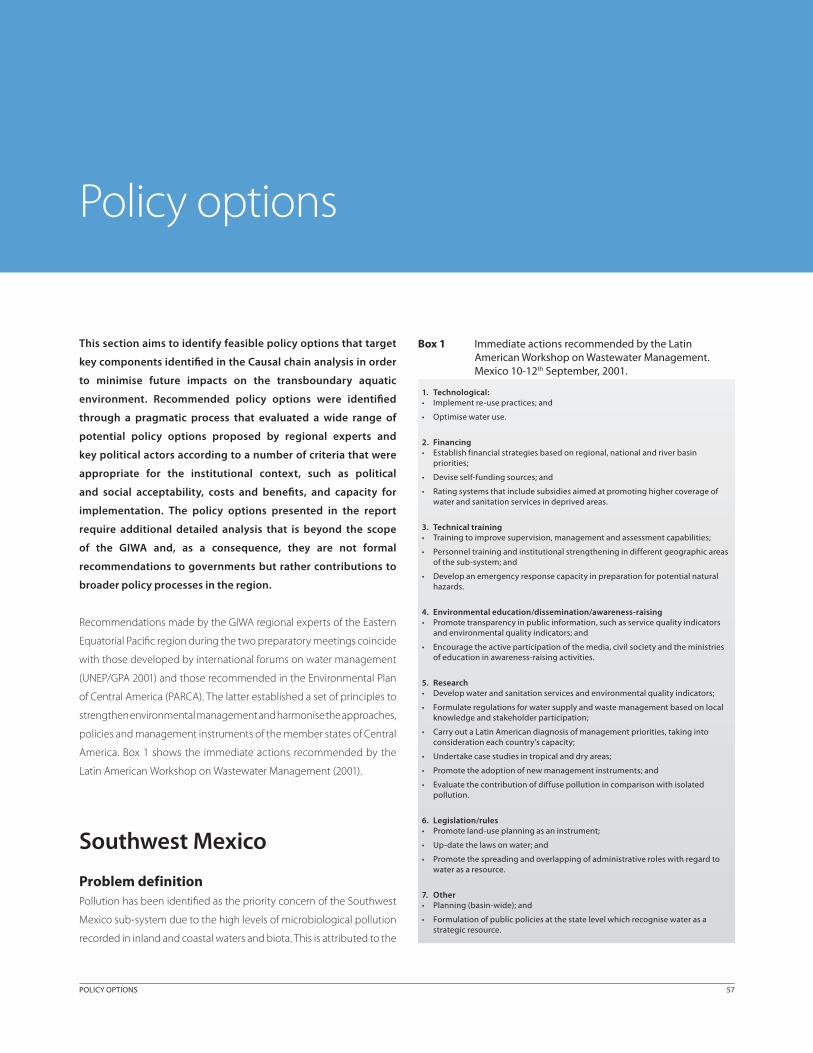
POLICY OPTIONS 57
Policy options
This section aims to identify feasible policy options that target
key components identifi ed in the Causal chain analysis in order
to minimise future impacts on the transboundary aquatic
environment. Recommended policy options were identifi ed
through a pragmatic process that evaluated a wide range of
potential policy options proposed by regional experts and
key political actors according to a number of criteria that were
appropriate for the institutional context, such as political
and social acceptability, costs and benefi ts, and capacity for
implementation. The policy options presented in the report
require additional detailed analysis that is beyond the scope
of the GIWA and, as a consequence, they are not formal
recommendations to governments but rather contributions to
broader policy processes in the region.
Recommendations made by the GIWA regional experts of the Eastern
Equatorial Pacifi c region during the two preparatory meetings coincide
with those developed by international forums on water management
(UNEP/GPA 2001) and those recommended in the Environmental Plan
of Central America (PARCA). The latter established a set of principles to
strengthen environmental management and harmonise the approaches,
policies and management instruments of the member states of Central
America. Box 1 shows the immediate actions recommended by the
Latin American Workshop on Wastewater Management (2001).
Southwest Mexico
Problem definition Pollution has been identifi ed as the priority concern of the Southwest
Mexico sub-system due to the high levels of microbiological pollution
recorded in inland and coastal waters and biota. This is attributed to the
1. Technological:• Implement re-use practices; and
• Optimise water use.
2. Financing• Establish financial strategies based on regional, national and river basin
priorities;
• Devise self-funding sources; and
• Rating systems that include subsidies aimed at promoting higher coverage of water and sanitation services in deprived areas.
3. Technical training• Training to improve supervision, management and assessment capabilities;
• Personnel training and institutional strengthening in different geographic areas of the sub-system; and
• Develop an emergency response capacity in preparation for potential natural hazards.
4. Environmental education/dissemination/awareness-raising• Promote transparency in public information, such as service quality indicators
and environmental quality indicators; and
• Encourage the active participation of the media, civil society and the ministries of education in awareness-raising activities.
5. Research• Develop water and sanitation services and environmental quality indicators;
• Formulate regulations for water supply and waste management based on local knowledge and stakeholder participation;
• Carry out a Latin American diagnosis of management priorities, taking into consideration each country’s capacity;
• Undertake case studies in tropical and dry areas;
• Promote the adoption of new management instruments; and
• Evaluate the contribution of diffuse pollution in comparison with isolated pollution.
6. Legislation/rules• Promote land-use planning as an instrument;
• Up-date the laws on water; and
• Promote the spreading and overlapping of administrative roles with regard to water as a resource.
7. Other• Planning (basin-wide); and
• Formulation of public policies at the state level which recognise water as a strategic resource.
Box 1 Immediate actions recommended by the Latin American Workshop on Wastewater Management. Mexico 10-12th September, 2001.

58 GIWA REGIONAL ASSESSMENT 65 EASTERN EQUATORIAL PACIFIC
discharge of untreated wastewater in the river basins of the sub-system.
The tourism industry is being adversely aff ected by polluted beaches
and the health risks of microbiological pollution.
Only 26% of Southwest Mexico’s population is connected to wastewater
treatment (OECD 2003). The sewage infrastructure that does exist is
commonly non operational, with most wastewater discharged directly
into the ocean or inland waterways without treatment. Coastal tourism
development is further increasing the pressure on sewer infrastructure.
Regulatory agencies have achieved increasing success in controlling
large volume industrial polluters whose wastes fl ow into federal
waterways. However, pollution levels are still high due to a lack of direct
control over municipal pollution sources and weak enforcement power
which prevents the collection of fi nes from municipalities who exceed
federal pollution limits. Local municipal governments lack technical
expertise and fi nancial capacity to create and maintain wastewater
treatment networks.
A variety of options to improve the quality of coastal waters along
Mexico’s tourist beaches were considered. The policy options aim to
address the root causes of microbiological pollution in the Southwest
Mexico sub-system and are therefore grouped under the various types
of root cause.
Policy options Technology and economy
Rehabilitate existing, and construct new, wastewater treatment
facilities
The government of Mexico must recognise wastewater treatment
as a priority issue and allocate greater funds for building new and
maintaining existing wastewater treatment facilities. In many cases,
facilities need to be rehabilitated in order to operate at their designed
capacity levels. Investment in sewer systems and wastewater treatment
facilities is currently co-funded by federal, state, and local sources.
Further funding is often received as loans from various development
banks. Since the federal government does not have the legal power to
earmark funds for specifi c purposes, a simple increase in grant funding
from the federal level to municipalities is unlikely to leverage funds for
the operation and maintenance of treatment facilities. One option
would be for the Federal government to match investment made by
local governments in treatment facilities with a grant.
Local circumstances defi ne the most appropriate technology and
implementation strategy. The fi nancial and technical limitations of local
communities must be considered so that the facilities can be operated
and maintained locally. There are a wide variety of conventional and
less-conventional municipal wastewater treatment technologies
available. Large treatment facilities consume a lot of energy, generate
large quantities of excess sludge that must be disposed of or used, and
require relatively sophisticated equipment that requires highly skilled
personnel. Alternatively, technologies such as lagoons, treatment
wetlands, anaerobic treatment, and reuse schemes are more
sustainable and cost-eff ective wastewater treatment options. Lagoons
and stabilisation ponds are biological treatment options with low
operational costs (UNEP 2000). Educating municipal decision makers
regarding the various conventional and non-conventional wastewater
treatment options will enable them to choose the most appropriate
facility for their community.
Introduce a fee-and-rebate system for municipal wastewater
Mexico’s current diffi culties in enforcing fi nes on municipalities are an
obstacle to developing a system of rebates and fees. A comprehensive
study of the feasibility of implementing such a scheme in Mexico
is necessary. Box 2 outlines the methodology of a fee-and-rebate
system.
Demography
Reduce excess water use
Consumers tend pay water rates that are far below the true cost of
water extraction and delivery, and, as a result, tend to overuse water.
In addition, urbanisation is tending to increase water use, requiring the
expansion of wastewater treatment infrastructure (Veenstra et al. 1997).
Several strategies can be employed to reduce water consumption. The
two main methods are education programmes and a fee-and-rebate
system applied to the end-users of water.
By reducing water consumption, less water drains into the sewage
system and is needed to be treated, thus reducing costs and the
pressure on existing treatment facilities (UNEP 2000). However, the
waste becomes more concentrated as domestic waste production per
capita remains fairly constant but the concentration of contaminants
varies with the amount of water consumed (Veenstra et al. 1997). The
eff ectiveness of this policy option varies according to the local water
supplier and only applies to municipalities with existing wastewater
treatment infrastructure.
In a fee-and-rebate system, the government sets a threshold pollution level for a municipality or industrial plant. Municipalities receive a rebate for each unit below the threshold or a fee (replacing the fine) for each unit above the threshold. The fees can be used to pay for the rebates. In essence, municipalities choosing to pollute forego the rebate opportunity, and thus face higher costs for polluting. Annex IV gives further details of the proposed fee-and-rebate system.
Box 2 Fee-and-rebate system
POLICY OPTIONS 59
Knowledge
Formulate and implement education and information strategies
Education and information strategies inform the public and government
offi cials about the problems caused by pollution. Increased technical
assistance is required for municipalities in the development, operation
and maintenance of wastewater treatment infrastructure. The following
groups could be targeted by education campaigns:
Public offi cials: Educating public offi cials about the costs of water
pollution allows them to make more informed and eff ective
decisions related to the control of water pollution.
The public: The coastal population should be aware of the impact of
water pollution on the tourism industry, their health and livelihood.
Small businesses: The waste discharged by larger industries has been
reduced considerably in response to Federal initiatives. Smaller
businesses, which discharge pollutants directly into municipal
sewer systems, need to be targeted by education campaigns in
order to reduce their contribution.
Publicly rate municipalities for their level of compliance with
wastewater treatment standards
Decision makers will be more likely to take action to improve wastewater
management if there is lobbying by the public. Grading municipalities
according to their level of compliance with water pollution standards
and publicising this information will engage the public and allow them
to identify which municipalities are failing to maintain adequate water
standards. This will foster competition among municipalities which will
ultimately improve standards. Introducing a public rating system that
applies to all Mexico’s larger municipalities will reduce opposition to the
current beach pollution rating system. Rating upstream communities
allows coastal municipalities to identify the sources of pollution and
apply political pressure on polluters.
Legal/Institutional
Create autonomous water districts
This policy option involves the creation of independent wastewater
districts consisting of representatives from the relevant municipalities.
Despite the involvement of municipal governments, the water district
itself should be a separate legal and political entity, with the exclusive
responsibility of managing water treatment operations. By removing
decisions regarding water treatment from the normal political
structures of local municipal governments, federal funding can be
targeted at developing treatment infrastructure.
Reform the pollution-related legal framework
Some reform of the Mexican legal framework could provide additional
power to regulatory agencies to more eff ectively control water pollution
and guarantee municipal investment in waste treatment infrastructure
and operations. These legal reforms fall into two general categories:
those designed to make current regulations more eff ective; and those
designed to increase stakeholder participation in waste management.
While the direct regulation of polluters and municipalities is an
important control instrument, it creates a dynamic in which polluters are
opposed only by federal bureaucrats, not by those harmed by pollution.
The victims of pollution can be empowered by being able to take legal
action against non-complying industries or municipalities, i.e. to create
a system of class-action civil law suits (Zilberman pers. comm.).
Central Equatorial Pacific sub-systemDefinition of the problem – Freshwater shortageFreshwater shortage was considered as the priority aquatic concern of
the Central Equatorial Pacifi c sub-system. Although the sub-system has
abundant water resources, they are unevenly distributed and seasonal
droughts aff ect extensive areas, especially during El Niño years. The
discharges of several rivers have reduced (Vörösmarty et al. 1998). The
high rate of deforestation is increasing erosion and the quantity of
suspended sediment in freshwater systems, thus modifying stream fl ow
in several areas of the sub-system. Human activities are polluting both
surface- and groundwater supplies in many of the sub-system’s river
basins. Because groundwater is the main source of freshwater supply,
many aquifers are overexploited in the sub-system.
Population growth and urbanisation have led to increasing demand
for freshwater resources and the concentration of demand in areas
that have limited freshwater availability. Because water supply and
sanitation services are subsidised, insuffi cient revenues are generated
to maintain current and invest in new technologies, and the population
has no incentive to save water.
Most countries in the sub-system have a weak and outmoded legal
framework for water management which does not provide for the
incorporation of new criterion and approaches. Institutions weakly
implement current legislation, are vulnerable to political pressures,
lack trained personnel and have limited budgets. There is a lack of an
integrated river basin approach to water management. Traditionally,
local stakeholders were not consulted in the management of water
resources. Countries in the sub-system lack water monitoring
programmes and public awareness of water issues is limited. The
60 GIWA REGIONAL ASSESSMENT 65 EASTERN EQUATORIAL PACIFIC
indirect benefi ts that water provides through ecosystem goods and
services are rarely valuated.
Countries of the region agreed during the Central American Dialogue
about Water, Food and Environmental Sustainability (San Jose, Costa
Rica, 2001) to adopt specifi c policies related to water management
(see Annex III). The policy options developed by the regional team
of the Central Equatorial Pacifi c sub-system, presented below, directly
address some of the priority root causes identifi ed during the Causal
chain analysis.
Policy options Demographic
Integrate territorial planning with water management
Urban planning regulations are not always enforced in the countries
of the sub-system. Even if they are enforced, these regulations usually
concentrate on territorial planning rather than addressing freshwater
shortage issues. This option would support the countries of the sub-
system, using economic and technological instruments, in developing
their own policies, legislation and regulations regarding urban planning,
which integrate territorial issues (i.e. migration, urban sprawl) with water
management.
Promote new development centres in rural areas
Urban water supply services are unable to provide for the increasing
numbers of migrants from rural areas. The promotion of new
development centres in rural areas, which take into consideration
existing activities, may reduce migration to cities. This can be achieved
by decentralising productive activities in order to create employment
and by improving social security in rural areas, particularly medical care,
education, appropriated family planning, water supply and other basic
services.
Knowledge
Strengthen and establish further monitoring programmes
The sub-system lacks a monitoring system for the control and
surveillance of water quality. This is important for assessing the extent
of freshwater shortages and defi ning the current and potential supply
capacity required for urban development. This option would establish
fi nancing mechanisms for governmental institutions to develop
programmes that monitor the factors determining land occupancy
and its aff ect on water availability and quality, as well as the impact
on aquatic ecosystems. The countries of the region need international
support in order to initiate urban development programmes which
include provisions for regulating water quality and availability. Studies
are also required to establish the carrying capacity of the ecosystems at
the sub-system level. Databases should be created for decision makers
to access policy relevant and current information so that they can
develop and adopt appropriate policies.
Develop and implement environmental awareness programmes
The public lack an awareness of water issues and the associated socio-
economic impacts, and there is no culture of water conservation. There
is a need to recognise the value of water for economic development,
particularly when formulating development strategies. There is
insuffi cient information and guidance regarding available techniques for
reducing water pollution and treating water. By establishing, promoting
and implementing environmental awareness training programmes at the
regional level this option aims to develop a culture of water conservation.
Awareness programmes should increase environmental consciousness
of the importance of a healthy environment and the impact of humans
on water resources. This supports the implementation of integrated
management plans. To create a water conservation culture in the long-
term, formal education programmes should include key environmental
issues in their curricula, including those related to water.
Governance, legal and institutional
Reorganise the water sector
Most countries in the sub-system have a weak legal and institutional
framework for water management with overlapping responsibilities and a
duplication of eff ort. Some regulations are obsolete or incomplete as they
omit provisions for new approaches and administration procedures. The
legislation considers water quantity separately from water quality, and
river basin and coastal management are not integrated (Escobar 2002).
The water sector needs to be reorganised in the short-term (OPS/
OMS 2001a). The modernisation of the water sector should include
the separation of operational and oversight powers, based on an
appropriate strengthening of the legal and institutional framework.
Several countries in the sub-system have policies and a legal framework
for water management; others are in the process of developing them
and require support. The following options should be considered within
an ecosystem-based management approach:
Promote the exchange of successful and unsuccessful experiences
regarding water policies, laws and regulations among the countries
of the sub-system.
Apply common water standards and quality criteria in the countries
sharing an international river basin.
The review of national and regional legal frameworks for water
management by a multitude of stakeholders.
Strengthen the current legal framework based on this review and
international recommendations, with an aim of improving the
POLICY OPTIONS 61
effi ciency and eff ectiveness of institutions responsible for water
management. The reform of the legal framework is necessary in
order to improve institutional governance in the region.
Integrate coastal area and river basin management.
Implement integrated river basin management to reduce the
negative eff ects on freshwater quantity and quality caused by
various water users in diff erent countries sharing a river basin.
Strengthen the agencies responsible for water management in
order to improve water use effi ciency and water quality in the
long-term.
Technology and economy
Finance the maintenance and expansion of water services by
introducing water rates
Currently, insuffi cient revenues are received to up-date technologies
because the governments of the sub-system subsidise water supply and
sanitation services. Overuse and waste of water is indirectly promoted
by subsides for water supply services. Privatisation agreements do not
stipulate that the company purchasing the public service has to strive
for greater water effi ciencies, adopt cleaner technology or control leaks
and other water loses from the distribution network.
The introduction of realistic water rates that refl ect the costs of
maintenance and the expansion of water services will promote the
effi cient use of the sub-system’s limited water resources. This will provide
greater revenues to invest in new appropriated technologies and to
develop a water monitoring programme. To improve the acceptability
of the increased charges, public awareness of the importance of water
conservation needs to be raised. Water users should be charged for
the costs of environmental remediation and river basin management
according to the quantity of water used, the impact of its activities
on the environment, and the mitigation measures it has adopted to
minimise this impact. Incentive frameworks are required to encourage
the private and public sector to adopt sustainable practices.
Definition of the problem – PollutionPollution was considered as the second priority concern of the Central
Equatorial Pacifi c sub-system. Due to the low level of wastewater
treatment, pathogenic microorganisms, solid wastes and heavy metals
are present along the coasts and in the water bodies of the entire sub-
system (PNUMA 2001). Low tariff rates for water and underinvestment
in sanitation infrastructure have resulted in a lack of basic sanitation
services for the rapidly expanding urban population. At least 12 diff erent
diseases have been linked to polluted water in the sub-system (PNUMA
2001).
The intensifi cation of agricultural production to feed the growing
population is leading to more agro-chemical pollution. Political will and
economic incentives to force or encourage industries and agriculture
to adopt more environmentally friendly technologies/practices are
lacking. Polluters are not taxed appropriately for the environmental
damage that their activities cause.
Legislation and environmental management instruments are often not
implemented due to an inappropriate institutional framework and a
lack of coordination among the diff erent governmental sectors. River
basin management focuses predominantly on water distribution and
consumption and stakeholder participation in the decision making
process is rarely encouraged. There is a lack of accurate and timely
information.
Countries of the sub-system have developed diff erent legal mechanisms
to address pollution problems. Annex III outlines some of the regional
agreements that include provisions for addressing pollution, such as
the Central American Ecological Summit of 1994 and the Convention
for Cooperation in the Protection and Sustainable Development of the
Marine and Coastal Environment of the North-East Pacifi c (Antigua
Convention) adopted in Guatemala, 2002 (see Annex III).
Policy options Economy
Invest in treatment infrastructure
Substantial investment is required to rehabilitate treatment systems
and increase the level of sanitation coverage. The countries of the sub-
system do not have suffi cient economic resources to develop such
facilities. Economic and technological support is required from donors
to rehabilitate existing treatment systems and/or to construct new
facilities in the countries of the sub-system.
Adopt the polluter pays-principle
Polluters are not charged for the environmental costs their activities
cause. Economic sectors are, therefore, given little incentive to
adopt cleaner technologies or to treat their wastes in order to
reduce the pollutant loads they contribute. Instead, governments
subsidise wastewater treatment and agro-chemicals resulting in
limited investment in sanitation and more pesticide contamination,
respectively.
This option would identify the sectors responsible for pollution and
impose load-based charges. The polluter pays-principle can be adopted
by implementing realistic tariff rates for wastewater discharges. The
principle should be developed based on environmental goals and
62 GIWA REGIONAL ASSESSMENT 65 EASTERN EQUATORIAL PACIFIC
objectives agreed upon by multiple stakeholders.
Legal/institutional
Review and reform national and regional legal frameworks
There are weak, and in some cases obsolete, legal frameworks and
a lack of coordination between the diff erent sectors and institutions
responsible for environmental management, many of which have
overlapping mandates. International best practice is not considered
in national regulations, nor are new approaches related to the use of
water. There is little or no coordination between river basin and coastal-
marine institutions, limiting the possibility of integrated river basin and
coastal area management.
This option proposes the review of national and international legal
frameworks for water management in order to reform institutional
frameworks at the national level. Based on this review, a regional legal
framework should be developed to apply in each country according
to their particularities, and water quality regulations should be
standardised. National regulations should be based on those inspired
by the Antigua Convention (2002).
Strengthen the capacity of the agencies responsible for water
management
Existing regulations are ineff ectively implemented and enforced.
Management instruments and institutional capacity are insuffi ciently
evaluated using, for example, environmental impact assessments and
environmental management programmes. Institutional weaknesses,
the failure to implement legislation and limited monitoring are the
main root causes of pollution in the sub-system. Therefore, institutional
strengthening is a priority issue at the regional level.
This option proposes strengthening the agencies responsible for
water management by creating mechanisms and opportunities for
institutional cooperation in order to adopt a holistic approach to water
management, in which the particularities of both coastal and marine
areas are considered. The strengthened capacity of the institutions
will allow them to implement programmes aimed at controlling and
monitoring pollution in coastal and marine areas. In particular, the
Network of National Institutions should be established, and coordinated
by the Central American Commission for Maritime Transportation in
collaboration with UNEP.
Knowledge
Develop and implement environmental awareness programmes
This option would establish, promote and implement environmental
training programmes at the regional level. Educational programmes
increase the environmental awareness of the population about the
importance of waste management. Environmental issues should be
included in formal education curricula.
Strengthen information management
Information about water quality is dispersed, not up-to-date and
used within specifi c sectors, thus impeding a holistic understanding
of the overall status of water resources. This option proposes the
improvement of information exchange mechanisms in the sub-system
by strengthening and updating the Regional Network for Resources
Monitoring and other initiatives related to water management and
surveillance in the sub-system. The countries need to cooperate and
share data regarding the water regime of the sub-system. To support
the implementation of the Plan of Action for the Protection of the
Marine and Coastal Environment of the North East Pacifi c, there needs
to be monitoring and surveillance of pollution from land-based sources.
The knowledge base would be improved by monitoring the pollution
load of coastal waters.
Pacific Colombian sub-system
Definition of the problemDuring the environmental and socio-economic impact assessment
of the Pacifi c Colombian sub-system, it was established that the
unsustainable exploitation of fi sh and other living resources was the
principal concern. Despite most of the fi sheries in Colombia being
small scale and/or subsistence, the current level of exploitation is
unsustainable; catches of some traditionally targeted species have
declined (INVEMAR 2003c, FAO 2004c). Stocks of freshwater commercial
species are also signifi cantly depleted (IIAP 2001b).
On the Pacifi c Colombian coast, non-selective and destructive fi shing
gear is used to increase short-term profi ts at the detriment of fi sh stocks
and marine ecosystems. As the distribution of fi sh species has changed
and stocks of traditionally exploited species have declined, the fi shing
fl eet has began to exploit stocks which are further off shore using new
technologies. The fi sheries sector concentrates on certain valuable
species to supply the export rather than domestic fi sh market. Existing
laws related to the fi sheries are weakly enforced allowing domestic and
foreign fi shing fl eets to avoid legislation. There is lack of institutional
cooperation, fi sheries statistics and stakeholder participation to aid and
improve the eff ectiveness of decision making processes.
Colombia has developed several programmes aimed at addressing

POLICY OPTIONS 63
the environmental problems aff ecting its Pacifi c coast, such as Pacifi c
Agenda 21 and the Project Biopacífi co. The policy options proposed
in this document should be considered as complementary actions to
those recommended in these initiatives. In a broader scope, Colombia
has signed several protocols and agreements with other countries of
the South East Pacifi c to address transboundary pollution problems,
notably the Convention for the Protection of the Marine Environment
and Coastal Areas in the South East Pacifi c, and the Plan of Action for the
Protection of the Marine Environment and Coastal Areas of the South
Pacifi c, which are briefl y described in Annex III. The Policy options
analysis focuses on mitigating the root causes identifi ed in the CCA,
including technology, knowledge, economic and governance drivers.
Policy options Technology
Transfer of sustainable technologies
The fi sheries industry in the sub-system has poor access to modern
technologies. The transfer of sustainable technologies can be
accomplished through cooperation among national agencies and
between municipalities and other regional and local administration
institutions.
Knowledge
Enhanced information management and education programmes
There is a need to widely disseminate key, policy relevant scientifi c
fi ndings to individuals and institutions responsible for fi sheries
management. This requires the active participation of, and cooperation
between, the scientifi c community and local stakeholders. Education
campaigns and training courses for local authorities can improve their
understanding of scientifi c fi ndings. Local authorities need access to
up-to-date fi sheries statistics.
Training courses for community and fi shing association leaders may
improve the adoption rate of sustainable fi shing practices. They are
often responsible for the implementation and oversight of appropriated
practices and have the power to change the behaviour of fi shers. Since
education is the responsibility of the government, this approach
requires the strengthening of the formal education sector so that it
considers environmental issues, including those related to the fi sheries.
This option would initiate ethno-education focused towards sustainable
development and the rational exploitation of living resources (clean
production and eco-effi ciency). Education should be directed at local
communities rather than productive sectors since the current legal
framework regulates the activities of the latter.
Governance
Further implement integrated coastal zone management (ICZM)
Coordinate institutional systems by adopting integrated coastal zone
management. Colombia has made signifi cant progress regarding this
approach including the establishment of the Integrated Management
Unit of Guapi Iscuande. Local authorities need to be monitored by
regional and national agencies to ensure governmental fi sheries
strategies are implemented. In parallel to this, the capacity of local
authorities needs strengthening regarding the management of fi sheries
resources.
Strengthen the self-regulation of coastal communities
Strengthen the self-regulation processes of coastal communities
so that they receive greater responsibilities which are currently
exclusive to the government. For this purpose, responsibilities must
be assigned independently of the current political-administrative
framework, as geographic boundaries of coastal communities often
do not correspond with political boundaries. It is expected that self-
regulation will lead to the increased participation of local communities,
especially those of Afro-Colombian and indigenous origin, in decision
making and implementation. This will legitimise their administrative
structures. This proposal follows the results obtained by Ostrom (2000)
and is in accordance with the community participation mechanisms
stipulated in the National Constitution. The option may prove diffi cult
to implement as local leaders may be unwilling to participate in the
process and there may be resistance to change by the authorities.
Fishing associations should also be strengthened so the interests of
the industry are considered.
64 GIWA REGIONAL ASSESSMENT 65 EASTERN EQUATORIAL PACIFIC
Conclusions and recommendations
Long-term recommendations
Create autonomous water districts; and
Reform the pollution-related legal framework.
In conclusion, pollution abatement is a major challenge for Southwest
Mexico. Increased understanding among public and policy makers of
the causes and eff ects of pollution, the establishment of communication
networks among the stakeholders of a river basin, the creation of
incentives as well as penalties for polluters, and greater civil legal powers
will shift the political situation in favour of environmental protection. A
healthy environment will improve the well-being of the sub-system’s
population.
Areas for further study
There is a general lack of information and data regarding wastewater
management and the transboundary eff ects of water-related pollution
in the coastal zone. This is presenting a signifi cant obstacle to selecting
and implementing appropriate policies. The following studies are
recommended:
Initiate studies to quantify the economic impact of coastal water
pollution; and
Conduct a survey of local public offi cials regarding their attitudes to
pollution control.
Central Equatorial Pacific sub-systemThe countries of the sub-system are inextricably linked by hydrological
processes. Water is a vector transporting not only a wide variety of
valuable resources but also problems from one country to another. For
example, deforestation in Nicaragua is aff ecting aquatic ecosystems in
Southwest Mexico
Pollution was considered to be the priority concern by the regional team.
Microbiological pollution was found to have the most severe impacts due
to its aff ect on the tourism industry and the health of the population.
Untreated wastewaters from inland and coastal sources enter coastal
waters where they degrade marine ecosystems, thus aff ecting tourism
and the commercial fi sheries. Some of the sub-system’s important tourism
beaches are the most polluted in Mexico resulting in the dissuasion of
tourists. The contamination of surface- and groundwater has reduced the
availability of freshwater for human consumption. Diseases associated
with microbiological pollution are highly prevalent in the sub-system.
Sewer and treatment infrastructure, which is commonly dilapidated,
has been unable to cope with the increasing quantities of wastewater
produced by the booming coastal tourism industry and rapidly
growing population. While regulatory agencies have made progress
in controlling large volume industrial polluters whose wastes fl ow
into federal waterways, they do not have the jurisdictional power to
control municipal pollution sources. Technical and fi nancial defi ciencies
often prevent local municipalities from developing and maintaining
wastewater treatment networks.
RecommendationsNear-term recommendations:
Formulate and implement education and information strategies;
Publicly rate municipalities for their level of compliance with
wastewater treatment standards; and
Rehabilitate existing, and construct new, wastewater treatment
facilities.
Medium-term recommendations
Introduce a fee-and-rebate system for municipal wastewater.
CONCLUSIONS AND RECOMMENDATIONS 65
Honduras, Guatemala and Costa Rica due to increased rates of erosion
resulting in sedimentation downstream and in coastal areas.
Freshwater shortage and pollution were considered to be the most
severe transboundary aquatic concerns in the Central Equatorial Pacifi c
sub-system. Both concerns are interlinked as the discharge of untreated
wastewater is contaminating surface- and groundwater, thus reducing
the availability of water suitable for human uses. At the same time,
population growth and economic development have led to increasing
demand for water resources. Water availability per capita has declined
by almost two-thirds between the 1950s and 1990s.
With the exception of Panama City, the other capitals and large cities
depend primarily on groundwater supplies. In Managua, San José,
San Salvador and the valleys of Choluteca and Tegucigalpa the level
of groundwater abstraction is exceeding the natural recharge rate of
the aquifers. Water supply infrastructure is not satisfying demand and
is beset with operational and maintenance failures. Because water
supply and sanitation services are subsidised, insuffi cient revenues are
generated to maintain current and invest in new technologies, and the
population has no incentive to save water.
These human dimensions to water availability are set against a backdrop
of variable climatic conditions throughout the sub-system, with some
parts of the region suff ering from intense periods of drought with a
marked reduction in river fl ow. The intensity of rainy periods and the
severity of droughts are expected to increase in the future. Water scarcity
will depress the agriculture sector, the cornerstone of the sub-system’s
economy, increasing unemployment and migration, and causing food
insecurity. Tourism, an increasingly important industry, will also be
severely impacted by water shortages.
Municipal wastewater is the major source of pollution in the sub-system;
95% is discharged without treatment. Only 60% of the population has
access to sanitation services, which are frequently latrines. ADD and
other water-related diseases are the main cause of the high rates of
morbidity and mortality in the sub-system.
The root causes of this situation include defi cient environmental policies,
institutional failures, biased sectorial approaches, resistance to change,
the use of obsolete technology, outmoded regulations, and the lack of
inter-institutional integration and stakeholder consultative processes.
RecommendationsIn order to address pollution in the coastal areas of the Central
Equatorial Pacifi c sub-system, a fi rst step would be the implementation
of regional instruments of cooperation such as the Plan of Action for
the Protection of the Marine Environment and Coastal Areas of the
North East Pacifi c. The institutions responsible for the management of
water and the control of pollution were found to lack administrative and
organisational capacity. The selected policy options, therefore, address
these institutional inadequacies as a prerequisite.
In the case of freshwater shortage, the following policy options are
recommended:
Develop and implement environmental awareness programmes;
and
Reorganise the water sector.
In the case of pollution, the following policy option is recommended:
Develop and implement environmental awareness programmes.
Pacific Colombian sub-system
Unsustainable exploitation of fi sh and other living resources was
selected as the priority concern of the Pacifi c Colombian sub-system.
The current level of exploitation is unsustainable; stocks of some
traditionally targeted species and coastal shellfi sh have been depleted.
Freshwater commercial species are also less abundant today. The fi shing
industry tends to target a limited number of species which are valuable
on the international market. Despite stocks of these species becoming
exhausted, total catches have been maintained or even increased as
fi shermen are targeting more abundant species in order to sustain their
income levels and food security. This has been achieved by the use of
new technologies which allow fi shermen to exploit stocks which are
further off shore in deeper water. They are also using non-selective and
destructive fi shing gear to increase short-term profi ts at the detriment of
fi sh stocks and marine ecosystems. It is weak enforcement rather than a
lack of laws and regulations that is allowing domestic and foreign fi shing
fl eets to operate illegally. The various institutions responsible for fi sheries
management inadequately cooperate and fail to involve stakeholders
in the decision making process. The lack of fi sheries statistics prevents
managers from having an accurate understanding of the state of the
fi sheries.
Colombia has developed several programmes aimed at addressing
the environmental problems aff ecting its Pacifi c coast, such as Pacifi c
Agenda 21 and the Project Biopacífi co. The policy options proposed in
this report should be considered as complementary actions to those
recommended in these initiatives.
66 GIWA REGIONAL ASSESSMENT 65 EASTERN EQUATORIAL PACIFIC
RecommendationsThe analysis of the policy options established that under current
conditions of environmental management and governance the most
feasible option for implementation is:
Enhanced information management and education programmes.
Following the implementation of the above option, which would result
in direct benefi ts for the management of natural resources, it is also
recommended to implement the option:
Strengthen the self-regulation of coastal communities.

REFERENCES 67
References
Ballesteros, M. (2003). Diagnóstico de Aguas de Costa Rica, Documento
para el Plan de Acción para la gestión integrada de los recurso
hídricos de Centroamérica, San José, Costa Rica.
Botello, A.V., Villanueva, S.F., Diaz, G.G. and Escobar-Briones, E. (1998).
Polycyclic aromatic hydrocarbons in sediments from Salina Cruz
Harbour and Coastal Areas, Oaxaca, Mexico. Marine Pollution
Bulletin 36(7):554-558.
Calero, L., Marrugo, E. and Casanova, R. (1996). La contaminación marina
en el Pacífi co colombiano bajo el enfoque social y económico.
Centro de Control de Contaminación del Pacífi co, CCCP, Dirección
General Marítima, DIMAR. Boletin Cientifi co 5:98-120.
Cantera, J.R. and Arnaud, P.M. (1995). Structure et distribution des
associations d’arbres de mangrove de deux baies de la cote
Pacifi que de Colombie: Málaga et Buenaventura. p 245-290 In:
Restrepo, J.D. and Cantera, J.R. (eds.). Delta del Río San Juan Bahías
de Málaga y Buenaventura Pacífi co Colombiano. COLCIENCIAS/Eafi t
/Universidad del Valle, Cali, Colombia.
Carvajal E.Y., Jiménez E.H. and Materón, M.H. (1997). Incidencia del
fenómeno del Niño en la Hidroclimatología del Valle del Río Cauca
– Colombia. Facultad de Ingeniería. Universidad del Valle, Colombia.
Retrieved May, 2004, from: http://www.unesco.org.uy/phi/libros/
enso/carvajal.html
Castro, E. Jiménez, L. and Leon, S. (2000). Valoración económica-
ecológica de la degradación de las aguas que desembocan en el
Golfo de Nicoya. Universidad Nacional, Costa Rica.
Castro, G. (2003). El manejo de la Cuenca del Canal de Panama (CCP),
Una evaluacion de sus necesidades y posibilidades en un proceso
GIRH, Universidad de Panama- Programna de Grado de Estudios
en Manejo Medioambiental-Ciudad del Saber. Departamento de
Sociologia, Universidad de Panama. Retrieved May, 2004 from: http:
// www.ciudaddelsaber.org.pa
Castro, L., Navarrete, A., Cardona, T. Tejada, C., Otero, L., Afanador,
F., Mogollón, A. and Pedroza, W. (2003). Panorama de la
Acurio, G., Rossin, A., Texeira. P.A and Zapata, F. (1997). Diagnostico de la
situación de manejo de residuos sólidos municipales en América
Latina y el Caribe, Banco Interamericano de Desarrollo BID. Pub.
BID/OPS, No. ENV, 97-107.
Alvarado, H. and Gutiérrez, F. (2002). Especies hidrobiológicas
introducidas y trasplantadas, y su distribución en Colombia.
Ministerio del Medio Ambiente-RAMSAR-Corporación Autónoma
Regional del Valle del Cauca. Bogotá, Colombia.
Álvarez, L. and Manelia, J.A. (1996). Informe Nacional sobre el estado
de la contaminación marina en el Pacífi co de Panamá, Comisión
Nacional de Medio Ambiente de Panamá CONAMA, documento
de la Reunión CPPS/PNUMA de Expertos del Pacífi co Sudeste para
revisar el desarrollo de CONPACSE y el estado de la contaminación
narina en el Pacífi co Sudeste, Guayaquil, Ecuador.
Álvarez, L., Dutary, A. and Palacios, J. (1989). Evaluación de pesticidas y
metales pesados en biota marina, sedimentos y agua del Pacífi co
de Panamá, CONAMA. En: Informe de Reunión CPPS/PNUMA de
expertos para revisar el desarrollo del CONPACSE y el estado de la
contaminación marina del Pacífi co Sudeste. Guayaquil, Ecuador.
Améndola, R., Castillo E. and Martínez, P.A (2005). México Part II. In
Country Pasture/forage resources profi les. Retrieved April, 2006
from http://www.fao.org/AG/AGP/AGPC/doc/Counprof/Mexico/
Mexico2.htm.
ANAM (1994). Primera Comunicación Nacional sobre el Cambio
Climático en Panamá. Autoridad Nacional del Ambiente de Panamá,
Panamá City Panamá.
Artiga, R. (2002). Limites y potencialidades para la gestion integrada de
los recursos hidricos de cuencas transfronterizas de Centroamerica.
Estudio de Caso: Gestion de la cuenca compartida del Rio Lempa
(Guatemala, El Salvador, Honduras, Plan Trifi nio) y su replicabilidad
–Fundacion del Servicio Exterior para la Paz y la Democracia
Fundepam. San Salvador, El Salvador.
68 GIWA REGIONAL ASSESSMENT 65 EASTERN EQUATORIAL PACIFIC
contaminación marina del Pacífi co colombiano. Centro de Control
de Contaminación del Pacífi co colombiano. DIMAR. Serie de
publicaciones especiales Vol 3, San Andrés de Tumaco.
CCAD (2002). Centro América en la Cumbre Mundia l de Desarrollo
Sostenible. Comisión Centroamericana de Ambiente y Desarrollo,
San José, Costa Rica.
CCAD/IUCN (1999a). Diagnostico del estado de los recursos naturales,
socioeconómicos e institucional de la zona costera del Golfo
de Fonseca. Doc: Informe del Proyecto Regional Conservación
de los Ecosistemas Costeros del Golfo PROGOLFO. Comisión
Centroamericana de Ambiente y Desarrollo/The World
Conservation Union. San José, Costa Rica, Morovia Costa Rica,
Gland, Switzerland.
CCAD/IUCN (1999b). Clasifi cacion Digital de Imagenes de Satelite
del Area de Progolfo, Proyecto Conservación de los Ecosistemas
Costeros del Golfo de Fonseca. CATIE Laboratorio de Sistemas de
Información Geográfi ca, Turrialba, Costa Rica.
CCCP (2003). Programa de Investigación sobre el Fenómeno El Niño.
Centro de Control de Contaminación del Pacífi co, Nariño, Colombia.
Retrieved April, 2004, from: www.cccp.org.co
CCO (2002). Lineamientos De La Politica Nacional Del Oceano Y Los
Espacios Costeros- LPNOEC. Comisión Colombiana del Océano,
Bogota, Colombia.
Cedeño, C.V. (1995). Informe del Estado del Medio Ambiente Marino-
Costero del Pacífi co de Nicaragua, Informe de Consultoría a la
Comisión Permanente del Pacífi co Sur, CPPS, Managua, Nicaragua.
CPPS, Lima Perú .
CNA (2002). Compendio Basico del Agua en Mexico. Plan Nacional de
Desarrollo/Comision Nacional del Agua/SEMARNAT, Mexico.
CONAZA (1994). Plan de Acción para combatir la desertifi cación en
México. Comisión Nacional de zonas Áridas, Secretaría de Desarrollo
Social, México.
Consejo Nacional de Rectores/Defensoría de los Habitantes/Programa
de las Naciones Unidas para el Desarrollo. Retrieved April, 2004
from: http://www.estadonacion.or.cr/info2002/nacion8/Po-
armonia/Agua%20transparente%20deuda%20invisible.pdf
Conservación Internacional (2002). Colombia, Serie Pacífi co: Ambiente
y culturas amenazadas. Retrieved April, 2004 from: http://
premioreportaje.org/index.php?pageId=sub&lang=en_US&curre
ntItem=article&docId=740&c=Colombia&cRef=Colombia&year=
2003&date=October%202002
Constitucion Nacional de Mexico (1992). Ley De Aguas Nacionales D.O.F.
01-Xii-, Mexico
Contreras, F. Castañeda, O., García-Nagaya, A. and Gutiérrez, F. (1995).
Nutrientes en 39 lagunas costeras mexicanas. Retrieved February,
2005 from: http://rbt.ots.ac.cr/revistas/44-2/contr.htm
Coral Reef Alliance. (2003). Watersheds and Healthy Reefs: Making the
Connection. The Coral Reef Alliance, San Francisco, United States.
Cortés, R., Muñoz, L. and Sotomayor, O. (1993). Envenenamiento
paralítico por mariscos (psp), causado por el dinofl agelado
Pyrodinium bahamense var. compressum en la costa suroeste de
México. Anales del Instituto de Ciencias del Mar y Limnología,
Universidad Nacional Autónoma de Mexico 20(1):43-54.
CPPS (2000). Escobar, J.J. (ed.). Estado del Medio Ambiente Marino y
Costero del Pacífi co Sudeste. Plan de Acción para la Protección
del Medio Marino y Áreas Costeras del Pacífi co Sudeste. Comision
Permanente del Pacifi co Sur, Quito, Ecuador.
CPPS (2001). Hidrocarburantes: La Contaminación Marina Regional
por Actividades Petroleras. Comisión Permanente del Pacífi co
Sur. Retrieved April 2004 from: http://www.cpps-int.org/spanish/
planaccion/hidrocarb.pdf
CPPS (2004). Borrador del informe de la 2da Reunión de Expertos
del Grupo Subregional GIWA 65: Análisis de la Cadena Causal
y Opciones de Política para los problemas prioritarios, Bogotá,
Colombia. Comisión Permanente del Pacífi co Sur, Guayaquil,
Ecuador.
Croom, M., Wolotira, R. and Henwood, W. (1995). Northeast Pacifi c.
p 55-106 In: Kelleher, G., Bleakley, C. and Well, S. (eds.). A Global
Representative System of Marine Protected Areas, Volume IV. Great
Barrier Reef Marine Park Authority/The World Bank/The World
Conservation Union. Washington D.C., United States.
DANE (2001). Cuentas regionales. PIB por actividad económica a
nivel departamental. Departamento Administrativo Nacional de
Estadísticas, Bogotá, Colombia.
DANE (2002). Departamento Administrativo Nacional de Estadística,
Bogota, Colombia. Retrieved April, 2004 from: http://
www.dane.gov.co
Díaz, C. J and Fernández, L.M. (1994): Situación Ambiental del Litoral
Pacífi co de Costa Rica. Informe de Consultoría a la Comisión
Permanente del Pacífi co Sur, San José Costa Rica.
Dourojeanni, A. (2001). Water management at the river basin level:
Challenges in Latin America. Report LC/L.1583-P. Serie Recursos
Naturales e Infraestructura No. 29.
El País (2004). Tasa retributiva enreda a empresas de servicios. Retrieved
April, 2004 from: http://elpais-cali.terra.com.co/paisonline/notas/
Marzo042003/C34N1.html
EPA (1983).Cabelli, V.J. Health eff ects criteria for marine recreational
waters. EPA-600/1-80-031, United States Environmental Protection
Agency. Research Triangle Park Foundation, United States.
EPA (2005). Procedures for derivation of equilibrium partitioning
sediment benchmarks for the protection of benthic organisms:
Metal mixtures (cadmium. copper, lead, nickel, silver and zinc).
REFERENCES 69
EPA-600-R-02-011. United States Environmental Protection
Agency Offi ce of Research and Development, Washington D.C.
United States.
Escobar, J.J. (1996). Políticas, estrategias y acciones para la conservación
de la diversidad biológica en los sistemas costero- marinos de las
áreas protegidas. Documento Técnico No 22, FP/0132-94-1. Proyecto
FAO Ofi cina Regional para América Latina y el Caribe/ Programa
de las Naciones Unidas para el Medio Ambiente. Conservación de
la Diversidad Biológica en Áreas Silvestres y Áreas Protegidas de
América Latina y el Caribe, Santiago, Chile.
Escobar, J.J. (2000). Estado del medio ambiente marino y costero del
Pacífi co Sudeste- Plan de Acción para la Protección del Medio
Marino y Áreas Costeras del P/SE, pub. Comisión Permanente del
Pacífi co Sur, Secretaria General, Quito, Ecuador.
Escobar, J.J. (2001). Evaluación sobre las fuentes terrestres y actividades
que afectan al medio marino, costero y de aguas dulces en la región
del Pacífi co Nordeste. 3/Inf/2. UNEP/DEC/NEP/EM.
Escobar, J.J. (2002). Sostenibilidad de recursos pesqueros, cultivos
ilícitos, metropolizacion y contaminación de aguas en Colombia.
In: Síndromes de Sostenibilidad Ambiental en América Latina y el
Caribe. Informe de Consultaría para la Comisión Económica para
América Latina y el Caribe. Unidad de Medio Ambiente y Desarrollo,
Santiago, Chile. (Unpublished)
Escobar, J.J. (2003). Perfi l de la capacidad de respuesta de la región
del Pacifi co Nororiental a la contaminación por petróleo a 2003.
Documento Informe de consultaría a COCATRAM para la IIa Reunión
Intergubernamental del Plan de Acción para la Protección y el
Desarrollo Sostenible del Medio Marino y Zona Costera del Pacifi co
Nororiental, Managua, Nicaragua. Retrieved April, 2004 from: http:
//www.cocatram.org.ni
Escobar, J.J. (2005). Evaluación a 2005 sobre las fuentes terrestres
y actividades que afectan l medio marino, costero y de aguas
dulces asociadas en la región del Pacífi co Nordeste (NEP). Informe
Regional. COCATRAM/PNE/IG.3/Informativo 10. III Reunión
Intergubernamental del Plan de Acción. Ciudad de Guatemala,
Guatemala.
Espinoza, A. (2002). Evolución de la industria mexicana de fertilizantes
en la agricultura. Secretaría de Agricultura, Ganadería, Desarrollo
Rural, Pesca y Alimentación. Retrieved February, 2005 from: http:
//www.sagarpa.gob.mx/Cicoplafest/evol_ind.htm
FAO (1997). Review of the state of world marine fi sheries. Marine
Resources Service. Fisheries Resources Division. Fisheries
Department. FAO Fisheries Circular No. 920, FIRM/C920. Food and
Agriculture Organization of the United Nations, Rome, Italy.
FAO (2002a). Uso de pesticidas. FAOSTAT. Retrieved March, 2004 from:
http//www.fao.org
FAO (2002b). Datos de captura de peces marinos y pesca de aguas
continentales FISHBASE. Retrieved March 2004 from: http://
www.fao.org
FAO (2003). Resumen informativo sobre la pesca por países: La república
de Colombia. Retrieved February 2004 from: http://www.fao.org/
fi /fcp/es/COL/body.htm
FAO (2004a). Perfi les Nacionales del Uso del Agua en la Agricultura.
Ofi cina Regional de la FAO AQUASTAT. Retrieved March, 2004
from: http://www.fao.org
FAO (2004b). Global capture and aquaculture databases updated to
2002. Retrieved May, 2004 from: http://www.fao.org
FAO (2004c). Capture production: by major fi shing areas. Fisheries
Department. Retrieved May, 2004 from: http://www.fao.org
FDA (1993). Fish and Fishery Products Hazards and Controls Guidance.
Food and Drug Administration, Center for Food Safety and Applied
Nutrition, Offi ce of Seafood, Washington D.C., United States.
Franco, A. (2001). Informe Nacional de Panamá: Evaluación de fuentes
terrestres y actividades que afectan al medio marino, costero y
dulceacuícola de la República de Panamá en el Océano Pacífi co
Nordeste. Programa de Naciones Unidas para el Medio Ambiente/
Global Programme of Action for the Protection of the Marine
Environment from Land-based Activities/Autoridad Marítima de
Panamá, Panamá.
Gamez, L. (2002). Octavo Informe sobre el Estado de la Nación en
desarrollo humano sostenible.
Garay, J.A., Marín, B. and Vélez, A.M. (2002). Contaminación marino-
costera en Colombia. p 101-130 In: Ospina-Salazar, G.H. and Acero,
A. (eds.). Informe del Estado de los Ambientes Marinos y Costeros
en Colombia: Año 2001. Serie de Publicaciones No. 8. Instituto de
Investigaciones Marinas y Costeras, Colombia.
García, J.E. (1998). Intoxicaciones agudas con plaguicidas: Costos
humanos y económicos. Revista Panamericana de Salud Pública/
Pan American Journal of Public Health 4(6):383-387.
Girot, P. and Jiménez, A. (2003). Marco regional de adaptación al cambio
climático para los recursos hídricos de Centro America. The World
Conservation Union, Morovia, San José Costa Rica.
Glynn, P.W. and Wellington, G.M. (1983). Corals and corals reef of the
Galápagos Islands. University of Berkeley Press, United States.
González, J. (2002). El virus de la mancha blanca un efecto de la
vulnerabilidad de la camaronicultura de la región de América Latina
y el Caribe. Retrieved February, 2005 from http://www.fao.org/
Regional/LAmerica/prior/recnat/recursos/pesca/virus.htm
Hancock, L.E. and Gilmore, M.S. (2004). Pathogenicity of Enterococci.
Retrieved February, 2000 from: http://www.enterococcus.ouhsc
.edu/

70 GIWA REGIONAL ASSESSMENT 65 EASTERN EQUATORIAL PACIFIC
Heckadon-Moreno, S., Ibañez, R.D. and Condit, R. (1999). La Cuenca del
Canal: Deforestación, Contaminación y Urbanización. Instituto de
Investigaciones Tropicales. Panamá.
IDEAM (2001). El Agua. p 114-189 In: El medio ambiente en Colombia.
Instituto de Hidrología, Meteorología y Estudios Ambientales de
Colombia. Retrieved from: http://www.ideam.gov.co/publica/
medioamb/cap4.pdf
IDEAM (2002). Efectos naturales y socioeconómicos del Fenómeno
El Niño en Colombia. Bogotá, Colombia. Instituto de Hidrología,
Meteorología y Estudios Ambientales de Colombia. Retrieved
May, 2004 from: http://www.ideam.gov.co/fenomenonino/
DOCUMENTOELNINO.pdf
IGAC (1999). Zonifi cación Ecológica de la Región Pacífi co Colombiana.
Instituto Geográfi co Agustín Codazzi, Bogota, Colombia.
IIAP (2001a). Agenda Pacífi co XXI, propuesta para la acción regional
del Pacífi co biodiverso en el presente milenio. Resumen ejecutivo.
Instituto de Investigaciones Ambientales del Pacífi co, Ministerio del
Medio Ambiente, Departamento Nacional de Planeación, Programa
BID y Plan Pacífi co. Quibdo, Colombia.
IIAP (2001b). Perfi l Ambiental del Pacífi co Colombiano en Perfi l de los
Recursos Naturales y del Medio Ambiente en Colombia. Sistema
de Información Ambiental de Colombia. IDEAM/SINCHI/IAvH/IIAP/
INVEMAR, Colombia.
INDERENA (1992). Leyva, P. (ed.). Colombia Pacífi co, Proyecto
BIOPACIFICO. Tomos I y II. INDERENA/DNP/GEF/PNUD/Fondo para
la Protección del Medio Ambiente (COL/92/G31)/José Celestino
Mutis/FEN. Retrieved April, 2004 from: http://www.banrep.gov.co
INEGI (1998). Estadísticas del Medio Ambiente: México 1997. Instituto
Nacional de Estadística, Geografía e Informática, Aguascalientes,
Mexico.
INEGI (2000). Instituto Nacional de Estadistícas Geografi a e Informatica,
Mexico. Retrived April 2004 from: http://www.inegi.gob.mx/
INPA (2000). Perfi l de la pesca y la acuicultura en Colombia. Informe
elaborado por Claudia Stella Beltrán Turriago y Abraham Alberto
Villaneda Jiménez. Instituto Nacional de Pesca y Acuicultura,
Bogotá, Colombia.
INVEMAR (2003a). Programa holandés de asistencia para estudios de
cambio climático, Colombia: defi nición de la vulnerabilidad de los
sistemas biogeofísicos y socioeconómicos debido a un cambio en
el nivel del mar en la zona costera colombiana (Caribe continental,
Caribe insular y Pacífi co) y medidas para su adaptación. VII tomos.
Instituto de Investigaciones Marinas y Costeras, Programa de
investigación para la gestión marina y costera/GEZ. Santa Marta,
Colombia.
INVEMAR (2003b). Diagnostico de la calidad ambiental marina en el
caribe y Pacífi co colombiano. Red de vigilancia para la protección y
conservación de las aguas marinas y costeras. Diagnostico Nacional
2003. Instituto de Investigaciones Marinas y Costeras, Colombia.
INVEMAR (2003c). Informe del Estado de los Ambientes Marinos y
Costeros en Colombia: AÑO 2002. Servifráfi cas, Medellín. Serie de
publicaciones periódicas No. 8. Instituto de Investigaciones Marinas
y Costeras, Colombia.
IPCC (2001). Houghton, J.T., Ding, Y., Griggs, D.J., Noguer, M., van del
Linden, P.J., Day, X., Maskell, K. and Johnson, C.A. (eds.). Climatic
Change 2001: The Scientifi c Basis. Contributions of Working Group
I to the Third Assessment Report of the Intergovernmental Panel
on Climate Change. Cambridge University Press, Cambridge, United
Kingdom and New York. United States.
ISAT 2001 Diagnóstico Situacional del Uso del DDT y el Control de la
Malaria: Informe regional para Mexico y Centroamerica. Instituto de
Salud, Ambiente y Trabajo S.C./PAHO/GEF/UNEP/CEC/CCA/CCE.
Jouravlev, A. (2001). Administración del agua en América Latina
y el Caribe en el umbral del siglo XXI. Recursos naturales e
infraestructura No 27 (LC/L.1564-P). Comisión Económica de las
Naciones Unidas para América Latina y el Caribe, Santiago, Chile.
Kiewcinsky, B. (1986). Contaminación Marina del Pacifi co de Panamá.
Comisión Permanente del Pacífi co Sur. Serie Seminarios y Estudios
(2):117-171.
Leal, M.T., García, J.L. and Gelover, S. 2000. Calidad del Agua en la Bahía
de Acapulco. Instituto Mexicano de Tecnología del Agua. Retrieved
February, 2005 from: http://www.imta.mx/muestras/2000/ca_04_
2000.pdf
Levin, B. 2002. El Salvador va a una crisis de agua. Retrieved from: http:
//www.cesta-foe.org/articulos/02-10/crisis_de_agua.htm
Lezama-López, M. (2003). La experiencia del grupo de trabajo de
humedales. p 265-280 In: Nicaragua Aportes a un proceso de
gestión de ecosistemas y el agua. Departamento de Ciencias
Ambientales y Agraria Universidad Centroamericana, Managua
Nicaragua.
Little, M. and Herrera, M. (1991). Checklist and catalogue of the fi sh
recorded in the by-catch of the Ecuadorian shrimp fl eet. Agreement
Overseas Development Administration of the UK. Government/
Instituto Nacional de Pesca, Guayaquil, Ecuador.
Living Lakes (2005). Lake Chapala. Retrieved February, 2005 from: http:
//www.livinglakes.org/chapala/
Llort, M. and Montufar, J.C. (2002). El Plan Trifi nio y la cuenca compartida
del río Lempa de El Salvador, Guatemala y Honduras. Secretaria
Ejecutiva Trinacional, San Salvador, El Salvador. p 247-264 In:
Memorias Día de las Américas /Tercer Foro Mundial sobre el Agua,
Miami, United States.
López, O., De León, E. and Sánchez, S. (1996). Perfi l costero del Pacífi co de
Panamá,.Ministerio de Planifi cación y Política Económica/Comisión

REFERENCES 71
Nacional del Medio Ambiente /Universidad de Panamá, Escuela
de Geógrafo Profesional. Informe a la Comisión Permanente del
Pacífi co Sur, Quito, Ecuador.
Loria, L.G., Jiménez, R. and Lizano, O.G. (2002). Radionucleídos naturales
y antropogénicos en el estuario del Golfo de Nicoya, Costa Rica. Top.
Meteoro. Oceanog. 9(2):74-78.
Lozano, J. and Pabón, J. (2005). Ascenso del nivel del mar. Presentation
(ppt). Retrieved February, 2005 from: http://www.invemar.org.co/
redcostera1/invemar/docs/
MARENA (2003). Estado del ambiente de Nicaragua, II Informe
GEO. Ministerio del Ambiente y los Recursos Naturales de
Nicaragua,Managua, Nicaragua.
Marín, R. (1992). Estadísticas sobre el recurso agua en Colombia.
Segunda edición. Ministerio de Agricultura e Instituto de hidrología,
meteorología y adecuación de tierras, ARFO Ltda., Santafé de
Bogotá, Colombia.
MARN El Salvador (1997). Estrategia nacional, plan de acción y primer
informe de país sobre diversidad biológica. Ministerio de Medio
Ambiente y Recursos Naturales de El Salvador/GEF/PNUD, San
Salvador, El Salvador.
MARN El Salvador (2000). Majano, A.M., Aguilar, M. and López, E.
(eds.). Primera Comunicación Nacional sobre cambio climático.
Ministerio de Medio Ambiente y Recursos Naturales de El Salvador,
San Salvador, El Salvador.
MARN Guatemala. (2001). Guatemala: Primera Comunicación Nacional
sobre Cambio Climático, Guatemala de la Asunción. Ministerio de
Ambiente y Recursos Naturales de Guatemala, Guatemala.
MINAE (2000). Instituto Meteorológico Nacional (ed.). Primera
Comunicación Nacional ante la Convención Marco de las Naciones
Unidas de Cambio Climático. Ministerio del Ambiente y Energía de
Costa Rica, San José, Costa Rica.
MMA (2002a). Programa Nacional para la Conservación de las Tortugas
Marinas y Continentales en Colombia. Ministerio del Medio
Ambiente, Dirección General de Ecosistemas, Colombia.
MMA (2002b). Programa Nacional de Uso Sostenible, Manejo y
Conservación de los Ecosistemas de Manglar. Ministerio del Medio
Ambiente, Dirección General de Ecosistemas, Colombia.
MMA (2002c). Impacto de la tasa por utilización de agua en los diferentes
sectores de la economía colombiana. Informe fi nal de consultoría.
Ministerio del Medio Ambiente, Colombia.
MMA (2002d). Memorias del taller conjunto para la reglamentación de
las tasas por utilización de aguas. Ministerio del Medio Ambiente.,
Bogotá, Colombia.
OECD (2003). Environmental Performance Reviews: Mexico. Organisation
for Economic Cooperation and Development, Paris, France.
Ofi cina de Coordinación del Plan Puebla-Panamá (2001). Pan Puebla-
Panamá-Diagnostico. Ofi cina de Coordinación, Presidencia
de la Republica, México. Retrieved May, 2004 from: http://
ppp.sre.gob.mx/
OPS/OMS (1999). El Huracán Mitch en Guatemala. Organización
Panamericana de la Salud Representación en Guatemala.
OPS/OMS (2001a). Informe Regional sobre la evaluación 2000 en la
región de las Américas: Agua potable y saneamiento básico-
Situación actual y perspectivas. Washington D.C., United States.
OPS/OMS (2001b). Panama, Programa de Políticas Públicas y
Salud, División de Salud y Desarrollo Humano y el Programa
de Saneamiento Básico, División de Salud y Ambiente de la
Organización Panamericana de la Salud, Ofi cina Regional de
la Organización Mundial de la Salud. Informe Técnico No. 9.
Washington D.C., United States.
OPS/OMS (2001c). El Salvador, Programa de Políticas Públicas y
Salud, División de Salud y Desarrollo Humano y el Programa
de Saneamiento Básico, División de Salud y Ambiente de la
Organización Panamericana de la Salud, Ofi cina Regional de
la Organización Mundial de la Salud. Informe Técnico No. 6.
Washington, D.C., United States.
OPS/OMS (2003). Jenkins, J. (ed.). Vulnerabilidad de los sistemas de
abastecimiento de agua potable y saneamiento en áreas rurales
de El Salvador. Washington D.C., United States.
OPS/OMS (2004). Numbers of reported cases of Dengue and Dengue
hemorrhagic fever (DHF), Region of the Americas (provisional
fi gures for reported and comfi rmed cases to week noted by each
country). Retrieved June, 2004 from: www.paho.org
Ostrom, E. (2000). El gobierno de los bienes comunes: la evolución de
las instituciones de acción colectiva. Universidad Autónoma de
México, Centro Regional de Investigaciones Multidisciplinarias.
México.
Páez, F. (1999). Contaminación por metales pesados en las costas de
México. Ciencia y Desarrollo 149:69-73.
PAHO (2001). Regional Report on the Evaluation 2000 in the Region
of the Americas: Water Supply and Sanitation, Current Status and
Prospects. Pan American Health Organization, Division of Health
and Environment, Washington, D.C. United States.
Palacios, D. and Gerodette, T. (1996). Potential impact on artisanal gillnet
fi sheries on small cetacean populations in the Eastern Tropical
Pacifi c. NOAA Administrative Report LJ-96-11.
Peña, J.J. (1995). Un modelo de caja aplicado al transporte de partículas
y tiempo de residencia del sector el Pindo, ensenada de Tumaco.
Centro de Control de Contaminación del Pacífi co. Dirección General
Marítima. Boletín Científi co CCCP 5:05-35.
72 GIWA REGIONAL ASSESSMENT 65 EASTERN EQUATORIAL PACIFIC
Pérez, C.A., Poveda, G., Mesa, O., Carvajal, L.F. and Ochoa, A. (1995).
Evidencias de cambio climático en Colombia: tendencias y cambios
de fase y amplitud de los ciclos anual y semianual. Retrieved
February, 2005 from: http://www.unesco.org.uy/phi/libros/enso/
poveda.html
Pineda-Polo, F. (1992). Biología y dinámica poblacional del camarón de
aguas someras Penaeus occidentales Streets, durante el año 1991, en
la costa Pacífi ca colombiana. Memorias VIII Seminario Nacional de
Ciencias y Tecnologías del Mar CCO 2:782-796.
PNUD 2003. Informe sobre el desarrollo de los Recursos Hídricos en el
mundo de las Naciones Unidas: Agua para todos, Agua para la Vida.
Programa de las Naciones Unidas para el Desarrollo.
PNUD/EU (1998). Estado de la Region 1998, The State of the Region
– Report on the sustainable human development Central America.
The Mandate of the State of the Region, San Jose Costa Rica.
Programa de las Naciones Unidas para el Desarrollo/European
Union. l
PNUMA (1999). Assessment of land-based sources and activities aff ecting
the marine, coastal and associated freshwater environment in the
South-East Pacifi c. UNEP Regional Seas Report and Studies No. 169.
UNEP/CPPS. The Hague, The Netherlands.
PNUMA (2000). GEO América latina y el Caribe, perspectivas del Medio
Ambiente. Retrieved April, 2004 from: http://www.eco-index.org/
search/resultss.cfm?ProjectID=767
PNUMA (2001). Evaluación sobre las Fuentes terrestres y actividades que
afectan al medio marino, costero y de aguas dulces asociadas en la
Región el Pacífi co Nordeste. UNEP/ DEC/ NEP/EM.
PNUMA/IUCN (1988). Coral reefs of the world. Volume 1: Atlantic and
Eastern Pacifi c. UNEP Regional Seas Directories and Bibliographies.
The World Conservation Union/United Nations Environmental
Programme, Gland, Switzerland and Nairobi, Kenya.
Poveda, G and Rojas W. (1997). Evidencias de la asociación entre brotes
epidémicos de malaria en Colombia y el fenómeno del Niño-
Oscilación Sur. Revista de la Academia de Ciencias exactas, Físicas
y Naturales Vol. VXXI (81).
Prahl., H., Cantera J. and Contreras R. (1990). Manglares y hombres
del Pacífi co Colombiano. Fondo FEN/CONCIENCIAS. Bogotá,
Colombia.
Pratt. L. and Girot, A.P. (1999). Perfi l ejecutivo para el dialogo regional
sobre medio ambiente: Subregion Mesoamerica. CLACOS/INCAE
Banco Interamericano de Desarrollo BI. Retrieved June, 2004 from:
http//www.idb.org
Ramírez, O. and Espejel, I. (2001). Las aguas residuales municipales como
fuentes terrestres de contaminación del medio marino costero de la
Region de America Latina y el Caribe. GPA/PNUMA, México.
República de Colombia (2002). Arroyo-V. J.E., Maribell Gonzalez A.,
Abadía, A., Pardo L., and Ramírez-A, A. Diagnosis de la biodiversidad
y ecosistemas en el Pacifi co Colombiano, Versión 02. Cali Valle Del
Cauca, Ministerio Del Medio Ambiente, Instituto De Investigaciones
Ambientales Del Pacifi co IIAP, Linea Base De Indicadores
Ambientales, Colombia.
Restrepo, J.D. and Kjerve, B. (2000). Water discharge and sediment load
from the western slopes of Colombian Andes with focus on rio San
Juan. The Journal of geology 108:17-33.
Reynolds, J. and Fraile, J. (2002). Presente y futuro de las aguas
subterráneas en el valle central. In: Vargas, J. (ed.). Manejo integrado
de aguas residuales, un reto para el futuro. UNED, San José, Costa
Rica.
Rivera-Arriaga, E. and Villalobos, G. (2001). The Coast of Mexico:
approaches for its management. Ocean and Coastal Management
44:729-756.
Rubio, E.R, Funes, C. and Gavidia, F.S. (2001). Evaluación de fuentes de
contaminación y actividades Humanas originadas en tierra que
afectan ambientes marinos, costeros y dulceacuícolas asociados
en El Salvador. Informe al PAM/PNUMA, El Salvador.
Rubio, R.E. (1994). Informe del estado del medio ambiente marino en el
area del Pacífi co de El Salvador. Informe a la Comision Permanente
del Pacifi co Sur, Lima, Perú.
Rueda, M., Blanco, J, Narváez, J.C., Vitoria, E., Newmark, F. and Santos,
M. (2003). Estado de los recursos sometidos a explotación en
Colombia. p 227-251 In: Informe del Estado de los Ambientes
Marinos y Costeros en Colombia: Año 2002. Serie de Publicaciones
No. 8. INVEMAR, Colombia.
Sainz, J. and Becerra, M. (2005). Los confl ictos por agua en México:
Avances de investigación. Instituto Nacional de Ecología, Coyoacán,
México.
Sánchez, M.J. (2001). Evaluación nacional fuentes de contaminación y
actividades humanas originadas en tierra que afectan los ambientes
marinos, costeros y dulceacuícolas asociados al litoral Pacífi co y
Golfo de Fonseca de Nicaragua. Programa de Acción Mundial para
la Protección del Medio Marino frente a las Actividades Realizadas
en Tierra, Managua, Nicaragua.
Santodomingo, N. and Rueda, M. (2003). Diversidad de especies marinas
en Colombia. p 208-228. In: Informe del Estado de los Ambientes
Marinos y Costeros en Colombia: Año 2002. Serie de Publicaciones
No. 8. INVEMAR. Colombia.
Schoijet, M. (2002). La evolución de los recursos pesqueros a escala
mundial. Problemas del Desarrollo. Revista Latinoamericana de
Economía 33(129):103-125.
Sea Around Us Project (2002). A global database on marine
fi sheries and ecosystems. Fisheries Centre, University of British

REFERENCES 73
Columbia, Vancouver, Canada. Retrieved April, 2004 from: http:
//seaaroundus.org/lme/SummaryInfo.aspx?LME=11
SEMAR (2004). Atlas de la Contaminación Marina en el Mar Territorial
y Zonas Costeras de la República Mexicana. Secretaría de Marina
Armada de México, México.
SEMARNAT (2002). Segundo informe de labores. Secretaría de medio
ambiente y recursos naturales, México.
SEMARNAT (2004). Problemática del lago de Chapala. Retrieved
February, 2005 from: http://www.semarnat.gob.mx/regiones/
chapala/problematica.shtml
SNET 2002. Condiciones hidrológicas en Diciembre 2002. Servicio
Hidrológico Nacional de El Salvador. Boletín de Condiciones
hidrológicas No 08, 2002.
Steer, R., Arias-Isaza, F., Ramos, A., Sierra-Correa, P.C. and Alonso, D.
(1997). Documento base para la elaboración de la política nacional
de ordenamiento ambiental y desarrollo sostenible de las zonas
costeras colombianas. Consultoría para el ministerio del medio
Ambiente, Colombia.
Tierramerica (2004). Agua: No hay escasez, sino desperdicio e
inefi ciencia. Retrieved March, 2004 from: http://tierramerica.net/
2004/0320/noticias3.shtml
Tribunal Centroamericano del Agua (2004). Enfermedades hídricas.
Retrieved June, 2004 from http://www.tragua.com/
UNEP (2000). Recommendations for decision-making on municipal
wastewater. United Nations Environmental Programme/ Global
Programme of Action for the Protection of the Marine Environment
from Land-based Activities, Nairobi, Kenya and The Hague, the
Netherlands.
UNEP-GPA (2001). Latín American Workshop on Municipal Wastewater:
Final Report México City, 10th-12th September, 2001, UNEP/LAC-GPA
1/7-, Mexico.
Ustate, Z. (2002). Diagnóstico de la cadena productiva pesquera en
Colombia Estudio de prospectiva para la cadena productiva de la
industria pesquera en la región de la costa el Pacífi co en América
del Sur. Project N° US/RLA/02/149, United Nations Industrial
Development Organization, Vienna, Austria.
Vargas, C. (1998). Gestión integrada de los recursos hídricos en la
cuenca del canal de Panamá. p 82-98 In: Gestión integrada de los
recursos hídricos en Mesoamérica. Organization of American States,
Washington D.C., United Status.
Veenstra, S., G.J. Alaerts, and M. Bijlsma. 1997. Technology Selection. p
46-72 In: Helmer, R. and Hespanol, I. (eds.). Water Pollution Control.
E & FN Spon, London, United Kingdom.
Vélez, A.M., Marín, G.B.J. and Ramírez, G. (2003). La calidad ambiental
marina y costera en Colombia. p 48-78 In: Informe del Estado de
los Ambientes Marinos y Costeros en Colombia: Año 2002. Serie de
Publicaciones No. 8. INVEMAR. Colombia.
Vörösmarty, C.J., Mrouthier, A., Wright, T., Baker, C. Fernández-Jauregui,
A. and Donoso, M.C. (1998). A regional hydrometerorological data
network for South America, Central America and the Caribbean.
Retrieved April, 2004 from: http://www.r-hydronet.sr.unh.edu
WCMC (1996). Southeast Pacifi c. In: Groombridge, B. and Jenkins ,M.D.
(eds). The Diversity of the Seas- A regional approach. WCMC
Biodiversity Series No. 4. World Conservation Monitoring Centre,
Cambridge, United Kingdom.
WFP/FAO (2002). Standardised food and livelihood assessment in
support of the Central American PRRO. World Food Programme/
Food and Agriculture Organization, Rome, Italy.
Windevoxhel, N., Rodríguez, J.J., and Lahmann, E. (2000). Situation of
integrated coastal zone manamagement in Central American:
Experiences of the IUCN Wetlands and Coastal Zone Conservation
Program, Moravia, San Jose Costa Rica. IUCN/ORMA.
Wo-Ching, S.E. and Cordero, C. (2001). Evaluación nacional sobre fuentes
de contaminación y actividades humanas originadas en tierra que
afectan ambientes marinos, costeros y dulce acuícola asociados
en Costa Rica. Informe Centro de Derecho Ambiental y Recursos
Naturales CEDARENA/GPA, San José, Colombia and The Hague,
The Netherlands.
WRI (2004). Earth trends: Environmental information. Retrieved June,
2004 from: www.earthtrends.wri.org
Yepes, F. (ed.) (1990). La salud en Colombia. Estudio Sectorial de Salud,
Ministerio de Salud, Departamento Nacional de Planeación Bogotá,
Colombia.
Zambrano, C. and Rubiano, D. (1996). Mapas del bosque de manglar
de la costa Pacífi ca colombiana, años 1969, 1996 y multitemporal.
Informe Técnico 7, Bogotá, OIMT/MMA, Colombia.
Personal communicationLeal Ascencio, T. (Instituto Mexicano de Tecnología del Agua, Mexico)
Muñoz-Pineda, C (Secretaría de medio ambiente y recursos naturales,
SEMARNAT, Mexico)
Zilberman, D. (University of California at Berkeley, United States)

74 GIWA REGIONAL ASSESSMENT 65 EASTERN EQUATORIAL PACIFIC
Annexes
Annex I List of contributing authors and organisations
Name Country Institution Field
Ulises Munaylla Peru CPPS Regional Coordinator. GIWA methodology.
Fernando Félix Ecuador CPPS Coordination, assistant, edition
Marcia Marques Brazil GIWA Regional Coordinator for Latin America and the Caribbean
Juan Carlos Belausteguigoitia Mexico GIWA Coordinator for the Southern Hemisphere
Antonio Díaz de León Corral¹ Mexico National Institute of Fisheries/ The Mexican School (LEAD Program)Fisheries assessment and management, coastal zone management, oceans environment and development
Corina Warfield¹ Mexico Goldman School of Public Policy. University of California, Berkeley Management – environmental policies
Juanito Rus¹ Mexico Goldman School of Public Policy. University of California, Berkeley Management – environmental policies
Ian Hart¹ Mexico Goldman School of Public Policy. University of California, Berkeley Management – environmental policies
Josh Bode¹ Mexico Goldman School of Public Policy. University of California, Berkeley Management – environmental policies
Iván Flores Morales Panama Maritime Authority of Panama AMP Oceanography
Rocío Ramírez Panama Maritime Authority of Panama AMP Coastal Zones Management.
Rodolfo Tejada Guatemala Consultant Management
Mario Coto H Costa Rica Ministry of the Environment and Energy MINAE Administration of protected areas
Paula Cristina Sierra Colombia Institute of Marine research INVEMAR Marine biology - Coastal Zones Management.
Maria Cristina Bernal² Colombia Institute of Marine research INVEMAR Biology- Legislation and Maritime policy
Walberto Troncoso² Colombia Institute of Marine research INVEMAR. Program CAM Marine biology
Vanesa Torres² Colombia Colombian Commission of Oceanography Biology-
Camilo Botero Colombia Colombian Commission of Oceanography Management – environmental policies
Luz M. Vis Londoño Colombia Institute of Marine research INVEMAR Economic valuation of resources
Francisco Arias² Colombia Institute of Marine research INVEMAR Marine Biology. Coastal Zones Management.
Milton Hermen Ruiz Colombia Professional Environmental Advise Consultancy Environmental management
Maria E. Posada Colombia Ministry of Foreign Affairs Environmental
Juan Acuna Colombia Ministry of Foreign Affairs Socio-economic, environment
Patricia Flores Ecuador CPPS Coordination, assistant
Mario Hurtado³ Ecuador Consultant Marine biology - conservation
J.Jairo Escobar R⁴ Colombia Consultant Marine biology - pollution
¹ Task team Southwest Mexico Subsystem
² Task team Colombian Pacific Subsystem
³ Consultant, first draft SR65.
⁴ Consultant, draft of the Subsystem Central American Pacific.

ANNEXES 75
I: Freshwater shortage
Environmental issues Score WeightEnvironmental
concern
Weight averaged
score
1. Modification of stream flow 2 20 Freshwater shortage 2
2. Pollution of existing supplies 2 50
3. Changes in the water table 2 30
Criteria for Economics impacts Raw score Score Weight %
Size of economic or public sectors affectedVery small Very large0 1 2 3
2 35
Degree of impact (cost, output changes etc.)Minimum Severe0 1 2 3
3 55
Frequency/DurationOccasion/Short Continuous0 1 2 3
2 10
Weight average score for Economic impacts 2.55
Criteria for Health impacts Raw score Score Weight %
Number of people affectedVery small Very large0 1 2 3
2 50
Degree of severityMinimum Severe0 1 2 3
2 40
Frequency/DurationOccasion/Short Continuous0 1 2 3
2 10
Weight average score for Health impacts 2.0
Criteria for Other social and community impacts
Raw score Score Weight %
Number and/or size of community affectedVery small Very large0 1 2 3
2 30
Degree of severityMinimum Severe0 1 2 3
2 50
Frequency/DurationOccasion/Short Continuous0 1 2 3
2 20
Weight average score for Other social and community impacts 2.0
Annex II Detailed scoring tables
II: Pollution
Environmental issues Score WeightEnvironmental
concern
Weight averaged
score
4. Microbiological 2 35 Pollution 1.85
5. Eutrophication 1 10
6. Chemical 2 25
7. Suspended solids 1 5
8. Solid wastes 2 15
9. Thermal 0 0
10. Radionuclides 0 0
11. Spills 2 10
Criteria for Economics impacts Raw score Score Weight %
Size of economic or public sectors affectedVery small Very large0 1 2 3
2 30
Degree of impact (cost, output changes etc.)Minimum Severe0 1 2 3
2 50
Frequency/DurationOccasion/Short Continuous0 1 2 3
2 20
Weight average score for Economic impacts 2.0
Criteria for Health impacts Raw score Score Weight %
Number of people affectedVery small Very large0 1 2 3
2 50
Degree of severityMinimum Severe0 1 2 3
2 40
Frequency/DurationOccasion/Short Continuous0 1 2 3
2 10
Weight average score for Health impacts 2.0
Criteria for Other social and community impacts
Raw score Score Weight %
Number and/or size of community affectedVery small Very large0 1 2 3
2 45
Degree of severityMinimum Severe0 1 2 3
2 35
Frequency/DurationOccasion/Short Continuous0 1 2 3
2 20
Weight average score for Other social and community impacts 2.0

76 GIWA REGIONAL ASSESSMENT 65 EASTERN EQUATORIAL PACIFIC
III: Habitat and community modification
Environmental issues Score WeightEnvironmental
concern
Weight averaged
score
12. Loss of ecosystems 2 40Habitat and community
modification2
13. Modification of ecosystems or ecotones, including community structure and/or species composition
2 60
Criteria for Economics impacts Raw score Score Weight %
Size of economic or public sectors affectedVery small Very large0 1 2 3
2 30
Degree of impact (cost, output changes etc.)Minimum Severe0 1 2 3
2 40
Frequency/DurationOccasion/Short Continuous0 1 2 3
2 30
Weight average score for Economic impacts 2.0
Criteria for Health impacts Raw score Score Weight %
Number of people affectedVery small Very large0 1 2 3
0
Degree of severityMinimum Severe0 1 2 3
0
Frequency/DurationOccasion/Short Continuous0 1 2 3
0
Weight average score for Health impacts 0
Criteria for Other social and community impacts
Raw score Score Weight %
Number and/or size of community affectedVery small Very large0 1 2 3
2 40
Degree of severityMinimum Severe0 1 2 3
2 40
Frequency/DurationOccasion/Short Continuous0 1 2 3
2 20
Weight average score for Other social and community impacts 2.0
IV: Unsustainable exploitation of fish and other living resources
Environmental issues Score Weight %Environmental
concern
Weight averaged
score
14. Overexploitation 3 40Unsustainable
exploitation of fish2.25
15. Excessive by-catch and discards
2 30
16. Destructive fishing practices 2 20
17. Decreased viability of stock through pollution and disease
0 5
18. Impact on biological and genetic diversity
1 5
Criteria for Economics impacts Raw score Score Weight %
Size of economic or public sectors affectedVery small Very large0 1 2 3
2 25
Degree of impact (cost, output changes etc.)Minimum Severe0 1 2 3
2 50
Frequency/DurationOccasion/Short Continuous0 1 2 3
2 25
Weight average score for Economic impacts 2.0
Criteria for Health impacts Raw score Score Weight %
Number of people affectedVery small Very large0 1 2 3
0
Degree of severityMinimum Severe0 1 2 3
0
Frequency/DurationOccasion/Short Continuous0 1 2 3
0
Weight average score for Health impacts 0
Criteria for Other social and community impacts
Raw score Score Weight %
Number and/or size of community affectedVery small Very large0 1 2 3
2 35
Degree of severityMinimum Severe0 1 2 3
2 40
Frequency/DurationOccasion/Short Continuous0 1 2 3
2 25
Weight average score for Other social and community impacts 2.0
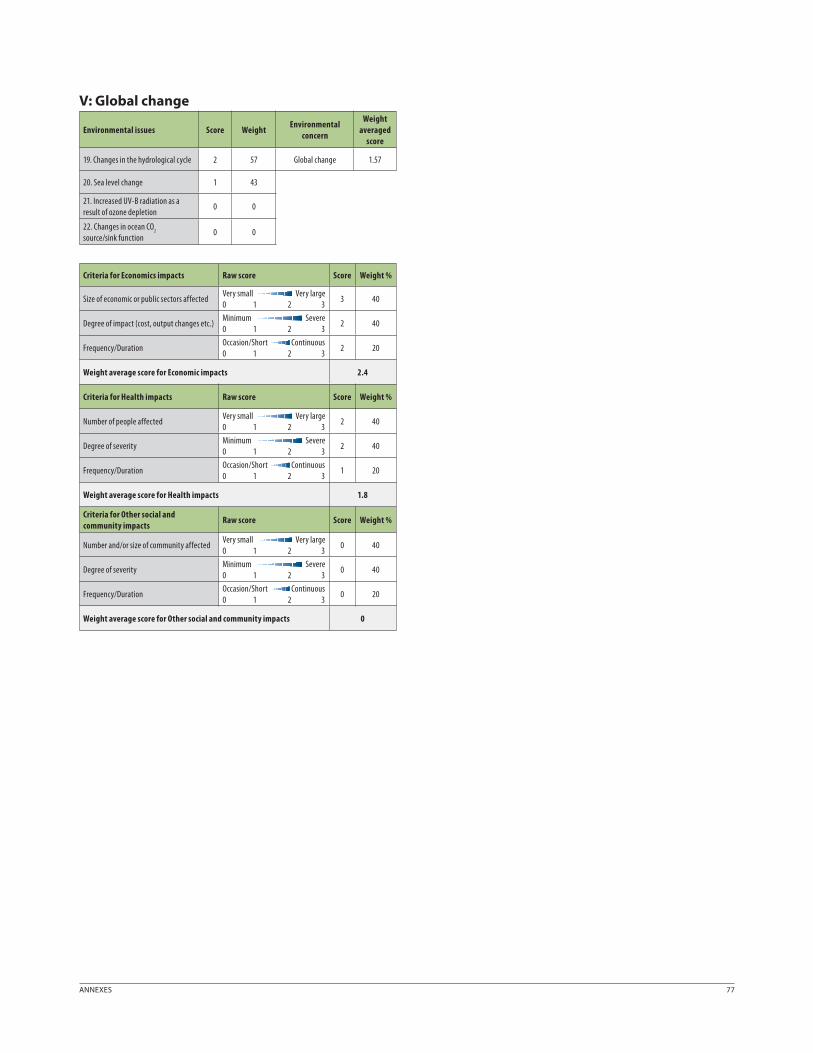
ANNEXES 77
V: Global change
Environmental issues Score WeightEnvironmental
concern
Weight averaged
score
19. Changes in the hydrological cycle 2 57 Global change 1.57
20. Sea level change 1 43
21. Increased UV-B radiation as a result of ozone depletion
0 0
22. Changes in ocean CO2
source/sink function0 0
Criteria for Economics impacts Raw score Score Weight %
Size of economic or public sectors affectedVery small Very large0 1 2 3
3 40
Degree of impact (cost, output changes etc.)Minimum Severe0 1 2 3
2 40
Frequency/DurationOccasion/Short Continuous0 1 2 3
2 20
Weight average score for Economic impacts 2.4
Criteria for Health impacts Raw score Score Weight %
Number of people affectedVery small Very large0 1 2 3
2 40
Degree of severityMinimum Severe0 1 2 3
2 40
Frequency/DurationOccasion/Short Continuous0 1 2 3
1 20
Weight average score for Health impacts 1.8
Criteria for Other social and community impacts
Raw score Score Weight %
Number and/or size of community affectedVery small Very large0 1 2 3
0 40
Degree of severityMinimum Severe0 1 2 3
0 40
Frequency/DurationOccasion/Short Continuous0 1 2 3
0 20
Weight average score for Other social and community impacts 0

78 GIWA REGIONAL ASSESSMENT 65 EASTERN EQUATORIAL PACIFIC
Central American Ecological Summit on Sustainable Development
(Cumbre Ecológica Centroamericana para el Desarrollo
Sostenible), Managua, Nicaragua, 13th October, 1994.
The Presidents of the Republics of Costa Rica, El Salvador, Guatemala,
Honduras, Nicaragua, and Panama, and the Representative of the First
Ministry of Belize, met at the Central American Ecological Summit on
Sustainable Development. They made the following commitments,
among others:
Water
To prioritise policies and legislation regarding the management and
conservation of hydrological resources, including, among others,
the strengthening of the legal and institutional framework, and
coordination mechanisms between the authorities in charge of the
management and administration of water resources either for human
consumption, irrigation or electricity generation. Commitments
were made for respective authorities to update studies about
Central American basins in order to prepare specifi c projects for their
sustainable use and management.
Pollution control
A two year period was allowed for the countries of the region to
implement mechanisms for the monitoring and control of pollution.
The Central American Commission of Environment and Development
is responsible for the gradual implementation of the commitments,
the establishment of decentralisation mechanisms for surveillance and
control, and the promotion of public participation in these processes.
A Dialogue about Water, Food and Environmental
Sustainability, San Jose, Costa Rica, 1st November, 2001.
Conclusions and commitments:
1. Foment integrated water resources management and take into
consideration the social, economic and environmental values in
order to improve the quality of life.
2. Adopt integrated water resources management, with the river
basins being the planning unit.
3. Promote opportunities for dialogue and participation of
communities and private, governmental, agricultural and
environmental sectors.
4. Formulate guidelines and policies that will assist in the sustainable
use and management of water resources.
5. Develop case studies for implementing the Local Dialogues and
activities that involve the sustainable use of water.
6. Develop methodologies to assess the economic value of water
resources.
7. Produce a Historical Record of the Meeting and distribute internally
within each country.
8. Based on the criteria for determining the locations, each country
should provide technical support for the proposed locations.
9. Interact as a Virtual Network by means of an electronic forum for
discussion.
10. Compile experiences and good practices in the region in order to
exchange information.
11. Design a proposal to be presented in Bonn, which should be
regional in nature in order to create a larger impact, although this
does not eliminate the possibility of generating pilot projects at the
micro-basin level.
12. A regional commission was formed to follow up the commitments of
“A Dialogue about Water, Food and Environmental Sustainability.”
Convention for Cooperation in the Protection and Sustainable
Development of the Marine and Coastal Environment of the
North-East Pacifi c (Antigua Convention), Antigua, Guatemala,
18th February 2002.
The aim of this Convention is to establish a regional co-operation
framework to encourage and facilitate the sustainable development
of marine and coastal resources of the countries of the North-
East Pacifi c for the benefi t of present and future generations. The
contracting parties recognised the need to protect and preserve the
marine and coastal environment of the North East Pacifi c against all
kinds of environmental pollution and degradation. The ecological,
economic, social and cultural value of the area was seen as a means
of bonding the countries of the region. The scope of application of
the Convention comprises the maritime areas of the North East Pacifi c,
defi ned in conformity with the United Nations Convention on the Law
of the Sea. The Secretariat of the Convention is the Central American
Commission for Maritime Transportation (COCATRAM) located in
Managua, Nicaragua.
Marine Corridor for the Conservation and Sustainable Development of
the South East Tropical Pacifi c
Annex III Regional agreements, conventions and projects

ANNEXES 79
This corridor was established on 2nd April 2004 and embraces the islands
Galapagos (Ecuador), Gorgona and Malpelo (Colombia), Coiba (Panama)
and Cocos (Costa Rica). The initiative reinforces cooperation between
these countries in order to protect biological diversity.
Large Marine Ecosystems (LMEs) of the world
Several institutions are providing and fostering scientifi c and technical
support for developing countries to establish new policies and actions
in order to eliminate the causes of marine environmental degradation,
as well as the loss of biodiversity and food security due to over-
exploitation. For the Central American Pacifi c coast, the LME stretches
from Cape Corrientes in Mexico in the north to Ecuador in the south,
including the basins of Guatemala and Panama and the Peru-Chile
trench. The system is located between the California and Humboldt
currents.
Conventions, protocols and projects relevant to the colombian pacific sub-system
Convention for the Protection of the Marine Environment and
Coastal Areas in the South East Pacifi c (1981)
This Convention, also known as the Lima Convention, was signed on 12th
November, 1981 by Chile, Colombia, Ecuador, Peru and Panama. It was
initiated by the United Nations Environment Programme (UNEP). The
main objective of the Convention is to promote regional cooperation
in the protection of the marine environment and coastal zones of the
South East Pacifi c, emphasizing the economic, social and cultural
signifi cance of the South Pacifi c.
Plan of Action for the Protection of the Marine Environment and
Coastal Areas of the South Pacifi c (1981)
This Plan has the same characteristics as other UNEP Regional Seas
Programmes. The main objective of this regional cooperation
mechanism is to protect the marine environment and coastal areas
in order to safeguard the heath and well being of current and future
generations. The general legal framework of the Plan of Action of the
South East Pacifi c is the Convention for the Protection of the Marine
Environment and Coastal Areas of the South East Pacifi c. The Plan of
Action for the South East Pacifi c has the following components:
Environmental assessment: This provides the scientifi c basis to
implement the other components of the Plan. It comprises an
assessment of the pollution caused by oil spills; the degree of
pollution caused by industrial, mining and agricultural wastes and
their eff ects; and pollution caused by domestic wastes, radioactive
pollution, and from the atmosphere, among others.
Environmental management: Formulation and application of
programmes to prevent, monitor, reduce and eliminate pollution.
Legal component: The development of regional instruments
constitutes a major achievement of the Plan of Action.
Institutional and fi nancial mechanisms: According to this component,
the General Authority of the Plan of Action remains with the regular
meeting of Government representatives (Intergovernmental
Meetings). They are mandated to assess the implementation progress
of the Plan of Action and approve the projects and activities.
Protocol for the Conservation and Management of Protected
Marine and Coastal Areas of the South East Pacifi c (1989)
This Protocol contains regulations regarding protected areas such
as common criteria to establish protected areas and the regulation
of activities through an integrated environmental management
mechanism. Guidelines include, among others, buff er areas; measures to
prevent, reduce and control pollution in protected areas; environmental
impact assessments; establishing an integrated analysis procedure;
scientifi c and technical cooperation; and promotion of stakeholder
participation and environmental education. This protocol was approved
by Colombia through Law 12 (1992).
Protocol on the Program for the Regional Study of the “El Niño”
Phenomenon in the South East Pacifi c (ERFEN) (1992)
The member States of the Permanent Commission for the South Pacifi c
(CPPS; Chile, Colombia, Ecuador and Peru) signed this protocol on 6th
November 1992 in Callao, Peru. The aim of ERFEN is to forecast ocean-
atmospheric changes with suffi cient warning time to allow the issue of
policies and emergency measures to limit the impact on productive
activities such as fi shing, agriculture and industry, among others.
Framework Agreement for the Conservation of Living
Resources on the High Seas of the Southeast Pacifi c (Galapagos
Agreement 2000)
The member States of CPPS signed this agreement in 2000. The main
objective of this Agreement is to defi ne the legal framework for the
80 GIWA REGIONAL ASSESSMENT 65 EASTERN EQUATORIAL PACIFIC
conservation and management of living marine resources in the high
seas of the South East Pacifi c, with special reference to straddling and
highly migratory fi sh populations. The Agreement is applicable to the
high seas beyond the external limits of the EEZ of the countries located
on the 120° W meridian between 5° N and 60° S.
Pacifi c Agenda 21
Pacifi c Agenda 21 has adopted a cultural approach to changing the
traditional model of communication between governments and
Pacifi c communities. It attempts to deal with social problems involving
various stakeholders and to fi nd solutions to problems that threaten the
environmental and cultural diversity of the Colombian Pacifi c region.
The objective of Pacifi c Agenda 21 is to provide a local perspective,
through the participation of stakeholders, to long-term policies, plans
and programmes for the development of this area, taking into account
the ethnic, cultural, social and economic realities of the Colombian
Pacifi c (IIAP 2001a).
Project Biopacifi co
This project, implemented by INDERENA and the National Department
of Planning, focuses on the Choco biogeographic region. The general
objective of the project is to contribute towards the consolidation
of a new development strategy, based on scientifi c knowledge, and
to identify options for the management of biodiversity in order to
guarantee its protection and sustainable use by local communities. The
goals of the project include, among others: i) assessment of the state
of the region’s biodiversity and the current practices aff ecting its use
and conservation; ii) assessment of the dynamics and eff ects of agro-
ecological systems; iii) development of conceptual and methodological
approaches for the valuation of biodiversity and environmental services;
iv) strengthening of communication, education and social organisation
processes related to the conservation and exploitation of biodiversity;
v) training of authorities about policies, planning and decentralized
management of biodiversity; vi) training of local people who are
involved in conservation and the sustainable use of biodiversity; and
vii) institutional coordination with other regional and national plans,
programmes and projects (INDERENA 1992).
ANNEXES 81
Annex IV Fee-and-rebate system (Southwest Mexico sub-system)
Adjustable implementation features of fees and rebates
A fee-and-rebate system for municipal waste can be adapted for
specifi c requirements. There are opportunities to decide on the number
and features of municipalities in the programme, the threshold or target
level of pollution, and the size of the rebates and fees. In addition,
innovative programmes have started to integrate fee and rebate
systems with tradable pollution permits.
Which cities to include
A fee-and-rebate system does not have to include every municipality.
Given that most municipal waste stems from urban areas and that wide
gaps in fi nancial resources exist between urban and rural zones, it is
more practical to focus a fee-and-rebate system on larger cities. The
population threshold can be set by SEMARNAT. Mexico already has
diff erent water infrastructure policies for rural and urban areas. The
same distinctions can be retained in the implementation of a fee-and-
rebate system.
Setting pollution thresholds
Threshold limits for pollution – where rebates switch to fees – have to
be set. The thresholds can be based on the prior history of pollution; the
population of the city; or environmental health indicators.
Basing threshold levels on prior history requires every city, regardless
of their past history of pollution, to make additional eff ort to meet the
threshold. This method favours cities which have not introduced any
pollution abatement methods. These municipalities will usually be
able to take advantage of more lower-cost technologies than cities
that were reducing water pollution before the implementation of fees
and rebates.
Basing allowable pollution levels on a municipality’s population
provides room for adjustment, and rewards cities who have already
made an eff ort to reduce and/or treat water pollution. Allowing time
for municipalities to update their wastewater infrastructure capacity
prior to implementation increases the political viability of the fee and
rebate structure.
Basing threshold levels on environmental health standards places the
main focus on safeguarding the local environment (as opposed to
aggregate watershed pollution). Standards have frequently been set in
the form of Total Maximum Daily Loads – maximum pollution levels on
waterways where the wastewater is discharged. This method places a
heavier burden on large cities and does little to reduce the pollution per
capita in smaller cities and cities that discharge wastewater into larger
waterways. The population of the city and the size of the receiving
water body aff ect the overall pollution levels in waterways. Large cities
can reduce wastewater pollution per capita, but have few options to
reduce the overall city population.
Setting fees and rebates
When it comes to municipal water pollution, the commitment to
a fee-and-rebate system has to be credible and long-term. Cities
will make decisions about whether or not to invest in wastewater
treatment infrastructure based on expected future returns. Year-to-
year uncertainty about the size of the rebates and fees complicates
local decisions about investment in water pollution infrastructure,
and may deter investment. Nonetheless, this does not mean fees and
rebates must remain fi xed. It does, however, require advanced warning
regarding upcoming changes to the structure of the fee and rebate
system.
A fi ve year timetable of fee-and-rebate changes is recommended
so that municipalities can calculate the costs and benefi ts of their
investments in wastewater infrastructure. Although the fee changes
require some advance notice, the penalties and rebates themselves do
not have to be fi xed in a given year. Penalties and rebates can be graded.
SEMARNAT can charge smaller fees per-pollution-unit to municipalities
that exceed the threshold by only a little and larger fees per-pollution-
unit for those that signifi cantly exceed threshold levels.

GLOBAL INTERNATIONAL WATERS ASSESSMENT i
The Global International Waters Assessment
This report presents the results of the Global International Waters
Assessment (GIWA) of the transboundary waters of the Eastern
Equatorial Pacifi c region. This and the subsequent chapter off er a
background that describes the impetus behind the establishment of
GIWA, its objectives and how the GIWA was implemented.
The need for a global international waters assessment
Globally, people are becoming increasingly aware of the degradation of
the world’s water bodies. Disasters from fl oods and droughts, frequently
reported in the media, are considered to be linked with ongoing global
climate change (IPCC 2001), accidents involving large ships pollute public
beaches and threaten marine life and almost every commercial fi sh stock
is exploited beyond sustainable limits - it is estimated that the global
stocks of large predatory fi sh have declined to less that 10% of pre-
industrial fi shing levels (Myers & Worm 2003). Further, more than 1 billion
people worldwide lack access to safe drinking water and 2 billion people
lack proper sanitation which causes approximately 4 billion cases of
diarrhoea each year and results in the death of 2.2 million people, mostly
children younger than fi ve (WHO-UNICEF 2002). Moreover, freshwater
and marine habitats are destroyed by infrastructure developments,
dams, roads, ports and human settlements (Brinson & Malvárez 2002,
Kennish 2002). As a consequence, there is growing public concern
regarding the declining quality and quantity of the world’s aquatic
resources because of human activities, which has resulted in mounting
pressure on governments and decision makers to institute new and
innovative policies to manage those resources in a sustainable way
ensuring their availability for future generations.
Adequately managing the world’s aquatic resources for the benefi t of
all is, for a variety of reasons, a very complex task. The liquid state of
the most of the world’s water means that, without the construction
of reservoirs, dams and canals it is free to fl ow wherever the laws of
nature dictate. Water is, therefore, a vector transporting not only a
wide variety of valuable resources but also problems from one area
to another. The effl uents emanating from environmentally destructive
activities in upstream drainage areas are propagated downstream
and can aff ect other areas considerable distances away. In the case of
transboundary river basins, such as the Nile, Amazon and Niger, the
impacts are transported across national borders and can be observed
in the numerous countries situated within their catchments. In the case
of large oceanic currents, the impacts can even be propagated between
continents (AMAP 1998). Therefore, the inextricable linkages within
and between both freshwater and marine environments dictates that
management of aquatic resources ought to be implemented through
a drainage basin approach.
In addition, there is growing appreciation of the incongruence
between the transboundary nature of many aquatic resources and the
traditional introspective nationally focused approaches to managing
those resources. Water, unlike laws and management plans, does not
respect national borders and, as a consequence, if future management
of water and aquatic resources is to be successful, then a shift in focus
towards international cooperation and intergovernmental agreements
is required (UN 1972). Furthermore, the complexity of managing the
world’s water resources is exacerbated by the dependence of a great
variety of domestic and industrial activities on those resources. As a
consequence, cross-sectoral multidisciplinary approaches that integrate
environmental, socio-economic and development aspects into
management must be adopted. Unfortunately however, the scientifi c
information or capacity within each discipline is often not available or
is inadequately translated for use by managers, decision makers and
ii REGIONAL ASSESSMENTS
policy developers. These inadequacies constitute a serious impediment
to the implementation of urgently needed innovative policies.
Continual assessment of the prevailing and future threats to aquatic
ecosystems and their implications for human populations is essential if
governments and decision makers are going to be able to make strategic
policy and management decisions that promote the sustainable use of
those resources and respond to the growing concerns of the general
public. Although many assessments of aquatic resources are being
conducted by local, national, regional and international bodies, past
assessments have often concentrated on specifi c themes, such as
biodiversity or persistent toxic substances, or have focused only on
marine or freshwaters. A globally coherent, drainage basin based
assessment that embraces the inextricable links between transboundary
freshwater and marine systems, and between environmental and
societal issues, has never been conducted previously.
International call for action
The need for a holistic assessment of transboundary waters in order to
respond to growing public concerns and provide advice to governments
and decision makers regarding the management of aquatic resources
was recognised by several international bodies focusing on the global
environment. In particular, the Global Environment Facility (GEF)
observed that the International Waters (IW) component of the GEF
suff ered from the lack of a global assessment which made it diffi cult
to prioritise international water projects, particularly considering
the inadequate understanding of the nature and root causes of
environmental problems. In 1996, at its fourth meeting in Nairobi, the
GEF Scientifi c and Technical Advisory Panel (STAP), noted that: “Lack of
an International Waters Assessment comparable with that of the IPCC, the
Global Biodiversity Assessment, and the Stratospheric Ozone Assessment,
was a unique and serious impediment to the implementation of the
International Waters Component of the GEF”.
The urgent need for an assessment of the causes of environmental
degradation was also highlighted at the UN Special Session on
the Environment (UNGASS) in 1997, where commitments were
made regarding the work of the UN Commission on Sustainable
Development (UNCSD) on freshwater in 1998 and seas in 1999. Also in
1997, two international Declarations, the Potomac Declaration: Towards
enhanced ocean security into the third millennium, and the Stockholm
Statement on inter action of land activities, freshwater and enclosed
seas, specifi cally emphasised the need for an investigation of the root
causes of degradation of the transboundary aquatic environment and
options for addressing them. These pro cesses led to the development
of the Global International Waters Assessment (GIWA) that would be
implemented by the United Nations Environment Programme (UNEP) in
conjunction with the University of Kalmar, Sweden, on behalf of the GEF.
The GIWA was inaugurated in Kalmar in October 1999 by the Executive
Director of UNEP, Dr. Klaus Töpfer, and the late Swedish Minister of the
Environment, Kjell Larsson. On this occasion Dr. Töpfer stated: “GIWA
is the framework of UNEP´s global water assessment strategy and will
enable us to record and report on critical water resources for the planet for
consideration of sustainable development management practices as part of
our responsibilities under Agenda 21 agreements of the Rio conference”.
The importance of the GIWA has been further underpinned by the UN
Millennium Development Goals adopted by the UN General Assembly
in 2000 and the Declaration from the World Summit on Sustainable
The Global Environment Facility (GEF)
The Global Environment Facility forges international co-operation and fi nances actions to address six critical threats to the global environment: biodiversity loss, climate change, degradation of international waters, ozone depletion, land degradation, and persistent organic pollutants (POPs).
The overall strategic thrust of GEF-funded international waters activities is to meet the incremental costs of: (a) assisting groups of countries to better understand the environmental concerns of their international waters and work collaboratively to address them; (b) building the capacity of existing institutions to utilise a more comprehensive approach for addressing transboundary water-related environmental concerns; and (c) implementing measures that address the priority transboundary environmental concerns. The goal is to assist countries to utilise the full range of technical, economic, fi nancial, regulatory, and institutional measures needed to operationalise sustainable development strategies for international waters.
United Nations Environment Programme (UNEP)
United Nations Environment Programme, established in 1972, is the voice for the environment within the United Nations system. The mission of UNEP is to provide leadership and encourage partnership in caring for the environment by inspiring, informing, and enabling nations and peoples to improve their quality of life without compromising that of future generations.
UNEP work encompasses:
■ Assessing global, regional and national environmental conditions and trends;
■ Developing international and national environmental instruments;
■ Strengthening institutions for the wise management of the environment;
■ Facilitating the transfer of knowledge and technology for sustainable development;
■ Encouraging new partnerships and mind-sets within civil society and the private sector.
University of Kalmar
University of Kalmar hosts the GIWA Co-ordination Offi ce and provides scientifi c advice and administrative and technical assistance to GIWA. University of Kalmar is situated on the coast of the Baltic Sea. The city has a long tradition of higher education; teachers and marine offi cers have been educated in Kalmar since the middle of the 19th century. Today, natural science is a priority area which gives Kalmar a unique educational and research profi le compared with other smaller universities in Sweden. Of particular relevance for GIWA is the established research in aquatic and environmental science. Issues linked to the concept of sustainable development are implemented by the research programme Natural Resources Management and Agenda 21 Research School.
Since its establishment GIWA has grown to become an integral part of University activities. The GIWA Co-ordination offi ce and GIWA Core team are located at the Kalmarsund Laboratory, the university centre for water-related research. Senior scientists appointed by the University are actively involved in the GIWA peer-review and steering groups. As a result of the cooperation the University can offer courses and seminars related to GIWA objectives and international water issues.
GLOBAL INTERNATIONAL WATERS ASSESSMENT iii
Development in 2002. The development goals aimed to halve the
proportion of people without access to safe drinking water and basic
sanitation by the year 2015 (United Nations Millennium Declaration
2000). The WSSD also calls for integrated management of land, water and
living resources (WSSD 2002) and, by 2010, the Reykjavik Declaration on
Responsible Fisheries in the Marine Ecosystem should be implemented
by all countries that are party to the declaration (FAO 2001).
The conceptual framework and objectivesConsidering the general decline in the condition of the world’s aquatic
resources and the internationally recognised need for a globally
coherent assessment of transboundary waters, the primary objectives
of the GIWA are:
■ To provide a prioritising mechanism that allows the GEF to focus
their resources so that they are used in the most cost eff ective
manner to achieve signifi cant environmental benefi ts, at national,
regional and global levels; and
■ To highlight areas in which governments can develop and
implement strategic policies to reduce environmental degradation
and improve the management of aquatic resources.
In order to meet these objectives and address some of the current
inadequacies in international aquatic resources management, the GIWA
has incorporated four essential elements into its design:
■ A broad transboundary approach that generates a truly regional
perspective through the incorporation of expertise and existing
information from all nations in the region and the assessment of
all factors that infl uence the aquatic resources of the region;
■ A drainage basin approach integrating freshwater and marine
systems;
■ A multidisciplinary approach integrating environmental and socio-
economic information and expertise; and
■ A coherent assessment that enables global comparison of the
results.
The GIWA builds on previous assessments implemented within the GEF
International Waters portfolio but has developed and adopted a broader
defi nition of transboundary waters to include factors that infl uence the
quality and quantity of global aquatic resources. For example, due to
globalisation and international trade, the market for penaeid shrimps
has widened and the prices soared. This, in turn, has encouraged
entrepreneurs in South East Asia to expand aquaculture resulting in
the large-scale deforestation of mangroves for ponds (Primavera 1997).
Within the GIWA, these “non-hydrological” factors constitute as large
a transboundary infl uence as more traditionally recognised problems,
such as the construction of dams that regulate the fl ow of water into
a neighbouring country, and are considered equally important. In
addition, the GIWA recognises the importance of hydrological units that
would not normally be considered transboundary but exert a signifi cant
infl uence on transboundary waters, such as the Yangtze River in China
which discharges into the East China Sea (Daoji & Daler 2004) and the
Volga River in Russia which is largely responsible for the condition of
the Caspian Sea (Barannik et al. 2004). Furthermore, the GIWA is a truly
regional assessment that has incorporated data from a wide range of
sources and included expert knowledge and information from a wide
range of sectors and from each country in the region. Therefore, the
transboundary concept adopted by the GIWA extends to include
impacts caused by globalisation, international trade, demographic
changes and technological advances and recognises the need for
international cooperation to address them.
The organisational structure and implementation of the GIWAThe scale of the assessmentInitially, the scope of the GIWA was confi ned to transboundary waters
in areas that included countries eligible to receive funds from the GEF.
However, it was recognised that a truly global perspective would only
be achieved if industrialised, GEF-ineligible regions of the world were
also assessed. Financial resources to assess the GEF-eligible countries
were obtained primarily from the GEF (68%), the Swedish International
Development Cooperation Agency (Sida) (18%), and the Finnish
Department for International Development Cooperation (FINNIDA)
International waters and transboundary issues
The term ”international waters”, as used for the purposes of the GEF Operational Strategy, includes the oceans, large marine ecosystems, enclosed or semi-enclosed seas and estuaries, as well as rivers, lakes, groundwater systems, and wetlands with transboundary drainage basins or common borders. The water-related ecosystems associated with these waters are considered integral parts of the systems.
The term ”transboundary issues” is used to describe the threats to the aquatic environment linked to globalisation, international trade, demographic changes and technological advancement, threats that are additional to those created through transboundary movement of water. Single country policies and actions are inadequate in order to cope with these challenges and this makes them transboundary in nature.
The international waters area includes numerous international conventions, treaties, and agreements. The architecture of marine agreements is especially complex, and a large number of bilateral and multilateral agreements exist for transboundary freshwater basins. Related conventions and agreements in other areas increase the complexity. These initiatives provide a new opportunity for cooperating nations to link many different programmes and instruments into regional comprehensive approaches to address international waters.

iv REGIONAL ASSESSMENTS
(10%). Other contributions were made by Kalmar Municipality, the
University of Kalmar and the Norwegian Government. The assessment of
regions ineligible for GEF funds was conducted by various international
and national organisations as in-kind contributions to the GIWA.
In order to be consistent with the transboundary nature of many of the
world’s aquatic resources and the focus of the GIWA, the geographical
units being assessed have been designed according to the watersheds
of discrete hydrographic systems rather than political borders (Figure 1).
The geographic units of the assessment were determined during the
preparatory phase of the project and resulted in the division of the
world into 66 regions defi ned by the entire area of one or more
catchments areas that drains into a single designated marine system.
These marine systems often correspond to Large Marine Ecosystems
(LMEs) (Sherman 1994, IOC 2002).
Considering the objectives of the GIWA and the elements incorporated
into its design, a new methodology for the implementation of the
assessment was developed during the initial phase of the project. The
methodology focuses on fi ve major environmental concerns which
constitute the foundation of the GIWA assessment; Freshwater shortage,
Pollution, Habitat and community modifi cation, Overexploitation of fi sh
and other living resources, and Global change. The GIWA methodology
is outlined in the following chapter.
The global networkIn each of the 66 regions, the assessment is conducted by a team of
local experts that is headed by a Focal Point (Figure 2). The Focal Point
can be an individual, institution or organisation that has been selected
on the basis of their scientifi c reputation and experience implementing
international assessment projects. The Focal Point is responsible
for assembling members of the team and ensuring that it has the
necessary expertise and experience in a variety of environmental
and socio-economic disciplines to successfully conduct the regional
assessment. The selection of team members is one of the most critical
elements for the success of GIWA and, in order to ensure that the
most relevant information is incorporated into the assessment, team
members were selected from a wide variety of institutions such as
Large Marine Ecocsystems (LMEs)
Large Marine Ecosystems (LMEs) are regions of ocean space encompassing coastal areas from river basins and estuaries to the seaward boundaries of continental shelves and the outer margin of the major current systems. They are relatively large regions on the order of 200 000 km2 or greater, characterised by distinct: (1) bathymetry, (2) hydrography, (3) productivity, and (4) trophically dependent populations.
The Large Marine Ecosystems strategy is a global effort for the assessment and management of international coastal waters. It developed in direct response to a declaration at the 1992 Rio Summit. As part of the strategy, the World Conservation Union (IUCN) and National Oceanic and Atmospheric Administration (NOAA) have joined in an action program to assist developing countries in planning and implementing an ecosystem-based strategy that is focused on LMEs as the principal assessment and management units for coastal ocean resources. The LME concept is also adopted by GEF that recommends the use of LMEs and their contributing freshwater basins as the geographic area for integrating changes in sectoral economic activities.
Figure 1 The 66 transboundary regions assessed within the GIWA project.
1a
62
21
45b
2
53
40b
38
52
57
30
54
11
41
42
4242
45a
23
3
22
44
17
46
2434
39
43
49
64
36
65
5027
4
33
56
31
47
4747
55
51
40a40a
61
58
63
16
28
15
32
18
59
19
60
20
121413
66
1d
10
26
25
8
1c
9
37
6
5
7
1b
áGIWAá2006
1a Russian Arctic (4 LMEs)1b Arctic Greenland (LME)1c Arctic European/Atlantic1d Arctic North American2 Gulf of Mexico (LME)3 Caribbean Sea (LME)4 Caribbean Islands (LME)5 Southeast Shelf (LME)6 Northeast Shelf (LME)7 Scotian Shelf (LME)
8 Gulf of St Lawrence9 Newfoundland Shelf (LME)10 Baffi n Bay, Labrador Sea,
Canadian Archipelago11 Barents Sea (LME)12 Norwegian Sea (LME)13 Faroe plateau14 Iceland Shelf (LME)15 East Greenland Shelf (LME)16 West Greenland Shelf (LME)
17 Baltic Sea (LME)18 North Sea (LME)19 Celtic-Biscay Shelf (LME)20 Iberian Coastal Sea (LME)21 North Africa and
Nile River Basin (LME)22 Black Sea (LME)23 Caspian Sea24 Aral Sea25 Gulf of Alaska (LME)
26 California Current (LME)27 Gulf of California (LME)28 Bering Sea (LME)30 Sea of Okhotsk (LME)31 Oyashio Current (LME)32 Kuroshio Current (LME)33 Sea of Japan (LME)34 Yellow Sea (LME)36 East China Sea (LME)37 Hawaiian Archipelago (LME)
38 Patagonian Shelf (LME)39 Brazil Current (LME)40a Northeast Brazil
Shelf (2 LMEs)40b Amazon41 Canary Current (LME)42 Guinea Current (LME)43 Lake Chad44 Benguela Current (LME)45a Agulhas Current (LME)
45b Indian Ocean Islands46 Somali Coastal
Current (LME)47 East African Rift
Valley Lakes49 Red Sea and
Gulf of Aden (LME)50 Euphrates and
Tigris River Basin51 Jordan
52 Arabian Sea (LME)53 Bay of Bengal54 South China Sea (2 LMEs)55 Mekong River56 Sulu-Celebes Sea (LME)57 Indonesian Seas (LME)58 North Australian
Shelf (LME)59 Coral Sea Basin60 Great Barrier Reef (LME)
61 Great Australian Bight62 Pacifi c Islands63 Tasman Sea64 Humboldt Current (LME)65 Eastern Equatorial
Pacifi c (LME)66 Antarctic (LME)
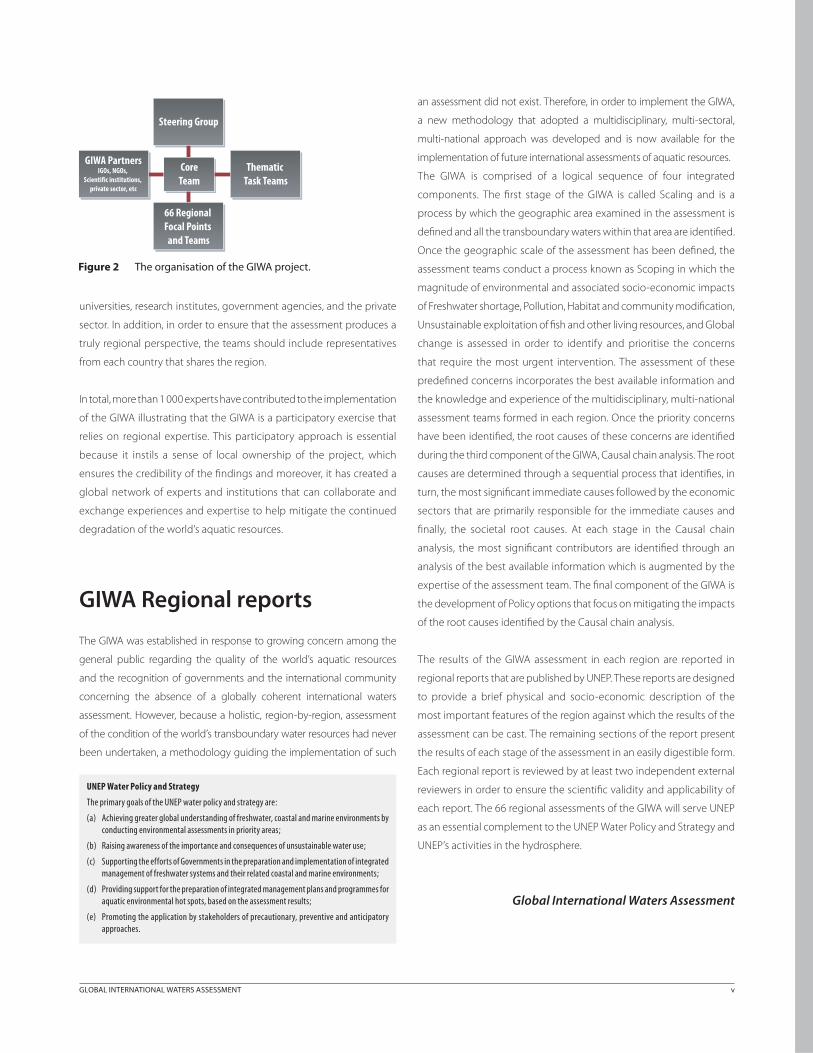
GLOBAL INTERNATIONAL WATERS ASSESSMENT v
universities, research institutes, government agencies, and the private
sector. In addition, in order to ensure that the assessment produces a
truly regional perspective, the teams should include representatives
from each country that shares the region.
In total, more than 1 000 experts have contributed to the implementation
of the GIWA illustrating that the GIWA is a participatory exercise that
relies on regional expertise. This participatory approach is essential
because it instils a sense of local ownership of the project, which
ensures the credibility of the fi ndings and moreover, it has created a
global network of experts and institutions that can collaborate and
exchange experiences and expertise to help mitigate the continued
degradation of the world’s aquatic resources.
GIWA Regional reports
The GIWA was established in response to growing concern among the
general public regarding the quality of the world’s aquatic resources
and the recognition of governments and the international community
concerning the absence of a globally coherent international waters
assessment. However, because a holistic, region-by-region, assessment
of the condition of the world’s transboundary water resources had never
been undertaken, a methodology guiding the implementation of such
an assessment did not exist. Therefore, in order to implement the GIWA,
a new methodology that adopted a multidisciplinary, multi-sectoral,
multi-national approach was developed and is now available for the
implementation of future international assessments of aquatic resources.
The GIWA is comprised of a logical sequence of four integrated
components. The fi rst stage of the GIWA is called Scaling and is a
process by which the geographic area examined in the assessment is
defi ned and all the transboundary waters within that area are identifi ed.
Once the geographic scale of the assessment has been defi ned, the
assessment teams conduct a process known as Scoping in which the
magnitude of environmental and associated socio-economic impacts
of Freshwater shortage, Pollution, Habitat and community modifi cation,
Unsustainable exploitation of fi sh and other living resources, and Global
change is assessed in order to identify and prioritise the concerns
that require the most urgent intervention. The assessment of these
predefi ned concerns incorporates the best available information and
the knowledge and experience of the multidisciplinary, multi-national
assessment teams formed in each region. Once the priority concerns
have been identifi ed, the root causes of these concerns are identifi ed
during the third component of the GIWA, Causal chain analysis. The root
causes are determined through a sequential process that identifi es, in
turn, the most signifi cant immediate causes followed by the economic
sectors that are primarily responsible for the immediate causes and
fi nally, the societal root causes. At each stage in the Causal chain
analysis, the most signifi cant contributors are identifi ed through an
analysis of the best available information which is augmented by the
expertise of the assessment team. The fi nal component of the GIWA is
the development of Policy options that focus on mitigating the impacts
of the root causes identifi ed by the Causal chain analysis.
The results of the GIWA assessment in each region are reported in
regional reports that are published by UNEP. These reports are designed
to provide a brief physical and socio-economic description of the
most important features of the region against which the results of the
assessment can be cast. The remaining sections of the report present
the results of each stage of the assessment in an easily digestible form.
Each regional report is reviewed by at least two independent external
reviewers in order to ensure the scientifi c validity and applicability of
each report. The 66 regional assessments of the GIWA will serve UNEP
as an essential complement to the UNEP Water Policy and Strategy and
UNEP’s activities in the hydrosphere.
Global International Waters Assessment
Steering Group
GIWA PartnersIGOs, NGOs,
Scientific institutions, private sector, etc
Thematic Task Teams
66 Regional Focal Points and Teams
Core Team
Figure 2 The organisation of the GIWA project.
UNEP Water Policy and Strategy
The primary goals of the UNEP water policy and strategy are:
(a) Achieving greater global understanding of freshwater, coastal and marine environments by conducting environmental assessments in priority areas;
(b) Raising awareness of the importance and consequences of unsustainable water use;
(c) Supporting the efforts of Governments in the preparation and implementation of integrated management of freshwater systems and their related coastal and marine environments;
(d) Providing support for the preparation of integrated management plans and programmes for aquatic environmental hot spots, based on the assessment results;
(e) Promoting the application by stakeholders of precautionary, preventive and anticipatory approaches.
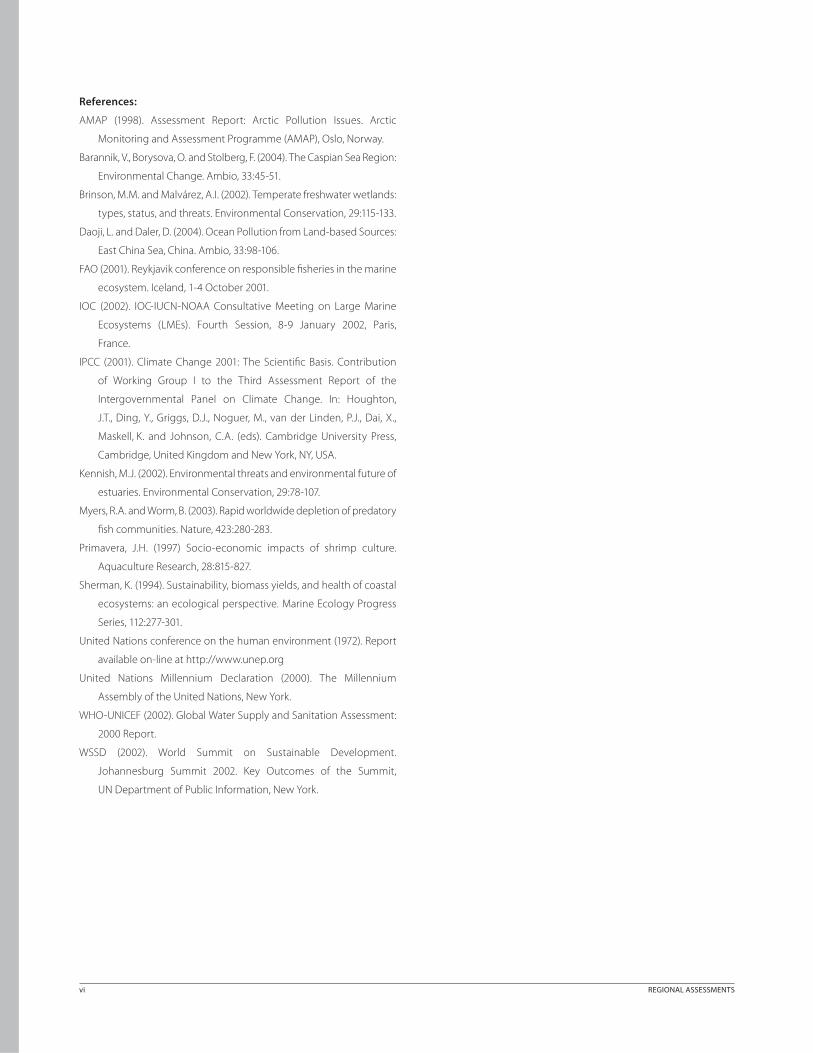
vi REGIONAL ASSESSMENTS
References:
AMAP (1998). Assessment Report: Arctic Pollution Issues. Arctic
Monitoring and Assessment Programme (AMAP), Oslo, Norway.
Barannik, V., Borysova, O. and Stolberg, F. (2004). The Caspian Sea Region:
Environmental Change. Ambio, 33:45-51.
Brinson, M.M. and Malvárez, A.I. (2002). Temperate freshwater wetlands:
types, status, and threats. Environmental Conservation, 29:115-133.
Daoji, L. and Daler, D. (2004). Ocean Pollution from Land-based Sources:
East China Sea, China. Ambio, 33:98-106.
FAO (2001). Reykjavik conference on responsible fi sheries in the marine
ecosystem. Iceland, 1-4 October 2001.
IOC (2002). IOC-IUCN-NOAA Consultative Meeting on Large Marine
Ecosystems (LMEs). Fourth Session, 8-9 January 2002, Paris,
France.
IPCC (2001). Climate Change 2001: The Scientifi c Basis. Contribution
of Working Group I to the Third Assessment Report of the
Intergovernmental Panel on Climate Change. In: Houghton,
J.T., Ding, Y., Griggs, D.J., Noguer, M., van der Linden, P.J., Dai, X.,
Maskell, K. and Johnson, C.A. (eds). Cambridge University Press,
Cambridge, United Kingdom and New York, NY, USA.
Kennish, M.J. (2002). Environmental threats and environmental future of
estuaries. Environmental Conservation, 29:78-107.
Myers, R.A. and Worm, B. (2003). Rapid worldwide depletion of predatory
fi sh communities. Nature, 423:280-283.
Primavera, J.H. (1997) Socio-economic impacts of shrimp culture.
Aquaculture Research, 28:815-827.
Sherman, K. (1994). Sustainability, biomass yields, and health of coastal
ecosystems: an ecological perspective. Marine Ecology Progress
Series, 112:277-301.
United Nations conference on the human environment (1972). Report
available on-line at http://www.unep.org
United Nations Millennium Declaration (2000). The Millennium
Assembly of the United Nations, New York.
WHO-UNICEF (2002). Global Water Supply and Sanitation Assessment:
2000 Report.
WSSD (2002). World Summit on Sustainable Development.
Johannesburg Summit 2002. Key Outcomes of the Summit,
UN Department of Public Information, New York.
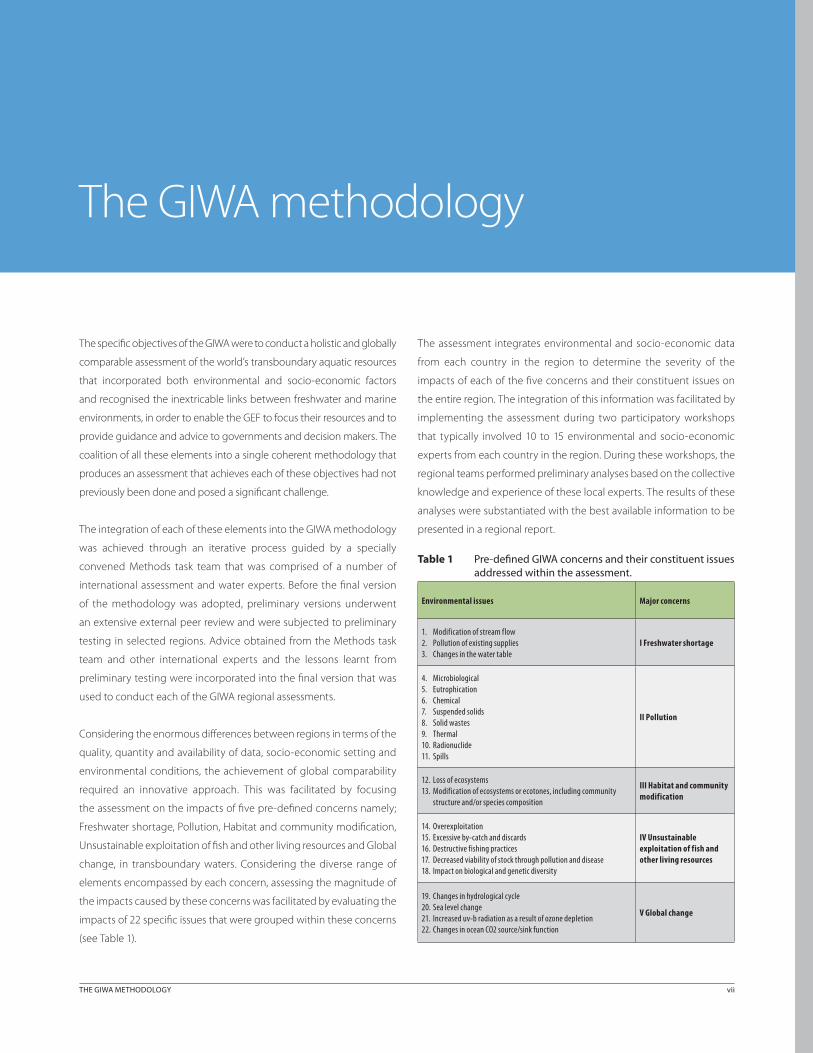
THE GIWA METHODOLOGY vii
The specifi c objectives of the GIWA were to conduct a holistic and globally
comparable assessment of the world’s transboundary aquatic resources
that incorporated both environmental and socio-economic factors
and recognised the inextricable links between freshwater and marine
environments, in order to enable the GEF to focus their resources and to
provide guidance and advice to governments and decision makers. The
coalition of all these elements into a single coherent methodology that
produces an assessment that achieves each of these objectives had not
previously been done and posed a signifi cant challenge.
The integration of each of these elements into the GIWA methodology
was achieved through an iterative process guided by a specially
convened Methods task team that was comprised of a number of
international assessment and water experts. Before the fi nal version
of the methodology was adopted, preliminary versions underwent
an extensive external peer review and were subjected to preliminary
testing in selected regions. Advice obtained from the Methods task
team and other international experts and the lessons learnt from
preliminary testing were incorporated into the fi nal version that was
used to conduct each of the GIWA regional assessments.
Considering the enormous diff erences between regions in terms of the
quality, quantity and availability of data, socio-economic setting and
environmental conditions, the achievement of global comparability
required an innovative approach. This was facilitated by focusing
the assessment on the impacts of fi ve pre-defi ned concerns namely;
Freshwater shortage, Pollution, Habitat and community modifi cation,
Unsustainable exploitation of fi sh and other living resources and Global
change, in transboundary waters. Considering the diverse range of
elements encompassed by each concern, assessing the magnitude of
the impacts caused by these concerns was facilitated by evaluating the
impacts of 22 specifi c issues that were grouped within these concerns
(see Table 1).
The assessment integrates environmental and socio-economic data
from each country in the region to determine the severity of the
impacts of each of the fi ve concerns and their constituent issues on
the entire region. The integration of this information was facilitated by
implementing the assessment during two participatory workshops
that typically involved 10 to 15 environmental and socio-economic
experts from each country in the region. During these workshops, the
regional teams performed preliminary analyses based on the collective
knowledge and experience of these local experts. The results of these
analyses were substantiated with the best available information to be
presented in a regional report.
The GIWA methodology
Table 1 Pre-defi ned GIWA concerns and their constituent issues addressed within the assessment.
Environmental issues Major concerns
1. Modification of stream flow2. Pollution of existing supplies3. Changes in the water table
I Freshwater shortage
4. Microbiological5. Eutrophication6. Chemical7. Suspended solids8. Solid wastes9. Thermal10. Radionuclide11. Spills
II Pollution
12. Loss of ecosystems13. Modification of ecosystems or ecotones, including community
structure and/or species composition
III Habitat and community modification
14. Overexploitation15. Excessive by-catch and discards16. Destructive fishing practices17. Decreased viability of stock through pollution and disease18. Impact on biological and genetic diversity
IV Unsustainable exploitation of fish and other living resources
19. Changes in hydrological cycle20. Sea level change21. Increased uv-b radiation as a result of ozone depletion22. Changes in ocean CO2 source/sink function
V Global change
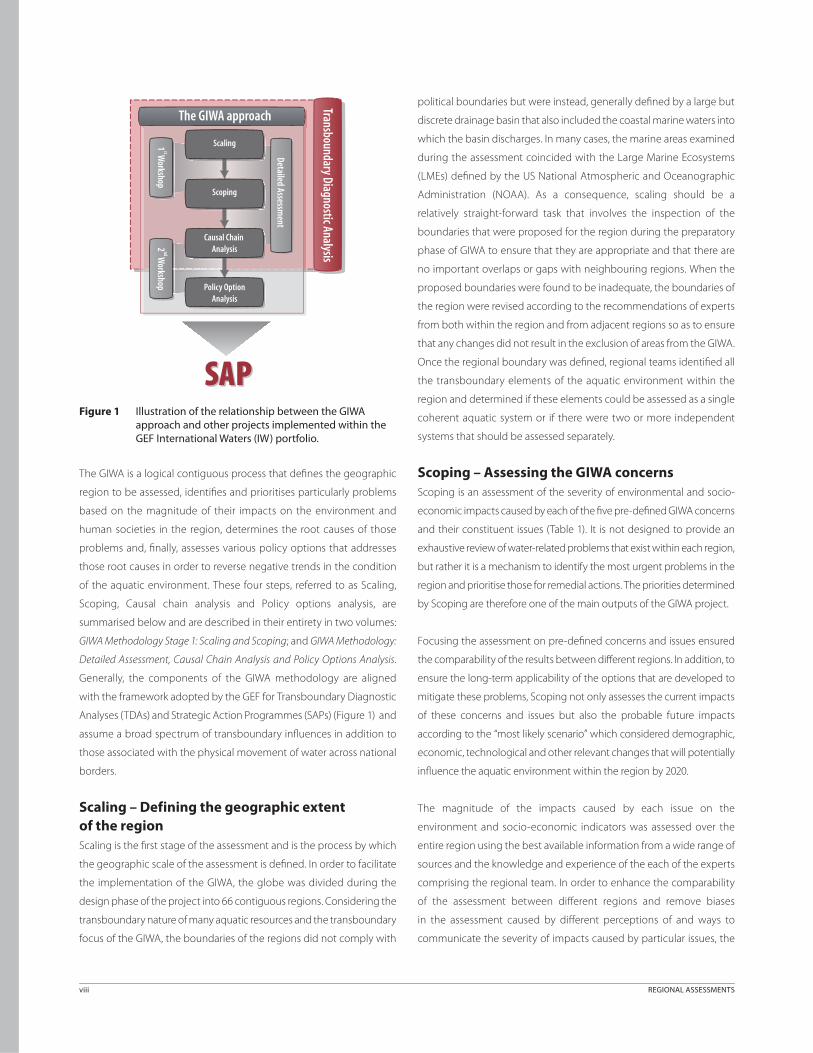
viii REGIONAL ASSESSMENTS
The GIWA is a logical contiguous process that defi nes the geographic
region to be assessed, identifi es and prioritises particularly problems
based on the magnitude of their impacts on the environment and
human societies in the region, determines the root causes of those
problems and, fi nally, assesses various policy options that addresses
those root causes in order to reverse negative trends in the condition
of the aquatic environment. These four steps, referred to as Scaling,
Scoping, Causal chain analysis and Policy options analysis, are
summarised below and are described in their entirety in two volumes:
GIWA Methodology Stage 1: Scaling and Scoping; and GIWA Methodology:
Detailed Assessment, Causal Chain Analysis and Policy Options Analysis.
Generally, the components of the GIWA methodology are aligned
with the framework adopted by the GEF for Transboundary Diagnostic
Analyses (TDAs) and Strategic Action Programmes (SAPs) (Figure 1) and
assume a broad spectrum of transboundary infl uences in addition to
those associated with the physical movement of water across national
borders.
Scaling – Defining the geographic extent of the regionScaling is the fi rst stage of the assessment and is the process by which
the geographic scale of the assessment is defi ned. In order to facilitate
the implementation of the GIWA, the globe was divided during the
design phase of the project into 66 contiguous regions. Considering the
transboundary nature of many aquatic resources and the transboundary
focus of the GIWA, the boundaries of the regions did not comply with
political boundaries but were instead, generally defi ned by a large but
discrete drainage basin that also included the coastal marine waters into
which the basin discharges. In many cases, the marine areas examined
during the assessment coincided with the Large Marine Ecosystems
(LMEs) defi ned by the US National Atmospheric and Oceanographic
Administration (NOAA). As a consequence, scaling should be a
relatively straight-forward task that involves the inspection of the
boundaries that were proposed for the region during the preparatory
phase of GIWA to ensure that they are appropriate and that there are
no important overlaps or gaps with neighbouring regions. When the
proposed boundaries were found to be inadequate, the boundaries of
the region were revised according to the recommendations of experts
from both within the region and from adjacent regions so as to ensure
that any changes did not result in the exclusion of areas from the GIWA.
Once the regional boundary was defi ned, regional teams identifi ed all
the transboundary elements of the aquatic environment within the
region and determined if these elements could be assessed as a single
coherent aquatic system or if there were two or more independent
systems that should be assessed separately.
Scoping – Assessing the GIWA concernsScoping is an assessment of the severity of environmental and socio-
economic impacts caused by each of the fi ve pre-defi ned GIWA concerns
and their constituent issues (Table 1). It is not designed to provide an
exhaustive review of water-related problems that exist within each region,
but rather it is a mechanism to identify the most urgent problems in the
region and prioritise those for remedial actions. The priorities determined
by Scoping are therefore one of the main outputs of the GIWA project.
Focusing the assessment on pre-defi ned concerns and issues ensured
the comparability of the results between diff erent regions. In addition, to
ensure the long-term applicability of the options that are developed to
mitigate these problems, Scoping not only assesses the current impacts
of these concerns and issues but also the probable future impacts
according to the “most likely scenario” which considered demographic,
economic, technological and other relevant changes that will potentially
infl uence the aquatic environment within the region by 2020.
The magnitude of the impacts caused by each issue on the
environment and socio-economic indicators was assessed over the
entire region using the best available information from a wide range of
sources and the knowledge and experience of the each of the experts
comprising the regional team. In order to enhance the comparability
of the assessment between diff erent regions and remove biases
in the assessment caused by diff erent perceptions of and ways to
communicate the severity of impacts caused by particular issues, the
SAP
Scaling1stW
orkshop2
ndWorkshop
DetailedAssessm
ent
Scoping
Causal ChainAnalysis
Policy OptionAnalysis
TransboundaryDiagnosticAnalysis
SAP
The GIWA approach
Figure 1 Illustration of the relationship between the GIWA approach and other projects implemented within the GEF International Waters (IW) portfolio.

THE GIWA METHODOLOGY ix
results were distilled and reported as standardised scores according to
the following four point scale:
■ 0 = no known impact
■ 1 = slight impact
■ 2 = moderate impact
■ 3 = severe impact
The attributes of each score for each issue were described by a detailed
set of pre-defi ned criteria that were used to guide experts in reporting
the results of the assessment. For example, the criterion for assigning
a score of 3 to the issue Loss of ecosystems or ecotones is: “Permanent
destruction of at least one habitat is occurring such as to have reduced their
surface area by >30% during the last 2-3 decades”. The full list of criteria is
presented at the end of the chapter, Table 5a-e. Although the scoring
inevitably includes an arbitrary component, the use of predefi ned
criteria facilitates comparison of impacts on a global scale and also
encouraged consensus of opinion among experts.
The trade-off associated with assessing the impacts of each concern
and their constituent issues at the scale of the entire region is that spatial
resolution was sometimes low. Although the assessment provides a
score indicating the severity of impacts of a particular issue or concern
on the entire region, it does not mean that the entire region suff ers
the impacts of that problem. For example, eutrophication could be
identifi ed as a severe problem in a region, but this does not imply that all
waters in the region suff er from severe eutrophication. It simply means
that when the degree of eutrophication, the size of the area aff ected,
the socio-economic impacts and the number of people aff ected is
considered, the magnitude of the overall impacts meets the criteria
defi ning a severe problem and that a regional action should be initiated
in order to mitigate the impacts of the problem.
When each issue has been scored, it was weighted according to the relative
contribution it made to the overall environmental impacts of the concern
and a weighted average score for each of the fi ve concerns was calculated
(Table 2). Of course, if each issue was deemed to make equal contributions,
then the score describing the overall impacts of the concern was simply the
arithmetic mean of the scores allocated to each issue within the concern.
In addition, the socio-economic impacts of each of the fi ve major
concerns were assessed for the entire region. The socio-economic
impacts were grouped into three categories; Economic impacts,
Health impacts and Other social and community impacts (Table 3). For
each category, an evaluation of the size, degree and frequency of the
impact was performed and, once completed, a weighted average score
describing the overall socio-economic impacts of each concern was
calculated in the same manner as the overall environmental score.
After all 22 issues and associated socio-economic impacts have
been scored, weighted and averaged, the magnitude of likely future
changes in the environmental and socio-economic impacts of each
of the fi ve concerns on the entire region is assessed according to the
most likely scenario which describes the demographic, economic,
technological and other relevant changes that might infl uence the
aquatic environment within the region by 2020.
In order to prioritise among GIWA concerns within the region and
identify those that will be subjected to causal chain and policy options
analysis in the subsequent stages of the GIWA, the present and future
scores of the environmental and socio-economic impacts of each
concern are tabulated and an overall score calculated. In the example
presented in Table 4, the scoping assessment indicated that concern III,
Habitat and community modifi cation, was the priority concern in this
region. The outcome of this mathematic process was reconciled against
the knowledge of experts and the best available information in order
to ensure the validity of the conclusion.
In some cases however, this process and the subsequent participatory
discussion did not yield consensus among the regional experts
regarding the ranking of priorities. As a consequence, further analysis
was required. In such cases, expert teams continued by assessing the
relative importance of present and potential future impacts and assign
weights to each. Afterwards, the teams assign weights indicating the
relative contribution made by environmental and socio-economic
factors to the overall impacts of the concern. The weighted average
score for each concern is then recalculated taking into account
Table 3 Example of Health impacts assessment linked to one of the GIWA concerns.
Criteria for Health impacts Raw score Score Weight %
Number of people affectedVery small Very large0 1 2 3
2 50
Degree of severityMinimum Severe0 1 2 3
2 30
Frequency/DurationOccasion/Short Continuous0 1 2 3
2 20
Weight average score for Health impacts 2
Table 2 Example of environmental impact assessment of Freshwater shortage.
Environmental issues Score Weight %Environmental
concerns
Weight averaged
score
1. Modification of stream flow 1 20 Freshwater shortage 1.50
2. Pollution of existing supplies 2 50
3. Changes in the water table 1 30
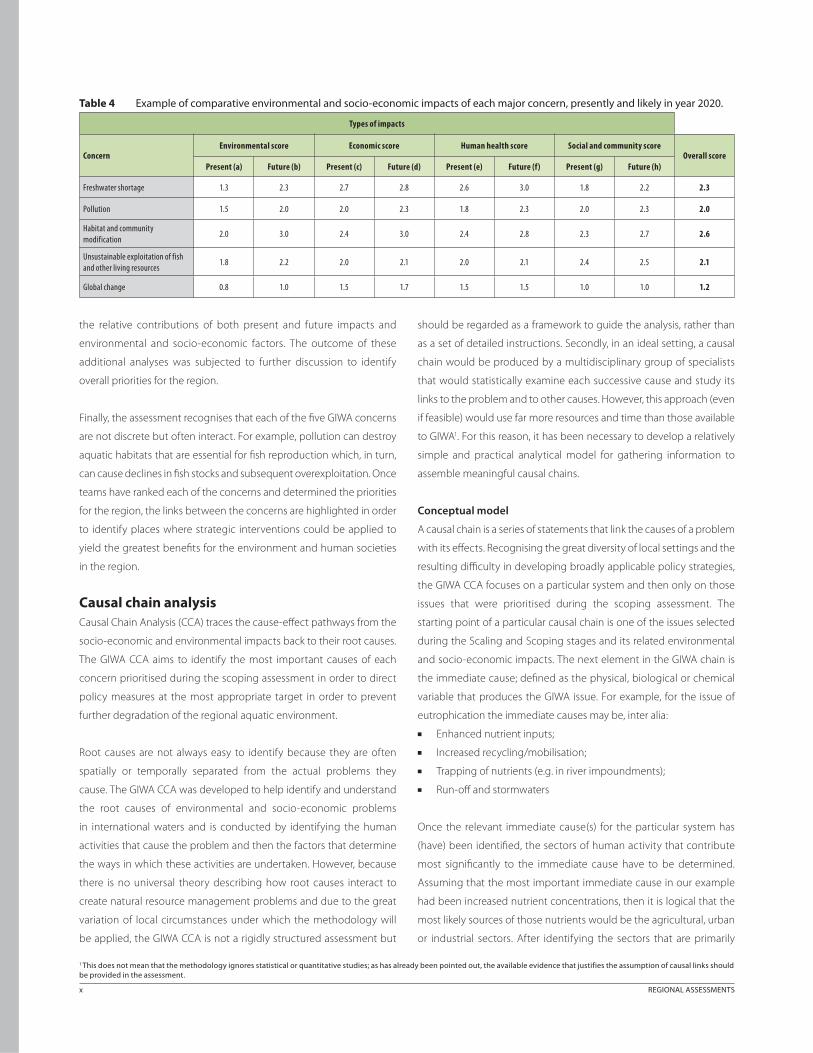
x REGIONAL ASSESSMENTS
the relative contributions of both present and future impacts and
environmental and socio-economic factors. The outcome of these
additional analyses was subjected to further discussion to identify
overall priorities for the region.
Finally, the assessment recognises that each of the fi ve GIWA concerns
are not discrete but often interact. For example, pollution can destroy
aquatic habitats that are essential for fi sh reproduction which, in turn,
can cause declines in fi sh stocks and subsequent overexploitation. Once
teams have ranked each of the concerns and determined the priorities
for the region, the links between the concerns are highlighted in order
to identify places where strategic interventions could be applied to
yield the greatest benefi ts for the environment and human societies
in the region.
Causal chain analysisCausal Chain Analysis (CCA) traces the cause-eff ect pathways from the
socio-economic and environmental impacts back to their root causes.
The GIWA CCA aims to identify the most important causes of each
concern prioritised during the scoping assessment in order to direct
policy measures at the most appropriate target in order to prevent
further degradation of the regional aquatic environment.
Root causes are not always easy to identify because they are often
spatially or temporally separated from the actual problems they
cause. The GIWA CCA was developed to help identify and understand
the root causes of environmental and socio-economic problems
in international waters and is conducted by identifying the human
activities that cause the problem and then the factors that determine
the ways in which these activities are undertaken. However, because
there is no universal theory describing how root causes interact to
create natural resource management problems and due to the great
variation of local circumstances under which the methodology will
be applied, the GIWA CCA is not a rigidly structured assessment but
should be regarded as a framework to guide the analysis, rather than
as a set of detailed instructions. Secondly, in an ideal setting, a causal
chain would be produced by a multidisciplinary group of specialists
that would statistically examine each successive cause and study its
links to the problem and to other causes. However, this approach (even
if feasible) would use far more resources and time than those available
to GIWA1. For this reason, it has been necessary to develop a relatively
simple and practical analytical model for gathering information to
assemble meaningful causal chains.
Conceptual model
A causal chain is a series of statements that link the causes of a problem
with its eff ects. Recognising the great diversity of local settings and the
resulting diffi culty in developing broadly applicable policy strategies,
the GIWA CCA focuses on a particular system and then only on those
issues that were prioritised during the scoping assessment. The
starting point of a particular causal chain is one of the issues selected
during the Scaling and Scoping stages and its related environmental
and socio-economic impacts. The next element in the GIWA chain is
the immediate cause; defi ned as the physical, biological or chemical
variable that produces the GIWA issue. For example, for the issue of
eutrophication the immediate causes may be, inter alia:
■ Enhanced nutrient inputs;
■ Increased recycling/mobilisation;
■ Trapping of nutrients (e.g. in river impoundments);
■ Run-off and stormwaters
Once the relevant immediate cause(s) for the particular system has
(have) been identifi ed, the sectors of human activity that contribute
most signifi cantly to the immediate cause have to be determined.
Assuming that the most important immediate cause in our example
had been increased nutrient concentrations, then it is logical that the
most likely sources of those nutrients would be the agricultural, urban
or industrial sectors. After identifying the sectors that are primarily
Table 4 Example of comparative environmental and socio-economic impacts of each major concern, presently and likely in year 2020.
Types of impacts
ConcernEnvironmental score Economic score Human health score Social and community score
Overall scorePresent (a) Future (b) Present (c) Future (d) Present (e) Future (f) Present (g) Future (h)
Freshwater shortage 1.3 2.3 2.7 2.8 2.6 3.0 1.8 2.2 2.3
Pollution 1.5 2.0 2.0 2.3 1.8 2.3 2.0 2.3 2.0
Habitat and community modification
2.0 3.0 2.4 3.0 2.4 2.8 2.3 2.7 2.6
Unsustainable exploitation of fish and other living resources
1.8 2.2 2.0 2.1 2.0 2.1 2.4 2.5 2.1
Global change 0.8 1.0 1.5 1.7 1.5 1.5 1.0 1.0 1.2
1 This does not mean that the methodology ignores statistical or quantitative studies; as has already been pointed out, the available evidence that justifies the assumption of causal links should be provided in the assessment.

THE GIWA METHODOLOGY xi
responsible for the immediate causes, the root causes acting on those
sectors must be determined. For example, if agriculture was found to
be primarily responsible for the increased nutrient concentrations, the
root causes could potentially be:
■ Economic (e.g. subsidies to fertilisers and agricultural products);
■ Legal (e.g. inadequate regulation);
■ Failures in governance (e.g. poor enforcement); or
■ Technology or knowledge related (e.g. lack of aff ordable substitutes
for fertilisers or lack of knowledge as to their application).
Once the most relevant root causes have been identifi ed, an
explanation, which includes available data and information, of how
they are responsible for the primary environmental and socio-economic
problems in the region should be provided.
Policy option analysisDespite considerable eff ort of many Governments and other
organisations to address transboundary water problems, the evidence
indicates that there is still much to be done in this endeavour. An
important characteristic of GIWA’s Policy Option Analysis (POA) is that
its recommendations are fi rmly based on a better understanding of
the root causes of the problems. Freshwater scarcity, water pollution,
overexploitation of living resources and habitat destruction are very
complex phenomena. Policy options that are grounded on a better
understanding of these phenomena will contribute to create more
eff ective societal responses to the extremely complex water related
transboundary problems. The core of POA in the assessment consists
of two tasks:
Construct policy options
Policy options are simply diff erent courses of action, which are not
always mutually exclusive, to solve or mitigate environmental and
socio-economic problems in the region. Although a multitude of
diff erent policy options could be constructed to address each root
cause identifi ed in the CCA, only those few policy options that have
the greatest likelihood of success were analysed in the GIWA.
Select and apply the criteria on which the policy options will be
evaluated
Although there are many criteria that could be used to evaluate any
policy option, GIWA focuses on:
■ Eff ectiveness (certainty of result)
■ Effi ciency (maximisation of net benefi ts)
■ Equity (fairness of distributional impacts)
■ Practical criteria (political acceptability, implementation feasibility).
The policy options recommended by the GIWA are only contributions
to the larger policy process and, as such, the GIWA methodology
developed to test the performance of various options under the
diff erent circumstances has been kept simple and broadly applicable.
Global International Waters Assessment
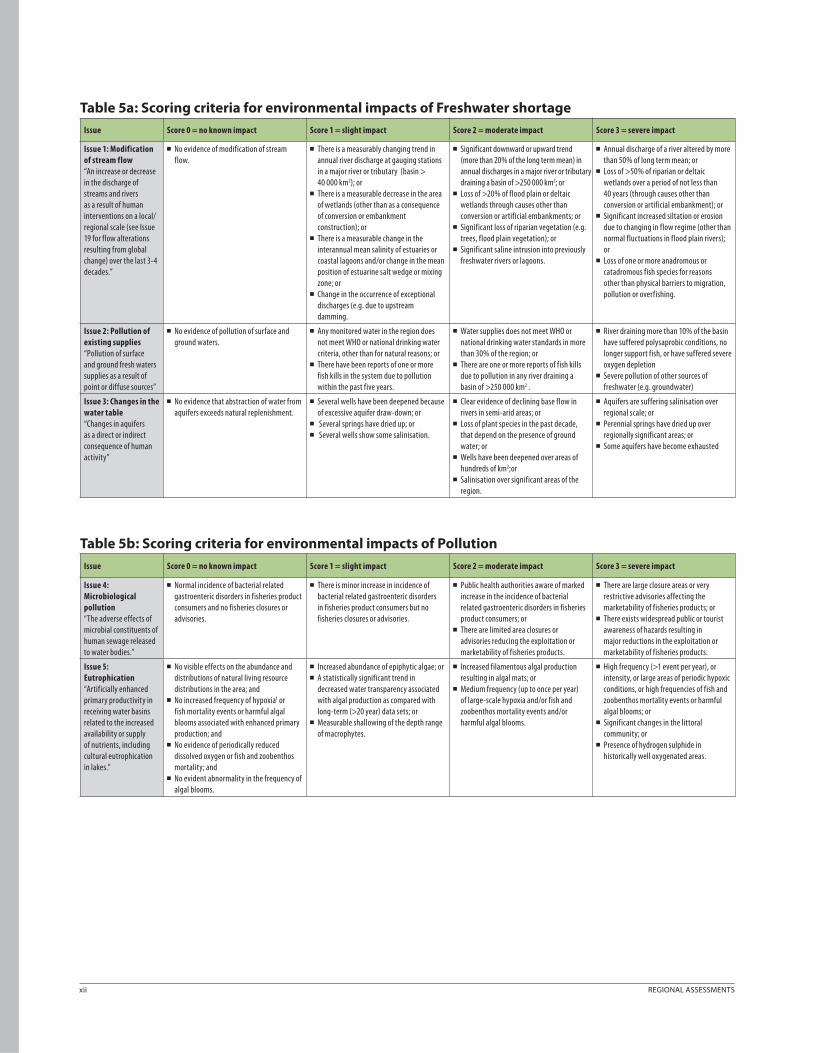
xii REGIONAL ASSESSMENTS
Table 5a: Scoring criteria for environmental impacts of Freshwater shortageIssue Score 0 = no known impact Score 1 = slight impact Score 2 = moderate impact Score 3 = severe impact
Issue 1: Modification of stream flow“An increase or decrease in the discharge of streams and rivers as a result of human interventions on a local/regional scale (see Issue 19 for flow alterations resulting from global change) over the last 3-4 decades.”
■ No evidence of modification of stream flow.
■ There is a measurably changing trend in annual river discharge at gauging stations in a major river or tributary (basin > 40 000 km2); or
■ There is a measurable decrease in the area of wetlands (other than as a consequence of conversion or embankment construction); or
■ There is a measurable change in the interannual mean salinity of estuaries or coastal lagoons and/or change in the mean position of estuarine salt wedge or mixing zone; or
■ Change in the occurrence of exceptional discharges (e.g. due to upstream damming.
■ Significant downward or upward trend (more than 20% of the long term mean) in annual discharges in a major river or tributary draining a basin of >250 000 km2; or
■ Loss of >20% of flood plain or deltaic wetlands through causes other than conversion or artificial embankments; or
■ Significant loss of riparian vegetation (e.g. trees, flood plain vegetation); or
■ Significant saline intrusion into previously freshwater rivers or lagoons.
■ Annual discharge of a river altered by more than 50% of long term mean; or
■ Loss of >50% of riparian or deltaic wetlands over a period of not less than 40 years (through causes other than conversion or artificial embankment); or
■ Significant increased siltation or erosion due to changing in flow regime (other than normal fluctuations in flood plain rivers); or
■ Loss of one or more anadromous or catadromous fish species for reasons other than physical barriers to migration, pollution or overfishing.
Issue 2: Pollution of existing supplies“Pollution of surface and ground fresh waters supplies as a result of point or diffuse sources”
■ No evidence of pollution of surface and ground waters.
■ Any monitored water in the region does not meet WHO or national drinking water criteria, other than for natural reasons; or
■ There have been reports of one or more fish kills in the system due to pollution within the past five years.
■ Water supplies does not meet WHO or national drinking water standards in more than 30% of the region; or
■ There are one or more reports of fish kills due to pollution in any river draining a basin of >250 000 km2 .
■ River draining more than 10% of the basin have suffered polysaprobic conditions, no longer support fish, or have suffered severe oxygen depletion
■ Severe pollution of other sources of freshwater (e.g. groundwater)
Issue 3: Changes in the water table“Changes in aquifers as a direct or indirect consequence of human activity”
■ No evidence that abstraction of water from aquifers exceeds natural replenishment.
■ Several wells have been deepened because of excessive aquifer draw-down; or
■ Several springs have dried up; or■ Several wells show some salinisation.
■ Clear evidence of declining base flow in rivers in semi-arid areas; or
■ Loss of plant species in the past decade, that depend on the presence of ground water; or
■ Wells have been deepened over areas of hundreds of km2;or
■ Salinisation over significant areas of the region.
■ Aquifers are suffering salinisation over regional scale; or
■ Perennial springs have dried up over regionally significant areas; or
■ Some aquifers have become exhausted
Table 5b: Scoring criteria for environmental impacts of PollutionIssue Score 0 = no known impact Score 1 = slight impact Score 2 = moderate impact Score 3 = severe impact
Issue 4: Microbiological pollution“The adverse effects of microbial constituents of human sewage released to water bodies.”
■ Normal incidence of bacterial related gastroenteric disorders in fisheries product consumers and no fisheries closures or advisories.
■ There is minor increase in incidence of bacterial related gastroenteric disorders in fisheries product consumers but no fisheries closures or advisories.
■ Public health authorities aware of marked increase in the incidence of bacterial related gastroenteric disorders in fisheries product consumers; or
■ There are limited area closures or advisories reducing the exploitation or marketability of fisheries products.
■ There are large closure areas or very restrictive advisories affecting the marketability of fisheries products; or
■ There exists widespread public or tourist awareness of hazards resulting in major reductions in the exploitation or marketability of fisheries products.
Issue 5: Eutrophication“Artificially enhanced primary productivity in receiving water basins related to the increased availability or supply of nutrients, including cultural eutrophication in lakes.”
■ No visible effects on the abundance and distributions of natural living resource distributions in the area; and
■ No increased frequency of hypoxia1 or fish mortality events or harmful algal blooms associated with enhanced primary production; and
■ No evidence of periodically reduced dissolved oxygen or fish and zoobenthos mortality; and
■ No evident abnormality in the frequency of algal blooms.
■ Increased abundance of epiphytic algae; or■ A statistically significant trend in
decreased water transparency associated with algal production as compared with long-term (>20 year) data sets; or
■ Measurable shallowing of the depth range of macrophytes.
■ Increased filamentous algal production resulting in algal mats; or
■ Medium frequency (up to once per year) of large-scale hypoxia and/or fish and zoobenthos mortality events and/or harmful algal blooms.
■ High frequency (>1 event per year), or intensity, or large areas of periodic hypoxic conditions, or high frequencies of fish and zoobenthos mortality events or harmful algal blooms; or
■ Significant changes in the littoral community; or
■ Presence of hydrogen sulphide in historically well oxygenated areas.
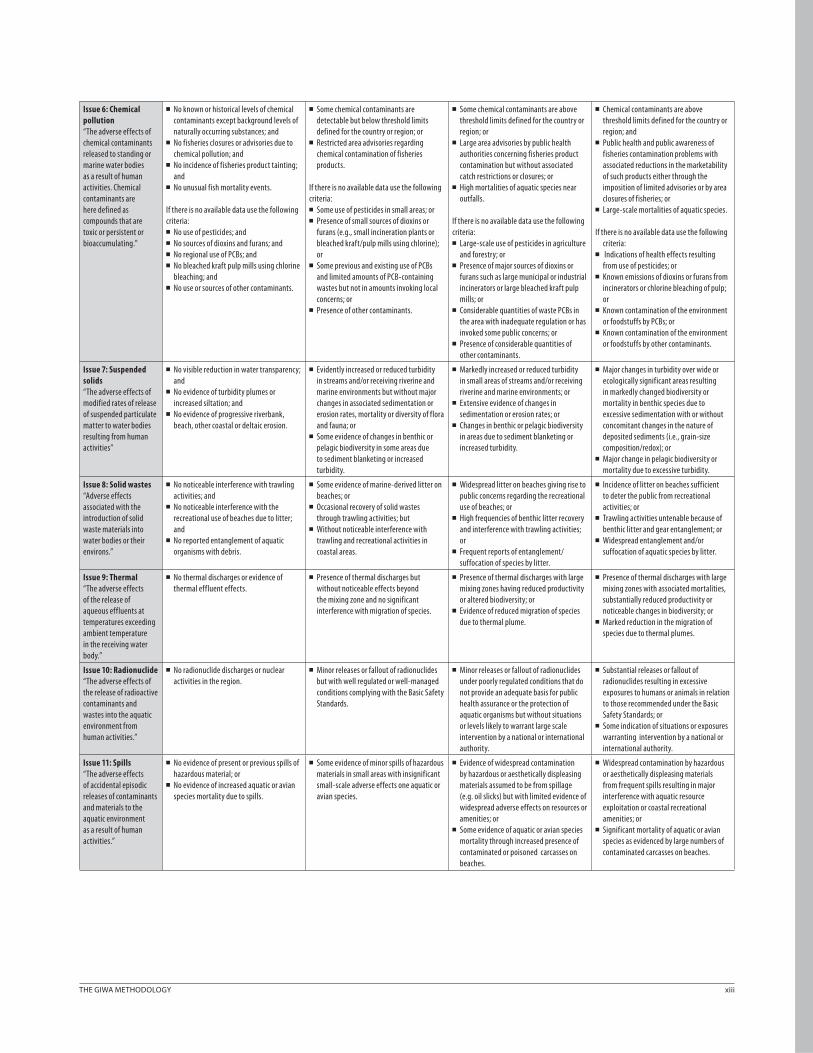
THE GIWA METHODOLOGY xiii
Issue 6: Chemical pollution“The adverse effects of chemical contaminants released to standing or marine water bodies as a result of human activities. Chemical contaminants are here defined as compounds that are toxic or persistent or bioaccumulating.”
■ No known or historical levels of chemical contaminants except background levels of naturally occurring substances; and
■ No fisheries closures or advisories due to chemical pollution; and
■ No incidence of fisheries product tainting; and
■ No unusual fish mortality events.
If there is no available data use the following criteria:■ No use of pesticides; and■ No sources of dioxins and furans; and■ No regional use of PCBs; and■ No bleached kraft pulp mills using chlorine
bleaching; and■ No use or sources of other contaminants.
■ Some chemical contaminants are detectable but below threshold limits defined for the country or region; or
■ Restricted area advisories regarding chemical contamination of fisheries products.
If there is no available data use the following criteria:■ Some use of pesticides in small areas; or ■ Presence of small sources of dioxins or
furans (e.g., small incineration plants or bleached kraft/pulp mills using chlorine); or
■ Some previous and existing use of PCBs and limited amounts of PCB-containing wastes but not in amounts invoking local concerns; or
■ Presence of other contaminants.
■ Some chemical contaminants are above threshold limits defined for the country or region; or
■ Large area advisories by public health authorities concerning fisheries product contamination but without associated catch restrictions or closures; or
■ High mortalities of aquatic species near outfalls.
If there is no available data use the following criteria:■ Large-scale use of pesticides in agriculture
and forestry; or ■ Presence of major sources of dioxins or
furans such as large municipal or industrial incinerators or large bleached kraft pulp mills; or
■ Considerable quantities of waste PCBs in the area with inadequate regulation or has invoked some public concerns; or
■ Presence of considerable quantities of other contaminants.
■ Chemical contaminants are above threshold limits defined for the country or region; and
■ Public health and public awareness of fisheries contamination problems with associated reductions in the marketability of such products either through the imposition of limited advisories or by area closures of fisheries; or
■ Large-scale mortalities of aquatic species.
If there is no available data use the following criteria:
■ Indications of health effects resulting from use of pesticides; or
■ Known emissions of dioxins or furans from incinerators or chlorine bleaching of pulp; or
■ Known contamination of the environment or foodstuffs by PCBs; or
■ Known contamination of the environment or foodstuffs by other contaminants.
Issue 7: Suspended solids“The adverse effects of modified rates of release of suspended particulate matter to water bodies resulting from human activities”
■ No visible reduction in water transparency; and
■ No evidence of turbidity plumes or increased siltation; and
■ No evidence of progressive riverbank, beach, other coastal or deltaic erosion.
■ Evidently increased or reduced turbidity in streams and/or receiving riverine and marine environments but without major changes in associated sedimentation or erosion rates, mortality or diversity of flora and fauna; or
■ Some evidence of changes in benthic or pelagic biodiversity in some areas due to sediment blanketing or increased turbidity.
■ Markedly increased or reduced turbidity in small areas of streams and/or receiving riverine and marine environments; or
■ Extensive evidence of changes in sedimentation or erosion rates; or
■ Changes in benthic or pelagic biodiversity in areas due to sediment blanketing or increased turbidity.
■ Major changes in turbidity over wide or ecologically significant areas resulting in markedly changed biodiversity or mortality in benthic species due to excessive sedimentation with or without concomitant changes in the nature of deposited sediments (i.e., grain-size composition/redox); or
■ Major change in pelagic biodiversity or mortality due to excessive turbidity.
Issue 8: Solid wastes“Adverse effects associated with the introduction of solid waste materials into water bodies or their environs.”
■ No noticeable interference with trawling activities; and
■ No noticeable interference with the recreational use of beaches due to litter; and
■ No reported entanglement of aquatic organisms with debris.
■ Some evidence of marine-derived litter on beaches; or
■ Occasional recovery of solid wastes through trawling activities; but
■ Without noticeable interference with trawling and recreational activities in coastal areas.
■ Widespread litter on beaches giving rise to public concerns regarding the recreational use of beaches; or
■ High frequencies of benthic litter recovery and interference with trawling activities; or
■ Frequent reports of entanglement/suffocation of species by litter.
■ Incidence of litter on beaches sufficient to deter the public from recreational activities; or
■ Trawling activities untenable because of benthic litter and gear entanglement; or
■ Widespread entanglement and/or suffocation of aquatic species by litter.
Issue 9: Thermal“The adverse effects of the release of aqueous effluents at temperatures exceeding ambient temperature in the receiving water body.”
■ No thermal discharges or evidence of thermal effluent effects.
■ Presence of thermal discharges but without noticeable effects beyond the mixing zone and no significant interference with migration of species.
■ Presence of thermal discharges with large mixing zones having reduced productivity or altered biodiversity; or
■ Evidence of reduced migration of species due to thermal plume.
■ Presence of thermal discharges with large mixing zones with associated mortalities, substantially reduced productivity or noticeable changes in biodiversity; or
■ Marked reduction in the migration of species due to thermal plumes.
Issue 10: Radionuclide“The adverse effects of the release of radioactive contaminants and wastes into the aquatic environment from human activities.”
■ No radionuclide discharges or nuclear activities in the region.
■ Minor releases or fallout of radionuclides but with well regulated or well-managed conditions complying with the Basic Safety Standards.
■ Minor releases or fallout of radionuclides under poorly regulated conditions that do not provide an adequate basis for public health assurance or the protection of aquatic organisms but without situations or levels likely to warrant large scale intervention by a national or international authority.
■ Substantial releases or fallout of radionuclides resulting in excessive exposures to humans or animals in relation to those recommended under the Basic Safety Standards; or
■ Some indication of situations or exposures warranting intervention by a national or international authority.
Issue 11: Spills“The adverse effects of accidental episodic releases of contaminants and materials to the aquatic environment as a result of human activities.”
■ No evidence of present or previous spills of hazardous material; or
■ No evidence of increased aquatic or avian species mortality due to spills.
■ Some evidence of minor spills of hazardous materials in small areas with insignificant small-scale adverse effects one aquatic or avian species.
■ Evidence of widespread contamination by hazardous or aesthetically displeasing materials assumed to be from spillage (e.g. oil slicks) but with limited evidence of widespread adverse effects on resources or amenities; or
■ Some evidence of aquatic or avian species mortality through increased presence of contaminated or poisoned carcasses on beaches.
■ Widespread contamination by hazardous or aesthetically displeasing materials from frequent spills resulting in major interference with aquatic resource exploitation or coastal recreational amenities; or
■ Significant mortality of aquatic or avian species as evidenced by large numbers of contaminated carcasses on beaches.
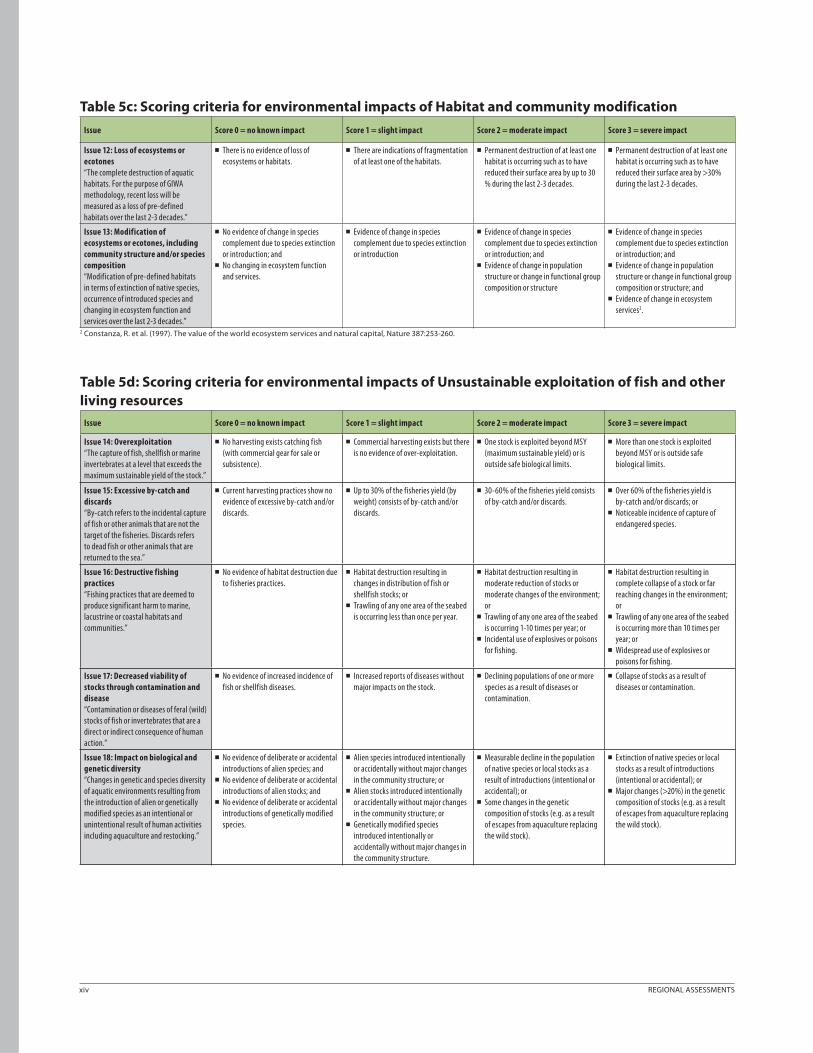
xiv REGIONAL ASSESSMENTS
Table 5c: Scoring criteria for environmental impacts of Habitat and community modification
Issue Score 0 = no known impact Score 1 = slight impact Score 2 = moderate impact Score 3 = severe impact
Issue 12: Loss of ecosystems or ecotones“The complete destruction of aquatic habitats. For the purpose of GIWA methodology, recent loss will be measured as a loss of pre-defined habitats over the last 2-3 decades.”
■ There is no evidence of loss of ecosystems or habitats.
■ There are indications of fragmentation of at least one of the habitats.
■ Permanent destruction of at least one habitat is occurring such as to have reduced their surface area by up to 30 % during the last 2-3 decades.
■ Permanent destruction of at least one habitat is occurring such as to have reduced their surface area by >30% during the last 2-3 decades.
Issue 13: Modification of ecosystems or ecotones, including community structure and/or species composition“Modification of pre-defined habitats in terms of extinction of native species, occurrence of introduced species and changing in ecosystem function and services over the last 2-3 decades.”
■ No evidence of change in species complement due to species extinction or introduction; and
■ No changing in ecosystem function and services.
■ Evidence of change in species complement due to species extinction or introduction
■ Evidence of change in species complement due to species extinction or introduction; and
■ Evidence of change in population structure or change in functional group composition or structure
■ Evidence of change in species complement due to species extinction or introduction; and
■ Evidence of change in population structure or change in functional group composition or structure; and
■ Evidence of change in ecosystem services2.
2 Constanza, R. et al. (1997). The value of the world ecosystem services and natural capital, Nature 387:253-260.
Table 5d: Scoring criteria for environmental impacts of Unsustainable exploitation of fish and other living resources
Issue Score 0 = no known impact Score 1 = slight impact Score 2 = moderate impact Score 3 = severe impact
Issue 14: Overexploitation“The capture of fish, shellfish or marine invertebrates at a level that exceeds the maximum sustainable yield of the stock.”
■ No harvesting exists catching fish (with commercial gear for sale or subsistence).
■ Commercial harvesting exists but there is no evidence of over-exploitation.
■ One stock is exploited beyond MSY (maximum sustainable yield) or is outside safe biological limits.
■ More than one stock is exploited beyond MSY or is outside safe biological limits.
Issue 15: Excessive by-catch and discards“By-catch refers to the incidental capture of fish or other animals that are not the target of the fisheries. Discards refers to dead fish or other animals that are returned to the sea.”
■ Current harvesting practices show no evidence of excessive by-catch and/or discards.
■ Up to 30% of the fisheries yield (by weight) consists of by-catch and/or discards.
■ 30-60% of the fisheries yield consists of by-catch and/or discards.
■ Over 60% of the fisheries yield is by-catch and/or discards; or
■ Noticeable incidence of capture of endangered species.
Issue 16: Destructive fishing practices“Fishing practices that are deemed to produce significant harm to marine, lacustrine or coastal habitats and communities.”
■ No evidence of habitat destruction due to fisheries practices.
■ Habitat destruction resulting in changes in distribution of fish or shellfish stocks; or
■ Trawling of any one area of the seabed is occurring less than once per year.
■ Habitat destruction resulting in moderate reduction of stocks or moderate changes of the environment; or
■ Trawling of any one area of the seabed is occurring 1-10 times per year; or
■ Incidental use of explosives or poisons for fishing.
■ Habitat destruction resulting in complete collapse of a stock or far reaching changes in the environment; or
■ Trawling of any one area of the seabed is occurring more than 10 times per year; or
■ Widespread use of explosives or poisons for fishing.
Issue 17: Decreased viability of stocks through contamination and disease“Contamination or diseases of feral (wild) stocks of fish or invertebrates that are a direct or indirect consequence of human action.”
■ No evidence of increased incidence of fish or shellfish diseases.
■ Increased reports of diseases without major impacts on the stock.
■ Declining populations of one or more species as a result of diseases or contamination.
■ Collapse of stocks as a result of diseases or contamination.
Issue 18: Impact on biological and genetic diversity“Changes in genetic and species diversity of aquatic environments resulting from the introduction of alien or genetically modified species as an intentional or unintentional result of human activities including aquaculture and restocking.”
■ No evidence of deliberate or accidental introductions of alien species; and
■ No evidence of deliberate or accidental introductions of alien stocks; and
■ No evidence of deliberate or accidental introductions of genetically modified species.
■ Alien species introduced intentionally or accidentally without major changes in the community structure; or
■ Alien stocks introduced intentionally or accidentally without major changes in the community structure; or
■ Genetically modified species introduced intentionally or accidentally without major changes in the community structure.
■ Measurable decline in the population of native species or local stocks as a result of introductions (intentional or accidental); or
■ Some changes in the genetic composition of stocks (e.g. as a result of escapes from aquaculture replacing the wild stock).
■ Extinction of native species or local stocks as a result of introductions (intentional or accidental); or
■ Major changes (>20%) in the genetic composition of stocks (e.g. as a result of escapes from aquaculture replacing the wild stock).
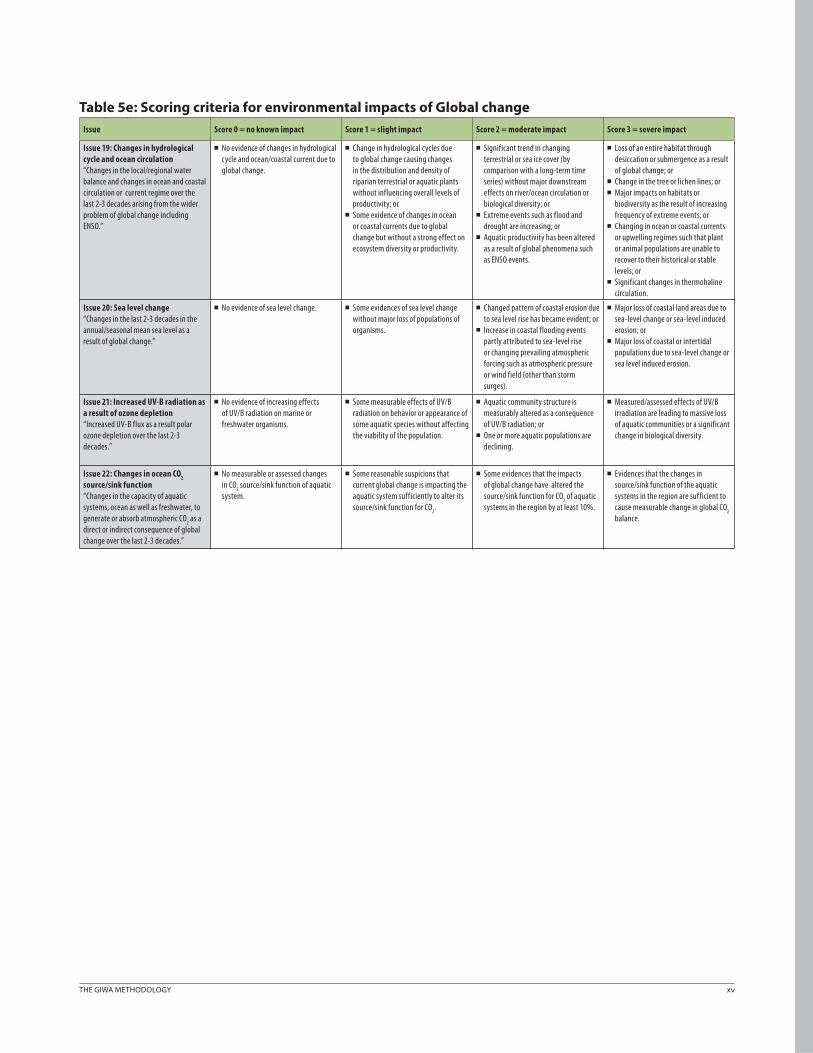
THE GIWA METHODOLOGY xv
Table 5e: Scoring criteria for environmental impacts of Global changeIssue Score 0 = no known impact Score 1 = slight impact Score 2 = moderate impact Score 3 = severe impact
Issue 19: Changes in hydrological cycle and ocean circulation“Changes in the local/regional water balance and changes in ocean and coastal circulation or current regime over the last 2-3 decades arising from the wider problem of global change including ENSO.”
■ No evidence of changes in hydrological cycle and ocean/coastal current due to global change.
■ Change in hydrological cycles due to global change causing changes in the distribution and density of riparian terrestrial or aquatic plants without influencing overall levels of productivity; or
■ Some evidence of changes in ocean or coastal currents due to global change but without a strong effect on ecosystem diversity or productivity.
■ Significant trend in changing terrestrial or sea ice cover (by comparison with a long-term time series) without major downstream effects on river/ocean circulation or biological diversity; or
■ Extreme events such as flood and drought are increasing; or
■ Aquatic productivity has been altered as a result of global phenomena such as ENSO events.
■ Loss of an entire habitat through desiccation or submergence as a result of global change; or
■ Change in the tree or lichen lines; or■ Major impacts on habitats or
biodiversity as the result of increasing frequency of extreme events; or
■ Changing in ocean or coastal currents or upwelling regimes such that plant or animal populations are unable to recover to their historical or stable levels; or
■ Significant changes in thermohaline circulation.
Issue 20: Sea level change“Changes in the last 2-3 decades in the annual/seasonal mean sea level as a result of global change.”
■ No evidence of sea level change. ■ Some evidences of sea level change without major loss of populations of organisms.
■ Changed pattern of coastal erosion due to sea level rise has became evident; or
■ Increase in coastal flooding events partly attributed to sea-level rise or changing prevailing atmospheric forcing such as atmospheric pressure or wind field (other than storm surges).
■ Major loss of coastal land areas due to sea-level change or sea-level induced erosion; or
■ Major loss of coastal or intertidal populations due to sea-level change or sea level induced erosion.
Issue 21: Increased UV-B radiation as a result of ozone depletion“Increased UV-B flux as a result polar ozone depletion over the last 2-3 decades.”
■ No evidence of increasing effects of UV/B radiation on marine or freshwater organisms.
■ Some measurable effects of UV/B radiation on behavior or appearance of some aquatic species without affecting the viability of the population.
■ Aquatic community structure is measurably altered as a consequence of UV/B radiation; or
■ One or more aquatic populations are declining.
■ Measured/assessed effects of UV/B irradiation are leading to massive loss of aquatic communities or a significant change in biological diversity.
Issue 22: Changes in ocean CO2
source/sink function“Changes in the capacity of aquatic systems, ocean as well as freshwater, to generate or absorb atmospheric CO
2 as a
direct or indirect consequence of global change over the last 2-3 decades.”
■ No measurable or assessed changes in CO
2 source/sink function of aquatic
system.
■ Some reasonable suspicions that current global change is impacting the aquatic system sufficiently to alter its source/sink function for CO
2.
■ Some evidences that the impacts of global change have altered the source/sink function for CO
2 of aquatic
systems in the region by at least 10%.
■ Evidences that the changes in source/sink function of the aquatic systems in the region are sufficient to cause measurable change in global CO
2
balance.