Lipid biomarker fluxes in the Arabian Sea, with a comparison to the equatorial Pacific Ocean
37
Deep-Sea Research II 49 (2002) 2265–2301 Lipid biomarker fluxes in the Arabian Sea, with a comparison to the equatorial Pacific Ocean Stuart G. Wakeham a, *, Michael L. Peterson b , John I. Hedges b , Cindy Lee c a Skidaway Institute of Oceanography, 10 Ocean Science Circle, Savannah, GA 31411, USA b School of Oceanography, Box 355351, University of Washington, Seattle, WA 98195-5351, USA c Marine Sciences Research Center, State University of New York, Stony Brook, NY 11794, USA Received 20 January 2001; received in revised form 7 August 2001; accepted 4 December 2001 Abstract Fluxes and distributions of organic carbon (OC) and lipid biomarkers were measured in the western Arabian Sea as a function of season, depth, and distance from the coast of Oman during the US JGOFS Arabian Sea Process Study in 1994–1995. A strong seasonal pattern in OC and lipid flux is related to the annual monsoon cycle in the western Arabian Sea, with the highest fluxes measured during the Southwest Monsoon. Fluxes were greatly attenuated with depth in the water column and in surface sediments as remineralization effectively consumed particulate organic matter. A comparison of water-column fluxes with OC and lipid accumulation rates in sediments confirms that the water– sediment interface is a ‘‘hot-spot’’ for organic matter degradation. Biomarker compositions also varied seasonally and with distance offshore, reflecting seasonal and spatial succession of their biological sources and their subsequent export through the water column. Degradation of OC and biomarkers was extremely efficient, with only a tiny fraction (o1%) of their water-column flux preserved in sediments, although a range of compound-specific degradation efficiencies was apparent. This intense degradation has strong implications for contemporary carbon cycling and for interpreting sediment records for paleoceanographic reconstructions. r 2002 Elsevier Science Ltd. All rights reserved. 1. Introduction Intense monsoons in the Arabian Sea closely link highly predictable seasonal patterns of physi- cal processes, biogeochemical cycles and climate (e.g., Luther et al., 1990; Prell et al., 1992; Smith et al., 1998a). Land–sea pressure gradients from seasonal heating of Asia in summer drive atmo- spheric circulation and alternately lead to persis- tent southwesterly winds of the Southwest Monsoon (SWM) in summer and northeasterly winds of the Northeast Monsoon (NEM) in winter, respectively. In summer, wind stress of the SWM forces upwelling of nutrient-rich deep- water and thinning of the mixed layer in the western Arabian Sea, stimulating primary produc- tion. Complex eddy circulation and topography produce conditions favorable for development and transport of cold filaments and mesoscale eddies that advect living biomass and detrital biogenic particles offshore (Brock and McClain, 1991; Flagg and Kim, 1998; Honjo et al., 1999; Kim *Corresponding author. Tel.: +1-912-598-2347; fax: +1- 912-598-2310. E-mail address: [email protected] (S.G. Wakeham). 0967-0645/02/$ - see front matter r 2002 Elsevier Science Ltd. All rights reserved. PII:S0967-0645(02)00037-1
-
Upload
independent -
Category
Documents
-
view
5 -
download
0
Transcript of Lipid biomarker fluxes in the Arabian Sea, with a comparison to the equatorial Pacific Ocean

Deep-Sea Research II 49 (2002) 2265–2301
Lipid biomarker fluxes in the Arabian Sea, with a comparisonto the equatorial Pacific Ocean
Stuart G. Wakehama,*, Michael L. Petersonb, John I. Hedgesb, Cindy Leec
aSkidaway Institute of Oceanography, 10 Ocean Science Circle, Savannah, GA 31411, USAbSchool of Oceanography, Box 355351, University of Washington, Seattle, WA 98195-5351, USAcMarine Sciences Research Center, State University of New York, Stony Brook, NY 11794, USA
Received 20 January 2001; received in revised form 7 August 2001; accepted 4 December 2001
Abstract
Fluxes and distributions of organic carbon (OC) and lipid biomarkers were measured in the western Arabian Sea as a
function of season, depth, and distance from the coast of Oman during the US JGOFS Arabian Sea Process Study in
1994–1995. A strong seasonal pattern in OC and lipid flux is related to the annual monsoon cycle in the western
Arabian Sea, with the highest fluxes measured during the Southwest Monsoon. Fluxes were greatly attenuated with
depth in the water column and in surface sediments as remineralization effectively consumed particulate organic matter.
A comparison of water-column fluxes with OC and lipid accumulation rates in sediments confirms that the water–
sediment interface is a ‘‘hot-spot’’ for organic matter degradation. Biomarker compositions also varied seasonally and
with distance offshore, reflecting seasonal and spatial succession of their biological sources and their subsequent export
through the water column. Degradation of OC and biomarkers was extremely efficient, with only a tiny fraction (o1%)
of their water-column flux preserved in sediments, although a range of compound-specific degradation efficiencies was
apparent. This intense degradation has strong implications for contemporary carbon cycling and for interpreting
sediment records for paleoceanographic reconstructions. r 2002 Elsevier Science Ltd. All rights reserved.
1. Introduction
Intense monsoons in the Arabian Sea closelylink highly predictable seasonal patterns of physi-cal processes, biogeochemical cycles and climate(e.g., Luther et al., 1990; Prell et al., 1992; Smithet al., 1998a). Land–sea pressure gradients fromseasonal heating of Asia in summer drive atmo-spheric circulation and alternately lead to persis-
tent southwesterly winds of the SouthwestMonsoon (SWM) in summer and northeasterlywinds of the Northeast Monsoon (NEM) inwinter, respectively. In summer, wind stress ofthe SWM forces upwelling of nutrient-rich deep-water and thinning of the mixed layer in thewestern Arabian Sea, stimulating primary produc-tion. Complex eddy circulation and topographyproduce conditions favorable for development andtransport of cold filaments and mesoscale eddiesthat advect living biomass and detrital biogenicparticles offshore (Brock and McClain, 1991;Flagg and Kim, 1998; Honjo et al., 1999; Kim
*Corresponding author. Tel.: +1-912-598-2347; fax: +1-
912-598-2310.
E-mail address: [email protected] (S.G. Wakeham).
0967-0645/02/$ - see front matter r 2002 Elsevier Science Ltd. All rights reserved.
PII: S 0 9 6 7 - 0 6 4 5 ( 0 2 ) 0 0 0 3 7 - 1

et al., 2001). High productivity leads to enhancedexport into deep waters, where remineralization ofsinking organic matter sustains one of the world’slargest and most intense open-ocean oxygenminimum zones. In winter, cooling and a weakerNEM results in a thickening of the mixed layerand a second, but weaker, pulse in productivityand export. Slack winds between SWM and NEMcharacterize the relatively unproductive springintermonsoon (SI) and fall intermonsoon (FI)periods.The dynamic meteorological and oceanographic
conditions of the Arabian Sea have led tosediment-trap investigations by an Indo-Germanconsortium since 1986 (Nair et al., 1989; Haakeet al., 1993; Haake et al., 1996; Rixen et al., 2000).These studies have documented the spatial andtemporal variability of biogenic and lithogenicparticle flux and composition in intermediate anddeep waters at three sites (west, central and eastArabian Sea), showing the close relationshipbetween monsoonal forcing and particle flux overmulti-year periods. Greater than 50% of theannual particle flux in the central Arabian Seaoccurs during the SWM, and biogenic materialdominates over lithogenic material. These studiesalso noted interannual variability in flux, lagsbetween the timing of physical forcings and peakparticle flux, and an offset between peak fluxes ofcarbonate and silica. About 85% of the variabilityin carbon flux can be attributed to monsoon-induced upwelling (there is disagreement regardingthe importance of open-ocean upwelling, e.g.,Rixen et al., 2000; Smith, 2001). Aspects of theorganic geochemistry of sinking particulate matterin the Arabian Sea provide information on localsources and decomposition of organic substances,in particular amino acids and hexosamines (Haakeet al., 1992; Rixen and Haake, 1993), carbohy-drates (Haake et al., 1996) and fatty acids(Reemtsma et al., 1990). Results from the westernArabian Sea (WAST) site are most pertinent to thepresent investigation.Using the Indo-German results as a basis for
further investigation, our goal in the Arabian SeaProcess Study (ASPS) was to characterize organicgeochemical changes associated with the annualmonsoon cycle in the western Arabian Sea in
concert with other ASPS process studies. Wesought to evaluate seasonal and spatial variationsin the flux and composition of organic biochem-icals and the relationship between these para-meters and physical and biogeochemical processesthat influence them. The questions we addressedincluded: How do fluxes and compositions ofbiochemicals vary over the monsoon cycles along atransect leading from the Oman coast to thecentral Arabian Sea? Does the composition oforganic matter change as it sinks through thewater column and accumulates in sediments, andwhat processes might be responsible? What frac-tion of biochemicals is preserved in sediments; howdoes this fraction vary with surface-water char-acter; and what are the implications for paleocea-nographic reconstructions? To address thesequestions, we determined elemental and biochem-ical fluxes and compositions in time-series sedi-ment traps deployed over an annual cycle alongthe southern US JGOFS section (Fig. 1) from offthe coast of Oman (MS-1) to the central ArabianSea (MS-4). This paper describes lipid biomarkerdistributions in sinking particulate mattercaptured by these traps in the context of thespatio-temporal variability in physical andbiogeochemical processes of the western ArabianSea.Several recent ASPS reports on sediment-trap
studies provide further background specific to thisstudy. Lee et al. (1998) compiled surface water-to-sediment organic carbon fluxes obtained fromprimary production measurements, water-columnexport determined by 234Th and sediment traps,and accumulation rates in underlying sediment forthe ASPS southern section. These results provide abroad overview of organic carbon removal andremineralization in the western Arabian Sea.Honjo et al. (1999) described detailed records ofseasonal and spatial variability in mass flux, andflux of organic and inorganic carbon, biogenicsilica and lithogenic Al to the interior of theArabian Sea obtained from moored sedimenttraps. Temporal and spatial variability in trap-derived fluxes are interpreted in terms of mon-soon-driven biogeochemical events. Prahl et al.(2000) developed an annual record of biomarkerexport to the interior of the central Arabian Sea at
S.G. Wakeham et al. / Deep-Sea Research II 49 (2002) 2265–23012266

2200m depth at site MS-4 (Fig. 1) in relation tobiological conditions of the upper ocean. Andfinally, analysis of particulate material using solidstate 13C-NMR (Hedges et al., 2001) and a newmechanistic model (Armstrong et al., 2002) bothconclude that extensive (>98%) biodegradation isaccompanied by minimal change in bulk organicmatter composition, implying physical protectionand ballasting of the organic fraction by mineralmatrices.
2. Methods
2.1. Sediment traps and sediment coring
Sinking particulate matter was collected usingmoored sediment traps with indented-rotatingsphere valves to exclude swimmers and withcarousels for time-series collections (IRS-C traps;Peterson et al., 1993; http://boto.ocean.washingto-n.edu/aog/traps/irs traps.html). Three sets of traps
Fig. 1. Site locations for moored IRS-C traps on the US JGOFS Arabian Sea Process Study southern section. Stations 1, 3, and 4
correspond to mooring sites MS-1, MS-3, and MS-4 of Honjo et al. (1999) and process study hydrographic stations S2, S4, and S7
(Smith et al., 1998a). The air–sea interface (ASI) buoy (Weller et al., 1998) was located 53 km south of MS-4. The farthest offshore
mooring, MS-5 is not discussed here but is included in Honjo et al. (1999). The WAST site is the Indo-German mooring in the western
Arabian Sea.
S.G. Wakeham et al. / Deep-Sea Research II 49 (2002) 2265–2301 2267
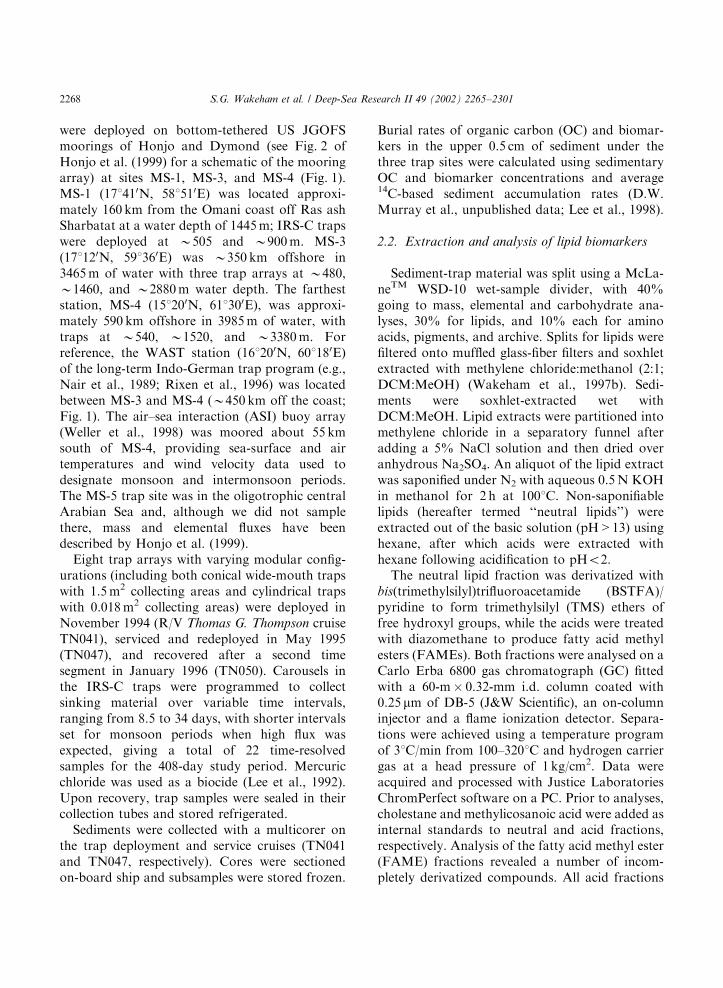
were deployed on bottom-tethered US JGOFSmoorings of Honjo and Dymond (see Fig. 2 ofHonjo et al. (1999) for a schematic of the mooringarray) at sites MS-1, MS-3, and MS-4 (Fig. 1).MS-1 (171410N, 581510E) was located approxi-mately 160 km from the Omani coast off Ras ashSharbatat at a water depth of 1445m; IRS-C trapswere deployed at B505 and B900m. MS-3(171120N, 591360E) was B350 km offshore in3465m of water with three trap arrays at B480,B1460, and B2880m water depth. The fartheststation, MS-4 (151200N, 611300E), was approxi-mately 590 km offshore in 3985m of water, withtraps at B540, B1520, and B3380m. Forreference, the WAST station (161200N, 601180E)of the long-term Indo-German trap program (e.g.,Nair et al., 1989; Rixen et al., 1996) was locatedbetween MS-3 and MS-4 (B450 km off the coast;Fig. 1). The air–sea interaction (ASI) buoy array(Weller et al., 1998) was moored about 55 kmsouth of MS-4, providing sea-surface and airtemperatures and wind velocity data used todesignate monsoon and intermonsoon periods.The MS-5 trap site was in the oligotrophic centralArabian Sea and, although we did not samplethere, mass and elemental fluxes have beendescribed by Honjo et al. (1999).Eight trap arrays with varying modular config-
urations (including both conical wide-mouth trapswith 1.5m2 collecting areas and cylindrical trapswith 0.018m2 collecting areas) were deployed inNovember 1994 (R/V Thomas G. Thompson cruiseTN041), serviced and redeployed in May 1995(TN047), and recovered after a second timesegment in January 1996 (TN050). Carousels inthe IRS-C traps were programmed to collectsinking material over variable time intervals,ranging from 8.5 to 34 days, with shorter intervalsset for monsoon periods when high flux wasexpected, giving a total of 22 time-resolvedsamples for the 408-day study period. Mercuricchloride was used as a biocide (Lee et al., 1992).Upon recovery, trap samples were sealed in theircollection tubes and stored refrigerated.Sediments were collected with a multicorer on
the trap deployment and service cruises (TN041and TN047, respectively). Cores were sectionedon-board ship and subsamples were stored frozen.
Burial rates of organic carbon (OC) and biomar-kers in the upper 0.5 cm of sediment under thethree trap sites were calculated using sedimentaryOC and biomarker concentrations and average14C-based sediment accumulation rates (D.W.Murray et al., unpublished data; Lee et al., 1998).
2.2. Extraction and analysis of lipid biomarkers
Sediment-trap material was split using a McLa-neTM WSD-10 wet-sample divider, with 40%going to mass, elemental and carbohydrate ana-lyses, 30% for lipids, and 10% each for aminoacids, pigments, and archive. Splits for lipids werefiltered onto muffled glass-fiber filters and soxhletextracted with methylene chloride:methanol (2:1;DCM:MeOH) (Wakeham et al., 1997b). Sedi-ments were soxhlet-extracted wet withDCM:MeOH. Lipid extracts were partitioned intomethylene chloride in a separatory funnel afteradding a 5% NaCl solution and then dried overanhydrous Na2SO4. An aliquot of the lipid extractwas saponified under N2 with aqueous 0.5N KOHin methanol for 2 h at 1001C. Non-saponifiablelipids (hereafter termed ‘‘neutral lipids’’) wereextracted out of the basic solution (pH>13) usinghexane, after which acids were extracted withhexane following acidification to pHo2.The neutral lipid fraction was derivatized with
bis(trimethylsilyl)trifluoroacetamide (BSTFA)/pyridine to form trimethylsilyl (TMS) ethers offree hydroxyl groups, while the acids were treatedwith diazomethane to produce fatty acid methylesters (FAMEs). Both fractions were analysed on aCarlo Erba 6800 gas chromatograph (GC) fittedwith a 60-m� 0.32-mm i.d. column coated with0.25 mm of DB-5 (J&W Scientific), an on-columninjector and a flame ionization detector. Separa-tions were achieved using a temperature programof 31C/min from 100–3201C and hydrogen carriergas at a head pressure of 1 kg/cm2. Data wereacquired and processed with Justice LaboratoriesChromPerfect software on a PC. Prior to analyses,cholestane and methylicosanoic acid were added asinternal standards to neutral and acid fractions,respectively. Analysis of the fatty acid methyl ester(FAME) fractions revealed a number of incom-pletely derivatized compounds. All acid fractions
S.G. Wakeham et al. / Deep-Sea Research II 49 (2002) 2265–23012268
were subsequently silylated with BSTFA/pyridineand reanalyzed as TMS-ethers/FAMEs, revealinga complex suite of hydroxy-acids. Selected sampleswere analysed by gas chromatography-mass spec-trometry (GCMS) using a Hewlett-Packard5980II-Finnigan Incos 50 system operated inelectron impact mode (scanning m/z 50–650 at0.8 scans s�1) to confirm compound identities andpeak purities. Analytical precision is estimated at720%, but as will be shown, the range in fluxescan be an order-of-magnitude or greater.
2.3. Statistical analyses
The matrix of samples (8 arrays� 24 samplecups=192 trap samples) and variables (B100biomarkers per sample) yields a very large dataset for a complex oceanographic regime. In manyof cases, several compounds carry similar, andhence redundant, biogeochemical information ifthey derive from the same or closely relatedsources. Many diatoms, for example, containsimilar mixtures of several fatty acids (e.g., C14:0,C16:0 and C16:1o9) and sterols (e.g., cholesta-5,22-dien-3b-ol, 24-methylcholest-5,22-dien-3b-ol, 24-methylcholesta-5,24(28)-dien-3b-ol), and discuss-ing details of distributions of all diatom-derivedbiomarkers may not be needed. At the same time,many biomarkers have multiple sources and thusare ambiguous source indicators. For instance, 24-methylcholest-5,22-dien-3b-ol is important inmany diatoms, many prymnesiophytes, and somedinoflagellates and cyanobacteria, making thissterol a poor biomarker. Therefore, selecting afew diagnostic biomarkers to decipher the under-lying biogeochemical relationships in this data setwas a daunting task.The traditional approach to identifying key
biomarkers is based on intuition and experiencein the context of potential allochthonous andautochthonous sources in the studied system. Ifdiatoms are present in the phytoplankton, forinstance, then common diatom-derived sterolsmay be useful; long-chain alkenones may bechosen if coccolithophorids are present. Multi-variate statistical approaches offer an alternative.Principal component analysis (PCA) was used inthis investigation to help reduce the multidimen-
sional nature of the data set. PCA transforms theinformation in a large data matrix into two smallermatrices that are linear combinations of theoriginal data set. The new ‘‘scores’’ matrixcontains information about the sample (sedimenttrap) patterns in the data, while loadings reflect theinfluence of variables (biomarkers) on samplepatterns. The new matrices or principal compo-nents (PC) are created in order of decreasingvariance, where the first PC accounts for most ofthe variance in the data, the second, less, and soforth. Thus, PCA classifies trap samples orbiomarker variables according to common beha-vior in the matrix of samples. Covariance thenprovides a means for selecting a few biomarkersfor further investigation. Several studies havesuccessfully applied PCA for discriminating terri-genous and marine origins of organic matter(Reemtsma and Ittekkot, 1992; Yunker et al.,1995; Go *ni et al., 2000; Canuel, 2001) and to assessdegradation of organic matter (Dauwe and Mid-delburg, 1998; Sheridan et al., 2002). PCAs wererun using Sirius for WindowsTM Pattern Recogni-tion software (version 1.2B, August 1995). Variousdata sets (biomarker flux, biomarker percentabundance, organic-carbon normalized concentra-tions) and preprocessing techniques (block nor-malization, log normalization) were tested.
3. Results
3.1. Diagnostic biomarkers
The analytical scheme used in this studyidentified and quantified B60 individual com-pounds in the neutral lipid fraction andB40 acids.The complete data set of fluxes is available on theUS JGOFS Database (http://usjgofs.whoi.edu/PI-NOTES/arabian/Wakeham/sedtrap lipid raw.html).Predominant neutral lipid classes included C25–C31
n-alkanes, C25-highly branched isoprenoid (HBI)alkenes, C14–C28 n-alkanols, C26–C30 sterols, C28–C32 alkyl diols and alkyl keto-ols, and C37–C39
alkenones. Fatty acid types included C12–C26 n-carboxylic acids, C15 and C17 iso and anteiso acids,various hydroxy acids, and homohopanoic acid.Total neutral lipid and acid fluxes, obtained by
S.G. Wakeham et al. / Deep-Sea Research II 49 (2002) 2265–2301 2269

summing these individual components, are avail-able on the Database: http://usjgofs.whoi.edu/jg/serv/jgofs/arabian/sedtrap lipid.html. For refer-ence, bulk carbon and nitrogen fluxes for ourtraps are at: http://usjgofs.whoi.edu/jg/serv/jgofs/arabian/sedtrap carbon.html.PCA using log-transformed abundance (% of
total lipids) data provided the most informativeresults. Because abundances of biomarkers werehigh in the 500m traps and low in the deep traps,any concentration-based data set combining trapsat different depths at a given site (MS-1, MS-3 orMS-4) was dominated by patterns determined bythe organic concentrations of the shallowest traps,so that differential behavior of the deeper trapswas difficult to discern. Grouping samples by
depth provided the best results, and Fig. 2a and billustrates sample scores for the B500 andB3000m traps at MS-3. Only B40 of the mostabundant biomarkers are plotted to aid in viewing,although trends would be similar if all B100compounds were plotted. In the shallow trap, C25-HBIs cluster together and project in the lowerright quadrant (most positively on PC1 and mostnegatively on PC2); thus, HBIs have the greatestinfluence on PC1 and a minor influence on PC2.Sterols, the 37:2 alkenone, and alkyl diols andketo-ol project more positively on PC1 and morenegatively on PC2. Of the biomarkers plotted, n-
carboxylic acids project most negatively on PC1.At 3000m, most HBIs project towards the centerof the biomarker cluster, while alkyl-diols project
PC1 (59.8%)
-0.1 0.1 0.2 0.3 0.40.0 0.5
PC
2 (
20
.2%
)
-0.4
-0.2
0.0
0.2
0.4 alcohols
phytolsterolsdiols/ketolalkenonen-acids
bacterial acidshydroxy acids
PC1 (64.8%)
-0.1 0.1 0.2 0.3 0.40.0 0.5
PC
2 (
16
.8%
)
-0.4
-0.2
0.0
0.2
0.4
NEMSISWMFI
PC1 (64.8%)-0.004 0.000 0.004 0.008 0.012
PC
2 (
16
.8%
)
-0.004
0.000
0.004
0.008
PC1 (59.8%)
-0.010 -0.005 0.000 0.005 0.010 0.015 0.020 0.025
PC
2 (
20
.2%
)
-0.01
0.00
0.01
0.02NEMSISWMFI
(a) (c)
(b) (d)
MS-3 500 m MS-3 500 m
MS-3 3000 m MS-3 3000 m
mid-SWM
first-SWM
last-SWM
mid-SWM
late-SWM
37:2
ω22OH
12OH28
30diol
HHA
30ketol
phytol
25:3 HBI
28∆ 5,24(28)
br fa
25:3 HBI
12OH28
ω 22OH
HHA
30diol
30ketol
28∆ 5,24(28)
37:2
phytol
30∆ 22
30∆ 22HBIs
Fig. 2. Principal component analysis (PCA) comparison for sediment traps at 500 and 3000m at MS-3: (a) and (b) variable
(biomarker) loadings; (c) and (d) sample (trap sample) scores. The variance accounted for by each principal component is shown in
parentheses after the axis label. Labeled biomarkers are described in the text (Section 3.1). Compound abbreviations: 25:3 HBI=25:3
highly branched isoprenoid alkene; o22OH=o-hydroxy-C22 acid; 12OH28=12-hydroxy-C28 acid; 28D5,24(28)=24-methylene
cholesterol; 30D22=dinosterol; 37:2=37:2 alkenone; br fa=C15+C17 branched fatty acids; HHA=homohopanoic acid; 30-
diol=1,15-C30-alkyl diol; 30-ketol=1,15-C30-alkyl keto-ol.
S.G. Wakeham et al. / Deep-Sea Research II 49 (2002) 2265–23012270

in the lower right corner of the plot. Thus, thequantitatively important contribution of HBIs tothe shallow traps gives way to an increasedsignificance to alkyl-diols in the deep traps, whilesterol and fatty acid influences remain similarat both depths. This contrast suggests that ingeneral most HBIs are highly labile while the alkyldiols are either stable and/or are produced atdepth.A plot of sample PCA loadings (Fig. 2c and d)
groups traps collecting during the SWM to theright of all other traps. At 500m, there is astrong separation of traps collecting duringthe mid-period of the SWM (projecting in theupper right quadrant) versus those collectingat the end of the SWM (projecting in thelower right quadrant). At 3000m, the firstSWM trap projects most positively on PC1 andmost negatively on PC2 (at the lower right), andthe last SWM trap projects most positively onboth PC1 and PC2 (upper right). The three mid-term SWM traps cluster together in the center ofthe plot, to the left of the first- and last-SWMtraps, but to the right on PC1 of non-SWM traps.SWM traps are clearly distinguished in terms oftheir biomarker composition from non-SWMtraps.Using the PCA results and information avail-
able about phytoplankton species compositionand succession during the ASPS program (Garri-son et al., 1998), the large list of measuredbiomarkers was reduced for further considerationto a ‘‘short list’’ of 11 compounds that provide arange of diagnostic information about organicmatter source and behavior. These compounds areidentified on the plots of PCA loadings (Fig. 2aand b).
* phytolFPhytol (3,7,11,15-tetramethylhexadec-1-enol) was a major alcohol in the Arabian Seatrap material. It is the esterified side-chain ofchlorophyll-a and is released by enzymatichydrolysis during zooplankton grazing of phy-toplankton in nature and/or by alkaline hydro-lysis (saponification) in the laboratory. Sincephytol in these samples is derived only from chl-a, it is used here as a generic indicator ofphytoplankton biomass.
* 25:3 highly branched isoprenoid (HBI) alkene-
FA series of C25 highly branched isoprenoid(HBI) alkenes were common, especially duringthe SWM. Among these alkenes, a C25-triene(hereafter abbreviated 25:3 HBI) dominated thedistribution during the SWM. C25 HBIs arebiosynthesized by some diatoms, notably Ha-
slea ostrearia and Rhizosolenia setigera (Beltet al., 2000, and references therein) that wereimportant components of the SWM diatom‘‘bloom’’ (Haake et al., 1993; Garrison et al.,1998). C30 HBI alkenes also are produced bysome diatoms, but these compounds werepresent only at trace levels in the Arabian Seasamples and will not be discussed further.
* 37:2 long-chain alkenoneFLong-chain C37–C39
alkenones, produced by a few haptophyte algae,primarily the cosmopolitan coccolithophoridsEmiliania huxleyi and Gephyrocapsa oceanica
(Brassell, 1993; Conte et al., 1994), were presentat low levels in Arabian Sea particulate matter.In the warm (27–301C) surface waters of theArabian Sea, the C37 alkadienone (37:2) domi-nated, constituting >95% of total C37 alke-nones (this study; ten Haven et al., 1992; Prahlet al., 2000). As a group, alkenones are the mostwidely used molecular proxies in paleoceano-graphy (Brassell, 1993; Eglinton et al., 2001).The other widespread haptophyte in theArabian Sea, Phaeocystis sp., does not bio-synthesize alkenones (Conte et al., 1994).
* 24-methylcholesta-5,24(28)-dien-3b-ol (24-
methylene cholesterol)FC26–C30 sterols werethe dominant class of neutral lipids in oursamples. Often cholest-5-en-3b-ol (cholesterol)was the major sterol, but in sediment-trapsamples, even those with swimmer-minimizingIRS valves, there is concern that cholesterol islargely of zooplankton origin. 24-Methylcho-lesta-5,22-dien-3b-ol (brassicasterol) and 24-methylcholesta-5,24(28)-dien-3b-ol (24-methy-lene cholesterol) dominated the phytosterols.24-Methylene cholesterol has been proposed tobe the most robust sterol indicator for diatoms(Volkman et al., 1998) because the traditionaldiatom-sterol, brassicasterol, is also present inother major classes of phytoplankton (Barrettet al., 1995; Volkman et al., 1998), including
S.G. Wakeham et al. / Deep-Sea Research II 49 (2002) 2265–2301 2271

E. huxleyi and Phaeocystis sp. in the ArabianSea. 24-Methylene cholesterol is used here as anindicator of diatom-derived organic matter.
* 4a,23,24-trimethyl-5a(H)-cholest-22-en-3b-ol
(dinosterol)FThe 4-methylsterol, dinosterol,was a minor sterol in the Arabian Sea, butalong with other 4-methylsterols is a widelyrecognized and relatively stable dinoflagellatebiomarker (e.g., Boon et al., 1979; Robinsonet al., 1984). Not all dinoflagellates have highcontents of dinosterol, however, and a fewother phytoplankton, including diatoms, bio-synthesize small amounts of this sterol (Volk-man et al., 1993, 1998).
* C30-alkyl diol (C30-diol)FLong-chain satu-rated and unsaturated C28–C32-alkyl-1,13-,1,14-, and 1,15-diols were major componentsin Arabian Sea trap material and sediments weanalyzed (see also ten Haven et al., 1992;Schouten et al., 2000). The C30-1,15-homologwas most abundant. Morris and Brassell (1988)originally proposed long-chain diols as beingderived from cyanobacteria, but a subsequentstudy (de Leeuw et al., 1992) questioned thissource. Long-chain diols are found in Eustig-matophyte microalgae of the genus Nannochlor-
opsis (Volkman et al., 1992, 1999; Gelin et al.,1997), where they may serve as building blocksof the highly aliphatic algaenan polymers (Gelinet al., 1997).
* C30-alkyl keto-1-ol (C30-keto-ol)FC28–C32
saturated and unsaturated keto-ols co-occurredin our Arabian Sea samples along with the alkyldiols. Although well known in sediments(Versteegh et al., 1997), long-chain keto-olshave not been reported in organisms. They maybe products of oxidation of long-chain diols(Versteegh et al., 1997).
* branched iso- and anteiso-C15 and C17 fatty
acidsFBranched C15 and C17 fatty acidsoccurring in our samples may be indicators ofbacterial alteration organic matter (Kaneda,1991; Wakeham, 1995).
* o-hydroxy-C22 acidFA wide range of C12–C28
hydroxy acids [a-, b-, o- and (o-1)] weredetected in Arabian Sea trap samples whenthe acid fractions were reanalyzed as TMS-ethers/FAMEs. Often, the most abundant
homolog was the o-hydroxy-C22 acid, whichin some instances was the most abundantcompound in the entire acid fraction. Micro-algae and cyanobacteria have been implicatedas sources of hydroxy acids (Matsumoto andNagashima, 1984; Matsumoto et al., 1984,1988). Hydroxy acids also are produced bymicrobial oxidation of fatty acids (Lehninger,1981) and are constituents of structural biopo-lymers of many microorganisms (Ratledge andWilkinson, 1988).
* 12-hydroxy-C28 acidFThe other dominant hy-droxy acid in our samples was 12-hydroxy-C28
acid. Its source is also uncertain, but fluxpatterns described below suggest a phytoplank-ton origin. Gelin et al. (1997) reported extendedmid-chain hydroxy acids in Eustigmatophytes,possibly related to algaenan.
* homohopanoic acidFWe propose that homo-hopanoic acid may serve as a biomarker forcyanobacteria in our Arabian Sea samples.Prokaryotes biosynthesize hopanoids (penta-cyclic triterpenoids) as structure-reinforcingsurrogates for sterols (Ourisson et al., 1987).Synechococcus was a major component of thepicoplankton during all seasons and through-out the Arabian Sea, while Prochlorococcus
dominated the phytoplankton in oligotrophicareas (Latasa and Bidigare, 1998; Campbellet al., 1998; Liu et al., 1998). Synechococcus
contains a variety of hopanoid derivativesrelated to bacteriohopanpolyols; it is unknownwhether Prochlorococcus contains hopanoids.
Long chain (C25–C33) n-alkanes indicative ofterrigenous vascular plant input were not includedin this list. The analytical procedure used was notdesigned to specifically isolate hydrocarbons, andthey were very minor constituents of the neutrallipid fraction that was analyzed by GC andGCMS. GCMS analysis did show the presence oflong-chain hydrocarbons in the samples. However,in many cases a petroleum component (unresolvedcomplex mixture and significant abundances ofeven carbon-chain length alkanes) was observed(not surprising given the setting in the oil-richMiddle East and near heavily used tanker lanes),leaving the odd-carbon number predominance
S.G. Wakeham et al. / Deep-Sea Research II 49 (2002) 2265–23012272

typical of vascular plant material barely visible.Thus, accurate determinations of terrigenous long-chain alkane fluxes were difficult to obtain.However, vascular plant hydrocarbons are impor-tant components of sedimentary hydrocarbons(see Section 4 and Prahl et al., 2000) and areconsistent with large-scale dust delivery to theArabian Sea off adjacent continental areas (Pye,1987).
3.2. Biomarker fluxes in the Arabian Sea
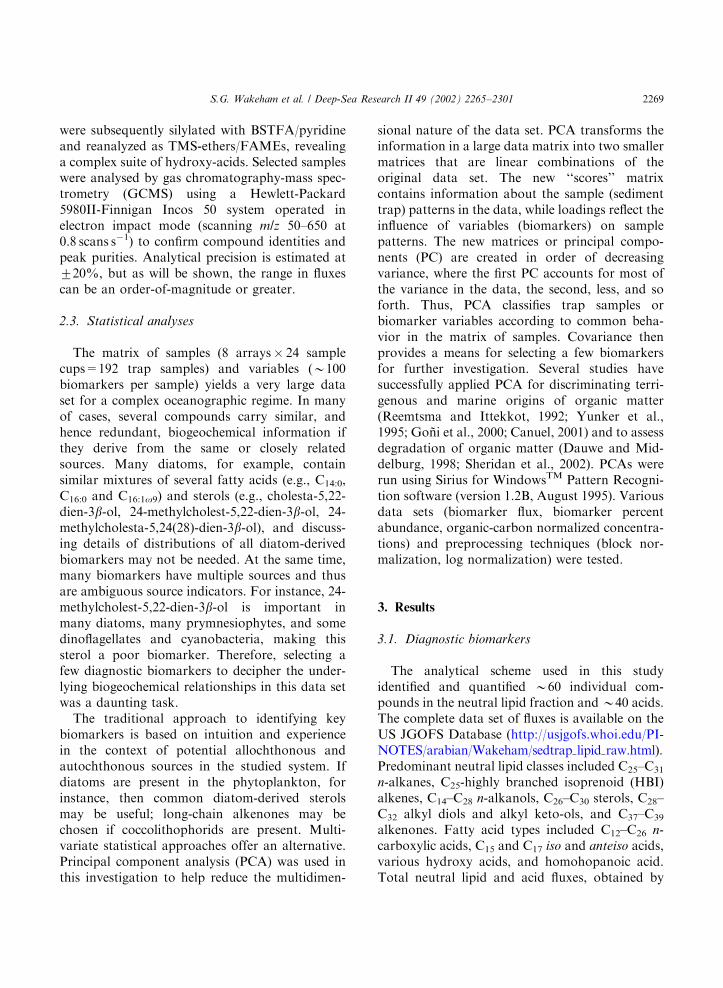
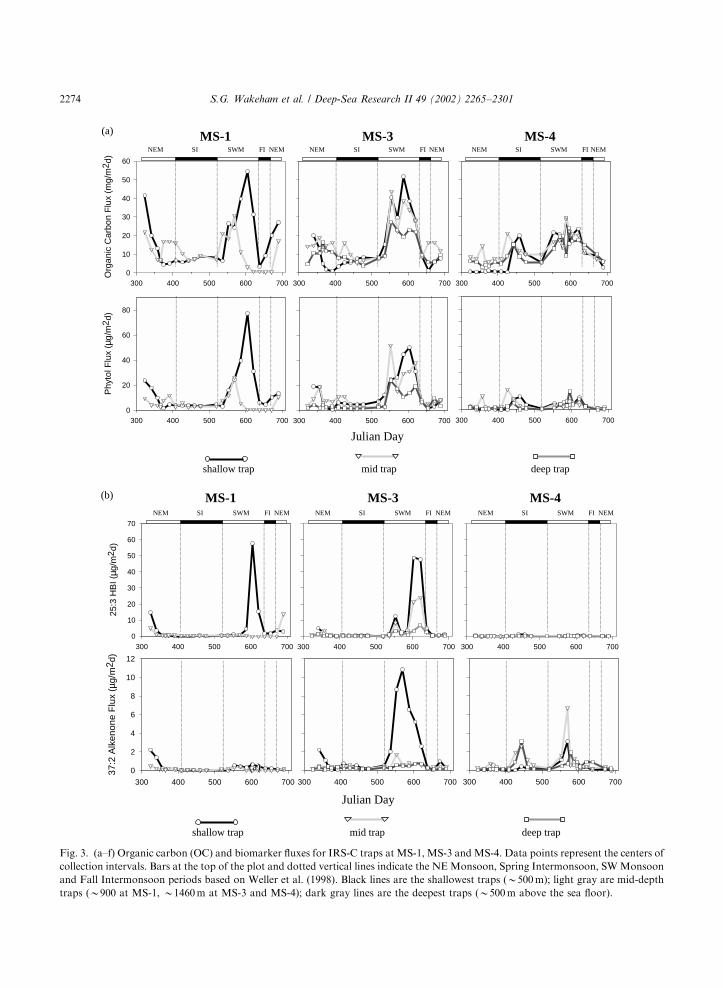
Fig. 3(a–f) shows time-series fluxes of organiccarbon (OC) and the 11 target biomarkersobtained with IRS-C sediment traps at the threemooring sites and as a function of trap depth (rawdata are on the JGOFS Database: http://usjgofs.-whoi.edu/PI-NOTES/arabian/Wakeham/sedtraplipid raw.html). Fluxes were highly variable inboth time (trap collection period and season) andspace (trap location and water-column depth).There is, however, a marked seasonality in OC andlipid flux. The complexity of biomarker fluxes canbe reduced by calculating average seasonal fluxes(Fig. 4a and b). This exercise is accomplished byseparating time-series collections by season asclosely as possible to those defined by the ASIbuoy data (Weller et al., 1998) and weightingfluxes according to temporal resolution.Maximum fluxes of OC and biomarkers
occurred during the SWM, regardless of traplocation. SWM fluxes during individual samplingintervals were usually >10-fold higher than duringIntermonsoon periods (up to 2 orders of magni-tude in some cases, e.g., 25:3 HBI, 12-hydroxy-C28
acid) and roughly 5-fold higher than NEM fluxes(keeping in mind an estimated precision of720%). The range in biomarker fluxes wassubstantially greater than for organic carbon, forwhich ratios of intermonsoon (SI and FI):-NEM:SWM fluxes were roughly 1:2:4. Jaggedpatterns in flux suggest pulses in export, possiblyrelated to passage of eddies or filaments. However,it is difficult to gauge the origin and significance ofspikes in flux since most were recorded only insingle trap collection cup. SWM fluxes measuredat MS-3 were usually higher than at either theinshore (MS-1) or offshore (MS-4) mooring sites.
Notable exceptions were phytol and 25:3 HBI,which also had high fluxes at MS-1, and o-hydroxy-C22 acid which had its highest flux at MS-4.Flux maxima were often asynchronous.
Although the SWM was the period of maximalflux for OC and individual compounds (Figs. 3and 4), the timing of maximal flux varied duringthe SWM. Fig. 5 shows the annual patterns offlux at 500m at MS-3 (complete data are in Fig. 3),where the flux for each component and at eachtime interval has been normalized to the highestflux value measured for that component duringthe year. These normalized fluxes are plottedoffset on the abscissa and using an expandedscale to better reveal temporal offsets duringthe SWM. Such normalized trends must beviewed with caution since absolute fluxes oftenwere markedly different. A sequence of biomarkerflux peaks is evident. The flux maximum for (i)C30-diol, C30-keto-ol and homohopanoic acidoccurred first, corresponding to the secondarymaximum in OC flux, followed in successive 17-day intervals (i.e., the next trap sample cup) bymaxima in (ii) 37:2 alkenone, (iii) 24-methylenecholesterol coincident with the primary maximumfor OC, phytol and dinosterol, (iv) 12-hydroxy-C28
acid and finally (v) 25:3 HBI. Branched fatty acidsshowed two roughly equal peaks in flux, coveringmost of the SWM period.Temporal variations in flux also differed among
trap sites. Normalized fluxes at B500m waterdepth at MS-1, MS-3, and MS-4 for OC and asubset of biomarkers are plotted in Fig. 6 (againnote significant differences in absolute fluxdisappear in this presentation; see Fig. 3). Thetypical patterns at MS-1 and MS-3 showed astrong primary maximum in flux during the SWM,along with a secondary peak during the NEM forOC and some biomarkers (25:3 HBI, 37:2 alke-none, 24-methylene cholesterol) but not others. Insome instances the SWM peak was stronglyunimodal (25:3 HBI), while for other components(OC, 37:2 alkenone, 24-methylene cholesterol, C30-diol, 12-hydroxy-C28 acid) the SWM flux appearssplit, suggesting pulses in export flux, possibly dueto the passage of eddies or filaments. At MS-4, onthe other hand, several compounds (OC, 25:3 HBI,24-methylene cholesterol, C30-diol) also had high
S.G. Wakeham et al. / Deep-Sea Research II 49 (2002) 2265–2301 2273
300 400 500 600 700
25:3
HB
I (µg
/m2 d
)
0
10
20
30
40
50
60
70
300 400 500 600 700 300 400 500 600 700
300 400 500 600 700
37:2
Alk
enon
e F
lux
(µg/
m2 d
)
0
2
4
6
8
10
12
300 400 500 600 700 300 400 500 600 700
Julian Day
shallow trap mid trap deep trap
NEM SI SWM NEMFI NEM SI SWM NEMFI NEM SI SWM NEMFI
300 400 500 600 700
Phy
tol F
lux
(µg/
m2 d
)
0
20
40
60
80
300 400 500 600 700 300 400 500 600 700
300 400 500 600 700
Org
anic
Car
bon
Flu
x (m
g/m
2 d)
0
10
20
30
40
50
60
300 400 500 600 700 300 400 500 600 700
NEM SI SWM NEMFI NEM SI SWM NEMFI NEM SI SWM NEMFI
Julian Day
shallow trap mid trap deep trap
MS-1 MS-4MS-3(a)
(b)
(a)
MS-1 MS-4MS-3
Fig. 3. (a–f) Organic carbon (OC) and biomarker fluxes for IRS-C traps at MS-1, MS-3 and MS-4. Data points represent the centers of
collection intervals. Bars at the top of the plot and dotted vertical lines indicate the NEMonsoon, Spring Intermonsoon, SWMonsoon
and Fall Intermonsoon periods based on Weller et al. (1998). Black lines are the shallowest traps (B500m); light gray are mid-depth
traps (B900 at MS-1, B1460m at MS-3 and MS-4); dark gray lines are the deepest traps (B500m above the sea floor).
S.G. Wakeham et al. / Deep-Sea Research II 49 (2002) 2265–23012274

300 400 500 600 700
30 2
2 F
lux (
µg/m
2d)
0
5
10
15
20
25
30
300 400 500 600 700 300 400 500 600 700
300 400 500 600 700
28 5
,24
(28
) Flu
x (
µg/m
2d)
0
15
30
45
60
75
90
300 400 500 600 700 300 400 500 600 700
NEM SI SWM NEMFI NEM SI SWM NEMFI NEM SI SWM NEMFI
Julian Day
shallow trap mid trap deep trap
300 400 500 600 700
C3
0 D
iol F
lux (
µg/m
2d
)
0
20
40
60
80
100
120
300 400 500 600 700 300 400 500 600 700
300 400 500 600 700
C3
0 K
eto
-ol F
lux (
µg/m
2d
)
0
2
4
6
8
10
12
300 400 500 600 700 300 400 500 600 700
Julian Day
shallow trap mid trap deep trap
NEM SI SWM NEMFI NEM SI SWM NEMFI NEM SI SWM NEMFI
(c)
(d)
∆∆
MS-1 MS-4MS-3
MS-1 MS-4MS-3
Fig. 3 (continued).
S.G. Wakeham et al. / Deep-Sea Research II 49 (2002) 2265–2301 2275

300 400 500 600 700
ω -O
H-C
22 F
lux
(µg/
m2 d)
0
40
80
120
160
300 400 500 600 700 300 400 500 600 700
300 400 500 600 700
Bra
nche
d A
cids
(µg
/m2 d)
0
20
40
60
80
100
300 400 500 600 700 300 400 500 600 700
Julian Day
shallow trap mid trap deep trap
NEM SI SWM NEMFI NEM SI SWM NEMFI NEM SI SWM NEMFI
(e)
(f)
300 400 500 600 700
12-O
H-C
28 F
lux
(µg/
m2 d)
0
40
80
120
160
300 400 500 600 700 300 400 500 600 700
300 400 500 600 700
Hom
ohop
anoi
c F
lux
(µg/
m2 d)
0
2
4
6
8
10
300 400 500 600 700 300 400 500 600 700
NEM SI SWM NEMFI NEM SI SWM NEMFI NEM SI SWM NEMFI
Julian Day
shallow trap mid trap deep trap
MS-1 MS-4MS-3
MS-1 MS-4MS-3
Fig. 3 (continued).
S.G. Wakeham et al. / Deep-Sea Research II 49 (2002) 2265–23012276
0
10
20
30
0
10
20
30
40
0
2
4
6
0
5
10
15
0
3
6
9
12
0
10
20
30
40
MS-1 MS-3 MS-4MS-1 MS-4MS-3
NEM
SI
SWM
FI
S
D
SM
DS M D
Flu
x (µ
g/m
2d)
Flu
x (µ
g/m
2d)
OC Phytol
25:3 HBI 37:2
28∆ ∆ 5,24(28) 30∆ ∆ 22
0
10
20
30
0
2
4
6
0
20
40
60
0
20
40
0
20
40
60
0
1
2
3
4
MS-1 MS-3 MS-4MS-1 MS-4MS-3
C -diol30 C -ketol30
br fa ω − ω − OH-C22
12-OH-C28 HHA
S
D
S M
D
S M D
(a)
(b)
Fig. 4. (a and b) Seasonally averaged fluxes of organic carbon and biomarkers at MS-1, MS-3, and MS-4. Individual trap fluxes were
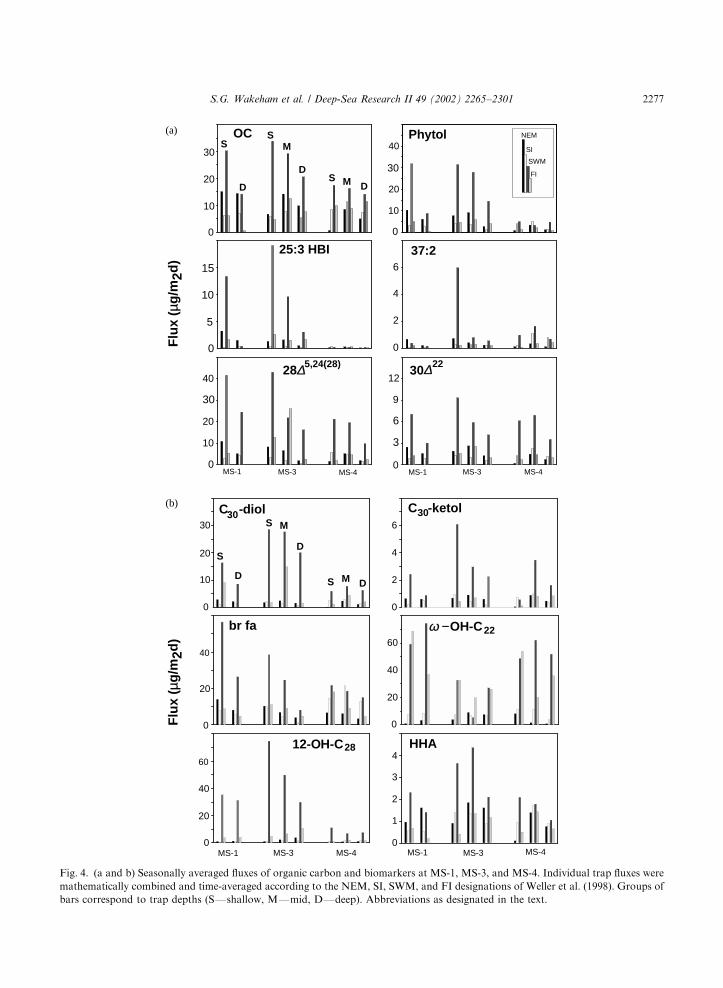
mathematically combined and time-averaged according to the NEM, SI, SWM, and FI designations of Weller et al. (1998). Groups of
bars correspond to trap depths (SFshallow, MFmid, DFdeep). Abbreviations as designated in the text.
S.G. Wakeham et al. / Deep-Sea Research II 49 (2002) 2265–2301 2277

flux during the SI period. The contrast between thesingle flux peak at MS-1 and MS-3 and thebimodal pattern at MS-4 must reflect geographicvariations in hydrography and nutrient regimethat are expressed in the ecology of the phyto-plankton, their succession, and the lipids theyproduce.In a few instances, fluxes measured at mid-depth
(e.g., OC, phytol and C30-diol at MS-3; 37:2alkenone, dinosterol and C30-keto-ol at MS-4; seeFig. 3) were higher than in the shallow trap.
Mid-water-column flux maxima are not consistentwith continual degradation of organic matter as itsinks into the interior of the Arabian Sea. Thesignificance of these apparent mid-depth maximaare difficult to evaluate due to lack of replicatesamples, analytical reproducibilities of about720%, and the temporal resolution of the time-series cup. However, most of the biomarkersshowing these subsurface maxima are biosynthe-sized by phytoplankton in surface waters, sodeep-water sources are unlikely.
Julian Day
400 500 600 700
No
rmal
ized
Flu
x
HHA
C30-diol
C30-ketol
OC
br fa
37:2
25:3 HBI
12-OH-C28
phytol
28∆ 5,24(28)
30∆ 22
NEM SI SWM NEMFI
Fig. 5. Organic carbon and biomarker fluxes for the 500m trap at MS-3, each normalized to the highest flux measured for the given
component during the year and off-set on the abscissa to facilitate viewing. Absolute fluxes are plotted in Fig. 3. Abbreviations as
designated in the text.
S.G. Wakeham et al. / Deep-Sea Research II 49 (2002) 2265–23012278
4. Discussion
4.1. Meteorological forcing as a control on organic
carbon cycling
Meteorological data obtained from the ASIbuoy located near MS-4 (Weller et al., 1998)characterize the NEM, SI, SWM, and FI periods
based on wind and temperature fields. Monsoonperiods are characterized by reduced surface watertemperatures that follow periods of elevated windstress. The SWM begins in June as southwesterlywinds strengthen about 3-fold over SI winds andsurface water temperatures begin to decrease inresponse to offshore advection of colder, upwelledwater. Continuous euphotic zone pigment
300 400 500 600 700
OC
Nor
mal
ized
Flu
x
0
1
2
300 400 500 600 700
25:3
HB
I Nor
mal
ized
Flu
x
0
1
2
300 400 500 600 700
37:2
Alk
enon
e N
orm
aliz
ed F
lux
0
1
2
300 400 500 600 700
28 5
,24(
28)
Nor
mal
ized
Flu
x
0
1
2
Julian Day
300 400 500 600 700
12-O
H-C
28 A
cid
Nor
mal
ized
Flu
x
0
1
2
Julian Day
300 400 500 600 700
C30
Dio
l Nor
mal
ized
Flu
x
0
1
2
MS-1
MS-3
MS-4
NEM SI SWM NEMFI NEM SI SWM NEMFI
∆
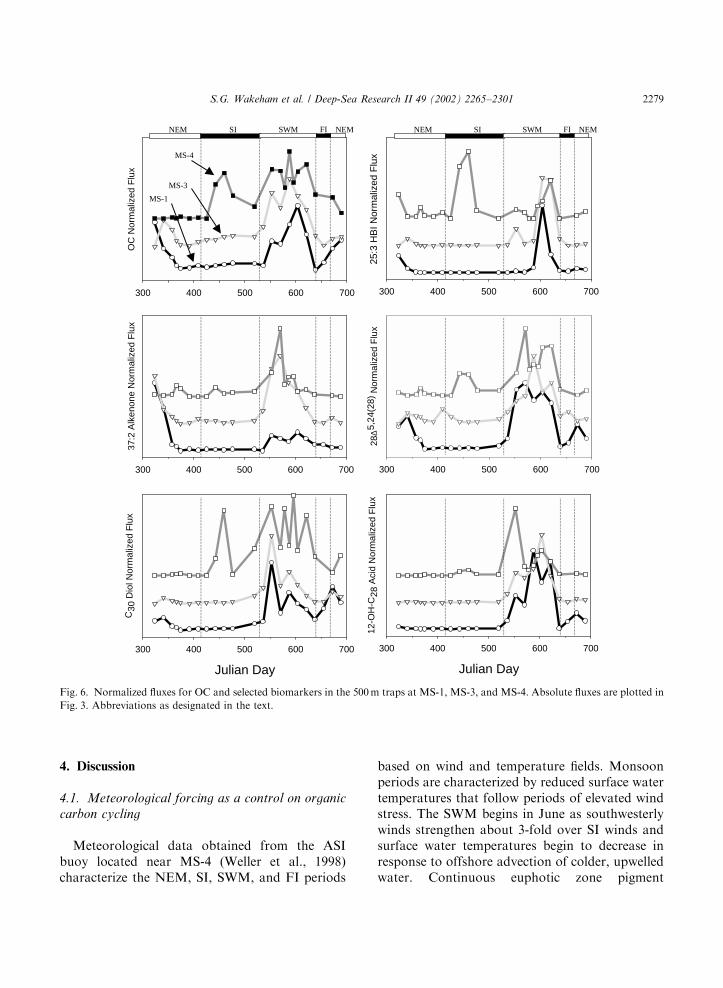
Fig. 6. Normalized fluxes for OC and selected biomarkers in the 500m traps at MS-1, MS-3, and MS-4. Absolute fluxes are plotted in
Fig. 3. Abbreviations as designated in the text.
S.G. Wakeham et al. / Deep-Sea Research II 49 (2002) 2265–2301 2279

estimates (Marra et al., 1998; Dickey et al., 1998)indicated enhanced primary production in theearly SI period (March) that increased until earlyJuly, even though the meteorological SWM beganabout a month earlier.A bloom of phytoplankton, which began in
coastal waters on the south coast of the Arabianpeninsula in June 1995, spread to cover most of thenorthwestern Arabian Sea out to MS-4 by Augustand September. Diatoms and Phaeocystis sp. weremajor components of microplankton biomassduring the SWM (Latasa and Bidigare, 1998;Garrison et al., 1998), with diatoms dominating incoastal upwelling areas and being advected infilaments up to 700 km off shore. Phaeocystis
colonies were more abundant offshore, up to1000 km from the Omani coast. Although cocco-lithophorids generally were not important con-tributors to phytoplankton biomass in 1994/1995,massive blooms occasionally occur (e.g., duringthe SWM in 1982; Brock and McClain, 1991) andare responsible for most of the calcium carbonateexport flux (Ramaswamy et al., 1991; Honjo et al.,1999). Particle and organic carbon fluxes peak atthe end of the NEM and early and late in theSWM (Nair et al., 1989; Ramaswamy et al., 1991;Honjo et al., 1999). Sediment-trap data of Honjoet al. (1999) indicate that there were temporaloffsets between flux events for different compo-nents at different trap locations that could beattributed to asynchronous onsets of the SWMand NEM. For example, the flux maximum at MS-3 occurred a month after that at MS-2. At MS-4,high export fluxes were associated with monsoon-driven eddies. Our temporal resolution was coarserthan that of Honjo et al. (1999), so fine details oftiming of flux events are more difficult to discern.
4.2. Constraints on organic matter flux
measurements in the Arabian Sea
Our results show marked temporal and spatialvariability in the amount and composition oforganic material reaching the sediment traps in theArabian Sea. High fluxes occur during the SWMand NEM periods. However, in several instances,the mid-depth (1500m) traps at MS-3 and MS-4collected more material than the shallow (500m)
traps (Fig. 3). Patchy surface water productionand lateral advection via eddies and filaments andresuspension of sediments off the shallow Omanshelf can all decouple deep-water trap collectionsfrom surface processes (Siegel and Deuser, 1997).We speculate that an elevated flux at MS-4 for 37:2alkenone or C30-keto-ol at 1500m might be aremnant of upcurrent production in surface watersin the vicinity of MS-3. Alternately, extensive dielvertical migrations by zooplankton in the ArabianSea, even into the oxygen minimum zone (Smithet al., 1998b; Wishner et al., 1998), could provide amechanism by which organic matter is injected asfecal pellets directly into the mid-water column,effectively bypassing a trap at 500m. This scenar-io, however, would not be expected to be selectivefor certain lipid compounds to the exclusion ofothers.Concerns about flux measurements derived
from sediment traps moored in water columnscharacterized by patchy biological production andspatially and temporally variable flow fields, suchas in the Arabian Sea, complicate interpretationsof ‘‘vertical flux’’. Siegel et al. (1990) and Siegeland Deuser (1997) described a theoretical modelillustrating that, even in the relatively quiescentSargasso Sea, trajectories of sinking particles couldbe far from vertical. Traps sample a complexmixture of geographically overlapping catchmentareas, and particles reaching trap depths originateat different times during the collection perioddepending on their sinking speeds. Catchmentareas in dynamic regions such as the Arabian Seamight be as large as 103–104 km2 (e.g., vanGyldenfeldt et al., 2000). In the Arabian Sea, thecombination of coastal upwelling, eddies, andfilaments could produce flux maxima in midwatertraps (Honjo et al. (1999), and data of the presentstudy). Lateral advection of suspended sedimentoff the Arabian shelf also may be important (Witteand Pfannkuche, 2000). Thus direct qualitativeand quantitative comparisons between productionof organic matter in surface waters and transportof that material to underlying traps and sedimentsare challenging in this oceanographically complexregion.The strong hydrodynamic regime in the
upper several hundred meters of the Arabian Sea
S.G. Wakeham et al. / Deep-Sea Research II 49 (2002) 2265–23012280

precluded our deployment of moored traps atdepths shallower than 500m. Thus, while a trapdeployed at 500m may be less subject to hydro-dynamic artifacts related to strong advectivefeatures than in shallower waters, organic materialcollected there probably has been considerablyaltered compared to the material initially bio-synthesized in the epipelagic zone. Typically>90% of OC produced in surface waters is lostin the several hundred meters of the upper watercolumn (e.g., Martin et al., 1987; Lee et al., 1998),and in the case of highly labile biomarkers,degradative loss may approach 100% (Wakehamet al., 1997a, b). Without direct measurement ofbiomarker production in and flux out of theeuphotic zone, assessing degradation throughoutthe water column and ultimate preservation insurface sediments is problematic. Thus, the follow-ing discussion is limited to the interval between500m water depth and 0–0.5 cm sediments.
4.3. Compositional variability in sinking particulate
organic matter
Fluxes indicate when more or less material issinking through the water column, but provideonly a restricted view of the composition of thismaterial. The contribution of each biomarker, andby inference its source organism(s), to particulateOC is better revealed by normalizing biomarkerfluxes to total organic carbon fluxes (mg biomar-ker/mg OC). This approach minimizes complica-tions related to variability in particle inorganiccomposition, especially for carbonate and silicatecontents. Fig. 7 shows normalized fluxes for OCand biomarkers along with organic carbon-basedbiomarker concentrations at 500m depth at MS-3.High flux during the SWM usually correspondedin time with high OC-normalized concentration,indicating that during the high-flux period sinkingparticles were enriched in these organic constitu-ents, not simply that there were more particles ofthe same composition as during times of low flux.On the other hand, there were periods of relativelylow flux during which particles contained relativelyhigh biomarker concentrations. For example, highconcentrations of 24-methylene cholesterol and37:2 alkenone were observed as the NEM and FI
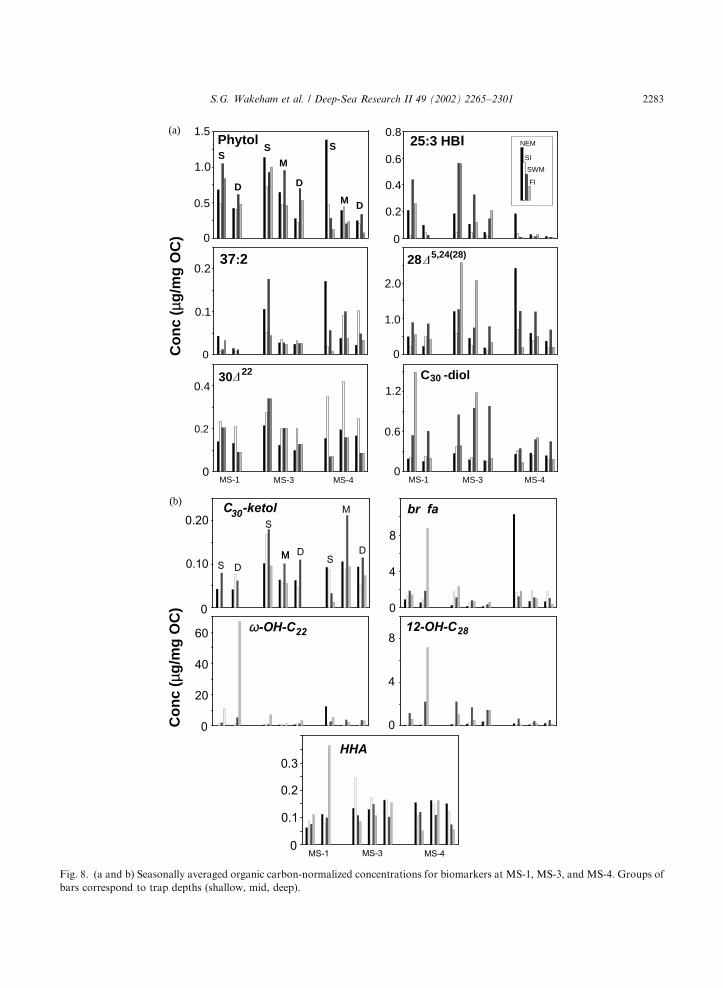
subsided, even though fluxes were relatively low.Thus, there were periods when flux and concentra-tions were coupled, and periods when they werenot.Seasonally averaged OC-normalized concentra-
tions were calculated for all trap sites (Fig. 8). Theseveral-fold range in biomarker concentrationsover the year was considerably lower than theorder-of-magnitude range in biomarker fluxes(Fig. 4). If the SWM period generally experiencedmaximal biomarker flux, it was by no meansalways the period during which OC-normalizedbiomarker concentrations were highest. For ex-ample, the diatom bloom that produced highSWM fluxes for OC and 24-methylene cholesterolexported particles that were, in fact, not particu-larly rich in this diatom-derived sterol (versusother sterols or OC). Rather it was during thepreceding NEM and during the FI (as the bloomwas subsiding) that the highest particulate 24-methylene cholesterol concentrations were re-corded. Although the SWM dominated the annualflux of 37:2 alkenone, haptophyte-derived lipidswere enriched relative to OC during both monsoonperiods. Dinoflagellate-derived OC was relativelyconstant throughout the year at MS-1 and MS-3(suggested by relatively uniform concentrations ofdinosterol), but at MS-4 dinoflagellates apparentlymade their most important contribution to phyto-plankton biomass during the SI. Such a decou-pling of biomarker flux and concentration is notsurprising since biomarkers constitute such a smallfraction of OC, but can place a further constrainton interpretations of OC cycling based onrelatively low-abundance lipid compounds.
4.3.1. Neutral lipid and acid class distributions
Relative abundances of the major lipid classes,of which the selected biomarkers are representa-tives, provide additional insight into the dynamicsof organic matter composition over the course ofthe ASPS study. Abundances of constituentneutral and acid classes (obtained by saponifica-tion) were calculated by summing individualcompounds determined by gas chromatographicanalysis. Neutral lipid class compositions in the500m trap at MS-3 are illustrated in Fig. 9a, whichalso shows the time-series flux of total neutral
S.G. Wakeham et al. / Deep-Sea Research II 49 (2002) 2265–2301 2281

lipids at the top of the figure. Neutral lipid classeswere dominated by C26–C30 sterols and C14–C26-n-alcohols. C23–C29-n-alkanes and long-chain C37–
C39-alkenones were minor neutral lipids. However,during both the NEM and SWM periods, alkyldiols and HBI-alkenes peaked in relative
300 400 500 600 700
Nor
mal
ized
Flu
x
25:3
37:2
28 5,24(28)
C30-diol
12-OH-C28
OC
Julian Day
300 400 500 600 700
OC
-Nor
mal
ized
Con
cent
ratio
n
25:3
37:2
285,24(28)
C30-diol
12-OH-C28
NEM SI SWM NEMFI
∆
∆
Fig. 7. Normalized fluxes and organic carbon-based concentrations for selected biomarkers at 500m at MS-3. Abbreviations as
designated in the text.
S.G. Wakeham et al. / Deep-Sea Research II 49 (2002) 2265–23012282
0
0.5
1.0
1.5
0
0.1
0.2
0
0.2
0.4
0
0.2
0.4
0.6
0.8
0
1.0
2.0
0
0.6
1.2
MS-1 MS-3 MS-4MS-1 MS-4MS-3
NEM
SI
SWM
FI
Phytol 25:3 HBI
37:2 28 5,24(28)
30 22 C -diol30
SM
D
SS
M D
D
�
�
Co
nc
(µg
/mg
OC
)C
on
c (µ
g/m
g O
C) 0
0.10
0.20
0
20
40
60
0
4
8
0
4
8
0
0.1
0.2
0.3
MS-1 MS-4MS-3
C -ketol30
ω ω -OH-C22
br fa
12-OH-C28
HHA
SM D
S
S
M
DM
D
(a)
(b)
Fig. 8. (a and b) Seasonally averaged organic carbon-normalized concentrations for biomarkers at MS-1, MS-3, and MS-4. Groups of
bars correspond to trap depths (shallow, mid, deep).
S.G. Wakeham et al. / Deep-Sea Research II 49 (2002) 2265–2301 2283

abundance, each reaching nearly 20% of neutrallipids, contrasting with minimal contributionsduring the remainder of the year. Note thatmaximal abundances of alkyl diols and HBI-alkenes were offset in time, consistent with theoffset in absolute flux and OC-normalized con-centrations for these compounds. Fatty acidcompositions were less variable temporally: abun-dances of saturated, monounsaturated, andbranched acids were relatively invariant through-out the year (Fig. 9b). On the other hand, hydroxyacids grew in relative importance during the SWMperiod, increasing from a few percent to 20% ofthe acid fraction, largely at the expense ofpolyunsaturated compounds. In some trap sam-ples during the SWM, o-hydroxy-C22 acid (atMS-4) and 12-hydroxy-C28 acid (at MS-3) wereamong the most abundant acids.
4.3.2. C25 HBI alkenes
The 25:3 HBI alkene discussed above is only oneof at least eight tri-unsaturated (25:3), tetra-unsaturated (25:4), and penta-unsaturated (25:5)C25 HBI alkenes in ASPS trap material (Fig. 10),although it usually was the most abundant C25
HBI alkene. Fluxes of total C25 HBI alkenestracked fluxes of 25:3. Cumulatively, C25 HBIalkenes comprised up to 17% of neutral lipids(Fig. 9a) and up to about 0.15% of OC. Structuralanalysis of these compounds is underway, and aconsiderable diversity of C25 HBI alkenes havebeen reported in several diatoms, H. ostrearia, R.
setigea, and Pleurosigma intermedium (Volkmanet al., 1994; Belt et al., 1996; Wraige et al., 1997,1998, 1999; Sinninghe Damst!e et al., 1999b; Beltet al., 2000). Both Halsea sp. and Rhizoselenia sp.are abundant in the SWM diatom bloom duringthe ASPS program (Garrison et al., 1998).Rhizoselenia sp. were the dominant diatomscontributing to the peaks in biogenic silica inprevious WAST sediment-trap collections (Haakeet al., 1993).Relative abundances of HBIs varied seasonally,
as illustrated in Fig. 11a. During the SWM, thethree most abundant compounds, labeled 25:3 (thecompound discussed above), 25:30, and 25:40 inFigs. 10 and 11a, together comprised up to about75% of total HBI’s, although abundances of these
compounds were offset temporally. The major C25
HBI alkene during the SWM was 25:3, whichaccounted for most of the C25 HBI flux during thatperiod. The major HBI alkene during most of therest of the year, especially at the onset of the SI,was 25:40.The Arabian Sea time-series trap record demon-
strates the complexity of distributions of C25 HBIalkenes that may occur over the annual monsooncycle. This temporal variability in composition andthe temporal offset relative to other diatombiomarkers (e.g., 24-methylene cholesterol) sug-gests that variations in diatom speciation andenvironmental conditions are involved. CellularHBI alkene concentration and unsaturation in thesource diatoms are affected by genotype or byenvironmental factors such as salinity, irradiance,and temperature, analogous to variations inalkenone concentrations and unsaturation inEmiliania huxleyi (e.g., Popp et al., 1998; Conteet al., 1998). Culturing experiments indicate inter-species or inter-strain variations in HBI alkenebiosynthesis (Volkman et al., 1994; SinningheDamst!e et al., 1999a). Growth conditions are alsoan important determinant on HBI distributions(Wraige et al., 1997, 1998, 1999). The Arabian Seais not the only locale where HBI distributions andconcentrations do not track more traditionaldiatom indicators. Tamar Estuary (UK) sedimentsshowed considerable temporal variability in HBIconcentrations and composition (Hird and Row-land, 1995; Cooke et al., 1998), and trends in HBIdistributions did not correspond with either HEH(heneicosahexaenene; Lee and Loeblich, 1971;Volkman et al., 1994) or fucoxanthin, both ofwhich are widely used diatom biomarkers. In theArabian Sea, it would have been surprising if therehad not been major variations in HBI distributionsover the range of environmental conditionsexperienced during an annual monsoon cycle.More importantly, the HBI variability pointstoward environmentally controlled fluctuations inthe ecology of at least a fraction of the diatomsthat constitute the monsoon blooms.Multiple double bonds in lipids confer high
reactivity, and highly unsaturated HBI alkenes areapparently quite reactive. The high fluxes of C25
HBIs observed in the upper traps of the Arabian
S.G. Wakeham et al. / Deep-Sea Research II 49 (2002) 2265–23012284

Neu
tral
Lip
id A
bund
ance
(%)
0
20
40
60
80
100
alkyl-keto-olsn-alkenones
alkyl-diolsHBI-alkenes
n-alkanes
n-alcoholssterols
1800
0µ
g/m2d
300 400 500 600 700
Julian Day
(a)
(b)
Fat
ty A
cid
A
bu
nd
ance
(%
)
0
20
40
60
80
100
hydroxy
PUFA
unsaturated
branched
n-saturated
800
0
µg/m
2d
300 400 500 600 700
Julian Day
Fig. 9. (a) Distribution of neutral lipid classes (n-alcohols, sterols, HBI-alkenes, n-alkanes, alkyl-diols, alkyl keto-ols, and long-chain
n-alkenones) at 500m at MS-3. (b) Distribution of fatty acid classes (saturated, branched, mono/diunsaturated, polyunsaturated
[PUFA], and hydroxy) at 500m at MS-3. Curves at the top indicate variations in total neutral lipid and acid flux during the sampling
period.
S.G. Wakeham et al. / Deep-Sea Research II 49 (2002) 2265–2301 2285

Sea were not transferred to the deeper traps andsediment (Figs. 3 and 10). (Heneicosahexaenene[HEH] was present only in near-surface suspendedparticle samples in the Arabian Sea [data not
shown] and did not even reach the 500m traps.)Thus, although C25 HBI alkenes are common inseawater particulate matter (e.g., Nichols et al.,1988; Wakeham, 1990; Wakeham et al., 1991;
Fig. 10. Gas chromatograms of the hydrocarbon fraction isolated from a 6-month composite trap sample from 500m at MS-3 and the
underlying 0–0.5 cm surface sediment. Numbers indicate n-alkane carbon numbers. 25 HBI=C25 HBI alkenes. The insert expands the
C25 HBIs with compound designations used in the text and in Fig. 11a. Structures are being determined and will be reported elsewhere.
S.G. Wakeham et al. / Deep-Sea Research II 49 (2002) 2265–23012286

Fig. 11. (a) Distribution of C25 HBI alkenes at 500m at MS-3. Compound designations are indicated on gas chromatograms in
Fig. 10. (b) Distribution of sterols at 500m at MS-3. 30D22=4a,23,24-trimethylcholest-22-en-3b-ol (dinosterol); 29D5=24-ethylcholest-
5-en-3b-ol; 28D5,24(28)=24-methylcholesta-5,24(28)-dien-3b-ol (24-methylene cholesterol); 28D5,22=24-methylcholesta-5,22-dien-3b-ol(24-methylcholesterol); 27D5=cholest-5-en-3b-ol (cholesterol); 27D5,22=cholesta-5,22-dien-3b-ol. Curves at the top indicate variationsin total HBI or sterol flux during the sampling period.
S.G. Wakeham et al. / Deep-Sea Research II 49 (2002) 2265–2301 2287

Bieger et al., 1997; Sinninghe Damst!e et al.,1999a, b; Prahl et al., 2000) and sediments (e.g.,Rowland and Robson, 1990; Wakeham et al.,1991; Hoefs et al., 1995; Cooke et al., 1998;Schouten et al., 2000) from diverse marine settings,their poorly characterized and possibly restrictedsources and high reactivity limit their utility asdiatom indicators in the sediment record. Thedecoupling between water-column particles andsediments with respect to HBIs is illustratedgraphically in Fig. 10, which compares hydrocar-bon compositions in Arabian Sea trap materialwith underlying surface sediments. The HBIs thatdominate trap material are minor components ofsedimentary hydrocarbons, while long-chain vas-cular plant alkanes that are minor components oftrap particles are selectively enriched in sediments(see below for further discussion).
4.3.3. Sterols
Sterols were the dominant neutral lipids in thetrap material, comprising 50–80% of neutral lipids(Fig. 9a). Distributions of the major sterols(Fig. 11b) were relatively uniform throughout theyear. C27 cholest-5-en-3b-ol (cholesterol; 27D5 inFig. 11b) is probably indicative of a significantcontribution of zooplankton-derived lipids(Wakeham et al., 1997a, b), although it is alsopresent in varying amounts in many phytoplankton(Volkman, 1986). Our use of swimmer ‘‘excluding’’IRS sediment traps resulted in relatively fewzooplankton carcasses in the trap material, soswimmer-derived cholesterol is thought to beminimal. On the other hand, since cholesterol isthe major sterol in fecal matter (Prahl et al., 1984;Wakeham and Canuel, 1986; Neal et al., 1986;Harvey et al., 1987), peaks in cholesterol abundancemay reflect enhanced zooplankton grazing andsubsequent sinking of fecal pellets. We do not knowthe contribution of fecal pellets to the trap material.The other sterols plotted are phytoplankton-
derived (Volkman, 1986). Most (brassicasterol[28D5,22], 24-methylene cholesterol [28D5,24(28)]and 24-ethylcholesterol [29D5]) are prevalent indiatoms. Picoplankton in the Arabian Sea, Syne-
chococcus and Prochlorococcus, are not significantsterol sources. The highest phytosterol abundancesoccurred toward the end of the SWM period, at
the time of low cholesterol abundance. Dinosterol(30D22) abundance did not change much through-out the year. Sterol composition should reflectphytoplankton succession. Perhaps those phyto-plankton dominating during the early SWMperiod were enriched in cholesterol relative tospecies, primarily diatoms, that developed laterand produced brassicasterol, 24-methylene choles-terol, and 24-ethylcholesterol. Dinoflagellate in-puts to sterol distributions, were relativelyconstant but low. Or, cholesterol in the trapsduring this period may be zooplankton in origin.Zooplankton grazing may have effectively con-trolled phytoplankton stocks and limited particleexport during the first half of the SWM period(Smith, 2001). However, at the close of the SWM,high particulate matter, silica and diatom-derivedbiomarker fluxes would occur if grazing bymacrozooplankton on diatoms and dinoflagellatesin the upwelling area ceased as the animalsmigrated to greater depths to reproduce (Smith,2001), allowing increased amounts of phytodetri-tus to aggregate and sink.
4.4. Trap record of plankton succession in the
western Arabian Sea
The progression in biomarker flux peaksthrough time should correspond to a successionin the source organisms that produced them. Byanalogy, the organism(s) producing C30-diol andC30-keto-ol, and cyanobacteria producing homo-hopanoic acid, were particularly abundant early inthe SWM. Next came haptophytes (alkenones),the bulk of diatoms (24-methylene cholesterol) anddinoflagellates (dinosterol). Towards the end ofthe SWM came those organism(s) that biosynthe-sized 12-hydroxy-C28 acid, and finally diatomsthat were the source of 25:3 HBI. Bimodal fluxesof both branched fatty acids and homohopanoicacid overlap, suggesting two periods of enhancedprokaryotic input (from heterotrophic bacteriaand phototrophic cyanobacteria, respectively).Calcium carbonate and biogenic silica flux
patterns reported by Honjo et al. (1999) for theASPS sites and Rixen et al. (2000) for the WASTsite established a temporal offset between thecoccolithophorid bloom and the subsequent
S.G. Wakeham et al. / Deep-Sea Research II 49 (2002) 2265–23012288

diatom bloom. Consistent with this scenario arethe offsets between broad peaks in flux for 24-methylene cholesterol, the diatom biomarker,and the 37:2 alkenone, the coccolithophoridindicator (Figs. 3 and 5). However, the sharp peakin 25:3 HBI flux (and total HBI flux in Fig. 11a),contrasting with the broad 24-methylene choles-terol peak, indicates that HBI-producing specieswere most abundant during the second half of thediatom bloom. In general, then, HBIs are pro-duced by a small subset of diatoms that apparentlydo not occur contemporaneously with the SWMdiatom ‘‘bloom’’ and therefore are poor proxiesfor export of total OC and silica.Spatial variations in biomarker flux, revealed by
comparing fluxes recorded at B500m depth alongthe transect from MS-1 to MS-4 (Fig. 6), indicatethat phytoplankton species composition, andhence biomarker production, was not homoge-neous among sites, consistent with physics in theArabian Sea and biological observations (e.g.,Garrison et al., 1998; Landry et al., 1998; Latasaand Bidigare, 1998). For example, if high 25:3 HBIfluxes at MS-1 and MS-3 during the SWM resultfrom relatively high abundances of HBI-producingdiatoms at that time, then low 25:3 HBI fluxescoincident with high 24-methylene cholesterol atthe farthest-offshore site (MS-4) could indicatethat the diatom assemblage there was depleted inHBI-producers. Taxonomic examination and HBIanalyses of net-phytoplankton collected on theASPS southern section during the SWM supportthis hypothesis (S. Belt and S. Wakeham, unpub-lished data). Alkenone-producing haptophytes(e.g., E. huxleyi) were also unevenly distributed(based on pigment analyses; Latasa and Bidigare,1998), with high abundances at MS-3 but lowabundances at MS-1 and MS-4.
Euphotic zone production during the SWMalone is not the driving force behind elevatedexport flux at MS-3 compared to MS-1 and MS-4,since primary production at MS-3 (88mmol C/m2 d) was lower than at either onshore or offshorestations (111, 115, and 123mmol C/m2 d at MS-1,MS-3, and MS-4, respectively, Lee et al., 1998;Barber et al., 2001). The efficiency of the biologicalpump and subsequent export of biogenic materialincreased during the SWM and was relatively
higher at MS-3 than at the other two mooringlocations. An increase in export would result if thebiological community shifted from one dominatedby small cells and a microbial loop that exportedrelatively little material, to an ecosystem domi-nated by large cells that sank individually (e.g.,Rhizoselenia or Haslea sp.), as aggregates, or weregrazed by meso- or macrozooplankton and ex-ported as fecal pellets (Smith et al., 1998b). Asnoted above, grazing by macrozooplankton ondiatoms and dinoflagellates was high at MS-3, butonly when grazing stopped as the zooplanktondescended into deep waters did the diatom bloomaggregate and sink.
4.5. Water-column flux versus sediment
accumulation
Biochemical compositions of material fromtraps and sediments allow a comparison of OCand biomarker fluxes at different stages of trans-port through the water column and of biomarkersaccumulating in surface sediments. Comparisonprovides information about relative reactivitiesand preservation potentials of organic substances.Annual OC and biomarker water-column fluxes,sediment accumulation rates, and OC-normalizedbiomarker concentrations in the water column andat the sediment surface (0–0.5 cm) at sites MS-1,MS-3, and MS-4 are given in Table 1. Annualfluxes and concentrations generally decreased byabout 2-fold or less between shallow and deepsediment traps, but accumulation rates and con-centrations in surface sediments were substantiallylower (orders of magnitude) than fluxes andconcentrations for traps 500m above bottom.Thus, relatively little remineralization occurs inthe water column, perhaps due to low O2-contentand physical protection by mineral ballast ormacromolecular organic material (Hedges et al.,2001; Armstrong et al., 2002). The benthicboundary region, below the deepest trap and atthe water–sediment interface, is a remineralization‘‘hot spot’’. Comparisons of trap flux (or concen-tration) with sediment accumulation (concentra-tion) must be tempered by the differing time scalesrepresented by trap samples (weeks) and surfacesediments (decades–centuries). The fact that
S.G. Wakeham et al. / Deep-Sea Research II 49 (2002) 2265–2301 2289

Table 1
Annual OC and biomarker fluxes and OC-normalized concentrations for sediment traps and surface (0–0.5 cm) sediments
OC
(mg/m2 yr)
Phytol 25:3 HBI 37:2 28D5,24(28) 30D22 C30-diol C30-keto-ol br-fas o-OH-C22 12-OH-C28 Homo-
hopanoic
(mg/m2/yr)
MS-1
505m 5480 4780 1750 115 3800 1100 2400 339 8290 9220 3900 412
900m 3640 1810 215 41.6 1340 561 1260 206 4290 1002 3540 370
Sediment 876 206 0 18.6 59.2 66.5 63.1 41.2 140 16.0 90.4 42.3
MS-3
480m 4890 4580 2190 720 6000 1320 3390 806 6410 5630 8000 623
1460m 5650 4360 3190 158 3960 1050 3740 466 4000 2820 5450 816
2880m 3900 2010 1210 103 1980 640 2340 320 1540 5150 3990 509
Sediment 256 11.6 0 2.5 1.8 7.1 7.8 4.3 21.9 6.0 7.7 8.4
MS-4
540m 3220 1070 68.8 131 3010 807 955 147 5310 9670 1310 343
1500m 4160 1320 74.0 324 3190 1150 1550 591 5190 8620 1120 570
3380m 3290 815 32.3 177 1460 608 1010 297 3460 7600 1200 309
Sediment 110 1.8 0 0.3 0.3 2.5 1.1 0.5 21.7 2 2.1 1
(mg/mg OC)
MS-1
505m F 0.873 0.319 0.021 0.693 0.200 0.438 0.062 1.513 1.682 0.711 0.075
900m F 0.497 0.069 0.011 0.532 0.154 0.345 0.057 1.176 2.750 0.970 0.101
Sediment F 0.236 0 0.021 0.068 0.076 0.072 0.047 0.160 0.018 0.103 0.048
MS-3
480m F 0.936 0.447 0.147 1.226 0.271 0.692 0.165 1.309 1.151 1.634 0.127
1460m F 0.771 0.216 0.028 0.701 0.186 0.662 0.082 0.707 0.498 1.017 0.144
2880m F 0.516 0.108 0.026 0.508 0.164 0.600 0.082 0.395 1.320 1.023 0.131
Sediment F 0.045 0 0.010 0.007 0.028 0.031 0.017 0.086 0.023 0.030 0.033
MS-4
540m F 0.332 0.021 0.041 0.937 0.251 0.297 0.046 1.652 3.008 0.408 0.107
1500m F 0.316 0.018 0.078 0.768 0.277 0.372 0.142 1.250 2.073 0.270 0.137
3380m F 0.247 0.010 0.054 0.443 0.185 0.305 0.090 1.052 2.306 0.363 0.094
Sediment F 0.016 0 0.001 0.003 0.023 0.010 0.005 0.198 0.018 0.019 0.009
S.G
.W
ak
eham
eta
l./
Deep
-Sea
Resea
rchII
49
(2
00
2)
22
65
–2
30
12290

OC-based concentrations (Table 1) did not changegreatly between the trap depths, but were sig-nificantly attenuated between traps and sediments,shows that lipid biomarkers are selectively de-graded near the water–sediment interface relativeto organic carbon.What fraction of the organic matter (flux-based
or OC-based) survives remineralization in thewater column and at the water–sediment interfaceto accumulate in surface sediments? Fig. 12 plotsthe percentages of 500-m trap and deep trap fluxes
that accumulate in sediments, and Fig. 13 plots thecomparable percentages of OC-normalized con-centrations (note the logarithmic abscissae). Sev-eral trends are apparent. First, the fraction of OCand individual biomarkers accumulating in surfacesediments varies over a wide range (>2 orders ofmagnitude) depending on the form of organicmatter (OC or specific biomarker). At the highextreme, B16% of the OC and the 37:2 alkenoneflux at 500m eventually accumulates in surfacesediments (Fig. 12; top panel), or up to 100% of
0.001
0.01
1
10
MS-3
MS-4
MS-1
0.001
0.01
0.1
1
10
44
0.1
sed
flux
/sha
llow
trap
flu
x (%
)se
dfl
ux/d
eep
trap
flu
x (%
)
OC
25:3
HB
I
phyt
ol
37:2
28∆ 5,
24(2
8)
C30
-dio
l
ω -O
H-C
22
brfa
HH
A
30∆ 22
C30
-ket
ol
12-O
H-C
28
Fig. 12. Ratios (as percent) of annually averaged flux at the surface sediment to annually averaged flux at 500m traps (top panel) and
sediment-to-deep trap fluxes (bottom panel) for MS-1, MS-3, and MS-4. Compound designations as in Fig. 2 and in the text.
S.G. Wakeham et al. / Deep-Sea Research II 49 (2002) 2265–2301 2291

37:2 alkenone relative to OC. At the oppositeextreme, no (none-detected) 25:3 HBI accumu-lates. Second, in some instances, ratios of sedimentflux (or concentration) to deep trap flux (concen-tration) were greater than the correspondingsediment:500m trap ratios. About 20% of OCand 44% of 37:2 passing the deep trap accumu-lates in the sediment (Fig. 12, bottom panel). Thisresult could arise if the flux (or concentration) tothe deep trap is greater than that to the shallowtrap, possibly due to lateral advection. Lastly,
regardless of the treatment (shallow trap versusdeep trap; flux versus concentration), less organicmatter generally accumulates in more-offshoresediments (e.g., from 16% for OC at MS-1 to5.5% at MS-3 and 3.4% at MS-4).The degradation efficiency at different stages of
transport and deposition can be calculated fromfluxes (or concentrations) for trap material andsediment (Table 2). Again, degradation efficienciesare quite variable, but always high. For example,using fluxes at MS-1, 33.5% of OC degrades
0.1
1
10
100MS-3 MS-4MS-1
0.1
1
10
100
sed
conc
/sha
llow
trap
con
c (%
)se
d co
nc/d
eep
trap
con
c (%
)
25:3
HB
I
phyt
ol
37:2
285,
24(2
8)
C30
-dio
l
ω -O
H-C
22
brfa
HH
A
30 22
C30
-ket
ol
12-O
H-C
28
∆
∆
Fig. 13. Ratios (as percent) of annually averaged OC-based concentrations for the surface sediment to annually averaged
concentrations at the 500m traps (top panel) and sediment to deep trap concentration (bottom panel) for MS-1, MS-3, and MS-4.
S.G. Wakeham et al. / Deep-Sea Research II 49 (2002) 2265–23012292

between the traps at 500 and 900m, 84% betweenthe 500m trap and the sediment, and 76% betweenthe 900m trap and the sediment. Degradationefficiency generally increases offshore from MS-1to MS-4. Greater fractions, in several cases up to100%, of specific biomarkers were degraded.Making the same calculation using OC-normalizedconcentrations indicates that the degradationefficiency of some compounds was reduced andpreservation enhanced. Nonetheless, degradationwas always highly efficient and very little organicmatter accumulated in surface sediments. Degra-dation below the 0–0.5 cm interval studied wouldfurther reduce the biomarker signal recorded indeeper sediments, and this fact would severelycomplicate any paleoceanographic interpretations(Wakeham et al., 1997b, 2000). On the other hand,study of the sediment record at nearshore siteswould be recommended since overall preservationis higher than at offshore locations. There con-tinues to be considerable debate in the literatureregarding the factors (e.g., OC rain rate versuswater-column oxygen content) controlling organicmatter preservation in the Arabian Sea (andelsewhere), although most studies have taken placeon the Pakistan or Indian continental margins(Schulte et al., 2000, and references therein) ratherthan in the western Arabian Sea.Although degradation is highly efficient overall,
individual biomarkers exhibit a range of reactivi-tiesFseveral orders-of-magnitudeFthat can beinferred from ratios of flux and concentrations intraps versus sediments and from subsequentestimates of biomarker destruction during trans-port and sedimentation. For example, compoundsdisplaying ratios of sediment-to-trap concentra-tion greater than that of OC (e.g., 37:2 alkenone,dinosterol, C30-keto-ol, homohopanoic acid) areless reactive than bulk OC, and vice versa. 25:3HBI is the most reactive compound (as are theother C25 HBI alkenes), while 37:2 alkenone is theleast reactive and hence best preserved, at least in arelative sense since on an absolute scale, most 37:2alkenone is in fact destroyed. While we do nothave solid data on n-alkane fluxes, their relativeenrichment in surface sediments (Fig. 10) agreeswith the good preservation potential reported byPrahl et al. (2000) at MS-4.
Preservation of organic compounds in naturedepends both on their intrinsic reactivity towarddegradative enzymes and the degree to whichthe molecules may be physically protectedfrom enzymatic attack by association with aresistant mineral or organic matrix (Hedgesand Keil, 1995; Hedges et al., 2001; Armstronget al., 2001). Intrinsic reactivities are oftenconsidered to be dependent on molecularstructures, whereby, for example, unsaturatedmolecules are generally considered more suscep-tible to degradation than saturated structures(e.g., Sun and Wakeham, 1994; Canuel andMartens, 1996). Hence, a high relative reactivityof the triunsaturated 25:3 HBI (and otherpolyunsaturated HBIs) is expected. On the otherhand, unsaturated long-chain alkenones alsocontain multiple (two [e.g., 37:2], three and four)double bonds, yet are better preserved than othercompounds (Wakeham et al., 1997b; Prahl et al.,2000). The usual, but as yet unproven, explanationfor alkenone stability is that the unusual trans-configuration of double bonds in alkenonesmay reduce the efficiency of attack by degradingenzymes (Rechka and Maxwell, 1988). Likewise,inclusion of a methyl group at the 4-position ofthe sterol skeleton appears to reduce metabolismof dinosterol compared to 4-desmethylsterols suchas 24-methylene cholesterol (Harvey et al., 1987),thus explaining why dinosterol is better preservedin Arabian Sea sediments than 24-methylenecholesterol. On the other hand, in an absolutesense, alkenones and dinosterol are still highlysusceptible to degradation (Table 2). Althoughthese compounds will still dominate biomarkerdistributions in sediments, the amount remainingin sediments is a small remnant (51%) ofwhat was initially produced in surface waters,compromising sediment-based reconstructionsof sea-surface conditions. Alternately, somelevel of protection may be offered to better-preserved, but nevertheless intrinsically reactive,biomarkers such as alkenones and dinosterol byan organo-mineral matrix with which they areintimately associated. But, apparently, HBIalkenes are not similarly protected by thesilicate test of the source diatoms. How andwhy organic substances are, or are not, associated
S.G. Wakeham et al. / Deep-Sea Research II 49 (2002) 2265–2301 2293

Table 2
Percentage of OC and biomarkers destroyed in the water column below 500m depth and at the water–sediment interface
OC Phytol 25:3 HBI 37:2 28D5,24(28) 30D22 C30-diol C30-keto-ol br-fas o-OH-C22 12-OH-C28 Homo-hopanoic
Flux-based
Deepest trap versus 500m trap
MS-1 33.5 62.1 87.7 63.9 48.9 48.9 47.6 39.1 48.3 (�8.8) 9.3 10.2
MS-3 20.2 56.1 80.8 85.7 67.0 51.7 30.8 60.4 75.9 8.6 50.1 18.3
MS-4 (�2.5)a 23.6 53.1 (�35.4) 51.5 24.7 (�5.3) (�102.3) 34.7 21.4 8.7 10.0
Sediment versus 500m trap
MS-1 84.0 95.7 100.0 83.8 98.4 93.9 97.4 87.8 98.3 99.8 97.7 89.7
MS-3 94.8 99.7 100.0 99.7 100.0 99.5 99.8 99.5 99.7 99.9 99.9 98.7
MS-4 96.6 99.8 100.0 99.9 100.0 99.7 99.9 99.7 99.6 100.0 99.8 99.7
Sediment versus deepest trap
MS-1 76.0 88.6 100.0 55.3 96.9 88.1 95.0 80.0 96.7 99.8 97.4 88.6
MS-3 93.5 99.4 100.0 97.6 99.9 98.9 99.7 98.7 98.6 99.9 99.8 98.4
MS-4 96.7 99.8 100.0 99.9 100.0 99.6 99.9 99.8 99.4 100.0 99.8 99.7
Concentration-based
Deepest trap versus 500m trap
MS-1 F 43.1 78.4 47.6 23.2 23.1 21.3 8.5 22.3 (�63.6) (�36.4) (�35.0)MS-3 F 44.9 59.7 82.3 58.6 39.5 13.2 50.3 69.8 (�14.6) 37.4 (�2.5)MS-4 F 25.5 52.4 (�31.7) 52.7 26.5 (�2.7) (�97.3) 36.3 23.3 10.9 12.2
Sediment versus 500m trap
MS-1 F 73.0 100.0 0.0 90.2 62.1 83.5 23.9 89.4 98.9 85.5 35.7
MS-3 F 95.1 100.0 93.2 99.4 89.7 95.6 89.8 93.5 98.0 98.2 74.2
MS-4 F 95.1 100.0 97.6 99.7 90.9 96.6 90.0 88.0 99.4 95.3 91.4
Sediment versus deepest trap
MS-1 F 52.6 100.0 (�90.9) 87.3 50.7 79.1 16.8 86.4 99.3 89.4 52.4
MS-3 F 91.2 100.0 61.5 98.6 83.0 94.9 79.5 78.3 98.2 97.1 74.8
MS-4 F 93.4 100.0 98.1 99.4 87.6 96.7 94.9 81.2 99.2 94.7 90.3
aNegative values in parentheses indicate fluxes or concentrations that are greater than the compared sample.
S.G
.W
ak
eham
eta
l./
Deep
-Sea
Resea
rchII
49
(2
00
2)
22
65
–2
30
12294

with organic and mineral matrices in oceanparticles and sediments is a critical area in needof investigation.
4.6. Lipid geochemistry in the Arabian Sea versus
the equatorial Pacific Ocean (EqPac)
We can directly compare aspects of the geo-chemistry of lipids in the Arabian Sea with thepreviously studied equatorial Pacific Ocean (Wa-keham et al., 1997a, b; Wakeham et al., 2000;Hernes et al., 2001), since both investigations usedsimilar sampling strategies within the US JGOFSprogram and both used the same analyticalmethodology. Both investigations included de-tailed lipid analyses of trap material and sedi-ments, and both covered a range of surface waterprimary production rates. The major differencesare that time-series lipid data are not available forEqPac, and we cannot estimate lipid ‘‘production’’in and export out of surface waters of the ArabianSea.Organic carbon and total lipid fluxes (obtained
by summing theB100 lipid compounds measured)for the Arabian Sea and EqPac are shown inFig. 14. Arabian Sea profiles are for MS-1, MS-3and MS-4 where annual primary production rateswere similar (B1380, 1100 and 1400mg C/m2 d,respectively; Lee et al., 1998; Barber et al., 2001).EqPac flux profiles are for the high productivity(B1200mg C/m2 d; Barber et al., 1996) equatorialand low productivity (B300mg C/m2 d) 91N sites.Both Arabian Sea and EqPac studies show acharacteristic trend that is now recognized astypical for sea surface-to-sediment flux patterns.Intense (orders-of-magnitude reduction in flux)remineralization of organic matter takes placeboth in the epipelagic zone and at the benthicboundary layer. By contrast, relatively little(several-fold reduction in flux) organic matter isremineralized in the meso- and bathypelagic zonesof the water column.The most useful comparison of fluxes is between
MS-4 in the Arabian Sea and the equator at EqPacsince both have similar primary productivities andsimilar water-column depths (1400mg C/m2 d and4000m water column for MS-4; 1200mg C/m2 dand 4200m water column for EqPac). Mid-depth
water column OC fluxes in the Arabian Sea(10.5–12mg C/m2 d at 500 and 1500m for MS-4)were 50% lower than at EqPac (16.8mg C/m2 d at1000m). However, deep water-column fluxes atB3500m were 2-fold higher in the Arabian Sea(9.6mg C/m2 d at MS-4 versus 5.4mg/m2 d atEqPac). Sediment fluxes were about 4-fold higherin the Arabian Sea (B0.37mg C/m2 d at MS-4versus 0.1mg C/m2 d at EqPac). Thus, at MS-4 inthe Arabian Sea, 3.9% of the OC flux penetratingto the deepest trap accumulates in surface sedi-ments compared to 1.8% in the equatorial PacificOcean. Given the similar surface-water primaryproduction rates, could a higher OC accumulationin the Arabian Sea reflect reduced remineralizationof organic matter within the oxygen minimumzone of the Arabian Sea? Our lipid results showlittle evidence of effects of the oxygen minimum onthe organic composition of particles collected insediment traps at about 1500m depth, near thebase of the O2 minimum zone. However, it isslowly sinking, fine ‘‘suspended’’ particles ob-tained by filtration rather than rapidly sinkinglarge particles collected by sediment traps thatshow substantial alteration in organic compositionin oxygen minimum zones (Wakeham and Canuel,1988; Wakeham et al., 1991). The higher OC rainand accumulation rates in the western Arabian Seasubsequently drive significantly higher sedimentcommunity oxygen consumption (3–6mmolO2/m
2 d at the WAST site; Witte and Pfannkuche,2000) than at the equator in the Pacific Ocean(0.6–0.8mmol O2/m
2 d; Hammond et al., 1996).For lipids, fluxes in the Arabian Sea were also2-fold lower at mid-depth (0.4mg lipid/m2 d forMS-4 versus 0.8mg lipid/m2 d at EqPac), 3-foldhigher in the deepest trap (0.24mg lipid/m2d forMS-4 versus 0.93mg lipid/m2 d at EqPac), but 8-fold lower at the sediment surface (0.0004mg lipid/m2 d at MS-4 versus 0.003mg lipid/m2 d for EqPac).In contrast to OC, lipid preservation appearsgreater in the equatorial Pacific: 3.4% of the deeptrap flux accumulated in sediments at EqPacagainst 0.17% at MS-4. Elevated benthic reminer-alization in the western Arabian Sea preferentiallyconsumed the more labile lipids over bulk OC.A detailed comparison of all measured biomar-
kers between EqPac and ASPS is beyond the scope
S.G. Wakeham et al. / Deep-Sea Research II 49 (2002) 2265–2301 2295

of this discussion. However, several biomarkersthat were important constituents of sinkingand sedimentary matter in the Arabian Sea wereabsent from the EqPac samples, reflecting thedifferent ecosystems at the two locations. Forexample, the C25 HBI alkenes that play such aprominent role in the lipid flux in the Arabian Seawere not found in the EqPac trap samples, eventhose that contained large amounts of diatoms.The buoyant diatom, Rhizosolenia castracanei,that formed dense surface accumulations observedas a ‘‘front’’ at 21N during Survey Cruise II(‘‘the line in the sea’’; Yoder et al., 1994; Barberet al., 1994), contains small amounts of C30 HBIsrather than C25 HBIs (Wakeham, unpublished).Nor were C25 HBIs significant components of
suspended particulate matter in surface waterscollected on the EqPac transect/survey cruises(Wakeham, unpublished results). EqPac samplesalso were not as enriched in the C30-alkanediol and the C30-alkane-keto-ol (and homologs ofboth) as were ASPS samples, suggesting thattheir (unknown) sources were not very importantin the equatorial Pacific Ocean although theywere important in the Arabian Sea. Finally,long-chain alkenones were relatively minorcomponents in the Arabian Sea surface sedi-ments, about 1% of total neutral lipids versusB10% of neutral lipids in EqPac surface sedi-ments, reflecting the greater contribution ofE. huxleyi to particle flux in the equatorial PacificOcean.
OC flux (mg/m2d)
0.01 0.1 1 10 100 1000
Dep
th (
m)
-5000
-4000
-3000
-2000
-1000
0
OC flux (mg/m2d)
0.01 0.1 1 10 100 1000
-5000
-4000
-3000
-2000
-1000
0
Lipid flux (mg/m2d)
0.00001 0.0001 0.001 0.01 0.1 1 10 100
Dep
th (
m)
-5000
-4000
-3000
-2000
-1000
0
Lipid flux (mg/m2d)
0.00001 0.0001 0.001 0.01 0.1 1 10 100
-5000
-4000
-3000
-2000
-1000
0
Arabian Sea
MS-3MS-4
9N equator
MS-3MS-4
9N equator
MS-1
MS-1
EqPac
Fig. 14. Annual fluxes of OC and total lipids at MS-1, MS-3 and MS-4 in the Arabian Sea and at 91N and the equator in the equatorial
Pacific Ocean (data from Wakeham et al., 1997b).
S.G. Wakeham et al. / Deep-Sea Research II 49 (2002) 2265–23012296

5. Overview
Distributions of lipid biomarkers demonstratethat the strong physical forcings and ensuingbiological cycles in the western Arabian Sea aremanifested in complex spatial and temporalpatterns of particulate organic matter flux andcomposition. Biomarker fluxes fluctuate in timeand space as a reflection of variations in biologicalproduction and community structure and succes-sion. Subsurface maxima in flux may result fromlateral (rather than strictly vertical) transport ofparticulate material in the physically high-energyregime of the western Arabian Sea characterizedby episodic events involving upwelling, eddies, andfilaments associated with the monsoon seasonsand surface ocean physics. Despite substantialproduction and subsequent transport of organicmatter through the water column, remarkablylittle accumulates in surface sediments, and selec-tive degradation leaves behind a highly reworkedorganic composition. Low efficiency of preserva-tion coupled with significant alteration in organicmatter composition can cause severe complica-tions in reconstructing the paleoenvironment ofthe Arabian Sea derived from examination of thesedimentary record.
Acknowledgements
Our study could not have succeeded without thetremendous effort of the WHOI/Oregon State/Brown University sediment trap/coring consor-tium, including S. Honjo, S. Manganini, J.Dymond, C. Moser, K. Brooksforce, T. Gann, J.Billings, W. Prell and D. Murray, the Captain andcrew of R/V T.G. Thompson, and the adminis-trative skills of S. Kadar. Analytical assistance atSkidaway was provided by A. Bradley, J. Johnson,and A. Biersmith. Reviews by S. Smith, S. Row-land, T.K. Pease and two anonymous refereesgreatly improved the manuscript. This researchwas supported by National Science Foundationgrants to SGW (OCE-9310364), JIH (OCE-9310684) and CL (OCE-9312694). This is USJGOFS contribution number 610.
References
Armstrong, R.A., Lee, C., Hedges, J.I., Honjo, S., Wakeham,
S.G., 2002. A new model for deep-ocean remineralization of
organic carbon and mineral ballasts. Deep-Sea Research II
49, 219–236.
Barber, R.T., Murray Jr., J.W., McCarthy, J.J., 1994.
Biogeochemical interactions in the equatorial Pacific.
Ambio 23, 62–66.
Barber, R.T., Sanderson, M.P., Lindley, S.T., Chai, F.,
Newton, J., Trees, C.C., Foley, D.G., Chavez, F.P., 1996.
Primary productivity and its regulation in the equatorial
Pacific during and following the 1991–92 El Ni *no. Deep-Sea
Research II 43, 963–969.
Barber, R.T., Marra, J., Bidigare, R.C., Codispoti, L.A.,
Halpern, D., Johnson, Z., Latasa, M., Goericke, R., Smith,
S.L., 2001. Primary productivity and its regulation in the
Arabian Sea during 1995. Deep-Sea Research II 48,
1127–1172.
Barrett, S.M., Volkman, J.K., Dunstan, G.A., LeRoi, J.-M.,
1995. Sterols of 14 species of marine diatoms (Bacillar-
iophyta). Journal of Phycology 31, 360–369.
Belt, S.T., Cooke, D.A., Robert, J.-M., Rowland, S., 1996.
Structural characterization of widespread polyunsaturated
isoprenoid biomarkers: a C25 triene, tetraene and pentaene
from the diatom Haslea ostrearia Simonsen. Tetrahedron
Letters 37, 4755–4758.
Belt, S.T., Allard, W.G., Mass!e, Robert, J.-M., Rowland, S.J.,
2000. Highly branched isoprenoids (HBIs): identification of
the most common and abundant sedimentary isomers.
Geochimica et Cosmochimica Acta 64, 3829–3851.
Bieger, T., Abrajano, T.-A., Hellou, J., 1997. Generation
of biogenic hydrocarbons during a spring bloom in
Newfoundland coastal (NW Atlantic) waters. Organic
Geochemistry 26, 207–218.
Boon, J.J., Rijpstra, W.I.C., De Lang, F., de Leeuw, J.W.,
1979. Black Sea sterolFa molecular fossil for dinoflagellate
blooms. Nature 277, 125–127.
Brassell, S.C., 1993. Application of biomarkers for delineating
marine paleoclimatic fluctuations during the Pleistocene. In:
Engel, M.H., Macko, S.A. (Eds.), Organic Geochemistry.
Principles and Applications. Plenum Press, New York, pp.
699–738.
Brock, J.C., McClain, C.R., 1991. Interannual variability of the
Southwest Monsoon phytoplankton bloom in the northwest
Arabian Sea. Journal of Geophysical Research 97 (C1),
733–750.
Campbell, L.L., Landry, M.R., Constantinou, J., Nolla, H.A.,
Brown, S.L., Liu, H., Caron, D.A., 1998. Response of
microbial community structure to environmental forcing in
the Arabian Sea. Deep-Sea Research II 45, 2301–2335.
Canuel, E.A., 2001. Relations between river flow, primary
production and fatty acid composition of particulate
organic matter in San Francisco and Chesapeake Bays: a
multivariate approach. Organic Geochemistry 32, 563–583.
Canuel, E.A., Martens, C.S., 1996. Reactivity of recently
deposited organic matter: degradation of lipid compounds
S.G. Wakeham et al. / Deep-Sea Research II 49 (2002) 2265–2301 2297
near the sediment–water interface. Geochimica et Cosmo-
chimica Acta 60, 1793–1806.
Conte, M.H., Volkman, J.K, Eglinton, G., 1994. Lipid
biomarkers of the Prymnesiophyceae. In: Green, J.C.,
Leadbetter, B.S.C. (Eds.), The Haptophyte Algae. Clar-
endon Press, Oxford, pp. 351–377.
Conte, M.H., Thompson, A., Lesley, D., Harris, R.P., 1998.
Genetic and physiological influences on the alkenone/
alkenoate versus growth temperature relationship in
Emiliania huxleyi and Gephyrocapsa oceanica. Geochimica
et Cosmochimica Acta 62, 51–68.
Cooke, D.A., Barlow, R., Green, J., Belt, S.T., Rowland, S.J.,
1998. Seasonal variations of highly branched isoprenoid
hydrocarbons and pigment biomarkers in intertidal sedi-
ments of the Tamar estuary. UK Marine Environmental
Research 45, 309–324.
Dauwe, B., Middelburg, J.J., 1998. Amino acids and hexosa-
mines as indicators of organic matter degradation state in
North Sea sediments. Limnology and Oceanography 43,
782–798.
Dickey, T., Marra, J., Sigurdson, D.E., Weller, R.A., Kinkade,
C.S., Zedler, S.E., Wiggert, J.D., Langdon, C., 1998.
Seasonal variability of bio-optical and physical properties
in the Arabian Sea: October 1994–October, 1995. Deep-Sea
Research II 45, 2001–2025.
Eglinton, T.I., Conte, M.H., Eglinton, G., Hayes, J.M., 2001.
Proceedings of a Workshop on Alkenone-based Paleocea-
nographic Indicators. Geochemistry, Geophysics, Geosys-
tems. Paper 2000GC00122, January 9, 2001.
Flagg, C., Kim, H.-S., 1998. Upper ocean currents in the
Northern Arabian Sea from shipboard ADCP measure-
ments collected during 1994–1996 US JGOFS and ONR
programs. Deep-Sea Research II 45, 1917–1959.
Garrison, D.L., Gowing, M.M., Hughes, M.P., 1998.
Nano- and microzooplankton in the northern Arabian
Sea during the Southwest Monsoon, August-September
1995: a US-JGOFS study. Deep-Sea Research II 45,
2269–2299.
Gelin, F., Volkman, J.K., de Leeuw, J.W., Sinninghe-Damst!e,
J.S., 1997. Mid-chain hydroxy long-chain fatty acids in
microalgae from the genus Nannochloropsis. Phytochemistry
45, 641–646.
Go *ni, M.A., Yunker, M.B., Macdonald, R.W., Eglinton, T.I.,
2000. Distribution and sources of organic biomarkers in
arctic sediments from the Mackenzie River and Beaufort
Shelf. Marine Chemistry 71, 23–51.
van Gyldenfeldt, A.B., Carstens, J., Meincke, J., 2000.
Estimation of the catchment area of a sediment trap by
means of current meters and foraminiferal tests. Deep-Sea
Research II 47, 1701–1717.
Haake, B., Ittekkot, V., Ramaswamy, V., Nair, R.R., Honjo,
S., 1992. Fluxes of amino acids and hexosamines to the deep
Arabian Sea. Marine Chemistry 40, 291–314.
Haake, B., Ittekkot, V., Rixen, T., Ramaswamy, V., Nair, R.R.,
Curry, W.B., 1993. Seasonality and interannual variability
of particle fluxes to the deep Arabian Sea. Deep-Sea
Research 40, 1323–1344.
Haake, B., Rixen, T., Reemtsma, T., Ramaswamy, V., Ittekkot,
V., 1996. Processes determining seasonal variability and
interannual variability of settling particle fluxes to the deep
Arabian Sea. In: Ittekkot, V., Schaefer, P., Honjo, S.,
Depetris, P.J. (Eds.), Particle Flux in the Ocean, SCOPE,
Vol. 57. Wiley, New York, pp. 251–270.
Hammond, D.E., McManus, J., Berelson, W.M., Kilgore, T.E.,
Pope, R.H., 1996. Early diagenesis of organic material in
equatorial Pacific sediments: stoichiometry and kinetics.
Deep-Sea Research II 43, 1365–1412.
Harvey, H.R., O’Hara, S.C.M., Eglinton, G., Corner, E.D.S.,
1987. Biotransformation and assimilation of dietary lipids
by Calanus feeding on a dinoflagellate. Geochimica et
Cosmochimica Acta 51, 3031–3040.
ten Haven, H.L., Eglinton, G., Farrimond, P., Kohnen,
M.E.L., Poynter, J.G., Rullk .otter, J., et al., 1992. Variations
in the content and composition of organic matter in
sediments underlying active up welling regimes: a study of
ODP Legs 108, 112, and 117. In: Summerhayes, C.P., Prell,
W.L., Emeis, K.C. (Eds.), Upwelling Systems: Evolution
Since the Early Miocene. Geological Society Special
Publication 64, pp. 229–246.
Hedges, J.I., Keil, R.G., 1995. Sedimentary organic matter
preservation: an assessment and speculative synthesis.
Marine Chemistry 49, 81–115.
Hedges, J.I., Baldock, J.A., Gelinas, Y., Lee, C., Peterson,
M.L., Wakeham, S.G., 2001. Evidence for non-selective
preservation of organic matter in sinking marine particles.
Nature 409, 801–804.
Hernes, P.J., Peterson, M.L., Murray, J.W., Wakeham, S.G.,
Lee, C., Hedges, J.I., 2001. Particulate carbon and nitrogen
fluxes and compositions in the central equatorial Pacific
Ocean. Deep-Sea Research II 48, 1999–2023.
Hird, S.J., Rowland, S.J., 1995. An investigation of the sources
and seasonal variations of highly branched isoprenoid
hydrocarbons in intertidal sediments of the Tamar Estuary.
UK Marine Environmental Research 40, 423–438.
Hoefs, M.J.L., Sinninghe Damst!e, J.S., de Leeuw, J.W., 1995. A
novel C35 highly branched isoprenoid hydrocarbon in recent
Indian Ocean sediments. Organic Geochemistry 23, 263–
267.
Honjo, S., Dymond, J., Prell, W., Ittekkot, V., 1999. Monsoon-
controlled export fluxes to the interior of the Arabian Sea.
Deep-Sea Research II 46, 1859–1902.
Kaneda, T., 1991. Iso and anteiso-fatty acids in bacteria:
biosynthesis, function, and taxonomic significance. Micro-
biological Reviews 55, 288–302.
Kim, H.-S., Flagg, C.N., Howden, S.D., 2001. Northern
Arabian Sea variability from TOPEX/Poseidon altimetry
data, an extension of the US JGOFS/ONR ADCP study.
Deep-Sea Research II 48, 1069–1096.
Landry, M.R., Brown, S.L., Campbell, L., Constantinou, J.,
Liu, H., 1998. Spatial patterns in phytoplankton growth and
microzooplankton grazing in the Arabian Sea during
monsoon forcing. Deep-Sea Research II 45, 2353–2367.
Latasa, M., Bidigare, R.R., 1998. A comparison of phyto-
plankton populations of the Arabian Sea during the Spring
S.G. Wakeham et al. / Deep-Sea Research II 49 (2002) 2265–23012298

Intermonsoon and Southwest Monsoon of 1995 as de-
scribed by HPLC-analyzed pigments. Deep-Sea Research II
45, 2133–2170.
Lee, R.F., Loeblich, A.R., 1971. Distribution of 21:6 hydro-
carbon and its relationship to 22:5 fatty acid in algae.
Phytochemistry 10, 593–602.
Lee, C., Hedges, J.I., Wakeham, S.G., Zhu, N., 1992.
Effectiveness of poisons and preservatives in retarding
bacterial activity in sediment trap material. Limnology
and Oceanography 37, 117–130.
Lee, C., Murray, D.W., Barber, R.T., Buesseler, K.O.,
Dymond, J., Hedges, J.I., Honjo, S., Manganini, S.J.,
Marra, J., Moser, C., Peterson, M.L., Prell, W.L., Wake-
ham, S.G., 1998. Particulate organic carbon fluxes: compi-
lation of results from the 1995 US JGOFS Arabian Sea
Process Study. Deep-Sea Research II 45, 2489–2501.
de Leeuw, J.W., Rijpstra, W.I.C., Muir, L.R., 1992. The
absence of long-chain alkyl diols and alkyl keto-ols in
cultures of the cyanobacterium Aphanizomenon flos-aquae.
Organic Geochemistry 18, 575–578.
Lehninger, A.L., 1981. Biochemistry. Worth Publishers, New
york, 1104pp.
Liu, H., Campbell, L., Landry, M.R., Nolla, H.A., Brown,
S.L., Constantinou, J., 1998. Prochlorococcus and Synecho-
coccus growth rates and contributions to production in the
Arabian Sea during the 1995 Southwest and Northeast
Monsoons. Deep-Sea Research II 45, 2327–2351.
Luther, M.E., O’Brien, J.J., Prell, W.L., 1990. Variability in
upwelling fields in the northwestern Indian Ocean: part 1:
model experiments over the past 18,000 years. Paleoceano-
graphy 5, 433–445.
Marra, J., Dickey, T.D., Ho, C., Kinkade, C.S., Sigurdson,
D.E., Weller, R.A., Barber, R.T., 1998. Variability in
primary production as observed from moored sensors in
the central Arabian Sea in 1995. Deep-Sea Research II 45,
2253–2267.
Martin, J.H., Knauer, G.A., Karl, D.M., Broenkow, W.W.,
1987. VERTEX: carbon cycling in the northeast Pacific.
Deep-Sea Research 34, 267–285.
Matsumoto, G.I., Nagashima, H., 1984. Occurrence of 3-
hydroxy acids in microalgae and cyanobacteria and their
geochemical significance. Geochimica et Cosmochimica
Acta 48, 1683–1687.
Matsumoto, G.I., Shioya, M., Nagashima, H., 1984. Occur-
rence of 2-hydroxy acids in microalgae. Phytochemistry 23,
1421–1423.
Matsumoto, G.I., Watanuki, K., Torii, T., 1988. Hydroxy acids
in Antarctic lake sediments and their geochemical significance.
In: Mattavelli, L., Novelli, L. (Eds.), Advances in Organic
Geochemistry 1987. Organic Geochemistry 13, 785–790.
Morris, R.J., Brassell, S.C., 1988. Long-chain alkane diols:
biological markers for cyanobacteria contributions to
sediments. Lipids 23, 256–258.
Nair, R.R., Ittekkot, V., Manganini, S.J., Ramaswamy, V.,
Haake, B., Degens, E.T., Desai, B.M., Honjo, S., 1989.
Increased particle flux to the deep ocean related to
monsoons. Nature 338, 749–751.
Neal, A.C., Prahl, F.G., O’Hara, S.C.M., Corner, E.D.S., 1986.
Lipid changes during a planktonic feeding sequence
involving unicellular algae, Elminius nauplii and adult
Calanus. Journal of the Marine Biological Association UK
66, 1–13.
Nichols, P.D., Volkman, J.K., Palmisano, A.H., Smith, G.A.,
White, D.C., 1988. Occurrence of an isoprenoid C25 alkene
and high neutral lipid content in Antarctic sea-ice diatom
communities. Journal of Phycology 24, 90–96.
Ourisson, G., Rohmer, M., Poralla, K., 1987. Prokaryotic
hopanoids and other polyisoprenoid sterol surrogates.
Annual Review of Microbiology 41, 310–333.
Peterson, M.L., Hernes, P.J., Thoreson, D.J., Hedges, J.I., Lee,
C., Wakeham, S.G., 1993. Field evaluation of a valved
sediment trap. Limnology and Oceanography 38,
1741–1761.
Popp, B.N., Kenig, F., Wakeham, S.G., Laws, E.A., Bidigare,
R.R., 1998. Does growth rate affect ketone unsaturation
and intracellular carbon isotopic variability in Emiliania
huxleyi? Paleoceanography 13, 35–41.
Prahl, F.G., Eglinton, G., Corner, E.D.S., O’Hara, S.C.M.,
Forsberg, T.E.V., 1984. Changes in plant lipids during
passage through the gut of Calanus. Journal of Marine
Biological Association UK 65, 547–560.
Prahl, F.G., Dymond, J., Sparrow, M.A., 2000. Annual
biomarker record for export production in the central
Arabian Sea. Deep-Sea Research II 47, 1581–1604.
Prell, W.L., Murray, D.W., Clemens, S.C., Anderson, D.W.,
1992. Evolution and variability of the Indian Ocean summer
monsoon: a synthesis of results from the Ocean Drilling
Program. Geophysical Monograph 70, American Geophy-
sical Union, Washington, DC, pp. 447–469.
Pye, K., 1987. In: Aeolian Dust and Dust Deposits. Academic
Press, London, pp. 76–80.
Ramaswamy, V., Nair, R.R., Manganini, S.J., Haake, B.,
Ittekkot, V., 1991. Lithogenic fluxes to the deep Arabian
Sea measured by sediment traps. Deep-Sea Research 38,
169–184.
Ratledge, C., Wilkinson, S.G. (Eds.), 1988. Microbial Lipids.
Academic Press, New York.
Rechka, J.A., Maxwell, J.R., 1988. Unusual long-chain ketones
of algal origin. Tetrahedron Letters 29, 2599–2600.
Reemtsma, T., Haake, B., Ittekkot, V., Nair, R.R., Brockmann,
U.H., 1990. Downward flux of particulate fatty acids in the
Central Arabian Sea. Marine Chemistry 29, 183–202.
Reemtsma, T., Ittekkot, V., 1992. Determination of factors
controlling the fatty acid composition of settling particles in
the water column by principal-component analysis and their
quantitative assessment by multiple regression. Organic
Geochemistry 18, 121–129.
Rixen, T., Haake, B., 1993. Fluxes and decomposition of
organic matter in the western Arabian Sea: amino acids and
hexosamines. In: Ittekkot, V., Nair, R.R. (Eds.), Monsoon
Biogeochemistry. Mitt. Geol., Pal.aontol. Inst. Univ. Ham-
burg, Vol. 76, pp. 113–130.
Rixen, T., Haake, B., Ittekkot, V., Guptha, M.V.S., Nair, R.R.,
Shulessel, P., 1996. Coupling between SW monsoon related
S.G. Wakeham et al. / Deep-Sea Research II 49 (2002) 2265–2301 2299

surface and deep ocean processes as discerned
from continuous particle flux measured and correlated
satellite data. Journal of Geophysical Research 101,
28569–28582.
Rixen, T., Haake, B., Ittekkott, V., 2000. Sedimentation in the
western Arabian Sea: the role of coastal and open-ocean
upwelling. Deep-Sea Research II 47, 2155–2178.
Robinson, N., Eglinton, G., Brassell, S.C., Cranwell, P.A.,
1984. Dinoflagellate origin for sedimentary 4a-methylster-oids and 5a(H)-stanols. Nature 308, 439–442.
Rowland, S.J., Robson, J.N., 1990. The widespread occurrence
of highly branched acyclic C20, C25, and C30 hydrocarbons
in recent sediments and biotaFa review. Marine Environ-
mental Research 30, 191–216.
Schouten, S., Hoefs, M.J.L., Sinninghe Damst!e, J.S., 2000. A
molecular and stable carbon isotope study of lipids in late
Quaternary sediments from the Arabian Sea. Organic
Geochemistry 31, 509–521.
Schulte, S., Mangelsdorf, K., Rullk .otter, J., 2000. Organic
matter preservation on the Pakistan continental margin as
revealed by biomarker geochemistry. Organic Geochemistry
31, 1005–1022.
Sheridan, C.C., Lee, C., Wakeham, S.G., Bishop, J.K.B., 2002.
Suspended particle organic composition and cycling in
surface and midwaters of the equatorial Pacific Ocean.
Deep-Sea Research, submitted.
Siegel, D.A., Deuser, W.G., 1997. Deep ocean time-series
particle trapping in the Sargasso Sea: the modelling of
‘‘statistical funnels’’. Deep-Sea Research I 44, 1519–1541.
Siegel, D.A., Granata, T.C., Michaels, A.F., Dickey, T.D.,
1990. Mesoscale eddy diffusion, particle sinking, and the
interpretation of sediment trap data. Journal of Geophysical
Research 95, 5305–5311.
Sinninghe Damst!e, J.S., Rijpstra, W.I.C., Schouten, S., Peletier,
H., van der Marcel, M.J.E.C., Gieskes, W.C., 1999a. A C25
highly branched isoprenoid alkene and C25 and C27 n-
polyenes in the marine diatom Rhizosolenia setigera.
Organic Geochemistry 30, 95–100.
Sinninghe Damst!e, J.S., Schouten, S., Rijpstra, W.I.C., Hop-
mans, E.C., Peletier, H., Gieskes, W.W.C., Geenevasen,
J.A.J., 1999b. Structural identification of the C25 highly
branched isoprenoid pentaene in the marine diatom
Rhizosolenia setigera. Organic Geochemistry 30, 1581–1583.
Smith, S.L., 2001. Understanding the Arabian Sea: reflections
on the 1994–1996 Arabian Sea expedition. Deep-Sea
Research II 48, 1385–1402.
Smith, S.L., Codispoti, L.A., Morrison, J.M., Barber, R.T.,
1998a. The 1994–1996 Arabian Sea expedition: an inte-
grated, interdisciplinary investigation of the response of the
northwestern Indian Ocean to Monsoonal forcing. Deep-
Sea Research II 45, 1905–1915.
Smith, S., Roman, M., Prusova, I., Wishner, K., Gowing, K.,
Codispoti, L.A., Barber, R., Marra, J., Flagg, C., 1998b.
Seasonal response of zooplankton to monsoonal reversals in
the Arabian Sea. Deep-Sea Research II 45, 2369–2403.
Sun, M.-Y., Wakeham, S.G., 1994. Molecular evidence for
degradation and preservation of organic matter in the
anoxic Black Sea basin. Geochimica et Cosmochimica Acta
58, 3395–3406.
Versteegh, G.J.M, Bosch, H.-J., de Leeuw, J.W., 1997.
Potential paleoenvironmental information of C24 to C36
mid-chain diols, keto-ols and mid-chain hydroxy fatty acids:
a critical review. Organic Geochemistry 27, 1–13.
Volkman, J.K., 1986. A review of sterol markers for marine and
terrigenous organic matter. Organic Geochemistry 9,
83–100.
Volkman, J.K., Barrett, S.M., Dunstan, G.A., Jeffrey, S.W.,
1992. C30–C32 alkyl diols and unsaturated alcohols in
microalgae of the class Eustigmatophyceae. Organic Geo-
chemistry 18, 131–138.
Volkman, J.K., Barrett, S.M., Dunstan, G.A., 1993. Geochem-
ical significance of the occurrence of dinosterol and other 4-
methyl sterols in a marine diatom. Organic Geochemistry
20, 7–15.
Volkman, J.K., Barrett, S.M., Dunstan, G.A., 1994. C25 and
C30 highly branched isoprenoid alkenes in laboratory
cultures of two marine diatoms. Organic Geochemistry 21,
407–413.
Volkman, J.K., Barrett, S.M., Blackburn, S.I., Mansour, M.P.,
Sikes, E.L., Gelin, F., 1998. Microalgal biomarkers, a
review of recent research developments. Organic Geochem-
istry 29, 1163–1179.
Volkman, J.K., Barrett, S.M., Blackburn, S.I., 1999. Eustigma-
tophyte microalgae are potential sources of C29 sterols, C22–
C28 n-alcohols and C28–C32 n-alkyl diols in freshwater
environments. Organic Geochemistry 30, 307–318.
Wakeham, S.G., 1990. Algal and bacterial hydrocarbons in
suspended particulate matter and interfacial sediment of the
Cariaco Trench. Geochimica et Cosmochimica Acta 54,
1325–1336.
Wakeham, S.G., 1995. Lipid biomarkers for heterotrophic
alteration of suspended particulate organic matter in
oxygenated and anoxic water columns of the ocean. Deep-
Sea Research 42, 1749–1771.
Wakeham, S.G., Canuel, E.A., 1986. Lipid composition of the
pelagic crab Pleuroncodes planipes, its feces, and sinking
particulate organic matter in the Equatorial North Pacific
Ocean. Organic Geochemistry 9, 331–343.
Wakeham, S.G., Canuel, E.A., 1988. Organic geochemistry of
particulate matter in the eastern tropical North Pacific
Ocean: implications for particle dynamics. Journal of
Marine Research 46, 183–213.
Wakeham, S.G., Beier, J.A., Clifford, C.H., 1991. Organic
matter sources in the Black Sea as inferred from hydro-
carbon distributions. In: Izdar, E., Murray, J.W. (Eds.),
Black Sea Oceanography. Kluwer, Dordrecht, pp. 319–341.
Wakeham, S.G., Lee, C., Hedges, J.I., Hernes, P.J., Peterson,
M.L., 1997a. Molecular indicators of diagenetic status in
marine organic matter. Geochimica et Cosmochimica Acta
61, 5363–5369.
Wakeham, S.G., Hedges, J.I., Lee, C., Peterson, M.L., Hernes,
P.J., 1997b. Compositions and transport of lipid biomarkers
through the water column and surficial sediments of the
S.G. Wakeham et al. / Deep-Sea Research II 49 (2002) 2265–23012300

Equatorial Pacific Ocean. Deep-Sea Research II 44,
2131–2162.
Wakeham, S.G., Lee, C., Hedges, J.I., 2000. Fluxes of major
biochemicals in the equatorial Pacific Ocean. In: Handa, N.,
Tanoue, E., Hama, T. (Eds.), Dynamics and Characteriza-
tion of Marine Organic Matter. Terra Scientific Publishing
Co. (TERRAPUB)/Kluwer Academic Publishers, Tokyo/
Dordrecht, pp. 117–140.
Weller, R.A., Baumgartner, M.M., Josey, S.A., Fischer, A.S.,
Kindle, J.C., 1998. Atmospheric forcing in the Arabian Sea
during 1994–1995: observations and comparisons with
climatology and models. Deep-Sea Research II 45,
1961–1999.
Wishner, K.F., Gowing, M.M., Gelfman, C., 1998. Mesozoo-
plankton biomass in the upper 1000m in the Arabian
Sea: overall seasonal and geographic patterns, and relation-
ship to oxygen gradients. Deep-Sea Research II 45,
2405–2431.
Witte, U., Pfannkuche, O., 2000. High rates of benthic carbon
remineralization in the abyssal Arabian Sea. Deep-Sea
Research II 47, 2785–2804.
Wraige, E.J., Belt, S.T., Lewis, C.A., Cooke, D.A., Robert, J.-
M., Mass!e, Rowland, S.J., 1997. Variations in structures
and distributions of C25 highly branched isoprenoid (HBI)
alkenes in cultures of the diatom, Haslea ostrearia
(Simonsen). Organic Geochemistry 27, 497–505.
Wraige, E.J., Johns, L., Belt, S.T., Mass!e, G., Robert, J.-M.,
Rowland, S.J., 1998. Variations in structures and distribu-
tions of highly branched C25 isoprenoids in cultures of the
diatom, Haslea ostrearia: effects of salinity. Organic
Geochemistry 28, 855–859.
Wraige, E.J., Belt, S.T., Johns, L., Mass!e, G., Robert, J.-M.,
Rowland, S., 1999. Highly branched C25 isoprenoids in
axenic cultures of Haslea ostrearia. Phytochemistry 51,
69–73.
Yoder, J.A., Ackleson, S.G., Barber, R.T., Flament, P., Balch,
W.M., 1994. A line in the sea. Science 371, 689–692.
Yunker, M.B., Macdonald, R.W., Veltkamp, D.J., Cretney,
W.J., 1995. Terrestrial and marine biomarkers in a
seasonally ice-covered Arctic estuaryFintegration of multi-
variate and biomarker approaches. Marine Chemistry 49,
1–50.
S.G. Wakeham et al. / Deep-Sea Research II 49 (2002) 2265–2301 2301