marine pollution and echinoderms: a biomarker study ...
260
University of Plymouth PEARL https://pearl.plymouth.ac.uk 04 University of Plymouth Research Theses 01 Research Theses Main Collection 2009 MARINE POLLUTION AND ECHINODERMS: A BIOMARKER STUDY INTEGRATING DIFFERENT LEVELS OF BIOLOGICAL ORGANISATION Canty, Martin Neil http://hdl.handle.net/10026.1/1936 University of Plymouth All content in PEARL is protected by copyright law. Author manuscripts are made available in accordance with publisher policies. Please cite only the published version using the details provided on the item record or document. In the absence of an open licence (e.g. Creative Commons), permissions for further reuse of content should be sought from the publisher or author.
-
Upload
khangminh22 -
Category
Documents
-
view
0 -
download
0
Transcript of marine pollution and echinoderms: a biomarker study ...

University of Plymouth
PEARL https://pearl.plymouth.ac.uk
04 University of Plymouth Research Theses 01 Research Theses Main Collection
2009
MARINE POLLUTION AND
ECHINODERMS: A BIOMARKER
STUDY INTEGRATING DIFFERENT
LEVELS OF BIOLOGICAL
ORGANISATION
Canty, Martin Neil
http://hdl.handle.net/10026.1/1936
University of Plymouth
All content in PEARL is protected by copyright law. Author manuscripts are made available in accordance with
publisher policies. Please cite only the published version using the details provided on the item record or
document. In the absence of an open licence (e.g. Creative Commons), permissions for further reuse of content
should be sought from the publisher or author.
MARINE POLLUTION AND ECHINODERMS: A BIOMARKER STUDY INTEGRATING DIFFERENT
L E V E L S OF BIOLOGICAL ORGANISATION
by
MARTIN NEIL CANTY
A thesis submit ted to the Universi ty of P lymouth in partial fulf i lment for the degree of
DOCTOR OF PHILOSOPHY
School of Biomedical a n d Biological Sciences University of P lymouth
December 2 0 0 9

MARINE POLLUTION AND ECHINODERMS: A BIOMARKER STUDY INTEGRATING DIFFERENT L E V E L S OF BIOLOGICAL ORGANISATION
Martin Neil Canty
Abstract
There is growing concern that the invertebrate lest organisms commonly
employed in the field of aquatic ecoloxicology may not be sufficient to
accurately screen for the possible deleterious effects of contaminants
discharged into the marine environment. The use of echinoderms has been
proposed to redress this problem, due to their ecological importance and their
evolutionary closeness to the chordates. But to date, there is a paucity of data
in the published literature which has utilised the adult stages of echinoderms in
laboratory based toxicology studies. The present studies aimed to fill this lack of
information.
A suite of biomarkers which operated at different levels of biological
organisation (sub-cellular, cellular and individual level) were identified for use
with different echinoderm species (the common sea star, Asterias rubens, the
purple sea urchin, Paracentrotus lividus and the common brittle star, Ophiothrix
fragilis). These biomarkers used were micronucleus induction, the Comet
assay, the modified Comet assay, phagocytosis, neutral red retention,
clearance rate and righting time.
Concurrent exposures showed that echinoderms were more sensitive to model
contaminants than a commonly used sentinel ecotoxicological test species,
namely the blue mussel, MytHus edulis. These contaminants included: the
reference toxicants hydrogen peroxide (Chapter 2) and methyl
methanesulphonate (Chapter 3); a pharmaceutical, cyclophosphamide (Chapter
3); a polycyclic aromatic hydrocarbon. benzo(a)pyrene (Chapter 4) and a heavy
metal, cadmium (Chapter 5).
The results for all the exposures showed that the biomarkers which operated at
the lower levels of biological organisation (i.e. at the subcellular level - namely
the micronucleus and Comet assays) were the most sensitive at detecting the
deleterious effects of the contaminants. But, interestingly, some strong
correlations were found between these sub-cellular consequences and those
that operated at higher levels of biological organisation (for example, between
righting time and both micronucleus induction and Comet assay in Asterias
rubens following cyclophosphamide exposure). Theses correlations suggest
that biomarkers which operate at the whole organism level (namely righting time
and clearance rate) may serve as rapid and accurate indicators of possible
damage induced by xenobiotics in echinoderms and bivalve molluscs.

CONTENTS
CHAPTER 1 1
Introduction 2
1.1 Pollution in aquatic ecosystems 2 1.2 Biomarkers and their use in aquatic toxicology 3 1.3 Specific types of marine pollutants 21 1.4 Reference toxicants 25 1.5 Use of echinoderms in toxicology and ecotoxicology 27 1.6 Aims and objectives 37
CHAPTER 2 41
Materials and methods 42
2.1 Test organism collection and maintenance 42 2.2 Haemolymph and coelomic fluid collection 47 2.3 Cell membrane stability (neutral red retention assay) 52 2.4 Protein determination 55 2.5 Immunocompetence (phagocytosis assay) 56 2.6 Micronuclei induction 59 2.7 Cellular viability (Eosin Y staining) 62 2.8 The Comet assay 63 2.9 Clearance rate 68 2.10 Righting behaviour 72 2.11 Determination of cadmium levels in tissues of organisms using
analytical methods 75
CHAPTER 3 79
Echinoderms {Asterias rubens) are more sensitive to know genotoxins than mahne molluscs {Mytilus edulis).
Genotoxic responses can be linked to cytotoxic and behavioural (physiological) consequences.
3.1 Introduction 80 3.2 Materials and methods 86 3.3 Results 92 3.4 Discussion 105
CHAPTER 4 117
A model PAH (benzo(a)pyrene can cause behavioural (physiological), cytotoxic and genotoxic consequences in three different echinoderm
IV

species {Asterias rubens, Paraceritrotus lividus and Ophiothrix fragilis) and a bivalve mollusc (MytHus edulis).
These consequences at different levels of biological organisation will be reversible.
4.1 Introduction 118 4.2 Materials and methods 124 4.3 Results 129 4.4 Discussion 139
CHAPTER 5 147
A heavy metal (cadmium) can cause behavioural (physiological) and cytotoxic consequences in echinoderms (Asterias rubens) and molluscs {Mytilus edulis), and reversible immunotoxic, genotoxic and oxidative stress consequences In both species.
5.1 Introduction 148 5.2 Materials and methods 151 5.3 Results 158 5.4 Discussion 186
CHAPTER 6 193
General discussion 194
LIST OF FIGURES
Fig. 1.1 At lower levels of biological organisation, biologists have an increased
mechanistic understanding the effects of pollutants, despite the low ecological
relevance at these levels. Conversely, at the more ecologically relevant levels,
there is a reduced understanding the effects of pollutants (from Hinton et al.,
2005) 4
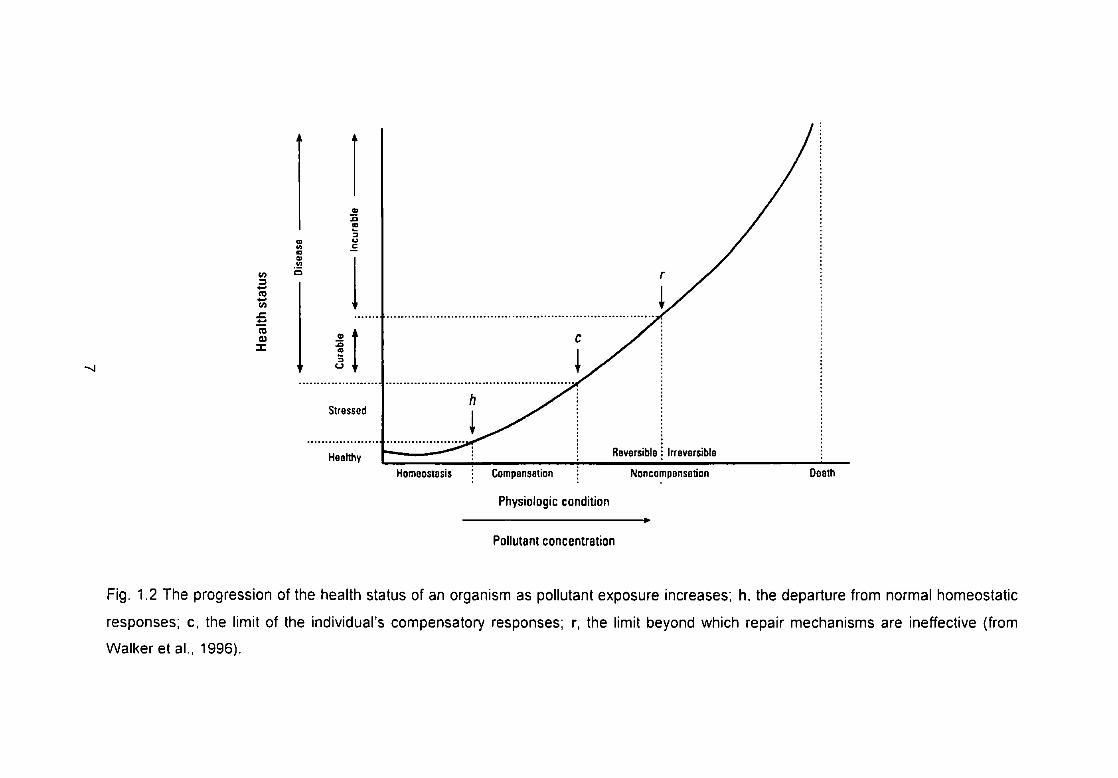
Fig. 1.2 The progression of the health status of an organism as pollutant
exposure increases; h, the departure from normal homeostatic responses; c,
the limit of the individual's compensatory responses; r, the limit beyond which
repair mechanisms are ineffective (from Walker et al., 1996) 7
Fig. 1.3 The methodology followed for the Comet assay and the modified
Comet assay. The enzyme incubation step is only used in the modified Comet
assay to quantify oxidised DNA bases; this step is omitted from the Comet
assay 17
Fig. 1.4 Micronuclei (Mn) formation in a dividing nucleated cell (adapted from
Fenech, 1993) 20
Fig. 1.5 The structure of the genotoxin cyclophosphamide 22
Fig. 1.6 The structures of eight of the sixteen priority PAHs as termed by the
USEPA (adapted from ATSDR, 1995) 23
Fig. 1.7 The structure of the genotoxin methyl methanesulphonate 26
Fig. 1.8 The structure of hydrogen peroxide 27
Fig. 1.9 Phylogenetic tree showing the closeness of echinoderms to the
chordates (vertebrates). The organisms along the top have specific genome
projects currently initiated or completed. (From Sodergren et al., 2006) 28
Fig. 1.10 Outline of the thesis, detailing the topics covered in each chapter... .40 vi

Fig. 2.1 The test species used in these studies (a) Asterias rubens
(b) Paracentrotus lividus (c) Ophiothrix fragilis (d) Mytilus edulis. Scale bars =
10 mm 44
Fig. 2.2 An outline of the British Isles and Eire with animal collection sites
highlighted (white circles denote collection areas at each specific site), (a) The
area in and around Plymouth Sound (Devon, UK) where sea stars and brittle
stars were collected, (b) The area near Bantry, (Co. Cork, Eire) where sea
urchins were collected, (c) Port Quin (Cornwall, UK) where mussels were
collected. (Satellite images from http://maps.google.co.uk) 45
Fig. 2.3 Husbandry stock tanks used to house Asterias rubens. Air-driven
filtration units and Mytilus edulis as food source are visible 46
Fig. 2.4 Haemolymph extraction from the posterior adductor muscle of Mytilus
edulis. (a) and (b) show syringe and needle positioned in the posterior adductor
muscle, (c) A syringe containing haemolymph and (d) is a mussel with both
valves opened, showing the position of the posterior adductor muscle (red
arrows) 48
Fig. 2.5 Giemsa stained haemocytes from Mytilus edulis haemolymph. Scale
bar =15 pm 49
Fig. 2.6 Coelomocyte extraction from the 'inter-arm' region of Asterias rubens..
50
Fig. 2.7 Giemsa stained cells from Asterias rubens coelomic fluid. Phagocytic
amoebocytes (pa) are the most common cell types, followed by spherule cells
(s). Scale bar = 10 pm 51
Fig. 2.8 Flow chart illustrating the experimental design for the in vitro validation
of the NRR assay in Asterias rubens, Paracentrotus lividus and Mytilus edulis.
54
VM

Fig. 2.9 Neutral red retention as expressed by cell membrane stability (optical
density at 550 nm mg'^ protein) following in vitro exposure to H 2 O 2 for Asterias
rubens, Paracentrotus lividus and Mytilus edulis. Concentrations are expressed
in pM. The values are means (n = 5) ± SEM. * indicates a significant difference
from controls at, or above, the 95 % confidence level 55
Fig. 2.10 Flow chart illustrating the experimental design for the in vitro validation
of the phagocytosis assay in Asterias rubens and Mytilus edulis 58
Fig. 2.11 Phagocytotic activity expressed as zymosan particles phagocytosed
(x 10^ mg protein'^) following in vitro exposure to H 2 O 2 for Asterias rubens and
Mytilus edulis. Concentrations are expressed in pM. The values are means
(n = 4)± SEM. * indicates a significant difference from controls at, or above, the
95 % confidence level 59
Fig. 2.12 The appearance of some typical Mn. (a) A cell with one Mn present,
(b) Two Mn present, one close to. but not overlapping the main nuclei, (c) A cell
with two Mn which are close to one another, but not overlapping 61
Fig. 2.13 Examples of Mn present in (a) a Mytilus edulis haemocyte and in (b)
an Asterias rubens coelomocyte. The Mn are shown by the arrows. Scale
bar = 10 pm 61
Fig. 2.14 Mussel haemocytes stained with Eosin Y. The cell on the left (a) is
viable (green), the cell on the right (b) is unviable/ dead (red). Scale bar =
10 Mm 62
Fig. 2.15 Mytilus edulis haemocytes illustrating increasing levels of DNA
damage as detected by the Comet assay, with (a) representing undamaged
cells, through to (d) exhibiting the most. Scale bar = 50 pm 64
Fig. 2.16 Flow chart illustrating the experimental design for the in vitro validation
of the modified Comet assay in Asterias rubens, Paracentrotus lividus and
Mytilus edulis 66
VIII
Fig. 2.17 Percentage tail DNA following in vitro exposure to H 2 O 2 for (a)
Asterias rubens, (b) Paracentrotus lividus and (c) MytHus edulis. Concentrations
are expressed in pM. The values are means (n = 5) ± SEM. * indicates a
significant difference from controls at. or above, the 95 % confidence level 67
Fig. 2.18 Clearance rate beakers arranged across two 15-point magnetic stirring
plates (IKA ® RO 15). Mussels are visible on the base of each of the
experimental vessels and the empty 'blank' beakers are seen at the front of
each stirring plate 69
Fig. 2.19 Beckman™ Coulter Particle Size and Count Analyser (Z2) used to
count algal particles in samples collected during the clearance rate assay 70
Fig. 2.20 Experimental set-up for determining the clearance rates of brittle stars.
The algal suspension in each vessel is kept in suspension via a Pasteur pipette
driven by an air pump. The left most beaker is a system blank and brittle stars
are visible on the base of the other beakers 71
Fig. 2.21 Aquarium used to determine righting behaviour (with a partially righted
Asterias rubens) 72
Fig. 2.22 Series of images illustrating the righting response in Asterias rubens
(the sequence of images runs from (a) to (i)). Scale bar = 10 mm
74
Fig. 2.23 (a) An opened mussel showing the location of the gills (red arrows)
and the gut (black arrow), (b) Mussel with gills removed, (c) Mussel with both
the gills and gut (digestive gland) removed, (d) The body compartments on
slides prior to drying to a constant weight 75
Fig. 2.24 (a) Asterias rubens specimen prior to dissection, (b) Outer dermis
removed from central disc revealing the cardiac stomach (black arrow), (c)
Specimen with cardiac stomach removed (black arrow), (d) Tubed feet along an
ambulacral ridge, (e) Pyloric caeca visible on two dissected arms (black
arrows) 77
ix
Fig. 3.1 Flow chart illustrating the integrated experimental design adopted in the
study to evaluate the behavioural (physiological), cytotoxic and genotoxic
effects of genotoxins in (a) Asterias rubens and (b) Mytilus edulis 89
Fig. 3.2 Behavioural (physiological), cytotoxic and genotoxic effects in Asterias
rubens exposed to MMS for 3, 5 and 7 d. Concentrations are expressed as
mg L'\ The values are means ± SEM. * indicates a significant difference from
controls at, or above, the 95 % confidence level. NT, not tested; M, 100%
mortality; NR. animal failed to right following 3 x 600 s attempts 96
Fig. 3.3 Behavioural (physiological), cytotoxic and genotoxic in Mytilus edulis
exposed to MMS for 3, 5 and 7 d. Concentrations are expressed as mg L"V The
values are means +/- SEM. * indicates a significant difference from controls at,
or above, the 95 % confidence level 97
Fig. 3.4 Linear regression analysis illustrating correlations for behavioural
(physiological), cytotoxic and genotoxic effects in Mytilus edulis following 7 d
exposure to MMS. The solid line is a linear regression and the dashed lines
represent 95 % confidence limits 98
Fig. 3.5 Behavioural (physiological), cytotoxic and genotoxic effects in Asterias
rubens exposed to CP for 3, 5 and 7 d. Concentrations are expressed as
mg L'V The values are means ± SEM. * indicates a significant difference from
controls at the 5 % level. NT, not tested 100
Fig. 3.6 Linear regression analysis illustrating correlations for behavioural
(physiological), cytotoxic and genotoxic effects in Asterias rubens following 7 d
exposure to CP. The solid line is a linear regression and the dashed lines
represent 95 % confidence limits 101
Fig. 3.7 Behavioural (physiological), cytotoxic and genotoxic effects in Mytilus
edulis exposed to CP for 3. 5 and 7 d at 15 ± 0.2 °C. Concentrations are
expressed as mg L'\ The values are means ± SEM. * indicates a significant
difference from controls at, or above, the 95 % confidence level 103
Fig. 3.8 Linear regression analysis illustrating correlations for behavioural
(physiological), cytotoxic and genotoxic effects in Mytilus edulis following 7 d
exposure to CP. The solid line is a linear regression and the dashed lines
represent 95 % confidence limits 104
Fig. 3.9 Metabolic pathway of cyclophosphamide in a vertebrate system
(McCarrolletal.. 2008) 108
Fig. 4.1 A benzo(a)pyrene molecule (consisting of a benzene ring attached to a
pyrene molecule) 119
Fig. 4.2 The sequence of metabolic activation of B(a)P in vertebrates. From
(Jacob. 1996) 120
Fig. 4.3 Flow chart illustrating the integrated experimental design adopted in the
studies to evaluate the behavioural (physiological), cytotoxic and genotoxic
effects of B(a)P in (a) sea stars/ urchins, (b) mussels and (c) brittle stars 126
Fig. 4.4 Behavioural (physiological), cytotoxic and genotoxic effects in Asterias
rubens exposed to B(a)P for 3 and 7 d and following a 3 d recovery period (in
clean seawater). Concentrations are expressed as \^g L'\ The values are
means ± SEM (n = 5). * indicates a significant difference from controls at, or
above, the 95 % confidence level 132
Fig. 4.5 Behavioural (physiological), cytotoxic and genotoxic effects in
Paracentrotus lividus exposed to B(a)P for 3 and 7 d and following a 3 d
recovery period (in clean seawater). Concentrations are expressed as pg L'\
The values are means ± SEM (n = 5). * indicates a significant difference from
controls at, or above, the 95 % confidence level 133
Fig. 4.6 Behavioural (physiological), cytotoxic and genotoxic effects in Mytilus
edulis exposed to B(a)P for 3 and 7 d and following a 3 d recovery period (in
clean seawater). Concentrations are expressed as pg L'\ The values are
means ± SEM (n = 5). * indicates a significant difference from controls at. or
above, the 95 % confidence level 134 xl

Fig. 4.7 Behavioural (physiological) effects in Ophiothrix fragilis exposed to
B(a)P for 3 and 7 d and following a 3 d recovery period (in clean seawater).
Concentrations are expressed as pg L'V The values are means ± SEM (n = 5).
* indicates a significant difference from controls at. or above, the 95 %
confidence level 135
Fig. 4.8 Linear regression analysis illustrating correlations for behavioural
(physiological), cytotoxic and genotoxic effects in >As^er/as rubens following 7 d
exposure to B(a)P. The solid line is a linear regression and the dashed lines
represent 95 % confidence limits 136
Fig. 4.9 Linear regression analysis illustrating correlations for behavioural
(physiological), cytotoxic and genotoxic effects in Paracentrotus lividus following
7 d exposure to B(a)P. The solid line is a linear regression and the dashed lines
represent 95 % confidence limits 137
Fig. 4.10 Linear regression analysis illustrating correlations for behavioural
(physiological), cytotoxic and genotoxic effects in Mytilus edulis following 7 d
exposure to B(a)P. The solid line is a linear regression and the dashed lines
represent 95 % confidence limits 138
Fig. 4.11 Linear regression analysis illustrating correlation for behavioural
(physiological) effects in Ophiothrix fragilis following 7 d exposure to B(a)P. The
solid line is a linear regression and the dashed lines represent 95 % confidence
limits 139
Fig. 4.12 Four possible pathways for the activation of B(a)P leading to DNA
lesions in vivo In a mammalian cell system (from Canova et al., 1998) 144
Fig. 5.1 Flow chart illustrating the integrated experimental designs adopted In
the studies to evaluate the behavioural (physiological) and cytotoxic effects of
Cd (as well as body burdens) in (a) sea stars and (b) mussels 153
XII

Fig. 5.2 Flow chart illustrating the integrated experimental designs adopted in
the studies to evaluate the immunotoxic and genotoxic effects of Cd in (a) sea
stars and (b) mussels 154
Fig. 5.3 Cadmium concentrations in exposure vessels at the beginning (0 d) and
following end (5 d) of static exposure of Mytilus edulis (n = 5) and Asterias
rubens (n - 5) for 5 d to nominal concentrations of 100, 180 and 320 pg L" of
cadmium. The values are the means ± SEM 160
Fig. 5.4 Cadmium body burdens for different body components in (a) Asterias
rubens and (b) Mytilus edulis (n = 5) following 5 d exposure to nominal
concentrations of 100, 180 and 320 pg L" of cadmium. The values are the
means ±SEM 161
Fig. 5.5 Linear regression analysis illustrating correlations for amount of Cd
removed from aqueous solution in the exposure vessels over the 5 d exposure
period (pg L'^) and Cd body compartment burdens (mg kg'^) for the (a) gut, (b)
pyloric caeca and (c) tubed feet in Asterias rubens following 5 d exposure to Cd.
The solid line is a linear regression and the dashed lines represent 95 %
confidence limits 162
Fig. 5.6 Linear regression analysis illustrating correlations for amount of Cd
removed from aqueous solution in the exposure vessels over the 5 d exposure
period (pg L'^) and Cd body compartment burdens (mg kg'^) for the (a) gut and
(b) gills in Mytilus edulis following 5 d exposure to Cd. The solid line is a linear
regression and the dashed lines represent 95 % confidence limits 163
Fig. 5.7 Behavioural (physiological) effects in (a) Asterias rubens (righting time)
and (b) Mytilus edulis (clearance rate) exposed to cadmium for 5 d.
Concentrations are expressed as pg l ' \ The values are means ± SEM (n = 5).
165
Fig. 5.8 Linear regression analysis illustrating correlations for behavioural
(physiological) effects and cadmium body compartment burdens (mg kg"^) for
the (a) gut, (b) pyloric caeca and (c) tubed feet in Asterias rubens following 5 d xiii
exposure to B(a)P. The solid line is a linear regression and the dashed lines
represent 95 % confidence limits 166
Fig. 5.9 Linear regression analysis Illustrating correlations for behavioural
(physiological) effects and cadmium body compartment burdens (mg kg"^) for
the (a) gut and (b) gill in Mytilus edulis following 5 d exposure to B(a)P. The
solid line is a linear regression and the dashed lines represent 95 % confidence
limits 167
Fig. 5.10 Cytotoxic effects (the neutral red retention assay) in (a) Asterias
rubens and (b) Mytilus edulis exposed to cadmium for 5 d. Concentrations are
expressed as yig L"V The values are means ± SEM (n = 5) 168
Fig. 5.11 Linear regression analysis Illustrating correlations for behavioural
(physiological) and cytotoxic effects in (a) Asterias rubens and (b) Mytilus edulis
following 5 d exposure to Cd. The solid line is a linear regression and the
dashed lines represent 95 % confidence limits 169
Fig. 5.12 Linear regression analysis illustrating correlations for cytotoxic effects
and cadmium body compartment burdens (mg kg'^) for the (a) gut, (b) pyloric
caeca and (c) tubed feet in Asterias rubens following 5 d exposure to Cd. The
solid line is a linear regression and the dashed lines represent 95 % confidence
limits 170
Fig. 5.13 Linear regression analysis illustrating correlations for cytotoxic effects
and cadmium body compartment burdens (mg kg'^) for the (a) gut and (b) gill in
Mytilus edulis following 5 d exposure to Cd. The solid line is a linear regression
and the dashed lines represent 95 % confidence limits 171
Fig. 5.14 Immunotoxic effects in (a) Asterias rubens and (b) Mytilus edulis
exposed to cadmium for 5 d. Concentrations are expressed as pg L'V The
values are means ± SEM (n = 3). * indicates a significant difference from
controls at, or above, the 95 % confidence level 175
XIV

Fig. 5.15 Genotoxic effects in Mytilus edulis exposed to cadmium for 5 d and
following 1 d and 5 d recovery periods. Modified Comet assay conditions:
(a) enzyme buffer control; (b) Endo III enzyme and (c) PPG enzyme.
Concentrations are expressed as pg L'V The values are means ± SEM (n = 3).
* indicates a significant difference from controls at, or above, the 95 %
confidence level 176
Fig. 5.16 Repair of single strand DNA breaks (a), oxidised purines (b) and
oxidised pyrimidines (c) by Asterias rubens coeiomocytes in vivo following 1 d
(Rdl) and 5 d (Rd5) recovery periods after a 5 d exposure to cadmium (d5).
Concentrations are expressed as pg L'\ The values are means ± SEM (n = 3). ..
177
Fig. 5.17 Linear regression analysis illustrating correlations for immunotoxic
(phagocytosis assay) and genotoxic responses (modified Comet assay, buffer
enzyme control treatment) in Mytilus edulis following (a) 5 d exposure to Cd. (b)
1 d recovery and (c) 5 d recovery. The solid line is a linear regression and the
dashed lines represent 95 % confidence limits 178
Fig. 5.18 Linear regression analysis illustrating correlations for immunotoxic
(phagocytosis assay) and genotoxic responses (modified Comet assay, Endo III
enzyme treatment) in Mytilus edulis following (a) 5 d exposure to Cd, (b) 1 d
recovery and (c) 5 d recovery. The solid line is a linear regression and the
dashed lines represent 95 % confidence limits 179
Fig. 5.19 Linear regression analysis illustrating correlations for immunotoxic
(phagocytosis assay) and genotoxic responses (modified Comet assay, FPG
enzyme treatment) in Mytilus edulis following (a) 5 d exposure to Cd. (b) 1 d
recovery and (c) 5 d recovery. The solid line is a linear regression and the
dashed lines represent 95 % confidence limits 180
Fig. 5.20 Genotoxic effects in Mytilus edulis exposed to cadmium for 5 d and
following 1 d and 5 d recovery periods. Modified Comet assay conditions:
(a) enzyme buffer control; (b) Endo III enzyme and (c) FPG enzyme.
Concentrations are expressed as pg L'V The values are means ± SEM (n = 3). XV

* indicates a significant difference from controls at. or above, the 95 %
confidence level 181
Fig. 5.21 Repair of single strand DNA breaks (a), oxidised purines (b) and
oxidised pyrimidines (c) by Mytilus edulis haemocytes in vivo following 1 d
(Rdl) and 5 d (Rd5) recovery period after a 5 d exposure to cadmium (d5).
Concentrations are expressed as M9 L 'V The values are means ± SEM (n = 3)...
182
Fig. 5.22 Linear regression analysis illustrating correlations for immunotoxic
(phagocytosis assay) and genotoxic responses (modified Comet assay buffer
enzyme control treatment) in Mytilus edulis following (a) 5 d exposure to
cadmium, (b) 1 d recovery and (c) 5 d recovery. The solid line is a linear
regression and the dashed lines represent 95 % confidence limits 183
Fig. 5.23 Linear regression analysis illustrating correlations for immunotoxic
(phagocytosis assay) and genotoxic responses (modified Comet assay Endo III
enzyme treatment) in Mytilus edulis following (a) 5 d exposure to cadmium, (b)
1 d recovery and (c) 5 d recovery. The solid line is a linear regression and the
dashed lines represent 95 % confidence limits 184
Fig. 5.24 Linear regression analysis illustrating correlations for immunotoxic
(phagocytosis assay) and genotoxic responses (modified Comet assay FPG
enzyme treatment) in Mytilus edulis following (a) 5 d exposure to cadmium, (b)
1 d recovery and (c) 5 d recovery. The solid line is a linear regression and the
dashed lines represent 95 % confidence limits 185
XVI
LIST OF T A B L E S
Table 1.1 Examples of selected biomarkers observed at different levels of
biological organisation in aquatic organisms 8
Table 1.2 Examples of biomarkers used with the adult stages of echinoderm
species belonging to the three echinoderm classes (Asleroidea. Echlnoidea and
Ophiuroidea) utilised in the present studies 30
Table 3.1 Percentage survival for Asterias rubens and Mytilus edulis following
7 d exposure to cyclophosphamide (Experiment 1) and methyl
methanesulphonate (Experiment 2) 93
Table 4.1 Estimated global input of PAHs into the marine environment (from
Clarke, 2001) 119
Table 4.2 Examples of selected in vivo ben2o(a)pyrene biomarker studies with
the adult stages of different aquatic test species 122
Table 6.1 Human disease genes and their sea urchin ortholog genes (adapted
from Sodergren et al, 2006) 198
XVII

Acknowledgements
There are countless individuals to whom I am deeply indebted to for their help
over the course of these studies. Firstly, and most importantly, I would like to
thank my director of studies, Dr Awadhesh Jha for his guidance and support
throughout this PhD. I am profoundly grateful for his words of wisdom and
encouragement from day one of these studies right through to their culmination.
I would also like to thank my other PhD supervisors. Prof Mai Jones, Prof Tom
Hutchinson and Dr Becky Brown for their support. I am also very grateful to
Debbie Petherick for her understanding and very kind words when I needed
them the most.
I am grateful to NERC and my former colleagues at Brixham Environmental
Laboratory (AstraZeneca) for their financial support which gave me the
opportunity to carry out this PhD.
Many other people have offered me support; these include members of T e a m
Ecotox' past and present - especially Dr Awantha Dissanayake, Dr Mark
Browne, Dr Marie Hannam, Dr Alan Scarlett. Dr Chris Pook, Dr Vikki Cheung
and Dr Jo Hagger. Thanks must also go to Dr Rob Clough and Dr Andy Fisher
for their tireless help with my metal analysis. Particular thanks also go to Stan
McMahon and Ben Eynon for assistance with livestock husbandry and to Chris
Booker (and other members of the University of Plymouth Diving School) for
carrying out animal collections on my behalf at very short notice.
I need to thank Lou Ramsay for going above and beyond the call of duty to help
out a friend in need. Finally, I would not have been in a position to commence
(let alone complete) this work if it had not been for the tireless love and support
offered to me by my family. Thank you so much Mum, Dad, Sis and Nige - I
hope one day to be able to repay you all for everything.
In loving memory of two people who inspired me to study all things aquatic,
Marcia Flint and Bob Hunter. In the words of two great men, Messrs. Lawrence
and Adams: "Stand still and eventually you go backwards" and "So long and
thanks for all the (star) fish". xviii

AUTHOR'S D E C L A R A T I O N
At no time during the registration for the degree of Doctor of Philosophy has the
author been registered for any other University award without prior agreement
of the Graduate Committee.
This study was financed with the aid of a CASE award studentship from the
Natural Environment Research Council in collaboration with AstraZeneca
(Brixham Environmental Laboratory, Brixham, U.K.).
Relevant scientific seminars and conferences were attended at which work was
presented and manuscripts were prepared for publication.
Publications (please refer to Appendix II for peer-reviewed manuscripts):
Martin N. Canty. Thomas H. Hutchinson, Rebecca J. Brown. Malcolm B. Jones
and Awadhesh N. Jha (2009). Linking genotoxic responses with cytotoxic and
behavioural or physiological consequences: differential sensitivity of
echlnoderms (Asterias rubens) and marine molluscs (Mytilus edulis). Aquatic
Toxicology. 94 (1): 68-76.
Martin N. Canty. Rebecca J. Brown, Thomas H. Hutchinson, Malcolm B. Jones
and Awadhesh N. Jha (2007). Determination of oxidative DNA damage and
cellular viability in marine invertebrates. Mutagenesis, 22 (6): e18.
Platform Presentations:
The differential sensitivity of echinoderms and molluscs to genotoxins using
multiple biomarkers. SETAC Europe 16th Annual Meeting, Hague, 8'^ May
2005.
xix
Poster Presentations:
Martin N. Canty. Thomas H. Hutchinson, Rebecca J. Brown, Malcolm B. Jones
and Awadhesh N. Jha (2007). Determination of oxidative DNA damage and
cellular viability in marine invertebrates. VII International Comet Workshop,
University of Ulster. Coleraine, 24'^ - 27'^ June 2007.
Word count of main body of thesis; 33,033
Signed nO^t^ Mor^A Ce^:
Date. !.t/p7/ i O .
XX
ABBREVIAT IONS AND A C R O N Y M S
ANOVA ASTM B(a)P BOA BER c. Cabs CAS Cd CHO CP CR d DMSO DNA EA ECETOC
EMS Endo III ERAS EU Fig. FPG 9 h H2O2 HEPES HNO3 ICP-MS ITS LC50 KCI LMP M MFO Min MMS Mn M MTC MTD MTs n Na2EDTA NADPH NER NMP NR
Analysis of variance American Society for Testing Materials Ben2o(a)pyrene Bicinchoninic acid Base excision repair Circa Chromosomal aberrations Chemical abstracts service Cadmium Chinese Hamster ovary cells Cyclophosphamide Clearance rate Day Dimethyl sulphoxide Deoxyribonucleic acid Environment Agency European Centre for Ecotoxicology and Toxicology of Chemicals Ethyl methanesulphonate Endonuclease III Environmental Risk Assessments European Union Figure Formamidopyrimidine DNA glycosylase Standard gravity Hour Hydrogen peroxide 4-(2-hydroxyethyl)-1 -piperazineelhanesuffonlc acid Nitric acid Inductively Coupled Plasma Mass Spectrometry intelligent testing strategies Lethal concentration (of 50% of test organisms) Potassium chloride Low melting point Mortality Mixed-function oxygenase Minute Methyl methanesulphonate Micronucleus/ micronuclei Mortality (100%) Maximum tolerated concentration Maximum tolerated dose Metallothioneins Number of test organisms per sample (concentration) Disodium ethylenediaminetetraacetic acid Nicotinamide adenine dinucleotide phosphate Nucleotide excision repair Normal melting point Neutral red
XXI

NRR Neutral red retention NT Not tested P Probability P450 Cytochrome P450 PAH Polycyclic aromatic hydrocarbon PAM Phosphoramide mustard Pb Lead PBS Phosphate buffered saline PCBs Polychiorinated biphenyls PCPs Personal care products ppb Parts per billion ppm Parts per million PRI Profileralive rate index PSU Practical salinity units R Pearson correlation coefficient rd Recovery day REACH Registration, evaluation, authorisation and restriction of
chemicals ROS Reactive oxygen species RT Righting time s Seconds SAC Special Areas of Conservation SCEs Sister chromatid exchanges SD Standard deviation SEM Standard error margin SCGE Single cell gel electrophoresis SSBs Single strand breaks SW Seawater TBT Tributyltin TPT Triphenyltin TIES Toxicity identification evaluations USEPA United States Environmental Protection Agency UV Ultraviolet V Volts v/v Volume/ volume w/v Weight/ volume WFD Water Framework Directive WSF Water-soluble fraction Zn Zinc
XXII

Chapter 1
Introduction

1. Introduction
1.1 Pollution in aquatic ecosystems
Coastal systems are experiencing ever increasing population and exploitation
pressures; nearly 4 0 % of the people in the world live within 100 km of the
coast. Within these coastal populations, 71 % live within 50 km of estuaries
(Agardy and Alder, 2005). These growing coastal populations inevitably lead to
anthropogenic inputs into the aquatic environment. Anthropogenic pollutants
can include (but. are not restricted to): Industrial chemicals (e.g. petrochemicals
and solvents); industrial products (e.g. flame retardants and lubricants);
consumer products (pharmaceuticals and personal care products); biocides
(e.g. insecticides and pesticides) and 'natural' chemicals and compounds (e.g.
heavy metals and human hormones) (Schwarzenbach et al., 2006). These
anthropogenic pollutants not only adversely affect the flora and fauna of aquatic
ecosystems, but can also ultimately impact on human health via the food chain
(Jha et al.. 2000a).
Traditionally chemical monitoring has been used to detect and monitor
pollutants in the aquatic environment. This approach however has limitations; it
is possible that certain pollutants may occur at levels below the detection limits
for chemical analysis, yet they may be present at sufficient concentrations to
deleteriously affect the health of marine organisms. As a result, biomonitoring is
carried out alongside chemical monitoring. Biomonitoring programmes utilise
'sentinel' organisms that are omnipresent in aquatic systems and are
representative of the communities they inhabit, the latter point being important

as it is not feasible to assess the health of all the different species present in a
given community (Depledge and Fossi, 1994). The health of these target
species are monitored on a frequent basis as a surrogate for the overall 'health'
of the aquatic environment. To this end, biomarkers have been devised and
utilised to determine the 'well being' of individual vertebrate and invertebrate
aquatic species at different levels of biological organisation.
1.2 Biomarkers and their use in aquatic toxicology
Biomarkers are indicators of adverse biological effects evident at the
biochemical, cellular, histological, physiological or behavioural levels of
biological organisation. Biomarkers may indicate exposure to, and the toxic
effect of a physical pollutant(s) or chemical(s) (Depledge and Fossi, 1994).
Biomarkers were originally used in the human health arena to specifically
determine, and evaluate, the genetic and cancer risk presented by a range of
environmental toxins (AlberlinI et al., 1996). Following this early work, the
'biomarker approach' has been adopted for use in the fields of biomonitoring
and toxicology.
Biomarkers can detect adverse effects of environmental contaminants at
concentrations below chemical detection limits (Rand, 1995). The majority of
toxins impact initially at lower levels of biological organisation (molecular, or
cellular levels) before they are apparent at higher levels (such as at the
physiological or behavioural levels). By implementing biomarkers in
environmental monitoring programmes, the potential impact of pollutants may

be detected in individual sentinel organisms before any deleterious
consequences are expressed at population levels (Hinton et al., 2005). These
lower levels of biological organisation are thought to have low ecological
relevance, but do provide an understanding of the mode of action of toxins at
these levels (Fig. 1.1). Traditionally, one of the problems with utilising these
lowers levels of biological organisation to detect environmental contamination is
that the ecological relevance of any individual-based responses are difficult to
extrapolate to higher levels of organisation. However, Depledge and Galloway
have made a clear case for the value of individuals in environmental monitoring
(Depledge and Galloway, 2005).
Increasing Ecological Relevance
C o m m u n i t y
P o p u l a t i o n
Ind iv idua l
Ce l lu la r
M o l e c u l a r
Increasing Mechanistic Understanding
Fig. 1.1 At lower levels of biological organisation, biologists have an increased
mechanistic understanding the effects of pollutants, despite the low ecological
relevance at these levels. Conversely, at the more ecologically relevant levels,
there is a reduced understanding the effects of pollutants (from Hinton et al.,
2005).

The biomarker concept is illustrated in Figure 1.2. Physiological state is show/n
on the horizontal axis and health status on the vertical axis. The figure shows
that at low levels of pollutant concentration the individual is healthy, as
exposure concentrations increase the organism becomes stressed. This is due
to energy expenditure on cellular defence mechanisms which are responsible
for reducing cellular levels of the xenobiotic. As pollutant concentration
continues to increase the individual becomes further stressed, but this damage
is reversible, the individual enters an irreversible stressed slate upon a further
increase concentration. Organism death will occur a short time later (Walker,
1998).
There is increasing pressure to implement the 'biomarker approach" in the
biomonitoring and protection of aquatic systems. One such example is the
application of biomarkers to improve environmental risk assessments (ERAs) of
chemicals in requirement of the European Commission's Water Framework
Directive (WFD) (2000/60/EC) (Hagger et al., 2008). The WFD is a piece of
legalisation from the European Union which aims to ensure that all EU member
countries have 'good quality' (in terms of good ecological and chemical status
(Hagger et al., 2006)) water bodies by 2015. Member countries are required to
periodically assess the 'quality' of all water bodies (including rivers, lakes,
estuaries, coastal waters and groundwater) and then classify them (from high
quality through to bad) dependent upon their ecological quality (EA, 2002).
Hagger et al (2008) showed that biomarkers could play an important role in
measuring organism health and therefore improve the quality and accuracy of
ERAs prepared in accordance with the WFD legalisation.
A second example of blomarker use in biomonitoring Is the application of
biomarkers to determine the ecological condition of Special Areas of
Conservation (SAC) at marine sites around England (Hagger et al., 2009). The
European Habitats Directive (Council Directive 92/43/EEC) designated areas
that contain rare, threatened, or endangered flora and or fauna as SACs.
Hagger et al (2009) illustrated the usefulness of the biomarker approach to
monitor the health of invertebrates present in a SAC and therefore help in
protecting these areas further.
Many different biomarkers have been devised to assess the deleterious effects
of a range of pollutants on aquatic organisms (examples of which are given in
Table 1.1). A number of the biomarkers listed in Table 1.1 are to be utilised in
these studies. The biomarkers selected operate at a wide-range of levels of
biological organisation, from the whole organism (righting time and clearance
rate), to cellular level (the neutral red retention and phagocytosis assays) and
genetic level (DNA strand breaks and micronucleus Induction).
n
X
Suessed
Reversible Irreversible
Compensation Noncompensation Homeostasis
Physiologic condition
Pollutant concentration
Fig. 1.2 The progression of the health status of an organism as pollutant exposure increases; h, the departure from normal homeostatic
responses; c, the limit of the individual's compensatory responses; r, the limit beyond which repair mechanisms are Ineffective (from
Walker eta l . , 1996).
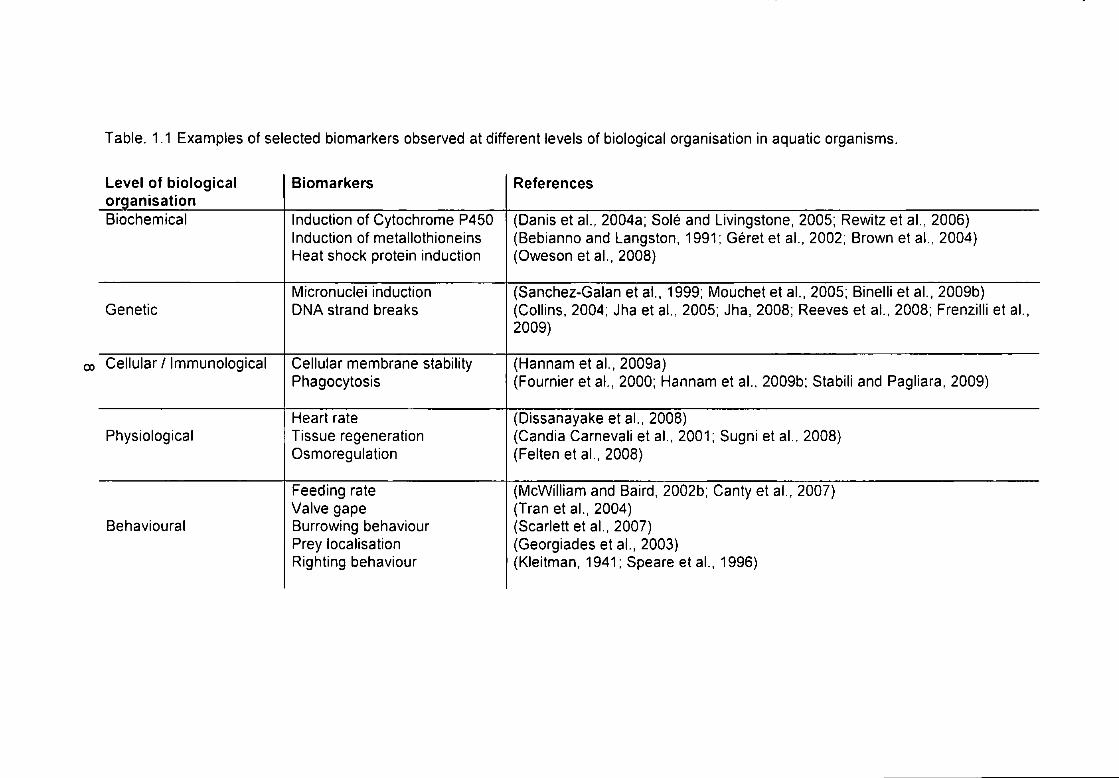
Table. 1.1 Examples of selected biomarkers observed at different levels of biological organisation in aquatic organisms.
Level of biological organisation
Biomarkers References
Biochemical Induction of Cytochrome P450 Induction of metallothioneins Heat shock protein induction
(Danis et al., 2004a; Sole and Livingstone, 2005; Rewitz et al., 2006) (Bebiannoand Langston, 1991; Gerete ta l . , 2002; Brown eta l . , 2004) (Oweson et al., 2008)
Genetic Micronuclei induction DMA strand breaks
(Sanchez-Galan et al., 1999; Mouchet et al.. 2005; Binelli et al., 2009b) (Collins, 2004; Jha et al., 2005; Jha, 2008; Reeves et al., 2008; Frenzilli et al., 2009)
Cellular / Immunological Cellular membrane stability Phagocytosis
(Hannam eta l . , 2009a) (Fournier et al., 2000; Hannam et al., 2009b; Stabili and Pagliara, 2009)
Physiological Heart rate Tissue regeneration Osmoregulation
(Dissanayake eta l . , 2008) (Candia Carnevali et al., 2001; Sugni et al., 2008) (Felten et al., 2008)
Behavioural
Feeding rate Valve gape Burrowing behaviour Prey localisation Righting behaviour
(McWilliam and Baird, 2002b; Canty et al., 2007) (Tranet al., 2004) (Scarlett et al.. 2007) (Georgiades eta l . , 2003) (Kleitman, 1941;Speare etal . , 1996)
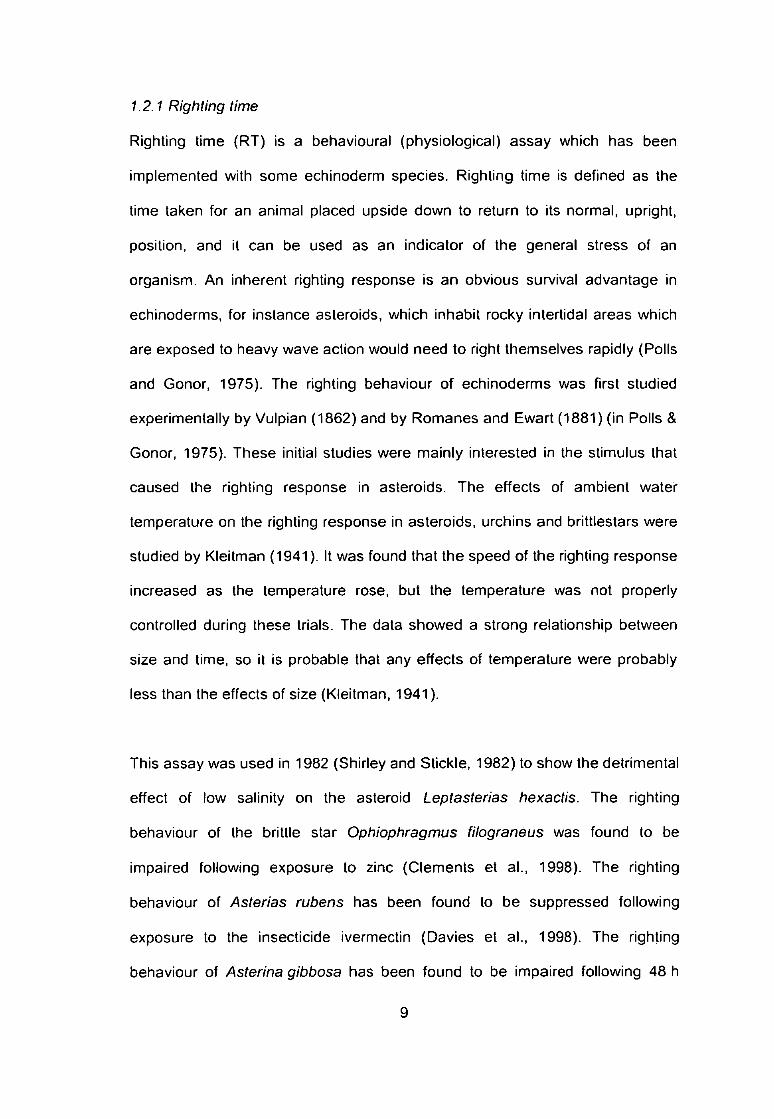
1.2.1 Righting time
Righting time (RT) is a behavioural (physiological) assay which has been
implemented with some echinoderm species. Righting time Is defined as the
time taken for an animal placed upside down to return to its normal, upright,
position, and it can be used as an indicator of the general stress of an
organism. An inherent righting response is an obvious survival advantage in
echinoderms, for instance asteroids, which inhabit rocky intertldal areas which
are exposed to heavy wave action would need to right themselves rapidly (Polls
and Conor, 1975). The righting behaviour of echinoderms was first studied
experimentally by Vulplan (1862) and by Romanes and Ewart (1881) (in Polls &
Conor, 1975). These initial studies were mainly interested in the stimulus that
caused the righting response In asteroids. The effects of ambient water
temperature on the righting response In asteroids, urchins and brittlestars were
studied by Kleitman (1941). It was found that the speed of the righting response
increased as the temperature rose, but the temperature was not properly
controlled during these trials. The data showed a strong relationship between
size and time, so it is probable that any effects of temperature were probably
less than the effects of size (Kleitman, 1941).
This assay was used in 1982 (Shirley and Stickle, 1982) to show the detrimental
effect of low salinity on the asteroid Leptasterias hexactis. The righting
behaviour of the brittle star Ophiophragmus filograneus was found to be
impaired following exposure to zinc (Clements et al., 1998). The righting
behaviour of Asterias rubens has been found to be suppressed following
exposure to the insecticide Ivermectin (Davies et al.. 1998). The righting
behaviour of Asterina gibbosa has been found to be impaired following 48 h

exposure to cadmium (Bowett, 2002) and exposure to ethyl methanesulphonate
(EMS) (Leaney. 2003). Australian sea stars Patiriella exigua were unable to
self-right after exposure to polycyclic aromatic hydrocarbon (PAH) contaminated
sediments for up to 32 d (Ryder et al., 2004). The righting behaviour of
echinoids has also been examined. Axiak and Saliba (1981) found that the
righting response of the urchin Paracentrotus lividus was prolonged following
topical exposure to crude oil. In cases of very slow righting times, a general low
level of tube feet activity was observed, suggesting a narcotising
(stupor-inducing) effect of the hydrocarbons (Axiak and Saliba, 1981). Despite
being a valuable indicator of stress at the whole organism level the intrinsic self-
righting behaviour of echinoderms has not been fully exploited to assess the
possible detrimental effects of environmental contaminants. This behavioural
trait could be a particularly valuable end-point to investigate following
contaminant exposure as it could be rapidly assessed and it is non-destructive
in nature.
1.2.2 Clearance rate
1.2.2.1 Clearance rate in bivalves
The clearance rates of bivalves, especially the blue mussel. MytHus edulis, have
been measured by researchers as a simple yet robust indication of the overall
health (or physiological condition) of an animal (Scarlett et al., 2005; Canty et
al., 2007; Scarlett et al., 2008). Clearance rate (CR) is sometimes used as a
component of the 'scope for growth' assessment (Widdows et al.. 1987;
Widdows et al., 1995). The CR (also termed feeding rate) is calculated by
determining the rate of loss of a known amount of algal particles from a given
volume of water over a given period of time. Polycyclic aromatic hydrocarbons
10

(PAHs) have been found to impair the CR of M. edulis in the form of
fluoranthene and benzo(a)pyrene (Eertman et al., 1995) and branched
alkylbenzenes (Scarlett et al., 2008). Chemicals used to disperse crude oil
spills, namely Corexit 9527 and Superdispersant-25, also significantly reduced
the CR of M. edulis (Scarlett et al., 2005), whereas the organophosphorus
pesticide azamethiphos had no effect (Canty et al., 2007).
1.2.2.2 Clearance rate in brittle stars
To date, no researchers have devised a means of quantifying the CR of
suspension-feeding echlnoderms, such as bhttlestars. In 1960, Roushdy and
Hansen observed the suspension-feeding behaviour of ophiuroids whilst
removing phytoplankton {Sceletonema costatum) particles from suspension in
static vessels. Ophiothrix fragilis removed c. 70 % of initial algal particles after
nine hours and Ophiopholis aculeate removed c. 60 %. The CR was the
greatest in the first hour (c. 35 %) for both species (Roushdy and Hansen,
1960). Field observations of O. fragilis have shown that this species can occur
in very dense aggregations (up to 2,000 individuals m^) and confirmed that it
does feed by using its arms to suspension-feed (Warner and Woodley, 1975;
Davoult and Gounin, 1995). Warner and Woodley described the particle capture
and handling technique utilised by O. fragilis. When suspension feeding,
particles were captured by the spines (located on the arms) and by the
mucus-coated tube feet; the feet also occasionally removed particles from the
spines. The captured 'food' particles then travelled down the arms towards the
mouth (Warner and Woodley. 1975). The suspension feeding behaviour of the
brittle star Amphiura filiformis has been examined in a laboratory flume and
found to be a function of flow velocity, with few animals extending their arms to
11

feed when the water was still (Loo et al., 1996). The orientation of the feeding
arms was also affected by the water flow rate. The suspension feeding
behaviour in the brittle star O. fragilis has also been investigated using video
recording equipment and polystyrene spheres, with which the particle-retention
efficiency of the animals was determined (Allen, 1998). Apart from these limited
studies, the potential use of measuring CR in suspension-feeding brittle stars,
as an indictor of pollutant exposure, has not been explored.
12.3 Neutral red retention
Neutral red (2-methyl-3-amino-7-dimethylamino-phenazine) is a weakly
cationic, supravital dye which readily penetrates cellular membranes by the
process of non-ionic diffusion (Babich and Borenfreund, 1993). Neutral red
(NR) has a history of use in the selective staining of low pH cellular
compartments, lysosomes and phagosomes (Rashid et a!., 1991). Neutral red
was first used to determine the cytotoxicity of six different toxicants to mouse
fibroblast cells using spectrophotometric analysis (Borenfreund and Puerner,
1985), the rationale being that healthy cells would take-up more NR dye than
stressed cells, therefore the higher the optical density measured
spectrophotometrically the 'healthier' the cells. This technique was termed the
neutral red retention (NNR) assay. The NRR assay gave an indication of overall
cellular membrane stability as the technique did not differentiate between NR
taken-up through the cell membrane and that which had entered the
lysosomes. Following this early work with NR, the technique was adapted for
use to specifically determine lysosomal membrane stability. In these cases a
light microscope was employed in the place of a spectrophotometer. The NR
dye was incubated on microscope slides along with the cells under investigation
12

and the time taken for the dye to enter the lysosomes of the cells was
determined. With this technique it was possible to quantify the amount of the
dye which entered the lysosomal compartment of the cells, thereby determining
the integrity (stability) of the lysosomal membranes (Babich and Borenfreund.
1991; Lowe and Pipe, 1994; Lowe et al., 1995; Cheung et a!., 1998; Binelli et
al.. 2009a). Damage to these membranes can have a detrimental effect on
maintenance of homeostasis (Lowe and Pipe. 1994), immunocompetence of an
organism, and may even lead to the autophagic loss of body tissue (Bayne and
Moore, 1998). The assay has since been modified to provide an indication of
overall cellular membrane stability through the use of a spectrophotometer and
a microtitre plate (Olabarrieta et al., 2001; Gomez-Mendikute et al., 2002;
Galloway et al.. 2004; Asensio et al., 2007; Dissanayake et al., 2008; Dailianis,
2009; Hannam et al., 2009b). This technique was much more efficient than the
NR 'slide technique' as multiple samples could be easily and rapidly assessed
at the same time.
The NRR assay has been employed with different aquatic species, including the
Arctic scallop. Chlamys islandica (Hannam et al., 2009a), the shore crab,
Carcinus maenas (Dissanayake et al., 2008), the blue mussel, M. edulis (Canty
et al., 2007; Scarlett et al., 2008) and the common limpet Patella vulgata
(Brown et al., 2004), but relatively few studies have employed this technique
with echinoderms. The lysosomal stability of Asterina gibbosa was reduced
following in vivo exposure to cadmium (Cd) (Bowett, 2002). Preliminary
investigations involving in vitro hydrogen peroxide (H2O2) exposures with
A. gibbosa and two other asteroid species (Asterias rubens and Marthasterias
glacialis) yielded mixed results. Of these test organisms only A. gibbosa
13

appeared to have reduced lysosomal stability at the very highest concentration
of H2O2 (100 |JM) (Leaney. 2003).
1.2.4 Phagocytosis
Many marine invertebrates (e.g. molluscs and echinoderms), in common with
vertebrates, possess phagocytic cells in their vascular systems (Andrew, 1962;
Warren, 1965). These cells are an important component of the immune system
as they are specialised in the recognition, ingestion and digestion of xenobiotics
(Sminia. 1980). The process of phagocytosis involves a number of stages
including chemotaxis, attachment, ingestion and killing of pathogens (Pipe et
al.. 1995). Measurement of phagocytic activity has been suggested as being a
generic and useful biomarker of immune function (Fournier et al.. 2000). One of
the simplest and most robust methods to determine the phagocytotic activity of
Invertebrates was devised by Pipe et al in 1995. This method determined
phagocytotic activity by measuring the uptake of zymosan particles (from yeast.
Saccharomyces cerevisiae) which had been dyed with NR dye. This assay has
been used to determine the immunotoxicity of a range of xenobiotics to
M. edulis haemocytes. The phagocytotic capability of M. edulis haemocytes
was impaired following exposure to PAHs (Grundy et a!., 1996; Hannam et al.,
2009b), whereas increased an increased Immune response was detected
following exposures to copper (0.2 ppm for 7 d) (Pipe et al., 1999) and the
organophosphorus compound azamethiphos (0.1 mg L" for 24 h) (Canty et al.,
2007).
There is only a very small body of work which has determined the phagocytotic
activity of echinoderms in response to xenobiotics. Exposure of the asteroid
14
Leptasterias polaris to tributyltin (TBT) led to a decrease in phagocytotic ability
(Bekri and Pelletier, 2004) and a similar trend was observed in A. rubens
following exposure to Cd (Coteur et al., 2005b). A five day manganese
exposure (at 15 mg L' ) caused a reduced phagocytotic response in A. rubens
(Oweson et al., 2008). The activity of lysozyme (an enzyme involved in immune
response to a bacterial threat) has been found to be reduced in the epidermal
mucus of the spiny sea star M. glacialis following an exposure to zinc (Stabili
and Pagliara, 2009).
1.2.5 The Comet assay
The Comet assay (sometimes termed single cell gel electrophoresis (SCGE)) is
the standard method for assessing DNA damage, with applications in
genotoxicity testing, human blomonitoring and molecular epidemiology,
ecogenotoxicology, as well as fundamental research In DNA damage and repair
(Collins, 2004). It is a rapid, sensitive and inexpensive method for measuring
DNA strand breaks (Lee and Steinert, 2003). The method was first developed in
1984 to detect double strand DNA breaks In cells that were induced following
exposure to X-rays (Ostling and Johanson, 1984), and was later adapted to
determine single strand breaks (Singh et al., 1988; Olive et al., 1990).
Subsequently, the assay was adapted and widely applied for use with aquatic
vertebrates and invertebrates as some of the other assays used to determine
DNA damage are unsuitable for aquatic organisms.
The assay detects DNA strand breaks by measuring the migration of DNA from
immobilized nuclear DNA (Fig. 1.3 outlines the procedure for preparing and
analysing samples in the Comet assay). Initially, the isolated cells are fixed in
15

an agarose gel on slides and then placed in a lysis solution. The DNA is then
denatured in an alkaline solution and the samples are subjected to
electrophoresis - when an electrical charge is applied across the slides. Once
the slides have been stained, the degree of migration away from the nucleus,
the so-called 'comet tail length", can be quantified using image analysis
software (the greater the migrafion, the greater the amount of DNA strands
breaks) (Yendle et al., 1997). The advantages of using this technique for
assessing DNA damage in aquafic organisms over other techniques are: DNA
damage in single cells is measured; only a small number of cells are required
(< 10,000 cells); the technique can be carried-out on virtually any eukaryotic
cell type and the assay is very sensifive (Lee and Sleinert, 2003). The slides
produced are scored under an epifluoresence microscope (e.g. Leica. DMR)
either by visually scoring, or using commercially available software, such as the
Komet 5.0 image-analysis software (Kinetic Imaging. Liverpool. UK). Although
the software provides a range of parameters (for example, Olive Tail Moment
and Tail Extent Moment), % tail DNA is considered to be the most reliable
parameter which allows inter-laboratory comparison (Kumaravel and Jha,
2006).
16

Cells embedded on agarose-coated slide
Cells lysed
Incubation with enzymes
Unwinding of DNA and electrophoresis
Scoring of slides
Microscope slide
Nucleus
Nucleoid
• EndoIII-Convertsoxidised pyrimidine bases to DNA strand breaks
• FPG-Converts oxidised purine bases to DNA strand breaks
Comet' tail
Cellular membrane
• •
• •
•
• •
• •
•
• t
f I
• •
• •
• • r 4 \
Comet head
Control cell Damaged ce l l -w i t h visible comet
Fig. 1.3 The methodology followed for the Comet assay and the modified Comet assay. The enzyme incubation step is only used in the
modified Comet assay to quantify oxidised DNA bases; this step is omitted from the Comet assay.

The Comet assay has been implemented previously with a number of different
aquatic invertebrate and vertebrate species (Jha, 2008; Frenzilli et al., 2009).
but its use with echinoderm species has been more limited. DNA strands breaks
have been quantified in a small number of echinoderm species. Studies carried
out on A. rubens in the North Sea found that animals collected at near shore
sites had lower DNA integrity than those from offshore reference sites
(Everaarts. 1995; Everaarts. 1997). The technique used was similar to the
Comet assay; it was the alkaline DNA unwinding assay. In vitro exposure of
coelomocytes to H2O2 has shown a dose-dependent effect on percentage tail
DNA in three different asteroid species: A. rubens, A. gibbosa and M. glacialis
(Leaney, 2003). Exposure to crude oil resulted in a significant
concentration-related increase of the percentage DNA in the comet tail of the
urchin species Strongylocentrotus droebachiensis (Taban et al., 2004). The
Comet assay has been successfully adapted to assess DNA strand breakage in
sea urchin eggs following exposure to UV radiation (Nahon et al., 2008). An
environmentally relevant dose of UV radiation caused significance increase in
percentage tail DNA in Paracentrotus lividus and Sphaerechinus granulans.
Apart from these limited studies; there have not been sufficient investigations to
determine the induction of DNA damage in different echinoderm species.
1.2.5.1 Modified Comet assay
The Comet assay can be modified with the addition of an enzyme digestion
stage to determine the degree of oxidative damage in the target DNA (Collins et
al., 1993; Dusinska and Collins, 1996). The enzymes used are
formamidopyrimidine DNA glycosylase (FPG) and endonuclease III (Endo III),
they convert oxidised purines and pyrimidines, respectively, into DNA single
18

strand breaks which can then be quantified to give an approximafion of
oxidative stress. Specifically, FPG recognises 8-hydroxydeoxyguanine and
open ringed pyrimidines, and it removes them to generate DNA strand breaks
(Kruszewski et al., 1998), whereas Endo III nicks DNA strand breaks at the sites
of oxidised pyrimidines (Collins et al.. 1993) (Fig. 1.3 outlines the procedure for
preparing modified Comet assay samples). This technique was first employed in
mammalian studies (Azqueta et al., 2009). but has also been used in vitro with
fish cells (Reeves et al., 2008) and in vivo with Mytilus edulis (Emmanouil et al.,
2007) . To date, there have been no studies which have investigated oxidafive
DNA damage in echinoderm species.
1.2.6 Micronuclei
Micronuclei (Mn) are caused by both chromosome breakages and spindle
apparatus dysfuncfion (chromosomes failing to correctly segregate at mitosis)
in mitotically dividing cells. This process of Mn formafion is illustrated in Figure
1.4. When viewed under a light microscope, Mn resemble smaller nuclei within
the cytoplasm of the cell, but, they appear completely separate to the main
nucleus.
Measuring Mn as an assessment of chromosome damage in mammalian
systems was first proposed in 1975 (Schmid, 1975). The assay has since been
employed with range of aquafic vertebrates and invertebrates, including fish
(Nepomuceno et al., 1997; Bombail et al., 2001; Grisolia, 2002; Guha et al..
2007; Winter et al.. 2007) and mussels (Dailianisa et al.. 2003; Kalpaxis et al.,
2004; Hagger et al.. 2005b; Jha et al., 2005; Villela et al.. 2007; Siu et al.,
2008) .
19

Cell
Nucleus
Chromosome Micronucleus (containing chromosome fragment)
Fragmentof chromosome Lagging
chromosome
Main nucleus
Micronucleus (containing chromosome)
Daughter cells with micron uclei
Fig. 1.4 Micronuclei (Mn) formation in a dividing nucleated cell (adapted from
Fenech, 1993).
The Mn assay has been applied to echinoderms, such as adults of the asteroid
A. gibbosa (Leaney, 2003) and larvae of the echinoids Strongylocentrotus
purpuratus (Hose and Puffer, 1983), Hemicentrotus pulcherrimus and
Clypeaster japonicus (Saotome, 1999; Saotome and Hayashi, 2003), but has
yet to be implemented successfully in other echinoderm species. The work of
Saotome initially lead to promising results following embryo larval exposure to
genotoxins (Saotome, 1999; Saotome and Hayashi, 2003), but the high density
of the embryos in the exposures may have impaired their development and
thereby, compromised the validity of these findings. Leaney (2003) found that a
3 d in vivo exposure of A. gibbosa to ethyl methanesulphonate (EMS) produced
a significant increase in Mn frequency. A parental exposure of 100 mg kg'^ of
benzo(a)pyrene was found to result in a significant increase in Mn abundance
in sea urchin gastrulae (Hose and Puffer, 1983).
20
1.3 Specific types of marine pollutants
Marine pollution is defined as "the introduction by man. directly or indirectly, of
substances or energy to the marine environment resulting in deleterious effects
such as: hazards to human health; hindrance of marine activities, including
fishing; impairment of the quality for the use of seawater, and reduction of
amenities" (Clark, 2001). Marine pollutants can take many forms, including
pharmaceuticals, polycyclic aromatic hydrocarbons (PAHs) and heavy metals.
1.3.1 Pharmaceuticals (i.e. cyclophosphamide)
Pharmaceutically active compounds are produced and administered in very
large volumes globally and their use, and diversity, increases annually (Bound
and Voulvoulis, 2004). As these compounds are not completely removed from
wastewaters by sewage treatment works they are found in surface waters and
even in potable (drinking) water (Jones et al., 2005).
One such pharmaceutical compound is cyclophosphamide (CP) {N.N-b'\s{2-
chloroethyl) tetra-hydro-2H-1,3,2-oxphosphorin-2-amine, 2-oxide monohydrate)
(Fig. 1.5). Cyclophosphamide is an indirect acting genotoxin, meaning that it
requires metabolic activation within the body of the test organism, which acts as
an alkylating agent. Cyclophosphamide is used frequently in cancer therapy to
inhibit the proliferation of tumour cells, although it is sometimes used in the
treatment of rheumatoid arthritis (Anderson et al., 1995).
21

CI
Fig. 1.5 The structure of the genotoxin cyclophosphamide.
Cyclophosphamide is normally administered orally (100 - 200 mg kg'^ daily) or
intravenously (600 - 1000 mg m^ every 3 - 4 weeks) for the treatment of cancer
(McCarroll et al., 2008). It has been detected in the sewage water from
hospitals (Steger-Hartmann et al.. 1996), as following its use in cancer
chemotherapy up to 20 % of the dose may leave the body in an unmetabolized
form (Steger-Hartmann et al., 1997). Little data exists for the impact of this
pharmaceufical by-product on the marine environment. The larvae of a marine
annelid Platynereis dumerilii were found to be sensitive to low levels of CP (Jha
et al., 1996). Chronic exposure to adult rats has been found to adversely affect
their spermatozoa (Qlu et al.. 1995), hence CP could have implications for
population structure and integrity.
1.3.2 Polycyclic aromatic hydrocarbons (i.e. benzo(a)pyrene)
Polycyclic aromafic hydrocarbons (PAHs) are a large group of persistent
organic pollutants of great environmental concern that occur ubiquitously in the
marine environment. They can originate from natural biological sources such
as plants, animals, bacteria and algae (Readman et al.. 2002). but It is the ever
increasing amount of anthropogenic PAH inputs that have led to elevated
22

concentrations in estuarine and marine systems. The sources of these inputs
include: vehicle exhaust fumes, run-off from roads, agricultural burning,
shipping traffic, discharges from industrial and/ or wastewater plants (ATSDR.
1995; Readman et al., 2002). Discharges from wastewater plants in North
America and Europe have been measured as being over 625 [jg L' and up to
4.4 mg L' from industrial effluent discharges (Latimer and Zheng, 2003).
Sixteen PAHs have termed 'priority PAH pollutants' by the United States
Environmental Protection Agency (USEPA) as they have been Identified as
being of particular importance due to their potential toxicity to mammals and
aquatic organisms. These PAHs were: acenapthylene, anthracene,
ben2o(a)athracene, benzo(a)pyrene, benzo(a)fluoranthene,
benzo(k)fluoarnthrene, benzo(ghi)perylene, chrysene, dibezo(ah)anthracene,
fluoranthene, indeno(1,2,3-cd)pyrene, naphthalene, phenanthrene and pyrene
(USEPA. 1987). The structures of eight of these sixteen priority PAHs are
shown in Figure 1.6.
Acenaphthylene
Fluoranthene
Acenaphthene Benzo(a)pyrene
Fluorene Pyrene
Chrysene
Phenanthrene
Fig. 1.6 The structures of eight of the sixteen priority PAHs as termed by the
USEPA (adapted from ATSDR. 1995).
23

Benzo(a)pyrene (B(a)P) (Fig.1.6) is one such priority PAH and it has also been
classed as one of 33 priority pollutants by the European Union (annex II of the
Directive 2008/105/EC). The impact of B(a)P has been investigated on a range
of aquatic organisms by many researchers, these include: flounder,
Paralichthys olivaceus (Woo el al., 2006), crab, Carcinus aestuarii (Fossi et al.,
2000), the marine annelid Platynereis dumerilii (Jha et al.. 1996), scallop,
Chlamys farreri (Pan et al., 2008), zebra mussel Dreissena polymorpha (Binelli
et al., 2008), green-lipped mussel Perna viridis (Ching et al.. 2001; Siu et al.,
2004; Fang et al., 2008; Siu et al., 2008) and Mediterranean mussel Mytilus
galloprovincialis (Venier et al.. 1997; Canova et al., 1998; Gomez-Mendikute et
al., 2002; Marigomez and Baybay-Villacorta, 2003). These studies have
encompassed a wide range of assays which operate at different levels of
biological organisation, from whole organism level (e.g. heart rate (Fossi et al.,
2000)), to cellular level (NRR (Gomez-Mendikute et al.. 2002; Fang et al.,
2008)), through to sub-cellular level (Mn induction (Venier et al., 1997; Siu et
al., 2004; Siu et al.. 2008) and at DNA level using the Comet assay (Bihari and
Fafandel. 2004; Siu et at., 2004; Siu et al., 2008)).
7.3.3 Heavy metals (i.e. cadmium)
Heavy metals pose an ecological and public health threat due to their toxicity,
persistence and their capacity to accumulate in organisms (Bolognesi et al.,
1999). The phrase 'heavy metal' commonly refers to metals that have a specific
gravity of four or five, but in terms of ecotoxicology it is often used to refer to
metals that have been shown to be of specific environmental concern
(Depledge et al.. 1994).
24
Cadmium (Cd) is one such heavy metal and although it is omnipresent in
seawater, it is of great environmental concern due to its high toxicity, its
industrial production and emissions from the combustion of fossil fuels (Erk et
al., 2005). Cadmium affects cell proliferation, differentiation, apoptosis and other
cellular activities and can cause numerous molecular lesions that could be
relevant to carcinogenesis (Filipic et al., 2006). Many different biomarkers have
been implemented with sea stars and mussels to determine the toxicity of Cd.
Increased levels of metallothioneins (MTs) have been quantified (den Besten et
al., 1989; Temara et al., 1997b; Erk et al., 2005) and reduced cellular immune
response (Coteur et al., 2005b) following Cd exposure in the sea star A.
rubens. Work with mussels that investigated the effects of Cd have
implemented a variety of endpoints, including genotoxicity (Bolognesi et al.,
1999; Emmanouil et al., 2007) and induction of MTs (Bebianno and Langston,
1991; Geret et al.. 2002; Erk etal., 2005).
1.4 Reference toxicants
In order to prove that biomarker responses used in toxicology studies are
sensitive, reliable and reproducible known reference toxicants are used as
positive controls (Jha, 2008). This approach was followed in these present
studies by using two reference agents, namely methyl methanesulphonate
(MMS) and hydrogen peroxide (H2O2).
25

1.4.1 Methyl methanesulphonate (MMS)
Methyl methanesulphonate (MMS) is an example of a direct-acfing genotoxic
compound (Fig. 1.7) which causes DNA lesions that lead to strand breaks MMS
as it acts a methylating agent (Pfuhler and Wolf, 1996).
o o
Fig. 1.7 The structure of the genotoxin methyl methanesulphonate.
Methyl methanesulphonate has been used previously as a reference genotoxin
(or positive control) in studies targefing various mammalian cells, including
Chinese hamster ovary cells (Natarajan et al., 1983) and human lymphocytes
(Andreoll et al.. 1999). This reference genotoxic chemical has also been used
with aquatic invertebrates, for example M. edulis larvae (Jha et al., 2000b;
McFadzen et al., 2000; Hagger et al.. 2005b).
1.5.1 Hydrogen peroxide
Hydrogen peroxide (H2O2) (Fig. 1.8) is often used as a model reference
compound in toxicology studies. It has previously been used specifically to
validate the Comet assay (Singh et al., 1988; Singh et al., 1991; Collins et al.,
1995; Lee et al., 1996; Collins et al., 1997; Horvathova et al.. 1998;
Mitchelmore et al., 1998; Andreoli et al., 1999; Bombail et al., 2001) and as a
reference cytotoxin (Richter-Landsberg and Vollgraf, 1998).
26
H H
Fig. 1.8 The structure of hydrogen peroxide.
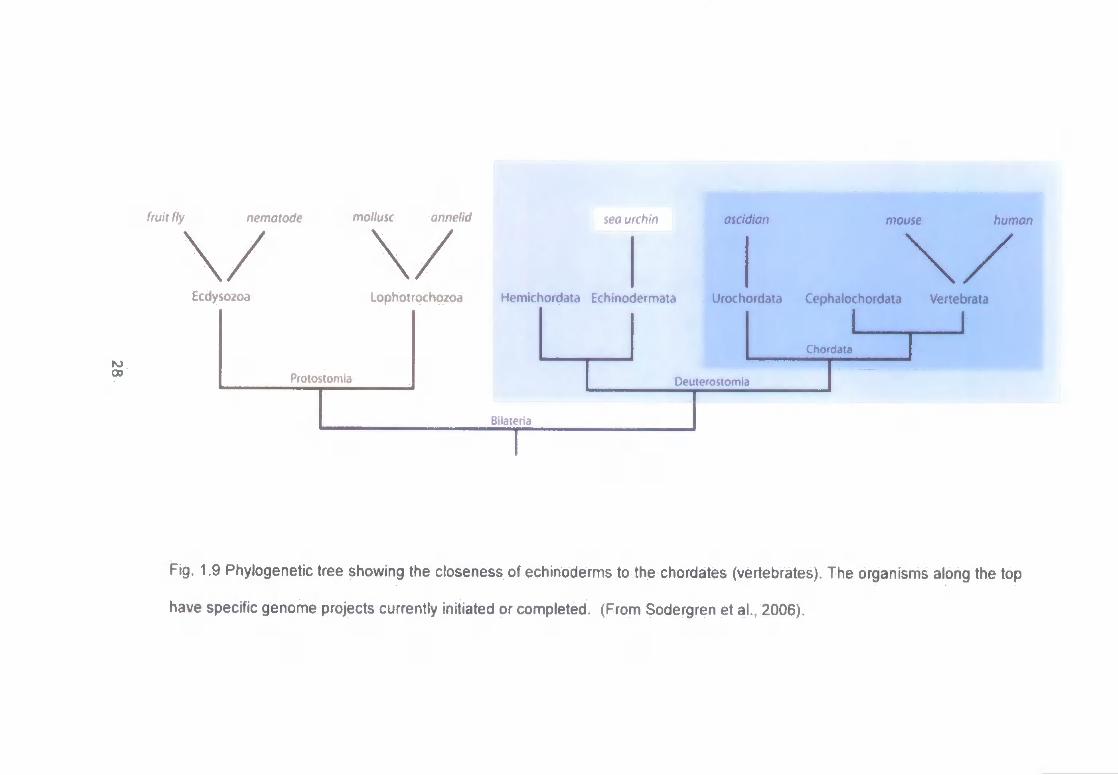
1.5 Use of echinoderms in toxicology and ecotoxicology
Echinoderms are closely positioned to the chordates on the deuteroslome line
of development of the Animal Kingdom. As can be seen in Figure 1.9,
echinoderms are more closely related to the chordates than the other
invertebrate phyla commonly investigated in aquatic ecotoxicology. The position
of all animal phyla on the classical evolutionary tree has been based on
anatomical features of adult animals and on specific features of their embryonic
development. The higher metazoans are separated into two very distinct
groups, the protostomes (consisting of the arthropods, annelids and molluscs)
and the deuterostomes (the echinoderms and chordates) (Campbell and
Reece, 2002). These two groups are divided by fundamental differences that
occur at three different stages during embryonic development. These
differences in protostome and deuterostome early development occur at the
following stages: during cleavage, the fate of the blastopore and the formation
of the coelom (Moore, 2001).
27
fruit fly nematode
ro 00
Ecdysozoa
iea urchin oscidian mouse mollusc annelid
\/ Lophotrochozoa Hemichordata Echinodermata Urochordata Cephalochordata Vertebrata
I
human
Protoslomia
Chordata
Deuterostomia
Bilateria
Fig. 1.9 Phylogenetic tree showing the closeness of echinoderms to the chordates (vertebrates). The organisms along the top
have specific genome projects currently initiated or completed. (From Sodergren et al., 2006).

Modern molecular techniques have been used to create different animal trees
from those based on traditional comparative anatomy and embryology.
How/ever, the close relationship between the echinoderms and chordates
remains unchanged; it is only the position of some of the other phyla which has
altered. Work carried to investigate the similarity between the echinoid immune
system and the phylogenetic occurrence of immune mechanisms in primitive
chordates further reinforces this evolutionary closeness between echinoderms
and chordates (Smith and Davidson, 1992). Regardless of which criteria are
used to show the relationships of the phyla in the Animal Kingdom, the
echinoderms and chordates show phylogenetic 'closeness'. Due to the similar
development pattern that the two deuterostome phyla exhibit, echinoderms are
very useful in ecotoxicological studies investigating the effects of chemicals on
the development of organisms (Roepke et al., 2005). The evolutionary
closeness of the echinoderms to vertebrates makes them very useful as
toxicologlcal test organisms, meaning that they could potentially replace the
vertebrates commonly used In aquatic toxicology testing (e.g. fish). This would
be in line with the three Rs (Replacement, Refinement and Reduction)
approach to vertebrate testing, as echinoderms could take the place of the
protected vertebrate species. This could be especially Important as industrial
companies have to conform to new European Union regulations (Regulation
(EC) No 1907/2006) concerning the Registration, Evaluation, Authorisation and
restriction of Chemicals (REACH) which came into force on 1st June 2007.
These regulations mean that it is necessary to conduct toxicological tests on
thousands of chemicals with the aim of determining their potential impact on
humans and the environment.
29

Table 1.2 Examples of biomarkers used with the adult stages of echinoderm species belonging to the three echinoderm classes (Asteroidea, Echinoidea and Ophiuroidea) utilised in the present studies.
C l a s s Species Biomarkers used References
Asteroidea Asterias rubens Heat shock protein induction Cytochromes P450 induction
Metallothionein induction Comet assay Phagocytosis
Neutral red retention Righting behaviour
(Oweson et al., 2008) (den Besten et a!., 1993; Everaarts et al., 1998; Danis eta l . , 2004a) (den Besten et a!., 1989; Temara et al., 1997b) (Everaarts, 1995; Everaarts, 1997) (Coteur et al., 2002; Coteur et al., 2005a; Coteur eta l . , 2005b) (Leaney, 2003) (Davies et al., 1998)
Asterina gibbosa Micronucleus induction Comet assay Neutral red retention Righting behaviour
(Leaney, 2003) (Leaney, 2003) (Bowett, 2002; Leaney. 2003) (Bowett, 2002; Leaney, 2003)
Coscinasterias muricata Cytochrome P450 Induction Prey localisation behaviour
(Georgiades eta l . . 2006) (Georgiades eta l . . 2003)
Leptasterias polaris Phagocytosis Neutral red retention
(Bekri and Pelletier, 2004) (Bekri and Pelletier, 2004)
Marthasterias glacialis Cytochrome P450 induction Comet assay Neutral red retention
(den Besten et al., 1990) (Leaney, 2003) (Leaney, 2003)
Patiriella exigua Contaminant avoidance behaviour (Ryder et al., 2004)
Echinoidea Diadmea antillarum Locomotion and spine orientation (Bielmyer et al., 2005)
o

CO
Echinus esculentus Cytochrome P450 induction (den Besten et al., 1990) Paracentrotus lividus Heat shock protein induction (Matranga eta l . , 2000)
Reactive oxygen species production (Coteuretal . , 2001) Stronglycocentrotus Comet assay (Tabaneta l . , 2004) droebachiensis Righting behaviour (Axlak and Saliba, 1981)
Ophiuroidea Amphiura chiajei Lysosomal integrity (Newton and McKenzie, 1998b) Sub-cuticular bacterial counts (Newton and McKenzie, 1995; Newton and
McKenzie, 1998a) Tissue regeneration (Nilsson. 1999) Burrowing behaviour (Newton and McKenzie, 1998a) Contaminant avoidance behaviour (Newton and McKenzie, 1998b)
Amphiura filiformis Sub-cuticular bacterial counts (Newton and McKenzie, 1995) Tissue regeneration (Nilsson and Skold, 1996; Nilsson, 1999) Contaminant avoidance behaviour (Bowmeret al., 1986)
Microphiopholis graciHima Tissue regeneration (D'Andrea eta l . , 1996) Ophioderma brevispina Tissue regeneration (Walsh eta l . , 1986) Ophiophragmus filograneus Tissue regeneration (Clements eta l . , 1998)
Burrowing behaviour (Clements eta l . , 1998) Ophiothrix fragilis Lysosomal integrity (Newton and McKenzie, 1998b)
Sub-cuticular bacterial counts (Newton and McKenzie. 1995) Righting behaviour (Newton and McKenzie, 1998b)
Ophiothrix ophiura Sub-cuticular bacterial counts (Newton and McKenzie, 1995) Feeding behaviour (Valentincic, 1991a; Valentincic, 1991b)

1.5.1 Class Asteroidea and their use in ecotoxicology
Asteroids (sea stars) have a recent history of use in ecotoxicological studies (see Table 1.2). Elevated metallothionein (proteins which can bind to heavy metals) levels have been found in A. rubens following Cd exposure (Temara et al., 1997b). The regeneration of amputated ambulacral spines (by the process of skeletogenesis) was impaired following exposure to lead (Pb) in the same species (Temara et al., 1997a). Biomonitoring studies involving asteroids have found evidence that they can accumulate various toxins and pollutants (a useful attribute in a sentinel organism). Asterias rubens is a valuable indicator of temporal and spatial trends of Pb and Cd contamination in the field. It is also possible to differentiate between evidence of long-term (by sampling skeletal tissue) and short-term exposure (by sampling the pyloric caeca) (Temara et al., 1998). Asterias rubens was also found to have accumulated Pb and Cd, along with zinc, copper and seven different PCBs when collected from a polluted region near the Belgian coast (Danis et al., 2004b). Other chemicals which have been shown to be bioaccumulated in field-collected asteroids include: radionuclides (Warnau et al.. 1999); triphenyltin (TPT) and TBT (Shim et al.. 2005). Longer term 'evidence' of the exposure was commonly found in the calcite-rich skeletal tissue. It is thought that toxins are partitioned in this tissue to detoxify them, as once these chemicals are in the calcite skeleton they are metabolically unavailable (Temara et al., 1997a; Temara et al., 1997b; Warnau et al., 1999; Boisson et al., 2002). The use of A. rubens larvae in ecotoxicological studies has been very limited, but exposure to the naturally occurring aldehyde 2, 4-decadienal reduced the survival rate of the larvae (Caldwell et al., 2004).
32

1.5.2 Class Echinoidea and their use in ecotoxicology
Echinoids (sea urchins) can occur at very high densities on intertidal rocky sites;
up to 100 individuals per (Prince, 1995), and as a result of their grazing
behaviour, are capable of affecting the community structure of benthic
environments, especially deep-water communities (Valentine el al., 2000). Sea
urchins have a relatively long life span, for example, Paracentrotus lividus can live
for up to nine years and remains relatively sessile during this time (Crook et al.,
2000). This longevity, coupled with a sessile lifestyle, means that adult urchins
would make useful sentinel organisms in monitoring marine pollution. One such
example of this is the use of the sea urchin Psammechinus miliaris in detecting
the presence of aquacufture antibiotics, such as oxytetracycline, in the water
column in the vicinity of fish farms (Campbell et al.. 2001). The densities of certain
echinoid species can also be used as indicators of the 'health' of a coral reef
ecosystem. Following events such as El Niiio in Northern Bahia, north-eastern
Brazil, the number of opportunistic sea urchin species {Diadems anttiHarum and
Echinometra lacunter) increased at the expense of overall species diversity (Altrill
e ta l . , 2004).
The use of sea urchins in ecotoxicology has been limited mainly to the use of their
gametes and embryos in developmental and cellular research which commenced
in the mid-1800s (Monroy, 1986). Gametes are useful toxicology tools as they are
very small, meaning that they have high surface area to volume ratios which
enables rapid toxicant interaction. Also, during spawning and fertilization a rapid
series of events occur that can be used as endpoints in short exposure periods
(these events include: sperm activation and motility, egg fertilization and protein
33
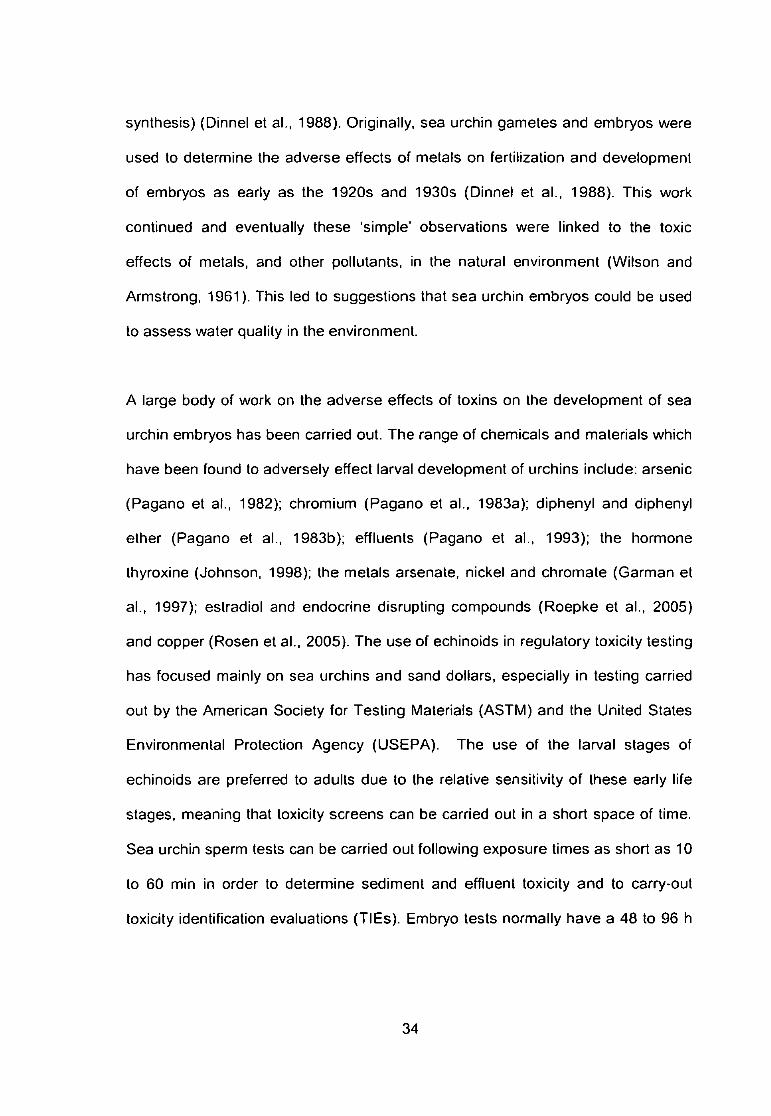
synthesis) (Dinnel et al., 1988). Originally, sea urchin gametes and embryos were
used to determine the adverse effects of metals on fertilization and development
of embryos as early as the 1920s and 1930s (Dinnel et al. , 1988). This work
continued and eventually these 'simple' observations were linked to the toxic
effects of metals, and other pollutants, in the natural environment (Wilson and
Armstrong, 1961). This led to suggestions that sea urchin embryos could be used
to assess water quality in the environmenL
A large body of work on the adverse effects of toxins on the development of sea
urchin embryos has been carried out. The range of chemicals and materials which
have been found to adversely effect larval development of urchins include: arsenic
(Pagano et al., 1982); chromium (Pagano et al., 1983a); diphenyl and diphenyl
ether (Pagano et al., 1983b); effluents (Pagano et al., 1993); the hormone
thyroxine (Johnson, 1998); the metals arsenate, nickel and chromate (Garman et
al., 1997); estradiol and endocrine disrupting compounds (Roepke et al., 2005)
and copper (Rosen et al., 2005). The use of echinoids in regulatory toxicity testing
has focused mainly on sea urchins and sand dollars, especially in testing carried
out by the American Society for Testing Materials (ASTM) and the United States
Environmental Protection Agency (USEPA). The use of the larval stages of
echinoids are preferred to adults due to the relative sensitivity of these early life
stages, meaning that toxicity screens can be carried out in a short space of time.
Sea urchin sperm tests can be carried out following exposure times as short as 10
to 60 min in order to determine sediment and effluent toxicity and to carry-out
toxicity identification evaluations (TIEs). Embryo tests normally have a 48 to 96 h
34

exposure lime and toxicity is determined by quantifying the frequency of embryo
malformations (Bay el al., 1993).
The use of adult echinoids in toxicology has been somewhat limited (see Table
1.2), when compared to the widespread use of their embryo-larval stages. This is
despite the fact that adult echinoids are easy to collect, are robust to laboratory
conditions and are often ecologically important in the areas where they are located
(Pearse, 2006). The relatively large size and robustness of the adults makes them
unsuitable for rapid screening assays (where gamete and embryo tests are better
suited). But, adults could be used to carry out longer term chronic tests to evaluate
the long-term effects of chronic pollution on growth and reproduction (Bay et al.,
1993). Behavioural endpoints have been used previously to assess the health of
adult echinoids. The righting behaviour of adult sea urchins (Paracentrotus lividus)
was found to be suppressed by topical (applied directly onto the outer dermis)
exposure to crude oil (Axlak and Saliba. 1981). The role of adult echinoids in
research and regulatory ecotoxicology is likely to become much more prominent
as a result of the recent sequencing of the sea urchin genome in 2006. The
complete genome (which encodes about 23,300 genes) of the California purple
sea urchin, Strongylocentrotus purpuratus was sequenced primarily due to the
usefulness of the urchin embryo as a model for modern molecular, evolutionary
and cellular biology (Sodergren et al., 2006). To date, this sea urchin genome is
the first non-chordate deuterostome genome to be fully sequenced (Davidson,
2006).
35
7 .5.3 Class Ophiuroidea and their use in ecotoxicology
In common with asteroids and echinoids, the ophluroids (the brittle stars) have
also been the subject of toxicological studies (see Table 1.2). The brittle star
Ophiothrix fragilis has been found to accumulate various radioisotopes (Hutchins
et al., 1996). The reproductive stage of ophluroids has been found to influence the
relative toxicology of different toxins (Bowmer et al. , 1986). The infaunal ophiuroid
Amphiura filiformis was more sensitive to both copper and pentachlorophenol
when the test animals were gravid (bearing sperm or eggs), compared to
individuals which had shed their gametes (Bowmer et al., 1986). The degree of
PCB accumulation in ophluroids can be influenced by the lipid content in the
animals. In the brittle stars A. filiformis and A. chiajei, PCBs were accumulated in
the disks of the animals (a site of high lipid content), but not in the arms (where
lipid levels were negligible) (Gunnarsson and Skold, 1999).
One Important ecological aspect of the capacity of ophiurolds to accumulate toxins
is the degree to which the animals are predated upon. Predalion on Infaunal
brittle stars may occur by the consumption of the whole animal, but more
commonly by the cropping of exposed arms by fish and crustaceans. Arm loss,
and subsequent regeneration, may occur in 50 % of a given population (Skold,
1998). Accumulation of PCBs by infaunal organisms has been shown to be the
first step in their transfer to higher trophic levels. Amphiura spp. arms were found
to account for 60 % of the stomach contents of the dab, Limanda limanda, which
is frequently consumed by humans. In this manner a trophic transfer of toxicants
can occur indirectly through the brittle stars (Skold, 1998). This involvement of
ophiuroids in the trophic transfer of toxins makes them very desirable organisms
36

for selection in aquatic toxicology studies. If certain ophiuroid species can be
shown to accumulate toxins, then the possible effects of this bioaccumulation al
higher levels in the trophic ladder can be addressed.
1.6 Aims and objectives
Against the backdrop of the above information, the overall aim of this research
programme was to implement a suite of non-destructive biomarkers which
operated al different levels of biological organisation on a range of adult
echinoderm species to evaluate the effects of a range of reference pollutants
under laboratory conditions.
The hypotheses to be tested were:
1) Echinoderms are more sensitive at different levels of biological organisation
following exposure to reference toxicants than molluscs.
2) Toxic responses a l lower levels of biological organisation are linked to, or
expressed at, higher level responses.
3) Different echinoderm species show different responses following exposure
to an environmentally relevant PAH (e.g. B(a)P).
37
4) Asteroid echinoderms and bivalve molluscs have differing DNA repair
capacities (as determined by the Comet assay).
5) Immunotoxic responses are linked to DNA damage and the DNA repair
capacity of the organisms.
6) Asteroids and bivalve molluscs show differential tissue specific
accumulation patterns for heavy metals (i.e. Cd).
Specifically, the aims and objectives were:
1) To devise, optimise and validate appropriate biomarkers (at different levels
of biological organisation) in a number of echinoderm species.
2) To determine the relative sensitivity of asteroids and bivalve molluscs to
known, or reference, genotoxins (Chapter 2).
3) To investigate whether any genotoxic responses can be linked to cytotoxic
and behavioural (or physiological) consequences (Chapter 2).
4) To determine the responses of three different echinoderms (sea stars, sea
urchin and brittle stars) and molluscs (blue mussel) to an environmentally
relevant PAH (Chapter 3).
38
5) To investigate the behavioural (physiological), cytotoxic, immunotoxic.
genotoxic and oxidative stress consequences in echinoderms {Asterias
rubens) and molluscs (Mytilus edulis) to a heavy metal (Chapter 4)
6) To determine whether any immunotoxic, genotoxic and oxidative stress
effects are reversible (Chapter 4).
A schematic outline illustrating the objectives of this PhD thesis is given in Figure
1.10.
39

Chapter 1 Introduction and Aims
Chapter 2 Genera! Materials and Methods
Chapter 3 Reference genotoxin effects on
A. rubens and M. edulis
J
Chapter 4 PAH effects on A. rubens, P. lividus,
O. fragilis and M. edulis
Chapter 5 Metal effects on A. rubens and M. eduh's
r Chapter 6 Discussion and conclusions
Recommendations for future work
Fig. 1.10 Outline of the thesis, detailing the topics covered in each chapter.
40
Chapter 2
Materials and methods
The results of part of this chapter were presented as a poster a l the 7'^
International Comet Assay Workshop, Coleraine, 2007 (Canty el al., 2007.
Mutagenesis 22, e1-e21).
41

2. Materials and methods
2.1 Test organism collection and maintenance
2.7.7 Collection and maintenance of common sea star, Asterias rubens
(Echinodermata: Asteroidea)
Adult common sea stars, Asterias rubens (Fig. 2.1a) were collected from In and
around Plymouth Sound. Devon, UK (Latitude 50.20° N; Longitude 4.10° W) (Fig.
2.2a), using SCUBA divers and trawling. Only intact, f ive-armed, sea stars were
returned to the laboratory. All starfish were 66 - 100 mm In diameter. They were
held in 20 L glass aquaria equipped with air-driven filters until required (Fig. 2.3).
The holding conditions were 15 °C ± 1.5 °C, 34 ± 1.5 PSU, with a light: dark cycle
of 12h: 12h. Water changes (50 % ) were carried out twice weekly. Any animal
which appeared stressed or unhealthy was immediately transferred into separate
holding aquaria to prevent mortalities adversely affecting the water quality. Prior to
use, A. rubens were acclimatised for a minimum of two weeks and were fed
mussels ad libitum.
2.1.2 Collection and maintenance of purple sea urchin, Paracentrotus lividus
(Echinodermata: Echinoidea)
Adult purple sea urchins (Fig. 2.1b) Paracentrotus lividus were purchased from
Dunmanus Seafoods Ltd (Durrus. Bantry, Co. Cork, Eire) (Latitude 51.41° N;
Longitude 9.28°W) (Fig. 2.2b). Upon arrival any damaged urchins (spines missing,
or broken) were immediately disposed of and the healthy animals were transferred
to glass aquaria under the same conditions as the sea stars. All sea urchins were
70 - 95 mm in test diameter (including the spines). They were fed a commercially
42
available algal pellet (Telra Variety Wafers, Tetra, UK) ad libitum and held for a
minimum of two weeks prior to use.
2.1.3 Collection and maintenance of common brittle star Ophiothrix fragilis
(Echinodermata: Ophiuroidea)
Common brittle stars (Fig. 2.1c), Ophiothrix fragilis were collected from in and
around Plymouth Sound, Plymouth, Devon, UK (Latitude 50.20° N; Longitude
4.10° W) (Fig. 2.2a) by trawling. Only intact, f ive-armed, brittle stars were returned
to the laboratory. All brittle stars were 40 - 65 mm In diameter. They were held in
glass aquaria under the same conditions as the sea stars with the exception that
they were fed a suspension of Isochrysis galbana algae (Varicon Aqua Solutions
Ltd., Malvern, UK) and a commercially available algal pellet (Tetra Variety Wafers,
Tetra. UK) ad libitum.
43

Fig. 2.1 The test species used in the studies (a) Asterias rubens (b) Paracentrotus lividus (c) Ophiothrix fragilis (d) Mytilus edulis.
Scale bars = 10 mm.

ii
(b)
cn (C)
Fig. 2.2 An outline of the British Isles and Eire with animal collection sites highlighted (white circles denote collection areas at each
specific site), (a) The area in and around Plymouth Sound (Devon, UK) where sea stars and brittle stars were collected, (b) The
area near Bantry, (Co. Cork, Eire) where sea urchins were collected by Dunmanus Seafoods Ltd (Durrus, Bantry, Co. Cork, Eire),
(c) Port Quin (Cornwall, UK) where mussels were collected. (Satellite images from http://maps.google.co.uk).

/ 1 f m-:
Fig. 2.3 Husbandry stock tanks used to house Asterias rubens. Air-driven filtration
units and Mytilus edulis as food source are visible.
2.1.4 Collection and maintenance of blue mussel Mytilus edulis (Mossuica: Bivalvia)
Adult blue mussels (Fig. 2.1d). Mytilus edulis were collected by hand from Port
Quin. Cornwall. UK (Latitude 50.35° N; Longitude 4.52° W) (Fig. 2.2c). All mussels
were 35 - 45 mm in length; they were cleaned of any epibioants and then placed
into 20 L glass aquaria until required (holding conditions were the same as for the
sea stars) Prior to use. they were acclimatised for a minimum of one week and
they were fed twice weekly with a standard aquarium invertebrate food mixture
(Waterlife Invert Food Liquidfry Mahne^ . Rotl-Rlch " and dried algae).
46
2.2 Haemolymph and coelomic fluid collection
2.2.1 Haemolymph extraction from Mytilus edulis
Haemolymph samples were extracted from the posterior adductor muscle of the
mussels (Fig. 2.4). A pair of scissors was used to slightly prise open the valves
and mantle water was allowed to drain onto absorbent paper. A 1 mL syringe fitted
with a 21 gauge needle was used to extract haemolymph (average volume
0.5 mL) from the adductor muscle (Fig. 2.4). The volume of haemolymph collected
was sufficient to carry-out all the necessary cellular and sub-cellular assays;
therefore it was not diluted with physiological saline. The needle was removed
from the syringe before transferring the sample to a siliconised centrifuge tube (to
prevent damaging the cells) and held on ice prior to use. The samples were
thoroughly mixed by vortexing prior to use. Giemsa stained haemocytes from
M. edulis are shown in Figure 2.5.
47
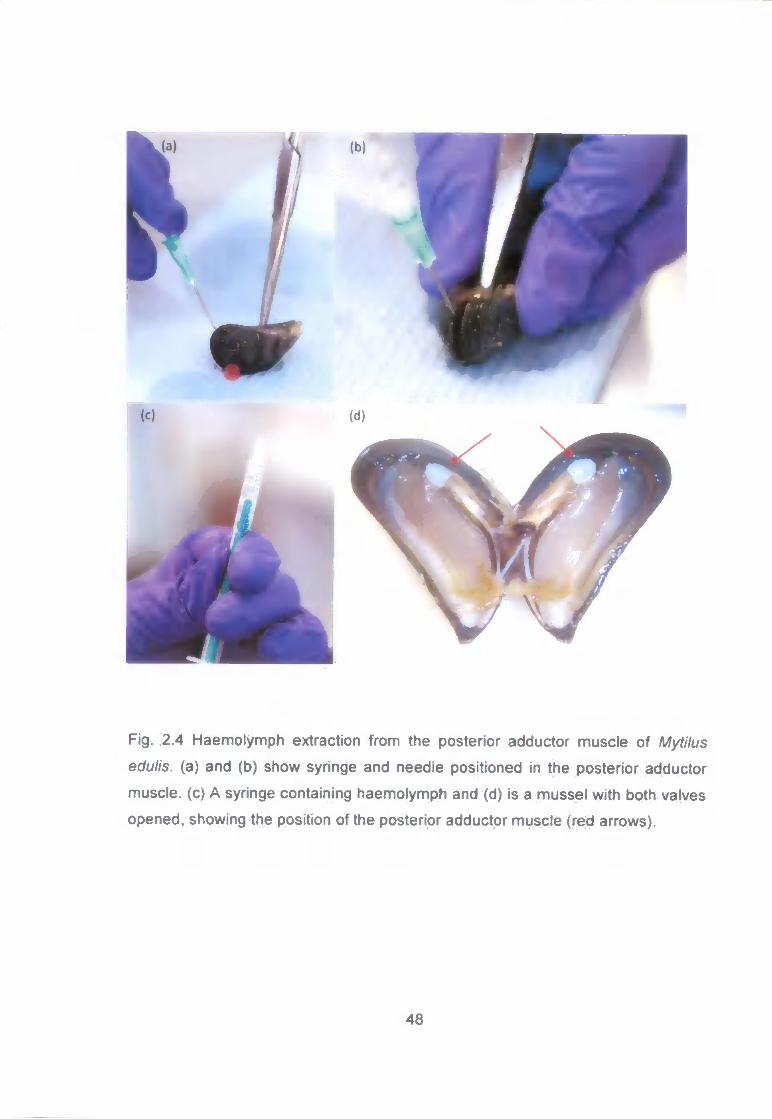
Fig. 2.4 Haemolymph extraction from the posterior adductor muscle of t\Aytilus
edulis. (a) and (b) show syringe and needle positioned in the posterior adductor
muscle, (c) A syringe containing haemolymph and (d) is a mussel with both valves
opened, showing the position of the posterior adductor muscle (red arrows).
48

Fig. 2.5 Giemsa stained haemocytes from Mytilus edulis haemolymph.
Scale bar = 15 pm.
2 2.2 Coelomic fluid extraction
2 2 2 1 Asterias rubens
A 1 mL syringe fitted with a 21 gauge needle was used to extract coelomocytes
from the inter-arm' region on the sea star (Fig. 2.6). The average volume collected
was 0.6 mL. The needle was removed from the syringe before transferring the
sample to a siliconised Eppendorf tube (to prevent the damaging the cells) and
held on ice prior to use. The samples were thoroughly mixed by vortexing prior to
use.
49

Fig. 2.6 Coelomocyte extraction from the inter-arm' region of >Asfer/as rubens.
Examples of the common cell types found in the coelomic fluid of A. rubens can be
seen in Figure 2.7. These cell types were common across all the echlnoderm
species used in these studies. Phagocytic amoebocytes are the most common
form of echlnoderm coelomocytes and have been found in every species studied
in the past (Smith, 1981) (Fig. 2.7a). For example, In A. rubens phagocytes were
found to constitute about 95 % of the total cell population (Pinsino et al., 2007) and
in Strongylocentrotus purpuratus they made up 66.3 ± 11.6 % (mean ± SD) of total
coelomocytes (Smith et al.. 1992). Historically, spherule cells have been given a
variety of names including morula cells, eleocytes, granulocytes and trephocytes
(Ratcliffe and Rowley. 1979) (Fig. 2.7b). Colourless spherule cells constituted
5.1 ± 4 . 6 % of total coelomocytes in Strongylocentrotus purpuratus, with red
spherule cells accounting for 14.8 ± 8.5 % (Smith et al., 1992).
50

(b)
S
Fig. 2.7 Giemsa stained cells from Astenas rubens coelomic fluid, (a) Phagocytic
amoebocytes (pa) are the most common cell types, fol lowed by (b) spherule cells
(s). Scale bar = 10 pm.
2.2 2.2 Paracentrotus lividus
A 1 mL syringe fitted with a 21 gauge needle was used to extract coelomic fluid
(average volume 0.5 mL) from the peristomal membrane which is located on the
aboral side of the urchin, around the Aristotle's Lantern (the jaw apparatus). The
needle was removed from the syringe before transferring the sample to a
sil lconised Eppendorf tube (to prevent damaging the cells) and held on ice prior to
use. These samples were thoroughly mixed by vortexing prior to use.
2 2 2.3 Ophiothnx fragilis
Difficulties were faced collecting sufficient coelomocytes from the brittle stars to
carry out the cellular and sub-cellular assays. Brittle stars did not contain very
much coelomic fluid in relation to body size, especially when compared to the sea
51

stars and sea urchins. Due to calcite skeleton of the animals, a needle and syringe
could not successfully be used to collect the cells. Instead, an individual brittle star
was placed in a clean Petri dish, a sharp blade was used to amputate an arm from
the central disc and the coelomic fluid was collected. Preliminary investigations
only yielded in the region 5 pL of coelomic fluid per animal, which was too small a
volume with which to carry-out cellular and subcellular assays. Therefore, only
behavioural/ physiological assays (clearance rate - Section 2.9.2 and righting time
- Section 2.10) were carried out with the brittle stars.
2.3 Cell membrane stability (neutral red retention assay)
The cell membrane stability (sometimes referred to as lysosomal membrane
stability) of the haemocytes/coelomocytes was determined by measuring the cells'
ability to retain neutral red (NR) dye (Babich and Borenfreund, 1992). This was
achieved through the implementation of the neutral red retention (NRR) assay.
The same protocol was implemented for all test species. That is. samples of
haemolymph. or coelomic fluid (50 pL) were incubated, in triplicate, for each test
organism, in a flat-bottomed microtitreplate in order to allow a monolayer of cells to
adhere to the wells. The plate had been pre-coated with 10 % (v/v) poly-i-lysine
solution, to aid cellular adhesion. After 50 min. non-adhered cells were discarded
and the plates washed with phosphate buffered saline (PBS) (see Appendix I). A
solution of 0.004 % neutral red dye (Sigma. U.K.) in distilled water (200 pL) (see
Appendix I) was added to each well and the cells incubated at 10 °C for 3 h. The
wells were washed and an acidified solution of 1 % acetic acid and 50 % ethanol
(see Appendix I) was added to resolubilise the dye. The plates were shaken for
52
l O m i n before reading the absorbance at 540 nm, in an Optimax tunable
microplate reader (Molecular Devices, USA), using Softpro Max (V.2.4.1) software.
Protein concentration was then determined following a recognised method, as a
surrogate for cell counts in each well (see Section 2.4). Results were presented as
optical density (at 540 nm) per mg of protein.
2.3.1 Validation of neutral red retention assay (NRR)
The NRR assay was validated in vitro in A. rubens, P. lividus and M. edulis using
hydrogen peroxide (H2O2) as a model toxicant (Richter-Landsberg and Vollgraf,
1998). The experimental procedures for the three species were identical (Fig. 2.8).
Following H2O2 exposure the same protocol as outlined in Section 2.3 was
followed to determine the cell membrane stability of the exposed cells. Briefly,
cells from 5 individual animals were collected and pooled. The cells were placed
onto a microtitre plate (in quintuplicate) and left to incubate. After 45 min excess
fluid was removed and replaced with H2O2 at concentrations of 0, 10, 50 and
100 pM for 10 min (on ice) (concentrations were selected to be similar to those
used by previous researchers (Mitchelmore et al., 1998; Cheung et al., 2006)).
The H2O2 was removed and the cells gently washed twice with PBS (to remove
any residual H2O2), the NRR assay was then carried out.
To interpret the results, statistical significance between means was determined
using one-way analysis of variance (ANOVA) and the data sets were analysed
with Statgraphics v5.1 software (Statsoft, USA). Differences between means which
were P < 0.05 were considered to be significant. The results of the validation study
(Fig. 2.9) showed significant a dose dependent decrease in cell membrane
53

stability across all the exposure concentrations for A. rubens (P < 0.001) and
M. edulis (P < 0.001) and for the two highest concentrations (50 and 100 pM) for
P. / /wc/us(P< 0.001).
Cells collected from 5 individuals and pooled
50 pL pipetted into 20 wells on microtitre plate (as 4 H2O2 concentrations, In
quintuplicate)
Cells incubated in plate for 45 min, then excess fluid removed. 50 pL of H2O2
(at 0, 10. 50, 100 pM) added to each well
H2O2 exposure for 10 min, on ice (in dark)
H2O2 removed, cells washed twice with PBS. NRR assay then carried out as per
Section 2.3
Fig. 2.8 Flow chart illustrating the experimental design for the in vitro validation of
the NRR assay in Asterias rubens, Paracentrotus lividus and Mytilus edulis.
54
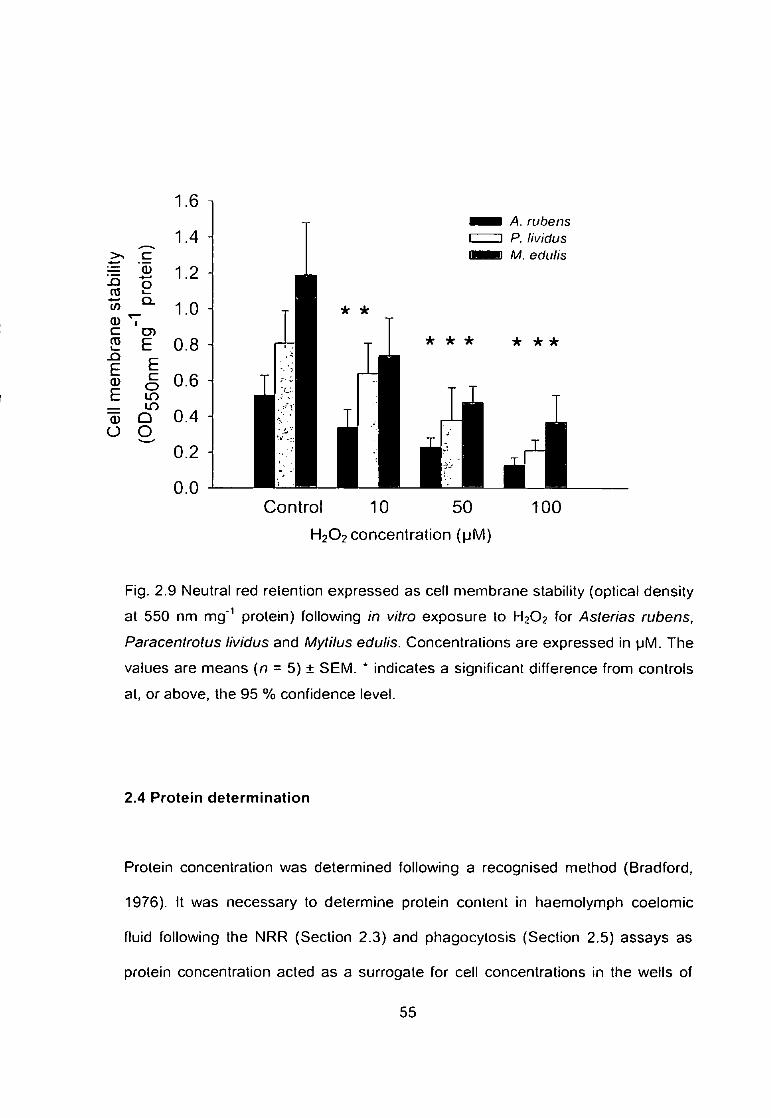
I A. rubens I P. lividus I M. edulis
Control 10 50
H2O2 concentration (pM)
100
Fig. 2.9 Neutral red retention expressed as cell membrane stability (optical density
at 550 nm mg'^ protein) following in vitro exposure to H2O2 for Asterias rubens,
Paracentrotus lividus and Mytilus edulis. Concentrations are expressed in pM. The
values are means (n = 5) ± SEM. * indicates a significant difference from controls
at, or above, the 95 % confidence level.
2.4 Protein determination
Protein concentration was determined following a recognised method (Bradford,
1976). It was necessary to determine protein content in haemolymph coelomic
fluid following the NRR (Section 2.3) and phagocytosis (Section 2.5) assays as
protein concentration acted as a surrogate for cell concentrations in the wells of
55

the microtitre plate. Results from both the NRR and phagocytosis assays are
divided by protein concentration to normalise for cell number/ concentration in
each well of the microlitre plate. Protein concentration in haemolymph/ coelomic
fluid was determined using the Pierce bicinchoninic acid (BCA) reagent. Protein
standard solutions (0.1 - 2.0 mg mL'^) were prepared in distilled water from bovine
serum albumin stock solution (2.0 mg mL^) (Sigma, U.K.) (see Appendix I). BCA
reagent, 200 pL, was added to 10 pL of haemolymph/ coelomic fluid, along with
10 pL of each protein standard and incubated at 37 °C for 30 min. Absorbance
was determined spectrophotometrically at 550 nm in an Optimax tunable
microplate reader (Molecular Devices, USA), using Softpro Max (\/.2.4.1) software.
2.5 Immunocompetence (phagocytosis a s s a y )
The phagocytotic activity of haemocytes and coelomocytes was determined by
measuring the uptake of zymosan particles (from yeast, Saccharomyces
cerevisiae) dyed with neutral red dye (Pipe et al., 1995; Canty et al., 2007;
Dissanayake et al., 2008; Hannam et al., 2009b). The same procedure was
followed for both A. rubens coelomocyte and M. edulis haemocyte samples. That
is, haemolymph/ coelomic fluid (50 pL) was pipetted in triplicate onto a microtitre
plate (pre-coated with 10 % (v/v) poly-L-lysine solution) and left for 50 min to allow
the cells at adhere. Following incubation, non-adhered cells were removed and
50 pL of dyed zymosan suspension (50 x 10^ particles mL"^) was added and
incubated with the cells for 30 min at 10 °C. The reaction was stopped by adding
100 pL of Baker's Formol Calcium (see Appendix I) which fixed the cells. The plate
56

was cenlrifuged (70 x g) for 5 min, the supernatant removed and the cells washed
twice with 100 of PBS (see Appendix I). Acidified ethanol (1 % acetic acid and
50 % ethanol in distilled water) (see Appendix I), 100 pL, was added to resolubilise
the dye. The phagocytic uptake of the dyed zymosan particles was determined
spectrophotometrically (at 550 nm) against a standard curve of zymosan
suspensions (50 - 1.56 x 10^ parlicles mL"^). Protein concentration was
determined (Section 2.4) and the results were presented as absorbance of stained
zymosan particles phagocytosed per mg of protein.
2.5.1 Validation of phagocytosis assay
The phagocytosis assay was validated in vitro in A. rubens and M.edulis using
H2O2 as a model toxicant. The experimental procedure for the two different
species was identical (Fig. 2.10). Following H2O2 exposure the same protocol as
outlined in Section 2.5 was followed to determine the phagocytotic activity of the
exposed cells. Briefly, cells from four individuals were collected and pipetted onto
a microtitre plate in quadruplicate. Following 45 min incubation, excess fluid was
replaced with 50 pL of H2O2 (at 0. 10. 50 and 100 pM).
To interpret the results, statistical significance between means was determined
using one-way analysis of variance (ANOVA) and the data sets were analysed
with Statgraphics v5.1 software (Statsoft, USA). Differences between means which
were P < 0.05 were considered to be significant. The results (Fig. 2.11) showed
significant a dose dependent decrease in cell membrane stability across all the
exposure concentrations for both A. rubens (P < 0.001) and M. edulis {P = 0.036).
57
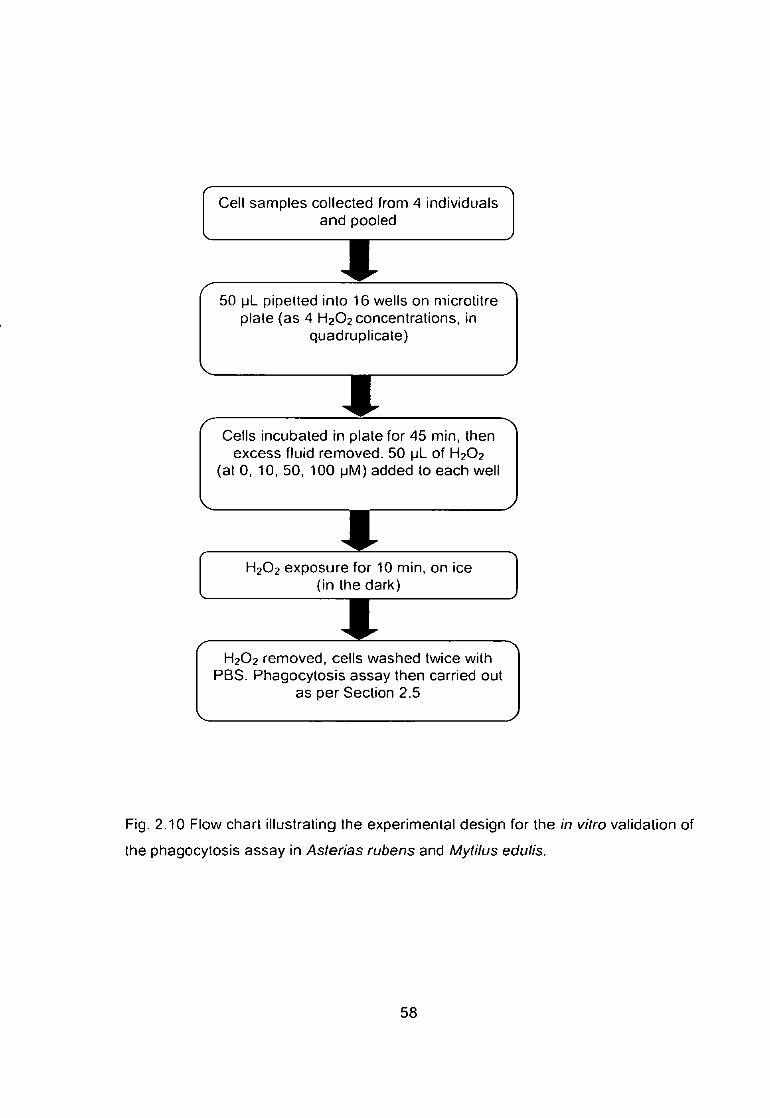
Cell samples collected from 4 individuals and pooled
50 pL pipetted into 16 wells on microtitre plate (as 4 H2O2 concentrations, in
quadruplicate)
Cells incubated in plate for 45 min. then excess fluid removed. 50 pL of H2O2
(at 0, 10, 50, 100 pM) added to each well
H2O2 exposure for 10 min. on ice (in the dark)
H2O2 removed, cells washed twice with PBS. Phagocytosis assay then carried out
as per Section 2.5
Fig. 2.10 Flow chart illustrating the experimental design for the in vitro validation of
the phagocytosis assay in Asterias rubens and Mytilus edulis.
58

CU CO
o o ^
"5 05
CO 0
2 Q.
CU Q . O
o E >^
N
2.5
2.0
1.5 H
1.0
0.5
0.0
I i
I ' rubens
X
Control 10 50
H2O2 c o n c e n t r a t i o n ( | j M )
1
100
Fig. 2.11 P h a g o c y l o l i c act iv i ty e x p r e s s e d as z y m o s a n par t ic les p h a g o c y t o s e d
(x 10^ m g prote in '^ ) fo l low ing in vitro e x p o s u r e to H2O2 for Asterias rubens a n d
Mytilus edulis. C o n c e n t r a t i o n s a re e x p r e s s e d in p M . T h e va lues a r e m e a n s (n = 4 )
± S E M . * ind ica tes a s ign i f icant d i f f e rence f rom con t ro ls at . or a b o v e , the 9 5 %
c o n f i d e n c e leve l .
2.6 Micronuclei induction
Mic ronuc le i ( M n ) a re c a u s e d by bo th c h r o m o s o m e b r e a k a g e s a n d sp i nd l e
a p p a r a t u s dys func t i on ( c h r o m o s o m e s fai l ing to cor rec t ly s e g r e g a t e at mi tos is ) . T h e
m i c r o n u c l e u s a s s a y d e t e r m i n e s the a b u n d a n c e of t hese M n a n d , the re fo re ,
59

eva lua tes c h r o m o s o m a l d a m a g e . M n are morpho log i ca l l y ident ica l to , but smal ler
t han nuc le i ( e x a m p l e s of Mn are s h o w n in F ig . 2 .12) . T h e y h a v e the fo l lowing
a t t r ibu tes :
I. M n normal ly have the s a m e s ta in ing in tensi ty as m a i n nuc le i , but they m a y
b e m o r e in tensely s t a i n e d .
II. M n are not phys ica l ly l inked to, or ove r l ap wi th the m a i n nuc le i .
III. M n m a y not over lap .
IV. A s Mn are non- re f rac t i le they c a n eas i ly b e d i f fe ren t ia ted f r o m a n y ar te fac ts ,
such as s ta in ing par t ic les ( F e n e c h , 2 0 0 0 ) .
T o p repa re M n s l ides, 2 0 0 pL of c o e l o m i c f lu id / h a e m o l y m p h w a s gen t l y sp read
on to a m i c r o s c o p e s l ide w h i c h had b e e n p r e - c o a t e d wi th 10 % (v /v ) poly-L- tys ine
so lu t ion ( to aid cel lu lar a d h e s i o n ) . T h e s l ides w e r e left for 30 m i n ; e x c e s s f luid
d ra ined and the s l ides left to air dry . T h e s l ides w e r e then f ixed in m e t h a n o l for
15 m i n , fo l l owed by s ta in ing w i th G i e m s a sta in (5 % (v /v) so lu t ion ) , for 20 m in .
Excess s ta in w a s r e m o v e d by r ins ing tw ice in dist i l led w a t e r a n d o n c e the s l ides
had air d r ied a covers l ip w a s m o u n t e d us ing D P X . T h e s l ides w e r e c o d e d and
r a n d o m i s e d , then e x a m i n e d unde r the m i c r o s c o p e for the induc t ion of M n . O n e
t h o u s a n d cel ls f rom e a c h s l ide w e r e sco red a c c o r d i n g to the cr i ter ia desc r i bed
p rev ious ly (Ven ier et aL, 1997; F e n e c h , 2 0 0 0 ; J h a et a l . , 2 0 0 5 ) . E x a m p l e s of M n
p resen t in M. edulis h a e m o c y t e s a n d in A. rubens c o e l o m o c y t e s a re s h o w n in
F igure 2 .13 .
60
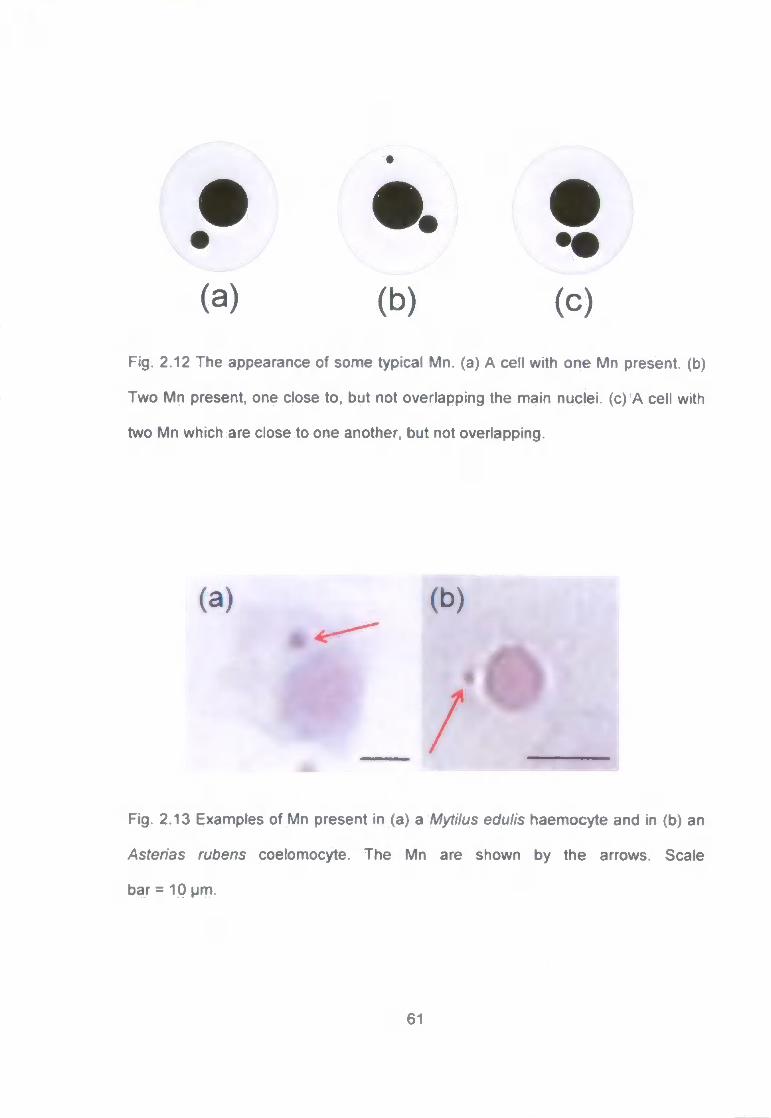
(a) (b) (c)
Fig . 2 .12 T h e a p p e a r a n c e of s o m e typ ica l M n . (a) A cel l w i t h o n e M n p resen t , (b)
T w o M n p resen t , one c lose to . bu t no t o v e r l a p p i n g the m a i n nuc le i , (c) A ce l l w i th
two M n w h i c h a re c lose to o n e ano the r , bu t no t o v e r l a p p i n g .
(a)
Fig . 2 .13 E x a m p l e s of M n p r e s e n t in (a) a Mytilus edulis h a e m o c y t e a n d in (b) a n
Asterias rubens c o e l o m o c y t e . T h e M n are s h o w n by t h e a r r o w s . Sca le
ba r = 10 p m .
61

2.7 Cellular viability (Eosin Y staining)
Prior to carrying out the Comet assay (Section 2.8) the viability of the cells (i.e.
coelomocytes or haemocytes) were determined by Eosin Y staining. This assay is
based on the principal that healthy cells with intact plasma membranes can
exclude Eosin Y, but injured cells will take up the dye (Lowe and Pipe, 1994). A
stock solution of 2 mg mL'^ of Eosin Y stain (Sigma, UK) was prepared in
physiological saline (Appendix I). A 40 pL sample of coelomic fluid/ haemolymph
was pipetted into an Eppendorf and 2 pL of Eosin Y solution was added. The tube
was gently vortexed and the contents transferred to a haemocytometer and the
cells observed under a light microscope (total magnification x 400). A minimum of
100 cells were scored as being either alive (both colourless and clear, or with a
slight green colouration) or dead (distinctly stained red) (Fig. 2.14). Only cell
samples with a cellular viability of > 70 % were used in the Comet assay (Tice et
al., 2000; Jha et al. .2005).
(a) (b)
Fig. 2.14 Mussel haemocytes stained with Eosin Y. The cell on the left (a) is viable
(green), the cell on the right (b) is unviable/ dead (red). Scale bar = 10 pm.
62
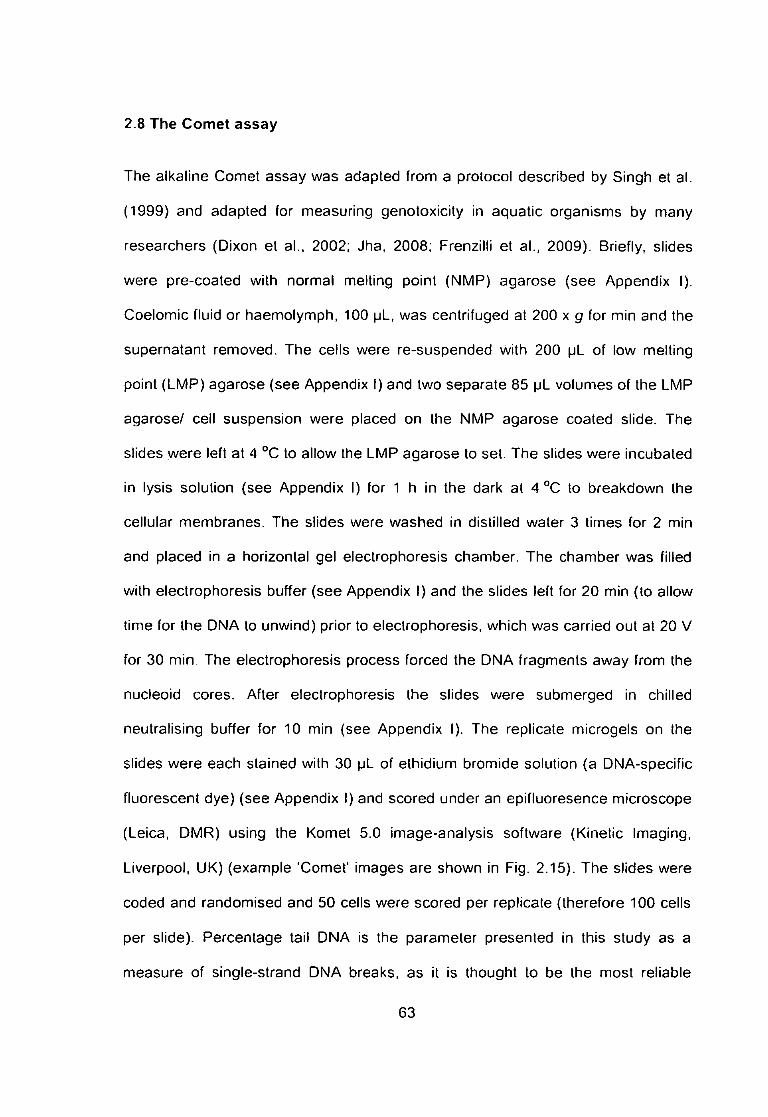
2.8 The Comet a s s a y
T h e a lka l ine C o m e t a s s a y w a s a d a p t e d f r o m a p ro toco l desc r i bed by S ingh et a l .
( 1 9 9 9 ) a n d a d a p t e d for m e a s u r i n g geno tox i c i t y in aqua t i c o r g a n i s m s by m a n y
resea rche rs (D ixon et a l . . 2002 ; Jha . 2 0 0 8 ; Frenzi l l i et a l . . 2 0 0 9 ) . Br ief ly , s l ides
w e r e p re - coa ted w i th n o r m a l mel t ing po in t ( N M P ) a g a r o s e ( s e e A p p e n d i x I).
C o e l o m i c f luid or h a e m o l y m p h , 100 \JL, w a s cen t r i fuged at 200 x g for m in a n d the
supe rna tan t r e m o v e d . T h e cel ls w e r e r e - s u s p e n d e d w i th 200 pL of low me l t ing
point ( L M P ) a g a r o s e ( see Append i x I) a n d two s e p a r a t e 85 pL v o l u m e s of the L M P
a g a r o s e / cel l s u s p e n s i o n w e r e p laced o n the N M P a g a r o s e coa ted s l ide. T h e
s l ides w e r e left at 4 °C to a l low the L M P a g a r o s e to set. T h e s l ides w e r e i ncuba ted
in lysis so lu t ion ( see A p p e n d i x I) for 1 h in the dark at 4 °C to b r e a k d o w n the
cel lu lar m e m b r a n e s . T h e s l ides w e r e w a s h e d in d ist i l led wa te r 3 t imes for 2 m in
and p laced in a hor izonta l ge l e lec t rophores is c h a m b e r . T h e c h a m b e r w a s f i l led
wi th e lec t ropho res i s buf fer ( s e e Append i x I) a n d the s l ides left for 2 0 min ( to a l low
t ime for the D N A to u n w i n d ) pr ior to e lec t rophores i s , w h i c h w a s car r ied out at 20 V
for 30 m i n . T h e e lec t rophores is p rocess fo rced the D N A f r a g m e n t s a w a y f rom the
nuc leo id co res . Af ter e lec t rophores is the s l ides w e r e s u b m e r g e d in ch i l led
neu t ra l i s ing buf fer for 10 min (see A p p e n d i x I). T h e rep l ica te m ic roge ls o n the
s l ides w e r e e a c h s ta ined wi th 30 \JL of e th id ium b r o m i d e so lu t ion (a DNA-spec i f i c
f l uo rescen t d y e ) (see A p p e n d i x I) and sco red unde r an ep i f l uo resence m i c r o s c o p e
(Le ica , D M R ) us ing the Kome t 5.0 image -ana l ys i s so f twa re (K ine t i c Imag ing ,
L ive rpoo l , U K ) ( e x a m p l e 'Come t ' images a re s h o w n in Fig. 2 .15) . T h e s l ides w e r e
c o d e d a n d r a n d o m i s e d a n d 50 cel ls w e r e s c o r e d per rep l ica te ( the re fo re 100 cel ls
per s l ide) . P e r c e n t a g e tail D N A is the p a r a m e t e r p resen ted in this s tudy as a
m e a s u r e of s ing le -s t rand D N A b reaks , a s it is t hough t to be the m o s t re l iab le
63

p a r a m e t e r a n d it e n a b l e s in te r - l abora to ry r e f e r e n c e (Co l l i ns . 2 0 0 4 ; K u m a r a v e l a n d
J h a . 2 0 0 6 ) . T h e s a m e e x p e r i m e n t a l p r o c e d u r e w a s f o l l o w e d for al l of t h e tes t
s p e c i e s i nves t i ga ted a n d th is p ro toco l w a s s u m m a r i s e d in F igu re 1.3.
(a) ( b )
(c)
•
Fig. 2 .15 Mytilus edulis h a e m o c y t e s i l lus t ra t ing i nc reas ing leve ls o f D N A d a m a g e
as d e t e c t e d by the C o m e t assay , w i th (a) r e p r e s e n t i n g u n d a m a g e d ce l ls , t h r o u g h
to (d) exh ib i t i ng the d a m a g e ( i .e. the la rges t ' C o m e t ta i l ' ) . S c a l e b a r = 50 p m .
2 8 1 The modified Comet assay
Fo l l ow ing the lysis s t age of the C o m e t a s s a y an e n z y m e d iges t i on s t e p w a s
ca r r ied ou t to ta rge t ox i d i sed b a s e s (Co l l i ns et a l . . 1 9 9 3 ; D u s i n s k ^ a n d Co l l i ns ,
1996 ; R e e v e s et a l . . 2 0 0 8 ) . T h e e n z y m e s u s e d w e r e f o r m a m i d o p y r i m i d i n e D N A
g l y c o s y l a s e ( F P G ) a n d e n d o n u c l e a s e III ( E n d o III). T h e e n z y m e s conve r t o x i d i s e d
p u r i n e s ( a d e n i n e a n d g u a n i n e ) a n d p y r i m i d i n e s ( cy tos ine a n d t h y m i n e ) ,
respec t i ve ly , in to D N A s ing le s t rand b r e a k s . T h r e e s l i des w e r e p r e p a r e d fo r e a c h
64
o r g a n i s m ; o n e e n z y m e buf fer cont ro l (no e n z y m e t rea tmen t ) , one s l ide w a s t rea ted
wi th E n d o III a n d the third s l ide t reated w i th F P G . Fo l l ow ing lysis the s l ides w e r e
w a s h e d th ree t imes in e n z y m e react ion bu f fe r ( s e e A p p e n d i x I) at 4 °C . T h e n
50 pL of e i ther e n z y m e reac t ion buf fer ( r e fe rence s l ides) or 1.5 pg m L ' ^ of F P G , or
E n d o II I , w a s app l i ed to e a c h ge l , a long w i th a covers l ip , pr ior to i ncuba t i on at
37 °C for 4 5 m i n in a humid i t y chamber . Immed ia te l y a f ter e n z y m e d iges t ion the
s l ides w e r e p laced in a n e lec t rophores is c h a m b e r as per Sec t ion 2.8. T h e C o m e t
sco res of the e n z y m e - t r e a t e d s l ides w e r e c o m p a r e d to app rop r ia te re fe rence
s l ides ( t hose t rea ted w i th e n z y m e react ion buf fer w i th no e n z y m e ) . T h e s a m e
expe r imen ta l p r o c e d u r e w a s fo l lowed for all the test spec ies Invest iga ted a n d this
pro toco l w a s s u m m a r i s e d in F igure 1.3.
2.8.1.1 Validation of modified Comet assay
T h e mod i f i ed C o m e t a s s a y w a s va l ida ted in vitro in A. rubens, P. lividus a n d
M.edulis us i ng H2O2 as a mode l tox icant (Co l l ins et a l . , 1995 ; Co l l ins et a l . , 1997 ;
Andreo l l et a l . . 1999 ; G ie lazyn et a l . . 2003 ; C h e u n g et a l . , 2 0 0 6 ) . T h e expe r imen ta l
p rocedu re for the th ree d i f ferent spec ies w a s ident ica l (F ig . 2 .16) . Fo l l ow ing the
H2O2 e x p o s u r e s tep the s a m e protoco l as ou t l i ned in Sec t i on 2.7.1 w a s fo l l owed to
d e t e r m i n e the ox ida t i ve D N A d a m a g e to the e x p o s e d cel ls. T h e stat is t ica l
s ign i f i cance b e t w e e n the m e a n s of the resu l ts w e r e d e t e r m i n e d us ing o n e - w a y
ana lys is of va r i ance ( A N O V A ) and the data se ts w e r e a n a l y s e d w i th S ta tg raph ics
v5.1 so f twa re (Sta tsof t , U S A ) . D i f fe rences b e t w e e n m e a n s w h i c h w e r e P < 0 .05
w e r e cons ide red to be s ign i f icant . The resu l ts o f the va l idat ion s tudy s h o w e d a
c lear d o s e d e p e n d e n t r e s p o n s e for all three spec ies ( P < 0 .001 ) (F ig . 2 .17) .
65
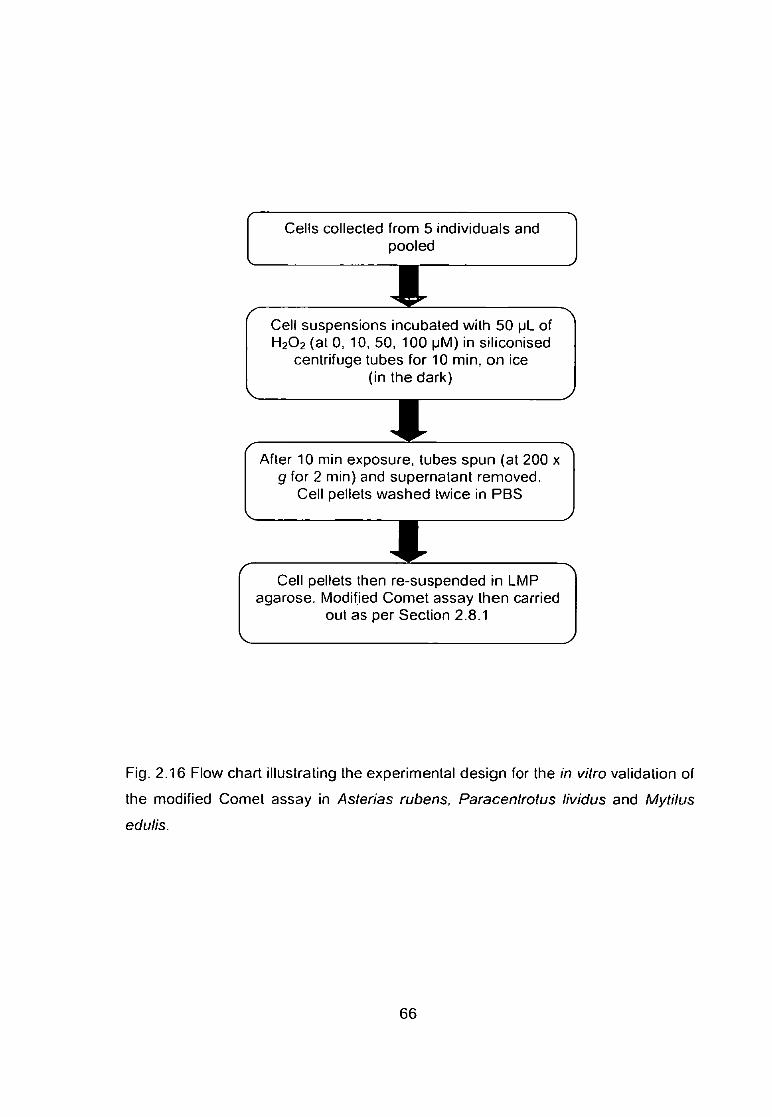
Cel ls co l lec ted f rom 5 ind iv idua ls and poo led
Cel l suspens ions i ncuba ted w i th 5 0 pL of H2O2 (at 0. 10, 50 . 100 p M ) in s l l i con ised
cen t r i fuge tubes for 10 m i n , o n ice ( in the da rk )
A f te r 10 m in exposu re , t ubes s p u n (at 200 x g for 2 m in ) and supe rna tan t r e m o v e d .
Cel l pel lets w a s h e d tw ice in P B S
Cel l pel lets then r e - s u s p e n d e d in L M P a g a r o s e . Modi f ied C o m e t a s s a y t h e n carr ied
out as per Sec t ion 2.8.1
F ig . 2 .16 F low char t i l lust rat ing the expe r imen ta l d e s i g n for the in vitro va l ida t ion of
the mod i f ied C o m e t a s s a y in Asterias rubens, Paracentrotus lividus a n d Mytilus
edulis.
6 6

(a) 60
50
< 40 z Q TO I-
20
10
0
Buffer E n d o III Buffer F P G
(b)
Control H2O2 concentration (pM)
(C) 70
100
ContrnI
Buffer E n d o III Buffer F P G
ContrnI
H2O2 concentration
Buffer E n d o Buffer F P G
100 H2O2 concentration (jjM)
Fig. 2.17 Percen tage tall D N A fol lowing in vitro exposure to H2O2 for (a) Asterias rubens. (b) Paracentrotus lividus and (c)
Mytilus edulis. Concent ra t ions are expressed in p M . The values are means (/7 = 5) ± S E M . * indicates a signi f icant d i f ference f rom
contro ls at, or above , the 95 % conf idence level.

2.9 Clearance rate
Clea rance ra te (a lso k n o w n as the feed ing ra te ) w a s d e t e r m i n e d pr ior to
h a e m o l y m p h / c o e l o m o c y t e co l lec t ion . T h e assay p rov i ded an ind ica t ion of the
overa l l hea l th of a n o r g a n i s m ( W i d d o w s , 1978 ; W i d d o w s and Sa lke ld , 1993) .
2.9.7 Mytilus edulis
The c lea rance rates ( C R ) w e r e d e t e r m i n e d us ing a stat ic s y s t e m based o n
p rev ious work ( W i d d o w s a n d Sa lke ld . 1993) . Br ief ly, m u s s e l s w e r e p laced into
ind iv idual 4 0 0 m L ta l l - form beake rs , f i l led w i th 350 mL s e a w a l e r (at 15 °C) . E a c h
beaker con ta ined a 12 x 6 m m t r iangular magne t i c fo l lower (F isher®) a n d w a s
p laced on a 15 -po in l m a g n e t i c st i rr ing p la te (IKA® R O 15) . A beake r ac t ing a s a
sys tem b lank w a s a lso p laced on each st i r r ing p late; t hese we re h a n d l e d the s a m e
as the expe r imen ta l beakers , wi th the excep t i on that t hey d id not h o u s e a m u s s e l
(F ig . 2 .18) . T h e musse l s w e r e left to acc l ima t i se ( in o rde r for t h e m to o p e n their
va lves) for 15 m in pr ior to the add i t ion of 500 pL o f Isochrysis galbana a lga l
s u s p e n s i o n (supp l ied by Var i con A q u a So lu t ions L td . , Ma lve rn , UK) , to g i ve c.
15 ,000 a lga l ce l ls mL"^ in e a c h vesse l . A 20 mL a l iquot of water w a s immed ia te l y
r e m o v e d f rom the vesse ls us ing a g lass sy r inge a n d aga in af ter 30 m in had
e l apsed . T h e s a m p l e s w e r e ana l ysed o n a Beckman^"^ Coul ter Par t ic le Size a n d
C o u n t Ana l yse r (Z2) , w i th a 100 p m aper tu re tube f i t ted and set to coun t par t ic les
b e t w e e n 4.0 a n d 10.0 p m in d iame te r (F ig . 2 .19) .
68

T h e C R (L h"^) o f the m u s s e l s w a s c a l c u l a t e d u s i n g t he f o l l ow ing e q u a t i o n
( C o u g h l a n . 1 9 6 9 ) :
C R = V ( l o g e C i - l o g e C2) /t
W h e r e C R = c l e a r a n c e ra te (L h^ ) , V = v o l u m e of w a t e r (L ) .
C i a n d C2 = a lga l concen t ra t i on at b e g i n n i n g a n d e n d o f t ime in te rva l t (h) .
Blank Blank
Fig. 2 .18 B e a k e r s u s e d to d e t e r m i n e t he c l e a r a n c e ra te o f Mytilus edulis a r r a n g e d
a c r o s s two 15-po in t m a g n e t i c st i r r ing p la tes ( IKA ® R O 15) . M u s s e l s a re v is ib le on
the b a s e o f e a c h o f t he e x p e r i m e n t a l v e s s e l s a n d t he e m p t y 'b lank ' b e a k e r s a re
s e e n at the f ront o f e a c h s t i r r ing p la te .
69

1 .
Fig 2 .19 Beckman^*^ Cou l te r Par t ic le S ize a n d C o u n t A n a l y s e r (Z2 ) u s e d to c o u n t
a lga l par t ic les in s a m p l e s co l l ec ted du r i ng the c l e a r a n c e ra te a s s a y .
2 9.2 Ophiothnx fragilis
Bri t t le s tars w e r e p l aced into ind iv idua l 2 L b e a k e r s , f i l led w i t h 1.5 L s e a w a t e r (at
15 °C ) . T h e b e a k e r s w e r e a e r a t e d by m e a n s o f a n air p u m p fed to i nd i v idua l
P a s t e u r p ipe t tes w h i c h w e r e h o u s e d in a uni t p l a c e d o v e r e a c h b e a k e r (F ig . 2 .20 ) .
T h e d e g r e e of ae ra t i on w a s iden t i ca l in e a c h b e a k e r a n d a d j u s t e d so that it w o u l d
70
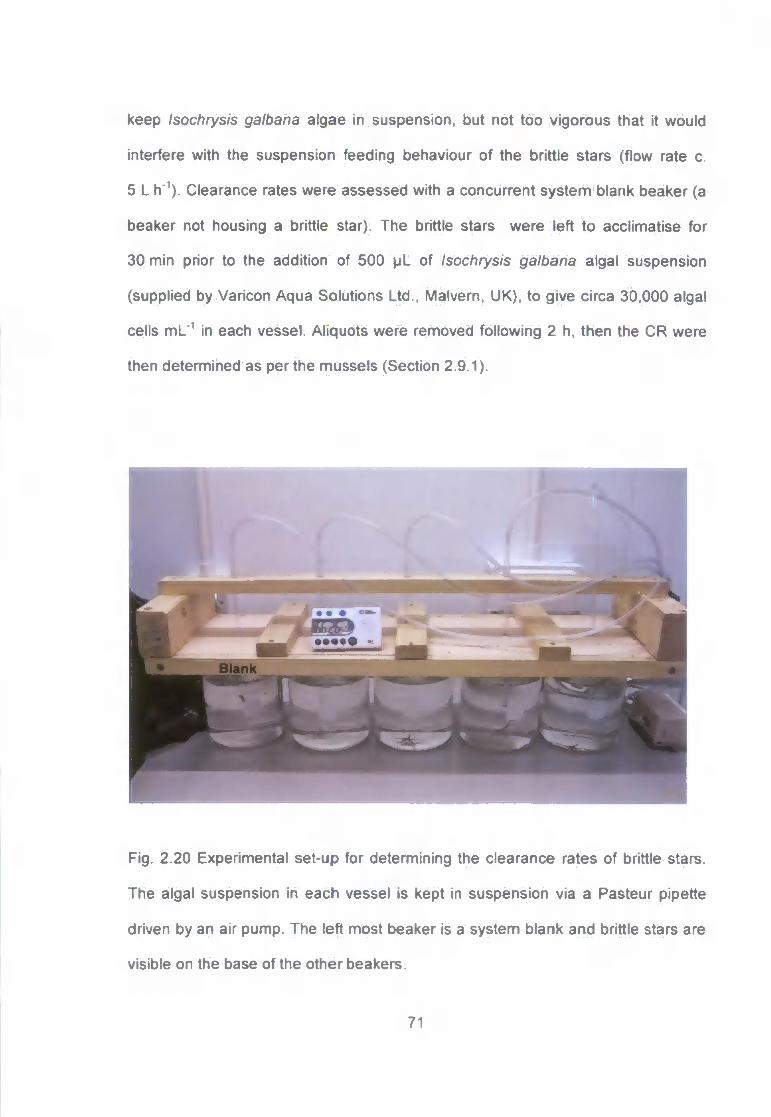
k e e p Isochrysis galbana a l g a e in s u s p e n s i o n , bu t no t t oo v i g o r o u s tha t it w o u l d
in te r fe re w i th the s u s p e n s i o n f e e d i n g b e h a v i o u r o f t he br i t t le s t a r s ( f low ra te c.
5 L h"^). C l e a r a n c e ra tes w e r e a s s e s s e d w i th a c o n c u r r e n t s y s t e m b lank b e a k e r (a
b e a k e r not hous ing a br i t t le s tar ) . T h e bri t t le s ta rs w e r e lef t t o acc l ima t i se for
3 0 m i n pr ior to t he add i t i on of 5 0 0 p L of Isochrysis galbana a lga l s u s p e n s i o n
( supp l i ed by V a r i c o n A q u a S o l u t i o n s L td . , M a l v e r n , U K ) , to g i ve c i r ca 3 0 , 0 0 0 a lga l
ce l ls m L ^ in e a c h v e s s e l . A l i q u o t s w e r e r e m o v e d f o l l ow ing 2 h. t h e n the C R w e r e
t hen d e t e r m i n e d as per t he m u s s e l s (Sec t i on 2 .9 .1 ) .
Bank
Fig 2 2 0 Expe r imen ta l s e t - u p for d e t e r m i n i n g the c l e a r a n c e ra tes of br i t t le s ta rs .
T h e a lga l s u s p e n s i o n in e a c h v e s s e l is kep t in s u s p e n s i o n v ia a P a s t e u r p ipe t te
d r i ven by a n air p u m p . T h e lef t m o s t b e a k e r is a s y s t e m b l a n k a n d br i t t le s ta rs a re
v is ib le o n the base of the o the r b e a k e r s .
71

2.10 Righting behaviour
Righ t i ng behav iou r in e c h i n o d e r m s p e c i e s g i ves a n ind ica t ion o f t h e ove ra l l hea l th
o f the o r g a n i s m . R igh t ing t i m e s w e r e d e t e r m i n e d pr ior to c o e l o m o c y t e co l l ec t i on .
T h i s a s s a y w a s ca r r ied ou t w i t h s e a s ta rs , s e a u rch ins a n d br i t t le s ta rs , w i th the
s a m e e x p e r i m e n t a l p ro toco l f o l l o w e d for e a c h s p e c i e s . E a c h a n i m a l w a s p l a c e d in
i nd i v idua l a q u a r i u m con ta i n i ng c l e a n s e a w a t e r (at 15 °C) (F ig . 2 .21 ) . T h e
d i m e n s i o n s of the a q u a r i u m a n d v o l u m e of the w a t e r w e r e s u c h tha t the a n i m a l
c o u l d no t t ouch the s ides (or t he s u r f a c e o f the w a t e r ) , a s th is w o u l d h a v e ass i s ted
t h e an ima l ' s r ight ing behav iou r , t h e r e b y lead ing to e r r o n e o u s resu l t s .
F ig . 2 .21 A q u a h u m used to d e t e r m i n e r ight ing b e h a v i o u r (w i th a par t ia l l y r i gh ted
Asterias rubens).
72
T h e an ima l w a s inver ted a n d p laced centra l ly on the base of the tank (n i t r i le
g l oves w e r e w o r n , to p reven t any c h e m o s e n s o r y con tam ina t i on (Za f i r i ou , 1972) ) .
T h e t ime taken for the an ima l to ful ly re tu rn onto its abo ra l s ide is m e a s u r e d , w i th
the a m b u l a c r a of al l the a r m s in con tac t w i th the b a s e of the tank. A n e x a m p l e of a
typical r ight ing r e s p o n s e s e q u e n c e in A. rubens c a n be s e e n in F igu re 2 .22 . Th is
p rocedu re w a s repea ted a total of th ree t imes and the m e a n t ime ca l cu la ted . F ive
m inu tes w e r e permi t ted for e a c h a t tempt , if the an ima l had not comp le te l y
se l f - r ighted af ter this t ime d id not r ight ' w a s reco rded .
73

Fig. 2.22 Ser ies of images i l lustrat ing the r ight ing response in Asterias rubens ( the sequence of images runs f rom (a) to (1)), Sca le bar = 10 m m .

2.11 Determination of cadmium levels in tissues of organisms using
analytical techniques
2.11.1 Mytilus edulis dissection
Following experimental exposure to cadmium (Chapter 5), body compartments
were dissected from mussels to determine the amount of cadmium (Cd) uptake.
To this end, the gills and gut (digestive gland) were removed.
7 (c)
•J
Fig. 2.23 (a) An opened Mytilus edulis showing the location of the gills (red
arrows) and the gut (black arrow), (b) Mussel with gills removed, (c) Mussel with
both the gills and gut (digestive gland) removed, (d) The body compartments on
slides prior to drying to a constant weight.
75

All dissection equipment and microscope slides were acid-washed (5 % HNO3
for at least 2 h) prior to use. For every animal dissected two microscope slides
were labelled and pre-weighed. The valves of each mussel were prised open
using scissors then the adductor muscles cut with a scalpel and the mussel
opened up fully (Fig. 2.23a). Both gills and the gut were removed from the
mussel, washed with Milii-Q water and placed onto the appropriate microscope
slide (Fig. 2.23b. c and d). These slides were placed in a drying oven (100 ±
4 °C) until a constant weight was reached.
2.11.2 Asterias rubens dissection
The same procedure as for M. edulis (Section 2.11.1) was followed with the
exception that different body compartments were analysed along with the gut
(stomach). As a surrogate for the gill tissue of the mussel, the tube feet were
dissected, as respiration occurs through a variety of structures in echinoderms
including the tube feet (Ratcliffe and Rowley, 1979). Additionally, the pyloric
caeca was analysed as biomonitoring studies have shown that this body
compartment is a good bioindicator of heavy metal exposure, especially Cd
(Temara et al., 1998; Danis et al., 2004b). The sea star was placed aboral side
upwards and scissors were used to remove the upper dermis of the central disc,
to reveal the cardiac stomach (gut) (Fig. 2.24b). Once the gut was removed, a
scalpel was used to amputate the arms of the sea star and the ambulacral ridge
which runs along the centre of each arm was separated from the outer dermis
of each arm. The tube feet were dissected from each ambulacral ridge and the
pyloric caecum was separated from the outer dermis of the arms (Fig. 2.24c, d
and e).
76

(a)
/
Fig. 2.24 (a) Asterias rubens specimen prior to dissection, (b) Outer dermis
removed from central disc revealing the cardiac stomach (black arrow), (c)
Specimen with cardiac stomach removed (black arrow), (d) Tubed feet along an
ambulacral ridge, (e) Pyloric caeca visible on two dissected arms (black
arrows).
2.11 3 Tissue digestion
Following collection of the appropriate tissues the process of t issue digestion
was carried out. Briefly, in a fume cupboard, each piece of dried tissue was
placed in 20 mL polythene screw-top digestion vials (scintillation vials, Simport.
Canada) and 1 mL of concentrated HNOawas added. Samples were digested at
70 °C for 2 h in a water bath. Once digestion was completed (no brown fumes
evolved), the tubes were allowed to cool, then diluted with 4 mL of Milli-Q water.
Tissue digest aliquots were stored at 20 °C (± 3 °C).
77
2.11.4 Inductively Coupled Plasma Mass Spectrometry (ICP-MS) analysis
Metal analysis was carried out following a recognised method (Hill. 1999;
Federici et al., 2007). Cadnnium concentrations were measured by using
Inductivity Coupled Plasma Mass Spectrometry (ICP-MS). The software used
with ICP-MS was PQ Vision 4.1.2. (Plasma Quod PQ2 Turbo. Thermo
Elemental. Winsford. UK). To validate the metal analysis, 0.25 mL of two
internal standards were added to all samples. These standards were indium (In)
and thallium (Ti). Cd standards were also prepared in order to calibrate the
instrument before metal analysis. The standard solutions were made by using
1000 mg L" Cd stock solution, diluted in 2 % nitric acid. The Cd standards used
were 0. 10. 20. 40 ppb. In all of the Cd standards 0.25 mL of the two internal
standards were added.
78

Chapter 3:
Echinoderms {Asterias rubens) are more sensitive to known
genotoxins than marine molluscs {Mytilus edulis).
Genotoxic responses can be linked to cytotoxic and behavioural
(physiological) consequences.
The results of this chapter were published in Aquatic Toxicology 94. 68-76
(Canty el al.. 2009) and presented as a platform presentation at SETAC
Europe, Hague, 2007.
79

3.1 Introduction
As global population levels continue to grow there are ever increasing
anthropogenic inputs into the aquatic environment. Of these inputs genotoxic
pollutants are of increasing concern (Wurgler and Kramers, 1992; Claxton et al.,
1998; Jha, 2004). For instance, in 1994 the USA released approximately
0.3 billion kg of substances which were known rodent carcinogens into the
environment, 2 . 9 % of which were discharged directly into surface waters
(USEPA, 1996). Little is known about the effects of these genotoxic agents on
aquatic flora and fauna. Therefore, in recent years environmentally realistic
assays have been developed and studies have been carried out to investigate
the effects of potential genotoxic compounds on aquatic organisms using a
variety of biological responses, or biomarkers (Dixon e l al., 2002; Jha, 2004).
Nevertheless, there is a lack of published literature which has explored links
between genotoxic responses with other responses at higher levels of biological
organisation (Anderson and Wild, 1994; Jha, 2008).
Many different species have been used as test organisms in the environmental
monitoring and toxicity testing of xenobiolics. The aquatic species historically
used are phylogenelically diverse; they include plants (e.g. duckweed (Wang,
1990)), annelids (e.g. Platynereis dumerilii (Jha et al. , 1997)) and crustaceans
(e.g. Daphnia magna (McWilliam and Baird, 2002a) and Carcinus maenas
(Dissanayake and Galloway, 2004)). The blue mussel, Mytilus edulis, has been
frequently used as a sentinel species in many monitoring programmes and
research protocols as a representative of the molluscs (Widdows el al., 1995;
O'Connor. 1996; Dixon e l al., 2002). There is increasing concern that basing
environmental health assessments on one species alone may not be sufficiently
80

robust (Cairns Jr, 1983) and there is a growing need to adopt 'new' test
organisms in the field of aquatic ecotoxicology (BEL, 2002). Many current
biomarker studies only utilise a limited number of lest species that are often
found at contaminated sites and the responses of these organisms may not be
indicative of other species in the community (Jha, 2004; Cheung et al., 2006;
Jha, 2008).
New regulations in the European Union under the Registration, Evaluation,
Authorisation and Restriction of Chemicals (REACH; EC 1907/2006)
programme have recognised these weaknesses. The regulations have
recommended that in order to protect marine organisms from contaminants that
have a high probability of causing toxicity, testing with freshwater fish,
crustaceans and algae should be supplemented with molluscs and
echinoderms. The European Centre for Ecoloxicology and Toxicology of
Chemicals (ECETOC) recommendations to reduce and replace both fish and
amphibian use in chemical toxicity testing included the proposed use of
echinoderms (ECETOC. 2007). The ECETOC task force slated that there is
worldwide interest in developing and adopting intelligent testing strategies (ITS)
for the environmental risk assessment (ERA) of chemicals that may enter the
aquatic realm. There is a need to adopt new invertebrate models into the ITS
approach to ERAs, the proposed use of echinoderms was suggested for two
main reasons: the complete genome of the sea urchin has been mapped (the
purple sea urchin Strongylocentrotus purpuratus (Sodergren el al.. 2006)) and
this genomic data could prove invaluable in the development of very specific
toxicity assays; the close evolutionary links of the echinoderms, at the molecular
level, to fish and amphibians (Adoutte et a!.. 2000) may enable the use of the
81

former in the place of vertebrates in toxicity testing (ECETOC, 2007). An
additional argument in favour of the use of echinoderm species in the
preparation of ERAs for human pharmaceuticals is that it is now deemed
necessary to determine the possible effects of human pharmaceuticals on non-
target, and environmentally relevant, organisms (i.e. echinoderms) in ERAs
(Winter et al., 2009). The potential replacement of vertebrate species (fish) with
echinoderms would have further benefits in that it would be in line with the
philosophy of the 3Rs (reduction, refinement and replacement) in vertebrate
toxicology (Russell and Burch. 1959) as it would comply with the ethical
principal of reducing fish use in acute ecotoxicity testing (Jeram et al., 2005).
However, relatively little is known about the sensitivity of echinoderms
(especially their adult stages) to environmental contaminants (Hutchinson,
2007). Therefore, the relative sensitivity of echinoderms compared with more
traditional invertebrate test species is worthy of further ecotoxicological
investigation.
In this study, the common sea star, Asterias rubens, was selected as a test
organism as representative of the echinoderms. The common sea star is a
euryhaline species that is abundant in the intertidal and sublittoral zones. It has
a widespread distribution around the British Isles and can be found throughout
the Atlantic and Arctic coastal waters of Europe (Picton, 1993; Sarantchova,
2001). Although this echinoderm species has been utilised in biomoniloring
studies (Temara el al.. 1997b; Danis et al., 2004b) it has not been used
extensively in ecotoxicology.
82
The effects of contaminants on behaviour (e.g. predator avoidance,
reproductive and social behaviour) in different fish species have been
extensively studied (for review see Scott and Sloman, 2004). The
implementation of behavioural endpoints has been less common with other lest
organisms frequently used in ecotoxicological studies. Examples of behavioural
and physiological responses studied include: the disruption of natural swimming
behaviour in the mysid shrimp Americamysis bahia following cadmium (Cd)
exposure (Roast et al.. 2000; Roast et al.. 2002); the reduced feeding rates and
locomotory behaviour of the gammarid Gammarus pulex following Cd exposure
(Felten et al., 2008); the impairment of natural burrowing activity in the marine
amphipod Corophium volutator following chronic exposure to crude oil
contaminated sediments (Scarlett et al.. 2007); the adverse impact of exposure
to oil-derived products on the prey-localisation behaviour of the Australian
eleven-armed asteroid Coscinasterias muricata (Georgiades et al.. 2003); the
suppression of feeding rates in Daphnia magna caused by a range of pollutants
(including heavy metals and PAHs) (McWilliam and Baird. 2002b); oil-induced
disruption of the foraging behaviour of the asteroid C. muricata (Temara el al..
1999) and the effects of crude oils on the righting behaviour of the purple sea
urchin Paracentrotus lividus (Axiak and Saliba, 1981). As behaviour, a
phenolypic modification, is controlled by the genetic make-up of individual and
because it links physiological function with ecological processes, it serves as a
useful indicator of toxicity a l the whole organism level. Organism level
responses can provide sensitive and general stress indicators that can be
correlated with community-level (population) responses (Maltby, 1999).
83

However, no attempt has been made previously to link or integrate the
genotoxic effects of contaminants with effects at physiological or behavioural
levels. Such studies would not only provide the opportunity to elucidate the
potential mechanisms of physiological (or behavioural) modifications but could
also stimulate the use of such alterations without the need to use invasive
techniques (Scott and Sloman, 2004). In this context, as previously mentioned,
'clearance rate' (CR) has been used recently (sometimes as a component of
'scope for growth' - an indicator of the energy status of an organism which
takes into account the processes of feeding, food absorption, respiration and
excretion (Bayne, 1984)) in bivalve molluscs as a sensitive indicator of pollutant
exposure (Eertman et al., 1995; Widdows et al., 1995; Canty el al.. 2007;
Scarlett et al., 2008) and 'righting time' (RT) (defined as the time taken for an
animal placed upside down to return to its normal, upright, position) has been
implemented as an indicator of overall health of echinoderm species (Axiak and
Saliba, 1981; Davies el al., 1998; Temara et al., 1999).
Against the backdrop of above information, the aims and objectives of the study
were:
(a) To validate the biomarker responses to determine the effects of genotoxic
agents in the blue mussel {M. edulis) and the common sea star {A. rubens).
(b) To compare the relative sensitivity of the two organisms {M. edulis and
A. rubens) for observed biological responses at different levels of biological
organisation.
84

(c) To test for correlations between genotoxic responses and higher levels of
biological response (including behavioural and physiological responses at the
whole organism level) with an aim to validate their usefulness as a potential
non-invasive tool for toxicological testing and pollution monitoring.
In order to achieve these objectives, a direct acting reference genotoxic agent,
methyl methanesulphonate (MMS) and an indirect acting (i.e. requiring
metabolic activation) agent cyclophosphamide (CP) were selected. Methyl
methanesulfonate (MMS) was selected as it has been used previously as a
reference genotoxin in many studies, including human or mammalian cells
(Natarajan et al., 1983; Andreoli et al., 1999) and in marine invertebrates (Jha et
al., 2000a; Jha et al., 2000b; McFadzen et al.. 2000; Rank and Jensen, 2003;
Hagger et al., 2005a). MMS modifies DNA via nucleotide alkylation through
DNA strand cleavage created at random in the genome (Schwartz and Kmiec,
2005). Cyclophosphamide (CP) (N.N-bis(2-chloroethyl) tetrahydro-2H-1,3,2-
oxphosphorin-2-amine, 2-oxide monohydrate), a chemotherapeutic and
immunosuppressive agent, acts as a neurotoxicant. (Hammer et al., 1994;
Rzeski et al.. 2004; Xiao et al., 2007; Perini et al.. 2008). This compound is
transformed by intracellular enzymes to active alkylating metabolites which
cross link with DNA strands (Anderson et al., 1995).
The production and use of pharmaceutically active compounds increase year by
year and the occurrence of pharmaceuticals (and their metabolites) in the
aquatic environment is of increasing concern (Bound and Voulvoulis, 2004).
Due to the incomplete removal of these pharmaceutical compounds by sewage
treatment works they are found in sewage waste waters, surface waters and
85
even in potable (drinking) water (Sacher et al. , 2001; Stackelberg et al., 2004;
Jones et al.. 2005). Cyclophosphamide is no exception to these trends. Once
administered to patients, CP and its metabolites are renally excreted in
substantial proportions, with up to 10 - 20 % being excreted unchanged
(Anderson et al., 1995; Buerge et al., 2006; Johnson et al., 2008). The active
compounds and metabolites which have poor degradability have been detected
in waste water (sewage) at concentrations up to 100 ng L'\- as a result there is
a growing environmental concern about CP both with respect to human and
ecosystem health (Steger-Hartmann et al.. 1997; Buerge et al., 2006; Johnson
et al., 2008). While CP has been used as a reference genotoxic agent for the
development of genotoxicity assays using embryo-larvae of the marine annelid,
Platynereis dumerilii (Jha et al., 1996), little further data exist for the impact of
this pharmaceutical on the marine organisms.
3.2 Materials and methods
3.2.1 Chemicals
All chemicals and reagents were of analytical grade and obtained from Sigma
Chemical Co., Poole, Dorset. UK. unless otherwise stated. Test chemicals were
methyl methanesulphonate (MMS; CAS number 66-27-3; purity 99 % ) and
cyclophosphamide monohydrate (CP; CAS number 6055-19-2; purity > 97 % ) .
As per the published information (e.g. Johnson et al., 2008;
http://dohs.ors.od.nih.gov), both MMS and CP are readily soluble in water at
room temperature (MMS 250 g L"^ CP up to 50 g L'^).
86

3.2.2 Species collection
Mytilus edulis (35 - 45 mm in length) were collected during March 2006 from
Port Quin (Latitude 50.35° N; Longitude 4.52° W). they were held in conditions
stated in Section 2.1.4. Asterias rubens were collected during March and April
2006 from in and around Plymouth Sound, Devon. UK (Latitude 50.20° N;
Longitude 4.10°W), using SCUBA divers and trawling. They were held in
conditions stated in Section 2.1.1.
3.2.3 Exposure to genotoxins and determination of MTC
The experimental design for the 7 d static exposures has been diagrammatically
represented in Figure 3 .1 . The exposure scenario for the two species differed
slightly in the sense that whilst RT for A. rubens was determined following 3, 5
and 7 d exposure period, cytotoxicity and genotoxicity in this species were
determined only after 5 and 7 d. In contrast, for M. edulis CR, cytotoxicity and
genotoxicily were determined following 3. 5 and 7 d exposure. The MMS
concentrations were selected based on the previous work on P. dumerilii {JUa et
al., 1996) and to mirror ethyl methanesulphonate (EMS: a closely related
alkylating agent), concentrations used in previous work using mussels (Jha et
al., 2005) and thereby the concentration range used ( i.e. 18, 32 and 56 mg L"")
incorporated the semi-logarithmic scale routinely used in ecotoxicity testing.
This range was replicated for the CP concentrations. The exposures were
carried out at 15 ± 0.2 °C and food was withheld. The exposure vessels were
individually aerated using Pasteur pipettes and were sealed with Parafilm^'^.
The vessels were checked daily for mortalities and the parameters of
temperature, salinity, dissolved oxygen and pH measured. In common with
regulatory mammalian genotoxicity criteria, maximum tolerated concentration
87

(MTC) for both the species was taken as being the concentration at which
mortalities occurred (Mackay, 1995).
88

(a)
00 CO
1 lb) f \ A. nibens individually exposed in 4 L
vessels (4 replicates per concentration)
V J
9 M. edulis in 1.8 L vessels (2 replicates)
\ y
t 1 After 3 days righting time determined
(4 A. rubens per concentration)
V J
/ N After 3, 5 & 7 days
(3 M.edulis sampled per replicate, therefore n = 6)
V J t 1 After 5 & 7 days righting time determined
(4 A. rubens per concentration)
V J
f \ Clearance rates determined
(6 M.edulis sampled per concentration)
\ J coelomocytes collected haemolymph collected
Neutral red, micronucleus & Comet assays carried out
(4 A. rubens per concentration)
V J
f \ Neutral red, micronucleus & Comet
assays carried out (6 M.edulis sampled per concentration)
V J
Fig. 3.1 Flow chart illustrating the integrated experimental design adopted In the studies to evaluate the behavioural (physiological),
cytotoxic and genotoxic effects of methyl methanesulphonate and cyclophosphamide in (a) Asterias rubens and (b) Mytilus edulis.
3.2.4 Determination of righting times (RT)
In order to assess the 'overall health' of the sea stars at the whole organism
level, the righting time (RT) of each animal was determined. The RTs of the sea
stars were determined prior to coelomocyte sample collection after 5 d and 7 d
(no cellular or sub-cellular assays were conducted following 3 d of the MMS or
CP exposures for the sea stars). Four sea stars per concentration were used.
The procedure for the RT assay was detailed in Section 2.10.
3.2.5 Determination clearance rate (CR)
As a surrogate for the RT assay in the sea stars, the clearance rates of the
mussels were determined after 3, 5 and 7 d (6 mussels per concentration). This
was carried out prior to haemolymph sample collection, as per the method
described in Section 2.9.1.
3.2.6 Collection of coelomocyte and haemocyte samples
Coelomic fluid and haemolymph were collected from the sea stars and mussels,
respectively, as detailed in Sections 2.2.1 and 2.2.2.1. Coelomic fluid was not
collected after 3 d of both sea star exposures as each individual was sampled
repealed during these studies. The coelomic fluid/ haemolymph samples were
held on ice until being used for cytotoxicity and genotoxicity assays. Samples
were thoroughly mixed by vortexing prior to use.
3.2.7 Determination of cellular membrane stability using NRR assay
The cellular membrane integrity of the coelomocytes and haemocytes were
assessed by the neutral red retention assay (NRR). The cell samples were in
triplicate for all individuals. This assay was carried out as per Section 2.3.
90
3.2.8 Determination of cytogenetic damage using Mn assay
T h e n u m b e r s of i nduced m ic ronuc le i ( M n ) in e a c h les t o r g a n i s m w e r e
d e t e r m i n e d w i th the Mn assay . T h e a s s a y w a s car r ied out as de ta i led in
Sec t i on 2.6. O n e s l ide w a s p r e p a r e d for e a c h o r g a n i s m a n d the s l ides w e r e
sco red a c c o r d i n g to the cr i ter ia d e s c r i b e d p rev ious l y (Ven ie r et a l . , 1997 ;
F e n e c h . 2 0 0 0 ; Jha et a l . , 2 0 0 5 ) .
3 .2 .9 Determination of DNA strand breaks using the Comet assay
Sing le s t rand D N A b reaks w e r e quan t i f i ed us ing the a lka l ine C o m e t a s s a y
( p r o c e d u r e is de ta i led in Sec t ion 2 .8) . T w o m ic roge ls per ind iv idua l w e r e
p r e p a r e d . A s requ i red as a p re requ is i te to ca r ry ing ou t the C o m e t assay , it w a s
n e c e s s a r y to d e t e r m i n e the ce l lu lar v iabi l i ty of the h a e m o c y t e s a n d
c o e l o m o c y t e s . Eos in Y d y e a n d a l ight m i c r o s c o p e w e r e used a s de ta i l ed in
Sec t i on 2.7 - on ly cel l s a m p l e s w i th a v iabi l i ty of > 70 % w e r e u s e d in the
C o m e t assay .
3.2.10 Statistical analysis
Stat is t ica l s ign i f i cance b e t w e e n m e a n s w a s d e t e r m i n e d us ing o n e - w a y ana lys i s
of v a r i a n c e ( A N O V A ) . All va lues a re p rov ided as m e a n s ± S E M . D i f f e rences
b e t w e e n m e a n s w h i c h w e r e P < 0 .05 w e r e c o n s i d e r e d s ign i f icant . Al l da ta se ts
w e r e a n a l y s e d us ing S ta tg raph i cs v5.1 so f twa re (Sta tSof t , U S A ) . A n y
co r re la t ions b e e n var iab les w e r e d e t e r m i n e d us ing the P e a r s o n co r re la t i on
coef f i c ien t .
91

3.3 Resul ts
3.3.7 Water quality parameters
W a t e r qual i ty p a r a m e t e r s de te rm ined be fo re a n d a f ter e x p o s u r e pe r iod w e r e in
the no rma l accep tab le range . T e m p e r a t u r e ranged f r o m 14.8 to 15.2 °C , sal in i ty
f rom 34 to 35 P S U , d isso lved o x y g e n leve ls r e m a i n e d a b o v e 70 % sa tu ra t ion
a n d p H f rom 8.0 to 8.2.
3 .3 .2 Determination of MTC
T h e cumu la t i ve mor ta l i t ies for bo th spec ies af ter e x p o s u r e to M M S a n d C P h a v e
b e e n s u m m a r i s e d in T a b l e 3 . 1 . For the M M S e x p o s u r e , the M T C s w e r e
32 m g L'^ a n d 18 m g L"* for M. edulis a n d A. rubens, respect ive ly . Fo l l ow ing C P
e x p o s u r e , the M T C for M. edulis w a s c o n s i d e r e d to be > 1 8 0 m g L"^ as no
mor ta l i ty w a s o b s e r v e d at this concen t ra t i on in m u s s e l s , c o m p a r e d to 56 m g L"^
for A. rubens.
92

Tab le 3.1
Percen tage survival for Asterias rubens and MytHus edulis fo l lowing 7 d exposure to cyc lophosphamide (Exper iment 1) and methy l
me thanesu lphona te (Exper iment 2) .
CD
Species
Exp. A rubens M. edulis
No. Treatment Survival (%) Treatment Survival (%)
(mg L- ) 3 d 5 d 7 d (mg L- ) 3 d 5 d 7 d
Exp. 1 SW Control 100 100 100 SW Control 100 100 100 C P - 18 100 100 100 CP - 18 100 100 100 C P - 3 2 100 100 100 C P - 3 2 100 100 100
CP - 56* 100 100 50 C P - 5 6 100 100 100 CP - 100 NT NT NT CP - 100 100 100 100
C P - 1 8 0 NT NT NT CP -180* 100 100 100
Exp. 2 SW Control 100 100 100 SW Control 100 100 100
MMS-18* 100 75 0 MMS - 18 100 100 100
M M S - 3 2 0 0 0 MIVIS-32* 100 100 50 M M S - 5 6 0 0 0 MMS - 56 100 50 17
* M T C deno ted by under l ined va lues; NT: not tes ted; SW: seawater

3.3.3 Biomarker responses following MMS exposures
3.3.3.1 A. rubens
Due to h igh mor ta l i t ies wh ich occu r red fo l low ing 5 d e x p o s u r e at 18 m g L'^ a n d
subsequen t l y at 3 d wi th h igher concen t ra t i ons ( i .e. 32 a n d 56 m g L ' \ T a b l e
3.1) , l imi ted b iomarke r s tud ies cou ld be p e r f o r m e d . T h e t ime t a k e n for the
an ima ls to r ight s h o w e d a s ign i f icant i nc rease b e t w e e n the cont ro l a n d
18 m g L'^ for 3 and 5 d ( P < 0 .05) . T h e cont ro l t imes w e r e 124 ± 8 s for bo th
days , c o m p a r e d to 223 ± 7 s and 365 ± 30 s, respec t i ve ly for 18 m g L"V
C o m p a r e d to sea wa te r ( S W ) cont ro ls , the m e a s u r e m e n t of cy to tox ic i ty a s
de te rm ined by the N R R a s s a y s h o w e d n o ef fect ( P = 0 .962) . Wh i l s t the N R R
assay s h o w e d no e f fec ts , bo th the Mn a n d C o m e t a s s a y s d e m o n s t r a t e d a
s igni f icant d i f f e rence b e t w e e n contro l va lues a n d at 18 m g L'^ a f te r 5 d (F i g .
3.2) . Mn fo rma t ion w a s i nduced fo l lowing 5 d e x p o s u r e at 18 m g L" \ 13.7 ± 3.5
c o m p a r e d to 5.8 ± 0.9 for the cont ro ls . T h e pauc i t y of b i omarke r da ta (as a
resul t of the h igh d e g r e e o f mor ta l i t ies) m e a n t that It w a s not poss ib le to
de te rm ine any cor re la t ions for this e x p o s u r e .
3.3.3.2 M. edulis
In c o m m o n w i th A. rubens, wh i le n o cy to tox ic e f fec ts (as d e t e r m i n e d by N R R
assay ) w e r e o b s e r v e d c o m p a r e d to con t ro ls , the c l e a r a n c e rate ( C R ) , Induct ion
of Mn and D N A s t rand b reaks ( i .e . C o m e t a s s a y ) s h o w e d a s ign i f icant
d i f fe rence on al l samp l i ng d a y s ac ross all e x p o s u r e concen t ra t i ons (F i g . 3.3) . A s
i l lustrated in F igure 3.4, the re w e r e re lat ive ly s t rong cor re la t ions b e t w e e n C R
and Mn (R = -0 .690 , P = 0 .013 ) a n d b e t w e e n C R a n d % tail D N A (R = -0 .728 .
P = 0 .007) . Fu r the rmore , the re w a s a lso a s t rong cor re la t ion b e t w e e n M n
94
Induct ion and D N A s t rand b reaks ( i .e. % tall D N A ) , a s de tec ted by the C o m e t
a s s a y ( P < 0 . 0 0 1 . R = 0.988).
95

to
250
200
CD
I 150
• | 100 ? ir
Q.
C
o o •o c
50
0
25
20
15
10
Day 3 Day 5 Day 7
IIMR.M_M[V1IV1 M Control 18 32 56
MMS concentration (mg L"')
KL
T-
M MMM. Control 18 32 56
MMS concentration (mg L' )
1.2
Q 0.8
0.6 E S 0.4
- Q 0) O U ^ 0.2
0.0
35
30
25
< Q 20 CO
15
10
5
0
M MMM. Control 18 32 56
MMS concentration (mg L'')
1
KL mi M MMJy MMM Control 18 32 56
MMS concentration (mg L"^)
Fig. 3.2 Behav ioura l (physio logical ) , cytotoxic and genotox ic ef fects In Asterias rubens exposed to M M S for 3. 5 and 7 d. Concent ra t ions are expressed as mg L'V The va lues are means ± S E M . * indicates a signi f icant d i f ference f rom contro ls at, or above , the 95 % conf idence level. NT, not tested; M, 100 % mortal i ty; NR, an imal fai led to right fo l lowing 3 x 600 s a t tempts .
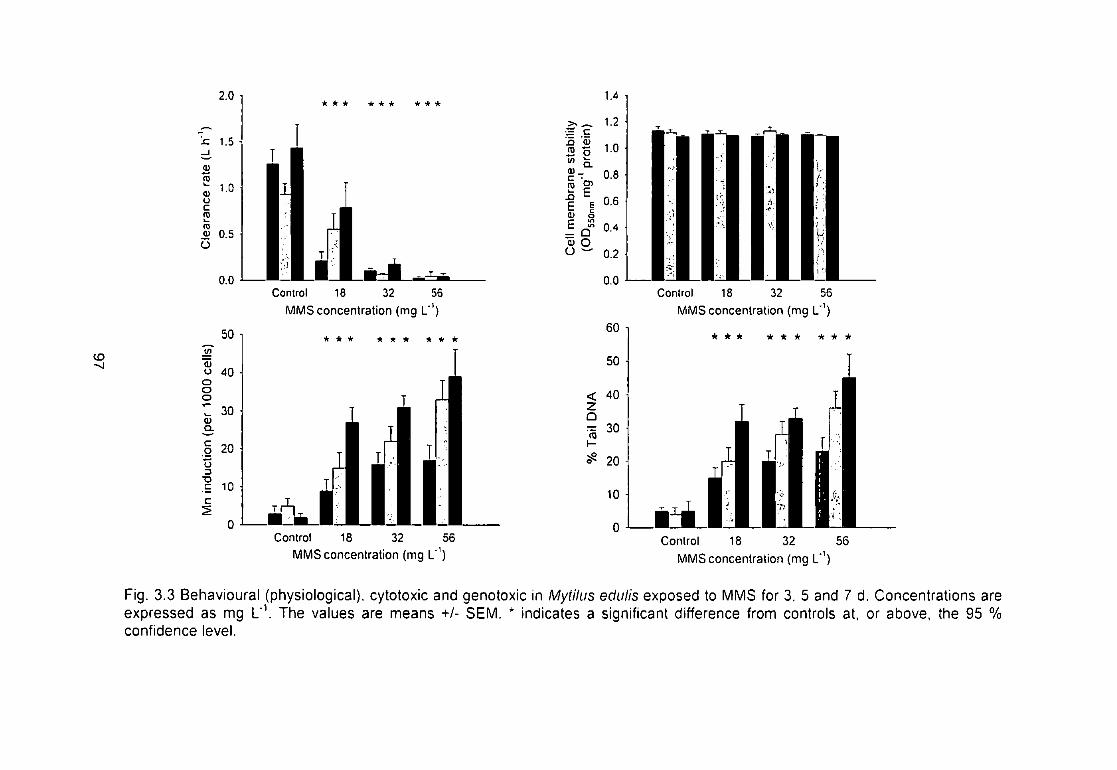
CD
<u 0.5
50
"53 o 40 o o o i_ 30 Q) Q.
ion 20
o 3
•D 10 _C 10
C
Control 32 56 MMS concentration (mg L )
* * • * * -k
Control MMS concentration (mg L ' )
60
50
< 40 Z Q ^ 30 I -
20
10
0
Control MMS concentration {mg L' )
* * * * * * * * *
Control MMS concentration (mg L
Fig. 3.3 Behav ioura l (physio logical ) , cytotoxic and genotox ic in Mytilus edulis exposed to M M S for 3. 5 and 7 d. Concent ra t ions are exp ressed as mg l ' \ The values are means +/- S E M . * indicates a signif icant d i f ference f rom controls at, or above, the 95 % conf idence level.
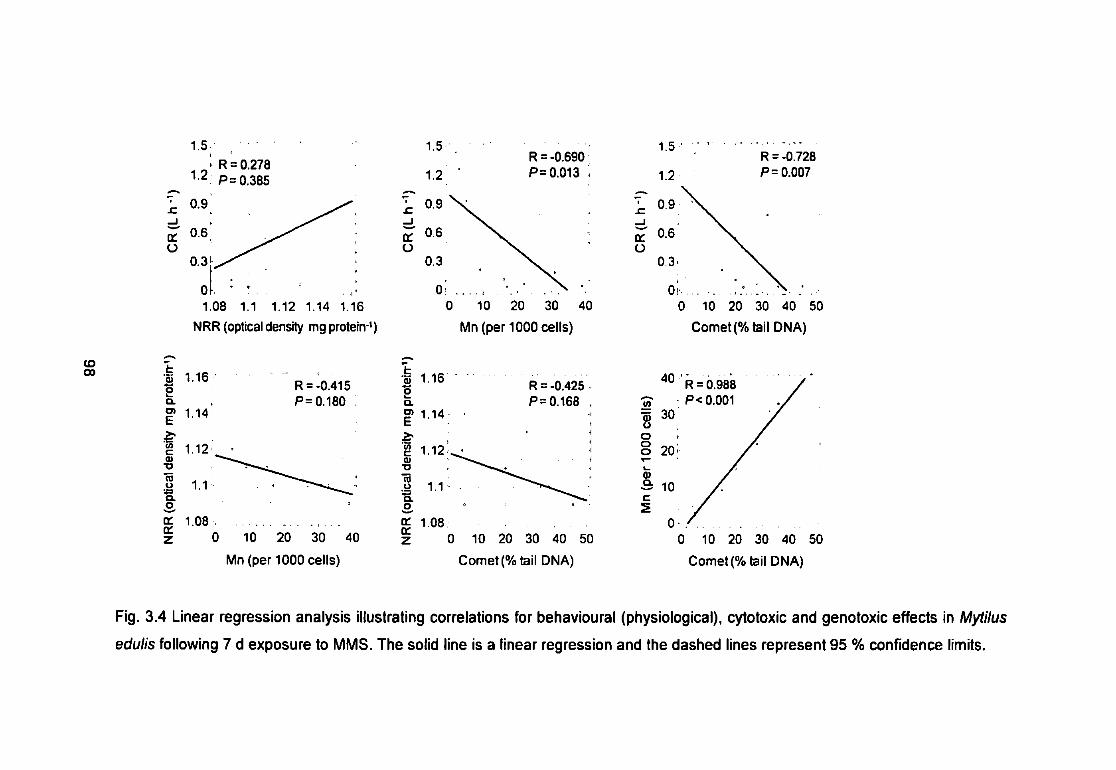
1.5
1.2 • R = 0.278
P= 0.385
1.08 1.1 1.12 1.14 1.16 NRR (optical density mg protein- )
R =-0.690 P= 0.013
o
0 10 20 30 40
Mn (per 1000 cells)
o
R =-0.728 P= 0.007
10 20 30 40 50
Comet(%tailDNA)
CD 00
c 0)
m u
z
1.16
1.14
1.12
1.1
1.08
R =-0.415 P= 0.180
10 20 30 40
Mn (per 1000 cells)
R = -0.425 P = 0.168 .
0 10 20 30 40 50
Comet (% tail DNA)
R = 0.988 ^ P< 0.001 =S 30
o 20
0 10 20 30 40 50
Comet(% tail DNA)
Fig. 3.4 Linear regression analysis illustrating correlations for behavioural (physiological), cytotoxic and genotoxic effects in Mytilus
edulis following 7 d exposure to MMS. The solid line is a linear regression and the dashed lines represent 95 % confidence limits.
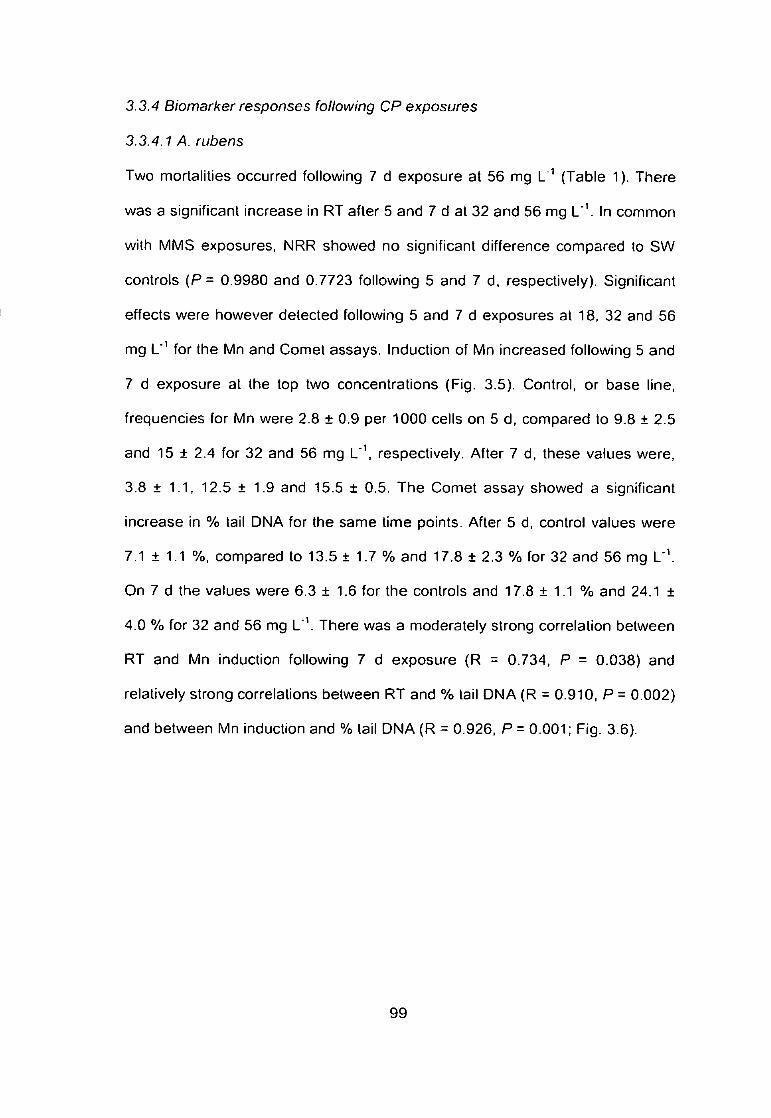
3.3 .^ Biomarker responses following CP exposures
3.3.4.1 A. rubens
T w o mor ta l i t ies occu r red fo l low ing 7 d e x p o s u r e at 56 m g L" (Tab le 1). T h e r e
w a s a s ign i f icant i nc rease in RT af ter 5 a n d 7 d at 32 a n d 56 m g L*V In c o m m o n
w i th M M S e x p o s u r e s . N R R s h o w e d n o s ign i f icant d i f f e rence c o m p a r e d to S W
con t ro ls ( P = 0 .9980 a n d 0 .7723 fo l l ow ing 5 a n d 7 d . respec t i ve ly ) . S ign i f i cant
e f fec ts w e r e h o w e v e r de tec ted fo l low ing 5 a n d 7 d e x p o s u r e s at 18, 32 and 56
m g L"^ for the Mn a n d C o m e t assays . Induc t ion of M n inc reased fo l l ow ing 5 a n d
7 d e x p o s u r e at the top two concen t ra t i ons (F ig . 3 .5) . Cont ro l , or base l ine,
f r equenc ies for M n w e r e 2.8 ± 0.9 per 1000 cel ls o n 5 d . c o m p a r e d to 9.8 + 2.5
and 15 + 2.4 for 32 and 56 m g L ' \ respec t i ve ly . A f te r 7 d , these va lues w e r e ,
3.8 ± 1 .1 , 12.5 ± 1.9 and 15.5 ± 0.5. T h e C o m e t a s s a y s h o w e d a s ign i f icant
i nc rease in % tail D N A for the s a m e t ime po in ts . Af ter 5 d , cont ro l va lues w e r e
7.1 ± 1.1 %, c o m p a r e d to 13.5 ± 1.7 % a n d 17.8 ± 2.3 % for 32 a n d 5 6 m g L'\
O n 7 d the va lues w e r e 6.3 ± 1.6 for t he cont ro ls a n d 17.8 ± 1.1 % a n d 24.1 ±
4 .0 % for 32 a n d 56 m g L" \ The re w a s a m o d e r a t e l y s t rong cor re la t ion b e t w e e n
R T a n d M n induc t ion fo l low ing 7 d e x p o s u r e (R = 0 .734 , P = 0 .038 ) a n d
re la t ive ly s t r ong cor re la t ions b e t w e e n R T a n d % tail D N A (R = 0 .910 . P = 0 .002 )
a n d b e t w e e n M n induc t ion a n d % tail D N A (R = 0 .926 , P = 0 . 0 0 1 ; F ig . 3.6) .
9 9
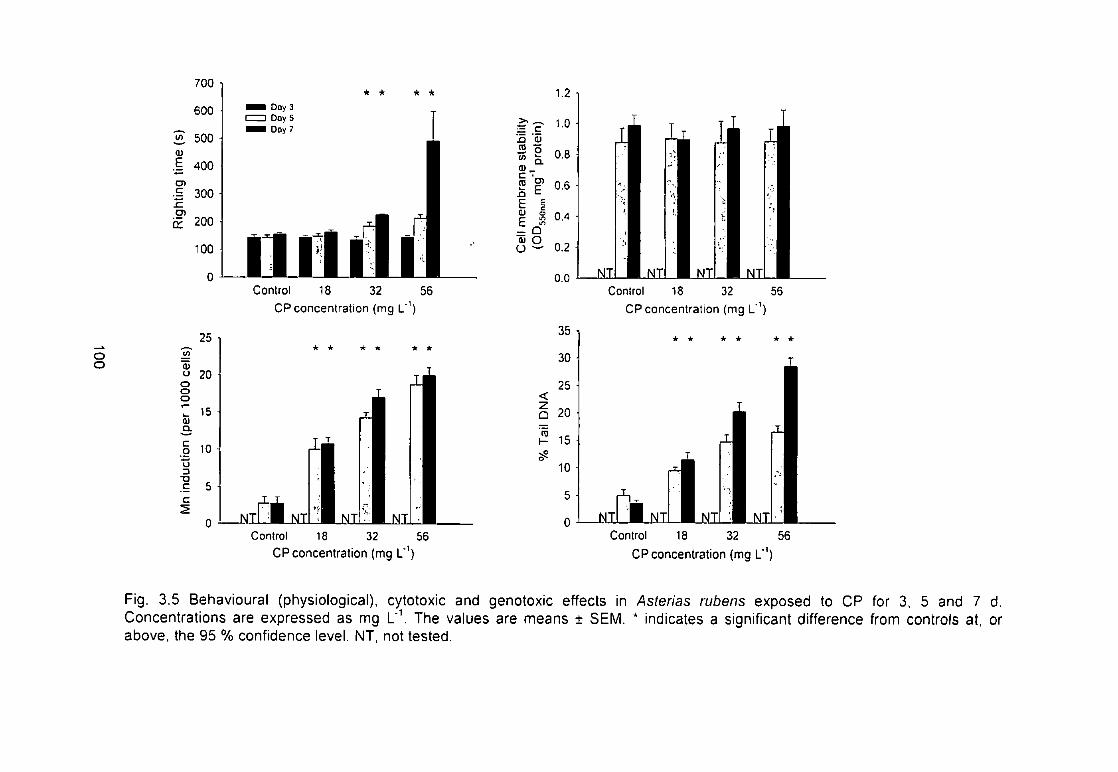
o o
w 500
Control CP concentration (mg L' )
<J 20
Control 18 32 56 CP concentration (mg L"')
Control 18 32 56 CP concentration {mg L'^)
Control 18 32 56
CP concentration (mg L'')
Fig. 3.5 Behav ioura l (physio logical ) , cytotoxic and genotox ic ef fects in Asterias rubens exposed to C P for 3, 5 and 7 d. Concent ra t ions are expressed as mg L'V The values are means ± S E M . * indicates a signif icant d i f ference f rom controls at, or above , the 95 % conf idence level. NT, not tested.
^ 200
0.8 0.9 1 1.1 1.2 NRR (opticaldensity rngprotein-^)
fc
E
t
1.2
1.1
0.9
0.110 0.795
0.81- , 0 5 10 15 20
Mn (per 1000 cells)
0.663 P= 0.073
cr 200
0 5 10 15 20 Mn (per 1000 celts)
fc
Q. O)
E
•t I 15 OC z
1.2
1.1
1
0.9
0.8[
R = 0.331 P= 0.424
0 5 10 15 20 25 30 Connet(%tail DNA)
R = 0.866 P= 0.005
^ 300
^ 200
0 5 10 15 20 25 30 Cometf% tail DNA)
R = 0.926 P= 0.001
0 5 10 15 20 25 30 Comet (% tail DNA)
Fig. 3.6 Linear regression analysis illustrating correlations for behavioural (physiological), cytotoxic and genotoxic effects in Asterias
rubens following 7d exposure to C P . The solid line is a linear regression and the dashed lines represent 95 % confidence limits.
3.3.4.2 M. edulis
N o mor ta l i t ies occu r red e v e n at the h ighes t concen t ra t i on of 180 m g L"^
(Tab le 1). In cont rast to M M S e x p o s u r e s , the C R a n d N R R a s s a y s s h o w e d no
ef fect ac ross all e x p o s u r e concen t ra t i ons and du ra t i ons (F ig . 3 .7) . T h e r e w a s .
howeve r , a s igni f icant d o s e a n d t i m e - d e p e n d e n t Inc rease for t he induc t ion of
M n a n d D N A s t rand b reaks (F ig . 3.7) . In add i t i on , t he re w a s a s t r ong cor re la t ion
b e t w e e n Mn Induct ion a n d D N A s t rand b reaks , as de tec ted by the C o m e t a s s a y
( P < 0 . 0 0 1 . R = 0 .788) (F ig . 3 .8) .
102

o
2.0
1.5
1.0
O 0.5
0.0 Control 18 32 56 100 180
CP concentration (mg L'')
it * -k ^, 1, * * * * * * * * * * 20
Control 18 32 56 100 180
CP concentration (mg L"')
!Q (1) i5 o « a
m 5
Q) O
1.4
1.2
1.0
0.8
0.6
0.4
0.2
0.0
60
50
40
30
20
10
0
i . ^ m 1 m,A L j . l.d
Control 18 32 56 100 180
CP concentration {mg L"^)
* * * * * * * * * * * * * * *
Control 18 32 56 100 180
CP concentration (mg L'')
Fig. 3.7 Behav ioura l (physio logical ) , cytotoxic and genotoxic ef fects in Mytilus edulis exposed to CP for 3, 5 and 7 d at 15 ± 0.2 °C. Concen t ra t ions are exp ressed as mg L'V The values are means ± S E M . * indicates a signif icant d i f ference f rom contro ls at, or above , the 95 % conf idence level.

R = -0.381 P=0.119
0 9 08 0.9 1 1.1 1.2
NRR (optical density mg protein- )
1.4
1-3|
1.2;
1-1'
1;
0.9:
R = 0.100 P = 0.693
0 3 6 9 12 15 Mn (per 1000 cells)
1.4
1.3
1.2
1.1
1
0.9
R = 0.220 P= 0.380 .
10 20 30 40 Comet (% tail DNA)
o 4:
•ffi 1.2,
E 1.T
I 0.9
DC 0.8
i 0
R =-0.371 P= 0.129
3 6 9 12 15 Mn (per 1000 cells)
R =-0.342 P= 0.165
0 10 20 30 40 Comet(% tail DNA)
R = 0.900 ^ 1 2 ^*=0001 8 .
10 20 30 40
Comet (% tail DNA)
Fig. 3.8 Linear regression analysis illustrating correlations for behavioural (physiological), cytotoxic and genotoxic effects in Mytilus
edulis following 7d exposure to C P . The solid line is a linear regression and the dashed lines represent 95 % confidence limits.

3.4 D i s c u s s i o n
T o da te the use fu lness of behav iou ra l (phys io log ica l ) b i o m a r k e r s in
eco tox ico log ica l s tud ies have not b e e n ful ly d e t e r m i n e d . A n a t tempt w a s m a d e
to inves t iga te the s ign i f i cance of two c o m m o n l y u s e d behav iou ra l a n d
phys io log ica l r e s p o n s e s In e c h i n o d e r m s and b iva lve mo l l uscs ( i .e. r igh t ing
behav iou r a n d c lea rance rate, respec t i ve ly ) . L imi ted s tud ies have d e m o n s t r a t e d
that these r e s p o n s e s a re in f luenced in a concen t ra t i on a n d e x p o s u r e
t i m e - d e p e n d e n t m a n n e r us ing a range of chem ica l c o n t a m i n a n t s . T h e r ight ing
response of the sea urch in Paracentrotus lividus w a s impa i red fo l low ing top ica l
e x p o s u r e to c rude oil (Axiak a n d Sa l iba . 1981) and the ant i -paras i t i c a g e n t
i ve rmec t in d id the s a m e to A. rubens (Dav ies et a l . . 1998) . T h e P A H s
b e n z o ( a ) p y r e n e a n d f l uo ran thene ( E e r t m a n et a l . , 1995) and a l k y l b e n z e n e s
(Scar le t t et a l . , 2 0 0 8 ) r educed the c l ea rance rate of M. edulis. Broad ly , wh i ls t
r ight ing behav iou r w a s a f fec ted fo l low ing lowes t concen t ra t i on of M M S ( in the
surv iv ing o r g a n i s m s ) a n d at the two h ighes t concen t ra t i ons of C P u s e d , the
c l ea rance ra te w a s a f fec ted on ly by M M S e x p o s u r e (at all the c o n c e n t r a t i o n s )
and not by a n y concen t ra t i on of C P u s e d .
It has to be e m p h a s i z e d that a d i rec t c o m p a r i s o n of t hese two behav iou ra l or
phys io log ica l r e s p o n s e s wi th d ive rse m e c h a n i s m s (and p u r p o s e ) in
phy logene t i ca l l y d i f ferent g r o u p s of o r g a n i s m s (one f ree l iv ing, the o ther sess i le )
is not log ica l . B a s e d o n th is s tudy , it a p p e a r s however that in g e n e r a l a d i rect
ac t ing g e n o t o x i n (i.e. M M S ) has a m o r e p r o n o u n c e d e f fec t at the w h o l e
o r g a n i s m level in bo th spec ies . Th is w a s a lso very we l l co r re la ted w i th the
mor ta l i ty ra te of the o r g a n i s m s , espec ia l l y in A. rubens, fo l low ing M M S
105
exposu re . Th is is very ev iden t w h e n the M T C v a l u e s of the two spec ies a r e
c o m p a r e d ( M M S : 1 8 m g L " a n d 32 m g L '^ C P 56 m g L"^ and > 1 8 0 m g L" for
A. rubens a n d M. edulis. respec t i ve ly ) .
T h e te rm M T C is s y n o n y m o u s w i th the te rm m a x i m u m to lera ted d o s e ( M T D )
used in the a rena of m a m m a l i a n tox ico logy. T h e c o n c e p t of M T C is bet ter su i ted
for use aquat ic tox ico logy t han M T D , as c h e m i c a l e x p o s u r e o c c u r s t h r o u g h
i m m e r s i o n in mos t aqua t i c tox ico logy s tud ies ( H u t c h i n s o n et a l . , 2 0 0 9 ) . G i ven
the relat ive impo r tance g i ven to the d e t e r m i n a t i o n of M T D in m a m m a l i a n
tox ico logy, it is surpr is ing to no te that he re has b e e n little work in the field o f
aqua t i c tox ico logy that has ut i l ised the M T C c o n c e p t ( Jha et a l . . 2 0 0 0 b ) . S o m e
s tud ies have adop ted the pr inc ipal (for e x a m p l e : ( J h a et a l . . 2 0 0 0 a ; Jha et a l . ,
2 0 0 0 b ; Hagge r et a l . . 2002 ; W in te r et a l . . 2 0 0 8 ) ) a n d these p resen t s tud ies
a t t emp ted to add ress this i ssue further.
T h e concep t of M T D w a s f i rst a d o p t e d in the ear ly 1970s in m a m m a l i a n
carc inogen ic i t y s tud ies and s ince this t ime there h a s b e e n d i s a g r e e m e n t on t he
exac t def in i t ion of the te rm (Buck ley a n d Dora to . 2 0 0 9 ) . T h e endpo in t for M T C
de te rm ina t i on in these s tud ies w a s a n i m a l mor ta l i t y . O the r au tho r s h a v e
s u g g e s t e d d i f fe rent endpo in t s for the de te rm ina t i on of M T D v a l u e s , such a s
b o d y we igh t a n d h i s topa tho logy (Fo ran , 1997) , but t h e s e e n d p o i n t s , a l t h o u g h
su i tab le for m a m m a l i a n in vivo s tud ies w e r e not su i tab le for this b o d y o f wo rk .
T h e b iomarke r techn iques u s e d w e r e of a non -des t ruc t i ve na tu re , the re fo re
h is topa tho logy cou ld not have been car r ied out , a n d the re lat ive ly sho r t du ra t ion
of t hese s tud ies wou ld have m e a n t that any we igh t loss and h i s topa tho log ica l
c h a n g e s in the test o r g a n i s m s w o u l d h a v e b e e n neg l ig ib le . It has b e e n
106

suggested that when assessing the genotoxicity of substances to aquatic
invertebrates behavioural, physiological, developmental and morphological
endpoints may be used to determine MTC (Jha et al.. 2000a). Although the
work presented here used the endpoint of mortality to determine MTC, the
results of the studies show that it would be more appropriate in future work to
use the behavioural (physiological) endpoints utilised here with echinoderms
and molluscs (RT and CR, respectively) when determining MTC in these two
lest organisms.
Cyclophosphamide, being an indirect acting genotoxin (as mentioned in Section
3.1). requires metabolic activation (which is enzyme dependent) prior to causing
a toxic effect. Figure 3.9 shows the metabolic pathway, and associated
metabolites, of CP in a model vertebrate system. Carboxyphosphamide is
formed by the oxidation of CP. which leads to the formation of nornitrogen (a
potent alkylating agent). The second pathway shown in Figure 3.9 leads to the
production of acrolein and phosphoramide mustard (PAM). The latter, PAM. is
the main cytotoxic metabolite of CP and it is responsible for the antineoplastic
(tumour suppressing) activity of CP (Anderson et al.. 1995). Acrolein (an
aldehyde which is ubiquitous in the environment) is believed to be involved in
the toxic side-effects of the medicinal use of CP (McCarroll et al., 2008). Studies
which have found acrolein to be mutagenic and/ or carcinogenic include: The
v79 assay using Chinese Hamster cells found that acrolein had mutagenic
properties (Smith et al., 1990) and dietary exposure of acrolein to adult rats
revealed that it initiated carcinogenesis in the bladder of rodents (Cohen et al.,
1992). Despite these findings, it is thought this metabolite is not itself a
mutagen, but it contributes to the carcinogenic properties of the parent
107
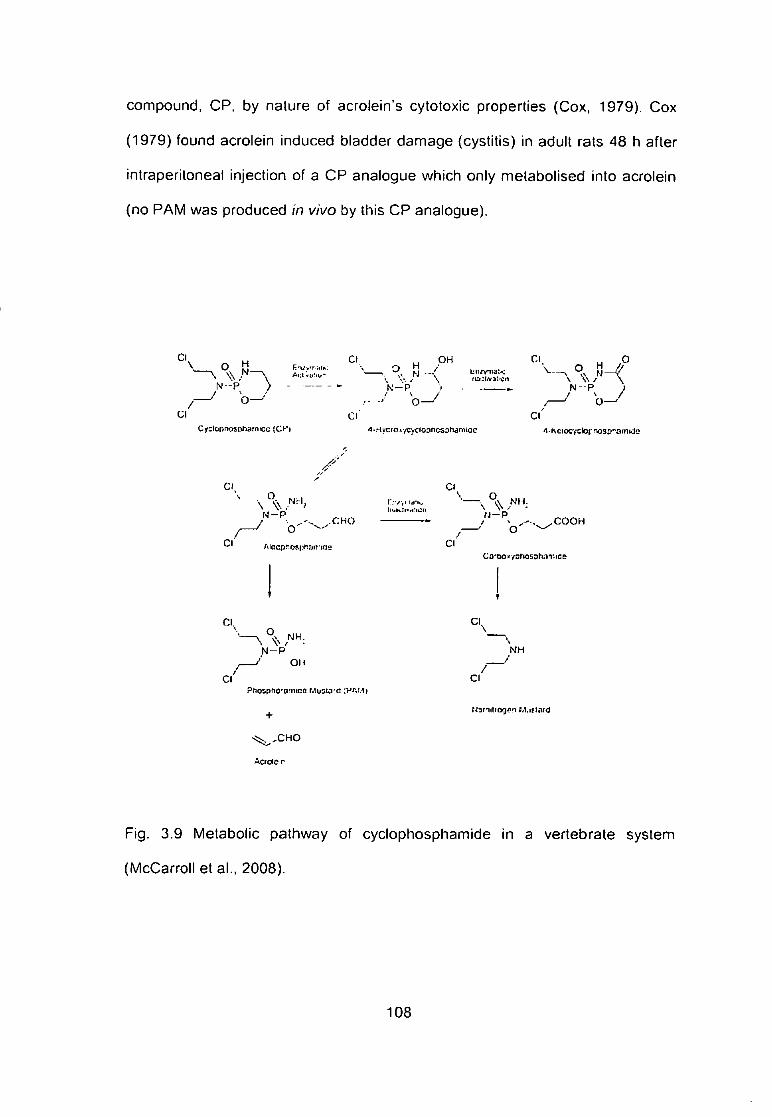
compound. CP, by nature of acrolein's cytotoxic properties (Cox, 1979). Cox
(1979) found acrolein Induced bladder damage (cystitis) in adult rats 48 h after
intraperitoneal injection of a CP analogue which only metabolised into acrolein
(no PAM was produced in vivo by this CP analogue).
Cl
N-^P >
Cl ^ OH Cl.
M fciwv'nat.c V
N - P . • N - P
O — Cl Cl Cl
Cydo(>r>ospnamicc (C^"t i.Hycio.yc>rtODftcsDl«nnioc 1-Kcioci-clcr^ospramKJc
Cl
N - P .CHO
a
Cl.
Cl
N - P
NH.
o n
Phospttca^iice Musia-a :H*.M|
+
^ , C H O
Cl
r . - / > i id :n , li>.>>.ti<>i!ii:i> N — P
) ^ ,COOH , ' o ^
Cl CnrDoxyshosshn'i-.iee
Cl.
NH
Cl
Fig. 3.9 Metabolic pathway of cyclophosphamide in a vertebrate system
(McCarroll e l a l . , 2008).
108

Cyclophosphamide was found to be more toxic at the individual level (as
detected by behavioural or physiological assays) in the echinoderm lest
organism compared to the mollusc. Given that CP requires metabolic activation,
this v^ould suggest that A. rubens has a better, or more efficient, mixed function
oxygenase system compared to that of M. edulis. Given the echinoderms close
evolutionary proximity to the vertebrates (Adoutte et al., 2000; Sodergren et al.,
2006; ECETOC. 2007) it could be expected that sea stars would have a more
efficient enzyme system with which to metabolise xenobiotics into reactive
electrophilic substances compared with that of the mussel. Therefore, toxicity al
the organism level would be more evident in A. rubens following exposure to a
compound such as CP.
While behavioural (or physiological) and genotoxic responses in both the
organisms showed significant effects, cytotoxicity was not found to be induced.
In this context, cellular membrane stability (as measured by NRR assay) in
haemocytes of M. edulis has been found to be significantly correlated with the
Comet response following exposure to Iribulyltin (TBT) under laboratory
conditions (Hagger el al., 2005b) and complex organics under field studies
(Rank el al., 2007). While comparing the relative sensitivity of mussels
(M. edulis) and fish (the Corkwing wrasse, Sympfiodus melops) following
exposure to styrene, it has also been shown that the sensitivity of haemocyles
is greater than peripheral erythrocytes of fish and destabillsatlon of the
lysosomal membrane is significantly associated with the Comet response
(Mamaca et al., 2005). The apparent lack of response for NRR assay in the
present study could be attributed to several factors. It should be noted that the
NRR assay technique used in the present study differs from the technique used
109

in these previous studies. The NRR technique utilised in this study determined
the total membrane stability of the cells (coelomocytes or haemocytes) through
the uptake of NR dye. This technique has been successfully used by many
authors (Olabarrieta et al., 2001 ; Gomez-Mendikute et al., 2002; Asensio et al.,
2007; Canty et al., 2007; Scarlett et al.. 2008; Hannam el al., 2009b) on a range
of cell types. Other authors (like those discussed here) have simply used NRR
uptake to determine the membrane stability solely of the cellular lysosomes.
Therefore caution has to be advised when comparing and contrasting these
NRR assay results as the techniques differ.
Both the genoloxic agents were able to induce genetic damage in the test
organisms, with A. rubens being more sensitive than M. edulis. In line with the
general observations that lower levels of organisation require less dose or
concentration to produce a biological response (Jha, 2008), the effects of two
genotoxins were more apparent at the DNA level. There is a paucity of
published data regarding the effects of genotoxins on echinoderms, but there is
a suite of previous studies which have investigated the effects of these
genotoxins on bivalve molluscs {e.g. M. edulis). Exposure to MMS led to
induction of cytogenetic damage (i.e. sister chromatid exchanges (SCEs) and
chromosomal aberrations (Cabs)) in embryo-larvae of mussels (Jha et al.,
2000a; Hagger et al., 2005a). The Comet assay has also been used to
determine the genotoxicity of MMS to gill cells and haemocytes in M. edulis
(Rank and Jensen, 2003) following exposures (up to 33 mg L*^) for 4 d. The
study suggested haemocytes were more sensitive than gill cells, with highest
level of damage recorded (25 to 30 % tail DNA), being comparable to the
results in these studies. Rank and Jensen (2003) however did not observe a
110

dose-response; in fact they noted a surprisingly low level of genoloxic damage
at the higher exposure levels and hypothesised that this may be due to high
concentration interfering with the processes which lead to DNA damage. In
annelids. MMS exposure to Platynereis dumerHii embryos also induced a clear
dose-response relationship for cytogenetic damage (i.e. SCEs and Cabs) at a
concentration range of 3.5 to 110 mg L" (Jha et al., 1996).
Despite being an environmentally relevant contaminant, there has been only
limited study pertaining to CP induced toxicity and genotoxicity in aquatic
organisms. CP exposure to P. dumerilii embryos induced a clear dose-response
relationship for the induction of cytogenetic damage (SCEs and Cabs) at a
concentration range of 9 - 28 mg L" (Jha et al., 1996). In addition, limited
studies using fish have suggested that intraperitoneal injections of CP to the
fathead minnow, Pimephales promelas, of up to 400 mg kg'^ failed to
significantly enhance the frequency of Mn in erythrocytes sampled from
peripheral blood and spleen samples, despite this dose being the MTC for the
species (Winter et al., 2007). Rodriguez-Cea (2003) exposed three species of
fish under in vivo conditions to CP at 25 and 50 mg L" for 72 h. The Mn assay
showed the trout to be the most sensitive of the species, followed by the
minnow, but the eel was not sensitive to the compound. Since early life stages
of the aquatic organisms are considered to be more sensitive, this may have
been due to the age of the lest organisms, given that both the trout and
minnows were juveniles, whereas the eels were immature adults (Rodriguez-
Cea et al., 2003). Unlike the current study, however, no dose-dependent effect
was observed in the sensitive species. While evaluating relative sensitivity of
fish and mammals, following an intraperitoneal injection of 20 mg kg"^ (the MTC)
111

of CP in Tilapia rendalli, and of 30 mg kg ' into the Swiss Mouse, there was a
significant increase in Mn induction (Grisolia, 2002). In this context, it has been
shown that compared to mussels (M. edulis), sea urchins (Strongylocentrotus
droebachiensis) are more sensitive to the induction of DNA strand breaks
following exposure to crude oil (Taban et al., 2004).
Except for the preliminary study by Taban et al. (2004) with adult sea urchins
and bivalves, and several studies using embryo-larval of sea urchins and
mussels (Pagano et al., 1996; His et al., 1999; Bellas et al. . 2005) there has
been no other study in which the relative sensitivity of adult echinoderms have
been concurrently compared at different levels of biological organisation, under
similar experimental conditions with any other organism. Taking into account
available information and comparing the results obtained in the present study
showing induction of genetic damage at relatively lower concentrations
(compared to concentrations required for adult life stages of fish and mice), it
could be suggested that echinoderms are relatively more sensitive than bivalve
molluscs. Furthermore, because of their close phylogenetic relationship, they
could serve as a potential substitute for other aquatic vertebrates (e.g. fish) for
toxicological studies.
This study suggested strong correlations between induction of DNA strand
breaks and the cytogenetic damage in both organisms. This is in line with other
studies where strong correlations between these two genotoxic parameters
have been demonstrated in fish, molluscs and mammalian cells both under in
vitro and in vivo conditions (Raisuddin and Jha, 2004; Nagger et al., 2005b; Jha
et al., 2005; Villela et al., 2007). For example, positive correlations were found
112

for the induction of Mn and percentage tail DNA as detected by the Comet
assay in Chinese Hamster ovary (CHO) cells and rainbow trout gonad cells
following exposure to sodium arsenate and arsenite (Raisuddin and Jha, 2004);
in adult M. edulis following TBT exposure (Hagger et al., 2005b) and in the
golden mussel, Limnoperna fortunei following exposure to contaminated field-
collected water samples (Villela et al., 2006).
In some studies targeting the erythrocytes of fish (which have some inherent
limitations as mentioned earlier) however, such correlations have not been
found (Belpaeme el al., 1996; Chang et al., 2005). Interestingly, the genoloxic
responses also showed good correlations with behavioural or physiological
responses in both the organisms. II is however to be remembered that
genotoxic responses were determined in coelomocytes and haemocytes of the
organisms (i.e. at the cellular level), whereas the behavioural responses were
measured al the whole organism level. Given the open vascular system of the
organisms, it could be assumed thai other target cells could be affected (either
directly or indirectly) leading to changes at the whole organism level.
The use of coelomocytes and haemocytes could be considered analogous to
the situation in mammalian or human health arena where use of surrogate cells
(e.g. lymphocytes and bone marrow cells) are widely used to evaluate the toxic
potential of environmental contaminants which could lead to adverse health
consequences at the whole organism or individual level. In this context,
although in this study, as previously mentioned, a cytotoxic effect was not
observed, a correlation between cytotoxic effect and genotoxic effect (as
113
determined by Mn assay) In different cell types (I.e. digestive gland and gill
cells) of mussels has been found (Kalpaxis et a!., 2004).
Given that behavioural effects could be directly controlled by the nervous
system, it is now emerging that neurotoxicity has become a frequent effect of
genotoxic and chemotherapeutic agents. Cyclophosphamide and other
chemotherapeutic agents (cisplatin, methotrexate, vinblastin and Ihlotepa) were
found to be neurotoxic both in vitro and in vivo (RzeskI et al., 2004). In vitro
exposure of these agents to rat neurons resulted in a concentration-dependent
neurotoxic effect. In vivo exposure, using juvenile rats (via intraperitoneal
injection), caused an array of brain lesions less than 24 h after injection of the
lest compounds (Rzeski et al., 2004). The genotoxins methylazoxymethanol
and nitrogen mustard induced reduced cellular viability and increased DNA
damage in nerve cells (granule and astrocyte cells) prepared from the cerebella
of young mice (Kisby et al.. 2006). Maternal injection of CP has been found to
Induce neuronal apoplosis and DNA damage In developing rat embryos (Xiao et
al.. 2007).
Echinoderms, as with mammals, have the ability to synthesize, store and
release neurotransmitters (e.g. acetylcholine, serotonin, dopamine etc.) and
possess homologous populations of receptors and their downstream signalling
cascades (Buznikov et al., 1970; Guslafson and Toneby, 1970; Buznikov et al.,
2007). It Is therefore not surprising that in addition to genotoxic responses, the
agents used in the present study also induced behavioural and physiological
responses, with the echinoderms being more sensitive than the molluscs. Given
that approximately one third of all industrial discharges could be genotoxic
114
(Claxton et al., 1998) and taking into account the vast amount of anthropogenic
discharges reaching the hydrosphere, ecotoxicological consequences of these
contaminants could be immense.
In addition to being neurotoxic, genotoxins can also act as cytotoxic,
immunotoxic and endocrine disrupting agents (Jha, 2008). For instance, TBT
exposure to P. dumerilii embryo-larvae resulted not only in a genotoxic effect
(as measured by SCEs and Cabs), but also a cytotoxic effect (proliferative index
(PRI)) (Hagger et al., 2002). In the human health arena, exposure to
environmental agents including genotoxins have been correlated to
developmental disorders (e.g. learning disabilities, attention deficit disorder) in
which interaction between environmental factors and genetic susceptibility play
an important role (Branum et al., 2003; Landrigan et al., 2004).
To conclude, whilst validating and employing a range of non-destructive
biomarkers at different levels of biological organisation, the relative sensitivities
of two ecologically relevant marine invertebrates have been evaluated. While a
small number of studies are available in literature where a range of biological
responses have been evaluated in a single species (e.g. Regoli et al., 2004),
there is a paucity of information available in the literature in which the sensitivity
of two groups of organisms have been concurrently compared. This study
indicated that when compared to marine bivalves, asteroids are more sensitive
to direct and indirect-acting genotoxicants.
This study also suggested that in addition to clearance rate in mussels, righting
behaviour in echinoderms has the potential to serve as a sensitive indicator of
115
behavioural (or physiological) alterations following exposure to genotoxins.
which could simultaneously act as neurotoxicants. In addition, while a direct link
was found between genotoxic and behavioural responses, these studies also
suggested that expression of different biological responses might not always be
linked or correlated. This further strengthens the notion that depending upon
levels of exposure, properties of contaminants and the target cells, toxicological
properties of any substance could be manifested in a variety of ways (Hagger et
al., 2002; Jha, 2008). Further studies will strengthen the use of adult
echinoderms as sensitive bioindlcator species for environmental studies. These
will Include the use of an environmentally relevant polycyclic aromatic
hydrocarbon (PAH), i.e. benzo(a)pyrene and the implementation of a recovery
period following in vivo exposure to determine If any deleterious effects are
irreversible.
116

Chapter 4:
A nnodel polycycl ic aromat ic hydrocarbon (benzo(a)pyrene) can
cause behavioural (physiological) , cytotoxic and genotox ic
consequences in three different ech inoderm spec ies (Asterias
rubens, Paracentrotus lividus and Ophiothrix fragilis) and a bivalve
mol lusc (Mytilus edulis).
These consequences at different levels of biological organisat ion will
be reversible.
117

4.1 Introduction
Polycyclic aromatic hydrocarbons (PAHs) are a group of more than 100
chemicals that are formed during the incomplete burning of coal, oil, gas, wood,
or other organic substances, such as tobacco (ATSDR, 1995). They are
omnipresent throughout the environment In the air, water, and soil. Levels of
PAHs In the world's oceans are increasing every year due to anthropogenic
activities (e.g. oil spills and the combustion of fossil fuels) (Woo et al., 2006).
Estimated world inputs (in million tonnes per year) of PAHs into the marine
environment are summarised in Table 4 .1 .
PAHs are a group of compounds which are very lipophilic and consist of 2, or
more, fused benzene rings (Readman et al., 2002). Benzo(a)pyrene (B(a)P) Is
an example of a PAH, which is a ubiquitous pollutant and an indirect acting
mutagen (Kim and Hyun. 2006). B(a)P is classed as one of 33 priority pollutants
by the European Union (annex II of the Directive 2008/105/EC) and one of 129
priority pollutants by the United States Environmental Protection Agency
(USEPA). The structure of B(a)P consists of a benzene ring attached to a
pyrene molecule (Fig. 4.1).
118
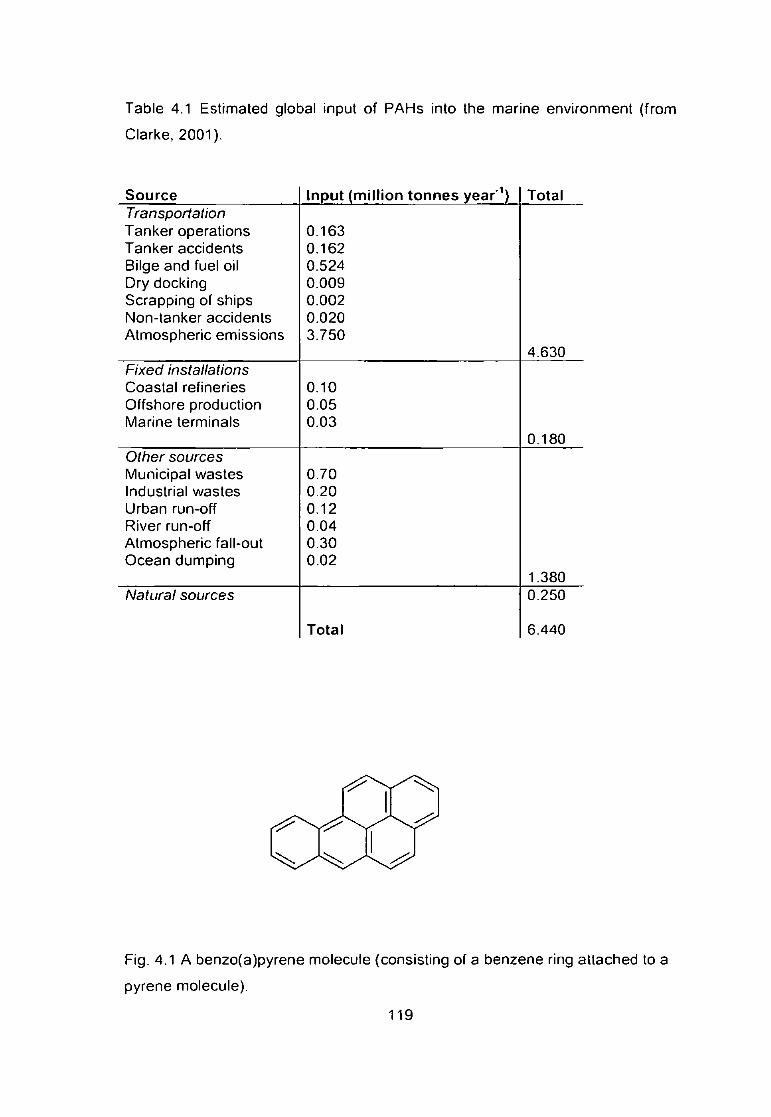
Table 4.1 Estimated global input of PAHs into the marine environment (from
Clarke, 2001).
Source Input (million tonnes year'^) Total Transportation Tanker operations 0.163 Tanker accidents 0.162 Bilge and fuel oil 0.524 Dry docking 0.009 Scrapping of ships 0.002 Non-tanker accidents 0.020 Atmospheric emissions 3.750
4.630 Fixed installations Coastal refineries 0.10 Offshore production 0.05 Marine terminals 0.03
0.180 Other sources Municipal wastes 0.70 Industrial wastes 0.20 Urban run-off 0.12 River run-off 0.04 Atmospheric fall-out 0.30 Ocean dumping 0.02
1.380 Natural sources 0.250
Total 6.440
Fig. 4.1 A ben2o(a)pyrene molecule (consisting of a benzene ring attached to a
pyrene molecule).
119

PAHs require metabolic activation before they cause mutagenic or carcinogen
effects. In mammalian systems, PAHs are initially activated into arene oxides by
cytochrome P450-depenadent monooxygenases. These arene oxides can
spontaneously isomerise into phenols or be converted into trans-dihydrodiols by
epoxide hydrases. When the trans-dihydrodiols are oxidised into diolepoxides,
the resultant compounds are believed to react with other metabolites to initiate
malign cell transformation (Jacob, 1996). The sequence of B(a)P metabolic
activation in vertebrates is detailed in Figure 4.2.
MonocnrygoniiMt 10)
^utcnridstlon OH
1 o Qluni
ghjtBtrilon or protilru HO H
avya«na Prolan
ydrast w th DNA
Fig. 4.2 The sequence of metabolic activation of B(a)P in vertebrates. (From
Jacob. 1996).
120

It is thought that invertebrate metabolism of PAHs follows a similar pathway as
that which occurs in vertebrate systems (Livingstone, 1991). Crustaceans have
been found to metabolise hydrocarbons faster than molluscs and fish
metabolise B(a)P faster than marine invertebrates (Bihari and Fafandel, 2004).
The Impact of B(a)P on a range of aquatic organisms has been investigated by
many researchers, these include: flounder, Paralichthys olivaceus (Woo et al.,
2006), European green crab, Carcinus aestuarii (Rossi et al., 2000), scallop,
Chlamys farreri {Pan et al., 2008), zebra mussel, Dreissena polymorpha (BInelli
et al., 2008), green-lipped mussel, Perna viridis (Ching et al.. 2001; Siu et al..
2004; Fang e l al., 2008; Slu e l al., 2008) and Mediterranean mussel, Mytilus
galloprovincialis (Venier el al., 1997; Canova et al.. 1998; Gomez-Mendikute el
al., 2002; Marigomez and Baybay-Villacorla, 2003). These studies have
encompassed a wide range of assays which operate at different levels of
biological organisation, from whole organism level (heart rate (Fossi et al. ,
2000)), to cellular level (NRR (Gomez-Mendikule et al., 2002; Fang el al. ,
2008)), through to sub-cellular level (Mn induction (Venier el al., 1997; Slu et al.,
2004; Slu el al., 2008) and the Comet assay (Bihari and Fafandel, 2004; Siu el
al.. 2004; Slu et al., 2008)). Examples of selected in vivo benzo(a)pyrene
biomarker studies with the adult stages of different aquatic organisms are given
in Table 4.2.
121
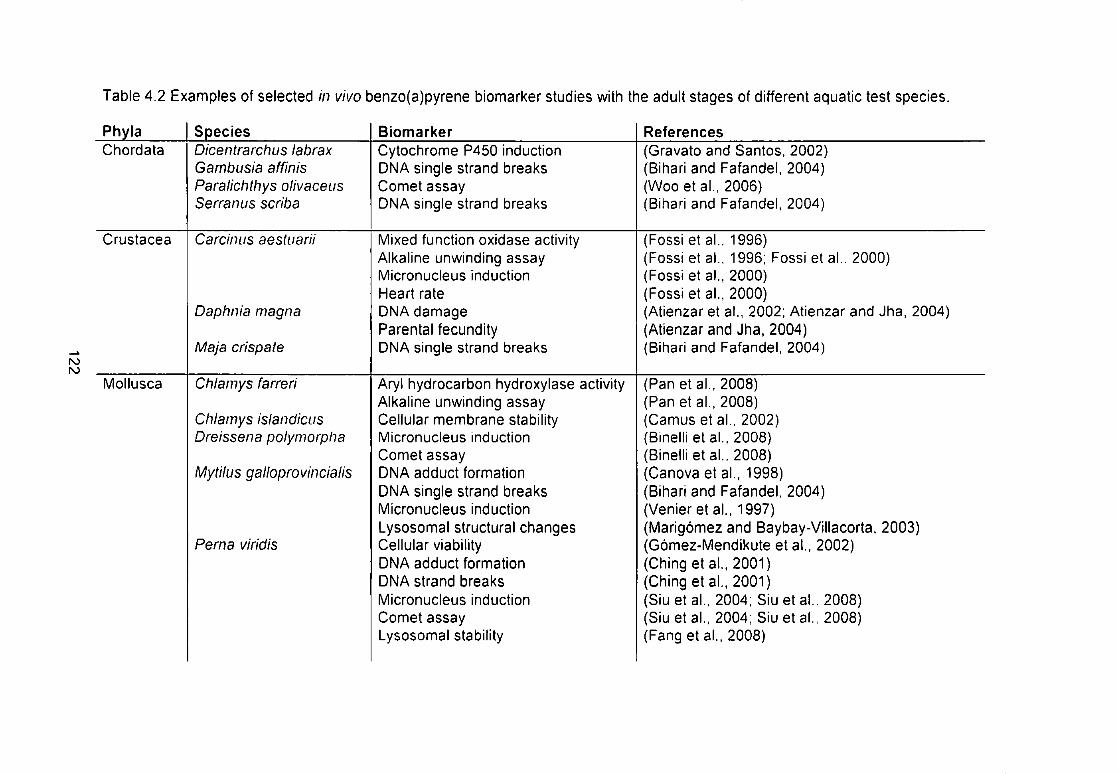
Table 4.2 Examples of selected in vivo benzo(a)pyrene biomarker studies with the adult stages of different aquatic test species.
Phyla Species Biomarker References Chordata Dicentrarchus labrax
Gambusia affinis Paralichthys olivaceus Serranus scriba
Cytochrome P450 induction DNA single strand breaks Comet assay DNA single strand breaks
(Gravato and Santos, 2002) (Bihah and Fafandel, 2004) (Woo etal . , 2006) (Bihari and Fafandel, 2004)
Crustacea Carcinus aestuarii
Daphnia magna
Maja crispate
Mixed function oxidase activity Alkaline unwinding assay Micronucleus induction Heart rate DNA damage Parental fecundity DNA single strand breaks
(Fossi et al.. 1996) (Fossi et al.. 1996; Fossi et al.. 2000) (Fossi et al., 2000) (Fossi eta l . , 2000) (Atienzar et a!., 2002; Atienzar and Jha, (Atienzarand Jha, 2004) (Bihari and Fafandel, 2004)
2004)
Mollusca Chlamys farreri
Chlamys islandicus Dreissena polymorpha
Mytilus galloprovincialis
Perna viridis
Aryl hydrocarbon hydroxylase activity Alkaline unwinding assay Cellular membrane stability Micronucleus induction Comet assay DNA adduct formation DNA single strand breaks Micronucleus induction Lysosomal structural changes Cellular viability DNA adduct formation DNA strand breaks Micronucleus induction Comet assay Lysosomal stability
(Pan eta l . . 2008) (Pan eta l . . 2008) (Camus et al.. 2002) (Binelli et al., 2008) (Binelli e ta l . . 2008) (Canova eta l . , 1998) (Bihari and Fafandel, 2004) (Venier eta l . . 1997) (Marigomez and Baybay-Villacorta. 2003) (Gomez-Mendikute et al., 2002) (Ching eta l . , 2001) (Ching eta l . , 2001) (Siu et al., 2004; Siu et al.. 2008) (Siu et al., 2004; Siu et al., 2008) (Fang eta l . , 2008)

These previous studies have covered a range of marine invertebrate species,
but there is a paucity of studies which have investigated the effects of B(a)P on
echinoderm species. To address this problem, the present study not only used
the blue mussel Mytilus edulis as a test organism, but also the common sea star
>As/er/as rubens, the purple sea urchin Paracentrotus lividus and the brittle star
Ophiothrix fragilis. The assays utilised evaluated the potential effects at different
levels of biological organisation from the whole animal level (righting time and
clearance rate), to cellular level (the neutral red assay) and sub-cellular levels
(micronucleus induction and the Comet assay). The experimental design
incorporated a recovery period to determine if any deleterious effects observed
at the different levels of biological organisation were reversible.
The aims and objectives of this study were:
(a) To determine if the relative sensitivity to B(a)P at different levels of biological
organisation in three different echinoderm species {Asterias rubens,
Paracentrotus lividus and Ophiothrix fragilis) compared to bivalve molluscs
{Mytilus edulis).
(b) Through the implementation of a recovery period into the experimental
designs, to assess whether any deleterious effects (at any of the levels of
biological organisation) were irreversible?
123
4.2 Materials and methods
4.2.1 Chemicals
All chemicals and reagents were of analytical grade and obtained from Sigma
Chemical Co.. Poole, Dorset, UK. The test chemical investigated was
benzo(a)pyrene (B(a)P; CAS number 50-32-8; purity > 96 % ) and the solvent
vehicle used was dimethyl sulphoxide (DMSO; CAS number 67-68-5).
Appropriate weights of B{a)P were dissolved in DMSO and added to the
exposure vessels to provide nominal concentrations of 0 .1 , 1.0 and 10 pg L'\
Final DMSO concentrations were 0.005 % (v/v) in all test vessels.
4.2.2 Species collection
Asterias rubens and O. fragilis were collected during January and February
2007 from in and around Plymouth Sound, Devon, UK (Latitude 50.20° N;
Longitude 4.10°W). using SCUBA divers and trawling. They were held under
the conditions slated in Sections 2.1.1 and 2.1.3. respectively. Paracentrotus
lividus were collected in Bantry (Co. Cork, Eire) (Latitude 51.41° N; Longitude
9.28° W) and supplied by Dunmanus Seafoods Ltd (Co. Cork, Eire) in January
2007. They were held as per Section 2.1.2. Mytilus edulis were collected during
April 2007 from Port Quin (Latitude 50.35° N; Longitude 4.52° W) they were held
in conditions outlined in Section 2.1.4.
4.2.3 Exposure to B(a)P
The experimental design for the series of B(a)P exposures incorporated a
sampling day on the third and seventh exposure days, then the animals were
placed in clean seawater (with 0.005 % DMSO) for a further three days to
assess their recovery. Five replicates at each concentration were used for all
124

species. The exposure vessels (7 L glass aquaria for the sea stars and urchins,
1.5 L glass beakers for the brittle stars and mussels) were spiked daily with the
appropriate nominal concentration of B(a)P solution (during the 7 d exposure
period). The experimental design for the static exposures is diagrammatically
represented in Figure 4.3. The exposure scenario for the four species differed
slightly because, as previously stated (see Section 2.2.2.3) it was not possible
to collect sufficient coelomic fluid from O. fragilis to carry out the cytotoxic and
genotoxic assays. Therefore only behavioural (RT) and physiological (CR)
assays were carried out on the three sampling days for this species. In the case
of the sea stars, sea urchins and mussels the complete suite of behavioural
(physiological), cytotoxic and genotoxic assays were carried out on each
sampling day.
Sublethal nominal concentrations of B(a)P, 0 .1 , 1.0 and 10 pg L'^ were used.
These concentrations were selected to be similar to those used in previous in
vivo studies with mussels (Siu et al., 2004) and crabs (Fossi et al., 2000); and
also to be environmentally realistic. In the open coastal waters of Hong Kong
B(a)P concentrations range from 10 to 40 pg L' (Ching et al.. 2001) and in
freshwater streams of the USA the maximum concentration of B(a)P detected
was 0.24 pg L' (Kolpin et al., 2002). The exposures were carried out at
15 ± 0.3 °C and food was withheld during the exposure period. The exposure
vessels were individually aerated using Pasteur pipettes and were sealed with
Parafi lm™. The vessels were checked daily for mortalities and the parameters
of temperature, salinity, dissolved oxygen and pH were measured.
125

(a) (b) (c)
Sea stars/ urchins individually exposed in 7 L vessels
(5 replicates per concentration)
3 mussels exposed in 1.5 L vessels (5 replicates per concentration)
Brittle stars individually exposed in 1.5 L vessels
f5 replicates per concentration)
After 3 & 5 days exposure & 3 days recovery, 1 animal sampled per replicate
(n = 5)
After 3 & 5 days exposure & 3 days recovery. 1 mussel sampled per
replicate (n = 5)
After 3 & 5 days exposure & 3 days recovery. 1 animal sampled per
replicate (n = 5)
Righting times determined (n = 5)
Clearance rates determined {n = 5)
coelomocytes collected haemolymph
Neutral red. micronucleus & Comet assays carried out
(n = 5)
collected
Neutral red, micronucleus & Comet assays carried out
(n = 5)
Righting times determined (^ = 5)
Clearance rates determined {n = 5)
Fig. 4.3 flow chart illustrating the integrated experimental design adopted in the studies to evaluate the behavioural (physiological),
cytotoxic and genotoxic effects of B(a)P in (a) sea stars/ urchins, (b) mussels and (c) brittle stars.

4.2.4 Determination of righting times (RT)
Righting times (RT) of the echinoderms were determined prior to coelomocyte
sample collection (5 sea stars, urchins or brittle stars per concentration) as
detailed in Section 2.10.
4.2.5 Determination of clearance rate (CR)
In the case of the mussels, CRs were determined (5 mussels per
concentration), prior to haemolymph sample collection, as per the method
described in Section 2.9.1. For the brittle stars (n = 5) clearance rates were
determined as per Section 2.9.2.
4.2.6 Collection of coelomocyte and haemocyte samples
Coelomic fluid and haemolymph was collected as per Sections 2.2.1, 2.2.2.1
and 2.2.2.2. The coelomic fluid/ haemolymph samples were held on ice until
used for cytotoxicity and genotoxicity assays. The samples were thoroughly
mixed by vortexing prior to use.
4.2.7 Determination of cellular membrane stability using NRR assay
The cellular membrane stability of the mussel haemocytes and the sea star and
sea urchin coelomocytes (all n = 5) were determined using the NRR assay. This
assay was carried out as per Section 2.3 and triplicate samples were analysed
for each individual organism.
127

4.2.8 Determination of cytogenetic damage using Mn assay
This assay was carried out as detailed in Section 2.6 for the mussels, sea stars
and sea urchins. One slide was prepared for each test organism and the slides
were randomised and coded prior to scoring under a light microscope according
to the criteria described previously (Venier et al., 1997; Fenech, 2000; Jha et
al., 2005).
4.2.9 Determination of DNA strand breaks using the alkaline Comet assay
The frequencies of single strand DNA breaks in the mussels, sea stars and sea
urchins (all n = 5) were quantified with the alkaline Comet assay. One slide
(each with 2 microgel replicates) was prepared for all test organisms. This
assay was carried out as per Section 2.8. As required as a prerequisite for the
Comet assay, it was necessary to determine the cellular viability of the
haemocytes and coelomocytes. To this end, Eosin Y dye and a light microscope
were used as detailed in Section 2.7 - only cell samples with a viability of >70 %
were used in the Comet assay.
4.2.10 Statistical analysis
Statistical significance between means was determined using one-way analysis
of variance (ANOVA). All values are provided as means ± SEM. Differences
between means which were P < 0.05 were considered significant. All data sets
were analysed using Statgraphics v5.1 software (StatSoft, USA). Any
correlations been variables were determined using the Pearson correlation
coefficient.
128
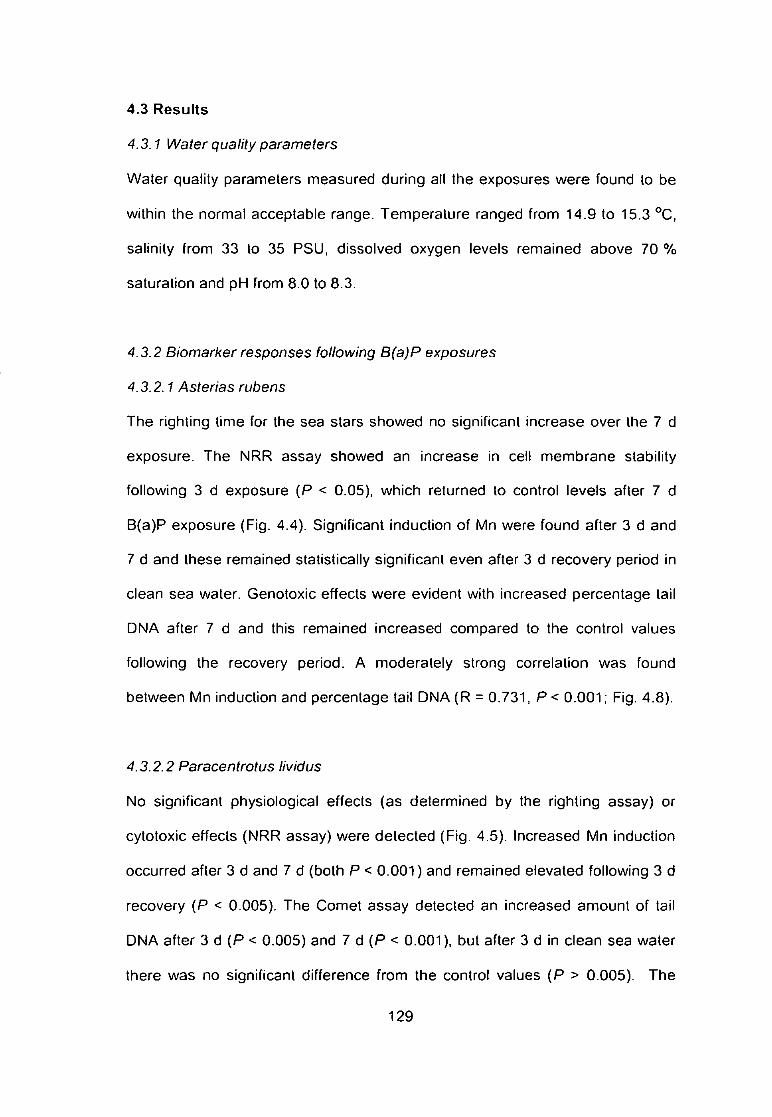
4.3 Results
4.3.1 Water quality parameters
Water quality parameters measured during all the exposures were found to be
within the normal acceptable range. Temperature ranged from 14.9 to 15.3 "^C,
salinity from 33 to 35 PSU, dissolved oxygen levels remained above 70 %
saturation and pH from 8.0 to 8.3.
4.3.2 Biomarker responses following B(a)P exposures
4.3.2.1 Asterias rubens
The righting time for the sea stars showed no significant increase over the 7 d
exposure. The NRR assay showed an increase in cell membrane stability
following 3 d exposure (P < 0.05), which returned to control levels after 7 d
B(a)P exposure (Fig. 4.4). Significant induction of Mn were found after 3 d and
7 d and these remained statistically significant even after 3 d recovery period in
clean sea water. Genotoxic effects were evident with increased percentage tail
DNA after 7 d and this remained increased compared to the control values
following the recovery period. A moderately strong correlation was found
between Mn induction and percentage tail DNA (R = 0.731, P < 0.001; Fig. 4.8).
4.3.2.2 Paracentrotus lividus
No significant physiological effects (as determined by the righting assay) or
cytotoxic effects (NRR assay) were detected (Fig. 4.5). Increased Mn induction
occurred after 3 d and 7 d (both P < 0.001) and remained elevated following 3 d
recovery (P < 0.005). The Comet assay detected an increased amount of tail
DNA after 3 d (P < 0.005) and 7 d (P < 0.001), but after 3 d in clean sea water
there was no significant difference from the control values (P > 0.005). The
129
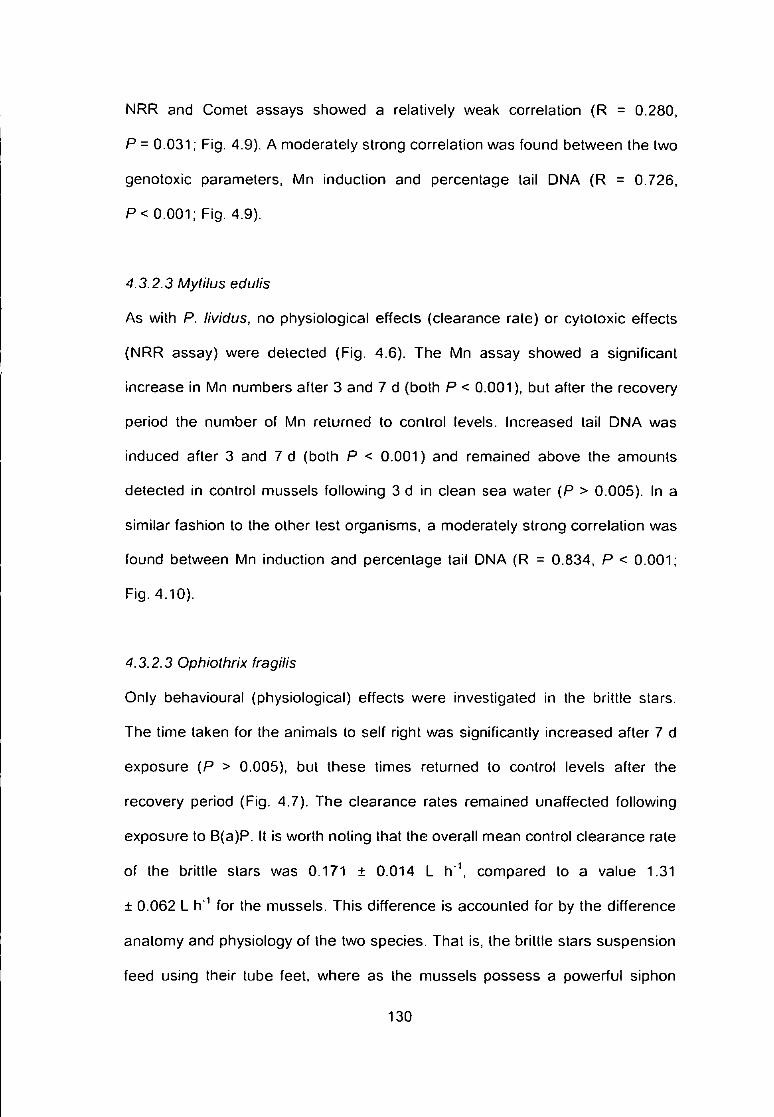
NRR and Comet assays showed a relatively weak correlation (R = 0.280,
P = 0.031; Fig. 4.9). A moderately strong correlation was found between the two
genotoxic parameters, Mn induction and percentage tail DNA (R = 0.726.
P < 0.001; Fig. 4.9).
4.3.2.3 Mytilus edulis
As with P. lividus, no physiological effects (clearance rate) or cytotoxic effects
(NRR assay) were detected (Fig. 4.6). The Mn assay showed a significant
increase in Mn numbers after 3 and 7 d (both P < 0.001), but after the recovery
period the number of Mn returned to control levels. Increased tail DNA was
induced after 3 and 7 d (both P < 0.001) and remained above the amounts
detected in control mussels following 3 d in clean sea water (P > 0.005). In a
similar fashion to the other test organisms, a moderately strong correlation was
found between Mn induction and percentage tail DNA (R = 0.834, P < 0.001;
Fig. 4.10).
4.3.2.3 Ophiothrix fragilis
Only behavioural (physiological) effects were investigated in the brittle stars.
The time taken for the animals to self right was significantly increased after 7 d
exposure (P > 0.005), but these times returned to control levels after the
recovery period (Fig. 4.7). The clearance rates remained unaffected following
exposure to B(a)P. It is worth noting that the overall mean control clearance rate
of the brittle stars was 0.171 ± 0.014 L h'\ compared to a value 1.31
± 0.062 L h" for the mussels. This difference is accounted for by the difference
anatomy and physiology of the two species. That is, the brittle stars suspension
feed using their tube feet, where as the mussels possess a powerful siphon
130

pump which is much for efficient. No correlation was found between righting
time and clearance rates In O. fragilis (Fig. 4.11).
131
300
250
30 1
cells
)
25
o o o 20 •
(per
15 • c g
indu
ct
10 -
c 5 •
Day 3 Day 7 Recovery Day 3
Control 0.1 1
B(a)P concentration (pg L'')
Day 3 Day 7 Recovery Day 3
Control 0.1 1 10
B(a)P concentration (pg L" )
0.7
0.6
0.5
0.4
0.3
30
25
20
Day 3 Day 7 Recovery Day 3
^ 0.2
Control 0.1 1 10
B(a)P concentration (pg L'')
I Day 3 ' Day 7
• Recovery Day 3
Control 0.1 1 10
B(a)P concentration (pg L*')
Fig. 4.4 Behavioural (physiological), cytotoxic and genotoxic effects in Asterias rubens exposed to B(a)P for 3 and 7 d and following a 3 d recovery period (In clean seawater). Concentrations are expressed as pg L"V The values are means ± SEM (n = 5). * indicates a significant difference from controls at, or above, the 95 % confidence level.

250
00
o. c o
' i •o c c
25
20
Day 3 Day 7 Recovery Day 3
P 100
Control 0.1 1 10
B(a)P concentration (pg L'')
Day 3 Day 7 Recovery Day 3
Control
B(a)P concentration (fjg L" )
1.5
c
o
30
Day 3 Day 7 Recovery Day 3
Control B(a)P concentration (pg L' )
Day 3 Day 7 Recovery Day 3 * *
Control B(a)P concentration (pg L"')
Fig. 4.5 Behavioural (physiological), cytotoxic and genotoxic effects in Paracentrottis lividus exposed to B(a)P for 3 and 7 d and following a 3 d recovery period (in clean seawater). Concentrations are expressed as pg L" significant difference from controls at, or above, the 95 % confidence level.
The values are means ± SEM (n = 5), * indicates a
2.0
CO
a c o u 3
•D C
c 5
15
12
3
0 ^
• Day 3 J Day 7
• Recovery Day 3
1.8
Control
B(a)P concentration (|jg L" )
Day 3 Day 7 Recovery Day 3
* •
* *
T
I (ML Control 0.1 1 10
B(a)P concentration (pg L"')
30
25
• Day 3 J Day 7 • Recovery Day 3
Control 0.1 1 10
B(a)P concentration (pg L"')
I _ Day 3 Day 7 Recovery Day 3
• * * * * *
Control 0.1 1 10 B(a)P concentration (pg L"')
Fig. 4.6 Behavioural (physiological), cytotoxic and genotoxic effects in Mytilus edulis exposed to B(a)P for 3 and 7d and following a 3 d recovery period (in clean seawater). Concentrations are expressed as pg L'\ The values are means ± SEM (/7 = 5). * indicates a significant difference from controls at. or above, the 95 % confidence level.

E
C
125
100
I Days 3 Day 7
I Recovery Day 3
Control 0.1 1 10
B(a)P concentration (pg L' )
B
c CD
O
0,30
0.25
0.20
0.15
0.10
0.05
0.00
mmm Oay 3 I 1 Day 7
Recovery Day 3
Control 0.1 1 10
B(a)P concentration (yg L'^)
Fig. 4.7 Behavioural (physiological) effects in Ophiothrix fragilis exposed to B(a)P for 3 and 7 d and following a 3 d recovery period (in
clean seawater). Concentrations are expressed as pg L'V The values are means + SEM (n = 5). * indicates a significant difference from
controls at, or above, the 95 % confidence level.
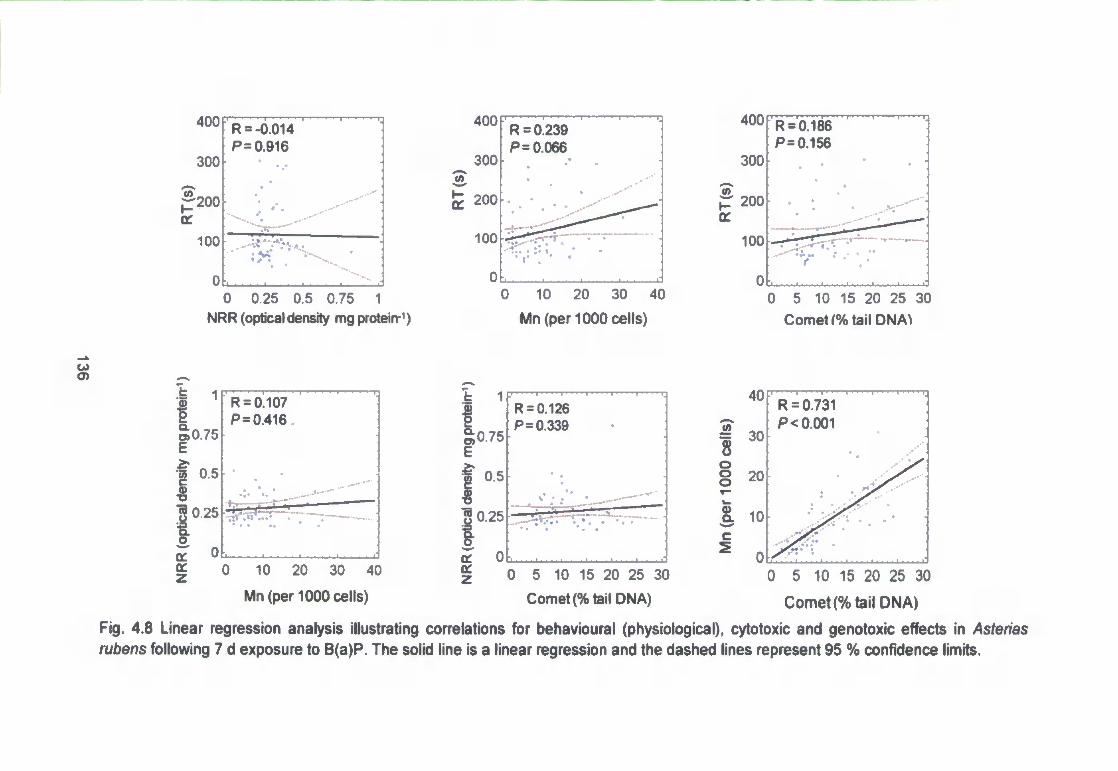
400
300
.^200
100
0
R =-0.014 P = 0.916
0 0.25 0.5 0.75 1 NRR (optical density mg proteirr )
400
300
200
R = 0.239 P = 0.066
0 10 20 30 40 Mn (per 1000 cells)
400 'R = 0.186 p = 0.156
300 • . • •
m • vt 200
QC
100 f
0 '• - •
0 5 10 15 20 25 30 Comet r% tail DNA)
R = 0.107 P = 0.416
0 25 - r r ;
Q: cr: z 0 10 20 30 40
Mn (per 1000 cells)
I 1
|o.75 E ^ 0.5
J 0.25
K 0
R = 0.126 P = 0.339
— : —
40
0 5 10 15 20 25 30 Comet (% tail DNA)
R = 0.731 P < 0.001
0 5 10 15 20 25 30
Comet(% tail DNA)
Fig. 4.8 Linear regression analysis illustrating correlations for behavioural (physiological), cytotoxic and genotoxic effects in Asterias rubens following 7 d exposure to B(a)P. The solid line is a linear regression and the dashed lines represent 95 % confidence limits.

400
300
^ 200
100
oL
R =-0.078 P = 0.552
0 0.5 1 1.5 2
NRR (opticaldensity mg protein- )
I 2 O
o) 1.5
0.5
R = 0.122 P= 0.352
•
0 5 10 15 20 25 Mn (per 1000 cells)
400
300
200
100
R = 0.217 P = 0.096
0 5 10 15 20 25 Mn (per 1000 cells)
R =0.280 P= 0.031
5> 1.5
I
0 10 20 30 40 Comet (% tail DNA)
400
300
R = 0.146 P= 0.266
^ 200
0 10 20 30 40 Comet (% tail DNA)
R =0.726 P< 0.001
0 10 20 30 40 Comet (% tail DNA)
Fig. 4.9 Linear regression analysis illustrating correlations for behavioural (physiological), cytotoxic and genotoxic effects in Paracentrotus lividus following 7 d exposure to B(a)P. The solid line is a linear regression and the dashed lines represent 95 % confidence limits.

2
^ 1.5
5 1 DC " 0.5
R = 0.211 P= 0.873
0 0.5 1 1.5 2 NRR (optical density mg protein- )
2
1.5
O 0.5
oL R =-0.003 P= 0.986
0 5 10 15 Mn (per 1000 cells)
2
^ 1.5
1 Q:
R =-0.051 P= 0.700
0 5 10 15 20 25 30 Comet(% tail DNA)
I 1.5 t c 1
0.5
g 0
-
R = 0.098 P = 0.457
0 5 10 15 Mn (per 1000 cells)
I ^ |» 1.5
.« 0.5 R = 0.010 P= 0.937
o 8
15
10
I 5
R = 0.a34 P < 0.001
1 ' ' • ' 1 •' " 1 • • • • 1.
• • • •
*
"i. • •. 1 • . . . 1 • • . .
0 5 10 15 20 25 30 Comet (% tail DNA)
0 5 10 15 20 25 30
Comet (% tail DNA) Fig. 4.10 Linear regression analysis illustrating correlations for t>ehavioural (physiological), cytotoxic and genotoxic effects in Mytilus edulis following 7 d exposure to B(a)P. The solid line is a linear regression and the dashed lines represent 95 % confidence limits.

42,
150
100
50
oL
R =-0.066 P = 0.616
:.
0 0.1 0.2 0.3 0.4
C R ( L h - ^ )
Fig. 4.11 Linear regression analysis illustrating correlation for behavioural
(physiological) effects in Ophiothrix fragilis following 7 d exposure to B(a)P. The
solid line is a linear regression and the dashed lines represent 95 % confidence
limits.
4.4 Discussion
The results of these integrated studies illustrate that genotoxic effects are nriore
evident in echinodenns and nrK>lluscs than behavioural (physiological) or
cytotoxic effects following short term exposure to B(a)P. as both the Mn and
Comet assays showed deleterious effects of the PAH in the sea stars, sea
urchins and mussels. The only significant behavioural (physiological) and
cytotoxic effects were in the righting tinr es of the brittle stars (following 7 d
exposure) and the cell membrane stability (NRR assay) of the sea stars
(following 3 d exposure). The genotoxic consequences detected by the Mn
assay were not reversed following the 3d recovery period in the sea stars or
139

urchins, but these consequences were partly reversed in the mussels.
Conversely, the consequences measured by the Comet assay were not
reversed In the sea stars and mussels following the recovery period, but the sea
urchins did recover.
Little data is present in the literature which reports the physiological or
behavioural effects of B(a)P on marine invertebrates. The physiological Impact
of B(a)P on the crab Carcinus aestuarii, as measured by heart rate, has been
studied (Fossi et al., 2000). Following a 10 d exposure to 1 ppm (1 mg L'^) a
significant increase In the mean rate of heart beats was detected, but, no
explanation was given for the occurrence of this physiological response. There
is a small body of work which has investigated the effects of PAHs in general on
the behaviour (physiology) of echinoderms. A mixture of PAHs in the form of oil
drill cuttings (a by-product of oil drilling which consisted of a complex mixture of
oil-based drilling muds, emulslflers, dispersanls and stabilisers (Newton and
McKenzie, 1998a)) was found to impair the burrowing behaviour of two brittle
star species, namely Amphiura chiajei and A. filiformis. These brittle stars
exhibit a natural tendency to burrow Into soft sediments, but when presented
with sediments high in PAH content (up to 1,200 ppm) this intrinsic burrowing
behaviour was impaired (Newton and McKenzie, 1998a). The foraging
behaviour of the eleven-armed asteroid Coscinasterias muricata was disrupted
following exposure to a complex mixture of PAHs in the form of a water-
accommodated fraction (WAF) of crude oil (Georgiades et al., 2003). The ability
of the sea star to locate a food item (in the form of a mussel) was reduced
following exposure to WAF with a total PAH content of 1.8 mg L" for 4 d,
although this behavioural response returned to control levels following a
140

recovery period of 7 d. The researchers suggest that this behavioural response
was either as a result of the PAH mixture disrupting the motor responses of the
tube feet, or due to the suppression of the sea stars' metabolic processes
brought about by hydrocarbon narcosis (Georgiades et al., 2003). The
Australian sea star, Patiriella exigua has been shov^n to actively avoid crude oil
contaminated sediments in laboratory studies (Ryder et al., 2004). It was noted
that the sea stars exposed to the highest levels of contaminated sediments
(initial oil concentration of 114.000 pg g'^ in the sediment, falling to 800 pg g'^
after 32 d) were unable to right themselves when they became inverted in the
test vessels. It was postulated that this was due to a narcotic effect (i.e. the tube
feet became less responsive, that is. they possibly enter a state of stupor) of the
PAHs (Ryder et al.. 2004).
In the studies presented here the righting behaviour of the sea stars and sea
urchins remained unaffected by B(a)P, suggesting that either the exposure
duration, or concentrations were insufficient to induce a narcotic effect on the
tube feet of these asteroids and echinoids. The reduced self-righting ability of
the brittle stars after 7 d exposure indicated that either the metabolic processes
of the organisms were Impaired or narcosis occurred In the tube feet, resulting
In a reduced capacity for the tube feet to assist In the righting mechanism.
Cellular membrane stability (including that of the lysosomes). as measured by
the NRR assay, was only adversely affected in the sea stars in (the sea urchins
and mussels remained unaffected). This reduction was only evident following
3 d exposure across all concentrations (0.1. 1.0 and 10 pg L'^) and returned to
the negative control levels following 7 d exposure and 3 d recovery. This
141

recovery, whilst still being exposed to the contaminant, suggests that either the
cells of the sea star were being regenerated, the cellular concentrations of
B(a)P had reached a maximum after 3 d and therefore decreased by the 7 d
sampling point, or that the rate of B(a)P metabolism had increased. Lysosomal
integrity (as assessed by the NRR slide technique) was investigated following
18 d and 42 d exposure of the green-lipped mussel Perna viridis to 100 pg L'
B(a)P (Fang et al., 2008). The lowest lysosomal integrity in the green-lipped
mussels was observed after 6 d ( 5 1 % reduction in initial levels) of the 18 d
exposure. A complete recovery in lysosomal integrity was observed after 20 d in
clean seawater (Fang et al., 2008). This showed that the lysosomal damage in
the mussels was reversible and the integrity of the lysosomes adapted to the
presence of the xenobiolics. In vitro studies with mussel haemocytes (MytHus
galloprovincialis) exposed to 0.5 - 40 pg mL'^ B(a)P for 1 h found a clear
dose-response reduction in the amount of NR taken up by the cells as
measured by the NRR assay (Gomez-Mendikute et al., 2002).
Significant induction of Mn occurred in the coelomocytes of the sea stars and
sea urchins were detected after 3 d exposure at all concentrations and Mn
frequency remained significantly increased after the 3 d recovery period.
Conversely, the Mn frequency detected in the mussels returned to control levels
following the recovery period. So although all three species studied were
susceptible to Mn induction when exposed to B(a)P, the mussel haemocytes
were better equipped to recover from Mn induction than the echinoderm
coelomocytes. Previous work has shown that Mn were induced in both the gill
cells and haemocytes of M. galloprovincialis as a consequence of in vivo
exposure to B(a)P for 2 d (Venier et al., 1997). Dose dependent increases in Mn
142

numbers were evident at concentrations from 50 to 1000 pg L" with higher
frequencies in the agranular haemocytes compared to the main gill cells.
Increased Mn frequency were observed in the haemocytes of the Carcinus
aestuarii ai[er a 10 d exposure to 1 mg L" of B(a)P (Fossi et al., 2000).
Increased levels of single strand DNA breaks (as quantified by the alkaline
Comet assay) were evident In the sea stars following 7 d exposure and
remained elevated following the 3 d recovery period. Increased levels were also
found in the urchins following 3 d and 7 d, but returned to baseline levels after
the recovery period. The mussels appeared to be the most sensitive of the three
speciess as the degree of DNA breaks showed a significant Increase after 3 d
and remained so at the end of the recovery period. Past work has found that
concentrations of 0.5 and 3.0 pg L" B(a)P for 6d caused an increase In the
frequency of DNA strand breaks In the gill tissue and digestive gland of the
scallop Chfamys farreri as detected by the alkaline unwinding assay (similar to
the Comet assay) (Pan et al., 2008). There was then a recovery to control levels
in the gill tissue, but not In the digestive gland following an additional 14 d
exposure. No increase in DNA strand breaks was detected at any time point
during 20 d exposure at 10 pg L'V There was no increase in DNA damage as
detected by the alkaline unwinding assay in the haemocytes of the crab
Carcinus aestuarii following a 10 d exposure to 1 mg L' of B(a)P (Fossi et al..
2000).
B(a)P needs to be metabolised in vivo in order to produce a toxic effect.
Although metabolism of PAHs is not fully understood in invertebrates, the
process is thought to be similar to that of vertebrate species (Livingstone,
143

1991). Figure 4.12 represents a schematic illustrating the four possible
molecular pathways involved in the activation of B(a)P into DNA reactive
intermediates In a model mammalian system under in vivo conditions.
b e n z o l a j p y r c n c
7 . B - c p o x i d c
r iyafc!ys s
7 .8 -d io l
:::r..v- v'^iur.
S - m c t h y l - i n l c f m c r l i ; i l c
/
mcnoGrygcnniion c a t e c h o l
s c m i q u i n o n c a n i o n r a d i c a l R O S
q u i n o n c s
o n c - o i e c t f o r oti-jauo- R r O S O i O H O P O ^ O H O C O C H . .
© d i o l o p o x t d c s r a d i c a l c a t i o n s b c n z y l i c c a r b c n i u m ton:
ON'M L E S l O r J S ( O N A a d d u c i s . o-icair.'a a a - n a g e dcpllr^.^a:lOn s J r a r a c r e a k s -
T ' J M O R I N ' l T l A l l O N
Fig. 4.12 Four possible pathways for the activation of B(a)P leading to DNA
lesions in vivo In a mammalian cell system (from Canova et al.. 1998).
144
Pathway 1 is based on the 'bay-region theory' in which epoxides, phenols, diols
and tetrols are formed through the monoxygenation of B(a)P by cytochromes
P450. Diols produced in pathway 1 can be dehydrogenated by dihydrodiol
dehydrogenase to produce catechols, quinones which can undergo redox
cycling to produce reactive oxygen species (ROS). DNA reactive radical cations
may also be formed by one electron oxidation (pathway 3). This pathway may
be mediated by cytochromes P450. The final potential cause of B(a)P activation
leading to DNA lesions are benzylic carbenium ions. These ions are formed
when a 6-methyl-intermediate of B(a)P undergoes either one electron oxidation
or formation of methyl ester derivatives (Canova et al., 1998).
Cytochromes P450 are a large and versatile group of proteins which are
involved in Phase 1 metabolism of many lipophilic xenobiotics including PAHs
(Rewitz et al., 2006). This metabolism is involved in both the detoxification and
activation into toxic derivatives (Stegeman, 1985). Evidence of P450 enzyme
activity and associated mixed-function oxygenase (MFC) activities have been
found in Cnidaria, Annelida. Mollusca, Arthropoda and Echinodermata
(Livingstone, 1991). The differential phylogenetic sensitivity of the organisms
tested in these studies may be as a result of their differing abilities to metabolise
B(a)P. Workers have found that M. edulis can metabolise 20-30 % of the B{a)P
they are exposed to, compared to polychaete worms Nereis spp. which can
metabolise 86-96 % (Rust et al.. 2004).
There is a paucity of data regarding the role and function of P450 in
echinoderms. Although there is evidence that cytochromes P450
monooxygenase system is found in asteroids, echinoids and holothuroids and it
145
Is not only Involved in the detoxification of xenoblotics, but also the metabolism
of steroids (den Besten, 1998). Cytochromes P450, along with other
components of the monooxygenase (MO) system, have been detected in
asteroids (A. rubens and Marthasterias glacialis), holothurians {Holothuria
forskali), and echinoids {Strongylocentrotus sp.) (Payne and May, 1979; den
Besten et al., 1990). As the B(a)P hydroxylase activity In the pyloric caeca of A.
rubens was found to be inhibited by compounds known to be Inhibit vertebrate
cytochromes P450, It was concluded that the echlnoderm mixed-function
oxygenase (MFC) system has more similarities to that found in vertebrates and
crustaceans than that of the molluscs (den Besten et al., 1990).
These integrated studies carried out on a range of echlnoderm species and a
bivalve mollusc found that B(a)P did cause deleterious effects at different levels
of biological organisation. These effects were most noticeable at the
sub-cellular level, as measured by the Comet assay. This merits further
investigation with the implementation of the modified Comet assay - a technique
which not only measures single strand DNA breaks, but also detects oxidative
DNA damage. This technique used in conjunction with a measure of
immunocompetence (the phagocytosis assay) would add to the paucity of data
available detailing any possible links between oxidative stress and
immunocompetence In marine invertebrates, especially the echinoderms.
146

Chapter 5
A heavy metal (cadmium) can cause behavioural (physiological) and
cytotoxic consequences in echinoderms (>As/enas rubens) and
molluscs {Mytilus edulis), and reversible immunotoxic, genotoxic and
oxidative stress consequences in both species.
147

5.1 Introduction
Heavy metals (a group of metals consisting of arsenic, cadmium, chromium,
cobalt, copper, lead, mercury and nickel) are one of the most widespread and
serious forms of environmental pollution (Pruski and Dixon, 2002). Heavy
metals enter the biosphere through volcanic activity, the weathering of rocks
and as a result of human activities including the release of sewage, mining and
the combustion of fossil fuels (Depledge et al., 1994). Most types of pollution,
regardless of its initial source, ultimately finds its way into the aquatic realm and
heavy metals are no exception. Cadmium (Cd) is one such heavy metal and it is
considered a priority pollutant due to its toxicity (USEPA, 1987). Cadmium has a
range of consumer and industrial uses. It is used in the protective plating of
steel; as a stabiliser in the production of poly-vinyl chlorides (PVCs); as a
pigment in glasses and plastics; and as an electrode material in nickel-cadmium
batteries and as a component in various alloys (WHO, 1992). Cadmium is a
nonessential metal, meaning that it is not essential to any organism (Muller et
al.. 1998). Although Cd is present in seawater at trace levels (Erk et al., 2005),
anthropogenic inputs can result in elevated levels in coastal marine
environments. The total input of Cd into the marine environment is estimated at
8000 tonnes per year, about half of which is believed to from anthropogenic
sources (Coles et al.. 1995).
There is a large pool of literature which has investigated the effects of Cd on a
range of aquatic organisms (for example; the water flea, Daphnia magna (den
Besten and Tuk, 2000); the aquatic clam, Corbicula fluminea (Tran et al.. 2001;
Tran et al., 2002); the Pacific oyster. Crassos/rea gigas (Geret el al., 2002); the
freshwater gammarid, Gammarus pulex (Felten et al.. 2008); turbot,
148

Scophthalmus maximus (Bolognesi et al., 2006); carp, Cyprinus carpio (Zhang
et al., 2007); Nile tilapia, Orecochromis niloticus (Almeida et al.. 2009) and the
white shrimp, Litopenaeus vannamei (Chang et al., 2009)). These studies have
investigated the effects of Cd at a wide range of levels of biological
organisation, from physiological and behavioural responses, through to
cytotoxicity, immunotoxiclty, oxidative stress and genotoxicity.
This study utilised the adult stages of the common sea star Asten'as rubens and
the blue mussel Mytilus edulis to determine the effects of Cd at different levels
of biological organisation. Increased levels of MTs have been quantified (den
Besten et al., 1989; Temara et al., 1997b; Erk et al., 2005) and reduced cellular
immune response (Coleur et al., 2005b) following Cd exposure in the sea star.
Toxicology studies with mussels that investigated the effects of Cd have
implemented a range of endpoints, including genotoxicity (Bolognesi et al.,
1999; Emmanouil et al., 2007), cytotoxicity (Dalllanis, 2009) and the induction of
MTs (Beblanno and Langston. 1991; Geret et al., 2002; Erk et al., 2005). There
is a lack of information available regarding the effects of Cd in the two named
species in terms of whole organism effect (physiological and/or behavioural
effects), cytotoxicity, immunotoxicity, Induction of oxidative stress and
genotoxicity. Therefore the aims and objectives of this study were:
(a) To determine If Cd exposure induced a response at higher levels of
biological organisation (i.e. the whole organism and cellular levels) in either of
the two test species.
149

(b) To determine if there is a relationship between any immunocompetence,
genotoxicity and/ or oxidative damage.
(c) To Investigate the recovery capability of the organisms to any incurred
immunotoxicity and/ or oxidative stress.
In order to achieve these objectives a series of in vivo experiments were
conducted. The first studies assessed the effects of a five day exposure of Cd
to A. rubens and M. edulis using behavioural / physiological (righting time and
clearance rates, respectively for the two species) to determine any deleterious
effect at the whole organism level. The neutral red retention (NRR) assay was
used along side these assays to determine any cytotoxicity of the heavy metal.
Chemical analysis In the form of Inductivity Coupled Plasma Mass Spectrometry
(ICP-MS) was carried out on exposure water samples and different body
compartments of the test species to determine any bioaccumulatlon. The
second suite of studies used the same exposure conditions, with the exception
of the implementation of a one and a five day 'recovery period' following a five
day Cd exposure. The assays employed were the phagocytosis assay (to
determine immunocompetence) and the modified Comet assay (to determine
genotoxicity and oxidative stress). By sampling on the recovery days it was
possible to determine the respective repair capabilities of the two species with
regard to immunotoxicity. genotoxicity and oxidative stress caused by the Cd
exposure.
150

5.2 Materials & methods
5.2.7 Chemicals
All chemicals and reagents were of analytical grade and obtained from Sigma
Chemical Co. (Poole, Dorset, UK). Cadmium (Cd) was used in the form of
calcium chloride hydrate (CdCb hydrate, CAS number 7790-78-5; purity
>98 % ) , it was readily soluble in water at room temperature, 133 mg mL'^
(http;//dohs.ors.od.nih.gov), therefore no solvent vehicle was required. All
glassware was acid-washed (5 % HNO3 for at least 2 h) and triple rinsed in
deionised water prior to use.
5.2.2 Species collection
Asterias rubens were hand collected by SCUBA divers during November 2008
from in and around Plymouth Sound, Devon. UK (Latitude 50.20° N; Longitude
4.10°W). They were 60 - 100 mm in diameter and were held under the
conditions stated in Section 2.1.1. Adult M. edulis (40 - 45 mm in length) were
collected during November 2008 from Port Quin (Latitude 50.35° N; Longitude
4.52° W), they were held in conditions outlined in Section 2.1.4.
5.2.3 Exposure of sea stars and mussels to cadmium
Due to logistical constraints the exposures for both species were separated into
two individual studies (therefore four separate exposures in total). In all cases
the exposure concentrations used were identical; seawater control, 100, 180
and 320 pg L" of Cd. The Cd concentrations were selected based on those
used in previous work using mussels (Bolognesi et al.. 1999; Geret et al., 2002;
Emmanouil et al., 2007) and sea urchins (Warnau et al., 1995), whilst still
incorporating the semi-logarithmic scale routinely used in ecotoxicity testing.
151

The first set of exposures for both species ran for 5 d. After the 5 d exposure
period the RT of the sea stars (Section 5.2.4) and CR of the mussels (Section
5.2.5) were determined. Coelomocyte and haemocyte samples were then
collected and the cellular membrane stability of the test organisms were
determined using the NRR assay (Section 5.2.7). Exposure water samples were
collected at the initiation of the study and following 5 d to determine Cd
concentrations at the start and termination of the exposure (Section 5.2.10.1).
Following collection of the coelomocyte and haemocyte samples different body
compartments were dissected from the two species in order to determine Cd
body burdens (Section 5.2.10.2). This experimental protocol can be seen in Fig.
5.1a and 5.1b (n = 5 in all cases). The second suite of exposures incorporated
two recovery periods (1 d and 5 d recovery) following an initial 5 d exposure to
Cd. On the three different sample days the phagocytosis assay (Section 5.2.8)
and modified Comet assay (Section 5.2.9) were used to determine the
immunocompetence, genotoxicity and oxidative stress, respectively {n = 3). The
protocol for these experiments can be seen in Fig. 5.2a and 5.2b.
The exposures were carried out at 15 ± 0.5 °C and food was withheld during the
exposure period. The exposure vessels were individually aerated using Pasteur
pipettes and were sealed with Parafi lm'". The vessels were checked daily for
mortalities and the parameters of temperature, salinity, dissolved oxygen and
pH measured.
152

(a) Sea stars individually exposed in 7 L vessels [n = 5)
Aqueous Cd concentrations determined at start and after 5 d of exposure (n = 5)
Righting times determined after 5 d (n = 5)
coelomocytes _ • _ collected
Neutral red assay carried out (n = 5)
Body compartments dissected (gut, pyloric caeca & tube feet) for Cd body burden analysis
(n = 5)
(b) Mussels individually exposed in 1 L vessels in = 5)
Aqueous Cd concentrations determined at start and after 5 d of exposure (/? = 5)
Clearance rates determined after 5 d (n = 5)
haemocytes collected
Neutral red assay carried out (/7 = 5)
Body compartments dissected (gut & gills) for Cd body burden analysis {n = 5)
Fig. 5.1 Flow chart Illustrating the Integrated experimental designs adopted in the studies to evaluate the behavioural (physiological) and
cytotoxic effects of cadmium (as well as body burdens) in (a) sea stars and (b) mussels.
153

(a) Sea stars Individually exposed in 7 L vessels (3 replicates per concentration)
Following 5 d exposure, 1 d & 5 d recovery 3 sea stars sampled per concentration
coelomocytes collected
Phagocytosis and modified Comet assays carried out (/? = 3)
(b) Mussels Individually exposed in 1 L vessels (3 replicates per concentration)
Following 5 d exposure, 1 d & 5 d recovery 3 mussels sampled per concentration
haemocytes collected
Phagocytosis and modified Comet assays carried out (n = 3)
Fig. 5.2 Flow chart Illustrating the integrated experimental designs adopted In the studies to evaluate the Immunotoxic, genotoxic and
oxidative stress effects of cadmium in (a) sea stars and (b) mussels.
154
5.2.4 Determination of righting times (RT)
Righting times (RTs) of the sea stars were recorded following 5 d exposure to
Cd. RT was determined prior to coelomocyte sample collection (5 sea stars per
concentration) as detailed in Section 2.10. The mean of three times per animal
was calculated.
5.2.5 Determination clearance rate (CR)
Clearance rates (CRs) were determined (5 mussels per concentration), prior to
haemolymph sample collection at the end of the 5 d exposure (as per the
method described in Section 2.9.1). The results were presented in L h" \
5.2.6 Collection of coelomocyte and haemocyte samples
Coelomic fluid and haemolymph samples were collected as per Sections 2.2.2.1
and 2.2.1, respectively. The coelomic fluid/ haemolymph samples were held on
ice until used for the cytotoxicity, immunocompetence, genotoxicity and
oxidative stress assays. The samples were thoroughly mixed by vorlexing prior
to use.
5.2.7 Determination of cellular membrane stability using NRR assay
The cellular membrane stability of the sea star coelomocytes and the mussel
haemocytes (both n = 5) were determined using the NRR assay following the
5d exposure. This assay was earned out as per Section 2.3 and triplicate
samples were assessed for each individual organism and the mean optical
density (at 550 nm) mg'^ protein was determined.
155

5.2.8 Determination of immunotoxicity using phagocytosis assay
The phagocytic activity of coelomocytes and haemocytes was determined by
measuring the uptake of zymosan particles dyed with neutral red dye (as
detailed in Section 2.5). This activity was quantified following 5 d exposure, 1 d
and 5 d recovery periods. Triplicate samples were assessed for each individual
organism (n = 3 for both species) and the mean calculated.
5.2.9 Determination of genotoxicity and oxidative stress using the modified
Comet assay
Determination of the induction of DNA single strand breaks (SSBs) and alkali
labile sites of coelomocytes and haemocytes were determined using the
modified Comet assay, as per the method described in detail in Section 2.8.1.
This was carried out following 5 d exposure, 1 d and 5 d recovery periods, with
three organisms per concentration. Three slides (each with 2 microgel
replicates) were prepared for all the test organisms, one slide was an 'enzyme
buffer' control (to detect single strand DNA breaks), one slide Endo III enzyme
treatment (to detect oxidised pyrimidlnes) and a FPG enzyme treatement slide
(for the detection of oxidised purines). As a required prerequisite for the
modified Comet assay, it was necessary to determine the cellular viability of the
coelomocytes and haemocytes. To this end, the Eosin Y dye exclusion assay
was used as detailed in Section 2.7 - only cell samples with a viability of
> 70 % were used in the modified Comet assay.
156

5.2.70 Chemistry (ICP-MS) analysis
5.2.10.1 Aqueous cadmium concentrations
At the start and following 5 d of the initial sea star and mussel exposures water
samples were taken from all of the exposure vessels. To this end, 10 mL of the
exposure water was removed and placed in polythene screw-top digestion vials
(scintillation vials, Simporl, Canada) (acid-washed ( 5 % HNO3 for at least 2 h)
prior to use). The samples were stored at 4 ''C prior to Inductivity Coupled
Plasma Mass Spectrometry ( ICP-MS) analysis as detailed in the next section
(Section 5.2.10.2).
5.2.10.2 Cadmium body burdens
Prior to Cd body burden analysis it was necessary to dissect the appropriate
body compartments from the sea stars (gut, pyloric caeca and tube feet) and
the mussels (gut and gills). The methodology followed was detailed in Sections
2.11.1 and 2.11.2. Once the tissue samples were dried to a constant weight
they were placed in polythene screw-top digestion vials and digested in 1 mL
concentrated HNO3 in a water bath (70 °C for 2 h). Once cooled, the samples
were diluted with 4 mL of Milli-Q water. Tissue digest aliquots were stored at
room temperature prior to ICP-MS analysis (this process is described In Section
2.11.3) . The software used with ICP-MS was PQ Vision 4.1.2 (Plasma Quod
PQ2 Turbo, Thermo Elemental. Winsford, UK). The data for aqueous Cd
samples was given In pg L' and the tissue digest data in mg kg'^ (Section
2.11.4) .
157

5.2,11 Statistical analysis
Statistical significance between means was determined using one-way analysis
of variance (ANOVA). All values are provided as means ± SEM. Differences
between means which were P < 0.05 were considered significant. All data sets
were analysed using Statgraphics v5.1 software (StatSoft. USA). Any
correlations been variables were determined using the Pearson correlation
coefficient.
5.3. Resul ts
5.3.7 Water quality parameters
Water quality parameters measured daily during all the exposures were in the
normal acceptable range. Temperature ranged from 14.5 to 15.5 °C, salinity
from 34 to 35 PSU, dissolved oxygen levels remained above 70 % saturation
and pH from 8.1 to 8.4.
5.3.2 Chemical analysis
The concentrations of Cd in the exposure water of the M. edulis test vessels
decreased markedly from the start of the exposure through to the final day (5 d).
This trend was not followed in the A. rubens exposure vessels, where Cd
concentrations remained relatively consistent during the 5 d exposure period
(Fig. 5.3). On average the tissue burdens of the mussels were a factor of 10
times greater that those found in the sea stars (Figs. 5.4a and 5.4b). Linear
regression analysis found no significant relationship between the amount of Cd
'lost' during the 5 d exposure from the A. rubens vessels and the amount taken-
up by the three body compartments (gut, pyloric caeca and the tubed feet)
analysed (Fig. 5.5a - c). Conversely moderately strong correlations were
158

observed for the M. edulis vessels and both the gut (R = 0.831. P < 0.001) and
the gills (R = 0.632. P = 0.003) (Fig. 5.6a and b).
159
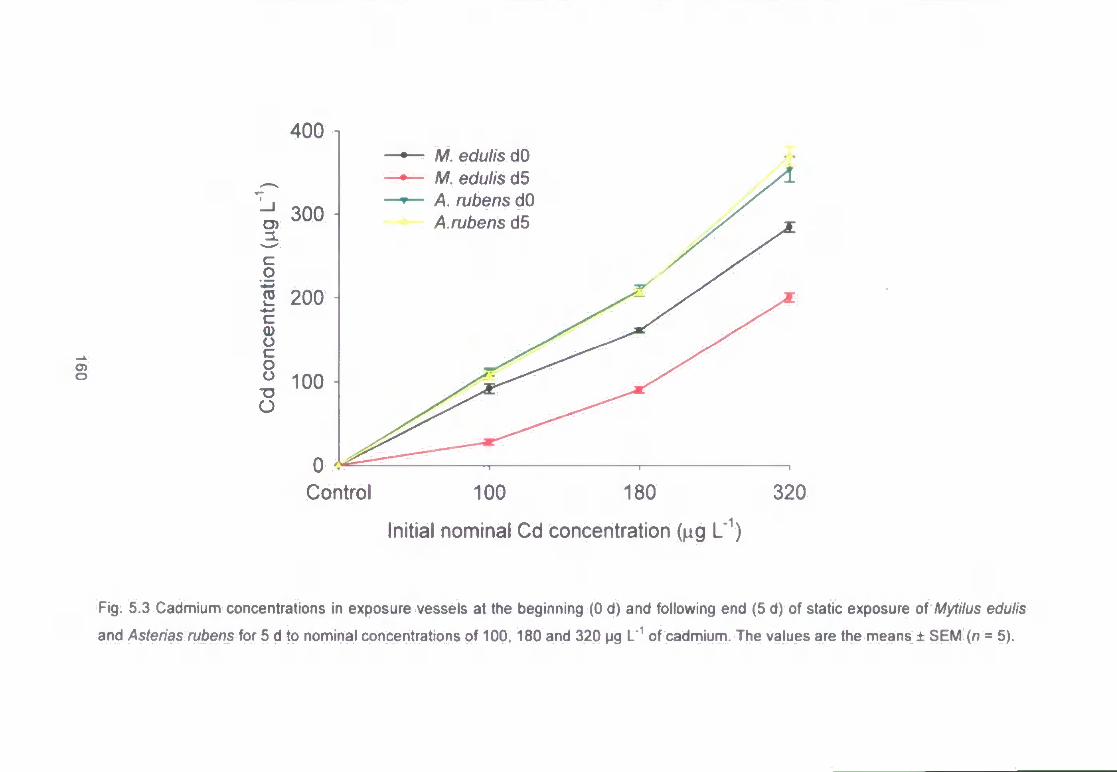
CD O
I I .
0) o c o o •D o
400
300
o 2 200
100
M. edulis dO M. edulis d5 A. rubens dO A.rubens d5
0 '! Control 100 180 320
Initial nominal Cd concentration (^g L' )
Fig. 5.3 Cadmium concentrations in exposure vessels at ttie beginning (0 d) and following end (5 d) of static exposure of Mytilus edulis
and Asterias rubens for 5 d to nominal concentrations of 100, 180 and 320 pg L' of cadmium. The values are ttie means ± S E M (rj = 5).

if) C o CO
c a; u
11 o <D 3
20 1
15
10
5
Gul 1 I Pyloric caeca H i Tube feet
(I))
Control 100 180 320
Cd concentration (pg L" )
to c o
c 0) (J
If u 0) D ifi {/)
350
300
250
200
150
100
50
Gut C = ) Gills
Control 100 180 320
Cd concentration (pg L'')
Fig. 5.4 Cadmium-body burdens for different body components In (a) Asterias rubens and (b) Mytilus edulis following 5 d exposure to
nominal concentrations of 100, 180 and 320 pg L' of cadmium. The values are the means ± SEM (/7 = 5).

(a)
32
^ 24
i I i 6F u
O M 0) 3 cr <
R = 0.250 P= 0.287
0 4 8 12 16 20 24 Tissue Cd burden (mg kg-i)
( b )
32 R = 0.232 P= 0.325
0 4 8 12 16 Tissue Cd burden (mg kg-')
1
g E SJ •o a (0 o 0)
(c)
32 - 2 4
c o
R = -0.004 P= 0.988
0 3 6 9 12 15 18
Tissue Cd burden (mg kg- )
Fig. 5.5 Linear regression analysis illustrating correlations for amount of Cd removed from aqueous solution in the exposure vessels over
the 5 d exposure period (pg L' ) and Cd body compartment burdens (mg kg' ) for the (a) gut, (b) pyloric caeca and (c) tubed feet In
Asterias rubens following 5 d exposure to Cd. The solid line is a linear regression and the dashed lines represent 95 % confidence limits.

(a) ( b )
g 100 o
80 Q) ^
E S
§ °
60
40
20
0
.1 • • ' ' T - 1 • • 1 ' ' ' ' 1 • * . ' • "
-
^ ' ^ a
• ' ' ^ * '" * "
^ /
y
R = 0.831 • -r-.''. . . P< 0.001
0 100 200 300 400 Tissue Cd burden (mg kg-"")
E 100 o
• 4 —
0) 80 > O
1
_ l E O)
3 . 60
O tion
40 C/) 3
O O 0)
(A 20 3
< 0
R = 0.632 P= 0.003
J , , L
0 30 60 90 120 150 Tissue Cd burden (mg kg-"')
Fig. 5.6 Linear regression analysis illustrating correlations for amount of Cd removed from aqueous solution in the exposure vessels over
the 5 d exposure period (pg L' ) and Cd body compartment burdens (mg kg" ) for the (a) gut and (b) gills in Myf//us edufe following 5 d
exposure to Cd. The solid line is a linear regression and the dashed lines represent 95 % confidence limits.

5.3.3 Behavioural (physiological) responses
All of the sea stars successfully self-righted within the allotted 600 s for every
RT assessment. The RT of the sea stars and CR of the mussels did not show a
significant Cd-induced effect across all concentrations (P = 0.838 and 0.180,
respectively) (Figs. 5.7a and b). Correlation analysis found no relationship
between the RT of the sea stars and the Cd body burdens measured in each of
the body compartments (RT : gul, R = -0.027, P = 0.912; Fig. 5.8a; RT ; pyloric
caeca. R = 0.133, P = 0.636; Fig. 5.8b; RT : tubed feet, R = -0.005, P = 0.985;
Fig. 5.8c). Equally, no significant correlations were found between the CR and
Cd body burdens in the mussels (CR : gut, R = 0.147, P = 0.535; Fig. 5.9a; CR ;
gill. R = -0.126, P = 0.596; Fig. 5.9b).
5.3.3 Cytotoxic responses
No significant cytotoxic response was observed in either species (sea stars
P = 0.275, mussels P = 0.749) as measured using the NRR (Figs. 5.10a and
5.10b). No correlations were found between the behavioural and cytotoxic
responses in either species {A. rubens: R = 0.069. P = 0.772; Fig. 5.11a,
M.edulis: R = -0.093, P = 0.696; Fig. 5.11b). Correlation analysis found no
relationship between the NRR of the sea stars and the Cd body burdens of the
body compartments (NRR : gut, R = 0.361, P = 0.118; Fig. 5.12a; NRR : pyloric
caeca, R = 0.036, P = 0.880; Fig. 5.12b; RT : tubed feet, R = -0.077, P = 0.747;
Fig. 5.12c). No statistically significant correlations were found between the NRR
and Cd body burdens In the mussels (NRR : gut, R = -0.192, P = 0.416; Fig.
5.13a; NRR : gill. R = -0.101, P = 0.673; Fig. 5.13b).
164
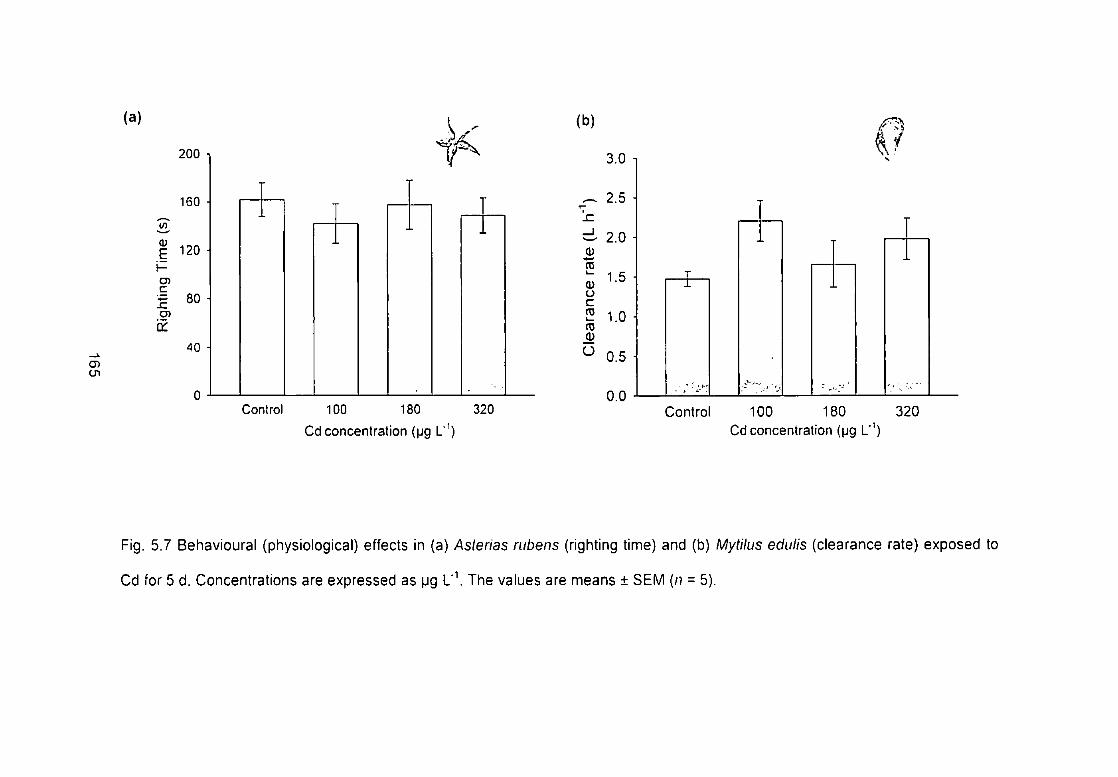
cn
(a)
200
160
I 120 i -
•I 80
40
i
Control 100 180 320 Cd concentration (ijg L' )
(b)
3.0
^ 2.5 1—
^ 2.0 Q) "5 0 o c ni \— nj Q) O
1.5
1.0
0.5
0.0 Control 100 180 320
Cd concentration ( jg L'')
Fig. 5.7 Behavioural (physiological) effects in (a) Asterias rubens (righting time) and (b) Mytilus edulis (clearance rate) exposed to
Cd for 5 d. Concentrations are expressed as pg l ' \ The values are means ± SEM (n = 5).

(a)
I-
0 4 8 12 16 20 24
Tissue Cd burden (mg kg-^)
( b )
220 • R =-0.027' 220
200 • P = 0.912..- 200
180 180
160 • • •
iT(s
;
160
140 A 140
120 120-
100 1 • 1 ' ' 100-
R = 0.113 P = 0.636
0 4 8 12 16
Tissue Cd burden (mg kg-i)
(c) 220
« R = -0.005 200 • P = 0.985...
180 M 1- 160
"T
140 •
120 ' • " V .
100 " i . . 1 . . I . . I . . 1 , . 1 . 1
0 3 6 9 12 15 18
Tissue Cd burden (mg kg-i)
Fig. 5.8 Linear regression analysis illustrating correlations for behavioural (physiological) effects and cadmium body compartment
burdens (mg kg' ) for the (a) gut, (b) pyloric caeca and (c) tubed feet in Asteiias rubens following 5 d exposure to Cd. The solid line
is a linear regression and the dashed lines represent 95 % confidence limits.

(a) (b )
0.5[- R = 0.147 P = 0.535
0 100 200 300 400
Tissue Cd burden (mg kg-^)
a: o
2.5
2
1.5
1
0.5
OL R =-0.126 P = 0.596
0 30 60 90 120 150 Tissue Cd burden (mg kg-i)
Fig. 5.9 Linear regression analysis illustrating correlations for behavioural (physiological) effects and cadmium body compartment
burdens (mg kg" ) for the (a) gut and (b) gill in Mytilus edulis following 5 d exposure to Cd. The solid line is a linear regression and
the dashed lines represent 95 % confidence limits.
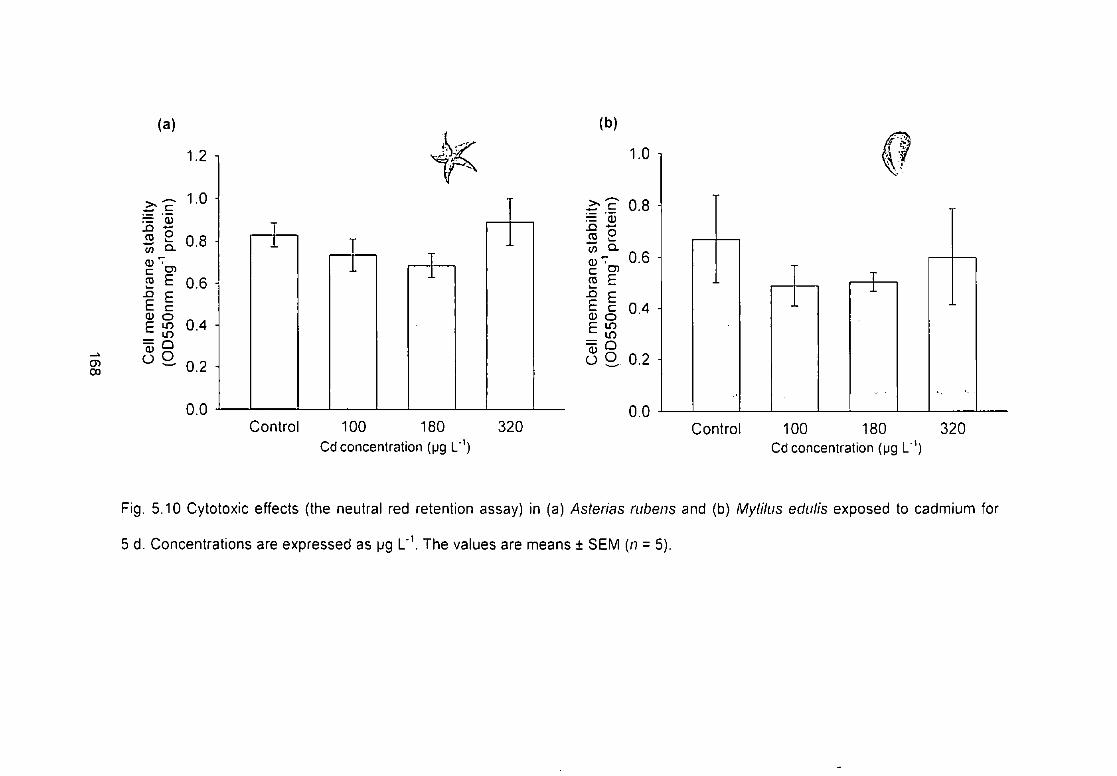
(a)
CD
1.2 1
2 E 0.6
f 1 E 0.4
o 2. 0.2
0.0
(b)
Control 100 180 Cd concentration (pg L ')
320
1.0
0.8
^ E
E c 0 4
^ in
O O 0.2
0.0 Control 100 180
Cd concentration (pg L" ] 320
Fig. 5.10 Cytotoxic effects (the neutral red retention assay) in (a) Asterias rubens and (b) Mytilus edulis exposed to cadmium for
5 d. Concentrations are expressed as pg l ' \ The values are means ± SEM {n = 5).

CD
(a)
220 200
^ 180
(A
H 160
140
120
100
R = 0.069 P = 0.772
0.55 0.75 0.95 1.15 1.35
NRR (opticaldensity mgprotein-i)
( b )
2.5
0.5
0
R = -0.093 F = 0.696
0 0.3 0.6 0.9 1.2 1.5
NRR (opticaldensity mgproteln-i)
Fig. 5.11 Linear regression analysis illustrating correlations for behavioural (physiological) and cytotoxic effects in (a) Asterias
rubens and (b) Mytilus edulis following 5 d exposure to Cd. The solid line is a linear regression and the dashed lines represent 95 %
confidence limits.
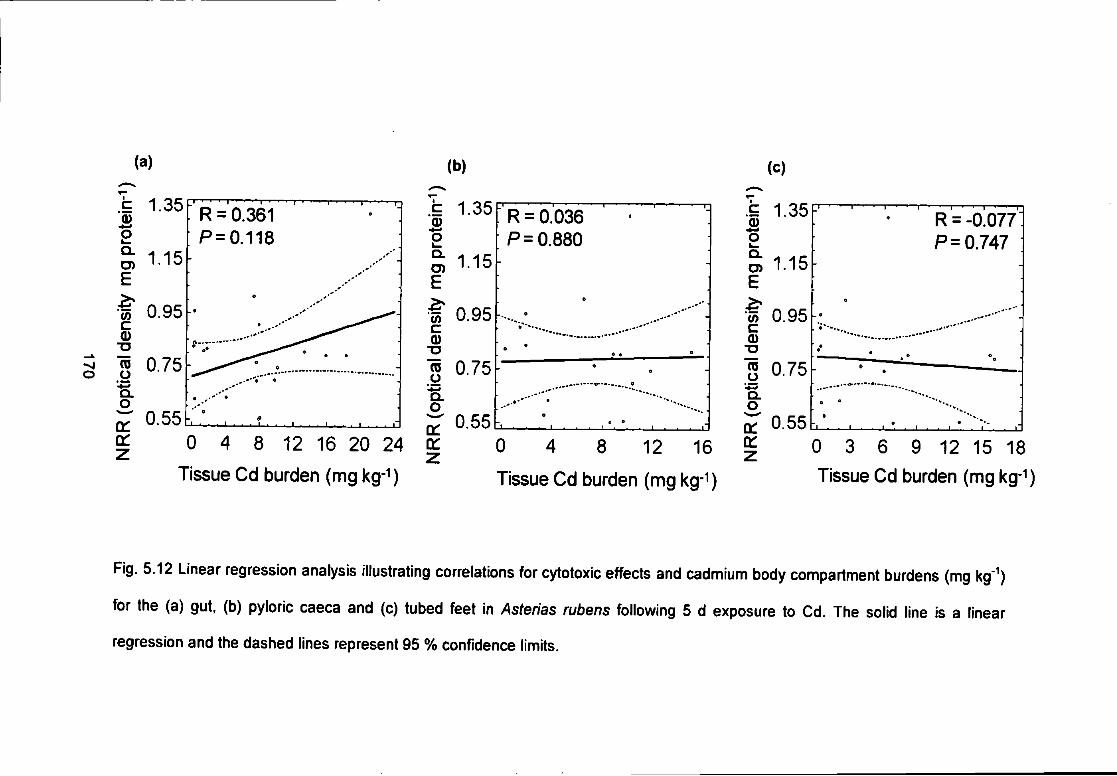
(a) (b ) (c)
- J o
.E 1.35 a> 2 S 1.15 E
S 0.75 Q.
a: a:
0.55
R = 0.361 P = 0.118
s 0.95
0 4 8 12 16 20 24
Tissue Cd burden (mg kg-i)
.9 1.35
2 S 1-15 E
• f 0.95 c
1 O
0.55
R = 0.036 P= 0.880
0 4 8
Tissue Cd burden
12 16
(mg kg-1)
g 1.35 c 0) o Q. O) E
c
0)
(0
1.15
0.95
0.75
0.55
R = -0.077 P= 0.747
0 3 6 9 12 15 18 Tissue Cd burden (mg kg-*")
Fig. 5.12 Linear regression analysis illustrating correlations for cytotoxic effects and cadmium body compartment burdens (mg kg" )
for the (a) gut. (b) pyloric caeca and (c) tubed feet in Asterias rubens following 5 d exposure to Cd. The solid line is a linear
regression and the dashed lines represent 95 % confidence limits.

(a) (b)
1 c
1.5 Q) "5 k_ 1.2 Q.
E 0.9
c 0.6 0)
0.6 TD 16 O 0.3
V-»
0 a:
z
R =-0.192 P = 0.416
0 100 200 300 400
Tissue Cd burden (mg kg-i)
I Q.
E
c
0)
CO
o •s . a:
1.5
1.2
0.9
0.6
0.3
0
R =-0.101 P = 0.673
0 30 60 90 120 150
Tissue Cd burden (mg kg-i)
Fig. 5.13 Linear regression analysis illustrating correlations for cytotoxic effects and cadmium body compartment burdens (mg kg" )
for the (a) gut and (b) gill in Mytilus edulis following 5 d exposure to Cd. Ttie solid line is a linear regression and the dashed lines
represent 95 % confidence limits.

5.3.4 Immunocompetence responses
The phagocytosis assay showed a reduced immunocompetence response after
5 d for the sea stars at the 100 and 180 pg L' exposure levels when compared
to the control means (P = 0.031). This response was still impaired after 1 d in
clean sea water (P = 0.002). but returned to control levels after the 5 d recovery
period (P = 0.169) (Fig. 5.14a). The exposed mussel haemocytes showed a
reduced mean phagocytic capacity across all concentrations after 5 d
(P = 0.012), there was no difference between the concentrations. This response
returned to control levels following 1 d recovery (P = 0.467) and remained so
after 5 d recovery ( P = 0.972) (Fig. 5.14b).
5.3.5 Genotoxic and oxidative stress responses
Cellular viability in the coelomocyles and haemocytes (as measured by the
exclusion of Eosin Y) exceeded the required 70 % viability required for use In
the modified Comet assay. For the sea stars a significant increase in DNA
SSBs as measured by the buffer control Comet assay slides was observed after
the 5 d exposure period for the two highest concentrations (P = 0.0004; Fig.
5.15a). The percentage tail DNA of the exposed coelomocytes returned to
control levels after the I d recovery period and remained there after the 5 d
recovery period (Fig. 5.17a). Significant increase in oxidised pyrimidines (Endo
III enzyme) ( P = 0.025) were detected for the 180 and 320 pg L" exposed sea
stars and an increase in the amount of oxidised purines (FPG enzyme) (P =
0.034) were measured at all exposure concentrations (Fig. 5.15b and c). As
with the DNA SSB these returned to control levels following 1 d recovery in
clean seawater. Figure 5.16 illustrates the repair of DNA damage detected by
the modified Comet assay. The figure is based on the same data presented in
172

Fig. 5.15, but better illustrates the repair kinetics over the recovery periods of
the appropriate modified Comet conditions (buffer control. Endo II and FPG) as
opposed to the dose-effects illustrated in the former figure. A moderately strong
correlation was found between immunoloxic (phagocytosis assay) and
genotoxic responses (modified Comet assay - buffer control) following 1 d
recovery (R = -0.579, P = 0.049; Fig. 5.17b). No correlations were found for the
Endo III and FPG treated Comet slides and the phagocytic response of the sea
stars (Figs. 5.18 and 5.19).
There was no statistically significant increase in DNA strand breaks for the
M. edulis haemocytes following 5 d exposure ( P = 0.072), although the mean
values appeared higher in the exposed mussels compared to the controls. But,
following the 1 and 5 d recovery periods significances increases were observed
(P = 0.008 and 0.001) (Fig. 5.20a). The enzyme Endo III delected a significant
increase in oxidised pyrimidines following 5 d exposure and 1 d recovery
(P = 0.001 and 0.004). The values returned to control levels after 5 d recovery
(P = 0.103) (Fig. 5.20b). A significant increase in oxidised purines (FPG
enzyme) were also observed after 5 d exposure and 1 d recovery (P = 0.029
and 0.001, respectively). The values returned to control levels after 5d recovery
( P = 0.419) (Fig. 5.20c). Figure 5.21 shows the repair kinetics of DNA damage
delected by the modified Comet assay. Moderately strong correlations were
present between immunoloxic (phagocytosis assay) and genotoxic/ oxidative
stress responses (modified Comet assay) following 5 d exposure for all the
modified Comet assay conditions, i.e. buffer control (R = -0.604, P = 0.038;
Fig. 5.22a), Endo III (R = -0.696, P = 0.012; Fig. 5.23a) and FPG (R = -0.704,
173

P= 0.011; Fig. 5.24a). No statistically significant correlations were present for
any of the recovery periods.
174

(a)
(J -o "c
w °-(U O)
y E
U o E
N
2.5 1
^ 2.0
1.5
1.0
0.5
0.0
d5 ' ' Recovery d1 warn Recovery d5
Control 100 180
Cd concentration (jjg L' )
320
(b)
u -
ro o E N
2.5
X. 2.0
1.5
1.0
0.5 ^
0.0
I I Recovery d1 • • 1 Recovery d5
Control 100 180 320
Cd concentration (fjg L'')
Fig. 5.14 Immunotoxic effects in (a) Asterias rubens and (b) MytHus edulis exposed to cadmium for 5 d. Concentrations are expressed as
pg L'V The values are means ± SEM (/? = 3). * Indicates a significant difference from controls at, or above, the 95 % confidence level.
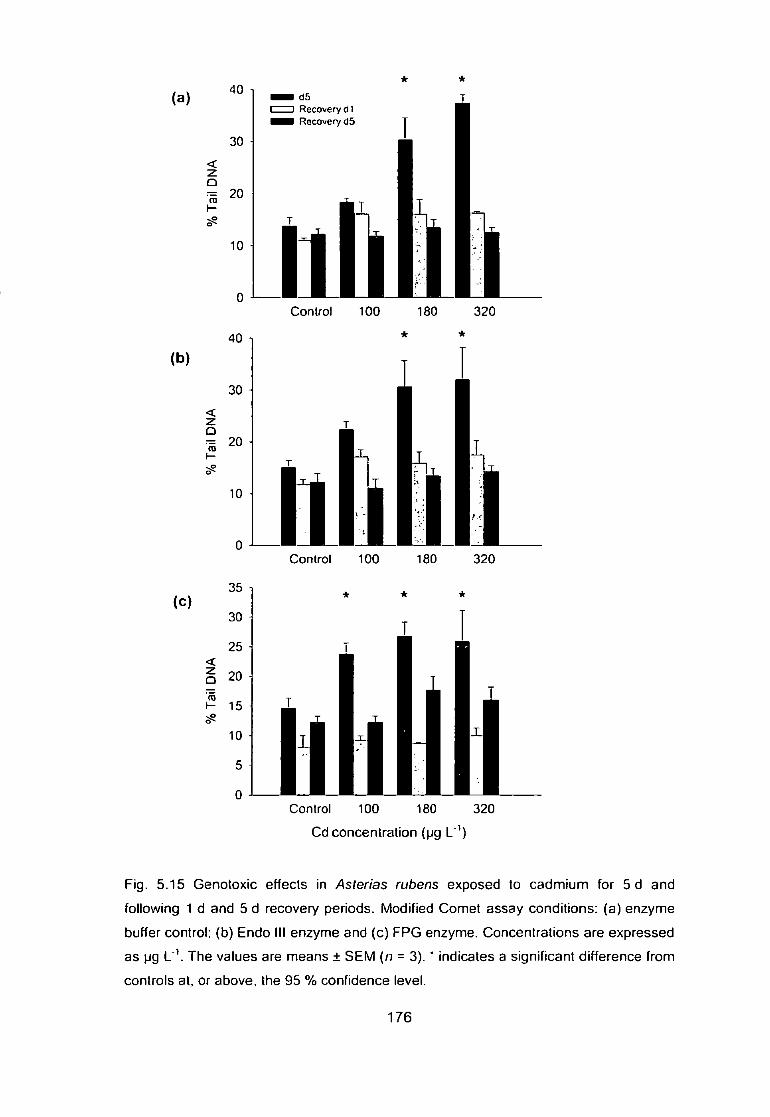
(a) 40
(b)
(c)
d5 I I Recovery dl
RecovervdS
Control 100 180 320
Control 100 180 320
Control 100 180 320
Cd concentration (pg L' )
Fig. 5.15 Genotoxic effects in Asterias rubens exposed to cadmium for 5 d and
following 1 d and 5 d recovery periods. Modified Gomel assay conditions: (a) enzyme
buffer control; (b) Endo III enzyme and (c) FPG enzyme. Concentrations are expressed
as Jg L'\ The values are means ± SEM {n = 3). ' indicates a significant difference from
controls at, or above, the 95 % confidence level.
176
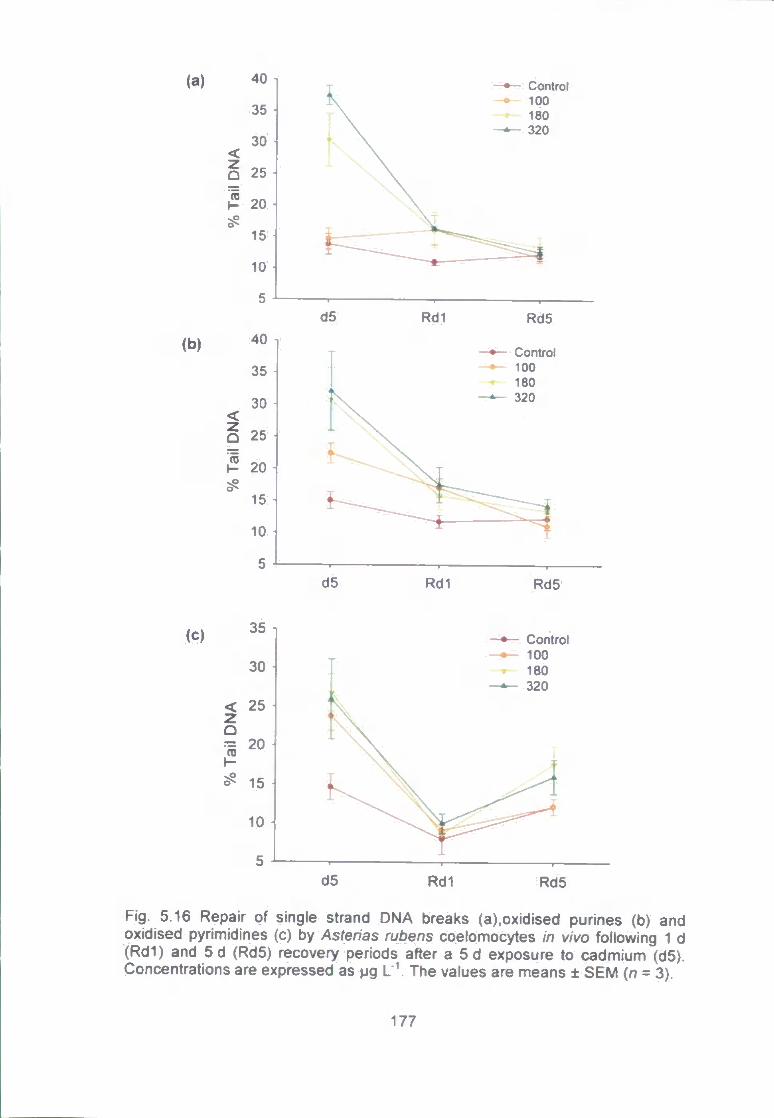
(a)
(b)
40
35
30
< Q 25
^ 20
15
10
5
40
35
30
< Q 25
J 20
15
10
5
Control
d5 Rdl Rd5
Control 100 180
d5 Rd1 Rd5
(c) 35
30
< 25
^ 20
^ 15
10
Control
d5 Rdl Rd5
Fig. 5.16 Repair of single strand DNA breaks (a).oxidised purines (b) and oxidised pyrimidines (c) by Asterias rubens coelomocytes in vivo following 1 d (Rd1) and 5 d (Rd5) recovery periods after a 5 d exposure to cadmium (d5). Concentrations are expressed as pg L V The values are means ± SEM (n = 3).
177

( »
I a> c (0 s Q. 2 M Q. " E
Q . O
o E
2.5
2
1.5
1
0.5
• v .
R»-0.150 P= 0.643
10 20 30 40 Comet (% tail DNA)
(b)
R =-0.579 P= 0.049
w Q. 0.8
1
N 10 14 18 22
Comet(% tail DNA)
(c)
2 ^ 1.3
o E
0 5
1 • • • 1 • • • 1 J
• •
/ .* R = 0.380
• j — ^ — - • -
P= 0.223 • 1 — - — » — • — . — • — » '
10 12 14 16 18 Comet (% tail DNA)
Fig. 5.17 Linear regression analysis illustrating correlations for immunotoxic (phagocytosis assay) and genotoxic responses (modified
Comet assay buffer enzyme control treatoDent) in Asterias rubens following (a) 5 d exposure to cadmium, (b) 1 d recovery and (c) 5 d
recovery. The solid line is a linear regression and the dashed lines represent 95 % confidence limits.
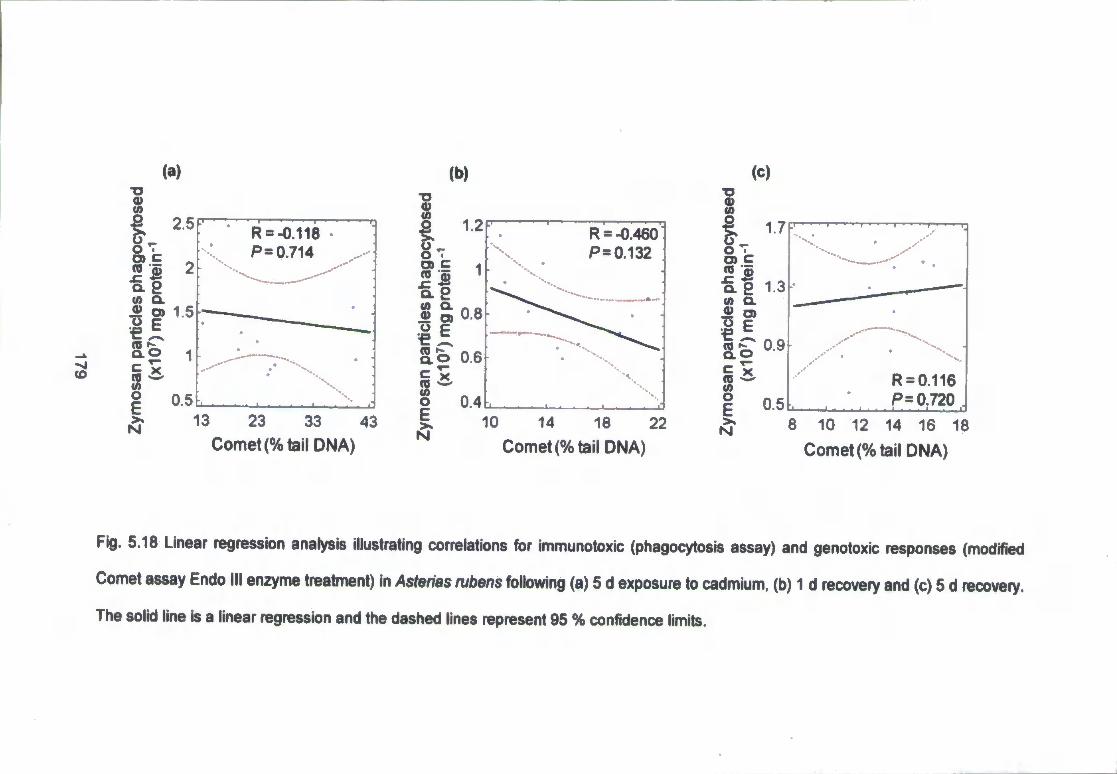
(«)
2.5
E >> N
R«-0.118 P=0.714
« o» 15
13 23 33 43 Comet (% tail DNA)
2.0 0,6
o E
0 4
R = -0.460:
• •
•
P=0132
— .. fc—«
10 14 18 22 Comet (% tail DNA)
1.3
' . • • • T • • • T J
< • •
R = 0.116 •
"l • • • 1 • 1 •
P= 0.720 . i • • . 1 . • . 1 . . . 1
8 10 12 14 16 18
Comet (% tail DNA)
Fig. S.18 Linear regression analysis illustrating correlations for immunotoxic (phagocytosis assay) and genotoxic responses (modified
Comet assay Endo III enzyme treatment) in Asterias rubens following (a) 5 d exposure to cadmium, (b) 1 d recovery and (c) 5 d recovery.
The solid line is a linear regression and the dashed lines represent 95 % confidence limits.
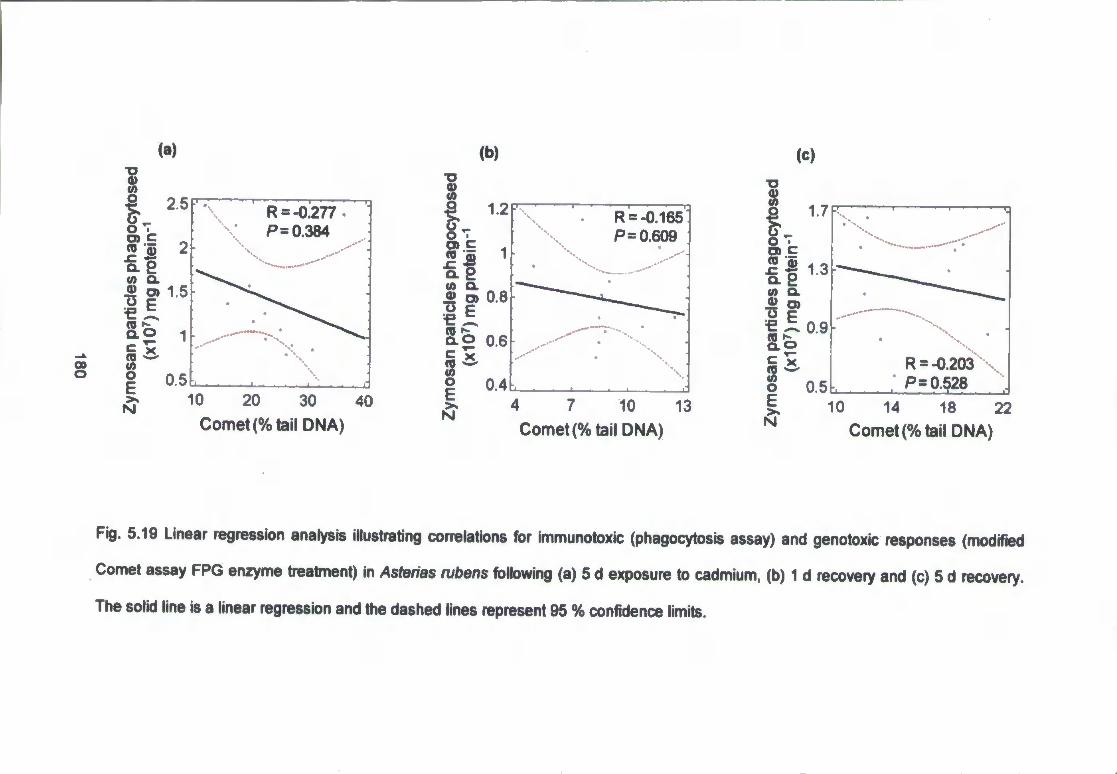
C30 O
TO Q.
(b) (c)
R =-0.277 P = 0.384
10 20 30 40 Comet (% tail DNA)
R =-0.165 P = 0.609
9> a> 0.8
Q - O 0.6
in CL 0)
Comet (% tail DNA)
O
I 0 5
R =-0.203 P= 0.528
10 14 18 22 Comet (% tall DNA)
Fig. 5.19 Linear regression analysis illustrating correlations for immunotoxic (phagocytosis assay) and genotoxic responses (nwdified
Comet assay FPG enzynte treatment) in Asterias rubens following (a) 5 d exposure to cadmium, (b) 1 d recovery and (c) 5 d recovery.
The solid line is a linear regression and the dashed lines represent 95 % confidence limits.
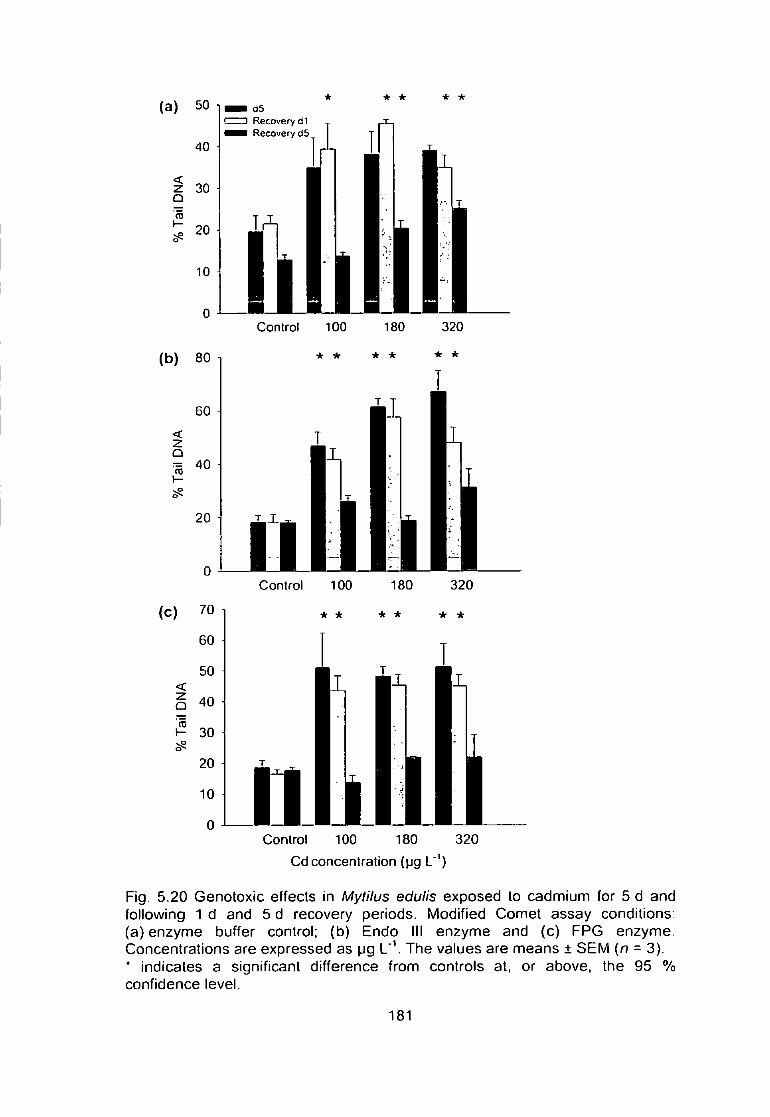
(a) 50
40
* *
< Q TO
(b) 80
60
< Q ^ 40
20
d5 Recovery d1 Recovery d5
0 -L
) 70 1
60
50 < Q 40 • CD
1 - 30
20
10
0
Control 100 180 320
* * * * * *
Control 100 180 320
* * * * * *
Control 100 180 320 Cd concentration {pg L'')
Fig. 5.20 Genotoxic effects in Mytilus edulis exposed to cadmium for 5 d and following 1 d and 5 d recovery periods. Modified Comet assay conditions: (a) enzyme buffer control; (b) Endo III enzyme and (c) FPG enzyme. Concentrations are expressed as pg L'V The values are means ± SEM (n = 3). * indicates a significant difference from controls at, or above, the 95 % confidence level.
181
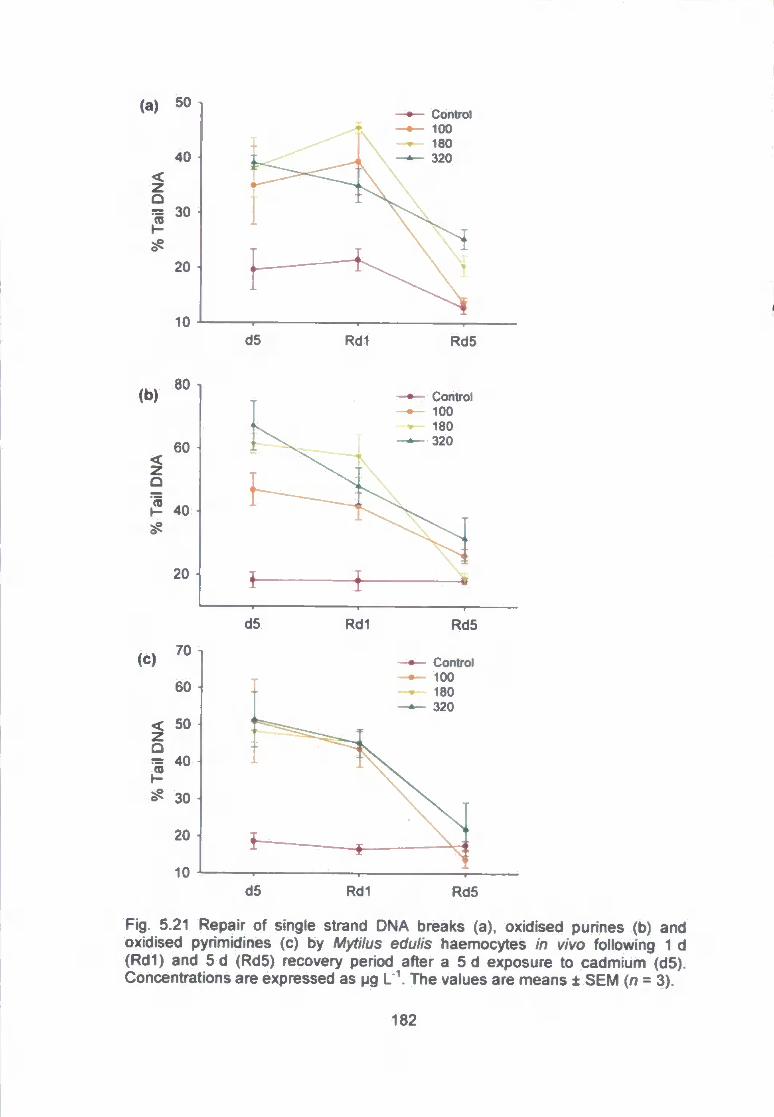
(a) 50
40
1 30
20
10 d5 Rdl Rd5
(b)
Q
I-
80
60
40
20
Control
d5 Rdl Rd5
Control 100 180 320
^ 30
Rd5
Fig. 5.21 Repair of single strand DNA breaks (a), oxidised purines (b) and oxidised pyrimidines (c) by Mytilus edulis haemocytes in vivo following 1 d (Rd1) and 5 d (Rd5) recovery period after a 5 d exposure to cadnfiium (dS). Concentrations are expressed as pg L'\ The values are means ± SEM (n = 3).
182

(a) (b)
R =-0.604 P= 0.038
E >« N 0 10 20 30 40 50
Comet (% tail DNA)
m<i. 0.9 Q.
R = 0.057 P=0.86
15 30 45 60
Comet (% tail DNA)
I CQ 'S
^ E
?-E
1.5
1.4
1.3
1.2
1.1
1
• R = 0.034 • P=0.915:
•
"l . . . . 1 . . . . t . . . . 1 . . . . r
10 15 20 25 30
Comet (% tail DNA)
Fig. 5.22 Linear regression analysis illustrating correlations for immunotoxic (phagocytosis assay) and genotoxic responses (nrwdified
Comet assay buffer enzyme control treatment) in Myfr/us edufe following (a) 5d exposure to cadmium, (b) 1 d recovery and (c) 5d
recovery. The solid line is a linear regression and the dashed lines represent 95 % confidence limits.

00 4: o
E
R =-0.696 P= 0.012
Si
9> 1.5
0 20 40 60 80
Comet (% tail DNA)
( O S P= 0.535 J
(c)
0 20 40 60 80
Comet (% tail DNA)
Q l
E
03
(/) 0) o (0 "X Q . O
m £ (D —" (0 O
1.5
1.4
1.3
1.2
1.1
1
•
T • • • • I • • • • 1 • • • • t • • • ' 1J
R = 0.029 P= 0.929 ^
•
•
' l . . . . 1 . . . . 1 . . . . 1 . . . . 1 • • • • 1 X
15 20 25 30 35 40 45
Comet (% tail DNA)
Fig. 5.23 Linear regression analysis illustrating correlations for immunotoxic (phagocytosis assay) and genotoxic responses (modified
Comet assay Endo III enzyme treatment) in Mytilus edulis following (a) 5 d exposure to cadmium, (b) 1 d recovery and (c) 5 d recovery.
The solid line is a linear regression and the dashed lines represent 95 % confidence limits.

CO
R = -0.704 P= 0.011
Q ) If)
0 20 40 60 80
Comet (% tail DNA)
(b)
It M Q .
03 (/) o E N
2 [ ' ' •—• ' ' ' • —
R = 0142 P= 0.660
15 . •
1
•
•
•
0 5 "i . . . . 1 . . . .
• * . . . . t . • • • r
15 25 35 45 55
Comet (% tail DNA)
0)
t-M a 1.3
• I I I s ' x 1.1 [
1 i o E N
R = 0.029 P= 0.929
10 20 30 40
Comet (% tail DNA)
Fig. 5.24 Linear regression analysis illustrating correlations for imnounotoxic (phagocytosis assay) and genotoxic responses (modified
Comet assay FPG enzyme treatment) in Wyft/us edu//s following (a) 5 d exposure to cadmium, (b) 1 d recovery and (c) 5 d recovery. The
solid line is a linear regression and the dashed lines represent 95 % confidence limits.
5.4 D iscuss ion
The suite of biomarkers used in this study clearly illustrated that the apparent
toxicity of the heavy metal cadmium varied with the level of biological
organisation Investigated. The degree of bioaccumulatlon of Cd in the mussels
when compared to the apparent lack thereof in the sea stars posed some
interesting questions.
The chemistry analysis of Cd levels in the test vessels at the end of the 5 d
exposure, coupled with the cadmium burden present in the different body
compartments of the two species yielded very interesting results. In the sea star
exposure vessels only a very nominal loss of Cd from the exposure water over
the 5 d period was measured. This was in stark contrast to the mussel vessels -
where there was on average mean loss of 48 % of Cd across all the exposure
vessels. Unsurprisingly, the amount of Cd accumulated in the tissues of the
mussels was substantially greater than that measured in the sea stars (a factor
of fifteen times higher). Control animals of both species showed very low Cd
concentrations in all the body compartments analysed. The gut (digestive gland)
of the mussels was found to have accumulated more Cd than the gills. This was
as expected because the gills are a more transient organ for the detection of the
accumulation of xenobiotics. were as the accumulation in the gut can indicate
longer term exposure. For the sea stars the tubed feet showed the least amount
of Cd uptake. This is to be expected as the tube feel were analysed as a
surrogate for the gill tissue analysed in the mussels, as the tube feet are the
primary site of oxygen uptake in asteroids (Lawrence. 1987) and are therefore a
very transient tissue for the detection of the bioaccumulation of xenobiotics. On
average across all the concentrations the gut and pyloric caeca showed a
186

similar amount of metal uptake in the sea stars. The pyloric caeca of A. rubens
has been shown to be a indicator of short-term (days to weeks) metal exposure,
with metals been rapidly taken up and then lost (Temara et al., 1998).
Following laboratory exposure to 50 pg L' Cd for sixteen weeks, Cd
accumulation was highest in the pyloric caeca compartment of A. rubens, then
the body wall, the stomach and least in the gonads with the highest
concentration being 10 pg g"' Cd in the pyloric caeca (den Besten et al., 1989).
The authors noted that compared to other marine invertebrates, sea stars
accumulated relatively low levels of Cd. The pyloric caeca of asteroids is
thought to be Involved in the digestion of food which passes to it from the gut,
the absorption of the products of digestion and the storage of nutrient reserves
(Anderson, 1953). This would explain why the gut and pyloric caeca showed
similar degrees of Cd bioaccumulatlon in this study. One possible explanation
for the apparent lack of uptake of Cd by the sea stars from the water column is
that the metal was taken up prior to the 5 d sampling period, yet was released
by the body compartments back into the water column. But, the initial
(undetected) Cd uptake was sufficient to adversely affect both the
immunocompetence and genotoxicity responses assessed in the sea stars.
The behavioural (physiological) endpoints studied for both species. RT
(A. rubens) and CR (M. edulis), did not yield any statistically significant results
following five day exposure to Cd, There Is a paucity of data on the effects of
heavy metals, especially Cd, on biological endpoints operating at the whole
organism level in aquatic invertebrates. Righting time of the cushion star
Asterina gibbosa was investigated following exposure to Cd (0.5, 1.0 and
5.0 pg L'^) for 2 and 7 d. The response was impended (that is RTs increased) at
187

all exposure concentrations following 2 d duration, but this trend was not
observed following the 7 d exposure period (Bowett, 2002). Sublethal
concentrations of sediment-bound zinc (Zn - a heavy metal, with similar
properties to those of Cd) was found to impede the burrowing response of the
brittle star Ophiophragmus filograneus (Clements et al., 1998). The brittle stars
were exposed to high levels of Zn in sediment (119 mg kg'^ dry sediment) for
21 d and their behaviour recorded at least every 48 h. As the duration of the
exposure increased the animals exhibited a suppressed tendency to burrow and
to adopt a natural feeding position in the sediment (i.e. central disc submerged
in the sediment with all five arms held prominently in the water column). The
burrowing behaviour of an isopod from the Baltic Sea has been investigated
after exposure to sediments spiked with Cd (Pynnonen, 1996). The natural
burrowing behaviour of Saduria entomon (a brackish water benthic scavenger)
was impaired when the isopod was presented with sediments containing
35 pg g"^ Cd. But, these findings could have been due to the detection and
avoidance of the sediment-bound Cd by the animal, rather than being as a
result of the metal impeding one the complex components of the physiological
instinctive burrowing response. The lack of any evident behavioural
(physiological) responses In this present study may have been due to the
exposure concentrations and duration used in the experimental design.
The lack of a cytotoxic effect in either the sea stars or mussels suggests that
both organisms were able to 'cope' with the metal by accumulating and
detoxifying the Cd in their lysosomes, therefore no deleterious effect was
observed for the cellular membrane stability of either the coelomocytes or
haemocytes. Cadmium was found to exert a cytotoxic effect on the lysosomes
188
of the asteroid Asterina gibbosa at concentrations as low as 0.5 [jg L' for 2 d
(Bowelt, 2002). The NNR microtitre plate technique when used as an indicator
of cell viability showed a LC50 of 400 pM (45 mg L'^) Cd following 24 h in vitro
exposure of M. galloprovincialis haemocytes (Olabarrieta et al., 2001).
Cadmium chloride at in vitro concentrations of 50 (5.62 mg L*^) for 1 h
reduced the amount of NR dye taken-up by the mussel haemocytes (Dailianis,
2009). The NR uptake of M. edulis haemocytes was found to be elevated
following a 7 d exposure to 400 pg L' Cd. indicating that there was actually an
increase in either the number of lysosomes and/ lysosomal compartment size in
the haemocytes (Coles et al., 1995).
The immunotoxic effect of the Cd, as detected by the phagocytosis assay, in
both species may be as a result of the lysosomes of the animals accumulating
the metal to detoxify it. Although both species had reduced immunocompetence
following 5 d exposure to the metal, the mussels returned to control levels after
just 1 d recovery in clean seawater, were as the sea stars required five days
recovery to return to control levels of immunocompetence. This indicates that
the mussels had a more efficient mechanism than the sea stars to reverse the
cadmium-induced immunotoxicity. Cadmium at concentrations of 40 and
400 pg L' had no statistically significant effect on the phagocytotic ability of
M. edulis haemocytes following in vivo exposure (Coles et al.. 1995). The NNR
microtitre plate technique when used as an indicator of cell viability showed a
LC50 of 400 pM Cd following 1 h. In vitro exposure of M. galloprovincialis
haemocytes to Cd at concentrations up to 2000 pM for 1 h stimulated the
phagocytotic of the cells in a non dose-dependent manner {Olabarrieta et al.,
2001). When A. rubens were fed Cd contaminated mussels the Immune cells in
189

the coelomic fluid showed a reduced phagocylotic ability and there was an
increase In the production of ROS (Coteur et al., 2005b). The activity of
lysozyme (an enzyme involved in immune response to a bacterial threat) has
been quantified in the epidermal mucus of the spiny sea star Marthasterias
glacialis following in vivo exposure to 5 mg L' of Zn (a heavy metal, with similar
properties to those of Cd) (Stabili and Pagliara, 2009). After a 2d exposure the
lysozyme-like activity of the mucus was inhibited, evident by the fact that the
reduced capacity mucus aliquots to clear (lyse) areas of the bacteria
Micrococcus lysodeikticus from a Petri dish. Once the sea stars had been
subjected to a 2 d recovery period (in clean seawater) this immune response
returned to control levels. Manganese (Mn), a heavy metal similar to Cd,
induced a suppressed immunotoxic response in A. rubens following a 5 6 in
vivo exposure al 15 mg L' (Oweson el al., 2008).
In the case of A. rubens, the modified Comet assay results indicated that the
sea stars were able to repair both DNA SSB (buffer control results) and
Cd-induced oxidative damage (Endo III and FPG enzyme treatments) after just
1 d recovery. The trend observed with the mussels was some what less clear.
The buffer control data showed a lag between the 5 d exposure period and the
increase in DNA SSB as indicated by percentage tail DNA. A significant
increase in genotoxic effect was not observed following the 5 d Cd exposure,
but was measured after I d recovery for all concentrations and this remained
elevated for the top two concentrations (180 and 320 pg L'^) on the 5 d
sampling period. The oxidative damage was not repaired (i.e. had not returned
to control levels) until the 5 d recovery sampling day. These results indicate that
there is a difference in the relative capabilities of these two phylogenetically
190
different species in their ability to cope with, and repair. DNA SSBs and
oxidative stress.
Oxidative stress is caused by an increase in production of ROS to such an
extent that the organism's antioxidant defence mechanisms are overwhelmed.
Reactive oxygen species are produced during normal metabolic processes
involving oxygen (Azqueta et al., 2009), but their production may increased as a
result of the presence of a toxicant. An organism's main way of coping with
oxidative DNA damage is through a repair pathway termed the base excision
repair (BER) pathway (Nilsen and Krokan, 2001). The BER pathway is initiated
by DNA glycosylases, which recognise and remove damaged bases (Hartwig,
1998). Once the damaged base is removed the gap is repaired by the addition
of a new base and the DNA helical structure is restored by DNA ligase (Azqueta
et al., 2009). A second repair pathway the nucleotide excision repair (NER)
pathway repairs much larger DNA lesions consisting of about 25 to 30 bases
(Azqueta et al., 2009). This process can involve in the region of 15 to 20
different enzymes and proteins in mammalian systems (Hartwig, 1998).
There Is only a very small body of previous work which has Investigated the
Cd-induction of DNA SSBs in marine bivalves and none In echlnoderms. Single
strand DNA breaks (as measured by the alkaline elutlon of DNA) were
significantly Increased following a 5 6 in vivo exposure of M. galloprovincialis to
184 pg L' Cd (Bolognesi et al., 1999). But, overall the authors concluded that
Cd was only a weakly genotoxic agent. A second study which employed the
modified Comet assay (FPG enzyme only) on M. edulis gill cells following a
10 d exposure to 10 and 200 pg L'\ found an increase in DNA SSBs at the
191

highest exposure concentration (Emmanouil et al., 2007). But, no increase in
FPG sensitive sites were measured, despite the oxidative potential of the metal
much to the surprise of the authors, given the oxidative potential of Cd. The
authors hypothesised that the increase in SSBs was caused by the inhibition of
the BER pathway (Emmanouil et al., 2007). When the results of this present
study are taken into account it is appropriate to hypothesise that the
echinoderms {A. rubens) are more tolerant than bivalves {M. edulis) to
genotoxic properties of Cd, whilst also possessing a better capacity to repair
oxidative damage. This could be due to the BER pathway in the bivalves being
more sensitive than that present in the echinoderms. Therefore the ability of the
mussels to repair the oxidative stress was suppressed when compared to that
of the sea stars - which was evident in the sea stars recovering from the
genotoxic and oxidative stress effects of the Cd after only 1 d in clean seawaler,
were as the mussels had not fully recovered following 5 d in clean sea water.
To conclude, Cd exposure did not induce behavioural (physiological) or a
cytotoxic responses in either the sea stars or mussels. But, immunoloxic,
oxidative stress and genotoxic effects were observed. The sea stars recovered
from the oxidative stress and genotoxic effects of the metal at a faster rate than
the mussels - indicating that the echinoderms possessed a more efficient
mechanism to cope with, and repair, this assault than the molluscs.
192

CHAPTER 6
General discussion
193

6. General d iscuss ion
The overall objective of these studies was to add the small volume of scientific
literature that has utilised the adult stages of echinoderms in toxicological
studies. Although a cross-section of echinoderms have been utilised in
biomoniloring studies, their use, to date, in laboratory-based ecotoxicological
studies have not been very comprehensive. Through the implementation of a
range of different non-destructive biomarker techniques on a selection of
echinoderm species following exposure to representative marine pollutants It
has been possible to fulfil this objective. By the concurrent use of a more
commonly used ecotoxicological test species, namely the blue mussel, Mytilus
edulis it has been possible to elucidate the experimental results in terms of the
relative sensitivity of the echinoderms to bivalve molluscs. As discussed in the
relevant section of the present study, generally the echinoderm test species
were found to be more sensitive to exposures to a cross-section of aquatic
xenobiotics.
One possible reason for the greater sensitivity of the echinoderms compared to
the molluscs could be considerable difference in surface area of the organisms.
For instance, when one compares the surface area of an adult sea star used to
that of an adult blue mussel, it is readily obvious that the echinoderm has a
much greater surface area than the mollusc. So. despite the fact that both
organisms have an open vascular system, and are therefore highly susceptible
to any aqueous contaminants, the sea stars are more likely to take-up more of
the contaminant than the mussels.
194
Respiration occurs over the total surface area of the sea star through
microscopic papulae (dermal branchiae) (Cobb, 1978) which are present across
the outer dermis of the animal and also through the tube feel (Smith, 1937). In
the mussels respiration only occurs in the gills (Bayne, 1976). Possible routes of
uptake would include absorption across the 'skin' or gills and by ingestion of the
surrounding water. As food was withheld during all exposures (in line with many
short-term regulatory aquatic toxicology studies), ingestion of 'contaminated'
exposure water can be excluded as a potential route of contaminant uptake.
A second reason which may account for the greater sensitivity of the
echinoderm species may be their more 'evolutionary advanced' capability to
metabolise xenobiotics. As mentioned previously, the echinoderms are more
closely related to the chordates (vertebrates) than the molluscs - and for that
matter, all of the other more frequently used aquatic invertebrate test species
used in toxicology (for example, the annelids and crustaceans). Therefore,
when the echinoderms were exposed to pollutants that required metabolic
activation (i.e. the pharmaceutical, cyclophosphamide and the polycycllc
aromatic hydrocarbon, benzo(a)pyrene) they would convert these compounds
into their toxic 'daughter' products at a faster rate than the mussels. As a result,
these metabolic by-products would result in deleterious consequences which
were much more evident In the echinoderms compared to the mussels -
despite the fact that the concurrent exposures were at the same concentrations
and duration for all the species examined.
It is important to keep In mind that whilst discussing these points of relative
sensitivity of the two phyla investigated, the only 'target' cells Investigated In the
195

present studies were the coelomocytes and haemocyles. That is, no other
potential target cells/ tissues that may have been adversely affected by the
contaminants were examined, for example the digestive gland or gonads. Given
the open vascular system of the organisms. It could be assumed that other
target cells/ tissues could be affected (either directly or Indirectly) by xenoblotics
leading to changes at higher levels of biological organisation. The use of
coelomocytes and haemocytes could be considered analogous to the situation
In mammalian toxicology, or in the human health arena where the use of
surrogate cells (e.g. lymphocytes or bone marrow cells) are widely used to
evaluate the toxic potential of environmental contaminants which could lead to
adverse health consequences at the whole organism or individual level. So, it
would be Interesting In future work to select other target cells/ tissues, in
addition to coelomocytes and haemocytes, to see what effect. If any. Is
observed.
The complete mapping of the sea urchin genome (the California purple sea
urchin, Strongylocentrotus purpuratus) was completed and published in 2006 by
The Sea Urchin Genome Project. Other commonly toxicity test organisms which
have had their complete genomes mapped include, the common house mouse
(Mus musculus) (Chinwalla et al., 2002). the sea squirt (Ciona intesiinalis)
(Dehal et al., 2002), the common fruit fly (Drosophila melanogaster) (Adams et
al., 2000) and the nematode worm Caenorhabditis elegans (Ainscough et al. ,
1998). But. the sea urchin genome was the first full genome available for a
nonchordate deuterostome (Davidson, 2006) and It opened the door for the
possible design of very specific toxicology assays using the sea urchin.
196

The 23,300 genes that made-up the complete sea urchin genome included
many genes that were thought only vertebrate innovations' and known only
outside of the deuterostomes (Sodergren et al., 2006). As both humans and
urchins have a shared ancestral evolutionary pathway, the sea urchin genome
contains a number of genes which are orthologs (genes present in two different
species that are similar to each other because both species originated from a
common ancestor) of human disease genes (Sodergren et al., 2006). A
cross-section of thirteen of these one hundred ortholog genes and their related
human diseases are shown in Table 6 .1 . The surprisingly high number of
urchin ortholog genes further reinforces the phylogenetic closeness of the
echinoderms to the chordates that other researchers have found (Smith and
Davidson, 1992; Littlewood et al., 1997; Littlewood el al., 1998; Adout le el al.,
2000).
The presence of these orlhologs for human diseases further reinforces the idea
that the use of echinoderms in aquatic toxicological studies could be of great
value, as it would be possible, for example, to screen pharmaceuticals and their
by-products for potential adverse side-effects using adults sea urchins in the
place of higher vertebrates (i.e. fish) in regulatory toxicity testing.
197

Table 6.1 Human disease genes and their sea urchin ortholog genes (adapted from Sodergren et al, 2006).
Human disease name Affected organ/ tissue/ cell
Human gene Sea urchin ortholog
Acute lymphoblastic leukaemia Blood Tec Sp-Tec
Alzheimer disease Brain Amyloid precursor protein
Sp-APP
Parkinson disease (type V) Brain UCHL1 Sp-UCHL
Cancer association Breast Ret finger protein 2 Sp-BRCA1
Deafness Ear ATP2B2 Sp-PMCA
Obesity Endocrine system PCSKI1 Sp-furin
Glaucoma Eye Myocilin Sp-Amassin
Respiratory distress syndrome Lung ABCA3 SP-ABCA3A
Huntington's disease Nerves Huntington (HD) Sp-Huntingtin
Spinal muscular atrophy Nerves, muscle Survival of motor neurone
Sp-SMNI
Diabetes and hyperprolnsulinemia Pancreas CPE Sp-carboxy-peptldase E-like
Male infertility Sperm ATP2B4 Sp-PMCA
Thyroditis Thyroid gland Thyroid hormone receptor Interactor 12
Sp-TRIP12
00
The different xenobiotics used in these studies were selected to be
representative of a wide-range of marine pollutants. But, all of these
laboratory-based experiments only examined the effects of a single contaminant
concurrently. While this approach was Invaluable In determining the suitably of
adult echinoderms as aquatic toxicology test species, it has to be remembered
that the organisms would never be exposed to single toxicants in the field.
Therefore, it would be very interesting in future work to examine the effects of
mixtures of pollutants on these test species. These mixtures could possibly take
the form of potycyclic aromatic hydrocarbon mixtures (for instance the water
accommodated fraction of crude oils) or effluent waste waters from sewage
treatment works.
199

Appendix I
Formulation of experimental reagents and solutions
200
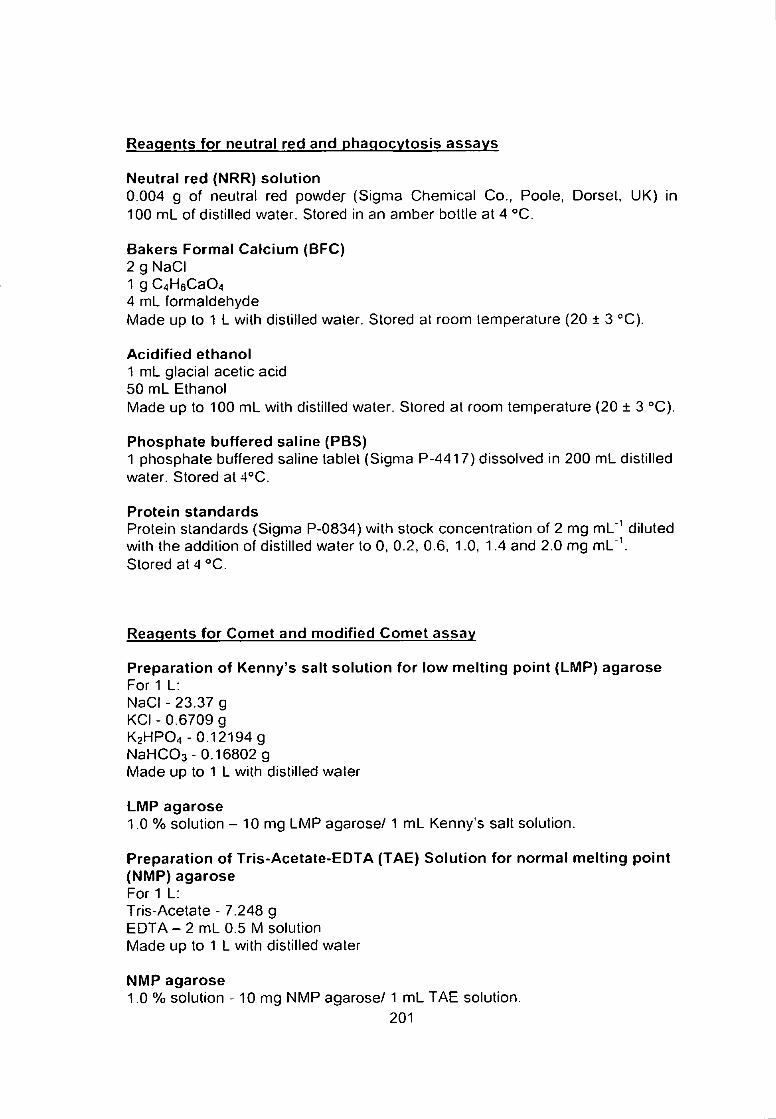
Reagents for neutral red and phagocytosis a s s a y s
Neutral red (NRR) solution 0.004 g of neutral red powder (Sigma Chemical Co., Poole, Dorset, UK) in 100 mL of distilled water. Stored in an amber bottle at 4 °C.
Bakers Formal Calcium (BFC) 2 g NaCI 1 g C4H6Ca04 4 mL formaldehyde Made up to 1 L with distilled water. Stored at room temperature (20 ± 3 °C).
Acidified ethanol 1 mL glacial acetic acid 50 mL Ethanol
Made up to 100 mL with distilled water. Stored at room temperature (20 ± 3 °C).
Phosphate buffered saline (PBS) 1 phosphate buffered saline tablet (Sigma P-4417) dissolved in 200 mL distilled water. Stored at 4°C. Protein standards Protein standards (Sigma P-0834) with stock concentration of 2 mg mL"' diluted with the addition of distilled water to 0, 0.2, 0.6, 1.0, 1.4 and 2.0 mg mL"V Stored a t 4 ° C .
Reagents for Comet and modified Comet a s s a y
Preparation of Kenny's salt solution for low melting point (LMP) agarose For 1 L: NaCl - 23.37 g K C I - 0 . 6 7 0 9 g K2HPO4 - 0.12194 g NaHCOa- 0.16802 g Made up to 1 L with distilled water
LMP agarose 1.0 % solution - 10 mg LMP agarose/1 mL Kenny's salt solution.
Preparation of Tr is-Acetate-EDTA (TAE) Solution for normal melting point (NMP) agarose For 1 L: Tris-Acetate - 7.248 g EDTA - 2 mL 0.5 M solution Made up to 1 L with distilled water
NMP agarose 1.0 % solution - 1 0 mg NMP agarose/1 mL TAE solution.
201

L y s i s Solution For 1 L: NaCI - 146.4 g N a 2 E D T A - 3 7 . 2 g Tris Base - 1.2 g pH adjusted to 10 by addition of NaOH N-Lauroyl-sarcosine - l O g Distilled water added to give a finally volume of 890 mL - as solutions added prior to use increase final volume to 1 L. Stored at 4 °C. Immediately prior to use add: TRITON X-100 - 1 % (e.g. 0.5 mL per 50 mL) DMSO - 10 % (e.g. 5 mL per 45 mL)
Electrophoresis Buffer NaOH - 40.0 g Made up to 1 L with distilled water. Stored at room temperature (20 ± 3 °C). 200 mM EDTA solution - 0.5M EDTA stock solution diluted 2.5 times (e.g. I m L EDTA and 1.5 mL distilled water). Stored at room temperature (20 ± 3 °C).
Electrophoresis buffer prepared immediately prior to use. For 1 L electrophoresis buffer; NaOH solution - 300 mL EDTA solution - 5 mL Distilled water - 695 mL
Neutralisation Buffer For 1 L: TRIS - 48.44 g pH adjusted to 7.5 by addition of concentrated HCI. Stored at room temperature (20 ± 3°C) .
Enzyme reaction buffer (for the modified Comet assay ) 40 mM HEPES 0.1 M KCI 0.5 mM EDTA 0.2 mg mL"^ BSA
pH adjusted to 8.0 by addition of KOH. Stored frozen (at -20 °C).
Ethidium bromide staining solution Preparation of stock ethidium bromide solution from original 10 mg mL'^ solution: Stock solution Is made up of 2.0 mg mL'^ ethidium bromide in distilled water (giving a x5 dilution) in an amber vial. Stored at room temperature, in the dark (20 ± 3 °C). Working solution made by adding 0.05 mL of 2.0 mg mL"^ stock solution to 4.95 mL distilled water (giving a xlOO dilution of the stock solution) In an amber vial. Stored at room temperature. In the dark (20 ± 3 °C).
202

A p p e n d i x I I
S c i e n t i f i c c o n t r i b u t i o n
203

Ccn:»o:s lists avaHabi£ «t ScierceOireci
Aquatic Toxicology
j i M ^ i n t l h o m t p a g e : www.o l t&v le i comMocatB/aqut tOx
Linking genotoxic responses w i t h cytotoxic and behavioural or physiological consequences: Differential sensitivity of echinoderms ( A > K Y m y n/i)o/]>) and marine molluscs {Myulus •. Wii/is) Martin N. Canny . Thomas H. Muichinson**. Rebecca J. Brov;n^ Malcolm D. lones-". Awadhesh N.Jha-' •Vi,sf»i.»i;irL-.i: h-r. tv^ii^^.^ tpvr' i j ' i '«:v-t ff.c• w n . w . t ^ : I Jt^TCJc-n
A R t I V L E I N i A B 5 r R A r
InirpJicd Jiwrj ior / r.Ldicj jcdrrtsrt! nulnplc btoirurVcr trstxnw^ in ihr sf j r.u As-.mii r j i fn ; j - r ihc WjT muiwl Mi iutii ftfL-ti cipovrd J urge of rorrrnL-jaons of dir.-^i in i indirfcr jr:in£ p ' f i u t o i n i : mrlhjH tranhj-ic sjUbruir 'M\1S' j n d n'^fcptoipturciz^ iCT* an rT."iiunTicn'. j l ly ' C r t j r i onii-cjnior^hjrmjr^uiif J l l . mprniwh',m ordci lodcicmirf if i:waip7*ss«Jf>.'':ir:rTiri:y nj~ nk-c«;rifiTr:i j : ihch rhirrlc-.Tiiorbrzlccic-j! j r g a n i v a i D a Trx-t-xr-rTi.Tirnu. driij-ri jirr^rd i ; r:»nrurrs'-lly r . - j ujlf b«.r:nirtrnclbchj-nQ-jijljndphi-«K)lr-g:f Jlrindriirnj 'nRhtns:mc"jr.tl'rIcj:j.imji« l;i
, Mr«. j rdmJ^vh . :ii'ir*'''^r.T!y ir. j d i r j c T t-rvintrjtrriiv r>i"urjl rrd rrurr!ii.-.T j ? u y . nduiT ••n< ' rwritTnjrlci. Mn. j r j W»4 iirand brejics: J i drTprnunrd by thr i'>nnn j i t j j • Thr p^ir^ol j iw i r ' uilcd itv drirrminarirtnof thr Tuwoum i n l r r j i r d CDnftnrrjticn' MTC . jtizt la g:?acxjiccvjlu.m.-p.Thf d MTC. Ji tJrirm ncdb>' ihclur.nvjloiihp wsarjims,nhowrtl v j « j n t o U ' mcir tCTi^r.vnhJr.mufM K ir« MMS ,15 J n d 33m£L triponnrly J i d CPiifi jnd iBOfr.jL ..-rspi-rnvriy • F iI tvih ^rvr.f* j r , J ctwminb.r.ioioxics^'wii not foun^ s tf stsnifKanity dutrri-ni crnvirrd iac::r.ir:li. Ap^i IY IFT- I .V MM^ pxpcnrf lo m s u n • w.Mc.n sho'Aed 1(KK rHnj1:T>- j i ^ . s ^ r rorwm'.rjticn! j l i r : hi nfiznAf^', CWJI daso rrsponsf rcljlismhi;?! wcir oi;icr.-ed for bc4t srrrtaxtniy rKlFKxr.tA n ojrh spcors l-:>l-k 'AT i? i^pcirrc :n CP. c'-irf C5rrPli[i:r.> wrr.* jiso frmnd bnwrc-. ihr N-rj^nrtitJi and pf.v*'N-yTjl rcii.pwws i - r cc.w:r djrrucr ir.rjcn s p t x i c t l u r i - M N B l ' K -0 .? j Ccrzn ST. t - O ' j ; nwiisrK MS V3 C!" R-0G9; CDrrr: -.-i. CR: K-0.73, Thi* intrjrjtcd jppfcutt.. jpph-.ng r j jn- invj! w j \s jv^ :oi:niuliJWoJt;'/tl.'ifrmir.pir* rt»pc>rws JI diff-'irn ir.rl^ofbicki^'J. Drj;jriuuLr..indo'jU*s ihi.' (> L'ni iJl v j . u c c f bfhj ' . . i ; / j i j» J . I . ; p l -v^nk^j j rri-Jw-rpN n d.-H'rTnxir.fi r r r iMiimy J >"r„-Tt; j l -i -nur.ncfKf jrisTO jnd r.ijhfcjni^ jl«?rnrn*h'«inrr nf i r * : lu: i rg Jdul i o r i i : i j i c r m M r . crvir-.r.iTKrijr
1. inirodudion
7 -c «: :curfc iKc c( gcr f--!luur-.i in &c I ^ J J U : crtv.. r>.TirA-n: i< of i r c r c j i i n i C( nccrr. •'.V.ii'',.v jnd Krjmcr^. I'JCO' L l j : * t T cl J 1 , i9 ' jK.; ' - j Jihi^I C'ln^csjiK-n:!-,- in rcfcr: \-c-'ri,man>' d i ' i ro r i cma l l v rcj;.;iu- J i S J y i hx.v hcor. J,;vTl-^pcd and siudicr hive been c jrr icc r- : u- invc«iij:jlc ilic-ol'ir^:* M porcntisi j:i'n.i-roxic rofT.poundi J i u j t r jrjran.^rr" y^srg s V3:.civ c f h K i b r i c A l r,:ii>.mcior biarr.-rkc;! D.tc-r c: ; | . I W . J . J - J . ^ C C S ' . These lu^-ic '*u jcrwMiccr CfHj . j - . ' r tponjvi rn..>::;• t^rneJ • ui i-i (orriacc ictl i are used j% ar inJ;caTo- - Ict i t r p j c t c - i h c Z>ir.v;nu:i
i A A: - It.
^lirjS; Nrvrnrwicis, there t2\ keen, hmilec tV-'-i fkr. thi l,nVjj^-* hci^ncrn p^nc-'xic re^p-'ir^cs aivj rc^r-'fw^ i ' ^l]:^cr level* r j ' bisIciTi.-j' o i s i n i u t k r . n i-w of ihc key ^ bjc.".ivcs i f cc^ i.wrcMcgi.-Jl studies..*ii:drru nandWi lJ , l f»4 Jhj 2C(:«; .'.KfS.
Tratlil cnjily, iScbtuc n u i i r l MVHiU.'i'd^i'li h j i b c r r j s c - l j - i scniinrl ipi.'cici in miny m-iru-.unnB prt prjmmc's jnd r r jc i ;ch p-i >• iM.i lsr.VidJj 'A-nel J L . Jl'O; ('"CvnnuL '.iJC«n: 3 w n ci 20ii2L hcwcvrr. '.here [s a gtjw.ns ccnccrn thai b i j : i s cnviionrr.cnia. hcjith A S i C i m e n i s cn c w jpcow rr.iy r.,it be !_f!icifrily :i b_sT: the mj in [:rt4j."cm be.n^ that : - r tcni b-Omar^cr j iuJics ir^ rr.tz.-SLicC m j l i n i i e d number of species. anJ then roporse? n u \ n n l-c ir.dK-atiwc -li oihct spccici ir. the mmun.iv iCbcung er J I . 200G. Jm. 2004, 200S\ New rc jul j i icns in ibe E-i tpcan Jr.i unJcr ;ne rtegisiraiKn, (Iva uJiKir, Autb'-nsj'.tjr. jr.d kci ini i ;oncf Chcn:i.-J i .RC^L!r1:Et i lK. '? j'XHilproi;; jr-.r-i^hj-.'efcrv'griisc^'.K•^ weaVnf« jf:d hjtve zca tnnwndcti ihai :.• f^ircvT marin*- ••'E-^**-
204
V> --rev
K ti:.:>* [cMinB vv:h i icfhwjicr fish aui.-j-'wn': i r d ihr. J^i be suf^plemenifdvMir. mbltuscj ancochiii^ Ciiir.t InJceJ jhc rrl^
im-crcbraic rrii jpccifi is v^onh-y of further «-'LV.»;c.rli jjitj: imd: ICS d u t r c their .::osc p<sM:cn lo:hc :h i . r f i a ic * : r ! h c dcuierrtir-rnr line i.f Jevrlopnicr.! t.f tho animal li;i^d.:r:-~.Wouiir o: J L I'tiOO v.hkh t:ciijld hrlp in jv-jijing iinncct.'njrv utPi;rvcr:cb:o:cs i rii' lish.-.fx loxicobsf^jl siudirs far ein:cji i ca j in^ Rc>'j:tvt:'.v Is. l x i w c \ T r kncvvn Aatx ihc scr.sf.tviiyA f t:njn.'ce:m'- v r w . l a m m u l c r K i t j m i r u n n . • l l u i c h m K : ; : . 20i.»?i Kf.-cn:iy p-i^'iM'-cd v.c:lt cchinodcrms in.-ludrt ihci - f fcci i ^:rrxii\i ir,d v:^^t-rt •J-jtupting compcL'nda lO-A-csan c: al.- HiA^i KtcF<c « jl_ 20i<': fusr i « 2007. ^OOEl scnoicAi: ciTivii iTaSar i-: j , . ? 0 M : r\if .-hrCTic P4jb srd hfai-5h>:L p r V i i r , . n u r - i n 'Cii'-M^UJc-, ft al- : :0X: Plmmoft jl_20tUJi. ir. ir.i« iiuJ>. thr rtTTimor if a iiof. ^s:^^tta rutsra WJS ictcctcd J i".?jn:[rr, J5 K hiz J w-idr d i t i n b u t i c n i h r >,;:shout thr.AiIanci.- j rHiArcr iCc;)^^:^! w j : c n 31 EurapciSaramdiava. 2UaiJ. Alth;wjfih i h i i cch:n^.icim has bfcn uiilisrc i r biafr ioni ionng itadirs tlvmara TI X . , U j n i s CI aL 20C-;i. it Kas no[ been used ocicmvcSv i r c.-Qiatt;cl.
tiTrcii of CD'niaminanisbn iHc bchjv:^jai Cf g - t i ^ ' ^ i av;«d-3n:e. rcproducm-c a^d w n l beKavicuri cf d.iTfreri nsh »pr.-'c* have b e e r studied extensively 'fol r c w c w see SeJ!I j r d 5lLn:jn 20(M1 Because bchx.'iour, j phcnc-ivnic ni.jJifi;j:ipn. li r.jfr.r..'.:«i by the genctkr n u k e - u p nf the irjin.nd,:al. and trrJU»c r, f j J i * phyiiclogiHlfunctHir vvtlh e<o(t.gii:jl prt;ri:!M-j. il s e n c ! - u i e -f j l indicator of loxiriry J ; the whclc cfpar-isr^ i r * t ' H'.-»i.cvci. TH.'-jiierr.pt has been mace previously olinVcrmtcjraie :hc^cr:^:..'n;i rffecrs of conumir j r t * w th cfTccij at f4:y^.i:l.-'fu'al ber .a^- . iLrx lewis-, w h i c h wuuid lead ti^'dctiinirnijt irr.pjct cn vi: j | lii'c f.rit-. •esses inrludtng the reprsdurtn-r pi.:cr.i;3. J I inr -wgin^i.-n'. :hs main -ibjccinr cf e c o i c A i r a b g i c i t stuJu-v. In addiiicn. such fi;:d-les n:it only provide cppontmtvio elucidjiepv:f nit^. rr.nrun'.u-na
physio}DCi»t cr bcha\iou:j3 inodi6ja:i,i:K :ould a'ii.) f::rr.U' Ijtc the use of s u f h i l ( c i J l i 3 t u M-i:h(-ui usiop.T.-u-ve te . -nr .q-es wilh jr. aim to uir appropniic behxvisural measures I3 rr.ininiisc c».poiiii< •fcomaniir.uua t c l c v c l s th« nt.iintain iuiiainihili:y uf ihe e m i r D n m e n t 'S:(!ii and Slomin. 30CH:. Iri ihis cpmcxt. ';'cjr> j n r c ni:e"CCR>hjsbcen3^pd irccnrlyiv-irci nici 3 f > ' .:: e• : pf scope for Eroxviii'i in bivjive mollusri as A irnsftr . 'C in J v j r ^ r ol puiluiini exposure CWiddaws et JI . . I 'JDS Ca:«>- Vt al. '_'0O7;. SjjiJeii et al^ 3D0S> arid rishtlns tirne i JefineJ a'l the ::mc taker fcr i r j n i n u l p b c c d upside dowm rojetun :.i ni > rmal, upright tSjCitijn} hai bccnimplcnicnted a^ an hucalcr ct cyera.L'hcJitt, »f cch.ncdemi speficJ'lAxtjK an j Sa^iba. l^SI Davici el J L llWS: Icmjra ct a L VJ'JOl
In the hackdrcptf abrt -e inicrrr - i i i -Jr" ' ' _ - « ; i x n v o i i.^-re :cr-a t vslldaie ihe biomarkcr re^p:rfiscb t>drtctnimeiHe effc^rivCjl ^'en-^ loAi; agents u> rrurinc masAcIs -IIV! cJu-'U; an J K-J l u r rtf^^fJSJ. •'b CMTjpjre the relative jensiiMty the ati jT 'irni ri r M rJulS. and A. fhtk'mi for i f b i e n c d rop*. nscs ai dJTcient .evtlj i C biolssical tHganitaiton: and Icjiesi f j r cf.irffTjruai bc:*Ai'o^>;rcnc-lusiirejponscswilhhijherlcvdstlhi. 'Jtjt. ' j^reiparisrsiin.-^vding' bervn-cural and ph>-5ic!ogicj| respcnscs j i the inanidiia. I .- \TI. to ntidaie iheii usctutnevs as a potpnual n'.rt-inv J i i v c i- A tj.i iuxt.'t*; I»S cal iciting and pcKniar moniioiinj
In Crdcr lo achieve : k c ob|crtiv?t, we lelcciec J cire--t j . ' i -in^ reference serw'cxic jpcni. meihyl n»c:h2rj;iu!-'i naif l^•V.i i i n j ar. indtrm a.nng^l.c. icqu.Tinj; m r u h - J K a:tivji:r<n* J i ^ n t . .•>x:li:phcq>h3mM3c(CPiLN'.V.S W31 sclecKdai i: hasbctTT. ' - s c d p r r viiJiiSi> as a refcrcnrc fcrcisxjni . - man>- siudipv.ir:;.^dinn a u r i a r ;ir mammal ianfd l i lN j : j ra ,anc ia l . . i l>a ; . i \nd-e i j l i c i j 3 . tCrry zr.c in marine imwnebrateitjhaei a l . IIJUC, SiJJpa.fc: HzrX and fynwii ? O 0 3 : Mj^gcr ft j ' J ipo . ' a .
: y . - r:t^-;;:*'-j'^'^« tCT • J ..-ir.:. ihcrapiui k and immunc»_p-piTT* l ivv i f cr.! -^ is as a t»r_-» i- \ti-ir.t '"HaniTic': ci a l , IDP-I; R /c ;k i fi aL 1 0 0 ^ : Iv i r ei i" . i , T . Thi-^ cc.rri^_r.d ij iTsnsfQrr::ed by inir.:*.c!lu 3r t-nrymj* :» j ; ; L• j'.K>1ai,ni: mffiab«-liiP5 vi-hich ::L-iS - - iViVj i t}: D%A saiand'- *jiJ;i>J:n et J L iCrS^J. Upcn appiica-i.cn.'.hcar.f Jndl,^emcta^. l.:.-cjrercnaIlve>:crcicdiniiibMimial Fr^-pi.-.i .n. up I-- I0-2I^'» .ycirc cV .T i i cd unihar.ged (Andciion n a L BL;CIJC CI JI. . ^ W V . ,loKn%cn :ei' a!.. 20081. The a;inTr rrrr.pc.-rds anc the rretptii ;itc» A i l h pocr dep-jdabiluy and high prrws>cn:c haw beer, ce icrc i l -n watte and ;iurfarc waiexs j i l•o^.:i:n::J:;•J:^ Jpio lOOnc. ' J i i r c s L l i thtfrcfiastpwingfT-n-1. -c rv - . ' j l . - i r r c m brtS -.-L-iin -^^pc j t i 3 n - jman a.id ecosysicn; h :a tn ^:ect>:-(tjrcman'>r J . 'J'J7; B ' J C I J C e: aL3000: ;chn» jn ct a". '^ItOS, VVh:>CPh3i|-»*r- u%«i M jJcfwcTtcjcrffitauicafCJii
• it-'.' Xr\t\ i::7-'cri '-f c i T ' ' •i-^ assay* u rn;? emfa-y-i-Iarvas ;.f if.o -an=o.jr.rclid: r.V!*'.. '.n'- JumrnJir ;ha ct j l„ ia9C>.(iitle futiniv •iaMi-A.*; hi iftc;—pi,- >fih:s phinnai'euncjlonmanrt .•"Tjanis-ni-
2. MJi f rubandmetbotb
ftlkl-er.icalj andirar!:nrj*.\-c:co£a.-.aJ>ii.-aIc.-adcandchla.red ItJ-n Lrii*mical C' -^ r< •'.»•, IJ ir jseL I K . i:nlrts ua'ted a the : -v.:it.Tciicrcrn.JiJs,tPcthjlrT:?:h.»nctulffyia;c'V..W.C\5nnTnber V C 0 7 - i pwnivW'tlarJi^-.i p h .spharnidemonshydrjicICPjCAS num'rvc* COSr-I'j-2'. puMv-'.i7? M-trc procured fr&m iKc same s r u : c i \ * ( per ihc publt>rft; ,-t"..im.«non .c.c.i-''ir.5cn ct aL'200S: ht :p;'i J .Iks'-jfs .vl.^lh.^:c*•', EX in .\'.MS anc L T a:e readily cduble in v .a ic* - iT . i - i t : u*inFeij:afc M.VS 2."illgl, ':CPupu»SOgl ' ) .
Kiv'iiis i^-iL-mm ir.f tcn.-iht i.vere c^.'^eclecCLnng Match 20001^. mfVti Quirt. C;uw.l!! ' . ( f l .snJ rerercr.cc. SWg72 a refcTcr . - rs .u- J^J^Iowin^Vt'I-Citi, Ji rniry.wc;r :-|eanedcfeptbioar.t& and placed.mic *0l giai* ^l;.a:.a t> aeeljnaiise under the lab-i.'ai^n: ;';nd.tii:»ns until rr^-rrrd. They were held at I 5 i 2 C. 34 i I ptu. tn .l ^ lm ti!lc:t'i;,M.-a.vatcr. with a lifjhtidark c>'dc cf >h I j h'.inii-'nsi'.y 3Vjiv. . h i v r >-u^*\[hcyv.T.'e fed UvlcriweHv
c:J Kt'ir.iiK w;:h a wand.Kd a ; _ A n i . m invrfirbrjic tf^cii miMiufe •\ViTrii:V :r.ixry F-jcd"^. L^iiJfrv Marine™. Rcn.Ridi™ and J i icJa l ja r A 'L6£Ww.'[rc..Lotiecdurin5\1a;chatidApnl20lMi fr->niPyini-::ibS3i:nd.l>ci-•- iJK-i:^d reference:SX4735]CXuS4ng iiJUOACivera j r J irjv.^in3:.i'.-rv ia :ac i . five-armed, sea stars were iei;_T.t'dii inc'jb.iratcr. ' .Ai.s;i:r:sfi wc:ci.rOG- ' .Mmmindnni-c i r : . Fhry rtoie hf lJ in ". JI c j is i J i ;uaT:j eq-aippeJ w-iih air-driven liliv-:; iin:iT rc<;..:ed lunJ-.-r '"v i j m e ciwdu'cni as the m j s s t l r ' . Pner :t- - i c :hey Arre red niu'.jr.'i ad .'itlium,
Thc<^er—.'cr{atcex:;rni - noV JsiatiLCxp<->ure>issh«v\-nin Tig I IJroc^pi luif i . o a * - t«: ?he two species differed slightly: nETi in^- ifxvrs' • ix A, ru^;':? - A C T Cercrryncd fti lowrg 3. 5 and 7dc.«i.p WTc pcrciand-r; , - i-.vxTiipy a r j genou.Aiaiy wcri: drtc:-mined a:ir: ^ anc 7 d . e » T " a * i .fjr M. fdvhs 'clearance raic?
M.i:v ard cer3ti«ikily'.^cie d e : c r r r j r ^ fallcwiinj; 3. S and 'dexp-'^urj- Ih r ^^^!S^T»•vcnl^'ft^^s w r e selected based o n pre-v;na-s -v v'r i-n ihe emhr>« ..J:-.,1V- i,( P. itunnrtlii artd Ai cdullS L'ha ri al. lis-j<j, 2C00i.by. k i i*jlK:a::^n pOrpau». iUnV and Jensen, ..'U(-3 jK. ,;fcJV\UiCt,r^cii:fJnorMnthtTar.Eciif I-33mgL ' i n mJi-r^v^J-_i•^! x'lJullL l.tLni-'.vihra;lirrit-dici Lir.embryo-ljrk-jc y'r Ut.Pi.Tli:: an J A) rtufs. i - c inc rcTul:i caiained hy Rark and )cricn _'v'«.a* usirg adult 1! r'-Jiii'^. :hr »ni;ccn;-aiinr range u'ied
205.

A / I d 7 J i l , > I ^ j h a n g lur te - J e i K i i T W ^ d ^
T . -
C-eaiaflce taw ammryr^^
assays carneo cu IComei
r^'.'iiirJ :Hr scni-U,giflift.T.ic sr j lc :cu:!rc]v,cicd tn c.'cmi-'irv tcvm^. This riHfc w i s ff(TJ.^'jiciJ fdf ihi' CP.e'jrKtr.UW^nt ir, lr,c; •M 'h. 'Kj ci'ii.OlKhJL "hpcxpoiuics ivew^irncdcui 4; 15 : 0.2 C iT'J t '*» Jnimali vvcfi- >,i fcJ duiins-hi* cNr-*j'^ff pcrttd. T^.c cVpi-tuic v«>ch. wiVri- jcr j icd ir j iviaujl lv usirjr'Pasicu,- pipcitrs ^ - J scaled with rj-'irrp-.'^' VesiclS d^vrc chrcicd daily mcr-(Jt.'.sor JtvJ ihr icTTijJcijruri* . sj:(riry./ai%*:4i-i:d V;xvgcp Ard pli
liiv v.'Jiei w e l l - i ) t i i - . . T . ^ j i iric i jh ic l i n u . In mriK-n viiih; rt-jTjtj^^ry matnrn^iliin rcrKid«ir TV c i i ; c r )A , ' r^ i . \ tmur r . ' i Jc i3 i« i J j t r . ^ i \;r'nccn(rj:i'Ji sXlTi or MZC, i i n . v A ' t sprr * ' ; tal.cn
.' -J. .•Je.'rrmuianu'; oj npir^^ nmnt • ffr •
SlgKcina [tmrj. ;KTi wcfr dciesmrcd: j y di:vf;:b*.'d by uhcf w i t c i > ! c . 2 . T e r T U : i f ; 31 (Mb; p r i j r ;f^«bmc>c>ic lair^plr l<rcia.n; whidi were uifd :?r cyitifcAi.MV and £CfK>icxiatv JS»»r 'ritfRT vvttr dv'ivrrrj i i f Ji'i^drtidbjUfv in j l ss * . -q i i i r ia 'd imehs>jrA iOin»> i O c m s j-l-zmj :urij:-\ir,(; i^-^ f c k j r . j f j .v i ;ct , t.i:n ^ca
W i s in-.-cned u-J STJri pri »:<Tnccr':r3r.i.nl And p l j ; c J ccn-:»ahy s - i : h c biSt d rhc unic, Nii iJf ;l^.-fv"Fi*her?irir^*^"vvrrc Viitn prc\Tnt iny ji'«-:'..tcrttii>* fiTL: jmiiu:irni7jrin<-HJ. f'JvJt ^fif* rr-.c liken U!>• jn i -nal 10 :Vrv--tYarri i-ni.i r^ abir j l s j ic w j i rr.ciiurcd w::h ihi- imhiJaci j • f jU I'he Jrnn in ; v r i x ; wiin iKcSJicpf ihecant, Tr. ipirx-cdurewaNrcFCJtecihrcc timcs.'OOOf v \ i i rilvft; forej:fc j:v.'n:ri >T)fi :f-CTTKjnKT JcifrrTyncd;
=^01 iohjtni'«.ymph-«Tiplcc;(Tciir:n c l c j r j i K c : ' * ; c wa
S.'3ik-.: rt al- 20()a HnL'ilj: indi\'rj-al l iL«^tls i'J ir.-isicU per ti-rc'eiiii j i i jo" V.\'TV pT:n,od ;ri Vcpjrii^ -1lJJml,bcjVcTs rcn t jx i r^ 3;'Gr-.: •w^wite j / l i l ic jcC i. JUttT. .A v^^'^.g h j r i 12 mrr. • V-mmi w::i idjcd.ro carh bco-Tt jnd p J i ^ d .n [v.i; rS-p^Jiiit nu^cciic i ' j f t i iv Vtissdswcrc^Ibwcdliac^lirtwin^ctr-r iVmtnf.rt^ i t l h c idJ.li<n->i^aa>i.l ^ f J S r f t n j U j l L ' ^ J a J F a . i - * p c r . 5 ! c n r>:iFpl.cd Iry Vjr;( o A q u j ^ -hi-n-n lld_M*^-er--; JK' . t t 7ivc e.'20CCc£EaI ^rlhml • IT. each bcikc:. imrrcdtJ^cly jfi'c: ihc 'iicM tTcf :f:e i l c i l iiu^pcnsicn j iMqur* •af wjic.- was'rcr't'^Td u'.fiE ^
vv.'.rigc. Tt-iv pi - i c J u - c vf3\ lefco'cd ii 30 anciGOmin i i K c
liibe fined jnd scl 10 rt;uhi;pjn:vlf i bciwccn -Jin jnd laOjwn in dumeiei. The clffirince ta;v ihe muncii A I S vaL-uIacd us in£ ihe fo!l;>wtn£ rquiMonfCauphtar. (0G!>*;
wTic f f CS,-flfarjr,fe r j i c . tcF;«rnicd i s Lh * . '."•wJumr ct wj ict . C: yni C/r algji o r c c n n i ^ i j r i : h<sxnm5 anJ end at i i i rc
Cfciomic fluid w » Cftttoc:cd irtm between ihi ; irmi («'ihe tea sur^ j n d hjcntdfymph wa^ c x : r j n c d frotr. the p:>stcnor addurisr n^iiiclr r>rthrniinfcls,inb>:th j a t n u i i r ^ a t fnl Ayringr Hlicdwiih 9^1 B J i i j c nccdic- The coc'omi: riutdJhiCTtwi»ympS a n g l e s wore uJ^)fcr^rdlruolIultvlduJI9iUc^^^^drpfTClld<>^fIu2>rs'J^
th^rcuabV miied by vartcxin^ pr ior to iist.
2.7. o;ujmK»3!ion ofatk.l.ff io\:\Ji} itsii£ KM oiSir,-
The jsu>' pTMccoi *va? j j j j M c d fr\:ni.'HP •r:*'rKr-d of !iabi.-h. •and 8f-isnfrp3ad 11993J. w,v^h « faaicd cn | h e ahilttv m'"ccl-i t:< r e u n ^ a p w i l j l ncutni! r e d J>T: I'txij^ M\-3S i^. u^rd rauii:«I> in c u : )jbcrji4f>- » J screeninj fwf the ccionrinj i fcn cf t:isde.e{tcci%Qf<tKKOCils w.-J ( u r . t J m i n j m s xzh under and
ilirO ondinors lCin iy c : j l :2007:'R»revdi i-i 3. 200at BrteCy. sampl«,7iTociomxfiurd>hjcfr.u^rnFHi5titj .L i-vereirtaibaicd. m dupjicjie tn a.flai-botto-neil rr.tci»iliireplaic pre-iTMicd witK lilt. \'iv;pclya^ly»inc-»oluiionf!C»a]t':vv am ivtayei .<fcells t_cadhrie ;3 ihf After.4Srnln rcji-adhered ic iU were d i ^ J r d c c and ihr plaics vi-asFcd w l i h pJ>>-'i"^gi'ra; ^alint-. A 5*'.uct;ip i f 0.034 V ;v.*.'vinccirjl red dye I'ndui l|ed wa'.cr .SCCuLvwJs added to carh • w e J a n d the CzWs incidiated J>r j b Jt -» C in a [.'injefaor TVr wc^'i Were waihed jiuJan jr .d)l;rd t«h.in->! » J j r i i i n . .A ac r ix arid. ,drd e;hanal m diKiHrd n-ateriadJcJ tJ:'ri:^iiwblUsoihcd>-T. The plate was shaken fcr :Smin hef.ire ri-i^ing (rfe^absorhance at 5«J0nm'in an Optimax u n i t l r rrjcrophie readet 'Moleriilw Dcv:ccsS. ut iPg Softpro Mj.»^V.2,^,i I tijf'.WAre Protein canceniia--tl;«r was deieimined ft4t.«ftirg a :ec*-pn'icd me:hjc -'aradhrd, lITfOi .=\rjulw were prei'erted'a* 'ipitcjj Jemiiy p « cf pr:.^ teia
206

In J-filon xfRul'^iuhik'In '^Uh: in ihtoi^cSis'iru *-if fesihc hav'-it-."ytri vfxs drtcrrnrncd as docnbrd Tiicvvbrre; n . d n r l u^mg
tluiit'hjhemdlvmpt; v»a? gMily, iprtfjj qrat^Ja fr.uiwsitiw sl:iii'
'zif aid CCIIUIAI iidrKiiJbl.The's!id« •M-te \eft Cut iOthiii: cir'tTi: lliuia ivAsdnrnf!^ afl ariolefito *ir d«^/TW j|;tl|Jcs itfTeinrp:Rxccli in m'cihinolif'jr iSmfn. followed by u'a;^rgV\fi:l^-i;i(:mj4 iiiir-
I'cmsvcd by linnng-.iVb-trc in d i i n j l ^ w j tc : i rd owe the Jlidi'i.
:<jdedjnd randomi«d :hcn cjiamr.ctl iitidtrthc micit^c^ tcf
in^Fplh(nitetljfirscTibcdpreviausiy ;jhjirt J L 2 i A Z \ .
2 0 onffmMsilon pKi^ i fwi i i irf jkS r^^CPTi?! . i jxn.
R?i«minat;ftri;rfWu<ncn cf D M ittranc, bicaiii jrw aii..!!; Jihilc iiffifuiiniCTwIsTTiocyin aid lufm;»c>Tff:rf5hr ivw orjjr^ ;i<rni w*rc deicrmihrd i i drsl^tbcJ clsiwi-hcre i lhj .c: CiOOf-:' Chc3h:a CI a]..-,iti06::1»n et 'Av2007;. Prior j'tb pcribrrr-irii the
KOKH y^jlito f t r ^ h the tpccini and tHr;iricrmle.jp!»ni^^ :hit:
l ionvcju j n«Vrww.T{. For ihcClMnevisMVvtricnv.riMicd i l i i c i
,jl,c!»c]<3rntr flui'i'hafii^.'yniphwas cier.ii:fu£t:d;200 - -jf.mi;* iitfi'
-JSiroie.ib ict,1He w-nt.then mcub^lcdir, tlrtliigIVS^I-VKT " j h jn ij«c d i r i Ji 4•ty^3^1bw^^^>hlA ihi^^wre *.jshrd m 'ifn-tiil«d'uvawr ind pljfCG in'etcanvliif;^)! ftumbcr; The ihvr.ttt wj> fOkd with banrr ind (he »hdc> Icf i ic i 30.Tiiiv*:t j jit>».-ihir D M W ucwtndl priar la cleciTi^>h3icu] fZOV for 30ruf : AT IH elf Jil^ph6'^nil..th)^>li^^^ wcrrtubmefE'rd iniKilttd.iwiiziilijinj; hcfTtt; Tti'e rrpJiciie mKTOprUion ih'e did w'wercf ich aaiTwif with ^cihidtumbnifntdf in j«c . i tcdurdf i - ipr^ mif:' ••c-j:! i lcica, P\WJu<[^i>wK'*t^5fl 'rtra Imf^n|.UverponLijk'l The ilides wcr^ SO <cti w'rre scciro [>v; r rplici^r; Alihc'ujh the urrm-arc pi r ^ c d . I 'rjhKf cffUTjmrrcfiVX tiil-DNA.w'jt coxutdeird lo be itve. Txnii icli3bti!;i'bojil wring irJei-litwnioi^-cAnipjnion I Kuntaiivcliftd JhxapOCJ.
-inc->vjy «ub-T:i.cf Mriance •AMJ^'AJ.'All v^liicj. jre .pnMced aJ'mtfJM'r S£M; Drfieicncin betwiih meant wMvh w*fRr- 0 OS [h-eirr^fitr.SBlfTrd signtfiunt. All 'dais scis^ vvere j i u ^ c d l ulm^' :^ljt4r«phics'vS^'£Dftwifc*'t£iai&ri U iVi .Anj c^r'teIjiiiHv;'heirfl' vjrutdc) wm.4 f i i^ *n i r^ asmg ihc ft>ijwn"> icr^rljri-S^coffi-
1 R n t d a
Tc'mpeijiute rah£ed,.fr3ri IVS, ialir^:^* fr^-n M Srtiwu. d:5«;%vd«yErniwej>frnu-wJji»^ rll*r<ini8Atcii,'2:
3 1 ..--T.T/niarridniif^urDyi v i i .
p.iMfi zrdfcPirysuinniartwflEr :j;h:¥,tvfiJi i.>rM\15MpOfire.liic Nn.^VwiTe.jrjnd iSmst Ft (5« rtiilbamlj^.nitwSjfcipctiively. l>!Uv.p?.CPtfipc>iurt ihi;MTCif - Al fi i i lS'wj'-oiniidcrcd icbe 'IKtiif.gl 3i'';vr! ntomt'.Lv H-^S' km:i>cd oi th»ccti:emijr»chin
JI iSn-ij - '"^Jnd iidH«;uen:l^* j i 3 d wiih higficr ciKi.-eniiiiiohp ' r i r i J '•ntnti.^^'Tsb.i li- "irri><;db;omjrtof *T^illiMff^iJd,tP
pcffcrniK;- Ihc rime u)cen fir::W jtsimilp'tit t i j o s^i^AVd 3 nin--4Tic in^-^ciic^lietween :hi'X3nn?!;'and!!-S,iR^i^ •^-fi^^J .and 5d, :(*«'(:/;r,. li)cV-cn:t3j'riin«vvp:cJJ^"t Sifrirbcib dayhircmpored^ i--^Tf'z 73n'iiC^-T3QsU t \Brns^ ' Compared:< sejwateriSV/l r*:Tl[i;^J. ihc mejJureir.cr4;ci"c}-iio4io:v'3Vflcferiri^
iJfuMicJ UA-rfjri^'bachthelMr. •in^C^nct-iMiyt dirmansiritcH a iignitiijni c'lncreWc b « w f P ^^^Vr#i wtur i jnd'jr';t&ni|L J'on id-F.-^ -2.. Mn forouiityn w i i induced folIcWinj Sd cxpOiare ai: :sirs.i< ' l3 7'i 35:«mpj[f^vt:'vSvai*.i3rifw^^
tfr"ji Myntoi-cdup. In riimn\'>rtiirtjh.^.h(ncjs.whLr A C T
I'.x.irclt'cAj i~3f~deicrminr!j.bv t>A^ a is^ - j cnn^sreil.ttl negativ-e. f>t:ic^-ta '.pr " J \ v ; ttmtt^ . J j i J pi't jhoyCnn'lhc.ftparanci rjtc; CRi .;riiirti..r. of M Q J7^] liNA-Virind biirjls 'u^. 'Cgrvrt atkly!
wrcreUio-'ea/jirtjnanjrrcutientaeiVkWftCK-jndy^ f;-Oi>:V JnJ'biMWttn CR 3 t w \ Uir DWA tR-: i>.?28. P-iO.O07j -'h . '- t rOtiric;^mfH'e;therc,vv3i> i'.iH t rdativcly'itfCTij ciinBixkM: feeiwccT Mmn^uciion and SNA s:r ird brr iki i I'e V;ail.UNA!i as det,S'tf<i by.rhc Conwi ai«^>P--'0 ftpl/ff-OiffiB^^
rMf,-nv:vtjlire^cccuriediind7Ai5GtngL . '^ihlc l iThcrtwi j i : a:jUEL-il^cint i i icrcuc in R7 Alter and Td'oi 3nd: {>'R1gL K Cvrinit^.iA«bAfMSrxFCt«r«^ NRB,*6biwj nfc «ftBf:»:jni,dincr-enrir'Tompai^d t i SWinm'iW iv V^niicjuii efit^ii weiv^ dfieri'M rDliMnng',5 ^d. 'Td CKpctaicir^^t 33 ind;^<Gfn^L > fpr i^c Mfi j n ^ Ccrinel JStjy?^ I^diklfyft of KV-'incfcavcd fclkwing > antl'7d e!(p^furc-,aj the icp hipheit ;cncenirjiicmV?lg.,3t. CfW -irat tiJie'pnc uequ7na,F>'ipr V c were Oif jr, ^.d.csmpared' t ^ a s j 2£ M'6 \b t lA tts J J ard 5 C m s L ' rci^ecuvely:After J.trhirwVj^jca w T r c i S i ' ! : ! IJ 5 : l^ar'd r53. t D.5.Tt:c Camci. i\v»> i*» wtJ J sJji^iitCani hwjrta« rti ' itiiMiSXrrr ihir ulticYimti picKJ? -Ai ;id;etmin:lvj1jcs'weie T i. t-l.li rinrirfirrd y ,I3;5 i 1,7 andlT&j j .Sf / j .^ IJ jndtPm^i /V . i r t?a ' tFTy j Ioow.xOJ^ l.f : Tr thc;tv:t; j s jnd 175^ U =rd 5,40 fc: 32 aac SCmsi . ^B0.r.dii:a;ed'by'MaimiC3l yjd'-irs there a n«:'dc;*:ely::siion5^ rvTtrljisjn bi-iwceri KT Acd Mn indac!Wir/f(i:cn*inBT<^-"(Wsuw /J-0^J4.l ' ' -6jOii> .ana'reUilvfIv' ur{in{;^«ircbi!i o'-bctween RT
ihd 4 i i: lDNA?K- OiHO. P - a t B i and'beiwiwn Mrvir^iif^ and i| rJilDNA:--H-6j&3fiiP-U0pi Fij i i l
^ir* h»tjn j ] ^ l o wcurre j . j j /Hc n r K c r t r x i i n r f xtmm: l! " i Ijb'^ l& In y«-n:ras: 1.5 MM5 r>;}i:'u:cSi.iKe CR -Jnd N^rt j>M>i •J:j^A'cd nc cffc'tl wi-TJj'all espcairr^/onredaaliooi.-
2 0 7

ij I J". .11*
.;• ' ') . r J \ S ! . i _
' r.r^ T el ' r.r^ T el
t 'c '•c
tV. . - • - 1 V.- \'S> r-o , ^ s ! J - 1:3) CP 16 .CI Lit vi> . ' •-• c c «> Gn
llv IM » <7 53 -OC 00 • CO r.c M f.l NT C f IM : K : .1-0 ion
M M v : CP lEOt . a : .Dl> ,00 •.•-!-->si IM ion iM" tftf-.r«l 00
r ; 7; 0 v , v s ts .or v v . : z ; v v , .cc 11.'
- c a WVS S£ .tKT 'A} •
57 V= f/VU
SF,
.1 r-i,-. (ST v J j r i - i - 1 J r.:L- .T'TT^tV
- r J c i j i a : i r n i ;i .•
I'l I !hi- -niu,-i!t n . :
s : i j n J br i ' j j . i . is J> i .1 J
i t ; . ! = 7-
H i VV.: IziX'-'^'A-e '"1 t-,t iniPC.M. IWtrr^
c '~v(.'nirJti j c jntJ ; i ir , [ : -dcpcndtTi; • . r u i c j i c j i i j :,-N^ v i . i n c b:ey» i ' 31 !r. j J o i -
r < - : * : . i ; i r i n b e r . v e e n \ ' r . i n d - j c i x n a n c i M . A x.u-t : l i c C . . n u - : J i i i v . f - 0 CHl . R - 3 J t f i '
-1. D i s c u s s i o n
^-ch ^^-.Jc•rms j n s . i - . - ^ - tc -y.c rr - n ^ n r l v i r e i r f u c n j c v : in z t j r i c n i r j i i ^ r ar.c ; " r "U'-.' ; . u c - c c p c T d m rr . j r .nci {.•r i tiTfc • : ct-f m . - j l cr>. i : jni injn:s i i ^ h n r ; ; h r K j v i .-jr: AwiV sn-J Sj - .ha ii.fti l>jv.e« CI j l . ' -X- l e m . i - j <•: ; :K't. <\?ii^n<:c ' i i f
*A;L"J ' ci j l . . <. j - i v et ."ll-'r, "-v.- ' lci; j , JCtte . IT
the ?rr>i"nt s i - C v n . " i t rKaM- ' ; , r v-is j l : e c ; e J J : i K c l r . v c i ! I i - i c n i r i i i - i n r f M M - P i r ; ^ u r v i v m / - J sjr iv—.s< jrnJ Jt ifK- ivv i h i j - 'ho: i : . i :Krn i : j ; i m i*' L , *eJ h iwc^c: . f l c z r i T i i . ' rate v.is i f !>.; . -c •••nlv fcv M'M* I- ' .?' >'jrf LIT aii : ro :• n . c n : r a i : . i»j" i r i m i K i.-.-. o n . r c r i : j : i .-i i J s e C . Ii t. be cmp! -M_ 'CC r t r e th.j: tlire^-i for-;-jr;%. n . : :ht-^c •:)ot-.v,i,.„riI s r d p:^y(i.-l >*ii.' l Tc^p' l i e * , wrrh dr...-'-.^- -ni.-."!"jni5r*-.i • i r i " u r p - j i c ' in pn>'.( ; :enc: '
u-jliy ci:*:eTcr.: g n - p t o; r rg jn is r r . * o r * IrM- . v i j : :rc i rn" s r ^ s i k ; . 11 r r . jJe wii'n H.UK ; j j; i£<r.. M y w o c r . p r e w m r c i _ . : s i r J u J i c i h j i 3 J . r c f i j c t i n j gt-r. i i j t m : e iV.VS' h.>> i iii -rr pi •• piTi-ncctj cf. 'cc: J : i h * m d u i d u j ; .evci .r acti ^Fo;;e» c--rr.r..i:cc •.v.:h Ji i i . itiiff:: J t l ing geni::i..i.ii- i f 7^!is w j * - iuppLi iec K tne rr .Lr i j I i i^ . . i .^os . L ' ipcci j l ly n . i r iPi ' f i i . [ '»,Ikn..rj; M M ; * \p i »_: .
•A'hilc bchj^-i-L-jrj l or piij-siij l if^ir;! j r . J ?cnC'iCAi; r c i p - . r s c i .n fc,*'.h ; r .o ' r / j n t u n s sh&wTt; «£ni i i< j m effpk'o :• MV- 'VWJ* n- i f r u n c [•-b? j i T c a c d Ir. t h ^ t a r i e x i : e l l j t j r ^iJ3:ii lV J - r - r a M t - f c : K r«3.? J « J \ - . r r j c i T - j v - . t c ) c f M. (Julii t u * b-.-vn f - ^ r J ;• ^l• M,'n:iK-jp;!y . o r r c l j i c d •.i.-tin : h r f i m?t • t . 's;Kn\f r -'l ..v -r; t; ;-. -l u i f 11 iribuTy : in ' FHT t under lab-^rj i rr>'C!J-u: . i , - r^• •-. lerf r ci i l . '(IDjb I j n G t i i r - p l c v a r E J r c t * u-iiicr f i e l d - l u d i c * K . n - -r* J I . O c . r 'A -n ' r c ' rLpanng the tci jTu.t r rs;> nse trui^el^ M t\iliUi iTic f.sn si.Tip.'ia^lii mfJppJl fi'.tcvMnr f i p i - , * - : c li - i vvn t - -f nvd •. ' f b Jcr*-,' i - / : c s . \ sJ icwn lo t.i: CTc i ' c f m a n t b j ' tivb c ' v ; b r iC",':c* a r d c e : i J3:l i iJ[ jr .r , the ,>S.T (Tr.ai m^^-i::a.^c m n;cTi^. .Me* •.%';s M^nlfi.Mrily j i h o : i a : r d \MI:I i.ie C» met 'e^p' ".»e i j I'l
j i . .'IWfi rnr^ppareni la i iV .>l ' ic\p'<.- .se! ':rNKS.:i \ j> - ;hep.-^-^cni f iydv : c u l d b? a i t rsbu icd i r several f j : : .nr* f . - i i l y n e •nlr^^Jnl lm^ •.I j . - n u r j fb^Th j " k v l a i i n c i ? e r . : v . e . M M £ j n i l t C j : e s - - ' - i ' J - : " ? ' er t 'ty.r.; i b e v i i i J i c s earned oui b j ' nthei v.-'rlrf - 'j» ' il I t r y e ^ c • I ;• r-.^.\j\c-?3n,<.f VJV.iif the Fr,mar> <::c*' "".t.-si *r . IA'p. 'S j n c
2 0 8

u' S -J
1 1 I I I 11 [bj :o
fie. 1 1 , .ar n r i r - v-c
t l ' n i h c l j r i A . n i ' . : i - iT. i ( {r fm i.e. nr.M-.Trrr j n c . i^rrFl fx^ -.^zr • I.M; .cutd i ir- ' j i iaw.'- -.;i.y j .- j j i rnv r-.i-r-.l^iaiu- U-vi.'' locli- iuf- ' i l .^c n^- lvs< M m ? * -Si'.-.'nJ V. trie c j r c o n i r j i i G r . s J ! ihe •zcri » i s j r I'lir u_dymi;^hi r i j - t". ufil.-.cn: •.-.hk.^ ^ ^ - - L I J JH f.v m u , j i ; r : i in the 'v^- i r j l ( J — p i r m ^ n : I rad i t \c ;hr mernn - jn t
j s r in each, i c i ! spi.i:u'i. •< rt .t ini , l-c n^ m- ' ic jr;»M!ivo tn jT M t Ju IU idc ipJ i t r i j . foi ^ n.t%">ii ij'.'uwin: MVIS c A p - i ^ r o ' In line %viih the ccnt 'T j ' \ .hn.'f\Ti,i r v i.*".!: [-•••ver I f w K . f r r^r -sat i j r . rcqyjrc c^- ic >: ;t.r.;cn:r:LiiC'r :v. pi^wJt.c a b .L l . . ; . i . r n p j r w ( ]h j . 20uh ' . iht- c i f f i U nt ific ' v . r gc.TOlrxin* vvrtc -n^ re jpp j rc r . t ai iho Otifi. levf C c j r . y t i iciv ir> a paun:>- cf p_3 n h c t i daia regarding : h c c : f c f n cf FPrc:c>i,ni t - i c r h i n c c r r r : * hu ; i r r r c
.> ;u:tc c f pre-." - u ' i i u d i e * vvhi.f- have in \ r%: i? . ' i cd I'.'c
I-, in nave (-' *!u -.v J t:- M ' - t c ' P " r * f f d a i i n i h i p i i- r .i-inz .11 : t hi:-n ..al j . - d p c r c i h : par j—i i^r iv . * u ? p i n i r j ; iJ-c r i c : - i v - - ^ ; . i - . : :e ; . ' . : inn.^ IUC: :c i f i - ' I 2J-y.£ R j i i -j n d . r «•
Vc " l i t r-t, an cr,'.*.r 'i"n.'-,:,'ll> ( c l c v j i i i vt i : j r : n j n t , t h c r j hj". K • : r i ; \:vcy .n'"^' - d u . f d :o.\ .ciiy j n c .•cnuirxi.ft%- i r j j ; , ^ - r . r.-an n n . !-xpi v;;-. • t ii / ' dljrriiT.'.'i: c inbr> js tnjwcoci J J . Jl J n»ert - : ; : i '-»:^ p:Vi tnc i n d - t i ^n .(i . -y iosrr .c i . t J j n - j j v - l l - " j n J C J 3 \ I . f J i i . e n i i j m - n tan^;: > f O - ^ B r T i j I . ' Jtia n: J - I P " ; In add.ti >-.. i i - z i o ^ : . i in^ l i ih t i j w luj-'grsicd i h a :
i n u - f \ r t n , ' j l injectt r i • (L Pr -1r»7 tj:Kr.-,<j rr.inn.Tw flnrp.' lJt. 'S rmi!.'..T'' • I 1. -JOO-nrK,; t j [cc :T siL'n.fT,:r: l> c n h m t c i n J _ i i • n t in c:>-rtu.-.-,:e i-. ' l- .- icdl'i . p c n p n c r d b V o d j r d ^-'f,— . j ^ . p f . , J r ^ p i i r t" • : h m g i h ? M i l l f •: the s f ^ f i c *
r .f J - 1 C<^nrl r* ta<l OtlA.
• iJ .11 4 . U i (par IIKlOc«1m|
^ . ••• I - :-.t r f. . -rli-\ t : ' : —i
c : : !o cc-C c n r l r'.; t3tl DMA)
j - i - l - I—I r*
2 0 9
^Vlnlcr c; i t . 2 ^ 7 c ^ e' if ^t.*-.' i-\p;'jed (F.rer spoji'r* v f n«h iffidw.ip !.•!'• >VfKHtcr* - ; i C-' Ji' and t f t m c l " >'rT 7?fc. lbcAla ai?J¥-t-w-*.?d lfit :r-*:;: -.i- M ic^«ivw, (if. Ifftvcdbv'tKetninn».w ^-ii.'»i.>*clM.ai(5if: ^fnM-rrwti ihe.triimp>/und: u'ruch may h a w b i : c K J i h c ' - a g c - f t f ^ h r [.*iT it^arusm'ij g:vc^ :tha': bLMh'lKr troUi andl i i '^r iVj^i fu- j jw^niJi^ vihe'rcai thi-^celi-
jFrri «tidy hcwevi:n>-J.'Stf-Ce?e-ndi«^ ifk^i wa j fcb ic rvTd in the' m ,:c wnji iBTipc;iei . inin: iC£;. 'ue«:. i i %j»ieen?h?«r.rha:cJf7\' •paleJ•tnr^yis«K^ftj,.^^.^i;^-M:iur^.^ni.*,"»r^^'l&a^^3 ,'w.'i.VilivVf5 ihe indi«h.'r «"{l3NA<ir3n'.i hii'-aJ.tftMlawxg.SKp'ja-.ire' Wfrudii ui! r o b i c «. / . 3t>P4'.fji-vp: f.-'r fpe ?*i'itrnnar>- ifud> by Tabai c'l aCf2C!iL-!i 'iH Jd.Ji;WA,urj:tir> flr»ii'[;ro'vet, ar^.sev « i ( «i;dlr>irttaij cTtkr>' «-\a5 Mage* <ei u-chin.-and mussetf;
edfic., iht:re,Kas.b*:e-r-t' j -t.vr j,iudy^yhi:ii' tYfi rtbitve scnilimsy-(if^ajLic Qr nuturc plnil-.i^V:rrti ha* l>een c. nrtcreni;j:-\-t>npaird^ .M.*;ih iny oiber W^onts-i^ under siniJir'/ j ip^Tiincntal rondntciu, iTakxyinidaccotri: ai'i-l.ib^ mrirniaiiiin j->ljhi>.*«^
rclaryely more iervn^T :Wan f rtalw m in line, w i th <Hf>c- (•« _*»o.and:pr i jvc.i i i^lej ititr :«uliii utt-
jested mori jcorrv^ati Jr< 3«vtttrtind_<i jfDNrtaiTjh and i h c cviOfcncrrt c^naifct^'heih'«pac»riiHJiiudd^naid 2£K» ; 'Higg,eret i i . JUtili ' VifleVa ei " ffOrV liv^icme. itudiet-ti-jw-evc; inlng crV!^^• *^':ci •C'fiih..v,ti -n fca> ivmt'iiihwerjtJ iuticm^ Biifh.correbl:rni ravi' ivi' .'>t<-' iBelpjiemf ct aL. ilMO ciiing et. V J-Vr*! ;ihrcTC?i'in?ly :hc,pri:f«iar,respnnscs, •3l5,-* »hcwed pKsd c^rrt-ijti^ir.s w:tfi;r«?h^^^^ rt- pnysiolssical retprrudinboih ihf t i ,*jrti)nji.- It-Wi'c-.-cr l necc.ic-texic rctpiintci. w i c delerinjiied i:!. ..'e^<nv>.7:c* i n J hjtir.aciu'% ci'ihc.iVgan-isiri i i i .cellula: It-.ii. Whereii i w nkj'ifi r u r j . mponMS Wif^-ircaturcd ar the %vh.cle.»S[?ihistr:liW'I 'ciivoTt-i.-w.appn Vatfulir syiiem .-rf tfie IWP le*; tpr\2C9..M jrciiM Jsiu^wd.iHaj CIKCT 'JiEci yeUa.couid yJvi Sim
indnrnly") leadin^ii'.i iV^pi^iset is ii-w i.sh(rfc^',":ffani»m jcvf L !frirespeaivfly;uw.i? l^ti^Crrn^iiiejandltacTri^ i idercd iana iagpuEi r IIK-kituaiian in c:::iirira£iatt'a turhan healih arrt*3 wlkre uitb:V.;trt»j:a:c\'rIl5li\jr; lv'mph:W>«i.-biinc rn j r row t r l ls lareMt ldsi" iKedt - iv '^ p i i i ienbi JTciivirflTWi talapi'ntswiih^jirierii.i' ^ t > r ^ hej'l;>N^'n«c<;Meiw« iSrgarij/mldfei.tnVeA^^ ^'Vx? jIi>»V»L^^^*'^'"*y-^^ cariier. wecqufanji rihca, O'li*)-*'; ciic-r.'. a rcnelaiion btnveen e!ll?>»'"'ic.efrcn and gen ifttrt effcc. I'js.ceiermlp.ed Mt i^vyf iriOffetcnt.ceatypcj.ii' Ji^cMP-vj^i.-vjandmllceili^ofmiHfsHj [mvh<en'foi:t»dl'Cj'p«A.'e»AUiCt4i t i f i i r tCta ie i i^ ikatdi f fcTeni ccHr>TMn(iSwldhf «:rrriliirt^ uilyifiVVii-i^^ fi:llJwrjei('iH)Su;t-ii^ ^ -r! jn-paritTi,
\n '(he above .cGpTcvt. jJA-c?' 'Hai >7hj»^yri l ; effcci* ccuU diifafyVfphirS'-'rc :r; if-yr^us •f>7f?r-.i i » n w cmerjing
(ha: necrnicracityi-is h'!fi,.n^ i'!:rii^ie-i:cfrc^: i f ECtwaih: j w l chenwihtiapcutik i ? m n :Rf eiki c:'j"! r20M Klsb>-el aL '206c i in *dJiiiijn' ta bcin? iv i r li'aii.-^'mmi.-v Vh- a:iire:nid(^'*'<^'d»s-ruFtin^jgrai U i a s ^ * ' * ' ' s ^ - . ' h a . ^Utla J'^nhL-rniDrc. nrjiriy ScKilibirm tncluJt.VA.Phj'.c:btffn ElH/v:r '.c fcc p'jsm nituiiiftOiiihi h-'th chder fn vKTi- j n J ' '.r.V,;f .-.-nUiff i i inirnjn-nial:i!n:sy?iem5 •nai«mrrrtaL li*4'.-X/p»Mc- iOW^ .S, a. -.T j i . •/pujv Inhuman FttjJrh arena. CTpni^fi »r >*ns.r''nriicnia*,4ffcp'i mil'Jdinjt'ecnSGjVl it;v:riivt>?en-corteij(rt: :( dtvcl jprttr-a. Ji i j rdcri le.^: lej rrtitiie; (lialiihneiiirtenui.a Jcfi. i.dnjriirf^.[r whiA: i r i i«p l jy between eriituSmehtal (ictLr, ' j r j jj/iietK" s-^wt-pr sihiy^^tail^ ab:i ;rfay ar. impi>rtan(ji^Ie l?f j i iu-n t: at. ;2f9>i.-l,j'Klr.f_aTi e:~at, 20041; ;r i h i l l.i;nirw.;li«c: .:-an:rraij efh,>^i: .rTni; hive zHr^Wi1il> l.» i>ri:het3e.,««e ar'JfclyaArncur'Titar*:!*.^^^ (c.g,,a>c;ykhjlihc^ * e ; iicnin. dapairjov vr^ l in^ p- fcTtK fh t-l^Cui pvpuIal'(^nlQf rev;'pr'jrA:ar,d ihei- ;.viA.::jtr?am wf.^J:i^•:F ja5czliKt3u7.n:i[0V;ffi
Vj?t ' .?i i j^ v i L T t a f s d n a n d l : nrh/. i'j^lLtiisihrttft'rrn'it s- r-' ptivr,s vhji ir -addiii m la si,* ,^ctpcniei, ttx. ige-.-Xi uti^-la, the pztscrx ^-C'f^ itisowniLiC^ bchovtourat arrfi phi'^iM.'^lcjl ria;p*.nJcV, WhiteJctmbeina tr.irc itTiiilivVi^an-^fiyih'r^
fp e^tfidiiif^v, vibjff vjlj^^ anj crnpIqying jVargc cf r,-i;»' dfnruV;uTi>:ii^m3>Uri aid^ wc hj>t'<^alw!rd the rd^^^ >sni5ii^;ni' o f E w c «f;r;-irn.jthr.rcici
matir.e (n-.vrtebiaics.VVhiiir.&^rne uudiH are:avaj'tableuiihe> {iictatiur :epcz:(r.f a rat ge of teajjit j l tapx-Mi ftism a Hit^e. ipisrifSTc fl. fle.^lirtiI,M34l^:th"eicha^e,bccrii>^^^ tamcasiin; rtnrijrrerdy'ihe- iir:.fi^j^O>^fiM^dtfteieni tpccie't fjrt J rijTScyfre.spaiim.Oin iiudy.triK-ares.ihai.ccpiparrd (o-mantt* bhranreti a&tcru-jy are rnoie s^niit-ve io'bqih.d:rec:-Jr>d indircfi xxits S!M*.yi?xtcar,u. Oiii siud^' atijVfCggeati thai in addition to, cleaian£-4 ^jre i n r r u y c U . ' jjf'in/li^hy^iaur tn 7k i - - n i t l-j-a p^xrntljl sr^^-c M'aMrst;iie.irdi^a;:»r'af bchavr.A't'al di jn^r\ rdlawujjTxpi-.iuri' teteiia**'uri". Vy. ^ cnjid fini;-!_tahcuu»l>- an is"pe>jioiAiijnfi^Funtm,iliidirt (^^ sitcrtgther: ih,c.uie-^'adull nrhlnodrrois Sy yrnimvc ikj^rjiv:'iiifr :iptxin-ia. m ;nidtc», In oddiiinn .while we 'r-avc ih^rftn a direct;Unt heiiveen, gcnctcxic jr.d bchavwuraSor phi^wtojical resptnte^'dur s dl >• i«>!l J S i c n i thatcipreulor bfcIiVfcrcni tsoltigibl re (pnnVesmijjhi tiot alwj^'i be linked-iiprci [:;:rielaied: Thii funhcf i t r c n g i h e R i thr ^tJtI^^'Ihar deprndibg.upon levels ai a^tute.'^fA^M^ie'f Qi {'omaminanif ano.ihe targei ;cellv-;<:.:^Kci<^ pmpeitievof iiAMinsexuuki be rnanlfesled i r a.variery of ways ^ifaKK « ^1-ipoj i jha. j o b s i
JlRin.ial -suiipji: bytheNATu'al '.r^^iniftnifrnl Rc*cAr/tiD*yn^ •<tl iNERQin assacunon vwilj arwham f.'rAir;jnn:cr.'taI Ubaratcry. Asira/'ehcca as a CAiE Ward .SKii'5.ufi0O4ii3(K: j n;2ratefyi|y ackhjmled^cd
atfenotn-
miCTI^ ww'jH««l«*i]r»wi> irt:i3.'limid iripii'iTiiHM »r-<?wt- ipi ( lhfK3^e>rulAei0rff^«rbw^i:ftS^
(i(»-rt<»»lf'si^s tiiMa9*tei7tk fiiaciricEitdjind^SE.^:J'JI.\t^;^urlv•T^
" iniW^ ::«;h,i |ri9|CPr!,pemMlr'tn:d i ^ h V ^ m t u i ^ linn
rwrha^ M A i i ? r « i H , 4 9 7 «)J,
Bt*«>,KiBSfiTfi*>ir.l591A.->l<y,^r;«hafr»iKrj,^
(w*iiit!| w ir.attw.tsirrtrtraa entwe-i^ij Lt;n«: a-=wtipafiMM-. smfrtn'&
jliiVier5rir.aiW«i-iJf»MJ'-i J •
r-ititjfjnfru Uciin fVripMtl;l.»'12-Sill
210
rr..;:nirfof»ej Jri-M •. 11 .-ilc ^ r;L--t':i-r,i.v. r ' J -J t r Cii ikf-i.
6j:r.'k=-..CA.!*^art.. a;'.*J-.l.M, y,t.'!^'I 1 i>r jrl^'^VV tM SJJi - i l i ' IA .KC^ Hif ir»-j«rarorr*(Ti j= tr.rr.rS"-'^-T.*-. : i - r » * m i i fir ii-^'-ffwiwnui -»«..-«r»< ii'fi>ci>> in^ i i i ' t nw l . i r i i r ' i ( j ! rffcrstofdTlorTVTjlsv.MiriifruIw *:;t.-vrrti:V,i 4rs--ro-'iic*v* iK il*.
irifirt ef »hon wf^ »>3:,iwt c i l f . ^rinr'( P-MI (-?*JK"*cr u j T f i»r:ir» IS Ih# tv;r.r» i ro lJci i .Ul l i lWiJsi* \L i - - i^ tVl..a-.* 1h. i^-r>
:-hjr^:.w T=ti»cj..c-.fjo-uDA.-e-*'L.n.f.v w ? . ^ y.-^- LW, i-t-^
fcf-.^•^«l^»IUfI•:,^Trt;x.•cl^u^-<i;Ilr-.-^.^ * \?rt- , ->:Ti<- " s r ^ e i r a i r -twtirWei jIjchL,; * t u i i r i / r r £m'-r?rT-fr;j; "-.i^x--rv :ac • . V n t i r v i K - t ? 7 , - • ' '
vV t .^ . .VV , Oepfnif7 M H, p i i .AJ* . 2;Oii ^ ol 'r j i n - »n'
t!i>liTiLt>.Ho«d. V i . HJ^^*1. I I, :9)t *.Mr,l-i:; t> -r „n:iiTlHJ-wJvTfi JfU e n ^ t a ML-J«r,ar>rjicrvK«in«-. n MJPJIWS ter.is:^ U C 2i" t-ii
lS&T>t»e»ir iu- ,<rcff i*r ir irc;:r)rtr i : t ' ;r-jtj-»,-tiHH.i?M-JiC.=^t
u.-rersm l e w i i B «ri;rirMt : M "arfi^^L M rt^fr^^ui
tr;nJi.Sarace zl 'i^u. Cr -vosMs: I t l l 11^ 175
Cre.-rucei. L I . D1.-HI.3. ClUn O C , DtSfta, T. "-rr^-i A. ii^<f*r3v t . » .
iifr^- IS77. - . L i a l i - t 1. l »»bt . M. |Q7G ^> cn* i r * - . J ir(.-«,.r'-a i -u jr-lvktv".' "if T * .
anft r.tpcrpptop-irt'i t»F"^rtrr<tjlC!:li^--ifi3j.L"i I J ; •. U
r d-v H .
XirrJasI-i.t-.^v-^1. Xi-in 'Aitrtt l A , t>fpW»e- Wtr. Ci:im.a» 15 ^t-'.U-. "fi»ifir.,-' "tr ml- i T
;U™mjT A S . C«(iU.TTvJMA- til-m' C L : mCrri, . C A . : .V . t 3 . F^.?-».r<. U StunV. ITA, C*3;i|i C C . I5r i Upr*9mrJ Frj-iJio»fcr> In iof j mrtr j ip I
:rf. i-rVaji»«?''J ^.-.P1 j rd *T* i-'O 3 -rtJ C- ' - I . - .TJ- f^J^^i (j'»:;"c,^j;%J%?
recarBTWitdstcnilji *:fjjiii:tn.».1«iJ'j,--ipJ'»|, (avtrntr: ' C ' J ' n-ii.-iifcan,7.H;B<?ri,C.W xn.V.LO»WO..IW.3X^1.GrtW-'Hi.;l-.hr rOx'Sitm
»<t«iic,BXiicciejr.-AjjanTl<nw;i-*v»l M i
»..,A.S, KKU &r-i=ii^cnirraM'-Jir! n J ; ijwr .-7;-u-rt 4 : . V t ; f
1 r
Ktx. O o n a . ^ - * - w f V V a * i r j C I . ^:f,ff (nw,-! r».l.-^ n'.
•ll C T M a i i a n n r r i m r *!»'J5t TiWii J ^ ^ I R T J» J pxilui^itT—'in r-.r
J-%r cpS5»rt- ui r t l jm of irj:iBvl; n ii-ilr ' ^EIQ jt i r j e iaar i ir^iJrh ^ .
f , AS Mjtttn'toT Z\i U J r U . |M nL*:t BM. 3 i . i . p s.^4l*:i I>.P v irBi j M trt IB ttin iriNifciuw *iiJif or r.r --i.- -T arrw rtom ^Jlfflirf? -SLT-f' Uit^otKkim-.Jifir^r; Mji^ttzi 3pt»J':iTrk i.^oi MiT iyt^^i i=fl
fcXiuAAC.IorfM'-i.Mi;. W-il *»-.i.C |_ »j-r:rrTTf V, *.':T«Htj-rs.A^ SL5rT:--
K»rrvioarrra-4r« T;jriS^hfiW>Airw.-^i*>* a J t K c i i^ nt ih (UJTJ ^
--I A Ss'anilr* V - i - >: C-iite. O J . - , . I, J , \. M j r ' j . L
n^arirJ';*- I'H 3 . *, .^. 7Mt. ll^.EJ^.r iJ''p;:'ll«V'Mrj';l-jriT,'r«.i fa d w t i
a«f.rtrT.^--;."< V,v.Kl..^f> j rdO: : \ , r /V i r . - * i lUJ i .c r r - i ' >f'S.T L i a d h / . i r r . -_T i - t ,CA.C} i - ' j .A . t i . i - - i * 3 ; 0 ( » l n i ^ r t u t r * - j i j r J d - »
tr.rrt; ^ri1t Frr:ienftrjri -^^TT
i i o M7^--.i i- Mi-ticrrvrtti
!iM-=r.*-,T.n.» L , ^ f ^ (TjiM-L W.-liii .itt i r n f U t f B ff>l.p»l
-Tt" c f * * . ; •r^*^li-Mf,i, i<-i.5^>*':i-.--4-»n*KirK;iTr^iT.-fp-h.Vtuaon
0"Ci-i»^t inct-Ti tt»U.-ii»r^r;:ii.m ir i r .v i t 'a J-K)oTJirrrc=-: jr!:i-J-j|.~*;7iheI.-!-i-.itlf(itt-1,-^^' V imsir . -sroa-r t i rJ C r w T l - ^ : ,
fywru,\< .\t...t:.|( ri-.vnp.A.Mi:--.-;?j.v :e^^; 8,2008 Virr :rTW*P-€0-!H- i]jff-r..a.rcnrtr>a» J-W: .I .'U .11; Ji^KT^xm tJ flu«n;i/t:w:r liir. ai^'d^ A L i - i * 'j.ij^ilotvl!^ er
rf^F£ii 4 jBTir-ti::r-,i-cjn inrr-eTi-BT i T n s f icrfh l u m l muicU, Ar:hnTt *.WFrt-!;.;:5Ti-TJlt--«jn;aJ-ti I'j."-.^tti/ils-, 31 ' ia ;^* ; *
Pi-v.i/j, * "N-T . - I ' f r , iT, S j n - r i - T ^-r*».tr.; j - i ATJTA. t . l A j a J n r s - V . LtKS I*J c;*3r(i»r\-.M ; r: »- n . l k.^Ktacr ct m i H i r i R w U l
i f i h J v C r t S^-i jrvlaK^c.:?* i t M . 5W
f :» i f VrfviTi.n srd .-»tot-.cw;i-r — Tur-Jdvis J IUB i^ii7rr«M-.m i a l
Rirri.-t- !*r>^r, •-. 7:^3 'O-rij-i - i . ^ , n't £rl i-.i-ci h V m . ^ » (njir ih» t j P .rr-«,r, mu iW MMi- I ' r .t-rv JOC » r , J : ^ f - ^ i l U M v 5'.. ^3 !;:•>,
arp^i, r j i . t-> £ U podd- ^ r l i . A S . t^Jrmyi f j A r J i ;0H: ire iiSir^irJ'*:i!i ' . .:.».Wt d's^iUr T ( C MTI wrrii-lnftJiej-d f-.tctorfrirv aid <i«-iiiT.» l-SAa-fTijT infbi-.fr k rai.t;i.;i3ne:r:STo-skirwru' mdltolec '
V ' n - -A,—.p^-jT.jc-" :- -'*;t;l<SI tr i -u'xl ' .s: I3SA-.:(:rtr;fV.iwi •w^i'iTilrjbt'ii-ii-jTitElr J tf>';:::i j j i^ fT j i^bic i j <li,r rrsfir'difsr.SfafLi-
E t i J ' l \ i P / A . A t ' t r i . r £j-.-,'i \ i . -ui. ' .Vt iOCl . VKT.^j:-;fu wai jn (^(h' • V r t 4if,';»i-ii;H>iir.-ituj- i r c'..i1 w-i)il[*-nHEi irylejjvor tit SPHIBTW** t.-t:rV;ccr.'^ jnj; i i , . t . , rc- .^; . - "...t-r.
rSnfpw l A -n-jjr.Mi.-CI-tfftA V. : T K T\:;^ JiLs3rialir>Jtt ilv^axiitC2^ po^iv id- . ; ;^ * 4ffr:;dr«--:»r%^m'Ii»i;wti»inrrTtnCj Jlr^.^,f;Brt»rllJ\• P7li-. l1l Cl; ^ lJllo^^ Aji.;i ."i ni^- .TV'' 1 ,1SS-ni .
U'lTT. : - - j i i t G S l r f j«u i * i B i i - . f c ? ll*m>mi.»~-ii,?.AM,Ania.-in;»t
' iliirii':.A<=Wj - r v i * L (.v-i r ir J - l i l - i i i ^ B w V . T - « - i n J ttifrm Sra
iJi-'iriL A ^ - - i l - a . v ( . C i J . ^ « t-, I f * I. AC . Bc.'-n.A v. WrS 0 -^r« -
| -« •^••-Tmr) ly^ .c •.•;-;;t'j;rT^"% 17 i t . 'SC? Wrtt t * - i l i v * * , . h A 22(M * l - r * ' " " •f>rT*'i5r:nrr-.jip,-| u\jnu iMiroiTT^'
.fiU s-irt i - l i f r n W i S i f ."T^-^ir^-w: stuntfJLflti tni'j.i'jm oi tCMttTf
^trre; >lJTTJ-'3^ K_-*.T*fr( ,<<.. ii.r.:: Jrn. A 1571 Mildnrjl ornat l i t» i sf
iccii. V vis.-v 3 aj-=jf;u, * a --AH-, ? Ci . - r r i i i . 20:;,
Jnk'-:rr t I'cK i-r.rjTj^H-J ar.i l o ^ r m i . «:rT=«>r^tafkil itr
iura UvMjn^-^y. tti.-lufte A . V=r?t r-, Eofii=fo r, T-^tr..-:idi. SL C w a
l - i C S l " . . . . .
211

IJ-™-. ; . . t j -: injnr^.clC ".j-n ~^••v.H.V^^t^ .t '. .- : i : i l^-irrri.fi A .o£ - *v . iJo- . c 1 Ui:rA,:. V ; . , r - . . M'_ ! i . l - c : - : : i . i->. A . t . 'N . \J : - rJCciani : i :<^ . : - i= : r -Jr : t t iK . fp i? i rC 'C 'n- l - - j i*;r . -c^ri 'J. . Wj locf i . M ) . I3«ft r;.r r i - M ^ t-'.r \ -'-V.*-:'-;Tr^:»;nn)i".uUrf iTf '-h-rai n \ c - . r ^ej j r i M d t U>tLlj ' . ' L ' t ' . I^'rv ta.liir^ - i - f l - r -
S^hj. ' L J i i f i h e iitr-ci-; i ' . U - » * r T T c l i : - - f i ;"i«. ' '"!-J n ." ! - ' i . r .h i - i i in 'Al-Hri, M 1, Tl i i LC I ,t{ j i h i a i i - i T»- IfC-l. " j r T - i ; * . a r L Ti i.i r r r , T ' i v i-wl-' W,jin.-&c;->r' tH, J-Tl 'OT M r s f jUjr- i r-i-iriJ* .qtc/^nt^: r.W"+;nijl:rr a.'.rr :v;rT^='
i T r u i — A_ ' .Vir t ja M. Djb.-.. •*. t ^ T i i i t r . W U ' 5 ? * Q<—> i.fiiVi-:; . 1 t - t : n u;;r»% r-.tii: rwv'.;^ho^jT-tOr M t u n n Cr-.pj-tl- Crtr-.i.- t'.,-kil=p>
f» t ;nTfa - - iVeT- i - i i , ! . 1. r J i i r a j r a A i j . l t ' l o . .©us, 2i , P 13. Wi.7:l ' \ V ,N, K f i n ^ * . f C N . r^T-.ixrpr.ij e ^ : ! c^ f - - . . ^ ; r s
- • • • . ^ . - T i ^ o r i r r - r t T TCW-C i4T T:I i-v- - n - n .,v:-r A : J J I « * sa t , V j - I L J>;3. i t r . Lunj (, k-r,-, : W;ar, v.", rJ-'7 L'--,-^>rH-iu'
".I H A I " . Ot-^.ia . V * h - •. 1 _ U L A II, '"- — ; A = C J • . I ' - i . | , lOT^ n . T I * - J i i n v '^ ' ' i r t r f » j : r r - i ! ( M f - J lU^l^fwrrz. V j c i i r t r r 7J. 4-,:riL»-tP-il tf»^nn-rt : r - r ; : . 5 J r - i i r* rr-,-:-.—ri^ r ." .-ri . n - r J . w r ^ - i L i l JT"
i , -c« •iixiiaiory f M . j J i i * = OifJi . ' t t.-*!^ - I , - ^ „ ; . > r r . ' r n i ! ' O'l L T
2 1 2
\lKinrt>
Pn>liT j S A .
T h r rffett uf 4:hnink' hu-iiuudr) V l roS un DiarkTrs. nf. ueniimit- •ifabQil>. amioUiluiu maiirt anil hrulih in rainboo.' inii i t 5rl'a.\lim >V. Rider'. Jamg^.fteexe^V t^eiinrlh AniiOiithy'. j j j i Kiii|:l« \ SuDUn J . D j v i o ' JIKI AwiiJirvh N. fli/. _% h.»'t jf 'BUilt'yuiil Siif 'tra. THi- i'iiiyyr'irx r.f p;i7j^.u{ii
»»• l. r Cimt, PhyTiKiik, UK. 'inMituw 'if Rf-'tirJtvat ,i Hmtt j .^i H-ncf. I^crn'isuli} Ci*U»-Kt'':if Mi Jidn^ and I •I 'lii ' I ' * /Vri(uitUi .KtetkrdlSvh-.'-.l.Si tjit»;'s.C.iia^'a,^..Hi'J7isri,-i• HftiJ.. t\\fit'». I'K. ''Kntz-hi Snaiufir /JJ, t,S Wulselej T h i ^ ItuuiKW ['-ui.. Plyiniiulli. i 'K ,
l lu^utiJry fnL iKes .L>MK:uttnJ uitli iiitrii\i>e jL|ui.uluitr Siu.h Us luiijl ing iuU t.%itiruieinatl, iiie ljHiwn lu>.dtArStir'v-i iii tWiV u.IiiLh iii ttim. mi\ le^ull in retluLcJ (fi-tfa\r<) rcM<.ijit';r jn;M>venll fcallh. Tlie hni between sirt*\ u i J jniniune i> ucl l JtLumctted hut dicre a I J L L fti Lmmkilire Vtii die. efreh.b m ht&baiiJr\-retaleU « t C A U \ tm ^inHiniL \LiiriUlv tuU 'inliitXKloiii ioaius^ Tli^eftinr| thU tiKl> carried tnii, it: ttmanitr, the tffl'nih :oI ichionk' hAitdliiit' unJ t ••ir?neiiirnl. suew nil ^fretiL 'sLd)itil> uu) ^ili(iiiJ:mi ^uiu^ HI ratid^m InHji )r>ii-/u>j^'r/iii nn'li.ui. fivh wcie 'dIc^^cd titt If) !•> l u K e daily netlin): Olid une>httir kiu wiler cumtnenicii im dllcrnjle JJVIL Al'bn in Jjv> Tt h uerc muciihciiwxJ i i iJ bUn*^. siiiiiptes ucTTc toLcn fd i iu lyvU O u i i i l U e DNA daiiujl'e u .-. ;le1=nniird in ihc ef>Utn(c>le^i u"dlI ; a [ikMirtird LiiriKt u tiivh iik-loled 3ncrv>iite digcMiiHM WiUi I ' lyi . lu >pevilK.iUlv t3ii:ei ii.viJriol DNA h<i.%ev CyKJ^xict i^' djitupc Wj^ ;al^) r v J u i j r J ill endink.}ies U^IIIF: ibc iiik'tviiuclcus *\s4>. "Hie' |XTOv}i>itrite >cr-iVcti(:Hii; cjiijcily'<rf pUMiU jriJ'Mij»ein*ide i:c;iieraJi<i'i tif the leu»ttSle> u'erc'iIeteTnilrted as a nii^x^isi <it itiol ui«Hi\itbnl c i i u c i u .aid uiunuiie: huulHiii ies>et-l^el> u^ini: i i nvc l -ABKLJ* l i tv T*i (.-imfinn s t r e v S ' t r c a i c d lldi,. .^uitiMil leveh and |Kri.eni4:e pacVcd cell, vulume »%fe ilHt' iitea-turoJ ali'n^ wilh'iiiJiiLGd p e u i i caisri^U. H i ? ie<4ilu will he pTT\etited VkiiNii Ihe i-iinic\l nf an cvaluaiiim iH the iectin'ijuev u « d and the intjilicalkHis (il hu>hmtdr> ?4ie«s /ui
Detrrmliiailon of, u x U u i i ^ DNA damuer u id , iTfluiur viabOil} In marinr bneitrbnites' M j t i i n N*. Ciint> . Rebecca J . Drtmn*. Thimta% II, Ituuhiiisim', Midb' tltn 11. Jinies*'3ii j .AMjJholi S". f lu '
'nivtr,,irv,,'fPlT.intuth. /VaC'Ci r r i * . . . /'.•v-rt*iriiA„^V^'-'i f't-\\.-\, i Av *Aarti2fr}M'yii. Clfrhal -WITV. Hcjtih trvi I'.irrf -'t-
TQ.' hk.
Viiluillv' 'mi mriiniLjliltii evius' Uii *<f!iiiiLiur<iDS tti iiiJUvcJ (i.\id:ilivc ON A J j i n j r c in ihjuiuit. uiirtiebT^iss, w-hii. h |'la> jn iiniiirUiDl rule in c\-:i>»leiii fuielHmiiit'- Itcaroie ihi* in iiiiii.l, v^e huve jitncd m e^'Juile ttie ^|Kiiuirt>u\ 3t)J iriJuLcJ il.\iJall^c Uonuj^e ^ i J i U p u i n i l i J L i i ^ L ^ i n effea*trii kelluLii >ijhdil> i l l . Ihiee; dilfemil ci.-<ii«Tj.-K all> bnixntaiil iiiiiuiz imertehriics. T l i c c sf^e^ie^ umludeJ Jtaiinvtfic • die jtiitinUui ^LIr1l>h iXftfruty ruHi-n'.-\._ i pi/ct - ihe (UfTle ^ej''tirvliui
cP.>rJ:tiM: tKwin l ditJ j Itllci tVcvbi - tti; Utur ttuisxl !;tM'tA« •Jdi'i'i. \W hvpi4hrsp>r i lu l llti«.^irr'ciciilijl teedin^' l-tflnkiiiui will haw, tnlvfiriri ihlTririi-e^ jif-ti'wiitiitrtiin aihl indthfd'>KiUj|i>.e J jn i2 } : r JiiJ .ctl <iiur>i\al. r iv lu ims^tc^ . lij?iiuN.%ies uetr'.{ilteLted ili.l e\|WfK\J In \j riiv'e tjf ^uiKen-ir.tiii*ii^.i>l ih:^ iii iKtl iiihlali>e^i!:nil h^^liojxn )vi[r\i(b UIHICT Mt'-'j»'--i LXiiJiii fiN. The ttHiliiteJ sllaline *«itie! x%tay tkas. Uteii-^jmrJ Uit uuiiji .tii..leiijl Vii/AUle^ trirriii.inikkit}VTtaii> tlias UNA Liy^^t\.\|j<c BIKI Iu),l.iiu.trit.« ID) aiul QK vtal'ilily Ml" I I K >'C|IX »a-» v'ctennineJ UMiie Uir iieuti;d red releilinn J^'>Jv, TIr . leMjlls wiD ly: \ IVu«io . l in lemii 4»| dilleietilul rutr- iir'h^^flillf .ukl i i iJ i i icI i>^i.|jlive DNA'.J;iiiuy'e' XIHI .ellular yiahihlv^
Helrnmi-cS I fc.*,, i ,> * . ! - l . » n K; >- J i l M \ . MV* *)
rhetatlypiC bpimurkcTi'.(f >mi\'pbbill l> — muicrnal and laiteroal iaiputi (in n n t h i r a o , Kit-*line &. G u l / i o ^ '. Tn ipnn M. Lui^'kilr". \ i l l e Sipirmi', .'^ViiJieu K Oi l l in i ' jiulCiuiuur UiunKtri:*
*\uti..nurhiuu,4r. .f Pi,h!»^ Iff'^J' u\tPtfK P r>Jlp^^ JJiU
Tit; uii.'ulcikc i«l cItilJhtKhl .411-=! 1.1 iirntiurip [livttdci.v «IL'II j s i ' j i n i j titil jlletv}..atr yi^i^luilU ilk. leaviii^-. Il iv helie^rd dui theiiiUaN |'ir>ciil ill I'IHIJ »nJ iii.tli: ca\intimwnt nuy be-r^iJtin^hie r.ir ihi* incie:i^e. L vniMfiiuciilK. NewOeneiB lNcui<uni>, jiiil CicmiliuiL rv|>ii>ijtc rMo). an tDttrjrnilcd yhifcit MiJiiii ihe. nurupe^tu blh banieu»rL ysnyrsimni' lLKU<dn^ 111 I'tiKl <fii)il'y aii l -sifciv. t^urLtvit The |;»al Iff NeiAt'feiirii> K i:» ettinms whsUtci tu l : i i i j molemal e\p(lhatre-iu pciiLit'iLii.' aiid iiiuiiuiifrtiuu' c.li7iiui.^\ frimi ihe e'liwiniviieiil (ti 'the diet teavh >•) ilHilnrirfat c.h3JiR:» in ihe' uiihuii child whith ultiin:iirK bad; Ui on nktcj^cd risl-nf .liiUhiHhl li«jii;l^s, TtiefelMrc,, inoii^' dirtrftnl ^t(nLpKt.a}*c^ hive hceti cMjHidicd. Out 'iVtjp is rsficv>j|lv ilHenSled ih usiiiv* s.Mstinr iiielhml^ hj.xrJ 'tn die titntel. ii vi' li* (fcrvrliip I'lieiMivfK t'HinLirici^ uaTi-iihliifilial >ut..cpithilU>' l « diilcirni'etnitl'iiinciilul ui dicLin *.iri.iiiii):eiik tit mimuniiiti^-iiiv in ^^T'tl. I3NA. ((oiiuv'e onJ trfoir p3lh-Aa>.> will tv >iulied in \iit>.\ .lyfii)-h[K>tev il'lllVt f ida l r . l lliun liie- v^ttJ*-jiid'iiHtlIiri«'l-lii;>t utilizing' Oic NivucL'ioii ni^idm^hiM hinli vtilbifi. A ^iiiitei loliJalii i i ^uly hj>~ bcviK)ir>i?\l-<'>t<. ^id the llintt^rhpul [«l Uir incthiid IIJN I t x n incTca-wrd- tesdls will he |?re«iti;i). .Ill Vvr.^ die aim is lit dcirriiiinc |uleiiul irrfluences ini yeikiiiixiL lu / ihK' iii iicuKiiiii., I h i s |\ ;hht;^ed ponly hy uiiaK^tnr yivnn j ' i r r in-vttr^ urji i i iri i lt with dilteieni J icury .h^miL jv onj (unly hy oii d^Mrer a *nh{ii1.-"l'^*cnil CitUeeleJ m Uhidfi'iJ. u-unj: Uie .^unicl a.vkjy. IIUMe>ci. dere'iiie -Jill iiicihkliikiVkiii pn>hlems widt dir ..tiitil a- av tm «penn Utoi 4ie>iiiK.Al t i .vi lvc iiioiiirt U''t>diil d i i fU4. .
Tills (itnrvl K ti^iKirlnl. h;> IIK;: C I , rtinniis&iuii ttiiV. NcwfJeiieii-.. I'-mti ,Vi O | h i 3 : li.
213

References
2 1 4

Adams, M. D., Celniker, S. E., Holt, R. A., Evans, C. A,. Gocayne, J. D., Amanatides, P. G., Scherer, S. E., Li, P. W,, Hoskins. R. A., Galle, R, F,, George, R, A,, Lew/is, S. E., Richards, S., Ashburner, M., Henderson, S, N,, Sutton, G. G., Wortman, J, R,, Yandell, M, D,, Zhang, Q., Chen, L. X., Brandon, R, C . Rogers, Y.-H. C . Blazej, R, G., Champe, M., Pfeiffer, 8, D.. Wan, K. H.. Doyle, C , Baxter, E. G., Helt, G., Nelson. C, R,, Gabor Miklos, G. L., Abril, J. F., Agbayani, A.. An, H,-J., Andrev^s-Pfannkoch, C., Baldwin, D,, Ballew, R. M., Basu, A., Baxendale, J. , Bayraktaroglu, L., Beasley, E. M,, Beeson. K, Y., Benos, P. V.. Berman, B, P., Bhandari, D., Bolshakov. S,, Borkova, D., Bolchan, M. R., Bouck, J., Brokstein, P,. Brottier, P,, Burtis, K. C . Busam, D. A., Butler, H,, Cadieu, E.. Center. A., Chandra. I., Cherry, J. M., Cawley, S., Dahike, C , Davenport, L, B,. Davies, P., Pablos, B, d., Delcher, A., Deng. Z,, Mays, A. D., Dew, I,, Dietz, S. M., Dodson, K,. Doup, L. E., Downes, M., Dugan-Rocha, S., Dunkov. B. C , Dunn, P., Durbin, K, J.. Evangelista, C. C , Ferraz. C , Ferriera, S.. Fleischmann, W., Fosler, C , Gabrielian, A. E., Garg, N. S,, Gelbart. W. M.. Glasser, K,, Glodek. A.. Gong, F., Gorrell. J, H,, Gu, Z,. Guan, P., Harris, M., Harris. N. L., Harvey, D., Heiman, T, J,, Hernandez, J, R,, Houck. J., Hostin. D,, Houston, K. A., Howland. T. J., Wei, M.-H., Ibegwam, C , et al. (2000), The Genome Sequence of Drosophila melanogaster. Science 287, 2185-2195,
Adoutte, A,. Balavoine, G,, Lartillot, N., Lespinet. O,, Prud'homme. B, and de Rosa, R. (2000). The new animal phylogeny: Reliability and implications. Proceedings of the National Academy of Sciences of tiie United States of America 97, 4453-4456.
Agardy, T. and Alder, J. (2005). Coastal Systems in Hassan, R., Scholes. R. and Ash, N. (Eds). Ecosystems and Human Well-being: Current State and Trends, Volume 1, Island Press, pp. 948.
Ainscough, R., Bardill, S,, Barlow, K,. Basham, V., Baynes, C . Beard, L,, Beasley, A., Berks. M. and Bonfield, J. (1998). Genome Sequence of the Nematode Caenorhabditis elegans: A Platform for Investigating Biology. Science 282, 2012-2018.
Albertini. R. J. , Nicklas. J, A. and Patrick O'Neill, J. (1996). Future Research Directions for Evaluating Human Genetic and Cancer Risk from Environmental Exposures, Environmental Health Perspectives 104 (SuppI 3) 503-510.
Allen, J. R. (1998), Suspension feeding in the brittle-star Ophiothrix fragilis: efficiency of particle retention and implications for the use of encounter-rate models. Marine Biology 132, 383-390.
Almeida. J. A,. Barreto. R. E., Novelli, E. L. B., Castro. F. J. and Moron, S, E, (2009). Oxidative stress biomarkers and aggressive behavior in fish exposed to aquatic cadmium contamination. Neotrophical Icthyology 7, 103-108.
Anderson, D., Bishop, J, B., Garner. R. C . Ostrosky-Wegman, P. and Selby. P, B. (1995). Cyclophosphamide: Review of its mutagenicity for an assessment of potential germ cell risks. Mutation Research/Fundamental and Molecular Mechanisms of Mutagenesis 330, 115-181.
Anderson, J. M. (1953). Structure and function in the pyloric caeca of >As/er/as forbesi Biol Bu/ /105, 47-61,
Anderson, S. L, and Wild, G. C. (1994). Linking Genotoxic Responses and Reproductive Success in Ecotoxicology Environmental Health Perspectives 102(Suppl 12), 9-12.
215
Andreoli, C , Leopardi, P., Rossi, S. and Crebelli, R, (1999), Processing of DNA damage induced by hydrogen peroxide and methyl methanesulfonate in human lymphocytes: analysis by alkaline single cell gel electrophoresis and cytogenetic methods. Mutagenesis 14, 497-503.
Andrew, W. (1962). Cells of the blood and coelomic fluids of tunicates and echinoderms. American Zoologist 2, 285-297,
Asensio, V,, Kille, P., Morgan, A. J,, Soto, M, and Marigomez, I. (2007). Metallothionein expression and Neutral Red uptake as biomarkers of metal exposure and effect in Eisenia fetida and Lumbricus terrestris exposed to Cd. European Journal of Soil Biology 43, S233-S238.
Atienzar, F. A. and Jha, A. N. (2004). The random amplified polymorphic DNA (RAPD) assay to determine DNA alterations, repair and transgenerational effects in B(a)P exposed Daphnia magna. Mutation Research/Fundamental and Molecular Mechanisms of Mutagenesis 552, 125-140,
Alienzar, F. A.. Venier, P,, Jha, A. N. and Depledge, M. H. (2002). Evaluation of the random amplified polymorphic DNA (RAPD) assay for the detection of DNA damage and mutations. Mutation Research/Genetic Toxicology and Environmental Mutagenesis 521, 151 -163.
ATSDR (1995). Toxicological Profile for Polycyclic Aromatic Hydrocarbons (PAHs), US Department of Health and Human Services, pp. 487.
Attrill, M. J.. Kelmo, F. and Jones, M, B. (2004). Impact of the 1997-98 El Nino event on the coral reef-associated echinoderm assemblage from Northern Bahia, northeastern Brazil. Climate Research 26, 151-158.
Axiak, V. and Saliba, L. J, (1981). Effects of surface and sunken crude oil on the behaviour of a sea urchin. Marine Pollution Bulletin 12, 14-19.
Azqueta, A,, Shaposhnikov, S, and Collins. A, R. (2009). DNA oxidation: Investigating its key role in environmental mutagenesis with the comet assay. Mutation Research/Genetic Toxicology and Environmental Mutagenesis 674, 101-108.
Babich, H, and Borenfreund, E. (1991), Cytotoxicity of T-2 toxin and its metabolites determined with the neutral red cell viability assay. Applied and Environmental Microbiology 57, 2101-2103.
Babich, H, and Borenfreund. E. (1992). Neutral red assay for toxicology in vitro in Watson, R. R. (Ed), In Vitro Methods of Toxicology, CRC Press, pp, 39-66.
Babich. H. and Borenfreund, E. (1993). Applications of the neutral red cytotoxicity assay to risk assessment of aquatic contaminants: an overview in Landis, W. G.. Hughes, J. S. and Lewis, M. A. (Eds), Environmental toxicity and risk assessment, American Society for Testing and Materials.
Bay, S.. Burgess, R. and Nacci, D. (1993). Status and applications of Echinoid (Phylum Echinodermata) toxicity lest methods in Landis. W. G., Hughes, J. S. and Lewis, M. A. (Eds). Environmental toxicity and risk assessment, American Society for Testing and Materials.
Bayne, B. L. (1976). Marine Mussels: their ecology and physiology. Cambridge University Press.
Bayne, B. L. (1984). Response to environmental stress: tolerance, resistance and adaptation in Gray, J. and Christenson, M, (Eds). Eighteenth European Marine Biology Symposium, Wiley.
216

Bayne, C. L. and Moore, M. N. (1998). Responses, biomarkers and risk assessment in Zetikoff, J, T. (Ed), Ecotoxicology, SOS Publications, pp. 243-261.
Bebianno, M. J. and Langston, W, J. (1991), Metallothionein induction in MytHus edulis exposed to cadmium. Marine Biology 108, 91-96.
Bekri. K. and Pelletier, E. (2004). Trophic transfer and in vivo immunotoxicologicat effects of tributyltin (TBT) in polar seastar Leptasterias polaris. Aquatic Toxicology 66, 39-53.
BEL (2002). Marine Risk Assessment, Brixham Environmental Laboratory, pp. 2.
Bellas, J.. Beiras, R,, Marino-Balsa, J. C, and Fernandez, N. (2005), Toxicity of organic compounds to marine invertebrate embryos and larvae: A comparison between the sea urchin embryogenesis bioassay and alternative test species. Ecotoxicology 14, 337-353.
Belpaeme, K., Delbeke, K,. Zhu, L. and Kirsch-Volders, M. (1996). Cytogenetic studies of PCB77 on brown trout (Salmo trutta fario) using the micronucleus test and the alkaline comet assay. Mutagenesis 11, 485-492.
Bielmyer, G. K., Brix. K. V,, Capo, T. R. and Grosell, M. (2005). The effects of metals on embryo-larval and adult life stages of the sea urchin. Diadema antillarum. Aquatic Toxicology 74, 254-263.
Bihari, N. and Fafandel, M. (2004). Interspecies differences in DNA single strand breaks caused by benzo(a)pyrene and marine environment. Mutation Research/Fundamental and Molecular Mechanisms of Mutagenesis 552, 209-217.
Bineiti, A., Cogni, D.. Parolini, M.. Riva, C. and Provini. A. (2009a). Cytotoxic and genotoxic effects of in vitro exposure to Triclosan and Trimethoprim on zebra mussel {Dreissena polymorpha) hemocytes. Comparative Biochemistry and Physiology Part C: Toxicology & Pharmacology 150, 50-56.
Binelli, A., Cogni, D.. Parolini, M., Riva. C. and Provini. A. (2009b). In vivo experiments for the evaluation of genotoxic and cytotoxic effects of Triclosan in Zebra mussel hemocytes. Aquatic Toxicology 91, 238-244.
Binelli, A., Riva, C , Cogni. D, and Provini, A, (2008), Assessment of the genotoxic potential of benzo(a)pyrene and pp'-dichlorodiphenyldichloroethylene in Zebra mussel (Dreissena polymorpha). Mutation Research/Genetic Toxicology and Environmental Mutagenesis 649, 135-145.
Boisson. F.. Cotret, O. and Fowler, S. W. (2002). Transfer and distribution of lead in the asteroid Asterias rubens following ingestion of contaminated food: a radiotracer study. Marine Pollution Bulletin 44, 1003-1009.
Bolognesi, C , Landini, E., Roggieri. P.. Fabbri, R. and Viarengo. A. (1999). Genotoxicity biomarkers in the assessment of heavy metal effects in mussels: Experimental studies. Environmental and Molecular Mutagenesis 33, 287-292.
Bolognesi, C . Perrone, E., Roggieri, P., Pampanin, D. M. and Sciutto, A. (2006). Assessment of micronuclei induction in peripheral erythrocytes of fish exposed to xenobiotics under controlled conditions. Aquatic Toxicology 78, S93-S98.
Bombail, V., Aw. D., Gordon, E. and Batty. J. (2001). Application of the comet and micronucleus assays to butterfish (Pholis gunnellus) erythrocytes from the Firth of Forth, Scotland. Chemosphere 44, 383-392.
217
Borenfreund, E. and Puerner. J. A. (1985). Toxicity determined in vitro by morphological alterations and neutral red absorption. Toxicology Letters 24, 119-124.
Bound, J. P. and Voulvoulis, N. (2004). Pharmaceuticals in the aquatic environment - a comparison of risk assessment strategies. Chemosphere 56, 1143-1155.
Bowett, T. J, (2002), Biomarkers of cadmium exposure in Asterina gibbosa, MSc Applied Marine Science Thesis, University of Plymouth, pp, 1-56.
Bowmer, T., Boelens, R. G. V., Keegan, B. F. and O'Neill, J. (1986). The use of marine benthic 'key' species in ecotoxicological testing: Amphiura filiformis (O.F. Muller) (Echinodermata: Ophiuroidea). Aquatic Toxicology 8, 93-109.
Bradford, M. M. (1976). A rapid and sensitive method for the quantitation of microgram quantities of protein utilizing the principle of protein-dye binding. Analytical Biochemistry 72, 248-254.
Branum, A. M.. Collman, G. W,, Correa, A., Keim, S. A.. Kessel, W.. Kimmel, C. A,, Klebanoff, M. A., Longnecker, M. P., Mendola, P., Rigas, M,, Selevan, S, G., Scheldt, P, C , Schoendorf, K., Smith-Khurl, E. and Yeargln-Allsopp, M. (2003). The national children's study of environmental effects on child health and development. Environmental Health Perspectives 111, 642-646.
Brown. R. J.. Galloway. T. S., Lowe, D., Browne, M. A., DIssanayake, A., Jones, M. B. and Depledge, M. H. (2004). Differential sensitivity of three marine invertebrates to copper assessed using multiple biomarkers. Aquatic Toxicology 66, 267-278.
Buckley, L. A, and Dorato, M. A, (2009). High dose selection in general toxicity studies for drug development: A pharmaceutical industry perspective. Regulatory Toxicology and Pharmacology 54, 301-307,
Buerge, I. J., Buser, H,-R., Poiger, T, and Muller, M, D, (2006). Occurrence and Fate of the Cytostatic Drugs Cyclophosphamide and Ifosfamide In Wastewater and Surface Waters, Environmental Science & Technology 40, 7242-7250.
Buznikov, G, A,. Kost, A. N., Kucherova, N. F.. Mndzhoyan, A. L., Suvorov, N. N. and Berdysheva, L. V. (1970), The role of neurohumours In early embryogenesis: III, Pharmacological analysis of the role of neurohumours In cleavage divisions. J Embryol Exp Morphol 23, 549-569.
Buznikov, G. A.. Nikltlna, L, A., Rakic, L. M., Milosevic, L, Bezuglov, V. V., Lauder. J. M. and Slotkin, T. A. (2007). The sea urchin embryo, an invertebrate model for mammalian developmental neurotoxicity, reveals multiple neurotransmitter mechanisms for effects of chlorpyrifos: Therapeutic Interventions and a comparison with the monoamine depleter, reserplne. Brain Research Bulletin 74, 221-231.
Cairns Jr, J. (1983). Are single species toxicity tests alone adequate for estimating environmental hazard? Hydrobiologia 100, 47-57.
Caldwell, G. S.. Lewis, C , Olive. P. J. W. and Bentley. M. G. (2004). Exposure to 2.4-decadlenal negatively impacts upon marine invertebrate larval fitness. Marine Environmental Research 59, 405-417.
Campbell. D. A., Pantazis, P. and Kelly, M, S. (2001). Impact and residence time of oxytetracycllne in the sea urchin, Psammechinus miliaris, a potential aquaculture species. Aquaculture 202, 73-87.
218

Campbell, N. A. and Reece, J. B. (2002). Biology, 6th edn. Benjamin Cummings.
Camus, L., Jones, M. B., Borselh, J. F., Grosvik, B. E., Regoli, F. and Depledge. M. H. (2002). Total oxyradical scavenging capacity and cell membrane stability of haemocyles of the Arctic scallop, Chlamys islandicus, following ben20(a)pyrene exposure. Marine Environmental Research 54, 425-430.
Candia Carnevali, M. D., Bonasoro, F., Patruno, M., Thorndyke, M. C. and Galassi, S. (2001). PCB exposure and regeneration in crinoids (Echinodermata). Marine Ecology Progress Series 215, 155-167.
Canova, S.. Degan, P.. Peters, L. D.. Livingstone, D. R., Voltan, R. and Venier, P. (1998). Tissue dose, DNA adducts, oxidative DNA damage and CYPIA-immunoposi t ive proteins in mussels exposed to waterborne benzo[a]pyrene. Mutation Research/Fundamental and Molecular Mechanisms of Mutagenesis 399, 17-30.
Canty, M. N., Hagger, J. A., Moore, R. T. B., Cooper, L. and Galloway, T. S. (2007). Short term exposure to the organophosphale pesticide azamethiphos alters haemocyte viability and function in the marine mollusc Mytilus edulis. Marine Pollution Bulletin 54, 396-402.
Chang, L. W., Toth, G. P.. Gordon. D. A., Graham, D. W., Meier, J. R., Knapp, C. W., Jerry deNoyelles. F., Campbell, S. and Laltier, D. L. (2005). Responses of molecular indicators of exposure in mesocosms: Common carp (Cyprinus carpio) exposed to the hebicides alachlor and atrazine. Environmental Toxicology and Chemistry 24, 190-197.
Chang. M.. Wang, W.-N., Wang, A.-L.. Tian. T.-T., Wang. P., Zheng. Y. and Liu. Y. (2009). Effects of cadmium on respiratory burst, intracellular Ca2+ and DNA damage in the white shrimp Litopenaeus vannamei. Comparative Biochemistry and Physiology Part C: Toxicology & Pharmacology 149, 581-586.
Cheung. V. V., Depledge, M. H. and Jha. A. N. (2006). An evaluation of the relative sensitivity of two marine bivalve mollusc species using the Comet assay. Marine Environmental Research 62, S301-S305.
Cheung, V. V., Wedderburn, R. J. and Depledge, M. H. (1998). Molluscan lysosomal responses as a diagnostic tool for the detection of a pollution gradient in Tolo Harbour, Hong Kong. Marine Environmental Research 46, 237-241.
Ching. E. W. K., Siu. W. H. L., Lam, P. K. S., Xu, L., Zhang, Y.. Richardson, B. J. and Wu. R. S. S. (2001). DNA Adduct Formation and DNA Strand Breaks in Green-lipped Mussels (Perna viridis) Exposed to Benzo[a]pyrene: Dose- and Time-Dependent Relationships. Marine Pollution Bulletin 42, 603-610.
Chinwalla, A. T.. Cook, L. L., Delehaunty, K. D.. Fewell. G. A., Fulton, L. A., Fulton, R. S. and Graves, T. A. (2002). Initial sequencing and comparative analysis of the mouse genome. Nature 420, 520-562.
Clark, R. B. (2001). Marine Pollution, 5th edition edn. Oxford University Press. Claxton, L. D., Houk, V. S. and Hughes, T. J. (1998). Genotoxicity of industrial
wastes and effluents. Mutation Research/Reviews in Mutation Research 410. 237-243.
Clements, L. A. J., Lauricella, A., Strasbaugh, A. and Serff, E. K. (1998). Effects of cadmium and zinc on regeneration and behavior in Ophiophragmus filograneus in Mooi. R. and Telford, M. (Eds), Proceedings of the ninth
219

international echinoderm conference San Francisco/ California/ USA/ 5-9 August 1996, A.A. Balkema, pp. 329-334.
Cobb. J. L. S. (1978). An ullrastructural study of the dermal papulae of the starfish, Asterias rubens, with special reference to innervation of the muscles. Cell and Tissue Research 187, 515-523.
Cohen. S. M., Garland, E. M., John, M. S., Okamura. T. and Smith. R. A. (1992). Acrolein Initiates Rat Urinary Bladder Carcinogenesis. Cancer Res 52, 3577-3581.
Coles, J. A., Farley, S. R. and Pipe, R. K. (1995). Alteration of the immune response of the common marine mussel Mytilus edulis resulting from exposure to cadmium. Diseases of Aquatic Organisms 22, 59-65.
Collins, A. R. (2004). The Comet Assay for DNA Damage and Repair. Molecular Biotechnology 26, 249-261.
Collins, A. R., Ai-guo, M. and Duthie, S. J. (1995). The kinetics of repair of oxidative DNA damage (strand breaks and oxidised pyrimidines) in human cells. Mutation Research/DNA Repair 336, 69-77.
Collins, A. R.. Dobson, V. L., Duinska, M., Kennedy, G. and Stetina, R. (1997). The comet assay: what can it really tell us? Mutation Research/Fundamental and Molecular Mechanisms of Mutagenesis 375, 183-193.
Collins, A. R.. Duthie, S. J. and Dobson, V. L. (1993). Direct enzymic detection of endogenous oxidative base damage in human lymphocyte DNA. Carcinogenesis 14, 1733-1735.
Coteur. G.. Danis, B., Fowler, S. W., Teyssie, J.-L., Dubois, P. and Warnau, M. (2001). Effects of PCBs on Reactive Oxygen Species (ROS) Production by the Immune Cells of Paracentrotus lividus (Echinodermata). Marine Pollution Bulletin 42, 667-672.
Coteur, G., Danis, B., Wantier, P., Pernet, P. and Dubois. P. (2005a). Increased phagocytic activity in contaminated seastars (Asterias rubens) collected in the Southern Bight of the North Sea. Marine Pollution Bulletin 50, 1295-1302.
Coteur, G., DeBecker. G.. Warnau, M., Jangoux. M. and Dubois. P. (2002). Differentiation of immune cells challenged by bacteria in the common European starfish, Asterias rubens (Echinodermata). European Journal of Cell Biology 8^, 413-418.
Coteur, G., Gillan, D., Pernet, P. and Dubois, P. (2005b). Alteration of cellular immune responses in the seastar Asterias rubens following dietary exposure to cadmium. Aquatic Toxicology 73, 418-421.
Coughlan, J. (1969). The estimation of filtering rate from the clearance of suspensions. Marine Biology 2, 356-358.
Cox, P. J. (1979). Cyclophosphamide cystitis - Identification of acrolein the causative agent. Biochemical Pharmacology 28, 2045-2049.
Crook, A. C , Long, M. and Barnes, D. K. A. (2000). Quantifying daily migration in the sea urchin Paracentrotus lividus. Journal of the Marine Biological Association of the UK 80, 177-178.
D'Andrea, A., F. , Stancyk, S. E. and Chandler, G. T. (1996). Sublethal effects of cadmium on arm regeneration in the burrowing brittlestar. Microphiopholis gracillima. Ecotoxicology 5, 115-133.
Dailianis, S. (2009). Production of superoxides and nitric oxide generation in haemocytes of mussel Mytilus galloprovincialis (Lmk.) after exposure to cadmium: A possible involvement of Na+/H+ exchanger in the induction of cadmium toxic effects. Fish & Shellfish Immunology 27, 446-453.
220

Dailianisa, S., Domouhlsidoub, G. P., Raftopouloub, E., Kaloyiannia, M. and Dimitriadisb, V. K. (2003). Evaluation of neutral red retention assay.micronucleus test, acetylcholinesterase activity and a signal transduction molecule (cAMP) in tissues of Mytilus galloprovincialis (L.), in pollution monitoring. Marine Environmental Research 56, 443-470.
Danis, B., Colret. O.. Teyssie. J. L., Fowler, S. W. and Warnau, M. (2004a). Coplanar PCB 77 uptake kinetics in the sea star Asterias rubens and subsequent effects on reactive oxygen species (ROS) production and levels of cytochrome P450 immunopositive proteins (CYP1A-IPP). Marine Ecology Progress Series 279, 117-128.
Danis, B., Wantier, P.. Dutrieux, S., Flammang, R., Dubois, P. and Warnau, M. (2004b). Contaminant levels in sediments and asteroids {Asterias rubens L.. Echinodermata) from the Belgian coast and Scheldt estuary: polychlorinated biphenyls and heavy metals. Science of the Total Environment 233, 149-165.
Davidson, E. H. (2006). The Sea Urchin Genome: Where Will it Lead Us? Science 314, 939-940.
Davies, I. M., Gillibrand, P. A., McHenery. J. G. and Rae, G. H. (1998). Environmental risk of ivermectin to sediment dwelling organisms. Aquaculture 163, 29-46.
Davoult, D. and Gounin, F. (1995). Suspension-feeding activity of a dense Ophiothrix fragilis (Abildgaard) population at the water-sediment interface: Time coupling of food availability and feeding behaviour of the species. Estuarine, Coastal and Shelf Science 41, 567-577.
Dehal, P.. Satou, Y., Campbell, R. K., Chapman, J., Degnan, B., De Tomaso, A., Davidson, B., Di Gregorio, A., Gelpke, M., Goodstein, D. M., Harafuj N.. Hastings, K. E. M., Ho. I., Hotta, K., Huang. W., Kawashima, T Lemaire, P., Martinez, D., Meinertzhagen, I. A., Necula, S., Nonaka, M Putnam. N., Rash. S.. Saiga, H., Satake, M., Terry, A., Yamada. L Wang, H.-G., Awazu. S., Azumi, K., Boore, J., Branno, M., Chin-bow. S DeSantis. R., Doyle. S.. Franclno. P.. Keys, D. N., Haga, S.. Hayashi, H Hino. K., Imai, K. S., Inaba, K., Kano, S., Kobayashi, K., Kobayashi, M Lee, B.-l.. Makabe, K. W., Manohar, C , Matassi, G., Medina, M Mochizuki, Y., Mount. S., Morishita, T., Miura, S., Nakayama, A Nishizaka, S., Nomoto, H.. Ohta. F.. Oishi, K.. Rigoutsos, !., Sano, M Sasaki, A., Sasakura, Y., Shoguchi. E., Shin-i, T., Spagnuolo, A Stainier, D., Suzuki, M. M.. Tassy, O., Takatori, N., Tokuoka, M., Yagi, K., Yoshizaki. F., Wada, S., Zhang, C , Hyatt. P. D.. Larimer, P., Detter. C , Doggett, N.. Glavina. T.. Hawkins. T., Richardson, P.. Lucas, S.. Kohara, Y., Levine. M., Satoh. N. and Rokhsar. D. S. (2002). The Draft Genome of Ciona intestinalis: Insights into Chordate and Vertebrate Origins. Science 298, 2157-2167.
den Besten, P. J. (1998). Cytochrome P450 monooxygenase system in echinoderms. Comparative Biochemistry and Physiology Part C: Pharmacology, Toxicology and Endocrinology ^2^, 139-146.
den Besten, P. J., Herwig, H. J., van Donselaar, E. G. and Livingston, D. R. (1990). Cytochrome P-450 monooxygenase system and benzo(a)pyrene metabolism in echinoderms. Marine Biology 107, 171-177.
den Besten, P. J. , Herwig, H. J. , Zandee, D. I. and Voogt, P. A. (1989). Cadmium accumulation and metallothionein-like proteins in the Sea star Asterias rubens. Marine Environmental Research 28, 163-166.
221
den Besten, P. J., Lemaire, P., Livingstone, D. R., Woodin, B., Slegeman. J. J., Herwig, H. J. and Seinen, W. (1993). Time-course and dose-response of the apparent induction of the cytochrome P450 monooxygenase system of pyloric caeca musomes of the female sea star Asferias rubens L. by benzo(a]pyrene and polychlorinated biphenyls. Aquatic Toxicology 26, 23-39.
den Besten, P. J. and Tuk, C. W. (2000). Relation between responses in the neutral red retention test and the comet assay and life history parameters of Daphnia magna. Marine Environmental Research 50, 513-516.
Depledge, M. H. and Fossi, M. C. (1994). The role of biomarkers in environmental assessment (2). Invertebrates. Ecotoxicology 2, 161-172.
Depledge, M. H. and Galloway. T. S. (2005). Healthy animals, healthy ecosystems. The Ecological Society of America 3, 251-258.
Depledge, M. H., Weeks. J. M. and Bjerregaard, P. (1994). Heavy Metals in Calow, P. (Ed), Handbook of ecotoxicology - Volume 2, Blackwell Scientific Publications, pp. 79-105.
Dinnel. P. A.. Pagano, G. G. and Oshida, P. S. (1988). A sea urchin test system for marine environmental monitoring in Burke, R. D.. Mladenov. P. V., Lambert, P. and Parsley, R. L. (Eds), Echinoderm Biology, A. A. Balkema, pp. 611-619.
Dissanayake, A. and Galloway, T. S. (2004). Evaluation of fixed wavelength fluorescence and synchronous fluorescence spectrophotometry as a biomonitoring tool of environmental contamination. Marine Environmental Research 58, 281-285.
Dissanayake, A., Galloway, T. S. and Jones, M. B. (2008). Physiological responses of juvenile and adult shore crabs Carcinus maenas (Crustacea: Decapoda) to pyrene exposure. Marine Environmental Research 66, 445-450.
Dixon, D. R., Pruski, A. M., Dixon. L. R. J. and Jha, A. N. (2002). Marine invertebrate eco-genotoxicology: a methodological overview. Mutagenesis 17, 495-507.
Dusinska, M. and Collins, A. (1996). Detection of oxidised purines and UV-induced photoproducts in DNA of single celts, by inclusion of lesion-specific enzymes in the comet assay. Alternatives to Laboratory Animals 24, 405-411.
EA (2002). The Water Framework Directive: Guiding principles on the technical requirements. Environment Agency, pp. 20.
ECETOC (2007). Intelligent Testing Strategies in Ecotoxicology: Mode of Action Approach for Specifcally Acting Chemicals. Technical Report No. 102, European Centre for Ecotoxicology and Toxicology of Chemicals, pp. 151.
Eertman. R. H. M., Groenink, C. L. F. M. G., Sandee, B. and Hummel, H. (1995). Response of the Blue Mussel Mytilus edulis L. following exposure to PAHs or contaminated sediment. Marine Environmental Research 39, 169-173.
Emmanouil, C , Sheehan, T. M. T. and Chipman, J. K. (2007). Macromolecule oxidation and DNA repair in mussel (Mytilus edulis L.) gill following exposure to Cd and Cr{VI). Aquatic Toxicology 82, 27-35.
Erk. M., Ruus, A., Ingebrigtsen, K. and Hylland, K. (2005). Cadmium accumulation and Cd-binding proteins in marine invertebrates - A radiotracer study. Chemosphere 61, 1651-1664.
222

Everaarls, J. M. (1995). DNA integrity as a biomarker of marine pollution: Strand breaks in seastar (Asterias rubens) and dab (Limanda limanda). Marine Pollution Bulletin 31, 431-438.
Everaarts, J. M. (1997). DNA integrity in Asterias rubens. a biomarker reflecting the pollution of the North Sea? Journal of Sea Research 37, 123-129.
Everaarts, J. M., Den Besten, P. J.. Hillebrand, M. T. J. , Halbrook, R. S. and Shugart, L. R. (1998). DNA strand breaks, cytochrome P-450-dependenl monooxygenase system activity and levels of chlorinated biphenyl congeners in the pyloric caeca of the seaslar {Asterias rubens) from the North Sea. Ecotoxicology 7, 69-79.
Fang, J. K. H., Wu. R. S. S.. Zheng, G. J., Lam. P. K. S. and Shin. P. K. S. (2008). Induction, adaptation and recovery of lysosomal integrity in green-lipped mussel Perna viridis. Marine Pollution Bulletin 57, 467-472.
Federici. G.. Shaw. B. J. and Handy. R. D. (2007). Toxicity of titanium dioxide nanoparticles to rainbow trout (Oncorhynchus mykiss). Gill injury, oxidative stress, and other physiological effects. Aquatic Toxicology 84, 415-430.
Felten, V., Charmantier, G., Mens. R.. Geffard. A., Rousselle, P., Coquery, M., Garric, J. and Geffard, O. (2008). Physiological and behavioural responses of Gammarus pulex (Crustacea: Amphipoda) exposed to cadmium. Aquatic Toxicology 413-425.
Fenech, M. (2000). The in vitro micronucleus technique. Mutation Research 455, 81-95.
Filipic, M., Falur, T. and Vudrag, M. (2006). Molecular mechanisms of cadmium induced mutagenicity. Human and Experimental Toxicology 25, 67-77.
Foran, J. A. (1997). Principles for the Selection of Doses in Chronic Rodent Bioassays Environmental Health Perspectives 105.
Fossi. M. C , Casini, S.. Savelli, C . Corbelli, C , Franchi, E., Mattei, N., Sanchez-Hernandez, J . C , Corsi, I., Bamber, S. and Depledge, M. H. (2000). Biomarker responses at different levels of biological organisation in crabs (Carcinus aestuarii) experimentally exposed to benzo(a)pyrene. Chemosphere 40, 861-874.
Fossi, M. C . Lari, L., Casini, S., Mallei, N.. Savelli, C , Sanchez-Hernandez. J. C , Caslellani, S.. Depledge, M., Bamber. S. and Walker, C. (1996). Biochemical and genoloxic biomarkers in the Mediterranean crab Carcinus aesluarii experimentally exposed to polychlorobiphenyls, benzopyrene and methyl-mercury. Marine Environmental Research 42, 29-32.
Fournier. M.. Cyr. D., Blakely, B.. Boermans. H. and Brousseau, P. (2000). Phagocytosis as a biomarker of immunotoxicity in wildlife species exposed to environmental xenobiolics. American Zoologist 40, 412-420.
Frenzilli, G., Nigro, M. and Lyons. B. P. (2009). The Comel assay for the evaluation of genotoxic impact in aquatic environments. Mutation Research/Reviews in Mutation Research 681, 80-92.
Galloway. T. S., Brown, R. J., Browne, M. A.. Dissanayake, A.. Lowe, D., Jones, M. B. and Depledge, M. H. (2004). A mullibiomarker approach to environmental assessment. Environmental Science & Technology 38, 1723-1731.
Garman. G. D., Anderson, S. L. and Cherr, G. N. (1997). Developmental abnormalities and DNA-prolein crosslinks in sea urchin embryos exposed to three metals. Aquatic Toxicology 39, 247-265.
223

Georgiades, E. T.. Danis. B., Gillan, D. C , Dubois. P., Temara, A. and Holdway, D. A. (2006). Effect of crude oil contaminated sediment exposure on cytochrome P450 enzymes in the Australian asteroid Coscinasterias muricata. Chemosphere 65, 1869-1877.
Georgiades, E. T., Holdway. D. A., Brennan, S. E., Butty, J. S. and Temara, A. (2003). The impact of oil-derived products on the behaviour and biochemistry of the eleven-armed asteroid Coscinasterias muricata (Echinodermala). Marine Environmental Research 55, 257-276.
Geret, F., Jouan. A., Turpin, V., Bebianno, M. J. and Cosson, R. P. (2002). Influence of metal exposure on metallothionein synthesis and lipid peroxidation in two bivalve mollusks: the oyster (Crassostrea gigas) and the mussel {Mytilus edulis) Aquatic Living Resources 15, 61-66.
Gielazyn. M. L.. Ringwood. A. H., Piegorsch, W. W. and Slancyk, S. E. (2003). Detection of oxidative DNA damage in isolated marine bivalve hemocytes using the comet assay and formamidopyrimidine glycosylase (Fpg). Mutation Research/Genetic Toxicology and Environmental Mutagenesis 542, 15-22.
Gomez-Mendikute, A., Etxeberria, A., Olabarrieta, I. and Cajaraville, M. P. (2002). Oxygen radicals production and actin filament disruption in bivalve haemocytes treated with benzo(a)pyrene. Marine Environmental Research 54, 431-436.
Gravato, C. and Santos, M. A. (2002). Juvenile Sea Bass Liver P450. EROD Induction, and Erythrocytic Genoloxic Responses to PAH and PAH-like Compounds. Ecotoxicology and Environmental Safety 51, 115-127.
Grisolia. C. K. (2002). A comparison between mouse and fish micronucleus test using cyclophosphamide, mitomycin C and various pesticides. Mutation Research/Genetic Toxicology and Environmental Mutagenesis 518, 145-150.
Grundy, M. M., Ratcliffe, N. A. and Moore, M. N. (1996). Immune inhibition in marine mussels by polycycllc aromatic hydrocarbons. Marine Environmental Research 42, 187-190.
Guha. B., Das, J. K. and Khuda-Bukhsh. A. R. (2007). Ameliorative effects of vitamin supplementation on ethyl methane sulphonate-induced genotoxicity in a fish. Anabas testudineus. Ecotoxicology and Environmental Safety 68, 63-70.
Gunnarsson, J. S. and Skold, M. (1999). Accumulation of polychlorinated biphenyls by the infaunal brittle stars Amphiura filiformis and A. chiajei: effects of eutrophication and selective feeding. Marine Ecology Progress Series 186, 173-185.
Gustafson, T. and Toneby, M. (1970). On the role of serotonin and acetylcholine in sea urchin morphogenesis. Experimental Cell Research 62, 102-117.
Hagger, J. A., Atienzar, F. A. and Jha, A. N. (2005a). Genotoxic, cytotoxic, developmental and survival effects of tritiated water in the early life stages of the marine mollusc, Mytilus edulis. Aquatic Toxicology 74, 205-217.
Hagger, J. A., Depledge, M. H. and Galloway, T. S. (2005b). Toxicity of tributyltin in the marine mollusc Mytilus edulis. Marine Pollution Bulletin 51, 811-816.
Hagger. J. A.. Fisher, A. S., Hill, S. J.. Depledge. M. H. and Jha, A. N. (2002). Genotoxic, cytotoxic and ontogenetic effects of tri-n-butyltin on the marine worm, Platynereis dumerilii (Polychaeta: Nereidae). Aquatic Toxicology 57, 243-255.
224

Hagger, J. A., Galloway, T. S., Langston, W. J. and Jones, M. B. (2009). Application of biomarkers to assess the condition of European Marine Sites. Environmental Pollution 157, 2003-2010.
Hagger, J. A., Jones. M. B., Leonard, D. P., Owen, R. and Galloway, T. S. (2006). Biomarkers and Integrated Environmental Risk Assessment: Are There More Questions Than Answers? Integrated Environmental Assessment and Management 2, 312-329.
Hagger, J. A., Jones, M. B., Lowe, D., Leonard, D. R. P.. Owen, R. and Galloway, T. S. (2008). Application of biomarkers for improving risk assessments of chemicals under the Water Framework Directive: A case study. Marine Pollution Bulletin 56, 1111-1118.
Hammer. A. S., Carothers. M. A., Harris, C. L., O'Keefe, D. A., Ayl, R. D.. Peterson, J. L., Shank, K. A. and Couto, C. G. (1994). Unexpected Neurotoxicity in Dogs Receiving a Cyclophosphamide, Dactinomycin, and 5-Fluorouracil Chemotherapy Protocol. Journal of Veterinary Internal Medicine 8, 240-243.
Hannam, M. L.. Bamber, S. D., Moody, J. A.. Galloway, T. S. and Jones, M. B. (2009a). Immune function in the Arctic Scallop, Chlamys islandica, following dispersed oil exposure. Aquatic Toxicology 92, 187-194.
Hannam, M. L.. Bamber. S. D.. Sundt. R. C. and Galloway, T. S. (2009b). Immune modulation in the blue mussel Mytilus edulis exposed to North Sea produced water. Environmental Pollution 157, 1939-1944.
Hartwig, A. (1998). Carcinogenicity of metal compounds: possible role of DNA repair inhibition. Toxicology Letters 102-103, 235-239.
Hill, S. J. (1999). Inductively Coupled Plasma Spectroscopy and its Applications, Sheffield Academic Press.
Hinton. D. E., Kullman. S. W., Hardman, R. C , Volz, D. C , Chen, P.-J., Carney, M. and Bencic, D. C. (2005). Resolving mechanisms of toxicity while pursuing ecotoxicological relevance? Marine Pollution Bulletin 51, 635-648.
His, E., Heyvang, I., Geffard, O. and de Montaudouin, X. (1999). A comparison between oyster (Crassos/rea gigas) and sea urchin (Paracentrotus lividus) larval bioassays for toxicological studies. Water Research 33, 1706-1718.
Horvathova, E., Slamenova, D.. HIinci'kova, L., Mandal, T. K., Gabelova, A. and Collins, A. R. (1998). The nature and origin of DNA single-strand breaks determined with the comet assay. Mutation Research/DNA Repair 409, 163-171.
Hose, J. E. and Puffer, H. W. (1983). Cytologic and cytogenetic anomalies induced in purple sea urchin embryos (Strongylocentrotus purpuratus S.) by parental exposure to benzo[a]pyrene. Marine Biology Letters 4, 87-95.
Hutchins, D. A., Teyssie, J.-L., Boisson, F., Fowler, S. W. and Fisher, N. S. (1996). Temperature effects on uptake and retention of contaminant radionuclides and trace metals by the brittle star Ophiothrix fragilis. Marine Environmental Research 41, 363-378.
Hutchinson, T. (2007). Small is useful in endocrine disrupter assessment—four key recommendations for aquatic invertebrate research. Ecotoxicology 16. 231-238.
Hutchinson, T. H., Bogi, C , Winter, M. J. and Owens, J. W. (2009). Benefits of the maximum tolerated dose (MTD) and maximum tolerated concentration (MTC) concept in aquatic toxicology. Aquatic Toxicology 91, 197-202.
225
Jacob, J. (1996). The significance of polycyclic aromatic hydrocarbons as environmental carcinogens. Pure and Applied Chemistry 68, 301-308.
Jeram, S., Sintes, J. M. R., Haider, M.. Fenlanes. J. B.. Sokull-Kluttgen, B. and Hutchinson, T. H. (2005). A strategy to reduce the use of fish in acute ecotoxicity testing of new chemical substances notified in the European Union. Regulatory Toxicology and Pharmacology 42, 218-224.
Jha, A. N. (2004). Genotoxicological studies in aquatic organisms: an overview. Mutation Research/Fundamental and Molecular Mechanisms of Mutagenesis 552, 1-17.
Jha. A. N. (2008). Ecotoxicological applications and significance of the comet assay. Mutagenesis 23, 207-221.
Jha. A. N., Cheung. V. V., Foulkes, M. E., Hill, S. J. and Depledge, M. H. (2000a). Detection of genotoxins in the marine environment: adoption and evaluation of an integrated approach using the embryo-larval stages of the marine mussel, Mytilus edulis. Mutation Research/Genetic Toxicology and Environmental Mutagenesis 464, 213-228.
Jha, A. N., Dogra, Y., Turner, A. and Millward, G. E. (2005). Impact of low doses of tritium on the marine mussel. Mytilus edulis: genotoxic effects and tissue-specific bioconcentraion. Mutation Research/Genetic Toxicology and Environmental Mutagenesis 586, 47-57.
Jha, A. N., H. Hutchinson, T., Mackay. J. M.. Elliott. B. M. and Dixon, D. R. (1997). Evaluation of the genotoxicity of municipal sewage effluent using the marine worm Platynereis dumerilii (Polychaeta: Nereidae). Mutation Research/Genetic Toxicology and Environmental Mutagenesis 391, 179-188.
Jha. A. N., Hagger. J. A.. Hill, S. J. and Depledge, M. H. (2000b). Genotoxic, cytotoxic and developmental effects of tributyltin oxide (TBTO): an integrated approach to the evaluation of the relative sensitivities of two marine species. Marine Environmental Research 50, 565-573.
Jha, A. N., Hutchinson. T. H., Mackay, J. M., Elliot, B. M. and Dixon, D. R. (1996). Development of an in vivo genotoxicity assay using the marine worm Platynereis dumerilii (Polychaeta: Nereidae). Mutation Research/Environmental Mutagenesis and Related Subjects 359, 141 -150.
Johnson. A. C , Jurgens, M. D., Will iams, R. J.. Kummerer. K., Kortenkamp, A. and Sumpter, J. P. (2008). Do cytotoxic chemotherapy drugs discharged into rivers pose a risk to the environment and human health? An overview and UK case study. Journal of Hydrology 348, 167-175.
Johnson, L. G. (1998). Short communication: Stage-dependent thyroxine effects on sea urchin development. New Zealand Journal of Marine and Freshwater Research 32, 531-536.
Jones, O. A., Lester, J. N. and Voulvoulis. N. (2005). Pharmaceuticals: a threat to drinking water? Trends in Biotechnology 23, 163-167.
Kalpaxis. D. L.. Theos, C , Xaplanteri. M. A., Dinos, G. P., Catsiki. A. V. and Leotsinidis, M. (2004). Biomonitoring of Gulf of Patras, N. Peloponnesus, Greece. Application of a biomarker suite including evaluation of translation efficiency in Mytilus galloprovincialis cells. Environmental Research 94, 211-220.
Kim, l.-Y. and Hyun, C.-K. (2006). Comparative evaluation of the alkaline comet assay with the micronucleus test for genotoxicity monitoring using aquatic organisms. Ecotoxicology and Environmental Safety 64, 288-297.
226

Kisby, G. E.. Olivas, A.. Standley, M.. Lu, X.. Pattee. P., O'Malley, J. , Li, X., Muniz, J. and Nagalla, S. R. (2006). Genotoxicants target distinct molecular networks in neonatal neurons Environmental Health Perspectives.
Kleitman, N. (1941). The effect of temperature on the righting of echinoderms. Biological Bulletin 80. 292-298.
Kolpin, D. W., Furlong. E. T.. Meyer. M. T., Thurman, E. M.. Zaugg, S. D., Barber. L. B. and Buxton, H. T. (2002). Pharmaceuticals. Hormones, and Other Organic Wastewater Contaminants in U.S. Streams, 1999-2000: A National Reconnaissance. Environ. Sci. Techno!. 36, 1202-1211.
Kruszewski, M.. Wojewodzka. M.. Iwanenko, T.. Collins, A. R. and Szumiel, I. (1998). Application of the comet assay for monitoring DNA damage in workers exposed to chronic low-dose irradiation: II. Base damage. Mutation Research/Genetic Toxicology and Environmental Mutagenesis 416, 37-57.
Kumaravel. T. S. and Jha, A. N. (2006). Reliable Comet assay measurements for detecting DNA damage induced by ionising radiation and chemicals. Mutation Research/Genetic Toxicology and Environmental Mutagenesis 605, 7-16.
Landrigan. P. J., Kimmel. C. A., Correa, A. and Eskenazi, B. (2004). Children's health and the environment: public health issues and challenges for risk assessment. Environmental Health Perspectives 112, 257-265.
Latimer, J. S. and Zheng. J. (2003). The sources, transport, and fate of PAHs in the marine environment in Douben, P. E. (Ed), PAHs: An Ecotoxicological Perspective., Wiley, pp. 9-33,
Lawrence, J. M. (1987). A Functional Biology of Echinoderms. Croom Helm. Leaney, S. (2003). Optimisation and validation of behavioural, cytological and
molecular biomarker responses in three asteriod echinoderm species, MRes thesis in Aquatic Ecotoxicology, University of Plymouth.
Lee. J.-G., Madden, M. C , Reed. W.. Adier. K. and Devlin, R. (1996). The use of single cell gel electrophoresis assay in detecting DNA single strand breaks in lung cells in vitro. Toxicology and Applied Pharmacology 141, 195-204.
Lee. R. F. and Steinert. S. (2003). Use of the single cell gel electrophoresis/ comet assay for detecting DNA damage in aquatic (marine and freshwater) animals. Mutation Research 544, 43-64.
Littlewood, D. T. J. , Smith, A. B., Clough, K. A. and Emson. R. H. (1997). The interrelationships of the echinoderm classes: morphological and molecular evidence. Biological Journal of the Linnean Society 61, 409-438.
Littlewood, D. T. J. , Smith, A. B., Clough. K. A. and Emson, R. H. (1998). Five classes of echinoderm and one school of thought in Mooi, R. and Telford, M. (Eds). Proceedings of the Ninth International Echinoderm Conference San Francisco/ California/ US/{/ 5-9 August 1996, Balkema, pp. 47-50.
Livingstone, D. R. (1991). Organic xenobiotic metabolism in marine invertebrates in Gilles. R. (Ed), Advances in Comparative and Environmental Physiology, Springer-Verlag. pp. 46-185.
Loo, L. O., Jonsson, P. R., Skold, M. and Karlsson, 1. (1996). Passive suspension feeding in Amphiura fHiformis (Echinodermata: Ophiuroidea): Feeding behaviour in flume flow and potential feeding rate of field populations. Marine Ecology Progress Series 139, 143-155.
227
Lowe, D. M.. Fossalo, V. U. and Depledge, M. H. (1995). Contaminant-Induced lysosomal membrane damage In blood cells of mussels Mytilus galloprovincialis from the Venice Lagoon: an in vitro study. Marine Ecology Progress Series 129, 189-196.
Lowe, D. M. and Pipe, R. K. (1994). Contaminant Induced lysosomal membrane damage in marine mussel digestive cells: an in vitro study. Aquatic Toxicology 30, 357-365.
Mackay, J. M. (1995). Dose selection In in vivo genetic toxicology assays. Environmental and Molecular Mutagenesis 25, 323-327.
Maltby, L. (1999). Studying stress: The importance of organism-level responses. Ecological Applications 9, 431-440.
Mamaca, E., Bechmann, R. K.. Torgrimsen. S., Aas, E., Bjornstad, A., Baussant. T. and Floch, S. L. (2005). The neutral red lysosomal retention assay and Comet assay on haemolymph cells from mussels (Mytilus edulis) and fish {Symphodus melops) exposed to styrene. Aquatic Toxicology 75, 191 -201.
Marigomez, I. and Baybay-Villacorta. L. (2003). Pollutant-specific and general lysosomal responses in digestive cells of mussels exposed to model organic chemicals. Aquatic Toxicology 64, 235-257.
Matranga, V., Toia, G., Bonaventura. R. and Muller. W. E. G. (2000). Cellular and biochemical responses to environmental and experimentally induced stress in sea urchin coelomocytes. Cell Stress Chaperones. 5, 113-120.
McCarroll, N., Keshava, N., Cimino, M., Chu, M., Dearfield, K., Keshava, C , Kligerman, A., Owen, R., Protzel, A.. Putzrath. R. and Schoeny, R. (2008). An evaluation of the mode of action framework for mutagenic carcinogens case study: Cyclophosphamide. Environmental and Molecular Mutagenesis 49, 117-131.
McFadzen, I.. Eufemia, N., Heath, C , Epel, D.. Moore, M. and Lowe. D. (2000). Multidrug resistance in the embryos and larvae of the mussel Mytilus edulis. Marine Environmental Research 50, 319-323.
McWilliam, R. A. and Baird, D. J. (2002a). Application of postexposure feeding depression bioassays with Daphnia magna for assessment of toxic effluents in rivers. Environmental Toxicology and Chemistry 21, 1462-1468.
McWill iam, R. A. and Baird. D. J. (2002b). Postexposure feeding depression: a new toxicity endpoint for use in laboratory studies with Daphnia magna. Environmental Toxicology and Chemistry 21, 1198-1205.
MItchelmore, C. L., Birmelin, C , Livingstone, D. R. and Chlpman, J. K. (1998). Detection of DNA Strand Breaks In Isolated Mussel {Mytilus edulis L.) Digestive Gland Cells Using the "Comet" Assay. Ecotoxicology and Environmental Safety 4A, 51-58.
Monroy, A. (1986). A centennial debt of developmental biology to the sea urchin. Biological Bulletin 171, 509-519.
Moore. J. (2001). An Introduction to the Invertebrates, 1st edn. Cambridge University Press.
Mouchet. F., Gauthier. L.. Mailhes, C , Ferrier, V. and Devaux. A. (2005). Comparative study of the comet assay and the micronucleus test in amphibian larvae {Xenopus laevis) using benzo(a)pyrene, ethyl methanesulfonate, and methyl methanesulfonate: Establishment of a positive control in the amphibian comel assay. Environmental Toxicology 20, 74-84.
228
Muller, W., E. G. , Batel, R., Lacorn, M., Stelnhart, H., Simat, T.. Lauenroth, S., Hassanein, H. and Schroder. H.. C. (1998). Accumulation of cadmium and zinc in the marine sponge Suberites domuncula and its potential consequences on single-strand breaks and on expression of heat-shock protein: a natural field study. Marine Ecology Progress Series 167, 127-135.
Nahon, S., Charles, F. and Pruski, A. M. (2008). Improved Comet assay for the assessment of UV genoloxicity in Mediterranean sea urchin eggs. Environmental and Molecular Mutagenesis 49, 351-359.
Natarajan, A. T., Tates, A. D., Meijers, M., Neuteboom, 1. and de Vogel, N. (1983). Induction of sisler-chromatid exchanges (SCEs) and chromosomal aberrations by mitomycin C and methyl methanesulfonate in Chinese hamster ovary cells. Mutation Research 121, 211-223.
Nepomuceno, J. C , Ferrari. I., Spano, M. A. and Centeno, A. J. (1997). Detection of micronuclei in peripheral erythrocytes of Cyprinus carpio exposed to metallic mercury. Environmental and Molecular Mutagenesis 30, 293-297.
Newton, L. C. and McKenzie, J. D. (1995). Echinoderms and oil pollution: A potential stress assay using bacterial symbionls. Marine Pollution Bulletin 31, 453-456.
Newton, L. C. and McKenzie, J. D. (1998a). Brittlestars, biomarkers and beryl: Assessing the toxicity of oil-based drill cuttings using laboratory, mesocosm and field studies. Chemistry and Ecology ^5, 143-155.
Newton, L. C. and McKenzie, J. D. (1998b). Development and evaluation of echinoderm pollution assays in Mooi, R. and Telford, M. (Eds), Proceedings of the Ninth International Echinoderm Conference San Francisco/ California/ USA/ 5-9 August 1996, A.A. Balkema, pp. 405-410.
Nilsen, H. and Krokan, H. E. (2001). Base excision repair in a network of defence and tolerance. Carcinogenesis 22, 987-998.
Nilsson, H. C. (1999). Effects of hypoxia and organic enrichment on growth of the brittle stars Amphiura filiformis (O.F. Muller) and Amphiura chiajei Forbes. Journal of Experimental Marine Biology and Ecology 237, 11-30.
Nilsson, H. C. and Skold. M. (1996). Arm regeneration and spawning in the brittle star Amphiura filiformis (O.F. Muller) during hypoxia. Journal of Experimental Marine Biology and Ecology 199, 193-206.
O'Connor, T. P. (1996). Trends in chemical concentrations in mussels and oysters collected along the US coast from 1986 to 1993. Marine Environmental Research 41, 183-200.
Olabarrieta, I., L'Azou, B., Yurie, S., Cambar, J . and Cajaraville, M. P. (2001). In vitro effects of cadmium on two different animal cell models. Toxicology in Vitro A5, 511-517.
Olive, P. J. , Banalh, J. P. and Durand, R. E. (1990). Heterogeneity in radiation induced DNA damage and repair in tumor and normal cells measured using the 'comet' assay. Radiation Research 122, 86-94.
Ostling, O. and Johanson. K. J. (1984). Microelectrophoretic study of radiation-induced DNA damage in individual mammalian cells. Biochemical and Biophysical Research Communications 123, 291-298.
Oweson, C , Skold, H., Pinsino. A., Matranga, V. and Hernroth, B. (2008). Manganese effects on haematopoietic cells and circulating coelomocyles of Asterias rubens (Linnaeus). Aquatic Toxicology 89, 75-81.
Pagano. G., Anselmi, B., Dinnel. P. A., Esposito, A., Guida, M., laccarino. M., Melluso, G.. Pascale, M. and Trieff, N. M. (1993). Effects on sea urchin
229
fertilization and embryogenesis of water and sediment from two rivers in Campania, Italy. Archives of Environmental Contamination and Toxicology 25, 20-26.
Pagano, G., Esposito, A.. Bove, P., de Angelis, M.. Rota, A. and Giordano, G. G. (1983a). The effects of hexavalent and trivalent chromium on fertilization and development in sea urchins. Environmental Research 30, 442-452.
Pagano, G.. Esposito, A., Bove, P., de Angelis. M.. Rota, A., Vamvakinos. E. and Giordano, G. G. (1982). Arsenic-induced developmental defects and mitotic abnormalities in sea-urchin development. Mutation Research 104, 351-354.
Pagano, G., Esposito, A., Giordano, G. G., Vamvakinos, E., Quinto, I., Bronzetti, G., Bauer, C , Corsi, C , Nieri, R. and Ciajolo. A. (1983b). Genotoxicity and teratogenicity of diphenyl and diphenyl ether: A study of sea urchins, yeast, and Salmonella typhimurium. Teratogenesis, Carcinogenesis, and Mutagenesis 3, 377-393.
Pagano, G.. His, E., Beiras. R., Biase, A., Korkina, L. G., laccarino, M., Oral, R.. Quiniou, F., Warnau, M. and Trieff. N. M. (1996). Cytogenetic, developmental, and biochemical effects of aluminum, iron, and their mixture in sea urchins and mussels. Archives of Environmental Contamination and Toxicology 31, 466-474.
Pan, L.. Miao, J. , Wang, J. and Liu. J. (2008). AHH activity, tissue dose and DNA damage in different tissues of the scallop Chlamys farreri exposed to benzo[a]pyrene. Environmental Pollution 153, 192-198.
Payne. J. F. and May. N. (1979). Further studies on the effect of petroleum hydrocarbons on mixed-function oxidases in marine organisms in Kahn, M. A. Q., Lech, J. J. and Menn, J. J. (Eds). Pesticide and Xenobiotic Metabolism in Aquatic Organisms, American Chemical Society, pp. 339-347.
Pearse, J. S. (2006). Ecological Role of Purple Sea Urchins. Science 314, 940-941 .
Perini, P.. Calabrese, M., Rinaldi, L. and Gallo, P. (2008). Cyclophosphamide-based combination therapies for autoimmunity. Neurological Sciences 29, S233-S234.
Pfuhler, S. and Wolf, H. U. (1996). Detection of DNA-crosslinking agents with the alkaline comet assay. Environmental and Molecular Mutagenesis 27, 196-201.
Picton, B. E. (1993). A Field Guide to the Shallow-water Echinoderms of the British Isles. Immel Publishing Limited.
Pinsino, A., Thorndyke, M. C. and Matranga. V. (2007). Coelomocytes and post-traumatic response in the common sea star Asterias rubens. Cell Stress Chaperones. 12, 331-341.
Pipe. R. K., Coles, J. A., Carissan, F. M. M. and Ramanathan, K. (1999). Copper induced immunomodulation in the marine mussel, Mytilus edulis. Aquatic Toxicology 46, 43-54.
Pipe, R. K., Coles. J. A. and Farley, S. R. (1995). Assays for measuring immune response in the mussel Mytilus edulis. Techniques Fish Immunol. 4.
Polls, I. and Gonor, J. (1975). Behavioral aspects of righting in two asteroids from the Pacific Coast of North America. Biological Bulletin 148, 68-84.
Prince, J. (1995). Limited effects of the sea urchin Echinometra mathaei (de Blainville) on the recruitment of benthic algae and macroinvertebrates
230

into intertidal rock platforms at Rottnest Island, Western Australia. Journal of Experimental Marine Biology and Ecology 186, 237-258.
Pruski, A. M. and Dixon, D. R. (2002). Effects of cadmium on nuclear integrity and DNA repair efficiency in the gill cells of Mytilus edulis I. Aquatic Toxicology 57, 127-137.
Pynnbnen, K. (1996). Heavy metal-induced changes in the feeding and burrowing behaviour of a Baltic isopod, Saduria (Mesidotea) entomon L. Marine Environmental Research 41 , 145-156.
Qiu, J., Hales, B. F. and Robaire, B. (1995). Damage to rat spermalozoal DNA after chronic cyclophosphamide exposure. Biology of Reproduction 53. 1465-1473.
Raisuddin, S. and Jha, A. N. (2004). Relative sensitivity of fish and mammalian cells to sodium arsenate and arsenite as determined by alkaline single-cell gel electrophoresis and cytokinesis-block micronucleus assay. Environmental and Molecular Mutagenesis 44, 83-89.
Rand, G. M. (1995). Fundamentals of Aquatic Toxicology. Taylor & Francis. Rank, J. and Jensen, K. (2003). Comet assay on gill cells and hemocytes from
the blue mussel Mytilus edulis. Ecotoxicology and Environmental Safety 54, 323-329.
Rank. J.. Lehtonen, K. K.. Strand, J. and Laursen, M. (2007). DNA damage, acetylcholinesterase activity and lysosomal stability in native and transplanted mussels (Mytilus edulis) in areas close to coastal chemical dumping sites in Denmark. Aquatic Toxicology 84, 50-61.
Rashid, F., Horobin, R. W. and Williams, M. A. (1991). Predicting the behaviour and selectivity of fluorescent probes for lysosomes and related structures by means of structure-activity models. Histochemical Journal 23, 450-459.
Ratcliffe. N. A. and Rowley, A. F. (1979). A comparl ive synopsis of the structure and function of the blood cells of insects and other invertebrates. Developmental and Comparative Immunology 3, 189-243.
Readman, J. W., Fillmann, G.. Tolosa, I., Bartocci, J., Villeneuve, J . P., Catinni, C. and Mee, L. D. (2002). Petroleum and PAH contamination of the Black Sea. Marine Pollution Bulletin 44, 48-62.
Reeves, J. F.. Davies, S. J.. Dodd. N. J. F. and Jha, A. N. (2008). Hydroxyl radicals (OH) are associated with titanium dioxide (T i02) nanoparticle-induced cytotoxicity and oxidative DNA damage in fish cells. Mutation Research/Fundamental and Molecular Mechanisms of Mutagenesis 640, 113-122.
Rewilz, K. F., Styrishave. B., Lobner-Olesen. A. and Andersen. O. (2006). Marine invertebrate cytochrome P450: Emerging insights from vertebrate and insect analogies. Comparative Biochemistry and Physiology Part C: Toxicology & Pharmacology 143, 363-381.
Richter-Landsberg. C. and Vollgraf, U. (1998). Mode of Cell Injury and Death after Hydrogen Peroxide Exposure in Cultured Oligodendroglia Cells. Experimental Cell Research 244, 218-229.
Roast, S. D., Widdows, J. and Jones, M. 8. (2000). Mysids and trace metals: disruption of swimming as a behavioural indicator of environmental contamination. Marine Environmental Research 50, 107-112.
Roast, S. D.. Widdows. J. and Jones, M. B. (2002). Behavioural responses of estuarine mysids to hypoxia and disruption by cadmium. Marine Environmental Research 54, 319-323.
231

Rodriguez-Cea, A.. Ayllon, F. and Garcia-Vazquez, E. (2003). Micronucleus lest In freshwater fish species: an evaluation of Its sensitivity for application In field surveys. Ecotoxicology and Environmental Safety 56, 442-448.
Roepke, T. A., Snyder, M. J. and Cherr, G. N. (2005). Estradiol and endocrine disrupting compounds adversely affect development of sea urchin embryos at environmentally relevant concentrations. Aquatic Toxicology 71, 155-173.
Rosen, G., Rivera-Duarte, I., Kear-Padilla. L. and Chadwick, D. B. (2005). Use of Laboratory Toxicity Tests with Bivalve and Echinoderm Embryos to Evaluate the Bioavailability of Copper in San Diego Bay, California, USA. Environmental Toxicology and Chemistry 24, 415-422.
Roushdy, H. M. and Hansen, V. K. (1960). Ophiuroids feeding on phytoplankton. Nature 188, 517-518.
Russell. W. M. S. and Burch, R. L. (1959). The Principles of Humane Experimental Techniques. Methuen.
Rust, A., J. , Burgess, R., M., Brownawell, B., J. and McElroy. A., E. (2004). Relationship between metabolism and bioaccumulation of Benzo[a]pyrene in benthic Invertebrates. Environmental Toxicology and Chemistry 23, 2587-2593.
Ryder, K., Temara, A. and Holdway, D. A. (2004). Avoidance of crude-oil contaminated sediment by the Australian seastar, Patiriella exigua (Echinodermata: Asteroidea). Marine Pollution Bulletin 49, 900-909.
Rzeski, W., Pruskll. S.. Macke. A.. Felderhoff-Mueser, U., Reiher. A. K.. Hoerster, F., Jansma, C , Jarosz, B., Stefovska, V., Bittigau, P. and Ikonomidou. C. (2004). Anticancer agents are potent neurotoxins in vitro and in vivo. Annals of Neurology 56, 351-360.
Sacher, F., Lange, F. T., Brauch, H.-J. and Btankenhorn, I. (2001). Pharmaceuticals in groundwaters: Analytical methods and results of a monitoring program in Baden-Wurltemberg, Germany. Journal of Chromatography A 938, 199-210.
Sanchez-Galan, S., Linde, A. R. and Garcia-Vazquez, E. (1999). Brown Trout and European Minnow as Target Species for Genotoxicity Tests: Differential Sensitivity to Heavy Metals. Ecotoxicology and Environmental Safety 43, 301-304.
Saolome, K. (1999). Chromosome number of sea urchin andromerogones during early development. Zoological Science 16, 87-92.
Saotome, K. and Hayashi. M. (2003). Application of a sea urchin micronucleus assay to monitoring aquatic pollution; influence of sample osmolality. Mutagenesis 18, 73-76.
Sarantchova. O. L. (2001). Research into tolerance for the environment salinity in sea starfish Asterias rubens L. from populations of the White Sea and Barentz Sea. Journal of Experimental Marine Biology and Ecology 264, 15-28.
Scarlett, A.. Canty. M. N., Smith. E. L., Rowland. S. J. and Galloway. T. S. (2007) . Can amphipod behavior help to predict chronic toxicity of sediments? Human and Ecological Risk Assessment 13, 506-518.
Scarlett. A.. Galloway, T. S., Canty, M., Smith, E. L., Nilsson, J. and Rowland. S. J. (2005). Comparative toxicity of two oil dispersants, superdispersant-25 and corexit 9527. to a range of coastal species. Environmental Toxicology and Chemistry 24, 1219-1227.
Scarlett, A., Rowland, S. J.. Galloway, T. S., Lewis. A. C. and Booth, A. M. (2008) . Chronic sublethal effects associated with branched
232

alkylbenzenes bioaccumulated by mussels. Environmental Toxicology and Chemistry 27, 561-567.
Schmid, W. (1975). The micronucleus test. Mutation Research 31, 9-15. Schwartz, T. R. and Kmiec. E. B. (2005). Using methyl methanesulfonate
(MMS) to stimulate targeted gene repair activity in mammalian cells. Gene Therapy and Molecular Biology 9, 193-202.
Schwarzenbach. R. P., Escher, B. I., Fenner, K., Hofstetter, T. B.. Johnson, C. A., von Gunlen, U. and Wehrli, B. (2006). The Challenge of Micropollutants in Aquatic Systems. Science 313, 1072-1077.
Scott, G. R. and Sloman, K. A. (2004). The effects of environmental pollutants on complex fish behaviour: integrating behavioural and physiological indicators of toxicity. Aquatic Toxicology 68, 369-392.
Shim. W. J., Yim, U. H., Kim. N. S., Hong, S. H., Oh, J. R.. Jeon. J. K. and Okamura. H. (2005). Accumulation of butyl- and phenyltin compounds in starfish and bivalves from the coastal environment of Korea. Environmental Pollution 133, 489-499.
Shirley. T. C. and Stickle. W. B. (1982). Responses of Lepasterias hexactis (Echinodermata. Asteroidea) to low salinity. I. Survival, activity, feeding, growth and absorption efficiency. Marine Biology 62, 147-154.
Singh, N. P.. McCoy, M. T.. Tice, R. R. and Schneider. E. L. (1988). A simple technique for quantitation of low levels of DNA damage for individual cells. Experimental Cell Research 175, 184-191.
Singh. N. P., Tice. R. R.. Stephens, R. E. and Schneider, E. L. (1991). A microgel electrophoresis technique for the direct quantitation of DNA damage and repair in individual fibroblasts cultured on microscope slides. Mutation Research 252, 289-296.
Siu, S. Y. M., Lam. P. K. S., Martin. M., Caldwell, C. W. and Richardson, B. J. (2008). The use of selected genotoxicity assays in green-lipped mussels (Perna viridis): A validation study in Hong Kong coastal waters. Marine Pollution Bulletin 57, 479-492.
Siu, W. H. L.. Cao, J., Jack. R. W., Wu. R. S. S., Richardson, B. J.. Xu. L. and Lam, P. K. S. (2004). Application of the comet and micronucleus assays to the detection of B[a]P genotoxicity in haemocytes of the green-lipped mussel {Perna viridis). Aquatic Toxicology 66, 381-392.
Skold. M. (1998). Escape responses in four epibenthic brittle stars (Ophiuroidea : Echinodermata). Ophelia 49, 163-179.
Sminia, T. (1980). Phagocytic cells in molluscs in Salomon, J. B. (Ed), >4spec/s of developmental and comparative immunology, Pergamon Press, pp. 125-132.
Smith, J. E. (1937). The structure and function of the tube feet in certain echinoderms. Journal of the Marine Biological Association of the UK 22, 345-357.
Smith, L. C , Britten, R. J. and Davidson, E. H. (1992). SpCoe l l : a sea urchin profilin gene expressed specifically in coelomocytes in response to injury. MolBiol Cell. 3, 403-414.
Smith, L. C. and Davidson, E. H. (1992). The echinoid immune system and the phlogenetic occurrence of immune mechanisms in deuterostomes. Immunology Today AZ, 356-362.
Smith. R. A., Cohen, S. M. and Lawson, T. A. (1990). Acrolein mutagenicity in the V79 assay. Carc/nogenes/s 11, 497-498.
Smith. V. J. (1981). The Echinoderms in Ratdiffe, N. A. and Rowley, A. F. (Eds). Invertebrate Blood Cells, Academic Press, pp. 513-562.
233

Sodergren, E., Weinstock, G. M., Davidson, E. H., Cameron, R. A., Gibbs, R. A. , Angerer, R. C , Angerer, L. M., Arnone, M. I., Burgess, D. R., Burke, R. D., Coffman, J. A., Dean, M., Elphick, M. R., Ettensohn, C. A.. Foltz, K. R.. Hamdoun, A., Hynes. R. O.. Klein, W. H., Marzluff. W., McClay, D. R., Morris, R. L., Mushegian, A., Rasl. J. P., Smith, L. C . Thorndyke. M. C , Vacquier, V. D.. Wessel. G. M., Wray, G., Zhang, L., Elsik. C. G., Ermolaeva, O., HIavina, W., Hofmann, G., Kitts, P., Landrum, M. J., Mackey, A. J., Maglotl, D., Panopoulou, G.. Poustka, A. J., Pruitt, K., Sapojnikov, V., Song. X., Souvorov, A.. Solovyev, V., Wei, Z., Whittaker, C. A., Worley. K., Durbin, K. J., Shen, Y., Fedrigo, O.. Garfield. D., Haygood, R.. Primus, A., Salija, R., Severson, T.. Gonzalez-Garay, M. L., Jackson, A. R., Milosavljevic, A., Tong, M., Killian, C. E., Livingston, B. T., Wilt, F. H., Adams, N., Belle, R., Carbonneau, S., Cheung, R., Cormier, P., Cosson, B., Croce, J., Fernandez-Guerra, A., Geneviere. A.-M., Goel, M., Kelkar, H.. Morales, J., Mulner-Loril lon, O.. Robertson, A. J., Goidstone. J. V., Cole, B., Epel, D.. Gold, B., Hahn, M. E., Howard-Ashby, M., Scally, M., Slegeman, J. J., Allgood, E. L.. Cool. J.. Judkins. K. M.. McCafferty, S. S., Musante, A. M., Obar, R. A., Rawson, A. P., Rossetti, B. J., Gibbons, I. R., Hoffman. M. P., Leone, A., Istrail. S., Materna, S. C , Samanta. M. P.. Stole. V.. Tongprasit. W.. et al. (2006). The Genome of the Sea Urchin Strongylocentrotus purpuratus. Science 314 ,941-952.
Sole, M. and Livingstone, D. R. (2005). Components of the cytochrome P450-dependent monooxygenase system and NADPH-independenl benzo[a]pyrene hydroxylase' activity in a wide range of marine invertebrate species. Comparative Biochemistry and Physiology Part C: Toxicology & Pharmacology 141, 20-31.
Speare, D. J., Cawlhorn, R. J. , Horney, B. S., MacMillan, R. and MacKenzie. A. L. (1996). Effects of formalin, chloramine-T, and low salinity dip on the behavior and hemolymph biochemistry of the American lobster. Can Vet J. 37, 729-734.
Stabili, L. and Pagliara, P. (2009). Effect of zinc on lysozyme-like activity of the seastar Marthasterias glacialis (Echinodermata, Asteroidea) mucus. Journal of Invertebrate Pathology ICQ, 189-192.
Stackelberg, P. E.. Furlong, E. T., Meyer, M. T., Zaugg, S. D., Henderson, A. K. and Reissman, D. B. (2004). Persistence of pharmaceutical compounds and other organic wastewater contaminants in a convential drinking-water-treatment plant. Science of The Total Environment 329, 99-113.
Stegeman, J . J. (1985). Benzo(a)pyrene oxidation and microsomal enzyme activity in the mussel {Mytilus edulis) and other bivalve mollusc species from the North Western Atlantic. Marine Biology 89, 21-30.
Steger-Harlmann, T., Kummerer, K. and Harlmann, A. (1997). Biological degradation of cyclophosphamide and its occurrence in sewage water. Ecotoxicology and Environmental Safety 36, 174-179.
Steger-Harlmann. T., Kummerer, K. and Schecker. J. (1996). Trace analysis of the antineoplastics ifosfamide and cyclophosphamide in sewage water by two step solid-phase extraction and gas chromatography-mass spectrometry. Journal of Chromatography A 726, 179-184.
Sugni, M., Manno, V., Barbaglio, A., Mozzi, D., Bonasoro, F., Tremolada, P. and Candia Carnevali, M. (2008). Echinoderm regenerative response as a sensitive ecotoxicological test for the exposure to endocrine disrupters:
234

effects of p,p'DDE and CPA on crinoid arm regeneration. Cell Biology and Toxicology 24, 573-586.
Taban, I. C , Bechmann, R. K., Torgrimsen, S., Baussanl. T. and Sanni, S. (2004). Detection of DNA damage in mussels and sea urchins exposed to crude oil using comet assay. Marine Environmental Research 58. 7 0 1 -705.
Temara, A., Gulec, I. and Holdway, D. A. (1999). Oil-induced disruption of foraging behaviour of the asteroid keystone predator, Cosinasterias muricaia (Echinodermata). Marine Biology 133, 501-507.
Temara, A., Nguyen. Q. A., Hogarth, A. N., Warnau, M., Jangoux, M. and Dubois, P. (1997a). High sensitivity of skeletogenesis to Pb in the asteroid Asterias rubens (Echinodermata). Aquatic Toxicology 40, 1-10.
Temara. A., Skei, J. M., Gillan, D., Warnau, M., Jangoux, M. and Dubois, P. (1998). Validation of the asteroid Asterias rubens (Echinodermata) as a bioindicator of spatial and temporal trends of Pb, Cd, and Zn contamination in the field. Marine Environmental Research 45, 341-356.
Temara, A., Warnau, M., Dubois, P. and Langston, W. J. (1997b). Quantification of metallothioneins in the common asteroid Asterias rubens (Echinodermata) exposed experimentally or naturally to cadmium. Aquatic Toxicology 38, 17-34.
Tice. R. R., Agurell, E., Anderson, D., Burlinson, B., Hartmann, A., Kobayashi, H., Miyamae, Y., Rojas. E., Ryu, J. C. and Sasaki. Y. F. (2000). Single cell gel/comet assay: Guidelines for in vitro and in vivo genetic toxicology testing. Environmental and Molecular Mutagenesis 35, 206-221.
Tran, D.. Boudou. A. and Massabuau, J.-C. (2002). Relationship between feeding-induced ventilatory activity and bioaccumulation of dissolved and algal-bound cadmium in the asiatic clam Corbicu/a fluminea. Environmental Toxicology and Chemistry 21, 327-333.
Tran, D., Boudou. A. and Massabuau, J. C. (2001). How water oxygenation level influences cadmium accumulation pattern in the asiatic clam Corhicula fluminea: a laboratory and field study. Environmental Toxicology and Chemistry 20, 2073-2080.
Tran, D., Fournier, E., Durrieu. G. and Massabuau, J.-C. (2004). Copper detection in the Asiatic clam Corbicula fluminea: optimum valve closure response. Aquatic Toxicology 66, 333-343.
USEPA (1987). Quality criteria for water 1986, pp. 447. USEPA (1996). 1994 Toxics Release Inventory Public Data Release: Executive
Summary. Valentincic, T. (1991a). Behavioral-Responses of the Brittle Star Ophiura-
Ophiura to Amino-Acids, Acetylcholine and Related Low-Molecular-Weight Compounds. Chemical Senses 16, 251-266.
Valentincic. T. (1991b). Behavioral-Responses of the Brittle Star Ophiura-Ophiura to Chemical Stimuli During Adaptation of Amino-Acid Chemoreceptors. Chemical Senses 16, 267-275.
Valentine. J. F.. Heck, K. L.. Kirsch. K. D. and Ebb, D. (2000). Role of sea urchin Lytechinus variegatus grazing in regulating subtropical turtlegrass Thalassia testudinum meadows in the Florida Keys (USA). Marine Ecology Progress Series 200, 213-228.
Venier, P., Maron, S. and Canova, S. (1997). Detection of micronuclei In gill cells and haemocytes of mussels exposed to benzo[a]pyrene. Mutation Research/Genetic Toxicology and Environmental Mutagenesis 390, 33-44.
235

Villela, I. v.. de Oliveira, I. M., da Siiva. J. and Henriques, J. A. P. (2006). DNA damage and repair in haemolymph cells of golden mussel {Limnoperna fortunei) exposed lo environmental contaminants. Mutation Research/Genetic Toxicology and Environmental Mutagenesis 605, 78-86.
Villela, 1. v., de Oliveira. I. M., Silveira, J. C . Dias, J. F.. Henriques, J. A. P. and da Sllva, J. (2007). Assessment of environmental stress by the micronucleus and comet assays on Limnoperna fortunei exposed to Guaiba hydrographic region samples (Brazil) under laboratory conditions. Mutation Research/Genetic Toxicology and Environmental Mutagenesis 628, 76-86.
Walker, C. H. (1998). Biomarker strategies lo evaluate the environmental effects of chemicals. Environmental Health Perspectives 106 (SuppI 2), 613-620.
Walsh. G. E.. McLaughlin. L. L.. Louie, M. K.. Deans. C. H. and Lores. E. M. (1986). Inhibition of arm regeneration by Ophioderma brevispina (echinodermata, ophiuroidea) by tributyltin oxide and triphenyltin oxide. Ecotoxicology and Environmental Safety 12, 95-100.
Wang, W. (1990). Literature review on duckweed toxicity testing. Environmental Research 52, 7-22.
Warnau, M., Fowler, S. W. and Teyssie, J.-L. (1999). Biokinelics of radiocoball in the asteroid Asterias rubens (Echinodermata): Sea water and food exposures. Marine Pollution Bulletin 39, 159-164.
Warnau, M., Ledent, G., Temara, A., Jangoux, M. and Dubois, P. (1995). Experimental cadmium contamination of the Echinoid Paracentrotus lividus - Influence of exposure mode and distribution of the metal in the organism. Marine Ecology Progress Series 116, 117-124.
Warner, G. F. and Woodley. J. D. (1975). Suspension-feeding in the brittle-star Ophiotrix fragilis. Journal of the Marine Biological Association of the UK 55, 199-210.
Warren, A. (1965). Comparative Hematology. Grune & Slratton. WHO (1992). Environmental Health Criteria 134 - Cadmium International
Programme on Chemical Safety ( IPCS) Monograph. World Health Organisation.
Widdows, J. (1978). Physiological indices of stress in Mytilus edulis. Journal of the Marine Biological Association of the United Kingdom 58, 125-142.
Widdows, J., Donkin, P., Brinsley, M. D., Evans, S. V., Salkeld. P. N., Franklin, A., Law, R. J. and Waldock, M. J. (1995). Scope for growth and contaminant levels in North Sea mussels Mytilus edulis. Marine Ecology Progress Series 127, 131-148.
Widdows, J., Donkin, P. and Evans, S. V. (1987). Physiological responses of Mytilus edulis during chronic oil exposure and recovery. Marine Environmental Research 23, 15-32.
Widdows, J. and Salkeld, P. (1993). Practical procedures for the measurement of scope for growth. Plymouth Marine Laboratory.
Wilson, D. P. and Armstrong, F. A. J. (1961). Biological differences between sea water: Experiments in 1960. Journal of the Marine Biological Association of the UK 41, 663-681.
Winter, M. J., Ellis, L. C. J. and Hutchinson. T. H. (2007). Formation of micronuclei in erythrocytes of the fathead minnow (Pimephales promelas) after acute treatment with mitomycin C or cyclophosphamide.
236

Mutation Research/Genetic Toxicology and Environmental Mutagenesis 629, 89-99.
Winter, M. J., Owen, S. F., Murray-Smith, R. M., Panter, G. H., Hetheridge, M. J. and Kinter, L. B. (2009). Using data from drug discovery and development to aid the aquatic Environmental Risk Assessment of human pharmaceuticals: concepts, considerations and challenges. Integrated Environmental Assessment and Management In press.
Winter, M. J.. Redfern, W. S.. Hayfield, A. J.. Owen. S. F., Valentin, J.-P. and Hutchinson, T. H. (2008). Validation of a larval zebrafish locomotor assay for assessing the seizure liability of early-stage development drugs. Journal of Pharmacological and Toxicological Methods 57, 176-187.
Woo, S.. Kim, S., Yum. S., Yim, U. H. and Lee, T. K. (2006). Comet assay for the detection of genotoxicity in blood cells of flounder {Paralichthys olivaceus) exposed to sediments and polycyclic aromatic hydrocarbons. Marine Pollution Bulletin 52, 1768-1775.
Wurgler, M. N. and Kramers, P. G. N. (1992). Environmental effect of genotoxins (eco-genotoxicology). Mutagenesis 7, 321-327.
Xiao, R.. Yu, H. L., Zhao, H. F., Liang. J . , Feng, J. F. and Wang. W. (2007). Developmental neurotoxicity role of cyclophosphamide on post-neural tube closure of rodents in vitro and in vivo. International Journal of Developmental Neuroscience 25, 531-537.
Yendle, J. E.. Tinwell, H., Elliott, B. M. and Ashby. J. (1997). The genetic toxicity of time: Importance of DNA-unwinding time to the outcome of single-cell gel electrophoresis assays. Mutation Research 375, 125-136.
Zafiriou, O. (1972). Response of Asierias vulgaris to chemical stimuli. Marine Biology 100-107.
Zhang, X., Sun, H., Zhang, Z.. Niu, Q., Chen, Y. and Crittenden, J. C. (2007). Enhanced bioaccumulalion of cadmium in carp in the presence of titanium dioxide nanoparticles. Chemosphere 67, 160-166.
237