Atmospheric Pollution Research
14
Atmospheric Pollution Research 12 (2021) 316–329 Available online 28 November 2020 1309-1042/© 2020 Turkish National Committee for Air Pollution Research and Control. Production and hosting by Elsevier B.V. All rights reserved. Air pollution and critical air pollutant assessment during and after COVID-19 lockdowns: Evidence from pandemic hotspots in China, the Republic of Korea, Japan, and India Meng Hu a, c , Zhongbing Chen b, ** , Haiyan Cui a, c , Tao Wang c , Chao Zhang a, c , Keming Yun a, c, * a School of Public Health, Shanxi Medical University, No. 56 Xinjian South Street, Taiyuan, 030001, China b Faculty of Environmental Sciences, Czech University of Life Sciences Prague, Kamýck´ a 129, 16500, Prague, Czech Republic c School of Forensic Medicine, Shanxi Medical University, No. 55 Wenhua Street, Jinzhong, 030600, China A R T I C L E INFO Keywords: Air pollution Critical air pollutant COVID-19 lockdown PM 2.5 Asian cites ABSTRACT The COVID-19 virus outbreak has been declared a “global pandemic”. Therefore, “lockdown” was issued in affected countries to control the spread of the virus. To assess air pollution during and after lockdowns, this study selected pandemic hotspots in China (Wuhan), Japan (Tokyo), the Republic of Korea (Daegu), and India (Mumbai) and compared the Air Quality Index (AQI) in these areas for the past three years. The results indicated that air pollution levels were positively correlated with a reduction in pollutant levels during and after lock- downs in these cities. In Tokyo, low levels of air pollution, no significant change in the distribution of “good” and “moderate” days was observed during lockdown. In Daegu, mid-level air pollution, the percentage of “unhealthy” days (AQI>100) markedly reduced during lockdown; however, this reverted after lockdown was lifted. In Wuhan and Mumbai, high air pollution levels, the percentage of unhealthy days remarkably decreased during lockdown and continued to reduce after lockdown. It was found that PM 2.5 was the critical pollutant for all cities because its sub-AQI was the largest of the six pollutant species for the majority of days. In addition, PM 10 dominated the overall AQI for 2.2–9.6% of the period in Wuhan and Mumbai, and its sub-AQI reduced during lockdown. The mean sub-AQI for NO 2 , SO 2 , CO, and O 3 was within the “good” category for all cities. In conclusion, the lock- down policy reduced air pollution in general and this reduction was more significant for regions with high air pollution levels. 1. Introduction The coronavirus disease 2019 (COVID-19) was declared a “global pandemic” by the World Health Organization (WHO) on March 12, 2020, and has posed an enormous threat to global public health security (Wang and Su, 2020; WHO, 2020a). As of May 31, 2020, the cumulative number of confirmed cases of COVID-19 was 5,934,936 globally, with 367,166 deaths caused by the pandemic (WHO, 2020b). In order to control the global spread of COVID-19, the governments of affected countries issued a state of emergency, which included “lockdown” re- strictions on the movement of people and transportation, while pro- hibiting economic, education, sporting, cultural, and religious activities. These measures appeared to have helped slow down the spread of the disease (Ali and Alharbi, 2020; Kerimray et al., 2020; Yunus et al., 2020). Among the early COVID-19 hotspot regions, several of them have shown progress in tackling the virus and recently lifted their lockdowns, while other regions have still not eased lockdown measures (Asyary and Veruswati, 2020; Kerimray et al., 2020; Ma et al., 2020; Nakada and Urban, 2020; Shahzad et al., 2020; Tosepu et al., 2020; Xie and Zhu, 2020). The use of lockdowns and their subsequent ends not only affected the spread of COVID-19 in those countries, but also influenced local air pollution levels as well as critical air pollutant levels. In China, the first official transmission case of COVID-19 was detected on December 31, 2019, in Wuhan (Ma et al., 2020), the capital of Hubei Province, and the virus then quickly spread nationwide. There were 84,572 cumulative cases confirmed by the health authorities in China by May 31, 2020, with 50,340 (59.5%) from Wuhan (Baidu, 2020). On January 23, 2020, a total of 571 cases were reported in China, * Corresponding author. School of Public Health, Shanxi Medical University, No. 56 Xinjian South Street, Taiyuan, 030001, China. ** Corresponding author. E-mail addresses: [email protected] (Z. Chen), [email protected] (K. Yun). Contents lists available at ScienceDirect Atmospheric Pollution Research journal homepage: www.elsevier.com/locate/apr https://doi.org/10.1016/j.apr.2020.11.013 Received 17 June 2020; Received in revised form 20 November 2020; Accepted 20 November 2020
-
Upload
khangminh22 -
Category
Documents
-
view
0 -
download
0
Transcript of Atmospheric Pollution Research

Atmospheric Pollution Research 12 (2021) 316–329
Available online 28 November 20201309-1042/© 2020 Turkish National Committee for Air Pollution Research and Control. Production and hosting by Elsevier B.V. All rights reserved.
Air pollution and critical air pollutant assessment during and after COVID-19 lockdowns: Evidence from pandemic hotspots in China, the Republic of Korea, Japan, and India
Meng Hu a,c, Zhongbing Chen b,**, Haiyan Cui a,c, Tao Wang c, Chao Zhang a,c, Keming Yun a,c,*
a School of Public Health, Shanxi Medical University, No. 56 Xinjian South Street, Taiyuan, 030001, China b Faculty of Environmental Sciences, Czech University of Life Sciences Prague, Kamýcka 129, 16500, Prague, Czech Republic c School of Forensic Medicine, Shanxi Medical University, No. 55 Wenhua Street, Jinzhong, 030600, China
A R T I C L E I N F O
Keywords: Air pollution Critical air pollutant COVID-19 lockdown PM2.5
Asian cites
A B S T R A C T
The COVID-19 virus outbreak has been declared a “global pandemic”. Therefore, “lockdown” was issued in affected countries to control the spread of the virus. To assess air pollution during and after lockdowns, this study selected pandemic hotspots in China (Wuhan), Japan (Tokyo), the Republic of Korea (Daegu), and India (Mumbai) and compared the Air Quality Index (AQI) in these areas for the past three years. The results indicated that air pollution levels were positively correlated with a reduction in pollutant levels during and after lock-downs in these cities. In Tokyo, low levels of air pollution, no significant change in the distribution of “good” and “moderate” days was observed during lockdown. In Daegu, mid-level air pollution, the percentage of “unhealthy” days (AQI>100) markedly reduced during lockdown; however, this reverted after lockdown was lifted. In Wuhan and Mumbai, high air pollution levels, the percentage of unhealthy days remarkably decreased during lockdown and continued to reduce after lockdown. It was found that PM2.5 was the critical pollutant for all cities because its sub-AQI was the largest of the six pollutant species for the majority of days. In addition, PM10 dominated the overall AQI for 2.2–9.6% of the period in Wuhan and Mumbai, and its sub-AQI reduced during lockdown. The mean sub-AQI for NO2, SO2, CO, and O3 was within the “good” category for all cities. In conclusion, the lock-down policy reduced air pollution in general and this reduction was more significant for regions with high air pollution levels.
1. Introduction
The coronavirus disease 2019 (COVID-19) was declared a “global pandemic” by the World Health Organization (WHO) on March 12, 2020, and has posed an enormous threat to global public health security (Wang and Su, 2020; WHO, 2020a). As of May 31, 2020, the cumulative number of confirmed cases of COVID-19 was 5,934,936 globally, with 367,166 deaths caused by the pandemic (WHO, 2020b). In order to control the global spread of COVID-19, the governments of affected countries issued a state of emergency, which included “lockdown” re-strictions on the movement of people and transportation, while pro-hibiting economic, education, sporting, cultural, and religious activities. These measures appeared to have helped slow down the spread of the disease (Ali and Alharbi, 2020; Kerimray et al., 2020; Yunus et al.,
2020). Among the early COVID-19 hotspot regions, several of them have shown progress in tackling the virus and recently lifted their lockdowns, while other regions have still not eased lockdown measures (Asyary and Veruswati, 2020; Kerimray et al., 2020; Ma et al., 2020; Nakada and Urban, 2020; Shahzad et al., 2020; Tosepu et al., 2020; Xie and Zhu, 2020). The use of lockdowns and their subsequent ends not only affected the spread of COVID-19 in those countries, but also influenced local air pollution levels as well as critical air pollutant levels.
In China, the first official transmission case of COVID-19 was detected on December 31, 2019, in Wuhan (Ma et al., 2020), the capital of Hubei Province, and the virus then quickly spread nationwide. There were 84,572 cumulative cases confirmed by the health authorities in China by May 31, 2020, with 50,340 (59.5%) from Wuhan (Baidu, 2020). On January 23, 2020, a total of 571 cases were reported in China,
* Corresponding author. School of Public Health, Shanxi Medical University, No. 56 Xinjian South Street, Taiyuan, 030001, China. ** Corresponding author.
E-mail addresses: [email protected] (Z. Chen), [email protected] (K. Yun).
Contents lists available at ScienceDirect
Atmospheric Pollution Research
journal homepage: www.elsevier.com/locate/apr
https://doi.org/10.1016/j.apr.2020.11.013 Received 17 June 2020; Received in revised form 20 November 2020; Accepted 20 November 2020

Atmospheric Pollution Research 12 (2021) 316–329
317
of which 375 were from the Hubei Province (WHO, 2020d). In order to suppress the transmission of COVID-19, the Government of China declared a state of emergency and issued a travel restriction order (lockdown) in Wuhan from January 23 to April 8, 2020, as shown in Table 1 (Li et al., 2020).
On January 15, 2020, the Ministry of Health, Labour and Welfare (MHLW) in Japan reported an imported case of laboratory-confirmed COVID-19 (WHO, 2020c). In Japan, there were 16,877 confirmed cases of the virus by May 31, 2020, of which 5,231 (31.0%) were from Tokyo. The Japanese Government issued a nationwide state of lockdown from April 7 to May 31, 2020 (Ministry of Health LaW, 2020), which was still ongoing during the data analysis for this study (Table 1).
On January 20, 2020, the National IHR Focal Point (NFP) for the Republic of Korea reported the first case of the novel coronavirus. Up to May 31, 2020, a total of 11,468 cases were identified by the health authorities in the Republic of Korea, with 6,883 cases (60.0%) from Daegu, which was the most severely affected city in the country (Headquarters, 2020). The Government of the Republic of Korea declared a state social distancing policy (lockdown) from February 23 to May 6, 2020 (Table 1) (Jun-yong, 2020; Staff, 2020).
The first confirmed case of coronavirus in India was on January 30, 2020 (Gupta et al., 2020; Sharma et al., 2020). A total of 186,186 cases were identified by the health authorities in India by May 31, 2020 (WHO, 2020b). The nationwide lockdown started on March 24, 2020, and the end date of this lockdown has been postponed several times and is still ongoing (Mahato et al., 2020). Mumbai is the most severely affected city in India and has been classified as a “red zone”, with lockdown measures being lifted on June 30, 2020 (Huaxia, 2020).
Typically, air quality is evaluated by measuring the concentrations of six pollutants: fine particulate matter (PM2.5, mass concentration of particles with diameters ≤2.5 μm), coarse particulate matter (PM10, mass concentration of particles with diameters ≤10 μm), ozone (O3), nitrogen dioxide (NO2), sulfur dioxide (SO2), and carbon monoxide (CO) (USEPA, 2018). The major sources of primary air pollutants (PM2.5, PM10, NO2, SO2, and CO) are emissions from vehicles, coal-fired power plants, natural gas power plants, biomass burning, natural forest fires, and volcanoes. Ozone is a secondary pollutant formed in the presence of sunlight from the chemical reactions of volatile organic compounds (VOCs) and nitrogen oxides (NOx) (IARC, 2016). Existing research has shown that the concentrations of these air pollutants changed during the lockdown periods because emissions from transportation, industries and many other sources were reduced. It has been reported that the mean concentrations of PM10, PM2.5, CO and NO2 reduced during the lock-down periods in Milan (Italy) and Rio de Janeiro (Brazil) and the mean concentrations of O3 increased (Collivignarelli et al., 2020; Dantas et al., 2020). In Hangzhou, China, the city lockdown has improved air quality by reducing the concentration of PM2.5, PM10, CO, and NO2, but has also decreased air quality by augmenting O3 and SO2 (Wang et al., 2020a). During the COVID-19 control period in northern China, the air quality improved due to reduced emissions from the transportation and
secondary industrial sectors. Specifically, the transportation sector was linked to the NO2 emission reductions, while lower emissions from secondary industries were the major cause for the reductions of PM2.5 and CO, and SO2 reduction was only linked to the industrial sector (Wang et al., 2020b). In India, around 43%, 31%, 10%, and 18% de-creases in PM2.5, PM10, CO, and NO2 were observed during the lockdown period compared to previous years from 22 cities, and the air quality index (AQI) reduced by 44%,33%,29%, 15% and 32% in north, south, east, central and western India, respectively (Sharma et al., 2020).
It was proposed that a polluted environment could enhance the transmission rate of such deadly viruses under moderate-to-high hu-midity conditions. This is because the aqueous atmospheric aerosols offer a conducive surface for adsorption/absorption of organic mole-cules and viruses onto them, facilitating a pathway for higher rate of transmission under favorable environmental conditions (Manoj et al., 2020). What’s more, the PM2.5 exhibited positive association (relative risk (RR) = 1.079, 95%CI 1.071–1.086, p < 0.01) with COVID-19 deaths, while the temperature was inversely associated with COVID-19 deaths (RR = 0.861, 95%CI 0.851–0.872, p < 0.01) based on the daily COVID-19 death number, air quality index (AQI), ambient air pollutant concentrations, and meteorological variables data of Wuhan between Jan 25 and April 7, 2020 (Jiang and Xu, 2020). There is a strong positive correlation between the concentration of atmospheric nitrogen dioxide (NO2) and both the absolute number of COVID-19 deaths (r =0.79, p < 0.05) and case fatality rate (r = 0.74, p < 0.05) in India (Chakraborty et al., 2020).
However, changes in the concentrations of individual pollutants are difficult to link to overall air pollution and it is difficult to evaluate the contribution of different pollution species to air quality. The concen-trations of different pollutants are not comparable with regard to their impact on human health (Sharma et al., 2020). In addition, analyzing only the mean values of six pollutants during the lockdown could lead to an oversight of important information. To communicate potential adverse health impacts associated with short-term changes in air pollution, the Air Quality Index (AQI) was introduced as a summary index by the United States Environmental Protection Agency (USEPA) in 1998. The construction of the AQI provides a mean to distinguish be-tween “good” and “unhealthy” air quality (Kowalska et al., 2009; Perl-mutt and Cromar, 2019).
In this study, to assess the impact on air pollution and critical pol-lutants, both during and after COVID-19 lockdowns, the overall AQI, individual AQI, and corresponding AQI categories for six pollutants in the four most severely affected regions in Asia were studied. The hot-spots cities were Wuhan in China, Tokyo in Japan, Daegu in the Republic of Korea, and Mumbai in India; it was assumed that these cities declared the strictest lockdown measures as they experienced the most serious virus outbreaks in their respective countries. A comparison of historical data from 2018 to 2020 for each city was carried out to assess the po-tential effects on air pollution during days with similar meteorological conditions. This study aimed to: (1) provide a direct evaluation of the dynamic overall air pollution of PM2.5, PM10, NO2, O3, SO2, and CO, by assessing the changes in AQI in cities before, during, and after lockdown, for the period from January 1 to May 17 for each city of the past three years (2018–2020); (2) determine the critical/dominant pollutant from the sub-AQI of the six pollutant species, for the period from January 1 to May 17; and (3) assess the variation in the critical pollutant and other pollutants, both before lockdown and during lockdown. The outcomes of this study could provide a reference for other countries to assess the impacts on air pollution due to COVID-19, especially when significant lockdown restrictions affected the production of emissions from various pollution sources. Accordingly, relevant authorities could consider these factors when planning strategies to safeguard air quality.
Table 1 Date when of lockdown measures started and ended at the 4 four cities studied in 2020.
Time Wuhan (WH) Daegu (DG) Mumbai (MB) Tokyo (TK)
LD start 23rd Jan 23rd Feb 24th Mar 7th April LD end 8th April 6th May Ongoing Ongoing LD duration 76 days 73 days 55 days 41 days LD ended
duration 40 days 12 days – –
BF period 1st Jan-22nd Jan
1st Jan-22nd Feb
1st Jan-23rd Mar
1st Jan-6th April
LD period 23rd Jan–7th April
23rd Feb-5th May
24th Mar- 17th May
7th April- 17th May
AF period 8th April- 17th May
6th May- 17th May
– –
M. Hu et al.

Atmospheric Pollution Research 12 (2021) 316–329
318
2. Material and methods
2.1. Selection of the study regions
Wuhan (WH), Daegu (DG), Tokyo (TK), and Mumbai (MB) were selected as the study regions. The selection process incorporated the following factors: (1) the city most severely affected by COVID-19 in each respective country (therefore, with a high possibility that the strictest lockdown restrictions were applied); (2) a mix of cities with low and high pollution levels; (3) a mix of periods when the lockdown measures begun and ended; (4) a mix of low to high economic devel-opmental stages in Asia; and (5) the availability of data for the six air pollutant species.
2.2. Data collection
In order to investigate air pollution during and after the lockdown periods, AQI data for the four cities were collected. The sub-AQI (AQIi) for each air pollutant species was converted from their raw concentra-tions using the Air Quality Open Data Platform, based on the USEPA 2016 standard. The conversion process is described in a USEPA technical report (USEPA, 2018). According to the USEPA standard, the overall AQI is the maximum AQIi among the six pollutants, and the pollutant with the highest AQIi is the critical/dominant pollutant. The AQI is represented by a value on a scale of 0–500, which is divided into six categories, namely: “good” (0–50), “moderate” (51–100), “unhealthy for sensitive groups” (101–200), “unhealthy” (201–300), “very un-healthy” (301–400), and “hazardous” (401–500). The levels, colors, and corresponding raw concentration levels of the AQIi for the six pollutant species are listed in Table 2. The time period used in this study was from January 1 to May 17 for the years 2018–2020; this time period was divided into three study periods for each city: before lockdown (BF), during lockdown (LD), and after lockdown (AF). The daily AQI data for the six pollutant species represented the median value calculated by several monitoring stations in each city. The dataset provided minimum, maximum, median, and standard deviations for each air pollutant spe-cies. The count column represented the number of samples used for calculating the median and standard deviation. All dates were Universal Time Coordinated (UTC) based. Daily air quality records were obtained from the World Air Quality Index Project (https://aqicn.org/) and USEPA.
2.3. Data analysis
Overall AQI calculation: To assess the overall changes in air qual-ity, the overall AQI was calculated using PM10, PM2.5, NO2, O3, CO, and SO2 concentrations and Eq. (1), which considers the maximum of all the AQIi values (USEPA, 2018):
AQI =max(AQIPM2.5, AQIPM10, AQIO3, AQINO2, AQICO, AQISO2) (1)
In order to assess air pollution, the overall AQI for each day in each city and for the relevant period in each of the three years was classified according to the AQI categories (i.e., good, moderate, unhealthy for sensitive groups, unhealthy, very unhealthy, and hazardous), based on the USEPA standard as shown in Table 2. The percentage of days for the different categories during the three periods were then compared. However, the overall AQI of all cities never reached the classification of “very unhealthy” or “hazardous” for any of the cities in this study.
In order to find the critical pollutant, the mean AQIi values for the six air pollutant species (pre-lockdown, lockdown, and post-lockdown) were calculated and analyzed.
Change ratio calculation: The change ratio (%) of the overall AQI and AQIi were calculated for each city before and after lockdown for three years using Eq. (2)–(4), as shown below. The “change ratio_LD” is the change during the lockdown (LD) period compared with the pre- lockdown period (BF); the “change ratio_AF” is the change after lock-down (AF) compared with the lockdown period (LD), and the “change ratio_TL” is the change after lockdown (AF) compared with the pre- lockdown period (BF). The overall AQI and AQIi values were the mean values during the corresponding three periods (BF, LD, and AF) in 2018, 2019, and 2020. The overall AQI, AQIi among BF, LD and AF were compared to discover the significant change of different periods, moreover, the AQI of the same periods from 2018 to 2020 were compared to take into account the influence of climate and other factors. The Wilcoxon test and Kruskal Wallis test were performed by “wilcox. test” function in the R4.0.2 and “kruskal” function of R package “agri-colae”. Wilcoxon test was used for comparing two samples, in specific, for comparing two periods of the same year (before and during lock-downs) of Tokyo and Mumbai, which were still have not ended lock-down during this study. Kruskal Wallis test was used for comparing N samples (N > 2), in specific, for Wuhan and Daegu, we compared three periods (pre-lockdown, lockdown and post-lockdowns). For all cities, we also compared the same period of three years by the Kruskal Wallis test (2018, 2019 and 2020). Both Wilcoxon and Kruskal Wallis tests were
Table 2 Air Quality Index (AQI) scale defined by the US-EPA standard. AQI categories, health implications and corresponding concentration levels of the six air pollutant species.
M. Hu et al.
Atmospheric Pollution Research 12 (2021) 316–329
319
applied for unpaired data.
Change ratio LD(%)=AQI(LD) − AQI(BF)
AQI(BF)X100%... (2)
Change ratio AF (%)=AQI(AF) − AQI(LD)
AQI(AF)X100%... (3)
Change ratio TL (%)=AQI(AF) − AQI(BF)
AQI(BF)X100%... (4)
Spearman correlation between the AQI of air pollutants and meteo-rological variables (temperature, humidity, wind speed, precipitation and air pressure), and the overall AQI of CO, NO2, SO2, O3, PM2.5, and PM10 in four cities in 2018, 2019 and 2020 was performed.
3. Results and discussion
3.1. Evaluation of air pollution using overall AQI
The purpose of the AQI is to inform the public about air quality so that individuals and communities can take adequate actions to protect their health. This is particularly important during days with unhealthy air quality (AQI>100). Such days are categorized as unhealthy for sensitive groups (orange), unhealthy (red), and very unhealthy (purple) using the USEPA standard (USEPA, 2018). The “sensitive groups” affected when each pollutant has an AQI exceeding 100 have been shown in Table S1 in the Supplementary Information.
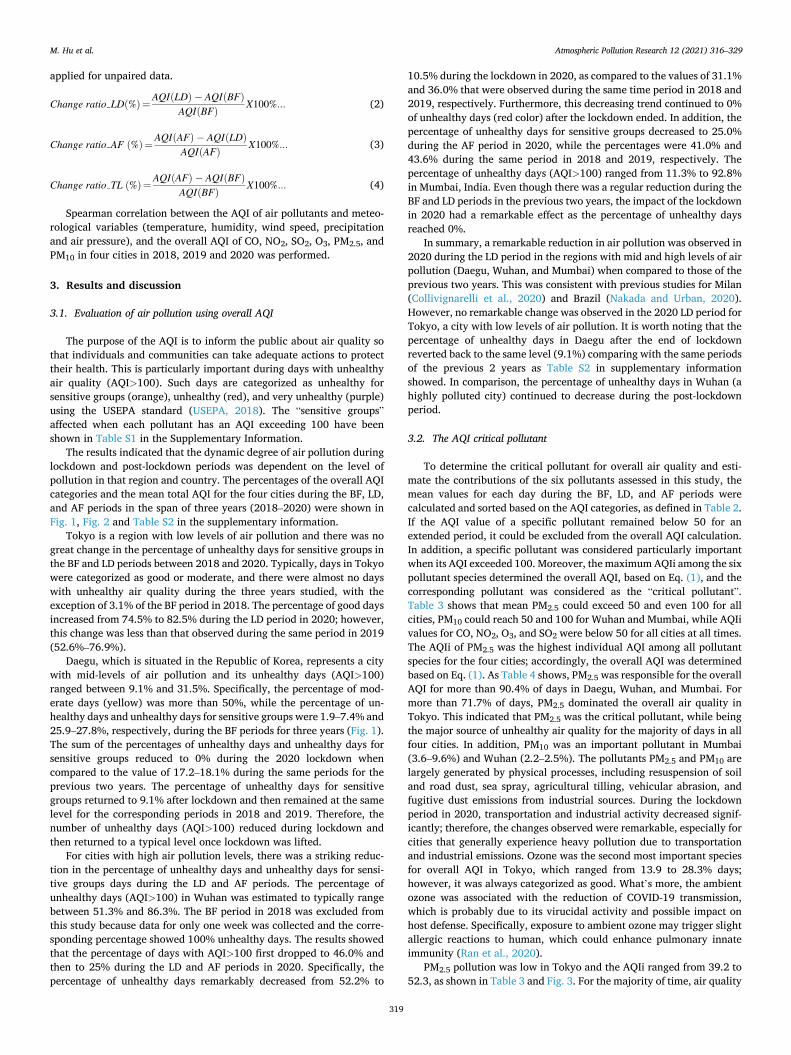
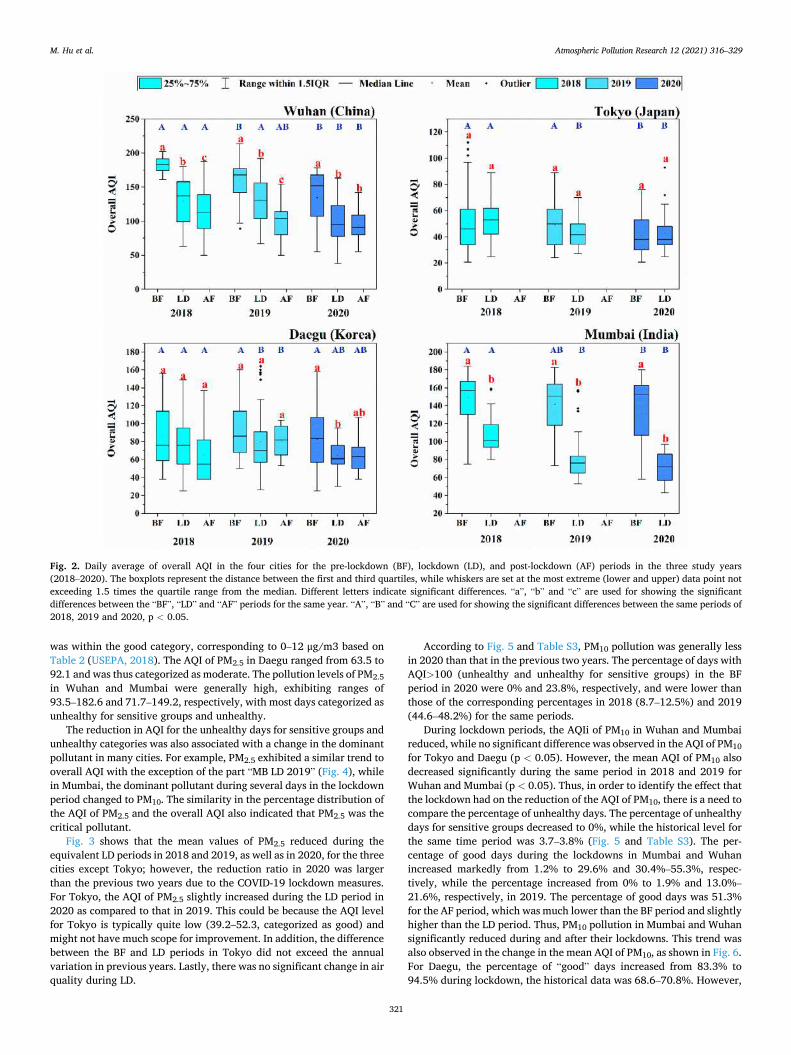
The results indicated that the dynamic degree of air pollution during lockdown and post-lockdown periods was dependent on the level of pollution in that region and country. The percentages of the overall AQI categories and the mean total AQI for the four cities during the BF, LD, and AF periods in the span of three years (2018–2020) were shown in Fig. 1, Fig. 2 and Table S2 in the supplementary information.
Tokyo is a region with low levels of air pollution and there was no great change in the percentage of unhealthy days for sensitive groups in the BF and LD periods between 2018 and 2020. Typically, days in Tokyo were categorized as good or moderate, and there were almost no days with unhealthy air quality during the three years studied, with the exception of 3.1% of the BF period in 2018. The percentage of good days increased from 74.5% to 82.5% during the LD period in 2020; however, this change was less than that observed during the same period in 2019 (52.6%–76.9%).
Daegu, which is situated in the Republic of Korea, represents a city with mid-levels of air pollution and its unhealthy days (AQI>100) ranged between 9.1% and 31.5%. Specifically, the percentage of mod-erate days (yellow) was more than 50%, while the percentage of un-healthy days and unhealthy days for sensitive groups were 1.9–7.4% and 25.9–27.8%, respectively, during the BF periods for three years (Fig. 1). The sum of the percentages of unhealthy days and unhealthy days for sensitive groups reduced to 0% during the 2020 lockdown when compared to the value of 17.2–18.1% during the same periods for the previous two years. The percentage of unhealthy days for sensitive groups returned to 9.1% after lockdown and then remained at the same level for the corresponding periods in 2018 and 2019. Therefore, the number of unhealthy days (AQI>100) reduced during lockdown and then returned to a typical level once lockdown was lifted.
For cities with high air pollution levels, there was a striking reduc-tion in the percentage of unhealthy days and unhealthy days for sensi-tive groups days during the LD and AF periods. The percentage of unhealthy days (AQI>100) in Wuhan was estimated to typically range between 51.3% and 86.3%. The BF period in 2018 was excluded from this study because data for only one week was collected and the corre-sponding percentage showed 100% unhealthy days. The results showed that the percentage of days with AQI>100 first dropped to 46.0% and then to 25% during the LD and AF periods in 2020. Specifically, the percentage of unhealthy days remarkably decreased from 52.2% to
10.5% during the lockdown in 2020, as compared to the values of 31.1% and 36.0% that were observed during the same time period in 2018 and 2019, respectively. Furthermore, this decreasing trend continued to 0% of unhealthy days (red color) after the lockdown ended. In addition, the percentage of unhealthy days for sensitive groups decreased to 25.0% during the AF period in 2020, while the percentages were 41.0% and 43.6% during the same period in 2018 and 2019, respectively. The percentage of unhealthy days (AQI>100) ranged from 11.3% to 92.8% in Mumbai, India. Even though there was a regular reduction during the BF and LD periods in the previous two years, the impact of the lockdown in 2020 had a remarkable effect as the percentage of unhealthy days reached 0%.
In summary, a remarkable reduction in air pollution was observed in 2020 during the LD period in the regions with mid and high levels of air pollution (Daegu, Wuhan, and Mumbai) when compared to those of the previous two years. This was consistent with previous studies for Milan (Collivignarelli et al., 2020) and Brazil (Nakada and Urban, 2020). However, no remarkable change was observed in the 2020 LD period for Tokyo, a city with low levels of air pollution. It is worth noting that the percentage of unhealthy days in Daegu after the end of lockdown reverted back to the same level (9.1%) comparing with the same periods of the previous 2 years as Table S2 in supplementary information showed. In comparison, the percentage of unhealthy days in Wuhan (a highly polluted city) continued to decrease during the post-lockdown period.
3.2. The AQI critical pollutant
To determine the critical pollutant for overall air quality and esti-mate the contributions of the six pollutants assessed in this study, the mean values for each day during the BF, LD, and AF periods were calculated and sorted based on the AQI categories, as defined in Table 2. If the AQI value of a specific pollutant remained below 50 for an extended period, it could be excluded from the overall AQI calculation. In addition, a specific pollutant was considered particularly important when its AQI exceeded 100. Moreover, the maximum AQIi among the six pollutant species determined the overall AQI, based on Eq. (1), and the corresponding pollutant was considered as the “critical pollutant”. Table 3 shows that mean PM2.5 could exceed 50 and even 100 for all cities, PM10 could reach 50 and 100 for Wuhan and Mumbai, while AQIi values for CO, NO2, O3, and SO2 were below 50 for all cities at all times. The AQIi of PM2.5 was the highest individual AQI among all pollutant species for the four cities; accordingly, the overall AQI was determined based on Eq. (1). As Table 4 shows, PM2.5 was responsible for the overall AQI for more than 90.4% of days in Daegu, Wuhan, and Mumbai. For more than 71.7% of days, PM2.5 dominated the overall air quality in Tokyo. This indicated that PM2.5 was the critical pollutant, while being the major source of unhealthy air quality for the majority of days in all four cities. In addition, PM10 was an important pollutant in Mumbai (3.6–9.6%) and Wuhan (2.2–2.5%). The pollutants PM2.5 and PM10 are largely generated by physical processes, including resuspension of soil and road dust, sea spray, agricultural tilling, vehicular abrasion, and fugitive dust emissions from industrial sources. During the lockdown period in 2020, transportation and industrial activity decreased signif-icantly; therefore, the changes observed were remarkable, especially for cities that generally experience heavy pollution due to transportation and industrial emissions. Ozone was the second most important species for overall AQI in Tokyo, which ranged from 13.9 to 28.3% days; however, it was always categorized as good. What’s more, the ambient ozone was associated with the reduction of COVID-19 transmission, which is probably due to its virucidal activity and possible impact on host defense. Specifically, exposure to ambient ozone may trigger slight allergic reactions to human, which could enhance pulmonary innate immunity (Ran et al., 2020).
PM2.5 pollution was low in Tokyo and the AQIi ranged from 39.2 to 52.3, as shown in Table 3 and Fig. 3. For the majority of time, air quality
M. Hu et al.
Atmospheric Pollution Research 12 (2021) 316–329
320
Fig. 1. The distribution of overall AQI categories of Daegu, Tokyo, Wuhan, and Mumbai for the pre-lockdown (BF), lockdown (LD), and post-lockdown (AF) periods in the recent three study years (2018–2020). The pie charts represent the percentages of days with “good” (green), “moderate” (yellow), “unhealthy for sensitive groups” (orange), and “unhealthy” (red) air quality according to the US-EPA standard.
M. Hu et al.
Atmospheric Pollution Research 12 (2021) 316–329
321
was within the good category, corresponding to 0–12 μg/m3 based on Table 2 (USEPA, 2018). The AQI of PM2.5 in Daegu ranged from 63.5 to 92.1 and was thus categorized as moderate. The pollution levels of PM2.5 in Wuhan and Mumbai were generally high, exhibiting ranges of 93.5–182.6 and 71.7–149.2, respectively, with most days categorized as unhealthy for sensitive groups and unhealthy.
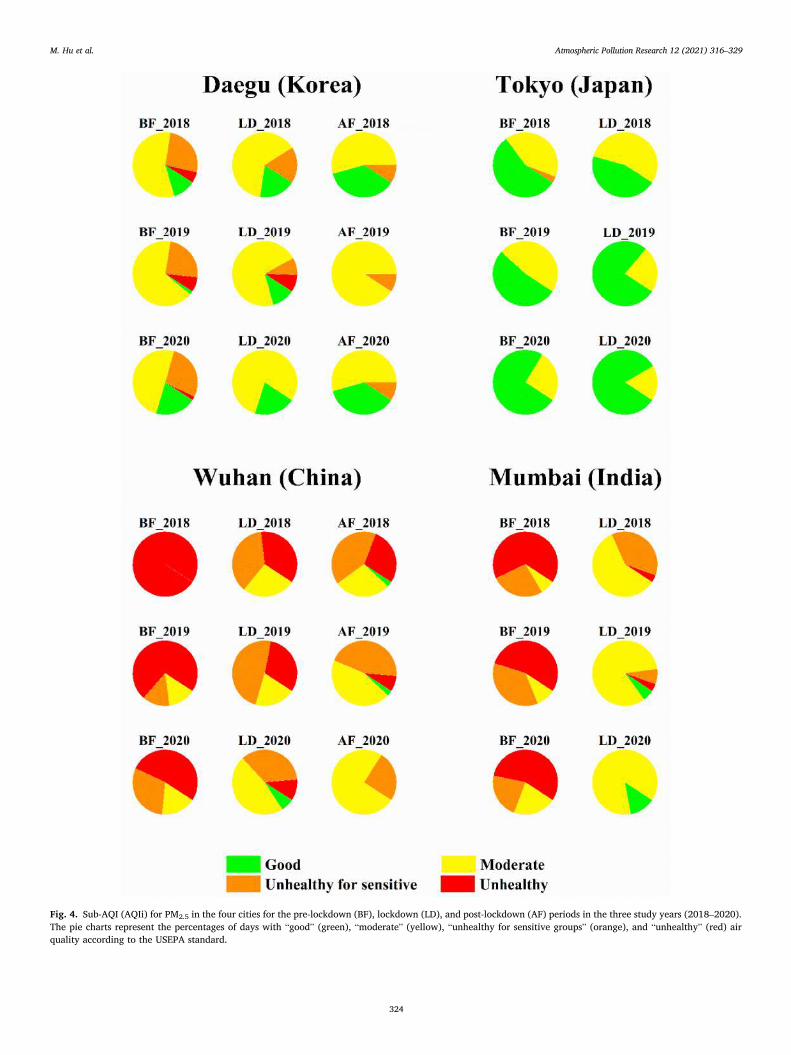
The reduction in AQI for the unhealthy days for sensitive groups and unhealthy categories was also associated with a change in the dominant pollutant in many cities. For example, PM2.5 exhibited a similar trend to overall AQI with the exception of the part “MB LD 2019” (Fig. 4), while in Mumbai, the dominant pollutant during several days in the lockdown period changed to PM10. The similarity in the percentage distribution of the AQI of PM2.5 and the overall AQI also indicated that PM2.5 was the critical pollutant.
Fig. 3 shows that the mean values of PM2.5 reduced during the equivalent LD periods in 2018 and 2019, as well as in 2020, for the three cities except Tokyo; however, the reduction ratio in 2020 was larger than the previous two years due to the COVID-19 lockdown measures. For Tokyo, the AQI of PM2.5 slightly increased during the LD period in 2020 as compared to that in 2019. This could be because the AQI level for Tokyo is typically quite low (39.2–52.3, categorized as good) and might not have much scope for improvement. In addition, the difference between the BF and LD periods in Tokyo did not exceed the annual variation in previous years. Lastly, there was no significant change in air quality during LD.
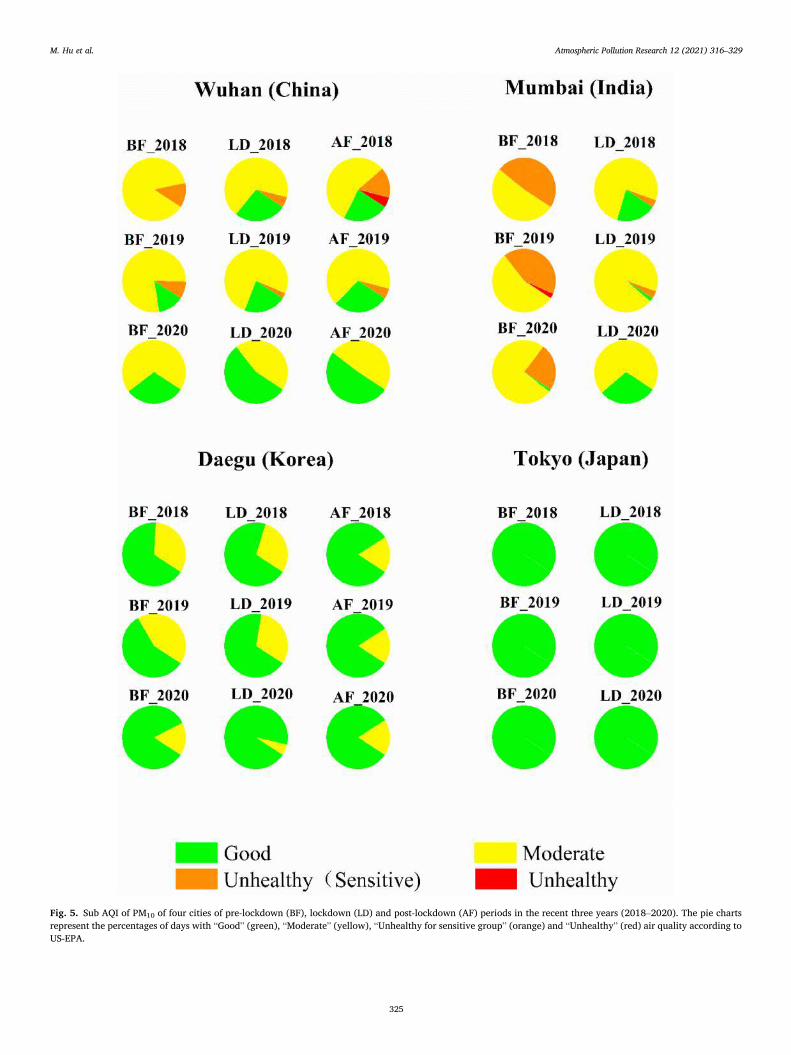
According to Fig. 5 and Table S3, PM10 pollution was generally less in 2020 than that in the previous two years. The percentage of days with AQI>100 (unhealthy and unhealthy for sensitive groups) in the BF period in 2020 were 0% and 23.8%, respectively, and were lower than those of the corresponding percentages in 2018 (8.7–12.5%) and 2019 (44.6–48.2%) for the same periods.
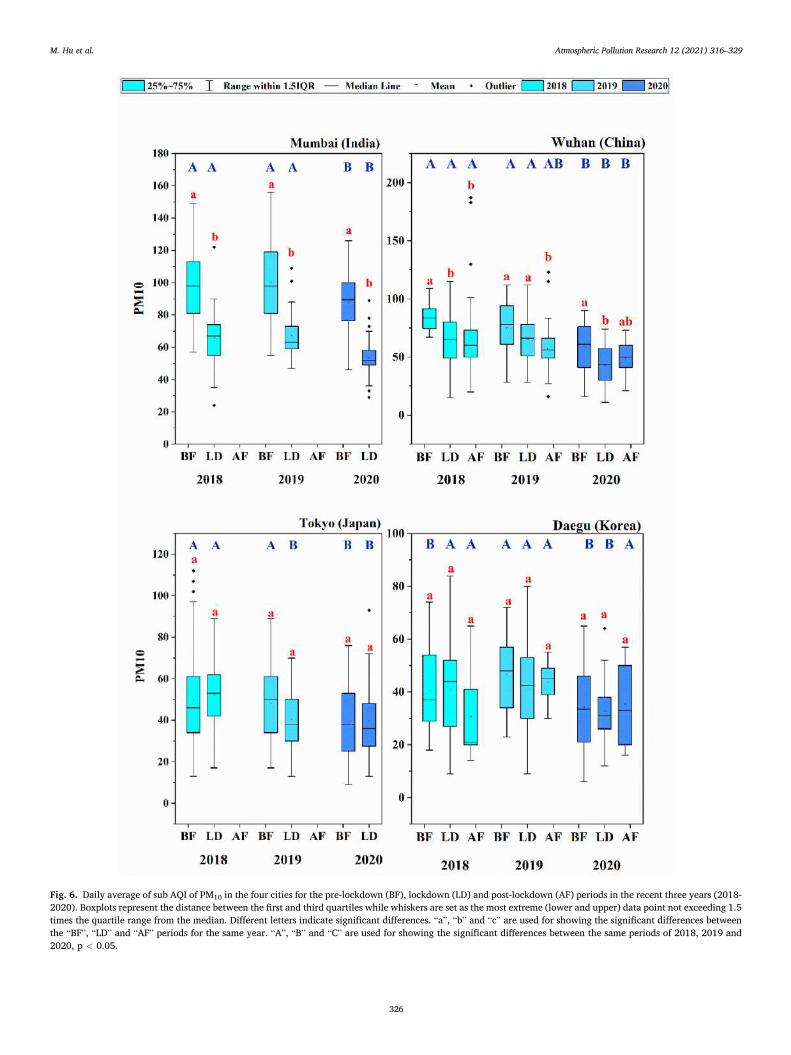
During lockdown periods, the AQIi of PM10 in Wuhan and Mumbai reduced, while no significant difference was observed in the AQI of PM10 for Tokyo and Daegu (p < 0.05). However, the mean AQI of PM10 also decreased significantly during the same period in 2018 and 2019 for Wuhan and Mumbai (p < 0.05). Thus, in order to identify the effect that the lockdown had on the reduction of the AQI of PM10, there is a need to compare the percentage of unhealthy days. The percentage of unhealthy days for sensitive groups decreased to 0%, while the historical level for the same time period was 3.7–3.8% (Fig. 5 and Table S3). The per-centage of good days during the lockdowns in Mumbai and Wuhan increased markedly from 1.2% to 29.6% and 30.4%–55.3%, respec-tively, while the percentage increased from 0% to 1.9% and 13.0%– 21.6%, respectively, in 2019. The percentage of good days was 51.3% for the AF period, which was much lower than the BF period and slightly higher than the LD period. Thus, PM10 pollution in Mumbai and Wuhan significantly reduced during and after their lockdowns. This trend was also observed in the change in the mean AQI of PM10, as shown in Fig. 6. For Daegu, the percentage of “good” days increased from 83.3% to 94.5% during lockdown, the historical data was 68.6–70.8%. However,
Fig. 2. Daily average of overall AQI in the four cities for the pre-lockdown (BF), lockdown (LD), and post-lockdown (AF) periods in the three study years (2018–2020). The boxplots represent the distance between the first and third quartiles, while whiskers are set at the most extreme (lower and upper) data point not exceeding 1.5 times the quartile range from the median. Different letters indicate significant differences. “a”, “b” and “c” are used for showing the significant differences between the “BF”, “LD” and “AF” periods for the same year. “A”, “B” and “C” are used for showing the significant differences between the same periods of 2018, 2019 and 2020, p < 0.05.
M. Hu et al.

Atmospheric Pollution Research 12 (2021) 316–329
322
there was no remarkable change after lockdown comparing with pre-vious years. The “good” days always were 100% for Tokyo during three years.
3.3. Other air pollutants
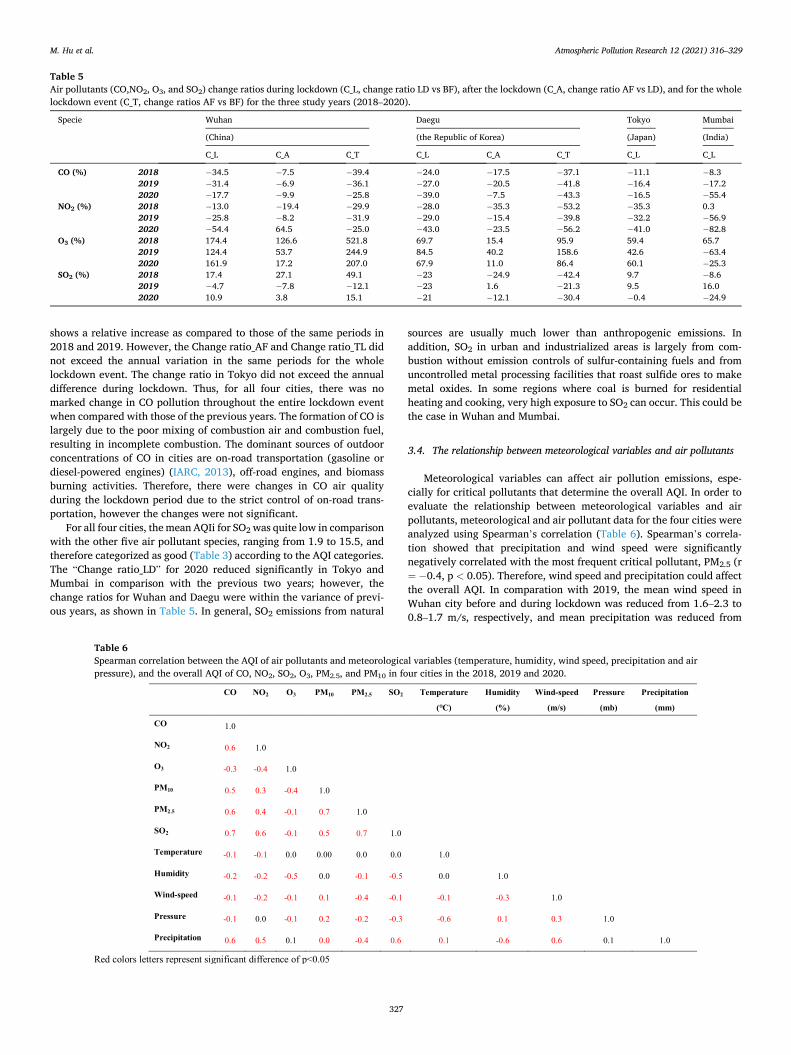
CO, NO2, O3, and SO2 were not the critical pollutant species because their AQIi values were below 100 for all days in all four cities. Thus, their changes had a slight contribution to the overall AQI based on Eq. (1). To investigate the minor changes in these species, the change ratio of their AQIi was compared during and after lockdown, as well as for the whole lockdown event (Table 5).
The mean AQIi of NO2 in the four cities in the three study years was 2.8–25.2, which was below 50 and therefore classified as good (Table 3). The mean AQI for NO2 for the BF, LD, and AF periods for the three years showed a decreasing trend. The change ratios between LD vs. BF, AF vs LD, and AF vs BF were calculated based on Eqs. (2)–(4) and are shown in Table 5. The change ratio_LD (C_L) shows the change in lockdown compared to pre-lockdown periods; change ratio_AF (C_A) shows the change in post-lockdown compared to lockdown, and change ratio_TL (C_T) evaluates the impact of the whole lockdown event, comparing the change ratio between post-lockdown and pre-lockdown. For all four cities, the AQI for NO2 during LD periods reduced because the change ratio_LD for 2020 showed a larger reduction compared to those in the
Table 3 Mean of sub AQI (AQIi) and corresponding categories of the six pollutant species in the four cities during the three study periods (BF, LD and AF) from January 1st to May 17th of the past three years (2018–2020).
M. Hu et al.

Atmospheric Pollution Research 12 (2021) 316–329
323
same periods of 2018 and 2019 (Table 5). However, the AQI for NO2 reverted after the end of lockdown in Wuhan but did not do likewise in Daegu. The change ratio_TL did not exceed the annual variation for the cities that had already ended their lockdowns (Wuhan and Daegu). Thus, there was a significant reduction in the AQIi for NO2 during the short-term lockdown. However, no marked change was observed following the LD period in the past three years. In cities, fossil fuel combustion is often the dominant source of air pollutants and includes stationary power generation, diesel-powered engines, and gasoline- powered engines. There has been some concern that diesel after- treatment technologies aimed at reducing PM emissions could shift the distribution of NOx emissions towards NO2, which will lead to higher
NO2 exposures near highways. In India, based on statistical analysis of the amount of annual fossil fuels consumption in transportation, and the annual average concentration of the atmospheric PM2.5, PM10, NO2, in the different states, suggest that one of the main sources of atmospheric NO2 is from fossil fuels combustion in transportation (Chakraborty et al., 2020).
The mean AQIi for O3 in the four cities for the three study years was 6.2–40.7, which represented good air quality (Table 3). With the exception of Mumbai, the mean AQI for O3 for the BF, LD, and AF pe-riods for the three years showed an increasing trend. However, the AQI for O3 change ratio_LD during the 2020 LD period did not exceed the range of annual variation when compared with those of the same periods in 2018 and 2019 (Table 5). The result of this study differed from the observed enhancement in O3 concentration reported for Milan (Colli-vignarelli et al., 2020); however, historical data were not included in their study. Moreover, the AQIi for O3 increased to a significantly less extent after the end of the lockdown period in both Wuhan and Daegu, as compared with those of the same periods in 2018 and 2019. The Change ratio_TL for 2020 was slightly lower than the annual variance for the cities that had already ended their lockdowns.
The mean AQIi for CO in the study years was 3.2–19.1 and therefore below 50 (Table 3). The mean AQI for CO gradually decreased in the BF, LD, and AF periods in the past three years. The Change ratio_LD of the AQI for CO in 2020 reduced significantly in Daegu and Mumbai; how-ever, the Change ratio_AF indicated that the CO level in Daegu started to return following lockdown. The Change ratio_LD for 2020 in Wuhan
Table 4 Percentage of critical pollutant species from January 1st to May 17th in 2018, 2019, and 2020.
Critical Pollutant Year Daegu Tokyo Mumbai Wuhan
2018 98.5% 86.1% 100.0% 97.5% PM2.5 2019 98.5% 76.5% 90.4% 97.8%
2020 97.8% 71.7% 96.4% 100.0% 2018 0.7% 0.0% 0.0% 2.5%
PM10 2019 0.0% 0.0% 9.6% 2.2% 2020 1.4% 0.0% 3.6% 0.0% 2018 1.5% 13.9% 0.0% 0.0%
O3 2019 1.5% 23.5% 0.0% 0.0% 2020 0.7% 28.3% 0.0% 0.0%
Fig. 3. Daily average of sub-AQI (AQIi) for PM2.5 in the four cities for the pre-lockdown (BF), lockdown (LD), and post-lockdown (AF) periods in the three study years (2018–2020). The boxplots represent the distance between the first and third quartiles, while whiskers are set at the most extreme (lower and upper) data point not exceeding 1.5 times the quartile range from the median. Different letters indicate significant differences. “a”, “b” and “c” are used for showing the significant differences between the “BF”, “LD” and “AF” periods for the same year. “A”, “B” and “C” are used for showing the significant differences between the same periods of 2018, 2019 and 2020, p < 0.05.
M. Hu et al.
Atmospheric Pollution Research 12 (2021) 316–329
324
Fig. 4. Sub-AQI (AQIi) for PM2.5 in the four cities for the pre-lockdown (BF), lockdown (LD), and post-lockdown (AF) periods in the three study years (2018–2020). The pie charts represent the percentages of days with “good” (green), “moderate” (yellow), “unhealthy for sensitive groups” (orange), and “unhealthy” (red) air quality according to the USEPA standard.
M. Hu et al.
Atmospheric Pollution Research 12 (2021) 316–329
325
Fig. 5. Sub AQI of PM10 of four cities of pre-lockdown (BF), lockdown (LD) and post-lockdown (AF) periods in the recent three years (2018–2020). The pie charts represent the percentages of days with “Good” (green), “Moderate” (yellow), “Unhealthy for sensitive group” (orange) and “Unhealthy” (red) air quality according to US-EPA.
M. Hu et al.
Atmospheric Pollution Research 12 (2021) 316–329
326
Fig. 6. Daily average of sub AQI of PM10 in the four cities for the pre-lockdown (BF), lockdown (LD) and post-lockdown (AF) periods in the recent three years (2018- 2020). Boxplots represent the distance between the first and third quartiles while whiskers are set as the most extreme (lower and upper) data point not exceeding 1.5 times the quartile range from the median. Different letters indicate significant differences. “a”, “b” and “c” are used for showing the significant differences between the “BF”, “LD” and “AF” periods for the same year. “A”, “B” and “C” are used for showing the significant differences between the same periods of 2018, 2019 and 2020, p < 0.05.
M. Hu et al.
Atmospheric Pollution Research 12 (2021) 316–329
327
shows a relative increase as compared to those of the same periods in 2018 and 2019. However, the Change ratio_AF and Change ratio_TL did not exceed the annual variation in the same periods for the whole lockdown event. The change ratio in Tokyo did not exceed the annual difference during lockdown. Thus, for all four cities, there was no marked change in CO pollution throughout the entire lockdown event when compared with those of the previous years. The formation of CO is largely due to the poor mixing of combustion air and combustion fuel, resulting in incomplete combustion. The dominant sources of outdoor concentrations of CO in cities are on-road transportation (gasoline or diesel-powered engines) (IARC, 2013), off-road engines, and biomass burning activities. Therefore, there were changes in CO air quality during the lockdown period due to the strict control of on-road trans-portation, however the changes were not significant.
For all four cities, the mean AQIi for SO2 was quite low in comparison with the other five air pollutant species, ranging from 1.9 to 15.5, and therefore categorized as good (Table 3) according to the AQI categories. The “Change ratio_LD” for 2020 reduced significantly in Tokyo and Mumbai in comparison with the previous two years; however, the change ratios for Wuhan and Daegu were within the variance of previ-ous years, as shown in Table 5. In general, SO2 emissions from natural
sources are usually much lower than anthropogenic emissions. In addition, SO2 in urban and industrialized areas is largely from com-bustion without emission controls of sulfur-containing fuels and from uncontrolled metal processing facilities that roast sulfide ores to make metal oxides. In some regions where coal is burned for residential heating and cooking, very high exposure to SO2 can occur. This could be the case in Wuhan and Mumbai.
3.4. The relationship between meteorological variables and air pollutants
Meteorological variables can affect air pollution emissions, espe-cially for critical pollutants that determine the overall AQI. In order to evaluate the relationship between meteorological variables and air pollutants, meteorological and air pollutant data for the four cities were analyzed using Spearman’s correlation (Table 6). Spearman’s correla-tion showed that precipitation and wind speed were significantly negatively correlated with the most frequent critical pollutant, PM2.5 (r = − 0.4, p < 0.05). Therefore, wind speed and precipitation could affect the overall AQI. In comparation with 2019, the mean wind speed in Wuhan city before and during lockdown was reduced from 1.6–2.3 to 0.8–1.7 m/s, respectively, and mean precipitation was reduced from
Table 5 Air pollutants (CO,NO2, O3, and SO2) change ratios during lockdown (C_L, change ratio LD vs BF), after the lockdown (C_A, change ratio AF vs LD), and for the whole lockdown event (C_T, change ratios AF vs BF) for the three study years (2018–2020).
Specie Wuhan Daegu Tokyo Mumbai
(China) (the Republic of Korea) (Japan) (India)
C_L C_A C_T C_L C_A C_T C_L C_L
CO (%) 2018 − 34.5 − 7.5 − 39.4 − 24.0 − 17.5 − 37.1 − 11.1 − 8.3 2019 − 31.4 − 6.9 − 36.1 − 27.0 − 20.5 − 41.8 − 16.4 − 17.2 2020 − 17.7 − 9.9 − 25.8 − 39.0 − 7.5 − 43.3 − 16.5 − 55.4
NO2 (%) 2018 − 13.0 − 19.4 − 29.9 − 28.0 − 35.3 − 53.2 − 35.3 0.3 2019 − 25.8 − 8.2 − 31.9 − 29.0 − 15.4 − 39.8 − 32.2 − 56.9 2020 − 54.4 64.5 − 25.0 − 43.0 − 23.5 − 56.2 − 41.0 − 82.8
O3 (%) 2018 174.4 126.6 521.8 69.7 15.4 95.9 59.4 65.7 2019 124.4 53.7 244.9 84.5 40.2 158.6 42.6 − 63.4 2020 161.9 17.2 207.0 67.9 11.0 86.4 60.1 − 25.3
SO2 (%) 2018 17.4 27.1 49.1 − 23 − 24.9 − 42.4 9.7 − 8.6 2019 − 4.7 − 7.8 − 12.1 − 23 1.6 − 21.3 9.5 16.0 2020 10.9 3.8 15.1 − 21 − 12.1 − 30.4 − 0.4 − 24.9
Table 6 Spearman correlation between the AQI of air pollutants and meteorological variables (temperature, humidity, wind speed, precipitation and air pressure), and the overall AQI of CO, NO2, SO2, O3, PM2.5, and PM10 in four cities in the 2018, 2019 and 2020.
M. Hu et al.
Atmospheric Pollution Research 12 (2021) 316–329
328
38.6 to 36.4 mm in 2020. The decrease in these two meteorological variables could have enhanced PM2.5 pollution. However, the mean AQI for PM2.5 was observed to decrease from 129.0 to 99.9 during lockdown, indicating that this change might not be due to the change in weather conditions. In Tokyo, the mean AQI for PM2.5 during the lockdown period was 39.2, which was lower than the value in 2019. This change could have been due to the lockdown event since wind speed in 2020 during the lockdown period (1.9 m/s) was lower than the same period in 2019 (2.07 m/s). The wind speed in Tokyo and Daegu (1.9–2.4 m/s) were at the same level and were higher than in Wuhan and Mumbai (0.6–1.7 m/s) and this could have contributed to the low PM2.5 pollution in the former two cities. However, the economic structures of Chinese and Indian cities may play a more important role, and their governments have established policies to reduce air pollutants.
Moreover, there was a positive correlation between precipitation with CO, NO2, SO2, and O3 (r = 0.5–0.6, p < 0.05). In addition, there was a negative correlation between humidity and SO2 and O3 (r = − 0.5, p <0.05), while pressure was also negatively correlated with SO2, (r = − 0.3, p < 0.05).
The meteorological changes contributed substantially to the observed changes in most air pollutants such as (PM2.5, SO2, and CO) on the national scale in China, while the nonmeteorological factors explained the increase of O3 (Zhao et al., 2020). Furthermore, meteo-rological variables may also be important factors affecting the COVID-19 mortality, for example, a positive association with COVID-19 daily death counts was observed for diurnal temperature range (r = 0.4), but negative association for relative humidity (r = − 0.3) in Wuhan, China during January 20, 2020 to February 29, 2020 (Ma et al., 2020). Results from Delhi, India, predicted PM2.5 could increase by only 33% in unfavourable meteorology based on the WRF-AERMOD model system (Sharma et al., 2020).
Meteorological conditions have an impact on all of the physical and chemical processes involved, which is the reason O3 concentrations follow a strong seasonal variation. The conditions necessary to maxi-mize ozone production are strong emissions of NOx and intense sunlight. These conditions generally occur together in the world’s mid-latitude industrialized regions during the summer months (Commission for Environmental Cooperation, 1997).
4. Conclusions
This study comprehensively assessed air pollution associated with the COVID-19 lockdowns in four pandemic hotspots in China, Japan, the Republic of Korea, and India. The main conclusions of this study are as follows:
The results indicated that the reduction in ambient air pollution was positively correlated with normal pollution levels in different regions. There was an insignificant change in the distribution of good and moderate days during the LD event for a city with low background levels of air pollution (such as Tokyo). In contrast, a notable reduction in the percentage of unhealthy days was observed during the short-term lockdown for a city with mid-level air pollution (Daegu); however, the AQI returned to an unhealthy level for sensitive groups once lockdown ended. Furthermore, the percentages of unhealthy days reduced during the lockdowns and continued this trend even after lockdown ended in cities with high background pollution (Wuhan and Mumbai). It was found that PM2.5 was the critical/dominant pollutant species for all cities (71.7–100% of days), while PM10 played a key role in Wuhan and Mumbai (2.2–9.6% of days). The mean AQIi of the four other air pol-lutants studied (NO2, SO2, CO, and O3) were good for the pre-lockdown, lockdown, and post-lockdown periods, and were negligible to overall air pollution.
Credit author statement
Meng Hu: Investigation, Data curation, Writing- Original draft
preparation. Zhongbing Chen: Supervision, Writing - Review & Editing, Conceptualization. Haiyan Cui: Validation, Methodology, Software. Tao Wang: Data Curation, Visualization, Software. Chao Zhang: Formal analysis, Validation. Keming Yun: Supervision, Writing - Review & Editing.
Declaration of competing interest
The authors declare that they have no known competing financial interests or personal relationships that could have appeared to influence the work reported in this paper.
Acknowledgments
The authors would like to thank the World Air Quality Index Project (https://aqicn.org/) and U.S. Environmental Protection Agency (US- EPA) for air quality data. This work was financially supported by the National Natural Science Foundation of China (Project No. 21806095 and Project No. 81601647).
Appendix A. Supplementary data
Supplementary data to this article can be found online at https://doi. org/10.1016/j.apr.2020.11.013.
References
Ali, I., Alharbi, O.M.L., 2020. COVID-19: disease, management, treatment, and social impact. Sci. Total Environ. 728, 138861.
Asyary, A., Veruswati, M., 2020. Sunlight exposure increased Covid-19 recovery rates: a study in the central pandemic area of Indonesia. Sci. Total Environ. 729, 139016.
Baidu, 2020. Covid-19 Real Time Report in China. Chakraborty, P., Jayachandran, S., Padalkar, P., Sitlhou, L., Chakraborty, S., Kar, R.,
Bhaumik, S., Srivastava, M., 2020. Exposure to nitrogen dioxide (NO2) from vehicular emission could increase the COVID-19 pandemic fatality in India: a perspective. Bull. Environ. Contam. Toxicol. 105 (2), 198–204.
Collivignarelli, M.C., Abba, A., Bertanza, G., Pedrazzani, R., Ricciardi, P., Carnevale Miino, M., 2020. Lockdown for CoViD-2019 in Milan: what are the effects on air quality? Sci. Total Environ. 732, 139280.
Commission for Environmental Cooperation, 1997. Long-range Transport of Ground- Level Ozone and its Precursors: Assessment of Methods to Quantify Transboundary Transport within the Northeastern United States and Eastern Canada.
Dantas, G., Siciliano, B., França, B.B., da Silva, C.M., Arbilla, G., 2020. The impact of COVID-19 partial lockdown on the air quality of the city of Rio de Janeiro, Brazil. Sci. Total Environ. 729, 139085.
Gupta, S., Raghuwanshi, G.S., Chanda, A., 2020. Effect of weather on COVID-19 spread in the US: a prediction model for India in 2020. Sci. Total Environ. 728, 138860.
Headquarters, C.D.M., 2020. Coronavirus Disease-19. Republic of Korea. Huaxia, 2020. Mumbai to Remain under Lockdown with Few Relaxations till June 30
XINHUANET. IARC, 2013. Outdoor air pollution. IARC Working Group on the Evaluation of
Carcinogenic Risks to Humans, 109. The International Agency for Research on Cancer.
IARC, International Agency for Research on Cancer, 2016. (IARC) Working Group on the Evaluation of Carcinogenic Risks to Humans, Lyon (France). Outdoor Air Pollution. IARC Monographs on the Evaluation of Carcinogenic Risks to Humans, No. 109. Section 1.2 Sources of air pollutants.
Jiang, Y., Xu, J., 2020. The association between COVID-19 deaths and short-term ambient air pollution/meteorological condition exposure: a retrospective study from Wuhan, China. Air Qual. Atmos. Health 5, 1–5.
Jun-yong, A., 2020. Daegu in Lockdown as Coronavirus Infections Soar. ChosunMedia. Kerimray, A., Baimatova, N., Ibragimova, O.P., Bukenov, B., Kenessov, B., Plotitsyn, P.,
et al., 2020. Assessing air quality changes in large cities during COVID-19 lockdowns: the impacts of traffic-free urban conditions in Almaty, Kazakhstan. Sci. Total Environ. 730, 139179.
Kowalska, M., Osrodka, L., Klejnowski, K., Zejda, J.E., MJAoEP, Wojtylak, 2009. Air quality index and its significance in environmental health risk communication, 35, 13–21.
Li, L., Li, Q., Huang, L., Wang, Q., Zhu, A., Xu, J., et al., 2020. Air quality changes during the COVID-19 lockdown over the Yangtze River Delta Region: an insight into the impact of human activity pattern changes on air pollution variation. Sci. Total Environ. 139282.
Ma, Y., Zhao, Y., Liu, J., He, X., Wang, B., Fu, S., et al., 2020. Effects of temperature variation and humidity on the death of COVID-19 in Wuhan, China. Sci. Total Environ. 724, 138226.
Mahato, S., Pal, S., Ghosh, K.G., 2020. Effect of lockdown amid COVID-19 pandemic on air quality of the megacity Delhi, India. Sci. Total Environ. 730, 139086.
M. Hu et al.
Atmospheric Pollution Research 12 (2021) 316–329
329
Manoj, M.G., Satheesh Kumar, M.K., Valsaraj, K.T., Sivan, C., Vijayan, S.K., 2020. Potential link between compromised air quality and transmission of the novel corona virus (SARS-CoV-2) in affected areas. Environ. Res. 190, 110001.
Ministry of Health LaW, 2020. Japan (MHLW) Basic Policies for Novel Coronavirus Disease Control by the Government of Japan.
Nakada, L.Y.K., Urban, R.C., 2020. COVID-19 pandemic: impacts on the air quality during the partial lockdown in Sao Paulo state, Brazil. Sci. Total Environ. 730, 139087.
Perlmutt, L.D., Cromar, KRJAe, 2019. Comparing associations of respiratory risk for the EPA Air Quality Index and health-based air quality indices, 202, 1–7.
Ran, J., Zhao, S., Han, L., Chen, D., Yang, Z., Yang, L., Wang, M.H., He, D., 2020. The ambient ozone and COVID-19 transmissibility in China: a data-driven ecological study of 154 cities. J. Infect. 81 (3), e9–e11.
Shahzad, F., Shahzad, U., Fareed, Z., Iqbal, N., Hashmi, S.H., Ahmad, F., 2020. Asymmetric nexus between temperature and COVID-19 in the top ten affected provinces of China: a current application of quantile-on-quantile approach. Sci. Total Environ., 139115
Sharma, S., Zhang, M., Anshika, Gao, J., Zhang, H., Kota, S.H., 2020. Effect of restricted emissions during COVID-19 on air quality in India. Sci. Total Environ. 728, 138878.
Staff, D.M., 2020. South Korean Clubs Reopening as Social Distance Is Relaxed. Thrust Publishing Ltd. https://djmag.com/news/south-korean-clubs-reopening-social -distancing-relaxed.
Tosepu, R., Gunawan, J., Effendy, D.S., Ahmad, L.O.A.I., Lestari, H., Bahar, H., et al., 2020. Correlation between weather and Covid-19 pandemic in Jakarta, Indonesia. Sci. Total Environ. 725, 138436.
USEPA, 2018. Technical Assistance Document for the Reporting of Daily Air Quality – the Air Quality Index. (AQI).
Wang, Q., Su, M., 2020. A preliminary assessment of the impact of COVID-19 on environment – a case study of China. Sci. Total Environ. 728, 138915.
Wang, L., Li, M., Yu, S., et al., 2020a. Unexpected rise of ozone in urban and rural areas, and sulfur dioxide in rural areas during the coronavirus city lockdown in Hangzhou, China: implications for air quality. Environ. Chem. Lett. 18, 1713–1723.
Wang, Y., Yuan, Y., Wang, Q., Liu, C.G., Zhi, Q., Cao, J., 2020b. Changes in air quality related to the control of coronavirus in China: implications for traffic and industrial emissions. Sci. Total Environ. 731, 139133.
WHO, 2020a. Coronavirus disease 2019. WHO, 2020b. Coronavirus Disease (COVID-19) Situation Report – 132 Coronavirus
Disease (COVID-19). WHO, 2020c. Novel Coronavirus (2019-nCoV) SITUATION REPORT - 1 21 JANUARY
2020 Novel Coronavirus (2019-nCoV) SITUATION REPORT. WHO, 2020d. Novel Coronavirus (2019-nCoV) SITUATION REPORT - 3 23 JANUARY
2020 Novel Coronavirus (2019-nCoV) SITUATION REPORT. Xie, J., Zhu, Y., 2020. Association between ambient temperature and COVID-19 infection
in 122 cities from China. Sci. Total Environ. 724, 138201. Yunus, A.P., Masago, Y., Hijioka, Y., 2020. COVID-19 and surface water quality:
improved lake water quality during the lockdown. Sci. Total Environ. 731, 139012. Zhao, Y., Zhang, K., Xu, X., Shen, H., Zhu, X., Zhang, Y., Hu, Y., Shen, G., 2020.
Substantial changes in nitrogen dioxide and ozone after excluding meteorological impacts during the COVID-19 outbreak in Mainland China. Environ. Sci. Technol. Lett. 6 (7), 402-408, 20200609.
M. Hu et al.