MIPAS: an instrument for atmospheric and climate research
99
ACPD 7, 8795–8893, 2007 MIPAS instrument overview H. Fischer et al. Title Page Abstract Introduction Conclusions References Tables Figures ◭ ◮ ◭ ◮ Back Close Full Screen / Esc Printer-friendly Version Interactive Discussion EGU Atmos. Chem. Phys. Discuss., 7, 8795–8893, 2007 www.atmos-chem-phys-discuss.net/7/8795/2007/ © Author(s) 2007. This work is licensed under a Creative Commons License. Atmospheric Chemistry and Physics Discussions MIPAS: an instrument for atmospheric and climate research H. Fischer 1 , M. Birk 2 , C. Blom 1 , B. Carli 3 , M. Carlotti 4 , T. von Clarmann 1 , L. Delbouille 5 , A. Dudhia 6 , D. Ehhalt 7 , M. Endemann 8 , J. M. Flaud 9 , R. Gessner 10 , A. Kleinert 1 , R. Koopmann 8 , J. Langen 8 , M. L ´ opez-Puertas 11 , P. Mosner 10 , H. Nett 8 , H. Oelhaf 1 , G. Perron 12 , J. Remedios 13 , M. Ridolfi 4 , G. Stiller 1 , and R. Zander 5 1 Forschungszentrum Karlsruhe und Universit ¨ at Karlsruhe, Institute for Meteorology and Climate Research, Karlsruhe, Germany 2 Deutsches Zentrum f ¨ ur Luft- und Raumfahrt, Germany 3 Istituto di Fisica Applicata, N. Carrara (IFAC) del Consiglio Nazionale delle Ricerche (CNR), Firenze, Italy 4 Dipartimento di Chimica Fisica e Inorganica – University of Bologna, Bologna, Italy 5 Groupe Infra-Rouge de Physique Atmosph´ erique et Solaire (GIRPAS), D´ epartement AGO, Universit ´ e de Li ` ege, Belgium 6 Atmospheric, Oceanic and Planetary Physics, Clarendon Laboratory, Oxford University, United Kingdom 7 Forschungszentrum J ¨ ulich, Institut f ¨ ur Atmosph ¨ arische Chemie, (ICG3), J ¨ ulich, Germany 8 ESA/ESRIN, Frascati, Italy and ESA/ESTEC, Noordwijk, Netherlands 9 Laboratoire Interuniversitaire des Syst ` emes Atmosph ´ eriques (LISA), CNRS, Universit´ e Paris VII et XII, France 10 EADS Astrium GmbH, Friedrichshafen und M¨ unchen, Germany 8795
Transcript of MIPAS: an instrument for atmospheric and climate research
ACPD
7, 8795–8893, 2007
MIPAS instrument
overview
H. Fischer et al.
Title Page
Abstract Introduction
Conclusions References
Tables Figures
◭ ◮
◭ ◮
Back Close
Full Screen / Esc
Printer-friendly Version
Interactive Discussion
EGU
Atmos. Chem. Phys. Discuss., 7, 8795–8893, 2007
www.atmos-chem-phys-discuss.net/7/8795/2007/
© Author(s) 2007. This work is licensed
under a Creative Commons License.
AtmosphericChemistry
and PhysicsDiscussions
MIPAS: an instrument for atmosphericand climate research
H. Fischer1, M. Birk
2, C. Blom
1, B. Carli
3, M. Carlotti
4, T. von Clarmann
1,
L. Delbouille5, A. Dudhia
6, D. Ehhalt
7, M. Endemann
8, J. M. Flaud
9, R. Gessner
10,
A. Kleinert1, R. Koopmann
8, J. Langen
8, M. Lopez-Puertas
11, P. Mosner
10,
H. Nett8, H. Oelhaf
1, G. Perron
12, J. Remedios
13, M. Ridolfi
4, G. Stiller
1, and
R. Zander5
1Forschungszentrum Karlsruhe und Universitat Karlsruhe, Institute for Meteorology and
Climate Research, Karlsruhe, Germany2Deutsches Zentrum fur Luft- und Raumfahrt, Germany
3Istituto di Fisica Applicata, N. Carrara (IFAC) del Consiglio Nazionale delle Ricerche (CNR),
Firenze, Italy4Dipartimento di Chimica Fisica e Inorganica – University of Bologna, Bologna, Italy
5Groupe Infra-Rouge de Physique Atmospherique et Solaire (GIRPAS), Departement AGO,
Universite de Liege, Belgium6Atmospheric, Oceanic and Planetary Physics, Clarendon Laboratory, Oxford University,
United Kingdom7Forschungszentrum Julich, Institut fur Atmospharische Chemie, (ICG3), Julich, Germany
8ESA/ESRIN, Frascati, Italy and ESA/ESTEC, Noordwijk, Netherlands
9Laboratoire Interuniversitaire des Systemes Atmospheriques (LISA), CNRS, Universite Paris
VII et XII, France10
EADS Astrium GmbH, Friedrichshafen und Munchen, Germany
8795
ACPD
7, 8795–8893, 2007
MIPAS instrument
overview
H. Fischer et al.
Title Page
Abstract Introduction
Conclusions References
Tables Figures
◭ ◮
◭ ◮
Back Close
Full Screen / Esc
Printer-friendly Version
Interactive Discussion
EGU
11Instituto de Astrofısica de Andalucıa (IAA), Granada, Spain
12ABB Bomem Inc., Quebec, Canada
13Earth Observation Science (EOS), Space Research Centre, Department of Physics and
Astronomy, University of Leicester, UK
Received: 1 June 2007 – Accepted: 1 June 2007 – Published: 25 June 2007
Correspondence to: H. Fischer ([email protected])
8796
ACPD
7, 8795–8893, 2007
MIPAS instrument
overview
H. Fischer et al.
Title Page
Abstract Introduction
Conclusions References
Tables Figures
◭ ◮
◭ ◮
Back Close
Full Screen / Esc
Printer-friendly Version
Interactive Discussion
EGU
Abstract
MIPAS, the Michelson Interferometer for Passive Atmospheric Sounding, is a mid-
infrared emission spectrometer which is part of the core payload of ENVISAT. It is
a limb sounder, i.e. it scans across the horizon detecting atmospheric spectral radi-
ances which are inverted to vertical temperature, trace species and cloud distributions.5
These data can be used for scientific investigations in various research fields including
dynamics and chemistry in the altitude region between upper troposphere and lower
thermosphere.
The instrument is a well calibrated and characterized Fourier transform spectrome-
ter which is able to detect many trace constituents simultaneously. The different con-10
cepts of retrieval methods are described including multi-target and two-dimensional
retrievals. Operationally generated data sets consist of temperature, H2O, O3, CH4,
N2O, HNO3, and NO2 profiles. Measurement errors are investigated in detail and ran-
dom and systematic errors are specified. The results are validated by independent
instrumentation which has been operated at ground stations or aboard balloon gon-15
dolas and aircraft. Intercomparisons of MIPAS measurements with other satellite data
have been carried out, too. As a result, it has been proven that the MIPAS data are of
good quality.
MIPAS can be operated in different measurement modes in order to optimize the
scientific output. Due to the wealth of information in the MIPAS spectra, many scientific20
results have already been published. They include intercomparisons of temperature
distributions with ECMWF data, the derivation of the whole NOy family, the study of
atmospheric processes during the Antarctic vortex split in September 2002, the deter-
mination of properties of Polar Stratospheric Clouds, the downward transport of NOx in
the middle atmosphere, the stratosphere-troposphere exchange, the influence of solar25
variability on the middle atmosphere, and the observation of Non-LTE effects in the
mesosphere.
8797
ACPD
7, 8795–8893, 2007
MIPAS instrument
overview
H. Fischer et al.
Title Page
Abstract Introduction
Conclusions References
Tables Figures
◭ ◮
◭ ◮
Back Close
Full Screen / Esc
Printer-friendly Version
Interactive Discussion
EGU
1 Introduction
MIPAS, the Michelson Interferometer for Passive Atmospheric Sounding, is a mid-
infrared emission spectrometer selected for the core payload of ENVISAT by ESA due
to several favourable properties (Fischer et al., 2000). Within this part of the atmo-
spheric spectrum there is a wide variety of important molecules which have vibration-5
rotation bands with absorption lines well suited for detection. Atmospheric signals are
generally higher than in other parts of the spectrum because the Planck function max-
imizes at about 10µm for atmospheric temperatures. Generally, instruments working
in the mid-infrared can be significantly smaller than those operating at longer wave-
lengths. This is dictated by diffraction limits and the high spectral resolution needed to10
observe the trace species of interest. An advantage of the mid-infrared in comparison
to spectral regions with shorter wavelengths is that instruments operating in this region
allow measurements during day and night.
MIPAS is a limb sounder, i.e. it scans across the horizon detecting spectral radi-
ances emitted by the atmosphere (Fischer and Oelhaf, 1996). Due to the measure-15
ment geometry, i.e. observing the atmosphere along tangential optical paths, MIPAS
can measure also trace gases with very low mixing ratios. The vertical resolution of the
measured vertical profiles is in the order of some kilometres, much better compared
to nadir sounding instruments. On the other hand, the limb geometry restricts the ob-
servable altitude range to heights above clouds so that information on tropospheric20
parameters is limited.
MIPAS can be used for scientific investigations in various research fields. A main
objective is to study dynamics and chemistry of the upper troposphere, stratosphere,
mesosphere, and lower thermosphere. Global measurements of many atmospheric
quantities over several years contribute to climatological analyses. Weather forecast-25
ing can use the global measurements at upper atmospheric levels for data assimilation.
Physical processes in the atmosphere causing e.g. non-local thermodynamic equilib-
rium can be studied with the highly resolved spectra much better than ever before.
8798
ACPD
7, 8795–8893, 2007
MIPAS instrument
overview
H. Fischer et al.
Title Page
Abstract Introduction
Conclusions References
Tables Figures
◭ ◮
◭ ◮
Back Close
Full Screen / Esc
Printer-friendly Version
Interactive Discussion
EGU
In order to detect many trace gases simultaneously the instrument has to cover a
wide spectral range with high spectral resolution. The concept underlying the space
version of MIPAS draws on the experience gained from several experiments exploit-
ing Fourier transform spectrometers. In particular, the MIPAS-B (balloon) experiment
(Friedl-Vallon et al, 2004) can be regarded as a precursor of the MIPAS satellite exper-5
iment even if the type of interferometer is not exactly the same. An instrument similar
to MIPAS-B was flown on different aircraft (Keim et al., 2004). Both types of experi-
ment have helped to establish the feasibility of the MIPAS space experiment. Basic
knowledge about interferometers gained from Fourier spectrometers measuring the at-
tenuated solar radiation has also been taken into account. In this context the ATMOS10
(Atmospheric Trace Molecule Spectroscopy) experiment has to be mentioned which
has yielded simultaneous measurements of a large number of trace constituents in the
Middle Atmosphere (Farmer et al., 1987).
The aim of this publication is to present an overview of the MIPAS space experi-
ment. It considers the scientific objectives and describes the instrument concept, the15
observing capabilities, and the calibration. A further challenge has been to fix the re-
trieval methods for the processing of the large amount of data in an efficient and timely
fashion. This problem is addressed in Sect. 4 while Sect. 5 describes the observation
strategy and the various measurement modes of MIPAS. This Sect. includes also a
short description of the functioning of the MIPAS instrument during the past years. The20
various measurement modes of MIPAS are to a certain degree related to the scientific
objectives. Due to the absolute calibration of the measurements of a mid-infrared in-
strument the errors of the derived parameters can be estimated with confidence. In
Sect. 7, the geophysical validation of the MIPAS measurements, which is necessary
for all space experiments, is described. Some examples of MIPAS results are pre-25
sented in Sect. 8 in order to demonstrate the capability of the experiment. Finally, the
conclusions are summarized and an outlook to the coming years is given.
8799
ACPD
7, 8795–8893, 2007
MIPAS instrument
overview
H. Fischer et al.
Title Page
Abstract Introduction
Conclusions References
Tables Figures
◭ ◮
◭ ◮
Back Close
Full Screen / Esc
Printer-friendly Version
Interactive Discussion
EGU
2 Scientific objectives
Within the earth system, the atmosphere has a central role: As an extremely efficient
medium of transport it interconnects the other compartments of the earth system by
cycling heat, water, and trace substances. At the same time – because of its com-
paratively low mass – it reacts rapidly to external forcing in particular to anthropogenic5
emissions.
It is well recognized that man has changed the composition of the atmosphere and
the properties at the land surface which has led to changes in temperature and radiative
fluxes in the atmosphere. Anthropogenic activities have also influenced the processes
in the upper atmosphere (e.g. an increase of stratospheric H2O concentrations as a10
consequence of the tropospheric increase in CH4).
These global changes require global observation systems, i.e. satellite-based re-
mote sensing experiments of spatial and temporal distributions of long and short-lived
species, temperature, cloud parameters and radiance spectra. As stated before, MI-
PAS can deliver these quantities on a global scale, during day and night and over a15
wide altitude region.
2.1 Stratospheric chemistry and dynamics
Considerable progress has been made in understanding the stratospheric ozone de-
pletion. In fact, the stratospheric ozone layer is expected to recover as a consequence
of the Montreal Protocol, which demanded a reduction of ozone-depleting substances.20
However, considerable uncertainty about the rate of ozone recovery and future ozone
levels exists, mainly due to the coupling to the growing greenhouse effect (Weather-
head and Andersen, 2006). For instance up-to-date climate models do not take into
account the spatial and temporal distribution of varying Polar Stratospheric Clouds
when forecasting future ozone levels. Their inclusion will present a difficult task, since25
in polar winter the processes of stratospheric chemistry and dynamics are very com-
plex. This was underlined in 2002, when the Antarctic vortex split into two parts and
8800
ACPD
7, 8795–8893, 2007
MIPAS instrument
overview
H. Fischer et al.
Title Page
Abstract Introduction
Conclusions References
Tables Figures
◭ ◮
◭ ◮
Back Close
Full Screen / Esc
Printer-friendly Version
Interactive Discussion
EGU
caused extraordinary conditions in the stratosphere.
Changes in the physical structure of the non-polar stratosphere are also taking place.
Modelling studies indicate that this is partly due to the cooling of the stratosphere
resulting from ozone depletion and from increasing CO2. Such changes in the basic
structure of the stratosphere may well be accompanied by changes in the circulation of5
air within it. This in turn will change the lifetime of species in the stratosphere.
2.2 Stratosphere-troposphere exchange
Interactions between troposphere and stratosphere are manifold. The chemical com-
position of the stratosphere is largely determined by input of air from the tropical tro-
posphere. The breakdown of the polar vortex is driven by wave disturbances from10
tropospheric weather systems. Mid- and high latitude tropospheric ozone depends
strongly on ozone transported down from the stratosphere. Upward and downward
propagating radiation fluxes are modified by the change in atmospheric composition.
There is increasing evidence that stratospheric dynamics can influence tropospheric
weather through the downward propagation of wave disturbances; such effects play a15
role in medium and long range weather forecasting.
Of particular interest are the upward transport in the Tropical Transition Layer (TTL)
and the exchange processes along the tropopause breaks. Accurate measurements
of long-lived trace species will help to improve our understanding of these processes.
2.3 Chemistry and physics of the upper troposphere20
The concentration of water vapour in the upper troposphere is of great importance for
the greenhouse effect due to its strong emission of radiation in the mid- and far infrared
spectral region. The water vapour emitted by aircraft causes under conditions of high
humidity cirrus clouds which influence the cloud cover and the radiation balance in re-
gions of heavy air traffic. Also, the emissions of the current commercial fleet of subsonic25
aircraft make a significant contribution to the NOy budget in the upper troposphere.
8801
ACPD
7, 8795–8893, 2007
MIPAS instrument
overview
H. Fischer et al.
Title Page
Abstract Introduction
Conclusions References
Tables Figures
◭ ◮
◭ ◮
Back Close
Full Screen / Esc
Printer-friendly Version
Interactive Discussion
EGU
In addition elevated concentrations of various trace gases (e.g. HCHO, acetone,
PAN) are often observed in the upper troposphere indicating rapid upward transport
of air from the lower troposphere and impact on ozone levels in the upper troposphere.
As a consequence, characteristic patterns of trace gases in the upper troposphere
point to areas of biomass burning in Africa and South America.5
2.4 Physics and chemistry of the upper atmosphere
MIPAS has the potential to measure also many important atmospheric parameters in
the mesosphere and lower thermosphere (MLT), namely temperature, carbon dioxide,
carbon monoxide, ozone, water vapour, methane and nitric oxide. These observations
contribute to improve our understanding of major research areas of the middle and10
upper atmosphere: the temperature structure and energy balance, the chemistry, and
the dynamics, and the interaction between them. In addition, the quality of MIPAS data
allows the study of the non-local thermodynamic equilibrium (Non-LTE) of the middle
and upper atmosphere. This knowledge is crucial when the species are retrieved from
their Non-LTE IR emission and hence helps in retrieving more accurate concentrations15
from wideband IR radiometers.
A very comprehensive review of the middle and upper atmosphere has been com-
piled by Siskind et al. (2000). This monograph provides an insight into and an update
of our current knowledge of this atmospheric region. The four major areas described
there are energetics, chemistry, dynamics, and long term changes. In case of ener-20
getics, MIPAS measures the most important emissions contributing to the IR radiative
cooling of the upper atmosphere (CO2, NO). MIPAS also measures the most signifi-
cant chemical compounds of this region, including O3, H2O, CH4, CO, and CO2. O3
is very much affected by tides (Smith and Marsh, 2005) and hence might help in un-
derstanding the chemistry/dynamics interactions. Water vapour plays a major role in25
the upper atmospheric chemistry. It has been found to increase in the middle atmo-
sphere during 1992–1996 (Nedoluha et al., 2000). It is then important to discern if
this change continues or regresses. Water vapour has been scarcely measured in the
8802
ACPD
7, 8795–8893, 2007
MIPAS instrument
overview
H. Fischer et al.
Title Page
Abstract Introduction
Conclusions References
Tables Figures
◭ ◮
◭ ◮
Back Close
Full Screen / Esc
Printer-friendly Version
Interactive Discussion
EGU
middle atmosphere, particularly in the cold summer mesopause.
Carbon monoxide and carbon dioxide yield the total carbon budget in the upper at-
mosphere. The distribution of these trace gases is significant for understanding the
interplay between molecular diffusion and vertical eddy diffusion in the upper meso-
sphere and lower thermosphere (Lopez-Puertas et al., 2001). Carbon monoxide will5
also provide important information on the dynamics of the mesosphere, e.g., the merid-
ional circulation at solstice and the transition from equinox to solstice conditions and
vice versa (see, e.g. Lopez-Valverde et al., 1996). Another essential topic is the dynam-
ics of the upper part of the polar vortex, such as the downward motion of air masses
from the mesosphere into the stratosphere during the polar night, for which CO is an10
excellent tracer.
The middle atmosphere is also influenced by the solar electromagnetic radiation
and particle flux. High solar activity is changing many trace gas concentrations in the
atmosphere; it causes even a decrease in the ozone amount of the stratosphere.
2.5 Climatology and weather forecasting15
Chemistry-climate interaction in the stratosphere is among other things due to the role
that ozone has in determining the stratospheric temperature. In this context it is im-
portant to study the year to year variation in the abundances of Cly, HOy and NOy as
they may provide insights into the causes of variations of ozone levels. MIPAS is able
to provide extensive observations of water vapour, both in the stratosphere and upper20
troposphere, which will be significant in further understanding of the cooling of the at-
mosphere. Another important contribution that MIPAS could make to climatology is to
provide observations of the global distribution of thin cirrus clouds and Polar Strato-
spheric Clouds (PSCs). The coverage and the optical properties of these clouds are
not well known, resulting in an uncertainty in their contribution to the radiation budget.25
The trends in the concentrations of trace constituents are small and over a period of
five years will probably be too small to be unambiguously detected by a limb sounding
experiment. For this the same instrument would have to be flown several times se-
8803
ACPD
7, 8795–8893, 2007
MIPAS instrument
overview
H. Fischer et al.
Title Page
Abstract Introduction
Conclusions References
Tables Figures
◭ ◮
◭ ◮
Back Close
Full Screen / Esc
Printer-friendly Version
Interactive Discussion
EGU
quentially. Another possibility is to combine the MIPAS data with other satellite or with
long term ground-based measurements.
Today’s operational meteorological satellites deliver profiles of temperature and wa-
ter vapour with limited vertical resolution and accuracy in the tropopause region and
above. Information on ozone is restricted to the vertical column amount.5
It has already been shown that the higher vertical resolution of MIPAS temperature
and ozone measurements in the upper troposphere/lower stratosphere has a positive
influence on the data assimilation of the weather forecast (Dethof, 2003). This means,
ECMWF is interested to obtain near real time MIPAS data on a regular basis for its
weather forecast.10
2.6 Further scientific areas
In recent years the chemical weather forecast and the forecast of ozone fields have
been developed. The operation of the numerical models requires data assimilation as
in case of the weather forecast. Consequently, there is a great demand for data from
global measurements of trace constituents in order to improve the initial conditions for15
the model runs.
3 The instrument
3.1 Instrument concept
3.1.1 General remarks
MIPAS is a Fourier transform infrared (FTIR) spectrometer aboard ENVISAT (Fischer20
et al., 2000, Fig. 1) for the detection of limb emission spectra in the middle and up-
per atmosphere. It observes a wide spectral interval ranging from 4.15µm to 14.6µm
with high spectral resolution. The measured data set is very rich in information as
8804
ACPD
7, 8795–8893, 2007
MIPAS instrument
overview
H. Fischer et al.
Title Page
Abstract Introduction
Conclusions References
Tables Figures
◭ ◮
◭ ◮
Back Close
Full Screen / Esc
Printer-friendly Version
Interactive Discussion
EGU
each spectrum comprises of the order of 50 000 spectral elements (Fig. 2). The pri-
mary geophysical parameters of interest are vertical profiles of atmospheric pressure,
temperature, and volume mixing ratios (vmrs) of at least 25 trace constituents.
The advantage of an FTIR instrument over spectrometers with dispersive elements
like gratings or prisms lies in the fact that a single detection element can be used to5
record a broadband spectrum with high spectral resolution while for dispersive spec-
trometers either a scanning detector must be used, or a large array detector must be
employed which simply did not exist in the mid-infrared at the time of constructing MI-
PAS. Thus an FTIR was the only way to obtain complete high resolution IR-spectra with
good sensitivity.10
The drawback of an FTIR is its mechanical complexity, comprising moving optical el-
ements which have to be guided with a very high precision over an extended distance,
and very high alignment stability required for all optical components in the interferom-
eter. In the case of MIPAS, the alignment constraints become even more challenging
as the optics is cooled down to 210 K by a large radiator in order to reduce the thermal15
radiation background of the instrument.
3.1.2 MIPAS functional design
As schematically shown in Figs. 3 and 4, the atmospheric radiance enters the instru-
ment through the Front End Optics where it is reflected at an azimuth and an elevation
scan mirror. Afterwards the IR beam traverses an off-axis anamorphotic telescope20
which matches the beam size to the input aperture of the interferometer and enters a
dual slide Michelson-type Interferometer with two input and two output ports. The sec-
ond input port receives as little IR radiation as possible from the cold focal plane inner
structure. Both input signals are divided at the beamsplitter inside the interferometer
and directed to two movable corner cubes from where they are reflected to the beam25
recombiner; the recombined intensity modulated signal constitutes the interferogram
and appears at both output ports.
As the interferogram mathematically corresponds to the Fourier transform of the
8805
ACPD
7, 8795–8893, 2007
MIPAS instrument
overview
H. Fischer et al.
Title Page
Abstract Introduction
Conclusions References
Tables Figures
◭ ◮
◭ ◮
Back Close
Full Screen / Esc
Printer-friendly Version
Interactive Discussion
EGU
measured spectrum, a highly accurate sampling allows to derive on-ground the origi-
nally measured spectrum of the modulated signal via an inverse Fourier transform. The
sampling is provided by a reference laser with a sampling frequency of 7612 cm−1
and
is also used to achieve a constant speed of the cube corners.
The output signal at each port enters the Focal Plane Subsystem which is actively5
cooled by a pair of low vibration Stirling-cycle coolers to 70 K for maximum sensitivity
of the detectors. Inside this subsystem each input signal is separated into four spec-
tral channels by optical filtering and analysed by dedicated CMT (Cadmium Mercuride
Telluride) detectors.
After pre-amplification, the eight signals enter the analogue part of the Signal Pro-10
cessing Electronics (SPE) where the DC-signals are suppressed by AC-coupling. The
AC-signals are amplified, lowpass filtered to avoid aliasing and then A/D converted with
16 bit resolution.
The digital part of the SPE separates in each band the spectral range of interest
by complex filtering. In a further processing step measurement data are multiplexed15
and formatted to source packets which include auxiliary data for ground processing
purposes.
A redundant Instrument Control Unit provides the telemetry/telecommand interface
to the platform and monitors autonomously the instrument status.
In the ground segment, the down-linked interferograms are converted into calibrated20
atmospheric spectra which are further used to retrieve the concentration profiles of the
relevant atmospheric species and other higher level products.
3.1.3 Functional description of the optics module
The MIPAS optics module is installed at the anti-sunward side of ENVISAT and has the
following major parts: Front End Optics, Interferometer and Focal Plane Subsystem.25
8806
ACPD
7, 8795–8893, 2007
MIPAS instrument
overview
H. Fischer et al.
Title Page
Abstract Introduction
Conclusions References
Tables Figures
◭ ◮
◭ ◮
Back Close
Full Screen / Esc
Printer-friendly Version
Interactive Discussion
EGU
Front End Optics
The Front End Optics consists of Azimuth Scan Unit, Elevation Scan Unit, telescope,
and calibration blackbody. The individual items are briefly described in the following:
The Azimuth Scan Unit (ASU) allows the selection of the line of sight within the
two field-of-view regions, and also enables the detectors to view an internal calibration5
blackbody source for gain calibration. A flat steering mirror is rotated about an axis
parallel to nadir to direct the light into the instrument. This steering mirror has a dimen-
sion of about 295 mm in height and 109 mm in width and thus forms the largest optical
component of MIPAS.
A second function of the ASU is the protection of the interior of the optics module10
from contamination; a shield is mounted behind the steering mirror and rotates with it.
When the mirror is turned to an end stop, the shield closes the input aperture to the
ASU and thus the ASU mirror is protected from contamination during ground handling
and in the early flight phase.
The Elevation Scan Unit (ESU) determines the actual limb height of a particular15
measurement, and thus requires a very high pointing accuracy over a limited angular
range. It comprises a flat steering mirror rotating around an axis that is orthogonal
to nadir and flight direction. The angle covered by this mirror is less than 3◦
which is
sufficient to reach tangent heights between 5 km and 250 km; the high value is used
for measurements of cold space to determine the instrument self emission for offset20
calibration.
After being reflected by the Elevation Scan Unit the beam enters the anamorphotic
telescope which reduces its dimensions to 25 mm by 50 mm. This telescope also
houses the field stop that determines the field-of-view of the instrument. The posi-
tion of the field stop in front of the interferometer ensures that all detectors view the25
same air volume.
Mounted in the azimuth scan unit is the calibration blackbody (CBB), used for the in-
flight calibration of the instrument responsivity. To fill the IFOV (Instantaneous Field-of-
8807

ACPD
7, 8795–8893, 2007
MIPAS instrument
overview
H. Fischer et al.
Title Page
Abstract Introduction
Conclusions References
Tables Figures
◭ ◮
◭ ◮
Back Close
Full Screen / Esc
Printer-friendly Version
Interactive Discussion
EGU
View), it needs a rather large clear aperture (about 165×55 mm2). Its design is derived
from the blackbody design for the along-track scanning radiometer (ATSR), flying on
the ERS-1 and -2 satellites. Its emissivity is above 99.6%, so that a high accuracy for
the gain calibration becomes achievable. For precision gain calibration measurements,
it can be heated to about 40 K above the ambient instrument temperature to increase5
its radiance emission. Its nominal temperature then reaches up to 250 K.
Interferometer
A symmetrical dual slide interferometer with dual input and dual output ports has been
selected in order to meet the radiometric and spectrometric performance requirements,
as well as the lifetime requirement of five years of continuous operation in space. This10
kind of interferometer provides highest detectable signal at the outputs, the least un-
certainties in design, the highest degree of redundancy, and the most compact dimen-
sions. It has a folded path to allow for a more compact arrangement of the interferom-
eter and to allow for a better compensation of the momentum generated by the corner
cubes during the reversal of their motion. The incident angle of the radiation onto the15
beamsplitter is 30◦
to reduce polarization effects by the beamsplitter. The MIPAS inter-
ferometer is 0.58 m long and about 0.36 m wide, and has a mass of about 30 kg. It has
the following major subassemblies: interferometer optics, drive units and optical path
difference sensor.
The interferometer optics comprises the beamsplitter assembly, flat steering mirrors,20
and the corner cubes on the slides. The beamsplitter coatings themselves are quite
critical, as they have to provide a reflectivity near 50% throughout the broad spectral
range. More difficult to manufacture are the broadband antireflection coatings on the
other surfaces that are essential to reduce undesired interferometer effects that would
modulate the transmission of the substrate and could result in ghost spectra. The25
beamsplitter assembly also has to compensate for the phase delays caused by the
varying refractive index throughout the spectral range. This is done with a second
8808

ACPD
7, 8795–8893, 2007
MIPAS instrument
overview
H. Fischer et al.
Title Page
Abstract Introduction
Conclusions References
Tables Figures
◭ ◮
◭ ◮
Back Close
Full Screen / Esc
Printer-friendly Version
Interactive Discussion
EGU
substrate of the same thickness as the beamsplitter itself and mounted with a narrow
gap to the beamsplitter coatings. Both substrates are slightly wedged to reduce the
residual Etalon effects.
The two identical Interferometer Drive Units perform the actual translation of the cor-
ner cubes. Linear motors behind the corner cubes generate the drive force. The slides5
are guided by mechanical bearings. Lifetime tests of the bearings have shown that
dry-lubricated ballbearings operating with a light preload can well achieve 20 million
motion cycles (in the meantime the interferometer has performed considerably more
motion cycles). The difference velocity between the two slides has to be controlled
with less than 1% rms error. A drive control loop processes the inputs from linear op-10
tical encoders in each of the drive arms for a coarse control and for centering of the
slides, and from a built-in laser interferometer (called the optical-path difference sensor
ODS) for fine velocity control. The laser interferometer is also required to trigger the
sampling of the detector output at very precise intervals of optical path values.
The built-in laser interferometer makes use of a single-mode 1.3 micron diode laser15
which is located in the optics module near the Stirling coolers. The output from the
diode laser is guided by a single mode polarizing optical fibre to the interferometer.
Although the individual components had been proven in many communication systems,
their use in a spaceborne instrument with operation over a wide temperature range is
new and required space qualification.20
Focal plane subsystem
The two output beams from the interferometer are reduced in size by two small off-axis
Newton telescopes, and directed into the cold focal plane subsystem, which houses
the signal detectors with their interfaces to the active coolers, as well as the associated
optics required for spectral separation and beam shaping. It is smaller than the interfer-25
ometer (0.36 m wide, 0.45 m high) and has a mass of 16 kg. The focal plane subsystem
has the following elements: detector/preamplifier unit and focal-plane cooler assembly.
To achieve the best radiometric sensitivity, a set of four detectors in each output port
8809
ACPD
7, 8795–8893, 2007
MIPAS instrument
overview
H. Fischer et al.
Title Page
Abstract Introduction
Conclusions References
Tables Figures
◭ ◮
◭ ◮
Back Close
Full Screen / Esc
Printer-friendly Version
Interactive Discussion
EGU
is used, each optimized for highest sensitivity in a spectral band. A set of dichroic
beamsplitters and steering mirrors separates the input from the two interferometer
ports to the different spectral bands, and the optics required to illuminate each de-
tector element. All optical elements are mounted and aligned in a very tight package.
All optics and the detectors are cooled to about 70 K to reduce their thermal emission5
and internal noise contribution. Cooling is performed by a pair of active Stirling cycle
coolers. Thus, although the focal plane subsystem is conceptually a simple design,
the numerous interfaces between the optics, the detectors, and the coolers under the
constraints of good thermal insulation and high alignment stability of the optical com-
ponents result in very demanding requirements.10
An analysis for the optimization of the detectors has shown that four spectral bands
(A, B, C, D) in each interferometer output port are required to achieve the low instru-
ment noise contribution and to provide some redundancy at the long wavelength region
for temperature measurements. Thus a total of eight detector elements are needed in
MIPAS. In the long wave spectral region (14.6 to about 7µm), only photoconductive15
HgCdTe detectors (PC-CMT) were able to meet the specifications on low noise contri-
bution and electronics bandwidth when the instrument was built. At the shorter wave-
lengths (7 to 4µm), photovoltaic HgCdTe detectors (PV-CMT) are the best choice. The
preamplifiers are individually optimized for each detector to fulfill stringent requirements
on noise, phase distortions and linearity. The cold part of the preamplifiers is mounted20
in the detector housing, while final amplification is performed in an externally mounted
package at ambient temperature. Stirling cycle coolers with a performance that satis-
fies the cooling requirements of MIPAS (500 mW heat lift at 70 K temperature) are used
in a twin-cooler arrangement, comprising two identical compressor and displacer units
that operate synchronously to compensate most vibrations from the oscillating parts.25
3.1.4 Further subsystems
Further subsystems are the Signal Processing Electronics and the Instrument Control
Unit.
8810
ACPD
7, 8795–8893, 2007
MIPAS instrument
overview
H. Fischer et al.
Title Page
Abstract Introduction
Conclusions References
Tables Figures
◭ ◮
◭ ◮
Back Close
Full Screen / Esc
Printer-friendly Version
Interactive Discussion
EGU
The Signal Processing Electronics (SPE) takes the analogue signal inputs from the
detector preamplifier unit and generates the associated digital bit streams, which are
then transformed into formatted data packets and sent to the platform bus for trans-
mission to ground. These data are accompanied by the requisite auxiliary data from
the SPE & ICE (Instrument Control Electronics) needed to interpret and process the5
instrument measurement data. In order to satisfy the downlink bandwidth allocated to
the instrument, the SPE must perform certain digital operations upon the bit streams.
The SPE processing can basically be divided into the analogue signal processing
(ASP), the digital signal processing (DSP) and the output processing (OP). In the ana-
logue signal processing the signals are, after input amplification, low pass filtered to10
eliminate aliasing in the sampling process and then A/D converted. Nominal sampling
frequency at the SPE is approximately 77 kHz in each channel, with the spectrum of
interest lying in the range 6.85 to 24.1 kHz. For the LOS calibration mode, data are
received only on the shorter wavelength (D1 and D2 for the two output ports) channels
and are sampled at around 100 Hz using an SPE-generated clock signal.15
The digital signal processing of the SPE isolates the five nominal bands (generated
by a combination of the 2 times 4 filter ranges, see Kleinert et al., 2007) through a
digital filtering operation and performs a channel addition to improve SNR. The SPE
performs additional digital operations to reduce the output data rate to the required
level. Following digitisation, the SPE records the maximum and minimum digital value20
recorded on each channel of each interferogram. Each channel is then digitally filtered
to isolate the band of interest and the data size is reduced by a sub-sampling operation.
The final operation in this chain is the truncation of the data words to be sent to the Data
Handling Assembly of the ENVISAT satellite. In a typical interferogram, only the very
central portion (around 1%) contains significant values and the data outside require25
considerably less bits for accurate representation. The most significant bits which are
set to zero can therefore be discarded without loss of information.
The Output Processor generates source packets in each of five bands and then
multiplexes the source packets into the output stream to the Data Handling Assembly.
8811
ACPD
7, 8795–8893, 2007
MIPAS instrument
overview
H. Fischer et al.
Title Page
Abstract Introduction
Conclusions References
Tables Figures
◭ ◮
◭ ◮
Back Close
Full Screen / Esc
Printer-friendly Version
Interactive Discussion
EGU
The controlling functions of the MIPAS instrument are performed by the Instrument
Control Unit, which runs the MIPAS specific application software. The functions of the
Instrument Control Unit comprise among others the control of the MIPAS operation and
its operational modes, recording of instrument events, commanding and monitoring of
MIPAS equipments, monitoring and processing of MIPAS house keeping data, and5
initiation of corrective actions in case of instrument failures.
3.2 Observing capability
MIPAS observes the emitted radiance from the atmosphere at the limb, i.e. the line of
sight penetrates the atmosphere down to a minimum altitude, named the tangent alti-
tude, and then, because of the Earth’s curvature emerges again towards space. This10
type of observation is selective to the atmospheric signal emitted from the tangent alti-
tude layer and, when a limb sequence with a discrete set of different tangent altitudes
is acquired, allows the determination of the vertical profile of atmospheric parameters.
In broad terms MIPAS can observe atmospheric parameters in the altitude range from
5 to 160 km with minimum and maximum steps of 1 and 8 km, respectively.15
To provide access to any air volume in the atmosphere the MIPAS pointing system
uses two mirrors. The elevation mirror selects the limb altitude and corrects for platform
attitude, orbital altitude and Earth’s geoid geometry. The azimuth mirror determines
the location of the observed air volume relative to the platform position. The azimuth
mirror provides access to limb targets rearwards within a 35◦
wide range around the20
anti-flight direction and sideways within a 30◦
wide range on the anti-Sun side of the
satellite (Fig. 5).
For operational measurements MIPAS performs observations in the rearward view-
ing direction. In this case the sampling strategy is to keep the azimuth mirror fixed
during each limb scanning sequence. The limb sequence is performed by changing25
the orientation of the elevation mirror with discrete steps in tangent altitude. At each
nominal position of the elevation mirror an interferometer sweep is acquired while the
elevation mirror is actively controlled in order to maintain a constant tangent altitude.
8812
ACPD
7, 8795–8893, 2007
MIPAS instrument
overview
H. Fischer et al.
Title Page
Abstract Introduction
Conclusions References
Tables Figures
◭ ◮
◭ ◮
Back Close
Full Screen / Esc
Printer-friendly Version
Interactive Discussion
EGU
As the tangent altitude is decreasing its location moves away from the platform. For
this reason the limb sequence is performed scanning down from high altitudes to low
altitudes, so that the geometrical effect partially compensates for the movement of the
platform and an almost vertical sequence of tangent altitude points is obtained. By
changing the azimuth angle with respect to the rearward direction it is possible to move5
the tangent altitude location away from the satellite ground track. Since the ground
track is limited to the latitude region between about 80◦S and 80
◦N (due to the inclina-
tion of the orbit) the azimuth angle is occasionally changed during the orbit in order to
perform observations from pole to pole.
For cross track observations, simultaneous changes of azimuth and elevation an-10
gle between subsequent sweeps can be considered in order to compensate for the
platform movement.
The time required to record one full resolution spectrum is about 4.5 s. A nominal
limb scanning sequence consists of 17 spectra, measured at tangent altitudes from
6 to 68 km with a spacing of 3 km at low altitudes and larger spacing above, and is15
acquired in a total time of about 76 s. During each orbit about 72 limb sequences are
acquired as well as calibration measurements. Each day about 14 orbits are obtained
for a total of about 1000 limb sequences or profiles per day.
Important features of the MIPAS observation strategy are:
– emission measurements with continuous observations independently of the pres-20
ence of external radiation sources and of the day/night conditions,
– limb sounding technique with good resolution of the vertical distribution of the
atmospheric parameters,
– polar orbit with azimuth correction for global (pole to pole) mapping,
– broadband FTS measurements with the simultaneous observation of an almost25
complete survey of the atmospheric constituents.
8813
ACPD
7, 8795–8893, 2007
MIPAS instrument
overview
H. Fischer et al.
Title Page
Abstract Introduction
Conclusions References
Tables Figures
◭ ◮
◭ ◮
Back Close
Full Screen / Esc
Printer-friendly Version
Interactive Discussion
EGU
The combination of these features makes it possible to obtain a comprehensive picture
of the atmospheric chemistry with daily three-dimensional (altitude-latitude-longitude)
global maps of the concentration of a considerable number of constituents for the full
duration of the instrument mission. The flexible altitude steps of the elevation mirror
allow the vertical sampling of the parameter profiles to be increased in atmospheric5
regions where the gradient in concentration is changing rapidly (e.g. tropopause, den-
itrificated layers in the stratosphere). No other satellite instrument has ever combined
all these features for the investigation of middle atmosphere phenomena (see Sect. 8).
3.3 Calibration and characterization
A detailed description of the calibration and characterization of the instrument is given10
by Kleinert et al. (2007). Therefore, only the main important processing steps and
results are summarized here.
3.3.1 NESR
The NESR (noise equivalent spectral radiance) quantifies the noise level of the data.
It ranges from 3 nW/(cm2
sr cm−1
) to 50 nW/(cm2
sr cm−1
), depending on the spectral15
range and channel. The two times four detectors comprise the spectral range from
685 till 2410 cm−1
which is split into five bands A, AB, B, C, and D, each band being
covered by one or two specific detectors (details see Kleinert et al., 2007). The NESR
is well within the requirements (Fig. 6), and no systematic evolution of the NESR over
time could be observed. The most important effect on the NESR is ice accumulation20
on the detector system, which may temporarily degrade the NESR by up to 20% (value
depends on the frequency of decontamination) with respect to an ice free detector.
3.3.2 Radiometric calibration
In order to assign absolute radiance units to the measured spectra, gain and offset
measurements are performed regularly. The instrument offset is determined by look-25
8814
ACPD
7, 8795–8893, 2007
MIPAS instrument
overview
H. Fischer et al.
Title Page
Abstract Introduction
Conclusions References
Tables Figures
◭ ◮
◭ ◮
Back Close
Full Screen / Esc
Printer-friendly Version
Interactive Discussion
EGU
ing into deep space, and measurements of a blackbody with known temperature are
performed to determine the gain function. In principle, the gain function G is calculated
as:
G =LBB
SBB − SDS
(1)
where SBB and SDS are the measured blackbody and deep-space spectra, respectively,5
and LBB is the spectral radiance of the blackbody. The atmospheric spectra are then
calibrated using:
Latm = G (Satm − SDS ) (2)
with Satm and Latm being the measured and calibrated spectrum, respectively.
3.3.3 Gain and offset stability10
The gain function is much more stable than the instrument offset. Therefore, it is
usually sufficient to generate a gain calibration function once per week while the offset
is measured several times per orbit (about every 7 min). The radiometric gain stability
is typically better than 1.5% per week, and the offset change between two consecutive
measurements is below 10% of the NESR. One reason for gain drift is the formation15
of ice on the cooled detector optical components which especially affects regions with
strong infrared absorption bands of ice.
3.3.4 Detector non-linearity
The photoconductive detectors from the long wavelength channels A, AB, and B are
subject to non-linearity depending on the total incident photon flux. This non-linearity20
needs to be corrected before the radiometric calibration Formulas (1) and (2) are ap-
plied. The non-linearity is corrected by scaling each interferogram with an appropriate
factor which is calculated from the non-linearity parameters and the peak-to-peak value
8815
ACPD
7, 8795–8893, 2007
MIPAS instrument
overview
H. Fischer et al.
Title Page
Abstract Introduction
Conclusions References
Tables Figures
◭ ◮
◭ ◮
Back Close
Full Screen / Esc
Printer-friendly Version
Interactive Discussion
EGU
of the interferogram, which is a measure for the total photon flux. The non-linear be-
haviour of the detectors has been characterized and parameterized on-ground and
cross-checked in-flight using commissioning phase data. Based on the intercompari-
son of the on-ground and in-flight data, the accuracy in the calibrated scene spectra
with respect to the non-linearity correction is estimated to be within a few percent,5
depending on the line intensities and the total photon flux. The error depends on in-
strument temperature, ice layer thickness on the detector optics, detector temperature,
and detector aging.
3.3.5 Spectral calibration
Spectral calibration is performed using known features of standard limb measurements.10
Appropriate spectral lines with well known peak positions are used in each spectral
band to determine a spectral shift in the measured spectrum. For the shift determi-
nation, four spectra of a tangent altitude of 32 km are co-added. The wavenumber
dependence of the spectral shift is in first approximation assumed to be linear but a
second order effect is also considered in the level 2 analysis (see Raspollini et al.,15
2006, this special issue). The spectral shift is assumed to be the same for all types of
measurements and is applied until a new calibration is performed. To ensure a stability
and an accuracy better than 0.001 cm−1
, the spectral calibration (shift determination)
is performed every four limb sequences, i.e. every 320 s. The spectral shift has not
changed significantly during the mission; its variation from July 2002 to March 2004 is20
in the order of 6 ppm.
3.3.6 Instrumental Line Shape
The instrumental line shape (ILS) is the area-normalized spectral response function
of the spectrometer. When a monochromatic spectral line at position σ0 is irradiated,
the ordinate value of the area-normalized response at σ is ILS(σ − σ0, σ0). Due to25
the normalization, the specification of an ILS is not affected by the calibration of the
8816
ACPD
7, 8795–8893, 2007
MIPAS instrument
overview
H. Fischer et al.
Title Page
Abstract Introduction
Conclusions References
Tables Figures
◭ ◮
◭ ◮
Back Close
Full Screen / Esc
Printer-friendly Version
Interactive Discussion
EGU
radiance axis. In contrast, there is an intimate connection with spectral shift, however,
the spectral shift may be treated separately (see Sect. 3.3.5).
The ILS of MIPAS is specified by means of a set of ILS variables. Because a physical
model of the interferometer is available for MIPAS, the subset of model variables which
affect the ILS can be adjusted to approximate the ILS of the real instrument. The5
suggested parameterization has been used in various studies. It is found that the loss
in peak response of the unapodized ILS due to misalignment amounts 2% at 800 cm−1
,
5% at 1200 cm−1
, 8% at 1600 cm−1
, and 11% at 2000 cm−1
when the instrument is
operated in full nominal resolution.
3.3.7 Field-Of-View characterization10
Analyses of the instrument’s field-of-view (FOV) response and the co-alignment of the
various detector channels were performed both prior to launch and post launch. Pre-
launch tests were based on a dedicated experimental setup allowing to acquire indi-
vidual detector signals, with the instrument collimated input beam viewing a blackbody
source equipped with a small circular aperture. The FOV widths as well as the co-15
alignment between all detector channels were found to be within expectations.
The co-alignment of the detector channels was also verified post-launch. For this
purpose specific in-orbit measurement geometry was chosen in which the instrument’s
line of sight was actively scanned across an infrared bright, ‘point like’ source while
raw mode interferograms were acquired simultaneously in all eight detector channels.20
A detailed analysis showed that the absolute POI (point of inflection) positions agree
within 1.3 mdeg for all channels, and that the FOV half width varies between 45.2 mdeg
for detectors A1 & A2 and 46.5 mdeg for detectors D1 & D2.
8817
ACPD
7, 8795–8893, 2007
MIPAS instrument
overview
H. Fischer et al.
Title Page
Abstract Introduction
Conclusions References
Tables Figures
◭ ◮
◭ ◮
Back Close
Full Screen / Esc
Printer-friendly Version
Interactive Discussion
EGU
4 Retrieval methods for MIPAS
4.1 The operational code for MIPAS data processing
While the level 1 analysis (see Sect. 3) determines the geolocated and calibrated spec-
tra from the raw instrument data, the level 2 analysis performs the retrieval of the geo-
physical parameters of interest from level 1b spectra. In the operational level 2 anal-5
ysis the pressure at tangent altitudes (denoted as tangent pressure) and the vertical
profiles of temperature and six species selected to have highest priority, namely: O3,
H2O, CH4, HNO3, N2O, and NO2, are retrieved. These profiles are the targets of the
operational analysis and are retrieved in dependence of the tangent pressures. Other
minor atmospheric constituents are retrieved with non-operational scientific codes (see10
Sect. 4.2).
All retrievals are based on the non-linear least-squares fit (Menke, 1984; Sivia, 1998;
Rodgers, 2000) of a parametrized forward model on the measured spectra. A theoret-
ical forward model calculation F(p, x) is fitted to the observations y. F(p, x) simulates
the observations starting from the quantities x to be retrieved and from a set of instru-15
mental and geophysical parameters p, that are assumed to be known. The solution is
found with an iterative procedure that uses the Gauss-Newton method for the minimi-
sation of a cost function. Usually, the cost function is theχ2
function, equal to:
χ2= nT
iterV
−1n niter, (3)
where niter=y−F (p,xiter) is the vector of the residuals at iteration iter, with xiter equal20
to either the initial guess or the result of the current iteration, and V n is the Covariance
Matrix of the observations.
An important feature of the MIPAS data inversion problem is that the limb sound-
ing technique provides a selective information on the atmospheric composition at the
tangent altitudes which, combined with the redundant information of the spectrally re-25
solved measurements, leads to an usually well conditioned inversion problem even if
made rather elaborate by the large number of available observations. The different
8818
ACPD
7, 8795–8893, 2007
MIPAS instrument
overview
H. Fischer et al.
Title Page
Abstract Introduction
Conclusions References
Tables Figures
◭ ◮
◭ ◮
Back Close
Full Screen / Esc
Printer-friendly Version
Interactive Discussion
EGU
retrieval codes differ in the adopted degree of sophistication and optimization of the
forward model calculation, for the choice of the cost function and in the selection of the
fitted observations.
The operational MIPAS level 2 data processor was conceived by an international
consortium which developed the scientific prototype, named Optimized Retrieval Model5
(ORM, Ridolfi et al., 2000), used for the operational implementation. The main chal-
lenge of the ORM has been the requirement of performing the complex operation of
mathematical inversion in near real time (NRT) for a large number of data. The ORM
code is also the prototype of the Off-Line (OL) level 2 processor that is used for the re-
analysis of the measurements with improved geolocation and set up of the level 1 and10
level 2 chain. In the off-line analysis the NRT requirement does not apply any longer,
but the continuous emission measurements of MIPAS still require that the computing
time is significantly shorter than the measurement time.
The main features of the level 2 operational code and the possible differences with
other scientific codes are briefly recalled. For a more detailed description of the ORM15
and of its performances we refer to Raspollini et al. (2006).
The ORM performs a non-linear least squares fit with a cost function modified ac-
cording to the Levenberg-Marquardt (Levenberg, 1944) method.
The choice of the fitted observations is a compromise between the maximum infor-
mation and the minimum complexity of the retrieval from the point of view of number20
of unknowns and observations. For this purpose, on one hand the global fit approach
(Carlotti, 1988)is adopted, with the simultaneous fit of the spectra of the full limb se-
quence, for the retrieval of each vertical profile. The global fit provides a full exploitation
of the measurements and a rigorous determination of the correlation between atmo-
spheric parameters at the different altitudes. On the other hand, apart from pressure25
and temperature that are simultaneously determined, the different target species are
individually retrieved with a sequence that follows the order of the reciprocal spectral
interference of the targets. Furthermore, the retrieval is performed using a set of nar-
row (less than 3 cm−1
width) spectral intervals, called “microwindows” that are selected
8819
ACPD
7, 8795–8893, 2007
MIPAS instrument
overview
H. Fischer et al.
Title Page
Abstract Introduction
Conclusions References
Tables Figures
◭ ◮
◭ ◮
Back Close
Full Screen / Esc
Printer-friendly Version
Interactive Discussion
EGU
as those intervals that contain the best information on the target parameters and are
less affected by systematic errors.
The forward model calculations are also the result of a compromise between ac-
curacy and computing time. The radiative transfer model calculates the atmospheric
emission spectrum taking properly into account the effect of refractive index in the op-5
tical path, the Voigt profile of the atmospheric line shape and using a high resolution
wavenumber grid for the calculation of the monochromatic spectral radiances. The for-
ward model determines the observed spectrum by convolving the monochromatic and
single-beam atmospheric spectrum with the line shape and instantaneous field-of-view
of the instrument. On the other hand, Non-LTE effects, line mixing and pressure shifts10
are not considered in the forward model, but are accounted for in the microwindows se-
lection and in the error budget. The atmosphere is assumed horizontally homogeneous
and in hydrostatic equilibrium.
Several mathematical and computing optimizations have been introduced in order to
reduce the computing time with either null or negligible effect on the accuracy of the15
calculations (Raspollini et al., 2006).
The operational processor requires a pre-retrieval cloud detection scheme which
filters the level 1b spectral data, as do all current MIPAS retrieval codes for trace gases.
This is required because strong cloud effects in the spectra result in anomalous mixing
ratios and instabilities of the retrieval solutions even for concentrations derived from20
lines-of-sight above the cloud-contaminated views. Both clouds in the troposphere and
polar stratospheric clouds can produce these effects. The operational processor uses
a cloud detection scheme based on the ratio of integrated signals in cloud microwindow
pairs (Spang et al., 2004) with one pair defined in each of 3 MIPAS bands (A, B, and D).
The tests operate hierarchically so that the cloud index in band A (CI-A) is tested first,25
and then the other bands if required because of the unavailability of band A. Hence
CI-A is normally the cloud index used and the threshold for cloud detection is currently
set such that CI-A <1.8 between 6 km and 45 km in the operational processor flags a
spectrum as cloudy (further details can be found in Spang et al., 2004).
8820
ACPD
7, 8795–8893, 2007
MIPAS instrument
overview
H. Fischer et al.
Title Page
Abstract Introduction
Conclusions References
Tables Figures
◭ ◮
◭ ◮
Back Close
Full Screen / Esc
Printer-friendly Version
Interactive Discussion
EGU
One of the main effects of cloud presence, particularly in the tropical upper tropo-
sphere, is to limit the cloud-free line-of-sight frequency. Greenhough et al. (2005) show
that this obscuration of the MIPAS views can result in less than 20% cloud-free obser-
vations at 12 km in the inter-tropical convergence zone (ITCZ) which is observed to drift
north and south according to season. However, outside the narrow band of latitudes5
of the ITCZ, the cloud-free line-of-sight frequencies at 12 km increase towards 40% in
the tropics and greater than 60% in mid-latitudes. Retrieval of trace gas concentra-
tions at upper tropospheric altitudes requires careful validation and joint retrieval with
aerosol extinction (e.g. Moore, 2006) or continuum parameters (e.g. von Clarmann et
al., 2003a). Work on many species is on-going but essentially considerable success is10
being achieved at these low altitudes (see Sect. 8). Aside from the cloud influences,
water vapour, the cold temperatures at the tropical tropopause and line-of-sight gra-
dients are most responsible for increased uncertainties. The last of these has led to
research into two-dimensional retrieval codes as described below.
4.2 Scientific codes for data processing15
Besides the operational MIPAS level-2 data processor operated under ESA responsi-
bility, there exist several further data processors which are used to produce scientific
level-2 data beyond the routine near real time data generation. Most of these proces-
sors involve modelling of aspects of radiative transfer not included in the ORM or use a
retrieval strategy of higher sophistication. This usually implies a higher computational20
burden and/or expert knowledge of the user, which explains why not all of these codes
are suitable for operational level-2 data generation.
Without being exhaustive, we shortly introduce the most widely used MIPAS level-2
data analysis codes. In the pre-launch phase of ENVISAT six codes were developed
and cross-validated within the “Advances MIPAS Level-2 Data Analysis” (AMIL2DA)25
project (von Clarmann et al., 2003c).
These are the extended scientific versions of the OFM/ORM by IFAC, the Retrieval
Control Program (RCP) by IMK/IAA, two distinct data processors by DLR, the RET2D
8821
ACPD
7, 8795–8893, 2007
MIPAS instrument
overview
H. Fischer et al.
Title Page
Abstract Introduction
Conclusions References
Tables Figures
◭ ◮
◭ ◮
Back Close
Full Screen / Esc
Printer-friendly Version
Interactive Discussion
EGU
code by the Rutherford Appleton Laboratory, and the Oxford University Processor to
Invert MIPAS Measurements (OPTIMO), which meanwhile has been replaced by the
MORSE software (Dudhia et al., 2005). Further MIPAS data processors are the one
coded and applied by Forschungszentrum Julich (Hoffmann et al., 2005), the OPERA
code of the University of Leicester (Moore et al., 2006), and the GMTR code by Bologna5
University (Carlotti et al., 2006).
As for the operational ESA retrieval code, also the scientific data processors re-
quire the forward modelling of atmospheric radiative transfer. This can be done either
by explicit line-by-line radiative transfer models (KOPRA (Stiller, 2000) in the case of
RCP, RFM (Dudhia, 2002b) in the case of OPTIMO, MORSE, and OPERA), by the use10
of precalculated absorption cross-sections (ORM-based codes) or by computationally
efficient but less accurate parametric radiative transfer codes as in the FZJ retrieval
algorithm. The more advanced radiative transfer line-by-line models support modelling
of radiative transfer physics which is, for reasons of computational efficiency, not in-
cluded in the ORM, e.g. non-local thermodynamic equilibrium or scattering of radiation15
by clouds.
In the infrared region scattering is usually neglected in the radiative transfer, that
means an aerosol free atmosphere is assumed and cloud filtering is applied (see
above). Hopfner et al. have shown that intermediate cases of great scientific interest
can also be considered. Since radiation from the lower atmosphere and the surface20
attenuated by the absorption of the atmosphere below the line of sight, is scattered e.g.
by thin clouds (e.g. cirrus or PSCc) into the line of sight of MIPAS, the KOPRA radiative
transfer algorithm has been complemented by a single scattering module (Hopfner et
al., 2005).
Besides differences in radiative transfer modelling, there are also important differ-25
ences between the processors with respect to the inversion strategy. While the ORM
retrieves atmospheric temperatures and mixing ratios of constituents on an altitude
grid defined by the tangent altitudes of the actual limb scan (Ridolfi et al., 2000), other
algorithms use a fixed altitude grid, which in case of the RCP is much finer than the
8822

ACPD
7, 8795–8893, 2007
MIPAS instrument
overview
H. Fischer et al.
Title Page
Abstract Introduction
Conclusions References
Tables Figures
◭ ◮
◭ ◮
Back Close
Full Screen / Esc
Printer-friendly Version
Interactive Discussion
EGU
MIPAS tangent altitude spacing (1 km vs. 3 km) (von Clarmann, 2003b). Most of the
processors either rely on the engineering information on the MIPAS elevation pointing
(e.g. RET2D) or correct pointing-related errors by adjusting the pressure profile to the
actual limb measurement. The RCP supports direct retrieval of the elevation pointing
in terms of tangent altitudes while it adjusts pressure assuming the hydrostatical equi-5
librium, and is thus well suited for monitoring of elevation pointing peculiarities (von
Clarmann et al., 2003b, Kiefer et al., 2007, this Special Issue).
While the majority of retrieval algorithms uses microwindows for the retrieval, for
species with excessively low signal like HOCl, however, it happens that the use of
extended spectral windows is necessary, whose width often is beyond of what is usually10
called microwindow (von Clarmann et al., 2006a). Other data analysis strategies rely
on broadband data rather than microwindows (RET2D, FZJ-code, OPERA).
All retrieval codes except the ORM-derivates and GMTR constrain the retrieval of
atmospheric state variables by application of a dedicated regularization term. This
helps to avoid instabilities in the retrieval, but adds a certain content of a priori in-15
formation to the retrieved profiles. OPTIMO, OPERA, and the FZJ-code use optimal
estimation (Rodgers, 1976), MORSE uses a sequential estimation application of op-
timal estimation, the DLR-codes use different variants of a Tikhonov-type (Tikhonov
1963a, b) constraint, and RCP supports any user-defined regularization matrix but is
usually operated with a Tikhonov-type first order finite differences regularization matrix20
(Steck, 2001).
Forward-modelling related issues of Non-LTE seem to be sufficiently well understood
not to be the driving error source in calculated spectra, if the vibrational temperatures
are accurately known. Since, however, the vibrational temperatures of the actual atmo-
sphere are typically unknown, Non-LTE is not only a forward modelling issue but also25
poses retrieval-related problems (von Clarmann et al., 2003b). At least, the vibrational
temperatures should be modelled for the actual atmosphere. In case of CO, whose
vibrational temperatures depend on the CO infrared emissions at other altitudes, this
requires the inclusion of a Non-LTE model which provides the vibrational temperatures
8823
ACPD
7, 8795–8893, 2007
MIPAS instrument
overview
H. Fischer et al.
Title Page
Abstract Introduction
Conclusions References
Tables Figures
◭ ◮
◭ ◮
Back Close
Full Screen / Esc
Printer-friendly Version
Interactive Discussion
EGU
within each step of iteration, as supported by the RCP-processing environment (Funke
et al., 2006). This approach, however, relies on a perfect Non-LTE model. Since high-
resolution spectra as provided by MIPAS in its original observation mode include a lot
of information on Non-LTE processes themselves, uncertain Non-LTE model parame-
ters like NO2 excitation rates, O3 nascent distributions, or CO2 collisional constants can5
also be retrieved directly from the measurements using the RCP processing, as shown
by Funke et al. (2005a), Kaufmann et al. (2006), and Lopez-Puertas et al. (2005c).
With no Non-LTE model available, the only possible approach except the use of clima-
tological vibrational temperature data (Lopez-Puertas et al., 2006) is the direct retrieval
of vibrational temperatures from the spectra. This, however, involves an inversion with10
many unknowns which tends to be ill-posed and thus needs regularization. Any physi-
cally meaningful regularization of vibrational temperatures, however, can be set up best
on the basis of a Non-LTE model.
With these scientific retrieval processors available, it is possible (a) to extend the
MIPAS data product towards lower altitudes, where clouds affect radiative transfer and15
where reduced measurement information in nearly saturated spectra requires regular-
ization of the retrieval; (b) towards higher altitudes where the correct treatment of Non-
LTE is important; (c) to investigate regions of the atmosphere where large horizontal
gradients make the horizontal homogeneity assumption fail, and (d) to derive many
more trace species characterized by excessively low signal/noise ratio which requires20
more sophisticated retrieval strategies than used for the operational data product.
4.3 Two-dimensional and multi-target retrievals
In recent years, significant efforts have also been made for the development of two-
dimensional (2-D) retrieval codes that avoid the assumption of horizontal homogeneity
of the atmosphere. Indeed, conventional retrieval schemes apply a one-dimensional25
approximation of the atmosphere, i.e., for each limb scan the retrieved physical state
variable is a function of altitude only, while horizontal variations are neglected (see,
e.g. McKee, 1969, Carlotti, 1988). In order to allow the retrieval of two-dimensional
8824

ACPD
7, 8795–8893, 2007
MIPAS instrument
overview
H. Fischer et al.
Title Page
Abstract Introduction
Conclusions References
Tables Figures
◭ ◮
◭ ◮
Back Close
Full Screen / Esc
Printer-friendly Version
Interactive Discussion
EGU
fields of atmospheric state variables in the orbit plane, dedicated algorithms have been
developed.
MIPAS observations taken along the orbit track can be analyzed in two dimensions by
exploiting the fact that the limb sequences are continuously repeated along the plane
of the orbit. This repetition makes it possible to gather the information about a given5
location of the atmosphere from all the lines of sight that cross that location whatever
sequence they belong to. Since the loop of overlap between nearby sequences closes
when the starting sequence is reached again at the end of the orbit, in a retrieval anal-
ysis the full gathering of information can be obtained by merging in a simultaneous
fit the observations of a complete orbit; this analysis strategy is named Geo-fit (Car-10
lotti, 2001). An important feature of the Geo-fit approach is that the retrieval grid is
independent of the measurement grid so that atmospheric profiles can be retrieved
with horizontal separations different from those of the measured limb scans. This fea-
ture often makes it possible to improve the usually poor horizontal resolution of limb
measurements (Ridolfi et al., 2004).15
MORSE, RET2D and the 2D-option of the RCP (Steck et al., 2005) use sequential
estimation, where the a priori information on the 2-D field is updated with each limb
scan newly included in the analysis. As a computationally more efficient substitute for
full 2-D retrievals, the RCP also supports the retrieval of horizontal gradients along with
the related atmospheric state variables.20
In the ESA operational data-analysis process, the preliminary retrieval of pressure
and temperature is followed by the sequential retrieval of the target vmrs. A drawback
of this approach is that the retrieval errors affecting pressure and temperature profiles
do propagate into the retrieved vmr values. Moreover, molecular species with a “rich”
spectrum (such as water and ozone) may also propagate their measurement error in25
the other products because their spectral features often contaminate the wavenumber
intervals analyzed for the retrieval of other species. This error propagation process
is minimized with a careful choice of both the analyzed spectral intervals (Dudhia et
al., 2002a) and the sequence of the retrievals. Nevertheless, in many cases, the er-
8825
ACPD
7, 8795–8893, 2007
MIPAS instrument
overview
H. Fischer et al.
Title Page
Abstract Introduction
Conclusions References
Tables Figures
◭ ◮
◭ ◮
Back Close
Full Screen / Esc
Printer-friendly Version
Interactive Discussion
EGU
ror propagation cannot be completely avoided and its assessment is rather difficult. A
strategy that eliminates this source of systematic errors is represented by the simul-
taneous retrieval of all the quantities whose correlation in the observed spectra is the
cause of the error propagation. With this strategy (referred to as Multi-Target Retrieval
(MTR)) the error due to the cross-talk between different target quantities is properly5
represented in the covariance matrix of the retrieved parameters (Dinelli et al., 2003).
Furthermore, the selection of the observations to be analyzed is no longer driven by
the necessity to reduce the interferences among the target species. Finally, the infor-
mation on pressure and temperature can be gathered from the spectral features of all
the target species that are simultaneously retrieved and not only from CO2 lines.10
Both the Geo-fit and MTR functionalities are implemented in the GMTR (Geofit Multi
Target Retrieval) open-source code available at http://www.science-and-technology.nl/
beat/ and http://www.mbf.fci.unibo.it.
4.4 Spectroscopic database for MIPAS retrievals
Although general databases such as HITRAN (Rothman et al., 2005) or GEISA15
(Jacquinet-Husson et al., 2005) existed it was decided at the beginning of the devel-
opment of the MIPAS data processing software to generate a dedicated spectroscopic
database for MIPAS, as was done for the ATMOS experiment (Gunson et al., 1996), in
order to be able to implement in the shortest possible time the best spectral parame-
ters and also to meet the specific needs of MIPAS. The first version “mipas pf2.0” was20
based on both the 1996 version of HITRAN and on new laboratory spectroscopic data
and new calculations (Flaud et al., 2003a; Flaud et al., 2003b). After launch, version
“mipas pf3.1” (Flaud et al., 2003c) of the MIPAS dedicated spectroscopic database was
released. With respect to the former one it contained improvements concerning mainly
the following molecules: CO2, HNO3, CH4, NO2, O3, and COF2. In particular, the25
new spectroscopic data for HNO3 in the 11.2µm spectral region are responsible for a
change of about 14% in the retrieved HNO3 volume mixing ratios (Flaud et al., 2003b).
This change was assessed and validated by simultaneous retrievals of atmospheric
8826
ACPD
7, 8795–8893, 2007
MIPAS instrument
overview
H. Fischer et al.
Title Page
Abstract Introduction
Conclusions References
Tables Figures
◭ ◮
◭ ◮
Back Close
Full Screen / Esc
Printer-friendly Version
Interactive Discussion
EGU
HNO3 profiles in the 11.2µm spectral region and in the pure rotation region (Men-
caraglia et al., 2006). More recently a new version “mipas pf3.2” including changes
concerning the NO, OCS, NH3, H2O2, and HNO3 molecules has been made available
and the MIPAS spectra have been used to validate the HNO3 line parameters on the
whole MIPAS spectral domain (Flaud et al., 2006a). Finally it proved possible using5
new spectroscopic data to observe in MIPAS spectra the H15
NO3 species (Flaud et al.,
2006b).
5 Observation strategy and measurement modes
5.1 Rationale
5.1.1 Introductory remarks10
The scientific objectives as described in Sect. 2 and the observing capabilities as out-
lined in Sect. 3 are manifold requiring a flexible observation strategy. The observing
capabilities allow vertical sampling steps of 1 to 8 km, tailored to the scientific objec-
tives. The altitude coverage that can be commanded is 5 to 160 km, thus including
the range from the free troposphere up to the thermosphere. Rearward and sideward15
views are possible with an azimuth scanning range of 35◦
and 30◦
respectively. In the
rearward (i.e. along-track) view this allows e.g. (1) a complete pole to pole coverage by
compensating for the inclination of the orbit or (2) to measure along tracks parallel to
the satellite subtrack. In the sidewards (i.e. cross-track) view the azimuth range allows
to adjust the observations to special targets, e.g. to view parallel to the terminator or to20
stare at a special event (e.g. volcanic eruption). Consequently, a high degree of free-
dom concerning possible observation modes is realised. On the other hand operational
constraints, the reliability of retrievals, and the standardization of processing routines
had to be taken into account. Based on this, a set of different observation modes was
specified and a mission plan, which defines the distribution of observation modes over25
8827
ACPD
7, 8795–8893, 2007
MIPAS instrument
overview
H. Fischer et al.
Title Page
Abstract Introduction
Conclusions References
Tables Figures
◭ ◮
◭ ◮
Back Close
Full Screen / Esc
Printer-friendly Version
Interactive Discussion
EGU
the lifetime of ENVISAT, was established.
The following sections describe the observation modes that were effective for the
first two years of MIPAS in space. Upon increasing failure rates in the interferometer
drive unit in 2004 a major change in the operation of the interferometer was introduced
with reduced optical path difference. Constrained by this the spectral resolution was5
reduced to about 40% of the prior value and the duty cycle of MIPAS was restricted
in 2005 to 35%. Recently, the duty cycle has been increased step by step reaching
60% in May 2007. In consequence, the observation modes and the mission plan had
to undergo major revisions which are not subject of this paper since this paper focuses
on to the first two years when MIPAS operated with full spectral resolution.10
5.1.2 Spatial coverage
The scientific objectives make it clear that polar, as well as mid- and low-latitude cov-
erage is required. Furthermore, given the importance of flexibility, it was requested
to ensure that MIPAS could observe any region of the globe as otherwise unexpected
phenomena could be missed. Consequently, it was requested to make both the eleva-15
tion and azimuth angles of MIPAS adjustable.
The elevation scan was requested to cover altitudes extending from the middle tro-
posphere to the lower thermosphere. Measurements in the upper troposphere are
needed e.g. to study troposphere-stratosphere exchange processes and pollution by
aircraft emissions. However, the primary scientific objective of MIPAS is the investiga-20
tion of stratospheric processes, in particular chemical reactions and transport, which
necessitates the simultaneous measurement of the distribution of many trace con-
stituents in this part of the atmosphere. Measurements in the meso- and thermosphere
are mainly used for studying Non-LTE processes and interactions between the thermo-,
meso- and stratosphere.25
8828
ACPD
7, 8795–8893, 2007
MIPAS instrument
overview
H. Fischer et al.
Title Page
Abstract Introduction
Conclusions References
Tables Figures
◭ ◮
◭ ◮
Back Close
Full Screen / Esc
Printer-friendly Version
Interactive Discussion
EGU
5.1.3 Spatial resolution
More recent field measurements have shown that the variability in the spatial distri-
bution of atmospheric constituents in the upper troposphere and lower stratosphere
can be quite large, in particular across the polar vortices and close to the tropopause.
However, classical limb viewing remote sensing sensors can provide only limited spa-5
tial resolution. MIPAS has an IFOV of about 3 km×30 km which, as a rule of thumb,
limits the resolution in the vertical domain to 3 km, and in the horizontal domain to
about 300 km along the line of sight and 30 km perpendicular to the line of sight. As a
consequence, it is not possible to resolve small scale phenomena in the atmosphere
with such instruments.10
On the other hand, space-borne remote sensing can provide good global surveys of
stratospheric composition. For studying the chemistry of the stratosphere a horizontal
resolution of about 500 km is mostly sufficient and equivalent to the resolution of state-
of-the-art chemical transport models.
Concerning troposphere-stratosphere exchange processes it is obvious that sin-15
gle medium and small scale processes like the effect of a single convective tower or
tropopause folds cannot be resolved with MIPAS. On the other hand, for the main up-
ward transport from the troposphere into the stratosphere the horizontal resolution of
MIPAS should suffice.
The relatively high signal-to-noise ratios of spectra observed in the UTLS (Upper20
Troposphere Lower Stratosphere) allows to gain from oversampling, i.e. using sampling
grids smaller than the width of the IFOV and thus to achieve vertical resolutions of better
than 3 km for certain parameters.
5.1.4 Temporal coverage and resolution
Various time scales are of importance, namely those associated with diurnal and with25
long term variations. The detection of diurnal variations can provide a powerful test of
photochemical theory but, in principle, a sun-synchronous orbit only allows two local
8829
ACPD
7, 8795–8893, 2007
MIPAS instrument
overview
H. Fischer et al.
Title Page
Abstract Introduction
Conclusions References
Tables Figures
◭ ◮
◭ ◮
Back Close
Full Screen / Esc
Printer-friendly Version
Interactive Discussion
EGU
times to be sampled at each latitude every day. When the spacecraft is crossing the
terminator a considerable number of measurements at different times of the day are
possible in case of the flexible scan mechanism of MIPAS.
The detection of longer term trends will be difficult due to the problem of instrument
drift and degradation. However, these requirements are taken into account in the cali-5
bration concept of MIPAS in an attempt to ensure that the retrieved data will be accurate
enough to contribute also to trend studies for various species (e.g. for CFC-22).
5.2 Observation modes
According to the scientific objectives several observation modes have been identified,
each associated with different objectives, altitude coverage, vertical and horizontal10
sampling, and, for some cases, spectral resolution. Typical observation modes are
summarized in Table 1. The nominal mode was defined as standard, addressing most
of the scientific objectives and covering about 80% of the measurement time. All other
modes are focused on special research tasks such as for example polar winter chem-
istry, the study of the upper atmosphere, or troposphere-stratosphere exchange.15
5.2.1 Nominal observation mode
This mode has been the standard mode for stratospheric chemistry and dynamics
though it has been extended down into the upper troposphere and up into the lower
mesosphere to allow to study linkages between the stratosphere and its adjacent at-
mospheric compartments, the troposphere and mesosphere. The vertical coverage of20
this mode is from 6 to 68 km globally. The vertical spacing in this mode was generally
adapted to the IFOV of the instrument, i.e. to 3 km. In the upper stratosphere and lower
mesosphere, however, the spacing is gradually relaxed from 3 km to 8 km in order to
maintain a horizontal (along-track) sampling of ∼500 km. Observations are performed
in the rearward pointing range, with the azimuth angle set as a function of orbit position25
to permit full pole-to-pole coverage.
8830
ACPD
7, 8795–8893, 2007
MIPAS instrument
overview
H. Fischer et al.
Title Page
Abstract Introduction
Conclusions References
Tables Figures
◭ ◮
◭ ◮
Back Close
Full Screen / Esc
Printer-friendly Version
Interactive Discussion
EGU
5.2.2 Polar winter chemistry mode
In polar regions, during winter and spring, the lower stratosphere is of major interest
because of PSC formation, perturbed chemistry, and potential ozone “hole” formation.
The high spatial variability of the relevant processes and associated fields of geophys-
ical parameters requires an optimum vertical and good horizontal resolution of the5
measured data. This was achieved with a denser altitude and along-track sampling in
the UTLS at the expense of a reduced coverage of the altitude region in the upper part
of the atmosphere. For this purpose the lowest point of the altitude scan was set to be
about 4 km below the climatological tropopause in order to ensure that the lowermost
limb view originated in the actual troposphere, i.e. to account for (1) the finite width of10
the instantaneous field-of-view (IFOV), (2) uncertainties of the acquisition and (3) for
actual fluctuations of the tropopause height compared to the climatological value. A
latitude dependent altitude offset was introduced according to
Minimum tangent altitude = 8 km + 2 km*cos(2*tangent point latitude)
in order to allow the lowermost tangent altitude to follow the climatological variation15
of the tropopause.
5.2.3 Upper atmosphere modes
As a limb emission sounder with broad-band spectral coverage along with high spec-
tral resolution MIPAS can provide unprecedented information on the upper atmosphere
(UA). These observations improve our understanding of the middle and upper atmo-20
sphere, e.g. with respect to the temperature structure and energy balance, the chem-
istry, the dynamics, and the interaction between them. In addition, the non-local ther-
modynamic equilibrium (Non-LTE) of the middle and upper atmosphere can be studied
in better detail than ever before (Lopez-Puertas et al., 2005c). For this purpose the
observing capabilities have been extended up to 160 km. Several reference tables with25
8831
ACPD
7, 8795–8893, 2007
MIPAS instrument
overview
H. Fischer et al.
Title Page
Abstract Introduction
Conclusions References
Tables Figures
◭ ◮
◭ ◮
Back Close
Full Screen / Esc
Printer-friendly Version
Interactive Discussion
EGU
different altitude ranges and incremental steps have been prepared for various pur-
poses of upper atmospheric research. For obtaining a complete scan from the strato-
sphere up into lower thermosphere a reduced horizontal and/or vertical resolution has
to be accepted.
At the beginning of the mission the most important objective of the UA measure-5
ments was to verify/falsify the predicted Non-LTE effects on the on-line/off-line re-
trievals. Other UA modes with various choices of altitude sampling and coverage were
devoted to (1) Upper polar vortex dynamics and stratosphere-mesosphere exchange
processes, (2) Energy budget, Non-LTE studies and budgets of hydrogen, nitrogen,
and carbon in the upper atmosphere, (3) Non-LTE studies related to NO specifically10
extending the measurements up to 160 km.
5.2.4 Troposphere-stratosphere exchange mode
For the investigation of troposphere-stratosphere exchange a rather dense spacing of
observations in the vertical and horizontal domain is needed. Fortunately, in this case
the required altitude range can be reduced. The achievable horizontal resolution de-15
pends on the number of sampling points in the vertical domain. The vertical resolution
is restricted by the IFOV of 3 km and the limb geometry. Nevertheless, oversampling
in the altitude domain allows to improve the vertical resolution. A minimum step size of
1.5 km has been regarded as sufficient. In this mode the identification of clouds in the
field-of-view is very important.20
5.2.5 Dynamics mode
To study medium to small scale structures in the middle atmosphere like gravity waves,
ozone laminae, and stratospheric intrusions a specific dynamics mode was foreseen.
In this case the horizontal resolution/coverage is considerably increased and at the
same time the altitude range and the vertical resolution of the nominal scan mode has25
to be kept constant. This can be achieved by reducing the spectral resolution (i.e. the
8832
ACPD
7, 8795–8893, 2007
MIPAS instrument
overview
H. Fischer et al.
Title Page
Abstract Introduction
Conclusions References
Tables Figures
◭ ◮
◭ ◮
Back Close
Full Screen / Esc
Printer-friendly Version
Interactive Discussion
EGU
maximum optical path difference of the interferometer sweep) by a factor between 4
and 10. Although the reduced spectral resolution reduces the number of retrievable
species, the rather long-lived species O3, H2O, and some important tracers like N2O,
CH4, and some CFCs are still measurable (see Fischer et al., 2000).
5.2.6 Cross track and special events modes5
Diurnal changes
The study of diurnal changes near the terminator requires a high latitudinal resolution.
This can be achieved with MIPAS by making cross track observations and adjusting the
azimuth angle during the elevation scan in order to maintain the observation of tangent
heights at nearly the same latitude/longitude spot for a complete limb scan sequence.10
Impact of aircraft emission (AE)
The AE mode is dedicated to the detection of aircraft emissions and their effects on
the chemistry in the upper troposphere and lowermost stratosphere. The sampling is
optimized to the 7 to 13 km altitudes range (1.5 km sampling) where the expected effect
is largest. Some layers are added on top in order to restrict the sensitivity of the retrieval15
to altitude regions above the aircraft corridor. The number of samples per sequence
is 12. The azimuth angles are optimized such that the lines of sight are as parallel as
possible to the aircraft corridors to enable long optical paths inside the aircraft corridors
and a high contrast between measurements within the aircraft corridors and those in
adjacent “unaffected” regions of the atmosphere.20
Special events mode
A stare scan mode can be commanded for special events such as volcanic eruptions
though the required vertical and horizontal spacing of the measurements will depend
strongly on the spatial extent of the event under investigation.
8833
ACPD
7, 8795–8893, 2007
MIPAS instrument
overview
H. Fischer et al.
Title Page
Abstract Introduction
Conclusions References
Tables Figures
◭ ◮
◭ ◮
Back Close
Full Screen / Esc
Printer-friendly Version
Interactive Discussion
EGU
6 Targeted constituents and estimates of measurement errors
6.1 The spectral coverage of MIPAS
From a scientific point of view it would be desirable to cover the whole atmospheric
emission spectrum simultaneously. However, technical constraints restrict the spectral
coverage in case of MIPAS to the mid-infrared from 4.15 till 14.6µm.5
Figure 7 shows the region of infrared spectrum observed by MIPAS. Due to the
scale of this plot (1 cm−1
) the spectral features of the different molecules cannot be
separated, but with the spectral resolution actually obtained by MIPAS (Fig. 8) individ-
ual lines can be resolved. Although MIPAS can, in principle, retrieve many different
species, the requirement for a robust retrieval led to the fairly conservative choice of10
the seven molecules with strongest line features (CO2 for the pressure/temperature
(pT) retrieval, plus six key species) in case of the operational data processing (see
also Sect. 4).
6.2 Microwindows
Computational costs restrict the number of spectral points that can be used in the op-15
erational retrieval to only a few percent of the complete spectrum. Rather than using
individual spectral points, the adopted approach is to use “microwindows”, i.e. spec-
tral regions of up to 3 cm−1
width (von Clarmann and Echle, 1998). One of the main
advantages of using microwindows instead of single lines is that a flat atmospheric con-
tinuum term can also be fitted, and therefore its effect can be greatly reduced within20
each microwindow, making the retrieval less sensitive to atmospheric aerosols and thin
clouds.
Between two and seven microwindows are used for each target species, as shown
in Fig. 9. For pT, O3, and H2O, the tangent altitude range of the microwindows varies
according to the strength of the spectral absorption feature, i.e. using the strongest25
absorption regions for high altitudes and weaker features for low altitudes. These mi-
8834
ACPD
7, 8795–8893, 2007
MIPAS instrument
overview
H. Fischer et al.
Title Page
Abstract Introduction
Conclusions References
Tables Figures
◭ ◮
◭ ◮
Back Close
Full Screen / Esc
Printer-friendly Version
Interactive Discussion
EGU
crowindows are selected (Dudhia et al., 2002a) to give the best compromise between
maximizing the precision of the target species retrieval and minimising the contribution
of interfering species and other systematic error sources (as listed in Table 2).
6.3 Error analysis
The microwindow selection aims to maximize the accuracy of the retrieval by modelling5
the propagation of not only the instrument noise but also other errors in both the mea-
surements and forward model. Therefore it contains all the information required for a
full error analysis of the retrieval. Figure 10 shows an example of the error analysis for
CH4 for the operational product. Between the upper troposphere and the stratopause
the total error (TOT) is nearly constant. The single errors as shown in the figure are10
more or less dependent on altitude.
The term systematic error (SYS) is used here to describe all errors apart from the
noise (RND). Each of these error sources is assumed to introduce some component of
correlated error into the measurement (or forward model calculation).
The systematic error correlations are only defined for the set of measurements that15
contribute to a single profile, and some care needs to be taken if these error analy-
ses are applied to larger datasets. For example, the spectroscopic database errors
(SPECDB) would be common to all profiles generated throughout the mission (effec-
tively appearing as a bias term) whereas the pT propagation errors might be random
from one profile to the next and disappear with averaging. Other errors would have in-20
termediate time-scales depending on atmospheric variability or calibration frequency.
Similar error analyses have been carried out for the other operational data products
and also for the scientific results.
8835

ACPD
7, 8795–8893, 2007
MIPAS instrument
overview
H. Fischer et al.
Title Page
Abstract Introduction
Conclusions References
Tables Figures
◭ ◮
◭ ◮
Back Close
Full Screen / Esc
Printer-friendly Version
Interactive Discussion
EGU
7 Validation of the MIPAS data products
7.1 General comments
As shown above MIPAS is an IR remote sensing experiment which yields absolutely
calibrated radiances; they are converted into vertical profiles of atmospheric parame-
ters with well defined error bars. The data processing software has been evaluated5
by intercomparisons of data processors of different institutions at an international level
(von Clarmann et al., 2003c) and by applying it to measurements as performed by sim-
ilar instrumentation (e.g. MIPAS balloon experiment). Nevertheless, the responsible
scientist of satellite experiments always wants to validate the satellite data with results
of independent instrumentation. Reasonably, the quality of these validation measure-10
ments should be better than that of the satellite data. However, this requirement is not
always met.
In order to intercompare measurements of instruments on different platforms it is
common practice to apply coincidence criteria. Differences in space and time are
restricted dependent on the atmospheric situation (in particular for the validation of15
satellite measurements by single non-satellite observations). The limitations depend
on horizontal gradients or diurnal variations of the observed parameters. Standard
coincidence criteria are a distance of 300 km and a few hours time difference. These
values are based on the experience on measurements of gradients of atmospheric pa-
rameters in the stratosphere. Larger differences are acceptable if the atmosphere is20
proven to be homogeneous or if the results at one location are transformed to the other
measurement location with the use of 3-D numerical models or trajectory calculations.
A general discussion on how to perform the validation of measurements is contained
in von Clarmann (2006b).
In the MIPAS Special Issue of ACP mainly the operational data products of the MIPAS25
experiment, namely temperature and mixing ratios of O3, H2O, CH4, N2O, HNO3, and
NO2 are validated. By doing this it is proven that the MIPAS instrument is behaving well
and the predicted error budgets are assessed at least in certain altitude regions. As a
8836
ACPD
7, 8795–8893, 2007
MIPAS instrument
overview
H. Fischer et al.
Title Page
Abstract Introduction
Conclusions References
Tables Figures
◭ ◮
◭ ◮
Back Close
Full Screen / Esc
Printer-friendly Version
Interactive Discussion
EGU
consequence, the data products are of good quality and can be applied for operational
and scientific use. In the meantime, also a considerable number of papers on the
validation of MIPAS data products as derived from scientific data processors have been
published and have demonstrated the capabilities of MIPAS.
7.2 Types of validation measurements5
Among the approaches to be considered for the validation of the MIPAS data products
are comparisons with data obtained by
– instruments operated during dedicated balloon and aircraft campaigns,
– ground-based networks and
– other satellite instruments.10
Remote sensing instruments flown on large stratospheric balloons can provide good
vertical resolution concentration profiles below their flight altitude (up to 40 km) and col-
umn abundances above it for a large number of atmospheric species. Other measure-
ment techniques are based on in-situ cryogenic sampling and on chemiluminescence
devices; these are being used during the ascent and descent segments of stratospheric15
flights. All the above mentioned approaches can provide measurements with the ver-
tical resolution needed to validate space-based observations of the upper troposphere
and the stratosphere.
In comparison to balloon measurements, aircraft experiments are generally re-
stricted in the altitude range of the measured vertical profiles. On the other hand,20
aircraft experiments are capable of covering quite large geographic regions, allowing
for example the investigation of latitudinal changes and in- and out-of-vortex measure-
ments in polar regions.
Ground-based facilities can provide regular observations of many trace species
throughout the entire lifetime of a space mission. They can thus help to character-25
ize the long-term instrument stability in orbit. Some of the ground-based instruments
8837
ACPD
7, 8795–8893, 2007
MIPAS instrument
overview
H. Fischer et al.
Title Page
Abstract Introduction
Conclusions References
Tables Figures
◭ ◮
◭ ◮
Back Close
Full Screen / Esc
Printer-friendly Version
Interactive Discussion
EGU
provide total vertical column abundances with limited information on vertical distribu-
tion while others (e.g. Lidars) yield detailed volume mixing ratio profiles of some trace
gases.
Validation of MIPAS data with other satellite measurements has the great advan-
tage of intercomparing many measurements and being able to derive results which are5
based on statistics. However, the accuracy of the satellite data employed is sometimes
not better than that of the satellite experiment to be validated.
Obviously, the different types of validation experiments have all their specific advan-
tages and disadvantages. In order to conclude about the quality of the MIPAS data we
need all of them in the validation process.10
7.3 Validation campaigns
In time ESA has planned a comprehensive validation programme for all the ENVISAT
instruments. The central part of this programme was the ENVISAT Stratospheric Air-
craft and Balloon Campaign (ESABC). It included within the first two years after the EN-
VISAT launch balloon campaigns in Kiruna/Sweden, Aire sur l’Adour/France, Sicily/Italy15
and Vanscoy/Canada, as well as a campaign with small balloons in Bauru/Brazil. Dur-
ing those campaigns a large number of vertical profiles of atmospheric trace con-
stituents have been recorded which played an important role during the validation
process (see validation papers in this Special Issue). The balloon data were com-
plemented by measurements from the research aircrafts Geophysica (in Forli/Italy and20
Kiruna/Sweden) and Falcon (flights from the tropics to the Arctic). All the experiments
have tried to optimize the coincidence with ENVISAT overflights and they succeeded
very often. This validation programme has been prolonged until the end of 2007 with
reduced intensity.
8838
ACPD
7, 8795–8893, 2007
MIPAS instrument
overview
H. Fischer et al.
Title Page
Abstract Introduction
Conclusions References
Tables Figures
◭ ◮
◭ ◮
Back Close
Full Screen / Esc
Printer-friendly Version
Interactive Discussion
EGU
7.4 Results of the validation
It is not intended to describe the detailed results of the validation exercise in this paper.
The interested reader is referred to the corresponding validation papers in this Special
Issue. But a summary of the validation results using ESA operational data 4.61/4.62
will be given in the following.5
The ESA workshops on validation in May 2004 and December 2006 as well as the
validation papers in this Special Issue have proven that the MIPAS operational data
products are throughout of good quality. The MIPAS data are also self-consistent as
shown by the data assimilation project ASSET (Lahoz et al., 2006).
The MIPAS global temperature data show a small bias (generally smaller than 1 or10
2 K depending on altitude) with respect to the validation data but this bias is consis-
tent with the error estimates. Also the discrepancies between MIPAS temperature and
the temperature fields resulting from the ECMWF analyses have been characterized.
The bias and the standard deviation of these discrepancies are consistent with those
obtained when comparing MIPAS data to correlative measurements; however, the de-15
tected bias to ECMWF data has a peculiar altitude dependence. But this seems to be
a problem of the ECMWF temperature distribution (see Ridolfi et al., 2007).
From the beginning the MIPAS ozone data showed very good agreement with various
validation data sets. A clear indication of the validity of MIPAS O3 vertical profiles
is obtained for most of the stratosphere, where the mean relative difference with the20
individual correlative data sets is always lower than ±10%. Larger discrepancies in
ozone concentrations have been recognized in the lower stratosphere but this effect is
largely due to the large atmospheric variability and the imperfect cloud flagging in this
height region (Cortesi et al., this Special Issue).
The MIPAS water vapour profiles show no bias in the altitude region between 10 and25
100 hPa with respect to various validation data. There seems to be a positive bias in the
order of 10% above 10 hPa and a low bias in the tropopause region. The operational
MIPAS data show still some oscillations in the vertical profiles (see Oelhaf et al., to be
8839
ACPD
7, 8795–8893, 2007
MIPAS instrument
overview
H. Fischer et al.
Title Page
Abstract Introduction
Conclusions References
Tables Figures
◭ ◮
◭ ◮
Back Close
Full Screen / Esc
Printer-friendly Version
Interactive Discussion
EGU
submitted in June 2007).
When intercomparing MIPAS N2O profiles with ground-based FTIR data no bias can
be identified. In case of CH4 the results are different: FTIR partial columns of the lower
stratosphere show a negative bias in the order of 10% (see Payan et al., 20071).
MIPAS HNO3 data generally agree with the various correlative data sets within the5
combined error bars. In many cases differences between the correlative measure-
ment pairs are less than 10% in the entire altitude range up to 38 km. The standard
deviations for the satellites comparisons (ODIN, ILAS, ACE) are generally larger than
the estimated measurement uncertainty, but this is associated with the temporal and
spatial coincidence error and the horizontal smoothing error which are not taken into10
account in the error budget (Wang et al., 2007). MIPAS NO2 profiles yield valuable
information on the vertical distribution of NO2 in the lower and middle stratosphere dur-
ing day and night with an overall accuracy of 10 to 20% and a precision of typically
5 to 15%. When extremely high NO2 occurs in the mesosphere in polar winter the
operationally generated NO2 profiles are less accurate; in these cases NO2 data as15
produced by special scientific software should be used (Wetzel et al., 2007).
The MIPAS operational data set exhibits already good quality even if some smaller
problems exist as explained above. It is intended to improve this data set further
by future reprocessing. Additional voluminous information about more than 20 non-
operational MIPAS data products exist which have also been validated to a consider-20
able degree.
8 Some remarkable results
Even if the MIPAS experiment is a novel research instrument in space the instrument
operates well in general. However since March 2004 the measurements are not con-
1Payan, S., Camy-Peyret, C., Oelhaf, H., et al.: Validation and data characteristics of
methane and nitrous oxide profiles observed by MIPAS and processed with version 4.61 al-
gorithm, Atmos. Chem. Phys. Discuss., submitted, 2007.
8840
ACPD
7, 8795–8893, 2007
MIPAS instrument
overview
H. Fischer et al.
Title Page
Abstract Introduction
Conclusions References
Tables Figures
◭ ◮
◭ ◮
Back Close
Full Screen / Esc
Printer-friendly Version
Interactive Discussion
EGU
tinuous anymore. The data have been used to retrieve operationally the temperature
and six key species as well as a large number of other parameters with non-operational
research algorithms. Already now, a large number of novel results in various research
fields have been published in peer-reviewed journals and many more results are ex-
pected in the coming years. In the following only a selection of results is presented.5
8.1 Temperature distribution and line-of-sight pointing retrieval
In the operational processing temperature and pressure are retrieved from CO2 spec-
tral signatures assuming hydrostatic equilibrium (Ridolfi et al., 2000). Total temperature
errors as a function of height are estimated by Oxford University. The values are about
1.2 K at 12 km and about 2.5 K at 60 km altitude (see http://www.atm.ox.ac.uk/group/10
mipas/err/). The results of a comprehensive validation for temperature profiles are not
fully consistent; they are described by Ridolfi et al. (2007, this Special Issue). The
retrieved tangent pressure is the parameter to which all retrieved profiles are to be
referred. The altitude increments between contiguous pressure levels are also deter-
mined and, given the reference of a known tangent altitude, an altitude scale can be15
reconstructed. However, these tangent altitudes are affected by the systematic error of
the reference tangent altitude. Indeed, systematic errors greater than 1 km were ob-
served in the altitude scale since the early MIPAS measurements (Ridolfi et al., 2002).
Within other approaches implemented in scientific processors, temperature fields are
retrieved simultaneously with line of sight pointing information from CO2 spectral lines20
(von Clarmann et al., 2003b), while the pressure distribution is constructed assuming
hydrostatic equilibrium from ECMWF information on pressure at 20 km altitude. Strato-
spheric temperatures derived by this approach have been validated to be consistent
to meteorological analyses, radiosondes, and other satellite instruments within about
3 K at 50 km and better than 1.5 K at altitudes in the lower stratosphere (Wang et al.,25
2005a). Engineering information on line of sight pointing has been found to be biased,
showing an annual cycle and latitudinal variation when compared to retrieved line of
sight pointing information. In particular the latitudinal variation could be traced back to
8841
ACPD
7, 8795–8893, 2007
MIPAS instrument
overview
H. Fischer et al.
Title Page
Abstract Introduction
Conclusions References
Tables Figures
◭ ◮
◭ ◮
Back Close
Full Screen / Esc
Printer-friendly Version
Interactive Discussion
EGU
an unrecognized bias in the roll angle of either instrument or platform of 0.05◦
(Kiefer
et al., 2007).
8.2 Trace gas distribution as generated operationally
MIPAS provides about 1000 profiles per day of temperature and the trace species
H2O, O3, HNO3, CH4, N2O, and NO2, covering the globe from pole to pole in the5
6–68 km altitude range (Carli et al., 2004; see also Fig. 11). Operationally retrieved
HNO3 as a proxy for NOy within the polar vortex has been used for the validation of
the denitrification scheme included in SLIMCAT (Davies et al., 2006). It was possible
to show, for the first time, that a sedimentation model, allowing the growth of nitric
acid trihydrate (NAT) “rocks”, could reproduce both the timing and spatial distribution of10
denitrification in the polar vortex. Assimilation schemes as such operated at University
of Cologne (Schwinger et al., 2005) or British Atmospheric Data Centre (Juckes, 2006)
make extensive use of the close-to-complete spatial and temporal coverage provided
by the operational MIPAS data set. Further, NO2 and HNO3 over the polar caps in Arctic
and Antarctic winters from 2002 to 2004 were studied to identify long-term downward15
transport of mesospheric/lower thermospheric air into the stratosphere and compare
it to the effects of severe solar storm events in October/November 2003 (see also
following sections).
8.3 NOy family
MIPAS is particularly capable of providing the total NOy budget in the stratosphere20
(HNO3, NO, NO2, ClONO2, N2O5, HO2NO2, (PAN); not observable are NO3 and
BrONO2). For this reason, MIPAS observations are well suited to study the processes
related to NOy partitioning and denitrification in polar vortices. For NO and NO2, so-
phisticated retrieval approaches taking into account Non-LTE effects have been devel-
oped (Funke et al., 2005a). The EC project TOPOZ-III (Kouker et al., 2005) was dedi-25
cated to the analysis and comparison of various chemical transport models regarding
8842
ACPD
7, 8795–8893, 2007
MIPAS instrument
overview
H. Fischer et al.
Title Page
Abstract Introduction
Conclusions References
Tables Figures
◭ ◮
◭ ◮
Back Close
Full Screen / Esc
Printer-friendly Version
Interactive Discussion
EGU
their ability to model NOy partitioning. Both the Antarctic winter 2002 and Arctic winter
2002/2003 were studied. The vortex build-up and break-up was reproduced well in all
models as a result of the well-described short-term dynamics in the ECMWF analyses.
Due to different microphysical parameterizations in the various models, however, the
onset and fate of Polar Stratospheric Clouds (PSCs) differed strongly. A common fea-5
ture of the models compared to the MIPAS measurements was the underestimation of
maximum HNO3 values in air parcels which had not been affected by heterogeneous
processes in the polar vortices.
8.4 Further trace species
Besides the near-to-complete NOy family, MIPAS spectra provide information on nu-10
merous further trace species. As a contribution to closure of the sulphur budget of
the atmosphere, SO2 in volcanic plumes (Burgess et al., 2004a), OCS (Burgess et al.,
2004a), and SF6 in the troposphere to lower stratosphere were derived (Burgess et
al., 2004b, 2006a). Burgess et al. showed that SF6 global mean distributions provide
information on inter-annual and seasonal variability, inter-hemispheric differences, as15
well as a tropospheric trend in accordance to ground-based in situ SF6 measurements,
although the derived absolute MIPAS SF6 values were biased low. Stiller et al. (2006)
demonstrated that a global set for 19 months of the mean age of stratospheric air can
be derived from MIPAS SF6 which is very consistent with model calculations of the
global meridional circulation. Comparison between model and observations allows to20
estimate the strength of the mesospheric sink of SF6 and the atmospheric lifetime of
this greenhouse gas.
An interesting field in stratospheric research still is the quantitative understanding of
the coupling of the HOx, NOx, and ClOx catalytic cycles involved in ozone destruction.
MIPAS is able to contribute also to this topic. Global distributions of H2O2 were derived25
by Papandrea et al. (2005) for December 2002, and March, June, and September 2003
although the single H2O2 signatures never exceed the Noise Equivalent Spectral Ra-
diance (NESR) of the MIPAS measurements (explanation see below). The retrieved
8843

ACPD
7, 8795–8893, 2007
MIPAS instrument
overview
H. Fischer et al.
Title Page
Abstract Introduction
Conclusions References
Tables Figures
◭ ◮
◭ ◮
Back Close
Full Screen / Esc
Printer-friendly Version
Interactive Discussion
EGU
H2O2 values showed an equatorial mid-stratospheric peak, enhanced values in the
Antarctic spring time lower stratosphere, and diurnal and seasonal variability and were
in qualitative agreement with expected photochemistry. Von Clarmann et al. (2005,
2006a) demonstrated that it is possible, similar to the H2O2retrievals, to retrieve global
distributions of HOCl from MIPAS data, although noise equivalent spectral radiance is5
about a factor of 10 larger than the signal of a typical single HOCl transition, by using
redundant information of 2225 HOCl spectral lines. HOCl mixing ratios were found to
peak in non-polar regions at 35 to 36 km altitude, show the typical diurnal variation and
are, after trend correction, consistent with former balloon-borne FIR measurements. In
Antarctic polar vortex measurements, there is indication for heterogeneously produced10
HOCl. After severe solar proton events, HOCl in the upper polar stratosphere was also
found to be enhanced (see below). HO2NO2 is of particular interest for stratospheric
chemistry since it couples the NOx and HOx catalytic cycles. Stiller et al. (2007) pro-
vided global distributions for HO2NO2 from the upper troposphere to the stratosphere,
and demonstrated its seasonal and diurnal variability, agreement with state-of-the-art15
chemical models, and the consistency to previous balloon-borne observations. Funke
et al. (2006) demonstrated the feasibility to retrieve CO from the upper troposphere up
to the mesosphere/lower thermosphere under appropriate consideration of Non-LTE
effects.
Further useful species within atmospheric studies are tracers which are often used20
for analysis of vertical and horizontal transport processes. CFC-11 and CFC-12 have
been derived by various groups for this purpose (Hoffmann et al., 2005; Moore et al.,
2006, Moore, 2005). Errors have been shown to be less than 10% for both gases
between 100 hPa and 10 hPa, except near 10 hPa in polar winter, which is comparable
to errors for N2O. The MIPAS measurements therefore provide the capability to study25
dynamical processes with multiple tracers. Correlations between CFC-12 and N2O
have been demonstrated to be excellent in the lower stratosphere (Moore et al., 2005)
as shown in Fig. 12 where the agreement between ATMOS data, adjusted for trends in
CFC-12 and N2O, and MIPAS data is of the order of 5%.
8844
ACPD
7, 8795–8893, 2007
MIPAS instrument
overview
H. Fischer et al.
Title Page
Abstract Introduction
Conclusions References
Tables Figures
◭ ◮
◭ ◮
Back Close
Full Screen / Esc
Printer-friendly Version
Interactive Discussion
EGU
8.5 Antarctic major warming event in September 2002
MIPAS data were extensively used to study the unusual Antarctic major stratospheric
warming in September 2002. Hopfner et al. (2004a) reported on MIPAS observations of
Antarctic stratospheric chlorine nitrate recovery during Austral spring 2002 (Figure 13).
They showed that after evaporation of the latest PSCs a strong increase of ClONO25
together with a simultaneous decrease of ClO indicated the conversion of activated
chlorine into its reservoir species. Chlorine nitrate values peaked on 25 September
and decreased afterwards, the chlorine being transferred into HCl as confirmed by
HALOE observations. While this behaviour was, in general, not unusual compared
to previous Antarctic winters, the levels of ClONO2 reached were extraordinarily high10
due to mixing of NOx rich air into the upper stratospheric vortex during this major
warming event. Simultaneously, ClO distributions were retrieved from MIPAS spectral
data (Glatthor et al., 2004). At the dayside of the Antarctic polar vortex, typical ClO
volume mixing ratios of 1 to 2 ppbv in the lower part of the polar vortex were observed
from 8 till 23 September 2002, increasing up to 17 September and decreasing rapidly15
afterwards. Comparisons to observations of the MLS instrument onboard the UARS
satellite between 1992 and 1997 showed, in general, a similar temporal development,
although providing evidence that the ClO deactivation was somewhat slower in those
days. The warming event obviously happened too late to lead to a premature chlorine
deactivation significantly different from previous Antarctic winters.20
The same major warming event brought NOx and O3 rich air masses from lower
latitudes near to the pole where the temperature was increased strongly by the ma-
jor warming event. Formation of N2O5 up to unusually high values of 4.4 ppbv at 32
to 37 km altitude in the dark was triggered by these preconditions (Mengistu Tsidu
et al., 2004). Inside the polar vortex denitrification took place as long as PSCs25
were present, leading, together with quasi-horizontal mixing, to a total NOy deficit of
12.5 ppbv (Mengistu Tsidu et al., 2005). During the major warming event the vortex
boundary in the upper stratosphere became considerably permeable for midlatitudinal
8845
ACPD
7, 8795–8893, 2007
MIPAS instrument
overview
H. Fischer et al.
Title Page
Abstract Introduction
Conclusions References
Tables Figures
◭ ◮
◭ ◮
Back Close
Full Screen / Esc
Printer-friendly Version
Interactive Discussion
EGU
air, leading to a re-nitrification above 600 K potential temperature level of up to 5 ppbv.
The NOy partitioning before and during the major warming event was neither constant
in time nor in space over the polar vortex, due to the heavily varying illumination situa-
tions, mixing across the vortex boundary, and high variability in temperature.
Mixing processes across the vortex boundary and ozone depletion in the lower part5
of the stratosphere were studied by Glatthor et al. (2005) on basis of distributions of
CH4, N2O, CFC-11, and O3. They found that mixing into the vortex had already taken
place during episodes of minor warmings before the vortex break-up event; the mixing
line derived from CH4-N2O correlations was already flat at the beginning of the major
warming so that no further mixing into the vortex could be deduced. Mixing out of10
the vortex, however, clearly took place above 400 K during the major warming event.
An ongoing slight ozone loss in the order of 0.4 ppmv below 500 K during the major
warming was derived from ozone-CFC-11 correlations. MIPAS ozone data were further
used by Feng et al. (2005) to validate their model calculations of ozone loss during the
Antarctic winter 2002.15
The dynamics of the vortex break-up during the major warming event was studied
by Wang et al. (2005b) on basis of MIPAS ozone and temperature distributions. They
analyzed the daily temperature and ozone fields by decomposition of the differences to
the means into their harmonic expansions. They found that the major warming started
with increased planetary wave 1 activity around 21 September. A striking feature was20
the presence of wave 3 variations before and after the polar vortex split on 21 and 26
September. Finally, around 27 September, wave 1 and 3 amplitudes were reduced, but
those of wave 2 significantly increased. These observations strongly support model
calculations (Manney et al., 2005) which indicated that wave number 3 forcing was
needed to generate the observed major warming.25
8.6 Properties of Polar Stratospheric Clouds
The MIPAS instrument has provided a unique capability for observing Polar Strato-
spheric Clouds (PSCs) due to its pole to pole coverage combined with wide spectral
8846
ACPD
7, 8795–8893, 2007
MIPAS instrument
overview
H. Fischer et al.
Title Page
Abstract Introduction
Conclusions References
Tables Figures
◭ ◮
◭ ◮
Back Close
Full Screen / Esc
Printer-friendly Version
Interactive Discussion
EGU
coverage and high spectral resolution. Simple cloud detection can be applied to PSCs,
as described by Spang et al. (2005a), and provides a valuable, easily processed prod-
uct named CI-A (cloud index from MIPAS channel A). This methodology was used to
good effect in the Vintersol campaign of 2002/3 in which PSC observations, PSC model
predictions and chemical models (assimilating MIPAS observations) were employed in5
near real time to observe and predict the evolution of polar ozone. Spang et al. (2005a)
validated the detection of PSCs against satellite and lidar measurements and demon-
strated that CI-A with a threshold of 4.0 could be used to track the evolution of PSCs
throughout a winter period. Spang et al. (2005b) extended this analysis to Antarctic
winter 2003 and showed the differing characteristics of Antarctic versus Arctic winters10
with much stronger PSC intensities and more dramatic decline in cloud top altitude
through the winter season in the Antarctic compared to the Arctic. The uncertainty
in detection increases as CI-A increases, nonetheless Kramer (2004) showed that a
threshold of 5.0 can be used for PSC detection (albeit of very low infrared opacity) in
the Artic and Antarctic at altitudes between 15 and 24 km.15
Microphysical as well as chemical composition of polar stratospheric clouds can be
derived from their spectral signature, provided that scattering by PSC particles is ap-
propriately taken into account (Hopfner et al., 2002). Spang and Remedios (2003)
had shown empirically from CRISTA observations that a prominent spectral band near
820 cm−1
which could be distinguished in spectrally resolved, infrared measurements20
of PSCs was probably due to nitric acid trihydrate (NAT). This inferred composition was
spectroscopically proven by Hopfner et al. (2006a). Spang et al. (2005a, 2005b) ap-
plied the observation of the NAT feature to MIPAS data using simple colour ratio meth-
ods to distinguish NAT particles (of mean radius <2µm) from supercooled ternary so-
lution (STS) particles and optically thick clouds (most likely ice). Hopfner et al. (2006a)25
extended this approach further to distinguish between the chemical composition of
PSCs – ice clouds, NAT, NAD (Nitric Acid Dihydrate) or STS clouds – by modelling
their spectral signatures on basis of the refractive indices for various chemical com-
positions and a single scattering approach for a spherical atmosphere. Inclusion of a
8847
ACPD
7, 8795–8893, 2007
MIPAS instrument
overview
H. Fischer et al.
Title Page
Abstract Introduction
Conclusions References
Tables Figures
◭ ◮
◭ ◮
Back Close
Full Screen / Esc
Printer-friendly Version
Interactive Discussion
EGU
Mie model into the radiative transfer calculation, also providing derivatives with respect
to the Mie model parameters – aerosol size distributions and chemical composition –
allowed retrieval of particle parameters directly from the spectral radiances (Hopfner
et al., 2002, 2004b). The chemical composition and particle size distribution as re-
trieved for observed PSCs during the Antarctic winter 2003 was compared and vali-5
dated against ground-based LIDAR observations. In particular, it was demonstrated
that the prominent 820 cm−1
feature of type 1a PSCs in MIPAS spectra could be best
fitted by the application of refractive indices of β-NAT; MIPAS observations without this
prominent signature could be identified as ice and STS-PSCs. No indication for the
appearance of NAD in Antarctic winter 2003 was found. Further, with the help of full10
radiative transfer calculations, the empirical colour ratio method developed on basis of
CRISTA data (Spang and Remedios, 2003) has been described quantitatively and con-
firmed as being able to distinguish between NAT, ice, and STS PSCs (Hopfner et al.,
2006a). Based on these techniques, Hopfner et al. (2006b) discovered the evolution
of a NAT belt around Antarctica in austral winter 2003, the initial appearance of which15
was triggered by mountain waves over the Antarctic peninsula and Ellsworth Island in
early June (Fig. 14). By taking into account the mesoscale temperature distributions
during the mountain wave event, the appearance and evolution of the NAT belt could
successfully be modelled.
8.7 Dynamics of the middle atmosphere and downward transport of NOx20
Mesospheric air often subsides in polar winter and intrusion of NOx into the strato-
sphere is observed. During the MIPAS high spectral resolution measurement period,
several episodes of severe subsidence were observed in each Arctic and Antarctic
winter. The deposition of high NOx amounts in the stratosphere, however, was consid-
erably variable. Funke et al. (2005b) analyzed the Antarctic winter 2003 and compared25
it to the Arctic winter 2002/2003. During Austral winter 2003, long-term continuous
transport of mesospheric air into the stratosphere was detected on basis of CO distri-
butions which are a suitable tracer for mesospheric air. Along with high amounts of CO,
8848

ACPD
7, 8795–8893, 2007
MIPAS instrument
overview
H. Fischer et al.
Title Page
Abstract Introduction
Conclusions References
Tables Figures
◭ ◮
◭ ◮
Back Close
Full Screen / Esc
Printer-friendly Version
Interactive Discussion
EGU
enormous burdens of NOx were transported from the upper atmosphere into the strato-
sphere over 2 months (Fig. 15). This was possible due to the dynamical situation in
this winter which provided subsidence in the non-illuminated part of the vortex, so that
the mesospheric barrier for NOx downward transport due to NOx photolysis was not
active. The NOx input from the upper atmosphere into the stratospheric polar vortex5
amounted to 2.4 GMoles which is about 9% of the burden due to N2O photolysis. The
continuous intrusion of NOx, reaching up to 100 ppbv in the upper stratosphere, led, via
formation of N2O5 and water ion cluster chemistry, to the formation of a second HNO3
maximum at altitudes between 35 and 45 km with maximum vmrs of 14 ppbv (Stiller et
al., 2005). Although downward transport of mesospheric air as low down as 25 km also10
happened in the Arctic winter 2002/2003, the deposition of NOx rich air was consider-
ably lower during this winter (Funke et al., 2005b; Konopka et al., 2007). This was due
to a major stratospheric warming in midwinter which interrupted the downward trans-
port, diluted the vortex air into midlatitudes, and led to conditions without significant
subsidence afterwards. The Arctic vortex in 2003/2004, in contrast, provided again15
favorable conditions for subsidence of mesospheric air into the stratosphere, however,
this time, after a major warming that had taken place at the end of December. The
vortex recovered during the first weeks in January, and developed to an extraordinary
strong vortex (Manney et al., 2005) which produced severe subsidence. The NOx
amounts transported from above and measured in the upper stratosphere by MIPAS20
(Lopez-Puertas et al., 2005a, 2007a) and other instruments (Rinsland et al., 2005a,
Randall et al., 2005) were the highest reported until then, with values up to 1 ppmv in
the upper stratosphere. From MIPAS-CH4 distributions it became obvious that rapid
downward transport, concentrated on a very narrow area under dark polar winter con-
ditions, was the cause for the high NOx amounts in the stratosphere (Lopez-Puertas et25
al., 2007a).
8849
ACPD
7, 8795–8893, 2007
MIPAS instrument
overview
H. Fischer et al.
Title Page
Abstract Introduction
Conclusions References
Tables Figures
◭ ◮
◭ ◮
Back Close
Full Screen / Esc
Printer-friendly Version
Interactive Discussion
EGU
8.8 Trace species and cirrus clouds in the upper troposphere
The investigation of the upper troposphere was not a main objective of the MIPAS in-
strument. However, vertical scans to low altitudes and the utilization of the cloud filter-
ing approach has provided valuable data relevant to the monitoring and distribution of
climate gases, the partitioning of sulphur compounds, and the understanding of ozone5
chemistry and pollution transport (by observing nitric acid and organic compounds).
The MIPAS mission yields measurements on both anthropogenic greenhouse gases,
such as CH4, N2O, and (H)CFCs, and natural greenhouses gases such as H2O and O3.
UTLS CFC-11 and CFC-12 profiles derived from MIPAS have been validated by com-
parison with balloon-borne and airborne in-situ observations (Baehr et al., 2005). After10
validation, CFC-11 has been used to derive Bry close to the tropopause according to
an empirical correlation proposed by Wamsley et al. (1998) and to compare this to BrO
derived from SCIAMACHY (Sinnhuber et al., 2005). HCFC-22 has been retrieved from
MIPAS measurements at altitudes down to 9 km with systematic and random errors
of less than 10% (Moore et al., 2005). Organic compounds are an important com-15
ponent of the troposphere whose concentrations illustrate large-scale influences such
as biomass burning, industrial pollution and convective uplift. The MIPAS instrument
has observed signatures of gases such as ethane which were expected from other
spaceborne observations (e.g. Rinsland et al., 1998; Rinsland et al., 2005b), but has
also provided the first spaceborne measurements of peroxyacetyl nitrate (Allen, 2005;20
Glatthor et al., 2006) and acetone (Remedios et al., 2006) and the first observations of
the spectral signature of formic acid from a satellite instrument (Waterfall et al., 2004)
(Fig. 16). Allen (2005) showed clear indications of enhanced mixing ratios for all these
gases in the vicinity of the East China Sea compared to the Mediterranean, a result of
anthropogenic activities such as biomass burning and industrial development. Glatthor25
and von Clarmann demonstrated that enhanced upper tropospheric mixing ratios of
ethane, PAN, HNO3, and O3 within a plume in the Southern hemisphere in autumn
2003 were due to biomass burning events in South America and Africa (Glatthor et al.,
8850
ACPD
7, 8795–8893, 2007
MIPAS instrument
overview
H. Fischer et al.
Title Page
Abstract Introduction
Conclusions References
Tables Figures
◭ ◮
◭ ◮
Back Close
Full Screen / Esc
Printer-friendly Version
Interactive Discussion
EGU
2006). NH3 plays an important role in formation of tropospheric aerosols; its retriev-
ability from MIPAS spectra has been demonstrated by Burgess et al. (2006b). In the
case of CO, despite the overburden of the high altitude concentration, useful results
have also been obtained in the upper troposphere (Belotti et al., 2006) where the com-
parison with MOPITT measurements (Deeter et al., 2003) shows a general agreement5
together with significant differences due to the complementarity of the two observation
techniques (limb sounding and nadir sounding, respectively). CO retrievals from the
mesosphere down to the middle troposphere as described by Funke et al. (2006) are in
good agreement with observations of other instruments like ACE-FTS or SMR/ODIN.
Finally, Ewen et al. (2005) applied a reverse method Monte-Carlo transfer model to-10
gether with a line-by-line model for radiative transfer to simulate multiple scattering by
ice particles in cirrus clouds. The simulations showed good agreement with MIPAS
spectra of cloudy scenes; in particular, H2O absorption lines which are due to up-
welling tropospheric radiation scattered into the line-of-sight by the cloud ice particles,
first detected in PSC signals (Hopfner et al., 2002), can be simulated.15
8.9 Stratosphere-troposphere exchange
The details of exchange processes between troposphere and stratosphere are not yet
fully understood up to now. MIPAS can contribute to this topic by the global distribu-
tions of water vapour and inert trace species in the upper troposphere and lowermost
stratosphere. SF6 distributions (Burgess et al., 2004b, 2006a; Stiller et al., 2006) allow20
to assess the mean age of stratospheric air, and thus help to validate the modelling of
the Brewer-Dobson circulation in various chemistry transport models (CTMs). Trans-
port of water vapour through the tropical tropopause can be studied in detail based on
high-quality water vapour distributions from MIPAS (Milz et al., 2005). Water vapour in
the tropical lowermost stratosphere in summer (JJA) showed values down to 2.5 ppmv,25
while typical tropospheric vmrs reached higher up in the subtropics, indicating differ-
ent processes of water vapour transport in the tropics and subtropics. In particular,
relatively high water vapour vmrs were found at about 20 km altitude in the Himalayan
8851
ACPD
7, 8795–8893, 2007
MIPAS instrument
overview
H. Fischer et al.
Title Page
Abstract Introduction
Conclusions References
Tables Figures
◭ ◮
◭ ◮
Back Close
Full Screen / Esc
Printer-friendly Version
Interactive Discussion
EGU
region, indicating monsoon activities to be responsible for these (Milz et al., 2005;
Fig. 17). Studies on the details of transport through the tropical tropopause and related
dehydration processes are supported by distributions of HDO in the troposphere and
lowermost stratosphere which can also be derived from MIPAS (Steinwagner et al.,
2005).5
8.10 Influence of solar variability
MIPAS characteristics and its global measurements mode enable us to capture, as with
no other instrument before, the chemical changes in the atmosphere induced by solar
proton events. MIPAS observed after the solar proton event (SPE) in Oct-Nov 2003,
composition changes in the stratosphere and mesosphere in both polar regions for a10
large number of atmospheric species (NO, NO2, O3, HNO3, N2O5, ClONO2, HOCl,
ClO) (Lopez-Puertas et al., 2005a, b; von Clarmann et al., 2005) (Fig. 18).
MIPAS observed very large SPE-induced changes in the NOx concentrations in
the stratosphere and mesosphere in both polar regions, with very large values (up
to 180 ppbv) over the Northern polar cap and a large asymmetry between the North-15
ern (winter) and Southern (summer) polar caps. Arctic mean polar cap (>60◦) NOx
enhancements of 20 to 70 ppbv between 40 to 60 km lasted for at least two weeks,
while the Antarctic mean NOx enhancement was between 10 and 35 ppbv and was
halved after two weeks. Also, ozone showed depletion signatures associated with both
HOx (H+OH+HO2) and NOx enhancements at different time scales from hours (HOx)20
to weeks (NOx). Arctic lower mesospheric (upper stratospheric) ozone was reduced
by 50–70% (30–40%) for about two weeks after the SPEs but a much smaller ozone
depletion was observed over the Antarctic polar cap.
MIPAS also observed significant enhancements of other NOy components such as
HNO3, N2O5, and ClONO2 in the Northern polar stratosphere after the intense solar25
proton events (Lopez-Puertas et al., 2005b). Two distinct enhancements were ob-
served for HNO3: an instantaneous increase of 1–2 ppbv (the origin of which is still
unclear although it seems that the water vapour ion chemistry might play an important
8852
ACPD
7, 8795–8893, 2007
MIPAS instrument
overview
H. Fischer et al.
Title Page
Abstract Introduction
Conclusions References
Tables Figures
◭ ◮
◭ ◮
Back Close
Full Screen / Esc
Printer-friendly Version
Interactive Discussion
EGU
role (Lopez-Puertas et al., 2007a)) and a larger second increase of 1–5 ppbv which
started around 10 November and lasted until the end of December 2003. The sec-
ond event is attributed to the enhanced NOx produced in the mesosphere during the
major SPEs, which was transported downwards in the following months, partially con-
verted to N2O5 in the upper stratosphere, and then finally converted to HNO3 via ion5
cluster reactions (Stiller et al., 2005). N2O5 was also observed to increase by 0.1–
0.4 ppbv one to three days after the major SPE, when the enhancement reached down
to 30 km. A second, more pronounced N2O5 enhancement of up to 1.2 ppbv appeared
at 40 km about 12–13 days after the major SPEs. The HNO3 and N2O5 enhancements
in the Southern hemisphere were generally much less pronounced (Lopez-Puertas et10
al., 2005b).
Besides ozone and NOy, MIPAS observed the impact of the SPEs on the strato-
spheric chlorine chemistry, for the first time ever (von Clarmann et al., 2005). An in-
crease in ClO, HOCl, and ClONO2 was observed, more pronounced over the Arctic
winter polar cap than in the Antarctic. The HOCl increase was pronounced but lasted15
only for about 2 days after the SPEs which is explained by reaction of HOx produced
locally during the SPEs with HCl. Increased vmrs of ClO and HOCl were spatially anti-
correlated indicating that missing HOCl production was not restricted by available ClO.
This also confirms that chlorine was provided from HCl for the production of ClO and
HOCl. The increase of ClONO2, starting later but lasting longer than the other chlo-20
rine species, indicates that a persistent change in the chlorine reservoir partitioning
between HCl and ClONO2 was caused by the SPEs.
8.11 Observation of Non-LTE effects
MIPAS has several advantages which makes it a very suitable instrument for studying
the atmospheric non-local thermodynamic equilibrium (Non-LTE) emissions. Reasons25
are its wide spectral coverage, allowing for measuring emissions from a given com-
pound in different spectral regions, its high spectral resolution, enabling the discrim-
ination of emissions from different species and between different bands of the same
8853
ACPD
7, 8795–8893, 2007
MIPAS instrument
overview
H. Fischer et al.
Title Page
Abstract Introduction
Conclusions References
Tables Figures
◭ ◮
◭ ◮
Back Close
Full Screen / Esc
Printer-friendly Version
Interactive Discussion
EGU
species, and its high sensitivity allowing to measure the emission in the upper atmo-
sphere where Non-LTE emissions are most important. All this has led MIPAS to provide
us with significant improvements in our knowledge of Non-LTE atmospheric emissions
of which we include here a succinct list.
MIPAS has provided the first evidence of CH4 (v4) Non-LTE emissions in the meso-5
sphere (Lopez-Puertas et al., 2005d). Regarding the Non-LTE processes in CO2, the
high spectral resolution of MIPAS has allowed to derive new collisional rates between
the CO2 0201, 0221, and 1001 states that emit the 4.3µm second hot bands, which dif-
fer by factors of 3.5 and 0.025, respectively, from previously consensus values (Lopez-
Puertas et al., 2005c) (Fig. 19).10
Concerning Non-LTE in O3, a preliminary analysis of MIPAS spectra in the 2080–
2130 cm−1
region has shown that current Non-LTE models underestimate the MIPAS
daytime radiance by a factor of 2–3 in the 60–70 km region (Fig. 19). Possible rea-
sons for this discrepancy are that O3is formed at lower vibrational levels, and/or the
collisional relaxation of the stretching (v1, v3) is weaker (Kaufmann et al., 2006).15
MIPAS has also taken the most unequivocal spectra of H2O in the mesosphere,
clearly demonstrating the distinct Non-LTE daytime emissions from the fundamental
and hot bands at 6.3µm. Furthermore, it has provided the most accurate collisional
rate for the relaxation of H2O(020) by O2, with a value of 1.36×10⁻¹²
cm3
s−1
with a
10% uncertainty (Koukouli et al., 2006, 20072), and the rate of quenching of O2(1)20
by atomic oxygen O(3P) measured by Kalogerakis et al. (2005) has been further con-
firmed.
In addition, MIPAS has given the first experimental confirmation of the Non-LTE
processes exciting the NO(2) level, emitting near 5.3µm, in the daytime stratosphere
(Funke et al., 2005a) as proposed by Kaye and Kumer (1987). MIPAS has also resolved25
the NO rotational and spin transitions in the 5.3µm emission in the thermosphere, both
2Koukouli, M. E., Lopez-Puertas, M., Funke, B., Gil-Lopez, G., Kaufmann, M., Milz, M., von
Clarmann, T., and Stiller, G. P.: Water vapour 6.3 µm non-local thermodynamic equilibrium
emissions as measured by MIPAS/ENVISAT, in preparation, 2007.
8854
ACPD
7, 8795–8893, 2007
MIPAS instrument
overview
H. Fischer et al.
Title Page
Abstract Introduction
Conclusions References
Tables Figures
◭ ◮
◭ ◮
Back Close
Full Screen / Esc
Printer-friendly Version
Interactive Discussion
EGU
under quiescent and geomagnetically perturbed conditions. A preliminary analysis has
confirmed previous spin temperatures (Gardner et al., 2005).
MIPAS has also made possible to throw light on the puzzle about whether or not the
NO2(v3) levels are Non-LTE excited in the daytime stratosphere. A recent analysis has
shown (Funke et al., 2005a) that the photochemical excitation of NO2(v3=1–4) levels5
is a factor of 50 smaller than previously thought, leading to small Non-LTE deviations
for these levels.
Finally, measurements of the Non-LTE emissions of the carbon monoxide first hot
band, CO(2-1) near 4.7µm (Fig. 19) and of N2O(001) near 4.5µm have also been
observed by MIPAS by the first time (Funke et al., 2007; Lopez-Puertas et al., 2007b).10
9 Conclusions and outlook
MIPAS provides global measurements of mid-infrared spectra of high quality for
the determination of temperature and more than 25 trace constituents as well as
aerosol/cloud parameters during day and night. The pole-to-pole measurements allow
to investigate the Arctic and the Antarctic areas with extraordinary good data coverage.15
The operational MIPAS data processing of ESA generates global distributions of tem-
perature and six key species (O3, H2O, CH4, N2O, NO2, HNO3) while scientific data
processing has already proven that many more trace gases can be derived from the
mid-infrared spectra (NO, N2O5, HNO4, ClONO2, ClO, HOCl, CO, CFCs, NH3, OCS,
SO2, SF6, PAN, HCN, C2H6, C2H2, H2O2, HDO, O3 isotopologues). Furthermore, the20
MIPAS broad-band spectra can be used for the determination of aerosol parameters
(polluted atmosphere) and concentration, mean radius, and composition of cloud par-
ticles (PSCs, cirrus).
The data quality of MIPAS results is generally good as is shown in various articles
of this ACP Special Issue and many other articles on validation of products as gener-25
ated by scientific MIPAS data processors. This statement is supported by the findings
of three ESA Aptmospheric Chemistry Validation of ENVISAT (ACVE)-Workshops in
8855
ACPD
7, 8795–8893, 2007
MIPAS instrument
overview
H. Fischer et al.
Title Page
Abstract Introduction
Conclusions References
Tables Figures
◭ ◮
◭ ◮
Back Close
Full Screen / Esc
Printer-friendly Version
Interactive Discussion
EGU
December 2002, May 2004, and December 2006.
Many interesting results have already been achieved from MIPAS measurements.
They include contributions to a better understanding of atmospheric processes like
pollution of the upper troposphere, troposphere-stratosphere exchange, chemistry and
dynamics of the stratosphere, stratospheric ozone depletion, downward transport from5
the mesosphere into the stratosphere, interaction between varying solar radiation and
atmospheric composition, and Non-LTE. Although MIPAS was designed as an instru-
ment for research purposes, the data have also been used by ECMWF for testing their
influence on weather forecast. Due to the positive outcome ECMWF is interested in
receiving MIPAS NRT data in the future.10
Due to certain problems with the constant movement of the retroreflectors of the in-
terferometer, the measurements of MIPAS have been performed with reduced spectral
resolution and a reduced duty cycle since the beginning of 2005. The spectral reso-
lution is reduced to 40% which in turn allows for a higher spatial resolution (vertically
and horizontally). The duty cycle has been reduced to about 35% in 2005. Neverthe-15
less, MIPAS is detecting in this mode more than 500 profiles of various atmospheric
parameters on an average every day. More recently it has been recognized that the
problems with the moving retroreflectors are decreasing. Therefore the duty cycle is
increased step-by-step to currently 60% (May 2007), following the recommendations
of the MIPAS Science Team.20
A new generation model of the MIPAS instrument is already in development for fu-
ture missions. The IMK (Institute for Meteorology and Climate Research)/Karlsruhe
in cooperation with the ICG (Institut fur Chemie und Dynamik der Geosphare)/Julich
has built up a FTIR with a two-dimensional detector array (128×128 elements, Friedl-
Vallon et al., 2006, Riese et al., 2005) in the laboratory. A corresponding instrument25
for aircraft application is being developed. This kind of instrument offers the chance
to perform future spectral IR measurements with considerably higher spatial resolution
and better coverage in the atmosphere. A similar instrument – the so-called IMIPAS
(Imaging MIPAS) – has been proposed in 2006 for an ESA Earth Explorer Mission and
8856
ACPD
7, 8795–8893, 2007
MIPAS instrument
overview
H. Fischer et al.
Title Page
Abstract Introduction
Conclusions References
Tables Figures
◭ ◮
◭ ◮
Back Close
Full Screen / Esc
Printer-friendly Version
Interactive Discussion
EGU
has been selected for a currently running prephase A study. It is expected that the new
IMIPAS will be able to yield essentially improved data for the investigation of mesoscale
processes in the atmosphere like the stratosphere-troposphere exchange.
Acknowledgements. We gratefully acknowledge the large effort of ESA to build and operate the
MIPAS experiment aboard ENVISAT and to provide MIPAS Level 1 and Level 2 data. Meteoro-5
logical analyses have been provided by ECMWF. The IMK team has been supported by several
EC and BMBF projects. The IAA team was supported by the Spanish project ESP2004-01556
and EC FEDER funds. The Leicester team was supported by grants from the UK Natural En-
vironment Research Council and from ESA. Many more scientist and engineers from various
institutions have contributed to the MIPAS experiment; their aid is greatly acknowledged.10
References
Allen, G.: The Infrared Remote Sensing of Peroxyacetyl Nitrate in the Upper Troposphere,
Ph.D. thesis, University of Leicester, 2005.
Andrews, A. E., Boering, K. A., Dauble, B. C., Wofsy, S. C., Loewenstein, M., Jost, H., Podolske,
J. R., Webster, C. R., Herman, R. L., Scott, D. C., Flesch, G. J., Moyer, E. J., Elkins, J.W.,15
Dutton, G. S., Hurst, D. F., Moore, F. L., Ray, E. A., Romashkin, P. A., and Strahan, S. E.:
Mean ages of stratospheric air derived from in situ observations of CO2, CH4, and N2O, J.
Geophys. Res., 106(D23), 32 295–32 314, 2001.
Baehr, J., Volk, C. M., Ivanova, E., Werner, A., Wetter, T., Engel, A., Haase, H.-P., Moebius,
T., Schmidt, U., Stiller, G., von Clarmann, T., Glatthor, N., Kellmann, S., Grunow, K., and20
Levin, I.: Validation of MIPAS-ENVISAT CH4, N2O, CFC-11, and CFC-12 by Airborne in situ
Observations, in: Proc. of the 2004 ENVISAT and ERS Symposium, edited by: Lacoste,
H. and Ouwehand, L., 6–10 September 2004, Salzburg, Austria, (ESA SP-572, April 2005)
CD-ROM, ISBN 92-9092-883-2, ISSN 1609-042X, 2005.
Belotti, C., Carli, B., Ceccherini, S., Del Bianco, S., Jin, J., and Raspollini, P.: Retrieval of tro-25
pospheric Carbon Monoxide from MIPAS measurements, Proc. of the Atmospheric Science
Conference- ESA ESRIN, May 2006 (http://earth.esa.int/cgi-bin/confatmos06.pl?abstract=
388, 2006.
Brizzi, G., Carlotti, M., Flaud, J.-M., Perrin, A., and Ridolfi, M.: First observation of H15NO3
8857
ACPD
7, 8795–8893, 2007
MIPAS instrument
overview
H. Fischer et al.
Title Page
Abstract Introduction
Conclusions References
Tables Figures
◭ ◮
◭ ◮
Back Close
Full Screen / Esc
Printer-friendly Version
Interactive Discussion
EGU
in atmospheric spectra, Geophys. Res. Lett., 34(3), L03802, doi:10.1029/2006GL028395,
2006.
Burgess, A. B., Grainger, R. G., and Dudhia, A.: Progress in the retrieval of sulphur species
from MIPAS, ESA: ENVISAT-ERS Symposium Proceedings (SP-572), 2004a.
Burgess, A. B., Grainger, R. G., Dudhia, A., Payne, V. H., and Jay, V. H.: MI-5
PAS Measurement of Sulphur Hexafluoride (SF6), Geophys. Res. Lett., 31(5), L07809,
doi:10.1029/2003GL019143, 2004b.
Burgess, A. B., Grainger, R. G., and Dudhia, A.: Zonal mean atmospheric distribution of sulphur
hexafluoride (SF6), Geophys. Res. Lett., 33, L07809, doi:10.1029/2005GL025410, 2006a.
Burgess, A. B., Dudhia, A., Grainger, R. G., and Stevenson, D.: Progress in tropospheric10
ammonia retrieval from the MIPAS satellite instrument, Adv. Space Res., 37, 12, 2218–2221,
2006b.
Carli, B., Alpaslan, D., Carlotti, M., Castelli, E., Ceccherini, S., Dinelli, B. M., Dudhia, A., Flaud,
J.-M., Hopfner, M., Jay, V., Magnani, L., Oelhaf, H., Payne, V., Piccolo, C., Prosperi, M.,
Raspollini, P., Remedios, J., Ridolfi, M., and Spang, R.: First results of MIPAS/ENVISAT15
with operational Level 2 code, Adv. Space Res., 33, 7, 1012–1019, doi:10.1016/S0273-
1177(03)00584-2, 2004.
Carlotti, M.: Global-fit approach to the analysis of limb-scanning atmospheric measurements,
Appl. Opt., 27, 3250–3254, 1988.
Carlotti, M., Dinelli, B. M., Raspollini, P., and Ridolfi, M.: Geo-fit approach to the analysis of20
limb-scanning satellite measurements, Appl. Opt., 40(12), 1872–1885, 2001.
Carlotti, M., Brizzi, G., Papandrea, E., Prevedelli, M., Ridolfi, M., Dinelli, B. M., and Magnani,
L.: GMTR: two-dimensional multi-target retrieval model for MIPAS/ENVISAT observations,
Appl. Opt., 45(4), 716–727, 2006.
Cortesi, U., Lambert, J. C., De Clercq, C., Bianchini, G., Blumenstock, T, Bracher, A., Castelli,25
E., Catoire, V., Chance, K. V., De Maziere, M., Demoulin, P., Godin-Beekmann, S., Jones,
N., Jucks, K., Keim, C., Kerzenmacher, T., Kuellmann, H., Kuttippurath, J., Iarlori, M., Liu, G,
Y., Liu, Y., McDermid, I. S., Meijer, Y. J., Mencaraglia, F., Mikuteit, S., Oelhaf, H., Piccolo, C.,
Pirre, M., Raspollini, P., Ravegnani, F., Reburn, W. J., Redaelli, G., Remedios, J. J., Sembhi,
H., Smale, D., Steck, T., Taddei, A., Varotsos, C., Vigouroux, C., Waterfall, A., Wetzel, G,30
and Wood, S.: Geophysical validation of MIPAS-ENVISAT operational ozone data, Atmos.
Chem. Phys. Discuss., 7, 5805–5939, 2007,
http://www.atmos-chem-phys-discuss.net/7/5805/2007/.
8858

ACPD
7, 8795–8893, 2007
MIPAS instrument
overview
H. Fischer et al.
Title Page
Abstract Introduction
Conclusions References
Tables Figures
◭ ◮
◭ ◮
Back Close
Full Screen / Esc
Printer-friendly Version
Interactive Discussion
EGU
Davies, S., Mann, G. W., Carslaw, K. S., Chipperfield, M. P., Remedios, J. J., Allen, G., Wa-
terfall, A. M., Spang, R., and Toon, G. C.: Testing our understanding of Arctic denitrification
using MIPAS-E satellite measurements in winter 2002/2003, Atmos. Chem. Phys., 6, 3149–
3161, 2006,
http://www.atmos-chem-phys.net/6/3149/2006/.5
Deeter, M. N., Emmons, L. K., Francis, G. L., Edwards, D. P., Gille, J. C., Warner, J. X.,
Khattatov, B., Ziskin, D., Lamarque, J.-F., Ho, S.-P., Yudin, V., Attie, J.-L., Packman, D.,
Chen, J., Mao, D., and Drummond, J. R.: Operational carbon monoxide retrieval algo-
rithm and selected results for the MOPITT instrument, J. Geophys. Res., 108(D14), 4399,
doi:10.1029/2002JD003186, 2003.10
Dethof, A.: Monitoring of retrievals from the MIPAS and SCIAMACHY instruments on board
ENVISAT, Contract Report to the European Space Agency, European Centre for Medium-
Range Weather Forecasts, December 2003, available from http://www.ecmwf.int, 2003.
Dinelli, B. M., Alpaslan, D., Carlotti, M., Magnani, L., and Ridolfi, M.: Multi-target retrieval
(MTR): the simultaneous retrieval of pressure, temperature and volume mixing ratio profiles15
from limb-scanning atmospheric measurements, J. Quant. Spectrosc. Radiat. Transf., 84,
141–157, 2003.
Dudhia, A., Jay, V. L., and Rodgers, C. D.: Microwindow selection for high-spectral-resolution
sounders, Appl. Opt., 41, 3665–3673, 2002a.
Dudhia, A, Morris, P. E., and Wells, R. J.: Fast monochromatic radiative transfer calculations20
for limb sounding, J. Quant. Spectrosc. Radiat. Transfer, 74, 745–756, 2002b.
Dudhia, A.: MIPAS Orbital Retrieval using Sequential Estimation, see websites: http://www.
atm.ox.ac.uk/MORSE/ and http://www.atm.ox.ac.uk/MORSE/plan.html, 2005.
Ewen, G. B. L., Grainger, R. G., Lambert, A., and Baran, A. J.: Infrared radiative transfer
modelling in a 3D scattering cloudy atmosphere: Application to limb sounding measurements25
of cirrus, J. Quant. Spectrosc. Radiat. Transf., 96, 45–74, 2005.
Farmer, C. B., Raper, O. F., and O’Callaghan, F. G.: Final Report on the First Flight of the
ATMOS instrument during the Spacelab 8 mission, JPL Publication, 82–87, 1987.
Feng, W., Chipperfield, M. P., Roscoe, H. K., Remedios, J. J., Waterfall, A. M., Stiller, G. P.,
Glatthor, N., Hopfner, M., and Wang, D.-Y.: Three-Dimensional Model Study of the Antarctic30
Ozone Hole in 2002 and Comparison with 2000, J. Atmos. Sci., 62(3), 822–837, 2005.
Fischer, H. and Oelhaf, H.: Remote sensing of vertical profiles of atmospheric trace con-
stituents with MIPAS limb-emission spectrometers, Appl. Opt., 35, 2787–2796, 1996.
8859

ACPD
7, 8795–8893, 2007
MIPAS instrument
overview
H. Fischer et al.
Title Page
Abstract Introduction
Conclusions References
Tables Figures
◭ ◮
◭ ◮
Back Close
Full Screen / Esc
Printer-friendly Version
Interactive Discussion
EGU
Fischer, H., Blom, C., Oelhaf, H., Carli, B., Carlotti, M., Delbouille, L., Ehhalt, D., Flaud, J.-
M., Isaksen, I., Lopez-Puertas, M., McElroy, C. T., and Zander, R.: ENVISAT-MIPAS, the
Michelson Interferometer for Passive Atmospheric Sounding; An instrument for atmospheric
chemistry and Climate Research, ESA SP-1229, C. Readings and R. A. Harris, eds., Euro-
pean Space Agency, Noordwijk, The Netherlands, 2000.5
Flaud, J.-M., Perrin, A., Orphal, J., Qingli K., Flaud, P.-M., Dutkiewicz, Z., and Piccolo, C.:
New analysis of the v5+ v9 - v9 hot band of HNO3, J. Quant. Spectrosc. Radiat. Transf., 77,
355–364, 2003a.
Flaud, J.-M., Wagner, G., Birk, M., Camy-Peyret, C., Claveau, C., De Backer-Barilly, M. R.,
Barbe, A., and Piccolo, C.: The Ozone absorption around 10 mm, J. Geophys. Res., 108(D9),10
4269, doi:10.1029/2002JD002755, 2003b.
Flaud, J.-M., Piccolo, C., Carli, B., Perrin, A., Coudert, L. H., Teffo, J.-L., and Brown, L. R.:
Molecular line parameters for the MIPAS (Michelson Interferometer for Passive Atmospheric
Sounding) experiment, J. Atmos. and Ocean Opt., 16, 172–182, 2003c.
Flaud, J.-M., Brizzi, G., Carlotti, M., Perrin, A., and Ridolfi, M.: MIPAS database: Validation of15
HNO3 line parameters using MIPAS satellite measurements, Atmos. Chem. Phys., 6, 5037–
5048, 2006,
http://www.atmos-chem-phys.net/6/5037/2006/.
Friedl-Vallon, F., Maucher, G., Seefeldner, M., Trieschmann, O., Kleinert, A., Lengel, A., Keim,
C., Oelhaf, H., and Fischer, H.: Design and characterization of the balloon-borne Michelson20
Interferometer for Passive Atmospheric Sounding (MIPAS-B2), Appl. Opt., 43, 3335–3355,
2004.
Friedl-Vallon, F., Riese, M., Maucher, G., Lengel, A., Hase, F., Preusse, P., and Spang, R.:
Instrument concept and preliminary performance analyses of GLORIA, Adv. Space Res.,
37(12), 2287–2291, 2006.25
Funke, B., Lopez-Puertas, M., von Clarmann, T., Stiller, G. P., Fischer, H., Glatthor, N.,
Grabowski, U., Hopfner, M:, Kellmann, S., Kiefer, M., Linden, A., Mengistu-Tsidu, G.,
Milz, M., Steck, T., and Wang, D.-J.: Retrieval of stratospheric NOx from 5.3 and 6.2µm
Non-LTE emissions measured by MIPAS on ENVISAT, J. Geophys. Res., 110, D09302,
doi:10.1029/2004JD005225, 2005a.30
Funke, B., Lopez-Puertas, M., Gil-Lopez, S., von Clarmann, T., Stiller, G., Kellmann, S., and
Fischer, H.: Downward transport of upper atmospheric NOx into the polar stratosphere and
lower mesosphere during the Antarctic 2003 and Arctic 2002/2003 winters, J. Geophys. Res.,
8860
ACPD
7, 8795–8893, 2007
MIPAS instrument
overview
H. Fischer et al.
Title Page
Abstract Introduction
Conclusions References
Tables Figures
◭ ◮
◭ ◮
Back Close
Full Screen / Esc
Printer-friendly Version
Interactive Discussion
EGU
110, D24308, doi:10.1029/2005JD006463, 2005b.
Funke, B.: for the MIPAS team: Carbon monoxide measurements from MIPAS on ENVISAT,
Geophys. Res. Abstracts, 8, 10642, SRef-ID:1607-7962/gra/EGU06-A-10642, 2006.
Funke, B., Lopez-Puertas, M., Bermejo-Pantaleon, D., von Clarmann, T., Stiller, G. P., Hopfner,
M., Grabowski, U., and Kaufmann, M.: Analysis of non-local thermodynamic equilibrium CO5
4.7µm fundamental, isotopic and hot band emissions measured by the Michelson Interfer-
ometer for Passive Atmospheric Sounding on Envisat, J. Geophys. Res., 12(D11), D11305,
doi:10.1029/2006JD028539, 2007.
Gardner, J. L., Lopez-Puertas, M., Funke, B., Miller, S. M., Lipson, S. J., and Sharma,
R. D.: Rotational and spin-orbit distributions of NO observed by MIPAS/ENVISAT dur-10
ing the solar storm of October/November 2003, J. Geophys. Res., 110, A09S34,
doi:10.1029/2004JA010937, 2005.
Glatthor, N., von Clarmann, T., Fischer, H., Grabowski, U., Hopfner, M., Kellmann, S., Kiefer,
M., Linden, A., Milz, M., Steck, T., Stiller, G. P., Mengistu Tsidu, G., Wang, D.-Y., and Funke,
B.: Spaceborne ClO observations by the Michelson Interferometer for Passive Atmospheric15
Sounding (MIPAS) before and during the Antarctic major warming in September/October
2002, J. Geophys. Res., 109(D11), D11307, doi:10.1029/2003JD004440, 2004.
Glatthor, N., von Clarmann, T., Fischer, H., Funke, B., Grabowski, U., Hopfner, M., Kellmann,
S., Kiefer, M., Linden, A., Milz, M., Steck, T., Stiller, G. P., Mengistu Tsidu, G., and Wang, D.-
Y.: Mixing processes during the Antarctic vortex split in September/October 2002 as inferred20
from source gas and ozone distributions from MIPAS/ENVISAT, J. Atm. Sci., Special issue
on Antarctic Vortex, 62(3), 787–800, 2005.
Glatthor, N., von Clarmann, T., Fischer, H., Funke, B., Grabowski, U., Hopfner, M., Kell-
mann, S., Kiefer, M., Linden, A., Milz, M., Steck, T., and Stiller, G.: Retrieval of peroxy-
acetylnitrate (PAN) in the upper troposphere from MIPAS level-1B spectra, Poster presen-25
tation, Atmospheric Science Conference, ESRIN, Frascati, 8–12 May 2006, available online
http://earth.esa.int/cgi-bin/confatmos06.pl?abstract=865, 2006.
Greenhough, J., Remedios, J. J., Sembhi, H., and Kramer, L. J.: Towards cloud detection and
cloud frequency distributions from MIPAS infra-red observations, Adv. Space Res., 36(5),
800–806, doi:10.1016/j.asr.2005.04.096, 2005.30
Gunson, M. R., Abbas, M. M., Abrams, M. C., Allen, M., Brown, L. R., Brown, T. L., Chang,
A. Y., Goldman, A., Irion, F. W., Lowes, L. L., Mahieu, E., Manney, G. L., Michelsen, H.
A., Newchurch, M. J., Rinsland, C. P., Salawitch, R. J., Stiller, G. P., Toon, G. C., Yung,
8861
ACPD
7, 8795–8893, 2007
MIPAS instrument
overview
H. Fischer et al.
Title Page
Abstract Introduction
Conclusions References
Tables Figures
◭ ◮
◭ ◮
Back Close
Full Screen / Esc
Printer-friendly Version
Interactive Discussion
EGU
Y. L., and Zander, R.: The Atmospheric Trace Molecule Spectroscopy (ATMOS) experiment:
Deployment on the ATLAS Space Shuttle missions, Geophys. Res. Lett., 23(17), 2333–2336,
1996.
Hoffmann, L., Spang, R., Kaufmann, M., and Riese, M.: Retrieval of CFC-11 and CFC-12 from
ENVISAT MIPAS observations by means of rapid radiative transfer calculations, Adv. Space5
Res., 36(5), 915–921, 2005.
Hopfner, M., Oelhaf, H., Wetzel, G., Friedl-Vallon, F., Kleinert, A., Lengel, A., Maucher,
G., Nordmeyer, H., Glatthor, N., Stiller, G., von Clarmann, T., and Fischer, H.: Ev-
idence of scattering of tropospheric radiation by PSCs in mid-IR limb emission spec-
tra: MIPAS-B observations and KOPRA simulations, Geophys. Res. Lett., 29(8), 1278,10
doi:10.1029/2001GL014443, 2002.
Hopfner, M., von Clarmann, T., Fischer, H., Glatthor, N., Grabowski, U., Kellmann, S., Kiefer, M.,
Linden, A., Mengistu Tsidu, G., Milz. M., Steck, T., Stiller, G. P., Wang, D.-Y., and Funke, B.:
First spaceborne observations of Antarctic stratospheric ClONO2 recovery: Austral spring
2002, J. Geophys. Res., 109, D11308, doi:10.1029/2004JD004609, 2004a.15
Hopfner, M.: Study on the impact of polar stratospheric clouds on high resolution mid-IR limb
emission spectra, J. Quant. Spectrosc. Radiat. Transfer, 83(1), 93–107, doi:10.1016/S0022-
4073(02)00299-6, 2004b.
Hopfner, M. and Emde, C.: Comparison of single and multiple scattering approaches for the
simulation of limb-emission observations in the mid-IR, J. Quant. Spectrosc. Radiat. Transfer,20
91(3), 275–285, doi:10.1016/j.jqsrt.2004.05.066, 2005.
Hopfner, M., Luo, B. P., Massoli, P., Cairo, F., Spang, R., Snels, M., Di Donfrancesco, G., Stiller,
G., von Clarmann, T., Fischer, H., and Biermann, U.: Spectroscopic evidence for NAT, STS,
and ice in MIPAS infrared limb emission measurements of polar stratospheric clouds, Atmos.
Chem. Phys., 6, 1201–1219, 2006a.25
Hopfner, M., Larsen, N., Spang, R., Luo, B. P., Ma, J., Svendsen, S. H., Eckermann, S. D.,
Knudsen, B., Massoli, P., Cairo, F., Stiller, G., von Clarmann, T., and Fischer, H.: MIPAS
detects Antarctic stratospheric belt of NAT PSCs caused by mountain waves, Atmos. Chem.
Phys., 6, 1221–1230, 2006b.
Jacquinet-Husson, N., Scott, N. A., Chedin, A., Garceran, K., Armante, R., Chursin, A .A.,30
Barbe, A., Birk, M., Brown, L. R., Camy-Peyret, C., Claveau, C., Clerbaux, C., Coheur,
P. F., Dana, V., Daumont, L., Debacker-Barilly, M. R., Flaud, J.-M., Goldman, A., Ham-
douni, A., Hess, M., Jacquemart, D., Kopke, P., Mandin, J. Y., Massie, S., Mikhailenko,
8862

ACPD
7, 8795–8893, 2007
MIPAS instrument
overview
H. Fischer et al.
Title Page
Abstract Introduction
Conclusions References
Tables Figures
◭ ◮
◭ ◮
Back Close
Full Screen / Esc
Printer-friendly Version
Interactive Discussion
EGU
S., Nemtchinov, V., Nikitin, A., Newnham, D., Perrin, A., Perevalov, V. I., Regalia-Jarlot, L.,
Rublev, A., Schreier, F., Schult, L., Smith, K. M., Tashkun, S. A., Teffo, J. L., Toth, R. A.,.
Tyuterev, VL. G, Vander Auwera, J., Varanasi, P., and Wagner, G.: The 2003 edition of the
GEISA/IASI spectroscopic database, J. Quant. Spectrosc. Radiat. Transfer, 95, 429–467,
doi:10.1016/j.jqsrt.2004.12.004, 2005.5
Juckes, M. N.: Evaluation of MIPAS ozone fields assimilated using a new algorithm constrained
by isentropic tracer advection, Atmos. Chem. Phys., 6, 1549–1565, 2006,
http://www.atmos-chem-phys.net/6/1549/2006/.
Kalogerakis, K. S., Copeland, R. A., and Slanger, T. G.: Measurement of the rate coefficient for
collisional removal of O2(X3Σ−
g , υ = 1) + O(3P), J. Chem. Phys., 123, 194–303, 2005.10
Kaye, J. A. and Kumer, J. B.: Nonlocal thermodynamic equilibrium effects in stratospheric NO
and implications for infrared remote sensing, Appl. Opt., 26(22), 4747–4754, 1987.
Kaufmann, M., Gil-Lopez, S., Funke, B., Garcıa-Comas, M., Koukouli, M. E., Lopez-Puertas,
M., Glatthor, N., Grabowski, U., Hopfner, M., Stiller, G. P., von Clarmann, T., and Riese,
M.: Vibrationally excited ozone in the middle atmosphere, J. Atmos. Sol. Terr. Phys.,15
doi:10.1016/j.jastp.2005.10.006, 68, 202–212, 2006.
Keim, C., Blom, C. E.; von der Gathen, P., Gulde, T., Hopfner, M., Liu, G. Y., Oulanovski,
A., Piesch, C., Ravegnani, F., Sartorius, C., Schlager, H., and Volk, C. M.: Validation of
MIPAS-ENVISAT by correlative measurements of MIPAS-STR. Proc. ACVE-2 meeting, 3-7
May 2004, Frascati, Italy, ESA SP-562, 2004.20
Kiefer, M., von Clarmann, T., Grabowski, U., De Laurentis, M., Mantovani, R., Milz, M., and
Ridolfi, M.: Characterization of MIPAS elevation pointing, Atmos. Chem. Phys., 7, 1615–
1628, 2007,
http://www.atmos-chem-phys.net/7/1615/2007/.
Kleinert, A., Aubertin, G., Perron, G., Birk, M., Wagner, G., Hase, F., Nett, H., and Poulin, R.:25
MIPAS Level 1B Algorithms Overview: Operational Processing And Characterization, Atmos.
Chem. Phys., 7, 1395–1406, 2007,
http://www.atmos-chem-phys.net/7/1395/2007/.
Koukouli, M. E., Lopez-Puertas, M., Gil-Lopez, S., Funke, B., and Milz, M.: for the IAA/IMK
MIPAS/ENVISAT team: Water vapour profiles and Non-LTE parameters from its mesospheric30
emissions derived from MIPAS/ENVISAT, Geophys. Res. Abstracts, 8, 03303, SRef-ID: 1607-
7962/gra/EGU06-A-03303, 2006.
Konopka, P., Engel, A., Funke, B., Mueller, R., Grooss, J.-U. ,Guenther, G., Wetter, T., Stiller,
8863
ACPD
7, 8795–8893, 2007
MIPAS instrument
overview
H. Fischer et al.
Title Page
Abstract Introduction
Conclusions References
Tables Figures
◭ ◮
◭ ◮
Back Close
Full Screen / Esc
Printer-friendly Version
Interactive Discussion
EGU
G., von Clarmann, T., Glatthor, N., Oelhaf, H., Wetzel, G., Lopez-Puertas, M., Pirre, M.,
Huret, N., and Riese, M.: Ozone loss driven by nitrogen oxides and triggered by strato-
spheric warmings can outweigh the effect of halogens, J. Geophys. Res., 112, D05105,
doi:10.1029/2006JD007064, 2007.
Kouker, W.: Towards the Prediction of Stratospheric Ozone (TOPOZ III), EC Contract No EVK2-5
CT-2001-00102, Scientific Report, 2005.
Kramer, L. J.: Sensitivity of the MIPAS instrument on ENVISAT to the detection of Polar Strato-
spheric Clouds, M. Phil. thesis, University of Leicester, 2004.
Levenberg, K.: A method for the solution of certain problems in least squares, Quart. Appl.
Math. 2, 164–168, 1944.10
Lahoz, W. A., Geer, A. J., Bekki, S., Bormann, N., Ceccherini, S., Elbern, H., Errera, Q., Eskes,
H. J., Fonteyn, D., Jackson, D. R., Khattatov, B., Massart, S., Peuch, V.-H., Rharmili, S.,
Ridolfi, M., Segers, A., Talagrand, O., Thornton, H. E., Vik, A. F., and von Clarmann, T.: The
Assimilation of ENVISAT data (ASSET) project, Atmos. Chem. Phys. Discuss., 6, 12 769–
12 824, 2006.15
Lopez-Puertas, M. and Taylor, F. W.: Non-LTE Radiative Transfer in the Atmosphere, Series
on Atmospheric, Oceanic and Planetary Physics, Vol. 3, World Scientific Publishing Co. Pte.
Ltd., ISBN 981-02-4566-1, 2001.
Lopez-Puertas, M., Funke, B., Gil-Lopez, S., von Clarmann, T., Stiller, G. P., Kellmann, S.,
Fischer, H., and Jackman, C. H.: Observation of NOx Enhancement and Ozone Depletion20
in the Northern and Southern hemispheres after the October-November 2003 Solar Proton
Events, J. Geophys. Res., 110, A09S43, doi:10.1029/2005JA011050, 2005a.
Lopez-Puertas, M., Funke, B., Gil-Lopez, S., von Clarmann, T., Stiller, G. P., Hopfner, M., Kell-
mann, S., Mengistu Tsidu, G., Fischer, H., and Jackman, C. H.: HNO3, N2O5 and ClONO2
Enhancements after the October-November 2003 Solar Proton Events, J. Geophys. Res.,25
110, A09S44, doi:10.1029/2005JA011051, 2005b.
Lopez-Puertas, M., Funke, B., Gil-Lopez, S., Lopez-Valverde, M. A., von Clarmann, T., Fis-
cher, H., Oelhaf, H., Stiller, G., Kaufmann, M., Koukouli, M. E., and Flaud, J.-M.: Atmo-
spheric non-Local Thermodynamic Equilibrium Emissions as Observed by the Michelson
Interferometer for Passive Atmospheric Sounding (MIPAS), C. R. Physique, 8, 848–863,30
doi:10.1016/j.crhy.2005.07.012, 2005c.
Lopez-Puertas, M., Koukouli, M. E., Funke, B., Gil-Lopez, S., Glatthor, N., Grabowski,
U., von Clarmann, T., and Stiller, G. P.: Evidence for CH4 7.6 µm non-local ther-
8864
ACPD
7, 8795–8893, 2007
MIPAS instrument
overview
H. Fischer et al.
Title Page
Abstract Introduction
Conclusions References
Tables Figures
◭ ◮
◭ ◮
Back Close
Full Screen / Esc
Printer-friendly Version
Interactive Discussion
EGU
modynamic equilibrium emission in the mesosphere, Geophys. Res. Lett., 32, L04805,
doi:10.1029/2004GL021641, 2005d.
Lopez-Puertas, M., Funke, B., Gil-Lopez, S., von Clarmann, T., Fischer, H., Glatthor, N.,
Grabowski, U., Hopfner, M., Kellmann, S., Kiefer, M., Linden, A., Milz, M., Reddmann, T.,
Steck, T., Stiller, G. P., and Sinnhuber, M.: Composition Changes Caused by the 2003 Solar5
Storm: MIPAS Measurements and Model Simulations, ENVISAT Atmosp. Sci. Conf., ESRIN,
Frascati, 2006.
Lopez-Puertas, M., Funke, B., Bermejo-Pantaleon, D., von Clarmann, T. Stiller, G. P.,
Grabowski, U., and Hopfner, M.: Evidence for N2O v3 4.5µm non-local thermody-
namic equilibrium emission in the atmosphere, Geophys. Res. Lett., 34(2), L02825,10
doi:10.1029/2006GL028539, 2007b.
Lopez-Puertas, M., Funke, B., von Clarmann, T., Fischer, H., and Stiller, G.: The stratospheric
and mesospheric NOy in the 2002–2004 polar winters as measured by MIPAS/ENVISAT,
Space Sci. Rev., 125, 403–416, doi:10.1007/s11214-006-9073-2, 2007a.
Lopez-Valverde, M. A., Lopez-Puertas, M., Remedios, J. J., Rodgers, C. D., Taylor, F. W., Zipf,15
E. C., and Erdman, P. W.: Validation of Measurements of Carbon Monoxide from the Im-
proved Stratospheric and Mesospheric Sounder, J. Geophys. Res., 101, 9929–9955, 1996.
Manney, G. L., Sabutis, J. L., Allen, D. R., Lahoz, W. A., Scaife, A. A., Randall, C. E., Pawson,
S., Naujokat, B., and Swinbank, R.: Simulations of Dynamics and Transport During the
September 2002 Antarctic Major Warming, J. Atmos. Sci., 62(3), 690–707, 2005.20
McKee, T. B., Whitman, R. I., and Lambiotte Jr., J. J.: A technique to infer atmospheric water-
vapor mixing ratio from measured horizon radiance profiles, NASA TN D-5252, 1969.
Mencaraglia, F., Bianchini, G., Boscaleri, A., Carli, B., Ceccherini, S., Raspollini, P., Per-
rin, A., and Flaud, J.-M.: Validation of MIPAS satellite measurements of HNO3 using
comparison of rotational and vibrational spectroscopy, J. Geophys. Res., 110, D19305,25
doi:1029/2005JD006099, 2006.
Mengistu Tsidu, G., von Clarmann, T., Stiller, G., Hopfner, M., Fischer, H., Funke, B., Glatthor,
N., Grabowski, U., Hopfner, M., Kellmann, S., Kiefer, M., Linden, A., Milz, M., Steck, T., and
Wang, D.-Y.: Stratospheric N2O5 in the Austral Spring 2002 as retrieved from limb emis-
sion spectra recorded by the Michelson Interferometer for Passive Atmospheric Sounding30
(MIPAS), J. Geophys. Res., 109, D18301, doi:10.1029/2004JD004856, 2004.
Mengistu Tsidu, G., Stiller, G. P., von Clarmann, T., Funk,e, B., Fischer, H., Glatthor, N.,
Grabowski, U., Hopfner, M., Kellmann, S., Kiefer, M., Linden, A., Milz, M., Steck, T., and
8865

ACPD
7, 8795–8893, 2007
MIPAS instrument
overview
H. Fischer et al.
Title Page
Abstract Introduction
Conclusions References
Tables Figures
◭ ◮
◭ ◮
Back Close
Full Screen / Esc
Printer-friendly Version
Interactive Discussion
EGU
Wang, D.-Y.: NOy from Michelson Interferometer for Passive Atmospheric Sounding on Envi-
ronmental Satellite during the Southern Hemisphere Polar Vortex Split in September/October
2002, J. Geophys. Res., 110(D11), D11301, doi:10.1029/2004JD005322, 2005.
Menke, W.: Geophysical Data Analysis: Discrete Inverse Theory, Academic, San Diego, Cali-
fornia, 1984.5
Milz, M., von Clarmann, T., Fischer, H., Glatthor, N., Grabowski, U., Hopfner, M., Kellmann,
S., Kiefer, M., Linden, A., Mengistu Tsidu, G., Steck, T., Stiller, G. P., Funke, B., and Lopez-
Puertas, M.: Water vapour distributions Measured with the Michelson Interferometer for Pas-
sive Atmospheric Sounding on board ENVISAT (MIPAS/ENVISAT), J. Geophys. Res., 110,
D24307, doi:10.1029/2005JD005973, 2005.10
Moore, D. P.: Measurements of HCFC-22 in the upper troposphere and lower stratosphere from
the MIPAS-E instrument, Ph.D. thesis, University of Leicester, 2005.
Moore, D. P., Waterfall, A. M., and Remedios, J. J.: The potential for radiometric retrievals of
halocarbon concentrations from the MIPAS-E instrument, Adv. Space Res., 37(12), 2238–
2246, 2006.15
Nedoluha, G. E., Bevilacqua, R. M., Gomez, R. M., Hicks, B. C., Russell III, J. M., and Connor,
B.: Ground-based microwave observations of middle atmospheric water vapour in the 1990s,
in Atmospheric Science Across the Stratopause, edited by: Siskind, D. E., Eckermann, S. D.,
Summers, M. E., et al., Am. Geophys. Union, Geophys. Monograph 123, 257–270, 2000.
Papandrea, E., Dudhia, A., Grainger, R. G., Vancassel, X., and Chipperfield, M. P.: Retrieval of20
Hydrogen Peroxide (H2O2) Profiles using ENVISAT-MIPAS, Geophys. Res. Lett., 32, L14809,
doi:10.1029/2005GL022870, 2005.
Randall, C. E., Harvey, V. L., Manney, G. L., et al.: Stratospheric effects of energetic particle
precipitation in 2003–2004, Geophys. Res. Lett., 32, L05802, doi:10.1029/2004GL022003,
2005.25
Raspollini, P., Belotti, C., Burgess, A., Carli, B., Carlotti, M., Ceccherini, S., Dinelli, B. M.,
Dudhia, A., Flaud, J.-M., Funke, B., Hopfner, M., Lopez-Puertas, M., Payne, V., Piccolo,
C., Remedios, J. J., Ridolfi, M., and Spang, R.: MIPAS level 2 operational analysis, Atmos.
Chem. Phys., 6, 5605–5630, 2006,
http://www.atmos-chem-phys.net/6/5605/2006/.30
Remedios, J. J., Allen, G., and Waterfall, A. M.: Infra-red remote sensing of organic compounds
in the upper troposphere, Proceedings of the ESA Atmospheric Science Conference, ESRIN,
Rome, May 2006.
8866
ACPD
7, 8795–8893, 2007
MIPAS instrument
overview
H. Fischer et al.
Title Page
Abstract Introduction
Conclusions References
Tables Figures
◭ ◮
◭ ◮
Back Close
Full Screen / Esc
Printer-friendly Version
Interactive Discussion
EGU
Ridolfi, M., Carli, B., Carlotti, M., von Clarmann, T., Dinelli, B. M., Dudhia, A., Flaud, J.-M.,
Hopfner, M., Morris, P. E., Raspollini, P., Stiller, G., and Wells, R. J.: Optimized forward model
and retrieval scheme for MIPAS near-real-time data processing, Appl. Opt., 39, 1323–1340,
2000.
Ridolfi, M., Alpaslan. D., Carli, B., Carlotti, M., Castelli, E., Ceccherini, S., Dinelli, B. M., Dudhia.5
A., Flaud, J.-M., Hopfner, M., Jay, V., Magnani, L., Oelhaf, H., Payne, V., Piccolo, C., Prosperi,
M., Raspollini, P., Remedios, J. J., and Spang, R.: MIPAS level 2 processor performance
and verification, in Proceedings of the ENVISAT Validation Workshop of European Space
Research Institute, 9–13 November 2002, ESRIN, Frascati, Italy, ESA SP-531 (http://envisat.
esa.int/pub/ESA DOC/envisat val 1202/proceedings/), 2002.10
Ridolfi, M., Magnani, L., Carlotti, M., and Dinelli, B. M.: MIPAS-ENVISAT limb-sounding mea-
surements: Trade-of study for improvement of horizontal resolution, Appl. Opt., 43(31),
5814–5824, 2004.
Ridolfi, M., Blum, U., Carli, B., Catoire, V., Ceccherini, S., Claude, H., De Clercq, C., Fricke, K.
H., Friedl-Vallon, F., Iarlori, M., Keckhut, P., Kerridge, B., Lambert, J.-C., Meijer, Y. J., Mona,15
L, Oelhaf, H., Pappalardo, G., Pirre, M., Rizi, V., Robert, C., Swart, D., von Clarmann, T.,
Waterfall, A., and Wetzel, G.: Geophysical validation of temperature retrieved by the ESA
processor from MIPAS/ENVISAT atmospheric limb-emission measurements, Atmos. Chem.
Phys. Discuss., 7, 5439–5513, 2007,
http://www.atmos-chem-phys-discuss.net/7/5439/2007/.20
Riese, M., Friedl-Vallon, F., Spang, R., Preusse. P., Schiller, C., Hoffmann, L., Konopka, P.,
Oelhaf, H., von Clarmann, T, and Hopfner, M.: GLObal limb Radiance Imager for the Atmo-
sphere (GLORIA): Scientific objectives, Adv. Space Res., 36(5), 989–995, 2005.
Rinsland, C. P., Gunson, M. R., Wang, P. H., et al.: ATMOS/ATLAS3 infrared profile measure-
ments of trace gases in the November 1994 tropical and subtropical upper troposphere, J.25
Quant. Spectrosc. Radiat. Transf., 60, 891–901, 1998.
Rinsland C. P., Boone, C., Nassar, R., Walker, K., Bernath, P., McConnell, J. C., and Chiou, L.:
Atmospheric Chemistry Experiment (ACE) Arctic stratospheric measurements of NOx during
February and March 2004: Impact of intense solar flares, Geophys. Res. Lett., 32, L16S05,
doi:10.1029/2005GL022425, 2005a.30
Rinsland C. P., Dufour, G., Boone, C. D., Bernath, P. F., and Chiou, L.: Atmospheric Chemistry
Experiment (ACE) measurements of elevated Southern Hemisphere upper tropospheric CO,
C2H6, HCN, and C2H2 mixing ratios from biomass burning emissions and long-range trans-
8867

ACPD
7, 8795–8893, 2007
MIPAS instrument
overview
H. Fischer et al.
Title Page
Abstract Introduction
Conclusions References
Tables Figures
◭ ◮
◭ ◮
Back Close
Full Screen / Esc
Printer-friendly Version
Interactive Discussion
EGU
port, Geophys. Res. Lett., 32, L20803, doi:10.1029/2005GL024214, 2005b.
Rodgers C. D.: Retrieval of atmospheric temperature and composition from remote measure-
ments of thermal radiation. Rev. Geophys. Space Phys., 14(4), 609–624, 1976.
Rodgers, C. D.: Inverse methods for atmospheric sounding – Theory and practise, edited by:
Taylor, F. W., World Scientific, Singapore, 2000.5
Rothman, L. S., Jacquemart, D., Barbe, A., Benner, D. C., Birk, M., Brown, L. R., Carleer, M.
R., Chackerian, C., Chance, K., Coudert, L. H., Dana, V., Devi, V. M., Flaud, J. M., Gamache,
R. R., Goldman, A., Hartmann, J. M., Jucks, K. W., Maki, A. G., Mandin, J. Y., Massie, S.
T., Orphal, J., Perrin, A., Rinsland, C. P., Smith, M. A. H., Tennyson, J., Tolchenov, R. N.,
Toth, R. A., Vander Auwera, J., Varanasi, P., and Wagner, G.: The HITRAN 2004 molecular10
spectroscopic database, J. Quantitative Spectroscopy Radiative Transfer, 96(2), 139–204,
doi:10.1016/j.jqsrt.2004.10.008, 2005.
Schwinger, J., Elbern, H., and Botchorishvili, R.: A new 4-dimensional variational assimila-
tion system applied to ENVISAT MIPAS observation, Proc. of the 2004 ENVISAT and ERS
Symposium, 6–10 September 2004, Salzburg, Austria, (ESA SP-572, April 2005) CD-ROM,15
ISBN 92-9092-883-2, ISSN 1609-042X, 2005.
Sinnhuber, B.-M., Rozanov, A., Sheode, N., Afe, O. T., Richter, A., Sinnhuber, M., Wittrock,
F., Burrows, J. P., Stiller, G. P., von Clarmann, T., and Linden, A.: Global observations of
stratospheric bromine monoxide from SCIAMACHY, Geophys. Res. Lett., 32(20), L20810,
doi:10.1029/2005GL023839, 2005.20
Siskind, D. E., Eckerman, S. D., and Summers, M. E. (Eds.): Atmospheric Science Across the
Stratopause, Am. Geophys. Union, Geophys. Monograph 123, Washington, 2000.
Sivia, D. S.: Data analysis, A Bayesian tutorial, Clarendon Press, Oxford, 1998.
Smith, A. K. and Marsh, D. R.: Processes that account for the ozone maximum at the
mesopause, J. Geophys. Res., 110, D23305, doi:10.1029/2005JD006298, 2005.25
Spang, R., and Remedios, J. J.: Observations of a distinctive infra-red spectral feature in the
atmospheric spectra of polar stratospheric clouds measured by the CRISTA instrument, Geo-
phys. Res. Lett., 30(16), 1875, doi:10.1029/2003GL017231, 2003.
Spang, R., Remedios, J. J., and Barkley, M. P.: Colour indices for the detection and differenti-
ation of cloud types in infra-red limb emission spectra, Adv. Space Res., 33(7), 1041–1047,30
2004.
Spang, R., Remedios, J. J., Kramer, L. J., Poole, L. R., Fromm, M. D., Muller, M., Baumgarten,
G., and Konopka, P.: Polar stratospheric cloud observations by MIPAS on ENVISAT: detec-
8868

ACPD
7, 8795–8893, 2007
MIPAS instrument
overview
H. Fischer et al.
Title Page
Abstract Introduction
Conclusions References
Tables Figures
◭ ◮
◭ ◮
Back Close
Full Screen / Esc
Printer-friendly Version
Interactive Discussion
EGU
tion method, validation and analysis of the northern hemisphere winter 2002/2003, Atmos.
Chem. Phys., 5, 679–692, 2005a.
Spang, R., Remedios, J. J., Tilmes, S., and Riese, M.: MIPAS observations of Polar Strato-
spheric Clouds in the Arctic 2002/3 and Antarctic 2003 winters, Adv. Space Res., 36, 868–
878, 2005b.5
Steck, T. and von Clarmann, T.: Constrained Profile Retrieval Applied to the Observation Mode
of the Michelson Interferometer for Passive Atmospheric Sounding, Appl. Opt., 40(21), 3559–
3571, 2001.
Steck, T., Hopfner, M., von Clarmann, T., and Grabowski, U.: Tomographic retrieval of atmo-
spheric parameter from infrared limb emission observations, Appl. Opt., 44(16), 3291–3301,10
2005.
Steinwagner, J., Rockmann, T., Glatthor, N., Grabowski, U., Hopfner, M., Stiller, G., and
von Clarmann, T.: Global distribution of water isotopes retrieved from MIPAS measure-
ments, Poster presentation at 7th Atmospheric Spectroscopy Application Colloquium, Reims,
France, 6–8 September, 2005.15
Stiller, G. P. (Editor) with contributions from von Clarmann, T., Dudhia, A., Echle, G., Funke, B,
Glatthor, N.,. Hase, F, Hopfner, M, Kellmann, S, Kemnitzer, H., Kuntz, M., Linden, A., Linder,
M., Stiller, G. P., and Zorn, S.: The Karlsruhe Optimized and Precise Radiative transfer
Algorithm (KOPRA), Forschungszentrum Karlsruhe, Wissenschaftliche Berichte, Bericht Nr.
6487, 2000.20
Stiller, G. P., Mengistu Tsidu, G., von Clarmann, T., Glatthor, N., Hopfner, M., Kellmann, S.,
Linden, A., Ruhnke, R., Fischer, H., Lopez-Puertas, M., Funke, B., and Gil-Lopez, S.: An
enhanced HNO3 second maximum in the Antarctic mid-winter upper stratosphere 2003, J.
Geophys. Res., 110, D20303, doi:10.1029/2005JD006011, 2005.
Stiller, G. P., von Clarmann, T., Fischer, H., Funke, B., Glatthor, N., Grabowski, U., Hopfner, M.,25
Kellmann, S., Kiefer, M., Linden, A., Lopez-Puertas, M., Milz, M., Reddmann, T., Steck, T.,
and Uhl, R.: Mean age of stratospheric air as derived from MIPAS/ENVISAT SF6 distribu-
tions, Geophys. Res. Abstracts, 8, 03450, SRef-ID: 1607-7962/gra/EGU06-A-03450, 2006.
Stiller, G. P., von Clarmann, T., Bruhl, Ch., Fischer, H., Funke, B., Glatthor, N., Grabowski, U.,
Hopfner, M., Jockel, P., Kellmann, S., Kiefer, M., Linden, A., Lopez-Puertas, M., Mengistu30
Tsidu, G., Milz, M., Steck, T., and Steil, B.: Global distributions of HO2NO2 as observed by
the Michelson Interferometer for Passive Atmospheric Sounding (MIPAS), J. Geophys. Res.,
112, D09314, doi:10.1029/2006JD007212, 2007.
8869
ACPD
7, 8795–8893, 2007
MIPAS instrument
overview
H. Fischer et al.
Title Page
Abstract Introduction
Conclusions References
Tables Figures
◭ ◮
◭ ◮
Back Close
Full Screen / Esc
Printer-friendly Version
Interactive Discussion
EGU
Tikhonov, A.: On the solution of incorrectly stated problems and method of regularization, Dokl.
Akad. Nauk. SSSR, 153(3), 501–504, 1963a.
Tikhonov, A.: On the regularization of incorrectly stated problems, Dokl. Akad. Nauk. SSSR,
153(1), 49-52, 1963b.
von Clarmann, T. and Echle, G.: Selection of Optimized Microwindows for Atmospheric Spec-5
troscopy, Appl. Opt., 37 (33), 7661–7669, 1998.
von Clarmann, T., Glatthor, N., Grabowski, U., Hopfner, M., Kellmann, S., Kiefer, M., Linden,
A., Mengistu Tsidu, G., Milz, M., Steck, T., Stiller, G. P., Wang, D.-Y., Fischer, H., Funke, B.,
Gil-Lopez, S., and Lopez-Puertas, M.: Retrieval of temperature and tangent altitude pointing
from limb emission spectra recorded from space by the Michelson Interferometer for Pas-10
sive Atmospheric Sounding (MIPAS), J. Geophys. Res., 108, doi:10.1029/2003JD003602,
2003a.
von Clarmann, T., Chidiezie Chineke, T., Fischer, H., Funke, B., Garcia-Comas, M., Gil-Lopez,
S., Glatthor, N., Grabowski, U., Hopfner, M., Kellmann, S., Kiefer, M., Linden, A., Lopez-
Puertas, M., Lopez-Valverde, M. A., Mengistu Tsidu, G., Milz, M., Steck, T., and Stiller, G. P.:15
Remote Sensing of the Middle Atmosphere with MIPAS, in: Remote Sensing of Clouds and
the Atmosphere VII, K. Schafer, O. Lado-Bordowsky, edited by: Comeron, A. and Picard, R.
H., Proceedings of SPIE Vol. 4882, SPIE, Bellingham, WA, USA, 172–183, 2003b.
von Clarmann, T., Hopfner, M., Funke, B., Lopez-Puertas, M., Dudhia, A., Jay, V., Schreier,
F., Ridolfi, M., Ceccherini, S., Kerridge, B., Reburn, J., Siddans, R., and Flaud, J.-M.: Mod-20
elling of atmospheric mid-infrared radiative transfer: the AMIL2DA algorithm intercomparison
experiment, J. Quant. Spectrosc. Radiat. Transf., 78(3–4), 381–407, 2003c.
von Clarmann, T., Glatthor, N., Hopfner, M., Kellmann, S., Ruhnke, R., Stiller, G. P., Fischer, H.,
Funke, B., Gil-Lopez, S., and Lopez-Puertas, M.: Experimental evidence of perturbed odd
hydrogen and chlorine chemistry after the October 2003 solar proton events, J. Geophys.25
Res., 110(A9), A09S45, doi:10.1029/2005JA011053, 2005.
von Clarmann, T., Glatthor, N., Grabowski, U., Hopfner, M., Kellmann, S., Linden, A., Mengistu
Tsidu, G., Milz, M., Steck, T., Stiller, G. P., Fischer, H., and Funke, B.: Global stratospheric
HOCl distributions retrieved from infrared limb emission spectra recorded by the Michelson
Interferometer for Passive Atmospheric Sounding (MIPAS), J. Geophys. Res., 111, D05311,30
doi:10.1029/2005JD005939, 2006a.
von Clarmann, T.: Validation of remotely sensed profiles of atmospheric state variables: strate-
gies and terminology, Atmos. Chem. Phys., 6, 4311–4320, 2006b.
8870

ACPD
7, 8795–8893, 2007
MIPAS instrument
overview
H. Fischer et al.
Title Page
Abstract Introduction
Conclusions References
Tables Figures
◭ ◮
◭ ◮
Back Close
Full Screen / Esc
Printer-friendly Version
Interactive Discussion
EGU
Wamsley, P. R., Elkins, J. W., Fahey, D. W., et al.: Distribution of halon-1211 in the upper
troposphere and lower stratosphere and the 1994 total bromine budget, J. Geophys. Res.,
103(D1), 1513–1526, 1998.
Wang, D.-Y., von Clarmann, T., Fischer, H., Funke, B., Gil-Lopez, S., Glatthor, N., Grabowski,
U., Hopfner, M., Kaufmann, M., Kellmann, S., Kiefer, M., Koukouli, M. E., Linden, A., Lopez-5
Puertas, M., Mengistu Tsidu, G., Milz, M., Steck, T., Stiller, G. P. , Simmons, A. J., Dethof,
A., Swinbank, R., Marquardt, C., Jiang, J. H., Romans, L. J., Wickert, J., Schmidt, T., Russell
III, J., and Remsberg, E.: Validation of stratospheric temperatures measured by MIPAS on
ENVISAT, J. Geophys. Res., 110(D8), D08301, 10.1029/2004JD005342, 2005a.
Wang, D.-Y., von Clarmann, T., Fischer, H., Funke, B., Garcıa-Comas, M., Gil-Lopez, S.,10
Glatthor, N., Grabowski, U., Hopfner, M., Kellmann, S., Kiefer, M., Linden, A., Lopez-
Puertas, M., Lopez-Valverde, M. A., Mengistu Tsidu, G., Milz, M., Steck, T., and Stiller,
G. P.: Longitudinal variations of temperature and ozone profiles observed by MIPAS during
the Antarctic Stratosphere Sudden Warming of 2002, J. Geophys. Res., 110(D20), D20101,
doi:10.1029/2004JD005749, 2005b.15
Wang, D. Y., Hopfner, M., Blom, C. E., Ward, W. E., Fischer, H., Blumenstock, T., Hase, F., Keim,
C., Liu, G. Y., Mikuteit, S., Oelhaf, H., Wetzel, G., Cortesi, U., Mencaraglia, F., Bianchini, G.,
Redaelli, G., Pirre, M., Catoire, V., Huret, N., Vigouroux, C., De Maziere, M., Mahieu, E.,
Demoulin, P., Wood, S., Smale, D., Jones, N., Nakajima, H., Sugita, T., Urban, J., Murtagh,
D., Boone, C. D., Bernath, P. F., Walker, K. A., Kuttippurath, J., Kleinbohl, A., Toon, G., and20
Piccolo, C.: Validation of MIPAS HNO3 operational data, Atmos. Chem. Phys. Discuss., 7,
5173–5251, 2007,
http://www.atmos-chem-phys-discuss.net/7/5173/2007/.
Waterfall, A. M., Remedios, J. J., Allen, G., and Sembhi, H.: Infrared remote sensing of organic
compounds in the upper troposphere, Proceedings of the ENVISAT Symposium, Salzburg,25
September, 2004.
Weatherhead, E. C. and Andersen, S. B.: The search for science of recovery of the ozone layer,
Nature, 441, 39–45, doi:10.1038/nature04746, 2006.
Wetzel, G., Bracher, A., Funke, B., Goutail, F., Hendrick, F., Lambert J.-C., Mikuteit, S., Piccolo,
C., Pirre, M., Bazureau, A., Belotti, C., Blumenstock, T., De Maziere, M., Fischer, H., Huret,30
N., Ionov, D., Lopez-Puertas, M., Maucher, G., Oelhaf, H., Pommereau, J.-P., Ruhnke, R.,
Sinnhuber, M., Stiller, G., Van Roozendael, M., and Zhang, G.: Validation of MIPAS-ENVISAT
NO2 operational data, Atmos. Chem. Phys. Discuss., 7, 3333–3395, 2007,
8871

ACPD
7, 8795–8893, 2007
MIPAS instrument
overview
H. Fischer et al.
Title Page
Abstract Introduction
Conclusions References
Tables Figures
◭ ◮
◭ ◮
Back Close
Full Screen / Esc
Printer-friendly Version
Interactive Discussion
EGU
http://www.atmos-chem-phys-discuss.net/7/3333/2007/.
8872
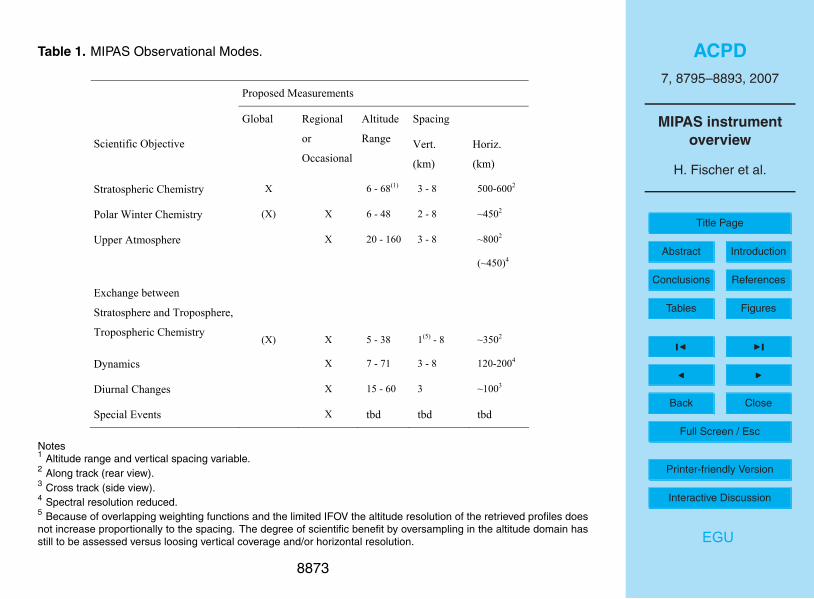
ACPD
7, 8795–8893, 2007
MIPAS instrument
overview
H. Fischer et al.
Title Page
Abstract Introduction
Conclusions References
Tables Figures
◭ ◮
◭ ◮
Back Close
Full Screen / Esc
Printer-friendly Version
Interactive Discussion
EGU
Table 1. MIPAS Observational Modes.
Proposed Measurements
Spacing
Scientific Objective
Global Regional
or
Occasional
Altitude
Range Vert.
(km)
Horiz.
(km)
Stratospheric Chemistry X 6 - 68(1) 3 - 8 500-6002
Polar Winter Chemistry (X) X 6 - 48 2 - 8 ~4502
Upper Atmosphere X 20 - 160 3 - 8 ~8002
(~450)4
Exchange between
Stratosphere and Troposphere,
Tropospheric Chemistry
(X)
X
5 - 38
1(5) - 8
~3502
Dynamics X 7 - 71 3 - 8 120-2004
Diurnal Changes X 15 - 60 3 ~1003
Special Events X tbd tbd tbd
Notes1
Altitude range and vertical spacing variable.2
Along track (rear view).3
Cross track (side view).4
Spectral resolution reduced.5
Because of overlapping weighting functions and the limited IFOV the altitude resolution of the retrieved profiles doesnot increase proportionally to the spacing. The degree of scientific benefit by oversampling in the altitude domain hasstill to be assessed versus loosing vertical coverage and/or horizontal resolution.
8873
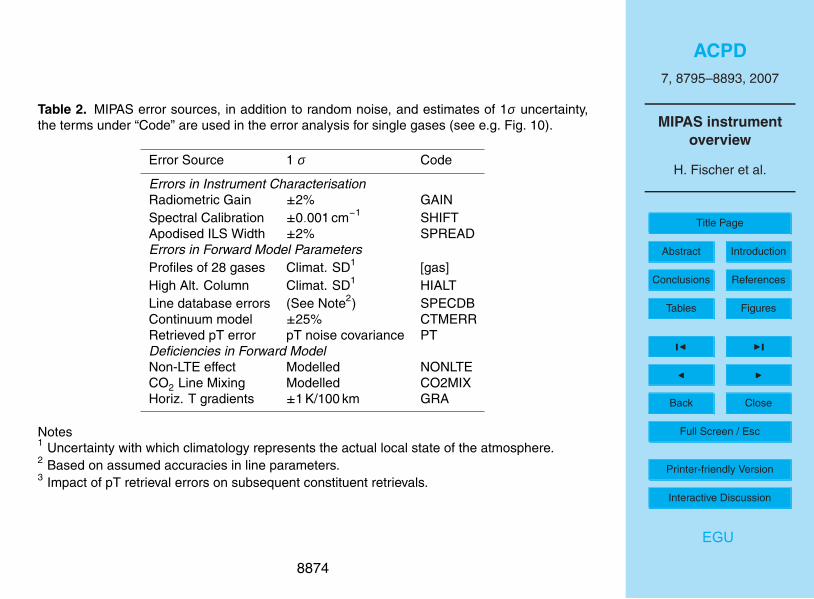
ACPD
7, 8795–8893, 2007
MIPAS instrument
overview
H. Fischer et al.
Title Page
Abstract Introduction
Conclusions References
Tables Figures
◭ ◮
◭ ◮
Back Close
Full Screen / Esc
Printer-friendly Version
Interactive Discussion
EGU
Table 2. MIPAS error sources, in addition to random noise, and estimates of 1σ uncertainty,
the terms under “Code” are used in the error analysis for single gases (see e.g. Fig. 10).
Error Source 1 σ Code
Errors in Instrument Characterisation
Radiometric Gain ±2% GAIN
Spectral Calibration ±0.001 cm−1
SHIFT
Apodised ILS Width ±2% SPREAD
Errors in Forward Model Parameters
Profiles of 28 gases Climat. SD1
[gas]
High Alt. Column Climat. SD1
HIALT
Line database errors (See Note2) SPECDB
Continuum model ±25% CTMERR
Retrieved pT error pT noise covariance PT
Deficiencies in Forward Model
Non-LTE effect Modelled NONLTE
CO2 Line Mixing Modelled CO2MIX
Horiz. T gradients ±1 K/100 km GRA
Notes1
Uncertainty with which climatology represents the actual local state of the atmosphere.2
Based on assumed accuracies in line parameters.3
Impact of pT retrieval errors on subsequent constituent retrievals.
8874
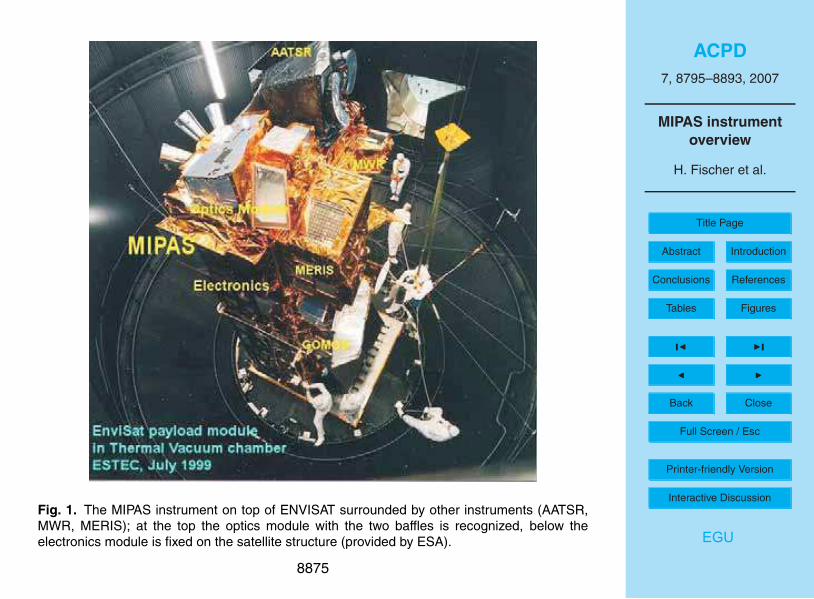
ACPD
7, 8795–8893, 2007
MIPAS instrument
overview
H. Fischer et al.
Title Page
Abstract Introduction
Conclusions References
Tables Figures
◭ ◮
◭ ◮
Back Close
Full Screen / Esc
Printer-friendly Version
Interactive Discussion
EGU
Fig. 1. The MIPAS instrument on top of ENVISAT surrounded by other instruments (AATSR,
MWR, MERIS); at the top the optics module with the two baffles is recognized, below the
electronics module is fixed on the satellite structure (provided by ESA).
8875
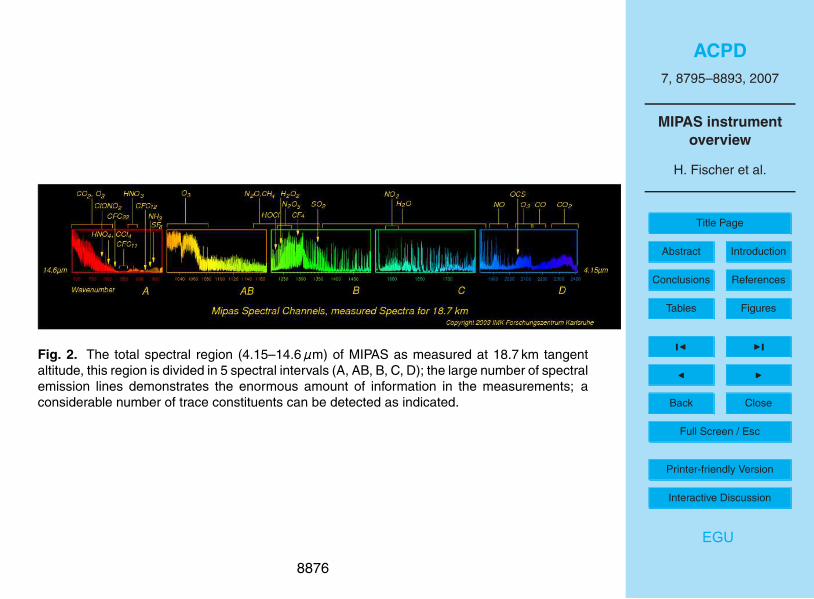
ACPD
7, 8795–8893, 2007
MIPAS instrument
overview
H. Fischer et al.
Title Page
Abstract Introduction
Conclusions References
Tables Figures
◭ ◮
◭ ◮
Back Close
Full Screen / Esc
Printer-friendly Version
Interactive Discussion
EGU
Fig. 2. The total spectral region (4.15–14.6µm) of MIPAS as measured at 18.7 km tangent
altitude, this region is divided in 5 spectral intervals (A, AB, B, C, D); the large number of spectral
emission lines demonstrates the enormous amount of information in the measurements; a
considerable number of trace constituents can be detected as indicated.
8876
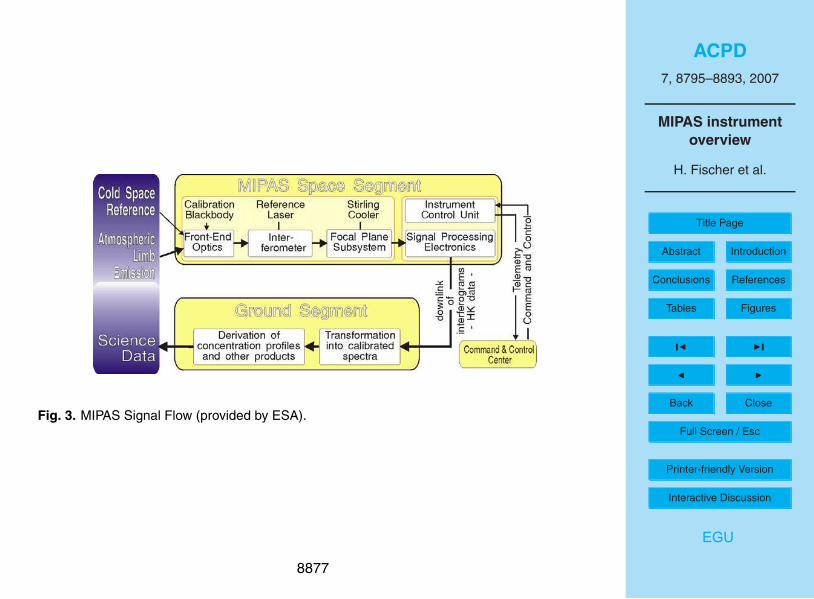
ACPD
7, 8795–8893, 2007
MIPAS instrument
overview
H. Fischer et al.
Title Page
Abstract Introduction
Conclusions References
Tables Figures
◭ ◮
◭ ◮
Back Close
Full Screen / Esc
Printer-friendly Version
Interactive Discussion
EGU
Fig. 3. MIPAS Signal Flow (provided by ESA).
8877
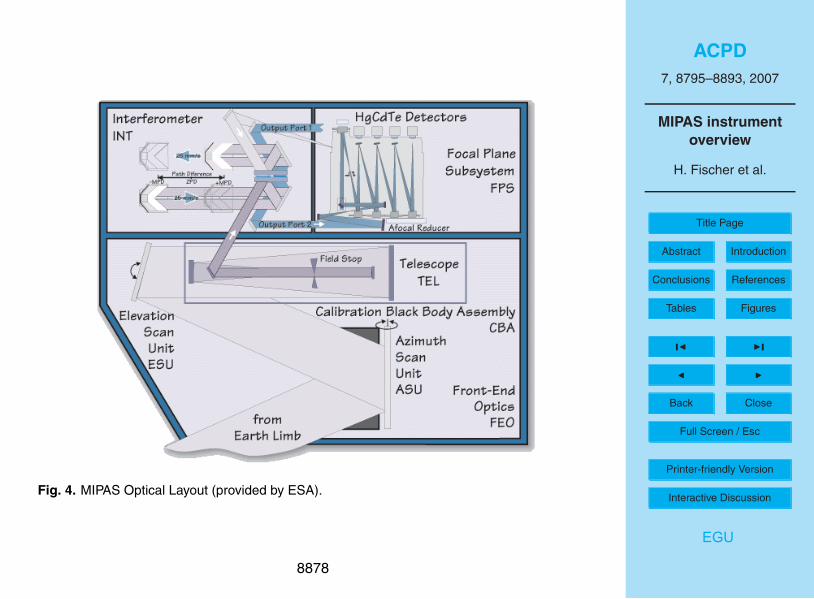
ACPD
7, 8795–8893, 2007
MIPAS instrument
overview
H. Fischer et al.
Title Page
Abstract Introduction
Conclusions References
Tables Figures
◭ ◮
◭ ◮
Back Close
Full Screen / Esc
Printer-friendly Version
Interactive Discussion
EGU
Fig. 4. MIPAS Optical Layout (provided by ESA).
8878
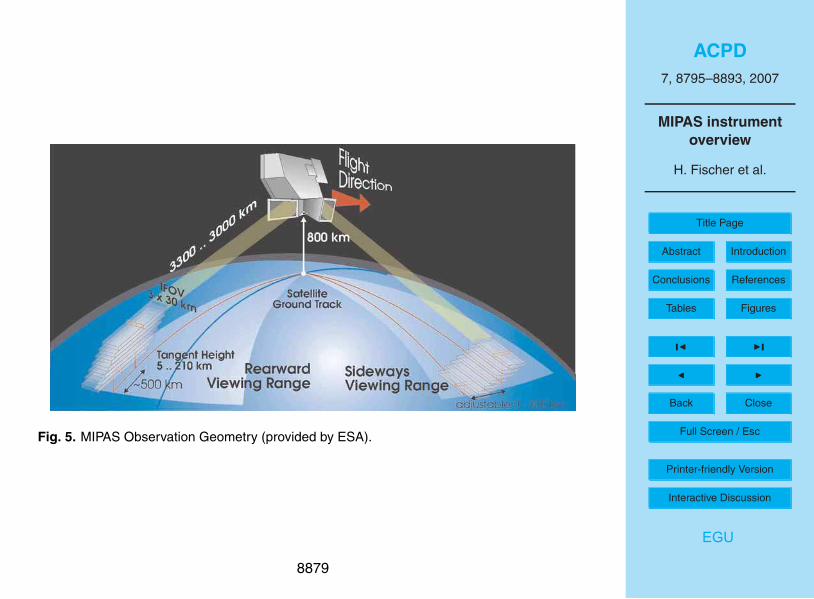
ACPD
7, 8795–8893, 2007
MIPAS instrument
overview
H. Fischer et al.
Title Page
Abstract Introduction
Conclusions References
Tables Figures
◭ ◮
◭ ◮
Back Close
Full Screen / Esc
Printer-friendly Version
Interactive Discussion
EGU
Fig. 5. MIPAS Observation Geometry (provided by ESA).
8879
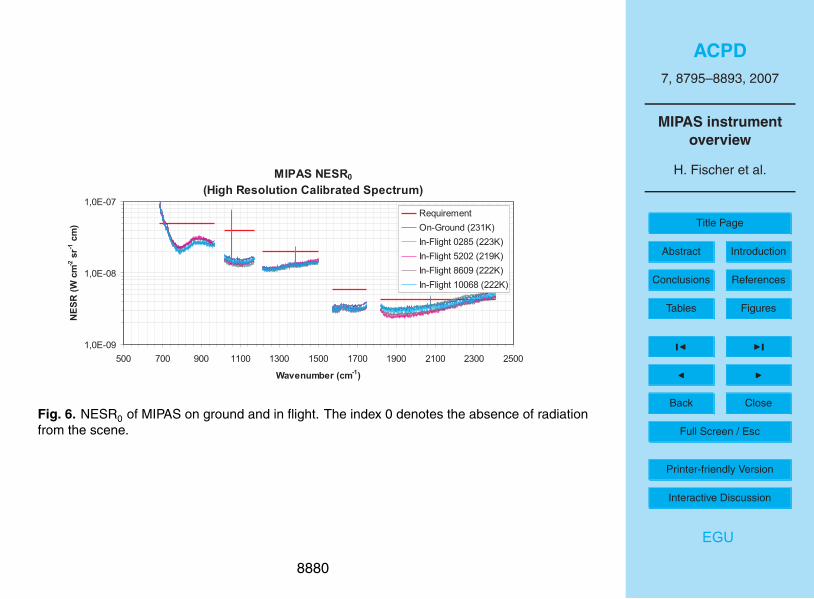
ACPD
7, 8795–8893, 2007
MIPAS instrument
overview
H. Fischer et al.
Title Page
Abstract Introduction
Conclusions References
Tables Figures
◭ ◮
◭ ◮
Back Close
Full Screen / Esc
Printer-friendly Version
Interactive Discussion
EGU
MIPAS NESR0
(High Resolution Calibrated Spectrum)
1,0E-09
1,0E-08
1,0E-07
500 700 900 1100 1300 1500 1700 1900 2100 2300 2500
Wavenumber (cm-1)
NE
SR
(Wcm
-2sr-1
cm
)
Requirement
On-Ground (231K)
In-Flight 0285 (223K)
In-Flight 5202 (219K)
In-Flight 8609 (222K)
In-Flight 10068 (222K)
Fig. 6. NESR0 of MIPAS on ground and in flight. The index 0 denotes the absence of radiation
from the scene.
8880
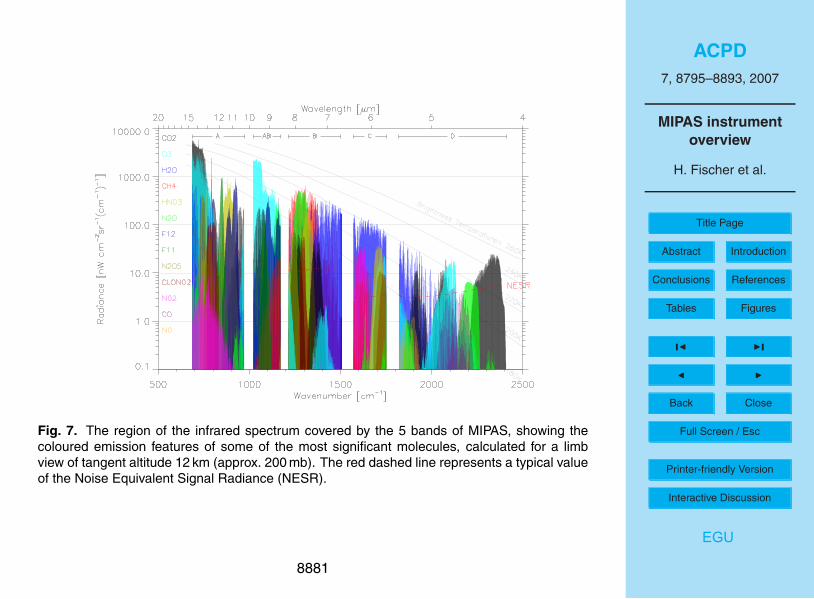
ACPD
7, 8795–8893, 2007
MIPAS instrument
overview
H. Fischer et al.
Title Page
Abstract Introduction
Conclusions References
Tables Figures
◭ ◮
◭ ◮
Back Close
Full Screen / Esc
Printer-friendly Version
Interactive Discussion
EGU
Fig. 7. The region of the infrared spectrum covered by the 5 bands of MIPAS, showing the
coloured emission features of some of the most significant molecules, calculated for a limb
view of tangent altitude 12 km (approx. 200 mb). The red dashed line represents a typical value
of the Noise Equivalent Signal Radiance (NESR).
8881
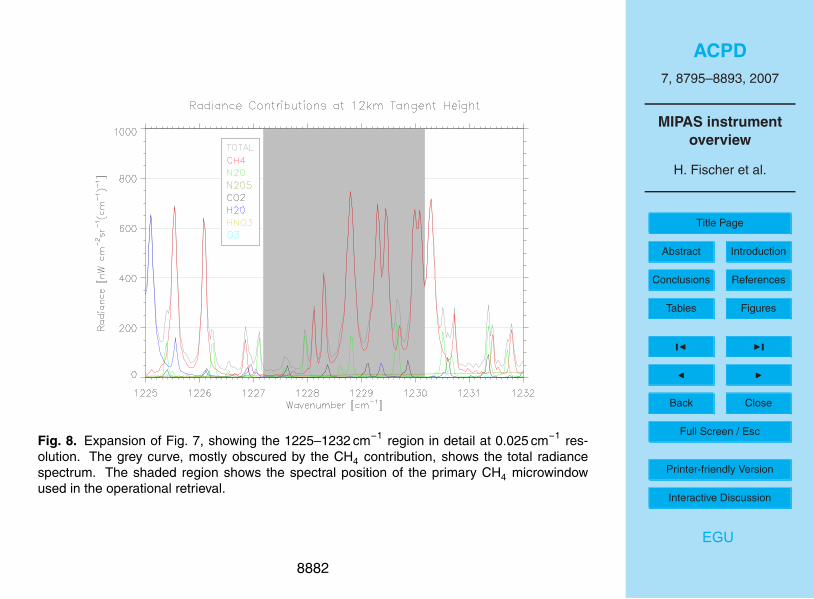
ACPD
7, 8795–8893, 2007
MIPAS instrument
overview
H. Fischer et al.
Title Page
Abstract Introduction
Conclusions References
Tables Figures
◭ ◮
◭ ◮
Back Close
Full Screen / Esc
Printer-friendly Version
Interactive Discussion
EGU
Fig. 8. Expansion of Fig. 7, showing the 1225–1232 cm
−1region in detail at 0.025 cm
−1res-
olution. The grey curve, mostly obscured by the CH4 contribution, shows the total radiance
spectrum. The shaded region shows the spectral position of the primary CH4 microwindow
used in the operational retrieval.
8882
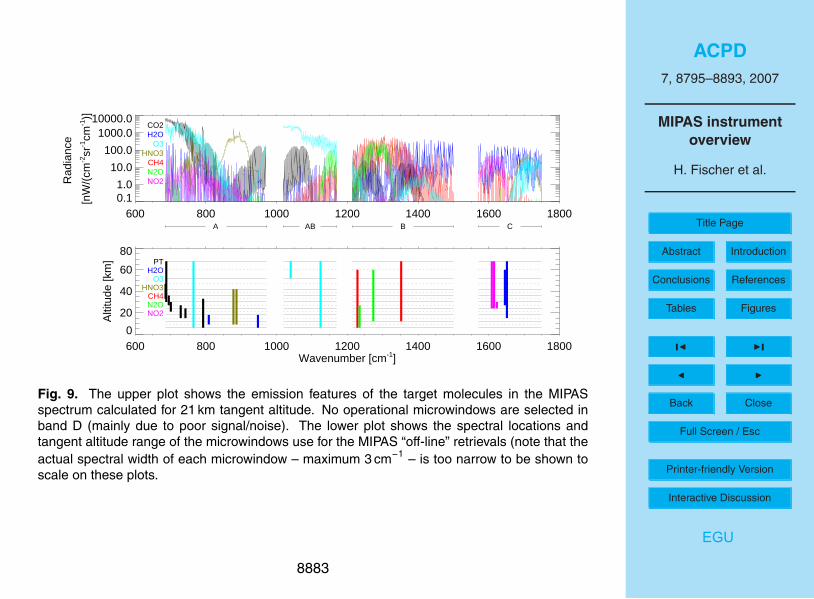
ACPD
7, 8795–8893, 2007
MIPAS instrument
overview
H. Fischer et al.
Title Page
Abstract Introduction
Conclusions References
Tables Figures
◭ ◮
◭ ◮
Back Close
Full Screen / Esc
Printer-friendly Version
Interactive Discussion
EGU
600 800 1000 1200 1400 1600 18000.11.0
10.0
100.0
1000.010000.0
Rad
ianc
e
[nW
/(cm
-2sr
-1cm
-1)]
CO2H2O
O3HNO3
CH4N2ONO2
600 800 1000 1200 1400 1600 1800Wavenumber [cm-1]
0
20
40
60
80
Alti
tude
[km
]
A AB B C
PTH2O
O3HNO3
CH4N2ONO2
Fig. 9. The upper plot shows the emission features of the target molecules in the MIPAS
spectrum calculated for 21 km tangent altitude. No operational microwindows are selected in
band D (mainly due to poor signal/noise). The lower plot shows the spectral locations and
tangent altitude range of the microwindows use for the MIPAS “off-line” retrievals (note that the
actual spectral width of each microwindow – maximum 3 cm−1
– is too narrow to be shown to
scale on these plots.
8883
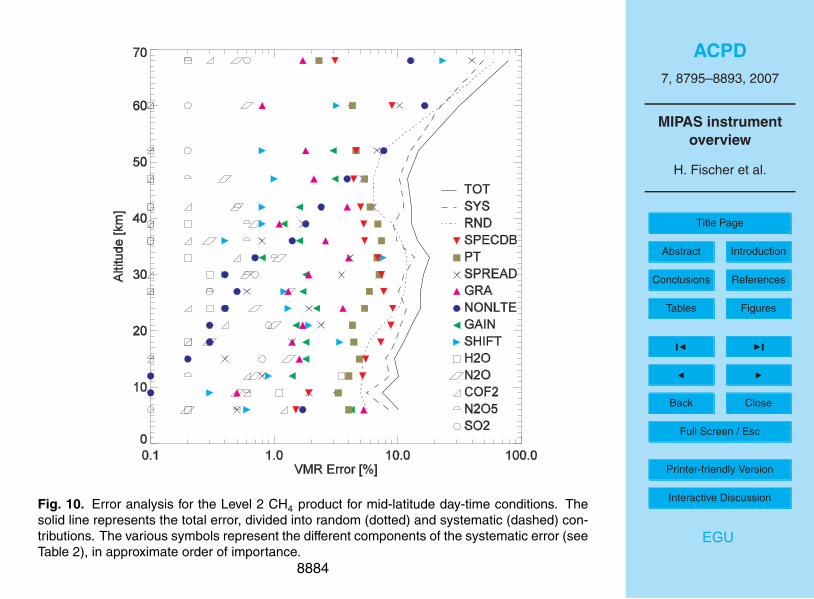
ACPD
7, 8795–8893, 2007
MIPAS instrument
overview
H. Fischer et al.
Title Page
Abstract Introduction
Conclusions References
Tables Figures
◭ ◮
◭ ◮
Back Close
Full Screen / Esc
Printer-friendly Version
Interactive Discussion
EGU
Fig. 10. Error analysis for the Level 2 CH4 product for mid-latitude day-time conditions. The
solid line represents the total error, divided into random (dotted) and systematic (dashed) con-
tributions. The various symbols represent the different components of the systematic error (see
Table 2), in approximate order of importance.
8884
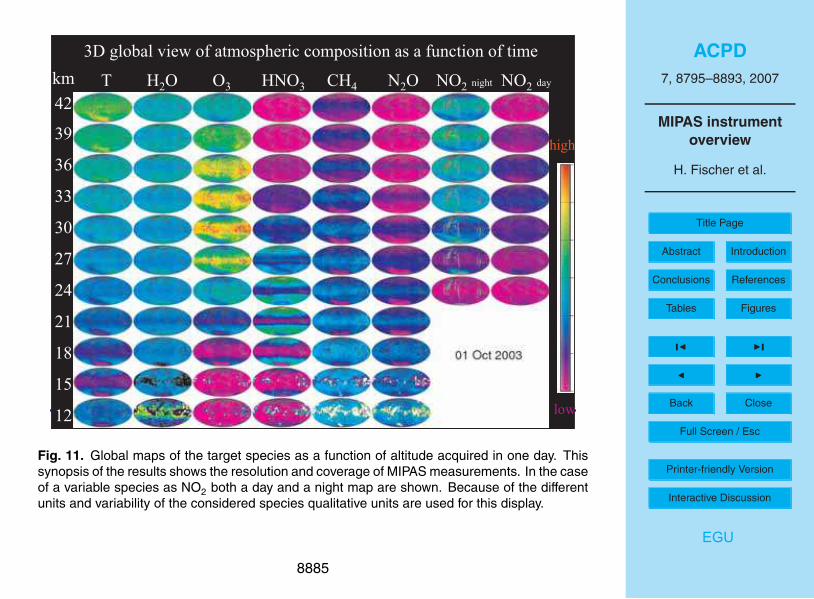
ACPD
7, 8795–8893, 2007
MIPAS instrument
overview
H. Fischer et al.
Title Page
Abstract Introduction
Conclusions References
Tables Figures
◭ ◮
◭ ◮
Back Close
Full Screen / Esc
Printer-friendly Version
Interactive Discussion
EGU
NRT L2 Measurements of MIPAS on Envisat - IRS, Busan, Corea - 23-28 August 2004
3D global view of atmospheric composition as a function of time
T H2O O3 HNO3 CH4 N2O NO2 night NO2 daykm
42
39
36
33
30
27
24
21
18
15
12
high
low
Fig. 11. Global maps of the target species as a function of altitude acquired in one day. This
synopsis of the results shows the resolution and coverage of MIPAS measurements. In the case
of a variable species as NO2 both a day and a night map are shown. Because of the different
units and variability of the considered species qualitative units are used for this display.
8885
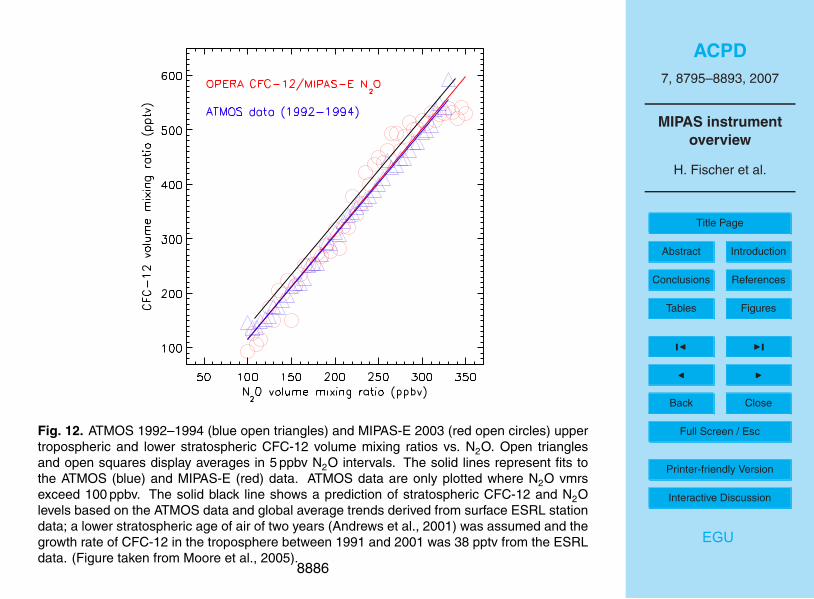
ACPD
7, 8795–8893, 2007
MIPAS instrument
overview
H. Fischer et al.
Title Page
Abstract Introduction
Conclusions References
Tables Figures
◭ ◮
◭ ◮
Back Close
Full Screen / Esc
Printer-friendly Version
Interactive Discussion
EGU
Fig. 12. ATMOS 1992–1994 (blue open triangles) and MIPAS-E 2003 (red open circles) upper
tropospheric and lower stratospheric CFC-12 volume mixing ratios vs. N2O. Open triangles
and open squares display averages in 5 ppbv N2O intervals. The solid lines represent fits to
the ATMOS (blue) and MIPAS-E (red) data. ATMOS data are only plotted where N2O vmrs
exceed 100 ppbv. The solid black line shows a prediction of stratospheric CFC-12 and N2O
levels based on the ATMOS data and global average trends derived from surface ESRL station
data; a lower stratospheric age of air of two years (Andrews et al., 2001) was assumed and the
growth rate of CFC-12 in the troposphere between 1991 and 2001 was 38 pptv from the ESRL
data. (Figure taken from Moore et al., 2005).8886
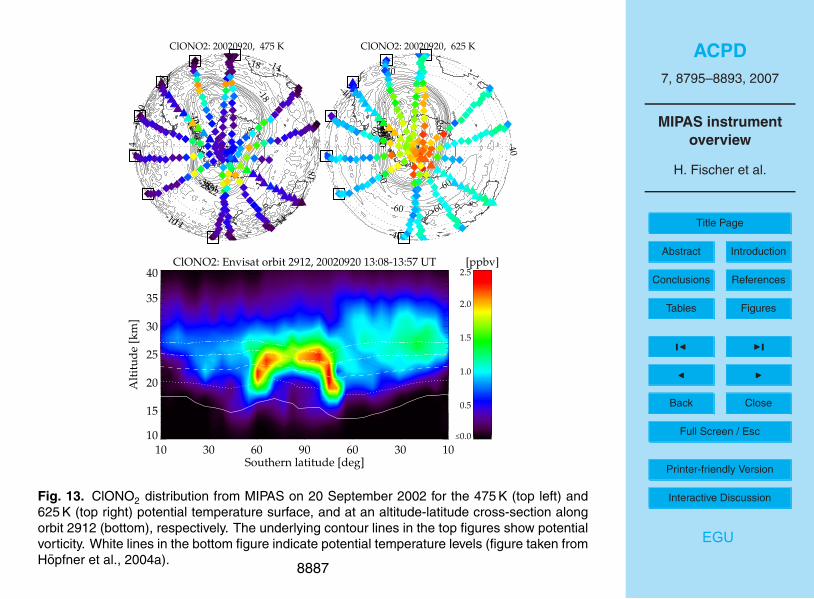
ACPD
7, 8795–8893, 2007
MIPAS instrument
overview
H. Fischer et al.
Title Page
Abstract Introduction
Conclusions References
Tables Figures
◭ ◮
◭ ◮
Back Close
Full Screen / Esc
Printer-friendly Version
Interactive Discussion
EGU
ClONO2: 20020920, 475 K
-58
-54-50
-46
-42
-38-34-30-26-22
-18
-18
-18
-18
-18
-14
-14
-14
-14-10
-10
-6
ClONO2: 20020920, 625 K
-260-240-22
0-2
00
-180-160-140
-120-100
-80
-60-60
-60
-60
-40
-40
-40
-40
[ppbv]
0.0
0.5
1.0
1.5
2.0
2.5ClONO2: Envisat orbit 2912, 20020920 13:08-13:57 UT
10 30 60 90 60 30 10Southern latitude [deg]
10
15
20
25
30
35
40
Alt
itu
de
[km
]
<_
Fig. 13. ClONO2 distribution from MIPAS on 20 September 2002 for the 475 K (top left) and
625 K (top right) potential temperature surface, and at an altitude-latitude cross-section along
orbit 2912 (bottom), respectively. The underlying contour lines in the top figures show potential
vorticity. White lines in the bottom figure indicate potential temperature levels (figure taken from
Hopfner et al., 2004a).8887
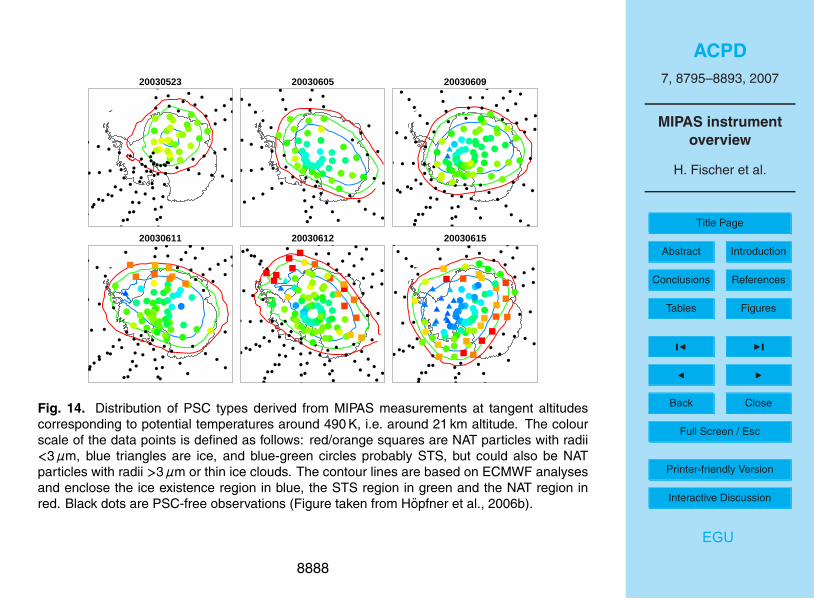
ACPD
7, 8795–8893, 2007
MIPAS instrument
overview
H. Fischer et al.
Title Page
Abstract Introduction
Conclusions References
Tables Figures
◭ ◮
◭ ◮
Back Close
Full Screen / Esc
Printer-friendly Version
Interactive Discussion
EGU
20030523 20030605 20030609
20030611 20030612 20030615
Fig. 14. Distribution of PSC types derived from MIPAS measurements at tangent altitudes
corresponding to potential temperatures around 490 K, i.e. around 21 km altitude. The colour
scale of the data points is defined as follows: red/orange squares are NAT particles with radii
<3µm, blue triangles are ice, and blue-green circles probably STS, but could also be NAT
particles with radii >3µm or thin ice clouds. The contour lines are based on ECMWF analyses
and enclose the ice existence region in blue, the STS region in green and the NAT region in
red. Black dots are PSC-free observations (Figure taken from Hopfner et al., 2006b).
8888
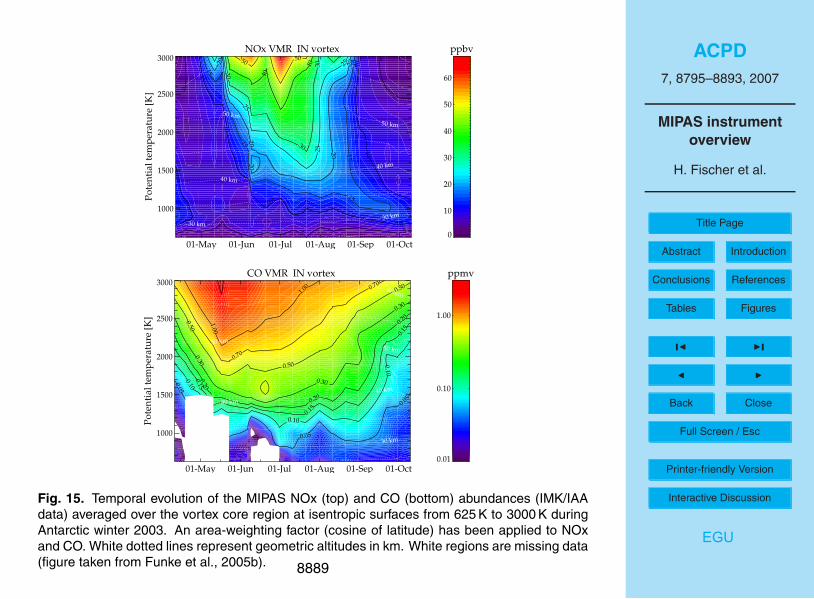
ACPD
7, 8795–8893, 2007
MIPAS instrument
overview
H. Fischer et al.
Title Page
Abstract Introduction
Conclusions References
Tables Figures
◭ ◮
◭ ◮
Back Close
Full Screen / Esc
Printer-friendly Version
Interactive Discussion
EGU
NOx VMR IN vortex
01-May 01-Jun 01-Jul 01-Aug 01-Sep 01-Oct
1000
1500
2000
2500
3000
Po
ten
tial
tem
per
atu
re [
K]
5 5
5
5
10
10
10
10
10
10
15
15
15
15
15
20 20
20
2020
25
25
25
30
30
30
40
40
50 50
30 km30 km
40 km
40 km
50 km
50 km
ppbv
0
10
20
30
40
50
60
CO VMR IN vortex
01-May 01-Jun 01-Jul 01-Aug 01-Sep 01-Oct
1000
1500
2000
2500
3000
Po
ten
tial
tem
per
atu
re [
K]
0.05
0.05
0.05
0.100.10
0.10
0.15
0.15
0.15
0.20
0.20
0.20
0.30
0.30
0.30
0.50
0.50
0.50
0.70
0.70
1.00
1.00
30 km
30 km
40 km
40 km
50 km50 km
60 km
ppmv
0.01
0.10
1.00
Fig. 15. Temporal evolution of the MIPAS NOx (top) and CO (bottom) abundances (IMK/IAA
data) averaged over the vortex core region at isentropic surfaces from 625 K to 3000 K during
Antarctic winter 2003. An area-weighting factor (cosine of latitude) has been applied to NOx
and CO. White dotted lines represent geometric altitudes in km. White regions are missing data
(figure taken from Funke et al., 2005b). 8889
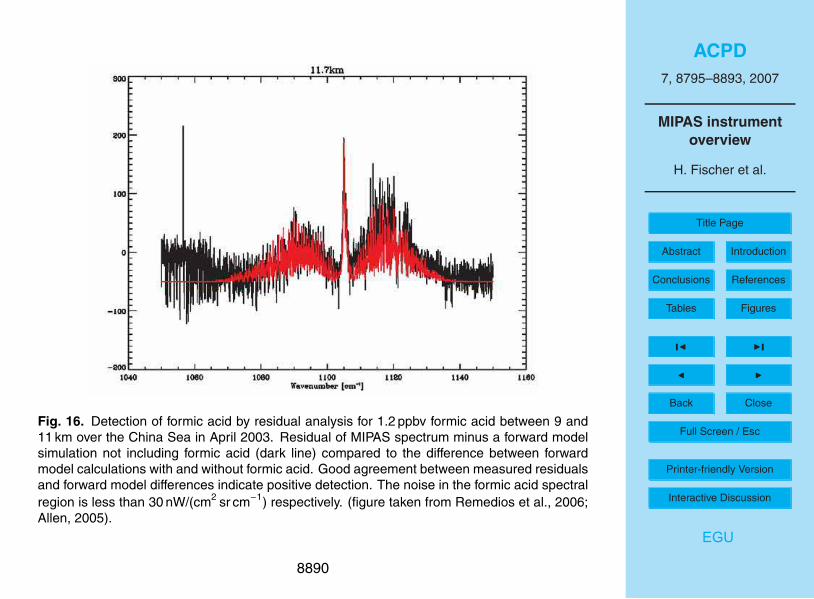
ACPD
7, 8795–8893, 2007
MIPAS instrument
overview
H. Fischer et al.
Title Page
Abstract Introduction
Conclusions References
Tables Figures
◭ ◮
◭ ◮
Back Close
Full Screen / Esc
Printer-friendly Version
Interactive Discussion
EGU
Fig. 16. Detection of formic acid by residual analysis for 1.2 ppbv formic acid between 9 and
11 km over the China Sea in April 2003. Residual of MIPAS spectrum minus a forward model
simulation not including formic acid (dark line) compared to the difference between forward
model calculations with and without formic acid. Good agreement between measured residuals
and forward model differences indicate positive detection. The noise in the formic acid spectral
region is less than 30 nW/(cm2
sr cm−1
) respectively. (figure taken from Remedios et al., 2006;
Allen, 2005).
8890
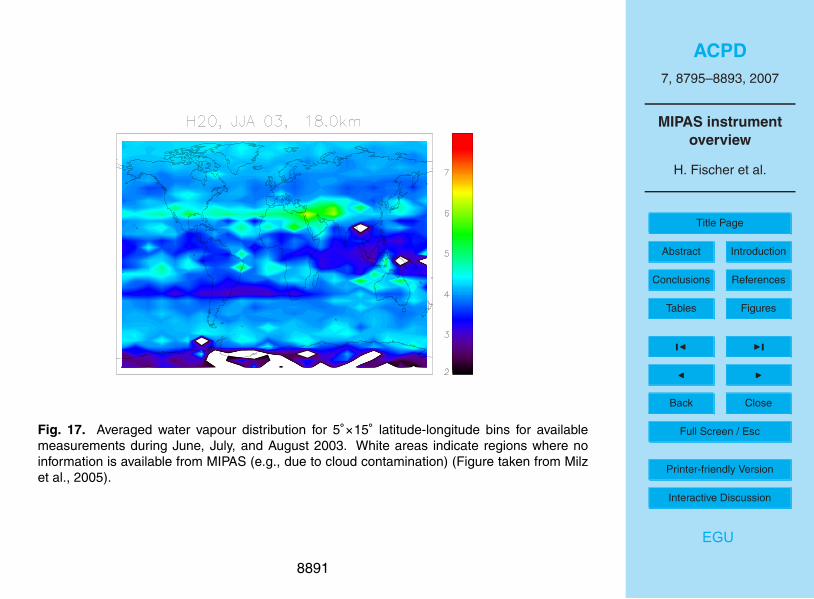
ACPD
7, 8795–8893, 2007
MIPAS instrument
overview
H. Fischer et al.
Title Page
Abstract Introduction
Conclusions References
Tables Figures
◭ ◮
◭ ◮
Back Close
Full Screen / Esc
Printer-friendly Version
Interactive Discussion
EGU
Fig. 17. Averaged water vapour distribution for 5◦
×15◦
latitude-longitude bins for available
measurements during June, July, and August 2003. White areas indicate regions where no
information is available from MIPAS (e.g., due to cloud contamination) (Figure taken from Milz
et al., 2005).
8891

ACPD
7, 8795–8893, 2007
MIPAS instrument
overview
H. Fischer et al.
Title Page
Abstract Introduction
Conclusions References
Tables Figures
◭ ◮
◭ ◮
Back Close
Full Screen / Esc
Printer-friendly Version
Interactive Discussion
EGU
Fig. 18. Temporal evolution of NOx (top left), O3 (top right), HNO3 (middle left), ClONO2 (middle
right), N2O5 (bottom left), and HOCl (bottom right) during and after the October–November
2003 solar proton events for the Southern hemisphere (70◦
S–90◦
S) (left panels) and Northern
hemisphere (70◦
N–90◦
N) (right panels) polar caps. Changes are shown relative to the mean
profiles measured on 25 October 2003 (Figures taken from Lopez-Puertas et al., 2005a (NOx
and O3), Lopez-Puertas et al., 2005b (HNO3, ClONO2, and N2O5), and von Clarmann et al.,
2005 (HOCl)).8892
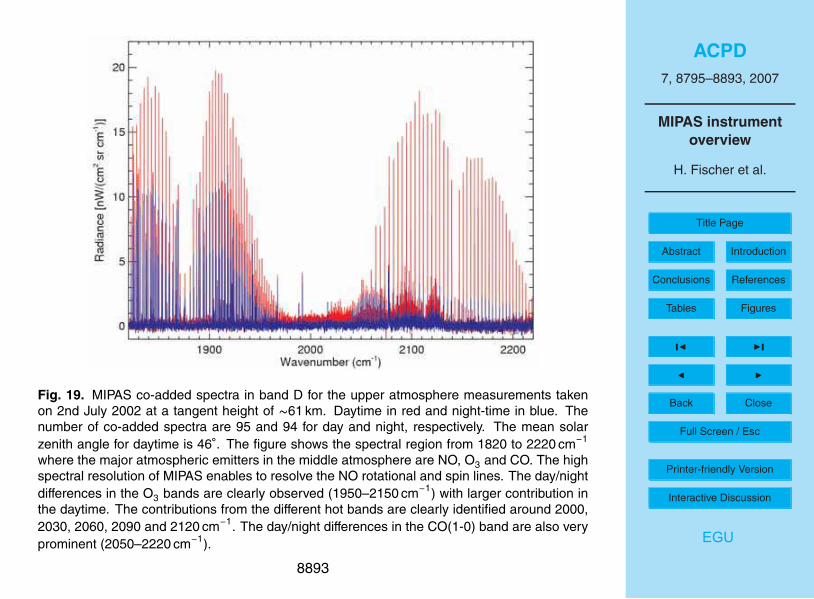
ACPD
7, 8795–8893, 2007
MIPAS instrument
overview
H. Fischer et al.
Title Page
Abstract Introduction
Conclusions References
Tables Figures
◭ ◮
◭ ◮
Back Close
Full Screen / Esc
Printer-friendly Version
Interactive Discussion
EGU
Fig. 19. MIPAS co-added spectra in band D for the upper atmosphere measurements taken
on 2nd July 2002 at a tangent height of ∼61 km. Daytime in red and night-time in blue. The
number of co-added spectra are 95 and 94 for day and night, respectively. The mean solar
zenith angle for daytime is 46◦
. The figure shows the spectral region from 1820 to 2220 cm−1
where the major atmospheric emitters in the middle atmosphere are NO, O3 and CO. The high
spectral resolution of MIPAS enables to resolve the NO rotational and spin lines. The day/night
differences in the O3 bands are clearly observed (1950–2150 cm−1
) with larger contribution in
the daytime. The contributions from the different hot bands are clearly identified around 2000,
2030, 2060, 2090 and 2120 cm−1
. The day/night differences in the CO(1-0) band are also very
prominent (2050–2220 cm−1
).
8893