VII: ATMOSPHERIC CIRCULATIONS
59
Atmospheric Circulations Danny M. Vaughn, Ph.D., CMS
-
Upload
independent -
Category
Documents
-
view
0 -
download
0
Transcript of VII: ATMOSPHERIC CIRCULATIONS

Atmospheric CirculationsDanny M. Vaughn, Ph.D., CMS

Scales of Atm ospheric M otion
(figure 7.1)
Wind Air in motion. Distributes storms, heat, moisture, particulates, insects, bacteria, and pollen.

Fig. 7-1

Microscale - up to a few meters, e.g. chim ney smoke. Mesoscale - a km to several hundred km , e.g. local winds, thunderstorms, tornadoes. Synoptic scale - weather systems (high and low pressure areas), and cyclonic storm s. Global scale - major circulation patterns.

Eddies - form when the linear vector of air motion is disrupted by an object in its flow path (figure 7.2).
Rotors occur on lower side of wind flowing wave-like over a mountain top. W ind shear may occur when the flow lines vary in speed (billow clouds often form in response.

Fig. 7-2
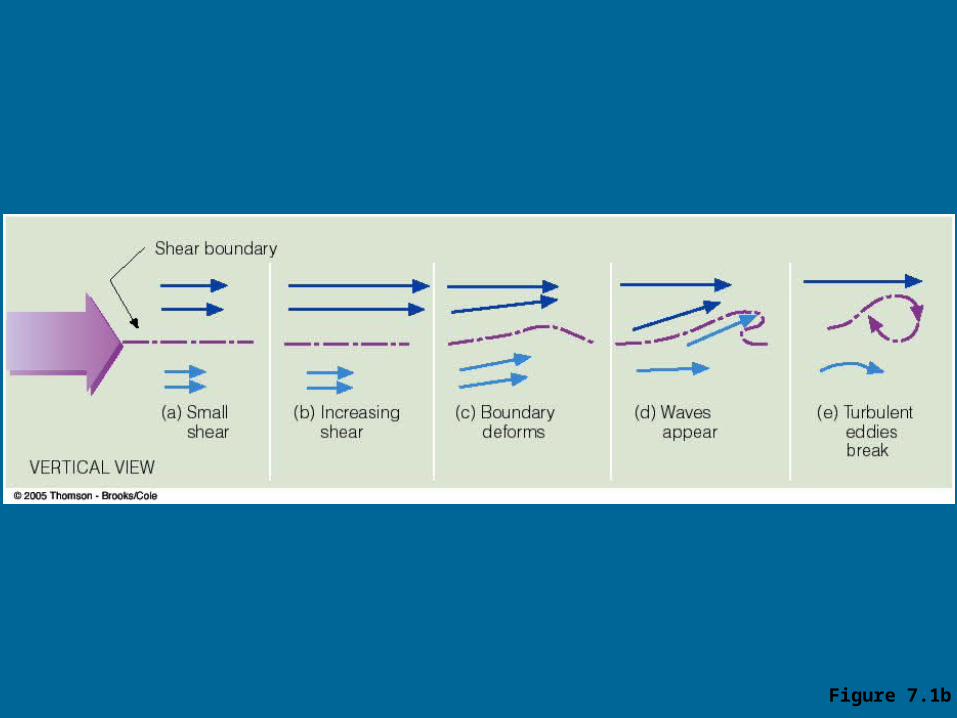
Figure 7.1b

Local W ind System s Thermal circulations (figure 7.3) Unequal heating at the surface causes air to rise in warm zone, while the air at the surface that is cooler is compressed. Pressure gradient force is developed aloft. Air moves from high to low pressure. Air accumulates over the colder region and sinks, increasing pressure at the surface. Surface air begins to m ove laterally towards the warmer, low pressure area.

Fig. 7-3

Sea breeze (figure 7.4a) - blows from water onto land. W ater has a high specific heat capacity. Higher pressure over water than land in daytim e. Heating of the earth land surface contributes to the pressure gradient between land & sea. Thunderstorm activity forms from moist, warmed air during the day (figure 7.5).

Fig. 7-4a

Fig. 7-5
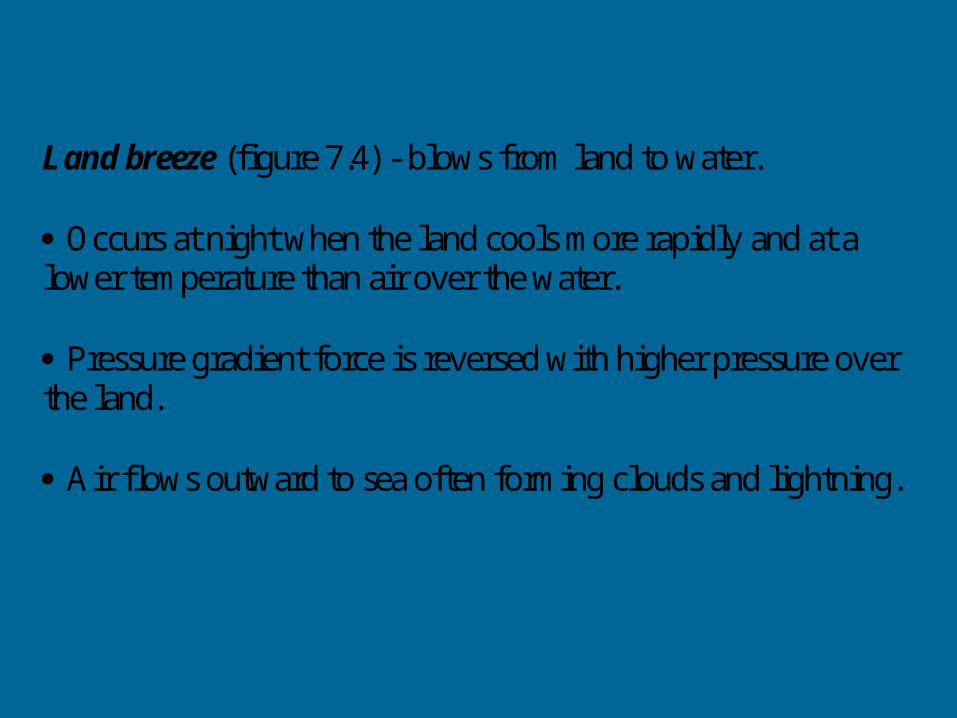
Land breeze (figure 7.4) - blows from land to water. Occurs at night when the land cools more rapidly and at a lower temperature than air over the water. Pressure gradient force is reversed with higher pressure over the land. Air flows outward to sea often forming clouds and lightning.

Fig. 7-4b

Seasonally Changing W inds
The Monsoon Seasonal reversal of winds. Winter monsoon - high pressure centered over Southeast Asian continent (figure 7.6a). Summer monsoon - low pressure over the Bay of Bengal and South China Sea (figure 7.6b). Southwest U.S. (Arizona/New M exico) experiences a mini-monsoon.

Fig. 7-6a

Fig. 7-6b

Valley breeze - Air along a slope is warmed and ascends up valley (figure 7.8a). Mountain breeze (drainage or gravity winds) – Night-time cooling results in denser (heavier) air flowing down valley (figure 7.8b). Katabatic winds A stronger type of m ountain breeze. From on plateaus with an inclined gap. Bora in Yugoslavia, Mistral in France. In North America, flow is west off the Columbia Plateau through the Columbia River gorge.

Fig. 7-8a

Fig. 7-8b

Chinook (F oehn) winds W arm, dry winds descending the lee side of the mountains. Term ed F oehn in the European Alps. Initiated by a low pressure trough aloft. Compressional heating on the lee side of the Rocky and Cascade M ountains. A Chinook wall cloud is a good indicator of an oncoming Chinook (figure 7.10).

Fig. 7-10

Santa Anna winds Dry, east-northeast winds blowing through canyons from mountain plateaus to the west (figure 7.12). Compressional heating from high-pressure systems.

Fig. 7-12

Desert winds Surface heating results in a number of exam ples. Haboob - African Sudan and southwest U.S. from downdrafts along the leading edge of thunderstorms (dust devils and tornadoes). Whirlwinds/dustdevils/willy-willys - spinning vortices (figures 7.13 & 7.14).
Form on clear, hot days.
Lateral winds form the vortex.
M ay be cyclonic or anticyclonic.
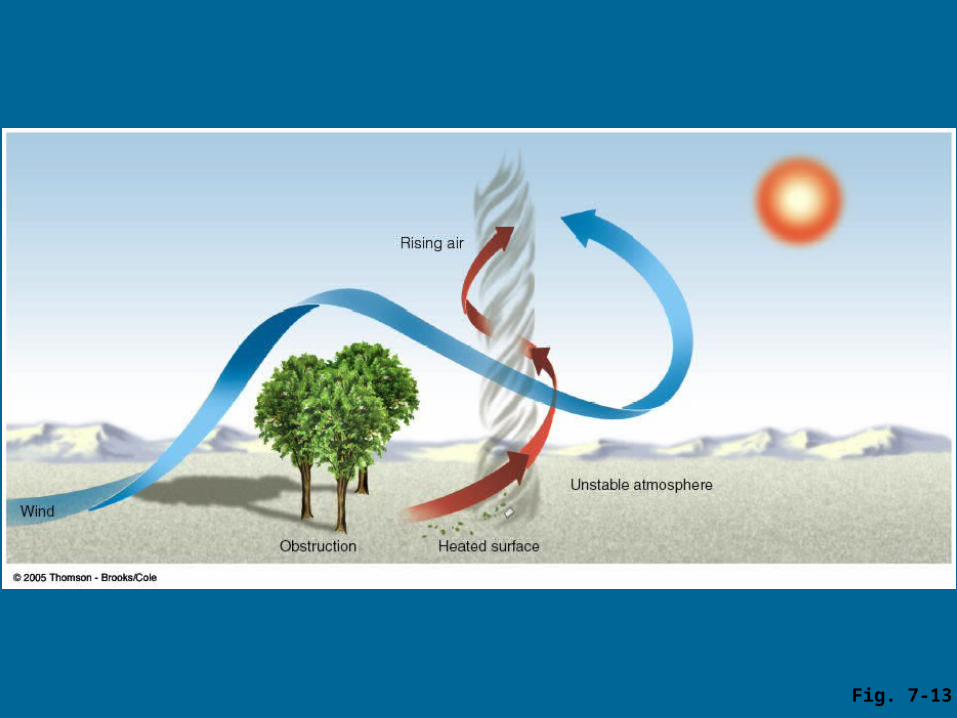
Fig. 7-13
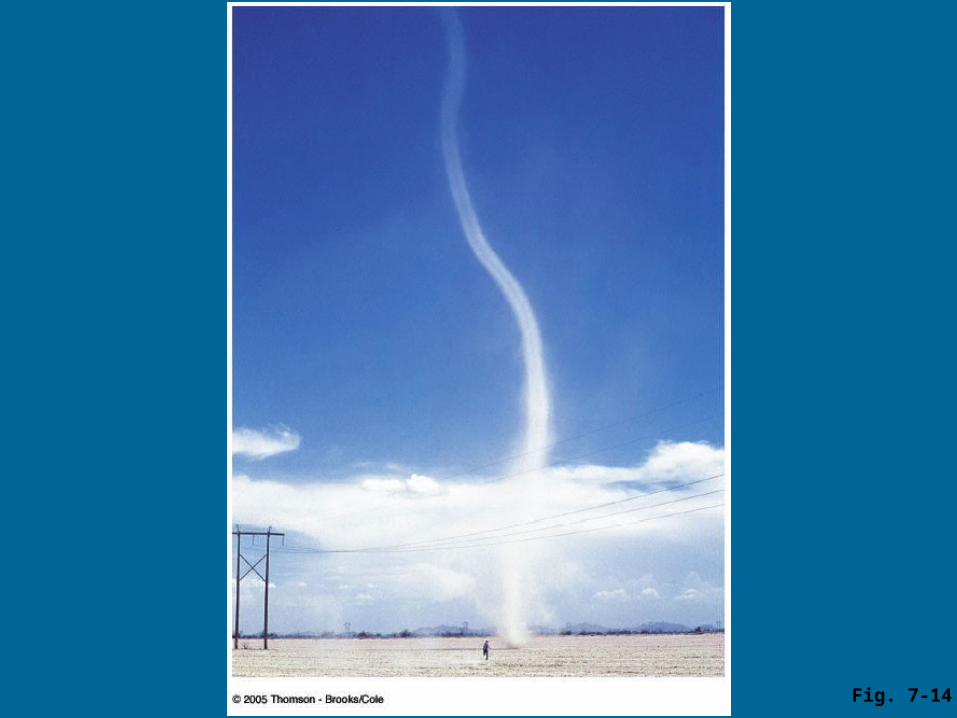
Fig. 7-14

Global W inds General Circulation of the Atmosphere Caused by unequal heating of the earth’s surface.

Single-cell (Hadley) model (fig. 7.15), assumes: A uniform surface covered with water (no differential heating between land/water. Sun is directly overhead at the equator (no seasonal shift in winds). A non-rotating earth (elim inates Coriolis force). Heated air about the equatoral region rises, migrates poleward, sinks, is warm ed (compression), and flows back to the equatoral region at the near surface. Sensible and latent heat are transported poleward.

Fig. 7-15

Three-cell model (figure 7.16) The earth is allowed to rotate. Three convection systems rather than one per hemisphere. From the equator to about 30° lat., circulation resembles the Hadley cells. W arm water over the equator, weak horizontal pressure gradients, and light winds begin the process (Doldrums). W arm air rises, condenses, and form s m assive cum ulo-form clouds. Large am ounts of latent heat is released.

Fig. 7-16

Air reaches the troposphere and is directed laterally, poleward. Air movement is deflected (Coriolis force) to the right in theN.H, to the left in the S.H. Air cools, converges (meridianal paths), and builds up(increased pressure) at approx. 30° lat. Produces sub-tropical high pressure regions. Air subsides, is warmed by compression, resulting in clearskys and warm surface temperatures. M ajor deserts of the world occur at these latitudes.

Over the oceans at 30 lat., pressure gradients in the center of thehigh are weak, thus winds are weak. Called Horse latitudes. Surface winds (unequal heating contributes to increased windsover land) flow from the northeast out of the highs in the N.H,and southeast out of the highs in the S.H. (Northeast andsoutheast trade winds). Convergence of these winds at the equator forms the ITC(intertropical convergence zone). W ith air forced to rise byconvergence and unequal heating. Some air moves poleward of the 30° latitudes, and is deflectedagain by Coriolis force creating the prevailing westerlies from30°-60° latitude). W hy do the winds blow more steadily in thewesterlies in the S.H.?

M ilder westerlies migrate poleward and come in contact withcolder air traveling towards the equatoral region. Little mixing initially occurs, and a polar front (a zone oflow pressure termed the sub-polar low) develops betweenthem. Surface air converges, rises, and forms storms along thisboundary. Some air migrates back to the Horse latitudes and subsidesaround 30°.

W inds out of the polar highs are deflected and result in polar easterlies. Some air aloft is m ixed with the westerlies, flows back to the poles, sinks, and flows back to the polar front to complete the third cell. Note high and low pressure areas in fig. 7.16b. There is reasonable agreement with conditions at the surface.

Fig. 7-16b

Average Surface Winds & Pressure (Real W orld) Topographic variances, land\water\ice contrasts, and unequal heating result in semi-permanent high and low pressure cells. the world, with ensuing prevailing wind directions (red) in fig Note pressure cells in January and July about. Figures 7.17a & 7.17b.

Fig. 7-17a
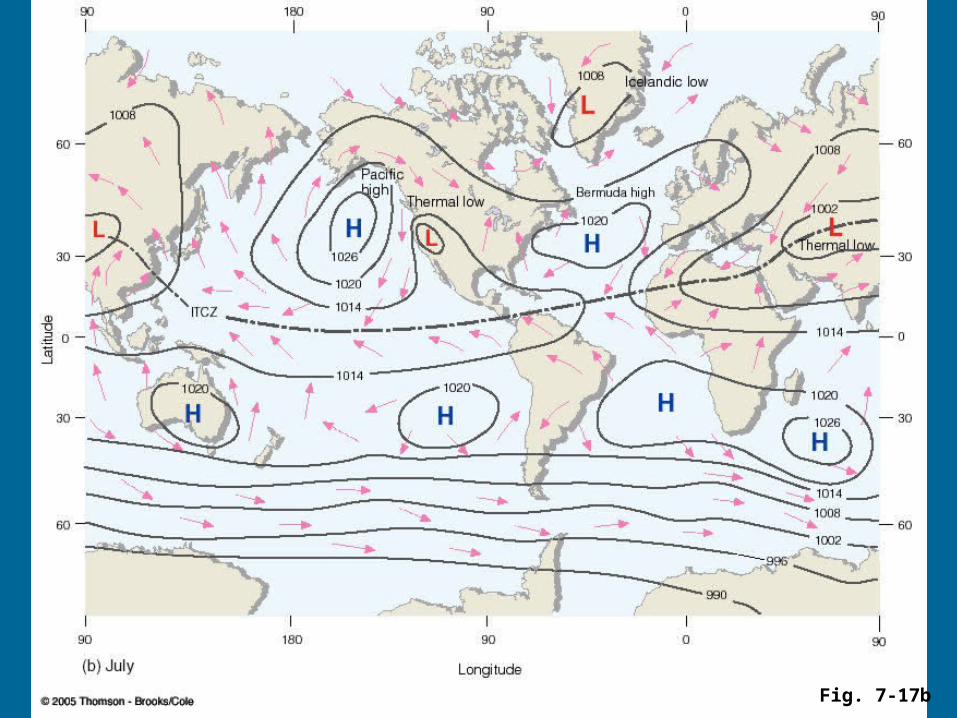
Fig. 7-17b
General Circulation and Precipitation Patterns (figure 7.18)
Rising air around tropical water results in abundant precipitation. Subsiding air around 30° results in dry, desert-like conditions. Cells m igrate annually about 10-15°. Produces dry conditions in coastal California, and moist conditions along the eastern seaboard (figure 7.19).

Fig. 7-18
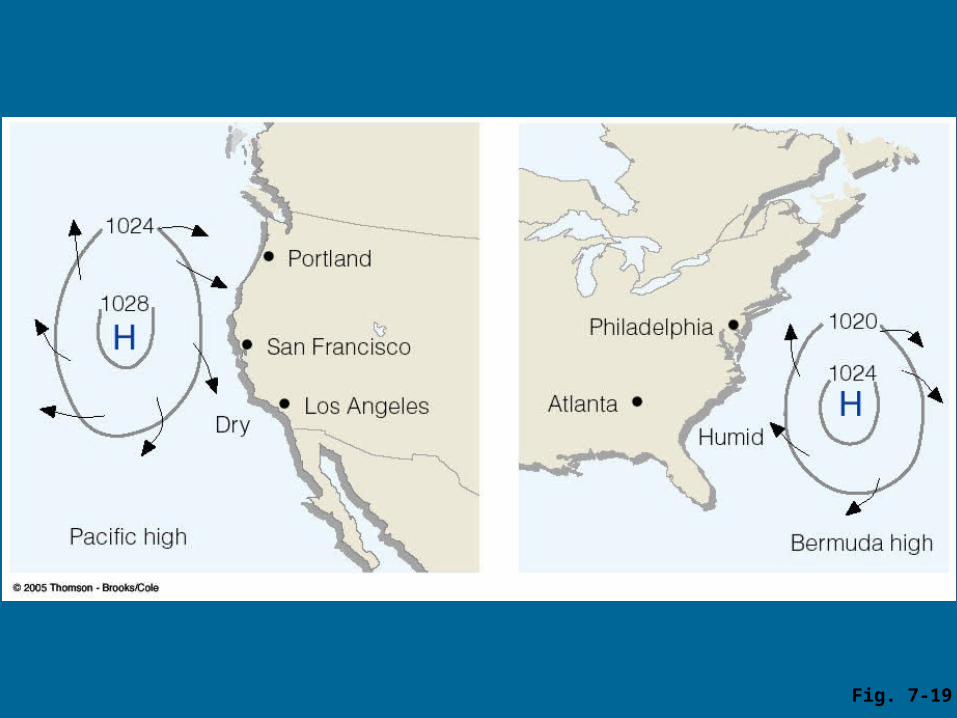
Fig. 7-19

W esterly W inds and the Jet Stream W esterly m ovement in m id-latitudes. Higher pressure over equatoral regions aloft lower pressure over the polar regions aloft. Form along the polar front (fig. 7.21). Strong temperature contrasts aloft result in rapid pressure changes. Establishes a steep pressure gradient aloft. W inds intensify along the front.
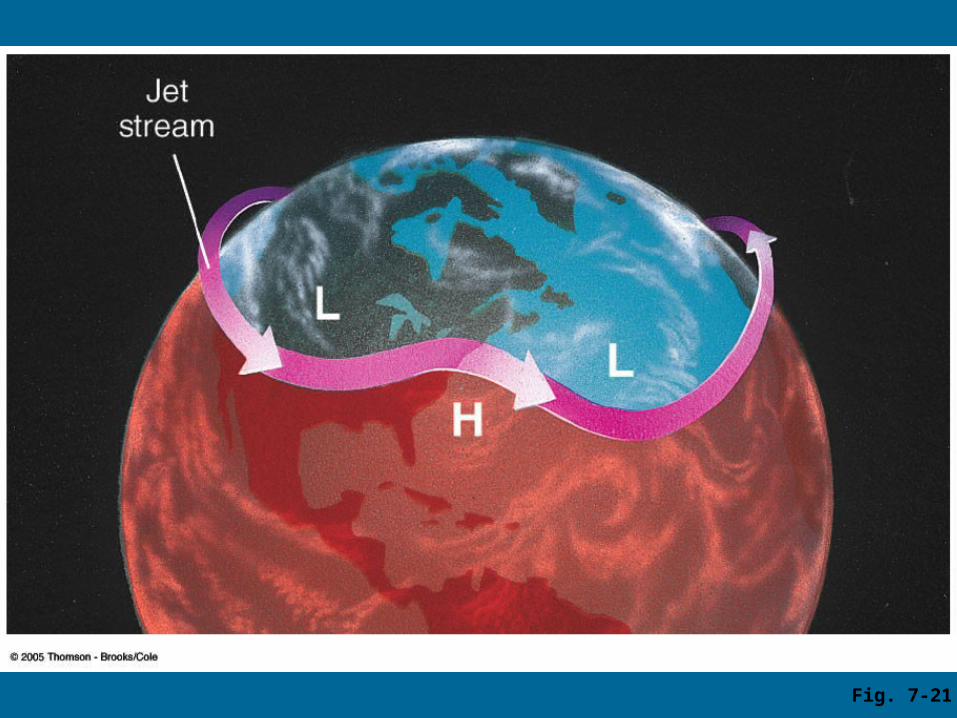
Fig. 7-21

Jet is approx. 1 mile thick, hundreds of miles long, and several hundred miles wide. W ind speeds are 100-200 knots. Generally occurs at the tropopause (figure 7.22, 33-46,000 ft.). Subtropical jet at 43,000 ft.

Fig. 7-22

Polar jet at 33,000 ft. Jet stream actually forms loops that flex throughout latitudes(figure 7.21). Troughs and ridges form directing warm and cold airpoleward and equatorward. Jet streams are effective transporters of heat on a global scale.

Global W ind Patterns and the Oceans Surface winds initiate m ovement of water. General circulation patterns of the ocean m ask the high pressure cells in the m iddle latitudes (com pare figure 7.16 with 7.24). Currents also help to transfer heat energy (40% of total heat transport in the N.H.) poleward. Discuss tab. 7.2 and warm\cold currents.

Fig. 7-24

W ind & Upwelling Parallel flowing winds along the west coast, plus Coriolis force draw surface flow of water out to sea (figure 7.26). Upwelling replaces the water near the coast as colder water along the coast from Canada to Baja, M exico (fig. 7.26b). M ost pronounced when the surface winds parallel the coast in summer. Results in foggy, overcast sky. Air overlying the cold water is chilled to the dew point. High energy transfer in winter with higher temperature contrasts between water and land.

Fig. 7-26a
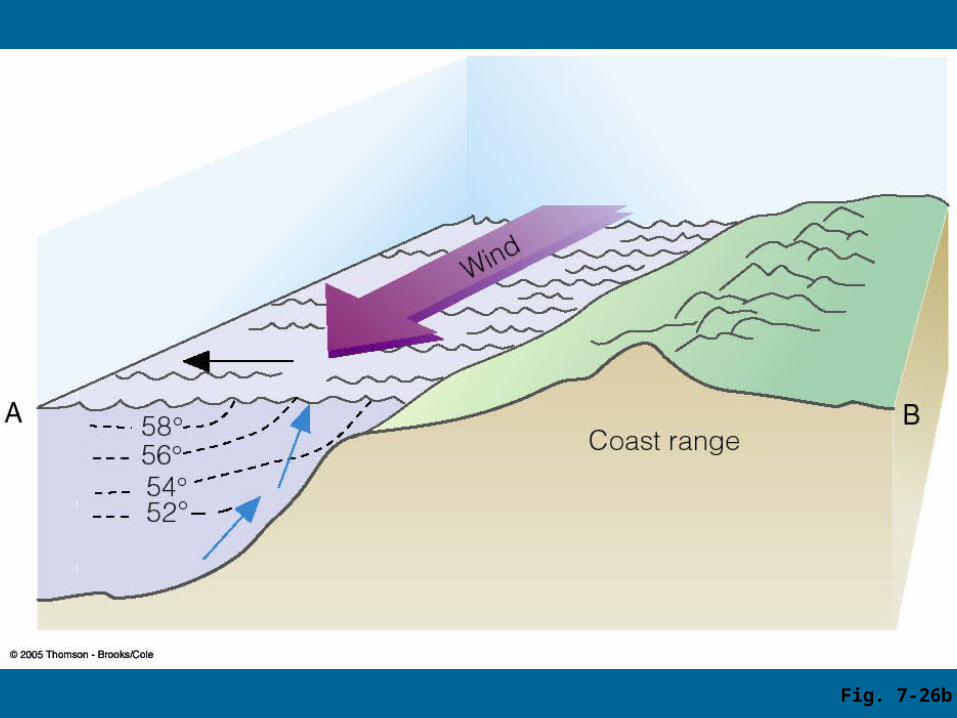
Fig. 7-26b

El Niño and the Southern Oscillation Normally, Cold, Humbolt\Peru current flows north along the South American coast. Driven in part by southeast (westward moving) trade winds m oving towards low pressure regions in Indonesia. Sea level rises to the west, and is lowered along the South Am erican coast. Produces a thicker layer of warm water to the west. A countercurrent south of the equator flows back toward South America.

Every 3-7 years an El Niño (boy child) event occurs (fig. 7.27).
Air pressure rises over the western Pacific and falls over the Eastern Pacific. Southeast trade winds weaken. W est winds replace them. The equator counter-current is strengthened, thus warm water dominates the m ovement east to South America. W arm, surface water is dragged to the South American coast raising sea level.
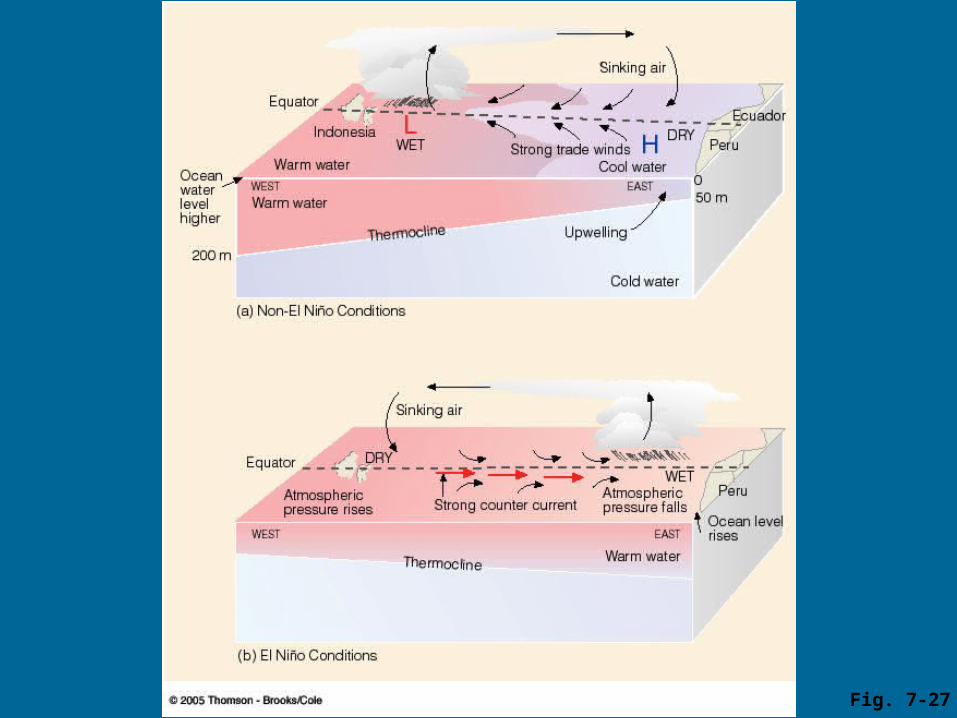
Fig. 7-27

Cold, nutrient-rich water is prevented from rising killing off the Anchovy harvests. (fishm eal is used to feed livestock in U.S.). W arm waters spread up on the North American coast. Clim ate changes result (fig. 7.30a). Pressure reverses and returns back to the normal pattern. The see-saw pattern is termed the Southern Oscillation. If the trade winds becom e exceptionally strong following an El Niño event, cold water migrates further west in the Pacific Ocean. Termed La Niña (girl child, figure 7.30b).

Fig. 7-30a

Fig. 7-30b