SURGICAL INSTRUMENT INDUSTRY - Google Groups
50
BOARD OF INVESTMENT GOVERNMENT OF PAKISTAN PAKISTAN LIGHT ENGINEERING SECTOR CONTENTS Page No. 1. Light Engineering - Engineering Vision – 2010 2-3 2. SURGICAL INSTRUMENT INDUSTRY . • Overview 4 • Pakistan Surgical Industry Structure 5 • Range of Instruments being manufactured 6 • Tariff Structure 7 • Major Manufacturing Units 8 • Process 9 • Export 10-14 • Imports 15 • Major Exporters 16-17 • Association 17 3. ELECTRICAL FAN INDUSTRY . • Overview 18 • Industry at a Glance 19-20 • Major Companies 21 • Export 22-24 • Average Unit Price Comparison 25 • Seasonal Variation in Production 26 • Association 26 4. CUTLERY INDUSTRY . • Overview 27 • Industry at a Glance 28 • Policies and Incentives 29 • Global Trade of Cutlery 30-31 • Export & Import 32-36 • Association 37 5. AUTO PART INDUSTRY • Industry at a Glance 38 • Motor Vehicles on Roads 39 • Production of Vehicles 40 • Imports of Vehicles 40 • Export of Auto parts 41 • Cost Break up 42 • Tariff structure 43 • Vendors 44 • Production product wise 45-47 • OEMs 48 • Association 49 1
-
Upload
khangminh22 -
Category
Documents
-
view
0 -
download
0
Transcript of SURGICAL INSTRUMENT INDUSTRY - Google Groups

BOARD OF INVESTMENT GOVERNMENT OF PAKISTAN
PAKISTAN LIGHT ENGINEERING SECTOR
C O N T E N T S P a g e N o .
1. Light Engineering - Engineering Vision – 2010 2-3
2. SURGICAL INSTRUMENT INDUSTRY . • Overview 4 • Pakistan Surgical Industry Structure 5 • Range of Instruments being manufactured 6 • Tariff Structure 7 • Major Manufacturing Units 8 • Process 9 • Export 10-14 • Imports 15 • Major Exporters 16-17 • Association 17
3. ELECTRICAL FAN INDUSTRY . • Overview 18 • Industry at a Glance 19-20 • Major Companies 21 • Export 22-24 • Average Unit Price Comparison 25 • Seasonal Variation in Production 26 • Association 26
4. CUTLERY INDUSTRY . • Overview 27 • Industry at a Glance 28 • Policies and Incentives 29 • Global Trade of Cutlery 30-31 • Export & Import 32-36 • Association 37
5. AUTO PART INDUSTRY • Industry at a Glance 38 • Motor Vehicles on Roads 39 • Production of Vehicles 40 • Imports of Vehicles 40 • Export of Auto parts 41 • Cost Break up 42 • Tariff structure 43 • Vendors 44 • Production product wise 45-47 • OEMs 48 • Association 49
1

LIGHT ENGINEERING SECTOR
Overview The state of the engineering industry describes the status of
industrialization of a country since it portrays the capability to add value to
the primary products and of indigenous production of plants and machinery.
The developed countries have assigned high priority to the engineering
industry in their own country.
The range of light engineering goods covers electrical goods, transport
equipment, domestic appliances, telecommunication equipment etc. There
are about 2,500 registered units and a much larger number in the
unorganized sector, with fixed assets of over Rs 100 billion. A number of
small industrial units are operating in Karachi, Lahore, Gujarat, Gujranwala
and Sialkot.
Engineering goods have already made a breakthrough in the export
market. In addition to exports of conventional surgical instruments, cutlery
goods and other light engineering product, Pakistan still is far behind in
export of engineering goods as compared to Newly Industrialized Counties
i.e. Korea and Malaysia and thus offers huge potential for manufacture of
engineering products
It is recognized that capital machinery, light engineering goods and
engineering consultancy services offer great opportunities for export mainly in
the Middle Eastern, African and neighboring countries.
The country has a limited capability to design, test and experiment on
new machines. The small and medium-sized units do not have the finances to
risk innovative efforts, while the large ones are preoccupied with their
production and have no time to spare for testing innovations.
2

There are a number of large industrial units which have successfully
duplicated certain models of machines or adopted the patent or design of a
few products or have acquired the rights on permanent basis on expiry of the
validity period. These are the slow speed engines, sewing machines, cycles,
electric fans and motors, dry electrical cells and pumps, to name a few.
These efforts have been effective in import substitution of commodities.
ENGINEERING VISION – 2010
The Government has formulated a “Engineering Vision 2010” to build an
economically strong Pakistan through an invigorated and integrated
engineering industry. In the light of Engineering Vision, the Government has
developed a growth strategy for the engineering industry for rapid
industrialization. The targets to be achieved up to 2010 are:
• Increase the share of manufacturing sector from existing level to 25%
and the share of engineering goods to 30%.
• A growth led strategy of value added quality production to be adopted
for exports and local consumption.
The Government is aiming at the following measures to accomplish the above
targets:
• Investment needed: US$ 10 to 12 billion.
• Engineering goods exports to be increased to 12% of total exports.
Exports of engineering goods will increase to US$ 2.13 billion in low road
and to US$ 5 billion by the year 2012
3
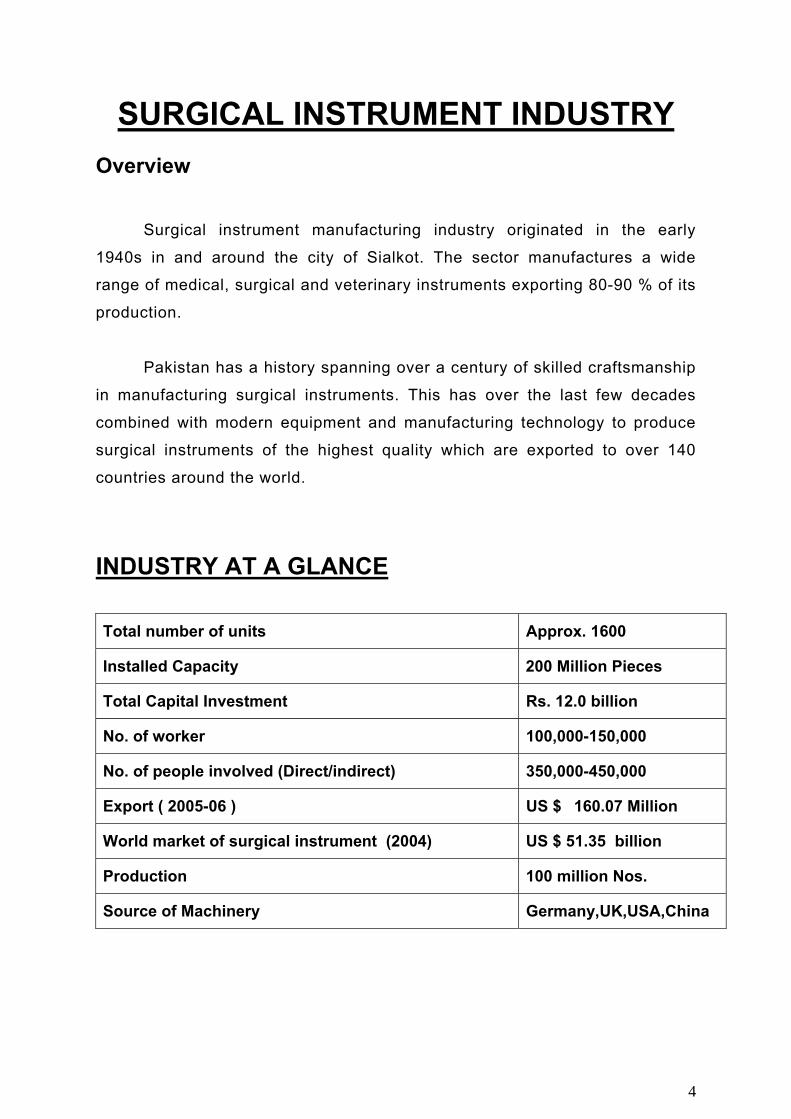
SURGICAL INSTRUMENT INDUSTRY Overview Surgical instrument manufacturing industry originated in the early
1940s in and around the city of Sialkot. The sector manufactures a wide
range of medical, surgical and veterinary instruments exporting 80-90 % of its
production.
Pakistan has a history spanning over a century of skilled craftsmanship
in manufacturing surgical instruments. This has over the last few decades
combined with modern equipment and manufacturing technology to produce
surgical instruments of the highest quality which are exported to over 140
countries around the world.
INDUSTRY AT A GLANCE
Total number of units Approx. 1600
Installed Capacity 200 Million Pieces
Total Capital Investment Rs. 12.0 billion
No. of worker 100,000-150,000
No. of people involved (Direct/indirect) 350,000-450,000
Export ( 2005-06 ) US $ 160.07 Million
World market of surgical instrument (2004) US $ 51.35 billion
Production 100 million Nos.
Source of Machinery Germany,UK,USA,China
4

Pakistan Surgical Industry Structure
LARGE: High Sales Segment
No of Firms 30
Annual Revenues Rs 60 – 100 million
Investment in Equipment Rs 50 - 100 million
MEDIUM: Medium Sales Segment
No of Firms 50
Annual Revenues Rs 10-60 million
Investment in Equipment Rs 10-25 million
SMALL: Low Sales Segment
No of Firms 150
Annual Revenues Rs 1-10 million
Investment in Equipment Rs 1-5million
VENDOR Segment
No of Firms 2000
Annual Revenues Rs 1-1.5 million
TRADERS
Besides all the above there are about 800 – 1000 traders who do not have their own production facility
5
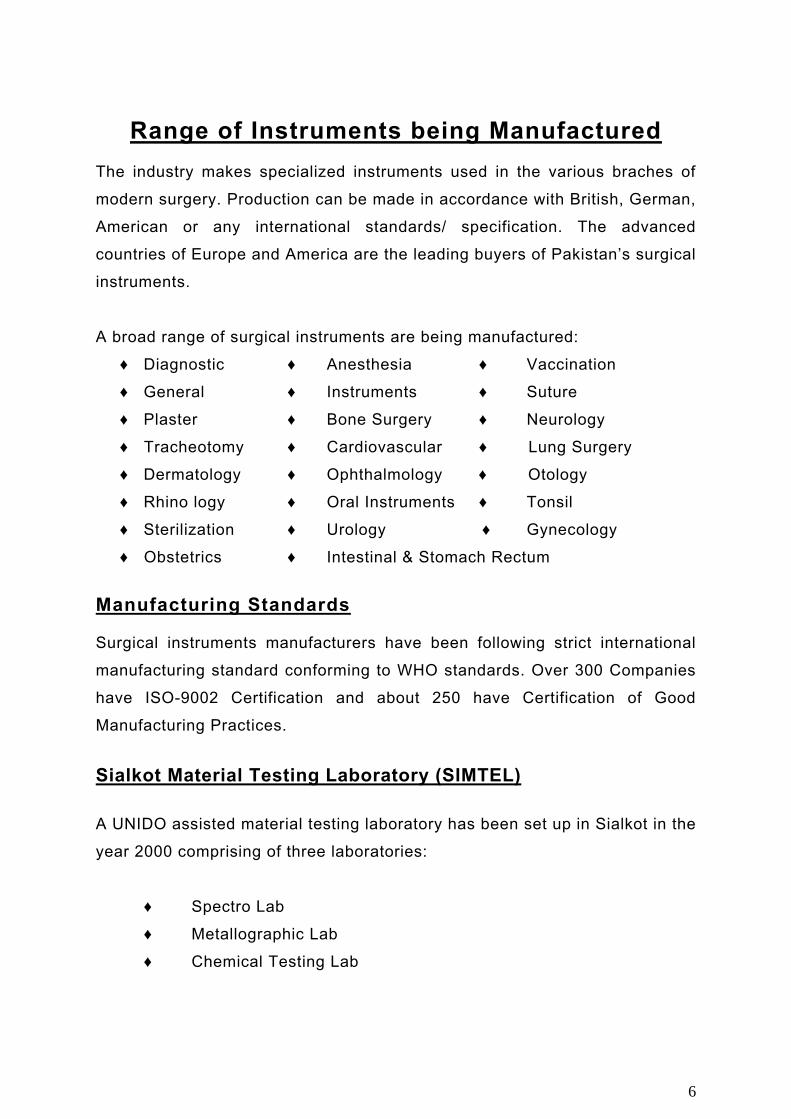
Range of Instruments being Manufactured
The industry makes specialized instruments used in the various braches of
modern surgery. Production can be made in accordance with British, German,
American or any international standards/ specification. The advanced
countries of Europe and America are the leading buyers of Pakistan’s surgical
instruments.
A broad range of surgical instruments are being manufactured:
♦ Diagnostic ♦ Anesthesia ♦ Vaccination
♦ General ♦ Instruments ♦ Suture
♦ Plaster ♦ Bone Surgery ♦ Neurology
♦ Tracheotomy ♦ Cardiovascular ♦ Lung Surgery
♦ Dermatology ♦ Ophthalmology ♦ Otology
♦ Rhino logy ♦ Oral Instruments ♦ Tonsil
♦ Sterilization ♦ Urology ♦ Gynecology
♦ Obstetrics ♦ Intestinal & Stomach Rectum
Manufacturing Standards Surgical instruments manufacturers have been following strict international
manufacturing standard conforming to WHO standards. Over 300 Companies
have ISO-9002 Certification and about 250 have Certification of Good
Manufacturing Practices.
Sialkot Material Testing Laboratory (SIMTEL)
A UNIDO assisted material testing laboratory has been set up in Sialkot in the
year 2000 comprising of three laboratories:
♦ Spectro Lab
♦ Metallographic Lab
♦ Chemical Testing Lab
6

TARIFF STRUCTURE
MATERIAL
CUTOM DUTY
SALES TAX
INCOME TAX
Glass beads 15% 15% 6%
Steel non magnet 5 -25% 15% 6%
Emery 5% 0% 1%
Rubber Belts 20% 15% 6%
Grinding Wheels 5% 0 -15% 1-6%
Files 20% 15% 6%
Triklone chemical % 15% 6%
Cutting oil 20% 15% 6%
Cutters (Milling) 5-10 % 15% 6%
Carbite Tips 5% 15% 6%
Forging 0-20% 0-15% 0-1%
7

MAJOR MANUFACTURING UNITS
S.NO.
Name of Units
Installed Capacity
(Million Nos.)
1. M /s T. S. K. Impex, Sialkot 20.0
2. M /s Dr. Frigz Surgical & Co. ( pvt) Limited 10.0
3. M /s Bashir Jamil & Brothers (Pvt ) Limited
10.0
4. M /s We Brother , Sialkot 8.0
5. M /s Hilbro Instruments ( Pvt ) Limited 6.0
6. M /s Technimen Gama (Pvt ) Limited 5.0
7. M /s Asim Surgical Revit Makers 5.0
8. M /s Tinopal Surgical (Pvt ) Limited 3.5
9. M /s A.D.Surgical ( Pvt ) Limited 2.0
10. M /s Garish Surgical ( Pvt ) Limited 2.0
11. M /s A-One Surgico 1.7
12. M /s Weldon Industries 1.5
13. M /s Medisporex ( Pvt ) Limited 1.2
14. M /s Ghulam Rasool Surgical 1.2
15. M /s Tata Services 1.1
8

MANUFACTURING PROCESS
9

EXPORT OF SURGICAL INSTRUMENTS
YEAR Value(US $ in million)
2000-01 124.137
2001-02 145.04
2002-03 149.96
2003-04 132.56
2004-05 182.87
2005-06 160.07 Source : EPB
EXPORT
124.137
145.04 149.96132.56
182.87
160.07
020406080
100120140160180200
2000-01 2001-02 2002-03 2003-04 2004-05 2005-06
YEARS
US
$ in
Mill
ion
10

PAKISTAN’S EXPORT IN 2004-05
COUNTRY SHARE (%)
USA 28.8%
Germany 13.7%
United Kingdom 9.1%
Italy 5.3%
UAE 4.7%
France 4.12%
Japan 2.2%
Rest of the World 32.1%
Export in 2004-05Rest of the
World, 32.1%
UAE, 4.7 %France, 4.12
JAPAN, 2.2%
Italy, 5.3%
United Kingdom, 9.1%
Germany, 13.7%
USA, 28.8 %
11
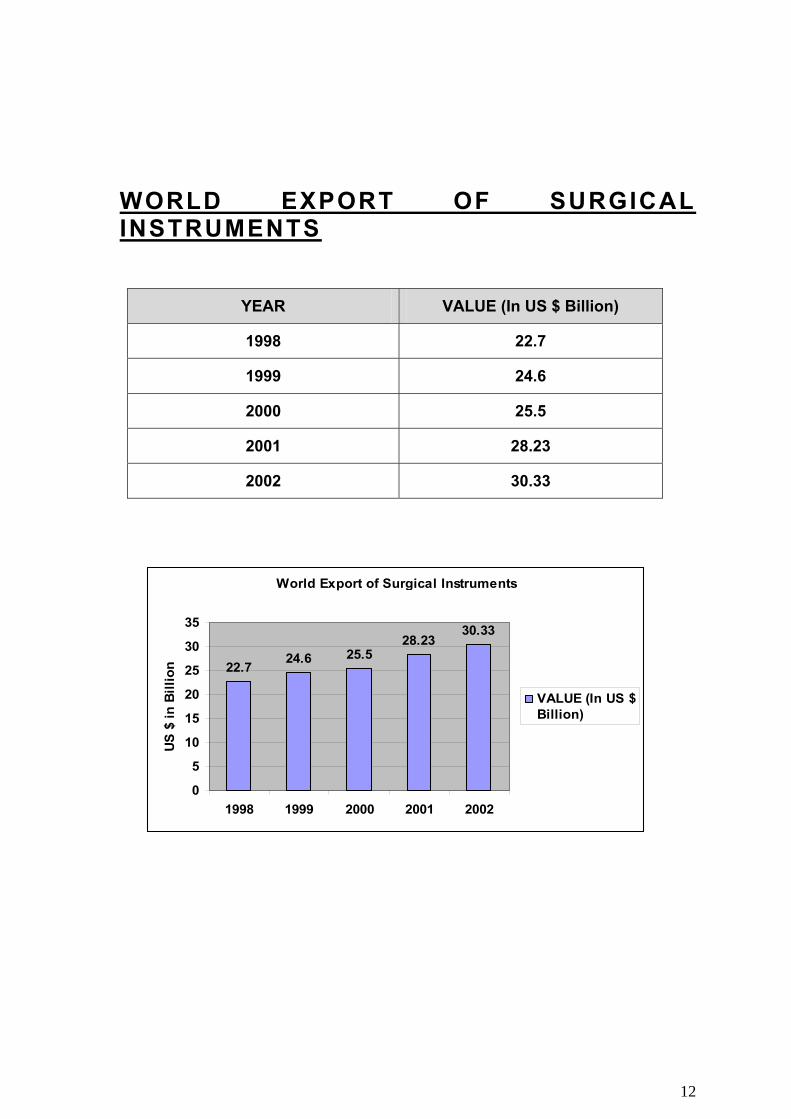
WORLD EXPORT OF SURGICAL INSTRUMENTS
YEAR VALUE (In US $ Billion)
1998 22.7
1999 24.6
2000 25.5
2001 28.23
2002 30.33
World Export of Surgical Instruments
22.724.6 25.5
28.2330.33
0
5
10
15
20
25
30
35
1998 1999 2000 2001 2002
US
$ in
Bill
ion
VALUE (In US $Billion)
12

COUNTRIES SHARES IN WORLD EXPORT
COUNTRY %AGE
USA 24.71
GERMANY 12.33
NETHERLAND 7.13
MEXICO 5.89
IRELAND 5.29
UK 5.23
FRANCE 5.07
JAPAN 4.57
BELGIUM 4.07
ITALY 3.45
PAKISTAN 0.49
OTHERS 21.74
TOTAL 100
Shares in % age
ITALY, 3.5%
OTHERS, 21.7%PAKISTAN,
0.5%
JAPAN, 4.6%
BELGIUM, 4.1%
UK, 5.2%FRANCE, 5.1%IRELAND, 5.3% MEXICO, 5.9%
NETHERLAND, 7.1%
GERMANY, 12.3%
USA, 24.7%
13

P A K I S T A N ’ S S U R G I C A L E X P O R T T O T O P 2 0 C O U N T R I E S
Value in 000 $
S.# Countries 2004-05 %
share 2003-04 %
share 2002-03%
share
1 USA 52,835 29.9 38,910 29.4 51,177 34.1 2 Germany 25,196 13.8 19,464 14.7 20,067 13.4 3 United Kingdom 16,808 9.2 9,738 7.4 11,890 7.9 4 Italy 9,653 5.3 6,565 4.9 6,219 4.2 5 UAE 8,677 4.7 6,992 5.3 6,480 4.3 6 France 7,541 4.1 7,412 5.59 5,870 3.9 7 South Korea 4,147 2.3 2,197 1.7 3,300 2.2 8 Japan 4,088 2.2 3,871 2.9 4,114 2.8 9 Mexico 4,016 2 2,346 1.8 3,906 2.6
10 Australia 2,979 1.6 1,702 1.3 2,202 1.5 11 Netherlands 2,893 1.6 3,561 2.7 2,541 1.7 12 Spain 2,588 1.4 2,021 1.5 2,400 1.6 13 Brazil 2,217 1.2 1,057 0.8 2,171 1.5
14 Canada 2,140 1.2 1,235 0.9 1,919 1.3
15 Belgium 2,101 1.2 1,589 1.2 2,006 1.3 16 Russia 2,029 1.1 1,879 1.4 604 0.4 17 Poland 1,944 1.1 697 0.53 845 0.56 18 Saudi Arabia 1,436 0.8 858 0.7 1,138 0.7 19 Singapore 1,347 0.7 1,089 0.9 1,582 1.1 20 Iran 1304 0.7 479 0.36 487 0.32
Total 155,939 85.3 113,662 85.74 130,918 87.3
Others 26,938 14.7 18,901 14.26 19,047 12.7
Total 182,877 100 132,563 100 149,965 100
14

IMPORTS OF SURGICAL INSTRUMENTS
YEARS Value (Million US $)
1998 32.5
1999 31.6
2000 32.9
2001 33.23
2002 36.37
Imports of Surgical Instruments
32.531.6
32.9
35.2 35.3
29
30
31
32
33
34
35
36
1998 1999 2000 2001 2002
US
$ in
Mill
ion
15

MAJOR EXPORTERS OF SURGICAL GOODS
M/s Tinopal Pvt Ltd P.O Box 518, S.I.E, Sialkot Tel: 052-3255354, 3255454 Fax: 052-3553354 E-mail: [email protected]
M/s Surgicaon (pvt) Ltd P.O.Box 244, Khadim Ali Shah Road, Sialkot Tel: 052-3262531 Fax: 052-3262532 E-mail: [email protected]
M/s QSA Sugical (Pvt) Ltd. P.O Box 1094, Daska Road, Sialkot, Tel: 052-3526387, 3526487, 3529587 Fax: 052-3526386, 3526486 E-mail: [email protected]
M/s Roal Cosmo Industries (Pvt) Ltd P.O.Box 712, Adda Daska Road, Sialkot Tel: 052-3560099, 3555699 Fax: 052-3557983 E-mail: [email protected]
M/s Medical Developers (Pvt) Ltd. Wazirabad Road, Sialkot Tel: 052-3510109-3510740 Fax: 052-3210138-3210915 E-mail: [email protected]
M/s Medisprorex(Pvt)Ltd. P.O.Box – 600, 438, Khadim Ali Road, Sialkot Tel: 052-3554148-3553658 Fax: 052-3255718 E-mail: [email protected]
Dr. Friqz Surgical (PVT) Ltd. Gohadpur Kulluwal Road, Sialkot Tel: 052-3262701-3262705 Fax: 052-3262704-3263315 E-mail : [email protected]
M/s Allen Surgical Co (Pvt) P.O.Box – 643, SIE, Sialkot Tel: 052-3552456- 3555456 Fax: 052-3551479 E-mail: [email protected]
M/s Durrani & Co Naul Wazirabad Road Sialkot Tel: 052-3553612 Fax: 052-3553418 E-mail : [email protected]
M/s Surgicrafts P.O.Box – 15, Muhammad Pura, Sialkot Tel: 052-3587280 Fax: 052- 3588497 E-mail: [email protected]
M/s Elmad Instruments P.O.Box 1656, Roras Road, Noul More, Sialkot Tel: 052-3557728 Fax: 052-3557730
M/s Solatch Sons P.O.Box – 1193, Chirstian town, Sialkot Tel: 052-3264859 Fax: 052-3264785 E-mail: [email protected]
16

E-mail : [email protected]
M/s Arain & Brothers (Pvt) Ltd P.O.Box 432 , Wazirabad Road, Sialkot Tel: 052-326926-3264759 Fax: 052-3264571-3264026 E-mail : [email protected]
M/s Farico Enterprises Near Mazar Mulik Shah Walii Ugoki Road, Sialkot Tel: 052-3511997 Fax: 052-3513700 E-mail: [email protected]
M/s Clif Trading Co (Pvt) Ltd P.O.Box 438, Khadim Ali Road, Sialkot Tel: 052-3563276, 255394 Fax: 052-3588851, 554718 E-mail: [email protected]
M/s Eltec Instruments (Pvt) Ltd 10-Km wazirabad road, Sialkot Tel: 052-3512690 Fax: 052-3512694 E-mail: [email protected]
M/s Hilbtro (PVT) Ltd. 12 Km Daska Road, Sialkot. Tel: 052-3526276-8 Fax: 052-3556279-80 E-mail: [email protected]
M/s Technimen (Pvt) Ltd P.O.Box – 241, Wazirabad, Sialkot Tel: 052-3263834-263836 Fax: 052-3263254 E-mail: [email protected]
M/s Towne Brothers P.O.Box 108, 52-B, SIE, Sialkot. Tel: 052-3553231 Fax: 052-3553217 E-mail: [email protected]
M/s Hico Surgical (Pvt) Ltd P.O.Box – 2141, Noul, Wazirabad Road, Sialkot Tel: 052-3562222 Fax: 052-3553661 E-mail: [email protected]
ASSOCIATION SURGICAL INSTRUMENT MANUFACTURERES ASSOCIATION OF PAKISTAN Marala Rd., Near Sublime Chowk Sialkot - Pakistan Tel: +92-52-3562940, 3563014, 3554890 Fax: +92-52-3554217 E-mail: [email protected] URL: www.simap.org.pk
17

ELECTRICAL FAN INDUSTRY
OVERVIEW
The fan industry is mainly clustered in the four major cities namely,
Gujrat, Gujranwala, Lahore and Karachi. Fan industry is producing about seven
(7) million fans per annum. Out of the total production, approximately 30 per
cent fans consist of pedestals, 7 per cent brackets and the remaining 63 per
cent are ceiling fans. The industry belongs to the light engineering industry
category, and is one of the industries that existed at the time of independence.
Besides small and medium units, a few units are quite large and have
integrated system i.e. from motor winding to high-pressure dies casting. These
units are the main players in the export field. Sales are also fairly concentrated
with five large firms in Gujrat and two in Gujranwala, accounting for 40% of total
industry sales
The industry is producing a variety of products in different sizes and
designs. The major products are: ceiling, pedestal, table, table-cum-pedestal
fans, circumatic fans, wall bracket, exhaust fans and propellers. Most of the raw
materials used by the fan industry are directly or indirectly imported from
different countries. Some of the raw materials used in the manufacturing of a fan
are: electric steel sheets, aluminum, enameled copper wire, ball bearing, steel
rod and PVC
Global fan trade is classified on the basis of energy consumption. The
fans that consume less than 125 watts of energy (SITC 74341) are generally
referred to as domestic fans and the fans that consume over 125 watts (SITC
74343) are classified as industrial fans.
18
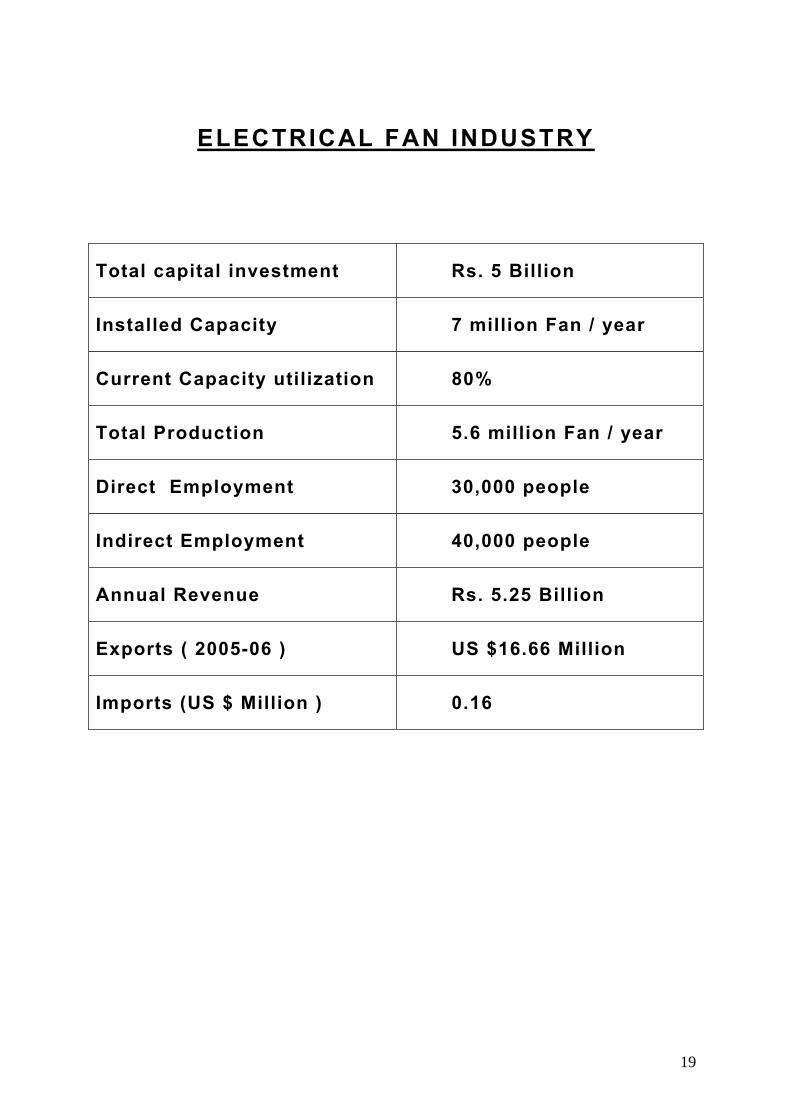
ELECTRICAL FAN INDUSTRY
Total capital investment Rs. 5 Billion
Installed Capacity 7 million Fan / year
Current Capacity utilization 80%
Total Production 5.6 million Fan / year
Direct Employment 30,000 people
Indirect Employment 40,000 people
Annual Revenue Rs. 5.25 Billion
Exports ( 2005-06 ) US $16.66 Million
Imports (US $ Million ) 0.16
19

LARGE SCALE UNITS
UNITS 8
PROJECT COST Rs. 250-350 Million
EMPLOYMENT 200-300
PRODUCTION 60,000-250,000
REVENUE GENERATED Rs. 150-250 Million
MEDIUM SCALE UNITS
UNITS 50
PROJECT COST Rs. 10-20 Million
EMPLOYMENT 60-80
PRODUCTION 20,000-60,000
REVENUE GENERATED Rs. 150-250 Million
SMALL SCALE UNITS
UNITS 450
PROJECT COST Rs. 0.5-1.0 Million
EMPLOYMENT 20-25
PRODUCTION 2,000-10,000
REVENUE GENERATED Rs. 2.0-5.0 Million
VENDORS
UNITS 1000
PROJECT COST Rs. 0.45-1.0 Million
EMPLOYMENT 5-20
20

MAJOR ELECTRIC FAN COMPANIES
BRAND NAME COMPANY
PAK FAN M/S Wahid Industries Limited, G.T. Road, Gujarat
G.F.C. FAN M /s General Fan Company(Pvt) Ltd, G.T. Road, Gujarat
YUNUS FAN M/s Younas Metal Works , G.T.Road, Gujarat
ROYAL FAN M/s Rafiq Engineering Industries (Pvt) Ltd, , G.T. Road, Gujarat
MATRO FAN M/s Hi Tech Industries (Pvt) Ltd, , G.T. Road, Gujarat
21

World’s Export of Other Fan (Industrial Fan) and Fan under 125 watt (Domestic Fan)
Major exporters of fans include Germany, China, Japan, USA and Taiwan exporting
nearly 70% of the total international market of fans industry. Major importers are
USA, Hong Kong, Germany, Japan and Canada which shared 57% of the total
imports.
COUNTRY- WISE EXPORT SHARES OF OTHER FAN (INDUSTRIAL FAN):
COUNTRY SHARES
PAKISTAN 0.02%
FRANCE 2%
NETHERLAND 3%
SWEEDEN 3%
KOREA 1%
CANADA 5%
UK 4%
ITALY 9%
USA 14%
JAPAN 19%
GERMANY 33%
TAIWAN 7%
22

COUNTRY- WISE EXPORT SHARES OF FAN UNDER 125 WATT (DOMESTIC FAN):
FAN UNDER 125 WATT (Domestic Fan)
COUNTRY SHARES
PAKISTAN 0.1%
SINGAPORE 1%
UK 1%
TAIWAN 20%
CHINA 44%
THAILAND 6%
GERMANY 5%
USA 3%
ITALY 2%
SPAIN 2%
JAPAN 2%
OTHER 13%
WORLD VS PAKISTAN EXPORT OF FANS IN 2003
VALUE IN US $ OTHER FAN FAN UNDER 125 WATT
WORLD US $ 3.9 Billion 73% 27%
PAKISTAN US $ 30 Million 34% 66%
23

COUNTRIES TO EXPORTS OF PAKISTAN’S FANS
COUNTRY Other Fan Fan under 125 Watt
BANGLADESH 44% 48%
SAUDI ARAB 14% 19%
UAE 25% 17%
OTHERS 17% 16%
Exports of Pakistan's Fan
17%25%
14%
44%
16%17%19%
48%
0%10%20%30%40%50%60%
BANG
LADE
SH
SAU
DI A
RAB
UAE
OTH
ERS
% a
ge Other FanFan under 125 Watt
24

AVERAGE UNIT PRICE COMPARAISON
COUNTRY Other Fan Unit Value (US $)
Fan under 125 Watt (US $)
PAKISTAN 16 17
USA 64 46
MALAYSIA 48 30
INDIA 40 16
CHINA 38 5
Average Unit Price Comparasion
64
4840 38
46
30
165
16
17
010203040506070
PAK
ISTA
N
USA
MAL
AYSI
A
INDI
A
CH
INA
US $
Other Fan
Fan under 125 Watt(US $)
25

SEASONAL VARIATION IN FAN PRODUCTION
SEASONAL VARIATION IN FAN PRODUCTION
01020304050607080
JAN
FAB.
MARCHAPRIL
MAYJU
NEJU
LY
AUGUST
SEPTEMBER
OCTOBER
NOVEMBER
DECEMBER
% AGE
ASSOCIATION:
PAKISTAN ELECTRIC FAN MANUFACTURERS ASSOCIATION PEFMA House (Gorali), P.O.Box 53 G.T.Road Gujrat Tel: 0092-53-3521429 Fax: 0092-53-3521427
26

CUTLERY INDUSTRY
SECTORAL OVERVIEW Cutlery means the cutting implements such as knives, swords, razors,
scissors, forks and spoons used for industrial, commercial, domestic purposes. It is
broadly divided into two categories i.e. kitchen and table cutlery and non – kitchen
and non – table cutlery. It is one of the important commodities of engineering sector
in Pakistan. The total export of cutlery items was almost US $33 Million . The main
exporting countries are USA, France Germany and UAE and the main competitive
countries are China, Germany, Korea and UK.
The cutlery items apart from tableware are almost 100% export oriented. The
average capacities utilization in this sector amounts to only 30% to 40%. The main
problem areas are the manual grinding, polishing and heat treatment of knife’s blade,
which are carried out in the very primitive style.
This sector is blessed with number of positive attributes like skilled labor,
foreign exposure, training centers, and raw material and export friendly government
policies. There is a wide untapped foreign market like Russia, Australia, Africa and
South America. There is a big threat from China, which is gradually holding the entire
global market. We must get rid of international manufacturing methodology, unethical
business practices, environment of mistrust and price based competition within
industry in order to become competitive at international market.
In the kitchen and table cutlery, the Knives, swords and Daggers are the main
items which exporting to 89% of total export of cutlery whereas 11% export is made
in non-kitchen and non table cutlery.
27

CUTLERY INDUSTRY AT GALANCE
No. of Units
300
Employments
About 25,000 people
Production
5,000 piece per day
Capacity utilization
40-50%
Export (2005-06 )
32.92 US $ in Million
Main Locality
Wazirabad, Nazimabad and Allahbad in Gujranwala district.
Nature
SME
28

POLICIES AND INCENTIVES
Rate of Tariffs on import of materials used in Cutlery is as follows:
PCT CODES
DESCRIPTION
TARIFF
7219.1100
Flats of stainless steel
5%
7407.2100
Copper-Zinc base alloys (Brass)
10%
6804.1000
Self dressing Magnesite wheel
5%
2513.1900
Emery green
5%
9603.2900
Stain brush
25%
5602.2100
Felt mop
15%
3405.1090
Polishes, Creams (luster)
25%
2921.1900
Plastic sheets
20%
4413.0000
Densified wood
5%
29

Global Trade of Cutlery
(Value In Billion Us $) YEARS VALUE
1998 3.94
1999 4.34
2000 4.48
2001 4.68
2002 4.88
2003 5.05
Global Trade of Cultery
3.944.34 4.48 4.68 4.88 5.05
0
1
2
3
4
5
6
1998 1999 2000 2001 2002 2003
US
$ in
Bill
ion
30

Shares in Global Trade of Cutlery
Countries % Share
CHINA 24.02
UK 18.27
GERMANY 14.4
USA 8.57
MEXICO 4.07
KOREA 3.77
FRANCE 3.06
JAPAN 2.81
ITALY 2.43
SWITZERLAND 2.38
PAKISTAN 0.53
OTHERS 15.65
Shares in Export
Japan, 2.81%
Italy, 2.43%
Switzerland, 2.38%
Pakistan, 0.53% others, 15.65%
Korea, 3.77%
France, 3.06%
USA, 8.57%Mesico, 4.04% Germany, 14.4%
IK, 18.27%China, 24.02%
31

EXPORT OF PAKISTANI CUTLERY
YEAR VALUE(US $ Million)
1999-00 20.67
2000-01 26.43
2001-02 24.50
2002-03 29.57
2003-04 29.67
2004–05 34.26
2005-06 32.92
20.6726.43 24.5 29.57
59.67
34.2632.92
0102030405060
US
$ in
Mill
ion
1999
-00
2000
-01
2001
-02
2002
-03
2003
-04
2004
-05
2005
-06
Years
Export of Cutlery
32

IMPORTS OF CUTLERY
YEAR VALUE(US $ Million)
1998-99 1.94
1999-00 2.28
2000-01 2.58
2001-02 2.31
2002-03 1.872
1.942.28
2.58 2.311.87
00.5
11.5
22.5
3
Valu
e in
US
$ M
illio
n
1998-99 1999-00 2000-01 2001-02 2002-03Years
Imports of Cutlery
33

Shares of Majors Countries importing Kitchen and Table Cutlery from Pakistan
COUNTRY SHARE
USA 67%
France 11%
Dubai 6%
Saudi Arabia 5%
Germany 3%
Belgium 1%
South Africa 1%
Others 5%
Total 100%
Export of Pakistan's Cultery
USA, 67%
Germany, 3%
Belgium, 1% South Africa, 1%
Others, 5%
Saudi Arabia, 5%
Dubai, 6%
France, 11%
34

Main exporting countries of Kitchen and Table Cutlery
COUNTRY Share (%)
CHINA 27
GERMANY 10
KOREA 9
JAPAN 7
SWITZERLAND 7
ITALY 4
OTHERS 36
Main importing countries of Kitchen and Table Cutlery
COUNTRY Share (%)
USA 32
GERMANY 10
HONG KONG 8
UK 6
FRANCE 5
CANADA 4
OTHERS 35
35

Main exporting countries of Non-Kitchen and Non-Table Cutlery
COUNTRY Share (%)
UK 24
USA 17
GERMANY 17
CHINA 8
FRANCE 5
KOREA 4
ITALY 4
OTHERS 21
Main importing countries of Non-Kitchen and Non-Table Cutlery
COUNTRY Share (%)
USA 13
UK 12
FRANCE 8
GERMANY 6
ITALY 6
JAPAN 5
OTHERS 50
36

ASSOCIATION PAKISTAN CUTLERY & STAINLESS UTENSILS MANUFACTURERS & EXPORTERS ASSOCIATION P.O.Box 41, G.T. Road , Wazirabad, Pakistan. Tel: 0092-556-602825 Fax: 0092-556-600740
37

AUTO PART INDUSTRY
OVERVIEW
Units
850
Investment
US $ 436.6 Million
Employment
171,000 Peoples
Contribution to GDP
Rs. 154 Billion
Contribution to Revenue
Rs. 8.00 Billion
Export 2005-06
$ 16.9 Million
Import Substitution
$ 2,400 Million
Foreign Exchange Saving
$ 1,252 Million
38

MOTOR VEHICLES ON ROAD IN 1991-92, 2000-01 & 2005-06
Unit
Vehicles 1991-92 2000-01 2005-06
(July –March)
Cars 429,100 928,000 1,445,100
M.Cab (Taxi) 42,400 72,400 78,600
Jeep 31,600 18,300 62,500
Buses 45,000 86,600 103,300
Trucks 75,800 132,300 151,800
Tractors 275,300 579,400 812,100
Tankers 4,600 8,000 8,600
Ambulances 1,700 1,700 4,500
Vans 61,400 72,400 138,300
Pickups 30,200 68,400 92,100
Stn. Wagons 43,600 93,800 140,700
Motorcycles 971,800 2,218,900 3,624,000
Motor Rickshaws 42,400 72,400 78,600
Others 49,500 89,000 62,600
Total 2,095,500 4,471,000 6,845,600
39

PRODUCTION OF VEHICLES / AUTOMOTIVES
PRODUCTION
VEHICLES 2002-03 2003-04 2004-05 2005-06 2006-07
(April, 07)
Cars 62,073 98,461 126,403 160,058 130,841
LCVs 12,548 14,896 25,177 32,053 30,354
Buses 1,296 1,380 1,762 825 758
Trucks 1,929 2,022 3,204 4,518 3,655
Tractors 26,240 35,770 43,200 48,887 43,839
Motorcycles 175,169 303,383 416,189 520,124 379,899
IMPORTS OF MOTOR VEHICLES
Vehicles 2002-03 2003-04 2004-05 2005-06
(July-Dec)
Cars 60,554 88,130 66,338 13,569
Buses 1,230 2429 411 264
Trucks 14,090 2,978 4,160 1,028
Tractors 15,854 14,633 11,127 6,336
Motorcycles 143,952 127,861 189,721 2,929
40

EXPORT OF AUTO PARTS
YEAR VALUE(US $ Million)
2001-02 9.4
2002-03 10.5
2003-04 24.7
2004-05 14.72
2005-06 16.91
9.4 10.5
24.7
14.7216.91
0
5
10
15
20
25
US
$ in
Mill
ion
2001-02 2002-03 2003-04 2004-05 2005-06Years
Export of Auto Parts
41

AUTO PARTS COST BREAK UP
Cost Factor Cars (Percentage)
LCVs (Percentage)
Tractor (Percentage)
Motorcycle(Percentage)
Raw Material and
Parts 53 60 57 49
Overheads 15 19 14 13
Labor 5 3.5 10 9.5
Utilities 2 0.5 3.5 3.5
Sales & Marketing
Advertising 1.5 1.5 1 2.5
Research &
Development 0.5 0 0.5 0.5
Financial Cost 2 2 1 2
Profit 4 2 8 4
Government Levies 17 12 5 15
42

TARIFFS STRUCTURES Custom Duty (%)
Buses Particulars CAR LCV Trucks
Fully - CNG
Non-CNG
Tractor Motorcycle
Raw Materials 0 0 0 0 0 0 0
Sub-Components 5 5 5 0 5 0 5
Components 10 10 10 10 10 0 10
Sub- Assemblies 20 15 & 20 15 0 15 0 20
CKD 35 20 & 35 10 & 20 0 5 0-10 30
Completely Built Units
(CBU)
50-75 60 & 50 30 & 60 20 10 90
Additional Duty on localized parts
15 30 & 15 25 & 30 35 & 30 35 & 25 20
43

VENDOR INDUSTRY
Components Vendor in Pakistan Collaboration
Shock absorbers M/s.Honda Atlas Services Showa, Japan
Radiator M/s. Alwin Engg. Industries U.E. Radiators, Japan
Car Air-conditioners M/s. Sanpak Sanden, Japan
Shock Absorber M/s. Agriauto Industries Kayaba, Japan
Radiator M/s. Loads ( PVT) LTD. Toyo Radiator, Japan
Radio Cassette Player M/s. Automate Industries Panasonic Thailand
Car Air-conditioners M/s. Thal Engineering Denso, Japan
Lamps M/s. Techno Pak Koito, Japan
Spark Plugs M/s. Shaigan Elec. & Engg NGK, Japan
Air Conditioners M/s. Thal Engineering Denso, Japan
Glass M/s. NGS Pakistan NGS, Japan
Steering case set M/s. Polymer & Precision I.S. Seiseki, Japan
Brake Drum Assy. M/s. Alson Autos Ltd. Nissin Kogyo, Japan
44
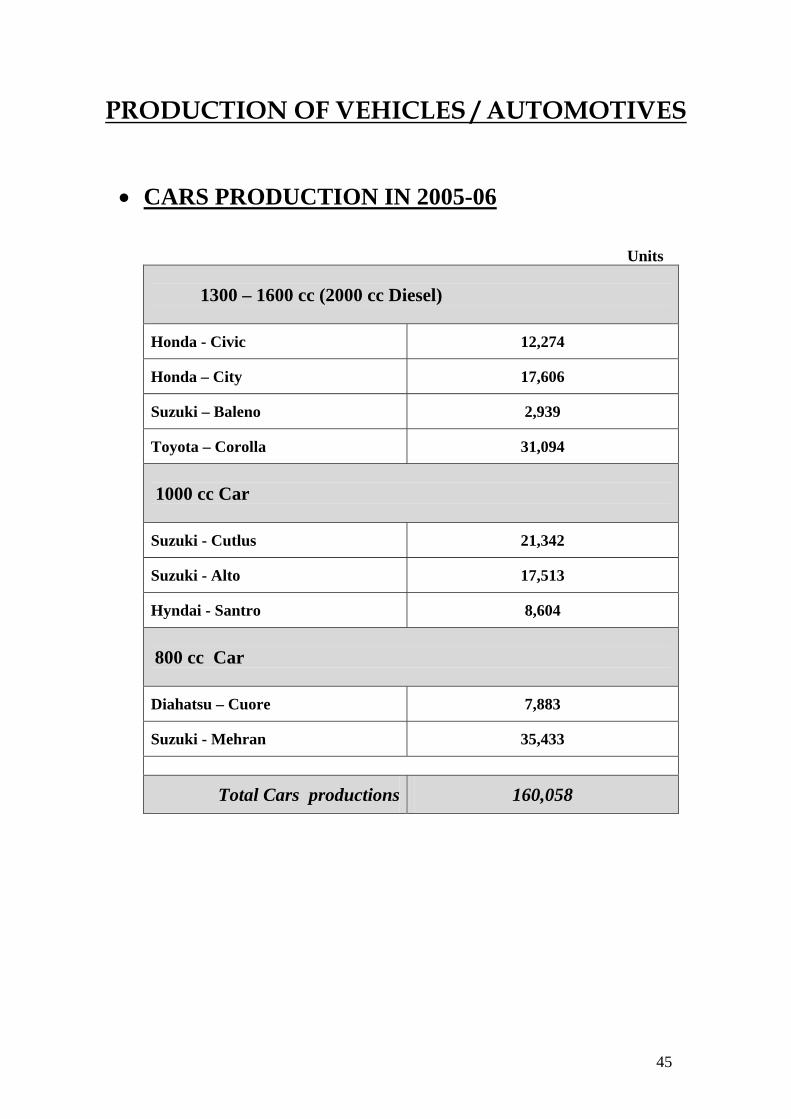
PRODUCTION OF VEHICLES / AUTOMOTIVES
• CARS PRODUCTION IN 2005-06
Units
1300 – 1600 cc (2000 cc Diesel)
Honda - Civic 12,274
Honda – City 17,606
Suzuki – Baleno 2,939
Toyota – Corolla 31,094
1000 cc Car
Suzuki - Cutlus 21,342
Suzuki - Alto 17,513
Hyndai - Santro 8,604
800 cc Car
Diahatsu – Cuore 7,883
Suzuki - Mehran 35,433
Total Cars productions 160,058
45

• TRUKS AND BUSES PRODUCTION IN 2005-06
TRUKS
Hino 1499
Nissan 1652
Dong Feng 4
Isuzu 897
Master 466
Total Truks 4,518
BUSES
Hino 668
Nissan 48
Dong Feng 40
Master 6
Isuzu 63
Total Buses 825
Total Trucks and Buses Production
5,343
• FARM TRACTORS PRODUCTION IN 2005-06
Fiat 24,574
Massey Ferguson 24,313
Total 48,887
46

• LCV PRODUCTION IN 2005-06
JEEP
Suzuki Jeep - Potohar 1,290
Sigma 1,182
VANS
Suzuki -Bolan 10,429
Pick-up
Suzuki – Ravi 5,418
Toyota – Hilux 2,575
Dong Feng 24
Hyundai - Shehzore 9,368
Master 1,767
Total LCVs Productions 26,635
• MOTOR CYCLES PRODUCTION IN 2005-06
Honda 360,561
Yamaha 74,423
Suzuki 16,954
Soharab 14,804
Sohrab (Tri-wheeler) 2,166
Qingqi 17,198
Fateh Hero 34,018
Total Motorcycles Production 520,124
47

ORIGINAL EQUIPMENT MANUFACTURER (OEMs)
Cars Commercial Vehicles
Dewan Farooque Motors Honda Atlas Cars Indus Motors Pak Suzuki Motors Raja Motors Adam Motors
Motorcycles
• Atlas Honda • Blue Star • Dawood Yamaha • Dewan Motorcycles • Excel Industries • Fateh Motors • Memon Associate Foundry • Metro Hi Tech • Pak Hero Industries • Pakistan Cycle Industrial Cooperative Society Ltd • Saigols Qingqi Motors • Super Asia Motors • Suzuki Motor Cycles • Unis Industries • United Sale • New Asia Automobiles • H.K.F Engineering • Suleman Auto Industries • King Hero Motorcycles • A.B. Engineering • Zxmco Pakistan • Eagle Industries • Raja Autocars
48

Tractors
• Al-Ghazi Tractors • G M Tractor • Millat Tractors • Raza Fecto Tractors • Universal Tractors Pak
Trucks Buses
• Adam Motor • Ghandhara Nissan Diesel • HinoPak Motors • Karakorum Motors • Master Motors • Sind Engineering • Sigma Motors
ASSOCIATION:
Pakistan Association of Automotive Parts and Accessories Manufacturers (PAAPAM) 16-B, West Wood Colony, Canal Bank Road Thokar Niaz Baig, Lahore. Tel# 0092-42-5430761-62 Fax# 0092-42- 5430763
Website: www.paapam.com
49

50