Atmospheric monitoring with arduino
89
www.it-ebooks.info
-
Upload
independent -
Category
Documents
-
view
3 -
download
0
Transcript of Atmospheric monitoring with arduino

AtmosphericMonitoringwithArduino
Patrick Di Justo and Emily Gertz
www.it-ebooks.info

ISBN: 978-1-449-33814-5
[LSI]
Atmospheric Monitoring with Arduinoby Patrick Di Justo and Emily Gertz
Copyright © 2013 Patrick Di Justo, Emily Gertz. All rights reserved.Printed in the United States of America.
Published by O’Reilly Media, Inc., 1005 Gravenstein Highway North, Sebastopol, CA 95472.
O’Reilly books may be purchased for educational, business, or sales promotional use. Onlineeditions are also available for most titles (http://my.safaribooksonline.com). For more infor-mation, contact our corporate/institutional sales department: 800-998-9938 or [email protected].
Editors: Shawn Wallace and Brian JepsonProduction Editor: Kara EbrahimProofreader: Kara EbrahimCover Designer: Mark PagliettiInterior Designer: David FutatoIllustrator: Rebecca Demarest
November 2012: First Edition
Revision History for the First Edition:
2012-11-19 First release
See http://oreilly.com/catalog/errata.csp?isbn=9781449338145 for release details.
Nutshell Handbook, the Nutshell Handbook logo, and the O’Reilly logo are registered trade-marks of O’Reilly Media, Inc. Atmospheric Monitoring with Arduino and related trade dressare trademarks of O’Reilly Media, Inc.
Many of the designations used by manufacturers and sellers to distinguish their productsare claimed as trademarks. Where those designations appear in this book, and O’Reilly Me-dia, Inc., was aware of a trademark claim, the designations have been printed in caps or initialcaps.
While every precaution has been taken in the preparation of this book, the publisher andauthors assume no responsibility for errors or omissions, or for damages resulting from theuse of the information contained herein.
www.it-ebooks.info

We dedicate this book to our sisters and brothers:Andy, Lucy, Mathius, and Melissa
www.it-ebooks.info

Contents
Preface. . . . . . . . . . . . . . . . . . . . . . . . . . . . . . . . . . . . . . . . . . . . . . . . . . . . . . . . . . . vii
1/The World’s Shortest Electronics Primer. . . . . . . . . . . . . . . . . . . . . . . . . . . . . 1
What Is Arduino?. . . . . . . . . . . . . . . . . . . . . . . . . . . . . . . . . . . . . . . . . . . . . . . . . . . 1
Electronic Circuits and Components. . . . . . . . . . . . . . . . . . . . . . . . . . . . . . . . . . . 3
Programming Arduino. . . . . . . . . . . . . . . . . . . . . . . . . . . . . . . . . . . . . . . . . . . . . . . 5
First Sketch: Make an LED Blink. . . . . . . . . . . . . . . . . . . . . . . . . . . . . . . . . . . . . . . 6
Parts. . . . . . . . . . . . . . . . . . . . . . . . . . . . . . . . . . . . . . . . . . . . . . . . . . . . . . . . . . . 6
Install the IDE. . . . . . . . . . . . . . . . . . . . . . . . . . . . . . . . . . . . . . . . . . . . . . . . . . . . 6
Breadboard the Circuit. . . . . . . . . . . . . . . . . . . . . . . . . . . . . . . . . . . . . . . . . . . . 6
Write the Code. . . . . . . . . . . . . . . . . . . . . . . . . . . . . . . . . . . . . . . . . . . . . . . . . . . 8
Things to Try. . . . . . . . . . . . . . . . . . . . . . . . . . . . . . . . . . . . . . . . . . . . . . . . . . . . 9
2/Gadget: Tropospheric Gas Detector. . . . . . . . . . . . . . . . . . . . . . . . . . . . . . . . . 11
How Gas Sensors Work. . . . . . . . . . . . . . . . . . . . . . . . . . . . . . . . . . . . . . . . . . . . . 13
Which Gases Can We Monitor?. . . . . . . . . . . . . . . . . . . . . . . . . . . . . . . . . . . . . . . 14
How This Gadget Works. . . . . . . . . . . . . . . . . . . . . . . . . . . . . . . . . . . . . . . . . . . . 14
Transistorized!. . . . . . . . . . . . . . . . . . . . . . . . . . . . . . . . . . . . . . . . . . . . . . . . . . . . 15
Build the Gadget. . . . . . . . . . . . . . . . . . . . . . . . . . . . . . . . . . . . . . . . . . . . . . . . . . 16
Load the Sketch. . . . . . . . . . . . . . . . . . . . . . . . . . . . . . . . . . . . . . . . . . . . . . . . . . . 21
Displaying and Storing Your Data. . . . . . . . . . . . . . . . . . . . . . . . . . . . . . . . . . . . . 25
Liquid Crystal Displays. . . . . . . . . . . . . . . . . . . . . . . . . . . . . . . . . . . . . . . . . . . 25
Reading Data Off EEPROM. . . . . . . . . . . . . . . . . . . . . . . . . . . . . . . . . . . . . . . . 26
Reading Data from an SD Card. . . . . . . . . . . . . . . . . . . . . . . . . . . . . . . . . . . . . 28
Things to Try. . . . . . . . . . . . . . . . . . . . . . . . . . . . . . . . . . . . . . . . . . . . . . . . . . . . . 28
Other Sensors. . . . . . . . . . . . . . . . . . . . . . . . . . . . . . . . . . . . . . . . . . . . . . . . . . 28
Solar Powered. . . . . . . . . . . . . . . . . . . . . . . . . . . . . . . . . . . . . . . . . . . . . . . . . . 28
GSM. . . . . . . . . . . . . . . . . . . . . . . . . . . . . . . . . . . . . . . . . . . . . . . . . . . . . . . . . . 29
Do Not Deploy Your Gadget in Public Without Official Permission. . . . . . . . . . . . 29
Get Official Permission. . . . . . . . . . . . . . . . . . . . . . . . . . . . . . . . . . . . . . . . . . . 30
Get Your Community Involved. . . . . . . . . . . . . . . . . . . . . . . . . . . . . . . . . . . . . . 30
3/A Brief Introduction to LEDs. . . . . . . . . . . . . . . . . . . . . . . . . . . . . . . . . . . . . . 33
v
www.it-ebooks.info

What Is a Diode?. . . . . . . . . . . . . . . . . . . . . . . . . . . . . . . . . . . . . . . . . . . . . . . . . . 33
What Is a Light Emitting Diode?. . . . . . . . . . . . . . . . . . . . . . . . . . . . . . . . . . . . . . 34
How Are We Using LEDs in the LED Photometer?. . . . . . . . . . . . . . . . . . . . . . . . 35
4/Gadget: LED Sensitivity Tester. . . . . . . . . . . . . . . . . . . . . . . . . . . . . . . . . . . . 37
Mission: Inputtable. . . . . . . . . . . . . . . . . . . . . . . . . . . . . . . . . . . . . . . . . . . . . . . . 37
Build the Gadget. . . . . . . . . . . . . . . . . . . . . . . . . . . . . . . . . . . . . . . . . . . . . . . . 38
5/Gadget: LED Photometer. . . . . . . . . . . . . . . . . . . . . . . . . . . . . . . . . . . . . . . . . . 51
Build the Gadget. . . . . . . . . . . . . . . . . . . . . . . . . . . . . . . . . . . . . . . . . . . . . . . . . . 52
Load the Sketch. . . . . . . . . . . . . . . . . . . . . . . . . . . . . . . . . . . . . . . . . . . . . . . . . . . 54
Calibrate the Gadget: Air Mass, Atmospheric Optical Thickness, andExtraterrestrial Constant. . . . . . . . . . . . . . . . . . . . . . . . . . . . . . . . . . . . . . . 59
Calculating Atmospheric Optical Thickness. . . . . . . . . . . . . . . . . . . . . . . . . . . . . 62
Things to Try. . . . . . . . . . . . . . . . . . . . . . . . . . . . . . . . . . . . . . . . . . . . . . . . . . . . . 64
Detecting “Ozone Holes”: Measuring the Ozone Layer. . . . . . . . . . . . . . . . . . 64
Add an Accelerometer. . . . . . . . . . . . . . . . . . . . . . . . . . . . . . . . . . . . . . . . . . . . 65
6/Using the LED Photometer. . . . . . . . . . . . . . . . . . . . . . . . . . . . . . . . . . . . . . . . 67
Atmospheric Aerosols. . . . . . . . . . . . . . . . . . . . . . . . . . . . . . . . . . . . . . . . . . . . . . 69
Photosynthetically Active Radiation (PAR). . . . . . . . . . . . . . . . . . . . . . . . . . . . . . 70
Water Vapor (WV). . . . . . . . . . . . . . . . . . . . . . . . . . . . . . . . . . . . . . . . . . . . . . . . . 70
Extracting Data from the LED Photometer. . . . . . . . . . . . . . . . . . . . . . . . . . . . . . 71
Graphing Data in a Spreadsheet. . . . . . . . . . . . . . . . . . . . . . . . . . . . . . . . . . . . 71
Sending Data to COSM. . . . . . . . . . . . . . . . . . . . . . . . . . . . . . . . . . . . . . . . . . . 72
7/Doing Science: How to Learn More from Your Atmospheric Data. . . . . . . . 73
The Scientific Method. . . . . . . . . . . . . . . . . . . . . . . . . . . . . . . . . . . . . . . . . . . . . . 73
Steps in the Scientific Method. . . . . . . . . . . . . . . . . . . . . . . . . . . . . . . . . . . . . . . 74
Observe Something in the World. . . . . . . . . . . . . . . . . . . . . . . . . . . . . . . . . . . . 74
Ask an Answerable Question. . . . . . . . . . . . . . . . . . . . . . . . . . . . . . . . . . . . . . . 75
Formulate a Hypothesis. . . . . . . . . . . . . . . . . . . . . . . . . . . . . . . . . . . . . . . . . . 75
Compare the Predicted to Actual Results, Considering the Results. . . . . . . . 75
Ask Another Question. . . . . . . . . . . . . . . . . . . . . . . . . . . . . . . . . . . . . . . . . . . . 76
vi Contents
www.it-ebooks.info

Preface
There’s a story (it’s either an old vaudeville jokeor a Zen koan) in which a fisherman asks a fish,“What’s the water like down there?” and thefish replies “What is water?” If the story is justa joke, the point is to make us laugh; but if it’sa koan, the point is that the most obvious andubiquitous parts of our immediate environ-ment are, paradoxically, often the easiest tooverlook.We as a species are probably a little bit smarter than fish: at least we knowthat we spend our lives “swimming” at the bottom of an ocean of air. About4/5th of that ocean is the relatively harmless gas nitrogen. Around another1/5 of it is the highly reactive and slightly toxic gas oxygen. The Earth’s at-mosphere also contains trace amounts of other harmless or slightly toxicgases like argon, carbon dioxide, and methane. And depending on where youlive, it may contain even smaller, but much more toxic, amounts of pollutantslike soot, carbon monoxide, and ozone.
Yet how many of us, like the fish in the koan, overlook the atmosphere? Whoin your life can tell you the general composition of the air around them? Howmany people know what’s inside every breath they take? Do you? Readingthis book and building these gadgets will take you on the first steps of a jour-ney toward understanding our ocean of air.
Conventions Used in This BookThe following typographical conventions are used in this book:
ItalicIndicates new terms, URLs, email addresses, filenames, and file exten-sions.
vii
www.it-ebooks.info
Constant widthUsed for program listings, as well as within paragraphs to refer to pro-gram elements such as variable or function names, databases, datatypes, environment variables, statements, and keywords.
Constant width boldShows commands or other text that should be typed literally by the user.
Constant width italicShows text that should be replaced with user-supplied values or by val-ues determined by context.
This icon signifies a tip, suggestion, or general note.
This icon indicates a warning or caution.
Using Code ExamplesThis book is here to help you get your job done. In general, if this book includescode examples, you may use the code in this book in your programs anddocumentation. You do not need to contact us for permission unless you’rereproducing a significant portion of the code. For example, writing a programthat uses several chunks of code from this book does not require permission.Selling or distributing a CD-ROM of examples from O’Reilly books does re-quire permission. Answering a question by citing this book and quoting ex-ample code does not require permission. Incorporating a significant amountof example code from this book into your product’s documentation doesrequire permission.
We appreciate, but do not require, attribution. An attribution usually includesthe title, author, publisher, and ISBN. For example: “Atmospheric Monitoringwith Arduino by Patrick Di Justo and Emily Gertz (O’Reilly). Copyright 2013Patrick Di Justo and Emily Gertz, 978-1-4493-3814-5.”
If you feel your use of code examples falls outside fair use or the permissiongiven above, feel free to contact us at [email protected].
Safari® Books OnlineSafari Books Online is an on-demand digital library thatdelivers expert content in both book and video form fromthe world’s leading authors in technology and business.
viii Preface
www.it-ebooks.info

Technology professionals, software developers, web designers, and businessand creative professionals use Safari Books Online as their primary resourcefor research, problem solving, learning, and certification training.
Safari Books Online offers a range of product mixes and pricing programs fororganizations, government agencies, and individuals. Subscribers have ac-cess to thousands of books, training videos, and prepublication manuscriptsin one fully searchable database from publishers like O’Reilly Media, PrenticeHall Professional, Addison-Wesley Professional, Microsoft Press, Sams, Que,Peachpit Press, Focal Press, Cisco Press, John Wiley & Sons, Syngress, Mor-gan Kaufmann, IBM Redbooks, Packt, Adobe Press, FT Press, Apress, Man-ning, New Riders, McGraw-Hill, Jones & Bartlett, Course Technology, anddozens more. For more information about Safari Books Online, please visitus online.
How to Contact UsYou can write to us at:
Maker Media, Inc.1005 Gravenstein Highway NorthSebastopol, CA 95472800-998-9938 (in the United States or Canada)707-829-0515 (international or local)707-829-0104 (fax)
Maker Media is a division of O’Reilly Media devoted entirely to the growingcommunity of resourceful people who believe that if you can imagine it, youcan make it. Consisting of Make magazine, Craft magazine, Maker Faire, aswell as the Hacks, Make:Projects, and DIY Science book series, Maker Mediaencourages the Do-It-Yourself mentality by providing creative inspiration andinstruction.
For more information about Maker Media, visit us online:
MAKE: www.makezine.comCRAFT: www.craftzine.comMaker Faire: www.makerfaire.comHacks: www.hackszine.com
We have a web page for this book, where we list examples, errata, examples,and plans for future editions. You can find this page at http://oreil.ly/atmospheric-arduino.
To comment or ask technical questions about this book, send email to [email protected].
For more information about our books, courses, conferences, and news, seeour website at http://www.oreilly.com.
Preface ix
www.it-ebooks.info

Find us on Facebook: http://facebook.com/oreilly
Follow us on Twitter: http://twitter.com/oreillymedia
Watch us on YouTube: http://www.youtube.com/oreillymedia
x Preface
www.it-ebooks.info

1/The World’s ShortestElectronics Primer
If you’re a DIY electronics or Arduino novice,the information in this chapter will help you getthe most out of building and programming thegadgets in this book.If you’re already building your own electronics, consider this chapter a re-fresher to dip into as needed.
What Is Arduino?Arduino is best described as a single-board computer that is deliberatelydesigned to be used by people who are not experts in electronics, engineer-ing, or programming. It is inexpensive, cross-platform (the Arduino softwareruns on Windows, Mac OS X, and Linux), and easy to program. Both Arduinohardware and software are open source and extensible.
Arduino is also powerful: despite its compact size, it has about as muchcomputing muscle as one of the original navigation computers from theApollo program, at about 1/35,000 the price.
Programmers, designers, do-it-yourselfers, and artists around the world takeadvantage of Arduino’s power and simplicity to create all sorts of innovativedevices, including interactive sensors, artwork, and toys.
We built each of the products in this book using the Arduino Uno (Figure 1-1and Figure 1-2), which, at the time of writing, is the latest model. By the timeyou’re reading this, there may be something newer.
You don’t have to know Arduino Uno’s technical specifications to build andprogram the gadgets in this book, but if you’re interested, you can find themat the official Arduino website.
1
www.it-ebooks.info
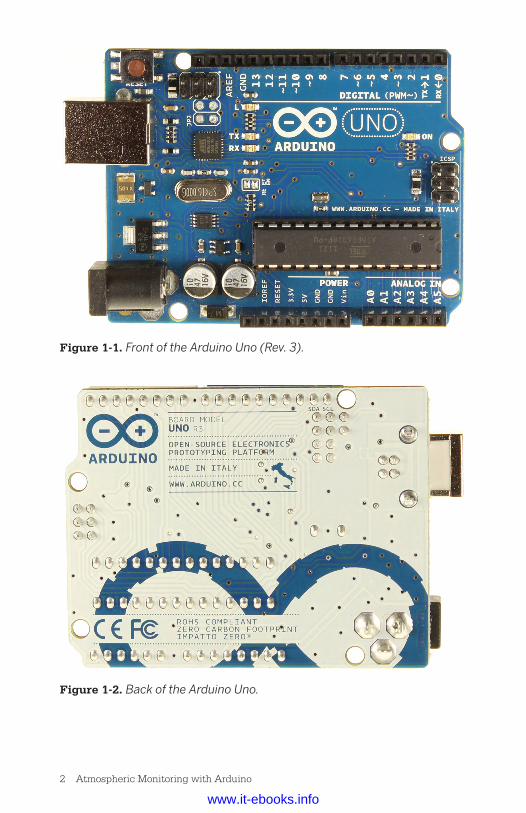
Figure 1-1. Front of the Arduino Uno (Rev. 3).
Figure 1-2. Back of the Arduino Uno.
2 Atmospheric Monitoring with Arduino
www.it-ebooks.info

Electronic Circuits and ComponentsAn electronic circuit is, as the term implies, electricity moving in a path verymuch like a circle. Each circuit has a beginning, a middle, and an end (whichis usually very close to where it began). Somewhere in the middle, the circuitoften runs through various electronic components that modify the electricalcurrent in some way.
Each device in this book is a circuit that combines Arduino with differentelectronic components. Some of these manage the power and path of theelectricity, others sense certain conditions in the environment, and still oth-ers display output about those conditions.
Let’s take a look at some of the components we will be using in our circuits:
Light emitting diodes (LEDs)An LED is a lamp made of various rare-earth metals, which give off alarge amount of light when a tiny current is run through them. The com-position of the substances within the LED determine the particularwavelength of light emitted: you can buy green, blue, yellow, red, evenultraviolet and infrared LEDs.
Technically, the LEDs used in our gadgets are “miniature LEDs,” tinylamps with two wire leads: one long (called the anode) and the other abit shorter (called the cathode). These come in various useful forms (in-cluding single lamps from 2 mm to 8 mm in diameter, display bars, andalphanumeric readouts) and can serve as indicators, illuminators, oreven data transmitters.
You’ll learn how to use these different types of LEDs while building thedifferent environmental sensors in this book.
ResistorsResistors are the workhorses of the electronics world. What do resistorsdo? They simply resist letting electricity flow through by being made ofmaterials that naturally conduct electricity poorly. In this way, resistorsserve as small dumb regulators to cut down the intensity of electric cur-rent.
Resistance is valuable because some electronic components are verydelicate: they burn out easily if they’re powered with too much current.Putting a resistor in the circuit ensures that only the proper amount ofelectricity reaches the component. It’s hard to imagine any circuit work-ing without a resistor, and with LEDs, resistors are almost mandatory.
While building the projects in this book, you’ll learn various creative waysto regulate current with resistors.
The World’s Shortest Electronics Primer 3
www.it-ebooks.info

SolderingSoldering involves heating up conductive metal, called solder, and thenusing it to fuse other pieces of metal together. In small-scale electronics,we use an electrical tool called a soldering iron, which has a small tip, toheat up thin wires of solder and drip the solder onto the components wewish to join into the circuit.
Soldering creates a very stable circuit, and that stability can be a draw-back. Fusing together components can make it difficult to reuse or re-configure circuits. You also must be very careful to not short-circuitcomponents while soldering. Knowing how to solder can be a very usefulskill in DIY electronics. If you’re interested in learning how, this onlineresource is a good place to start.
The alternative to soldering is to use a solderless breadboard.
Solderless breadboardsSolderless breadboards are small plastic boards studded with pins thatcan hold wires (more about these next). These wires can then be con-nected to other electronic components, including Arduino.
Solderless breadboards make it much easier to design circuits, becausethey allow you to quickly try out various assemblies and componentswithout having to solder the pieces together. While solderless bread-boards typically are intended for use only in the design phase, manyhobbyists keep a breadboard in the final version of a device becausethey’re so fast and easy to use.
If you don’t feel like soldering circuit boards, solderless breadboards arethe way to go. Each gadget in this book uses a solderless breadboard.
WireWire is the most basic electronic component, creating the path alongwhich electrons move through a circuit. The projects in this book use1 mm “jumper wires,” which have solid metal tips perfectly sized to fitinto Arduino and breadboard pins, and come sheathed in various colorsof insulation.
Get as much jumper wire as you can afford, in several colors.When building circuits with Arduino, you can’t have too manyjumper wires.
4 Atmospheric Monitoring with Arduino
www.it-ebooks.info

We order most of our electronics components from these online retailers:
• Adafruit Industries
• Eemartee
• Electronic Goldmine
• SparkFun
Maker Shed, from MAKE and O’Reilly Media, sells books, kits, and tools, aswell as many of the components needed to build the projects in this bookincluding Arduino, breadboards, sensors, and basic electronic components.Maker Shed also supplies convenient bundles for many of the projects in thisbook (you can find more information about these bundles in the individualproject chapters).
Don’t count out your friendly local RadioShack, though. While writing thisbook, more than once we ran out to RadioShack for a last-minute compo-nent.
For years RadioShack cut back on its electronic components inventory, ap-parently seeing a better future for the business by featuring cell phones andother consumer electronics. But the company has recently begun to em-brace the maker movement; at the time of writing, most of their storesaround the country are even carrying Arduinos. We’re hopeful RadioShackis on the return path to being the hacker heaven it was years ago.
Programming ArduinoA computer program is a coded series of instructions that tells the computerwhat to do. The programs that run on Arduino are called sketches.
The sketches used in this book mostly tell Arduino to read data from one ofthe pins, such as the one connected to a sensor, and to write information toa different pin, such as the pin connected to an LED or display unit.
Sometimes the sketches also instruct Arduino to process that informationin a certain way: to combine data streams, or compare the input with somereference, or even place the data into a readable format.
An Arduino program has two parts: setup() and loop().
setup()The setup() part tells Arduino what it needs to know in order to do whatwe want it to do. For example, setup() tells Arduino which pins it needsto configure as input, which pins to configure as output, and which pinswon’t be doing much of anything. If we’re going to use a special type ofoutput to show our results, such as an LCD display, setup() is where we
The World’s Shortest Electronics Primer 5
www.it-ebooks.info

tell Arduino how that output works. If we need to communicate with theoutside world through a serial port or an ethernet connection, setup()is where we put all the instructions necessary to make that connectionwork.
loop()loop() tells Arduino what to do with the input or output. Arduino runsthe instructions in loop(), then goes back to the top of loop() and runsthem again. And again. And again. loop() continues to loop as long asthe Arduino has power.
First Sketch: Make an LED BlinkBy long tradition (going back to 2006), the first Arduino sketch you will writeis to make an LED blink.
Arduino pins can be used for input and output, as long as you tell the com-puter which is which. So in this sketch, we tell the Arduino to set pin 13 to bethe LED OUTPUT pin, and then we alternately send electricity to pin 13 (set-ting the pin HIGH) and cut off the electricity to pin 13 (setting the pin LOW).With each alternation, the LED turns on and off.
We’ll write all the sketches in this book using the Arduino integrated devel-opment environment (IDE), which, simply put, is special software for writingand uploading code to Arduino.
Parts1. Arduino Uno
2. Breadboard
3. LED
Install the IDEDownload the Arduino IDE, and follow the provided instructions to install iton your computer.
Once you’ve installed the software, open the IDE. You should see a screenthat looks something like Figure 1-3.
Breadboard the CircuitThe circuit portion of this project is very simple: take an LED and place thelong lead into pin 13 on Arduino, as you can see in the Figure 1-4 breadboardview.
6 Atmospheric Monitoring with Arduino
www.it-ebooks.info

Figure 1-3. The Arduino IDE on a Mac.
Figure 1-4. LED long lead inserted into pin 13 on the Arduino (image madewith Fritzing).
The World’s Shortest Electronics Primer 7
www.it-ebooks.info

Write the CodeYou can find this code in the Arduino IDE under File → Examples or on theEMWA GitHub Repository → chapter-1 → blink.
/* Blink Turns on an LED for one second, then off for one second, repeatedly. This example code is based on example code that is in the public domain.*/
void setup() { // initialize the digital pin as an output. // Pin 13 has an LED connected on most Arduino boards: pinMode(13, OUTPUT);}
void loop() { digitalWrite(13, HIGH); // set the LED on delay(1000); // wait for a second digitalWrite(13, LOW); // set the LED off delay(1000); // wait for a second}
Normally, you’d need to put a resistor in between the powersource and the LED, so as not to burn out the LED. ArduinoUnos (and later models) have a resistor built into pin 13, sothat’s taken care of.
In this sketch, the code in loop() simply tells Arduino to set pin 13 HIGH—taking it up to 5 volts—for 1,000 milliseconds (one second), followed by set-ting it LOW—taking it down to 0 volts—for another 1,000 milliseconds.
Do you notice the /* … */ sections and the // lines in the example above?Those are ways to put comments into your code to explain to others (and toyourself) what the code does:
• /* and */ tell the computer that everything between those marks shouldbe ignored while running the program.
8 Atmospheric Monitoring with Arduino
www.it-ebooks.info

• // tells the computer that everything afterward on that line is a com-ment.
Why Comment Code?Commenting code simply means adding explanations in plain English to yoursketch that describe how the code works. Adding comments to code is a verygood idea. Here’s why:
Suppose, after hours trying to get your Arduino to do something, the solutionsuddenly comes to you. Eureka! You hook up your Arduino, bang out yourcode, load it up, and voilà: it works.
Fast forward: months later, working on another project, you want your Ardu-ino to do something similar to your earlier project. “No sweat, I’ll just reusemy earlier code,” you think. But you open up the sketch and … none of it makessense!
You wrote that earlier code in a highly creative state of mind, when your brainchemicals were flowing like a river and your ideas were flashing like summerlightning. In all the excitement, you didn’t comment your code. So now,months later, when you’re in a completely different state of mind, you can’tremember what the code does, and you have to start all over. Is that any wayto live?
If you had commented your code from the beginning, you’d know exactlywhat each variable was used for, what each function did, and what each pincontrolled. Your life would be so much more enjoyable.
In short, always take a few minutes to comment your code.
Things to TryModify this sketch to make the LED do something different:
1. Blink twice as quickly.
2. Blink twice as slowly.
3. Light up for half a second with a 2-second pause between blinks.
Congratulations, you’re an Arduino programmer! Now let’s have some realfun.
The World’s Shortest Electronics Primer 9
www.it-ebooks.info

2/Gadget:Tropospheric Gas
Detector
We can easily go several hours without drinkingwater. We can comfortably go the better partof a day without eating food. But try and gomore than a few minutes without breathing.(No, don’t really try.) Understanding the com-position of the lower atmosphere—the tropo-sphere—is among the most important envi-ronmental measurements we can take.Everything floating around the troposphere—nitrogen, oxygen, carbon diox-ide, water vapor, and all sorts of pollution—winds up in our lungs, on ourplants, in our food, and in our water (see Figure 2-1). It dusts our windows,our automobiles, and our buildings. For this reason, the authors (as well asorganizations like the American Lung Association) believe that it’s vitally im-portant to know what’s inside every breath we take.
In the old days, when people wanted to know what was in the atmosphere,they used chemically-treated filter paper, and hung it in a breeze. The chem-icals reacted with whatever was in the air and would respond by changingcolor. Or they bubbled the atmosphere through water and measured the dif-ferent compounds that resulted as gas dissolved in water. This kind of workcould only be performed in a dedicated chemistry lab.
11
www.it-ebooks.info

Figure 2-1. This illustration shows how different chemicals and other sub-stances move into and through the troposphere. Credit: U.S. ClimateChange Science Program, 2003.
Fortunately for us, we can now purchase a small, complete atmospheric lab-oratory for less than $10, in the form of an electronic gas sensor (Figure 2-2).These sensors detect different substances in the atmosphere by measuringthe changing resistance of a film made of tin dioxide.
12 Atmospheric Monitoring with Arduino
www.it-ebooks.info

Figure 2-2. There are lots of inexpensive sensors on the market that can beused for DIY monitoring.
How Gas Sensors WorkOxygen in the atmosphere removes electrons from the tin dioxide film, whichdecreases its conductivity (and increases its resistance). When other typesof gases, particularly those that are chemically reducing, touch the tin dioxidefilm, electrons are injected into the material. This increases the conductivity(and lowers the resistance) of the tin dioxide layer. You can use your Arduinoto measure that change in resistance.
It’s important to keep in mind that tin dioxide sensors tend to be broadlyselective. While certain sensors may be marketed as being “alcohol” sensorsor “carbon monoxide” sensors, they actually respond to more than just al-cohol or carbon monoxide, respectively; they respond to a wide family of
Gadget: Tropospheric Gas Detector 13
www.it-ebooks.info

similar gases. Manufacturers can make the tin dioxide-based gas sensorsmore selective by adding various catalysts into the sensor head, or by usingexternal filters. The datasheet provided with each sensor explains morecompletely how to adjust the sensitivity of each sensor for various gases.
Which Gases Can We Monitor?There are electronic sensors for a wide range of gases. As we write this bookin the summer of 2012, there are easy-to-use inexpensive sensors on themarket to detect carbon monoxide, carbon dioxide, liquid petroleum gas,butane, propane, methane (natural gas), hydrogen, ethyl alcohol, benzene,volatile organic compounds, ammonia, ozone, hydrogen sulfide, and more.It’s not unreasonable to expect that it won’t be long before cheap sensors hitthe market that can detect nitrogen oxides and other contaminants. All ofthese gases count as pollutants; in varying concentrations, all of them canbe harmful.
How This Gadget WorksWe’re going to use the MQ-2 and MQ-6 sensors from Hanwei, Inc. in thisgadget. Both detect combustible gases: the MQ-6 detects butane and liq-uefied petroleum gas (LPG), also called propane (both hydrocarbons), whilethe MQ-2 is sensitive to LPG, methane (the primary component of naturalgas, and a potent greenhouse gas), and smoke. We feel that both sensorstogether are a great way to start measuring ground-level air pollution.
What Is Smoke?Smoke, for our purposes, is defined as a byproduct of incompletely burnedcarbon-based fuel. It includes solid and liquid particulate matter (otherwiseknown as soot), as well as some gaseous remnants of the original fuel mixedwith air. Hanwei’s datasheet for the MQ-2 does not specify what “smoke”means for this sensor. But since we know that the MQ-2 detects certain hy-drocarbon gases, we’re assuming that the smoke it detects is alsohydrocarbon-based: a component of automobile or truck exhaust, or theburning of natural gas.
A heating element in the electronic circuit heats the metal, making it morereactive with atmospheric gases. As the various gases react with the metal,the resistance changes in proportion to the amount of that gas present in theair exposed to the sensor. This change in resistance is measured by the Ar-duino analog port. That’s basically it.
If we plug the heater directly into Arduino, we find ourselves with a problem.The heater consumes 800 mW, which works out to equal 200 mA (.8 W / 5
14 Atmospheric Monitoring with Arduino
www.it-ebooks.info

V = .2 A). A standard Arduino pin can only reliably source 20 mA (in otherwords, only about 10% of the power the heater needs). We have correspond-ence from the manufacturers indicating that the heater can be powered byconnecting it to the +5 V Arduino pin, but frankly, we’re skeptical. We’ve gotto come up with a way to use Arduino to control the amount of power thatgoes to the heating units, so that the heating unit is not on constantly, withoutactually having Arduino provide that power.
Both these problems—providing power to the heater and controlling thatpower—have a single solution, probably the greatest invention of the 20thcentury: the transistor.
Transistorized!Transistors are used to amplify electronic signals cheaply and efficiently, withvery little noise, while giving off very little heat (Figure 2-3). Transistors alsoact as tiny, efficient digital switches. Since all computer activity breaks downinto a series of binary “on and off” states represented by 1s and 0s, transis-tors by the millions, embedded into a silicon chip, control those on and offsignals.
We really can’t overstate the importance of the transistor. We don’t haveroom in this book to discuss the details of how transistors work; suffice it tosay that the lightweight, cheap electronic gadgets in our lives—handheld cellphones, computers, digital cameras, flat screen TVs, microwave ovens, cabletelevision, touchtone phones, simple portable AM/FM radios, essentiallyanything more complicated than a flashlight—would be impossible withoutthe transistor.
Figure 2-3. Various transistors. Source: Ulf Seifert.
Gadget: Tropospheric Gas Detector 15
www.it-ebooks.info

The first thing you notice when you look at a transistor is that unlike almostevery other electronic device we’ve seen so far, a transistor has three termi-nals. We can control the voltage between two of the terminals by applying aspecific electric current or voltage to the third terminal. The three terminalsare the base, the collector, and the emitter. The base is the controller; voltageapplied here determines whether or not electricity flows from the collectorto the emitter. The collector is the “source” of the electrical current, and theemitter is the output.
If we were to send varying levels of current from the base, we can regulatethe amount of current flowing from the collector to the emitter. This is howa transistor acts as an amplifier: a very low signal coming into the base isrepeated at a much larger voltage provided by the collector.
When we use a transistor as a switch, the circuitry is even simpler. A transistorswitch is either fully on or fully off. A small data signal to the base determineswhether the transistor is switched on or off. When it is switched on, currentflows between the ground and the collector. This simple setup lets us useArduino to turn on components that have a separate power supply.
Build the GadgetAmount Part Type Properties/(Assembly Code)
2 1 k Ω resistor Package THT; tolerance 5%; bands 4; resistance1 k Ω; pin spacing 400 mil (R1 & R2)
1 Voltage regulator, 5 V Package TO220 [THT]; voltage 5 V (U1)
2 NPN-transistor Package TO92 [THT]; type NPN (Q1 & Q2)
1 Arduino UNO R3 (Arduino1)
1 LCD screen Character type, 16 pins (LCD1)
1 Battery block 9 V (VCC1)
1. Connect a wire from the GND pin of Arduino to the GND rail of the bread-board. Connect the GND rail of the breadboard to the EMITTER pin ofthe transistor (Figure 2-4).
2. Connect the BASE pin of the transistor to a 1 K resistor, and connect theresistor to an Arduino digital pin (Figure 2-5).
16 Atmospheric Monitoring with Arduino
www.it-ebooks.info

Figure 2-4. Step one. Source: these images were created with Fritzing.
Figure 2-5. Step two.
Gadget: Tropospheric Gas Detector 17
www.it-ebooks.info

3. Connect the COLLECTOR pin of the transistor to the GND pin of thesensor (Figure 2-6).
Figure 2-6. Step three.
4. Connect the +5 (VCC) sensor pins to the breadboard’s power rail(Figure 2-7). Don’t worry; we’re going to add a power supply later.
5. Connect the data lines from the sensors to Arduino analog ports 4 and5 (Figure 2-8).
18 Atmospheric Monitoring with Arduino
www.it-ebooks.info

Figure 2-7. Step four.
Figure 2-8. Step five.
Gadget: Tropospheric Gas Detector 19
www.it-ebooks.info

6. Connect the 7805 +5 VDC voltage regulator. This regulates the voltagecoming from your independent power source for the sensor heaters.Like the transistor, the voltage regulator also has three terminals: a cen-ter pin goes to GND, the pin on the left is input, and the pin on the rightis output (Figure 2-9).
Figure 2-9. Step six.
7. Connect the GND pin to the GND rail of the breadboard AND to the black(or –) wire on your power supply. Connect the input pin to the red (or +)wire on your power supply. Connect the output pin to the power rail onthe breadboard (Figure 2-10).
20 Atmospheric Monitoring with Arduino
www.it-ebooks.info

Figure 2-10. Step seven.
This device takes an input current (up to 35 volts), and changes it to a stable,fixed +5 VDC. In our example, we’re using a standard 9 volt battery at thecurrent source, but you can use just about anything: a 6 volt lantern battery,two 3.7 volt lithium polymer batteries connected in series, even a bunch ofAA batteries. The total capacity of your power source should be your maindetermining factor: smaller batteries generally provide fewer amp-hours,meaning that the lifespan of your gadget can be cut short if you run out ofpower.
Don’t connect the battery until you actually need it, or add an ON-OFF switchto power it up when you’re ready to start taking readings.
Optionally, connect the LCD. The data line is Arduino pin 2,ground goes to GND, and the power supply is Arduino’s 3.3 Vpin.
Load the SketchYou can find this sketch in the AMWA GitHub repository.
#include <SoftwareSerial.h>#include <SD.h>#include <EEPROM.h>#include<stdlib.h>
// Liquid Crystal Display
Gadget: Tropospheric Gas Detector 21
www.it-ebooks.info

// Define the LCD pins: We'll be using a serial-based LCD display// which only required +3.3Volts, GND, and a single data line.// databuff and displaybuff hold the data to be displayed#define LCDIn 2#define LCDOut 5SoftwareSerial mySerialPort(LCDIn, LCDOut);
// Data Buffers for the LCDchar databuff1[16];char databuff2[16];char dispbuff[16];
// GAS SENSORS// Analog input pin that reads the first gas sensorconst int gasPin1 = A5;
// Analog input pin that reads the gas sensorconst int gasPin2 = A4;
// The digital pin that controls the heater of gas sensor 1const int heaterPin1 = 7;
// The digital pin that controls the heater of gas sensor 2const int heaterPin2 = 9;
// LED connected to digital pin 13const int ledPin = 13;
// value read from the sensor A5int gasVal1 = 0;
// value read from the sensor A4int gasVal2 = 0;
long warmup = 180000; // enter time for heaters to warmup, in milliseconds.// 180,000 milliseconds = 3 minutes
long downtime = 360000; // enter delay between readings, in milliseconds.// 360,000 milli seconds = 6 minutes
//EEPROM records require two bytes to store a 1024 bit value.//Each gas sensor returns a value from 0-1024, taking 2 bytes.//To store gas sensor data would require a record index,//plus two bytes for the first gas sensor, two bytes for the second gas sensor//For a total of five bytes per record.
// current EEPROM addressint addr =0;
//EEPROM record numberint record = 0;
22 Atmospheric Monitoring with Arduino
www.it-ebooks.info

//EEPROM record lengthint reclen = 5;
//switch to tell if an SD card is presentint SDPresent = 1;
void setup(){ // initialize serial communications at 9600 bps: Serial.begin(9600);
pinMode(heaterPin1, OUTPUT); // sets the digital pins as output pinMode(heaterPin2, OUTPUT); pinMode(LCDOut, OUTPUT);
//reset the LCD mySerialPort.begin(9600); mySerialPort.write(0xFE); mySerialPort.write(0x01); sprintf(databuff1,"Wakeup Test"); sprintf(dispbuff,"%-16s",databuff1); mySerialPort.print(dispbuff);
// Set up SD card, let us know if SD card is absent pinMode(10, OUTPUT); if (!SD.begin(4)) { SDPresent =0; sprintf(databuff2,"NO SD CARD!!!"); sprintf(dispbuff,"%-16s",databuff2); mySerialPort.print(dispbuff); Serial.println("NO SD CARD!!!"); delay(6000); } delay(3333);}
void loop(){ long scratch=0; // scratch variable
// set the timer unsigned long counter = millis();
//turn first heater on digitalWrite(heaterPin1, HIGH);
// wait 3 minutes for heater to heat up while(millis() < (counter + warmup)) { sprintf(databuff1,"Unit1 Activated"); sprintf(dispbuff,"%-16s",databuff1); mySerialPort.print(dispbuff);
Gadget: Tropospheric Gas Detector 23
www.it-ebooks.info

scratch = (int)((counter+warmup - millis())/1000); sprintf(databuff2,"Countdown: %3d", scratch); sprintf(dispbuff,"%-16s",databuff2); mySerialPort.print(dispbuff);
Serial.println(scratch); }
// read the analog in value: gasVal1 = analogRead(gasPin1); sprintf(databuff1,"read unit 1"); sprintf(dispbuff,"%-16s",databuff1); mySerialPort.print(dispbuff);
// shut off the first heater digitalWrite(heaterPin1, LOW);
//turn second heater on digitalWrite(heaterPin2, HIGH); sprintf(databuff2,"turning on unit2"); sprintf(dispbuff,"%-16s",databuff2); mySerialPort.print(dispbuff);
// wait 3 minutes for heater to heat up while(millis() < (counter + warmup + warmup)) { sprintf(databuff1,"Unit2 Activated"); sprintf(dispbuff,"%-16s",databuff1); mySerialPort.print(dispbuff);
scratch = (int)((counter+warmup+warmup - millis())/1000); sprintf(databuff2,"Countdown: %3d", scratch); sprintf(dispbuff,"%-16s",databuff2); mySerialPort.print(dispbuff);
Serial.println(scratch); }
// read the analog in value: gasVal2 = analogRead(gasPin2); sprintf(databuff2,"reading unit2"); sprintf(dispbuff,"%-16s",databuff2); mySerialPort.print(dispbuff);
// shut off the second heater digitalWrite(heaterPin2, LOW);
//Display on LCD sprintf(databuff1,"Gas1:%4d",gasVal1); sprintf(dispbuff,"%-16s",databuff1); mySerialPort.print(dispbuff); sprintf(databuff2,"Gas2:%4d",gasVal2); sprintf(dispbuff,"%-16s",databuff2); mySerialPort.print(dispbuff);
24 Atmospheric Monitoring with Arduino
www.it-ebooks.info

//write to SD card if(SDPresent = 1) { writeDataToSD(databuff1, databuff2); }
//Wait downtime and start again //to make more frequent measurements, change value of downtime while(millis() < (counter +downtime)) { }}
void writeDataToSD(String dataString1, String dataString2){ // open the file. note that only one file can be open at a time, // so you have to close this one before opening another. File dataFile = SD.open("datalog.txt", FILE_WRITE);
// if the file is available, write to it: if (dataFile) { Serial.println("Hooray, we have a file!"); dataFile.print(millis()); dataFile.print(","); dataFile.print(dataString1); dataFile.print(","); dataFile.println(dataString2);
dataFile.close();
// print to the serial port too: Serial.print(millis()); Serial.print(","); Serial.print(dataString1); Serial.print(","); Serial.println(dataString2);
//Print to LCD mySerialPort.print("Datafile written"); }}
Displaying and Storing Your DataYou can connect Arduino to components that display data, as well as thosethat store data for later use.
Liquid Crystal DisplaysLiquid crystal displays (LCDs) are cheap and easy ways to display data, sta-tus, warnings, and other messages from Arduino. They come in manydifferent colors: you can buy LCDs with amber characters on a black back-
Gadget: Tropospheric Gas Detector 25
www.it-ebooks.info

ground, black characters on a green background, yellow characters on a bluebackground, and other color combinations. Some LCDs have two rows of 16characters, others four rows of 20 characters, and other display combina-tions are available as well. But for our uses, the biggest differences in LCDsinvolve the way they handle data.
The most basic (and least expensive) LCDs make you do all the data handling.They can take up as many as 10 digital data pins (most Arduinos only have13), and might even require you to design your own characters. Some makerslove doing stuff like that, but others just want to plug in a device and have itwork.
For our uses, we’ve decided to go with a serial-controlled LCD, one in whicha small microprocessor attached to the LCD takes care of all the data andcharacter management. It’s more expensive, but also much easier to use. Allwe need to do is ground the device, give it some power, and feed it data.
Step seven of the build explains how to connect the LCD to the troposphericgas detector.
Reading Data Off EEPROMYou might have noticed in the code that Arduino writes the data it recievesto something called EEPROM. This stands for “Electrically Erasable Pro-grammable Read-Only Memory.” This is a type of computer memory that isnonvolatile; it remains in place after Arduino is powered down, or after a newprogram is loaded. EEPROM is perfect for storing data that has to last a longtime (a long time by Arduino standards, that is), such as months or years.Our gadget uses 5 bytes of EEPROM to store a single observation record: 1byte for the record number, and 2 bytes apiece for each sensor’s data.
We’ve included a small program to extract tropospheric gas data from theArduino’s EEPROM. Simply connect your Arduino to your computer via theUSB cable, upload the following sketch, and then view the serial monitor.
#include <EEPROM.h>
// start reading from the first byte (address 0) of the EEPROM
int address = 1;int record = 0;unsigned int Sensor1 = 0;unsigned int Sensor2 = 0;
int q;int m;
void setup(){ Serial.begin(9600); Serial.println("Record#, Sensor1, Sensor2");
26 Atmospheric Monitoring with Arduino
www.it-ebooks.info

for(int i =0; i<=95; i++) { readData(); }}
void loop(){ // There's no need for this program to loop. We know what we want to do, // and we just did it in setup().}
void readData(){ record = EEPROM.read(address++); Serial.print(record); Serial.print(","); q = EEPROM.read(address++); delay(20); m = EEPROM.read(address++); delay(20); Sensor1 = (q*256)+m;
Serial.print(Sensor1); Serial.print(","); q = EEPROM.read(address++); delay(20); m = EEPROM.read(address++); delay(20); Sensor2 = (q*256)+m;
Serial.print(Sensor2); Serial.print(","); q = EEPROM.read(address++); delay(20); m = EEPROM.read(address++); delay(20);
}
The result is a CSV display of your data, ready to be copied and pasted intoyour favorite spreadsheet program.
The Limits of EEPROMEEPROM is not limitless. The Arduino Duemilanove and Uno each have a sin-gle kilobyte of EEPROM available, which (at 5 bytes per observation record)will hold about 200 observations worth of data. At 5 observations per hour,that’s enough for more than a day and a half of solid observation. ArduinoMegas have 4 kilobytes of EEPROM, about enough to hold a week’s worth ofatmospheric data. The old Arduino NGs, Nanos, and Diecimilas have a paltry512 bytes of EEPROM, about 20 hours’ worth.
Gadget: Tropospheric Gas Detector 27
www.it-ebooks.info
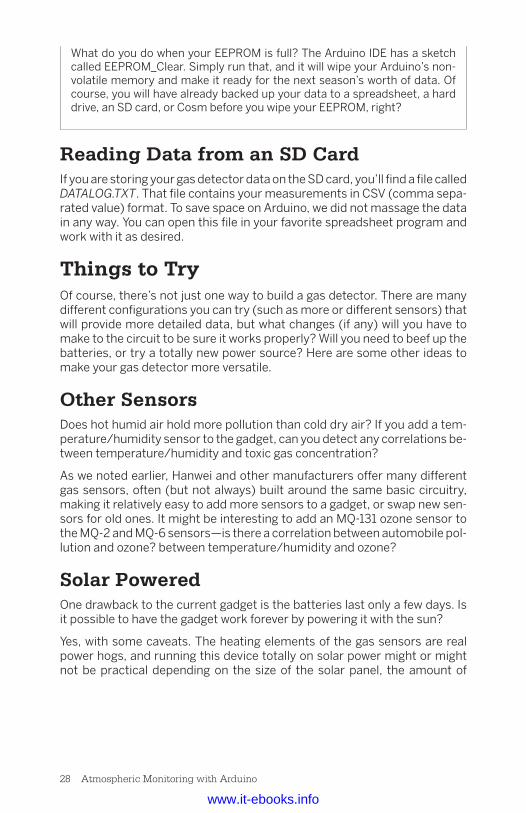
What do you do when your EEPROM is full? The Arduino IDE has a sketchcalled EEPROM_Clear. Simply run that, and it will wipe your Arduino’s non-volatile memory and make it ready for the next season’s worth of data. Ofcourse, you will have already backed up your data to a spreadsheet, a harddrive, an SD card, or Cosm before you wipe your EEPROM, right?
Reading Data from an SD CardIf you are storing your gas detector data on the SD card, you’ll find a file calledDATALOG.TXT. That file contains your measurements in CSV (comma sepa-rated value) format. To save space on Arduino, we did not massage the datain any way. You can open this file in your favorite spreadsheet program andwork with it as desired.
Things to TryOf course, there’s not just one way to build a gas detector. There are manydifferent configurations you can try (such as more or different sensors) thatwill provide more detailed data, but what changes (if any) will you have tomake to the circuit to be sure it works properly? Will you need to beef up thebatteries, or try a totally new power source? Here are some other ideas tomake your gas detector more versatile.
Other SensorsDoes hot humid air hold more pollution than cold dry air? If you add a tem-perature/humidity sensor to the gadget, can you detect any correlations be-tween temperature/humidity and toxic gas concentration?
As we noted earlier, Hanwei and other manufacturers offer many differentgas sensors, often (but not always) built around the same basic circuitry,making it relatively easy to add more sensors to a gadget, or swap new sen-sors for old ones. It might be interesting to add an MQ-131 ozone sensor tothe MQ-2 and MQ-6 sensors—is there a correlation between automobile pol-lution and ozone? between temperature/humidity and ozone?
Solar PoweredOne drawback to the current gadget is the batteries last only a few days. Isit possible to have the gadget work forever by powering it with the sun?
Yes, with some caveats. The heating elements of the gas sensors are realpower hogs, and running this device totally on solar power might or mightnot be practical depending on the size of the solar panel, the amount of
28 Atmospheric Monitoring with Arduino
www.it-ebooks.info

sunlight at your location, and the number of gas sensors you have. If you wantto give it a try, we’d recommend starting with something like the AdafruitUSB/SOLAR LiPoly charger. This device will handle all the power manage-ment for you.
The key question is the size of the solar panel: if you calculate the amount ofpower your Arduino and sensors use, and compare it to the net power youcan expect from the solar panel/charger (taking into account your locationand time of year), you can get a good idea if solar will work for your gadget.
GSMWouldn’t it be great if, instead of having to fetch data from your gadget, youcould make your gadget send you its data? You can, with a GSM module. Thisdevice, available from all the usual suppliers like Sparkfun and Adafruit, isessentially the guts of a cell phone without the keypad, display, speaker, mi-crophone, or ringtones. By connecting it in place of (or along with) the LCDdisplay, you can have your gadget send you text messages (or even post onTwitter!) its latest findings. You’ll need to get a separate SIM card with a dataplan, but these usually cost in the range of $5 to $10 per month.
Do Not Deploy Your Gadget in PublicWithout Official PermissionNow we come to the strangest part of this book: the warning not to leave yourgas detector unattended, anywhere, ever. Here’s why:
In May 2012, Takeshi Miyakawa, a visual artist and furniture designer in NewYork City, placed a portable battery-powered light inside a translucent “I LoveNY” plastic shopping bag, and hung it from a metal rod attached to a tree.When the lamp was on, the bag glowed from within. A friend of the artist saidhe did this “to lift people’s spirits. He was simply trying to say that he lovesthe city and spread that attitude around.”
Unfortunately for Miyakawa, someone in the neighborhood saw a contrap-tion with wires, batteries, and plastic boxes and called the New York PoliceDepartment’s bomb squad, which evacuated the area and took two hours todetermine that a battery and a light was just a battery and a light. When thepolice tracked the device to Miyakawa, they arrested him and charged himwith two counts of first-degree reckless endangerment, two counts of placinga false bomb or hazardous substance in the first degree, two counts of placinga false bomb or hazardous substance in the second degree, two counts ofsecond-degree reckless endangerment, and two counts of second-degreecriminal nuisance. A judge ordered him sent to Bellevue hospital for psychi-atric evaluation, as well.
All for hanging a light in a tree.
Gadget: Tropospheric Gas Detector 29
www.it-ebooks.info

Miyakawa’s experience is not unique, unfortunately. In another case, re-searchers from Carnegie-Mellon University built similar detectors to ours,and placed them at various points around the Pittsburgh area. While thesensors were enclosed in professionally made plastic cases, and were clearlylabeled as an approved research project, once again the police bomb squadwas called. (The students didn’t report being arrested. However, they did sayit took a great deal of negotiation with the authorities to get their equipmentback.)
The US Department of Homeland Security (DHS) urges people to “be vigi-lant, take notice of your surroundings, and report suspicious items oractivities to local authorities immediately.” As a result, homemade electronicgadgets that once upon a time (at least, in the lifetimes of the authors) mighthave been regarded as interesting curiosities are now treated as threats.Many people don’t understand hobby electronics, and are frightened by whatthey do not understand. Police believe they must treat every suspiciouspackage as if it may be harmful.
The point of telling you all this is not to scare you from building monitoringdevices, but to warn you that a home-built, Arduino-based gas sensor might,to the unknowing eye, look like a box of batteries and wires and a scary thingwith blinking lights. Leaving something like this unattended, without permis-sion, on property you don’t own, can get you into a world of trouble.
The following subsections are a couple ideas for solving this problem.
Get Official PermissionLook into official channels through which you can deploy experimental pack-ages in public. At A.M.W.A. World Headquarters in New York City, we lookedto the Parks Department, which allows researchers to leave experimentaldevices in some of the city’s parks. The entire application process is on thecity’s website. It’s fairly extensive, requiring an explanation of the experimentand a description of the device, but can be filled out in a single sitting.
Unfortunately, processing these permits seems to take a long time. We ap-plied for one in early May 2012, and it still hadn’t arrived by the time this bookwent to press in November.
Get Your Community Involved• If you’re a student, get your teachers on your side when it comes to your
projects. Arduino is so new that there’s a good chance you’ll be teachingthe teachers for a change, and once your teachers understand whatyou’re doing, they’ll be among your staunchest supporters.
30 Atmospheric Monitoring with Arduino
www.it-ebooks.info

• If you’re a member of a hackerspace, have an open house. Invite mem-bers of the community to meet you in person and learn about what you’redoing. This may work wonders toward alleviating some of the public’sfear of DIY electronics.
• If you’re not a member of a hackerspace, consider joining one, or evenstarting one. Good online resources for finding and learning moreabout hackerspaces are the Hackerspace Wiki and the UK HackspaceFoundation.
Gadget: Tropospheric Gas Detector 31
www.it-ebooks.info

3/A Brief Introductionto LEDs
Before we start working on the LED photome-ter, we’re going to take a brief look at why andhow the gadget’s crucial component—the lightemitting diode, or LED—can be used to moni-tor certain properties of the atmosphere.Even if you’ve worked with LEDs before, chances are your projects used themsimply as lights or indicators of some sort, with the color choices more aboutaesthetics than science. By comparison, in this book we use LEDs in waysthat take advantage of the physics of light.
We think you’ll get more out of building and using the LED photometer if youknow more about that. But if you’re feeling impatient, skip to the project inChapter 4, the LED Sensitivity Tester, and proceed from there.
It is essential to test your LEDs before you build the LED pho-tometer. Testing takes two forms: (1) testing to see if the LEDslight up and (2) testing the LEDs for wavelength sensitivity.The first test is easy: you can connect the short wire of an LEDto Arduino GND and the long end to pin 13, and run the BLINKsketch that comes with the Arduino IDE software; if the LEDblinks, it works. (An even easier way is to connect an LED to a3 v coin cell—with the long wire on the positive side of the bat-tery. If the LED lights, it works.)
Testing the LED for wavelength sensitivity is much more com-plicated; we deal with that in Chapter 4.
What Is a Diode?A diode is a two-terminal electronic device that lets electricity flow easily inone direction, and prevents (or resists) it from flowing in the other direction.
33
www.it-ebooks.info

Many electrical components can be run “backwards”: for example, a loud-speaker can be used as a microphone, and vice versa. A motor, which turnselectricity into movement, can often be used as a generator that turns move-ment into electricity.
This reversibility of electronic components is partly thanks to the fact thatelectricity usually has no problem flowing both ways through a circuit; itmakes no difference to an electron if it flows from a battery to a motor orfrom a motor to a battery.
But the direction of electron flow matters if we’re designing a generator cir-cuit: we don’t want that circuit to suddenly work in reverse and start spinninglike a motor! This is where diodes are useful. They work like valves that pre-vent the “backflow” of electricity, ensuring that electrons will move only inthe direction we want them to.
Discovery of the DiodeThe 1870s were an exciting time to be working with electricity. In America,Thomas Edison was inventing some of the devices that would define the 20thcentury: the light bulb, the phonograph, and an improved telephone. Mean-while in Europe, scientists were taking a more theoretical approach, seekingto understand how electricity flowed.
In 1874, a German scientist named Karl Ferdinand Braun published an ac-count of what he called “the unilateral conduction of current by natural metalsulfides.” Up to this point, scientists knew that electricity could travel alonga wire in either direction. Braun discovered that a crystal of tetrahedrite (acompound of copper, antimony, and sulfur) let electricity flow through it inonly one direction. This demonstration of one-way electrical flow was the firstknown semiconductor diode—in fact, it was the first semiconductor inhistory.
What Is a Light Emitting Diode?A light emitting diode is a diode that emits light.
Okay, snark aside, in 1907 a scientist named Henry Joseph Round discoveredthat crystals of carborundum gave off a faint yellow light when they wereenergized by electrons. These crystals were also diodes, and didn’t emit lightwhen electricity tried to flow the other way. Scientists later discovered thatin an LED, electrons combine with electron “holes” in the crystal, and releaseexcess energy as photons in a very narrow range of wavelengths known asthe emission band. The narrowness of this emission band is rivaled only bylaser light, and explains the jewel-like purity of LED light.
Figure 3-1 shows some LEDs in sizes 8 mm, 5 mm, and 3 mm. Two importantthings to know for DIY purposes are that the longer lead is called the anode
34 Atmospheric Monitoring with Arduino
www.it-ebooks.info

(commonly thought of as the positive terminal), and the shorter lead is calledthe cathode (commonly thought of as the negative terminal). An easy wayto remember this is that the negative terminal has something “subtracted”from it. Because an LED is a diode, electricity will only easily flow through itin one direction. So when you plug an LED into a circuit, be sure to connectthe anode to the positive side of the circuit and the cathode to the negativeside or ground, if you expect to make it glow.
Figure 3-1. LEDs in 8 mm, 5 mm, and 3 mm sizes.
How Are We Using LEDs in the LEDPhotometer?LEDs not only emit light; they absorb it, too. An amateur scientist discoveredthis capability of LEDs in the 1970s. Forrest M. Mims III, a former US Air Forceofficer, had been doing experiments with photocells and light since he was aboy. Understanding that many electronic devices can be run “backwards”[see “What Is a Diode?” (page 33)], Mims reasoned that since LEDs take inelectricity and emit light (along that narrow emission band, remember), theyshould also take in light and give off electricity. A series of experiments provedhim right, and by 1973 he had formalized what is now known as the MimsEffect: LEDs will absorb light along a relatively narrow band of color, and emita small amount of electricity. These light-absorbing qualities of LEDs arewhat we put to work in our LED photometer.
A Brief Introduction to LEDs 35
www.it-ebooks.info

An LED absorbs light occurring in wavelengths near its own emission band,or slightly shorter. A green LED absorbs light in the greenish-blue part of thespectrum, a red LED absorbs light in the reddish-orange part of the spec-trum, and so on. We can use this difference in the way LEDs absorb light totell us a great deal about the atmosphere.
What Is Color?Color is a property of matter that we perceive depending upon which lightwaves matter absorbs, and which it reflects or emits. Our eyes see the re-flected or emitted light waves, and our brains process that information ascolor. The shorter wavelengths occur in what we percieve as the blue-indigo-violet range of the spectrum; the wavelengths we think of as green sit in themiddle; and the longer wavelengths occur in what we see as the red-orange-yellow range. Ultraviolet (a very short wavelength of light) and infrared (a verylong one) are ends of the spectrum not visible to human eyes—although wecan see the re-emission of ultraviolet light, as with the psychedelic “black-light” posters of the 1960s and 1970s, which were printed with inks containingmaterials that excelled at absorbing those short light waves and re-emittingvisible light. And we can feel the long heat waves created by infrared. Whensomething appears white in sunlight, it is made of matter that reflects allwavelengths of light; if it looks black, it’s made up of stuff that absorbs nearlyall wavelengths.
36 Atmospheric Monitoring with Arduino
www.it-ebooks.info

4/Gadget: LEDSensitivity Tester
Before building and using the LED photometer,we first need to figure out exactly which wave-lengths of light each of our LEDs is sensitive to.Otherwise, we won’t be able to get good datawith the photometer. Unfortunately, no LEDdatasheet that we’ve ever seen troubles itselfwith listing LED input wavelength, becauseLED manufacturers generally don’t think oftheir products as input devices. Fortunately, wecan determine input wavelengths with a gadgetwe can build ourselves: the LED sensitivitydetector.
Mission: InputtableYour mission, should you choose to accept it, is to determine the peak inputwavelength for a series of LEDs. You will do this by shining every wavelengthof visible light, from 350–700 nm, into each candidate LED, and measuringthat LED’s responsive voltage. The LED that’s most sensitive to the wavelengthis the one that produces the highest response voltage. Good luck.
How are we going to generate every visible wavelength of light to test ourLEDs, from ultraviolet to infrared? If your answer is “use a full-spectrum LED,”you’re correct. This special type of LED is called an RGB LED and it can outputred light, green light, blue light, and any combination of those colors: the fullROY G. BIV. Since it’s beyond the scope of this book to go too deeply into thescience of combining light to make different colors, suffice it to say that bymixing varying intensities of red, green, and blue light, just about any colorcan be reproduced. (Look very carefully at the pixels of your computer screento see this in action.)
37
www.it-ebooks.info

Amount Part Type Properties/(Assembly Code)
1 Loudspeaker (SPKR1)
1 TEST LED, 5 mm 5 mm [THT]; (LED2)
1 RGB LED (com. anode, rbg) 5 mm [THT]; pin order rgb; polaritycommon anode; rgb RGB (LED1)
2 47 Ω resistor Package THT; tolerance ±5%; bands 4;resistance 47 Ω; pin spacing 400 mil (R1 &R2)
1 62 Ω resistor Package THT; tolerance ±5%; bands 4;resistance 62 Ω; pin spacing 400 mil (R3)
1 Arduino UNO R3 (Arduino1)
1 LCD screen Character type 16 pins (LCD1)
1 Permanent marker in a darkcolor
Build the Gadget1. Connect the RGB LED to Arduino. Most RGB LEDs are common
anode, so follow the datasheet that came with your LED to connect theanode to the +5 pin on Arduino (Figure 4-1). The R, G, and B pins shouldbe connected to Arduino pins 8, 6, and 4, respectively. For our RGB LED,the red cathode needed a 62 ohm resistor, while the green and bluecathodes needed a 47 ohm resistor. (Your values may vary.)
When we say “connect an LED to Arduino” in these instruc-tions, we intend for you to do this via a breadboard and jumperwires, as illustrated in the figures for each step. Given theamount of gadget handling involved in testing a bunch of LEDs,using a breadboard will save a lot of wear and tear on Arduino.
38 Atmospheric Monitoring with Arduino
www.it-ebooks.info

Figure 4-1. Step one.
2. Connect the LCD. Connect the common ground lead on the LCD(screen display) to the GND pin on Arduino. Connect the VCC lead onthe LCD to the 3.3 power pin on Arduino. Connect the DATA lead on theLCD to Arduino pin 2 (Figure 4-2).
Gadget: LED Sensitivity Tester 39
www.it-ebooks.info

Figure 4-2. Step two.
3. Add an audio speaker for additional fun. Connect the speaker’s blackwire to GND on Arduino, and the speaker’s red wire to Arduino pin 8. Theschematic looks something like Figure 4-3.
40 Atmospheric Monitoring with Arduino
www.it-ebooks.info

Figure 4-3. Step three.
4. Load the sketch. Now we need a way to translate a wavelength of lightinto its red, green, and blue values. Fortunately, a scientist named DanBrunton has developed a formula that will do just that. We programmedBrunton’s algorithm into the following Arduino sketch. After setting upall the components, running this code will cause the RGB LED to emitlight from 350–700 nm, the range of visible light.
You can find this sketch in the AMWA GitHub repository.
/** * Determining RGB color from a wavelength * The code is based on an algorithm from Dan Bruton's Color Science Page. * http://www.midnightkite.com/color.html * by Patrick Di Justo * 2012 08 28 * **/
Gadget: LED Sensitivity Tester 41
www.it-ebooks.info

#include <EEPROM.h>#include <SoftwareSerial.h>
//Set up the Liquid Crystal Display#define LCDIn 3#define LCDOut 2SoftwareSerial mySerialPort(LCDIn, LCDOut);
//LCD Display bufferschar databuff[16];char dispbuff[16];
// Variables needed for RGB calculationsfloat Gamma = 1.00;int MaxIntensity = 255;float fBlue;float fGreen;float fRed;float Factor;
int iR;int iG;int iB;
//Our eyes can generally see light wavelengths between 350 and 700 nanometers.//Here, we start the RGB Led with 350int i = 350;
//RGB is plugged into these arduino digital pinsconst int redOutPin = 8;const int greenOutPin = 6;const int blueOutPin = 4;
// LED to be tested is plugged into A0int testPin = A0;
// variables to store the value coming from the sensorint sensorValueTest =0;int oldTest =0;int peaknm =0;
//EEPROM start dataint addr=0;
//Musicint notelen = 90;int dlx = 130;
void setup(){ pinMode(LCDOut, OUTPUT); pinMode(LCDIn, INPUT);
42 Atmospheric Monitoring with Arduino
www.it-ebooks.info

//Set the RGB LED pins to output
pinMode(redOutPin, OUTPUT); pinMode(greenOutPin, OUTPUT); pinMode(blueOutPin, OUTPUT);
// Initialize the LCD display mySerialPort.begin(9600); mySerialPort.write(0xFE); mySerialPort.write(0x01);
// test to see if the RGB LED works makeColor(i); analogWrite(redOutPin,255-iR); analogWrite(greenOutPin, 255-iG); analogWrite(blueOutPin, 255-iB); delay(5000);}
void loop(){
// set the RGB LED to a specific color makeColor(i); analogWrite(redOutPin, 255-iR); analogWrite(greenOutPin, 255-iG); analogWrite(blueOutPin, 255-iB); delay(500);
// read the sensitivity of the Test LED sensorValueTest= analogRead(testPin);
if (sensorValueTest > oldTest) { oldTest = sensorValueTest; peaknm = i; }
// Display the values on the LCD sprintf(databuff,"CV:%3d Cnm:%3d",sensorValueTest,i); sprintf(dispbuff,"%-16s",databuff); mySerialPort.print(dispbuff);
sprintf(databuff,"XV:%3d Xnm:%3d",oldTest, peaknm); sprintf(dispbuff,"%-16s",databuff); mySerialPort.print(dispbuff);
writeData(); i++;
// If we've reached the upper limit of 700 nm, play a little melody if (i>700)
Gadget: LED Sensitivity Tester 43
www.it-ebooks.info

{ for (int f = 0; f<=100; f++) { tone(7,196,notelen); delay(dlx);
tone(7,131,notelen); delay(dlx);
tone(7,261,notelen); delay(dlx);
tone(7,330,notelen); delay(dlx);
tone(7,294,notelen); } delay(10000); }}
void writeData(){ int quotient = i/256; int mod = i % 256;
EEPROM.write(addr++,quotient); EEPROM.write(addr++,mod);
quotient = sensorValueTest/256; mod = sensorValueTest % 256; EEPROM.write(addr++,quotient); EEPROM.write(addr++,mod);}
void makeColor(int lambda){ if (lambda >= 350 && lambda <= 439) { fRed = -(lambda - (float)440.0) / ((float)440.0 - (float)350.0); fGreen = (float)0.0; fBlue = (float)1.0; } else if (lambda >= (float)440.0 && lambda <= (float)489.0) { fRed = 0.0; fGreen = (lambda - (float)440.0) / ((float)490.0 - (float)440.0); fBlue = 1.0; } else if (lambda >= (float)490.0 && lambda <= (float)509.0) {
44 Atmospheric Monitoring with Arduino
www.it-ebooks.info
fRed = 0.0; fGreen = 1.0; fBlue = -(lambda - (float)510.0) / ((float)510.0 - (float)490.0);
} else if (lambda >= (float)510.0 && lambda <= (float)579.0) { fRed = (lambda - (float)510.0) / ((float)580.0 - (float)510.0); fGreen = 1.0; fBlue = 0.0; } else if (lambda >= (float)580.0 && lambda <= (float)644.0) { fRed = 1.0; fGreen = -(lambda - (float)645.0) / ((float)645.0 - (float)580.0); fBlue = 0.0; } else if (lambda >= 645.0 && lambda <= 780.0) { fRed = 1.0; fGreen = 0.0; fBlue = 0.0; } else { fRed = 0.0; fGreen = 0.0; fBlue = 0.0; }
if (lambda >= 350 && lambda <= 419) { Factor = 0.3 + 0.7*(lambda - (float)350.0) / ((float)420.0 - (float)350.0); } else if (lambda >= 420 && lambda <= 700) { Factor = 1.0; } else if (lambda >= 701 && lambda <= 780) { Factor = 0.3 + 0.7*((float)780.0 - lambda) / ((float)780.0 - (float)700.0); } else { Factor = 0.0; } iR = factorAdjust(fRed, Factor, MaxIntensity, Gamma); iG = factorAdjust(fGreen, Factor, MaxIntensity, Gamma); iB = factorAdjust(fBlue, Factor, MaxIntensity, Gamma);}
int factorAdjust(float C, float Factor, int MaxIntensity, float Gamma){
Gadget: LED Sensitivity Tester 45
www.it-ebooks.info

if(C == 0.0) { return 0; } else { return (int) round(MaxIntensity * pow(C * Factor, Gamma)); }}
5. Select an LED to test. If you’ve purchased a large number of LEDs totest, they’re likely to arrive in individual plastic pouches. Neatly pull orcut open the plastic pouch containing the LED, take the LED out, and setthe pouch aside; you’ll need it again soon (Figure 4-4).
Figure 4-4. Step four.
6. Connect the LED. Hook up the anode to Arduino analog pin 0, and thecathode to GND (Figure 4-5).
46 Atmospheric Monitoring with Arduino
www.it-ebooks.info

Figure 4-5. Step five.
As you test each LED, be careful to plug it into the breadboardwith the proper polarity: anode to Arduino’s analog pin 0 andcathode to Ardunio’s GND pin.
7. Test the LED. For best results, enclose the test LED and the RGB LED ina single small, opaque tube, such as a piece of shrinkwrap tubing, ablackened soda straw, or even the opaque, sawed-off body of a ball pointpen. Ideally, the two LEDs should be extremly close without actuallytouching. When everything is ready, turn on or reset Arduino.
Several things will happen. The RGB LED will start to glow, and the topline of the LCD will inform you that the RGB LED is currently displayinga particular wavelength of light ranging from 350–700 nm. At eachwavelength, the test LED absorbs the light being put out by the RGB LED,and converts that to a voltage.
Gadget: LED Sensitivity Tester 47
www.it-ebooks.info
• Low voltage means that the test LED is not absorbing much light atthat wavelength; in other words, the test LED is not very sensitive tothis color. A higher voltage indicates that the test LED is more sensitiveto this particular wavelength and is therefore creating more electricityfrom the light it absorbs.
• As Arduino works its way up the spectrum, it keeps track of the peakvoltage the test LED puts out, and the particular wavelength thatcaused the peak voltage.
• You’ll know the test is complete when the counter reaches 700 nm,and Arduino plays a little melody.
8. Note your results. Using the permanent marker, write your data—thepeak voltage and the light wavelength that caused it—on the plasticpouch that you set aside in step four. Carefully remove the test LED fromthe gadget and slide it back into the pouch.
9. Return to step five and hit the reset button on Arduino to repeat thesensitivity test with another LED.
In order to build an LED photometer that works properly, it’s very importantto test each LED before you use it in the photometer. You need to know theparticular wavelengths of light that your LEDs are detecting, because thisimpacts the types of gases you’ll be able to detect in the atmosphere, andhow well you’ll be able to detect them.
nm? What is this nm?Wavelengths of light are so small they are measured not in millimeters(1/1,000ths of a meter) or micrometers (1/1,000,000ths of a meter) but innanometers (1/1,000,000,000ths of a meter). Because wavelengths of lightare so small, a great many things interfere with them. Imagine that you’reinside a walk-in closet or windowless bathroom: by simply sealing the door,it would be easy to stop all light waves from entering the room. But if you hada portable radio with you (if you know what that is), or your cell phone (whichis very much like a portable radio), you’d have no problem getting a radiosignal even though all external light into your room was cut off—unless yourcloset was deep inside an underground, reinforced concrete security bunker!
Radio waves and light waves are the same physical phenomena: electromag-netic radiation, differing only in wavelength size. So we can say that clearly,light waves are more easily stopped by physical objects than other types ofelectromagnetic waves. In fact, that’s the whole purpose of this LED photo-meter. Molecules of gas and particles of dust that by themselves are invisibleto the naked eye all are large enough to interfere with certain wavelengths of
48 Atmospheric Monitoring with Arduino
www.it-ebooks.info

light. By measuring which light waves are affected more strongly and whichlight waves are affected less strongly by the given particles in the atmosphere,we can get a very good estimate of the concentration of those gases or par-ticles in the atmosphere.
Table 4-1 shows some values we got with a sample of LEDs from differentmanufacturers. Notice that while the LED peak input value is usually lowerthan the output value, that’s not always the case. LEDs at the blue end of thespectrum have input wavelengths almost exactly the same as their outputwavelengths. As we move down the spectrum toward the red end, the dis-tance between input and oputput wavelength grows, but not uniformly. Forexample, look at the two yellow LEDs giving off light with a wavelength of 592nm. Their input values are exactly 20 nm different!
This explains why we said earlier that it is important to test your LEDs. Youneed to know exactly which peak wavelength your LEDs are absorbing.
Table 4-1. Frequencies of light for various LEDs by part number.
Manufacturer Mfgr Part Number Color Output nm Input nm
Jameco Valuepro LVB3330 Blue 430 429
Avago Technologies QLMP-LB98 Blue 470 471
Avago Technologies QLMP-LM98 Green 525 498
Agilent HLMP-CM39-UVCDD Green 535 505
Siemans Corporation LG5469FH Green 565 507
Valuepro LUY3833H Yellow 590 537
Valuepro BVT-5E1TT4E Yellow 592 552
Jameco Valuepro BVT-529TT8E Yellow 592 532
Valuepro LVY3333/A Yellow 595 532
Valuepro RL50-PY543 Yellow 595 517
Valuepro LUE3333 Orange 620 625
Valuepro UT9C13-86-UDC2-R Red 630 580
Jameco Valuepro BVT-5E1QT4ER Red 634 555
Valuepro RL50-PR543 Red 635 534
Gadget: LED Sensitivity Tester 49
www.it-ebooks.info

5/Gadget: LEDPhotometer
A photometer is a device that measures one ormore qualities of light. Most photometers con-sist of an interference filter and a photo detec-tor. The interference filter is a colored piece ofplastic or glass that filters out nonessential col-ors, letting through only the precise wave-lengths of light we’re interested in studying. Aphoto detector behind that filter monitors theintensity of the light that makes it through thefilter.In this gadget, LEDs replace both the interference filter and the photo de-tector. As Forrest Mims showed, LEDs are photodiodes: diodes that generateelectrical current proportional to the light that falls on them, and they act astheir own color filter. As you learned from your own experiments with the LEDsensitivity tester, a blue LED is most sensitive to blue light and much lesssensitive to red. By recording the amount of current from differently coloredLEDs, we can learn how much of each color of the sun’s light (blue, green,and red) is getting through the atmosphere to the gadget.
The main advantage of an LED photometer is that it is relatively inexpensive.LEDs are cheap, rugged, and stable. They come in a variety of colors and avariety of spectral responses. The electronics that go with them can be pur-chased online or at any good electronics store.
A couple things to keep in mind:
• Although LEDs can work as detectors, they were not built for this pur-pose. Whereas an ideal detector for our needs would detect only a verynarrow range of wavelengths, and be perfectly centered around the
51
www.it-ebooks.info

wavelengths we wish to study, LEDs can detect light over a fairly widerange of wavelengths. That’s why we’ve tested the LEDs: to know theirdetection peaks, so that we know which wavelengths of light we’remeasuring.
• Also, the current generated by an LED can change with the temperatureof the LED; for this reason, we advise you to keep the gadget at roomtemperature, and make all outside measurements relatively quickly, be-fore the gadget heats up (or cools down) too much.
Even allowing for these shortcomings, however, it is perfectly possible to getscientifically valid data by using the LED detectors to measure the upperatmosphere.
Build the GadgetAmount Part Type Properties
1 Piezo Speaker
1 Blue LED, 5 mm Package 5 mm [THT]; leg yes; color Blue
1 Green LED, 5 mm Package 5 mm [THT]; leg yes; color Green
1 Red LED, 5 mm Package 5 mm [THT]; leg yes; color Red
1 Arduino Processor ATmega; variant Arduino
1 LCD screen Type character; pins 16
There are two sequences of steps that are equally essential to creating theLED photometer: building it, and calibrating it.
1. Connect the LEDs to Arduino (Figure 5-1). We’ve found it’s easiest to dothis as follows:
a. Connect the negative (i.e., shorter wire) of each LED to the GND railof the breadboard.
b. Connect the positive (i.e., longer wire) of each LED to the breadboard.
c. Using jumpers, connect each LED to the appropriate Analog pin onArduino. Our Arduino sketch expects the red LED to be plugged intoA1, the green LED into A2, and the blue LED into A3.
2. Connect the speaker (Figure 5-2). Plug the positive lead into Arduinodigital pin 7 and the negative pin into Arduino GND. Many speakers don’tlist the polarity of their connection, so don’t worry too much about this;just plug it in!
52 Atmospheric Monitoring with Arduino
www.it-ebooks.info

Figure 5-1. Step one.
Figure 5-2. Step two.
Gadget: LED Photometer 53
www.it-ebooks.info

3. Connect the LCD unit to Arduino (Figure 5-3). The data line connects toArduino digital pin 5, the power line connects to Arduino 3.3 v pin, andGND line connects to GND.
Figure 5-3. Step three.
Load the SketchYou can find this sketch in the AMWA GitHub repository.
/* LED Photometer, based on Analog Input by Patrick Di Justo 2012 08 30 */
#include <EEPROM.h>#include <SD.h>#include <SoftwareSerial.h>
// Liquid Crystal Display// Define the LCD pins: We'll be using a serial-based LCD display// which only required +3.3Volts, GND, and a single data line.// databuff and displaybuff hold the data to be displayed
#define LCDIn 3#define LCDOut 5
54 Atmospheric Monitoring with Arduino
www.it-ebooks.info
SoftwareSerial mySerialPort(LCDIn, LCDOut);
// Data Buffers for the LCDchar databuff1[16];char databuff2[16];char dispbuff[16];
// LED variables section// Which Arduino pin goes to which LEDint redPin = A1;int greenPin =A2;int bluePin=A3;
// A place to store the values coming from the analog portint sensorValueRed =0;int sensorValueGreen =0;int sensorValueBlue = 0;
//A place to store the maximum value for each LEDint maxRed = 0;int maxGreen =0;int maxBlue = 0;
//EEPROM variables// The record length is 7: 1 byte for the record number, 2 bytes// each for the 3 LEDs. For each additional LED you add, increase// the record length by 2.int record=0;int reclen = 7;int addr =0;
// the following variable is long because the time, measured in miliseconds,// will quickly become a bigger number than can be stored in an int.long timeSinceLastSensorHigh = 0;int dataWritten = 0;
// music sectionint notelen =40;int dlx = notelen *1.33;
//switch to tell if an SD card is presentint SDPresent = 1;
void setup(){ // initialize serial communications at 9600 bps: Serial.begin(9600);
// Set the Analog Pins // Why are we setting input pins to output? // We're doing this to prevent "leakage" from the pins. // Setting the pins to output activates a pullup resistor,
Gadget: LED Photometer 55
www.it-ebooks.info

// which makes it difficult for voltage to come into the Arduino, // until we're ready for it.
Serial.println("Setting up the Analog Pins");
pinMode(redPin, OUTPUT); digitalWrite(redPin, LOW); pinMode(greenPin, OUTPUT); digitalWrite(greenPin, LOW); pinMode(bluePin, OUTPUT); digitalWrite(bluePin, LOW);
// Set up SD card, let us know if SD card is absent pinMode(10, OUTPUT); if (!SD.begin(4)) delay(10); SDPresent =0;
//Set up LCD pinMode(LCDOut, OUTPUT);
mySerialPort.begin(9600); mySerialPort.write(0xFE); mySerialPort.write(0x01); sprintf(databuff1,"Wakeup Test"); sprintf(dispbuff,"%-16s",databuff1); mySerialPort.print(dispbuff);
//set up EEPROM record = EEPROM.read(0); addr = (record * reclen) +1; Serial.println("BEEP");
// Play music to let user know the gadget is ready tone(7,294,notelen); delay(dlx); tone(7,330,notelen); delay(dlx); tone(7,261,notelen); delay(dlx); tone(7,131,notelen); delay(dlx); tone(7,196,notelen); delay(dlx); delay(3000);}
void loop(){ // read the value from the sensor: /* Back in setup(), we enabled a pullup resistor on the analog pins, which made it difficult for electricity to come into the analog pins. Here, we disable the pullup resistor, wait 10ms for the pin to
56 Atmospheric Monitoring with Arduino
www.it-ebooks.info

stabilize, read the voltage coming into the pin, then reenable the pullup resistor. */
pinMode(redPin, INPUT); delay(10); Serial.print("Reading red: "); sensorValueRed= analogRead(redPin); pinMode(redPin, OUTPUT); Serial.println(sensorValueRed); delay(10);
pinMode(greenPin, INPUT); delay(10); sensorValueGreen = analogRead(greenPin); pinMode(greenPin, OUTPUT); delay(10);
pinMode(bluePin, INPUT); delay(10); sensorValueBlue = analogRead(bluePin); pinMode(bluePin, OUTPUT); delay(10);
Serial.println("Comparing sensor values...");
// Here we compare each sensor to its maximum value. // If any of the sensors has reached a new peak, sound a tone if( (sensorValueRed>maxRed) || (sensorValueGreen>maxGreen) || (sensorValueBlue>maxBlue)) { tone(7,maxRed+maxGreen+maxBlue,500); timeSinceLastSensorHigh = millis(); }
// Here we reset the old maximum value with a new one, if necessary if(sensorValueRed>maxRed) maxRed = sensorValueRed; if(sensorValueGreen>maxGreen) maxGreen = sensorValueGreen; if(sensorValueBlue>maxBlue) maxBlue = sensorValueBlue;
// Display the sensor values on the LCD screen sprintf(databuff1,"R%3d G%3d B%3d",maxRed,maxGreen,maxBlue); sprintf(dispbuff,"%-16s",databuff1); mySerialPort.print(dispbuff); Serial.print(dispbuff);
// If 10 seconds has gone by without any new measurements, write// data to storage.
if(millis() > (timeSinceLastSensorHigh + 10000)) { if(dataWritten ==0) {
Gadget: LED Photometer 57
www.it-ebooks.info

writeData(); if(SDPresent = 1) { writeDataToSD(databuff1, databuff2); } } }}
void writeData(){ Serial.print("I'm writing data!!!!!!!!!!!!!!!"); record++; EEPROM.write(0, record); EEPROM.write(addr++, record);
/* The problems of data storage: The analog pins read a value from 0 to 1023. This is 1024 different values, and 1024 = 2 ^ 10. It would take 10 bits of data space to safely store the value from the analog pins. Unfortunately, a standard byte of data is only 8 bits. How can you fit 10 bits into 8 bits? You can't.
What we're doing here is splitting the 10 bits of data into two sections, which can be stored in two bytes of memory space. */
int quotient = sensorValueRed/256; int mod = sensorValueRed % 256; EEPROM.write(addr++,quotient); EEPROM.write(addr++,mod);
quotient = sensorValueGreen/256; mod = sensorValueGreen % 256; EEPROM.write(addr++,quotient); EEPROM.write(addr++,mod);
quotient = sensorValueBlue/256; mod = sensorValueBlue % 256; EEPROM.write(addr++,quotient); EEPROM.write(addr++,mod); dataWritten = 1;
sprintf(databuff1,"EEPROM written"); sprintf(dispbuff,"%-16s",databuff1); mySerialPort.print(dispbuff); Serial.println("FINAL BEEP");
tone(7,196,notelen); delay(dlx);
58 Atmospheric Monitoring with Arduino
www.it-ebooks.info
tone(7,131,notelen); delay(dlx);
tone(7,261,notelen); delay(dlx);
tone(7,330,notelen); delay(dlx);
tone(7,294,notelen);}
void writeDataToSD(String dataString1, String dataString2){ // open the file. note that only one file can be open at a time, // so you have to close this one before opening another. File dataFile = SD.open("LEDdata.txt", FILE_WRITE);
// if the file is available, write to it: if (dataFile) { dataFile.print(millis()); dataFile.print(","); dataFile.println(dataString1); dataFile.close();
sprintf(databuff1,"SDCard written"); sprintf(dispbuff,"%-16s",databuff1); mySerialPort.print(dispbuff); }}
Calibrate the Gadget: Air Mass,Atmospheric Optical Thickness, andExtraterrestrial ConstantRemember when we said that the sunlight travels to the ground through dif-ferent thickness of atmosphere, depending on how high the sun is above thehorizon? This can have an effect on the readings you get with your LED pho-tometer, as well (see Figure 5-4).
Gadget: LED Photometer 59
www.it-ebooks.info

Figure 5-4. Sun angles in spring, summer, fall, and winter.
60 Atmospheric Monitoring with Arduino
www.it-ebooks.info

Generally, this device is meant to measure the atmosphere at around nooneach day, when the sun is at its highest in the sky and its path through theatmosphere is shortest. At the very least, if you can’t make regular noonmeasurements, you should try to take measurements around the same timeeach day.
As long as you keep the components as they are (e.g., don’tswap out various LEDs, or use a different Arduino), your pho-tometer doesn’t need to be calibrated ever again. There areexamples of LED photometers that have been working for 20years without further calibration.
But that raises an interesting problem: as the Earth revolves around the sun,the position of the sun at noon changes enormously over the course of theyear. On the first day of summer, the noonday sun is as close to being directlyoverhead as it will ever get, while on the first day of winter, the noonday sunhugs the horizon 47° lower than the summer sun. This can have a profoundeffect on the measurements you get with your LED photometer, since thesunlight is moving through significantly differing distances of air through thecourse of a year.
This is why we have to take into account a value called air mass. The formulafor air mass is very simple:
m = 1 / sin(theta)
where theta is the angle of the sun above the horizon.
Let’s take a look at how the air mass at noon will differ over the course of ayear from A.M.W.A. World Headquarters (see Table 5-1).
Table 5-1. Sun angles and air mass from New York City.
Date Noon Sun Angle Air Mass
March 20, 2013 49.4 1.3170
June 21, 2013 72.7 1.0474
September 22, 2013 49.3 1.3190
December 21, 2013 25.9 2.2894
At noon on the first day of spring, March 20, the noon sun is 49.4° above thehorizon. Plugging that into the preceding formula results in an air mass ofabout 1.3170. This means that the sun’s light had to travel through 1.3170times as much air as it would if the sun were directly overhead.
Gadget: LED Photometer 61
www.it-ebooks.info

At midday on the first day of summer, June 21, the sun was at 72.7° abovethe horizon. This gives us an air mass of 1.0474, meaning that the sun’s lighthad to travel through 1.0474 times as much air as it would if the sun weredirectly overhead; that’s a pretty negligible difference on its own terms, butabout 25% lower than the air mass in March.
On September 22, the first day of autumn, the sun returned to 49.3° abovethe horizon, almost exactly where it was in March.
On December 21, the first day of winter, the sun at noon was 25.9° above thehorizon. Plugging that into the preceding formula, we see that the air massis a whopping 2.2895! The sun’s light is traveling through more than twice asmuch air as it did on the first day of summer. This is an enormous difference,and, if uncorrected, would have an effect on the data we collect.
To fix this, we can use the data we collect to calculate a value called theatmospheric optical thickness (AOT). AOT measures the clarity of the air forany given air mass by comparing the data that you measure on the surfaceof the earth with the data your LED photometer would get if it were above theatmosphere, out in space.
Are we going to send our LED photometer into space? If only! Although thatsounds like a great project, it’s a little beyond the scope of this book—andunnecessary. What we’re going to do is to take several measurements thatwill tell us what our LED photometer would measure if it were out in space.
Calculating Atmospheric OpticalThicknessOnce you’ve built your LED photometer, wait for an exceptionally clear day.You’ll want a day where the humidity remains constant, the cloud cover isalmost nonexistent, and a place where there are no obvious nearby forestfires, or anything else that would contribute haze to the atmosphere. (Con-versely, you could also wait for an overcast day, as long as the cloud cover isuniform. However, the data you get might not be as good as one from anexceptionally clear day.)
On this clear day, you’re going to take a series of measurements with yourLED photometer every half hour for half of the daylight hours (Table 5-2). Youcan take these measurements from dawn until noon, or from noon until sun-set. Carefully keep track of the sun’s angle above the horizon at each meas-urement point.
Table 5-2. Solar data, noon to near sunset.
Time Sun Angle Air Mass Averaged LED Value
12:00 58 1.179 578.33
12:30 57.2 1.189 539
13:00 55 1.220 553
62 Atmospheric Monitoring with Arduino
www.it-ebooks.info

13:30 51.8 1.272 552
14:00 47.9 1.347 563.33
14:30 43.3 1.458 552.66
15:00 38.3 1.613 575
15:30 33 1.836 520.33
16:00 27.5 2.165 539
16:30 21.9 2.681 502
17:00 16.3 3.562 490
17:10 14.4 4.021 474.66
17:20 12.5 4.620 472.66
17:30 10.6 5.436 463.33
17:40 8.7 6.611 443.33
To find the angle of the sun at any given time of day, visit theUS Naval Observatory’s Sun Calculator.
Once you’ve collected this data, take it back to your workstation and, usinggraph paper or a spreadsheet program, create a scatter chart in which the Yaxis is the logarithm of the data from any one of the LEDs (or all of the LEDs)and the X axis is the air mass at which these readings were taken.
Draw a best-fit line through the data points you get, and extend that line backto the Y intercept where the air mass is zero. The Y value at that point is knownas the extraterrestrial constant, or EC. (If you’re using a spreadsheet, look fora function called linear regression to accomplish the same thing.) Onceyou’ve calculated the EC, your LED photometer is calibrated.
Now that we’ve derived EC, we can finally use that to calculate atmosphericoptical thickness, using the following formula:
AOT = (log(EC) / log(LED photometer reading)) / m
When your data is run through this formula, it will be scientifically “fit.” Thenatural variance in the height of the sun above the horizon at various timesof year is now accounted for. The AOT is the true measure of atmosphericoptical thickness and should apply to all data you collect with your LEDphotometer.
Gadget: LED Photometer 63
www.it-ebooks.info

Every LED Photometer Has a UniqueExtraterrestrial Constant
The extraterrestrial constant varies for each LED photometer. Our LED pho-tometer will have an EC that’s very slightly different then the LED photometeryou build. The variability may be as simple as different thickness of wire usedto connect the LEDs to Arduino, or different models of Arduino, or differentmodels of LEDs. The atmosphere’s opacity may change from day to day asweather and environmental conditions shift, but the extraterrestrial constantis a property of the instrument. Once you determine the extraterrestrial con-stant for your own LED photometer, it shouldn’t need to be recalibrated everagain.
Things to TryNow that you’ve built the apparatus, let’s look at some things that you cando with it.
Detecting “Ozone Holes”: Measuring theOzone LayerThe ozone layer is a narrow band in the Earth’s atmosphere, approximately25 kilometers above the surface, where the concentration of the O₃ ozonemolecule is relatively high, reaching about 10 parts per million (compared tothe usual 0.6 ppm in other parts of the atmosphere).
The ozone layer is essential to life on Earth, because it absorbs around 97%of the ultraviolet radiation from the sun, in the range of about 200–315 nm(what scientists and sunscreen manufacturers call the UV-B band). UV-Brays have enough energy to damage many biological molecules, includingDNA. Without an ozone layer, the Earth might never have developed life.
Save the Ozone Layer!Widespread use of molecules called chlorofluorocarbons (CFCs) as propel-lants in aerosol cans did a significant amount of damage to the ozone layerin the 20th century; CFCs can break apart ozone molecules, leaving themunable to absorb UV light. A 1987 international agreement, called the Mon-treal Protocol on Substances that Deplete the Ozone Layer (or just “MontrealProtocol” for short), banned most CFCs from use; nearly 200 nations have
64 Atmospheric Monitoring with Arduino
www.it-ebooks.info

ratified it. Still, CFC residues remain in the stratosphere; some studies reporta 4% decrease in ozone concentrations per decade since the late 20th cen-tury. However, since the turn of the century, scientists have begun to detectevidence of ozone layer recovery, as well.
Measuring the ozone layer with LEDs is conceptually not very difficult: allyou’d need to do is to find an LED that aborbs ultraviolet light in the UV-Arange (about 200–315 nm), and compare its output with an LED that absorbslight in the UV-B range. If the ozone layer didn’t exist, the surface measure-ment of UV-A and UV-B would be equal, so any difference in the reading ofthe two LEDs would most likely be related to the presence of the ozone layer.
All this seems easy enough to allow you to build an upper atmosphere ozonemonitor; but as a practical matter, UV LEDS become more and more expen-sive as you go down the wavelengths. It’s also considerably more difficult(and requires more and different equiment) to test a UV LED to see its ab-sorption range.
However, there might be another way to make this work. Everyone knowsthat ozone absorbs ultraviolet light, but not many people know that ozonealso has an absorption band centered around 602 nm, in the orange part ofthe spectrum. This region, called the Chappuis band, is nowhere near as deepas the UV-B absorption bands; still, scientists have gotten good data frommeasuring how ozone absorbs orange light. Perhaps you can build an LEDphotometer that measures the ozone absorption in the orange part of thespectrum, if you can find an LED sensitive to 602 nm. Good luck!
Add an AccelerometerAdding an accelerometer to the LED photometer will automatically tell youthe angle at which you’re pointing the device at the sun.
As we noted earlier, the sun’s angle at noon can vary by 47° over the courseof a year. While it’s not going to kill you to expend the effort to look up orcalculate the sun’s declination when you take a measurement, it would beinfinitely easier if Arduino itself told you the angle. You can make this happenwith a multiple axis accelerometer attached to your Arduino. This can makethe calculation of AOT so simple you might be able to include it in the Arduinocode, and store the resulting value with the rest of the data.
But there’s a drawback: most accelerometers use up to three analog inut pinsto get data to Arduino. You might have to cut back on the number of LEDsyou’re using, if you use an accelerometer. If you can think of another way tomake this work, we’d love to hear from you.
Gadget: LED Photometer 65
www.it-ebooks.info

6/Using the LEDPhotometer
One of the oldest bits of weather lore is “Redsky at night, sailor’s delight. Red sky in morn-ing, sailors take warning.” The sky is often red,or reddish orange, at sunrise and sunset. Reds,pinks, and oranges dominate at these times ofday because the distance from your eye to thesun is greater at these times than when the sunis directly overhead. When sunlight travelsthrough the atmosphere—and especially whenit travels that extra distance from the horizon—an effect known as Rayleigh scattering takesplace.The British physicist John William Strutt (the third Baron Rayleigh) explainedin 1871 that air molecules are so small they interfere with and scatter photonsof light. The various molecules that make up the Earth’s natural atmosphere—mostly nitrogen and oxygen, with trace amounts of other gases—scatterblue light (shorter wavelength light) more efficiently than red, orange, or yel-low light (longer wavelengths). So when you look up, you see more scatteredblue light than red or orange light. This is why our sky appears blue duringmost of the daytime (Figure 6-1).
When the sun is on the horizon at dawn or dusk, however, its light must travelthrough more of the atmosphere before we see it than when it is overhead(Figure 6-2). This leads to more and more of the blue light being scatteredaway, leaving behind the red-orange-yellow light. As well, dust and aerosolsin the atmosphere more ably scatter long wavelengths of light—leading tolurid red sunsets.
67
www.it-ebooks.info
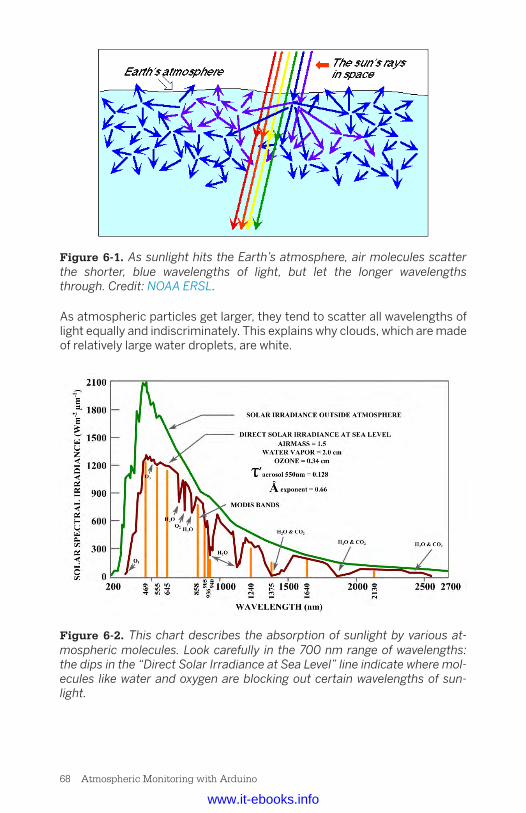
Figure 6-1. As sunlight hits the Earth’s atmosphere, air molecules scatterthe shorter, blue wavelengths of light, but let the longer wavelengthsthrough. Credit: NOAA ERSL.
As atmospheric particles get larger, they tend to scatter all wavelengths oflight equally and indiscriminately. This explains why clouds, which are madeof relatively large water droplets, are white.
Figure 6-2. This chart describes the absorption of sunlight by various at-mospheric molecules. Look carefully in the 700 nm range of wavelengths:the dips in the “Direct Solar Irradiance at Sea Level” line indicate where mol-ecules like water and oxygen are blocking out certain wavelengths of sun-light.
68 Atmospheric Monitoring with Arduino
www.it-ebooks.info

Of course, molecules don’t just scatter wavelengths of light. Certain mole-cules, such as water vapor, carbon dioxide, and ozone, also absorb specificwavelengths of light. To a measuring instrument on the ground, there is lesslight at those specific wavelengths than there is at other nearby wavelengths,because some of that light has been absorbed. By measuring these “holes”where wavelengths of light are absent, you can get a very good estimate ofhow much water vapor, ozone, and some other substances are in the atmos-phere above your head.
Atmospheric AerosolsAtmospheric aerosols are tiny particles of matter suspended in the atmos-phere. These minute particles scatter and absorb sunlight, reducing theclarity and color of what we see. This is the effect we’re referring to when wetalk about “haze” in the sky.
Sources of HazeAtmospheric haze comes from diverse sources. Most inhabited places onEarth always have some water vapor in the atmosphere, and enough watervapor can cause haze. Clouds and fog add more particles to the atmosphere,making visibility even hazier. Forest fires, volcanic eruptions, and dust stormscan all increase haze in the atmosphere, sometimes hundreds of miles awayfrom where they originate.
Human activites contribute to haze as well: smoke given off by cooking orheating fires, for example, or by industrial facilities such as coal-fired powerplants. When sunlight hits the exhaust from automotive vehicles, the nitrogenoxides and hydrocarbons in the exhaust react to create photochemical smogand ozone; both create haze. Even contrails from high flying airplanes canmake the sky hazy.
According to the US Environmental Protection Agency, since 1988 the at-mosphere in national parks and wilderness areas in the United States hasgotten so hazy that average visibility has dropped from 90 miles to 15–25miles in the east, and from 140 miles to 35–90 miles in the west.
The LED photometer measures the difference between the voltage producedby a red LED, which absorbs light around the 580 nm range, and the voltageproduced by a green LED, which absorbs light around the 500 nm range. Thereadings appear on the LCD, and are then stored on the Arduino’s EEPROM(and/or SD card, if you choose to use one).
You can chart this data by hand, extract the data, and graph it in a spread-sheet program, or upload it to Cosm (formerly Pachube) to share it with theworld. More on this shortly.
Using the LED Photometer 69
www.it-ebooks.info

On a clear day with very little haze, the voltages produced by the green LEDand red LED will be somewhat similar. As atmospheric aerosols increase,however—whether over the course of a day, several days, or from season toseason—the difference between the red LED’s voltage and the green LED’svoltage will increase. The green LED will produce less current when there ismore atmospheric haze, because less green light than usual is reaching it.
The voltages will almost never be exactly the same; Rayleighscattering guarantees that more green light will be scatteredby our atmosphere than red light. Also, white light reflected byclouds can sometimes cause the green LED to spike. The bestresults come from days without clouds (or with a uniformcloud cover).
Photosynthetically Active Radiation(PAR)Photosynthesis, the process by which green plants turn sunlight into carbo-hydrates, does not use green light.
Plants appear green precisely because they reflect green light; they have nouse for those wavelengths, and therefore can afford to throw them away.Green leaves absorb a great deal of the light at red and blue wavelengths. Youcan use LEDs to measure how much of those wavelengths—how much pho-tosynthetically active radiation—is reaching your detector.
You do this by summing the outputs from two LEDs: the same red LED as inthe aerosol detector, and a blue LED. As with the aerosol detector, Arduinoreads the voltages produced by the red and blue LEDs, displays them, andstores them where they can be graphed, extracted into a spreadsheet, oruploaded to Cosm.
Forrest M. Mims, the man who discovered the Mims effect, hasshown that using red and blue LEDs to measure photosyn-thetically active radiation agrees very well with more “profes-sional” PAR sensors.
Water Vapor (WV)Atmospheric water vapor absorbs EM wavelengths in the range of infraredlight, at around 940 nm. By using an infrared LED specifically designed toabsorb light at 940 nm, you can get a very accurate representation of theamount of water vapor in the atmosphere. Simply compare the outputs ofthe 940 nm LED with a similar infrared LED sensitive to around 880 nm.
70 Atmospheric Monitoring with Arduino
www.it-ebooks.info

One thing to keep in mind, however, is that this type of measurement is in-credibly dependent upon local weather conditions. The rapid passage of astorm front over your observational area can play havoc with your readings:obviously there’s going to be more water vapor in the air when it is raining,snowing, or about to do either. Thus, this gadget is better suited to measuringupper atmosphere water vapor—water vapor high above what we might thinkof as “the weather.” Because of this, the best water vapor measurements arethose made on clear days.
Extracting Data from the LEDPhotometerOkay, so you’ve collected a bunch of data with your LED photometer. Whatdo you do now?
Graphing Data in a SpreadsheetOnce you’ve processed the data in a spreadsheet, you can graph it. Yourresults might end up looking like these charts by Forrest M. Mims, who hasbeen collecting atmospheric data with an LED photometer in Texas since theearly 1990s (Figure 6-3).
Figure 6-3. Forrest Mims III has gathered this data on total water vapor inthe atmosphere using an LED-based photometer. Image used withpermission.
Using the LED Photometer 71
www.it-ebooks.info

Notice the patterns in Mims’s decades of data: nearly every reading showssome kind of seasonal variation. It might take a year or more before you cansee a full cycle in your data.
Sending Data to COSMYou can upload your data for all the Internet to see thanks to a service calledCosm. Our previous book, Environmental Monitoring With Arduino (O’Reilly),contains a whole tutorial on getting started with Cosm; for now, let’s just saythat Cosm makes it very easy to upload a CSV data file. Just cut and pastethe serial output of the EEPROM reader program, or use the file DATA-LOG.TXT from the SD card, and place it on your website. Then go to yourCosm account and tell it where to find that file. Before you know it, your LEDphotometer data will be on the internet, neatly graphed, for all the world tosee.
72 Atmospheric Monitoring with Arduino
www.it-ebooks.info

7/Doing Science: Howto Learn More from
Your Atmospheric Data
Science can be defined as the practice of ob-serving the natural world, and trying to makeobjective sense of it by uncovering facts orcause-and-effect relationships.The gadgets in this book detect substances and conditions in the atmos-phere that otherwise would be invisible to your senses. (Essentially, thegadgets are technological extensions of your senses.) Building them will helphone your skills with DIY electronics and Arduino programming. These arefun, interesting, and practical things to do—but doing them by themselves isnot doing science.
Suppose you’d like to learn more from what you uncover. Maybe you’d like tomeasure atmospheric conditions over days or weeks, and then interpretthose readings; or monitor the atmosphere in different parts of your neigh-borhood, county, or state, and compare that data usefully; or perhaps evenorganize people around the world to build gas sensors or photometers, andcompare findings from these different places in meaningful ways. To do thesethings, you’ll need to apply some intellectual elbow grease to how you useyour gadget. You’ll have to do some science.
The Scientific MethodThe scientific method is the foundation of how most of the serious sciencein the world gets done. It’s a systematic process of investigation that testsideas about how cause and effect operate in the natural world, helps to re-duce or eliminate bias, and allows the meaningful comparison of informationfrom different sources.
The scientific method is appealingly linear in the abstract: an observationleads to a question, which leads to a hypothesis, which leads to an experi-ment, which leads to a result, which (if you’re lucky) can lead to anotherquestion, and so the process begins again.
73
www.it-ebooks.info

Testing hypotheses by gathering evidence is a core concern of science. Whatmost scientists will tell you, though, is that their work tends not to progressas tidily as the scientific method looks on paper. More often they move backand forth between these steps, because science is an iterative process: arepeating process in which the end result is used as a starting point for thenext run. Researchers often repeat the same steps over and over in order totest new ideas and tools, to deepen their questions about what they’re study-ing, and to figure out how to do their research more effectively and accurately.
Researchers also test each other’s hypotheses, because modern sciencedemands that a result be replicable: that different people conducting iden-tical experiments can come up with very similar, even identical results. If anexperiment’s results cannot be duplicated independently of the original re-searcher or team, then those results are cast into doubt.
Still, the scientific method is featured in the early chapters of many a Science101 textbook because it’s a good jumping-off point for learning how to set upan experiment and collect data.
Steps in the Scientific MethodAt their most basic, the steps in the scientific method go like this:
• Observe something in the world.
• Ask a question about it.
• Formulate a potential answer (a hypothesis) for it.
• Conduct an experiment that tests the hypothesis.
• Compare the predicted result to the actual result:
— Result supports the hypothesis.
— Result doesn’t support the hypothesis.
— Result partially supports the hypothesis.
• Consider the result.
• Ask another question and begin again.
Let’s look more closely at each step.
Observe Something in the WorldObservation and exploration of what’s going on in the environment is essen-tial to figuring out what questions to ask. Asking a question really means“asking an answerable question,” one that you can then test with an experi-ment. Testable questions begin with how, what, when, who, or which (“why”is impossible to answer).
74 Atmospheric Monitoring with Arduino
www.it-ebooks.info

Ask an Answerable QuestionDevising a good experiment question can itself involve several steps. Is yourquestion uninteresting or interesting? Can it be narrowed down to look at asingle thing, to collect data on one variable only (an observational question),or to change one variable and learn what results (a manipulative question)?It’s important to test only one variable—a factor that exists at different levelsor amounts—at a time in your experiment, in order to be reasonably sureyour test and the conclusions you draw from it are valid. If you test more thanone variable at a time, then cause and effect relationships are much less clear.
An example of a testable question that would work with one of the gadgetsin this book is, “When are atmospheric hydrocarbon levels outside my win-dow at their highest concentration?”
Formulate a HypothesisFormulating a hypothesis involves using what you already know to come upwith a potential answer to your question: an explanation for what you’ve ob-served. It’s not merely an educated guess; it is your formal statement of whatyou’re going to test (the variable) and a prediction of what the results will be.
For example, working off the previous question, you could form your hypoth-esis statement as, “If heavier car traffic increases atmospheric hydrocarbonsoutside my window, and I measure those levels from 4 to 6 pm as well as from4 to 6 am, then I should detect higher levels from 4 to 6 pm, which is afternoonrush hour.” The IF statement is your hypothesis; the AND statement is thedesign of your experiment; the THEN statement is your prediction of whatyou’ll learn from the experiment. Since what you’re measuring will be at-mospheric hydrocarbons, the variable in this experiment is time.
Compare the Predicted to Actual Results,Considering the ResultsOn the face of it, this experiment sounds like a no-brainer: rush hour trafficmeans more car exhaust means higher levels of hydrocarbons, right? If yourresults support your hypothesis, then this experiment may be over.
But what if levels are low during both time periods? Those results fail to sup-port your hypothesis. It wouldn’t hurt to check your build and programming,to be sure the gadget is working correctly. Assuming it is, you may need toask a new question, or broaden the scope of your experiment—such as takingmeasurements more often during the day, or on different days of the week,or during different types of weather.
And what if you get high hydrocarbon levels from 4 to 6 pm, and also from 4to 6 am? That’s a partial confirmation of your hypothesis that may lead youto…
Doing Science: How to Learn More from Your Atmospheric Data 75
www.it-ebooks.info

Ask Another QuestionMaybe there’s something going on in the world around you that you didn’tknow about, like a delivery truck idling on the street early in the morning (weget that a lot on our street!). Do deliveries happen often enough to affecthydrocarbon levels most of the time, or just some of the time? To learn more,you’ll need to figure out the next interesting, testable question, reformulateyour hypothesis, and restructure your experiment.
By testing enough variables (time of day, day of week, month, weather con-ditions, etc.) you should be able to build up a very accurate profile of thehydrocarbon pollution outside your window. In fact, you should be able topredict future events: for example, if tomorrow is a delivery day, you couldconfidently predict there will be more pollution than usual. Or if tomorrow isgoing to be rainy, there will be less pollution, as the raindrops wash the pol-lution out of the atmosphere.
When you feel you’ve gotten the pollution profile for your neighborhood downpat, your work has just begun—now it’s time to measure a different neigh-borhood! Science never stops!
76 Atmospheric Monitoring with Arduino
www.it-ebooks.info

Built with Atlas. O’Reilly Media, Inc., 2013.
About the AuthorsPatrick Di Justo is a contributor to Wired magazine—where he writes themagazine’s monthly “What’s Inside” column—and the author of The Scienceof Battlestar Galactica (Wiley, October 2010). His work has appeared in Dwell,Scientific American, Popular Science, The New York Times, and more. He hasalso worked as a robot programmer for the Federal Reserve. He bought hisfirst Arduino in 2007.
Emily Gertz has been covering DIY environmental monitoring since 2004,when she interviewed engineer-artist Natalie Jeremijenko for Worldchang-ing.com. Her work has also appeared in Popular Science, Popular Mechan-ics, Scientific American, Grist, Dwell, OnEarth, and more. She has beenhands-on with Internet technologies since 1994 as a web producer, commu-nity host, and content and social media strategist.
www.it-ebooks.info