Environmental Monitoring with Arduino
96
Transcript of Environmental Monitoring with Arduino


EnvironmentalMonitoringwith Arduino
Emily Gertz andPatrick Di Justo
Beijing • Cambridge • Farnham • Köln • Sebastopol • Tokyo

Environmental Monitoring with Arduinoby Emily Gertz and Patrick Di Justo
Copyright © 2012 Emily Gertz and Patrick Di Justo. All rights reserved.Printed in the United States of America.
Published by O’Reilly Media, Inc., 1005 Gravenstein Highway North, Sebastopol, CA 95472.
O’Reilly books may be purchased for educational, business, or sales promotional use. Onlineeditions are also available for most titles (http://my.safaribooksonline.com). For more informa-tion, contact our corporate/institutional sales department: (800) 998-9938 [email protected].
Editors: Shawn Wallace and Brian JepsonProduction Editor: Teresa ElseyCover Designer: Mark PagliettiInterior Designers: Ron Bilodeau and Edie FreedmanIllustrator: Robert Romano
January 2012: First Edition.
Revision History for the First Edition:January 20, 2012 First release
See http://oreilly.com/catalog/errata.csp?isbn=9781449310561 for release details.
Nutshell Handbook, the Nutshell Handbook logo, and the O’Reilly logo are registered trademarksof O’Reilly Media, Inc. Environmental Monitoring with Arduino and related trade dress are trade-marks of O’Reilly Media, Inc.
Many of the designations used by manufacturers and sellers to distinguish their products areclaimed as trademarks. Where those designations appear in this book, and O’Reilly Media, Inc.was aware of a trademark claim, the designations have been printed in caps or initial caps.
Important Message to Our Readers: The technologies discussed in this publication, the limi-tations on these technologies that technology and content owners seek to impose, and the lawsactually limiting the use of these technologies are constantly changing. Thus, some of the projectsdescribed in this publication may not work, may cause unintended harm to systems on whichthey are used, or may not be consistent with current laws or applicable user agreements.
Your safety is your own responsibility, including proper use of equipment and safety gear, anddetermining whether you have adequate skill and experience. Electricity and other resourcesused for these projects are dangerous unless used properly and with adequate precautions, in-cluding safety gear. These projects are not intended for use by children. While every precautionhas been taken in the preparation of this book, O’Reilly Media, Inc., and the authors assume noresponsibility for errors or omissions. Use of the instructions and suggestions in EnvironmentalMonitoring with Arduino is at your own risk. O’Reilly Media, Inc., and the authors disclaim allresponsibility for any resulting damage, injury, or expense. It is your responsibility to make surethat your activities comply with applicable laws, including copyright.
ISBN: 978-1-449-31056-1[LSI]
1327090789

To all our nieces andnephews, who we hope
will make a moreunderstandable world.


Contents
Preface . . . . . . . . . . . . . . . . . . . . . . . . . . . . . . . . . . . . . . . . . . . . . . . . . . . . . . . . . . . . . . ix
1/The World’s Shortest Electronics Primer . . . . . . . . . . . . . . . . . . . . . . . . . . . . . . . 1
What Is Arduino? . . . . . . . . . . . . . . . . . . . . . . . . . . . . . . . . . . . . . . . . . . . . . . . . . . . . . 1
Electronic Circuits and Components . . . . . . . . . . . . . . . . . . . . . . . . . . . . . . . . . . . . 1
Programming Arduino . . . . . . . . . . . . . . . . . . . . . . . . . . . . . . . . . . . . . . . . . . . . . . . . 5
First Sketch: Make an LED Blink . . . . . . . . . . . . . . . . . . . . . . . . . . . . . . . . . . . . . . . . 6
Parts . . . . . . . . . . . . . . . . . . . . . . . . . . . . . . . . . . . . . . . . . . . . . . . . . . . . . . . . . . . . 6
Install the IDE . . . . . . . . . . . . . . . . . . . . . . . . . . . . . . . . . . . . . . . . . . . . . . . . . . . . .6
Breadboard the Circuit . . . . . . . . . . . . . . . . . . . . . . . . . . . . . . . . . . . . . . . . . . . . .6
Write the Code . . . . . . . . . . . . . . . . . . . . . . . . . . . . . . . . . . . . . . . . . . . . . . . . . . . . 7
Things to Try . . . . . . . . . . . . . . . . . . . . . . . . . . . . . . . . . . . . . . . . . . . . . . . . . . . . . 9
2/Project: Noise Monitor/LED Bar Output . . . . . . . . . . . . . . . . . . . . . . . . . . . . . . . . 11
Measuring Noise: The Microphone . . . . . . . . . . . . . . . . . . . . . . . . . . . . . . . . . . . . . 11
The LED Bar . . . . . . . . . . . . . . . . . . . . . . . . . . . . . . . . . . . . . . . . . . . . . . . . . . . . . 12
Make the Gadget . . . . . . . . . . . . . . . . . . . . . . . . . . . . . . . . . . . . . . . . . . . . . . . . . . . . 13
Parts . . . . . . . . . . . . . . . . . . . . . . . . . . . . . . . . . . . . . . . . . . . . . . . . . . . . . . . . . . . 13
Breadboard the Circuit . . . . . . . . . . . . . . . . . . . . . . . . . . . . . . . . . . . . . . . . . . . .14
Write the Code . . . . . . . . . . . . . . . . . . . . . . . . . . . . . . . . . . . . . . . . . . . . . . . . . . . 16
Things to Try . . . . . . . . . . . . . . . . . . . . . . . . . . . . . . . . . . . . . . . . . . . . . . . . . . . . 18
3/New Component: 4Char Display . . . . . . . . . . . . . . . . . . . . . . . . . . . . . . . . . . . . . 19
Test Project . . . . . . . . . . . . . . . . . . . . . . . . . . . . . . . . . . . . . . . . . . . . . . . . . . . . . . . . 20
Parts . . . . . . . . . . . . . . . . . . . . . . . . . . . . . . . . . . . . . . . . . . . . . . . . . . . . . . . . . . . 20
Breadboard the Circuit . . . . . . . . . . . . . . . . . . . . . . . . . . . . . . . . . . . . . . . . . . . 20
Write the Code . . . . . . . . . . . . . . . . . . . . . . . . . . . . . . . . . . . . . . . . . . . . . . . . . . . 21
Things to Try . . . . . . . . . . . . . . . . . . . . . . . . . . . . . . . . . . . . . . . . . . . . . . . . . . . . 24
4/Detecting Electromagnetic Interference (and making bad music) . . . . . . . 25
Detecting EMI Sources in the Environment . . . . . . . . . . . . . . . . . . . . . . . . . . . . . 26
Make the Gadget . . . . . . . . . . . . . . . . . . . . . . . . . . . . . . . . . . . . . . . . . . . . . . . . . . . . 27
Parts . . . . . . . . . . . . . . . . . . . . . . . . . . . . . . . . . . . . . . . . . . . . . . . . . . . . . . . . . . . 27
The 8-Ohm Speaker . . . . . . . . . . . . . . . . . . . . . . . . . . . . . . . . . . . . . . . . . . . . . . 27
Construct the EMI Monitor . . . . . . . . . . . . . . . . . . . . . . . . . . . . . . . . . . . . . . . . 28
Write the Code . . . . . . . . . . . . . . . . . . . . . . . . . . . . . . . . . . . . . . . . . . . . . . . . . . 30
Run the Sketch . . . . . . . . . . . . . . . . . . . . . . . . . . . . . . . . . . . . . . . . . . . . . . . . . . .31
Contents v

Powering the Gadget in Mobile Mode . . . . . . . . . . . . . . . . . . . . . . . . . . . . . . . 32
What Are We Measuring with This Gadget? . . . . . . . . . . . . . . . . . . . . . . . . . . . . . 32
Things to Try . . . . . . . . . . . . . . . . . . . . . . . . . . . . . . . . . . . . . . . . . . . . . . . . . . . . 33
5/Project: Water Conductivity/Numerical Output . . . . . . . . . . . . . . . . . . . . . . . . 35
What Is Conductivity, and Why Do I Care? . . . . . . . . . . . . . . . . . . . . . . . . . . . . . . 35
Make the Gadget . . . . . . . . . . . . . . . . . . . . . . . . . . . . . . . . . . . . . . . . . . . . . . . . . . . .35
Parts . . . . . . . . . . . . . . . . . . . . . . . . . . . . . . . . . . . . . . . . . . . . . . . . . . . . . . . . . . . 36
Construct the Probe . . . . . . . . . . . . . . . . . . . . . . . . . . . . . . . . . . . . . . . . . . . . . .36
Breadboard the Circuit . . . . . . . . . . . . . . . . . . . . . . . . . . . . . . . . . . . . . . . . . . . 38
Write the Code . . . . . . . . . . . . . . . . . . . . . . . . . . . . . . . . . . . . . . . . . . . . . . . . . . 39
How to Take a Reading . . . . . . . . . . . . . . . . . . . . . . . . . . . . . . . . . . . . . . . . . . . 40
Things to Try . . . . . . . . . . . . . . . . . . . . . . . . . . . . . . . . . . . . . . . . . . . . . . . . . . . . 40
6/New Component: Ethernet Shield . . . . . . . . . . . . . . . . . . . . . . . . . . . . . . . . . . . . 43
Using the Ethernet Shield . . . . . . . . . . . . . . . . . . . . . . . . . . . . . . . . . . . . . . . . . . . . 44
The Ethernet Port . . . . . . . . . . . . . . . . . . . . . . . . . . . . . . . . . . . . . . . . . . . . . . . . 44
The MAC Address . . . . . . . . . . . . . . . . . . . . . . . . . . . . . . . . . . . . . . . . . . . . . . . .44
The IP Address . . . . . . . . . . . . . . . . . . . . . . . . . . . . . . . . . . . . . . . . . . . . . . . . . . 45
The SD Card Slot . . . . . . . . . . . . . . . . . . . . . . . . . . . . . . . . . . . . . . . . . . . . . . . . 48
Testing the Ethernet Shield . . . . . . . . . . . . . . . . . . . . . . . . . . . . . . . . . . . . . . . . . . 49
Parts . . . . . . . . . . . . . . . . . . . . . . . . . . . . . . . . . . . . . . . . . . . . . . . . . . . . . . . . . . . 49
Assembly . . . . . . . . . . . . . . . . . . . . . . . . . . . . . . . . . . . . . . . . . . . . . . . . . . . . . . . 49
Testing the SD Card Slot . . . . . . . . . . . . . . . . . . . . . . . . . . . . . . . . . . . . . . . . . . . . . 50
Parts . . . . . . . . . . . . . . . . . . . . . . . . . . . . . . . . . . . . . . . . . . . . . . . . . . . . . . . . . . . 50
Assembly . . . . . . . . . . . . . . . . . . . . . . . . . . . . . . . . . . . . . . . . . . . . . . . . . . . . . . . 50
Things to Try . . . . . . . . . . . . . . . . . . . . . . . . . . . . . . . . . . . . . . . . . . . . . . . . . . . . . . . 50
7/Project: Humidity, Temperature & Dew Point/4Char Display . . . . . . . . . . . . 51
You Don’t Have to Be a Weatherman to Measure the Weather . . . . . . . . . . . . . 51
Getting Usable Measurements . . . . . . . . . . . . . . . . . . . . . . . . . . . . . . . . . . . . . . . . 52
First Electronic Sensor: The DHT-22 . . . . . . . . . . . . . . . . . . . . . . . . . . . . . . . . . . . 54
Using Code Libraries . . . . . . . . . . . . . . . . . . . . . . . . . . . . . . . . . . . . . . . . . . . . . . . . 54
Make the Gadget . . . . . . . . . . . . . . . . . . . . . . . . . . . . . . . . . . . . . . . . . . . . . . . . . . . .55
Parts . . . . . . . . . . . . . . . . . . . . . . . . . . . . . . . . . . . . . . . . . . . . . . . . . . . . . . . . . . . 55
Breadboard the Circuit . . . . . . . . . . . . . . . . . . . . . . . . . . . . . . . . . . . . . . . . . . . 56
Write the Code . . . . . . . . . . . . . . . . . . . . . . . . . . . . . . . . . . . . . . . . . . . . . . . . . . 56
Things to Try . . . . . . . . . . . . . . . . . . . . . . . . . . . . . . . . . . . . . . . . . . . . . . . . . . . . 61
8/Real-Time, Geo-Tagged Data Sharing with Pachube . . . . . . . . . . . . . . . . . . . 63
Test Project: Connecting and Uploading Data to Pachube . . . . . . . . . . . . . . . . 63
Parts . . . . . . . . . . . . . . . . . . . . . . . . . . . . . . . . . . . . . . . . . . . . . . . . . . . . . . . . . . . 64
Open a Pachube Account . . . . . . . . . . . . . . . . . . . . . . . . . . . . . . . . . . . . . . . . . 64
Write the Code . . . . . . . . . . . . . . . . . . . . . . . . . . . . . . . . . . . . . . . . . . . . . . . . . . 65
vi Contents
Things To Try . . . . . . . . . . . . . . . . . . . . . . . . . . . . . . . . . . . . . . . . . . . . . . . . . . . . . . 66
9/Project: Radiation Counter/Sharing Data on the Internet . . . . . . . . . . . . . . . 67
What’s a Geiger Counter? . . . . . . . . . . . . . . . . . . . . . . . . . . . . . . . . . . . . . . . . . . . . 68
Make the Gadget . . . . . . . . . . . . . . . . . . . . . . . . . . . . . . . . . . . . . . . . . . . . . . . . . . . .70
Parts . . . . . . . . . . . . . . . . . . . . . . . . . . . . . . . . . . . . . . . . . . . . . . . . . . . . . . . . . . . 71
Breadboard the Circuit . . . . . . . . . . . . . . . . . . . . . . . . . . . . . . . . . . . . . . . . . . . . 71
Write the Code . . . . . . . . . . . . . . . . . . . . . . . . . . . . . . . . . . . . . . . . . . . . . . . . . . .72
What Are We Measuring with This Gadget? . . . . . . . . . . . . . . . . . . . . . . . . . . . . . 76
Failure Mode Analysis . . . . . . . . . . . . . . . . . . . . . . . . . . . . . . . . . . . . . . . . . . . . . . . .77
Things to Try . . . . . . . . . . . . . . . . . . . . . . . . . . . . . . . . . . . . . . . . . . . . . . . . . . . . . . . 78
10/Casing the Gadget . . . . . . . . . . . . . . . . . . . . . . . . . . . . . . . . . . . . . . . . . . . . . . . . . 79
Contents vii


Preface
This book is all about making the invisible visible.
Each project introduces a particular environmental condition, and thenteaches you step by step how to build a small, inexpensive electronic devicethat can monitor that condition, and communicate back what it finds.
When you start monitoring the environment, something happens: You startto understand the world around you in a new way.
Build a water quality tester, and a beautiful, clear-running stream may be-come a beautiful clear stream with a high particulate count (see Chapter 6).
Build a gadget to measure temperature and humidity, and you’ll see foryourself that “high noon” is not the hottest part of the day; that actuallycomes around 3 p.m. (see Chapter 8).
Build an electromagnetic field detector, and you’ll discover even a quietroom is buzzing with unseen, unheard electrical vibrations (see Chapter 4).
We usually turn environmental monitoring over to the scientific experts atgovernment agencies, universities, and corporations. They come armedwith complicated and expensive equipment as well as specialized educa-tions, and occasionally their own institutional agendas.
Since the natural environment is complex, even more so for all the stuff wehuman beings and our activities have added to the mix, this sort of expertisehas an important role in our lives and in our communities. Scientific analysisand expertise are key to creating effective regulations that control the im-pacts human activities have on the environment and our health.
Monitoring the environment for ourselves, however, pulls the curtain backon what all those experts are doing. Understanding brings knowledge, andwith knowledge comes the power to make decisions that can change ourlives for the better—from lowering the electric bill, to holding polluters ac-countable, to helping scientists study the changing climate.
How to Use This BookWe suggest that you build the projects that follow in the given order, sincethey progress from easier to more complex.

If you already have some experience with Arduino, and want more challengesin making and using these gadgets, look for the “Things to Try” section atthe end of each project chapter. We make suggestions for changing the buildor the programming that will exercise your skills. We hope you’ll come upwith your own ideas, too, and tell us about them.
One straightforward way to increase each project’s difficulty, once you havebuilt and tested a gadget, is to rebuild it in a more permanent way by sol-dering the components together. We also offer a few general suggestionsfor creating enclosures—handy and rugged cases for your gadgets—at theend of this book. You can make enclosures as simply or elaborately as youchoose.
Finally: We do our best to describe how to build each gadget as clearly aspossible. But as it’s almost inevitable that even a “simple” project will frus-trate you now and then, here are some tips to keep things fun and interesting:
Break it downIt may be difficult to get a gadget to work correctly the first time. Butdon’t get discouraged! Most of these gadgets didn’t work the first timefor us, either. What we’ve found, and what we think will work for you, isto break every gadget down into separate components, typically inputand output components.
Don’t skip the preliminariesMake sure each component works individually before connecting it withothers. If it’s working on its own, it will be much more likely to work whencombined into a gadget.
Save. Back up. Document.When it comes to coding, this is our mantra:
1. Save: Save your code frequently as you work on it.
2. Back up: Always back up your code to at least one location otherthan your hard drive, such as a peripheral drive, memory card, orflash drive.
3. Document: As you write programming code, include comments(more on this in Chapter 2) that explain what the code does; whenyou look at your code several days later, you might not remember.As you build a gadget, take notes about what you discover, so thatyou can refer to them later.
Do these three simple things consistently, and when your computercrashes, your laptop falls out of your bag and onto the concrete, or yourcat walks across the keyboard, you will be calm in the knowledge thatyou always have a copy of your work safely stored somewhere else.
x Preface

Change only one thing at a timeIf you decide to make any changes to the code or the design of thesegadgets (and we heartily encourage you to do so), we suggest that youchange only one thing at a time, and test it before making anotherchange.
This is important because your change may cause the gadget to stopworking. If you’ve made only one change, it will be easy to undo it andreturn to a working version of the gadget. This allows you to move aheadwith confidence, because you know that any glitch is easy to fix.
Mash it upWe’ve done our best to design these gadgets in a modular fashion, sothat with only a little tweaking, you can swap the the input and outputcomponents between them. Want to modify the temperature gadget tooutput to Pachube rather than a display? Go for it! The hardware shouldbe easy to modify, and changing the code will usually be a simple matterof cutting and pasting from one gadget’s code to the next.
Granted, some swaps don’t seem to make much sense: it might berather odd to build a thermometer with an audio output. But give it a tryif you want to. Who knows what you’ll come up with? Here’s our ownfavorite mashup so far: If you combine the audio output of the electro-magnetic field detector with the Geiger counter input, and then tweakthe code just right, you can make an old-fashioned click-click-click ra-diation detector, just like in the movies. So mix and match! Have fun! Bebold!
Ask for helpThere is absolutely zero shame in asking for help, and there is less thanzero shame in asking for help with an Arduino project. The entire Ar-duino ecosystem is built on a philosophy of open access to knowledge.Some people may know more about building circuits or writing codethan you know. You might know more than someone else.
But to a certain extent, no one is an expert, because no one has madeArduino do everything it can do. Whether online or face-to-face, peoplewill be happy to help you learn if you’re respectful, gracious, and willingto share. We guarantee that after weeks of feeling like all you ever do isask questions, there is nothing like the thrill you’ll get the first time you’reable to help someone else solve a problem.
Here are some resources for connecting with fellow Arduino users:
• http://www.arduino.cc: The online home of Arduino features userforums and more.
Preface xi
• http://forums.oreilly.com/: O’Reilly, this book’s publisher, has anactive Arduino user community.
• http://hackerspaces.org/wiki/Hackerspaces: The HackerspaceWiki is a good place to start looking for face-to-face maker workshopsand meetups in your area.
Don’t be afraid to experimentThere’s more than one way to put together any device in this book. Don’thave a 1 megaohm resistor to use in the EMF detector? Try using a 470Kresistor plus a 560K resistor instead. They add up to a bit more than1 megaohm, but that’s OK.
We know that there are other, perhaps even better ways to build eachand every one of the gadgets shown here. We hope you’ll find them andlet us know about them.The code examples in the following chapters areavailable for download at GitHub at the official code repository for thisbook. We encourage you to monitor this repository for the latest bug-fixed code, as well as extended examples by the author and the rest ofthe social coding community.
Conventions Used in This BookThe following typographical conventions are used in this book:
ItalicIndicates new terms, URLs, email addresses, filenames, and fileextensions.
Constant widthUsed for program listings, as well as within paragraphs to refer to pro-gram elements such as variable or function names, databases, datatypes, environment variables, statements, and keywords.
Constant width boldShows commands or other text that should be typed literally by the user.
Constant width italicShows text that should be replaced with user-supplied values or by val-ues determined by context.
TIP: This icon signifies a tip, suggestion, or generalnote.
xii Preface

CAUTION: This icon indicates a warning or caution.
Using Code ExamplesThis book is here to help you get your job done. In general, you may use thecode in this book in your programs and documentation. You do not need tocontact us for permission unless you’re reproducing a significant portion ofthe code. For example, writing a program that uses several chunks of codefrom this book does not require permission. Selling or distributing a CD-ROMof examples from O’Reilly books does require permission. Answering aquestion by citing this book and quoting example code does not require per-mission. Incorporating a significant amount of example code from this bookinto your product’s documentation does require permission.
We appreciate, but do not require, attribution. An attribution usually includesthe title, author, publisher, and ISBN. For example: “Environmental Moni-toring with Arduino by Emily Gertz and Patrick Di Justo (O’Reilly). Copyright2012 Emily Gertz and Patrick Di Justo, 978-1-4493-1056-1.”
If you feel your use of code examples falls outside fair use or the permissiongiven above, feel free to contact us at [email protected].
Safari® Books OnlineSafari Books Online is an on-demand digital library that lets youeasily search over 7,500 technology and creative referencebooks and videos to find the answers you need quickly.
With a subscription, you can read any page and watch any video from ourlibrary online. Read books on your cell phone and mobile devices. Accessnew titles before they are available for print, and get exclusive access tomanuscripts in development and post feedback for the authors. Copy andpaste code samples, organize your favorites, download chapters, bookmarkkey sections, create notes, print out pages, and benefit from tons of othertime-saving features.
O’Reilly Media has uploaded this book to the Safari Books Online service. Tohave full digital access to this book and others on similar topics from O’Reillyand other publishers, sign up for free at http://my.safaribooksonline.com.
Preface xiii

How to Contact UsPlease address comments and questions concerning this book to thepublisher:
O’Reilly Media, Inc.1005 Gravenstein Highway NorthSebastopol, CA 95472800-998-9938 (in the United States or Canada)707-829-0515 (international or local)707-829-0104 (fax)
We have a web page for this book, where we list errata, examples, and anyadditional information. You can access this page at:
http://shop.oreilly.com/product/0636920021582.do
To comment or ask technical questions about this book, send email to:
For more information about our books, courses, conferences, and news, seeour website at http://www.oreilly.com.
Find us on Facebook: http://facebook.com/oreilly
Follow us on Twitter: http://twitter.com/oreillymedia
Watch us on YouTube: http://www.youtube.com/oreillymedia
xiv Preface

1/The World’s ShortestElectronics Primer
If you’re a DIY electronics or Arduino novice, the information in this chapterwill help you get the most out of building and programming the gadgets inthis book.
If you’re already building your own electronics, consider this chapter a re-fresher to dip into as needed.
What Is Arduino?Arduino is best described as a single-board computer that has deliberatelybeen designed to be used by people who are not experts in electronics, en-gineering, or programming. It is inexpensive, cross-platform (the Arduinosoftware runs on Windows, Mac OS X, and Linux), and easy to program. BothArduino hardware and software are open source and extensible.
Arduino is also powerful: despite its compact size, it has about as muchcomputing muscle as one of the original navigation computers from theApollo program, at about 1/35,000 the price.
Programmers, designers, do-it-yourselfers, and artists around the worldtake advantage of Arduino’s power and simplicity to create all sorts of inno-vative devices, including interactive sensors, artwork, and toys.
We built each of the products in this book using the Arduino Uno (Fig-ure 1-1 and Figure 1-2), which at this writing (late 2011) is the latest model.By the time you’re reading this, there may be something newer.
It’s not necessary to know Arduino Uno’s technical specifications to buildand program the gadgets in this book. But if you’re interested, you can findthem at the official Arduino website.
Electronic Circuits and ComponentsAn electronic circuit is, as the term implies, electricity moving in a path verymuch like a circle. Each circuit has a beginning, a middle, and an end (whichis usually very close to where it began). Somewhere in the middle, the circuit
1

often runs through various electronic components that modify the electricalcurrent in some way.
Each device in this book is a circuit that combines Arduino with differentelectronic components. Some of these essentially manage the power andpath of the electricity; others sense certain conditions in the environment;and still others display output about those conditions.
Let’s take a look at some of the components we will be using in our circuits:
Light emitting diodes (LEDs)An LED is a lamp made of various rare-earth metals, which give off alarge amount of light when a tiny current is run through them. The com-position of the substances within the LED determine the particularwavelength of light emitted: green, blue, yellow, red, and even ultravioletand infrared are among the possible colors.
Technically, the LEDs used in our gadgets are “miniature LEDs,” tinylamps with two wire leads, one long (called the anode) and the other abit shorter (called the cathode). These come in various useful forms,including single lamps from 2mm to 8mm in diameter, display bars, andalphanumeric readouts, and can serve as indicators, illuminators, oreven data transmitters.
Figure 1-1. Front of the Arduino Uno (Rev. 2).
2 Environmental Monitoring with Arduino

You’ll learn how to use these different types of LEDs while building thedifferent environmental sensors in this book.
ResistorsResistors are the workhorses of the electronics world. What do resistorsdo? They simply resist letting electricity flow through them, and they dothis by being made of materials that naturally conduct electricity poorly.In this way resistors serve as small dumb regulators to cut down theintensity of electric current.
Resistance is valuable because some electronic components are verydelicate, burning out easily if they’re powered with too much current.Putting a resistor in the circuit ensures that only the proper amount ofelectricity reaches the component. It’s hard to imagine any circuit work-ing without a resistor, and with LEDs resistors are almost mandatory.
While building the projects in this book, you’ll learn various creative waysto regulate current with resistors.
Figure 1-2. Back of the Arduino Uno.
The World’s Shortest Electronics Primer 3

SolderingSoldering involves heating up conductive metal, called solder, and thenusing it to fuse other pieces of metal together. In small-scale electronics,we use an electrical tool called a soldering gun, which has a small tip, toheat up thin wires of solder and drip the solder onto the components wewish to join into the circuit.
Soldering creates a very stable circuit, and that stability can be a draw-back. Fusing together components can make it difficult to reuse or re-configure circuits. You also must be very careful to not short-circuitcomponents while soldering. It is beyond the scope of this book to to gointo the details of soldering, which can be a very useful skill in DIY elec-tronics. If you’re interested in learning how, this online resource is a goodplace to start.
The alternative to soldering is to use a breadboard.
Solderless breadboardsSolderless breadboards are small plastic boards studded with pins thatcan hold wires. (More about these below.) These wires can then be con-nected to other electronic components, including Arduino.
Solderless breadboards make it much easier to design circuits, becausethey allow you to quickly try out various assemblies and componentswithout having to solder the pieces together. While solderless bread-boards typically are intended for use only in the design phase, manyhobbyists keep a breadboard in the final version of a device becausethey’re so fast and easy to use.
If you don’t feel like soldering circuit boards, solderless breadboards arethe way to go. Each gadget in this book uses a solderless breadboard.
WireWire is the most basic electronic component, creating the path alongwhich electrons move through a circuit. The projects in this book use1mm “jumper wires,” which have solid metal tips perfectly sized to fitinto Arduino and breadboard pins, and come sheathed in various colorsof insulation.
Get as much jumper wire as you can afford, in sev-eral colors. When building circuits with Arduino, youcan’t have too many jumper wires.
4 Environmental Monitoring with Arduino

We order most of our electronics components from these online retailers:
• Adafruit Industries
• Eemartee
• Electronic Goldmine
• SparkFun
Maker Shed, from MAKE and O’Reilly Media, sells books, kits, and tools, aswell as many of the electronic components needed to build the projects inthis book. Maker Shed also supplies convenient bundles for many of theprojects in this book (you can find more information about these bundles inthe individual project chapters).
Don’t count out your friendly local RadioShack, though. While writing thisbook, more than once we ran out to RadioShack for a last-minutecomponent.
For years RadioShack cut back on its electronic components inventory, ap-parently seeing a better future for the business by featuring cell phones andother consumer electronics. But the company has recently begun to em-brace the maker movement; at this writing, some stores around the countryare even carrying Arduinos. We’re hopeful RadioShack is on the return pathto being the hacker heaven it was years ago.
Programming ArduinoA computer program is a coded series of instructions that tells the computerwhat to do. The programs that run on Arduino are called sketches.
The sketches used in this book mostly tell Arduino to read data from one ofthe pins, such as the one connected to a sensor; and to write information toa different pin, such as the pin connected to an LED or display unit.
Sometimes the sketches also instruct Arduino to process that informationin a certain way: to combine data streams, or compare the input with somereference, or even place the data into a readable format.
An Arduino program has two parts: setup() and loop().
setup()The setup() part tells Arduino what it needs to know in order to do whatwe want it to do. For example, setup() tells Arduino which pins it needsto configure as input, which pins to configure as output, and (by default)which won’t be doing anything. If we’re going to use a special type ofoutput to show our results, such as a four-character display, setup() iswhere we tell Arduino how that output works. If we need to communicate
The World’s Shortest Electronics Primer 5

with the outside world through a serial port or an Ethernet connection,all the instructions necessary to make that connection go here.
loop()loop() tells Arduino what to do with the input or output. Unlike someother computers, it never stops; once the instructions in a loop havebeen executed, Arduino goes right back to the top of the loop() andstarts executing instructions all over again.
First Sketch: Make an LED BlinkBy long tradition (going back to 2006), the first Arduino sketch you write isto make an LED blink.
Arduino pins can be used for input and output, as long as you tell the com-puter which is which. So in this sketch, we tell the Arduino to set pin 13 to bethe LED OUTPUT pin, and then we alternately send electricity to pin 13 (set-ting the pin HIGH) and cut off the electricity to pin 13 (setting the pin LOW).With each alternation, the LED turns on and off.
We’ll write all the sketches in this book using the Arduino “integrated devel-opment environment” (IDE), which, simply put, is special software for writingand uploading code to Arduino.
Parts1. Arduino Uno
2. Breadboard
3. LED
Install the IDEDownload the Arduino IDE from http://arduino.cc/en/Main/Software, andfollow the provided instructions to install it on your computer.
Once you’ve installed the software, open the IDE. You should see a screenthat looks something like Figure 1-3.
Breadboard the CircuitThe circuit portion of this project is very simple:
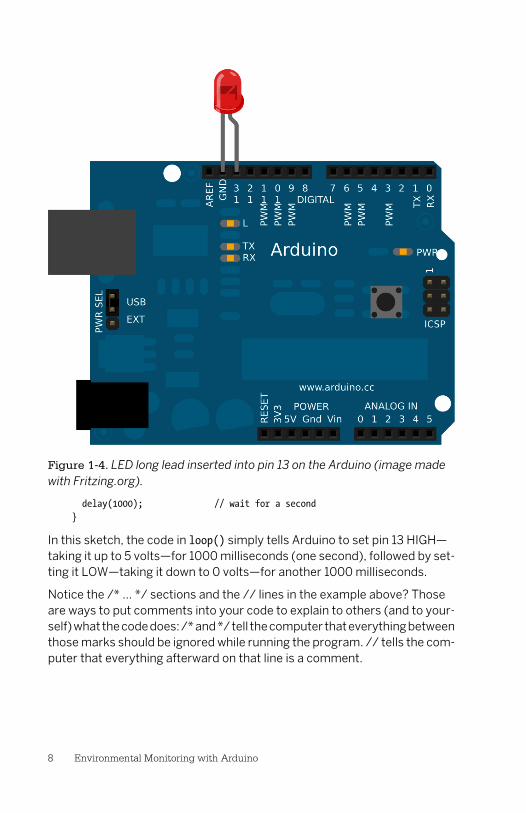
Take an LED and place the long lead into pin 13 on Arduino, as you can seein the Figure 1-4 breadboard view.
6 Environmental Monitoring with Arduino

Write the CodeYou can find this code in the Arduino IDE under File → Examples or on theEMWA GitHub Repository | chapter-1 | blink.
/* Blink Turns on an LED on for one second, then off for one second, repeatedly. This example code is based on example code that is in the public domain.*/
void setup() { // initialize the digital pin as an output. // Pin 13 has an LED connected on most Arduino boards: pinMode(13, OUTPUT);}
void loop() { digitalWrite(13, HIGH); // set the LED on delay(1000); // wait for a second digitalWrite(13, LOW); // set the LED off
Figure 1-3. The Arduino IDE on a Mac.
The World’s Shortest Electronics Primer 7
delay(1000); // wait for a second}
In this sketch, the code in loop() simply tells Arduino to set pin 13 HIGH—taking it up to 5 volts—for 1000 milliseconds (one second), followed by set-ting it LOW—taking it down to 0 volts—for another 1000 milliseconds.
Notice the /* ... */ sections and the // lines in the example above? Thoseare ways to put comments into your code to explain to others (and to your-self) what the code does: /* and */ tell the computer that everything betweenthose marks should be ignored while running the program. // tells the com-puter that everything afterward on that line is a comment.
Figure 1-4. LED long lead inserted into pin 13 on the Arduino (image madewith Fritzing.org).
8 Environmental Monitoring with Arduino

Why Comment Code?Commenting code simply means adding explanations in plainEnglish to your sketch that describe how the code works. Addingcomments to code is a very good idea. Here’s why:
Suppose, after hours trying to get your Arduino to do something,the solution suddenly comes to you. Eureka! You hook up yourArduino, bang out your code, load it up, and voilà: It works.
Fast forward: Months later, working on another project, you wantyour Arduino to do something similar to your earlier project. “Nosweat, I’ll just reuse my earlier code,” you think. But you open upthe sketch and…none of it makes sense!
You wrote that earlier code in a highly creative state of mind, whenyour brain chemicals were flowing like a river and your ideas wereflashing like summer lightning. In all the excitement, you didn’tcomment your code. So now, months later, when you’re in a com-pletely different state of mind, you can’t remember what the codedoes, and you have to start all over. Is that any way to live?
If you had commented your code from the beginning, you’d knowexactly what each variable was used for, what each function did,and what each pin controlled. Your life would be so much moreenjoyable.
In short, always take a few minutes to comment your code.
Things to TryModify this sketch to make the LED do something different:
1. Blink twice as quickly.
2. Blink twice as slowly.
3. Light up for half a second with a two-second pause between blinks.
Congratulations, you’re an Arduino programmer! Now let’s have some realfun.
The World’s Shortest Electronics Primer 9

2/Project:Noise Monitor/
LED Bar Output
We cannot smell, taste, or touch a sound. But noise (which is what most ofus call a sound we don’t like) is one of the most pervasive environmentalcontaminants around.
Noise pollution is defined as a sound that is constant, very loud, unwanted,or disturbing to everyday activities in the places we live, play, work, or learn.Cars on the street, planes overhead, construction equipment, or your neigh-bor’s loud TV leaking through the wall—these and more can become noisepollution. And it’s not merely a case of acute annoyance: According to theU.S. Environmental Protection Agency, noise pollution is directly linked tostress and stress-related illnesses (“all that noise is making me sick”), highblood pressure, fatigue, and hearing loss, among many other adverseeffects.
Even the thick-skinned residents of New York City lose their cool when itcomes to noxious sounds: unwanted noise is far and away the number-onecomplaint to the city’s 311 info and services line.
Measuring Noise: The MicrophoneSound is made by the movement of air molecules. When an object vibrates,it moves back and forth, creating pressure waves that compress the air firstin one direction, and then in the other. These waves of compression traveloutward in all directions from the source of the vibration until they hit anobstacle and get absorbed, reflected, or attenuated into nothingness.
When the wave reaches our microphone, its pressure causes a membranein our microphone to vibrate. As the microphone membrane vibrates, itchanges the magnetic field of a magnet behind it. This varying magnetic fieldcauses a very small electric current to flow from the microphone’s wires.That current is what we actually measure with this gadget.
11

Typically a microphone current is very low—so low that Arduino would findit difficult to detect much variation in the signal. So we chose the Mini SoundSensor mic (Emartee part number 42021). This mic comes loaded onto abreakout board equipped with an amplifier. This particular amp boosts thesignal to one strong enough for Arduino to detect easily, which gives us a lotto work with.
If the Emartee Mini Sound Sensor isn’t available when you’re reading thisbook, a mini microphone from Jameco (part number ECM-60PC-R) shouldalso work, although it may require some tweaking of the Arduino sketch forthis gadget.
Save the Whales…from Noise PollutionWe’ve been talking about pressure waves moving through the air,but noise can move just as easily through nearly any continuousmedium: metals, glass, even water. In fact, there is a growing bodyof proof that increasing levels of undersea noise, largely caused byship engines, are harming social sea mammals like dolphins andwhales.
These animals, which communicate using underwater sound, arehaving a harder time talking to one another because of all theseunmuffled engines. Scientists using underwater recording devicespublished research in 2010 showing that endangered North At-lantic right whales are being forced to turn up their call volume tofind each other over the undersea din. If they can’t find each other,they can’t mate and produce offspring.
Modifying this gadget to listen to ocean noise would make a greatproject, albeit a complicated one The microphone would need tobe waterproofed, as well as designed to pick up the frequenciesused by creatures like dolphins and whales. A waterproof housingwould be essential for Arduino itself as well, plus a method to eitherstore the data (see more about the SD card in “The SD CardSlot” on page 48) or output the data to a device elsewhere.
If you attempt this, remember to let us know how it turns out!
The LED BarThe LED bar display, available from SparkFun (sku COM-09935) and otherelectronics suppliers, is nothing but a collection of light emitting diodes in afancy plastic case (see Figure 2-1). There is no other circuitry. There aren’t
12 Environmental Monitoring with Arduino

even any built-in resistors to regulate the current. For that reason, we stressstrongly that if you do not want to use the LED bar, you certainly don’t haveto.
Feel free to substitute any number of standard LEDs in its place. Just becertain to change the variable number_of_LEDs in the sketch to reflect theactual number of LEDs that you use.
One advantage to using individual LEDs is that you can color-code them byintensity. Try five green LEDs, three yellow LEDs and two red LEDs to giveyour readout a sense of urgency.
Make the Gadget
Parts1. Arduino
2. Breadboard
3. Mini Sound Sensor microphone (Emartee part number 42021)
4. 5–10 LEDs, one or more colors, or LED bar display
Figure 2-1. An LED bar display plugged into a breadboard, along with jumperwires to connect it to Arduino. You can also create an LED bar display usingindividual LEDs, as seen in the breadboard view.
Project: Noise Monitor/LED Bar Output 13
5. 220-ohm resistor
6. 10–15 jumper wires in varied colors
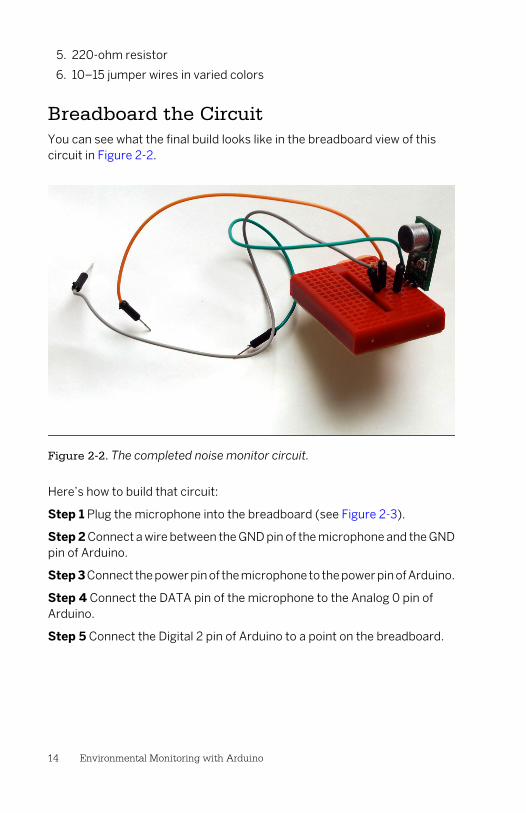
Breadboard the CircuitYou can see what the final build looks like in the breadboard view of thiscircuit in Figure 2-2.
Figure 2-2. The completed noise monitor circuit.
Here’s how to build that circuit:
Step 1 Plug the microphone into the breadboard (see Figure 2-3).
Step 2 Connect a wire between the GND pin of the microphone and the GNDpin of Arduino.
Step 3 Connect the power pin of the microphone to the power pin of Arduino.
Step 4 Connect the DATA pin of the microphone to the Analog 0 pin ofArduino.
Step 5 Connect the Digital 2 pin of Arduino to a point on the breadboard.
14 Environmental Monitoring with Arduino

Figure 2-3. The noise sensor plugged to the breadboard, with jumper wiresleading from its GND, power, and DATA pins.
Step 6 Connect the LONG or ANODE lead of an LED (or the ANODE lead ofan LED bar) to a pin in the same breadboard row as the jumper from D2.Have the LED straddle the breadboard trench, and plug the SHORT lead orCATHODE (or the CATHODE lead of an LED bar) to a pin in the correspondingrow on the other side of the breadboard.
Step 7 Plug a 220-ohm resistor into the breadboard, connecting the cathoderow and the GND rail.
Step 8 Connect a wire from the GND rail to the Arduino GND pin.
Repeat steps 5 through 7 nine times—or once for every LED you want to use.Increase the digital Arduino pin and breadboard row for each LED, to makea nice row of lights.
To keep yourself from going crazy, don’t use the same color wire for eachLED, since that makes it unbelievably difficult to spot mistakes made byplugging an LED to the wrong Arduino pin. Alternate colors, or use a wholerainbow of wires.
Project: Noise Monitor/LED Bar Output 15

Write the CodeYou can find this sketch on the EMWA GitHub repository | chapter-2 | Noise-Monitor.
/* Noise Monitor Sketch for an Arduino gadget that detects noise. This example code is based on example code that is in the public domain. */
int sensorPin = A0; // select the input pin for the input device
const int numberOfLEDs = 10;
const int numberOfSamples = 16;int sample;long signal[numberOfSamples];long runningAverage;long sumOfSamples = 0;int counter =0;
int threshold[] = { 0, 47, 99, 159, 227, 308, 407, 535, 715, 800, 900};
// You can play with the sensitivity of the LEDs by removing the above// threshold and using the one below. Try different values. Experiment!//int threshold[]={ 0, 25, 50, 75, 100, 125, 150, 175, 200, 225};
void setup(){ // declare the ledPins as an OUTPUT. // We're doing it line-by-line, so you can see what's happening. pinMode(2, OUTPUT); pinMode(3, OUTPUT); pinMode(4, OUTPUT); pinMode(5, OUTPUT); pinMode(6, OUTPUT); pinMode(7, OUTPUT); pinMode(8, OUTPUT); pinMode(9, OUTPUT); pinMode(10, OUTPUT); pinMode(11, OUTPUT);
// setting each pin to LOW so as not to light the LED digitalWrite(2, LOW); digitalWrite(3, LOW); digitalWrite(4, LOW); digitalWrite(5, LOW); digitalWrite(6, LOW); digitalWrite(7, LOW); digitalWrite(8, LOW);
16 Environmental Monitoring with Arduino

digitalWrite(9, LOW); digitalWrite(10, LOW); digitalWrite(11, LOW);
// set the analog 0 pin to input pinMode(sensorPin, INPUT);
// Getting a baseline noise signal for(int i =0; i <=numberOfSamples; i++) { sample = analogRead(sensorPin);
signal[i] = abs(sample -512); sumOfSamples = sumOfSamples + signal[i]; }
// Tests the LEDs by turning them on. // This time, we're using a for() loop to do the job. // Using for(), while(), and other loops is probably // how you should handle tasks like this. for(int i=0; i <=numberOfLEDs; i++) { digitalWrite(i+1, HIGH); delay(100); }
// ... and then turning them off. for(int i=0; i <=numberOfLEDs; i++) { digitalWrite(i+1, LOW); delay(100); }
Serial.begin(9600);}
void loop(){ // We want to take a "running average" of the output of the // microphone. We started getting a baseline average back // in setup(). Now, we're subtracting the oldest sound // sample from the running total, taking a new sound sample, // adding that to the running total, and taking the average. // This gives us a "typical" sound sample.
// Here we increase our counter, to keep track of how many // audio samples we're taking. If we use more than the number // of samples, use the % (modulo) operator to set the counter to zero.
counter = ++counter % numberOfSamples;
Project: Noise Monitor/LED Bar Output 17

// subtract the oldest sample from our total audio sample sumOfSamples -= signal[counter];
// take a new audio sample sample = analogRead(sensorPin);
// assign the sample to an array, normalize and adjust it to remove // negative values signal[counter] = abs(sample -512);
// Add the most recent sample to the total audio sample sumOfSamples = sumOfSamples + signal[counter];
// And (this is the key part), take an average of all the samples runningAverage = sumOfSamples/numberOfSamples;
Serial.print("Running Value = "); Serial.println(runningAverage); Serial.println(" ");
// light up the LEDs for (int i =0; i <=numberOfLEDs; i++) { // Then see if the average sound meets that LED's threshold value if(runningAverage>threshold[i]) { // if so, light the LED digitalWrite(i+1, HIGH); delay(10); } }
// turn all LEDs off from right to left. This keeps the display // "active", like the display on an audio amplifier for (int i =numberOfLEDs; i >=1; i--) { digitalWrite(i+1, LOW); }}
Things to Try1. Adapt the device for underwater listening, as suggested earlier.
2. Adjust the code so that the LEDs display the loudest noise on a sliding,not fixed, scale.
3. Leave the “maximum” LED lit for a few seconds.
18 Environmental Monitoring with Arduino

3/New Component:4Char Display
In the next project, we’re going to display our data on a serially driven four-character LED display (see Figure 3-1). This is a wonderfully versatile littletool that incorporates four seven-segment LED displays that show, natch,four characters of data at a time (as well as a colon and decimal points).
The four-character display can show all of the Arabic numerals from 0 to 9,as well as 20 of the 26 letters used in English, some of them in both upperand lower cases. To see how they look, check out Figure 3-2. (There are somepseudoconventions for displaying the letters k, m, v, w, and x, but if you usethem, most people won’t recognize them as letters—some of them look justlike random illuminated segments—and will think there’s something screwywith the display).
“Serially driven” is the distinction that makes this display so useful. With astandard seven-segment display, each segment of the display needs its owndedicated data line from Arduino to control it. Using four characters in thistype of display architecture (along with the associated decimal points andcolon) would require 34 dedicated data lines, more than the standard Ardu-ino even has. (Granted, there are tricks to get around this, but even then, thedisplay would still need a lot of lines.)
So the people at SparkFun, who make this product, added a microcontrollerto the back of the display. This microcontroller can take serial data sent froma single Arduino pin and interpret it to properly control all four displaycharacters.
But every boon has a price. In this case, the boon is that we need only twodedicated data lines to use the 4Char; the price is that you must format yourdata so that it is sent in groups of four characters at a time. Always. No ex-ceptions. Do you have only three characters to display? Too bad. You mustadd a space or a legend character so that you’re feeding exactly four char-acters to the display. If you have five or more characters to display, you mustformat your data into four-character chunks and add some code to makeyour data scroll past the display.
19

Test ProjectTo get a feel for how the 4Char display works, let’s wire it up and run somesample code.
Parts1. Arduino
2. Breadboard
3. 4Char display (SparkFun sku COM-09765)+
4. Jumper wires in various colors
Breadboard the CircuitThis is a very simple circuit to build, as you can see in the breadboard viewFigure 3-3.
Step 1 Connect a jumper from Arduino GND to the GND pin on the 4Char.
Step 2 Place the jumper through the GND hole on the display, and anchor itin the breadboard. (It doesn’t matter which breadboard row you use. Try notto use one of the rails.)
Figure 3-1. Front (left) and back (right) of the 4Char LED display.
Figure 3-2. How English letters look on the seven-segment, four-characterdisplay.
20 Environmental Monitoring with Arduino

Step 3 Connect a jumper between Arduino digital pin 3 and the RX pin onthe 4Char. Once again, put the jumper through the RX hole in the display,and anchor it to the breadboard.
Write the CodeThe following sample sketch includes tips as to what your 4Char display cando. You can find it on EMWA GitHub repository | chapter-3 | 4Char.
Load it onto Arduino.
/* 4Char Test Sketch in Programming to test a scrolling 4Char display. The traditional 'first code' is to display "Hello World", but the 4char can't display the letter "w". So we improvise... This example code is based on example code that is in the public domain.*/
#include <SoftwareSerial.h>
#define SerialIn 2#define SerialOut 3
Figure 3-3. The completed 4char test circuit.
New Component: 4Char Display 21
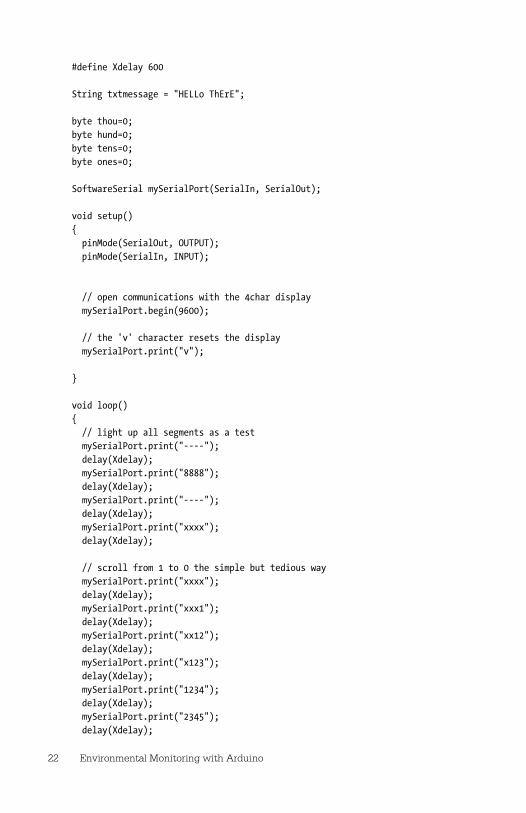
#define Xdelay 600
String txtmessage = "HELLo ThErE";
byte thou=0;byte hund=0;byte tens=0;byte ones=0;
SoftwareSerial mySerialPort(SerialIn, SerialOut);
void setup(){ pinMode(SerialOut, OUTPUT); pinMode(SerialIn, INPUT);
// open communications with the 4char display mySerialPort.begin(9600);
// the 'v' character resets the display mySerialPort.print("v");
}
void loop(){ // light up all segments as a test mySerialPort.print("----"); delay(Xdelay); mySerialPort.print("8888"); delay(Xdelay); mySerialPort.print("----"); delay(Xdelay); mySerialPort.print("xxxx"); delay(Xdelay);
// scroll from 1 to 0 the simple but tedious way mySerialPort.print("xxxx"); delay(Xdelay); mySerialPort.print("xxx1"); delay(Xdelay); mySerialPort.print("xx12"); delay(Xdelay); mySerialPort.print("x123"); delay(Xdelay); mySerialPort.print("1234"); delay(Xdelay); mySerialPort.print("2345"); delay(Xdelay);
22 Environmental Monitoring with Arduino

mySerialPort.print("3456"); delay(Xdelay); mySerialPort.print("4567"); delay(Xdelay); mySerialPort.print("5678"); delay(Xdelay); mySerialPort.print("6789"); delay(Xdelay); mySerialPort.print("7890"); delay(Xdelay); mySerialPort.print("8900"); delay(Xdelay); mySerialPort.print("9000"); delay(Xdelay); mySerialPort.print("0000"); delay(Xdelay);
// Count from -1009 to 2000
for(int i = -1009; i<2000; i++) { if((i<-999) || (i>9999)) { mySerialPort.print("ERRx"); return; } char fourChars[5]; sprintf(fourChars, "%04d", i);
mySerialPort.print("v"); mySerialPort.print(fourChars);
//add a delay if the numbers go by too fast //delay(Xdelay);
}
delay(Xdelay); mySerialPort.print("xxxx"); delay(Xdelay);
// Scroll a txtmessage a more complicated way // First add the appropriate buffer txtmessage = "xxxx"+txtmessage+"xxxxx"; // then convert from String object to char array, // which is the only thing SoftwareSerial can print char temps[txtmessage.length()]; txtmessage.toCharArray(temps,txtmessage.length());
// then scroll through the txtmessage for(int i = 0; i <= txtmessage.length()-5; i++)
New Component: 4Char Display 23

{ mySerialPort.print(temps[i]); mySerialPort.print(temps[i+1]); mySerialPort.print(temps[i+2]); mySerialPort.print(temps[i+3]); delay(Xdelay); }
delay(Xdelay); delay(Xdelay); delay(Xdelay);}
Did it work? Way to go! You’ve successfully programmed a scrolling 4Chardisplay.
Things to Try1. The LED 4Char display product user guide from SparkFun describes
how to control each individual segment of the display, as well as thecolon, apostrophe, and decimal points. Can you use this knowledge tocreate a countdown timer that counts from 59:59 to 00:00?
2. Suppose you really needed to use this display to show the letters k, m,v, w, or x. For example, if you absolutely had to display the words mywax Vostok (though we can’t think of why you would), how would youdo it? Which segments would you light up?
24 Environmental Monitoring with Arduino

4/DetectingElectromagnetic
Interference(and making
bad music)
The gadget we’re going to build next can detect electromagnetic interfer-ence (EMI), and give you a rough idea of the intensity of the EMI signal.
EMI is a form of electromagnetic radiation: a combination of electric andmagnetic waves traveling outward from anywhere that an electrical powersignal is changing or being turned on and off rapidly.
Sometimes, an electrical device that has the potential to give off EMI is verycarefully shielded to prevent the interference from escaping; however, agreat many devices that emit EMI are shielded not at all or very lightly.
Since EMI is a type of radio signal, this gadget is essentially a type of radio.We won’t be listening for any particular station or program, however. We’relistening for electromagnetic energy being emitted from various electronicdevices in the local environment, and converting that into an output that ourhuman senses can detect.
Where this gadget excels is spotting “phantom” or “vampire” energy loads.More correctly called standby power, this is the amount of electricity thatconstantly flows through some electronic devices, even when they’re sup-posedly switched off or in standby mode. Devices use standby power onfeatures such as digital clocks, remote control reception, and thermome-ters. Relatively weak energy efficiency regulations in the United States resultin many devices drawing far more wattage than they need in standby mode.
The result? Phantom load accounts for 10% or more of the average U.S.household’s home energy use. In 2009, that added $15.65 billion or more tothe nation’s domestic electric bill (about $125 a year per household), as wellas 836 million metric tons of greenhouse gas pollution to the atmosphere.
25
Once you’ve found the energy vampires, a brief guide from NRDC’s SmarterLiving website and the “Energy Savers” booklet from the U.S. Departmentof Energy offer tips to cut back their energy use. But the easiest way to startcurbing pollution and saving money is to pull the plug.
Detecting EMI Sources in theEnvironmentMoving the EMI detector around our home offices revealed a fascinatingvariety of unsuspected energy vampires. The Toshiba laptop computer weuse for development gives off a phenomenal amount of EMI. The office tel-evision, a 1998 cathode ray tube model from Sony, gave off even more. Thismakes sense, because the TV is essentially built to give off EMI. (That light-saber-like hum you hear from very old televisions? EMI artifacts.)
Strangely enough, the WiFi router emitted very little EMI, at least in the rangethat this detector can spot.
The most surprising phantom load that we found with the EMI detector camefrom the office stereo system, a component bookshelf model. The 4Char litup and the speaker squealed from several feet away.
It turns out that the stereo system uses nearly as much electricity turned offas our netbook does turned on.
Demystifying RadiationThe term “radiation” often scares people when it comes to envi-ronmental monitoring, because it’s used for several similar but notidentical phenomena.
Radiation simply refers to something that radiates outward froma source. In the case of uranium and plutonium, the stuff beingradiated outward is subatomic particles, which have been provenvery dangerous to living tissue. In the case of EMI, the stuff beingradiated is electromagnetic waves.
We’ve been living with human-created EMI radiation for 100 years,and only in the case of very high energies has it been shown tocause any harm.
26 Environmental Monitoring with Arduino

Make the GadgetThis gadget is one of the simplest environmental sensors you can make. Allit does is connect an antenna to one of Arduino’s analog ports and outputthe results as numbers and sounds.
There are some things about this device and how it works that make moresense once you’ve actually created and used it. So we’ve included that in-formation after the build.
Parts1. Arduino
2. 8-ohm speaker
3. 4Char display
4. 1-megaOhm resistor
5. 3–5 feet of solid core wire
6. Battery pack
7. Red and black jumpers
The 8-Ohm SpeakerWe’re going to be using a standard 8-ohm speaker as the output. This isprobably the most common kind of hobby audio output, one of the mostbasic (and oldest) electronic devices.
Simply put, a speaker is an electromagnet connected to a membrane. Var-iations in an electric current cause the electromagnet to turn on and off. Thismoves the membrane back and forth, which moves air molecules back andforth, which causes what we call sound.
If the movement is done rapidly enough, and if the voltage signal can beprecisely controlled, the speaker will emit sound we can recognize—like mu-sic, or a person talking.
Before we begin to build the gadget, let’s be sure the 8-ohm speaker works:
Step 1 Plug your 8-ohm speaker into Arduino, as shown in the breadboardview (Figure 4-1): the red wire into digital pin 8 and the black wire into GND.
Step 2 Find the sketch “ToneMelody” in the IDE at File | Examples | Digital| ToneMelody. Load it onto Arduino and run it.
Detecting Electromagnetic Interference (and making bad music) 27

In the sketch, the header file pitches.h tells the Arduino which audio fre-quencies correspond to which musical notes. The sketch then includes thedata for a little eight-note melody, in two arrays—one containing the notes,and the other containing the duration of those notes. The sketch then playsthese tones through Arduino pin 8.
Did you hear a pleasing little melody when you ran the sketch? Then itworked. If not, check your connections, and try again. Make sure that thespeaker is plugged into Arduino pin 8 (and not any other pin) and GND.
Construct the EMI MonitorStep 1 Cut a three-foot long piece of solid core wire (Figure 4-2).
Step 2 Strip about 1.5 inches from one end of the core wire.
Step 3 Wrap one end of the 1MOhm resistor around the stripped end of thecore wire.
Figure 4-1. The speaker’s red wire should be inserted in digital pin 8 and theblack wire in GND.
28 Environmental Monitoring with Arduino

Step 4 Insert the wire into analog port A5 on Arduino, and the end of theresistor into GND.
Step 5 Connect one lead of the 8-ohm speaker to digital port 9 on Arduino,and the other lead into GND, as shown in the breadboard view (Figure 4-3).
Step 6 Connect the lead of the 4Char to digital pin 7 on Arduino and the otherlead into GND.
Figure 4-2. Solid core wire, used as the “antenna” for the EMI detector.
Detecting Electromagnetic Interference (and making bad music) 29

Figure 4-3. EMI detector: one lead of 8-ohm speaker connected to GND pinon Arduino, the other to digital port 8.
Write the CodeLoad the following sketch onto Arduino, and you’ve got yourself an EMIdetector:
// Arduino Electromagnetic interference detector// Code modified by Patrick Di Justo, based on// Aaron ALAI EMF Detector April 22nd 2009 VERSION 1.0// [email protected]//// This outputs sound and numeric data to the 4char
#include <SoftwareSerial.h>#define SerialIn 2#define SerialOut 7
#define wDelay 900
int inPin = 5;int val = 0;
SoftwareSerial mySerialPort(SerialIn, SerialOut);
void setup()
30 Environmental Monitoring with Arduino
{ pinMode(SerialOut, OUTPUT); pinMode(SerialIn, INPUT);
mySerialPort.begin(19200); mySerialPort.print("vv");
mySerialPort.print("xxxx"); delay(wDelay); mySerialPort.print("----"); delay(wDelay); mySerialPort.print("8888"); delay(wDelay); mySerialPort.print("xxxx"); delay(wDelay);
Serial.begin(9600);}
void loop(){ val = analogRead(inPin); Serial.println(val); dispData(val); val = map(val, 1, 100, 1, 2048); tone(9,val,10);}
void dispData(int i){ if ((i<-999) || (i>9999)) { mySerialPort.print("ERRx"); return; } char fourChars[5]; sprintf(fourChars, "%04d", i);
mySerialPort.print("v"); mySerialPort.print(fourChars);}
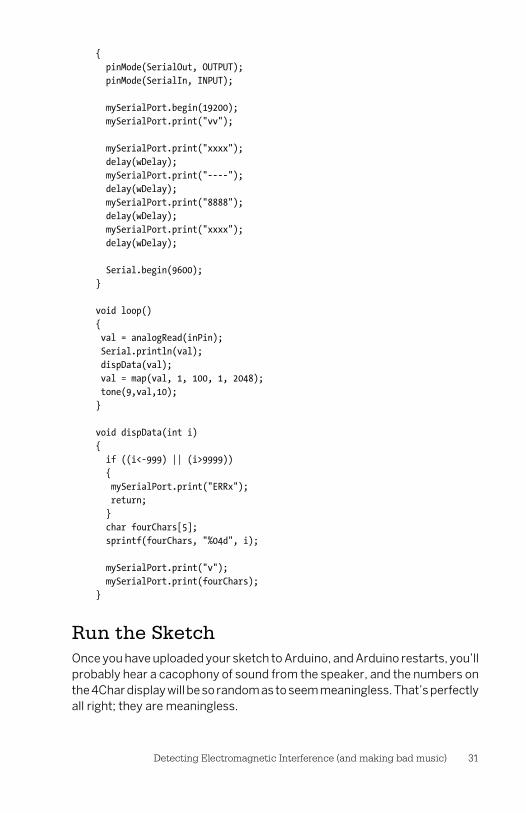
Run the SketchOnce you have uploaded your sketch to Arduino, and Arduino restarts, you’llprobably hear a cacophony of sound from the speaker, and the numbers onthe 4Char display will be so random as to seem meaningless. That’s perfectlyall right; they are meaningless.
Detecting Electromagnetic Interference (and making bad music) 31

Because Arduino is connected by a USB cable to your computer, it is re-ceiving a flood of electromagnetic interference from the computer. Evenworse, that EMI is being pumped into Arduino via the USB cable.
To make this detector really work, we’ve got to go mobile.
Powering the Gadget in Mobile ModeWhen not operating off the USB cable, Arduino needs a power supply of 7 to12 volts to work. Anything higher than 12 volts might damage the circuitry;anything lower than 6 volts won’t start Arduino at all.
A fresh 9-volt battery should be enough to get this gadget running.
Step 1 Carefully unplug the Arduino from the USB cable.
Step 2 Snap the power connector to the top of the 9-volt battery, and plugthe round end into the power input on Arduino.
Your Arduino should start up normally: the LEDs mounted on the Arduinoboard should flash, and within a few seconds the EMI code should be up andrunning.
What Are We Measuring with ThisGadget?Now that you’ve successfully built the mobile EMI detector, we can explainwhat it is measuring.
Arduino’s analog input normally takes a reading of the electrical energycoming into the analog port. But because we have connected an antenna tothat port, the antenna is absorbing electrical voltage from the radio signalsgiven off by electronic equipment, and directing it into the analog port.
Arduino analog’s port can take voltage from zero to a maximum of 5 volts,and it measures this voltage in 1024 discrete slices (making each slice worth0.0048828 volts). For example, when Arduino tells us that the reading fromthe analog port is, say, 250, it is telling us that the antenna wire is picking up1.2207 volts of EMI energy (250 × 0.0048828).
32 Environmental Monitoring with Arduino

The Truth Is Out ThereDo a little online research into EMI detectors (sometimes calledEMF detectors), and you’ll quickly discover people who claim touse electromagnetic disturbances to “detect” paranormal activitysuch as ghosts, poltergeists, and spirits.
Sorry to go all Scully on you, but we’ve yet to encounter compellingevidence that ghosts exist—or, if they do, that they obey the rulesof electromagnetic propagation.
Anyone who wishes to use this EMI detector to go ghost huntingprobably can’t be stopped. But please: don’t contact us for adviceor argument, and don’t say you read it here first.
The raw number from the analog port is then sent to the speaker, where it isconverted to a tone, and to the 4Char, where it is displayed as a value.
The rapidly changing nature of the EMI voltage picked up by the antennagives rise to rapidly changing tones, ranging from a low electronic growl toa high pitched electric squeal.
The voltage induced in the antenna wire is very de-pendent on the length of the wire. It seems prettyobvious: a longer wire can collect more voltage thana shorter one. If you want consistent results fromyour EMI detector, make certain that you reuse thesame wire every time, or at least a wire of the samelength.
Things to Try1. What happens if you make the wire shorter? If you make the wire longer?
If you coil the wire into a circle? Does the detector become more sensi-tive? Less sensitive?
2. What are some other ways to display the data you obtain? A row of LEDlights, as in the noise sensor?
Detecting Electromagnetic Interference (and making bad music) 33


5/Project:Water Conductivity/
Numerical Output
The conductivity meter is probably the simplest environmental meter in thisbook. Its workings rely upon the fact that pure water does not actually carryan electric charge very well. So what we’re really doing with this device isassessing the concentration of conductive particles that are floating in the(mostly nonconductive) water.
What Is Conductivity, and Why Do ICare?Water is very seldom just the sum of its basic chemical formula: two atomsof hydrogen and one of oxygen. Typically, water is a mixture that also in-cludes other substances that have dissolved into it, including minerals, met-als, and salts. In chemistry, water is the solvent, the other substances thesolutes, and combined they make a solution.
Solutes create ions: atoms that carry an electric charge. These ions are whatactually move electricity through water.
That’s why measuring conductivity is a good way to learn how pure (really,how impure) a water sample may be: the more stuff that’s dissolved in thewatery solution, the faster electricity will move through it.
Make the GadgetTo make this device, we’ll start by constructing the probe that you’ll dip intowater samples to get a conductivity reading—which we created by repur-posing a binding post (Radio Shack catalog #274-718) typically used in homeaudio/video and ham radio electronics. It may seem like a complicated buildon first glance, because there are several steps involved. But it’s mostly astraightforward matter of connecting wires to the binding post—as you cansee in the photo of the finished probe.
35

Water and Electricity Don’t Mix…Right?All our lives we’ve been told to keep water and electricity far apartfor our safety. Lifeguards order swimmers out of the water whenlightning threatens. Electricians wire bathroom power outlets es-pecially to prevent water-based electric shocks. We’re told not todrive through flooded streets if there are downed power lines inthe water.
So how can we say that water is not very conductive?
Well, it’s all relative. Compared to air, water is highly conductive.One reason lightning bolts are so powerful is that they need enor-mous energy to overcome the electrical resistance of the air. How-ever, when compared to metal, which conducts electricity ex-tremely well, water is so resistant that it is practically an insulator.
Parts1. Arduino
2. Breadboard
3. 10K resistor
4. 8-ohm speaker
5. 4Char display
6. Chassis-mount dual female binding post (RadioShack catalog#274-718)
7. Jumper wires in various colors
8. Several feet of insulated solid core wire
9. Small piece of aluminum foil
10. 4-inch adjustable wrench
11. Distilled water (can be purchased at some pharmacies or health foodstores)
Construct the ProbeCheck your work by comparing it to the photo of a completed probe (Fig-ure 5-1).
Step 1 Cut two three-foot lengths of solid core wire and two four-inch lengthsof solid core wire.
36 Environmental Monitoring with Arduino

Step 2 Strip about an inch of insulation off both ends of each long wire. Stripone inch of insulation off one end of each short wire, and one and a half inchesoff the other end.
Step 3 Unscrew the binding post’s black and red knobs partway (they won’tcome all the way off), so that you can see the hole drilled through each of thetwo posts.
Step 4 Insert a stripped end of one long length of solid core wire throughone of the holes, and then screw that post’s knob back down until it is holdingthe wire securely in place. Clip the tip of the wire flush with the knob, so thatyou won’t accidentally stab yourself with it later when using the probe. Re-peat with the other post and the second long length of wire.
Step 5 Using the small adjustable wrench, unscrew the outermost nuts onthe opposite, bare metal ends of each post, until they are about halfway upthe post (but still engaged with the threads).
Step 6 Wrap the one-inch stripped end of one short length of wire aroundone of the posts, in between the two nuts. Then screw the loosened nut backdown until the wire is held tightly between the two nuts. Repeat for the othershort length of wire and the other post.
Step 7 Bend these wires so that they extend straight past the ends of theposts.
Figure 5-1. The probe!
Project: Water Conductivity/Numerical Output 37

Step 8 Shape the ends of these wires into small spirals, and then neatly folda small piece of aluminum foil—just a few inches—over and around eachspiral to cover. Position these two “paddles” so that their flat surfaces areparallel to each other and about 1 centimeter apart.
Breadboard the CircuitCheck your work by comparing it to the breadboard view of the completedcircuit (Figure 5-2).
Step 1 Connect one jumper from the probe to Arduino analog pin A5. Con-nect the other to a row in the breadboard.
Step 2 Add a 10K resistor (color code brown-black-orange) to the bread-board, in the same row as the jumper from the probe. Have the resistorbridge the gap between both sides of the breadboard.
Step 3 Connect a ground jumper from the GND pin on Arduino to the bread-board, in the same row as the 10K resistor.
Step 4 Connect a data jumper from the breadboard to Arduino Analog pinA0. Note carefully that the data jumper starts on the same row as the resistorand GND jumper, but before the resistor. This is extremely important. Thecircuit will not work otherwise.
Figure 5-2. The completed water conductivity circuit.
38 Environmental Monitoring with Arduino

Write the CodeYou can find this code on the EMWA GitHub repository | chapter-5 | Water-Conductivity.
Load the following sketch onto Arduino.
/* Water Conductivity Monitor Sketch for an Arduino gadget that measures the electrical conductivity of water. This example code is based on example code that is in the public domain.*/
const float ArduinoVoltage = 5.00; // CHANGE THIS FOR 3.3v Arduinosconst float ArduinoResolution = ArduinoVoltage / 1024;
const float resistorValue = 10000.0;int threshold = 3;
int inputPin = A0;int ouputPin = A5;
void setup(){ Serial.begin(9600); pinMode(ouputPin, OUTPUT); pinMode(inputPin, INPUT);}
void loop(){ int analogValue=0; int oldAnalogValue=1000; float returnVoltage=0.0; float resistance=0.0; double Siemens; float TDS=0.0;
while(((oldAnalogValue-analogValue)>threshold) || (oldAnalogValue<50)) { oldAnalogValue = analogValue; digitalWrite( ouputPin, HIGH ); delay(10); // allow ringing to stop analogValue = analogRead( inputPin ); digitalWrite( ouputPin, LOW ); }
Serial.print("Return voltage = "); returnVoltage = analogValue *ArduinoResolution; Serial.print(returnVoltage);
Project: Water Conductivity/Numerical Output 39

Serial.println(" volts");
Serial.print("That works out to a resistance of "); resistance = ((5.00 * resistorValue) / returnVoltage) - resistorValue; Serial.print(resistance); Serial.println(" Ohms.");
Serial.print("Which works out to a conductivity of "); Siemens = 1.0/(resistance/1000000); Serial.print(Siemens); Serial.println(" microSiemens."); Serial.print("Total Dissolved Solids are on the order of "); TDS = 500 * (Siemens/1000); Serial.print(TDS); Serial.println(" PPM."); if (returnVoltage>4.9) Serial.println("Are you sure this isn't metal?");
delay(5000);}
How to Take a ReadingTo use this device, first open a “serial monitor” window in the Arduino IDE.This is where your water conductivity readings will appear.
Pour some of the distilled water into a glass, and set it down a couple feetaway from your computer, Arduino, and circuit, such that they wouldn’t bedamaged if the glass were to accidentally tip over.
Dip the probe’s two “paddles” into the water, and watch the serial monitorwindow for the readings to appear. Since distilled water is nearly free of sol-utes, the conductivity should be quite low.
To take further readings on this or other water samples, simply press thereset button on Arduino.
Things to Try1. Build a conductivity meter without Arduino. This small gadget will give
you a very broadly accurate (i.e., not very accurate at all) idea of theconductivity of a sample of water: Simply connect an LED to a 1-mega-ohm resistor to a 9-volt battery. This will give you a binary sense of thewater’s electrical conductivity: if the LED lights up, the water is conduc-tive. if it doesn’t, the water is not very conductive (we told you it wasn’tvery accurate).
2. Improve the accuracy of this device by calibrating the gadget and usingdifferent resistors in the circuit. Take a known quantity of distilled water
40 Environmental Monitoring with Arduino

(say, 1000 milliliters) and add a known quantity of salt (say 1 gram) toit. That will give you a calibration solution of 1000 parts per million. Byusing different resistors until the LED just comes on, you can make aconductivity meter that checks for water with varying levels of dissolvedsolids.
3. Try making different calibration solutions and using different resistorsto find when the LED comes on. You’ll end up with a chart of differentconductivities, and highly accurate ways to test for them.
Project: Water Conductivity/Numerical Output 41


6/New Component:Ethernet Shield
Arduino does many interesting things on its own, but it can’t do everything.Fortunately, thanks to the open design of Arduino, building add-on boardsto extend what Arduino can do is pretty easy.
These boards are called “shields,” because they usually fit over the top ofArduino like a protecting shield.
Shields contain their own circuitry, components, and sometimes processingchips that can augment Arduino’s capabilities. There are shields that enableArduino to read GPS signals, drive robot motors, take pictures, connect toBluetooth devices, control electroluminescent wire…as of this writing, thereare more than 300 shields. Keep up to date on shields at http://shieldlist.org.
In our opinion, the Ethernet shield (Figure 6-1 and Figure 6-2) is the mostimportant Arduino shield, and the first one you should make or buy. Hookingyour Arduino to an Ethernet connection can put it on the Internet, and oncethat’s done your options become nearly endless. Want to use your Arduinoto set up a small web server? No problem. Place data online for other peopleto see? Simple. Send tweets via Twitter? Easy breezy!
Notice how the Ethernet shield is shaped very much like Arduino? It’s beenbuilt that way to be compatible: the pins in an Ethernet shield reach down-ward into Arduino’s sockets and make a firm connection.
The Ethernet shield also has sockets with the same layout and the samefunctions as Arduino itself. This means that you can plug the shield into Ar-duino and then forget it. Each gadget in this book can be plugged into anArduino+Ethernet shield combo as easily as into Arduino itself. In fact, usu-ally we keep our Ethernet shield plugged into Arduino at all times, and de-velop our gadgets that way.
43

Using the Ethernet ShieldLet’s take a look at the Ethernet shield’s special features.
The Ethernet PortThe Ethernet shield we use comes from SparkFun (sku DEV-09026). It re-quires a standard RJ-45 cable (the cable that looks like a fat landline phonecord). One end of the RJ-45 cable plugs into the shield, while the other endplugs into your Internet router or possibly your cable modem. It will mostlikely be plugged into your router.
The MAC AddressAt the bottom of the shield, or in the packaging, you should see a stickerprinted with a cryptic sequence of letters and numbers, something like “90-A2-DA…” and so on. This is the shield’s Media Access Control (MAC)address.
Figure 6-1. Front of the Ethernet shield.
44 Environmental Monitoring with Arduino

A MAC address is a completely unique identifier for anything that is going tobe connected to the Internet. Everything you own that connects to the In-ternet, from your computer to your digital music player to your mobilephone, has a unique MAC address.
For the devices that you don’t program, you normally don’t need to be con-cerned with the MAC address. But in this book, you’ll be programming yourEthernet shield, so knowing the MAC address is vital.
So write down the MAC address of your Ethernet shield somewhere safe,and DO NOT REMOVE THE STICKER. Since all Ethernet shields look alike,the easiest way you’ll be able to tell one from another is by reading the MACaddress sticker. An Ethernet shield without a known MAC address is an an-noyance you don’t want to deal with.
The IP AddressYou’ll also need to know the Internet Protocol (IP) address for your router.This is the number that gets assigned to every device on a local network. Formost routers sold in North America, the default IP address is 192.168.1.1.
Figure 6-2. Back of the Ethernet shield.
New Component: Ethernet Shield 45

(Apple routers often default to an IP address of 10.0.1.1, because that’s howApple rolls.)
The good thing about this is that if you don’t know what your router addressis, and you are not using an Apple product, 192.168.1.1 is probably the correctIP address.
Find your router’s IP address: Windows
1. Click on Network Connections. (See Figure 6-3.)
2. Right-click a network connection.
3. Click Status, and then click the Support tab.
4. The “Default gateway” is the router’s IP address, which in this case isindeed 192.168.1.1.
5. Also, take note of the Subnet Mask (255.255.255.0). You might need itlater on.
Figure 6-3. The network connections panel in Windows.
46 Environmental Monitoring with Arduino
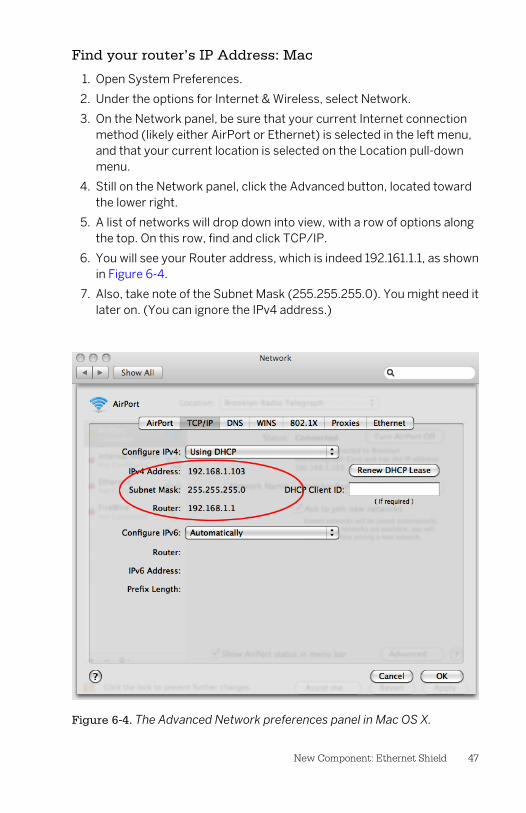
Find your router’s IP Address: Mac
1. Open System Preferences.
2. Under the options for Internet & Wireless, select Network.
3. On the Network panel, be sure that your current Internet connectionmethod (likely either AirPort or Ethernet) is selected in the left menu,and that your current location is selected on the Location pull-downmenu.
4. Still on the Network panel, click the Advanced button, located towardthe lower right.
5. A list of networks will drop down into view, with a row of options alongthe top. On this row, find and click TCP/IP.
6. You will see your Router address, which is indeed 192.161.1.1, as shownin Figure 6-4.
7. Also, take note of the Subnet Mask (255.255.255.0). You might need itlater on. (You can ignore the IPv4 address.)
Figure 6-4. The Advanced Network preferences panel in Mac OS X.
New Component: Ethernet Shield 47

The SD Card SlotThe SD card slot is a wonderful bonus of the Ethernet shield. It allows you towrite and read (store and retrieve) data to and from a microSD card. We’vetested ours with a 4 GB microSD card, and it works like a charm.
You may want to buy a microSD card that comes with a full-size SD cardadapter (Figure 6-5), or buy an adapter separately, because this will enableyou to swap the card back and forth between Arduino and conventionallysized card readers or slots.
Figure 6-5. The MicroSD card can be moved between your Ethernet shieldand an adapter sized for the typical SD card slot on a computer.
Because the signals for the SD card slot and theEthernet port travel over the same circuitry, Ardu-ino can only use one of these devices at a time. Forpractical purposes, this shouldn’t matter much, butbe aware of it while writing sketches that use boththe SD card slot and the Ethernet port.
48 Environmental Monitoring with Arduino

Testing the Ethernet ShieldThe Ethernet shield is an essential part of the rest of the gadgets in this book.So let’s test it to be sure it works before building anything with it.
Parts1. Arduino
2. Ethernet shield
AssemblyStep 1 Attach the Ethernet shield to Arduino.
Step 2 Plug the shield into your Internet router.
Step 3 Find the sketch “Web Server” in the Arduino IDE, under File | Exam-ples | Ethernet | WebServer, or on EMWA GitHub repository | chapter-6 |WebServer. Load it onto Arduino.
Be certain to insert the MAC address of your Ether-net shield and the IP address you wish to give toyour Arduino into the following sketch. A good ruleof thumb is to add 20 to the IP address of yourrouter, which should ensure that your Arduinodoesn’t have the same address as other devices onyour local network (as long as you have no morethan 20 devices on the network.) That is, if yourrouter is at IP address 192.168.1.1, make your Ar-duino’s IP address 192.168.1.21.
Step 4 When you’ve uploaded the sketch to Arduino, and the sketch is run-ning, go to your computer, open up your Internet browser (Chrome, Safari,Firefox, Internet Explorer, or whichever), and enter your Arduino’s IP ad-dress into the address bar.
You should see a very simple little web page, resembling what the Weblooked like in 1994. Congratulations! Your Arduino is now a web server onthe Internet.
New Component: Ethernet Shield 49

Testing the SD Card SlotNow we want to test the SD card slot, since it can be used in all the subse-quent gadgets in this book.
Parts1. Arduino
2. Ethernet shield
3. microSD card
AssemblyStep 1 Insert the microSD card into the holder.
Step 2 Load the sketch “SD card read/write,” which you can find in the IDEunder File | Examples |SD |ReadWrite or on EMWA GitHub repository | chap-ter-6 | SDCardReadWrite.
Step 3 If the Arduino successfully reads “testing 1, 2, 3” from the SD cardand displays it on the serial output, the SD card slot works.
If instead, the serial output displays the words “error opening test.txt,” thereis an error somewhere and you’ll need to do some troubleshooting.
Things to Try1. Can you write a sketch that displays meaningful data on a web page?
2. Can you write a sketch that displays data on a web page and saves it tothe SD card?
50 Environmental Monitoring with Arduino

7/Project: Humidity,Temperature & DewPoint/4Char Display
Weather may be the most fundamental experience we have of the naturalworld. Every day we make decisions based on present and near-future en-vironmental conditions: Do I need a coat? Should I bring an umbrella? Can Ibicycle to work, or do I need to catch the train?
You Don’t Have to Be a Weatherman toMeasure the WeatherWe put a lot of effort into controlling how the weather affects us. We buildstructures that shield us from rain, snow, wind, and sun. We create all sortsof specialty textiles, and use them in complex garments to protect ourselvesfrom the elements when we go outdoors. And we use lots of electricity topower systems that keep us comfortably warm or cool, as well as devicesthat put moisture into the air or suck it dry.
Weather is so important to our personal and economic well-being that agovernment agency is devoted to doing nothing but predicting and trackingthe weather and keeping the public informed. One of the most popular chan-nels on cable TV devotes almost every hour of every day to reporting nothingbut weather. Dozens of computer, smartphone, and tablet apps exist to doone thing: hook us into the latest info about the weather.
In other words, it’s high time makers take on some independent monitoringof the weather. With Arduino, we can measure the basics: temperature, hu-midity, and dew point. Further, we can collect these measurements overtime to create a weather record by saving the data to an SD card, using theEthernet shield’s SD card slot.
51

What’s Dew Point?The dew point, simply put, is the temperature at which moisturecondenses to form dew. A low dew point temperature indicatesdrier conditions, while a higher dew point temperature means wet-ter conditions.
To find the dew point, our device takes current temperature andhumidity readings, and performs a calculation to determine howsaturated the air is with water.
Dew point is a particularly important weather factor in transpor-tation, because in low temperatures it can help predict whether icewill form on airplane exteriors, roads, or train tracks.
Getting Usable MeasurementsThere are a lot of variables involved in getting accurate temperature read-ings. Are you measuring the temperature indoors or outdoors? In a closedstuffy room, or in one with lots of ventilation? Over a black asphalt drivewayor over relatively cool white concrete, in full sunlight or in the shade?
These widely varied conditions can result in wildly different readings, evenif they’re taken at the exact same moment.
Weather professionals have developed a method to ensure they’re all meas-uring temperature the same way across multiple outdoor locations. Theyplace a thermometer in a Cotton Region Shelter (CRS), a white-paintedpinewood box with a solid top, slatted sides, and a slotted bottom, and placeit five to six feet off the ground.
The CRS protects the thermometer from sun, rain, snow, and more—fromeverything except air temperature.
You don’t need a CRS in order to use this gadget (though building one wouldbe an awfully cool project—here are some sample specs from the NationalWeather Service). But we do recommend that you find a way to create con-sistent conditions when you use it.
Indoors, this should be fairly easy. Find a place to keep the gadget that em-ulates the advantages of a CRS: out of direct sunlight, away from heating orcooling vents, several feet off the ground.
Outdoors, however, you’re going to need something more like a CRS, some-thing that is waterproof but allows for circulation of air around the sensor.
52 Environmental Monitoring with Arduino

Weather and Climate:What’s the Difference?
The next time the ground somewhere in the country is covered indrifts of snow, and temperatures stay frigid for several days onend, it probably won’t be long before you hear a TV pundit saysomething like, “Get a load of this cold! So much for globalwarming.”
This confused pundit is giving voice to a common misunderstand-ing: the difference between weather and climate.
Weather is the blanket term for the immediate atmospheric con-ditions in the environment right around us right now, and in thecoming hours and days—cloud cover, wind, temperature, precip-itation, and more.
Climate, on the other hand, is a concept that’s much broader inboth time and space. Climate is the aggregate over several yearsof a geographic area’s temperature, precipitation, humidity, andmore. In climate science, researchers typically look at weatherpatterns as well as other factors (such as ice cover in the Arctic)over a decade or longer to find trends.
When we discuss the impacts of anthropogenic (human-caused)climate change, we’re talking about weather trends that have beentracked over years and decades.
The major driver of human-propelled climate change is the buildupin the atmosphere of heat-trapping greenhouse gas pollution frompower plants, transportation, burning forests, and manufacturing.The sun’s heat can move through these greenhouse gases to reachthe Earth’s surface, but they prevent some of the reflected heatfrom going back into space.
A little of this is a good thing: The buildup of heat-trapping gasesin the atmosphere helped warm ancient Earth enough to supportliving organisms. But human activities since the Industrial Revo-lution of the mid-1700s have put much more greenhouse gas intothe atmosphere than at any time in human history, increasing theEarth’s surface temperature just enough to alter weather and cli-mate conditions, in ways we’re still trying to completelyunderstand.
Project: Humidity, Temperature & Dew Point/4Char Display 53

Citizen Climate and Weather ScienceGathering sufficient weather data to understand climate trendscan be a scientist’s life work. But researchers sometimes turn tothe public for help gathering data, by creating “citizen science”collaborations. These can range from digitizing old weather re-cords, to making observations outdoors, to taking environmentalmeasurements.
One good resource for finding these collaborations is SciStarter.Search on “Climate and Weather” to find projects; there are typi-cally dozens to choose from.
First Electronic Sensor: The DHT-22This gadget requires a manufactured electronic sensor, since there is notmuch point to building a device to measure warmth, coldness, and humidityunless it returns data in standard, precisely calibrated units ofmeasurement.
The sensor we selected is the DHT-22 (Figure 7-1), manufactured by AosongElectronics of China. The DHT-22 uses a polymer capacitor to sense thetemperature and humidity, measuring the temperature of the air between–40 and 80 degrees Centigrade (which Arduino can convert to Fahrenheit),and the relative humidity between 0 and 100%.
The necessary calibration information is stored in a tiny 8-bit computer in-side the DHT-22, and each unit is tested in the factory. In other words, thissensor is ready to use right out of the box.
The DHT-22 has four pins, but only three are used. When looking at the sen-sor face-on, the leftmost pin is for voltage to power the sensor (anywherefrom 3.3 to 6 volts; we’ll use the 3.3 volt pin on Arduino); the second pinoutputs data from the sensor to the Arduino; the third pin is null (not con-nected to anything); and the rightmost pin is GND.
Using Code LibrariesWith this project, we start doing something new: using code libraries.
A library is a chunk of code that is specifically written to do a common task.Sensor code libraries give makers the means to access the functions of asensor (as well as other electronic components) fairly confidently, becausethe code has been tested by the author and updated by people who use it.
54 Environmental Monitoring with Arduino
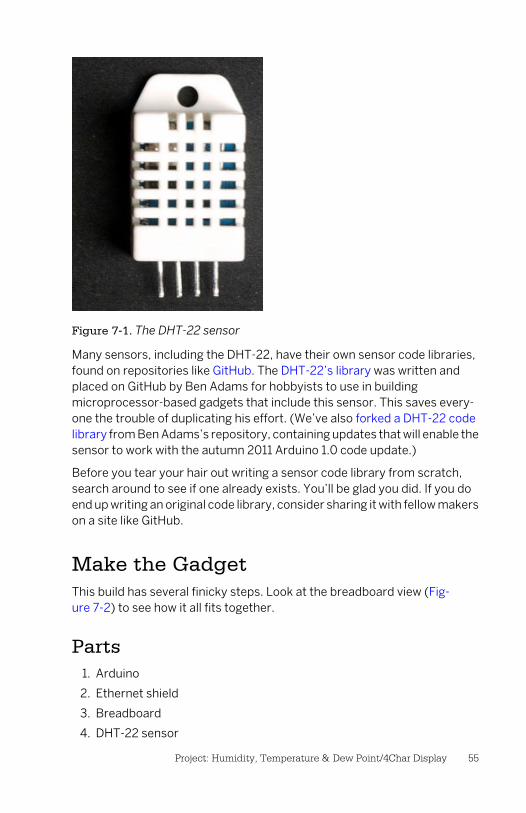
Many sensors, including the DHT-22, have their own sensor code libraries,found on repositories like GitHub. The DHT-22’s library was written andplaced on GitHub by Ben Adams for hobbyists to use in buildingmicroprocessor-based gadgets that include this sensor. This saves every-one the trouble of duplicating his effort. (We’ve also forked a DHT-22 codelibrary from Ben Adams’s repository, containing updates that will enable thesensor to work with the autumn 2011 Arduino 1.0 code update.)
Before you tear your hair out writing a sensor code library from scratch,search around to see if one already exists. You’ll be glad you did. If you doend up writing an original code library, consider sharing it with fellow makerson a site like GitHub.
Make the GadgetThis build has several finicky steps. Look at the breadboard view (Fig-ure 7-2) to see how it all fits together.
Parts1. Arduino
2. Ethernet shield
3. Breadboard
4. DHT-22 sensor
Figure 7-1. The DHT-22 sensor
Project: Humidity, Temperature & Dew Point/4Char Display 55

5. 4Char display
6. 4.7K resistor
7. Red and black jumper wires
Breadboard the CircuitStep 1 Power the breadboard rails.
Step 2 Connect a red jumper wire from the 3.3v pin on the Arduino to thevoltage (red) rail on the breadboard, and a black jumper from the GND pinto the ground (black) rail on the breadboard.
Step 3 Connect a short red jumper from the voltage rail to the voltage (left-most) pin of the DHT-22 temperature and humidity sensor.
Step 4 Connect a short black jumper from the GND rail to the GND (right-most) pin of the DHT-22.
Step 5 Connect a green jumper from the DATA (second from the left) pinon the sensor to digital pin 4 on the Arduino.
Step 6 Add a 4.7K resistor between the DATA pin of the sensor and theVOLTAGE pin.
Step 7 Connect a green jumper from Arduino pin 3 to the RX (rightmost) pinof the four-character display, and a black jumper from the GND rail to theGND (leftmost) pin of the four-character display.
Write the CodeLoad the following sketch onto Arduino. You can find it at EMWA GitHubrepository | chapter-7 | TempHumidDewpoint.
/* Temperature-Humidity-Dew Point Monitor This sketch gathers temperature and humidity data via a DHT22 sensor, and also calculates dew point based on those measurements.*/
#include <SoftwareSerial.h>#include <stdlib.h>
#define DHT22_ERROR_VALUE -99.5
#define DHT22_PIN 4
typedef enum{ DHT_ERROR_NONE = 0,
56 Environmental Monitoring with Arduino

DHT_BUS_HUNG, DHT_ERROR_NOT_PRESENT, DHT_ERROR_ACK_TOO_LONG, DHT_ERROR_SYNC_TIMEOUT, DHT_ERROR_DATA_TIMEOUT, DHT_ERROR_CHECKSUM, DHT_ERROR_TOOQUICK} DHT22_ERROR_t;
class DHT22{ private: uint8_t _bitmask; volatile uint8_t *_baseReg; unsigned long _lastReadTime; float _lastHumidity; float _lastTemperature;
public: DHT22(uint8_t pin); DHT22_ERROR_t readData(void); float getHumidity(); float getTemperatureC(); void clockReset();};
// Set up a DHT22 instance
Figure 7-2. The completed circuit for the temperature-humidity-dew pointmonitor.
Project: Humidity, Temperature & Dew Point/4Char Display 57

DHT22 myDHT22(DHT22_PIN);
#define SerialIn 2#define SerialOut 3#define WDelay 900
byte thou=0;byte hund=0;byte tens=0;byte ones=0;
SoftwareSerial mySerialPort(SerialIn, SerialOut);
void setup(void){// start serial portSerial.begin(9600);Serial.println("DHT22 Library Demo");pinMode(SerialOut, OUTPUT);pinMode(SerialIn, INPUT);mySerialPort.begin(9600);mySerialPort.print("v");mySerialPort.print("xxxx");delay(WDelay);mySerialPort.print("----");delay(WDelay);mySerialPort.print("8888");delay(WDelay);mySerialPort.print("xxxx");delay(WDelay);}
void loop(void){ float tempC; float tempF; float humid; float dewPoint;
DHT22_ERROR_t errorCode;
delay(2000); errorCode = myDHT22.readData(); Serial.print(errorCode);
switch(errorCode) { case DHT_ERROR_NONE: Serial.print("Temperature: "); tempC = myDHT22.getTemperatureC();
58 Environmental Monitoring with Arduino

Serial.print(tempC); Serial.print("C Humidity: ");
dispData((int)tempC, 'C');
tempF = (tempC*1.8)+32;
delay(WDelay); dispData((int) tempF, 'F'); delay(WDelay);
humid = myDHT22.getHumidity();
Serial.print(humid); Serial.println("%");
dispData((int)humid, 'h'); delay(WDelay);
dewPoint = calculateDewpoint(tempC, humid); dispData((int) dewPoint, 'd'); Serial.print(dewPoint); Serial.println("d"); delay(WDelay); break; case DHT_ERROR_CHECKSUM: Serial.print("Error Cheksum"); break; case DHT_BUS_HUNG: Serial.print("Bus Hung"); break; case DHT_ERROR_NOT_PRESENT: Serial.print("Not Present"); break; case DHT_ERROR_ACK_TOO_LONG: break; case DHT_ERROR_SYNC_TIMEOUT: break; case DHT_ERROR_DATA_TIMEOUT: break; case DHT_ERROR_TOOQUICK: break; }}
float calculateDewpoint(float T, float RH){ // approximate dew point using the formula from // Wikipedia's article on dew point float dp = 0.0; float gTRH = 0.0;
Project: Humidity, Temperature & Dew Point/4Char Display 59

float a = 17.271; float b = 237.7;
gTRH = ((a*T)/(b+T))+log(RH/100); dp = (b*gTRH)/(a-gTRH);
return dp;}
void dispData(int i, char c){ if (c == 'k' || c=='K' || c=='m' || c=='l' || c == 'v' || c=='V' || c=='W' || c=='Z' || c=='w' || c=='z') { mySerialPort.print("bAdx"); return; }
if ((i<-999) || (i>9999)) { mySerialPort.print("ERRx"); return; }
mySerialPort.print("v");
if (i > 999) { // i between 1000 and 9999 inclusive mySerialPort.print(i, DEC); } else if (i > 99) { // i between 100 and 999, inclusive mySerialPort.print(i, DEC); mySerialPort.print(c); } else if (i > 9) { // i between 10 and 99 inclusive mySerialPort.print(i, DEC); mySerialPort.print("x"); mySerialPort.print(c); } else if (i > 0) { // i between 1 and 9 inclusive mySerialPort.print("x"); mySerialPort.print(i, DEC); mySerialPort.print("x"); mySerialPort.print(c); } else if (i < -99) { // i between -100 and -999, inclusive mySerialPort.print(i, DEC); mySerialPort.print(c); } else if (i < -9) { // i between -10 and -99, inclusive mySerialPort.print(i, DEC); mySerialPort.print(c); } else if (i < 0) { // i between -1 and -9 inclusive mySerialPort.print(i, DEC); mySerialPort.print("x"); mySerialPort.print(c);
60 Environmental Monitoring with Arduino

}}
Things to Try1. Write your weather data to a web page and/or an SD card. Modify the
code examples found in the Arduino IDE under Examples | Ethernet |WebServer, and Examples | SD | Datalogger to work with our sketch.
2. If you create the webpage, adjust your network settings so that thewhole world can see it, instead of only the computers on your localnetwork.
Project: Humidity, Temperature & Dew Point/4Char Display 61


8/Real-Time,Geo-Tagged Data
Sharing with Pachube
Your weather data doesn’t have to be lonely. Pachube is a London-baseddatabase service center through which developers (like you) can connectgeographically-oriented sensor data to the Web and share it with others.
(Yes, it looks like it should be pronounced “patch-OOO-bee,” but it is in factpronounced “patch-bay.” This is a geek inside joke of such depth and com-plexity it would take several pages to explain it. The short version is that inengineering, a patch bay is a place to hook lots of different electronic devicestogether, and that’s exactly what Pachube does.)
Through the use of fairly simple application programming interfaces (APIs),Pachube can take data from your environmental monitoring device, store itonline, and graph it for others to see online. If enough people put enoughdata into Pachube, a great deal of information can emerge.
Pachube was primarily a geek thing until March 2011, when a major earth-quake and tsunami led to reactor meltdowns at Japan’s Fukushima nuclearpower station. Unhappy with the radiation information they were gettingfrom their government, many Japanese makers did exactly what you’reabout to do—they connected their Geiger counters to the Internet, geo-tagged the readings, and shared that data online. This enabled them to cre-ate and share radiation maps of Japan quickly and independently of dataprovided by either the power utility or the government.
Test Project: Connecting and UploadingData to PachubeTo get started using Pachube, you must first open up a Pachube account.We’ll walk through that below, and then upload some test data to the site.
63
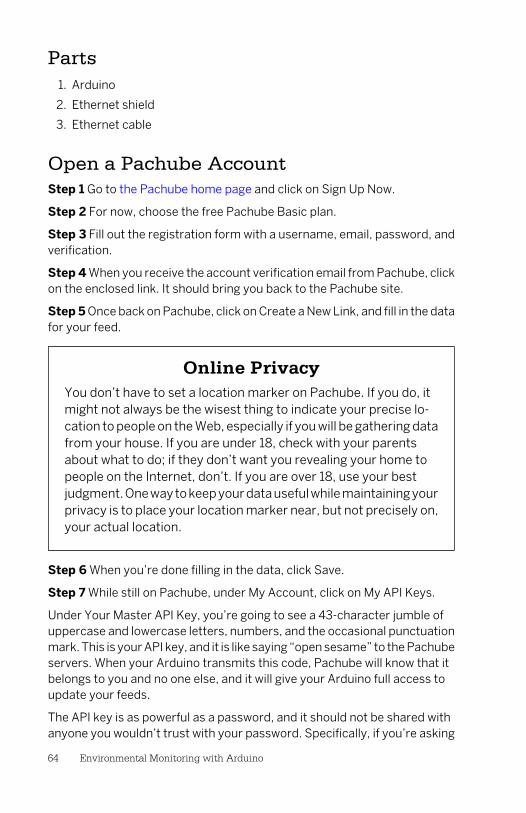
Parts1. Arduino
2. Ethernet shield
3. Ethernet cable
Open a Pachube AccountStep 1 Go to the Pachube home page and click on Sign Up Now.
Step 2 For now, choose the free Pachube Basic plan.
Step 3 Fill out the registration form with a username, email, password, andverification.
Step 4 When you receive the account verification email from Pachube, clickon the enclosed link. It should bring you back to the Pachube site.
Step 5 Once back on Pachube, click on Create a New Link, and fill in the datafor your feed.
Online PrivacyYou don’t have to set a location marker on Pachube. If you do, itmight not always be the wisest thing to indicate your precise lo-cation to people on the Web, especially if you will be gathering datafrom your house. If you are under 18, check with your parentsabout what to do; if they don’t want you revealing your home topeople on the Internet, don’t. If you are over 18, use your bestjudgment. One way to keep your data useful while maintaining yourprivacy is to place your location marker near, but not precisely on,your actual location.
Step 6 When you’re done filling in the data, click Save.
Step 7 While still on Pachube, under My Account, click on My API Keys.
Under Your Master API Key, you’re going to see a 43-character jumble ofuppercase and lowercase letters, numbers, and the occasional punctuationmark. This is your API key, and it is like saying “open sesame” to the Pachubeservers. When your Arduino transmits this code, Pachube will know that itbelongs to you and no one else, and it will give your Arduino full access toupdate your feeds.
The API key is as powerful as a password, and it should not be shared withanyone you wouldn’t trust with your password. Specifically, if you’re asking
64 Environmental Monitoring with Arduino

someone for help with Pachube, never include your API key in demo code,email it to anyone, or post it in a forum.
With your Pachube API key in hand, as well as your Ethernet IP address andMAC address (from your Ethernet shield set-up in Chapter 6), you’re nowready to test a data upload to Pachube.
Write the CodeNow you’ll test your connection to Pachube.
Step 1 Carefully put your Arduino and Ethernet shield together.
Step 2 Connect an Ethernet cable from the port on the shield to a port onyour router.
Step 3 Load the sketch “Pachube Sensor Client” onto Arduino. You can findit in the IDE under FILE | EXAMPLES | PACHUBE CLIENT or on EMWA GitHubrepository | chapter-8 | PachubeSensorClient. As always, substitute infor-mation about your components and your Pachube account for the place-holders in the sketch:
1. Replace the MAC address in the code with your Ethernet shield’s MACaddress.
2. Replace the Ethernet IP address in the code with your Ethernet IP ad-dress.
3. Replace the gateway numbers in the code with your router address.
4. Replace YOUR_FEED_HERE with the number of your feed.
5. Replace YOUR_KEY_HERE with the 43-digit Pachube API key. It wouldprobably be better to cut and paste it from the Pachube website than totype it in by hand.
Step 4 Run the sketch. If some data appears on the screen, congratulations:you’ve made the connection to Pachube!
If nothing happens, run through Steps 1–4 again to troubleshoot your buildand code:
• Check that the Arduino and Ethernet shield are joined correctly.
• Be sure you’re using the correct MAC address, Ethernet IP address, andother information about your components and your Pachube account.
• Check that you’ve correctly inserted the information about your com-ponents and your Pachube account into the sketch, and removed theplaceholders from the sketch.
Real-Time, Geo-Tagged Data Sharing with Pachube 65

Things To TryShare some location-specific temperature and humidity data on Pachube.
66 Environmental Monitoring with Arduino

9/Project:Radiation Counter/
Sharing Data on theInternet
Let’s be blunt: measuring radiation levels in the environment is a tricky busi-ness, usually best left to the professionals. It’s easy to come up with datathat will scare you for no good reason, and it’s a challenge to compare yourdata in useful ways to data collected by others.
What’s more, few of us will ever face the risk of being exposed to excessiveamounts of radiation.
In this chapter, we are talking about atomic radia-tion, not the electromagnetic radiation coveredearlier in this book. These are different phenomenawith similar names. For a refresher, see the side baron Demystifying Radiation in Chapter 4.
So, why are we going to teach you how to build your own Geiger counter withArduino, and how to share your readings online with people around theworld?
First, because it’s a fun and challenging thing to do. Second, because recenthistory shows that the professionals don’t always plan for everything, leavinggaps that makers can help fill. As we mentioned in the previous chapter,that’s what happened in March 2011, after northeastern Japan was hit by a9.0 earthquake, followed minutes later by a 49-foot-high tsunami.
The twin disasters knocked out grid and backup electricity, respectively, tothe Fukushima One (Fukushima Dai’ichi) nuclear power station in Futuba,located about 150 miles north of Tokyo. This shut down crucial cooling sys-tems for the reactors, as well as pools in the reactor buildings holding
67

super-hot spent fuel rods. The devastating wave also destroyed a networkof radiation monitors around the plant.
Fukushima One’s three working reactor cores, as well as their spent fuelpools, overheated far past their safety points, leading to a complex nuclearcrisis (one beyond the scope of this book to explain) and several leaks ofdangerous radioactive materials into the atmosphere. Lacking nearby radi-ation monitors, officials had trouble assessing the releases, leaving peoplein Japan and around the world understandably angry and frightened for theirhealth and the environment.
On both sides of the Pacific, people who happened to have Geiger countersbegan monitoring radiation levels wherever they were, comparing them togovernment data, and sharing this information online with systems likePachube.
As we write, these networks are still going and growing. Hackers who colla-borated over the Fukushima disaster (Emily covered this in an April 2011article for OnEarth Magazine, “Got iGeigie? Radiation Monitoring MeetsGrassroots Mapping”) have created the Safecast citizen sensor network formonitoring radiation worldwide.
Using Arduino as the backbone of a DIY Geiger counter, we’ll show you howto join them.
It’s Never Too Soon to StartDon’t wait for an emergency to begin monitoring your local rads.Common substances, like the concrete, brick, and marble used inbuilding construction, often emit minute, nonharmful amounts ofradiation. It’s important to know the highs and lows of this “back-ground radiation” in the local environment over weeks, months,and even years, so that significant increases in that radiation levelare easier to detect.
What’s a Geiger Counter?When you break it down, a Geiger counter is not a very complicated device.In fact, it has more than a few things in common with the EMI monitor de-scribed in an earlier project. Just as the EMI monitor used a wire to detectelectromagnetic radiation, the radiation detector uses a wire in the middleof a gas-filled metal tube to detect the charged particles given off by radio-active atoms.
68 Environmental Monitoring with Arduino

As the heart of our radiation detector, we’ll be using the Sensitive GeigerCounter (sku C6979ASB) from Electronic Goldmine. To save time, webought our Geiger counter already assembled, but if you’re feeling daring,you can save some money by getting yours in kit form and assembling ityourself.
The Soviet-era SBM-20 detection tube of our Geiger counter is filled with alow-pressure mixture of neon, bromine, and argon gases. A high-voltagetransformer charges a wire inside the tube with 450 volts of electricity, andan output device alerts us when the tube detects a particle. With our model,there are two output devices: a flashing LED and a speaker to make the“click” the public has come to expect from a Geiger counter.
The outside of the metal tube is connected to the ground. When no radiationis present, the gas does not conduct any electricity from the wire to thetube’s metal casing. But when ionizing radiation enters the tube, the gasmolecules become ionized (i.e., they lose an electron, resulting in positivelycharged atoms and free electrons floating around the tube). These electri-cally charged particles can complete a circuit between the tube’s metal cas-ing and the internal wire, which results in a short sharp shock to the gadget’scircuitry.
This shock is passed to a speaker to produce an audible click, to a lamp orLED to produce a flash of light, or to an internal counter to display the numberof clicks the tube receives per minute. (Some fancy Geiger counters have allthree types of output.)
When a particle is detected, the Geiger tube is mo-mentarily charged with high-voltage electricity. Thecurrent is not very strong, so it shouldn’t harm youif you accidentally touch the circuitry—but don’t bea smart-aleck about it. What might not be harmfulto you will almost certainly be harmful to the elec-tronic components of this device. Shorting out thecircuitry with your hand will more than likely be theend of your Geiger counter. For that reason, don’ttouch the Geiger counter when it is powered up.
Project: Radiation Counter/Sharing Data on the Internet 69

If you’ve electrically connected your Geiger counterto your Arduino, and then electrically connectedyour Arduino to your computer or to your Internetrouter, an unexpected short circuit in the Geigercounter can fry it, your Arduino, your computer,and your router. Don’t risk it. Make a nice woodenor plastic case for your Geiger counter, and keepyour contact with the circuitry to a minimum.
Because of the danger a short circuit might cause to our equipment, we’regoing to forgo an electrical connection between the Arduino and Geigercounter. Instead we’re going to “optoisolate” the two. Optoisolation is a pro-cess of transferring electrical signals between electronic devices using light(optic-) instead of electricity, to ensure that voltage spikes from one devicecan’t damage components in the other. Since the entire point of a Geigercounter is to produce voltage spikes, we consider this a prudent precaution.
We’re fortunate that the our Geiger counter has very bright flashing LEDoutput. To read that flash, we’ll be using a phototransistor from aRadioShack infrared emitter and detector package (catalog #276-0142).The phototransistor looks just like a clear LED (and it has a lot in commonwith an LED), but it is specially designed to detect light, not to emit it. We’llbe using it to detect the flashing light of our Geiger counter.
Make the GadgetAlthough monitoring radiation can be tricky, building this gadget is prettystraightforward. More complexity comes in when programming Arduino anduploading radiation readings to Pachube.
The Infrared EmitterThe infrared emitter is unmistakable—it looks like a funky grayLED. But the collector is essentially indistinguishable from a clearLED unless you look very carefully along the vertical axis. The col-lector looks dark gray when seen from above, while a clear LEDlooks light gray when seen from above. For this reason, we suggestyou keep the emitter and detector in a special place in your partsbox, apart from other components—you can go crazy trying to findthe collector in a sea of clear LEDs.
70 Environmental Monitoring with Arduino

Parts1. Arduino
2. Ethernet shield
3. Breadboard
4. Geiger counter
5. IR collector (RadioShack catalog #276-0142)
6. 1k resistor (color code brown, black, red)
7. Long solid strand wire, 18–22 gauge
8. 1 package of heat-shrink tubing. We used tubing from RadioShack (cat-alog #278-1611); you can use others.
Breadboard the CircuitCheck your work on the breadboard view (Figure 9-1).
Step 1 Connect one end of a long red wire to the collector lead (the shorterlead) on the IR detector and the other into a row on the breadboard.
Step 2 Connect one end of a long black wire to the emitter lead (the longerlead) on the IR detector. Plug the other end into a different row on the bread-board.
Step 3 Connect a jumper wire from the emitter on the detector to GND onArduino.
Step 4 Insert the 1K resistor into the same row on the breadboard as thelong red wire from the detector.
Step 5 Connect a jumper wire from the 5v pin on Arduino to the resistor onthe breadboard.
Step 6 Connect a jumper wire from digital pin 2 on Arduino to the place onthe breadboard where the collector wire meets the 1K resistor.
Project: Radiation Counter/Sharing Data on the Internet 71
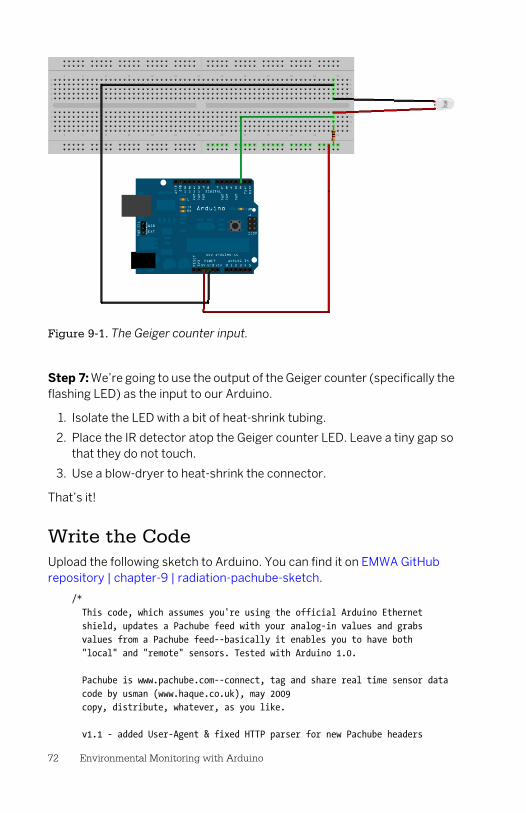
Figure 9-1. The Geiger counter input.
Step 7: We’re going to use the output of the Geiger counter (specifically theflashing LED) as the input to our Arduino.
1. Isolate the LED with a bit of heat-shrink tubing.
2. Place the IR detector atop the Geiger counter LED. Leave a tiny gap sothat they do not touch.
3. Use a blow-dryer to heat-shrink the connector.
That’s it!
Write the CodeUpload the following sketch to Arduino. You can find it on EMWA GitHubrepository | chapter-9 | radiation-pachube-sketch.
/* This code, which assumes you're using the official Arduino Ethernet shield, updates a Pachube feed with your analog-in values and grabs values from a Pachube feed--basically it enables you to have both "local" and "remote" sensors. Tested with Arduino 1.0.
Pachube is www.pachube.com--connect, tag and share real time sensor data code by usman (www.haque.co.uk), may 2009 copy, distribute, whatever, as you like.
v1.1 - added User-Agent & fixed HTTP parser for new Pachube headers
72 Environmental Monitoring with Arduino

and check millis() for when it wraps around
Ethernet shield attached to pins 10, 11, 12, 13
http://www.tigoe.net/pcomp/code/category/arduinowiring/873 This code is in the public domain.
Modified autumn 2011 by Patrick Di Justo, based on code by Tom Igoe*/
#include <SPI.h>#include <Ethernet.h>
// assign a MAC address for the Ethernet controller.// Newer Ethernet shields have a MAC address on a sticker on the shield// fill in your address here:
byte mac[] = { 0xDE, 0xAD, 0xBE, 0xEF, 0xCA, 0xFE};
// initialize the library instance:EthernetClient client;// last time you connected to the server, in millisecondslong lastConnectionTime = 0;// state of the connection last time through the main loopboolean lastConnected = false;// delay between updates to Pachube.comconst int postingInterval = 15000;
int minuteFactor = 60000 / postingInterval;
int geiger_input = 2;long timePreviousMeassure = 0;long countPerMinute = 0;long count = 0;float radiationValue = 0.0;
// Define the SPI pin for the SD Card#define SD_CARD 4
//This is the conversion factor for the SBM-20 radiation detection tube#define CONV_FACTOR 0.0057
// replace the Xs with YOUR Pachube feed ID:#define SHARE_FEED_ID XXXXX
// replace the Xs with your Pachube API key:#define PACHUBE_API_KEY "__YOUR KEY HERE__" // fill in your API key
void setup(){
Project: Radiation Counter/Sharing Data on the Internet 73

// If using the Wiznet SD card/Ethernet shield, these two lines // are absolutely necessary to temporarily disable the SD card // so that the Ethernet port will work.
pinMode(SD_CARD, OUTPUT); digitalWrite(SD_CARD, HIGH);
// start serial port: Serial.begin(9600); // start the Ethernet connection: delay(1000);
if (Ethernet.begin(mac) == 0) { Serial.println("Failed to configure Ethernet using DHCP"); // no point in carrying on, so do nothing forevermore: for(;;) ; }
// give the Ethernet module time to boot up: delay(1000);
// Set the Geiger counter input to HIGH so we can tell when it // changes. We are going to use Arduino interrupt 0, connected // to digital pin 2, which we are using for geiger_input.
pinMode(geiger_input, INPUT); digitalWrite(geiger_input,HIGH);
attachInterrupt(0,countPulse,CHANGE);}
void loop(){ if (millis()-timePreviousMeassure > postingInterval) { countPerMinute = count*minuteFactor; radiationValue = countPerMinute * CONV_FACTOR; timePreviousMeassure = millis(); Serial.println(count); Serial.print("cpm = "); Serial.print(countPerMinute,DEC); Serial.print(" - "); Serial.print("uSv/h = "); Serial.println(radiationValue,4); count = 0; }
// if there's incoming data from the net connection. // send it out the serial port. This is for debugging
74 Environmental Monitoring with Arduino

// purposes only: if (client.available()) { char c = client.read(); Serial.print(c); }
// if there's no net connection, but there was one last time // through the loop, then stop the client: if (!client.connected() && lastConnected) { Serial.println(); Serial.println("disconnecting."); client.stop(); }
// if you're not connected, and ten seconds have passed since // your last connection, then connect again and send data: if (!client.connected() && (millis() - lastConnectionTime > postingInterval)) { sendData(radiationValue); }
// store the state of the connection for next time through // the loop: lastConnected = client.connected();}
void countPulse(){ detachInterrupt(0); count++; digitalWrite(13,HIGH); while(digitalRead(2)==0){} digitalWrite(13,LOW);
attachInterrupt(0,countPulse,CHANGE);}
// this method makes a HTTP connection to the server:void sendData(int thisData) { // if there's a successful connection: if (client.connect("www.pachube.com", 80)) { Serial.println("connecting..."); // send the HTTP PUT request. // fill in your feed address here: client.print("PUT /api/"); client.print(SHARE_FEED_ID); client.print(".csv HTTP/1.1\nHost: pachube.com\nX-PachubeApiKey: "); client.print(PACHUBE_API_KEY); client.print("\nContent-Length: ");
// calculate the length of the sensor reading in bytes:
Project: Radiation Counter/Sharing Data on the Internet 75

int thisLength = getLength(thisData); client.println(thisLength, DEC);
// last pieces of the HTTP PUT request: client.print("Content-Type: text/csv\n"); client.println("Connection: close\n");
// here's the actual content of the PUT request: client.println(thisData, DEC);
// note the time that the connection was made: lastConnectionTime = millis(); } else { // if you couldn't make a connection: Serial.println("connection failed"); }}
// This method calculates the number of digits in the// sensor reading. Since each digit of the ASCII decimal// representation is a byte, the number of digits equals// the number of bytes:
int getLength(int someValue){ // there's at least one byte: int digits = 1; // continually divide the value by ten, // adding one to the digit count for each // time you divide, until you're at 0: int dividend = someValue /10; while (dividend > 0) { dividend = dividend /10; digits++; }
// return the number of digits: return digits;}
What Are We Measuring with ThisGadget?This gadget is measuring radiation in “counts per minute” (CPM), which atthis writing is the most commonly used increment for sharing DIY radiationcounter data on Pachube. Each time a subatomic particle ionizes the gas
76 Environmental Monitoring with Arduino

molecules in the detection tube, thus closing the circuit, Arduino registersthat as one count.
We use CPM because we can’t assume that DIY radiation detectors are cali-brated to an official standard. The detector tube used in this build claims tohave a factor that can convert counts per minute into sieverts, a unit of ra-diation measurement commonly used by scientists. But since most of usdon’t have access to the kinds of laboratory facilities that would allow us toconfirm this calibration, counts per minute are the best units to use.
Taken over weeks, months, and years, CPM give us a useful qualitativemeasurement of radiation levels, rather than a quantitative measurement.That is, the readings can tell us if the radiation level changes dramatically,such as jumping from 50 to 150CPM. A significant increase like that mightbe worth looking into, even if we don’t know exactly what it means in sieverts.
Failure Mode AnalysisThis is the most complicated project in the book, so it would be amazing ifyour gadget worked perfectly the first time. It took us nearly a week to getall the pieces of our gadget working.
So don’t be discouraged if, on your first try, your Pachube data is a big flatline of nothing.
Remember, the first point of our workbench philosophy back in Chapter 1 isto break it down when something doesn’t work.
So, break it down:
• Check your build: Be sure the gadget is assembled correctly.
• Next, mentally divide the project in two parts: input (what comes intoArduino) and output (what goes out of Arduino).
— Input:
— Does your Geiger counter detect background radiation?
— Does your Arduino successfully record each flash of the Geigercounter?
— Does the data show up in the serial monitor?
— Once you’ve gotten the input working, don’t fiddle with it.
— Output:
— Does your Arduino show up on your local network?
— Did you run the Arduino web page and Arduino Pachube examplesketches successfully?
Project: Radiation Counter/Sharing Data on the Internet 77

— Did you replace the values in the sketch with your IP address,gateway, subnet mask, and Pachube API code?
Troubleshoot your gadget methodically, changing only one thing at a timeuntil you’ve solved a particular problem—and then simply move on to thenext. Also, remember that it’s okay to ask for help--both online on Arduinoforums and at your local hacker space.
Uploading data successfully to Pachube was thehardest part of building this gadget for us. In theprocess we learned a valuable lesson: always usethe most recent tutorial on the Pachube website. Atthe time of this writing, there are still tutorials from2009 on the Pachube website. These are worthless.Find the most recent tutorials.
Things to Try1. If you find yourself in possession of a few bags of high-potassium com-
mercial fertilizer, or potassium chloride water softener tablets, or po-tassium chloride ice/snow melter, or potassium-based salt substitute,or even a bowl of Brazil nuts, try getting a radiation measurement fromthem with your Geiger counter. It’s not difficult to get a reading that’stwice the normal background radiation. The key is the potassium:household items that are high in potassium are very slightly more radi-oactive than other objects. This is because elemental potassium has anaturally occurring isotope called potassium-40 (about 1 in every 8,000atoms), which is very slightly radioactive. (We keep emphasizing veryslightly so that you don’t panic at the sight of a bunch of bananas, whichare high in potassium.) This very slight radioactivity is more than enoughto be detected by your Geiger counter.
2. Rather than using the preassembled Geiger counter, buy a kit, such asElectronic Goldmine’s Sensitive Geiger Counter Kit (sku C6979), andbuild it yourself. Note: This kit requires intermediate-level solderingskills; we recommend it for makers who have accomplished at least afew successful soldering projects.
78 Environmental Monitoring with Arduino

10/Casing the Gadget
If you want to take your Arduino gadget mobile, or simply protect it fromdust, you’ll need to secure it inside some sort of portable, durable case.Properly, such cases are called “Arduino project enclosures.”
Since almost any smallish, box-like object has enclosure potential, this is anarena where your creativity can really take off. Just browse any retail storespecializing in home, school, and office storage products, and your head willstart to spin with the possibilities.
Also, don’t forget to think outside the enclosure box! Hardware stores, dollarstores, craft stores, toy stores—these and more have all sorts of productsthat may inspire you to adapt, or to design and create, a totally original con-tainer to enclose your gadget.
You can also check out DIY websites like Instructables and MAKE Maga-zine for ideas and examples.
All this said, building enclosures does add time to a project, and doesn’tappeal to everyone. So in the last few years, a variety of ready-made Arduinoproject enclosures have become available for purchase, often at the samesites that sell electronic components.
While we don’t endorse any particular enclosure, here are a few suppliersand products to consider:
Adafruit Industries: Enclosure for Arduino (ID: 271) Clear Enclosure forArduino (ID: 337)
SparkFun Electronics: Crib for Arduino (sku: PRT-10033) Arduino ProjectEnclosure (sku: PRT-10088)
Solarbotics: Solarbotics Arduino Freeduino Enclosure (sku: 60100)
Nathan Masuda’s Shapeways Shop: Stackable Arduino Enclosure
More enclosures may be on the market by the time you read this book, sobe sure to look around online, or ask friends at your local hacker space whatthey recommend.
79