Best Practices In Environmental Monitoring - RSSL
21
White Paper Author: Dr Tim Sandle Best Practices In Environmental Monitoring
-
Upload
khangminh22 -
Category
Documents
-
view
6 -
download
0
Transcript of Best Practices In Environmental Monitoring - RSSL
1
White Paper
Author:Dr Tim Sandle
Best Practices In Environmental Monitoring

2
Contents
Introduction 3
What environmental monitoring is and what it is not 4
Cleanroom environments 4
Sources of microbial contamination 5
The environmental monitoring programme 6
Summary 17
References and further reading 18
3
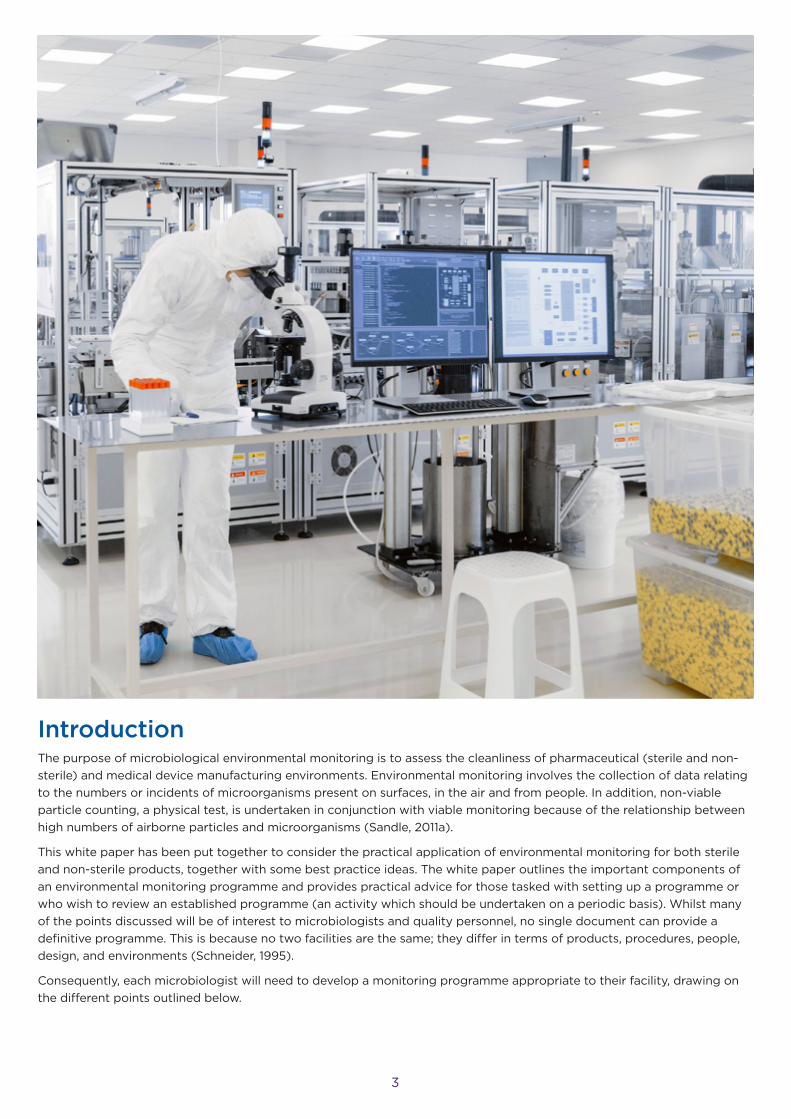
Introduction The purpose of microbiological environmental monitoring is to assess the cleanliness of pharmaceutical (sterile and non-sterile) and medical device manufacturing environments. Environmental monitoring involves the collection of data relating to the numbers or incidents of microorganisms present on surfaces, in the air and from people. In addition, non-viable particle counting, a physical test, is undertaken in conjunction with viable monitoring because of the relationship between high numbers of airborne particles and microorganisms (Sandle, 2011a).
This white paper has been put together to consider the practical application of environmental monitoring for both sterile and non-sterile products, together with some best practice ideas. The white paper outlines the important components of an environmental monitoring programme and provides practical advice for those tasked with setting up a programme or who wish to review an established programme (an activity which should be undertaken on a periodic basis). Whilst many of the points discussed will be of interest to microbiologists and quality personnel, no single document can provide a definitive programme. This is because no two facilities are the same; they differ in terms of products, procedures, people, design, and environments (Schneider, 1995).
Consequently, each microbiologist will need to develop a monitoring programme appropriate to their facility, drawing on the different points outlined below.

4
What environmental monitoring is and what it is not Environmental monitoring is not the same as environmental control (which is outlined in regulations such as 21 CFR Part 820.70). Environmental control is concerned with the design measures necessary to maintain environments within the required operating parameters. Such parameters include: temperature, relative humidity, air velocity, unidirectional air flow, HEPA filtration, and pressure differentials between rooms of different classification (Ramstorp, 2000). Environmental monitoring does, however, relate to environmental control in that monitoring can indicate a failure of a control and it is sensible to, from a risk-based perspective, target monitoring where control is weakest.
The implementation of environmental monitoring in an organisation should be through the construction of a planned environmental monitoring programme. The requirement to perform monitoring is described in the following standards and guidelines:
• EU GMP Guide
• USP <1116>
• FDA Code of Federal Regulations 21 CFR 211
• ISO 14698 Part 1
• PDA Technical Report Number 13
The essential factors of any well-designed environmental monitoring programme are similar (Moldenhauer, 2008). However, the way in which different factors are weighted and the decisions made by facilities will vary in terms of how programmes are carried out.
The objectives of an environmental monitoring programme are:
• To monitor cleanrooms, collect data and to examine trends to show the state of microbiological control of an environment. Monitoring is more meaningful when the environment is assessed under representative conditions (normally when cleanrooms are occupied, and processing is taking place) o Data collection may relate to either numbers of microorganisms or to the incidence of detection, or to both (using pre-defined monitoring limits). In addition, some of the microorganisms recovered should be characterised and trended
• To show that contamination levels do not increase through manufacturing as the process is designed to become cleaner (that is contamination levels should decrease through ISO class 9, 8 and 7 areas)
• To assess the risk to the environment and most importantly to the product. This is achieved by selecting monitoring locations which are meaningful and by monitoring at frequencies will allow the trend to be discerned
• When action levels are exceeded or adverse trends are detected appropriate investigations must be performed using documented procedures to determine the contamination source, the impact upon the product and to set corrective or preventative actions. For this risk based methodologies can be deployed
• To allow the effectiveness of the cleaning and sanitisation programme to be assessed
• To understand the performance of the people and equipment, and the suitability of operating protocols
• To provide information about environmental control
In constructing an environmental monitoring programme, it is important to be aware of the limitations of monitoring. The methods deployed, for example, are highly variable in terms of collection efficiency (Boschi, 2006). Furthermore, the culture media selected and the incubation parameters chosen will only detect those microorganisms which will grow under the set of conditions adopted. A further limitation is the time of sampling. Monitoring only provides a ‘snapshot’ of one moment in time and this may or may not reflect conditions throughout the process. It follows that individual environmental monitoring results are rarely significant (with the exception of the continual monitoring of aseptic processing batches where some samples can relate to specific events). Thus, the most important aspect of environmental monitoring is the examination of trends over time (Reich et al, 2003).
Cleanroom environmentsThe environments in which processing occurs are either classified (to a cleanroom standard, such as ISO 14644) or controlled. Cleanrooms and clean zones are typically classified according to their use (the main activity within each room or zone), controlled through the physical operation of HVAC (Heating Ventilation and Air Conditioning), with the classification confirmed by the cleanliness of the air by the measurement of particles. In addition, recommended limits are applied for microorganisms.
With control of cleanliness, the pharmaceutical manufacturing environment is based around a series of rooms with specially controlled environments. These are termed ‘cleanrooms’. A cleanroom, on one level, is simply a room that is clean. The key aspect, however, is that the level of cleanliness is controlled. The definition of cleanliness, according to the international cleanroom standard, ISO 14644-1 is (ISO 14644-1, 2015):
“A room with control of particulates and set environmental parameters. Construction and use of the room is in a manner to minimise the generation and retention of particles. The classification is set by the cleanliness of the air.”
While control of airborne particles is important, the ISO 14644 standard does not differentiate whether these particles are inert or biologic. Reference to

5
biocontamination in relation to cleanrooms is detailed in ISO 14698, although this latter standard is not, in this author’s experience, widely followed in drug manufacture (although it does contain some useful advice relating to the qualification of environmental monitoring methods).
A controlled environment is similar, in that airborne particulate and microorganism levels are controlled, but the rooms are not classified against a national or international standard (Whyte, 2001). These are sometimes referred to as ‘controlled but not classified’ (CNC) areas.
Once a room has been assigned a classification, certain environmental parameters (physical and microbiological) are to be met on a routine basis. This is assigned by collecting data and examining the results of monitoring against pre-set criteria. Part of this assessment is through a microbiological environmental monitoring programme. The extent of monitoring and the monitoring limits assigned will relate to the class of cleanroom, the activities taking place and the relative risks. Thus, an important question to answer before launching a monitoring programme is “what cleanliness levels are expected?”
Sources of microbial contaminationThere are different sources of microbiological contamination within clean environments: water, air, surfaces (both within the room and from equipment) and personnel. These hazards should be evaluated by the microbiologist in terms of the relative risks to the product, and the environmental monitoring programme should be orientated towards the points of greatest risk. The sampling methods should be appropriate in relation to the types of contamination sources (and a comprehensive monitoring programme should assess each of the main contamination sources). The greatest risks are those which could lead to product contamination. This is illustrated in the diagram below:
Figure 2: Diagram showing sources of microbial contamination within a cleanroom
Secondarysources
Primarysources
Risk of Ingress
• Product• Personnel• Water
• Surfaces• Air• Equipment
Figure 1: Working in a cleanroom
6
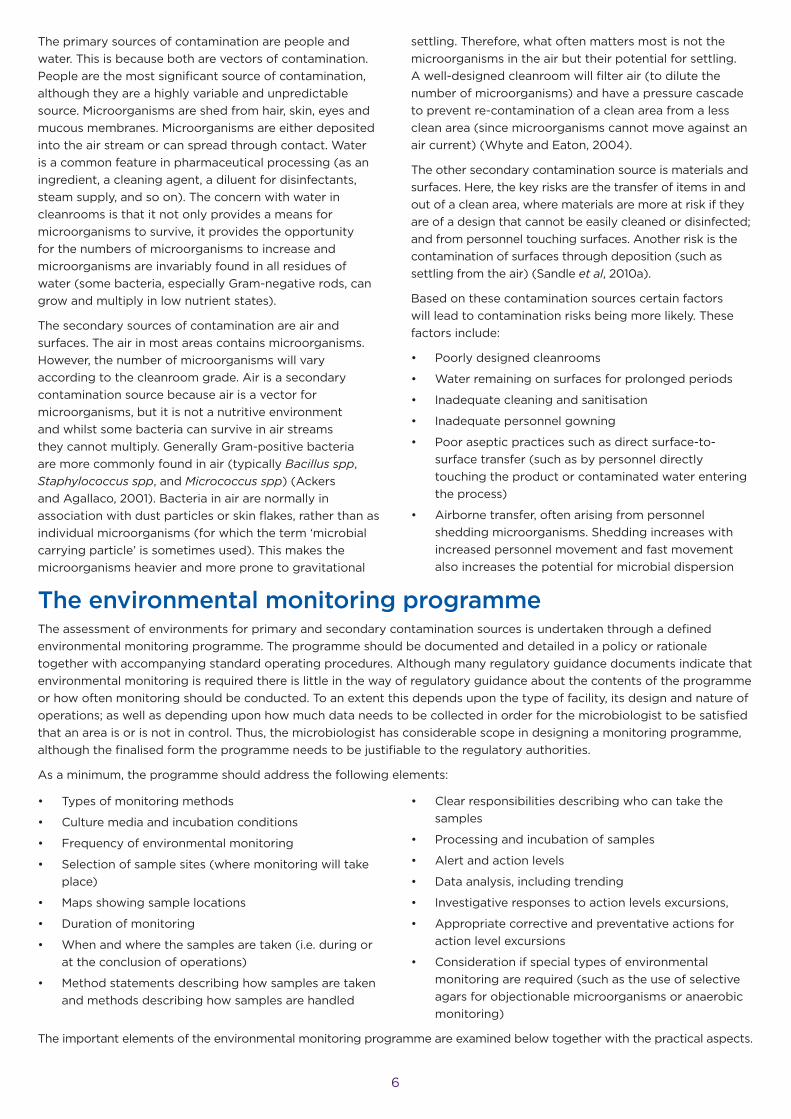
The primary sources of contamination are people and water. This is because both are vectors of contamination. People are the most significant source of contamination, although they are a highly variable and unpredictable source. Microorganisms are shed from hair, skin, eyes and mucous membranes. Microorganisms are either deposited into the air stream or can spread through contact. Water is a common feature in pharmaceutical processing (as an ingredient, a cleaning agent, a diluent for disinfectants, steam supply, and so on). The concern with water in cleanrooms is that it not only provides a means for microorganisms to survive, it provides the opportunity for the numbers of microorganisms to increase and microorganisms are invariably found in all residues of water (some bacteria, especially Gram-negative rods, can grow and multiply in low nutrient states).
The secondary sources of contamination are air and surfaces. The air in most areas contains microorganisms. However, the number of microorganisms will vary according to the cleanroom grade. Air is a secondary contamination source because air is a vector for microorganisms, but it is not a nutritive environment and whilst some bacteria can survive in air streams they cannot multiply. Generally Gram-positive bacteria are more commonly found in air (typically Bacillus spp, Staphylococcus spp, and Micrococcus spp) (Ackers and Agallaco, 2001). Bacteria in air are normally in association with dust particles or skin flakes, rather than as individual microorganisms (for which the term ‘microbial carrying particle’ is sometimes used). This makes the microorganisms heavier and more prone to gravitational
settling. Therefore, what often matters most is not the microorganisms in the air but their potential for settling. A well-designed cleanroom will filter air (to dilute the number of microorganisms) and have a pressure cascade to prevent re-contamination of a clean area from a less clean area (since microorganisms cannot move against an air current) (Whyte and Eaton, 2004).
The other secondary contamination source is materials and surfaces. Here, the key risks are the transfer of items in and out of a clean area, where materials are more at risk if they are of a design that cannot be easily cleaned or disinfected; and from personnel touching surfaces. Another risk is the contamination of surfaces through deposition (such as settling from the air) (Sandle et al, 2010a).
Based on these contamination sources certain factors will lead to contamination risks being more likely. These factors include:
• Poorly designed cleanrooms
• Water remaining on surfaces for prolonged periods
• Inadequate cleaning and sanitisation
• Inadequate personnel gowning
• Poor aseptic practices such as direct surface-to-surface transfer (such as by personnel directly touching the product or contaminated water entering the process)
• Airborne transfer, often arising from personnel shedding microorganisms. Shedding increases with increased personnel movement and fast movement also increases the potential for microbial dispersion
The environmental monitoring programmeThe assessment of environments for primary and secondary contamination sources is undertaken through a defined environmental monitoring programme. The programme should be documented and detailed in a policy or rationale together with accompanying standard operating procedures. Although many regulatory guidance documents indicate that environmental monitoring is required there is little in the way of regulatory guidance about the contents of the programme or how often monitoring should be conducted. To an extent this depends upon the type of facility, its design and nature of operations; as well as depending upon how much data needs to be collected in order for the microbiologist to be satisfied that an area is or is not in control. Thus, the microbiologist has considerable scope in designing a monitoring programme, although the finalised form the programme needs to be justifiable to the regulatory authorities.
As a minimum, the programme should address the following elements:
• Types of monitoring methods
• Culture media and incubation conditions
• Frequency of environmental monitoring
• Selection of sample sites (where monitoring will take place)
• Maps showing sample locations
• Duration of monitoring
• When and where the samples are taken (i.e. during or at the conclusion of operations)
• Method statements describing how samples are taken and methods describing how samples are handled
• Clear responsibilities describing who can take the samples
• Processing and incubation of samples
• Alert and action levels
• Data analysis, including trending
• Investigative responses to action levels excursions,
• Appropriate corrective and preventative actions for action level excursions
• Consideration if special types of environmental monitoring are required (such as the use of selective agars for objectionable microorganisms or anaerobic monitoring)
The important elements of the environmental monitoring programme are examined below together with the practical aspects.

7
Figure 3: Working in a cleanroom (Image: Tim Sandle)
Monitoring methods
Monitoring methods are divided into viable monitoring and non-viable particle monitoring. This distinction may become less relevant in the future with the advent of rapid methods which, through the application of fluorescence counting technologies, can detect both non-viable and viable particles from the same sample of air. In the meantime the classic sampling techniques remain commonplace in most facilities.
Viable monitoring
The objective of viable environmental monitoring is to enumerate the numbers of microorganisms present at a location within a cleanroom. This is undertaken using a range of different air and surface counting methods:
a. Active air-sampling: volumetric air-sampler
b. Passive air-sampling: settle plates
c. Surface samples: contact (RODAC) plates and swabs
d. Personnel samples: finger plates and gown plates
Although these methods are well established there are several practical aspects to consider when using each of these methods. These are considered below.
Active air-samples
An active (or volumetric) air sampler collects a proportion of the microorganisms present in a given volume of air. The volume of air sampled is normally one cubic meter (with results expressed as x CFU / m3).
When assessing the results from active air sampling it is not often known if the numbers of microorganisms recovered reflects those which may have settled onto a critical surface. For aseptic filling operations an indication of this likelihood is provided from the analysis of airflow visualisation patterns (‘smoke studies). For other operations the relative risk is assessed from the location of the sampler and an understanding of the
activities on-going in the area at the time of sampling. Settle plates, if located in a meaningful place, can provide a further indication of the chance of microorganisms in the air-stream settling. It is sensible to have settle plates positioned close to air samplers and to have both monitoring methods located close to the critical activity within the cleanroom.
Figure 4: Active air-sampler (Image: Tim Sandle)
There are two main types of active air-sampler: impaction or centrifugal, although samplers of a filter type design are also used. An impaction air-sampler functions by accelerating air, at an angle of 90o, through holes in the head of an air sampler (often a ‘sieve like’ design). The force impacts the microorganisms onto an agar strip or plate. A centrifugal air-sampler draws air into the sampler head through a rotating vane mechanism. The vane causes microorganisms to be thrown out of the air and onto the agar through the effect of the centrifugal force. Effective air-samplers must be able to precipitate particle sizes of

8
at least 2μm. The ability of a sampler to capture particles sized 10μm or larger is more efficient because most airborne microorganisms are attached to larger particles like skin detritus (Mwier and Zingre, 2000). The choice of active air sampler is not straightforward as different models of air-sampler vary in their efficiency (Kaye, 1986). Furthermore, in order to maintain reliability samplers should be calibrated at a minimum of annual intervals.
Another consideration for air-samplers is that the devices themselves can generate a relatively high level of non-viable particle counts, and this should be considered in the design qualification of such devices especially when used in ISO class 5 / Grade A environments. Other design considerations include the suitability of the sampler to the sanitisation agents used for cleanroom equipment. For samplers used in UDAF cabinets the impact of this should be assessed through airflow mapping studies.
Settle plates
Settle plates are agar plates, typically of either 9cm or 14cm diameter. They are designed to detect any microorganisms carried in the air-stream which directly settle within a particular area. If settle plates are located in appropriate locations then they can provide an indication of how often and, possibly, how many microorganisms may have been deposited onto a critical surface or into any exposed product.
The results from settle plates can either be assessed as the number of microbial colonies per plate or semi-quantified by calculating the number of microorganisms per unit of time (the time being the length of time that the plate has been exposed for). Guidelines such as EU GMP express action levels as CFU (colony forming unit) per four hours. Nevertheless, the use of settle plates as a semi-quantitative measure is contested. One problem is where a microbial carrying particle settles and forms a colony forming unit for it is unknown if the particle consisted of one or more microorganisms. This is why some microbiologists elect to use settle plates as a measure of what may have settled (incident “hits”) rather than as a quantifiable measure (Andon, 2006).
Figure 5: Microbial colony on a settle plate (Image: Tim Sandle)
The length of time a settle plate can be exposed must be validated in order to determine if the weight loss of the agar in the plate affects the growth promotion properties of the plate post-exposure. This can be assessed by designing an experiment where settle plates are pre-weighed, exposed for a pre-defined time under the worst-case conditions (normally within a unidirectional airflow (UDAF) cabinet since this environment will cause the greatest desiccation). After exposure the plates can be challenged with a suitable range of microorganisms to determine if the amount of ‘drying out’ has affected the ability of the plates to support microbial growth.
Surface samples: contact plates and swabs
The two primary surface sampling techniques: contact plates and swabs. Contact plates are agar plates, typically of 25cm2 diameter, with a raised (domed) surface designed such that when the plate is inverted the agar will press against a surface. The reproducibility of the contact plate can be strengthened by setting the sample time and by controlling the pressure applied. Commercial devices are available for this purpose. Variations to the contact plate are flexible plastic strips with raised agar surfaces.
Swabs are typically made up of sterile cotton (or more commonly superior synthetic materials) tips. They are either contained within a transport medium or require pre-wetting with a suitable recovery medium (such as Phosphate Buffered Saline or sterile water). Swabs are either designed to be sub-cultured on agar or dissolved and membrane filtered. Swabs are useful for sampling small areas or curved surfaces.
The microbial recovery from a contact plate is superior to that of the swab and contact plate should preferably be used (with swabs used where contact plates cannot, such as on narrow or irregular surfaces). Swabs that are have a flocked tip have been shown to give better recoveries than swabs with ‘plain’ tips (Goverde et al, 2016).
There are some practical considerations for surface sampling. Importantly after using either contact plates or swabs the residue (agar or diluent) should always be wiped clean with a suitable sanitiser to avoid providing residual material for microbial growth. Another consideration is that for monitoring critical activities this is often carried out at the end of the activity due to the invasive nature of the act of sampling.
Both contact plates and swabs can be quantified. The typical surface area of a contact plate is 25cm2 and when sampling using a swab a template can be used so that a known surface area is sampled, although such templates are not always practical for the types and shapes of surfaces that swabs are typically used to sample. Thus, both methods allow the number of microorganisms detected in a given area to be estimated and such data can be extrapolated for a larger surface.
Surface monitoring is further differentiated between floor surfaces and surface at working height. Surfaces at working height generally have tighter limits and

9
are considered to be more critical as they relate to a preparation step or product contact area. Samples from floors normally have lower limits, since no product touches the floor, and the monitoring of these locations acts as a check of cleaning and sanitisation practices.
Personnel samples
For some operations, most notably aseptic filling, samples are taken from the personnel working in the cleanrooms. These samples are finger plates (or finger dabs) and samples of the gowns worn by the operators (where the sleeves are often the areas of greatest risk area in relation to personnel manipulations of product or equipment).
Gloves are sampled by finger plates where each finger of the gloved hand is pressed onto the surface of an agar plate (of 9cm size or larger). Sleeves are sampled by using contact plates. Therefore, both sample types can be quantified as CFU per five fingers per hand or as CFU per 25cm2. Additionally, gloveport gauntlets and sleeves of isolators and RABS (Rapid Access Barrier Systems) are also sampled at the end of batch campaigns (although these samples do not avoid the need for the leak testing of gloves and sleeves in situ).
Samples of personnel hands are taken at different intervals during batch campaigns and should be taken after each critical activity (such as an intervention into a UDAF device). To be representative of the activity hands must not be sprayed before sampling. However, after sampling, hands must be disinfected using a glove sanitiser. Samples from gowns and face masks are taken at the end of the test session because the act of sampling will compromise the integrity of the material.
Particle monitoring
Particle counting is performed using a discrete particle counter. This is a device that measures the size and number of air-borne particles (some of which will be viable and many more which will be non-viable). The counter functions by having a photodiode which detects light scattered by single particles passing through a laser, sited within the sensing zone. The scattered light from the laser is then concentrated by a lens system and converted into electrical pulses by the photodiode. The amplitude of the pulses is proportional to the particle size. The particle counter will also count the number of pulses produced by the photodiode, which gives the number of particle counts. Like any electronic system particle counters can be prone to electrical interference which can create ‘background noise’ and the occasional ‘false’ particles.
The key particle sizes for pharmaceutical manufacturing and testing are 0.5μm (required by the 2004 FDA guide to aseptic filling, EU GMP and ISO 14644) and 5.0μm (required by EU GMP). These guidelines provided recommended limits for one cubic meter of air. Particle counting is an important part of the environmental monitoring programme as sampling can dynamically indicate the quality of the air continuously over time and hence the effectiveness of cleanroom parameters, such
as, pressure differentials, HEPA filtration and so on. A high level of particles may imply corresponding levels of microorganisms (De Abreu et al, 2004). Research has shown the relationship to be that for every 105 particles recorded, one particle is a microorganism (Ljungqvist and Reinmuller 1996).
Particle counting is used for either classification purposes (to assess a cleanroom under different operating conditions: as built, at rest or in operation); for routine spot checks; for the continuous monitoring of aseptic filling; or as an investigation tool when examining out of limits events.
An important consideration for spot checking and continuous monitoring is the location of the particle counter within the cleanroom. For classification the ISO 14644 standard provides a formula for the location of each particle counter (where the square root of the surface area of the cleanroom is calculated and counters are situated at equidistant locations). The location of a particle counter for routine monitoring requires a rationale and could be determined from:
• The results of the particle count classification study, if one location was ‘worst case’
• By means of examining the process flow and selecting representative tests of the operation
• By means of risk assessment. This could include considering which parts of the process are most at risk from ingress (for example, with aseptic filling the point of fill is a point where product vials are vulnerable). An alternative consideration is the risk to clean area from a less clean adjacent area. Here it might be better to particle count the less clean area to note for any upward build upo in particles which might present at risk to the cleaner area.
Other important considerations when using particle counters are that the counters must be located close to the activity being measured so that the sampling tubing is no longer than three meters (any longer then the risk of ‘drop out’ or particle loss, rendering the sample results inaccurate. This risk is greater of 5.0μm sized particles). In addition, where counters are used in UDAF devices they should be fitted with isokinetic probes in order to ensure that the air velocity entering the counter is the same as the speed of the air within the clean zone (which also minimised particle loss).
Locations for viable monitoring
Having reviewed sampling methods (above) the next important consideration is where, within the cleanroom, to take the samples. The number of environmental monitoring locations will depend upon the size of the cleanroom and the activities taking place. To determine this, a study of the room (layout and equipment) and the process (understanding what happens, what equipment is used and what the people working in the area do) is required. It is important that the types and locations for monitoring have relevance to the process; that the data

10
produced must is meaningful (Lowry, 2001). This is often achieved by mapping the process and the flow of people and materials, by applying risk assessment tool such as HACCP (Hazard Analysis and Critical Control Points) (Jahnke and Kuhn, 2003) or FMEA (Failure Modes and Effects Analysis) (Sandle, 2003a).
These risk tools are similar in that they identify potential hazards (WHO, 2003). The key aspects are:
• Constructing a route map (where the facility is drawn and the process flow indicated).
• Identification of hazards (which can be divided into biological, physical, equipment, transport and chemical). The hazards of greatest risk (severity) can be distinguished from those of lower risk.
• An assessment of existing control measures.
• Consideration of measures to improve control, which will minimise the probability (likelihood) of a contamination event happening.
• Pinpointing areas of greatest risk (where control is weakest).
• Orientating monitoring towards areas where control remains weak.
• Deciding on the most appropriate monitoring methods to use.
Thus, when setting locations for monitoring, the main areas of risk are considered. This often centres on areas where personnel activity is the greatest. This will bias monitoring to areas like routes of human traffic; primary items of equipment in the room, such as open processing; areas which might become more heavily contaminated, such as door handles; where contamination is likely to spread or proliferate such as near water outlets and product contact sites. In addition, some focus of the environmental monitoring programme should also be towards areas which could be neglected by cleaning regimes or which are generally inaccessible. Other areas can be chosen based on where there is potential for direct product impact; where microbial contamination would affect product quality and where contamination could spread through movement of samples, equipment or personnel. As room usages differ, the environmental monitoring locations will vary from room to another.
After completing the mapping exercise each selected site should be justified as to why it has been selected and described on a sampling map so that sampling is consistent and reproducible. Here, each location can be given a risk rating (such as high, medium, or low risk) based upon proximity to the critical area (such as exposed product or vials) and taking into account the ease of transfer of any contamination towards product, vials, or other critical areas. Documenting this will show the regulators that attention has gone onto site selection.
Although the optimal sites for monitoring should be selected this is not always possible. Sometimes what appear to be most appropriate locations for activities should not be sampled because the act of sampling itself
could cause contamination (such as with an aseptic filling line). In such cases this should be detailed in a rationale. Instead locations close by should be assessed and post-activity sampling carried out.
Some facilities elect not to fix monitoring locations and instead rotate monitoring positions. The argument in favour of rotation is that in doing so more areas of a cleanroom will be monitored and that the personnel tasked with sanitisation will not be able to ‘guess’ where monitoring will occur therefore ensuing a better standard of cleaning. The argument against rotation is that having fixed locations allows for long term trends to be examined. Random sampling can be useful when assessing newly built facilities where the determining the most representative locations is not straightforward. However, if the locations have been selected by risk assessment they are most meaningful and there would appear to be no need for sample rotation.
Figure 6: Pharmaceutical processing
In determining the final number of sample locations, a balance needs to be struck between the objective of generating sufficient monitoring data in order to show adequate control, on one side, and interference with the production process and the costs of monitoring on the other side. The use of a documented risk based approach, as outlined, is a good way to achieve this (Baird, 2015).
Sampling responsibilities
The individuals who take the environmental monitoring samples should be clearly defined in the written programme. Normally trained microbiologists take samples in lower class cleanrooms (ISO 8 and 9). For sampling aseptic filling areas there are two different approaches. One approach is that all environmental monitoring samples should be taken by independent QC staff. The other approach is that the presence of additional staff in a cleanroom increases the risk and to avoid this risk process staff should undertake monitoring. A ‘middle way’ approach is for process staff to take the majority of the samples for aseptic filling but in addition having QC staff monitor filling runs periodically (such as on a basis

11
of 1 in 10) or to take finger dab samples at unannounced intervals.
Where process staff do take samples, it is important that they go through the same rigorous training programme as QC staff and are trained in microbiological awareness (Sandle, 2010b).
Frequency of monitoring
The frequency of environmental monitoring for sterile products (aseptically filled or terminally sterilised) is set out in regulatory guidance: it should be continuous throughout the fill and at times where product or product components are exposed. Environmental monitoring for other activities requires the microbiologist to set the monitoring frequency. The frequency should be based on a risk assessment of the activities in the cleanroom and should be often enough to enable meaningful trends to be assessed (Gordon et al, 2015).
The risk assessment should examine the different parameters of the cleanroom and weight these according to the severity of the contamination, should it occur, and the likelihood that contamination will occur. For this different frequency categories can be drawn up or numerical scoring processes used. Some of the risks to be considered are:
• Room temperature (cold rooms are a lower risk than ambient rooms due to the microstatic effect on most bacterial from the lower temperature. Based on this ambient rooms would be monitored more often than cold rooms);
• Whether the room is normally ‘wet’ (such as a wash bay) or dry. Wet areas present a greater contamination risk and could be monitored more often;
• Whether a drain is present (where there is a drain the risk may be higher due to back-flow);
• The environmental monitoring history of the cleanroom. A room with a poor history will require more assessment;
• Whether equipment is cleaned-in-place or whether it is mobile and is cleaned elsewhere (fixed equipment is easier to control);
• Whether equipment cleaning is manual or automated (automated cleaning is easier to validate and thus more reliable);
• Whether open or closed processing occurs (with open processing at the greatest risk);
• The duration of processing (where the longer the process then the greater the possibility of something affecting the product);
• The room occupancy (where higher occupancies present a greater risk because personnel are the primary contamination source within cleanrooms).
When such factors are examined, weighted and monitoring frequencies set then a pattern tends to emerge where rooms in which open processing occurs or which have a high personnel involvement tend to require more
frequent monitoring whereas rooms in which automated processing takes place or are used infrequently tend to require a lower level of monitoring.
How often different categories or sets of rooms are monitored can only be established by an historical review of data and by looking at the frequency interval between excursions. Suitable monitoring frequencies for non-sterile processing are twice-weekly, weekly, fortnightly and monthly. With these sets of frequencies different rooms will be monitored at different times based on risk assessment.
Figure 7: Preparing an active air-sampler for monitoring (Image: Tim Sandle)
In addition to the established programme other sampling sessions may be performed, such as immediately after sanitisation so that the effectiveness of the cleaning and sanitisation can be assessed (so termed ‘field trials’). Another example of targeted monitoring is following maintenance and after process area shutdowns to that the suitability to commence manufacturing can be assessed. Other types of monitoring may be undertaken less often. This might include examinations using selective agars (such as during seasons where fungi may be a concern) or for special incubation conditions (such as monitoring for anaerobic bacteria where nitrogen gas lines are used).
Room conditions for monitoring
Microbiological monitoring should ordinarily be performed in the in operation (or ‘dynamic’) state, as opposed to the at rest (or ‘static’) state, because the former represents the “worst case” scenario (that is the cleanroom with people present, equipment operating and processing
12
on-going) (Sutton, 2010). Practically, in large facilities, there may be occasions when areas are not used very often however attempts should be made to sample under operational conditions. There may be occasions when at rest monitoring is useful. For example, to establish a baseline with which to compare rooms in the operation state against. Such comparisons are particularly useful when examining particle count excursions.
Duration of monitoring
For the filling of sterile products, the duration of monitoring should be for the entire length of the filling operation. For other activities and in lower classes of cleanrooms, monitoring sessions are normally between one and four hours (which is based on the time for the settle plate exposure). This is normally sufficient for no microbiological monitoring programme can (or needs to) assess all of the microbiological contamination in a clean area at times of use. Programmes are designed to provide “snap shots” of a cleanroom at a particular time and provided that the rooms are in use at the time of sampling and that the frequencies of monitoring are often enough so that data trends can be assessed then a short duration of monitoring is normally sufficient. Unless there is something very specific about the process monitored then no specific time represents “worst case” and therefore any given monitoring time is “equal case” (Cundell et al, 1998).
For sterile filling, where continuous monitoring is required by GMPs, a typical sampling regimen is:
• Settle plates are exposed for the duration of a fill (additional settle plates may need to be used if the fill exceeds the validated plate exposure time).
• Active air samples will be taken at the (near) start and (near) end of the fill.
• Finger plates will be taken immediately after a connection activity, for any persons present during the fill at a random time during the fill and after a Grade A / ISO Class 5 zone intervention.
• Surface monitoring will take place immediately at the end of the fill. This is not performed during filling due to the invasive and disruptive nature of the techniques.
• Contact plates of gowns will be taken from all personnel immediately before they exit the Grade B area (Aseptic Filling Suite).
For batch campaigns the monitoring of shift changes should be monitored.
Culture media
The objective of most environmental monitoring programmes is to detect mesophilic bacteria and fungi (organisms which will grow between 20 and 35°C) for these microorganisms are most likely to be present and pose the greatest risk to most products. To monitor for such microorganisms, it is typical to use either one culture medium, which is subject to a two-step incubation regime; or to use two microbiological culture media which are incubated at different temperatures. With both regimes the intention is to recover both bacteria and fungi (with
two media one medium is designed to encourage the growth of bacteria and the other medium is designed to select fungi) (Sandle, 2014).
Where one medium is used this is often soya-bean casein digest medium (tryptic soya agar (TSA)). This is a non-selective, highly nutritious medium and has a long history of being used within cleanrooms. Where two media are used, the medium for recovering bacteria is often TSA. For fungi, a selective medium is used. The actual medium will depend upon the types of environmental fungi most prevalent. Common media include Sabouraud Dextrose Agar, Malt Extract Agar, Potato Dextrose Agar or Rose Bengal Agar. These media may have an altered pH or contain antibiotics to inhibit bacterial growth. If it can be shown that the majority of microorganisms can be recovered from one culture medium then this offers considerable time and cost savings. To adopt one medium requires confirmatory studies using fungi isolated from the cleanroom environment or from adjacent cleanrooms.
Before use, all culture medium must be validated. Validation of culture media normally consists of testing articles of the medium at all of the applicable incubation temperatures and against a range of microorganisms. The microorganisms used include those recommended by the pharmacopeia (typed cultures from ATCC or a similar culture collection including Bacillus subtilis, Staphylococcus aureus, Candida albicans, Pseudomonas aeruginosa and Aspergillus niger) and a number of environmental isolates from the cleanroom environments. The challenge inoculum is to be less than 100 CFU. The use of a low challenge is of particular importance because high numbers of microorganisms will not be present in the cleanroom environment. Following validation, routine growth promotion testing should be performed on each lot as part of the release of the culture media (in additional to physical tests, such as pH, appearance and gel strength) at a representative incubation temperature. This is necessary, partly due to the variations with media manufacture and partly due to the risks involved with shipping media where media can be subjected to extremes of temperature.
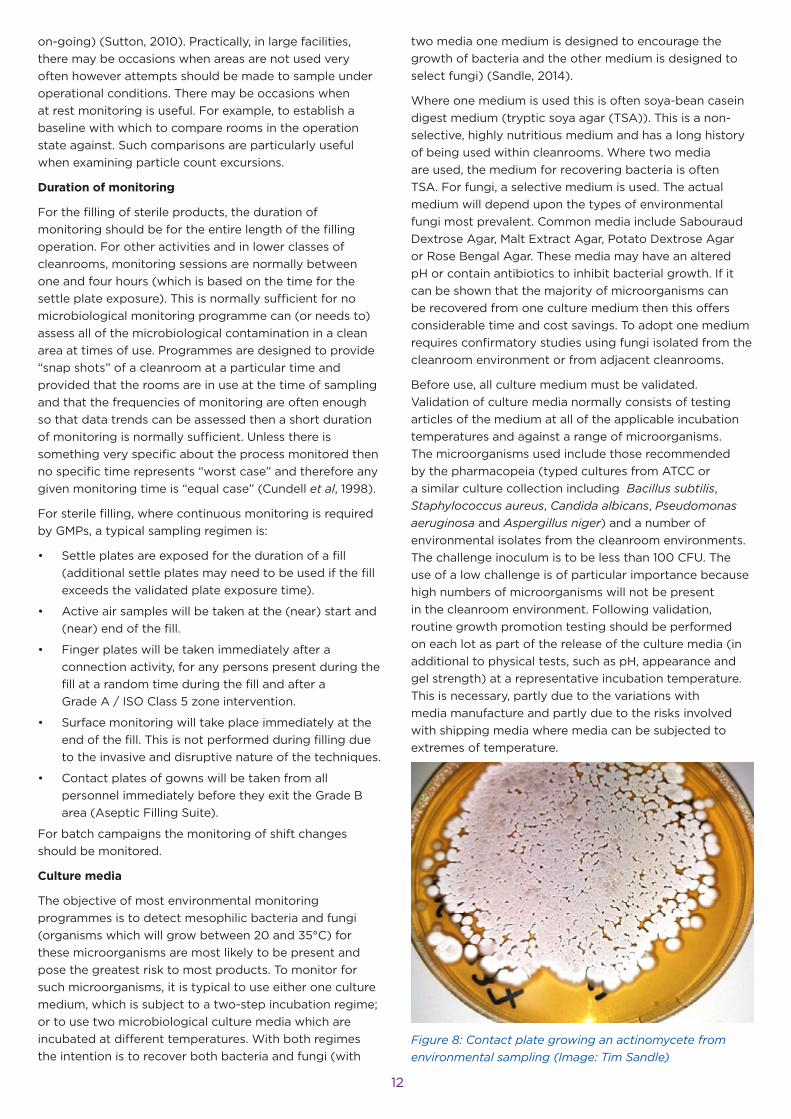
Figure 8: Contact plate growing an actinomycete from environmental sampling (Image: Tim Sandle)
13
Some practical aspects relating to the use of culture media include the importance of performing an assessment of the method of transferring the culture media into cleanroom from an adjacent clean area or into an isolator in order to check that the method does not cause inhibition of microbial growth.
It may be, for example, that the hydrogen peroxide or peracetic acid used to sanitise loads into an isolator or the fumigant used to sanitise a cleanroom could cause inhibition if the sanitiser penetrated the bags containing the media. To counter this the media can have neutralisers added to it (such as pyruvate to neutralise hydrogen peroxide (Ohresser et al, 2004)).
A further consideration is that where disinfectant residues are likely, the media used for surface samples (like RODAC plates) or for sampling personnel hands (finger plates) should also contain a suitable disinfectant neutraliser to counteract disinfectant residues on surfaces or remnants of hand sanitisation agents on gloved hands (Russell, 1997).
Another issue is that media should be sterile. The sterilisation of culture media is normally by gamma irradiation. Studies should be conducted to show that the method of sterilisation does not cause then inhibition of microbial growth.
Incubation of test samples
Samples from environmental monitoring should be incubated at a pre-defined time and temperature regime. In terms of incubation time this can be assessed by removing samples at set intervals, counting them (taking care not to cause adventitious contamination) and the re-incubating over a period of time to establish a point where the growth of visible colonies no longer occurs.
In terms of temperature requirements, this depends whether one or two culture media are used (as described above). Where two culture media are used, the regime is typically:
• For bacteria: 30-35°C
• For fungi: 20-25°C
The important choice is the order of incubation. An argument for the lower temperature first is that fungi are more likely to be in a stressed state and should be encouraged to grow first.
An argument for the higher temperature first is that, should a filamentous fungus be present, this could grow in a way which obscures the bacterial colonies (Sandle, 2014). The decision taken should be justified and based on sample data (Marshall et al, 1998).
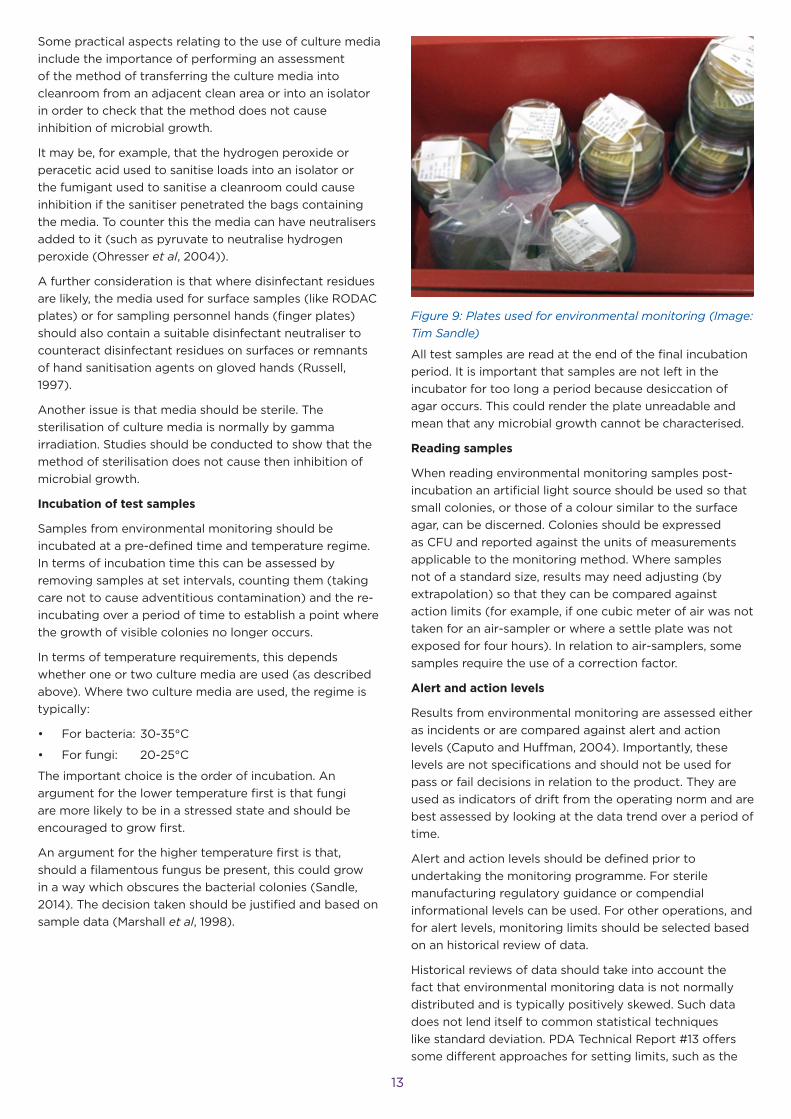
Figure 9: Plates used for environmental monitoring (Image: Tim Sandle)
All test samples are read at the end of the final incubation period. It is important that samples are not left in the incubator for too long a period because desiccation of agar occurs. This could render the plate unreadable and mean that any microbial growth cannot be characterised.
Reading samples
When reading environmental monitoring samples post-incubation an artificial light source should be used so that small colonies, or those of a colour similar to the surface agar, can be discerned. Colonies should be expressed as CFU and reported against the units of measurements applicable to the monitoring method. Where samples not of a standard size, results may need adjusting (by extrapolation) so that they can be compared against action limits (for example, if one cubic meter of air was not taken for an air-sampler or where a settle plate was not exposed for four hours). In relation to air-samplers, some samples require the use of a correction factor.
Alert and action levels
Results from environmental monitoring are assessed either as incidents or are compared against alert and action levels (Caputo and Huffman, 2004). Importantly, these levels are not specifications and should not be used for pass or fail decisions in relation to the product. They are used as indicators of drift from the operating norm and are best assessed by looking at the data trend over a period of time.
Alert and action levels should be defined prior to undertaking the monitoring programme. For sterile manufacturing regulatory guidance or compendial informational levels can be used. For other operations, and for alert levels, monitoring limits should be selected based on an historical review of data.
Historical reviews of data should take into account the fact that environmental monitoring data is not normally distributed and is typically positively skewed. Such data does not lend itself to common statistical techniques like standard deviation. PDA Technical Report #13 offers some different approaches for setting limits, such as the

14
percentile cut-off approach where alert levels can be set at the 95th or 97th percentile and the action level set at the 97th or 99th percentile (Moldenhauer et al, 2001). Once set, levels should be reviewed periodically with an annual review recommended. There should be a documented rationale describing how alert and action levels are established.
Trending microorganisms
A selection of microorganisms identified from the monitoring programme should be examined and trended. For this assessment all microorganisms from the environmental monitoring samples taken in the Grade A / ISO 5 area should be identified to species level. For lower class clean areas, it is recommended that all sample results which exceed the action level should be identified.
The most important reasons for examining microflora are to look for objectionable microorganisms which might pose a product risk or in relation to cleaning and disinfection practices, and to assist with investigations into out of limits results.
Objectionable microorganisms are organisms which would cause harm to patients if they survive in the product, thus objectionable microorganisms are of most concern in relation to non-sterile products. Whether a microorganism is objectionable is assessed by risk assessment based on the type of product and the risk of product contamination (Moldenhaurer, 2010). Some species of microorganism are more likely to proliferate in certain types of products than others.
Regular recoveries of microorganisms which are theoretically more resistant to disinfectants may indicate concerns with the cleaning and sanitisation regime. EU GMP places a particular emphasis upon “resistant strains” and implies that any microorganisms resistant to the in-use disinfectants or an isolator sanitisation process should be characterised. If detected, the expectation is that these microorganisms are challenged against the disinfectants through microbial disinfectant efficacy tests (Sandle, 2003b).
A third reason for trending microorganisms is as part of investigations into out of limits events. Characterising the microflora allows the microbiologist to determine whether two or more microorganisms may be related; this information can provide an indication as to the possible origin of the contamination.
With environmental monitoring it is expected that a large proportion of the microflora will be primarily of human origin (such as Staphylococci or Micrococci). Some Gram-positive rods will be recovered from lower class cleanrooms (such as Bacillus spp. and Corynebacterium spp.), possibly transferred into the area from equipment. Where water is present, such as wash-bays, Gram-negative rods will additionally be isolated. Where unusual microorganisms are detected, such as, Gram-negative bacteria from dry areas or unusually high numbers of endospore forming bacteria, these should warrant special
investigation and they may indicate a breakdown of environmental control (Sandle, 2011b).
Investigating microbiological data deviations
Environmental monitoring results which exceed the action level; or where there is an upward trend relating to excursions of the alert level; or where the frequency of incidents exceeds a predetermined cut-off value, represent scenarios which should be investigated.
Care should be taken when reacting to individual results for microbiological results are often difficult to interpret. This is for several reasons:
• Microorganisms are ubiquitous in nature and are common environmental contaminants
• A single result does not by itself indicate a breakdown of environmental control
• More meaningful data is often assessed from trends (see below)
• The microbiologist has the potential to introduce contaminating microorganisms during sampling and/or testing
• Microbiological sampling methods are subject to considerable inherent variability
Therefore, the most important consideration when interpreting environmental monitoring data is the trend.
The investigation of an environmental monitoring level excursion should be covered by a Standard Operation Procedure (SOP) and be formally documented. The SOP should contain decision trees to ensure that, where possible, the conclusions reached are consistent. Before proceeding with a formal investigation, a check should be made in the microbiology laboratory to ensure that the result is not due to “laboratory error”. Laboratory error investigations should be undertaken independently, that is by someone not directly involved with conducting the test. Such investigations should be carried out in a timely manner. Laboratory error investigations include whether the sample was taken and handled correctly; if the correct culture media was used; if the equipment was within calibration date (such as the active air-sampler); if the sample was incubated for the correct time and temperature; if there is any possibility of sample contamination (issues of aseptic technique); and whether the result was read correctly and reported to the correct units of measurement. In the event of a laboratory error, measures should be taken to prevent the error from reoccurring.
Once a data deviation is confirmed or an adverse trend established an investigation should be conducted. The scope of the investigation will depend upon the nature of the trend or the risk to the product (growth from a swab taken of a filling needle from an aseptic fill is of a substantially higher risk than a floor contact plate from an ISO class 8 preparation area). Assessing trends requires some experience in order to determine if the datum is part of an adverse trend, whether is signals an unusual problem or loss of control; or if it is an isolated event. Several alert

15
level hits are often indicative of a gradual drift towards an action level event. To do this requires a look-back at past data, such as a three to six-month period.
There are many different approaches for examining out-of-limits events. In general, approaches include (Sandle, 2006):
a. A description of the problem or event
b. Examination of trends
c. Data collection
d. Investigation
e. Risk assessment (focusing on the product)
f. Determination of the most probable root cause
g. Consideration of corrective and preventative actions
h. Summary
Completed investigations should be copied to local managers and discussed at a regular review meeting, where senior managers are present.
The purpose of the investigation is to determine, where possible, the root cause of the incident (why the action level was exceeded and why the contamination event has occurred) and to consider if it can be prevented from reoccurring. Often, the process of assigning a root cause involves a process of elimination, by working through an investigation checklist to determine what “is” or “is not” a potential problem.
For determining the source of the contamination invaluable data can come from understanding the microflora. The range of microorganisms found in the cleanroom environment can be subcategorised according to the source (such as a skin commensurable linking the organism to personnel) or their probable location (such as from an item of equipment) (Hussong and Madsen, 2004).
Investigations should focus on ‘cause and effect’: how did the event occur and what is the impact upon the product or environment? This will involve an understanding of what has happened with the process and an examination of both routine events, like cleaning and sanitisation regimes, and any unusual occurrences.
Here risk assessment tools can again be useful particularly in relation to the concepts of severity and probability. With severity, this is a consideration of the maximum impact of the event upon the product or process where the most severe outcome is product contamination. Probability is concerned with the likelihood of contamination affecting the product or reoccurring in the environment. In weighing up probability an investigation will need to consider the time that event occurred and the frequency of contamination events over a given time period.
Consideration of likelihood will also need to assess the contamination source and the if transfer to product could occur, through either direct transfer or through the air. This is illustrated in Figure 10 above, right.
Figure 10: Relationship of contamination sources
Corrective actions relate to either things that can be done at the time or if any additional testing or monitoring can be performed (to determine the extent of the problem). This may include a particle count being noticed during an operation (from an alarm or beacon on a counter) and an activity being halted and corrective measures taken. Or, the impact of particle counts may be re-assessed through the conducting of an airflow (or smoke) pattern to note air direction and turbulence.
Preventative actions can be difficult to set, especially where isolated action level excursions have occurred. As a minimum, preventative actions include additional cleaning sanitisation, additional sampling, and briefing and retraining of operators. If a particular microorganism is isolated on several occasions consideration should be given to the effectiveness of the sanitisation programme or the resistance of the organism to the in-use disinfectants. Other preventative actions can include re-designing an activity (such as situations where cross contamination has occurred); changes to process times; modifications to the HVAC system of a cleanroom; or major repairs to equipment and machinery. Senior management should endorse the conclusions. For aseptic filling a conclusion relating to the batch disposition will be required.
It is important that all investigations have a clear and succinct summary, which briefly describes the origin of the contamination, the risk upon the product and process, and measures to prevent reoccurrence. Such summaries are useful for senior management and for showing to regulators.
Contamination Source
DirectTransfer
Air
Product

16
Trend analysis
There is little value in undertaking environmental monitoring unless the data is reviewed. Environmental monitoring data should be studied for trends. Trending provides valuable information about environmental control (Tetzlaff, 1992). For example, data from the environmental monitoring programme is important for measuring the effectiveness of cleaning and sanitisation procedures such as the rotation of disinfectants.
Trending is particularly important for low count data where trends cannot be readily discerned. For example, the data displayed below (in Table 1) is the mean of settle plates taken at the periphery of a filling zone within an isolator.
Day Mean Count Day Mean Count
1 0 26 0.25
2 0.25 27 0.25
3 0 28 0.75
4 0 29 0
5 0 30 0
6 0 31 0
7 0 32 0.5
8 0 33 0.5
9 0 34 1
10 0 35 1.25
11 1 36 0.25
12 0.25 37 0.5
13 0.25 38 0.75
14 0 39 0.5
15 0 40 0.25
16 0 41 1
17 0 42 1.25
18 0 43 0.25
19 0 44 0.25
20 0 45 0
21 0.25 46 0.5
22 0.25 47 1
23 0 48 0.25
24 0 49 1.25
25 0.5 50 0.25
Table 1: Example data from the environmental monitoring of an isolator using settle plates
From the table it is not immediately clear as to the direction that the trend is taking. However, when this data is plotted in a simple chart in MS Excel, with the use of a three-point moving average, the trend becomes much clearer.
Figure 11: Plot of data from the environmental monitoring of an isolator using settle plates
With the use of the graph, an upward trend is much clearer to visualize.
Mean settle plate count
Number of days
Mean
co
un
t (c
fu /
pla
te)

17
Environmental monitoring documentation
This white paper has placed a strong emphasis on the need for a documented environmental monitoring programme. The salient points should be capture in a rationale. To support this, a well constricted Standard Operating Procedure (SOP) is required. The SOP should cover such aspects of the programme as:
• Types of culture media
• Methods for transferring culture media into cleanrooms
• Responsibilities for monitoring
• Monitoring techniques
• Location map showing monitoring sites
• Frequencies of monitoring
• Incubation parameters
• Results reading and reporting
• Alert and action limits
• Method of data analysis
• Actions required for out of limits events
In addition, recording when samples were taken, the duration of monitoring, who took the samples is important and should be captured. This, together with the SOP, ensures that data is traceable.
SummaryFrom the first look environmental monitoring appears relatively straightforward. The methods are long established and the process generates large quantities of data. However, an environmental monitoring programme will be inadequate if it is not thought out. The wrong types of samples maybe taken in the wrong locations; the times of monitoring maybe too infrequent; data maybe be generated but not analysed and data deviation investigations maybe imperfect. To guard against this a practical, well-structured and thought out monitoring programme is required. For this a programme based on risk assessment is required.
This white paper has outlined many of the important factors which require consideration when an environmental monitoring programme is designed and later reviewed. If such a practical approach is adopted then a rigorous and defensible system will emerge and be able to satisfy regulatory expectations. Furthermore, some of the best practice tips presented will help to make the monitoring programme more meaningful in terms of what the results are telling you as well as having something that is easier to explain to auditors.

18
ReferencesAckers, J. and Agallaco, J. (2001). Environmental Monitoring: Myths and Misapplications. PDA Journal of Pharmaceutical Science and Technology, 55 (3): 176-184
Andon, B.M. (2006). Active Air vs. Passive Air (Settle Plate) Monitoring in Routine Environmental Monitoring Programmes, PDA Journal of Pharmaceutical Science and Technology, Vol. 60, No. 6, pp350-355
Baird, R. (2015) Microbiological Environmental Monitoring. In Hanlon, G. and Sandle, T. (Eds.) Industrial Pharmaceutical Microbiology: Standards and Controls, Euromed Publications, Passfield, UK, pp8.1-8.28
Boschi, F. (2006). Issues That Can Affect The Accuracy Of Environmental Monitoring Data in Sandle, T. and Boschi, F. Environmental Monitoring: A Handbook, Institute of Validation Technology: Duluth, MN, USA.
Caputo, R.A. and Huffman, A. (2004): Environmental Monitoring: Data Trending Using a Frequency Model, PDA Journal of Pharmaceutical Science and Technology, Vol. 58, No. 5, pp254-260
Cundell, A., Bean, R., Massimor, L. and Maier, C. (1998). Statistical Analysis of Environmental Monitoring Data: Does a Worst Case Time for Monitoring Clean Rooms Exist?, PDA Journal of Pharmaceutical Science and Technology, 52 (6): 326-330
De Abreu, C., Pinto, T. and Oliveira, D. (2004): Environmental Monitoring: A Correlation Study Between Viable and Nonviable Particles in Cleanrooms, PDA Journal of Pharmaceutical Science and Technology, Vol. 58, No. 1, pp45-53
Hussong, D. and Masden, R. E. (2004). Analysis of Environmental Microbiology Data from Cleanroom Samples. Pharmaceutical Technology Aseptic Processing 2004, pp10-15
Gordon, O., Goverde, M., Pazdan, J., Staerk, A and Roesti, D. (2015) Comparison of Different Calculation Approaches for Defining Microbiological Control Levels Based on Historical Data, PDA J Pharm Sci Technol.;69(3):383-98
Goverde, M., Willrodt, J. and Staerk, A. (2016) Evaluation of the recovery rate of different swabs for microbial environmental monitoring, PDA J Pharm Sci Technol. 2016. pii: pdajpst.2016.006783
International Standards Organization (2003) ISO 14698-1. Cleanrooms and associated controlled environments–Biocontamination Control’: Part 1: ‘General principles and methods. ISO, Geneva, Switzerland
International Standards Organization (2003) ISO 14698-2. Cleanrooms and associated controlled environments. Biocontamination control - Part 2. Evaluation and interpretation of biocontamination data
International Standards Organization (2015) ISO 14644 - Cleanrooms and associated controlled environments - Part 1: Classification of air cleanliness, ISO, Geneva, Switzerland
International Standards Organization (2015) ISO 14644 - Cleanrooms and associated controlled environments - Part 2: Monitoring to provide evidence of cleanroom performance related to air cleanliness by particle concentration, ISO, Geneva, Switzerland
Jahnke, M and K-D Kuhn. 2003. Use of the Hazard Analysis and Critical Control Points (HACCP) Risk Assessment on a Medical Device for Parenteral Application. PDA Journal of Pharmaceutical Science and Technology, Vol. 57, No.1, pp32-42.
Kaye, S. (1986): Efficiency of Biotest RCS as a Sampler of Airborne Bacteria, PDA Journal of Pharmaceutical Science and Technology, Vol. 42, No. 5, pp147-152
Ljungqvist, B. and Reinmuller, B. (1996): Cleanroom Design: Minimizing Contamination Through Proper Design, Interpharm Press: Colorado, USA
Lowry, S. 2001. Designing a Contamination Control Programme. In Prince, R. (Ed.) Microbiology in Pharmaceutical Manufacturing. DHI/PDA Publ., pp203-266.
Marshall, V., Poulson-Cook, S. and Moldenhauer, J. (1998). Comparative Mold and Yeast Recovery Analysis (The Effect of Differing Incubation Temperature Ranges and Growth Media), PDA Journal of Pharmaceutical Science and Technology, Vol. 52, No.4, pp165-169
Meir, R. and Zingre, H. (2000): Qualification of air-sampler systems: MAS-100, Swiss Pharma, 22 (1-2): 15- 21
Moldenhauer, J. et al. (2001). Fundamentals of an Environmental Monitoring Programme,” PDA Technical Report No. 13, PDA J. Pharma. Sci. Technol. 55 (5), supplement (2001).
Moldenhauer, J. (2008). Environmental Monitoring. In Prince, R. (Ed.). Microbiology in Pharmaceutical Manufacturing, Parenetral Drug Association, Bethesda, MD, USA, pp19-92
Moldenhaurer, J. (2010). Passing Cleanroom Inspections. Pharmaceutical Technology Europe. 22 (12): 7-8
19
Ohresser, S., Griveau, S. and Schann, C. (2004): Validation of Microbial Recovery from Hydrogen Peroxide-Sterilised Air, PDA J Pharm Sci Tech. 58 (2): 75-80
Ramstorp, M. (2000). Introduction to Contamination Control and Cleanroom Technology, Wiley-VCH: Weinheim
Reich, R., Miller, M., and Patterson, H. (2003). Developing a viable environmental monitoring programme for nonsterile pharmaceutical operations. Pharmaceutical Technology. March 2003: 92-100
Russell, A.D., Furr J R and Maillard J-Y (1997). Microbial Susceptibility and Resistance to Biocides, ASM News, Vol. 9, pp. 481-487
Sandle, T. (2003a): The use of a risk assessment in the pharmaceutical industry – the application of FMEA to a sterility testing isolator: a case study, European Journal of Parenteral and Pharmaceutical Sciences, 2003; 8(2): 43-49
Sandle, T (2003b).: Selection and use of cleaning and disinfection agents in pharmaceutical manufacturing. In Hodges, N and Hanlon, G. (2003 edition): Industrial Pharmaceutical Microbiology Standards and Controls, Euromed Communications: Basingstoke, UK
Sandle, T. (2006). Environmental Monitoring Risk Assessment, Journal of GXP Compliance, Volume 10, Number 2, 2006, pp. 54-73.
Sandle, T., Saghee, M.R. and Ramstrop, M. (2010): Environmental Monitoring and Cleanrooms, IDMA-APA Guideline, Technical Monograph No.5, Indian Drug Manufacturers Association, Mumbai.
Sandle, T. (2010b): Best practices in microbiology laboratory training in Hodges, N. and Hanlon, G.(2010 edition): Industrial Pharmaceutical Microbiology: Standards and Controls, Supplement 11, ppS11.1 to S11.16
Sandle, T. (2011a): Environmental Monitoring. In Saghee, M.R., Sandle, T. and Tidswell, E.C. (Eds.) (2011): Microbiology and Sterility Assurance in Pharmaceuticals and Medical Devices, New Delhi: Business Horizons, pp293-326
Sandle, T. (2011b): A Review of Cleanroom Microflora: Types, Trends, and Patterns, PDA Journal of Pharmaceutical Science and Technology, Vol. 65, No. 4, pp392-403
Sandle, T. (2014) Examination of the Order of Incubation for the Recovery of Bacteria and Fungi from Pharmaceutical Cleanrooms, International Journal of Pharmaceutical Compounding, 18 (3): 242 – 247
Schneider, P.K. (1995). Practical Cleanroom Design, Business News Publishing Company: Troy, MI, USA.
Suton, S. (2007). Surface Sampling. In Dixon, A.M. (Editor) Environmental monitoring for cleanrooms and controlled environments. CRC Press: New York.
Sutton, S. (2010). The Environmental Monitoring Programme in a GMP Environment, Journal of GXP Compliance, 14 (3): 22-30
Tetzlaff, R.F. (1992). Investigational Trends: Clean Room Environmental Monitoring. PDA Journal of Pharmaceutical Science and Technology, Vol. 46, No. 6, pp206214.
Whyte, W. (2001). Cleanroom Technology: Fundamentals of Design, Testing and Operation. Wiley-Blackwell: Oxford, UK
Whyte, W. and Eaton, T. (2004). Assessing Microbial Risk to Patients from Aseptically Manufactured Pharmaceuticals. European Journal of Parenteral and Pharmaceutical Science. 9 (3): 71-79
World Health Organization (2003): Application of Hazard Analysis and Critical Control Point (HACCP) Methodology to Pharmaceuticals, WHO Technical Report Series No. 908, Annex 7, World Health Organization, Geneva, 2003 (http://www.who.int/medicines/library/qsm/trs908/trs908-7.pdf).
About the authorDr Tim Sandle
Dr. Tim Sandle has over twenty-five years’ experience of microbiological research and biopharmaceutical processing. He is a member of several editorials boards and he has written over six-hundred book chapters, peer reviewed papers and technical articles relating to microbiology. Dr. Sandle works for a pharmaceutical manufacturer in the UK, and is a visiting tutor at both the University of Manchester and UCL.

20
Reading Scientific Services Limited (RSSL), is an award-winning Contract Research Organisation (CRO) and winner of Best CRO at 2019 OBN awards. We pride ourselves on our excellence in science, quality and service.
Excellence in Science and Service
For over 30 years, we have been providing support to the Pharmaceutical Sterile Manufacturing Industry and recently launched Sterility Testing (membrane filtration and direct inoculation), with Mycoplasma Testing to be offered soon. Our expert team can also support with raw material, vial and stopper testing to microbial analysis such as TAMC/TYMC and endotoxin (LAL).
We work in partnership with our clients to ensure that they meet the regulatory requirements both with routine testing as well as more complex projects such as cleaning validation and environmental monitoring, using the wealth of experience from our multi-disciplinary team of technical experts and consultants.
Sterile Manufacturing Support Services:
• Sterility Testing
• Endotoxin Testing
• Environmental Monitoring
• Raw Materials
• Vial and Stopper Testing
• Mycoplasma
• Investigative Problem Solving
• 24/7 Emergency Response Service
• Training and Consultancy
To find out more about how we can support your Sterile Manufacturing or to discuss your needs further, please contact us on: +44 (0)118 918 4076, email [email protected], or visit www.rssl.com

21
Contact us to find out more about our expertise and how we can support you:Tel: +44 (0)118 918 4076 Email: [email protected] Web: www.rssl.com
Reading Scientific Services Ltd
The Reading Science Centre, Whiteknights Campus, Pepper Lane, Reading, Berkshire RG6 6LA
About Reading Scientific Services Ltd (RSSL)RSSL is an award-winning Contract Research
Organisation (CRO), providing analytical,
investigational, consultancy and training
services to clients in the global pharmaceutical,
biopharmaceutical and healthcare sectors.
Our chemical, physical, biochemical, biological
and microbiological services are wide ranging, and
provide support through the full product lifecycle.
RSSL is routinely inspected by the MHRA, FDA
and UKAS which ensures that our analytical
services meet the needs of industry. We are trusted
by industry to provide a solution with scientific
excellence, outstanding customer service and
professionalism.
© 2020 RSSL. All rights reserved.