Best Practices 2013 - Bio-IT World
254
2013 | Best Practices Compendium | Bio l IT World [1] Best Practices 2013 Compendium from the Bio l IT World Best Practices Awards Program 2013 Focus on
-
Upload
khangminh22 -
Category
Documents
-
view
1 -
download
0
Transcript of Best Practices 2013 - Bio-IT World
2013 | Best Practices Compendium | BiolIT World [1]
Best Practices 2013Compendium from the BiolIT World Best Practices Awards Program 2013
Focus on
2013 | Best Practices Compendium | BiolIT World [2]
Best Practices 2013INTRODUCTION 3
KNOWLEDGE MANAGEMENT 4Searching for Gold: GSK’s New Search Program that Saved Them MillionsGlaxoSmithKline
JUDGES’ PRIZE 5Genentech Finds Big Savings in Small PlacesGenentech
CLINICAL AND HEALTH IT 6PRO-ACT: Bigger and Better ALS Database Open for MiningPrize4Life
INFORMATICS 7From DNA to PDF: Harnessing the Genome and Phenome to Make Better DiagnosesGenomic Medicine Institute, Geisinger Health System - nominated by SimulConsult
IT INFRASTRUCTURE/HPC 8The Cloud’s the Limit: Rentable Supercomputers for Improving Drug DiscoverySchrodinger - nominated by Cycle Computing
EDITORS’ PRIZE 9GeneInsight: Genetic Knowledge to ActionGeneInsight
HONORABLE MENTION: 10 - 11Faster, Scarless AssembliesJBI and Amgen - nominated by TeselaGen Biotechnology
TrialShare Brings Much Needed Transparency to Clinical Trials DataImmune Tolerance Network - nominated by LabKey Software
2013 BEST PRACTICES OVERVIEW 12
2013 BEST PRACTICES ENTRIES 13
Clinical and Health IT 13
Informatics 65
IT Infrastructure/HPC 155
Knowledge Management 202
2013 JudgesThe 2013 Best Practices Awards were organized by Bio-IT World managing editor Allison Proffitt and editor Kevin Davies. Joining the editors in judging the entries was a distinguished panel of experts:
Joe Cerro, SchoonerGroupBill Van Etten, The BioTeamStephen Fogelson, DevelotronMartin Gollery, Tahoe InformaticsPhillips Kuhl, Cambridge Healthtech InstituteAlan Louie, IDC Health InsightsSusan Ward, ConsultantBrenda Yanak, Pfizer
INTRODUCTION
4
5
8 11
2013 | Best Practices Compendium | BiolIT World [3]
INTRODUCTION
The Bio-IT World Best Practices Awards have been around long enough for us—as editors and judges—to get a little jaded. But instead, our enthusiasm is renewed each year by the excellent entries, innovative ideas, and passion to better our industry. Bio-IT World is honored to be in a position to share these projects with the industry at large.
The 2013 awards season was no exception. Our honorees span the whole of the life sciences industry. From an animal work project that saved nearly half a million dollars a year, to a clinical trials data interpretation platform, these truly are best practices for the breadth of the industry.
Although every project won’t be applicable to every group, it is our hope that there will be some aspect in each one to emulate and apply for more cost efficient and effective research.
The 2014 Bio-IT World Best Practices Call for Entries opens this month, and we have high hopes for the next round of competition. We welcome all collaborations and projects that have advanced the life sciences, and look forward to seeing you at the 2014 Bio-IT World Conference & Expo as we announce the next round of winners.
- Allison Proffitt, Editorial Director
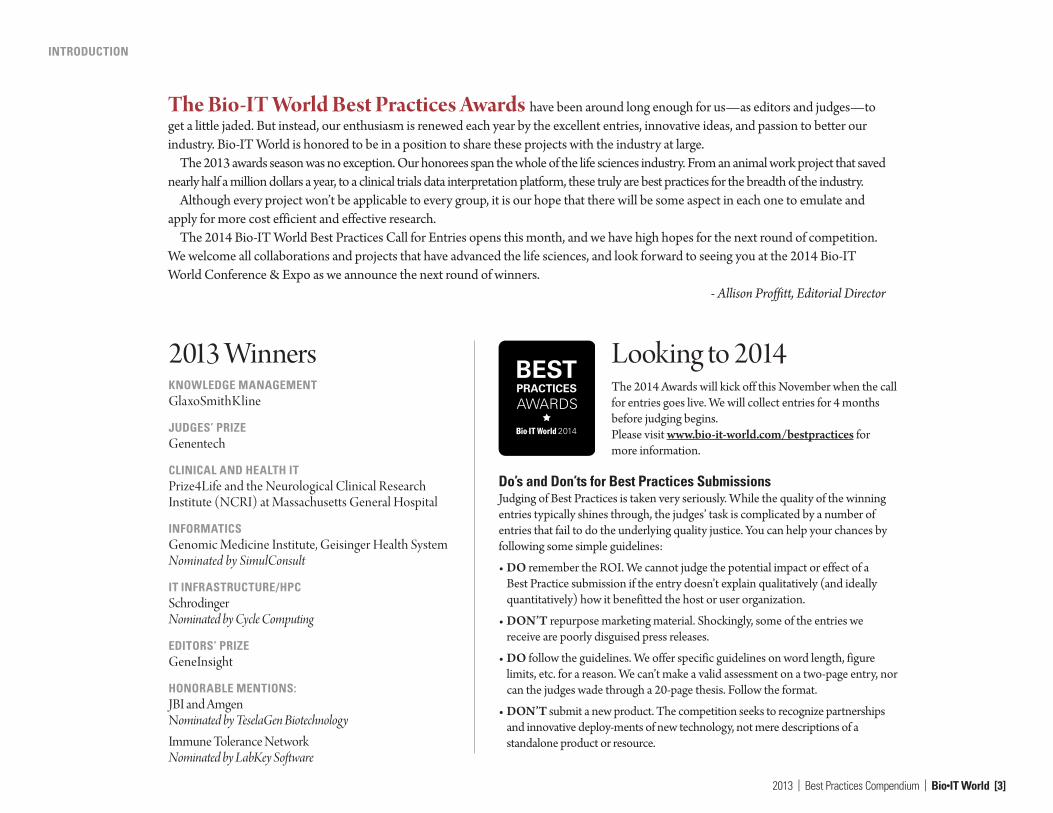
BESTPRACTICES
AWARDS
2014
2013 WinnersKNOWLEDGE MANAGEMENTGlaxoSmithKline
JUDGES’ PRIZEGenentech
CLINICAL AND HEALTH ITPrize4Life and the Neurological Clinical Research Institute (NCRI) at Massachusetts General Hospital
INFORMATICSGenomic Medicine Institute, Geisinger Health SystemNominated by SimulConsult
IT INFRASTRUCTURE/HPCSchrodinger Nominated by Cycle Computing
EDITORS’ PRIZEGeneInsight
HONORABLE MENTIONS: JBI and AmgenNominated by TeselaGen BiotechnologyImmune Tolerance NetworkNominated by LabKey Software
Looking to 2014The 2014 Awards will kick off this November when the call for entries goes live. We will collect entries for 4 months before judging begins. Please visit www.bio-it-world.com/bestpractices for more information.
Do’s and Don’ts for Best Practices SubmissionsJudging of Best Practices is taken very seriously. While the quality of the winning entries typically shines through, the judges’ task is complicated by a number of entries that fail to do the underlying quality justice. You can help your chances by following some simple guidelines:
• DO remember the ROI. We cannot judge the potential impact or effect of a Best Practice submission if the entry doesn’t explain qualitatively (and ideally quantitatively) how it benefitted the host or user organization.
• DON’T repurpose marketing material. Shockingly, some of the entries we receive are poorly disguised press releases.
• DO follow the guidelines. We offer specific guidelines on word length, figure limits, etc. for a reason. We can’t make a valid assessment on a two-page entry, nor can the judges wade through a 20-page thesis. Follow the format.
• DON’T submit a new product. The competition seeks to recognize partnerships and innovative deploy-ments of new technology, not mere descriptions of a standalone product or resource.
2013 | Best Practices Compendium | BiolIT World [4]
Searching for Gold:GSK’s New Search Program that Saved Them Millions
By Matt Luchette | June 5, 2013
In 2011, the leadership in the GlaxoSmithKline’s R&D department made a troubling realization: their scientists were having a tough time finding their data.
By that point, GSK’s research staff was logging all of their experimental results in electronic lab notebooks. But once the data was saved, the company’s search program,
GSKSearch, wasn’t able to parse the records. If researchers in one division wanted to investigate a compound for clinical development, they had no way of efficiently accessing any studies the company had already done on the compound. And for the data GSKSearch could access, the program couldn’t recognize many of the chemical, biological, and clinical terms that identified specific experiments.
“The search capabilities were not adequate,” said Mirna Samano, the program manager for GlaxoSmithKline’s MaxData strategic program.
Hard-to-reach data and archived experiments meant lost time and money for the company, so Samano and her R&D division set up focus groups with GSK scientists to identify what they needed in order to make the most of their data.
The message from the scientists was resounding: “Why can’t we have something like Google?”To resolve the program, the R&D engineers’ first instinct was to investigate Autonomy, the
text search program used for GSKSearch, for any limitations or errors in the code. But the program was full-functioning and gave robust results. What they realized, though, was that the search requirements for their scientists were different than those of a standard text search engine. They didn’t need Google; they needed a specialized program that could recognize the various chemical compounds or drug targets that GSK researchers test every day.
“We needed to help R&D maximize the value of their data,” said Samano.The R&D IT engineers set to work developing a new search program that would expand the
capabilities of GSKSearch. Most importantly, the engineers wanted the program to search the company’s entire library of electronic lab notebooks and recognize chemicals through their various generic and scientific names, as well as drawings and substructures. In addition, they wanted to add new capabilities, such as recognizing combination drugs, gene aliases, or standard disease vocabulary, to make searches more streamlined.
Socrates Search, as the project came to be known, was made by combining a number of commercial search programs, many of which were already in place at GSK. Autonomy’s text search and ChemAxon’s JChem Oracle cartridge, which allows users to search for chemicals with their various names or structure, were already a part of GSKSearch, but now had added
capabilities, including improved text analytics and data extraction with software from NextMove, and web integration with Microsoft’s C# ASP.NET libraries. The result was a new program that could search through the company’s archived electronic lab notebooks and recognize a vast library of scientific terms, bringing once inaccessible data to scientists’ fingertips.
Samano said the program was an excellent exercise in “how to combine a company’s existing tools to accomplish goals.”
Samano added that while Socrates has been optimized to recognize the company’s chemical and biological experiments, in future iterations, she hopes to make the program more useful for other areas of R&D, such as clinical and regulatory records.
Today, Socrates Search has access to over 2 million of the company’s online lab notebooks, has indexed over 70 million unique terms, and supports an average of 500 users every month. GSK spent about 1 million pounds (about $1.5 million) on the project, and the company estimates that Socrates Search could save as much as $2 million pounds each year in improved efficiency.
“The value of the tool is greatly recognized at GSK,” Samano explained. As a director in GSK’s Animal Research Strategy remarked, “This tool allows us to more fully apply our considerable experience, link internal experience, and design more robust experiments.”
The program’s capabilities have been recognized outside of the company as well, most recently by winning the2013 Best Practices Award for Knowledge Management at the Bio-IT World Expo in April. Winning the award, Samano said, has been instrumental in gaining interest from more colleagues throughout GlaxoSmithKline who would like to take advantage of Socrates’ capabilities. “The project has been a great experience for our team,” she said. n
KNOWLEDGE MANAGEMENT
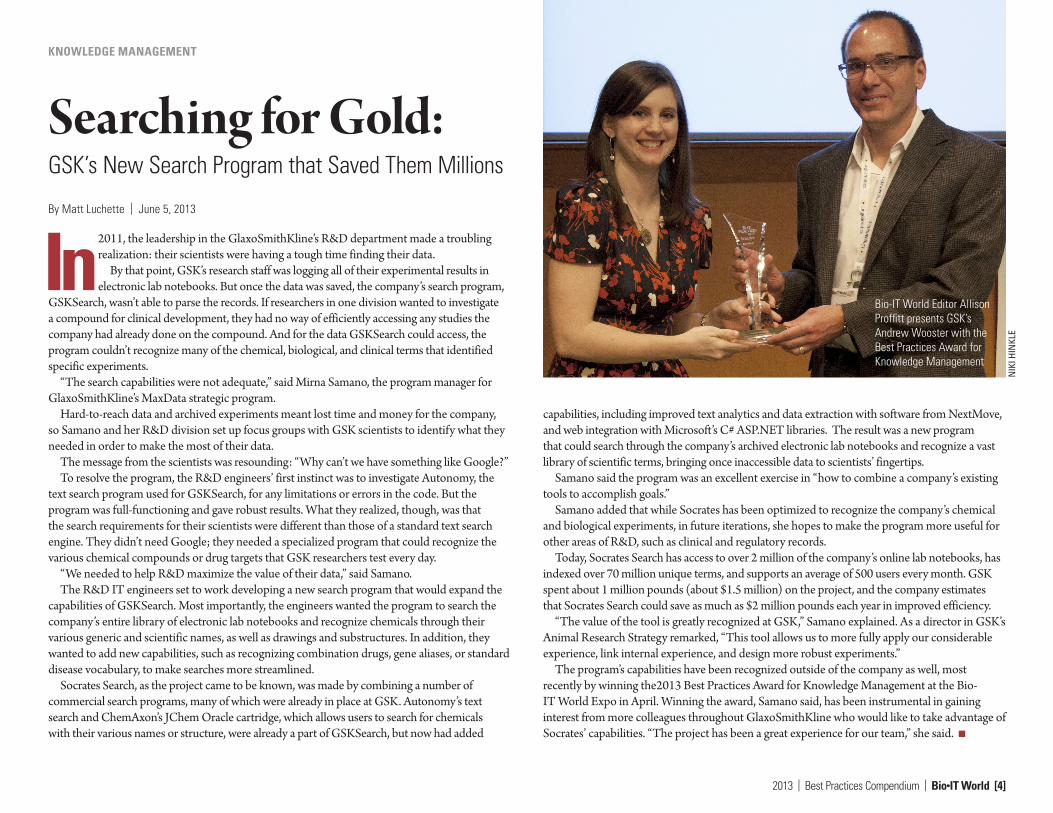
Bio-IT World Editor Allison Proffitt presents GSK’s Andrew Wooster with the Best Practices Award for Knowledge Management
NIK
I HIN
KLE
2013 | Best Practices Compendium | BiolIT World [5]
JUDGE’S PRIZE
Genentech Finds Big Savings in Small PlacesBy Aaron Krol | July 19, 2013
At Genentech’s Mouse Genetics Department in South San Francisco, Dr. Rhonda Wiler and her team are proving that the simplest investments in IT can yield the biggest returns.
Dr. Wiler’s department oversees a breeding facility for genetically engineered mice, which produces over 40,000 pups a month representing almost a thousand distinct genetic lines. Keeping track of so many animals, while running regular genotypic assays and maintaining a humane living environment, is a labor-intensive job, with plenty of opportunities for waste and redundancy. But a recent innovation in Genentech’s cage changing procedure showcased the savings that can be achieved when waste is tackled aggressively, and won Genentech the Judges’ Prize at the 2013 Bio-IT World Best Practices Awards.
Changing cages for washing is an important feature of mouse husbandry, providing clean bedding and food, and clearing animal excreta. It’s also a stressful time for the mice, and a time-consuming task for the veterinary staff. When staff observed that the current system—an entire rack of 160 cages was changed together every two weeks—occasionally led to the changing of clean cages with plenty of food, Dr. Wiler decided to experiment with a more data-driven strategy.
Genentech already collected detailed information on the history of all the mice and cages, through their colony management system (CMS), developed in-house and implemented in 2008. CMS is a flexible bioinformatics system that incorporates portable devices, such as tablets, so that staff can both access and enter data remotely as they perform tasks.
“CMS has allowed us to capture information at a level that people never had considered doing before,” said Erik Bierwagen, Principal Programmer Analyst at Genentech, “maintaining detailed information about every single animal in the facility, addressing and barcoding every single location within our facility, and capturing all the key details of the genetics of the animals.” Tasked with streamlining the cage change procedure, Bierwagen and his in-house programmers at the Bioinformatics & Computational Biology Department set to work creating a new software tool, Directed Cage Change (DCC), to record and prompt cage changes.
The trouble with the old system was that cages are sometimes moved from one rack to another, or have to be changed prematurely for weaning or mating. As a result, not all cages in a given rack have waited the same amount of time to be changed. In addition, some cages contain more mice than others; lower occupancy cages can afford to be changed less frequently. A preliminary analysis in CMS suggested that, with all these variables accounted for, over six thousand cages a week were being changed unnecessarily. DCC would eliminate this redundancy.
Outperforming Expectations
Instead of assigning an entire rack of cages to be changed, DCC tracks the status of each cage individually, based on its occupancy and most recent changing. A cage with a single mouse can be changed once every four weeks, and a breeding cage with 10-day-old pups once a week, without
throwing off any other cages’ schedules. DCC also records unexpected changing events, and updates each cage’s history accordingly.
The key to making DCC functional is an intuitive user interface on the mobile devices already in use at the facility. A veterinarian can select a specific rack on her tablet, and see a map in which the cages that need to be changed are highlighted in blue. Like other software built out of CMS, this procedure is smoothly integrated into the staff ’s daily routine and requires little training to use.
The DCC program outperformed expectations, reducing the number of cages changed each week by 40%. This saves not only in labor, but also food, bedding, water, and electricity. The DCC program also produced less quantifiable, but equally important benefits: in the veterinary staff ’s increased sense of job satisfaction, and in better living conditions for the mice. A preliminary analysis has revealed fewer evidence of stress behavior such as pup cannibalization or male fighting after DCC’s implementation, and even increased breeding in certain colonies.
Altogether, the DCC system saved Genentech a staggering $411,000 a year, for an initial investment of just $40,000 in software development. While updating the procedures for cage changes in a mouse breeding facility may not be the most glamorous of projects, this huge return on investment highlights the results that can be achieved on every level of the industry with attention to bioinformatics systems.
“I was not surprised that there was a positive return on investment, but was very happily surprised at the magnitude,” said Bierwagen, adding that CMS has been helping the team discover new efficiencies ever since its implementation. CMS has already paved the way for high-throughput genotyping that saves Genentech $750,000 annually, and large-scale cryopreservation of genetic lines that has allowed the facility to breed 100,000 fewer mice each year.
DCC’s “staggering ROI” and creative use of bioinformatics were recognized this April, when Genentech took home the Judges’ Prize at the 2013 Bio-IT World Best Practices Awards, part of the Bio-IT World Conference & Expo held in Boston. The annual Best Practices competition recognizes excellence in data management in the life sciences, and draws a distinguished panel of judges from the field. n
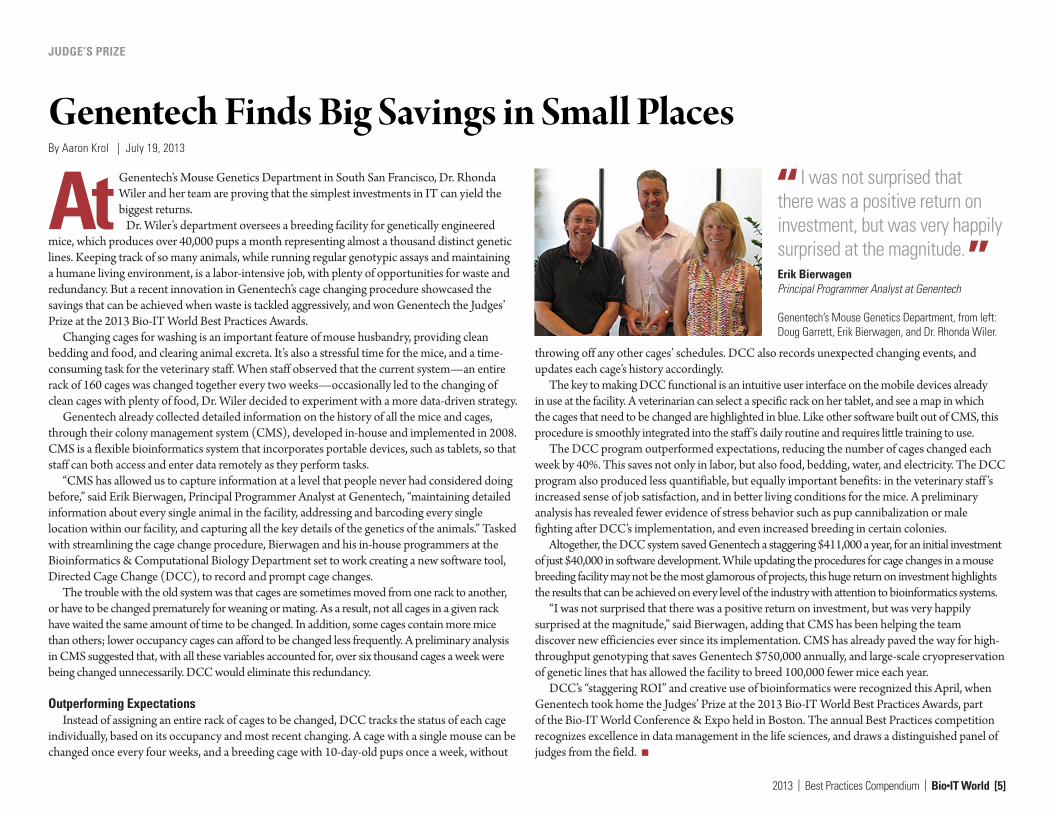
I was not surprised that there was a positive return on investment, but was very happily surprised at the magnitude. Erik BierwagenPrincipal Programmer Analyst at Genentech
Genentech’s Mouse Genetics Department, from left: Doug Garrett, Erik Bierwagen, and Dr. Rhonda Wiler.

2013 | Best Practices Compendium | BiolIT World [6]
PRO-ACT:Bigger and Better ALS Database Open for Mining
By Deborah Borfitz | May 10, 2013
A myotrophic lateral sclerosis (ALS) research is getting a major boost from a newly launched Pooled Resource Open-access ALS Clinical Trials (PRO-ACT) platform, which has amassed more than 8,500 de-identified clinical patient records into a single, harmonized dataset. Multiple pharmaceutical companies are now actively exploring
PRO-ACT, seeking ways to streamline clinical trials and develop better treatments for the rare and highly heterogeneous disease more commonly known as Lou Gehrig’s disease.
For jointly developing PRO-ACT, the Neurological Clinical Research Institute (NCRI) at Massachusetts General Hospital and Cambridge-based nonprofit Prize4Life share the 2013 Bio-IT World Best Practices Award in the clinical and health IT category. PRO-ACT took nearly two painstaking years to bring to fruition, with funding from the ALS Therapy Alliance, says Alexander Sherman, director of strategic development and systems for NCRI.
A subset of the data last year turned up potential new ways to predict ALS progression early on in the disease, when Prize4Life went crowdsourcing for solutions, says Chief Scientific Officer Melanie Leitner. The algorithms, once validated, could increase the likelihood of future ALS clinical trial success as well as reduce the required number of trial subjects by 23%.
Currently, only five industry-sponsored trials and another 20 or so smaller academic ones are testing remedies for the life-robbing disease in ways ranging from stem cells and viral vectors to drugs and devices—even exercise and diet modifications. While these trials are designed to demonstrate the efficacy of a particular intervention, they are individually too small to reveal disease patterns by age, gender, or many other defining patient characteristics.
Merging multiple clinical trial datasets makes those sorts of correlations statistically possible, say Leitner. Disease biomarkers also become more easily identifiable. Some ALS patients (like Lou Gehrig) die within two years and others (like Stephen Hawking) survive for decades. Once progression speed can be predicted, trial design can start to reflect those basic differences.
Information gets organized in PRO-ACT using a disease-specific Common Data Structure (CDS) built according to Common Data Elements used by research consortia and recommendations by the National Institute of Neurological Disorders and Stroke, says Sherman. The platform allows for any necessary re-assignment and sharing of data fields between multiple data elements.
Data curation and mapping is enormously time-consuming given that donated datasets arrive with their own data structure and semantics, and in some cases lack data dictionaries entirely, Sherman adds. The exercise can take anywhere from several weeks to half a year. As the CDS
itself may potentially change because of new guidelines and discoveries, PRO-ACT allows those changes to be implemented without data re-importation.
Repurposed Data Data from 18 completed ALS clinical trials have to date been donated to PRO-ACT, 13 from
four pharmaceutical companies (Sanofi, Regeneron, Teva Pharmaceuticals, and Novartis) and the remainder from academic sites participating in the Northeast ALS (NEALS) consortium. Industry provided valuable treatment-arm as well as placebo data. Decades of ALS research have resulted in only a single FDA-approved drug, in the mid-1990s, and many companies have abandoned the effort, says Leitner. “So PRO-ACT gave the data donors the opportunity to do something good with the investment they’d made.”
Prize4Life has a seven-year working relationship with NCRI, the coordinating center for the 104-site NEALS consortium. Clinical datasets from NEALS trials, including more than 60,000 bio-samples from ALS patients as well as disease and healthy controls, have always been freely distributed for legitimate research purposes, says Sherman. PRO-ACT essentially takes that concept to the crowdsourced level. Users of PRO-ACT currently number 125 and are rising “almost daily” in advance of major outreach efforts, says Leitner. Most of them are neither ALS clinicians nor medical researchers, but biostatisticians and others with quantitative expertise.
Anyone with a valid research purpose who agrees to basic terms and conditions (i.e. no data repackaging and reselling) can download the database or portions thereof from the Prize4Life PRO-ACT website, says Sherman. Data subtypes include demographics, family history, laboratory, vital signs and ALS functional measures, and mortality. PRO-ACT currently contains over eight million longitudinally collected data points, inclusive of nearly 1.7 million laboratory test results, ten times the number previously available from NEALS.
Sponsorship Needs
PRO-ACT is poised for substantial growth, with at least seven other datasets yet to be added and industry as a whole being noticeably more collaboration-minded, says Leitner. Data from a recently completed phase III ALS trial by Biogen Idec may add between 500 and 1,000 subject records to PRO-ACT by the end of the year. Some other ALS solicitation efforts are being slowed by recent merger and acquisition activity, making the necessary permissions difficult to come by and throwing data possession rights into question.
Charitable funding is being sought to cover the estimated $500,000 annual cost of soliciting, cleaning, and harmonizing data for import into PRO-ACT, says Sherman. Future ALS trials designed to harmonize with the CDS used by PRO-ACT will make it easier to import resulting datasets into the platform.
PRO-ACT is expected to promote collaboration among academic researchers as well as between academia, nonprofits, and industry. It can be used as-is by researchers to learn about neurodegenerative diseases other than ALS, says Sherman. But to benefit the more than 7,000 other rare diseases in the U.S., the concept will need to be replicated many times over. n
CLINICAL AND HEALTH IT
2013 | Best Practices Compendium | BiolIT World [7]
From DNA to PDF:Harnessing the Genome and Phenome to Make Better Diagnoses
By Matt Luchette | May 28, 2013
W hen doctors like Marc Williams need to analyze thousands of variants in a patient’s genome to make a diagnosis, a little help can go a long way.
Williams, the director of the Genomic Medicine Institute at the Geisinger Health System, won a Bio-IT World Best Practices award in Informatics at the Bio-IT World
Conference & Expo this past month for his project testing the effectiveness of SimulConsult’s “Genome-Phenome Analyzer,” a tool to help clinicians analyze a patient’s genome. His goal for the project was to “test the impact of bringing the power of genome analysis to clinical practice.”
“If we were able to pull this off, it was going to dramatically improve my ability as a clinician to help diagnose my patients.” Williams told Bio-IT World.
In the decade since the Human Genome Project, the cost of whole-genome sequencing has plummeted from nearly $100 million per genome in 2001 to almost $1,000 per genome today. And with costs continuing to fall, many researchers think genome analysis may soon become a common clinical tool—like taking a patient’s blood pressure or pulse—to help doctors make more accurate diagnoses. The issue now, for physicians and researchers alike, is no longer sequencing the genome, but rendering clinically-actionable recommendations based on the data.
Currently when a doctor needs to analyze a patient’s genome, the sequence may be given to a number of geneticists who try to correlate some 30,000 possible genetic variants with the patient’s reported symptoms. “That’s great if you’re at a large academic center,” says Williams, but if it’s going to be useful in the clinic, doctors will need programs that improve the efficiency of the interpretive process.
SimulConsult’s “Genome-Phenome Analyzer” hopes to do just that: it combines a patient’s sequenced genome with the physician’s clinical findings to help determine a diagnosis. The program calculates the severity of thousands of genetic variants, based on peer-reviewed genetic articles from GeneReviews’ and GeneTests’ online databases, and correlates the relevant variants with the patient’s signs and symptoms. The result is a differential diagnosis ranked by the likelihood that each disease is the culprit, with links to GeneReviews and GeneTests for published studies on the genes of interest.
The program “takes a process that was once 10-40 hours down to 10 minutes,” said Lynn Feldman, CEO of SimulConsult who first became involved with the company four years ago as an angel investor. Feldman said what drew her most to SimulConsult was her desire to “lower the cost and improve diagnoses in health care,” a goal she hopes to achieve with the Analyzer.
For his Best Practices study, Williams wanted to show just how powerful the Analyzer could be for geneticists and physicians alike. He used the program to test three genetic “trios,” a patient’s genome along with the parents’ genomes. The test analyzed the patients’ genomes for
homozygosity, inheriting the same defective gene from each parent, compound heterozygosity, inheriting a different defective gene from each parent that together create a disease phenotype, or novel genetic variants not found in either parent. Williams then assessed whether the Analyzer was able to select the relevant variants and assign an appropriate diagnosis for each of the patients. In all three trios, the Analyzer correctly identified 100% of the relevant genes, and for one of the patients, ranked the correct diagnosis and pertinent gene as the most probable. For the other two patients, the pertinent genes were ranked among the top three.
In addition to finding known genetic variants, the Analyzer may even help researchers discover new variants. “There’s 80% of the genome that we don’t know anything about,” Feldman said, “so there’s still so much we don’t know.” By analyzing genetic trios, the Analyzer can identify diseases caused by heterozygous genes, where only homozygous cases have been documented, or vice versa. Furthermore, for variants that have
no documented human cases, the Analyzer can search for articles on similar variants seen in animal or human studies to help doctors render an appropriate diagnosis.
One novelty of the Analyzer, according to Feldman, is that “it turns the testing paradigm on its head.” When a doctor requests a cholesterol test, for example, the test is typically analyzed once, and may be administered repeatedly to follow trends over time. With the Genome-Phenome Analyzer, “the test is administered once, and can be reanalyzed repeatedly as a patient develops new symptoms.”
To help streamline the program for doctors, Williams hopes that future editions of the Analyzer will integrate seamlessly with electronic health records and pick out relevant symptoms from the doctor’s notes. Feldman hopes to improve communication in the other direction as well, from the Analyzer to the doctor, by including brief summaries on each report that explain the most relevant clinical findings.
“Clinicians want information presented to them in a medical way, not in a PhD way,” she explained. Winning the Best Practice award may have given SimulConsult the momentum to continue
making such improvements. “Staying front and center is very helpful,” Feldman said, and the increased recognition may convince potential clients to trust the program and sign on. “People are afraid to take the first step.” n
INFORMATICS
If we were able to pull this off, it was going to dramatically improve my ability as a clinician to help diagnose my patients. Marc WilliamsDirector, Genomic Medicine Institute at the Geisinger Health System
2013 | Best Practices Compendium | BiolIT World [8]
The Cloud’s the Limit:Rentable Supercomputers for Improving Drug Discovery
By Matt Luchette | July 11, 2013
Creating a computer program that accurately tells pharmaceutical companies which candidate drugs they should spend millions of dollars developing may seem like a daunting task, but Schrodinger, a software company that specializes in life science applications, hopes to do just that.
“Our mission is to advance computational drug design to the point of becoming a true enabling technology,” said Alessandro Monge, Schrodinger’s VP of Strategic Business.
Schrodinger won the Bio-IT World Best Practice Award for IT Infrastructure at the Bio-IT World Expo this past April for a drug discovery project they ran in collaboration with Cycle Computing that harnessed the power of cloud-based computing, a tool that allows companies to rent high performance computing hardware.
Since the mid-1900s, the power of the cloud, or infrastructure that provides remote access to digital information, was restricted mainly to scientists and academics, but by the 1990s, with the birth of the internet and email clients like Hotmail, the cloud entered the public realm, providing users access to their files from anywhere they had an internet connection. Users didn’t own the storage space; the company housed the hardware, but allocated a certain amount of storage for each customer.
In 2006, Amazon opened up its Amazon Web Services (AWS) to businesses by providing remote computing through the cloud, as opposed to just remote storage. While Amazon provided the infrastructure, other companies such as Cycle Computing helped clients tailor AWS hardware to their computational needs.
A few years ago, Schrodinger began a project that they hoped would show the power AWS’s supercomputing could have in drug discovery. One of their programs, Glide, could simulate the interaction between a small chemical compound and its target on the molecular level (see, “Going Up: Cycle Launches 50,000-Core Utility Supercomputer in the Cloud”).
These so-called “Docking Algorithms” have been the Holy Grail for many pharmaceutical companies; an efficient, reliable program that could mimic the interaction between a drug and its target, and quickly scan thousands of small molecules for the drugs that provide the strongest fit, could mean enormous savings for a process that can take over a billion dollars and nearly a decade to complete.
Yet the computational requirements for algorithms like Glide are extensive; for each of the thousands of small molecules these algorithms screen, the program must simulate each drug’s many possible conformations, as well as the multiple ways for it to bind with its target. The hardware that runs the program needs to be efficient and high-performing; any time or computational constraints on the program would decrease its accuracy and lead to false positives or negatives.
“To run simulations quickly, it comes at the cost of accuracy,” said Monge. Schrodinger turned to Cycle Computing for help. In collaboration with Nimbus Discovery,
a computational drug discovery company, Schrodinger wanted to test Glide’s capabilities by screening a staggering 21 million small molecule ligands against a protein target. By building a 50,000 core cloud-based supercomputer in AWS, Cycle Computing provided Schrodinger with the computational power their program required, without the upfront capital needed to purchase new hardware.
“There are a lot of questions in the cloud” in terms of its reliability and security, Monge explained, “but Cycle was able to work with us and build our infrastructure with AWS.”
Using the 50,000 core supercomputer, Cycle was able to screen the 21 million compounds in three hours, a process that would have taken Schrodinger engineers an estimated 12 years to run on their own. Furthermore, while Schrodinger would have needed to invest several millions of dollars to build a similar supercomputer in-house, “the project cost was less than $4,900 per hour at peak,” according to Cycle. The software even identified a number of promising candidate compounds that the program would have rejected without the increased accuracy AWS provided.
As Monge explained in a presentation at the “Big Data and High Performance Computing in the Cloud” conference in Boston last year, a “50,000 core Glide run represents a proof of concept that we can start attacking a scientific problem without being constrained by computational resources.”
As evidenced by the high efficiency and fidelity Schrodinger was able to achieve by running Glide on the cloud, Monge remarked that “the cloud is the next level of Moore’s Law.”
While Monge was not able to comment on updates to the program or new projects the company is undertaking, he said that winning the award has generated even more momentum within Schrodinger to pursue cloud-based computing. “Our customers know we have a serious effort in the cloud,” he said.
In the nomination application for the Best Practice award, Cycle Computing summarized the possible implications of the project, stating that rentable supercomputing hardware can make drug-testing algorithms possible that would otherwise be “too compute intensive to justify the cost.” n
IT INFRASTRUCTURE/HPC
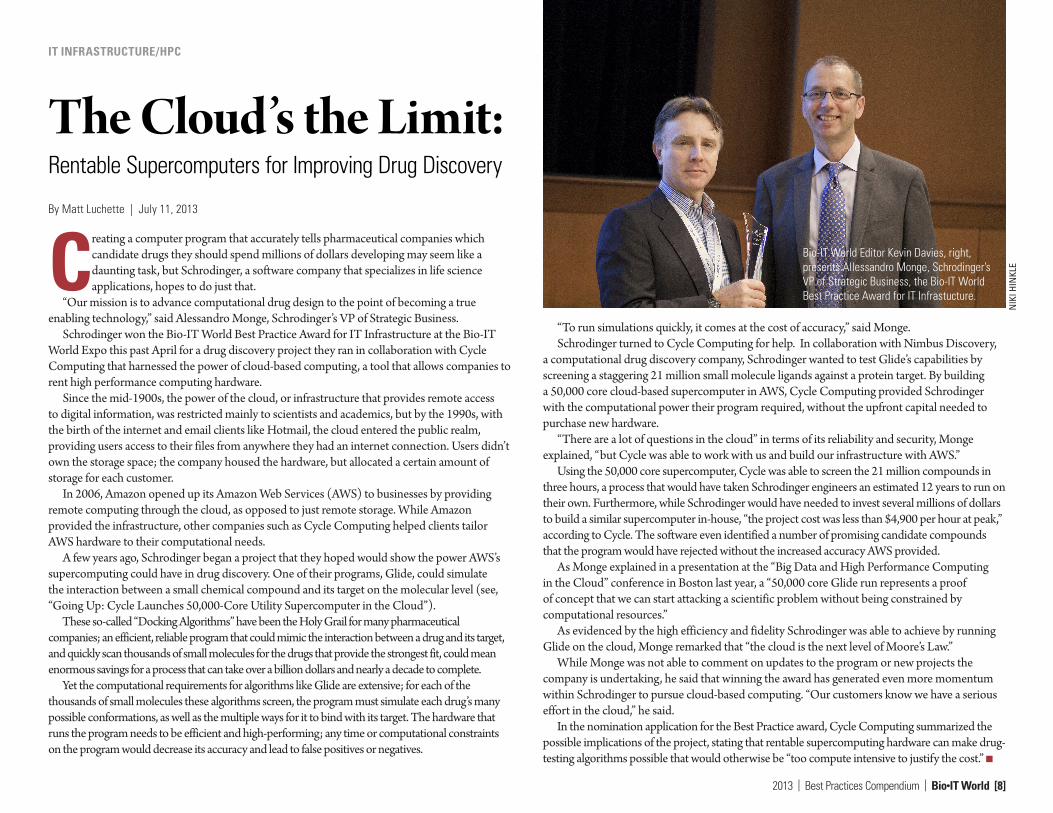
Bio-IT World Editor Kevin Davies, right, presents Allessandro Monge, Schrodinger’s VP of Strategic Business, the Bio-IT World Best Practice Award for IT Infrastucture.
NIK
I HIN
KLE
2013 | Best Practices Compendium | BiolIT World [9]
GeneInsight:Genetic Knowledge to Action
By Allison Proffitt | June 6, 2013
Today’s biotech grail is surely genomics in the clinic—using sequencing to inform care, treatment, and disease prevention. Implementation is easier said than done, but Partners Healthcare has been doing it since 2005. Its GeneInsight suite of applications was awarded the 2013 Bio-IT World Best Practices Editors’ Prize.
Heidi Rehm of Brigham and Women’s Hospital and Director of the Laboratory for Molecular Medicine, Partners Healthcare Center for Personalized Genetic Medicine (PCPGM) in Boston has been running a clinical genetics lab for over 10 years. For years the lab used Sanger sequencing, Rehm said, but was able to make major leaps in the volume of testing when it shifted to next generation sequencing a few years ago.
Thankfully, Rehm had been working closely with an IT team led by Sandy Aronson, Executive Director of IT of PCPGM to develop a platform designed to assist labs in, “storing genetic knowledge across genes and diseases and variants and tests in a way that allows data to be structured more efficiently,” Rehm says.
The problem isn’t a new one, and GeneInsight isn’t a new solution. GeneInsight has been in, “full production clinical use since 2005,” says Aronson. “Our
Laboratory for Molecular Medicine—[Rehm’s lab]—began providing sequence-based tests very quickly after it opened,” he says. “When you do sequencing-based tests you start finding these variants of unknown significance on a regular basis and you need mechanisms for dealing with that, and that really was the impetus for building GeneInsight and tracking the data and the knowledge lifecycle around each one of these variants.”
The platform has grown with the genetic data. The goal, Rehm says, has always been a platform that can effectively analyze data and automatically generate patient reports. Her lab has been using GeneInsight for over eight years and has generated 30,000 reports.
Two Sides, One Solution
The clinical genomics problem has always been two-sided, says Aronson. “You have a physician that is treating patients, and you need to be able to both communicate
results effectively to them, give them the ability to manage those results, and then also keep those clinicians up to date as more is learned about their patients over time,” he explains.
“From the laboratory perspective, what goes into that is you begin running genetic tests on patients, you start sequencing genes, and you find more and more variants of uncertain
significance in those genes. And one of your objectives becomes to do as good a job as possible at re-classifying those variants… into pathogenic categories or benign categories.”
Building a platform to address those challenges needed to be multi-faceted. “GeneInsight consists of a clinician-facing application that can be integrated with electronic
health records or stand alone, a laboratory-focused application that manages knowledge, and facilitates reporting. Those applications can be federated either lab- to-clinic or lab-to-lab,” Aronson says.
The clinician-facing application—GeneInsight Clinic—simplifies genetic testing reports, while also staying dynamic. GeneInsight, “uses a lot of sophisticated rules-based logic to enable the auto-drafting of patient reports using patient-specific and disease-specific information,” explained Rehm. The platform delivers Web-based reports to physicians and can be integrated into several electronic health records (EHRs). But keeping the reports connected to the system, “allows the variant database to be connected to patient reports, so if knowledge changes in variants, it can be delivered in real time to physicians,” Rehm says.
Partners’ Partners
Early on, Partners Healthcare knew that this wasn’t a task to tackle alone. “Even a place with the scope of Partners will not be able to curate the genome by themselves for every indication that could be seen in one of our patients. Achieving our goal required working with others,” Aronson said.
First, GeneInsight was registered as a Class 1 exempt medical device with FDA, so it could be shared with other labs and clinics across the country. Later, GeneInsight LLC was set up to facilitate that distribution.
Aronson says Partners is working with Mount Sinai Medical Center, the New York Genome Center, Illumina’s CLiA laboratory, Rehm’s lab, and ARUP Laboratories in Utah to define how “share and share alike” networks could work and what the governance surrounding that should be.
Aronson wants to encourage, “more and more places to operate under a model where in exchange for contributing your data… [labs] can benefit from the data that are contributed by other places.”
Rehm agrees that interpretation is the major bottleneck in clinical sequencing, and believes that as a community, “[we] can evolve and improve that process over time through widespread data sharing.”
Moving Forward
Even after almost eight years, Aronson still has a GeneInsight wishlist. He plans to provide deeper support for kinds of variants that are becoming more and more important, such as structural variants and other types of omics data. He also hopes to develop deeper integration with clinical process to take advantage of the “clinical context” that clinicians can bring. n
EDITORS’ PRIZE
2013 | Best Practices Compendium | BiolIT World [10]
HONORABLE MENTION
Faster, Scarless AssembliesBy Aaron Krol | October 22, 2013
There are plenty of plaudits for organizations in the life sciences that change the industry’s conceptions of what is possible, but one purpose of the Bio-IT World Best Practices Awards is to highlight those who refine those achievements until the merely possible becomes truly practical. That is why Bio-IT World was pleased to award an honorable mention at the 2013
Best Practices Awards to TeselaGen Biotechnology, a startup that spun out from the Berkeley Lab’s Joint BioEnergy Institute ( JBEI) in 2011, and Amgen for the development of TeselaGen: j5, an automated platform for designing DNA assembly protocols. This new, cloud-based platform allows even small institutions to quickly find the most cost-effective protocols for assembling scarless, multipart DNA.
While DNA assembly has become a standard laboratory function in recent years, used in biologics, synthetic genomes and a variety of other applications, researchers struggle to move through the process efficiently. Traditional cloning can be hugely time-consuming for any substantial assortment of DNA constructs, delaying a project’s completion by months. Direct oligonucleotide synthesis is faster, but the price, while falling, is likely to be many times higher than cloning for complex tasks. For even moderately-ambitious projects, like creating a combinatorial DNA library, the time and cost constraints imposed by these methods quickly exceed the means of smaller laboratories.
The middle ground is to design protocols for assembling large strands of DNA out of shorter sequences, but existing platforms have significant drawbacks. The popular BioBrick assembly method leaves “scars” of several non-coding base pairs between the pieces being assembled, and only allows two pieces to be combined at a time. A few more recent methods, like SLIC and Golden Gate, allow scarless, multipart assembly, but their design protocols cannot be easily optimized: users might spend hours working on a protocol that produces the desired sequence, only to find that molecular constraints make it unworkable in practice, or that the assembly will actually be more expensive than outsourcing direct synthesis.
The purpose of j5 is to leverage the power of these assembly methods, while automating the tedious work of finding the optimal design protocol. TeselaGen believed they could create an algorithm that would quickly generate possible protocols, eliminate unpromising avenues, and compare costs between those protocols that arrive at functional assemblies. Users simply upload to j5 the DNA pieces they want combined, choose an assembly method like Golden Gate that the program will design for, and specify any additional constraints they wish their protocol to follow—for instance, that two given parts must always appear together and in a specified order. From these specifications, j5 will not only provide a functional protocol for assembling the parts,
but will also determine, for each part, whether DNA synthesis, PCR, or oligo embedding will be most cost-effective.
TeselaGen began testing j5 with Amgen in 2012, and released a commercial version in early 2013. The software’s success was immediately apparent: in a test run, a medium-sized DNA library of around 250 constructs was assembled with j5 almost eight times as quickly as with traditional cloning, and at an eighteenth the cost of direct DNA synthesis—without wasting researchers’ time on dead ends. “For our customers, time is the biggest consideration,” Michael Fero, the CEO of TeselaGen, told Bio-IT World. “We are taking timelines that would otherwise extend out to the horizon and are bringing them down to the scale of a few weeks. The software is truly enabling.”
At the Bio-IT World Conference & Expo in Boston this April, the design team behind j5 received an honorable mention in the Best Practices Awards in recognition of the program’s massive cost-saving potential and the simplified workflow it offers genetic researchers. Fero was pleased to receive recognition for this major technical achievement. “There are not many venues for getting recognized for this type of hard-core informatics work,” he said. “Bio-IT World stands pretty much alone in that regard… I think that Nathan’s insight [Nathan Hillson, the team leader at JBEI] was that the informatics behind the assembly challenge was getting ignored or trivialized.”
Since receiving the award, TeselaGen has revamped j5 with a new, more streamlined interface for browsers and tablets. Users can also store their DNA libraries in the j5 cloud, powered by Amazon. “The primary factor for the core software was that it could do the job correctly,” says Fero, but moving forward ease of use will be an equally key focus. TeselaGen is also developing a system for direct integration with automation hardware, allowing j5’s design protocols to be immediately implemented. n
We are taking timelines that would otherwise extend out to the horizon and are bringing them down to the scale of a few weeks. The software is truly enabling. Michael FeroCEO, TeselaGen

2013 | Best Practices Compendium | BiolIT World [11]
TrialShare Brings Much Needed Transparency to Clinical Trials DataBy Ann Neuer | July 15, 2013
Making sense of the millions of data points that characterize a clinical trials database is a tough challenge for sponsors in pursuit of new therapies. For therapeutic areas such as autoimmune disease, allergy and asthma, and transplantation, the Immune Tolerance Network (ITN), an international clinical research consortium, can
help. Through TrialShare, a simple-to-use clinical trials research web portal developed at ITN, investigators and study management teams can better interpret data throughout the clinical trials process.
TrialShare is part of ITN, a non-profit sponsored largely by the National Institute of Allergy and Infectious Diseases (NIAID) and funded by the National Institutes of Health. ITN has a mission to accelerate the clinical development of immune tolerance therapies through an interactive process with established investigators in academia and industry. Built using the open source LabKey Server framework, TrialShare provides open access to ITN’s clinical studies, its datasets, and bio-repository to the scientific community.
Adam Asare, Senior Director of Bioinformatics and the visionary behind TrialShare, explains ITN’s open access policy, “Being publicly funded, there is a big push to be transparent and provide public access to the datasets from our clinical trials. But clinical trial data can be very complex, so making them transparent to the public can be difficult. Through methodologies made available in TrialShare, this goal can be met. As part of this process, TrialShare allows researchers to reproduce and possibly expand our findings.”
The process works by ITN soliciting proposals to answer the best scientific questions within its areas of focus. ITN collaborates mostly with the academic community across the globe, but also from the biopharmaceutical industry to co-sponsor clinical trials, most of which are Phase II. ITN then publishes the clinical data results in scholarly journals. “Through TrialShare, data and analysis code used in the manuscripts become interactive as users can click on links and see detailed descriptions of how the datasets were analyzed so they can re-run clinical analyses,” Asare says.
This ability to make data and analyses reproducible is one of the most significant values of TrialShare. According to research presented in Nature Genetics in 2009, reproducibility of gene signature biomarker data in published literature is iffy at best. Almost half the data cannot be reproduced for reasons such as data are not available, software is not available, or the methods are unclear.
In the ten years since the launch of ITN, more than 1,000 clinical datasets have been released, with statistical code from six of its publications. Many of ITN’s clinical trials originate from solicited proposals utilizing specimens from ITN’s extensive biorepository of more than 270,000 de-identified samples maintained by ITN. These samples are linked to extensive laboratory assay results using flow cytometry, gene expression, and immunohistochemistry. Users can access assay and other clinical information about these samples through download. TrialShare also includes visualization tools that allow users to see the original analysis and then further interpret that information through user-defined filters.
Accessing ITN TrialShare is simple. Interested users can visit www.itntrialshare.org and click on “Create an Account.”
“We had more than 30,000 page hits within the first few months of the launch of TrialShare. It’s proven successful because we understand how researchers would like to look at their data and make the best use of it,” Asare notes.
For this work, ITN was awarded an Honorable Mention prize at the at the recent Bio-IT World Best Practices Awards held at the Bio-IT World Conference & Expo in Boston. Of the 34 projects evaluated, ITN received one of two honorable mentions for outstanding innovations and excellence in the use of technologies and novel business strategies that will advance biomedical and translational research, drug development, and/or clinical trials. n
HONORABLE MENTION
We had more than 30,000 page hits within the first few months of the launch of TrialShare. It’s proven successful because we understand how researchers would like to look at their data and make the best use of it. Adam AsareSenior Director of Bioinformatics, TrialShare

2013 | Best Practices Compendium | BiolIT World [12]
2013 BEST PRACTICES ENTRIES
CATEGORY USER ORGANIZATION NOMINATING ORGANIZATION
ENTRY TITLE
Clinical & Health-IT
Immune Tolerance NetworkQ LabKey Software ITN TrialShare Clinical Trials Research Portal: Advancing translational research through open access to clinical trials data and bio-repository information
Merck & Co., Inc. BioFortis A knowledge management system for biomarker and translational research - Merck BBMS
Pfizer Global R&D/ICON/PAREXEL IMS Health DecisionView StudyOptimizer
PHT Corporation LogPad APP
Prize4Life and the Neurological Clinical Research Institute (NCRI) at Massachusetts General HospitalY
The Pooled Resource Open-access ALS Clinical Trials (PRO-ACT) platform
VR Foundation CloudBank for Rare Disease R&D
Informatics Bayer HealthCare AG HCA Live Cell Analyzer – Every cell tells a Story
Cincinnati Children's Hospital Medical Center Qlucore Identification of unique signals and pathways in tumor cells
Genomic Medicine Institute, Geisinger Health SystemY SimulConsult Overcoming the clinical interpretation bottleneck using integrated genome--phenome analysis
Ingenuity Systems Ingenuity Systems Collaborates with Erasmus University to Discover Novel Genetic Links to Disease
Ingenuity Systems Institute of Systems Biology Identification of Novel Causal Variants in Alternating Hemiplegia of Childhood (AHC) Familial and Sporadic Cases Using Whole Genome Sequence Analysis by the Institute for Systems Biology, in collaboration with Ingenuity® Systems and the University of Utah
JBI and AmgenQ TeselaGen Biotechnology TeselaGen:j5
Neusentis, Pfizer Ltd Tessella A ROBUST METHOD FOR DATA EXTRACTION FROM MICRONEUROGRAPHY RECORDINGS
Pfizer Worldwide Research and Development In Silico Biosciences Systems Pharmacology Modeling in Neuroscience: Prediction and Outcome of a New Symptomatic Drug for Cognition in a Clinical Scopolamine Impairment Challenge
Sanofi Genedata Using an Integrated Genomic and Chemical Screening Platform To Accelerate Oncological Target Identification and Validation
IT Infrastructure Accunet Solutions Accunet Solutions Completes State-of-the-Art Data Center Build-Out for the National Cancer Institute’s Frederick National Lab
BGI Aspera EasyGenomics Bioinformatics Platform
CDC/Georgia Tech NVIDIA Acceleration of Hepatitis E Modeling with Keeneland GPU-based Supercomputer at Georgia Institute of Technology
Département de Médecine Moléculaire, Université Laval, Québec, Canada
Cray High Performance Genome Assembly: Ray a New Generation of Assembler Programs
Karlsruhe Institute of Technology & BioQuant University of Heidelberg Large Scale Data Facility (LSDF)
Merck & Co., Inc. Redefining the business-to-business research engagement through Life-Sciences Identity Broker in the Cloud
Research Programme on Biomedical Informatics (GRIB) at IMIM (Hospital del Mar Medical Research Institute) and UPF (Pompeu Fabra University)
NVIDIA Simulation of critical step in HIV-1 protease maturation
SchrodingerY Cycle Computing
The Genome Analysis Centre Convey Computer Corporation Accelerated Trait Analysis for Advances in Food and Biofuels
The Jackson Laboratory Convey Computer Corporation Advanced technologies for high performance analytics of NGS data
Knowledge Management
GenentechY An Innovative Cage Change Process
GlaxoSmithKlineY Socrates Search
i3 Analytics Biopharma Navigator
InSilico Genomics InSilico DB Genomics Datasets Hub
LabRoots LabRoots for enhanced collaboration and networking
Merck & Co., Inc. PerkinElmer Agile Co-Development Adds Biologics Capabilities to Ensemble® for Biology
Momenta Pharmaceuticals IDBS Momenta Pharmaceuticals R&D ELN Project
pharma industry Pistoia Alliance Pistoia Alliance AppStore for Life Sciences
YWinner QHonorable Mention
250 First Avenue, Suite 300, Needham, MA 02494 | phone: 781-972-5400 | fax: 781-972-5425
Published Resources for the Life Sciences
1. Nominating Organization, Contact Person & Contact Details
LabKey Software (www.labkey.com)
Elizabeth Nelson
Scientific Outreach Director
(206)409-8975 (cell)
2. User Organization, Contact Person & Contact Details
Immune Tolerance Network (www.immunetolerance.org)
Adam Asare
Senior Director, Data Management and Data Analysis
(240) 235-6149
3. Project Title:
ITN TrialShare Clinical Trials Research Portal: Advancing translational research through open access to clinical trials
data and bio-repository information
4. Project Summary and Further Details:
Summary
Mechanisms are needed to disseminate the large quantities of data associated with clinical trials in easy-to-use and
intuitive formats for verification and extension of findings. One of the challenges with published results in medical
journals is that the data are often presented in the best possible light and in a way that does not allow independent
researchers to verify results. The Immune Tolerance Network (ITN) developed the TrialShare Clinical Trials Research
Portal (https://www.itntrialshare.org) to provide a single point of access to solve these issues, along with tools and
workflows to merge, analyze and review assay and clinical data, plus access bio-repository data. The system already
provides the data and analysis codes that back key research findings published in the New England Journal of
Medicine, the Journal of the American Medical Association (JAMA), and the Journal of Clinical Investigation (JCI).
The system is particularly notable as a best practice for:
• Exceptional support for interactive, real-time sharing of complex clinical trial and research assay data in
simple and easy-to-use formats, both within the ITN and beyond to the larger research community.
• Support for reproducible, transparent research that still maintains the privacy of study participants.
• Facilitation of better-informed decisions during the course of a study regarding experimental design and
hypothesis generation.
• Streamlining workflows to deliver greater efficiencies in data delivery to researchers and clinicians during
the course of the study. These efficiencies have enabled management and biostatistical staff to move their
focus from the mundane task of dataset delivery to knowledge discovery, analysis and interpretation. Most
importantly, by providing broader access during the course of the study to internal staff, data quality is
substantially higher, leading to earlier study lock and more rapid manuscript development.
2013 | Best Practices Compendium | Bio-IT World [13]
250 First Avenue, Suite 300, Needham, MA 02494 | phone: 781-972-5400 | fax: 781-972-5425
Published Resources for the Life Sciences
• An open source approach that has allowed investments in the platform to benefit other publicly funded
research organizations.
• Scale and scope of successful implementation for a research network that encompasses over 100
investigators, over 50 phase I/II clinical trials, and $350M in funding.
• Reduction in the need for internal software development staff by 50%.
• Rapid deployment (online within a year) due to leveraging an open source platform (LabKey Server) that has
already benefited from over $15M in investment.
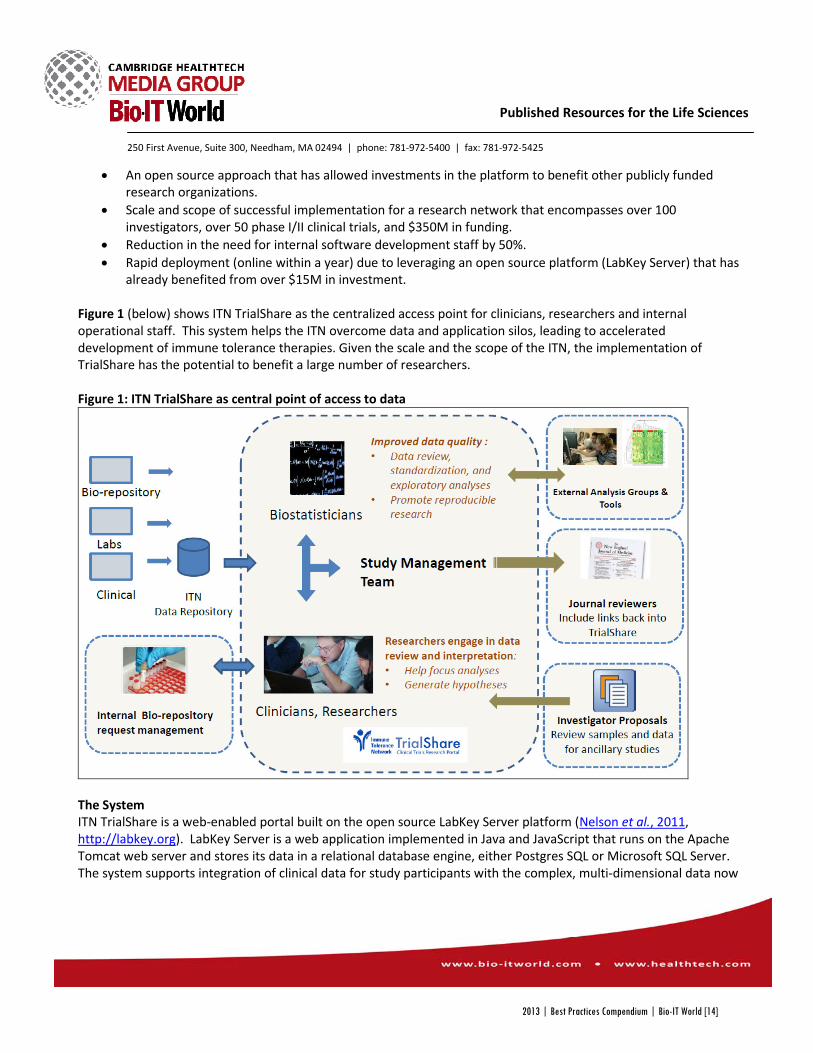
Figure 1 (below) shows ITN TrialShare as the centralized access point for clinicians, researchers and internal
operational staff. This system helps the ITN overcome data and application silos, leading to accelerated
development of immune tolerance therapies. Given the scale and the scope of the ITN, the implementation of
TrialShare has the potential to benefit a large number of researchers.
Figure 1: ITN TrialShare as central point of access to data
The System
ITN TrialShare is a web-enabled portal built on the open source LabKey Server platform (Nelson et al., 2011,
http://labkey.org). LabKey Server is a web application implemented in Java and JavaScript that runs on the Apache
Tomcat web server and stores its data in a relational database engine, either Postgres SQL or Microsoft SQL Server.
The system supports integration of clinical data for study participants with the complex, multi-dimensional data now
2013 | Best Practices Compendium | Bio-IT World [14]
250 First Avenue, Suite 300, Needham, MA 02494 | phone: 781-972-5400 | fax: 781-972-5425
Published Resources for the Life Sciences
available through advanced cellular and molecular techniques, including multiplexed assays, DNA sequencing and
flow cytometry. ITN Trialshare includes analysis pipelines that leverage SAS and BioConductor R routines to process
large volumes of complex data in a reproducible, traceable manner using the latest analytical methods. Interactive
plots, visualizations and reports are configured for dynamic generation by non-specialists. At the same time, the
system also provides flexible tools for custom investigations of data, including tools for querying, charting, R
scripting, and graphically joining data. Hierarchical, group-based permissions settings support secure sharing of data,
analyses and files with appropriate collaborators or the public (after data de-identification). Wikis, message boards,
discussion threads, and email notifications support collaboration workflows.
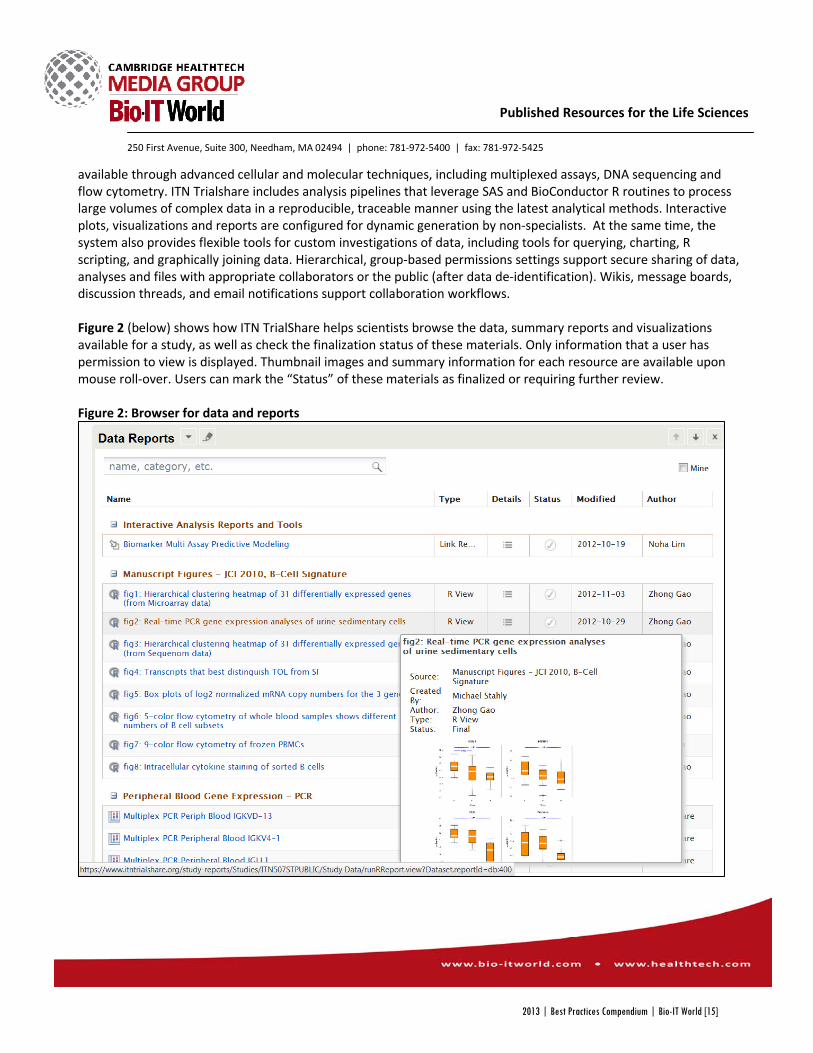
Figure 2 (below) shows how ITN TrialShare helps scientists browse the data, summary reports and visualizations
available for a study, as well as check the finalization status of these materials. Only information that a user has
permission to view is displayed. Thumbnail images and summary information for each resource are available upon
mouse roll-over. Users can mark the “Status” of these materials as finalized or requiring further review.
Figure 2: Browser for data and reports
2013 | Best Practices Compendium | Bio-IT World [15]
250 First Avenue, Suite 300, Needham, MA 02494 | phone: 781-972-5400 | fax: 781-972-5425
Published Resources for the Life Sciences
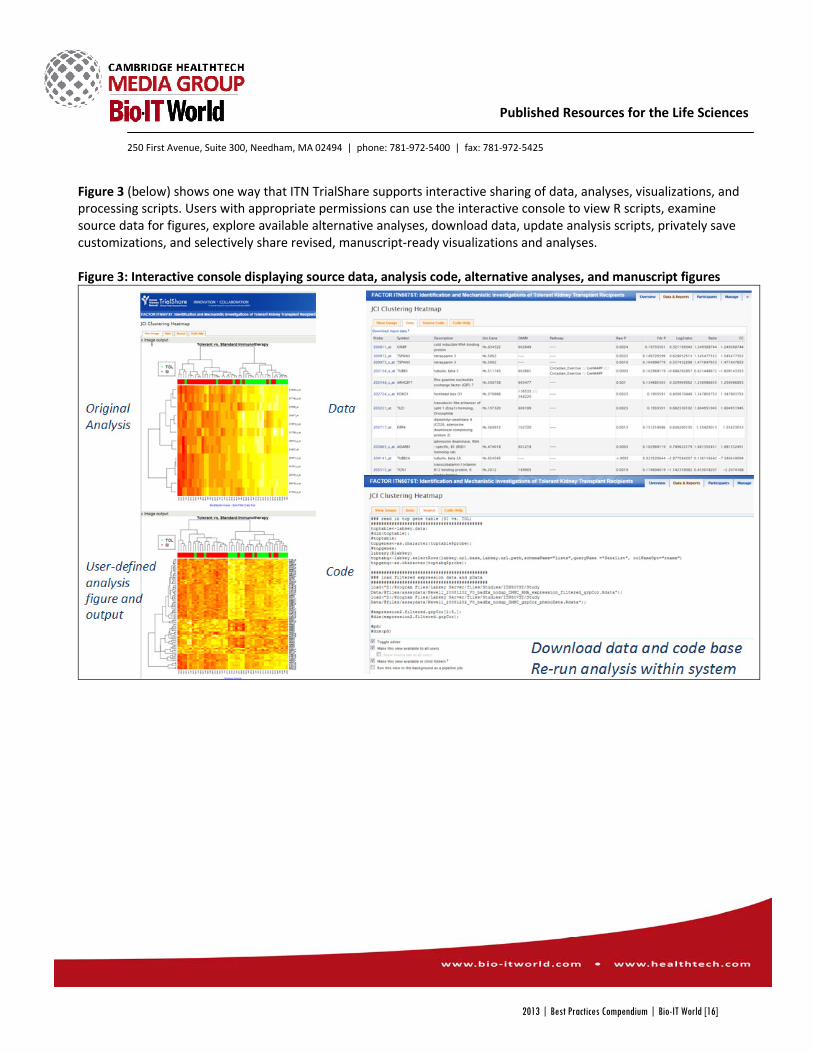
Figure 3 (below) shows one way that ITN TrialShare supports interactive sharing of data, analyses, visualizations, and
processing scripts. Users with appropriate permissions can use the interactive console to view R scripts, examine
source data for figures, explore available alternative analyses, download data, update analysis scripts, privately save
customizations, and selectively share revised, manuscript-ready visualizations and analyses.
Figure 3: Interactive console displaying source data, analysis code, alternative analyses, and manuscript figures
2013 | Best Practices Compendium | Bio-IT World [16]

250 First Avenue, Suite 300, Needham, MA 02494 | phone: 781-972-5400 | fax: 781-972-5425
Published Resources for the Life Sciences
Figure 4 (below) shows how ITN TrialShare allows users without expertise in R scripting to rapidly access and review
sophisticated visualizations of flow cytometric gating.
Figure 4: Flow cytometry gating visualization
2013 | Best Practices Compendium | Bio-IT World [17]
250 First Avenue, Suite 300, Needham, MA 02494 | phone: 781-972-5400 | fax: 781-972-5425
Published Resources for the Life Sciences
Additional Technologies
LabKey Server (and thus ITN TrialShare) includes built-in support for a variety of bioinformatics tools, including
FlowJo and FCSExpress for flow cytometry; Mascot, Sequest, X!Tandem, the Trans Proteomic Pipeline, Proteowizard,
Skyline, and Panorama for proteomics; and the Galaxy bioinformatics workflow engine for sequence-based
genotyping and other applications. The platform also integrates a variety of other technologies relevant to life
scientists. Among other things, it includes a built-in environment for R scripting; Single Sign-On authentication via
LDAP or SSO; WebDav support for file transfer; a SQL query language; Lucene-driven full-text search for many types
of data and documents; SNOMED ontology support; a wiki language; and APIs in a variety of languages (e.g., SAS, R,
JavaScript, Java, Python, and Perl) for interacting with data on the server and building custom interfaces. LabKey
Server can be configured to access and integrate data from multiple external data sources, including PostgreSQL,
Microsoft SQL Server, SAS, Oracle, or MySQL database servers managed by an institution.
Initial Usage Scenarios
Since implementation, the system has been used effectively for:
1. Experimental design and selection of samples for follow-up ancillary studies
2. Monitoring of mechanistic trends
3. Collaboration among team members for manuscript development, interim and final analyses
4. Providing a public resource for future exploration of published data by providing interactive access to
anonymized data, scripts, analyses, and visualizations used in a pilot publication (currently in review by the
NEJM)
5. Supporting reproducible research by providing public access to the analysis codes and de-identified data
that back key research findings already published in the NEJM, JAMA, and JCI.
Benefits and ROI
1. Removal of redundancies and inconsistencies in having separate workflows for data delivery to
biostatisticians, internal sample management staff, external researchers, and the Immport repository. All
groups see and use the same data.
2. Transparency with regard to analytical methods and the re-running of analyses using alternative analysis
approaches within the portal based on user defined sub-setting of clinical or assay parameters.
3. Higher quality data and faster study lock due to internal validation routines developed by the ITN as data is
loaded and refreshed during the course of the study.
4. Reduction in internal software developers by 50%
5. Fast development cycle. By building on an open source platform that has benefited from over $15M in
public investment since 2005, ITN TrialShare was brought online for scientific use with a year from the start
of its development.
Open Source Approach
The foundation of ITN TrialShare is the open source LabKey Server platform, which provides a flexible framework for
rapidly developing biomedical research portals. ITN’s use of an open source approach means that investments in the
core open source platform can be leveraged by other research organizations. This helps public funding for
translational research go further and speeds dissemination of tools for applying new analytical techniques and best
practices for data management. The LabKey Server platform has been supported and maintained by a team of
2013 | Best Practices Compendium | Bio-IT World [18]
250 First Avenue, Suite 300, Needham, MA 02494 | phone: 781-972-5400 | fax: 781-972-5425
Published Resources for the Life Sciences
professional engineers since 2005, so the witty assertion that “open source has the half life of a graduate student”
(Don Litwin, founder of the Canary Foundation) does not apply.
Improvements to the core open source platform contributed by the ITN are already being used by other large
organizations that manage their translational research projects on installations of LabKey Server. These groups
include leading HIV research organizations, such as the Statistical Center for HIV/AIDS Research and Prevention
(SCHARP) at the Fred Hutchinson Cancer Research Center (FHCRC), the HIV Vaccine Trial Network (HVTN), and the
Center for AIDS Vaccine Discovery (CAVD). Organizations currently establishing notable LabKey Server installations
include the Juvenile Diabetes Research Foundation Network for Pancreatic Organ Donors With Diabetes (JDRF
nPOD); Northwest BioTrust (a collaboration between the FHCRC, the University of Washington (UW), and other
Northwest-based research organizations and care providers); and the UW’s International Centers of Excellence for
Malaria Research (ICEMR). There are currently over 70 active LabKey Server installations worldwide.
The synergistic development of the ancillary study management features of LabKey Server (Nelson et al. 2013)
provides a particularly good example of how contributions to the open source platform by multiple research
networks (including the ITN) are providing shared benefits to the research community.
The LabKey Server source code is freely available under the Apache 2.0 license. An Amazon Web Services AMI
(Amazon Machine Image) is published for every LabKey Server release, along with installers for Windows and Linux,
plus compiled binaries for other platforms.
System Development
ITN TrialShare was developed by ITN with the assistance of LabKey Software, which provided system design,
development and support. The ITN has invested approximately 6.5 person years in configuring ITN TrialShare,
creating content associated with manuscripts, establishing the data load/refresh processes, and other setup steps.
LabKey Software’s direct work towards TrialShare goals has involved roughly 5.5 person years of effort. This work
has built on an open source foundation that represents over $15M of investment in the LabKey Server platform since
2005.
Future
Over the long term, ITN TrialShare aims to provide transparent access to all ITN research assay data and samples,
along with the code for analytical approaches, supporting reproducible research and exploration of alternative
analysis approaches. By broadening the number of researchers who can bring their expertise and insights to bear on
ITN data and results, ITN TrialShare will accelerate findings and publications from ITN's translational research
studies.
References
ITN TrialShare
https://www.itntrialshare.org/
2013 | Best Practices Compendium | Bio-IT World [19]
250 First Avenue, Suite 300, Needham, MA 02494 | phone: 781-972-5400 | fax: 781-972-5425
Published Resources for the Life Sciences
Nelson EK, Piehler B, Eckels J, Rauch A, Bellew M, Hussey P, Ramsay S, Nathe C, Lum K, Krouse K, Stearns D, Connolly
B, Skillman T, Igra M: LabKey Server: An open source platform for scientific data integration, analysis and
collaboration. BMC Bioinformatics 2011, 12:71.
http://www.biomedcentral.com/1471-2105/12/71
Nelson EK, Piehler B, Rauch A, Ramsay S, Holman D, Asare S, Asare A, Igra M: Ancillary study management systems:
a review of needs. BMC Medical Informatics and Decision Making 2013, 13:5.
http://www.biomedcentral.com/1472-6947/13/5
LabKey Server Documentation, Tutorials and Demos
http://www.labkey.org
Further Reading
Transparency in clinical trials research
Thomas K: British Medical Journal to Require Detailed Clinical Trial Data. The New York Times 2012.
http://www.nytimes.com/2012/11/01/business/british-medical-journal-to-require-detailed-clinical-trial-data.html
Reproducible research
Bailey DH, Borwein JM: Set the Default to “Open”: Reproducible Science in the Computer Age. Huffington Post
2013.
http://www.huffingtonpost.com/david-h-bailey/set-the-default-to-open-r_b_2635850.html
5. Category in which entry is being submitted (1 category per entry, highlight your choice)
• Clinical & Health-IT: Trial design, eCTD, EDC, ePrescribing, RHIOs, EMR/PHR
• IT infrastructure/HPC: High Performance Computing, storage, Cloud technologies
• Informatics: LIMS, data visualization, imaging technologies, NGS analysis
• Knowledge Management: Data mining, idea/expertise mining, text mining, collaboration, resource
optimization
• Research & Drug Discovery: Disease pathway research, applied and basic research, compound-focused
research, drug safety
• Personalized & Translational Medicine: Responders/non-responders, biomarkers, Feedback loops,
predictive technologies
2013 | Best Practices Compendium | Bio-IT World [20]

250 First Avenue, Suite 300, Needham, MA 02494 | phone: 781‐972‐5400 | fax: 781‐972‐5425
Published Resources for the Life Sciences
Bio‐IT World 2013 Best Practices Awards
1. Nominating Organization (Fill this out only if you are nominating a group other than your own.) A. Nominating Organization Organization name: BioFortis Inc Address:10320 Little Patuxent Pkwy. Suite 410, Columbia, MD, 21044 B. Nominating Contact Person Name: Mark A Collins, Ph.D Title: Director of Marketing Tel: 412 897 0514 Email: [email protected]
2. User Organization (Organization at which the solution was deployed/applied)
A. User Organization Organization name: Merck & Co., Inc. Address: 351 N. Sumneytown Pike, North Wales, PA 19454‐2505 B. User Organization Contact Person Name: Manish Dave Title: Account Manager Tel: Email: [email protected]
3. Project Title: : A knowledge management system for biomarker and translational research ‐ Merck BBMS
Team Leader: Manish Dave Team members – name(s), title(s) and company (optional): Bob Stelling, Program Manager, Merck David Hoffner, Project Manager, Merck Mark Morris, Business Analyst, Merck Dan Nemeth, Solution Architect, Aetea Amelia Warner, Director Clinical Research, Merck Kenneth Wilke, Pharmacogenomics Project Manager, Merck
2013 | Best Practices Compendium | Bio-IT World [21]

250 First Avenue, Suite 300, Needham, MA 02494 | phone: 781‐972‐5400 | fax: 781‐972‐5425
Published Resources for the Life Sciences
4. Category in which entry is being submitted (1 category per entry, highlight your choice)
Clinical & Health‐IT: Trial design, eCTD, EDC, ePrescribing, RHIOs, EMR/PHR IT infrastructure/HPC: High Performance Computing, storage, Cloud technologies Informatics: LIMS, data visualization, imaging technologies, NGS analysis Knowledge Management: Data mining, idea/expertise mining, text mining, collaboration, resource optimization
Research & Drug Discovery: Disease pathway research, applied and basic research, compound‐focused research, drug safety
Personalized & Translational Medicine: Responders/non‐responders, biomarkers, Feedback loops, predictive technologies
(Bio‐IT World reserves the right to re‐categorize submissions based on submission or in the event that a category is refined.) 5. Description of project (4 FIGURES MAXIMUM):
A. ABSTRACT/SUMMARY of the project and results (150 words max.)
The vision of personalized medicine is impacting the pharmaceutical industry in many ways, especially in the increasing use of biomarkers in clinical trials to better target therapies to patient populations and improve risk profiles. With thousands of trials and trial sites, complex protocols, millions of biospecimens and large amounts of biomarker data, Merck faced numerous challenges from operational biospecimen and data management, to how to efficiently generate and use data to drive decision making for current trials and future research. Developed in a 2 year Agile project, Merck BBMS, provides an elegant solution that combines traditional specimen management capability with advanced knowledge management features to create a central resource for biomarker and translational research. BBMS deployment has brought key benefits to Merck such as improved operational visibility and efficiency, integration of clinical and specimen assay data, coupled to novel analytics that generate scientific insights that will enable better decision‐making for drug development.
B. INTRODUCTION/background/objectives Background Over the last decade, clinical trials have become more complex in response to the vision of personalized medicine, which seeks to better target therapies for patients based on assessing biomarkers for drug efficacy and safety. A typical biomarker‐based clinical program may now have multiple protocols, procedures, trial lengths, number of participating partners and sites and data types. Large‐scale use of biomarkers in trials has provided new surrogate endpoints that enhance knowledge for drug efficacy but has also, in turn, placed greater operational burdens on the management of biospecimens from
2013 | Best Practices Compendium | Bio-IT World [22]
250 First Avenue, Suite 300, Needham, MA 02494 | phone: 781‐972‐5400 | fax: 781‐972‐5425
Published Resources for the Life Sciences
trials due to variations in biospecimen types, collection sites, consents, and data formats from different business partners. In addition to these operational challenges, ensuring that each specimen can be linked to its corresponding clinical data and specimen assay results is key to creating real scientific insights both during the trial and in future research. Additionally, as data on clinical response including unanticipated adverse events is accumulated, the need for enabling previously unplanned analyses during in‐life trial execution has increased significantly. "How to organize and provide an interface to clinical specimens, merged with newly accumulating biomarker data that can be a central resource for biomarker‐based clinical and translational studies?" This was the two‐fold challenge faced by Merck in both managing millions of valuable biospecimens collected from past and current clinical trials and using the knowledge about such specimens to gain scientific insights. Operationally, the Clinical Pharmacogenomics (PGx) and Clinical Specimen Management (CSM) team deals with varied data spread over many different systems, both internal and external to Merck, complex trial protocols, changing consents and an ever expanding set of analytical data (Next Gen Sequencing, imaging etc)
Merck’s goal was to rapidly develop an application to support the day‐to‐day operational management of clinical samples along with the ability to link sample data, consent and permission data, clinical data, and specimen assay data in a common knowledge repository that could enable clinical and translational research. Starting with a repository encompassing thousands of trials and millions of specimens, Merck would have a powerful resource to more effectively support ongoing trials, while building an ever‐growing knowledge base to support future research. Overall Goals
• Support clinical study management of ongoing trials • Seamlessly, link specimen data, consent and permission data, specimen assay data, and patient
demographic / clinical data • Improve operational visibility, increase efficiency, and maintain biospecimen traceability for
clinical trial stakeholders, ensuring compliance and auditability for regulatory purposes. • Establish a centralized resource of highly annotated patient‐specimen‐biomarker data and
associated data exploration tools to drive the science. Detailed Objectives
• Management of Future Biomedical Research (FBR) biospecimens consented for future‐use; i.e. samples collected during clinical trials that can also be utilized for research projects beyond the endpoints/scope of clinical trials.
• Create and curate electronic records of sample data, sample status, sample shipments and chain of custody across multiple external vendors.
• Provide automated “in‐life” tracking of sample consent and permissions
2013 | Best Practices Compendium | Bio-IT World [23]
250 First Avenue, Suite 300, Needham, MA 02494 | phone: 781‐972‐5400 | fax: 781‐972‐5425
Published Resources for the Life Sciences
• Integrate with internal and external data systems (e.g. CTMS, EDC, and lab systems) to support operational workflows, annotation and report generation.
• Provide real‐time reports of specimen collection across trials, to allow remediation of low collection rates during protocol execution
• Manage both planned and “un‐planned / in‐life” requests for sample usage and new analyses. • Manage specimen destruction workflows.
C. RESULTS (highlight major R&D/IT tools deployed; innovative uses of technology). A close collaboration between the Merck and BioFortis teams, using an Agile approach resulted in the deployment of BBMS R1.0 (operational specimen management, initial data integration and consent management) within 10 months of the project starting. Subsequent releases, BBMS R1.1 and R2, were completed over the following 12 months; these added further data integrations, more specimen data features, request / analysis functionality, and reporting tools to allow scientific enquiry. The combined Merck and BioFortis core team was 9 FTE’s. With the deployment of BBMS R2, Merck achieved the following key benefits; Significantly improved operational trial sample management ‐ BBMS now allows all Merck biospecimens collected from clinical trials with consent for future research to be viewed, consent verified, and tracked anywhere in the world. Prior to BBMS, Merck had only a limited ability to track a narrow portion of their biospecimens, which hampered both trials and future research. Furthermore, BBMS provides comprehensive consent tracking to ensure Future Biomedical Research (FBR) use and maintain security and compliance. Highly annotated patient‐specimen‐biomarker data – integration of specimens with internal and external data systems (EDC, CTMS etc) so that researchers have a holistic view of all data needed to effectively manage the trial and respond to requests in a timely manner. For example, cycle times for specimen release have dropped from 12 weeks to 2 weeks with release of the system. Ability to respond quickly to “unplanned” events – BBMS provides an automated “in‐life” tracking tool to enable verification of consent and access to trial specimens so that new analyses can be mobilized. Since BBMS “knows” in real‐time that the specimen is consented, additional analyses can be rapidly mobilized to respond to emerging scientific data or regulatory questions.
A centralized resource for biomarker‐based research and translational study ‐ With millions of highly annotated specimens in the BBMS inventory, with full traceability, Merck has established one of the most robust specimen and biomarker data collections in the world, which will truly enable real‐time visualizations and cutting‐edge biomarker‐based research for clinical drug development. Technology Used: The Labmatrix Framework
2013 | Best Practices Compendium | Bio-IT World [24]
250 First Avenue, Suite 300, Needham, MA 02494 | phone: 781‐972‐5400 | fax: 781‐972‐5425
Published Resources for the Life Sciences
Merck chose the Labmatrix software as the foundation for BBMS, which was then specifically configured for Merck. Labmatrix was chosen for the following reasons:
• The core Labmatrix data infrastructure already included clinical, patient, and biospecimen data domains – the prerequisite for creating a centralized resource of patient‐biomarker‐specimen information.
• A highly configurable workflow management system to support operational needs. • A flexible, extensible framework that allows data integration from multiple sources and data
types, via programmatic connectivity (Web Services and Java APIs) and large‐scale file import (ETL) tools.
• Highly configurable user roles & data access permissions for security and collaboration, coupled with advanced audit infrastructure and capabilities, to ensure regulatory compliance across a complex research ecosystem.
• A unique data exploration and reporting tool (Qiagram) that allows users to easily execute structured and ad‐hoc queries against broad sets of data. Qiagram is a visual query engine that does not require SQL expertise to use and Qiagram queries can be deployed as dashboard “widgets” that provide a real‐time picture of the biospecimen inventory.
Specifically, Merck made extensive use of the following Labmatrix infrastructure to deliver the functionality needed for BBMS in the time window with limited FTE resources:
o Custom data forms, which are configurable and extensible user‐defined forms enabled rapid configuration of the user interface
o File import framework facilitated multiple imports (e.g. >800,000 specimens on go‐live) o Qiagram‐backed operational search queries, workflow tools and dashboard widgets. o User roles & data access permissions
Once user roles were pre‐configured, assignment of users to one or more roles was made possible through the user interface by system admins.
o Audit infrastructure Level 1 log: General information about changes, visible on the user interface Level 2 log: Details about changes, visible via database‐level query
o Programmatic connectivity to numerous data systems Clinical trial operational data brought in from clinical trial management
systems (CTMS) and made visible through an EII layer to BBMS. This data did not reside in BBMS but is queried by BBMS to populate reports within the system. (Figure 1.0)
Reconciled specimen information from clinical data systems
2013 | Best Practices Compendium | Bio-IT World [25]
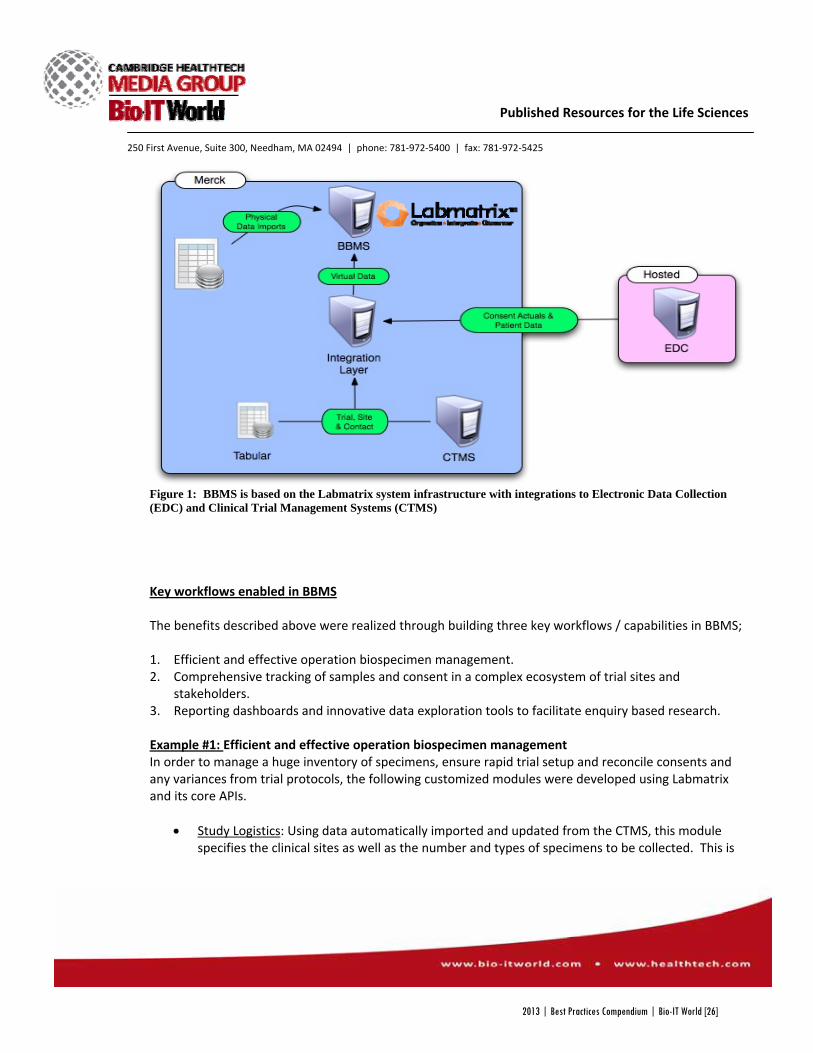
250 First Avenue, Suite 300, Needham, MA 02494 | phone: 781‐972‐5400 | fax: 781‐972‐5425
Published Resources for the Life Sciences
Figure 1: BBMS is based on the Labmatrix system infrastructure with integrations to Electronic Data Collection (EDC) and Clinical Trial Management Systems (CTMS) Key workflows enabled in BBMS The benefits described above were realized through building three key workflows / capabilities in BBMS; 1. Efficient and effective operation biospecimen management. 2. Comprehensive tracking of samples and consent in a complex ecosystem of trial sites and
stakeholders. 3. Reporting dashboards and innovative data exploration tools to facilitate enquiry based research. Example #1: Efficient and effective operation biospecimen management In order to manage a huge inventory of specimens, ensure rapid trial setup and reconcile consents and any variances from trial protocols, the following customized modules were developed using Labmatrix and its core APIs.
• Study Logistics: Using data automatically imported and updated from the CTMS, this module specifies the clinical sites as well as the number and types of specimens to be collected. This is
2013 | Best Practices Compendium | Bio-IT World [26]

250 First Avenue, Suite 300, Needham, MA 02494 | phone: 781‐972‐5400 | fax: 781‐972‐5425
Published Resources for the Life Sciences
used to generate a scope of work for each trial for the external biorepository partner. Study close‐out information is also recorded in this module.
• Specimens: Registers and manages clinical specimen records. Periodically imports updated inventory data from external biorepository partners to maintain synchronicity between BBMS and the partner inventories. Tracks chain of custody for entire specimen life‐cycle.
• Permissions: Implements a document‐based strategy for defining and managing specimen permissions. Recognizes limits of specimen use as imposed by consent type, protocol, site, country, and IRB restrictions. These consent documents are also confirmed during specimen reconciliation using a unique tracking number for each trial site that is included in EDC reconciliation data.
• Analysis: Creates a “pull‐list” of specimens for testing and generates a workflow for specimen released. The pull‐list is established based on a variety of parameters that can be set by specimen curators, as well as system‐generated flags on key data points such as specimen quality and quantity. This module also can associate relevant assay testing results from previous analyses.
• Reconciliation: Through the specimen reconciliation function, the system confirms subject consent and indicates that and specimen collection data is accurate for each specimen in the BBMS inventory. The trial data management group generates a specimen reconciliation file based on data collected from the external biorepository partner and the EDC system. This file is consumed by BBMS to mark biospecimens in the BBMS inventory as reconciled.
• Destruction: Facilitates a business workflow to ensure accurate and timely specimen destructions. Initiated by a site request to destroy biospecimens for various reasons (or for inventory management purposes by Merck), the request is entered into BBMS and the workflow initiated. Status of the specimens identified for destruction is maintained in real time throughout the multi‐step process of approvals, partner communications, and destruction certificates.
• Facilities: Maintains information regarding external partners and their physical facilities. • Reports: Provides a series of drill‐down reports that enable verification of consent and access to
specimens, enrollment and reconciliation expected versus actual. User can quickly review the state of a trial in real‐time and make corrective actions before database lock. (Figure 2)
2013 | Best Practices Compendium | Bio-IT World [27]
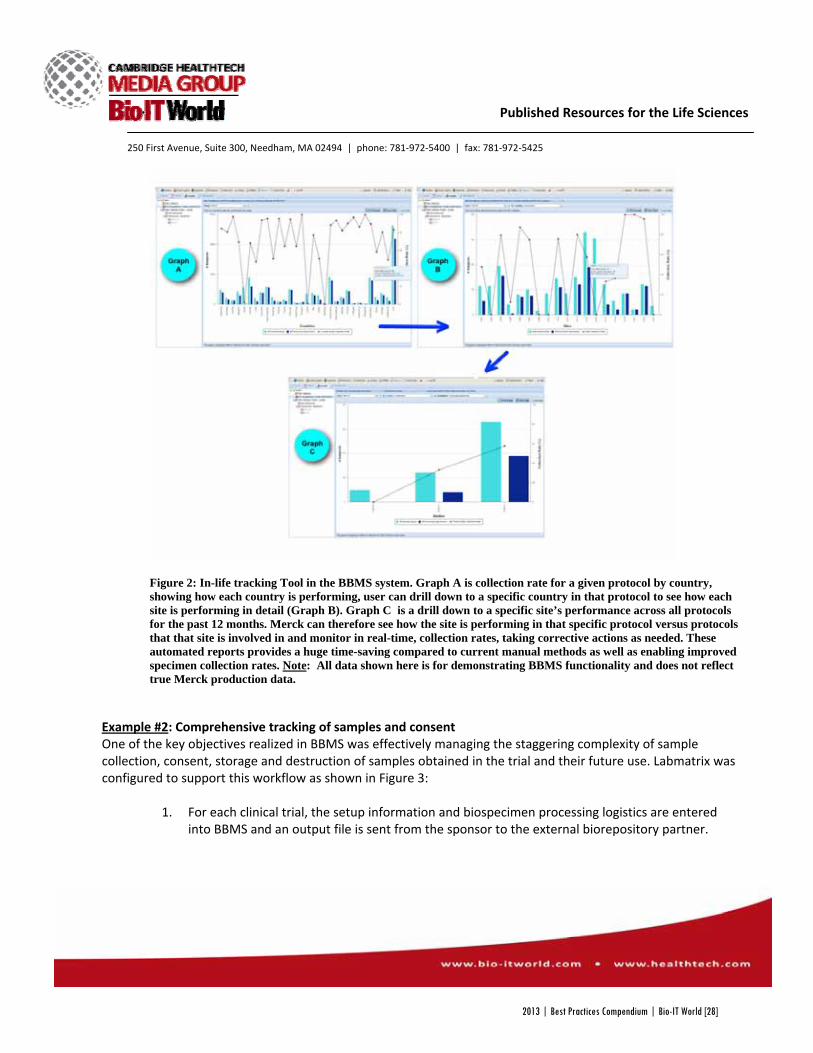
250 First Avenue, Suite 300, Needham, MA 02494 | phone: 781‐972‐5400 | fax: 781‐972‐5425
Published Resources for the Life Sciences
Figure 2: In-life tracking Tool in the BBMS system. Graph A is collection rate for a given protocol by country, showing how each country is performing, user can drill down to a specific country in that protocol to see how each site is performing in detail (Graph B). Graph C is a drill down to a specific site’s performance across all protocols for the past 12 months. Merck can therefore see how the site is performing in that specific protocol versus protocols that that site is involved in and monitor in real-time, collection rates, taking corrective actions as needed. These automated reports provides a huge time-saving compared to current manual methods as well as enabling improved specimen collection rates. Note: All data shown here is for demonstrating BBMS functionality and does not reflect true Merck production data.
Example #2: Comprehensive tracking of samples and consent One of the key objectives realized in BBMS was effectively managing the staggering complexity of sample collection, consent, storage and destruction of samples obtained in the trial and their future use. Labmatrix was configured to support this workflow as shown in Figure 3:
1. For each clinical trial, the setup information and biospecimen processing logistics are entered
into BBMS and an output file is sent from the sponsor to the external biorepository partner.
2013 | Best Practices Compendium | Bio-IT World [28]
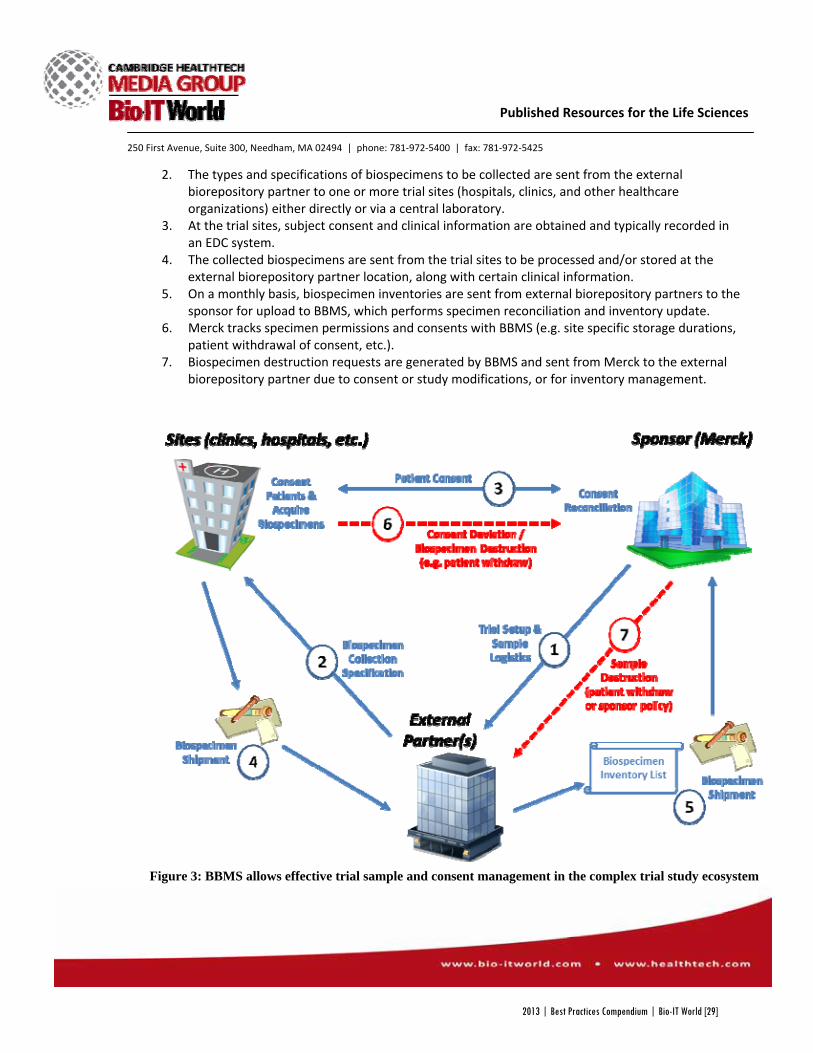
250 First Avenue, Suite 300, Needham, MA 02494 | phone: 781‐972‐5400 | fax: 781‐972‐5425
Published Resources for the Life Sciences
2. The types and specifications of biospecimens to be collected are sent from the external biorepository partner to one or more trial sites (hospitals, clinics, and other healthcare organizations) either directly or via a central laboratory.
3. At the trial sites, subject consent and clinical information are obtained and typically recorded in an EDC system.
4. The collected biospecimens are sent from the trial sites to be processed and/or stored at the external biorepository partner location, along with certain clinical information.
5. On a monthly basis, biospecimen inventories are sent from external biorepository partners to the sponsor for upload to BBMS, which performs specimen reconciliation and inventory update.
6. Merck tracks specimen permissions and consents with BBMS (e.g. site specific storage durations, patient withdrawal of consent, etc.).
7. Biospecimen destruction requests are generated by BBMS and sent from Merck to the external biorepository partner due to consent or study modifications, or for inventory management.
Figure 3: BBMS allows effective trial sample and consent management in the complex trial study ecosystem
2013 | Best Practices Compendium | Bio-IT World [29]
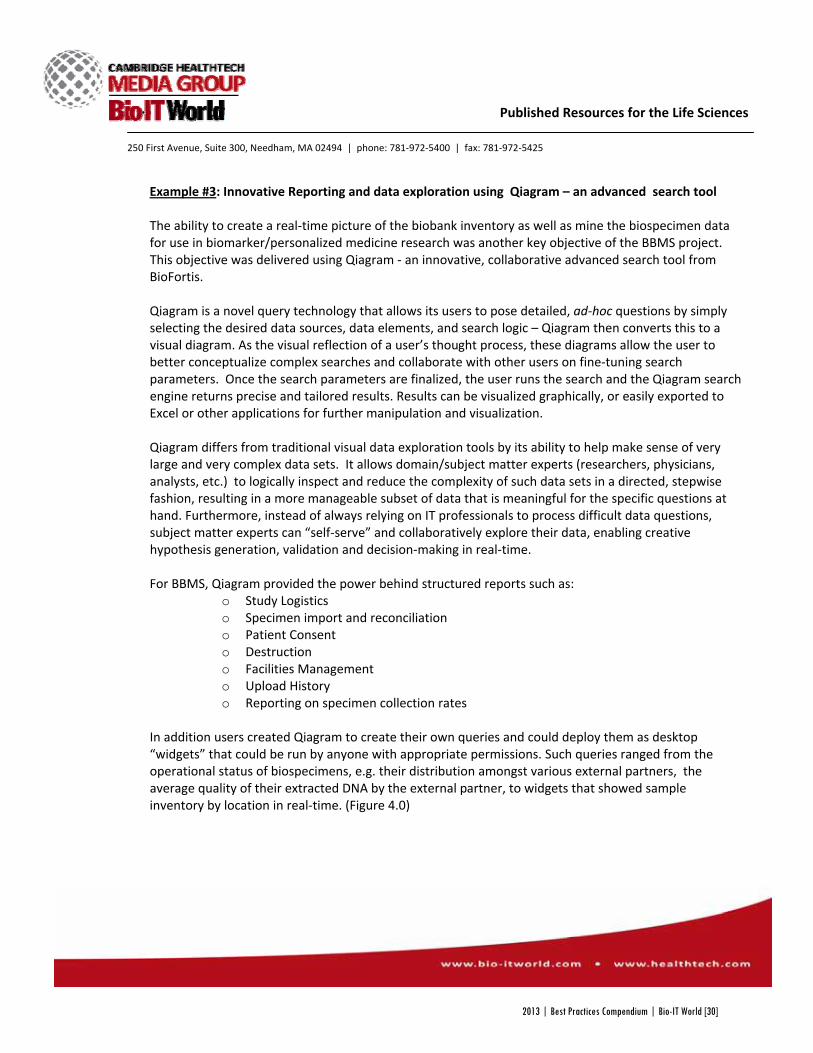
250 First Avenue, Suite 300, Needham, MA 02494 | phone: 781‐972‐5400 | fax: 781‐972‐5425
Published Resources for the Life Sciences
Example #3: Innovative Reporting and data exploration using Qiagram – an advanced search tool The ability to create a real‐time picture of the biobank inventory as well as mine the biospecimen data for use in biomarker/personalized medicine research was another key objective of the BBMS project. This objective was delivered using Qiagram ‐ an innovative, collaborative advanced search tool from BioFortis. Qiagram is a novel query technology that allows its users to pose detailed, ad‐hoc questions by simply selecting the desired data sources, data elements, and search logic – Qiagram then converts this to a visual diagram. As the visual reflection of a user’s thought process, these diagrams allow the user to better conceptualize complex searches and collaborate with other users on fine‐tuning search parameters. Once the search parameters are finalized, the user runs the search and the Qiagram search engine returns precise and tailored results. Results can be visualized graphically, or easily exported to Excel or other applications for further manipulation and visualization. Qiagram differs from traditional visual data exploration tools by its ability to help make sense of very large and very complex data sets. It allows domain/subject matter experts (researchers, physicians, analysts, etc.) to logically inspect and reduce the complexity of such data sets in a directed, stepwise fashion, resulting in a more manageable subset of data that is meaningful for the specific questions at hand. Furthermore, instead of always relying on IT professionals to process difficult data questions, subject matter experts can “self‐serve” and collaboratively explore their data, enabling creative hypothesis generation, validation and decision‐making in real‐time.
For BBMS, Qiagram provided the power behind structured reports such as:
o Study Logistics o Specimen import and reconciliation o Patient Consent o Destruction o Facilities Management o Upload History o Reporting on specimen collection rates
In addition users created Qiagram to create their own queries and could deploy them as desktop “widgets” that could be run by anyone with appropriate permissions. Such queries ranged from the operational status of biospecimens, e.g. their distribution amongst various external partners, the average quality of their extracted DNA by the external partner, to widgets that showed sample inventory by location in real‐time. (Figure 4.0)
2013 | Best Practices Compendium | Bio-IT World [30]
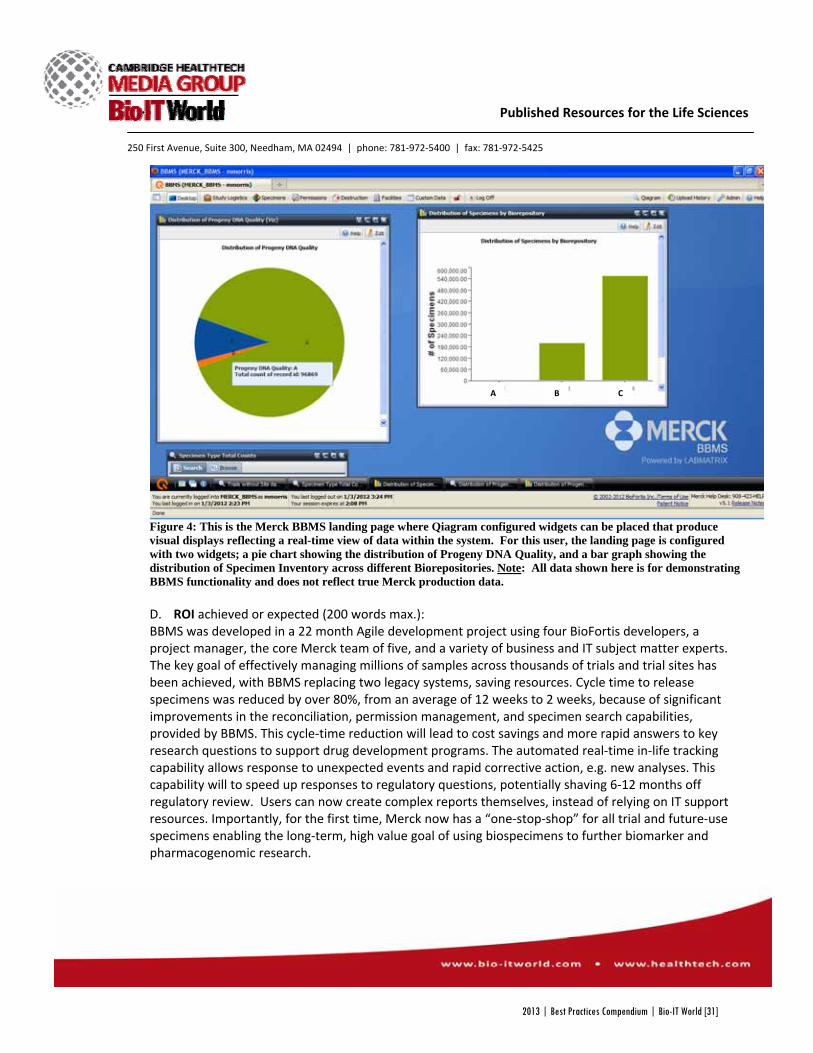
250 First Avenue, Suite 300, Needham, MA 02494 | phone: 781‐972‐5400 | fax: 781‐972‐5425
Published Resources for the Life Sciences
Figure 4: This is the Merck BBMS landing page where Qiagram configured widgets can be placed that produce visual displays reflecting a real-time view of data within the system. For this user, the landing page is configured with two widgets; a pie chart showing the distribution of Progeny DNA Quality, and a bar graph showing the distribution of Specimen Inventory across different Biorepositories. Note: All data shown here is for demonstrating BBMS functionality and does not reflect true Merck production data. D. ROI achieved or expected (200 words max.): BBMS was developed in a 22 month Agile development project using four BioFortis developers, a project manager, the core Merck team of five, and a variety of business and IT subject matter experts. The key goal of effectively managing millions of samples across thousands of trials and trial sites has been achieved, with BBMS replacing two legacy systems, saving resources. Cycle time to release specimens was reduced by over 80%, from an average of 12 weeks to 2 weeks, because of significant improvements in the reconciliation, permission management, and specimen search capabilities, provided by BBMS. This cycle‐time reduction will lead to cost savings and more rapid answers to key research questions to support drug development programs. The automated real‐time in‐life tracking capability allows response to unexpected events and rapid corrective action, e.g. new analyses. This capability will to speed up responses to regulatory questions, potentially shaving 6‐12 months off regulatory review. Users can now create complex reports themselves, instead of relying on IT support resources. Importantly, for the first time, Merck now has a “one‐stop‐shop” for all trial and future‐use specimens enabling the long‐term, high value goal of using biospecimens to further biomarker and pharmacogenomic research.
A B C
2013 | Best Practices Compendium | Bio-IT World [31]
250 First Avenue, Suite 300, Needham, MA 02494 | phone: 781‐972‐5400 | fax: 781‐972‐5425
Published Resources for the Life Sciences
E. CONCLUSIONS/implications for the field. The increasing need to develop and utilize biomarkers for clinical research necessitates collecting, processing and storing biomaterials (blood, tissue, saliva etc) and linking in the associated clinical, assay testing and patient data. With BBMS, Merck has achieved a dual goal; a system to effectively manage millions of biospecimens across hundreds of clinical trials, conducted at thousands of sites with tens of thousands of patients; and a central repository of knowledge about these highly annotated specimens. As a result, Merck can now fully maximize their specimen resources in support of the overall goal to execute biomarker based clinical trials with maximum efficiency, scientific rigor and regulatory compliance. This is predicted to have considerable impact on successful outcomes of drug trials and Merck’s ability to maintain a healthy pipeline of new drug and vaccine products. Furthermore as the biospecimen inventory increases and the richness of the annotations also grows (e.g. Next Generation sequencing, epigenetics, imaging etc.) the longer‐term value of this biobank also increases substantially. Companies that have access to millions of highly annotated biospecimens with clear consent, traceability and tools to rapidly mine for desired profiles will have an edge in biomarker‐based discovery, segmenting patients for clinical trials and developing companion/theranostic applications. With BBMS, Merck has gone beyond just specimen management, building a “next generation biobank” which forms a solid foundation to achieve better outcomes for patients.
1. REFERENCES/testimonials/supporting internal documents (If necessary; 5 pages max.)
“Release of BBMS R1.0 is a major milestone toward Merck's objective to be an industry leader in the area of Pharmacogenomics and Clinical Specimen Management.” Kenneth Wilke, BBMS Business System Owner “I can now electronically and securely connect specimens to their limits of use (i.e. their sample permissions), based on the future use informed consent that each study subject signed. BBMS reduces the types of errors that have been problematic with the manual processes. Most importantly, this state‐of‐the‐art tool enables rapid exploration of new hypotheses that seek to deliver safe and effective personalized medicines to the right patient populations.” Teresa Hesley, Associate Director, Clinical Pharmacogenomics and Clinical Specimen Management "BBMS R2.0 will revolutionize Merck biospecimen inventory management, biorepository utilization, biomarker data integration and overall compliance for specimens consented for storage and future research. Now, all Merck biospecimens collected from Merck clinical trials with consent for future research can be viewed, consent verified, and tracked anywhere we send them in the world. Merck has gone from a limited ability to track a narrow portion of our biospecimen inventory to today's state, where all biospecimens are available/viewable for future biomedical research. Additionally, with integrated clinical and biomarker data, we can better enable new analyses and track trends in patient response rates across a program. We are also now able to answer our development team's questions
2013 | Best Practices Compendium | Bio-IT World [32]
250 First Avenue, Suite 300, Needham, MA 02494 | phone: 781‐972‐5400 | fax: 781‐972‐5425
Published Resources for the Life Sciences
regarding project feasibility in real‐time. Cycle times for specimen release have dropped from 12 weeks to 2 weeks with release of this system. Merck is now able to rapidly execute in‐life analyses to answer key questions from our development programs. With 3.5 million specimens in inventory, annotated with clinical and biomarker data (if generated), Merck is now able to visualize one of the most robust specimen and biomarker data collections in the world and enable cutting edge research for clinical drug development.” Amelia Wall Warner, PharmD, RPh, Director and Head, Clinical Pharmacogenomics and Clinical Specimen Management "As a business user, I am excited about the functionality that BBMS R1.0 provides and the reporting and search possibilities that the Qiagram tool can create. Specimen Releases can now be handled in 1 system as opposed to having to go to various sources both internal and external. The amount of legwork in getting information and the manual labor in combining data sources for just inventory assessment has become so streamlined that it's makes my job so enjoyable and not a painstaking process. By enabling the business to have "real‐time" access to specimen inventory, I am able to answer leadership questions much faster which will empower Merck to make business decisions quicker and build programs faster. Additionally by having consent information linked to the specimen level, specimen releases can be reduced from 12 weeks to 2 weeks. Since BBMS has all the information pre‐loaded into the system for association, it reduces the reactive time it takes to handle requests and respective back‐log work it normally required to get the information to even review, allowing day‐to‐day work activities to not be disrupted for these types of requests. Lastly, BBMS allows clinical specimen management to work smoothly and efficiently with dynamic information. Not only will it enable Merck to be proactive rather than reactive with building a biorepository of active future use specimens and enabling research, but it will enhance specimen quality management, compliance, and cost savings." Kate Dugan, Clinical Specimen Curator, Clinical Pharmacogenomics and Clinical Specimen Management
2013 | Best Practices Compendium | Bio-IT World [33]
250 First Avenue, Suite 300, Needham, MA 02494 | phone: 781‐972‐5400 | fax: 781‐972‐5425
Published Resources for the Life Sciences
Bio‐IT World 2013 Best Practices Awards
1. Nominating Organization (Fill this out only if you are nominating a group other than your own.)
A. Nominating Organization Organization name: IMS Health Address: 301 Howard St., Suite 910
San Francisco, CA 94105 USA
B. Nominating Contact Person Name: Dan Maier Title: Marketing Manager Tel: +1 408‐836‐7184 Email: [email protected]
2. User Organization (Organization at which the solution was deployed/applied)
A. User Organization 1 Organization name: Pfizer Global Research and Development Address: Eastern Point Road
Groton, CT 06340 USA
B. User Organization Contact Person 1 Name: Michael Foster Title: Director, Global Feasibility and Enrollment Tel: 860‐441‐6930 Email: [email protected]
C. User Organization 2 Organization name: ICON plc Address: South County Business Park
Leopardstown Dublin 18 Ireland
D. User Organization Contact Person 2
2013 | Best Practices Compendium | Bio-IT World [34]

250 First Avenue, Suite 300, Needham, MA 02494 | phone: 781‐972‐5400 | fax: 781‐972‐5425
Published Resources for the Life Sciences
Name: Ryan Shane Title: Feasibility Recruitment and Planning, Manager Tel: (215) 616‐6750 Email: [email protected]
E. User Organization 3 Organization name: PAREXEL International Address: 195 West Street
Waltham, MA 02451 USA
F. User Organization Contact Person 3 Name: Abigaile Betteridge Title: Manager, Feasibility & Clinical Informatics Tel: +1.508.488.6384 Email: [email protected]
3. Project Title: DecisionView StudyOptimizer
Team Leader: Michael Foster Contact details if different from above: Director, Global Feasibility and Enrollment 860‐441‐6930 [email protected] Team members – name(s), title(s) and company (optional):
• Beth Stack, Global Feasibility and Enrollment Lead, Pfizer • Ben Connolly, DOR Business Analyst, Pfizer • Evelyn Moy, Global Feasibility and Enrollment Lead, Pfizer • Zahida Aktar, Global Feasibility and Enrollment Lead, Pfizer • Susan Young, Feasibility Specialist, Aerotek Scientific (on assignment at Pfizer) • Ryan Shane, Feasibility Recruitment and Planning Manager, ICON • Louise Bryson, Associate Director, Feasibility and Recruitment Planning, ICON • Abigaile Betteridge, Manager Feasibility and Clinical Informatics, PAREXEL • Ayelet Malka, Senior Director – Feasibility & Clinical Informatics, PAREXEL
4. Category in which entry is being submitted (1 category per entry, highlight your choice)
Clinical & Health‐IT: Trial design, eCTD, EDC, ePrescribing, RHIOs, EMR/PHR IT infrastructure/HPC: High Performance Computing, storage, Cloud technologies Informatics: LIMS, data visualization, imaging technologies, NGS analysis Knowledge Management: Data mining, idea/expertise mining, text mining, collaboration, resource optimization
X
2013 | Best Practices Compendium | Bio-IT World [35]
250 First Avenue, Suite 300, Needham, MA 02494 | phone: 781‐972‐5400 | fax: 781‐972‐5425
Published Resources for the Life Sciences
Research & Drug Discovery: Disease pathway research, applied and basic research, compound‐focused research, drug safety
Personalized & Translational Medicine: Responders/non‐responders, biomarkers, Feedback loops, predictive technologies
(Bio‐IT World reserves the right to re‐categorize submissions based on submission or in the event that a category is refined.) 5. Description of project (4 FIGURES MAXIMUM):
A. ABSTRACT/SUMMARY of the project and results (150 words max.) Optimizing Enrollment In An Outsourced Environment Pfizer has outsourced most of the study planning, initiation, and execution across nearly 250 clinical trials to its two Alliance Partners (APs), PAREXEL and ICON. In order to maintain visibility into the planning and progress of these trials, both Pfizer and the APs are using a web‐based patient enrollment forecasting, planning and tracking solution called StudyOptimizer. This allows the organizations to create and compare study plan scenarios with different country allocations and timelines, track study status in near‐real time, quickly diagnose study delays, and propose and review rescue scenario recommendations with different cost and timeline implications. This shared system provides the transparency, visibility and accessibility to trusted data needed by Pfizer and the APs, providing a platform for common language and processes. As a result, communication and decision making is more efficient as study teams focus on the assumptions, rather than the algorithms.
B. INTRODUCTION/background/objectives Pharmaceutical companies continue to face pressures to improve timelines and reduce costs in drug development and commercialization, and as a result they are increasing their level of outsourcing. As they look to manage these external relationships more efficiently and cost‐effectively, the models for partnering are evolving. Unlike simple transactional or functional service outsourcing, these emerging relationships are highly collaborative. In May 2011, Pfizer announced the formation of strategic partnerships with the CROs ICON and PAREXEL. Both of these Alliance Partners (APs) serve as strategic providers of clinical‐trial implementation services over a five‐year period. The goal of this collaboration is to increase R&D productivity. As John Hubbard, Ph.D., senior VP and worldwide head of development operations for Pfizer stated in a 2012 interview (http://www.lifescienceleader.com/magazine/current‐issue‐3/item/3801‐a‐new‐paradigm‐for‐strategic‐partnerships), there are a number of advantages to this approach:
Capital efficiency
2013 | Best Practices Compendium | Bio-IT World [36]
250 First Avenue, Suite 300, Needham, MA 02494 | phone: 781‐972‐5400 | fax: 781‐972‐5425
Published Resources for the Life Sciences
“The industry as a whole has been very capital‐intensive in terms of the amount of money spent versus each dollar received. We thought we should be able to get a higher efficiency against the amount of capital we spent, and that’s what drove the decision to move from around 17 functional service providers to 2 strategic partners.” Redundancies Pfizer wanted to build in some redundancies, which is one of the reasons it decided to implement the two‐partner model. “When you have two, they really feel accountable” Volume He wanted to be able to provide partner CROs with a volume of work significant enough to keep their attention. To achieve this, Pfizer picked CROs where the percentage of work would represent a significant part of their business, but not to the point they couldn’t support it. Visibility over Development Activities “I don’t have to chase down multiple providers to find out if there’s a problem,” he affirms. “It gives me a clear picture by function and by therapeutic area into two providers.” Hubbard explains, “The governance of the new relationships is already easier to manage by meeting with the senior executives from both organizations together and having very candid and open discussions regarding our progress and potential challenges. Given the size of our organization and the number of projects we run, simplicity, focus, and accountability are really critical.”
Enrollment Challenge Patient enrollment is a critical process for clinical trials, with a big impact on many other “downstream” processes. Historically across the industry, almost 80% of clinical trials fail to meet their enrollment timelines. In this new collaborative environment, Pfizer and the APs needed to develop an approach for optimized management of patient enrollment. The APs needed to be able to deliver clinical trials consistently and predictably, according to goals that they would jointly agree with Pfizer for each trial. In addition, they needed to have the freedom and accountability to execute the trials however they felt would meet the study goals within Pfizer’s prescribed quality requirements. On Pfizer’s side, they remained committed to the timely and cost effective delivery of drugs to market. They needed visibility into how the APs were executing each trial, and the ability to engage and advise on delays and other potential challenges as they arose. They also needed an on‐demand ability to look at the status of trials across the entire Pfizer portfolio.
C. RESULTS (highlight major R&D/IT tools deployed; innovative uses of technology). Solution – Shared System Provides Transparency
2013 | Best Practices Compendium | Bio-IT World [37]
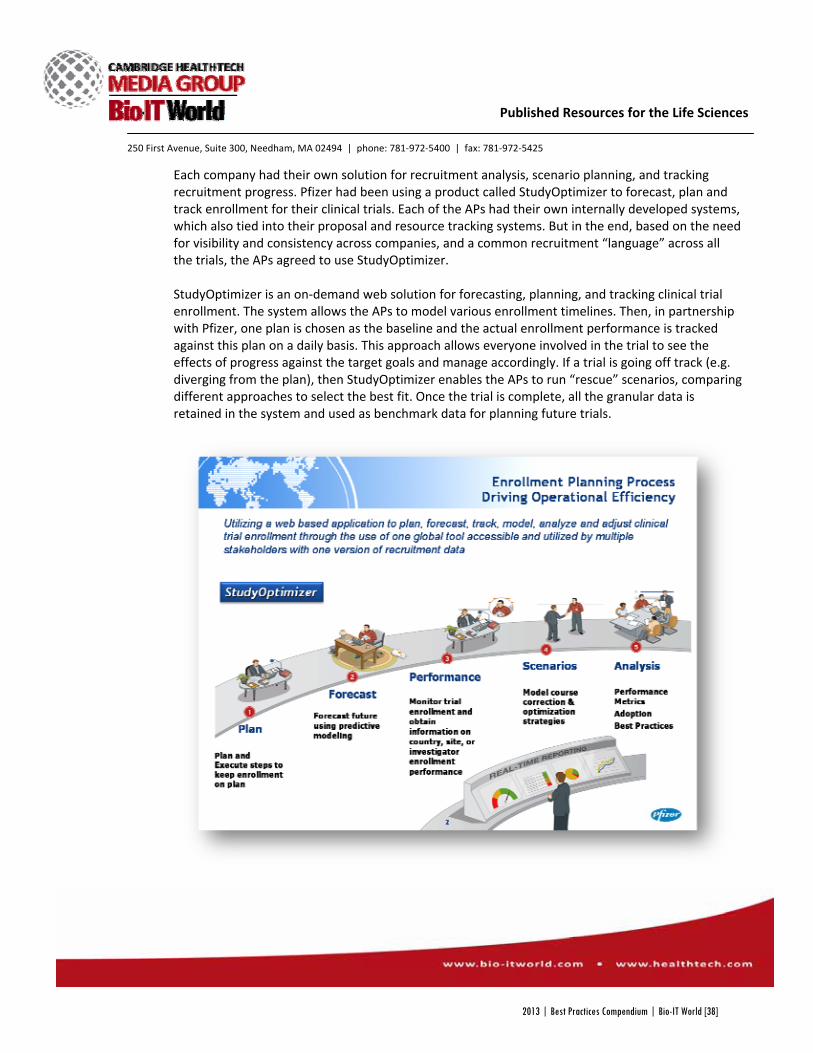
250 First Avenue, Suite 300, Needham, MA 02494 | phone: 781‐972‐5400 | fax: 781‐972‐5425
Published Resources for the Life Sciences
Each company had their own solution for recruitment analysis, scenario planning, and tracking recruitment progress. Pfizer had been using a product called StudyOptimizer to forecast, plan and track enrollment for their clinical trials. Each of the APs had their own internally developed systems, which also tied into their proposal and resource tracking systems. But in the end, based on the need for visibility and consistency across companies, and a common recruitment “language” across all the trials, the APs agreed to use StudyOptimizer. StudyOptimizer is an on‐demand web solution for forecasting, planning, and tracking clinical trial enrollment. The system allows the APs to model various enrollment timelines. Then, in partnership with Pfizer, one plan is chosen as the baseline and the actual enrollment performance is tracked against this plan on a daily basis. This approach allows everyone involved in the trial to see the effects of progress against the target goals and manage accordingly. If a trial is going off track (e.g. diverging from the plan), then StudyOptimizer enables the APs to run “rescue” scenarios, comparing different approaches to select the best fit. Once the trial is complete, all the granular data is retained in the system and used as benchmark data for planning future trials.
2013 | Best Practices Compendium | Bio-IT World [38]
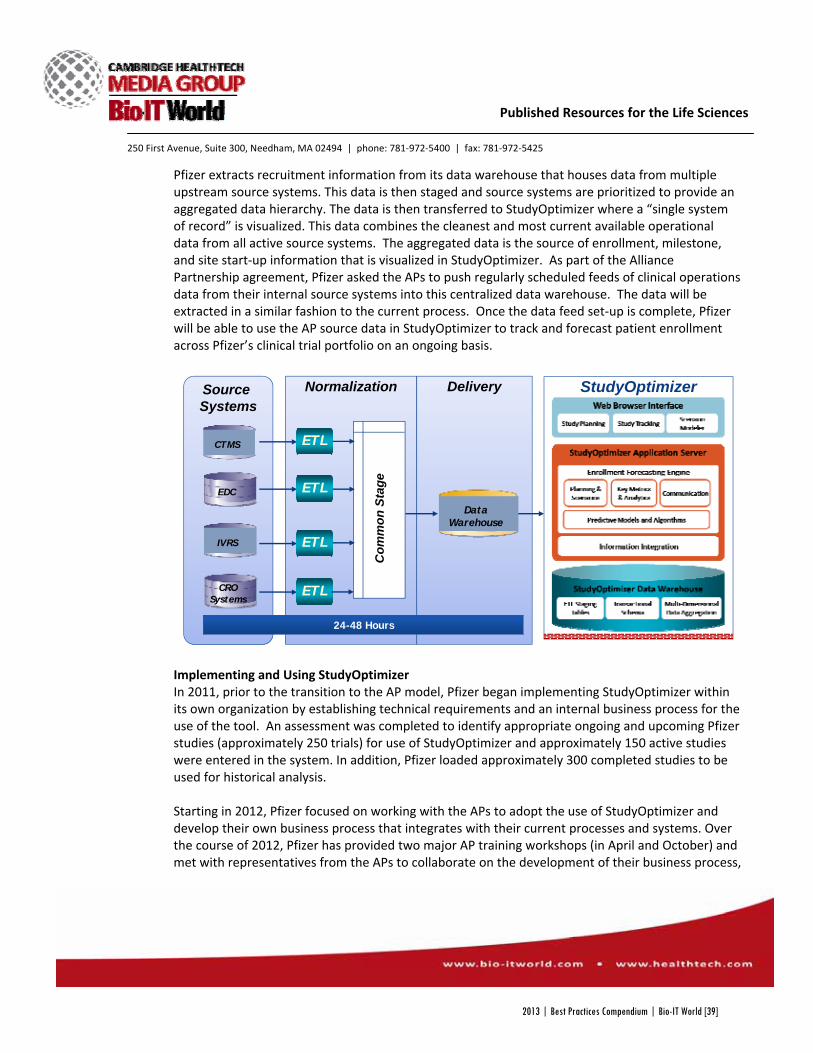
250 First Avenue, Suite 300, Needham, MA 02494 | phone: 781‐972‐5400 | fax: 781‐972‐5425
Published Resources for the Life Sciences
Pfizer extracts recruitment information from its data warehouse that houses data from multiple upstream source systems. This data is then staged and source systems are prioritized to provide an aggregated data hierarchy. The data is then transferred to StudyOptimizer where a “single system of record” is visualized. This data combines the cleanest and most current available operational data from all active source systems. The aggregated data is the source of enrollment, milestone, and site start‐up information that is visualized in StudyOptimizer. As part of the Alliance Partnership agreement, Pfizer asked the APs to push regularly scheduled feeds of clinical operations data from their internal source systems into this centralized data warehouse. The data will be extracted in a similar fashion to the current process. Once the data feed set‐up is complete, Pfizer will be able to use the AP source data in StudyOptimizer to track and forecast patient enrollment across Pfizer’s clinical trial portfolio on an ongoing basis.
Implementing and Using StudyOptimizer In 2011, prior to the transition to the AP model, Pfizer began implementing StudyOptimizer within its own organization by establishing technical requirements and an internal business process for the use of the tool. An assessment was completed to identify appropriate ongoing and upcoming Pfizer studies (approximately 250 trials) for use of StudyOptimizer and approximately 150 active studies were entered in the system. In addition, Pfizer loaded approximately 300 completed studies to be used for historical analysis. Starting in 2012, Pfizer focused on working with the APs to adopt the use of StudyOptimizer and develop their own business process that integrates with their current processes and systems. Over the course of 2012, Pfizer has provided two major AP training workshops (in April and October) and met with representatives from the APs to collaborate on the development of their business process,
DeliveryNormalizationSource Systems
Com
mon
Sta
ge
ETL
ETL
ETL
ETL
StudyOptimizer
EDC
IVRS
CROSystems
CTMS
24-48 Hours
DataWarehouse
2013 | Best Practices Compendium | Bio-IT World [39]
250 First Avenue, Suite 300, Needham, MA 02494 | phone: 781‐972‐5400 | fax: 781‐972‐5425
Published Resources for the Life Sciences
sharing lessons learned and best practices. Moving forward, the APs will assess all new trials for the use of StudyOptimizer to plan and track enrollment. Today, for most Pfizer trials, enrollment planning and tracking is done in StudyOptimizer by a team that consists of both Pfizer and AP representatives:
• Pfizer provides study targets to the AP teams (e.g. target dates, number of patients required, etc.).
• The AP feasibility group models enrollment plans using various assumptions and parameters (participating countries, number of sites, enrollment rates, timelines, etc.), and then recommends optimized recruitment scenarios.
• Joint Pfizer/AP study teams discuss the assumptions that have gone into the plans. • After review and discussion of the proposed scenarios, the joint Pfizer/AP study teams
reach a consensus on the plan that best fits the business requirements for that study (in terms of budget, timeline, and resources), and aligns with contractual agreements. This plan defines the enrollment performance “goals” for that study and provides transparency to both Pfizer and AP teams.
• The AP study teams use the enrollment plans in StudyOptimizer for on‐demand study tracking (daily data refresh), as well as for diagnosing study delays and creating proposed rescue scenarios when necessary.
• Pfizer Management can use StudyOptimizer to track the enrollment health and performance of their portfolio of trials.
• When delays or other problems arise, the APs will use StudyOptimizer to create mitigation strategies and collaboratively agree upon corrective actions.
The APs are responsible for facilitating smooth and efficient mapping of data from AP operational reporting systems into StudyOptimizer. This common language will result in efficiency, consistency, and clarity when maintaining and updating study plans. The output of which (plan to actual study enrollment progress and performance) will be accessible to both the APs and Pfizer for analysis and recruitment management. Thereby, early risk mitigation is facilitated across both teams. Introducing StudyOptimizer at ICON and PAREXEL During introduction of StudyOptimizer, the feasibility teams at ICON and PAREXEL understood clearly that the main reasons for adding StudyOptimizer to the planning process were:
• Transparency of study enrollment plans and recruitment performance • Centralized single repository of all proposed plans, with ability to dynamically model
multiple scenarios at once, highlighting and allowing increased visibility into the assumptions/parameters and their impact
• Ability to view enrollment status across a program or portfolio in addition to the study level
The APs worked to integrate StudyOptimizer into their feasibility process in several ways. This included the application of study assumptions into their own enrollment calculation and planning
2013 | Best Practices Compendium | Bio-IT World [40]

250 First Avenue, Suite 300, Needham, MA 02494 | phone: 781‐972‐5400 | fax: 781‐972‐5425
Published Resources for the Life Sciences
tools, then translation of those data points into parameters that can be used in StudyOptimizer. With StudyOptimizer, the APs were able to enhance the development of proposed enrollment scenarios to facilitate discussion with the Pfizer team and make more optimized recommendations for country and site allocation based on the dynamic modeling capabilities. The early signs of success have been the evolution of a common feasibility planning “language” between ICON, PAREXEL, and Pfizer. This common language between the APs and Pfizer helped to strengthen mutual confidence in the planning of studies, with StudyOptimizer providing assumption consistency and transparency into the driving factors behind the various scenario models (countries, sites, etc.). This meant that time and discussions between the APs and Pfizer could be more focused on the underpinning justification for the strategy rather than scrutinizing the minutiae of the calculation(s). Going forward, the APs will also use StudyOptimizer for “in‐life” management of the trials, including tracking of site initiation, subject screening, and subject randomization, and daily re‐forecasting to predict if trials are on track to hit planned enrollment targets.
D. ROI achieved or expected (200 words max.): While it is extremely difficult to quantify the value of “better informed decisions”, below are some discussions of the anticipated benefits that a shared common platform for enrollment planning and tracking can provide. Trial Planning and Administration Administration of outsourced clinical trials can be an arduous process, and working across teams to ensure that execution details, plans, and changes are aptly communicated and well understood requires a significant commitment. Using StudyOptimizer as a trusted model for planning and tracking studies removes a significant amount of noise and friction from these discussions, allowing the participants to focus on the assumptions and problems at hand, rather than how calculations were made. Trial Execution The trial execution side is more difficult to estimate and quantify without baselines of the current processes. Some of the potential benefits might include:
• Proactive recruitment management and earlier intervention when recruitment is falling off track
• Fewer studies requiring recruitment rescue, minimizing the number of studies adding centers mid‐stream due to more effective upfront planning
• Reduced overages and drug waste resulting from more accurate and predictable enrollment
• A reduction in non‐performing sites over time as site performance data is tracked. • Better staff utilization resulting from more accurate and predictable enrollment.
2013 | Best Practices Compendium | Bio-IT World [41]
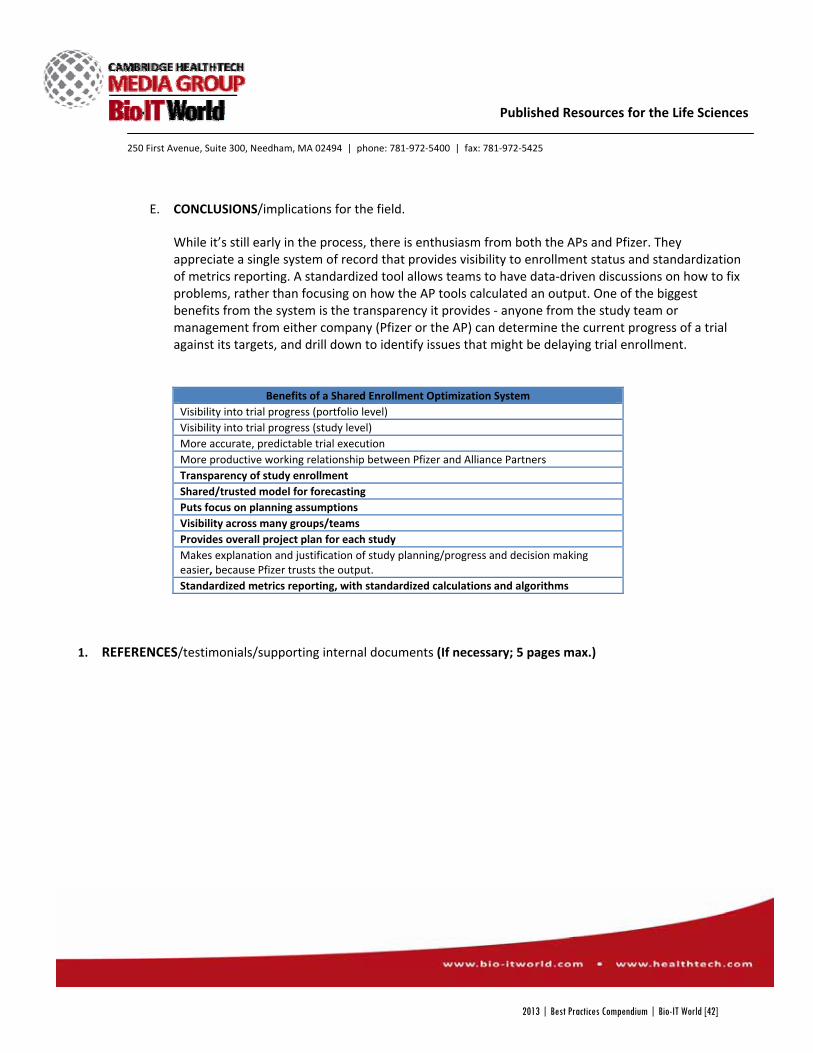
250 First Avenue, Suite 300, Needham, MA 02494 | phone: 781‐972‐5400 | fax: 781‐972‐5425
Published Resources for the Life Sciences
E. CONCLUSIONS/implications for the field. While it’s still early in the process, there is enthusiasm from both the APs and Pfizer. They appreciate a single system of record that provides visibility to enrollment status and standardization of metrics reporting. A standardized tool allows teams to have data‐driven discussions on how to fix problems, rather than focusing on how the AP tools calculated an output. One of the biggest benefits from the system is the transparency it provides ‐ anyone from the study team or management from either company (Pfizer or the AP) can determine the current progress of a trial against its targets, and drill down to identify issues that might be delaying trial enrollment.
Benefits of a Shared Enrollment Optimization System Visibility into trial progress (portfolio level) Visibility into trial progress (study level) More accurate, predictable trial execution More productive working relationship between Pfizer and Alliance Partners Transparency of study enrollment Shared/trusted model for forecasting Puts focus on planning assumptions Visibility across many groups/teams Provides overall project plan for each study Makes explanation and justification of study planning/progress and decision making easier, because Pfizer trusts the output. Standardized metrics reporting, with standardized calculations and algorithms
1. REFERENCES/testimonials/supporting internal documents (If necessary; 5 pages max.)
2013 | Best Practices Compendium | Bio-IT World [42]
250 First Avenue, Suite 300, Needham, MA 02494 | phone: 781‐972‐5400 | fax: 781‐972‐5425
Published Resources for the Life Sciences
Bio‐IT World 2012 Best Practices Awards
Required Information:
1. Nominating Organization, Contact Person & Contact Details (Fill this out only if you’re nominating an organization other than your own.)
PHT Corporation, Carolyn Peterson, Marketing Manager, [email protected], 617‐973‐1920 2. User Organization, Contact Person & Contact Details
(Organization that did the work, at which the solution was deployed or applied.)
PHT Corporation, Carolyn Peterson, Marketing Manager, [email protected], 617‐973‐1920
3. Project Title: LogPad APP
4. Project Summary: (What was the project and why should our judges consider it a best practice?)
LogPad APP is the next generation of ePRO technology, delivered over the internet as a web app on a clinical research program patient’s own Apple or Android smartphone. LogPad APP allows a new level of flexibility for pharmaceutical companies in how to deploy ePRO for their studies – flexibility for a wide range of devices, and for delivery over the internet. The primary usage for LogPad APP will be on late phase, exploratory, and observational studies; Phase 2, 3 and 4 studies. The first version of LogPad APP is focused on clinical research program patients entering data using mobile smartphones in their daily lives. Patients install the LogPad APP on their own Apple and Android smartphones. Once the app is installed, the patient can enter data on their smartphone whether they have a signal and connection to the internet or not. They’ll need a signal to transmit, of course. Data is stored in PHT’s StudyWorks online reporting portal, with a proven audit trail, data transfer, SmartReports online reporting tool, and Smart Dashboards which enable researchers to drill down into the data. LogPad APP technology supports clinician completed questionnaires through PHT’s StudyWorks online reporting portal.
2013 | Best Practices Compendium | Bio-IT World [43]
250 First Avenue, Suite 300, Needham, MA 02494 | phone: 781‐972‐5400 | fax: 781‐972‐5425
Published Resources for the Life Sciences
LogPad APP is a simpler eDiary platform. PHT will add features over time, with the intent to keep the product use and design simple and low‐cost. For example, in the future LogPad APP will include patient questionnaires filled out during office visits. Supplemental Information: (These sections aren’t required, but more details sometimes help our judges differentiate projects.)
5. Category in which entry is being submitted (1 category per entry, highlight your choice) • Clinical & Health‐IT: Trial design, eCTD, EDC, ePrescribing, RHIOs, EMR/PHR • IT infrastructure/HPC: High Performance Computing, storage, Cloud technologies • Informatics: LIMS, data visualization, imaging technologies, NGS analysis • Knowledge Management: Data mining, idea/expertise mining, text mining, collaboration, resource
optimization • Research & Drug Discovery: Disease pathway research, applied and basic research, compound‐focused
research, drug safety • Personalized & Translational Medicine: Responders/non‐responders, biomarkers, Feedback loops,
predictive technologies
6. Further details about the project; may include:
• background/objectives • innovative uses of technology; major R&D/IT tools deployed • ROI achieved or expected; time, money, other resources saved? • conclusions or implications for the field? • figures • references, testimonials, supporting documents
Worldwide, people are dropping feature phones for smartphones. Analysts at IDC predict only 4% annual growth in 2012 for mobile phone sales overall but nearly 40% growth in smartphone sales (See this article: http://www.idc.com/getdoc.jsp?containerId=prUS23523812) Not surprisingly, people around the world are starting to use their smartphones for more and more activities like banking and payments. Some areas of the world such as India have even been identified as having a high concentration (more than 60% of consumers) of “smartphonatics” who use their phones for banking, shopping and other daily activities (See this article: http://www.marketwatch.com/story/global‐study‐identifies‐impact‐of‐smartphone‐use‐on‐mobile‐banking‐and‐payments‐2012‐05‐14)
2013 | Best Practices Compendium | Bio-IT World [44]
250 First Avenue, Suite 300, Needham, MA 02494 | phone: 781‐972‐5400 | fax: 781‐972‐5425
Published Resources for the Life Sciences
Patients will be demanding the same of clinical trials software as well. Patients can use LogPad APP to enter data online or offline on their own phones, just as they would with the other apps they’re using for banking, shopping, keeping up to date, and sharing information. Many companies using ePRO in clinical trials are seeing pressure to reduce costs for hardware, reduce complexity associated with getting hardware to clinical trial sites around the world, and increase global reach. Companies that figure out how to respond will be in the lead. LogPad APP can be installed on patients’ own phones, eliminating these costs. Did you know – the Facebook smartphone app shows a “frowny” when you try to use it and your smartphone doesn’t have a WiFi or mobile signal? A frowny looks like this, by the way: :‐( That can be a pretty disappointing experience, especially if all you want to do is quickly add a status and maybe a photo or two, and you don’t care if it doesn’t get posted for a few hours. LogPad APP is different. It allows patients to enter data any time, whether or not a connection is available. PHT doesn’t like frownies – especially when it comes to being able to enter time‐sensitive clinical trial data. PHT offers the iPhone 4S and Samsung Galaxy Nexus for the LogPad APP. Samsung has become the leader in Android phone providers, shipping 44% of Android phones in 2Q2012 (http://money.cnn.com/2012/08/08/technology/smartphone‐market‐share/index.html). The Galaxy Nexus is Google’s reference phone for Android 4.1, meaning Samsung delivered the phone with the base Android operating system. Other manufacturers deliver phones with custom features just for their phones, which can have bugs and other issues. PHT chose the iPhone 4S for several reasons. Apple offers their products for years at a time, much longer than the 6‐18 month lifespan for phones. And iPhones have a very good reputation in the market for usability and good design. There is no way for a patient or anyone else to see or alter the clinical data. Patients can delete the data they have not yet sent if they clear cached data and cookies on their phone. However, the Logpad APP transmits data on each login and at the end of each questionnaire, so it is likely they’ll not have many stored diaries at any one time. If ensuring that the questionnaires are all displayed on screens with the same size and resolution for all subjects is important to the sponsor or for regulatory reviewers PHT can configure the LogPad APP for a study to only install on devices with screens with the same resolution and screen size. PHT can work with sponsors to deploy smartphones with the same resolution and screen size for their LogPad APP study.
PHT LogPad APP
Feature Benefit
Online/Offline Patients can enter data whenever and wherever they want whether or not an
2013 | Best Practices Compendium | Bio-IT World [45]
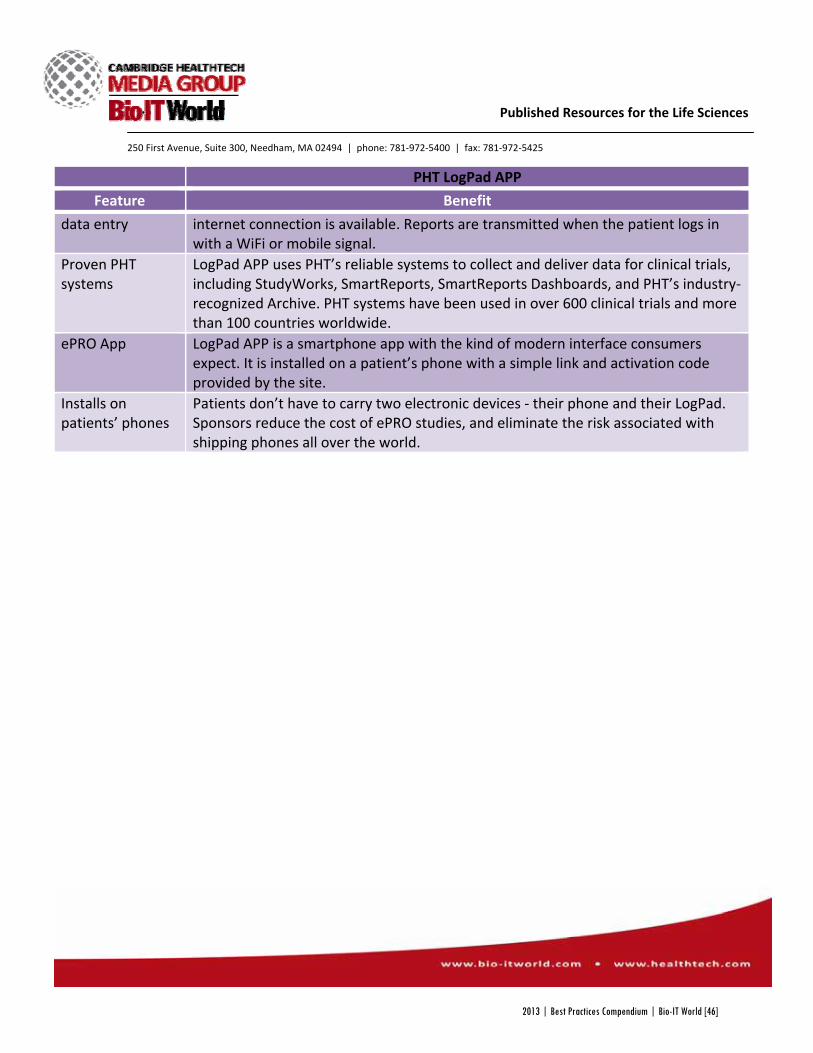
250 First Avenue, Suite 300, Needham, MA 02494 | phone: 781‐972‐5400 | fax: 781‐972‐5425
Published Resources for the Life Sciences
PHT LogPad APP
Feature Benefit
data entry internet connection is available. Reports are transmitted when the patient logs in with a WiFi or mobile signal.
Proven PHT systems
LogPad APP uses PHT’s reliable systems to collect and deliver data for clinical trials, including StudyWorks, SmartReports, SmartReports Dashboards, and PHT’s industry‐recognized Archive. PHT systems have been used in over 600 clinical trials and more than 100 countries worldwide.
ePRO App LogPad APP is a smartphone app with the kind of modern interface consumers expect. It is installed on a patient’s phone with a simple link and activation code provided by the site.
Installs on patients’ phones
Patients don’t have to carry two electronic devices ‐ their phone and their LogPad. Sponsors reduce the cost of ePRO studies, and eliminate the risk associated with shipping phones all over the world.
2013 | Best Practices Compendium | Bio-IT World [46]

User Organization
Organization name: Prize4Life, Inc.
Address: PO Box 425783, Cambridge, MA 02142
User Organization Contact Person
Name: Patrick Bayhylle
Title: Marketing and Communications Manager
Tel: 617‐500‐7527
Email: [email protected]
Project Title
The Pooled Resource Open‐access ALS Clinical Trials (PRO‐ACT) platform
Team Leaders
Dr. Melanie Leitner, Prize4Life Chief Scientific Officer
Alex Sherman, Director of Strategic Development and Systems, Neurological Clinical Research Institute at Massachusetts General Hospital
Category in which entry is being submitted
Knowledge Management: Data mining, idea/expertise mining, text mining, collaboration, resource optimization
2013 | Best Practices Compendium | Bio-IT World [47]
Confidential Page | 2
ABSTRACT/SUMMARY of the project and results The Pooled Resource Open‐access ALS Clinical Trials (PRO‐ACT) platform and database houses the largest harmonized dataset from completed clinical trials in ALS (amyotrophic lateral sclerosis, a.k.a. Lou Gehrig’s disease). The initial goal of PRO‐ACT was to establish a common research support infrastructure to merge and integrate placebo patient data from completed ALS clinical trials to create a powerful new open‐access research tool for researchers, statisticians, clinicians, and anyone interested in “Big Data”, both in academia and industry.
The PRO‐ACT platform makes possible the merging of heterogeneous data from diverse internationally conducted clinical trials, generating an invaluable resource for both the design of future clinical trials and the identification of unique observations, novel correlations, and biomarkers of disease.
Currently, there are no effective treatments for ALS. The PRO‐ACT platform helps to accelerate the discovery, development, and delivery of future ALS treatments, providing new hope to patients and their families.
INTRODUCTION/background/objectives One of the greatest challenges facing biomedical sciences is the development of fundamentally better treatments for neurodegenerative diseases. Large datasets are critical for identifying statistically significant and biologically relevant observations, particularly for diseases resulting from the intricate interplay of genetic and environmental factors. However, because the cost of running a single large clinical trial (on several thousand patients) would be exorbitant, it is unlikely that such a thing will be undertaken by the pharmaceutical industry in the near future. While it is unlikely that a multi‐thousand record sample set will ever be derived from a single clinical trial, it is possible to pool smaller datasets to obtain the statistical power necessary for a variety of analyses. The Pooled Resource Open‐access ALS Clinical Trials (PRO‐ACT) platform has provided an unprecedented opportunity to increase our understanding of the ALS patient population and the natural history of the disease. The ALS Prediction Prize Challenge, launched using a subset of the data within PRO‐ACT, has already given the field a potential new way to predict ALS progression early on in the disease, and this approach has already begun to be explored by pharmaceutical companies. Prize4Life and the Neurological Clinical Research Institute at Massachusetts General Hospital (NCRI) created the PRO‐ACT platform with funding from the ALS Therapy Alliance and in partnership with the Northeast ALS Consortium.
PRO‐ACT allows the merging of data from existing publicly and privately conducted ALS clinical trials and makes these data available for research, creating an invaluable resource for anyone interested in this field. Global availability of ALS clinical trial data will catalyze ALS discoveries.
The objective for PRO‐ACT is simple: to provide ALS researchers around the world access to sufficient quantities of validated data, allowing them to begin answering some very basic questions about the disease such as, how much does ALS differ between men and women? In addition, PRO‐ACT has the power to cause pharmaceutical companies to rethink their strategies regarding ALS, since the data it contains may help the development of Phase II and Phase III treatments. The results garnered through the use of the PRO‐ACT platform will benefit more than just the scientific and medical research fields; they will also impact ALS patients and their families, potentially by giving them answers to their currently unanswerable questions about what to expect following diagnosis.
RESULTS A team comprised of specialists from multiple academic, non‐profit, and for‐profit institutions, and from various disciplines, scientists, clinicians, software engineers, intellectual property attorneys, data specialists, and biostatisticians, was assembled in 2011. Within a two‐year period, four major pharmaceutical companies signed legal data transfer agreements and delivered data. The software platform (.Net, MS SQL Server) was designed, developed and validated at the Neurological Clinical Research Institute. The data were analyzed, treated, mapped, imported and posted for download and analyses. The platform allows qualified individuals to register and solicit access to data. Upon approval, the data can be viewed and downloaded.
2013 | Best Practices Compendium | Bio-IT World [48]

Confidential Page | 3
The PRO‐ACT platform was designed to enable users to create a highly‐customizable disease‐specific Common Data Structure (CDS). In addition to being flexible, this design allows the CDS to be modified, without the need to re‐import existing data.
There are currently over 900 Common Data Elements (CDEs) in the PRO‐ACT Common Data Structure that are being used to map data from thirteen ALS clinical trials donated by four pharmaceutical companies plus five academic trials. These CDEs were specified while adhering to NINDS Common Data Elements guidelines wherever possible.
The database is accessible to the research community for download and analysis at http://www.alsdatabase.org .
The following describes the PRO‐ACT data curation, harmonization, and processing procedures. Data coming from a multitude of sources were homogenized and organized according to a Common Data Structure (CDS):
• The CDS was created to accommodate NINDS‐recommended and/or institution‐specific Common Data Elements
• Data Dictionaries from multiple trials were analyzed, and data relationships were identified
• A Transformation Matrix was then developed with a set of rules for mapping fields and field‐encoded values between the Study Data and the CDS elements. A map was then created between the original datasets’ dictionaries and the CDS and its elements
• The original data were further de‐identified by removing any information that could connect the entered data to a specific subject, trial or dates
• The datasets were imported preserving their natural grouping and properties
• The built‐in flexibility of the platform was designed to allow for the re‐assigning of individual fields to different Common Data Elements (CDEs) or the sharing of individual fields between multiple data elements. This powerful feature allows for future interoperability, scalability, and the eventual registration of CDEs with regulatory authorities.
As of today, the PRO‐ACT dataset contains:
• More than 8,500 fully de‐identified unique clinical patient records • Placebo and, in many cases, treatment‐arm data from 18 late stage (Phase II/III) industry and academic clinical trials • The world’s largest collection of laboratory tests results from ALS patients, with close to 1.7 million records • Over 8 million longitudinally collected data points • Ten times the number of ALS patient clinical records as was previously available from a single source
Since its launch December 2012, 85 data scientists, clinicians, pharmaceutical experts, and foundation representatives have already requested access to the PRO‐ACT dataset to further their ALS research and this number continues to increase on a daily basis.
ROI achieved or expected The PRO‐ACT platform encourages scientific and medical collaboration, in fields that are normally fiercely competitive, and gives scientists and medical experts another weapon in their arsenal to use in the fight against ALS.
Currently, ALS trials must include large numbers of patients to account for the enormous variance in the course of the disease within the ALS patient population, making these trials costly, slow, and more difficult to interpret. As a “proof of concept”, a subset of the PRO‐ACT dataset was used to run The ALS Prediction Prize Challenge. Using a quarter of the
2013 | Best Practices Compendium | Bio-IT World [49]
Confidential Page | 4
full PRO‐ACT dataset, solvers of the challenge developed algorithms that predicted a given patient’s disease status within a year’s time based on three months of data. Upon final validation, these solutions will have two important and immediate benefits: they will increase the likelihood of clinical trial success by providing a new tool to measure inter‐patient variability, and given this ability to gauge variability early on in disease, these algorithms have the power to reduce the number of patients in a clinical trial by 23 percent.
In addition, without significant modifications, the PRO‐ACT platform and approach could be applicable to any disease.
CONCLUSIONS/implications for the field More than 600,000 people around the world are battling ALS. The disease strikes indiscriminately, and typically patients will die within 2‐5 years following diagnosis. Currently, there are no effective treatments or a cure for ALS. Global access to the PRO‐ACT platform has already begun to accelerate the discovery, development, and delivery of ALS treatments
The uniquely powerful PRO‐ACT Platform is the result of a collective effort by industry, academic, and foundation partners to obtain, pool, and provide access to precious and rare ALS patient clinical trial records.
The PRO‐ACT platform enables users to build a disease‐specific Common Data Structure that can then allow heterogeneous datasets from multiple clinical trials to be mapped and the data imported to create a single homogenous dataset. If there is a need to change the CDS because of new guidelines and discoveries, the platform allows users to execute the change without data re‐importation
PRO‐ACT was envisioned and designed to be a dynamic and expanding resource, and efforts are underway to obtain and incorporate additional patient data. PRO‐ACT has become the platform of choice for making ALS clinical trial data available to the global community of data scientists, researchers, and computer mavens. This will undoubtedly speed up the process of ALS research by driving down the costs of discovery, which is good news for both the scientific and patient communities alike. PRO‐ACT is a powerful example of how “Big Data” can drive advances in medicine and one that is sure to be embraced by many other disease areas.
REFERENCES/testimonials/supporting internal documents 1. http://www.alsdatabase.org
http://www.Prize4Life.org http://www.massgeneral.org/research/researchlab.aspx?id=1255 (NCRI website)
2. ALS Prediction Prize announcement (attached to email submission) 3. Boston Globe article regarding “Big Data” reference PRO‐ACT and the ALS Prediction Prize (attached to email
submission) 4. Alzheimer’s Research Forum article discussing PRO‐ACT 5. Letter of Support from Dr. Doug Kerr, Medical Director of the Neurodegeneration Clinical Development, Biogen Idec
(attached to email submission) 6. Letter of Support from Dr. Merit Cudkowicz, Co‐Director of the Northeast ALS Consortium, Chair of the Department
of Neurology at Massachusetts General Hospital (attached to email submission)
2013 | Best Practices Compendium | Bio-IT World [50]
FOR IMMEDIATE RELEASE
Prize4Life Announces $50,000 ALS Prediction Prize Winners
Solutions Take Researchers a Step Closer to Predicting the Future for ALS Patients Cambridge, Mass. – November 13, 2012 – Prize4Life, a nonprofit organization whose mission is to accelerate the discovery of treatments and a cure for ALS (Amyotrophic Lateral Sclerosis, also known as Lou Gehrig’s disease), announced today three winners of its $50,000 DREAM-Phil Bowen ALS Prediction Prize4Life Challenge (or ALS Prediction Prize), which was run in collaboration with InnoCentive, Inc., the global leader in open innovation, crowdsourcing and prize competitions, and IBM’s DREAM Project. ALS, a fatal disease, is difficult to predict. Although the average life expectancy of an ALS patient is about three years, some people live for decades, while others succumb within months. This lack of predictability makes the design of clinical trials to discover new treatments a long, costly and complex process. The ALS Prediction Prize provided competing teams with access to anonymous ALS patient data collected in previous clinical trials. With more than 1,000 participants in the Challenge, crowdsourcing via InnoCentive’s global network approach resulted in 37 potential solutions from teams and individuals around the globe. Two teams have secured first place in the ALS Prediction Prize: a duo from Stanford University, postdoctoral candidate in mathematics and statistics Lester Mackey, PhD and recent JD and Master’s Degree recipient Lilly Fang; and the team of Liuxia Wang, PhD Principal Scientist, and her colleague Guang Li, Quantitative Modeler at Washington, DC-based Scientific Marketing Company, Sentrana. Each team will receive $20,000 for generating the top-performing solutions to predict disease progression in ALS patients. In addition, Torsten Hothorn, PhD, a distinguished statistics professor from Germany, was awarded a second-place prize of $10,000 for his unique solution, which included an alternative approach to assessing disease progression to that specified in the Challenge criteria. The Prize4Life judging panel found Hothorn’s contribution to be highly valuable so they honored him with second place and a $10,000 prize. “At the outset of the Challenge, we hoped to receive just one viable solution that would help improve the prediction of disease progression in ALS patients,” said Prize4Life CEO Avi Kremer. “Not only have we seen multiple great results, but the winners come from around the world. We couldn’t have been more thrilled with the results generated by all of our winning teams, which gives greater hope to those of us coping with ALS.” The ALS Prediction Prize Challenge initially sought one winner and originally allocated an award amount of $25,000, but the solutions submitted by the Stanford University team and the Sentrana team performed equally well in their predictive capabilities, leading the Prize4Life judging panel to conclude that the prize purse should be expanded.
2013 | Best Practices Compendium | Bio-IT World [51]
“These winning solutions to the ALS Prediction Prize Challenge will give us important new insights into disease progression in ALS patients. Currently, ALS clinical trials must include large numbers of patients to account for the enormous variance in the course of the disease progression, which makes these trials expensive, and more difficult to interpret,” said Prize4Life Chief Scientific Officer Dr. Melanie Leitner. “The solutions to the ALS Prediction Prize will have two important and immediate benefits: they will increase the likely hood of clinical trial success and our experts estimate that these algorithms can reduce the number of patients in a clinical trial by 23 percent.” Prize winner Lester Mackey notes, "Lilly and I were eager to be part of the ongoing effort to make ALS disease prognosis more accurate and useful and we are thrilled that our solution was chosen as one of the best to contribute to the cause of defeating ALS." The ALS Prediction Prize Challenge was based on the PRO-ACT database, which was developed in collaboration with the Northeast ALS Consortium (NEALS) with funding from the ALS Therapy Alliance. A subset of the PRO-ACT database was made available to participants via the InnoCentive platform and the full PRO-ACT dataset will be made available to the global scientific community for research on December 5, 2012. PRO-ACT will contain clinical data from over 8,500 ALS patients from completed clinical trials, ten times more than had been available previously. The ALS Prediction Prize is the second Challenge in which Prize4Life partnered with InnoCentive. The first was the $1 million ALS Biomarker Prize awarded in early 2011 to Dr. Seward Rutkove of Beth Israel Deaconess Medical Center in Boston for his development of a technology that accurately measures the progression of ALS in patients in order to match them to the correct clinical trials. About Prize4Life Prize4Life is a 501(c)(3) nonprofit organization whose mission is to accelerate the discovery of treatments and a cure for ALS (Amyotrophic Lateral Sclerosis, also known as Lou Gehrig's disease) by using powerful incentives to attract new people and drive innovation. Prize4Life believes that solutions to some of the biggest challenges in ALS research will require out-of-the-box thinking, and that some of the most critical discoveries may come from unlikely places. Founded in 2006 by Avi Kremer, who was diagnosed with ALS at the age of 29, Prize4Life encourages and rewards creative approaches that will yield real results for ALS patients. For more information, visit www.prize4life.org. About InnoCentive InnoCentive is the global leader in crowdsourcing innovation problems to the world’s smartest people who compete to provide ideas and solutions to important business, social, policy, scientific, and technical challenges. For more than a decade, leading commercial, government, and nonprofit organizations have partnered with InnoCentive to rapidly generate innovative new ideas and solve pressing problems. For more information, visit www.innocentive.com.
### Media Contacts: Chrissy Kinch Version 2.0 Communications for Prize4Life 617-426-2222 [email protected]
2013 | Best Practices Compendium | Bio-IT World [52]

Marisa Borgasano Schwartz MSL for InnoCentive 781-684-0770 [email protected]
2013 | Best Practices Compendium | Bio-IT World [53]
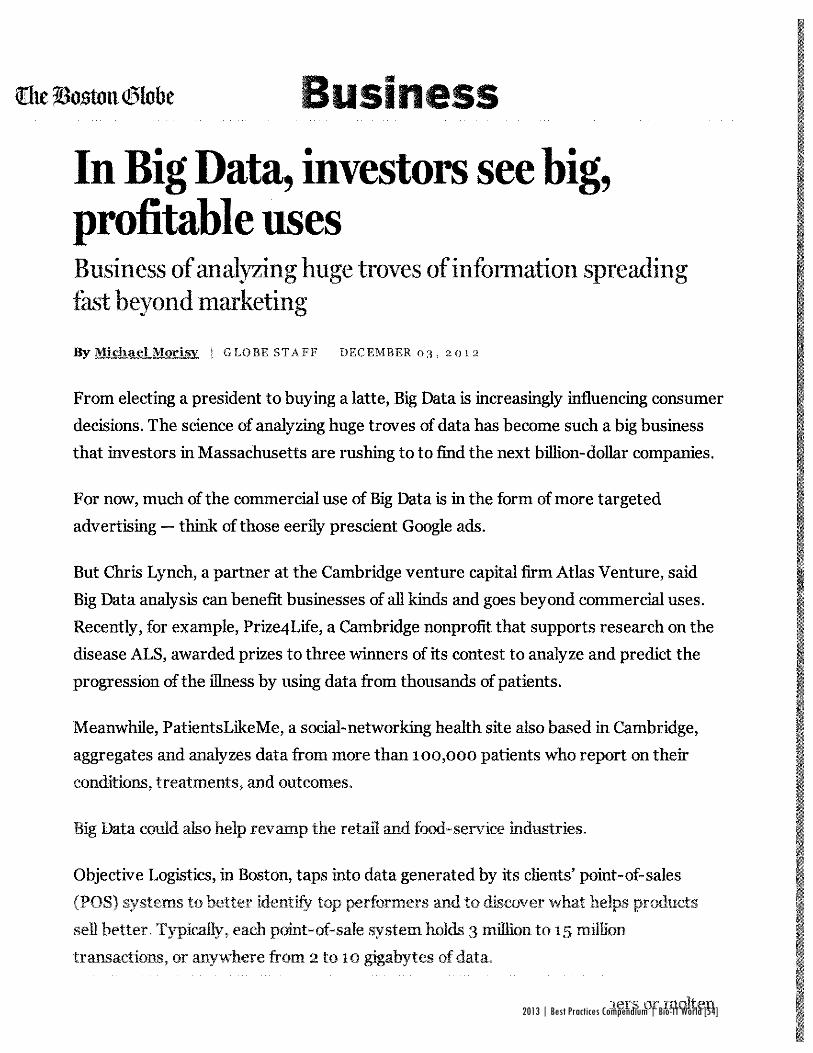
2013 | Best Practices Compendium | Bio-IT World [54]
2013 | Best Practices Compendium | Bio-IT World [55]
2013 | Best Practices Compendium | Bio-IT World [56]
2013 | Best Practices Compendium | Bio-IT World [57]
Biogen Idec 14 Cambridge Center Cambridge, MA 02142 Phone 617-679-2000 www.biogenidec.com
February 4, 2013 Melanie Leitner, PhD Chief Scientific Officer Prize4Life 10 Cambridge Center Cambridge, MA 02142 Dear Dr. Leitner: As Biogen Idec’s Medical Director of the Neurodegeneration Clinical Development, I know how important the creation of the Pooled Resource Open‐access ALS Clinical Trials (PRO‐ACT) platform is to future ALS clinical trials. I have personally witnessed your commitment to the PRO‐ACT initiative over the past three years and could not be more pleased to write this letter of support for a Bio‐IT World 2013 Best Practices Award. The PRO‐ACT platform has given companies such as Biogen Idec cause to rethink our priorities and strategies regarding ALS. The abundant clinical and patient data contained within it will help us develop viable Phase II and Phase III treatments for ALS in the future. Currently, ALS trials must include large numbers of patients to account for the enormous variance in the course of the disease within the ALS patient population. This makes these trials costly, slow, and more difficult to interpret. PRO‐ACT will cut the cost and reduce the length of time needed for ALS clinical trials because we will be able to better design trials that need fewer participants. The algorithms developed in the ALS Prediction Prize used a small subset of data from PRO‐ACT, yet produced results which could have an immediate impact on how Biogen Idec will design new ALS clinical trials to test our drugs in development. While our Phase III ALS clinical trial of Dexpramipexole failed, we are looking forward to adding our clinical data to PRO‐ACT in the near future. Prior to the creation of PRO‐ACT, many ALS research and pharmaceutical organizations have not shared the valuable information acquired from patients during clinical trials. I am confident that ALS research will move forward when scientists are able to identify the patterns hiding in the millions of data points in PRO‐ACT collected from thousands of courageous and generous ALS patients who participated in previous clinical trials. To that end, it is my pleasure to support your nomination for a Bio‐IT World 2013 Best Practices Award. Sincerely, Douglas Kerr, MD, PhD Medical Director, Neurodegeneration – Clinical Development Biogen Idec 10 Cambridge Center Cambridge, MA 02142
2013 | Best Practices Compendium | Bio-IT World [58]
2013 | Best Practices Compendium | Bio-IT World [59]

2013 | Best Practices Compendium | Bio-IT World [60]
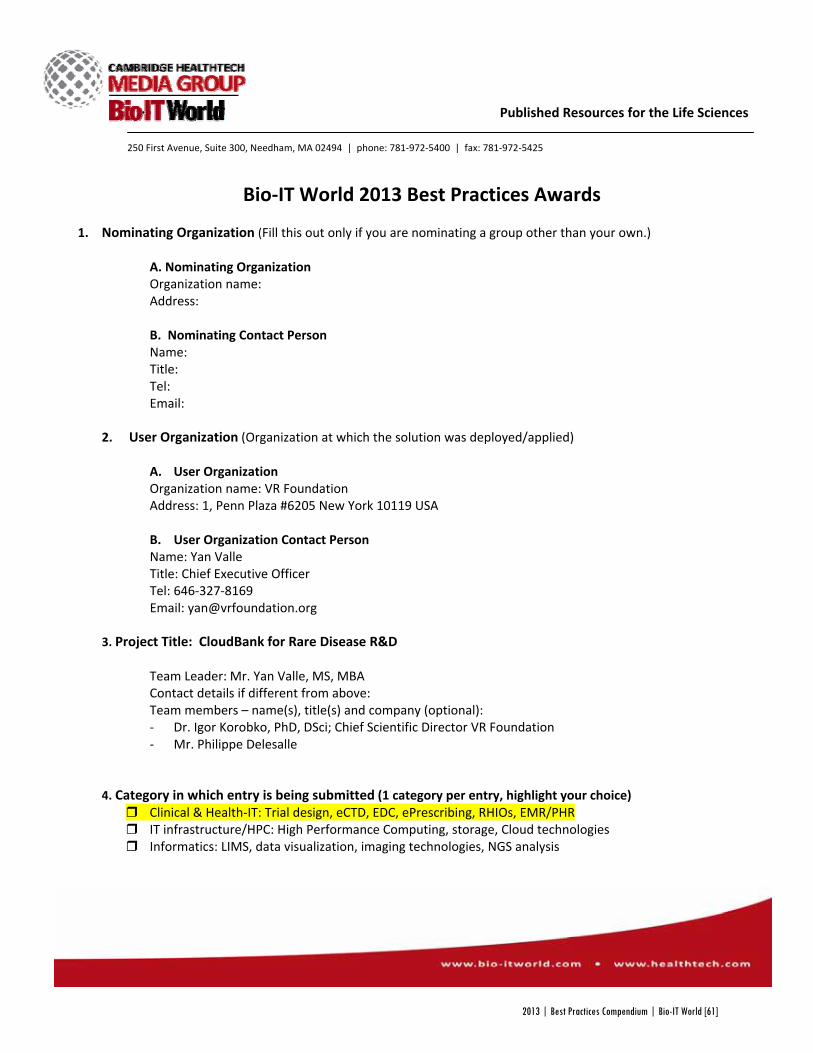
250 First Avenue, Suite 300, Needham, MA 02494 | phone: 781‐972‐5400 | fax: 781‐972‐5425
Published Resources for the Life Sciences
Bio‐IT World 2013 Best Practices Awards
1. Nominating Organization (Fill this out only if you are nominating a group other than your own.) A. Nominating Organization Organization name: Address: B. Nominating Contact Person Name: Title: Tel: Email:
2. User Organization (Organization at which the solution was deployed/applied)
A. User Organization Organization name: VR Foundation Address: 1, Penn Plaza #6205 New York 10119 USA B. User Organization Contact Person Name: Yan Valle Title: Chief Executive Officer Tel: 646‐327‐8169 Email: [email protected]
3. Project Title: CloudBank for Rare Disease R&D
Team Leader: Mr. Yan Valle, MS, MBA Contact details if different from above: Team members – name(s), title(s) and company (optional): ‐ Dr. Igor Korobko, PhD, DSci; Chief Scientific Director VR Foundation ‐ Mr. Philippe Delesalle
4. Category in which entry is being submitted (1 category per entry, highlight your choice)
Clinical & Health‐IT: Trial design, eCTD, EDC, ePrescribing, RHIOs, EMR/PHR IT infrastructure/HPC: High Performance Computing, storage, Cloud technologies Informatics: LIMS, data visualization, imaging technologies, NGS analysis
2013 | Best Practices Compendium | Bio-IT World [61]
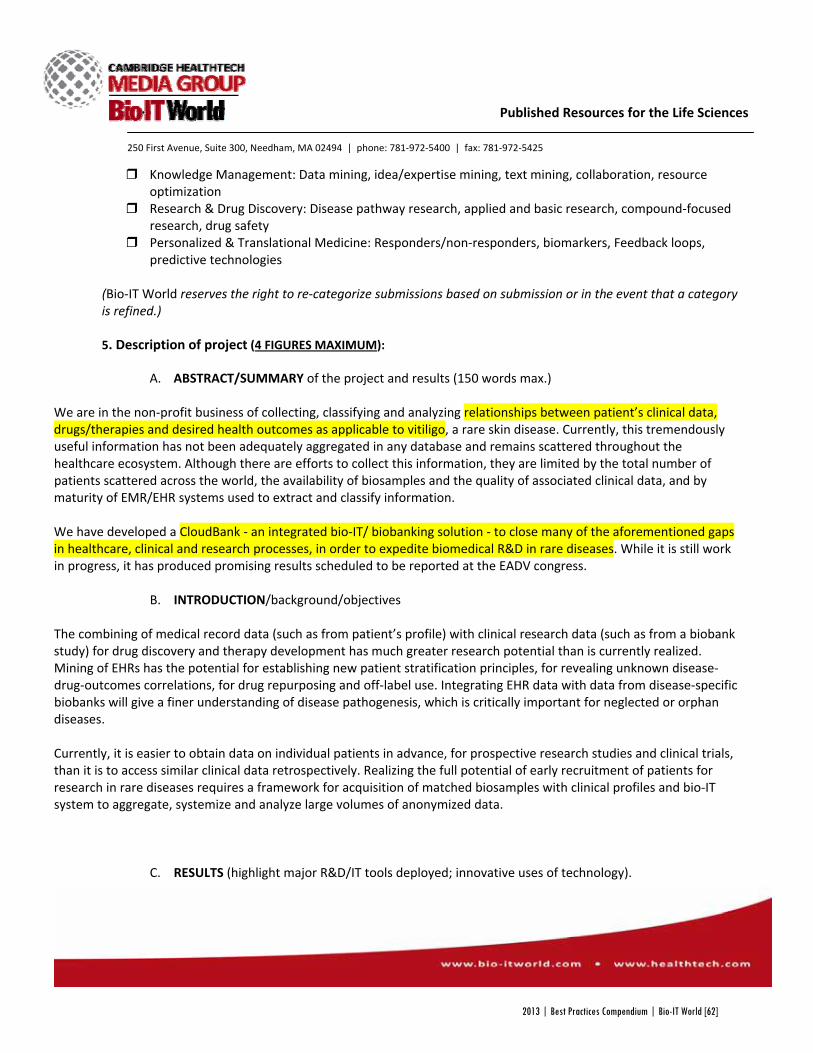
250 First Avenue, Suite 300, Needham, MA 02494 | phone: 781‐972‐5400 | fax: 781‐972‐5425
Published Resources for the Life Sciences
Knowledge Management: Data mining, idea/expertise mining, text mining, collaboration, resource optimization
Research & Drug Discovery: Disease pathway research, applied and basic research, compound‐focused research, drug safety
Personalized & Translational Medicine: Responders/non‐responders, biomarkers, Feedback loops, predictive technologies
(Bio‐IT World reserves the right to re‐categorize submissions based on submission or in the event that a category is refined.) 5. Description of project (4 FIGURES MAXIMUM):
A. ABSTRACT/SUMMARY of the project and results (150 words max.)
We are in the non‐profit business of collecting, classifying and analyzing relationships between patient’s clinical data, drugs/therapies and desired health outcomes as applicable to vitiligo, a rare skin disease. Currently, this tremendously useful information has not been adequately aggregated in any database and remains scattered throughout the healthcare ecosystem. Although there are efforts to collect this information, they are limited by the total number of patients scattered across the world, the availability of biosamples and the quality of associated clinical data, and by maturity of EMR/EHR systems used to extract and classify information. We have developed a CloudBank ‐ an integrated bio‐IT/ biobanking solution ‐ to close many of the aforementioned gaps in healthcare, clinical and research processes, in order to expedite biomedical R&D in rare diseases. While it is still work in progress, it has produced promising results scheduled to be reported at the EADV congress.
B. INTRODUCTION/background/objectives
The combining of medical record data (such as from patient’s profile) with clinical research data (such as from a biobank study) for drug discovery and therapy development has much greater research potential than is currently realized. Mining of EHRs has the potential for establishing new patient stratification principles, for revealing unknown disease‐drug‐outcomes correlations, for drug repurposing and off‐label use. Integrating EHR data with data from disease‐specific biobanks will give a finer understanding of disease pathogenesis, which is critically important for neglected or orphan diseases. Currently, it is easier to obtain data on individual patients in advance, for prospective research studies and clinical trials, than it is to access similar clinical data retrospectively. Realizing the full potential of early recruitment of patients for research in rare diseases requires a framework for acquisition of matched biosamples with clinical profiles and bio‐IT system to aggregate, systemize and analyze large volumes of anonymized data.
C. RESULTS (highlight major R&D/IT tools deployed; innovative uses of technology).
2013 | Best Practices Compendium | Bio-IT World [62]
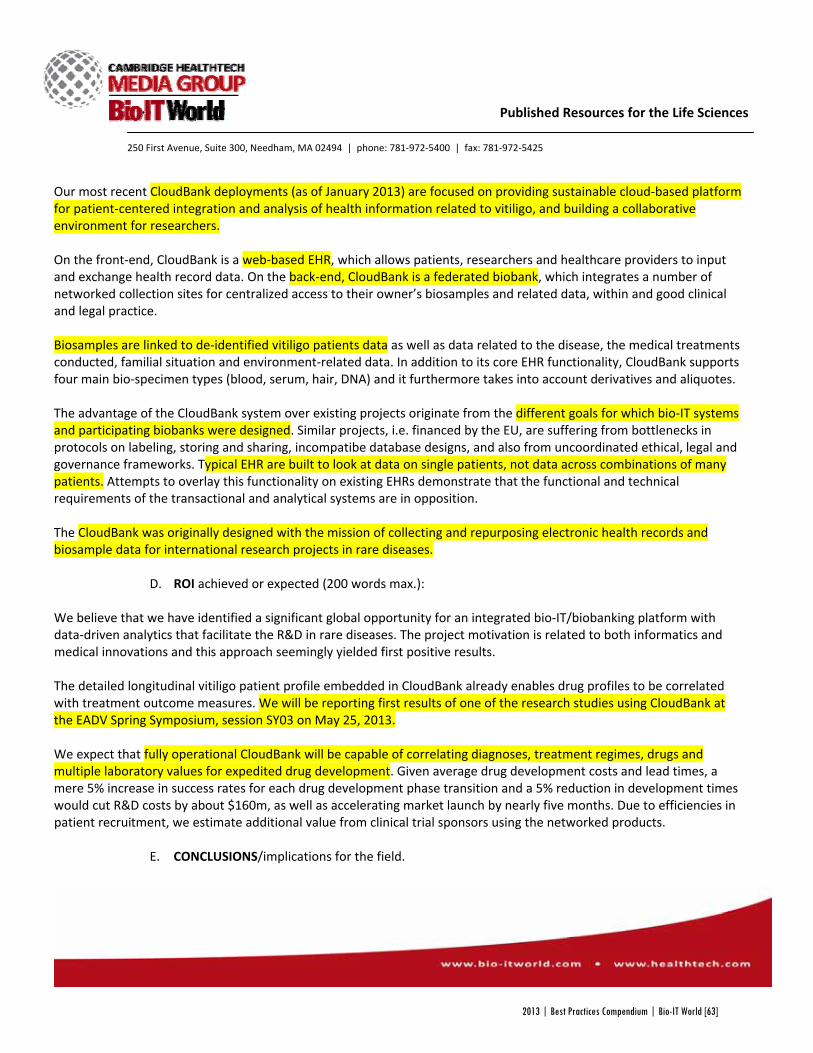
250 First Avenue, Suite 300, Needham, MA 02494 | phone: 781‐972‐5400 | fax: 781‐972‐5425
Published Resources for the Life Sciences
Our most recent CloudBank deployments (as of January 2013) are focused on providing sustainable cloud‐based platform for patient‐centered integration and analysis of health information related to vitiligo, and building a collaborative environment for researchers. On the front‐end, CloudBank is a web‐based EHR, which allows patients, researchers and healthcare providers to input and exchange health record data. On the back‐end, CloudBank is a federated biobank, which integrates a number of networked collection sites for centralized access to their owner’s biosamples and related data, within and good clinical and legal practice. Biosamples are linked to de‐identified vitiligo patients data as well as data related to the disease, the medical treatments conducted, familial situation and environment‐related data. In addition to its core EHR functionality, CloudBank supports four main bio‐specimen types (blood, serum, hair, DNA) and it furthermore takes into account derivatives and aliquotes. The advantage of the CloudBank system over existing projects originate from the different goals for which bio‐IT systems and participating biobanks were designed. Similar projects, i.e. financed by the EU, are suffering from bottlenecks in protocols on labeling, storing and sharing, incompatibe database designs, and also from uncoordinated ethical, legal and governance frameworks. Typical EHR are built to look at data on single patients, not data across combinations of many patients. Attempts to overlay this functionality on existing EHRs demonstrate that the functional and technical requirements of the transactional and analytical systems are in opposition. The CloudBank was originally designed with the mission of collecting and repurposing electronic health records and biosample data for international research projects in rare diseases.
D. ROI achieved or expected (200 words max.): We believe that we have identified a significant global opportunity for an integrated bio‐IT/biobanking platform with data‐driven analytics that facilitate the R&D in rare diseases. The project motivation is related to both informatics and medical innovations and this approach seemingly yielded first positive results. The detailed longitudinal vitiligo patient profile embedded in CloudBank already enables drug profiles to be correlated with treatment outcome measures. We will be reporting first results of one of the research studies using CloudBank at the EADV Spring Symposium, session SY03 on May 25, 2013. We expect that fully operational CloudBank will be capable of correlating diagnoses, treatment regimes, drugs and multiple laboratory values for expedited drug development. Given average drug development costs and lead times, a mere 5% increase in success rates for each drug development phase transition and a 5% reduction in development times would cut R&D costs by about $160m, as well as accelerating market launch by nearly five months. Due to efficiencies in patient recruitment, we estimate additional value from clinical trial sponsors using the networked products.
E. CONCLUSIONS/implications for the field.
2013 | Best Practices Compendium | Bio-IT World [63]

250 First Avenue, Suite 300, Needham, MA 02494 | phone: 781‐972‐5400 | fax: 781‐972‐5425
Published Resources for the Life Sciences
The CloudBank is designed to be able to collect multi‐dimensional data and quantitatively estimate the complex interplay of clinical factors in relation to treatments and desired outcomes. It plays a crucial role in therapy development for vitiligo by the VR Foundation, and it can serve as a standard R&D tool in other rare or orphan diseases.
6. REFERENCES/testimonials/supporting internal documents (If necessary; 5 pages max.)
Multidisciplinary approach to R&D in vitiligo, a neglected skin disease. Valle, Y., Lotti, T. M., Hercogova, J., Schwartz, R. A. and Korobko, I. V. (2012) Dermatologic Therapy, 25: S1–S9 http://onlinelibrary.wiley.com/doi/10.1111/dth.12009/abstract
Cloud Medical Research Management (MRM): a Bio‐IT tool for correlative studies in dermatology. Valle Y., Couture P., Lotti T., Korobko I. Treat Strategies (Dermatol). 2011; 1(1): 82‐86. http://viewer.zmags.com/publication/06b8bb6d#/06b8bb6d/1
2013 | Best Practices Compendium | Bio-IT World [64]
250 First Avenue, Suite 300, Needham, MA 02494 | phone: 781‐972‐5400 | fax: 781‐972‐5425
Published Resources for the Life Sciences
Bio‐IT World 2013 Best Practices Awards
1. Nominating Organization (Fill this out only if you are nominating a group other than your own.) A. Nominating Organization Organization name: Address: B. Nominating Contact Person Name: Title: Tel: Email:
2. User Organization (Organization at which the solution was deployed/applied)
A. User Organization Organization name: Bayer HealthCare AG Address: Kaiser‐Wilhelm‐Allee 1, 51373 Leverkusen, Germany B. User Organization Contact Person Name: Dr. Jesus del Valle Title: Head of O&I R&D Research Biology Systems Tel: +49‐30‐46814617 Email: [email protected]
3. Project Title: HCA Live Cell Analyzer – Every cell tells a Story
Team Leader: Sebastian Räse Contact details if different from above: Bayer HealthCare AG GDD‐GCGE‐LDB‐Screening‐High Content Analysis Müllerstr. 178, 13353 Berlin, Germany Tel. +49 30 468 193081, E‐Mail: [email protected] Team members – name(s), title(s) and company (optional): Prof. Thomas Berlage, Fraunhofer Institute FIT Stefan Borbe, Fraunhofer Institute FIT Jan Bornemeier, Fraunhofer Institute FIT Dr. Stefan Prechtl, Bayer Pharma AG
2013 | Best Practices Compendium | Bio-IT World [65]
250 First Avenue, Suite 300, Needham, MA 02494 | phone: 781‐972‐5400 | fax: 781‐972‐5425
Published Resources for the Life Sciences
Dr. Maik Zielinsky, Bayer Business Services GmbH Dr. Jesus del Valle, Bayer HealthCare AG
Heidi Habicht, Bayer HealthCare AG 4. Category in which entry is being submitted (1 category per entry, highlight your choice) Please note: Actually it could also be considered for the Research & Drug Discovery Award, we are unsure which category fits best.
Clinical & Health‐IT: Trial design, eCTD, EDC, ePrescribing, RHIOs, EMR/PHR IT infrastructure/HPC: High Performance Computing, storage, Cloud technologies Informatics: LIMS, data visualization, imaging technologies, NGS analysis Knowledge Management: Data mining, idea/expertise mining, text mining, collaboration, resource optimization
Research & Drug Discovery: Disease pathway research, applied and basic research, compound‐focused research, drug safety
Personalized & Translational Medicine: Responders/non‐responders, biomarkers, Feedback loops, predictive technologies
(Bio‐IT World reserves the right to re‐categorize submissions based on submission or in the event that a category is refined.) 5. Description of project (4 FIGURES MAXIMUM):
A. ABSTRACT/SUMMARY of the project and results (150 words max.)
B. INTRODUCTION/background/objectives
C. RESULTS (highlight major R&D/IT tools deployed; innovative uses of technology). D. ROI achieved or expected (200 words max.):
E. CONCLUSIONS/implications for the field.
1. REFERENCES/testimonials/supporting internal documents (If necessary; 5 pages max.)
2013 | Best Practices Compendium | Bio-IT World [66]
250 First Avenue, Suite 300, Needham, MA 02494 | phone: 781‐972‐5400 | fax: 781‐972‐5425
Published Resources for the Life Sciences
ABSTRACT/SUMMARY of the project and results (150 words max.) To analyze the impact of Bayer’s substances to reduce tumor growth, we needed a software that can “recognize” the different phases of cellular division, follow individual cells, and perform statistical, complex time‐dependent analyses using automated microscopy. In a collaboration, the ZETA software architecture from Fraunhofer FIT was customized and optimized towards our requirements. Living cell High Content Analysis combined with ZETA enables the quantification of dynamic, spatial cellular processes. Project completion times are reduced by as much as 10 times due to faster automated image analysis. Multiple single time point assays are replaced by one live cell experiment. Quality was improved due to greater coverage of events in automated image analysis. This process has been recognized as a best‐practice example for several other data analysis chains at Bayer and has positively influenced the innovation culture towards increased use of data‐driven research.
INTRODUCTION/background/objectives High‐Content Analysis (HCA) is an important research technique supporting the development of new drugs for cancer therapy established at Bayer HealthCare Global Drug Discovery in Berlin, Germany. In order to fight cancer the colleagues have to visualize and analyze the impact of Bayer’s substances to reduce tumor growth. We needed a software that can “recognize” the different phases of cellular division, follow individual cells, and perform statistical, complex time‐dependent analyses. Using automated microscopy thousands of cell images are analyzed and statistically firm data of drug impact are generated – so far only for fixed time points. Listening to the complete story of each living cell was missing. We took advantage of a collaboration between Bayer HealthCare AG and the Fraunhofer Institute (FIT) and initiated a project towards a novel software solution. The goals were
• refine and extend existing qualification methods for cellular processes by enabling statistical analysis • find and validate cellular mechanisms • optimize image analysis workflow by introducing standardized and reproducible algorithms • speed up and optimize assay development and project support
RESULTS (highlight major R&D/IT tools deployed; innovative uses of technology).
The “ZETA Software” from Fraunhofer FIT was customized and optimized towards our requirements, and we are now able to listen to the story of each living cell. Living cell HCA combined with ZETA enables the quantification of dynamic, spatial cellular processes. It opens insight into novel previously unknown mechanisms supporting novel concepts for therapeutic interventions in human diseases. It was integrated into the (German) Federal Ministry of Education and Research (BMBF) funded project “QuantPro” on living cell imaging within Bayer HealthCare Lead Discovery Berlin. Innovation: Time Lapse Image Analysis
2013 | Best Practices Compendium | Bio-IT World [67]
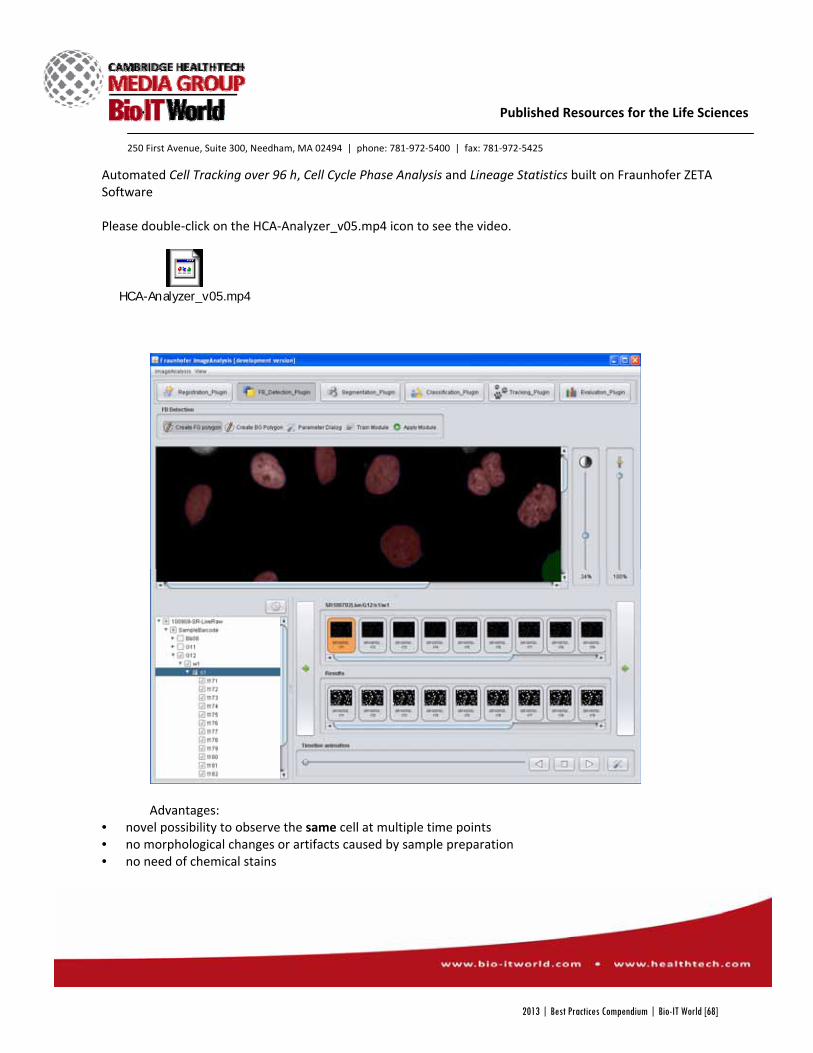
250 First Avenue, Suite 300, Needham, MA 02494 | phone: 781‐972‐5400 | fax: 781‐972‐5425
Published Resources for the Life Sciences
Automated Cell Tracking over 96 h, Cell Cycle Phase Analysis and Lineage Statistics built on Fraunhofer ZETA Software Please double‐click on the HCA‐Analyzer_v05.mp4 icon to see the video.
HCA-Analyzer_v05.mp4
Advantages:
• novel possibility to observe the same cell at multiple time points • no morphological changes or artifacts caused by sample preparation • no need of chemical stains
2013 | Best Practices Compendium | Bio-IT World [68]
250 First Avenue, Suite 300, Needham, MA 02494 | phone: 781‐972‐5400 | fax: 781‐972‐5425
Published Resources for the Life Sciences
• novel analysis of complex, time‐depended cellular processes and scenarios; e.g. cell cycle progression; inheritance of nuclear phenotype in adjacent cellular generations; impact on target specific compound interference
• calculate the exact duration of multiple phases • generate genealogical trees and mother‐child‐relationships • cause‐and‐effect analysis during cell divisions and compound treatment
• acquired images can be re‐analyzed using new analysis setups for answering multiple questions • generate, observe relationships between images taken at different time points • tracking of cells and cell specific parameters • use of „supervised learning machines“ to reduce the IT knowledge required for using the analysis tools • modular software structure enables high efficiency and high level flexibility for different imaging approaches
ROI achieved:
More relevant assay promises better decisions Project completion times are reduced by as much as 10 times due to faster automated image analysis Potential of savings in personnel and material resources, since multiple single time point assays are replaced by one live cell experiment in the order of 10 to 30 per cent per experiment Improved quality due to greater coverage of events in image analysis: anomalies can be detected Strategic development: software architecture and principal analysis workflow are already being successfully adapted to other departments and assay types (2 projects ongoing)
CONCLUSIONS/implications for the field.
New challenges appeared during the project with regard to biology and IT solutions:
• approaches in cell lines used, fluorescent labels and imaging devices have been revised and optimized • "comprehensive data" issues solved by novel data management and data analysis approaches together
with Fraunhofer FIT The improved new approach had to be developed step‐wise in close collaboration between the research department and internal as well as external IT specialists. This process has been recognized as a best‐practice example for several other analysis chains in other research departments of Bayer and has positively influenced the innovation culture towards increased use of data‐driven research.
2013 | Best Practices Compendium | Bio-IT World [69]
250 First Avenue, Suite 300, Needham, MA 02494 | phone: 781‐972‐5400 | fax: 781‐972‐5425
Published Resources for the Life Sciences
Bio‐IT World 2013 Best Practices Awards
1. Nominating Organization (Fill this out only if you are nominating a group other than your own.)
A. Nominating Organization Organization name: Qlucore AB Address: Ideon Science Park, Scheelevägen 17, 22370 Lund, Sweden B. Nominating Contact Person Name: Carl‐Johan Ivarsson Title: President Tel: +46 46 286 3110 Email: carl‐[email protected]
2. User Organization (Organization at which the solution was deployed/applied)
A. User Organization Organization name: Cincinnati Children's Hospital Medical Center Address: 3333 Burnet Avenue, Cincinnati, OH 45229, United States B. User Organization Contact Person Name: James Mulloy Title: Ph.D., Associate Professor Tel: +1 513‐636‐1844 Email: [email protected]
3. Project Title: Identification of unique signals and pathways in tumor cells
Team Leader: James Mulloy Contact details if different from above: Team members – name(s), title(s) and company (optional):
4. Category in which entry is being submitted (1 category per entry, highlight your choice)
Clinical & Health‐IT: Trial design, eCTD, EDC, ePrescribing, RHIOs, EMR/PHR IT infrastructure/HPC: High Performance Computing, storage, Cloud technologies
X Informatics: LIMS, data visualization, imaging technologies, NGS analysis Knowledge Management: Data mining, idea/expertise mining, text mining, collaboration, resource optimization
Research & Drug Discovery: Disease pathway research, applied and basic research, compound‐focused research, drug safety
Personalized & Translational Medicine: Responders/non‐responders, biomarkers, Feedback loops, predictive technologies
(Bio‐IT World reserves the right to re‐categorize submissions based on submission or in the event that a category is refined.)
2013 | Best Practices Compendium | Bio-IT World [70]
250 First Avenue, Suite 300, Needham, MA 02494 | phone: 781‐972‐5400 | fax: 781‐972‐5425
Published Resources for the Life Sciences
5. Description of project (4 FIGURES MAXIMUM):
A. ABSTRACT/SUMMARY of the project and results (150 words max.) A Team of scientists at Cincinnati Children's Hospital Medical Center in the United States, led by Dr James Mulloy, Ph.D., Associate Professor, is currently working on studies that aim to identify the signals and pathways that are unique to tumour cells, primarily leukaemia cells. With tens of thousands of data points being generated by hundreds of different patients, the analysis of the data had become cumbersome and time consuming using existing programs. So, a new approach was required to solve this problem: Qlucore Omics Explorer offered a simple, visual, intuitive data analysis solution that would make it easier for Dr Mulloy and his Team to compare the vast quantity of data generated by their gene expression studies, to test different hypotheses, and to explore alternative scenarios within seconds.
B. INTRODUCTION/background/objectives
The Team’s overall research goal is to identify important signals involved in leukaemia. Studies are typically set up to compare normal hematopoietic cells with leukaemia samples; to identify the signals and pathways that are unique to tumour cells. The Team primarily works with leukaemia cells, and often use comparative studies to determine how leukaemia cells differ from normal blood cells. However, once they have identified the signals that are unique, they need to perform tests to determine whether the tumour cells are dependent on these signals, or addicted to these signals. Today’s Challenge ‐ Trying to make sense of complex ‘Big Data’ In the past, researchers had to rely upon glass slides that revealed just a few hundred features of the genes being studied. In recent years, however, that number has grown to hundreds of thousands, thanks to technological advances in this area. As a result however, it has become increasingly difficult for researchers to identify which genes are being expressed, and to what level, especially when working with tens of thousands of data points being generated by hundreds of different patients. Dr Mulloy has used various data analysis programs in the past, but has found the interface and complexity of the programs to be cumbersome to master, somewhat frustrating and therefore providing very little in the way of meaningful results. Most of these programs took a great deal of time to learn and weren’t very intuitive. This meant that his research Team often needed to collaborate with trained bioinformatics specialists in order to analyze the data, which was a time‐consuming endeavour adding an extra layer onto the process, and allowed little creativity in testing hypotheses. A new approach to “Big Data” analysis was required and fortunately for Dr Mulloy and his Team, Qlucore’s software provided the answer. C. RESULTS (highlight major R&D/IT tools deployed; innovative uses of technology).
Benefits of a new approach to ‘Big Data’ analysis – visual, simple, fast, effective and easy to implement Dr Mulloy selected Qlucore Omics Explorer as his software of choice for his Team’s research analyses. Omics Explorer provides a very visual, intuitive data analysis solution that makes it easier for the Team to compare the vast quantity of data generated by their gene expression studies, to test different hypotheses, and to explore alternative scenarios within seconds, as opposed to previously, when it would take hours or even
2013 | Best Practices Compendium | Bio-IT World [71]
250 First Avenue, Suite 300, Needham, MA 02494 | phone: 781‐972‐5400 | fax: 781‐972‐5425
Published Resources for the Life Sciences
days, especially if a bioinformatician was required. With an easy‐to‐understand user interface, the deployment of Omics Explorer in his group has also been easy, and it has been possible to change and enhance workflow directly without calling on trained bioinformatics specialists, which earlier had been a time‐consuming endeavour. Qlucore has significantly enabled the biologists themselves do the initial tests and trial alternative hypotheses and explore different scenarios ‐ effectively and efficiently. The exceptional speed that this kind of software can deliver is also very important, since the fast analysis of the data contributes significantly to the identification of subpopulations in a sample collection or a list of variables for the Team. In addition, visualization methods offered by the software range from an innovative use of principal component analysis (PCA) to interactive heatmaps and flexible scatter plots. How it works ‐ Data Visualization and 3D mapping enables intuitive decision making Data visualization works by projecting high dimensional data down to lower dimensions, which can then be plotted in 3D on a computer screen, and then rotated manually or automatically, and examined by the naked eye. With the benefit of instant user feedback on all of these actions, scientists and researchers studying microarray data can now easily analyse their findings in real‐time, directly on their computer screen, in an easy‐to‐interpret graphical form. When used during gene expression research, the ability to visualize data in 3D represents a very powerful tool for scientists and researchers, since the human brain is very good at detecting structures and patterns. In practice, this means that Dr Mulloy and his Team are able to make decisions based on information that they can identify and understand easily. By using dynamic PCA, the Team can manipulate different PCA plots interactively and in real time, directly on their computer screens. The Team then has full freedom to explore all possible versions of the presented view and can visualise, and therefore analyse, even the very largest datasets easily. Also by using a heatmap alongside dynamic PCA analysis, the Team has yet another method for visualising its data, since heatmaps can take the values of a variable in a two‐dimensional map and represent them as different colours. The following two figures are examples of the type of plots that were generated by the Team. One of the unique features of Qlucore Omics Explorer is the use of highly interactive PCA (principal component analysis). The two plots are merely a snapshot of all the different plots the groups looked at as the plots are updated by moving a slider. As an example, in order to understand how the variance of the measured genes affects data, by moving a slider the user can watch how the PCA plot is updated continuously.
2013 | Best Practices Compendium | Bio-IT World [72]
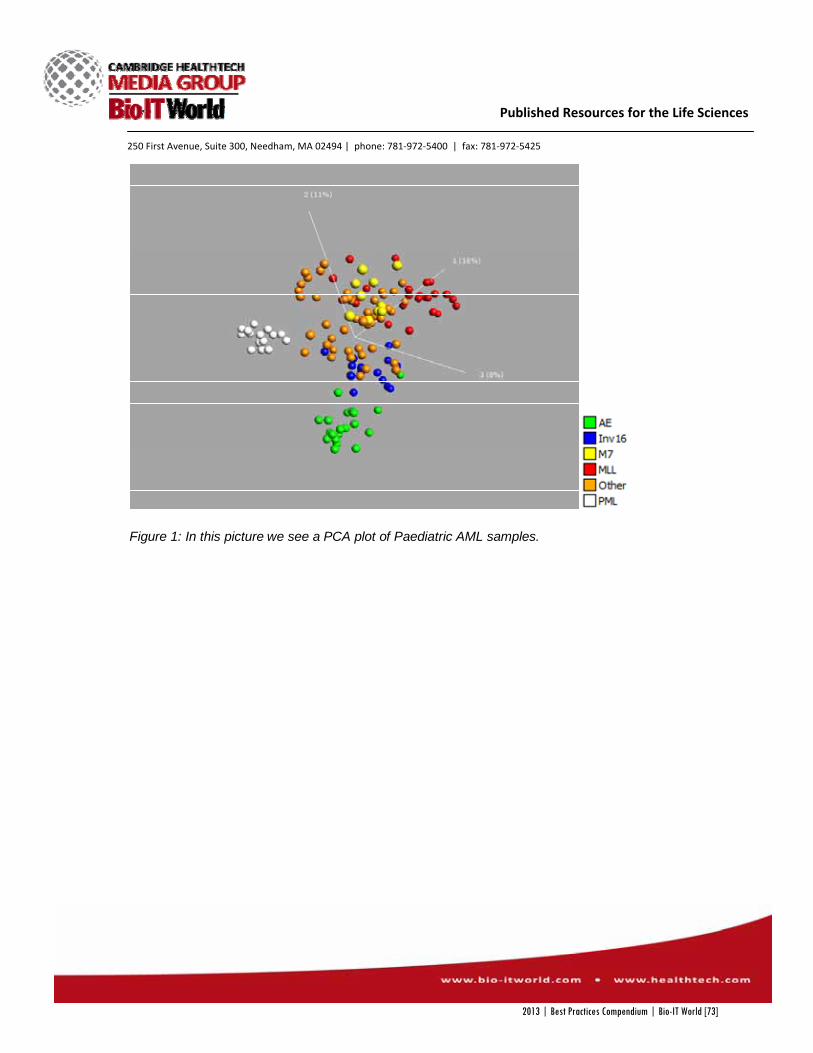
250 First Avenue, Suite 300, Needham, MA 02494 | phone: 781‐972‐5400 | fax: 781‐972‐5425
Published Resources for the Life Sciences
Figure 1: In this picture we see a PCA plot of Paediatric AML samples.
2013 | Best Practices Compendium | Bio-IT World [73]
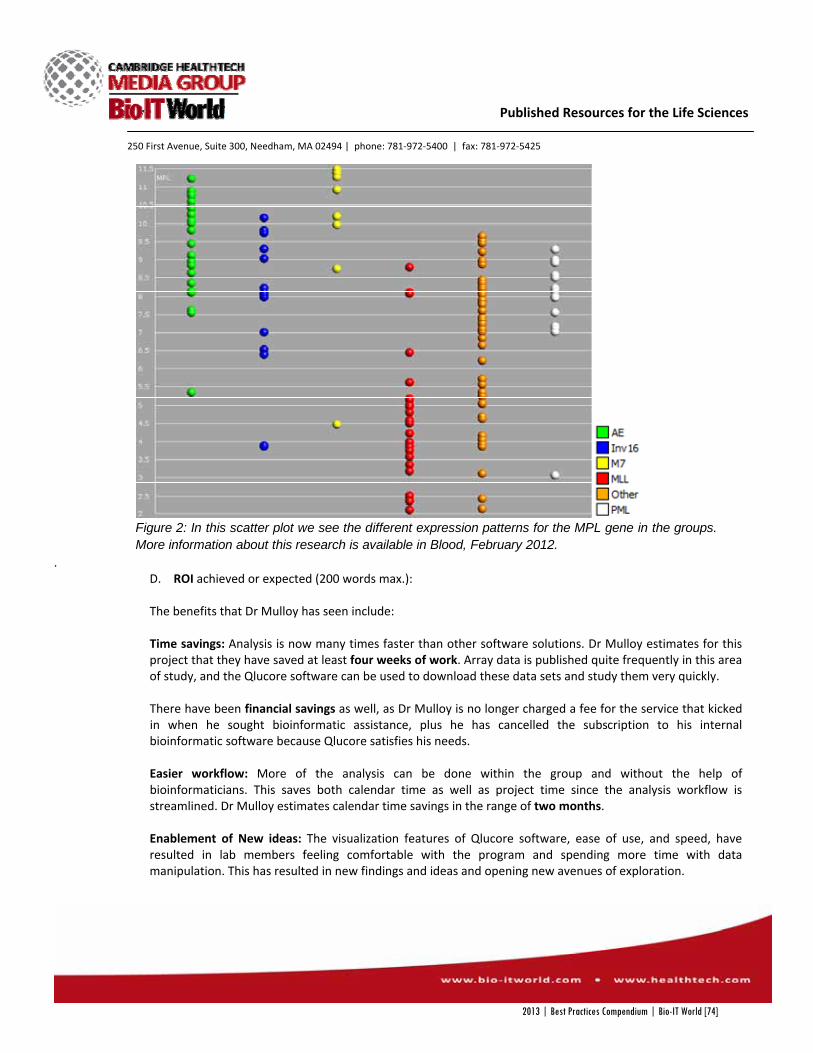
250 First Avenue, Suite 300, Needham, MA 02494 | phone: 781‐972‐5400 | fax: 781‐972‐5425
Published Resources for the Life Sciences
Figure 2: In this scatter plot we see the different expression patterns for the MPL gene in the groups.More information about this research is available in Blood, February 2012.
. D. ROI achieved or expected (200 words max.): The benefits that Dr Mulloy has seen include: Time savings: Analysis is now many times faster than other software solutions. Dr Mulloy estimates for this project that they have saved at least four weeks of work. Array data is published quite frequently in this area of study, and the Qlucore software can be used to download these data sets and study them very quickly. There have been financial savings as well, as Dr Mulloy is no longer charged a fee for the service that kicked in when he sought bioinformatic assistance, plus he has cancelled the subscription to his internal bioinformatic software because Qlucore satisfies his needs. Easier workflow: More of the analysis can be done within the group and without the help of bioinformaticians. This saves both calendar time as well as project time since the analysis workflow is streamlined. Dr Mulloy estimates calendar time savings in the range of two months. Enablement of New ideas: The visualization features of Qlucore software, ease of use, and speed, have resulted in lab members feeling comfortable with the program and spending more time with data manipulation. This has resulted in new findings and ideas and opening new avenues of exploration.
2013 | Best Practices Compendium | Bio-IT World [74]
250 First Avenue, Suite 300, Needham, MA 02494 | phone: 781‐972‐5400 | fax: 781‐972‐5425
Published Resources for the Life Sciences
E. CONCLUSIONS/implications for the field. With a pharma industry that is struggling with innovation and the generation of ever more data, the use of instant visualization for large data sets and the creativity that it affords offers solutions that can benefit the industry. Qlucore’s Omics Explorer clearly provides such a solution to researchers and scientists ‐ like Dr Mulloy and his Team ‐ who are seeking ways of maximizing the impact of their studies for the benefit of the community and their patients. Qlucore’s Omics Explorer with its powerful data visualization has helped Dr Mulloy and his Team to streamline analysis and increase innovation. Also without a doubt, these rapid results – and the way in which the data is visualized – have prompted Dr Mulloy and his Team to perform analyses that they would have never performed otherwise. Having access to such a fast and powerful software has helped Dr Mulloy encourage a sense of creativity in his Team’s research, as it allows the Team to test a number of different hypotheses very quickly, in rapid succession. For example, because array data is published quite frequently in this area of study, the software can be used to download these data sets and study them very quickly, in order to find concepts that are of interest to each scientist’s particular research. Dr Mulloy says that it takes less than 5 seconds to download and generate this type of overview presentation (not including download time). Dr Mulloy is also looking forward to using the software on future projects. He commented, “For this project, we have used Qlucore Omics Explorer for gene expression array data, but we also have data for methylation arrays and miRNA arrays, and will be moving on to this type of data in the future. We expect the Qlucore software will work just as well for these data sets”. Dr Mulloy’s final comments sum up his complete satisfaction, “We love the program, it makes life very easy for us!”
1. REFERENCES/testimonials/supporting internal documents (If necessary; 5 pages max.)
About Dr James Mulloy: http://www.cincinnatichildrens.org/research/divisions/e/ex‐hem/labs/mulloy/default/ A selection of Testimonials showing the benefits that Qlucore’s software provide and the Return of Investment for its users: “Qlucore Omics Explorer is the best software on the market and I use it several times a week.” ‐ Professor Finn Cilius Nielsen, Copenhagen University Hospital, Denmark “Qlucore Omics Explorer fulfils an idea we have been considering for 18 months or so, all in the space of a few minutes.” – John Lock, PhD, Karolinska Institutet, Sweden
2013 | Best Practices Compendium | Bio-IT World [75]

250 First Avenue, Suite 300, Needham, MA 02494 | phone: 781‐972‐5400 | fax: 781‐972‐5425
Published Resources for the Life Sciences
"With Qlucore we have been able to visualize and rapidly explore microarray data collected from two years research in less than a few hours."‐ Carl Borrebaeck, Professor Lund University
"With synchronized plots of patients and genes I have discovered new patterns." – Frida Abel, PhD, Sahlgrenska University Hospital Gothenburg "The freedom for me to explore data in innovative ways has led to new discoveries" – Pierre Åman, Professor, Gothenburg University ”Qlucore Omics Explorer is adding more creativity to our research than any other software I have used.” ‐ David Gisselsson Nord, MD, PhD, Associate Professor, Department of Clinical Genetics Lund University “Qlucore is indeed an impressive tool. It is very fast and delivers excellent control of the analysis. I really enjoy it.” – Ole Ammerpohl, Ph D, Kiel University, Germany "Qlucore enables very rapid and intuitive data analysis. By that scientists themselves are doing advanced bioinformatic analysis." ‐ Matthew Arno, Ph.D, Genomics Centre Manager, King's College London, UK "For me, one of the most compelling reasons for choosing Qlucore's Omics Explorer for the Human Protein Atlas program was its simplicity" ‐ Professor Mathias Uhlén, Royal Institute of Technology, Sweden "Not only was the software highly interactive, but it could also be easily understood by biologists, even if they had little or no previous knowledge of bioinformatics." ‐ Dr Kulkarni, Division of Ophthalmology and Visual Sciences at Queen’s Medical Centre (QMC), University of Nottingham, UK “I’m very excited using Qlucore Omics Explorer which, as well as 3D dynamic PCA, offers a broad range of statistical methods such as t‐test, ANOVA and regression” ‐ Philippe Guardiola, Ph D, Plateforme SNP, Transcriptome & Epigenomique, University Hospital Angers, France "Qlucore Omics Explorer is a key tool for us at BEA. It is used both for analysis and for communication of results to our customers at other departments at the Karolinska Institute. The ease of use combined with visualization and speed enables dynamic analysis of large data sets", ‐ David Brodin, Bioinformatician, BEA ‐ the core facility for Bioinformatics and Expression Analysis at the Karolinska Institute, Sweden Qlucore Omics Explorer´s intuitive user interface, extensive plot options and straightforward importing of GEO datasets facilitate detailed analysis of array data. The stability of the software offers effective, user‐friendly analysis of gene expression, miRNA, DNA‐methylation and protein‐array data. ‐ Matthias Wielscher, AIT Austrian Institute of Technology – Molecular Diagnostics
2013 | Best Practices Compendium | Bio-IT World [76]
250 First Avenue, Suite 300, Needham, MA 02494 | phone: 781-‐972-‐5400 | fax: 781-‐972-‐5425
Published Resources for the Life Sciences
ENTRY FORM Direct questions about entry criteria/process to:
Allison Proffitt, Managing Editor, 617.233.8280 or [email protected] Please email completed entry to:
Allison Proffitt, Managing Editor, [email protected] Subject: 2012 Best Practices Entry
Early bird deadline: December 14, 2012; Deadline: January 11, 2013
1. Nominating Organization (Fill this out only if you are nominating a group other than your own.) A. Nominating Organization Organization name: SimulConsult, Inc. Address: 27 Crafts Road, Chestnut Hill, MA 02467 B. Nominating Contact Person Name: Lynn Feldman Title: CEO Tel: 617-‐879-‐1670 Email: [email protected]
2. User Organization (Organization at which the solution was deployed/applied)
A. User Organization Organization name: Genomic Medicine Institute, Geisinger Health System Address: 100 North Academy Ave, Danville, PA 17822-‐2620 B. User Organization Contact Person Name: Marc Williams, MD Title: Director, Genomic Medicine Institute Tel: 570-‐214-‐7941 Email: [email protected]
3. Project Title: Overcoming the clinical interpretation bottleneck using integrated genome-‐phenome analysis
Team Leader: Michael M. Segal, MD PhD, founder and Chief Scientist Contact details if different from above: SimulConsult, 617-‐566-‐5383 Team members – name(s), title(s) and company (optional):
2013 | Best Practices Compendium | Bio-IT World [77]
250 First Avenue, Suite 300, Needham, MA 02494 | phone: 781-‐972-‐5400 | fax: 781-‐972-‐5425
Published Resources for the Life Sciences
4. Category in which entry is being submitted (1 category per entry, highlight your choice)
Clinical & Health-‐IT: Trial design, eCTD, EDC, ePrescribing, RHIOs, EMR/PHR IT infrastructure/HPC: High Performance Computing, storage, Cloud technologies INFORMATICS: LIMS, DATA VISUALIZATION, IMAGING TECHNOLOGIES, NGS ANALYSIS Knowledge Management: Data mining, idea/expertise mining, text mining, collaboration, resource
optimization Research & Drug Discovery: Disease pathway research, applied and basic research, compound-‐focused
research, drug safety Personalized & Translational Medicine: Responders/non-‐responders, biomarkers, Feedback loops,
predictive technologies
(Bio-‐IT World reserves the right to re-‐categorize submissions based on submission or in the event that a category is refined.) 5. Description of project (4 FIGURES MAXIMUM):
A. ABSTRACT/SUMMARY of the project and results (150 words max.) We used SimulConsult’s “Genome-‐Phenome Analyzer” to automate genome analysis and clinical correlation. Inputs were the phenotype (patient clinical, imaging and laboratory results) and genotype (annotated variant table). We used SimulConsult’s curated database of diseases and their findings (“phenome”) and association with diseases (“genome”) to automate the clinical correlation step, the bottleneck for other genome analysis approaches. Three trios were analyzed. Importing tables of ~30,000 variants annotated in a 43-‐column format took ~1.5 seconds. Review of genes by Geisinger clinicians and preparation of a report for a trio took ~45 minutes, much faster than the iterative filtering and manual genotype-‐phenotype comparisons used in other genomic pipelines. SimulConsult’s novel metric of gene pertinence was strikingly effective: despite the difficulty of the cases (all would be considered gene discovery, and 2 involved combined effects of 2 genes) gene pertinence ranked the relevant genes within the top 3 genes in each trio.
B. INTRODUCTION/background/objectives The declining cost of genomic sequencing is nearing the point at which the adoption into clinical practice will be limited largely by the cost of interpreting the results and comparing them to the patient’s clinical findings. Bruce Korf, the past president of the American College of Medical Genetics and Genomics, summarized the concerns about the clinical usefulness of genome sequencing when he stated, “We are close to having a $1,000 genome sequence, but this may be accompanied by a $1 million interpretation” (Davies 2010).
2013 | Best Practices Compendium | Bio-IT World [78]
250 First Avenue, Suite 300, Needham, MA 02494 | phone: 781-‐972-‐5400 | fax: 781-‐972-‐5425
Published Resources for the Life Sciences
Our project combined the power of using diagnostic software to examine all known diagnoses (the “phenome”) with the power of whole genome sequencing to examine the genome. In automating the genome-‐phenome analysis, this project was designed to test the impact of bringing the power of genome analysis to clinical practice. In addition, it was designed to engage the referring physician in the process by providing them with a tool to submit clinical findings and returning the lab report using an interactive tool. For this analysis we used the SimulConsult “Genome-‐Phenome Analyzer”, built using the base of SimulConsult’s widely used tool for phenome analysis. SimulConsult’s “Diagnostic Decision Support” tool is a widely used, with thousands of users in 100 countries. Its status as key infrastructure in diagnosis is indicated by the fact that all new or revised GeneReviews articles since December 2010 include the following text (with a disease-‐specific hyperlink) “For a patient-‐specific ‘simultaneous consult’ related to this disorder, go to SimulConsult, an interactive diagnostic decision support software tool that provides differential diagnoses based on patient findings.” Our objectives were to assess the:
Accuracy of differential diagnosis in highlighting the correct diagnosis Accuracy of SimulConsult’s measure of gene pertinence in finding the relevant genes when a
human phenotype was known for the gene Usefulness of the differential diagnosis and gene pertinence metrics to the Geisinger clinician Ability to leverage SimulConsult’s trio novelty and compound heterozygosity analysis to speed
assessment of genes with no known human phenotype
C. RESULTS (highlight major R&D/IT tools deployed; innovative uses of technology). For typical genomic diagnosis efforts, the clinical interpretation of the annotated variant table is slow and laborious. The variant table annotations contain many types of information for each of the ~30,000 variants typically found, including:
Zygosity for each member of the trio Type of variant (missense, frameshift etc.) Frequency in the population Annotation scores for functional impact, evolutionary conservation, depth of reads and quality
of the reads. What is typically missing is the ability to automate the clinical correlation. Standard practice is to filter variants in a Boolean manner using cutoffs for various annotations to develop a list of genes with severe variants and then analyze each manually (typically with a large team of experts) for clinical correlation. When the initial stringent criteria fail to produce an obvious answer, the criteria are progressively relaxed, followed by more rounds of manual clinical correlation assessment.
2013 | Best Practices Compendium | Bio-IT World [79]
250 First Avenue, Suite 300, Needham, MA 02494 | phone: 781-‐972-‐5400 | fax: 781-‐972-‐5425
Published Resources for the Life Sciences
In contrast, SimulConsult employs a computational approach. For genetic information, SimulConsult assigns quantitative severity scores for each gene based on the variant table. It then uses novelty and compound heterozygosity analysis of the trio to assign severity scores for each possible zygosity for a disease. These measures for variants are attached not to the gene as a whole, but to the individual possible zygosities of a gene, which have different associations with diseases. For clinical information, it assigns clinical probability scores for each disease. These are based on the patient findings, including not only presence of findings, but onset information for each finding, absence of findings, and a detailed inheritance model (Segal 2010). For each disease, the tool takes into account the incidence, treatability and detailed inheritance pattern, including zygosity, penetrance frequency of novel mutations. For each finding in each disease it takes into account the frequency, age of onset and age of disappearance. It then combines these two types of information to do a computational genome-‐phenome analysis. The result is a genome-‐phenome correlation that allows the combination of an adequate genomic fit with a reasonably matched phenome to rise to the top of the analysis in a single automated step, without the need for iterative modeling and manual correlation. In this way, the heuristic process of applying multiple filters manually is changed to a single quantitative solution. This is practical both because of the automation involved and because of the availability of the detailed genome and phenome information in SimulConsult’s curated database to automate the genome-‐phenome analysis. The genome-‐phenome analysis produced two core metrics:
A differential diagnosis that ranks likely diseases by probability. This includes not only genetic diseases detectable on next generation sequencing, but also genetic diseases not well detected (e.g., trinucleotide repeats and large copy number variants), and nongenetic diseases allowing the clinician to perform appropriate testing in addition to next generation sequencing.
A “pertinence score” for each zygosity of each gene, measuring the degree to which that zygosity found for that gene changes the differential diagnosis. The pertinence score is the retrospective version of the usefulness approach described in Segal (2004). The pertinence score proved to be remarkably useful in identifying pathogenic genes, even in cases in which 2 genes were pathogenic and were responsible for different aspects of the patient phenotype.
Since this genome-‐phenome analysis is automated, it provides an analysis within seconds that identifies the most interesting genes associated with known phenotypes. The database includes detailed information from many original articles and other sources, including all the information in GeneReviews and GeneTests, and wider information as well for less well described genetic conditions. All the flagged variants that had human phenotypes in OMIM were in the database and considered in the genome-‐phenome analysis.
2013 | Best Practices Compendium | Bio-IT World [80]
250 First Avenue, Suite 300, Needham, MA 02494 | phone: 781-‐972-‐5400 | fax: 781-‐972-‐5425
Published Resources for the Life Sciences
For all three families, SimulConsult correctly predicted 100% of the relevant genes. A total of 5 relevant genes were found. In one case, the disease was #1 in the differential diagnosis and its gene was #1 in pertinence, and
the Geisinger clinician chose that disease/gene. In the other two cases, the phenotypes were similar to those of known diseases, but the match was
not exact, in part because the Geisinger clinician concluded that two genes were involved, so there was no full match to a described human phenotype. In both cases the similar diseases were in the top 20 diseases in the differential diagnosis, but strikingly, the relevant 2 genes in each case were in the top 3 genes in the gene pertinence. Although the Geisinger clinician examined the entire list of ~50 genes flagged in the genome-‐phenome analysis, a process that took ~30 minutes, the pertinence measure was so predictive that only the top 3 in the lists were ones that actually needed consideration.
Other teams assessed the same 3 trios, providing independent verification of accuracy of the Genome-‐Phenome Analyzer. In all cases, human judgment was still important. For example, in one of the cases where two genes were implicated the gene with top pertinence was a poor average of unrelated findings, and the diagnoses were the genes ranked two and three in the gene pertinence list. This was immediately obvious to the clinical geneticist, using a variety of tools provided by SimulConsult for assessing the findings and diseases. While not needed for the cases tested, the tool also supports situations where a similar disease was known, but the zygosity of the presentation was novel. Although there was no known human phenotype for the zygosity found, the ability to compare to diseases of the different zygosity using information in SimulConsult makes gene identification straightforward in such situations. A separate collaboration between SimulConsult and a gene discovery lab has identified genes of such type. Also not needed for these cases was the capability of SimulConsult to assist with assessment of genes for which no human phenotype is known. By using the same novelty and compound heterozygosity analysis, and assignment of severity scores, SimulConsult can provide a list of relevant genes for gene discovery situation, prioritized by severity score. Assessment of these genes was done for each trio, and took 1-‐2 hours, leveraging annotations passed through from the variant table such as OMIM links for the genes, some of which provided biochemical or animal model data that allowed flagging of additional genes of interest. Flagging these genes could assist in discovery of novel genes responsible for human disease. D. ROI achieved or expected (200 words max.): SimulConsult’s Genome-‐Phenome Analyzer reduces by ~75-‐90% the time required to do clinical interpretation for symptomatic patients getting genome analysis. As a result, a clinical geneticist
2013 | Best Practices Compendium | Bio-IT World [81]
250 First Avenue, Suite 300, Needham, MA 02494 | phone: 781-‐972-‐5400 | fax: 781-‐972-‐5425
Published Resources for the Life Sciences
associated with a laboratory should be able to do complete interpretation and reporting on ~50 genomes per week (~2,500 per year). A completely interpreted genomic trio is typically priced at ~$7,000. Assuming a 15% profit margin, there is room for ~$6,000 of costs. With ~$2,000 as the cost of reagents, chips and wet lab processes for three sequences, $4,000 remains for mapping, annotation and interpretation of the trio. At an average cost of $80/hour, that budget represents ~50 hours per trio. Some of that time is devoted to alignment, mapping and annotation, but the bulk is spent on interpretation. SimulConsult enables the labs to reduce this to < 1 hour per trio for clinical diagnosis situations and 1-‐2 hours for gene discovery situations. The productivity gains are significant and if the lab were to pass all of the savings through to the patient/payor, the average cost of WES or WGS could approach $1,200 per sequenced individual. E. CONCLUSIONS/implications for the field. Use of SimulConsult by clinical labs will enable faster, cheaper, and highly accurate diagnosis for genome analysis, which should help increase the speed of adoption of Next Generation Sequencing in diagnosis. Some users also believe that similar benefits will be available for larger panels (although that is still being tested.) The most vulnerable substitutes -‐-‐ traditional reflexive testing (order a few, if negative, order a few more…) are likely to be seen as uneconomical. The speed benefit of interpretation using SimulConsult should also reduce turnaround times in labs, where cases waiting interpretation are queued up for weeks because of the clinical correlation backlog and turnaround times are measured in months. Using SimulConsult should allow turnaround times to be defined by the wet lab and alignment/mapping processes and could result in times as short as 2 days for urgent cases.
6. REFERENCES/testimonials/supporting internal documents (If necessary; 5 pages max.)
Davies K. A Grand Vision for Genomic Medicine. Bio-‐IT World, 2010, 28 September, http://www.bio-‐itworld.com/BioIT_Article.aspx?id=101670 Segal MM. Systems and methods for diagnosing medical conditions. US Patent 6,754,655 issued June 22, 2004. Segal, MM. Hyper-‐fractionation of transmission history for medical diagnostic software. US Patent 7,742,932, issued June 22, 2010.
2013 | Best Practices Compendium | Bio-IT World [82]
250 First Avenue, Suite 300, Needham, MA 02494 | phone: 781‐972‐5400 | fax: 781‐972‐5425
Published Resources for the Life Sciences
Bio‐IT World 2013 Best Practices Awards
1. Nominating Organization (Fill this out only if you are nominating a group other than your own.) A. Nominating Organization Organization name: Canale Communications Address: 4010 Goldfinch St., San Diego, CA, 92103 B. Nominating Contact Person Name: Maya Ziv Title: Account Associate Tel: 619‐849‐5389 Email: [email protected]
2. User Organization (Organization at which the solution was deployed/applied)
A. User Organization Organization name: Ingenuity Systems Address: Redwood City, California B. User Organization Contact Person Name: Dione Bailey Title: Director of Marketing Tel: 650‐381‐5025 Email: [email protected]
3. Project Title: Ingenuity Systems Collaborates with Erasmus University to Discover Novel Genetic Links to Disease
Team Leader: Peter van der Spek Contact details if different from above: Erasmus Medical Center, Dr. Molewaterplein 50, NL‐3015 GE, Rotterdam, NL. +31 10 4087491, [email protected] Team members – name(s), title(s) and company (optional): Sigrid Swagemakers, Research Analyst, Erasmus Medical Center Daphne Heijsman, Research Analyst, Erasmus Medical Center Douglas Bassett, CSO/CTO, Ingenuity Systems IM Mathijssen, Professor, Erasmus Medical Center, Department of Plastic Surgery Dan Richards, VP, Biomedical Informatics, Ingenuity Systems
2013 | Best Practices Compendium | Bio-IT World [83]

250 First Avenue, Suite 300, Needham, MA 02494 | phone: 781‐972‐5400 | fax: 781‐972‐5425
Published Resources for the Life Sciences
4. Category in which entry is being submitted (1 category per entry, highlight your choice) Clinical & Health‐IT: Trial design, eCTD, EDC, ePrescribing, RHIOs, EMR/PHR IT infrastructure/HPC: High Performance Computing, storage, Cloud technologies Informatics: LIMS, data visualization, imaging technologies, NGS analysis Knowledge Management: Data mining, idea/expertise mining, text mining, collaboration, resource optimization
Research & Drug Discovery: Disease pathway research, applied and basic research, compound‐focused research, drug safety
Personalized & Translational Medicine: Responders/non‐responders, biomarkers, Feedback loops, predictive technologies
(Bio‐IT World reserves the right to re‐categorize submissions based on submission or in the event that a category is refined.) 5. Description of project (4 FIGURES MAXIMUM):
A. ABSTRACT/SUMMARY of the project and results (150 words max.) A family of four presented two children with Craniosynostosis, a disease that leads to malformation of the skull. The parents did not show signs of the disease so wanted to know why it presented in both children. All existing diagnostic tests came up negative. Researchers at Erasmus University in the Netherlands weren’t convinced, so they sequenced all four family members and used Variant Analysis software created by Ingenuity Systems to discover a genetic link to the disease. Both parents were shown to have a recessive copy of a gene upstream of one known Craniosynostosis causing gene, and both children each had two copies, leading them to develop the disease. The parents walked away from this experience with valuable information for family planning purposes, while the researchers found a new genetic variant to drive development of a novel diagnostic test and better understanding of the biology underlying Craniosynostosis.
B. INTRODUCTION/background/objectives
The development of craniofacial bones and teeth involves complex tissue interactions, cell migration, and coordinated growth. The genetic networks and signaling pathways underlying these developmental processes have been uncovered by the identification of gene mutations that cause human malformations and by mutational and experimental studies in model animals. Craniosynostosis, the premature closure of cranial sutures, occurs in one of the 2500 newborns. In Craniosynostosis, some or several of the sutures between cranial and facial bones are obliterated prematurely, often prenatally. The precocious fusion of calvarial bones limits the space available for the brain growth and the skull becomes deformed as a result of compensatory growth in other sutures. Mutations in multiple genes have been identified, most in syndromic forms of Craniosynostosis, including activating mutations of fibroblast growth factor receptors and loss‐of‐function mutations in TWIST1, EFNB1 and EFNA4 genes. RUNX2 is required for bone formation, and its mutations lead to deficient bone formation and a calvarial phenotype that is opposite to Craniosynostosis and features wide cranial sutures and open fontanelles. Through this partnership, the researchers at Erasmus University were able to describe the genetic mapping and identification of IL11RA mutations in an autosomal‐recessive form of Craniosynostosis associated with delayed tooth eruption, maxillary hypoplasia, super‐numerary teeth and digit abnormalities.
2013 | Best Practices Compendium | Bio-IT World [84]
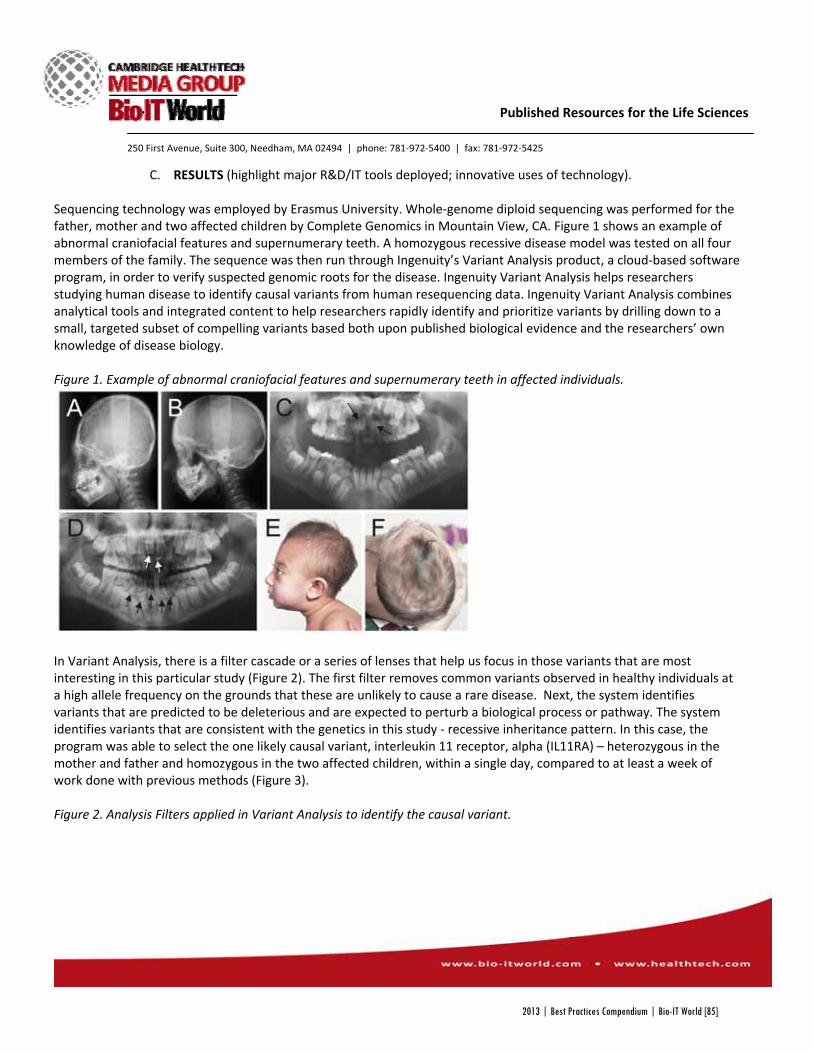
250 First Avenue, Suite 300, Needham, MA 02494 | phone: 781‐972‐5400 | fax: 781‐972‐5425
Published Resources for the Life Sciences
C. RESULTS (highlight major R&D/IT tools deployed; innovative uses of technology).
Sequencing technology was employed by Erasmus University. Whole‐genome diploid sequencing was performed for the father, mother and two affected children by Complete Genomics in Mountain View, CA. Figure 1 shows an example of abnormal craniofacial features and supernumerary teeth. A homozygous recessive disease model was tested on all four members of the family. The sequence was then run through Ingenuity’s Variant Analysis product, a cloud‐based software program, in order to verify suspected genomic roots for the disease. Ingenuity Variant Analysis helps researchers studying human disease to identify causal variants from human resequencing data. Ingenuity Variant Analysis combines analytical tools and integrated content to help researchers rapidly identify and prioritize variants by drilling down to a small, targeted subset of compelling variants based both upon published biological evidence and the researchers’ own knowledge of disease biology. Figure 1. Example of abnormal craniofacial features and supernumerary teeth in affected individuals.
In Variant Analysis, there is a filter cascade or a series of lenses that help us focus in those variants that are most interesting in this particular study (Figure 2). The first filter removes common variants observed in healthy individuals at a high allele frequency on the grounds that these are unlikely to cause a rare disease. Next, the system identifies variants that are predicted to be deleterious and are expected to perturb a biological process or pathway. The system identifies variants that are consistent with the genetics in this study ‐ recessive inheritance pattern. In this case, the program was able to select the one likely causal variant, interleukin 11 receptor, alpha (IL11RA) – heterozygous in the mother and father and homozygous in the two affected children, within a single day, compared to at least a week of work done with previous methods (Figure 3). Figure 2. Analysis Filters applied in Variant Analysis to identify the causal variant.
2013 | Best Practices Compendium | Bio-IT World [85]

250 First Avenue, Suite 300, Needham, MA 02494 | phone: 781‐972‐5400 | fax: 781‐972‐5425
Published Resources for the Life Sciences
Figure 3. IL11RA variant details by family member.
By leveraging the extensive content within Ingenuity Variant Analysis, the system also identifies variants that have a relevant causal network – variants that are expected to exert pressure on genes or pathways/sub‐networks known to be associated with Craniosynostosis. The IL11RA gene has a direct causal network context that links it through multiple layers of biology down to the phenotype of interest, Craniosynostosis (Figure 4). Figure 4. Path to Phenotype
2013 | Best Practices Compendium | Bio-IT World [86]
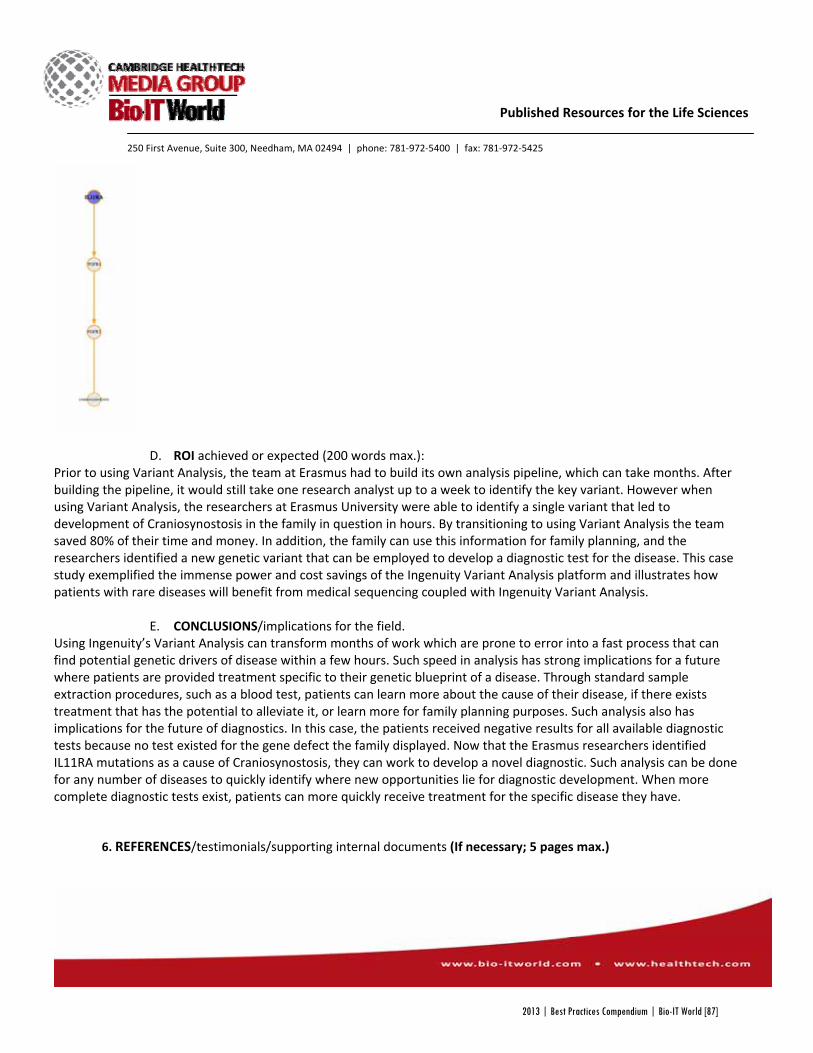
250 First Avenue, Suite 300, Needham, MA 02494 | phone: 781‐972‐5400 | fax: 781‐972‐5425
Published Resources for the Life Sciences
D. ROI achieved or expected (200 words max.):
Prior to using Variant Analysis, the team at Erasmus had to build its own analysis pipeline, which can take months. After building the pipeline, it would still take one research analyst up to a week to identify the key variant. However when using Variant Analysis, the researchers at Erasmus University were able to identify a single variant that led to development of Craniosynostosis in the family in question in hours. By transitioning to using Variant Analysis the team saved 80% of their time and money. In addition, the family can use this information for family planning, and the researchers identified a new genetic variant that can be employed to develop a diagnostic test for the disease. This case study exemplified the immense power and cost savings of the Ingenuity Variant Analysis platform and illustrates how patients with rare diseases will benefit from medical sequencing coupled with Ingenuity Variant Analysis.
E. CONCLUSIONS/implications for the field. Using Ingenuity’s Variant Analysis can transform months of work which are prone to error into a fast process that can find potential genetic drivers of disease within a few hours. Such speed in analysis has strong implications for a future where patients are provided treatment specific to their genetic blueprint of a disease. Through standard sample extraction procedures, such as a blood test, patients can learn more about the cause of their disease, if there exists treatment that has the potential to alleviate it, or learn more for family planning purposes. Such analysis also has implications for the future of diagnostics. In this case, the patients received negative results for all available diagnostic tests because no test existed for the gene defect the family displayed. Now that the Erasmus researchers identified IL11RA mutations as a cause of Craniosynostosis, they can work to develop a novel diagnostic. Such analysis can be done for any number of diseases to quickly identify where new opportunities lie for diagnostic development. When more complete diagnostic tests exist, patients can more quickly receive treatment for the specific disease they have.
6. REFERENCES/testimonials/supporting internal documents (If necessary; 5 pages max.)
2013 | Best Practices Compendium | Bio-IT World [87]

250 First Avenue, Suite 300, Needham, MA 02494 | phone: 781‐972‐5400 | fax: 781‐972‐5425
Published Resources for the Life Sciences
“Inactivation of IL11 Signaling Causes Craniosynostosis, Delayed Tooth Eruption and Supernumerary Teeth” The American Journal of Human Genetics: 89, 67‐81. 2011.
2013 | Best Practices Compendium | Bio-IT World [88]
250 First Avenue, Suite 300, Needham, MA 02494 | phone: 781‐972‐5400 | fax: 781‐972‐5425
Published Resources for the Life Sciences
Bio‐IT World 2013 Best Practices Awards
1. Nominating Organization (Fill this out only if you are nominating a group other than your own.) A. Nominating Organization Organization name: Ingenuity Systems, Inc. Address: 1700 Seaport Blvd., Redwood City, CA 94063 B. Nominating Contact Person Name: Dione Bailey Title: Director, Marketing Tel: (650) 381‐5025 Email: [email protected]
2. User Organization (Organization at which the solution was deployed/applied)
A. User Organization Organization name: Institute for Systems Biology Address: 401 Terry Avenue North,�Seattle, WA 98109‐5234 B. User Organization Contact Person Name: Gustavo Glusman Title: Senior Research Scientist Tel: (206) 732‐1273 Email: [email protected]
3. Project Title: Identification of Novel Causal Variants in Alternating Hemiplegia of Childhood (AHC) Familial and Sporadic Cases Using Whole Genome Sequence Analysis by the Institute for Systems Biology, in collaboration with Ingenuity® Systems and the University of Utah.
Team Leader: Gustavo Glusman Contact details if different from above: Team members – name(s), title(s) and company (optional): Hannah Cox, Postdoctoral Fellow, Institute for Systems Biology Jared C. Roach, Senior Research Scientist, Institute for Systems Biology Leroy Hood, President, Institute for Systems Biology Kelley J. Murphy, Research Lab Specialist, University of Utah Louis Viollet, University of Utah Kathryn J. Swoboda, Associate Professor, University of Utah Chad Huff, former Postdoctoral Fellow, University of Utah, currently faculty member at MD Anderson Cancer Center
2013 | Best Practices Compendium | Bio-IT World [89]
250 First Avenue, Suite 300, Needham, MA 02494 | phone: 781‐972‐5400 | fax: 781‐972‐5425
Published Resources for the Life Sciences
Lynn B. Jorde, Professor, University of Utah Douglas Bassett, CTO/CSO, Ingenuity Systems, Inc.
4. Category in which entry is being submitted (1 category per entry, highlight your choice)
Clinical & Health‐IT: Trial design, eCTD, EDC, ePrescribing, RHIOs, EMR/PHR IT infrastructure/HPC: High Performance Computing, storage, Cloud technologies Informatics: LIMS, data visualization, imaging technologies, NGS analysis Knowledge Management: Data mining, idea/expertise mining, text mining, collaboration, resource optimization
Research & Drug Discovery: Disease pathway research, applied and basic research, compound‐focused research, drug safety
Personalized & Translational Medicine: Responders/non‐responders, biomarkers, Feedback loops, predictive technologies
(Bio‐IT World reserves the right to re‐categorize submissions based on submission or in the event that a category is refined.)
1. Description of project (4 FIGURES MAXIMUM): A. ABSTRACT/SUMMARY of the project and results (150 words max.)
Alternating Hemiplegia of Childhood (AHC) is a rare neurological disorder presenting repeated, temporary paralysis of either side of the body. Most cases are sporadic, making it difficult to identify the causal variants associated with AHC. However, there are some families with two or more affected members, indicating at least some hereditary component. We used whole‐genome sequencing (WGS) to identify candidate causal mutations in both a family with five affected individuals, and sporadic cases affected with AHC. Sequencing was performed by Complete Genomics and analysis was done using Ingenuity® Variant Analysis™ (www.ingenuity.com/variants). We identified disruptions in the ATP1A3 gene in 15 of 18 sporadic AHC cases, and in two of three sequenced affected individuals in the family. The combination of WGS and analytical tools that leverage multiple sources of content, disease models, and pathways for exploring different biological hypotheses are critical for achieving clinical‐grade genome interpretation.
B. INTRODUCTION/background/objectives Recent technological advances in whole‐genome sequencing (WGS) are bringing clinicians one step closer to using sequencing as a diagnostic tool. However, in the diagnostic context, false negatives and false positives constitute a pressing challenge for WGS technologies and analyses. We leveraged high‐quality WGS produced by Complete Genomics from a set of 18 individuals with Alternating Hemiplegia of Childhood (AHC) and a family with five affected family members with AHC (three of whom were sequenced) and three unaffected family members. We analyzed the data using Ingenuity Variant Analysis. Variant Analysis is a web application that combines analytical tools and integrated content to rapidly identify and prioritize variants by drilling down to a small, targeted subset of compelling variants based both upon published biological evidence contained with the Ingenuity® Knowledge Base and our knowledge of the disease in question, AHC. The
2013 | Best Practices Compendium | Bio-IT World [90]
250 First Avenue, Suite 300, Needham, MA 02494 | phone: 781‐972‐5400 | fax: 781‐972‐5425
Published Resources for the Life Sciences
advantage of this approach is that we can use our deep understanding and experience of phenotypes pertaining to AHC in conjunction with deep pathway information from the Ingenuity Knowledge Base to uncover novel potential key genes and variants contributing to AHC.
C. RESULTS (highlight major R&D/IT tools deployed; innovative uses of technology). From a set of 18 sporadic AHC samples, we identified over 13 million variants. In order to filter down to a reasonable set of variants, we leveraged Ingenuity Variant Analysis. Variant Analysis is built upon the Ingenuity Knowledge Base, which is a repository of biological interactions and functional annotations created from millions of individually modeled relationships between proteins, genes, complexes, cells, tissues, metabolites, drugs and diseases. These modeled relationships, or Findings, include rich contextual details, links to the original article, and are manually reviewed for accuracy. The Ingenuity Knowledge Base is used as a starting point for exploration and a bridge between novel discovery and known biology. When accessed through Ingenuity Variant Analysis, it provides a powerful resource for searching relevant and substantiated knowledge from the literature, and for interpreting experimental results in the context of larger biological systems for greater confidence. After uploading the data sets to Variant Analysis, we performed a set of filtering steps to reduce from 13,265,294 variants to a smaller set in order to try and identify the causal variant. The first filter removed variants from the data set by excluding common variants with an observed allele frequency greater than 1% of the 1000 Genomes Project, public Complete Genomics genomes, or 6500 NHLBI Exomes. Using the predicted deleterious filter, we kept only gain or loss of function variants. We then applied two specific genetic analysis filters. First, we excluded homozygous and compound heterozygous variants ‐ consistent with the expected autosomal dominant inheritance mode. Next, we kept only variants that were present in at least half the samples, at the gene level. Using this filtering cascade we were able to reduce the >13 M variants down to 543 variants affecting 98 genes, in minutes. In order to prioritize the remaining variants, we applied a biological context filter which allows for the identification of variants that affect genes known to be involved in AHC either directly or indirectly using causal network analysis (Figure 1). The platform also allows for the identification of genes within in one or two network “hops” upstream or downstream of a gene known to directly related to AHC. We applied a “2 hops upstream” approach, i.e. we asked the platform to identify variants in genes that have a known relationship/interaction with another gene that has a known relationship/interaction with a gene known to be associated with AHC. This type of extended search to review the literature and construct such a network view could take weeks or months, versus seconds in Ingenuity Variant Analysis.
2013 | Best Practices Compendium | Bio-IT World [91]
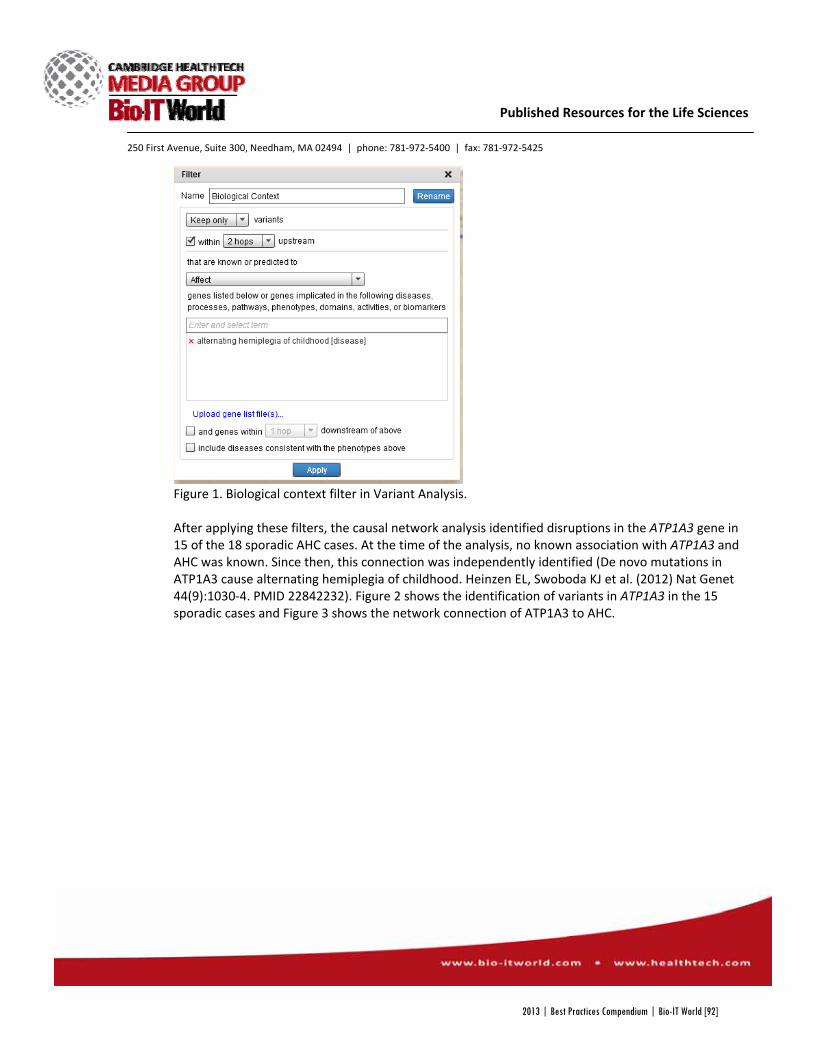
250 First Avenue, Suite 300, Needham, MA 02494 | phone: 781‐972‐5400 | fax: 781‐972‐5425
Published Resources for the Life Sciences
Figure 1. Biological context filter in Variant Analysis. After applying these filters, the causal network analysis identified disruptions in the ATP1A3 gene in 15 of the 18 sporadic AHC cases. At the time of the analysis, no known association with ATP1A3 and AHC was known. Since then, this connection was independently identified (De novo mutations in ATP1A3 cause alternating hemiplegia of childhood. Heinzen EL, Swoboda KJ et al. (2012) Nat Genet 44(9):1030‐4. PMID 22842232). Figure 2 shows the identification of variants in ATP1A3 in the 15 sporadic cases and Figure 3 shows the network connection of ATP1A3 to AHC.
2013 | Best Practices Compendium | Bio-IT World [92]
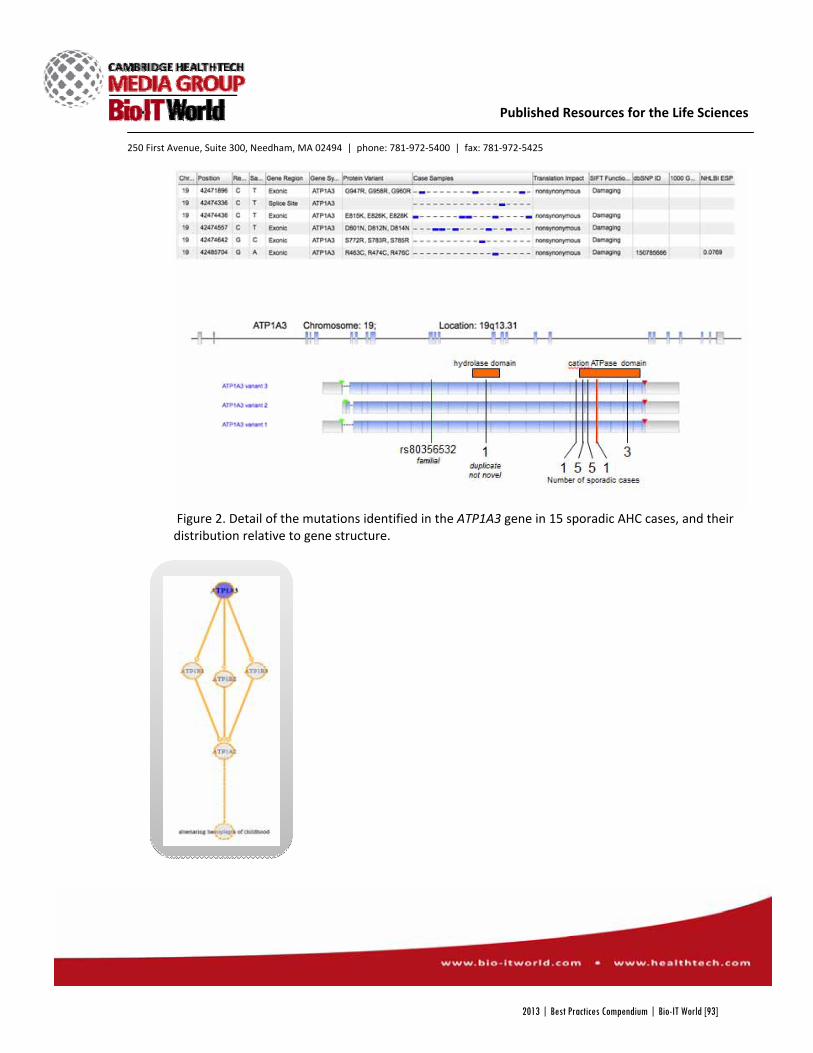
250 First Avenue, Suite 300, Needham, MA 02494 | phone: 781‐972‐5400 | fax: 781‐972‐5425
Published Resources for the Life Sciences
Figure 2. Detail of the mutations identified in the ATP1A3 gene in 15 sporadic AHC cases, and their distribution relative to gene structure.
2013 | Best Practices Compendium | Bio-IT World [93]
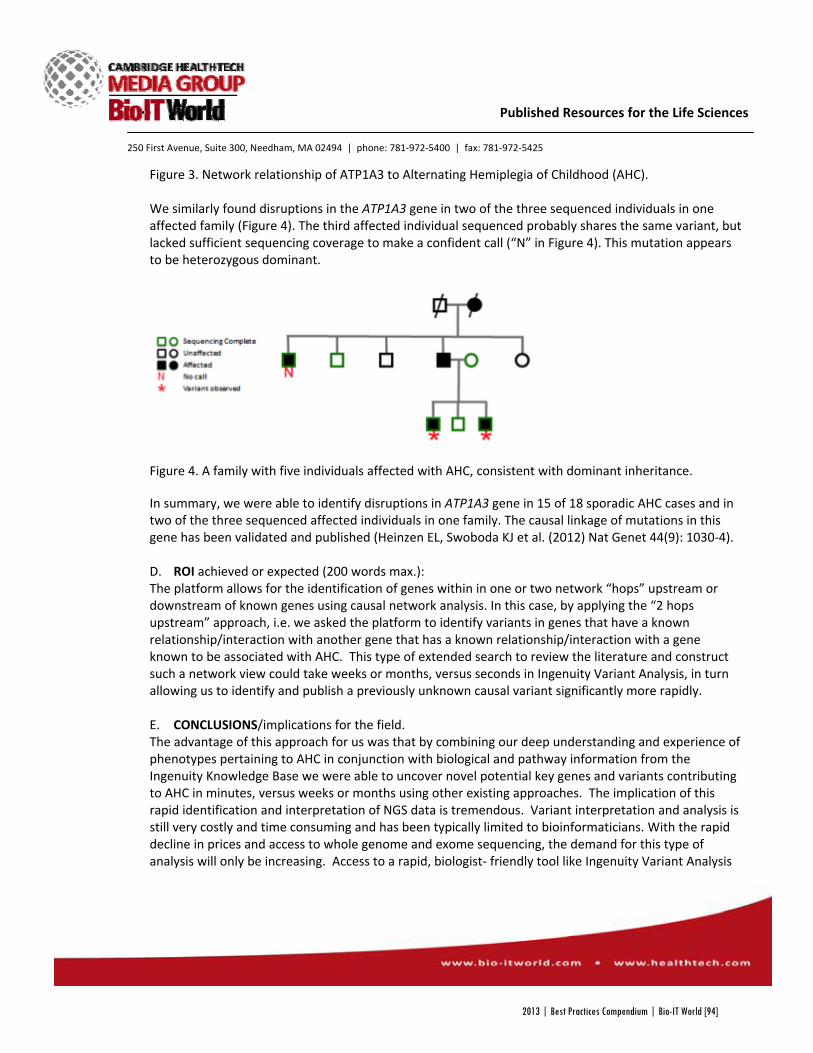
250 First Avenue, Suite 300, Needham, MA 02494 | phone: 781‐972‐5400 | fax: 781‐972‐5425
Published Resources for the Life Sciences
Figure 3. Network relationship of ATP1A3 to Alternating Hemiplegia of Childhood (AHC). We similarly found disruptions in the ATP1A3 gene in two of the three sequenced individuals in one affected family (Figure 4). The third affected individual sequenced probably shares the same variant, but lacked sufficient sequencing coverage to make a confident call (“N” in Figure 4). This mutation appears to be heterozygous dominant.
Figure 4. A family with five individuals affected with AHC, consistent with dominant inheritance. In summary, we were able to identify disruptions in ATP1A3 gene in 15 of 18 sporadic AHC cases and in two of the three sequenced affected individuals in one family. The causal linkage of mutations in this gene has been validated and published (Heinzen EL, Swoboda KJ et al. (2012) Nat Genet 44(9): 1030‐4). D. ROI achieved or expected (200 words max.): The platform allows for the identification of genes within in one or two network “hops” upstream or downstream of known genes using causal network analysis. In this case, by applying the “2 hops upstream” approach, i.e. we asked the platform to identify variants in genes that have a known relationship/interaction with another gene that has a known relationship/interaction with a gene known to be associated with AHC. This type of extended search to review the literature and construct such a network view could take weeks or months, versus seconds in Ingenuity Variant Analysis, in turn allowing us to identify and publish a previously unknown causal variant significantly more rapidly.
E. CONCLUSIONS/implications for the field. The advantage of this approach for us was that by combining our deep understanding and experience of phenotypes pertaining to AHC in conjunction with biological and pathway information from the Ingenuity Knowledge Base we were able to uncover novel potential key genes and variants contributing to AHC in minutes, versus weeks or months using other existing approaches. The implication of this rapid identification and interpretation of NGS data is tremendous. Variant interpretation and analysis is still very costly and time consuming and has been typically limited to bioinformaticians. With the rapid decline in prices and access to whole genome and exome sequencing, the demand for this type of analysis will only be increasing. Access to a rapid, biologist‐ friendly tool like Ingenuity Variant Analysis
2013 | Best Practices Compendium | Bio-IT World [94]

250 First Avenue, Suite 300, Needham, MA 02494 | phone: 781‐972‐5400 | fax: 781‐972‐5425
Published Resources for the Life Sciences
can dramatically alter the time and way in which we analyze and interpret causal variants, greatly increasing our understanding and treatment of human disease.
2. REFERENCES/testimonials/supporting internal documents (If necessary; 5 pages max.)
De novo mutations in ATP1A3 cause alternating hemiplegia of childhood. Heinzen EL, Swoboda KJ et al. (2012) Nat Genet 44(9):1030‐4. PMID 22842232.
2013 | Best Practices Compendium | Bio-IT World [95]
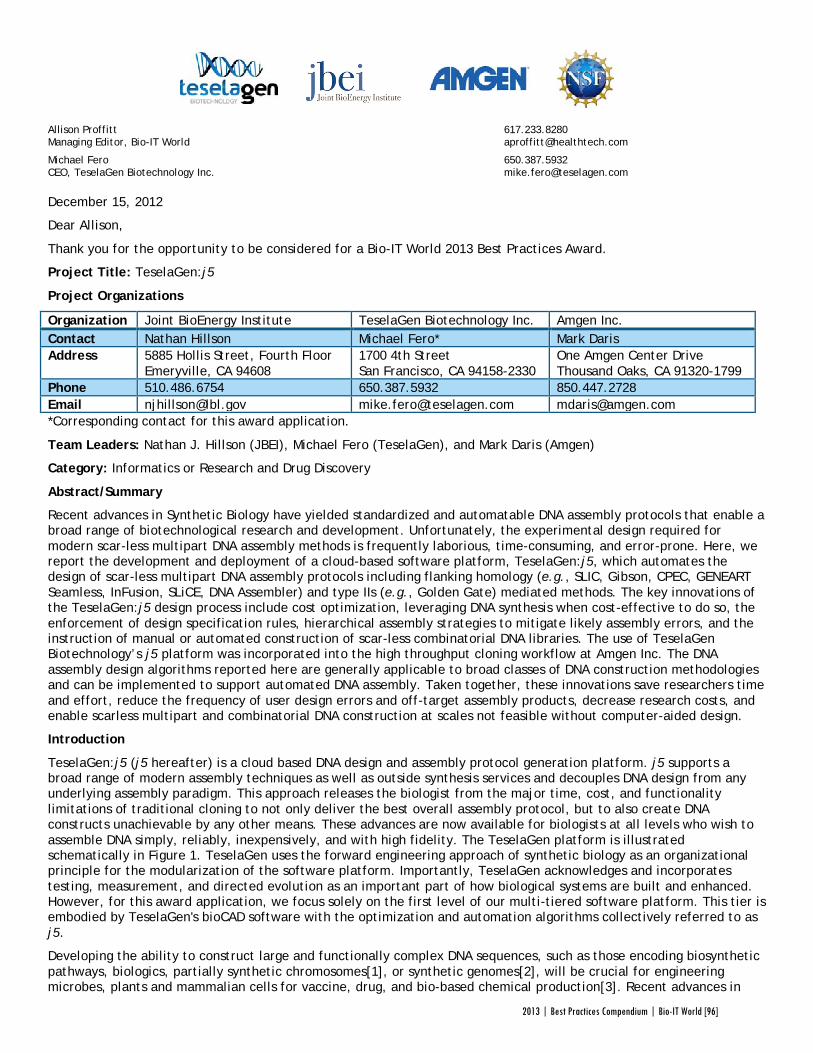
Allison Proffitt 617.233.8280 Managing Editor, Bio-IT World [email protected]
Michael Fero 650.387.5932 CEO, TeselaGen Biotechnology Inc. [email protected] December 15, 2012
Dear Allison,
Thank you for the opportunity to be considered for a Bio-IT World 2013 Best Practices Award.
Project Title: TeselaGen:j5
Project Organizations
Organization Joint BioEnergy Institute TeselaGen Biotechnology Inc. Amgen Inc. Contact Nathan Hillson Michael Fero* Mark Daris Address 5885 Hollis Street, Fourth Floor
Emeryville, CA 94608 1700 4th Street San Francisco, CA 94158-2330
One Amgen Center Drive Thousand Oaks, CA 91320-1799
Phone 510.486.6754 650.387.5932 850.447.2728 Email [email protected] [email protected] [email protected] *Corresponding contact for this award application.
Team Leaders: Nathan J. Hillson (JBEI), Michael Fero (TeselaGen), and Mark Daris (Amgen)
Category: Informatics or Research and Drug Discovery
Abstract/Summary
Recent advances in Synthetic Biology have yielded standardized and automatable DNA assembly protocols that enable a broad range of biotechnological research and development. Unfortunately, the experimental design required for modern scar-less multipart DNA assembly methods is frequently laborious, time-consuming, and error-prone. Here, we report the development and deployment of a cloud-based software platform, TeselaGen:j5, which automates the design of scar-less multipart DNA assembly protocols including flanking homology (e.g., SLIC, Gibson, CPEC, GENEART Seamless, InFusion, SLiCE, DNA Assembler) and type IIs (e.g., Golden Gate) mediated methods. The key innovations of the TeselaGen:j5 design process include cost optimization, leveraging DNA synthesis when cost-effective to do so, the enforcement of design specification rules, hierarchical assembly strategies to mitigate likely assembly errors, and the instruction of manual or automated construction of scar-less combinatorial DNA libraries. The use of TeselaGen Biotechnology’s j5 platform was incorporated into the high throughput cloning workflow at Amgen Inc. The DNA assembly design algorithms reported here are generally applicable to broad classes of DNA construction methodologies and can be implemented to support automated DNA assembly. Taken together, these innovations save researchers time and effort, reduce the frequency of user design errors and off-target assembly products, decrease research costs, and enable scarless multipart and combinatorial DNA construction at scales not feasible without computer-aided design.
Introduction
TeselaGen:j5 (j5 hereafter) is a cloud based DNA design and assembly protocol generation platform. j5 supports a broad range of modern assembly techniques as well as outside synthesis services and decouples DNA design from any underlying assembly paradigm. This approach releases the biologist from the major time, cost, and functionality limitations of traditional cloning to not only deliver the best overall assembly protocol, but to also create DNA constructs unachievable by any other means. These advances are now available for biologists at all levels who wish to assemble DNA simply, reliably, inexpensively, and with high fidelity. The TeselaGen platform is illustrated schematically in Figure 1. TeselaGen uses the forward engineering approach of synthetic biology as an organizational principle for the modularization of the software platform. Importantly, TeselaGen acknowledges and incorporates testing, measurement, and directed evolution as an important part of how biological systems are built and enhanced. However, for this award application, we focus solely on the first level of our multi-tiered software platform. This tier is embodied by TeselaGen's bioCAD software with the optimization and automation algorithms collectively referred to as j5.
Developing the ability to construct large and functionally complex DNA sequences, such as those encoding biosynthetic pathways, biologics, partially synthetic chromosomes[1], or synthetic genomes[2], will be crucial for engineering microbes, plants and mammalian cells for vaccine, drug, and bio-based chemical production[3]. Recent advances in
2013 | Best Practices Compendium | Bio-IT World [96]
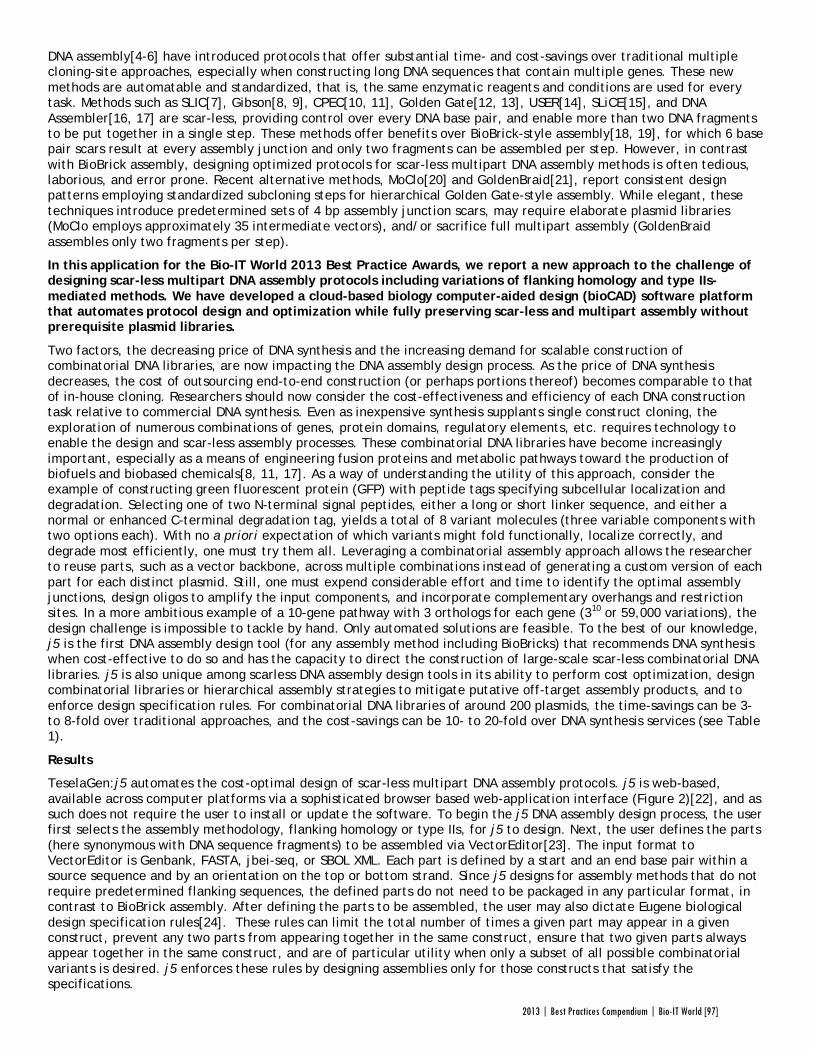
DNA assembly[4-6] have introduced protocols that offer substantial time- and cost-savings over traditional multiple cloning-site approaches, especially when constructing long DNA sequences that contain multiple genes. These new methods are automatable and standardized, that is, the same enzymatic reagents and conditions are used for every task. Methods such as SLIC[7], Gibson[8, 9], CPEC[10, 11], Golden Gate[12, 13], USER[14], SLiCE[15], and DNA Assembler[16, 17] are scar-less, providing control over every DNA base pair, and enable more than two DNA fragments to be put together in a single step. These methods offer benefits over BioBrick-style assembly[18, 19], for which 6 base pair scars result at every assembly junction and only two fragments can be assembled per step. However, in contrast with BioBrick assembly, designing optimized protocols for scar-less multipart DNA assembly methods is often tedious, laborious, and error prone. Recent alternative methods, MoClo[20] and GoldenBraid[21], report consistent design patterns employing standardized subcloning steps for hierarchical Golden Gate-style assembly. While elegant, these techniques introduce predetermined sets of 4 bp assembly junction scars, may require elaborate plasmid libraries (MoClo employs approximately 35 intermediate vectors), and/or sacrifice full multipart assembly (GoldenBraid assembles only two fragments per step).
In this application for the Bio-IT World 2013 Best Practice Awards, we report a new approach to the challenge of designing scar-less multipart DNA assembly protocols including variations of flanking homology and type IIs-mediated methods. We have developed a cloud-based biology computer-aided design (bioCAD) software platform that automates protocol design and optimization while fully preserving scar-less and multipart assembly without prerequisite plasmid libraries.
Two factors, the decreasing price of DNA synthesis and the increasing demand for scalable construction of combinatorial DNA libraries, are now impacting the DNA assembly design process. As the price of DNA synthesis decreases, the cost of outsourcing end-to-end construction (or perhaps portions thereof) becomes comparable to that of in-house cloning. Researchers should now consider the cost-effectiveness and efficiency of each DNA construction task relative to commercial DNA synthesis. Even as inexpensive synthesis supplants single construct cloning, the exploration of numerous combinations of genes, protein domains, regulatory elements, etc. requires technology to enable the design and scar-less assembly processes. These combinatorial DNA libraries have become increasingly important, especially as a means of engineering fusion proteins and metabolic pathways toward the production of biofuels and biobased chemicals[8, 11, 17]. As a way of understanding the utility of this approach, consider the example of constructing green fluorescent protein (GFP) with peptide tags specifying subcellular localization and degradation. Selecting one of two N-terminal signal peptides, either a long or short linker sequence, and either a normal or enhanced C-terminal degradation tag, yields a total of 8 variant molecules (three variable components with two options each). With no a priori expectation of which variants might fold functionally, localize correctly, and degrade most efficiently, one must try them all. Leveraging a combinatorial assembly approach allows the researcher to reuse parts, such as a vector backbone, across multiple combinations instead of generating a custom version of each part for each distinct plasmid. Still, one must expend considerable effort and time to identify the optimal assembly junctions, design oligos to amplify the input components, and incorporate complementary overhangs and restriction sites. In a more ambitious example of a 10-gene pathway with 3 orthologs for each gene (310 or 59,000 variations), the design challenge is impossible to tackle by hand. Only automated solutions are feasible. To the best of our knowledge, j5 is the first DNA assembly design tool (for any assembly method including BioBricks) that recommends DNA synthesis when cost-effective to do so and has the capacity to direct the construction of large-scale scar-less combinatorial DNA libraries. j5 is also unique among scarless DNA assembly design tools in its ability to perform cost optimization, design combinatorial libraries or hierarchical assembly strategies to mitigate putative off-target assembly products, and to enforce design specification rules. For combinatorial DNA libraries of around 200 plasmids, the time-savings can be 3- to 8-fold over traditional approaches, and the cost-savings can be 10- to 20-fold over DNA synthesis services (see Table 1).
Results
TeselaGen:j5 automates the cost-optimal design of scar-less multipart DNA assembly protocols. j5 is web-based, available across computer platforms via a sophisticated browser based web-application interface (Figure 2)[22], and as such does not require the user to install or update the software. To begin the j5 DNA assembly design process, the user first selects the assembly methodology, flanking homology or type IIs, for j5 to design. Next, the user defines the parts (here synonymous with DNA sequence fragments) to be assembled via VectorEditor[23]. The input format to VectorEditor is Genbank, FASTA, jbei-seq, or SBOL XML. Each part is defined by a start and an end base pair within a source sequence and by an orientation on the top or bottom strand. Since j5 designs for assembly methods that do not require predetermined flanking sequences, the defined parts do not need to be packaged in any particular format, in contrast to BioBrick assembly. After defining the parts to be assembled, the user may also dictate Eugene biological design specification rules[24]. These rules can limit the total number of times a given part may appear in a given construct, prevent any two parts from appearing together in the same construct, ensure that two given parts always appear together in the same construct, and are of particular utility when only a subset of all possible combinatorial variants is desired. j5 enforces these rules by designing assemblies only for those constructs that satisfy the specifications.
2013 | Best Practices Compendium | Bio-IT World [97]
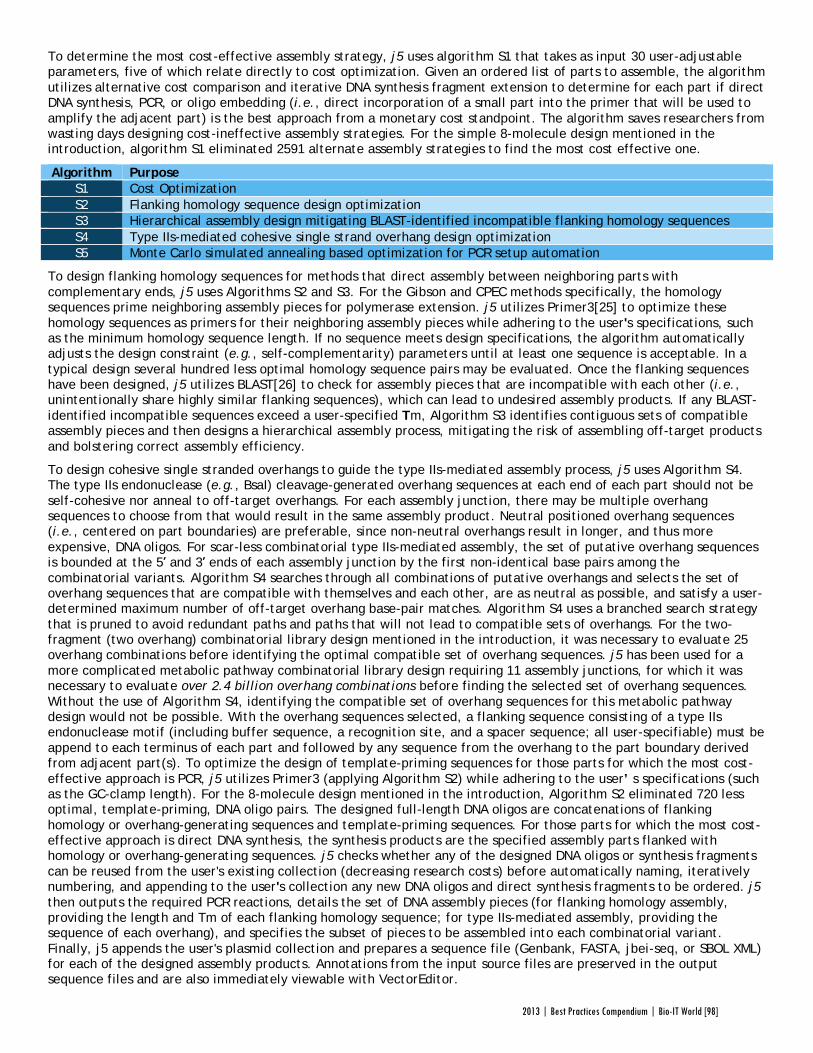
To determine the most cost-effective assembly strategy, j5 uses algorithm S1 that takes as input 30 user-adjustable parameters, five of which relate directly to cost optimization. Given an ordered list of parts to assemble, the algorithm utilizes alternative cost comparison and iterative DNA synthesis fragment extension to determine for each part if direct DNA synthesis, PCR, or oligo embedding (i.e., direct incorporation of a small part into the primer that will be used to amplify the adjacent part) is the best approach from a monetary cost standpoint. The algorithm saves researchers from wasting days designing cost-ineffective assembly strategies. For the simple 8-molecule design mentioned in the introduction, algorithm S1 eliminated 2591 alternate assembly strategies to find the most cost effective one.
Algorithm Purpose S1 Cost Optimization S2 Flanking homology sequence design optimization S3 Hierarchical assembly design mitigating BLAST-identified incompatible flanking homology sequences S4 Type IIs-mediated cohesive single strand overhang design optimization S5 Monte Carlo simulated annealing based optimization for PCR setup automation
To design flanking homology sequences for methods that direct assembly between neighboring parts with complementary ends, j5 uses Algorithms S2 and S3. For the Gibson and CPEC methods specifically, the homology sequences prime neighboring assembly pieces for polymerase extension. j5 utilizes Primer3[25] to optimize these homology sequences as primers for their neighboring assembly pieces while adhering to the user's specifications, such as the minimum homology sequence length. If no sequence meets design specifications, the algorithm automatically adjusts the design constraint (e.g., self-complementarity) parameters until at least one sequence is acceptable. In a typical design several hundred less optimal homology sequence pairs may be evaluated. Once the flanking sequences have been designed, j5 utilizes BLAST[26] to check for assembly pieces that are incompatible with each other (i.e., unintentionally share highly similar flanking sequences), which can lead to undesired assembly products. If any BLAST-identified incompatible sequences exceed a user-specified Tm, Algorithm S3 identifies contiguous sets of compatible assembly pieces and then designs a hierarchical assembly process, mitigating the risk of assembling off-target products and bolstering correct assembly efficiency.
To design cohesive single stranded overhangs to guide the type IIs-mediated assembly process, j5 uses Algorithm S4. The type IIs endonuclease (e.g., BsaI) cleavage-generated overhang sequences at each end of each part should not be self-cohesive nor anneal to off-target overhangs. For each assembly junction, there may be multiple overhang sequences to choose from that would result in the same assembly product. Neutral positioned overhang sequences (i.e., centered on part boundaries) are preferable, since non-neutral overhangs result in longer, and thus more expensive, DNA oligos. For scar-less combinatorial type IIs-mediated assembly, the set of putative overhang sequences is bounded at the 5′ and 3′ ends of each assembly junction by the first non-identical base pairs among the combinatorial variants. Algorithm S4 searches through all combinations of putative overhangs and selects the set of overhang sequences that are compatible with themselves and each other, are as neutral as possible, and satisfy a user-determined maximum number of off-target overhang base-pair matches. Algorithm S4 uses a branched search strategy that is pruned to avoid redundant paths and paths that will not lead to compatible sets of overhangs. For the two-fragment (two overhang) combinatorial library design mentioned in the introduction, it was necessary to evaluate 25 overhang combinations before identifying the optimal compatible set of overhang sequences. j5 has been used for a more complicated metabolic pathway combinatorial library design requiring 11 assembly junctions, for which it was necessary to evaluate over 2.4 billion overhang combinations before finding the selected set of overhang sequences. Without the use of Algorithm S4, identifying the compatible set of overhang sequences for this metabolic pathway design would not be possible. With the overhang sequences selected, a flanking sequence consisting of a type IIs endonuclease motif (including buffer sequence, a recognition site, and a spacer sequence; all user-specifiable) must be append to each terminus of each part and followed by any sequence from the overhang to the part boundary derived from adjacent part(s). To optimize the design of template-priming sequences for those parts for which the most cost-effective approach is PCR, j5 utilizes Primer3 (applying Algorithm S2) while adhering to the user’ s specifications (such as the GC-clamp length). For the 8-molecule design mentioned in the introduction, Algorithm S2 eliminated 720 less optimal, template-priming, DNA oligo pairs. The designed full-length DNA oligos are concatenations of flanking homology or overhang-generating sequences and template-priming sequences. For those parts for which the most cost-effective approach is direct DNA synthesis, the synthesis products are the specified assembly parts flanked with homology or overhang-generating sequences. j5 checks whether any of the designed DNA oligos or synthesis fragments can be reused from the user's existing collection (decreasing research costs) before automatically naming, iteratively numbering, and appending to the user's collection any new DNA oligos and direct synthesis fragments to be ordered. j5 then outputs the required PCR reactions, details the set of DNA assembly pieces (for flanking homology assembly, providing the length and Tm of each flanking homology sequence; for type IIs-mediated assembly, providing the sequence of each overhang), and specifies the subset of pieces to be assembled into each combinatorial variant. Finally, j5 appends the user's plasmid collection and prepares a sequence file (Genbank, FASTA, jbei-seq, or SBOL XML) for each of the designed assembly products. Annotations from the input source files are preserved in the output sequence files and are also immediately viewable with VectorEditor.
2013 | Best Practices Compendium | Bio-IT World [98]
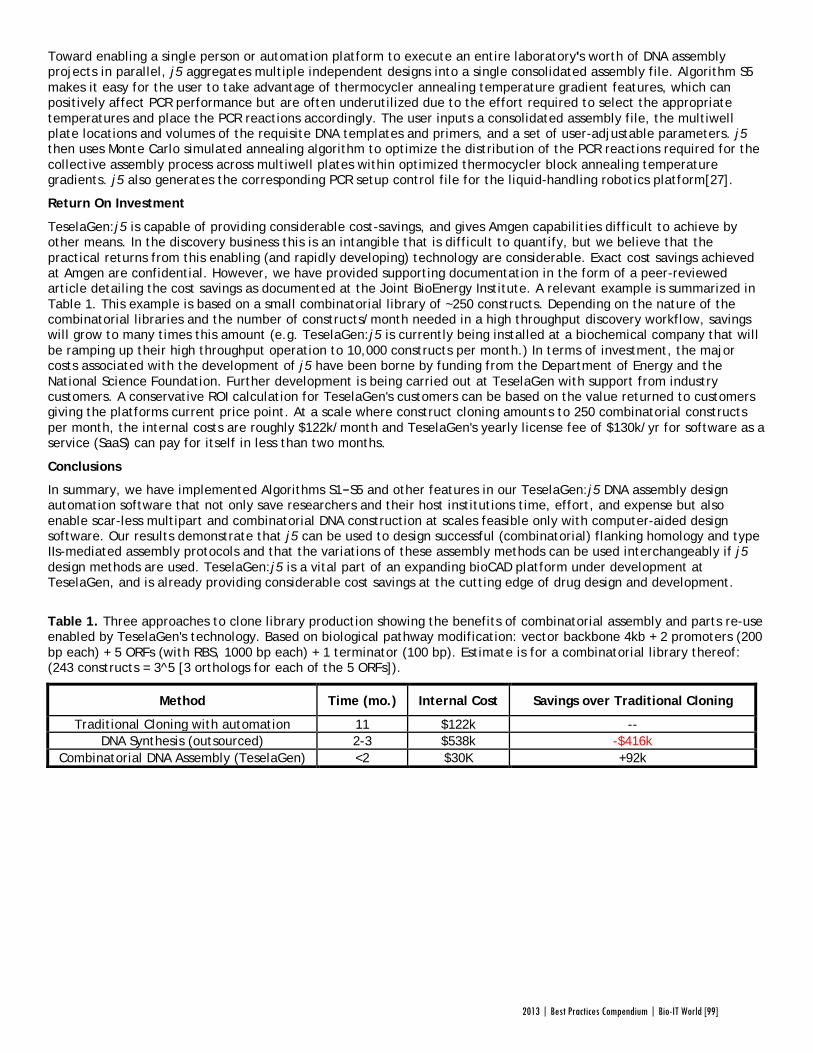
Toward enabling a single person or automation platform to execute an entire laboratory's worth of DNA assembly projects in parallel, j5 aggregates multiple independent designs into a single consolidated assembly file. Algorithm S5 makes it easy for the user to take advantage of thermocycler annealing temperature gradient features, which can positively affect PCR performance but are often underutilized due to the effort required to select the appropriate temperatures and place the PCR reactions accordingly. The user inputs a consolidated assembly file, the multiwell plate locations and volumes of the requisite DNA templates and primers, and a set of user-adjustable parameters. j5 then uses Monte Carlo simulated annealing algorithm to optimize the distribution of the PCR reactions required for the collective assembly process across multiwell plates within optimized thermocycler block annealing temperature gradients. j5 also generates the corresponding PCR setup control file for the liquid-handling robotics platform[27].
Return On Investment
TeselaGen:j5 is capable of providing considerable cost-savings, and gives Amgen capabilities difficult to achieve by other means. In the discovery business this is an intangible that is difficult to quantify, but we believe that the practical returns from this enabling (and rapidly developing) technology are considerable. Exact cost savings achieved at Amgen are confidential. However, we have provided supporting documentation in the form of a peer-reviewed article detailing the cost savings as documented at the Joint BioEnergy Institute. A relevant example is summarized in Table 1. This example is based on a small combinatorial library of ~250 constructs. Depending on the nature of the combinatorial libraries and the number of constructs/month needed in a high throughput discovery workflow, savings will grow to many times this amount (e.g. TeselaGen:j5 is currently being installed at a biochemical company that will be ramping up their high throughput operation to 10,000 constructs per month.) In terms of investment, the major costs associated with the development of j5 have been borne by funding from the Department of Energy and the National Science Foundation. Further development is being carried out at TeselaGen with support from industry customers. A conservative ROI calculation for TeselaGen's customers can be based on the value returned to customers giving the platforms current price point. At a scale where construct cloning amounts to 250 combinatorial constructs per month, the internal costs are roughly $122k/month and TeselaGen's yearly license fee of $130k/yr for software as a service (SaaS) can pay for itself in less than two months.
Conclusions
In summary, we have implemented Algorithms S1−S5 and other features in our TeselaGen:j5 DNA assembly design automation software that not only save researchers and their host institutions time, effort, and expense but also enable scar-less multipart and combinatorial DNA construction at scales feasible only with computer-aided design software. Our results demonstrate that j5 can be used to design successful (combinatorial) flanking homology and type IIs-mediated assembly protocols and that the variations of these assembly methods can be used interchangeably if j5 design methods are used. TeselaGen:j5 is a vital part of an expanding bioCAD platform under development at TeselaGen, and is already providing considerable cost savings at the cutting edge of drug design and development.
Table 1. Three approaches to clone library production showing the benefits of combinatorial assembly and parts re-use enabled by TeselaGen's technology. Based on biological pathway modification: vector backbone 4kb + 2 promoters (200 bp each) + 5 ORFs (with RBS, 1000 bp each) + 1 terminator (100 bp). Estimate is for a combinatorial library thereof: (243 constructs = 3^5 [3 orthologs for each of the 5 ORFs]).
Method Time (mo.) Internal Cost Savings over Traditional Cloning
Traditional Cloning with automation 11 $122k -- DNA Synthesis (outsourced) 2-3 $538k -$416k
Combinatorial DNA Assembly (TeselaGen) <2 $30K +92k
2013 | Best Practices Compendium | Bio-IT World [99]
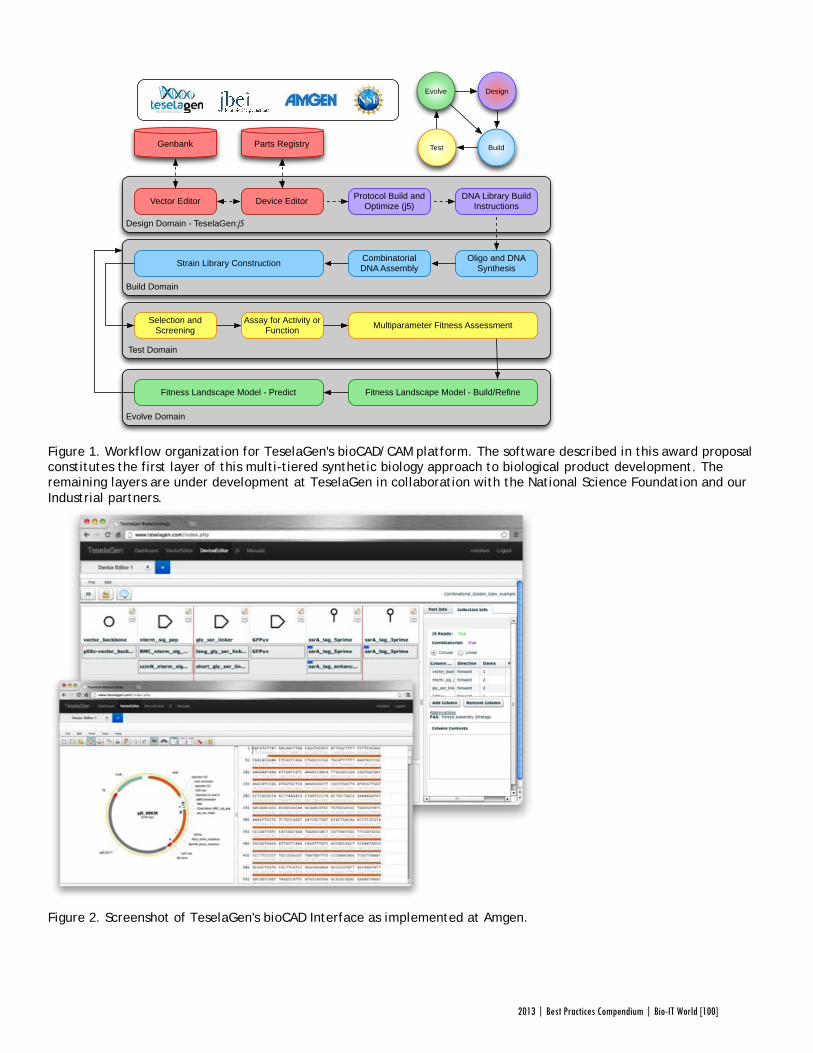
Figure 1. Workflow organization for TeselaGen's bioCAD/CAM platform. The software described in this award proposal constitutes the first layer of this multi-tiered synthetic biology approach to biological product development. The remaining layers are under development at TeselaGen in collaboration with the National Science Foundation and our Industrial partners.
Figure 2. Screenshot of TeselaGen's bioCAD Interface as implemented at Amgen.
Design
BuildTest
Evolve
Evolve Domain
Test Domain
Design Domain - TeselaGen:j5
Parts Registry
Device Editor Protocol Build and Optimize (j5)
DNA Library Build Instructions
Selection and Screening
Assay for Activity or Function Multiparameter Fitness Assessment
Fitness Landscape Model - Build/Refine
Build Domain
Combinatorial DNA AssemblyStrain Library Construction Oligo and DNA
Synthesis
Fitness Landscape Model - Predict
Vector Editor
Genbank
2013 | Best Practices Compendium | Bio-IT World [100]
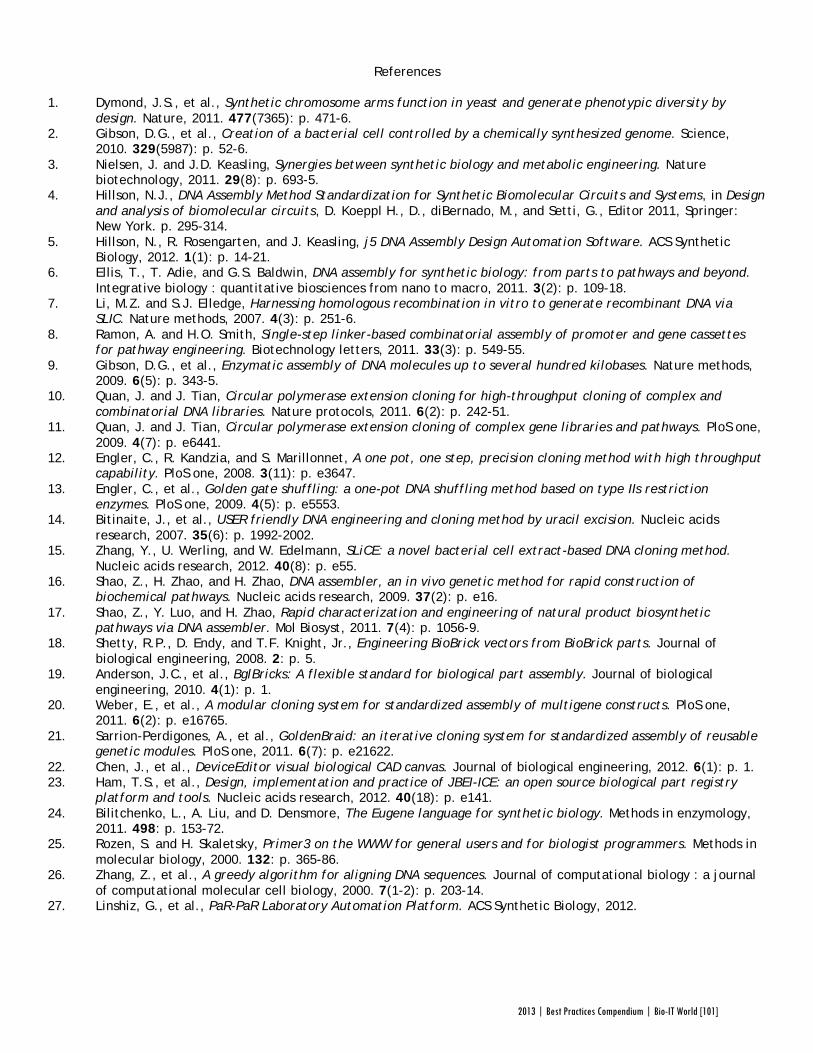
References
1. Dymond, J.S., et al., Synthetic chromosome arms function in yeast and generate phenotypic diversity by
design. Nature, 2011. 477(7365): p. 471-6. 2. Gibson, D.G., et al., Creation of a bacterial cell controlled by a chemically synthesized genome. Science,
2010. 329(5987): p. 52-6. 3. Nielsen, J. and J.D. Keasling, Synergies between synthetic biology and metabolic engineering. Nature
biotechnology, 2011. 29(8): p. 693-5. 4. Hillson, N.J., DNA Assembly Method Standardization for Synthetic Biomolecular Circuits and Systems, in Design
and analysis of biomolecular circuits, D. Koeppl H., D., diBernado, M., and Setti, G., Editor 2011, Springer: New York. p. 295-314.
5. Hillson, N., R. Rosengarten, and J. Keasling, j5 DNA Assembly Design Automation Software. ACS Synthetic Biology, 2012. 1(1): p. 14-21.
6. Ellis, T., T. Adie, and G.S. Baldwin, DNA assembly for synthetic biology: from parts to pathways and beyond. Integrative biology : quantitative biosciences from nano to macro, 2011. 3(2): p. 109-18.
7. Li, M.Z. and S.J. Elledge, Harnessing homologous recombination in vitro to generate recombinant DNA via SLIC. Nature methods, 2007. 4(3): p. 251-6.
8. Ramon, A. and H.O. Smith, Single-step linker-based combinatorial assembly of promoter and gene cassettes for pathway engineering. Biotechnology letters, 2011. 33(3): p. 549-55.
9. Gibson, D.G., et al., Enzymatic assembly of DNA molecules up to several hundred kilobases. Nature methods, 2009. 6(5): p. 343-5.
10. Quan, J. and J. Tian, Circular polymerase extension cloning for high-throughput cloning of complex and combinatorial DNA libraries. Nature protocols, 2011. 6(2): p. 242-51.
11. Quan, J. and J. Tian, Circular polymerase extension cloning of complex gene libraries and pathways. PloS one, 2009. 4(7): p. e6441.
12. Engler, C., R. Kandzia, and S. Marillonnet, A one pot, one step, precision cloning method with high throughput capability. PloS one, 2008. 3(11): p. e3647.
13. Engler, C., et al., Golden gate shuffling: a one-pot DNA shuffling method based on type IIs restriction enzymes. PloS one, 2009. 4(5): p. e5553.
14. Bitinaite, J., et al., USER friendly DNA engineering and cloning method by uracil excision. Nucleic acids research, 2007. 35(6): p. 1992-2002.
15. Zhang, Y., U. Werling, and W. Edelmann, SLiCE: a novel bacterial cell extract-based DNA cloning method. Nucleic acids research, 2012. 40(8): p. e55.
16. Shao, Z., H. Zhao, and H. Zhao, DNA assembler, an in vivo genetic method for rapid construction of biochemical pathways. Nucleic acids research, 2009. 37(2): p. e16.
17. Shao, Z., Y. Luo, and H. Zhao, Rapid characterization and engineering of natural product biosynthetic pathways via DNA assembler. Mol Biosyst, 2011. 7(4): p. 1056-9.
18. Shetty, R.P., D. Endy, and T.F. Knight, Jr., Engineering BioBrick vectors from BioBrick parts. Journal of biological engineering, 2008. 2: p. 5.
19. Anderson, J.C., et al., BglBricks: A flexible standard for biological part assembly. Journal of biological engineering, 2010. 4(1): p. 1.
20. Weber, E., et al., A modular cloning system for standardized assembly of multigene constructs. PloS one, 2011. 6(2): p. e16765.
21. Sarrion-Perdigones, A., et al., GoldenBraid: an iterative cloning system for standardized assembly of reusable genetic modules. PloS one, 2011. 6(7): p. e21622.
22. Chen, J., et al., DeviceEditor visual biological CAD canvas. Journal of biological engineering, 2012. 6(1): p. 1. 23. Ham, T.S., et al., Design, implementation and practice of JBEI-ICE: an open source biological part registry
platform and tools. Nucleic acids research, 2012. 40(18): p. e141. 24. Bilitchenko, L., A. Liu, and D. Densmore, The Eugene language for synthetic biology. Methods in enzymology,
2011. 498: p. 153-72. 25. Rozen, S. and H. Skaletsky, Primer3 on the WWW for general users and for biologist programmers. Methods in
molecular biology, 2000. 132: p. 365-86. 26. Zhang, Z., et al., A greedy algorithm for aligning DNA sequences. Journal of computational biology : a journal
of computational molecular cell biology, 2000. 7(1-2): p. 203-14. 27. Linshiz, G., et al., PaR-PaR Laboratory Automation Platform. ACS Synthetic Biology, 2012.
2013 | Best Practices Compendium | Bio-IT World [101]
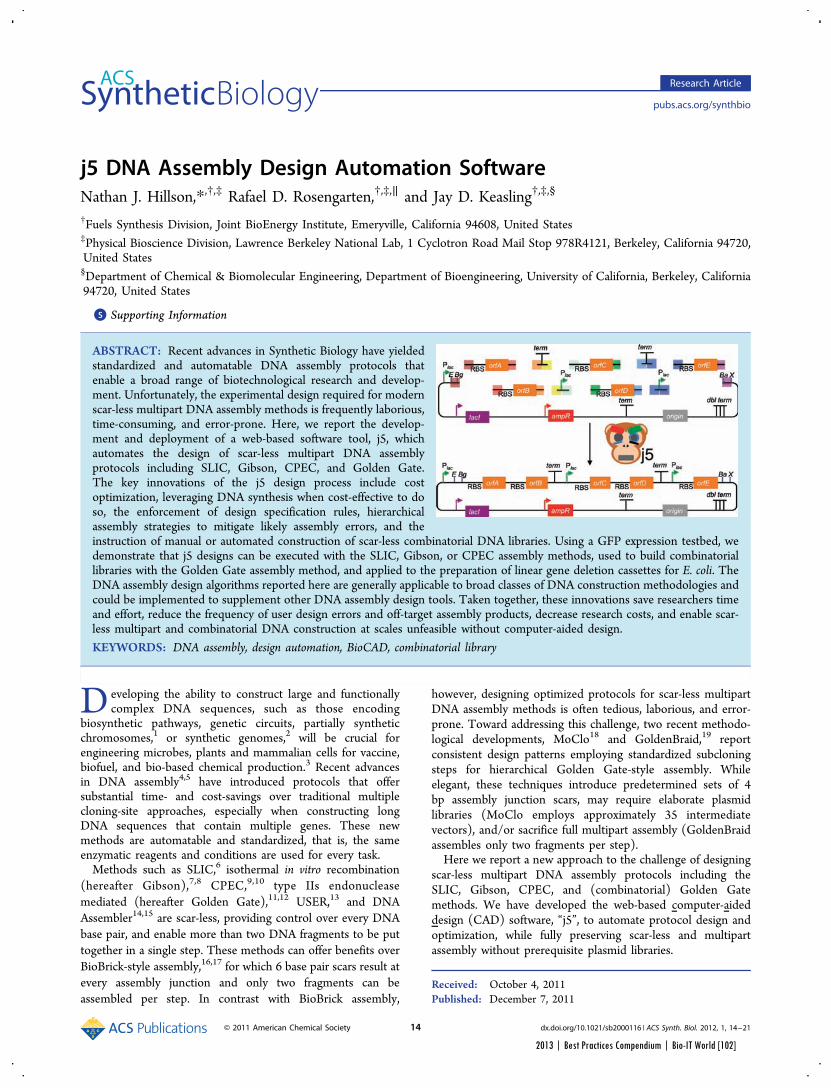
j5 DNA Assembly Design Automation SoftwareNathan J. Hillson,*,†,‡ Rafael D. Rosengarten,†,‡,∥ and Jay D. Keasling†,‡,§
†Fuels Synthesis Division, Joint BioEnergy Institute, Emeryville, California 94608, United States‡Physical Bioscience Division, Lawrence Berkeley National Lab, 1 Cyclotron Road Mail Stop 978R4121, Berkeley, California 94720,United States§Department of Chemical & Biomolecular Engineering, Department of Bioengineering, University of California, Berkeley, California94720, United States
*S Supporting Information
ABSTRACT: Recent advances in Synthetic Biology have yieldedstandardized and automatable DNA assembly protocols thatenable a broad range of biotechnological research and develop-ment. Unfortunately, the experimental design required for modernscar-less multipart DNA assembly methods is frequently laborious,time-consuming, and error-prone. Here, we report the develop-ment and deployment of a web-based software tool, j5, whichautomates the design of scar-less multipart DNA assemblyprotocols including SLIC, Gibson, CPEC, and Golden Gate.The key innovations of the j5 design process include costoptimization, leveraging DNA synthesis when cost-effective to doso, the enforcement of design specification rules, hierarchicalassembly strategies to mitigate likely assembly errors, and theinstruction of manual or automated construction of scar-less combinatorial DNA libraries. Using a GFP expression testbed, wedemonstrate that j5 designs can be executed with the SLIC, Gibson, or CPEC assembly methods, used to build combinatoriallibraries with the Golden Gate assembly method, and applied to the preparation of linear gene deletion cassettes for E. coli. TheDNA assembly design algorithms reported here are generally applicable to broad classes of DNA construction methodologies andcould be implemented to supplement other DNA assembly design tools. Taken together, these innovations save researchers timeand effort, reduce the frequency of user design errors and off-target assembly products, decrease research costs, and enable scar-less multipart and combinatorial DNA construction at scales unfeasible without computer-aided design.
KEYWORDS: DNA assembly, design automation, BioCAD, combinatorial library
Developing the ability to construct large and functionallycomplex DNA sequences, such as those encoding
biosynthetic pathways, genetic circuits, partially syntheticchromosomes,1 or synthetic genomes,2 will be crucial forengineering microbes, plants and mammalian cells for vaccine,biofuel, and bio-based chemical production.3 Recent advancesin DNA assembly4,5 have introduced protocols that offersubstantial time- and cost-savings over traditional multiplecloning-site approaches, especially when constructing longDNA sequences that contain multiple genes. These newmethods are automatable and standardized, that is, the sameenzymatic reagents and conditions are used for every task.Methods such as SLIC,6 isothermal in vitro recombination
(hereafter Gibson),7,8 CPEC,9,10 type IIs endonucleasemediated (hereafter Golden Gate),11,12 USER,13 and DNAAssembler14,15 are scar-less, providing control over every DNAbase pair, and enable more than two DNA fragments to be puttogether in a single step. These methods can offer benefits overBioBrick-style assembly,16,17 for which 6 base pair scars result atevery assembly junction and only two fragments can beassembled per step. In contrast with BioBrick assembly,
however, designing optimized protocols for scar-less multipartDNA assembly methods is often tedious, laborious, and error-prone. Toward addressing this challenge, two recent methodo-logical developments, MoClo18 and GoldenBraid,19 reportconsistent design patterns employing standardized subcloningsteps for hierarchical Golden Gate-style assembly. Whileelegant, these techniques introduce predetermined sets of 4bp assembly junction scars, may require elaborate plasmidlibraries (MoClo employs approximately 35 intermediatevectors), and/or sacrifice full multipart assembly (GoldenBraidassembles only two fragments per step).Here we report a new approach to the challenge of designing
scar-less multipart DNA assembly protocols including theSLIC, Gibson, CPEC, and (combinatorial) Golden Gatemethods. We have developed the web-based computer-aideddesign (CAD) software, “j5”, to automate protocol design andoptimization, while fully preserving scar-less and multipartassembly without prerequisite plasmid libraries.
Received: October 4, 2011Published: December 7, 2011
Research Article
pubs.acs.org/synthbio
© 2011 American Chemical Society 14 dx.doi.org/10.1021/sb2000116 | ACS Synth. Biol. 2012, 1, 14−21
2013 | Best Practices Compendium | Bio-IT World [102]
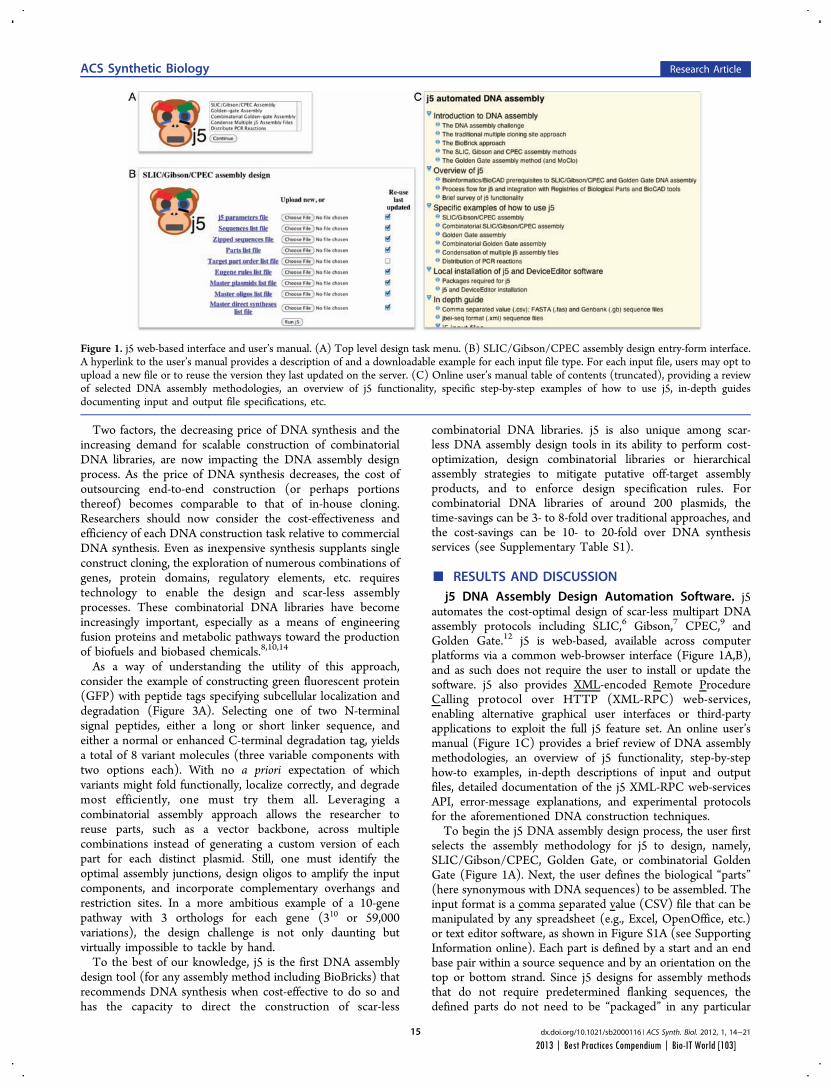
Two factors, the decreasing price of DNA synthesis and theincreasing demand for scalable construction of combinatorialDNA libraries, are now impacting the DNA assembly designprocess. As the price of DNA synthesis decreases, the cost ofoutsourcing end-to-end construction (or perhaps portionsthereof) becomes comparable to that of in-house cloning.Researchers should now consider the cost-effectiveness andefficiency of each DNA construction task relative to commercialDNA synthesis. Even as inexpensive synthesis supplants singleconstruct cloning, the exploration of numerous combinations ofgenes, protein domains, regulatory elements, etc. requirestechnology to enable the design and scar-less assemblyprocesses. These combinatorial DNA libraries have becomeincreasingly important, especially as a means of engineeringfusion proteins and metabolic pathways toward the productionof biofuels and biobased chemicals.8,10,14
As a way of understanding the utility of this approach,consider the example of constructing green fluorescent protein(GFP) with peptide tags specifying subcellular localization anddegradation (Figure 3A). Selecting one of two N-terminalsignal peptides, either a long or short linker sequence, andeither a normal or enhanced C-terminal degradation tag, yieldsa total of 8 variant molecules (three variable components withtwo options each). With no a priori expectation of whichvariants might fold functionally, localize correctly, and degrademost efficiently, one must try them all. Leveraging acombinatorial assembly approach allows the researcher toreuse parts, such as a vector backbone, across multiplecombinations instead of generating a custom version of eachpart for each distinct plasmid. Still, one must identify theoptimal assembly junctions, design oligos to amplify the inputcomponents, and incorporate complementary overhangs andrestriction sites. In a more ambitious example of a 10-genepathway with 3 orthologs for each gene (310 or 59,000variations), the design challenge is not only daunting butvirtually impossible to tackle by hand.To the best of our knowledge, j5 is the first DNA assembly
design tool (for any assembly method including BioBricks) thatrecommends DNA synthesis when cost-effective to do so andhas the capacity to direct the construction of scar-less
combinatorial DNA libraries. j5 is also unique among scar-less DNA assembly design tools in its ability to perform cost-optimization, design combinatorial libraries or hierarchicalassembly strategies to mitigate putative off-target assemblyproducts, and to enforce design specification rules. Forcombinatorial DNA libraries of around 200 plasmids, thetime-savings can be 3- to 8-fold over traditional approaches, andthe cost-savings can be 10- to 20-fold over DNA synthesisservices (see Supplementary Table S1).
■ RESULTS AND DISCUSSIONj5 DNA Assembly Design Automation Software. j5
automates the cost-optimal design of scar-less multipart DNAassembly protocols including SLIC,6 Gibson,7 CPEC,9 andGolden Gate.12 j5 is web-based, available across computerplatforms via a common web-browser interface (Figure 1A,B),and as such does not require the user to install or update thesoftware. j5 also provides XML-encoded Remote ProcedureCalling protocol over HTTP (XML-RPC) web-services,enabling alternative graphical user interfaces or third-partyapplications to exploit the full j5 feature set. An online user’smanual (Figure 1C) provides a brief review of DNA assemblymethodologies, an overview of j5 functionality, step-by-stephow-to examples, in-depth descriptions of input and outputfiles, detailed documentation of the j5 XML-RPC web-servicesAPI, error-message explanations, and experimental protocolsfor the aforementioned DNA construction techniques.To begin the j5 DNA assembly design process, the user first
selects the assembly methodology for j5 to design, namely,SLIC/Gibson/CPEC, Golden Gate, or combinatorial GoldenGate (Figure 1A). Next, the user defines the biological “parts”(here synonymous with DNA sequences) to be assembled. Theinput format is a comma separated value (CSV) file that can bemanipulated by any spreadsheet (e.g., Excel, OpenOffice, etc.)or text editor software, as shown in Figure S1A (see SupportingInformation online). Each part is defined by a start and an endbase pair within a source sequence and by an orientation on thetop or bottom strand. Since j5 designs for assembly methodsthat do not require predetermined flanking sequences, thedefined parts do not need to be “packaged” in any particular
Figure 1. j5 web-based interface and user’s manual. (A) Top level design task menu. (B) SLIC/Gibson/CPEC assembly design entry-form interface.A hyperlink to the user’s manual provides a description of and a downloadable example for each input file type. For each input file, users may opt toupload a new file or to reuse the version they last updated on the server. (C) Online user’s manual table of contents (truncated), providing a reviewof selected DNA assembly methodologies, an overview of j5 functionality, specific step-by-step examples of how to use j5, in-depth guidesdocumenting input and output file specifications, etc.
ACS Synthetic Biology Research Article
dx.doi.org/10.1021/sb2000116 | ACS Synth. Biol. 2012, 1, 14−21152013 | Best Practices Compendium | Bio-IT World [103]
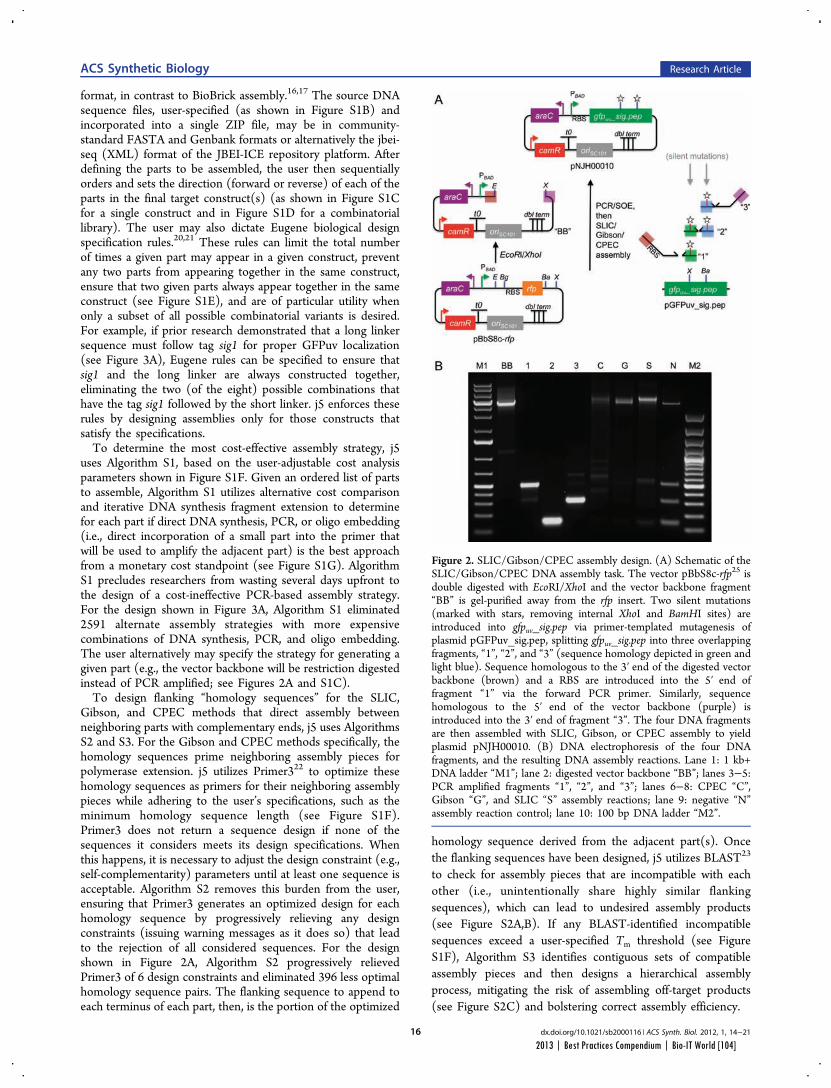
format, in contrast to BioBrick assembly.16,17 The source DNAsequence files, user-specified (as shown in Figure S1B) andincorporated into a single ZIP file, may be in community-standard FASTA and Genbank formats or alternatively the jbei-seq (XML) format of the JBEI-ICE repository platform. Afterdefining the parts to be assembled, the user then sequentiallyorders and sets the direction (forward or reverse) of each of theparts in the final target construct(s) (as shown in Figure S1Cfor a single construct and in Figure S1D for a combinatoriallibrary). The user may also dictate Eugene biological designspecification rules.20,21 These rules can limit the total numberof times a given part may appear in a given construct, preventany two parts from appearing together in the same construct,ensure that two given parts always appear together in the sameconstruct (see Figure S1E), and are of particular utility whenonly a subset of all possible combinatorial variants is desired.For example, if prior research demonstrated that a long linkersequence must follow tag sig1 for proper GFPuv localization(see Figure 3A), Eugene rules can be specified to ensure thatsig1 and the long linker are always constructed together,eliminating the two (of the eight) possible combinations thathave the tag sig1 followed by the short linker. j5 enforces theserules by designing assemblies only for those constructs thatsatisfy the specifications.To determine the most cost-effective assembly strategy, j5
uses Algorithm S1, based on the user-adjustable cost analysisparameters shown in Figure S1F. Given an ordered list of partsto assemble, Algorithm S1 utilizes alternative cost comparisonand iterative DNA synthesis fragment extension to determinefor each part if direct DNA synthesis, PCR, or oligo embedding(i.e., direct incorporation of a small part into the primer thatwill be used to amplify the adjacent part) is the best approachfrom a monetary cost standpoint (see Figure S1G). AlgorithmS1 precludes researchers from wasting several days upfront tothe design of a cost-ineffective PCR-based assembly strategy.For the design shown in Figure 3A, Algorithm S1 eliminated2591 alternate assembly strategies with more expensivecombinations of DNA synthesis, PCR, and oligo embedding.The user alternatively may specify the strategy for generating agiven part (e.g., the vector backbone will be restriction digestedinstead of PCR amplified; see Figures 2A and S1C).To design flanking “homology sequences” for the SLIC,
Gibson, and CPEC methods that direct assembly betweenneighboring parts with complementary ends, j5 uses AlgorithmsS2 and S3. For the Gibson and CPEC methods specifically, thehomology sequences prime neighboring assembly pieces forpolymerase extension. j5 utilizes Primer322 to optimize thesehomology sequences as primers for their neighboring assemblypieces while adhering to the user’s specifications, such as theminimum homology sequence length (see Figure S1F).Primer3 does not return a sequence design if none of thesequences it considers meets its design specifications. Whenthis happens, it is necessary to adjust the design constraint (e.g.,self-complementarity) parameters until at least one sequence isacceptable. Algorithm S2 removes this burden from the user,ensuring that Primer3 generates an optimized design for eachhomology sequence by progressively relieving any designconstraints (issuing warning messages as it does so) that leadto the rejection of all considered sequences. For the designshown in Figure 2A, Algorithm S2 progressively relievedPrimer3 of 6 design constraints and eliminated 396 less optimalhomology sequence pairs. The flanking sequence to append toeach terminus of each part, then, is the portion of the optimized
homology sequence derived from the adjacent part(s). Oncethe flanking sequences have been designed, j5 utilizes BLAST23
to check for assembly pieces that are incompatible with eachother (i.e., unintentionally share highly similar flankingsequences), which can lead to undesired assembly products(see Figure S2A,B). If any BLAST-identified incompatiblesequences exceed a user-specified Tm threshold (see FigureS1F), Algorithm S3 identifies contiguous sets of compatibleassembly pieces and then designs a hierarchical assemblyprocess, mitigating the risk of assembling off-target products(see Figure S2C) and bolstering correct assembly efficiency.
Figure 2. SLIC/Gibson/CPEC assembly design. (A) Schematic of theSLIC/Gibson/CPEC DNA assembly task. The vector pBbS8c-rfp25 isdouble digested with EcoRI/XhoI and the vector backbone fragment“BB” is gel-purified away from the rfp insert. Two silent mutations(marked with stars, removing internal XhoI and BamHI sites) areintroduced into gfpuv_sig.pep via primer-templated mutagenesis ofplasmid pGFPuv_sig.pep, splitting gfpuv_sig.pep into three overlappingfragments, “1”, “2”, and “3” (sequence homology depicted in green andlight blue). Sequence homologous to the 3′ end of the digested vectorbackbone (brown) and a RBS are introduced into the 5′ end offragment “1” via the forward PCR primer. Similarly, sequencehomologous to the 5′ end of the vector backbone (purple) isintroduced into the 3′ end of fragment “3”. The four DNA fragmentsare then assembled with SLIC, Gibson, or CPEC assembly to yieldplasmid pNJH00010. (B) DNA electrophoresis of the four DNAfragments, and the resulting DNA assembly reactions. Lane 1: 1 kb+DNA ladder “M1”; lane 2: digested vector backbone “BB”; lanes 3−5:PCR amplified fragments “1”, “2”, and “3”; lanes 6−8: CPEC “C”,Gibson “G”, and SLIC “S” assembly reactions; lane 9: negative “N”assembly reaction control; lane 10: 100 bp DNA ladder “M2”.
ACS Synthetic Biology Research Article
dx.doi.org/10.1021/sb2000116 | ACS Synth. Biol. 2012, 1, 14−21162013 | Best Practices Compendium | Bio-IT World [104]
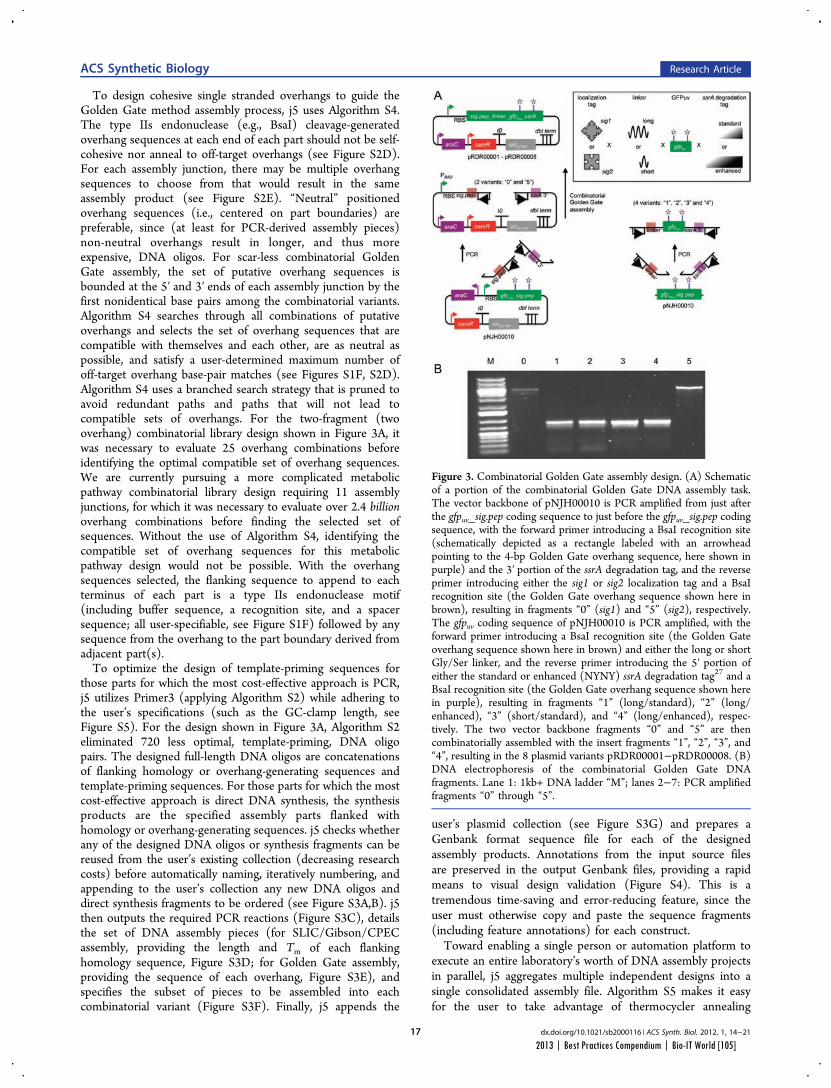
To design cohesive single stranded overhangs to guide theGolden Gate method assembly process, j5 uses Algorithm S4.The type IIs endonuclease (e.g., BsaI) cleavage-generatedoverhang sequences at each end of each part should not be self-cohesive nor anneal to off-target overhangs (see Figure S2D).For each assembly junction, there may be multiple overhangsequences to choose from that would result in the sameassembly product (see Figure S2E). “Neutral” positionedoverhang sequences (i.e., centered on part boundaries) arepreferable, since (at least for PCR-derived assembly pieces)non-neutral overhangs result in longer, and thus moreexpensive, DNA oligos. For scar-less combinatorial GoldenGate assembly, the set of putative overhang sequences isbounded at the 5′ and 3′ ends of each assembly junction by thefirst nonidentical base pairs among the combinatorial variants.Algorithm S4 searches through all combinations of putativeoverhangs and selects the set of overhang sequences that arecompatible with themselves and each other, are as neutral aspossible, and satisfy a user-determined maximum number ofoff-target overhang base-pair matches (see Figures S1F, S2D).Algorithm S4 uses a branched search strategy that is pruned toavoid redundant paths and paths that will not lead tocompatible sets of overhangs. For the two-fragment (twooverhang) combinatorial library design shown in Figure 3A, itwas necessary to evaluate 25 overhang combinations beforeidentifying the optimal compatible set of overhang sequences.We are currently pursuing a more complicated metabolicpathway combinatorial library design requiring 11 assemblyjunctions, for which it was necessary to evaluate over 2.4 billionoverhang combinations before finding the selected set ofsequences. Without the use of Algorithm S4, identifying thecompatible set of overhang sequences for this metabolicpathway design would not be possible. With the overhangsequences selected, the flanking sequence to append to eachterminus of each part is a type IIs endonuclease motif(including buffer sequence, a recognition site, and a spacersequence; all user-specifiable, see Figure S1F) followed by anysequence from the overhang to the part boundary derived fromadjacent part(s).To optimize the design of template-priming sequences for
those parts for which the most cost-effective approach is PCR,j5 utilizes Primer3 (applying Algorithm S2) while adhering tothe user’s specifications (such as the GC-clamp length, seeFigure S5). For the design shown in Figure 3A, Algorithm S2eliminated 720 less optimal, template-priming, DNA oligopairs. The designed full-length DNA oligos are concatenationsof flanking homology or overhang-generating sequences andtemplate-priming sequences. For those parts for which the mostcost-effective approach is direct DNA synthesis, the synthesisproducts are the specified assembly parts flanked withhomology or overhang-generating sequences. j5 checks whetherany of the designed DNA oligos or synthesis fragments can bereused from the user’s existing collection (decreasing researchcosts) before automatically naming, iteratively numbering, andappending to the user’s collection any new DNA oligos anddirect synthesis fragments to be ordered (see Figure S3A,B). j5then outputs the required PCR reactions (Figure S3C), detailsthe set of DNA assembly pieces (for SLIC/Gibson/CPECassembly, providing the length and Tm of each flankinghomology sequence, Figure S3D; for Golden Gate assembly,providing the sequence of each overhang, Figure S3E), andspecifies the subset of pieces to be assembled into eachcombinatorial variant (Figure S3F). Finally, j5 appends the
user’s plasmid collection (see Figure S3G) and prepares aGenbank format sequence file for each of the designedassembly products. Annotations from the input source filesare preserved in the output Genbank files, providing a rapidmeans to visual design validation (Figure S4). This is atremendous time-saving and error-reducing feature, since theuser must otherwise copy and paste the sequence fragments(including feature annotations) for each construct.Toward enabling a single person or automation platform to
execute an entire laboratory’s worth of DNA assembly projectsin parallel, j5 aggregates multiple independent designs into asingle consolidated assembly file. Algorithm S5 makes it easyfor the user to take advantage of thermocycler annealing
Figure 3. Combinatorial Golden Gate assembly design. (A) Schematicof a portion of the combinatorial Golden Gate DNA assembly task.The vector backbone of pNJH00010 is PCR amplified from just afterthe gfpuv_sig.pep coding sequence to just before the gfpuv_sig.pep codingsequence, with the forward primer introducing a BsaI recognition site(schematically depicted as a rectangle labeled with an arrowheadpointing to the 4-bp Golden Gate overhang sequence, here shown inpurple) and the 3′ portion of the ssrA degradation tag, and the reverseprimer introducing either the sig1 or sig2 localization tag and a BsaIrecognition site (the Golden Gate overhang sequence shown here inbrown), resulting in fragments “0” (sig1) and “5” (sig2), respectively.The gfpuv coding sequence of pNJH00010 is PCR amplified, with theforward primer introducing a BsaI recognition site (the Golden Gateoverhang sequence shown here in brown) and either the long or shortGly/Ser linker, and the reverse primer introducing the 5′ portion ofeither the standard or enhanced (NYNY) ssrA degradation tag27 and aBsaI recognition site (the Golden Gate overhang sequence shown herein purple), resulting in fragments “1” (long/standard), “2” (long/enhanced), “3” (short/standard), and “4” (long/enhanced), respec-tively. The two vector backbone fragments “0” and “5” are thencombinatorially assembled with the insert fragments “1”, “2”, “3”, and“4”, resulting in the 8 plasmid variants pRDR00001−pRDR00008. (B)DNA electrophoresis of the combinatorial Golden Gate DNAfragments. Lane 1: 1kb+ DNA ladder “M”; lanes 2−7: PCR amplifiedfragments “0” through “5”.
ACS Synthetic Biology Research Article
dx.doi.org/10.1021/sb2000116 | ACS Synth. Biol. 2012, 1, 14−21172013 | Best Practices Compendium | Bio-IT World [105]
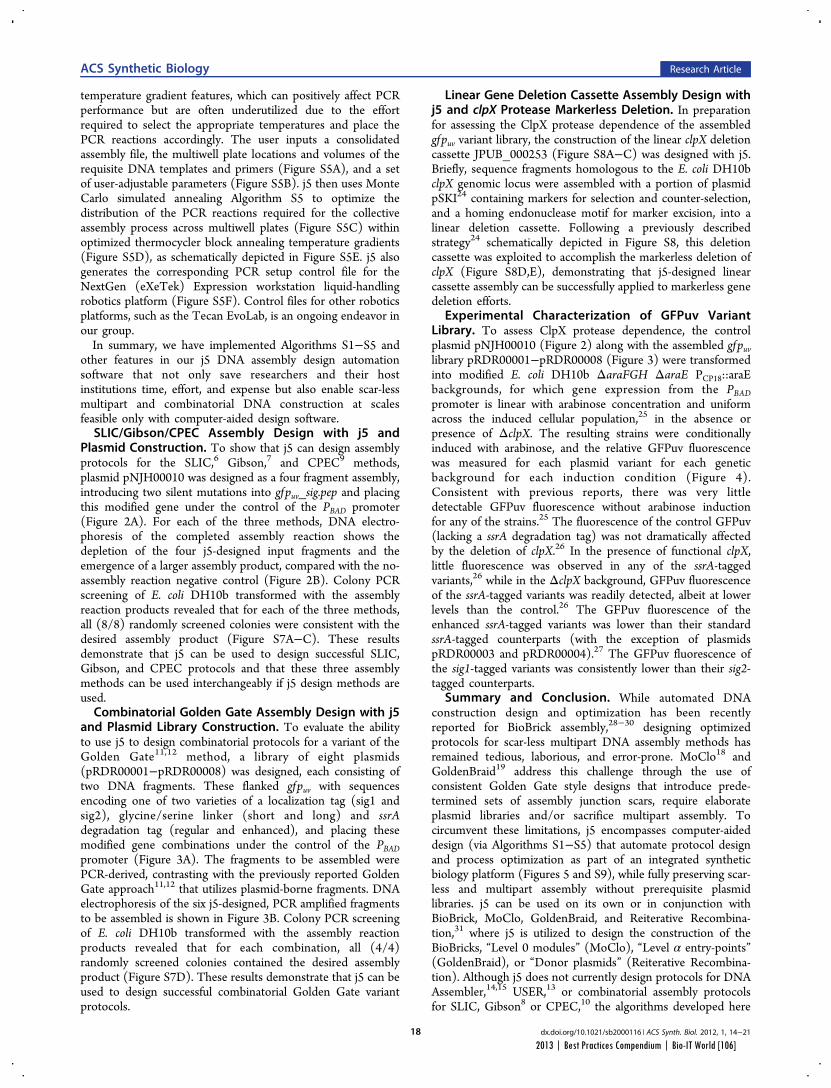
temperature gradient features, which can positively affect PCRperformance but are often underutilized due to the effortrequired to select the appropriate temperatures and place thePCR reactions accordingly. The user inputs a consolidatedassembly file, the multiwell plate locations and volumes of therequisite DNA templates and primers (Figure S5A), and a setof user-adjustable parameters (Figure S5B). j5 then uses MonteCarlo simulated annealing Algorithm S5 to optimize thedistribution of the PCR reactions required for the collectiveassembly process across multiwell plates (Figure S5C) withinoptimized thermocycler block annealing temperature gradients(Figure S5D), as schematically depicted in Figure S5E. j5 alsogenerates the corresponding PCR setup control file for theNextGen (eXeTek) Expression workstation liquid-handlingrobotics platform (Figure S5F). Control files for other roboticsplatforms, such as the Tecan EvoLab, is an ongoing endeavor inour group.In summary, we have implemented Algorithms S1−S5 and
other features in our j5 DNA assembly design automationsoftware that not only save researchers and their hostinstitutions time, effort, and expense but also enable scar-lessmultipart and combinatorial DNA construction at scalesfeasible only with computer-aided design software.SLIC/Gibson/CPEC Assembly Design with j5 and
Plasmid Construction. To show that j5 can design assemblyprotocols for the SLIC,6 Gibson,7 and CPEC9 methods,plasmid pNJH00010 was designed as a four fragment assembly,introducing two silent mutations into gfpuv_sig.pep and placingthis modified gene under the control of the PBAD promoter(Figure 2A). For each of the three methods, DNA electro-phoresis of the completed assembly reaction shows thedepletion of the four j5-designed input fragments and theemergence of a larger assembly product, compared with the no-assembly reaction negative control (Figure 2B). Colony PCRscreening of E. coli DH10b transformed with the assemblyreaction products revealed that for each of the three methods,all (8/8) randomly screened colonies were consistent with thedesired assembly product (Figure S7A−C). These resultsdemonstrate that j5 can be used to design successful SLIC,Gibson, and CPEC protocols and that these three assemblymethods can be used interchangeably if j5 design methods areused.Combinatorial Golden Gate Assembly Design with j5
and Plasmid Library Construction. To evaluate the abilityto use j5 to design combinatorial protocols for a variant of theGolden Gate11,12 method, a library of eight plasmids(pRDR00001−pRDR00008) was designed, each consisting oftwo DNA fragments. These flanked gfpuv with sequencesencoding one of two varieties of a localization tag (sig1 andsig2), glycine/serine linker (short and long) and ssrAdegradation tag (regular and enhanced), and placing thesemodified gene combinations under the control of the PBADpromoter (Figure 3A). The fragments to be assembled werePCR-derived, contrasting with the previously reported GoldenGate approach11,12 that utilizes plasmid-borne fragments. DNAelectrophoresis of the six j5-designed, PCR amplified fragmentsto be assembled is shown in Figure 3B. Colony PCR screeningof E. coli DH10b transformed with the assembly reactionproducts revealed that for each combination, all (4/4)randomly screened colonies contained the desired assemblyproduct (Figure S7D). These results demonstrate that j5 can beused to design successful combinatorial Golden Gate variantprotocols.
Linear Gene Deletion Cassette Assembly Design withj5 and clpX Protease Markerless Deletion. In preparationfor assessing the ClpX protease dependence of the assembledgfpuv variant library, the construction of the linear clpX deletioncassette JPUB_000253 (Figure S8A−C) was designed with j5.Briefly, sequence fragments homologous to the E. coli DH10bclpX genomic locus were assembled with a portion of plasmidpSKI24 containing markers for selection and counter-selection,and a homing endonuclease motif for marker excision, into alinear deletion cassette. Following a previously describedstrategy24 schematically depicted in Figure S8, this deletioncassette was exploited to accomplish the markerless deletion ofclpX (Figure S8D,E), demonstrating that j5-designed linearcassette assembly can be successfully applied to markerless genedeletion efforts.
Experimental Characterization of GFPuv VariantLibrary. To assess ClpX protease dependence, the controlplasmid pNJH00010 (Figure 2) along with the assembled gfpuvlibrary pRDR00001−pRDR00008 (Figure 3) were transformedinto modified E. coli DH10b ΔaraFGH ΔaraE PCP18::araEbackgrounds, for which gene expression from the PBADpromoter is linear with arabinose concentration and uniformacross the induced cellular population,25 in the absence orpresence of ΔclpX. The resulting strains were conditionallyinduced with arabinose, and the relative GFPuv fluorescencewas measured for each plasmid variant for each geneticbackground for each induction condition (Figure 4).Consistent with previous reports, there was very littledetectable GFPuv fluorescence without arabinose inductionfor any of the strains.25 The fluorescence of the control GFPuv(lacking a ssrA degradation tag) was not dramatically affectedby the deletion of clpX.26 In the presence of functional clpX,little fluorescence was observed in any of the ssrA-taggedvariants,26 while in the ΔclpX background, GFPuv fluorescenceof the ssrA-tagged variants was readily detected, albeit at lowerlevels than the control.26 The GFPuv fluorescence of theenhanced ssrA-tagged variants was lower than their standardssrA-tagged counterparts (with the exception of plasmidspRDR00003 and pRDR00004).27 The GFPuv fluorescence ofthe sig1-tagged variants was consistently lower than their sig2-tagged counterparts.
Summary and Conclusion. While automated DNAconstruction design and optimization has been recentlyreported for BioBrick assembly,28−30 designing optimizedprotocols for scar-less multipart DNA assembly methods hasremained tedious, laborious, and error-prone. MoClo18 andGoldenBraid19 address this challenge through the use ofconsistent Golden Gate style designs that introduce prede-termined sets of assembly junction scars, require elaborateplasmid libraries and/or sacrifice multipart assembly. Tocircumvent these limitations, j5 encompasses computer-aideddesign (via Algorithms S1−S5) that automate protocol designand process optimization as part of an integrated syntheticbiology platform (Figures 5 and S9), while fully preserving scar-less and multipart assembly without prerequisite plasmidlibraries. j5 can be used on its own or in conjunction withBioBrick, MoClo, GoldenBraid, and Reiterative Recombina-tion,31 where j5 is utilized to design the construction of theBioBricks, “Level 0 modules” (MoClo), “Level α entry-points”(GoldenBraid), or “Donor plasmids” (Reiterative Recombina-tion). Although j5 does not currently design protocols for DNAAssembler,14,15 USER,13 or combinatorial assembly protocolsfor SLIC, Gibson8 or CPEC,10 the algorithms developed here
ACS Synthetic Biology Research Article
dx.doi.org/10.1021/sb2000116 | ACS Synth. Biol. 2012, 1, 14−21182013 | Best Practices Compendium | Bio-IT World [106]
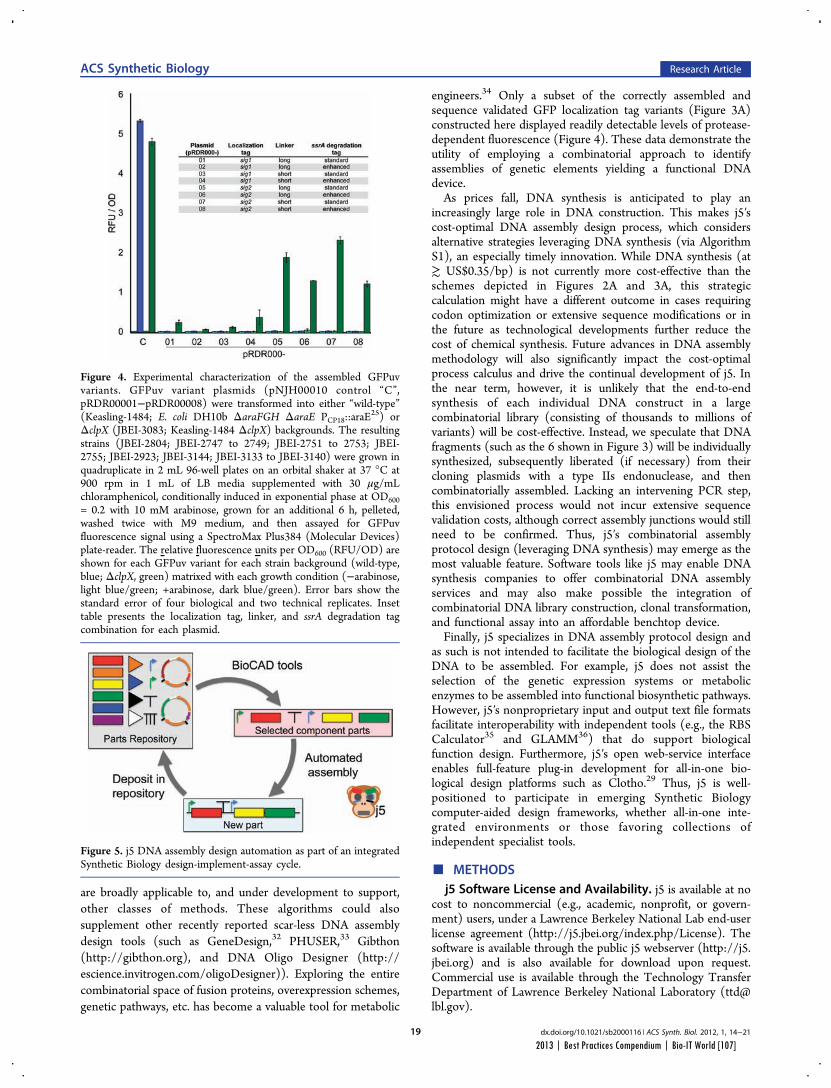
are broadly applicable to, and under development to support,other classes of methods. These algorithms could alsosupplement other recently reported scar-less DNA assemblydesign tools (such as GeneDesign,32 PHUSER,33 Gibthon(http://gibthon.org), and DNA Oligo Designer (http://escience.invitrogen.com/oligoDesigner)). Exploring the entirecombinatorial space of fusion proteins, overexpression schemes,genetic pathways, etc. has become a valuable tool for metabolic
engineers.34 Only a subset of the correctly assembled andsequence validated GFP localization tag variants (Figure 3A)constructed here displayed readily detectable levels of protease-dependent fluorescence (Figure 4). These data demonstrate theutility of employing a combinatorial approach to identifyassemblies of genetic elements yielding a functional DNAdevice.As prices fall, DNA synthesis is anticipated to play an
increasingly large role in DNA construction. This makes j5′scost-optimal DNA assembly design process, which considersalternative strategies leveraging DNA synthesis (via AlgorithmS1), an especially timely innovation. While DNA synthesis (at≳ US$0.35/bp) is not currently more cost-effective than theschemes depicted in Figures 2A and 3A, this strategiccalculation might have a different outcome in cases requiringcodon optimization or extensive sequence modifications or inthe future as technological developments further reduce thecost of chemical synthesis. Future advances in DNA assemblymethodology will also significantly impact the cost-optimalprocess calculus and drive the continual development of j5. Inthe near term, however, it is unlikely that the end-to-endsynthesis of each individual DNA construct in a largecombinatorial library (consisting of thousands to millions ofvariants) will be cost-effective. Instead, we speculate that DNAfragments (such as the 6 shown in Figure 3) will be individuallysynthesized, subsequently liberated (if necessary) from theircloning plasmids with a type IIs endonuclease, and thencombinatorially assembled. Lacking an intervening PCR step,this envisioned process would not incur extensive sequencevalidation costs, although correct assembly junctions would stillneed to be confirmed. Thus, j5′s combinatorial assemblyprotocol design (leveraging DNA synthesis) may emerge as themost valuable feature. Software tools like j5 may enable DNAsynthesis companies to offer combinatorial DNA assemblyservices and may also make possible the integration ofcombinatorial DNA library construction, clonal transformation,and functional assay into an affordable benchtop device.Finally, j5 specializes in DNA assembly protocol design and
as such is not intended to facilitate the biological design of theDNA to be assembled. For example, j5 does not assist theselection of the genetic expression systems or metabolicenzymes to be assembled into functional biosynthetic pathways.However, j5′s nonproprietary input and output text file formatsfacilitate interoperability with independent tools (e.g., the RBSCalculator35 and GLAMM36) that do support biologicalfunction design. Furthermore, j5′s open web-service interfaceenables full-feature plug-in development for all-in-one bio-logical design platforms such as Clotho.29 Thus, j5 is well-positioned to participate in emerging Synthetic Biologycomputer-aided design frameworks, whether all-in-one inte-grated environments or those favoring collections ofindependent specialist tools.
■ METHODSj5 Software License and Availability. j5 is available at no
cost to noncommercial (e.g., academic, nonprofit, or govern-ment) users, under a Lawrence Berkeley National Lab end-userlicense agreement (http://j5.jbei.org/index.php/License). Thesoftware is available through the public j5 webserver (http://j5.jbei.org) and is also available for download upon request.Commercial use is available through the Technology TransferDepartment of Lawrence Berkeley National Laboratory ([email protected]).
Figure 4. Experimental characterization of the assembled GFPuvvariants. GFPuv variant plasmids (pNJH00010 control “C”,pRDR00001−pRDR00008) were transformed into either “wild-type”(Keasling-1484; E. coli DH10b ΔaraFGH ΔaraE PCP18::araE
25) orΔclpX (JBEI-3083; Keasling-1484 ΔclpX) backgrounds. The resultingstrains (JBEI-2804; JBEI-2747 to 2749; JBEI-2751 to 2753; JBEI-2755; JBEI-2923; JBEI-3144; JBEI-3133 to JBEI-3140) were grown inquadruplicate in 2 mL 96-well plates on an orbital shaker at 37 °C at900 rpm in 1 mL of LB media supplemented with 30 μg/mLchloramphenicol, conditionally induced in exponential phase at OD600= 0.2 with 10 mM arabinose, grown for an additional 6 h, pelleted,washed twice with M9 medium, and then assayed for GFPuvfluorescence signal using a SpectroMax Plus384 (Molecular Devices)plate-reader. The relative fluorescence units per OD600 (RFU/OD) areshown for each GFPuv variant for each strain background (wild-type,blue; ΔclpX, green) matrixed with each growth condition (−arabinose,light blue/green; +arabinose, dark blue/green). Error bars show thestandard error of four biological and two technical replicates. Insettable presents the localization tag, linker, and ssrA degradation tagcombination for each plasmid.
Figure 5. j5 DNA assembly design automation as part of an integratedSynthetic Biology design-implement-assay cycle.
ACS Synthetic Biology Research Article
dx.doi.org/10.1021/sb2000116 | ACS Synth. Biol. 2012, 1, 14−21192013 | Best Practices Compendium | Bio-IT World [107]
j5 Software Implementation. Mediawiki software(http://www.mediawiki.org) coupled with a PostgreSQLdatabase (http://www.postgresql.org/) serves to automate thecreation and maintenance of user accounts on the public j5web-server. Perl-CGI web-form entry provides an interface to j5(Figures 1A,B), although XML-RPC web-services andcommand-line interfaces are also available. j5 is written in thePerl programming language (http://www.perl.org/) andheavily draws upon the BioPerl37 package as well as modulesfrom the Comprehensive Perl Archive Network (CPAN,http://www.cpan.org) repository. j5 makes external calls toPrimer3,22 for primer and flanking homology sequence design,and to BLAST,23 for identifying putative mis-priming andflanking homology sequence incompatibility events (see Resultsand Discussion). Circus Ponies Notebook software (http://www.circusponies.com/) was used to compose and generatethe online j5 user’s manual (Figure 1C).Strain and Sequence Availability. E. coli strains (JBEI-
2747 to 2749, JBEI-2751 to 2753, JBEI-2755, JBEI-2804, JBEI-2923, JBEI-2948, JBEI-3083, JBEI-3133 to JBEI-3140, andJBEI-3144) and DNA sequences (pNJH00010, pRDR00001−pRDR00008, and deletion cassette JPUB_000253), along withtheir associated information (annotated Genbank-formatsequence files, j5 assembly design files including DNA oligosequences, and sequencing trace files) have been deposited inthe public instance of the JBEI Registry (https://public-registry.jbei.org) and are physically available from the authorsand/or addgene (http://www.addgene.org) upon request.Additional details of plasmid and strain construction andfunctional characterization, beyond that described in theResults and Discussion section and in Figures 2−4 and S8,are provided Supporting Information.
■ ASSOCIATED CONTENT*S Supporting InformationSupporting tables, methods, algorithms, and figures. Thismaterial is available free of charge via the Internet at http://pubs.acs.org.
■ AUTHOR INFORMATIONCorresponding Author*Tel: +1 510 486 6754. Fax: +1 510 486 4252. E-mail:[email protected].
Present Address∥Department of Molecular and Human Genetics, BaylorCollege of Medicine, Houston, TX 77030.
Author ContributionsN.J.H. designed and developed the software, N.J.H and R.D.Rdesigned the experiments, R.D.R performed all experiments,N.J.H. wrote the software user’s manual, and N.J.H, R.D.R, andJ.D.K wrote the manuscript.
FundingThis work conducted by the Joint BioEnergy Institute wassupported by the Office of Science, Office of Biological andEnvironmental Research, of the U.S. Department of Energy(Contract No. DE-AC02-05CH11231); and the BerkeleyLaboratory Directed Research and Development Program (toN.J.H.).
NotesThe authors declare the following competing financial interest-(s):The authors declare competing financial interests in the
form of pending patent applications whose value may beaffected by the publication of this article.
■ ACKNOWLEDGMENTS
The authors thank James N. Kinney for providing plasmidpGFPuv_sig.pep and the sig1 and sig2 localization tagsequences; Taek Soon Lee for providing plasmid pBbS8c-rfp;John W. Thorne for assistance constructing plasmidpNJH00010 and pSKI; Anna Chen for assistance constructingplasmids pRDR00001-pRDR00008; Chris Fields for incorpo-rating proposed changes into the Primer3Redux BioPerlpackage; David Pletcher, Steve Lane, Zinovii Dmytriv, IanVaino, and William Morrell for providing informationtechnology support; and Timothy Ham, James Carothers, andVivek Mutalik for constructive comments on the manuscript.
■ REFERENCES(1) Dymond, J. S., Richardson, S. M., Coombes, C. E., Babatz, T.,Muller, H., Annaluru, N., Blake, W. J., Schwerzmann, J. W., Dai, J.,Lindstrom, D. L., Boeke, A. C., Gottschling, D. E., Chandrasegaran, S.,Bader, J. S., and Boeke, J. D. (2011) Synthetic chromosome armsfunction in yeast and generate phenotypic diversity by design. Nature477, 471−476.(2) Gibson, D. G., Glass, J. I., Lartigue, C., Noskov, V. N., Chuang, R.Y., Algire, M. A., Benders, G. A., Montague, M. G., Ma, L., Moodie, M.M., Merryman, C., Vashee, S., Krishnakumar, R., Assad-Garcia, N.,Andrews-Pfannkoch, C., Denisova, E. A., Young, L., Qi, Z. Q., Segall-Shapiro, T. H., Calvey, C. H., Parmar, P. P., Hutchison, C. A. 3rd,Smith, H. O., and Venter, J. C. (2010) Creation of a bacterial cellcontrolled by a chemically synthesized genome. Science 329, 52−56.(3) Nielsen, J., and Keasling, J. D. (2011) Synergies betweensynthetic biology and metabolic engineering. Nat. Biotechnol. 29, 693−695.(4) Ellis, T., Adie, T., and Baldwin, G. S. (2011) DNA assembly forsynthetic biology: from parts to pathways and beyond. Integr. Biol. 3,109−118.(5) Hillson, N. J. (2011) DNA Assembly Method Standardization forSynthetic Biomolecular Circuits and Systems, in Design and Analysis ofBio-molecular Circuits (Koeppl, H., Densmore, D., di Bernardo, M.,Setti, G., Eds.) 1st ed., pp 295−314, Springer-Verlag, Dordrecht.(6) Li, M. Z., and Elledge, S. J. (2007) Harnessing homologousrecombination in vitro to generate recombinant DNA via SLIC. Nat.Methods 4, 251−256.(7) Gibson, D. G., Young, L., Chuang, R. Y., Venter, J. C., Hutchison,C. A. 3rd, and Smith, H. O. (2009) Enzymatic assembly of DNAmolecules up to several hundred kilobases. Nat. Methods 6, 343−345.(8) Ramon, A., and Smith, H. O. (2011) Single-step linker-basedcombinatorial assembly of promoter and gene cassettes for pathwayengineering. Biotechnol. Lett. 33, 549−555.(9) Quan, J., and Tian, J. (2009) Circular polymerase extensioncloning of complex gene libraries and pathways. PLoS One 4, e6441.(10) Quan, J., and Tian, J. (2011) Circular polymerase extensioncloning for high-throughput cloning of complex and combinatorialDNA libraries. Nat. Protoc. 6, 242−251.(11) Engler, C., Gruetzner, R., Kandzia, R., and Marillonnet, S.(2009) Golden gate shuffling: a one-pot DNA shuffling method basedon type IIs restriction enzymes. PLoS One 4, e5553.(12) Engler, C., Kandzia, R., and Marillonnet, S. (2008) A one pot,one step, precision cloning method with high throughput capability.PLoS One 3, e3647.(13) Bitinaite, J., Rubino, M., Varma, K. H., Schildkraut, I., Vaisvila,R., and Vaiskunaite, R. (2007) USER friendly DNA engineering andcloning method by uracil excision. Nucleic Acids Res. 35, 1992−2002.(14) Shao, Z., Luo, Y., and Zhao, H. (2011) Rapid characterizationand engineering of natural product biosynthetic pathways via DNAassembler. Mol. Biosyst. 7, 1056−1059.
ACS Synthetic Biology Research Article
dx.doi.org/10.1021/sb2000116 | ACS Synth. Biol. 2012, 1, 14−21202013 | Best Practices Compendium | Bio-IT World [108]
(15) Shao, Z., and Zhao, H. (2009) DNA assembler, an in vivogenetic method for rapid construction of biochemical pathways.Nucleic Acids Res. 37, e16.(16) Anderson, J. C., Dueber, J. E., Leguia, M., Wu, G. C., Goler, J.A., Arkin, A. P., and Keasling, J. D. (2010) BglBricks: A flexiblestandard for biological part assembly. J. Biol. Eng. 4, 1.(17) Shetty, R. P., Endy, D., and Knight, T. F. Jr. (2008) EngineeringBioBrick vectors from BioBrick parts. J. Biol. Eng. 2, 5.(18) Weber, E., Engler, C., Gruetzner, R., Werner, S., andMarillonnet, S. (2011) A modular cloning system for standardizedassembly of multigene constructs. PLoS One 6, e16765.(19) Sarrion-Perdigones, A., Falconi, E. E., Zandalinas, S. I., Juarez,P., Fernandez-Del-Carmen, A., Granell, A., and Orzaez, D. (2011)GoldenBraid: An iterative cloning system for standardized assembly ofreusable genetic modules. PLoS One 6, e21622.(20) Bilitchenko, L., Liu, A., Cheung, S., Weeding, E., Xia, B., Leguia,M., Anderson, J. C., and Densmore, D. (2011) Eugene−a domainspecific language for specifying and constraining synthetic biologicalparts, devices, and systems. PLoS One 6, e18882.(21) Bilitchenko, L., Liu, A., and Densmore, D. (2011) The Eugenelanguage for synthetic biology. Methods Enzymol. 498, 153−172.(22) Rozen, S., and Skaletsky, H. (2000) Primer3 on the WWW forgeneral users and for biologist programmers. Methods Mol. Biol. 132,365−386.(23) Zhang, Z., Schwartz, S., Wagner, L., and Miller, W. (2000) Agreedy algorithm for aligning DNA sequences. J. Comput. Biol. 7, 203−214.(24) Yu, B. J., Kang, K. H., Lee, J. H., Sung, B. H., Kim, M. S., andKim, S. C. (2008) Rapid and efficient construction of markerlessdeletions in the Escherichia coli genome. Nucleic Acids Res. 36, e84.(25) Khlebnikov, A., Datsenko, K. A., Skaug, T., Wanner, B. L., andKeasling, J. D. (2001) Homogeneous expression of the P(BAD)promoter in Escherichia coli by constitutive expression of the low-affinity high-capacity AraE transporter. Microbiology 147, 3241−3247.(26) Farrell, C. M., Grossman, A. D., and Sauer, R. T. (2005)Cytoplasmic degradation of ssrA-tagged proteins. Mol. Microbiol. 57,1750−1761.(27) Hersch, G. L., Baker, T. A., and Sauer, R. T. (2004) SspBdelivery of substrates for ClpXP proteolysis probed by the design ofimproved degradation tags. Proc. Natl. Acad. Sci. U.S.A. 101, 12136−12141.(28) Densmore, D., Hsiau, T. H., Kittleson, J. T., DeLoache, W.,Batten, C., and Anderson, J. C. (2010) Algorithms for automated DNAassembly. Nucleic Acids Res. 38, 2607−2616.(29) Xia, B., Bhatia, S., Bubenheim, B., Dadgar, M., Densmore, D.,and Anderson, J. C. (2011) Developer’s and user’s guide to Clothov2.0 A software platform for the creation of synthetic biologicalsystems. Methods Enzymol. 498, 97−135.(30) Leguia, M., Brophy, J., Densmore, D., and Anderson, J. C.(2011) Automated assembly of standard biological parts. MethodsEnzymol. 498, 363−397.(31) Wingler, L. M., Cornish, V. W. (2011) ReiterativeRecombination for the in vivo assembly of libraries of multigenepathways, Proc. Natl. Acad. Sci. U.S.A.(32) Richardson, S. M., Nunley, P. W., Yarrington, R. M., Boeke, J.D., and Bader, J. S. (2010) GeneDesign 3.0 is an updated syntheticbiology toolkit. Nucleic Acids Res. 38, 2603−2606.(33) Olsen, L. R., Hansen, N. B., Bonde, M. T., Genee, H. J., Holm,D. K., Carlsen, S., Hansen, B. G., Patil, K. R., Mortensen, U. H., andWernersson, R. (2011) PHUSER (Primer Help for USER): a noveltool for USER fusion primer design. Nucleic Acids Res. 39, W61−67.(34) Santos, C. N., and Stephanopoulos, G. (2008) Combinatorialengineering of microbes for optimizing cellular phenotype. Curr. Opin.Chem. Biol. 12, 168−176.(35) Salis, H. M., Mirsky, E. A., and Voigt, C. A. (2009) Automateddesign of synthetic ribosome binding sites to control proteinexpression. Nat. Biotechnol. 27, 946−950.
(36) Bates, J. T., Chivian, D., and Arkin, A. P. (2011) GLAMM:Genome-Linked Application for Metabolic Maps. Nucleic Acids Res. 39,W400−405.(37) Stajich, J. E., Block, D., Boulez, K., Brenner, S. E., Chervitz, S. A.,Dagdigian, C., Fuellen, G., Gilbert, J. G., Korf, I., Lapp, H.,Lehvaslaiho, H., Matsalla, C., Mungall, C. J., Osborne, B. I., Pocock,M. R., Schattner, P., Senger, M., Stein, L. D., Stupka, E., Wilkinson, M.D., and Birney, E. (2002) The Bioperl toolkit: Perl modules for the lifesciences. Genome Res. 12, 1611−1618.
ACS Synthetic Biology Research Article
dx.doi.org/10.1021/sb2000116 | ACS Synth. Biol. 2012, 1, 14−21212013 | Best Practices Compendium | Bio-IT World [109]
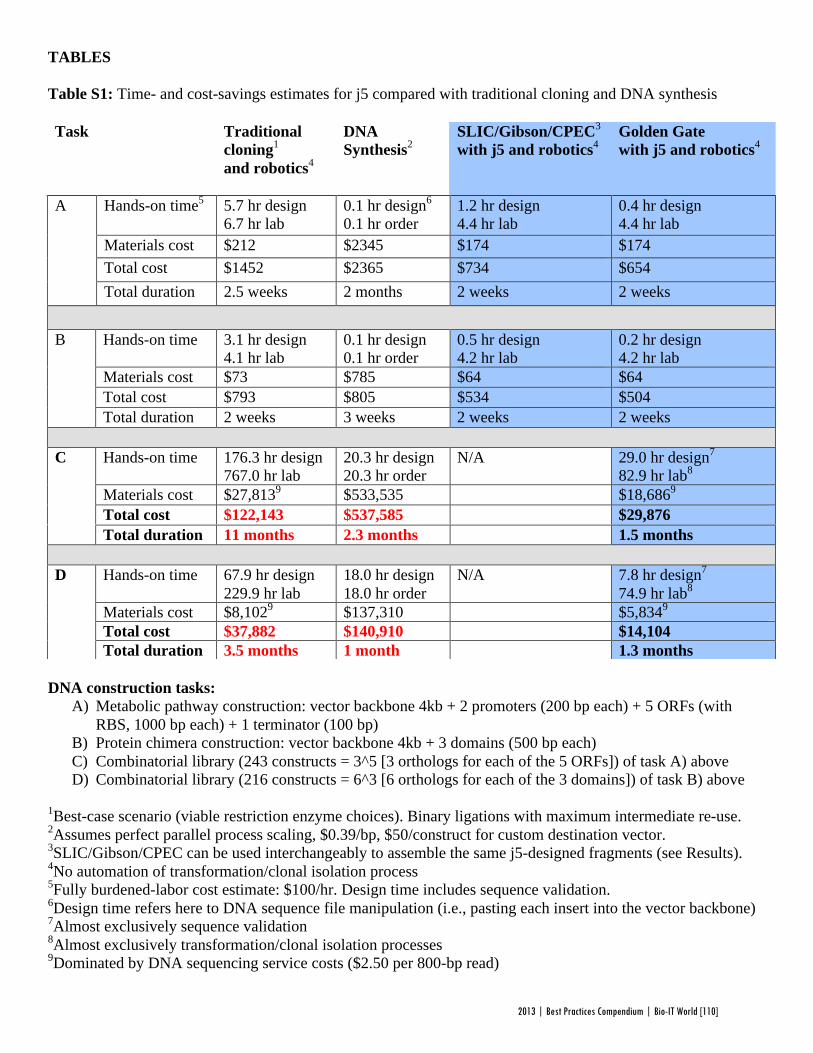
TABLES Table S1: Time- and cost-savings estimates for j5 compared with traditional cloning and DNA synthesis
DNA construction tasks:
A) Metabolic pathway construction: vector backbone 4kb + 2 promoters (200 bp each) + 5 ORFs (with RBS, 1000 bp each) + 1 terminator (100 bp)
B) Protein chimera construction: vector backbone 4kb + 3 domains (500 bp each) C) Combinatorial library (243 constructs = 3^5 [3 orthologs for each of the 5 ORFs]) of task A) above D) Combinatorial library (216 constructs = 6^3 [6 orthologs for each of the 3 domains]) of task B) above
1Best-case scenario (viable restriction enzyme choices). Binary ligations with maximum intermediate re-use. 2Assumes perfect parallel process scaling, $0.39/bp, $50/construct for custom destination vector. 3SLIC/Gibson/CPEC can be used interchangeably to assemble the same j5-designed fragments (see Results). 4No automation of transformation/clonal isolation process 5Fully burdened-labor cost estimate: $100/hr. Design time includes sequence validation. 6Design time refers here to DNA sequence file manipulation (i.e., pasting each insert into the vector backbone) 7Almost exclusively sequence validation 8Almost exclusively transformation/clonal isolation processes 9Dominated by DNA sequencing service costs ($2.50 per 800-bp read)
Task Traditional cloning1 and robotics4
DNA Synthesis2
SLIC/Gibson/CPEC3
with j5 and robotics4 Golden Gate
with j5 and robotics4
Hands-on time5 5.7 hr design 6.7 hr lab
0.1 hr design6 0.1 hr order
1.2 hr design 4.4 hr lab
0.4 hr design 4.4 hr lab
Materials cost $212 $2345 $174 $174 Total cost $1452 $2365 $734 $654
A
Total duration 2.5 weeks 2 months 2 weeks 2 weeks
Hands-on time 3.1 hr design 4.1 hr lab
0.1 hr design 0.1 hr order
0.5 hr design 4.2 hr lab
0.2 hr design 4.2 hr lab
Materials cost $73 $785 $64 $64 Total cost $793 $805 $534 $504
B
Total duration 2 weeks 3 weeks 2 weeks 2 weeks
Hands-on time 176.3 hr design 767.0 hr lab
20.3 hr design 20.3 hr order
N/A 29.0 hr design7 82.9 hr lab8
Materials cost $27,8139 $533,535 $18,6869 Total cost $122,143 $537,585 $29,876
C
Total duration 11 months 2.3 months 1.5 months
Hands-on time 67.9 hr design 229.9 hr lab
18.0 hr design 18.0 hr order
N/A 7.8 hr design7 74.9 hr lab8
Materials cost $8,1029 $137,310 $5,8349 Total cost $37,882 $140,910 $14,104
D
Total duration 3.5 months 1 month 1.3 months
2013 | Best Practices Compendium | Bio-IT World [110]
METHODS All DNA sequences and E. coli strains identified as JPUB_XXXXXX have been accessioned in the JBEI public registry (http://public-registry.jbei.org) and are available upon request. j5 design files, related oligo lists, and chromatogram sequence trace files are linked to the JPUB entries and can be downloaded or viewed there. Plasmid pNJH00010 construction Plasmid pNJH00010 (JPUB_000226) was constructed as designed by j5 (see the j5 design file pNJH00010.csv that is attached to the pNJH00010 registry entry). Briefly, plasmid pBbS8c-RFP (1) (JPUB_000041) was purified from E. coli strain JBEI-2566 (JPUB_000199) by Qiagen miniprep kit (per manufacturer’s instructions), 3.5 ug was digested with 25 units each EcoRI and XhoI (Fermentas), and the vector backbone fragment gel purified (Qiagen). Insert parts were generated by PCR using Phusion polymerase (New England Biosciences, manufacturer’s instructions) and primers RDR00130/132, RDR00134/136, and RDR00138/140 (see the pNJH00010.csv design file for the primer specifications). For the initial SLIC chew-back step, 360 ng of each assembly piece was digested with T4 DNA polymerase. Subsequently, 275 ng digested backbone was combined with equimolar parts 1 & 3, and 4-fold molar excess of part 2 due to its small size to mitigate the risk of excessive exonuclease degradation. The CPEC and Gibson assembly reactions used 100 ng vector, equimolar parts 1 and 3, and 4-fold molar excess part 2. Assembly reactions proceeded according to published methods (2-4) and 5 µL each reaction was transformed into 100 µL Keasling-1484 (E. coli DH10b ΔaraFGH ΔaraE PCP18::araE (1)) chemically competent cells, yielding strain JBEI-2804 (JPUB_000235). Transformants were selected for on LB-agar plates with 30 µg/mL chloramphenicol, and screened by PCR (primers RDR00001 and RDR00142, see the DNA_oligo_file.csv attached to the pNJH00010 registry entry for the primer specifications) for the correct inserts. Plasmid DNA was isolated by miniprep (Qiagen kit) and the success of plasmid assembly verified by Sanger sequencing of plasmid DNA (sequencing trace files are attached to the Seq. Analysis tab of the pNJH00010 registry entry). Construction of plasmids pRDR00001 – pRDR00008 Eight GFPuv-signal peptide plasmid variants (pRDR00001 – pRDR00008; JPUB_000227-234) were assembled by the Golden Gate method (5, 6) from linear PCR products amplified from pNJH00010. Specifications of all oligos, PCR reactions, and assembly combinations are provided in the j5 design files attached to the respective JBEI public registry entries. Briefly, the vector backbone was amplified with primers incorporating either a sig1 or sig2 signal peptide, and the gfpuv open reading frame was amplified with primers incorporating either a long or short linker sequence at the 5’ end of the gene and either a regular or enhanced ssrA tag at the 3’ end of the gene. PCR amplicons were purified by Qiagen column (manufacturer’s instructions) and DNA concentrations determined by nanodrop. Golden Gate assembly reactions were set up in 15 µL containing 100 ng vector backbone and equimolar insert, 1/10th volume 10X T4 DNA ligase buffer, 2,000 cohesive end units T4 DNA ligase (i.e. 1 μL high concentration) and 10 units BsaI (all enzymes, New England Biosciences). Reactions proceeded at 37˚C for 1 hour, followed by 5 minute incubations at 50˚C and 80˚C. Five µL of each reaction was transformed into E. coli strain Keasling-1484 (1), yielding strains JBEI-2747-9,2923,2751-3,2755 (JPUB_000236-43) and cells plated on LB-agar with 30 μg/mL chloramphenicol. Transformants were screened by colony PCR, plasmid DNA isolated by miniprep (Qiagen kit) and the success of plasmid assembly verified by Sanger sequencing of plasmid DNA (sequencing trace files are attached to the Seq. Analysis tab of the pRDR00001 – pRDR00008 registry entries). Markerless deletion of clpX In order to test the efficacy of the ssrA degradation tag on the GFPuv variants, the protease encoding gene clpX was removed from the Keasling-1484 (1) genome by a markerless deletion strategy (7) (see also Figure S8). Keasling-1484 was transformed with pREDI (7) (JPUB_000019), encoding the lambda red recombinase machinery under the control of Pbad and I-SceI homing endonuclease under the control of PrhaB with a temperature sensitive origin of replication, resulting in strain JBEI-2948 (JPUB_000253). A j5-designed linear deletion cassette containing a kanamycin resistance marker, sacB sucrose counter-selection marker, I-SceI cleavage motif, and genomic sequence flanking clpX for targeted recombination regions was amplified using Phusion polymerase and primers RDR00044 and RDR00045 from template pSKI (7) (JPUB_000270), resulting in DNA part ΔclpX_cassette (JPUB_000255) (see the j5 design file DclpX_j5_design.csv that is attached to the ΔclpX_cassette registry entry). Because our aim was to generate a linear cassette rather than a circularized plasmid, these primers were manually modified from the j5 design file to remove the 5’ overlapping regions
2013 | Best Practices Compendium | Bio-IT World [111]

introduced by the software. Due to the length of the oligos and formation of inhibitory primer dimers, successful amplification required the addition of 1M betaine, 5% DMSO, and 50 µM 7deaza-GTP (8). Amplicons were incubated with 10 units DpnI for 1 hour at 37˚C, gel purified, and concentrated to ~ 100 ng/uL. Four µL (400 ng) of deletion cassette was transformed into electrocompetent JBEI-2948, cells were recovered at 30˚C, and plated on LB-agar with 100 µg/mL ampicillin, 50 µg/mL kanamycin, and 10 mM arabinose. Four recovered clones were screened by colony PCR with primers flanking (RDR00050/051) and specific to (RDR00050/052) the inserted deletion cassette (see the DNA_oligo_file.csv attached to the ΔclpX_cassette registry entry for the primer specifications). Those colonies yielding the expected PCR products were replica plated on LB-agar with ampicillin and kanamycin versus LB-agar with ampicillin and sucrose. One of the two clones demonstrating kanamycin resistance and sucrose sensitivity was archived as JBEI-3080 (JPUB_000269). The insertion cassette was then excised by growing JBEI-3080 to O.D.600 ~ 0.4 in LB plus ampicillin and 10 mM rhamnose over three 10% dilutions and plating on LB-agar plus ampicillin, rhamnose and 5% sucrose. Recovered colonies were replica plated on agar containing either sucrose or kanamycin, and strain JBEI-3083 (JPUB_000254) was selected for sucrose growth and kanamycin sensitivity. Markerless deletion was confirmed by colony PCR using flanking and insert specific primers, as above, and by Sanger sequencing of the resulting amplicons (sequencing trace files are attached to the Seq. Analysis tab of the JBEI-3083 registry entry). GFP expression from plasmid variants Plasmid pNJH00010 and each GFPuv plasmid variant were transformed by heat shock into chemically competent JBEI-3083, resulting in strains JBEI-3144,3133-40 (JPUB_000244-52). Recovered colonies were grown overnight at 42˚C to cure pREDI and restreaked on LB-agar plus chloramphenicol. Cells harboring the GFPuv plasmid but not pREDI were selected by colony PCR. Four colonies per plasmid variant for each host JBEI-3083 and Keasling-1484 (1) were grown overnight in deep well 96-well plates containing 1 mL LB + 30 µg/mL chloramphenicol per well. These were diluted 1:100, grown to an average O.D. ~ 0.2, induced with 5 mM arabinose, and grown an additional 6 hours. Cells were pelleted, washed twice in M9 minimal media, and GFP fluorescence and optical density measured in duplicate in a SpectroMax Plus384 (Molecular Devices) plate reader.
2013 | Best Practices Compendium | Bio-IT World [112]
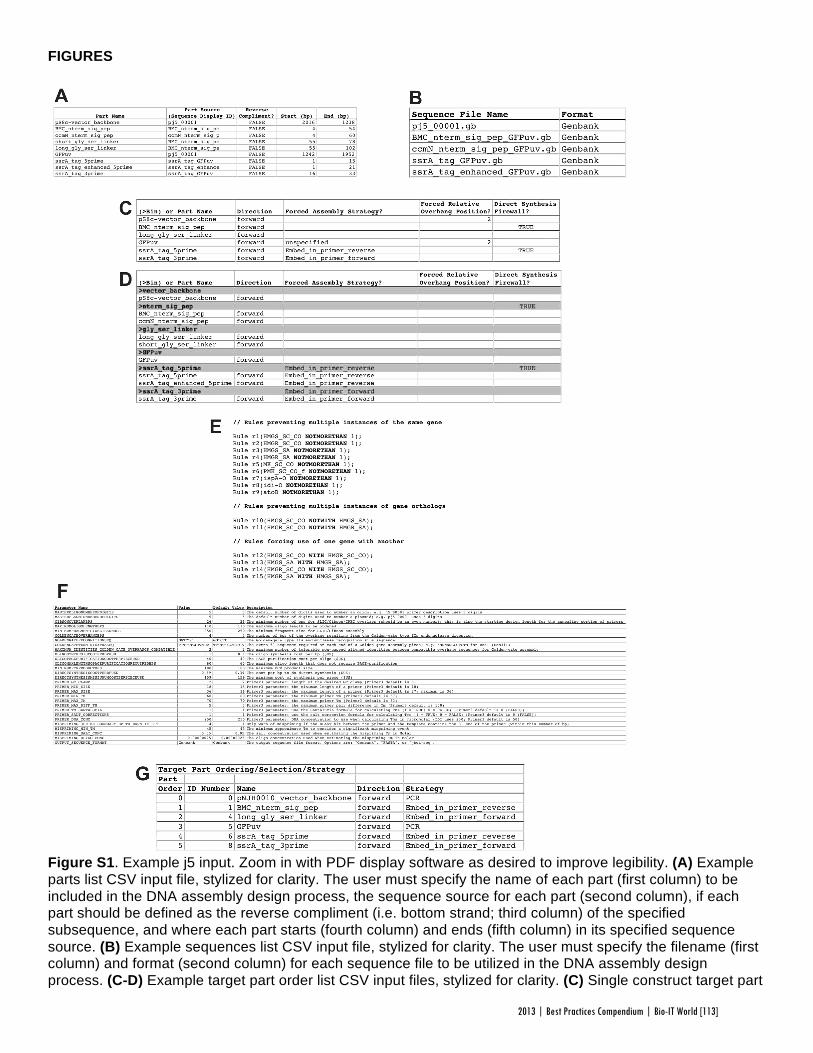
FIGURES
Figure S1. Example j5 input. Zoom in with PDF display software as desired to improve legibility. (A) Example parts list CSV input file, stylized for clarity. The user must specify the name of each part (first column) to be included in the DNA assembly design process, the sequence source for each part (second column), if each part should be defined as the reverse compliment (i.e. bottom strand; third column) of the specified subsequence, and where each part starts (fourth column) and ends (fifth column) in its specified sequence source. (B) Example sequences list CSV input file, stylized for clarity. The user must specify the filename (first column) and format (second column) for each sequence file to be utilized in the DNA assembly design process. (C-D) Example target part order list CSV input files, stylized for clarity. (C) Single construct target part
2013 | Best Practices Compendium | Bio-IT World [113]
order list example. The user must specify the sequential order (from top to bottom, first column) of the parts to be assembled together, the direction of each part (second column), and as well as optionally whether to force j5 to use a particular assembly strategy for each part (third column), whether to force j5 to use a particular relative overhang position (in bp, Golden Gate assembly only) following each part (fourth column), and whether to place a direct DNA synthesis firewall following each part (fifth column). (D) Combinatorial library target part order list example. The user must specify the sequential order (from top to bottom, first column) of the combinatorial part bins to be assembled together (each denoted by a leading ‘>’ character, grey rows) and the parts within each bin (immediately following each bin name). Other columns are as in (C). (E) Eugene design specification rules example file. When designing assemblies with j5, it is possible to set design specification rules that limit the total number of times a given part appears in a given assembly (NOTMORETHAN statements, rules r1-r9), if two given parts should not appear together in the same assembly (NOTWITH statements, rules r10-r11), or if two given parts should only appear together in the same assembly (WITH statement, rules r12-r15). The design specification rules understood by j5 (shown as those shown here) are derived from (and are a strict subset of) the Eugene biological design specification computer language (9, 10). (F) Example j5 parameters CSV input file, stylized for clarity. The user may optionally change parameter values by modifying entries in the second column. Default values (third column) and descriptions (fourth column) are provided as a reference for each parameter. (G) Example Target Part Ordering/Selection/Strategy section of an assembly design CSV output file, stylized for clarity. The assembly order (top to bottom) and direction (fourth column), and the optimal assembly strategy (as determined by Algorithm S1, fifth column), are shown for each part to be assembled (third column).
2013 | Best Practices Compendium | Bio-IT World [114]
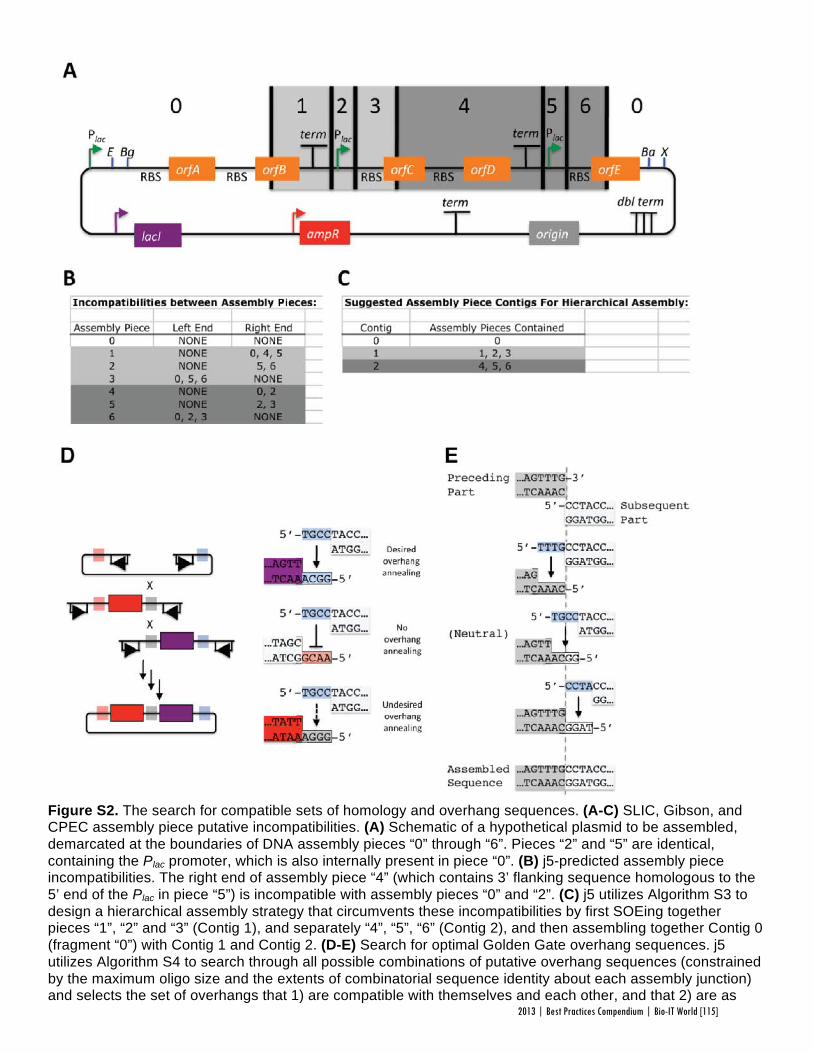
Figure S2. The search for compatible sets of homology and overhang sequences. (A-C) SLIC, Gibson, and CPEC assembly piece putative incompatibilities. (A) Schematic of a hypothetical plasmid to be assembled, demarcated at the boundaries of DNA assembly pieces “0” through “6”. Pieces “2” and “5” are identical, containing the Plac promoter, which is also internally present in piece “0”. (B) j5-predicted assembly piece incompatibilities. The right end of assembly piece “4” (which contains 3’ flanking sequence homologous to the 5’ end of the Plac in piece “5”) is incompatible with assembly pieces “0” and “2”. (C) j5 utilizes Algorithm S3 to design a hierarchical assembly strategy that circumvents these incompatibilities by first SOEing together pieces “1”, “2” and “3” (Contig 1), and separately “4”, “5”, “6” (Contig 2), and then assembling together Contig 0 (fragment “0”) with Contig 1 and Contig 2. (D-E) Search for optimal Golden Gate overhang sequences. j5 utilizes Algorithm S4 to search through all possible combinations of putative overhang sequences (constrained by the maximum oligo size and the extents of combinatorial sequence identity about each assembly junction) and selects the set of overhangs that 1) are compatible with themselves and each other, and that 2) are as
2013 | Best Practices Compendium | Bio-IT World [115]
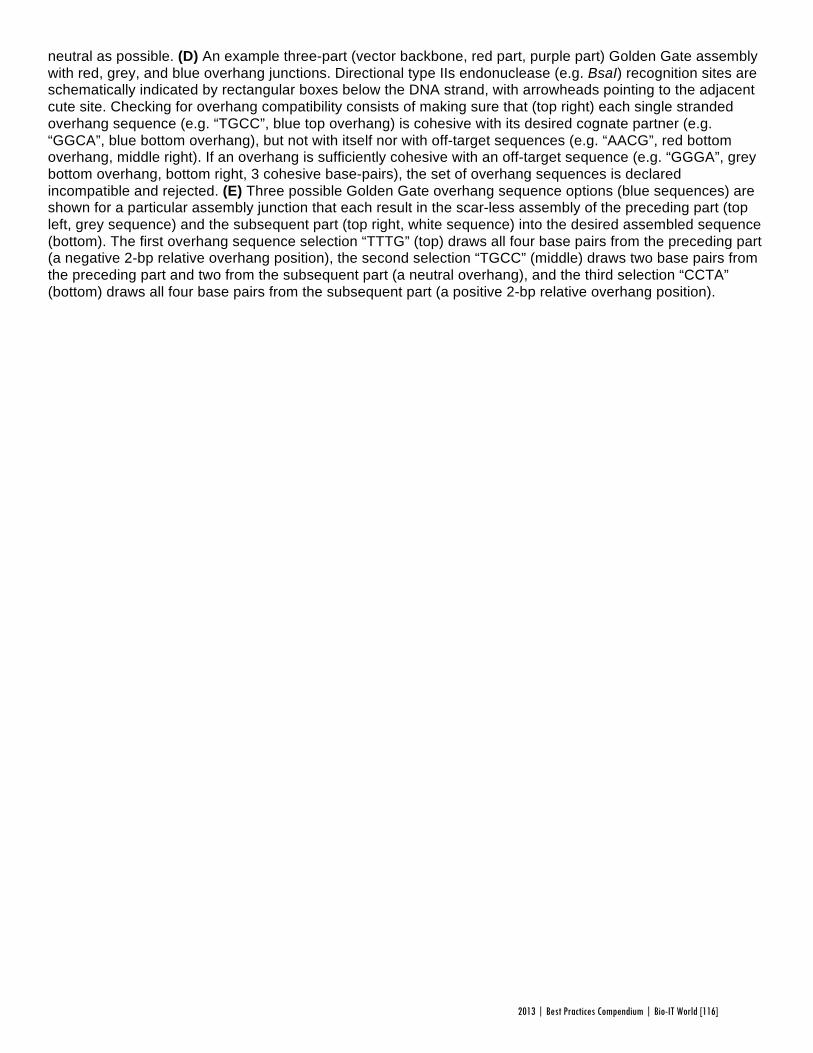
neutral as possible. (D) An example three-part (vector backbone, red part, purple part) Golden Gate assembly with red, grey, and blue overhang junctions. Directional type IIs endonuclease (e.g. BsaI) recognition sites are schematically indicated by rectangular boxes below the DNA strand, with arrowheads pointing to the adjacent cute site. Checking for overhang compatibility consists of making sure that (top right) each single stranded overhang sequence (e.g. “TGCC”, blue top overhang) is cohesive with its desired cognate partner (e.g. “GGCA”, blue bottom overhang), but not with itself nor with off-target sequences (e.g. “AACG”, red bottom overhang, middle right). If an overhang is sufficiently cohesive with an off-target sequence (e.g. “GGGA”, grey bottom overhang, bottom right, 3 cohesive base-pairs), the set of overhang sequences is declared incompatible and rejected. (E) Three possible Golden Gate overhang sequence options (blue sequences) are shown for a particular assembly junction that each result in the scar-less assembly of the preceding part (top left, grey sequence) and the subsequent part (top right, white sequence) into the desired assembled sequence (bottom). The first overhang sequence selection “TTTG” (top) draws all four base pairs from the preceding part (a negative 2-bp relative overhang position), the second selection “TGCC” (middle) draws two base pairs from the preceding part and two from the subsequent part (a neutral overhang), and the third selection “CCTA” (bottom) draws all four base pairs from the subsequent part (a positive 2-bp relative overhang position).
2013 | Best Practices Compendium | Bio-IT World [116]
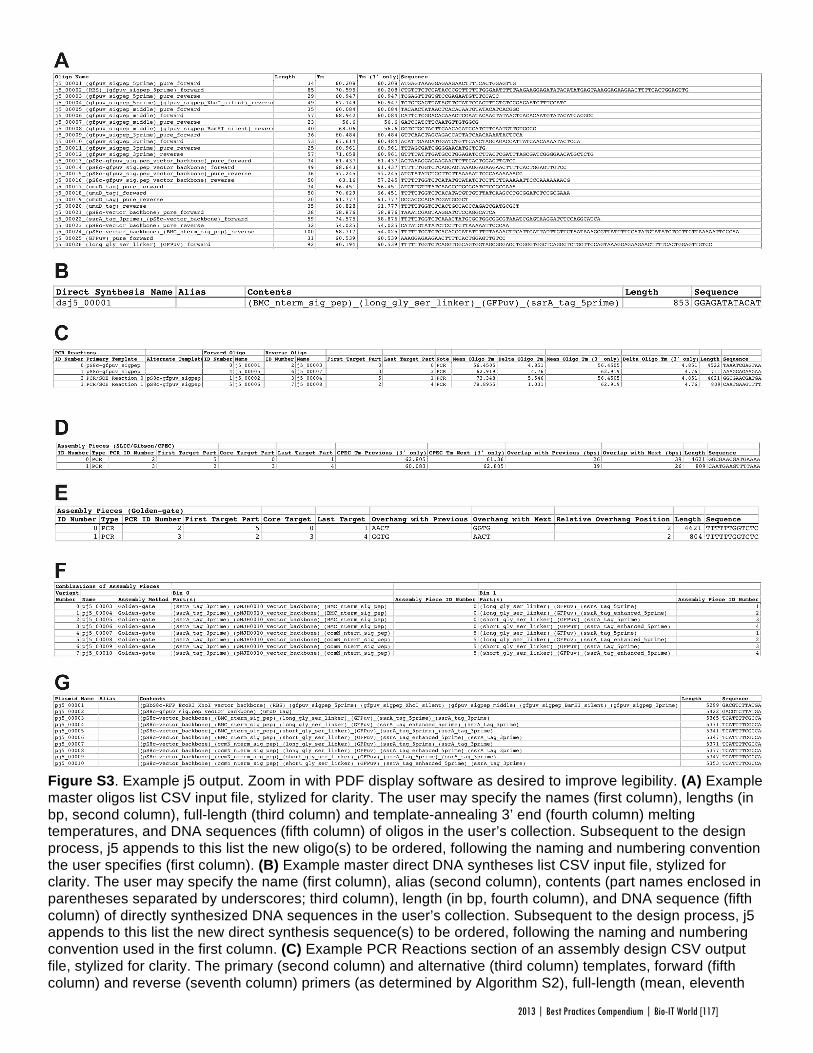
Figure S3. Example j5 output. Zoom in with PDF display software as desired to improve legibility. (A) Example master oligos list CSV input file, stylized for clarity. The user may specify the names (first column), lengths (in bp, second column), full-length (third column) and template-annealing 3’ end (fourth column) melting temperatures, and DNA sequences (fifth column) of oligos in the user’s collection. Subsequent to the design process, j5 appends to this list the new oligo(s) to be ordered, following the naming and numbering convention the user specifies (first column). (B) Example master direct DNA syntheses list CSV input file, stylized for clarity. The user may specify the name (first column), alias (second column), contents (part names enclosed in parentheses separated by underscores; third column), length (in bp, fourth column), and DNA sequence (fifth column) of directly synthesized DNA sequences in the user’s collection. Subsequent to the design process, j5 appends to this list the new direct synthesis sequence(s) to be ordered, following the naming and numbering convention used in the first column. (C) Example PCR Reactions section of an assembly design CSV output file, stylized for clarity. The primary (second column) and alternative (third column) templates, forward (fifth column) and reverse (seventh column) primers (as determined by Algorithm S2), full-length (mean, eleventh
2013 | Best Practices Compendium | Bio-IT World [117]

column; delta, twelfth column) and template-annealing 3’ end (mean, thirteenth column; delta, fourteenth column) primer melting temperatures, product length (in bp, fifteenth column) and sequence (sixteenth column), are shown for each PCR reaction. The parts contained within each PCR product (from first part, eighth column, to the last part, ninth column, corresponding to that shown in Figure S1F), and a note (tenth column) indicating whether the PCR product should be SOE’d together with adjacent assembly pieces prior to the DNA assembly process, are also shown for each PCR reaction. (D-E) Example Assembly Pieces section of an assembly design CSV output file, stylized for clarity. (D) SLIC/Gibson/CPEC assembly. The upstream (seventh column) and downstream (eighth column) flanking homology sequence melting temperatures, corresponding upstream (ninth column) and downstream (tenth column) flanking homology sequence overlap lengths, length (in bp, eleventh column) and sequence (twelveth column), are shown for each assembly piece. The parts contained (from first part, fourth column, to the last part, sixth column, corresponding to that shown in Figure S1F), derivation (e.g. PCR or digest; second column), and corresponding PCR reaction number (if applicable, third column, corresponding to that shown in (C) are also shown for each assembly piece. (E) Golden Gate assembly. The upstream (seventh column) and downstream (eighth column) top strand overhang sequences (as determined by Algorithm S4), and the downstream relative overhang position (in bp, ninth column; see Figure S2E), are shown for each assembly piece. Other columns are as in (D). (F) Example Combinations of Assembly Pieces section of an assembly design CSV output file, stylized for clarity. The assembly method (third column) and the assembly piece in each combinatorial bin corresponding to the variant (fourth and columns thereafter) is shown for each plasmid variant to be constructed (second column). (G) Example master plasmids list CSV input file, stylized for clarity. The user may optionally specify the names (first column), aliases (second column), contents (part names enclosed in parentheses separated by underscores, third column), lengths (in bp, fourth column), and DNA sequences (fifth column) of plasmids in the user’s collection. Subsequent to the design process, j5 appends to this list the new plasmid(s) to be constructed, following the naming and numbering convention the user specifies (first column).
Figure S4. Plasmid map of pNJH00010 derived from the Genbank-format sequence file resulting from j5-designed SLIC/Gibson/CPEC assembly (Figure 2).
2013 | Best Practices Compendium | Bio-IT World [118]
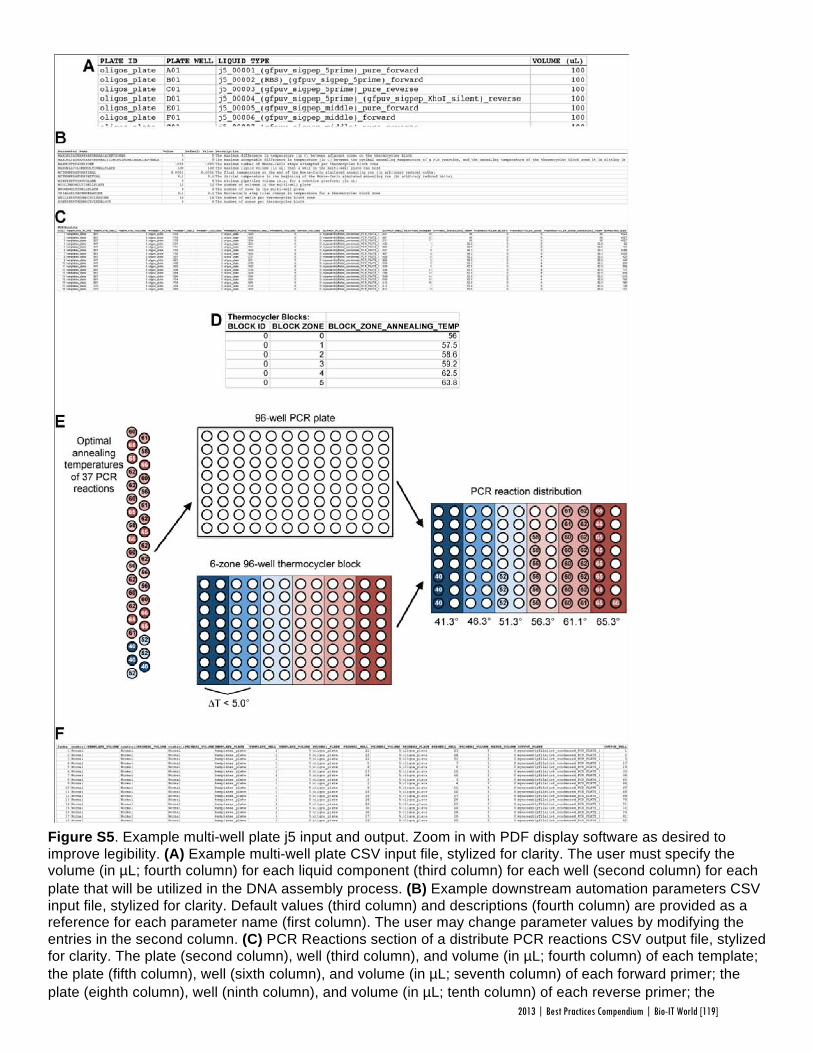
Figure S5. Example multi-well plate j5 input and output. Zoom in with PDF display software as desired to improve legibility. (A) Example multi-well plate CSV input file, stylized for clarity. The user must specify the volume (in µL; fourth column) for each liquid component (third column) for each well (second column) for each plate that will be utilized in the DNA assembly process. (B) Example downstream automation parameters CSV input file, stylized for clarity. Default values (third column) and descriptions (fourth column) are provided as a reference for each parameter name (first column). The user may change parameter values by modifying the entries in the second column. (C) PCR Reactions section of a distribute PCR reactions CSV output file, stylized for clarity. The plate (second column), well (third column), and volume (in µL; fourth column) of each template; the plate (fifth column), well (sixth column), and volume (in µL; seventh column) of each forward primer; the plate (eighth column), well (ninth column), and volume (in µL; tenth column) of each reverse primer; the
2013 | Best Practices Compendium | Bio-IT World [119]
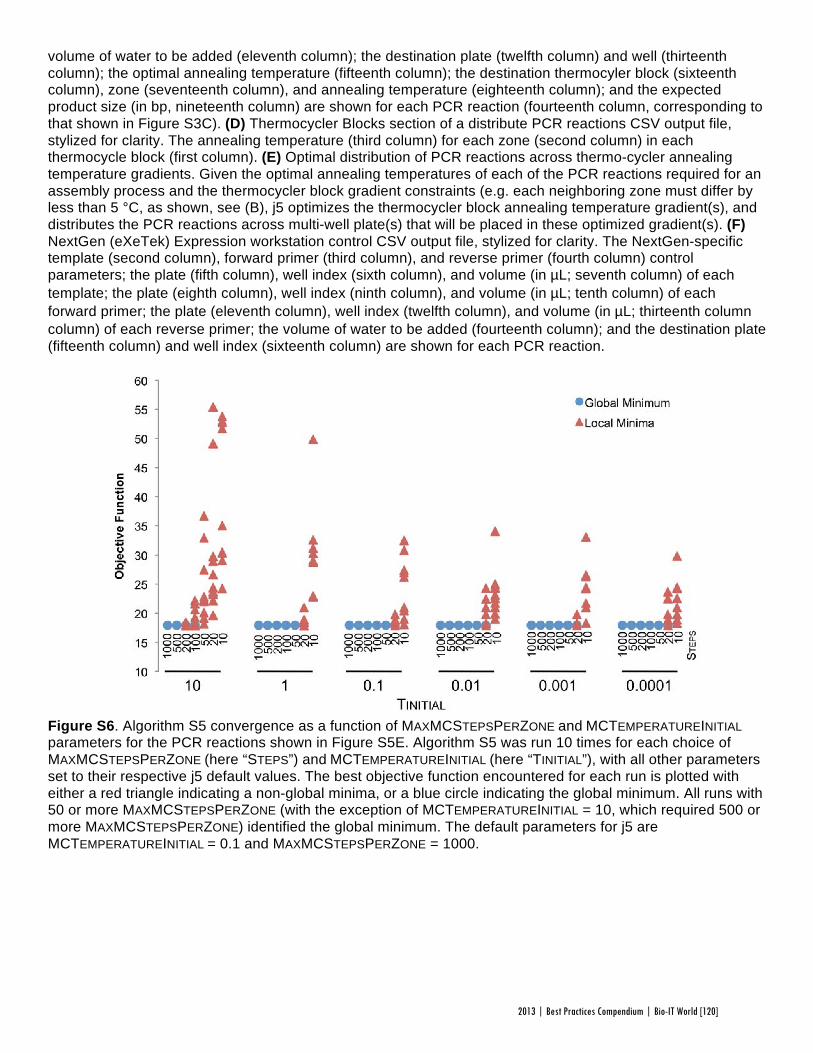
volume of water to be added (eleventh column); the destination plate (twelfth column) and well (thirteenth column); the optimal annealing temperature (fifteenth column); the destination thermocyler block (sixteenth column), zone (seventeenth column), and annealing temperature (eighteenth column); and the expected product size (in bp, nineteenth column) are shown for each PCR reaction (fourteenth column, corresponding to that shown in Figure S3C). (D) Thermocycler Blocks section of a distribute PCR reactions CSV output file, stylized for clarity. The annealing temperature (third column) for each zone (second column) in each thermocycle block (first column). (E) Optimal distribution of PCR reactions across thermo-cycler annealing temperature gradients. Given the optimal annealing temperatures of each of the PCR reactions required for an assembly process and the thermocycler block gradient constraints (e.g. each neighboring zone must differ by less than 5 °C, as shown, see (B), j5 optimizes the thermocycler block annealing temperature gradient(s), and distributes the PCR reactions across multi-well plate(s) that will be placed in these optimized gradient(s). (F) NextGen (eXeTek) Expression workstation control CSV output file, stylized for clarity. The NextGen-specific template (second column), forward primer (third column), and reverse primer (fourth column) control parameters; the plate (fifth column), well index (sixth column), and volume (in µL; seventh column) of each template; the plate (eighth column), well index (ninth column), and volume (in µL; tenth column) of each forward primer; the plate (eleventh column), well index (twelfth column), and volume (in µL; thirteenth column column) of each reverse primer; the volume of water to be added (fourteenth column); and the destination plate (fifteenth column) and well index (sixteenth column) are shown for each PCR reaction.
Figure S6. Algorithm S5 convergence as a function of MAXMCSTEPSPERZONE and MCTEMPERATUREINITIAL parameters for the PCR reactions shown in Figure S5E. Algorithm S5 was run 10 times for each choice of MAXMCSTEPSPERZONE (here “STEPS”) and MCTEMPERATUREINITIAL (here “TINITIAL”), with all other parameters set to their respective j5 default values. The best objective function encountered for each run is plotted with either a red triangle indicating a non-global minima, or a blue circle indicating the global minimum. All runs with 50 or more MAXMCSTEPSPERZONE (with the exception of MCTEMPERATUREINITIAL = 10, which required 500 or more MAXMCSTEPSPERZONE) identified the global minimum. The default parameters for j5 are MCTEMPERATUREINITIAL = 0.1 and MAXMCSTEPSPERZONE = 1000.
2013 | Best Practices Compendium | Bio-IT World [120]
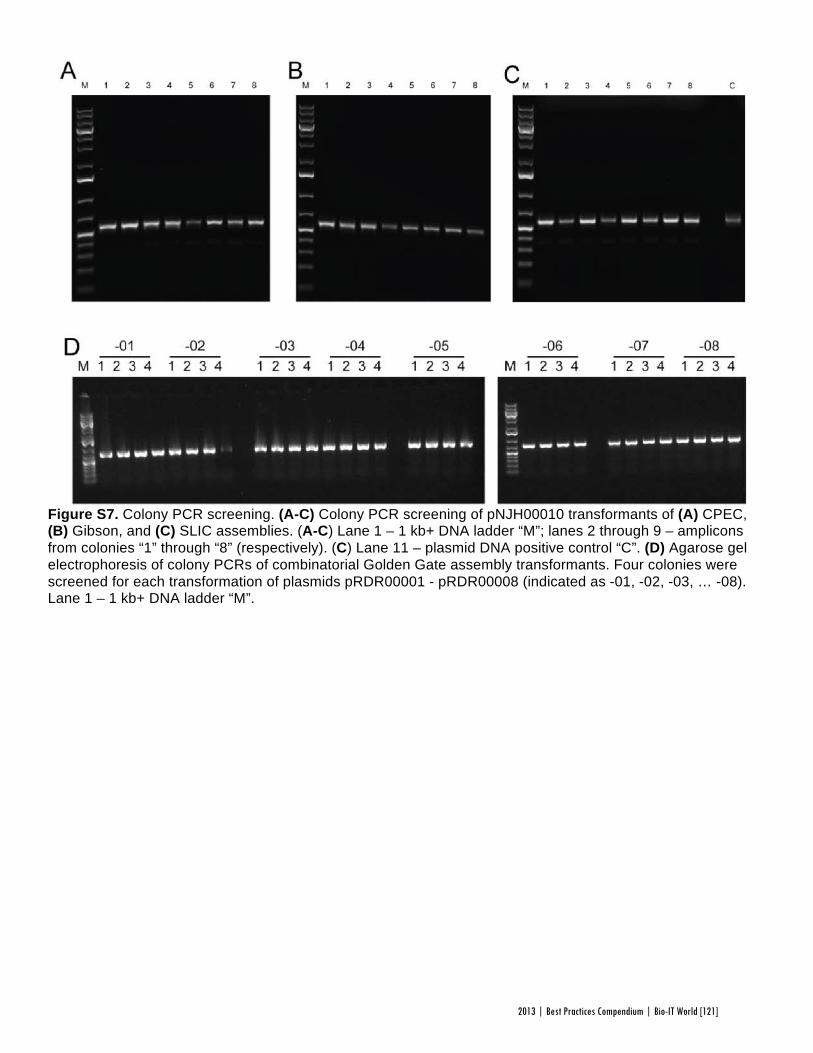
Figure S7. Colony PCR screening. (A-C) Colony PCR screening of pNJH00010 transformants of (A) CPEC, (B) Gibson, and (C) SLIC assemblies. (A-C) Lane 1 – 1 kb+ DNA ladder “M”; lanes 2 through 9 – amplicons from colonies “1” through “8” (respectively). (C) Lane 11 – plasmid DNA positive control “C”. (D) Agarose gel electrophoresis of colony PCRs of combinatorial Golden Gate assembly transformants. Four colonies were screened for each transformation of plasmids pRDR00001 - pRDR00008 (indicated as -01, -02, -03, … -08). Lane 1 – 1 kb+ DNA ladder “M”.
2013 | Best Practices Compendium | Bio-IT World [121]
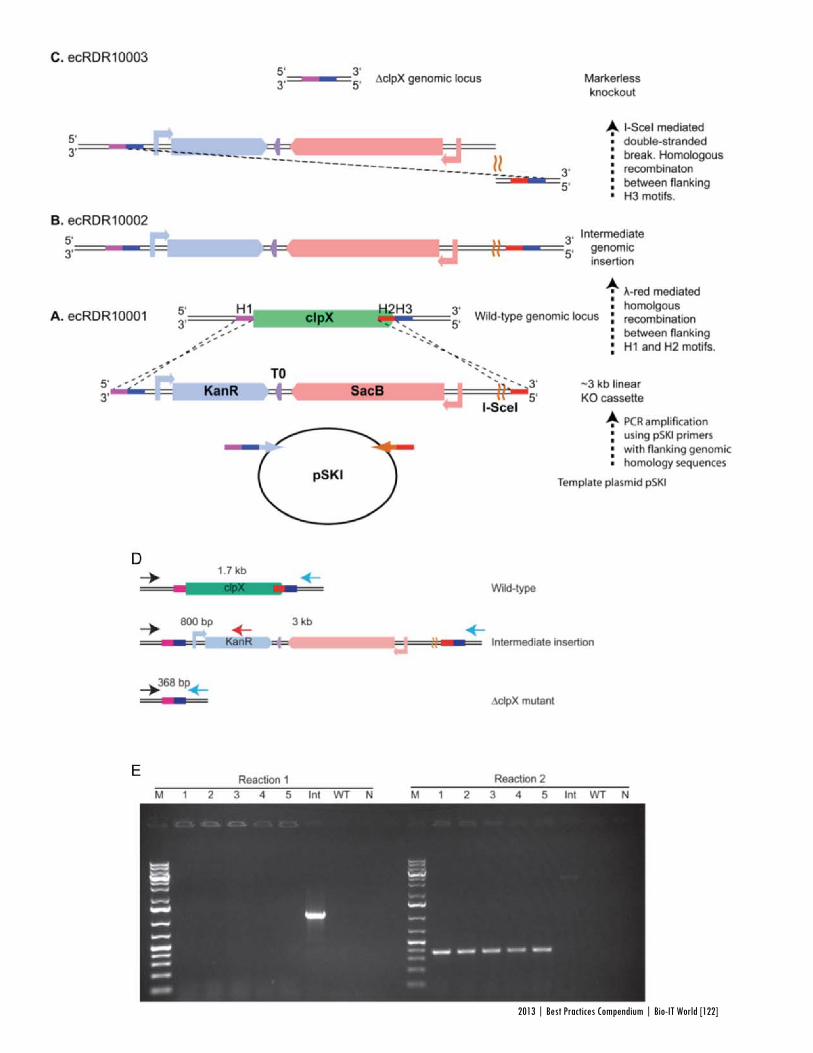
2013 | Best Practices Compendium | Bio-IT World [122]
Figure S8. clpX deletion. (A-B) clpX deletion cassette design. (A) Schematic of the linear clpX deletion cassette (JPUB_000255) assembly task. The deletion cassette region from plasmid pSKI (7), spanning from the promoter region upstream of kanR through the I-SceI homing-endonuclease recognition sequence is PCR amplified, with the forward primer introducing a sequence homologous to the E. coli genome immediately upstream of the clpX coding sequence (H1) and a sequence homologous to the genome immediately downstream of the clpX coding sequence (H3), and the reverse primer introducing a sequence homologous to a portion of clpX coding sequence (H2). (B) Schematic of the marker-less deletion of the genomic copy of clpX utilizing the linear deletion cassette. The deletion cassette depicted in (A) is transformed into E. coli (strain ecRDR10001/JBEI-2948) expressing the λ-red recombinase system from plasmid pREDI (7). Following λ -red mediated double-homologous recombination (at the H1 and H2 loci), replacing clpX in situ with the deletion cassette, transformant colonies are selected from kanamycin agar plates (strain ecRDR10002/JBEI-3080). Following the expression of the I-SceI homing-endonuclease from the pREDI plasmid, double stranded break at the I-SceI recognition site within the deletion cassette, and homologous recombination at the H3 locus, colonies are selected from sucrose (sacB counter-selection) agar plates, and counter-screened for kanamycin sensitivity, indicating the markerless deletion of clpX (strain ecRDR10003/JBEI-3083). (D-E) Colony PCR clpX protease deletion validations. (D) Schematic of diagnostic colony PCR reactions. Reaction 1: forward primer (black arrows) anneals to sequence flanking the 5’ end of the clpX coding sequence (CDS), reverse primer (red arrow) anneals within the kanR CDS. Reaction 1 should result in an 800 bp product for the clpX deletion cassette integration intermediate, but in no product for ΔclpX mutant nor wildtype. Reaction 2: forward primer (black arrows) anneals to sequence flanking the 5’ end of the clpX CDS, reverse primer (blue arrows) anneals to sequence flanking the 3’ end of the clpX CDS. Reaction 2 should result in a 368 bp product for a ΔclpX mutant, a 3 kb product for the clpX deletion cassette integration intermediate, or a 1.7 kb product for WT. (E) Colony PCR validations of clpX markerless deletion (JBEI-3083). For each reaction 1 and reaction 2: Lane 1 – 1kb DNA ladder “M”, lanes 2 through 6 – ΔclpX mutants 1 through 5 (respectively), lane 7 – clpX deletion cassette integration intermediate (strain JBEI-3080), lane 8 – WT control (JBEI-2948), lane 9 – no DNA template control. All bands were observed at the expected size. In reaction 2, the integration intermediate band is faint but present, while the expected wildtype band was not detected.
2013 | Best Practices Compendium | Bio-IT World [123]
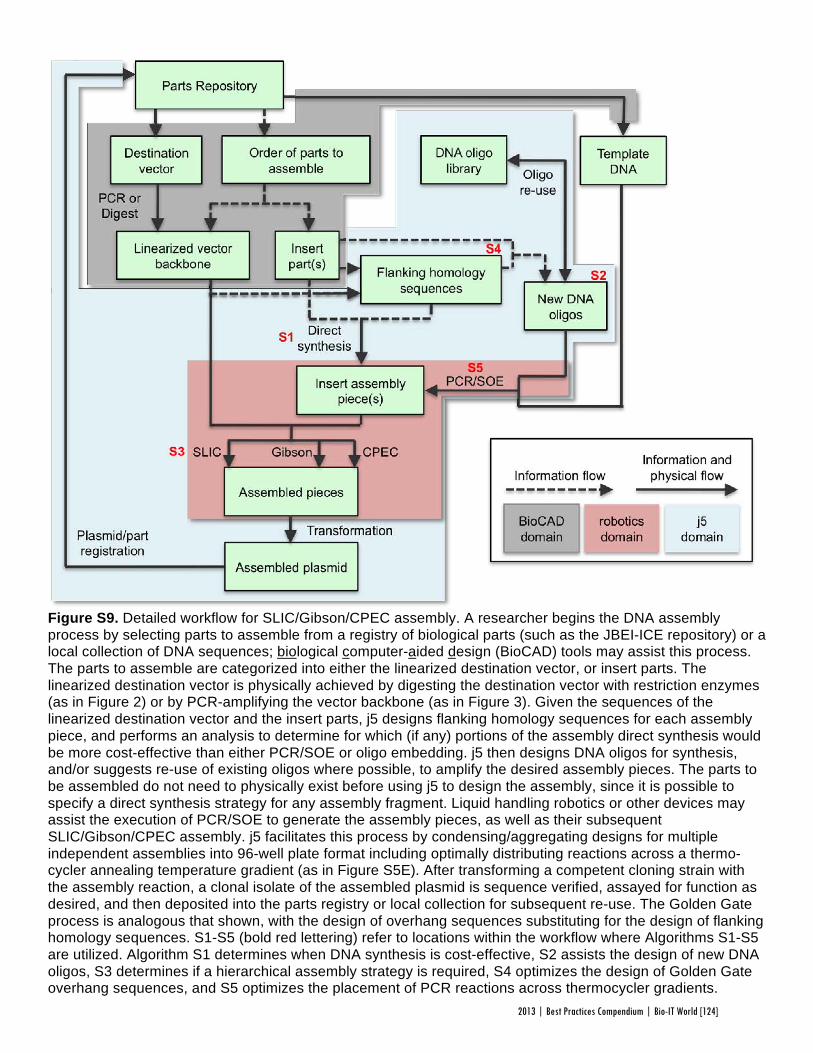
Figure S9. Detailed workflow for SLIC/Gibson/CPEC assembly. A researcher begins the DNA assembly process by selecting parts to assemble from a registry of biological parts (such as the JBEI-ICE repository) or a local collection of DNA sequences; biological computer-aided design (BioCAD) tools may assist this process. The parts to assemble are categorized into either the linearized destination vector, or insert parts. The linearized destination vector is physically achieved by digesting the destination vector with restriction enzymes (as in Figure 2) or by PCR-amplifying the vector backbone (as in Figure 3). Given the sequences of the linearized destination vector and the insert parts, j5 designs flanking homology sequences for each assembly piece, and performs an analysis to determine for which (if any) portions of the assembly direct synthesis would be more cost-effective than either PCR/SOE or oligo embedding. j5 then designs DNA oligos for synthesis, and/or suggests re-use of existing oligos where possible, to amplify the desired assembly pieces. The parts to be assembled do not need to physically exist before using j5 to design the assembly, since it is possible to specify a direct synthesis strategy for any assembly fragment. Liquid handling robotics or other devices may assist the execution of PCR/SOE to generate the assembly pieces, as well as their subsequent SLIC/Gibson/CPEC assembly. j5 facilitates this process by condensing/aggregating designs for multiple independent assemblies into 96-well plate format including optimally distributing reactions across a thermo-cycler annealing temperature gradient (as in Figure S5E). After transforming a competent cloning strain with the assembly reaction, a clonal isolate of the assembled plasmid is sequence verified, assayed for function as desired, and then deposited into the parts registry or local collection for subsequent re-use. The Golden Gate process is analogous that shown, with the design of overhang sequences substituting for the design of flanking homology sequences. S1-S5 (bold red lettering) refer to locations within the workflow where Algorithms S1-S5 are utilized. Algorithm S1 determines when DNA synthesis is cost-effective, S2 assists the design of new DNA oligos, S3 determines if a hierarchical assembly strategy is required, S4 optimizes the design of Golden Gate overhang sequences, and S5 optimizes the placement of PCR reactions across thermocycler gradients.
2013 | Best Practices Compendium | Bio-IT World [124]
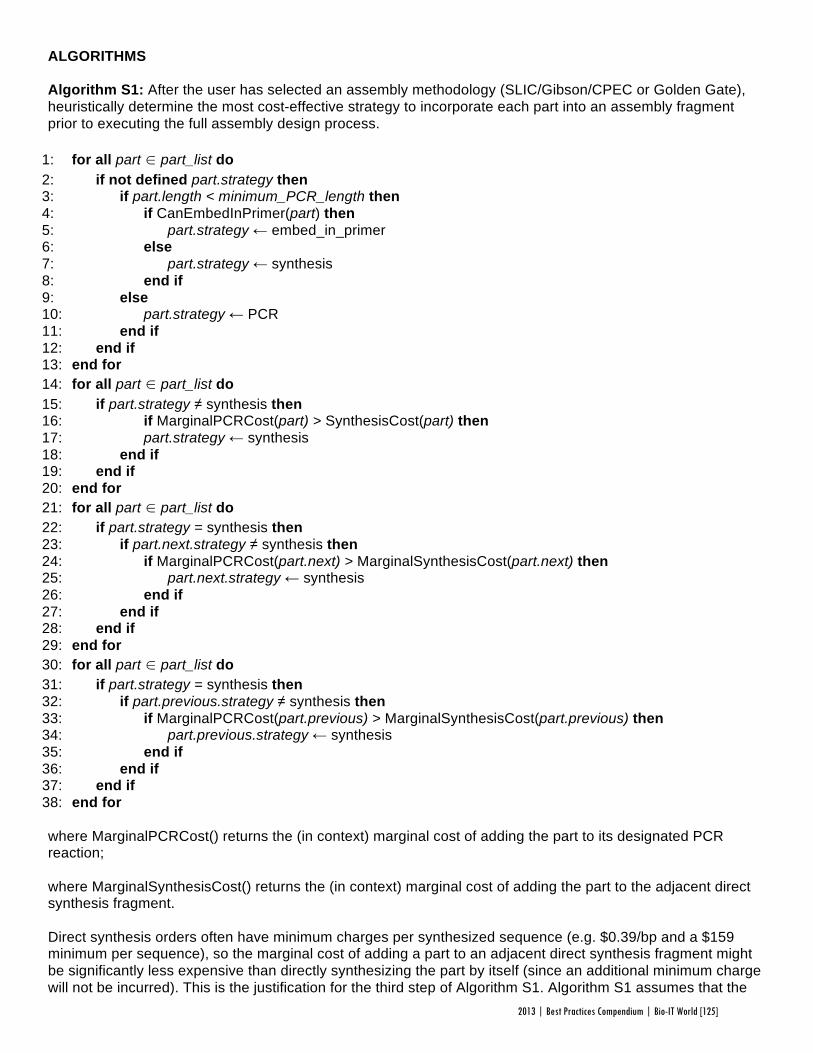
ALGORITHMS Algorithm S1: After the user has selected an assembly methodology (SLIC/Gibson/CPEC or Golden Gate), heuristically determine the most cost-effective strategy to incorporate each part into an assembly fragment prior to executing the full assembly design process.
1: for all part ∈ part_list do 2: if not defined part.strategy then 3: if part.length < minimum_PCR_length then 4: if CanEmbedInPrimer(part) then 5: part.strategy ← embed_in_primer 6: else 7: part.strategy ← synthesis 8: end if 9: else 10: part.strategy ← PCR 11: end if 12: end if 13: end for 14: for all part ∈ part_list do 15: if part.strategy ≠ synthesis then 16: if MarginalPCRCost(part) > SynthesisCost(part) then 17: part.strategy ← synthesis 18: end if 19: end if 20: end for 21: for all part ∈ part_list do 22: if part.strategy = synthesis then 23: if part.next.strategy ≠ synthesis then 24: if MarginalPCRCost(part.next) > MarginalSynthesisCost(part.next) then 25: part.next.strategy ← synthesis 26: end if 27: end if 28: end if 29: end for 30: for all part ∈ part_list do 31: if part.strategy = synthesis then 32: if part.previous.strategy ≠ synthesis then 33: if MarginalPCRCost(part.previous) > MarginalSynthesisCost(part.previous) then 34: part.previous.strategy ← synthesis 35: end if 36: end if 37: end if 38: end for where MarginalPCRCost() returns the (in context) marginal cost of adding the part to its designated PCR reaction; where MarginalSynthesisCost() returns the (in context) marginal cost of adding the part to the adjacent direct synthesis fragment. Direct synthesis orders often have minimum charges per synthesized sequence (e.g. $0.39/bp and a $159 minimum per sequence), so the marginal cost of adding a part to an adjacent direct synthesis fragment might be significantly less expensive than directly synthesizing the part by itself (since an additional minimum charge will not be incurred). This is the justification for the third step of Algorithm S1. Algorithm S1 assumes that the
2013 | Best Practices Compendium | Bio-IT World [125]
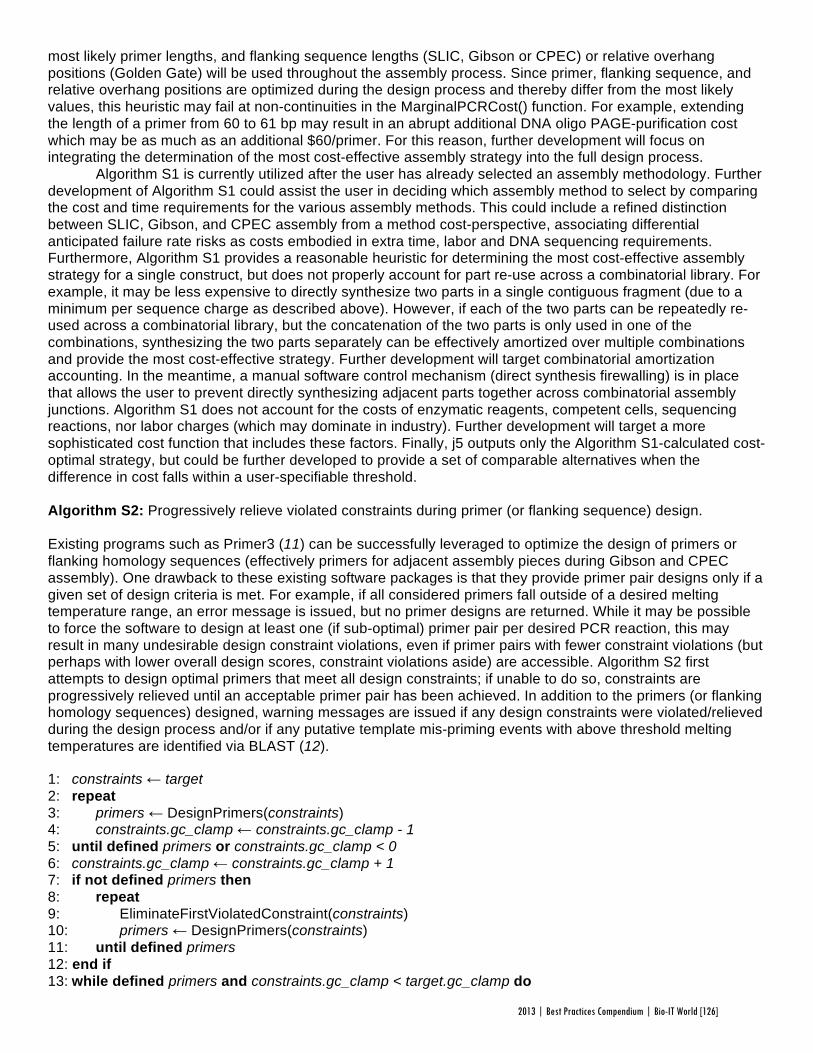
most likely primer lengths, and flanking sequence lengths (SLIC, Gibson or CPEC) or relative overhang positions (Golden Gate) will be used throughout the assembly process. Since primer, flanking sequence, and relative overhang positions are optimized during the design process and thereby differ from the most likely values, this heuristic may fail at non-continuities in the MarginalPCRCost() function. For example, extending the length of a primer from 60 to 61 bp may result in an abrupt additional DNA oligo PAGE-purification cost which may be as much as an additional $60/primer. For this reason, further development will focus on integrating the determination of the most cost-effective assembly strategy into the full design process.
Algorithm S1 is currently utilized after the user has already selected an assembly methodology. Further development of Algorithm S1 could assist the user in deciding which assembly method to select by comparing the cost and time requirements for the various assembly methods. This could include a refined distinction between SLIC, Gibson, and CPEC assembly from a method cost-perspective, associating differential anticipated failure rate risks as costs embodied in extra time, labor and DNA sequencing requirements. Furthermore, Algorithm S1 provides a reasonable heuristic for determining the most cost-effective assembly strategy for a single construct, but does not properly account for part re-use across a combinatorial library. For example, it may be less expensive to directly synthesize two parts in a single contiguous fragment (due to a minimum per sequence charge as described above). However, if each of the two parts can be repeatedly re-used across a combinatorial library, but the concatenation of the two parts is only used in one of the combinations, synthesizing the two parts separately can be effectively amortized over multiple combinations and provide the most cost-effective strategy. Further development will target combinatorial amortization accounting. In the meantime, a manual software control mechanism (direct synthesis firewalling) is in place that allows the user to prevent directly synthesizing adjacent parts together across combinatorial assembly junctions. Algorithm S1 does not account for the costs of enzymatic reagents, competent cells, sequencing reactions, nor labor charges (which may dominate in industry). Further development will target a more sophisticated cost function that includes these factors. Finally, j5 outputs only the Algorithm S1-calculated cost-optimal strategy, but could be further developed to provide a set of comparable alternatives when the difference in cost falls within a user-specifiable threshold. Algorithm S2: Progressively relieve violated constraints during primer (or flanking sequence) design. Existing programs such as Primer3 (11) can be successfully leveraged to optimize the design of primers or flanking homology sequences (effectively primers for adjacent assembly pieces during Gibson and CPEC assembly). One drawback to these existing software packages is that they provide primer pair designs only if a given set of design criteria is met. For example, if all considered primers fall outside of a desired melting temperature range, an error message is issued, but no primer designs are returned. While it may be possible to force the software to design at least one (if sub-optimal) primer pair per desired PCR reaction, this may result in many undesirable design constraint violations, even if primer pairs with fewer constraint violations (but perhaps with lower overall design scores, constraint violations aside) are accessible. Algorithm S2 first attempts to design optimal primers that meet all design constraints; if unable to do so, constraints are progressively relieved until an acceptable primer pair has been achieved. In addition to the primers (or flanking homology sequences) designed, warning messages are issued if any design constraints were violated/relieved during the design process and/or if any putative template mis-priming events with above threshold melting temperatures are identified via BLAST (12). 1: constraints ← target 2: repeat 3: primers ← DesignPrimers(constraints) 4: constraints.gc_clamp ← constraints.gc_clamp - 1 5: until defined primers or constraints.gc_clamp < 0 6: constraints.gc_clamp ← constraints.gc_clamp + 1 7: if not defined primers then 8: repeat 9: EliminateFirstViolatedConstraint(constraints) 10: primers ← DesignPrimers(constraints) 11: until defined primers 12: end if 13: while defined primers and constraints.gc_clamp < target.gc_clamp do
2013 | Best Practices Compendium | Bio-IT World [126]
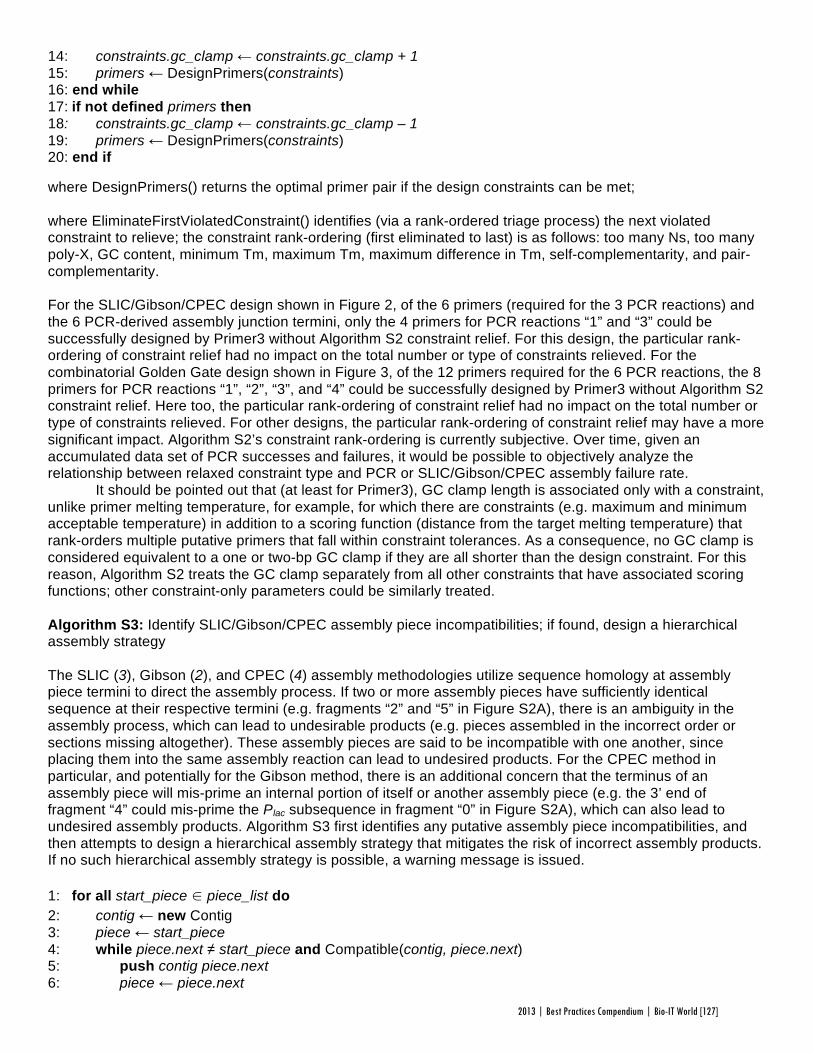
14: constraints.gc_clamp ← constraints.gc_clamp + 1 15: primers ← DesignPrimers(constraints) 16: end while 17: if not defined primers then 18: constraints.gc_clamp ← constraints.gc_clamp – 1 19: primers ← DesignPrimers(constraints) 20: end if
where DesignPrimers() returns the optimal primer pair if the design constraints can be met; where EliminateFirstViolatedConstraint() identifies (via a rank-ordered triage process) the next violated constraint to relieve; the constraint rank-ordering (first eliminated to last) is as follows: too many Ns, too many poly-X, GC content, minimum Tm, maximum Tm, maximum difference in Tm, self-complementarity, and pair-complementarity. For the SLIC/Gibson/CPEC design shown in Figure 2, of the 6 primers (required for the 3 PCR reactions) and the 6 PCR-derived assembly junction termini, only the 4 primers for PCR reactions “1” and “3” could be successfully designed by Primer3 without Algorithm S2 constraint relief. For this design, the particular rank-ordering of constraint relief had no impact on the total number or type of constraints relieved. For the combinatorial Golden Gate design shown in Figure 3, of the 12 primers required for the 6 PCR reactions, the 8 primers for PCR reactions “1”, “2”, “3”, and “4” could be successfully designed by Primer3 without Algorithm S2 constraint relief. Here too, the particular rank-ordering of constraint relief had no impact on the total number or type of constraints relieved. For other designs, the particular rank-ordering of constraint relief may have a more significant impact. Algorithm S2’s constraint rank-ordering is currently subjective. Over time, given an accumulated data set of PCR successes and failures, it would be possible to objectively analyze the relationship between relaxed constraint type and PCR or SLIC/Gibson/CPEC assembly failure rate.
It should be pointed out that (at least for Primer3), GC clamp length is associated only with a constraint, unlike primer melting temperature, for example, for which there are constraints (e.g. maximum and minimum acceptable temperature) in addition to a scoring function (distance from the target melting temperature) that rank-orders multiple putative primers that fall within constraint tolerances. As a consequence, no GC clamp is considered equivalent to a one or two-bp GC clamp if they are all shorter than the design constraint. For this reason, Algorithm S2 treats the GC clamp separately from all other constraints that have associated scoring functions; other constraint-only parameters could be similarly treated. Algorithm S3: Identify SLIC/Gibson/CPEC assembly piece incompatibilities; if found, design a hierarchical assembly strategy The SLIC (3), Gibson (2), and CPEC (4) assembly methodologies utilize sequence homology at assembly piece termini to direct the assembly process. If two or more assembly pieces have sufficiently identical sequence at their respective termini (e.g. fragments “2” and “5” in Figure S2A), there is an ambiguity in the assembly process, which can lead to undesirable products (e.g. pieces assembled in the incorrect order or sections missing altogether). These assembly pieces are said to be incompatible with one another, since placing them into the same assembly reaction can lead to undesired products. For the CPEC method in particular, and potentially for the Gibson method, there is an additional concern that the terminus of an assembly piece will mis-prime an internal portion of itself or another assembly piece (e.g. the 3’ end of fragment “4” could mis-prime the Plac subsequence in fragment “0” in Figure S2A), which can also lead to undesired assembly products. Algorithm S3 first identifies any putative assembly piece incompatibilities, and then attempts to design a hierarchical assembly strategy that mitigates the risk of incorrect assembly products. If no such hierarchical assembly strategy is possible, a warning message is issued. 1: for all start_piece ∈ piece_list do 2: contig ← new Contig 3: piece ← start_piece 4: while piece.next ≠ start_piece and Compatible(contig, piece.next) 5: push contig piece.next 6: piece ← piece.next
2013 | Best Practices Compendium | Bio-IT World [127]
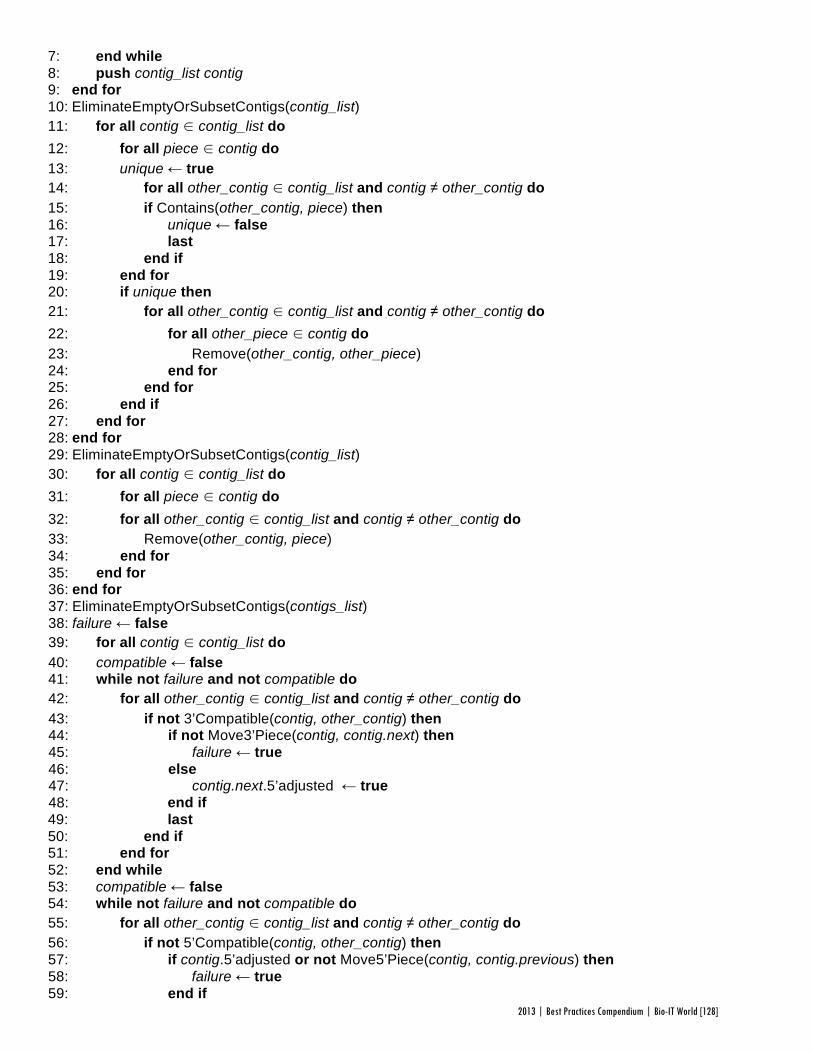
7: end while 8: push contig_list contig 9: end for 10: EliminateEmptyOrSubsetContigs(contig_list) 11: for all contig ∈ contig_list do 12: for all piece ∈ contig do 13: unique ← true 14: for all other_contig ∈ contig_list and contig ≠ other_contig do 15: if Contains(other_contig, piece) then 16: unique ← false 17: last 18: end if 19: end for 20: if unique then 21: for all other_contig ∈ contig_list and contig ≠ other_contig do 22: for all other_piece ∈ contig do 23: Remove(other_contig, other_piece) 24: end for 25: end for 26: end if 27: end for 28: end for 29: EliminateEmptyOrSubsetContigs(contig_list) 30: for all contig ∈ contig_list do 31: for all piece ∈ contig do 32: for all other_contig ∈ contig_list and contig ≠ other_contig do 33: Remove(other_contig, piece) 34: end for 35: end for 36: end for 37: EliminateEmptyOrSubsetContigs(contigs_list) 38: failure ← false 39: for all contig ∈ contig_list do 40: compatible ← false 41: while not failure and not compatible do 42: for all other_contig ∈ contig_list and contig ≠ other_contig do 43: if not 3’Compatible(contig, other_contig) then 44: if not Move3’Piece(contig, contig.next) then 45: failure ← true 46: else 47: contig.next.5’adjusted ← true 48: end if 49: last 50: end if 51: end for 52: end while 53: compatible ← false 54: while not failure and not compatible do 55: for all other_contig ∈ contig_list and contig ≠ other_contig do 56: if not 5’Compatible(contig, other_contig) then 57: if contig.5’adjusted or not Move5’Piece(contig, contig.previous) then 58: failure ← true 59: end if
2013 | Best Practices Compendium | Bio-IT World [128]
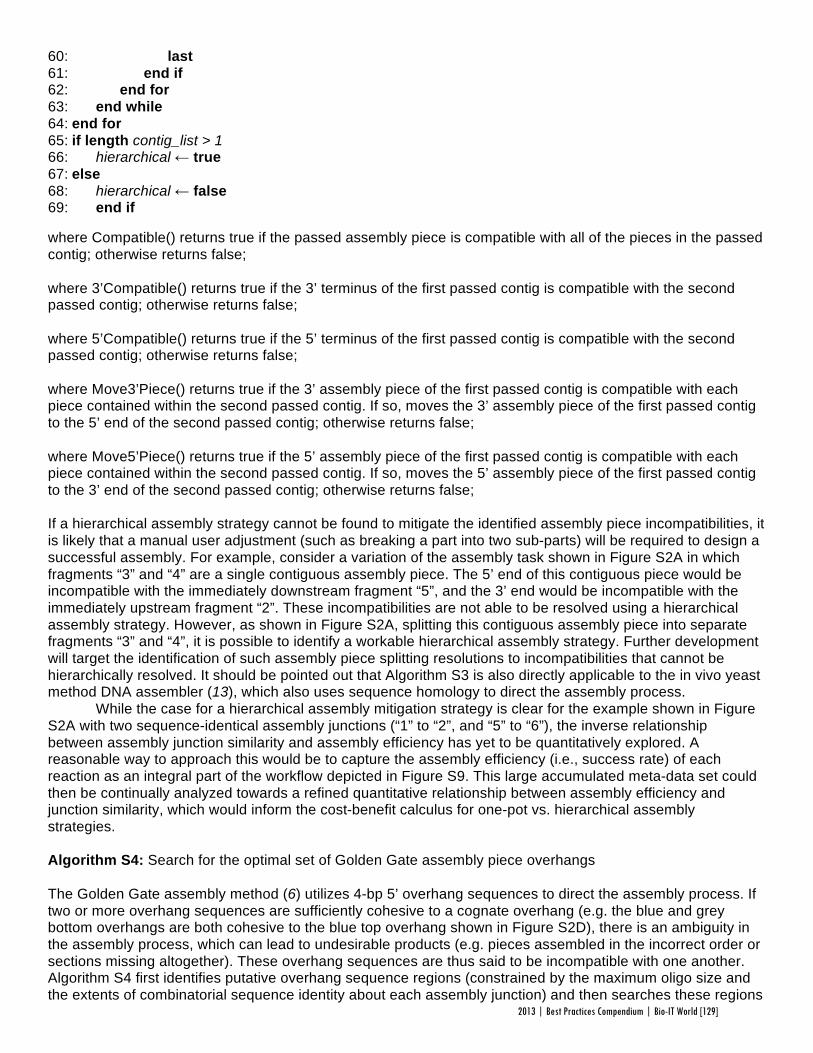
60: last 61: end if 62: end for 63: end while 64: end for 65: if length contig_list > 1 66: hierarchical ← true 67: else 68: hierarchical ← false 69: end if where Compatible() returns true if the passed assembly piece is compatible with all of the pieces in the passed contig; otherwise returns false; where 3’Compatible() returns true if the 3’ terminus of the first passed contig is compatible with the second passed contig; otherwise returns false; where 5’Compatible() returns true if the 5’ terminus of the first passed contig is compatible with the second passed contig; otherwise returns false; where Move3’Piece() returns true if the 3’ assembly piece of the first passed contig is compatible with each piece contained within the second passed contig. If so, moves the 3’ assembly piece of the first passed contig to the 5’ end of the second passed contig; otherwise returns false; where Move5’Piece() returns true if the 5’ assembly piece of the first passed contig is compatible with each piece contained within the second passed contig. If so, moves the 5’ assembly piece of the first passed contig to the 3’ end of the second passed contig; otherwise returns false; If a hierarchical assembly strategy cannot be found to mitigate the identified assembly piece incompatibilities, it is likely that a manual user adjustment (such as breaking a part into two sub-parts) will be required to design a successful assembly. For example, consider a variation of the assembly task shown in Figure S2A in which fragments “3” and “4” are a single contiguous assembly piece. The 5’ end of this contiguous piece would be incompatible with the immediately downstream fragment “5”, and the 3’ end would be incompatible with the immediately upstream fragment “2”. These incompatibilities are not able to be resolved using a hierarchical assembly strategy. However, as shown in Figure S2A, splitting this contiguous assembly piece into separate fragments “3” and “4”, it is possible to identify a workable hierarchical assembly strategy. Further development will target the identification of such assembly piece splitting resolutions to incompatibilities that cannot be hierarchically resolved. It should be pointed out that Algorithm S3 is also directly applicable to the in vivo yeast method DNA assembler (13), which also uses sequence homology to direct the assembly process. While the case for a hierarchical assembly mitigation strategy is clear for the example shown in Figure S2A with two sequence-identical assembly junctions (“1” to “2”, and “5” to “6”), the inverse relationship between assembly junction similarity and assembly efficiency has yet to be quantitatively explored. A reasonable way to approach this would be to capture the assembly efficiency (i.e., success rate) of each reaction as an integral part of the workflow depicted in Figure S9. This large accumulated meta-data set could then be continually analyzed towards a refined quantitative relationship between assembly efficiency and junction similarity, which would inform the cost-benefit calculus for one-pot vs. hierarchical assembly strategies. Algorithm S4: Search for the optimal set of Golden Gate assembly piece overhangs The Golden Gate assembly method (6) utilizes 4-bp 5’ overhang sequences to direct the assembly process. If two or more overhang sequences are sufficiently cohesive to a cognate overhang (e.g. the blue and grey bottom overhangs are both cohesive to the blue top overhang shown in Figure S2D), there is an ambiguity in the assembly process, which can lead to undesirable products (e.g. pieces assembled in the incorrect order or sections missing altogether). These overhang sequences are thus said to be incompatible with one another. Algorithm S4 first identifies putative overhang sequence regions (constrained by the maximum oligo size and the extents of combinatorial sequence identity about each assembly junction) and then searches these regions
2013 | Best Practices Compendium | Bio-IT World [129]
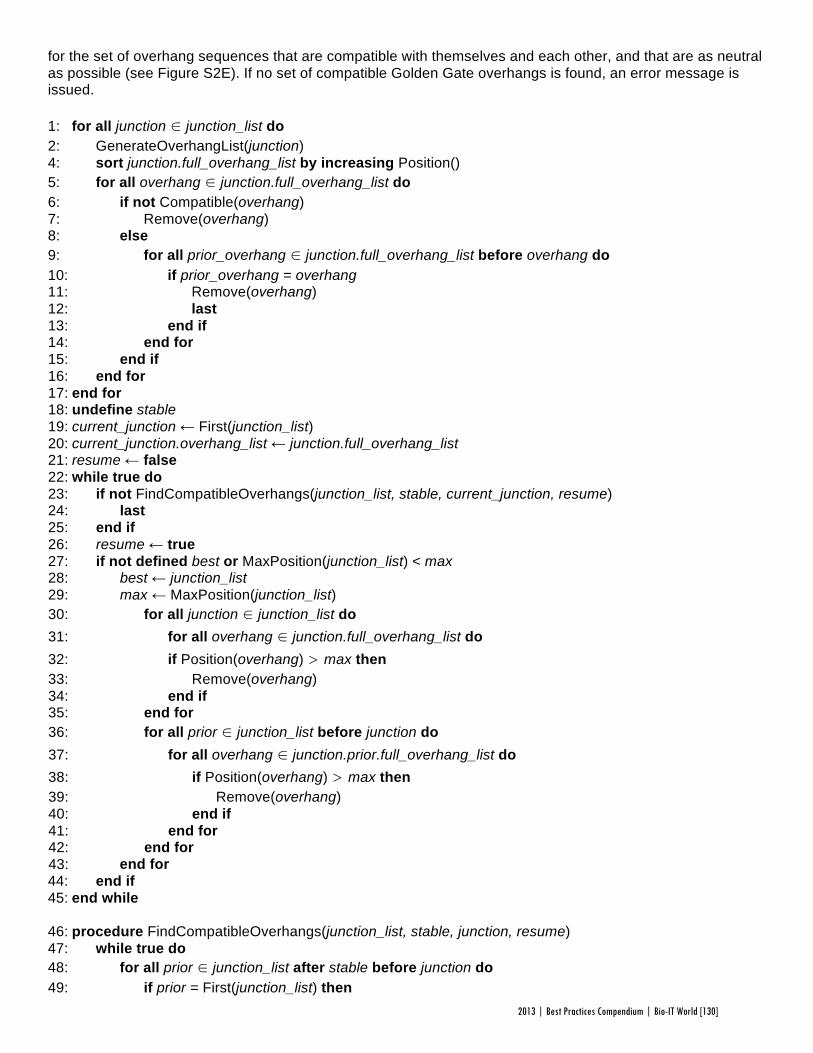
for the set of overhang sequences that are compatible with themselves and each other, and that are as neutral as possible (see Figure S2E). If no set of compatible Golden Gate overhangs is found, an error message is issued. 1: for all junction ∈ junction_list do 2: GenerateOverhangList(junction) 4: sort junction.full_overhang_list by increasing Position() 5: for all overhang ∈ junction.full_overhang_list do 6: if not Compatible(overhang) 7: Remove(overhang) 8: else 9: for all prior_overhang ∈ junction.full_overhang_list before overhang do 10: if prior_overhang = overhang 11: Remove(overhang) 12: last 13: end if 14: end for 15: end if 16: end for 17: end for 18: undefine stable 19: current_junction ← First(junction_list) 20: current_junction.overhang_list ← junction.full_overhang_list 21: resume ← false 22: while true do 23: if not FindCompatibleOverhangs(junction_list, stable, current_junction, resume) 24: last 25: end if 26: resume ← true 27: if not defined best or MaxPosition(junction_list) < max 28: best ← junction_list 29: max ← MaxPosition(junction_list) 30: for all junction ∈ junction_list do 31: for all overhang ∈ junction.full_overhang_list do 32: if Position(overhang) > max then 33: Remove(overhang) 34: end if 35: end for 36: for all prior ∈ junction_list before junction do 37: for all overhang ∈ junction.prior.full_overhang_list do 38: if Position(overhang) > max then 39: Remove(overhang) 40: end if 41: end for 42: end for 43: end for 44: end if 45: end while 46: procedure FindCompatibleOverhangs(junction_list, stable, junction, resume) 47: while true do 48: for all prior ∈ junction_list after stable before junction do 49: if prior = First(junction_list) then
2013 | Best Practices Compendium | Bio-IT World [130]

50: junction.prior.overhang_list ← junction.full_overhang_list 51: else 52: junction.prior.overhang_list ← junction.Previous(prior).overhang_list 53: end if 54: for all overhang ∈ junction.prior.overhang_list do 55: if not Compatible(prior.current_overhang, overhang) 56: Remove(overhang) 57: end if 58: end for 59: if junction = Last(junction_list) and resume 60: Remove(First(junction.Previous(junction).overhang_list)) 61: end if 62: if junction = First(junction_list) then 63: junction.current_overhang ← First(junction.overhang_list) 64: else 65: junction.current_overhang ← First(Previous(junction).overhang_list) 66: end if 67: while not defined junction.current_overhang do 68: if junction = First(junction_list) then 69: return false 70: end if 71: junction ← Previous(junction) 72: stable ← Previous(junction) 73: repeat 74: if junction = First(junction_list) then 75: Remove(junction.current_overhang) 76: junction.current_overhang ← First(junction.overhang_list) 77: else 78: Remove(junction.Previous(junction).current_overhang) 79: junction.current_overhang ← First(junction.Previous(junction).overhang_list) 80: end if 81: until not (defined junction.current_overhang and RedundantSearchPath(junction)) 82: end while 83: if junction = Last(junction_list) then 84: return true 85: else 86: junction ← Next(junction) 87: end while 88: end procedure 89: procedure RedundantSearchPath(junction_list, junction) 90: for all prior ∈ junction_list before junction do 91: if junction.current_overhang ∈ prior.overhang_list and 92: prior.current_overhang ∈ junction.overhang_list then 93: if Max(Position(junction.current_overhang),Position(prior.current_overhang)) > 94: Max(Position(junction.overhang_list.(prior.current_overhang)), 95: Position(prior.overhang_list.(junction.current_overhang))) then 96: return true 97: else if Max(Position(junction.current_overhang),Position(prior.current_overhang)) = 98: Max(Position(junction.overhang_list.(prior.current_overhang)), 99: Position(prior.overhang_list.(junction.current_overhang))) then 101: if junction.current_overhang ∈ junction.overhang_list after 102: prior.current_overhang ∈ junction.overhang_list then 103: return true
2013 | Best Practices Compendium | Bio-IT World [131]
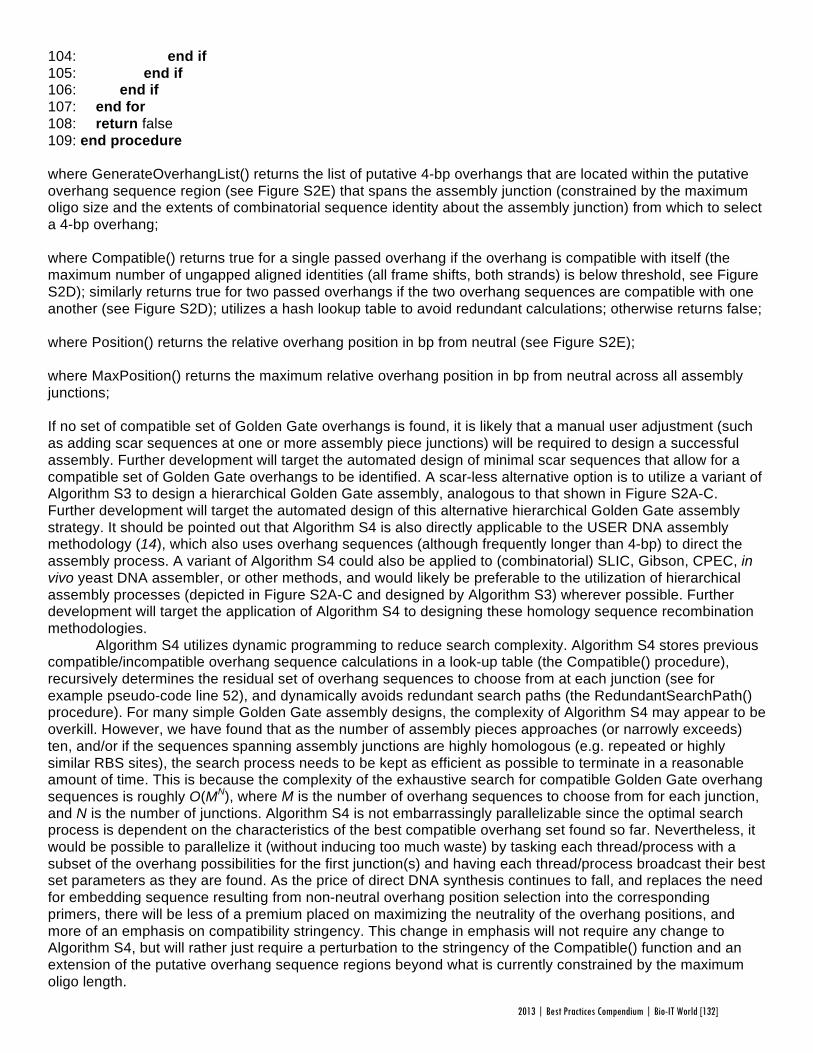
104: end if 105: end if 106: end if 107: end for 108: return false 109: end procedure where GenerateOverhangList() returns the list of putative 4-bp overhangs that are located within the putative overhang sequence region (see Figure S2E) that spans the assembly junction (constrained by the maximum oligo size and the extents of combinatorial sequence identity about the assembly junction) from which to select a 4-bp overhang; where Compatible() returns true for a single passed overhang if the overhang is compatible with itself (the maximum number of ungapped aligned identities (all frame shifts, both strands) is below threshold, see Figure S2D); similarly returns true for two passed overhangs if the two overhang sequences are compatible with one another (see Figure S2D); utilizes a hash lookup table to avoid redundant calculations; otherwise returns false; where Position() returns the relative overhang position in bp from neutral (see Figure S2E); where MaxPosition() returns the maximum relative overhang position in bp from neutral across all assembly junctions; If no set of compatible set of Golden Gate overhangs is found, it is likely that a manual user adjustment (such as adding scar sequences at one or more assembly piece junctions) will be required to design a successful assembly. Further development will target the automated design of minimal scar sequences that allow for a compatible set of Golden Gate overhangs to be identified. A scar-less alternative option is to utilize a variant of Algorithm S3 to design a hierarchical Golden Gate assembly, analogous to that shown in Figure S2A-C. Further development will target the automated design of this alternative hierarchical Golden Gate assembly strategy. It should be pointed out that Algorithm S4 is also directly applicable to the USER DNA assembly methodology (14), which also uses overhang sequences (although frequently longer than 4-bp) to direct the assembly process. A variant of Algorithm S4 could also be applied to (combinatorial) SLIC, Gibson, CPEC, in vivo yeast DNA assembler, or other methods, and would likely be preferable to the utilization of hierarchical assembly processes (depicted in Figure S2A-C and designed by Algorithm S3) wherever possible. Further development will target the application of Algorithm S4 to designing these homology sequence recombination methodologies. Algorithm S4 utilizes dynamic programming to reduce search complexity. Algorithm S4 stores previous compatible/incompatible overhang sequence calculations in a look-up table (the Compatible() procedure), recursively determines the residual set of overhang sequences to choose from at each junction (see for example pseudo-code line 52), and dynamically avoids redundant search paths (the RedundantSearchPath() procedure). For many simple Golden Gate assembly designs, the complexity of Algorithm S4 may appear to be overkill. However, we have found that as the number of assembly pieces approaches (or narrowly exceeds) ten, and/or if the sequences spanning assembly junctions are highly homologous (e.g. repeated or highly similar RBS sites), the search process needs to be kept as efficient as possible to terminate in a reasonable amount of time. This is because the complexity of the exhaustive search for compatible Golden Gate overhang sequences is roughly O(MN), where M is the number of overhang sequences to choose from for each junction, and N is the number of junctions. Algorithm S4 is not embarrassingly parallelizable since the optimal search process is dependent on the characteristics of the best compatible overhang set found so far. Nevertheless, it would be possible to parallelize it (without inducing too much waste) by tasking each thread/process with a subset of the overhang possibilities for the first junction(s) and having each thread/process broadcast their best set parameters as they are found. As the price of direct DNA synthesis continues to fall, and replaces the need for embedding sequence resulting from non-neutral overhang position selection into the corresponding primers, there will be less of a premium placed on maximizing the neutrality of the overhang positions, and more of an emphasis on compatibility stringency. This change in emphasis will not require any change to Algorithm S4, but will rather just require a perturbation to the stringency of the Compatible() function and an extension of the putative overhang sequence regions beyond what is currently constrained by the maximum oligo length.
2013 | Best Practices Compendium | Bio-IT World [132]
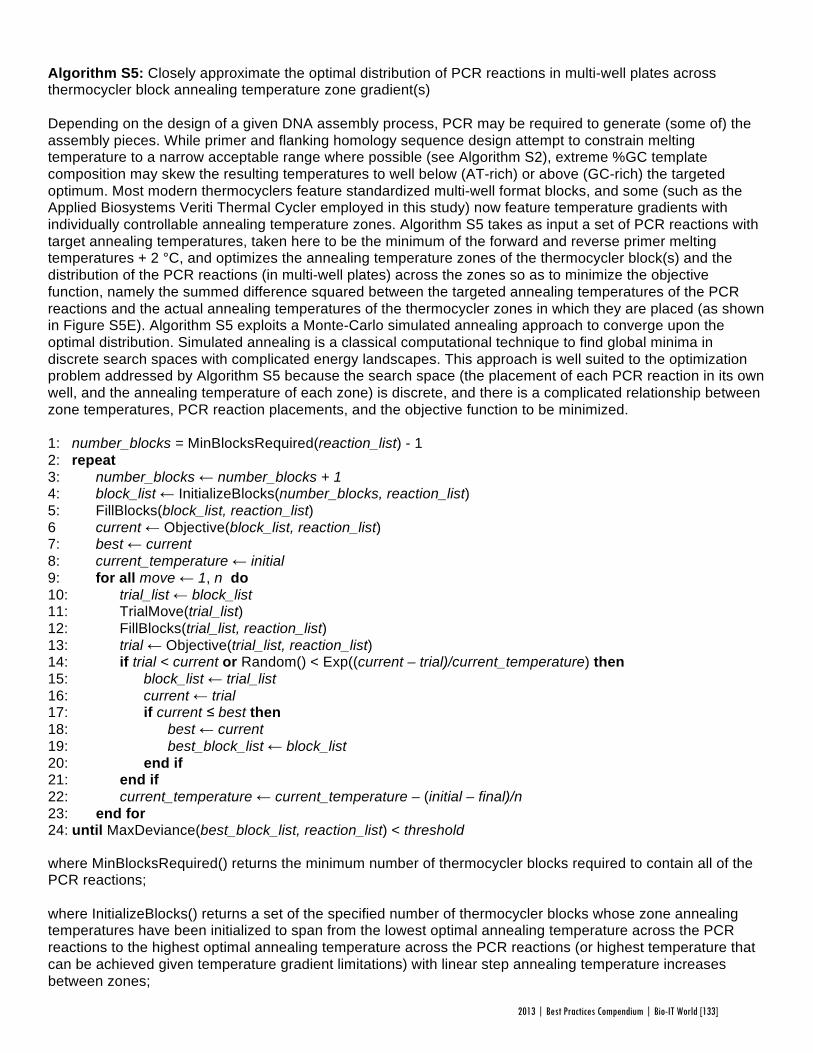
Algorithm S5: Closely approximate the optimal distribution of PCR reactions in multi-well plates across thermocycler block annealing temperature zone gradient(s) Depending on the design of a given DNA assembly process, PCR may be required to generate (some of) the assembly pieces. While primer and flanking homology sequence design attempt to constrain melting temperature to a narrow acceptable range where possible (see Algorithm S2), extreme %GC template composition may skew the resulting temperatures to well below (AT-rich) or above (GC-rich) the targeted optimum. Most modern thermocyclers feature standardized multi-well format blocks, and some (such as the Applied Biosystems Veriti Thermal Cycler employed in this study) now feature temperature gradients with individually controllable annealing temperature zones. Algorithm S5 takes as input a set of PCR reactions with target annealing temperatures, taken here to be the minimum of the forward and reverse primer melting temperatures + 2 °C, and optimizes the annealing temperature zones of the thermocycler block(s) and the distribution of the PCR reactions (in multi-well plates) across the zones so as to minimize the objective function, namely the summed difference squared between the targeted annealing temperatures of the PCR reactions and the actual annealing temperatures of the thermocycler zones in which they are placed (as shown in Figure S5E). Algorithm S5 exploits a Monte-Carlo simulated annealing approach to converge upon the optimal distribution. Simulated annealing is a classical computational technique to find global minima in discrete search spaces with complicated energy landscapes. This approach is well suited to the optimization problem addressed by Algorithm S5 because the search space (the placement of each PCR reaction in its own well, and the annealing temperature of each zone) is discrete, and there is a complicated relationship between zone temperatures, PCR reaction placements, and the objective function to be minimized. 1: number_blocks = MinBlocksRequired(reaction_list) - 1 2: repeat 3: number_blocks ← number_blocks + 1 4: block_list ← InitializeBlocks(number_blocks, reaction_list) 5: FillBlocks(block_list, reaction_list) 6 current ← Objective(block_list, reaction_list) 7: best ← current 8: current_temperature ← initial 9: for all move ← 1, n do 10: trial_list ← block_list 11: TrialMove(trial_list) 12: FillBlocks(trial_list, reaction_list) 13: trial ← Objective(trial_list, reaction_list) 14: if trial < current or Random() < Exp((current – trial)/current_temperature) then 15: block_list ← trial_list 16: current ← trial 17: if current ≤ best then 18: best ← current 19: best_block_list ← block_list 20: end if 21: end if 22: current_temperature ← current_temperature – (initial – final)/n 23: end for 24: until MaxDeviance(best_block_list, reaction_list) < threshold where MinBlocksRequired() returns the minimum number of thermocycler blocks required to contain all of the PCR reactions; where InitializeBlocks() returns a set of the specified number of thermocycler blocks whose zone annealing temperatures have been initialized to span from the lowest optimal annealing temperature across the PCR reactions to the highest optimal annealing temperature across the PCR reactions (or highest temperature that can be achieved given temperature gradient limitations) with linear step annealing temperature increases between zones;
2013 | Best Practices Compendium | Bio-IT World [133]
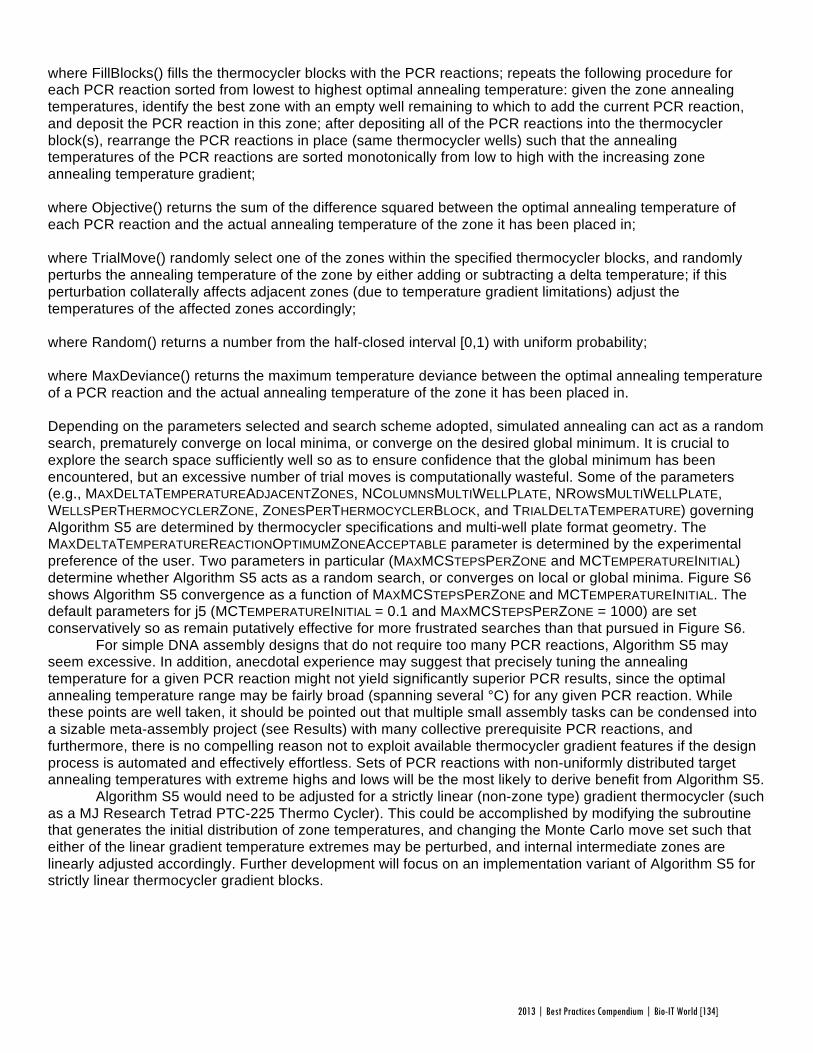
where FillBlocks() fills the thermocycler blocks with the PCR reactions; repeats the following procedure for each PCR reaction sorted from lowest to highest optimal annealing temperature: given the zone annealing temperatures, identify the best zone with an empty well remaining to which to add the current PCR reaction, and deposit the PCR reaction in this zone; after depositing all of the PCR reactions into the thermocycler block(s), rearrange the PCR reactions in place (same thermocycler wells) such that the annealing temperatures of the PCR reactions are sorted monotonically from low to high with the increasing zone annealing temperature gradient; where Objective() returns the sum of the difference squared between the optimal annealing temperature of each PCR reaction and the actual annealing temperature of the zone it has been placed in; where TrialMove() randomly select one of the zones within the specified thermocycler blocks, and randomly perturbs the annealing temperature of the zone by either adding or subtracting a delta temperature; if this perturbation collaterally affects adjacent zones (due to temperature gradient limitations) adjust the temperatures of the affected zones accordingly; where Random() returns a number from the half-closed interval [0,1) with uniform probability; where MaxDeviance() returns the maximum temperature deviance between the optimal annealing temperature of a PCR reaction and the actual annealing temperature of the zone it has been placed in. Depending on the parameters selected and search scheme adopted, simulated annealing can act as a random search, prematurely converge on local minima, or converge on the desired global minimum. It is crucial to explore the search space sufficiently well so as to ensure confidence that the global minimum has been encountered, but an excessive number of trial moves is computationally wasteful. Some of the parameters (e.g., MAXDELTATEMPERATUREADJACENTZONES, NCOLUMNSMULTIWELLPLATE, NROWSMULTIWELLPLATE, WELLSPERTHERMOCYCLERZONE, ZONESPERTHERMOCYCLERBLOCK, and TRIALDELTATEMPERATURE) governing Algorithm S5 are determined by thermocycler specifications and multi-well plate format geometry. The MAXDELTATEMPERATUREREACTIONOPTIMUMZONEACCEPTABLE parameter is determined by the experimental preference of the user. Two parameters in particular (MAXMCSTEPSPERZONE and MCTEMPERATUREINITIAL) determine whether Algorithm S5 acts as a random search, or converges on local or global minima. Figure S6 shows Algorithm S5 convergence as a function of MAXMCSTEPSPERZONE and MCTEMPERATUREINITIAL. The default parameters for j5 (MCTEMPERATUREINITIAL = 0.1 and MAXMCSTEPSPERZONE = 1000) are set conservatively so as remain putatively effective for more frustrated searches than that pursued in Figure S6.
For simple DNA assembly designs that do not require too many PCR reactions, Algorithm S5 may seem excessive. In addition, anecdotal experience may suggest that precisely tuning the annealing temperature for a given PCR reaction might not yield significantly superior PCR results, since the optimal annealing temperature range may be fairly broad (spanning several °C) for any given PCR reaction. While these points are well taken, it should be pointed out that multiple small assembly tasks can be condensed into a sizable meta-assembly project (see Results) with many collective prerequisite PCR reactions, and furthermore, there is no compelling reason not to exploit available thermocycler gradient features if the design process is automated and effectively effortless. Sets of PCR reactions with non-uniformly distributed target annealing temperatures with extreme highs and lows will be the most likely to derive benefit from Algorithm S5.
Algorithm S5 would need to be adjusted for a strictly linear (non-zone type) gradient thermocycler (such as a MJ Research Tetrad PTC-225 Thermo Cycler). This could be accomplished by modifying the subroutine that generates the initial distribution of zone temperatures, and changing the Monte Carlo move set such that either of the linear gradient temperature extremes may be perturbed, and internal intermediate zones are linearly adjusted accordingly. Further development will focus on an implementation variant of Algorithm S5 for strictly linear thermocycler gradient blocks.
2013 | Best Practices Compendium | Bio-IT World [134]
REFERENCES 1. Khlebnikov, A., Datsenko, K. A., Skaug, T., Wanner, B. L., and Keasling, J. D. (2001) Homogeneous
expression of the P(BAD) promoter in Escherichia coli by constitutive expression of the low-affinity high-capacity AraE transporter, Microbiology 147, 3241-3247.
2. Gibson, D. G., Young, L., Chuang, R. Y., Venter, J. C., Hutchison, C. A., 3rd, and Smith, H. O. (2009) Enzymatic assembly of DNA molecules up to several hundred kilobases, Nat Methods 6, 343-345.
3. Li, M. Z., and Elledge, S. J. (2007) Harnessing homologous recombination in vitro to generate recombinant DNA via SLIC, Nat Methods 4, 251-256.
4. Quan, J., and Tian, J. (2009) Circular polymerase extension cloning of complex gene libraries and pathways, PLoS One 4, e6441.
5. Engler, C., Gruetzner, R., Kandzia, R., and Marillonnet, S. (2009) Golden gate shuffling: a one-pot DNA shuffling method based on type IIs restriction enzymes, PLoS One 4, e5553.
6. Engler, C., Kandzia, R., and Marillonnet, S. (2008) A one pot, one step, precision cloning method with high throughput capability, PLoS One 3, e3647.
7. Yu, B. J., Kang, K. H., Lee, J. H., Sung, B. H., Kim, M. S., and Kim, S. C. (2008) Rapid and efficient construction of markerless deletions in the Escherichia coli genome, Nucleic Acids Res 36, e84.
8. Musso, M., Bocciardi, R., Parodi, S., Ravazzolo, R., and Ceccherini, I. (2006) Betaine, dimethyl sulfoxide, and 7-deaza-dGTP, a powerful mixture for amplification of GC-rich DNA sequences, J Mol Diagn 8, 544-550.
9. Bilitchenko, L., Liu, A., Cheung, S., Weeding, E., Xia, B., Leguia, M., Anderson, J. C., and Densmore, D. (2011) Eugene--a domain specific language for specifying and constraining synthetic biological parts, devices, and systems, PLoS One 6, e18882.
10. Bilitchenko, L., Liu, A., and Densmore, D. (2011) The Eugene language for synthetic biology, Methods Enzymol 498, 153-172.
11. Rozen, S., and Skaletsky, H. (2000) Primer3 on the WWW for general users and for biologist programmers, Methods Mol Biol 132, 365-386.
12. Zhang, Z., Schwartz, S., Wagner, L., and Miller, W. (2000) A greedy algorithm for aligning DNA sequences, J Comput Biol 7, 203-214.
13. Shao, Z., and Zhao, H. (2009) DNA assembler, an in vivo genetic method for rapid construction of biochemical pathways, Nucleic Acids Res 37, e16.
14. Bitinaite, J., Rubino, M., Varma, K. H., Schildkraut, I., Vaisvila, R., and Vaiskunaite, R. (2007) USER friendly DNA engineering and cloning method by uracil excision, Nucleic Acids Res 35, 1992-2002.
2013 | Best Practices Compendium | Bio-IT World [135]
250 First Avenue, Suite 300, Needham, MA 02494 | phone: 781‐972‐5400 | fax: 781‐972‐5425
Published Resources for the Life Sciences
Bio‐IT World 2013 Best Practices Awards
Celebrating Excellence in Innovation 1. Nominating Organization (Fill this out only if you are nominating a group other than your own.)
A. Nominating Organization Organization name: Tessella Ltd Address: 26 The Quadrant, Abingdon Science Park, Abingdon, Oxfordshire, OX14 3YS B. Nominating Contact Person Name: Christina Tealdi MCIPR Title: Senior PR and Marketing Communications Manager Tel: D: +44 (0)1235 546 638, M:+44 (0) 7799346453 S: +44 (0) 1235 55 5511 Email: [email protected]
2. User Organization (Organization at which the solution was deployed/applied)
A. User Organization Organization name: Neusentis, Pfizer Ltd Address: Granta Park, Great Abington, Cambridge CB21 6GP B. User Organization Contact Person Name: Huw Rees Title: Senior Principal Scientist Tel: 01304 644640 Email: [email protected]
3. Project Title:
Team Leader: James Myatt (Tessella), Huw Rees (Neusentis, Pfizer Ltd) Contact details if different from above: Team members – name(s), title(s) and company (optional): Dave Dungate (Tessella), Jason Miranda
(Neusentis, Pfizer Ltd), Fred Wilson (Neusentis, Pfizer Ltd) 4. Category in which entry is being submitted (1 category per entry, highlight your choice)
Clinical & Health‐IT: Trial design, eCTD, EDC, ePrescribing, RHIOs, EMR/PHR IT infrastructure/HPC: High Performance Computing, storage, Cloud technologies Informatics: LIMS, data visualization, imaging technologies, NGS analysis
2013 | Best Practices Compendium | Bio-IT World [136]
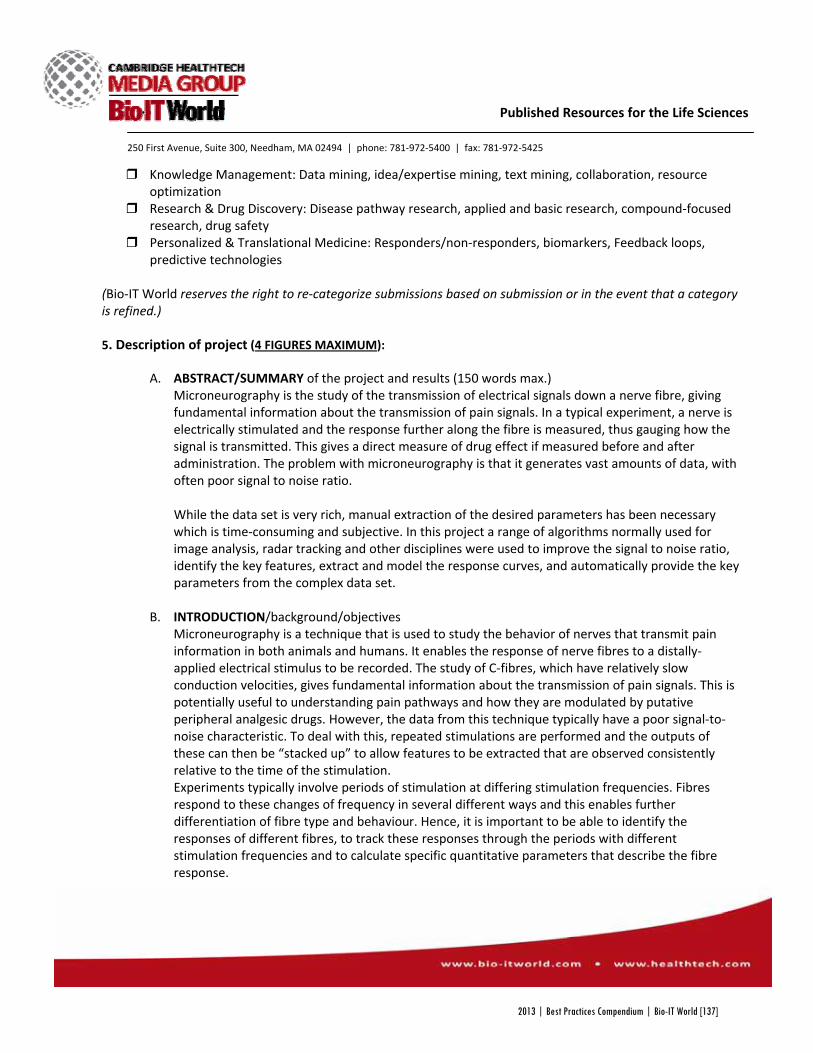
250 First Avenue, Suite 300, Needham, MA 02494 | phone: 781‐972‐5400 | fax: 781‐972‐5425
Published Resources for the Life Sciences
Knowledge Management: Data mining, idea/expertise mining, text mining, collaboration, resource optimization
Research & Drug Discovery: Disease pathway research, applied and basic research, compound‐focused research, drug safety
Personalized & Translational Medicine: Responders/non‐responders, biomarkers, Feedback loops, predictive technologies
(Bio‐IT World reserves the right to re‐categorize submissions based on submission or in the event that a category is refined.) 5. Description of project (4 FIGURES MAXIMUM):
A. ABSTRACT/SUMMARY of the project and results (150 words max.) Microneurography is the study of the transmission of electrical signals down a nerve fibre, giving fundamental information about the transmission of pain signals. In a typical experiment, a nerve is electrically stimulated and the response further along the fibre is measured, thus gauging how the signal is transmitted. This gives a direct measure of drug effect if measured before and after administration. The problem with microneurography is that it generates vast amounts of data, with often poor signal to noise ratio. While the data set is very rich, manual extraction of the desired parameters has been necessary which is time‐consuming and subjective. In this project a range of algorithms normally used for image analysis, radar tracking and other disciplines were used to improve the signal to noise ratio, identify the key features, extract and model the response curves, and automatically provide the key parameters from the complex data set.
B. INTRODUCTION/background/objectives Microneurography is a technique that is used to study the behavior of nerves that transmit pain information in both animals and humans. It enables the response of nerve fibres to a distally‐applied electrical stimulus to be recorded. The study of C‐fibres, which have relatively slow conduction velocities, gives fundamental information about the transmission of pain signals. This is potentially useful to understanding pain pathways and how they are modulated by putative peripheral analgesic drugs. However, the data from this technique typically have a poor signal‐to‐noise characteristic. To deal with this, repeated stimulations are performed and the outputs of these can then be “stacked up” to allow features to be extracted that are observed consistently relative to the time of the stimulation. Experiments typically involve periods of stimulation at differing stimulation frequencies. Fibres respond to these changes of frequency in several different ways and this enables further differentiation of fibre type and behaviour. Hence, it is important to be able to identify the responses of different fibres, to track these responses through the periods with different stimulation frequencies and to calculate specific quantitative parameters that describe the fibre response.
2013 | Best Practices Compendium | Bio-IT World [137]
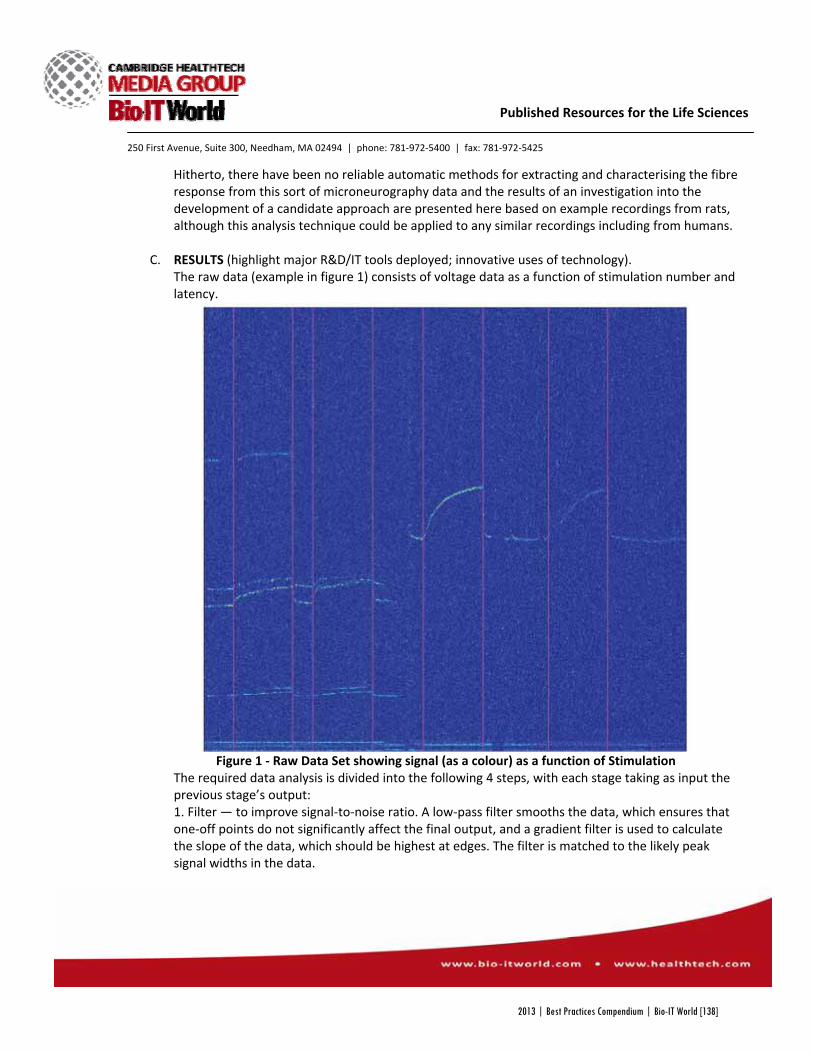
250 First Avenue, Suite 300, Needham, MA 02494 | phone: 781‐972‐5400 | fax: 781‐972‐5425
Published Resources for the Life Sciences
Hitherto, there have been no reliable automatic methods for extracting and characterising the fibre response from this sort of microneurography data and the results of an investigation into the development of a candidate approach are presented here based on example recordings from rats, although this analysis technique could be applied to any similar recordings including from humans.
C. RESULTS (highlight major R&D/IT tools deployed; innovative uses of technology). The raw data (example in figure 1) consists of voltage data as a function of stimulation number and latency.
Figure 1 ‐ Raw Data Set showing signal (as a colour) as a function of Stimulation
The required data analysis is divided into the following 4 steps, with each stage taking as input the previous stage’s output: 1. Filter — to improve signal‐to‐noise ratio. A low‐pass filter smooths the data, which ensures that one‐off points do not significantly affect the final output, and a gradient filter is used to calculate the slope of the data, which should be highest at edges. The filter is matched to the likely peak signal widths in the data.
2013 | Best Practices Compendium | Bio-IT World [138]

250 First Avenue, Suite 300, Needham, MA 02494 | phone: 781‐972‐5400 | fax: 781‐972‐5425
Published Resources for the Life Sciences
2. Extract — to identify points that are likely to belong to part of the nerve response i.e. a coherent “line” in the data. This can be considered to be a hypothesis test for each pixel. A test with an adaptive threshold (set based on pure noise data sections together with a robust standard deviation estimation algorithm) tuned to a specific false alarm rate is used. An approach with hysteresis is used, such that a higher threshold is used to start a line and a lower one for its continuation. This is achieved using a flood‐fill‐based algorithm that starts with all points that are above the upper threshold and continues adding points that are both above the lower threshold and adjacent to selected points until no more points can be added. Example data following this step is shown in figure 2.
Figure 2 Detail of connected component tracks after the filter and extract steps, showing points assigned to the same track via colour coding. The remaining gaps in the lines, and multiple lines
remaining within each track, can be clearly seen. 3. Track — to group points that belong to the response from the same fibre, noting that the previous step does not handle gaps in lines, crossing lines, or use the expected line shape. As line behaviour between changes in protocol is well understood, this is exploited using a Kalman filter, which combines measurements based on an underlying system process. This describes how the response varies between stimulations, and includes the constraint that the gradient of the line should vary slowly between measurements. The system model also includes the width of the line, allowing multiple adjacent detections from the same response to be appropriately combined. Example output from the Kalman filter is shown in figure 3.
2013 | Best Practices Compendium | Bio-IT World [139]
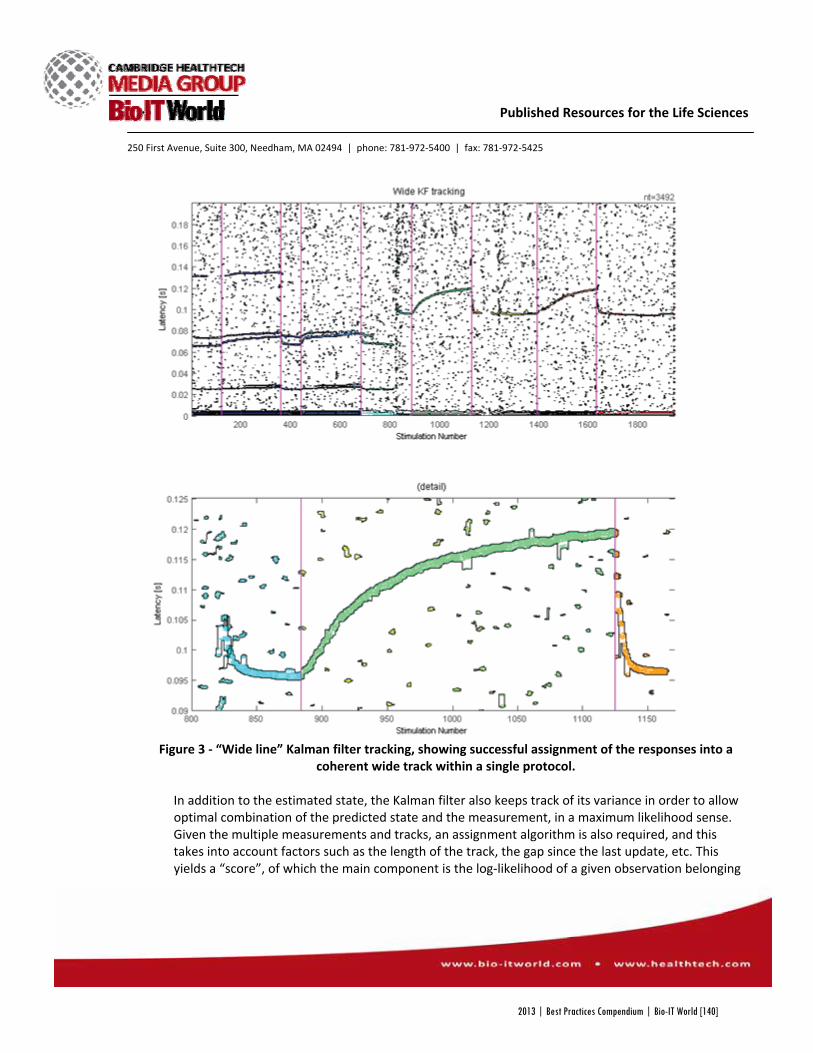
250 First Avenue, Suite 300, Needham, MA 02494 | phone: 781‐972‐5400 | fax: 781‐972‐5425
Published Resources for the Life Sciences
Figure 3 ‐ “Wide line” Kalman filter tracking, showing successful assignment of the responses into a
coherent wide track within a single protocol.
In addition to the estimated state, the Kalman filter also keeps track of its variance in order to allow optimal combination of the predicted state and the measurement, in a maximum likelihood sense. Given the multiple measurements and tracks, an assignment algorithm is also required, and this takes into account factors such as the length of the track, the gap since the last update, etc. This yields a “score”, of which the main component is the log‐likelihood of a given observation belonging
2013 | Best Practices Compendium | Bio-IT World [140]
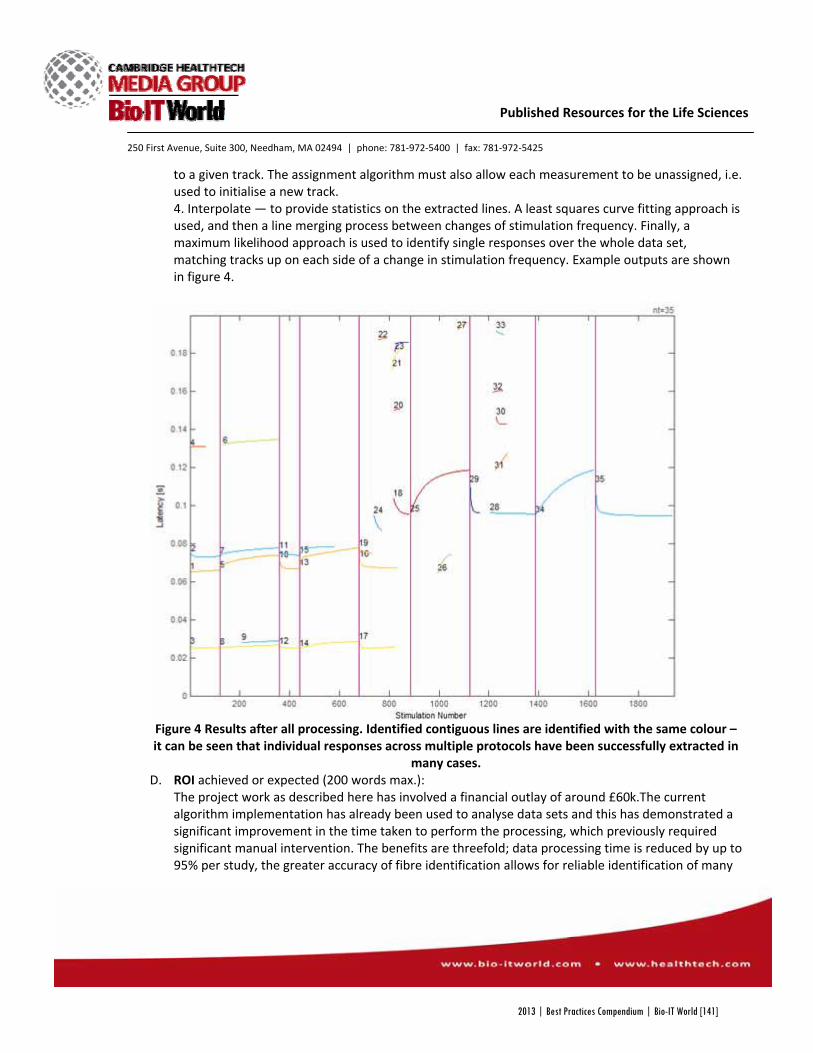
250 First Avenue, Suite 300, Needham, MA 02494 | phone: 781‐972‐5400 | fax: 781‐972‐5425
Published Resources for the Life Sciences
to a given track. The assignment algorithm must also allow each measurement to be unassigned, i.e. used to initialise a new track. 4. Interpolate — to provide statistics on the extracted lines. A least squares curve fitting approach is used, and then a line merging process between changes of stimulation frequency. Finally, a maximum likelihood approach is used to identify single responses over the whole data set, matching tracks up on each side of a change in stimulation frequency. Example outputs are shown in figure 4.
Figure 4 Results after all processing. Identified contiguous lines are identified with the same colour – it can be seen that individual responses across multiple protocols have been successfully extracted in
many cases. D. ROI achieved or expected (200 words max.):
The project work as described here has involved a financial outlay of around £60k.The current algorithm implementation has already been used to analyse data sets and this has demonstrated a significant improvement in the time taken to perform the processing, which previously required significant manual intervention. The benefits are threefold; data processing time is reduced by up to 95% per study, the greater accuracy of fibre identification allows for reliable identification of many
2013 | Best Practices Compendium | Bio-IT World [141]
250 First Avenue, Suite 300, Needham, MA 02494 | phone: 781‐972‐5400 | fax: 781‐972‐5425
Published Resources for the Life Sciences
more fibres reducing the number of studies (and animals) required to adequately test drug effects, and the objective nature of the analysis removes a source of experimental bias increasing the confidence and power of the results generated. The availability of the approach and associated tool also opens up the possibility to perform more experiments, which previously could not have been analysed, thus accelerating the use of the approach and associated benefits.
E. CONCLUSIONS/implications for the field.
The approach has been implemented in a MATLAB tool and tested against a range of selected data sets, over a range of perceived data quality. In addition to graphical outputs such as those illustrated in Figure 4, detailed tables of track data, fitted parameters and connectivity of multisegment lines are produced. The results demonstrate that the approach and the algorithms can be used to successfully extract the required information from the microneurography data. The approach described makes the minimum number of assumptions about the nature of the underlying data making it suitable as a basis for the development of a general data analysis tool. Furthermore, some refinements of the approach have been identified that can be expected to further improve performance, such as automatic scaling of algorithm parameters with sampling and stimulation frequencies. However, the current form of the algorithm has already been used to analyse data sets and this has demonstrated a significant improvement in the time taken to perform the processing, which previously required significant manual intervention.
1. REFERENCES/testimonials/supporting internal documents (If necessary; 5 pages max.)
The team at Neusentis are working, together with academia and other industry partners, on ‘Europain’, which is a public‐private consortium funded by the European Innovative Medicines Initiative (IMI) aimed at improving the treatment of patients with chronic pain and includes microneurography in several work packages, both preclinical and clinical. The project work was presented as a poster at the IASP 14th World Congress of Pain, held in Milan in August 2012.
2013 | Best Practices Compendium | Bio-IT World [142]
250 First Avenue, Suite 300, Needham, MA 02494 | phone: 781‐972‐5400 | fax: 781‐972‐5425
Published Resources for the Life Sciences
Bio‐IT World 2013 Best Practices Awards
Systems Pharmacology Modeling in Neuroscience: Prediction and Outcome of a New
Symptomatic Drug for Cognition in a Clinical Scopolamine Impairment Challenge 1. Nominating Organization
In Silico Biosciences Name: Hugo Geerts Title: Chief Scientific Officer Tel: 1‐267‐679‐8090 Email: Hugo‐Geerts@In‐Silico‐Biosciences.com
2. User Organization (Organization at which the solution was deployed/applied)
Pfizer Worldwide Research and Development
3. Project
Project Title: Systems Pharmacology Modeling in Neuroscience: Prediction and Outcome
of a new symptomatic drug for cognition in a Clinical Scopolamine Impairment Trial Team members – name(s), title(s) and company (optional):
Hugo Geerts, Athan Spiros, Patrick Roberts, In Silico Biosciences, Berwyn, PA Timothy Nicholas, Sridhar Duvvuri, Claire Leurent, David Raunig, Tracey Rapp, Phil Iredale,
Carolyn Rowinski, Pfizer, USA
Background: 5HT4 receptors in cortex and hippocampus area are considered a possible target for
modulation of cognitive functions in Alzheimer’s disease (AD). A systems pharmacology approach was
adopted to evaluate the potential of the 5HT4 modulation in providing beneficial effects on cognition in
AD.
2013 | Best Practices Compendium | Bio-IT World [143]
250 First Avenue, Suite 300, Needham, MA 02494 | phone: 781‐972‐5400 | fax: 781‐972‐5425
Published Resources for the Life Sciences
Methods: A serotonergic synaptic cleft model was developed by integrating serotonin firing, release,
synaptic half-life, drug/tracer properties (affinity and agonism) as inputs and 5HT4 activity as output. The
serotonergic model was calibrated using both in vivo data on free 5-HT levels in preclinical models and
human imaging data. The model was further expanded to other neurotransmitter systems and incorporated
into a computer-based cortical network model which implemented the physiology of 12 different
membrane CNS targets. A biophysically realistic, multi-compartment model of 80 pyramidal cells and 40
interneurons was further calibrated using data reported for working memory tasks in healthy humans and
schizophrenia patients. Model output was the duration of the network firing activity in response to an
external stimulus. Alzheimer’s disease (AD) pathology, in particular synapse and neuronal cell loss in
addition to cholinergic deficits, was calibrated to align with the natural clinical disease progression.
The model was used to provide insights into the effect of 5HT4 activation on working memory and to
simulate the response of PF-04995274, a 5HT4 partial agonist, in a scopolamine-reversal trial in healthy
human subjects.
Results: The model output suggested a beneficial effect of strong 5HT4 agonism on working memory. The
model also projected no effect or an exacerbation of scopolamine impairment for low intrinsic activity
5HT4 agonists, which was supported by the subsequent human trial outcome. The clinical prediction of the
disease model strongly suggests that 5HT4 agonists with high intrinsic activity may have a beneficial effect
on cognition in AD patients.
Discussion. The use of computer-based mechanistic disease-modeling in cognitive enhancement drug
discovery (and development) projects is a relatively inexpensive way to explore novel hypotheses in CNS
indications, based upon the underlying neurobiology. Identification of the processes that affect this
neurobiology can lead to more optimal compound selection, better clinical trial design, and probably a
higher success rate in clinical trials. In this instance, the healthy volunteer population and design were
good to evaluate the underlying 5-HT4 mechanism. The systems pharmacology model provides the
connection between the underlying research, the results from this study, and future studies and disease state
2013 | Best Practices Compendium | Bio-IT World [144]
250 First Avenue, Suite 300, Needham, MA 02494 | phone: 781‐972‐5400 | fax: 781‐972‐5425
Published Resources for the Life Sciences
populations, thereby continuing the iterative learn and confirm paradigm in the quantitative drug
development field.
4. Category in which entry is being submitted (1 category per entry)
Basic Research & Biological Research: Disease pathway research, applied and basic research
Drug Discovery & Development: Compound‐focused research, drug safety Clinical Trials & Research: Trial design, eCTD
X Translational Medicine: Feedback loops, predictive technologies Personalized Medicine: Responders/non‐responders, biomarkers IT & Informatics: LIMS, High Performance Computing, storage, data visualization, imaging technologies
Knowledge Management: Data mining, idea/expertise mining, text mining, collaboration, resource optimization
Health‐IT: ePrescribing, RHIOs, EMR/PHR Manufacturing & Bioprocessing: Mass production, continuous manufacturing
(Bio‐IT World reserves the right to re‐categorize submissions based on submission or in the event that a category is refined.)
6. Further Details
Impact for the field
A well calibrated and validated computer-based mechanistic disease model as a systems
pharmacology approach that is based upon the best parts of preclinical animal physiology, but
extensively parameterized with human data as a real translation tool, allows for the reduction of specific
animal-related problems in drug discovery and can provide previously unavailable insights that can
increase the likelihood of clinical, and commercial, success.
Incorporation of this approach in early drug discovery could lead to dramatic increases in program
efficiency and productivity. Based upon this example, it is likely that use of a systems pharmacology
2013 | Best Practices Compendium | Bio-IT World [145]
250 First Avenue, Suite 300, Needham, MA 02494 | phone: 781‐972‐5400 | fax: 781‐972‐5425
Published Resources for the Life Sciences
model, to better understand the neurobiology of the maintenance part of a working memory test in the
human brain, could lead to more optimal compounds entering development, targeted to the patients who
could benefit most, and improved interrogation of the fundamental hypothesis; all leading to an increased
success rate in the clinic. Overall, incorporation of this approach in early Drug discovery could
dramatically reduce the time to get better drugs to the right patients.
This approach is a unique attempt to introduce engineering-based principles of modeling and
simulation that have been so successful in other industries into the world of pharmaceutical drug
discovery and development.
Because of its unique virtual and humanized nature, this modeling approach can address some of the
animal specific problems that have hampered drug discovery, such as species differences in physiology,
the presence of unique metabolites, specific human genotypes or some off-target effects that might affect
functional clinical outcome. Advanced mechanistic disease computer modeling of complex CNS
diseases could be an additional helpful tool for drug discovery and development that has the potential to
reduce clinical trial attrition. The platform can serve as a systematic biological knowledge repository and
help to better understand the biology of emergent network properties by incorporating feedback of
successful and unsuccessful clinical trials.
2013 | Best Practices Compendium | Bio-IT World [146]
Genedata/Sanofi Entry Page 1 Bio‐IT World Best Practices Award January 11, 2013
250 First Avenue, Suite 300, Needham, MA 02494 | phone: 781‐972‐5400 | fax: 781‐972‐5425
Published Resources for the Life Sciences
Bio‐IT World 2013 Best Practices Awards
Celebrating Excellence in Innovation ENTRY FORM Early bird deadline: December 14, 2012; Deadline: January 11, 2013
1. Nominating Organization (Fill this out only if you are nominating a group other than your own.) A. Nominating Organization Organization name: Genedata Address: 1 Cranberry Hill, Lexington, MA 02421 B. Nominating Contact Person Name: Jackie Thrasivoulos Title: Genedata Public Relations Tel: +1 508 881 3109 Email: [email protected]
2. User Organization (Organization at which the solution was deployed/applied)
A. User Organization Organization name: SANOFI Address: 270 Albany Street, Cambridge, MA 02139 B. User Organization Contact Person Name: Serena Silver, PhD Title: Principal Research Investigator Tel: +1 617 665 4292 Email: [email protected]
3. Project Title: Accelerating Oncology Target Identification and Validation With an Integrated Genomic and Chemical Screening Platform
Team Leader: Serena Silver Team members – name(s), title(s) and company (optional): Sanofi Target Discovery Screening Group Rich Newcombe, Principal Research Investigator ([email protected]; (617) 665‐4279) Joern Hopke, Senior Research Investigator ([email protected]; (617) 665‐4460) Sanofi Research IS
2013 | Best Practices Compendium | Bio-IT World [147]
Genedata/Sanofi Entry Page 2 Bio‐IT World Best Practices Award January 11, 2013
250 First Avenue, Suite 300, Needham, MA 02494 | phone: 781‐972‐5400 | fax: 781‐972‐5425
Published Resources for the Life Sciences
Matt Smicker, IS Consultant Solution Leader ([email protected]; (617) 665‐4758)\ Don Schilp, IS Head of Solution Center for Oncology R&D ([email protected]; (617) 665‐4271) Collaborators Genedata Oliver Leven, Head of Professional Services, [email protected]; +41 61 5118 451 Andre Stephan, Account Executive, [email protected] ; +41 61 5118 480
4. Category in which entry is being submitted (1 category per entry, highlight your choice)
Clinical & Health‐IT: Trial design, eCTD, EDC, ePrescribing, RHIOs, EMR/PHR IT infrastructure/HPC: High Performance Computing, storage, Cloud technologies XX Informatics: LIMS, data visualization, imaging technologies, NGS analysis XX Knowledge Management: Data mining, idea/expertise mining, text mining, collaboration, resource optimization
Research & Drug Discovery: Disease pathway research, applied and basic research, compound‐focused research, drug safety
Personalized & Translational Medicine: Responders/non‐responders, biomarkers, Feedback loops, predictive technologies
(Bio‐IT World reserves the right to re‐categorize submissions based on submission or in the event that a category is refined.) 5. Description of project (4 FIGURES MAXIMUM):
A. ABSTRACT/SUMMARY of the project and results (150 words max.) The Sanofi Oncology Target Discovery group has established a novel and agile automated platform for functional genomic and compound screening. To effectively and efficiently use data generated by such a comprehensive robotics system, the Target Discovery group identified the need for a unified data management platform (the ‘TIDVal platform’) to: 1) cover a broad range of screening applications and technologies in a single environment; 2) enable the efficient comparison of experimental conditions and results across multiple cell lines; 3) support multiple substances (combinations from small molecules and biological substances) per well in the same plate (an industry first); and 4) have the solution built in parallel to the setup of the lab automation and biological research. This submission outlines: the Target Identification and Validation (TIDVal) project; components required to create an efficient screening data management platform for target validation; and how this platform enables analysis of screening data related to functional and chemical genomics in combination with high‐throughput automation. The project goal was to create a platform that successfully links genes to cancer by helping researchers determine new oncology targets and combination partners for existing therapeutics, and enable better understanding of drug mechanism of action (MOA).
2013 | Best Practices Compendium | Bio-IT World [148]
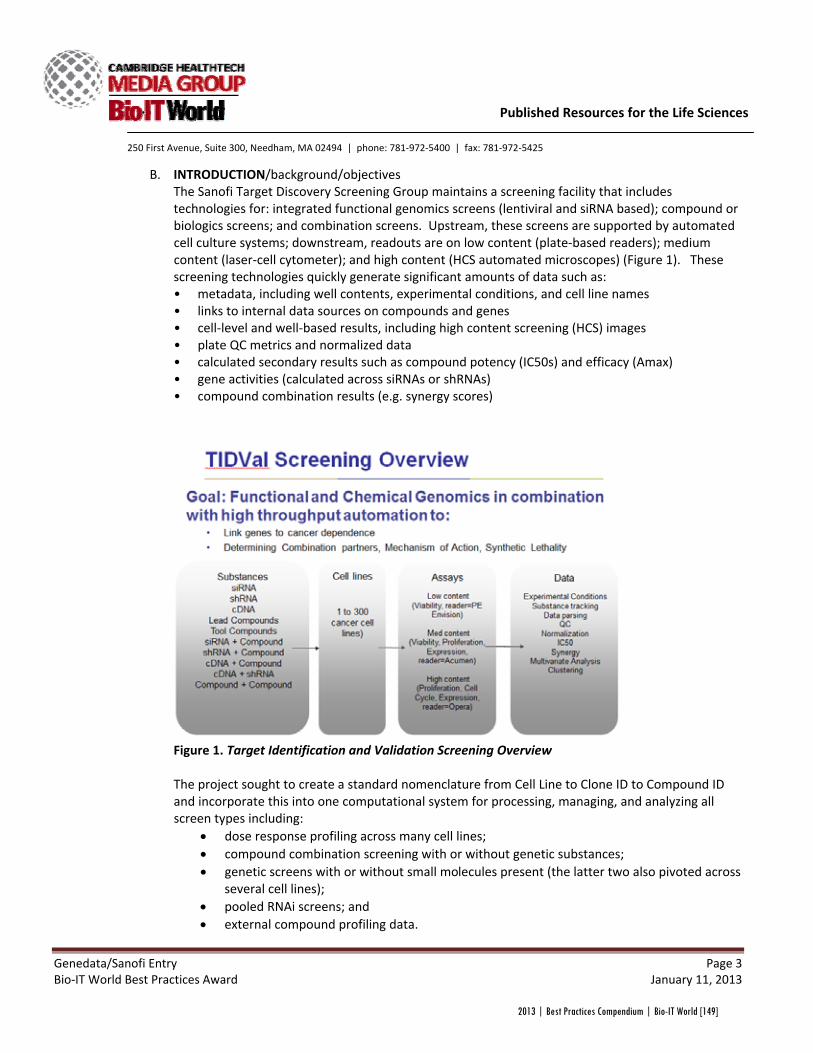
Genedata/Sanofi Entry Page 3 Bio‐IT World Best Practices Award January 11, 2013
250 First Avenue, Suite 300, Needham, MA 02494 | phone: 781‐972‐5400 | fax: 781‐972‐5425
Published Resources for the Life Sciences
B. INTRODUCTION/background/objectives The Sanofi Target Discovery Screening Group maintains a screening facility that includes technologies for: integrated functional genomics screens (lentiviral and siRNA based); compound or biologics screens; and combination screens. Upstream, these screens are supported by automated cell culture systems; downstream, readouts are on low content (plate‐based readers); medium content (laser‐cell cytometer); and high content (HCS automated microscopes) (Figure 1). These screening technologies quickly generate significant amounts of data such as: • metadata, including well contents, experimental conditions, and cell line names • links to internal data sources on compounds and genes • cell‐level and well‐based results, including high content screening (HCS) images • plate QC metrics and normalized data • calculated secondary results such as compound potency (IC50s) and efficacy (Amax) • gene activities (calculated across siRNAs or shRNAs) • compound combination results (e.g. synergy scores)
Figure 1. Target Identification and Validation Screening Overview The project sought to create a standard nomenclature from Cell Line to Clone ID to Compound ID and incorporate this into one computational system for processing, managing, and analyzing all screen types including:
• dose response profiling across many cell lines; • compound combination screening with or without genetic substances; • genetic screens with or without small molecules present (the latter two also pivoted across
several cell lines); • pooled RNAi screens; and • external compound profiling data.
2013 | Best Practices Compendium | Bio-IT World [149]
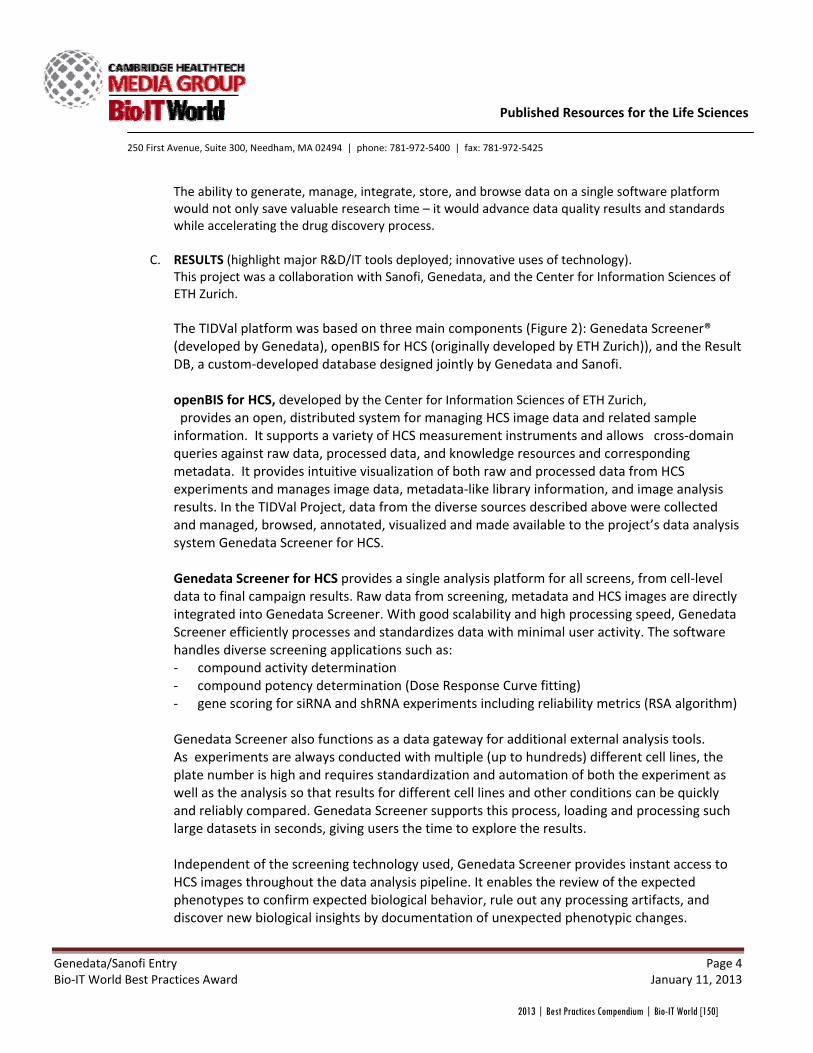
Genedata/Sanofi Entry Page 4 Bio‐IT World Best Practices Award January 11, 2013
250 First Avenue, Suite 300, Needham, MA 02494 | phone: 781‐972‐5400 | fax: 781‐972‐5425
Published Resources for the Life Sciences
The ability to generate, manage, integrate, store, and browse data on a single software platform would not only save valuable research time – it would advance data quality results and standards while accelerating the drug discovery process.
C. RESULTS (highlight major R&D/IT tools deployed; innovative uses of technology). This project was a collaboration with Sanofi, Genedata, and the Center for Information Sciences of ETH Zurich. The TIDVal platform was based on three main components (Figure 2): Genedata Screener® (developed by Genedata), openBIS for HCS (originally developed by ETH Zurich)), and the Result DB, a custom‐developed database designed jointly by Genedata and Sanofi. openBIS for HCS, developed by the Center for Information Sciences of ETH Zurich, provides an open, distributed system for managing HCS image data and related sample information. It supports a variety of HCS measurement instruments and allows cross‐domain queries against raw data, processed data, and knowledge resources and corresponding metadata. It provides intuitive visualization of both raw and processed data from HCS experiments and manages image data, metadata‐like library information, and image analysis results. In the TIDVal Project, data from the diverse sources described above were collected and managed, browsed, annotated, visualized and made available to the project’s data analysis system Genedata Screener for HCS. Genedata Screener for HCS provides a single analysis platform for all screens, from cell‐level data to final campaign results. Raw data from screening, metadata and HCS images are directly integrated into Genedata Screener. With good scalability and high processing speed, Genedata Screener efficiently processes and standardizes data with minimal user activity. The software handles diverse screening applications such as: ‐ compound activity determination ‐ compound potency determination (Dose Response Curve fitting) ‐ gene scoring for siRNA and shRNA experiments including reliability metrics (RSA algorithm) Genedata Screener also functions as a data gateway for additional external analysis tools. As experiments are always conducted with multiple (up to hundreds) different cell lines, the plate number is high and requires standardization and automation of both the experiment as well as the analysis so that results for different cell lines and other conditions can be quickly and reliably compared. Genedata Screener supports this process, loading and processing such large datasets in seconds, giving users the time to explore the results. Independent of the screening technology used, Genedata Screener provides instant access to HCS images throughout the data analysis pipeline. It enables the review of the expected phenotypes to confirm expected biological behavior, rule out any processing artifacts, and discover new biological insights by documentation of unexpected phenotypic changes.
2013 | Best Practices Compendium | Bio-IT World [150]
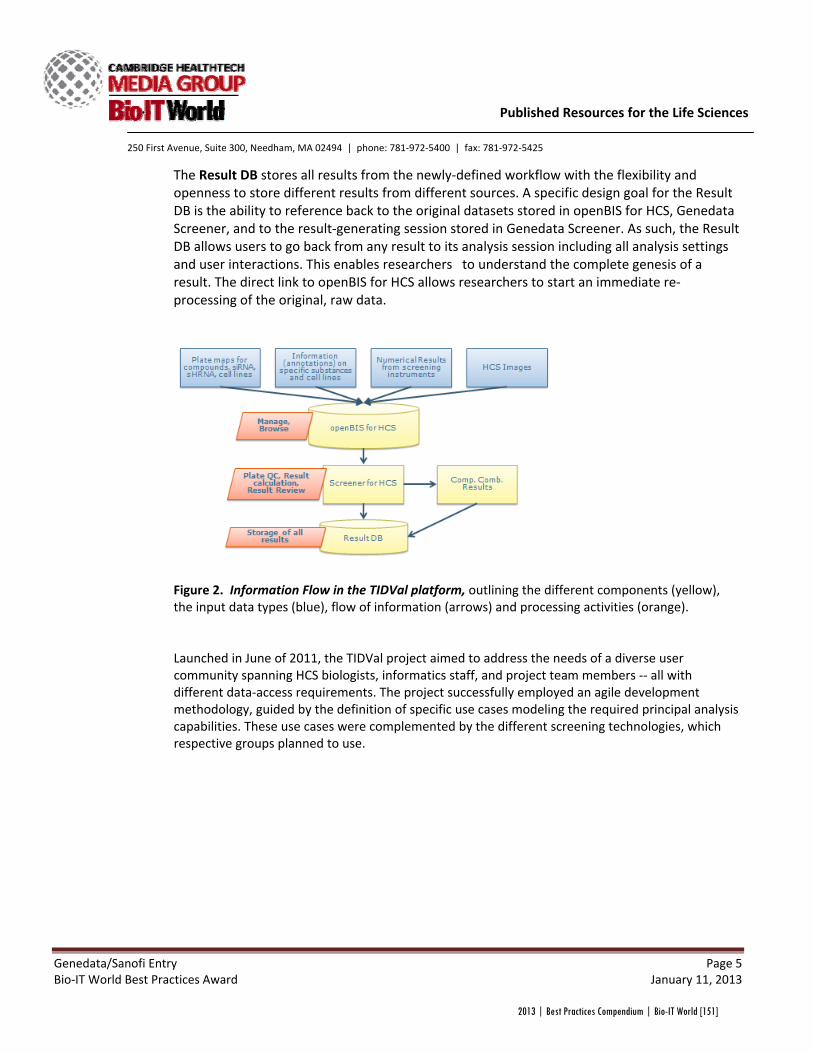
Genedata/Sanofi Entry Page 5 Bio‐IT World Best Practices Award January 11, 2013
250 First Avenue, Suite 300, Needham, MA 02494 | phone: 781‐972‐5400 | fax: 781‐972‐5425
Published Resources for the Life Sciences
The Result DB stores all results from the newly‐defined workflow with the flexibility and openness to store different results from different sources. A specific design goal for the Result DB is the ability to reference back to the original datasets stored in openBIS for HCS, Genedata Screener, and to the result‐generating session stored in Genedata Screener. As such, the Result DB allows users to go back from any result to its analysis session including all analysis settings and user interactions. This enables researchers to understand the complete genesis of a result. The direct link to openBIS for HCS allows researchers to start an immediate re‐processing of the original, raw data.
Figure 2. Information Flow in the TIDVal platform, outlining the different components (yellow), the input data types (blue), flow of information (arrows) and processing activities (orange). Launched in June of 2011, the TIDVal project aimed to address the needs of a diverse user community spanning HCS biologists, informatics staff, and project team members ‐‐ all with different data‐access requirements. The project successfully employed an agile development methodology, guided by the definition of specific use cases modeling the required principal analysis capabilities. These use cases were complemented by the different screening technologies, which respective groups planned to use.
2013 | Best Practices Compendium | Bio-IT World [151]
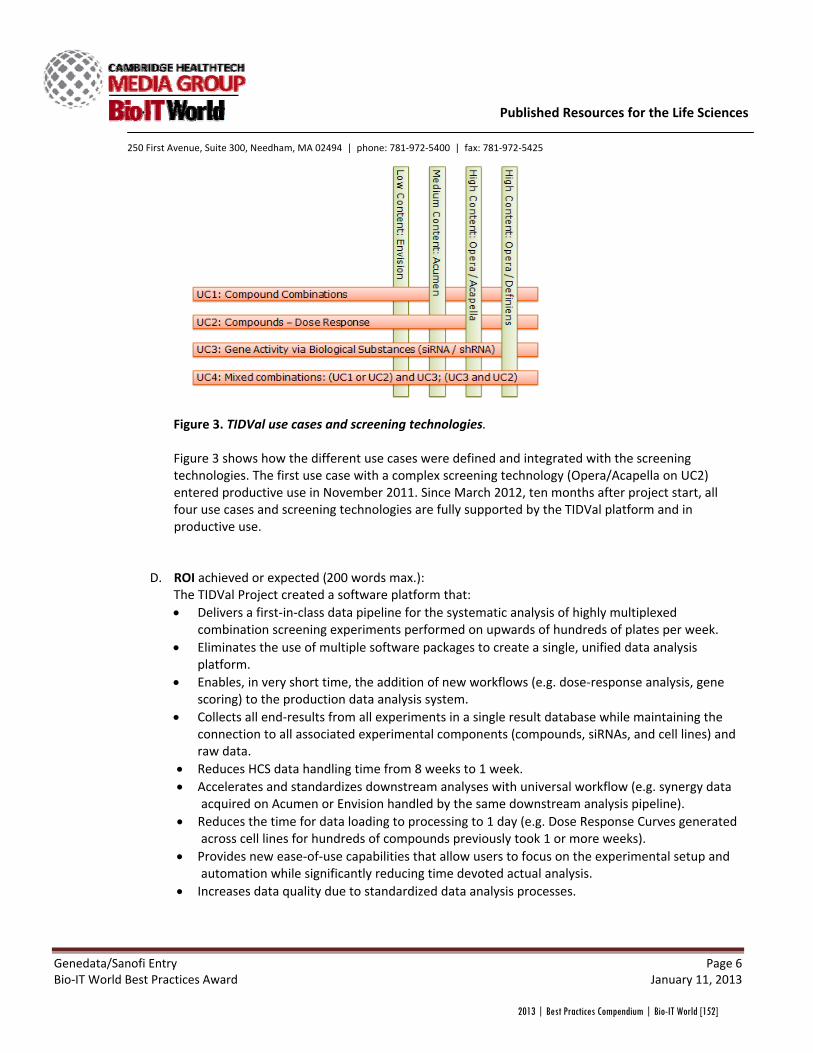
Genedata/Sanofi Entry Page 6 Bio‐IT World Best Practices Award January 11, 2013
250 First Avenue, Suite 300, Needham, MA 02494 | phone: 781‐972‐5400 | fax: 781‐972‐5425
Published Resources for the Life Sciences
Figure 3. TIDVal use cases and screening technologies. Figure 3 shows how the different use cases were defined and integrated with the screening technologies. The first use case with a complex screening technology (Opera/Acapella on UC2) entered productive use in November 2011. Since March 2012, ten months after project start, all four use cases and screening technologies are fully supported by the TIDVal platform and in productive use.
D. ROI achieved or expected (200 words max.):
The TIDVal Project created a software platform that: • Delivers a first‐in‐class data pipeline for the systematic analysis of highly multiplexed
combination screening experiments performed on upwards of hundreds of plates per week. • Eliminates the use of multiple software packages to create a single, unified data analysis
platform. • Enables, in very short time, the addition of new workflows (e.g. dose‐response analysis, gene
scoring) to the production data analysis system. • Collects all end‐results from all experiments in a single result database while maintaining the
connection to all associated experimental components (compounds, siRNAs, and cell lines) and raw data.
• Reduces HCS data handling time from 8 weeks to 1 week. • Accelerates and standardizes downstream analyses with universal workflow (e.g. synergy data
acquired on Acumen or Envision handled by the same downstream analysis pipeline). • Reduces the time for data loading to processing to 1 day (e.g. Dose Response Curves generated
across cell lines for hundreds of compounds previously took 1 or more weeks). • Provides new ease‐of‐use capabilities that allow users to focus on the experimental setup and
automation while significantly reducing time devoted actual analysis. • Increases data quality due to standardized data analysis processes.
2013 | Best Practices Compendium | Bio-IT World [152]
Genedata/Sanofi Entry Page 7 Bio‐IT World Best Practices Award January 11, 2013
250 First Avenue, Suite 300, Needham, MA 02494 | phone: 781‐972‐5400 | fax: 781‐972‐5425
Published Resources for the Life Sciences
E. CONCLUSIONS/implications for the field. This project integrates state‐of‐the‐art HCS technologies to automate screening processes and enables a diversity of research approaches. Using Genedata expertise, the project was created in parallel to implementation of the instrumentation and automation for the automated cell‐line breeding lab. The system’s inherent flexibility and agile design make it amenable to the addition of new technologies and approaches while permitting development with minimal impact on the existing environment and functionality. Unification of both informatics and laboratory automation capabilities will have far‐reaching effects , including the discovery of new targets for oncology drugs, the identification of new combination therapies, and more insights into such drugs’ mechanisms of action.
2013 | Best Practices Compendium | Bio-IT World [153]
Genedata/Sanofi Entry Page 8 Bio‐IT World Best Practices Award January 11, 2013
250 First Avenue, Suite 300, Needham, MA 02494 | phone: 781‐972‐5400 | fax: 781‐972‐5425
Published Resources for the Life Sciences
6. REFERENCES/testimonials/supporting internal documents (If necessary; 5 pages max.)
‐ “A Data Management Framework for High-Throughput, High-Content Screening” Matthew Smicker, January 10, 2012 2012 High Content Analysis Meeting
‐ “An Integrated Genomic and Chemical Screening Platform for Oncology Target Discovery” Serena Silver, October 3, 2012 Functional Genomics Screening Strategies, 2012
‐ openBIS: a flexible framework for managing and analyzing complex data in biology research Bauch, Angela; Adamczyk, Izabela; Buczek, Piotr; Elmer, Franz-Josef; Enimanev, Kaloyan; Glyzewski, Pawel; Kohler, Manuel; Pylak, Tomasz; Quandt, Andreas; Ramakrishnan, Chandrasekhar; Beisel, Christian; Malmström, Lars; Aebersold, Ruedi; Rinn, Bernd (2011). BMC Bioinformatics 12: 468. doi:10.1186/1471-2105-12-468.
‐ “Getting Traction in HCS Informatics”
Oliver Leven, 2010 Innovations in Pharmaceutical Technology issue 34, 2010
- “A Unified Infrastructure for Multi-instrument, Multi-site High Content Screening Data”
Oliver Leven et al., January 12, 2011 2011 High Content Analysis Meeting
‐ “The Software of Choice: Genedata Screener® version 10”
Stephan Heyse et al., February 5, 2012 2012 Society for Laboratory Automation and Screening Conference
2013 | Best Practices Compendium | Bio-IT World [154]
Address: 20 Park Plaza, 4th Floor, Boston, MA 02116 Contact Person: Deanna O’Donnell, Marketing Manager Contact Information: (978) 877‐7913; [email protected] Project Title: Accunet Solutions Completes State‐of‐the‐Art Data Center Build‐Out for the National Cancer Institute’s Frederick National Lab Category: IT Infrastructure Preliminary Abstract Overview: In mid‐2012, Accunet Solutions (Accunet) completed the build‐out of a fully integrated and scalable computing infrastructure for data‐intensive operations at the Frederick National Laboratory for Cancer Research (FNL). Issues Addressed: The next‐generation platform ensures high‐performance “big data” protection, availability and management for a distributed, worldwide network of biomedical researchers. “The system, housed in our new, state‐of‐the‐art R&D facility in Frederick, Maryland, will enable us to keep pace with the escalating amounts of biomedical data that our scientists work with every day,” said Greg Warth, Director of IT Operations at SAIC‐Frederick, Inc., the prime operations and technical support contractor for FNL. Relevant technologies/Products Used in the Project: Fully optimized across all tiers, the efficient, cost‐effective and scalable infrastructure includes:
• Fabric technology and cloud‐capable UCS platform servers from Cisco Systems, Inc.
• Server and data center virtualization technologies from VMware, Inc.
• SAN and NAS storage for Tiers 1‐3 from EMC Corporation and EMC Isilon
• Network data management from CommVault Systems, Inc. Broader Impact for Life Science Community: NCI’s genome sequencing programs aim to connect specific genomic mutations in adult, childhood, lymphoid, and HIV‐associated cancers with clinical outcome data. As the researchers planned for expanded world‐wide access to the increasingly large and complex biomedical database, they correspondingly forecasted potentially serious legacy‐architecture failures. Accunet understood the substance and critical nature of NCI’s work, and designed a viably comprehensive, sophisticated, and scalable infrastructure solution to manage and analyze the “big data.” In mid‐2012, NCI officially shifted IT operations the new resource‐efficient, “green,” and cloud‐capable data center in Frederick, MD. “Informed by our deep experience with the unique IT concerns of bioinformatics organizations, we were able to work side‐by‐side with the visionary National Cancer Institute and SAIC‐Frederick team to architect an Advanced Technology Research Facility solution that is capable of supporting their vital work — both now and in the future.”
2013 | Best Practices Compendium | Bio-IT World [155]

BIO-IT AWARD SUBMISSION ENTRY FORM Nominating Organization Organization Name: Aspera Address: 5900 Hollis Street, Suite E, Emeryville, CA 94608� Nominating Contact Person Name: Francois Quereuil Title: Director of Marketing Phone: 510.849.2386 Email: [email protected] User Organization Organization name: BGI (Beijing Genomics Institute) Address: Beishan Industrial Zone, Yantian District, Shenzhen, 518083, China User Organization Contact Person Name: Sifei He Title: Cloud Product Director Tel: 86‐755‐25273751 Email: [email protected] Project Title: EasyGenomics ™ Bioinformatics Platform Team Leader: (same as above) Category in which entry is being submitted IT infrastructure/HPC: High Performance Computing, storage, Cloud technologies Description of project ABSTRACT/SUMMARY of the project and results (150 words max.) Patented high‐speed file transfer technology from Aspera, creators of next‐generation software technologies that move the world’s data at maximum speed, is an integral feature of EasyGenomics™, a cloud‐based software as a service (SaaS) next‐generation bioinformatics platform developed by the Beijing Genomics Institute (BGI).
2013 | Best Practices Compendium | Bio-IT World [156]
Aspera Connect Server provides a web‐based file transfer framework that serves as the foundation for the website. Using the APIs available in the Aspera Software Development Kit (SDK) and Aspera Developer Network (ADN), Aspera’s fasp™ transport protocol is integrated directly into the EasyGenomics™ web portal, powering high‐speed import and export of terabytes of NGS data to and from the cloud platform. The Aspera platform enables global data exchange at increased speed with full bandwidth utilization, improved reliability and end‐to‐end security ‐‐ regardless of distance and fluctuating network conditions. EasyGenomics™ speeds global collaboration, enabling high‐speed data exchange, easy data and resource management, and point‐to‐click data analysis workflows, including whole genome resequencing, targeted resequencing, RNA‐Seq, small RNA and De novo assembly.
INTRODUCTION/background/objectives BGI, the world’s largest genomics organization, was faced with the challenge of sharing large volumes of data between internationally dispersed sample collectors, data analyzers and researchers, a process that has been plagued by unreliable transfers and slow connection speeds due to the inherent throughput bottlenecks of traditional transfer technologies. BGI needed a high‐speed file transfer solution that would allow users to rapidly upload sequencing data to the cloud for processing and then quickly download completed projects, speeding up the data analysis process for customers, and providing a more efficient, cost‐effective data collection and sharing process.
RESULTS (highlight major R&D/IT tools deployed; innovative uses of technology). BGI—along with three participating organizations—China Education and Research Network (CERNET), the National Science Foundation (NSF) and Indiana University—successfully demonstrated genomic data transfer at a sustained rate of almost 10 Gigabits per second (Gbps) over a new link connecting US and China research and education networks. This data rate is equivalent to moving more than 100 million megabytes in a single day.
BGI also transferred 24 Gigabytes of genomic data from Beijing to UC Davis in less than 30 seconds. A file of the same size sent over the public Internet a few days earlier took more than 26 hours.
The speeds demonstrated are, to our knowledge, the fastest file transfers over public wide area networks at such distances using commodity hardware, and make
2013 | Best Practices Compendium | Bio-IT World [157]
possible a host of new data intensive applications in genomics analysis and medicine in which geography is truly no limit.
ROI achieved or expected (200 words max.): In addition to saving hard costs of shipping data‐filled disks, cloud‐based file transport and streamlined global workflows eliminate the risk of upfront IT investments and allow BGI and other organizations to scale out and back by quickly adding or removing resources ‐‐ paying only for the capacity used. Specifics to be added. CONCLUSIONS/implications for the field. While the cost of DNA sequencing is steadily decreasing, the amount of data generated with next‐generation sequencing (NGS) technologies is growing at an unprecedented pace. In the age of Big Genomics Data, how to conveniently share the tremendous volume of data has become a significant research bottleneck. In addition to enhancing genomic data transfer times, speeding and enhancing global collaboration and providing new tools for data sharing, Aspera technology delivers precise rate control guaranteeing transfer times, fully utilizing BGI’s 10 Gbps of available bandwidth while prioritizing other network traffic.
Built‐in, enterprise‐grade security features include user authentication, data encryption, and data integrity verification, protecting valuable genomics data during the entire transfer process. Open APIs allow easy integration into systems, services and hardware.
REFERENCES/testimonials/supporting internal documents
Cloud infrastructure diagram: http://asperasoft.com/technology/platforms/cloud/
Sifei He, BGI Cloud Product Director:
“Aspera is the industry standard for the transport and management of large data files produced by life sciences,” said BGI’s cloud product director Sifei He.“Aspera’s superior file transfer speed, bandwidth management and reliability coupled with
2013 | Best Practices Compendium | Bio-IT World [158]
BGI’s newly released “EasyGenomics™ bioinformatics platform delivers a powerful solution for our customers and collaborators.” Dr. Dawei Lin, Director of Bioinformatics Core of Genome Center:
“The 10 Gigabit network connection is even faster than transferring data to most local hard drives. The use of a 10 Gigabit network connection will be groundbreaking, very much like email replacing hand‐delivered mail for communication. It will enable scientists in the genomics‐related fields to communicate and transfer data more rapidly and conveniently, and bring the best minds together to better explore the mysteries of life science.”
2013 | Best Practices Compendium | Bio-IT World [159]

250 First Avenue, Suite 300, Needham, MA 02494 | phone: 781-972-5400 | fax: 781-972-5425
Published Resources for the Life Sciences
1. Nominating Organization A. Nominating Organization NVIDIA 2701 San Tomas Expressway Santa Clara, CA 95050 B. Nominating Contact Person George Millington Senior PR Manager 408-562-7226 [email protected]
2. User Organization A. User Organization Centers for Disease Control and Prevention (CDC) and Georgia Institute of Technology
B. User Organization Contact Person Mitchel D. Horton, Research Scientist Georgia Institute of Technology 2621 Sevier Avenue Knoxville, TN 37920 (865) 221-5476 [email protected]
3. Project Title: Acceleration of Hepatitis E Modeling with Keeneland GPU-based Supercomputer at Georgia Institute of Technology
Team Members: Mitchel D. Horton – Georgia Institute of Technology Kyle L. Spafford – Oak Ridge National Laboratory Jeremy S. Meredith – Oak Ridge National Laboratory Michael A. Purdy – CDC Jeffery S. Vetter – Georgia Institute of Technology & Oak Ridge National Laboratory
4. Category in which entry is being submitted (1 category per entry, highlight your choice) Clinical & Health-IT: Trial design, eCTD, EDC, ePrescribing, RHIOs, EMR/PHR IT infrastructure/HPC: High Performance Computing, storage, Cloud technologies Informatics: LIMS, data visualization, imaging technologies, NGS analysis Knowledge Management: Data mining, idea/expertise mining, text mining, collaboration, resource
optimization
2013 | Best Practices Compendium | Bio-IT World [160]
250 First Avenue, Suite 300, Needham, MA 02494 | phone: 781-972-5400 | fax: 781-972-5425
Published Resources for the Life Sciences
X Research & Drug Discovery: Disease pathway research, applied and basic research, compound-focused research, drug safety
Personalized & Translational Medicine: Responders/non-responders, biomarkers, Feedback loops, predictive technologies
5. Description of project (4 FIGURES MAXIMUM):
A. ABSTRACT/SUMMARY Hepatitis E is a global endemic liver disease. Hepatitis E virus transmission and population dynamics is complex. Analysis of these dynamics and transmission patterns with Bayesian statistics can take two weeks to more than two months. Researchers at the Centers for Disease Control and Prevention (CDC) and Georgia Institute of Technology leveraged supercomputing resources to accelerate the analysis of hepatitis E virus sequence information. Using the Keeneland supercomputer with NVIDIA Tesla GPU accelerators, the researchers achieved a 300X improvement in their analysis time versus an analysis run on multi-core CPU-based systems. Results that would have taken 12 days are now available in approximately one hour. This research advances the science of molecular epidemiology to better identify hepatitis E virus dynamics and transmission behavior. This information can potentially help researchers develop effective treatments to minimize the spread and impact of hepatitis E infections and similar viruses.
B. INTRODUCTION
Hepatitis E is a global endemic liver disease, commonly spread via contaminated drinking water. It is particularly dangerous for pregnant women in developing countries, as a hepatitis E infection is typically much more serious than has been observed in other regions, and has proven fatal in 10 to 30 percent of cases. Hepatitis E is also a rare cause of liver failure in the United States. When the hepatitis E virus is transmitted, it generates a million or more minor sequence variations in a single milliliter of blood. Analyzing these variations and transmission patterns can take two weeks to more than two months. The analysis of these sequences in an outbreak through the use of Bayesian statistics can lead to an understanding of the population dynamics and molecular epidemiology of the outbreak. Researchers at the Georgia Institute of Technology and CDC have leveraged supercomputing resources to accelerate the analysis of hepatitis E virus sequence information. The focus of their work is to determine the molecular epidemiology of the virus, as well as the course it takes during an outbreak. The ultimate goal is to quickly identify virus variations and transmission behavior,
2013 | Best Practices Compendium | Bio-IT World [161]
250 First Avenue, Suite 300, Needham, MA 02494 | phone: 781-972-5400 | fax: 781-972-5425
Published Resources for the Life Sciences
which can potentially enable researchers to developing effective treatments to minimize the spread and impact of hepatitis E infections.
C. RESULTS Researchers at the Georgia Institute of Technology and CDC leveraged supercomputing resources to accelerate the analysis of hepatitis E virus sequence information, in order to determine the molecular epidemiology of the virus, as well as the course it takes during an outbreak through the analysis of viral population dynamics. They conducted their research on the Keeneland supercomputer located at Oak Ridge National Laboratory in Oak Ridge, Tennessee, which is equipped with NVIDIA Tesla M2090 GPU accelerators. GPU accelerators are ultra-high performance, power-efficient computer processors designed for high performance computing (HPC), computational science and supercomputing. Delivering dramatically higher application acceleration for a range of scientific and commercial applications than a CPU-only approach, NVIDIA GPU accelerators enable breakthrough research across multiple scientific disciplines, and power some of the world’s most powerful supercomputers, including the current No. 1 system, the Titan supercomputer at Oak Ridge National Laboratory. Using the Keeneland Tesla GPU-based system, researchers achieved a 300X improvement in their analysis time versus analysis run on multi-core CPU-based systems.
D. ROI
Using the Keeneland supercomputer equipped with NVIDIA Tesla M2090 GPUs, the researchers were able to dramatically increase the speed of their analysis of hepatitis E virus sequence information. They achieved a 300X improvement in their analysis time as compared to running the same analysis on multi-core CPU-based systems. With this significant performance increase, results that would have taken 12 days are now available in approximately one hour. This increase in speed allows more rapid analysis of hepatitis E virus sequences and efforts are under way to analyze hepatitis E virus outbreaks to improve knowledge of molecular epidemiology of this virus.
E. CONCLUSIONS
This research advances the science of molecular epidemiology through computational science to better identify hepatitis E virus variations and transmission behavior. It also helps advance understanding of the long-term evolution of the virus. Armed with this information, in the future researchers can potentially develop effective treatments to minimize the spread and impact of hepatitis E infections and similar viruses.
2013 | Best Practices Compendium | Bio-IT World [162]
250 First Avenue, Suite 300, Needham, MA 02494 | phone: 781-972-5400 | fax: 781-972-5425
Published Resources for the Life Sciences
In addition, the research will provide to the broader scientific community a greater understanding and lessons learned in accelerating computational science with GPU accelerator technology, insight into the field of molecular epidemiology of hepatitis E, and meet CDC’s mission and vision to improve prevention of illness, disability and death.
6. REFERENCES
Mast, E. E., M. A. Purdy, and K. Krawczynski. (1996). "Hepatitis E." Baillieres Clin.Gastroenterol. 10(2): 227-242.
Purdy, M. A. and Y. E. Khudyakov (2010). “Evolutionary history and population dynamics of hepatitis E virus.” PLoS ONE 5(12): e14376. http://www.plosone.org/article/info%3Adoi%2F10.1371%2Fjournal.pone.0014376 Purdy, M. A. and Y. E. Khudyakov (2011). “The molecular epidemiology of hepatitis E virus infection.” Virus Research 161(1): 31-39. http://www.sciencedirect.com/science/article/pii/S0168170211001675
2013 | Best Practices Compendium | Bio-IT World [163]

250 First Avenue, Suite 300, Needham, MA 02494 | phone: 781‐972‐5400 | fax: 781‐972‐5425
Published Resources for the Life Sciences
Bio‐IT World 2013 Best Practices Awards
1. Nominating Organization (Fill this out only if you are nominating a group other than your own.) A. Nominating Organization Organization name: Convey Computer Corporation Address: 1302 E. Collins Boulevard, Richardson, Texas 75081 B. Nominating Contact Person Name: Alison Golan Title: Public Relations, Convey Computer Tel: 904‐230‐3369 Email: [email protected]
2. User Organization (Organization at which the solution was deployed/applied)
A. User Organization Organization name: The Genome Analysis Centre (TGAC) Address: Norwich Research Park Norwich NR4 7UH UK
B. User Organization Contact Person Name: Dr. Mario Caccamo Title: Deputy Director of TGAC Tel: +44 1603 450861 Email: [email protected]
3. Project Title: "Accelerated Trait Analysis for Advances in Food and Biofuels"
Team Leader: Dr. Mario Caccamo, Deputy Director and Head of Bioinformatics at TGAC Contact details if different from above: Team members – name(s), title(s) and company (optional):
2013 | Best Practices Compendium | Bio-IT World [164]
250 First Avenue, Suite 300, Needham, MA 02494 | phone: 781‐972‐5400 | fax: 781‐972‐5425
Published Resources for the Life Sciences
4. Category in which entry is being submitted (1 category per entry, highlight your choice) Clinical & Health‐IT: Trial design, eCTD, EDC, ePrescribing, RHIOs, EMR/PHR
x IT infrastructure/HPC: High Performance Computing, storage, Cloud technologies Informatics: LIMS, data visualization, imaging technologies, NGS analysis Knowledge Management: Data mining, idea/expertise mining, text mining, collaboration, resource optimization
Research & Drug Discovery: Disease pathway research, applied and basic research, compound‐focused research, drug safety
Personalized & Translational Medicine: Responders/non‐responders, biomarkers, Feedback loops, predictive technologies
(Bio‐IT World reserves the right to re‐categorize submissions based on submission or in the event that a category is refined.) 5. Description of project (4 FIGURES MAXIMUM):
A. ABSTRACT/SUMMARY of the project and results (150 words max.)
The installation of two hybrid‐core Convey HC‐1ex computers by The Genome Analysis Centre (TGAC) is not only accelerating efforts to identify important gene variants in wheat; it’s also showcasing the critical role heterogeneous computing is playing in genomics research.
Founded in 2009 and based in Norwich, U.K., TGAC focuses on the use of next generation sequencing and bioinformatics to advance the food and biofuel industries. The two Convey HC‐1ex systems are the latest addition to TGAC’s powerful computing infrastructure, which already includes one of the world’s largest Red Hat Linux ccNUMA systems (2560 cores, 20TB RAM), a 3000 core Linux cluster and 5 petabytes of storage. By installing hybrid‐core Convey HC‐1ex systems, TGAC expanded their ccNUMA and cluster‐based HPC environment to include leading edge, heterogeneous computing capabilities.
INTRODUCTION/background/objectives
OBJECTIVE: * Assemble leading edge HPC infrastructure necessary for advanced genomics research
* Accelerate re‐sequencing efforts searching for gene variants in plants and animals
TGAC, based in the U.K., is an aggressive adopter of advanced sequencing and IT technology. TGAC is one of seven institutes that receives strategic funding from the U.K.’s Biotechnology and Biological Sciences Research Council (BBSRC). BBSRC’s broad mission is to support innovation in non‐biomedical bioscience in the U.K. and around the world.
2013 | Best Practices Compendium | Bio-IT World [165]
250 First Avenue, Suite 300, Needham, MA 02494 | phone: 781‐972‐5400 | fax: 781‐972‐5425
Published Resources for the Life Sciences
In 2012, TGAC deployed two Convey HC‐1ex hybrid‐core systems for advanced genomics research. “No single tool is right for all tasks,” noted Dr. Mario Caccamo, Deputy Director and Head of Bioinformatics at TGAC. “Heterogeneous computing shows a significant performance improvement in certain computationally intensive applications.” TGAC is a key member of the International Wheat Genome Sequencing Consortium (IWGSC) and was on the team that recently demonstrated how next‐generation sequencing could be used effectively to fine map genes in polyploid wheat. Among other things, TGAC is leveraging Convey’s architecture to accelerate computationally challenging jobs such as resequencing various wheat strains to identify favorable traits. Besides wheat, TGAC has worked on the rubber tree, tomato, pig and bovine species, and animal diseases.
B. RESULTS (highlight major R&D/IT tools deployed; innovative uses of technology). * Expanded cluster‐based HPC with heterogeneous computing capability by installing hybrid‐core
Convey HC‐1ex systems
* Offloaded bioinformatics (e.g. BWA) that run slowly on the large cluster to Convey HC‐1ex hardware to speed execution
* Galaxy‐based workflow makes it easy for biologists to launch Convey accelerated analysis
According to Dr. Caccamo, TGAC users need to analyze data quickly and precisely, which takes time on clusters. “We offloaded some of our sequence alignment demand to the Convey hybrid‐core systems, because they can handle the alignment algorithms much more efficiently. Using the Convey systems, the initial performance jump we have seen on computationally intense applications, such as resequencing data analysis, is a major improvement,” explained Dr. Caccamo
Convey’s hybrid‐core architecture achieves performance gains by pairing classic Intel® x86 microprocessors with a coprocessor comprised of FPGAs. Particular algorithms are optimized and translated into code that’s loadable onto the coprocessor at runtime. Convey architecture also features a highly parallel memory subsystem, which removes memory bottlenecks inherent to commodity servers. The overall result is a dramatic speed‐up for applications that can be parallelized. Speeding up BWA (Burrows‐Wheeler Aligner) is a good example. Besides performing alignment for research purposes, virtually all next‐generation sequencing centers—including TGAC—conduct contamination screening to ensure the integrity of the data. Screening is part of our primary analysis workflow. Every job we do undergoes it,” said Dr. Caccamo.
2013 | Best Practices Compendium | Bio-IT World [166]
250 First Avenue, Suite 300, Needham, MA 02494 | phone: 781‐972‐5400 | fax: 781‐972‐5425
Published Resources for the Life Sciences
Instrument reads are screened against likely contaminant reference sequences using BWA. Any identified contaminant segments can then be removed. Convey’s implementation of BWA, optimized to run on its hybrid‐core platform, can dramatically speed this recurring task—which typically consumes a significant portion of a sequencing center’s compute time. “Using the Convey system, we are seeing a 15x acceleration running BWA compared to running it on our x86 cluster,” explained Caccamo. With the Convey machines deployed, TGAC is now implementing a Galaxy‐based workflow interface to hide the complexity of TGAC’s sophisticated computational infrastructure and make it easy for biologist collaborators to launch analysis pipelines. “We want to ensure when a user says ‘I want to run this BWA job,’ he or she doesn’t need to know whether it’s running on the Convey system or elsewhere on the cluster or ccNUMA systems,” explained Dr. Caccamo. “For now, most users of the Convey systems are on my staff, but we will soon extend reach to collaborators.”
C. ROI achieved or expected (200 words max.): * BWA application 15x faster than previously possible;
* Improvements in both overall throughput and individual project completion time
Convey’s implementation of BWA, optimized to run on its hybrid‐core platform, dramatically speeds the recurring task of contamination screening. Because this task is part of TGAC’s primary analysis workflow ‐‐ every job they do undergoes it – the process typically consumes a significant portion of a sequencing center’s compute time. Using the Convey system, TGAC is seeing a 15x acceleration running BWA compared to running it on our x86 cluster, which is a tremendous time savings for them. “The initial performance jump we have seen is a major improvement,” concluded Dr. Caccamo. “We expect to achieve even better performance in the future as we gain experience using the Convey platform.”
D. CONCLUSIONS/implications for the field.
Implications of heterogeneous computing for the field: Heterogeneous computing is a growing trend in this industry to improve performance. Many bioinformatics applications commonly experience bandwidth limitations. Convey’s highly parallel memory approach allows application‐specific logic to directly address individual words
2013 | Best Practices Compendium | Bio-IT World [167]

250 First Avenue, Suite 300, Needham, MA 02494 | phone: 781‐972‐5400 | fax: 781‐972‐5425
Published Resources for the Life Sciences
in memory, increasing effective memory bandwidth for random access to memory compared with cache‐based memory typically found on commodity servers.
“We’re pleased to be working with BBSRC and TGAC in support of their mission to advance bioscience,” said Dr. George Vacek, Director of Convey Computer’s Life Sciences business unit. “It’s increasingly clear more than one HPC approach is needed to efficiently tackle the full scope of genomics research. Hybrid‐core computing has a major role to play, because it accelerates many key bioinformatics applications in an easy to use and economical way.”
Implications for the field concerning the accelerated work conducted at TGAC:
TGAC is the newest of the seven BBSRC institutes; roughly half of its staff is devoted to bioinformatics and half to the lab. Besides the state of the art computational infrastructure, TGAC has several next‐generation sequencers from different suppliers. Working with advanced NGS technology and developing associated bioinformatics to analyze and present the data are important elements of TGAC’s mission.
1. REFERENCES/testimonials/supporting internal documents (If necessary; 5 pages max.)
2013 | Best Practices Compendium | Bio-IT World [168]

250 First Avenue, Suite 300, Needham, MA 02494 | phone: 781‐972‐5400 | fax: 781‐972‐5425
Published Resources for the Life Sciences
Bio‐IT World 2013 Best Practices Awards
1. Nominating Organization (Fill this out only if you are nominating a group other than your own.)
2. User Organization (Organization at which the solution was deployed/applied)
A. User Organization The project is the result of the cooperation between 2 universities. Therefore I have added two addresses. Organization name: Karlsruhe Institute of Technology Address: Hermann von Helmholtzplatz 1 76344 Eggenstein – Leopoldshafen Germany BioQuant University of Heidelberg Im Neuenheimer Feld 267 D‐69120 Heidelberg Germany B. User Organization Contact Person Name: Jos van Wezel Title: head storage department Tel: +49 721 608 26305 Email: [email protected]
3. Project Title:
Team Leader: Marc Hemberger (BioQuant) and Jos van Wezel (KIT) Contact details if different from above: Name: Marc Hemberger Title: Head IT department Tel: +49 6221 5451300 Email: [email protected]‐heidelberg.de Team members – name(s), title(s) and company (optional):
2013 | Best Practices Compendium | Bio-IT World [169]
250 First Avenue, Suite 300, Needham, MA 02494 | phone: 781‐972‐5400 | fax: 781‐972‐5425
Published Resources for the Life Sciences
Ariel Garcia, LSDF project coordinator at KIT Rainer Stotzka, LSDF head software development at KIT
4. Category in which entry is being submitted (1 category per entry, highlight your choice)
Clinical & Health‐IT: Trial design, eCTD, EDC, ePrescribing, RHIOs, EMR/PHR IT infrastructure/HPC: High Performance Computing, storage, Cloud technologies Informatics: LIMS, data visualization, imaging technologies, NGS analysis Knowledge Management: Data mining, idea/expertise mining, text mining, collaboration, resource optimization
Research & Drug Discovery: Disease pathway research, applied and basic research, compound‐focused research, drug safety
Personalized & Translational Medicine: Responders/non‐responders, biomarkers, Feedback loops, predictive technologies
(Bio‐IT World reserves the right to re‐categorize submissions based on submission or in the event that a category is refined.) 5. Description of project (4 FIGURES MAXIMUM):
A. ABSTRACT/SUMMARY of the project and results (150 words max.) Leveraging its expertise and capitalizing on its data centre infrastructure the Steinbuch Center for Computing (SCC) of the Karlsruhe Institute of Technology (KIT) together with BioQuant, the Center for “Quantitative Analysis of Molecular and Cellular Biosystems” at Heidelberg University, joint forces and built a shared Large Scale Data Storage and Analysis facility (LSDF) which efficiently and reliably stores data at petabyte‐scale size for systems biology and genome research at BioQuant (Heidelberg) and many other communities at KIT (Karlsruhe). Scientists of the 50 km distributed facility, can draw from the available IT expertise at SCC while IT staff of SCC can use the experience gained from the LSDF for their research in data intensive computing. Using state of the art technologies (hadoop, 100 gigabit networking, large data archives, special data management tools etc.) the facility allows the processing of high speed genome sequencing devices and automated high throughput microscope screens and analysis of the output of several other novel imaging technologies in use at both interconnected sites.
B. INTRODUCTION/background/objectives The LSDF has been constructed to serve research by diverse biologists communities at BioQuant and at KIT. Next to biology, at KIT the LSDF serves several other disciplines that have expressed their need for an efficient, secure and economically feasible IT Infrastructure. The Scientific communities at BioQuant and at KIT are delivering massive amounts of observation data to which recently output files of genome
2013 | Best Practices Compendium | Bio-IT World [170]
250 First Avenue, Suite 300, Needham, MA 02494 | phone: 781‐972‐5400 | fax: 781‐972‐5425
Published Resources for the Life Sciences
sequencing machines and images from e.g. high throughput and the novel light‐sheet microscopes 1 were added. In order to be able to store and process the data streams that already deliver tens of TB per day, teams from BioQuant and the Steinbuch Centre for Computing (SCC) designed a distributed data infrastructure with locations in Heidelberg and Karlsruhe. The infrastructure currently comprises 12 PB of on line storage, 6 PB archival storage and a cluster of 52 compute nodes and funding for further expansion in the coming years is already secured. Both organizations benefit from the arrangement scientifically and economically.
C. RESULTS (highlight major R&D/IT tools deployed; innovative uses of technology).
The technical concept is based on existing data management techniques which include commercial, open source products developed for Grid computing and novel tools developed specifically for operation of the LSDF. SCC runs the ‘GridKa’ compute and storage cluster which is the German T1 vor the World Wide LHC Computing Grid. Analog to the proven WLCG architecture the LSDF has several storage tiers. A tiered storage structure comprises high speed storage, local to the acquisition system (Tier 0), via intermediate (Tier 1) buffer storage to low latency (Tier 2) archival storage. Automatic data movement between the tiers is driven by the computing applications and enabled with open source middleware, commercial applications special purpose tools.
1 P.J. Keller, A.D. Schmidt, J. Wittbrodt, E.H.K. Stelzer: Reconstruction of Zebrafish Early Embryonic Development by Scanned Laser Light Sheet Microscopy. Science, 2008. DOI: 10.1126/science.1162493
2013 | Best Practices Compendium | Bio-IT World [171]

250 First Avenue, Suite 300, Needham, MA 02494 | phone: 781‐972‐5400 | fax: 781‐972‐5425
Published Resources for the Life Sciences
The experiment data flow from source to destination involves a number of data copies. At time of acquisition the data is labeled and an identifier is entered into a central, measurement specific meta‐data database. The meta‐data database couples the location of the data with a globally unique identifier which allows off site searches and references. Data in the LSDF is archived on tape currently being the most economic media for data storage. Although access to archived data incurs an access penalty, the meta‐data framework allows data searches without reading the actual data. Therefore in many case the data can be selected at forehand and retrieved from the archive via automated procedures running overnight. Because many tools from the particle physics community are used, data management in the LSDF can rely on high-quality and above all ‘high performance’ software with a proven track record in the computing framework of the LHC of CERN.
D. ROI achieved or expected (200 words max.):
Data intensive computing and data mining technologies made possible by the LSDF bring about new scientific discoveries and will increase the scientific information velocity. Two institutes are able to double the investment in equipment which resulted in very competitive storage costs because of the economy of scale. The infrastructure itself is more reliable and has an increased availability because hardware and services are distributed. Last but not least scientists of different domains are sharing publications. This ‘pays’ for the work done by computer scientists in developing and running the LSDF who at the same time have a platform for where they can try innovations in a controlled realm.
2013 | Best Practices Compendium | Bio-IT World [172]
250 First Avenue, Suite 300, Needham, MA 02494 | phone: 781‐972‐5400 | fax: 781‐972‐5425
Published Resources for the Life Sciences
E. CONCLUSIONS/implications for the field. The large shared infrastructure is beneficial for each of the two partner of the LSDF. Biology research at BioQuant and applied IT engineering at SCC stay competitive in their respective field by mutual fertilization and increased scientific production using a cost effective storage infrastructure.
1. REFERENCES/testimonials/supporting internal documents (If necessary; 5 pages max.)
The LSDF was inaugurated with festive meetings on each location:
- KIT, February 2011, “Mastering big data in science”, http://www.scc.kit.edu/en/research/lsdf-kolloquium.php - BioQuant May 2011, “First Byte Symposium”, http://www.bioquant.uni-heidelberg.de/about-
us/organization/bioquant-it/it-service/workshops/first-byte-symposium-may-26-2011.html
Research described in the following publications was accomplished on the LSDF:
- Jones, Jäger et al. 2012, Dissecting the genomic complexity underlying medulloblastoma. Nature, 488(7409): 100-105
- García, A.; Bourov, S.; Hammad, A.; Hartmann, V.; Jejkal, T.; Otte, J. C. ; Pfeiffer, S.; Schenker, T.; Schmidt, C.; Neuberger, P.; Stotzka, R.; van Wezel, J.; Neumair, B.; Streit, A. , Data-intensive analysis for scientific experiments at the Large Scale Data Facility Proceedings of the IEEE Symposium on Large-Scale Data Analysis and Visualization (LDAV 2011), IEEE Computer Society Press, 2011, pages 125-126, http://dx.doi.org/10.1109/LDAV.2011.6092331
- Garcia, A.; Bourov, S.; Hammad, A.; van Wezel, J.; Neumair, B.; Streit, A.; Hartmann, V.; Jejkal, T.; Neuberger, P.; Stotzka, R. The Large Scale Data Facility: data intensive computing for scientific experiments Proceedings of the 25th IEEE International Parallel & Distributed Processing Symp. (IPDPS-11), IEEE Computer Society, 2011, pages 1467-1474, http://dx.doi.org/10.1109/IPDPS.2011.286
- Rausch, et al. 2012, Genome Sequencing of Pediatric Medulloblastoma Links Catastrophic DNA Rearrangements with TP53 Mutations. Cell, 148(1-2): 59–71
- Richter, Schlesner et al. 2012, Recurrent mutation of the ID3 gene in Burkitt lymphoma identified by integrated genome, exome and transcriptome sequencing. Nature Genetics, advance online publication. 11 November 2012
- Stotzka, R.; Hartmann, V.; Jejkal, T.; Sutter, M.; van Wezel, J.; Hardt, M.; Garcia, A.; Kupsch, R.; Bourov, S. Perspective of the Large Scale Data Facility (LSDF) supporting nuclear fusion applications Proceedings of the 19th International Euromicro Conference on Parallel, Distributed, and Network-Based Processing (PDP 2011), IEEE Computer Society, 2011, pages 373-379, http://dx.doi.org/10.1109/PDP.2011.59
2013 | Best Practices Compendium | Bio-IT World [173]
250 First Avenue, Suite 300, Needham, MA 02494 | phone: 781‐972‐5400 | fax: 781‐972‐5425
Published Resources for the Life Sciences
Bio‐IT World 2013 Best Practices Awards
1. Nominating Organization (Fill this out only if you are nominating a group other than your own.)
A. Nominating Organization Organization name: Merck & Co., Inc Address: One Merck Drive, Whitehouse Station New Jersey, USA 08889 B. Nominating Contact Person Name: Cathy Carfagno Title: Associate Director Communication & Change External Partner Portal Program Tel: 610‐291‐4794 Email: [email protected]
2. User Organization (Organization at which the solution was deployed/applied)
A. User Organization Organization name: Merck & Co., Inc Address: One Merck Drive, Whitehouse Station New Jersey, USA 08889 B. User Organization Contact Person Name: Andy Porter Title: Director IT Architecture Tel: +1 908‐ 423 4034 Email: Porter, Andrew K <[email protected]>
3. Project Title:
Project Title: Redefining the business‐to‐business research engagement through Life‐Sciences Identity Broker in the Cloud Team Leader: Phyllis Post Program Director: Andrea Kirby Team members – See supporting materials
4. Category in which entry is being submitted (1 category per entry, highlight your choice)
Clinical & Health‐IT: Trial design, eCTD, EDC, ePrescribing, RHIOs, EMR/PHR
2013 | Best Practices Compendium | Bio-IT World [174]
250 First Avenue, Suite 300, Needham, MA 02494 | phone: 781‐972‐5400 | fax: 781‐972‐5425
Published Resources for the Life Sciences
X IT infrastructure/HPC: High Performance Computing, storage, Cloud technologies Informatics: LIMS, data visualization, imaging technologies, NGS analysis Knowledge Management: Data mining, idea/expertise mining, text mining, collaboration, resource optimization
Research & Drug Discovery: Disease pathway research, applied and basic research, compound‐focused research, drug safety
Personalized & Translational Medicine: Responders/non‐responders, biomarkers, Feedback loops, predictive technologies
(Bio‐IT World reserves the right to re‐categorize submissions based on submission or in the event that a category is refined.) 5. Description of project (4 FIGURES MAXIMUM):
A. ABSTRACT/SUMMARY of the project and results The traditional model of centralized R&D in the pharmaceutical industry is moving towards a distributed, global operating model that emphasizes communication and collaboration with external partners. Another trend in information technology is to move from on‐premises deployment of software to a distributed architectural model leveraging the cloud for the delivery of software and services. Merck partnered with Exostar to redefine business‐to‐business engagements by creating a Life‐Sciences Identity Broker in the Cloud. This secure cloud‐based hub is where teams from multiple companies can access any number of technology services through a multi‐tenant identity broker, protecting sensitive data and intellectual property from unauthorized access. The result included the reduction of time to stand up business‐to‐business collaborations, minimized administrative cost, and elimination of the need to replicate redundant technology infrastructure. In addition, the model improves the security and risk profiles for these teams by moving away from point‐to‐point engagements to a highly‐scalable service model that can be monitored and protected from outside threats. These benefits are expected to deliver an ROI of $2‐3 million through 2014.
B. INTRODUCTION/background/objectives
2013 | Best Practices Compendium | Bio-IT World [175]
250 First Avenue, Suite 300, Needham, MA 02494 | phone: 781‐972‐5400 | fax: 781‐972‐5425
Published Resources for the Life Sciences
Over the past five years, the Pharmaceutical / Life Sciences industry has continued to evolve. The move from monolithic organizations, controlling the full product lifecycle from idea to distribution, to a system integrator model leveraging external partners has introduced new requirements for businesses. The ability to successfully engage partners in research, trials, design, development, manufacturing and distribution has become a differentiator in the industry. The Merck business model includes teams distributed across the globe. Allowing these teams to quickly connect and share information created new risks to security and data control. The administration required to manage these distributed teams was growing and the infrastructure investment was following closely behind. The scalability, cost, and risk profiles of establishing numerous point‐to‐point connections were a growing concern. Feedback from the product teams and partners indicated that the process to get connected was not fast enough to support the business need. Teams were utilizing unapproved technologies as temporary solutions while they waited for the IT team to get them connected to approved services. These workarounds might carry on for extended periods, as they were seen as easier to use than the approved services. Getting partners connected was quickly becoming a business‐critical function.
C. RESULTS (highlight major R&D/IT tools deployed; innovative uses of technology). In response to this shift in the delivery model, Merck identified the need for a solution that could facilitate and simplify partner engagements across the product lifecycle. Two driving principles emerged in the effort to address this need: First, the solution had to be easy to use or the partner community would not engage; and Second, the solution had to deliver efficiencies that would positively impact Merck and each of the partners so that the business case to invest in this change would be supported across the community. In order to assess options to address the partner connection and information sharing challenge, the Merck team looked to others in Life Sciences, as well as to other industries, to see if there was a best practice for connecting this type of partner community. The Merck team found a similar partner community that was successfully deployed for the Aerospace & Defense (A&D) community. The A&D industry was similarly challenged with a broad and diverse supplier base, 100,000+ suppliers distributed globally, and compliance‐regulated, sensitive content that required a highly‐secure infrastructure to reduce the risk of data loss. This community was connected via an identity hub called Managed Access Gateway, a cloud‐based service offering delivered by Exostar LLC. The Exostar hub service provides a central, connect‐once identity broker which enables validated users to establish federated connections that support single sign‐on (SSO) to applications that are
2013 | Best Practices Compendium | Bio-IT World [176]
250 First Avenue, Suite 300, Needham, MA 02494 | phone: 781‐972‐5400 | fax: 781‐972‐5425
Published Resources for the Life Sciences
connected to the hub. The hub included federated connections from five global A&D industry leaders, recognized government (DoD) issued credentials and delivered a user identity service that ensured the broad partner community could securely access the application services connected to the hub. This seemed like an excellent model for the Pharma/Life Sciences industry to consider. Merck engaged the Exostar team to build out a similar cloud‐based identity hub for Life Sciences, named Secure Access Manager (SAM), which is now in production. The SAM service provides the identity framework and credentialing services needed to connect Merck to its broad partner community. Over the last 12 months, Merck has on‐boarded over 2,000 employee users and over 1,500 partner users in the SAM service. This community is growing by ~10% monthly as additional study and product teams are on‐boarded to the community. The Merck users log in to their company network each day and get seamless SSO‐enabled access to the services connected to the SAM hub. Seven applications are connected to the SAM production service today, including Intralinks and Liaison services. NIH and another major pharmaceutical company are connected to the Test service and are moving toward production connections to SAM. Partners using the SAM identities are enabled with distributed administration tools so that they have the ability to approve new user identities for their organization as well as review/approve/suspend access to applications connected to the hub. In addition to the identity broker trust framework, the A&D experience has been applied to user credentialing requirements for Life Sciences. Second factor authentication can be supported with short messaging service (SMS) delivered one‐time passwords (OTP), token‐based OTP or public key infrastructure (PKI) credentials cross‐certified with the SAFE‐BioPharma certificate authority. This service supports the NIST authentication levels and will allow the Life Science users to comply with second factor authentication requirements for electronic/digital signatures and for managing controlled substances. The Merck team is actively sharing the SAM identity broker vision with other large Pharma/Life Science companies in order to drive more value for their partners. By sharing the identity hub and building an industry community, they are able to share infrastructure costs, reduce the costs of multiple credential/account management by partners, and reduce the cost of user administration for all community members. The SAM approach includes an advisory council that provides guidance on acceptable policy, defining levels of authentication required to access specific types of data shared within the community. The community has ownership of the underlying rules supporting the trust framework that is facilitated by the SAM identity broker. Finally, in support of the easy‐to‐use principle, the service has been designed to deliver to a highly–available, ‘zero downtime’ service requirement. The ability to maintain system login and federated access to connected services, even during maintenance windows, is critical to ensuring that the community of users is completely satisfied with the service.
2013 | Best Practices Compendium | Bio-IT World [177]
250 First Avenue, Suite 300, Needham, MA 02494 | phone: 781‐972‐5400 | fax: 781‐972‐5425
Published Resources for the Life Sciences
D. ROI achieved or expected (200 words max.):
Estimated program benefits through 2014 associated with the Identify Broker are $2-3 Million:
• Productivity:
o More efficient processes for engaging with external partners – $500K-1M o Faster provisioning due to process improvements – $600K
• Cost Avoidance o Faster support & issue-resolution and lower Merck Research Labs Service Desk costs due to
process improvements and self-service – $200-300K • Shared Infrastructure cost avoidance – $500K-1M • Partner Connection cost avoidance
o Reduced number of federation connections of a Partner to Major Pharma – $100K * *estimating 2-3 individual federation verse single hub connects
E. CONCLUSIONS/implications for the field. Through the implementation of this solution, Merck and Exostar have enabled a secure, cloud‐based platform to quickly establish corporate connections to execute on external business‐to‐business engagements. The use of the external life sciences hub has increased Merck’s security profile by centralizing administration and access, while still allowing the team the flexibility of quickly adding new members. The security profile has increased as Merck no longer has to issue credentials and grant direct access to our network in order to collaborate with an external partner. This function is now hosted externally with Exostar. As industry adoption for Secure Access Manager (SAM) expands, the value proposition will continue to increase for all organizations involved. Through shared investment in a common infrastructure and multi‐tenant solution, our investments can be focused on the outcomes we are seeking to achieve and not on the administration of the interaction.
2013 | Best Practices Compendium | Bio-IT World [178]
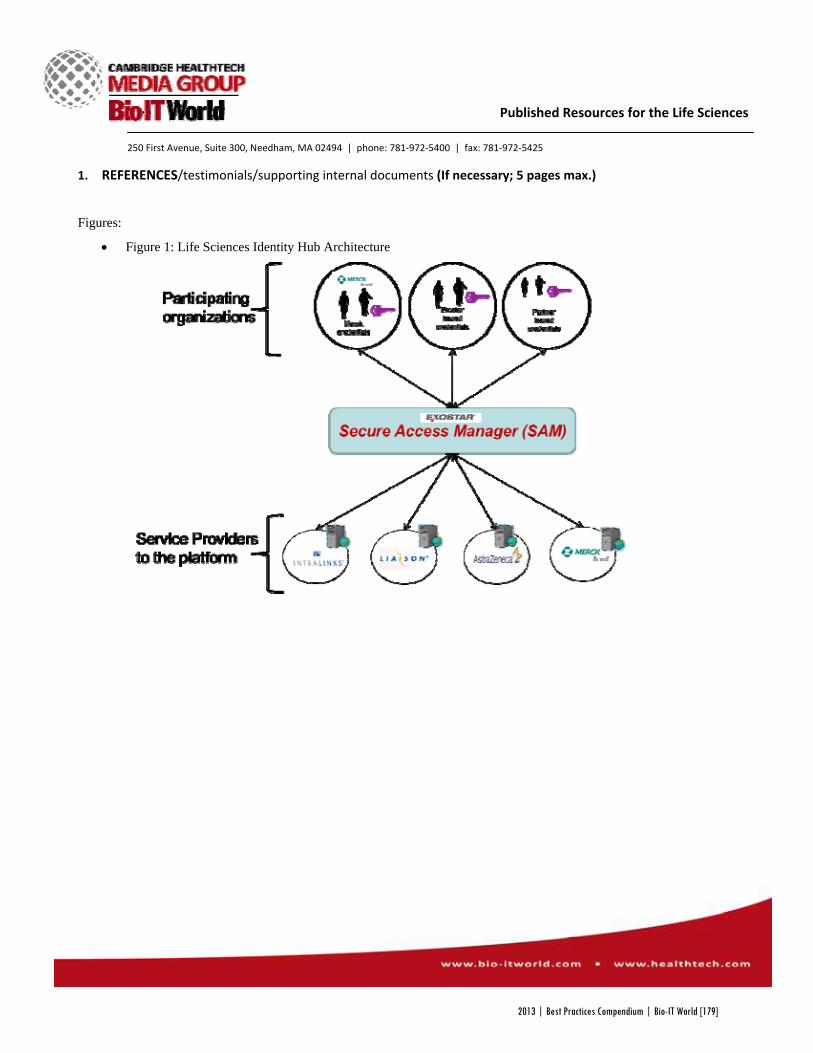
250 First Avenue, Suite 300, Needham, MA 02494 | phone: 781‐972‐5400 | fax: 781‐972‐5425
Published Resources for the Life Sciences
1. REFERENCES/testimonials/supporting internal documents (If necessary; 5 pages max.)
Figures:
• Figure 1: Life Sciences Identity Hub Architecture
2013 | Best Practices Compendium | Bio-IT World [179]
250 First Avenue, Suite 300, Needham, MA 02494 | phone: 781‐972‐5400 | fax: 781‐972‐5425
Published Resources for the Life Sciences
Extended Team
Merck: Andy Porter – Architecture Jason Victor – Architecture Keith Respass ‐ Info Security & Risk Management Terry Rice ‐ Info Security & Risk Management Andrea Kirby – Program Director Terry Bauman – Team Lead Steve Borst – Team Lead Vish Gadgil – Compliance Ken Endersen – Engagement Manager JoAnn Weitzman – Program Manager Cathy Carfagno – Communication and Change Lead Maria Pascual – Business Analyst Brian Swartley – Project Manager John Litvinchuck – Project Manager Exostar: Tom Johnson Dan McConnell Vijay Takanti Ben Maphis Raju Nadakuduty Paul Rabinovich Rob Sherwood Lisa Sullivan
References
• National Institute of Standards and Technology (NIST)
o www.nist.gov
2013 | Best Practices Compendium | Bio-IT World [180]
250 First Avenue, Suite 300, Needham, MA 02494 | phone: 781‐972‐5400 | fax: 781‐972‐5425 Published Resources for the Life Sciences
1. Nominating Organization (Fill this out only if you are nominating a group other than your own.)
A. Nominating Organization Organization name: NVIDIA Address: 2701 San Tomas Expressway Santa Clara, CA 95050 B. Nominating Contact Person Name: George Millington Title: Senior PR Manager Tel: (408) 562‐7226 Email: [email protected]
User Organization (Organization at which the solution was deployed/applied)
A. User Organization Organization name: Research Programme on Biomedical Informatics (GRIB) at IMIM (Hospital del Mar Medical Research Institute) and UPF (Pompeu Fabra University) Address: Gianni De Fabritiis Computational Biophysics Laboratory (GRIB‐IMIM/UPF) Parc de Recerca Biomèdica de Barcelona (PRBB) Dr. Aiguader, 88, office 492.02 08003 Barcelona B. User Organization Contact Person Name: Gianni De Fabritiis Title: Dr Tel: +34678077951 Email: [email protected]
3. Project Title: Simulation of critical step in HIV‐1 protease maturation
Team Leader: Gianni De Fabritiis Contact details if different from above:
2013 | Best Practices Compendium | Bio-IT World [181]

250 First Avenue, Suite 300, Needham, MA 02494 | phone: 781‐972‐5400 | fax: 781‐972‐5425 Published Resources for the Life Sciences
Team members – name(s), title(s) and company (optional): Dr Kashif Sadiq
4. Category in which entry is being submitted (1 category per entry, highlight your choice)
Clinical & Health‐IT: Trial design, eCTD, EDC, ePrescribing, RHIOs, EMR/PHR IT infrastructure/HPC: High Performance Computing, storage, Cloud technologies Informatics: LIMS, data visualization, imaging technologies, NGS analysis Knowledge Management: Data mining, idea/expertise mining, text mining, collaboration, resource optimization
Research & Drug Discovery: Disease pathway research, applied and basic research, compound‐focused research, drug safety
Personalized & Translational Medicine: Responders/non‐responders, biomarkers, Feedback loops, predictive technologies
(Bio‐IT World reserves the right to re‐categorize submissions based on submission or in the event that a category is refined.) 5. Description of project (4 FIGURES MAXIMUM):
A. ABSTRACT/SUMMARY of the project and results (150 words max.) Computational biologists at IMIM (Hospital del Mar Medical Research Institute) and UPF (Pompeu Fabra University) have for the first time simulated the behavior of the first crucial step in the HIV maturation process. This involves action of a specific protein called ‘HIV protease,’ which is responsible for this initial step, and enables the virus to become infectious. By providing new visibility into how the HIV protease protein behaves, researchers can potentially design new antiretroviral drugs to halt the HIV maturation process to stop it from becoming infectious. The researchers achieved this breakthrough by harnessing the power of thousands of NVIDIA GPU accelerators via GPUGrid.net – a distributed‐computing network of individual computers that are “volunteered” for scientific research. This gave the Barcelona team access to a level of processing power that once was only available on dedicated, multi‐million dollar supercomputers.
B. INTRODUCTION/background/objectives AIDS is a devastating disease that directly attacks and weakens the human immune system, making it vulnerable to a wide range of infections, and is responsible for the death and infection of millions of people around the world. AIDS is caused by the HIV virus. The goal of this research by IMIM and UPF aimed was to better understand the action of a specific protein, ‘HIV protease,’ which is responsible for the initial step of the HIV virus maturation process, and what enables the virus to become infectious. HIV protease acts like a pair of scissors, cutting
2013 | Best Practices Compendium | Bio-IT World [182]
250 First Avenue, Suite 300, Needham, MA 02494 | phone: 781‐972‐5400 | fax: 781‐972‐5425 Published Resources for the Life Sciences
the long chain of connected proteins that form HIV into individual proteins that will form the infectious structure of new virions. Using commercially available molecular dynamics software called ACEMD from Acellera Ltd. and NVIDIA GPU accelerators, the researchers for the first time were able to simulate the behavior of this initial crucial step in the HIV maturation process. In doing so, they showed how the first HIV “scissors proteins” can cut themselves out from within the middle of these poly‐protein chains, beginning the infectious phase of HIV.
C. RESULTS (highlight major R&D/IT tools deployed; innovative uses of technology).
The researchers achieved this breakthrough by running commercially available molecular dynamics software called ACEMD on thousands of high‐performance NVIDIA GPU accelerators via GPUGRID.net – a distributed‐computing network of individual computers that are “volunteered” for scientific research. This gave the Barcelona team access to a level of processing power that once was only available on dedicated, multi‐million dollar supercomputers. GPU accelerators are ultra‐high performance, power‐efficient computer processors designed for high performance computing (HPC), computational science and supercomputing. Delivering dramatically higher application acceleration for a range of scientific and commercial applications than a CPU‐only approach, NVIDIA GPU accelerators enable breakthrough research across multiple scientific disciplines, and power some of the world’s most powerful supercomputers, including the current No. 1 system, the Titan supercomputer at Oak Ridge National Laboratory in Oak Ridge, Tennessee.
D. ROI achieved or expected (200 words max.):
With this tremendous computing power at their disposal, the researchers were able to run thousands of complex computer simulations of HIV protease, each for hundreds of nanoseconds for a total of almost a millisecond. This gave them a very high‐probability that their simulation represented real‐world behaviors.
The GPUs also resulted in significant time and money savings. The total compute time required for this research was between 3 to 6 months. Simulations of this length and complexity would have been unfeasible to achieve using a computing system based on CPUs alone. GPU acceleration provides computing power that is around 10 times higher than that generated by computers based on CPUs alone, and GPUGRID provides a level computational power that previously was only available on dedicated, multi‐million dollar supercomputers.
E. CONCLUSIONS/implications for the field.
2013 | Best Practices Compendium | Bio-IT World [183]
250 First Avenue, Suite 300, Needham, MA 02494 | phone: 781‐972‐5400 | fax: 781‐972‐5425 Published Resources for the Life Sciences
By providing this new visibility into how the HIV protease behaves, bio‐tech researchers can potentially design new antiretroviral drugs to halt the HIV maturation process to stop it from becoming infectious. This work provides a greater understanding of a crucial step in the life cycle of HIV and will allow researchers to advance in this field. It also will provide an alternative approach in the design of future pharmaceutical products based on the use of these new molecular mechanisms.
6. REFERENCES/testimonials/supporting internal documents (If necessary; 5 pages max.)
1. Research Paper: “Kinetic characterization of the critical step in HIV‐1 protease maturation”. S Kashif Sadiq, Frank Noe and Gianni De Fabritiis. PNAS. DOI:10.1073/pnas.1210983109. http://www.pnas.org/content/early/2012/11/21/1210983109.abstract?sid=9e8d7340‐4d4c‐4fa5‐85a2‐c68194eff067 2. Press release: http://www.imim.es/news/view.php?ID=159
3. Video protease : http://www.gpugrid.net/science.php?topic=hiv
4. Media response from IMIM: http://www.imim.es/news/view.php?ID=159
2013 | Best Practices Compendium | Bio-IT World [184]
250 First Avenue, Suite 300, Needham, MA 02494 | phone: 781‐972‐5400 | fax: 781‐972‐5425
Published Resources for the Life Sciences
Bio‐IT World 2013 Best Practices Awards
Celebrating Excellence in Innovation
1. Nominating Organization (Fill this out only if you are nominating a group other than your own.) A. Nominating Organization Organization name: Cycle Computing Address: 151 Railroad Avenue, Suite 3F, Greenwich CT 06830 B. Nominating Contact Person Name: Shaina Mardinly Title: Account Executive Tel: 212‐255‐0080 ext. 15 Email: [email protected]
2. User Organization (Organization at which the solution was deployed/applied)
A. User Organization Organization name: Schrodinger Address: New York, NY B. User Organization Contact Person Name: James Watney Title: Product Manager Tel: Email: [email protected]
3. Project Title:
Team Leader: James Watney, Jason Stowe Contact details if different from above: Team members – name(s), title(s) and company (optional):
4. Category in which entry is being submitted (1 category per entry, highlight your choice)
Clinical & Health‐IT: Trial design, eCTD, EDC, ePrescribing, RHIOs, EMR/PHR IT infrastructure/HPC: High Performance Computing, storage, Cloud technologies Informatics: LIMS, data visualization, imaging technologies, NGS analysis
2013 | Best Practices Compendium | Bio-IT World [185]
250 First Avenue, Suite 300, Needham, MA 02494 | phone: 781‐972‐5400 | fax: 781‐972‐5425
Published Resources for the Life Sciences
Knowledge Management: Data mining, idea/expertise mining, text mining, collaboration, resource optimization
Research & Drug Discovery: Disease pathway research, applied and basic research, compound‐focused research, drug safety
Personalized & Translational Medicine: Responders/non‐responders, biomarkers, Feedback loops, predictive technologies
(Bio‐IT World reserves the right to re‐categorize submissions based on submission or in the event that a category is refined.) 5. Description of project (4 FIGURES MAXIMUM):
A. ABSTRACT/SUMMARY of the project and results (150 words max.) In order to enable scientific accuracy, Cycle Computing orchestrated a 50,000‐core utility supercomputer in the Amazon Web Services (AWS) cloud for Schrödinger and Nimbus Discovery to accelerate the complex screening process of locating compounds that could lead to potential new cancer treatments. The global 50,000‐core cluster replicated data across seven AWS regions while automating the provisioning of resources, with an average run time of 11 minutes and over 100,000 hours of total work completed. Schrödinger’s researchers completed more than 4,480 days of work, nearing 12.5 years of computations, in less than three hours. The project cost was less than $4,828 per hour at peak and required no upfront capital. Schrödinger compared the utility supercomputing results to results from normal runs, and discovered many compounds that are good potential candidates for cancer treatment. These candidates would have never been discovered if Cycle’s software hadn’t made this impossible science possible.
B. INTRODUCTION/background/objectives In April 2012, Cycle Computing’s CycleCloud software orchestrated a 50,000‐core utility supercomputer in the Amazon Web Services (AWS) cloud for Schrödinger and Nimbus Discovery to accelerate the complex screening process of locating compounds that could lead to potential new cancer treatments. Schrödinger’s widely used computational docking application, Glide, performs high‐throughput virtual screening of compound libraries for identification of drug discovery leads. Computing resource and time constraints traditionally limit the extent with which ligand conformations can be explored, potentially leading to false negatives or false positives. Schrödinger and Nimbus Discovery used Cycle Computing’s software to screen 21 million compounds against a protein target, with the objective of avoiding false negatives and positives that were likely to appear with Glide.
2013 | Best Practices Compendium | Bio-IT World [186]
250 First Avenue, Suite 300, Needham, MA 02494 | phone: 781‐972‐5400 | fax: 781‐972‐5425
Published Resources for the Life Sciences
C. RESULTS (highlight major R&D/IT tools deployed; innovative uses of technology). Tapping into Cycle’s utility supercomputing to enable scientific accuracy, Schrödinger, in collaboration with Nimbus Discovery, ran a virtual screen of 21 million compounds against a protein target. The run was commissioned for drug discovery, though we are unable to disclose what specifically Schrodinger was researching. Cycle enabled scientific accuracy and allowed them to push the boundaries of computation research. CycleServer, Cycle’s cluster and performance analytics software, tracked utilization, diagnosed performance and managed scientific workflow. Replicating the success of employing next generation developments, Cycle’s engineers utilized open source software, including HTCondor scheduling, Linux, and the Opscode Chef cloud infrastructure automation system. Cycle’s Chef monitoring and analytics plug‐in, Grill, provided visualization into scaling the infrastructure environment and eliminated the need for additional servers. This additional view into the infrastructure supported data around installations, driving down preparation and operational overhead. Lastly, Cycle’s DataManager module scheduled the data required for the run, placing data between all the regions that were used for computing. When analyzing the feedback, Schrodinger found numerous compounds that showed as negative when using older, less precise technique, but that turned out to be excellent matches when using the higher fidelity algorithms of utility supercomputing.
D. ROI achieved or expected (200 words max.): The global 50,000‐core cluster was run with CycleCloud, Cycle’s flagship high performance computing (HPC) in the cloud service that runs on AWS. Replicating data across seven AWS regions while automating the provisioning of resources, CycleCloud’s run time per job averaged 11 minutes and the total work completed topped 100,000 hours. Schrödinger’s researchers completed more than 4,480 days of work, nearing 12.5 years of computations, in less than three hours. Running the environment in three hours using CycleCloud was 219,000 percent faster than the average time of nine months that it takes to evaluate, design, and build a 50,000‐core environment and then get it fully operational. The project cost was less than $4,900 per hour at peak. The CycleCloud project also required no upfront capital, compared to an in‐house cloud, which could cost $20 million to $25 million, and is 1,380 times more expensive than Cycle’s run.
E. CONCLUSIONS/implications for the field.
Schrödinger compared the utility supercomputing results to results from normal runs, and discovered many compounds that are good potential candidates that would have never been discovered if Cycle’s software hadn’t made this impossible science possible. Cycle Computing believes that with access to enough compute power, all science, engineering and mathematical problems become solvable. The growing availability of compute power for the life sciences industry in particular will lead researchers to attack diseases in a more efficient and thorough manner by aggregating larger sets of data across patients. New algorithms that were not possible before because they would be too compute intensive to justify the cost are now becoming available for drug testing, and companies are much more likely to invest thousands of dollars to rent compute, than the millions of dollars it takes to build infrastructure to run compute in house.
2013 | Best Practices Compendium | Bio-IT World [187]

250 First Avenue, Suite 300, Needham, MA 02494 | phone: 781‐972‐5400 | fax: 781‐972‐5425
Published Resources for the Life Sciences
1. REFERENCES/testimonials/supporting internal documents (If necessary; 5 pages max.)
2013 | Best Practices Compendium | Bio-IT World [188]
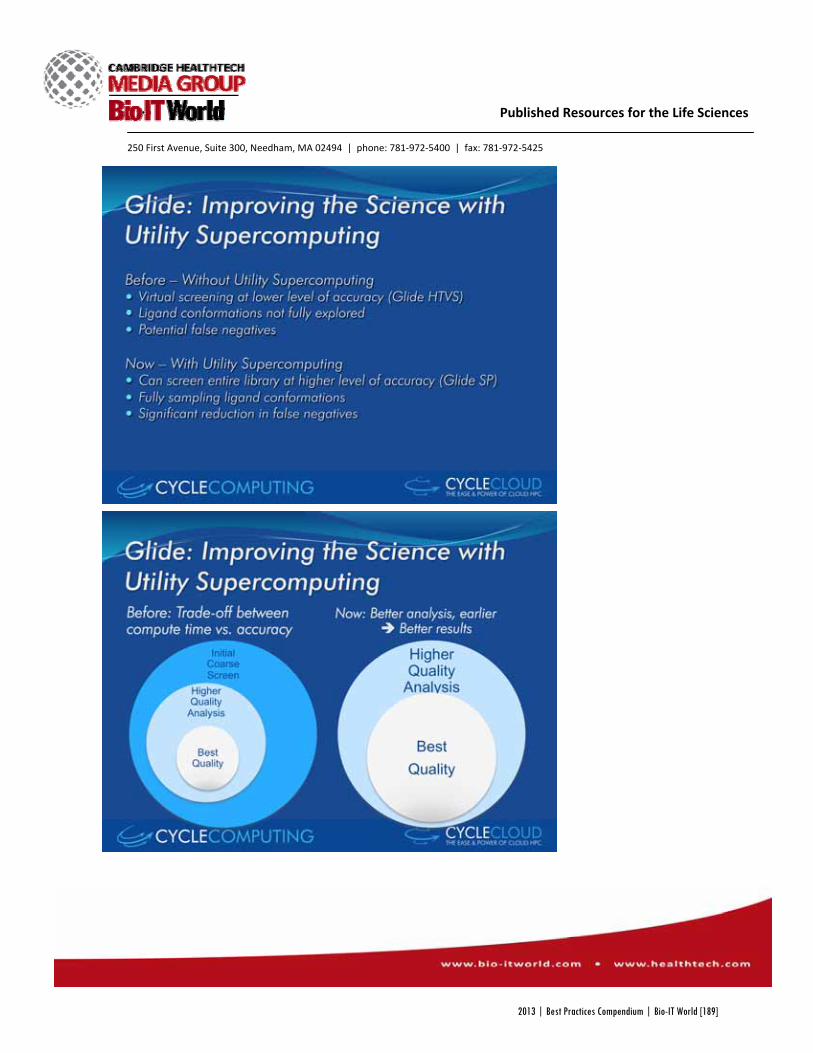
250 First Avenue, Suite 300, Needham, MA 02494 | phone: 781‐972‐5400 | fax: 781‐972‐5425
Published Resources for the Life Sciences
2013 | Best Practices Compendium | Bio-IT World [189]
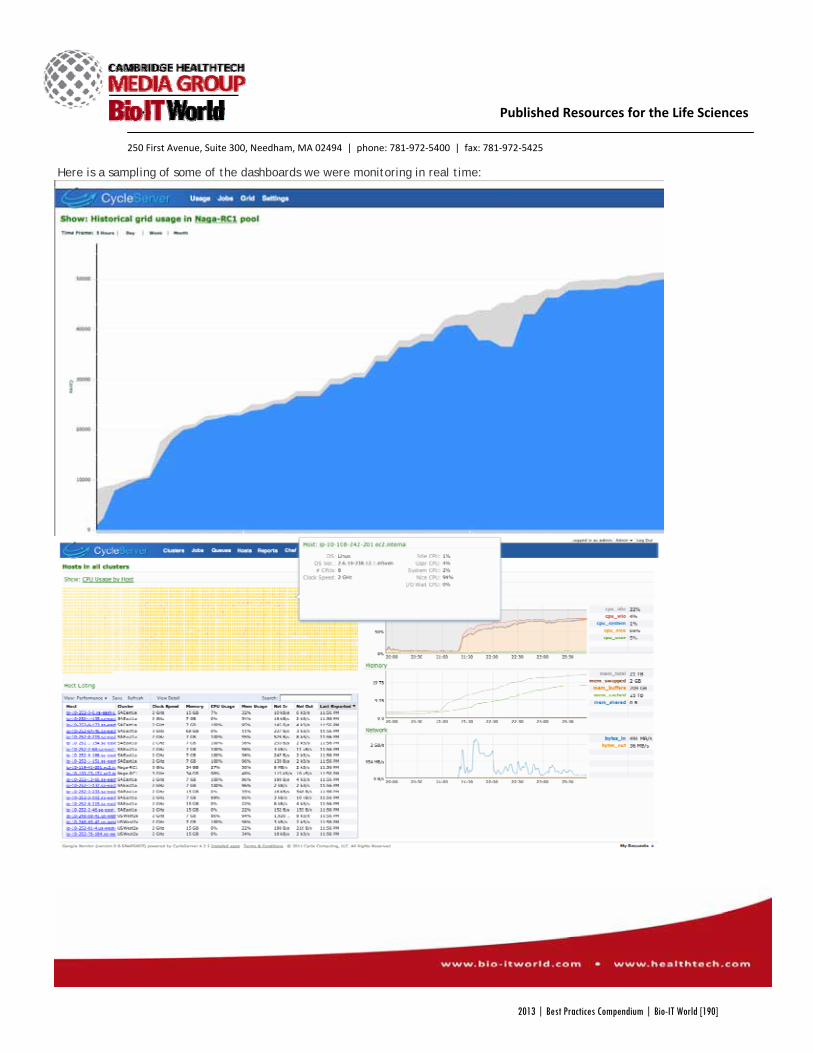
250 First Avenue, Suite 300, Needham, MA 02494 | phone: 781‐972‐5400 | fax: 781‐972‐5425
Published Resources for the Life Sciences
Here is a sampling of some of the dashboards we were monitoring in real time:
2013 | Best Practices Compendium | Bio-IT World [190]
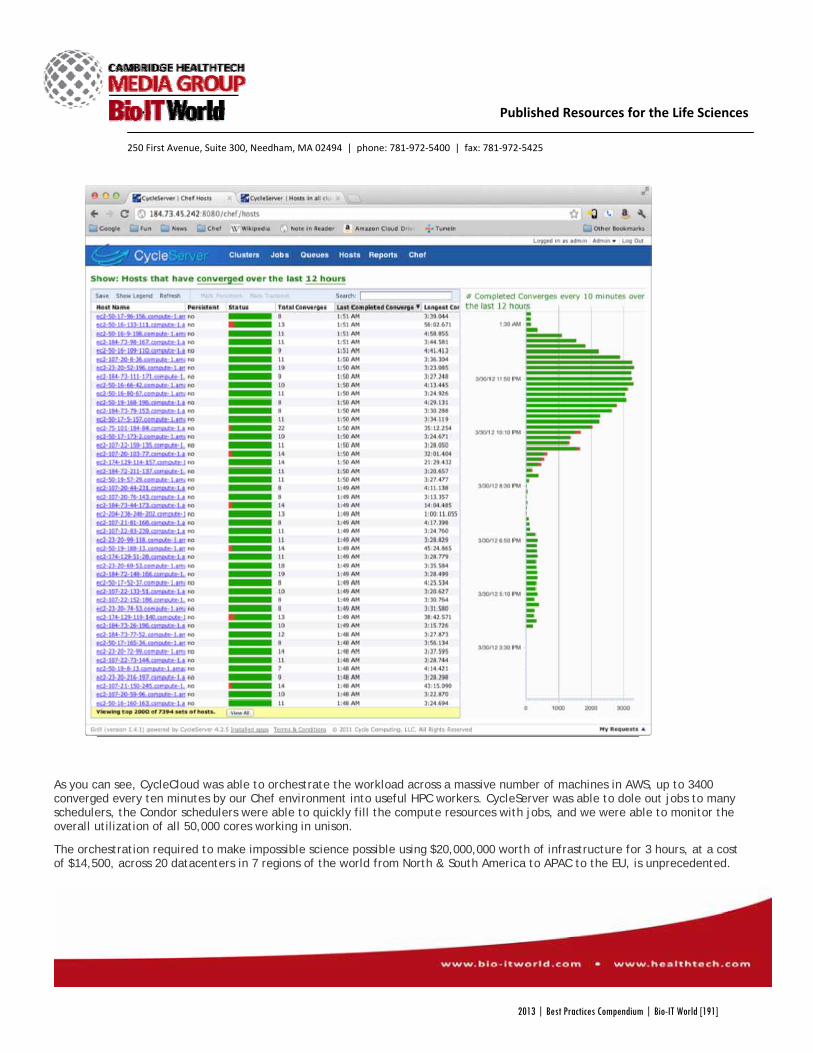
250 First Avenue, Suite 300, Needham, MA 02494 | phone: 781‐972‐5400 | fax: 781‐972‐5425
Published Resources for the Life Sciences
As you can see, CycleCloud was able to orchestrate the workload across a massive number of machines in AWS, up to 3400 converged every ten minutes by our Chef environment into useful HPC workers. CycleServer was able to dole out jobs to many schedulers, the Condor schedulers were able to quickly fill the compute resources with jobs, and we were able to monitor the overall utilization of all 50,000 cores working in unison.
The orchestration required to make impossible science possible using $20,000,000 worth of infrastructure for 3 hours, at a cost of $14,500, across 20 datacenters in 7 regions of the world from North & South America to APAC to the EU, is unprecedented.
2013 | Best Practices Compendium | Bio-IT World [191]
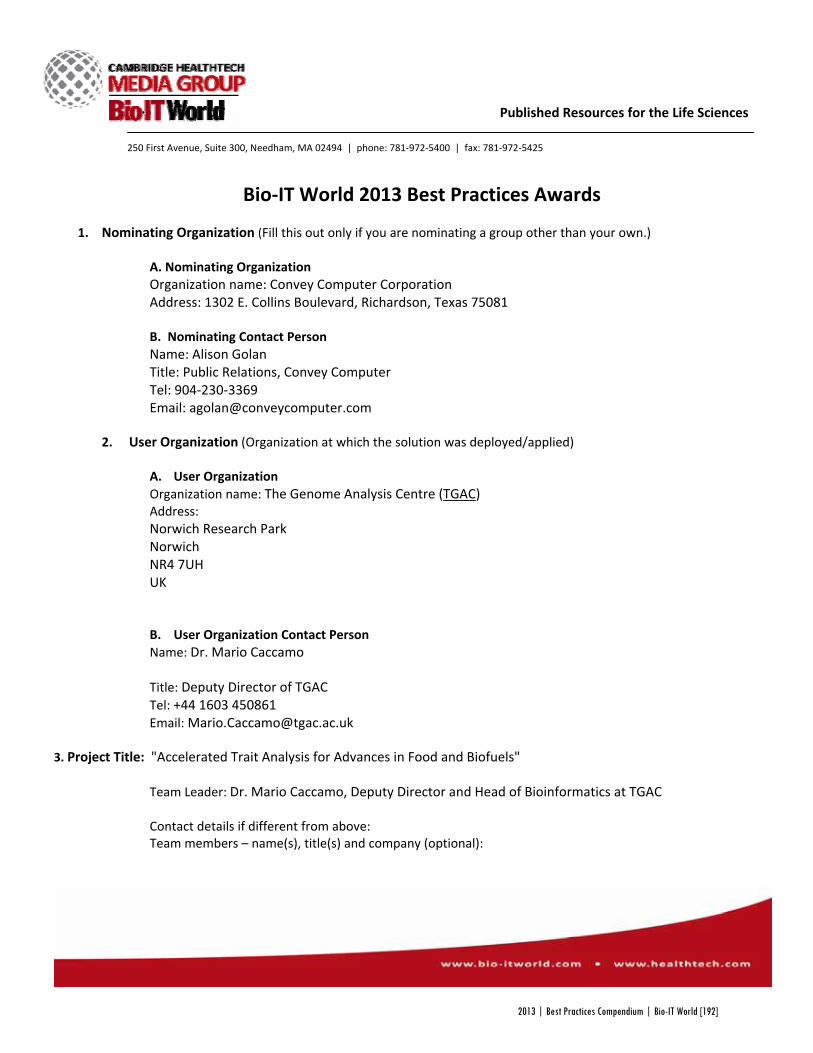
250 First Avenue, Suite 300, Needham, MA 02494 | phone: 781‐972‐5400 | fax: 781‐972‐5425
Published Resources for the Life Sciences
Bio‐IT World 2013 Best Practices Awards
1. Nominating Organization (Fill this out only if you are nominating a group other than your own.) A. Nominating Organization Organization name: Convey Computer Corporation Address: 1302 E. Collins Boulevard, Richardson, Texas 75081 B. Nominating Contact Person Name: Alison Golan Title: Public Relations, Convey Computer Tel: 904‐230‐3369 Email: [email protected]
2. User Organization (Organization at which the solution was deployed/applied)
A. User Organization Organization name: The Genome Analysis Centre (TGAC) Address: Norwich Research Park Norwich NR4 7UH UK
B. User Organization Contact Person Name: Dr. Mario Caccamo Title: Deputy Director of TGAC Tel: +44 1603 450861 Email: [email protected]
3. Project Title: "Accelerated Trait Analysis for Advances in Food and Biofuels"
Team Leader: Dr. Mario Caccamo, Deputy Director and Head of Bioinformatics at TGAC Contact details if different from above: Team members – name(s), title(s) and company (optional):
2013 | Best Practices Compendium | Bio-IT World [192]

250 First Avenue, Suite 300, Needham, MA 02494 | phone: 781‐972‐5400 | fax: 781‐972‐5425
Published Resources for the Life Sciences
4. Category in which entry is being submitted (1 category per entry, highlight your choice) Clinical & Health‐IT: Trial design, eCTD, EDC, ePrescribing, RHIOs, EMR/PHR
x IT infrastructure/HPC: High Performance Computing, storage, Cloud technologies Informatics: LIMS, data visualization, imaging technologies, NGS analysis Knowledge Management: Data mining, idea/expertise mining, text mining, collaboration, resource optimization
Research & Drug Discovery: Disease pathway research, applied and basic research, compound‐focused research, drug safety
Personalized & Translational Medicine: Responders/non‐responders, biomarkers, Feedback loops, predictive technologies
(Bio‐IT World reserves the right to re‐categorize submissions based on submission or in the event that a category is refined.) 5. Description of project (4 FIGURES MAXIMUM):
A. ABSTRACT/SUMMARY of the project and results (150 words max.)
The installation of two hybrid‐core Convey HC‐1ex computers by The Genome Analysis Centre (TGAC) is not only accelerating efforts to identify important gene variants in wheat; it’s also showcasing the critical role heterogeneous computing is playing in genomics research.
Founded in 2009 and based in Norwich, U.K., TGAC focuses on the use of next generation sequencing and bioinformatics to advance the food and biofuel industries. The two Convey HC‐1ex systems are the latest addition to TGAC’s powerful computing infrastructure, which already includes one of the world’s largest Red Hat Linux ccNUMA systems (2560 cores, 20TB RAM), a 3000 core Linux cluster and 5 petabytes of storage. By installing hybrid‐core Convey HC‐1ex systems, TGAC expanded their ccNUMA and cluster‐based HPC environment to include leading edge, heterogeneous computing capabilities.
INTRODUCTION/background/objectives
OBJECTIVE: * Assemble leading edge HPC infrastructure necessary for advanced genomics research
* Accelerate re‐sequencing efforts searching for gene variants in plants and animals
TGAC, based in the U.K., is an aggressive adopter of advanced sequencing and IT technology. TGAC is one of seven institutes that receives strategic funding from the U.K.’s Biotechnology and Biological Sciences Research Council (BBSRC). BBSRC’s broad mission is to support innovation in non‐biomedical bioscience in the U.K. and around the world.
2013 | Best Practices Compendium | Bio-IT World [193]

250 First Avenue, Suite 300, Needham, MA 02494 | phone: 781‐972‐5400 | fax: 781‐972‐5425
Published Resources for the Life Sciences
In 2012, TGAC deployed two Convey HC‐1ex hybrid‐core systems for advanced genomics research. “No single tool is right for all tasks,” noted Dr. Mario Caccamo, Deputy Director and Head of Bioinformatics at TGAC. “Heterogeneous computing shows a significant performance improvement in certain computationally intensive applications.” TGAC is a key member of the International Wheat Genome Sequencing Consortium (IWGSC) and was on the team that recently demonstrated how next‐generation sequencing could be used effectively to fine map genes in polyploid wheat. Among other things, TGAC is leveraging Convey’s architecture to accelerate computationally challenging jobs such as resequencing various wheat strains to identify favorable traits. Besides wheat, TGAC has worked on the rubber tree, tomato, pig and bovine species, and animal diseases.
B. RESULTS (highlight major R&D/IT tools deployed; innovative uses of technology). * Expanded cluster‐based HPC with heterogeneous computing capability by installing hybrid‐core
Convey HC‐1ex systems
* Offloaded bioinformatics (e.g. BWA) that run slowly on the large cluster to Convey HC‐1ex hardware to speed execution
* Galaxy‐based workflow makes it easy for biologists to launch Convey accelerated analysis
According to Dr. Caccamo, TGAC users need to analyze data quickly and precisely, which takes time on clusters. “We offloaded some of our sequence alignment demand to the Convey hybrid‐core systems, because they can handle the alignment algorithms much more efficiently. Using the Convey systems, the initial performance jump we have seen on computationally intense applications, such as resequencing data analysis, is a major improvement,” explained Dr. Caccamo
Convey’s hybrid‐core architecture achieves performance gains by pairing classic Intel® x86 microprocessors with a coprocessor comprised of FPGAs. Particular algorithms are optimized and translated into code that’s loadable onto the coprocessor at runtime. Convey architecture also features a highly parallel memory subsystem, which removes memory bottlenecks inherent to commodity servers. The overall result is a dramatic speed‐up for applications that can be parallelized. Speeding up BWA (Burrows‐Wheeler Aligner) is a good example. Besides performing alignment for research purposes, virtually all next‐generation sequencing centers—including TGAC—conduct contamination screening to ensure the integrity of the data. Screening is part of our primary analysis workflow. Every job we do undergoes it,” said Dr. Caccamo.
2013 | Best Practices Compendium | Bio-IT World [194]

250 First Avenue, Suite 300, Needham, MA 02494 | phone: 781‐972‐5400 | fax: 781‐972‐5425
Published Resources for the Life Sciences
Instrument reads are screened against likely contaminant reference sequences using BWA. Any identified contaminant segments can then be removed. Convey’s implementation of BWA, optimized to run on its hybrid‐core platform, can dramatically speed this recurring task—which typically consumes a significant portion of a sequencing center’s compute time. “Using the Convey system, we are seeing a 15x acceleration running BWA compared to running it on our x86 cluster,” explained Caccamo. With the Convey machines deployed, TGAC is now implementing a Galaxy‐based workflow interface to hide the complexity of TGAC’s sophisticated computational infrastructure and make it easy for biologist collaborators to launch analysis pipelines. “We want to ensure when a user says ‘I want to run this BWA job,’ he or she doesn’t need to know whether it’s running on the Convey system or elsewhere on the cluster or ccNUMA systems,” explained Dr. Caccamo. “For now, most users of the Convey systems are on my staff, but we will soon extend reach to collaborators.”
C. ROI achieved or expected (200 words max.): * BWA application 15x faster than previously possible;
* Improvements in both overall throughput and individual project completion time
Convey’s implementation of BWA, optimized to run on its hybrid‐core platform, dramatically speeds the recurring task of contamination screening. Because this task is part of TGAC’s primary analysis workflow ‐‐ every job they do undergoes it – the process typically consumes a significant portion of a sequencing center’s compute time. Using the Convey system, TGAC is seeing a 15x acceleration running BWA compared to running it on our x86 cluster, which is a tremendous time savings for them. “The initial performance jump we have seen is a major improvement,” concluded Dr. Caccamo. “We expect to achieve even better performance in the future as we gain experience using the Convey platform.”
D. CONCLUSIONS/implications for the field.
Implications of heterogeneous computing for the field: Heterogeneous computing is a growing trend in this industry to improve performance. Many bioinformatics applications commonly experience bandwidth limitations. Convey’s highly parallel memory approach allows application‐specific logic to directly address individual words
2013 | Best Practices Compendium | Bio-IT World [195]
250 First Avenue, Suite 300, Needham, MA 02494 | phone: 781‐972‐5400 | fax: 781‐972‐5425
Published Resources for the Life Sciences
in memory, increasing effective memory bandwidth for random access to memory compared with cache‐based memory typically found on commodity servers.
“We’re pleased to be working with BBSRC and TGAC in support of their mission to advance bioscience,” said Dr. George Vacek, Director of Convey Computer’s Life Sciences business unit. “It’s increasingly clear more than one HPC approach is needed to efficiently tackle the full scope of genomics research. Hybrid‐core computing has a major role to play, because it accelerates many key bioinformatics applications in an easy to use and economical way.”
Implications for the field concerning the accelerated work conducted at TGAC:
TGAC is the newest of the seven BBSRC institutes; roughly half of its staff is devoted to bioinformatics and half to the lab. Besides the state of the art computational infrastructure, TGAC has several next‐generation sequencers from different suppliers. Working with advanced NGS technology and developing associated bioinformatics to analyze and present the data are important elements of TGAC’s mission.
1. REFERENCES/testimonials/supporting internal documents (If necessary; 5 pages max.)
2013 | Best Practices Compendium | Bio-IT World [196]
250 First Avenue, Suite 300, Needham, MA 02494 | phone: 781‐972‐5400 | fax: 781‐972‐5425
Published Resources for the Life Sciences
Bio‐IT World 2013 Best Practices Awards
1. Nominating Organization (Fill this out only if you are nominating a group other than your own.)
A. Nominating Organization Organization name: Convey Computer Corporation Address: 1302 E. Collins Boulevard, Richardson, Texas 75081 B. Nominating Contact Person Name: Alison Golan Title: Public Relations, Convey Computer Tel: 904‐230‐3369 Email: [email protected]
2. User Organization (Organization at which the solution was deployed/applied)
A. User Organization Organization name: The Jackson Laboratory Address: 600 Main St, Bar Harbor, ME 04609
B. User Organization Contact Person Name: Chuck Donnelly Title: Director of Computational Sciences, JAX Tel: 207‐288‐6339 Email: [email protected]
3. Project Title: Advanced technologies for high performance analytics of NGS data
Team Leader: Chuck Donnelly, Director of Computational Sciences, JAX Contact details if different from above: Team members – name(s), title(s) and company (optional): Chuck Donnelly, Director of Computational Sciences, JAX Dave Walton: Manager of Scientific Computing Group, JAX Glen Beane, Senior Software Engineer, JAX Laura Reinholdt, Ph.D., Research Scientist, JAX
2013 | Best Practices Compendium | Bio-IT World [197]
250 First Avenue, Suite 300, Needham, MA 02494 | phone: 781‐972‐5400 | fax: 781‐972‐5425
Published Resources for the Life Sciences
4. Category in which entry is being submitted (1 category per entry, highlight your choice)
Clinical & Health‐IT: Trial design, eCTD, EDC, ePrescribing, RHIOs, EMR/PHR x IT infrastructure/HPC: High Performance Computing, storage, Cloud technologies
Informatics: LIMS, data visualization, imaging technologies, NGS analysis Knowledge Management: Data mining, idea/expertise mining, text mining, collaboration, resource optimization
Research & Drug Discovery: Disease pathway research, applied and basic research, compound‐focused research, drug safety
Personalized & Translational Medicine: Responders/non‐responders, biomarkers, Feedback loops, predictive technologies
(Bio‐IT World reserves the right to re‐categorize submissions based on submission or in the event that a category is refined.) 5. Description of project (4 FIGURES MAXIMUM):
A. ABSTRACT/SUMMARY of the project and results (150 words max.) The Jackson Laboratory (JAX) is a nonprofit biomedical research institution. They use mice to conduct next generation sequencing (NGS) analysis for discovery of spontaneous mutations, strain specific variation, and genome wide analysis of gene expression. In 2012 JAX added heterogeneous computing to their traditional HPC environment. Their goal was twofold: eliminate bottlenecks in data analysis and undertake whole genome studies that were previously impractical due to limited performance of their current compute cluster. They achieved both goals using a Convey hybrid‐core system. The Convey HC‐2 accelerates BWA‐based alignment—a critical step in identifying disease‐causing mutations in the mouse genome—roughly ten‐fold compared with the original workflow on their 32‐core servers. Additionally, the increased performance allows them to conduct research previously impossible, such as initiate whole genome studies. JAX believes that the faster computations are important to one day discovering the genetic basis for preventing, treating and curing human disease.
INTRODUCTION/background/objectives OBJECTIVES • Eliminate bottleneck in data analysis • Undertake whole genome studies, which were previously impractical due to limited performance
2013 | Best Practices Compendium | Bio-IT World [198]

250 First Avenue, Suite 300, Needham, MA 02494 | phone: 781‐972‐5400 | fax: 781‐972‐5425
Published Resources for the Life Sciences
Long at the forefront of mammalian genetics research and an NCI designated Cancer Center, JAX has rapidly increased its use of next generation sequencing. “Once we could afford whole genome sequencing, we found a significant bottleneck in the time required to process the data,” said Laura Reinholdt, Ph.D. a research scientist at JAX. “That’s when biologists here began to seek tools and infrastructures to more expediently manage and process the expanding volumes of NGS data.” JAX settled on heterogeneous computing for several reasons. “It comes down to power consumption, space, and performance for a fixed amount of dollars,” said Glen Beane, senior software engineer, JAX. “We looked at various options for hybrid systems. We found GPUs weren’t a good fit for alignment—there are packages that do alignment but the performance isn’t that compelling. We looked at other FPGA (field programmable gate array) system vendors, but they didn’t have the number of tools Convey does or the system wasn’t as easy to use. Also a developer community is evolving around the Convey systems where we could share third‐party tools.”
B. RESULTS (highlight major R&D/IT tools deployed; innovative uses of technology). • Added heterogeneous computing to traditional HPC environment • Installed innovative, hybrid‐core technology: the Convey HC‐2
The Convey HC‐2 complements the existing 32‐core servers at JAX. “Rather than add five more nodes to our cluster, this system will essentially allow us to add one optimized alignment node that we can use instead. There are two ways to look at the Convey addition,” said Beane. “One is we are scaling up because we need to add more alignment capacity. There was no question about that. The other aspect is we looked at how scaling up could help do things that we weren’t able to do before. The Convey system also helps achieve that goal.”
The hybrid‐core architecture of the Convey system pairs classic Intel® processors with a coprocessor comprised of FPGAs. Particular algorithms—DNA sequence assembly, for example—are optimized and translated into code that’s loadable onto the FPGAs at runtime, greatly accelerating performance‐critical applications.
The combination of Convey’s high performance hardware and the Convey Bioinformatics Suite (CBS)—which includes optimized versions of BWA (alignment) and CGC (short read assembly)—greatly speeds throughput.
For example, it’s common for researchers to want to tweak BWA alignment parameters to improve the results. If researchers must wait a few days between each alignment run, optimizing parameters isn’t as practical.
2013 | Best Practices Compendium | Bio-IT World [199]
250 First Avenue, Suite 300, Needham, MA 02494 | phone: 781‐972‐5400 | fax: 781‐972‐5425
Published Resources for the Life Sciences
“You can end up spending weeks just trying to find the right parameters. If you can do two or three alignment runs in parallel, optimization of the alignment becomes much less time consuming,” noted Reinholdt. Most recently, Reinholdt’s group has used high throughput sequencing to improve mouse models of ALS (Lou Gehrig’s), Down syndrome and Alzheimer’s disease. Performing alignment on JAX’s existing 32‐core servers is a slow process. The HC‐2’s higher throughput gives researchers more flexibility to adjust parameters, quickly perform multiple runs, and achieve better results. Besides doing more refined alignment and whole genome sequencing analysis, JAX researchers also plan to wade carefully into de novo assembly where it can help their research. The HC‐2, with its high performance memory subsystem, and the Convey Graph Constructor (an optimized version of Velvet), will make tackling de novo assembly practical.
C. ROI achieved or expected (200 words max.):
• Improving performance ten‐fold over existing cluster • Enabling more and better research, including research on whole genome studies that JAX was unable to attempt prior to the installation of the Convey system. “From our initial benchmarks, we anticipate a ten-fold performance improvement in BWA, a key program we use in our research,” said Donnelly, referring to the Burrows-Wheeler Aligner. “Faster computing analysis with the Convey system means that we can see results faster—which helps us fulfill our mission to discover the genetic basis for preventing, treating and curing human disease.”
According to JAX, the Convey system is helping in two ways. “One is that by scaling up, we are adding more alignment capacity. The other is that the increased performance allows us to attempt things we could never do before, such as initiate whole genome studies.”
D. CONCLUSIONS/implications for the field.
Implications of heterogeneous computing for the field: Heterogeneous computing is a growing trend in this industry to improve performance. Many bioinformatics applications commonly experience bandwidth limitations. Convey’s highly parallel memory approach allows application‐specific logic to directly address individual words in memory, increasing effective memory bandwidth for random access to memory compared with cache‐based memory typically found on commodity servers.
Implications for the field concerning the accelerated work conducted at JAX:
2013 | Best Practices Compendium | Bio-IT World [200]
250 First Avenue, Suite 300, Needham, MA 02494 | phone: 781‐972‐5400 | fax: 781‐972‐5425
Published Resources for the Life Sciences
Because mice and humans share 95% of their genes, mice are an effective and efficient model for human diseases. Along with the research JAX conducts, they provide scientific resources, techniques, software and data to scientists around the world. Their mission is to discover the genetic basis for preventing, treating and curing human disease, and to enable research and education for the global biomedical community. The Convey system accelerates the important research JAX is conducting. Additionally, it allows them to conduct research on the whole genome they were unable to do previously.
1. REFERENCES/testimonials/supporting internal documents (If necessary; 5 pages max.)
2013 | Best Practices Compendium | Bio-IT World [201]
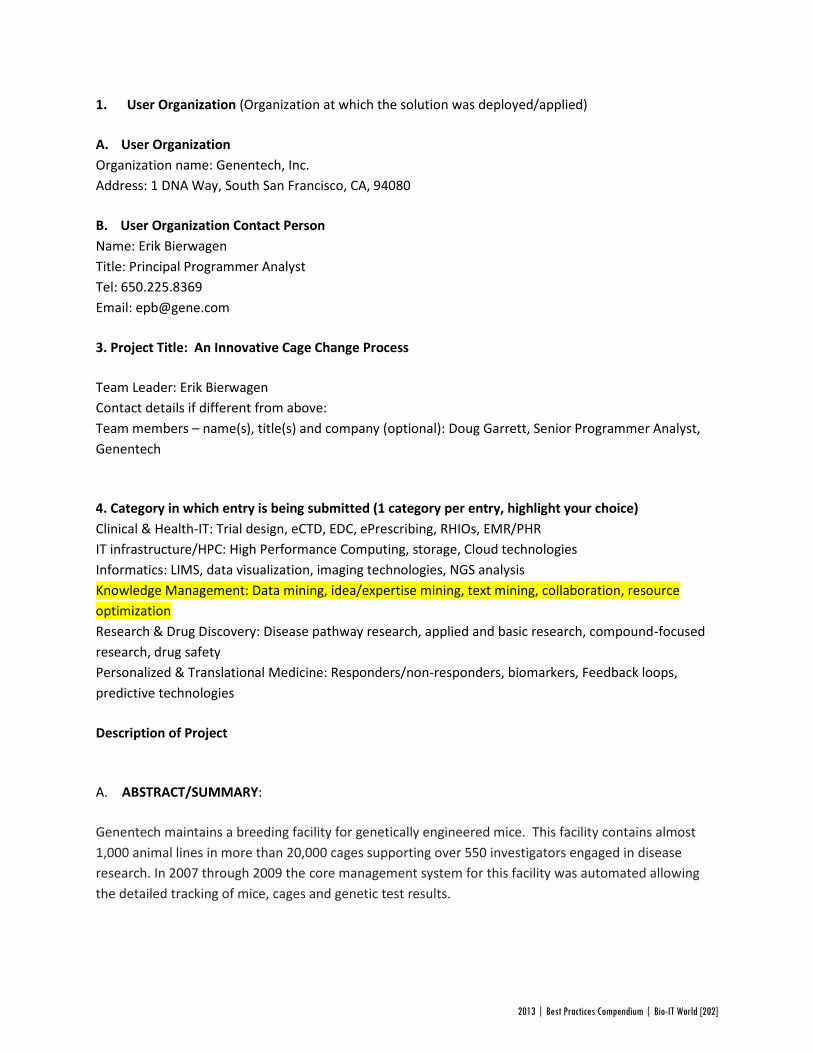
1. User Organization (Organization at which the solution was deployed/applied)
A. User OrganizationOrganization name: Genentech, Inc.Address: 1 DNA Way, South San Francisco, CA, 94080
B. User Organization Contact PersonName: Erik BierwagenTitle: Principal Programmer AnalystTel: 650.225.8369Email: [email protected]
3. Project Title: An Innovative Cage Change Process
Team Leader: Erik BierwagenContact details if different from above:Team members – name(s), title(s) and company (optional): Doug Garrett, Senior Programmer Analyst,Genentech
4. Category in which entry is being submitted (1 category per entry, highlight your choice)Clinical & Health-IT: Trial design, eCTD, EDC, ePrescribing, RHIOs, EMR/PHRIT infrastructure/HPC: High Performance Computing, storage, Cloud technologiesInformatics: LIMS, data visualization, imaging technologies, NGS analysisKnowledge Management: Data mining, idea/expertise mining, text mining, collaboration, resourceoptimizationResearch & Drug Discovery: Disease pathway research, applied and basic research, compound-focusedresearch, drug safetyPersonalized & Translational Medicine: Responders/non-responders, biomarkers, Feedback loops,predictive technologies
Description of Project
A. ABSTRACT/SUMMARY:
Genentech maintains a breeding facility for genetically engineered mice. This facility contains almost1,000 animal lines in more than 20,000 cages supporting over 550 investigators engaged in diseaseresearch. In 2007 through 2009 the core management system for this facility was automated allowingthe detailed tracking of mice, cages and genetic test results.
2013 | Best Practices Compendium | Bio-IT World [202]
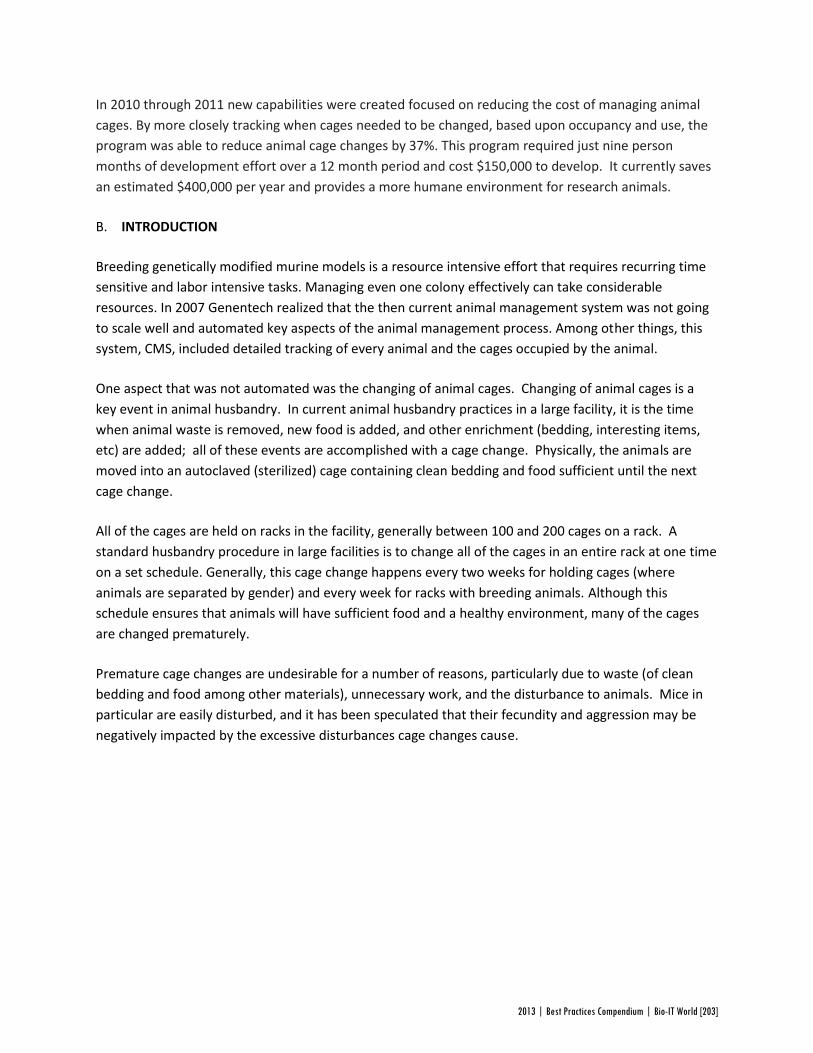
In 2010 through 2011 new capabilities were created focused on reducing the cost of managing animalcages. By more closely tracking when cages needed to be changed, based upon occupancy and use, theprogram was able to reduce animal cage changes by 37%. This program required just nine personmonths of development effort over a 12 month period and cost $150,000 to develop. It currently savesan estimated $400,000 per year and provides a more humane environment for research animals.
B. INTRODUCTION
Breeding genetically modified murine models is a resource intensive effort that requires recurring timesensitive and labor intensive tasks. Managing even one colony effectively can take considerableresources. In 2007 Genentech realized that the then current animal management system was not goingto scale well and automated key aspects of the animal management process. Among other things, thissystem, CMS, included detailed tracking of every animal and the cages occupied by the animal.
One aspect that was not automated was the changing of animal cages. Changing of animal cages is akey event in animal husbandry. In current animal husbandry practices in a large facility, it is the timewhen animal waste is removed, new food is added, and other enrichment (bedding, interesting items,etc) are added; all of these events are accomplished with a cage change. Physically, the animals aremoved into an autoclaved (sterilized) cage containing clean bedding and food sufficient until the nextcage change.
All of the cages are held on racks in the facility, generally between 100 and 200 cages on a rack. Astandard husbandry procedure in large facilities is to change all of the cages in an entire rack at one timeon a set schedule. Generally, this cage change happens every two weeks for holding cages (whereanimals are separated by gender) and every week for racks with breeding animals. Although thisschedule ensures that animals will have sufficient food and a healthy environment, many of the cagesare changed prematurely.
Premature cage changes are undesirable for a number of reasons, particularly due to waste (of cleanbedding and food among other materials), unnecessary work, and the disturbance to animals. Mice inparticular are easily disturbed, and it has been speculated that their fecundity and aggression may benegatively impacted by the excessive disturbances cage changes cause.
2013 | Best Practices Compendium | Bio-IT World [203]
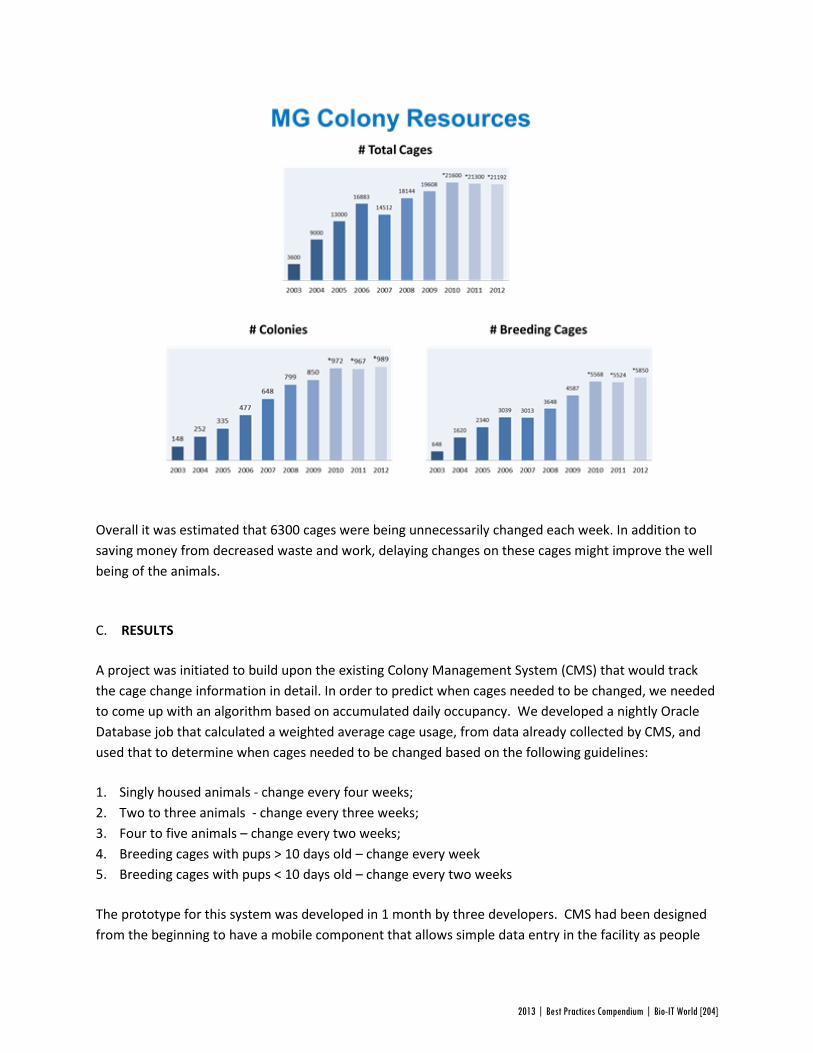
Overall it was estimated that 6300 cages were being unnecessarily changed each week. In addition tosaving money from decreased waste and work, delaying changes on these cages might improve the wellbeing of the animals.
C. RESULTS
A project was initiated to build upon the existing Colony Management System (CMS) that would trackthe cage change information in detail. In order to predict when cages needed to be changed, we neededto come up with an algorithm based on accumulated daily occupancy. We developed a nightly OracleDatabase job that calculated a weighted average cage usage, from data already collected by CMS, andused that to determine when cages needed to be changed based on the following guidelines:
1. Singly housed animals - change every four weeks;2. Two to three animals - change every three weeks;3. Four to five animals – change every two weeks;4. Breeding cages with pups > 10 days old – change every week5. Breeding cages with pups < 10 days old – change every two weeks
The prototype for this system was developed in 1 month by three developers. CMS had been designedfrom the beginning to have a mobile component that allows simple data entry in the facility as people
2013 | Best Practices Compendium | Bio-IT World [204]
execute their work. The Directed Cage Change leveraged this capability, and initially the system usedprinted PDFs showing rack sides and a map indicating the specific cages that needed to be changed. AnIntermec PDA with a bar code scanner was used to scan a barcode on the PDF indicating which rack tochange, and the technician could then indicate to the system that an entire set of cages were changed,or changed with certain exceptions.
One problem with this procedure was that cages moved so frequently that the printed PDF was oftenout of date by the time it was used, even if it were used within the same day of printing! Over the nextnine months the system continued to evolve, adding key reports to help fine tune the system.Ultimately we replaced the PDF plus Intermec PDA with an iPad version that indicated in real time whatcages required changing. This final point has been key to getting widespread utility and adoption of theapplication. Without being able to see the information match the physical world in real time, thisprocedure would not be successful.
D. ROI
The aggregate work to make the application changes to support the directed cage change totaled about$150,000, spread out over two efforts: an initial development effort that cost about $50,000, and thenrefinements spread out over an additional 9 months costing about $100,000. The ROI is quite
2013 | Best Practices Compendium | Bio-IT World [205]
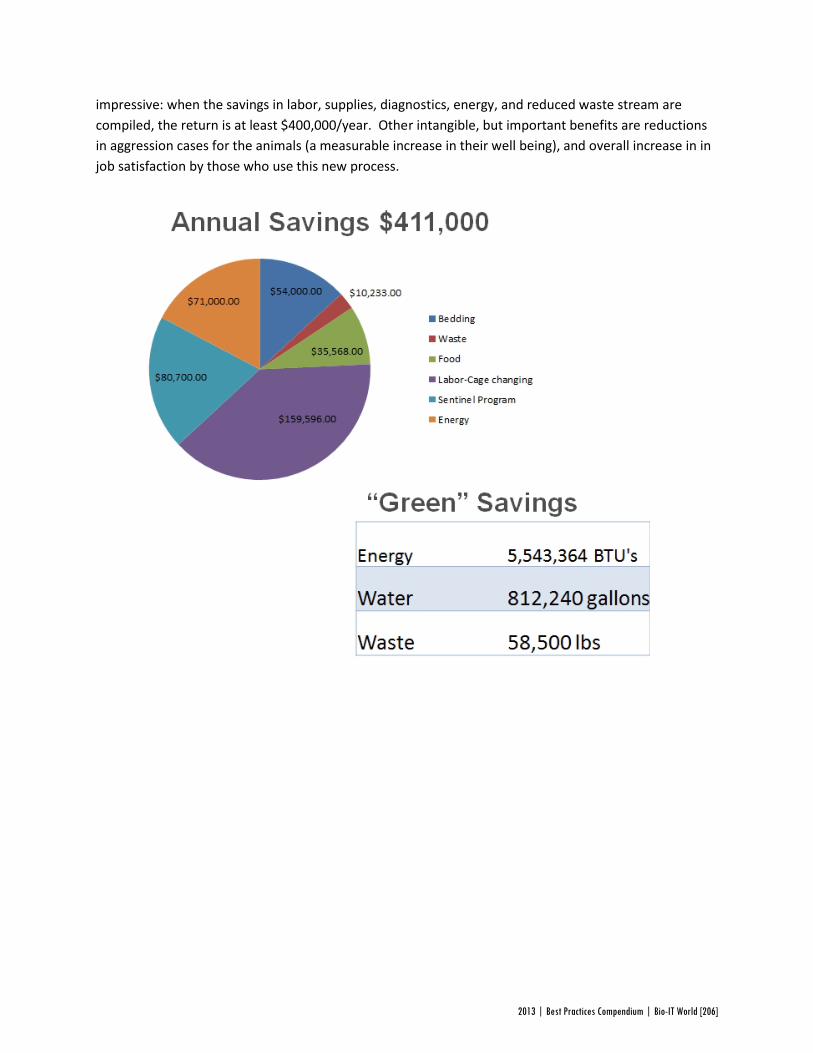
impressive: when the savings in labor, supplies, diagnostics, energy, and reduced waste stream arecompiled, the return is at least $400,000/year. Other intangible, but important benefits are reductionsin aggression cases for the animals (a measurable increase in their well being), and overall increase in injob satisfaction by those who use this new process.
2013 | Best Practices Compendium | Bio-IT World [206]
E. CONCLUSIONS
Genentech was wise to make the initial investment in the Colony Management System (CMS) starting in2007. Because of the detail of information collected by the application, and the ability to track thisinformation in real time, CMS served as a foundation upon which we were able build the Directed CageChange application. The Directed Cage Change in particular, and CMS in general, have demonstratedthat it is possible and important to collect detailed information about the entire animal managementprocess.
We were able to quickly deliver a completely novel way of analyzing our operational data for newpurposes because we already had a process that collected the key data in real time. This rapidity (andattendant flexibility) was important, as the new process for cage management had never been usedbefore; it was unclear how well it would work. We knew that it would be subject to change as theoperational and experimental data was collected and analyzed. As the process evolved, we weregenerally able to make the required changes within a week, and often as quickly as a day. The finalprocess that is used was a result of these many process iterations.
One key aspect of all of the software we use within our animal facility is the strong mobile component.We used this strong mobile foundation to add the additional screens needed for the Directed CageChange. Because everyone in the facility is familiar with using mobile devices and barcode scanners aspart of their daily work process, there was very little planning needed to roll out the initial version orsubsequent improvements for the application. And, because we specifically designed the application tobe as easy to use as possible, little training was necessary for people to use the application. Themajority of the training, and the majority of the planning to roll out the new process focused on the newhusbandry processes, and not the underlying technology.
We believe that we are well positioned to address additional operational improvements as they aredreamed up because we capture such rich information for all of the animals, and because we have spentso much effort making the capture of the information as easy as possible. We make heavy use ofbarcodes, scanners, mobile devices, and simplified and intuitive user interfaces. The data captured isassured to be high quality, and the users appreciate the simplicity and ease of use of the system. All ofthese efforts, as demonstrated with the rollout of the new Directed Cage Change, have allowed thepeople working in the facility to focus less on the technology, since it meshes well with their daily workprocesses, and can focus more on the well being of the animals.
6. REFERENCES
2013 | Best Practices Compendium | Bio-IT World [207]
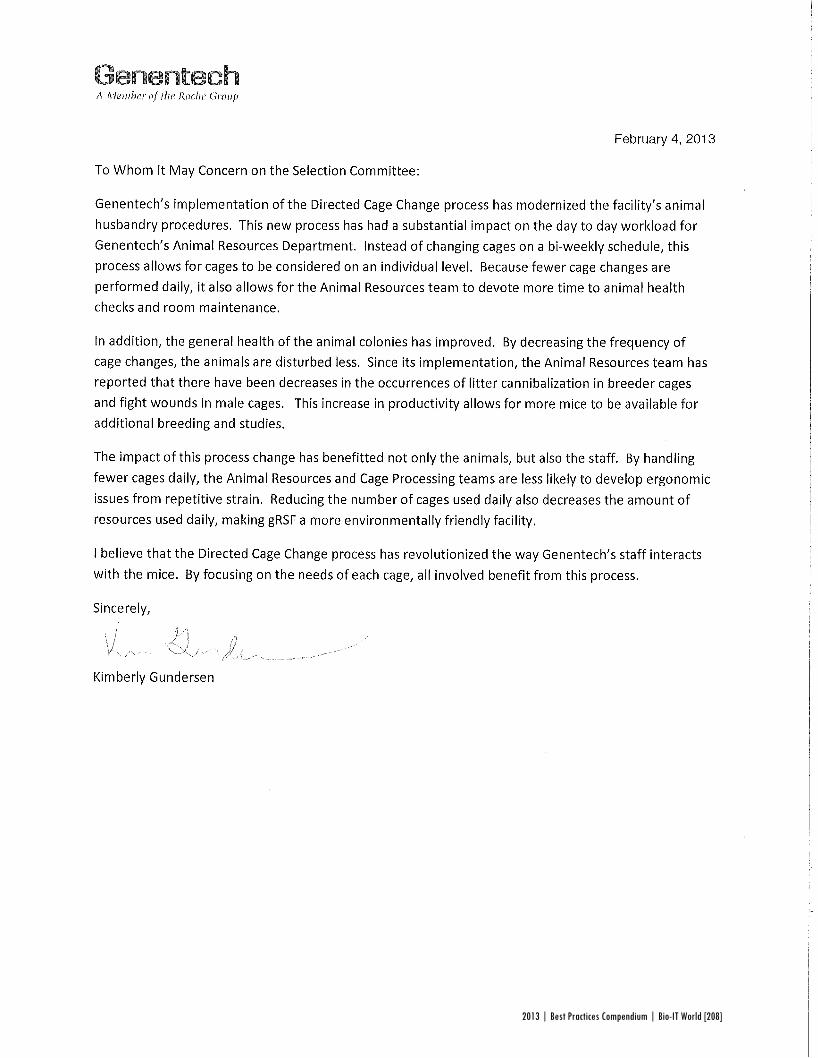
2013 | Best Practices Compendium | Bio-IT World [208]
Included are excerpts from a paper detailing the veterinary aspects of the Directed Cage Change (Wiler,R, ALN Magazine, 30 Oct 2012, http://www.alnmag.com/article/reducing-waste-innovative-cage-change-process-gemm-production-facility?page=0,1)
Reducing Waste via an Innovative Cage Change Process in a GEMM ProductionFacilityRhonda Wiler, DVM, DACLAM
The Impact of Being Large ScaleBreeding genetically modified murine models is a resource intensive effort that requiresreoccurring time sensitive and labor intensive tasks. Managing even one colony effectively cantake considerable resources. For example, a typical breeding colony consists of 30 cages andwill produce approximately 60 pups per month. This typical colony will have two modifiedalleles that will requires 4-6 PCR reactions for each tissue sample (240-360 reactions/mo in thiscase) to interrogate the genotypes. Even at this singular scale it is necessary to use a system toorganize work and maintain colony records. Without an effective system time sensitive tasksare missed or delayed resulting in a doubling of cages or overcrowding. Now expand the scaleto 1000 breeding colonies, 4000 breeding cages and 8,000 females producing 40,000pups/month. At this scale, logistics becomes critical to the success of the operation becauseeven small inefficiencies can lead to significant waste of resources. Managing this scaleeffectively requires the ability to quickly locate cages that contain litters amongst thousands ofother cages and then individually identifying the pups and taking tail samples by 10 days of age.These 40,000 tails samples have to be tracked while going through the genetic analysis process.The genetic analysis lab needs to identify which of the 450 assays to use for each colony andthen report the results (60,000/month) to the record of the specific mouse the tissue sampleoriginated from, all by weaning time. If the genotypes are delayed the cage occupancy canincrease by 6000 (26%) in one month. In addition to breeding colony maintenance tasks, thereare new colonies to be initiated, genetic assays to be developed, production goals to set andthen old colonies to cryopreserve and “take off the shelf” and making sure the needs of ourcollaborators are being met all while minimizing costs. This scale and complexity requires arobust data and task management system. Using a standard off the shelf record keepingmethods would have place unacceptable limits on the use of this valuable research tool.
Integrated Data Systems are Critical to Managing Large Scale OperationsIn 2007, we initiated an in-house design and development of a colony data-managementsystem (CMS). This system supports task management and is a repository for colonyinformation that can be accessed real-time by our staff and by the colony owners (internalinvestigators). The Murine Genetics Department completely transitioned to this system at the
2013 | Best Practices Compendium | Bio-IT World [209]
end of 2008. The story of the creation and implementation of this system is out of scope forthis article but its existence has enabled the Murine Genetics Operation to be several fold moreefficient, Figure 1. CMS tracks at the level of an individual animal and is a record of the animal’slife history. It records date of birth, genetic information, health observations, protocol, tasksperformed and cage location. This allows us to know where every mouse is located in ourfacility as well as how many mice are in each cage and provides a time stamped record of anytasks performed on that cage or its occupants. CMS was designed to support work flow and theinterface is used to initiate all standard processes such as weaning, setting up matings,identification and tissue sample collection etc. It extensively employs the use of automateddata entry devices such as PDAs or Tablets at the cage level. Figure 2 shows both the PDAprocess interface and the animal specific data interface screen for CMS. Changes can be easilyassessed at any given moment providing an accurate real-time view of the state of ouroperation. This global view provides the insight to understand how a change in one areaimpacts the operation as a whole. Having this level of visibility recently exposed the real cost ofhaving excess feed in cages sent to cage wash.
Using Data to Interrogate a Wasteful ProcessIt started when the Cage Processing Team reported that an excessive number of dirty cages stillcontained a large quantity of feed. In our facility cages are supplied as a complete unitconsisting of an autoclaved cage containing corn cob bedding, a wire food hopper filled with ameasured amount of feed, and a nestlet. The following solutions were attempted to addressthis problem. Initially, the food delivered to the hoppers during cage preparation wasdecreased. This led to a significant amount of adding food to the cage during daily checkswhich was an unacceptable increase in labor. Next, the formulation of the diet was changedfrom pelleted to extruded to decrease density of the diet. In this case, the mice consumed ittoo quickly and again led to excessive “topping off”. These solutions failed because they werenot addressing the underlying problem that produced the wasted food. This required analyzinghow our production and husbandry practices were sending cages with too much food back tocage processing. The mouse husbandry practice during this time was to change a rack or roomof cages on a set schedule (every 2 weeks for holding and weekly for breeder racks). Schedulingcage changes allowed us to track the day the service was performed and to plan resourcesrequired for the process (clean caging, Staff workloads, cage-processing throughput). TheAnimal Care Technician was instructed to change all cages in the assigned group regardless ofthe state of the cage (when it was last placed into a clean cage, the number of mice in the cageor the cage is assigned to be transferred or culled). After reviewing reports generated frominformation from the CMS it was determined that this standard husbandry practice resulted inpremature changing of 10% of cages. These clean cages are added weekly as a result of thecolony maintenance processes such as weaning, mating and receiving mice (2200 cages/week).
2013 | Best Practices Compendium | Bio-IT World [210]
It was also determined that an additional 5% of the cages were changed and then culled thesame week or put into a different cage for transfer (1100 cages/week). Combined, this led tothe premature changing of over 3300 cages/week, the primary source of the wasted feed. Inaddition, 70 % of our cages contain 2-3 mice, if the cage change frequency can be extendedfrom 2 weeks to 3 weeks for this cage occupancy then this decreases the number of cages thatcontribute to the food waste by an additional 3000 cages/week. The thought of over 6300cages not going to cage processing per week and the potential to significantly impact our wastestream was the primary driver for this innovation, to automate the cage change process. I feltconfident that this could be accomplished using our existing data system to assign and thentrack cage changes based on the state of the cage (occupancy, date cage last changed, assignedto be shipped or culled) instead of a set schedule. An added benefit will be to minimizeunnecessary disruption of the cage environment which can positively impact mouse well-being(decrease aggression and cannibalization of pups).
Developing a New Process for Changing CagesTo realize this vision, the first step was to modify the existing Colony Management System(CMS) and create a new interface. Fortunately, our organization has a talented internal Bio-Informatics group that develops software tools (integrated data management systems) tomanage our research data. This group is also responsible for programming and supportingCMS. Therefore, it was relatively straightforward to engage this group to help develop the ideaof a Directed Cage Change (DCC) system that guides the Husbandry Staff during the cagechange process. The developers created a program that uses an algorithm that schedules acage change based on the occupancy of the cage (data exists in CMS). For instance, a cage withone mouse is scheduled to be changed once every 4 weeks, 2-3 mice every 3 weeks, 4-5 miceevery 2 weeks. This algorithm requires the date when the cage was last changed to make anaccurate assignment. To provide this, the interface has a cage change completion processwhich automatically updates the system when cage changes are acknowledged by theTechnician. Since it is important to know when the cage was last changed, a process for offschedule changes was developed. This is used to record an off schedule cage change due tolow food, excessively dirty or wet. In addition, many of our standard breeding colonymaintenance processes actually result in a cage change. To avoid changing these cagesunnecessarily the interface for these tasks were modified to capture this activity as a cagechange. For example, the process of weaning mice involves consolidating litters andsegregation by gender into new cages. Once the mice are placed into the new cage the systemknows the number of mice in a cage and then automatically assigns the next cage change datefor it. The system also knows that a cage is assigned to be culled and this cage shows up as adifferent color on the interface. The technician can then cull the cage instead of changing thecage. The Husbandry Technician interacts with the DCC system through the use of wireless
2013 | Best Practices Compendium | Bio-IT World [211]
technology (barcodes, PDA’s, Tablets) as depicted in Figure 3. The same technology theyalready used to record health observations, record transfers, receiving and other animalspecific information. The DCC interface displays a map of all cages on half of a 160 cage rackand uses Tablet touch pad technology. The cages highlighted in blue are scheduled to bechanged. A technician can tap on the cage on the map and it will bring up another screen withmore detailed information of what is in the cage. For unscheduled changes the Technician cantap on a cage and the detail screen shows and then the Technician can select the reason for theunscheduled change and submit which resets the next scheduled change for this cage.
Reaping the BenefitsImplementation of the Directed Cage Change method resulted in a 40% reduction of assignedcages per week (greater than a 6,300 cage decrease as predicted) with no impact to mouseproductivity, a reduction in aggression cases and an overall increase in job satisfaction byHusbandry Staff (increased control of daily work) and Management Staff (increasedtransparency and ease of assigning workloads and coverage). Transitioning to this newmethod had an additional unforeseen positive impact on operational costs related to changesthat needed to be made in the Sentinel Program. Previously, a sentinel cage was dedicated to aside of the rack and dirty bedding from each cage on that side was added to the sentinel cage atthe schedule change date. This became unrealistic for the new cage changing process sincecages changed on a specific day were located on all racks in the room resulting in creating anirregular exposure interval. In addition, maintaining this sampling methodology meanthandling 30 sentinel cages/day/room compared to handling 4 sentinel cages per day previously.To solve this problem a new sentinel sample method was developed that used a sentinel cagefor each day of the work week for holding racks and a dedicated cage for each rack of breeders.Dirty bedding from all holding cages changed on Monday in a room is placed in the sentinelcage designated Monday and so on. This method was validated by the ability to detectNorovirus (endemic in our facility) within two weeks of implementation. In addition, thedatabase maintains a history of all the cages that contributed bedding to the sentinel cages,based on the last changed date. If a sentinel cage becomes positive a report based on thehistorical information can be generated to initiate the investigation to identify the source of thecontamination. As a result of implementing this new program, the sentinel cages per roomwere reduced from 30 to11 which provided an additional return in labor, diagnostic servicesand decreased animal use. Overall, when the savings in labor, supplies, diagnostics, energy andreduced waste stream are compiled the return is at least $400,000/year as shown in Figure 4.The cost to program the Directed Cage Change system was around $40,000 (excludes thedevelopment cost of CMS). This new cage change process, without question, has provided anexcellent return on investment but perhaps more importantly implementing this new processhas created a better environment in which to work and live.
2013 | Best Practices Compendium | Bio-IT World [212]
250 First Avenue, Suite 300, Needham, MA 02494 | phone: 781‐972‐5400 | fax: 781‐972‐5425
Published Resources for the Life Sciences
1. Nominating Organization (Fill this out only if you are nominating a group other than your own.)
A. Nominating Organization Organization name: GlaxoSmithKline Address: 5 Moore Dr, Research Triangle Park, NC, USA B. Nominating Contact Person Name: Andrew Wooster Title: Technical Director Tel: (919) 523‐6043 Email: [email protected]
2. User Organization (Organization at which the solution was deployed/applied)
A. User Organization Organization name: GlaxoSmithKline Address: Gunnels Wood Rd, Stevenage, Hertfordshire, SG1 2NY, UK B. User Organization Contact Person Name: Faiz Parkar Title: Senior Information Scientist Tel: +44 20 8990 2325 Email: [email protected]
3. Project Title:
Project Title: Socrates Search Team Leader Name: John Apathy Title: VP, Data Analytics Strategy Email: [email protected]
4. Category in which entry is being submitted (1 category per entry, highlight your choice)
Clinical & Health‐IT: Trial design, eCTD, EDC, ePrescribing, RHIOs, EMR/PHR IT infrastructure/HPC: High Performance Computing, storage, Cloud technologies Informatics: LIMS, data visualization, imaging technologies, NGS analysis Knowledge Management: Data mining, idea/expertise mining, text mining, collaboration, resource optimization
Research & Drug Discovery: Disease pathway research, applied and basic research, compound‐focused research, drug safety
2013 | Best Practices Compendium | Bio-IT World [213]
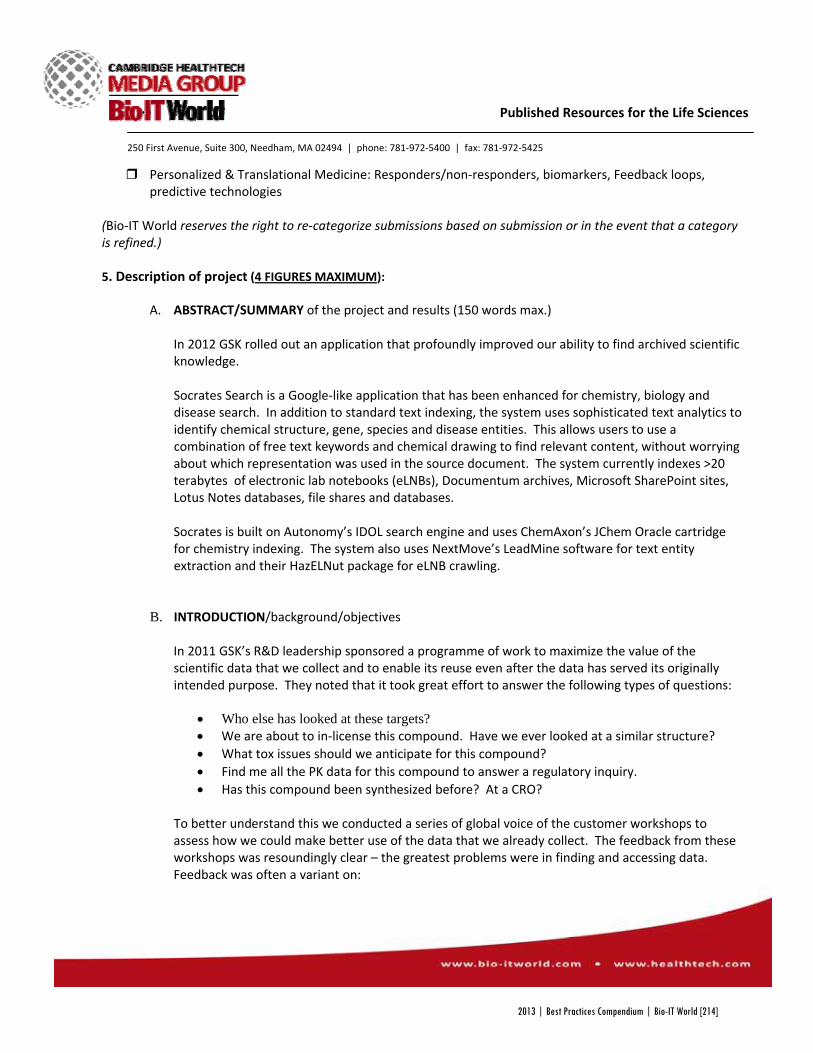
250 First Avenue, Suite 300, Needham, MA 02494 | phone: 781‐972‐5400 | fax: 781‐972‐5425
Published Resources for the Life Sciences
Personalized & Translational Medicine: Responders/non‐responders, biomarkers, Feedback loops, predictive technologies
(Bio‐IT World reserves the right to re‐categorize submissions based on submission or in the event that a category is refined.) 5. Description of project (4 FIGURES MAXIMUM):
A. ABSTRACT/SUMMARY of the project and results (150 words max.) In 2012 GSK rolled out an application that profoundly improved our ability to find archived scientific knowledge. Socrates Search is a Google‐like application that has been enhanced for chemistry, biology and disease search. In addition to standard text indexing, the system uses sophisticated text analytics to identify chemical structure, gene, species and disease entities. This allows users to use a combination of free text keywords and chemical drawing to find relevant content, without worrying about which representation was used in the source document. The system currently indexes >20 terabytes of electronic lab notebooks (eLNBs), Documentum archives, Microsoft SharePoint sites, Lotus Notes databases, file shares and databases. Socrates is built on Autonomy’s IDOL search engine and uses ChemAxon’s JChem Oracle cartridge for chemistry indexing. The system also uses NextMove’s LeadMine software for text entity extraction and their HazELNut package for eLNB crawling.
B. INTRODUCTION/background/objectives In 2011 GSK’s R&D leadership sponsored a programme of work to maximize the value of the scientific data that we collect and to enable its reuse even after the data has served its originally intended purpose. They noted that it took great effort to answer the following types of questions:
• Who else has looked at these targets? • We are about to in‐license this compound. Have we ever looked at a similar structure? • What tox issues should we anticipate for this compound? • Find me all the PK data for this compound to answer a regulatory inquiry. • Has this compound been synthesized before? At a CRO?
To better understand this we conducted a series of global voice of the customer workshops to assess how we could make better use of the data that we already collect. The feedback from these workshops was resoundingly clear – the greatest problems were in finding and accessing data. Feedback was often a variant on:
2013 | Best Practices Compendium | Bio-IT World [214]
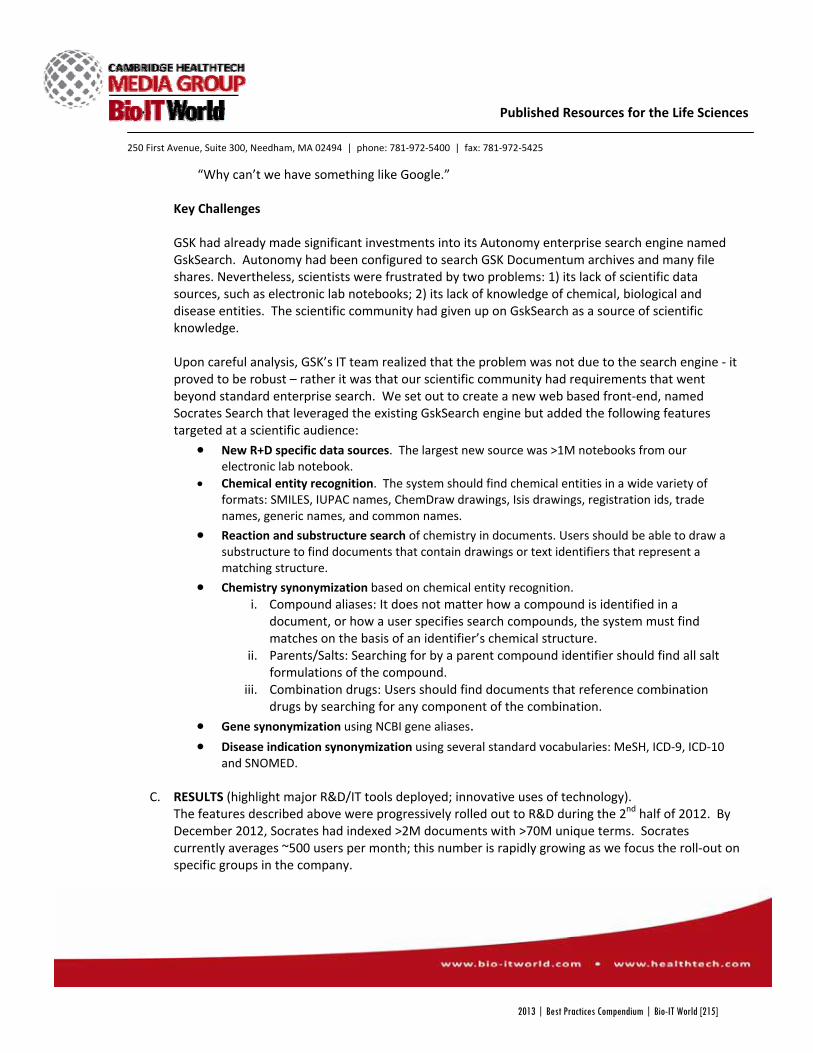
250 First Avenue, Suite 300, Needham, MA 02494 | phone: 781‐972‐5400 | fax: 781‐972‐5425
Published Resources for the Life Sciences
“Why can’t we have something like Google.” Key Challenges GSK had already made significant investments into its Autonomy enterprise search engine named GskSearch. Autonomy had been configured to search GSK Documentum archives and many file shares. Nevertheless, scientists were frustrated by two problems: 1) its lack of scientific data sources, such as electronic lab notebooks; 2) its lack of knowledge of chemical, biological and disease entities. The scientific community had given up on GskSearch as a source of scientific knowledge. Upon careful analysis, GSK’s IT team realized that the problem was not due to the search engine ‐ it proved to be robust – rather it was that our scientific community had requirements that went beyond standard enterprise search. We set out to create a new web based front‐end, named Socrates Search that leveraged the existing GskSearch engine but added the following features targeted at a scientific audience:
• New R+D specific data sources. The largest new source was >1M notebooks from our electronic lab notebook.
• Chemical entity recognition. The system should find chemical entities in a wide variety of formats: SMILES, IUPAC names, ChemDraw drawings, Isis drawings, registration ids, trade names, generic names, and common names.
• Reaction and substructure search of chemistry in documents. Users should be able to draw a substructure to find documents that contain drawings or text identifiers that represent a matching structure.
• Chemistry synonymization based on chemical entity recognition. i. Compound aliases: It does not matter how a compound is identified in a
document, or how a user specifies search compounds, the system must find matches on the basis of an identifier’s chemical structure.
ii. Parents/Salts: Searching for by a parent compound identifier should find all salt formulations of the compound.
iii. Combination drugs: Users should find documents that reference combination drugs by searching for any component of the combination.
• Gene synonymization using NCBI gene aliases. • Disease indication synonymization using several standard vocabularies: MeSH, ICD‐9, ICD‐10
and SNOMED.
C. RESULTS (highlight major R&D/IT tools deployed; innovative uses of technology). The features described above were progressively rolled out to R&D during the 2nd half of 2012. By December 2012, Socrates had indexed >2M documents with >70M unique terms. Socrates currently averages ~500 users per month; this number is rapidly growing as we focus the roll‐out on specific groups in the company.
2013 | Best Practices Compendium | Bio-IT World [215]
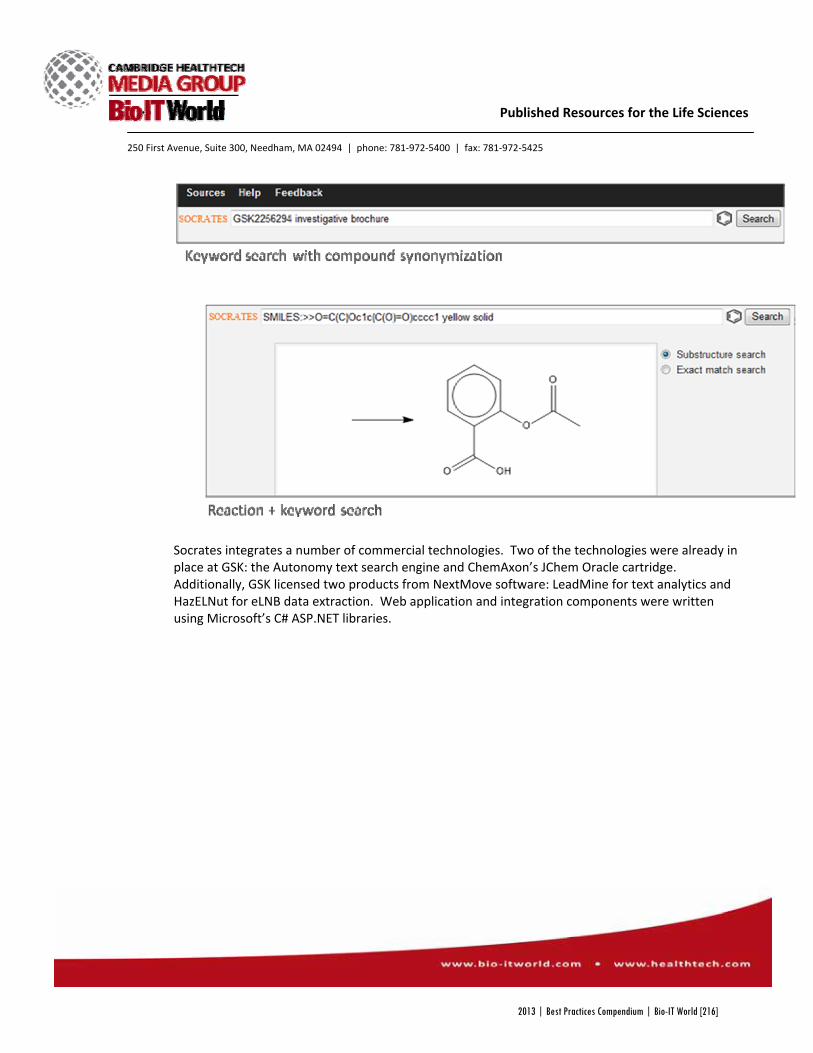
250 First Avenue, Suite 300, Needham, MA 02494 | phone: 781‐972‐5400 | fax: 781‐972‐5425
Published Resources for the Life Sciences
Socrates integrates a number of commercial technologies. Two of the technologies were already in place at GSK: the Autonomy text search engine and ChemAxon’s JChem Oracle cartridge. Additionally, GSK licensed two products from NextMove software: LeadMine for text analytics and HazELNut for eLNB data extraction. Web application and integration components were written using Microsoft’s C# ASP.NET libraries.
2013 | Best Practices Compendium | Bio-IT World [216]
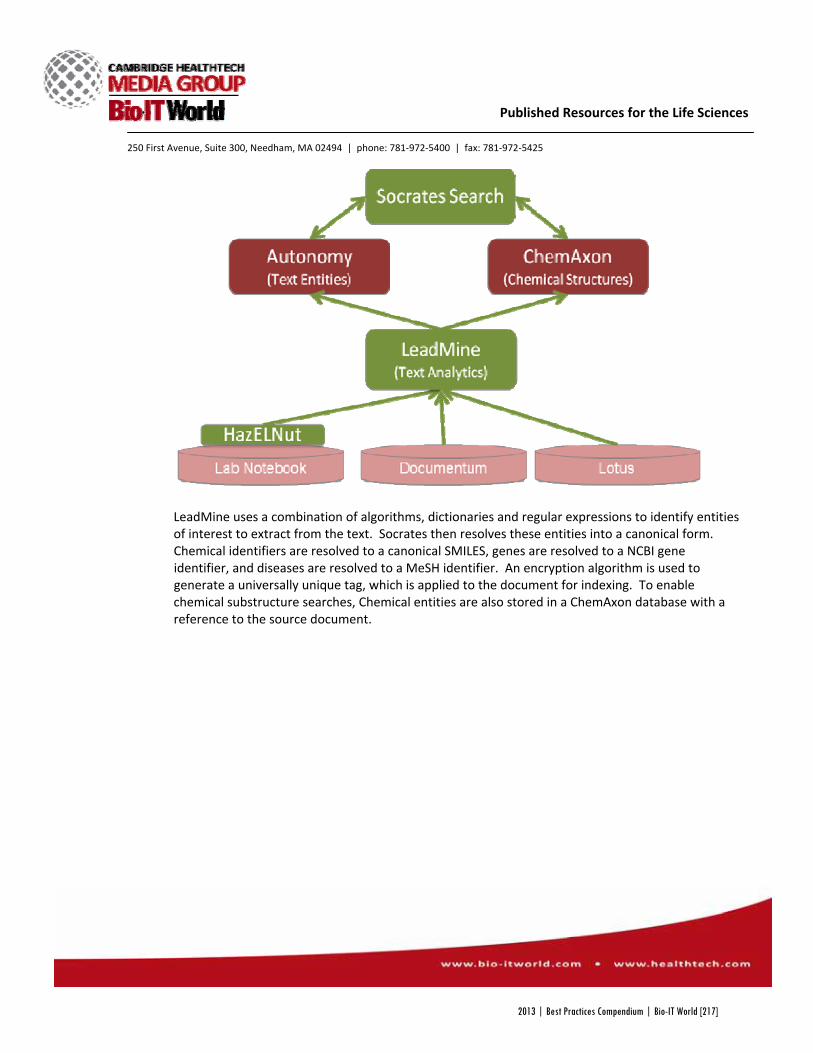
250 First Avenue, Suite 300, Needham, MA 02494 | phone: 781‐972‐5400 | fax: 781‐972‐5425
Published Resources for the Life Sciences
LeadMine uses a combination of algorithms, dictionaries and regular expressions to identify entities of interest to extract from the text. Socrates then resolves these entities into a canonical form. Chemical identifiers are resolved to a canonical SMILES, genes are resolved to a NCBI gene identifier, and diseases are resolved to a MeSH identifier. An encryption algorithm is used to generate a universally unique tag, which is applied to the document for indexing. To enable chemical substructure searches, Chemical entities are also stored in a ChemAxon database with a reference to the source document.
2013 | Best Practices Compendium | Bio-IT World [217]
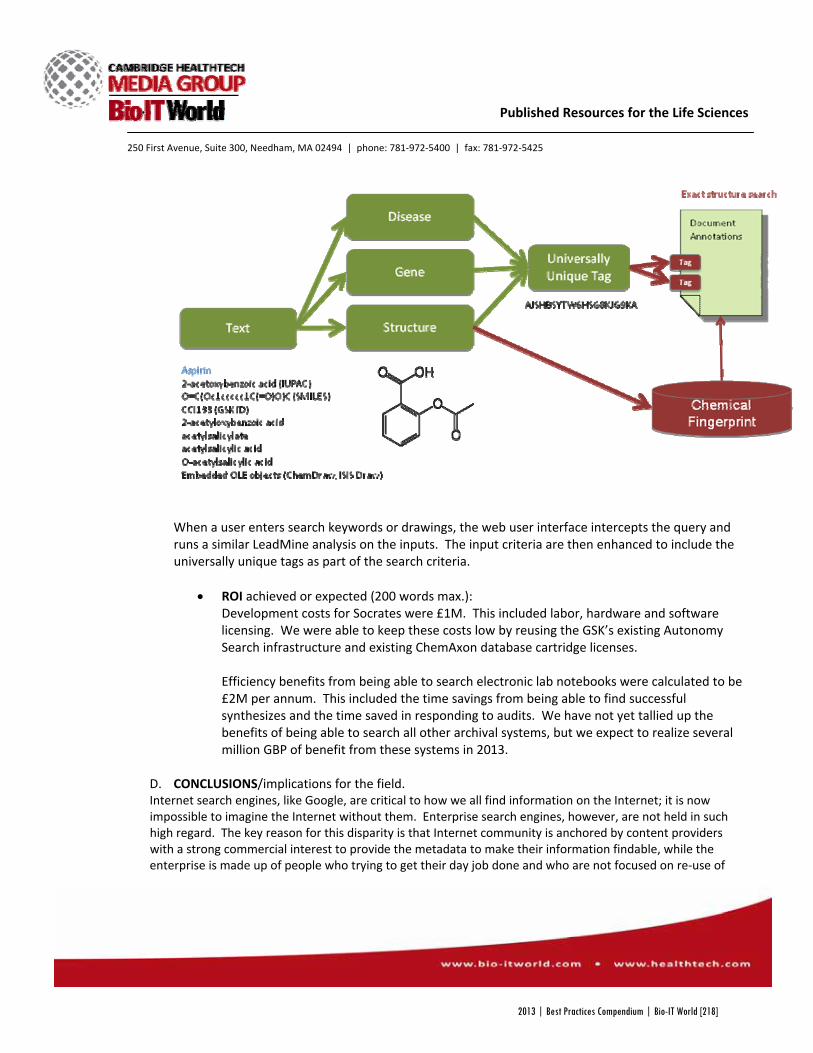
250 First Avenue, Suite 300, Needham, MA 02494 | phone: 781‐972‐5400 | fax: 781‐972‐5425
Published Resources for the Life Sciences
When a user enters search keywords or drawings, the web user interface intercepts the query and runs a similar LeadMine analysis on the inputs. The input criteria are then enhanced to include the universally unique tags as part of the search criteria.
• ROI achieved or expected (200 words max.):
Development costs for Socrates were £1M. This included labor, hardware and software licensing. We were able to keep these costs low by reusing the GSK’s existing Autonomy Search infrastructure and existing ChemAxon database cartridge licenses. Efficiency benefits from being able to search electronic lab notebooks were calculated to be £2M per annum. This included the time savings from being able to find successful synthesizes and the time saved in responding to audits. We have not yet tallied up the benefits of being able to search all other archival systems, but we expect to realize several million GBP of benefit from these systems in 2013.
D. CONCLUSIONS/implications for the field. Internet search engines, like Google, are critical to how we all find information on the Internet; it is now impossible to imagine the Internet without them. Enterprise search engines, however, are not held in such high regard. The key reason for this disparity is that Internet community is anchored by content providers with a strong commercial interest to provide the metadata to make their information findable, while the enterprise is made up of people who trying to get their day job done and who are not focused on re‐use of
2013 | Best Practices Compendium | Bio-IT World [218]

250 First Avenue, Suite 300, Needham, MA 02494 | phone: 781‐972‐5400 | fax: 781‐972‐5425
Published Resources for the Life Sciences
their data. In order to overcome this disparity, GSK invested in making its enterprise search smarter so that it could infer the necessary metadata to make content more findable. Socrates Search is now integral to how GSK scientists find and re‐use knowledge. Socrates is a foundational capability in our broader R&D‐wide knowledge engineering strategy. In 2013, GSK will invest in further enhancing clinical and biology search. We will integrate a number of late stage sources, such as our clinical trial and biopharm databases. We also expect to add features to support ontology mining and biological sequence indexing.
1. REFERENCES/testimonials/supporting internal documents (If necessary; 5 pages max.)
1. “Socrates Search is an amazing tool and a great advance in our ability to leverage our internal data. Our investigators have been heavily reliant on external and anecdotal data for designing new experiments. This tool allows us to more fully apply our considerable experience, link internal expertise, and design more robust experiments.” Director, Animal Research Strategy
2. “30 seconds to find with Socrates would have taken 5 – 20 minutes without Socrates.” Legal Counsel
3. “Socrates has just saved us a lot of time today regarding regulatory question around an impurity in [respiratory product X].” Director, Computational Toxicology
4. “I had to find out the solubility in FaSSIF for 38 compounds. I had very little progress for almost 3 weeks, until I started to use the Socrates last week….took me about 3 days to find all the information with about 3-4 hours per day. Investigator
5. “DMPK get requests from Scientists for data, which is in their eLNBs. Since eLNB is indexed in Socrates Search, DMPK can now refer requesters to Socrates Search since eLNB searching is much better than the native eLNB.” Manager, Oncology Epigenetics
6. “I am very impressed with the speed of the searches. …would be totally impractical to do directly with the current eLNB interface.” Chemist, Green Chemistry
7. “I was able to quickly retrieve program documents for programs that I was working on in the early 1990s!” Director, Protein Dynamics, Oncology
8. “When I search a registration number for a structure, the chemistry and biology experiments are linked….Socrates gives us a great way to go to the biologists notebooks directly.” Investigator, Metabolic Pathways
9. “Socrates has helped us to uncover data for audit purposes that was previously difficult to track down.” Head, R&D Operations
2013 | Best Practices Compendium | Bio-IT World [219]

250 First Avenue, Suite 300, Needham, MA 02494 | phone: 781‐972‐5400 | fax: 781‐972‐5425
Published Resources for the Life Sciences
Bio‐IT World 2013 Best Practices Awards
1. Nominating Organization (Fill this out only if you are nominating a group other than your own.) A. Nominating Organization Organization name: LaVoie Group Address: 201 Broadway, Cambridge, MA 02139 B. Nominating Contact Person Name: Stacey Falardeau Title: Account Coordinator Tel: (617) 374‐8800 Email: [email protected]
2. User Organization (Organization at which the solution was deployed/applied)
A. User Organization Organization name: i3 Analytics Address: 10500 Little Patuxent Pkwy, Suite 710, Columbia, MD 21044 B. User Organization Contact Person Name: Will Zerhouni Title: President and Chief Executive Officer Tel: (443) 518‐7156 Email: [email protected]
3. Project Title: Biopharma Navigator
Team Leader: Will Zerhouni Contact details if different from above: Team members – Archna Bhandari, Vice President of Data and Analytics Kirk Baker, Vice President of Technical Development David Mir, Vice President of Strategy and Business Development
4. Category in which entry is being submitted (1 category per entry, highlight your choice)
Clinical & Health‐IT: Trial design, eCTD, EDC, ePrescribing, RHIOs, EMR/PHR IT infrastructure/HPC: High Performance Computing, storage, Cloud technologies
2013 | Best Practices Compendium | Bio-IT World [220]
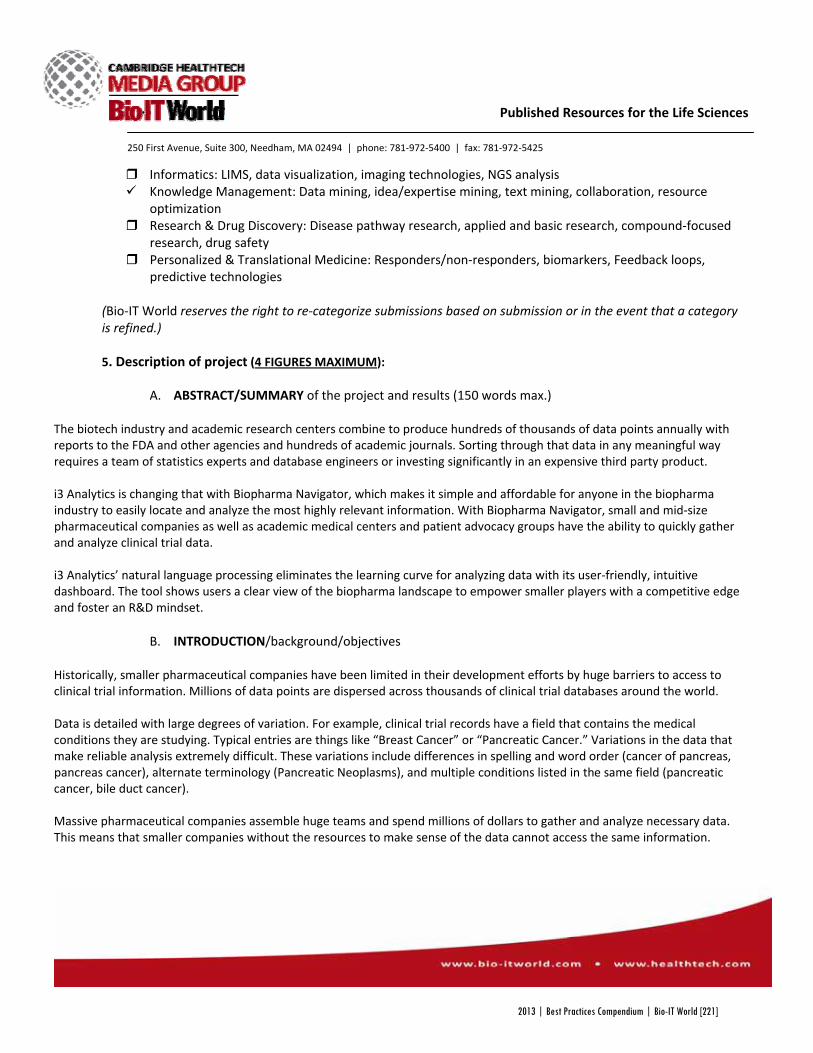
250 First Avenue, Suite 300, Needham, MA 02494 | phone: 781‐972‐5400 | fax: 781‐972‐5425
Published Resources for the Life Sciences
Informatics: LIMS, data visualization, imaging technologies, NGS analysis Knowledge Management: Data mining, idea/expertise mining, text mining, collaboration, resource optimization
Research & Drug Discovery: Disease pathway research, applied and basic research, compound‐focused research, drug safety
Personalized & Translational Medicine: Responders/non‐responders, biomarkers, Feedback loops, predictive technologies
(Bio‐IT World reserves the right to re‐categorize submissions based on submission or in the event that a category is refined.) 5. Description of project (4 FIGURES MAXIMUM):
A. ABSTRACT/SUMMARY of the project and results (150 words max.) The biotech industry and academic research centers combine to produce hundreds of thousands of data points annually with reports to the FDA and other agencies and hundreds of academic journals. Sorting through that data in any meaningful way requires a team of statistics experts and database engineers or investing significantly in an expensive third party product. i3 Analytics is changing that with Biopharma Navigator, which makes it simple and affordable for anyone in the biopharma industry to easily locate and analyze the most highly relevant information. With Biopharma Navigator, small and mid‐size pharmaceutical companies as well as academic medical centers and patient advocacy groups have the ability to quickly gather and analyze clinical trial data. i3 Analytics’ natural language processing eliminates the learning curve for analyzing data with its user‐friendly, intuitive dashboard. The tool shows users a clear view of the biopharma landscape to empower smaller players with a competitive edge and foster an R&D mindset.
B. INTRODUCTION/background/objectives
Historically, smaller pharmaceutical companies have been limited in their development efforts by huge barriers to access to clinical trial information. Millions of data points are dispersed across thousands of clinical trial databases around the world. Data is detailed with large degrees of variation. For example, clinical trial records have a field that contains the medical conditions they are studying. Typical entries are things like “Breast Cancer” or “Pancreatic Cancer.” Variations in the data that make reliable analysis extremely difficult. These variations include differences in spelling and word order (cancer of pancreas, pancreas cancer), alternate terminology (Pancreatic Neoplasms), and multiple conditions listed in the same field (pancreatic cancer, bile duct cancer). Massive pharmaceutical companies assemble huge teams and spend millions of dollars to gather and analyze necessary data. This means that smaller companies without the resources to make sense of the data cannot access the same information.
2013 | Best Practices Compendium | Bio-IT World [221]
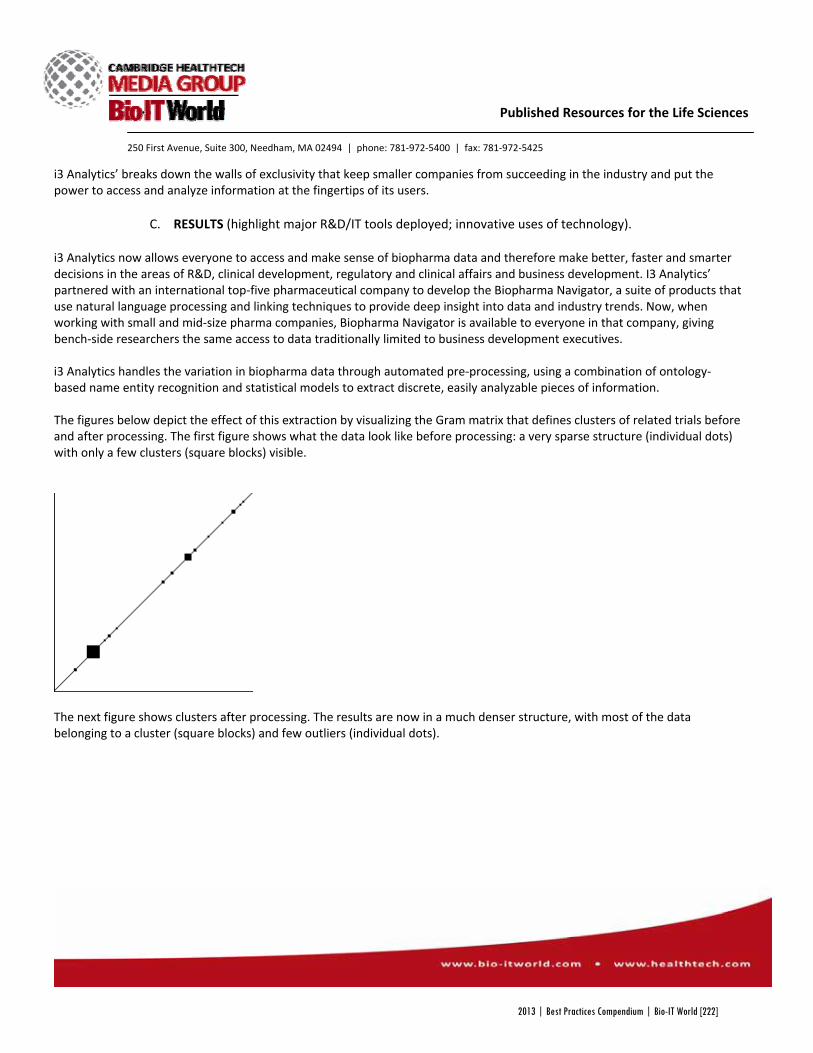
250 First Avenue, Suite 300, Needham, MA 02494 | phone: 781‐972‐5400 | fax: 781‐972‐5425
Published Resources for the Life Sciences
i3 Analytics’ breaks down the walls of exclusivity that keep smaller companies from succeeding in the industry and put the power to access and analyze information at the fingertips of its users.
C. RESULTS (highlight major R&D/IT tools deployed; innovative uses of technology).
i3 Analytics now allows everyone to access and make sense of biopharma data and therefore make better, faster and smarter decisions in the areas of R&D, clinical development, regulatory and clinical affairs and business development. I3 Analytics’ partnered with an international top‐five pharmaceutical company to develop the Biopharma Navigator, a suite of products that use natural language processing and linking techniques to provide deep insight into data and industry trends. Now, when working with small and mid‐size pharma companies, Biopharma Navigator is available to everyone in that company, giving bench‐side researchers the same access to data traditionally limited to business development executives. i3 Analytics handles the variation in biopharma data through automated pre‐processing, using a combination of ontology‐based name entity recognition and statistical models to extract discrete, easily analyzable pieces of information. The figures below depict the effect of this extraction by visualizing the Gram matrix that defines clusters of related trials before and after processing. The first figure shows what the data look like before processing: a very sparse structure (individual dots) with only a few clusters (square blocks) visible.
The next figure shows clusters after processing. The results are now in a much denser structure, with most of the data belonging to a cluster (square blocks) and few outliers (individual dots).
2013 | Best Practices Compendium | Bio-IT World [222]
250 First Avenue, Suite 300, Needham, MA 02494 | phone: 781‐972‐5400 | fax: 781‐972‐5425
Published Resources for the Life Sciences
In essence, i3 Analytics return structure to data, revealing patterns that are otherwise hidden. The Biopharma navigator suite contains three components: clinical trials, news and researchers. Clinical Trials
Users can view the biopharma landscape with charts and graphs, focus on the most relevant pieces of data and filter out the “noise”
News
Users can search the most up to date information available and create news alerts to save time and see news events as they happen
Researchers
Users can stay connected with experts in their fields of inquiry and discover the key thought leaders with measurable metrics of expertise
D. ROI achieved or expected (200 words max.):
The user‐friendly interface and the natural language processing of the Biopharma Navigator suite has become attractive point for potential partnering. I3 Analytics’ team members received initial validation from the National Institutes of Health and being used by an international top‐five pharmaceutical company. Members of the i3 Analytics team played leading roles on the NIH dashboard project which led to the development of the NIH Reporter. i3 Analytics Biopharma Navigator tool provides access to over 210,000 clinical trials, over 4.500,000 experts in the field and over 350,000 news articles.
E. CONCLUSIONS/implications for the field.
2013 | Best Practices Compendium | Bio-IT World [223]

250 First Avenue, Suite 300, Needham, MA 02494 | phone: 781‐972‐5400 | fax: 781‐972‐5425
Published Resources for the Life Sciences
I3 Analytics is data analytics for everyone. The platform allows universal access to information that was previously only available to those companies with the resources to build their own systems of data compilation. The i3 Analytics customer might be a researcher in the library in an academic medical center or a patient advocacy group looking to translate clinical data knowledge into ideas to better the industry it operates within. The user‐friendly platform is sold as a partnership so that all members of the team can access the software. I3 Analytics’ aim is that this level of accessibility will unlock the R&D mindset in researchers and academic medical centers to small organizations a competitive edge.
1. REFERENCES/testimonials/supporting internal documents (If necessary; 5 pages max.)
To learn more about the Biopharma Navigator or access a free trial to see the tool in action, please visit www.i3analytics.com
2013 | Best Practices Compendium | Bio-IT World [224]
250 First Avenue, Suite 300, Needham, MA 02494 | phone: 781‐972‐5400 | fax: 781‐972‐5425
Published Resources for the Life Sciences
Bio‐IT World 2013 Best Practices Awards
1. Nominating Organization (Fill this out only if you are nominating a group other than your own.) A. Nominating Organization Organization name: Address: B. Nominating Contact Person Name: Title: Tel: Email:
2. User Organization (Organization at which the solution was deployed/applied)
A. User Organization Organization name: InSilico Genomics Address: 61, Rue Montagne de Saint‐Job 1180 – Uccle – Belgium B. User Organization Contact Person Name: David Weiss Title: Chief Executive Officer Tel: +32 488 364 795 Email: [email protected]
3. Project Title: InSilico DB Genomics Datasets Hub
Team Leader: Alain Coletta, Chief Technology Officer Contact details if different from above: Team members – name(s), title(s) and company (optional): David Steenhoff, Senior Software Engineer Robin Duqué, Senior Software Engineer Virginie de Schaetzen, Data Quality Officer
4. Category in which entry is being submitted (1 category per entry, highlight your choice)
Clinical & Health‐IT: Trial design, eCTD, EDC, ePrescribing, RHIOs, EMR/PHR IT infrastructure/HPC: High Performance Computing, storage, Cloud technologies Informatics: LIMS, data visualization, imaging technologies, NGS analysis
2013 | Best Practices Compendium | Bio-IT World [225]
250 First Avenue, Suite 300, Needham, MA 02494 | phone: 781‐972‐5400 | fax: 781‐972‐5425
Published Resources for the Life Sciences
Knowledge Management: Data mining, idea/expertise mining, text mining, collaboration, resource optimization
Research & Drug Discovery: Disease pathway research, applied and basic research, compound‐focused research, drug safety
Personalized & Translational Medicine: Responders/non‐responders, biomarkers, Feedback loops, predictive technologies
(Bio‐IT World reserves the right to re‐categorize submissions based on submission or in the event that a category is refined.) 5. Description of project (4 FIGURES MAXIMUM):
A. ABSTRACT/SUMMARY of the project and results (150 words max.) Genomics datasets are increasingly useful for gaining biomedical insights, with adoption in the clinic underway. However, multiple hurdles related to data management stand in the way of their efficient large‐scale utilization. The solution proposed is a web‐based data storage hub. Having clear focus, flexibility and adaptability, InSilico DB seamlessly connects genomics dataset origniating from multiple genome‐measurement technologies to state‐of‐the‐art GUI and command‐line data analysis tools. The InSilico DB platform is a powerful collaborative environment, with advanced capabilities for biocuration, dataset sharing, and dataset subsetting and combination. InSilico DB is available from ttps://insilicodb.org. B. INTRODUCTION/background/objectives The precipitous decrease in cost of sequencing and increasing usefulness of the contained information in research and the clinic is resulting in a steep increase of genomics datasets production and accumulation. However, from the mountains of data generated to actionable information analysis tools are needed. Worldwide efforts are producing aver more powerful and accurate bioinformatics algorithms and tools. By some estimates, more than 10,000 bioinformatics analysis tools exist and are available to the community (Michael Reich, Broad Institute of MIT and Harvard, personal communication). However, the throughput of data arriving into the right tools in front of the right person to produce actionable information is dismal and medical breakthroughs are one‐shot and require teams of scientists in state‐of‐the‐art facilities, sifting through the data for months in order to extract actionable knowledge. Moreover, the throughput of data arriving into the right tools in front of the right person to produce actionable information is dismal and medical breakthroughs are one‐shot and require teams of scientists in state‐of‐the‐art facilities, sifting through the data for months in order to extract actionable knowledge.
2013 | Best Practices Compendium | Bio-IT World [226]
250 First Avenue, Suite 300, Needham, MA 02494 | phone: 781‐972‐5400 | fax: 781‐972‐5425
Published Resources for the Life Sciences
The hurdles to efficient data utilization are multiple, among which:
1. Different genome measurement technologies 2. Different data formats accepted by different bioinformatics tools 3. Highly specialized, evolving, pre‐processing algorithms 4. Meta‐Data from samples unstructured and kept in user's computers as spreadsheets 5. Meta‐data from genomics features are redefined as new genome references are published and
knowledge about genes evolve 6. Patient data are updated during follow‐up 7. Sharing data and results is cumbersome and unsafe 8. Lack of access control to data endangers patients privacy 9. Comparing new and legacy results, sometimes from different platforms is a challenging and
time‐consuming 10. Data can be scattered on hard drives and irreversibly lost or misplaced, especially with typically
high personnel turnover 11. Collaborating between people using different analysis tools is challenging 12. The above‐mentioned challenges are accentuated with voluminous NGS experiments 13. Processing power is limiting 14. Large raw datasets are difficult to transfer
In short, It is extremely difficult to analyze data arising from different technologies on different tools used by different people—the whole process is notoriously tedious, error‐prone, and unsafe. To address this problem the objectives are: to build a centralized, secure, web‐based collaborative platform to efficiently gather and distribute genomic datasets in a flexible manner to unlock their potential for widespread application.
C. RESULTS (highlight major R&D/IT tools deployed; innovative uses of technology). To improve the efficiency in genomics data utilization, we have created InSilico DB. InSilico DB makes the process of handling genomics datasets automated and transparent to the user. InSilico DB accepts data from the main legacy and current genomics platforms and provides an output to the best available analysis tools (plus a generic web‐services‐based API for inbound‐connecting analysis tools). The platform encapsulates all necessary computational power, and deploys it behind the scenes, to allow the biomedical scientist to concentrate on biomedical discovery, not IT. InSilico DB comes pre‐installed with the largest collection of genome‐wide datasets and acts as a web‐based central warehouse containing ready‐to‐use genome‐wide datasets. Detailed documentation and tutorials are available at the InSilico DB website https://insilicodb.org. • InSilico DB connects the following genomics platforms, pre‐processed with the latest published
algorithms:
2013 | Best Practices Compendium | Bio-IT World [227]

250 First Avenue, Suite 300, Needham, MA 02494 | phone: 781‐972‐5400 | fax: 781‐972‐5425
Published Resources for the Life Sciences
‐ Illumina, ‐ IonTorrent, ‐ Roche, and ‐ Affymetrix
• to the following annalysis tools:
‐ R/Bioconductor through the specialized R packages: inSilicoDb for computationally accessing InSilico DB
(http://www.ncbi.nlm.nih.gov/pubmed/21937664), and inSilicoMerging for conducting meta‐analyses on microarray datasets
‐ GenePattern (Broad/MIT), ‐ GenomeSpace: InSilico DB is the primary access to largest public datasets repository GEO ‐ Through GenomeSpace, InSilico DB provides access to:
Integrative Genomics Viewer, Galaxy, and Cytoscape, and more.
• InSilico DB is hosted in a secure data center with the following technological features:
o System based on MySQL/Linux/Apache/PhP architecture, o A proprietary Java large‐scale job scheduler, o An interactive web‐based interface with Javascript frameworks Sencha and JQuery, o A proof of concept has been done with Cloudera (www.cloudera.com) for Hadoop/HBase
implementation of a highly scalable solution. Overall the InSilico DB team has a deep expertise in genomics and academic publishing track record with a recent publication in Genome Biology about InSilico DB (http://genomebiology.com/2012/13/11/R104, highly accesed). Recently InSilico DB has attracted private investment to expand its offering (see http://www.genomeweb.com/informatics/newly‐minted‐insilico‐genomics‐commercialize‐genomic‐data‐hub‐offer‐rna‐seq‐anal) InSilico DB is gaining significant traction with the following statistics as of February 2013: 143,000 manually curated samples (in‐house + contributions) 10,000 exports to third‐party analysis tools 1,000 registered users from top institutions in industry and academia Two publications resulting from use of website have appeared before publication of the resource in
December 2011 (see testimonials below) D. ROI achieved or expected (200 words max.):
2013 | Best Practices Compendium | Bio-IT World [228]

250 First Avenue, Suite 300, Needham, MA 02494 | phone: 781‐972‐5400 | fax: 781‐972‐5425
Published Resources for the Life Sciences
The ROI attained from using InSilico DB is large for standard groups active in biomedical research and applied biomedical research: Immediate access to NGS without: Investment in IT infrastructure: at least several tens of thousands of dollars in equipment if
adeqquate facilities exist (ventilated room, fast internet connection, etc.) + maintenance Hiring specialized bioinformatics staff: highly paid staff hired in‐house added to payroll Implementing NGS pipelines: 6 months needed to implement pipelines, 6 months salary of
bioinformatics expert, with whole organization without access to latest technologies Minutes instead of days to reuse public datasets: weeks worth of highly specialized wages saved in
a typical laboratory Archiving legacy datasets at risk of being lost and using them to leverage experiments done with
new technologies: up to thousands of genomic experiments costing roughly $1000 each, leveraging potentially millions in investment.
Easy to reuse public datasets, saving in experiments and expanding reach of in‐house efforts] Expanding capacity through collaborations and safe data sharing
E. CONCLUSIONS/implications for the field. InSilico DB increases the bandwidth for useful information to traverse the bioinformatics value chain by relieving the bottleneck posed by data management problems. As a consequence more genome data will arrive from diverse sources, archived and new, into the right hands on the right tool, at the right time to make a difference for the patient. In this capacity InSilico DB is poise to become a main actor in the commoditization of genomics. A difficult to quantify but potentially game‐changing benefit of using InSilico DB are: the possibility to safely engage in public/private partnerships to accelerate drug discovery, and enabling collaboration between computational and bench scientists. A Spin‐Off of the universities where InSilco DB was designed (Universite Libre de Bruxelles/Vrije Universiteit Brussel) has been created with the aim of becoming a permanent self‐sustaining structure. In the medium‐term, through its unique focus, scale, and its role as a systematic connector of data and algorithms InSilico DB is uniquely positioned to become a marketplace for the part of tomorrow's personalized medicine that will consist in professionally applying third‐party proprietary diagnosis algorithms to human genomes. 6. REFERENCES/testimonials/supporting internal documents (If necessary; 5 pages max.)
Note: The addition of private datasets handling very is recent (dates back a couple of months) and thus the following support letters refer to the InSilico DB when it was limited to the handling of public datasets.
From Pablo Tamayo, Broad Institute of MIT and Harvard:
2013 | Best Practices Compendium | Bio-IT World [229]

250 First Avenue, Suite 300, Needham, MA 02494 | phone: 781‐972‐5400 | fax: 781‐972‐5425
Published Resources for the Life Sciences
Dear InSilicoDB team, This message is to commend you for putting together such a useful resource and database. Recently I had the opportunity of using InSilicoDB in a project that required the analysis of a large collection of datasets including many different tissue types and conditions. InSilicoDB was very useful to quickly identify, select and download the relevant datasets. We managed to complete the analysis very quickly and we just submitted a paper containing the results to PLoS Computational Biology. I particularly like the capability of InSilicoDB to split and subset datasets according to the different types of phenotypic information which are well kept and organized by the InSilicoDB system. The integration of InSilicoDB with GenePattern is a particularly important feature that brings together data sources and a wide variety of analyses. This capability saves considerable time to the computational expert but also opens up many new opportunities to analyze data for the biologist or clinician user. I enthusiastically support the development of InSilicoDB and would like to see it well funded and its features and capabilities increased. There is a real need for this type of resource in the genomic community. Sincerely, --Pablo Tamayo Senior Computational Biologist Cancer and Computational Biology and Bioinformatics Programs Eli and Edythe Broad Institute
Relating to publication: An erythroid differentiation signature predicts response to lenalidomide in myelodysplastic syndrome. Ebert BL, Galili N, Tamayo P, Bosco J, Mak R, Pretz J, Tanguturi S, Ladd-Acosta C, Stone R, Golub TR, Raza A. PLoS Med. 2008 Feb;5(2):e35. doi: 10.1371/journal.pmed.0050035. A more recent publication from the same author with a very large scale analysis involving ~50 datasets: The limitations of simple gene set enrichment analysis assuming gene independence. Tamayo P, Steinhardt G, Liberzon A, Mesirov JP. Stat Methods Med Res. 2012 Oct 14. [Epub ahead of print]
From Gíl Tomás, InSilico DB quickly grew to become a pivotal tool in our research. One of its virtues is to provide an interface to the biggest online repository of microarray studies available online, the Gene Expression Omnibus (GEO, see http://www.ncbi.nlm.nih.gov/geo/).
2013 | Best Practices Compendium | Bio-IT World [230]
250 First Avenue, Suite 300, Needham, MA 02494 | phone: 781‐972‐5400 | fax: 781‐972‐5425
Published Resources for the Life Sciences
In our 2012 paper entitled “A general method to derive robust organ‐specific gene expression‐based differentiation indices: application to thyroid cancer diagnostic”, we used inSilico DB to retrieve four gene atlases profiling healthy human tissues. The inSilico DB web interface allowed us to quickly browse for relevant studies to address our questions; to publicly re‐annotate and standardize sample names across different studies; and finally to download a ready‐to‐use, normalized gene expression matrixes for each study. Since then, we have embarked in a larger integrative meta‐analysis requiring the processing of an important number of microarray studies from GEO. This project demanded the collection of several cancer expression profiles and the standardization of their corresponding clinical annotation data. Again, the inSilico DB framework saved us many hours of tedious and prone to error data manipulation through the use of the Bioconductor inSilicoDb R package. This tool, coupled with the web‐based clinical annotation editor, allowed us to set up a pipeline automating all the required pre‐processing of the several studies under analysis. In the past ten years, the analysis of microarray data has provided us with many insights on the biology of cancer. However, this ever‐growing wealth of biomolecular data entails a greater challenge: the need to coherently mobilize and integrate its complexity so to tap its underlying biological fabric. Facing this task, inSilico DB has provided the researcher with an elegant, flexible and resourceful solution to creatively revisit microarray experiments. Relating to publication: A general method to derive robust organ‐specific gene expression‐based differentiation indices: application to thyroid cancer diagnostic. Tomás G, Tarabichi M, Gacquer D, Hébrant A, Dom G, Dumont JE, Keutgen X, Fahey TJ 3rd, Maenhaut C, Detours V. Oncogene. 2012 Oct 11;31(41):4490‐8. doi: 10.1038/onc.2011.626. Epub 2012 Jan 23. Andrew Beck, Beth Israel Deaconess Medical Center Harvard Medical School
Dear InSilico DB, I direct a molecular pathology research laboratory focused on the study of cancer. My lab was recently introduced to InSilicoDB, and we have found it to be an amazingly valuable resource for our
2013 | Best Practices Compendium | Bio-IT World [231]
250 First Avenue, Suite 300, Needham, MA 02494 | phone: 781‐972‐5400 | fax: 781‐972‐5425
Published Resources for the Life Sciences
work. We have struggled for years to link clinical and disease annotation with gene expression profiles in a computer-readable form. InSilicoDB provides well-annotated gene expression data, which is absolutely essential for translational research. inSilicoDB has already facilitated several large scale projects in my lab using publically available data to identify new prognostic and predictive biomarkers for the diagnosis and treatment of breast cancer. Therefore, I strongly support the continuing development and expansion of InSilicoDB, as I'm confident this will be an extremely valuable resource for the biomedical research community. Best Wishes, Andy Beck
2013 | Best Practices Compendium | Bio-IT World [232]
Bio‐IT World Best Practices 2013 Entry
2. User Organization (Organization at which the solution was deployed/applied) A. User Organization Organization name: LabRoots, Inc
Address: 18340 Yorba Linda Blvd. Suite 107 | Yorba Linda, CA 92886
B. User Organization Contact Person Name: Jennifer Ellis
Title: Marketing Manager
Tel: 206‐679‐3228
Email: [email protected]
3. Project Title:
Team Leader: Greg Cruikshank
Contact details if different from above: 714‐463‐4673 [email protected]
4. Category in which entry is being submitted (1 category per entry, highlight your choice)
Knowledge Management: Data mining, idea/expertise mining, text mining, collaboration, resource optimization
ABSTRACT/SUMMARY of the project and results (150 words max.) LabRoots is an online tool developed to address the need for collaboration and networking among the scientific community. Collaboration between scientists, labs, and institutions promotes and accelerates the advancement of science and research though researchers sometimes find it hard to connect with others in their field. LabRoots provides a global platform for this kind of teamwork. It also promotes the initiation of casual discussions between users that might not normally interact, driving research forward and expanding thinking. LabRoots features individual profiles, a publication database, videos, news specific to a user’s field of study, and a resources page that combines tools professionals need daily in one location for easy searching and use, all of which users can add to with their own data.
INTRODUCTION/background/objectives LabRoots was founded in 2008 but was re‐designed in September 2012 to better fit the goals and objectives of the tool. Several new functions and features were added in order to make the site user friendly and practical. The main objective of the re‐design was to create a user interface that is easily navigable, allow easy access to resources that professionals use daily, and promote the networking and connections among scientists that are so valuable to the advancement of science. Collaboration
2013 | Best Practices Compendium | Bio-IT World [233]
between industry and academia is increasingly becoming the norm for the discovery and development of new biologicals. Scientific advances are greatly facilitated when scientists from around the globe are able to collaborate on a regular basis. LabRoots is a tool that fosters this kind of increased communication among scientists and across industries. RESULTS (highlight major R&D/IT tools deployed; innovative uses of technology). With the re‐design, LabRoots has increased the functionality and features on the site to escalate the value of the site itself. Some new key functions include: data mining to improve the experience for the user by customizing their experience and finding and directing them to information most relevant to them including publications, peers, companies, and products; resources to address a scientist’s need for numerous sources of information all consolidated in one place for easy access and use; a highly user‐friendly interface comparable to other well‐known networking tools. The data mining used for the new LabRoots is based on extracting a subset of information from a user’s history and analyzing the data and patterns to customize the site to that user. When the user then clicks on any page, information relevant to that user automatically loads. If a user would like other unrelated information, the search capabilities allow for that as well. The data mining function is designed for minimal burden on the user and maximal output. The new Resources page consolidates information scientists and professionals use and need on a daily basis. This includes links to major and useful websites (Pubmed, NCBI, BLAST, Encode, etc.), reference materials, protocols, datasheets, conversion tables, tutorials, MSDS’s, and other useful information. LabRoots created a Resources page so users do not have to spend time searching for information that should be at their fingertips. The Resources functionality allows users to take advantage of embedded widgets to customize information to their research or simply calculate data points, enzyme measurements, reagent volumes, and more right on the site. The new user interface makes the site attractive to use, allows users to navigate between pages and contacts easily, build a profile that includes publications, skills, disciplines, and interests, and share their own data and content with other users. With the main pages and links located on the left‐hand side of each page, users can work with multiple features yet have a home‐base. Each user profile page allows individuals to post, save, and share their own publications, videos, files, images, and skillsets in one location for enhanced networking capabilities. Users can also share opinions and make recommendations to others in need of help in their research field using the Groups Topics space. It has been shown that people trust and believe their peer’s reviews and recommendations over other avenues. LabRoots enables interactions among peers and discussions between institutions to contribute to the betterment of science. ROI achieved or expected (200 words max.): The ROI that LabRoots provides is a “One Stop Shop” scientific portal for all science verticals. There are websites that provide a discussion board, others that provide a jobs board, and even others that focus solely on publications or news. All of this variation requires researchers to spend time searching instead of getting the information they need. The LabRoots tool provides all of these in one place, allowing users to limit their search time and get to the information they need quickly and easily. Each function contains feeds from other important sites, such as publications from PubMed or Jobs from Indeed. By using one site that consolidates all of this information for them, users can find everything they need without
2013 | Best Practices Compendium | Bio-IT World [234]
spending valuable time. Networking is a valuable part of this all‐encompassing tool, facilitating communication and collaboration among users and groups. CONCLUSIONS/implications for the field. LabRoots has created a venue for scientific collaboration and networking both globally and locally. It also is a tool for scientists to use on a daily basis, providing numerous essential resources such as publications, presentations, news feeds, images, and videos combined with social networking tools, all available together in one highly functional user‐friendly website. Integrating one’s work with the online community expands the reach of important findings and increases the potential to drive more research and progress. The LabRoots tool addresses this need for the scientific community.
2013 | Best Practices Compendium | Bio-IT World [235]

250 First Avenue, Suite 300, Needham, MA 02494 | phone: 781‐972‐5400 | fax: 781‐972‐5425
Published Resources for the Life Sciences
Bio‐IT World 2012 Best Practices Awards
Required Information:
1. Nominating Organization, Contact Person & Contact Details (Fill this out only if you’re nominating an organization other than your own.) PerkinElmer, Inc.
2. User Organization, Contact Person & Contact Details
(Organization that did the work, at which the solution was deployed or applied.) Merck
3. Project Title: Agile Co‐Development Adds Biologics Capabilities to Ensemble® for Biology
4. Project Summary: (What was the project and why should our judges consider it a best practice?) Biologics & Vaccines R&D at Merck sought to equip its scientists, researchers and engineers with world-class technology to support biologics research and development activities. There was a gap, however, in the ability of existing enabling technologies and processes to support the structured data capture, analysis, and workflow management required for the various complex stages of biology research and development. Consistent with its collaborative environment, Merck also desired an integrated platform from which users could search, access and share biologics data and manage tasks. At Merck Research Laboratories, biologics researchers used a combination of spreadsheets, paper lab notebooks and limited use of the previously deployed electronic laboratory notebook from PerkinElmer. Without integrated biology specific workflow capabilities, the objective therefore was to develop a standard solution that would provide a data structure around research and development candidates so that results could be easily searched and shared. In collaboration with PerkinElmer, Merck identified and provided the requirements for expanded biology workflow functionalities. Subsequently, PerkinElmer embarked on enhancing the E-notebook to manage structured data, results, and further enable sample tracking and management system. The result was a unique biology workflow management system that has now been deployed, being leveraged and expanding its user base at Merck. Ongoing collaboration between Merck and Perkin Elmer will continue to refine the tools and expand capabilities to continuously improve the system from the original release.
Supplemental Information: (These sections aren’t required, but more details sometimes help our judges differentiate projects.)
5. Category in which entry is being submitted (1 category per entry, highlight your choice) • Clinical & Health‐IT: Trial design, eCTD, EDC, ePrescribing, RHIOs, EMR/PHR • IT infrastructure/HPC: High Performance Computing, storage, Cloud technologies
2013 | Best Practices Compendium | Bio-IT World [236]
250 First Avenue, Suite 300, Needham, MA 02494 | phone: 781‐972‐5400 | fax: 781‐972‐5425
Published Resources for the Life Sciences
• Informatics: LIMS, data visualization, imaging technologies, NGS analysis • Knowledge Management: Data mining, idea/expertise mining, text mining, collaboration, resource
optimization • Research & Drug Discovery: Disease pathway research, applied and basic research, compound‐focused
research, drug safety • Personalized & Translational Medicine: Responders/non‐responders, biomarkers, Feedback loops,
predictive technologies
6. Further details about the project; may include:
• background/objectives • innovative uses of technology; major R&D/IT tools deployed • ROI achieved or expected; time, money, other resources saved? • conclusions or implications for the field? • figures • references, testimonials, supporting documents
2013 | Best Practices Compendium | Bio-IT World [237]
250 First Avenue, Suite 300, Needham, MA 02494 | phone: 781‐972‐5400 | fax: 781‐972‐5425
Published Resources for the Life Sciences
Bio‐IT World 2013 Best Practices Awards
1. Nominating Organization (Fill this out only if you are nominating a group other than your own.) A. Nominating Organization Organization name: IDBS Address: ID BUSINESS SOLUTIONS LTD. 2 Occam Court, Surrey Research Park Guildford, Surrey, GU2 7QB, UK B. Nominating Contact Person Name: Simon Beaulah Title: Marketing Director, Translational Medicine Tel: +44 7884 000102 Email: [email protected]
2. User Organization (Organization at which the solution was deployed/applied)
A. User Organization Organization name: Momenta Pharmaceuticals Address: 675 Kendall St, Cambridge, MA 02142, United States B. User Organization Contact Person Name: Kevin Gillespie Title: Sr. Manager, Laboratory Information Systems Tel: +1 617‐491‐9700 Email: [email protected]
3. Project Title: Momenta Pharmaceuticals R&D ELN Project
Team Leader: As above Contact details if different from above: Team members – name(s), title(s) and company (optional):
4. Category in which entry is being submitted (1 category per entry, highlight your choice)
Clinical & Health‐IT: Trial design, eCTD, EDC, ePrescribing, RHIOs, EMR/PHR IT infrastructure/HPC: High Performance Computing, storage, Cloud technologies Informatics: LIMS, data visualization, imaging technologies, NGS analysis
2013 | Best Practices Compendium | Bio-IT World [238]
250 First Avenue, Suite 300, Needham, MA 02494 | phone: 781‐972‐5400 | fax: 781‐972‐5425
Published Resources for the Life Sciences
Knowledge Management: Data mining, idea/expertise mining, text mining, collaboration, resource optimization
Research & Drug Discovery: Disease pathway research, applied and basic research, compound‐focused research, drug safety
Personalized & Translational Medicine: Responders/non‐responders, biomarkers, Feedback loops, predictive technologies
(Bio‐IT World reserves the right to re‐categorize submissions based on submission or in the event that a category is refined.) 5. Description of project (4 FIGURES MAXIMUM):
A. ABSTRACT/SUMMARY of the project and results (150 words max.) Momenta Pharmaceuticals has demonstrated best practice by implementing IDBS E-WorkBook as a knowledge management foundation to support biologics research, development, and pilot manufacturing, combined with a short-term, high-impact ROI from its rich ELN capability. The company expects to recognize long-term benefits from greater access to shared knowledge and operational status within domains, and improved technology transfer between different departments. In the first year, Momenta has also achieved the equivalent of a $2 million per year time saving from the paper replacement project in Research. After many years where ELNs focused on medicinal chemistry, Momenta’s implementation of a cross domain R&D ELN demonstrates the potential for systems that can support the complexities of cell-line development, bioreactors, and genealogy of laboratory material. Momenta’s pragmatic approach also demonstrates best practice by incorporating vendor trust relationship, realistic short- and long-term goals, rapid implementation, and the employment of user champions to delivering a successful project. B. INTRODUCTION/background/objectives Momenta develops complex generics, biosimilars and potentially interchangeable biologics as well as discovering their own novel drugs. Their ability to analyze and reproduce complex biologics structures is one of their key differentiators in the market place, and is based on extensive knowledge and processes developed over time within the company. Momenta decided in 2010 that the time was right to invest in a data-driven ELN/knowledge management foundation that could not only replace their paper-based methods, but also provide a knowledge base of insight into their processes and projects that could be shared within the company. Pragmatic short- and long-term goals The overall objectives of Momenta’s project were to identify a commercial partner and product that would allow them to accomplish the following:
• capture, contextualize, and secure data across domains, from basic research to pilot manufacturing; • provide a sustainable platform for Momenta to manage its company-wide current and future knowledge base
of scientific information and insight; • improve operational efficiency by reducing or eliminating the non-value-adding time and effort required to
assemble the paper-based record of an experiment and make it useful for consumers of the information; • improve compliance with record-keeping policies, with a focus on strengthening Momenta’s ability to provide
evidence, showing dates of experiments or date of conception; • improve the genealogy of a material produced in the laboratory, in a manner that can stand up to regulatory
and legal scrutiny;
2013 | Best Practices Compendium | Bio-IT World [239]
250 First Avenue, Suite 300, Needham, MA 02494 | phone: 781‐972‐5400 | fax: 781‐972‐5425
Published Resources for the Life Sciences
• record the execution of experiments and creation of research samples across Momenta R&D, including all laboratories.
Momenta employs approximately 125 laboratory scientists and engineers engaged in a broad set of disciplines including, but not limited to analytical chemistry, molecular biology, synthetic chemistry, Omics, in vitro and in vivo biology and biological and chemical development. To be effective in the biologics domain and other R&D sectors, the system needed to be data driven, not document driven; to capture the deep experimental context that is required to be able not just to search and find data, but to query the system to identify past experiments that reflect a new scenario or operational question.
Accelerated vendor evaluation process By having a clearly defined set of business objectives, Momenta was able to adopt an accelerated vendor selection process. Detailed requirements were sent to a select set of vendors who were required to register their interest and then provide a written response. The evaluation comprised two stages:
• Stage One identified a shortlist of candidate vendors by evaluating their responses to a Request for Information and internet demonstration of the vendors’ software;
• Stage Two was a more detailed assessment, based on the construction and evaluation of a proof of concept solution demonstrated against Momenta’s requirements for an ELN/knowledge management foundation. Assessment of the solutions included installation of the systems on site and hands-on workshops. During these workshops, Momenta scientists assessed the system for fit to requirements and potential business benefit using before and after scenarios of laboratory notebook-related tasks.
Employing user champions selected from different departments is a particularly effective way of evaluating vendor products, as they were able to provide immediate feedback from a user perspective regarding ease of use, likelihood of user adoption, and the ability of the product to have a positive impact on business processes. These individuals were involved throughout the subsequent development and roll-out of E-WorkBook. The following criteria were used to decide which vendor was best suited to Momenta’s needs:
• Product evaluation – which product(s) best helps users perform their business tasks such as documenting and tracking the cell line preparation; optimizing processes to improve expression levels; and running biologic assays to determine drug effectiveness?
• Vendor evaluation – which vendor makes the best long-term partner and is most knowledgeable about our domain?
• Technology evaluation – which solution provides the best long-term laboratory information systems foundation for Momenta, and works well with biologics data types such as cell lines, bioreactors, and genealogy?
• Total cost of ownership – which solution will be most economical over a time frame of several years? IDBS E-WorkBook, as one of the industry’s leading enterprise ELNs (Ref: ‘Manufacturers Must Consider Scientific Domain Expertise During ELN Selection’, Gartner, published January 11, 2013), is well suited to this challenge through its ability to support research, development, and even pilot manufacturing environments through a highly configurable data capture and management framework. Progressive levels of lock-down can be imposed during data entry to reduce errors and flexibility, and to support regulated (GxP) environments. In addition, the modular nature of E-WorkBook’s architecture allows a foundation ELN to be deployed initially with more sophisticated spreadsheet and data warehouse capabilities, task management, process execution, and predictive capabilities, providing added value at a later stage.
2013 | Best Practices Compendium | Bio-IT World [240]
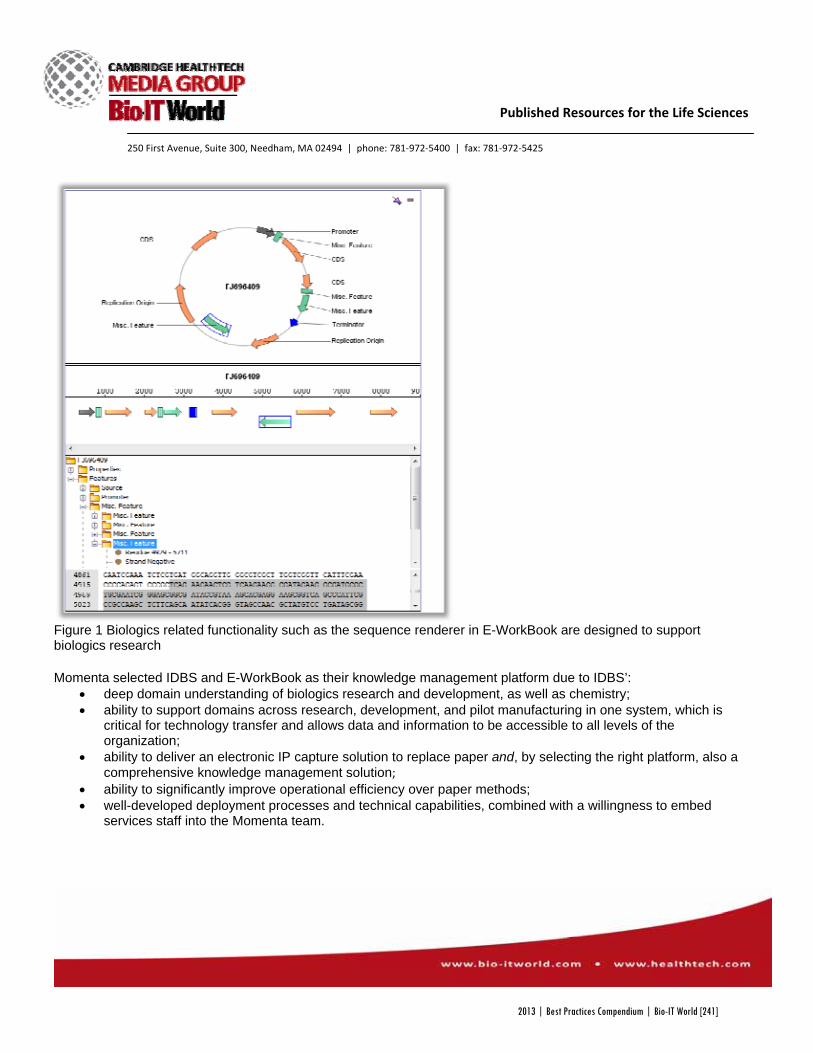
250 First Avenue, Suite 300, Needham, MA 02494 | phone: 781‐972‐5400 | fax: 781‐972‐5425
Published Resources for the Life Sciences
Figure 1 Biologics related functionality such as the sequence renderer in E-WorkBook are designed to support biologics research Momenta selected IDBS and E-WorkBook as their knowledge management platform due to IDBS’:
• deep domain understanding of biologics research and development, as well as chemistry; • ability to support domains across research, development, and pilot manufacturing in one system, which is
critical for technology transfer and allows data and information to be accessible to all levels of the organization;
• ability to deliver an electronic IP capture solution to replace paper and, by selecting the right platform, also a comprehensive knowledge management solution;
• ability to significantly improve operational efficiency over paper methods; • well-developed deployment processes and technical capabilities, combined with a willingness to embed
services staff into the Momenta team.
2013 | Best Practices Compendium | Bio-IT World [241]
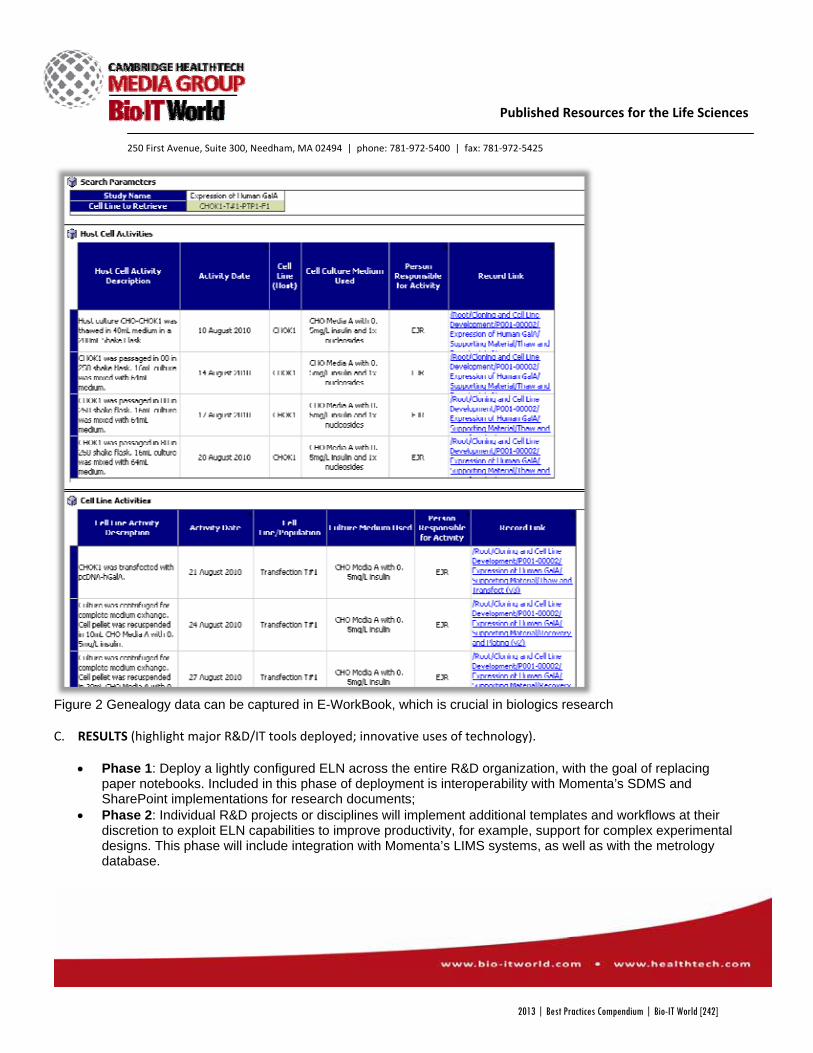
250 First Avenue, Suite 300, Needham, MA 02494 | phone: 781‐972‐5400 | fax: 781‐972‐5425
Published Resources for the Life Sciences
Figure 2 Genealogy data can be captured in E-WorkBook, which is crucial in biologics research C. RESULTS (highlight major R&D/IT tools deployed; innovative uses of technology).
• Phase 1: Deploy a lightly configured ELN across the entire R&D organization, with the goal of replacing paper notebooks. Included in this phase of deployment is interoperability with Momenta’s SDMS and SharePoint implementations for research documents;
• Phase 2: Individual R&D projects or disciplines will implement additional templates and workflows at their discretion to exploit ELN capabilities to improve productivity, for example, support for complex experimental designs. This phase will include integration with Momenta’s LIMS systems, as well as with the metrology database.
2013 | Best Practices Compendium | Bio-IT World [242]
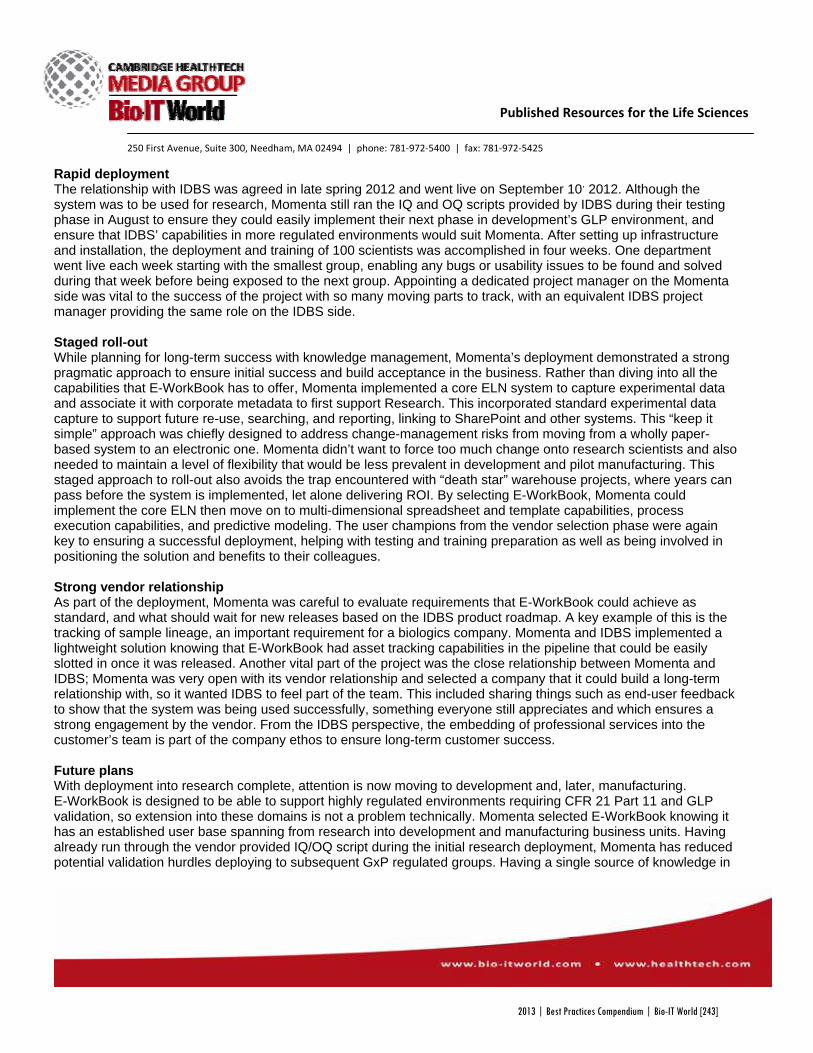
250 First Avenue, Suite 300, Needham, MA 02494 | phone: 781‐972‐5400 | fax: 781‐972‐5425
Published Resources for the Life Sciences
Rapid deployment The relationship with IDBS was agreed in late spring 2012 and went live on September 10, 2012. Although the system was to be used for research, Momenta still ran the IQ and OQ scripts provided by IDBS during their testing phase in August to ensure they could easily implement their next phase in development’s GLP environment, and ensure that IDBS’ capabilities in more regulated environments would suit Momenta. After setting up infrastructure and installation, the deployment and training of 100 scientists was accomplished in four weeks. One department went live each week starting with the smallest group, enabling any bugs or usability issues to be found and solved during that week before being exposed to the next group. Appointing a dedicated project manager on the Momenta side was vital to the success of the project with so many moving parts to track, with an equivalent IDBS project manager providing the same role on the IDBS side. Staged roll-out While planning for long-term success with knowledge management, Momenta’s deployment demonstrated a strong pragmatic approach to ensure initial success and build acceptance in the business. Rather than diving into all the capabilities that E-WorkBook has to offer, Momenta implemented a core ELN system to capture experimental data and associate it with corporate metadata to first support Research. This incorporated standard experimental data capture to support future re-use, searching, and reporting, linking to SharePoint and other systems. This “keep it simple” approach was chiefly designed to address change-management risks from moving from a wholly paper-based system to an electronic one. Momenta didn’t want to force too much change onto research scientists and also needed to maintain a level of flexibility that would be less prevalent in development and pilot manufacturing. This staged approach to roll-out also avoids the trap encountered with “death star” warehouse projects, where years can pass before the system is implemented, let alone delivering ROI. By selecting E-WorkBook, Momenta could implement the core ELN then move on to multi-dimensional spreadsheet and template capabilities, process execution capabilities, and predictive modeling. The user champions from the vendor selection phase were again key to ensuring a successful deployment, helping with testing and training preparation as well as being involved in positioning the solution and benefits to their colleagues. Strong vendor relationship As part of the deployment, Momenta was careful to evaluate requirements that E-WorkBook could achieve as standard, and what should wait for new releases based on the IDBS product roadmap. A key example of this is the tracking of sample lineage, an important requirement for a biologics company. Momenta and IDBS implemented a lightweight solution knowing that E-WorkBook had asset tracking capabilities in the pipeline that could be easily slotted in once it was released. Another vital part of the project was the close relationship between Momenta and IDBS; Momenta was very open with its vendor relationship and selected a company that it could build a long-term relationship with, so it wanted IDBS to feel part of the team. This included sharing things such as end-user feedback to show that the system was being used successfully, something everyone still appreciates and which ensures a strong engagement by the vendor. From the IDBS perspective, the embedding of professional services into the customer’s team is part of the company ethos to ensure long-term customer success. Future plans With deployment into research complete, attention is now moving to development and, later, manufacturing. E-WorkBook is designed to be able to support highly regulated environments requiring CFR 21 Part 11 and GLP validation, so extension into these domains is not a problem technically. Momenta selected E-WorkBook knowing it has an established user base spanning from research into development and manufacturing business units. Having already run through the vendor provided IQ/OQ script during the initial research deployment, Momenta has reduced potential validation hurdles deploying to subsequent GxP regulated groups. Having a single source of knowledge in
2013 | Best Practices Compendium | Bio-IT World [243]
250 First Avenue, Suite 300, Needham, MA 02494 | phone: 781‐972‐5400 | fax: 781‐972‐5425
Published Resources for the Life Sciences
the company will greatly support technology transfer between research and development, and development and manufacturing.
Figure 3 E-WorkBook integrates into the QC Phase
D. ROI achieved or expected (200 words max.): Momenta kicked off its implementation on June 25 2012 and went live on September 10 2012. The internal team had 14 scientists (20% time each) and two IT people (50% time each) dedicated to the project. The first year of deployment has seen an average time saving of 9.5 hours per scientist per week, across approximately 100 users. Based on an hourly rate for bench scientists in Boston of $40/hr, this is equivalent to a $2 million per year benefit in terms of time used for research. Assessment of the ROI is based on analysis of the following scenarios:
• weekly hours spent capturing results from assays into paper notebooks before vs. after ELN; • weekly hours spent printing and pasting templates into paper notebooks vs. ELN; • weekly hours spent scanning paper materials to be placed in notebooks before vs. after ELN; • weekly hours spent generating final reports before vs. after ELN.
This is a significant payback for the first phase of a long-term project and illustrates Momenta’s best practice approach in designing for knowledge management, something that is inherently long-term in payback, yet recognizes significant ROI in the short-term. E. CONCLUSIONS/implications for the field.
2013 | Best Practices Compendium | Bio-IT World [244]

250 First Avenue, Suite 300, Needham, MA 02494 | phone: 781‐972‐5400 | fax: 781‐972‐5425
Published Resources for the Life Sciences
• Best practice for enterprise ELNs is to design for long-term knowledge management and incorporate short-term, high-impact ROI from initial ELN deployment;
• The use of ELNs in biologics is growing, with Momenta Pharmaceuticals defining best practice across its industry;
• Close collaboration is vital to promote project success and build trust – this includes: having user champions across all departments, embedding IDBS staff within teams, and encouraging open, honest communications;
• A cross-domain knowledge management approach provides greater insights into processes and projects, and drives efficiency and collaboration with short-term paper replacement;
• A single system to support domains across research, development, and pilot manufacturing is critical in making data and information accessible to all organizational levels;
• Improving the genealogy of laboratory material stands up better to regulatory and legal scrutiny, while improving compliance with evidence showing dates of experiments or conception;
• A single source of knowledge greatly enhances technology transfer between research and development and pilot manufacturing.
An important aspect of the selection of IDBS and E-WorkBook was the ability to work with the wide spectrum of domains and disciplines engaged in biologics R&D. The use of ELNs across chemistry is well documented, but their use in biologics is relatively new. The traditional chemistry and document-centric ELNs lack the ability to support biological workflows, and there is a lack of domain understanding in the companies selling the systems. IDBS’ biological knowledge and extensive experience combined with E-WorkBook’s capabilities make this an ideal combination. The latest generation of enterprise ELNs is designed to achieve a greater level of operational efficiency within a specific business area (like biologics) by automating data-driven processes and deep systems integration, thereby eliminating errors and providing faster reporting for decision-making. E-WorkBook’s scalable systems with N-tier architecture, relational database back-end, web-based user interface, and domain-specific process module provide long-term information management and security for knowledge assets. Biologics is an expanding domain that is adopting this new approach and defining best practice across the industry.
6. REFERENCES/testimonials/supporting internal documents (If necessary; 5 pages max.)
About Momenta Pharmaceuticals Momenta is a leader in the analysis, characterization, and design of complex pharmaceutical products. Their scientific foundation is a set of tools and methods that enable one to develop a deep understanding of the links between a compound’s chemical structure, its manufacturing process and its biological function. These innovative tools enable Momenta to develop complex generics and follow-on biologics, as well as facilitate the discovery of novel drugs. About IDBS IDBS is a global provider of innovative enterprise data management, analytics and modeling solutions. The company’s uniquely sophisticated platform technologies are used by more than 200 pharmaceutical companies, major healthcare providers, global leaders in academic study, and high-tech companies to increase efficiency, reduce costs and improve the productivity of industrial R&D and clinical research. IDBS is clearly differentiated by its unique combination of award-winning enterprise technologies and domain knowledge in R&D.
2013 | Best Practices Compendium | Bio-IT World [245]

250 First Avenue, Suite 300, Needham, MA 02494 | phone: 781‐972‐5400 | fax: 781‐972‐5425
Published Resources for the Life Sciences
IDBS’ solutions help scientists, hospitals and R&D businesses produce the world’s newest therapeutics, diagnostics, and personalized treatments; high-tech materials and consumer products; faster, cleaner engines and fuels; breakthroughs in productive agriculture; and healthy, safer food products. Founded in 1989 and privately held, IDBS is headquartered in Guildford, UK, with a direct sales and support presence worldwide. IDBS is a Profit Track 100 company and the recipient of multiple awards including the Frost and Sullivan 'Enabling Technology' Award in R&D data management, and Queen's Award for Enterprise in the International Trade category.
2013 | Best Practices Compendium | Bio-IT World [246]
250 First Avenue, Suite 300, Needham, MA 02494 | phone: 781‐972‐5400 | fax: 781‐972‐5425
Published Resources for the Life Sciences
Bio‐IT World 2013 Best Practices Awards
1. Nominating Organization (Fill this out only if you are nominating a group other than your own.) A. Nominating Organization Organization name: Pistoia Alliance Address: The West Wing Sandhill House Middle Claydon Buckinghamshire MK18 2LD UK B. Nominating Contact Person Name: John Wise Title: Executive Director Tel: +44 7768 173518 Email: John Wise <[email protected]>
2. User Organization (Organization at which the solution was deployed/applied)
A. User Organization Organization name: Open environment so users are the life sciences community, Pistoia Alliance member companies on the AppStrategy team including Merck & Co., Inc., Bristol ‐Myers Squibb, GSK Address: (Please use Pistoia Alliance Organization Address) The West Wing Sandhill House Middle Claydon Buckinghamshire MK18 2LD UK B. User Organization Contact Person Name: Ingrid Akerblom (Pistoia Alliance Board Member) Title: Executive Director, Merck & Co., Inc. Tel: 650‐544‐3364 Email: [email protected]
3. Project Title: Pistoia Alliance AppStore for Life Sciences
2013 | Best Practices Compendium | Bio-IT World [247]
250 First Avenue, Suite 300, Needham, MA 02494 | phone: 781‐972‐5400 | fax: 781‐972‐5425
Published Resources for the Life Sciences
Team Leader: Ingrid Akerblom, Ph.D., Board Member, Pistoia Alliance Contact details if different from above: Team members – name(s), title(s) and company (optional): Alex Clark, John Wise, Sean Ekins, Ashley
George, Ramesh Durvasula, Michael Braxenthaler, John Marshall (Airwatch) 4. Category in which entry is being submitted (1 category per entry, highlight your choice)
Clinical & Health‐IT: Trial design, eCTD, EDC, ePrescribing, RHIOs, EMR/PHR IT infrastructure/HPC: High Performance Computing, storage, Cloud technologies XXX Informatics: LIMS, data visualization, imaging technologies, NGS analysis XXX Knowledge Management: Data mining, idea/expertise mining, text mining, collaboration, resource optimization
Research & Drug Discovery: Disease pathway research, applied and basic research, compound‐focused research, drug safety
Personalized & Translational Medicine: Responders/non‐responders, biomarkers, Feedback loops, predictive technologies
(Bio‐IT World reserves the right to re‐categorize submissions based on submission or in the event that a category is refined.) Team Lead Comment: We find it difficult to categorize our entry so we are welcome to categorization by BioIT 5. Description of project (4 FIGURES MAXIMUM):
A. ABSTRACT/SUMMARY of the project and results (150 words max.) The Pistoia Alliance (PA) has launched a mobile AppStore for life scientists that serves as a community space where scientists find relevant “apps” and connect with other scientists and app creators. Here they can share feedback and build a robust science app community to accelerate innovation. Together with our partner AirWatch, PA has built a platform where apps currently available on the public stores are submitted by their owners and screened for relevance prior to addition to the store. The result is a catalogue that makes it easier to find science apps that are hidden amongst the hundreds of thousands of apps in public stores. App developers are committed to participating in discussion forums with users and responding to comments encouraging rich dialogue not possible on the public stores. The AppStore has launched with over 40 science Apps including the Open Drug Discovery Teams app initiated from PA activities.
B. INTRODUCTION/background/objectives
The Pistoia Alliance (PA) (www.pistoiaalliance.org) was formed as a non-profit organization with the mission of “lowering the barriers to innovation by improving the inter-operability of R&D business processes through pre-competitive collaboration”. Members include R&D IT leaders in the pharmaceutical industry, major life sciences software and hardware suppliers, and life sciences thought leaders. In reviewing potential opportunities where the Pistoia Alliance could play a unique role due to its mission, members identified the new mobile app environment as an area where early pre-competitive influence could accelerate access to innovation by the life sciences community. The Pistoia Alliance leaders approved implementing a strategy to foster the development of a next generation collaborative scientific environment and marketplace for sharing data and tools that would spur continuous innovation across the life sciences R&D eco-system through these new mobile platforms. Aligned with our goals, the Pistoia Alliance is lowering
2013 | Best Practices Compendium | Bio-IT World [248]
250 First Avenue, Suite 300, Needham, MA 02494 | phone: 781‐972‐5400 | fax: 781‐972‐5425
Published Resources for the Life Sciences
the barriers to innovation by providing an environment for simplifying scientist access to life science apps and building a participative community for discussions and feedback amongst users and app creators. We have now delivered on our objectives and launched the Pistoia Alliance AppStore for the life sciences. In the future, Pistoia plans to expand beyond the AppStore to sponsoring the definition and development of broad scientific services and infrastructure environments where necessary to support mobile platforms for life sciences R&D, as well as endorsing emerging services and standards developed in the life sciences R&D community.
C. RESULTS
The PA AppStore is hosted by our partner the enterprise mobile platform provider AirWatch. AirWatch technically expanded their platform to accommodate cataloguing public apps on the external public app stores.
How does it work:
2013 | Best Practices Compendium | Bio-IT World [249]
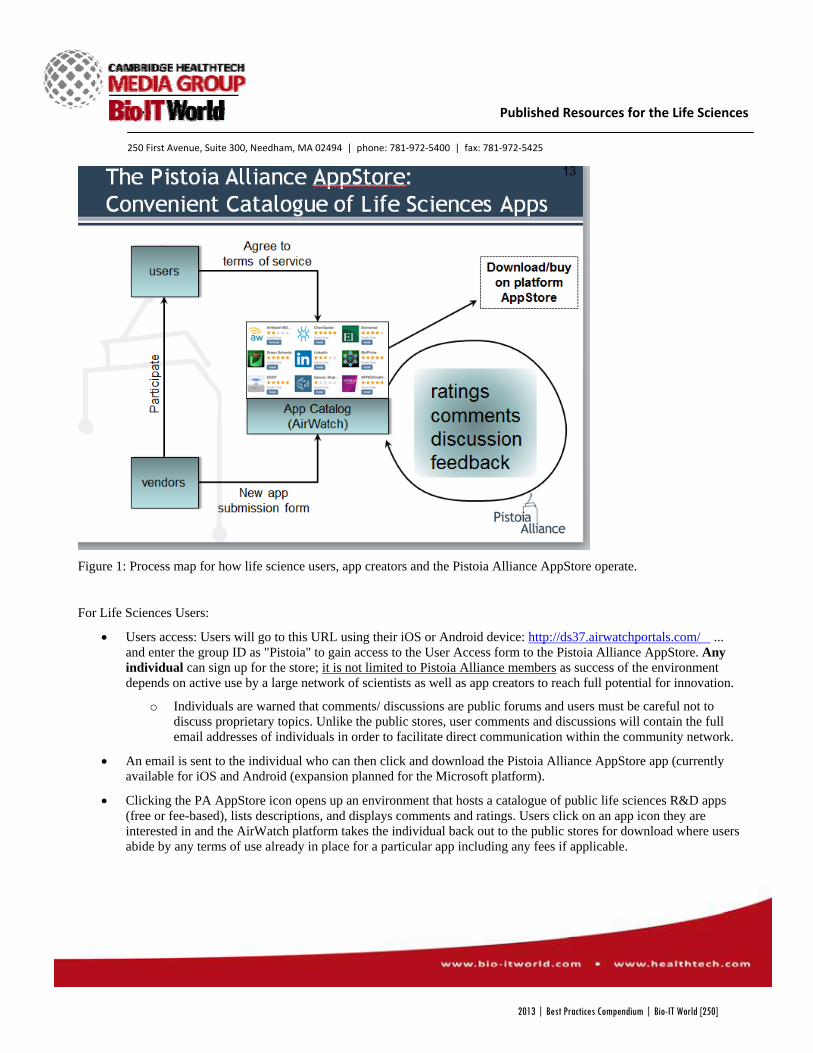
250 First Avenue, Suite 300, Needham, MA 02494 | phone: 781‐972‐5400 | fax: 781‐972‐5425
Published Resources for the Life Sciences
Figure 1: Process map for how life science users, app creators and the Pistoia Alliance AppStore operate.
For Life Sciences Users:
• Users access: Users will go to this URL using their iOS or Android device: http://ds37.airwatchportals.com/ ... and enter the group ID as "Pistoia" to gain access to the User Access form to the Pistoia Alliance AppStore. Any individual can sign up for the store; it is not limited to Pistoia Alliance members as success of the environment depends on active use by a large network of scientists as well as app creators to reach full potential for innovation.
o Individuals are warned that comments/ discussions are public forums and users must be careful not to discuss proprietary topics. Unlike the public stores, user comments and discussions will contain the full email addresses of individuals in order to facilitate direct communication within the community network.
• An email is sent to the individual who can then click and download the Pistoia Alliance AppStore app (currently available for iOS and Android (expansion planned for the Microsoft platform).
• Clicking the PA AppStore icon opens up an environment that hosts a catalogue of public life sciences R&D apps (free or fee-based), lists descriptions, and displays comments and ratings. Users click on an app icon they are interested in and the AirWatch platform takes the individual back out to the public stores for download where users abide by any terms of use already in place for a particular app including any fees if applicable.
2013 | Best Practices Compendium | Bio-IT World [250]
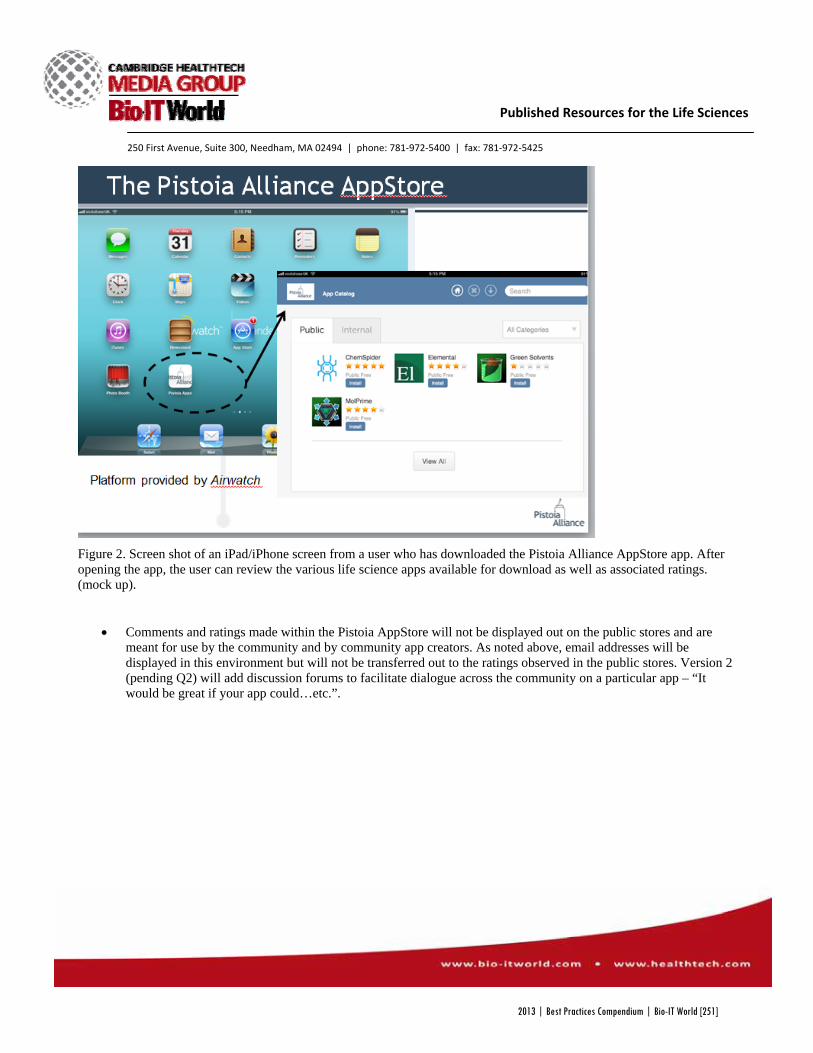
250 First Avenue, Suite 300, Needham, MA 02494 | phone: 781‐972‐5400 | fax: 781‐972‐5425
Published Resources for the Life Sciences
Figure 2. Screen shot of an iPad/iPhone screen from a user who has downloaded the Pistoia Alliance AppStore app. After opening the app, the user can review the various life science apps available for download as well as associated ratings. (mock up).
• Comments and ratings made within the Pistoia AppStore will not be displayed out on the public stores and are meant for use by the community and by community app creators. As noted above, email addresses will be displayed in this environment but will not be transferred out to the ratings observed in the public stores. Version 2 (pending Q2) will add discussion forums to facilitate dialogue across the community on a particular app – “It would be great if your app could…etc.”.
2013 | Best Practices Compendium | Bio-IT World [251]

250 First Avenue, Suite 300, Needham, MA 02494 | phone: 781‐972‐5400 | fax: 781‐972‐5425
Published Resources for the Life Sciences
Figure 3: Screenshots of placement of app comments and ratings within the Pistoia Alliance AppStore.
An example of a mobile app whose development was initiated out of Pistoia Alliance activities:
The Open Drug Discovery Teams (ODDT) mobile app was developed for the Dragons’ Den session at the Pistoia meeting in February 2012 and launched on the Apple AppStore in April 2012 by Sean Ekins and Alex Clark. The work on ODDT demonstrates the importance of the Pistoia Alliance’s appification strategy, which aims to make informatics tools accessible to scientists and the broader community interested in using mobile devices to conduct and communicate about science. Recognizing that parent-led rare disease organizations use Twitter and actively blog to promote the study of their diseases, the ODDT app tracks Twitter hashtags and Google Alerts corresponding to certain diseases and aggregates links to articles and other information under topic headings (Figure 4). The app is chemistry aware, enabling scientists to tweet the molecules they are making, want to share with others, or need to find. Structure-activity data can also be shared in the app, giving motivated citizen scientists, such as parents and patients, who want to learn about scientific software the opportunity to work with tools similar to those used in larger research organizations. All information aggregated by ODDT is crowd-curated; users can endorse or disapprove links to improve both the quantity and quality of the data reported in the app. ODDT helps parent-led organizations highlight their causes and endorse content relevant to their communities, ensuring rapid and more substantive conversations that can lead to more effective collaboration. In the process of developing and communicating ODDT, it has raised the profile of the rare diseases featured, bringing them to the attention of thousands of people through mentions on blogs, in papers, posters, and oral presentations, and even through an IndieGoGo crowdfunding campaign. ODDT capitalizes on the shift towards low-cost, consumer-friendly apps and serves as a flagship effort to bring together professional scientists, charitable foundations, and
2013 | Best Practices Compendium | Bio-IT World [252]
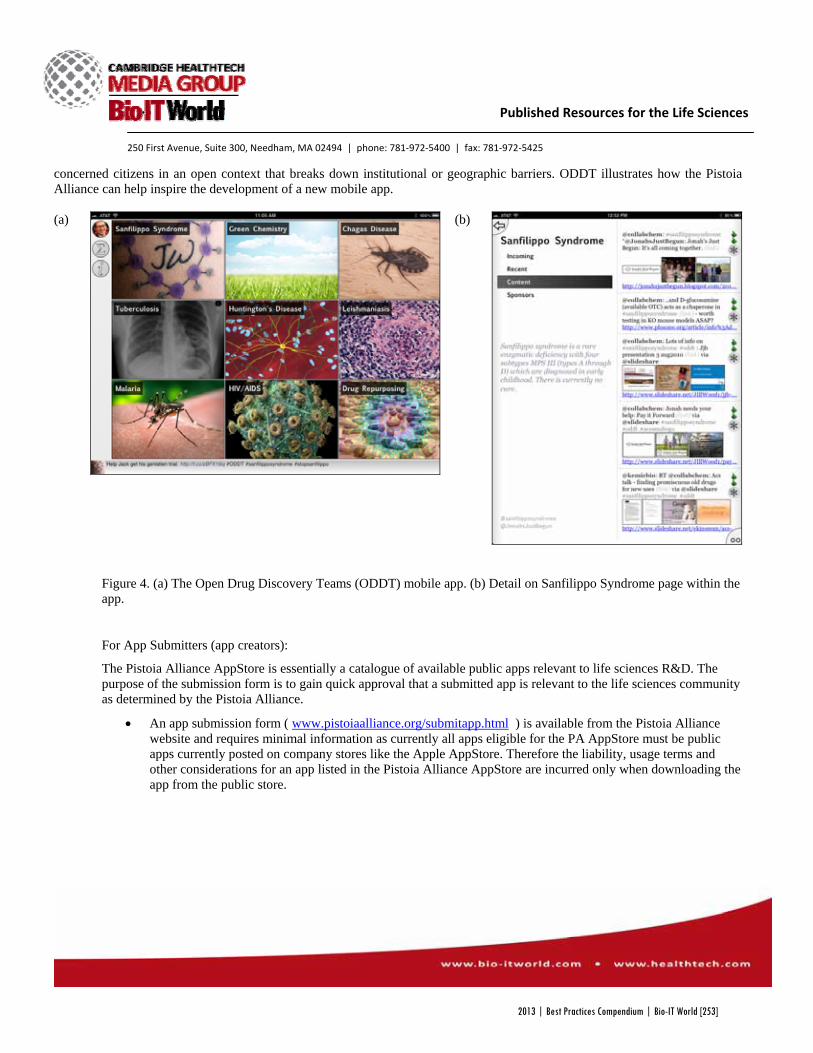
250 First Avenue, Suite 300, Needham, MA 02494 | phone: 781‐972‐5400 | fax: 781‐972‐5425
Published Resources for the Life Sciences
concerned citizens in an open context that breaks down institutional or geographic barriers. ODDT illustrates how the Pistoia Alliance can help inspire the development of a new mobile app. (a)
(b)
Figure 4. (a) The Open Drug Discovery Teams (ODDT) mobile app. (b) Detail on Sanfilippo Syndrome page within the app.
For App Submitters (app creators):
The Pistoia Alliance AppStore is essentially a catalogue of available public apps relevant to life sciences R&D. The purpose of the submission form is to gain quick approval that a submitted app is relevant to the life sciences community as determined by the Pistoia Alliance.
• An app submission form ( www.pistoiaalliance.org/submitapp.html ) is available from the Pistoia Alliance website and requires minimal information as currently all apps eligible for the PA AppStore must be public apps currently posted on company stores like the Apple AppStore. Therefore the liability, usage terms and other considerations for an app listed in the Pistoia Alliance AppStore are incurred only when downloading the app from the public store.
2013 | Best Practices Compendium | Bio-IT World [253]
250 First Avenue, Suite 300, Needham, MA 02494 | phone: 781‐972‐5400 | fax: 781‐972‐5425
Published Resources for the Life Sciences
ROI achieved or expected (200 words max.): The AppStore concept and implementation has required $15K in team time from team members or other required experts. The Project leverages a new Airwatch implementation already under development on the company’s roadmap. Though the Pistoia Alliance has done formal business case analysis on this program, we are not convinced that a strict productivity increase measure truly reflects the potential ROI of streamlined scientist access to new innovative and productivity apps on mobile platforms. The greater impact will come from exposing scientists to novel apps that may trigger new ideas, connections and collaborations across the life sciences R&D community. Scientists through feedback and discussions will accelerate progress in the usability and content of apps while app creators will find larger marketplaces to experiment and benefit from community guidance. We strongly believe that the Pistoia AppStore will serve as a nucleus for the future app world of life sciences. Development of ODDT has required minimal investment but has brought visibility to the ultra‐rare diseases covered, resulting in several interviews and publications which is priceless for their fund raising efforts.
CONCLUSIONS/Implications for the field. The emerging world of mobile apps has the potential to transform how scientists will interact with both public and proprietary information, build communities globally with shared interests and passions, and drive towards the research innovations of the future. Catalysts such as the Pistoia Alliance AppStore are experiments to accelerate this future and to learn what will be of value to the life sciences community within this new eco‐system. Connecting scientists in an open platform to share ideas pre‐competitively and guide development of novel tools they can apply to their research whether within or outside firewalls is an important goal within the Pistoia Alliance’s mission of lowering the barriers to innovation for the life sciences. The ODDT app, whose genesis initially arose from challenges sponsored by the PA community on the future value of apps to life sciences, has raised the profile of the rare diseases featured, bringing them to the attention of thousands of people through mentions on blogs, in papers, posters, and oral presentations. ODDT capitalizes on the shift towards low‐cost, consumer‐friendly apps and serves as a flagship effort to bring together professional scientists, charitable foundations, and concerned citizens in an open context that breaks down institutional or geographic barriers. The Pistoia Alliance, through our sponsorship of AppStore, expects many more app examples like ODDT that will be easily accessible for comment and collaboration across the global life sciences community; like ODDT, their impact can stretch all the way to positively impacting patient’s lives, a goal we all share.
1. REFERENCES/testimonials/supporting internal documents (If necessary; 5 pages max.)
1. Clark AM, Williams AJ and Ekins S, Cheminformatics workflows using mobile apps, Chem-Bio Informatics Journal, 13: 1-18 2013.
2. Ekins S, Clark AM and Williams AJ, Incorporating Green Chemistry Concepts into Mobile Applications and their potential uses, ACS Sustain Chem Eng, 1. 8-13, 2013.
3. Ekins S, Clark AM and Williams AJ, Open Drug Discovery Teams: A Chemistry Mobile App for Collaboration, Mol Informatics, 31: 585-597, 2012.
4. Clark, AM, Ekins S and Williams AJ, Redefining cheminformatics with intuitive collaborative mobile apps, Mol Informatics, 31: 569-584, 2012.
5. Williams, AJ, Ekins S, Clark AM, Jack JJ and Apodaca RL, Mobile apps for chemistry in the world of drug discovery, Drug Disc Today, 16:928-939, 2011.
2013 | Best Practices Compendium | Bio-IT World [254]