
ALCF Operations Best Practices and Highlights
39
ALCF Operations Best Practices and Highlights Mark Fahey The 6 th AICS International Symposium Feb 22-23, 2016 RIKEN AICS, Kobe, Japan
-
Upload
khangminh22 -
Category
Documents
-
view
4 -
download
0
Transcript of ALCF Operations Best Practices and Highlights

ALCF Operations Best Practices and HighlightsMark Fahey
The6th AICSInternational SymposiumFeb22-23,2016
RIKENAICS,Kobe,Japan

Overview¤ ALCF Organization and Structure¤ IBM BG/Q Mira ¤ Storage/Archive ¤ Operational highlights
¥ Scheduling¥ Monitoring¥ Operational Assessment and Job Failure Analysis
¤ CORAL¥ Theta and Aurora¥ What’s new/what stays the same
¤ Collaboration opportunities
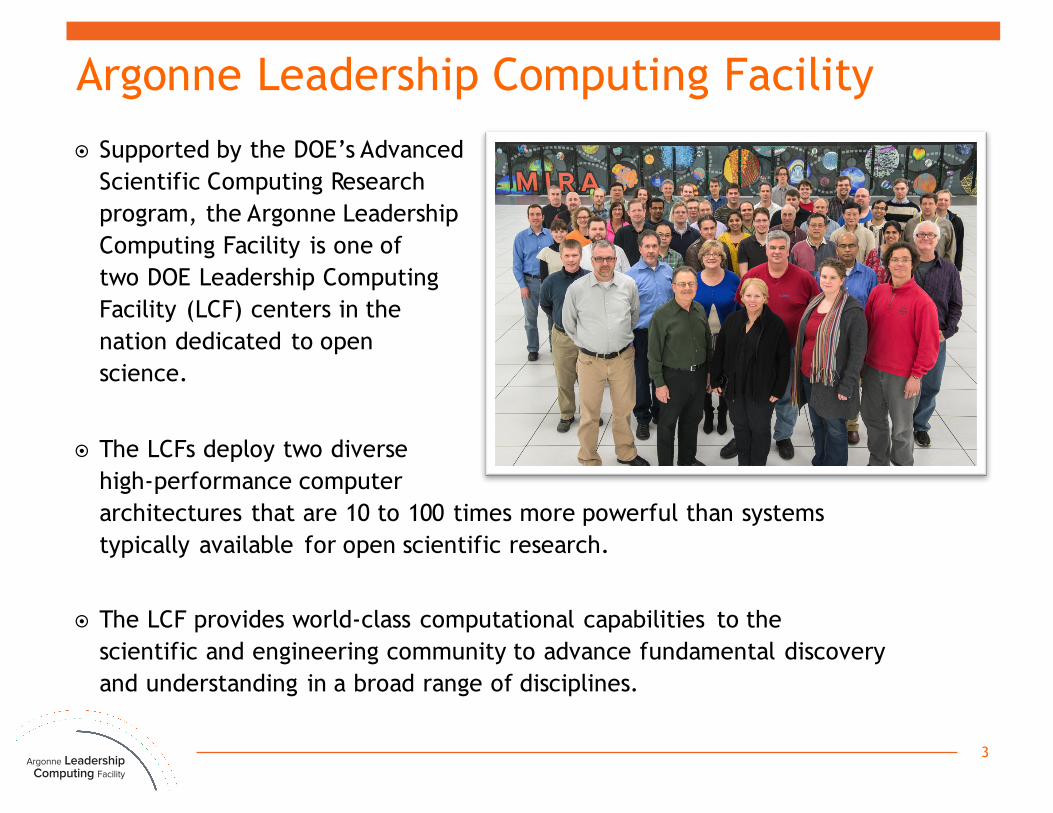
Argonne Leadership Computing Facility¤ Supported by the DOE’s Advanced
Scientific Computing Research program, the Argonne Leadership Computing Facility is one of two DOE Leadership Computing Facility (LCF) centers in the nation dedicated to open science.
¤ The LCFs deploy two diverse high-performance computer architectures that are 10 to 100 times more powerful than systems typically available for open scientific research.
¤ The LCF provides world-class computational capabilities to the scientific and engineering community to advance fundamental discovery and understanding in a broad range of disciplines.
3
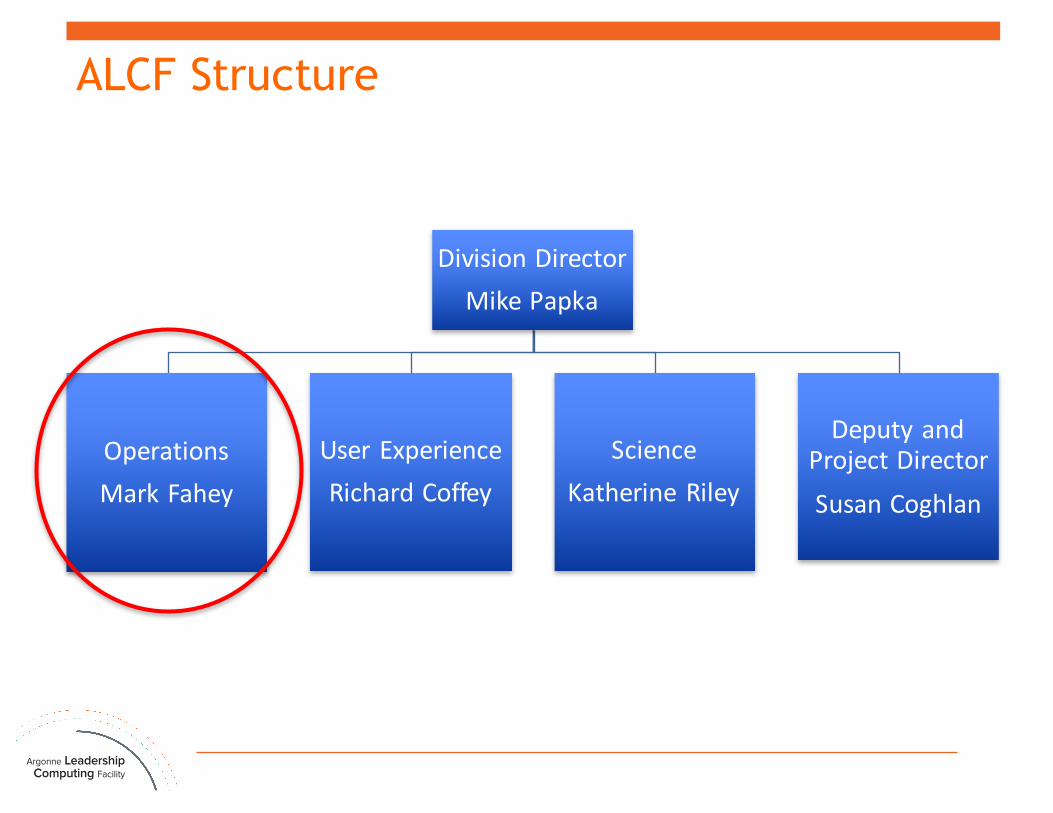
ALCF Structure
Division DirectorMikePapka
OperationsMarkFahey
UserExperienceRichardCoffey
ScienceKatherineRiley
DeputyandProjectDirectorSusanCoghlan

ALCF Operations Org Chart
DirectorMarkFahey
SystemsandNetworkingRyanMilner(L)BenAllen(JLSE)
Bowen(Cheetah)Goletz (.5)EdHolohanAdamScovelOpeningx2
StorageJackO’Connel (L)
Anping LiuGordonMcPheeters
ZachNaultEricRoss
Mirek Suliba
InfrastructureSkipReddy(L)AndrewCherryTommieJacksonBenLenardGabeWestOpening
AdvancedIntegrationGrpBillAllcock (L)EricPersheyPaulRich
GeorgeRojasBrianToonenTomUram
PhilCarns (.25)
ANLCyberSecurityRep
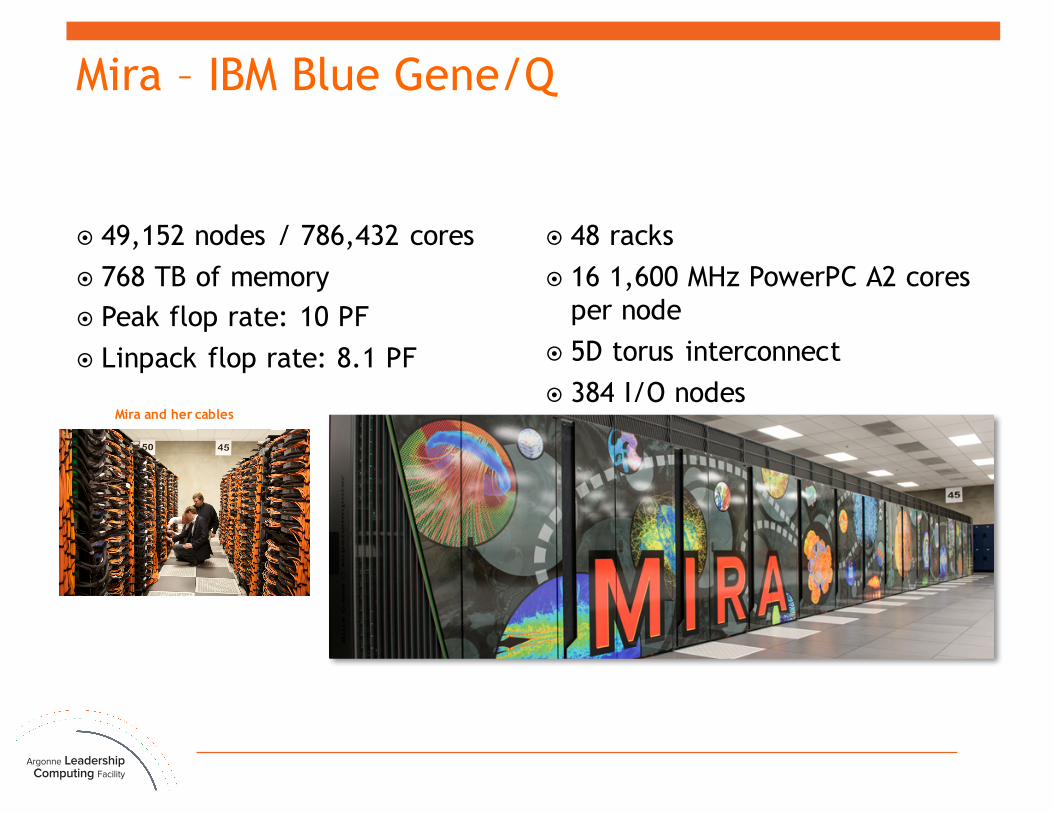
Mira – IBM Blue Gene/Q
¤ 49,152 nodes / 786,432 cores¤ 768 TB of memory¤ Peak flop rate: 10 PF¤ Linpack flop rate: 8.1 PF
¤ 48 racks¤ 16 1,600 MHz PowerPC A2 cores
per node¤ 5D torus interconnect¤ 384 I/O nodes
Mira and her cables
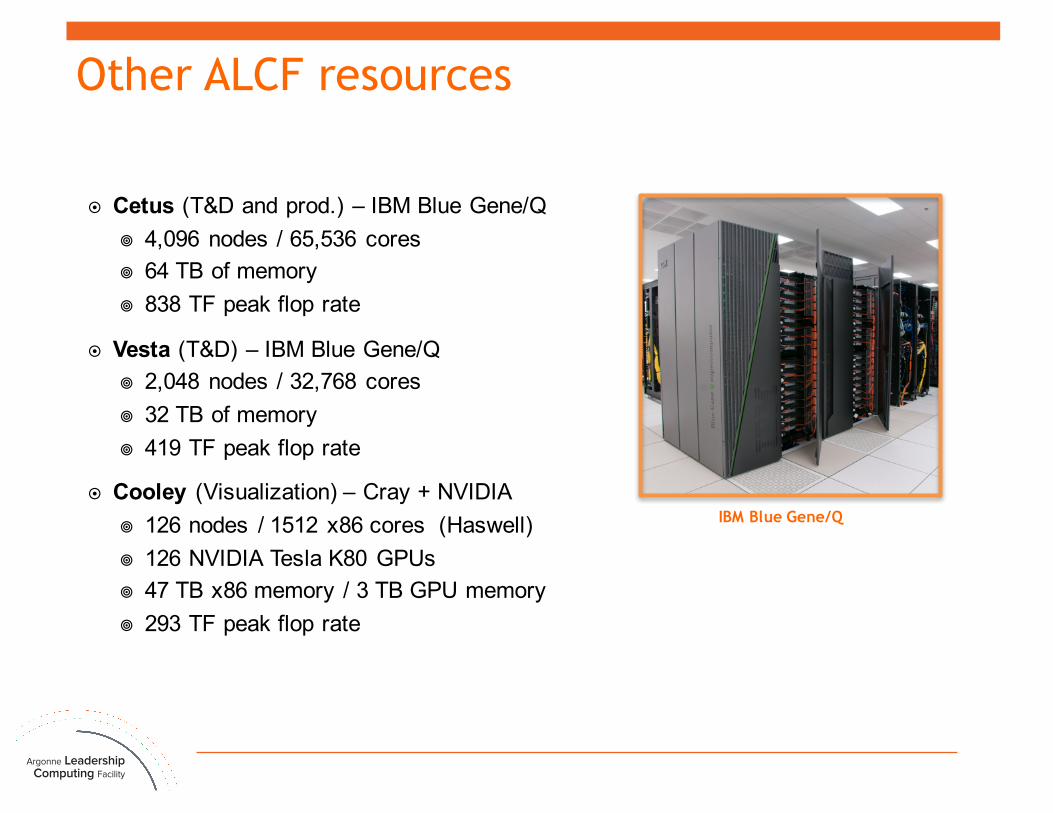
Other ALCF resources
¤ Cetus (T&D and prod.) – IBM Blue Gene/Q ¥ 4,096 nodes / 65,536 cores¥ 64 TB of memory¥ 838 TF peak flop rate
¤ Vesta (T&D) – IBM Blue Gene/Q ¥ 2,048 nodes / 32,768 cores¥ 32 TB of memory¥ 419 TF peak flop rate
¤ Cooley (Visualization) – Cray + NVIDIA ¥ 126 nodes / 1512 x86 cores (Haswell)¥ 126 NVIDIA Tesla K80 GPUs¥ 47 TB x86 memory / 3 TB GPU memory¥ 293 TF peak flop rate
IBM Blue Gene/Q
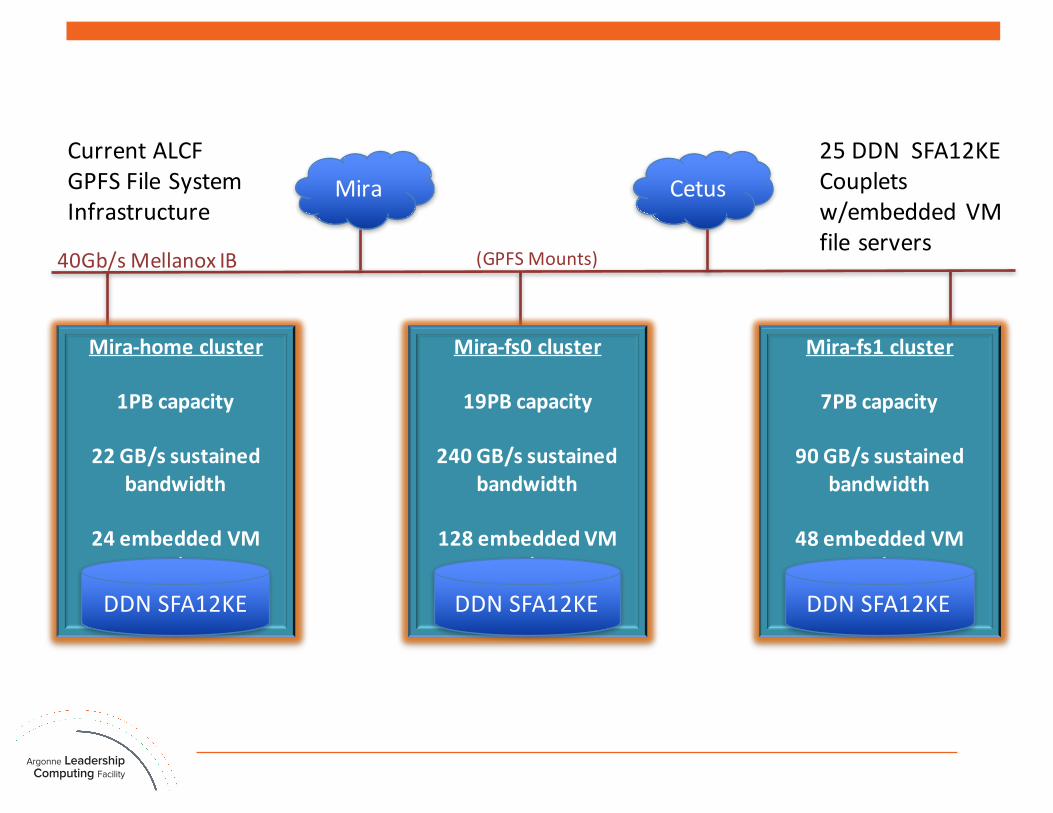
Mira-fs1cluster
7PBcapacity
90GB/ssustainedbandwidth
48embeddedVMnodes
Mira-fs0cluster
19PBcapacity
240GB/ssustainedbandwidth
128embeddedVMnodes
Mira-homecluster
1PBcapacity
22GB/ssustainedbandwidth
24embeddedVMnodes
Mira
40Gb/sMellanox IB (GPFSMounts)
Cetus
DDNSFA12KE DDNSFA12KE DDNSFA12KE
CurrentALCFGPFSFileSystemInfrastructure
25DDNSFA12KECoupletsw/embedded VMfileservers
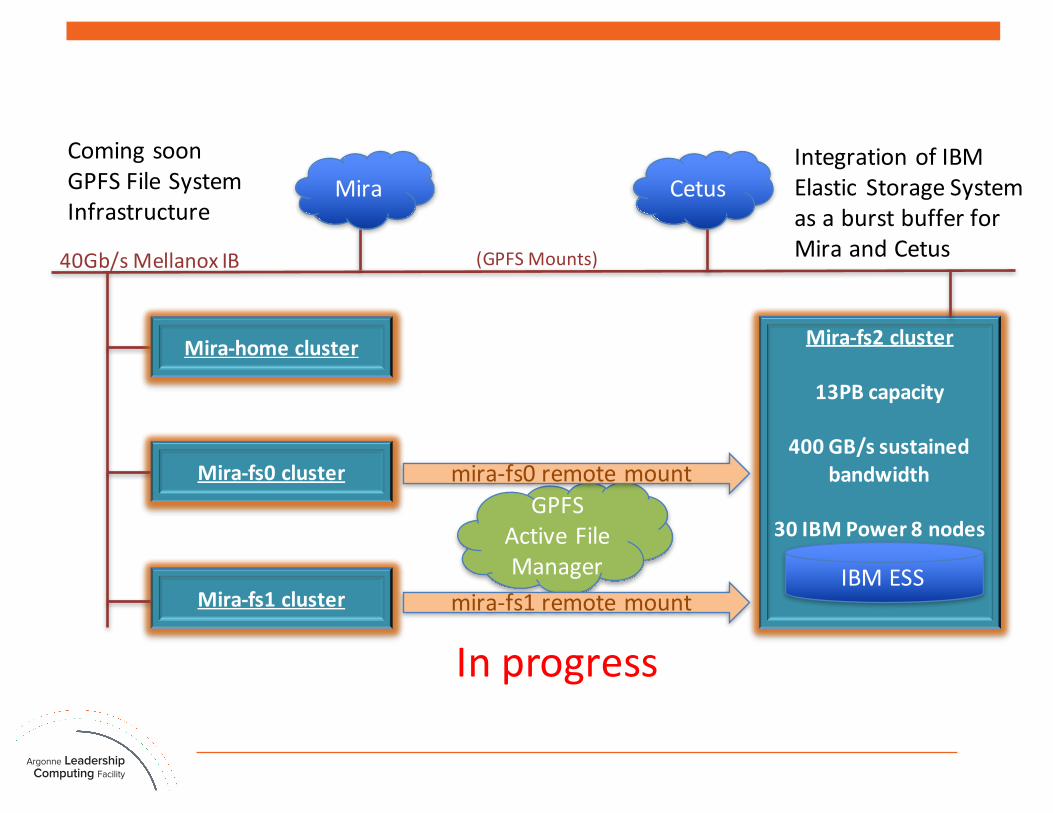
Mira-fs2cluster
13PBcapacity
400GB/ssustainedbandwidth
30IBMPower8nodes
GPFSAFM
Mira
40Gb/sMellanox IB (GPFSMounts)
CetusComingsoonGPFSFileSystemInfrastructure
Mira-fs1cluster
Mira-homecluster
Mira-fs0cluster
IBMESS
IntegrationofIBMElastic StorageSystemasaburstbufferforMiraandCetus
GPFSActiveFileManager
mira-fs0remotemount
mira-fs1remotemount
Inprogress
Scheduling - Cobalt¤ Orginally COBALT (Component-Based Lightweight Toolkit) was a set
of component-based system software for system and resource management developed within Argonne’s Mathematics and Computer Science Division
¤ Cobalt is a set of system software for high performance machines¥ The main piece is a set of resource management components for IBM BG
systems and clusters.
¤ ALCF adopted the resource scheduling component and continued to enhance it for use within the facility¥ ALCF sees resource scheduling a major component of future facilities
and its research/development efforts are focused on future needs
Row0
Row1
Row2
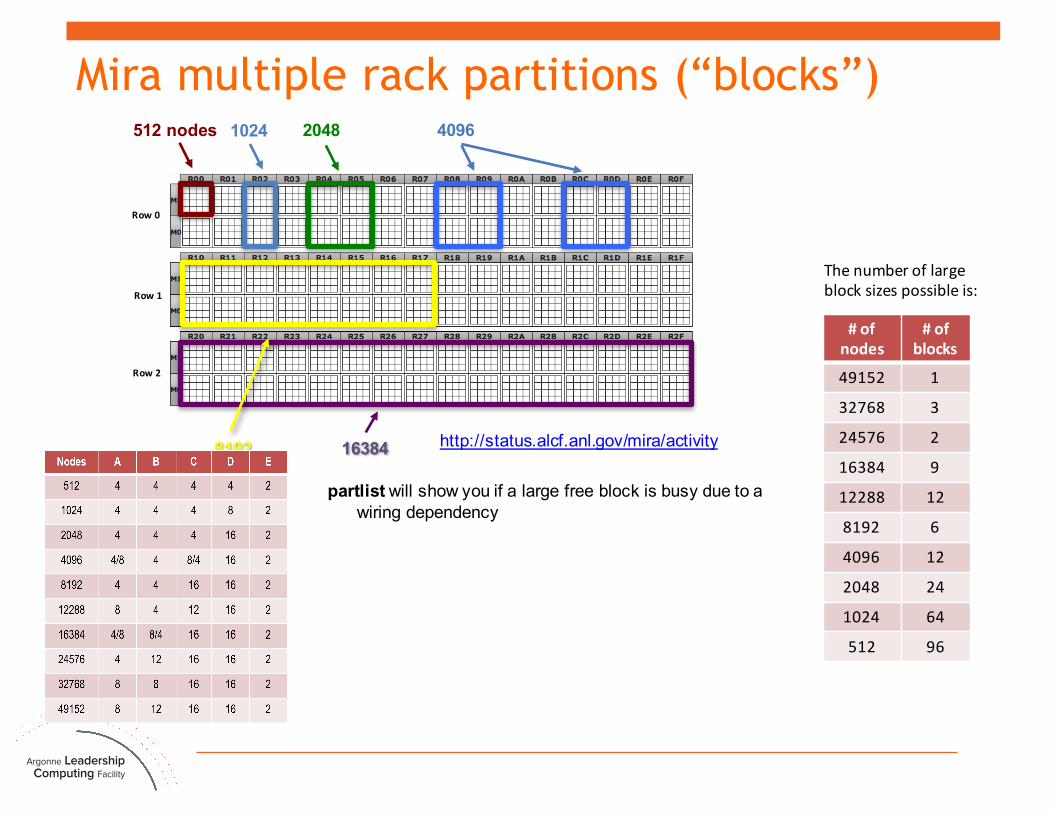
#ofnodes
#ofblocks
49152 1
32768 3
24576 2
16384 9
12288 12
8192 6
4096 12
2048 24
1024 64
512 96
partlist will show you if a large free block is busy due to a wiring dependency
Thenumberoflargeblocksizespossibleis:
20481024512 nodes 4096
8192 16384
Mira multiple rack partitions (“blocks”)
http://status.alcf.anl.gov/mira/activity
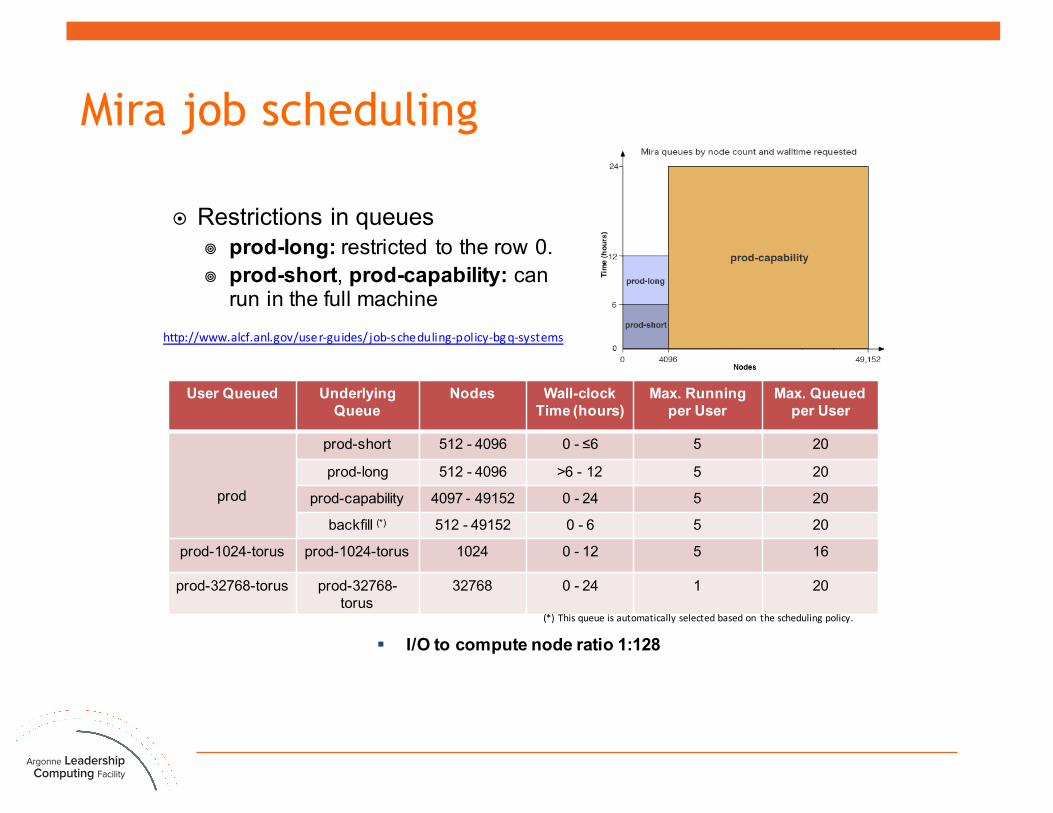
Mira job scheduling
User Queued Underlying Queue
Nodes Wall-clock Time (hours)
Max. Running per User
Max. Queued per User
prod
prod-short 512 - 4096 0 - ≤6 5 20
prod-long 512 - 4096 >6 - 12 5 20
prod-capability 4097 - 49152 0 - 24 5 20
backfill (*) 512 - 49152 0 - 6 5 20
prod-1024-torus prod-1024-torus 1024 0 - 12 5 16
prod-32768-torus prod-32768-torus
32768 0 - 24 1 20
(*) Thisqueueisautomaticallyselectedbasedon theschedulingpolicy.
http://www.alcf.anl.gov/user-guides/ job-scheduling-policy-bgq-systems
¤ Restrictions in queues¥ prod-long: restricted to the row 0.¥ prod-short, prod-capability: can
run in the full machine
§ I/O to compute node ratio 1:128
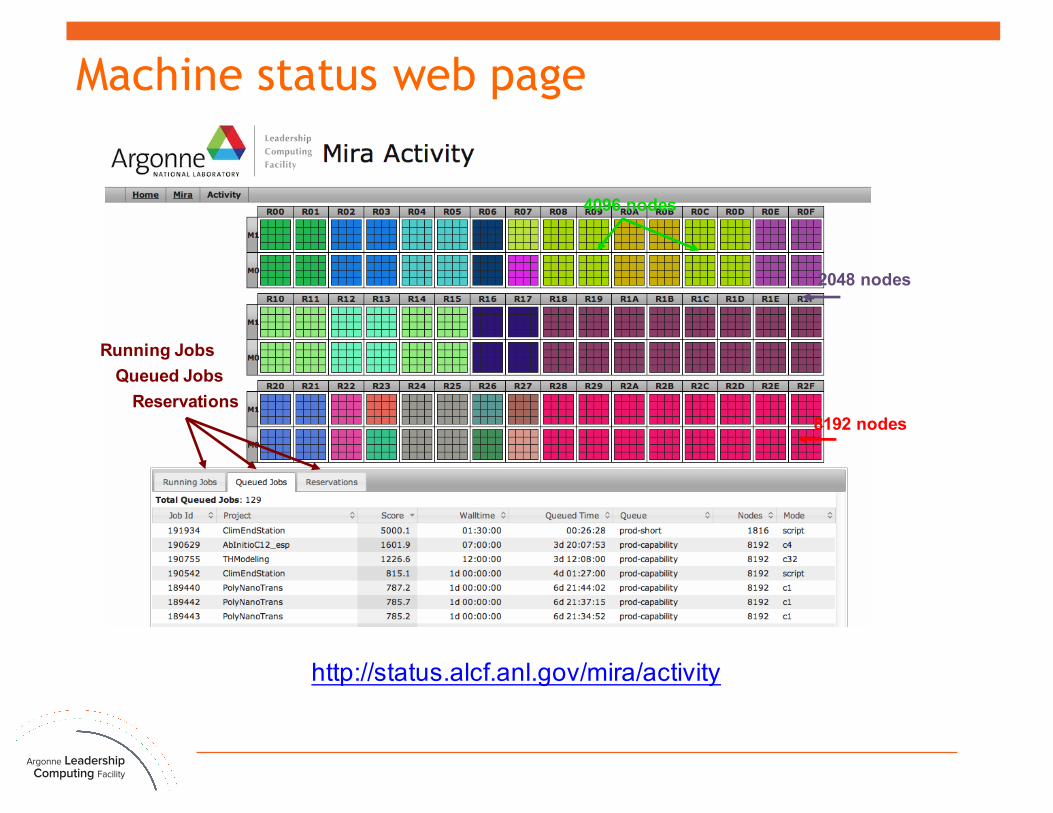
Machine status web page
http://status.alcf.anl.gov/mira/activity
Running JobsQueued Jobs
Reservations
4096 nodes
2048 nodes
8192 nodes
Monitoring
¤ Check_MK is a comprehensive Open-Source-Solution for monitoring developed around the Nagios-core¥ Allows creating rule-based configuration using Python and offloading
work from the Nagios core to make it scale better, allowing more systems to be monitored from a single Nagios server
¥ Checks that consist of agent-side and server-side parts
¤ Check_MK is monitored using monit and MRTG¤ Team members are asked to subscribe to categories of alerts.
Individual subscriptions are meant to ensure that notifications remain relevant for each team member.
¤ Stakeholders are required to tune the monitoring of hosts and services
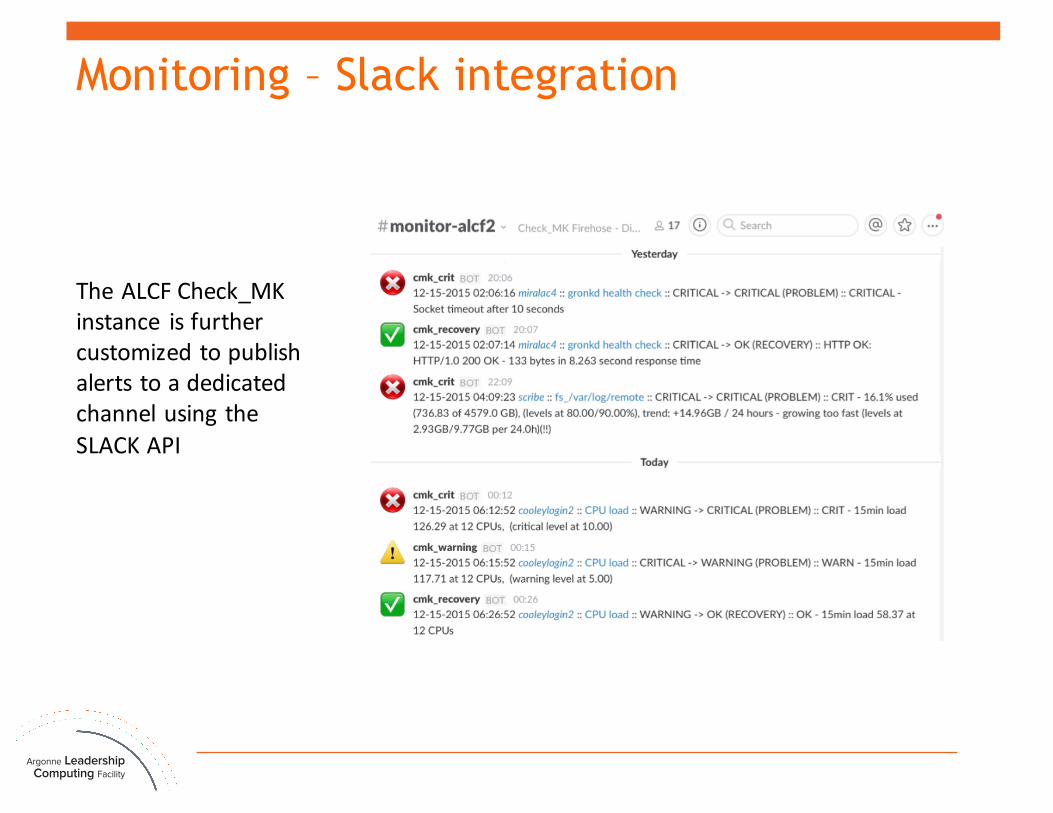
Monitoring – Slack integration
TheALCFCheck_MKinstance isfurthercustomizedtopublishalertstoadedicatedchannelusingtheSLACKAPI
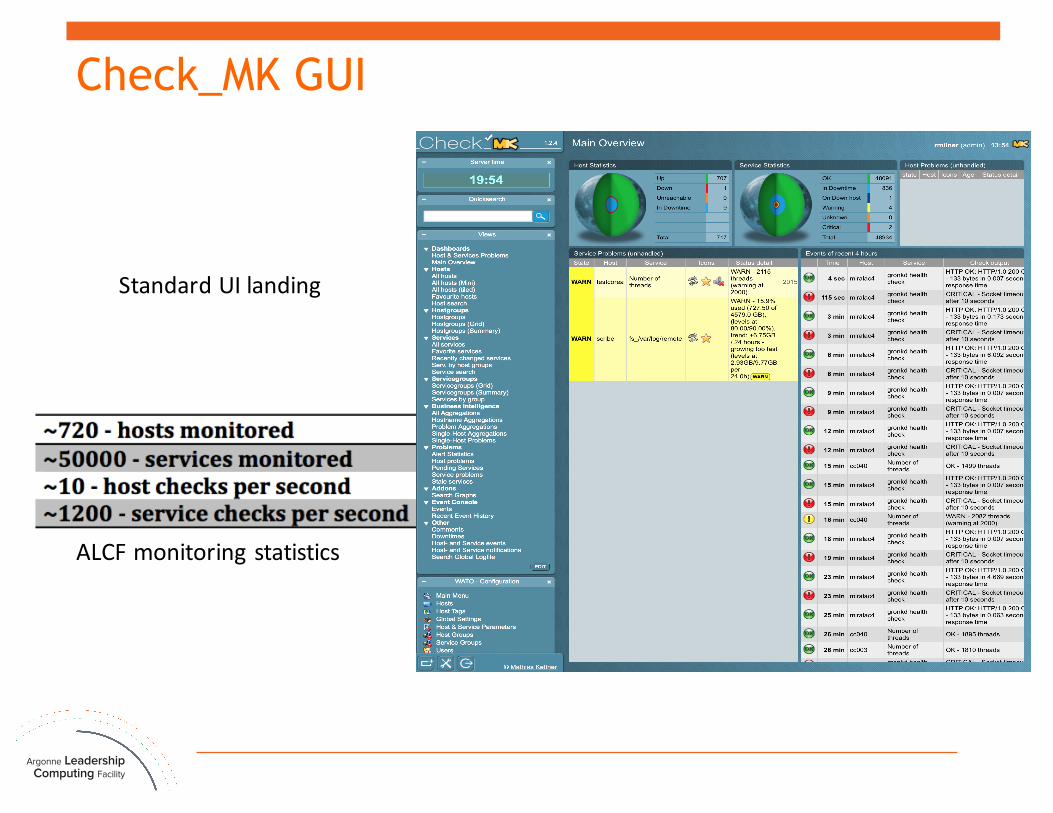
Check_MK GUI
StandardUIlanding
ALCFmonitoringstatistics
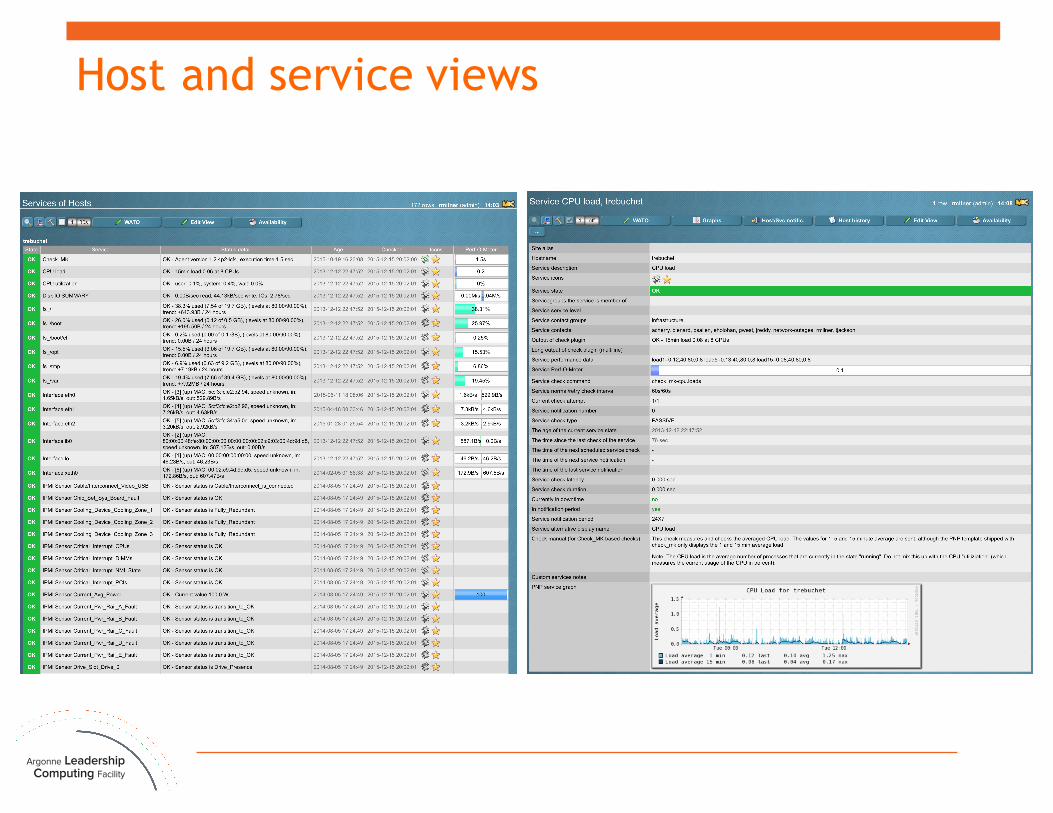
Host and service views

Operational Assessment Process¤ We account for every core-second on the primary production
machines¤ We track the fate of every job launched on the system and
classify the cause of interrupt if it does not end successfully ¤ Once a week, at least one member representing the major
components of the machine (BG, storage, networking, infrastructure, etc.) meets to validate the previous weeks data.Most can be done automatically, but some require scrubbing logs
¤ All results are stored in a database and we use this information to drive where we focus our improvement efforts
Job Failure Analysis Process
¤ How we track availability, outages, and failure categories¤ We do weekly Job Failure Analysis (JFA)
¥ We do root cause analysis on every job that ran the previous week; Considered system error unless we can find explicit proof / “probable cause” it is user error.
¥ On Wednesday afternoon, the Ops team gets in a room and walks through anything that wasn’t pre-classified
¥ Produces Job MTTI, which internally is what we track. Also categorizes failures, which drives improvement projects.
¤ We account for every core-second on the machine¥ Up, scheduled down, unscheduled down; utilized or idle¥ Integers make reconciliation easy
¤ This software is very specific to us, but maybe someday (more on that later)¤ We try to have a command for everything that also logs relevant data for later
reporting¥ [begin|end]-service-action; maintman for maintenance; Scheduler reservations.¥ The Blue Gene comes with this built-in; porting to the Cray is going to be a challenge

Maintenance Manager – maintman or mm2
¤ Script that automates our maintenance processes¤ In our opinion, a very nice tool ¤ For this discussion, what is apropos is that it writes records into our
database and modifies scheduler reservations that are part of the availability calculation
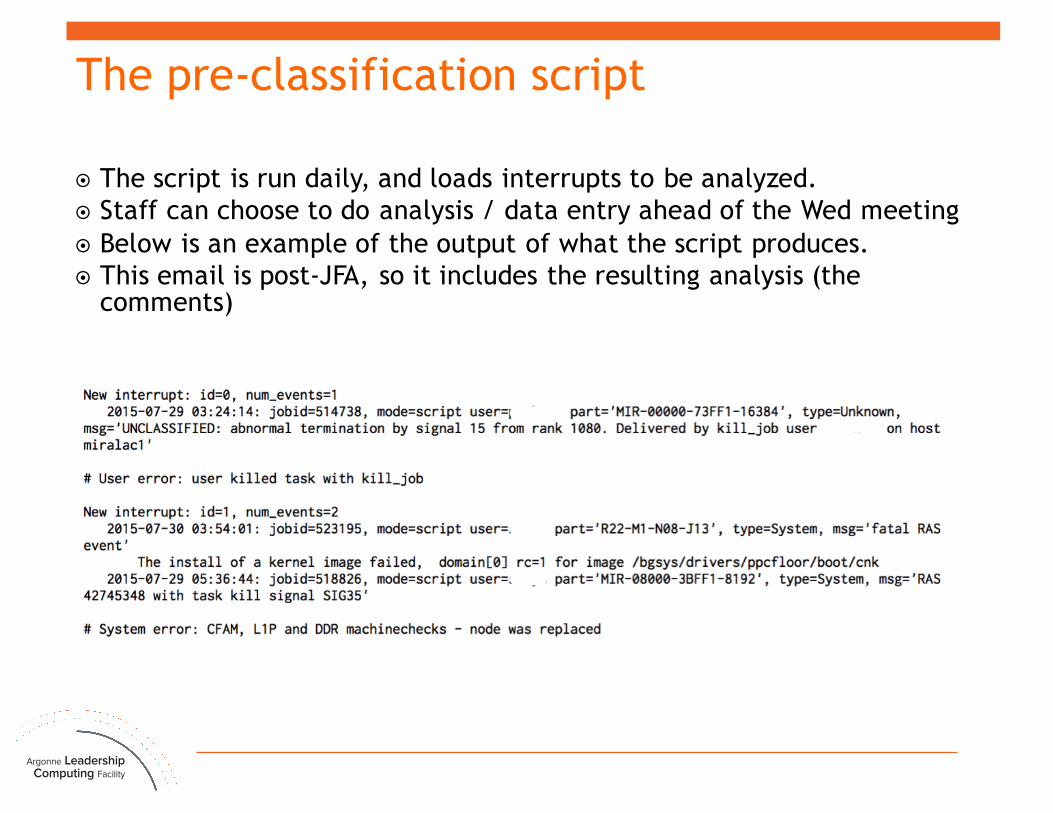
The pre-classification script
¤ The script is run daily, and loads interrupts to be analyzed.¤ Staff can choose to do analysis / data entry ahead of the Wed meeting¤ Below is an example of the output of what the script produces.¤ This email is post-JFA, so it includes the resulting analysis (the
comments)
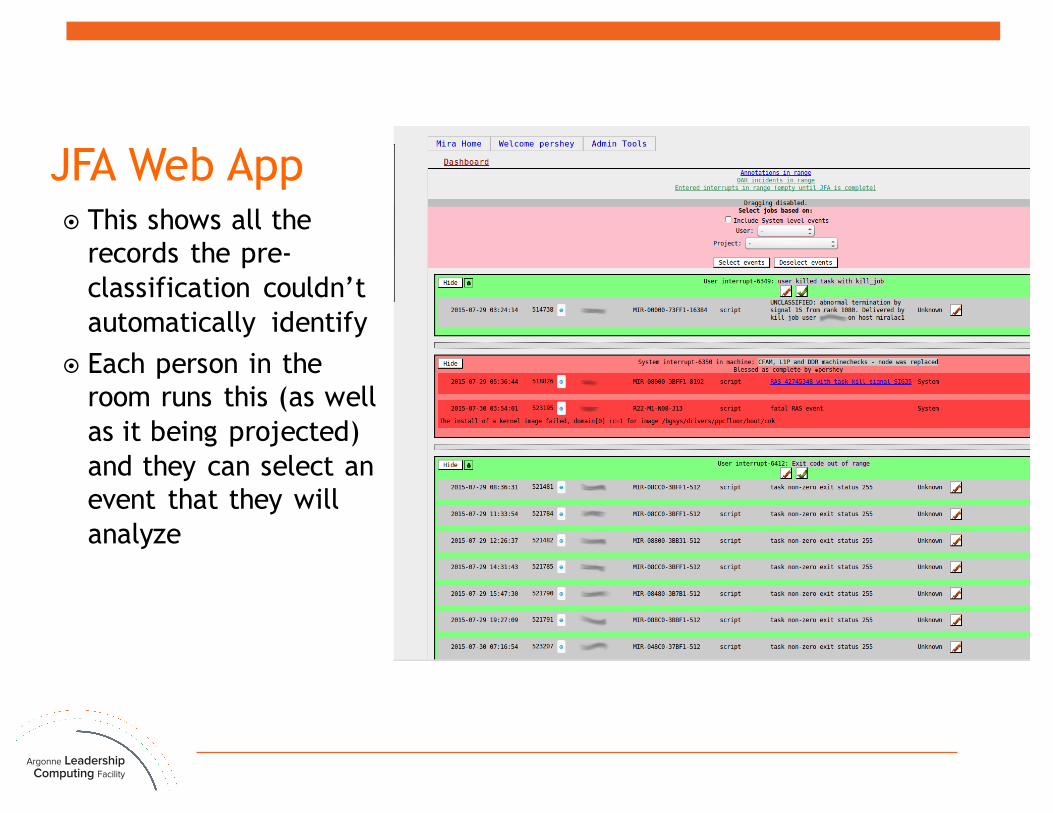
JFA Web App¤ This shows all the
records the pre-classification couldn’t automatically identify
¤ Each person in the room runs this (as well as it being projected) and they can select an event that they will analyze

“Component” Analysis
¤ We also classify by “component”¤ This allows us to see what is giving us
problems and drives improvement projects.
¤ One of the first real wins: We discovered that GPFS was 3x the next source of failures. We investigated and discovered we were getting timeouts and moving the management functions to dedicated nodes dropped GPFS down into the noise.
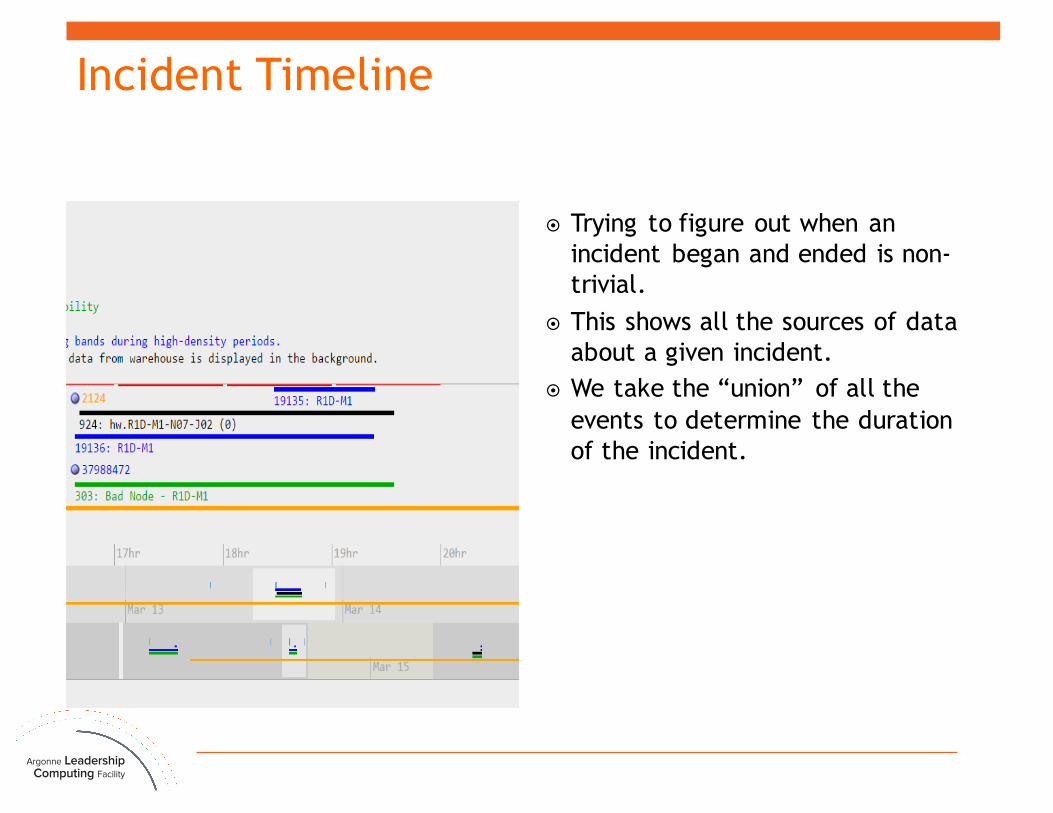
Incident Timeline
¤ Trying to figure out when an incident began and ended is non-trivial.
¤ This shows all the sources of data about a given incident.
¤ We take the “union” of all the events to determine the duration of the incident.

Incident Timeline – drill down
¤ From this screen you can drill down into the details for any entry.

Our standard availability report

The (complicated) Big Picture…
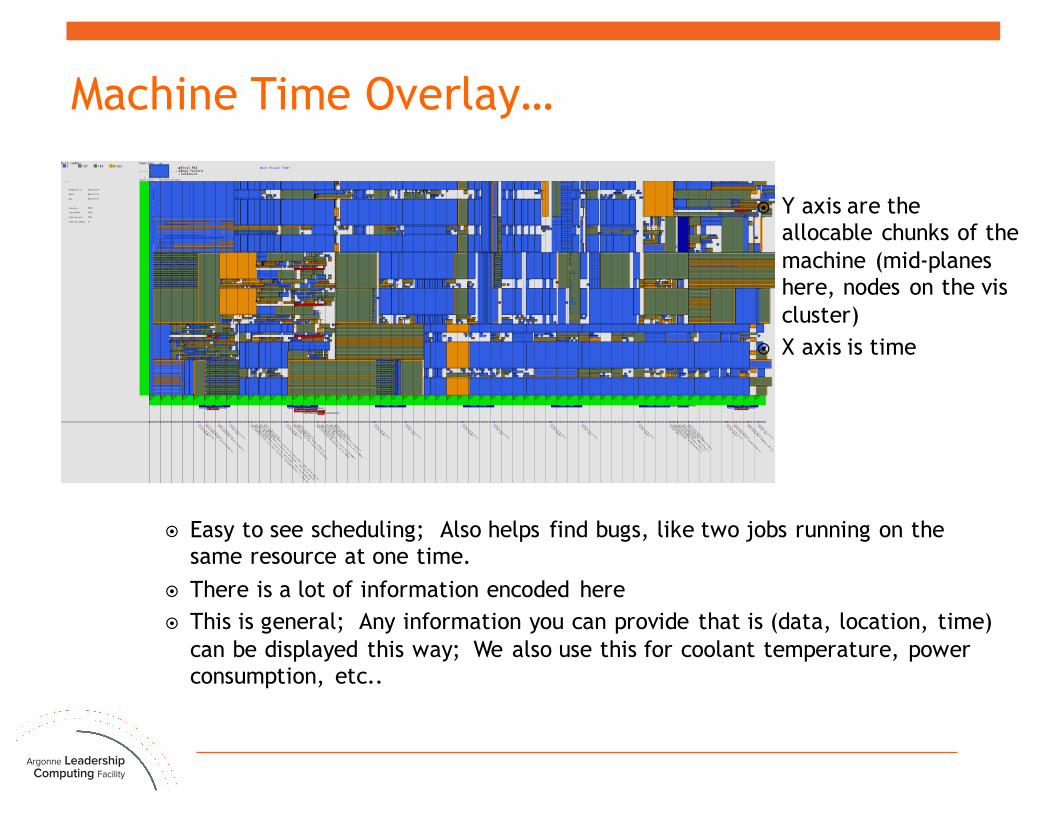
Machine Time Overlay…
¤ Y axis are the allocable chunks of the machine (mid-planes here, nodes on the viscluster)
¤ X axis is time
¤ Easy to see scheduling; Also helps find bugs, like two jobs running on the same resource at one time.
¤ There is a lot of information encoded here¤ This is general; Any information you can provide that is (data, location, time)
can be displayed this way; We also use this for coolant temperature, power consumption, etc..
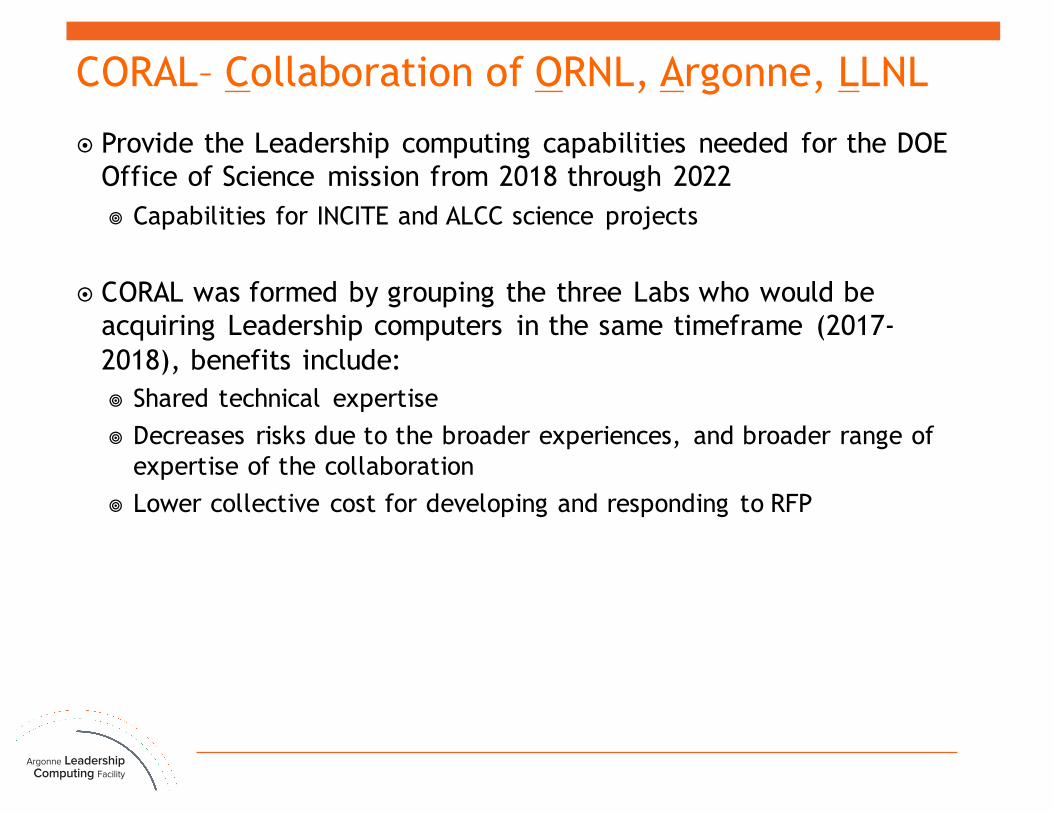
CORAL– Collaboration of ORNL, Argonne, LLNL
¤ Provide the Leadership computing capabilities needed for the DOE Office of Science mission from 2018 through 2022 ¥ Capabilities for INCITE and ALCC science projects
¤ CORAL was formed by grouping the three Labs who would be acquiring Leadership computers in the same timeframe (2017-2018), benefits include: ¥ Shared technical expertise ¥ Decreases risks due to the broader experiences, and broader range of
expertise of the collaboration ¥ Lower collective cost for developing and responding to RFP
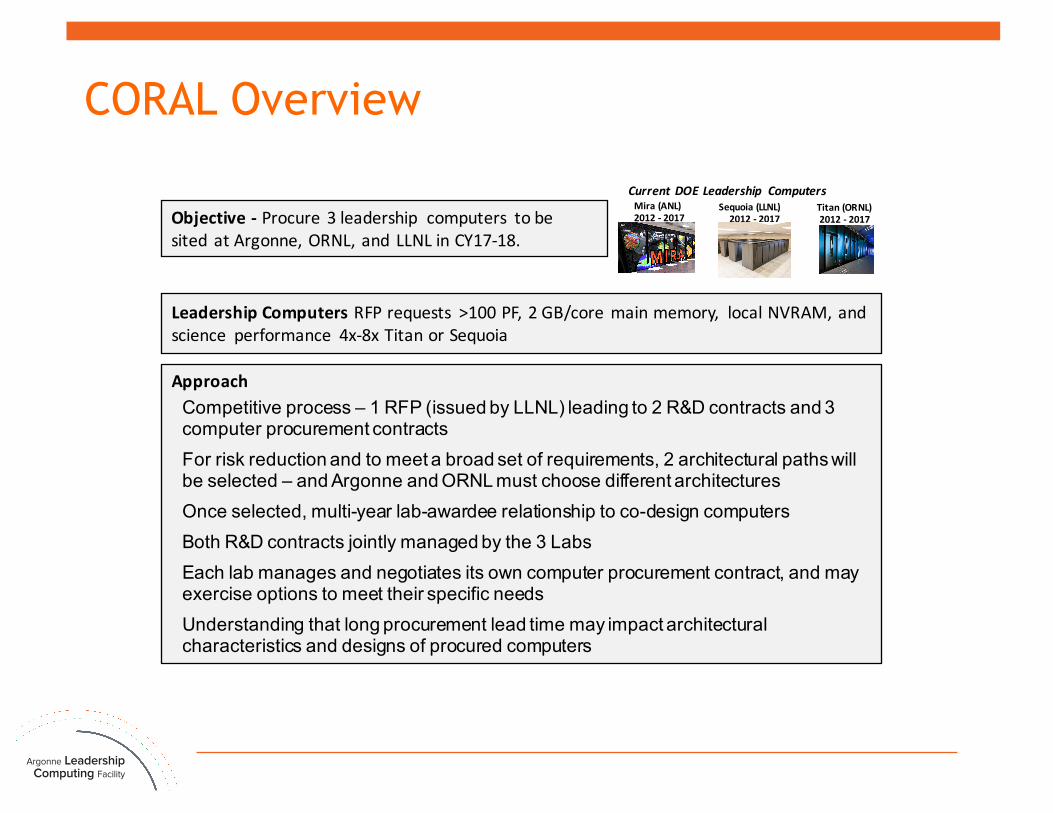
ApproachCompetitive process – 1 RFP (issued by LLNL) leading to 2 R&D contracts and 3 computer procurement contractsFor risk reduction and to meet a broad set of requirements, 2 architectural paths will be selected – and Argonne and ORNL must choose different architectures Once selected, multi-year lab-awardee relationship to co-design computers Both R&D contracts jointly managed by the 3 LabsEach lab manages and negotiates its own computer procurement contract, and may exercise options to meet their specific needsUnderstanding that long procurement lead time may impact architectural characteristics and designs of procured computers
CORAL Overview
LeadershipComputersRFPrequests >100PF, 2GB/coremainmemory, localNVRAM, andscience performance 4x-8xTitanorSequoia
Objective- Procure 3leadership computers tobesited atArgonne,ORNL, and LLNLinCY17-18.
Sequoia(LLNL)2012- 2017
Mira(ANL)2012- 2017
Titan(ORNL)2012- 2017
Current DOELeadership Computers
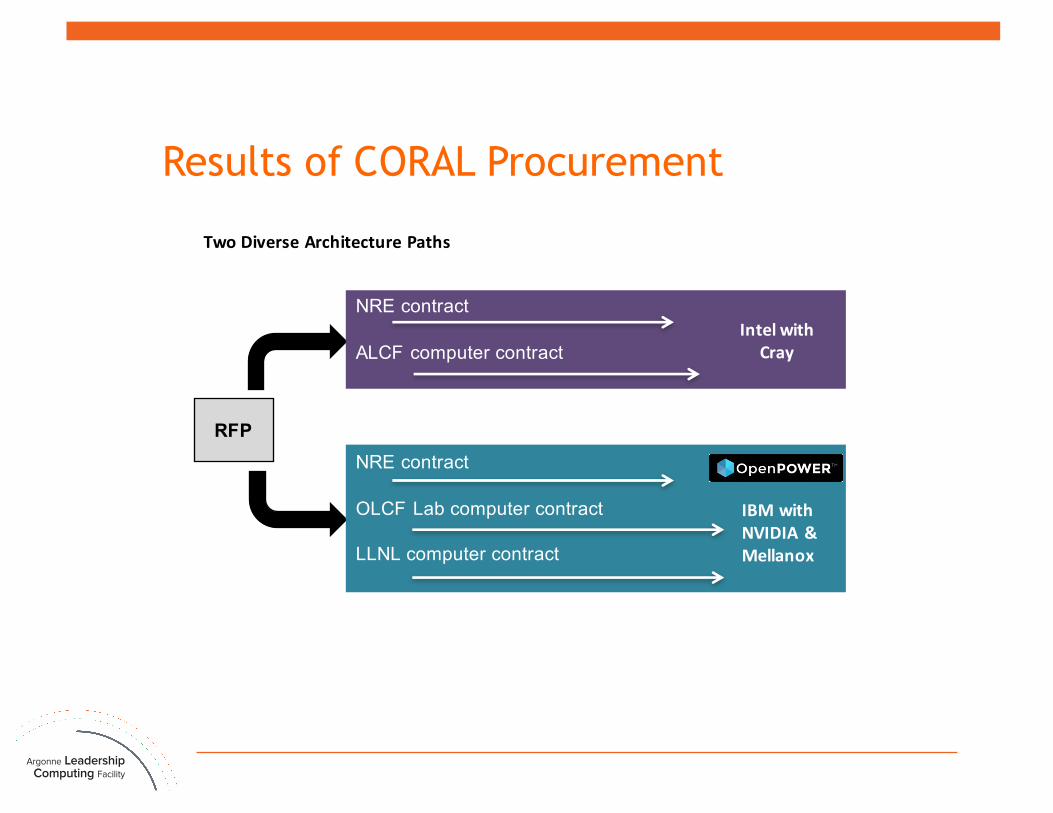
Results of CORAL Procurement
RFP
TwoDiverseArchitecturePaths
NRE contract
OLCF Lab computer contract
LLNL computer contract
IBMwithNVIDIA&Mellanox
NRE contract
ALCF computer contractIntelwith
Cray
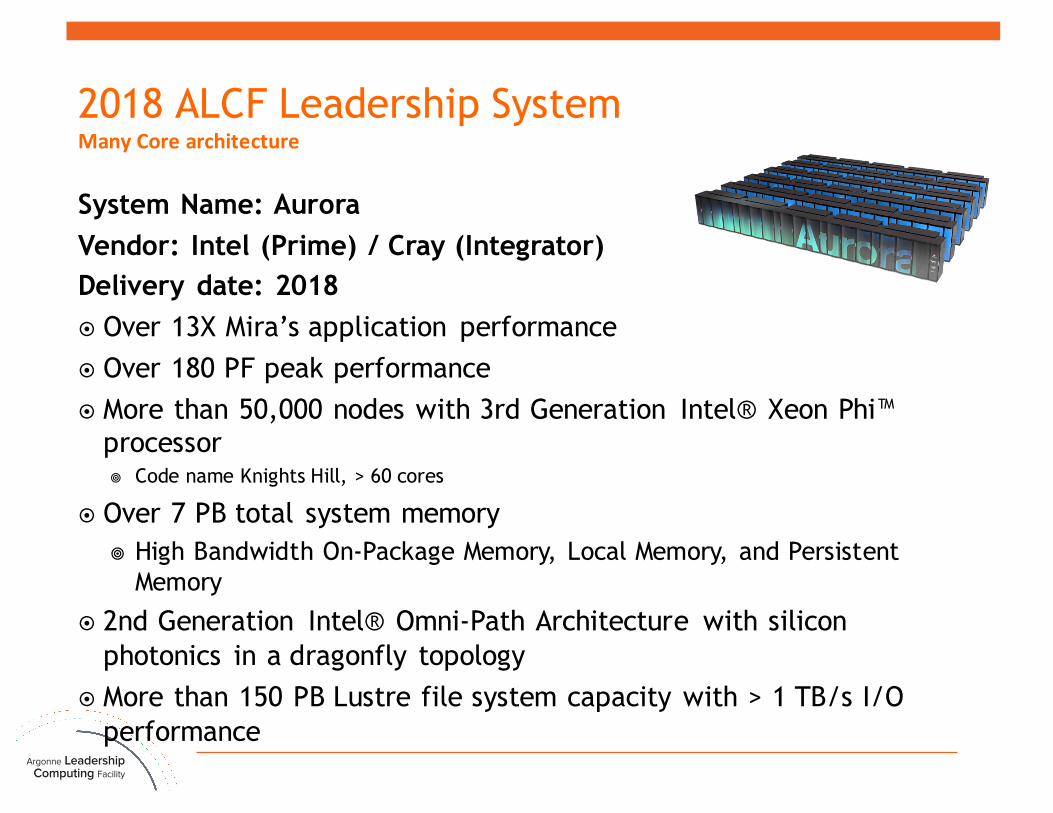
2018 ALCF Leadership SystemManyCorearchitecture
System Name: AuroraVendor: Intel (Prime) / Cray (Integrator)Delivery date: 2018¤ Over 13X Mira’s application performance¤ Over 180 PF peak performance¤ More than 50,000 nodes with 3rd Generation Intel® Xeon Phi™
processor¥ Code name Knights Hill, > 60 cores
¤ Over 7 PB total system memory¥ High Bandwidth On-Package Memory, Local Memory, and Persistent
Memory
¤ 2nd Generation Intel® Omni-Path Architecture with silicon photonics in a dragonfly topology
¤ More than 150 PB Lustre file system capacity with > 1 TB/s I/O performance
2016 ALCF Theta SystemMany Core architecture
Vendor: Intel (Prime) / Cray (Integrator)¤ Transition and data analytics system¤ Over 8.5 PF peak performance¤ More than 2,500 nodes with 2nd Generation Intel® Xeon Phi™ processor
¥ Code name Knights Landing, > 60 cores
¤ 192GB DDR4 memory and up to 16GB HBM on each node¤ 128GB SSD on each node¤ Cray Aries high speed interconnect in dragonfly topology¤ Initial file system: 10PB Lustre file system, 200 GB/s throughput¤ Cray XC system¤ Cray software stack¤ ~1.7 MW peak power

Systems feature summary
SystemFeature Mira(2012) Theta(2016) Aurora (2018)
PeakPerformance 10PF >8.5PF 180PF
NumberofNodes 49,152 >2,500 >50,000
AggregateHBM,localmemory,andpersistentmem 786TB >480TB >7PB
File systemcapacity 26PB 10PB(initial) >150PB
Filesystemthroughput 300GB/s 210GB/s(initial) >1TB/s
Peak PowerConsumption 4.8MW 1.7MW 13MW
GFLOPS/watt 2.1 >5 >13
FacilityArea 1,536sq. ft. ~1,000 sq.ft. ~3,000sq.ft.

What changes, what doesn’t
¤Same¥many core¥GPFS¥MPI+OpenMP¥Cobalt scheduler
¤Different¥Network¥RAS¥Lustre¥System software¥Cray Programming
Environment¥On package, HBM
memory¥ Intel x86, not powerpc¥SSDs
Future/Opportunities
¤ We WILL port ¥ Cobalt¥ Monitoring¥ JFA process
¤ Much of our reporting depends on it¤ We are looking at abstractions and architectural improvements that
will make this easier to use on general machines¤ We have also been leaning on Cray and Intel to work with us to
develop standardized interfaces and mechanisms for obtaining this kind of data
¤ Opportunities to share/codevelop tools

Other opportunities¤ Evaluate each other’s Petascale computers and software stacks
¥ Scaling studies, tools, libraries, compilers
¤ Modeling and simulation of applications¤ Community codes¤ Visualization support: software, techniques¤ Industry engagements
Acknowledgment¤ This research used resources of the Argonne Leadership Computing
Facility, which is a DOE Office of Science User Facility supported under Contract DE-AC02-06CH11357.