Financial Highlights » Massmart
244
FINANCIAL HIGHLIGHTS FOR THE YEAR ENDED DECEMBER 2013 The comparative numbers used above are for the 52 weeks ended December 2012. Walmart integration and related costs have been included in the prior financial year. Prior year numbers exclude the effect of Walmart costs. More detail on headline earnings per share can be found in note 11. ‘Definitions and formulas’ can be found here. 1 1 2 3
-
Upload
khangminh22 -
Category
Documents
-
view
2 -
download
0
Transcript of Financial Highlights » Massmart

FINANCIAL HIGHLIGHTSFOR THE YEAR ENDED DECEMBER 2013
The comparative numbers used above are for the 52 weeks ended December 2012.
Walmart integration and related costs have been included in the prior financial year.
Prior year numbers exclude the effect of Walmart costs.
More detail on headline earnings per share can be found in note 11.
‘Definitions and formulas’ can be found here.
1
1
2
3
INTRODUCTION
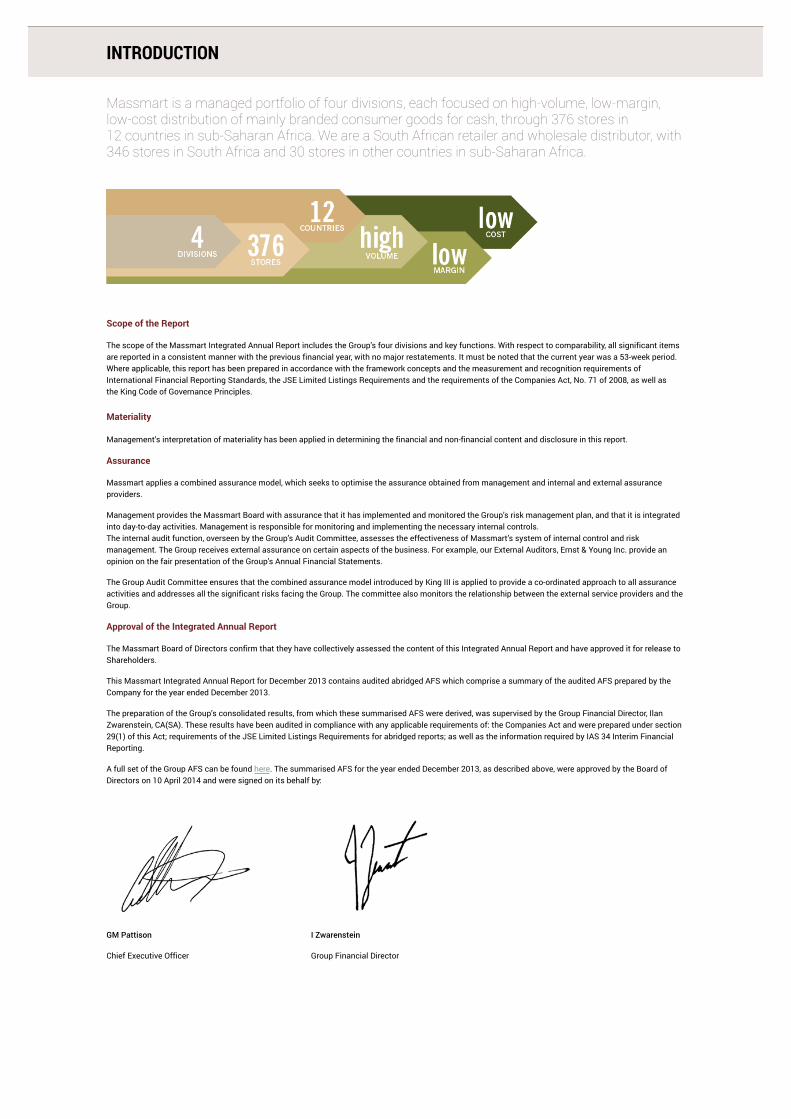
Massmart is a managed portfolio of four divisions, each focused on high-volume, low-margin,low-cost distribution of mainly branded consumer goods for cash, through 376 stores in12 countries in sub-Saharan Africa. We are a South African retailer and wholesale distributor, with346 stores in South Africa and 30 stores in other countries in sub-Saharan Africa.
Scope of the Report
The scope of the Massmart Integrated Annual Report includes the Group’s four divisions and key functions. With respect to comparability, all significant items
are reported in a consistent manner with the previous financial year, with no major restatements. It must be noted that the current year was a 53-week period.
Where applicable, this report has been prepared in accordance with the framework concepts and the measurement and recognition requirements of
International Financial Reporting Standards, the JSE Limited Listings Requirements and the requirements of the Companies Act, No. 71 of 2008, as well as
the King Code of Governance Principles.
Materiality
Management’s interpretation of materiality has been applied in determining the financial and non-financial content and disclosure in this report.
Assurance
Massmart applies a combined assurance model, which seeks to optimise the assurance obtained from management and internal and external assurance
providers.
Management provides the Massmart Board with assurance that it has implemented and monitored the Group’s risk management plan, and that it is integrated
into day-to-day activities. Management is responsible for monitoring and implementing the necessary internal controls.
The internal audit function, overseen by the Group’s Audit Committee, assesses the effectiveness of Massmart’s system of internal control and risk
management. The Group receives external assurance on certain aspects of the business. For example, our External Auditors, Ernst & Young Inc. provide an
opinion on the fair presentation of the Group’s Annual Financial Statements.
The Group Audit Committee ensures that the combined assurance model introduced by King III is applied to provide a co-ordinated approach to all assurance
activities and addresses all the significant risks facing the Group. The committee also monitors the relationship between the external service providers and the
Group.
Approval of the Integrated Annual Report
The Massmart Board of Directors confirm that they have collectively assessed the content of this Integrated Annual Report and have approved it for release to
Shareholders.
This Massmart Integrated Annual Report for December 2013 contains audited abridged AFS which comprise a summary of the audited AFS prepared by the
Company for the year ended December 2013.
The preparation of the Group’s consolidated results, from which these summarised AFS were derived, was supervised by the Group Financial Director, Ilan
Zwarenstein, CA(SA). These results have been audited in compliance with any applicable requirements of: the Companies Act and were prepared under section
29(1) of this Act; requirements of the JSE Limited Listings Requirements for abridged reports; as well as the information required by IAS 34 Interim Financial
Reporting.
A full set of the Group AFS can be found here. The summarised AFS for the year ended December 2013, as described above, were approved by the Board of
Directors on 10 April 2014 and were signed on its behalf by:
GM Pattison
Chief Executive Officer
I Zwarenstein
Group Financial Director

MASSMART MISSION AND VISION
Massmart mission
Massmart is a South African-based, globally competitive, regional management group, investedin a portfolio of differentiated, complementary, focused wholesale and retail formats, eachreliant on high volumes and operational excellence as the foundation of price leadership, in thedistribution of mainly branded consumer goods for cash. The Group actively seeks thecontinual improvement of performance in the portfolio and its parts, through strategic andstructural clarity, high market shares, excellent management, principle-driven ethical leadership,cost-effective technology and the sharing or agglomeration of capabilities, knowledge,resources, influence and information.
To this end, thought, leadership, individual and collective performance, and collaborationthroughout the Group are appropriately rewarded, with executive management incentivisedpredominantly on Group performance.
As part of these priorities, in 2014 the Group will invest in new retail formats and newcategories. We will be trialling new formats in East and West Africa; will open more low-incomehome improvement stores in South Africa; and will launch new e-commerce offerings in ourbrands. New or extended categories include Fresh; Clothing; and Food Retail. Additionally, wewill focus on owning more of our stores, will rationalise some stores in certain over-tradedmarkets, and will continue to invest in product quality and safety.
The Board of Massmart is responsible for directing the Group towards the achievement of theMassmart vision and mission and whilst doing so are also accountable to certain governanceframeworks.
IS DRIVEN BY A FOCUS TO MEET THE EXPECTATIONS OF ALL OF OUR STAKEHOLDERS. IN DOING SO MASSMART ISAWARE THAT WE MUST EMBRACE THE REQUIREMENTS OF THE RELEVANT GOVERNANCE AND REGULATORYFRAMEWORKS, AS WELL AS CORPORATE BEST PRACTICE
Massmart vision
In an attempt to align the Massmart December2013 Integrated Annual Report with our vision,we have structured the report through the eyes ofour stakeholders:
will regard Massmart’s wholesale and retailformats as their first choice when buying thosecategories of merchandise offered by theformats;
including Government, will regard Massmart as asocially accountable corporation;
will regard Massmart as the preferred employer inthe retail industry;
will regard Massmart as a portfolio renderingsuperior returns relative to the JSE Retail sector;and
will regard Massmart as a valued partner inaccessing and understanding theirend-consumers.

INVESTMENT PROPOSITION
Massmart’s strategy is to be considered a leader by all stakeholders in our chosen markets withinsub-Saharan retail and wholesale distribution.
Massmart offers a unique investment proposition:
STRATEGIC AND STRUCTURAL CLARITYThrough four focused Divisions, each a leader in its target market andbusiness model, where additional value is created through inter-Divisional collaboration and behaviour is aligned through short- andlong-term incentives, while adhering strictly to organic and acquisitivegrowth criteria.
MANAGEMENT DEPTH, QUALITY AND DIVERSITYThe 47 Group and Divisional Executives hold 75 qualifications, ofwhich 55 are degrees; are an average age of 37 years; and 15% areAfrican, Coloured or Indian.
DIVERSIFICATIONMerchandise – Massmart is the second largest distributor ofconsumer goods in Africa, and is the leading retailer of generalmerchandise, liquor, home improvement and building supplies,and the leading food wholesaler;Formats – trading through a variety of formats;Customers – serving all mass-market consumers;Geography – operating in 12 sub-Saharan African countries.
LOW RISK Earnings underpinned by high cash generation; sensible financialleverage; and conservative through-the-cycle store opening plans.
GROWTHContinuously improving the productivity of capital, space andlabour;Strengthening Supply Chain activities;Up-weighting Group private label efforts;Complementing store growth through targeted acquisitionsand greenfield opportunities; andExpansion into Food Retail through Cambridge Foods, GameFoodco and Makro Fresh.
GOOD GOVERNANCEBoard composition – three executive and seven non-executivedirectors, four of whom are independent;Recognised record of good disclosure;Compliant with King III Report and the JSE SRII;Member of the Ethics Institute of Southern Africa; andFounding member of the Institute of Directors.

MASSMART’S APPLICATION OF THE CONCEPT OF CAPITALS
In March 2013, the International Integrated Reporting Council (IIRC) released a background papertalking to the Concept of Capitals, which explores the multiple capitals that are recognised as afundamental concept for reporting and they defined six types of capitals for the purpose ofreporting.
When reported together, these capitals represent an important picture of an
organisation’s value creation. All organisations depend on various forms of
capital for their success and the IIRC believes that businesses should report
in terms of the different capitals and that the capitals should be part of the
organisation’s business model and strategy.
Massmart has not adopted the new outline proposed by the IIRC, and we will
only report formally against these principles once the framework has been
approved, but activities and performance relating to the concept of capitals
are covered in the following sections of our Integrated Annual Report:
NATURAL CAPITALis addressed in the ‘Our Community’ section;
INTELLECTUAL CAPITALis addressed in the ‘Our Business’ section;
SOCIAL AND RELATIONSHIP CAPITALis addressed in the ‘Our Community’ and ‘Our Business’ (in the Social and
Ethics Committee Report) sections;
HUMAN CAPITALis addressed in the ‘Our Employees’ section;
FINANCIAL CAPITALis addressed in the ‘Our Investors’ section; and
MANUFACTURED CAPITALis addressed in the ‘Our Customers’ section.
We will be following updates on this background paper, and will integrate the
principles in more detail going forward, should the background paper be
approved.

FORWARD-LOOKING STATEMENTS
The Massmart Integrated Annual Report includes forward-looking statements which relate to thepossible future financial position and results of the Group’s operations. These statements by theirnature involve known and unknown risks, uncertainties and other important factors that couldcause the actual results, performance or achievements of the Group to be materially differentfrom the future results, performance or achievements expressed or implied by such forwardlooking statements, as they relate to events and depend on circumstances that may or may notoccur in the future.Factors that could cause actual results to differ materially from those in forward looking statements include, but are not limited to, global and nationaleconomic and market conditions, competitive conditions, the cyclical nature of the retail sector, credit and the associated risks of lending, inventory levels andregulatory factors.
The Group is not under any obligation to update or alter any of our forward-looking statements publicly, whether as a result of new information, future events orotherwise. Investors are cautioned not to place undue reliance on any forward-looking statements contained herein, as they have not been reviewed or reportedon by the Group’s External Auditors.

LETTER TO STAKEHOLDERSFOR THE YEAR ENDED DECEMBER 2013
Most will be aware that Massmart changed its financial year-end to December with effect fromDecember 2012. This means that this report includes audited financial information forMassmart’s 53-week reporting period to December 2013, but that the comparative period used inthe Group and Company Annual Financial Statements is the audited financial results for the 26weeks ended December 2012.
Overview
For the year ending on December 2013, Massmart’s total sales increased by 9.8% over the previous year’s52-week period. Boosted by the additional week’s sales and the foreign exchange translation profit causedby the weakening Rand, Operating Profit increased by 26.0% and Headline Earnings increased by 29.9%.
The difficult South African consumer environment was reflected in 52-week comparable stores’ sales of3.8% with estimated product inflation of 2.7%. This is the sixth year that Massmart’s product inflation hasbeen below South African Consumer Price Inflation.
Adjusting for foreign exchange translation movements in both years, Walmart transaction costs in the prioryear, and the 53rd week, the Group’s underlying operating profit performance decreased by 7.0%.
This was an improvement on the half-year’s performance as management responded with greater costcontrol and margin management given the deteriorating sales environment.
All Divisions performed well relative to their chosen markets other than Game South Africa which wascaught in the very difficult trading environment of selling durable goods to financially challenged low- andmiddle-income consumers.
Pleasing progress was made in the implementation of the Group’s strategies and operationally andstrategically we are much better positioned than a year ago.
Environment
Commentators are forecasting a difficult South African consumer economy in 2014. The recent interest ratehike seems certain to make things more difficult for middle-income customers who, as suggested by theconsumer credit statistics, are in a weak financial position. By contrast, the upper-income customer appearsto be in a better financial position but their spending will be dependent on their confidence levels.
We seem to be in an unusual retail cycle. Retailers’ recent results confirm that sales of non-durables andsemi-durables are out-performing those of durables, a situation typical of a higher interest rate cycle whereinterest rates had been increased to curb inflation. But interest rates have until recently been at historicallows and so one might expect the opposite sales trends. This suggests that cyclical retailers are starting arising interest rate cycle already under some pressure, and so managing cyclicality is becoming a keymanagement skill.
As the economic landscape is changing, so is the customer landscape, particularly in our historically corecategories of General Merchandise and Wholesale Food. The change in technology to tablets and smartphones, for example, is changing the spending patterns in many of the General Merchandise categoriesincluding digital cameras, laptops and toys. This mega-trend, amongst many other minor ones in GeneralMerchandise categories, requires us to reposition both our offering and space allocation. The 2012 demiseof a major South African wholesale food competitor and its subsequent disposal to independent operatorsis changing the distribution patterns of basic food across South Africa and requires us to trade in new ways.
In both the Home Improvement and Food Retail industries we are leading change, albeit being relatively newentrants into Food Retail.
The economic performances of countries outside South Africa have been mostly positive, although there aresome early signs of currency issues in a couple. The weaker Rand bolstered our reported Rand performanceof our non-South African operations. Currency liquidity and pricing remains the greatest risk.

Comprises the 121-store General Merchandise discounter and Food retailer Game, which trades in SouthAfrica, Botswana, Ghana, Lesotho, Malawi, Mozambique, Namibia, Nigeria, Tanzania, Uganda and Zambia;and the 22-store Hi-tech retailer DionWired.
Total Divisional sales for the 53-week period increased by 8.6%. Comparable sales for the 52-week periodincreased by 1.0% with product inflation of 0.5%.
Given the hardening middle-income environment, Game South Africa’s comparable sales showed a declineof 2.6% which caused severe pressure on profitability and so Massdiscounters’ trading profit before interestand tax decreased by 39.3%. The roll-out of Dry Groceries and Fresh continues with 48 Game stores nowoffering both these categories. Food sales growth in these comparable stores is exceptionally strong.
DionWired’s total sales growth was 19.5% and this brand has become the destination store within thiscategory. Game Africa’s total Rand sales and sales in local currencies increased by 22.0% and by 14.7%respectively. Profit growth in both businesses was above sales growth.
Three DionWired stores and 11 Game stores were opened, and four Game stores were closed, increasingspace by 33,949m² (7.7%).
Masswarehouse
Comprises the 19-store Makro warehouse-club trading in Food, General Merchandise and Liquor in SouthAfrica; and Fruitspot.
Total Divisional sales for the 53-week period increased by 14.4%. Comparable sales for the 52-week periodincreased by 4.0% with product inflation of 2.1%. The new Alberton, Johannesburg, store is tradingexceptionally well. The relocated Amanzimtoti, Durban, store is also trading well but, as with most storerelocations, has not yet seen significant new incremental sales and is carrying higher current costs. Makro’strading profit before interest and tax increased by 13.4%.
Two stores were opened and one store was closed, increasing space by 16,592m² (9.3%).
Massbuild
Comprises 92 stores, trading in DIY, Home Improvement and Building Materials, under the BuildersWarehouse, Builders Express, Builders Trade Depot and Builders Superstore brands in South Africa,Mozambique and Botswana.
Total Divisional sales for the 53-week period increased by 11.9%. Comparable sales for the 52-week periodincreased by 8.2% with product inflation of 4.1%. Despite its leading market position, Massbuild investedheavily in its operating capacity this year: opening the highest number of stores ever; converting BuildersTrade Depot onto our SAP IT platform; opening a national Distribution Centre in Johannesburg; opening twostores of the new format, Builders Superstore, aimed at lower-income consumers; and opening a new storein Botswana and two new stores in Mozambique. Trading profit before interest and tax increased by 26.7%.Six Builders Warehouse stores were opened; five Builders Express stores were opened and two closed; threeBuilders Trade Depot stores were closed and one was sold; and two Builders Superstores were opened,resulting in net trading space increasing by 14,675m² (3.7%).
Divisional Operational Review
Massdiscounters

Governance
As mentioned in the previous Integrated Annual Report, the Board and its committees have adapted andwhere necessary introduced new practices and processes necessary to address the governance nuancesrelated to a public company with a value adding controlling shareholder. Liaison at Board level betweenWalmart and Massmart has been constructive and respectful of both company’s governanceresponsibilities to shareholders.
Directorate
The Group’s non-Executive Chairman, Mark Lamberti, has been appointed CEO of the Imperial Group, from 1March 2014. As a consequence, he has chosen to relinquish his directorships of other public companies andhas resigned as Chairman of Massmart. Kuseni Dlamini has been appointed the new Chairman ofMassmart, with effect from 10 April 2014. His details can be found here.
Grant Pattison has resigned as Chief Executive Officer of the Group with effect from 1 June 2014. GuyHayward has been appointed to succeed Grant. The careers of both Grant and Guy, including their combined28 years of service to the Group are set out in more detail here.
Corporate Accountability Review
Massmart continues to implement a comprehensive Corporate Accountability programme and we wereproud to again, be identified as one of only ten best performers in the Johannesburg Stock ExchangeSocially Responsible Investment (SRI) Index. Broad-based Black Economic Empowerment (B-BBEE) remainsa priority focus area and we were pleased to retain our level 4 B-BBEE contributor status which was basedon the new six- to ten-year Employment Equity and Preferential Procurement scorecard targets. Walmart’spositive sustainable development impact has been keenly felt, specifically in relation to new orre-invigorated interventions in areas that include energy efficiency, waste management, packagingrationalisation, ethical sourcing and women’s empowerment. A more detailed overview covering the Group’scorporate accountability performance for the year ended December 2013 is described here.
Prospects and Appreciation
For the 14 weeks to 6 April 2014, total sales increased by 11.4% and comparable sales increased by 7.1%, amuch stronger start to the financial year than we anticipated.
Whilst too early to be confident about this new trend, the strong start suggests a better overall performancethis year than last year. Whilst we remain cautious about the economy, we are much more positive about thebusiness as we reap the rewards from the operational focus of last year.
Our appreciation and gratitude is due to all stakeholders for their contribution and commitment toMassmart during this period. Your support fuels our dedication to entrenching Massmart’s unique positionand performance in the distribution of consumer goods on Africa.
On behalf of the Board
Mark J. Lamberti
Out-going Chairman
10 April 2014
Grant Pattison
Chief Executive Officer
10 April 2014
Guy Hayward
Chief Operating Officer
10 April 2014
Masscash
Comprises 75 Wholesale Cash and Carry and 47 Retail Cash and Carry stores trading in South Africa,Botswana, Lesotho, Mozambique, Namibia and Swaziland; and Shield, a voluntary buying association.
Total Divisional sales for the 53-week period increased by 6.5%. Comparable sales for the 52-week periodincreased by 3.8% with product inflation of 4.2%. Trading in the Wholesale environment was difficult giventhe pressure on lower-income consumers, low product inflation and a very competitive market. Our firststore in Mozambique is trading well and we continue to seek more sites in this and other southern Africancountries. Cambridge management has done an exceptional task of stabilising the control environment andinstalling a common IT platform and this business began to show strong trading performances towards theend of the financial year. Comparable sales growth was 7.8%. Masscash’s trading profit before interest andtax increased by 4.1%.
One Wholesale store and five Retail stores were opened; and three Wholesale and two Retail stores wereclosed. Net trading space increased by 2,519m² (0.6%).

MASSMART BUSINESS MODEL
Massmart has evolved a business model that empowers its Divisions to take trading decisionssuited to their individual operating needs but within a strategic operating and financial frameworkset by the Group.
This has several advantages:
The framework guarantees consistent compliance with the best governance standards and national legislative requirements. It commits each Divisionto implementing Massmart’s core strategy of being a high-volume, low-margin distributor of quality branded consumer goods for cash, and ensuresexpansion plans add net value to the Group.At the same time, Divisions can extract greater value from being part of a larger Group with greater access to goods and services or negotiating betterterms and rebates with suppliers and service providers. The Divisions are differentiated as retail or wholesale formats that address different customerand market profiles.Decentralised decision-making is given effect through a Group Executive Committee reporting to the Group Chief Executive Officer (CEO). TheCommittee’s members comprise the CEOs/Managing Directors of Massmart’s four operating Divisions and a Group Executive from each of MassmartHoldings, Channel and Shared Services. Massmart Holdings’ Executives are also represented on each of the four Divisional boards as non-executivedirectors.
The model operates through the following four units:
MASSMART HOLDINGS
Massmart Holdings performs the Group management roleand defines the strategic and broad operating principlesthat guide the Group’s activities.
MASSMART CHANNEL
Massmart Channel consists of formal trading andfunctional forums where ideas on collaboration acrossDivisions are shared.
MASSMART SHARED SERVICES
Massmart Shared Services implements collaborativeagreements reached by Channel. The most important areGroup supplier negotiations for all products sold acrossthe Group.
MASSMART DIVISIONS
Massmart’s Divisions, who report directly to the ChiefOperating Officer, comprise Massdiscounters,Masswarehouse, Massbuild and Masscash.

AFRICAN STORE MAP

SOUTH AFRICAN REGIONAL STORE MAP

MASSDISCOUNTERS DIVISIONAL REVIEWGENERAL MERCHANDISE DISCOUNTER AND FOOD RETAILER
FINANCIAL PERFORMANCE
STORE HIGHLIGHTS

The Massdiscounters’ brands
Massdiscounters operates two retail formats: Game and DionWired. Game is a discount retailerof General Merchandise and non-perishable and dry groceries for home, leisure and businessuse, operating throughout South Africa and in 14 cities in sub-Saharan Africa. TraditionallyGame has been a discounter of General Merchandise, but our format renewal, with theintroduction of perishable food has intentionally pushed the brand towards a multi-categoryformat.
We now have 107 Game stores in South Africa and 14 in Africa, bringing our total footprint to121. We also have 22 DionWired stores, which sell middle- to upper-end electronics andappliances across South Africa.
The Game positioning offers customers the widest range of branded products, at the best pricefor a given set of product specifications and a quality guarantee for customers . We ensure thatcustomers are assured of the best value at every logical price point. The Game trading model ispromotionally-driven, with five million copies of our weekly promotional leaflets distributed inSouth Africa. By working closely with our suppliers and benchmarking ourselves againstcompetitors, we are able to offer our customers well-priced products representing great value.
Currently 48 Game stores provide a perishable food offering adding further everyday value toour customers. Over the next few years, we intend to roll out perishable food to mostGame stores.
Game Liquor was included with the format renewal to complete our offering and increase foottraffic. We now have 30 Game Liquor stores, which are performing in line with expectations.
DionWired’s product displays create an easy, exciting and interactive shopping experience,offering the latest in-home entertainment, computing, video and digital photographicequipment and appliances. DionWired sells complete technological solutions, oftendemonstrating the interconnectivity of the latest innovations and products in-store. The Techexperts manning our in-store Hi-tech Smart service centres are on hand to offer the best adviceand onsite repairs and services.
Although all our products are competitively priced, DionWired’s proposition is not founded onprice alone. Our main proposition is to offer the widest range of some of the world’s leading anddiscerning brands such as Apple, Smeg, Miele, Marantz, Bose and Onkyo to the South Africanhigher-income consumer.
Future outlook
Over the next financial year, Massdiscounters will focus on bedding down and leveraging manyof the changes implemented over the past three years. With seven Game stores to open inSouth Africa, three Game stores to open in the rest of sub-Saharan Africa, and one newDionWired store planned, we expect our growth strategy to continue to take market share anddeliver our low-cost, low-margin, high-volume business model to more customers in a highlycompetitive retail sector.
At Game we will continue to seek out and introduce the world’s leading consumer brandsalongside our roll-out of Private Label and perishable food to ensure that we offer the range ofproducts required to attract customers in this challenging market. We will partially reduce ourexposure to HiTech and Multimedia and will introduce limited ranges of Baby and Clothing.
At DionWired our focus on a unique customer experience, as well as our extensive bouquet ofservices, will differentiate the brand on a national basis as discerning customers seek valueand solutions in their purchases.
We plan to open or convert 13 more stores in the next 12 months, bringing the total to 61 Gamestores selling perishable food by December 2014.
Divisional Strategy 2014
Focus on Game SA brand promise – lowestprices, focused ranges and qualityguaranteeImprove in-store shopping experiencesImprove IT and Supply Chain efficienciesContinue roll out of foodIncrease Game Liquor stores
Improving Efficiencies
Our Regional Distribution Centres (RDC’s) havehelped to:
Improve business efficienciesImprove in-stock levelLeverage supply chain
INVESTING IN OUR COMMUNITYNow in its seventh year, Amalunchbox was born from the belief that “you can’t teach a hungrychild”, and we work together with the Department of Education to make their national SchoolNutrition Programme more effective.
INVESTING IN OURHUMAN RESOURCES
B-BBEE LEVEL 3

Grant Pattison
ChairmanRobin Wright
Chief Executive OfficerNorman Drieselmann
FinancialRichard Fuller
Store Operations
John Hart
LogisticsGuy Hayward
Non-executiveMark Huxtable
ITAndrew Jackson
Dion Wired
Rogany Ramiah
Human ResourcesMike Spivey
Non-executiveMark Turner
AfricaAlan van der Bergh
Food
Tyrone Vieira
MerchandiseIlan Zwarenstein
Non-executive
Living Standards measure (LSM)
The South African Advertising Research Foundation (SAARF) Living Standards Measure (LSM) has become the most widelyused segmentation tool in South Africa. It is a means of segmenting the South African market that cuts across race, gender,age or any other variable used to categorise people. Instead, it groups people according to their living standards.
READ MORE:
Letter to StakeholdersFinancial Director’s Review
MASSWAREHOUSE DIRECTORATE

MASSWAREHOUSE DIVISIONAL REVIEWWAREHOUSE CLUB
FINANCIAL PERFORMANCE
STORE HIGHLIGHTS

The Masswarehouse brands
The Makro model is unusual in that it sells General Merchandise primarily to retail customerswhile much of its Food and Liquor is sold to wholesale customers, although increasingly retailcustomers are taking advantage of the low food prices afforded by the warehouse model. Thisblend gives the brand a robustness that enables it to trade comfortably through most economiccycles. The big-box warehouse club format with our no-frills approach keeps costs down andprovides the platform for our high-volume, low-margin sales offering of quality brandedmerchandise. Our customer database of Makro store cards used at the point of purchase helpsus to keep track of the spending patterns of our 2.4 million active members and wecommunicate regularly with them through targeted promotional material.
Fruitspot is an established wholesaler and distributor of fresh and cut fruit and vegetables, andwas bought by Makro in 2012.
Makro’s offerings are tailor-made to fit a variety of customer needs across all ourmerchandising categories.
Our Food offering caters to wholesale shoppers ranging from informal traders and grocerystore owners to hoteliers, restaurateurs, offices and schools. Wholesalers account for the bulkof Makro’s food sales and most shop during the week for the convenience of our wide range ofgood-value, quality consumables. At weekends, our focus shifts to promoting good buys forretail food and grocery shoppers who can achieve substantial savings on their monthlyhousehold basket compared with other traditional food retail outlets.
Our Liquor offering also caters to both the retail and wholesale customer. Makro’s liquoroutlets, immediately adjacent to our main stores, carry a range of standard and premiumbrands especially in wine, champagne, whisky and brandy. These products are sold at a lowmargin to maintain and grow our share of the market. At the same time we have maintained astrong presence in beer and budget brands for liquor wholesalers looking for good value.
Future outlook
Initiatives for the year ahead include the continued focus on Food Retail, including the additionof a fresh fruit and vegetable offering as well as a redesigned butchery format in all Makrostores. We also plan to continue to drive the performance and growth of Fruitspot by ensuringthat it becomes the supplier of choice to Gauteng-based businesses across the MassmartGroup.
Our e-commerce plan is underway with the launch of our online retail store having happened inQ1 2014. This will provide access to our General Merchandise proposition for customers in thechannel of their choice, at a time most convenient to them, while also allowing the brand,through the use of social media and digital direct marketing, to drive footfall into our stores.
Having launched a mobile solution to facilitate sales and improve customer service tocommercial customers, we now look to the next level of servicing our corporate and businesscustomer by implementing a Business-to-Business solution.
In the year ahead, Masswarehouse will continue building momentum to maximise operatingincome, exploring new business areas and product categories, and optimising the returns withparticular focus on the new online business.
Divisional strategy 2014
Get new stores to trading maturityEnhance Food Retail offering, and refineFresh and Butchery offeringGain market share in Food and LiquorWiden Baby categoryIncrease number of commercial customersSupply Chain and Inventory optimisationLeverage CRMRefocus on low cost, high volume businessmodelRelaunch web site in support of omnichannel strategy
INVESTING IN OUR COMMUNITYThe SUCCEED (Supporting Caregivers and Centres in Early Childhood Development) Project is acollaboration between Makro and Hope Worldwide, and has as its objective the building of acapacity of Early Childhood Development Centres that serve vulnerable children, so that thechildren in their care receive the stimulation, education, protection, development and nutrition tofulfil their potential. As at the end of 2013, the SUCCEED Project was supporting 4,016 youngchildren through 44 ECD (Early Childhood Development) Centres.
Through supporting the ECD Centres, this initiatives set specific overall ECD Centre norms andstandards, trained some of the Practitioners working at these centres in NQF Level 4, improved theoverall infrastructure at these facilities to make it more conducive to early childhood development,conduct ECD parenting workshops and monitor the overall nutritional intake of these youngchildren. This Project is in the process of being expanded to the Eastern Cape and Western Cape toexpand the reach and to better serve the communities in which Makro operates.
INVESTING IN OURHUMAN RESOURCES
B-BBEE LEVEL 5
INVESTING IN OURENVIRONMENTWinner of the 2013 of the 2013Eskom ETA award in theCommercial category

Grant Pattison
ChairmanDoug Jones
Divisional Managing DirectorGuy Hayward
Non-executiveGarry Hendry
Food
Derick Kalan
General MerchandiseJonathan Koff
LiquorGert Lourens
OperationsMelanie Louw
Marketing
Pieter Schoeman
ITMike Spivey
Non-executive DirectorJulie Wilford
FinancialDonovan Wright
Human Resources
Ilan Zwarenstein
Non-executive
DEFINITION: Trading Space (m2)
Trading space excludes parking, yard, warehouse space, office space and receiving areas
READ MORE:
Letter to StakeholdersFinancial Director’s Review
MASSWAREHOUSE DIRECTORATE

MASSBUILD DIVISIONAL REVIEWHOME IMPROVEMENT RETAILER AND BUILDING MATERIALS SUPPLIER
FINANCIAL PERFORMANCE

STORE HIGHLIGHTS
The Massbuild brands
Massmart, with its strategy of investing in the acquisitive and organic growth, previously madeseveral acquisitions in the home improvement sector. The acquisitions of Builders Warehouse(2003), Federated Timbers (2005), De La Rey (2005) and Servistar (2005) have established thegroup as the largest participant and, in many respects, the leader in this growing consumersector. In order to ensure focus and extract synergies these assets constituted the MassbuildDivision of Massmart. The division consolidated into one single legal entity in July 2010 whichhouses all four formats, each clearly defined in its client focus and market.
In order to achieve its aspirations, Massbuild will continue with its four distinctive formats:
Builders Warehouse: One stop, big box outlets positioned in the major urban andregional areas in southern Africa;Builders Express: Small neighbourhood stores positioned to target the home owner;Builders Trade Depot: Building merchant and truss manufacturing outlets ideallypositioned to target the contractor and tradesmen; andBuilders Superstore: Discount Home Improvement format in townships and towns,servicing surrounding rural areas. Conveniently located, close to transport nodes and amajor food retailer.
Future outlook
Massbuild has now entered an accelerated growth phase with the aim of increasing itsfootprint by opening new stores in South Africa and southern Africa. Furthermore the division isintent on increasing its market penetration through its 4th format, Builders Superstore.Massbuild’s objective remains to be South Africa’s market leader in home improvement, DIYand building materials.
Improving efficiencies
RDC’s
Improve utilisationReduce costsImprove in-stock levels in stores
Less promotionally driven
Promotions last for longer periodsLess marketing spend
Divisional strategy 2014
New stores roll-out: grow southern Africastore footprint.Optimise Builders Trade Depot: inventoryrange, IT platform value extraction,contractors.Optimise Superstore offering and grow thebrand.Leverage RDC including Western Cape.Focus on Trade Customers and Business-to-Business (B2B).Everyday low price (EDLP).
INVESTING IN OUR COMMUNITYBuilders and Ripples for Good joined forces in 2012 with the main objective of assisting schoolswith building and renovation projects specifically targeted at impoverished South Africancommunities. In just under 2 years we have managed to reach 100 schools with another 70schools identified for 2014. One such project was Lebowa Primary School. This school caters toover 650 learners, predominantly from Sharpeville and is a no-fee school. Massbuild together withRipples For Good, carried out extensive renovations including repainting of both boys and girls’bathrooms, installation of 21 new toilet seats as well as the fixing of 18 leaking toilets. Wereplaced leaking taps and changed all lights to energy savers. We furthermore installed 18 chalkboards, built library bookshelves and sanded and varnished school desks for the library.
INVESTING IN OURHUMAN RESOURCES
B-BBEE LEVEL 5

Grant Pattison
ChairmanLlewellyn Walters
Chief Executive OfficerNeville Hatfield
Merchandise DirectorGuy Hayward
Non-executive Director
Diane Hoffman
Supply ChainChris Lourens
Operations DirectorZandile Manana
Marketing DirectorLizelle Petersen
Financial Director
Alex Rymaszewski
Store Development DirectorMike Spivey
Non-executive DirectorChris Tugman
IT DirectorSimon White
Commercial Director
Ilan Zwarenstein
Non-executive DirectorAndre Steyn
Builders Express & Builders TradeDepot Director
DEFINITION
BWH: Builders WarehouseBEX: Builders Express
Read more:
More detail relating to specific stores whichhave opened or closed can be found in theGroup Financial Director’s Review
MASSBUILD DIRECTORATE

MASSCASH DIVISIONAL REVIEWFOOD WHOLESALER, RETAILER AND BUYING ASSOCIATION
FINANCIAL PERFORMANCE

STORE HIGHLIGHTS
The Masscash brands
Masscash consists of a Wholesale Division with cash and carry food and cosmeticsbusinesses, and a Retail Division which consists of food outlets which target the lower LSMgroups. Our Wholesale Division consists of CBW, Jumbo Cash and Carry, Trident and Shieldwhilst our Retail Division is consolidated under the Cambridge Food banner and the RhinoGroup.
CBW and Trident wholesale food, liquor, groceries and cosmetics in bulk to independentdealers, Government feeding schemes, franchise members, small traders and hawkers inperi-urban and rural areas within southern Africa.
Jumbo sells mainly cosmetics, toiletries and hair-care products to individual customers andindependent general dealers.
Shield is a voluntary buying association that buys products in bulk on behalf of 431 memberswho own wholesale or retail businesses in South Africa, Botswana and Swaziland.
Masscash offer wholesale customers with formal operations the ability to trade under nationalretail brands such as Saverite, Multisave, Powersave Liquorland and Club 10 Taverns. Ourmarketing team offers support to these supermarkets and bottle stores, assisting owners withmarketing initiatives such as designing of leaflets, signage and implementing nationaltelevision and radio advertising campaigns.
On the retail side, outlets are consolidated under the Cambridge Food or Rhino brands.Cambridge Food’s mission is to help its customers save money every day so that they can livebetter. Food Retail service departments, consisting of an on-site bakery, butchery and fresh fruitand vegetable offering form an important component of our Cambridge Food retail offering.
Future outlook
We anticipate a continuation of the aggressive trading from the corporate food retailers servingthe low-income customer. However, we are cautiously optimistic about our growth over the nextyear. The LSM 2-6 market remains highly fragmented, and Masscash is well-positioned to offernew retail formats and to expand our current footprint to better supply food, cosmetics, liquor,cigarettes and cellular services to lower-income consumers.To ensure future growth, Masscash will focus on building its Retail Division, expanding thewholesale range to include meat as well as fruit and vegetables, growing the franchise formatsand expanding into Southern Africa. Our strategy is to open 10 more stores each year as weseek to grow our footprint nationally.
Improving efficiencies
Forefront of energy efficiency in the retailenvironmentIntegrated stock system
Divisional strategy 2014
New store roll-out in South AfricaExpand into Southern Africa
Wholesale
Operate for less whilst improving customershopping experiencesReview store portfolioImprove Supply Chain & Logistics capabilityFocus on Saverite franchise
Retail
Grow profitable regionsClose smaller or less profitable stores:closed threeCambridge stores in Q1 FY14Improve fresh food assortment
INVESTING IN OUR COMMUNITYLily of the Valley has been rescuing, raising and restoring HIV/AIDS orphans for the past twentyyears in KwaZulu-Natal. The goal of the project is to raise children who are affected by theHIV/AIDS pandemic, to be sustainable leaders in their communities. Partnered with Lily of theValley in KwaZulu Natal through an agricultural fresh produce project, Masscash sponsored theconstruction of a hydroponic tunnel which is used for growing vegetables. The project seeks toraise funds for the Lily of the Valley Children’s Home. Valley Fresh is the commercial hydroponicfarming enterprise built to sustain the work of Lily of the Valley and they currently produce around5 – 8 tons of tomatoes a week, along with lettuce and salad herbs. The Lily of the Valleyorphanage is home to over 126 children and these children are the main beneficiaries of the ValleyFresh enterprise. Over 500 people access medical services through a clinic facility in theorphanage premises, which is open to surrounding community members.
INVESTING IN OURHUMAN RESOURCES
B-BBEE LEVEL 5

Grant Pattison
ChairmanGuy Hayward
Non-executivePearl Maphoshe
Non-executiveMncane Mthunzi
Non-executive
Mike Spivey
Non-executiveRobin Wright
Non-executiveRobin Wright
Non-executive
Neville Dunn
Managing DirectorJane Bruyns
Human ResourcesDino Holmes
Financial
Kevin Vyvyan-Day
Chief ExecutiveBronwynne Bester
HRChris Knight
Regional GautengEben Mare
Financial
Mike Marshall
CommercialAndrew Stein
MarketingCraig Surmon
Operations
DEFINITION: DC Space
Distribution Centre space excludes parking and yard
READ MORE:
Letter to StakeholdersFinancial Director’s Review
MASSCASH DIRECTORATE
WHOLESALE DIRECTORATE
RETAIL DIRECTORATE

CORPORATE ACCOUNTABILITY
Massmart aspires to be trusted by all our stakeholders but we are clear that earning and keepingtrust is a journey rather than a destination.
It is about the way in which we conduct our business; the way that we source merchandise and deal withour suppliers; the way that we sell merchandise and engage with our customers; the way that we manageour operations and treat our associates; the way that we optimise returns and report to our shareholders;the way that we comply with the law and provide transparent disclosure; and the way that we demonstrategood corporate citizenship.
This section seeks to provide a balanced perspective that demonstrates that doing the right thing is core toour business philosophy. Specifically it summarises:
THE WAY THAT WE ENGAGE WITH STAKEHOLDERS;
OUR PROGRESS IN ENABLING SUSTAINABLE SUPPLY AND CONSUMERISM,MINIMIZING OUR ENVIRONMENTAL FOOTPRINT AND CHAMPIONINGSOCIAL EQUALITY INITIATIVES; AND
PERFORMANCE INDICATORS THAT ENABLE AN A COMPARATIVEASSESSMENT OF PERFORMANCE
Recognising that different readers may require
more issue specific detail we also provide an
additional reading list to provide greater clarity
wherever possible.
If after reading this update you require more
information or if you wish to engage us on a
particular issue then please contact
QUICK RE-CAP AND ORIENTATION
As we have reported previously, Massmart’s Corporate Accountability initiatives are identified and prioritised on thebasis of feedback from stakeholders and with reference to the following six assessment criteria:
This has resulted in a Corporate Accountability agenda which is described in the matrix below:
(M) mandatory initiatives

STAKEHOLDER ENGAGEMENT
Massmart practises an open-door-policy with our stakeholders to whom we provide various
platforms to share and help us understand their perspectives. Our approach to stakeholder
engagement is relatively fluid but typically involves the following steps:
1 RESEARCH
Conduct desktop, mostly web-based research, to identify public policyissues, specifically those that are relevant to the retail industry;
2 DISCOURSE ANALYSIS
Review leading media coverage to identify retail-related publicinterest issues that have a high share of voice in the public discourse;
3 ASSESS
Deploy employee, customer and supplier surveys to assessMassmart-specific organisational and supply chain expectations andperceptions;
4 CONSOLIDATE
Prioritise the identified input and formulate it into thematic focusareas;
5 VALIDATE
Facilitate face-to-face interaction with subject matter expertsincluding employees, suppliers, customers and representatives fromcivil society and government to expand our understanding of theidentified focus areas; and
6 REVIEW AND CONTEXTUALISE
Consolidate and contextualise the output of these meetings withreference to our Accountability Agenda which typically results in thevalidation, removal or addition of Group accountability objectiveswithin our sphere of influence.
Although we have presented our engagement approach
as a structured linear process it tends, in practise, to be
applied flexibly and to benefit from informal, often
unplanned, feedback.

The table below summarises some of the issues that we engaged with in 2013:

ACCOUNTABILITY THEMES, INITIATIVES AND OBJECTIVES
THEME 1:
ENABLE SUSTAINABLE SUPPLYAND CONSUMERISM
OBJECTIVES› Direct Farm ProgrammeTo support and integrate emerging farmers intoMassmart’s fresh produce supply chain.
› Responsible SourcingTo partner with private label, direct import andnon-branded merchandise suppliers to ensureadherence to Walmart Supplier Standards.
› Primary packaging rationalisationTo partner with willing suppliers to identify andimplement opportunities to rationalise privatelabel product packaging.
› Local Supplier AdvocacyTo share knowledge with willing local suppliersto facilitate voluntary achievement of higherenvironmental and human rights standards in theretail supply chain.
› Consumer E-Waste RecyclingTo implement post-consumer e-waste recyclingschemes in major metropolitan areas.
› Eco-Label AdvocacyTo promote adoption by suppliers ofindependently verified eco-labels, such as MarineStewardship Council (MSC).
› Consumer EmpowermentTo empower consumers to make responsibleconsumer choices more frequently throughbetter labelling standards.
THEME 2:
MINIMISE THE GROUPENVIRONMENTAL FOOTPRINT
OBJECTIVES› Energy EfficiencyTo improve energy efficiency in line with format-specific energy intensity benchmarks.
› Secondary Packaging RecyclingTo recycle secondary packaging (specificallyboard and plastic waste) that is generated instores and distribution centres.
› Water EfficiencyTo harvest rainwater to supplement nurseries (atBuilders Warehouse) and landscaping irrigationrequirements
THEME 3:
CHAMPION SOCIAL EQUALITYINITIATIVES
OBJECTIVES› Broad-Based Black Economic EmpowermentTo achieve and maintain level 4 B-BBEEcontributor status.
› Socio-Economic DevelopmentTo invest a minimum of 1% profit after tax (PAT)in education-focused social developmentinitiatives that benefit the poorest of the poor.
› Women’s Economic EmpowermentTo increase economic opportunities for womenby improving employment, education andbusiness opportunities.
› Employee Healthcare and HIV/AIDS BenefitsTo increase permanent employees’ access toaffordable subsidised private medical benefits.To combat the rate of infection amongstemployees and to provide all employees andtheir spouses with free access to pre-highlyactive anti-retroviral therapy and programmes.

DIRECT FARM PROGRAMME
Since its August 2012 launch with 12 smallholder farmers in Limpopo province, ourWalmart-inspired Ezemvelo Direct Farm programme has been expanded to 164 smallholder farmers operating in five provinces in South Africa. Ezemvelo provides emergingfarmers with support such as input loans for farming vegetables, agriculturalextension services, mentorship and basic financial management training. Mostimportantly it offers participating farmers market access, which includes supplying ourstores. In the period January to December 2013, total smallholder farmer sales wereR4.3 million.
During the same period 800 tons of vegetables, accounting for 45% of total vegetablesales, were supplied to Massmart stores, with the remaining 55% flowing to othercustomers including public feeding programmes and other retailers. Our future planswill include extending the programme to red meat and poultry farmers.
RESPONSIBLE SOURCING
We continue to implement Walmart’s ethical sourcing programme to ensureresponsible procurement of the products that we sell. In line with this objective, in 2013we embarked on supplier assessment projects focusing primarily on private label andexclusive brands. The first stage involved asking suppliers to disclose the factoriesfrom which they source products, facilitating buyer and supplier awareness trainingand orientating suppliers to the factory assessment process.
Our objective in 2014 is
to initiate assessments
of the factories that have
been disclosed by
suppliers.

In 2012 we embarked, under Walmart’s guidance, on an initiative to identifyopportunities to rationalise and improve private label packaging. As a first step, in June2012 we committed to develop and conduct packaging rationalisation workshops withour private label buyers.To date 64 private label buyers have received training intechniques to reduce packaging resources and optimise packaging recyclability andsafety. Early wins have included improving the recyclability of the Makro M brand rangeof detergents, and the introduction of child-safety lids on our range of 1l and 5l solventscontainers. We plan, in 2014, to conduct private label packaging audits in order toidentify packaging improvement opportunities.
LOCAL SUPPLIER ADVOCACY
In 2009 we launched an advocacy process to motivate and benchmark responsibleenvironmental practices in our supply chain. As a result, we have collected and sharedcomparative information about supplier environmental practices that has enabledinterested suppliers to compare their performance with that of their peers. Altogether268 of our suppliers participated in the environmental advocacy survey that wedeployed during the year ending December 2013. We also conducted four specialistadvocacy surveys during 2013 which covered the energy labelling, seafood, timber andpalm oil practices of a further 32 suppliers. Since inception we have, as the result ofthis advocacy approach, been able to profile the practices of 983 of our suppliers.
In 2014 we intend
intensifying our
advocacy efforts through
site visits and
one-on-one meetings
with suppliers of high
priority products such as
seafood and timber.
CONSUMER E-WASTE RECYCLING
To help divert e-waste from landfill and ensure its safe disposal, we have, since2008, provided Fujitsu-Siemens sponsored customer e-waste take back facilitiesat ten selected Makro stores.Since launching the project 464 tons of e-waste has been processed, 130 tons ofwhich was collected during the year ending December 2013.In 2012 we communicated our intention to engage with more Hi-tech suppliers toexplore opportunities to expand the project. The outcome of this engagement isthat Samsung Electronics has agreed to sponsor the project which will now beexpanded to all 19 Makro stores. We plan to increase consumer awareness ofthese facilities during 2014.
POST-CONSUMER WASTE RECYCLING
Beyond the good progress that we have made in the area of e-waste recycling, we havealso pilot-tested other post-consumer waste take-back schemes covering items suchas compact fluorescent light (CFL) light bulbs and batteries. Unfortunately theseinitiatives have generated indifferent customer interest and so we have decided todiscontinue them, although we will remain open to new opportunities that may beproposed by external parties.
WE CONTINUE TO INCLUDE, IN OUR INTERNAL OPERATIONAL RECYCLINGPROCESSES, BOARD AND PLASTIC WASTE THAT CUSTOMERS DROP-OFFAT OUR STORES.
PRIMARY PACKAGING RATIONALISATION

We engage pro-actively with suppliers about their voluntary adoption of eco-labelsalthough, as communicated previously, we do not use eco-labels as a procurementscreen. During 2013, our activities in this area included investigating supplierreadiness to apply energy efficiency labelling to major appliances and working with theForest Stewardship Council (FSC) to assess local supplier awareness of the FSC label.Through these interactions we learnt that the European Union energy efficiencylabelling standard is the most commonly used energy label in South Africa whilsttimber suppliers perceive a lack of consumer demand for FSC labelling.
OUR PRIORITY IN 2014 IS TO INCREASE THE INCIDENCE OF ENERGYEFFICIENCY LABELLING ON THE MAJOR APPLIANCES THAT WE SELL IN OURSTORES.
CONSUMER EMPOWERMENT
Empowering customers to make better informed purchasing decisions while in our stores remains an area of interest. One area wherewe have made modest progress involves the incorporation of an eco-wise consumer information panel on all private label productsintroduced by Builders Warehouse since January 2013. The panel provides information about environmental product and packagingattributes, relating to factors such as water efficiency, energy efficiency and recyclability.We also continue to offer a range ofenvironmentally friendly products that include solar geysers, Light Emitting Diode (LED) and solar lighting, and, low Volatile OrganicCompound (VOC) paints. Consumer-demand driven highlights in 2013 include 222% growth in sales of Solar Flare garden lights andthe expansion of our solar geysers range to include 150l and 200l units.
ECO-LABEL ADVOCACY

ENERGY EFFICIENCY
Energy efficiency is an on-going area of focus for Massmart. Walmart has extensiveexpertise in this area and we have, with their guidance, developed an energy efficiencyroadmap based on a Business As Usual (BAU) energy model. The model, which uses2010 as a baseline, defines energy efficiency targets to the year 2020.To achieve thisgoal we will continue to implement technologies such as LED sales floor lighting,daylight harvesting systems and high-performance refrigeration plants in our newstores and retrofit programmes. In recognition of the progress we have made in drivingenergy efficiency at our stores, Makro was selected as an
ESKOM ETA AWARD 2013 WINNER IN THE COMMERCIAL CATEGORY.Included in our energy goals is an initiative to pilot test a photovoltaic-basedrenewable energy pilot project at our standalone stores. Unfortunately, we have beenunable to develop a solution that meets our commercial guidelines, specifically ourfive year payback target.Notwithstanding this challenge, we will continue to assess potential renewable energysolutions in 2014.
SECONDARY PACKAGING RECYCLING
Massmart is committed tominimising the volume ofwaste that our operationssend to landfill.
To achieve this we work with our stores to optimise board, plastic and paperrecycling opportunities.Calculating the volume of operational waste produced andrecycled by our stores is challenging and is achieved through the deployment of anonline waste self-assessment survey that is completed by store managers. Basedon this feedback we estimate that 15,400 tons of waste, representingapproximately 50% of the total waste produced by the Group, was diverted fromlandfill during the financial year ending December 2013.
IN 2014 WE INTEND INTRODUCING A DUE DILIGENCE REVIEW OF OURWASTE SERVICE PROVIDERS.

Although we are not an intensive user of water, we are interested in moreaccurately calculating our water usage, particularly at our standalone stores.To do this we have installed independent water meters at selected BuildersWarehouse and Makro stores.
THIS HAS GIVEN US BETTER VISIBILITY OF OUR WATERCONSUMPTION AND HAS ALSO IMPROVED OUR UNDERSTANDING OFTHE WATER SAVINGS ACHIEVED THROUGH RAINWATER ANDREFRIGERATION CONDENSATE HARVESTING.In 2013, we expanded our water harvesting initiative to an additional 22Builders Warehouse, Builders Express and Makro sites. We estimate thatthese initiatives helped us save approximately 7,450kl of rainwater across theGroup for the period ended December 2013. We will continue to pro-activelyidentify and implement programmes to conserve water in our operations.
WATER EFFICIENCY

BROAD-BASED BLACK EMPOWERMENT
In June 2009 Massmart committed to achieving level 4 Broad-based Black EconomicEmpowerment (B-BBEE) Contributor status by June 2011. We achieved this objectivein February 2010 and maintained level 4 status through to February 2014. However, weanticipate that our B-BBEE score will fall significantly as a consequence of theintroduction of the amended B-BBEE Codes of Good Practice. Notwithstanding this, wecontinue to make good qualitative B-BBEE progress.
ONE RECENT HIGHLIGHT IS THE WORK OF THE MASSMARTSUPPLIER DEVELOPMENT FUND WHICH HAS, SINCE ITS INCEPTION,DEPLOYED R21.7M IN FUNDING TO 183 BLACK- OWNED SUPPLIERSTO THE GROUP.Black owned participants in fund initiatives include emerging smallholder farmers andmanufacturers such as Korema Farm, X-Chem Chemicals, Biolotion Cosmetics andKurhula Paints.
WOMENS ECONOMIC EMPOWERMENT
In line with Walmart’s focus on the empowerment of women in our workplace, localcommunities and supply chain, we have established the Massmart Chief ExecutiveOfficer’s Council of Women Leaders which fosters and promotes the progression ofwomen. Initial achievements have included identifying existing women suppliers inthe Massmart supply chain, prioritising women farmers in our direct farm programmeand increasing representation of women on the Massmart graduate traineeprogramme. A key focus in 2014 will be to explore ways to optimize supplyopportunities for existing women suppliers in our supply chain.

Providing permanent employees with affordable access to private health cover is anon-going priority for Massmart. In June 2009 we set a target to increase privatemedical cover from 38% to 60% of permanent staff within a 24-month period. Althoughwe missed the 24-month time line, we have made steady progress and our currentestimate is that private medical benefits have, as at December 2013, been extended to53.6% of permanent employees. Our flagship employee wellness programme, Impilo, afully-funded wellness programme for employees with no medical cover, continues tooffer a 24-hour medical advisory and support service to permanent employees andtheir spouses, including: a fully funded HIV programme inclusive of medication; andtesting for and early diagnosis of chronic diseases such as high blood pressure, raisedcholesterol, diabetes and asthma.
SOCIO-ECONOMIC DEVELOPMENT
Primary school nutrition, Early Childhood Development (ECD), schoolmaintenance and infrastructure projects remain at the centre of our Socio-Economic Development focus. We have maintained our commitment to investa minimum of 1% Profit After Tax (PAT) in social projects.In the financial yearending December 2013, we invested R41.7 million which is equivalent to 3.1%PAT. Initiatives to support under-resourced schools included Game stores’ andMasscash’s deployment of 49 mobile kitchens under the on-goingAmalunchbox and EconoKitchen projects respectively.R41.7 MILLION / 49 AMALUNCHBOX AND ECONO KITCHENS / 28 SIYASIZATOOLKITS / 72 SCHOOL MAINTENANCE PROJECTS / R20M FOOD DONATIONS /R3.2M FUNDING FOR IMPROVED PRE-SCHOOL TEACHING
Builders Warehouse installed 28 Siyasiza gardening and maintenance toolkits and provided building maintenance and repairs to 72 primary schools across thecountry. In line with our focus on nutrition, over R20m in food donations were made to Food Bank and Feed-a-Child. Makro continued its involvement in ECD, inpartnership with HOPE Worldwide, through its provision of R3.2m in funding for the improvement of teaching and learning in preschools and crèches. To aidmeaningful and interactive learning in schools for children living with disabilities, DionWired donated projection display ‘Smart Boards’ to 16 schools. Inaddition, Massmart together with our suppliers donated 5,500 food hampers to the families of South African National Defence Force members deployed on ourborders and serving under a United Nations mandate on peace keeping missions in other countries.
EMPLOYEE HEALTH CARE AND HIV/AIDS BENEFITS

PERFORMANCE INDICATORS
HUMAN CAPITAL PERFORMANCE INDICATORS
Notes
Comparative data represents the best available performance disclosed by South African retailers, except for:
Black management as a % of all management and professionals sourced from 2012 – 2013 Commission for Employment Equity Annual Report;
Average minimum wage sourced from Sectoral Determination for Wholesale and Retail Sectors; and
HIV prevalence which represents published national prevalence rate according to Statistics South Africa Mid-year population estimates 2013.
MEASUREMENTS AND ASSUMPTIONS
Human capital data is based on Group and Divisional payroll data. HIV prevalence is based on Healthy Choices VCT testing figures. Due to the large number
and geographical positioning of stores, testing is not conducted at all stores every year. HIV prevalence is based on staff tested in a particular year. Data is
internally audited prior to publication.

PERFORMANCE INDICATORS
B-BBEE PERFORMANCE INDICATORS
Notes
Comparative data represents the best performance in the Retail Sector as published in the Empowerdex EEC Survey 2013.(%) Indicates percentage score achieved on the B-BBEE scorecard.
MEASUREMENTS AND ASSUMPTIONS
Massmart’s B-BBEE figures are calculated externally by Empowerdex Economic Empowerment Rating Agency. These figures are based on actual staff numbers(not estimates). B-BBEE scores are calculated retrospectively, therefore the data reported is based on the scorecard complied in February 2013 for the periodJanuary – December 2012.

PERFORMANCE INDICATORS
CSI PERFORMANCE INDICATORS
MEASUREMENTS AND ASSUMPTIONS
CSI data is based on actual Group expenditure figures which have been internally audited.
Notes
Government beneficiaries include the Department of Basic Education, the South African National Defence Force and the South African Police Service.Support is provided through the provision of school container kitchens, school building and infrastructure maintenance, library containers, foodhampers and assistance with service delivery.Investment in feeding schemes includes spend on container kitchens, vegetable gardens, NGO and government feeding schemes and Foodbankcontributions.Investment in Early Childhood Development (ECD) includes Game’s Tools 2 Play ECD kits and Tools 2 Teach stationary hampers, as well as Makro’scontributions to ECD partners such as HOPE Worldwide.Investment in infrastructure and school maintenance is primarily based on a Builders Warehouse project that provides schools with equipment andsupplies for basic repair and maintenance.Investment in discretionary projects includes donations to Community Chest, Vodacom Wheelchair Fund and ad hoc requests.

PERFORMANCE INDICATORS
CLIMATE CHANGE AND ENVIRONMENTAL PERFORMANCE INDICATORS
MEASUREMENTS AND ASSUMPTIONS
Scope 1 and 2 emissions figures are calculated externally by GCX Africa consultants. Scope 1 emissions relate to direct emissions resulting fromCompany-owned vehicles, generator use and refrigerant gas emissions. Scope 2 figures are based on Divisional electricity consumption figures. Energyconsumption data is annualised and normalised (outlying data is excluded). Consequently the margin of error on reported data is considered to between 10% –15%. Electricity consumption and Scope 2 emissions figures include Masscash African operations but exclude divisional Distribution Centres and HeadOffices. This year emissions data for Cambridge stores and Fruitspot were included in the calculation. Scope 2 emissions factor has been updated from 0.99 to1.00. The total Group sales are used to calculate Scope 1 and 2 emissions’ intensity per Rand million (Rm). Water usage has been derived with reference to thecost of water consumed. Water consumption is based on Rand Water Tariff for retail customers.

PERFORMANCE INDICATORS
CONSUMER PROTECTION ACT PERFORMANCE INDICATORS
Notes
Customer complaints refer to those logged through the central complaints system and exclude those at stores which are resolved immediately at thestore.

REMUNERATION REPORTFOR THE YEAR ENDED DECEMBER 2013
Massmart, through the Remuneration Committee, implements remuneration policies that enableit to recruit, retain and motivate the executive talent needed to achieve superior performance. TheCommittee, with periodic advice from external executive remuneration consultants, ensures theprovision of executive remuneration packages that are competitive with reference to other majorSouth African retail companies, as well as other companies similar to Massmart in their size,spread and complexity.
Our executive remuneration policy has three components, being:
guaranteed package, specifically the basic salary and benefits including motor vehicles, retirement funding and medical aid;
short-term incentives, represented as multiples of basic monthly salary linked to the achievement of targets and/or personal performance. If achieved,
these incentives are paid annually; and
long-term equity incentives, represented as a percent of guaranteed package in a mix of Performance and Restricted shares.
The Massmart remuneration policy strives for the guaranteed package to align with the median of the market; and the upper quartile of the market for all three
components of remuneration combined.
With regard to short-term incentives, Massmart places particular emphasis on generous annual incentives for high performance for both executive directors
and executive management. This policy, communicated to and understood by the Group’s executives, codifies a range of performance incentives linked to the
approved annual Operating Income targets for both Group and Divisions. Executives can earn an increasing multiple of their monthly basic salary depending
upon achievement against these agreed targets. The Committee also has the discretion to reward superior individual performance.
The long-term equity incentive plan ensures alignment of executive reward with shareholders’ interests, in particular the sustained creation of shareholder
value. Shareholders approved a new plan in May 2013 which provides for a mix of Performance share awards and grants of Restricted shares.
The Performance share awards are linked to approved annual revenue and ROI targets over three separate years. The targets have ranges so that the final
amount awarded is based on a sliding scale. If achieved, the awards are share-settled at the end of the third year. Restricted share grants are made for
retention purposes and vest on a time basis, one third each at the end of years 3, 4 and 5. The awards and grants are made annually in amounts calculated
together on a 70/30 split, based on 25% – 100% of guaranteed packages for eligible employees, at each approved grade level. No consideration is imputed for
the issue of awards or grants and for the calculation of subsequent gains.
At least every two years the Committee receives a report prepared by independent remuneration consultants on the recent trends in, and the current levels of,
short and long-term executive remuneration in South Africa. Annually the Committee also reviews the Group’s employee benefit funds, being the in-house
medical scheme and the provident and pension funds, considering their governance, performance, financial stability and the general principles central to the
benefit levels being applied.
Top three executives’ salaries
King III recommends that the salaries of the top three executives, excluding executive directors, should be disclosed. Due to their specialised retail skills, the
highly competitive South African retail environment and the employees’ value to Massmart, the Board does not wish to disclose this information for each of the
individuals but has instead disclosed the total salaries of the three employees concerned.
During the year ended December 2013, the top three executives’ combined salaries (comprising basic salary, motor vehicle, medical aid and retirement
benefits) were R23.6 million (26 weeks ended Dec 2012: R14.7 million).
Non-executive directors’ fees
The Board’s policy is to pay non-executive directors’ fees that are competitive but not in the top quartile. As noted in the ‘Our Business’ section on the web,
attendance fees are not paid. The Walmart-appointed non-executive directors do not receive fees from Massmart. The following fees for the 2014 financial year
will be proposed at the May 2014 Annual General Meeting:
22001144 2013
RR R
Chairman of the Board 871,000 822,000
Deputy Chairman 625,000 590,000
Directors 259,000 244,000
Committee Chairmen 252,000 238,000
Committee Members 120,000 113,000
Chris SeabrookeChairman of the Remuneration Committee
10 April 2014

INTEREST OF DIRECTORS IN THE COMPANY SHARE SCHEMEFOR THE YEAR ENDED DECEMBER 2013
Details of directors’ shares and share options per director:
Relevant date
Subscriptionprice
(R)Market price
(R)
Number ofshares/share
options
Gain onsale/exercise
(R 000′s) Expiry date
Pattison, GM
Employee Share Option Scheme (note 28)
Balance at June 2012 733,021
Options exercised 1 April 2005 41.90 174.50 (49,000) 6,495
Balance at December 2012684,021 6,495
Options exercised/shares sold - - - - -
Balance at December 2013684,021 -
Comprising: 1 April 2005 41.90 47,000 31 March 2015
23 May 2006 54.13 367,500 22 May 2016
24 May 2007 94.25 26,948 23 May 2017
26 May 2008 72.86 41,768 25 May 2018
27 May 2009 77.56 42,202 26 May 2019
1 September 2011 153.84 158,603 31 August 2021
Employee Share Awards Scheme (note 28)
Balance at December 2012 -
Performance awards granted 16 September 2013 - - 28,705 -
Retention awards granted 16 September 2013 - - 9,569 -
Balance at December 2013 38,274
Comprising: Performance awards 16 September 2013 - - 28,705 - -
Retention awards 16 September 2013 - - 9,569 - -
Hayward, GRC
Employee Share Option Scheme (note 28)
Balance at June 2012 628,406
Shares sold 1 April 2005 41.90 168.9 (98,000) 12,410
Shares sold 23 May 2006 54.13 168.9 (73,500) 8,409
Balance at December 2012456,906 20,819
Options exercised/ shares sold - - - - -
Balance at December 2013456,906 -
24 May 2007 94.25 - 24,444 23 May 2017
1 April 2008 66.91 - 19,912 31 March 2018
26 May 2008 72.86 - 36,573 25 May 2018
27 May 2009 77.56 - 105,448 26 May 2019
1 September 2011 153.84 - 120,987 31 August 2021
16 May 2012 159.62 - 149,542 15 May 2022
Employee Share Awards Scheme (note 28)
Balance at December 2012 -
Performance awards granted 16 September 2013 - - 20,848 -
Retention awards granted 16 September 2013 - - 6,950 -
Balance at December 2013 27,798
Comprising: Performance awards 16 September 2013 - - 20,848 - -
Retention awards 16 September 2013 - - 6,950 - -
Zwarenstein, I
Employee Share Option Scheme (note 28)
Balance at June 2012 202,659
Options exercised 1 April 2008 66.91 172.4 (5,484) 576
Options exercised 26 May 2008 72.86 172.4 (10,840) 1,075
Options exercised 27 May 2009 77.56 172.4 (3,676) 347
Balance at December 2012182,659 1,998
Options exercised 1 April 2008 66.91 196.0 (2,742) 354
Options exercised 26 May 2008 72.86 196.0 (5,234) 644
Options exercised 27 May 2009 77.56 196.0 (7,352) 871
Balance at December 2013167,331 1,868
Comprising: 26 May 2008 72.86 - 8,037 25 May 2018
27 May 2009 77.56 - 3,677 26 May 2019
1 September 2011 153.84 - 63,941 31 August 2021
16 May 2012 159.62 - 91,676 15 May 2022
Employee Share Awards Scheme (note 28)
Balance at December 2012 -
Performance awards granted 16 September 2013 - - 12,759 -
Retention awards granted 16 September 2013 - - 4,253 -
Balance at December 2013 17,012
Comprising: Performance awards 16 September 2013 - - 12,759 - -
Retention awards 16 September 2013 - - 4,253 - -
Shares and options at reporting date can be found in the Director’s Report.

DIRECTORS’ EMOLUMENTS
The comments below provide further background and context to the figures disclosed in note 35 , Directors’ emoluments, and Interests of directors in theCompany’s Share Scheme.
GM Pattison
Following a third party executive remuneration analysis which assessed positions of similar stature and complexity, the Remuneration Committee awardedGrant a 25.0% increase to his salary and allowances in January 2013. In terms of the Group’s Short-term Executive Incentive Scheme which rewards executivesbased on the Group’s actual financial performance compared to the Plan for the same year, he received no bonus. The Committee however, awarded him aqualitative bonus of three months (R1.30 million) in recognition of the strategic initiatives successfully implemented in 2013.
During the year ended December 2013 Grant did not convert or sell any Massmart options, but did sell 100,000 shares from the Pattison Family Trust, realisinga pre-tax gain on sale of shares of R18.8 million.
Through the Employee Share Option Scheme, Grant holds 684,021 Massmart shares and options of which 42,202 shares and 158,603 options are held in thePattison Family Trust, of which Grant is a beneficiary. The average length of time that he has held these is 6.1 years and the average strike price is R80.58 pershare. The Pattison Family Trust also directly owns 118,055 Massmart shares.
Through the Employee Share Awards Scheme, Grant was awarded 28,705 conditional performance awards and 9,569 retention awards on 16 September 2013.
GRC Hayward
The Remuneration Committee awarded Guy a 6.0% increase to his salary and allowances in July 2013. In terms of the Group’s Short-term Executive IncentiveScheme which rewards executives based on the Group’s actual financial performance compared to the Plan for the same year, he received no bonus. TheCommittee however, awarded him a qualitative bonus of three months (R0.92 million) in recognition of his sound direction of the operating Divisions in 2013.
During the year ended December 2013 Guy did not convert or sell any Massmart options or shares.
Through the Employee Share Option Scheme, Guy holds 456,906 Massmart shares and options of which 19,912 shares are held in the Bluett-Hayward Trust, ofwhich Guy is a discretionary beneficiary. The average length of time that he has held these is 3.3 years and the average strike price is R124.67 per share. Guyalso owns 36,517 Massmart shares directly.
Through the Employee Share Awards Scheme, Guy was awarded 20,848 conditional performance awards and 6,650 retention awards on 16 September 2013.
I Zwarenstein
The Remuneration Committee awarded Ilan a 6.0% increase to his salary and allowances in July 2013. In terms of the Group’s Short-term Executive IncentiveScheme which rewards executives based on the Group’s actual financial performance compared to the Plan for the same year, he received no bonus. TheCommittee however, awarded him a qualitative bonus of three months (R0.56 million) in recognition of the high standards achieved in the Group’s Finance andAccounting functions.
During the year ended December 2013 Ilan converted and sold 15,328 Massmart options, realising a pre-tax gain on exercise of share options of R1.9 million.
Through the Employee Share Option Scheme, Ilan holds 167,331 options. The average length of time that he has held these is 2.2 years and the average strikeprice is R151.44 per share.
Through the Employee Share Awards Scheme, Ilan was awarded 12,759 conditional performance awards and 4,253 retention awards on 16 September 2013.
Services asdirectors of
MassmartHoldings
LimitedSalary and
allowances
Bonuses andperformance
relatedpayments
Otherbenefits
Retirementand related
benefits Subtotal
Fringe benefitof interest-free
loans used tofinanceshares
Gains onexercise of
shareoptions and
on sharespurchased
by directors TotalR000 R000 R000 R000 R000 R000 R000 R000 R000
For the 53 week year endedDecember 2013EExxeeccuuttiivvee ddiirreeccttoorrssPattison, GM - 5,215 1,304 772 365 7,656 1,413 - 9,069Hayward, GRC - 3,560 916 686 249 5,411 814 - 6,225Zwarenstein, I - 2,447 561 113 153 3,274 1 1,863 5,138
- 11,222 2,781 1,571 767 16,341 2,228 1,863 20,432NNoonn--eexxeeccuuttiivvee ddiirreeccttoorrssLamberti, MJ 1,213 - - - - 1,213 - - 1,213Seabrooke, CS 1,256 - - - - 1,256 - - 1,256Cheesewright, D - - - - - - - - -Davis, JA - - - - - - - - -Gwagwa, NN 451 - - - - 451 - - 451Langeni, P 689 - - - - 689 - - 689Suarez, JP - - - - - - - - -
3,609 - - - - 3,609 - - 3,609PPrreessccrriibbeedd OOffffiicceerrssPrescribed Officer A - - - - - 9,712 370 2,702 12,784Prescribed Officer B - - - - - 6,161 - - 6,161Prescribed Officer D - - - - - 3,694 6 5,904 9,604Prescribed Officer E - - - - - 4,327 - - 4,327Prescribed Officer F - - - - - 7,756 - 389 8,145Prescribed Officer G - - - - - 2,530 229 - 2,759Prescribed Officer I - - - - - 2,831 43 719 3,593Prescribed Officer K - - - - - 2,979 - - 2,979Prescribed Officer L - - - - - 2,930 - - 2,930Prescribed Officer M - - - - - 2,582 73 - 2,655
- - - - - 45,502 721 9,714 55,937Total 3,609 11,222 2,781 1,571 767 65,452 2,949 11,577 79,978
In order to match incentive awards with the performance to which they relate, bonuses above reflect the amounts accrued in respect of each year and not amounts paid in that year.Held in terms of the rules of the Company’s share scheme.Resigned with effect from 10 April 2014
1 2
3
1
2
3

Services asdirectors of
MassmartHoldings
LimitedSalary and
allowances
Bonuses andperformance
relatedpayments
Otherbenefits
Retirementand related
benefits Subtotal
Fringe benefitof interest-free
loans used tofinanceshares
Gains onexercise of
shareoptions and
on sharespurchased
by directors TotalR000 R000 R000 R000 R000 R000 R000 R000 R000
For the 26 week year endedDecember 2012EExxeeccuuttiivvee ddiirreeccttoorrssPattison, GM - 2,085 - - 325 219 2,629 751 6,495 9,875Hayward, GRC - 1,728 - 262 182 2,172 490 20,819 23,481Zwarenstein, I - 1,187 - - 6 111 1,304 2 1,998 3,304
- 5,000 - 593 512 6,105 1,243 29,312 36,660NNoonn--eexxeeccuuttiivvee ddiirreeccttoorrssLamberti, MJ 505 - - - - 505 - - 505Seabrooke, CS 460 - - - - 460 - - 460Cheesewright, D - - - - - - - - -Davis, JA - - - - - - - - -Gwagwa, NN 183 - - - - 183 - - 183Langeni, P 296 - - - - 296 - - 296Suarez, JP - - - - - - - - -
1,444 - - - - 1,444 - - 1,444PPrreessccrriibbeedd OOffffiicceerrssPrescribed Officer A - - - - - 6,099 243 4,524 10,866Prescribed Officer B - - - - - 3,420 4 4,665 8,089Prescribed Officer C - - - - - 1,892 314 5,566 7,772Prescribed Officer D - - - - - 1,523 4 4,801 6,328Prescribed Officer E - - - - - 5,218 - - 5,218Prescribed Officer F - - - - - 3,400 - 39 3,439Prescribed Officer G - - - - - 1,000 120 1,850 2,970Prescribed Officer H - - - - - 2,152 - 452 2,604Prescribed Officer I - - - - - 1,139 39 1,390 2,568Prescribed Officer J - - - - - 1,607 148 - 1,755Prescribed Officer K - - - - - 1,597 - - 1,597Prescribed Officer L - - - - - 1,115 - - 1,115Prescribed Officer M - - - - - 1,030 38 - 1,068Prescribed Officer N - - - - - 451 87 - 538
- - - - - 31,643 997 23,287 55,927Total 1,444 5,000 - 593 512 39,192 2,240 52,599 94,031
In order to match incentive awards with the performance to which they relate, bonuses above reflect the amounts accrued in respect of each year and not amounts paid in that year.Held in terms of the rules of the Company’s share scheme.Appointed 20 August 2012.Resigned in the year ended December 2012.
1 2
3
4
4
1
2
3
4

APPROVAL OF THE AUDITED ANNUAL FINANCIAL STATEMENTSFOR THE YEAR ENDED DECEMBER 2013
The audited annual financial statements were approved by the Board of Directors on 10 April 2014 and signed on its behalf by:
GM Pattison I ZwarensteinChief Executive Officer Financial Director
The preparation of the Group’s consolidated results was supervised by the Financial Director, Ilan Zwarenstein, BCom, CA(SA). These results have been auditedin compliance with any applicable requirements of the Companies Act of South Africa and were prepared under s29(1) of this Act.
Company Secretary Certificate
I, Philip Sigsworth, the Company Secretary of Massmart Holdings Limited, certify that to the best of my knowledge and belief, all returns required of a publiccompany have, in respect of the year under review, been lodged with the Registrar of Companies and that all such returns are true, correct and up to date.
Philip SigsworthCompany Secretary
Annual compliance certificate for issuers with a primary listing on the JSE
I, the undersigned, Ilan Zwarenstein, being duly authorised hereto, certify to the JSE Limited (the JSE) that Massmart Holdings Limited and its directors have,during the 12 months ended 31 December 2013, complied with all Listings Requirements and every disclosure requirement for continued listing on the JSEimposed by the JSE during that period.
I ZwarensteinDuly authorised hereto, for and on behalf of the Directors of the Company

INDEPENDENT AUDITORS’ REPORT ON THE AUDITED ANNUAL FINANCIALSTATEMENTSFOR THE YEAR ENDED 29 DECEMBER 2013
To the shareholders of Massmart Holdings Limited
We have audited the consolidated and separate annual financial statements of Massmart Holdings Limited set out from the Income Statement to note 44 andthe Company Income Statement to note 16, which comprise the statements of financial position as at 29 December 2013, and the income statement,statements of comprehensive income, statements of changes in equity and statements of cash flows for the year then ended, and the notes, comprising asummary of significant accounting policies and other explanatory information.
Directors’ Responsibility for the Consolidated Financial Statements
The Company’s directors are responsible for the preparation and fair presentation of these consolidated and separate financial statements in accordance withInternational Financial Reporting Standards and the requirements of the Companies Act of South Africa, and for such internal control as the directorsdetermine is necessary to enable the preparation of consolidated and separate financial statements that are free from material misstatement, whether due tofraud or error.
Auditor’s Responsibility
Our responsibility is to express an opinion on these consolidated and separate financial statements based on our audit. We conducted our audit in accordancewith International Standards on Auditing. Those standards require that we comply with ethical requirements and plan and perform the audit to obtainreasonable assurance about whether the financial statements are free from material misstatement.
An audit involves performing procedures to obtain audit evidence about the amounts and disclosures in the financial statements. The procedures selecteddepend on the auditor’s judgment, including the assessment of the risks of material misstatement of the financial statements, whether due to fraud or error. Inmaking those risk assessments, the auditor considers internal control relevant to the entity’s preparation and fair presentation of the financial statements inorder to design audit procedures that are appropriate in the circumstances, but not for the purpose of expressing an opinion on the effectiveness of the entity’sinternal control. An audit also includes evaluating the appropriateness of accounting policies used and the reasonableness of accounting estimates made bymanagement, as well as evaluating the overall presentation of the financial statements.
We believe that the audit evidence we have obtained is sufficient and appropriate to provide a basis for our audit opinion.
Opinion
In our opinion, the consolidated and separate financial statements present fairly, in all material respects, the consolidated and separate financial position ofMassmart Holdings Limited as at 29 December 2013, and its consolidated and separate financial performance and consolidated and separate cash flows forthe year then ended in accordance with International Financial Reporting Standards and the requirements of the Companies Act of South Africa.
Other reports required by the Companies Act
As part of our audit of the consolidated and separate financial statements for the year ended 29 December 2013, we have read the Directors’ Report, the Auditand Risk Committee’s Report and the Company Secretary’s Certificate for the purpose of identifying whether there are material inconsistencies between thesereports and the audited consolidated and separate financial statements. These reports are the responsibility of the respective preparers. Based on readingthese reports we have not identified material inconsistencies between these reports and the audited consolidated and separate financial statements. However,we have not audited these reports and accordingly do not express an opinion on these reports.
Ernst & Young Inc.
Per: Allister Carshagen
DirectorRegistered Auditor10 April 2014
102 Rivonia RoadJohannesburgGautengSouth Africa

DIRECTORS’ REPORTFOR THE YEAR ENDED DECEMBER 2013
Directors’ responsibilities
The Directors acknowledge responsibility for the preparation of the Annual Financial Statements, which, in their opinion, fairly present the results and cashflows for the year ended December 2013 and the state of affairs of Massmart Holdings Limited and its subsidiaries at the end of the period. The ExternalAuditors are responsible for reporting on the fair presentation of these financial statements.
The Company and its subsidiaries have maintained satisfactory accounting records and an effective system of internal controls to ensure the integrity of theunderlying information. Appropriate accounting policies, supported by sound and prudent managerial judgments and estimates, have been consistentlyapplied.
The Audit Committee of the Board reviews the financial information presented and ensures that there has been adherence to International Financial ReportingStandards. Internal and External Auditors of Group companies have unrestricted access to the Committee.
Group financial results
The financial results of the Group are set out in the income statement, statement of comprehensive income, the statement of cash flows and the statement ofchanges in equity. The financial position of the Group is set out in the statement of financial position and accompanying notes.
Dividend
The Company’s dividend policy is to declare and pay an interim and final cash dividend representing a 1.55 times dividend cover unless circumstances dictateotherwise. For the year ended December 2013, the Board has resolved to maintain the absolute value of the final cash dividend at the level that it was in theprior financial year, due to the strong liquidity position of the Group and its growth prospects.With regard to the final distribution to shareholders, the Directors resolved to distribute to shareholders registered in the books of the Company on 20 March2014, a final cash dividend of 275 cents (December 2012: 275 cents).
Shares in issue
The movement in ordinary and preference shares for the period under review can be found below:
OOrrddiinnaarryy SShhaarreess
Balance at June 2012 216,124,461Converted preference shares 785,734
Balance at December 2012 216,910,195Converted preference shares 198,849
OOrrddiinnaarryy sshhaarreess iinn iissssuuee aatt DDeecceemmbbeerr 22001133 221177,,110099,,004444
PPrreeffeerreennccee SShhaarreess
Balance at June 2012 13,247,409Converted to ordinary shares (785,734)
Balance at December 2012 12,461,675Converted to ordinary shares (198,849)Residual shares automatically redeemed (9,395,053)
PPrreeffeerreennccee sshhaarreess iinn iissssuuee aatt DDeecceemmbbeerr 22001133 22,,886677,,777733
The preference shares in the prior year relate to Massmart’s Thuthukani Empowerment Trust and Black Scarce Skills Trust’** The preference shares in the current year relate toMassmart’s Black Scarce Skills TrustThe preference shares in the current year relate to Massmart’s Black Scarce Skills Trust
Directorate and secretary
The current directorate of the Company is shown here.
The Board comprises ten Directors of whom seven are non-executive and four are independent. In addition, each Board committee is chaired by an independentDirector.
The Company Secretary provides a central source of guidance and advice to the Board, and within the Company, on matters of ethics and good governance.The Company Secretary is Philip Sigsworth, CA (SA), whose business and postal addresses are the same as that of the Company. Philip was appointed on 7May 2012.
In accordance with the provisions of the Company’s Memorandum of Incorporation, Messrs CS Seabrooke, D Cheesewright and GRC Hayward, and Dr NNGwagwa will retire, and Mr D Dlamini will resign, at the Annual General Meeting. Being eligible, they all offer themselves for re-election.
1
2
1
2
1
2

Interests of Directors in the Company’s shares
At December 2013, Directors owned, directly or indirectly, ordinary shares or options over ordinary shares in the Company. These holdings were all beneficialand are aggregated in the table below:
At December 2013, Directors owned, directly or indirectly, ordinary shares or options over ordinary shares in the Company. These holdings were all beneficial and and are aggregated inthe table below:
Dec-13 Dec-12
SharesOptions/
Share AwardsShares
Options/Share Awards
NNoonn--eexxeeccuuttiivvee DDiirreeccttoorrss
MJ Lamberti - - - -
CS Seabrooke - - - -
D Cheesewright - - - -
JA Davis - - - -
NN Gwagwa 9,800 - 9,800 -
P Langeni 9,800 - 9,800 -
JP Suarez - - - -
EExxeeccuuttiivvee DDiirreeccttoorrss
GM Pattison 596,473 205,603 696,473 205,603
GRC Hayward 222,894 270,529 222,894 270,529
Ilan Zwarenstein - 167,331 - 182,659
At the date of this report, the Directors’ beneficial holdings were as follows:
Apr 14 Apr 13
SharesOptions/
Share AwardsShares
Options/Share Awards
NNoonn--eexxeeccuuttiivvee DDiirreeccttoorrss
MJ Lamberti - - - -
CS Seabrooke - - - -
D Cheesewright - - - -
JA Davis - - - -
NN Gwagwa 9,800 - 9,800 -
P Langeni 8,800 - 9,800 -
JP Suarez - - - -
EExxeeccuuttiivvee DDiirreeccttoorrss
GM Pattison 596,473 205,603 596,473 205,603
GRC Hayward 222,894 270,529 222,894 270,529
Ilan Zwarenstein - 167,331 - 182,659
There were no non-beneficial interests in either of these periods.
Resigned with effect from 10 April 2014.
Subsidiaries
As at the date hereof, the following companies are principal subsidiaries of the Company:
Capensis Investments 241 (Pty) Limited 2000/007070/07
Massbuild (Proprietary) Limited (previously Builders Trade Depot) 2004/035206/07
Masscash Holdings (Proprietary) Limited 1997/014716/07
Massmart International Holdings Limited (incorporated in Mauritius) 47902 C1/GBL
Massmart Management & Finance Company (Proprietary) Limited 1992/004084/07
Masstores (Proprietary) Limited 1991/006805/07
Mystic Blue Trading 62 (Proprietary) Limited 2005/018657/07
Details of the Company’s interests in material subsidiaries are set out in note 36. Total net profit after tax for all subsidiaries for the year ended December 2013amounted to R1.3 billion (Dec 2012: R240.4 million/Jun 2012: R458.6 million).
Borrowing powers
In terms of the Memorandum of Incorporation, the Group has unlimited borrowing powers. At December 2013, borrowings were R2.3 billion (December 2012:R1.7 billion).
Going concern
The Directors are of the opinion that the business will be a going concern in the year ahead. In reaching this opinion, the Directors considered the followingfactors:
strong positive cash flows from trading;no recurring material operating losses at Divisional and Group level;well-controlled working capital and good quality inventory;approved short- and long-term financing, with sufficient additional short-term borrowing capacity if required;key executive management in place;there have been no material changes that may affect the Group in any of our customer, product or geographic markets; andbudgets to December 2014 reflect a continuation of the above positive issues.
1
1
1

Litigation
There are no current, pending or threatened legal or arbitration proceedings that may have, or have had in the previous 12 months,a material effect on the Group’s financial position.
As part of the litigation relating to the Massmart-Walmart acquisition, Massmart has either satisfied or is in the process of satisfying the conditions ordered bythe 2012 Competition Appeal Court order. Two conditions remain active.
Firstly, Massmart has established a Supplier Development Fund that has commenced distributing funds to qualifying beneficiaries.
Secondly, in cooperation with the Competition Commission, Massmart has initiated its remedial plan to re-instate the approximately 230 employees who wereeither not located or did not accept their original re-instatement offer from the pool of 503 retrenched employees.
The objective of the remedial plan is to ensure that Massmart has fully complied with the court order to re-instate all employees. The first annual report of theFund was submitted to the Competition Commission in December 2013.
Change in year-end
In order to align the Group better with Wal-Mart Stores, Inc. (Massmart’s ultimate holding Company), in 2012 Massmart’s year-end was changed from June toDecember. The change in year-end meant that Massmart reported audited results for the six months to December 2012 in April 2013, and audited results forthe twelve months to December 2013 in April 2014.
Direct and ultimate holding companies
The Company’s direct holding company is Main Street 830 (Proprietary) Limited and the ultimate holding company isWal-Mart Stores, Inc.
Subsequent events
The Group’s non-Executive Chairman, Mark Lamberti, has been appointed CEO of the Imperial Group, from 1 March 2014. As a consequence, he has chosen torelinquish his directorships of other public companies and has resigned as Chairman of Massmart. Kuseni Dlamini has been appointed the new Chairman ofMassmart, with effect from 10 April 2014. His details can be found here.
Grant Pattison has resigned as Chief Executive Officer of the Group with effect from 1 June 2014. Guy Hayward has been appointed to succeed Grant. Thecareers of both Grant and Guy, including their combined 30 years of service to the Group are set out in more detail here.
There were no other significant subsequent events after the year-end.
On behalf of the Board
Philip Sigsworth
Company Secretary10 April 201
Company Secretary certificate
In terms of section 88(e) of the Companies Act No. 71 of 2008, as amended (“Companies Act”), I, Philip Sigsworth, in my capacity as Company Secretary ofMassmart Holdings Limited, confirm that, to the best of my knowledge and belief, in respect of the year under review, Massmart Holdings Limited has filedwith the Companies and Intellectual Property Commission all such returns and notices as are required of a public company in terms of the Companies Actand that all such returns and notices appear to be true, correct and up to date.

GROUP FINANCIAL DIRECTOR’S REVIEWFOR THE YEAR ENDED DECEMBER 2013
The 2013 financial year was a particularly difficult year. Fractious labour conditions continuedto plague the South African economy throughout the year, labour unions in numerous sectorswent on strike and the rate of unemployment in the country reached an all-time high. Thesignificant slowdown in credit extension, specifically unsecured credit, led to moderate growthin consumer spending. These factors affected all consumers, but the lower and middle incomeconsumers were definitely hardest hit. Massmart’s formats which sell to the higher LivingStandards Measures (LSM) customer performed considerably better than those which sell tothe lower and middle LSM sectors. Strong performances in Massbuild, Makro and Africa wereunfortunately offset by a poor trading result in Game SA and difficult trading conditions inWholesale Food.
The 2013 year was also an important year from an investment perspective as the Groupreached the end of: a number of years of rolling-out Regional Distribution Centres (RDCs); theaggressive roll-out of new Makro stores; the introduction of Food Retail across three divisions;and the Walmart integration. These investments resulted in high occupancy and depreciationcosts which should all have annualised during the current year.
The benefits to date to Massmart of the Walmart transaction have largely been through thetransfer of intellectual property and therefore are difficult to usefully quantify. These benefitsinclude assisting the Group with its strategic journey into Food Retail; leaning on theexperience of Walmart as we rolled out our supply chain and logistics strategy; a focus onlowering new stores’ capital costs; an appreciation of Every Day Low Price (EDLP); the Group’sdirect-to-farm process; and the introduction of some new private label brands.
Being part of the Walmart global organisation, does however introduce some incremental costincluding the cost of compliance with US regulations and the cost of various expatriatesoperating in the Group. These costs will be on‑going and as such we have chosen to treat themas normal costs. From the 2013 financial year, these costs have not been separately disclosedbut rather included on a line-by-line basis in the income statement.
Financial targets
The Group has medium-term financial targets or measures that we believe represent optimalperformance levels within the income statement, statement of financial position, or thecombination of both. Certain of these targets are ‘stretch targets’ that will only be achieved inthe medium term. In addition, these targets are also ‘through-the-cycle’ targets, meaning thatduring a strongly negative or positive economic environment, we may under- or over-performagainst those targets.
These target ratios are shown below:
Medium-term target ratios Definition
ROS – 5.0% Return on sales (ROS) is the ratio of earnings beforeinterest and tax, excluding foreign exchangeamounts, to sales
ROE > 35% Return on equity (ROE) is the ratio of headlineearnings excluding Walmart costs (prior to Dec 2013)and foreign exchange, to average ordinaryshareholders’ equity
Gearing ˜ 40% Gearing is the ratio of average long-term interest-bearing debt to average ordinary shareholders’ equity
Dividend cover of x 1.55 Dividend cover represents the ratio of headlineearnings to dividends paid to ordinary shareholders
Return on sales (ROS)
This ratio combines all the key income statement elements, being sales, gross margin, supplierincome expenses (including depreciation and amortisation), but excludes foreign exchangetranslation gains or losses. Every key financial aspect of the retail or wholesale business modelis therefore captured in this ratio. The reason foreign exchange translation gains or losses areexcluded is because they are largely beyond management’s control, are volatile, and do notreflect the sustainable profitability of the Division or Group.
Returns for December 2013 and the prior year were negatively impacted by the disappointingperformance in Game SA, the difficult trading conditions in the Wholesale Food sector, andincreased depreciation and occupancy costs. Game SA comparable sales, specifically ingeneral merchandise, slowed significantly during the year. Game SA sales were affected by theslowdown of the middle income consumer, the global slowdown in general merchandise, inparticular electronics, and some disappointing operating disciplines, including poor in-stocklevels. Toward the end of the 2012 calendar year, the Group’s only ‘formal’ Wholesalecompetitor ceased trading. Many of the sites were taken over by strong independent traderswhich resulted in a much tougher, more competitive environment during 2013. Depreciation andOccupancy costs comprised 6.4% and 22.2% of total costs respectively and the high increaseson prior year are a consequence of the Group’s significant increase in RDCs, the roll-out of newstores and the introduction and continued roll-out of Food Retail in three Divisions.
All periods are 12-month periods.

Return on equity
Massmart is committed to delivering superior returns to shareholders over the longer term. TheGroup’s medium-term targets are to exceed a 35% return on average ordinary shareholders’equity (ROE).
The decline in the Group’s profitability (measured by ROS) coupled with the Group’s strategicsignificant investment in Food Retail and supply chain were the main causes of the decline inthe Group’s return on shareholders’ equity. The Group’s on-going investment in new stores andnew businesses increased the size of the net asset value. As the Group’s profitability improves,and as the new stores, RDCs and business begin to trade optimally, the ROE will improve tohigher levels. During the periods under review, the significant strategic investment in capitalassets caused the ROE to remain at lower levels.
The Divisions are responsible for delivering operational returns, being their returns to their networking capital and non-current assets excluding goodwill and trademarks. In addition to theseoperational returns, Massmart, through the Board and Executive Committee, is responsible fordelivering investment returns that will also include the book value of intangibles (specificallygoodwill arising from the acquisition of subsidiaries), as well as setting the Group’s gearinglevels that will influence returns to shareholders and the overall risk profile. Depending uponthe purchase price, retail and wholesale acquisition of subsidiaries tend to generate significantaccounting goodwill owing to the relatively low net asset values of these business models.
The Divisions are recapitalised annually by Massmart with non-interest-bearing shareholders’ funds that are equivalent to the book value of long-term assets ineach Division. Each Division must therefore fund its net working capital position through cash or interest-bearing debt, depending upon the characteristics ofthat business model. This process enables divisional returns to be evaluated and compared on a consistent basis across the Group, and from one year to thenext.
Massmart’s current return on average shareholders’ equity (excluding Walmart costs (in the prior year) and foreign exchange) is 25.9% (Dec 2012: 30.8%).
Gearing (or leverage)
Massmart prefers some gearing, up to approximately 40%, in order to leverage the return on shareholders’ equity but without introducing excessive financialrisk to the Group. It should be noted here however, that our stores’ lease obligations represent a significant form of permanent gearing (these lease obligationscurrently represent a discounted present value of approximately R8.9 billion (Dec 2012: R8.1 billion)).
The Group has decided to own rather than lease certain of its larger, stand-alone, key strategic store formats, specifically Makro and Builders Warehousestores, and this will add incrementally to the Group’s gearing. This change does not represent a major financial shift however as it will result in converting afixed long-term lease commitment, which is recorded off-balance sheet, to an on-balance sheet asset or liability. Significantly, the Group acquired control ofseven Makro stores that had previously been lease-held with effect from January 2013. This transaction has been covered in the ‘Acquisition of subsidiariesand property’ paragraph on the next page. There are currently two separate transactions to acquire properties, totalling R550.0 million, where we are awaitingtransfer. As regards to financing any future acquisition of subsidiaries, depending on the target company’s cash profile and cash generation ability, this gearingratio may be increased.
In addition to the above, the Group’s strategic focus on: owning more of our stores, trialling new formats in East and West Africa, increased roll-out of FoodRetail and opening more low-income home improvement stores in South Africa, has had the effect of pushing the gearing levels up in the short term.
The Group’s average gearing was 39.8% (Dec 2012: 28.5%).
Dividend cover
Massmart’s dividend policy is to declare and pay a total annual cash dividend representing a 1.55 times dividend cover unless circumstances dictateotherwise. There were no STC credits available for use as part of this declaration. The number of shares in issue at the date of declaration was 217,109,044.
The Group maintained the absolute value of the dividend in the prior 12 months despite the lower effective headline earnings per share. Notice was given that agross final cash dividend of 275.00 cents per share in respect of the period ended December 2013 was declared. The dividend was declared out of incomereserves and will be subject to the Dividend Tax rate of 15% which will result in a net dividend of 233.75 cents per share to those shareholders who are notexempt from paying dividend tax. Massmart’s tax reference number is 9900/196/71/9.
The dividend cover ratio is not a target – because it is already being achieved – but is disclosed to give shareholders clarity on future dividend levels. TheBoard believes that this dividend cover ratio is appropriate, given the Group’s current and forecast cash generation, planned capital expenditure and gearinglevels.
Historical actual dividend cover ratios:
Dec 2013 Dec 2012 June 2012 Dec 2011 June 2011 June 2010 June 2009 June 2008 June 2007 June 2006
Actual dividend cover x 1.46 x 1.18 x 1.41 x 1.65 x 1.07 x 1.50 x 1.56 x 1.70 x 1.70 x 2.00
Change in financial year-end and reviewed financial information
To align with Wal-Mart Stores, Inc. (Massmart’s ultimate holding company), in 2012 Massmart changed its financial year from June to December with effectfrom the previous reporting cycle. To assist with comparisons of the prior financial year of 26 weeks, reviewed 52-week information for December 2012 hasbeen provided where appropriate.
Acquisition of subsidiaries and property
With effect from 25 January 2013, Massmart acquired control of seven Makro stores that had previously been lease-held. The cash consideration paid forcontrol amounted to R577.2m and was funded by long-term interest-bearing debt. This transaction was aligned to the Group’s strategy of investing for thefuture. In the 52 weeks to December 2012, the Group acquired the trading assets of five small businesses, all in the Masscash division. The net cash purchaseprice of R56.9 million gave rise to goodwill of R38.4 million. No contingent payments were provided for any of these acquisitions. During this same period, theGroup acquired two businesses, being Fruitspot and the Rhino Group. Both of these acquisitions were aligned to the Group’s strategy of rolling out Food Retail.Makro acquired Fruitspot with effect from 2 January 2012 and Cambridge acquired the Rhino Group with effect from 1 March 2012. Together theseacquisitions amounted to a net cash purchase price of R326.7 million and gave rise to goodwill of R485.2 million. Liabilities were raised on the businessacquisitions of R182.3 million, dependent on these businesses achieving certain profit hurdles in the two years following the deal. Both businesses have metthese profit hurdles and the business acquisition liabilities have been paid except for R24.1 million that is being carried at December 2013 in the Group’sstatement of financial position as a short term provision for the Rhino Group and is due to be paid within the next 12 months. Acquisition of subsidiaries andproperty is described in more detail in note 3.
Massmart has continued with its stated intention to acquire strategic properties from which it operates. There are currently two separate transactions toacquire properties, totalling approximately R550.0 million, where we are awaiting legal transfer.

Disposals
During the 52 weeks to December 2012, the Group disposed of a small Mozambican Masscash cash and carry business. The loss on disposal amounted toR3.8 million after tax. In this same period, another small Masscash business in South Africa was in the process of being sold. The assets and liabilities werere-valued to the lower of carrying value and fair value less costs to sell and disclosed separately as non-current assets or liabilities classified as held for sale inthe statement of financial position. This business was sold in the current period at book value and no gain or loss was recorded on the transaction. Disposalsare described in more detail in note 20.
Accounting policies
There were no significant changes in accounting policies during the year.The accounting policies are detailed in note 1. The adoption of new accounting policies are detailed in note 2.
Impact of the 53rd week
In line with most major international retailers, Massmart runs its internal accounting and administrative timetable using the retail calendar which treats eachfinancial year as an exact 52-week period. This has the effect of a day per year being ‘lost’ which is then caught up every seventh year by including a 53rd weekin the financial calendar. This is not an ‘artificial’ week – the Group’s earnings and cash are higher as a result of trading during this week.
This additional week includes sales, the associated gross margin and a limited amount of variable expenses. The estimated impact of the 53rd week is shownbelow:
The 53rd week has another future consequence, namely that the growth in the second half of the 2014 financial year will appear to be relatively mutedcompared to this 27-week period.
All figures shown below in this report are for the 53-week period, unless noted otherwise.
Income statement
for the year ended 29 December 2013
December 2013 December 2012 December 2012
53 weeks 52 weeks 26 weeks
Rm Rm Rm
(Audited) (Reviewed) (Audited)
Revenue 72,512.9 66,050.3 36,234.5Sales 72,263.4 65,839.5 36,122.6Cost of sales (58,926.4) (53,563.0) (29,523.2)Gross profit 13,337.0 12,276.5 6,599.4Other income 249.5 210.8 111.9Depreciation and amortisation (731.1) (661.2) (342.6)Impairment of assets (41.6) (21.6) (5.4)Employment costs (5,423.5) (4,686.5) (2,487.5)Occupancy costs (2,555.3) (2,296.5) (1,225.6)Foreign exchange loss 67.8 (231.6) (76.7)Walmart transaction, integration and related costs - (348.9) (205.2)Other operating costs (2,750.3) (2,533.0) (1,243.2)
Operating profit 2,152.5 1,708.0 1,125.1Finance costs (283.8) (217.4) (106.0)Finance income 28.7 90.0 45.6Net finance costs (255.1) (127.4) (60.4)Profit before taxation 1,897.4 1,580.6 1,064.7Taxation (555.3) (549.6) (342.3)
Profit for the year 1,342.1 1,031.0 722.4
Profit attributable to:Owners of the parent 1,283.0 972.3 691.8Preference shareholders - 5.0 1.4Non-controlling interests 59.1 53.7 29.2
Profit for the year 1,342.1 1,031.0 722.4
Earnings per share (cents)
Basic EPS 591.4 449.8 319.7Diluted basic EPS 585.1 443.2 315.4

Sales
Total Group sales for the December 2013 financial year increased by 9.8% to R72.3 billion. Total andcomparable store sales for the 52-week period increased by 7.5% and 3.8% respectively over thecomparative period. Comparable store sales exclude new store openings or closings in the current and prioryear. Sales in our African businesses represented 7.7% of total sales and increased by 16.6% in Rands and10.9% in local currencies. The Group’s average product selling price inflation rate for the year was 2.7%(52 weeks to Dec 2012: 4.4%/ 26 weeks to Dec 2012: 3.7%), suggesting a real comparable volume growth of1.1%. The Group succeeded in maintaining or growing market share in each major category it trades induring the year. The Group’s formats which retail to higher LSM customers performed significantly betterthan those formats which sell to lower and middle LSM consumers.
Inflation for each of the Group’s major product categories is shown in the table below.
General Merchandise inflation measured 2.1% for the 52 weeks to December 2012, positive for the first timein almost five years, but slowed to 0.1% for the year to December 2013, significantly below the Group’s costinflation. Some inflation in this category will be positive for the business as the Group will need to move lessvolume in order to achieve the same level of sales, thereby incurring lower costs. Food and Liquor’s inflationslowed to 4.1% and Home Improvement inflation increased to 3.7% for December 2013.
Looking ahead to December 2014, inflation is expected to increase slightly in General Merchandise due to acombination of the weaker Rand and product inflation out of the East. Food inflation is likely to increasesignificantly, driven by commodities such as maize and sugar. If the Rand remains at current levels, weestimate product inflation should range between 4% and 6%.
During the December 2013 financial year, 15 stores were closed, one store was sold and 35 stores wereopened, resulting in a total of 376 stores at December 2013. Net trading space increased by 4.8% to a totalof 1,481,308m². New space has not been proportionately adjusted if the store was not open for part of thefinancial year. The detailed store movement is explained in the table alongside.
Gross profit
The Group’s gross profit of 18.46% is lower than that of the comparative prior period of 18.65%. This is as aresult of a combination of an increased contribution from Game Africa and an improved marginperformance in Massbuild; both of which were offset by the difficult trading conditions in Wholesale Food, agreater overall Group Food contribution at a lower margin and General Merchandise margins in Game SAbeing under pressure throughout the year.
The Group’s gross margin is dependent upon the sales mix across the Divisions and the required tradingaggression occasioned by competitor activity. In a positive economic cycle, it should increase marginallyowing to the increased contribution from the higher-margin Massbuild Division, as well as a higherproportion of General Merchandise sales. Gross profit includes rebates and other forms of income earnedfrom suppliers as well as on-going revenue from sales of cellular products and airtime.
Other income
Other income for the year to December 2013 of R249.5 million (52 weeks toDec 2012: R210.8 million/26 weeks to Dec 2012: R111.9 million) comprises royalties and franchise feesfrom in-store third parties, property rentals, investment income excluding interest, dividend income, sundrythird party management and administration fees, distribution income, commission from RCS sales andincome from extended warranty insurance. Other income is described in more detail in note 4.
Expenses
December 2013 December 2012 December 2012
53 weeks 52 weeks 26 weeks
Rm Rm % change Rm
Depreciation and amortisation (731.1) (661.2) 10.6% (342.6)Impairment of assets (41.6) (21.6) (5.4)Employment costs (5,423.5) (4,686.5) 15.7% (2,487.5)Occupancy costs (2,555.3) (2,296.5) 11.3% (1,225.6)Other operating costs (2,750.3) (2,533.0) 8.6% (1,243.2)Walmart integration and related costs* - (208.9) - (65.2)
Total expenses (11,501.8) (10,407.7) 10.5% (5,369.5)
Operating expenses as % of sales (15.9%) (15.8%) (14.9%)
* Walmart integration and related costs does not include Walmart transaction costs.
Previously Walmart integration and related costs were separately disclosed. During the current year, we have treated these costs as ‘normal’ business costsand have therefore included them on a line-by-line basis.
Total expenses (excluding foreign exchange movements in both years and Walmart transaction costs in the prior year) increased by 10.5%. The impact of theGroup’s continued investment in capacity and growth can be seen in the 10.6% higher depreciation and amortisation charge; the 11.3% increase in occupancycosts, and the increased employment cost to man the new stores and RDCs. These increases relate to the opening of the Massbuild National DistributionCentre and 35 new stores. Comparable expenses increased by 7.2%.
Total expenses represent 15.9% of sales, an increase compared to the comparative period’s 15.8%. The major expense categories and significant expensesincluded in total expenses are discussed in more detail below.

Employment costs
Employment costs are the Group’s single largest cost category and contribute 47.2% of total expenses. Employment costs are 15.7% higher than the 52 weeksto December 2012. As a percentage of sales, employment costs increased to 7.5% (52 weeks to Dec 2012: 7.1%). On a comparable basis, these costs increasedby 9.5%. Included in employment costs are IFRS 2 Share-based Payments charges of R126.3 million (52 weeks to Dec 2012: R141.1 million) which arise fromshares and options issued to beneficiaries of the Massmart Employee Share Trust, the Massmart Thuthukani Empowerment Trust BEE Staff Scheme (onlyrelating to the prior comparative period as this scheme was terminated in this period) and Black Scarce Skills Trust. The Group employed 4.2% more employees(on a full-time equivalent basis) compared to December 2012, increasing as we opened new stores. Included in the current year are costs relating to resourcesrequired for compliance, including the US Foreign Corruption Prevention Act compliance, and the cost of the remaining Walmart expatriates.
On 1 October 2012, the final conversion of ‘A’ preference shares to ordinary shares for the beneficiaries occurred through the Massmart ThuthukaniEmpowerment Trust. The employees had the option of converting their remaining share allocation into Massmart ordinary shares and continue to receive 100%of the dividend on their ordinary shares or they could sell their remaining share allocation and receive net proceeds after tax and selling expenses. The relatedshare-based payment reserve was released to retained income and this entry had no impact on the income statement. Going forwards, the Group will notaccount for any share-based payment expenses relating to the Massmart Thuthukani Empowerment Trust BEE Staff Scheme.
For the forthcoming year, the Group’s salary increases will be between 5.0% and 7.0% and wage increases, many of which have already been agreed, are in arange of 7.0% to 8.5%.
Occupancy costs
The Group’s second biggest cost at 22.2% of total expenses is 11.3% higher than the 52 weeks to December 2012, largely due to the opening of the MassbuildNational Distribution Centre and 35 new stores resulting in a net new total space of 5.9%. On a comparable basis, these costs increased by 8.7%.
Property lease costs comprise 65.3% of total occupancy costs; the balance comprises ancillary property costs including municipal rates and services whichcontinue to increase significantly above national South African inflation levels. Expressed as a percentage of sales, occupancy costs, at 3.5%, are flat on thecomparative period. Resulting from the Group’s strategic focus on owning more property, these costs should reduce as a percentage of sales from 2014.
The lease-smoothing accounting policy applicable to operating leases (thereby affecting all store leases) has the effect of keeping comparable-store leasecharges broadly equal from one year to the next, and so any increase in property lease costs between the years would be from new stores and lease renewals.Another effect of this accounting policy is that annual lease escalations no longer increase the Group’s lease charge. Adjusting for the non-cash lease-smoothing adjustment in both December 12 month periods shows that annual cash occupancy costs increased by 6.6% while total trading space increased by4.8% and DC space increased by 11.4% during the same period.
Depreciation and amortisation
Depreciation and amortisation is the Group’s third largest cost category and represents 6.4% of total expenses. Owing to the accelerated capital investment innew stores and RDCs, the depreciation and amortisation charge increased by 10.6% which is ahead of sales growth, and will continue to increase ahead ofsales growth, for the next 12 months due to the Group’s strategic focus on owning more property.
The three major cost categories described above together represent 75.7% of the Group’s total expenses. Other operating costs represent every other item ofexpense in the Group, including insurance, bad debts, travel, professional fees, advertising and marketing, stationery and consumables. Combined, thiscategory represents the most manageable or variable costs and so while total costs in this category increased by 8.6%, comparable costs were well controlledand increased by only 3.3% and continue to receive intense management focus.
Impairment of assets
The impairment of assets in the current year relates to the impairment of acquired goodwill of R26.3 million, leasehold improvements of R4.4 million andfixture, fittings, plant and equipment of R10.9 million in Masscash as a result of store closures. The impairment of assets for the 52 weeks to December 2012year relates to the impairment of leasehold improvements in Masscash of R5.4 million and to the impairment of certain acquired goodwill in Masscash ofR16.5 million. More information relating to impairment of assets can be found in note 5.
Other significant items
As noted in the summarised income statement above, included in operating profit are net unrealised and realised gains on foreign currency transactions andtranslations of R67.8 million (52 weeks to Dec 2012: net loss of R231.6 million).
December 2013 December 2012 December 2012
53 weeks 52 weeks 26 weeks
Foreign exchange movement arising from: Rm Rm Rm
Loans to African operations 73.1 (226.3) (82.8)Hedges - 5.2 (0.7)Investment in a trading and logistics structure 22.3 (14.4) 1.0Translation of foreign creditors (27.6) 3.9 5.8
67.8 (231.6) (76.7)
During the December 2013 financial year, the translation of the Group loans in the African balance sheets amounted to a R73.1 million foreign exchange gain inthe income statement (52 weeks to Dec 2012: R226.3 million loss). The remaining net translation loss from other foreign monetary balances was R5.3 million(52 weeks to Dec 2012: R5.3 million loss). During May 2012, the Government of Malawi devalued the country’s currency by 50%. The effect of this was a loss ontranslation of the loans in Malawi amounting to R145.6 million. This loss was calculated on the day of devaluation and falls in the 52 weeks to December 2012figures above. The Malawian Kwacha continued to devalue, and only strengthened against the Rand around June 2013. It then weakened further to closeDecember 2013 net weaker on the Rand. During January and February 2013, the Group successfully managed to repatriate almost all its foreign currency cashfrom Malawi and has maintained these cash reserves at a very low balance of R12.6 million at December 2013. The Rand weakened against the Group’s Africancurrencies basket, except against the Malawian Kwacha (already mentioned) and the Ghanaian New Cedi, and explains much of the gain recognised in thecurrent year. Should the Rand continue to weaken against these currencies, it is likely that the Group will again report foreign exchange gains in the 2014financial period. The foreign exchange gain/(loss) is described in more detail in note 7.
When a new store is opened, large once-off or exceptional operating costs are incurred in preparing the store (including temporary staff, marketing initiatives,special promotions, amongst others). These costs are referred to as store pre-opening costs and in the current year amount to R108.5 million (52 weeks to Dec2012: R70.3 million). The current year includes the opening of the new stores for Game, DionWired, Makro, Builders Warehouse, Builders Express and BuildersSuperstores.

Trading and operating profit
Reconciliation between Trading profit and Operating profit before interest
and tax December 2013 December 2012 December 2012
53 weeks 52 weeks 26 weeks
Rm Rm % change Rm
Trading profit before interest and taxation 2,145.4 2,147.8 (0.1%) 1,361.9Asset impairments (41.6) (21.6) (5.4)Walmart transaction costs - (140.0) (140.0)Loss on disposal of business (1.8) (16.5) (4.4)Fair value adjustment on assets classified as held for sale - (8.3) (0.4)BEE transaction IFRS 2 charge (17.3) (21.8) (9.9)Foreign exchange loss 67.8 (231.6) (76.7)
Operating profit before taxation 2,152.5 1,708.0 26.0% 1,125.1Trading profit as % of sales 3.0% 3.3% 3.8%Operating profit as % of sales 3.0% 2.6% 3.1%
Group trading profit before interest and tax, which is shown before accounting for the Walmart transaction costs (only in the 52 weeks and 26 weeks toDecember 2012) and foreign exchange, decreased by 0.1% on the 52 weeks to December 2012 which is significantly below sales growth of 9.8%. The Group’slower net margin growth is a result of comparable sales being well below the growth in nominal gross domestic product coupled with expense pressure due toinvesting in new stores and RDCs, the roll-out of Food Retail throughout the Group and the additional costs resulting from the need to move additional volumesdue to the continued low inflation in General Merchandise. Expressed as a percentage of sales, Group trading profit before interest and taxation deterioratedfrom 3.3% to 3.0%. To expand net margins, the Group needs comparable sales growths to approximate the rate of nominal gross domestic product growth.
Group operating profit, which includes the foreign currency translation movements, was 26% up on the 52 weeks to December 2012. After excluding foreignexchange, operating profit of R2,084.7 million was up 7.5% on the 52 weeks to December 2012. Considering the Group’s strategic investment in the futureEBITDAR for December 2013 was up 10.0% on the 52 weeks to December 2012.
EBITDA and EBITDAR
December 2013 December 2012 December 2012
53 weeks 52 weeks 26 weeks
Rm Rm % change Rm
Operating profit before foreign exchange 2,084.7 1,939.6 7.5% 1,201.8Depreciation and amortisation 731.1 661.2 10.6% 342.6Impairment of assets 41.6 21.6 5.4EBITDA 2,857.4 2,622.4 9.0% 1,549.8Occupancy costs 2,555.3 2,296.5 11.3% 1,225.6
EBITDAR 5,412.7 4,918.9 10.0% 2,775.4
The Group’s December 2013 financial performance has been covered in detail above, but can broadly be summarised as:
Total sales growth boosted by new stores and acquisition of subsidiaries;An additional trading week’s performance;Subdued comparable sales growth achieved in a low product inflation environment but still achieving real volume growth;Lower Group gross margins from a greater Food contribution at a lower margin contribution, difficult trading conditions in Wholesale Food and GeneralMerchandise margins in Game SA being under pressure. These were offset slightly by improved gross margins in Massbuild and a higher contributionfrom Game Africa;High occupancy and depreciation costs in line with the Group’s strategic investment in the future; andIncreased employment costs required for the additional investments and to meet the additional Walmart requirements.
Net finance costs
Net interest paid of R255.1 million, increased partly as a result of the Group’s capital expenditure programme, including the acquisition of certain keyproperties, and due to some inefficiencies in working capital levels specifically in Game SA. At R4.3 billion, the Group’s average borrowings are higher than theprior year’s figure of R3.2 billion and approximately R600.0 million of this relates to acquired properties.
The Group’s gearing ratio (debt:equity) increased to 39.8% (Dec 2012: 28.5%). Taking into account anticipated capital expenditure and excluding anyunforeseen developments or new initiatives, the Group will remain net geared at similar levels for the foreseeable future.
Taxation
Tax rate reconciliation
December 2013 December 2012 December 2012
53 weeks 52 weeks 26 weeks
% % %
South African corporate taxation 28.0 28.0 28.0Non-taxable income and disallowable expenditure (2.0) (2.1) 2.3Allowances on lease premiums (0.3) (0.5) (0.6)Assessed loss not utilised 1.4 1.5 2.1Withholding tax 0.1 (0.7) (1.1)Secondary Tax on Companies - 3.5 0.1Other – including foreign tax adjustments and transaction related costs 2.1 5.1 1.3Overall tax rate 29.3 34.8 32.1TOTAL TAX CHARGE (Rm) 555.3 549.6 342.3
The total tax charge represents an effective tax rate of 29.3% (52 weeks to Dec 2012: 34.8%/26 weeks to Dec 2012: 32.1%). Due to the abolishment of STC inthe prior year, there is no STC impact in December 2013 and a very small STC impact in the 26 weeks to December 2012 (52 weeks to Dec 2012: 3.5%/26 weeksto Dec 2012: 0.1%). The rate is also lower than the prior year due to the decreased level of non-deductible expenditure relating to the Walmart transaction in thecurrent year. We expect Massmart’s future effective tax rate to normalise just below 30%, although higher tax rates in certain foreign jurisdictions maymarginally increase this.

Massmart is unconcerned at any specific element of historical tax risk in the Group, but there remains the uncertainty that material adjustments arising frompotentially unfavourable tax assessments of previous tax returns, some of which have not yet been assessed by SARS, could impact future tax charges.Extending this uncertainty is that SARS can reopen any tax assessment within three years of issuing such assessment. More information relating to taxationcan be found in note 9.
Statement of comprehensive income
for the year ended 29 December 2013
December 2013 December 2012 December 2012
26 weeks 52 weeks 26 weeks
Rm Rm Rm
(Audited) (Reviewed) (Audited)
Profit for the year 1,342.1 1,031.0 722.4
Items that will not be re-classified subsequently to the income statement
Post-retirement medical aid actuarial gain 5.7
Items that will be re-classified subsequently to the income statement
Foreign currency translation reserve 47.2 6.0 25.1Revaluation of listed shares 4.7 1.7 1.6Cash flow hedges 7.0 (10.7) (5.8)Less Income tax relating to the revaluation of listed shares (1.2) - -Less Income tax relating to the cash flow hedges (1.9) 2.9 1.6Other comprehensive income for the year, net of tax 55.8 (0.1) 22.5Total other comprehensive income for the year, net of tax 61.5 (0.1) 22.5
Total comprehensive income for the year 1,403.6 1,030.9 744.9
Total comprehensive income attributable to:Owners of the parent 1,344.5 972.2 714.3Preference shareholders - 5.0 1.4Non-controlling interests 59.1 53.7 29.2
Total comprehensive income for the year 1,403.6 1,030.9 744.9
The Group accounts for three movements in other comprehensive income that will be re-classified subsequently to the income statement: the movement of theforeign currency translation reserve; the revaluation of listed shares; and the net movement of cash flow hedges. As from the current financial year, the Grouprecords the post-retirement medical aid actuarial gain/(loss) in other comprehensive income. This amount will not be re-classified subsequently to the incomestatement. This change in accounting was required due to the changes to IAS 19 Employee Benefits and more information can be found in note 2.
Headline earnings
Headline earnings, before foreign exchange, of R1,285.7 million is 7.7% above the 52 weeks to December 2012 of R1,193.8 million. Including foreign exchangehowever, increases headline earnings to R1,334.5 million which is 29.9% up on the 52 weeks to December 2012. The more representative figure is 7.7% whichbetter reflects the Group’s actual trading performance in December 2013.
December 2013 December 2012 December 2012
53 weeks 52 weeks 26 weeks
Rm Rm % change Rm
Reconciliation of net profit for the year to headline earningsNet profit attributable to owners of the parent 1,283.0 972.3 32.0% 691.8Impairment of assets 41.6 21.6 5.4Loss on disposal of fixed assets 11.9 16.4 6.2Loss on disposal of business 1.8 16.5 4.4Fair value adjustment on assets classified as held for sale - 8.3 0.4Total tax effects of adjustments (3.8) (8.1) (2.7)Headline earnings 1,334.5 1,027.0 29.9% 705.5Headline earnings before foreign exchange (taxed) 1,285.7 1,193.8 7.7% 760.7Headline EPS (cents) 615.2 475.2 29.5% 326.0Headline EPS before foreign exchange (taxed) (cents) 592.7 552.3 7.3% 351.5Diluted headline EPS (cents) 608.6 468.1 30.0% 321.7Diluted headline EPS before foreign exchange (taxed) (cents) 586.4 544.1 7.8% 346.9
Headline earnings per share (HEPS), before foreign exchange, of 592.7 cents is 7.3% higher than the 52 weeks to December 2012 HEPS of 552.3 cents.Including foreign exchange however, increases HEPS to 615.2 cents which is 29.5% higher than the 52 weeks to December 2012.
After adjusting for the potential future conversion of 2.3 million shares (52 weeks to Dec 2012: 3.3 million shares), the diluted HEPS before foreign exchange is586.4 cents (52 weeks to Dec 2012: 544.1 cents). Under the calculation required by IFRS, the number of potentially dilutive shares arose due to the significantlyhigher weighted-average Massmart share price during this financial year in comparison to the exercise price on the grants. This number decreased on last yeardue to the lower closing share price in the current year compared to the prior year. Headline earnings is described in more detail in note 11.

Statement of financial position
for the year ended 29 December 2013
December 2013 December 2012
Rm Rm
(Audited) (Audited)
Assets
Non-current assets 10,111.8 7,595.1Property, plant and equipment 5,988.1 3,868.2Goodwill 2,532.0 2,557.7Other intangibles 396.8 387.6Investments 231.9 258.8Other financial assets 290.9 126.5Deferred taxation 672.1 396.3
Current assets 16,036.1 15,422.2Inventories 10,115.5 9,691.5Trade, other receivables and prepayments 3,712.5 3,681.7Taxation 12.0 17.0Cash and bank balances 2,196.1 2,032.0Non-current assets classified as held for sale - 2.5
Total assets 26,147.9 23,019.8
Equity and liabilities
Equity attributable to equity holders of the parent 5,173.0 4,739.7Share capital 2.2 2.2Share premium 743.3 752.1Other reserves 517.6 323.3Retained profit 3,909.9 3,662.1Non-controlling interests 196.6 175.6
Total equity 5,369.6 4,915.3
Non-current liabilities 2,206.4 1,183.4Non-current liabilities:- Interest-bearing 1,178.7 671.8- Interest-free 838.9 305.7Non-current provisions and other 102.2 169.2Deferred taxation 86.6 36.7
Current liabilities 18,571.9 16,921.1Trade and other payables 16,774.2 15,305.5Current provisions and other 327.0 363.8Taxation 331.3 298.5Other current liabilities 531.6 561.2Bank overdrafts 607.8 392.1
Total equity and liabilities 26,147.9 23,019.8
This review covers the consolidated statement of financial position and the related notes.
Non-current assets
December 2013 December 2012
Rm Rm
Non-current assets 10,111.8 7,595.1
Property, plant and equipment 5,988.1 3,868.2Goodwill 2,532.0 2,557.7Other intangibles 396.8 387.6Investments 231.9 258.8Other financial assets 290.9 126.5Deferred taxation 672.1 396.3
Tangible and intangible assets
Property, plant and equipment and goodwill together represent 84.3% (Dec 2012: 84.6%) of the Group’s total non-current assets.
Massmart continually refurbishes older stores and is building new stores and RDCs, and so during December 2013 capital expenditure of R1,987.1 million (52weeks to Dec 2012: R1,163.0 million/26 weeks to Dec 2012: R666.8 million) was spent on property, plant and equipment. Of this, R683.7 million (52 weeks toDec 2012: R511.1 million/26 weeks to Dec 2012: R279.8 million) was replacement capital expenditure, while the balance of R1,303.4 million (52 weeks to Dec2012: R651.9 million/26 weeks to Dec 2012: R387.0 million) was invested in new capital assets, including new stores and the new RDC. The increase inexpansionary capital assets can largely be attributed to the acquisition of the seven Makro stores for R577.2 million. Acquisition of subsidiaries did not impactGroup property, plant and equipment in the current year but added a further R114.6 million for the 52 weeks to December 2012 (26 weeks to Dec 2012: R7.8million).

All periods are 12-month periods.
* ‘Property Investments’ are included under ‘Investments and financial assets’.
In December 2013, goodwill decreased by R25.7 million, largely attributable to the impairment of goodwill in Masscash of R26.3 million. Under IFRS all goodwillmust be tested annually against the value of the business units with which it is associated and, if overstated, that goodwill must be impaired. In the prior 52weeks to December 2012, goodwill increased by R505.2 million, reflecting the two principal movements of goodwill arising from the acquisition of the tradingassets in five entities in Masscash, the acquisition of Fruitspot and the acquisition of the Rhino Cash and Carry Group (totalling R522.7 million) less animpairment of R16.5 million in Masscash. For the 26 weeks to December 2012, goodwill increased by R36.3 million in most part due to the acquisition of thetrading assets in five entities in Masscash for R38.4 million. No impairment was required in this period.
Other intangibles primarily represent computer software that IFRS requires to be disclosed in this category. In terms of IFRS the depreciation charge arisingfrom this asset category is classified as an amortisation charge.
During the 2009 financial year the Group began to implement its strategic plan of investing in the future. This included the opening of a number of RDCs (spaceincrease of 187% in the last five and a half years); the roll-out of new Makro stores (opened eight new stores in the last three and a half years); the purchase ofleased Makro stores, and the roll-out of Food Retail across the Group including Masscash Retail and Foodco. Masscash Retail now operates out of 47 storeswhile Foodco can be found in 48 stores (including six outside of South Africa). Capital expenditure as a percentage of sales therefore increased from 1.2% ofsales in 2006 to 2.9% at December 2013. Capital expenditure excluding property and property-related acquisitions for the year amounted to 2.1% of sales.
Capital expenditure, excluding property acquisitions for the next 12 months is budgeted to slow down as we begin to realise some of the benefits of theinvestments we have made during the last few years. We will continue to invest with the Group’s strategic drive to: own more of our stores; roll-out Fresh intoGame; roll-out Food Retail stores; increase the rate of expansion in Africa; and open more low income home improvement stores in South Africa. Moreinformation relating to property, plant and equipment, goodwill and intangible assets can be found in note 12, 13 and 14 respectively.
All periods are 12-month periods.
* ‘Property Investments’ are included under ‘Investments and financial assets’.
Investments and other financial assets
Investments comprise a R117.4 million (Dec 2012: 104.0 million) participation in an international treasury, shipping and trading business unit, re-valued toreflect the foreign-denominated net assets within that business unit. The R110.0 million shown as a bare dominium revaluation in December 2012 representsthe Group’s proportionate share of the estimated market value of the right to acquire bare dominiums in seven Makro stores in 2020. With effect from January2013, Massmart acquired control of these Makro stores. Investments in insurance cell captives of R100.3 million (Dec 2012: R34.8 million) relates to insurancearrangements with Mutual & Federal pertaining to extended warranties sold within the Group and general insurance within the Group. More information relatingto investments can be found in note 15.
Other financial assets of R290.9 million (Dec 2012: R126.5 million) include executive and employee loans of R46.7 million (Dec 2012: R70.6 million) owed byparticipants in the Massmart Employee Share Purchase Trust that attract zero percent interest. This loan amount reduces as employees sell their shares andrepay the associated loans and increases where executives elect to own Massmart shares, funded with these loans, rather than options issued by the trust.The finance lease deposit of R21.9 million (Dec 2012: R33.0 million) relates to the financing of the Makro Strubens Valley store originally built in 2003. Duringthe current financial year the Group purchased a property where transfer was not yet effected at year-end. Due to the time delay, the Group has placed thepurchase price on deposit with the seller honouring the transaction. Once transfer is affected, the property will be recorded by the Group as land and buildingsand the loan asset will be paid to the seller. More information relating to other financial assets can be found in note 16.
Deferred tax
The deferred tax asset arises primarily from numerous temporary differences, including tax deductions on trademarks, the operating lease liability arising fromthe lease-smoothing accounting policy, and unutilised assessed losses. This net asset will reduce over time as the associated tax benefits are utilised. Netdeferred tax increased from R359.6 million at December 2012 to R585.5 million at December 2013. More information relating to deferred tax can be found innote 17.

Current assets
December 2013 December 2012
Rm Rm
Current assets 16,036.1 15,422.2
Inventories 10,115.5 9,691.5Trade, other receivables and prepayments 3,712.5 3,681.7Taxation 12.0 17.0Cash and bank balances 2,196.1 2,032.0
Net inventories represent approximately 63.7 days’ sales (on historic sales basis), lower than the December 2012 comparative figure of 65.9 days. The 4.4%increase in stock on December 2012 indicates that inventory was well managed within the Group other than the over-stocked position in Massdiscountersgiven the slower comparable store sales in Game SA.
In general, Massdiscounters, being a retail discounter with 143 stores, with several stores in Africa with longer supply-chains, has the highest inventory levelsand its sales days in inventory are almost double those for Massmart’s wholesale businesses (Makro and Masscash). Builders Warehouse also has higherinventory days than the Group average, given the broader and deeper merchandise range in its stores.
Net inventory days December 2013 December 2012
Group 63.7 65.9Massdiscounters 109.3 108.7Masswarehouse 59.2 59.9Massbuild 92.3 80.1Masscash 35.2 42.0
General Merchandise net inventory of R4,596.3 million (Dec 2012: R4,250.7 million) represents about 45.4% (Dec 2012: 43.9%) of total Group inventory and isthe category holding the Massdiscounters overstocked position. Food net inventory at R2,857.5 million (Dec 2012: R3,068.0 million) is the second largestGroup inventory category but with the fastest stock-turns. More information relating to inventories can be found in note 18.
Inventory by category net of provisions: December 2013 December 2012
Rm Rm
Food 2,857.5 3,068.0Liquor 753.1 762.6General merchandise 4,596.3 4,250.7Home improvement 1,908.6 1,610.2
10,115.5 9,691.5
Total trade and other receivables, net of provisions, is 0.8% higher than December 2012 and is below sales growth. Included here are net trade accountsreceivable of R1,822.8 million (Dec 2012: R1,692.9 million), which increased by 7.7%. The businesses continue to focus on keeping debtors within their terms.Although trade credit is offered to certain customers in Makro, Massbuild and in Masscash, it is well controlled, is insured with a credit risk insurer, and is keptwithin the Group’s parameters. Allowances for doubtful debts at year-end was 5.0% of total trade receivables (Dec 2012: 4.7%). Trade and other receivables aredescribed in more detail in note 19.
Non-current liabilities
December 2013 December 2012
Rm Rm
Non-current liabilities 2,206.4 1,183.4
Non-current liabilities:– Interest-bearing 1,178.7 671.8– Interest-free 838.9 305.7Non-current provisions 102.2 169.2Deferred taxation 86.6 36.7
Major items included in the total of R2,206.4 million (Dec 2012: R1,183.4 million) are medium-term bank loans, capitalised finance leases, the operating leaseliability arising from the lease-smoothing adjustment, non-current provisions and deferred tax.
The interest-bearing liabilities included in this category are medium-term bank loans. This balance increased substantially during the financial year as a R600.0million, five-year, fixed-rate, bullet profile loan was raised at 7.5% from Walmart and a R275.0 million three-year, fixed rate external bank loan, was raised at7.2%. In the 52 weeks to December 2012 a R750.0 million five-year, fixed rate, amortising loan was raised at 7.9%. Capitalised finance lease balances are R16.6million (Dec 2012: R55.2 million). The largest balance in non-current non-interest-bearing liabilities is the net operating lease liability of R822.2 million (Dec2012: R302.7 million) arising from the lease-smoothing accounting policy and which will be released over the remaining period of the Group’s operating leases.The large increase is in most part due to the release of the lease smoothing asset relating to the seven Makro stores that were leased but have now beenpurchased. More information relating to non-current liabilities can be found in note 23.
Included in non-current provisions is the long-term provision of R84.2 million (Dec 2012: R81.5 million) arising from the actuarial valuation of the Group’spotential unfunded liability, arising from post-retirement medical aid contributions owed to current and future retirees. With effect from 1999, post- retirementmedical aid benefits were no longer offered to new employees joining the Group. The Supplier Development Fund constituted as part of the CompetitionTribunal’s approval of the Walmart transaction has been recognised as a current provision and more information has been provided in note 26.
Also included in non-current provisions in the previous year are liabilities raised on business acquisitions relating to the long-term portion of the final cashsettlement from the acquisition of Fruitspot, amounting to R64.7 million. More information relating to non-current provisions can be found in note 24.

Current liabilities
December 2013 December 2012
Rm Rm
Current liabilities 18,571.9 16,921.1
Trade and other payables 16,774.2 15,305.5Current provisions 327.0 363.8Taxation 331.3 298.5Other current liabilities 531.6 561.2Bank overdrafts 607.8 392.1
Included in the total trade and other payables figure are trade payables of R13,702.5 million (Dec 2012: R12,601.3 million) representing approximately 75.7 daysof cost of sales (using the historic basis), which is slightly higher than the December 2012 comparative figure of 75.1 days. The figure is representative of theGroup’s supplier terms and we continue to monitor this ratio very closely. Owing to payments to creditors being made shortly after each month-end, the Grouptrade payables balances at year-end are not representative of the average during the remaining financial period. The amount by which year-end trade payablesare “overstated” in comparison to the average cannot be accurately calculated but is approximately R1.7 billion. More information relating to trade and otherpayables can be found in note 25.
Included in current provisions are liabilities raised on business acquisitions related to the short-term portion of the final cash settlements from the acquisitionsof Fruitspot of R68.8 million (Dec 2012: R0 million) and the Rhino Group of R24.1 million (Dec 2012: R124.1 million). The Supplier Development Fund of R202.5million (Dec 2012: R225.4 million) is reported on annually to the Tribunal highlighting our expenditure and achievements. More information relating to currentprovisions can be found in note 26.
The current taxation liability reflects the Group’s liability for provisional corporate tax payments that are generally payable within a few days of the financialyear-end.Other current liabilities of R531.6 million (Dec 2012: R561.2 million) include the short-term portion of the medium-term loans noted above. More informationrelating to other current liabilities can be found in note 27.
Contingent liabilities
There are no current or pending legal or arbitration proceedings, of which the Group is aware, which would have a material adverse effect on the Group’sfinancial position.
Commitments
Commitments in respect of capital expenditure approved by Directors:
December 2013 December 2012
Contracted for 1,249.3 954.8Not contracted for 783.4 715.5
2,032.7 1,670.3
More information relating to these capital expenditure commitments can be found in note 30. Massmart has the right of first refusal on the sale of any sharesby the minority shareholders in various Masscash stores. Historically Massmart has exercised this right. The amount to be paid in future, should Massmartexercise its rights, totals R309.6 million (Dec 2012: R370.5 million). Capital commitments will be funded using current facilities.
The Group is exposed to the following operating lease commitments:
December 2013 December 2012
Rm Rm
Land and buildings 14,410.7 13,348.1Year 1 1,639.8 1,430.8Years 2 to 5 6,164.5 5,537.4Subsequent to year 5 6,606.4 6,379.9Plant and equipment 12.1 12.8Year 1 5.2 4.9Years 2 to 5 6.9 7.9Other 22.9 22.5Year 1 11.0 10.2Years 2 to 5 11.9 12.3
14,445.7 13,383.4
In the prior year, promissory notes of R208.9 million that represented commitments under non-cancellable operating leases entered into by Masstores (Pty) Ltdon behalf of certain Makro stores were included in operating lease commitments in land and buildings. The promissory notes have been reclassified from‘operating lease liability’ to ‘promissory notes’ as a result of Massmart acquiring control of the leased properties in the current financial period. The finalpromissory note payment was honoured on 31 December 2013.
Other reserves
December 2013 December 2012
Rm Rm
Other reserves 517.6 323.3
Foreign currency translation reserve 104.5 57.3Hedging reserve 6.8 1.7Share-based payment reserve 708.2 579.2Capital redemption reserve fund 0.2 0.2Fair value adjustment of available-for-sale financial asset (13.2) (13.2)Fair value adjustment on listed shares 7.5 4.0Change in non-controlling interests 1.9 1.9Cost of acquiring minority interests (302.3) (306.1)Treasury shares (1.7) (1.7)Post-retirement medical aid actuarial gain 5.7 -

Major items in other reserves include the share-based payments reserve of R708.2 million (Dec 2012: R579.2 million), the foreign currency translation reserveof R104.5 million (Dec 2012 R57.3 million) and the debit balance for cost of acquiring minority interests of R302.3 million (Dec 2012: R306.1 million). The costof acquiring non-controlling interests comprises the costs paid for increasing the Group’s interest in a Group company above the company’s non-controllinginterest balance in the statement of financial position. This was previously recognised in goodwill, and even though it is now recognised in other reserves, thebalance will remain a debit balance.
On 1 October 2012, the final conversion for the beneficiaries of the Massmart Thuthukani Employment Trust took place. The employees had the option ofconverting their remaining share allocation into Massmart ordinary shares and continue to receive 100% of the dividend on their ordinary shares or they couldsell their remaining share allocation and receive net proceeds after tax and selling expenses. The relevant share-based payment reserve was released toretained income as can be seen in the ‘Release of share-based payment reserve’ of R292.6 million in the statement of changes in equity. More informationrelating to other reserves can be found in note 22.
Statement of changes in equity
for the year ended 29 December 2013
Share
capital
Share
premium
Other
reserves
Retained
profit
Equity
attributable to
equity holders of
the parent
Non-controlling
interests Total
Rm Rm Rm Rm Rm Rm Rm
Balance as at June 2012 2.2 750.6 - 614.7 - 2,989.4 4,356.9 207.9 4,564.8Total comprehensive income - - 22.5 693.2 715.7 29.2 744.9Profit for the period - - - 693.2 693.2 29.2 722.4Other comprehensive income for the period - - 22.5 - 22.5 - 22.5Dividends declared - - - (317.0) (317.0) - (317.0)Net changes in non-controlling interests - - - - - (21.9) (21.9)Distribution to non-controlling interests - - - - - (39.6) (39.6)Cost of acquiring non-controlling interests - - (13.6) - (13.6) - (13.6)Share-based payment expense - - 68.5 - 68.5 - 68.5Share trust net consideration - - - (72.6) (72.6) - (72.6)Release of share-based payment reserve(note 22) - - (292.6) 292.6 - - -Release of amortisation of trademark reserve - - (76.5) 76.5 - - -Treasury shares - 1.5 0.3 - 1.8 - 1.8
Balance as at December 2012 2.2 752.1 - 323.3 - 3,662.1 - 4,739.7 - 175.6-
4,915.3Total comprehensive income - - 61.5 1,283.0 1,344.5 59.1 1,403.6Profit for the period - - - 1,283.0 1,283.0 59.1 1,342.1Other comprehensive income for the period - - 61.5 - 61.5 - 61.5Dividends declared - - - (913.4) (913.4) - (913.4)Net changes in non-controlling interests - - 3.8 - 3.8 (7.2) (3.4)Distribution to non-controlling interests - - - - - (30.9) (30.9)Share-based payment expense - - 129.0 - 129.0 - 129.0Share trust net consideration - - - (121.8) (121.8) - (121.8)Treasury shares - (8.8) - - (8.8) - (8.8)
Balance as at December 2013 2.2 743.3 - 517.6 - 3,909.9 - 5,173.0 - 196.6-
5,369.6
The non-controlling interests comprise mainly CBW store managers’ holdings in certain Masscash stores. Net changes in non-controlling interests represents the acquisition of non-controlling interests by the Group. Distribution to non-controlling interests comprise dividends paid to non-controlling shareholders of a Group company. Cost of acquiring non-controlling interests comprise the costs paid for increasing the Group’s interest in a Group company above the company’s non-controlling interest balance in thestatement of financial position. The share trust net consideration is the cost of buying shares in the market above the exercise price to meet the demands of the Massmart share schemes.
1
2
3
4
5
2
3
5
1
2
3
4
5

Statement of cash flows
for the year ended 29 December 2013
December 2013 December 2012 December 2012
53 weeks 52 weeks 26 weeks
Rm Rm Rm
(Audited) (Reviewed) (Audited)
Cash flow from operating activities
Operating cash before working capital movements 2,984.0 2,681.8 1,707.5Working capital movements 752.6 (775.5) 1,110.0
Cash generated from operations 3,736.6 1,906.3 2,817.5Interest received 28.7 90.0 45.6Interest paid (283.8) (217.4) (106.0)Dividends received 79.2 0.1 -Taxation paid (732.8) (601.5) (369.1)Dividends paid (913.4) (864.7) (317.0)
Net cash inflow from operating activities 1,914.5 312.8 2,071.0
Cash flow from investing activities
Investment to maintain operations (780.2) (650.0) (347.6)Investment to expand operations (1,306.8) (685.2) (402.6)Proceeds on disposal of property, plant and equipment 25.6 14.2 8.6Proceeds on disposal of assets classified as held for sale 2.5 6.4 5.7Investment in subsidiaries - (383.6) (56.9)Disposal of subsidiaries - (50.7) (50.7)Other investing activities (247.4) 84.2 82.3
Net cash outflow from investing activities (2,306.3) (1,664.7) (761.2)
Cash flow from financing activities
(Decrease)/increase in non-current liabilities 483.5 303.8 (159.8)(Decrease)/increase in current liabilities (68.1) 1.6 (108.1)Non-controlling interests acquired (0.6) (27.3) (27.3)Net acquisition of treasury shares (121.8) (142.5) (72.6)
Net cash (outflow)/inflow from financing activities 293.0 135.6 (367.8)Net increase/(decrease) in cash and cash equivalents (98.8) (1,216.3) 942.0Foreign exchange movements 47.2 6.0 25.1Cash and cash equivalents at the beginning of the year 1,639.9 2,850.2 672.8
Cash and cash equivalents at the end of the year 1,588.3 1,639.9 1,639.9
Operating cash performance remains resilient and increased by 11.3% to R2,984.0 million (52 weeks to Dec 2012: R2,681.8 million). This is a good indication ofthe quality of earnings of the Group. Cash released from working capital increased to R752.6 million (52 weeks to Dec 2012: (R775.5 million)). Theimprovement is a combination of an improved working capital performance across the business outside of Game SA; and the positive effect of the additional53rd week.
December 2013 December 2012
Rm Rm
Working capital movements 752.6 (775.5)
Increase in inventories (424.0) (1,248.0)Increase in trade receivables (30.7) (134.5)Increase in trade payables 1,254.6 622.7Decrease in provisions (47.3) (15.7)
Total tangible and intangible capital expenditure (replacement and expansion) was R2,087.0 million, an increase on the 52 weeks to December 2012 ofR1,335.2 million (26 weeks to December 2012: R750.2 million). Capital expenditure is the highest in the history of the Group but is in line with the Group’sstrategy of investing for the future. Excluding property acquisitions; capital expenditure as a % of sales was in line with expectations. Capital expenditureexcluding property acquisitions, will slow down during the next 12 months as the Group begins to realise the benefits of its investments over the last few years.We will however continue to invest in the Group’s strategic drive to: own more of our key stand-alone properties; roll-out Food Retail stores; roll-out Fresh intoGame; increase the rate of expansion in Africa; and open more lower-income home improvement stores in South Africa.
Investment in subsidiaries has been covered in the ‘Acquisition of subsidiaries and property’ paragraph. More information relating to the statement of cashflows can be found in note 37.
Financial risks
These are described very briefly below, however, more information relating to the Group’s financial risk management and related sensitivity analysis can befound in financial instruments note 39.
Liquidity risk
Liquidity risk is considered low owing to the Group’s conservative funding structure and its high cash generation. Massmart’s liquidity requirements arecontinually assessed through the Group’s cash management and treasury function. The Group has total banking facilities, incorporating overnight, short- andmedium-term borrowings, letters of credit and forward exchange contracts of R7,235.7 million (Dec 2012: R5,428.6 million). As at December 2013, totalinterest-bearing debt amounted to R2.3 billion (Dec 2012: R1.7 billion). As the Group builds inventory levels for the festive season, net interest-bearing debtincreases up to approximately R4.0 billion in October/November, but will reduce rapidly as Christmas trading accelerates with commensurately higher cashproceeds.
Interest risk
Interest rate exposure is actively monitored owing to the Group’s significant intra-month cash movements and the seasonal changes in its net funding profileduring the financial year. As noted above, interest rates on the medium-term bank loans are fixed ranging between 7.2% and 8.1%. The remaining interest-bearing funding is financed through overnight facilities at floating interest rates. Of the Group’s total financial instrument liabilities of R18.4 billion, 85.7% orR15.8 billion is represented by non-interest-bearing trade and other payables funding.

Credit risk
Credit is available to wholesale customers at Makro, Massbuild and Masscash, and is adequately controlled by using appropriately trained personnel, applyingcredit granting criteria, continual monitoring and the use of software tools. A portion of the trade debtors’ book in Masscash is insured and a further portion issecured through general notarial bonds, pledges and other forms of security. Similarly, the trade debtors books in Builders Warehouse and Builders Trade Depotare also largely insured.
Currency risk
Where possible and practical, currency risk in the Group is actively managed. All foreign-denominated trading liabilities are covered by matching forward-exchange contracts. At financial year-end, there were open forward exchange contracts totalling R759.2 million (Dec 2012: R713.1 million) of which 98.0% (Dec2012: 98.6%) were US Dollar liabilities. The sensitivity of the Group to this exposure is shown in note 39. In brief, using the US Dollar as a proxy for the Group’stotal currency exposure, if the Rand strengthened by 10% (Dec 2012: 5%) from the period-end rate of R10.54/US Dollar (Dec 2012: R8.59/US Dollar), there wouldbe a R4.6 million charge, while a 10% weakening would give rise to a R4.6 million gain (Dec 2012 equivalent figures were R3.9 million). The Group has increasedthe sensitivity calculation from 5% to 10% to appropriately reflect the large movement in the Rand in the current year.
Foreign-denominated assets are not covered by forward exchange contracts, as these are permanent assets held for the long-term. The Walmart creditor, whilstcurrent in nature, has not been covered.
The Group’s exposure to the basket of African currencies has been explained in note 7 and further detail on the sensitivity analysis can be found in note 39.
Segmental review
Primary business segments
The Group is organised into four divisions for operational and management purposes, being Massdiscounters, Masswarehouse, Massbuild and Masscash.Massmart reports its business segment information on this basis. The principal offering for each division is as follows:
for the year ended 29 December 2013
Total Corporate Massdiscounters Masswarehouse Massbuild Masscash
Rm Rm Rm Rm Rm Rm
Sales 72,263.4 - 16,740.6 19,675.1 9,583.6 26,264.1Operating profit before interest and taxation 2,152.5 (37.9) 449.0 988.1 505.3 248.0Trading profit before interest and taxation 2,145.4 - 366.6 990.2 507.6 281.0Net finance (costs)/income (255.1) (349.6) 34.0 38.5 29.2 (7.2)Operating profit before taxation 1,897.4 (387.5) 483.0 1,026.6 534.5 240.8Trading profit before taxation 2,239.9 - 400.6 1,028.7 536.8 273.8
Inventory 10,115.5 12.6 3,647.2 2,618.2 1,597.0 2,240.4Total assets 26,147.9 (2,614.7) 7,718.3 7,166.8 5,212.0 8,665.5Total liabilities 20,778.3 (6,027.7) 7,522.2 6,587.8 4,857.4 7,838.6
Net capital expenditure 2,061.4 759.0 489.7 344.8 275.1 192.8Depreciation and amortisation 731.1 33.9 256.4 145.4 121.2 174.2Impairment losses 41.6 - - 2.1 - 39.5Non-cash items other than depreciation and impairment 138.0 458.0 23.3 (352.2) 13.6 (4.7)
Cash flow from operating activities 1,914.5 399.4 990.1 273.9 356.9 (105.8)Cash flow from investing activities (2,306.3) (1,424.0) (490.6) (385.2) (275.2) 268.7Cash flow from financing activities 293.0 819.4 (621.6) 209.3 1.4 (115.5)
Inventory days 63.7 - 109.3 59.2 92.3 35.2Number of stores 376 - 143 19 92 122Trading area (m ) 1,481,308 - 475,331 195,794 410,546 399,637Trading area (m ) increase on December 2012 4.8% - 7.7% 9.3% 3.7% 0.6%Trading area (m ) increase on December 2012 (excluding re-measurements) 4.8% - 6.5% 9.3% 5.8% -0.2%Average trading area per store (m ) 3,940 - 3,324 10,305 4,462 3,276Distribution centre space (m ) 323,813 - 178,488 51,300 61,733 32,292Distribution centre space (m ) increase on December 2012 11.4% - - - 108.4% 3.2%Number of full-time equivalents 37,554 403 12,870 4,929 8,882 10,470Number of full-time equivalents increase on December 2012 4.2% 28.3% -6.5% 27.9% 9.9% 4.3%
The corporate column includes certain consolidation entries. All intercompany transactions have been eliminated in the above results. Trading profit before taxation is earnings before corporate net interest, asset impairments, BEE transaction IFRS 2 charges, foreign exchange movements, loss on disposal of business, and assetsclassified as held for sale.
Net capital expenditure is defined as capital expenditure less disposal proceeds.
2
2
2
2
2
2

For the 26 week year ended December 2012
Total Corporate Massdiscounters Masswarehouse Massbuild Masscash
Rm Rm Rm Rm Rm Rm
Sales 36,122.6 - 8,422.1 9,630.2 4,663.1 13,407.2Operating profit before interest and taxation 1,125.1 (214.9) 352.5 516.4 269.1 202.0Trading profit before interest and taxation 1,427.1 - 426.5 518.1 271.0 211.5Net finance (costs)/income (60.4) (131.8) 23.1 17.0 21.6 9.7Operating profit before taxation 1,064.7 (346.7) 375.6 533.4 290.7 211.7Trading profit before taxation 1,498.5 - 449.6 535.1 292.6 221.2
Inventory 9,691.5 31.2 3,406.2 2,376.9 1,321.6 2,555.6Total assets 23,019.8 (3,462.5) 7,667.1 6,136.0 4,594.9 8,084.3Total liabilities 18,104.5 (7,176.7) 7,492.7 6,299.1 4,236.5 7,252.9
Net capital expenditure 741.6 22.4 261.8 265.9 73.8 117.7Depreciation and amortisation 342.6 9.4 128.1 62.0 61.6 81.5Impairment losses 5.4 - - - - 5.4Non-cash items other than depreciation and impairment 234.4 190.9 34.5 22.6 12.1 (25.7)
Cash flow from operating activities 2,071.0 1,545.9 37.2 100.9 102.4 284.6Cash flow from investing activities (761.2) 54.9 (261.6) (253.2) (73.7) (227.6)Cash flow from financing activities (367.8) (1,087.6) 388.0 249.1 (11.8) 94.5
Inventory days 59.9 - 99.7 53.6 73.7 38.8Number of stores 359 - 133 18 85 123Trading area (m ) 1,413,573 - 441,382 179,202 395,871 397,118Trading area (m ) increase on June 2012 (excluding re-measurements) 4.7% - 5.8% 17.0% 0.5% 3.3%Average trading area per store (m ) 3,938 3,319 9,956 4,657 3,229Distribution centre space (m ) 290,704 - 178,488 51,300 29,624 31,292Distribution centre space (m ) increase on June 2012 11.1% 314 5.6% 32.2% 0.0% 29.3%Number of full-time equivalents 36,053 314 13,767 3,854 8,083 10,035Number of full-time equivalents increase on June 2012 11.1% 0.3% 38.1% 9.5% 9.4% -10.8%
Secondary geographic segments
The Group’s four divisions operate in two principal geographical areas – South Africa and the rest of Africa.
Total South Africa Rest of Africa Total South Africa Rest of Africa
December 2013 December 2013 December 2013 December 2012 December 2012 December 2012
53 weeks 53 weeks 53 weeks 26 weeks 26 weeks 26 weeks
Rm Rm Rm Rm Rm Rm
Sales 72,263.4 66,676.1 5,587.3 36,122.6 33,503.5 2,619.1Segment assets 19,238.5 18,320.0 918.5 16,719.2 16,218.3 500.9Net capital expenditure 2,061.4 1,891.9 169.5 741.6 700.6 41.0
All inter-company transactions have been eliminated in the above results. Segment assets excludes financial instruments and deferred taxation and reflects the geographic location of the Group’sphysical current and non-current assets.
Net capital expenditure is defined as capital expenditure less disposal proceeds.
More information relating to segmental reporting can be found in note 40.
Related-party transactions
Related-party transactions comprise:
Transactions between the Company and its subsidiaries, which have been eliminated on consolidation and are thus not disclosed.Compensation of key-management personnel.Transactions between the Company and Wal-Mart Stores, Inc. (its ultimate Holding Company).The Group holds cash reserves on behalf of the Group’s out-going Chairman, Lamberti Education Foundation Trust.Loans to directors.The post-retirement medical aid liability, Massmart Pension Fund and Massmart Provident Fund are managed for the benefit of past and currentemployees of the Group.
More information on related-party transactions can be found in note 33.
Directors’ emoluments
A detailed review can be found in ‘Our Employees’.This information can also be found in note 34 and 35
2
2
2
2
2

Technical review
The appropriate accounting policies, supported by sound and prudent management judgement and estimates, have been consistently applied in all materialrespects with those of the previous financial year, except for:
IFRS 7 Disclosures – Offsetting Financial Assets and Financial Liabilities – Amendments to IFRS 7;IFRS 10 Consolidated Financial Statements;IAS 27 Separate Financial Statements;IFRS 11 Joint Arrangements;IAS 28 Investments in Associates and Joint Ventures;IFRS 12 Disclosure of Interests in Other Entities;IFRS 13 Fair Value Measurement; andIAS 19 Employee Benefits (Revised).
No restatement was required in these financial statements and only IAS 19 Employee Benefits has a financial impact on the Group.
These financial statements have been prepared in accordance with the framework concepts and the measurement and recognition requirements ofInternational Financial Reporting Standards (IFRS), its interpretations issued by the IFRS Interpretations Committee, the SAICA Financial Reporting Guides asissued by the Accounting Practices Committee and Financial Pronouncements as issued by the Financial Reporting Council, the JSE Listing Requirements andthe requirements of the Companies Act of South Africa. A technical review has been provided in note 2 of standards issued and not yet effective as well asstandards that became effective in the current period.
Independent auditors
To align with Wal-Mart Stores, Inc. (Massmart’s ultimate holding company), Massmart changed its External Auditors to Ernst & Young Inc. with effect from theprevious reporting cycle.
Critical judgements in applying the Group’s accounting policies
In the process of applying the Group’s accounting policies, management has not made any critical judgements that have a significant effect on the amountsrecognised in the financial statements. Management applies judgement in classifying a lease as financing or operating at its inception.
Key sources of estimation uncertainty
The following areas highlight where estimation has been used in the Group financial results:Property, plant and equipment useful lives and residual valuesGoodwill impairment
Inventory provisionsAllowance for doubtful debtsFair value of equity awards grantedProvision for post-retirement medical aidDeferred tax assets – estimation of future taxable profitFair value measurement of financial instruments
More detail on estimation uncertainty is provided in note 42
Going-concern assertion
The Board has formally considered the going-concern assertion for Massmart and its subsidiaries and believes that it is appropriate for the forthcomingfinancial year. The going concern assertion can be found in the Directors’ report.
Appreciation
I would like to acknowledge and pay tribute to my Finance colleagues and their teams in the Massmart Divisions, the Massmart Corporate Office and Walmartfor their continued commitment to the integration process and on-going demands of their Divisions and those of the Group. The significant effort andhigh-quality of their performance allows the Group to deliver results at an expected high standard to our various stakeholders.
I Zwarenstein
Group Financial Director10 April 2014

FIVE YEAR REVIEWFOR THE YEAR ENDED 29 DECEMBER 2013
Income statement (Rm)
FFoouurr--yyeeaarrccoommppoouunnddggrroowwtthh %% 22001133 22001122 22001111 22001100 22000099
Revenue 12.9 72,512.9 66,050.3 57,177.8 50,795.2 44,633.3Sales 12.9 72,263.4 65,839.5 57,066.5 50,673.3 44,524.0Cost of sales (58,926.4) (53,563.0) (46,767.6) (41,513.1) (36,518.3)
Gross profit 13.6 13,337.0 12,276.5 10,298.9 9,160.2 8,005.7Other income 249.5 210.8 111.3 121.9 109.3Depreciation and amortisation (731.1) (661.2) (530.4) (417.3) (358.9)Impairment of assets (41.6) (21.6) (10.3) (3.7) (1.6)Employment costs (5,423.5) (4,686.5) (4,066.9) (3,568.4) (3,094.2)Occupancy costs (2,555.3) (2,296.5) (1,826.6) (1,552.9) (1,270.9)Foreign exchange gain/(loss) 67.8 (231.6) 89.6 (175.1) (199.9)Other operating costs (2,750.3) (2,533.0) (1,783.9) (1,621.3) (1,433.9)
Operating profit before Walmart transaction costs and loss on disposal of Makro Zimbabwe 5.2 2,152.5 2,056.9 2,281.7 1,943.4 1,755.6Walmart transaction, integration and related costs - (348.9) (450.5) - -Loss on disposal of Makro Zimbabwe - - (38.6) - -
Operating profit 5.2 2,152.5 1,708.0 1,792.6 1,943.4 1,755.6Finance costs (283.8) (217.4) (154.6) (102.3) (100.5)Finance income 28.7 90.0 40.0 41.4 54.5Net finance costs (255.1) (127.4) (114.6) (60.9) (46.0)
Profit before taxation 1,897.4 1,580.6 1,678.0 1,882.5 1,709.6Taxation (555.3) (549.6) (633.7) (625.7) (587.2)
Profit for the year 4.6 1,342.1 1,031.0 1,044.3 1,256.8 1,122.4
PPrrooffiitt aattttrriibbuuttaabbllee ttoo::Owners of the parent 1,283.0 972.3 993.2 1,174.7 1,036.2Preference shareholders - 5.0 24.0 49.9 39.7Non-controlling interests 59.1 53.7 27.1 32.2 46.5
Profit for the year 1,342.1 1,031.0 1,044.3 1,256.8 1,122.4
Earnings per share (cents)
Basic EPS 3.4 591.4 449.8 461.7 581.9 517.6Diluted basic EPS 3.7 585.1 443.2 454.4 545.2 506.5
Trading profit before interest and taxation 1.4 2,145.4 2,147.8 2,233.9 2,173.0 2,032.6
EBITDA before foreign exchange 5.4 2,857.4 2,971.3 2,732.8 2,539.5 2,316.0
EBITDAR before foreign exchange 10.8 5,412.7 5,267.8 4,559.4 4,092.4 3,586.9
Headline earnings 6.5 1,334.5 1,027.0 1,037.6 1,183.8 1,038.8Headline earnings before foreign exchange (taxed) 2.1 1,285.7 1,193.8 973.1 1,309.9 1,182.7
Details of the ratios and terms can be found in definitions and formulas All periods are 12 month periods Foreign exchange movements relating to the cost of stock were reallocated from ‘Foreign exchange gain/(loss)’ to ‘Cost of sales’ from the December 2011 financial year onwards, in linewith the Group’s accounting policy.2013 was a 53-week periodWalmart integration and related costs have been included in the prior financial yearExcludes Walmart transaction, integration and related costs and the loss on disposal of Makro Zimbabwe
1
2
3
3
1
2
3

Statement of financial position and statement of cash flows (Rm)
FFoouurr--yyeeaarrccoommppoouunnddggrroowwtthh %% 22001133 22001122 22001111 22001100 22000099
Statement of financial position (Rm)
AAsssseettssNon-current assets 20.9 10,111.8 7,595.1 6,289.5 5,536.0 4,739.3Current assets 9.4 16,036.1 15,422.2 14,972.3 12,440.6 11,192.5Inventory 14.0 10,115.5 9,691.5 8,385.2 7,336.1 5,997.3Non-current assets classified as held for sale - 2.5 2.1 4.6 -
Total assets13.2 26,147.9 23,019.8 21,263.9 17,981.2 15,931.8
EEqquuiittyy aanndd lliiaabbiilliittiieessTotal equity 9.9 5,369.6 4,915.3 4,864.6 4,009.7 3,677.7Equity attributable to equity holders of the parent 5,173.0 4,739.7 4,658.1 3,857.5 3,547.9Non-current liabilities 28.0 2,206.4 1,183.4 928.9 859.8 821.2Current liabilities 12.9 18,571.9 16,921.1 15,470.4 13,111.7 11,432.9Trade payables 10.7 13,702.5 12,601.3 12,281.1 10,261.4 9,116.7
Total equity and liabilities13.2 26,147.9 23,019.8 21,263.9 17,981.2 15,931.8
Statement of cash flows (Rm)
Operating cash 7.6 2,984.0 2,681.8 2,536.8 2,383.3 2,226.1Working capital movements 752.6 (775.5) 450.3 (96.9) 292.4
Cash generated from operations10.4 3,736.6 1,906.3 2,987.1 2,286.4 2,518.5
Net Interest paid (255.1) (127.4) (114.6) (60.9) (46.0)Investment income 79.2 0.1 18.4 43.7 49.0Taxation paid (732.8) (601.5) (691.4) (602.3) (688.2)Dividends paid (913.4) (864.7) (826.7) (827.4) (813.4)
Net cash flow from operating activities1,914.5 312.8 1,372.8 839.5 1,019.9
Investment to maintain operations (752.1) (629.4) (453.8) (362.3) (368.4)Investment to expand operations (1,306.8) (685.2) (920.8) (542.7) (278.5)Businesses acquired - (383.6) (84.0) (310.9) (197.3)Other (247.4) 33.5 133.2 (169.2) 31.1
Net cash flow from investing activities29.8 (2,306.3) (1,664.7) (1,325.4) (1,385.1) (813.1)
Net cash flow from financing activities293.0 135.6 707.7 33.5 (145.4)
Net (decrease)/increase in cash and cash equivalents (98.8) (1,216.3) 755.1 (512.1) 61.4Foreign exchange losses taken to FCTR 47.2 6.0 95.2 (4.9) (89.4)Cash and cash equivalents at the beginning of the period 1,639.9 2,850.2 1,999.9 2,516.9 2,544.9
Cash and cash equivalents at the end of the period1,588.3 1,639.9 2,850.2 1,999.9 2,516.9
Details of the ratios and terms can be found in definitions and formulas All periods are 12 month periods2013 was a 53-week period.
1
1

Stores and productivity measures in Rands
FFoouurr--yyeeaarrccoommppoouunnddggrroowwtthh %% 22001133 22001122 22001111 22001100 22000099
RRaattiiooss//iinnddiiccaattoorrss
Operating statistics
Depreciation and amortisation costs as a % of sales 1.0 1.0 0.9 0.8 0.8Impairment costs as a % of sales 0.1 - - - -Employment costs as a % of sales 7.5 7.1 7.1 7.0 6.9Occupancy costs as a % of sales 3.5 3.5 3.2 3.1 2.9Total operating costs before foreign exchange as a % of sales 15.9 15.3 14.2 14.1 13.8
Number of stores by chain
Game 121 114 106 97 92DionWired 22 19 16 12 10MMaassssddiissccoouunntteerrss 143 133 122 109 102
Makro 19 18 16 14 13MMaasssswwaarreehhoouussee 19 18 16 14 13
Builders Warehouse 34 28 28 27 23Builders Trade Depot 20 29 26 23 29Builders Express 36 28 30 30 21Builders Superstore 2 - - - -MMaassssbbuuiilldd 92 85 84 80 73
Wholesale Cash and Carry 75 77 80 79 87Retail Cash and Carry 47 44 28 26 -MMaassssccaasshh 122 121 108 105 87
Total number of stores8.1 376 357 330 308 275
FTE (full-time equivalents) 6.7 37,554 36,053 33,638 29,759 29,020
Trading space (m ) 6.5 1,481,308 1,413,573 1,321,233 1,249,584 1,149,590
Distribution centre space (m2) 22.7 323,813 290,704 246,252 212,738 142,738
Sales per store (R’000) 183,008 175,887 164,306 154,351 152,584Sales per FTE (R’000) 1,924 1,826 1,696 1,703 1,534Sales per trading m (R’000) 49 47 43 41 39
Details of the ratios and terms can be found in definitions and formulas All periods are 12 month periods2013 was a 53-week period.Excludes Walmart transaction, integration and related costs and the loss on disposal of Makro Zimbabwe
1
2
2
2
1
2

Returns, profitability and share information in Rands
FFoouurr--yyeeaarrccoommppoouunnddggrroowwtthh %% 22001133 22001122 22001111 22001100 22000099
Productivity ratios
Net asset turn 11.0 11.8 10.9 11.6 11.9Gross margin (%) 18.5 18.6 18.0 18.1 18.0Operating margin (%) 3.0 3.1 4.0 3.8 3.9
Trading profit before interest and taxation margin (%) 3.0 3.3 3.9 4.3 4.6
EBITDA before foreign exchange margin (%) 4.0 4.5 4.8 5.0 5.2
Effective tax rate (%) 29.3 34.8 37.8 33.2 34.3
Profitability and gearing ratios
Return on average shareholders’ equity before foreign exchange (taxed) (%) 25.9 27.6 24.5 35.4 34.9
Return on capital employed before foreign exchange (%) 35.0 36.2 35.7 52.3 54.1
Return on invested capital (%) 18.2 17.7 21.5 21.2 21.7Debt: Equity (%) 18.0 10.7 8.2 5.6 4.2Cash earnings cover 2.2 2.6 2.4 2.0 2.1
Solvency and liquidity ratios
Net cash to total equity (%) 29.6 33.4 58.6 49.9 68.4Current ratio 0.9 0.9 1.0 0.9 1.0Quick ratio 0.3 0.3 0.4 0.4 0.5Inventory days days 63.7 65.9 65.3 64.3 59.8Inventory turn 5.8 5.5 5.6 5.7 6.1Payable days days 75.7 75.1 83.8 78.9 79.7Asset turn 2.8 2.9 2.7 2.8 2.8Total liabilities to total equity 3.9 3.7 3.4 3.5 3.3
Per share performance (cents)
Headline earnings 4.4 615.2 475.2 479.2 584.4 518.1Headline earnings before foreign exchange (taxed) 0.1 592.7 552.3 449.4 646.6 589.9Diluted headline earnings 4.6 608.6 468.1 475.1 549.6 507.6Attributable earnings 3.4 591.4 449.8 458.7 579.9 516.8Dividends/distribution 2.2 421.0 421.0 386.0 386.0 386.0Cash generated from operations before working capital movements 5.5 1,375.5 1,240.8 1,171.5 1,176.5 1,110.2Operating cash flow 9.3 1,303.6 544.8 1,015.7 822.9 914.3Net asset value 7.8 2,382.7 2,185.1 2,158.0 1,893.2 1,761.9Dividend cover 1.46 1.13 1.24 1.51 1.34
Stock exchange information
Shares in issue (millions) 217.1 216.9 215.9 203.8 201.4Weighted average number of shares (millions) 216.9 216.1 216.5 202.6 200.5Diluted weighted average number of shares (millions) 219.3 219.4 218.9 218.9 205.3Shares traded (millions) 98.0 73.7 137.6 232.2 206.7Percentage of shares traded (%) 45.1 34.0 63.7 114.0 102.6Earnings yield (%) 4.4 2.4 2.7 4.0 5.9Dividends yield (%) 3.1 2.2 2.2 2.6 4.4Market capitalisation (Rm) 29,414 41,041 37,194 29,849 17,737Share price South African (cents):High 20,800 19,241 17,449 15,316 9,257Low 12,710 15,652 12,600 8,341 6,120Closing 13,548 18,921 17,237 14,650 8,808
Details of the ratios and terms can be found in definitions and formulas All periods are 12 month periods2013 was a 53-week period.Excludes Walmart transaction, integration and related costs and the loss on disposal of Makro ZimbabweWalmart integration and related costs have been included in the prior financial yearExcludes Walmart transaction costsTaking into account intra-day high and low prices.
1
2
3
2
4
5
5
1
2
3
4
5

Income statement, statement of financial position and statement of cash flows in US Dollars ($m)
FFoouurr--yyeeaarrccoommppoouunnddggrroowwtthh %% 22001133 22001122 22001111 22001100 22000099
Income statement
Revenue
Sales 9.3 7,519.6 8,029.2 7,893.0 6,913.1 5,269.1Cost of sales (6,131.8) (6,532.1) (6,468.5) (5,663.5) (4,321.7)
Gross profit10.0 1,387.8 1,497.1 1,424.5 1,249.6 947.4
Other income and expenses (1,163.8) (1,246.3) (1,108.9) (984.6) (739.7)
Operating profit before Walmart transaction costs and loss on disposal of Makro Zimbabwe1.9 224.0 250.8 315.6 265.0 207.7
Walmart transaction, integration and related costs - (42.5) (62.3) - -Loss on disposal of Makro Zimbabwe - - (5.3) - -Net finance costs (26.5) (15.5) (15.9) (8.3) (5.4)
Profit before tax(0.6) 197.5 192.8 232.1 256.7 202.3
Taxation (57.8) (67.0) (87.6) (85.4) (69.5)
Profit for the year1.3 139.7 125.8 144.5 171.3 132.8
Profit attributable to:
Owners of the parent 2.2 133.6 118.6 137.4 160.3 122.6Preference shareholders - 0.6 3.3 6.8 4.7Non-controlling interests 6.1 6.5 3.7 4.4 5.5
Profit for the year 1.3 139.7 125.7 144.4 171.5 132.8
Headline earnings 3.1 138.9 125.2 143.5 161.5 122.9
Statement of financial position
Total equity 1.2 510.4 572.2 596.2 590.5 487.1Cash and cash equivalents at the end of the period 151.0 190.9 349.3 294.5 333.4Total assets 4.2 2,485.5 2,679.8 2,605.9 2,648.2 2,110.2Inventories 4.9 961.5 1,128.2 1,027.6 1,080.4 794.3Trade and other payables 1.9 1,302.5 1,467.0 1,505.0 1,511.3 1,207.5
Statement of cash flows
Cash generated from operations 6.9 388.8 232.5 413.2 311.9 298.0Net cash flow from operating activities 13.3 199.2 38.1 189.9 114.5 120.7Net cash flow from investing activities 25.7 (240.0) (203.0) (183.3) (189.0) (96.2)
Exchange rates (Rand/US$)
At year-end 10.52 8.59 8.16 6.79 7.55Average for the year 9.61 8.20 7.23 7.33 8.45
Details of the ratios and terms can be found in definitions and formulas All periods are 12 month periods2013 was a 53-week period.
1
1

Profitability and share performance in US Dollars
FFoouurr--yyeeaarrccoommppoouunnddggrroowwtthh %% 22001133 22001122 22001111 22001100 22000099
Ratios/indicators
PPrrooffiittaabbiilliittyy aanndd ggeeaarriinngg rraattiioossReturn on average shareholders’ equity before foreign exchange (taxed) (%) 28.4 28.9 27.7 32.8 31.2
Return on capital employed before foreign exchange (%) 47.0 43.7 45.4 53.1 51.6
Return on invested capital (%) 18.2 17.9 21.7 21.0 21.7Debt: Equity (%) 18.0 10.7 8.2 5.6 4.2
LLiiqquuiiddiittyy rraattiioossCurrent ratio 0.9 0.9 1.0 0.9 1.0Inventory days 58.2 62.9 57.8 69.4 66.9
Per share performance (cents)
Headline earnings (3.9) 58.5 55.3 58.7 86.1 68.6Diluted headline earnings (3.7) 57.9 54.5 58.2 80.9 67.2Attributable earnings (4.8) 56.2 52.4 56.2 85.4 68.5Dividends/distribution (5.9) 40.0 49.0 47.3 56.8 51.1Cash generated from operations before working capital movements (2.9) 130.8 144.4 143.6 173.3 147.0Operating cash flow 0.6 123.9 63.4 124.5 121.2 121.1Net asset value (0.7) 226.5 254.4 264.5 278.8 233.4Dividend cover 1.5 1.1 1.2 1.5 1.3
Stock exchange information
Market capitalisation ($m) 2,796.0 4,777.8 4,558.1 4,396.0 2,349.3
Exchange rates (Rand/US$)
At year-end 10.52 8.59 8.16 6.79 7.55Average for the year 9.61 8.20 7.23 7.33 8.45
Details of the ratios and terms can be found in definitions and formulas All periods are 12 month periods2013 was a 53-week period.Excludes Walmart transaction costs
1
2
1
2

INVESTOR RELATIONS
We strive to provide useful and frequent disclosure to our shareholders, regardlessof how uncomfortable this may be in periods of difficulty or underperformance.
Massmart reports formally to shareholders twice a year (in February and August)when its full-year and half-year results, together with a thorough Executiveoverview, are announced and issued to shareholders and the media. On bothoccasions the CEO, COO, Group FD and certain Group Executives givepresentations to institutional investors, analysts and the media.
Early in January and July, shortly after the conclusion of the full-year and half-yeartrading periods, on release of the Integrated Annual Report and at the Group’sannual general meeting in May, Massmart releases sales updates reporting on theGroup’s year-to-date sales performance. In addition, annually in November, theCEO, COO and Group FD host a day-long visit by institutional analysts andinvestors to Massmart stores. A sales update is released along with this visit.
During the year, apart from closed periods, the CEO, COO and Group FD togethermeet regularly with institutional shareholders and, in addition, are available formeetings or conference calls with analysts and any existing or prospectiveMassmart shareholders.
Company SecretaryP Sigsworth, CA(SA)
Contact details
Registered office Postal addressMassmart House Private Bag X416 Peltier Drive SunninghillSunninghill Ext 6 2157Sandton South Africa2146South Africa
Telephone number+ 27 (0) 11 517 0000Facsimile number+ 27 (0) 11 517 0020Websitewww.massmart.co.za
Indicators
Company registration number1940/014066/06 (incorporated in South Africa)JSE share codeMSMISINZAE000152617
Stock exchange information at 29 December 2013
Shares in issue (millions) 217.1
Shares traded (millions) 98.0
Percentage of shares traded (%) 45.1
Earnings yield (%) 4.4
Dividends yield (%) 3.1
Market capitalisation (Rm) 29,414
Closing share price South African (Rand) 135.48
Design partners
Publisher Integrated Annual ReportInceDesignStudio Shelf
PhotographerMaritza KrielGareth Gilmour
Corporate partners
Transfer secretariesComputershare Investor Services Proprietary Limited70 Marshall StreetJohannesburg2001
Principal bankersABSA Bank LimitedFirst National Bank(A division of FirstRand Bank Limited)Investec Bank LimitedNedbank Group LimitedThe Standard Bank of South Africa Limited
AuditorsErnst & Young Inc.
Corporate law advisorsCliffe Dekker HofmeyrEdward Nathan Sonnenbergs
Lead sponsorDeutsche Securities (SA) Proprietary Limited

DEFINITIONS AND FORMULAS
Employment costs
Includes the IFRS 2 Share-based Paymentexpense.
Trading profit before interest and
taxation margin (%)
Trading profit before interest and taxation Sales
Other operating costs
Includes the foreign exchange gains andlosses.
EBITDA margin (%)
EBITDA Sales
Net finance costs
Interest received less interest paid.
Effective tax rate (%)
Taxation Profit before tax
Note 9 of the financial section holds furtherinformation.
EBITDA
Earnings before interest, taxation, depreciation,
amortisation and asset impairments.
Return on average shareholders’ equity
(%)
Headline earnings Average of opening and closing equity
attributable to equity holders of the parent
Asset turn
Sales Total assets
EBITDAR
Earnings before interest, taxation, depreciation,amortisation, asset impairments andoccupancy costs.
Return on capital employed (%)
Operating profit before asset impairments Average of opening and closing capital
employed balances
The Group defines capital employed as capitaland reserves and interest-bearing LT liabilities.
Total liabilities to total equity
Current and non-current liabilities Total equity
Trading profit before interest and
taxation
Earnings before interest, taxation, assetimpairments, the BEE IFRS 2 charge, foreignexchange movements, loss on disposal ofbusiness, assets classified as held for sale andWalmart related costs.
Return on invested capital (%)
Adjusted operating profi t Average invested capital
Adjusted operating profit includes financeincome and adds back depreciation,amortisation and occupany costs. Averageinvested capital is average total assets ofcontinuing operations plus averageaccumulated depreciation and amortisationless average accounts payable less averageaccrued liabilties plus occupancy costs x8.
Diluted headline earnings per share
Headline earnings Diluted weighted average number of shares
in issue
Comparable sales
Sales figures quoted for stores that havetraded, for all 12 months of the current andprior year.
Debt: Equity (%)
Debt Capital and reserves
Debt comprises non-current interest-bearingliabilities.
Attributable earnings per share
Earnings attributable to the equity holdersof the parent
Weighted average number of shares in issue
FTE (full-time equivalents)
Includes all permanent employees and thepermanent equivalent of temporary employeesand contracted workers.
Cash earnings cover
Operating cash flow per share Headline earnings per share
Trading space (m )
Trading space excludes parking, yard,warehouse space, office space and receivingareas.
2

Net cash to total equity (%)
Cash and cash equivalents, net ofborrowings
Total equity at the end of the year
Cash generated from operations before
working capital movements per share
Cash generated from operations beforeworking capital movements
Weighted average number of shares in issue
Distribution centre space (m2)
Distribution centre space excludes parkingand yard space.
Sales per store (R000)
Sales Number of stores
Current ratio
Current assets Current liabilities
Dividends/distribution
Distribution to shareholders
Operating cash fl ow per share
Net cash flow from operations Weighted average number of shares in issue
Net cash flow from operations is after workingcapital movements, and excludes exceptionalitems and dividends paid.
Sales per FTE (R000)
Sales FTEs
Quick ratio
Current assets excluding inventory Current liabilities
Net asset value per share
Capital and reserves Total number of shares in issue
Sales per trading m (R000)
Sales Trading m
Sales for Shield, CellShack, Saverite, Kawenaand Kangela are excluded as they do not havestores.
Dividend cover
Headline earnings per share Interim and final dividend per share
Net asset turn
Sales Net assets
The Group defines net assets as capitalreserves and interest-bearing LT liabilities.
Gross margin (%)
Gross profit Sales
Operating margin (%)
Operating profit Sales
2
2

GROUP INCOME STATEMENTFOR THE YEAR ENDED 29 DECEMBER 2013
December 2013 December 2012
53 weeks 26 weeks
Notes Rm Rm
Revenue 4 72,512.9 36,234.5
Sales 4 72,263.4 36,122.6
Cost of sales (58,926.4) (29,523.2)
Gross profit 13,337.0 6,599.4
Other income 4 249.5 111.9
Depreciation and amortisation 12 and 14 (731.1) (342.6)
Impairment of assets 5 (41.6) (5.4)
Employment costs (5,423.5) (2,487.5)
Occupancy costs (2,555.3) (1,225.6)
Foreign exchange gain/(loss) 7 67.8 (76.7)
Other operating costs (2,750.3) (1,243.2)
Operating profit before Walmart costs 2,152.5 1,330.3
Walmart transaction, integration and related costs 6 - (205.2)
Operating profit 6 2,152.5 1,125.1
Finance costs 8 (283.8) (106.0)
Finance income 8 28.7 45.6
Net finance costs (255.1) (60.4)
Profit before taxation 1,897.4 1,064.7
Taxation 9 (555.3) (342.3)
Profit for the year 1,342.1 722.4
PPrrooffiitt aattttrriibbuuttaabbllee ttoo::
Owners of the parent 1,283.0 691.8
Preference shareholders - 1.4
Non-controlling interests 59.1 29.2
Profit for the year 1,342.1 722.4
Earnings per share (cents)
Basic EPS 11 591.4 319.7
Diluted basic EPS 11 585.1 315.4

GROUP STATEMENT OF COMPREHENSIVE INCOMEFOR THE YEAR ENDED 29 DECEMBER 2013
December 2013 December 201253 weeks 52 weeks
Rm Rm
Profit for the year 1,342.1 722.4
IItteemmss tthhaatt wwiillll nnoott bbee rree--ccllaassssiiffiieedd ssuubbsseeqquueennttllyy ttoo tthhee iinnccoommee ssttaatteemmeenntt
Post-retirement medical aid actuarial gain (note 22) 5.7 -
5.7 -
IItteemmss tthhaatt wwiillll bbee rree--ccllaassssiiffiieedd ssuubbsseeqquueennttllyy ttoo tthhee iinnccoommee ssttaatteemmeenntt
Foreign currency translation reserve (note 22) 47.2 25.1
Revaluation of listed shares (note 15) 4.7 1.6
Cash flow hedges (note 22) 7.0 (5.8)
Less Income tax relating to the revaluation of listed shares (note 17) (1.2) -
Less Income tax relating to the cash flow hedges (note 17) (1.9) 1.6
Other comprehensive income for the year, net of tax 55.8 22.5
Total other comprehensive income for the year, net of tax 61.5 22.5
Total comprehensive income for the year 1,403.6 744.9
TToottaall ccoommpprreehheennssiivvee iinnccoommee aattttrriibbuuttaabbllee ttoo::
Owners of the parent 1,344.5 714.3
Preference shareholders - 1.4
Non-controlling interests 59.1 29.2
TToottaall ccoommpprreehheennssiivvee iinnccoommee ffoorr tthhee yyeeaarr 1,403.6 744.9

GROUP STATEMENT OF FINANCIAL POSITIONFOR THE YEAR ENDED 29 DECEMBER 2013
December 2013 December 2012Notes Rm Rm
Assets
Non-current assets 10,111.8 7,595.1
Property, plant and equipment 12 5,988.1 3,868.2
Goodwill 13 2,532.0 2,557.7
Other intangibles 14 396.8 387.6
Investments 15 231.9 258.8
Other financial assets 16 290.9 126.5
Deferred taxation 17 672.1 396.3
Current assets 16,036.1 15,422.2
Inventories 18 10,115.5 9,691.5
Trade and other receivables 19 3,712.5 3,681.7
Taxation 12.0 17.0
Cash and cash equivalents 37.11 2,196.1 2,032.0
Non-current assets classified as held for sale 20 - 2.5
Total assets 26,147.9 23,019.8
Equity and liabilities
Equity attributable to equity holders of the parent 5,173.0 4,739.7
Share capital 21 2.2 2.2
Share premium 21 743.3 752.1
Other reserves 22 517.6 323.3
Retained profit 3,909.9 3,662.1
Non-controlling interests 196.6 175.6
Total equity 5,369.6 4,915.3
Non-current liabilities 2,206.4 1,183.4
Non-current liabilities:
- Interest-bearing 23 1,178.7 671.8
- Interest-free 23 838.9 305.7
Non-current provisions 24 102.2 169.2
Deferred taxation 17 86.6 36.7
Current liabilities 18,571.9 16,921.1
Trade and other payables 25 16,774.2 15,305.5
Current provisions 26 327.0 363.8
Taxation 331.3 298.5
Other current liabilities 27 531.6 561.2
Bank overdrafts 37.11 607.8 392.1
Total equity and liabilities 26,147.9 23,019.8

GROUP STATEMENT OF CASH FLOWSFOR THE YEAR ENDED 29 DECEMBER 2013
December 2013 December 201253 weeks 26 weeks
Notes Rm Rm
Cash flow from operating activitiesOperating cash before working capital movements 37.1 2,984.0 1,707.5
Working capital movements 37.2 752.6 1,110.0
Cash generated from operations 3,736.6 2,817.5
Interest received 28.7 45.6
Interest paid (283.8) (106.0)
Dividends received 79.2 -
Taxation paid 37.3 (732.8) (369.1)
Dividends paid (913.4) (317.0)
Net cash inflow from operating activities 1,914.5 2,071.0
Cash flow from investing activitiesInvestment to maintain operations 37.4 (780.2) (347.6)
Investment to expand operations 37.5 (1,306.8) (402.6)
Proceeds on disposal of property, plant and equipment 37.6 25.6 8.6
Proceeds on disposal of assets classified as held for sale 37.7 2.5 5.7
Investment in subsidiaries 37.8 - (56.9)
Disposal of subsidiaries 37.9 - (50.7)
Other investing activities 37.10 (247.4) 82.3
Net cash outflow from investing activities (2,306.3) (761.2)
Cash flow from financing activitiesIncrease/(decrease) in non-current liabilities 483.5 (159.8)
Decrease in current liabilities (68.1) (108.1)
Non-controlling interests acquired (0.6) (27.3)
Net acquisition of treasury shares (121.8) (72.6)
Net cash (outflow)/inflow from financing activities 293.0 (367.8)
Net (decrease)/increase in cash and cash equivalents (98.8) 942.0
Foreign exchange movements 47.2 25.1
Cash and cash equivalents at the beginning of the year 1,639.9 672.8
Cash and cash equivalents at the end of the year 37.11 1,588.3 1,639.9

GROUP STATEMENT OF CHANGES IN EQUITYFOR THE YEAR ENDED 29 DECEMBER 2013
Share
capital
Share
premium
Other
reserves
Retained
profit
Equity
attributable to
equity holders of
the parent
Non-controlling
interests Total
Rm Rm Rm Rm Rm Rm Rm
Balance as at June 2012 2.2 750.6 614.7 2,989.4 4,356.9 207.9 4,564.8
Total comprehensive income - - 22.5 693.2 715.7 29.2 744.9
Profit for the period - - - 693.2 693.2 29.2 722.4
Other comprehensive income for the period - - 22.5 - 22.5 - 22.5
Dividends declared (note 10) - - - (317.0) (317.0) - (317.0)
Net changes in non-controlling interests - - - - - (21.9) (21.9)
Distribution to non-controlling interests - - - - - (39.6) (39.6)
Cost of acquiring non-controlling interests - - (13.6) - (13.6) - (13.6)
Share-based payment expense (note 22) - - 68.5 - 68.5 - 68.5
Share trust net consideration - - - (72.6) (72.6) - (72.6)
Release of share-based payment reserve (note 22) - - (292.6) 292.6 - - -
Release of amortisation of trademark reserve - - (76.5) 76.5 - - -
Treasury shares - 1.5 0.3 - 1.8 - 1.8
Balance as at December 2012 2.2 752.1 323.3 3,662.1 4,739.7 175.6 4,915.3
Total comprehensive income - - 61.5 1,283.0 1,344.5 59.1 1,403.6
Profit for the period - - - 1,283.0 1,283.0 59.1 1,342.1
Other comprehensive income for the period - - 61.5 - 61.5 - 61.5
Dividends declared (note 10) - - - (913.4) (913.4) - (913.4)
Net changes in non-controlling interests - - 3.8 - 3.8 (7.2) (3.4)
Distribution to non-controlling interests - - - - - (30.9) (30.9)
Share-based payment expense (note 22) - - 129.0 - 129.0 - 129.0
Share trust net consideration - - - (121.8) (121.8) - (121.8)
Treasury shares (notes 21 and 22) - (8.8) - - (8.8) - (8.8)
Balance as at December 2013 2.2 743.3 517.6 3,909.9 5,173.0 196.6 5,369.6
The non-controlling interests comprise mainly CBW store managers’ holdings in certain Masscash stores.
Net changes in non-controlling interests represents the acquisition of non-controlling interests by the Group.
Distribution to non-controlling interests comprise dividends paid to non-controlling shareholders of a Group company.
Cost of acquiring non-controlling interests comprise the consideration paid for increasing the Group’s interest in a Group company above the company’s non-controlling interest balance
in the statement of financial position.
The share trust net consideration is the cost of buying shares in the market above the exercise price to meet the demands of the Massmart share schemes. Additional information can be
found in note 28.
1
2
3
4
5
2
3
5
1
2
3
4
5

NOTES TO THE ANNUAL GROUP FINANCIAL STATEMENTS 1-8FOR THE YEAR ENDED 29 DECEMBER 2013
1. ACCOUNTING POLICIES
General
Massmart Holdings Limited operates retail stores in nine formats in sub-Saharan Africa, aggregated into four reportable segments, focused on high-volume,low-margin, low-cost distribution of mainly branded consumer good for cash.
The principal offering for each segment is as follows:
The Group’s four divisions operate in two principal geographical areas, South Africa and the rest of Africa, and the Group’s geographic segments are reportedon this basis.
Basis of accounting
The financial statements have been prepared on the historical cost basis, except for the revaluation of certain non-current assets and financial instruments tofair value.
These financial statements have been prepared in accordance with the framework concepts and the measurement and recognition requirements ofInternational Financial Reporting Standards (IFRS), the SAICA Financial Reporting Guides as issued by the Accounting Practices Committee, the FinancialReporting Pronouncements as issued by the Financial Reporting Standards Council, the JSE Listing Requirements and the requirements of the Companies Act,71 of 2008 of South Africa. The accounting policies are consistent with that of the previous financial year, except for IFRS 10: Consolidated FinancialStatements, IFRS 12: Disclosure of Interests in Other Entities, IFRS 13 Fair Value Measurement and IAS 19: Employment Benefits. When an accounting policyis altered, comparative figures are restated if required by the applicable accounting statement and where material. No restatement was required in thesefinancial statements. The impact of IFRS 10, IFRS 12, IFRS 13 and IAS 19 are covered in note 2 Technical Review.
The principal accounting policies adopted are set out below.
Basis of consolidation
The Group annual financial statements incorporate the annual financial statements of the Company (Massmart Holdings Limited) and the entities it controls asat 29 December 2013. Control is achieved when the Group is exposed, or has rights, to variable returns from its involvement with the investee and has theability to affect those returns through its power over the investee. The Group considers all relevant facts and circumstances in assessing whether it has powerover an investee and re-assesses whether or not it controls an investee if facts and circumstances indicate that there are changes to one or more of the threeelements of control. Consolidation of a subsidiary begins when the Group obtains control over the subsidiary and ceases when the Group loses control of thesubsidiary. A change in the ownership interest of a subsidiary, without a loss of control, is accounted for as an equity transaction. Assets, liabilities, income andexpenses of a subsidiary acquired or disposed of during the year are included in the statement of comprehensive income from the date the Group gains controluntil the date the Group ceases to control the subsidiary.
All inter-company transactions and balances, income and expenses are eliminated in full on consolidation. The financial statements of the subsidiaries areprepared for the same reporting period as the parent company, using consistent accounting policies. Where necessary, adjustments are made to the financialstatements of subsidiaries to bring the accounting policies used in line with those used by the Group.
Separate disclosure is made of non-controlling interests where the Group’s investment is less than 100%. Non-controlling interests consist of the amount ofthose interests at the date of the original business combination and the allocated share of changes in equity since the date of the combination. Totalcomprehensive income within a subsidiary is attributed to the non-controlling interest even if it results in a deficit balance.
Fair value measurement
The Group measures financial instruments, such as, derivatives and certain investments at fair value at each reporting date. The fair values of financialinstruments measured at amortised cost are disclosed should it be determined that the carrying value of these instruments does not reasonability approximatetheir fair value at each reporting date.
Fair value is the price that would be received to sell an asset or paid to transfer a liability in an orderly transaction between market participants at themeasurement date. The fair value measurement is based on the presumption that the transaction to sell the asset or transfer the liability takes place either:
In the principal market for the asset or liability, orIn the absence of a principal market, in the most advantageous market for the asset or liability
The principal or the most advantageous market must be accessible by the Group.
The fair value of an asset or a liability is measured using the assumptions that market participants would use when pricing the asset or liability, assuming thatmarket participants act in their economic best interest. A fair value measurement of a non-financial asset takes into account a market participant’s ability togenerate economic benefits by using the asset in its highest and best use or by selling it to another market participant that would use the asset in its highestand best use.

The Group uses valuation techniques that are appropriate in the circumstances and for which sufficient data are available to measure fair value, maximisingthe use of relevant observable inputs and minimising the use of unobservable inputs.All assets and liabilities for which fair value is measured or disclosed in the financial statements are categorised within the fair value hierarchy, described asfollows, based on the lowest level input that is significant to the fair value measurement as a whole:
Level 1 — Quoted (unadjusted) market prices in active markets for identical assets or liabilitiesLevel 2 — Valuation techniques for which the lowest level input that is significant to the fair value measurement is directly or indirectly observableLevel 3 — Valuation techniques for which the lowest level input that is significant to the fair value measurement is unobservable
For assets and liabilities that are recognised in the financial statements at fair value on a recurring basis, the Group determines whether transfers haveoccurred between the Levels in the hierarchy by re-assessing categorisation (based on the lowest level input that is significant to the fair value measurementas a whole) at the end of each reporting period.
For the purpose of fair value disclosures, the Group has determined classes of assets and liabilities on the basis of the nature, characteristics and risks of theasset or liability and the level of the fair value hierarchy as explained above.
Business combinations
The acquisition of subsidiaries is accounted for using the acquisition method. The cost of an acquisition is measured at the aggregate of the fair values, at thedate of exchange, of assets given, liabilities incurred or assumed, and equity instruments issued by the Group in exchange for control of the acquiree.Acquisition related costs are expensed as incurred and included in ‘Other operating costs’ in the income statement. The acquiree’s identifiable assets, liabilitiesand contingent liabilities that meet the conditions for recognition under IFRS 3 Business Combinations are recognised at their fair values at the acquisitiondate, except for non-current assets (or disposal groups) that are classified as held for sale in accordance with IFRS 5 Non-current Assets Held for Sale andDiscontinued Operations, which are recognised and measured at fair value less costs to sell. For each business combination, the Group elects whether tomeasure the non-controlling interests in the acquiree at fair value or at the proportionate share of the acquiree’s net fair value of the identifiable net assets.
Any contingent consideration forming part of the purchase price is recognised at fair value at the acquisition date. Contingent consideration classified as anasset or liability that is a financial instrument and within the scope of IAS 39 Financial Instruments: Recognition and Measurement, is measured at fair valuewith changes in fair value recognised either in the income statement or as a charge to other comprehensive income. If the contingent consideration is notwithin this scope, it is measured in accordance with the appropriate IFRS. Contingent consideration that is classified as equity is not remeasured andsubsequent settlement is accounted for within equity.
Goodwill
Goodwill arising on consolidation of a subsidiary represents the excess of the cost of acquisition over the Group’s interest in the net fair value of theidentifiable assets, liabilities and contingent liabilities of a subsidiary at the date of acquisition. Any deficiency of the cost of acquisition below the fair valuesof the identifiable net assets acquired (ie discount on acquisition) is credited to the income statement as a gain on bargain purchase in the period ofacquisition.
Goodwill is initially recognised as an asset at cost and is subsequently measured at cost less any accumulated impairment losses. For the purpose ofimpairment testing, goodwill is allocated to each of the Group’s cash-generating units expected to benefit from the synergies of the combination.Cash-generating units to which goodwill has been allocated are tested for impairment annually, or more frequently when there is an indication that the unit maybe impaired. If the recoverable amount of the cash-generating unit is less than the carrying amount of the unit, the impairment loss is allocated first to reducethe carrying amount of any goodwill allocated to the unit and then to the other assets of the unit pro-rata on the basis of the carrying amount of each asset inthe unit. An impairment loss recognised for goodwill is not reversed in a subsequent period.
On disposal of a subsidiary, the attributable amount of goodwill is included in the determination of the profit or loss on disposal.
Non-current assets held for sale
Non-current assets and disposal groups are classified as held for sale if their carrying amount will be recovered principally through a sale transaction ratherthan through continuing use. This condition is regarded as met only when the sale is highly probable and the asset (or disposal group) is available forimmediate sale in its present condition. Management must be committed to the sale which should be expected to qualify for recognition as a completed salewithin one year from the date of classification.
Non-current assets (and disposal groups) classified as held for sale are measured at the lower of the assets’ previous carrying amount and fair value less coststo sell.
Property, plant and equipment and intangible assets are not depreciated or amortised once classified as held for sale.
Property, plant and equipment
Freehold land is shown at cost and is not depreciated. Property, plant and equipment is shown at cost less accumulated depreciation, and reduced by anyaccumulated impairment losses.
Property cost includes professional fees. Depreciation of these assets, on the same basis as other property assets, commences when the assets are availablefor their intended use.
Where expenditure incurred on property, plant and equipment will lead to future economic benefits accruing to the Group, these costs are capitalised. Repairsand maintenance not meeting this criterion are expensed as and when incurred.
Depreciation is charged so as to write off the cost of assets, other than land, over their estimated useful lives, using the straight-line method, on the followingbases:
Buildings 50 yearsFixtures, fittings, plant, equipment and motor vehicles 4 to 15 yearsComputer hardware 3 to 8 yearsLeasehold improvements Shorter of lease period or useful life
Useful life and residual value is reviewed annually and the prospective depreciation is adjusted accordingly.
Assets held under finance leases are depreciated over their expected useful lives on the same basis as owned assets or, where shorter, over the term of therelevant lease.
The gain or loss arising on the disposal or retirement of an asset is determined as the difference between the sales proceeds and the carrying amount of theasset and is recognised in the income statement.

Intangible assets
Trademarks and computer software are measured initially at purchased cost. Right of use assets are measured at cost, which is calculated based on the sitenegotiation agreement. The cost of intangible assets acquired in a business combination is their fair value at the date of acquisition. Internally generatedintangibles assets are not capitalised but rather expensed in the income statement in the period in which the expenditure is incurred. Intangible assets aremeasured at cost less accumulated amortisation, and reduced by any accumulated impairment losses.
The useful lives of intangible assets are assessed as either finite or indefinite. The Group has no intangible assets with indefinite useful lives other thangoodwill which is detailed separately.
For intangible assets with finite useful lives, amortisation is charged so as to write off the asset over the estimated useful life, using the straight-line method,on the following basis:
Trademarks 10 yearsRight of use 10 yearsComputer software 3 to 8 years
Useful life is reviewed annually and the prospective amortisation is adjusted accordingly.
Impairment of non-financial assets
At each reporting date, the Group reviews the carrying amounts of its tangible and intangible assets (excluding goodwill) to determine whether there is anyindication that those assets may be impaired. If any such indication exists, the recoverable amount of the asset is estimated in order to determine the extent ofthe impairment loss (if any). Where it is not possible to estimate the recoverable amount for an individual asset, the recoverable amount is determined for thecash-generating unit to which the asset belongs. Where a reasonable and consistent basis of allocation can be identified, corporate assets are also allocatedto individual cash-generating units, or otherwise they are allocated to the smallest group of cash-generating units for which a reasonable and consistentallocation basis can be identified.
The recoverable amount is the higher of fair value less costs of disposal and value in use. In assessing value in use, the estimated future cash flows arediscounted to their present value using a pre-tax discount rate that reflects current market assessments of the time value of money and the risks specific tothe asset. In determining fair value less costs of disposal, recent market transactions are taken into account. If no such transactions can be identified, anappropriate valuation model is used.
If the recoverable amount of an asset (or cash-generating unit) is estimated to be less than its carrying amount, the carrying amount of the asset (cash-generating unit) is reduced to its recoverable amount. Impairment losses are recognised as an expense immediately in the income statement.
An assessment is made at each reporting date to determine whether there is an indication that previously recognised impairment losses no longer exist orhave decreased. If such indication exists, the Group estimates the asset’s or CGU’s recoverable amount. Where an impairment loss subsequently reverses, thecarrying amount of an asset (cash-generating unit) is increased to the revised estimate of its recoverable amount. This is done so that the increased carryingamount does not exceed the carrying amount that would have been determined had no impairment loss been recognised for the asset (cash-generating unit) inprior years. A reversal of an impairment loss is recognised immediately in the income statement.
Goodwill is tested annually for impairment as indicated above. However, impairment losses relating to goodwill cannot be reversed in future periods.
Revenue recognition
Revenue of the Group comprises net sales, royalties and franchise fees, investment income, finance charges, property rentals, management and administrationfees, commissions and fees, dividends, distribution income, income from insurance premium contributions and excludes value-added tax. Revenue isrecognised to the extent that it is probable that the economic benefits will flow to the Group and the revenue can be reliably measured, regardless of whenpayment is being made. Revenue is measured at the fair value of the consideration received or receivable and represents amounts receivable for goods andservices provided in the normal course of business, net of discounts and sales-related taxes. The Group assesses its revenue arrangements against specificcriteria to determine if it is acting as principal or agent. The specific recognition criteria described below must also be met before revenue is recognised.
Sales of goodsRevenue is recognised when the significant risks and rewards of ownership have passed to the buyer, usually when the goods are delivered and title haspassed.
Rendering of servicesRevenue is earned from delivering goods to customers and goods to stores and distribution centres. Revenue is recognised by reference to stage ofcompletion.
Interest incomeRevenue is accrued on a time basis, by reference to the principal outstanding and the effective interest rate.
Dividend incomeRevenue is recognised when the shareholders’ right to receive payment has been established, which is generally when shareholders approve thedividend.
Other revenue is recognised on the accrual basis in accordance with the substance of the relevant agreements and measured at fair value of theconsideration receivable.
Leasing
The determination of whether an arrangement is, or contains, a lease is based on the substance of the arrangement at the inception date. The arrangement isassessed for whether fulfilment of the arrangement is dependent on the use of a specific asset or assets or the arrangement conveys a right to use the assetor assets, even if that right is not explicitly specified in an arrangement.
Leases are classified as finance leases whenever the terms of the lease transfer substantially all the risks and rewards of ownership to the lessee. All otherleases are classified as operating leases.
Assets held under finance leases are capitalised at their fair value at the inception of the lease or, if lower, at the present value of the minimum lease payments.The corresponding liability to the lessor, net of finance charges, is included in the statement of financial position as a finance lease obligation. Lease paymentsare apportioned between finance charges and reduction of the lease obligation so as to achieve a constant rate of interest on the remaining balance of theliability. Finance charges are charged to income statement.
A leased asset is depreciated over the useful life of the asset. However, if there is no reasonable certainty that the Group will obtain ownership by the end of thelease term, the asset is depreciated over the shorter of the estimated useful life of the asset and the lease term.
Rentals payable under operating leases are charged to the income statement on a straight-line basis over the term of the relevant lease. Contingent rental
costs are expensed when incurred.

Foreign currencies
The individual financial statements of each Group entity are presented in the currency of the primary economic environment in which the entity operates (ie itsfunctional currency). For the purpose of the consolidated financial statements, the results and financial position of each entity are expressed in the functionalcurrency of the Group, which is the presentation currency for the consolidated financial statements (South African Rand).
TTrraannssaaccttiioonnss aanndd bbaallaanncceess
Transactions denominated in foreign currencies are initially recorded at their functional currency spot rates on the dates of the transactions.
At each reporting date, monetary assets and liabilities that are denominated in foreign currencies are translated using functional currency spot rates on thereporting date. Non-monetary items carried at fair value that are denominated in foreign currencies are translated using functional currency spot rates on thedate when the fair value was determined. Non-monetary items that are measured in terms of historical cost in a foreign currency are translated using thefunctional currency spot rates at the date of the initial transactions.
Exchange differences arising on the settlement and translation of monetary items are included in the income statement for the period. Exchange differencesarising on the translation of non-monetary items carried at fair value are included in the income statement for the period. However, where fair valueadjustments of non-monetary items are recognised in other comprehensive income, exchange differences arising on the translation of these non-monetaryitems are also recognised in other comprehensive income.
Goodwill and fair value adjustments arising on the acquisition of a foreign operation are treated as assets and liabilities of the foreign operation and translatedat the spot rate on the reporting date.
GGrroouupp ccoommppaanniieess
On consolidation, the assets and liabilities of the Group’s foreign operations (including comparatives) are translated at exchange rates prevailing on thereporting date. Income and expense items are translated at exchange rates prevailing at the dates of the transactions where possible, or at the averageexchange rates for the period. Exchange differences are recognised in other comprehensive income and transferred to the Group’s foreign currency translationreserve. Such translation differences are recycled in the income statement in the period in which the foreign operation is disposed of.
HHyyppeerriinnffllaattiioonn
The financial statements (including comparatives) of foreign subsidiaries and associates that report in the currency of a hyperinflationary economy arerestated in terms of the measuring unit current at the reporting date before they are translated into the Group’s presentation currency, South African Rands.
Government grants
Government grants for staff training costs are recognised in the income statement over the periods necessary to match them with the related costs and arededucted in reporting the related expense. Income is not recognised until there is reasonable assurance that the grants will be received.
Retirement benefit costs
Payments to defined contribution plans are charged as an expense as they fall due. There are no defined retirement benefit plans in the Group.
Post-retirement healthcare benefit
Post-retirement healthcare benefits are provided by certain Group companies to qualifying employees and pensioners. Contributions are made to a separatelyadministered fund. The healthcare benefit costs are determined through annual actuarial valuations by independent consulting actuaries using the projectedunit credit method. Past service costs are recognised in profit or loss on the earlier of the date of the plan amendment or curtailment, and the date that theGroup recognises restructuring-related costs. Actuarial gains and losses are recognised in full in other comprehensive income in the period in which they occurand are not recycled through profit or loss in subsequent periods.
Taxation
Income tax expense represents the sum of the tax currently payable and deferred tax.
Current income tax
The tax charge payable is based on taxable profit for the year. Taxable profit differs from profit as reported in the income statement because it excludes itemsof income or expense that are taxable or deductible in other years and it further excludes items that are never taxable or deductible. The Group’s liability forcurrent tax is calculated using tax rates and tax laws that have been enacted or substantively enacted by the reporting date in the countries where the Groupoperates and generates taxable income.
Current income tax relating to items recognised through other comprehensive income is also recognised through other comprehensive income and not in theincome statement. Where applicable tax regulations are subject to interpretation, management will raise the appropriate provisions.
Deferred tax
Deferred tax is accounted for using the liability method in respect of temporary differences arising between the carrying amounts of assets and liabilities in thefinancial statements and the corresponding tax bases used in the computation of taxable profit.
Deferred tax liabilities are recognised for all taxable temporary differences. Deferred tax assets are recognised for all deductible temporary differences, and thecarry forward of unused tax credits and any unused tax losses to the extent that it is probable that taxable profit will be available against which these can beutilised. Deferred tax assets and liabilities are not recognised if the temporary difference arises from goodwill or from the initial recognition (other than in abusiness combination) of other assets and liabilities, which affects neither the tax profit nor the accounting profit at the time of the transaction. Deferred taxliabilities are recognised for taxable temporary differences arising on investments in subsidiaries and associates, and interests in joint ventures, except wherethe Group is able to control the reversal of the temporary difference and it is probable that the temporary difference will not reverse in the foreseeable future. Inrespect of deductible temporary differences associated with investments in subsidiaries, associates and interests in joint ventures, deferred tax assets arerecognised only to the extent that it is probable that the temporary differences will reverse in the foreseeable future and taxable profit will be available againstwhich the temporary differences can be utilised
The carrying amount of deferred tax assets is reviewed at each reporting date and reduced to the extent that it is no longer probable that sufficient taxableprofits will be available to allow all or part of the asset to be recovered. Unrecognised deferred tax assets are reassessed at each reporting date and arerecognised to the extent that it has become probable that future taxable profits will allow the deferred tax asset to be recovered.
Deferred tax is calculated at the tax rates that are expected to apply to the period when the asset is realised or the liability settled, using tax rates and tax lawsthat have been enacted or substantively enacted by the reporting date. Deferred tax is recognised in the income statement, except when it relates to itemscredited or charged to other comprehensive income or directly to equity, in which case the deferred tax is recognised in either other comprehensive income ordirectly in equity.

Sales tax
Income, expenses, assets and liabilities are recognised net of the amount of sales tax, except when the sales tax is not recoverable from, or payable to, thetaxation authority, in which case it is recognised as part of the underlying item, or when receivables and payables are stated including sales tax. The netamount of sales tax recoverable from, or payable to, the taxation authority is included as part of receivables or payables in the statement of financial position.
Any tax on capital gains is deferred if the proceeds of the sale of the assets are invested in similar assets, but the tax will ultimately become payable on sale ofthat similar asset.
Inventories
Inventories, which consist of merchandise, are valued at the lower of cost and net realisable value. Cost is calculated on the weighted-average method. Netrealisable value represents the estimated selling price less all estimated costs of completion and costs to be incurred in marketing, selling and distribution.Rebates and discounts received as a reduction in the purchase price of inventories is deducted from the cost of those inventories. Rebates earned on the saleof products based on advertising requirements are regarded as a reimbursement of costs already incurred in general (i.e. not linked to inventories) and isdeducted from cost of sales..
Financial instruments
Financial assets and financial liabilities are recognised on the Group’s statement of financial position when the Group becomes a party to the contractualprovisions of the instrument.
Financial assets
Financial assets are classified into the following specified categories:
Fair value through profit or loss (FVTPL)These include financial assets held for trading and financial assets designated upon initial recognition at fair value through profit or loss. Financialassets are classified as held for trading if they are acquired for the purpose of selling or repurchasing in the near term. Derivatives are coveredseparately and have their own accounting policy ‘Derivative financial instruments and hedge accounting’.
Loans and receivablesThese are non-derivative financial assets with fixed or determinable payments that are not quoted in an active market.
Held-to-maturity investmentsThese are non-derivative financial assets with fixed or determinable payments and fixed maturities and the Group has the positive intention and abilityto hold them to maturity.
Available-for-sale investmentsThese include equity investments and debt securities. Equity investments classified as available for sale are those that are neither classified as held fortrading nor designated at fair value through profit or loss. Debt securities are those that are intended to be held for an indefinite period of time and thatmay be sold for liquidity needs or in response to changes in market conditions. The Group holds no debt securities classified as available for sale.
The classification depends on the nature and purpose of the financial assets and is determined at the time of initial recognition. All financial assets are initiallyrecognised at fair value plus transaction costs, except for financial assets recorded at fair value through profit or loss which are measured at fair value.
Financial assets are subsequently measured according to their category classification:
Fair value through profit or loss (FVTPL)These are held at fair value and any adjustments to fair value are taken to the income statement. Listed investments are carried at market value, whichis calculated by reference to stock exchange quoted selling prices at the close of business on the reporting date.
Loans and receivablesThese are held at amortised cost using the effective interest rate method less any impairment losses recognised to reflect irrecoverable amounts.Amortised cost is calculated considering any discount or premium on acquisition and fees or costs that are an integral part of the effective interest rate.Amortisation is recognised in finance income in the income statement. Impairment losses on loans are recognised in finance costs and impairmentlosses on receivables are recognised in ‘Other operating costs’ in the income statement.
Held-to-maturity investmentsThese are held at amortised cost using the effective interest rate method less any impairment losses recognised to reflect irrecoverable amounts.Amortised cost is calculated considering any discount or premium on acquisition and fees or costs that are an integral part of the effective interest rate.Amortisation is recognised in finance income in the income statement. Impairment losses on loans are recognised in finance costs and impairmentlosses on receivables are recognised in ‘Other operating costs’ in the income statement.
Available-for-sale investmentsThese are held at fair value and any adjustment to fair value is recognised as other comprehensive income as a non-distributable reserve until theinvestment is derecognised, at which time the cumulative gain or loss is recognised in the income statement. Where the investment is determined to beimpaired, the cumulative gain or loss is reclassified to the income statement.
Purchases or sales of financial assets that require delivery of assets within a time frame established by regulation or convention in the market place (regularway trades) are recognised on the trade date, which is the date that the Group commits to purchase or sell the asset.
Derecognition
A financial asset is derecognised when the rights to receive cash flows have expired or the Group has transferred its right to receive cash flows from the asset,or has assumed an obligation to pay the received cash flows in full without material delay to the third party (where the Group has transferred the risk andrewards of the asset or has transferred control of the asset).

Impairment
At each reporting date, the Group reviews whether there is any objective evidence that a financial asset may be impaired as a result of one or more events thathave occurred since the initial recognition of the asset and that loss event has an impact on the estimated future cash flows of the financial asset. Whereobjective evidence exists an impairment loss is calculated.
Financial assets carried at amortised costThe impairment loss is measured as the difference between the asset’s carrying amount and the present value of estimated future cash flows. Thediscount rate is the original effective interest rate and where a loan has a variable interest rate, the discount rate is the current effective interest rate.Impairment losses are reversed in subsequent periods when an increase in the investment’s recoverable amount can be related objectively to an eventoccurring after the impairment was recognised, subject to the restriction that the carrying amount of the investment at the date the impairment isreversed shall not exceed what the amortised cost would have been had the impairment not been recognised. The recovery is credited to the incomestatement.
Available-for-sale investmentThe impairment loss is measured as the difference between the acquisition cost and the current fair value, less any impairment loss previouslyrecognised. Impairment losses on equity investments are not reversed through the income statement; increases in fair value of the instrument that canbe objectively related to an event occurring after the recognition of the impairment, are recognised directly in other comprehensive income.
Effective interest rate method
This is a method of calculating the amortised cost of a financial asset and of allocating interest income over the relevant period. The effective interest rate isthe rate that exactly discounts estimated future cash receipts through the expected life of the financial asset, or, where appropriate, a shorter period.
Income is recognised on an effective interest basis for debt instruments other than those financial assets designated as ‘at fair value through profit or loss’.
Financial liabilities and equity
Financial liabilities are classified according to the substance of the contractual arrangements entered into and the definitions of a financial liability and anequity instrument. An equity instrument is any contract that evidences a residual interest in the assets of the Group after deducting all of its liabilities.
Financial liabilities are classified into the following specified categories:
Fair value through profit or loss (FVTPL)These include financial liabilities held for trading and financial liabilities designated upon initial recognition at fair value through profit or loss. Financialliabilities are classified as held for trading if they are acquired for the purpose of selling or repurchasing in the near term. Derivatives are coveredseparately and have their own accounting policy ‘Derivative financial instruments and hedge accounting’.
Liabilities at amortised costThese are non-derivative financial liabilities with fixed or determinable payments that are not quoted in an active market.
The classification depends on the nature and purpose of the financial liabilities and is determined at the time of initial recognition. All financial liabilities areinitially recognised at fair value and, in the case of liabilities at amortised cost, net of directly attributable transaction costs.
Financial liabilities are subsequently measured according to their category classification:
Fair value through profit or loss (FVTPL)Fair value gains and losses on liabilities at fair value through profit or loss are recognised in the income statement.
Liabilities at amortised costThese are held at amortised cost using the effective interest rate method. Amortised cost is calculated considering any discount or premium onacquisition and fees or costs that are an integral part of the effective interest rate. Amortisation costs are recognised in finance costs in the incomestatement.
Derecognition
A financial liability is derecognised when the obligation under the liability is discharged or cancelled, or expires. Gains are recognised in the income statementwhen the liability is derecognised. When an existing financial liability is replaced by another from the same lender on substantially different terms, or the termsof an existing liability is substantially modified, such an exchange or modification is treated as the derecognition of the original liability and the recognition of anew liability. The difference in the respective carrying amounts is recognised in the income statement.
Fair value of financial instruments
The fair values of listed investments are calculated by reference to stock exchange quoted selling prices at the close of business on the reporting date, withoutany deduction for transaction costs. For financial instruments not traded in an active market, the fair value is determined using the appropriate valuationtechniques which include:
Using recent arm’s length market transactionsReference to the current fair value of another instrument that is substantially the sameA discounted cash flow analysis or other valuation models

Derivative financial instruments and hedge accounting
The Group’s activities expose it primarily to the financial risks of changes in foreign exchange rates and interest rates.
The Group uses foreign exchange forward contracts to hedge its exposure to foreign currency fluctuations relating to certain firm trading commitments. Theuse of financial derivatives is governed by the Group’s policies approved by the Board, which provide written principles on the use of financial derivativesconsistent with the Group’s risk management strategy. At the inception of a hedge relationship, the Group formally designates and documents the hedgerelationship to which the Group wishes to apply hedge accounting. The documentation includes identification of the hedging instrument, the hedged item ortransaction, the nature of the risk being hedged and how the entity will assess the effectiveness of changes in the hedging instrument’s fair value in offsettingthe exposure to changes in the cash flows attributable to the hedged risk. Such hedges are expected to be highly effective in achieving offsetting changes incash flows and are assessed on an ongoing basis to determine that they have been highly effective throughout the financial reporting periods for which theywere designated. The Group does not trade in derivative financial instruments for speculative purposes.
Derivative financial instruments are initially measured at fair value on the contract date, and are re-measured to fair value at subsequent reporting dates.Derivatives are carried as financial assets when the fair value is positive and as financial liabilities when the fair value is negative.
The effective portion of the changes in fair value of derivative financial instruments that are designated and qualify as cash flow hedges are recognised inother comprehensive income in the hedging reserve. The gain or loss relating to the ineffective portion is recognised immediately in the income statement. Ifthe hedged firm commitment or forecast transaction results in the recognition of an asset or liability, then, at the time the asset or liability is recognised, theassociated gains or losses on the derivative that had previously been recognised in other comprehensive income are included in the initial measurement of theasset or liability. All other amounts deferred in other comprehensive income are recognised in the income statement in the same period in which the hedgedfirm commitment affects the income statement.
Changes in the fair value of derivative financial instruments that do not qualify as cash flow hedges are recognised in the income statement as they arise.
The hedge is de-designated as a cash flow hedge at the Shipped on Board date, and discontinued when the hedging instrument is sold, expired, terminated,exercised, or no longer qualifies for hedge accounting. At the time, any cumulative gain or loss on the hedging instrument recognised in other comprehensiveincome is retained in equity until the forecast transaction is recognised in the income statement. If a hedged transaction is no longer expected to occur, the netcumulative gain or loss recognised in other comprehensive income is transferred to the income statement.
The Group does not hold any fair value hedges or hedges of a net investment in a foreign operation.
Cash and cash equivalents
Cash and cash equivalents comprise cash on hand, deposits held on call with banks and investments in money-market instruments that are readily convertibleto a known amount of cash and are subject to an insignificant risk of change in value.
Treasury shares
Own equity instruments that are reacquired are recognised at cost and deduced from equity. No gain or loss is recognised in the income statement on thepurchase, sale, issue or cancellation of the Group’s own equity instruments. Voting rights related to treasury shares are nullified for the Group and no dividendsare allocated to them. Share options exercised during the reporting period are satisfied with treasury shares, and where required, shares purchased in themarket. Any difference between the exercise price and the market price is recognised as a gain or loss in the statement of changes in equity.
Provisions
Provisions are recognised when the Group has a present legal or constructive obligation as a result of past events, it is probable that the Group will be requiredto settle that obligation and a reliable estimate can be made of the amount of the obligation. Provisions are measured at management’s best estimate of theexpenditure required to settle the obligation at the reporting date, and are discounted to present value where the effect is material.
Share-based payments
The Group issues equity-settled share-based payments to employees who are beneficiaries of the various Group share schemes. Equity-settled share-basedpayments are measured at fair value (excluding the effect of non-market-based vesting conditions) at the date of grant. The fair value determined at the grantdate of the equity-settled share-based payments is expensed in the income statement on a straight-line basis over the vesting period with a correspondingincrease in other capital reserves in equity, based on the Group’s estimate of shares that will eventually vest and adjusted for the effect of non-market-basedvesting conditions. The cumulative expense recognised at each reporting date until the vesting date reflects the extent to which the vesting period has expiredand the Group’s best estimate of the number of equity instruments that will ultimately vest.
Fair value is measured by use of a binomial model. The expected life used in the model has been adjusted, based on management’s best estimate, for theeffects of non-transferability, exercise restrictions, and behavioural considerations.
Borrowing costs
All borrowing costs that are directly attributable to the acquisition, construction or production of a qualifying asset form part of the cost of that asset. All otherborrowing costs are recognised as an expense in the income statement in the period in which they are incurred. Borrowing costs consist of interest and othercosts that the company incurs in connection with the borrowing of funds.

NOTES TO THE ANNUAL GROUP FINANCIAL STATEMENTS 1-8FOR THE YEAR ENDED 29 DECEMBER 2013
2. TECHNICAL REVIEW
IIAASS 11 PPrreesseennttaattiioonn ooff FFiinnaanncciiaall SSttaatteemmeennttss AAmmeennddmmeennttss rreessuullttiinnggffrroomm AAnnnnuuaallIImmpprroovveemmeennttss 22000099--22001111 CCyyccllee ((ccoommppaarraattiivveeiinnffoorrmmaattiioonn))
The amendment clarified that:Comparative information in respect ofthe previous period (the requiredcomparative information) forms partof a complete set of financialstatements; andThe required comparative informationincludes comparatives for allamounts presented in the currentperiod. An entity may presentadditional comparative informationfor periods before the requiredcomparative period, as long as it isprepared in accordance with IFRS. Allaccompanying notes and disclosuresmust be provided. This amendmenthad no financial or disclosure impacton the Group's results.
IIAASS 1166 PPrrooppeerrttyy,, PPllaanntt aanndd EEqquuiippmmeenntt AAmmeennddmmeennttss rreessuullttiinngg ffrroommAAnnnnuuaall IImmpprroovveemmeennttss22000099--22001111 CCyyccllee ((sseerrvviicciinnggeeqquuiippmmeenntt))
The amendment clarified that:Servicing equipment is Property, Plantand Equipment (PP&E) when used formore than one period; otherwise itshould be classified as inventory.The amendment deletes therequirement that spare parts andservicing equipment used only inconnection with an item of PP&Eshould be classified as PP&E. Thisamendment had no financial ordisclosure impact on the Group'sresults.
IIAASS 1199 EEmmppllooyyeeee BBeenneeffiittss AAmmeennddeedd ssttaannddaarrdd rreessuullttiinnggffrroomm tthhee ppoosstt--eemmppllooyymmeennttbbeenneeffiittss aanndd tteerrmmiinnaattiioonnbbeenneeffiittss pprroojjeeccttss
This revised standard was amended in June2011 resulting from the post-employmentbenefits and termination benefits projects. Asignificant amendment was the removal ofthe corridor approach for recognisingactuarial gains and losses, requiring fullrecognition of surpluses and deficits in OCI.The Group recognised the full actuarial gainand loss regarding its Post-RetirementHealthcare in profit or loss. With effect of thisset of financial statements, the actuarial gainor loss has been recognised in OCI and therequired disclosure has been presentedaccordingly. Refer to note 24. An additionalamendment relates to the distinction betweenshort-term and other long term benefits. Thisdistinction will be based on the expectedtiming of settlement rather than theemployee's entitlement to the benefits andhad an impact on the manner in which leavepay and similar liabilities are currentlyclassified and accounted for. However, for theGroup this amendment has had no financial ordisclosure impact on the Group's results.
Standard/Interpretation Pronouncement Description
Massmart first adopted International Financial Reporting Standards (IFRS) with effect from 1 July 2005. Subsequent amendments have been made to thestandards, resulting in revised issues. All these amendments have been complied with in line with the transitional provisions of the relevant standards.
Standards or Interpretations that became effective in the current period

IIAASS 2277 SSeeppaarraattee FFiinnaanncciiaall SSttaatteemmeennttss ((aass aammeennddeedd iinn22001111))
OOrriiggiinnaall iissssuuee This standard was amended to take intoaccount the changes required due to theintroduction of IFRS 10 ConsolidatedFinancial Statements. IAS 27 SeparateFinancial Statements, as revised, is limited tothe accounting for investments insubsidiaries, joint ventures and associates inthe separate financial statements of theinvestor. This standard had no financial ordisclosure impact on the Group's results.
IIAASS 2288 IInnvveessttmmeennttss iinn AAssssoocciiaatteess aanndd JJooiinntt VVeennttuurreess OOrriiggiinnaall iissssuuee This was a consequential revision due to theissue of IFRS 10 Consolidated FinancialStatements and IFRS 11 Joint Arrangements.The revised standard caters for joint ventures(now accounted for by applying the equityaccounting method) in addition to prescribingthe accounting for investments in associates.This standard had no financial or disclosureimpact on the Group's results as the Grouphas no associates or joint ventures.
IIAASS 3322 FFiinnaanncciiaall IInnssttrruummeennttss:: PPrreesseennttaattiioonn AAmmeennddmmeennttss rreessuullttiinngg ffrroommAAnnnnuuaall IImmpprroovveemmeennttss22000099--22001111 CCyyccllee ((ttaaxx eeffffeecctt ooffeeqquuiittyy ddiissttrriibbuuttiioonnss))
The amendment clarified the treatment ofincome tax relating to distributions andtransaction costs. The amendment clarifiedthat the treatment was in accordance with IAS12 Income Taxes. Income tax related todistributions is recognised in the incomestatement, and income tax related to thecosts of equity transactions is recognised inequity. This amendment had no financial ordisclosure impact on the Group's results.
IIAASS 3344 IInntteerriimm FFiinnaanncciiaall RReeppoorrttiinngg AAmmeennddmmeennttss rreessuullttiinngg ffrroommAAnnnnuuaall IImmpprroovveemmeennttss22000099--22001111 CCyyccllee ((iinntteerriimmrreeppoorrttiinngg ooff sseeggmmeenntt aasssseettss))
The amendment aligns the disclosurerequirements in IAS 34 Interim FinancialReporting with those of IFRS 8 OperatingSegments. The amendment clarified that totalassets for a particular reportable segmentneed only be disclosed when both:
The amounts are regularly provided tothe chief operating decision maker;andThere has been a material change inthe total assets for that segmentfrom the amount disclosed in the lastannual financial statements. Thisamendment had no financial ordisclosure impact on the Group'sresults.
IIFFRRSS 11 FFiirrsstt--ttiimmee AAddooppttiioonn ooff IInntteerrnnaattiioonnaall FFiinnaanncciiaallRReeppoorrttiinngg SSttaannddaarrddss
AAmmeennddmmeennttss ffoorr ggoovveerrnnmmeennttllooaannss wwiitthh aa bbeellooww--mmaarrkkeett rraatteeooff iinntteerreesstt wwhheenn ttrraannssiittiioonniinnggttoo IIFFRRSSss
The amendments dealing with loans receivedfrom governments at a below market rate ofinterest, give first-time adopters of IFRSsrelief from full retrospective application ofIFRSs when accounting for these loans ontransition. This is the same relief that wasgiven to existing preparers of IFRS financialstatements. This amendment had no financialor disclosure impact on the Group's results.
AAmmeennddmmeennttss rreessuullttiinngg ffrroommAAnnnnuuaall IImmpprroovveemmeennttss22000099--22001111 CCyyccllee ((rreeppeeaattaapppplliiccaattiioonn,, bboorrrroowwiinngg ccoossttss))
The amendment clarified that an entity mayapply IFRS 1 First-time Adoption of IFRS morethan once under certain circumstances. Theamendment clarified that an entity canchoose to adopt IAS 23 Borrowing costs,either from its date of transition or from anearlier date. The consequential amendment(as a result of the amendment to IAS 1Presentation of Financial Statementsdiscussed below) clarified that a first-timeadopter should provide the supporting notesfor all statements presented. This amendmenthad no financial or disclosure impact on theGroup's results.

IIFFRRSS 1100 CCoonnssoolliiddaatteedd FFiinnaanncciiaall SSttaatteemmeennttss AAmmeennddmmeennttss ttoo ttrraannssiittiioonnaallgguuiiddaannccee
The amendment clarified that the date ofinitial application is the first day of the annualperiod in which IFRS 10 ConsolidatedFinancial Statements is adopted. Entitiesadopting IFRS 10 Consolidated FinancialStatements should assess control at the dateof initial application; the treatment ofcomparative figures depends on thisassessment. The amendment also requirescertain comparative disclosures under IFRS12 Disclosure of Interests in Other Entitiesupon transition. This amendment had nofinancial or disclosure impact on the Group'sresults.
OOrriiggiinnaall iissssuuee This standard replaces the consolidation requirements in SIC12 Consolidation –Special Purpose Entities and IAS 27 Consolidated and Separate Financial Statements. This standard builds on the existing principles by identifying the concept of control as the determining factor in whether an entity should be included within the consolidated financial statements of the parent company and provides additional guidance to assist in the determination of control where this is difficult to assess. IFRS 10 Consolidated Financial Statements does not change the consolidation process; rather it changes whether an entity is consolidated by revising the definition of control. The revised definition of control requires consideration of aspects such as de-facto control, substantive versus protective rights, agency relationships, silo accounting and structured entities when evaluating whether or not an entity is controlled by the investor. This standard had a financial and disclosure impact on the Group's results and is covered in more detail in note 15.
IIFFRRSS 1111 JJooiinntt AArrrraannggeemmeennttss AAmmeennddmmeennttss ttoo ttrraannssiittiioonnaallgguuiiddaannccee
The amendment clarified that the date ofinitial application is the first day of the annualperiod in which IFRS 11 Joint Arrangements isadopted. Entities adopting IFRS 11 JointArrangements should assess joint control atthe date of initial application; the treatment ofcomparative figures depends on thisassessment. The amendment also requirescertain comparative disclosures under IFRS12 Disclosure of Interests in Other Entitiesupon transition. This amendment had nofinancial or disclosure impact on the Group'sresults.
OOrriiggiinnaall iissssuuee IFRS 11 Joint Arrangements replaces IAS 31Interests in Joint Ventures and SIC 13 JointlyControlled Entities and refers to IFRS 10Consolidated Financial Statements reviseddefinition of 'control' when referring to 'jointcontrol'. Under IFRS 11 Joint Arrangements ajoint arrangement is accounted for as either a:
joint operation – by showing theinvestor's interest/ relative interest inthe assets, liabilities, revenues andexpenses of the joint arrangement; orjoint venture – by applying the equityaccounting method. Proportionateconsolidation is no longer permitted.Under IFRS 11 Joint Arrangementsthe structure of the joint arrangementis not the only factor consideredwhen classifying the jointarrangement as either a jointoperation or joint venture. Thisstandard had no financial ordisclosure impact on the Group'sresults.

IIFFRRSS 1122 DDiisscclloossuurree ooff IInntteerreessttss iinn OOtthheerr EEnnttiittiieess AAmmeennddmmeennttss ttoo ttrraannssiittiioonnaallgguuiiddaannccee
The amendment clarified that the date ofinitial application is the first day of the annualperiod in which IFRS 10 ConsolidatedFinancial Statements is adopted. Entitiesadopting IFRS 10 Consolidated FinancialStatements should assess control at the dateof initial application; the treatment ofcomparative figures depends on thisassessment. The amendment also requirescertain comparative disclosures under IFRS12 Disclosure of Interests in Other Entitiesupon transition. This amendment had nofinancial or disclosure impact on the Group'sresults.
OOrriiggiinnaall iissssuuee IFRS 12 Disclosure of Interests in OtherEntities is a comprehensive standard ondisclosure requirements for all forms ofinterests in other entities, includingsubsidiaries, joint arrangements, associatesand special purpose vehicles. IFRS 12Disclosure of Interests in Other Entitiesrequires sufficient transparency to enableusers of financial statements to evaluate thenature of, and risks associated with itsinterests in other entities and the effects ofthose interests on its financial position,financial performance and cash flows. Thisstandard has resulted in additional disclosurefor the Group – refer to note 36.
IIFFRRSS 1133 FFaaiirr VVaalluuee MMeeaassuurreemmeenntt OOrriiggiinnaall iissssuuee This standard provides guidance on fair valuemeasurement and provides additionaldisclosure requirements. This standard had alimited financial impact on the Group's results.Currently the Group has extensive financialinstrument disclosure and as such thisstandard had a limited impact on disclosureas well. Refer to note 38 for the reviseddisclosures.
AAmmeennddmmeennttss rreessuullttiinngg ffrroomm AAnnnnuuaall IImmpprroovveemmeennttss 22001100--22001122 CCyyccllee ((sshhoorrtt tteerrmm rreecceeiivvaabblleess aanndd ppaayyaabblleess))
The IASB clarified in the Basis of Conclusions that short term receivables and payables with no stated interest rates can be held at invoice amounts when the effect of discounting is immaterial. This amendment is effective immediately and was adopted by the Group in this year’s annual financial statements as part of the IFRS 13 first-time adoption.
IIFFRRSS 77 FFiinnaanncciiaall IInnssttrruummeennttss:: DDiisscclloossuurreess AAmmeennddmmeennttss rreellaatteedd ttoo tthheeooffffsseettttiinngg ooff aasssseettss aannddlliiaabbiilliittiieess
The IASB has published an amendment toIFRS 7 Financial instruments: Disclosures,reflecting the joint requirements with theFASB to enhance current offsettingdisclosures. These new disclosures areintended to facilitate comparison betweenthose entities that prepare IFRS financialstatements to those that prepare financialstatements in accordance with US GAAP. Thisamendment had no financial or disclosureimpact on the Group's results.
IIAASS 3366 IImmppaaiirrmmeenntt ooff AAsssseettss AAmmeennddmmeennttss aarriissiinngg ffrroommRReeccoovveerraabbllee AAmmoouunnttDDiisscclloossuurreess ffoorr NNoonn--FFiinnaanncciiaallAAsssseettss
The amendment relates to the disclosure inrespect of fair value less costs of disposal.The amendment is intended to clarify theIASB’s original intentions when amendmentswere made to IAS 36 Impairment of Assets asa result of the issuance of IFRS 13 Fair ValueMeasurement. The amendment also requiresadditional information about the fair valuemeasurement of impaired assets when therecoverable amount is based on fair value lesscosts of disposal and the discount rates thathave been used when calculating therecoverable amount. This amendmentbecomes effective for year-ends beginning onor after 1 January 2014, however the Grouphas early adopted this amendment in theDecember 2013 financial statements. Theimpact of early adopting this amendment isthe reduced disclosure necessary forrecoverable amounts used in impairmentassessments.

Standards or Interpretations issued but not yet effective
At the date of authorisation of these financial statements, the following relevant standards were in issue but not yet effective. The Group has elected not toearly adopt any of these standards.
IIAASS 2277 SSeeppaarraattee FFiinnaanncciiaall SSttaatteemmeennttss ((aass aammeennddeedd iinn22001111)) IIFFRRSS 1100 CCoonnssoolliiddaatteedd FFiinnaanncciiaall SSttaatteemmeennttssIIFFRRSS 1122 DDiisscclloossuurree ooff IInntteerreessttss iinn OOtthheerr EEnnttiittiieess
AAmmeennddmmeennttss ffoorr iinnvveessttmmeenntteennttiittiieess
The amendment is effective for annualperiods beginning on or after 1 January 2014which is the Group’s December 2014 year-end.The investment entities amendments apply toinvestments in subsidiaries, joint venturesand associates held by a reporting entity thatmeets the definition of an investment entity.The exception to consolidation requiresinvestment entities to account forsubsidiaries at fair value through profit or lossin accordance with IFRS 9 FinancialInstruments (or IAS 39 Financial Instruments:Recognition and Measurement, as applicable),except for investments in subsidiaries,associates and joint ventures that provideservices that relate only to the investmententity, which must be consolidated oraccounted for using the equity method. Thisamendment is not expected to have anyfinancial or disclosure impact on the Group’sresults.
IIAASS 3322 FFiinnaanncciiaall IInnssttrruummeennttss:: PPrreesseennttaattiioonn AAmmeennddmmeennttss rreellaattiinngg ttoo tthheeooffffsseettttiinngg ooff aasssseettss aannddlliiaabbiilliittiieess
The amendment clarifies the meaning of theentity currently having a legally enforceableright to set off financial assets and financialliabilities as well as the application of IAS 32Financial Instruments: Presentation offsettingcriteria to settlement systems. Thisamendment becomes effective for year-endsbeginning on or after 1 January 2014 which isthe Group’s December 2014 year-end. Thisamendment is not expected to have anyfinancial or disclosure impact on the Group’sresults.
IIAASS 3399 FFiinnaanncciiaall IInnssttrruummeennttss:: RReeccooggnniittiioonn aannddMMeeaassuurreemmeenntt
AAmmeennddmmeennttss ffoorr nnoovvaattiioonnss ooffddeerriivvaattiivveess
The IASB amended IAS 39 FinancialInstruments: Recognition and Measurementto provide relief from discontinuing hedgeaccounting when novation of a derivativedesignated as a hedging instrument meetscertain criteria. Novation indicates thatparties to a contract agree to replace theiroriginal counterparty with a new one. Thisamendment becomes effective for year-endsbeginning on or after 1 January 2014 which isthe Group’s December 2014 year-end. Thisamendment is not expected to have anyfinancial or disclosure impact on the Group’sresults as novations don’t normally occur forMassmart’s derivatives.
IIFFRRSS 77 FFiinnaanncciiaall IInnssttrruummeennttss:: DDiisscclloossuurreess DDeeffeerrrraall ooff mmaannddaattoorryyeeffffeeccttiivvee ddaattee ooff IIFFRRSS 99 aannddaammeennddmmeennttss ttoo ttrraannssiittiioonnddiisscclloossuurreess
The IASB has published an amendment toIFRS 9 Financial instruments, which delaysthe effective date to annual periods beginningon or after 1 January 2015 which is theGroup’s December 2015 year-end. The originaleffective date was for annual periodsbeginning on or after from 1 January 2013.This amendment is a result of the boardextending its timeline for completing theremaining phases of its project to replace IAS39 Financial Instruments: Recognition andMeasurement beyond June 2011, as well asthe delay in the insurance project. Theamendment confirms the importance ofallowing entities to apply the requirements ofall the phases of the project to replace IAS 39Financial Instruments: Recognition andMeasurement at the same time. Therequirement to restate comparatives and thedisclosures required on transition have alsobeen modified. This amendment is notexpected to have any financial or disclosureimpact on the Group’s results.Thisamendment has subsequently becomeirrelevant as the effective date of IFRS 9 hasbeen removed.
Standard/Interpretation Pronouncement Description

IIFFRRSS 99 FFiinnaanncciiaall IInnssttrruummeennttss DDeeffeerrrraall ooff mmaannddaattoorryyeeffffeeccttiivvee ddaattee ooff IIFFRRSS 99 aannddaammeennddmmeennttss ttoo ttrraannssiittiioonnddiisscclloossuurreess
The mandatory effective date for IFRS 9Financial instruments has been deferred to 1January 2015 which is the Group’s December2015 year-end. Amendments to IFRS 7Financial instruments: Disclosures depend onwhen IFRS 9 Financial instruments is adoptedand affect the extent of comparativeinformation required to be disclosed. Thisamendment is not expected to have anyfinancial or disclosure impact on the Group’sresults.This amendment has subsequentlybecome irrelevant as the effective date ofIFRS 9 has been removed.
OOrriiggiinnaall iissssuuee ((CCllaassssiiffiiccaattiioonnaanndd mmeeaassuurreemmeenntt ooff ffiinnaanncciiaallaasssseettss))
This is the first phase of the IASB’s project toreplace IAS 39 Financial Instruments:Recognition and Measurement in its entirety,and addresses the classification andmeasurement of financial instruments. Allfinancial assets are initially measured at fairvalue. IFRS 9 Financial instrumentsintroduces a ‘business model test’ and the‘characteristics of financial asset test’ andsubsequent measurement of debtinstruments is only at amortised cost if theinstrument meets these tests. All other debtinstruments are subsequently measured atfair value. An entity also has the option todesignate a financial asset at fair valuethrough profit or loss in certaincircumstances. All equity investments aresubsequently measured at fair value eitherthrough OCI or profit and loss. Embeddedderivatives contained in non-derivative hostcontracts are not separately recognised,unless the hybrid contract qualifies foramortised cost accounting, and the entireinstrument is subsequently recognised at fairvalue through profit and loss.Phase one iseffective for year-ends beginning on or after 1January 2015, which is the Group’s December2015 year-end. These amendments are notexpected to have any financial impact on theGroup’s results, however there will bedisclosure changes. The second and thirdphases of the project will deal with theimpairment of financial instruments andhedge accounting, respectively.
RReeiissssuuee ttoo iinncclluuddeerreeqquuiirreemmeennttss ffoorr tthheeccllaassssiiffiiccaattiioonn aannddmmeeaassuurreemmeenntt ooff ffiinnaanncciiaalllliiaabbiilliittiieess aanndd iinnccoorrppoorraatteeeexxiissttiinngg ddeerreeccooggnniittiioonnrreeqquuiirreemmeennttss
The amendments published in October 2010incorporate the existing derecognitionprinciples of IAS 39 Financial Instruments:Recognition and Measurement directly intoIFRS 9 Financial instruments and providesguidance for financial liabilities. For liabilitiesdesignated at fair value through profit andloss, the change in the fair value of the liabilityattributable to changes in credit risk ispresented in OCI. The remainder of the changein fair value is presented in profit and loss. Allother classification and measurementrequirements in IAS 39 Financial Instruments:Recognition and Measurement have beencarried forward into IFRS 9 Financialinstruments.Phase one is effective foryear-ends beginning on or after 1 January2015, which is the Group’s December 2015year-end. These amendments are notexpected to have any financial impact on theGroup’s results, however there will bedisclosure changes. The second and thirdphases of the project will deal with theimpairment of financial instruments andhedge accounting, respectively.
HHeeddggee AAccccoouunnttiinnggRReeqquuiirreemmeennttss
The IASB issued a new version of IFRS 9Financial Instruments (Hedge Accounting andamendments to IFRS 9, IFRS 7, and IAS 39)which includes the new hedge accountingrequirements and some related amendmentsto IAS 39. There is no mandatory effectivedate for IFRS 9 (2013). The entity has notelected the option of applying thisamendment now. The impact on the Group’sfinancial results will be determined once aneffective date has been set by the IASB.

IIFFRRIICC 2211 LLeevviieess IFRIC 21 Levies provides guidance on when torecognise a liability for a levy imposed by agovernment, both for levies that areaccounted for in accordance with IAS 37Provisions, Contingent Liabilities andContingent Assets and those where the timingand amount of the levy is certain. TheInterpretation covers the accounting foroutflows imposed on entities by governments(including government agencies and similarbodies) in accordance with laws and/orregulations. However, it does not includeincome taxes, fines and other penalties,liabilities arising from emissions tradingschemes and outflows within the scope ofother Standards. The Interpretation does notsupersede IFRIC 6 Liabilities arising fromParticipating in a Specific Market — WasteElectrical and Electronic Equipment, whichremains in force and is consistent with IFRIC21 Levies. . This interpretation becomeseffective for year-ends beginning on or after 1January 2014 which is the Group’s December2014 year-end. This interpretation is notexpected to have any financial or disclosureimpact on the Group’s results.
IIAASS 1199 DDeeffiinneedd BBeenneeffiitt PPllaannss DDeeffiinneedd BBeenneeffiitt PPllaannss::EEmmppllooyyeeee CCoonnttrriibbuuttiioonnssAAmmeennddmmeenntt
The narrow-scope amendments apply tocontributions from employees or third partiesto defined benefit plans. The objective of theamendments is to simplify the accounting forcontributions that are independent of thenumber of years of employee service. Theamendments are effective for annual periodsbeginning on or after 1 July 2014 which is theGroup’s 2014 year-end. This amendment isnot expected to have any financial ordisclosure impact on the Group’s results.
IIFFRRSS 22 SShhaarree--bbaasseedd PPaayymmeenntt AAmmeennddmmeennttss rreessuullttiinngg ffrroommAAnnnnuuaall IImmpprroovveemmeennttss22001100--22001122 CCyyccllee ((ddeeffiinniittiioonnssrreellaattiinngg ttoo vveessttiinngg ccoonnddiittiioonnss))
Performance condition and service conditionare defined in order to clarify various issues,including the following:
A performance condition mustcontain a service conditionA performance target must be metwhile the counterparty is renderingserviceA performance target may relate tothe operations or activities of anentity, or to those of another entity inthe same groupA performance condition may be amarket or non-market conditionIf the counterparty, regardless of thereason, ceases to provide serviceduring the vesting period, the servicecondition is not satisfied.
This amendment is effective from 1 July 2014.The new definitions will be assessed by theGroup in order to determine the impact on theresults of the Group.
IIFFRRSS 33 BBuussiinneessss CCoommbbiinnaattiioonnss AAmmeennddmmeennttss rreessuullttiinngg ffrroommAAnnnnuuaall IImmpprroovveemmeennttss22001100--22001122 CCyyccllee ((ccoonnttiinnggeennttccoonnssiiddeerraattiioonn))
Contingent consideration that is not classifiedas equity is subsequently measured at fairvalue through profit and loss whether or not itfalls within the scope of IFRS 9 FinancialInstruments. The amendment becomeseffective on 1 July 2014.This amendment mayimpact future Business Combinations of theGroup.

This disclosure is only required if thereconciliation is reported to the chiefoperating decision maker, similar to thedisclosure for segment liabilities. Thisdisclosure is already provided by theGroup.The amendment becomes effective on1 July 2014.
IIAASS 2244 RReellaatteedd PPaarrttyy DDiisscclloossuurreess AAmmeennddmmeennttss rreessuullttiinngg ffrroommAAnnnnuuaall IImmpprroovveemmeennttss22001100--22001122 ((kkeeyy mmaannaaggeemmeennttppeerrssoonnnneell))
The amendment clarifies that a managemententity – an entity that provides keymanagement personnel services – is a relatedparty subject to the related party disclosures.In addition, an entity that uses a managemententity is required to disclose expensesincurred for management services. Eventhough an entity incurs key managementpersonnel expenses, detailed keymanagement personnel compensationdisclosures do not apply if the individual ispart of a separate management entity. Theamendment becomes effective on 1 July 2014and the impact of this amendment is stillbeing considered by the Group.
IIFFRRSS 1144 RRaattee rreegguullaatteedd eennttiittiieess IFRS 14 allows rate-regulated entities tocontinue recognising regulatory deferralaccounts in connection with their first-timeadoption of IFRS. The standard is effective forannujal periods beginning on or after 1January 2016.Existing IFRS preparers areprohibited from adopting this standard andthus this will have no impact on the Group.
IIFFRRSS 88 OOppeerraattiinngg SSeeggmmeennttss AAmmeennddmmeennttss rreessuullttiinngg ffrroommAAnnnnuuaall IImmpprroovveemmeennttss22001100--22001122 CCyyccllee ((aaggggrreeggaattiioonnooff ooppeerraattiinngg sseeggmmeennttss))
Operating Segments may becombined/aggregated if they are consistentwith the core principle of the standard, if thesegments have similar economiccharacteristics and if they are similar in otherqualitative aspects. If they are combined theentity must disclose the economiccharacteristics used to assess the segmentsas ‘similar’.The amendment becomeseffective on 1 July 2014.The impact of thisamendment is still being considered by theGroup.
AAmmeennddmmeennttss rreessuullttiinngg ffrroommAAnnnnuuaall IImmpprroovveemmeennttss22001100--22001122 CCyyccllee((rreeccoonncciilliiaattiioonn ooff tthhee ttoottaall oofftthhee rreeppoorrttaabbllee sseeggmmeenntt aasssseettssttoo tthhee eennttiittyy’’ss ttoottaall aasssseettss))

NOTES TO THE ANNUAL GROUP FINANCIAL STATEMENTS 1-8FOR THE YEAR ENDED 29 DECEMBER 2013
3. ACQUISITION OF SUBSIDIARIES
Subsidiaries acquiredPurchasing Principal Date of Control
division activity acquisition acquired(%)
December 2013Capensis Investments 241 (Pty) Ltd Masswarehouse Property Company 25 January 2013 100
Massmart acquired control of Capensis (Pty) Ltd which houses seven Makro stores that had previously been lease-held. The acquisition was accounted for as an asset acquisition.
December 2012Masscash (Pty) Ltd T/A Upington Cash and Carry Masscash Wholesale Cash and Carry 27 August 2012 100Masscash (Pty) Ltd T/A Super Bloemfontein Cash and Carry Masscash Wholesale Cash and Carry 3 August 2012 100Masscash (Pty) Ltd T/A Kimberly Cash and Carry Masscash Wholesale Cash and Carry 16 November 2012 100Masscash (Pty) Ltd T/A Sydenham Liquors Cash and Carry Masscash Wholesale Cash and Carry 1 November 2012 100Cambridge Food (Pty) Ltd T/A Temba Masscash Retail Cash and Carry 28 June 2012 100
The acquisitions listed above for 2012 were for the purchase of business assets and not the entity’s shares. The business assets acquired were transferred into the purchasing entityabove.
These acquisitions increased the Group’s store profile by four stores.
Fair value analysis of the assets and liabilities acquiredThe net fair value of the assets acquired and liabilities assumed during the year was R1 345.3 million (December 2012: R22.8 million) on the date of acquisition.
Net cash outflow on acquisition
December 2013 December 201253 weeks 26 weeks
Rm Rm
Total purchase price (577.4) (56.9)Less: Cash and cash equivalents of subsidiary 0.2 -Net cash position for the Group (577.2) (56.9)
The cash outflow of R577.2 million relates to a 50.1% share in Capensis Investments (Pty) Ltd. The ‘bare dominium’ investment reflected in the prior financial year was Massmart’s rightto acquire a 49.9% share in Capensis Investments 241 (Pty) Ltd, which was exercised in the current financial year. Additional information can be found in note 15.
The net cash outflow as reflected above for December 2012 can be found in note 37.8. A liability was raised on the asset acquisition in the current financial year for R10.5 million. The entire liability raised is short-term in nature and can be found in note 26. There were noliabilities raised on the business acquisitions in the prior financial year.
Goodwill arising on acquisition No goodwill arose in the current financial year. The only acquisition of Capensis (Pty) Ltd fell outside the scope of a business combination (December 2012: R38.4 million). Goodwill was recognised in the prior financial year on all the acquisitions listed above. Additional information can be found in note 13.

NOTES TO THE ANNUAL GROUP FINANCIAL STATEMENTS 1-8FOR THE YEAR ENDED 29 DECEMBER 2013
4. REVENUE
December 2013 December 2012
53 weeks 26 weeks
Rm Rm
Sales 72,263.4 36,122.6
Other income 249.5 111.9
Change in fair value of financial assets carried at fair value through profit or loss 39.0 27.7
Instalment-sale finance charges - 0.9
Dividends from listed investments 0.3 -
Dividends from unlisted investments 78.8 -
Royalties and franchise fees 41.5 19.5
Management and administration fees 0.8 2.4
Property rentals 10.3 3.5
Commissions and fees 35.3 34.0
Distribution income 4.9 3.2
Income from insurance of extended warranties - 18.7
Retirement of aged gift cards 7.6 -
Contributions from landlords 7.2 -
Other 23.8 2.0
72,512.9 36,234.5
Additional information on financial assets carried at fair value through profit or loss can be found in note 15.
The dividend relates to the unwinding of the insurance cell-captive on premium contributions with Unison. Additional information can be found in note 15.
‘Royalties and franchise fees’ are earned in Massdiscounters from various third party sources.
‘Commissions and fees’ are earned on the RCS outsourced retail card program.
‘Income from insurance of extended warranties’ related to an insurance arrangement with Mutual & Federal pertaining to extended warranties sold within the Group. In the current
financial year this cell-captive has been deconsolidated as a result of the implementation of IFRS 10 Consolidated Financial Statements. The ‘investment in an insurance cell-captive on
extended warranties’ has been designated as a financial asset at fair value through profit or loss, and accounted for under ‘change in fair value of financial assets carried at fair value
through profit or loss’ above. Additional information can be found in note 15.
1
2
3
4
5
1
2
3
4
5

NOTES TO THE ANNUAL GROUP FINANCIAL STATEMENTS 1-8FOR THE YEAR ENDED 29 DECEMBER 2013
5. IMPAIRMENT OF ASSETS
December 2013 December 201253 weeks 26 weeks
Notes Rm Rm
Leasehold improvements 12 4.4 5.4Fixtures, fittings, plant and equipment 12 10.9 -Goodwill 13 26.3 -
41.6 5.4
The impairment of assets in the current financial year relates to the impairment of leasehold improvements, fixture, fittings, plant and equipment and goodwill in Masscash due to theclosure of a store. Additional information can be found in note 13.
The impairment of assets in the prior financial year relates to the impairment of leasehold improvements in Masscash. For those assets impaired to their fair values less costs of disposal, fair value has been assessed as the highest and best use as no market or other factors suggest that a different useby market participants would maximise the value of the asset.

NOTES TO THE ANNUAL GROUP FINANCIAL STATEMENTS 1-8FOR THE YEAR ENDED 29 DECEMBER 2013
6. OPERATING PROFIT
December 2013 December 2012
53 weeks 26 weeks
Rm Rm
Credits to operating profit include:
Foreign exchange profit 95.4 147.4
Profit on disposal of tangible and intangible assets 7.6 3.6
Charges to operating profit include:
Depreciation and amortisation (owned assets): 703.7 330.2
Buildings 25.8 6.5
Fixtures, fittings, plant and equipment 423.4 202.2
Computer hardware 67.5 38.4
Leasehold improvements 49.3 26.7
Motor vehicles 34.0 15.5
Computer software 98.5 37.9
Right of use 4.8 2.8
Trademarks 0.4 0.2
Depreciation and amortisation (leased assets): 27.4 12.4
Buildings 2.0 1.0
Fixtures, fittings, plant and equipment 5.4 2.4
Computer hardware 5.7 4.1
Motor vehicles 14.3 4.9
Foreign exchange loss 27.6 224.1
Share-based payment expense: 126.3 39.9
Massmart Holdings Limited Employee Share Trust (note 22) 109.0 30.0
Massmart Thuthukani Empowerment Trust (note 22) - 1.8
Massmart Black Scarce Skills Trust (note 22) 17.3 8.1
Operating lease charges: 1,772.0 788.2
Land and buildings 1,668.2 736.2
Plant and equipment 67.1 31.3
Computer hardware 1.4 0.7
Motor vehicles 35.3 20.0
Loss on disposal of tangible and intangible assets 21.3 9.8
Walmart transaction, integration and related costs: - 205.2
Share-based payment charge - 28.6
Supplier Development Fund - 140.0
Integration and related costs - 36.6
Fees: 117.3 48.4
Administrative and outsourcing services 86.6 39.9
Consulting 30.7 8.5
Auditors’ remuneration: 20.6 12.7
Current year fee 20.3 12.9
Prior year under/(over) provision 0.3 (0.2)
Professional fees 7.7 1.4

NOTES TO THE ANNUAL GROUP FINANCIAL STATEMENTS 1-8FOR THE YEAR ENDED 29 DECEMBER 2013
7. FOREIGN EXCHANGE GAINS AND LOSSES
December 2013 December 201253 weeks 26 weeks
Rm Rm
Foreign exchange gain/(loss) arising from loans to African operations 73.1 (82.8)Foreign exchange loss arising from hedges - (0.7)Foreign exchange gain arising from an investment in a trading and logistics structure (note 15) 22.3 1.0Foreign exchange (loss)/gain arising from the translation of foreign creditors (27.6) 5.8
67.8 (76.7)
Includes foreign exchange gain/(loss) arising from the translation of other small monetary loan balances as described in the explanation below.
The Group was exposed to the following currencies for the period under review and their year-end exchange rates were:Spot rate Spot rate Spot rate
Country Currency June 2012 December 2012 December 2013United States US Dollar 8.4049 8.5878 10.5372United Kingdom Pound Sterling 13.1009 13.8878 17.3686European Union Euro 10.5201 11.2948 14.4703Botswana Botswana Pula 1.0854 1.0993 1.2012Ghana Ghanaian New Cedi 4.3563 4.5238 4.4177Malawi Malawian Kwacha 0.0311 0.0259 0.0255Mozambique Mozambican New Metical 0.3037 0.2906 0.3508Nigeria Nigerian Naira 0.0517 0.0546 0.0653Tanzania Tanzanian Shilling 0.0053 0.0054 0.0066Uganda Uganda Shilling 0.0034 0.0032 0.0042Zambia Zambian New Kwacha 1.6000 1.7000 1.8966Source: Oanda Currency converter
The Bank of Zambia rebased the Kwacha, effective from 1 January 2013. The Zambian New Kwacha was rebased at a rate of one New Kwacha to a thousand old Kwacha. Prior periodcomparatives have been adjusted accordingly to allow for comparability.
The Group also operates in Lesotho, Nambia and Swaziland. As the Lesotho Loti, the Namibian Dollar and Swazi Lilangeni are pegged to the Rand on a 1:1 basis, there is no exposure tothose currencies and thus they have not been included in the table above.
Foreign exchange gain/(loss) arising from loans to African operations
In Massdiscounters, Massbuild and Masscash a loan has been provided to African operations as start up capital and then maintained as a working capital loan. This loan attracts foreignexchange gains/(losses) when it is translated into the functional currency of that entity at year-end. Where the operation holds other monetary balances not in its functional currency,that balance will also attract foreign exchange gains/(losses) when translated at year-end. These balances are not material and have been ignored in the explanation below.
The graph below indicates the appreciation (rise in line) or depreciation (fall in line) of each currency to the Rand in the previous financial year.In May 2012, the Malawian Kwacha devalued by 50%. The Malawian Kwacha continued to devalue against the Rand in the previous financial year. This devaluation along with thedevaluation in the Mozambican New Metical and the Ugandan Shilling offset the gains experienced by the other African currencies which strengthened against the Rand in the previousfinancial year.
African currencies’ spot rate relative to the Rand (based to June 2012)
1
1
2
2
The graph below indicates the appreciation (rise in line) or depreciation (fall in line) of each currency to the Rand in the current financial year.The Malawian Kwacha has stabilised atfter the 50% devalued position experienced in the previous financial years to May 2012, however, it does remain volatile. The Malawian Kwacha strengthened against the Rand around June 2013, only to close December 2013 net weaker on the Rand. This volatility along with the devaluation in the Ghanaian New Cedi offset some of the gains experienced by the other African currencies which strengthened against the Rand in the current financial year.

African currencies’ spot rate relative to the Rand (based to December 2013)
Where there is a depreciation of the African currency (alternatively, a strengthening in the Rand) the resulting impact is a foreign exchange loss on the loan. From the graph, it is evidentthat most the African currencies strengthened against the Rand, which would explain a foreign exchange gain in the income statement.
To minimise the impact of the volatile Malawian Kwacha on the Group results, management have substantially reduced these loan balances to R12.3 million at December 2013, and thusour exposure to this currency.
The African operations trade in their local currency, which for reporting purposes is also their functional currency. The foreign exchange gain/(loss) that arises when translating theforeign operation into Rands (the Group’s presentation currency) is accounted for in the Foreign Currency Translation Reserve on the statement of financial position. Additionalinformation on these translations can be found in note 22.
Foreign exchange loss arising from hedges
The Group uses foreign exchange forward contracts (FEC’s) to hedge its exposure to foreign currency fluctuations relating to certain firm trading commitments. The foreign exchange
gains that arise from the hedges are recognised in the income statement when they become ineffective or for effective hedges when the firm commitment is terminated resulting in the
FEC being cancelled. The income statement impact on ineffective or cancelled hedges, where applicable, is immaterial.
Foreign exchange gain arising from an investment in a trading and logistics structure (note 15)
The Group’s trading and logistics structure is a US Dollar denominated investment. The graph shows that the Rand closed weaker on the US Dollar in the current and prior financial years,which gave rise to a foreign exchange gain on this investment in both periods.
US Dollar spot rate relative to the Rand
Foreign exchange gain arising from an investment in a trading and logistics structure (note 15)
The Group’s trading and logistics structure is a US Dollar denominated investment. The graph above shows that the Rand closed weaker on the US Dollar in the current and prior financialyears, which gave rise to a foreign exchange gain on this investment in both periods.
Foreign exchange (loss)/gain arising from the translation of foreign creditors
Foreign creditors resulting from foreign stock purchases and transactions with the ultimate holding company, being Wal-Mart Stores Inc., are translated into functional currency atyear-end and the exchange difference is accounted for in the income statement. As the bulk of foreign creditors and transactions with Walmart are recorded in US Dollars, this exchangedifference can in most part be explained by the movement of the Rand against the US Dollar as illusatrated in the graph above. As the Rand weakened in both periods, this would explainan exchange loss in both periods. However, as payments are made to creditors throughout the year that attract different rates of exchange, the entire exchange gain/(loss) cannot belinked to the closing Rand/US Dollar movement, which would explain the Group recording a gain in the prior year.

NOTES TO THE ANNUAL GROUP FINANCIAL STATEMENTS 1-8FOR THE YEAR ENDED 29 DECEMBER 2013
8. NET FINANCE COSTS
December 2013 December 201253 weeks 26 weeks
Rm Rm
Finance costsInterest on bank overdrafts and loans (276.3) (101.0)Interest on obligations under finance leases (7.5) (5.0)
(283.8) (106.0)
Finance incomeIncome from investments, receivables and bank accounts 28.7 45.6
28.7 45.6
Net finance costs (255.1) (60.4)
Additional information on the loans and finance leases can be found in note 23.

NOTES TO THE ANNUAL GROUP FINANCIAL STATEMENTS 9-16FOR THE YEAR ENDED 29 DECEMBER 2013
9. TAXATION
December 2013 December 201253 weeks 26 weeks
Rm Rm
Current yearSSoouutthh AAffrriiccaann nnoorrmmaall ttaaxxaattiioonn::
Current taxation 653.5 356.6
Deferred taxation (231.8) (80.8)
FFoorreeiiggnn ttaaxxaattiioonn::
Current taxation 94.4 43.5
Deferred taxation 8.3 (0.4)
Withholding tax 18.5 12.1
Taxation effect of participation in export partnerships 0.4 0.5
Total 543.3 331.5
Prior year under/(over) provision:SSoouutthh AAffrriiccaann nnoorrmmaall ttaaxxaattiioonn::
Current taxation 0.9 (3.7)
Deferred taxation (0.6) 18.1
FFoorreeiiggnn ttaaxxaattiioonn::
Current taxation 2.9 (11.1)
Deferred taxation 8.8 6.8
Secondary taxation on companies - 0.7
12.0 10.8
Taxation as reflected in the income statement 555.3 342.3
Two companies in the Group participate in Trencor export partnerships. As the companies are liable for the tax effect of the participation, the amount is classified as a taxation charge.
Additional information on the export partnership can be found in note 15.
The withholdings tax relates to interest and dividends on foreign controlled entities.
December 2013 December 2012% %
The rate of taxation is reconciled as follows:Standard corporate taxation rate 28.0 28.0
Exempt income (1.1) -
Disallowable expenditure 0.1 3.2
Foreign income 1.1 0.9
Prior year over-provision 0.6 0.9
Allowances on lease premiums and improvements (0.3) (0.6)
Assessed loss not utilised 1.4 2.1
Withholding tax 0.1 (1.1)
Secondary taxation on companies - 0.1
Other (0.6) (1.4)
Effective rate 29.3 32.1
2
1
1
2

NOTES TO THE ANNUAL GROUP FINANCIAL STATEMENTS 9-16FOR THE YEAR ENDED 29 DECEMBER 2013
10. DIVIDENDS PAID TO SHAREHOLDERS
December 2013 December 201253 weeks 26 weeks
Rm Rm
Final cash dividend No 26 (Dec 2012: No 25) 596.5 315.6
Interim cash dividend No 27 316.9 -
Final Thuthukani preference share dividend (Dec 2012: No 12) - 1.4
Total dividends paid 913.4 317.0
Dividend/distribution per share (cents)Interim 146.0 -
Final 275.0 275.0
Total 421.0 275.0
No 25 of 146.0 cents declared on 21 August 2012 and paid on 17 September 2012 (R315.6 million).
No 26 of 275.0 cents declared on 27 February 2013 and paid on 25 March 2013 (R596.5 million).
No 27 of 146.0 cents declared on 20 August 2013 and paid on 16 September 2013 (R316.9 million).
No 28 of 275.0 cents declared on 26 February 2014 and paid on 24 March 2014 (R597.0 million).
No 12 of 146.0 cents declared on 21 August 2012 and paid on 17 September 2012 to the Massmart Thuthukani Empowerment Trust (R1.4 million).
On 1 October 2012, the final conversion for the beneficiaries took place. No dividend was, therefore, declared by the Thuthukani Trust in the current period.
Withholding tax of 15% was applied to the dividends declared on 27 February 2013 and paid on 25 March 2013 and the dividends declared on 20 August 2013 and paid on 16 September
2013. Withholding tax applies to the dividend declared on 26 February 2014 and paid on 24 March 2014, and will be accounted for in the next financial year. The Group was acting as an
agent with regards to the withholding tax paid on behalf of shareholders on dividends declared. Withholding tax has been included in the total amount of the dividend paid.

NOTES TO THE ANNUAL GROUP FINANCIAL STATEMENTS 9-16FOR THE YEAR ENDED 29 DECEMBER 2013
11. EARNINGS PER SHARE
December 2013 December 2012
53 weeks 26 weeks
Per share (cents)
Basic EPS 591.4 319.7
Diluted basic EPS 585.1 315.4
Headline EPS (cents) 615.2 326.0
Headline EPS before foreign exchange (taxed) (cents) 592.7 351.5
Diluted headline EPS (cents) 608.6 321.7
Diluted headline EPS before foreign exchange (taxed) (cents) 586.4 346.9
Ordinary shares (number)
In issue 217,109,044 216,910,195
Weighted average 216,934,934 216,413,814
Diluted weighted average 219,268,221 219,312,755
December 2013 December 2012
53 weeks 26 weeks
Pre-taxation Post-taxation Pre-taxation Post-taxation
Rm Rm Cents/share Rm Rm Cents/share
Attributable and headline earnings per share
The calculation of atttributable and headline
earnings per share is based on the weighted average
number of ordinary shares.
The calculation is reconciled as follows:
Profit attributable to the equity holders of the
parent 1,897.4 1,283.0 591.4 1,063.3 691.8 319.7
Adjustments after minorities:
Loss on disposal of tangible and intangible assets 11.9 8.6 4.0 6.2 4.2 1.9
Loss on disposal of business 1.8 1.3 0.6 4.4 3.8 1.8
Fair value adjustment on assets classified as held
for sale - - - 0.4 0.3 0.1
Impairment of assets (note 5) 41.6 41.6 19.2 5.4 5.4 2.5
Headline earnings 1,952.7 1,334.5 615.2 1,079.7 705.5 326.0
Foreign exchange (profit)/loss (67.8) (48.8) (22.5) 76.7 55.2 25.5
Headline earnings before foreign exchange 1,884.9 1,285.7 592.7 1,156.4 760.7 351.5
December 2013 December 2012 December 2013 December 2012
53 weeks 26 weeks 53 weeks 26 weeks
Rm Rm Cents/share Cents/share
Diluted attributable and diluted headline
earnings per share
The calculation of diluted atttributable and diluted headline earnings per share is based on the
weighted average number of ordinary shares.
The calculation is reconciled as follows:
Profit attributable to the equity holders of the
parent 1,283.0 691.8 591.4 319.7
Adjustment for impact of issuing ordinary shares - - (6.2) (4.3)
Diluted attributable earnings 1,283.0 691.8 585.1 315.4
Headline earnings 1,334.5 705.5 615.2 326.0
Adjustment for impact of issuing ordinary shares - - (6.6) (4.3)
Diluted headline earnings 1,334.5 705.5 608.6 321.7
Diluted headline earnings before foreign exchange 1,285.7 760.7 586.4 346.9
December 2013 December 2012
Weighted average shares outstanding No of shares No of shares
Weighted average shares outstanding for basic and headline earnings per share 216,934,934 216,413,814
Potentially dilutive ordinary shares resulting from outstanding options 2,333,287 2,898,941
Weighted average shares outstanding for diluted and diluted headline earnings per share 219,268,221 219,312,755
The Black Scarce Skills ‘B’ preference shares are predominantly dilutive and have a small effect on diluted basic and diluted headline earnings per share.

NOTES TO THE ANNUAL GROUP FINANCIAL STATEMENTS 9-16FOR THE YEAR ENDED 29 DECEMBER 2013
12. PROPERTY, PLANT AND EQUIPMENT
CostAccumulated depreciation
and impairment Net book valueRm Rm Rm
December 2013OOwwnneedd aasssseettss
Freehold land and buildings 2,460.8 85.7 2,375.1
Leasehold improvements 743.3 274.5 468.8
Fixtures, fittings, plant and equipment 4,713.2 2,033.8 2,679.4
Computer hardware 586.9 354.2 232.7
Motor vehicles 232.8 99.3 133.5
8,737.0 2,847.5 5,889.5
CCaappiittaalliisseedd lleeaasseedd aasssseettss
Freehold land and buildings 49.4 18.0 31.4
Fixtures, fittings, plant and equipment 34.8 10.4 24.4
Computer hardware 17.3 11.0 6.3
Motor vehicles 59.7 23.2 36.5
161.2 62.6 98.6
Total 8,898.2 2,910.1 5,988.1
December 2012OOwwnneedd aasssseettss
Freehold land and buildings 908.9 58.9 850.0
Leasehold improvements 663.5 231.0 432.5
Fixtures, fittings, plant and equipment 3,836.6 1,668.4 2,168.2
Computer hardware 511.2 317.9 193.3
Motor vehicles 210.6 76.1 134.5
6,130.8 2,352.3 3,778.5
CCaappiittaalliisseedd lleeaasseedd aasssseettss
Freehold land and buildings 49.5 16.1 33.4
Fixtures, fittings, plant and equipment 38.4 8.3 30.1
Computer hardware 25.2 13.2 12.0
Motor vehicles 32.2 18.0 14.2
145.3 55.6 89.7
Total 6,276.1 2,407.9 3,868.2
Certain capitalised leased property, plant and equipment is encumbered as per note 23.

NOTES TO THE ANNUAL GROUP FINANCIAL STATEMENTS 9-16FOR THE YEAR ENDED 29 DECEMBER 2013
12. PROPERTY, PLANT AND EQUIPMENT CONTINUED
Reconciliation of property, plant and equipment
Opening
net book
value Additions
Additions
through
acquisitions Disposals Depreciation
Foreign
exchange
gain/(loss) Reclassifications Impairment
Classified
as held for
sale
Closing
net book
value
Rm Rm Rm Rm Rm Rm Rm Rm Rm Rm
December 2013
OOwwnneedd aasssseettss
Freehold land & buildings 850.0 195.4 1,354.6 (3.5) (25.8) 5.4 (1.0) - - 2,375.1
Leasehold improvements 432.5 82.8 - (11.6) (49.3) 18.5 0.3 (4.4) - 468.8
Fixtures, fittings, plant & equipment 2,168.2 949.3 - (10.2) (423.4) 19.5 (13.1) (10.9) - 2,679.4
Computer hardware 193.3 104.7 - (0.6) (67.5) 2.8 - - - 232.7
Motor vehicles 134.5 55.3 - (8.1) (34.0) 0.9 (15.1) - - 133.5
3,778.5 1,387.5 1,354.6 (34.0) (600.0) 47.1 (28.9) (15.3) - 5,889.5
CCaappiittaalliisseedd lleeaasseedd aasssseettss
Freehold land & buildings 33.4 - - - (2.0) - - - - 31.4
Fixtures, fittings, plant & equipment 30.1 - - - (5.4) - (0.3) - - 24.4
Computer hardware 12.0 - - - (5.7) - - - - 6.3
Motor vehicles 14.2 22.9 - (1.4) (14.3) - 15.1 - - 36.5
89.7 22.9 - (1.4) (27.4) - 14.8 - - 98.6
Total 3,868.2 1,410.4 1,354.6 (35.4) (627.4) 47.1 (14.1) (15.3) - 5,988.1
December 2012
OOwwnneedd aasssseettss
Freehold land & buildings 857.5 20.7 - (0.2) (6.5) (0.7) (20.8) - - 850.0
Leasehold improvements 392.4 56.4 - (1.1) (26.7) (3.3) 20.8 (5.4) (0.6) 432.5
Fixtures, fittings, plant & equipment 1,881.9 487.3 7.7 (7.0) (202.2) 0.7 - - (0.2) 2,168.2
Computer hardware 181.3 55.1 - (4.7) (38.4) - - - - 193.3
Motor vehicles 104.6 43.4 - (1.6) (15.5) (0.9) 4.5 - - 134.5
3,417.7 662.9 7.7 (14.6) (289.3) (4.2) 4.5 (5.4) (0.8) 3,778.5
CCaappiittaalliisseedd lleeaasseedd aasssseettss
Freehold land & buildings 34.4 - - - (1.0) - - - 33.4
Fixtures, fittings, plant & equipment 32.5 - - - (2.4) - - - 30.1
Computer hardware 16.1 - - - (4.1) - - - 12.0
Motor vehicles 19.9 3.9 - (0.2) (4.9) (4.5) - - 14.2
102.9 3.9 - (0.2) (12.4) - (4.5) - - 89.7
Total 3,520.6 666.8 7.7 (14.8) (301.7) (4.2) - (5.4) (0.8) 3,868.2
The acquisition of ‘freehold land and buildings’ in the current financial year relates to the acquisition of the seven Makro properties, which has been included as part of ‘Investment to
expand operations’ in note 37. The acquisitions in the prior financial year were included under ‘ Investment in subsidiaries’ in note 37.
The Group has reviewed the residual values and useful lives of the assets. No material adjustment resulted from such review in the current financial year.
The impairment in the current year relates to the impairment of owned assets in Masscash and Makro as a result of store closures.
The following useful lives are used in the calculation of depreciation.
- Buildings 50 years
- Fixtures, fittings, plant and equipment 4 to 15 years
- Motor vehicles 4 to 10 years
- Computer hardware 3 to 8 years
- Leasehold improvements Shorter of lease period or useful life
There is no investment property in the Group and all assets are held at historical cost.
1
1

NOTES TO THE ANNUAL GROUP FINANCIAL STATEMENTS 9-16FOR THE YEAR ENDED 29 DECEMBER 2013
13. GOODWILL
December 2013 December 2012Rm Rm
Reconciliation of goodwill:Balance at the beginning of the year 2,557.7 2,521.4
Additions through acquisitions - 38.4
Impairment (26.3) -
Disposal (2.8) (2.0)
Transferred to assets classified as held for sale - (0.7)
Foreign exchange gain/(loss) 3.4 0.6
Balance at the end of the year 2,532.0 2,557.7
Carrying amount of significant goodwill:Masscash Holdings (Pty) Ltd 1,086.6 1,122.9
Massbuild (Pty) Ltd 902.0 900.9
The Fruitspot (Pty) Ltd 173.9 168.2
Rhino Cash and Carry Group 321.3 321.3
The impairment of goodwill in the current financial year relates to the impairment of certain acquired goodwill in Masscash due to the closure of a store. The remaining decrease in
goodwill relates to the transfer of a business to The Fruitspot (Pty) Ltd, in order to improve the operational performance of the Group, and the disposal of a business externally.
No businesses were acquired by Massbuild (Pty) Ltd in the current financial year. The movement in goodwill relates to the translation of goodwill from its functional currency to its
presentation currency through the Foreign Currency Translation Reserve. Additional information can be found in note 22.
The increase in goodwill relates to the transfer of a business from Masscash Holdings (Pty) Ltd, in order to improve the operational performance of the Group.
Goodwill acquired in a business combination is allocated, at acquisition, to the cash generating units (CGUs) that are expected to benefit from that business combination.
The Group tests goodwill annually for impairment, or more frequently if there are indications that goodwill might be impaired.
When testing goodwill for impairment, the recoverable amounts of the CGUs are determined as the higher of value in use and fair value less costs of disposal. The key assumptions for
the value in use calculations are discount and growth rates. Management estimates discount rates using rates that reflect current market assumptions of the time value of money and
the risks specific to the CGUs. The growth rates are based on industry growth forecasts.
The Group prepares cash flow forecasts based on the CGUs’ results for the next five financial years. A terminal value is calculated based on a conservative growth rate of 3% (December
2012: 3%). This rate does not exceed the average long-term growth rate for the relevant markets. The valuation method applied is consistent with the prior financial year.
The rate used to discount the forecast cash flows is 10.5% (December 2012: 10.5%).
No reasonable change of the assumptions applied in testing goodwill for impairment would result in an impairment loss.
The additions through acquisitions in December 2012 relate to purchases in Masscash. Additional information can be found in note 3.
1
1
2
3
1
2
3

NOTES TO THE ANNUAL GROUP FINANCIAL STATEMENTS 9-16FOR THE YEAR ENDED 29 DECEMBER 2013
14. OTHER INTANGIBLES
Cost
Accumulated
amortisation
and
impairment
Net book
value
Rm Rm Rm
December 2013
OOwwnneedd aasssseettss
Computer software 748.1 388.3 359.8
Right of use 48.8 12.7 36.1
Trademarks 4.3 3.4 0.9
Total 801.2 404.4 396.8
December 2012
OOwwnneedd aasssseettss
Computer software 653.4 306.1 347.3
Right of use 46.9 7.9 39.0
Trademarks 4.3 3.0 1.3
Total 704.6 317.0 387.6
Reconciliation of other intangible assets
Opening
net book
value Additions Disposals Amortisation
Foreign
exchange
gain Reclassifications
Classified as
held for sale
Closing
net book
value
Rm Rm Rm Rm Rm Rm Rm Rm
December 2013
OOwwnneedd aasssseettss
Computer software 347.3 98.0 (1.1) (98.5) - 14.1 - 359.8
Right of use 39.0 1.9 - (4.8) - - - 36.1
Trademarks 1.3 - - (0.4) - - - 0.9
Total 387.6 99.9 (1.1) (103.7) - 14.1 - 396.8
December 2012
OOwwnneedd aasssseettss
Computer software 304.3 80.9 - (37.9) - - - 347.3
Right of use 41.3 2.4 - (2.8) (0.8) - (1.1) 39.0
Trademarks 1.5 - - (0.2) - - - 1.3
Total 347.1 83.3 - (40.9) (0.8) - (1.1) 387.6
The Group has reviewed the useful lives of the assets for reasonability. There were no material adjustments in the current financial year.
The following useful lives are used in the calculation of amortisation.
- Computer software 3 to 8 years
- Right of use 10 years
- Trademarks 10 years

NOTES TO THE ANNUAL GROUP FINANCIAL STATEMENTS 9-16FOR THE YEAR ENDED 29 DECEMBER 2013
15. INVESTMENTS
December 2013 December 2012
Rm Rm
Unlisted investments
Fair value through profit or loss (FVTPL)
HHeelldd ffoorr ttrraaddiinnggBare dominium - 110.0Investment in a trading and logistics structure 117.4 104.0Total financial assets classified as held for trading 117.4 214.0
DDeessiiggnnaatteedd aass aatt FFVVTTPPLLInvestment in insurance cell-captive on extended warranties 44.4 -Investment in insurance cell-captive on premium contributions 55.9 34.8Total financial assets designated as at FVTPL 100.3 34.8
Total fair value through profit or loss (FVTPL) 217.7 248.8
Loans and receivables
Trencor export partnership 2.1 2.5Total loans and receivables 2.1 2.5
Held-to-maturity investments carried at amortised
cost
Other investments - 0.1Total held-to-maturity investments - 0.1
Total unlisted investments 219.8 251.4
Listed investments
Available-for-sale investments
Other investments 12.1 7.4Total listed investments 12.1 7.4
TToottaall iinnvveessttmmeennttss 223311..99 225588..88
For IAS 39 Financial Instruments: Recognition and Measurement accounting treatment of these investments, see note 38.
December 2013 December 2012
Rm Rm
Reconciliation of financial assets carried at fair value through profit or loss (FVTPL)
Opening balance 248.8 313.1Fair value adjustments taken to the income statement (4.2) 27.7Interest on investment taken to finance income 1.1 0.5Realisation of a portion of the investment in offshore trading structure recognised in cash reserves (1.6) (74.7)Deconsolidation/(consolidation) of investment in insurance cell-captive on extended warranties 23.3 (18.8)Foreign exchange gains taken to the income statement (note 7) 22.3 1.0Realisation of the right in the bare dominium on the acquisition of the Makro properties (122.0) -Capital contribution made to the investment in insurance cell-captive on premium contributions 50.0 -Closing balance 217.7 248.8
FFuurrtthheerr ddeettaaiillss oonn tthhee iinnvveessttmmeennttss iinn tthhiiss ccaatteeggoorryy::The ‘bare dominium’ reflected Massmart’s right to acquire a 49.9% share in Capensis Investments 241 (Pty) Ltd, the holdingcompany of the bare dominium over seven Makro properties. At the end of January 2013, Massmart acquired control of theseven Makro properties, and in doing so exercised its right in the bare dominium. The fair value of the right in the baredominium at acquition date of R122.0 million was included as part of the consideration transferred to obtain control.The ‘investment in a trading and logistics structure’ is in M-class preference shares representing an international treasury,shipping and trading business unit.The ‘investment in an insurance cell-captive on extended warranties’ relates to an insurance arrangement with Mutual & Federalpertaining to extended warranties sold within the Group. In the current financial year this cell-captive has been deconsolidatedas a result of the implementation of IFRS 10 Consolidated Financial Statements. The cell-captive does not meet the definitionof a “deemed separate entity” and, as a result, has not been consolidated. The ‘investment in an insurance cell-captive onextended warranties’ has been designated as a financial asset at fair value through profit or loss.The ‘investment in an insurance cell-captive on premium contributions’ relates to an insurance arrangement with Mutual &Federal pertaining to general insurance within the Group. The cell-captive does not meet the definition of a “deemed separateentity”, and as a result, has not been consolidated. The ‘investment in an insurance cell-captive on premium contributions’ hasbeen designated as a financial asset at fair value through profit or loss. The previous structure was unwound in the currentreporting period and replaced with the cell-captive referred to above.
Additional information on the fair value of ‘investments’ can be found in note 38.
Reconciliation of loans and receivables
Opening balance 2.5 3.0Investment realised (0.4) (0.5)Closing balance 2.1 2.5
FFuurrtthheerr ddeettaaiillss oonn tthhee iinnvveessttmmeennttss iinn tthhiiss ccaatteeggoorryy:: The ‘Trencor export partnership’ represents our participation in export containers.
Reconciliation of held-to-maturity investments
Opening balance 0.1 0.1Amortisation taken to the income statement (0.1) -Closing balance - 0.1
Reconciliation of available-for-sale investments
Opening balance 7.4 5.7Fair value adjustment 4.7 1.7Closing balance 12.1 7.4
FFuurrtthheerr ddeettaaiillss oonn tthhee iinnvveessttmmeennttss iinn tthhiiss ccaatteeggoorryy:: Listed investments include shares held on the JSE and the Zimbabwe Stock Exchange.
1
2
3
4
1
1
2
3
4
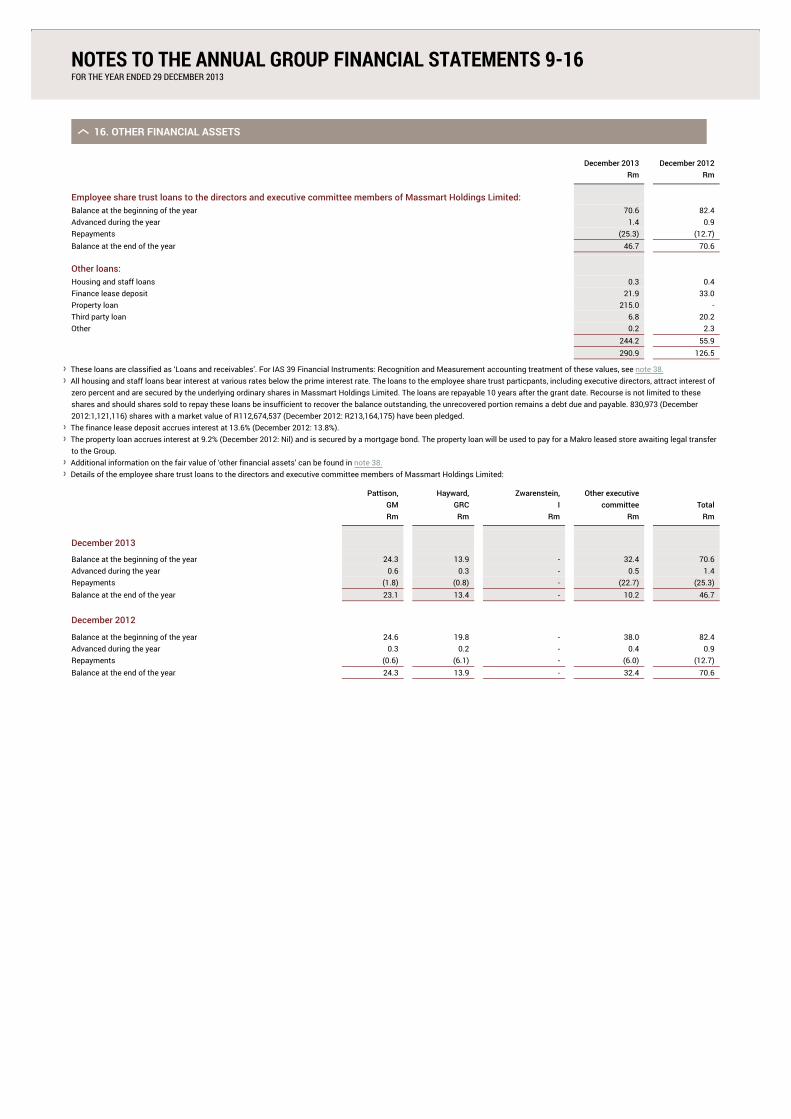
NOTES TO THE ANNUAL GROUP FINANCIAL STATEMENTS 9-16FOR THE YEAR ENDED 29 DECEMBER 2013
16. OTHER FINANCIAL ASSETS
December 2013 December 2012Rm Rm
Employee share trust loans to the directors and executive committee members of Massmart Holdings Limited:Balance at the beginning of the year 70.6 82.4Advanced during the year 1.4 0.9Repayments (25.3) (12.7)Balance at the end of the year 46.7 70.6
Other loans:Housing and staff loans 0.3 0.4Finance lease deposit 21.9 33.0Property loan 215.0 -Third party loan 6.8 20.2Other 0.2 2.3
244.2 55.9290.9 126.5
These loans are classified as ‘Loans and receivables’. For IAS 39 Financial Instruments: Recognition and Measurement accounting treatment of these values, see note 38. All housing and staff loans bear interest at various rates below the prime interest rate. The loans to the employee share trust particpants, including executive directors, attract interest ofzero percent and are secured by the underlying ordinary shares in Massmart Holdings Limited. The loans are repayable 10 years after the grant date. Recourse is not limited to theseshares and should shares sold to repay these loans be insufficient to recover the balance outstanding, the unrecovered portion remains a debt due and payable. 830,973 (December2012:1,121,116) shares with a market value of R112,674,537 (December 2012: R213,164,175) have been pledged.
The finance lease deposit accrues interest at 13.6% (December 2012: 13.8%). The property loan accrues interest at 9.2% (December 2012: Nil) and is secured by a mortgage bond. The property loan will be used to pay for a Makro leased store awaiting legal transferto the Group.
Additional information on the fair value of ‘other financial assets’ can be found in note 38. Details of the employee share trust loans to the directors and executive committee members of Massmart Holdings Limited:
Pattison, Hayward, Zwarenstein, Other executiveGM GRC I committee TotalRm Rm Rm Rm Rm
December 2013
Balance at the beginning of the year 24.3 13.9 - 32.4 70.6Advanced during the year 0.6 0.3 - 0.5 1.4Repayments (1.8) (0.8) - (22.7) (25.3)Balance at the end of the year 23.1 13.4 - 10.2 46.7
December 2012
Balance at the beginning of the year 24.6 19.8 - 38.0 82.4Advanced during the year 0.3 0.2 - 0.4 0.9Repayments (0.6) (6.1) - (6.0) (12.7)Balance at the end of the year 24.3 13.9 - 32.4 70.6

NOTES TO THE ANNUAL GROUP FINANCIAL STATEMENTS 17-25FOR THE YEAR ENDED 29 DECEMBER 2013
17. DEFERRED TAXATION
December 2013 December 2012
Rm Rm
The movements during the year are analysed as follows:
Net asset at the beginning of the year 359.6 301.7Credit to the income statement (including foreign exchange movements) 226.3 56.3(Charge)/credit to other comprehensive income (3.1) 1.6Credit to the statement of changes in equity (note 22) 2.7 -Net asset at the end of the year 585.5 359.6
Deferred taxation balances are presented in the statement of financial position as follows:
Deferred taxation assets 672.1 396.3Deferred taxation liabilities (86.6) (36.7)
585.5 359.6
Opening
balance
Credit/(charge) to the
income statement
Credit/(charge) to other
comprehensive income
Credit to the
statement of
changes in
equity
Foreign exchange
movements Closing balance
Rm Rm Rm Rm Rm Rm
December 2013
TTeemmppoorraarryy ddiiffffeerreenncceessTrademarks 1.1 (0.3) - - - 0.8Assessed loss unutilised 198.4 78.5 - - (3.6) 273.3Export partnerships (2.7) 0.4 - - - (2.3)Debtors provisions 17.7 3.5 - - 0.1 21.3Prepayments (228.2) 210.6 - - - (17.6)Creditors provisions 66.2 106.6 - - 0.2 173.0Property, plant and equipment (130.6) (59.2) - - (1.5) (191.3)Finance leases (1.7) (4.4) - - - (6.1)Long-term provisions 85.9 (5.5) - - - 80.4Income not accrued - (1.0) - - - (1.0)Deferred income 48.8 2.1 - - (0.1) 50.8Operating lease adjustment 315.5 (61.4) - - 0.3 254.4Other temporary differences (10.8) (54.6) (3.1) 2.7 15.6 (50.2)Total 359.6 215.3 (3.1) 2.7 11.0 585.5
December 2012
TTeemmppoorraarryy ddiiffffeerreenncceessTrademarks 0.8 0.3 - - - 1.1Assessed loss unutilised 158.6 42.2 - - (2.4) 198.4Export partnerships (3.2) 0.5 - - - (2.7)Debtors provisions 18.2 (0.5) - - - 17.7Prepayments (206.6) (21.6) - - - (228.2)Creditors provisions 55.1 11.3 - - (0.2) 66.2Property, plant and equipment (109.7) (20.7) - - (0.2) (130.6)Finance leases 0.7 (2.4) - - - (1.7)Long-term provisions 48.5 37.4 - - - 85.9Income not accrued - - - - - -Deferred income 42.1 6.6 - - 0.1 48.8Operating lease adjustment 303.8 11.9 - - (0.2) 315.5Other temporary differences (6.6) 2.2 1.6 - (8.0) (10.8)Total 301.7 67.2 1.6 - (10.9) 359.6
‘Other temportary differences’ consists of deferred tax raised on lease premiums and foreign exchange movements, amongst other insignificant items.
Deferred tax assets have not been recognised for assessed losses to the value of R94.7 million (December 2012: R113.6 million). Had a deferred tax asset been raised, the asset valuewould have been R26.5 million (December 2012: R34.3 million).
1
1
1

NOTES TO THE ANNUAL GROUP FINANCIAL STATEMENTS 17-25FOR THE YEAR ENDED 29 DECEMBER 2013
18. INVENTORIES
December 2013 December 2012
Rm Rm
Food
Inventory at cost 3,119.5 3,339.8Provisions (262.0) (271.8)
2,857.5 3,068.0
Liquor
Inventory at cost 794.0 800.5Provisions (40.9) (37.9)
753.1 762.6
General Merchandise
Inventory at cost 4,982.8 4,619.0Provisions (386.5) (368.3)
4,596.3 4,250.7
Home Improvement
Inventory at cost 2,139.2 1,820.8Provisions (230.6) (210.6)
1,908.6 1,610.2Total inventory net of provisions 10,115.5 9,691.5
Carrying amount of inventories carried at net realisable value 123.1 182.8Inventory recognised as expense in period 58,926.4 29,523.2
Inventories are carried at the lower of cost and net realisable value. Provisions include: shrinkage and obsolescence provisions, write-downs to net realisable value and unearned rebates and settlement discounts per SAICA Circular 9/2006 Transactionsgiving rise to Adjustments to Revenue/Purchases.
Inventory is fully funded by trade payables. Details of trade payables can be found in note 25.
No inventory is pledged as security.
Composition of total inventories (%):

NOTES TO THE ANNUAL GROUP FINANCIAL STATEMENTS 17-25FOR THE YEAR ENDED 29 DECEMBER 2013
19. TRADE AND OTHER RECEIVABLES
December 2013 December 2012Rm Rm
Trade receivables 1,918.9 1,777.0
Allowance for doubtful debts (96.1) (84.1)
1,822.8 1,692.9
Prepayments 46.4 71.6
Other accounts receivable 1,816.8 1,908.7
FEC asset 26.5 8.5
Total receivables net of provisions 3,712.5 3,681.7
Movement in allowance for doubtful debtsBalance at the beginning of the year 84.1 82.8
Amounts previously in the provision written off during the year (15.8) (12.8)
Amounts previously in the provision recovered during the year (5.0) (7.1)
Increase in provision recognised in the income statement 32.8 21.2
Balance at the end of the year 96.1 84.1
Ageing of debtors provided for:30 to 60 days 16.3 10.2
60 to 90 days 3.4 3.1
90 to 120 days 4.8 3.2
120+ days 71.6 67.6
Total 96.1 84.1
Trade receivables are well controlled throughout the Group, with trade receivable days of 8.6 (December 2012: 7.9 days), a slight increase due to the 53rd week of trading in the current
financial year. Allowance for doubtful debts at year-end was 5.0% of trade receivables (December 2012: 4.7%).
No interest is charged on the trade receivables. Trade receivables between 30 days and 180 days are provided for based on estimated irrecoverable amounts from the sale of goods,
determined by reference to past default experience. It is the Group’s policy to provide fully for all receivables that are past due that are not insured or the Group does not hold any security
over the debtors, because historical experience is such that these receivables are generally not recoverable.
Before accepting any new customer, the Group uses an external credit scoring system to assess the potential customer’s credit quality and defines credit limits by customer. Limits and
scoring attributed to customers are reviewed quarterly to once a year. There is no customer who represents more than 5% of the total balance of trade receivables.
Included in the Group’s trade receivables balance are debtors with a carrying amount of R126.8 million (December 2012: R138.6 million) which are past due at the reporting date for which
the Group has not provided. The Group considers the amounts recoverable and currently holds security over these debtors or the debtors are insured. The average age of these
receivables is 91 days (December 2012: 57 days).
December 2013 December 2012Rm Rm
Ageing of past due debtors but not impaired30 to 60 days 29.5 18.9
60 to 90 days 56.6 57.4
90 to 120 days 11.2 31.9
120+ days 29.5 30.4
Total 126.8 138.6
In determining the recoverability of a trade receivable, the Group considers any change in the credit quality of the trade receivable from the date credit was initially granted up to the
reporting date. The concentration of credit risk is limited due to the customer base being large and unrelated. Accordingly, the directors believe that there is no further credit provision
required in excess of the allowance for doubtful debts.
There were no specific trade receivables under liquidation in the current financial year. In the prior financial year, a debtor in Massbuild filed for liquidation and was fully provided for.
Trade receivables are classified as ‘Loans and receivables’. For IAS 39 Financial Instruments: Recognition and Measurement accounting treatment of these values, see note 38.

NOTES TO THE ANNUAL GROUP FINANCIAL STATEMENTS 17-25FOR THE YEAR ENDED 29 DECEMBER 2013
20. NON-CURRENT ASSETS CLASSIFIED AS HELD FOR SALE
No assets have been classified as held for sale in the current financial year. Assets classified as held for sale in the prior financial year comprised of a small South African cash and carry
business in the Masscash segment, which has been sold in the current financial year. The proceeds of R2.5 million have been disclosed under ‘proceeds on disposal of assets classified
as held for sale’ in note 37.7.
December 2013 December 2012Rm Rm
Included in the income statement in other operating costs:Fair value adjustment on assets classified as held for sale - (0.4)
Loss on disposal of business - (4.4)
Included in the statement of financial position:NNoonn--ccuurrrreenntt aasssseettss - 2.2
Property, plant and equipment - 0.4
Goodwill - 0.7
Other intangibles - 1.1
Deferred taxation - -
CCuurrrreenntt aasssseettss - 0.3
Inventories - -
Trade and other receivables - 0.3
Taxation - -
TToottaall aasssseettss - 2.5

21. ISSUED CAPITAL
Share capital Share premium
December 2013 December 2012 December 2013 December 2012Rm Rm Rm Rm
Authorised500,000,000 (December 2012: 500,000,000) ordinary shares of 1 cent each 5.0 5.0 - -20,000,000 (December 2012: 20,000,000) non-redeemable cumulative non-participatingpreference shares of 1 cent each 0.2 0.2 - -18,000,000 (December 2012: 18,000,000) ‘A’ convertible redeemable non-cumulative participatingpreference shares of 1 cent each 0.2 0.2 - -4,000,000 (December 2012: 4,000,000) ‘B’ convertible redeemable non-cumulative participatingpreference shares of 1 cent each - - - -
Issued217,109,044 (December 2012: 216,910,195) ordinary shares of 1 cent each 2.2 2.2 743.3 752.1Nil (December 2012: 9,395,053) ‘A’ convertible redeemable non-cumulative participatingpreference shares of 1 cent each - 0.1 - -2,867,773 (December 2012: 3,066,622) ‘B’ convertible redeemable non-cumulative participatingpreference shares of 1 cent each - - - -
Number of Share capital Share premiumshares Rm Rm
Ordinary sharesBalance at June 2012 216,124,461 2.2 750.6Shares issued in terms of the Massmart Thuthukani Empowerment Trust 739,578 - -Shares issued in terms of the Massmart Black Scarce Skills Trust 46,156 - -Ordinary shares issued – December 2012 216,910,195 2.2 750.6Treasury shares (30,510) - 1.5Ordinary shares issued excluding treasury shares – December 2012 216,879,685 2.2 752.1
Balance at December 2012 216,910,195 2.2 752.1Shares issued in terms of the Massmart Black Scarce Skills Trust 198,849 - -Ordinary shares issued – December 2013 217,109,044 2.2 752.1Treasury shares (86,221) - (8.8)Ordinary shares issued excluding treasury shares – December 2013 217,022,823 2.2 743.3
Ordinary shares, which have a par value of 1 cent, carry one vote per share and carry the right to dividends.
‘A’ convertible redeemable non-cumulative participating preference sharesBalance at June 2012 - - -Net shares issued in terms of the Massmart BEE transaction 10,134,631 0.1 -Shares converted to ordinary shares (739,578) - -Treasury shares (9,395,053) (0.1) -Balance at December 2012 - - -Net shares issued in terms of the Massmart BEE transaction 9,395,053 0.1 -Shares redeemed in accordance with the provisions of the Memorandum of Incorporation (9,395,053) (0.1) -Balance at December 2013 - - -
There are no ‘A’ convertible redeemable non-cumulative participating preference shares in issue as the residual shares were automatically redeemed on the vesting of the MassmartThuthukani Empowerment Trust scheme, in terms of the Trust Deed. On 1 October 2012, the final conversion for the beneficiaries took place. At December 2013, beneficiaries that hadretained their shares in Massmart amounted to 389 shareholders holding 114 933 shares.
‘B’ convertible redeemable non-cumulative participating preference sharesBalance at June 2012 - - -Net shares issued in terms of the Massmart BEE transaction 3,112,778 - -Shares converted to ordinary shares (46,156) - -Treasury shares (3,066,622) - -Balance at December 2012 - - -Net shares issued in terms of the Massmart BEE transaction 3,066,622 - -Shares converted to ordinary shares (198,849) - -Treasury shares (2,867,773) - -Balance at December 2013 - - -
B’ convertible redeemable non-cumulative participating preference shares, which have a par value of 1 cent, are held in the Massmart Black Scarce Skills Trust. These shares carry onevote per share, which are cast by the trustees, and do not carry the right to dividends. On election of the beneficiary, the shares will convert to ordinary shares on a one-for-one basis andwill rank pari passu with all ordinary shares then in issue.
Share options granted under the Massmart Holdings Limited Employee Share Trust At December 2013, executives and senior employees have options of 9,723,039 (December 2012: 10,457,825) ordinary shares of which 6,649,943 (December 2012: 8,369,052) areunvested.
Share options granted under the employee share incentive scheme carry no rights to dividends and no voting rights. Additional information of the Employee Share Incentive Scheme canbe found in note 28.
During the current financial year, the only shares bought in the market by the Massmart Holdings Limited Executive Share Trust where 1.2 million shares (0.6% of average shares in issue)at an average price of R186.76 totalling R223.0 million.
During the prior financial year, the only shares bought in the market were by the Share Trust where 0.7 million shares (0.3% of average shares in issue) were bought at an average price ofR174.38 totalling R124.5 million.
The directors have the authority, until the next annual general meeting, to issue the ordinary shares of the Company up to a maximum of 5% of the shares already issued.

NOTES TO THE ANNUAL GROUP FINANCIAL STATEMENTS 17-25FOR THE YEAR ENDED 29 DECEMBER 2013
22. OTHER RESERVES
December 2013 December 2012Rm Rm
Foreign currency translation reserve 104.5 57.3
Hedging reserve 6.8 1.7
Share-based payment reserve 708.2 579.2
Capital redemption reserve fund 0.2 0.2
Fair value adjustment of available-for-sale financial asset (13.2) (13.2)
Fair value adjustment on listed shares 7.5 4.0
Change in non-controlling interests 1.9 1.9
Cost of acquiring minority interests (302.3) (306.1)
Treasury shares (1.7) (1.7)
Post-retirement medical aid actuarial gain 5.7 -
517.6 323.3
December 2013 December 2012Reconciliation of the foreign currency translation reserve: Rm RmBalance at the beginning of the year 57.3 32.2
Translation on consolidation 47.2 25.1
Balance at the end of the year 104.5 57.3
Exchange differences relating to the translation from functional currencies of the Group’s foreign subsidiaries into Rands are accounted for in the foreign currency translation reserve.
December 2013 December 2012Reconciliation of the hedging reserve: Rm RmBalance at the beginning of the year 1.7 5.9
Foreign exchange (gain)/loss in cost of sales (18.8) 13.1
FEC asset 18.0 (12.4)
FEC liability 7.8 (6.5)
Deferred taxation (1.9) 1.6
Balance at the end of the year 6.8 1.7
The hedging reserve represents hedging gains and losses recognised on the effective portion of cash flow hedges. The hedge is released from equity at the same time the forecast
transaction is recognised in profit or loss. If a hedged transaction is no longer expected to occur, the net cumulative gain or loss recognised in equity is transferred to profit or loss for the
period. The cash flows are expected to occur and impact the income statement in the next financial year.
December 2013 December 2012Reconciliation of the share-based payment reserve: Rm RmBalance at the beginning of the year 579.2 803.3
Share-based payment expense related to the Massmart Holdings Limited Employee Share Trust 109.0 30.0
Deferred tax recognised in equity related to the Massmart Holdings Limited Employee Share Trust 2.7 -
Share-based payment expense related to the Massmart Thuthukani Empowerment Trust - 1.8
Share-based payment expense related to the Massmart Black Scarce Skills Trust 17.3 8.1
Share-based payment expense related to Walmart - 28.6
Share-based payment expense related to the Massmart Thuthukani Empowerment Trust released to distributable
reserves- (292.6)
Balance at the end of the year 708.2 579.2
Massmart introduced a new share incentive scheme in the current financial year. The share-based payment reserve arises on the granting of share options and share awards to
employees under the Employee Share Incentive Schemes.
There were no Walmart integration share-based payment costs in the current financial period, and nor are there any expected in future financial years. The ‘share-based payment expense
related to Walmart’ in the prior financial year is part of the schemes offered by the Massmart Holdings Limited Employee Share Trust.
In the previous financial year, the final conversion of ‘A’ preference shares to ordinary shares for the beneficiaries occurred through the Massmart Thuthukani Empowerment Trust. The
employees had the option of converting their remaining share allocation into Massmart ordinary shares and continue to receive 100% of the dividend on their ordinary shares or they
could sell their remaining share allocation and receive net proceeds after tax and selling expenses. The relevant share-based payment reserve was released to retained income in the prior
period.
Additional information, including the valuation of the share schemes, can be found in note 28.
1
2
3
1
2
3

NOTES TO THE ANNUAL GROUP FINANCIAL STATEMENTS 17-25FOR THE YEAR ENDED 29 DECEMBER 2013
23. NON-CURRENT LIABILITIES
December 2013 December 2012Rm Rm
Interest-bearing
UnsecuredMedium-term loans 4.6 4.4
Less: Included in current liabilities (4.6) (4.4)
- -
SecuredMedium-term loans 600.0 -
Medium-term bank loans 891.7 1,031.3
Less: Included in current liabilities (329.6) (414.7)
1,162.1 616.6
Capitalised finance leases 61.3 88.6
Less: Included in current liabilities (44.7) (33.4)
16.6 55.2
TToottaall nnoonn--ccuurrrreenntt iinntteerreesstt--bbeeaarriinngg lliiaabbiilliittiieess 1,178.7 671.8
Interest-free
UnsecuredLoans to non-controlling interests 3.0 3.0
Operating lease liability 932.8 393.3
Less: Included in trade and other payables (97.1) (90.6)
835.7 302.7
Other 0.2 -
TToottaall nnoonn--ccuurrrreenntt iinntteerreesstt--ffrreeee lliiaabbiilliittiieess 838.9 305.7
Total non-current liabilities 2,017.6 977.5
Included in medium-term bank loans above is a fixed term loan of R500.0 million which was secured during the second half of the June 2011 financial year repayable quarterly over three
years. The drawdown of the loan occurred on 18 April 2011 at a fixed interest rate of 8.12%. The long-term portion of the loan at the end of the current financial year is Nil (December
2012: R83.3 million). The loan is secured by intragroup cross suretyships. The short-term portion has been accounted for in note 27.
Included in medium-term bank loans above is a fixed term loan of R750.0 million which was secured during the second half of the June 2012 financial year repayable quarterly over five
years. The drawdown of the loan occurred on 25 May 2012 at a fixed interest rate of 7.88%. The long-term portion of the loan at the end of the current financial year is R375.0 million
(December 2012: R525.0 million). The loan is secured by intragroup cross suretyships. The short-term portion has been accounted for in note 27.
Included in medium-term bank loans above is a fixed term loan of R275.0 million which was secured during the second half of the December 2013 financial year repayable quarterly over
three years. The drawdown of the loan occurred on 28 November 2013 at a fixed interest rate of 7.23%. The long-term portion of the loan at the end of the current financial year is R183.3
million (December 2012: Nil). The loan is secured by intragroup cross suretyships. The short-term portion has been accounted for in note 27.
Included in medium-term bank loans above are other loans with a long-term portion of R3.8 million (December 2012: R8.3 million).
Included in medium-term loans above is a fixed term loan of R600.0 million with Wal-mart Stores Inc., Massmart’s ultimate holding company. The loan is repayable quarterly over five
years and was effective from 18 April 2013 at a fixed interest rate of 7.46%. The loan is secured by intragroup cross suretyships.
Capitalised finance leases include vehicle, fixtures, fittings, plant and computer equipment and property leases, repayable in monthly instalments varying from one to five years at varying
interest rates between 5.8% and 13.8% (December 2012: between 8.0% and 16.0%). The short-term portion has been accounted for in note 27.
The capitalised finance leases are secured by moveable assets with a book value of R67.2 million (December 2012: R56.3 million) and the property lease by the value of the underlying
land amounting to R31.4 million (December 2012: R33.4 million). These assets are accounted for in note 12.
The operating lease liability relates to the lease smoothing adjustment of R822.2 million as required by IAS 17 Leases. Two leases in the Masswarehouse division included a provision to
adjust the lease payments for changes in store development costs. The impact of these changes resulted in an additional operating lease liability of R14.8 million being raised in the
current financial year, of which R1.3 million is short-term. The short-term portion has been accounted for in note 25.
For IAS 39 Financial Instruments: Recognition and Measurement accounting treatment of these values, see note 38.
Additional information on the fair value of ‘non-current liabilities’ can be found in note 38.

NOTES TO THE ANNUAL GROUP FINANCIAL STATEMENTS 17-25FOR THE YEAR ENDED 29 DECEMBER 2013
24. NON-CURRENT PROVISIONS
December 2013 December 2012
Rm Rm
Onerous lease provision 26.6 30.4Less: Payable within one year included in current provisions (note 26) (8.6) (7.3)
Liabilities raised on business acquisitions - 188.7Less: Payable within one year included in current provisions (note 26) - (124.1)
Provision for post-retirement medical aid contributions 84.2 81.5
102.2 169.2
Reconciliation of non-current provisions
Opening
balance
Reallocated to
current
provisions
Additional
amounts
provided Amounts utilised
Unused amounts
reversed Closing balance
Rm Rm Rm Rm Rm Rm
December 2013
Onerous lease provision 23.1 - - (2.4) (2.7) 18.0Liabilities raised on business acquisitions 64.6 (68.8) 4.2 - - -Provision for post-retirement medical aid contributions 81.5 - 2.7 - - 84.2
169.2 (68.8) 6.9 (2.4) (2.7) 102.2
December 2012
Onerous lease provision 27.7 - - (2.8) (1.8) 23.1Provision for Supplier Development Fund 94.9 (94.9) - - - -Liabilities raised on business acquisitions 58.2 - 6.4 - - 64.6Provision for post-retirement medical aid contributions 78.2 - 3.3 - - 81.5
259.0 (94.9) 9.7 (2.8) (1.8) 169.2
Repayable
within 1 year*
Repayable in 2 – 5
years
Repayable after 5
years Total
Rm Rm Rm Rm
December 2013 8.6 13.5 88.7 110.8December 2012 131.4 82.2 87.0 300.6
* Included in current provisions in note 26.
Post-retirement medical aid
Employees of Massmart participate on Massmart Health Plan and Resolution Health Medical Scheme administered by Medscheme Holdings (Pty) Ltd and Agility Global Health SolutionsAfrica (Pty) Ltd respectively. The post-employment subsidy policy valued is summarised below:
Members who joined Makro and Dion Stores prior to 1 July 1999 are eligible for a subsidy of medical scheme contributions in retirement. Members who joined Massmart prior to 1January 2000 are also eligible for a subsidy in retirement;
Members and their spouses are entitled to a 50% subsidy of medical scheme contributions in retirement; and Dependants of eligible continuation members receive a subsidy before and after the death of the principal member.
If a member eligible for a subsidy of medical scheme contributions in retirement dies in service, their dependants are eligible for a subsidy of medical scheme contributions as describedabove for a period of three months.
The significant risks faced by Massmart as a result of the post-employment healthcare obligation can be summarised as follows:
The risk that future CPI inflation and healthcare cost inflation are higher than expected and uncontrolled; and
The risk that pensioners live longer than expected and thus their healthcare benefit is payable for longer than expected.
This fund is accounted for as a defined benefit plan and measured using the projected unit credit method. The liability is unfunded. The significant assumptions are listed below. Ofparticular importance is the ‘interest rate – medical inflation rate’ gap of 0.8% (December 2012: 0.5%) used in calculating the provision.
December 2013 December 2012
Significant assumptions:
Discount rate 10.1% pa 9.5% paHealthcare cost inflation 9.3% pa 9.0% paConsumer Price Index inflation 7.3% pa 7.0% paExpected retirement age 65 years 65 yearsMembership discontinued at retirement or death-in-service 0% 0%
Movements in the post-retirement medical aid liability (Rm):
Opening defined benefit obligation 81.5 78.2Current service cost 2.8 1.3Interest cost 7.6 3.1Employer benefits paid (2.0) (0.9)Net actuarial gain recognised in the year (5.7) (0.2)Closing defined-benefit obligation 84.2 81.5
The implementation of the amended version to IAS 19 Employee Benefits, effective from 1 January 2013, has resulted in the ‘Net actuarial gain recognised in the year’, being accountedfor in other comprehensive income and no longer in the income statement. As the prior financial year net actuarial gains/losses are not material the implementation of IAS 19 EmployeeBenefits has been applied prospectively. All other movements in the defined benefit obligation are expensed in the income statement in ‘Employment costs’.CPI inflation by itself is not a significant assumption used in the valuation. This assumption has been based on the relationship between current conventional bond yields and currentindex-linked bond yields. The healthcare cost inflation exceeds CPI inflation by an average of 2.0% per annum over the long term, which is seen to be appropriate.
2
1
1
2

The last valuation of the liability for the post-retirement medical aid contributions was performed as at December 2013 by Alexander Forbes, Fellow of the Institute of Actuaries(December 2012: Alexander Forbes, Fellow of the Institute of Actuaries). The current financial year costs have been assessed in accordance with the advice of independent actuaries.
The net actuarial gain in the current year arose as a result of a combination of the following factors: Unexpected changes in the membership and membership profile resulted in a net gain of R0.4 million (December 2012: R0.4 million); Lower than expected healthcare cost inflation resulted in a gain of R0.7 million; and An unexpected gain of R4.6 million arose as a result of an increase in the real discount rate, ie a increase in the difference between the discount rate and the healthcare costinflation assumption from 0.5% per annum to 0.8% per annum.
Projection of defined benefit obligation
Provided that all actuarial assumptions are borne out in practice the accrued liability is expected to increase each year in line with: The rate of discount; Plus the cost of an additional year’s accrual for in-service members (service cost); and Less the benefit payments made by the employer in respect of continuation members.
A projection of results: December 2014
84.22.58.4
(2.4)
Defined benefit obligation at December 2013Current service costInterest costExpected employer benefits paidDefined benefit obligation at December 2014 92.7
Maturity profile of defined benefit obligation
The following payments are expected contributions to the defined benefit plan obligation in future years: December 2013 December 2012
Rm Rm
- -84.2 81.5
Current liability (payable within 12 months)Non-current LiabilityTotal expected payments 84.2 81.5
The average duration of the defined benefit plan obligation at the end of the reporting period is 21.4 years (December 2012: 21.5 years).
Sensitivity analysis
The valuation results are based on a number of assumptions. The value of the defined-benefit obligation could be overstated or understated, depending on the extent to which actualexperience differs from the assumptions adopted.
Central assumption Decrease Increase
9.3% -1.0% 1.0%84.2 70.7 101.4
-16.0% 20.4%9.3% -0.5% 0.5%
84.2 82.4 85.9-8.5% 2.1%
9.3% 5.0% 10.0%
84.2 103.8 127.123.3% 51.0%
10.1% - 1% + 1%84.2 101.4 71.0
20.4% -15.7%65 years - 1 year + 1 year
84.2 88.5 80.2
SSeennssiittvviittyy aannaallyyssiiss oonn tthhee ddeeffiinneedd bbeenneeffiitt oobblliiggaattiioonn::11%% iinnccrreeaassee oorr ddeeccrreeaassee iinn tthhee rraattee ooff hheeaalltthhccaarree ccoosstt iinnffllaattiioonnDefined-benefit obligation in (Rm)% change00..55%% iinnccrreeaassee oorr ddeeccrreeaassee iinn tthhee rraattee ooff hheeaalltthhccaarree ccoosstt iinnffllaattiioonn ffoorr tthhee nneexxtt 55 yyeeaarrss,, tthheerreeaafftteerrrreettuurrnniinngg ttoo aa hheeaalltthhccaarree ccoosstt iinnffllaattiioonn ooff 99..33%%Defined-benefit obligation in (Rm)% change55%% oorr 1100%% iinnccrreeaassee iinn tthhee rraattee ooff hheeaalltthhccaarree ccoosstt iinnffllaattiioonn ffoorr tthhee nneexxtt 55 yyeeaarrss,, tthheerreeaafftteerr rreettuurrnniinngg ttoo aahheeaalltthhccaarree ccoosstt iinnffllaattiioonn ooff 99..33%%Defined-benefit obligation in (Rm)% change11%% iinnccrreeaassee oorr ddeeccrreeaassee iinn tthhee ddiissccoouunntt rraatteeDefined-benefit obligation in (Rm)% change11 yyeeaarr iinnccrreeaassee oorr ddeeccrreeaassee iinn tthhee eexxppeecctteedd rreettiirreemmeenntt aaggeeDefined-benefit obligation in (Rm)% change 5.2% -4.7%
9.0% -1.0% 1.0%10.5 8.6 12.9
Sensitvity analysis on the aggregate of the current service and interest cost:
11%% iinnccrreeaassee oorr ddeeccrreeaassee iinn tthhee rraattee ooff hheeaalltthhccaarree ccoosstt iinnffllaattiioonn ffrroomm pprreevviioouuss vvaalluuaattiioonnCurrent service cost and interest cost from the previous valuation (Rm)% change -18.1% 23.6%

NOTES TO THE ANNUAL GROUP FINANCIAL STATEMENTS 17-25FOR THE YEAR ENDED 29 DECEMBER 2013
25. TRADE AND OTHER PAYABLES
December 2013 December 2012Rm Rm
Trade payables 13,702.5 12,601.3
Operating lease liability – short-term portion 97.1 90.6
Leave pay accrual 220.1 195.4
FEC liability 2.7 10.5
Income received in advance 40.1 27.6
Insurance premiums received in advance - 91.6
Rebates and advertising owing to buying members 92.4 91.3
Shareholders for dividends 12.0 15.0
Interest accrual 15.3 10.3
Amounts due to Walmart 136.3 76.7
Promissory notes 104.5 -
Sundry payables and other accruals 2,351.2 2,095.2
16,774.2 15,305.5
The operating lease liability relates to the lease smoothing adjustment required by IAS 17 Leases. Two leases in the Masswarehouse division included a provision to adjust the lease
payments for changes in store development costs. The impact of these changes resulted in an additional operating lease liability of R14.8 million being raised in the current financial
year, of which R1.3 million is short-term. The long-term portion has been accounted for in note 23.
The Group has financial risk management policies in place to ensure that all payables are paid within the credit timeframe, normally around 60 days. Payables are non-interest bearing
and have an average term of 76 days (December 2012: 68 days). Settlement discounts received range from 1.0% to 2.1% (December 2012: 1.1% to 2.5%).
‘Promissory notes’ represent commitments under a non-cancellable lease agreement of R104.5 million (December 2012: R208.9 million) entered into by Masstores (Pty) Ltd on behalf of
certain Makro stores. In the current financial year the ‘promissory notes’ have been reclassified from ‘operating lease liability’ to ‘promissory notes’ as a result of Massmart acquiring
control of the leased properties. The ‘promissory notes’ are due for payment on 31 December 2013. Additional information can be found in note 31.
For IAS 39 Financial Instruments: Recognition and Measurement accounting treatment of these values, see note 38.

NOTES TO THE ANNUAL GROUP FINANCIAL STATEMENTS 26-34FOR THE YEAR ENDED 29 DECEMBER 2013
26. CURRENT PROVISIONS AND OTHER
December 2013 December 2012
Rm Rm
Onerous lease provision 8.6 7.3
Liabilities raised on business acquisitions 101.4 124.1
Provision for Supplier Development Fund 202.5 225.4
Other 14.5 7.0
327.0 363.8
Provisions raised against specific assets, for example inventories and trade receivables, are accounted for with those assets and are detailed in the relevant notes.
A provision for Liabilities raised on business acquisitions was accounted for as a non-current provision in the prior financial year but falls into current provisions in this financial year.
Liabilities raised on business acquisitions decreased in the current financial year due to the payment of R100.0 million as a result of contigent consideration hurdles being met from
historic transactions.
The Group established the Supplier Development Fund in line with the judgement of the Competition Appeal Court. The purpose of the fund is to assist the Group’s suppliers, particularly
Black Economic Empowerment suppliers, in order to promote and benefit the growth of their businesses.
Reconciliation of current provisions
Opening
balance
Reallocated from
non-current
provisions
Amounts
provided
Amounts
utilised
Unused
amounts
reversed Closing balance
Rm Rm Rm Rm Rm Rm
December 2013
Onerous lease provision 7.3 - 7.2 (2.3) (3.6) 8.6
Liabilities raised on business acquisitions 124.1 68.8 10.5 (102.0) - 101.4
Provision for Supplier Development Fund 225.4 - - (22.9) - 202.5
Other 7.0 - 13.9 (5.4) (1.0) 14.5
363.8 68.8 31.6 (132.6) (4.6) 327.0
December 2012
Onerous lease provision 6.2 - 2.9 - (1.8) 7.3
Liabilities raised on business acquisitions 124.1 - - - - 124.1
Provision for Supplier Development Fund - 94.9 140.0 (9.5) - 225.4
Other 9.4 - 4.0 (4.1) (2.3) 7.0
139.7 94.9 146.9 (13.6) (4.1) 363.8

NOTES TO THE ANNUAL GROUP FINANCIAL STATEMENTS 26-34FOR THE YEAR ENDED 29 DECEMBER 2013
27. OTHER CURRENT LIABILITIES
December2013
December2012
Rm Rm
Medium-term bank loans 329.6 414.7Capitalised finance leases 44.7 33.4Massmart Education Foundation loan 4.6 4.4Trade finance facility 117.6 94.9Short-term bank loan 21.1 -Lamberti Education Foundation Trust loan 14.0 13.8
531.6 561.2
Included in medium-term bank loans above are the loan repayments due within one year and arising from a fixed term loan ofR500.0 million which was secured during the second half of the 2011 financial year repayable quarterly over three years. Thedrawdown of the loan occurred on 18 April 2011 at a fixed interest rate of 8.12%. The short-term portion of the loan at the end ofthe current financial year is R83.3 million (December 2012: R166.7 million). The loan is secured by intragroup cross suretyships.The long-term portion has been accounted for in note 23.
Included in medium-term bank loans above are the loan repayments due within one year and arising from a fixed term loan ofR750.0 million which was secured during the second half of the June 2012 financial year repayable quarterly over five years. Thedrawdown of the loan occurred on 25 May 2012 at a fixed interest rate of 7.88%. The short-term portion of the loan at the end ofthe current financial year is R150.0 million (December 2012: R150.0 million). The loan is secured by intragroup cross suretyships.The long-term portion has been accounted for in note 23.
Included in medium-term bank loans above are the loan repayments due within one year and arising from a fixed term loan ofR275.0 million which was secured during the second half of the 2013 financial year repayable quarterly over three years. Thedrawdown of the loan occurred on 28 November 2013 at a fixed interest rate of 7.23%. The short-term portion of the loan at the endof the current financial year is R91.7 million (December 2012: Nil). The loan is secured by intragroup cross suretyships. Thelong-term portion has been accounted for in note 23.
Included in medium-term bank loans above are other loans with a short-term portion of R4.6 million (December 2012: R4.2 million).A fixed term loan of R500.0 million which was secured during the second half of the 2010 financial year at a fixed interest rate of9.8% was settled in the current financial year. The short-term portion of the loan at the end of the current financial year is nil(December 2012: R93.8 million).
Capitalised finance leases include vehicle, fixtures, fittings, plant and computer equipment and property leases, repayable inmonthly installments varying from one to five years at varying interest rates between 5.8% and 13.8% (December 2012: between8.0% and 16.0%). The long-term portion has been accounted for in note 23.
The capitalised finance leases are secured by moveable assets with a book value of R67.2 million (December 2012: R56.3 million)and the property lease by the value of the underlying land amounting to R31.4 million (December 2012: R33.4 million). Theseassets are accounted for in note 12.
The Massmart Education Foundation loan represents cash reserves invested with Group Treasury. The ‘trade finance facility’ is an offshore US Dollar facility available for working capital requirements. The Group has used thisfacility to fund four African working capital loans – namely Botswana, Ghana, Malawi and Mozambique (2012: Botswana, Ghana,Malawi and Mozambique). The facility is capped at USD 20.0 million, of which the Group has utilised USD 11.2 million (December2012: USD 11.0 million) at the year-end.
The ‘short-term bank loan’ is an offshore US Dollar facility entered into in the current financial year for capital expenditurerequirements in Africa. The Group has drawndown USD 2.0 million of the USD 30.0 million facility at year-end.
The Lamberti Education Foundation Trust loan represents cash reserves invested with Group Treasury. For IAS 39 Financial Instruments: Recognition and Measurement accounting treatment of these values, see note 38.

NOTES TO THE ANNUAL GROUP FINANCIAL STATEMENTS 26-34FOR THE YEAR ENDED 29 DECEMBER 2013
28. EMPLOYEE SHARE INCENTIVE SCHEMES
Massmart Holdings Limited Employee Share Trust
Massmart introduced a new share incentive scheme in the current financial year referred to as the Employee Share Award Scheme. Massmart Holdings Limited’s shareholders approvedthe scheme at the Annual General Meeting held on 22 May 2013. The new scheme entails participation through a Retention Share Grant and/or a Performance Share Award, furtherexplained below. The first grant of retention and performance awards under the new scheme was made on 16 September 2013. The purpose of the new scheme is to replace the existingEmployee Share Option Awards Scheme which had its last grant date on 1 May 2013. The Employee Share Option Award Scheme will continue to give rise to an equity-settledshare-based payment expense until the financial year ending in December 2018. The final options of this scheme will expire in the 2023 financial year. Both Employee Share IncentiveSchemes are administered through the Massmart Holdings Limited Employee Share Trust.
Employee Share Option Scheme (Old Scheme)Massmart granted share options entitling certain employees within the Group to its shares under the Employee Share Incentive Scheme. The options were granted by Massmart in itsown shares resulting in them being accounted for as equity-settled share-based payments. Employees are required to be employed up to the date of vesting in order to receive the shareoptions earned by them. The share-based payment valuation was performed by Alexander Forbes for all periods with respect to the share option awards.
December 2013 December 2012000s 000s
Total shares and options available to the scheme 39,500 39,500
Total shares and options available to the scheme 39,500 39,500Shares and treasury shares issued to the scheme (16,493) (16,493)Remaining capacity for issue in terms of the JSE practice 23,007 23,007
Opening balance of shares and options 11,579 11,085New shares and options offered to employees and executive directors 805 1,676Shares and options sold by employees and directors (1,437) (988)Shares repurchased from/ forfeited by employees and options lapsed/ forfeited (393) (194)Closing balance of shares and options 10,554 11,579
The closing balance includes 830,973 (December 2012: 1,121,116) shares and 9,723,039 (December 2012: 10,457,825) options. Shares and options previously issued to employees whothen subsequently left the Group are excluded from the figures above. The amendments needed to bring the Share Trust rules in line with the new JSE Schedule 14 requirements wereapproved by the shareholders at the AGM on 24 November 2010.
Options may be exercised at any time, but shares arising out of options may only be sold when they have vested with the participant.
Vesting occurs over a five-year period as follows:- 25% two years after the offer date;- 50% three years after the offer date;- 75% four years after the offer date;- 100% five years after the offer date; and- expires ten years after the offer date.
In terms of the scheme rules, all share loans on offers must be repaid or options exercised no later than 10 years from the offer date.

The following options granted to employees and directors in terms of the Massmart Employee Share Incentive Scheme (the Old Scheme) have not yet been exercised:
Offer date Expiry dateExerciseprice (R)
No of options atDecember 2012
No of optionsforfeited and
expiredNo of options
exercised New options grantedNo of options closing
balance
1 April 2005 31 March 2015 41.91 47,000 - - - 47,00027 May 2005 26 May 2015 42.97 16,753 - 3,450 - 13,30331 May 2005 30 May 2015 42.88 12,570 - 12,570 - -1 November 2005 31 October 2015 51.91 1,240 - 244 - 99630 November 2005 29 November 2015 51.19 8,622 - 5,004 - 3,6181 April 2006 31 March 2016 58.74 16,093 - 8,428 - 7,66523 May 2006 22 May 2016 54.13 36,196 - 13,333 - 22,86325 August 2006 24 August 2016 51.93 5,547 - 823 - 4,7241 October 2006 30 September 2016 56.42 3,674 - 3,674 - -15 November 2006 14 November 2016 62.04 16,905 - 2,205 - 14,70023 February 2007 22 February 2016 67.79 60,918 - 28,766 - 32,1522 April 2007 1 April 2017 82.67 6,432 - 859 - 5,57324 May 2007 23 May 2017 94.25 315,046 - 75,973 - 239,07324 August 2007 23 August 2017 80.75 50,657 - 9,441 - 41,21630 November 2007 29 November 2017 71.58 49,392 - 36,538 - 12,8541 April 2008 31 March 2018 66.91 356,000 - 127,398 - 228,60226 May 2008 25 May 2018 72.86 916,631 683 325,358 - 590,5901 September 2008 31 August 2018 79.86 170,570 - 50,406 - 120,16427 October 2008 26 October 2018 72.42 129,126 - - - 129,12615 November 2008 14 November 2018 79.91 32,549 - - - 32,5491 March 2009 28 February 2019 70.71 117,833 - 10,139 - 107,69427 May 2009 26 May 2019 77.55 884,547 11,790 248,668 - 624,0891 September 2009 31 August 2019 79.15 53,426 3,776 9,989 - 39,6611 October 2009 30 September 2019 87.60 23,038 - 5,115 - 17,92316 November 2009 15 November 2019 88.71 27,365 - 8,545 - 18,8201 March 2010 28 February 2020 90.49 133,028 - 19,253 - 113,7751 April 2010 31 March 2020 108.95 79,423 21,989 38,342 - 19,0921 May 2010 30 April 2020 110.00 43,995 - 11,247 - 32,7481 September 2010 31 August 2020 120.42 243,172 8,030 35,527 - 199,6151 September 2011 31 August 2021 153.84 3,543,023 169,830 55,092 - 3,318,1011 November 2011 31 October 2021 157.27 468,863 36,498 - - 432,3651 March 2012 28 February 2022 174.88 437,786 16,308 - - 421,4781 April 2012 31 March 2022 164.09 122,954 - - - 122,95416 May 2012 15 May 2022 159.62 377,779 - - - 377,7791 September 2012 31 August 2022 168.03 1,271,853 36,696 - - 1,235,15715 October 2012 14 October 2022 167.06 377,819 56,090 - - 321,72901 March 2013 28 February 2023 186.05 - 31,497 - 770,881 739,38401 May 2013 30 April 2023 187.53 - - - 33,907 33,907
10,457,825 393,187 1,146,387 804,788 9,723,039
Employee Share Awards Scheme (New Scheme)Massmart granted share awards entitling certain employees within the Group to fully-paid shares under the Employee Share Incentive Scheme. The awards were granted by Massmart inits own shares resulting in the awards being treated as equity-settled share-based payments. The Employee Share Award Scheme is split into two incentive structures, mainly, retentionand performance awards. Retention shares require the employee to remain employed at the date of vesting in order to receive the shares earned by them. Performance shares are subjectto non-market conditions in years 1, 2 and 3 based on 50% Group Return of Investment (ROI) and 50% of Group nominal sales against the budgeted equivalent for that year. Theshare-based payment valuation was performed using a valuation system acquired by the Group with the necessary model inputs having been determined by management. Managementderived these inputs through consultation with various financial institutions, and they are representative of the market data available for Massmart Holdings Limited’s share at thereporting date. Vesting occurs over a five-year period for retention awards and over a three-year period for performance awards as follows:
RetentionAwards
PerformanceAwards
33% 100%33% N/A
- Three years after the offer date- Four years after the offer date- Five years after the offer date 33% N/A
Expense Charged to Profit or LossThe expense recognised for employee services received during the year on equity-settled share-based payment transactions is shown in the following table:
December 2013 December 2012Rand Rand105.7 68.5
3.3 -Expense arising from Employee Share Option Scheme (Old Scheme)Expense arising from Employee Share Awards Scheme (New Scheme)Total expense arising from equity-settled share-based payment transactions 109.0 68.5

Movement in the YearEEmmppllooyyeeee SShhaarree OOppttiioonn SScchheemmee ((OOlldd SScchheemmee))Details of the share options outstanding during the year are as follows:
December 2013 December 2012
Number ofshare options
Weightedaverage
exercise price Number of share optionsWeighted average
exercise priceRand Rand
Outstanding at the beginning of the year 10,457,825 130.0 9,702,840 119.5Granted during the year 804,788 186.1 1,676,064 167.8Forfeited during the year (393,187) 154.5 (194,474) 140.1Exercised during the year (1,146,387) 81.4 (726,605) 73.7Expired during the yearOutstanding at the end of the year 9,723,039 139.4 10,457,825 130.0
Exercisable at the end of the year 3,073,096 2,088,773
In December 2013, the weighted average share price at the date of exercise for share options exercised during the year was R184.24. The options outstanding at the end of the year had aweighted average remaining contractual life of 7.2 years. Options were granted on 1 March 2013 and 1 May 2013. The estimated fair values of the options granted on these dates wereR52.69 and R49.48.
In December 2012, the weighted average share price at the date of exercise for share options exercised during the year was R174.99. The options outstanding at the end of the year had aweighted average remaining contractual life of 7.8 years. Options were granted on 1 September 2012 and 15 October 2012. The estimated fair values of the options granted on thesedates were R47.63 and R47.97.
EEmmppllooyyeeee SShhaarree AAwwaarrdd SScchheemmee ((NNeeww SScchheemmee))Details of the Group share awards issued during the year were as follows:
December 2013 December 2012
Retention awardsNumber of
share awardsVestingPeriod Number of share awards Vesting Period
16 September 2013 379,863 2016 to 2018 - -Performance awards16 September 2013 841,951 2016 - -Total awards issued at the end of the year 1,221,814
At the reporting date the estimated fair values of the retention awards granted was R32.19 and the performance awards was R31.46. No Employee Share Award Scheme share-basedpayments were issued in the prior year.
Shares to Satisfy Awards and OptionsIt is Massmart’s practice to satisfy awards and options granted under the Executive Share Incentive Scheme through shares purchased in the market and held by the Massmart HoldingsLimited Employee Share Trust, which was established for the purpose of satisfying awards under the Executive Share Incentive Scheme, and is funded by the Company.
Fair Value of Employee Share AwardsEEmmppllooyyeeee SShhaarree OOppttiioonn SScchheemmee ((OOlldd SScchheemmee)) December 2013 December 2012
189.32 170.3027.57% – 28.53% 29.2% – 29.65%
5 – 6 years 5 – 6 years5.66% – 6.11% 5.95% – 6.2%
These fair values were calculated using the Black Schöles Model. The inputs into the model were as follows:Weighted average share price (Rand) at grant datesExpected volatilityExpected lifeRisk-free rateExpected dividend yield 2.5% – 5.0% 2.5% – 5.0%
Expected volatility was determined by calculating the historical volatility of the Company’s share price over the number of previous years corresponding with the option lifetime. Theexpected life used in the model has been adjusted, based on management’s best estimate, for the effects of non-transferability, exercise restrictions and behavioural considerations. Therisk-free rate used was the implied yield on a South African zero-coupon government bond issued over the appropriate expected life of the option.
EEmmppllooyyeeee SShhaarree AAwwaarrdd SScchheemmee ((NNeeww SScchheemmee)) December 2013 December 2012
171.49 -19.92% – 26.19% -2.75 – 4.75 years -
6.61% – 7.33% -3.52% -
171.49 -19.92% -
2.75 years -6.61% -
These fair values were calculated using the Lattice Model. The inputs into the model at Reporting Date were as follows:Retention awardsWeighted average share price (Rand)Expected volatilityExpected lifeRisk-free rateExpected dividend yieldPerformance awardsWeighted average share price (Rand)Expected volatilityExpected lifeRisk-free rateExpected dividend yield 3.52% -
Expected volatility was determined by calculating the historical volatility of the Company’s share price over the number of previous years corresponding with the share awards vestingperiod. The expected life used in the model has been adjusted, based on management’s best estimate, for the effects of non-transferability, exercise restrictions and behaviouralconsiderations. The risk-free rate used was the swap rate over the vesting period of the share award.

Massmart Thuthukani Empowerment Trust
On 1 October 2012, the final conversion for the beneficiaries took place. In December 2012, the weighted average share price at the date of exercise for share options was R168.24.Additional information can be found in note 22.
December 2013 December 2012000s 000s
Total shares and options available to participants of the scheme in the Trust - 18,000
- 1,053- (1,053)
Opening balance of share unitsShares soldClosing balance of share units - -
The following options granted to eligible employees in terms of the Massmart Thuthukani Empowerment Trust had not yet been exercised in the prior financial year:
Exerciseprice (R)
No of optionsopening balance
No of optionsforfeited and
Offer date Expiry date expiredNo of options
exercisedNo of options closing
balance
December 20121 October 2006 30 September 2012 50.0 1,052,860 - 1,052,860 -
Massmart Black Scarce Skills Trust
The Black Scarce Skills Trust is a share-scheme used to attract and retain African, Coloured and Indian employees. The Executive Committee of each of the divisions and the MassmartRemuneration Committee submit their nominations to the Black Scarce Skills Trust trustees for approval, upon which allocations are made bi-annually in April and October of each year. Abeneficiary can only receive one allocation.
December 2013 December 2012000s 000s
Total preference shares available to the scheme to participants of the scheme in the Trust 3,979 3,979
1,755 1,7401,094 250(369) (155)(132) (80)
Reconciliation of unitsOpening balance of share unitsNew share units offered to employeesShares sold by employeesShare units repurchased from/forfeited by employees and options lapsed/forfeitedClosing balance of share units 2,348 1,755
In December 2013, the weighted average share price at the date of exercise for share options exercised during the year was R179.30. The options outstanding at the end of the year had aweighted average remaining contractual life of 3.8 years. Options were granted on 1 April 2013 and 1 October 2013. The estimated fair values of the options granted on these dates wereR37.21 and R37.03.
In December 2012, the weighted average share price at the date of exercise for share options exercised during the year was R131.54. The options outstanding at the end of the year had aweighted average remaining contractual life of 3.3 years. Options were granted on 1 October 2012. The estimated fair values of the options granted on this date was R36.09.
Vesting occurs over a five-year period as follows:- 25% two years after the offer date;- 50% three years after the offer date;- 75% four years after the offer date;- 100% five years after the offer date; and- expires five years after the offer date.
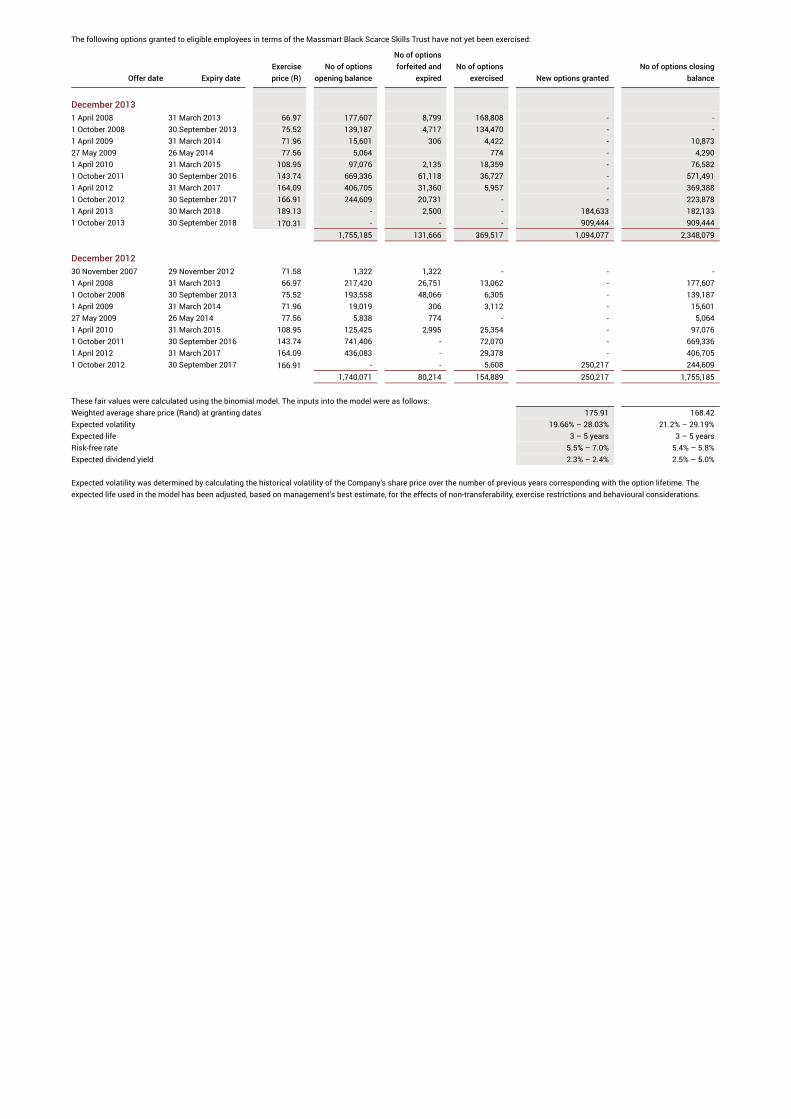
The following options granted to eligible employees in terms of the Massmart Black Scarce Skills Trust have not yet been exercised:
Offer date Expiry dateExerciseprice (R)
No of optionsopening balance
No of optionsforfeited and
expiredNo of options
exercised New options grantedNo of options closing
balance
December 20131 April 2008 31 March 2013 66.97 177,607 8,799 168,808 - -1 October 2008 30 September 2013 75.52 139,187 4,717 134,470 - -1 April 2009 31 March 2014 71.96 15,601 306 4,422 - 10,87327 May 2009 26 May 2014 77.56 5,064 774 - 4,2901 April 2010 31 March 2015 108.95 97,076 2,135 18,359 - 76,5821 October 2011 30 September 2016 143.74 669,336 61,118 36,727 - 571,4911 April 2012 31 March 2017 164.09 406,705 31,360 5,957 - 369,3881 October 2012 30 September 2017 166.91 244,609 20,731 - - 223,8781 April 2013 30 March 2018 189.13 - 2,500 - 184,633 182,1331 October 2013 30 September 2018 170.31 - - - 909,444 909,444
1,755,185 131,666 369,517 1,094,077 2,348,079
December 201230 November 2007 29 November 2012 71.58 1,322 1,322 - - -1 April 2008 31 March 2013 66.97 217,420 26,751 13,062 - 177,6071 October 2008 30 September 2013 75.52 193,558 48,066 6,305 - 139,1871 April 2009 31 March 2014 71.96 19,019 306 3,112 - 15,60127 May 2009 26 May 2014 77.56 5,838 774 - - 5,0641 April 2010 31 March 2015 108.95 125,425 2,995 25,354 - 97,0761 October 2011 30 September 2016 143.74 741,406 - 72,070 - 669,3361 April 2012 31 March 2017 164.09 436,083 - 29,378 - 406,7051 October 2012 30 September 2017 166.91 - - 5,608 250,217 244,609
1,740,071 80,214 154,889 250,217 1,755,185
These fair values were calculated using the binomial model. The inputs into the model were as follows:Weighted average share price (Rand) at granting dates 175.91 168.42Expected volatility 19.66% – 28.03% 21.2% – 29.19%Expected life 3 – 5 years 3 – 5 yearsRisk-free rate 5.5% – 7.0% 5.4% – 5.8%Expected dividend yield 2.3% – 2.4% 2.5% – 5.0%
Expected volatility was determined by calculating the historical volatility of the Company’s share price over the number of previous years corresponding with the option lifetime. Theexpected life used in the model has been adjusted, based on management’s best estimate, for the effects of non-transferability, exercise restrictions and behavioural considerations.

NOTES TO THE ANNUAL GROUP FINANCIAL STATEMENTS 26-34FOR THE YEAR ENDED 29 DECEMBER 2013
29. RETIREMENT BENEFIT INFORMATION
All full-time permanent Massmart staff are members of either the Massmart Pension Fund, the Massmart Provident Fund or the SACCAWU National Provident Fund. These funds are
defined contribution funds and are subject to the Pension Funds Act, 1956. Following the recent acquisitions, many of their staff are still members of the retirement funds of the previous
business owners. Projects are underway to transfer these employees to one of the above funds in future.
The Massmart Pension Fund and Massmart Provident Fund have been classified as valuation exempt. The Board of Trustees succesfully submitted applications for exemption from
valuation in 2013 and the funds were, therefore, exempt from the provisions of sections 9A and 16 of the Pension Funds Act, with effect from 28 February 2013. The exemption granted
was a permanent valuation exemption at that stage. However, the Financial Services Board has in 2014 published Information Circular 2 of 2014 wherein they indicated that permanence
of valuation exemption is being reviewed and will most likely be withdrawn. Consequently the fund exemptions may expire on 28 February 2016. The fund will reapply if required.
Contributions received by the funds for the year ended 30 December 2013 amounted to R410.0 million (December 2012: R192.0 million). The Group’s contribution of R245.4 million
(December 2012: R115.0 million) was included in the income statement for the year in ‘Employee costs’.

NOTES TO THE ANNUAL GROUP FINANCIAL STATEMENTS 26-34FOR THE YEAR ENDED 29 DECEMBER 2013
30. COMMITMENTS
December 2013 December 2012Rm Rm
Commitments in respect of capital expenditure approved by directors:
Contracted forStores to be opened 925.2 713.1
Distribution centre to be opened 23.6 37.3
Stores to be refurbished 83.4 9.5
Purchase of plant and equipment 20.1 62.3
Purchase of new system software 69.3 14.3
Purchase of new computer hardware 15.6 7.2
Purchase of motor vehicles 0.2 1.0
Store relocations 50.1 53.8
Store conversions 30.4 -
Minor revamps 31.4 56.3
1,249.3 954.8
Not contracted forStores to be opened 259.4 225.0
Stores to be refurbished 50.1 14.2
Purchase of plant and equipment 162.9 143.4
Purchase of new system software 41.4 85.1
Purchase of new computer hardware 14.2 48.4
Purchase of motor vehicles 30.4 19.0
Store conversions 94.0 67.5
Minor revamps 88.5 55.6
Distribution centre to be opened - 57.3
Minority buyouts and acquisitions 20.0 -
Logistical expansion 22.5 -
783.4 715.5
2,032.7 1,670.3
Massmart has the right of first refusal on the sale of any shares by non-controlling shareholders in various Masscash stores. Historically Massmart has exercised this right. The amount
to be paid in future, should Massmart exercise its rights, totals R309.6 million (December 2012: R370.5 million).
Capital commitments will be funded using current facilities.

NOTES TO THE ANNUAL GROUP FINANCIAL STATEMENTS 26-34FOR THE YEAR ENDED 29 DECEMBER 2013
31. OPERATING LEASE COMMITMENTS
December 2013 December 2012
Rm Rm
Land and buildings
Year 1 1,639.8 1,430.8Years 2 to 5 6,164.5 5,537.4Subsequent to year 5 6,606.4 6,379.9
14,410.7 13,348.1
Plant and equipment
Year 1 5.2 4.9Years 2 to 5 6.9 7.9
12.1 12.8
Other
Year 1 11.0 10.2Years 2 to 5 11.9 12.3
22.9 22.5
14,445.7 13,383.4
Promissory notes represent commitments under a non-cancellable lease agreement of R104.5 million (December 2012: R208.9 million) entered into by Masstores (Pty) Ltd on behalf ofcertain Makro stores. The promissory notes have been reclassified from ‘operating lease liability’ to ‘promissory notes’ as a result of the Group acquiring control of the leased propertiesin the current financial year. The final promissory notes of R104.5 million are due for payment on 31 December 2013, and due to the short-term nature of the cash outflow the carryingamount represents the present value at the reporting date. In the prior reporting period the promissory notes had a discounted present value of R193.6 million, applying a discount rate of10.5%. The lease terminates in December 2020. Additional information can be found in note 25.

NOTES TO THE ANNUAL GROUP FINANCIAL STATEMENTS 26-34FOR THE YEAR ENDED 29 DECEMBER 2013
32. CONTINGENT LIABILITIES
December 2013 December 2012Rm Rm
Contingent liabilities - -
There are no current or pending legal or arbitration proceedings, of which the Group is aware, which would have a material adverse effect on the Group’s financial position.

NOTES TO THE ANNUAL GROUP FINANCIAL STATEMENTS 26-34FOR THE YEAR ENDED 29 DECEMBER 2013
33. RELATED-PARTY TRANSACTIONS
December 2013 December 2012
53 weeks 52 weeks
Rm Rm
Transactions between the Company and its subsidiaries, which are related parties of the Company, have been eliminated onconsolidation and are not disclosed in this note. Details of transactions between the Group and other related parties are disclosedbelow.
Compensation of key management personnel:
The remuneration of executive directors and other key management were as follows:Short-term benefits (salaries, benefits and short-term incentives) 59.5 36.0Retirement benefits 2.3 1.7Other long-term benefits 3.0 2.3Gains on exercise of share options 11.6 52.6
76.4 92.6
Key management is defined as the 13-person (December 2012: 13-person) Massmart Executive Committee. The remuneration of directors and key executives is determined by the Nomination and Remuneration Committee having regard to the performance of individuals and market trends.There was no movement to the Executive Committee in the current financial year. Four members of the Executive Committee resigned in the prior financial year.
Other related-party transactions:
The Walmart transaction costs are behind us and integration costs are now included as part of our normal operating costs. In the prior financial year Walmart transaction, integration andrelated costs comprised professional fees, integration costs, expatriate costs, share-based payments, travel, consulting costs and other direct expenses relating to the Walmarttransaction, as well as the additional R140.0 million being the increase in the Supplier Development Fund required by the judgement of the Competition Appeal Court. Of the Walmartintegration and related costs, an amount due to Walmart of R136.3 million (December 2012: R76.7 million) remains unpaid at the end of the current financial year and has been includedin ‘Amount due to Walmart’ in note 25. An amount due from Walmart of R10.3 million (December 2012: R0.5 million) remains receivable at the end of the current financial year and hasbeen included in ‘other accounts receivable’ in note 19. As a shareholder, Wal-Mart Stores Inc. receives dividends from Massmart Holdings Ltd. Of the dividend paid on 25 March 2013 for275.0 cents, an amount of R313.1 million was paid to Wal-Mart Stores Inc. and of the dividend paid on 16 September 2013 for 146.0 cents, an amount of R166.2 million was paid toWal-Mart Stores Inc.
During the current financial year the Group secured a medium-term loan with Walmart repayable after five years. Interest of 7.46% is repaid quarterly. The loan of R600.0 million isaccounted for under interest-bearing non-current liabilities. Additional information can be found in note 23.
From time to time, in the normal course of business, Massmart and its divisions make use of private aircraft hired from competitively selected charter companies, two of which operateaircraft that is indirectly beneficially owned by the Group’s “outgoing” Chairman, Mark Lamberti.
The Group holds cash reserves on behalf of the Group’s “outgoing” Chairman, Lamberti Education Foundation Trust. Additional information can be found in note 27. Loans to directors have been disclosed in note 16. The post-retirement medical aid liability, Massmart Pension Fund and Massmart Provident Fund are managed for the benefit of past and current employees of the Group. Additionalinformation can be found in note 24 and note 29.

NOTES TO THE ANNUAL GROUP FINANCIAL STATEMENTS 26-34FOR THE YEAR ENDED 29 DECEMBER 2013
34. DIRECTORS’ EMOLUMENTS
The comments below provide further background and context to the figures disclosed in this note, Directors’ emoluments, and Interests of directors in the Company’s Share Scheme(note 35).
GM PattisonFollowing a third party executive remuneration analysis which assessed positions of similar stature and complexity, the Remuneration Committee awarded Grant a 25.0% increase to hissalary and allowances in January 2013. In terms of the Group’s Short-term Executive Incentive Scheme which rewards executives based on the Group’s actual financial performancecompared to the Plan for the same year, he received no bonus. The Committee however, awarded him a qualitative bonus of three months (R1.30 million) in recognition of the strategicinitiatives successfully implemented in 2013.
During the 53 weeks ended 29 December 2013 Grant did not convert or sell any Massmart options, but did sell 100,000 shares from the Pattison Family Trust, realising a pre-tax gain onsale of shares of R18.8 million.
Through the Employee Share Option Scheme, Grant holds 684,021 Massmart shares and options of which 42,202 shares and 158,603 options are held in the Pattison Family Trust, ofwhich Grant is a beneficiary. The average length of time that he has held these is 6.1 years and the average strike price is R80.58 per share. The Pattison Family Trust also directly owns118,055 Massmart shares.
Through the Employee Share Awards Scheme, Grant was awarded 28,705 conditional performance awards and 9,569 retention awards on 16 September 2013.
GRC HaywardThe Remuneration Committee awarded Guy a 6.0% increase to his salary and allowances in July 2013. In terms of the Group’s Short-term Executive Incentive Scheme which rewardsexecutives based on the Group’s actual financial performance compared to the Plan for the same year, he received no bonus. The Committee however awarded him a qualitative bonus ofthree months (R0.92 million) in recognition of his sound direction of the operating Divisions in 2013.
During the 53 weeks ended 29 December 2013 Guy did not convert or sell any Massmart options or shares.
Through the Employee Share Option Scheme, Guy holds 456,906 Massmart shares and options of which 19,912 shares are held in the Bluett-Hayward Trust, of which Guy is adiscretionary beneficiary. The average length of time that he has held these is 3.3 years and the average strike price is R124.67 per share. Guy also owns 36,517 Massmart sharesdirectly.
Through the Employee Share Awards Scheme, Guy was awarded 20,848 conditional performance awards and 6,650 retention awards on 16 September 2013.
I ZwarensteinThe Remuneration Committee awarded Ilan a 6.0% increase to his salary and allowances in July 2013. In terms of the Group’s Short-term Executive Incentive Scheme which rewardsexecutives based on the Group’s actual financial performance compared to the Plan for the same year, he received no bonus. The Committee however, awarded him a qualitative bonus ofthree months (R0.56 million) in recognition of the high standards achieved in the Group’s Finance and Accounting functions.
During the 53 weeks ended 29 December 2013 Ilan converted and sold 15,328 Massmart options, realising a pre-tax gain on exercise of share options of R1.9 million.
Through the Employee Share Option Scheme, Ilan holds 167,331 options. The average length of time that he has held these is 2.2 years and the average strike price is R151.44 per share.
Through the Employee Share Awards Scheme, Ilan was awarded 12,759 conditional performance awards and 4,253 retention awards on 16 September 2013.

Services asdirectors of
MassmartHoldings
LimitedSalary and
allowances
Bonuses andperformance
relatedpayments
Otherbenefits
Retirementand related
benefits Subtotal
Fringe benefitof interest-free
loans used tofinanceshares
Gains onexercise of
shareoptions and
on sharespurchased
by directors TotalR000 R000 R000 R000 R000 R000 R000 R000 R000
For the 53 week year endedDecember 2013EExxeeccuuttiivvee ddiirreeccttoorrssPattison, GM - 5,215 1,304 772 365 7,656 1,413 - 9,069Hayward, GRC - 3,560 916 686 249 5,411 814 - 6,225Zwarenstein, I - 2,447 561 113 153 3,274 1 1,863 5,138
- 11,222 2,781 1,571 767 16,341 2,228 1,863 20,432NNoonn--eexxeeccuuttiivvee ddiirreeccttoorrssLamberti, MJ 1,213 - - - - 1,213 - - 1,213Seabrooke, CS 1,256 - - - - 1,256 - - 1,256Cheesewright, D - - - - - - - - -Davis, JA - - - - - - - - -Gwagwa, NN 451 - - - - 451 - - 451Langeni, P 689 - - - - 689 - - 689Suarez, JP - - - - - - - - -
3,609 - - - - 3,609 - - 3,609PPrreessccrriibbeedd OOffffiicceerrssPrescribed Officer A - - - - - 9,712 370 2,702 12,784Prescribed Officer B - - - - - 6,161 - - 6,161Prescribed Officer D - - - - - 3,694 6 5,904 9,604Prescribed Officer E - - - - - 4,327 - - 4,327Prescribed Officer F - - - - - 7,756 - 389 8,145Prescribed Officer G - - - - - 2,530 229 - 2,759Prescribed Officer I - - - - - 2,831 43 719 3,593Prescribed Officer K - - - - - 2,979 - - 2,979Prescribed Officer L - - - - - 2,930 - - 2,930Prescribed Officer M - - - - - 2,582 73 - 2,655
- - - - - 45,502 721 9,714 55,937Total 3,609 11,222 2,781 1,571 767 65,452 2,949 11,577 79,978
In order to match incentive awards with the performance to which they relate, bonuses above reflect the amounts accrued in respect of each year and not amounts paid in that year.Held in terms of the rules of the Company’s share scheme.Resigned with effect from 10 April 2014.
Services asdirectors of
MassmartHoldings
LimitedSalary and
allowances
Bonuses andperformance
relatedpayments
Otherbenefits
Retirementand related
benefits Subtotal
Fringe benefitof interest-free
loans used tofinanceshares
Gains onexercise of
shareoptions and
on sharespurchased
by directors TotalR000 R000 R000 R000 R000 R000 R000 R000 R000
For the 26 week year endedDecember 2012EExxeeccuuttiivvee ddiirreeccttoorrssPattison, GM - 2,085 - - 325 219 2,629 751 6,495 9,875Hayward, GRC - 1,728 - 262 182 2,172 490 20,819 23,481Zwarenstein, I - 1,187 - - 6 111 1,304 2 1,998 3,304
- 5,000 - 593 512 6,105 1,243 29,312 36,660NNoonn--eexxeeccuuttiivvee ddiirreeccttoorrssLamberti, MJ 505 - - - - 505 - - 505Seabrooke, CS 460 - - - - 460 - - 460Cheesewright, D - - - - - - - - -Davis, JA - - - - - - - - -Gwagwa, NN 183 - - - - 183 - - 183Langeni, P 296 - - - - 296 - - 296Suarez, JP - - - - - - - - -
1,444 - - - - 1,444 - - 1,444PPrreessccrriibbeedd OOffffiicceerrssPrescribed Officer A - - - - - 6,099 243 4,524 10,866Prescribed Officer B - - - - - 3,420 4 4,665 8,089Prescribed Officer C - - - - - 1,892 314 5,566 7,772Prescribed Officer D - - - - - 1,523 4 4,801 6,328Prescribed Officer E - - - - - 5,218 - - 5,218Prescribed Officer F - - - - - 3,400 - 39 3,439Prescribed Officer G - - - - - 1,000 120 1,850 2,970Prescribed Officer H - - - - - 2,152 - 452 2,604Prescribed Officer I - - - - - 1,139 39 1,390 2,568Prescribed Officer J - - - - - 1,607 148 - 1,755Prescribed Officer K - - - - - 1,597 - - 1,597Prescribed Officer L - - - - - 1,115 - - 1,115Prescribed Officer M - - - - - 1,030 38 - 1,068Prescribed Officer N - - - - - 451 87 - 538
- - - - - 31,643 997 23,287 55,927Total 1,444 5,000 - 593 512 39,192 2,240 52,599 94,031
In order to match incentive awards with the performance to which they relate, bonuses above reflect the amounts accrued in respect of each year and not amounts paid in that year.Held in terms of the rules of the Company’s share scheme.Appointed 20 August 2012.Resigned in the year ended December 2012.
1 2
3
1
2
3
1 2
3
4
4
1
2
3
4

NOTES TO THE ANNUAL GROUP FINANCIAL STATEMENTS 35-44FOR THE YEAR ENDED 29 DECEMBER 2013
35. INTERESTS OF DIRECTORS IN THE COMPANY’S SHARE SCHEME
Details of directors’ shares and share options per director:
Relevant date
Subscriptionprice
(R)Market price
(R)
Number ofshares/share
options
Gain onsale/exercise
(R 000′s) Expiry date
Pattison, GM
Employee Share Option Scheme (note 28)
Balance at June 2012 733,021
Options exercised 1 April 2005 41.90 174.50 (49,000) 6,495
Balance at December 2012684,021 6,495
Options exercised/shares sold - - - - -
Balance at December 2013684,021 -
Comprising: 1 April 2005 41.90 47,000 31 March 2015
23 May 2006 54.13 367,500 22 May 2016
24 May 2007 94.25 26,948 23 May 2017
26 May 2008 72.86 41,768 25 May 2018
27 May 2009 77.56 42,202 26 May 2019
1 September 2011 153.84 158,603 31 August 2021
Employee Share Awards Scheme (note 28)
Balance at December 2012 -
Performance awards granted 16 September 2013 - - 28,705 -
Retention awards granted 16 September 2013 - - 9,569 -
Balance at December 2013 38,274
Comprising: Performance awards 16 September 2013 - - 28,705 - -
Retention awards 16 September 2013 - - 9,569 - -
Hayward, GRC
Employee Share Option Scheme (note 28)
Balance at June 2012 628,406
Shares sold 1 April 2005 41.90 168.9 (98,000) 12,410
Shares sold 23 May 2006 54.13 168.9 (73,500) 8,409
Balance at December 2012456,906 20,819
Options exercised/ shares sold - - - - -
Balance at December 2013456,906 -
24 May 2007 94.25 - 24,444 23 May 2017
1 April 2008 66.91 - 19,912 31 March 2018
26 May 2008 72.86 - 36,573 25 May 2018
27 May 2009 77.56 - 105,448 26 May 2019
1 September 2011 153.84 - 120,987 31 August 2021
16 May 2012 159.62 - 149,542 15 May 2022
Employee Share Awards Scheme (note 28)
Balance at December 2012 -
Performance awards granted 16 September 2013 - - 20,848 -
Retention awards granted 16 September 2013 - - 6,950 -
Balance at December 2013 27,798
Comprising: Performance awards 16 September 2013 - - 20,848 - -
Retention awards 16 September 2013 - - 6,950 - -
Zwarenstein, I
Employee Share Option Scheme (note 28)
Balance at June 2012 202,659
Options exercised 1 April 2008 66.91 172.4 (5,484) 576
Options exercised 26 May 2008 72.86 172.4 (10,840) 1,075
Options exercised 27 May 2009 77.56 172.4 (3,676) 347
Balance at December 2012182,659 1,998
Options exercised 1 April 2008 66.91 196.0 (2,742) 354
Options exercised 26 May 2008 72.86 196.0 (5,234) 644
Options exercised 27 May 2009 77.56 196.0 (7,352) 871
Balance at December 2013167,331 1,868
Comprising: 26 May 2008 72.86 - 8,037 25 May 2018
27 May 2009 77.56 - 3,677 26 May 2019
1 September 2011 153.84 - 63,941 31 August 2021
16 May 2012 159.62 - 91,676 15 May 2022
Employee Share Awards Scheme (note 28)
Balance at December 2012 -
Performance awards granted 16 September 2013 - - 12,759 -
Retention awards granted 16 September 2013 - - 4,253 -
Balance at December 2013 17,012
Comprising: Performance awards 16 September 2013 - - 12,759 - -
Retention awards 16 September 2013 - - 4,253 - -
Shares and options at reporting date can be found in the Director’s Report.

NOTES TO THE ANNUAL GROUP FINANCIAL STATEMENTS 35-44FOR THE YEAR ENDED 29 DECEMBER 2013
36. PRINCIPAL SUBSIDIARIES
Details of Massmart’s material subsidiary companies are as follows:
Number of
shares in
issue
Place of
incorporation and
operation Ownership
Voting
power
Interest in
Subsidiaries
Name of company 000s % % Principal activity Rm
December 2013
Massbuild (Pty) Ltd - South Africa 100.0 100.0 Wholesale and retail of DIY products 1,472.4Masscash Holdings (Pty) Ltd - South Africa 100.0 100.0 Holding company 82.2Massmart International Holdings Ltd - Mauritius 100.0 100.0 Holding company 81.4
Masstores (Pty) Ltd 200 South Africa 100.0 100.0Retailing, warehousing, mass
merchandising (417.2)Mystic Blue Trading 62 (Pty) Ltd 100 South Africa 100.0 100.0 Selling of retail food 200.0Capensis Investments 241 (Pty) Ltd 1 South Africa 100.0 100.0 Property Holding Company 1,343.9Other smaller subsidiaries 10.1
2,772.8
December 2012
Massbuild (Pty) Ltd - South Africa 100.0 100.0 Wholesale and retail of DIY products 1,552.0Masscash Holdings (Pty) Ltd - South Africa 100.0 100.0 Holding company 165.4Massmart International Holdings Ltd - Mauritius 100.0 100.0 Holding company 81.4Massmart Management & Finance Company (Pty)Ltd - South Africa 100.0 100.0 Management, investment and finance (48.4)
Masstores (Pty) Ltd 200 South Africa 100.0 100.0Retailing, warehousing, mass
merchandising (437.6)Mystic Blue Trading 62 (Pty) Ltd 100 South Africa 100.0 100.0 Selling of retail food 200.0Other smaller subsidiaries 34.0
1,546.8
The above details are given in respect of interests in subsidiaries, where material. A full list of subsidiaries is available to shareholders, on request, at the registered office of the Company.
There were no material non-controlling interests identified within the Group in the current and prior financial years.

NOTES TO THE ANNUAL GROUP FINANCIAL STATEMENTS 35-44FOR THE YEAR ENDED 29 DECEMBER 2013
37. NOTES TO THE STATEMENT OF CASH FLOWS
December 2013 December 2012
53 weeks 26 weeks
Rm Rm
37.1 Cash flow from trading
Profit before taxation 1,897.4 1,064.7
AAddjjuusstteedd ffoorr::
Depreciation, amortisation and impairment 772.7 348.0
Net loss on disposal of property, plant and equipment 13.7 6.2
Interest received (28.7) (45.6)
Interest paid 283.8 106.0
Dividends received (79.2) -
Share-based payment expense 126.3 39.9
Unrealised foreign exchange loss (31.6) 2.1
Other non-cash movements 29.6 17.6
Other Walmart non-cash movements - 168.6
Supplier Development Fund - 140.0
Share-based payment expense - 28.6
2,984.0 1,707.5
37.2 Working capital movements
Increase in inventories (424.0) (2,060.9)
Increase in trade receivables and prepayments (30.7) (728.5)
Increase in trade payables 1,254.6 3,910.2
Decrease in provisions (47.3) (10.8)
752.6 1,110.0
37.3 Taxation paid
Normal taxation:
Amounts owing at the beginning of the year (281.5) (238.0)
Amounts owing at the end of the year 319.3 281.5
Other - (13.9)
Receiver of Revenue balance acquired on current year acquisitions - (0.1)
Taxation charged to the income statement (excluding deferred taxation) (770.6) (398.6)
(732.8) (369.1)
37.4 Investment to maintain operations
Land and buildings/leasehold improvements (47.8) (34.7)
Vehicles (43.3) (18.1)
Fixtures, fittings, plant and equipment (521.7) (192.9)
Computer hardware (70.9) (34.1)
Computer software (96.5) (65.4)
Right of use - (2.4)
(780.2) (347.6)
37.5 Investment to expand operations
Land and buildings/leasehold improvements (807.1) (42.5)
Vehicles (34.9) (29.2)
Fixtures, fittings, plant and equipment (427.6) (294.4)
Computer hardware (33.8) (21.0)
Computer software (1.5) (15.5)
Right of use (1.9) -
(1,306.8) (402.6)

37.6 Proceeds on disposal of property, plant and equipment
Land and buildings/leasehold improvements 13.1 2.4
Vehicles 4.8 1.9
Fixtures, fittings, plant and equipment 4.2 (0.3)
Computer equipment and software 0.9 4.6
Other 2.6 -
25.6 8.6
37.7 Proceeds on disposal of assets classified as held for sale 2.5 5.7
37.8 Investment in subsidiaries
FFaaiirr vvaalluuee ooff aasssseettss aanndd lliiaabbiilliittiieess aaccqquuiirreedd iinn ssuubbssiiddiiaarriieess::
Cash and cash equivalents - -
Inventories - (15.0)
Trade and other receivables and prepayments - -
Tangible assets - (7.8)
Intangible assets - -
Taxation - -
Trade payables - -
Provisions - 4.3
Long term debt - -
Deferred taxation - -
Goodwill - (38.4)
TToottaall ppuurrcchhaassee pprriiccee - (56.9)
Less: Cash and cash equivalents of subsidiary - -
Cash impact of acquisition, net of cash and cash equivalents acquired - (56.9)
37.9 Disposal of subsidiaries
NNeett aasssseettss aatt ddaattee ooff ddiissppoossaall::
Attributable goodwill - 2.0
Trade receivables 23.1 -
Cash and cash equivalents 96.4 52.5
Loans and investments - 2.0
Trade payables (94.2) -
Taxation (1.9) -
Net liabilities associated to assets classified as held for sale - (42.9)
Non-controlling interest - (8.2)
Other - 0.2
Total net assets at date of disposal 23.4 5.6
Loss on disposal (23.4) (3.8)
PPrroocceeeeddss rreecceeiivveedd oonn ssaallee - 1.8
Less: Cash and cash equivalents of subsidiary disposed - (52.5)
Cash impact of disposal, net of cash and cash equivalents disposed - (50.7)
37.10 Other investing activities
Capital contribution made to the investment in insurance cell-captive on premium contributions (note 15) (50.0) -
Withdrawal of cash from investment in a trading and logistics structure (note 15) 1.6 73.2
Property loan (note 16) (215.0) -
Third party loan (note 16) 13.4 -
Other 2.6 9.1
(247.4) 82.3
37.11 Cash and cash equivalents at the end of the year
Cash on hand and balances with banks 2,196.1 2,032.0
Bank overdrafts (607.8) (392.1)
Cash and cash equivalents at the end of the year 1,588.3 1,639.9

NOTES TO THE ANNUAL GROUP FINANCIAL STATEMENTS 35-44FOR THE YEAR ENDED 29 DECEMBER 2013
38. FAIR VALUE
Review of the statement of financial position split into financial instruments and non-financial instruments
The statement of financial position is reviewed in order to identify financial instruments that have a carrying amount that does not equate to their respective fair values. Thereare no non-financial instruments carried at fair value in terms of the Group’s accounting policy.
TotalNon-financial
instrumentFinancial
instrumentRm Rm Rm
December 2013NNoonn--ccuurrrreenntt aasssseettssProperty, plant and equipment 5,988.1 5,988.1 -Goodwill 2,532.0 2,532.0 -Other intangibles 396.8 396.8 -Investments 231.9 - 231.9Investment in a trading and logistics structure 117.4 - 117.4Investment in insurance cell-captive on extended warranties 44.4 - 44.4Investment in insurance cell-captive on premium contributions 55.9 - 55.9Trencor export partnership 2.1 - 2.1Available for sale listed investments 12.1 - 12.1Other financial assets 290.9 - 290.9Housing and staff loans 0.3 - 0.3Employee share trust loans 46.7 - 46.7Finance lease deposit 21.9 - 21.9Property loan 215.0 - 215.0Third party loan 6.8 - 6.8Other loans 0.2 - 0.2Deferred taxation 672.1 672.1 -
CCuurrrreenntt aasssseettssInventories 10,115.5 10,115.5 -Trade and other receivables 3,712.5 194.1 3,518.4Trade receivables 1,822.8 - 1,822.8Other accounts receivable 1,816.8 147.7 1,669.1FEC asset 26.5 - 26.5Prepayments 46.4 46.4 -Taxation 12.0 12.0 -Cash and bank balances 2,196.1 - 2,196.1
Total assets 26,147.9 19,910.6 6,237.3
NNoonn--ccuurrrreenntt lliiaabbiilliittiieessNon-current liabilities – interest-bearing 1,178.7 - 1,178.7Medium-term payable 600.0 - 600.0Medium-term bank loans 562.1 - 562.1Capitalised finance lease 16.6 - 16.6Non-current liabilities – interest-free 838.9 835.9 3.0Loans to non-controlling interests 3.0 - 3.0Operating lease liability 835.7 835.7 -Other 0.2 0.2 -Non-current provisions and other 102.2 102.2 -Onerous lease provision 18.0 18.0 -Provision for post-retirement medical aid contributions and other medical aid provisions 84.2 84.2 -Deferred taxation 86.6 86.6 -
CCuurrrreenntt lliiaabbiilliittiieessTrade and other payables 16,774.2 1,000.8 15,773.4Trade payables 13,702.5 - 13,702.5Operating lease liability 97.1 97.1 -Leave pay accrual 220.1 220.1 -FEC liability 2.7 - 2.7Income received in advance 40.1 40.1 -Rebates and advertising 92.4 - 92.4Shareholders for dividends 12.0 - 12.0Interest accrual 15.3 - 15.3Walmart accrual 136.3 - 136.3Promissory notes 104.5 - 104.5Sundry payables and other accruals 2,351.2 643.5 1,707.7Current provisions and other 327.0 19.9 307.1Onerous lease provision 8.6 8.6 -Liabilities raised on business acquisitions 101.4 - 101.4Provision for Supplier Development Fund 202.5 - 202.5Other current provisions 14.5 11.3 3.2Taxation 331.3 331.3 -Other current liabilities 531.6 - 531.6Medium-term payable 157.3 - 157.3Medium-term bank loans 329.6 - 329.6Capitalised finance lease 44.7 - 44.7
Bank overdrafts 607.8 - 607.8
Total liabilities 20,778.3 2,376.7 18,401.6
1

TotalNon-financial
instrumentFinancial
instrumentRm Rm Rm
December 2012NNoonn--ccuurrrreenntt aasssseettssProperty, plant and equipment 3,868.2 3,868.2 -Goodwill 2,557.7 2,557.7 -Other intangibles 387.6 387.6 -Investments 258.8 - 258.8Bare dominium revaluation 110.0 - 110.0Investment in a trading and logistics structure 104.0 - 104.0Investment in insurance cell-captive on premium contributions 34.8 - 34.8Trencor export partnership 2.5 - 2.5Other unlisted investments 0.1 - 0.1Other listed investments 7.4 - 7.4Other financial assets 126.5 - 126.5Housing and staff loans 0.4 - 0.4Employee share trust loans 70.6 - 70.6Finance lease deposit 33.0 - 33.0Third party loan 20.2 - 20.2Other loans 2.3 - 2.3Deferred taxation 396.3 396.3 -
CCuurrrreenntt aasssseettssInventories 9,691.5 9,691.5 -Trade, other receivables and prepayments 3,681.7 194.7 3,487.0Trade receivables 1,692.9 - 1,692.9Other accounts receivable 1,908.7 123.1 1,785.6FEC asset 8.5 - 8.5Prepayments 71.6 71.6 -Taxation 17.0 17.0 -Cash and bank balances 2,032.0 - 2,032.0Non-current assets classified as held for sale 2.5 2.5 -
Total assets 23,019.8 17,115.5 5,904.3
NNoonn--ccuurrrreenntt lliiaabbiilliittiieessNon-current liabilities – interest-bearing 671.8 - 671.8Medium-term bank loans 616.6 - 616.6Capitalised finance lease 55.2 - 55.2Non-current liabilities – interest-free 305.7 302.7 3.0Loans to non-controlling interests 3.0 - 3.0Operating lease liability 302.7 302.7 -Non-current provisions and other 169.2 104.6 64.6Onerous lease provision 23.1 23.1 -Liabilities raised on business acquisitions 64.6 - 64.6Provision for post-retirement medical aid contributions and other medical aid provisions 81.5 81.5 -Deferred taxation 36.7 36.7 -
CCuurrrreenntt lliiaabbiilliittiieessTrade and other payables 15,305.5 613.7 14,691.8Trade payables 12,601.3 - 12,601.3Operating lease liability 90.6 90.6 -Leave pay accrual 195.4 195.4 -FEC liability 10.5 - 10.5Income received in advance 27.6 - 27.6Insurance income received in advance 91.6 - 91.6Rebates and advertising 91.3 - 91.3Shareholders for dividends 15.0 - 15.0Interest accrual 10.3 - 10.3Walmart accrual 76.7 - 76.7Sundry payables and other accruals 2,095.2 327.7 1,767.5Current provisions and other 363.8 11.2 352.6Onerous lease provision 7.3 7.3 -Liabilities raised on business acquisitions 124.1 - 124.1Provision for Supplier Development Fund 225.4 - 225.4Other current provisions 7.0 3.9 3.1Taxation 298.5 298.5 -Other current liabilities 561.2 - 561.2Medium-term payable 113.1 - 113.1Medium-term bank loans 414.7 - 414.7Capitalised finance lease 33.4 - 33.4
Bank overdrafts 392.1 - 392.1
Total liabilities 18,104.5 1,367.4 16,737.1
The cash flows expected from the Group’s Investment in the Trencor export partnership over the next two to five years cannot, in the opinion of the directors, be accurately fairvalued and therefore have not been discounted. For fair presentation purposes, it is noted that any fair value impairment in the amounts due to the Group by virtue of itsInvestment in such partnerships would result in a corresponding reduction in the fair value of the related deferred tax liability. Consequently, such fair value impairment wouldhave no impact on either the statement of cash flows or income statement of the Group.
1
1

Fair value hierarchyThe Group uses the following hierarchy for determining and disclosing the fair value of financial instruments identified above. The financial assets and liabilities presented havecarrying amounts that differ from their fair values. The following valuation techniques apply:
Level 1: quoted (unadjusted) prices in active markets for identical assets or liabilities Level 2: other techniques for which all inputs that have a significant effect on the recorded fair value are observable, either directly or indirectly Level 3: techniques that use inputs that have a significant effect on the recorded fair value that are not based on observable market data
TotalCarring
Amount Total Fair Value Level 1 Level 2 Level 3FFiinnaanncciiaall iinnssttrruummeennttss iinn tthhee ssttaatteemmeenntt ooff ffiinnaanncciiaall ppoossiittiioonn Rm Rm Rm Rm Rm
December 2013FFiinnaanncciiaall AAsssseettssFinancial assets at fair value through profit or loss 244.2 244.2 - 244.2 -Investment in a trading and logistics structure 117.4 117.4 - 117.4 -Investment in insurance cell-captive on extended warranties 44.4 44.4 - 44.4 -Investment in insurance cell-captive on premium contributions 55.9 55.9 - 55.9 -FEC asset 26.5 26.5 - 26.5 -Loans and receivables 46.7 34.9 - 34.9 -Employee share trust loans 46.7 34.9 - 34.9 -Available-for-sale financial assets 12.1 12.1Listed investments 12.1 12.1 12.1 - -
303.0 291.2 12.1 279.1 -
FFiinnaanncciiaall lliiaabbiilliittiieessFinancial liabilities at amortised cost 1,710.3 1,724.8 - 1,724.8 -Medium-term payable 757.3 762.2 - 762.2 -Medium-term bank loans 891.7 876.4 - 876.4 -Capitalised finance lease 61.3 86.2 - 86.2 -Financial liabilities at fair value through profit or loss 2.7 2.7 - 2.7 -FEC liability 2.7 2.7 - 2.7 -
1,713.0 1,727.5 - 1,727.5 -
There were no transfers between Level 1 and Level 2 fair value measurements during the December 2013 financial year, and no transfers into or out of Level 3. The financial assests and financial liabilities have been presented based on an analysis of their respective natures, characteristics and risks.
TotalCarring
Amount Total Fair Value Level 1 Level 2 Level 3FFiinnaanncciiaall iinnssttrruummeennttss iinn tthhee ssttaatteemmeenntt ooff ffiinnaanncciiaall ppoossiittiioonn Rm Rm Rm Rm Rm
December 2012FFiinnaanncciiaall AAsssseettssFinancial assets at fair value through profit or loss 257.3 257.3 8.5 248.8 -Bare dominium revaluation 110.0 110.0 - 110.0 -Investment in a trading and logistics structure 104.0 104.0 - 104.0 -Investment in insurance cell-captive on extended warranties 34.8 34.8 - 34.8 -FEC asset 8.5 8.5 8.5 - -Available-for-sale financial assets 7.4 7.4 7.4 - -Listed investments 7.4 7.4 7.4 - -
264.7 264.7 15.9 248.8 -
FFiinnaanncciiaall lliiaabbiilliittiieessFinancial liabilities at fair value through profit or loss 10.5 10.5 10.5 - -FEC Liability 10.5 10.5 10.5 - -
10.5 10.5 10.5 - -
There were no transfers between Level 1 and Level 2 fair value measurements during the December 2012 financial year, and no transfers into or out of Level 3.

Fair value measurement and valuation techniques
TTyyppee ooff ffiinnaanncciiaall iinnssttrruummeennttFair value December
2013Valuationtechnique
Significantinputs Range 2013
FFiinnaanncciiaall AAsssseettss
Financial assets at fair value through profit or loss 244.2Investment in a trading and logistics structure 117.4 NAV Cash and cash
equivalentsR117.6m
Investment in insurance cell-captive on extended warranties 44.4 NAV Cash and cashequivalents
R23.7m
Investment inunit trusts
R117.9m
Insurance fundliabilities
(R95.0)m
Investment in insurance cell-captive on premium contributions 55.9 NAV Cash and cashequivalents
R94.7m
Insurance fundliabilities
(R39.1)m
FEC asset 26.5 DCF Yield curvesMarket interestrateMarket foreignexchange rate
R10.51 toR11.07
Loans and receivables 34.9Employee share trust loans 34.9 DCF Market interest
rate4.55%
Available-for-sale financial assets 12.1Listed investments 12.1 Listed share price $0.20
Market foreignexchange rate
R10.54
291.2
FFiinnaanncciiaall lliiaabbiilliittiieess
Financial liabilities at amortised cost 1,724.8Medium-term payable 762.2 DCF Market interest
rate7.2%
Medium-term bank loans 876.4 DCF Market interestrate
7.2%
Capitalised finance lease 86.2 DCF Market interestrate
6.6% to 7.2%
Financial liabilities at fair value through profit or loss 2.7FEC liability 2.7 DCF Yield curves
Market interestrateMarket foreignexchange rate
R10.51 toR11.07
1,727.5
VVaalluuaattiioonn tteecchhnniiqquuee Description of valuation technique
Net asset value (NAV) Net asset value is used as a valuation technique where the underlying assets andliabilities have been assessed to represent the fair value of the investment. Due tothe nature of the investment, specifically the significant composition of liquidassets and liabilities, the net asset value is seen to be the most appropriaterepresentation of fair value.
Discounted cash flow (DCF) The DCF method involves the projection of a series of cash flows. To thisprojected cash flow series, an appropriate, market-derived discount rate is appliedto establish the present value of the income stream associated with the item. Fairvalue is estimated using explicit assumptions regarding the benefits and liabilitiesof ownership over the asset’s life including an exit or terminal value.

NOTES TO THE ANNUAL GROUP FINANCIAL STATEMENTS 35-44FOR THE YEAR ENDED 29 DECEMBER 2013
39. FINANCIAL INSTRUMENTS
Capital risk managementThe Group manages its capital to ensure that entities in the Group will be able to continue as a going concern while maximising the return tostakeholders through the optimisation of the debt and equity balances.
The capital structure of the Group consists of debt, more specifically medium-term interest-bearing debt and equity attributable to equity holders ofthe parent, comprising share capital, share premium, other reserves and retained profit. (See note 21 and note 22 respectively).
The targeted level of gearing is determined after consideration of the following key factors :- the needs of the Group to fund current and future capital expenditure to achieve its stated production growth target; and- the desire of the Group to maintain its gearing within levels considered to be acceptable taking into account potential business opportunities andthe position of the Group in the business cycle.The targeted level of gearing was adequately managed in the current financial year.
The Group has medium-term debt facilities that include certain covenants, including:- maximum gearing ratio- minimum interest cover- specified levels of shareholders’ equity.
The Group’s general banking facility can be analysed as follows:
December 2013 December 2012Rm Rm
Available cash reserves 1,588.3 1,639.9General banking facility 4,250.0 3,332.4
5,838.3 4,972.3
The Group complies with all externally imposed capital requirements relating to loan covenants.
Categories of financial instruments
Financial assets
FFaaiirr vvaalluuee tthhrroouugghh pprrooffiitt oorr lloossss ((FFVVTTPPLL))These are held at fair value and any adjustments are taken to the income statement. Listed investments are carried at market value by reference tostock exchange quoted selling prices.
LLooaannss aanndd rreecceeiivvaabblleessThese are held at amortised cost less any impairment losses recognised to reflect irrecoverable amounts.
HHeelldd--ttoo--mmaattuurriittyy iinnvveessttmmeennttssThese are held at amortised cost less any impairment losses recognised to reflect irrecoverable amounts.
AAvvaaiillaabbllee--ffoorr--ssaallee iinnvveessttmmeennttssThese are held at fair value and any adjustment to fair value is taken to other comprehensive income.
Financial liabilities
FFaaiirr vvaalluuee tthhrroouugghh pprrooffiitt oorr lloossss ((FFVVTTPPLL))These are held at fair value and any adjustments are taken to the income statement.
LLiiaabbiilliittyy aatt aammoorrttiisseedd ccoossttThese are held as non-trading liabilities and are shown at amortised cost.

Classification of financial instruments
Financialinstrument FVTPL
Liability atamortised
costLoans and
receivables
Held-to-maturity
investments
Available-for-sale
financialinstruments
Rm Rm Rm Rm Rm Rm
December 2013NNoonn--ccuurrrreenntt aasssseettssInvestments 231.9 217.7 - 2.1 - 12.1Investment in a trading and logistics structure 117.4 117.4 - - - -Investment in insurance cell-captive onextended warranties 44.4 44.4 - - - -Investment in insurance cell-captive onpremium contributions 55.9 55.9 - - - -Trencor export partnership 2.1 - - 2.1 - -Available for sale listed investments 12.1 - - - - 12.1Other financial assets 290.9 - - 290.9 - -Housing and staff loans 0.3 - - 0.3 - -Employee share trust loans 46.7 - - 46.7 - -Finance lease deposit 21.9 - - 21.9 - -Property loan 215.0 - - 215.0 - -Third party loan 6.8 - - 6.8 - -Other loans 0.2 - - 0.2 - -
CCuurrrreenntt aasssseettssTrade, other receivables and prepayments 3,518.4 26.5 - 3,491.9 - -Trade receivables 1,822.8 - - 1,822.8 - -Other accounts receivable 1,669.1 - - 1,669.1 - -FEC asset 26.5 26.5 - - - -
Cash and bank balances 2,196.1 - - 2,196.1 - -
Total assets 6,237.3 244.2 - 5,981.0 - 12.1
NNoonn--ccuurrrreenntt lliiaabbiilliittiieessNon-current liabilities – interest-bearing 1,178.7 - 1,178.7 - - -Medium-term payable 600.0 - 600.0 - - -Medium-term bank loans 562.1 - 562.1 - - -Capitalised finance lease 16.6 - 16.6 - - -Non-current liabilities – interest-free 3.0 - 3.0 - - -Loans to non-controlling interests 3.0 - 3.0 - - -
CCuurrrreenntt lliiaabbiilliittiieessTrade and other payables 15,773.4 2.7 15,770.7 - - -Trade payables 13,702.5 - 13,702.5 - - -FEC liability 2.7 2.7 - - - -Rebates and advertising 92.4 - 92.4 - - -Shareholders for dividends 12.0 - 12.0 - - -Interest accrual 15.3 - 15.3 - - -Amounts due to Walmart 136.3 - 136.3 - - -Promissory notes 104.5 - 104.5 - - -Sundry payables and other accruals 1,707.7 - 1,707.7 - - -Current provisions and other 307.1 - 307.1 - - -Liabilities raised on business acquisitions 101.4 - 101.4 - - -Provision for Supplier Development Fund 202.5 - 202.5 - - -Other current provisions 3.2 - 3.2 - - -Other current liabilities 531.6 - 531.6 - - -Medium-term payable 157.3 - 157.3 - - -Medium-term bank loans 329.6 - 329.6 - - -Capitalised finance lease 44.7 - 44.7 - - -
Bank overdrafts 607.8 - 607.8 - - -
Total liabilities 18,401.6 2.7 18,398.9 - - -

Financialinstrument FVTPL
Liability atamortised
costLoans and
receivables
Held-to-maturity
investments
Available-for-sale
financialinstruments
Rm Rm Rm Rm Rm Rm
December 2012NNoonn--ccuurrrreenntt aasssseettssInvestments 258.8 248.8 - 2.5 0.1 7.4Bare dominium revaluation 110.0 110.0 - - - -Investment in a trading and logistics structure 104.0 104.0 - - - -Investment in insurance cell-captive onpremium contributions 34.8 34.8 - - - -Trencor export partnership 2.5 - - 2.5 - -Other unlisted investments 0.1 - - - 0.1 -Other listed investments 7.4 - - - - 7.4Other financial assets 126.5 - - 126.5 - -Housing and staff loans 0.4 - - 0.4 - -Employee share trust loans 70.6 - - 70.6 - -Finance lease deposit 33.0 - - 33.0 - -Third party loan 20.2 - - 20.2 - -Other loans 2.3 - - 2.3 - -
CCuurrrreenntt aasssseettssTrade, other receivables and prepayments 3,487.0 8.5 - 3,478.5 - -Trade receivables 1,692.9 - - 1,692.9 - -Other accounts receivable 1,785.6 - - 1,785.6 - -FEC asset 8.5 8.5 - - - -
Cash and bank balances 2,032.0 - - 2,032.0 - -
Total assets 5,904.3 257.3 - 5,639.5 0.1 7.4
NNoonn--ccuurrrreenntt lliiaabbiilliittiieessNon-current liabilities – interest-bearing 671.8 - 671.8 - - -Medium-term bank loans 616.6 - 616.6 - - -Capitalised finance lease 55.2 - 55.2 - - -Non-current liabilities – interest-free 3.0 - 3.0 - - -Loans to non-controlling interests 3.0 - 3.0 - - -Non-current provisions and other 64.6 - 64.6 - - -Liabilities raised on business acquisitions 64.6 - 64.6 - - -
CCuurrrreenntt lliiaabbiilliittiieessTrade and other payables 14,691.8 10.5 14,681.3 - - -Trade payables 12,601.3 - 12,601.3 - - -FEC liability 10.5 10.5 - - - -Income received in advance 27.6 - 27.6 - - -Insurance income received in advance 91.6 - 91.6 - - -Rebates and advertising 91.3 - 91.3 - - -Shareholders for dividends 15.0 - 15.0 - - -Interest accrual 10.3 - 10.3 - - -Amounts due to Walmart 76.7 - 76.7 - - -Sundry payables and other accruals 1,767.5 - 1,767.5 - - -Current provisions and other 352.6 - 352.6 - - -Liabilities raised on business acquisitions 124.1 - 124.1 - - -Provision for supplier development fund 225.4 - 225.4 - - -Other current provisions 3.1 - 3.1 - - -Other current liabilities 561.2 - 561.2 - - -Medium-term payable 113.1 - 113.1 - - -Medium-term bank loans 414.7 - 414.7 - - -Capitalised finance lease 33.4 - 33.4 - - -
Bank overdrafts 392.1 - 392.1 - - -
Total liabilities 16,737.1 10.5 16,726.6 - - -
Financial risk managementThe Group does not trade in financial instruments, but in the ordinary course of business operations, the Group is exposed to a variety of financialrisks arising from the use of financial instruments. These risks include:- market risk (comprising interest rate risk and currency risk);- liquidity risk; and- credit risk.The Group has developed a comprehensive risk management process to facilitate, control and monitor these risks. This process includes formaldocumentation of policies, including limits, controls and reporting structures. The Executive Committee is responsible for risk managementactivities within the Group.
Market risk managementMarket risk is the risk that the fair value or future cash flows of a financial instrument will fluctuate because of changes in market prices. Themarket risks that the Group is primarily exposed to include interest rate risk and currency risk. Market risk is managed by identifying andquantifying risks on the basis of current and future expectations and ensuring that all trading occurs within defined parameters. This involves thereview and implementation of methodologies to reduce risk exposure. The reporting on the state of the risk and risk practices to executivemanagement is part of this process. The processes set up to measure, monitor and mitigate these market risks are described below. There hasbeen no change to the Group’s exposure to market risk or the manner in which it manages and measures the risk since the prior financial year.

Interest rate risk managementDuring the year, the surplus cash position of the Group strengthened. The size of the Group’s position, be it either surplus cash or borrowings,exposes it to interest rate risk. The interest-bearing debt funding requirements and the investment of surplus cash funds are managed by the Groupthrough its own commercial bank facilities.
The carrying amount of the Group’s financial assets and liabilities at reporting date that are subject to interest rate risk is as follows :Subject to interest rate
movementNon-interest
bearing TotalFixed Floating
Rm Rm Rm Rm
December 2013FFiinnaanncciiaall aasssseettssInvestments - 2.1 229.8 231.9Investment in a trading and logistics structure - - 117.4 117.4Investment in insurance cell-captive on extended warranties - - 44.4 44.4Investment in insurance cell-captive on premium contributions - - 55.9 55.9Trencor export partnership - 2.1 - 2.1Available for sale listed investments - - 12.1 12.1Other financial assets 237.2 6.8 46.9 290.9Housing and staff loans 0.3 - - 0.3Employee share trust loans - - 46.7 46.7Finance lease deposit 21.9 - - 21.9Property loan 215.0 - - 215.0Third party loan - 6.8 - 6.8Other loans - - 0.2 0.2Trade, other receivables and prepayments - 1,822.8 1,695.6 3,518.4Trade receivables - 1,822.8 - 1,822.8Other accounts receivable - - 1,669.1 1,669.1FEC asset - - 26.5 26.5
Cash and bank balances - 2,196.1 - 2,196.1
Total financial assets 237.2 4,027.8 1,972.3 6,237.3
FFiinnaanncciiaall lliiaabbiilliittiieessNon-current liabilities – interest-bearing 1,178.7 - - 1,178.7Medium-term payable 600.0 - - 600.0Medium-term bank loans 562.1 - - 562.1Capitalised finance lease 16.6 - - 16.6Non-current liabilities – interest-free - - 3.0 3.0Loans to non-controlling interests - - 3.0 3.0Trade and other payables - - 15,773.4 15,773.4Trade payables - - 13,702.5 13,702.5FEC liability - - 2.7 2.7Rebates and advertising - - 92.4 92.4Shareholders for dividends - - 12.0 12.0Interest accrual - - 15.3 15.3Amounts due to Walmart - - 136.3 136.3Promissory note - - 104.5 104.5Sundry payables and other accruals - - 1,707.7 1,707.7Current provisions and other - - 307.1 307.1Liabilities raised on business acquisitions - - 101.4 101.4Provision for Supplier Development Fund - - 202.5 202.5Other current provisions - - 3.2 3.2Other current liabilities 374.3 157.3 - 531.6Medium-term payable - 157.3 - 157.3Medium-term bank loans 329.6 - - 329.6Capitalised finance lease 44.7 - - 44.7
Bank overdrafts - 607.8 - 607.8
Total financial liabilities 1,553.0 765.1 16,083.5 18,401.6

Subject to interest ratemovement
Non-interestbearing Total
Fixed FloatingRm Rm Rm Rm
December 2012FFiinnaanncciiaall aasssseettssInvestments - 2.5 256.3 258.8Bare dominium revaluation - - 110.0 110.0Investment in a trading and logistics structure - - 104.0 104.0Investment in insurance cell-captive on premium contributions - - 34.8 34.8Trencor export partnership - 2.5 - 2.5Other unlisted investments - - 0.1 0.1Other listed investments - - 7.4 7.4Other financial assets 33.4 - 93.1 126.5Housing and staff loans 0.4 - - 0.4Employee share trust loans - - 70.6 70.6Finance lease deposit 33.0 - - 33.0Third party loan - - 20.2 20.2Other loans - - 2.3 2.3Trade, other receivables and prepayments - 1,692.9 1,794.1 3,487.0Trade receivables - 1,692.9 - 1,692.9Other accounts receivable - - 1,785.6 1,785.6FEC asset - - 8.5 8.5
Cash and bank balances - 2,032.0 - 2,032.0
Total financial assets 33.4 3,727.4 2,143.5 5,904.3
FFiinnaanncciiaall lliiaabbiilliittiieessNon-current liabilities – interest-bearing 671.8 - - 671.8Medium-term bank loans 616.6 - - 616.6Capitalised finance lease 55.2 - - 55.2Non-current liabilities – interest-free - - 3.0 3.0Loans to non-controlling interests - - 3.0 3.0Non-current provisions and other - - 64.6 64.6Liabilities raised on business acquisitions - - 64.6 64.6Trade and other payables - - 14,691.8 14,600.2Trade payables - - 12,601.3 12,601.3FEC liability - - 10.5 10.5Income received in advance - - 27.6 27.6Insurance income received in advance 91.6Rebates and advertising - - 91.3 91.3Shareholders for dividends - - 15.0 15.0Interest accrual - - 10.3 10.3Amounts due to Walmart - - 76.7 76.7Sundry payables and other accruals - - 1,767.5 1,767.5Current provisions and other - 124.1 228.5 352.6Liabilities raised on business acquisitions - 124.1 - 124.1Provision for Supplier Development Fund - - 225.4 225.4Other current provisions - - 3.1 3.1Other current liabilities 448.1 113.1 - 561.2Medium-term payable - 113.1 - 113.1Medium-term bank loans 414.7 - - 414.7Capitalised finance lease 33.4 - - 33.4
Bank overdrafts - 392.1 - 392.1
Total financial liabilities 1,119.9 629.3 14,987.9 16,737.1
Interest rate sensitivityThe Group is sensitive to the movements in the SA Prime interest rate. The rates of sensitivity represents management’s assessment of thepossible change in interest rates. The average interest rate for the Group for the year was 6.00% (December 2012: 6.77%), and the variable interestpaid was R188.1 million (December 2012: R15.1 million). If the SA Prime interest rate increased and decreased by 150 average basis points(December 2012: increased and decreased by 50 average basis points) at year-end, the income for the year would have decreased and increased byR47.7 million respectively (December 2012: decreased and increased by R1.1 million respectively).
Currency risk managementAll foreign-denominated trading liabilities are covered by forward exchange contracts. Foreign-denominated assets are not covered by forwardexchange contracts.The carrying amount of the Group’s foreign currency denominated monetary assets at reporting date is as follows :
South AfricanRand US Dollar Euro Other Total
Rm Rm Rm Rm Rm
December 2013Investments 103.2 117.4 - 11.3 231.9Trade receivables 3,339.6 - - 178.8 3,518.4Cash and bank balances 1,109.9 (79.7) 14.4 543.7 1,588.3
4,552.7 37.7 14.4 733.8 5,338.6
December 2012Investments 148.1 104.0 - 6.7 258.8Trade receivables 3,337.0 0.8 - 149.2 3,487.0Cash and bank balances 1,256.4 (63.6) 11.6 435.5 1,639.9
4,741.5 41.2 11.6 591.4 5,385.7

Foreign currency sensitivityThe US Dollar is the primary currency to which the Group is exposed.In the past, the US Dollar movement against the Rand has been a good proxy for the Group’s exposure to the basket of African currencies. Duringthe 2009 financial year, this relationship broke as the African currencies weakened considerably more than the US Dollar as can be seen in thegraph below. In the 2010 and the 2011 financial years, the relationship was restored. In 2012 , the relationship was maintained, except for Malawi,where the Kwacha devalued by 50% in May 2012. The devalued Malawian Kwacha distorts the graph illsutrated below showing the African basketweakening against the Rand. This was restored in December 2012. In the current financial year, the African basket and the US Dollar strengthenedagainst the Rand. The African basket did, however, remain consistent with the 6 months to December 2012, while the US Dollar strenthenedconsiderably against the Rand. The weakening of the Rand is as a result of the tough economic climate experienced specifically in South Africa inthe current financial year. The African basket below gives no weighting to the different African currencies nor is impacted by the exposure to therelevant countries. As a result, the graph below illustrates a different foreign exchange outcome to that in the income statement where theDecember 2011 high Malawian loan balance and large currency devaluation had a large impact.
Relationship between the African basket and the US Dollar (%)
This graph shows the annual change of closing spot rates at each financial year-end.
The table below indicates the Group’s sensitivity at year-end to movements in the relevant foreign currencies on financial instruments, excludingforward exchange contracts. The rates of sensitivity are the rates used when reporting the currency risk to the Executive Committee of the Groupand represents management’s assessment of the possible change in reporting foreign currency exchange rates. The rate sensitivity was increasedin the current financial to 10% (December 2012: 5%) in light of the significant devaluation of the Rand in the current year. For each 10% increase,profit is increased and the financial asset is increased, for each 10% decrease, profit is decreased and the financial asset is decreased.
December 2013 10% increase10%
decreaseCurrency Spot rate Rm Rm
US Dollar 10.5372 2.6 (2.6)Pound Sterling 17.3686 0.2 (0.2)Euro 14.4703 0.1 (0.1)Botswana Pula 1.2012 0.7 (0.7)Ghanaian New Cedi 4.4177 0.6 (0.6)Malawian Kwacha 0.0255 1.7 (1.7)Mozambican New Metical 0.3508 1.8 (1.8)Nigerian Naira 0.0653 2.6 (2.6)Tanzanian Shilling 0.0066 2.1 (2.1)Uganda Shilling 0.0042 3.1 (3.1)Zambian Kwacha 1.8966 0.2 (0.2)
December 2012 5% increase5%
decreaseCurrency Spot rate Rm Rm
US Dollar 8.5878 0.1 (0.1)Pound Sterling 13.8878 - -Euro 11.2948 - -Botswana Pula 1.0993 0.1 (0.1)Ghanaian New Cedi 4.5238 - -Malawian Kwacha 0.0259 3.6 (3.6)Mozambican New Metical 0.2906 0.5 (0.5)Nigerian Naira 0.0546 0.4 (0.4)Tanzanian Shilling 0.0054 0.1 (0.1)Uganda Shilling 0.0032 0.4 (0.4)Zambian Kwacha 1.7000 - -

Forward foreign exchange contractsForward exchange contracts are entered into to manage exposure to fluctuations in foreign currency exchange rates on specific tradingtransactions. The Group’s policy is to enter into forward contracts for all committed foreign currency purchases to hedge the Group’s exposure tovariability in cash flows. These FEC hedges are classified as cash flow hedges and have been accounted for according to IAS 39 FinancialInstruments: Recognition and Measurement. Fair value has been determined using money market derivative rates at 29 December 2013 (23December 2013) and the net gain or exposure on the contracts has been reflected in the financial statements. There are no other hedges in theGroup.
Foreigncurrency
Fair valueadjustment
Contractequivalent
Averageexchange
rateAt year-end, the open forward exchangecontracts were as follows: (millions) Rm Rm
December 2013US Dollar 70.3 23.1 744.2 10.6Sterling 0.4 0.2 6.4 14.6Euro 0.4 0.6 8.6 20.4
23.9 759.2
December 2012US Dollar 80.8 (2.3) 703.0 8.7Sterling 0.3 0.1 3.9 13.6Euro 0.6 0.2 6.2 11.1
(2.0) 713.1
The contract equivalent represents the balance at the end of the current financial year and is included in Trade and other receivables (FEC assetbalance) and included in Trade and other payables (FEC liability balance). As the average duration is three months, these FEC balances would bederecognised and the resulting impact would be accounted for in the income statement within the next financial year for both periods under review.
During the December 2013 financial year an amount of -R5.1 million (December 2012: -R4.2 million) relating to the FEC hedges was recognised inother comprehensive income.
Forward foreign exchange contracts sensitivityThe following table indicates the Group’s sensitivity of the outstanding forward exchange contracts at the reporting date to movements in the USDollar. The US Dollar is the primary currency in which the Group has entered into forward foreign exchange contracts. The rates of sensitivity are therates used when reporting the currency risk to the Executive Committee of the Group and represents management’s assessment of the possiblechange in foreign currency exchange rates. The Rand/US Dollar year-end rate was R10.54 (December 2012: R8.59).
US Dollar US Dollar5% increase 5% decrease
Rm Rm
December 2013Profit/(loss) 19.7 (19.7)Derivative financial assets/(liabilities) 27.1 (27.1)Equity 7.4 (7.4)
December 2012Profit/(loss) 30.9 (39.1)Derivative financial assets/(liabilities) 35.0 (35.0)Equity 4.1 4.1
Liquidity risk managementLiquidity risk is the risk that the Group will be unable to meet a financial commitment in any location or currency. This risk is minimised through theholding of cash balances and sufficient available borrowing facilities (refer to note 23). In addition, detailed cash flow forecasts are regularlyprepared and reviewed so that the cash needs of the Group are managed according to its requirements.
The following table details the Group’s contractual maturity for its non-derivative financial liabilities. The table has been compiled based on theundiscounted cash flows of financial liabilities based on the earliest date on which the Group can be required to repay the liability. The cash flowsinclude both the principal and interest payments.
Repayable Repayable Repayable
within 1 year 2 – 5 yearsafter 5years Total
Rm Rm Rm Rm
December 2013FFiinnaanncciiaall lliiaabbiilliittiieessNon-current and current liabilities – interest-bearing 647.2 1,379.9 - 2,027.1Medium-term payable 214.0 748.0 - 962.0Medium-term bank loans 384.2 614.0 - 998.2Capitalised finance lease 49.0 17.9 - 66.9Non-current liabilities – interest-free 1.9 - 1.1 3.0Loans to non-controlling interests 1.9 - 1.1 3.0Non-current and current provisions and other 307.1 - - 307.1Trade and other payables 15,773.4 - - 15,773.4Trade payables 13,702.5 - - 13,702.5FEC liability 2.7 - - 2.7Sundry payables and other accruals 2,068.2 - - 2,068.2
Bank overdrafts 607.8 - - 607.8Total undiscounted cash flows of the Group’sfinancial liabilities 17,337.4 1,379.9 1.1 18,718.4Less: Future finance charges (316.8) *
Total financial liabilities 18,401.6
* Included in future finance charges is R5.6 million that relates to finance leases. Finance charges of R4.3 million are repayable in year 1 and R1.3million in years 2 – 5, respectively.

Repayable Repayable Repayable
within 1 year 2 – 5 yearsafter 5years Total
Rm Rm Rm Rm
December 2012FFiinnaanncciiaall lliiaabbiilliittiieessNon-current and current liabilities – interest-bearing 631.9 674.9 76.6 1,383.4Medium-term payable 113.1 - - 113.1Medium-term bank loans 478.4 615.9 76.6 1,170.9Capitalised finance lease 40.4 59.0 - 99.4Non-current liabilities – interest-free - - 3.0 3.0Loans to non-controlling interests - - 3.0 3.0Non-current and current provisions and other 352.6 64.6 - 417.2Trade and other payables 14,691.8 - - 14,691.8Trade payables 12,601.3 - - 12,601.3FEC liability 10.5 - - 10.5Sundry payables and other accruals 2,080.0 - - 2,080.0
Bank overdrafts 392.1 - - 392.1Total undiscounted cash flows of the Group’sfinancial liabilities 16,068.4 739.5 79.6 16,887.5
Less: Future finance charges (150.4)*
Total financial liabilities 16,737.1
* Included in future finance charges is R10.8 million that relates to finance leases. Finance charges of R7.0 million are repayable in year 1 and R3.8million in years 2 – 5, respectively.
The average duration of the FEC’s are three months and so they would fall in the repayable within one year for both periods under review.
Credit risk managementThe carrying amount of the financial assets represents the Group’s maximum exposure to credit risk without taking into consideration any collateralprovided.
Financial assets High exposureMedium
exposureLow
exposureCredit risk analysed: Rm Rm Rm Rm
December 2013NNoonn--ccuurrrreenntt aasssseettssInvestments 231.9 - 2.1 229.8Investment in a trading and logistics structure 117.4 - - 117.4Investment in insurance cell-captive onextended warranties 44.4 - - 44.4Investment in insurance cell-captive onpremium contributions 55.9 - - 55.9Trencor export partnership 2.1 - 2.1 -Available for sale listed investments 12.1 - - 12.1Other financial assets 290.9 - - 290.9Housing and staff loans 0.3 - - 0.3Employee share trust loans 46.7 - - 46.7Finance lease deposit 21.9 - - 21.9Property loan 215.0 - - 215.0Third party loan 6.8 - - 6.8Other loans 0.2 - - 0.2
CCuurrrreenntt aasssseettssTrade and other receivables 3,518.4 - - 3,518.4Trade receivables 1,822.8 - - 1,822.8Other accounts receivable 1,669.1 - - 1,669.1FEC asset 26.5 - - 26.5
Cash and bank balances 2,196.1 - - 2,196.1
Total financial assets 6,237.3 - 2.1 6,235.2

Financial assets High exposureMedium
exposureLow
exposureCredit risk analysed: Rm Rm Rm Rm
December 2012NNoonn--ccuurrrreenntt aasssseettssInvestments 258.8 - 2.5 256.3Bare dominium revaluation 110.0 - - 110.0Investment in a trading and logistics structure 104.0 - - 104.0Investment in insurance cell-captive onextended warranties - - - -Investment in insurance cell-captive onpremium contributions 34.8 - - 34.8Trencor export partnership 2.5 - 2.5 -Other unlisted investments 0.1 - - 0.1Other listed investments 7.4 - - 7.4Other financial assets 126.5 - - 126.5Housing and staff loans 0.4 - - 0.4Employee share trust loans 70.6 - - 70.6Finance lease deposit 33.0 - - 33.0Third party loan 20.2 - - 20.2Other loans 2.3 - - 2.3
CCuurrrreenntt aasssseettssTrade and other receivables 3,487.0 - - 3,487.0Trade receivables 1,692.9 - - 1,692.9Other accounts receivable 1,785.6 - - 1,785.6FEC asset 8.5 - - 8.5
Cash and bank balances 2,032.0 - - 2,032.0
Total financial assets 5,904.3 - 2.5 5,901.8
Potential areas of credit risk include trade and consumer accounts receivable and short-term cash investments. Credit risk arises from the risk thata counterparty may default or not meet its obligations timeously. Trade accounts receivable consist primarily of a large, widespread customer base.Group companies regularly monitor the financial position of their customers. Where considered appropriate, credit guarantee insurance is used. Thegranting of credit is controlled by application and account limits. Provision is made for both specific and general portfolio impairments, and at theyear-end management did not consider there to be any material credit risk exposure that was not already covered by credit guarantee insurance orportfolio impairment provisions. Additional information relating to trade and other receivables can be found in note 19.

NOTES TO THE ANNUAL GROUP FINANCIAL STATEMENTS 35-44FOR THE YEAR ENDED 29 DECEMBER 2013
40. SEGMENTAL REPORTING
Operating segments
The Group is organised into four divisions for operational and management purposes, being Massdiscounters, Masswarehouse, Massbuild and Masscash. Massmart reports its
operating segment information on this basis. The principal offering for each division is as follows:
Total Corporate Massdiscounters Masswarehouse Massbuild Masscash
Rm Rm Rm Rm Rm Rm
For the 53 week year ended December 2013
Sales 72,263.4 - 16,740.6 19,675.1 9,583.6 26,264.1
Operating profit before interest and taxation 2,152.5 (37.9) 449.0 988.1 505.3 248.0
Trading profit before interest and taxation 2,145.4 - 366.6 990.2 507.6 281.0
Net finance (costs)/income (255.1) (349.6) 34.0 38.5 29.2 (7.2)
Operating profit before taxation 1,897.4 (387.5) 483.0 1,026.6 534.5 240.8
Trading profit before taxation 2,239.9 - 400.6 1,028.7 536.8 273.8
Inventory 10,115.5 12.6 3,647.3 2,618.2 1,597.0 2,240.4
Total assets 26,147.9 (2,614.7) 7,718.3 7,166.8 5,212.0 8,665.5
Total liabilities 20,778.3 (6,027.7) 7,522.2 6,587.8 4,857.4 7,838.6
Net capital expenditure 2,061.4 759.0 489.7 344.8 275.1 192.8
Depreciation and amortisation 731.1 33.9 256.4 145.4 121.2 174.2
Impairment losses 41.6 - - 2.1 - 39.5
Non-cash items other than depreciation and impairment 138.0 458.0 23.3 (352.2) 13.6 (4.7)
Cash flow from operating activities 1,914.5 399.4 990.1 273.9 356.9 (105.8)
Cash flow from investing activities (2,306.3) (1,424.0) (490.6) (385.2) (275.2) 268.7
Cash flow from financing activities 293.0 819.4 (621.6) 209.3 1.4 (115.5)
Inventory days 63.7 - 109.3 59.2 92.3 35.2
Number of stores 376 - 143 19 92 122
Trading area (m ) 1,481,308 - 475,331 195,794 410,546 399,637
Trading area (m ) increase on December 20124.8% - 7.7% 9.3% 3.7% 0.6%
Average trading area per store (m ) 3,940 - 3,324 10,305 4,462 3,276
Distribution centre space (m ) 323,813 - 178,488 51,300 61,733 32,292
Distribution centre space (m ) increase on December 2012 11.4% - - - 108.4% 3.2%
Number of full-time equivalents 37,554 403 12,870 4,929 8,882 10,470
Number of full-time equivalents increase on December
2012 4.2% 28.3% -6.5% 27.9% 9.9% 4.3%
Sales for December 2013 Trading profit before tax for December 2013
2
2
2
2
2

Total Corporate Massdiscounters Masswarehouse Massbuild Masscash
Rm Rm Rm Rm Rm Rm
For the 26 week year ended December 2012
Sales 36,122.6 - 8,422.1 9,630.2 4,663.1 13,407.2
Operating profit before interest and taxation 1,125.1 (214.9) 352.5 516.4 269.1 202.0
Trading profit before interest and taxation 1,427.1 - 426.5 518.1 271.0 211.5
Net finance (costs)/income (60.4) (131.8) 23.1 17.0 21.6 9.7
Operating profit before taxation 1,064.7 (346.7) 375.6 533.4 290.7 211.7
Trading profit before taxation 1,498.5 - 449.6 535.1 292.6 221.2
Inventory 9,691.5 31.2 3,406.2 2,376.9 1,321.6 2,555.6
Total assets 23,019.8 (3,462.5) 7,667.1 6,136.0 4,594.9 8,084.3
Total liabilities 18,104.5 (7,176.7) 7,492.7 6,299.1 4,236.5 7,252.9
Net capital expenditure 741.6 22.4 261.8 265.9 73.8 117.7
Depreciation and amortisation 342.6 9.4 128.1 62.0 61.6 81.5
Impairment losses 5.4 - - - - 5.4
Non-cash items other than depreciation and impairment 234.4 190.9 34.5 22.6 12.1 (25.7)
Cash flow from operating activities 2,071.0 1,545.9 37.2 100.9 102.4 284.6
Cash flow from investing activities (761.2) 54.9 (261.6) (253.2) (73.7) (227.6)
Cash flow from financing activities (367.8) (1,087.6) 388.0 249.1 (11.8) 94.5
Inventory days 59.9 - 99.7 53.6 73.7 38.8
Number of stores 357 - 133 18 85 121
Trading area (m ) 1,413,573 - 441,382 179,202 395,871 397,118
Trading area (m ) increase on June 2012 (excluding
re-measurements) 4.7% - 5.8% 17.0% 0.5% 3.3%
Average trading area per store (m ) 3,960 - 3,319 9,956 4,657 3,229
Distribution centre space (m ) 290,704 - 178,488 51,300 29,624 31,292
Distribution centre space (m ) increase on June 2012 11.1% - 5.6% 32.2% - 29.3%
Number of full-time equivalents 36,053 314 13,767 3,854 8,083 10,035
Number of full-time equivalents increase on June 2012 11.1% 0.3% 38.1% 9.5% 9.4% -10.8%
Sales for December 2012 Trading profit before tax for December 2012
The corporate column includes certain consolidation entries.
All intercompany transactions have been eliminated in the above results.
Additional information can be found in ‘Our Customers’ and the ‘Group Financial Director’s Review’.
Trading profit before taxation is earnings before corporate net interest, asset impairments, BEE transaction IFRS 2 charges, foreign exchange movements, loss on disposal of business,
and assets classified as held for sale.
Net capital expenditure is defined as capital expenditure less disposal proceeds.
Geographic segments
The Group’s four divisions operate in two principal geographical areas – South Africa and the rest of Africa.
Total South Africa Rest of Africa Total South Africa Rest of Africa
December 2013 December 2013 December 2013 December 2012 December 2012 December 2012
53 weeks 53 weeks 53 weeks 26 weeks 26 weeks 26 weeks
Rm Rm Rm Rm Rm Rm
Sales 72,263.4 66,676.1 5,587.3 36,122.6 33,503.5 2,619.1
Segment assets 19,238.5 18,320.0 918.5 16,719.2 16,218.3 500.9
Net capital expenditure 2,061.4 1,891.9 169.5 741.6 700.6 41.0
All intercompany transactions have been eliminated in the above results.
Segment assets excludes financial instruments and deferred taxation and reflects the geographic location of the Group’s physical current and non-current assets.
Net capital expenditure is defined as capital expenditure less disposal proceeds.
2
2
2
2
2

NOTES TO THE ANNUAL GROUP FINANCIAL STATEMENTS 35-44FOR THE YEAR ENDED 29 DECEMBER 2013
41. VALUE ADDED STATEMENT
December 2013 December 201253 weeks 26 weeks
Rm % Rm %
Sales, royalties, franchise fees, rentals and management and adminisitration fees (inclusive of VAT) 82,650.9 42,447.9Cost of sales (58,926.4) (29,523.2)Interest and investment income 40.7 73.3Net costs of services and other operating expenses (5,279.3) (2,707.0)Value added 18,485.9 10,291.0AApppplliieedd aass ffoolllloowwss ::To employees as salaries, wages and other benefits 5,423.5 29.4 2,536.6 24.6To Government as taxation 10,705.3 57.9 6,583.5 64.0To shareholders as dividends 913.4 4.9 317.0 3.1To lenders as interest 283.8 1.5 106.0 1.0Depreciation and amortisation 731.1 4.0 342.6 3.3Non-controlling interests 59.1 0.3 29.2 0.3Net earnings retained 369.7 2.0 376.1 3.7Total 18,485.9 100.0 10,291.0 100.0
NOTES TO THE ANNUAL GROUP FINANCIAL STATEMENTS 35-44FOR THE YEAR ENDED 29 DECEMBER 2013
42. CRITICAL ACCOUNTING JUDGEMENTS AND KEY SOURCES OF ESTIMATION UNCERTAINTY
Critical judgements in applying the Group’s accounting policiesIn the process of applying the Group’s accounting policies, which are described in note 1, management has not made any critical judgements that have a significant effect on theamounts recognised in the financial statements, except for:
Classification of leases as financing or operating in natureThe Group enters into commercial property leases for the majority of its stores. Where management has determined, based on an evaluation of the terms and conditions, that the lessorretains all significant risks and rewards of these properties, it will account for the contracts as operating leases.
Key sources of estimation uncertainty
Property, plant and equipmentProperty, plant and equipment is depreciated over its useful life taking into account, where appropriate, residual values. Assessment of useful lives and residual values are performedannually, taking into account factors such as technological innovation, maintenance programmes, market information and management considerations. In assessing the residual values,the remaining life of the asset, its projected disposal value and future market conditions are taken into account. Detail on property, plant and equipment can be found in note 12.
Goodwill impairmentDetermining whether goodwill is impaired requires an estimation of the value in use of the cash-generating units to which goodwill has been allocated. The value in use calculationrequires the Group to estimate the future cash flows expected to arise from the cash-generating unit and a suitable discount rate in order to calculate present value. The carrying amountof goodwill at the reporting date was R2,532.0 million (December 2012: R2,557.7 million). The impairment of goodwill in the current and prior years relates to the impairment of certainacquired goodwill in Masscash. Details of the impairment loss calculation can be found in note 13.
Inventory provisionsInventory provisions include shrinkage, obsolescence and write-downs which take into account historical information related to sales trends and stock counts and represent the expectedwrite-down between the estimated net realisable value and the original cost. Net realisable value represents the estimated selling price less all estimated costs of completion and coststo be incurred in marketing, selling and distribution. Details on the provisions can be found in note 18.
Allowance for doubtful debtsThe Group assesses it doubtful debt allowance at each reporting date. Key assumptions applied are the estimated debt recovery rates and the future market conditions that could affectrecovery. Details of the allowance can be found in note 19.
Fair value of equity awards grantedThe fair value of shares and options granted in terms of IFRS 2 Share-based Payment is obtained using Lattice and Binomial pricing models. Assumptions include expected volatility,expected life, risk-free rate and expected dividend yield. By obtaining an external valuation by accredited valuators and through consultation with various financial institutions,management is of the opinion that the risk relating to estimation uncertainty has been mitigated. Details of the valuations can be found in note 28.
Provision for post-retirement medical aidPost-retirement healthcare benefits are provided to certain retired employees. Actuarial valuations are performed to assess the financial position of the fund. Assumptions used includethe discount rate, healthcare cost inflation, mortality rates, withdrawal rates and membership. By obtaining an external valuation by accredited valuators, management is of the opinionthat the risk relating to estimation uncertainty has been mitigated. Details can be found in note 24 and note 26.
Deferred tax assetsDeferred tax assets are raised to the extent that it is probable that future taxable profit will be available against which the unused tax losses and unused tax credits can be utilised.Assessment of future taxable profit is performed at every reporting date, in the form of future cash flows using a suitable growth rate. Additional information can be found in note 17.
Fair value measurement of financial instrumentsWhen the fair values of financial assets and financial liabilities recorded in the statement of financial position cannot be measured based on quoted prices in active markets, their fairvalue is measured using valuation techniques including the discounted cash flow model. The inputs to these models are taken from observable markets where possible, but where this isnot feasible, a degree of judgement is required in establishing fair values. Judgements include considerations of inputs such as liquidity risk, credit risk and volatility. Changes inassumptions about these factors could affect the reported fair value of financial instruments. Details of fair value measurements can be found in note 38.Contingent consideration, resulting from business combinations, is valued at fair value at the acquisition date as part of the business combination. When the contingent considerationmeets the definition of a financial liability, it is subsequently re-measured to fair value at each reporting date. The determination of the fair value is based on discounted cash flows. Thekey assumptions take into consideration are the probability of meeting each performance target and the discount factor. Details of fair value measurements can be found in note 26.

NOTES TO THE ANNUAL GROUP FINANCIAL STATEMENTS 35-44FOR THE YEAR ENDED 29 DECEMBER 2013
43. EVENTS AFTER THE REPORTING DATE
The Group’s non-Executive Chairman, Mark Lamberti, has been appointed CEO of the Imperial Group, from 1 March 2014. As a consequence, he has chosen to relinquish his directorshipsof other public companies and has resigned as Chairman of Massmart. Kuseni Dlamini has been appointed the new Chairman of Massmart, with effect from 10 April 2014. Additionalinformation can be found in ‘Our Business’.Grant Pattison has resigned as Chief Executive Officer of the Group with effect from 1 June 2014. Guy Hayward has been appointed tosucceed Grant. The careers of both Grant and Guy, including their combined 28 years of service to the Group are set out in more detail in ‘Our Business’.

NOTES TO THE ANNUAL GROUP FINANCIAL STATEMENTS 35-44FOR THE YEAR ENDED 29 DECEMBER 2013
44. SHAREHOLDER ANALYSIS
The following analysis of shareholders was extracted from the shareholders register as at December 2013:
Number % Number of shares %
Shareholder spread1 – 1,000 shares 4,621 85.4 1,000,369 0.5
1,001 – 10,000 shares 573 10.6 1,733,761 0.8
10,001 – 100,000 shares 148 2.7 4,331,919 2.0
100,001 – 1,000,000 shares 50 0.9 15,703,936 7.2
1,000,001 shares and over 22 0.4 194,339,059 89.5
5,414 100.0 217,109,044 100.0
Distribution of shareholdersWalmart subsidiary: Main Street 830 (Pty) Ltd 1 - 113,859,293 52.4
Unit Trusts/Mutual Funds 92 1.7 54,626,317 25.2
Pension Funds 77 1.4 23,528,450 10.8
Other Managed Funds 40 0.7 8,506,160 3.9
Sovereign Wealth 19 0.4 6,628,600 3.1
Private Investors 14 0.3 2,448,736 1.1
Custodians 13 0.2 2,993,748 1.4
Charities 8 0.1 1,213,864 0.6
Insurance Companies 5 0.1 833,643 0.4
Exchange-Traded Fund Total 1 - 253,586 0.1
BEE 1 - 115,477 0.1
Investment Trusts 2 - 98,780 -
Local Authorities 2 - 64,238 -
American Depositary Receipt 1 - 39,169 -
University 1 - 37,594 -
Remainder 5,137 95.1 1,861,389 0.9
5,414 100.0 217,109,044 100.0
Public/non-public shareholdersNNoonn--ppuubblliicc sshhaarreehhoollddeerrss::
Walmart subsidiary: Main Street 830 (Pty) Ltd 1 - 113,859,293 52.4
Directors and Group Executives of the Company 4 0.1 838,967 0.4
Share trusts 1 - 86,221 -
PPuubblliicc sshhaarreehhoollddeerrss 5,408 99.9 102,324,563 47.2
5,414 100.0 217,109,044 100.0
Custodians and managers holding 3% or moreTThhee ffoolllloowwiinngg ccuussttooddiiaannss aanndd mmaannaaggeerrss hheelldd bbeenneeffiicciiaallllyy,, ddiirreeccttllyy oorr iinnddiirreeccttllyy,, mmoorree
tthhaann 33%% ooff tthhee CCoommppaannyy’’ss sshhaarreess::
Aberdeen Asset Management Group 37,953,752 17.5
Public Investment Corporation 12,332,411 5.7
J.P. Morgan Asset Management 8,736,981 4.0

COMPANY INCOME STATEMENTFOR THE YEAR ENDED 29 DECEMBER 2013
December 2013 December 2012
53 weeks 26 weeks
Notes Rm Rm
Revenue 1 1,707.3 483.0
Management and administration fees received 20.7 8.2
Dividends received 1,686.6 474.8
Employment costs (22.3) (10.1)
Other income 16.0 11.3
Other operating costs (4.7) (1.6)
Operating profit 2 1,696.3 482.6
Finance income 2.1 1.5
Finance costs (1.0) (1.6)
Net finance income/(costs) 3 1.1 (0.1)
Profit before taxation 1,697.4 482.5
Taxation 4 (4.7) (0.5)
Profit for the year 1,692.7 482.0
Profit attributable to:
Owners of the company 1,692.7 482.0
Profit for the year 1,692.7 482.0
With the exception of the accounting policies relevant to the basis of consolidation, the accounting policies are in line with the Massmart Group accounting policies. Refer to note 1 in the
Group Financial Statements. The accounting policy of the Company is to hold investments in subsidiaries at cost.

COMPANY STATEMENT OF COMPREHENSIVE INCOMEFOR THE YEAR ENDED 29 DECEMBER 2013
December 2013 December 2012Notes Rm Rm
Profit for the year 1,692.7 482.0
Items that will not be re-classified subsequently to the income statement - -
Items that will be re-classified subsequently to the income statementRevaluation of listed investments (note 6) 6 - 0.1
Less Income tax relating to the revaluation of listed shares - -
Other comprehensive income for the year, net of tax - 0.1
Total comprehensive income for the year 1,692.7 482.1
TToottaall ccoommpprreehheennssiivvee iinnccoommee aattttrriibbuuttaabbllee ttoo::
Owners of the company 1,692.7 482.1
Total comprehensive income for the year 1,692.7 482.1

COMPANY STATEMENT OF FINANCIAL POSITIONFOR THE YEAR ENDED 29 DECEMBER 2013
December 2013 December 2012Notes Rm Rm
Assets
Non-current assets 1,207.0 475.7
Investment in subsidiaries 5 1,167.9 469.9
Other financial assets 6 37.2 5.8
Deferred taxation 7 1.9 -
Current assets 1,629.6 1,596.1
Trade and other receivables 11.0 11.0
Amounts owing by subsidiaries 5 1,611.2 1,577.5
Cash and cash equivalents 7.4 7.6
Total assets 2,836.6 2,071.8
Equity and liabilities
Capital and reserves 2,206.3 1,552.6
Share capital 8 2.2 2.2
Share premium 8 743.3 752.1
General reserves 9 17.5 12.5
Retained profit 1,443.3 785.8
Preference shares 8 - 0.1
Total equity 2,206.3 1,552.7
Non-current liabilities - 0.2
Deferred taxation 7 - 0.2
Current liabilities 630.3 518.9
Trade and other payables 18.4 17.4
Taxation 7.1 0.9
Amounts owing to subsidiaries 5 604.8 500.6
Total equity and liabilities 2,836.6 2,071.8
With the exception of the accounting policies relevant to the basis of consolidation, the accounting policies are in line with the Massmart Group accounting policies. Refer to note 1 in the
Group Financial Statements. The accounting policy of the Company is to hold investments in subsidiaries at cost.

COMPANY STATEMENT OF CASH FLOWSFOR THE YEAR ENDED 29 DECEMBER 2013
December 2013 December 201253 weeks 26 weeks
Notes Rm Rm
Cash flow from operating activitiesCash inflow from trading 11.1 2.8 11.8
Working capital movements 11.2 1.0 (15.7)
Cash generated from operations 3.8 (3.9)
Finance costs 3 (1.0) (1.6)
Finance income 3 2.1 1.5
Dividends received 1,686.6 474.8
Taxation paid 11.3 (0.6) (0.1)
Dividends paid 11.4 (913.4) (330.3)
Net cash inflow from operating activities 777.5 140.4
Cash flow from investing activitiesInvestment in subsidiaries (575.0) -
Loans to subsidiaries (30.7) 6.1
Loans from subsidiaries (18.8) (73.6)
Other investing activities 11.5 (31.4) (0.5)
Net cash outflow from investing activities (655.9) (68.0)
Cash flow from financing activitiesNet acquisition of treasury shares 11.6 (121.8) (72.6)
Net cash outflow from financing activities (121.8) (72.6)
Net decrease in cash and cash equivalents (0.2) (0.2)
Cash and cash equivalents at the beginning of the year 7.6 7.8
Cash and cash equivalents at the end of the year 7.4 7.6
With the exception of the accounting policies relevant to the basis of consolidation, the accounting policies are in line with the Massmart Group accounting policies. The accounting
policy of the Company is to hold investments in subsidiaries at cost. Refer to note 1 in the Group Financial Statements.

COMPANY STATEMENT OF CHANGES IN EQUITY
Share
capital
Share
premium
Preference
shares
Other
reserves
Retained
profit Total
Rm Rm Rm Rm Rm Rm
Balance as at June 2012 2.2 750.6 0.1 8.5 706.7 1,468.1
Total comprehensive income - - - 0.1 482.0 482.1
Profit for the period - - - - 482.0 482.0
Other comprehensive income for the period - - - 0.1 - 0.1
Share trust loss - - - - (72.6) (72.6)
Dividends paid - - - - (330.3) (330.3)
Treasury shares (note 8 and note 9) - 1.5 - 0.3 - 1.8
Share-based payment reserve (note 9) - - - 3.6 - 3.6
Balance as at December 2012 2.2 752.1 0.1 12.5 785.8 1,552.7
Total comprehensive income - - - - 1,692.7 1,692.7
Profit for the period - - - - 1,692.7 1,692.7
Other comprehensive income for the period - - - - - -
Share trust loss - - - - (121.8) (121.8)
Dividends paid - - - - (913.4) (913.4)
Treasury shares (note 8 and note 9) - (8.8) - (2.2) - (11.0)
Shares redeemed in accordance with the provisions of the Memorandum of
Incorporation (note 8) - - (0.1) - - (0.1)
Share-based payment reserve (note 9) - - - 7.2 - 7.2
Balance as at December 2013 2.2 743.3 - 17.5 1,443.3 2,206.3
December
2013
December
2012
Dividend per share (cents)
- Interim 146.0 -
- Final 275.0 275.0
Total 421.0 275.0
Declared after the financial year-end.
Details of the dividend can be found in note 10 in the Group Financial Statements.
With the exception of the accounting policies relevant to the basis of consolidation, the accounting policies are in line with the Massmart Group accounting policies. Refer to note
1 in the Group Financial Statements. The accounting policy of the Company is to hold investments in subsidiaries at cost.
1
1

NOTES TO THE ANNUAL COMPANY FINANCIAL STATEMENTS 1-10FOR THE YEAR ENDED 29 DECEMBER 2013
1. REVENUE
December 2013 December 201253 weeks 26 weeks
Rm Rm
Dividends received (included are dividends from subsidiary companies) 1,686.6 474.8Management and administration fees received (included are management and administration fees from subsidiary companies) 20.7 8.2
1,707.3 483.0

NOTES TO THE ANNUAL COMPANY FINANCIAL STATEMENTS 1-10FOR THE YEAR ENDED 29 DECEMBER 2013
2. OPERATING PROFIT
December 2013 December 2012
53 weeks 26 weeks
Rm Rm
Other income includes:
Foreign exchange profit 1.4 0.3
Ongoing cellular income 14.6 11.0
Other operating costs includes:
Share-based payment expense 7.2 3.6
Contribution to pension scheme 1.2 0.4

NOTES TO THE ANNUAL COMPANY FINANCIAL STATEMENTS 1-10FOR THE YEAR ENDED 29 DECEMBER 2013
3. NET FINANCE INCOME/(COSTS)
December 2013 December 201253 weeks 26 weeks
Rm Rm
Finance costsInterest on Group loans (1.0) (1.6)
Finance incomeInterest on Group loans 2.1 1.1Interest from Receiver of Revenue - 0.4
2.1 1.5
Net finance income/(costs) 1.1 (0.1)

NOTES TO THE ANNUAL COMPANY FINANCIAL STATEMENTS 1-10FOR THE YEAR ENDED 29 DECEMBER 2013
4. TAXATION
December 2013 December 201253 weeks 26 weeks
Rm Rm
Current yearSSoouutthh AAffrriiccaann nnoorrmmaall ttaaxxaattiioonn Current taxation 6.5 0.2 Deferred taxation (2.1) 0.1
Withholding taxation 0.3 0.2
Total 4.7 0.5
The withholdings tax relates to interest and dividends on foreign controlled entities.
December 2013 December 2012
The rate of taxation is reconciled as follows: % %
Standard corporate taxation rate 28.0 28.0Exempt income (27.8) (28.2)Disallowable expenditure 0.1 0.2Withholding taxation - 0.1
Effective rate 0.3 0.1
1
1

NOTES TO THE ANNUAL COMPANY FINANCIAL STATEMENTS 1-10FOR THE YEAR ENDED 29 DECEMBER 2013
5. INTEREST IN SUBSIDIARIES
December 2013 December 2012Rm Rm
Interest in subsidiariesMasscash Holdings (Proprietary) Limited 82.2 82.2
Massbuild (Proprietary) Limited 296.2 296.2
Tiradeprops 60 (Proprietary) Limited 5.0 5.0
Tiradeprops 66 (Propretary) Limited 5.0 5.0
Game Discount World (Mauritius) Limited 0.1 0.1
Massmart International Holdings Limited 81.4 81.4
Capensis Investments 241 (Proprietary) Limited 698.0 -
1,167.9 469.9
Details of net shares at cost can be found in note 36 in the Group Financial Statements.
December 2013 December 2012Rm Rm
Amounts owing by subsidiariesMasscash Holdings (Proprietary) Limited 83.2 83.2
Massmart Management and Finance Company (Proprietary) Limited 145.3 -
Massbuild (Proprietary) Limited 1,176.2 1,255.8
Massmart Holdings Executive Share Trust - 38.3
Mystic Blue Trading 62 (Proprietary) Limited 200.0 200.0
Massmart Trust - 0.2
Imagegate Limited 6.5 -
1,611.2 1,577.5
The loan to Massmart Management and Finance Company (Proprietary) Limited bears interest at a variable rate linked to the prime overdraft rate, and has no fixed terms of repayment.
The rest of the loans are unsecured, interest free and have no fixed terms of repayment.
December 2013 December 2012Rm Rm
Amounts owing to subsidiariesMassmart Management and Finance Company (Proprietary) Limited - (48.4)
Masstores (Proprietary) Limited (589.2) (437.6)
Tiradeprops 60 (Proprietary) Limited (5.9) (5.9)
Tiradeprops 66 (Propretary) Limited (5.9) (5.9)
Game Discount World (Mauritius) Limited (0.1) (0.1)
The Drop Inn Group of Liquor Supermarkets (Proprietary) Limited (2.7) (2.7)
Capensis Investments 241 (Pty) Ltd (1.0) -
(604.8) (500.6)
These loans are unsecured, interest free and have no fixed terms of repayment.

NOTES TO THE ANNUAL COMPANY FINANCIAL STATEMENTS 1-10FOR THE YEAR ENDED 29 DECEMBER 2013
6. OTHER FINANCIAL ASSETS
December 2013 December 2012Rm Rm
Employee share trust loansBalance at the beginning of the year 38.3 -Advanced during the year 0.8 -Repayments (2.6) -Balance at the end of the year 36.5 -
Unlisted investmentsInvestment in Imagegate Limited (UK) - 4.9Investment in Massmart Black Scarce Skills Trust and Massmart Thuthukani Empowerment Trust - 0.2
- 5.1
Listed investmentsInvestment in listed shares 0.7 0.7
0.7 0.7
37.2 5.8
The amount owing by the ‘Massmart Holdings Executive Share Trust’ has been reclassified to ‘other financial assets’ in the current financial year, due to a detailed assessment of theunderlying circumstances relating to repayment. The loans to the employee share trust particpants, including executive directors, attract interest of zero percent and are secured by theunderlying ordinary shares in Massmart Holdings Limited. The loans are repayable 10 years after the grant date. Recourse is not limited to these shares and should shares sold to repaythese loans be insufficient to recover the balance outstanding, the unrecovered portion remains a debt due and payable. 664,795 (December 2012:664,795) shares with a market value ofR90,139,554 (December 2012: R126,404,121) have been pledged.On 1 October 2012, the final conversion for the beneficiaries took place, as a result the investment was written-off to the income statement in the current financial year.
For IAS 39 Financial Instruments: Recognition and Measurement accounting treatment of these financial assets. Additional information can be found in note 39 of the Group financialstatements.
1
2
1
2

NOTES TO THE ANNUAL COMPANY FINANCIAL STATEMENTS 1-10FOR THE YEAR ENDED 29 DECEMBER 2013
7. DEFERRED TAXATION
December 2013 December 2012Rm Rm
The major movements during the year are analysed as follows:Liability at the beginning of the year (0.2) (0.1)
Charge to profit or loss for the year 2.1 (0.1)
Asset/(Liability) at the end of the year 1.9 (0.2)
The major components of deferred taxation are analysed as follows:Other temporary differences 1.9 (0.2)
1.9 (0.2)
Included in this amount is deferred tax on short-term provisions.
1
1

NOTES TO THE ANNUAL COMPANY FINANCIAL STATEMENTS 1-8FOR THE YEAR ENDED 29 DECEMBER 2013
8. ISSUED CAPITAL
Share capital Share premiumDecember
2013 December 2012December
2013December
2012Rm Rm Rm Rm
Authorised500,000,000 (December 2012: 500,000,000) ordinary shares of 1 cent each 5.0 5.0 - -20,000,000 (December 2012: 20,000,000) non-redeemable cumulative non-participating preference shares of 1cent each 0.2 0.2 - -18,000,000 (December 2012: 18,000,000) ‘A’ convertible redeemable non-cumulative participating preferenceshares of 1 cent each 0.2 0.2 - -4,000,000 (December 2012: 4,000,000) ‘B’ convertible redeemable non-cumulative participating preference sharesof 1 cent each
- - - -
Issued217,109,044 (December 2012: 216,910,195) ordinary shares of 1 cent each 2.2 2.2 743.3 752.1Nil (December 2012: 9,395,053) ‘A’ convertible redeemable non-cumulative participating preference shares of 1cent each - 0.1 - -2,867,773 (December 2012: 3,066,622) ‘B’ convertible redeemable non-cumulative participating preference sharesof 1 cent each
- - - -
Number of Share capitalShare
premiumshares Rm Rm
Ordinary sharesBalance at June 2012 216,124,461 2.2 750.6Shares issued in terms of the Massmart Thuthukani Empowerment Trust 739,578 - -Shares issued in terms of the Massmart Black Scarce Skills Trust 46,156 - -Ordinary shares issued – December 2012 216,910,195 2.2 750.6Treasury shares (30,510) - 1.5Ordinary shares issued excluding treasury shares – December 2012 216,879,685 2.2 752.1
Balance at December 2012 216,910,195 2.2 752.1Shares issued in terms of the Massmart Black Scarce Skills Trust 198,849 - -Ordinary shares issued – December 2013 217,109,044 2.2 752.1Treasury shares (86,221) - (8.8)Ordinary shares issued excluding treasury shares – December 2013 217,022,823 2.2 743.3
Ordinary shares, which have a par value of 1 cent, carry one vote per share and carry the right to dividends.
‘A’ convertible redeemable non-cumulative participating preference sharesBalance at June 2012 - - -Net shares issued in terms of the Massmart BEE transaction 10,134,631 0.1 -Shares converted to ordinary shares (739,578) - -Balance at December 2012 9,395,053 0.1 -Shares redeemed in accordance with the provisions of the Memorandum of Incorporation (9,395,053) (0.1) -Balance at December 2013 - - -
There are no ‘A’ convertible redeemable non-cumulative participating preference shares in issue as the residual shares were automatically redeemed on the vesting of the MassmartThuthukani Empowerment Trust scheme, in terms of the Trust Deed. On 1 October 2012, the final conversion for the beneficiaries took place. At December 2013, beneficiaries that hadretained their shares in Massmart amounted to 389 shareholders holding 114 933 shares.
‘B’ convertible redeemable non-cumulative participating preference sharesBalance at June 2012 - - -Net shares issued in terms of the Massmart BEE transaction 3,112,778 - -Shares converted to ordinary shares (46,156) - -Balance at December 2012 3,066,622 - -Shares converted to ordinary shares (198,849) - -Balance at December 2013 2,867,773 - -
B’ convertible redeemable non-cumulative participating preference shares, which have a par value of 1 cent, are held in the Massmart Black Scarce Skills Trust. These shares carry onevote per share, which are cast by the trustees, and do not carry the right to dividends. On election of the beneficiary, the shares will convert to ordinary shares on a one-for-one basis andwill rank pari passu with all ordinary shares then in issue.
Share options granted under the Massmart Holdings Limited Employee Share Trust At December 2013, executives and senior employees have options of 9,723,039 (December 2012: 10,457,825) ordinary shares of which 6,649,943 (December 2012: 8,369,052) areunvested.
Share options granted under the employee share incentive scheme carry no rights to dividends and no voting rights. Details of the Employee Share Incentive Scheme can be found in note28 in the Group Financial Statements.
During the current year, the only shares bought in the market by the Massmart Holdings Limited Executive Share Trust where 1.2 million shares (0.6% of average shares in issue) at anaverage price of R186.76 totalling R223.0 million.
During the prior year, the only shares bought in the market were by the Share Trust where 0.7 million shares (0.3% of average shares in issue) were bought at an average price of R174.38totalling R124.5 million.
The directors have the authority, until the next annual general meeting, to issue the ordinary shares of the Company up to a maximum of 5% of the shares already issued.

NOTES TO THE ANNUAL COMPANY FINANCIAL STATEMENTS 1-10FOR THE YEAR ENDED 29 DECEMBER 2013
9. OTHER RESERVES
December 2013 December 2012Rm Rm
Balance at the beginning of the year 12.5 8.5Treasury shares (2.2) 0.3Share-based payment reserve 7.2 3.6Revaluation of listed investments - 0.1Balance at the end of the year 17.5 12.5
Reconciliation of the treasury share reserveBalance at the beginning of the year 2.4 2.1Movement on treasury shares (2.2) 0.3Balance at the end of the year 0.2 2.4
Reconciliation of the share-based payment reserveBalance at the beginning of the year 9.3 5.7Share-based payment expense related to Massmart Holdings Limited Employee Share Trust 7.2 3.6Balance at the end of the year 16.5 9.3
Reconciliation of the listed investments reserveBalance at the beginning of the year 0.8 0.7Revaluation of listed investments to market value - 0.1Balance at the end of the year 0.8 0.8
The Group introduced a new share incentive scheme in the current financial year. The share-based payment reserve arises on the granting of share options, referred to as the EmployeeShare Option Scheme, and share awards, referred to as the Employee Share Award Scheme, to employees under the Employee Share Incentive Schemes of the Group. Details of theEmployee Share Incentive Schemes can be found in note 28 in the Group financial statements. The share-based payment valuation of the Employee Share Option Scheme was performedby Alexander Forbes. The share-based payment valuation of the Employee Share Award Scheme was performed using a valuation system acquired by the Group with the necessarymodel inputs having been determined by management. Management derived these inputs through consultation with various financial institutions, and they are representative of themarket data available for Massmart Holdings Limited’s share at the reporting date.

NOTES TO THE ANNUAL COMPANY FINANCIAL STATEMENTS 1-10FOR THE YEAR ENDED 29 DECEMBER 2013
10. CROSS-SURETYSHIPS AND PROMISSORY NOTES
December 2013 December 2012Rm Rm
Cross-suretyships under banking and other financial facilities 7,403.1 5,903.1
7,403.1 5,903.1
Banking facilities incorporate, amongst others, letters of credit, forward exchange contracts and electronic fund transfers. These facilities have been secured by cross-suretyshipsbetween Group companies.
The Company signed surety over promissory note commitments under a non-cancellable lease agreement of R104.5 million (December 2012: R208.9 million) entered into by Masstores(Pty) Ltd on behalf of certain Makro stores. The final promissory notes of R104.5 million are due for payment on 31 December 2013. Additional information can be found in note 25 of theGroup Financial Statements.
At the balance sheet date the Massmart Group was net cash positive.

NOTES TO THE ANNUAL COMPANY FINANCIAL STATEMENTS 11-16FOR THE YEAR ENDED 29 DECEMBER 2013
11. NOTES TO THE STATEMENT OF CASH FLOWS
December 2013 December 2012
Rm Rm
11.1 Cash inflow from trading
Profit before taxation 1,697.4 482.5
AAddjjuussttmmeenntt ffoorr::
Finance costs 1.0 1.6
Finance income (2.1) (1.5)
Dividends received (1,686.6) (474.8)
Share-based payment expense 7.2 3.6
Other non-cash movements (14.1) 0.4
2.8 11.8
11.2 Working capital movements
Increase/(decrease) in trade and other payables 1.0 (4.7)
Increase in trade and other receivables - (11.0)
1.0 (15.7)
11.3 Taxation paid
Amounts owing at the beginning of the year (0.9) (0.6)
Amounts charged to the income statement (4.7) (0.5)
Deferred taxation (2.1) 0.1
Amounts owing at the end of the year 7.1 0.9
Cash amounts paid (0.6) (0.1)
11.4 Dividends paid
Cash dividends paid to shareholders (913.4) (330.3)
11.5 Other investing activities
Other financial assets (31.4) (0.5)
(31.4) (0.5)
11.6 Net acquisition of treasury shares
Share trust losses (121.8) (72.6)
(121.8) (72.6)

NOTES TO THE ANNUAL COMPANY FINANCIAL STATEMENTS 11-16FOR THE YEAR ENDED 29 DECEMBER 2013
12. RELATED PARTIES
Dividendsreceived
Management Feesreceived
Interestreceived Dividends paid Interest paid
Rm Rm Rm Rm Rm
December 2013Income statement transactions between related parties are as follows
-Massbuild (Proprietary) Limited 337.3 - - - -
-Masscash Holdings (Proprietary) Limited 339.7 - - - -
-Game Discount World (Mozambique) 1.9 - - - -
-Masstores (Proprietary) Limited 897.0 20.7 - - -
-Massmart Management & Finance Company (Proprietary) Limited - - 2.1 - 0.9
-Main Street 830 (Proprietary) Ltd - - - 479.3 -
-The Massmart Thuthukani Empowerment Trust 31.6 - - - -
1,607.5 20.7 2.1 479.3 0.9
December 2012Income statement transactions between related parties are as follows
-Massbuild (Proprietary) Limited 272.4 - - - -
-Masscash Holdings (Proprietary) Limited 200.0 - - - -
-Game Discount World (Mozambique) 1.5 - - - -
-Masstores (Proprietary) Limited - 8.2 - - -
-Massmart Management & Finance Company (Proprietary) Limited - - 1.1 - 1.6
-Massmart Black Scarce Skills Trust 0.9 - - - -
-Main Street 830 (Proprietary) Ltd - - - 166.2 -
-The Massmart Thuthukani Empowerment Trust - - - 14.7 -
474.8 8.2 1.1 180.9 1.6
Additional information can be found in Note 1 for dividends and management fees received in the Company Financial Statements.
Additional information can be found in Note 3 for interest received and paid in the Company Financial Statements.
Additional information can be found in note 5 for loans to and from related parties in the Company Financial Statements.
Additional information can be found in Note 34 and note 35 in the Group Financial Statement in regards to Directors’ emoluments and interest of directors in the Company’s share
scheme.

NOTES TO THE ANNUAL COMPANY FINANCIAL STATEMENTS 9-16FOR THE YEAR ENDED 29 DECEMBER 2013
13. FAIR VALUE
Review of the statement of financial position split into financial instruments and non-financial instruments
The statement of financial position is reviewed in order to identify financial instruments that have a carrying amount that does not equate to their respective fair values. There are no
non-financial instruments carried at fair value in terms of the accounting policy.
TotalNon-financial
instrumentFinancial
instrumentRm Rm Rm
December 2013
Non-current assets 1,207.0 1,169.8 37.2
Investment in subsidiaries 1,167.9 1,167.9 -
Other financial assets 37.2 - 37.2
Deferred taxation 1.9 1.9 -
Current assets 1,629.6 - 1,629.6
Trade and other receivables 11.0 - 11.0
Amounts owing by subsidiaries 1,611.2 - 1,611.2
Cash and cash equivalents 7.4 - 7.4
Total assets 2,836.6 1,169.8 1,666.8
Current liabilities 630.3 16.9 613.4
Trade and other payables 18.4 9.8 8.6
Taxation 7.1 7.1 -
Amounts owing to subsidiaries 604.8 - 604.8
Total liabilities 630.3 16.9 613.4
TotalNon-financial
instrumentFinancial
instrumentRm Rm Rm
December 2012
Non-current assets 475.7 469.9 5.8
Investment in subsidiaries 469.9 469.9 -
Other financial assets 5.8 - 5.8
Current assets 1,596.1 - 1,596.1
Trade and other receivables 11.0 - 11.0
Amounts owing by subsidiaries 1,577.5 - 1,577.5
Cash and cash equivalents 7.6 - 7.6
Total assets 2,071.8 469.9 1,601.9
Non-current liabilities 0.2 0.2 -
Deferred taxation 0.2 0.2 -
Current liabilities 518.9 2.1 516.8
Trade and other payables 17.4 1.2 16.2
Taxation 0.9 0.9 -
Amounts owing to subsidiaries 500.6 - 500.6
Total liabilities 519.1 2.3 516.8

TotalCarryingAmount
Total FairValue Level 1 Level 2 Level 3
FFiinnaanncciiaall iinnssttrruummeennttss iinn tthhee ssttaatteemmeenntt ooff ffiinnaanncciiaall ppoossiittiioonn Rm Rm Rm Rm Rm
December 2013FFiinnaanncciiaall AAsssseettss
Loans and receivables 37.2 28.0 0.7 27.3 -
Employee share trust loans 36.5 27.3 - 27.3 -
Investment in listed shares 0.7 0.7 0.7 - -
37.2 28.0 0.7 27.3 -
There were no transfers between Level 1 and Level 2 fair value measurements during the December 2013 financial year, and no transfers into or out of Level 3.
The financial assests and financial liabilities have been presented based on an analysis of their respective natures, characteristics and risks.
Fair value measurement and valuation techniques
TTyyppee ooff ffiinnaanncciiaall iinnssttrruummeenntt
Fair value at29
December2013
Valuationtechnique
Significantinputs Range 2013
FFiinnaanncciiaall AAsssseettss
Loans and receivables 28.0
Employee share trust loans 27.3 DCF Market interest
rate
4.6%
Investment in listed shares 0.7 Share price Listed share
price
R52.00 to
R162.30
28.0
VVaalluuaattiioonn tteecchhnniiqquuee Description of valuation technique
Discounted cash flow (DCF) The DCF method involves the projection of a series of cash flows. To
this projected cash flow series, an appropriate, market-derived
discount rate is applied to establish the present value of the income
stream associated with the item. Fair value is estimated using explicit
assumptions regarding the benefits and liabilities of ownership over
the asset’s life including an exit or terminal value.
Fair value hierarchyThe fair value hierarchy is used for determining and disclosing the fair value of financial instruments identified above. There is no difference between the fair value and carrying value of
financial assets and liabilities that are not included in the hierarchy. The following valuation techniques apply:
Level 1: quoted (unadjusted) prices in active markets for identical assets or liabilities
Level 2: other techniques for which all inputs that have a significant effect on the recorded fair value are observable, either directly or indirectly
Level 3: techniques that use inputs that have a significant effect on the recorded fair value that are not based on observable market data

NOTES TO THE ANNUAL COMPANY FINANCIAL STATEMENTS 9-16FOR THE YEAR ENDED 29 DECEMBER 2013
14. FINANCIAL INSTRUMENTS
Capital risk management
The Company manages its capital to ensure that it will be able to continue as a going concern while maximising the return to stakeholders through the optimisation of the debt andequity balances.
The capital structure of the Company consists of equity attributable to equity holders of the parent, comprising share capital, share premium, other reserves and retained profit.Additional information can be found in note 7 and note 8 respectively.
The targeted level of gearing is determined after consideration of the following key factors :- the needs of the Company to fund current and future capital expenditure to achieve its stated production growth target; and- the desire of the Company to maintain its gearing within levels considered to be acceptable taking into account potential business opportunities and the position of the Company in thebusiness cycle.The targeted level of gearing was adequately managed in the current financial year.
Categories of financial instruments
Financial assets
FFaaiirr vvaalluuee tthhrroouugghh pprrooffiitt oorr lloossss ((FFVVTTPPLL))These are held at fair value and any adjustments are taken to the income statement. Listed investments are carried at market value by reference to stock exchange quoted selling prices.
LLooaannss aanndd rreecceeiivvaabblleessThese are held at amortised cost less any impairment losses recognised to reflect irrecoverable amounts.
HHeelldd--ttoo--mmaattuurriittyy iinnvveessttmmeennttssThese are held at amortised cost less any impairment losses recognised to reflect irrecoverable amounts.
AAvvaaiillaabbllee--ffoorr--ssaallee iinnvveessttmmeennttssThese are held at fair value and any adjustment to fair value is taken to other comprehensive income.
Financial liabilities
FFaaiirr vvaalluuee tthhrroouugghh pprrooffiitt oorr lloossss ((FFVVTTPPLL))These are held at fair value and any adjustments are taken to the income statement.
LLiiaabbiilliittyy aatt aammoorrttiisseedd ccoossttThese are held as non-trading liabilities and are shown at amortised cost.
Classification of financial instruments
Financial
instrument FVTPL
Liability at
amortised
cost
Loans and
receivables
Held-to-
maturity
investments
Available-
for-sale
financial
instruments
Rm Rm Rm Rm Rm Rm
December 2013
Non-current assets 37.2 - - 36.5 - 0.7Other financial assets 37.2 - - 36.5 - 0.7
Current assets 1,629.6 - - 1,629.6 - -Trade and other receivables 11.0 - - 11.0 - -Amounts owing by subsidiaries 1,611.2 - - 1,611.2 - -Cash and cash equivalents 7.4 - - 7.4 - -
Total assets 1,666.8 - - 1,666.1 - 0.7
Current liabilities 613.4 - 613.4 - - -Trade and other payables 8.6 - 8.6 - - -Amounts owing to subsidiaries 604.8 - 604.8 - - -
Total liabilities 613.4 - 613.4 - - -
Financial
instrument FVTPL
Liability at
amortised
cost
Loans and
receivables
Held-to-
maturity
investments
Available-
for-sale
financial
instruments
Rm Rm Rm Rm Rm Rm
December 2012
Non-current assets 5.8 - - 5.1 - 0.7Other financial assets 5.8 - - 5.1 - 0.7Unlisted investments 5.1 - - 5.1 - -Listed investments 0.7 - - - - 0.7
Current assets 1,596.1 - - 1,596.1 - -Trade and other receivables 11.0 - - 11.0 - -Amounts owing by subsidiaries 1,577.5 - - 1,577.5 - -Cash and cash equivalents 7.6 - - 7.6 - -
Total assets 1,601.9 - - 1,601.2 - 0.7
Current liabilities 516.8 - 516.8 - - -Trade and other payables 16.2 - 16.2 - - -Amounts owing to subsidiaries 500.6 - 500.6 - - -
Total liabilities 516.8 - 516.8 - - -

Financial risk management
The Company does not trade in financial instruments, but in the ordinary course of business operations, the Group is exposed to a variety of financial risks arising from the use offinancial instruments. These risks include:
market risk (comprising interest rate risk and currency risk); liquidity risk; and credit risk.The Company has developed a comprehensive risk management process to facilitate, control and monitor these risks. This process includes formal documentation of policies, includinglimits, controls and reporting structures. The Executive Committee is responsible for risk management activities within the Company.
Market risk management
Market risk is the risk that the fair value or future cash flows of a financial instrument will fluctuate because of changes in market prices. The market risks that the Company is primarilyexposed to include interest rate risk and currency risk. Market risk is managed by identifying and quantifying risks on the basis of current and future expectations and ensuring that alltrading occurs within defined parameters. This involves the review and implementation of methodologies to reduce risk exposure. The reporting on the state of the risk and risk practicesto executive management is part of this process. The processes set up to measure, monitor and mitigate these market risks are described below. There has been no change to theCompany’s exposure to market risk or the manner in which it manages and measures the risk since the prior period.
Interest rate risk management
The Company is exposed to interest rate risk because it borrows and invests surplus funds with Massmart Management and Finance (Proprietary) Limited to fund its operations. Thisinterest rate risk is managed by floating rate borrowings by Massmart Management and Finance (Proprietary) Limited. The Company is exposed to interest rate risk through theseborrowings.
The carrying amount of the Group’s financial assets and liabilities at reporting date that are subject to interest rate risk is as follows :Subject to interest rate
movement
Non-interest
bearing Total
Fixed Floating
Rm Rm Rm Rm
December 2013
Non-current assets - - 37.2 37.2Other financial assets - - 37.2 37.2
Current
assets - 152.7 1,476.9 1,629.6Trade and other receivables - - 11.0 11.0Amounts owing by subsidiaries - 145.3 1,465.9 1,611.2Cash and cash equivalents - 7.4 - 7.4
Total assets - 152.7 1,514.1 1,666.8
Current liabilities - - 613.4 613.4Trade and other payables - - 8.6 8.6Amounts owing to subsidiaries - - 604.8 604.8
Total liabilities - - 613.4 613.4
Subject to interest rate
movement
Non-interest
bearing Total
Fixed Floating
Rm Rm Rm Rm
December 2012
Non-current assets - - 5.8 5.8Other financial assets - - 5.8 5.8Unlisted investments - - 5.1 5.1Listed investments - - 0.7 0.7
Current assets - 7.6 1,588.5 1,596.1Trade and other receivables - - 11.0 11.0Amounts owing by subsidiaries - - 1,577.5 1,577.5Cash and cash equivalents - 7.6 - 7.6
Total assets - 7.6 1,594.3 1,601.9
Current liabilities - 48.4 468.4 516.8Trade and other payables - - 16.2 16.2Amounts owing to subsidiaries - 48.4 452.2 500.6
Total liabilities - 48.4 468.4 516.8
Interest rate sensitivity
The Company is sensitive to the movements in the SA Prime interest rate. The rates of sensitivity represents management’s assessment of the possible change in interest rates. Theaverage interest rate for the Company for the year was 6.00% (December 2012: 5.86%), and the variable interest paid was R1.0 million (December 2012: R1.6 million). If the SA Primeinterest rate increased and decreased by 150 average basis points (December 2012: increased and decreased by 50 average basis points) at year-end, the income for the year would havedecreased and increased by R0.3 million respectively (December 2012: decreased and increased by less than R1.0 million respectively).

Currency risk management
All foreign-denominated trading liabilities are covered by forward exchange contracts. Foreign-denominated assets are not covered by forward exchange contracts.The carrying amount of the Group’s foreign currency denominated monetary assets at reporting date is as follows :
South
African
Rand Euro GBP Total
Rm Rm Rm Rm
December 2013
LLooaannss aanndd rreecceeiivvaabblleessOther financial assets 37.2 - - 37.2Trade receivables 11.0 - - 11.0Amounts owing by subsidiaries 1,604.7 - 6.5 1,611.2Cash and cash equivalents 7.4 - - 7.4
1,660.3 - 6.5 1,666.8
December 2012
LLooaannss aanndd rreecceeiivvaabblleessOther financial assets 0.9 - 4.9 5.8Trade receivables 11.0 - - 11.0Amounts owing to subsidiaries 1,577.3 0.2 - 1,577.5Cash and cash equivalents 7.6 - - 7.6
1,596.8 0.2 4.9 1,601.9
Foreign currency sensitivity
The Company is exposed to the movements in the British pound. The rates of sensitivity represents management’s assessment of the possible change in currency rates. If the BritishPound currency rate increased and decreased by 10% (December 2012: increased and decreased by 5%) at year-end, the income for the year would have decreased and increased by lessthan R0.1 million respectively (December 2012: decreased and increased by less than R1.0 million respectively).
Liquidity risk management
Liquidity risk is the risk that the Company will be unable to meet a financial commitment in any location or currency. This risk is minimised through the holding of cash balances andsufficient available borrowing facilities. In addition, detailed cash flow forecasts are regularly prepared and reviewed so that the cash needs of the Company are managed according to itsrequirements.
The following table details the Company’s contractual maturity for its non-derivative financial liabilities. The table has been compiled based on the undiscounted cash flows of financialliabilities based on the earliest date on which the Company can be required to repay the liability. The cash flows include both the principal and interest payments.
Repayable Repayable Repayable
within 1
year
2 – 5
years
after 5
years Total
Rm Rm Rm Rm
December 2013
FFiinnaanncciiaall lliiaabbiilliittiieessTrade and other payables 8.6 - - 8.6Amounts owing to subsidiaries 604.8 - - 604.8Total undiscounted cash flows of the Group’s financial liabilities 613.4 - - 613.4Less: Future finance charges -
Total financial liabilities 613.4
Repayable Repayable Repayable
within 1
year
2 – 5
years
after 5
years Total
Rm Rm Rm Rm
December 2012
FFiinnaanncciiaall lliiaabbiilliittiieessTrade and other payables 16.2 - - 16.2Amounts owing to subsidiaries 500.6 - - 500.6Total undiscounted cash flows of the Group’s financial liabilities 516.8 - - 516.8Less: Future finance charges -
Total financial liabilities 516.8
Credit risk management
The carrying amount of the financial assets represents the Company’s maximum exposure to credit risk without taking into consideration any collateral provided:Financial
assets
High
exposure
Medium
exposure
Low
exposure
Credit risk analysed: Rm Rm Rm Rm
December 2013
Financial assets and other credit exposures
Other financial assets 37.2 - - 37.2Trade receivables 11.0 - - 11.0Amounts owing by subsidiaries 1611.2 - - 1,611.2Cash and cash equivalents 7.4 - - 7.4
1,666.8 - - 1,666.8
December 2012
Other financial assets 5.8 - - 5.8Trade receivables 11.0 - - 11.0Amounts owing by subsidiaries 1577.5 - - 1,577.5Cash and cash equivalents 7.6 - - 7.6
1,601.9 - - 1,601.9

NOTES TO THE ANNUAL GROUP FINANCIAL STATEMENTS 9-16FOR THE YEAR ENDED 29 DECEMBER 2013
15. INVESTMENTS
December 2013 December 2012
Rm Rm
Unlisted investments
Fair value through profit or loss (FVTPL)
HHeelldd ffoorr ttrraaddiinnggBare dominium - 110.0Investment in a trading and logistics structure 117.4 104.0Total financial assets classified as held for trading 117.4 214.0
DDeessiiggnnaatteedd aass aatt FFVVTTPPLLInvestment in insurance cell-captive on extended warranties 44.4 -Investment in insurance cell-captive on premium contributions 55.9 34.8Total financial assets designated as at FVTPL 100.3 34.8
Total fair value through profit or loss (FVTPL) 217.7 248.8
Loans and receivables
Trencor export partnership 2.1 2.5Total loans and receivables 2.1 2.5
Held-to-maturity investments carried at amortised
cost
Other investments - 0.1Total held-to-maturity investments - 0.1
Total unlisted investments 219.8 251.4
Listed investments
Available-for-sale investments
Other investments 12.1 7.4Total listed investments 12.1 7.4
TToottaall iinnvveessttmmeennttss 223311..99 225588..88
For IAS 39 Financial Instruments: Recognition and Measurement accounting treatment of these investments, see note 38.
1
2
3
4

December 2013 December 2012
Rm Rm
Reconciliation of financial assets carried at fair value through profit or loss (FVTPL)
Opening balance 248.8 313.1Fair value adjustments taken to the income statement (4.2) 27.7Interest on investment taken to finance income 1.1 0.5Realisation of a portion of the investment in offshore trading structure recognised in cash reserves (1.6) (74.7)Deconsolidation/(consolidation) of investment in insurance cell-captive on extended warranties 23.3 (18.8)Foreign exchange gains taken to the income statement (note 7) 22.3 1.0Realisation of the right in the bare dominium on the acquisition of the Makro properties (122.0) -Capital contribution made to the investment in insurance cell-captive on premium contributions 50.0 -Closing balance 217.7 248.8
FFuurrtthheerr ddeettaaiillss oonn tthhee iinnvveessttmmeennttss iinn tthhiiss ccaatteeggoorryy::The ‘bare dominium’ reflected Massmart’s right to acquire a 49.9% share in Capensis Investments 241 (Pty) Ltd, the holdingcompany of the bare dominium over seven Makro properties. At the end of January 2013, Massmart acquired control of theseven Makro properties, and in doing so exercised its right in the bare dominium. The fair value of the right in the baredominium at acquition date of R122.0 million was included as part of the consideration transferred to obtain control.The ‘investment in a trading and logistics structure’ is in M-class preference shares representing an international treasury,shipping and trading business unit.The ‘investment in an insurance cell-captive on extended warranties’ relates to an insurance arrangement with Mutual & Federalpertaining to extended warranties sold within the Group. In the current financial year this cell-captive has been deconsolidatedas a result of the implementation of IFRS 10 Consolidated Financial Statements. The cell-captive does not meet the definitionof a “deemed separate entity” and, as a result, has not been consolidated. The ‘investment in an insurance cell-captive onextended warranties’ has been designated as a financial asset at fair value through profit or loss.The ‘investment in an insurance cell-captive on premium contributions’ relates to an insurance arrangement with Mutual &Federal pertaining to general insurance within the Group. The cell-captive does not meet the definition of a “deemed separateentity”, and as a result, has not been consolidated. The ‘investment in an insurance cell-captive on premium contributions’ hasbeen designated as a financial asset at fair value through profit or loss. The previous structure was unwound in the currentreporting period and replaced with the cell-captive referred to above.
Additional information on the fair value of ‘investments’ can be found in note 38.
Reconciliation of loans and receivables
Opening balance 2.5 3.0Investment realised (0.4) (0.5)Closing balance 2.1 2.5
FFuurrtthheerr ddeettaaiillss oonn tthhee iinnvveessttmmeennttss iinn tthhiiss ccaatteeggoorryy:: The ‘Trencor export partnership’ represents our participation in export containers.
Reconciliation of held-to-maturity investments
Opening balance 0.1 0.1Amortisation taken to the income statement (0.1) -Closing balance - 0.1
Reconciliation of available-for-sale investments
Opening balance 7.4 5.7Fair value adjustment 4.7 1.7Closing balance 12.1 7.4
FFuurrtthheerr ddeettaaiillss oonn tthhee iinnvveessttmmeennttss iinn tthhiiss ccaatteeggoorryy:: Listed investments include shares held on the JSE and the Zimbabwe Stock Exchange.
1
1
2
3
4

NOTES TO THE ANNUAL COMPANY FINANCIAL STATEMENTS 11-16FOR THE YEAR ENDED 29 DECEMBER 2013
16. EVENTS AFTER THE REPORTING DATE
Grant Pattison has resigned as Chief Executive Officer of the Company with effect from 1 June 2014, but will remain on the Board of Directors. Grant has indicated that it is his intention
to resign from the Board of Directors effective 31 December 2014.

MASSMART SUPPLIER DEVELOPMENT FUND
Who we are
Arising from the Massmart-Walmart ruling at the Competition Tribunal, Massmart established a
R240 million Supplier Development Fund to assist in developing South African suppliers,
particularly any Small Medium Enterprise (SME) which is Black-Owned; Black Empowered; or a
local manufacturer of products. The mandate of the Supplier Development Fund is carried out in
two areas: the Supplier Development Programme and Ezemvelo Direct Farm Programme.
The purpose of the Supplier Development Fund is to assist Massmart’s existing and new
suppliers to enhance the quality of their products, thereby improving their procurement and
supply chain.
Objectives
The following are the key objectives of the Supplier Development Programme:
Improve quality of products;Assist local suppliers to expand production capacity (existing and potential);Assist suppliers to reduce input costs;Enable Massmart to increase and diversify its local sourcing capacity;Provide a route to market to deserving products (locally and internationally); andEstablish and build long-term, effective supplier partnerships.
Supplier eligibility
Eligibility for support from the Supplier Development Fund will vary among programmes. Basic suppliereligibility includes:
South African domiciled companies;Small, medium or micro enterprises;Agreement of programme terms and conditions, including periodic audit of company operationsunder certain programmes;Can be a manufacturer or service provider;If a funding programme is requested, the applicant must have a reasonable likelihood of success asdetermined by the Supplier Development Fund management;Priority and preference shall be given to manufacturers of products that are environmentally andsocially sustainable;Supplier operations that have no negative impact on the South African economy;Encourage positive South African development effects;Creates or maintains employment; andWomen-owned, black-owned and black-empowered companies are encouraged to apply

FUND APPLICATION PROCESS OVERVIEW
“Massmart is extremely proud of the success that we have managed to achieve as far as
developing our local suppliers is concerned. Our approach is to allow suppliers to grow gradually
based on their capability and ability to cope with the complexity of our supply chain.”
Mncane Mthunzi, Group Africa and Supplier Development Executive
The first annual report of the Fund was submitted to the Competition Commission in December 2013, and provides more insight to the fund.

ASSESSMENT OF PRINCIPLES OF KING III
Massmart believes that the first steps towards good corporate governance must includeembracing the requirements of the relevant governance and regulatory frameworks, as well ascorporate best practice.
More than this, Massmart believes that sustainable and effective corporate governance is bestdemonstrated through a consistent pattern of doing the right thing regardless of the circumstances.
The primary South African corporate governance framework is the King Report on Governance for SouthAfrica, 2009 and King Code of Governance Principles (King III), which forms the backbone to Massmart’sown corporate governance framework; in addition Massmart applies high ethical standards to its operatingenvironment as reflected in the Group’s Code of Ethical Conduct.
Massmart believes that these guides to corporate decision making are essential for any governanceframework to achieve desired outcomes consistent with our Company values. In addition to this corporategovernance framework, the Group is committed to complying with all legislation, regulations and bestpractices relevant to our business, in every country where we conduct business. A register documenting theassessment of all 75 principles of King III is available here.
The purpose of King III
The philosophy of King III revolves around leadership, sustainability and corporate citizenship. To facilitatean understanding of the thought process, debate and changes in King III, the following key aspects arehighlighted:
Good governance is essentially about effective leadership. Leaders should rise to the challenges ofmodern governance. Such leadership is characterised by the ethical values of responsibility,accountability, fairness and transparency and based on moral duties that find expression in theconcept of Ubuntu. Responsible leaders direct company strategies and operations with a view toachieving sustainable economic, social and environmental performance.Sustainability is the primary moral and economic imperative of the 21st century. It is one of the mostimportant sources of both opportunities and risks for businesses. Nature, society, and business areinterconnected in complex ways that should be understood by decision-makers. Most importantly,current incremental changes towards sustainability are not sufficient – we need a fundamental shiftin the way companies and directors act and organise themselves.The concept of corporate citizenship which flows from the fact that the company is a person andshould operate in a sustainable manner. Sustainability considerations are rooted in the South AfricanConstitution which is the basic social contract that South Africans have entered into. TheConstitution imposes responsibilities upon individuals and juristic persons for the realisation of themost fundamental rights.
Main chapters of King III
CHAPTER 1
Ethical Leadershipand Corporate Citizenship
CHAPTER 2
Boards and Directors
CHAPTER 3
Audit Committees
CHAPTER 4
The governance of risk
CHAPTER 5
The Governance of InformationTechnology (IT)
CHAPTER 6
Compliance with Laws, Rules,Codes and Standards
CHAPTER 7
Internal audit
CHAPTER 8
Governing StakeholderRelationships
CHAPTER 9
Integrated reportingand disclosure
For the year ended December 2013, apart from the exceptions outlined below, the Boardconfirms that the Group complied with the Code of Governance Principles as set out in King III.
Massmart exceptions to King III
PRINCIPLE 2.25
NOTAPPLIED
The Company remunerates its Directors and Executives fairly.
Non-executive Directors’ fees comprise both a base fee and an attendance fee per meeting.
The Board does not believe that Directors should earn attendance fees in addition to a base fee. Many Directors add significantvalue and apportion significant time to the Group outside of the formal Board and Committee meetings, sometimes greatervalue than they might do within the confines of a formal meeting.
PARTIALLYAPPLIED
The remuneration report discloses performance measures for vesting of share options and the reasons for choosing thoseperformance measures.
The report discloses performance measures for vesting of share options but not the reasons for choosing those performancemeasures.

NOTAPPLIED
The Company has disclosed the remuneration of each individual Director and prescribed officer.
The remuneration report includes the term of Executive service contracts as well as the notice period for termination. Theremuneration report discloses both the nature and period of restraint provided for in Executive service contracts.Whilst the remuneration of each Director and prescribed officer is disclosed, their notice periods for termination are notdisclosed. There are no executive service contracts.
PRINCIPLE 3.4
PARTIALLYAPPLIED
The Audit Committee oversees integrated reporting.
The Audit Committee recommends to the Board to engage an external assurance provider over material elements of thesustainability reporting within the integrated report. The Audit Committee evaluates both the independence and quality of theexternal providers of assurance on sustainability.
Massmart’s sustainability report has not been audited by an external assurance provider but verification of the keysustainability metrics have been obtained through agreed upon procedures performed by Massmart Internal Audit Services(MIAS). A copy of the agreed upon procedures report is available at the registered offices of the Company.
PRINCIPLE 9.3
PARTIALLYAPPLIED
Sustainability reporting and disclosure should be independently assured.
The integrated report discloses the scope and methodology of independent assurance of the sustainability report, as well asthe name of the assurer. Sustainability reporting is independently assured in accordance with a formal assurance processestablished.
Massmart’s sustainability report has not been audited by an external assurance provider but verification of the keysustainability metrics have been obtained through agreed upon procedures performed by MIAS. A copy of the agreed uponprocedures report is available at the registered offices of the Company.
PRINCIPLE 2.26

REGISTER DOCUMENTING THE ASSESSMENT OF THE 75 PRINCIPLES OF KINGIII
Massmart believes that the first steps towards good corporate governance must includeembracing the requirements of the relevant governance and regulatory frameworks, as well ascorporate best practice. More than this, Massmart believes that sustainable and effectivecorporate governance is best demonstrated through a consistent pattern of doing the right thingregardless of the circumstances.The primary South African corporate governance framework is the King Report on Governance for South Africa, 2009, and King Code of Governance Principles(King III), which forms the backbone to Massmart’s own corporate governance framework; in addition Massmart applies high ethical standards to its operatingenvironment as reflected in the Group’s Code of Ethical Conduct.
Massmart believes that these guides to corporate decision making are essential for any governance framework to achieve desired outcomes consistent withour Company values. In addition to this corporate governance framework, the Group is committed to complying with all legislation, regulations and bestpractices relevant to our business, in every country where we conduct business.
For the year ended December 2013, apart from the exceptions outlined below, the Board confirms that the Group complied with the Code of GovernancePrinciples as set out in King III.
PRINCIPLE 1.1 - 1.3
PRINCIPLE 1.1
APPLIED
The Board provides effective leadership base on ethical foundationBoth these statements are correct:- The Board sets the values that the Company adheres to; and- These values are documented inthe Company's code of conduct.Comment: These values, which the Board sets, are documented in Massmart's Code of Ethical Conduct
PRINCIPLE 1.1
APPLIED
The Board provides effective leadership base on ethical foundationThe Board ensures that the Board's and Management's conduct align with the Company values.Comment: This is delegated to Massmart's Ethics Office who provide regular feedback to the Social and Ethics Committee.
PRINCIPLE 1.1
APPLIED
The Board provides effective leadership base on ethical foundationThe Board promotes the stakeholder-inclusive approach of governance and takes account of the impact of the Company'soperations on internal and external stakeholders.
PRINCIPLE 1.1
APPLIED
The Board provides effective leadership base on ethical foundationDeliberations, decisions and actions of the Board are based on fairness, accountability, responsibility and transparency.
PRINCIPLE 1.1
APPLIED
The Board provides effective leadership base on ethical foundationDirectors, in performing their stewardship role, live the following five moral duties: conscience; care; competence; commitment;courage.
PRINCIPLE 1.2
APPLIED
The Board ensures that the Company is and is seen to be a responsible corporate citizenThe Board satisfies itself that management has thoroughly examined and dealt with all risks affecting strategy and business plans.Comment: This is achieved through a review of the Divisional risk registers by the Risk Committee on behalf of the Board.
PRINCIPLE 1.2
APPLIED
The Board ensures that the Company is and is seen to be a responsible corporate citizenThe Board gives adequate consideration to the impact of the Company's operations on society and the environment.
PRINCIPLE 1.2
APPLIED
The Board ensures that the Company is and is seen to be a responsible corporate citizenThe Board pro-actively protects, enhances and invests in the well being of the economy, society and the environment.Comment: The Group has a comprehensive CSI programme, focussed on three accountability themes of: enabling sustainable supply andconsumerism; minimising the Group's environmental footprint; and championing social equality issues.
PRINCIPLE 1.2
APPLIED
The Board ensures that the Company is and is seen to be a responsible corporate citizenThe Board ensures that the Company's performance and its interaction with its stakeholders are guided by the Constitution and theBill of Rights.
PRINCIPLE 1.2
APPLIED
The Board ensures that the Company is and is seen to be a responsible corporate citizenEvaluating and managing the risks of doing business in weak governance zones form an important part of the Company's riskmanagement.

PRINCIPLE 1.2
APPLIED
The Board ensures that the Company is and is seen to be a responsible corporate citizenThe Board ensures that there is sufficient collaboration with stakeholders to promote ethical conduct and good corporatecitizenship.
PRINCIPLE 1.2
APPLIED
The Board ensures that the Company is and is seen to be a responsible corporate citizenThe Board ensures that measurable corporate citizenship programmes and policies are developed and implemented.
PRINCIPLE 1.3
APPLIED
The Board ensures that the Company ethics are managed effectivelyThe Board ensures that ethical risks and opportunities are assessed (i.e. identified and evaluated in terms of probability and impact)and that an ethics risk and opportunity profile is compiled.Comment: This is done internally and is also outsourced to the Ethics Institute of South Africa.
PRINCIPLE 1.3
APPLIED
The Board ensures that the Company ethics are managed effectivelyThe Board ensures that the Company's ethics performance is monitored, reported internally and disclosed.Comment: From 1 July 2011 the Massmart Ethics Office adopted Walmart's ethics system, IntegriLink, to record all calls received. Calls areinvestigated by the Divisional Ethics Officers and, where necessary, by Massmart Internal Audit Services (MIAS). All calls are monitored by theMassmart Ethics Office, and significant calls by the Walmart Global Ethics Office. The Group Ethics Forum meets twice a year where the callstatistics and trends are discussed. This is reported to the Board quarterly by Massmart's General Counsel and Chief Compliance Officer, andon an ad hoc basis as necessary.
PRINCIPLE 1.3
APPLIED
The Board ensures that the Company ethics are managed effectivelyThe Board has ensured that: a code of conduct and ethics-related policies have been established and implemented; and the codeand policies clearly set out ethical standards.Comment: The Massmart Code of Ethical Conduct can be viewed at www.massmart.co.za.
PRINCIPLE 1.3
APPLIED
The Board ensures that the Company ethics are managed effectivelyThe Board ensures that compliance with the code of conduct is effectively integrated into the strategy and operations of theCompany; i.e. the ethical organisational culture is reflected in the Company's vision and mission, strategies and operations,decisions and conduct, and how it treats its internal and external stakeholders.
PRINCIPLE 2.1 - 2.27
PRINCIPLE 2.1
APPLIED
The Board acts as the focal point for and custodian of corporate governanceThe Board has a charter that clearly sets out its role and duties.Comment: The Board Charter is reviewed and approved by the Board on an annual basis
PRINCIPLE 2.1
APPLIED
The Board acts as the focal point for and custodian of corporate governanceThe Board meets at least four times each year.Comment: The dates of these quarterly meetings are determined a year in advance and communicated to the Board members at the sametime. The Board also meets on an ad hoc basis should a particular issue demand its attention.
PRINCIPLE 2.2
APPLIED
The Boards appreciates that the strategy, risk, performance and sustainability are inseparableThe Board both informs and approves strategy.Comment: As per the Board Charter, the Board assumes responsibility for annually approving and reviewing the Group's competitive strategy.The Board of Massmart is responsible for directing the Group towards the achievement of the Massmart vision and mission. The Board istherefore accountable for the development and execution of the Group's strategy.
PRINCIPLE 2.2
APPLIED
The Boards appreciates that the strategy, risk, performance and sustainability are inseparableThe Board takes adequate steps to ensure that long-term planning results in sustainable outcomes that take into account people,planet and profit.Comment: The Board conducts strategy sessions on an annual basis and in terms of the Board Charter, annually approves and reviews theGroup's competitive strategy and sustainability and adopts business plans and budgets for the achievement thereof.
PRINCIPLE 2.2
APPLIED
The Boards appreciates that the strategy, risk, performance and sustainability are inseparableThe Board ensures that the strategy is aligned with all of the following: the purpose of the Company; the value drivers of itsbusiness; and the legitimate interests and expectations of its stakeholders.Comment: The Board of Massmart is responsible for directing the Group towards the achievement of the Massmart vision and mission.
PRINCIPLE 2.2
APPLIED
The Boards appreciates that the strategy, risk, performance and sustainability are inseparableStrategy implementation meets both of the following conditions: Strategy is translated into key performance and risk areas thatinclude finance, ethics, compliance and sustainability; and The associated performance and risk measures are adequately identifiedand clear.
PRINCIPLE 2.2
APPLIED
The Boards appreciates that the strategy, risk, performance and sustainability are inseparableThe Board views sustainability as a business opportunity; i.e. long-term sustainability is considered when strategy is formulated andit guides strategy-setting.
PRINCIPLE 2.3
APPLIED
The Board should provide effective leadership based on an ethical foundation.Comment: Refer to principle 1.1 for more detail.

PRINCIPLE 2.4
APPLIED
The Board should ensure that the Company is and is seen to be a responsible corporate citizen.Comment: Refer to principle 1.2 for more detail.
PRINCIPLE 2.5
APPLIED
The Board should ensure that the Company ethics are managed effectively.Comment: Refer to principle 1.3 for more detail.
PRINCIPLE 2.6
APPLIED
The Board should ensure that the Company has an effective and independent Audit Committee.Comment: Refer to principle 3.1 for more detail.
PRINCIPLE 2.7
APPLIED
The Board should be responsible for the governance of risk.Comment: Refer to principle 4.1 for more detail.
PRINCIPLE 2.8
APPLIED
The Board should be responsible of information technology (IT) governance.Comment: Refer to principle 5.1 for more detail.
PRINCIPLE 2.9
APPLIED
The Board should ensure that the company complies with applicable laws and considers adherence to non binding rules, codes andstandards.Comment: Refer to principle 6.1 for more detail.
PRINCIPLE 2.10
APPLIED
The Board should ensure that there is an effective risk based internal audit.Comment: Refer to principle 7.1 for more detail.
PRINCIPLE 2.11
APPLIED
The Board should appreciate that stakeholders' perceptions affect a company's reputation.Comment: Refer to principle 8.1 for more detail.
PRINCIPLE 2.12
APPLIED
The Board should ensure the integrity of the company's integrated report.Comment: Refer to principle 9.1 for more detail.
PRINCIPLE 2.13
APPLIED
The Board should report on the effectiveness of the Company's system of internal controls.Comment: Refer to principles 7.1-7.5 and principles 9.1-9.3 for more detail.
PRINCIPLE 2.14
APPLIED
The Board and its Directors should act in the best interests of the Company.Comment: The Board and its Directors always act in the best interests of the Company.
PRINCIPLE 2.14
APPLIED
The Board and its Directors should act in the best interests of the Company.The Board has unrestricted access to all Company information, records, documents and property if it follows the Board approvedprocess.Comment: The Board also has access to this information through the Executive Directors, who also sit on the Group Divisional Boards.
PRINCIPLE 2.14
APPLIED
The Board and its Directors should act in the best interests of the Company.Both these statements are true: Directors are permitted to take independent advice related to their duties; and The Company will payfor such advice if the Board approved procedure has been followed.Comment: Directors are encouraged to take independent advice, at the Company's cost, for the proper execution of their duties andresponsibilities.
PRINCIPLE 2.14
APPLIED
The Board and its Directors should act in the best interests of the Company.Real or perceived conflicts of interest are both: disclosed to the Board; and when disclosed, managed appropriately.Comment: Conflicts of interest are disclosed at every Board meeting and on an ad hoc basis as necessary.
PRINCIPLE 2.14
APPLIED
The Board and its Directors should act in the best interests of the Company.The Company has a policy on dealing in securities by Directors, officers and selected employees.Comment: This policy is set out in the Board Charter and in the Share Offers made to participating employees.
PRINCIPLE 2.15
APPLIED
The Board will/has consider/ed business rescue proceedings or other turnaround mechanisms as soon asthe Company has been/may be financially distressed as defined in the Company's Act, 71 of 2008The Board continually monitors whether the Company is financially distressed for the purposes of considering business rescueproceedings; i.e. whether it appears reasonably: unlikely that the Company can pay its debts when due within the next six months; orlikely that the Company will become insolvent within the next six months.

PRINCIPLE 2.16
APPLIED
The Board has elected a Chairman of the Board who is an independent non executive Director. The CEO ofthe Company does not also fulfil the role of Chairman of the Board.The Company discloses whether the Chairman is an independent non-executive Director, and if not, the reason for this.
PRINCIPLE 2.16
APPLIED
The Board has elected a Chairman of the Board who is an independent non executive Director. The CEO ofthe Company does not also fulfil the role of Chairman of the Board.The Chairman of the Board is not the Chairman of the Remuneration Committee.
PRINCIPLE 2.16
APPLIED
The Board has elected a Chairman of the Board who is an independent non executive Director. The CEO ofthe Company does not also fulfil the role of Chairman of the Board.The Nominations Committee oversees a formal succession plan for the Board, CEO and certain senior executive appointments.
PRINCIPLE 2.16
APPLIED
The Board has elected a Chairman of the Board who is an independent non executive Director. The CEO ofthe Company does not also fulfil the role of Chairman of the Board.The Chairman is an independent non-executive Director or in the alternative, a lead independent Director has been appointed.Comment: Kuseni Dlamini was appointed non-executive Chairman in April 2014 and is an independent Director. Chris Seabrooke, thenon-executive Deputy Chairman, maintains his role as the Group's Lead Independent Director. In addition, to ensure good governance, and asrecommended by King III, the chairmanship of four of the five Board Committees is held by independent Directors other than then Chairman.
PRINCIPLE 2.16
APPLIED
The Board has elected a Chairman of the Board who is an independent non executive Director. The CEO ofthe Company does not also fulfil the role of Chairman of the Board.The Chairman has not been the CEO of the Company in the last three years.
PRINCIPLE 2.16
APPLIED
The Board has elected a Chairman of the Board who is an independent non executive Director. The CEO ofthe Company does not also fulfil the role of Chairman of the Board.The Chairman is appointed by the Board every year.Comment: The Chairman is verbally appointed by the Board on an annual basis.
PRINCIPLE 2.16
APPLIED
The Board has elected a Chairman of the Board who is an independent non executive Director. The CEO ofthe Company does not also fulfil the role of Chairman of the Board.The Chairman's ability to add value, and his performance against what is expected of this role and function, is assessed every year.
PRINCIPLE 2.16
APPLIED
The Board has elected a Chairman of the Board who is an independent non executive Director. The CEO ofthe Company does not also fulfil the role of Chairman of the Board.A clear, written role description exists for the Chairman.Comment: The role of the Chairman is set-out in his contract with the Company.
PRINCIPLE 2.16
APPLIED
The Board has elected a Chairman of the Board who is an independent non executive Director. The CEO ofthe Company does not also fulfil the role of Chairman of the Board.There is succession planning in place for the Chairman.Comment: The Board, assisted by the Nomination Committee, ensures that adequate succession planning is in place for the Chairman.
PRINCIPLE 2.17
APPLIED
The Board has appointed the Chief Executive Officer and has established a framework for the delegation ofauthorityThe Board appoints the CEO.
PRINCIPLE 2.17
APPLIED
The Board has appointed the Chief Executive Officer and has established a framework for the delegation ofauthorityThe Board contributes to decisions about senior executive appointments.
PRINCIPLE 2.17
APPLIED
The Board has appointed the Chief Executive Officer and has established a framework for the delegation ofauthorityThe Board defines its own level of materiality and approves a framework for the delegation of authority.
PRINCIPLE 2.17
APPLIED
The Board has appointed the Chief Executive Officer and has established a framework for the delegation ofauthorityThe role and function of the CEO are clearly formulated in writing.
PRINCIPLE 2.17
APPLIED
The Board has appointed the Chief Executive Officer and has established a framework for the delegation ofauthorityThe CEO is not a member of the Remuneration Committee.Comment: The members are Chris Seabrooke, Kuseni Dlamini and David Cheesewright.
PRINCIPLE 2.17
APPLIED
The Board has appointed the Chief Executive Officer and has established a framework for the delegation ofauthorityThe CEO is not a member of the Audit and Risk Committee.Comment: The members are Chris Seabrooke, Lulu Gwagwa and Phumzile Langeni.

PRINCIPLE 2.17
APPLIED
The Board has appointed the Chief Executive Officer and has established a framework for the delegation ofauthorityThe CEO is not a member of the Nomination Committee.Comment: The members are Kuseni Dlamini, Chris Seabrooke and David Cheesewright.
PRINCIPLE 2.17
APPLIED
The Board has appointed the Chief Executive Officer and has established a framework for the delegation ofauthorityThere is a formal succession plan in place for the CEO and other senior executives.
PRINCIPLE 2.17
APPLIED
The Board has appointed the Chief Executive Officer and has established a framework for the delegation ofauthorityThere is an appropriate benchmark; i.e. agreed performance measures, in place to evaluate the performance of the CEO.Comment: These performance measures are included in the CEO's contract of employment.
PRINCIPLE 2.18
APPLIED
The Board comprises a balance of power, with a majority of non executive Directors. The majority of nonexecutive Directors are independent.The Board comprises a majority of non-executive Directors.Comment: Seven of the nine Directors are non-executive, namely Kuseni Dlamini, Chris Seabrooke, David Cheesewright, Jeff Davis, LuluGwagwa, Phumzile Langeni and JP Suarez.
PRINCIPLE 2.18
APPLIED
The Board comprises a balance of power, with a majority of non executive Directors. The majority of nonexecutive Directors are independent.A majority of the non-executive Directors on the Board are independent.Comment: Four of the seven executive Directors on the Board are independent.
PRINCIPLE 2.18
APPLIED
The Board comprises a balance of power, with a majority of non executive Directors. The majority of nonexecutive Directors are independent.There is a policy addressing division of responsibilities at Board level to ensure a balance of power and authority, such that that noone individual has unfettered powers of decision-making.Comment: The Board has a charter setting out its policies, roles and responsibilities in the execution of its mandate which includes division ofresponsibilities.
PRINCIPLE 2.18
APPLIED
The Board comprises a balance of power, with a majority of non executive Directors. The majority of nonexecutive Directors are independent.The Board has a minimum of two executive Directors, consisting of the CEO and the Director responsible for finance.Comment: The Board consists of three executive Directors: the CEO, the COO, and the Group FD.
PRINCIPLE 2.18
APPLIED
The Board comprises a balance of power, with a majority of non executive Directors. The majority of nonexecutive Directors are independent.When determining the number of Directors to serve on the Board, the Company considers the knowledge, skills and resources thatare necessitated by the size and nature of its business.Comment: The Nomination Committee Charter makes recommendations on the composition of the Board with respect to specialist orindustry-specific skills required by the Group.
PRINCIPLE 2.18
APPLIED
The Board comprises a balance of power, with a majority of non executive Directors. The majority of nonexecutive Directors are independent.The Board has considered whether its size, diversity and demographics make it effective.Comment: The annual Board Self-Assessment considers whether the Board is the right size to fulfil its duties and comprises an appropriatemix of skills, knowledge and background.
PRINCIPLE 2.18
APPLIED
The Board comprises a balance of power, with a majority of non executive Directors. The majority of nonexecutive Directors are independent.At least one third of non-executive Directors rotates every year.Comment: In addition, the Executive Directors also retire by rotation, on the same basis.
PRINCIPLE 2.18
APPLIED
The Board comprises a balance of power, with a majority of non executive Directors. The majority of nonexecutive Directors are independent.Independent non-executive Directors serving for longer than nine years are subjected to a rigorous review of their independence andperformance by the Board.Comment: Non-executive Directors self-assess their independence on an annual basis and those serving for longer than nine years aresubjected to a rigorous review.
PRINCIPLE 2.18
APPLIED
The Board comprises a balance of power, with a majority of non executive Directors. The majority of nonexecutive Directors are independent.The Board, through the Nomination Committee, recommends whether retiring non-executive Directors should be eligible forre-election based on past performance, contribution and the objectivity of business decisions.Comment: In terms of the Remuneration and Nomination Committee Charter, the Committee assists the Board with recommending Directorswho are retiring by rotation, for re-election.

PRINCIPLE 2.18
APPLIED
The Board comprises a balance of power, with a majority of non executive Directors. The majority of nonexecutive Directors are independent.Non-executive Directors that are classified as 'independent' by the Company are subjected to an annual evaluation of theirindependence by the Chairman and the Board.Comment: Non-executive Directors, who are considered independent also self-assess their independence on an annual basis.
PRINCIPLE 2.18
APPLIED
The Board comprises a balance of power, with a majority of non executive Directors. The majority of nonexecutive Directors are independent.The Nominations Committee makes recommendations for appointment as Director based on all of the following: knowledge andexperience gap on the Board; integrity of the candidate; and skills and capacity of the candidate.
PRINCIPLE 2.18
APPLIED
The Board comprises a balance of power, with a majority of non executive Directors. The majority of nonexecutive Directors are independent.The classification of Directors as independent or otherwise in the integrated report is disclosed on the basis of a yearly assessmentof the independence of the non-executive Directors.
PRINCIPLE 2.18
APPLIED
The Board comprises a balance of power, with a majority of non executive Directors. The majority of nonexecutive Directors are independent.There is reporting on the procedure and outcome of the assessment of the suitability of non-executive independent Directors tocontinue serving on the Board for longer than nine years.Comment: The Board considers whether the Director is independent, and the rigorous assessment given in terms of the Directors who havebeen appointed for longer than nine years is documented in the Board minutes.
PRINCIPLE 2.19
APPLIED
Directors are appointed through a formal processThe integrated report gives details of both Directors' appointment procedures, and the composition of the Board.Comment: This is disclosed under the "Nominations Committee responsibilities" in the "Our Business" section.
PRINCIPLE 2.19
APPLIED
Directors are appointed through a formal processThe integrated report classifies Directors as executive, non-executive or independent and provides information about individualDirectors that shareholders may need to make their own assessments in regard to all of the following: independence; education,qualification and experience; length of service and age; significant other Directorships; political connections; and other relevantinformation.Comment: The Directors' CV's can all be found in the "Our Business" section of Massmart's Integrated Annual Report.
PRINCIPLE 2.19
APPLIED
Directors are appointed through a formal processReasons for the removal, resignation or retirement of Directors are provided in the integrated report.
PRINCIPLE 2.19
APPLIED
Directors are appointed through a formal processThe Company discloses: the number of meetings held each year by the Board and each Board committee; and which meetings eachDirector attended (as applicable).Comment: The Board and Committee Attendance table can be found in the "Our Business" section of Massmart's Integrated Annual Report.
PRINCIPLE 2.19
APPLIED
Directors are appointed through a formal processThe Nominations Committee identifies and participates in selecting Board members.
PRINCIPLE 2.19
APPLIED
Directors are appointed through a formal processThe Nominations Committee ensures that new Directors have not been declared delinquent or are not serving probation in terms ofsection 162 of the Companies Act, 2008.
PRINCIPLE 2.19
APPLIED
Directors are appointed through a formal processProcedures for appointments to the Board are all of the following: formally set out in a policy; transparent; and a matter for theBoard as a whole (although the Board may be assisted by the Nomination Committee).Comment: In terms of the Board Charter "Directors are appointed through a formal process and the Nomination Committee will assist with theprocess of identifying suitable candidates to be proposed to the Board and shareholders". The Nomination Committee Charter sets out thefunctions of the Committee in identifying and nominating candidates.
PRINCIPLE 2.19
APPLIED
Directors are appointed through a formal processBoth these statements are true: Before candidates are nominated for Board appointments, there are procedures in place toinvestigate the candidates' backgrounds; and These procedures are in line with the JSE's requirements for listed companies.Comment: This is done as part of the formal process described above.
PRINCIPLE 2.19
APPLIED
Directors are appointed through a formal processNon-executive Directors agree all of the following in their letters of appointment: the Directors' code of conduct; the contributionthat is expected from each Director; the remuneration for holding office as Director; and the terms of Directors' and officers' liabilityinsurance. A brief CV of each Director standing for election or re-election at the annual general meeting (AGM) accompanies thenotice of the AGM.Comment: The notice of AGM forms part of the Integrated Report, which is distributed to shareholders in a single document, includingbiographical details of all Directors. These details are cross-referenced in the notice of the AGM.

PRINCIPLE 2.20
APPLIED
The induction of and ongoing training, as well as the development of Directors are conducted through aformal processThe Board ensures that inexperienced Directors are developed through mentorship programmes.
PRINCIPLE 2.20
APPLIED
The induction of and ongoing training, as well as the development of Directors are conducted through aformal processThe Board ensures that continuing professional development programmes are implemented.Comment: In terms of the Remuneration and Nomination Committee Charter the Committee assists the Board with on-going training anddevelopment of Directors.
PRINCIPLE 2.20
APPLIED
The induction of and ongoing training, as well as the development of Directors are conducted through aformal processThe Board ensures that Directors receive regular and adequate briefings on changes in risks, laws and the business environment.Comment: Information pertaining to risks, laws and the business environment is included in the Board papers distributed to the Directorsbefore each meeting, and on an ad hoc basis as required.
PRINCIPLE 2.20
APPLIED
The induction of and ongoing training, as well as the development of Directors are conducted through aformal processThe development of an induction programme for new Directors meets both the following requirements: It is tailored to the needs ofboth the Company and the new Director; and It enables new Directors to contribute effectively as quickly as possible.Comment: The Board Charter provides that, "the Board will ensure that a comprehensive induction programme is available for all new Directorsand this will be implemented under the responsibility of the Company Secretary". Details of this induction programme do not appear to bedocumented.
PRINCIPLE 2.21
APPLIED
The Board is assisted by a competent, suitably qualified and experienced Company secretary.The Company secretary is empowered by the Board to effectively perform his or her duties.
PRINCIPLE 2.21
APPLIED
The Board is assisted by a competent, suitably qualified and experienced Company secretary.The Board is entitled to both appoint and remove the Company secretary.
PRINCIPLE 2.21
APPLIED
The Board is assisted by a competent, suitably qualified and experienced Company secretary.The Company complies with the provisions of the Companies Act, 2008 in relation to the appointment and removal, and the dutiesallocated to the Company secretary.
PRINCIPLE 2.21
APPLIED
The Board is assisted by a competent, suitably qualified and experienced Company secretary.The role and function of the Company secretary are clearly formulated in writing.
PRINCIPLE 2.21
APPLIED
The Board is assisted by a competent, suitably qualified and experienced Company secretary.The Nominations Committee establishes procedures for appointments to the Board and ensures that these are properly carried out.
PRINCIPLE 2.22
APPLIED
The evaluation of the Board, its committees and individual Directors is performed every year.In so far as the role, function and duties of the Board, the Board committees and individual Directors are concerned, there areperformance criteria in place that serve as a benchmark for performance appraisals.Comment: The Board Charter clearly sets out the roles and responsibilities of the Board, against which individual Directors' performances areassessed.
PRINCIPLE 2.22
APPLIED
The evaluation of the Board, its committees and individual Directors is performed every year.Assessment of the performance of the CEO and other executive Directors as employees takes place every year and the results ofthis assessment affect remuneration.Comment: The Remuneration and Nomination Committee Charter provides that the Committee shall assist the Board with the annualevaluation of senior executives' salary packages against the extent to which executives have met their performance targets, goals andobjectives.
PRINCIPLE 2.22
APPLIED
The evaluation of the Board, its committees and individual Directors is performed every year.Yearly evaluations of the Board's, Board committees' and individual Directors' performance are performed.
PRINCIPLE 2.22
APPLIED
The evaluation of the Board, its committees and individual Directors is performed every year.The results of performance evaluations are constructively used to identify training and development needs for Directors.Comment: The results of the annual evaluations are reviewed by the Chairman and CEO, and are presented to the Board.
PRINCIPLE 2.22
APPLIED
The evaluation of the Board, its committees and individual Directors is performed every year.The nomination for re-appointment of a Director only occurs after an evaluation of the performance of the Director.

PRINCIPLE 2.22
APPLIED
The evaluation of the Board, its committees and individual Directors is performed every year.The Nominations Committee oversees the process and reviews the results of the evaluation of the performance and independenceof individual Directors, the Board and Board Committees.
PRINCIPLE 2.22
APPLIED
The evaluation of the Board, its committees and individual Directors is performed every year.The Nominations Committee comprises the Board Chairman and non-executive Directors.Comment: The members are Mark Lamberti, Chris Seabrooke and David Cheesewright.
PRINCIPLE 2.22
APPLIED
The evaluation of the Board, its committees and individual Directors is performed every year.To determine the remuneration of the CEO and other executive Directors, the Remuneration Committee considers the results of theevaluation of their performance, both as a Directors and as executives.
PRINCIPLE 2.22
APPLIED
The evaluation of the Board, its committees and individual Directors is performed every year.The integrated report discloses all of the following: an overview of the appraisal process of the Board, Board committees, individualDirectors; the results of this appraisal process; and action plans emanating from results of the appraisal.Comment: An overview of the appraisal process of the Board, Board committees, individual Directors is included and the results of thisappraisal process and action plans emanating from results of the appraisal are managed by the Nomination Committee.
PRINCIPLE 2.23
APPLIED
The Board delegates certain functions to well-structured committees without abdicating from its ownresponsibilities.Both of the following are disclosed in the integrated report regarding each Board Committee: composition; and role and mandate.Comment: This can be found in the Corporate Governance section of Massmart's Integrated Annual Report.
PRINCIPLE 2.23
APPLIED
The Board delegates certain functions to well-structured committees without abdicating from its ownresponsibilities.The names and details of all external advisers who regularly attend or are invited to attend committee meetings are disclosed.Comment: This can be found in the Corporate Governance section of Massmart's Integrated Annual Report.
PRINCIPLE 2.23
APPLIED
The Board delegates certain functions to well-structured committees without abdicating from its ownresponsibilities.The Audit Committee terms of reference deal adequately with all of the following: composition; objectives, purpose and activities;delegated authorities including the extent of power to make decisions; tenure; and reporting mechanism to the Board.
PRINCIPLE 2.23
APPLIED
The Board delegates certain functions to well-structured committees without abdicating from its ownresponsibilities.The Audit Committee is entitled to obtain independent professional advice on any issue within its scope and the Company will payfor such advice if the Board approved procedure has been followed.
PRINCIPLE 2.23
APPLIED
The Board delegates certain functions to well-structured committees without abdicating from its ownresponsibilities.The Risk Committee's terms of reference have been approved by the Board and are reviewed every year.
PRINCIPLE 2.23
APPLIED
The Board delegates certain functions to well-structured committees without abdicating from its ownresponsibilities.The Risk Committee is chaired by a non-executive Director.Comment: The Chairman of the Audit and Risk Committee is Chris Seabrooke.
PRINCIPLE 2.23
APPLIED
The Board delegates certain functions to well-structured committees without abdicating from its ownresponsibilities.The Risk Committee's terms of reference deal adequately with all of the following: composition; objectives, purpose and activities;delegated authorities including the extent of power to make decisions; tenure; and reporting mechanism to the Board.
PRINCIPLE 2.23
APPLIED
The Board delegates certain functions to well-structured committees without abdicating from its ownresponsibilities.The Risk Committee is entitled to obtain independent professional advice on any issue within its scope and the Company will payfor such advice if the Board approved procedure has been followed.
PRINCIPLE 2.23
APPLIED
The Board delegates certain functions to well-structured committees without abdicating from its ownresponsibilities.There is a Board Remuneration Committee.Comment: The members are Chris Seabrooke, Mark Lamberti and David Cheesewright.
PRINCIPLE 2.23
APPLIED
The Board delegates certain functions to well-structured committees without abdicating from its ownresponsibilities.The Remuneration Committee terms of reference deal adequately with all of the following: composition; objectives, purpose andactivities; delegated authorities including the extent of power to make decisions; tenure; and reporting mechanism to the Board.TheRemuneration Committee meets at least twice per year.

PRINCIPLE 2.23
APPLIED
The Board delegates certain functions to well-structured committees without abdicating from its ownresponsibilities.The Remuneration Committee is entitled to obtain independent professional advice on any issue within its scope and the Companywill pay for such advice if the Board approved procedure has been followed.
PRINCIPLE 2.23
APPLIED
The Board delegates certain functions to well-structured committees without abdicating from its ownresponsibilities.The Nominations Committee's terms of reference have been approved by the Board and are reviewed every year.
PRINCIPLE 2.23
APPLIED
The Board delegates certain functions to well-structured committees without abdicating from its ownresponsibilities.There is a Nomination Committee consisting of Board members.Comment: The members are Mark Lamberti, Chris Seabrooke and David Cheesewright.
PRINCIPLE 2.23
APPLIED
The Board delegates certain functions to well-structured committees without abdicating from its ownresponsibilities.The Nominations Committee terms of reference deal adequately with all of the following: composition; objectives, purpose andactivities; delegated authorities including the extent of power to make decisions; tenure; and reporting mechanism to the Board.
PRINCIPLE 2.23
APPLIED
The Board delegates certain functions to well-structured committees without abdicating from its ownresponsibilities.The Nomination Committee is entitled to obtain independent professional advice on any issue within its scope and the Company willpay for such advice if the Board approved procedure has been followed.
PRINCIPLE 2.23
APPLIED
The Board delegates certain functions to well-structured committees without abdicating from its ownresponsibilities.Is the Company required, in terms of section 72 of the Companies Act, to have a Social and Ethics Committee?Comment: Yes
PRINCIPLE 2.23
APPLIED
The Board delegates certain functions to well-structured committees without abdicating from its ownresponsibilities.The Company has a Social and Ethics CommitteeComment: The members are: Phumzile Langeni, Grant Pattison and JP Suarez.
PRINCIPLE 2.23
APPLIED
The Board delegates certain functions to well-structured committees without abdicating from its ownresponsibilities.The Social and Ethics Committee comprises of not less than three Directors or prescribed officers of the Company, at least one ofwhom is a non-executive Director?Comment: The members are: Phumzile Langeni (independent non-executive), Grant Pattison (executive) and JP Suarez (non-executive).
PRINCIPLE 2.23
APPLIED
The Board delegates certain functions to well-structured committees without abdicating from its ownresponsibilities.The Social and Ethics Committee has monitored the Company's activities relating to corruption, including: the OECDrecommendations regarding corruption and the reduction of corruption.Comment: This is documented in the Social and Ethics Committee Report and in the Corporate Governance section of Massmart's IntegratedAnnual Report.
PRINCIPLE 2.23
APPLIED
The Board delegates certain functions to well-structured committees without abdicating from its ownresponsibilities.The Social and Ethics Committee has monitored the Company's activities relating to corporate citizenship, including: the Company'sstanding in terms of the goals and purposes of the 10 principles set out in the UN Global Compact Principles, contribution todevelopment of communities in which its activities are conducted or in which is products/services are marketed, and record ofsponsorship, donations and charitable giving.Comment: This is documented in the Social and Ethics Committee Report and in the Corporate Governance section of Massmart's IntegratedAnnual Report.
PRINCIPLE 2.23
APPLIED
The Board delegates certain functions to well-structured committees without abdicating from its ownresponsibilities.The Social and Ethics Committee has monitored the Company's activities relating to the environment, health and public safety,including the impact of the Company's activities and of its products or services.Comment: This is documented in the Social and Ethics Committee Report and in the Corporate Governance section of Massmart's IntegratedAnnual Report.
PRINCIPLE 2.23
APPLIED
The Board delegates certain functions to well-structured committees without abdicating from its ownresponsibilities.The Social and Ethics Committee has monitored the Company's activities relating to consumer relationships, including theCompany's advertising, public relations and compliance with consumer protection laws.Comment: This is documented in the Social and Ethics Committee Report and in the Corporate Governance section of Massmart's IntegratedAnnual Report.

PRINCIPLE 2.23
APPLIED
The Board delegates certain functions to well-structured committees without abdicating from its ownresponsibilities.The Social and Ethics Committee has monitored the Company's activities relating to labour and employment including: TheEmployment Equity Act and the BBBEE Act Promotion of equality and prevention of unfair discrimination, the Company's standing interms of the International Labour Organization Protocol on decent work and working conditions, the Company's employmentrelationships, the Company's contribution toward the educational development of its employees.Comment: This is documented in the Social and Ethics Committee Report and in the Corporate Governance section of Massmart's IntegratedAnnual Report.
PRINCIPLE 2.23
APPLIED
The Board delegates certain functions to well-structured committees without abdicating from its ownresponsibilities.The Social and Ethics Committee has drawn matters within its mandate to the attention of the Board as occasion required.Comment: This is documented in the Social and Ethics Committee Report and in the Corporate Governance section of Massmart's IntegratedAnnual Report.
PRINCIPLE 2.23
APPLIED
The Board delegates certain functions to well-structured committees without abdicating from its ownresponsibilities.The Social and Ethics Committee has reported, through one of its members, to the shareholders of the Company at the Company'sannual general meeting, on matters within its mandate.Comment: This is documented in the Social and Ethics Committee Report and in the Corporate Governance section of Massmart's IntegratedAnnual Report.
PRINCIPLE 2.23
APPLIED
The Board delegates certain functions to well-structured committees without abdicating from its ownresponsibilities.The majority of members of the Nominations Committee consists of non-executive Directors and a majority of the non-executiveDirectors is independent.
PRINCIPLE 2.23
APPLIED
The Board delegates certain functions to well-structured committees without abdicating from its ownresponsibilities.The Remuneration Committee is chaired by an independent Director.Comment: The Chairperson is Chris Seabrooke (independent non-executive).
PRINCIPLE 2.23
APPLIED
The Board delegates certain functions to well-structured committees without abdicating from its ownresponsibilities.All members of the Remuneration Committee are non-executive Directors and a majority of the members is independent.Comment: The members are: Mark Lamberti (independent non-executive), Chris Seabrooke (independent non-executive) and DavidCheesewright (non-executive).
PRINCIPLE 2.24
NOTAPPLICABLE
A governance framework has been agreed upon between the group and its subsidiary BoardsThe integrated report provides details of the implementation and adoption of the holding Company's governance policies, processesor procedures.Comment: Not applicable
PRINCIPLE 2.24
APPLIED
A governance framework has been agreed upon between the group and its subsidiary BoardsThere is a governance framework between the Group and its subsidiary Boards.Comment: The divisional Boards report directly to the COO.
PRINCIPLE 2.24
APPLIED
A governance framework has been agreed upon between the group and its subsidiary BoardsImplementation and adoption of the holding Company's governance policies, processes or procedures are considered and approved.
PRINCIPLE 2.24
APPLIED
A governance framework has been agreed upon between the group and its subsidiary BoardsThe holding Company Board consults with the Chairman of the subsidiary Board and nomination committee prior to nominating ashareholder representative Director.Comment: Massmart Holdings' Executives are represented on each of the Divisional Boards as non-executive Directors.
PRINCIPLE 2.24
APPLIED
A governance framework has been agreed upon between the group and its subsidiary BoardsThe holding Company that appoints a Director to represent its shareholder interests on the Board of the subsidiary Company,respects the fiduciary duty of that Director to the subsidiary Company.
PRINCIPLE 2.24
APPLIED
A governance framework has been agreed upon between the group and its subsidiary BoardsInsider trading is dealt with in terms of relevant stock exchange rules.
PRINCIPLE 2.24
APPLIED
A governance framework has been agreed upon between the group and its subsidiary BoardsThere are formal policies and practices in place to ensure equal treatment of shareholders within the group.

PRINCIPLE 2.25
PARTIALLYAPPLIED
The Company remunerates its Directors and executives fairly.The remuneration report discloses performance measures for vesting of share options and the reasons for choosing thoseperformance measures.Comment: The report discloses performance measures for vesting of share options but not the reasons for choosing those performancemeasures.
PRINCIPLE 2.25
APPLIED
The Company remunerates its Directors and executives fairly.The remuneration report includes details of the main performance parameters or targets for threshold, expected and beyondexpectation performance of executive Directors and other senior executives.
PRINCIPLE 2.25
APPLIED
The Company remunerates its Directors and executives fairly.Remuneration policies and practices are in place that adequately address all of the following: base pay and bonuses; termination ofemployee contracts; severance and retirement benefits; and share-based and other long-term incentive schemes.
PRINCIPLE 2.25
APPLIED
The Company remunerates its Directors and executives fairly.Participation in the Company's share-based and long-term incentive schemes is subject to both of these conditions: It is limited toemployees and executive Directors; and It provides appropriate limits for individual participation.Comment: Non-executive Directors are not entitled tp participate in the Company's incentive scheme, Maximum participation in theshare-based incentive scheme is four million shares.
PRINCIPLE 2.25
APPLIED
The Company remunerates its Directors and executives fairly.Remuneration policies and practices are both: aligned with Company strategy; and linked to individual performance.
PRINCIPLE 2.25
APPLIED
The Company remunerates its Directors and executives fairly.High leveraging of share-based incentive schemes through extensive financing thereof is avoided.
PRINCIPLE 2.25
APPLIED
The Company remunerates its Directors and executives fairly.Incentives are based on targets that are both: related to both finances and sustainability; and stretching, verifiable and relevant.
PRINCIPLE 2.25
APPLIED
The Company remunerates its Directors and executives fairly.The awards of share-based incentives and options are granted regularly and consistently, generally once a year.
PRINCIPLE 2.25
APPLIED
The Company remunerates its Directors and executives fairly.Awards of share-based incentives and options are not allowed in closed periods.
PRINCIPLE 2.25
APPLIED
The Company remunerates its Directors and executives fairly.More than one performance measure is used for the award of incentives to avoid manipulation of results or poor businessdecisions.
PRINCIPLE 2.25
APPLIED
The Company remunerates its Directors and executives fairly.Backdating of awards of share-based incentives and options is not allowed.Comment: This is specifically prohibited in the share incentive documents.
PRINCIPLE 2.25
APPLIED
The Company remunerates its Directors and executives fairly.Remuneration levels reflect the contribution to Company performance by senior executives.
PRINCIPLE 2.25
APPLIED
The Company remunerates its Directors and executives fairly.Incentives for long-term and short-term goals meet both of the following conditions:- Incentives are different for long-term andshort-term goals; and- There is a balance between rewarding short-term and long-term goals.
PRINCIPLE 2.25
APPLIED
The Company remunerates its Directors and executives fairly.Awards of shares and share options, in expectation of service over a performance measurement period, have a vesting period, or areexercisable, within three to seven years from date of grant.Comment: In terms of the existing employee share scheme, vesting occurs over a five-year period, starting two years after the offer date andexpiring ten years after the offer date. The new share plan which is being proposed to shareholders at the May 2013 AGM complies with theabove requirement.
PRINCIPLE 2.25
APPLIED
The Company remunerates its Directors and executives fairly.The value of awards of share options and incentives is not significant compared to base pay.
PRINCIPLE 2.25
APPLIED
The Company remunerates its Directors and executives fairly.Employment contracts do not commit the Company to pay on termination if the termination arises from an executive's failure.

PRINCIPLE 2.25
APPLIED
The Company remunerates its Directors and executives fairly.There is no automatic entitlement to bonus or share-based payments on early termination of employment.
PRINCIPLE 2.25
APPLIED
The Company remunerates its Directors and executives fairly.There is not automatic vesting of share-based and other long-term incentives (although pro rating the benefit based on time andperformance or creating new instruments to preserve value may be considered) in the event of the following: change of control ofthe Company; roll-over for capital reconstruction; early termination of employment; and dismissal for good cause.
PRINCIPLE 2.25
APPLIED
The Company remunerates its Directors and executives fairly.There is no provision in employment contracts for severance payments as result of change in control of the Company.
PRINCIPLE 2.25
APPLIED
The Company remunerates its Directors and executives fairly.The Company has established share-based and/or long-term incentive schemes.
PRINCIPLE 2.25
NOTAPPLIED
The Company remunerates its Directors and executives fairly.Non-executive Directors' fees comprise both a base fee and an attendance fee per meeting.Comment: The Board does not believe that Directors should earn attendance fees in addition to a base fee. Many Directors add significantvalue to the Group outside of the formal Board and Committee meetings, sometimes greater value than they might do within the confines of aformal meeting.
PRINCIPLE 2.25
APPLIED
The Company remunerates its Directors and executives fairly.Shareholders approve non-executive Directors' fees in advance by special resolution.Comment: Refer to Special Resolution Number 2 in the Notice of AGM.
PRINCIPLE 2.25
APPLIED
The Company remunerates its Directors and executives fairly.The Remuneration Committee ensures that the mix of fixed and variable pay (in cash, shares and other elements) meets theCompany's needs and strategic objectives.
PRINCIPLE 2.25
APPLIED
The Company remunerates its Directors and executives fairly.The Remuneration Committee assists the Board in setting and administering remuneration policies for all levels in the Company, butfocuses on the remuneration of executive Directors and other senior executives, and non-executive Directors.
PRINCIPLE 2.25
APPLIED
The Company remunerates its Directors and executives fairly.The Remuneration Committee advises on the remuneration of non-executive Directors.
PRINCIPLE 2.25
APPLIED
The Company remunerates its Directors and executives fairly.The Remuneration Committee considers the appropriateness of early vesting of share-based incentive schemes at the end ofemployment.
PRINCIPLE 2.25
APPLIED
The Company remunerates its Directors and executives fairly.The Remuneration Committee regularly reviews incentive schemes to ensure their continued contribution to shareholder value.
PRINCIPLE 2.25
APPLIED
The Company remunerates its Directors and executives fairly.The remuneration committee ensures that remuneration levels reflect the contribution of senior executives and executive Directorsto Company performance.
PRINCIPLE 2.25
APPLIED
The Company remunerates its Directors and executives fairly.The Remuneration Committee selects an appropriate comparative group when determining remuneration levels.
PRINCIPLE 2.25
APPLIED
The Company remunerates its Directors and executives fairly.The Remuneration Committee ensures that all benefits, including retirement benefits and other financial arrangements, are bothjustified and correctly valued.
PRINCIPLE 2.25
APPLIED
The Company remunerates its Directors and executives fairly.The Remuneration Committee satisfies itself on the accuracy of recorded performance measures that govern vesting of incentives.
PRINCIPLE 2.25
APPLIED
The Company remunerates its Directors and executives fairly.The Remuneration Committee's terms of reference have been approved by the Board and are reviewed every year.

PRINCIPLE 2.25
APPLIED
The Company remunerates its Directors and executives fairly.Incentive schemes to encourage retention are established separately, or are clearly distinguished, from those to reward performanceand details thereof are disclosed in the remuneration report.Comment: The existing employee share scheme and the new share plan which is being proposed to shareholders at the May 2013 AGM dealwith this.
PRINCIPLE 2.25
APPLIED
The Company remunerates its Directors and executives fairly.The remuneration report includes details of limits for participation in incentive schemes.Comment: Limits are included in the incentive scheme documents: max four million per participant.
PRINCIPLE 2.26
APPLIED
The Company has disclosed the remuneration of each individual Director and prescribed officer.The remuneration report includes details about the use of comparative benchmarks for setting remuneration levels.
PRINCIPLE 2.26
APPLIED
The Company has disclosed the remuneration of each individual Director and prescribed officer.The remuneration report includes details of material payments that are ex gratia in nature.
PRINCIPLE 2.26
APPLIED
The Company has disclosed the remuneration of each individual Director and prescribed officer.The remuneration report includes justification of a policy to pay salaries on average above the median of the benchmark used forsetting the remuneration levels.
PRINCIPLE 2.26
NOTAPPLIED
The Company has disclosed the remuneration of each individual Director and prescribed officer.The remuneration report includes the term of executive service contracts as well as the notice period for termination.
PRINCIPLE 2.26
NOTAPPLIED
The Company has disclosed the remuneration of each individual Director and prescribed officer.The remuneration report discloses both the nature and period of restraint provided for in executive service contracts.
PRINCIPLE 2.26
APPLIED
The Company has disclosed the remuneration of each individual Director and prescribed officer.A remuneration report is included in the integrated report.
PRINCIPLE 2.26
APPLIED
The Company has disclosed the remuneration of each individual Director and prescribed officer.The remuneration report discloses the maximum and the expected potential dilution due to incentive awards.Comment: Refer to the Group's Income Statement and Note 11 to the Group AFS.
PRINCIPLE 2.26
APPLIED
The Company has disclosed the remuneration of each individual Director and prescribed officer.The remuneration report discloses the non-executive Directors' fees, including fees for serving on a Board committee.
PRINCIPLE 2.26
APPLIED
The Company has disclosed the remuneration of each individual Director and prescribed officer.The remuneration report includes an overview of the policy on base pay.
PRINCIPLE 2.26
APPLIED
The Company has disclosed the remuneration of each individual Director and prescribed officer.The remuneration report includes details of all benefits paid and awarded to individual Directors.
PRINCIPLE 2.27
APPLIED
The shareholders have approved the Company's remuneration policy.Shareholders pass a non-binding advisory vote on the Company's remuneration policy every year.Comment: The rationale and basis for the Group’s executive remuneration policy is carefully considered by the Remuneration Committee andis documented in the integrated annual report.
PRINCIPLE 3.1 - 3.10
PRINCIPLE 3.1
APPLIED
The Board has ensured that the Company has an effective and independent audit committeeThe Audit Committee's terms of reference have been approved by the Board and are reviewed every year.
PRINCIPLE 3.1
APPLIED
The Board has ensured that the Company has an effective and independent audit committeeThe Nominations Committee presents shareholders with suitable candidates for election as Audit Committee members.

PRINCIPLE 3.1
APPLIED
The Board has ensured that the Company has an effective and independent audit committeeThe Company has an Audit Committee.Comment: The members are Chris Seabrooke, Mark Lamberti, Lulu Gwagwa and Phumzile Langeni.
PRINCIPLE 3.1
APPLIED
The Board has ensured that the Company has an effective and independent audit committeeThe Audit Committee meets at least twice a year.
PRINCIPLE 3.1
APPLIED
The Board has ensured that the Company has an effective and independent audit committeeAt least once a year, the Audit Committee meets with the external and internal auditors without management being present.
PRINCIPLE 3.2
APPLIED
Audit committee members are suitably skilled and experienced independent non-executive DirectorsThe Nominations Committee evaluates whether Audit Committee members collectively have the required level of qualifications andexperience.
PRINCIPLE 3.2
APPLIED
Audit committee members are suitably skilled and experienced independent non-executive DirectorsThe shareholders elect the Audit Committee members at the AGM.Comment: Refer to the Ordinary Resolution number 6 of the Notice of AGM.
PRINCIPLE 3.2
APPLIED
Audit committee members are suitably skilled and experienced independent non-executive DirectorsThe Audit Committee consists of at least three members.Comment: The members are Chris Seabrooke, Lulu Gwagwa and Phumzile Langeni.
PRINCIPLE 3.2
APPLIED
Audit committee members are suitably skilled and experienced independent non-executive DirectorsAll members of the Audit Committee are independent non-executive Directors.
PRINCIPLE 3.2
APPLIED
Audit committee members are suitably skilled and experienced independent non-executive DirectorsAudit Committee members collectively have knowledge and experience of financial risks, financial and sustainability reporting, andinternal controls.
PRINCIPLE 3.2
APPLIED
Audit committee members are suitably skilled and experienced independent non-executive DirectorsAudit Committee members collectively have knowledge and experience of corporate law.
PRINCIPLE 3.2
APPLIED
Audit committee members are suitably skilled and experienced independent non-executive DirectorsAudit Committee members collectively have a thorough understanding of the complexities of International Financial ReportingStandards, South African Statements of Generally Accepted Accounting Practice, Global Reporting Initiative Standards, or any otherfinancial reporting framework and set of standards applicable.
PRINCIPLE 3.2
APPLIED
Audit committee members are suitably skilled and experienced independent non-executive DirectorsIf vacancies on the Audit Committee arise, the Board fills them until the next AGM when shareholders elect members formally.
PRINCIPLE 3.2
APPLIED
Audit committee members are suitably skilled and experienced independent non-executive DirectorsThe integrated report summarises the role and duties of the Audit Committee.Comment: This included in the Corporate Governance section of the Massmart's Integrated Annual Report.
PRINCIPLE 3.2
APPLIED
Audit committee members are suitably skilled and experienced independent non-executive DirectorsThe Audit Committee includes in the integrated report both the following: a statement on whether or not it considered andrecommended the internal audit charter for approval by the Board; and a description of its working relationship with the Chief AuditExecutive.Comment: This included in the Corporate Governance section of the Massmart's Integrated Annual Report.
PRINCIPLE 3.2
APPLIED
Audit committee members are suitably skilled and experienced independent non-executive DirectorsThe integrated report discloses whether the Audit Committee has satisfied its responsibilities for the year in accordance with theformal terms of reference.Comment: This included in the Corporate Governance section of the Massmart's Integrated Annual Report.
PRINCIPLE 3.2
APPLIED
Audit committee members are suitably skilled and experienced independent non-executive DirectorsIt is disclosed in the integrated report whether the Audit Committee has adopted a formal terms of reference.Comment: This included in the Corporate Governance section of the Massmart's Integrated Annual Report.
PRINCIPLE 3.2
PARTIALLYAPPLIED
Audit committee members are suitably skilled and experienced independent non-executive DirectorsThe integrated report discloses the names and qualifications of all members of the Audit Committee during the period under review,and the period that each member has served on the Committee.Comment: We do not disclose the period that each member has served on the committee but do for Board in their CV's in Massmart at aGlance.

PRINCIPLE 3.2
APPLIED
Audit committee members are suitably skilled and experienced independent non-executive DirectorsThe integrated report includes information about duties that the Board has assigned to the Audit Committee.Comment: A summary of the these duties is included in the Board Committees table.
PRINCIPLE 3.3
APPLIED
The audit committee is chaired by an independent non-executive Director.The Chairman of the Audit Committee is an independent non-executive Director and not the Chairman of the Board.Comment: The Chairman of the Audit and Risk Committee is Chris Seabrooke.
PRINCIPLE 3.3
APPLIED
The audit committee is chaired by an independent non-executive Director.The Chairman of the Audit Committee is selected by the Board.
PRINCIPLE 3.3
APPLIED
The audit committee is chaired by an independent non-executive Director.The Chairman of the Audit Committee attends the AGM.Comment: Refer to the Board and Committee Attendance table.
PRINCIPLE 3.4
APPLIED
The audit committee oversees integrated reportingThe Audit Committee is informed where there is disagreement on auditing or accounting matters between the management and theexternal auditors.
PRINCIPLE 3.4
APPLIED
The audit committee oversees integrated reportingThe Audit Committee has regard to all factors and risks that may affect the integrity (i.e. accuracy and reliability of information) ofthe integrated report, including the following: judgements; changes in accounting policies; significant or unusual transactions;factors that may predispose management to present misleading information; and any evidence that brings into question anypreviously published financial information, etc.
PRINCIPLE 3.4
APPLIED
The audit committee oversees integrated reportingThe Audit Committee reviews a written assessment (documented by management) of the going concern premise of the Company.
PRINCIPLE 3.4
APPLIED
The audit committee oversees integrated reportingThe Audit Committee recommends to the Board whether the external auditor should perform assurance procedures on interimresults and review the results of such engagement.
PRINCIPLE 3.4
APPLIED
The audit committee oversees integrated reportingThe Audit Committee reviews the content of summarised information for whether it provides a balanced view of the Company'sinformation.
PRINCIPLE 3.4
APPLIED
The audit committee oversees integrated reportingThe Audit Committee recommends the integrated report to the Board for approval.
PRINCIPLE 3.4
APPLIED
The audit committee oversees integrated reportingThe Audit Committee engages the external auditors to provide assurance on the summarised financial information.
PRINCIPLE 3.4
PARTIALLYAPPLIED
The audit committee oversees integrated reportingThe Audit Committee recommends to the Board to engage an external assurance provider over material elements of thesustainability reporting within the integrated report.Comment: Massmart's sustainability report has not been audited by an external assurance provider but verification of the key sustainabilitymetrics have been obtained through agreed upon procedures performed by Massmart Internal Audit Services (MIAS). A copy of the agreedupon procedures report is available at the registered offices of the Company.
PRINCIPLE 3.4
PARTIALLYAPPLIED
The audit committee oversees integrated reportingThe Audit Committee evaluates both the independence and quality of the external providers of assurance on sustainability.Comment: Massmart's sustainability report has not been audited by an external assurance provider but verification of the key sustainabilitymetrics have been obtained through agreed upon procedures performed by MIAS. A copy of the agreed upon procedures report is available atthe registered offices of the Company.
PRINCIPLE 3.4
APPLIED
The audit committee oversees integrated reportingThe Audit Committee reviews the disclosure of sustainability issues in the integrated report to ensure that it is both reliable and notin conflict with the financial information.
PRINCIPLE 3.5
APPLIED
The audit committee has ensured that a combined assurance model has been applied which provides acoordinated approach to all assurance activities.The Audit Committee ensures that the combined assurance received from management, internal and external assurance providersis sufficient to address all significant risks facing the Company.

PRINCIPLE 3.5
APPLIED
The audit committee has ensured that a combined assurance model has been applied which provides acoordinated approach to all assurance activities.The Audit Committee monitors the relationship between the external assurance providers and the Company.
PRINCIPLE 3.6
APPLIED
The audit committee is satisfied with the expertise, resources and experience of the Company's financefunction.The integrated report discloses the results of the Audit Committee's evaluation of both the finance Director and the finance function.
PRINCIPLE 3.6
APPLIED
The audit committee is satisfied with the expertise, resources and experience of the Company's financefunction.The Audit Committee does both of the following: considers and satisfies itself of the suitability of the expertise and experience ofthe financial Director every year; and reviews the finance function every year.
PRINCIPLE 3.7
APPLIED
The audit committee oversees the internal audit functionThe Audit Committee is responsible for the appointment, performance assessment and dismissal of the Chief Audit Executive oroutsourced internal audit service provider.
PRINCIPLE 3.7
APPLIED
The audit committee oversees the internal audit functionThe internal audit plan is approved by the Audit Committee.
PRINCIPLE 3.7
APPLIED
The audit committee oversees the internal audit functionThe Audit Committee ensures that the Company's internal audit function both: is independent; and has the necessary resources,standing and authority within the Company to enable it to discharge its functions.
PRINCIPLE 3.7
APPLIED
The audit committee oversees the internal audit functionThe Audit Committee oversees cooperation between external and internal audit to avoid overlap of audit scope.
PRINCIPLE 3.7
APPLIED
The audit committee oversees the internal audit functionThe Audit Committee ensures that the internal audit function goes through an independent quality review in line with Institute ofInternal Auditors' standards or whenever it considers it appropriate.
PRINCIPLE 3.8
APPLIED
The audit committee is an integral component of the risk management process.The terms of reference of the Audit Committee set out its responsibilities for risk management.Comment: This is included in the Audit and Risk Committee Charter.
PRINCIPLE 3.8
APPLIED
The audit committee is an integral component of the risk management process.The Audit Committee oversees all of the following: financial reporting risks; internal financial controls; fraud risks related tofinancial reporting; and IT risks related to financial reporting.
PRINCIPLE 3.8
APPLIED
The audit committee is an integral component of the risk management process.There is a Board committee (either a risk committee or the audit committee) that assists the Board in carrying out its riskresponsibilities. (Further questions will refer to a risk committee, even if the audit committee carries out this function.)Comment: This is dealt with by the risk component of the Audit and Risk Committee.
PRINCIPLE 3.8
APPLIED
The audit committee is an integral component of the risk management process.The Risk Committee oversees the Company's risk management function.
PRINCIPLE 3.8
APPLIED
The audit committee is an integral component of the risk management process.Both these statements are correct: In the integrated report, the Audit Committee makes a statement on the effectiveness of thesystem of internal financial controls; and This statement is based on a formal documented review performed by internal audit aswell as reports from other assurance providers, management and the external auditors.Comment: This is included in the Corporate Governance section of the Massmart's Integrated Annual Report.
PRINCIPLE 3.8
APPLIED
The audit committee is an integral component of the risk management process.The Audit Committee discloses in the integrated report the nature and extent of material weaknesses in the design, implementationor execution of financial controls that resulted in material financial loss, fraud or material errors.Comment: There has been no material financial loss, fraud or material errors resultant from weakness in financial controls.
PRINCIPLE 3.9
APPLIED
The audit committee is responsible for the recommending the appointment of the external auditor andoverseeing the external audit process.The Audit Committee approves both the external auditor's terms of engagement and remuneration.
PRINCIPLE 3.9
APPLIED
The audit committee is responsible for the recommending the appointment of the external auditor andoverseeing the external audit process.The Audit Committee monitors and reports on the external auditor's independence.

PRINCIPLE 3.9
APPLIED
The audit committee is responsible for the recommending the appointment of the external auditor andoverseeing the external audit process.The Audit Committee has defined a policy for non-audit services provided by the external auditor.
PRINCIPLE 3.9
APPLIED
The audit committee is responsible for the recommending the appointment of the external auditor andoverseeing the external audit process.The Audit Committee recommends to shareholders the appointment, reappointment and removal of the external auditor.Comment: Refer to the Ordinary Resolution Number 5 in the Notice of AGM.
PRINCIPLE 3.9
APPLIED
The audit committee is responsible for the recommending the appointment of the external auditor andoverseeing the external audit process.The Audit Committee reviews any accounting and auditing concerns identified as a result of the internal or external audit.
PRINCIPLE 3.9
APPLIED
The audit committee is responsible for the recommending the appointment of the external auditor andoverseeing the external audit process.The Audit Committee is informed of Reportable Irregularities identified and reported by the external auditor in terms of the AuditingProfession Act.Comment: There aren't any to report on.
PRINCIPLE 3.9
APPLIED
The audit committee is responsible for the recommending the appointment of the external auditor andoverseeing the external audit process.The Audit Committee reviews the quality and effectiveness of the external audit process.
PRINCIPLE 3.10
APPLIED
The audit committee has reported to the Board and the shareholders as to how it has discharged its duties.The integrated report describes how the Audit Committee carried out its functions during the period under review.Comment: This is included in the Corporate Governance section of the Massmart's Integrated Annual Report.
PRINCIPLE 3.10
APPLIED
The audit committee has reported to the Board and the shareholders as to how it has discharged its duties.The integrated report includes a statement on whether the Audit Committee is satisfied that the auditor is independent of theCompany.Comment: This is included in the Audit and Risk Committee Report.
PRINCIPLE 3.10
APPLIED
The audit committee has reported to the Board and the shareholders as to how it has discharged its duties.The integrated report includes commentary by the Audit Committee on all of the following: the financial statements; the accountingpractices; and the internal financial controls of the Company.Comment: This is included in the Audit and Risk Committee Report.
PRINCIPLE 3.10
APPLIED
The audit committee has reported to the Board and the shareholders as to how it has discharged its duties.The Audit Committee reports internally to the Board both on its statutory duties and on those duties that the Board assigns to it.
PRINCIPLE 3.10
APPLIED
The audit committee has reported to the Board and the shareholders as to how it has discharged its duties.The Audit Committee reports to the shareholders on all of its statutory duties.Comment: This is included in the Audit and Risk Committee Report.
PRINCIPLE 4.1 - 4.10
PRINCIPLE 4.1
APPLIED
The Board is responsible for the governance of risk.A policy and a plan that provide for an effective system and process of risk management have been developed and approved by theBoard.Comment: This function is delegated to the Audit and Risk Committee, which oversees the development and annual review of the Group's riskmanagement policy, process and structures, and makes recommendations from time-to-time to the Board.
PRINCIPLE 4.1
APPLIED
The Board is responsible for the governance of risk.Management demonstrates to the Board that the risk responses provide for the identification and exploitation of opportunities toimprove the performance of the Company.
PRINCIPLE 4.1
APPLIED
The Board is responsible for the governance of risk.The risk policy includes all of the following: the Company's definitions of risk terms and risk management; - risk managementobjectives; the risk approach and philosophy; and the various responsibilities and ownership for risk management within theCompany.
PRINCIPLE 4.1
APPLIED
The Board is responsible for the governance of risk.The Board's responsibility for risk governance is set out in both the Board charter and risk policy and plan.Comment: The Board Charter provides that the Board and Board Committees assume responsibility for ensuring that a relevant system ofpolicies and procedures is in place to identify, monitor and manage risk and to ensure regulatory and legal compliance.

PRINCIPLE 4.1
APPLIED
The Board is responsible for the governance of risk.The risk plan includes all of the following: the Company's risk management structure; the risk management framework; i.e. theapproach followed (for example, COSO, ISO, IRMSA ERM Code of Practice, IRM (UK), etc.); the standards and methodology adopted;i.e. the measureable milestones (for example, tolerances, intervals, frequencies, frequency rates, etc.); risk management guidelines;reference to integration of risk (for example, communication, training and awareness programmes); and details of the assuranceand review of the risk management process.
PRINCIPLE 4.1
APPLIED
The Board is responsible for the governance of risk.The integrated report discloses details of how the Board has satisfied itself that risk assessments, responses and interventions areeffective.Comment: This is included in the Corporate Governance section of the Massmart's Integrated Annual Report.
PRINCIPLE 4.2
APPLIED
The Board has determined the levels of risk tolerance.The Company discloses in the integrated report details of where the limits of risk appetite (willingness to tolerate risk) exceed, ordeviate materially from, the limits of the Company's risk tolerance (ability to tolerate risks).Comment: The Company's risk appetite has not exceeded its risk tolerance levels.
PRINCIPLE 4.2
APPLIED
The Board has determined the levels of risk tolerance.The Board monitors that risks are taken within the Company's tolerance and appetite levels.Comment: The Audit and Risk Committee monitors that risks are managed within the level of tolerance and appetite, as approved by theBoard.
PRINCIPLE 4.2
APPLIED
The Board has determined the levels of risk tolerance.The Board sets the levels of risk tolerance every year.Comment: The Audit and Risk Committee makes recommendations to the Board concerning levels of tolerance and appetite, which the Boardapproves.
PRINCIPLE 4.3
APPLIED
The risk committee and/or audit committee has assisted the Board in carrying out its risk responsibilities.The Risk Committee adequately reviews all of the following: the risk management progress and maturity of the Company; theeffectiveness of risk management activities; the key risks facing the Company; and the responses to address these key risks.
PRINCIPLE 4.3
APPLIED
The risk committee and/or audit committee has assisted the Board in carrying out its risk responsibilities.The Risk Committee monitors the whole risk management process.
PRINCIPLE 4.3
APPLIED
The risk committee and/or audit committee has assisted the Board in carrying out its risk responsibilities.The Risk Committee considers the risk policy and plan.
PRINCIPLE 4.3
APPLIED
The risk committee and/or audit committee has assisted the Board in carrying out its risk responsibilities.Both the following statements are true: Membership of the Risk Committee includes executive and non-executive Directors; andMembers of senior management and independent risk management experts are invited to attend, if necessary.
PRINCIPLE 4.3
APPLIED
The risk committee and/or audit committee has assisted the Board in carrying out its risk responsibilities.The Risk Committee has at least three members.Comment: The members are Chris Seabrooke, Mark Lamberti, Lulu Gwagwa and Phumzile Langeni.
PRINCIPLE 4.3
APPLIED
The risk committee and/or audit committee has assisted the Board in carrying out its risk responsibilities.The Risk Committee members collectively have adequate and appropriate knowledge, skills and experience in risk.
PRINCIPLE 4.4
APPLIED
The Board has delegated to management the responsibility to design, implement and monitor the riskmanagement plan.The Board's risk policy and plan is effectively implemented by management through risk management systems and processes.Comment: On behalf of the Board, the Audit & Risk Committee oversees the Group's risk management programme. Responsibility for riskmanagement and loss prevention rests however, with the Group and Divisional Executive Committees.
PRINCIPLE 4.4
APPLIED
The Board has delegated to management the responsibility to design, implement and monitor the riskmanagement plan.A Chief Risk Officer (CRO) or other senior employee responsible for risk management has been appointed and meets both thefollowing requirements: The CRO or senior employee is a suitably experienced person; and The CRO or senior employee has accessto and regular interaction on strategic matters with the Board or appropriate Board committee, and executive management.Comment: Massmart's Chief Risk Officer (CRO) is the Group's Financial Director.
PRINCIPLE 4.5
APPLIED
The Board has ensured that risk assessments are performed on a continual basis.The Board ensures that effective and on-going risk assessments (i.e. identification and evaluation of risks in terms of probabilityand impact) are performed.Comment: The Risk Committee tables a Group risk register, aggregated from those prepared by the Divisions and the Group ExecutiveCommittee, to the Board annually in February.

PRINCIPLE 4.5
APPLIED
The Board has ensured that risk assessments are performed on a continual basis.A systematic, documented, formal risk assessment is conducted at least once a year.Comment: The Risk Committee tables a Group risk register, aggregated from those prepared by the Divisions and the Group ExecutiveCommittee, to the Board annually.
PRINCIPLE 4.5
APPLIED
The Board has ensured that risk assessments are performed on a continual basis.Risks are prioritised and ranked in order to focus responses and interventions to those risks outside the Board's tolerance limits.Comment: Risks are ranked within the Group risk register.
PRINCIPLE 4.5
APPLIED
The Board has ensured that risk assessments are performed on a continual basis.A top-down approach is adopted in risk assessments without limiting focus to strategic or high-end risks only.Comment: The Risk Committee considers there to be two categories of Group risk which can broadly be described as Strategic/Environmentalrisks and Operational risks.
PRINCIPLE 4.5
APPLIED
The Board has ensured that risk assessments are performed on a continual basis.The Board regularly receives and reviews a register of the Company's key risks.
PRINCIPLE 4.5
APPLIED
The Board has ensured that risk assessments are performed on a continual basis.The risk assessment process (i.e. identification and evaluation of risks in terms of probability and impact) involves all of thefollowing: the risks affecting the various income streams of the Company; the critical dependencies of the business; and thesustainability and the legitimate interests and expectations of stakeholders.Comment: Refer to our Group Risk Landscape section of the Massmart Integrated Annual Report
PRINCIPLE 4.5
NOTAPPLICABLE
The Board has ensured that risk assessments are performed on a continual basis.The Board ensures that key risks are quantified where practicable.
PRINCIPLE 4.6
APPLIED
The Board has ensured that frameworks and methodologies are implemented to increase the probability ofanticipating unpredictable risks.The Board ensures that an effective framework and processes are in place to anticipate unpredictable risks.
PRINCIPLE 4.7
APPLIED
The Board has ensured that management has considered and has implemented appropriate risk responses.Management determines risk responses, and notes the risk responses in the risk register.
PRINCIPLE 4.8
APPLIED
The Board has ensured the continual risk monitoring by management.The Board ensures that effective and continual monitoring of risk management takes place.Comment: The Audit and Risk Committee Charter provides that the Company monitors the implementation of the policy and plan for riskmanagement taking place by means of risk management systems and processes.
PRINCIPLE 4.9
APPLIED
The Board has received assurance regarding the effectiveness of the risk management process.Management provides assurance to the Board that the risk management plan is integrated in the daily activities of the Company.
PRINCIPLE 4.10
APPLIED
The Board has ensured that there are processes in place which enable complete, timely, relevant, accurateand accessible risk disclosure to stakeholders.There is disclosure of undue, unexpected or unusual risks taken, and if there are any resulting material losses that the Companysuffered for the period under review, also disclosure of all of the following: the causes of these losses; the effect that these losseshave had on the Company; and the steps taken by the Board and the management to prevent a recurrence.Comment: The unexpected risk of significant currency devaluations is disclosed in the Group's Annual Financial Statements.
PRINCIPLE 4.10
APPLIED
The Board has ensured that there are processes in place which enable complete, timely, relevant, accurateand accessible risk disclosure to stakeholders.There is disclosure of any current, imminent or envisaged risk that is considered to threaten the long-term sustainability of theCompany.Comment: There is no current imminent or envisaged risk existing.
PRINCIPLE 4.10
APPLIED
The Board has ensured that there are processes in place which enable complete, timely, relevant, accurateand accessible risk disclosure to stakeholders.The Board has ensured that there are processes in place which enable complete, timely, relevant, accurate and accessible riskdisclosure to stakeholders.Comment: The Board discloses in the integrated report its views on the effectiveness of the Company's risk management processes.
PRINCIPLE 5.1 - 5.7
PRINCIPLE 5.1
APPLIED
The Board is responsible of information technology (IT) governance.The IT governance framework includes the structures, processes and mechanisms that will enable the delivery of value to thebusiness and reduce IT risk.

PRINCIPLE 5.1
APPLIED
The Board is responsible of information technology (IT) governance.The Board receives independent assurance on the effectiveness of the IT internal controls, including on outsourced IT services.Comment: Independent review and assurance is provided by the External Auditors and MIAS.
PRINCIPLE 5.1
APPLIED
The Board is responsible of information technology (IT) governance.The Board assumes responsibility for the governance of IT and places it on the Board agenda.Comment: Ensuring proper system security, data integrity and business continuity is the responsibility of the Board, but is given effect by theAudit and Risk Committee, the Massmart Technology Information and Process Forum (TIP Forum) and Massmart's formally contracted ITbusiness partners and service providers.
PRINCIPLE 5.1
APPLIED
The Board is responsible of information technology (IT) governance.The Company has an IT governance framework that supports effective and efficient management of its IT resources.
PRINCIPLE 5.1
APPLIED
The Board is responsible of information technology (IT) governance.The Board ensures that an effective IT charter and policies are established and implemented.
PRINCIPLE 5.2
APPLIED
IT has been aligned with the performance and sustainability objectives of the Company.The Board ensures that IT strategy is effectively integrated with the Company's strategic and business processes.
PRINCIPLE 5.2
APPLIED
IT has been aligned with the performance and sustainability objectives of the Company.The Board ensures that there is an effective process in place to identify and exploit opportunities to improve the performance andsustainability of the Company through the use of IT.Comment: Opportunities are identified by MIAS and through collaboration in the TIP Forum.
PRINCIPLE 5.3
APPLIED
The Board has delegated to management the responsibility for the implementation of an IT governanceframework.Management is responsible for the implementation of all the structures, processes and mechanisms of the IT governanceframework.
PRINCIPLE 5.3
APPLIED
The Board has delegated to management the responsibility for the implementation of an IT governanceframework.A Chief Information Officer (CIO) or other senior employee responsible for IT has been appointed and meets both the followingrequirements: The CIO or senior employee is a suitably experienced person; and The CIO or senior employee has access to andregular interaction on strategic matters with the Board or appropriate Board Committee, and executive management.Comment: The Chairman of the TIP Forum, Mike Marshall, has access to the Executive Directors and is suitably experienced to fulfill therequirements of this role.
PRINCIPLE 5.4
APPLIED
The Board monitors and evaluates significant IT investments and expenditure.The Board both oversees the value delivery of IT, and monitors the return on investment from significant IT projects.
PRINCIPLE 5.4
APPLIED
The Board monitors and evaluates significant IT investments and expenditure.The role of IT in achieving business strategies and objectives is clear.
PRINCIPLE 5.4
APPLIED
The Board monitors and evaluates significant IT investments and expenditure.Good governance principles apply to all parties in the supply chain or channel for the acquisition and disposal of IT goods orservices.Comment: All new major IT systems in the Group require specific MIAS sign-off prior to implementation and all significant IT projects aresubject to MIAS review.
PRINCIPLE 5.5
APPLIED
IT is an integral part of the Company's risk management plan.IT risks form an integral part of the Company's risk management process.
PRINCIPLE 5.5
APPLIED
IT is an integral part of the Company's risk management plan.Management regularly demonstrates to the Board that the Company has adequate business resilience arrangements in place for ITdisaster recovery.
PRINCIPLE 5.5
APPLIED
IT is an integral part of the Company's risk management plan.The Board ensures that the Company complies with IT laws and that IT-related rules, codes and standards are considered.
PRINCIPLE 5.6
APPLIED
The Board ensured that information assets are managed effectively.The Board ensures that the Company identifies all personal information and treats it as an important business asset.

PRINCIPLE 5.6
APPLIED
The Board ensured that information assets are managed effectively.The following two statements are correct: The Board ensures that an Information Security Management System is developed,recorded and implemented; and The Information Security Management System ensures security, confidentiality, integrity andavailability of information.
PRINCIPLE 5.7
APPLIED
A risk committee and audit committee assists the Board in carrying out its IT responsibilities.The Risk Committee assists the Board in carrying out its IT governance responsibilities by ensuring that IT risks are adequatelyaddressed through its risk management and monitoring processes.
PRINCIPLE 6.1 - 6.4
PRINCIPLE 6.1
APPLIED
The Board ensures that the Company complies with applicable laws and considers adherence to non bindingrules, codes and standards.The Board assumes responsibility for the Company's compliance with applicable laws and those non-binding rules, codes andstandards that the Company has voluntarily elected to comply with.Comment: The Board Charter provides that the Board shall ensure compliance with laws and regulations by the Group and the Group's owngoverning documents, codes of conduct and legal standards.
PRINCIPLE 6.1
APPLIED
The Board ensures that the Company complies with applicable laws and considers adherence to non bindingrules, codes and standards.The Board appreciates that the duty to act in the best interest of the Company involves having regard to, not only the obligationsthat laws create, but also the rights and protection that they afford to the Company.
PRINCIPLE 6.1
APPLIED
The Board ensures that the Company complies with applicable laws and considers adherence to non bindingrules, codes and standards.The Board oversees that the compliance policy and process take account of the context of law, and how applicable laws relate toone other.
PRINCIPLE 6.1
APPLIED
The Board ensures that the Company complies with applicable laws and considers adherence to non bindingrules, codes and standards.The Board continually monitors the Company's voluntary compliance with applicable laws, rules, codes and standards.Comment: On-going compliance is monitored and tested through various means including MIAS, external audit and third party serviceproviders. Reports from these entities are presented to the Audit and Risk Committee.
PRINCIPLE 6.1
APPLIED
The Board ensures that the Company complies with applicable laws and considers adherence to non bindingrules, codes and standards.The integrated report discloses the extent of voluntary adherence to applicable non-binding rules, codes and standards.
PRINCIPLE 6.1
APPLIED
The Board ensures that the Company complies with applicable laws and considers adherence to non bindingrules, codes and standards.The integrated report discloses details of how the Board discharges its responsibility to establish an effective complianceframework and processes.
PRINCIPLE 6.2
APPLIED
The Board and each individual Director have a working understanding of the effect of applicable laws, rules,codes and standards on the Company and its business.Both the induction and on-going training programmes of Directors include an overview of, and changes to, applicable laws, rules,codes and standards.
PRINCIPLE 6.2
APPLIED
The Board and each individual Director have a working understanding of the effect of applicable laws, rules,codes and standards on the Company and its business.Directors know the general content of applicable laws, rules, codes and standards sufficiently well to discharge their legal duties.
PRINCIPLE 6.3
APPLIED
Compliance risk should form an integral part of the Company's risk management process.The risk of non-compliance is identified, assessed and responded to through the risk management processes.
PRINCIPLE 6.4
APPLIED
The Board should delegate to management the implementation of an effective compliance framework andprocesses.There is disclosure of material or repeated regulatory penalties, sanctions or fines for contraventions of, or non-compliance with,statutory obligations whether imposed on the Company or its Directors or officers.Comment: There were no such material or repeated regulatory penalties, sanctions or fines for contraventions of, or non-compliance with,statutory obligations during the reporting period.
PRINCIPLE 6.4
APPLIED
The Board should delegate to management the implementation of an effective compliance framework andprocesses.Management has established the appropriate structures to educate, train, communicate about, and measure compliance.Comment: The Executive Committee has recently established a Compliance sub-committee in order to focus on issues of compliance.

PRINCIPLE 6.4
APPLIED
The Board should delegate to management the implementation of an effective compliance framework andprocesses.The CEO has appointed an individual responsible for the management of compliance; e.g. a Chief Compliance Officer.Comment: Massmart's General Counsel, who sits on the Executive Committee, is the Group's Chief Compliance Officer.
PRINCIPLE 6.4
APPLIED
The Board should delegate to management the implementation of an effective compliance framework andprocesses.A Chief Compliance Officer or other senior employee responsible for compliance has been appointed and meets both the followingrequirements: The Chief Compliance Officer or senior employee is a suitably experienced person; and The Chief Compliance Officeror senior employee has access to and regular interaction on strategic matters with the Board or appropriate Board Committee, andexecutive management.
PRINCIPLE 6.4
APPLIED
The Board should delegate to management the implementation of an effective compliance framework andprocesses.The compliance function has adequate resources to fulfil its duties.
PRINCIPLE 6.4
APPLIED
The Board should delegate to management the implementation of an effective compliance framework andprocesses.The Board ensures that management has implemented a legal compliance policy, approved by the Board.
PRINCIPLE 6.4
APPLIED
The Board should delegate to management the implementation of an effective compliance framework andprocesses.The Board receives assurance on the effectiveness of the internal controls intended to ensure compliance with laws, rules, codesand standards.Comment: Massmart General Counsel and MIAS report to the Board on any matters of compliance.
PRINCIPLE 6.4
APPLIED
The Board should delegate to management the implementation of an effective compliance framework andprocesses.Compliance with laws, rules, codes and standards is dealt with in the code of conduct of the Company.
PRINCIPLE 7.1 - 7.5
PRINCIPLE 7.1
APPLIED
The Board should ensure that there is an effective risk based internal audit.The Company has established an internal audit function.
PRINCIPLE 7.1
APPLIED
The Board should ensure that there is an effective risk based internal audit.The internal audit function evaluates the Company's governance processes.
PRINCIPLE 7.1
APPLIED
The Board should ensure that there is an effective risk based internal audit.The internal audit function performs an objective assessment of the effectiveness of risk management and the internal controlframework.Comment: The Audit and Risk Committee Chairman has given the Chief Audit Executive the task of working on this.
PRINCIPLE 7.1
APPLIED
The Board should ensure that there is an effective risk based internal audit.The internal audit function systematically analyses and evaluates business processes and associated controls.
PRINCIPLE 7.1
APPLIED
The Board should ensure that there is an effective risk based internal audit.The internal audit function adheres to the Institute of Internal Auditors' Standards for the Professional Practice of Internal Auditingand Code of Ethics.
PRINCIPLE 7.1
APPLIED
The Board should ensure that there is an effective risk based internal audit.The internal audit function appropriately provides information on instances of fraud, corruption, unethical behaviour andirregularities.
PRINCIPLE 7.1
NOTAPPLICABLE
The Board should ensure that there is an effective risk based internal audit.Where there is no formal internal audit function, the integrated report discloses:- the reasons for this; and- how adequate assuranceof an effective governance, risk management and internal control environment has been maintained.Comment: N/A
PRINCIPLE 7.2
APPLIED
Internal Audit should follow a risk based approach to its plan.The internal audit plan and approach are informed by the strategy and risks of the Company.
PRINCIPLE 7.3
APPLIED
Internal Audit should provide a written assessment of the effectiveness of the Company's system of internalcontrols and risk management.Internal controls are established over all of the following areas: financial; operational; compliance; and sustainability.

PRINCIPLE 7.3
APPLIED
Internal Audit should provide a written assessment of the effectiveness of the Company's system of internalcontrols and risk management.Internal audit provides the Board with a written assessment of the system of internal controls and risk management.
PRINCIPLE 7.3
APPLIED
Internal Audit should provide a written assessment of the effectiveness of the Company's system of internalcontrols and risk management.Internal audit provides a documented review of internal financial controls to the audit committee.
PRINCIPLE 7.4
APPLIED
The Audit Committee should be responsible for overseeing internal audit.Comment: MIAS report functionally to the Audit and Risk Committee.
PRINCIPLE 7.5
APPLIED
Internal audit should be strategically positioned to achieve its objectives.The internal audit function is independent and objective.
PRINCIPLE 7.5
APPLIED
Internal audit should be strategically positioned to achieve its objectives.The internal audit function reports functionally to the Audit Committee.
PRINCIPLE 7.5
APPLIED
Internal audit should be strategically positioned to achieve its objectives.The Chief Audit Executive has a standing invitation to attend Executive Committee meetings.
PRINCIPLE 7.5
APPLIED
Internal audit should be strategically positioned to achieve its objectives.The internal audit function has the appropriate skills and resources to meet the complexity and volume of risk, and the assuranceneeds of the Company.
PRINCIPLE 7.5
APPLIED
Internal audit should be strategically positioned to achieve its objectives.The Chief Audit Executive develops and maintains a quality assurance and improvement programme that covers all aspects of theinternal audit function.
PRINCIPLE 8.1 - 8.6
PRINCIPLE 8.1
APPLIED
The Board should appreciate that stakeholders' perceptions affect a Company's reputation.The gap between stakeholders' perceptions and the performance of the Company is measured and managed to enhance or protectthe Company's reputation.Comment: A formal stakeholder engagement process is undertaken from a corporate accountability point of view, the aim of which is tooptimise the Group's performance by integrating profitability and accountability. In addition, the Executive Directors formally engage withstakeholders twice a year, and informally on an ad hoc basis.
PRINCIPLE 8.1
APPLIED
The Board should appreciate that stakeholders' perceptions affect a Company's reputation.The Company's reputation, and how its relationships with stakeholders affect it, is a regular Board agenda item.Comment: Stakeholder relationships and the Company's reputation are discussed under sustainability and investor relations discussions;The latest Social and Ethics Committee Report is included in every Board pack; andThe Group General Counsel discusses matters relating to FCPA and the Consumer Protection Act.
PRINCIPLE 8.1
APPLIED
The Board should appreciate that stakeholders' perceptions affect a Company's reputation.All of the following statements are correct in relation to stakeholders that could materially affect the operations of the Company:Stakeholders are identified; and Stakeholders' legitimate interests and expectations are evaluated; and The above takes place aspart of the risk management process.Comment: Stakeholders and their interests and expectations are identified and evaluated. The Group Risk Landscape is reviewed on an annualbasis to address this.
PRINCIPLE 8.2
APPLIED
The Board should delegate to management to proactively deal with stakeholder relationships.Management develops a strategy and formulates policies for the management of the relationship with each stakeholder grouping.
PRINCIPLE 8.2
APPLIED
The Board should delegate to management to proactively deal with stakeholder relationships.The Board oversees the establishment of mechanisms and processes that support constructive engagement by the Company withits stakeholders.
PRINCIPLE 8.2
APPLIED
The Board should delegate to management to proactively deal with stakeholder relationships.The Board encourages shareholders to attend the AGMs.
PRINCIPLE 8.3
APPLIED
The Board should strive to achieve the appropriate balance between its various stakeholder groupings, in thebest interests of the Company.The Board takes account of the legitimate interests and expectations of its stakeholders in making decisions in the best interests ofthe Company.

PRINCIPLE 8.4
APPLIED
Companies should ensure the equitable treatment of shareholders.There is equitable treatment of all holders of the same class of shares.Comment: The equitable treatment of all holders of the same class of shares is protected by the Board.
PRINCIPLE 8.4
APPLIED
Companies should ensure the equitable treatment of shareholders.The Board ensures that minority shareholders are sufficiently protected.
PRINCIPLE 8.5
APPLIED
Transparent and effective communication with stakeholders is essential for building and maintaining theirtrust and confidence.The Board has adopted stakeholder communication guidelines that support a responsible communication programme.Comment: There do not appear to be any formal guidelines that have been adopted by the Board.
PRINCIPLE 8.5
APPLIED
Transparent and effective communication with stakeholders is essential for building and maintaining theirtrust and confidence.The Company provides information to its stakeholders that is both: complete, timely, relevant, accurate, honest and accessible; andin accordance with legal constraints and strategy.
PRINCIPLE 8.5
NOTAPPLICABLE
Transparent and effective communication with stakeholders is essential for building and maintaining theirtrust and confidence.The integrated report includes reasons for refusals of requests for information that were lodged with the Company in terms of thePromotion of Access to Information Act, 2000.Comment: N/A
PRINCIPLE 8.6
PARTIALLYAPPLIED
The Board should ensure that disputes are resolved effectively and expeditiously as possible.The Board has adopted formal dispute resolution processes for internal and external disputes.Comment: The Board does not have a formal dispute resolution process as it believes that the existing processes within the Group operatesatisfactorily and do not require a more formal and separate mechanism.
PRINCIPLE 9.1 - 9.3
PRINCIPLE 9.1
APPLIED
The Board should ensure the integrity of the Company's integrated report.The Company has controls to enable it to verify and safeguard the integrity, i.e. accuracy and reliability, of its integrated report.
PRINCIPLE 9.2
APPLIED
Sustainability reporting and disclosure should be integrated with the Company's financial reporting.The Board includes commentary on the Company's financial results in the integrated report.Comment: This is included in the Report to Shareholders section of Massmart's Integrated Annual Report.
PRINCIPLE 9.2
APPLIED
Sustainability reporting and disclosure should be integrated with the Company's financial reporting.The Board discloses in the integrated report the following: whether the Company is a going concern and if it will continue to be agoing concern in the year ahead; and if there is concern about the Company's going concern status, the reasons therefor and thesteps the Company are taking to remedy the situation.Comment: This is included in the Financial Director's Review, of Massmart's Integrated Annual Report.
PRINCIPLE 9.2
APPLIED
Sustainability reporting and disclosure should be integrated with the Company's financial reporting.The Board ensures that the integrated report sets out: the positive and negative effects of the Company's operations on theenvironment and society; and the plans to improve the positive effects and remove or reduce the negative effects in the financialyear ahead.Comment: We talk to the effects of the Company's operations on the environment and society.
PRINCIPLE 9.2
APPLIED
Sustainability reporting and disclosure should be integrated with the Company's financial reporting.The integrated report discloses the nature of the Company's dealings with stakeholders and the outcomes of these dealings.Comment: The integrated report discloses the nature of the Company's dealings with stakeholders and the outcomes of these dealings.
PRINCIPLE 9.3
PARTIALLYAPPLIED
Sustainability reporting and disclosure should be independently assured.The integrated report discloses the scope and methodology of independent assurance of the sustainability report, as well as thename of the assurer.Comment: Massmart's sustainability report has not been audited but verification of the key sustainability metrics on have been obtainedthrough agreed upon procedures performed by MIAS. A copy of the agreed upon procedures report is available at the registered offices of theCompany.
PRINCIPLE 9.3
PARTIALLYAPPLIED
Sustainability reporting and disclosure should be independently assured.Sustainability reporting is independently assured in accordance with a formal assurance process established.Comment: Massmart's sustainability report has not been audited by an external party but verification of the key sustainability metrics havebeen obtained through agreed upon procedures performed by MIAS. A copy of the agreed upon procedures report is available at the registeredoffices of the Company.

BOARD AND COMMITTEE ATTENDANCE
THE TABLE BELOW REFLECTS THE BOARD MEMBERS’ ATTENDANCE AT THE MEETINGS FOR THE YEAR ENDED DECEMBER 2013
Status/Position Board AGM Audit Risk Nomination Remuneration Social and Ethics
Board members
MJ Lamberti Independent Non-executive 4/4 1/1 3/3 2/2 4/4 4/4 -
CS Seabrooke Independent Non-executive 4/4 1/1 3/3 2/2 4/4 4/4 -
D Cheesewright Non-executive 4/4 0/1 3/3* 2/2* 4/4 4/4 1/2*
JA Davis Non-executive 4/4 1/1 3/3* 1/2* - - -
NN Gwagwa Independent Non-executive 3/4 1/1 3/3 2/2 - - -
GRC Hayward Executive 4/4 1/1 2/3* 2/2 4/4* 4/4* -
P Langeni Independent Non-executive 4/4 1/1 3/3 2/2 - - 2/2
GM Pattison Executive 4/4 1/1 2/3* 1/2* 4/4* 4/4* 2/2
JP Suarez Non-executive 4/4 0/1 - - - - 1/2
I Zwarenstein Executive 4/4 1/1 3/3* 2/2 - - -
Management
T Doorasamy Chief Compliance Officer - - 2/2* 1/1* - - 1/1*
N Gray Chief Audit Executive - 1/1* 3/3* 2/2 - - -
B Leroni Corporate Affairs Executive - 1/1* - - - - 2/2*
P Maphoshe Human Capital Executive - - - - - - 1/2*
M Mthunzi Supplier Development Executive 1/4* - - - - - -
P Sigsworth Company Secretary 4/4* 1/1* 3/3* 2/2* - - -
M Spivey General CounselDivisional Chief Executive
4/4* 1/1* 3/3* 2/2 4/4* 4/4* 2/2*
L Walters Massbuild Financial Director - - - 1/1 - - -
J Wilford Masswarehouse - - - 1/1 - - -
C Chairperson* Invitee1 With effect from 22 May 2013 the Audit and Risk Committee was split into two Committees to allow each committee to give more focus to their different roles. Themembership of the committees can be seen below and on the next page. The first meeting in the 2013 financial year took place on 25 February 2013, before the split,and the attendance at this meeting has been included in both the “Audit” and “Risk” columns above.2 In accordance with King III, with effect from 4 March 2013 the Nomination and Remuneration Committee was split into two committees: the membership ofthe committees remains the same as that of the former combined committee. The first meeting in the 2013 financial year took place on 26 February 2013, beforethe split, and the attendance at this meeting has been included in both the “Nomination” and “Remuneration” columns above.3 Resigned with effect from 10 April 2014.4 Appointed as Chief Compliance Officer on 1 July 2013, and as such was only invited to meetings after that date in the 2013 financial year.
1 1 2 2
3 C C C
C C C
C
4

BOARD COMMITTEES
Composition Scheduled meetings Responsibility
Audit Committee
OUR BUSINESS
More information on the activitiesand responsibility of the AuditCommittee can be found here
CChhrriiss SSeeaabbrrooookkeeLulu GwagwaMark Lamberti*Phumzile Langeni
* Mark Lamberti wasappointed a memberof the AuditCommittee with effectfrom 4 March, 2013.
3x a year Overseeing the effectiveness of the Group’s internal controlsystems.Reviewing the scope and effectiveness of the external andinternal audit functions.Ensuring that adequate accounting records have beenmaintained.Ensuring the appropriate accounting policies have been adoptedand consistently applied.Overseeing the quality and integrity of the annual financialstatements.
Risk Committee
OUR BUSINESS
More information on the activitiesand responsibility of the RiskCommittee can be found on theweb:
CChhrriiss SSeeaabbrrooookkeeLulu GwagwaGuy HaywardMark LambertiPhumzile LangeniIlan ZwarensteinMichael SpiveyLlewellyn WaltersJulie Wilford
twice a year Reviewing and reporting on compliance with King III.Testing that the Group’s going-concern assertion remainsappropriate.Overseeing the Group’s risk management programme ascontemplated in King III.
Nomination Committee
OUR BUSINESS
More information on the activitiesand responsibility of theNomination Committee can befound on the web:
MMaarrkk LLaammbbeerrttiiDavid CheesewrightChris Seabrooke
4x a year The assessment, recruitment and nomination of new executiveand non-executive Directors.Making recommendations as to the composition of the Board.Formulating succession plans for the approval of the Board forthe appointment of new executive and non-executive Directors,including the Chairperson and CEO.
Remuneration Committee
OUR EMPLOYEES
More information on the activitiesand responsibilityof the Remuneration Committeecan be found on p.38.
CChhrriiss SSeeaabbrrooookkeeDavid CheesewrightMark Lamberti
4x a year Designing, monitoring and communicating the Group’sremuneration policies.Considering and approving executive remuneration includingshort- and long-term incentives.
Social and Ethics Committee
OUR BUSINESS
More information on the activitiesand responsibility of the Social andEthics Committee can be found onthe web:
PPhhuummzziillee LLaannggeenniiGrant PattisonJP Suarez
twice a year Assisting the Group with its responsibility towards sustainabilitywith respect to practices that are consistent with good corporatecitizenship.Assessing the company’s standing in terms of the UnitedNations Global Compact Principles.Considering the company’s standing in terms of consumerrelationships, with particular attention to the United NationsGlobal Compact Principles and the OECD recommendationsconcerning corruption.Considering the Group’s contribution to the social and economicdevelopment within our communities.Monitoring the Group’s activities relating to labour andemployment, the environment, health and public safety andconsumer relationships.

OUR BUSINESS
Biographical details of eachExecutive Committee member canbe found on p.92-p.94.
GGrraanntt PPaattttiissoonnGuy HaywardIlan ZwarensteinNeville DunnDoug JonesBrian LeroniPearl MaphosheMncane MthunziMichael SpiveyLlewellyn SteeneveldtKevin Vyvyan-DayLlewellyn WaltersRobin Wright
monthly Deliberating and taking decisions or making recommendationson all matters affecting Group strategy and operations, includingrisk management, and executive and senior managementsuccession.
Executive Committee

EXECUTIVE DIRECTORS
GRANT PATTISON (43)BSC (ENG) (HONS) (UCT)
Chief Executive Officer and member of the
Social and Ethics Committee
Employee since 1988Appointed 7 December 2004
Grant graduated from the University of CapeTown as an electrical engineer. After four yearswith the Anglo American group and two yearsconsulting with The Monitor Group, Grant joinedMassmart as Executive Assistant to theExecutive Chairman in 1998. He has since heldvarious positions within the Group, includingManaging Director of Massdiscounters andGroup Commercial Executive. He joined theExecutive Committee in 2000 and the Board in2004, becoming Deputy Chief Executive Officerin 2005, Chief Executive Officer Designate in2006 and Chief Executive Officer on 1 July 2007.
Grant has been co-chair of CGCSA (ConsumerGoods Council of South Africa) since April 2009and was elected in May 2013 as Chairman ofCGSO (Consumer Goods and Services Ombud).He has also served as a Director on theAmerican Chamber of Commerce in South Africa(Amcham) Board since 2011.
GUY HAYWARD (48)BCOM, CTA (UCT), CA (SA)
Chief Operating Officer
Employee since 2000Appointed 15 May 2001
Guy graduated from the University of Cape Townin 1986 and, after serving articles with DeloitteHaskins & Sells, qualified as a CharteredAccountant in 1989. During the 1990s he heldfinancial roles at Malbak and CNA Gallo in SouthAfrica and at Goldman Sachs in London.
He joined Massmart as Group FinancialExecutive in 2000 and was appointed ChiefFinancial Officer in 2001. In May 2012 he wasappointed Chief Operating Officer. Guy is also aGovernor of Hilton College.
ILAN ZWARENSTEIN (39)BCOM, BACC, CA (SA)
Group Financial Director
Employee since 2005Appointed 8 May 2012
Ilan graduated from the University of theWitwatersrand in 1997. After completing hisarticles in 2000, he remained with GrantThornton where he served as a manager inCorporate Finance and in Audit.
In February 2003, Ilan was appointed as apartner at Grant Thornton. He joined Massmartat the end of 2005 as Group Finance Executiveand was appointed Company Secretary in 2006.In May 2012 Ilan was appointed as GroupFinancial Director.

NON-EXECUTIVE DIRECTORS
MARK J LAMBERTI (63)BCOM, MBA (WITS), PPL (HARVARD)
Outgoing Chairman of the Board, Chairman
of the Nomination Committee and member
of the Audit, Remuneration and
Risk Committees
Appointed 30 August 1990Resigned 10 April 2014
Following progress through a multi-functionalretail career that began in 1975, Mark wasappointed Managing Director of the ailingsix-store Makro chain in 1988. After successfullyrepositioning the chain, he founded Massmart in1990 to pursue an aggressive growth strategy inhigh-volume, low-gross margin, low-expenseretailing and wholesaling.
In 1996, he was appointed Executive Chairmanof Massmart and from July 2003 CEO andDeputy Chairman of the Board. At the end ofJune 2007 he relinquished his executive role tobecome non-executive Chairman. His role asarchitect and leader of Massmart has beenwidely recognised with numerous awardsincluding that of the Ernst & Young SouthAfrican Entrepreneur of the Year in 2001.
In 2013 he was designated a Chartered Director,CD(SA), by the Institute of Directors on the basisof his public record and established status as adirector.
From June 2008 to January 2015 Mark served asthe Executive Chairman and later the ChiefExecutive Officer of Transaction Capital, anon-deposit taking financial services group, andcurrently serves as Chief Executive Officer ofImperial Group and as a Director and ExecutiveCommittee member of Business LeadershipSouth Africa.
KUSENI DLAMINI (45)BA (HONS)(KZN), MPHIL (OXON)
Incoming Chairman of the Board,
Chairman of the Nomination Committee
and a member of the Remuneration
Committee
Appointed 10 April 2014
Kuseni Dlamini is the Chairman of Times MediaGroup Ltd (formerly Avusa), a leading media andentertainment company listed on theJohannesburg Stock Exchange. He is the formerChief Executive Officer of Old Mutual SouthAfrica and Emerging Markets. Prior to this hewas the Head of Anglo American South Africaand a member of the Executive Committee ofAnglo American plc in London and was Directorof Anglo Platinum Ltd. He is also the formerExecutive Chairman of Richards Bay CoalTerminal Company Ltd and a former Chairman ofAnglo Operations (Pty) Ltd. As part of his careerin mining he held a number of senior positions atAnglo Gold Ashanti and De Beers ConsolidatedMines Ltd in South Africa and the UnitedKingdom. Kuseni is a graduate of theUniversities of KwaZulu-Natal, Durban, andOxford where he was a Rhodes Scholar. In March2008, he was named a ‘Young Global Leader’ bythe World Economic Forum and, during the samemonth, Miningx selected him as one of the top100 most influential people in South Africanmining. In June 2008, the Mail & Guardiannamed him as one of the top 200 young peopleworth taking to lunch and in the same year andmonth, The Economist referred to him as “A RareCommodity’. In 2010, the World Economic Forumappointed him a member of the Global AgendaCouncil on Economic Growth and PovertyAlleviation.
In 2011, he was appointed Co-Chairman of theannual World Economic Forum Africa Summitwhich brings together Heads of States, leadingpoliticians and business leaders to debate thestate of Africa in a changing world on an annualbasis. Kuseni is active in professional bodiesand charities which include the South AfricanInstitute of International Affairs, CommonPurpose and the Advisory Board of WitsBusiness School. He is also a member of theCouncil of the University of Pretoria andChairman of the Board of South African NationalParks.
CHRIS SEABROOKE (61)BCOM, BACC, MBA, FCMA
Deputy Chairman of the Board and Lead
Independent Director, Chairman of the
Audit Committee, Chairman of the Risk
Committee, Chairman of the Remuneration
Committee and a member of the
Nomination Committee
Appointed 1 February 2000
Chris has been a director of over 25 stockexchange-listed companies. He is currently CEOof Sabvest Limited, Chairman of MetrofileHoldings Limited and Transaction CapitalLimited and a director of Datatec Limited, TorreIndustrial Holdings Limited, Net1 UEPSTechnologies Inc (Nasdaq/JSE) and Brait S.E.(Luxembourg/JSE).
He is also a director of a number of unlistedcompanies including Mineworkers InvestmentCompany (Pty) Ltd, and is Deputy Chairman ofPrimedia Holdings (Pty) Ltd.
He is a former Chairman of the South AfricanState Theatre and former Deputy Chairman ofthe inaugural National Arts Council of SouthAfrica. He is a member of the Institute ofDirectors.

DAVID CHEESEWRIGHT (51)BSC (1ST CLASS) MATHEMATICS &SPORTS SCIENCE, LOUGHBOROUGHUNIVERSITY (UK)
President and Chief Executive Officer -
Walmart EMEA, a member of the
Nomination Committee and a member of
the Remuneration Committee
Appointed 23 November 2011
David Cheesewright is President and CEO ofWalmart International. Prior to being named tothis role, he was President and CEO forWalmart’s EMEA and Canada region sinceSeptember 2011, where he oversaw integrationof Walmart’s acquisition of Massmart, thecompany’s business in Sub-Saharan Africa, andmore aggressive growth in the United Kingdomand Canada.
David’s career spans more than 25 years in theinternational retail and manufacturing sectors.He was appointed president and CEO of WalmartCanada in February 2008, following a term asCOO of Asda in the U.K. and a prior term as COOof Walmart Canada from 2004 to 2005. He joinedAsda in 1999 where he held leadership positionsin operations, merchandising, logistics, strategyand format development, and he helped developand expand Asda’s online grocery program.
Prior to his career with Asda, David held a rangeof key positions with Mars Confectionary in theU.K.
David is also a member of the board of directorsof Yihaodian, Queens Business School and TheRetail Council of Canada, Canada’s largest retailindustry association.
JEFFREY DAVIS (51)BS ACCOUNTING (PENNSYLVANIASTATE UNIVERSITY), EMBA(UNIVERSITY OF PITTSBURGH)
Chief Financial Officer of Walmart US and
Executive Vice-President Finance of
Wal-Mart Stores Inc.
Appointed 20 June 2011
Jeffrey Davis is Chief Financial Officer ofWalmart US and Executive Vice-PresidentFinance of Walmart Stores Inc. He hasresponsibility for treasury operations, capitalmarkets, investor relations, risk managementand US M&A. Jeffrey was previously Treasurerfor Wal-Mart Stores Inc. and prior to that wasSenior Vice President of Finance and Strategy,Operations, for Walmart U.S.
Jeffrey joined Walmart in 2006 as Vice Presidentof Finance for the Walmart U.S. health andwellness merchandise unit. Previously, he servedas Chief Financial Officer for Lakeland Tours,LLC, where he led its acquisition growth strategyand was responsible for all accounting, financialreporting treasury and capital structuring, andstrategic planning functions.
Prior to that, Jeffrey was Chief Financial Officerfor McKesson General Medical and he held anumber of financial leadership roles at theHillman Co, a private investment holdingcompany. He also spent four years at KPMGPeat Marwick as an audit supervisor.
DR NOLULAMO (‘LULU’) GWAGWA (55)MSC (KZN), MSC (LSE), PHD (UCL)
Member of the Audit and the Risk
Committees
Appointed 1 November 2006
Lulu is Chief Operating Officer of LerekoInvestments Proprietary Limited. She wasDeputy Director General in the NationalDepartment of Public Works, responsible forestablishing the national public worksprogramme, and completed a five-year term asthe CEO of the Independent Development Trust.She has served on various Governmentcommissions, is the CEO of Lereko, and is anon-executive director of FirstRand Limited andSun International Limited.

PHUMZILE LANGENI (39)BCOM (NATAL), BCOM HONS (UNISA)
Chairperson of the Social and Ethics
Committee and a member of the Audit and
the Risk Committees
Appointed 25 August 2004
Phumzile is the Executive Chairperson ofAfropulse Group Proprietary Limited, awomen-led investment, investor relations andcorporate advisory house. She is a stock brokerby training and was previously the economicadviser to the Minister of Minerals and Energy,and an executive director of dual-listed juniorplatinum miner, Anooraq Resources. Phumzile isthe non-executive chairman of Astrapak Limited,a non-executive director of Imperial HoldingsLimited, Peermont Global Proprietary Limited,the Mineworkers Investment CompanyProprietary Limited, Primedia ProprietaryLimited, Transaction Capital Proprietary Limited,Metrofile Holdings Limited and a member of thePort Regulator.
JP SUAREZ (50)BA (HONS) (TUFTS UNIVERSITY) JD(UNIVERSITY OF PENNSYLVANIA)
Senior Vice President of Realty Design,
Construction and Strategy for Walmart US
and a member of the Social
and Ethics Committee
Appointed 20 June 2011
John Peter (JP) Suarez is the Senior VicePresident of Realty Design, Construction, andStrategy for Walmart US. JP is responsible forleading Walmart’s development activities for USstores including Supercenters, NeighborhoodMarkets and test formats along with designingnew prototypes. Prior to his current role, JP wasresponsible for Business Development inWalmart’s International Division and looked aftermerger and acquisition activities andinternational real estate, and global formatdevelopment efforts. Prior to that, JP was SeniorVice President and General Counsel for WalmartInternational. He joined the company in 2004 asVice President and General Counsel for Sam’sClub. JP also serves as a board member on theUniversity of Pennsylvania Law School Board OfOverseers. His previous experience includesserving as the United States’ EPA AssistantAdministrator for Enforcement and Compliance,acting as a federal and state prosecutor, andworking as Chief Enforcement Officer over NewJersey’s gaming industry.

EXECUTIVE COMMITTEE MEMBERS
GRANT PATTISON (43)BSC (ENG) (HONS) (UCT)
Chief Executive Officer
Employee since 1988Appointed 7 December 2004
Grant graduated from the University of CapeTown as an electrical engineer. After four yearswith the Anglo American group and two yearsconsulting with The Monitor Group, Grant joinedMassmart as Executive Assistant to theExecutive Chairman in 1998. He has since heldvarious positions within the Group, includingManaging Director of Massdiscounters andGroup Commercial Executive. He joined theExecutive Committee in 2000 and the Board in2004, becoming Deputy Chief Executive Officerin 2005, Chief Executive Officer Designate in2006 and Chief Executive Officer on 1 July 2007.
Grant has been co-chair of CGCSA (ConsumerGoods Council of South Africa) since April 2009and was elected in May 2013 as Chairman ofCGSO (Consumer Goods and Services Ombud).He has also served as a Director on theAmerican Chamber of Commerce in South Africa(Amcham) Board since 2011.
GUY HAYWARD (48)BCOM, CTA (UCT), CA (SA)
Chief Operating Officer
Employee since 2000Appointed 15 May 2001
Guy graduated from the University of Cape Townin 1986 and, after serving articles with DeloitteHaskins & Sells, qualified as a CharteredAccountant in 1989. During the 1990s he heldfinancial roles at Malbak and CNA Gallo in SouthAfrica and at Goldman Sachs in London. Hejoined Massmart as Group Financial Executive in2000 and was appointed Chief Financial Officerin 2001. In May 2012 he was appointed ChiefOperating Officer. Guy is also a Governor ofHilton College.
ILAN ZWARENSTEIN (39)BCOM, BACC, CA (SA)
Group Financial Director
Employee since 2005Appointed 8 May 2012
Ilan graduated from the University of theWitwatersrand in 1997. After completing hisarticles in 2000, he remained with GrantThornton where he served as a manager inCorporate Finance and in Audit. In February2003, Ilan was appointed as a partner at GrantThornton. He joined Massmart at the end of2005 as Group Finance Executive and wasappointed Company Secretary in 2006. In May2012 Ilan was appointed as Group FinancialDirector.

NEVILLE DUNN (45)BCOM (NATAL), CA (SA)
Divisional Managing Director MasscashWholesale and Chairman of MassmartLiquor Forum
Neville graduated from University of Natal(Durban) in 1990 with a BCom in Accountingfollowed by a post graduate diploma and afterserving articles with Deloitte and Touche,qualified as a Chartered Accountant in 1992.From 1995, Neville held various financial roleswith Robertsons Proprietary Limited and thenwith The Hub (a division of the Mr Price Group),and in 2002 joined Masscash as FinancialDirector, becoming Operations Director in 2008.In February 2012, Neville was appointedDivisional Managing Director, MasscashWholesale and became a member of theMassmart Executive Committee.
DOUG JONES (41)BCOM, PGDA (UCT), CA (SA)
Divisional Managing Director ofMasswarehouse, Chairman of MassmartFood Forum and Chairman of MassmartCorporate University’s School ofManagement Development
After qualifying as a Chartered Accountant in1998 Doug moved to Canada with Deloitte. Heworked for Coca-Cola Enterprises in Toronto fora number of years before returning to SouthAfrica to join ABI(the Soft Drink Division of SAB Limited). Dougjoined Makro as Finance Director in 2007 andbecame Commercial Director in 2010. Doug wasappointed Divisional Managing Director inSeptember 2012, and joined the MassmartExecutive Committee at the same time.
BRIAN LERONI (49)BA (WITS), MPHIL (STELLENBOSCH)
Group Corporate Affairs Executive andmember of the Social and EthicsCommittee
Brian’s work experience includes executivepositions at Masstores Proprietary Limited, anassociate partner at Andersen Consulting (nowAccenture) and Marketing Director at CNA. Hejoined Massmart as Group Projects Executive inSeptember 2004 and was appointed GroupCorporate Affairs Executive in September 2005.Brian joined the Massmart Executive Committeein July 2007.

PEARL MAPHOSHE (45)BA (HONS), HDIPED (DURBAN-WESTVILLE), MA (LONDON)
Group Human Capital Executive,Chairperson of the HR Forum and memberof the Social and Ethics Committee
Prior to joining Massdiscounters Pearl workedfor Telkom and Old Mutual and for Umgeni Wateras General Manager: Corporate Services. Prior toassuming responsibility for Human Capital onthe Massmart Executive Committee from August2007, Pearl was Director of Human Resources atMassdiscounters. Pearl is also a guest lecturerand external examiner on the MBA programmeat the University of Kwazulu Natal. She bringsbroad experience in managing and developinghuman capital to the Group. Pearl serves on thecouncil at the University of Zululand. She is amember of the executive committee of theCouncil and she serves as the Chairperson of theHR and Remuneration committee of the Council.
MNCANE MTHUNZI (42)B.COM (ECONOMICS), PMD, GEDP(GIBS), AMP (HARVARD)
Group Africa and Supplier DevelopmentExecutive
Mncane is the former CEO of the ConsumerGoods Council of South Africa (CGCSA), anindustry association for the retailers,manufactures and service providers. He was theManaging Director of the Black ManagementForum (BMF) for a period of three years. Prior tojoining the BMF he worked for Microsoft as anEnterprise Strategy Consultant and later in aSales Executive role within Microsoft. He wasalso a Senior Manager atPricewaterhouseCoopers. Mncane started hiscareer at Accenture, where he worked in anumber of industries both locally andinternationally handling large-scale systemsintegrations and business solutions for anumber of clients. His leadership andstakeholder involvement includes being amember of various boards of directors andcharity organisations. Mncane’s career span isacross a number of industries which includeTransport, Industrial Products, Retail,Telecommunications, Broadcasting, InformationTechnology and the Government. Mncane joinedthe Massmart Executive Committee inSeptember 2011.
MICHAEL SPIVEY (50)BSC AND JURIS DOCTORATE(UNIVERSITY OF ARKANSAS),MASTER’S IN LAW IN INTERNATIONALBANKING AND FINANCE (BOSTONUNIVERSITY).
Massmart General Counsel and a memberof the Risk Committee
Mike joined Massmart in 2011. He has a multi-faceted 20 year global business career thatincludes transactional, regulatory, finance andbusiness development experiences. At Walmart,Mike provided legal and regulatory compliancecounsel to numerous segments of the business.As a leader at the Export-Import Bank of theUnited States, Mike served as a senior attorneyfocusing on cross-border trade and structuredtransactions, and later led the Bank’s sales,marketing and product development operations.Early in his career, Mike lived in Budapest,Hungary and worked as an associate with aninternational law firm and a foreign trade bankwhere he specialised in cross-border merger andacquisition transactions. At Massmart,Mike directs the Company’s legal, regulatory andethics affairs and serves on the MassmartExecutive Committee.

LLEWELLYN STEENEVELDT (45)BSC ENG (PHYS MET), GDE(INDUSTRIAL), MBA
Group Commercial Executive andChairman of the Real Estate Committeeand TIP and Operations Forums
Llewellyn graduated from the University of theWitwatersrand in 1991 as a PhysicalMetallurgist. After seven years with Tongaat-Hulett group and three years with the IndustrialDevelopment Corporation, Llewellyn joinedMassmart as Business Analyst in 2002. He hassince held various positions within the Group,including Executive Assistant to the CEO andManaging Director of Builders Express. Llewellynwas appointed Group Commercial Executive andjoined the Massmart Executive Committeein July 2009.
KEVIN VYVYAN-DAY (49)BCOM, BACC (WITS), CA (SA)
Divisional Chief Executive of CambridgeFood and Chairman of the GeneralMerchandise Forum
After qualifying as a Chartered Accountant in1989, Kevin consulted at both the StrategyGroup (Deloitte) and Gemini Consulting. Hejoined UPD as Group Operations and SystemsDirector in 1995 and became Group ChiefExecutive Officer in 1996. Kevin joinedMassmart as Divisional Chief Executiveresponsible for Makro and as a member of theMassmart Executive Committee in 2005. InSeptember 2012, Kevin was appointed DivisionalChief Executive responsible for Cambridge Food.
LLEWELLYN WALTERS (50)BA, LLB (WITS)
Divisional Chief Executive of Massbuild,Chairman of the Supply Chain Forum and amember of the Risk Committee
Llewellyn spent thirteen years in the bankingindustry where he held senior positions in anumber of specialist financial institutions beforejoining ABSA. In June 2003, Llewellyn joinedSuper Group, a JSE-listed supply chain andlogistics company where his last position wasDivisional MD responsible for the group’s Africanoperations. He joined Massmart in November2008 as Divisional Chief Executive for BuildersWarehouse, later becoming responsible for thewhole division, and was appointed to theMassmart Executive Committee upon joining.

ROBIN WRIGHT (58)BCOM (NATAL), CA (SA)
Managing Director Massdiscounters
After graduating from Natal University with aBCom degree and qualifying with his CA (SA) in1978, Robin spent six years in retailing andwholesaling at WG Brown before founding CCWin 1985. In 1998, he sold a controlling interest inCCW to Massmart and was appointed to theMassmart Executive Committee. He led theacquisition and integration of Browns and Weirs,and has spearheaded the growth of the Divisionto become South Africa’s leading foodwholesaler. In February 2012, Robin wasappointed Group Food Executive, before beingappointed as Managing Director ofMassdiscounters in January 2013 and heremains a member of the Massmart ExecutiveCommittee.

EXECUTIVE COMMITTEE
The Massmart Executive Committee is the most senior executive decision- making body in the Group. The Committee is chaired by the CEO (Grant Pattison)and comprises the COO (Guy Hayward), Group FD (Ilan Zwarenstein), Group Human Capital Executive (Pearl Maphoshe), Group Corporate Affairs Executive(Brian Leroni), the five divisional Chief Executives (Neville Dunn, Doug Jones, Kevin Vyvyan-Day, Llewellyn Walters and Robin Wright), the Group Africa andSupplier Development Executive (Mncane Mthunzi) and the Group Commercial Executive (Llewellyn Steeneveldt). Following the Walmart transaction, theCommittee was bolstered by a General Counsel (Michael Spivey).
The Committee deliberates, takes decisions or makes recommendations on all matters of strategy and operations. Within the parameters described by theBoard-approved Governance Authorities, the decisions or recommendations are sometimes referred to the Board or its relevant Committee for final approval,while in other cases the power to take decisions is delegated to Divisional Boards or Executive Committees.
The Executive Committee has specific responsibility, inter alia, for:
monitoring and measuring the structures, trends and performance of markets and competition;strategic planning;defining, configuring, financing and structuring the Group’s portfolio of assets;shaping and approving the competitive strategies, operating plans and budgets of the Divisions and functional departments;measuring, monitoring and taking proactive corrective action on Divisional performance;ensuring adequate risk management, internal controls, governance, compliance and ethical behaviour throughout the Group; andshaping and approving succession plans and senior executive management appointments.

THE BOARD
The Board of Massmart is responsible for directing the Group towards the achievement of theMassmart vision and mission. The Board is therefore accountable for the development andexecution of the Group’s strategy, operating performance and financial results, as well as beingthe custodian of the Group’s corporate governance. The Board appreciates that strategy, risk,performance and sustainability are inseparable.
The Board is responsible for its own composition, the appointment of the Chairman and CEO, and theconstitution and composition of its Committees. The Board has a charter setting out its policies, roles andresponsibilities in the execution of its mandate described above. Each Board Committee also has a charter,or terms of reference, that is formally signed off by the Board. Annually in November the Committees andBoard review, and amend if necessary, the respective charters to ensure their relevance.
The role of all Directors is to bring independent judgement and experience to the Board’s deliberations anddecisions. The Board comprises three executive Directors, four independent non-executive Directors andthree non-executive Directors.
Annually, the Nomination Committee prepares and circulates a questionnaire aimed at gauging theindependence status of each non-executive director. This is completed by each non-executive director andreturned to the Committee, which then considers each director’s independence.
The Committee feels that the following aspects are important in assessing a non-executive director’sindependence:
whether the director had been employed in an executive capacity in the Group in the previous threeyears;whether the director had served on the Board for longer than nine years. In this case, the Committeeconsiders whether that director’s independence, judgement and contribution to the Board’sdeliberation could be compromised, or may appear to be compromised, by this length of service;whether the director is a representative of a major shareholder; andwhether the proportion of that director’s shareholding in Massmart (if any) or director’s feesrepresented a material part (10% or more) of their wealth or income.
In addition to the above, the Committee considers whether the director is independent in character andjudgement and whether there are circumstances which are likely to affect, or could appear to affect, thedirector’s judgement.
Having considered the circumstances of each non-executive director, the Committee believes that four ofthe non- executive Directors can be considered independent while the three Walmart- appointees are notconsidered independent. Finally, the Committee believes that none of the four independent non-executiveDirectors, or entities associated with or controlled by him/her, owns shares in Massmart which, relative tohis/her personal wealth or income, are sufficiently material to affect his/her independence.
The Board is comfortable that it meets the King III principle of having an arm’s-length relationship with theCompany Secretary and confirms that the Company Secretary is not a director of any of the main operatingcompanies within the Group. The Company Secretary, Mr Philip Sigsworth, CA(SA), was the financial directorof another listed company, Austro Group, prior to joining Massmart, where he also performed companysecretarial work. As such, the Board confirms that it has assessed and is happy with the qualification,competence and expertise of the Company Secretary.
The Company Secretary assists the Board in fulfilling its functions and is empowered by the Board toperform his duties. The Company Secretary, directly or indirectly:
assists the Chairman, CEO, COO and FD with induction of new Directors;assists the Board with director orientation, development and education;ensures that the Group complies with all legislation applicable/relevant to Massmart;monitors the legal and regulatory environment and communicates new legislation and any changesto existing legislation relevant to the Board and the Divisions; andprovides the Board with a central source of guidance and assistance.
One-third of the non-executive Directors are required to retire every year and Massmart executive Directorshave elected to also retire on this basis. As a result, all Directors retire by rotation at least every three yearsand are then eligible for re-election. In addition, shareholders must ratify the initial appointment of eachdirector at the first annual general meeting following that director’s appointment. As a result of therequirement that at least one-third of the non-executive Directors compulsorily retire every year or followingtheir initial appointment to the Board, and the voluntary retirement of executive Directors on the same basis,at the 30 May 2014 annual general meeting the following Directors retire by rotation but all offer themselvesfor re-election: Messrs CS Seabrooke, D Cheesewright and GRC Hayward; and Dr NN Gwagwa.

Board process and evaluation
The Board meets four times a year and on an ad hoc basis should a particular issue demand its attention. Inaddition, the Board meets annually to formally consider and approve the strategies of the MassmartDivisions and Group.
The Board’s authority is devolved sequentially through the Massmart Executive Committee, the DivisionalBoards and the Divisional Executive Committees, as formally prescribed by the Massmart GovernanceAuthorities (described below). In addition, the Board has delegated certain specific responsibilities to fiveBoard Committees, also described more fully below. These Committees assist the Board and Directors indischarging their duties and responsibilities under King III and the Governance Authorities. Full transparencyof the Committees’ deliberations is encouraged and the minutes of all Committee meetings are included inthe formal Board papers at the ensuing Board meeting. All Directors are welcome to attend any BoardCommittee meeting or Divisional Board meeting.
The Massmart Governance Authorities describes the specific levels of authority and required approvals forall major decisions at both Group and Divisional level. It clarifies which executive position, Committee orBoard needs to be consulted prior to taking the decision, which body makes the decision and which bodiesshould thereafter be informed of the decision. Where appropriate, it now includes the Walmart position onthe decision. The Board has also adopted a policy which describes Walmart’s access to the Massmartbusiness. This policy is fully described on the Company’s website under FAQ.
The Board works to a formal agenda that covers strategy, structure, operating performance, growthinitiatives, sustainability, investor relations, risk and governance, and any other key activities of the Group.An annual agenda structure ensures that other areas including IT and compliance are addressed. Formal

AUDIT COMMITTEE
With effect from 22 May 2013 the Audit and Risk Committee was split into two Committees to allow each committee to give more focus to their different roles.The Audit Committee comprises:
Mr Chris Seabrooke (Chairman) – member since 2000;Mr Mark Lamberti – member since 2013;Ms Phumzile Langeni – member since 2009; andDr Lulu Gwagwa – member since 2011,
all of whom are independent non-executive directors and who each have the requisite financial and commercial skills and experience to contribute to theCommittee’s deliberations. The Audit Committee met three times in the year ended December 2013.
Responsibilities of the Audit Committee:
Overseeing the effectiveness of the Group’s governance, risk and internal control systems.With regard to the External Auditors, to nominate their appointment, to determine audit fees payable, to pre- determine fees and scope of non-auditservices, and monitor their independence.Reviewing the scope and effectiveness of the External and Internal Audit functions.Ensuring that adequate accounting records have been maintained.Ensuring the appropriate accounting policies have been adopted and consistently applied.Reviewing and reporting on the application of King III.Testing that the Group’s going-concern assertion remains appropriate.Overseeing the quality and integrity of the annual financial statements.Ensuring that Massmart Internal Audit Services (MIAS) reports functionally to the Committee, is considered independent, applies King III standards andadheres to the Institute of Internal Auditors’ Standards for the Professional Practice of Internal Auditing and Code of Ethics.It approves MIAS’s plan and ensures that MIAS have sufficient resource and skill to effectively perform their function.Reviewing the adequacy and effectiveness of combined assurance, compliance and IT.Receiving and reviewing the assurance assertion of MIAS and presenting this to the Board.
The CEO, the COO, the FD, senior financial executives of the Group and representatives from the External and Internal Auditors attend all meetings by invitation.
The Internal and External Auditors have unfettered access to the Audit Committee and its members, and both present formal reports to the Committee.
The Chairman of the Committee meets quarterly with the Chief Audit Executive (CAE), and at the start of every Committee meeting the External Auditors have aprivate audience with the Committee.
In specific response to the requirements of the Companies Act, King III and in terms of its charter, the Committee can report as follows:
The Committee has reviewed the scope, quality, effectiveness, independence and objectivity of the External Auditors and is satisfied with all of theseareas. The audit firm Ernst and Young Inc., and audit partner Allister Carshagen, will be proposed to the shareholders at the May 2014 annual generalmeeting for approval to be the Group’s auditor for the 2014 financial year. Ernst and Young Inc., are, in the Committee’s opinion, independent of theGroup.The Committee is satisfied that the internal financial controls of the Divisions and Group operated effectively during the year ended December 2013 andcan be relied upon. In addition, the Committee is satisfied with the Group’s accounting policies and that these have been appropriately and consistentlyapplied during the year ended December 2013.The Committee reviewed this Integrated Annual Report and recommended it to the Board for approval.The nature and extent of non-audit services provided by the External Auditors is reviewed annually to ensure that fees for such services do not becomeso significant as to call into question their independence of Massmart.The nature and extent of any future non-audit services have been defined and pre-approved, and the total fee associated with those non-audit servicesmay not exceed 50% of the total audit fee without approval of the Committee. During the year ended December 2013, there were no non-audit servicesincluded in the audit fee. If it appears that this guideline will be exceeded on a consistent basis, non-audit services will be outsourced to alternativeauditors.No reportable irregularities were identified and reported by the External Auditors to the Committee.The Massmart website (www.massmart.co.za) has a link enabling the general public to lodge complaints with the Committee. Since establishing thisfunctionality in 2009, no complaints have been received.
Annually the Committee considers whether it is meeting its duties and responsibilities as set out in the Committee charter and in terms of the requirements ofthe Companies Act.
As part of the Audit function, the Committee receives reports on Group companies’ financial performance, governance, and internal controls, adherence toaccounting policies, compliance and areas of significant risk, amongst others. The Committee also receives written reports by both the External and InternalAuditors, which are accompanied by discussion with Committee members. After considering these reports, the Committee formally reports to the Board, twiceeach year, regarding the overall control framework and effectiveness of controls.
Each of the four Divisions has at least one Financial Review Committee which meets twice a year – before the finalisation and release of the Group’s Interimand Preliminary financial results, respectively. These Committees effectively function as Divisional Audit Committees but not strictly in the manner required bythe regulators or King III. The attendance at these meetings includes the following invitees: the Group’s Financial Director, Divisional Chief Executive andDivisional Finance Director, key finance and accounting staff, members of Internal and External Audit, and Massmart Corporate Finance executives. Minutesfrom these meetings are included with the papers of the following Committee meeting. Twice a year the Audit Committee reviews the Financial ReviewCommittee minutes and the External Audit report, and annually they review the annual financial statements to comply with the Companies Act requirements ofa holding company audit committee and its responsibilities in regard to all Company subsidiaries.
The Group’s interim and provisional reports are always subject to independent review by the External Auditors.
The Committee’s report in accordance with section 94(7)(f) of the Companies Act, can be found in the Corporate Governance section.

As required by the JSE, the Committee and Board have considered the skills, qualifications and performance of the Group Financial Director, Ilan Zwarenstein,and are unanimously satisfied of his continuing suitability for the position. His biographical details can be found in the Corporate Governance section.
EXTERNAL AUDIT
During the year ended December 2013, Ernst and Young Inc. were the External Auditors for all Group companies, with the exception of:
Massmart International Limited who are audited by RBC Trust Company (Guernsey) Limited;Masscash Swaziland (Proprietary) Limited who are audited by Synergy Chartered Accountants; andMakro (Lesotho) (Proprietary) Limited, Maseru Cash & Carry (Proprietary) Limited and Game Discount World (Lesotho) (Proprietary) Limited who are allaudited by New Dawn Chartered Accountants.
Total fees incurred to Ernst and Young Inc. during the year ended December 2013 were R20.6 million (2012: R12.7 million).
INTERNAL AUDIT
The Committee considers Massmart Internal Audit Services (MIAS) to be an independent, objective body providing assurance to the Group’s governance, riskand control activities. MIAS comprises a dedicated team that, although managed from Massmart Corporate, is deployed Group-wide. The team comprisesappropriately tertiary qualified and experienced personnel, including internal audit and retail/wholesale professionals, to ensure the delivery of a relevant andhigh-quality risk-based audit service. Pleasingly, 93% of the audit team is African, Coloured or Indian.
MIAS is an objective body providing assurance concerning the Group’s governance, risk and control activities.MIAS has the unequivocal support of the Board and Audit Committee.MIAS is considered independent and has been subjected to a quality review.The MIAS team formally reports any material findings at the Divisional Boards and the Audit Committee on a quarterly basis.There is significant MIAS involvement in Information Technology (IT) throughout the Group to ensure satisfactory IT governance and assurance.
The responsibilities of MIAS are defined and governed by a charter approved by the Audit Committee and the Board. MIAS has the unequivocal support of theBoard and this Committee and has access to any part of or person in Massmart. All employees are expected to co-operate positively with MIAS.
To ensure independence, MIAS reports functionally to the Audit Committee and administratively to the CEO. The Internal Audit function has adopted arisk-based methodology for several years in order to ensure appropriate coverage of governance, risk management and control processes that are key to therealisation of strategic objectives. The internal audit plan is based on risk assessments, risk registers, group strategies and input from management, the Boardand the Audit Committee. The Audit Committee approves the annual MIAS plan and the MIAS budgets. The CAE has unrestricted access to anyone in theorganisation, has frequent and independent discussions and updates with the Committee Chairman and Massmart Executive Directors. The CAE holds a seniorexecutive position in the organisation and has an influential impact across the business strategically and operationally. The Board provides MIAS with theauthority to attend any strategic session, Committee or Board meeting and to have unrestricted access to all information across the Group to assist with itsdetermination of the types and levels of governance, control and risk that exist across Massmart.
The MIAS team formally reports any material findings and matters of significance to the Divisional Boards on a quarterly basis and to the Audit Committeewhen it meets. The reports highlight whether actual or potential risks to the business are being appropriately managed and controlled. Progress in addressingprevious unsatisfactory audit findings is monitored until MIAS reports the proper resolution of the problem area.
There is significant MIAS involvement in IT throughout the Group in order to ensure satisfactory IT governance and assurance. All new major IT systems in theGroup require specific MIAS sign-off prior to implementation and all significant IT projects are subject to MIAS review. The MIAS role is twofold: to assess theprocess and controls around large IT projects at significant phases of these projects; and to assess the control environment within existing IT systems and theGroup’s general computer control environment. MIAS adopted the Control Objectives for Information and related Technologies (COBIT) methodology fortechnology auditing several years ago.
MIAS and External Audit’s scope and work-plans, and those of other assurance providers, are properly co-ordinated and when appropriate are relied upon inorder to provide efficient and effective assurance to the Committee and to reduce the governance burden.
MIAS applies the standards of the International Standards for the Professional Practise of Internal Auditor and the recommendations of King III. In accordancewith the International Standards for the Professional Practise of Internal Audit standards, it has been determined that MIAS will be subjected to an independentexternal quality assessment review at least once in five years. An independent external audit firm conducted the last quality review and concluded thatMassmart’s Internal Audit function ‘generally conforms’ to the standards of the Institute of Internal Audit which is the highest standard possible.
SUITABILITY OF THE FINANCIAL DIRECTOR

AUDIT COMMITTEE REPORT
The audit committee met three times in the year ended 29 December 2013 and the Internal and External Auditors presented formal reports to the Committee
and attended these meetings by invitation. In response to the requirements of the Companies Act, King III and in terms of its charter, the Committee can report
as follows:
The scope, independence and objectivity of the External Auditors was reviewed.
The External Auditors Ernst and Young Inc., and audit partner Allister Carshagen, are, in the Committee’s opinion, independent of the Company and have
been proposed to the shareholders for approval to be the Group’s auditor for the 2014 financial year.
On an on-going basis, the Committee reviews and approves the fees proposed by the External Auditors.
The appointment of the External Auditors complies with the Companies Act, and with all other legislation relating to the appointment of External
Auditors.
The nature and extent of non-audit services provided by the External Auditors has been reviewed to ensure that the fees for such services do not
become so significant as to call into question their independence.
The nature and extent of future non-audit services have been defined and pre-approved.
No reportable irregularities were identified and reported by the External Auditors to the Committee.
The Committee is satisfied that the internal financial controls of the Divisions and Group operated effectively throughout the 53 weeks ended 29
December 2013 and can be relied upon. In addition, the Committee is satisfied with the Group’s accounting policies and that these have been
appropriately and consistently applied throughout the 53 weeks ended 29 December 2013.
The Committee reviewed this Integrated Annual Report and recommended it to the Board for approval;
As at the date of this report, no complaints have been received relating to accounting practices and internal audit of the Company or to the content or
auditing of the Company’s fi nancial statements, or to any related matter.
The Massmart website (www.massmart.co.za) has a link enabling the general public to lodge complaints with the Committee. Since establishing this
functionality in 2009, no complaints have been received.
Chris SeabrookeChairperson of the Audit Committee
10 April 2014

RISK COMMITTEE
With effect from 22 May 2013 the Audit and Risk Committee was split into two Committees to allow each committee to give more focus to their different roles. The Risk Committee comprises: Mr Chris Seabrooke (Chairman); Mr Norman Gray; Dr Lulu Gwagwa; Messrs Guy Hayward, Mark Lamberti, Michael Spivey,Llewellyn Walters and Ilan Zwarenstein; Ms Phumzile Langeni; and Mrs Julie Wilford, four of whom are independent non-executive directors and who each havethe requisite financial and commercial skills and experience to contribute to the Committee’s deliberations. The Risk Committee met twice in the year endedDecember 2013.
The Board recognises its responsibility to report a balanced and accurate assessment of the Group’s financial results and position, its business, operations andprospects. Aspects of how this is achieved are covered in the section below.
The Board considers risk management to be a key business discipline designed to balance risk and reward, and to protect the Group against risks anduncertainties that could threaten the achievement of business objectives. The Board’s risk strategy has been established through debate with the executivedirectors where the Group’s risk tolerance has been considered and balanced against the drive towards the achievement of its strategies and objectives.
The Committee is responsible to the Board for overseeing the Group’s risk management programme. The day-to-day responsibility for risk management,including maintaining an appropriate loss prevention and internal control framework, remains with the executives of the Group and of each Division.
The Committee’s primary role is one of oversight and therefore it reviews and assesses the dynamic interventions, within the Group’s available resources andskills, required in response to business-specific, industry-wide and general risks. The Committee tables a Group risk register, aggregated from those preparedby the Divisions and the Group Executive Committee, to the Board annually in February. The Committee considers there to be two categories of Group riskwhich can broadly be described as Strategic/Environmental risks and Operational risks.
Strategic/Environmental risks tend to be longer-term and more material in nature and can, in most cases, only be monitored, managed and partiallymitigated through longer-term strategic or tactical business responses. These risks, which, for example, include executive talent retention and succession,transformation and supply chain, are the primary focus of the Group’s Risk Management process. The Group risk register summarises the major risksfacing the Group, taking into account the likelihood of occurrence, the potential impact and any mitigating factors or compensating controls. The RiskCommittee oversees the maintaining of a sound system of governance, risk management and control with regard to operations, safeguarding assets,reliability of management reporting, and compliance with laws and regulations.
Operational risks by their nature can be immediately addressed or mitigated by local management actions. These risks – which include in-store health,safety and security, compliance, fire prevention and detection, IT systems and food safety, amongst others – are therefore the direct responsibility of eachDivisional Executive Committee where a Loss Prevention or Risk Officer has line-responsibility for overseeing these risks.
INTERNAL CONTROL FRAMEWORK
Massmart maintains clear principles and procedures designed to achieve corporate accountability and control across the Group. These are codified in theMassmart Governance Authorities that describes the specific levels of authority and the required approvals necessary for all major decisions at both Group andDivisional level. Through this framework, operational and financial responsibility is formally and clearly delegated to the Divisional Boards. This is designed tomaintain an appropriate control environment within the constraints of Board-approved strategies and budgets, while providing the necessary local autonomyfor day-to-day operations.
The Board is responsible for the risk management programme that attempts to balance the risks and rewards in achieving the Group’s objectives. On behalf ofthe Board, the Risk Committee oversees the Group’s risk management programme. Responsibility for risk management and loss prevention rests however, withthe Group and Divisional Executive Committees.
LITIGATION AND LEGAL
There are no current, pending or threatened legal or arbitration proceedings that may have, or have had in the previous 12 months, a material effect on theGroup’s financial position. As part of the litigation relating to the Massmart-Walmart acquisition, Massmart has either satisfied or is in the process ofsatisfying the conditions ordered by the 2012 Competition Appeal Court order. Two conditions remain active. Firstly, Massmart has established a SupplierDevelopment Fund that has commenced distributing funds to qualifying beneficiaries. The first annual report of the Fund was submitted to the CompetitionCommission in December 2013. Secondly, in cooperation with the Competition Commission, Massmart has initiated its remedial plan to re-instate theapproximately 230 employees who were either not located or did not accept their original re-instatement offer from the pool of 503 retrenched employees. Theobjective of the remedial plan is to ensure that Massmart has fully complied with the court order to re-instate all employees.
FINANCIAL RISK AND APPRAISAL
Financial targets agreed in Group budgets and strategy processes are predicated on assumptions about the future that are uncertain and may prove incorrector inaccurate. The monitoring and management of this risk is the responsibility of the Group Executive Committee. Monthly performance is measured andcompared to the budget and prior year, and corrective or remedial action taken as appropriate.
Despite extensive financial, accounting and management controls and procedures, including reviews by Internal and External Auditors, there are risks arisingfrom the Group’s cash management and treasury operations, direct and indirect taxation, and employee or third-party fraud or economic crime.
In addition to financial reviews, Massmart participates in externally-facilitated review and disclosure processes that enable independent reviews of itscorporate accountability performances. These include a bi-annual ethics review by the South African Institute of Ethics, Carbon Disclosure Projectparticipation, Broad-based Black Economic Empowerment verification and an annual JSE Socially Responsible Investment Index review.

GROUP RISK LANDSCAPE
STRATEGIC/ENVIRONMENTAL RISK
BUSINESS MODEL / STRATEGIC EXECUTION DEFINITION
Non-adherence to business model or poor strategicexecution
Through poor design, implementation, execution or prioritisation of our business model orstrategy, the Group’s longer-term financial performance and competitive positioning could beseverely compromised. The resultant financial performance may be suboptimal on either anabsolute or relative basis.
Volatility of key economic variables
Unpredictable or dramatic changes in economic factors (inflation, interest rates, exchangerates).Margin decline from product deflation.Effect on consumer confidence and spending from interest rate and/or inflation rate volatility.Impact on imported stock valuation.Impact on foreign operations’ results and net assets reported in SA currency, with possiblematerial translation gains/losses.
Talent retention and succession
Scarcity of retail-specific skills.Developing and retaining sufficient business, leadership and senior management skills toensure long term competitiveness.Over dependence on key leaders in the Group.The need for an actively managed leadership succession pipeline.
Ineffective cost control
It is strategically important to maintain a low cost base and essential that the Group implementssustainably low and efficient operational and overhead cost structures.
Insufficient progress with Transformation
In the broader national context, inadequate transformation at all levels by Massmart and otherSouth African businesses will curb the country’s longer-term growth potential. Adversereputational exposure due to under delivering in respect of B-BBEE requirements.This issue includes insufficient Black representation at Executive level at the Group andDivisions.
POTENTIAL IMPACT RISK MITIGATION
2012 2013
PROBABLITY LOW
FINANCIAL IMPACT HIGH
ECONOMIC IMPACT HIGH
The Group insists on strategic clarity at the Divisions and Massmart Corporate.
The strategies of all Divisions and the Group are formally documented and are reviewed annuallyat Divisional level, at Group Executive Committee level and then by the Board.A Division’s strategies dictate management’s operational tactics and priorities. The annualbudget process is an output of these reviews and on-going monthly monitoring of annualfinancial results and comparison to budget at Divisional Boards and Group Executive Committeelevel takes place.

2012 2013
PROBABLITY HIGH
FINANCIAL IMPACT MEDIUM
ECONOMIC IMPACT MEDIUM
All direct foreign exchange import liabilities are covered forward.
Interest rates on the Group’s medium-term debt have been fixed.
Property lease escalation rates are negotiated as low as possible and certain property leases areinflation-linked.
The Group continually explores means of keeping the net assets of its African operations to aminimum, thereby reducing the translation effect of any currency movement. This includesrepatriating cash profits as frequently as possible and settling cross-border liabilities timeously.
2012 2013
PROBABLITY LOW
FINANCIAL IMPACT HIGH
ECONOMIC IMPACT HIGH
This remains a major focus area. The Executive Committee actively monitors the progress,development and possible succession plans for the ‘Top 200’ employees, as well as monitoring afurther 200 employees.
There are in-house education programmes prepared and presented in conjunction with local andinternational business schools that focus on developing middle and junior executives, and thereis an in-house graduate recruitment programme in place.
Annual ‘fire-side chats’ are held with each executive in the Group, which are attended by thatperson’s superior and a third executive.
The Group’s remuneration policy, incorporating short- and longer-term incentives, is designed toreward significant outperformance and provides an opportunity for staff to accumulate wealth.The Share Scheme may act as a retention mechanism.
2012 2013
PROBABLITY LOW
FINANCIAL IMPACT LOW
ECONOMIC IMPACT LOW
Ongoing cost control through monitoring, benchmarking, review and innovation.
RDC and supply chain strategy. Reduce cost and waste.
Improve effectiveness and efficiency in procurement and inventory management.
Eliminate unnecessary complexity.
Careful new store roll-outs.
Collaborate with Walmart/ASDA on We Operate for Less programmes.
2012 2013
PROBABLITY LOW
FINANCIAL IMPACT MEDIUM
ECONOMIC IMPACT HIGH
The Board needs to set appropriate targets and expectations in the context of new codes and tomaximise the visibility of initiatives such as the Supplier Development Fund and Thuthukani (orits successor scheme) even if these initiatives do not directly influence the scorecard.
Transformation is an agenda item at all Divisional and Group Board meetings and a seniorexecutive at Massmart has overall responsibility for delivering the strategy.
STRATEGIC & ENVIRONMENTAL RISKS: tend to be longer-term and more material in nature and can, in most cases, only be monitored, managed andpartially mitigated through longer-term strategic or tactical business responses. These risks, which, for example, include executive talent retention andsuccession, transformation and supply chain, are the primary focus of the Group’s Risk Management process.

Complexity of the Group’s African operations
The complexity, of doing business in 12 African countries, each with different regulatory, fiscaland customs environments. Political risk can become an issue. African currencies can be illiquid,making cash repatriation vulnerable. There are also operational and logistical challenges inmanaging the lengthy supply chain. There are, in addition, often challenges presented in securinglegal title to land in some countries.
Food Safety & Hygiene
Non adherence to food safety standards and/ or failure to maintain appropriate hygiene levelsmay result in legal liability and significant reputational damage as well as impact tradingperformance. The concern extends especially to ‘Private Label’ products.
Failure to address in-store Health and Safety issues
Legal consequences of non-compliance with Occupational Health and Safety Act.Ensuring staff and customer safety when moving and storing inventory, including racking andstacking.Possible significant reputational risk from customer or employee injury or death.
POTENTIAL IMPACT RISK MITIGATION
2012 2013
PROBABLITY MEDIUM
FINANCIAL IMPACT MEDIUM
ECONOMIC IMPACT MEDIUM
Maintain a relevant and competitive product offering that offers affordable value to ourcustomers. Invest in brand awareness and loyalty.
Manage low-cost efficient operations.
Ensure suppliers believe that our stores and associated supply chain offer an ideal route tomarket.
Optimise our store locations, and ensure regular store refurbishments and format renewal.
2012 2013
PROBABLITY LOW
FINANCIAL IMPACT HIGH
ECONOMIC IMPACT HIGH
Careful pre-selection of countries for new stores, with a thorough evaluation of customs, tax,exchange control and business legislation. Regular repatriation of cash.
Although there is a natural economic hedge in place because our SA operations supply theAfrican stores, IFRS accounting standards have broken this hedge, resulting in increasedvolatility of reported foreign currency movements. Dedicated executives across several functionsmonitor and manage the African operations.
Keep supply chain as short as practical.
Develop relationships with key government and regulatory authorities in those countries.
2012 2013
PROBABLITY LOW
FINANCIAL IMPACT LOW
ECONOMIC IMPACT HIGH
Supplier compliance audits.
Use of QA tests by third parties (Food Consulting Services).
Food safety management system audited by Diverse.
Food Forum focus. Formulated product-recall procedure.
Internal audit focus.
OPERATIONAL RISK
BUSINESS MODEL / STRATEGIC EXECUTION DEFINITION
Competitor attack on our major merchandise categories
Negative impact from a sustained attack by a major competitor (international or local) aimed atone or more of the Group’s major categories or formats.

OPERATIONAL RISKS: by their nature can be immediately addressed or mitigated by local management actions. These risks – which include in-store health,safety and security, compliance, fire prevention and detection, IT systems and food safety, amongst others – are therefore the direct responsibility of eachDivisional Executive Committee where a Loss Prevention or Risk Officer has line-responsibility for overseeing these risks.
2012 2013
PROBABLITY LOW
FINANCIAL IMPACT LOW
ECONOMIC IMPACT LOW
Increase executive, staff and customer awareness in-stores.
Internal Audit reviews.
Use of professional third parties to assess in-store health and safety issues, including legislativeand regulatory compliance.
Supply chain focus to reduce inventory volumes.

NOMINATION COMMITTEE
The Nominations Committee’s functions include assisting the Board with making recommendations on the composition of the Board with respect to race,
gender and the balance between executive, non-executive and independent non-executive members appointed to the Board, as well as acknowledging the
specialist or industry-specific skills required by the Group. The Nomination Committee assists the Board in identifying and nominating candidates and
formulating succession plans for the approval of the Board for the appointment of new executive and non-executive Directors, including the Chairperson and
CEO. The Committee recommends Directors who are retiring by rotation, for re-election.
The Committee is responsible for monitoring the principles of governance and code of best practice in respect of Board composition, structure and process
and ensuring that the Board has the appropriate composition to execute its duties effectively. They ensure that the induction and on-going training and
development of Directors take place.
The Committee assists the Board to ensure that the achievement of the competitive strategies, operating plans and financial objectives of the Group are
supported by appropriate executive recruitment, succession and compensation strategies which take account of:
each Group company’s stage in its life cycle and the executive capabilities appropriate for that stage;
the present and future posts which need to be filled to mitigate risk;
the availability of individuals to fill such posts;
the cost and composition of remuneration packages paid to individuals holding comparable positions in the retail and wholesale industry or other
industries as appropriate;
the Company’s policies regarding the various components and mix of compensation, incentivisation and wealth creation;
the cost of executive compensation to the company relative to short, medium and long term performance;
the time required to recruit, induct, inculcate and train individuals to be fully effective in new positions; and
the total compensation programme is designed with full consideration of all accounting, tax and regulatory requirements and shall be of the highest
quality.

SOCIAL AND ETHICS COMMITTEE REPORT
The Massmart Social and Ethics Committee was constituted in June 2011 and comprises two non-executive Directors and the Massmart CEO. An independentexternal advisor, the Group Chief Compliance Offi cer, the Group’s Corporate Affairs Executive, the Group General Counsel and the Group’s Human ResourcesExecutive attend meetings by invitation.
The Committee is governed by a charter and monitors Group performance in terms of defi ned social and ethics performance indicators that have beenformulated with reference to Regulation 43(5) of the Companies Act.
These indicators, which include but are not limited to, OECD anti-corruption guidelines, United Nations Global Compact principles, the Employment Equity Act,Johannesburg Stock Exchange Socially Responsible Index criteria and Broad-based Black Economic Empowerment elements, are reviewed by the Committee,on a rotational or core agenda basis.
The Committee met twice during the 53 weeks ended December 2013, at which meetings performance in the following areas were reviewed, in response to therequirements of the Companies Act:
JSE Socially Responsible Investment Index;Anti-corruption Compliance;Consumer and Product Safety;Human capital management;Regulatory and compliance matters;Stakeholder Relations;Socio-Economic Development; andEnvironmental Impact.
The Committee confirms that no material issues were identified during this review.
Phumzile LangeniChairperson of the Social and Ethics Committee
10 April 2014

COMPLIANCE, TRANSPARENCY AND ACCOUNTABILITY
AGM
Attendance by all Directors at Massmart’s Annual General Meeting is strongly encouraged while attendance for Board Committee Chairpersons is compulsory.
At the May 2013 Massmart Annual General Meeting the Chairperson of the Nomination Committee and the Chairperson of the Remuneration Committee, theAudit Committee and the Risk Committee were in attendance, as were the Board Chairman, CEO, COO and FD. In total, five non-executive directors attended theAnnual General Meeting.
The Company’s transfer secretaries attend every general meeting of shareholders to assist with the recording of shareholders’ attendance and to tally thevotes. The Chairman confirms with the meeting that votes will be counted by way of poll, i.e. all votes are counted, rather than by way of a show of hands.
Share buy-back programme
Annually the Group seeks, and obtains, the approval of the shareholders in general meeting to repurchase Massmart shares. This authority – valid until thefollowing year’s Annual General Meeting and subject to the Listings Requirements of the JSE – allows the Group to purchase its own shares not exceeding 5%of that class of the Company’s issued share capital, at a price not greater than 10% above the preceding five-day volume-weighted average. Shareholders havebeen asked to renew this authority at the forthcoming May 2014 Annual General Meeting.
During 53 weeks ended 29 December 2013, no Massmart shares were purchased on the open market by a Massmart subsidiary. The amount and timing of anyfuture purchases will be determined by the Board and are dependent on the Board’s view on the intrinsic value of Massmart shares, the ruling market price fromtime to time, the Group’s cash position and future cash requirements, and prevailing market conditions.
The Massmart Employee Share Trust acquires shares from time to time on the JSE open-market to mitigate the dilution caused by the Company issuing newshares when options are exercised by participants. During the 53 weeks ended 29 December 2013, the Massmart Employee Share Trust purchased 1.2 millionshares for R223.0 million which were utilised to meet vesting share options.
Share dealings
No Director, Executive or employee may deal, directly or indirectly, in Massmart shares where that person may be aware of unpublished price-sensitiveinformation. There are strict closed periods during which all directors, executives and employees are not allowed to deal in Massmart shares.
The periods begin one month prior to the end of each reporting date (these reporting dates being December and June) and end on the public release of theGroup results. A closed period also applies from the date when Massmart issues a cautionary announcement.
In addition, all Directors, Executives and employees, and their associates as defined by the JSE, are not allowed to deal in Massmart shares in the final hour oftrading on the JSE. All share dealings by a Director, Executive or employee must be authorised by the CEO, the COO or the FD. Any dealings by the CEO areauthorised by the Chairman, and dealings by the COO and the FD are authorised by the CEO.
Corporate Ethics
Massmart is committed to achieving the highest standards of ethical behaviour and continued its strong emphasis on promoting awareness of, andcompliance with, Massmart’s Code of Ethical Conduct. Massmart’s Code of Ethical Conduct was revised in January 2013, to bring it in line with the WalmartStatement of Ethics, and distributed to all 36 000 Massmart employees and contractors between April and August 2013.
Massmart Ethics Line
Massmart has an Ethics Line that is independently run by Deloitte Tip-Offs Anonymous. Deloitte Tip-Offs Anonymous has been certified by the ExternalWhistle-blowing Hotline Services Provider Standard E01.1.1. This Line can be used by all Massmart employees and suppliers to report any suspected unethicalbehaviour. Controls are in place to ensure callers can make good faith anonymous claims, without fear of retaliation.
Ethics structure and system
The Massmart Ethics Office adopted Walmart’s ethics system, IntegriLink, to record all calls received. Calls are investigated by the Divisional Ethics Officersand, where necessary, by Massmart Forensic Services Department. All calls are monitored by the Massmart Ethics Office, and significant calls in conjunctionwith the Walmart Global Ethics Office. The Group Ethics Forum meets twice a year where the call statistics and trends are discussed. The appointment ofEthics Officers in all Divisions, and the formulation and regular meetings of the Group Ethics Forum, have ensured the continued focus on the consistentapplication of ethics practice and training within Massmart.
Call statistics
During the weeks ended 31 December 2013, 40.3% of calls received were HR-related matters with 59.7% of calls involving ethics issues (see table below).

BREAKDOWN OF CALLS
MASSMART ETHICS LINE
Total calls2013 2012
January 66 43
February 51 42
March 58 53
April 51 58
May 54 76
June 29 49
July 75 61
August 75 64
September 77 55
October 88 59
November 73 57
December 58 33
Total 755 650
Increase 16.2%
Ethics awareness
The Massmart Ethics Office continuously distributes ethics awareness communications throughout Massmart:Regular “emailers” providing communication on relevant topics are sent to all employees with access to an email address and for management to display on allnotice boards. The “Gifts and Entertainment” emailer was distributed during the Nov/Dec period. Ethics posters are situated in all stores and head offices. Theposters displayed are: ‘Do what is right’ and ‘What does ethics mean?’ which will soon be available in ten languages, and two other posters that explain theMassmart Ethics Line and our values. Ethics “tone-at-the-top” messaging is also a recurring topic with Group Executives during store meetings.
Ethics surveys
In 2013, Walmart Global Ethics partnered with Corporate Executive Board (CEB) to administer a 21-item integrity survey to a statistically significant globalsample of employees deployed to all businesses. As Massmart had conducted an integrity risk assessment through the Ethics Institute of South Africa theprevious year, we tailored the CEB questions to be part of the BUA engagement survey. This BUA survey involved ascertaining the involvement and ownershipthat drives an employee to make a valuable contribution for the betterment and success of the Organisation. When the engagement is high, the employee ismuch better able to respect, add value, and seek opportunities to go above what the job requires. This, we believe, then directly impacts the culture andsuccess of the Organisation.
The table below reflects the response on similar questions between the Ethics survey 2012 and the BUA survey 2013.
Themes BUA 2013 Ethics Institute of South Africa 2012 % Improvement
Comfort speaking up 57% 37% 20%
Tone at the Top 44% 39% 8%
Director Manager Leadership 59% 41% 18%
Ethical pressure 65% 55% 10%
Awareness 81% 73% 8%
Observed misconduct 63% 47% 16%
As seen in the table above, the percentage improvement increased across all themes. It can thus be noted that Massmart is in line with actively improving thevarious elements such as increased productivity, active awareness campaigns, and engaging employees from all levels for greater commitment to theOrganisation.
Suppliers and service providers
Massmart regularly communicates its ethical and ethical-sourcing standards to suppliers and service providers, and attempts to ensure that they comply withthese standards as well as all legal requirements in all the countries where we operate including laws and regulations relating to corrupt activities. This isachieved in the following ways: suppliers and service providers are invited to make use of the Ethics Line, Massmart’s formal trading agreements detail ethicalpractices that suppliers are expected to uphold, and supplier ethics messages are distributed in supplier communications.
Contact the Massmart Ethics Line:
Call 0800 20 32 46Outside of SA +22 31 508 6488SMS 32846Fax 0800 00 77 88Email [email protected] www.walmartethics.com
Legal and Regulatory Compliance
Monitoring and managing legal and regulatory risks across the Group has always been a fundamental tenet of our business model. King III requires that aneffective compliance framework should include, among other features, formalized control processes with clear responsibilities and reporting channels. Toensure compliance with King III in an increasingly regulated market, the Group has sharpened its focus in this area by expanding and realigning certainfunctional legal and regulatory areas, including the following:
In 2011, the Board appointed a Group General Counsel and Legal Executive with Group-wide scope;In 2013, Management created a Compliance and Ethics Sub-Committee of its Executive Committee to focus on governance, regulatory compliance andethics matters;In 2013, Management divided the role of General Counsel and Chief Compliance Officer and appointed an executive to lead the regulatory compliancefunction. Management has realigned certain reporting lines and added resources within both the regulatory and legal areas to accommodate thisenhanced structure.

The environment is monitored, formally and informally, via several sources including key subject matter experts within the Group legal/regulatoryfunction, external service providers that review all proposed or impending legislation and regulations, as well as non-executive Directors, and contactswithin government bodies, supplier bodies and consumer groups;Depending upon where the response to the pending legislation can most efficiently and effectively be addressed, the task falls to one of the tradingforums (Food, Liquor, General Merchandise, Cellular) or functional forums (TIP, Finance) or even the Group Executive Committee. The members of theseforums are also tasked with keeping their respective Divisions apprised of intentions to support the role of the Divisional Compliance Officers; andOn-going compliance is monitored and tested through various means including internal compliance monitoring, MIAS, External Audit and third-partyservice providers. Reports from these entities are presented to the Risk Committee and the newly constituted Compliance and Ethics Committee.
Pending legislation or recently enacted laws that may have a potentially material impact on the Group include:
Payment Card Industry Data Security Standard;Labour and Employment legislationProtection of Personal Information Act; andVarious regulations relating to food safety and product safety, most significantly the Consumer Protection Act.
Extraterritorial laws now relevant to Massmart via our subsidiary association with Walmart that may have a material impact on the Group include:
The U.S. Foreign Corrupt Practices Act;Sarbanes Oxley;Dodd-Frank; andVarious trade sanctums relevant to subsidiaries of US companies.
These expanded and realigned resources have dual objectives of (i) providing legal/regulatory subject matter expertise to the Divisions and (ii) ensuring thateach division assesses and manages those legal/regulatory risks that the Group identifies. With support from the Group, the Finance Directors in each Divisionwill continue to ensure that legal/regulatory risks are appropriately assessed and managed. Compliance across the Group is exercised as follows:

NOTICE OF ANNUAL GENERAL MEETINGFOR THE YEAR ENDED DECEMBER 2013
Notice is hereby given that the Annual General Meeting of holders of all classes of shares of the Company will be held on Friday, 30 May 2014, at 09h00, atMassmart House, 16 Peltier Drive, Sunninghill Ext 6, Sandton, for purposes of:
1. Transacting the following business:
1.1 to present the audited Annual Financial Statements of the Company and its subsidiaries (Group) for the year ended December 2013, and theassociated Directors’ report and External Auditors’ report, the Audit Committee report and the Social and Ethics Committee report;1.2 to elect Directors in the place of those resigning and retiring in accordance with the Company’s Memorandum of Incorporation; and1.3 such other business as may be transacted at an Annual General Meeting.
2. Considering and, if deemed fit, passing, with or without modification, the below mentioned ordinary and special resolutions.
The Board of Directors of the Company has determined, in accordance with section 59 of the Companies Act, 71 of 2008, as amended (Act), that the respectiverecord dates for shareholders to be recorded as shareholders in the securities register of the Company in order to: (i) be entitled to receive this notice of AnnualGeneral Meeting is Thursday, 17 April 2014; and (ii) be entitled to attend, participate and vote at the Annual General Meeting is Friday, 23 May 2014. The lastdate to trade to be entitled to attend, participate and vote at the Annual General Meeting is Friday, 16 May 2014.
Ordinary business
The summarised audited Annual Financial Statements of the Company and the Group (as approved by the Directors of the Company), including the Directors’report and External Auditors’ report, the Audit Committee report and the Social and Ethics Committee report for the year ended December 2013, circulatedtogether with this notice, are presented to the shareholders for their consideration.
The summarised audited Annual Financial Statements for the year ended December 2013 are set out in the ‘Group Financial Director’s Review’ of the MassmartIntegrated Annual Report. The complete audited financial statements for the year ended December 2013 can be found here.
Ordinary resolutions
Ordinary Resolution Number 1
“Resolved that Mr D Cheesewright, who retires by rotation and has offered himself for re-election, be and is hereby re-elected to the Board of Directors of theCompany.”In terms of the Act, more than 50% of the voting rights exercised on this resolution must be cast in favour of ordinary resolution number 1 for it to beadopted.
Ordinary Resolution Number 2
“Resolved that Mr D Dlamini, who resigns as required by the Memorandum of Incorporation and has offered himself for re-election, be and is hereby re-electedto the Board of Directors of the Company.”
In terms of the Act, more than 50% of the voting rights exercised on this resolution must be cast in favour of ordinary resolution number 2 for it to be adopted.
Ordinary Resolution Number 3
“Resolved that Dr NN Gwagwa, who retires by rotation and has offered herself for re-election, be and is hereby re-elected to the Board of Directors of theCompany.”
In terms of the Act, more than 50% of the voting rights exercised on this resolution must be cast in favour of ordinary resolution number 3 for it to be adopted.
Ordinary Resolution Number 4
“Resolved that Mr GRC Hayward, who retires by rotation and has offered himself for re-election, be and is hereby re-elected to the Board of Directors of theCompany.”
In terms of the Act, more than 50% of the voting rights exercised on this resolution must be cast in favour of ordinary resolution number 4 for it to be adopted.
Ordinary Resolution Number 5
“Resolved that Mr CS Seabrooke, who retires by rotation and has offered himself for re-election, be and is hereby re-elected to the Board of Directors of theCompany.”
In terms of the Act, more than 50% of the voting rights exercised on this resolution must be cast in favour of ordinary resolution number 5 for it to be adopted.
Ordinary Resolution Number 6
“Resolved that Ernst & Young Inc. (with Mr Allister Carshagen as the Audit Partner) be and are hereby elected as the Company’s auditors for the ensuingfinancial year to hold office until the Company’s next Annual General Meeting, as approved by the Audit Committee and recommended to shareholders.”
In terms of the Act, more than 50% of the voting rights exercised on this resolution must be cast in favour of ordinary resolution number 6 for it to be adopted.
Ordinary Resolution Number 7
“Resolved that the following persons be and are hereby appointed, each by way of a separate vote, as members of the Audit Committee:
7.1 CS Seabrooke (Chairman)1;7.2 NN Gwagwa2; and7.3 P Langeni”.1 Subject to his re-election as a Director pursuant to ordinary resolution number 52 Subject to her re-election as a Director pursuant to ordinary resolution number 3
In terms of the Act, more than 50% of the voting rights exercised on each of these resolutions must be cast in favour of each of ordinary resolution numbers7.1, 7.2 and 7.3 for such resolutions to be adopted.

Ordinary Resolution Number 8
“Resolved that, subject to the JSE Limited Listings Requirements (JSE Listings Requirements), the Directors be and are hereby authorised to issue the ordinaryshares in the authorised but unissued shares of the Company (or to issue options or convertible securities convertible into ordinary shares) for cash to suchperson or persons on such terms and conditions as they may deem fit, subject to the following:
8.1 the securities shall be of a class already in issue, or convertible into a class already in issue;8.2 the securities shall be issued to public shareholders (as defined in the JSE Listings Requirements) and not to related parties (as defined in the JSEListings Requirements);8.3 the issues of securities in the aggregate under the authority of this resolution during the period in 8.5 below shall not exceed 5% of the number ofsecurities of that class already in issue as at the date of this notice of Annual General Meeting being 10,855,476 ordinary shares, determined inaccordance with the relevant provisions of the JSE Listings Requirements, provided that:8.3.1 any equity securities issued under the authority during the period contemplated in 8.5 below must be deducted from such number in 8.3 above; and8.3.2 in the event of a sub-division or consolidation of the issued equity securities during the period contemplated in 8.5 below, the existing authoritymust be adjusted accordingly to represent the same allocation ratio;8.4 the maximum discount at which the shares may be issued shall be 10% of the weighted average traded price of the shares of the Company measuredover the 30 business days prior to the date that the price of the issue is agreed between the Company and the party subscribing for the shares;8.5 the authority hereby granted will be valid until the Company’s next Annual General Meeting, provided that it will not extend beyond 15 months fromthe date on which this resolution is passed; and8.6 once shares representing, on a cumulative basis within the period contemplated in 8.5 above, 5% or more of the Company’s issued ordinary and/orpreference shares prior to that issue, have been issued, the Company shall publish an announcement in accordance with the JSE Listings Requirements.”
Pursuant to the JSE Listings Requirements, the Company will only be entitled to implement this general authority to allot and issue ordinary shares for cash ifthis ordinary resolution number 8 is passed by a majority of 75% or more of the votes cast by all shareholders present or represented by proxy at the AnnualGeneral Meeting, excluding any votes cast by the Massmart Holdings Limited Employee Share Trust.
Ordinary Resolution Number 9
“Resolved that, by way of a non-binding advisory vote, the remuneration policy of the Company, as outlined in the Remuneration report on pages 38 to 39 of theIntegrated Annual Report, is endorsed.”
As this is a non-binding advisory vote, no minimum voting threshold is required. Nevertheless, for record purposes, in terms of King III, more than at least 50%of the voting rights exercised on this resolution must be cast in favour of ordinary resolution number 9 for it to be adopted. This non-binding advisory voteallows shareholders to express their views on the remuneration policies adopted by the Company and on their implementation.
Special resolutions
Special Resolution Number 1
“Resolved, as a special resolution, that the Company and/or its subsidiaries be and are hereby authorised to generally repurchase the ordinary and/orpreference shares in the issued shares of the Company from such shareholder/s, at such price, in such manner and subject to such terms and conditions asthe Directors may deem fit, but subject to the Memorandum of Incorporation of the Company, the Act and the JSE Listings Requirements, and provided that:
1.1 the authority hereby granted will be valid until the Company’s next Annual General Meeting or for 15 months from the date of this special resolution,whichever period is shorter;1.2 repurchases may not be made at a price greater than 10% above the weighted average of the market value for the shares determined over the fivebusiness days immediately preceding the date that the repurchase is effected (or, if no shares of the Company have been traded in that period, subject to aruling by the JSE);1.3 repurchases in the aggregate in any one financial year shall not exceed 15% of that class of the Company’s issued shares;1.4 the repurchase of shares will be effected through the order book operated by the JSE trading system and will be done without any priorunderstanding or arrangement between the Company and the counterparty;1.5 the Company may only appoint one agent, at any point in time, to effect the repurchases on the Company’s behalf;1.6 neither the Company nor its subsidiaries may repurchase shares during a prohibited period (as defined in the JSE Listings Requirements) unless arepurchase programme is in place where the dates and quantities of shares to be traded during the relevant period are fixed (not subject to any variation)and where full details of the programme have been disclosed in an announcement on the Stock Exchange News Service prior to the commencement of theprohibited period;1.7 an announcement complying with paragraph 11.27 of the JSE Listings Requirements will be published by the Company when the Company and/or itssubsidiaries have cumulatively repurchased 3% of the Company’s initial number of issued ordinary and/or preference shares at the time that the generalauthority from shareholders is granted and for each 3% in aggregate of the initial number of that class acquired thereafter; and1.8 a resolution by the Board of Directors that it authorises such repurchase, that the Company and its subsidiaries have passed the solvency andliquidity test as set out in section 4 of the Act and that, since the application by the Board of Directors of the solvency and liquidity test, there have been nomaterial changes to the financial position of the Group, has been passed.”
Statement by the Board of Directors
In accordance with the JSE Listings Requirements, the Directors state that:
(a) the intention of the Directors is to utilise the authority given under special resolution number 1 at a future date, provided that the cash resources of theCompany are in excess of its requirements. In this regard, the Directors will take into account, inter alia, an appropriate capitalisation structure for the Companyand the long-term cash needs of the Company, and will ensure that any such utilisation is in the interests of the shareholders; and(b) having considered the effect of the maximum number of ordinary and preference shares that may be acquired pursuant to the authority given underspecial resolution number 1:
the Company and the Group will in the ordinary course of business be able to pay its debts for a period of 12 months after the date of this notice ofAnnual General Meeting;the assets of the Company and the Group will be in excess of the liabilities of the Company and the Group for a period of 12 months after the date ofthis notice of Annual General Meeting, such assets and liabilities being recognised and measured in accordance with the accounting policies used inthe Annual Financial Statements of the Company and the Group for the year ended December 2013;the issued share capital and reserves of the Company and the Group will be adequate for ordinary business purposes for a period of 12 months after thedate of this notice of Annual General Meeting; andthe working capital available to the Company and the Group will be adequate for ordinary business purposes for a period of 12 months after the date ofthis notice of Annual General Meeting.
The Company will ensure that its sponsor provides the necessary sponsor letter on the adequacy of the working capital in terms of the JSE ListingsRequirements, prior to the commencement of any repurchase of the Company shares under the authority given in terms of special resolution number 1.

The following additional information, which appears in the Integrated Annual Report of which this notice forms part, is provided in terms of the JSE ListingsRequirements for purposes of special resolution number 1:
Directors and management – p.89 to p.94;Major shareholders – p.82;Material changes – p.104;Directors’ interests in shares – p.49;Share capital of the Company – p.48;Responsibility statement – p.104; andLitigation – p.50.
The Directors, whose names are set out on pages 89 to 91 of the Integrated Annual Report, collectively and individually, accept responsibility for the accuracyof information contained in this statement and certify that, to the best of their knowledge and belief, there are no other facts, the omission of which wouldmake any statement false or misleading and that they have made all reasonable enquiries in this regard.
Other than the facts and developments reported in the Integrated Annual Report, to which this notice of Annual General Meeting is attached, there have beenno material changes in the financial or trading position of the Company and its subsidiaries since the publication of the Audited Financial Statements for theyear ended December 2013.
In terms of the Act, at least 75% of the voting rights exercised on this resolution must be cast in favour of special resolution number 1 for it to be adopted.
Special Resolution Number 2
“Resolved, as a special resolution, that the following Directors’ remuneration (payable to the applicable Directors for services to be rendered by them in theircapacities as such), be and is hereby approved, each by way of a separate vote, for the period commencing on 30 May 2014 to the date on which theCompany’s Annual General Meeting in respect of its financial year ending December 2014 will be held:
2.1 Chairman of the Board R871,0002.2 Deputy Chairman R625,0002.3 Directors R259,0002.4 Committee Chairmen R252,0002.5 Committee Members R120,000
In terms of the Act, at least 75% of the voting rights exercised on each of these resolutions must be cast in favour of special resolution numbers 2.1, 2.2, 2.3,2.4 and 2.5 for such resolutions to be adopted.
Special Resolution Number 3
“Resolved, as a special resolution, to the extent required in terms of, and subject to the provisions of, section 45 of the Act, that the shareholders herebyapprove of the Company providing, at any time and from time to time during the period of two years commencing on the date of this special resolution, anydirect or indirect financial assistance as contemplated in such section of the Act to any one or more related or inter-related companies or corporations (asdefined in the Act) of the Company and/or to any one or more members of any such related or inter-related company or corporation and/or to any one or morepersons related to any such company or corporation, on such terms and conditions as the Board of Directors of the Company, or any one or more personsauthorised by the Board of Directors of the Company from time to time for such purpose, deems fit, provided that any such financial assistance shall not in theaggregate exceed an amount of R13 billion in any financial year.”
In terms of the Act, at least 75% of the voting rights exercised on this resolution must be cast in favour of special resolution number 3 for it to be adopted.
The following direct and/or indirect financial assistance was provided by the Company to related and/or inter-related companies and/or corporations of theCompany as at the financial year ended December 2013:
RbnCross Suretyships in respect of banking facilities 7.4Loans to subsidiary companies 1.0Total 8.4
It is anticipated that such financial assistance will increase during the period of two years commencing on the date of special resolution number 3, mainly as aresult of the Group’s expansion and acquisition plans but that the total financial assistance after such anticipated increase will not exceed R13 billion.
In the event that the Company provides financial assistance to its subsidiary companies in the form of loans, the Company’s solvency and liquidity will not beimpaired as the Company will raise an asset in its books for the equivalent amount then due by that subsidiary.
Notice to shareholders of the Company in terms of section 45(5) of the Act of a resolution adopted by the Board authorising the Company to provide direct orindirect financial assistance.
By the time this notice of Annual General Meeting is delivered to shareholders, the Board of Directors will have adopted a resolution (section 45 BoardResolution) authorising the Company to provide, at any time and from time to time during the period of two years commencing on the date on which specialresolution number 3 is adopted, any direct or indirect financial assistance as contemplated in section 45 of the Act to any one or more related or inter-relatedcompanies or corporations of the Company and/or to any one or more members of any such related or inter-related company or corporation and/or to any oneor more persons related to any such company or corporation, provided that any such financial assistance shall not in the aggregate exceed an amount of R13billion in any financial year.
The section 45 Board Resolution will be effective only if and to the extent that special resolution number 3 is adopted by the shareholders, and the provision ofany such direct or indirect financial assistance by the Company, pursuant to such resolution, will always be subject to the Board of Directors being satisfiedthat: (i) immediately after providing such financial assistance, the Company will satisfy the solvency and liquidity test as referred to in section 45(3)(b)(i) of theAct; and that (ii) the terms under which such financial assistance is to be given are fair and reasonable to the Company as referred to in section 45(3)(b)(ii) ofthe Act.
In as much as the section 45 Board Resolution contemplates that such financial assistance will in the aggregate exceed one–tenth of one percent of theCompany’s net worth at the date of adoption of such resolution, the Company hereby provides notice of the section 45 Board Resolution to shareholders. Suchnotice will also be provided to any trade union representing any employees of the Company.

General
Identification, voting and proxies
Shareholders are entitled to attend, speak and vote at the Annual General Meeting.
In terms of section 63(1) of the Act, any person attending or participating in the Annual General Meeting must present reasonably satisfactory identificationand the person presiding at the general meeting must be reasonably satisfied that the right of any person to participate in and vote (whether as a shareholderor as proxy for a shareholder) has been reasonably verified. Forms of identification include valid identity documents, driver’s licences or passports.
Shareholders holding dematerialised shares, but not in their own name, must furnish their Central Securities Depository Participant (CSDP) or broker with theirinstructions for voting at the Annual General Meeting. If your CSDP or broker, as the case may be, does not obtain instructions from you, it will be obliged to actin accordance with your mandate furnished to it, or if the mandate is silent in this regard, complete the form of proxy attached.
Unless you advise your CSDP or broker, in terms of the agreement between you and your CSDP or broker by the cut-off time stipulated therein, that you wish toattend the Annual General Meeting or send a proxy to represent you at the Annual General Meeting, your CSDP or broker will assume that you do not wish toattend the Annual General Meeting or send a proxy.
If you wish to attend the Annual General Meeting or send a proxy, you must request your CSDP or broker to issue the necessary letter of authority to you.Shareholders holding dematerialised shares, and who are unable to attend the Annual General Meeting and wish to be represented thereat, must complete theform of proxy attached in accordance with the instructions therein and lodge it with or mail it to the transfer secretaries, Computershare Investor ServicesProprietary Limited (Computershare).
A form of proxy (which is attached) must be dated and signed by the shareholder appointing a proxy and should be forwarded to reach Computershare by nolater than 09h00 on Wednesday, 28 May 2014. Before a proxy exercises any rights of a shareholder at the Annual General Meeting, such form of proxy must beso delivered.
In compliance with the provisions of section 58(8)(b)(i) of the Act, a summary of the rights of a shareholder to be represented by proxy, as set out in section 58of the Act, is set out immediately hereunder:
A shareholder entitled to attend and vote at the Annual General Meeting may appoint any individual (or two or more individuals) as a proxy or as proxiesto attend, participate in and vote at the Annual General Meeting in the place of the shareholder. A proxy need not be a shareholder of the Company.A proxy appointment must be in writing, dated and signed by the shareholder appointing a proxy and, subject to the rights of a shareholder to revokesuch appointment (as set out below), remains valid only until the end of the annual general meeting.A proxy may delegate the proxy’s authority to act on behalf of a shareholder to another person, subject to any restrictions set out in the instrumentappointing the proxy.The appointment of a proxy is suspended at any time and to the extent that the shareholder who appointed such proxy chooses to act directly and inperson in the exercise of any rights as a shareholder.The appointment of a proxy is revocable by the shareholder in question cancelling it in writing, or making a later inconsistent appointment of a proxy,and delivering a copy of the revocation instrument to the proxy and to Computershare. The revocation of a proxy appointment constitutes a completeand final cancellation of the proxy’s authority to act on behalf of the shareholder as of the later of: (i) the date stated in the revocation instrument, if any;and (ii) the date on which the revocation instrument is delivered to Computershare as required in the first sentence of this paragraph.If the instrument appointing the proxy or proxies has been delivered to Computershare, as long as that appointment remains in effect, any notice that isrequired by the Act or the Company’s Memorandum of Incorporation to be delivered by the Company to the shareholder, must be delivered by theCompany to: (i) the shareholder; or (ii) the proxy or proxies, if the shareholder has: (a) directed the Company to do so in writing; and (b) paid anyreasonable fee charged by the Company for doing so.Attention is also drawn to the “Notes to the form of proxy”.The completion of a form of proxy does not preclude any shareholder from attending the Annual General Meeting.
Shareholders may participate (but not vote) electronically in the Annual General Meeting. Shareholders wishing to participate in the Annual General Meetingelectronically should contact the Assistant Company Secretary on [email protected] or +27 11 517 0000 not less than five business days prior to theAnnual General Meeting. Access to the Annual General Meeting by way of electronic participation will be at the shareholder’s expense. Only persons physicallypresent at the Annual General Meeting or represented by a valid proxy shall be entitled to cast a vote on any matter put to a vote of shareholders.
By order of the Board
Philip SigsworthCompany Secretary10 April 2014

For use by certificated and dematerialised shareholders who have ‘own name’ registration of shares on Friday, 23 May 2014 at the Annual General Meeting to be held on Friday, 30 May 2014, at 09h00, at Massmart House, 16 Peltier Drive, Sunninghill Ext 6, Sandton.
I/We (Please PRINT full names)
Of (address) being the
holders of ordinary shares/‘A’ preference shares/‘B’ preference shares, hereby appoint (see note 3),
1. or failing him/her,
2. or failing him/her,
the Chairman of the Annual General Meeting as my/our proxy to participate in, speak and vote for me/us on my/our behalf at the Annual General Meeting which will be held for the purpose of considering and, if deemed fit, passing the ordinary and special resolutions to be proposed and at each adjournment of the Annual General Meeting and to vote for or against the ordinary and special resolutions or to abstain from voting in respect of the shares in the issued capital of the Company registered in my/our name/s, in accordance with the following instructions (see note 4).
Signed at on 2014
Signature
Assisted by me (where applicable)
Massmart Holdings Limited Incorporated in the Republic of South Africa Registration number 1940/014066/06
JSE share code: MSM ISIN: ZAE000152617(“Massmart” or “the Company”)
FOR AGAINST ABSTAIN
OS* PS* OS* PS* OS* PS*ORDINARY RESOLUTIONS1. re-election of mr d cheesewright to the board of directors 2. re-election of mr d dlamini to the board of directors3. re-election of dr nn Gwagwa to the board of directors 4. re-election of mr Grc hayward to the board of directors 5. re-election of mr cS Seabrooke to the board of directors 6. election of ernst & young Inc. as the company’s auditors 7. appointment of the audit committee members:
7.1 cS Seabrooke 7.2 nn Gwagwa 7.3 P Langeni
8. authorisation for the directors to issue ordinary shares for cash, not exceeding5% of the shares in issue
9. endorsement of the company’s remuneration policySPECIAL RESOLUTIONS1. authorisation for the company and/or its subsidiaries to repurchase its own shares 2. approval of directors’ remuneration
2.1 chairman of the board2.2 deputy chairman2.3 directors2.4 committee chairmen2.5 committee members
3. authorisation to provide financial assistance
Insert an "X" or the number of ordinary shares/“A” Preference shares/“B” preference shares (see note 4)
completed forms of proxy must be lodged with computershare Investor Services Proprietary Limited, not less than 48 (forty-eight) hours before the time for holding the annual General meeting, i.e. by no later than 09h00 on Wednesday, 28 may 2014.
Please read the notes on the reverse side of this form of proxy.
(Indicate with an “X” or the relevant number of shares, in the applicable space, how you wish your votes to be cast.) If you return this form duly signed, without any specific directions, the proxy will vote as he/she thinks fit.
*OS – ordinary shares*PS – Preference shares
FORM OF PROXY

1. A form of proxy is only to be completed by those shareholders who are: 1.1 holding shares in certificated form; or 1.2 recorded on the sub-register of the Company in dematerialised electronic form in “own name” on the record date for
attending, participating and voting at the Annual General Meeting.
2. If you have already dematerialised your shares through a Central Securities Depository Participant (CSDP) or brokerand wish to attend the Annual General Meeting, you must request your CSDP or broker to provide you with a letter ofrepresentation or you must instruct your CSDP or broker to vote by proxy on your behalf in terms of the agreement between yourself and your CSDP or broker.
3. A shareholder may insert the name of a proxy or the names of alternative proxies of the shareholder’s choice in the space/s provided, with or without deleting ‘the Chairman of the Annual General Meeting’ but any such deletion must be initialledby the shareholder. The person whose name stands first on this form of proxy and who is present at the Annual GeneralMeeting will be entitled to act as proxy to the exclusion of those whose names follow.
4. Please insert an ‘X’ in the relevant space according to how you wish your votes to be cast. However, if you wish to castyour votes in respect of a lesser number of shares than you own in the Company, insert the number of shares held inrespect of which you wish to vote. Failure to comply with the above will be deemed to authorise the proxy to vote or toabstain from voting at the Annual General Meeting as he/she deems fit in respect of all the shareholders’ votes exercisable at the Annual General Meeting. A shareholder or his/her proxy is not obliged to use all the votes exercisable by theshareholder or by his/her proxy, but the total of the votes cast and in respect of which an abstention is recorded may notexceed the total of the votes exercisable by the shareholder or by his/her proxy.
5. Forms of proxy must be received by the transfer secretaries, Computershare Investor Services Proprietary Limited(Computershare), Ground Floor, 70 Marshall Street, Johannesburg, 2001 (PO Box 61051, Marshalltown, 2107) by nolater than 09h00 on Wednesday, 28 May 2014.
6. The completion and lodging of this form of proxy will not preclude the relevant shareholder from attending the AnnualGeneral Meeting and speaking and voting in person at such meeting to the exclusion of any proxy appointed in terms ofthis form of proxy.
7. Documentary evidence establishing the authority of a person signing this form of proxy in a representative capacity orother legal capacity must be attached to this form of proxy unless previously recorded by Computershare or waived by the Chairman of the Annual General Meeting.
8. Any alterations or corrections made to this form of proxy must be initialled by the signatory/ies.
9. A minor must be assisted by his/her parent or guardian unless the relevant documents establishing his/her legal capacityare produced or have been registered by Computershare.
10. The Chairman of the Annual General Meeting may accept any form of proxy which is completed other than in accordance with these notes if the Chairman is satisfied as to the manner in which the shareholder wishes to vote.
11. If any shares are jointly held, the first name appearing in the register shall, in the event of a dispute, be taken as ashareholder.
for the year ended december 2013
NOTES TO THE FORM OF PROXY
Transfer secretariesComputershare Investor Services Proprietary LimitedGround Floor70 Marshall StreetJohannesburg, 2011PO Box 61051, Marshalltown, 2107Telephone: +27 11 370 5000Call Centre: 086 110 09818