Highlights of Youth Development Index
341
Highlights of Youth Development Index YOUTH DEVELOPMENT INDEX: 0.453 • Himachal Pradesh ranks first in the Youth Development Index with a value 0.590 closely followed by Goa (0.588) and Delhi (0.587). • Twenty one states have YDI value greater than the national average. • Bihar ranks the lowest (0.383) among the 29 states for which YDI was calculated. YOUTH GENDER DEVELOPMENT INDEX: 0.444 • When calculated separately for males and females, the Youth Development Index is much lower for females as compared to males in all the states. At the National level, the value for females is lower by 0.13 points. • Delhi, which is 3 rd in the overall YDI, ranks first in the YDI for males but ranks only 10 th in the YDI for females. • There is no difference in the ranking of YDI for males and YDI for females for Maharashtra and Tamil Nadu. • Meghalaya is the only state that has a higher rank for the YDI females (4 th rank) as compared to males (17 th rank). • There is a reduction in the value of YDI when corrected for gender disparity in youth development, bringing down the National YDI value from 0.453 to 0.444. YOUTH GENDER DEVELOPMENT INDEX WITH CORRECTION FOR SEX RATIO : 0.426 • When corrected for the differences in the proportion of males and females in the youth population, the value of the index comes down further to 0.426. YOUTH DEVELOPMENT INDEX (INCLUDING PARTICIPATION) : 0.482 • When the dimension of participation is included, among the 11 states for which a revised YDI was calculated, Kerala ranks first with a value of 0.611. • The YDI value for the 11 states together is 0.482 as compared to the earlier value of 0.453.
-
Upload
khangminh22 -
Category
Documents
-
view
1 -
download
0
Transcript of Highlights of Youth Development Index

�
Highlights of Youth Development Index
YOUTH DEVELOPMENT INDEX: 0.453
• HimachalPradeshranksfirstintheYouthDevelopmentIndexwithavalue0.590closelyfollowedbyGoa(0.588)andDelhi(0.587).
• TwentyonestateshaveYDIvaluegreaterthanthenationalaverage.• Biharranksthelowest(0.383)amongthe29statesforwhichYDIwas
calculated.
YOUTH GENDER DEVELOPMENT INDEX: 0.444
• Whencalculatedseparatelyformalesandfemales,theYouthDevelopmentIndexismuchlowerforfemalesascomparedtomalesinallthestates.AttheNationallevel,thevalueforfemalesislowerby0.13points.
• Delhi,whichis3rd in the overall YDI, ranks first in the YDI for males butranksonly10thintheYDIforfemales.
• Thereisnodifferenceintherankingof YDIformalesandYDIforfemalesforMaharashtraandTamilNadu.
• MeghalayaistheonlystatethathasahigherrankfortheYDIfemales(4thrank)ascomparedtomales(17thrank).
• Thereisareductioninthevalueof YDIwhencorrectedforgenderdisparityinyouthdevelopment,bringingdowntheNationalYDIvaluefrom0.453to0.444.
YOUTH GENDER DEVELOPMENT INDEX WITH CORRECTION FOR SEX RATIO : 0.426
• Whencorrectedforthedifferencesintheproportionof malesandfemalesintheyouthpopulation,thevalueof theindexcomesdownfurtherto0.426.
YOUTH DEVELOPMENT INDEX (INCLUDING PARTICIPATION) : 0.482
• Whenthedimensionof participationisincluded,amongthe11statesforwhich a revised YDI was calculated, Kerala ranks first with a value of 0.611.
• TheYDIvalueforthe11statestogetheris0.482ascomparedtotheearliervalueof 0.453.

India Youth Development Report 20�0 2
• AcrossthestatesthelargestdifferenceinmaleandfemaleYDIisobservedinDelhi(0.20points)andBihar(0.19points)
• ThelowestdifferencewasobservedintheNorth-easternstatesof India,viz.,MeghalayafollowedbyNagalandandArunachalPradesh.
YOUTH GENDER DEVELOPMENT INDEX (INCLUDING PARTICIPATION) : 0.474
Whentheparticipationdimensionwasincluded,therevisedYDIadjustedforgenderdisparityinyouthdevelopment,thevaluebecomes0.474.YOUTH GENDER DEVELOPMENT INDEX (INCLUDING PARTICIPATION) WITH CORRECTION FOR SEX RATIO : 0.454
YOUTH HEALTH INDEX : 0.580
• AttheNationalleveltheYouthHealthIndexvalueisat0.580,withtheindexof malesandfemalesbeing0.612and0.545respectively.
• Kerala(0.749)ranksthehighestinHealthIndexcloselyfollowedbyGoa(0.728)andDelhi(0.691).
• ThelowestrankingstatesareJharkhand(0.515)followedbyAssam(0.518)andBihar(0.523).
• Thedifferencebetweenthehighestandlowestvalueis0.234.• ElevenstateshaveaHealthIndexbelowNationalaverage.• TherelationshipbetweenHealthIndexandYDIshowsalinearrelationship
meaningthatanimprovementinHealthIndexcontributeslinearlytoanincreaseintheYouthDevelopmentIndex.
• YouthHealthOutcomeIndex:0.609• YouthHealthAccessIndex:0.482YOUTH EDUCATION INDEX : 0.413.
• ThehighestrankingstatesareHimachalPradeshwithavalueof 0.611(havingaveryhighenrolmentrateof 131)followedbyDelhi(0.603)andKerala(0.575).
• ThelowestrankingstatesareBihar(0.298),Jharkhand(0.315),andRajasthan(0.325).Thedifferencebetweenthehighestandlowestrankingstatesis0.313.

�
• TwelvestateshaveanEducationalIndexValuethatisbelowtheNationalaverage.
• ThegendergapisthehighestinBihar(0.17)followedbyMadhyaPradeshandRajasthan(0.16each).
• TheleastgendergapisfoundinKerala(0.01)andMizoram(0.01).• TheEducationIndexalsogenerallyshowsalinearcorrelationwiththe
YDI.• YouthEducationOutcomeIndex:0.472• YouthEducationAccessIndex:0.223YOUTH WORK INDEX : 0.636
• MeghalayaranksthehighestinWorkIndex(0.804),Chattisgarh(0.754)followedbyAndhraPradesh(0.747).
• ThelowestWorkIndexisTripura(0.486)followedbyJammuandKashmir(0.519).
• Therangeof variationinWorkIndexis0.235.• SixteenstateshaveaWorkIndexthatisbelowtheNationalaverage.• TheoutliersareDelhiandKerala,twodevelopedstateshavingaverylow
WorkIndex.• ThereisanegativecorrelationbetweenEducationIndexandWorkIndex
asonemayexpect.• StateshavinghighEducationIndextendstohavealowWorkIndexas
manyof thoseintheyouthagegroupisstillintheeducationalsystemthusnotworking.
• Whencalculatedseparatelyformalesandfemales,theYouthWorkIndexis0.868formalesand0.384forfemales,indicatingawidegendergapinemployment.
• YouthWorkOutcomeIndex:0.594• YouthWorkAccessIndex:0.957
YOUTH AMENITIES INDEX : 0.380
• TheAmenitiesIndexintegratesindicatorsrelatedtoBasicAmenitiesandthoseModernAmenitiesthataremorerelevanttoyouth.
• Thelowvalueistheresultof acombinationof highvalue(0.65)forbasicamenities(consistingof water,toiletfacilities,electricity,andhousing)withaverylowvalue(0.19)foryouthrelevantmodernamenities(information,communicationandtechnology).
Highlights of Youth Development Index

India Youth Development Report 20�0 �
• Intermsof YouthAmenitiesIndex,thehighestrankingstateisDelhi(0.611)followedbyGoa(0.580)andKerala(0.518).
• ThelowestrankingstateisBihar(0.272).• OtherstateshavingaLowAmenityIndexareOrissa,Jharkhandand
Chattisgarh.• ElevenstatesarebelowtheNationalaverageof 0.381.• Therangeof variationinAmenityIndexis0.339whichishigh.• ExceptAssam,BiharandJharkhand,allthestateshaveanAmenitiesIndex
valuegreaterthan0.5.• WhenYouthAmenitiesIndexiscalculatedformalesandfemalesseparately,
thevaluesfortheNationallevelare0.389formalesand0.373forfemales.• YouthBasicAmenitiesIndex:0.658• YouthModernAmenitiesIndex:0.195
YOUTH PARTICIPATION INDEX : 0.622
• Thevalueof ParticipationIndex,wascomputedusingenrollmentasavoterandvotingbehavior.
• TheParticipationIndexcomputedusingdatafrom11statesis0.622.• Whilethereareinter-statevariations,thelevelof participationishighinall
of thestatesexceptDelhiwhichhasavalueof 0.488.• Whilethestateof enrollmentleavesmuchtobedesired(theenrollment
valueis0.503),thevotingbehaviorappearstobehigh(0.80).

�
Youth form an integral part of any society and are an essential part of the development process. India is a ‘young’ nation. As per Census of India 2001, the size of the youth population in the country is 422.3 million, with 219 million males and 203 million females comprising above 41 percent of the total Indian population. Youth population in the age group 15-34 years is expected to increase over the coming years as per the population projections. Between the last and the forthcoming 2011 census, the youth population is expected to increase by 77 million while during 2011-21 the number would increase by 34 million.
The Rajiv Gandhi National Institute for Youth Development [RGNIYD] assigned the Tata Institute of Social Sciences to construct a Youth Development Index [YDI] for India “to enable assessment of the status of the Youth in the country, facilitate comparisons between the States and Union Territories and also be able to identify the gaps which need policy intervention”. This project is the first attempt in the country to develop such an index for youth.
The creation of a Youth Development Index is expected to contribute in three ways. First, it would help to recognize youth as a population category that requires separate consideration. For instance, despite the existence of a National Youth Policy for the past 20 years, youth as a significant category did not get recognition in many quarters. Second, development of a summary index would help to make comparison across geographical areas and categories, as Human Development Index has done in comparing the development situation across regions, nations and localities. Third, the proposed index, apart from measuring the achievement made (in comparison with other societies and in comparison with the past), would help in advocacy activities related to youth development in general and of specific categories in particular.
Youth Development Index
Exe
cuti
ve
Sum
mar
y
I am young, and I too have a dream. I dream of an India – strong, independent, self-reliant and in the front rank of the nations of the world in the service of mankind.
–RajivGandhi

India Youth Development Report 20�0 �
Though the Youth Development Index would provide a basic idea of the relative level in a particular society or a category of youth within a society, a comprehensive understanding of youth development could be achieved only if the index is studied along with information on so many other facets of youth development that cannot be captured by a Summary Index. Subjective perceptions on the selected indicators, non- hierarchical variables such as identity and culture, nature of familial relationships and aspects where adequate national data is not available cannot be easily included in a Summary Index.
Objectives 1. Construct a Youth Development Index which can be used across the country
by the State, Academia, and other Organizations/Institutions in Civil Society, to ascertain the status of youth vis-à-vis the systemic dimensions which influence their growth and empowerment.
2. Understand and analyse the status of youth in the country vis-à-vis the objectives of the National Youth Policy (NYP).
3. Obtain perceptions of youth about the factors that facilitate/impinge on their growth and empowerment.
4. Provide policy makers with a tool and data to formulate programmes for youth.
Principles for Construction of YDIThe Youth Development Index aims at substantial contribution to the situational analysis of the development of youth across the sections of society. In order to build a comprehensive index, the following principles are considered:1. The YDI would be ‘youth centred’. 2. Youth are not a homogeneous group and differences across the categories
mentioned below would be studied: a. Location: urban, rural , tribal b. Terrain : hills, plainsc. Shelter : those with shelter, homelessd. Economic class : upper, middle and lowere. Gender : male, female, f. Sexual orientationsg. Role :student, non-student; employed , unemployed
Among the categories mentioned above, there is a large proportion of youth who are socially marginalized.
Some of these groups are mentioned as priority target groups in the National Youth Policy [2003]. These are rural and tribal youth; out-of-school youth; adolescents, particularly female youth; youth with disability: and youth under difficult circumstances like victims of trafficking, orphans and street children.

�
3. Youth are shaped by all their experiences from birth. 4. The dimensions of the YDI would consider and include two facets of ‘youth’:
a) A group that has specific life goals and tasks related to their stage of growth. e.g., education, identity, work, family (Youth Development)
b) A group that can be mobilized for social and cultural change e.g., participation in societal issues (Youth for Development).
5. The YDI aims to obtain objective data [e.g., access to systems and services, status in each dimension] and subjective interpretations [e.g., factors facilitating/ blocking access and participation] by the youth.
6. The themes are derived from the major documents which have addressed the issues related to youth, globally in the Indian context.
7. The YDI is based on the HDI model, but certain themes would be added considering the youth’s specific characteristics and rights. It would be a standardized tool to measure certain critical areas of youth development. It is not intended to study and evaluate all aspects of youth development.
MethodologyThe process of construction of the index involved deliberations with youth themselves and related stakeholders in five regional consultations, and then enfolded across various stages, each adding on to understanding of youth in India and making the indicators of development progressively more incisive. As a result of these consultations, five domains of the YDI were finalized. These domains are: Health, Education, Employment, Amenities and Participation. Data available under each of the domains were compared across years and across the different States in order to look for variation. Since there were several indicators within each domain, comparing variation in data helped to filter out those indicators that showed meaningful variability. Therefore this exercise further sharpened the indicators within each domain. However, we had to remove the domain of participation in constructing YDI from secondary data due to lack of information. But this dimension was included later for the 11 selected states for which data was available from primary research. Hence there were two Youth Development Indexes constructed:1. Youth Development Index (based on dimensions health, education, work and
amenities) computed for 29 states2. Youth Development Index (based on dimensions health, education, work,
amenities and participation) computed for 10 states
It was decided to consider the gender dimension as well as a correction for sex ratio in the youth population, while computing the Youth Development Index.
The next step was to identify and collate national data on the selected indicators. For this, analysis of NSS and NFHS primary data was carried out. This data was
Youth Development Index – Executive Summary

India Youth Development Report 20�0 �
subjected to Principal Component Analysis to examine the (communalities) and thus to determine which indicators could be finally selected for the index construction. In order to further validate the inclusion of indicators, Analytical Hierarchical Process was used.
Selected Indicators
Health • Percentage of Assisted/Institutional delivery (represents access)• Life expectancy at age 15 (represents outcome)• Percentage of youth- Non-Anaemic (represents outcome)• Body Mass Index (represents outcome)
Education• Gross Enrolment Ratio (GER secondary+GER tertiary) (represents
access)• Level of education attained (literate, primary, secondary, tertiary, vocational)
(represents outcome)
Work• Work participation rate (represents outcome)• Available days of work in a year per youth (represents access)
Amenities Basic Amenities
• Access to safe water• Type of house• Access to electricity• Toilet facility
Youth Amenities • Information• Communication• Technology
Participation• Percentage of youth aged 18 and above who have enrolled as a voter• Percentage of those voted in the last election among those enrolled as a
voter

�
While the chosen dimensions were given equal weights in the YDI, differential weights were given to sub- indexes within a dimension and to indicators within sub-dimensions.
The sub-indexes are: YHIf = Youth Health Index for FemaleYHIm = Youth Health Index for MaleYEIf = Youth Education Index for FemaleYEIm = Youth Education Index for MaleYWIf = Youth Work Index for FemaleYWIm = Youth Work Index for MaleYAIf = Youth Amenities Index for FemaleYAIf = Youth Amenities Index for MaleYPIf = Youth Participation Index for Female YPIm = Youth Participation Index for Male
and YDIf = Youth Development Index for FemaleYDIm = Youth Development Index for MaleYDI = Youth Development Index
Considering the four (Health, Education, Work and Amenities) dimensions based on secondary data, the YDI for males was calculated as follows:
In the same way YDI was computed for females.
The dimension of participation was obtained through primary research. Thus, considering the five (Health, Education, Work, Amenities and Participation) dimensions, the YDI for males and females were computed as:
a) YDI = Youth Development Index = (Proportion of Females * YDIf ) + (Proportion of Males * YDIm)
Youth Development Index – Executive Summary

India Youth Development Report 20�0 �0
b) YGDI = Youth Gender Development Index
c) YGDISR = Youth Gender Development Index adjusted for Sex-ratio = Sex-ratio Correction Factor * YGDI
Firstly, the YDI was computed with the four dimensions of Health, Education, Work, and Amenities. This index was then adjusted initially for gender disparity (Youth Gender Development Index) and sex ratio (Youth Gender Development Index Adjusted for Sex ratio). Subsequently, the YDI was calculated including the fifth dimension of Participation for the 11 states from where primary data was collected. This was also adjusted for gender disparity and sex ratio. In both the cases, the YDI was initially computed separately for males and females.
The Youth Development IndexThe Youth Development Index for India is 0.453. Himachal Pradesh ranks first in the Youth Development Index with a value of 0.590 closely followed by Goa (0.588) and Delhi (0.587). Twenty one states have YDI value greater than the National average. Bihar ranks the lowest (0.383) among the 29 states for which YDI was calculated; this state ranked the lowest for HDI (2004-05) also with a value of 0.441. Some of the North Indian states fair poorly in all spheres of youth development; especially notable is the situation in Bihar and Uttar Pradesh. Kerala which ranks first in the HDI since 1981 gets a lower rank (4th) in YDI. In the HDI calculation, Kerala had the highest rank since social indicators had a greater weight in the computation of HDI. However, it has been found that when HDI is calculated by including economic and growth- related indicators, its position was 9th in 2005 (Kerala Human Development Report 2005). This is validated by the YDI as this index also included a Work Index which incorporated measures of work status and access to work.
However, when the dimension of Participation is included, among the 11 states for which a revised YDI was calculated, Kerala ranks first with a value of 0.611. The YDI value for the 11 states together is 0.482 as compared to the earlier value of 0.453.
The Gender DimensionWhen calculated separately for males and females, the Youth Development Index is much lower for females as compared to males in all the states. At the National level,

��
the value for females is lower by 0.13 points. Though it is a predictable outcome, this is a matter of concern as the status of female youth continues to remain low despite the various efforts made by the government and civil society to enhance their position in the society. Across the states, the largest difference in male and female YDI is observed in Delhi (0.20 points) and Bihar (0.19 points) and the lowest difference was observed in the North-eastern states of India, viz., Meghalaya followed by Nagaland and Arunachal Pradesh.
It is interesting to see that Kerala which is known for the prevalence of matrilineal system of inheritance and for progressive social development, the value of female YDI is lower by 0.14 points as compared to males. In some of the states that are known for gender bias, the difference between male and female YDI is more striking. Delhi, which is 3rd in the overall YDI, ranks first in the YDI for males but ranks only 10th in the YDI for females. There is no difference in the ranking of YDI for males and YDI for females for Maharashtra and Tamil Nadu. Meghalaya is the only state that has a higher rank for the YDI females (4th rank) as compared to males (17th rank).
The Youth Gender Development Index for India is 0.444 as compared to the value of 0.453 of the YDI without adjusting for gender disparity in youth development. There is a reduction in the value of YDI when corrected for gender disparity in youth development, bringing down the National YDI value from 0.453 to 0.444. When corrected for the differences in the proportion of males and females in the youth population, the value of the index comes down further to 0.426. This situation can be observed for all the states. However, the ranking of the states in terms of youth development does not change.
When the participation dimension was included, the revised YDI adjusted for gender disparity in youth development, the value becomes 0.474 and when corrected for sex ratio, the value is 0.454.
Youth Health IndexAt the National level the Youth Health Index value is at 0.580, with the index of males and females being 0.612 and 0.545 respectively. Kerala (0.749) ranks the highest in health index closely followed by Goa (0.728) and Delhi (0.691). The lowest ranking states are Jharkhand (0.515) followed by Assam (0.518) and Bihar (0.523). The difference between the highest and lowest value is 0.234. Eleven states have a health index below the National average. The relationship between Health Index and YDI shows a linear relationship meaning that an improvement in Health Index contributes linearly to an increase in the Youth Development Index.
Youth Education IndexIndia’s Youth Education Index is 0.413. There is a considerable difference between males and females in the value of Education Index. The gender gap is the
Youth Development Index – Executive Summary

India Youth Development Report 20�0 �2
highest in Bihar (0.17) followed by Madhya Pradesh and Rajasthan (0.16 each). The least gap is found in Kerala (0.01) and Mizoram (0.01). The highest ranking states are Himachal Pradesh with a value of 0.611 (having a very high enrolment rate of 131) followed by Delhi (0.603) and Kerala (0.575). The lowest ranking states are Bihar (0.298), Jharkhand (0.315) and Rajasthan (0.325). The difference between the highest and lowest ranking states is 0.313. Twelve states have an Educational Index value that is below the National average. The Education Index also generally shows a linear correlation with the YDI. However, in the states of Andhra Pradesh, Madhya Pradesh, Chhattisgarh and Meghalaya, it is seen that the YDI is high, and the Education Index is low. These states have performed better in the other dimensions of the YDI.
Youth Work IndexThe Youth Work Development Index in India is 0.636. Meghalaya ranks the highest in Work Index (0.804), Chattisgarh (0.754) followed by Andhra Pradesh (0.747). The lowest Work Index is Tripura (0.486) followed by Jammu and Kashmir (0.519). The range of variation in Work Index is 0.235. Sixteen states have a Work Index that is below the National average. The outliers in this case are Delhi and Kerala, two developed states having a very low Work Index. There is a negative correlation between Education Index and Work Index as one may expect. States having high Education Index tends to have a low Work Index as many of those in the youth age group is still in the educational system thus not working. When calculated separately for males and females, the Youth Work Index is 0.868 for males and 0.384 for females, indicating a wide gender gap in employment.
Youth Amenities IndexIn India, the Youth Amenities Index is 0.381. The Amenities Index considered here integrates indicators related to basic amenities and those modern amenities that are more relevant to youth. This low value is the result of a combination of high value (0.65) for basic amenities (consisting of water, toilet facilities, electricity, and housing) with a very low value (0.19) for youth relevant modern amenities (information, communication and technology). The greater values found for basic Amenities Index are not surprising as the primary focus of the government developmental efforts has been in providing the basic facilities. Even in this respect, there are regions that are still denied of basic amenities like electricity, drinking water and toilet facilities. However, since this is an attempt to construct a Youth Development Index, it was necessary to include facilities which are considered important for youth development. The dimensions of communication, information and technology are considered in the National Youth Policy as key sectors for youth development. Since both basic and youth amenities are largely household- based facilities, the gender differences are minimal. When Youth Amenities Index is calculated for males and females separately, the values for the National level are 0.389 for males and 0.373 for females. In terms

��
of Youth Amenities Index, the highest ranking state is Delhi (0.611) followed by Goa (0.580) and Kerala (0.518). The lowest ranking state is Bihar (0.272). Other states having a low Amenities Index are Orissa, Jharkhand and Chattisgarh. Eleven states are below the national average of 0.381. The range of variation in Amenities Index is 0.339 which is high. As in the case of Health Index, the relationship of Amenities Index with YDI is linear.
Except Assam, Bihar and Jharkhand, all the states have an Amenities Index value greater than 0.5. Regarding housing types, the states in the southern region, and those in the north-west region have a greater proportion of pucca houses. Though it is believed that access to safe water is believed to be low, the data shows that 89 percent of youth have access to safe drinking water. Even some of the states which have very low values for other indicators have reported high level of access to safe water. Access to electricity varies widely across states. The variation in access to electricity and housing index are much higher as compared to that in access to water.
Youth Participation IndexThe Participation Index computed using data from 11 states is 0. 622. While there are inter-state variations, the level of participation is high in all of the states except Delhi which has a value of 0.488.
Conclusion A Youth Development Index with a value of 0.453 is low; it is important to note that this value gives the level of development of 41 percent of the total population of the country. When gender disparities in Youth Development Index are considered, the value is reduced further. This indicates that the youth population requires greater focused attention from policy makers and programme planners and concerted efforts in order to attain gender equity among youth. Among the five dimensions of the YDI, India as a whole has relatively low value for the Education Index and Youth Modern Amenities Index, with some states showing a dismal performance.
The Health Index value, derived from a set of outcome and access- related indicators, gives a value of 0.580 that can be considered above average. But keeping in mind that, in general, youth are considered to be the healthiest section of the population, this value indicates the issues related to both nutritional status and access to services. Also, the male-female difference in the Health Outcome Index is considerable for some of the states and so is the difference in access.
The factor which is of great concern is the low Gross Enrolment Ratio (GER), which indicates poor access and wastage at the primary, secondary and tertiary levels of education. India still has a long way to go in achieving the targets of VISION 2020 in terms of producing a youth force which is ready for the challenges of a globalised world. The country now needs to move beyond the parameters of literacy and primary
Youth Development Index – Executive Summary

India Youth Development Report 20�0 ��
education as yardsticks of educational achievement for youth. For this, mere expansion of colleges and universities will not achieve the required results unless there is value addition in terms of quality and relevance.
The Youth Work Index in India is 0.636 with considerable inter-state variations. It needs to be mentioned here that work participation among youth is not very high in states that are developed educationally while the rate is high in less developed states. It is necessary to increase work participation among youth, especially female youth, for ensuring appropriate utilization of the demographic window of opportunities.
The Youth Amenities Index, which is a combination of basic amenities and more youth- specific amenities, has a value of 0.38; this resulted from a relatively high value of 0.65 for the basic amenities and a very low value of 0.19 for youth- specific amenities. The sub-dimensions considered for youth-specific amenities were information, communication and technology. Given the current understanding that improvement in access related to these dimensions is crucial for the development of a Nation, special attention needs to be given to these aspects.
The theme of ‘Citizenship’ is emphasized in the National Youth Policy, UNWAPY, and the WDR. UNWPAY describes this as ‘the full and effective participation of youth in the life of society and in decision making’. The Right to Participation from childhood is emphasized in the Convention for the Rights of the Child, and this Right is integral to any democratic society. It is important for citizens, especially youth, to have a say in matters that affect their life.
The value of Participation Index, computed using enrolment as a voter and voting behaviour was 0.622. While the state of enrolment leaves much to be desired (the enrolment value is 0.503), the voting behaviour appears to be high (0.80). This situation can be enhanced further with appropriate interventions to increase youth participation in various dimensions of development.
Thus, the Youth Development Index helps us to provide an opportunity to comprehensively assess the situation of youth and the differentials. Though the YDI was computed based on available data for the period 2004-05 or 2005-06, it can be safely assumed that the situation of youth development in India largely remains unchanged since then.

��
Youth form an integral part of any society and are an essential part of the development process. India is a ‘young’ nation where persons below 35 years comprise about 70% of the total population [Annual Report of Ministry of Youth Affairs and Sports, 2009–10]. Definitions of youth have changed continuously in response to fluctuating political, economic and socio-cultural realities. The National Youth Policy [2003] defines youth as those persons in the age group of 13 to 35 years. As this age range would have differing social roles and requirements, it is divided into two broad sub-groups of 13–19 years and 20–35 years. The Policy also states that the youth belonging to the age group of 13–19 years, which comprises a major part of the adolescent age group, will be regarded as a separate constituency.
Since the United Nations International Youth Year in 1985, the General Assembly of the United Nations has defined youth as the age group between 15 and 24 years, while it also recognizes the diversity of definitions used by Member States. The Commonwealth Youth Programme includes those in the age range of 15 to 29 years.
It must be stated here that there is no consensus on the age group for ‘adolescents’. For instance, the National Council for Education Research and Training (NCERT) has identified three main stages of adolescence: early adolescence (9–13 years); mid adolescence (14–15 years), and late adolescence (16–19 years).
Since children, adolescents and youth are not universal categories, the differences between these groups in a given society cannot simply be seen as physical differences. Thus, one finds overlaps between the three categories and the legal definitions of children, adolescents and youth vary according to the roles expected, and the services to be provided. The Convention for the Rights of the Child defines a child as those up to the age of 18 years, which
Youth in India
Our road is long and arduous. Together we will share the burden and the delight of building our India.
–RajivGandhi
CH
AP
TE
R
I

India Youth Development Report 20�0 ��
overlaps with the definition of youth. Similarly, the definition of Indian Census of a child as one below 15 years, overlaps with the National Youth Policy definition of youth. The Integrated Child Development Services considers adolescent girls as those between 11 and 18 years, while the Reproductive and Child Health Programme of the Ministry of Health and Family Welfare defines adolescents as being between 10 and 19 years. The legal age for voting in the Central and State elections is 18 years, while the permissible ages for marriage are 18 years and 21 years for girls and boys respectively.
1.1 Characteristics of YouthEisenstadt [1972] defined youth as the period of transition from childhood to full adult status with full membership in the society. As a stage of human development, youth is a phase of high expectations, high risk taking and great enthusiasm and, therefore, is a strong force to reckon with in society. They can be mobilized for physical target achievements [e.g. war] and for psychological purposes [integration of society] by utilizing their capacity for sacrifice, courage, endurance and initiative [for nation building]. Youth is also a period of training and acquisition of skills.
Rosenmayr [1972: 227–28] identifies five conceptual approaches to defining youth:a) Youth as ‘a phase in the individual life-cycle’: the physiological and biological
growthb) Youth as ‘a social subset’: forms of behaviour in a roughly determined age rangec) Youth as ‘an incomplete status’: transition between childhood and adulthood.d) Youth as ‘a socially structured generation–unit’: experiencing certain common
conditions and generating common activitiese) Youth as ‘an ideal value concept’: idealism, alertness, traits called ‘youthfulness’
check
The definition of youth was highly debated at the regional workshops. Oneof thesuggestionswas that theagegroupshouldbe furtherdividedintothreegroups:
• 13–17years:ayoungpersonisvulnerableandneedstobeprotected[teenageyears]
• 18–29years:stageof maturing,takingrisksintermsof makingchoicesrelatedtoeducation/career
• 30–35years:settledownwithfullresponsibilityforself andfamily
��
During the regional and youth consultations for the YDI [2008], the characteristics mentioned were: high energy; high risk appetite; less corrupt; contribute to social change; feeling of alienation; associated with political power; rebellious and frustrated; vulnerable to substance abuse.
However, in the conventional sense, youth is considered a phase of high expectations, high risk taking and great enthusiasm and, hence, a strong force within society. Youth are futuristic and hence, their thoughts, values and behaviour are often determined by their vision of tomorrow.
Youth in India
If youth are persons up to the age of 35 years, then their life experiences have largely been shaped by the events after the 1980s. They are products of post-independent India, and hence, the notions of independence and democracy are taken for granted. They have witnessed the rapid advancement of technology; the spread of media and connectivity across the country. For many youth, the concept of time and space can be reorganized, where they can experience and connect to other locations, internal and global. As a social category, youth have always been there in the process of globalization – sometimes as an actor and mobilizer of change and many a time as the victim of the process.
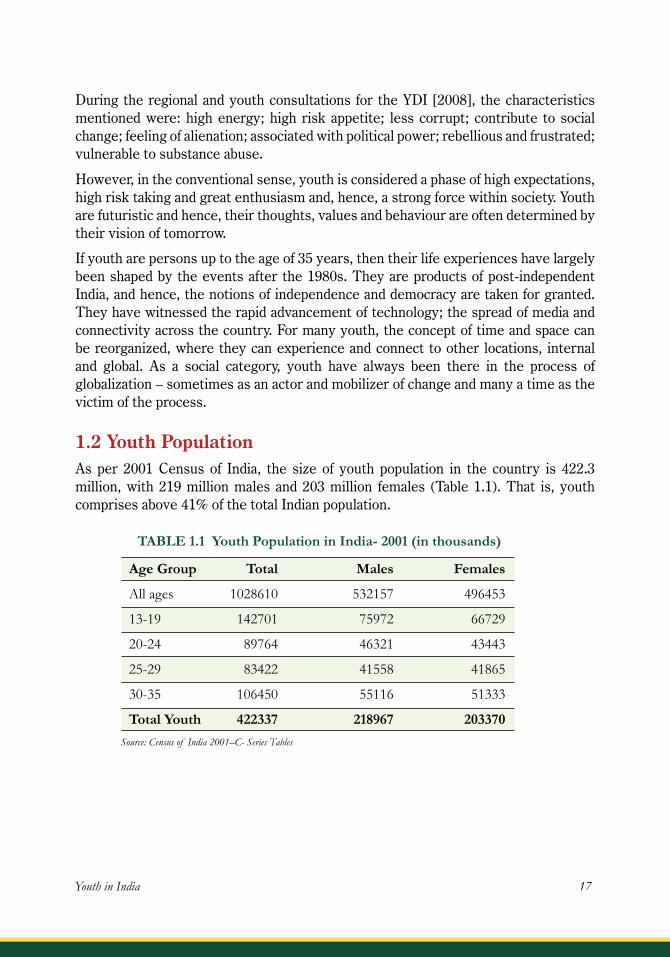
1.2 Youth PopulationAs per 2001 Census of India, the size of youth population in the country is 422.3 million, with 219 million males and 203 million females (Table 1.1). That is, youth comprises above 41% of the total Indian population.
TABLE 1.1 Youth Population in India- 2001 (in thousands)
Age Group Total Males Females
Allages 1028610 532157 496453
13-19 142701 75972 66729
20-24 89764 46321 43443
25-29 83422 41558 41865
30-35 106450 55116 51333
Total Youth 422337 218967 203370Source: Census of India 200�–C- Series Tables

India Youth Development Report 20�0 ��
TABLE 1.2 Youth Population in India: 2001-2026 (numbers in million and%)
Age 2001 2011 2021 2026
T M F T M F T M F T M F
15-34 354 182 172 431 226 205 465 244 221 459 241 218yrs(no.)
Percent 34.4 34.3 34.6 36.1 36.6 35.6 34.7 35.1 34.3 32.8 33.2 32.3of youthpopulation
Source: RGI, 200� Population Projections
From Table 1.1, it can also be inferred that, among the youth population, the largest share is in the age group 13–19 years, which constitutes the adolescents, followed by the 30–35 years age group of young adults. However, those in the age group of 20–29 years – who constitute the commonly accepted notion of youth who form the bulk of the youth population (41.11%).
Table 1.2 shows that the youth population in the age group 15–34 years is expected to increase over the coming years as per the population projections. Between 2001 and the 2011 census, the youth population is expected to increase by 77 million, while this number would increase by 34 million during 2011–21. It is projected that the number of youth will subsequently decline and by 2026, the number of youth will be 459 million, 6 million less than that in 2021. In other words, the youth population is growing currently at an average annual rate of 2.2%; this growth rate will decrease to 0.80% in the coming decade and will experience a negative growth rate of 0.27% during 2021–26.

��
FIGURE 1.1 Growth of Youth Population in India: 1981-2021
Youth in India
1.3 LocationThe youth in India may also be classified by geographical location, i.e., urban, rural, tribal. The characteristics of youth also vary from state to state and from region to region. Figure 1.2 shows the number of youth residing across the regions. More than one-fourth of the Indian youth reside in the northern region. The Western and North-western regions also contribute to a quarter of the youth population in India, while the Southern region accounts for 23% of youth population. The remaining 25% reside in the Central, Eastern and North-eastern regions of the country.

India Youth Development Report 20�0 20
FIGURE 1.2 Regional Distribution of Youth in India
The variation in the size of youth population can be seen from Table 1.3. The Table shows that about 91 million youth are in the northern region, followed by 80 million in the southern region. However, if we consider west and north-west regions together, then 87 million youth stay in this region. While about 41 million youth are in the Eastern region, 35 million stay in the Central and 14 million in the North-eastern regions.
TABLE 1.3 Regional Distribution of Youth Population in India : 2001
Region 15-34 years Youth Population (in Million)
North 90.8
North-east 13.6
East 40.7
North-west 34.7
West 52.4
Central 35.2
South 80.1
Source: Census of India 200�

2�
Table 1.4 further illustrates the differences in the distribution of youth by locations, in this case across States and Union Territories. Union Territories and smaller staes have, in general, less than 1% of India’s youth staying in them. Eight states accommodate 1 to 3% of the Indian youth. Another five states accommodate 3–7% of youth. While Bihar, Andhra Pradesh, Madhya Pradesh and Maharashtra have 5–7% each of the Indian youth population, Uttar Pradesh accommodates more than 10% of the Indian youth.
TABLE 1.4 Distribution of Youth across Indian States: 2001
Lessthan1% Lakshadweep;Daman&Diu;Dadra&NagarHaveli;Andaman&Nicobar;Sikkim;Mizoram;Chandigarh;ArunachalPradesh;Pondicherry;Goa;Nagaland;Meghalaya;Manipur;Tripura;HimachalPradesh;Uttaranchal
1-3% JammuandKashmir;Delhi;Chattisgarh;Haryana;Jharkhand;Punjab;Assam
3-5% Orissa
5-7% Rajasthan;Karnataka;MadhyaPradesh;TamilNadu
7-10% Bihar;AndhraPradesh;WestBengal;Maharashtra
10%andabove UttarPradesh
Source: Census of India, as given in Saraswathi (200�)
Out of the total youth population, about 70% live in rural India (Figure 1.3). There are no age differences in the rural–urban distribution of youth population. In all the youth age groups, more than 68% of the population resides in rural India. It may also be noted that the distribution according to place of residence is not much different from that of the total population.
When we examine the ratio of Rural youth to Urban youth over the years, it can be seen that this ratio has decreased over the last three decades showing clear migration trends.
The census of 1981 shows the size of Rural youth population as over 2 ½ times the Urban youth population. The census of 2001 shows a reduction in this size to just about 2 ¼ times that of the Urban youth population (Saraswati, 2009).
Youth in India

India Youth Development Report 20�0 22
FIGURE 1.3 Distribution of Youth by Place of Residence, 2001
Source: Based on Census of India (200�)
Urbanization is occurring at a rapid pace. Goldman Sachs (cited in Stokes, 2010) forecasts that 140 million Indians will move to cities by 2020 and that by 2031, 17 Indian cities will have more than 5 million people each.
The place of residence and nature of urban development provides the youth with different socializing experiences during the growing up years. The youth in the metros and large cities are exposed to all the trappings of developed societies: more and better services (e.g., education, health), work opportunities, access to modern technology, better amenities, and values of materialism, consumerism and competition.
However, a significant majority of youth stay in the rural/tribal regions. It is generally seen that the rural and tribal youth are exposed to less diverse viewpoints than their urban counterparts, and have a stronger social system reinforcing values by the family and the village community. The rural and tribal areas experience greater levels of poverty, have poor access to quality services for education, health and livelihoods. A study for the Planning Commission estimated that 37% of the population is poor, of which 42% were in rural areas and 26% were urban citizens. However, with increasing migration of the poor to urban centres, the extent of poverty in the urban areas is also increasing at an alarming rate.
InaremotetribalvillagecalledKarnavale,about80km.fromMumbai, theschoolcomprises only one room. There is no school teacher, no sanitary facilities at theschool,andif peoplewanttogotoahospitaltheyhavetotravelabout80kmtocometoMumbai.…Whatkindof developmentisthis?–YouthinMumbaiworkshop.

2�
However, since the nineties, rural society has undergone changes as a result of globalization and the liberalization of markets. It has resulted in greater educational opportunities in rural areas and greater information exposure due to the rapid development of the mass media, the internet and so on. There is an increasing number of rural youth joining colleges in towns/cities close to their homes. However, here too, it is the class of the youth which largely determines the opportunities available to him/her.
The rural and tribal youth are beginning to assert themselves and are crying for leadership, power and a greater say in the development processes. We read that Mercedes-Benz marketing is moving into interiors like wheat-rich Punjab, and tobacco-rich Guntur. ‘Rural-Urban’ India is set to be transformed into an extension of urban conglomerate, with liberalization as a key catalyst. The National Council of Applied Economic Resources [NCAER] predicted that by 2006, the rural consuming class will have risen to 75.5% of all households. Low-income homes will be down to a mere 16.5% of the population. Rapid lifestyle changes in villages will see a shrinking of poverty levels (The Times of India, May 14, 2000). This is yet only applicable to the rural rich, which is a small proportion of the total rural population.
In contrast, the urban youth – especially in the major metros – are influenced by the values of materializm and consumerizm to a greater extent than the rural youth. Due to the relative anonymity of urban living, they seem to be less accountable or sensitive to the needs of their environment. At the same time, they have greater access to information and, therefore, many have greater awareness about larger social issues. They live relatively fast lives in the age of computers, cyberspace and fast foods. Thus, they are often forced into patterns of time slots and schedules against the needs of their age and phase of development, and are expected to be conscious of time management. Paradoxically, teenage years are also characterised by sloppy and disorganised behaviour.
Urban youth have greater opportunities to participate in extra-curricular activities, take up hobbies and the like. There is an increasing pressure to use time constructively, e.g. the vacations are spent in summer jobs for work experience or updating their knowledge through short courses. Urban youth definitely feel superior and more confident than rural youth, especially those that have had an English medium education.
Growing urban poverty is a rising phenomenon, with rapid migration rates from rural to urban cities. A consumerist lifestyle of the cities raises the aspirations of poor urban youth, who see the opportunities available, but cannot access them due to poor financial power.
Urban youth are not inclined to develop the tribal youth and those residing in the remote areas……Youthworkshop,Guwahati,
Youth in India

India Youth Development Report 20�0 2�
1.4 GenderGender equity is seen as a major factor to social and economic development of a nation.
No nation, no society, no community can hold its head high and claim to be part of the civilised world if it condones the practice of discriminating against one half of humanity represented by women – Dr. Manmohan Singh, Prime Minister, 2006.
The Global Human Development Report 2003 advocates that,
Gender equality is at the core of whether the Millennium Development Goals will be achieved – from improving health and fighting disease, to reducing poverty and mitigating hunger, to expanding education and lowering child mortality, to increasing access to safe drinking water, to ensuring environmental sustainability.
The sex ratio in India [number of females per 1000 males] declined from 934 in 1981 to 927 in 1991 [1991 Census], while the National Family Health Survey, [NFHS] 1992–93, showed an increase in the sex ratio [944]. The 2001 census registered a sex ratio of 933. Among youth the sex ratio is lower at 929.
The low sex ratio denotes the low worth of women in India today. Strong ‘son’ preference, female infanticide and maternal mortality are some of the factors that have caused the declining sex ratio. State-wise sex ratios vary from 1058 in Kerala to 861 in Haryana. The superiority of males has been sanctioned and propagated by religion, law and social norms. Hence, males are singled out for special attention, right from birth, in terms of better quality nutrition, education and other opportunities. In their pursuit of a better standard of living, a large proportion of male youth from rural areas migrate to urban areas for education and employment.
All along, women have been denied educational and occupational opportunities and their tasks have been rigidly confined to sustaining a home and child rearing, while the work they do as a part of the household occupation, or to supplement family living, remains unrecognized. The impact of poverty is also higher in females, and this phenomenon is termed as ‘intersectional discrimination’ by feminist scholars, when gender discrimination intersects with other forms of discrimination [e.g, scheduled caste, rural, poor]. It is also clear that these intersections have a multiplier effect which compounds the deprivation faced by women [Kumar, 2008].
Table 1.5 presents the sex ratio situation among youth in India. According to the 2001 Census of India, the sex ratio in the age group 15–34 was 940 (Saraswathi, 2007) as compared to the total population sex ratio of 933. In 2001, the youngest age group showed a low sex ratio of 858. The proportion in other age groups are higher than the population sex ratio. The ratio is particularly high the older age groups of 25–29 and 30–34. It may also be noted that there has been a decline in the sex ratio in the 15–19 and the 20–24 age groups during 1991–2001 and an increase in the two older age groups.

2�
TABLE 1.5 Sex Ratio among Youth: 1991 and 2001 (females per 1000 males)
Age Group in years 1991 2001
15-19 871 858
20-24 985 938
25-29 1004 1007
30-34 952 988
Source: Census 200�
Though several changes have taken place after Independence, these have had a differential impact on different sections of women.
There have been certain policy measures, which have affected women’s position significantly. The Constitution emphasizes equal status for women, and there have been certain progressive legal enactments which have empowered women [e.g. amendments in the Hindu Succession Act, 1955, providing equal share to women in the property; Maternity Benefit Act, 1961, Dowry Prohibition Act, 1961, amended in 1986]. The Women’s Reservation Bill of 2010 that proposes to reserve 33.3% seats in the Parliament and state legislatures for women; and The Protection of Women Against Domestic Violence Act of 2005 are two recent legal measures aimed at empowerment of women.Women have also been inducted in decision-making bodies at the local level of the district and the municipality, thus giving them more power in development. The need for women’s education is now widely accepted and more opportunities are being provided to enter higher education. There have been more opportunities for middle class and upper class women to take up jobs and work in non-traditional areas.
Although women’s roles and relationships have changed and are changing, there is a big gap between their legal, political and economic rights and privileges, and what they actually enjoy and utilise in the current social realities. Whenever patriarchal norms are challenged and resisted, it has triggered off violence against women. The image of a middle-class, educated and seemingly liberated woman belies the fact that patriarchal values persist, and the reality of the subordinate position of the woman is indicated by the growing domestic violence, increasing number of dowry deaths and rape cases and the growing numbers of girls being trafficked for sexual exploitation.
We, therefore, find that in the Indian context, the urban male youth are more privileged in the pecking order in terms of access to opportunities. The rural male youth follow second, while the female rural youth are the most disadvantaged. Urban female youth are slowly gaining in status and power, though there is still tremendous resistance towards gaining equality with male youth.
TheUNDP report [2007] stated that girls andwomenwere increasingly trafficked toPunjabandHaryana,where theywere sexually exploiteduntil theybore amalechild.Therewasapattern–traffickingof girlsfrompoorerdistrictstoprosperousstateswithawideninggendergap.Thesegirlswerealsooftentribalgirls.
Youth in India

India Youth Development Report 20�0 2�
AccordingtotheWorldEconomicForum’s latestGenderGapIndexReport,Indiahas been placed at the 114th position after taking into account economic, political,educationalandhealthparities,amongatotal128countries.Accordingtothereport,Indiahasanoverall59.4%genderequality,whileforeconomicparticipationandopportunityitstandsat39.8%.Indiahas faredmuchbetter in termsof politicalempowerment (21st).Thecountryhas106womeninParliamentand118inministerialpositions.(TheHindustanTimes,November12th,2007).
1.5 ReligionAs in the case of total population, among youth also Hindus form the majority (about 80%) [Table 1.6], while Muslims form about 16% of Indian youth. Other religious groups constitute 6% of the country’s youth population. Thus only about 22% of the youth population belong to minority religious groups.
It cannot be assumed that the proportion of major religious groups in different age groups will remain constant. The proportion undergoes changes due to many reasons like migration, and adoption of birth control measures (Saraswathi, 2007: 21).
The rural–urban distribution of youth among the religious groups show that a greater proportion of youth from the minority religious groups live in urban areas as compared to Hindus.
TABLE 1.6 Youth Population by Religious Community, Age Group and Residence
Age Group Rural Urban
Total Percentage Total Percentage
Hindu
Allages 611263295 216315573
10-14 74865661 81.03 23625586 72.77
15-19 57197932 81.63 22245708 73.77
20-24 50689599 82.55 21466250 75.67
25-29 47982623 83.18 19944703 77.49
30-34 43192451 83.33 17493082 77.93

2�Youth in India
Age Group Rural Urban
Total Percentage Total Percentage
Muslim
Allages 88794744 49393496
10-14 12511900 13.54 6692382 20.61
15-19 8688255 12.40 5826578 19.32
20-24 7049913 11.48 4880032 17.20
25-29 6366284 11.03 3975113 15.44
30-34 5630354 10.86 3333622 14.85
Christian
Allages 15893958 8186058
10-14 1809041 1.96 807510 2.49
15-19 1565345 2.23 817456 2.71
20-24 1382417 2.25 818352 2.89
25-29 1306513 2.26 763219 2.97
30-34 1137558 2.19 666747 2.97
Sikh
Allages 14106481 5109249
10-14 1655206 1.79 568878 1.76
15-19 1445308 2.06 536469 1.78
20-24 1294383 2.11 497058 1.75
25-29 1066885 1.85 411859 1.60
30-34 1002350 1.93 379099 1.69
Buddhist
Allages 4893610 3061597
10-14 620361 0.67 370696 1.14
15-19 490798 0.70 339011 1.12
20-24 406419 0.66 312893 1.10
25-29 379821 0.66 289571 1.13
30-34 332371 0.64 243388 1.08

India Youth Development Report 20�0 2�
Source: Censusof India,2001,TableC15India. (S. Saraswathi, Youth in the New Millennium: The Scene in India, 200�: 20–2�).
Note: Percentages are based on the figures given.
In terms of numbers, it can be seen that Jains are more in urban areas as compared to rural areas. Only 24% of youth in this religious group live in rural areas whereas about half of the youth among Muslims, Christians and Buddhists live in the urban areas.
1.6 Caste Historically, caste has been a basis for social stratification in India. Caste has been recognized as a major indicator of deprivation as exploitation in the country. According to the Constitution, there are 1092 Scheduled Castes (SCs), and 547 Scheduled Tribes (STs) and these groups are considered the most backward groups in the country. The SC population comprises 16.2% of the total population, STs 7.5% and Other Backward Classes (OBCs) 52%. [Census of India, 2001].Today, there is a move towards a secular new identity, ‘dalits’ [the oppressed] which encapsulates all aspects of oppression.
The formation of this new and secular recognition has been the result of their prolonged struggle in search of emancipation from the traditional, polluting and stigmatised identity that was based on caste and occupation. (Wankhede, 2002: 39).
Age Group Rural Urban
Total Percentage Total Percentage
Jain
Allages 1009347 3215706
10-14 105406 0.11 298939 0.92
15-19 97805 0.14 299961 0.99
20-24 92302 0.15 314352 1.11
25-29 80439 0.14 283221 1.10
30-34 75223 0.16 270122 1.20
Others
Allages 6002468 637158
10-14 754274 0.82 78088 0.24
15-19 530173 0.76 69090 0.23
20-24 443239 0.72 57930 0.20
25-29 464548 0.81 53050 0.21
30-34 424868 0.82 45471 0.20

2�
TABLE 1.7 Size of SC and ST Youth Population: 2001 (million)
Age group SC ST
15-19 16.1 7.9
20-24 14.0 6.7
25-29 13.1 6.6
30-34 11.5 6.0
Source: Censusof India,2001
The progress of different dalit groups has been varied depending on the location, region and other factors. Yet, there are a substantial proportion who exist in sub-human conditions. Loksatta [2002] states that there are 65 lakh manual scavengers in the country. [cited in Wankhede, 2002]
The most common problems faced by dalits today are [1] victimization by caste and tribe; [2] victimization under untouchability; [3] suffering from poverty; [4] vulnerability to all kinds of atrocities; [5] being based in remote rural areas. (Wankhede, 2002: 40)
However, changes are taking place in India concerning how people view the caste system and how it shapes their lives. There are studies which show that college students in large cities do not subscribe to the caste hierarchies and there are changes related to the issues of marriage and religion. However, there are also studies which show that while the influence of the Indian caste system may be disappearing, many inequalities still persist in the light of changing attitudes and oppression and harassment continue to be meted out to the dalits [Anant (1978); Deshpande (2002), Mathur and Parameswaran (2004)].
A study by the Indian economist Sukhdeo Thorat and Princeton University sociologist Katherine Newman a few years ago found that a low-caste surname is a great disadvantage when applying for a job. Applicants with lower-caste surnames were not likely to be interviewed (Atul Sethi and Divya A., The Times of India, Mumbai, May 16, 2010: 22).
Over the years, there have been several efforts by the Government to remove discrimination, and equalise the social, economic, political rights of these groups. Reservations in educational institutions, job quotas in public institutions, scholarships, freeships, and hostels are some of the provisions made to enable the dalit youth to access the opportunities available and empower themselves.
1.7 Standard of Living In India, according to Planning Commission figures, during 2004–05, 27.5% of the population lived below the poverty line. The extent of poverty was 28.3% in rural areas and 25.7% in urban areas. Figure 1.4 shows that as per the standard of living
Youth in India

India Youth Development Report 20�0 �0
index, computed based on the NFHS-3 (2005–06) data, the highest percentage of youth are in the high standard of living category. However, the percentage of those in ‘high’ (67.6%) among the urban youth is double the percentage in the ‘high’ (30.2%) category in the rural areas. If we compare the standard of living of youth with the total population it can be seen that the situation of young people is better than the overall population in terms of standard of living measured by ownership of household assets. However, shadows of poverty, illiteracy, unemployment and malnutrition fall more darkly on the rural and tribal youth. They are also the victims of natural calamities like droughts, famines and floods. This often leads to migration to other areas in search of livelihood.
Table 1.8 presents the standard of living of youth according to various background characteristics. While rural–urban differences in the distribution of youth across standard of living categories are substantial, gender differences are only marginal and age differences minimal. Caste differences are substantial with a large proportion of youth in the ST and SC categories being in the low standard of living groups. This in turn reflects on access to opportunities to education, kind of work and health status. Religion-wise differences are marked only for religions other than Hindu and Muslim.
FIGURE 1.4 Percentage Distribution of Youth across Standard of Living Categories

��
Variables Standard of Living Index Low Medium High
Place of residence
Urban 8.1 24.2 67.6
Rural 31.1 38.6 30.2
Sex
Male 22.0 34.1 43.9
Female 24.8 33.6 41.6
Age-group
13-19 24.0 35.7 40.3
20-24 20.7 33.9 45.4
25-29 24.1 32.0 43.8
30-34 25.2 32.1 42.6
Caste
Scheduledtribe 45.4 36.4 18.2
Scheduledcaste 36.1 36.7 27.2
Otherbackwardclass 21.2 38.1 40.8
Others 12.1 25.4 62.5
Nocaste/tribe 26.5 34.6 38.9
Religion
Muslim 24.6 34.3 41.1
Hindu 23.7 34.4 41.9
Others 17.1 24.7 58.2
Total 23.5 33.8 42.7
Source: ComputedfromNFHS3(2005-06)Data
Responses from the regional workshops show that the minimum income requirements reported by the participants vary widely across locations (Table 1.9), and the differences in perceived requirements between rural, urban and tribal youth are substantial. Even within rural and urban categories, the income requirement as reported by both rural and urban youth is quite high in Guwahati and Sriperumbudur.
TABLE 1.8 Youth Population aged 13-34 belonging to Various Categories of Standard of Living by Selected Characteristics, NFHS-2005-06
Youth in India

India Youth Development Report 20�0 �2
TABLE 1.9 Responses of Youth in the Regional Workshops on Minimum Income Requirements
City Urban Rural Tribal
Mumbai `.300-400perday `.80perday StreetyouthRs.100perday
Bhubaneshwar `.100perday `.70perday `.60perday
Guwahati `.5000permonth `.3000permonth NA [approx.`.167perday] [approx.`.100perday]
Sriperumbudur `.8000-20,000permonth `.2000-5000permonth NA [Approx. [Approx. `.267-667perday] `.67-167perday]
1.9 DisabilityAs per the World Health Organization manual, a disability is a restriction or lack of ability [resulting from an impairment] to perform an activity in the manner or within the range considered normal for a human being. These include physical disabilities [poliomyelitis, cerebral palsy, leprosy, orthopaedic impairment]; mental disability [mental retardation, mental illness]; hearing disability; visual impairment; developmental disability [learning disability, attention deficit hyperactivity disorder, autism]; multiple disabilities. Disabilities affect the different developmental tasks of youth, such as access to opportunities related to education and work; building a mature identity; forming relationships; understanding sexuality; achieving socially responsible behaviour.
The disabled are the largest minority group in the world [Mishra and Gupta, 2006]. The Census of India, 2001 defines five types of disabilities viz. seeing, speech, hearing, movement, and mental. A person who cannot see at all (has no perception of light) or has blurred vision even with the help of spectacles will be treated as visually disabled. As per the Census, the disabled form 2.13% of the total population, with the proportion of those with visual disabilities being the highest, followed by those with movement disability. The 2001 Census of India shows that 1.67% [7 million] of those in the age group of 0–19 years are living with disability. Less than 1% of them have access to education.

��
TABLE 1.10 The Disabled in India by Types of Disabilities
Typesof Disabilities Numberof Disabled Percentage
Seeing 10634881 48.55
Speech 1640868 7.49
Hearing 1261722 5.76
Movement 6105477 27.87
Mental 2263821 10.33
Total 21906769 100.00
Source: Censusof India2001
The Government of India as well as the various state governments have framed various policies for persons with physical disabilities:
• Scholarship • Concessionary assistive devices • Job reservation • Concession facilities in travelling • Special training institutions • Tax benefits • Loan for business at a concessionary rate etc.
In spite of the various schemes, the care of the disabled is largely left to families and a few organizations/institutions. There have been several schemes and projects initiated for this population, but the
educational, social, health, transport and residential arrangements made by local, state, central governments or voluntary organizations frequently fall short of the requirement [Mishra and Gupta, 2006: 4026].
The number of persons out of 100,000 persons who have at least one disability was relatively higher in the younger age groups for both males and females. The main type of disability among both males and females was locomotor disability. Other major disability was related to speech, hearing and speech (together), and hearing. The number of disabled persons was much higher in rural areas as compared to urban areas. The differentials by age and caste group shows that in urban areas, the number of disabled persons per 1000 was relatively lower among SCs and STs in all the youth age groups, except in 30–34 years. But in rural areas, the number was found to be much higher among the STs.With regard to persons aged 15–34 years with mental retardation, it was found that most of them were mentally retarded since birth. There were 77 out of 1000 persons in urban areas who became mentally retarded at the age of 15–19 years. All of the mentally retarded persons in rural areas were mentally disabled since their birth.
Youth in India

India Youth Development Report 20�0 ��
Similarly, all the females who were mentally retarded were mentally disabled since their birth. Among urban males, the onset of mental retardation for 131 out of 1000 was at the age of 15–19 years. In the case of mental illness, although majority of them had it since birth, a considerable proportion had got it at later ages and the highest number occurred at the age of 30–34 years.
The number of persons with at least one disability was found to be the highest among those who are aged 15–19 years and those who belong to rural areas. This number decreases with an increase in age in both rural and urban areas. Locomotor disability was the most commonly reported disability. The other major disabilities reported were hearing, speech, and mental retardation.
Among males, the highest number of disabled persons was from the SCs, while among females the highest number belonged to other caste groups. There were considerable caste differentials in the number of disabled persons according to place of residence. The number of cases of blindness, hearing disability, speech disability and locomotor disability was found to be the highest among those aged 30–34 years and those who lived in rural areas. The number of cases of blindness and hearing disability was relatively higher among males, while the number of cases of speech disability was relatively higher among females.
The major Acts pertaining to Disability are the Mental Health Act, 1987; the Rehabilitation Council of India [RCI] Act, 1992; the Persons with Disabilities [Equal Opportunities, Protection of Rights and Full Participation] Act, or the PWD Act, 1995; the National Trust for Welfare of Persons with Autism, Cerebral Palsy, Mental Retardation, and Multiple Disabilities Act, 1999; and the National Policy for Persons with Disabilities Act 2006.
The PWD Act of 1995 provides for equal opportunities to the disabled. This includes 3% reservation for disabled persons in government and public sector open employment and suggests incentives for private sector if they recruit disabled persons. There are also schemes for enabling the disabled to initiate self-employment. The recent 86th Constitutional Amendment Act, which made the Right to Education a fundamental right, allows a disabled child to be integrated into the general schools.
For the 2009 Lok Sabha elections, the Election Commission had made special arrangements for the disabled voters, such as ramps for wheelchairs, stickers embossed in Braille, etc.
A ‘Disability Index’ was formulated by Mishra and Gupta (2006) on the lines of theHumanPovertyIndexandcomputedfor16states.Themajorareaswereeducation,skilldevelopmentandemployment.Ascoreof 100indicatedthehighestlevelof deprivation.TheDisabilityIndexof Orissawasthemaximum[80.39–highestdeprivation]andtheDisabilityIndexforHimachalPradeshwasthelowest[73.92–leastdeprivation].Thisshowedthatoveralltherewasaveryhighlevelof deprivation.Accordingtotheirsurvey,1.8%[18.49million]aredisabled.

��
AccesstoPublicUtilitiesisEssentialforEmpoweringtheDisabledYouth-ACaseStudyRuchika was a ��- year old girl who had completed her graduation with a high percentage. She was afflicted by polio at a young age, and hence, walked with calipers, having difficulty climbing staircases. Her college was sensitive to her specific needs and ensured that her classes were always held on the ground floor. After graduation she applied for a job in a bank, and was called for the written test. She wished to use the washroom at the centre, and found that the ladies toilet was on the second floor. This was difficult for her, and being in a new setting she was embarrassed to ask for help in being carried up. She left the venue without completing her examination, as she needed to use the washroom and could not wait for three more hours till the examination time was over. She was in tears and very depressed that she had lost an opportunity due to no fault of hers.
1.10 Family and Marriage The family is still the basic unit of society which provides physical and emotional security to children and youth. Though the joint family is considered the prototype of the Indian family, the 1981 Census showed that the nuclear family is the most prevalent prototype of the family structure. The youth continue to be emotionally dependent on their parents and family, and this characteristic cuts across all locations, class, caste and other divisions. Families have plurality of forms, which are determined by class, ethnicity, geographical location and individual choice.
Family is the critical ‘bank on’ for youth, supports success and happiness, key motivator and aids in resolving conflict. In fact it’s like a concentric circular reality of me –surrounded by my family – surrounded by the society- surrounded by the environment… all need to be in harmony for a successful living (Delhi youth)
The Indian family has shown unique adaptability in the context of all-round change. Industrialization, urbanization, migration of population to cities, the spread of education, changes in the occupational structure and legal measures for the promotion of the status of women, are some of the factors affecting the family. Thus, today, families have plurality of forms that are determined by class, ethnicity, geographical location and individual choice. In this process of change, families are also undergoing changes whereby structure and interrelationships within have altered. Yet its basic elements like strong kinship bonds have endured and they still retain their core patriarchal, patrilineal and patrilocal structure [Kashyap, 2009]. The number of youth without families is also on the increase e.g., street youth; those orphaned due to calamities, war, riots.
Honour killings, rampant in Haryana, have led to a bizarre trend in rural areas: villagers are increasingly marrying off their minor daughters , fearing love affairs may force the girls to run away from homes. According to the state women and child development department, about �00 child marriages were stopped in the last one year.”[TheTimesof India,June27th,2010].
Youth in India

India Youth Development Report 20�0 ��
Youth are not only a part of the family, but they are also in the process of forming their own family. Marriages are largely arranged, but there is an increase in the number of youth who wish to have a greater say in the decisions made regarding their life partner. Inter-caste and inter-religious marriages are on the rise, though not always without opposition from the elders. Simultaneously, it is alarming to note that the number of ‘honour’ killings [young couples being killed by their family or community for marrying outside their caste/community] are on the rise, and these are being justified by the community.
According to the 2001 Census, the mean age at marriage is 18.3 for females and 22.5 for males. The NFHS-3 [2005–06] shows that the median age at marriage for women between 25–49 years is only 16.8 years, as compared to 22.7 years for men.
Both the Census and the NFHS data show the prevalence of child marriages in spite of laws banning this practice (See Tables 1.11, 1.12 and 1.13). As Table 1.11 shows, even if one considers the 10–14 and 15–19 age groups among males, about 1% in the former and about 6.3% in the latter age groups are married, divorced, widowed or separated. The number of married youth before the age of 18 years was 6.4 million, of which 1.52 million were males and 4.87 million were females.
The NFHS data also shows that child marriage still prevails as one in every four women in the age group of 25–29 years were married before the age of 15 years. Men were less likely to get married at an early age. The percentage of women who were married before 18 years ranged from 12% in Himachal Pradesh and Goa to 69% in Bihar. The report further states that the age at marriage increases with education and wealth. However, for women, the age at marriage increases with increase in education, while for men it is the wealth factor that increases the age at marriage. Early marriages can have a significant influence on the overall development of a young person by affecting educational opportunities, by assuming adult roles early in life and by affecting reproductive and sexual health.
TABLE 1.11 Marital Status of Children and Youth (10–34 years)
Age Group Males Females
NM M W D/S NM M W D/S
10-14 99.0 0.91 0.04 0.07 97.44 2.38 0.13 0.04
15-19 94.68 5.20 0.06 0.05 75.14 24.45 0.20 0.20
20-24 65.21 34.35 0.24 0.19 22.97 75.72 0.68 0.63
25-29 27.74 71.38 0.55 0.32 5.65 92.14 1.37 0.83
30-34 8.70 90.01 0.90 0.38 2.19 94.22 2.60 0.99

��
TABLE 1.12 Marital Status of Children and Youth by Sex and Residence (10–34 years)
Age Group Males Females
NM M W D/S NM M W D/S
Rural
10-14 98.91 1.00 0.02 0.03 97.19 2.64 0.13 0.0
15-19 93.61 6.26 0.07 0.06 70.97 28.57 0.22 0.23
20-24 59.36 40.11 0.30 0.27 16.96 81.60 0.73 0.70
25-29 22.88 76.1 0.65 0.37 3.90 93.76 1.44 0.89
30-34 7.14 91.40 1.04 0.41 1.61 94.69 2.67 1.03
Urban
10-14 99.24 0.67 0.06 0.04 98.17 1.64 0.14 0.05
15-19 97.18 2.73 0.04 0.05 84.79 14.91 0.16 0.12
20-24 77.19 22.56 0.12 0.11 36.76 62.22 0.55 0.45
25-29 38.22 61.23 0.32 0.22 9.73 88.38 1.19 0.69
30-34 12.16 86.94 0.59 0.31 3.59 93.08 2.42 0.90
Note: NM=NevermarriedM=MarriedW=WidowedD/S=Divorced/SeparatedSource: CalculatedfromTableC–2,Censusof India,2001onMaritalStatusbyAgeandSex.(Saraswathi,YouthintheNewMillennium:TheSceneinIndia,2007:23–24).
Youth in India

India Youth Development Report 20�0 ��
TAB
LE 1
.13
Per
cent
age
Dis
trib
utio
n of
Wom
en a
nd M
en 1
5-49
by
Age
at F
irst
Mar
riage
, ac
cord
ing
to E
duca
tiona
l Atta
inm
ent a
nd W
ealth
Qui
ntile
, NFH
S-3,
Ind
ia
Age
at fi
rst m
arria
ge: W
omen
A
ge a
t firs
t mar
riage
: Men
<
15
15-1
7 18
-20
21-2
4 25
+
Not
To
tal%
<
15
15-1
7 18
-20
21-2
4 25
+
Not
To
tal%
m
arrie
d
M
arrie
d
Edu
catio
n
Non
e41
.6
34.8
14
.7
2.6
0.7
5.6
100.
08.
916
.2
29.3
20
.2
10.7
14
.7
100.
0
0-4
year
s26
.8
35.0
18
.0
4.4
1.5
14.3
10
0.0
5.4
11.5
23
.9
24.3
12
.9
22.1
10
0.0
5-9
year
s14
.3
28.3
20
.9
7.4
1.8
27.3
10
0.0
4.7
8.6
16.0
17
.7
12.9
40
.2
100.
0
10-1
1ye
ars
4.7
17.8
23
.5
12.4
4.
037
.7
100.
02.
55.
29.
415
.3
18.1
49
.5
100.
0
12+
yea
rs
1.6
6.5
19.0
23
.5
11.3
38
.1
100.
01.
94.
07.
614
.9
28.8
42
.9
100.
0
Wea
lth Q
uint
ile
Low
est
38.5
33
.3
12.9
2.
10.
712
.5
100
.0
8.2
15.6
26
.1
17.0
8.
824
.4
100.
0
Seco
nd
33.8
32
.7
14.2
3.
20.
915
.3
100.
07.
112
.2
21.6
18
.8
10.2
30
.2
100.
0
Mid
dle
26.1
30
.3
17.7
5.
01.
519
.6
100.
05.
39.
617
.9
19.0
12
.8
35.5
10
0.0
Four
th
17.2
27
.2
21.9
8.
42.
722
.6
100.
03.
16.
613
.6
18.6
17
.8
40.2
10
0.0
Hig
hest
8.
317
.7
22.7
17
.5
6.9
26.9
10
0.0
1.1
3.1
7.8
16.3
28
.2
43.4
10
0.0
Tota
l 23
.9
27.8
18
.2
7.7
2.7
19.8
10
0.0
4.6
8.8
16.6
17
.9
16.4
35
.7
100.
0

��
Many girls are married at the early teens in spite of the legal age being 18 years. Youth need to be aware of the responsibilities, which go along with marriage and parenting, e.g., use of family planning methods, maternal and reproductive health services, child health. The percentage of youth who are widowed/divorced or separated is of the order of 2% with substantial gender and age differences. The proportion increases with age as one would expect, and the extent is greater among females, especially among older youth.
TABLE 1.14Percentage of Widowed/Divorced and Separated Persons among Youth 2001
Age Group Males Females
15-19 0.11 0.40
20-24 0.43 1.31
25-29 0.87 2.21
30-34 1.28 3.59Source: Censusof India,2001
Female Headed Households
According to the NFHS-3, 2005–06, in the 13 years between NFHS 1 and NFHS 3, the proportion of women-headed households has risen from 9% to 14%. The report also suggests that female-headed households are more likely to be economically vulnerable than male-headed households. In terms of states, it was seen that most of the states in the North, West and Central parts had a low percentage of female-headed households, as compared to the South or North-east.
1.11 Marginalized and Vulnerable YouthThe National Youth Policy makes special mention of certain populations of youth, who require priority focus in terms of opportunities for their development. All the regional workshops of youth organizations and youth emphasized the need for reaching out to the marginalized and vulnerable youth populations. These are the youth populations who have minimal economic, social, cultural and political rights, and hence, do not have any say in the decisions related to their own lives. Considering that they are on the fringes of society, there is very little data on these specific groups , and they do not count in the census and other national data bases.
The India Development Report [Parikh and Radhakrishna, 2004:3] states that while poverty has been reduced in all major states during the 1990s, the process has been very much uneven. It further states that there are strong indications that interstate inequality has been rising during the post- reform period and poverty has become concentrated in the backward regions in Central and Eastern India. As stated earlier,
Youth in India

India Youth Development Report 20�0 �0
a large proportion of Indians live below the poverty line [22–28%: 220–275 million] of which youth form a significant number.
Majority of the marginalized and vulnerable youth come from the economically deprived sections of society where the psychological and social problems experienced by the individuals are inextricably intertwined with poverty. Poverty also leaves its scars on the emotional and mental growth of an individual and it is seen that a significant number of children do not experience the concept of a ‘childhood’ and hence take on young and adult roles at an early age in life. The socially marginalized youth would include those with weakened or severed family and social ties; those with disability; socially stigmatised groups [e.g., eunuchs, delinquents]; victims of violence and abuse [physical, emotional, sexual]; groups that are more vulnerable to substance abuse [street youth]; refugees and those displaced by natural and human-made disasters; those in detention [prisons, shelter homes, observation homes]. Specific categories mentioned in the regional consultations [2008] also included those in caste-based prostitution; and de-notified tribes.
Lack of family and social ties can be worsened by social stigmas. Whether they are members of ethnic, national or religious minorities; migrants or young people in “floating populations”; street children viewed as nuisances or criminals; or homosexual youth facing discrimination or repression; the indifference or hostility with which society treats these youth may further traumatize them. They may be subject to harsh discrimination at mainstream health service delivery points and in the marketplace, and they may internalize society’s negative views of them, damaging their self-esteem and their ability to have healthy relationships with others.
Poverty may require these youth to work long hours to support themselves or their families, but they are often not recognized officially as workers. They may be forced to work under exploitative and hazardous conditions that endanger their physical, mental, and social development. Since they lack job skills, the youth tend to work in informal sectors of the economy.
Many of these youth are victims of violence and physical abuse, including sexual abuse. Domestic workers may be forced to provide sex to their employers, street youth may be abused by other street youth or by adults, and refugees and youth in areas of armed conflict may be obligated to grant “sexual favours” in return for documentation, relief goods, or both. Young girls are trafficked into slave-like conditions in brothels. This abuse can result in sexually transmitted infections (STIs), unwanted pregnancy, and physical injury, as well as psychological trauma that increase vulnerability to future abuse.
Some of these youth – especially those who live on the street – use drugs to diminish hunger, cold, and emotional pain or to help them sleep or stay awake. Repeated use of these drugs can cause physical and psychological problems, including hallucinations, pulmonary oedema, kidney failure and brain damage. When intravenous drugs are used, the additional risk of contracting HIV, hepatitis and other diseases increases.

��
Collectively, all of these characteristics make these youth more vulnerable to unintended pregnancy and STI/HIV infections. Poverty and lack of education and job skills make them more vulnerable to all kinds of exploitation. Social stigma and lack of a stable, supportive environment diminish the self-efficacy needed to undertake self-protective behaviour. Sexual abuse stunts the skills needed to prevent unintended pregnancy and STIs. Drugs diminish inhibitions and impair judgment, making it less likely that youth will use information and skills to protect themselves from risk.
The situation of one marginalized population, i.e., street youth is given below to illustrate the levels of vulnerability and deprivation faced by marginalized groups. This is a section of the youth population which is on the rise especially due to the rate of urbanization in the country.
Street Youth
Though family is considered as the primary caregiver for a child, there are increasing number of children and youth who prefer to escape from the family and seek life on their own. Reasons such as poverty, urbanization and family violence drive youngsters from rural and tribal areas to the so called ‘civilised’ urban centres across the country. This phenomenon expresses itself in the increasing presence of street youth who may be homeless migrants, runaways or abandoned seeking survival on the streets. A large percentage of these youth have spent their childhood on the streets and their childhood and youthhood experiences differ drastically from the conventional notions of these constructs.
The powerful social forces effectively usher people to the margins of society, where their sense of security is threatened. The immediate and long term repercussions range from mental illness, poor levels of physical health, and anti-social behavior, to low self-esteem and a confused self identity. (D’Souza et al, 2004)
There is no absolute figure on street youth in the country, as it is not clarified in the census or other national studies. The issues of shelter, care, security, inclusion and acceptance leading to a constructive positive identity, weigh heavily on this group of youth. They do not have access to schemes related to education, health, livelihood and
Survivalonthestreethasmanyfacets:
• Exhilarating:asenseof new-foundfreedom,inductionintotheglamourquotientof streetlife-drugsandsex
• Debilitating:physically,psychologicallyandemotionallyabusedbypeers,olderboys,employersandpolice
Barnabas D’SouzaDon Bosco Rehabilitation and Research Centre
Youth in India

India Youth Development Report 20�0 �2
so on, due to their lack of a legal identity. They are often described as victims of the development process and also deviants in terms of behaviour and actions.
It is also alarming to see that the number of young girls on the streets is increasing, while the age at which they come on the streets is decreasing. Thus, the number of youth spending most of his/her life on the streets and pavements is increasing.
Ramesh used to live in a small village with his family. His father was a farmer andmanaged to send him to school. But Ramesh found it very difficult to cope with his studiesatschoolashewasaslowlearner.Howeverhardhetried,hecouldnotpasshisthirdstandardexams.Hisfriends,neighboursandevenhisfamilystartedlaughingathimandinsultinghimduetofailure.Frustrated,heranawayfromhomeonenightandboardedatrainforMumbai.LifeinMumbaiturnedouttobeharderforhimthanever.Hehadnomoney,nofood,noshelter.Hehadonlythestreetsof Mumbaiandsomeof hisnewstreetfriendsforcompany.Hisfriendstookhimtoworkundera‘seth’[employer]inazariwork[handembroidery]business.Thus,hestartedworkingthereattheageof eight.Butevenhere,hewentthroughahardphaseof life.Hewassexuallyexploitedbythe‘seth’formoney,foodandshelter.Hewasexploitedfortwoyearsuntilthepoliceraidedtheplace.Hemanagedtoescapefromtheplaceandfromthepolicetoo.Onedayhewasfoundbyanoutreachworkerof ShelterDonBoscoandhecametotheShelteralongwiththem.Ramesh,now16years,isappearingfortheNIOSexamination.Withdifferentteachingtechniquesandcounselingsessions,heisnolongeradullstudentoratraumatisedchildwhohasbeenabused.
Case File ,Don Bosco Shelter, Mumbai, ����
Refugees
This is a small section of the population, invisible and with no legal identity as citizens. India is neither party to the 1951 Convention on Refugees nor the 1967 Protocol. The lack of specific refugee legislation in India has led the government to adopt an ad hoc approach to different refugee influxes. Some groups are granted a full range of benefits including legal residence and the ability to be legally employed, whilst others are criminalized and denied access to basic social resources. There is no specific data on refugees who are youth, but it can be safely assumed that a significant number of the refugees are youth. The countries from where India has refugee youth are: Tibet, Sri Lanka, Bhutan, Myanmar, (Hindus from) Pakistan, Somalia , Palestine and Afghanistan.
Some of them like the Tibetans are given more rights than others. Most of them face problems of adjusting to a new culture, language etc. and cannot access formal systems such as education, work and health. They have no legal identity in India and cannot return easily to their own country.

��
1.12 Schemes and Programmes for YouthThe Government of India has formulated several schemes and programmes which take into consideration some of the issues of this population.
Sports and Adventure • The Sports Authority of India [SAI] implements several sports promotion schemes
for different age groups. It also implements academic courses through its various institutes all over the country., e.g., the Netaji Subhash National Institute of Sports, Patiala, SAI NS Eastern Centre, Kolkata
• The Laxmibai National Institute of Physical Education [LNIPE], Gwalior, a deemed University, offers courses at the Bachelor’s, Master’s, and MPhil levels.
• Scholarships; Awards; National Welfare Fund for Sports Persons; Promotion of Sports and Games in Schools; National Sports Development Fund; Sports Fund for Pension to Meritorious Sports Persons
• Establishment and Development of Mountaineering Institutes and assistance for promotion of adventure activities.
• Assistance for Scouting and Guiding activities
Participation and Character Development• The National Service Scheme [NSS] focuses on the development of the personality
of students through community service: the scheme covers more than 2.6 million volunteers spread over 200 Universities.
• The Nehru Yuva Kendra Sangathan [NYKS] caters to the needs of non-student rural youth through youth clubs. The Youth Ministry website states that this is the largest community based non-political youth organization of its kind in the world. It caters to 80 lakh non-student rural youth in the age group of 13–35 years. 17,000 trained volunteers are enrolled every year.
• Establishment of Youth Hostels to promote youth tourism.• Programme of National Integration • Assistance to Youth Clubs in communities.• National Youth Awards and Youth Club Awards• Financial Assistance to NGOs for imparting Vocational Training and
Entrepreneurial Skills • Pilot Scheme of National Reconstruction Corps which provides opportunities
to youth to dedicate, voluntarily, one year of their life to the task of national reconstruction.
• Nodal Agency for United Nations Volunteer Scheme which helps Indian Nationals to serve as UN Volunteers in developing and underdeveloped countries.
• National Service Volunteer Scheme which provides opportunities to students to involve themselves on a voluntary basis in nation- building activities.
Youth in India

India Youth Development Report 20�0 ��
Youth Institutions• The Vishwa Yuvak Kendra in Delhi is involved in a large number of linked activities
ranging through training, grassroots level work and policy advocacy. The themes taken up for training include literacy promotion, skill development, community mobilization, project management, preventive health, substance abuse, sanitation and issues of women.
• Rajiv Gandhi National Institute of Youth Development [RGNIYD] at Sriperambudur, Tamil Nadu, promotes training of youth functionaries and is a centre of research, evaluation and documentation in the field of youth.
There are also various schemes and programmes which directly or indirectly address the needs of the youth. Some of these are: the Integrated Child Development Services [ICDS] scheme, the Kishori Shakti Yojana, Mahila Samakya Programme, Reproductive and Child Health Programme and programmes for addressing the issue of HIV/AIDS.
1.13 ConclusionYouth is a very significant constituency in India, both in terms of numbers and human power. Thus, it is imperative that youth are given adequate opportunities to enhance their potential to the optimum, and contribute as productive citizens to the growth of the country. This chapter has provided a profile of Indian youth. Further analysis is done in the relevant chapters throughout this report. The next chapter explains the need and significance of constructing a Youth Development Index for the country.

��
This chapter presents the rationale, background and relevance of the Youth Development Index (YDI) and its potential implications on various efforts for youth development. Measuring human progress has been a landmark achievement in the 1990s. This was marked by a significant transformation from viewing economic growth as reflected mainly by per capita GNP as the most important indicator of development to the inclusion of non-economic indicators. The most crucial result was the construction of the Human Development Index (HDI) and the publication of human development reports since 1990. The primary objective in constructing the HDI was to provide a summary index that can measure the achievement in some basic capabilities required to ensure human development.
In its basic form, the HDI attempted to measure human progress by looking at three dimensions: Health, Knowledge and Standard of Living. Originally, one variable each was used to measure the achievement in these spheres. Thus, per capita GNP, adult literacy and expectation of life at birth were used to construct the HDI. Later modifications, however, included more variables on these aspects. While the health component is measured by life expectancy at birth, knowledge level is measured by a combination of adult literacy and the combined primary, secondary and tertiary gross enrolment ratios, and standard of living by GDP per capita. The introduction of HDI successfully created a lot of interest given the recognition of its utility in comparing the levels across societies and groups, and its use in advocacy activities. Quite reasonably, the index was subjected to serious analysis at various quarters including academics, policy makers and activists.
From the beginning, there were apprehensions sounded as to the HDI being simplistic in measuring human progress, as the dimensions of human development cannot be captured
Youth Development Index:Relevance & Dimensions
Our task today is to bring India to the threshold of the twenty-first century, free of the burden of poverty, legacy of our colonial past, and capable of meeting the rising aspirations of our people.
–RajivGandhi
CH
AP
TE
R
II
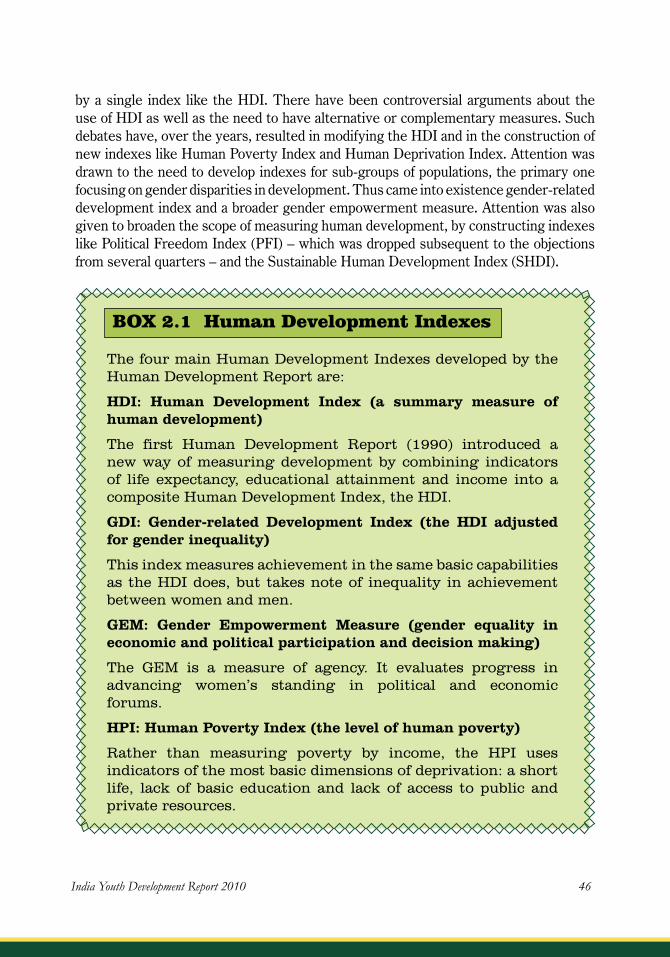
India Youth Development Report 20�0 ��
by a single index like the HDI. There have been controversial arguments about the use of HDI as well as the need to have alternative or complementary measures. Such debates have, over the years, resulted in modifying the HDI and in the construction of new indexes like Human Poverty Index and Human Deprivation Index. Attention was drawn to the need to develop indexes for sub-groups of populations, the primary one focusing on gender disparities in development. Thus came into existence gender-related development index and a broader gender empowerment measure. Attention was also given to broaden the scope of measuring human development, by constructing indexes like Political Freedom Index (PFI) – which was dropped subsequent to the objections from several quarters – and the Sustainable Human Development Index (SHDI).
The four main Human Development Indexes developed by the Human Development Report are:
HDI: Human Development Index (a summary measure of human development)
The first Human Development Report (1990) introduced a new way of measuring development by combining indicators of life expectancy, educational attainment and income into a composite Human Development Index, the HDI.
GDI: Gender-related Development Index (the HDI adjusted for gender inequality)
This index measures achievement in the same basic capabilities as the HDI does, but takes note of inequality in achievement between women and men.
GEM: Gender Empowerment Measure (gender equality in economic and political participation and decision making)
The GEM is a measure of agency. It evaluates progress in advancing women’s standing in political and economic forums.
HPI: Human Poverty Index (the level of human poverty)
Rather than measuring poverty by income, the HPI uses indicators of the most basic dimensions of deprivation: a short life, lack of basic education and lack of access to public and private resources.
BOX 2.1 Human Development Indexes

��
2.1 Youth Development Index – An initiativeIt is reasonable to argue that, in a country with substantial socio-cultural and economic diversity, allocation of the usually limited resources has to be made based on an objective judgment of comparative situations. The process of judgment involves a situation analysis in order to identify priorities as well as to identify population categories that require special and immediate attention. Often, certain categories are neglected due to lack of detailed information on their situation. Youth is one such category, which did not get much attention until 1985 when the United Nations declared it as the International Year of Youth. This has resulted in an unprecedented focus on young people all over the world. But the actual extent of activities did slow down after sometime. In fact, the development of the HDI, in a way, helped to revive attention to this rather neglected category by bringing in the idea of developing a YDI. The idea was initially sounded by the Commonwealth Youth Programme. Originally, YDI was perceived to be constructed along the lines of HDI and to be used as a tool to evaluate the situation of youth in 54 commonwealth nations1. Subsequent deliberations resulted in Brazil creating the UNESCO Youth Development Index in 2004. This success motivated other nations to attempt development of a similar index taking into account the diversities and unique features of youth situation in individual nations.
The Rajiv Gandhi National Institute for Youth Development [RGNIYD] initiated a project in 2006 to construct a YDI “to enable assessment of the status of the Youth in the country, facilitate comparisons between the States and Union Territories and also be able to identify the gaps which need policy intervention”.In order to initiate such a process,a) A meeting of the Core Committee was held on 18th May 2006 at Delhi.b) A concept note was prepared by Dr. Bhagbanprakash, the Lead Advisor for the
project.c) The Tata Institute of Social Sciences was invited to develop a proposal for
implementation of the project.
The creation of a YDI would contribute in three ways. First, it would help to recognise youth as a population category that requires separate consideration. For instance, despite the existence of a national youth policy for the past 20 years, youth as a significant category did not get recognition in many quarters. Second, development of a summary index would help to make comparison possible across geographical areas and categories, as the HDI has done in comparing the development situation across regions, nations and localities. Third, the proposed index, apart from measuring the achievement made (in comparison with other societies and in comparison with the past), would help in advocacy activities related to youth development, in general, and of specific categories in particular.
1St.Bernad(2005):YouthEmpowermentandIndicatorsof HumanDevelopment-ChallengesFacingCommonwealthCaribbeanCountries,paperpresentedattheInter-agencyconsultationontheformulationanddevelopmentof youthdevelopmentindex,London,11-12July.
Youth Development Index: Relevance & Dimensions
India Youth Development Report 20�0 ��
It is essential to underline the fact that the YDI is at best a crude approximation of the youth development situation, considering the numerous aspects that can be included in it. Thus, the importance of other indicators related to youth development should not be undermined. Though the YDI would provide a basic idea of the relative level in a particular society or a category of youth within a society, a comprehensive understanding of youth development could be achieved only if the index is studied along with information on so many other facets of youth development that cannot be captured by a Summary Index. Subjective perceptions on the selected indicators, non-hierarchical variables such as identity and culture, nature of familial relationships, and aspects where adequate national data is not available cannot be easily included in a Summary Index.
It is evident that the potential for development of any society is dependent, to a large extent, upon its capacity to utilise the potentials of the young population. If we define youth as those in the age group 15–34 years, as per the 2001 Census, 33% of the Indian population are youth. This percentage will increase over the coming years due to the younger age structure of population in most of our states, even if fertility and mortality decline further. Recognizing its enormous size, unlimited potentials and the fact that youth can contribute to the well-being of the society only if they are healthy, the health of youth has become a concern of social scientists in recent decades.
2.2 Relevance of YDI The first Human Development Report (1990) introduced a new way of measuring development by combining indicators of life expectancy, educational attainment and income into a HDI. The breakthrough for the HDI was the creation of a single statistic, which was to serve as a frame of reference for both social and economic development. The HDI sets a minimum and a maximum for each dimension, called a goalpost, and then shows where each country stands in relation to these goalposts, expressed as a value between 0 and 1. The indicators taken into account are education, health and income. India is ranked at 126 among a total of 177 countries, going up one rank as compared to 2006. The HDI for India is 0.611. Among South Asian countries, India ranks third after Sri Lanka and Maldives, but above Pakistan, Bhutan, Bangladesh and Nepal.
Human development is about the realization of human potential. It is about what people can do and become – their capabilities – and about the freedom they have to exercise real choices in their lives (UNDP 200�).

��
BOX 2.2 UNDP — Millennium Development Goals
The Global Challenge: Goals and Targets
The Millennium Development Goals are an ambitious agenda for reducing poverty and improving lives that world leaders agreed upon at the Millennium Summit in September 2000. For each goal one or more targets have been set, most using 2015 as a benchmark.
Current Status
Population Below Poverty Line, 1999-2000
India 26.10 %
Nagaland 32.67 %
School Enrolment Rate (6-11 years), 1991
India 68.3 %
Nagaland 65.5 %
GDI, 1991
India 0.676
Nagaland 0.729
Under 5 Mortality Rate, 1991India 94Nagaland 67
Maternal Mortality Rate, 1998-99India 5.4 per 1000Nagaland <1 per 1000
1. Eradicate Extreme Poverty and Hunger
Target for 2015: Halve the proportion of people living on less than a dollar a day.
2. Achieve Universal Primary Education
Target for 2015: Ensure that all boys and girls complete primary School.
3. Promote Gender Equality and Empower Women
Targets for 2005 and 2015: Eliminate gender disparities in primary and secondary education preferably by 2005 and at all levels by 2015.
4. Reduce Child Mortality
Target for 2015: Reduce by two-thirds the mortality rate (under 5) among children.
5. Improve Maternal Health
Target for 2015: Reduce by three-quarters the ratio of women dying in childbirth.
Youth Development Index: Relevance & Dimensions

India Youth Development Report 20�0 �0
6. Combat HIV/AIDS, Malaria and Other DiseasesTarget for 2015: Halt and begin to reverse the spread of HIV/AIDS and the incidence of Malaria and other major diseases.
7. Ensure Environmental StabilityTargets• Integrate the principles of
sustainable development into country policies and programmes and reverse the loss of environmental resources.
• By 2015 reduce by half the proportion of people without access to safe drinking water.
8. Develop a Global Partnership for Development
Targets• Develop further an open
trading and financial system that includes a commitment to good governance, development and poverty reduction – Nationally and Internationally.
• Address the least developed countries’ special needs and the special needs of landlocked and small island developing states.
• Deal comprehensively with developing countries’ debt problems.
HIV Prevalence
India 0.8 %
Nagaland >1 %
Incidence of Malaria
India 3.7 %
Nagaland 16.2 %
Access to Safe Drinking Water, 1991
India 62.3%
Nagaland 53.3%
Source: NationalSampleSurveyOrganizationSurvey55thRound,NationalHumanDevelopmentReport2001,NationalFamilyHealthSurvey1998-1999;CitedinNagalandStateHumanDevelopmentReport,Pg.173-174

��
BOX 2.3 How do the Human Development Goals relate to the Millennium Development Goals?
Key Capabilities for Human Development
Living a long and healthy life
Being educated
Having a decent standard of living
Enjoying political and civil freedom to participate in the life of one’s community
Essential Conditions for Human Development
Environment sustainability
Equity, especially gender equity
Enabling global economic environment
Corresponding Millennium Development Goals
Goal 4, 5, 6: reducing child mortality, improving maternal health and combating major diseases.
Goal 2 and 3: achieving universal primary education, promoting gender equality (especially in education) and empowering women.
Goal 1: reducing poverty and hunger
Not a Goal but an important global objective included in the Millennium Declaration
Corresponding Millennium Development Goals
Goal 7: ensuring environ-mental sustainability
Goal 3: promoting gender equality and empowering women
Goal 8: strengthening partnership between rich and poor countries
Source: HumanDevelopmentReport2003,CitedinNagalandStateHumanDevelopmentReport,Pg.173-174
The Millennium Development Goals state five goals which pertain directly to youth, though the others also indirectly impact youth.• Education attainment • Gender balance in education• Improved maternal health
Youth Development Index: Relevance & Dimensions

India Youth Development Report 20�0 �2
• Combating HIV and AIDS, Malaria and Tuberculosis• Employment opportunities for the youth
When a large proportion of the population is in the productive age group or in the labour force, it is seen as an advantage to the growth of a Nation. However it is also acknowledged that this dynamic and vibrant energy can be productive or destructive depending how these energies are channelled, and the range and quality of opportunities provided. As a Nation, we need to take this group very seriously, and social institutions need to respond effectively to the changing needs. If they are not provided the space and opportunities for actualizing their dreams, a significant percentage will be left behind in the process of change and be lured into activities which can be detrimental to the Nation’s development. Since youth have been clubbed with adults or children in most National data, there is no holistic, comprehensive understanding of youth and their needs in the Indian context. The development of a YDI is a crucial and necessary step in this direction.
The 1986 Youth Policy and National Youth Policy (2003) provide a comprehensive overview of youth issues and concerns including making a distinction between the age of adolescent (13–19 years) and the age of attainment of maturity (20–35 years). The HDI measures development by including the data related to the entire population of a country. It does not provide the levels of development for specific age groups or other population groups.
Amartya Sen in his book ‘Development as Freedom’ describes poverty as the deprivation in terms of basic capabilities rather than just a low level of income. However, he adds that low incomes can be a major source of deprivation of capabilities and thus of poverty. Relation between capability and income may vary depending on the person’s age, gender, location, epidemiological atmosphere, and other factors on which the person has no or minimum control. Sen argues that capabilities built through basic education and health facilities will actually improve the standard of living, increase the quality of work and thus reduce poverty. Income, political freedom, civil rights, freedom of expression, and participation among others become part and parcel of the overall development, which in turn refers to expansion of people’s real freedom or capabilities.
2.3 Benefits of YDIThe present study is informed by, and substantive understanding is drawn from, YDI-related work from other countries. The YDI would have larger representational value and thus applicable for use in different socio-economic, cultural and political contexts.
Objectives1. Construct a Youth Development Index which can be used across the country
by the State, academia, and other organizations/institutions in civil society, to ascertain the status of youth vis-à-vis the systemic dimensions which influence their growth and empowerment.

��
2. Understand and analyse the status of youth in the country vis-à-vis the objectives of the National Youth Policy (NYP).
3. Obtain perceptions of youth about the factors that facilitate/impinge on their growth and empowerment.
4. Provide policy makers with a tool and data to formulate programmes for youth.5. To initiate a process for developing a Youth Empowerment Measure.
Substantive understanding will be drawn from YDI-related work from other Asian countries. The YDI developed would have larger representational value and thus applicable for use in different socio-economic, cultural and political context.
BOX 2.4 Benefits of YDI [Bhagbanprakash, 2006]
• A National Youth Development Index and Report can be an effective tool for Governments – Central as well as States – civil society and the independent sector, youth and community development organizations, student youth and non-student youth networks, Universities and tertiary education sectors, youth wings of political, religious, cultural and secular organizations and all those who are interested in youth development issues.
• It would also open new doors to policy and planning perspectives and analysis on youth. It can inform the policy makers about progress as well as setbacks in youth development policies, planning and implementation strategies and suggest alternatives and options.
• As an observatory of social change, the YDI indicator database can help youth programmers use the quantitative and qualitative information to improve/ revise the process and content of the programmes.
• It can be used as an effective decision support tool for National and regional policy making bodies for judicious resource allocation and priority identification. Besides, the Commonwealth Youth Ministers Meeting and subsequently the CHOGM have already endorsed the idea. The Plan of Action for Youth Empowerment [PAYE] has recommended this to all the member countries including India.
Youth Development Index: Relevance & Dimensions

India Youth Development Report 20�0 ��
2.4 Principles Underlying the YDI
The YDI aims at substantial contribution to the situational analysis of development of youth across the sections of society. In order to build a comprehensive index, the following principles are considered. 1. The YDI would be ‘youth centered’. Youth have the capacity to articulate their
needs and opinions, and their ‘voices’ and expressions will be given unadulterated respect and credence. The principle of the right to participation will be practiced wherein they will be involved in the finalization of the YDI.
2. Youth are not a homogeneous group and data would be collected across all the categories mentioned below. a. Location : urban, rural, tribal b. Terrain : hills, plainsc. Shelter : those with shelter, homelessd. Economic class : upper, middle and lowere. Gender : male, female, f. Sexual orientationsg. Role : student, non-student; employed, unemployed
Among the categories mentioned above, there is a large proportion of youth who are socially marginalized as described in Chapter 1. Some of these groups are mentioned as priority target groups in the National Youth Policy [2003]. These are rural and tribal youth; out of school youth; adolescents, particularly female youth; youth with disability, and youth under specially difficult circumstances like victims of trafficking, orphans and street children.3. Youth are shaped by all their experiences from birth, and thus dimensions such as
education and health need to be tracked right from their birth and childhood.4. The dimensions of the YDI would consider and include two facets of ‘youth’:
a. A group that has specific life goals and tasks related to their stage of growth. e.g., education, identity, work, family (Youth Development)
It is crucial to recognize that young people are the bearers of rights. …but taking these international commitments seriously carries with it major responsibilities for adults. It involves taking seriously what young people say and do, providing opportunities for young people to express their views on matters relevant to their own lives; it involves listening carefully, and it involves taking young people’s perspectives into account when planning and providing services. Such a perspective is in contrast to the dominant paradigm, which persists in seeing young people as ‘collections of difficulties and problems’ that require treatment, supervision and intervention calls for partnership and participation.
(Aggletonetal.,2006:3)

��
b. A group that can be mobilized for social and cultural change e.g., participation in societal issues (Youth for Development).
5. The YDI would obtain objective data [e.g., access to systems and services, status in each dimension] and subjective interpretations [e.g., factors facilitating/ blocking access and participation] by the youth.
6. The themes would be derived from the major documents which have addressed the issues related to youth, globally and in the Indian context. • India formulated the National Youth Policy first in 1986, revised in 2001, and
the current Policy of 2003 highlights certain themes as priority concerns for empowerment and development of youth. The policy provides the framework for issues to be worked on by the State.
• The HDI would be kept in mind when identifying themes and indicators.• The United Nations World Plan of Action for Youth [UNWPAY], which was
initiated in 1995, identified 10 priority areas which need to be emphasized when developing programmes for the youth. Five additional areas were added by the General Assembly in 2003.
• The World Development Report [WDR], 2007 of the World Bank is entirely devoted to youth, and identifies five youth transitions to keep human capital ‘safe, developed and deployed’. The report puts a ‘youth lens’ on policies, and suggests three strategic directions for reform: broaden opportunities; develop capabilities; provide effective systems for second chances.
• The Commonwealth Plan of Action for Youth Empowerment [PAYE], 2006–2015 provides 10 strategic objectives empowering youth. There is also an agenda to develop a YDI for all the member countries. However, this process is not complete.
• All the dimensions are also part of the Human Rights Dialogue, and find mention in the Universal Declaration of the Human Rights.
7. The YDI would be based on the HDI model, but certain themes would be added considering the youth’s specific characteristics and rights. It would be a standardised tool to measure certain critical areas of youth development. It is not intended to study and evaluate all aspects of youth development.
2.5 Youth Development Index: Earlier InitiativesProcedures used for the YDI would be similar to those used by the HDI. Studies conducted in the international community are taken as a point of reference for the construction of YDI for India. The Commonwealth initiative to construct a YDI in 2005 (CYP, 2005) suggested having common indicators on education, health, participation and sustainable livelihood. A rights-based approach was suggested as the underpinning paradigm.
Youth Development Index: Relevance & Dimensions

India Youth Development Report 20�0 ��
TABLE 2.1Themes highlighted by National Youth Policy, UNWPAY and the WDR
National Youth Policy UNWPAY WDR, 2007
Education Education Learning,education
Trainingandemployment Employment Work
Health Hunger Healthylifestyle
Environment Environment –
Recreationandsports Leisure-timeactivities –
Artandculture – –
Civicsandcitizenship Thefullandeffective Exercisecitizenship participationof youthinthe lifeof societyandindecision making
Scienceandtechnology – –
Endeavourstoattachpriority Poverty –totheneedsof underprivilegedandmarginalizedyouth.
GirlsandYoungWomen GirlsandYoungWomen –
– DrugAbuse –
JuvenileDelinquency
Additionalareasof concern Family foryouthadoptedbythe GeneralAssemblyin2003are,
1.Globalization
2.Informationand Communication Technology[ICT]
3.HIV/AIDS
The major questions to be answered are related to the selection of criteria for arriving at a comprehensive picture of youth development in the country. We need to consider the factors that are unique to youth, which are not captured in the indicators of the HDI. At the same time, we need to understand that an index has a few key indicators which can be applied to all youth wherever they are. Other aspects may need to be studied through in-depth, legalized studies to understand contextual variations.

��
The Brazilian model is useful in the context in which it was developed and gives a picture of different dimensions. The UNESCO in Moscow also conducted a similar study. References are made in the forthcoming sections to ongoing international discussions related to the YDI such as within the Commonwealth Secretariat – an international agency that has spearheaded efforts toward developing a YDI. Several developments have taken place in this area since the end of the last century, such as in 1998 when the Commonwealth PAYE was developed and formally approved at the Commonwealth Youth Ministers Meeting in Kuala Lumpur, Malaysia. The PAYE recognizes the significance of enabling conditions that would, in turn, facilitate empowerment among young men and women. One of these conditions which this report will consider is: ‘the dissemination of knowledge, information, skills and values’. The sources of data for a qualitative study are limited and as part of this project the view of stakeholders will be considered in the final analysis of the report.
Figure 2.1 illustrates the model Brazil used for designing its own YDI.
The analytical framework comprised the three dimensions of Education, Income and Health, with sub-category indicators as shown in Table 2.2.
FIGURE 2.1 Dimensions of Youth Development in Brazil’s Youth Development Index
Youth Development Index: Relevance & Dimensions

India Youth Development Report 20�0 ��
TABLE 2.2 Dimensions and Indicators for YDI Brazil
Dimension Indicator Crossed For
Education %Literateyouth
%of schooling
%of adequateschooling
Yearsof schooling
Qualityof Education
Income Familyincomepercapita
Youthactivities
Housework
Health MortalitybyViolentcauses
Mortalitybyinternalcauses
Maternityage11to19
Bygender
Byagegroups
Byresidence
Byrace
Byfamilyincome
Forthe5Regionsandthe27FederativeUnits
Other attempts at studying youth development in a comprehensive way include the development of a YDI for Malaysia and the preparation of human development reports focusing on youth development by Turkey, Cyprus and Croatia (Human Development Report – Turkey 2008; UNDP, 2008; Cyprus Human Development Report, 2009–Youth in Cyprus: Aspirations, Lifestyles & Empowerment, UNDP, University of Nicosia, KADEM. 2009; Human Development Report Croatia, 2004 – Youth, UNDP, 2004).
The index prepared for Malaysia depends on primary data to compute it (Ministry of Youth and Sports, Government of Malaysia, 2006). The eight domains that were considered for the Malaysian YDI are self-development, social relationship, identity, health, self- potential, media penetration, leisure time, and deviant behaviour. Linear averaging method is used to compute the YDI. A similar approach was used for the construction of Brunei’s YDI (Ministry of Culture, Youth and Sports, Government of Brunei, 2008). The report for Turkey uses both quantitative and qualitative methods to gather data to depict the youth development situation. This report identifies 25 qualities of life indicators. However, the Turkey and Cyprus reports do not attempt to construct a composite index, and analyse the individual indicators to describe the youth development situation.

��
Indicator1 Proportionof birthsattendedbyhealthpersonnel
Indicator2 Fullimmunisationrate
Indicator3 Lowbirthweightrate
Indicator4 a)Infantmortalityrate(0-28daysand1-11months)
b) Under-five mortality rate
Indicator5 Moderncontraceptiveprevalencerate
Indicator6 Populationperdoctorandperhospitalbed
Indicator7 Adultliteracyrate
Indicator8 Pre-schooleducationparticipationrate(36-72months)
Indicator9 Proportionof pupilsreachinggrade8
Indicator10 Netenrolmentrateinprimaryeducation
Indicator11 Netenrolmentrateinsecondaryeducation
Indicator 12 Population benefiting within the framework of extended education, num-berof coursesandpopulationregisteredpercourse
Indicator13 Proportionandnumberof childrenwhosebirthswereregisteredlate
Indicator14 Completedsuiciderateandnumberof attemptedsuicides
Indicator15 Proportionandnumberof childrenwhohavecommittedcrime
Indicator16 Numberof plaintiff,accused,andcourtcasesforoffencescommittedagainstpersonsandproperty,percentageof accusedpersons
Indicator17 Percentageandnumberof childrenwhohavesufferedabuse.
Indicator18 Percentageandnumberof homelesspersons
Indicator19 Percentageandnumberof personsunderProtectionandSpecialCare(children[0-17],adult[18-64],elderly[65+],anddisabled)
Indicator20 Percentageandnumberof personswaitingforInstitutionalProtectionandCare(children[0-17],adult[18-64],elderly[65+],anddisabled)
Indicator21 Percentageandnumberof personscoveredbyanySocialSecurityScheme(working,retired,dependent)
Indicator 22 Percentage and number of persons benefiting from Social Assistance and SolidarityFoundationsandLawNo.2022
Indicator23 Numberof associations,foundationsandunionsandnumberof mem-bersandunionizationrate
Indicator24 Proportionof householdswithnoaccesstosafedrinkingwater
Indicator25 Proportionof householdswithnoaccesstoadequatesanitation
Youth Development Index: Relevance & Dimensions

India Youth Development Report 20�0 �0
The ‘Handbook of Positive Youth Outcomes’ by the Youth Development Institute suggests seven youth developmental competencies and positive identity.
i. Creative competence,ii. Personal competenceiii. Cognitive competenceiv. Civic competencev. Physical health competencevi. Mental health competencevii. Employability and social competence [Networks for Youth Development
1998]
Ezhar et al. [2005] list three types of indicators:i. Criterion indicator: a normative indicator that sets target or outcome for
public policy and planning.ii. Life satisfaction indicator: seeks to measure psychological satisfaction. iii. Descriptive indicator: focuses on social measurement and analysis to improve
understanding of how society operates.
For each of the themes, the following levels could be studied: Awareness, Availability, Access, Utilisation, and Perceptions. These indicators can then be converted to an index; the Index may include objective as well as subjective indicators. Combining the above mentioned categories, Table 2.3 below suggests the broad indicators by which each theme could be understood.
2.6 Themes/Dimensions for the Proposed YDIThe themes highlighted at the national and global levels are listed below. The major themes are common across the policy documents and were finalized after the five regional consultation workshops. (Also see Figure 2.2).
TABLE 2.3 Classification of Indicators
Type of Indicator Broad Indicator
CriterionIndicator • AvailabilityOf Service/Opportunity
• Access
• Utilisation
LifeSatisfactionIndicator • Perceptions
DescriptiveIndicator • Awareness
• Factors Influencing the Utilisation of thatOpportunity

��
1. Health 2. Education and Training 3. Work and Employment 4. Amenities5. Citizenship and Participation6. Culture and Lifestyle
2.7 SummaryThis chapter stated the need and relevance of the YDI, and the identification of themes for such an index. The next chapter on Methodology details out the steps taken for finalizing the Index, which included a modification of the themes and indicators mentioned in this chapter.
FIGURE 2.2 Dimensions of YDI for India
Youth Development Index: Relevance & Dimensions

India Youth Development Report 20�0 �2
The Youth Development Index (YDI), India, is important for mapping the development of youth particularly when diversity is substantial. The implicit understanding is that, as a population group, the youth have features that need to be measured separately, which have been lost in the all encompassing Human Development Index (HDI). The process of construction of the index involved deliberations with youth themselves and related stakeholders in five regional consultations, and then enfolded across various stages, each adding on to an understanding of youth in India and making the indicators of development progressively more incisive.
3.1 Phases of the Project
Methodology
Innovation, imagination and an alert awareness of evolving circumstances constitute the life-breath of a dynamic society.
–RajivGandhi
CH
AP
TE
R
III
Phase1 Preparationof conceptpapersonthefive themes: Health, Education, Work, Participation,IdentityandCulture
Phase2 FiveRegionalConsultationsatMumbai,Delhi,Guwahati,BhubaneswarandSriperumbudur
Phase3 a)PrimaryDataCollectionfromtenStatesandUnionTerritories
b)Constructionof YDIbasedonsecondarydata
Phase4 Preparationof YouthDevelopmentReportfromYDIandPrimaryresearch
TABLE 3.1 The Four Phases
For preparing the concept papers, secondary data on the dimensions of youth development were collated from various sources such as the Census, NSS and NFHS and relevant tables extracted from them. These tables reflected available data in terms of sex, location (urban and rural) and age. The summary of recommendations of the regional consultations is given in the appendix to this

��
chapter. One of the major changes from the original proposal was the exclusion of the domain ‘identity and culture’ from the proposed YDI. The need to include marginalized and vulnerable groups was also strongly suggested at these consultations. By and large, participants of the regional consultations agreed to the broad definition of youth stated in the National Youth Policy (13–35 years). However, it was also felt that sub-categorisation of this age group was essential for understanding youth development and, therefore, needs to be incorporated as such in the youth development report based on primary data.
Consultative meetings with experts working in the field of Development Index were conducted in order to plan the methodology. The first consultative meeting of experts led to the formulation of a list of indicators based on vulnerability, development and empowerment (Table 3.2).
TABLE 3.2 Suggested Indicators from the First Consultative Meeting
YDI–Youth Development Youth Vulnerability or Youth Empowerment Index Poverty or Deprivation Index Index
1.Lifeexpectancy
2.Literacy—10thstandardeducation
3.Enrolment
4.Numberof yearsof secondaryeducation
5.Numberof yearsof vocationaleducation
6.Numberof yearsof highersecondaryeducation
7.Numberof yearsineducation
8.Intensityof employment(Numberof daysandwage)
9.Intensityof employment(whichisdiscountedbyunemploymentindex)
(Note:Takeyouthfromthewealthindexusethosefortheincomecriteria)
1.Communication
2.WaterandSanitation
3.Ownershipof land
4.Typeof house(KachhaHousing)
5.Consumption
6.Unemployment
7.YouthinKachhahousesi.e.%of youthinKachhahouses(dataontypeof housingbytheNFHSandNSScanbeused)
8.Youthlivinginhouseholdswithbasicamenities
9.Crime
10.Illiteracy
11.Dropout
12.Nutrition
13.Deformities–congenitalandacquired
1.Participation
2.Voting
3.Youthstandingforelection
4.Electedmembers
5.Percentageof youthwhovote
6.Numberof candidates
7.Employment
8.Proportionof youthinthewealthIndex
Methodology

India Youth Development Report 20�0 ��
YDI–Youth Development Youth Vulnerability or Youth Empowerment Index Poverty or Deprivation Index Index
14.Socialhealth–RTIandSTI’s
15.Childmarriageandteenagepregnancy
16.Disability
17.Anaemia
18.Substanceabuse
Further consultations identified the following indicators to be considered within each domain.
Health Mortality–lifeexpectancyattheageof 15Nutrition–BMI,anaemiaDisability–percentagesufferingfromatleastonedisabilityMaternalhealth–teenagepregnancy,MMR,ageatmarriage,institutionaldeliveryMorbidity–chronic(TBanddiabetes)andacuteillness,AIDSandSTDsReproductivehealth–awarenessandutilisationof contraceptionMentalhealth–suicidesSocialhealth–substanceuse(smokingandalcoholconsumption)Accesstohealth–numberof PrimaryHealthCentres
EducationPercentagecompletedprimary,secondaryandtertiarylevelPercentageilliterateinthe13–35agegroupPercentageof youthhavingprofessionalskillsandtrainingAccess–numberof schools/collegesof alltypes
EmploymentWorkparticipationrateActivitystatus(whatareyoudoingatpresent?)UnemploymentrateUnderemploymentrateEconomicactivitycross-tabulatedbylevelsof educationandcorrelationOccupationcross-tabulatedbylevelsof educationandcorrelationWage pattern (percentage of employed youth having a steady work) (distribution of peopleworkingaccordingtotypesof labour)

��
Standard of living and Amenities Amenities—house,toilet;assets,water,fuel,housing,sanitationHouseholdexpenditureEnergy—electricityandcookingfuelWater—drinking,sanitationHousing—typeCommunication–road,telecommunication,possessionof vehicles,TV,radio,internet
Further discussions at other consultations examined the suitability, availability and sufficiency of each indicator in detail. It was felt that the YDI must serve the purpose of comparison between units. There can be an all-India index and also an index for each state, so that states can be compared with respect to their YDI. An Index should have a minimum number of indicators and yet be capable of providing an accurate picture of the situation. The main purpose of an Index is that it should indicate the future course of action. While selecting the indicators as the first step, availability of data cannot be the sole reason to select a particular indicator, as data can also be generated.
Selection and aggregation are the two main steps in developing an Index. The selection of indicators depends on availability and variation. Only those indicators that show substantial variation across states can be selected. The variation in indicator values needs to be observed across an extended time span as well. While the youth development report should contain all indicators that are important, the composite YDI should only include relevant aspects and which show high variation across units. By not including an indicator like mortality, which has very little variation across the states, we would be leaving out an important aspect. Therefore, in such cases relevant indicators would have to be included even if variation is low. Variation is one aspect, but importance from the perspective of policy development is also important.
As a result of these consultations, five domains of the YDI were finalized – Health, Education, Employment, Amenities and Participation. Data available under each of the domain were compared across years and across the different States in order to look for variation. Since there were several indicators within each domain, comparing variation in data helped to filter out those indicators that showed meaningful variability. Therefore, this exercise further sharpened the indicators within each domain. However, we had to remove the domain of participation in constructing YDI from secondary data due to lack of information. But this dimension was included later for the 10 selected states for which data was available from primary research. Hence, two Youth Development Indexes were constructed:1. Youth Development Index (based on dimensions of health, education, work and
amenities)2. Youth Development Index (based on dimensions of health, education, work,
amenities and participation).
Methodology
India Youth Development Report 20�0 ��
It was decided to consider the gender dimension while computing the YDI. The next step was to identify and collate national data on the above indicators. For this, analysis of NSS and NFHS primary data had to be carried out. Once this analysis was completed, the data was subjected to Principal Component Analysis to examine the commonalities and thus to determine which indicators could be finally selected for the index construction. In order to further validate the inclusion of indicators, Multi Criteria Analysis was used, the details of which are provided in the later sections of this chapter.
3.2 The Basic PremiseIn general, the construction of Youth Development Index (YDI) will follow the basics of Human Development Index (HDI) with an aim to go beyond the boundaries set by it. The paradigm shift that concept of human development had over conventional output-based ideas of development is two-fold. First, is the issue of one-dimensionality – attributed as the most serious drawback of Gross National Product (GNP) like measures – where human progress is assessed through the single dimension of economic prosperity in monetary terms. Criticizing this aspect of the monetary measures, the chief architect behind Human Development Report (HDR)1, once remarked that any measure that values a Gun several hundred times more than a Bottle of Milk is bound to raise serious questions about its relevance for human progress (Haq, 1995). ‘Human welfare’ or ‘Quality of Life’ have multiple facets in terms of human capabilities and functioning, and hence are multi-dimensional2. So, unidimensional measures like GNP are both inadequate and incompatible.
Human development framework’s second point of departure from the conventional development theory centres round the ‘means and ends debate’. Human beings are both ‘ends’ and ‘means’; they not only happen to be – directly or indirectly – the primary means of all productions, but are also the beneficiaries or adjudicators of progress; hence ends in themselves (Sen, 1989). And these ends, most of the times do not figure in monetary based indicators. For example, investment in education and health, may not directly add to GNP, but adds value to human capital and thus contributes to economy and social well-being (Nathan et al, 2009). So, people’s well-being as the central objective of human development led to consideration of different dimensions under HD and finally, the development of HDI3.
1Thehumandevelopmentreportisbeingpublishedannuallysince1990andservesasacornerstoneintermsof philosophyaswellasanapproachof theUnitedNationsDevelopmentProgramme(UNDP).2ForfurtherdiscussionsonthisseeStreetenetal.(1981),Sen(1989,1997,1999and2000),Desai(1991),Streeten(1994),Haq(1995),andAnandandSen(2000)amongothers.3Forchronologyof literaturesondifferentdimensionsof HDseeRoutandPanda(2009).

��
As measured today, the HDI has three dimensions; namely health, education and the ability to achieve a ‘decent standard of living’ (UNDP, 2007). Health is measured by life expectancy at birth, education is measured in terms of weighted average4 of adult literacy rate and combining enrolment ratio and standard of living is measured through logarithm of income5 (see Fig 1). All the three dimensions are normalized6 to the scale of 0 to 1. For every country the score is determined for three dimensions – health (h), education (e) and income (y) where 0 ≤ h, e, y ≤ 1. Then the composite HDI for each country is calculated by averaging out the above three (i.e. say for country j HDIj = 1/3(hj + ej + yj) (Figure 3.1). The countries are ranked according to their respective HDI.
4Adultliteracyrate(2/3rdweight)andcombiningenrollmentratio(1/3rdweight)5Logarithmof incomeistakentoconsider‘diminishingreturns’toincreaseinincome.6Thenormalizationused:Index=(actualvalue–minimumvalue)/(maximumvalue–minimumvalue)
FIGURE 3.1 Three Dimensions of HDI
FIGURE 3.2 Aggregation for Construction of HDI
Methodology

India Youth Development Report 20�0 ��
The measurement of HDI has its share of critiques through the works of Lüchters and Menkhoff, 1996; Hicks, 1997; Noorbakhsh, 1998, Raworth and Stewart, 2003, Foster, Lopez-Calva and Szekely, 2003, Chakravarty, 2003 and more recently, Grimm et al., 2008, Nathan et al., 2008, Nathan and Mishra, 2008. However, these critiques helped to refine the measure over time (Jahan, 2003) leading to construction of related indices to capture various dimensions of development and deprivation (Anand and Sen, 1993, 1995, 1997, 2000; Sen, 2000). The UNDP’s gender development measures in terms of Gender Development Index (GDI) and Gender Empowerment Measure (GEM) and Human Poverty Indices (HPI-1 and HPI-2) are examples in this regard. Nevertheless, HDI, for the first time as a measure, brought a paradigm shift in the thought process which considered development as an expansion of choice of freedoms, rather than not just income. It had a significant impact on drawing the attention of governments, corporations and international agencies on indicators of human well-being other than per capita income and in turn, contributed to policy discourse (Fukuda-Parr et al., 2003).
The current exercise to develop YDI for India and its States is an offshoot of the HDI framework and methodology. However, as rationalized in the previous chapters, there is a gamut of reasons for YDI to follow a different course from HDI as the issues which are specific to youth may be different from the whole population. Moreover, HDI methodology can be improved upon following the recent developments in the literature. Hence, in this chapter, we will revisit the methodology step-wise to develop the framework for YDI construction as follows:
(i) Choice of dimensions(ii) Finding the scope to split the dimensions into components(iii) Selection of indicators under each components(iv) Normalization of indicators(v) Determination of weights of each indicators(vi) Aggregation of components to get the composite
3.3 Dimensions of Youth DevelopmentFor a multi-dimensional indicator, the dimensions reflect the purpose of the indicators. This is the precise reason why the choice of dimensions is the most critical activity in the construction of HDI-like indicators. The YDI is expected to fulfil the desirability of HDI and go a step further in bringing forth the issues pertaining to youth. The major purpose of HDI is to broaden the assessment of development levels away from income (McGillivray and White, 1993), measure the human capital (Hopkins, 1993; Ivanova, 1994), expose the impacts of policy manipulations and influence planning programme (Kelley, 1991 and Osama, 1994), and act as a tool for the governments to assess the performance (Khatib, 1994). With these in mind, the HDI is conceptualized across three dimensions, namely (i) ‘a long and healthy life’; (ii) knowledge; and (iii) the
��
ability to achieve a decent standard of living. The HDI was criticized for non-inclusion of deprivation and gender-inequality dimensions, which were later addressed, not by increasing the number of dimensions further, but by adding new indicators like Human Poverty Indexes (HPI-1 and HPI-2), and gender-based measures, namely Gender Development Index (GDI) and Gender Empowerment Measure (GEM). Similarly, separate measures can be developed in the youth development arena. Since deprivations and inequalities (among gender and other socio-economic groups) occur in every dimension (health, education, etc), it is pertinent to develop separate indexes to capture these aspects rather than integrating them into YDI through additional dimensions.
However, there are suggestions and advocacies to include new dimensions like ‘political freedom and civil and political rights’ dimension (Trabold-Nubler, 1991; Rao, 1991; Hopkins, 1991; Desai, 1991; Dasgupta and Weale, 1992; Boer and Koekkoek, 1993; Khatib, 1994); ‘environmental’ dimensions depicting depletion of natural resources (Murray, 1993; Khatib, 1994); ‘nutritional status’ (Murray, 1993); ‘culture’ (Khatib, 1994), mobility (Ryten, 2000), ‘freedom from crime and violence’ (Rao, 1991; Ryten, 2000); ‘self respect’ and opportunity to be creative and productive (Rao, 1991). Inclusion of such dimensions is debatable as the choice of dimensions gets constrained by the fact that underlining data must be valid, relevant to policy and of high quality, which the data related to above dimensions do not meet internationally (Raworth, 2001; Raworth and Stewart, 2003). Also, the number of dimensions needs to be less; and the interpretations of these dimensions need to be straightforward to keep YDI simple and widely comprehensible. So, inclusion of all possible dimensions (like all possible indicators under each dimension) is not possible as it defeats the purpose of indicators altogether; as, by definition, indicators reduce the number of measurements and parameters to provide the exact representation of a given situation (Nathan and Reddy, 2010).
Nevertheless, we need to take note of the criticisms and develop dimensions as per the need of the youth. Out of the three existing dimensions of HDI, income has been subjected to maximum criticism. Though income may be the closest proxy for a decent standard of living, development-based indicators – in line with UNDP’s human development paradigm – intend to make operational Sen’s Idea on capabilities with their functioning (Comim, 2001; Fukuda-Parr, 2003) and income is not considered as a functioning (Srinivasan, 1994). Hence, a dimension based on youth in the work force (those who are not enrolled in regular curricula) can be a better substitute to income. Also, in the days of pockets of religious extremism, naxalism and terrorism, the question of identity, outlook, lifestyle and culture is important. One of the most important reasons for youth falling prey to extremist behaviour has been identified with poverty. Access to basic amenities like safe house, drinking water, energy and electricity ensure the foundation over which the holistic development of the youth can happen.
Methodology

India Youth Development Report 20�0 �0
So, the list of dimensions for the YDI can potentially include health, education, income, work/employment, identity/outlook, culture, lifestyle, socio-political participation, amenities, etc. The best way to resolve which dimension should be part of YDI, and which should not, is through discussion among stakeholders. The number of dimensions need to be optimal, neither more nor less. Also, it must be kept in mind that from a practical point of view, the underlining data need to be valid, of high quality and comparable state-wise across India and in the long run comparable across countries as other countries come up with youth development indicators. Hence, the debate on the inclusion of and addition to HDI dimensions can be floored at regional consultation meetings where all the stakeholders including the youth participate.
3.4 Dimensions of Youth Development IndexTo facilitate the selection of indicators, componentization of each dimension helps. For example, health dimension can be componentized as health-achievements or functioning or outcomes (which capture the underlying capabilities) and health-care facilities (which attend to the process aspect of justice and equity) (Figure 3.3). So, an indicator like life expectancy shows the ‘outcome’ component of health dimension and institutional delivery or number of beds available per thousand population will be a ‘process’-related indicator. Similarly, for education dimension, literacy rate can be an outcome indicator, whereas access to school education can be a process indicator.
However, all dimensions cannot be componentized as above for two reasons. First, there can be dimension for which distinction between process and outcome will be difficult. For example, dimension like amenities, the percentage of youth having access to safe water is both an access and outcome indicator. Unlike education where access to educational institute need not completely translate into educational attainment; access to safe water means intake of the same. The other reason for which process-outcome componentization is not possible for all dimensions is the fact that there can be other components such as awareness, utilization, quality of services, satisfaction,
FIGURE 3.3 Possible Components of Health Dimension

��
etc. In the present exercise the components can be dimension-specific and the decision of componentization can be left to the expert group consultation meetings.
3.5 Selection of IndicatorsAny indicator to find a place in the final list has to meet several criteria such as relevance to objective, simplicity in understanding, analytical soundness, policy responsiveness, flexibility, etc. The set of criteria may change with purpose, but in general, criteria are multiple and multi-dimensional.7 Criteria, too, may have different importance and may form different levels (Nathan and Reddy, 2010). So, as a first step, the selection of indicators involves determination of the criteria under which the indicators are going to be evaluated.
3.5.1 Selection of Criteria
The nomenclature and classification of criteria followed three indicator initiatives – DEAT (2001), OECD (2003) and Nathan and Reddy (2010) – in the field of sustainable development and environment. Figure 3.4 represents the criteria and sub-criteria under which the indicators are going to be evaluated.
7Here,multi-dimensionalitymeansonecriterionmaynotbedirectlyrelatedtootherandbothof thesemaynothaveanydirectrelationtothird
FIGURE 3.4 Selection Criteria Tree
3.5.2 Weights to Criteria
To find the relative importance of each criteria against other, Analytical Hierarchical Process (AHP) developed by Saaty (1980). The AHP adopts a linear additive model, but uses pair-wise comparison for deriving the weights and the scores. In assessing weights, the decision makers are asked questions on how important one particular criterion is relative to another. The AHP has been chosen over other Multi Criteria Analysis (MCA) techniques for the following reasons (Nathan and Reddy, 2010):
Methodology

India Youth Development Report 20�0 �2
(i) AHP is widely used in a variety of applications involving multi-stakeholder analysis.
(ii) Pair -wise comparison is most suitable for non-experts as well(iii) AHP is suitable to handle qualitative data
Figure 3.5 gives the list of matrices to be filled up by the decision- makers to get the score against each criterion. In total there will be four matrices (one top level, and three branch level – see Figure 3.4). The diagonal of the matrices will be unity as the criterion is weighed against itself. The shaded region is not to be filled as the score for the same can be derived from the filled score as pair-wise comparison is consistent in reciprocals.8 For each pair of criteria, the decision-maker is then required to respond to a pair-wise comparison question asking the relative importance of the two. Responses are gathered in verbal form and subsequently codified on a five-point intensity scale, as given in Table 3.3.
8However,pairwisecomparisonisnotconsistentinatransitivesense,herethedecisionmakerspreferenceisgivenmoreimportancethanthetransitiveproperty.
FIGURE 3.5 AHP Matrices to be filled up for Criteria Weights

��
TABLE 3.3 Relative Importance Scale
How important is Criteria A relative to B Preference Index Assigned
Equallyimportant 1
Moderatelymoreimportant 2
Stronglymoreimportant 3
Verystronglymoreimportant 4
Overwhelminglymoreimportant 5
If the judgement is that B is more important than A, then the reciprocal of the relevant index value is assigned. The weight for each criterion is calculated by finding the geometric mean for each row and normalizing each geometric mean with the sum of geometric means.
3.5.3 Selection of Indicators
To find key indicators from a bigger pool of potential indicators, the decision makers were asked to score each indicator against each criteria in an integer scale of 1 to 5; 1: Poor, 2: Average, 3: Good, 4: Very good, and 5: Excellent. Then the final score, Si, for indicator, i, is obtained from the following formula.
Si = ∑wcIci
where, wc = weight for criterion c Ici = score for indicator i for criterion c
Selected Indicators
Health• Percent Assisted/Institutional delivery (represents access)• Life expectancy at age 15 (represents outcome)• Percent youth-Non-Anaemic (represents outcome)• Body Mass Index (represents outcome)
Education• Gross Enrolment Ratio (GERsecondary +GERtertiary) (represents access)• Level of education attained (literate, primary, secondary, tertiary, vocational)
(represents outcome)
Work/Employment• Work participation rate (represents outcome)• Available days of work in a year per youth (represents access)
Methodology

India Youth Development Report 20�0 ��
Amenities• Basic Amenities: Access to safe water, Type of house, Access to electricity,
Toilet facility• Youth Amenities: Information, Communication, Technology
The results of multi-criteria analysis can be seen from the graphs presented in the appendix of this chapter.
3.6 NormalizationNormalization is done for indicators to make these values fall within a small range like 0.0 (minimum value) to 1.0 (maximum value) so that different data can be made comparable. Normalization helps prevent attributes with initially large ranges from outweighing attributes with initially smaller ranges (Han and Kambler, 2001). There are primarily three methods of normalization: z-score normalization; normalization by decimal scaling; and min-max normalization (Han and Kambler, 2001; Shalabi et al, 2006; Visalakshi and Thangavel, 2009). In the YDI construction, min-max normalization has been preferred for the following reasons(i) Min-max normalization does a linear transformation of original data and hence,
preserves the relationship among the original values(ii) For most of the indicators the minimum and maximum values are known, so min-
max normalization is convenient.(iii) HDI uses min-max normalization technique
The min-max normalization is expressed as:
Actual - MinimumIndex = ______________________________________
Maximum - Minimum
3.6.1 Choice between Relative and Absolute Maximum & Minimum
The HDI calculations in the initial years use relative maximum and minimum in each year (from the values corresponding to extreme countries every year). However, this methodology has been criticized for sacrificing more benefit of creating a comparable time series which, by definition cannot have shifting goalposts (Raworth and Stewart, 2003). On the advocacies of literatures like Kanbur (1990), Kelley (1991), Trabold-Nubler (1991), Pyatt (1992), Pal and Pant (1992), McGillivray and White (1993), Khatib (1994), Ivanova (1994) and Dutta et al (1997). So, in the construction of the YDI, fixed level of maximum and minimum will be used to avoid undesirable externalities whereby the indices can change simply due to changes in extreme values. If in future, these levels change (eg., in case of life expectancy or income), a recalculation of the YDI will be done with the changed levels (i.e. global maximum and minimum).

��
3.7 Relative Weights for Each Indicator Relative weight for each indicator is one of the trickiest affairs. The weight of indicators is, primarily, related to three considerations: 1. Which component of which dimension is the indicator representative of? The
importance of component and dimension must get reflected in the assigned weight of the indicator.
2. What was the score of the indicator when it was shortlisted as the representative indicator? A higher score at this stage implies higher importance.
3. How many indicators are representing the same component of the same dimension? If the indicator is a sole one, its weight will be naturally higher; when multiple indicators are representing the same component/dimension then weight is shared.
Like decision on components (section 3.3), the relative weights for each indicator need to be decided in expert group consultation meetings.
3.8 AggregationFor aggregation across criteria in multiple dimensions, linear additive technique is not suitable as it imposes perfect substitutability assumption across dimensions. An alternative to linear addition is Displaced Ideal (DI) technique developed by Zeleny (1974), which uses the concept that better system should have less distance from ideal. Ideal denotes maximum score in all dimensions. For n number of indicators along n dimensions, the ideal would be
I = ( x1*, x2
*, x3*, ....... xn
*)
xj*= condition for maximum score; i.e. max (xj) for maximization criteria or min (xj)
for minimisation criteria. By normalizing to the scale of [0 1], 0 being least favoured and 1 being most, the ideal point would be defined by unity vector, I = (1,1,…1). The diametrically opposite point would be known as origin or least favoured point 0 =(0,0, …0). For presentation purpose, a two-dimensional criteria scenario (x1, x2) is considered with two options (p1, p2) having scores (x11, x12) and (x21, x22), respectively.
FIGURE 3.6 Displaced Ideal Method
Methodology

India Youth Development Report 20�0 ��
The distance of option pi from ideal point is . Hence, p1 has higher, equal or lower rank than p2 depending upon d1>d2 or d1=d2 or d1<d2, respectively.
DI technique will be used in constructing the overall performance based on inverse of Euclidian distance. Figure 4a shows the present value tree mapping and 4b the resultant. Linear Additive (LA) technique can be used only when constituting criteria of a particular criterion are additive in nature and are perfectly substitutable.
The DI technique of aggregation has been used in HDI constructions (Mishra and Nathan, 2008 and Nathan, Mishra and Reddy, 2008, Nathan, Mishra and Rampal, 2009). Taking thread from this Mandira (2008) has used the same technique to compute financial inclusion index. Through axiomatic characterisation, Mishra and Nathan (2008) and Nathan, Mishra and Reddy (2008) have shown the advantages of DI technique over the conventional method. Under DI, uniform, as against skewed, development is rewarded. Through an ‘ideal path’, it signals a future course of action. These signify that a given increment in any one dimension, with other dimensions remaining constant, has a greater significance for the index at a lower level than at a higher level. In other words, stagnancy in the dimension that has a lower value is more serious than stagnancy in other dimensions. DI method of aggregation will be used for YDI to utilise these advantages.
3.9 Youth Gender Development IndexUNDP’s current methodology for construction of Gender Development Index (GDI) is based on the premise of Anand and Sen (1995). GDI is measured across the same three dimensions as HDI adjusting for gender inequality. Following computation of GDI (UNDP, 2007), Youth Gender Development Index (YGDI) can be calculated across all dimensions (and for each indicator in every dimension).
In a recent work, Nathan (2008) has shown how the construction of GDI, makes it bias towards higher performing gender, which in turn gives a wrong signal to countries to skew the sex ratio towards the better performing gender. By giving an instance of life expectancy data (UNDP, 2007) for United Arab Emirates (UAE) and United Kingdom (UK), the author has shown how, UAE has managed a better rank in health dimension of GDI than UK, though UK has a higher mean and lower difference in life expectancy for female and male. This has resulted because UAE has got unduly rewarded because of highly skewed sex ratio (UAE has more than two males for female) and UK has got relatively punished for maintaining a relatively balanced sex-ratio.
He has addressed this anomaly by introducing a sex ratio correction factor y, which adjusts the measure for deviation from ideal sex ratio. Following Nathan (2008), the sex-ratio adjusted Youth Gender Development Index (YGDISR) can be computed. The details of all computations are given in the following section.

��
3.10 Detailed Calculations of Youth Development Index (YDI)
Nomenclature
YDI = Youth Development Index
YDI will have five dimensions – 1. Health (H) 2. Education (E) 3. Work (W) 4. Amenities (A) 5. Participation (P)
(Please note participation dimension is not considered in the first stage because of unavailability of data; so YDI is calculated over the four dimensions)
Accordingly,
YHI = Youth Health IndexYEI = Youth Education IndexYWI = Youth Work IndexYAI = Youth Amenities IndexYPI = Youth Participation Index
For every dimension, Male and Female indexes have been separately calculated with m and f as subscript respectively. So,YDIf = Youth Development Index for FemaleYDIm = Youth Development Index for MaleYHIf = Youth Health Index for FemaleYHIm = Youth Health Index for MaleYEIf = Youth Education Index for FemaleYEIm = Youth Education Index for MaleYWIf = Youth Work Index for FemaleYWIm = Youth Work Index for MaleYAIf = Youth Amenities Index for FemaleYAIm = Youth Amenities Index for MaleYPIf = Youth Participation Index for Female YPIm = Youth Participation Index for Male
The proportion of female and male in the population is given as: Pf = Proportion of female in the populationPm = Proportion of male in the population
For overall and every dimension, we will calculate gender indexes which take note of gender inequality in performance/achievement. This is in line with Gender Development Index (GDI) of UNDP where harmonic mean of both genders is considered instead of arithmetic mean. The nomenclature of such indices is given below.
Methodology

India Youth Development Report 20�0 ��
YGDI = Youth Gender Development IndexYGHI = Youth Gender Health IndexYGEI = Youth Gender Education IndexYGWI = Youth Gender Work IndexYGAI = Youth Gender Amenities IndexYGPI = Youth Gender Participation Index
The sex-ratio (SR) correction factor will be also introduced to take account of inequality in male and female population proportion. These sex-ratio adjusted indexes will be calculated for overall, and for each dimension.
YGDISR = Youth Gender Development Index adjusted for Sex-ratio
YGHISR = Youth Gender Health Index adjusted for Sex-ratio
YGEISR = Youth Gender Education Index adjusted for Sex-ratio
YGWISR = Youth Gender Work Index adjusted for Sex-ratio
YGAISR = Youth Gender Amenities Index adjusted for Sex-ratio
YGPISR = Youth Gender Participation Index adjusted for Sex-ratio
The sex-ratio (SR) correction factor is denoted by y
y = Sex-ratio correction factor
The Health (H), Education (E), and Work (W) dimensions, we have two components each – 1. Outcome (O) 2. Access (A)
So, YHI, YEI, and YWI can be componentized as follows. [Also, for separately finding the male and female indexes, we can put the above indices with m and f subscripts.]YHOI = Youth Health Outcome Index YHOIf = Youth Health Outcome Index for Female YHOIm = Youth Health Outcome Index for MaleYHAI = Youth Health Access Index YHAIf = Youth Health Access Index for Female YHAIm = Youth Health Access Index for MaleYEOI = Youth Education Outcome Index YEOIf = Youth Education Outcome Index for Female YEOIm = Youth Education Outcome Index for MaleYEAI = Youth Education Access Index YEAIf = Youth Education Access Index for Female
YEAIm = Youth Education Access Index for Male

��
YWOI = Youth Work Outcome Index YWOIf = Youth Work Outcome Index for Female YWOIm = Youth Work Outcome Index for MaleYWAI = Youth Work Access Index YWAIf = Youth Work Access Index for Female YWAIm = Youth Work Access Index for Male
For these Outcome and Access components for each dimension taking note of gender inequality in performance the following indices are calculated YGHOI = Youth Gender Health Outcome IndexYGHAI = Youth Gender Health Access IndexYGEOI = Youth Gender Education Outcome IndexYGEAI = Youth Gender Education Access IndexYGWOI = Youth Gender Work Outcome IndexYGWAI = Youth Gender Work Access Index
With Sex-ratio (SR) adjustmentYGHOISR = Youth Gender Health Outcome Index adjusted for Sex-ratioYGHAISR = Youth Gender Health Access Index adjusted for Sex-ratioYGEOISR = Youth Gender Education Outcome Index adjusted for Sex-ratioYGEAISR = Youth Gender Education Access Index adjusted for Sex-ratioYGWOISR = Youth Gender Work Outcome Index adjusted for Sex-ratioYGWAISR = Youth Gender Work Access Index adjusted for Sex-ratio
Health Outcome has two sub-components – 1. Life Expectancy (LE) and 2. Nutrition (N). In turn, Nutrition has bio-physical and bio-chemical components measured through Body-Mass Index (BMI) and Non-Anaemic (NA) cases. Accordingly, the following nomenclatures are used.
YLEI = Youth Life Expectancy Index YLEIf = Youth Life Expectancy Index for Female YLEIm = Youth Life Expectancy Index for MaleYNI = Youth Nutrition Index YNIf = Youth Nutrition Index for Female YNIm = Youth Nutrition Index for Male YBMII = Youth BMI Index YBMIIf = Youth BMI Index for Female
YBMIIm = Youth BMI Index for Male
Methodology

India Youth Development Report 20�0 �0
YNAI = Youth Non-Anaemic Index
YNAIf = Youth Non-Anaemic Index for Female
YNAIm = Youth Non-Anaemic Index for Male
Considering gender inequalities achievementsYGLEI = Youth Gender Life Expectancy IndexYGNI = Youth Gender Nutrition IndexYGBMII = Youth Gender BMI IndexYGNAI = Youth Gender Non-Anaemic Index
With Sex-ratio (SR) adjustmentYGLEISR = Youth Gender Life Expectancy adjusted for Sex-ratioYGNISR = Youth Gender Nutrition Index adjusted for Sex-ratioYGBMIISR = Youth Gender BMI Index adjusted for Sex-ratioYGNAISR = Youth Gender Non-Anaemic Index adjusted for Sex-ratio
The Amenities dimension has two components – 1. Basic (B) amenities and 2. Modern (M) amenities. Accordingly, YAI is componentizedYABI = Youth Amenities (Basic) Index YABIf = Youth Amenities (Basic) Index for Female YABIm = Youth Amenities (Basic) Index for MaleYAMI = Youth Amenities (Modern) Index YAMIf = Youth Amenities (Modern) Index for Female YAMIm = Youth Amenities (Modern) Index for Male
Considering gender inequalities achievementsYGABI = Youth Gender Amenities (Basic) IndexYGAMI = Youth Gender Amenities (Modern) Index
With Sex-ratio (SR) adjustment
YGABISR = Youth Gender Amenities (Basic) Index adjusted for Sex-ratio
YGAMISR = Youth Gender Amenities (Modern) Index adjusted for Sex-ratio
The Basic Amenities has four components: 1. Access to Electricity 2. Access to Safe Water 3. Access to Safe Housing and 4. Access to Toilet FacilityYAEI = Youth Access to Electricity Index YAEIf = Youth Access to Electricity Index for Female YAEIm = Youth Access to Electricity Index for Male

��
YAWI = Youth Access to Water Index YAWIf = Youth Access to Water Index for Female YAWIm = Youth Access to Water Index for MaleYAHI = Youth Access to Housing Index YAHIf = Youth Access to Housing Index for Female YAHIm = Youth Access to Housing Index for MaleYATFI = Youth Access to Toilet Facility Index YATFIf = Youth Access to Toilet Facility Index for Female YATFIm = Youth Access to Toilet Facility Index for Male
Considering gender inequalities achievements:YGAEI = Youth Gender Access to Electricity IndexYGAWI = Youth Gender Access to Water IndexYGAHI = Youth Gender Access to Housing IndexYGATI = Youth Gender Access to Toilet Index
With Sex-ratio (SR) adjustment:YGAEISR = Youth Gender Access to Electricity Index adjusted for Sex-ratioYGAWISR = Youth Gender Access to Water Index adjusted for Sex-ratioYGAHISR = Youth Gender Access to Housing Index adjusted for Sex-ratioYGATISR = Youth Gender Access to Toilet Index adjusted for Sex-ratio
The Modern Amenities has three components: 1. Access to Information 2. Access to Communication 3. Access to Technology;YAII = Youth Access to Information Index YAIIf = Youth Access to Information Index for Female YAIIm = Youth Access to Information Index for MaleYACI = Youth Access to Communication Index YACIf = Youth Access to Communication Index for Female YACIm = Youth Access to Communication Index for MaleYATI = Youth Access to Technology Index YATIf = Youth Access to Technology Index for Female YATIm = Youth Access to Technology Index for Male
Considering Gender Inequalities AchievementsYGAII = Youth Gender Access to Information IndexYGACI = Youth Gender Access to Communication IndexYGATI = Youth Gender Access to Technology Index
Methodology

India Youth Development Report 20�0 �2
With Sex-ratio (SR) adjustment:YGAIISR = Youth Gender Access to Information Index adjusted for Sex-ratioYGACISR = Youth Gender Access to Communication Index adjusted for Sex-ratioYGATISR = Youth Gender Access to Technology Index adjusted for Sex-ratio
Participation dimension has two components – 1. Enrolment and 2. Voting. Accordingly, YPI is componentized:YPEI = Youth Participation in Enrolment Index YAPIf = Youth Participation in Enrolment Index for Female YAPIm = Youth Participation in Enrolment Index for MaleYPVI = Youth Participation in Voting Index YPVIf = Youth Participation in Voting Index for Female YPVIm = Youth Participation in Voting Index for Male
Considering Gender Inequalities AchievementsYGPEI = Youth Gender Participation in Enrolment IndexYGPVI = Youth Gender Participation in Voting Index
With Sex-ratio (SR) adjustmentYGPEISR = Youth Gender Participation in Enrolment Index adjusted for Sex-ratioYGPVISR = Youth Gender Participation in Voting Index adjusted for Sex-ratio
1. HEALTH DIMENSION
1.1 Health Outcome
1.1.1 Life Expectancy
a) YLEIf = Youth Life Expectancy Index for Female.
b) YLEIm = Youth Life Expectancy Index for Male.
c) YLEI = Youth Life Expectancy Index
= (Proportion of Female * YLEIf ) + (Proportion of Male * YLEIm)

��
d) YGLEI = Youth Gender Life Expectancy Index
e) YGLEISR = Youth Gender Life Expectancy Index adjusted for Sex-ratio
= Sex-ratio Correction Factor * YGLEI
1.1.2 Nutrition
1.1.2.1 BMI
f) YBMIIf = Youth BMI Index for Female
= Proportion of female youth within the normal BMI range
g) YBMIIm = Youth BMI Index for Male
= Proportion of male youth within the normal BMI range
h) YBMII = Youth BMI Index
= (Proportion of Female * YBMIIf ) + (Proportion of Male * YBMIIm)
i) YGBMII = Youth Gender BMI Index
j) YGBMIISR = Youth Gender BMI Index adjusted for Sex-ratio
= Sex-ratio Correction Factor * YGBMII
1.1.2.2 Non-Anaemia
k) YNAIf = Youth Non-Anaemic Index for Female
= Proportion of female youth who are non-Anaemic
= 1- Proportion of female youth who are Anaemic
Methodology

India Youth Development Report 20�0 ��
l) YNAIm = Youth Non-Anaemic Index for Male
= Proportion of male youth with in the normal BMI range
= 1- Proportion of male youth who are Anaemic
m) YNAI = Youth Non-Anaemic Index
= (Proportion of Female * YNAIf ) + (Proportion of Male * YNAIm)
n) YGNAI = Youth Gender Non-Anaemic Index
o) YGNAISR = Youth Gender Non-Anaemic Index adjusted for Sex-ratio
= Sex-ratio Correction Factor * YGNAI
1.1.2.3 BMI and Non-Anaemia aggregated to form Nutrition
p) YNIf = Youth Nutrition Index for Female
q) YNIm = Youth Nutrition Index for Male
r) YNI = Youth Nutrition Index
= (Proportion of Female * YNIf ) + (Proportion of Male * YNIm)
s) YGNI = Youth Gender Nutrition Index

��
t) YGNISR = Youth Gender Nutrition Index adjusted for Sex-ratio
= Sex-ratio Correction Factor * YGNI
1.1.3 Life Expectancy and Nutrition aggregated to form Health Outcome
u) YHOIf = Youth Health Outcome Index for Female
v) YHOIm = Youth Health Outcome Index for Male
w) YHOI = Youth Health Outcome Index
= (Proportion of Female * YHOIf ) + (Proportion of Male * YHOIm)
x) YGHOI = Youth Gender Health Outcome Index
y) YGHOISR = Youth Gender Health Outcome Index adjusted for Sex-ratio
= Sex-ratio Correction Factor * YGHOI
1.2 Health Access
z) YHAI = Youth Health Access Index
Safe delivery has been considered as the single indicator to measure the access to health care for both male and female. Hence, YHAIf i.e. Youth Health Access Index for Female, and YHAIm i.e. Youth Health Access Index for Male are equal.
Methodology

India Youth Development Report 20�0 ��
YHAI = YHAIf = YHAIm = Proportion of mothers having safe delivery
Since, YHAIf = YHAIm; YGHAI = YHAI and
1.3 Health Outcome and Health Access aggregated to form Health Index
aa) YHIf = Youth Health Index for Female
bb) YHIm = Youth Health Index for Male
cc) YHI = Youth Health Index
= (Proportion of Female * YHIf ) + (Proportion of Male * YHIm)
dd) YGHI = Youth Gender Health Index
ee) YGHISR = Youth Gender Health Index adjusted for Sex-ratio
= Sex-ratio Correction Factor * YGHI

��
2. EDUCATION DIMENSION
2.1 Education Outcome
ff) YEOIf = Youth Education Outcome Index for Female
YEOIf = 0.25 * (proportion of female just literates) + 0.50 * (proportion of female primary educated) + 0.75 * (proportion of female secondary educated) + 1 * (proportion of female tertiary educated) + 1 * (proportion of female vocational educated)
gg) YEOIm = Youth Education Outcome Index for Male
YEOIm = 0.25 * (proportion of male literates) + 0.50 * (proportion of male primary educated) + 0.75 * (proportion of male secondary educated) + 1 * (proportion of male tertiary educated) + 1 * (proportion of male vocational educated)
hh) YEOI = Youth Education Outcome Index
= (Proportion of Female * YEOIf ) + (Proportion of Male * YEOIm)
ii) YGEOI = Youth Gender Education Outcome Index
jj) YGEOISR = Youth Gender Education Outcome Index adjusted for Sex-ratio
= Sex-ratio Correction Factor * YGEOI
2.2 Education Access
kk) YEAIf = Youth Education Access Index for Female:
YEAIf = GER for female
GER for female is calculated by combining the GER at Secondary and Tertiary level.
Methodology

India Youth Development Report 20�0 ��
YEAIf = Pop. Prop. (Secondary) (female) * GER (Secondary) (female)
+ Pop. Prop. (Tertiary) (female) * GER (Tertiary) (female)
ll) YEAIm = Youth Education Access Index for Male:
YEAIm = GER for Male
GER for male is calculated by combining the GER at Secondary and Tertiary level.
YEAIm = Pop. Prop. (Secondary) (male) * GER (Secondary) (male)
+ Pop. Prop. (Tertiary) (male) * GER (Tertiary) (male)
mm) YEAI = Youth Education Access Index
= (Proportion of Female * YEAIf ) + (Proportion of Male * YEAIm)
nn) YGEAI = Youth Gender Education Access Index

��
oo) YGEAISR = Youth Gender Education Access Index adjusted for Sex-ratio
= Sex-ratio Correction Factor * YGEAI
2.3 Education Outcome and Education Access to form Education Index
pp) YEIf = Youth Education Index for Female
qq) YEIm = Youth Education Index for Male
rr) YEI = Youth Education Index
= (Proportion of Female * YEIf ) + (Proportion of Male * YEIm)
ss) YGEI = Youth Gender Education Index
tt) YGEISR = Youth Gender Education Index adjusted for Sex-ratio
= Sex-ratio Correction Factor * YGEI
3. WORK/EMPLOYMENT DIMENSION
3.1 Work Outcome
uu) YWOIf = Youth Work Outcome Index for Female
YWOIf = Work Participation Rate (WPR) for Female
Methodology

India Youth Development Report 20�0 �0
vv) YWOIm = Youth Work Outcome Index for Male
YWOIm = Work Participation Rate (WPR) for Male
ww) YWOI = Youth Work Outcome Index
= (Proportion of Female * YWOIf ) + (Proportion of Male * YWOIm)
xx) YGWOI = Youth Gender Work Outcome Index
yy) YGWOISR = Youth Gender Work Outcome Index adjusted for Sex-ratio
= Sex-ratio Correction Factor * YGWOI
3.2 Work Access
YWAIf = Youth Work Access Index for Female. YWAIf is calculated on the basis of the number of days one has worked.
YWAIf = (proportion of females working for 0 days * 0) + (proportion of females working for 1 day * 0.2) + (proportion of females working for 2 days * 0.4) + (proportion of females working for 3 days * 0.6) + (proportion of females working for 4 days * 0.8) + (proportion of females working for 5 days or more * 1.0)
zz) YWAIm = Youth Work Access Index for Male. YWAIm is calculated on the basis of the number of days one has worked.
YWAIm = (proportion of males working for 0 days * 0) + (proportion of males working for 1 day * 0.2) + (proportion of males working for 2 days * 0.4) + (proportion of males working for 3 days * 0.6) + (proportion of males working for 4 days * 0.8) + (proportion of males working for 5 days or more * 1.0)

��
aaa) YWAI = Youth Work Access Index
= (Proportion of Female * YWAIf ) + (Proportion of Male * YWAIm)
bbb) YGWAI = Youth Gender Work Access Index
ccc) YGWAISR = Youth Gender Work Access Index adjusted for Sex-ratio
= Sex-ratio Correction Factor * YGWAI
3.3 Work Outcome and Work Access aggregated to form Work Index
ddd) YWIf = Youth Work Index for Female
eee) YWIm = Youth Work Index for Male
fff) YWI = Youth Work Index
= (Proportion of Female * YWIf ) + (Proportion of Male * YWIm)
ggg) YGWI = Youth Gender Work Index
Methodology

India Youth Development Report 20�0 �2
hhh) YGWISR = Youth Gender Work Index adjusted for Sex-ratio
= Sex-ratio Correction Factor * YGWI
4. AMENITIES DIMENSION
4.1 Basic Amenities
4.1.1 Electricity
iii) YAEIf = Youth Access to Electricity Index for Female
YAEIf = Portion of Female Youth having access to Electricity
jjj) YAEIm = Youth Access to Electricity Index for Male
YAEIm = Portion of Male Youth having access to Electricity
kkk) YAEI = Youth Access to Electricity Index
= (Proportion of Female * YAEIf ) + (Proportion of Male * YAEIm)
lll) YGAEI = Youth Gender Access to Electricity Index
mmm) YGAEISR = Youth Gender Access to Electricity Index adjusted for Sex-ratio
= Sex-ratio Correction Factor * YGAEI
4.1.2 Water
nnn) YAWIf = Youth Access to Water Index for Female
YAWIf = Portion of Female Youth having access to Safe Water

��
ooo) YAWIm = Youth Access to Water Index for Male
YAWIm = Portion of Male Youth having access to Safe Water
ppp) YAWI = Youth Access to Water Index
= (Proportion of Female * YAWIf ) + (Proportion of Male * YAWIm)
qqq) YGAWI = Youth Gender Access to Water Index
rrr) YGAWISR = Youth Gender Access to Water Index adjusted for Sex-ratio
= Sex-ratio Correction Factor * YGAWI
4.1.3 Housing
sss) YAHIf = Youth Access to Housing Index for Female
YAHIf = 0 * Proportion of female homeless + 0.25 * Proportion of female kaccha house + 0.50 * Proportion of female semi-pucca house + 1 * Proportion of female pucca house
ttt) YAHIm = Youth Access to Housing Index for Male
YAHIm = 0 * Proportion of male homeless + 0.25 * Proportion of male kaccha house + 0.50 * Proportion of male semi-pucca house + 1 * Proportion of male pucca house
uuu) YAHI = Youth Access to Housing Index
= (Proportion of Female * YAHIf ) + (Proportion of Male * YAHIm)
Methodology

India Youth Development Report 20�0 ��
vvv) YGAHI = Youth Gender Access to Housing Index
www) YGAHISR = Youth Gender Access to Housing Index adjusted for Sex-ratio
= Sex-ratio Correction Factor * YGAHI
4.1.4 Toilet Facility
xxx) YATFIf = Youth Access to Toilet facility Index for Female
YATFIf = Portion of Female Youth having access to Toilet Facility
yyy) YATFIm = Youth Access to Toilet facility Index for Male
YATFIm = Portion of Male Youth having access to Toilet Facility
zzz) YATFI = Youth Access to Toilet Facility Index
= (Proportion of Female * YATFIf ) + (Proportion of Male * YATFIm)
aaaa) YGATFI = Youth Gender Access to Toilet Facility Index
bbbb) YGATFISR = Youth Gender Access to Toilet Index adjusted for Sex-ratio
= Sex-ratio Correction Factor * YGATFI

��
4.1.5 Access to Electricity, Water, Housing and Toilet are aggregated toform Basic Amenities Index
cccc) YABIf = Youth Amenities (Basic) Index for Female
dddd) YABIm = Youth Amenities (Basic) Index for Male
eeee) YABI = Youth Amenities (Basic) Index
= (Proportion of Female * YABIf ) + (Proportion of Male * YABIm)
ffff) YGABI = Youth Gender Amenities (Basic) Index
gggg) YGABISR = Youth Gender Amenities (Basic) Index adjusted for Sex-ratio
= Sex-ratio Correction Factor * YGABI
4.2 Modern Amenities
4.2.1 Communication
Note - Access to communication will have two linearly additive components – 1. Access to Land phone and 2. Access to Mobile
hhhh) YACIf = Youth Access to Communication Index for Female
Methodology

India Youth Development Report 20�0 ��
iiii) YACIm = Youth Access to Communication Index for Male
jjjj) YACI = Youth Access to Communication Index
= (Proportion of Female * YACIf ) + (Proportion of Male * YACIm)
kkkk) YGACI = Youth Gender Access to Communication Index
llll) YGACISR = Youth Gender Access to Communication Index adjusted for Sex-ratio
= Sex-ratio Correction Factor * YGACI
4.2.2 Information
mmmm) YAIIf = Youth Access to Information Index for Female
YATIf = Portion of female youth having access to Television
nnnn) YAIIm = Youth Access to Information Index for Male
YAIIm = Portion of male youth having access to Television
oooo) YAII = Youth Access to Information Index
= (Proportion of Female * YAIIf ) + (Proportion of Male * YAIIm)
pppp) YGAII = Youth Gender Access to Information Index

��
qqqq) YGAIISR = Youth Gender Access to Information Index adjusted for Sex-ratio
= Sex-ratio Correction Factor * YGAII
4.2.3 Technology
rrrr) YATIf = Youth Access to Technology Index for Female
YATIf = Portion of Female Youth having access to Computers
ssss) YATIm = Youth Access to Technology Index for Male
YATIm = Portion of Male Youth having access to Computers
tttt) YATI = Youth Access to Technology Index
= (Proportion of Female * YATIf ) + (Proportion of Male * YATIm)
uuuu) YGATI = Youth Gender Access to Technology Index
vvvv) YGATISR = Youth Gender Access to Technology Index adjusted for Sex-ratio
= Sex-ratio Correction Factor * YGATI
4.2.4 Communication, Information and Technology aggregated to form Amenities (Modern) Index
wwww) YAMIf = Youth Amenities (Modern) Index for Female
Methodology

India Youth Development Report 20�0 ��
xxxx) YAMIm = Youth Amenities (Modern) Index for Male
yyyy) YAMI = Youth Amenities (Modern) Index
= (Proportion of Female * YAMIf ) + (Proportion of Male * YAMIm)
zzzz) YGAMI = Youth Gender Amenities (Modern) Index
aaaaa) YGAMISR = Youth Gender Amenities (Modern) Index adjusted for Sex-ratio
= Sex-ratio Correction Factor * YGAMI
4.3 Basic Amenities and Modern Amenities are aggregated to form Amenities Index
bbbbb) YAIf = Youth Amenities Index for Female
ccccc) YAIf = Youth Amenities Index for Male
ddddd) YAI = Youth Amenities Index
= (Proportion of Female * YAIf ) + (Proportion of Male * YAIm)

��
eeeee) YGAI = Youth Gender Amenities Index
fffff) YGAISR = Youth Gender Amenities Index adjusted for Sex-ratio
= Sex-ratio Correction Factor * YGAI
5. PARTICIPATION DIMENSION
5.1 Enrolment
ggggg) YPEIf = Youth Participation in Enrolment Index for Female
YPEIf = Portion of Female Youth enrolled as voter
hhhhh) YPEIm = Youth Participation in Enrolment Index for Male
YPEIm = Portion of Male Youth enrolled as voter
iiiii) YPEI = Youth Participation in Enrolment Index
= (Proportion of Female * YPEIf ) + (Proportion of Male * YPEIm)
jjjjj) YGPEI = Youth Gender Participation in Enrolment Index
kkkkk) YGPEISR = Youth Gender Participation in Enrolment adjusted for Sex-ratio
= Sex-ratio Correction Factor * YGPEI
5.2 Voting
lllll) YPVIf = Youth Participation in Voting Index for Female
YPVIf = Portion of Female Youth voted
Methodology

India Youth Development Report 20�0 �00
mmmmm) YPVIm = Youth Participation in Voting Index for Male
YPVIm = Portion of Male Youth voted
nnnnn) YPVI = Youth Participation in Voting Index
= (Proportion of Female * YPVIf ) + (Proportion of Male * YPVIm)
ooooo) YGPVI = Youth Gender Participation in Voting Index
ppppp) YGPVISR = Youth Gender Participation in Voting adjusted for Sex-ratio
= Sex-ratio Correction Factor * YGPVI
5.3 Enrolment and Voting are aggregated to form Participation Index
qqqqq) YPIf = Youth Participation Index for Female
rrrrr) YPIm = Youth Participation Index for Male
sssss) YPI = Youth Participation Index
= (Proportion of Female * YPIf ) + (Proportion of Male * YPIm)
ttttt) YGPI = Youth Gender Participation Index

�0�
uuuuu) YGPISR = Youth Gender Participation Index adjusted for Sex-ratio
= Sex-ratio Correction Factor * YGPI
6. YOUTH DEVELOPMENT INDEX
Note: YDI can be constructed considering first four dimensions viz., health, education, work and amenities) or all five dimensions which includes the fifth dimension participation
vvvvv) YDIf = Youth Development Index for Female
Considering four (health, education, work and amenities) dimensions
Considering five (health, education, work, amenities and participation) dimensions
wwwww)
YDIm = Youth Development Index for Male
Considering four (health, education, work and amenities) dimensions
Considering five (health, education, work, amenities and participation) dimensions
Methodology

India Youth Development Report 20�0 �02
xxxxx) YDI = Youth Development Index
= (Proportion of Female * YDIf ) + (Proportion of Male * YDIm)
yyyyy) YGDI = Youth Gender Development Index
zzzzz) YGDISR = Youth Gender Development Index adjusted for Sex-ratio
= Sex-ratio Correction Factor * YGDI
3.11 Methodology for Primary ResearchIt was decided to select primary data from ten locations across the country. These locations/states were selected in such a way that the heterogeneity in developmental contexts was captured. The states thus selected were: Andaman and Nicobar Islands, Assam, Delhi, Jammu and Kashmir, Kerala, Maharashtra, Nagaland, Rajasthan, Tamil Nadu, Uttar Pradesh and West Bengal.
Two districts were selected from each state, based on their position in the state HDI rankings. One district had a HDI around the state value and the second had a low rank in the state HDI list. In cases where there was no HDI report for the state, three indicators related to literacy, work participation [as per the census] and infant mortality rate were used to select the two districts having an average and poor performance. It was decided that the sample size per district would be 200 to 300. Total sample per state was expected to be between 500 and 600. Thus the final sample size was expected to be around 5,000. Further details of sample selection are given in Appendix III at the end of this chapter. Table 3.4 gives the a profile of the sample for each state by sex, age and location.

�0�
TAB
LE 3
.4 D
istr
ibut
ion
of I
ndia
n Yo
uth
by S
ex, A
ge G
roup
and
Pla
ce o
f R
esid
ence
Stat
e
Sex
A
ge
Pla
ce o
f re
side
nce
To
tal
M
ale
Fem
ale
<18
!8
to 2
4 25
to 3
5 R
ural
U
rban
A&
N
57(4
5.6)
68
(54.
4)
19(1
5.2)
60
(48.
0)
46(3
6.8)
10
0(80
.0
25(2
0.0)
12
5(10
0.0)
Ass
am
303(
56.4
))22
5(43
.6)
130(
24.1
)15
9(29
.5)
250(
46.4
)29
7(55
.1)
242(
44.9
)53
9(10
0.0)
Del
hi
278(
51.7
)26
0(48
.8)
130(
24.2
)17
9(33
.3)
229(
42.6
)22
1(41
.1)
317(
58.9
)53
8(10
0.0)
Jam
mu
and
Kas
hmir
324(
56.1
))25
4(43
.9)
103(
17.8
)22
2(38
.4)
253(
43.8
)47
9(83
.0)
98(1
7.0)
57
8(10
0.0)
Ker
ala
172(
57.3
)12
8(42
.7)
57(1
9.1)
88
(29.
4)
154(
51.5
)24
7(82
.3)
53(1
7.7)
29
9(10
0.0)
Mah
aras
htra
27
5(52
.6)
248(
47.4
)12
6(24
.1)
153(
29.3
)24
4(49
.7)
298(
57.0
)22
5(43
.0)
523(
100.
0)
Nag
alan
d28
4(54
.5)
234(
45.5
)14
1(27
.1)
190(
36.5
)19
0(36
.5)
326(
62.6
)19
5(37
.4)
521(
100.
0)
Raj
asth
an
414(
75.5
))13
4(24
.5)
103(
18.7
)17
2(31
.2)
276(
50.1
)37
3(67
.7)
178(
32.3
)55
1(10
0.0)
Tam
ilN
adu
291(
50.4
)28
6(49
.6)
110(
19.1
)20
3(35
.2)
264(
45.8
)47
7(82
.6)
100(
17.3
)57
7(10
0.0)
Utta
rPra
desh
28
6(47
.7)
314(
52.3
)12
2(27
.2)
202(
40.2
)23
3(32
.7)
425(
70.8
)17
5(59
.2)
600(
100.
0)
Wes
tBen
gal
280(
50.5
)24
5(49
.5)
163(
22.3
)24
1(36
.3)
196(
41.8
)37
5(67
.3)
182(
32.7
)55
7(10
0.0)
Indi
a 29
64 (5
4.9)
24
38 (4
5.1)
12
02 (2
2.3)
18
69 (3
4.6)
23
35 (4
3.2)
36
18 (6
6.9)
17
90 (3
3.1)
54
08 (1
00)
3.12
Con
clus
ion
Thi
s ch
apte
r de
taile
d ou
t th
e m
etho
dolo
gy u
sed
in t
he c
onst
ruct
ion
of t
he Y
DI.
The
fol
low
ing
chap
ters
ana
lyse
you
th
deve
lopm
ent s
ituat
ion
usin
g th
e co
nstr
ucte
d Y
DI a
nd p
rim
ary
data
. Cha
pter
5 e
xam
ines
the
yout
h de
velo
pmen
t ind
ex fo
r th
e na
tion
and
the
stat
es.
Methodology

India Youth Development Report 20�0 �0�
AHP Analysis for Various Dimensions
AHP ANALYSIS FOR HEALTH INDICATORS
INDICATORS
1 Life Expectancy at Age 15
2 Probability of Surviving (13-35)
3 BMI
4 Anaemia
5 % Youth suffering from some Disability
6 % Teenage Pregnancy
7 MMR
8 Age at Marriage
9 % Safe Delivery
10 Use of Contraceptives
11 % Suicides
12 Substance Use
13 Number of Youth per PHC
Appendix I

�0�
AHP ANALYSIS FOR EDUCATION INDICATORS
INDICATORS1 Literacy2 Primary Education3 Secondary Education4 Tertiary Education5 Vocational Training6 Access to Education
AHP ANALYSIS FOR WORK INDICATORS
Methodology

India Youth Development Report 20�0 �0�
INDICATORS1 Work Participation Rate2 Activity Status3 Unemployment Rate4 Underemployment5 Casual Labour
AHP ANALYSIS OF STANDARD OF BASIC AMENITIES
INDICATORS1 Household Amenities2 Toilet Facility3 Access to Safe Water4 Type of House5 Communication6 Electricity

�0�
Sources of All Indicators
Appendix II
Indicator Source Year
HEALTH
% Safe Delivery (Births assisted by a doctor/nurse/LHV/ANM/other health personnel)
Life Expectancy at Birth (India, states)
Life tables for WHO member states (2006) (10-14 yrs)
Life expectancy (10-14 yrs)(India, States)
% Non-Anaemic (13-35 yrs) (Male/Female), (India, States)
BMI (Male, Female), (13-35 yrs), (India, States)
Population 1991, 2001 (for calculating proportion of population for 15-35 yrs age group, population 10 yrs and above, for North-eastern States)
Population for 15-35 yrs age group & Population 10 years and above (India, major States)
NATIONAL HEALTH PROFILE(source: NFHS-III, 2005-06, MOHFW/ GOI)
Dept. Of Demography,University of Kerala.
WHO statistics(WHOSIS)
SRS Based Abridged Life Tables.
NFHS-III
NFHS-III
Census 1991, 2001
Population estimates based on the: “Report of the Technical Group On Population Projections Constituted By the National Commission on Population” & Census 2001.
2007
2004
2006
2002-06
2005-06
2005-06
1991, 2001
2006
Methodology

India Youth Development Report 20�0 �0�
Indicator Source Year
EDUCATION
Literacy levels- Educational status of Youth (13-35) (India, States)
Literacy level- Vocational Education (India, States)
GER (sec & higher sec - class 9 to 12 - enrolment) (India, States)
GER (tertiary/ higher education enrolment) (classes above 12) (India, States)
% 14-18 yrs, 18-24 yrs, 14-24 yrs age groups (for calculation of level of education) (India, States)
AMENITIES
% Youth using Electricity (13-35 yrs), (Male/Female)
% Youth having Access to Safe Water (13-35 yrs), (Male/Female)
House Type (13-35 yrs), (Male/Female)
% Youth having Access to Toilet facilities (13-35 yrs), (Male/Female)
NSS data, 62nd round
NSS data, 62nd round
Compiled from the statistics released by Ministry of Human Resource Development, GOI. (Indiastat)
Compiled from the statistics released by Ministry of Human Resource Development, GOI. (Indiastat)
Total projected population 2005: Selected Educational statistics (2004-05) from:Population estimates based on the: “Report of the Technical Group on Population Projections Constituted by the National Commission on Population” & Census 2001.
NFHS-III
NFHS-III
NFHS-III
2005-06
2005-06
2004-05
2004-05
2005-06
2005-06
2005-06
2005-06

�0�
Indicator Source Year
% Youth having Access to Mobiles (13-35 yrs), (Male/Female)
% Youth having Access to Telephones (13-35 yrs), (Male/Female)
% Youth having Access to Television (13-35 yrs), (Male/Female)
% Youth having Access to Computers (13-35 yrs), (Male/Female)
Population Proportions
WORK/EMPLOYMENT
WPR (18-35 yrs) (Male/Female)
Total number of days worked (18-35 yrs) (Male/Female)
PARTICIPATION
% Youth 18 and above enrolled as voter
% Youth voted in the last Gramsabha election out of those enrolled
NFHS-III
NFHS-III
NFHS-III
NFHS-III
Population estimates based on the: “Report of the Technical Group on Population Projections Constituted by the National Commission on Population” & Census 2001.Census 1991, 2001
NSS data, 61st round
NSS data, 61st round
Primary Data
Primary Data
2005-06
2005-06
2005-06
2005-062006,
1991, 2001
2004-05
2004-05
2009 2009
Notes: • YDIcalculationnotpossibleforUTs-Chandigarh,Daman&Diu,Dadra&N.Haveli,Lakshdweep,Pondicherry,Andaman
&Nicobar.• SinceanaemiavaluesarenotavailableforNagaland,theIndianaveragevaluesareusedforcomputingtheNagalandvalues.
Methodology

India Youth Development Report 20�0 ��0
Appendix III
The following steps would be used to select the sample from each district:1. Selection of the rural locations: Using Census 2001 primary census abstract of
the district, 8 villages will be identified based on literacy and work participation rates.
Since we are taking only two indicators, the following are the possibilities: Literacy WPR L L H L L H H H It is possible to include a medium category also, but this may complicate the
procedure. If the above four categories are present, then 2 villages from each category would be selected randomly (in certain cases convenience may be considered). If there are not four categories, the total sample size (200) would be divided in to the available categories;
2. At the village level, we will decide the sample size based on the predetermined sample size at the district level. For example if we decide to select 300 from each district and 200 from rural and 100 from urban areas, the following will be the method;
3. Once the villages are selected, a list of young persons aged 13-35 would be prepared (names, contacts) from a house listing exercise. We will list those youth staying for the past one year in the village. This list will be done separately for the age groups:13-17, 18-24, 25-29 and 30-35. Then, based on the obtained age distribution, the sample size per village (that is say 25) will be allocated proportionately across age groups. [see illustration given at the end];
4. Similar sampling method would be adopted for urban areas. We propose to select at least 2 urban areas from each district. This may be 3 in certain cases to accommodate variety;
5. Get the census data [available on C.D from your local census office]. Data till the Village level is available. In case the population size for urban areas is too large [e.g., in Delhi], the NSS categorisation may be used. This would be available with the Department of Economics and Statistics at the State Level.

���
State (400 - 600 sample size)
2 Districts
(One with mean HDI, One with low HDI)
District 1 District 2 [same procedure]
Rural (200) Urban (100)
8 villages 2 urban areas
(or in some cases 3- one small and large).
Four ‘mean’ villages and four ‘low’ villages [25 youth from each village]
Illustration of proportionate sampling from each village
Age Village 1 Village 2
Total Sample Total Sample Population [N=25] Population [N=25] of youth of youth
15-17years 8 8x25/38=5 10 6
18-24 10 7 9 6
25-29 12 8 6 4
30-35 8 5 15 9
Total 38 25 40 25
Methodology
Following is the structure which depicts the methodology adopted for primary survey of data collection:

India Youth Development Report 20�0 ��2
Formula for proportionate sampling of youth:
Actual number of youth in that age group x 25 [required number for the sample]
Total number of youth in the village
If the final answer is less than 0.5, round off to the smaller number; and if more than 0.5, round off to more than 0.5.
We will use systematic sampling for the purpose of interview. The interviewer will begin from any number between 1 and 9, and then systematically select the next number. The next number will depend upon the total number of youth in the specific age group and the distribution across age groups.
For example, if we have a total of 15 youth in a selected village in the age group 13-17, and we need to select 7 from them, the interval would be 15/7 = 2.1. We round it off to 2. Thus if we begin with the 3rd youth in our listing, the next one to be considered is the 5th youth in the list and so on till we get the required number of youth in the age group.

���
YDI IN INDIA AT A GLANCE
Youth Development Index (2010) 0.453
Youth Gender Development Index 0.444
Youth Gender Development Index with Correction for Sex Ratio 0.426
Youth Development Index 0.482 (including Participation)
Youth Gender Development Index 0.474 (including Participation)
Youth Gender Development Index 0.454 (including Participation) with Correction for Sex Ratio
Youth Health Index 0.580
Youth Education Index 0.413
Youth Work Index 0.636
Youth Amenities Index 0.380
Youth Participation Index 0.622
Human Development Index (2004-05) 0.544
Human Development Index (2007) 0.612
Youth Development Index
CH
AP
TE
R
IV
We are one of the world’s oldest civilizations and one of the youngest nations. We have to look very hard at the problems of youth. At the same time, the Youth must look at the problems of the nation. Youth must prepare themselves for the responsibilities which lays ahead.
–RajivGandhi

India Youth Development Report 20�0 ���
The Youth Development Index (YDI) provides an opportunity to understand the situation of youth and to define the focus areas for developing policies and programmes for youth. Its greatest advantage is the fact that its construction now and over the next few years would make it possible to understand and monitor the status and progress in youth development. It will be possible to point out the critical aspects, areas for advocacy, and situations where youth are exposed to vulnerability and social exclusion. This will serve as a basis for evaluation of social policies and for decision-making. While the YDI can be used as an important advocacy tool, it is to be understood that youth development is the broader concern.
The factors influencing the variations in youth development across states can be several. It can be argued that the inadequacy in the functioning of social institutions has been a key factor affecting the cohesiveness in the Indian society. Poverty, illiteracy, inadequacy in satisfying basic needs, rise in communal and ethnic identity, gender inequity, changing aspirations of youth, migration from rural to urban, and the values that maintained caste distinctions and occupations are some of the barriers to youth development. At the same time, progress in technology, communication and access to information have positively contributed to the empowerment of youth in several ways.
This chapter is divided into the following sections:4.1 The Youth Development Index4.2 Youth Gender Development Index4.3 Youth Health Index4.4 Youth Education Index4.5 Youth Work Index4.6 Youth Amenities Index4.7 Inter-correlations between YDI and its Dimension4.8 Youth Participation Index4.9 Conclusion
4.1 The Youth Development IndexAs stated in the Methodology chapter, different formulae were used to compute the YDI. First, the YDI was computed with the four dimensions of health, education, work and amenities. This Index was then adjusted initially for gender disparity (Youth Gender Development Index) and Sex Ratio (Youth Gender Development Index (YGDI) adjusted for sex ratio). Subsequently, the YDI was calculated including the fifth dimension of participation for the 10 states from where primary data was collected. This was also adjusted for gender disparity and sex ratio. In both the cases, the YDI was initially computed separately for males and females. When calculating the YDI from the male and female YDIs, the proportion of males and females among youth were used as weights and the arithmetic mean was computed.

���
The YDI for India is 0.453 (Table 4.1). As the possible range of variation in YDI is from 0 to 1, the value of 0.453 indicates a low level of youth development in the country. The YDI has used a different methodology for computation as compared to the Human Development Index (HDI) and, therefore, strict comparison is not possible. However, it can be seen that the YDI value is lower than the HDI for the year 2004–05 (0.544) and for the year 2007 (0.612).
BOX 4.1 Dimensions and Weight for YDI
• Health 0.25
• Education 0.25
• Work 0.25
• Amenities 0.25
• Participation 0.25
FIGURE 4.1 Youth Development Index across Indian States
Himachal Pradesh ranks first in the YDI with a value 0.590, closely followed by Goa (0.588) and Delhi (0.587). Twenty-one states have a YDI value greater than the national average (see Figure 4.1 also). Bihar ranks the lowest (0.383) among the 29 states for which YDI was calculated; it ranked the lowest for HDI (0.441). The range of variation in YDI across states is 0.207 points. Some of the North Indian states fair poorly in all spheres of youth development; especially Bihar and Uttar Pradesh. Yet, one may observe that among the North-eastern states, Mizoram, Sikkim and Meghalaya have
Youth Development Index

India Youth Development Report 20�0 ���
ranked within the first 10 positions. Of the states that have the four major metro cities, three of them (Delhi, Mumbai, Chennai) rank relatively high in YDI, while West Bengal (Kolkata) ranks 23rd. Kerala, which has been ranked first in HDI since 1981, gets a lower rank (4th) in YDI. In the HDI calculation, Kerala had the highest rank since social indicators had a greater weight in the computation of HDI. However, it has been found that when HDI is calculated by including economic and growth- related indicators, its position was 9th
in 2005 (Kerala Human Development Report 2005). This is validated by the YDI as this index also included a Work Index, which incorporated measures of work status and access to work.
States YDIf YDIf YDIm YDIm Difference YDI YDI Rank Rank (YDIm - YDIf) RankIndia 0.387 0.514 0.126 0.453AndhraPradesh 0.465 12 0.563 15 0.098 0.514 13ArunachalPradesh 0.451 15 0.511 22 0.060 0.482 19Assam 0.353 24 0.503 26 0.150 0.430 25Bihar 0.284 29 0.473 29 0.188 0.383 29Chattisgarh 0.413 18 0.499 27 0.086 0.457 21Delhi 0.478 10 0.676 1 0.198 0.587 3Goa 0.525 3 0.648 3 0.123 0.588 2Gujarat 0.438 16 0.575 11 0.136 0.510 14Haryana 0.411 19 0.586 8 0.175 0.506 15HimachalPradesh 0.553 1 0.625 4 0.072 0.590 1Jammu&Kashmir 0.399 21 0.572 12 0.173 0.490 17Jharkhand 0.340 27 0.474 28 0.134 0.410 28Karnataka 0.477 11 0.570 14 0.093 0.525 12Kerala 0.508 5 0.653 2 0.145 0.579 4MadhyaPradesh 0.409 20 0.519 19 0.110 0.467 20Maharashtra 0.504 6 0.601 6 0.097 0.555 5Manipur 0.460 13 0.547 16 0.087 0.503 16Meghalaya 0.519 4 0.545 17 0.026 0.532 9Mizoram 0.525 2 0.580 10 0.055 0.553 6Nagaland 0.456 14 0.517 20 0.061 0.487 18Orissa 0.364 23 0.505 23 0.141 0.435 24Punjab 0.428 17 0.613 5 0.185 0.527 11Rajasthan 0.382 22 0.515 21 0.132 0.452 22Sikkim 0.494 8 0.581 9 0.088 0.540 8TamilNadu 0.503 7 0.596 7 0.093 0.549 7Tripura 0.350 26 0.504 24 0.155 0.428 26UttarPradesh 0.335 28 0.503 25 0.168 0.424 27Uttaranchal 0.482 9 0.571 13 0.090 0.527 10WestBengal 0.353 25 0.524 18 0.171 0.441 23
TABLE 4.1 Youth Development Index in India
Note: YDIf-YDIforfemales;YDIm-YDIformales

���
Table 4.1 clearly shows that when considered separately for males and females, the YDI is much lower for females as compared to males in all the states. At the national level, the value for females is lower by 0.13 points. Though it is a predictable outcome, this is a matter of concern, as the status of female youth continues to remain low despite various efforts made by the government and civil society to enhance their position in the society. Across the states, the largest difference between male and female YDI is observed in Delhi (0.20 points) and Bihar (0.19 points); and the lowest difference was observed in the North-eastern state of Meghalaya followed by Nagaland and Arunachal Pradesh.
It is interesting to see that in Kerala – which is known for the prevalence of matrilineal system of inheritance and progressive social development – the value of female YDI is lower by 0.14 points as compared to males. In some of the states that are known for gender bias, the difference between male and female YDI is more striking. Delhi, which is 3rd in overall YDI, ranks first in the YDI for males, but ranks only 10th in the YDI for females. There is no difference in the ranking of YDI for males and YDI for females for Maharashtra and Tamil Nadu. Meghalaya is the only state that has a higher rank for the YDI of females (4th rank) as compared to males (17th rank).
FIGURE 4.2 Classification of States according to YDI Values
Figure 4.2 shows that if the YDI values are categorized into three groups, it may be seen that eight states fall into low group, nine into the medium group and 12 in the high group. However, it is to be noted that the highest value is only 0.590, which is not much above the 50% mark. Figure 4.3 compares YDI values with HDI values for 15 states; it can be seen that in all the states, the YDI value is lower than the HDI value.
Youth Development Index

India Youth Development Report 20�0 ���
FIGURE 4.3 Comparison of YDI and HDI across Indian States
Table 4.2 presents the YDI computed by including the Participation Dimension from the primary data. This new YDI is henceforth mentioned as YDI-P, which could be calculated only for the 10 states.

���
TABLE 4.2 YDI with Participation Dimension
States YDI f-P YDI m -P YDI- P YDIOverall* 0.416 0.544 0.482 0.453
Assam 0.408 0.539 0.475 0.430
Delhi 0.441 0.666 0.566 0.587
Jammu&Kashmir 0.437 0.601 0.523 0.490
Kerala 0.552 0.672 0.611 0.579
Maharashtra 0.537 0.623 0.583 0.555
Nagaland 0.490 0.546 0.519 0.487
Rajasthan 0.428 0.554 0.494 0.452
TamilNadu 0.528 0.612 0.570 0.549
UttarPradesh 0.376 0.553 0.471 0.424
WestBengal 0.402 0.565 0.486 0.441
*Basedondatafromthe10states;thoughprimaryresearchwascarriedoutinAndamanandNicobar(A&N)Islands,secondarydataonsomeof thedimensionswerenotavailable.Therefore,YDIwasnotcalculatedforA&NIslands.YDI-PYouthDevelopmentIndexincludingParticipation;YDIf-P:YouthDevelopmentIndexincludingParticipation-females;YDIm-P:YouthDevelopmentIndexincludingParticipation-males
Combining data from the 10 states, YDI-P is 0.482 as compared to the YDI value of 0.453. A comparison of YDI with YDI-P shows that the inclusion of this dimension has contributed to a slight increase in the YDI in all the states except for Delhi where the participation index is low. This is an encouraging sign as youth participation is vital to the development of a society (See Figure 4.4 also). The state with the highest YDI-P is Kerala (0.611) and the lowest is Uttar Pradesh (0.471), followed by Assam (0.475).
Youth Development Index

India Youth Development Report 20�0 �20
FIGURE 4.4 YDI and YDI-P for Ten States
4.2 Youth Gender Development IndexAs stated earlier, there is a difference between males and females in terms of the values of the YDI. To adjust for gender disparity observed from male and female YDIs, the harmonic mean was used instead of the arithmetic mean to calculate the YGDI. Further, to account for the sex ratio in the population, a correction factor was introduced and a final YDI adjusted for both gender disparity in youth development and sex ratio was calculated. It can be noted that there is a progressive reduction in the value of YDI when corrected for gender disparity in youth development and for sex ratio, bringing down the national YDI value from 0.453 to 0.444 and then to 0.426 (Table 4.3). This situation can be observed for all the states. However, the ranking of the states in terms of youth development does not change.
At the national level, the YGDI is 0.444 as compared to the value of 0.453 of the overall YDI without adjusting for gender disparity. The largest gap between YDI and YGDI is 0.024 in Bihar and the smallest gap is in Meghalaya where YDI and YGDI are the same. A comparison of YDI, YGDI, and YGDI-Sex Ratio is provided in Figure 4.5.

�2�
States YDI YDI-Rank YGDI Diff YDI-YGDI YGDISR
India 0.453 0.444 0.009 0.426
AndhraPradesh 0.514 13 0.510 0.005 0.504
ArunachalPradesh 0.482 19 0.480 0.002 0.471
Assam 0.430 25 0.417 0.013 0.408
Bihar 0.383 29 0.359 0.024 0.343
Chattisgarh 0.457 21 0.453 0.004 0.446
Delhi 0.587 3 0.570 0.017 0.509
Goa 0.588 2 0.581 0.007 0.566
Gujarat 0.510 14 0.501 0.009 0.474
Haryana 0.506 15 0.490 0.016 0.449
HimachalPradesh 0.590 1 0.587 0.002 0.574
Jammu&Kashmir 0.490 17 0.475 0.015 0.451
Jharkhand 0.410 28 0.399 0.011 0.385
Karnataka 0.525 12 0.521 0.004 0.508
Kerala 0.579 4 0.570 0.009 0.557
MadhyaPradesh 0.467 20 0.461 0.007 0.435
Maharashtra 0.555 5 0.551 0.004 0.516
Manipur 0.503 16 0.500 0.004 0.495
Meghalaya 0.532 9 0.531 0.000 0.524
Mizoram 0.553 6 0.552 0.001 0.539
Nagaland 0.487 18 0.486 0.002 0.468
Orissa 0.435 24 0.423 0.011 0.422
Punjab 0.527 11 0.511 0.017 0.474
Rajasthan 0.452 22 0.442 0.010 0.419
Sikkim 0.540 8 0.537 0.004 0.503
TamilNadu 0.549 7 0.545 0.004 0.545
Tripura 0.428 26 0.414 0.014 0.410
UttarPradesh 0.424 27 0.407 0.017 0.381
Uttaranchal 0.527 10 0.523 0.004 0.513
WestBengal 0.441 23 0.424 0.017 0.412
TABLE 4.3 YDI, YGDI and YGDI-SR across Indian States
Youth Development Index

India Youth Development Report 20�0 �22
FIGURE 4.5 Comparison of YDI, YGDI and YGDI- SR

�2�
TABLE 4.4 Participation Index and Corrections for Gender Differences
States YDI-P YGDI-P YGDISR-P
Assam 0.475 0.466 0.456
Delhi 0.566 0.543 0.484
Jammu&Kashmir 0.523 0.510 0.484
Maharashtra 0.583 0.579 0.543
Nagaland 0.519 0.518 0.499
Rajasthan 0.494 0.486 0.461
TamilNadu 0.570 0.567 0.567
UttarPradesh 0.471 0.454 0.424
WestBengal 0.486 0.472 0.459
Kerala 0.611 0.605 0.591
Overall 0.482 0.474 0.454
Table 4.4 presents the revised YDI (including participation, YDI-P) corrected gender differences and sex ratio for the ten states. As seen in the YDI, the values progressively decrease when corrected for gender differences and sex ratio. At the overall level, while YDI-P is 0.482, the YGDI-P is 0.474; the decrease being smaller than that observed in YDI and YGDI, indicating that gender differences in youth participation is less substantial.
4.3 Youth Health index
BOX 4.2 Selected Indicators: Health
Health Outcome Index - Two third weight
Life Expectancy Index • Life expectancy at age 15 (represents outcome)Nutrition Index• % youth- Non-Anaemic (represents outcome)• Body Mass Index (represents outcome)
Access Index – One third weight• % Assisted/Institutional delivery (represents
access)
At the national level the Youth Health Index (YHI) value is at 0.580, with considerable inter-state variations (See Table 4.5, Figures 4.6 and 4.7). Kerala (0.749) ranks the highest in Health Index closely followed by Goa (0.728) and Delhi (0.691). The lowest
Youth Development Index

India Youth Development Report 20�0 �2�
States YDI YHIm YHIf YHI YHI Rank YGHI YGHISR
India 0.453 0.612 0.545 0.580 0.578 0.554
AndhraPradesh 0.514 0.692 0.592 0.643 10 0.639 0.631
ArunachalPradesh 0.482 0.607 0.561 0.585 18 0.584 0.573
Assam 0.430 0.552 0.481 0.518 28 0.515 0.504
Bihar 0.383 0.561 0.482 0.523 27 0.520 0.497
Chattisgarh 0.457 0.597 0.534 0.566 23 0.564 0.556
Delhi 0.587 0.722 0.652 0.691 3 0.689 0.615
Goa 0.588 0.754 0.700 0.728 2 0.727 0.708
Gujarat 0.510 0.647 0.573 0.612 17 0.610 0.576
Haryana 0.506 0.663 0.582 0.626 14 0.624 0.571
HimachalPradesh 0.590 0.648 0.607 0.628 13 0.627 0.613
Jammu&Kashmir 0.490 0.688 0.615 0.653 8 0.651 0.619
Jharkhand 0.410 0.551 0.476 0.515 29 0.512 0.494
Karnataka 0.525 0.677 0.607 0.643 9 0.641 0.625
Kerala 0.579 0.770 0.728 0.749 1 0.748 0.731
MadhyaPradesh 0.467 0.650 0.588 0.621 16 0.619 0.584
Maharashtra 0.555 0.668 0.607 0.639 11 0.638 0.598
Manipur 0.503 0.638 0.612 0.625 15 0.625 0.619
Meghalaya 0.532 0.702 0.674 0.688 4 0.687 0.678
Mizoram 0.553 0.655 0.620 0.638 12 0.638 0.623
Nagaland 0.487 0.608 0.539 0.575 19 0.573 0.552
Orissa 0.435 0.599 0.531 0.565 24 0.563 0.562
ranking states are Jharkhand (0.515) followed by Assam (0.518) and Bihar (0.523). The difference between the highest and lowest value is 0.234. Eleven states have a Health Index below the national average. The relationship between Health Index and YDI is linear, meaning that an improvement in the Health Index contributes linearly to an increase in the YDI.
The YHI is higher for males (0.612) as compared to females (0.545). The largest difference is in Andhra Pradesh where the difference between male and female YHI is 0.10 followed by Tamil Nadu and Sikkim. The least is in Manipur followed by Meghalaya. As observed in the case of the YDI, when adjusted for gender difference in youth health, the value of the index decreases but only marginally. As compared to YDI, the YHI shows greater gender equality in health (See Table 4.5). Detailed analysis of components of the Health Index is provided in Chapter 5.
TABLE 4.5 Youth Health Index

�2�
States YDI YHIm YHIf YHI YHI Rank YGHI YGHISR
Punjab 0.527 0.705 0.654 0.682 5 0.681 0.631
Rajasthan 0.452 0.587 0.539 0.564 25 0.563 0.534
Sikkim 0.540 0.700 0.611 0.658 7 0.655 0.615
TamilNadu 0.549 0.728 0.634 0.681 6 0.678 0.677
Tripura 0.428 0.596 0.545 0.571 20 0.570 0.564
UttarPradesh 0.424 0.560 0.523 0.543 26 0.542 0.507
Uttaranchal 0.527 0.596 0.536 0.567 22 0.565 0.554
WestBengal 0.441 0.608 0.526 0.568 21 0.565 0.549
Note: YHIfYouthHealthIndexforFemales;YHImYouthHealthIndexforMales;YGHIYouthGenderHealthIndex;YGHISRYouthGenderHealthIndexadjustedforSexRatio
FIGURE 4.6 Youth Health Index across Indian States
Youth Development Index

India Youth Development Report 20�0 �2�
FIGURE 4.7 Comparison of YDI and YHI
4.4 Youth Education Index (YEI)Education is the second main thrust area of the Vision 2020 document of the planning commission. As per the 2001 Census, the all India literacy rate is only 65.38% (males: 75.85%, females: 54.16%). Though the literacy rates have gone up, there are still 468 million illiterates, of which 101 million are in the age group of 15–34 (Saraswati, 2009).

�2�
BOX 4.3 Youth Education Index
Education Outcome Index: 2/3 weight
Life Expectancy Index • Level of education attained (literate,
primary, secondary, tertiary, vocational)–differential weights to levels
Education Access Index: 1/3 weight• Gross Enrolment Ratio (GER
secondary +GER tertiary)
India’s Youth Education Index (YEI) is 0.413 which is low [figure 4.8 and table 4.6]. The highest ranking states are Himachal Pradesh with a value of 0.611 (having a very high enrolment rate of 131) followed by Delhi (0.603) and Kerala (0.575). The lowest ranking states are Bihar (0.298), Jharkhand (0.315) and Rajasthan (0.325). The difference between the highest and lowest ranking states is 0.313.
FIGURE 4.8 Youth Education Index across Indian States
Youth Development Index

India Youth Development Report 20�0 �2�
TABLE 4.6 Youth Education Index
States YDI YEIm YEIf YEI YEI Rank YGEI YEGISR
India 0.453 0.462 0.360 0.413 0.407 0.390
AndhraPradesh 0.514 0.471 0.344 0.408 18 0.398 0.393
ArunachalPradesh 0.482 0.391 0.315 0.354 25 0.350 0.343
Assam 0.430 0.449 0.385 0.417 17 0.415 0.406
Bihar 0.383 0.376 0.212 0.298 29 0.275 0.262
Chattisgarh 0.457 0.419 0.279 0.350 26 0.336 0.331
Delhi 0.587 0.624 0.577 0.603 2 0.602 0.537
Goa 0.588 0.552 0.543 0.548 4 0.548 0.533
Gujarat 0.510 0.482 0.370 0.429 13 0.421 0.398
Haryana 0.506 0.507 0.409 0.462 11 0.457 0.418
HimachalPradesh 0.590 0.644 0.577 0.611 1 0.610 0.596
Jammu&Kashmir 0.490 0.470 0.366 0.421 15 0.414 0.394
Jharkhand 0.410 0.384 0.240 0.315 28 0.298 0.288
Karnataka 0.525 0.456 0.381 0.419 16 0.416 0.405
Kerala 0.579 0.578 0.572 0.575 3 0.575 0.562
MadhyaPradesh 0.467 0.423 0.295 0.363 24 0.351 0.331
Maharashtra 0.555 0.539 0.475 0.509 6 0.507 0.475
Manipur 0.503 0.535 0.497 0.515 5 0.515 0.510
Meghalaya 0.532 0.408 0.395 0.402 19 0.401 0.396
Mizoram 0.553 0.487 0.475 0.481 9 0.481 0.470
Nagaland 0.487 0.451 0.431 0.441 12 0.441 0.425
Orissa 0.435 0.453 0.328 0.391 22 0.381 0.380
Punjab 0.527 0.488 0.471 0.481 10 0.480 0.446
Rajasthan 0.452 0.403 0.238 0.325 27 0.303 0.287
Sikkim 0.540 0.453 0.391 0.424 14 0.421 0.395
TamilNadu 0.549 0.526 0.465 0.496 8 0.494 0.493
Tripura 0.428 0.419 0.378 0.399 21 0.398 0.394
UttarPradesh 0.424 0.430 0.306 0.372 23 0.361 0.338
Uttaranchal 0.527 0.515 0.487 0.501 7 0.500 0.490
WestBengal 0.441 0.444 0.351 0.399 20 0.393 0.382
Note: YEIf-YouthEducationIndexforFemales;YEImYouthEducationIndexforMales;YGEIYouthGenderEducationIndex;YGEISR-YouthGenderEducationIndexadjustedforSexRatio

�2�
FIGURE 4.9 Youth Development Index and Youth Education Index
Figure 4. 9 shows a comparison between YDI and YEI and it can be seen that YEI is lower than YDI in all states, except Goa, Himachal Pradesh and Manipur. Twelve states have an Educational Index value that is below the national average. The Education Index also generally shows a linear correlation with the YDI. However, in Andhra Pradesh, Madhya Pradesh, Chattisgarh and Meghalaya, it is seen that the YDI is high, and the YEI
Youth Development Index

India Youth Development Report 20�0 ��0
is low. These states have performed better in the other dimensions. Manipur, Nagaland and Assam, all of which are in the North-eastern region, though have a relatively high YEI, and a low YDI because their relative positions in other sub indexes.
There is considerable difference between males and females in the value of the Education Index. The gender gap is the highest in Bihar (0.17) followed by Madhya Pradesh and Rajasthan (0.16 each). The least gap is found in Kerala and Mizoram (both 0.01). When the Education Index is corrected for gender differences, Bihar shows the greatest reduction in the value of Education Index (by 0.023 points), followed by Rajasthan (0.022 points) and Jharkhand (0.017 points). It is encouraging to note that eight states showed no gender differences in education, while three others showed only marginal difference (0.001 points). Detailed analysis of components of the Education Index is provided in Chapter 6.
4.5 Youth Work Index (YWI)
FIGURE 4.10 Youth Work Index in
Indian States

���
The report of the Committee on India Vision 2020 of the Planning Commission has employment as the prime thrust area. The Youth Work Index (YWI) in India is 0.636 (Table 4.7). The level of YWI across states can also be seen from Figure 4.11. Meghalaya ranks the highest in Work Index (0.804) followed by Chattisgarh (0.754), and Andhra Pradesh (0.747). The lowest Work Index is Tripura (0.486) followed by Jammu and Kashmir (0.519). The range of variation in Work Index is 0.235. Sixteen states have a Work Index that is below the national average. The outliers in this case are Delhi and Kerala, two developed states having a very low Work Index. A comparison of YDI and YWI across states is given in Figure 4.10. While in Kerala, Goa and Delhi the value of YDI is higher than that of YWI, in all the other states, the value of YDI is higher.
The Work Index corrected for gender differences is 0.542, much lower than the Work Index 0.636 as a result of much higher level of work participation among males. Correction for sex ratio among youth brings down the Work Index further to 0.519. When calculated separately for males and females, the Youth Work Index is 0.868 for males and 0.384 for females, indicating a wide gender gap in employment.
BOX 4.4 Youth Work Index
Outcome Index: 2/3 weightWork participation rate
Access Index: 1/3 weightAvailable days of work in a week(Differential weight for levels)
The most prominent gender difference in Work Index is observed in Punjab (the difference being 0.694 points) followed by Bihar (0.654) and Uttar Pradesh. (0.631). It is interesting to note that Delhi, which has a high rank in YDI, has a high gender difference in Work Index (0.596). The three states with the least male–female difference in Work Index are in the North-east region: Meghalaya (0.179), Nagaland (0.199) and Arunachal Pradesh (0.217). The lower value of Work Index in itself does not mean that female youth do not contribute, but household work is not considered as productive work in the major data sources. And, there are several cultural factors that prevent female youth from participating in economic activities. A detailed analysis of the different aspects of work is given in Chapter 7.
Youth Development Index

India Youth Development Report 20�0 ��2
TABLE 4.7 Youth Work Index in India and States
States YDI YWI YWI Rank YWIf YWIm YGWI YGWISR
India 0.453 0.636 0.384 0.868 0.542 0.519
AndhraPradesh 0.514 0.747 3 0.598 0.892 0.718 0.709
ArunachalPradesh 0.482 0.711 6 0.600 0.818 0.694 0.681
Assam 0.430 0.557 22 0.254 0.848 0.395 0.387
Bihar 0.383 0.558 21 0.218 0.868 0.359 0.342
Chattisgarh 0.457 0.754 2 0.634 0.871 0.736 0.725
Delhi 0.587 0.526 27 0.195 0.792 0.335 0.299
Goa 0.588 0.561 20 0.341 0.771 0.477 0.465
Gujarat 0.510 0.667 12 0.407 0.901 0.572 0.541
Haryana 0.506 0.574 18 0.252 0.846 0.407 0.372
HimachalPradesh 0.590 0.688 10 0.566 0.804 0.667 0.652
Jammu&Kashmir 0.490 0.519 28 0.236 0.775 0.372 0.354
Jharkhand 0.410 0.633 14 0.398 0.851 0.550 0.531
Karnataka 0.525 0.726 4 0.539 0.903 0.679 0.662
Kerala 0.579 0.531 26 0.288 0.785 0.417 0.407
MadhyaPradesh 0.467 0.706 7 0.488 0.902 0.644 0.607
Maharashtra 0.555 0.695 8 0.504 0.863 0.647 0.606
Manipur 0.503 0.539 25 0.388 0.692 0.496 0.492
Meghalaya 0.532 0.804 1 0.715 0.894 0.794 0.783
Mizoram 0.553 0.695 9 0.552 0.832 0.666 0.651
Nagaland 0.487 0.585 17 0.482 0.681 0.568 0.547
Orissa 0.435 0.617 16 0.350 0.883 0.501 0.501
Punjab 0.527 0.549 24 0.176 0.870 0.308 0.286
Rajasthan 0.452 0.671 11 0.437 0.882 0.595 0.564
Sikkim 0.540 0.666 13 0.514 0.801 0.635 0.595
TamilNadu 0.549 0.711 5 0.537 0.885 0.669 0.668
Tripura 0.428 0.486 29 0.187 0.779 0.303 0.300
UttarPradesh 0.424 0.571 19 0.235 0.866 0.384 0.359
Uttaranchal 0.527 0.625 15 0.452 0.792 0.578 0.567
WestBengal 0.441 0.556 23 0.235 0.859 0.376 0.365
Note: YWIf YouthWorkIndexforFemales;YWImYouthWorkIndexforMales;YGWIYouthGenderWorkIndex;YGWISRYouthGenderWorkIndexadjustedforSexRatio

���
FIGURE 4.11 YDI and YWI
4.6 Youth Amenities IndexThe Youth Amenities Index (YAI) considered here integrates indicators related to basic amenities and those modern amenities that are more relevant to youth. For India, the Youth Amenities Index is 0.381 (Table 4.8). This low value is the result of a combination of high value (0.65) for basic amenities (consisting of water, toilet facilities, electricity, and housing) with a very low value (0.19) for youth- relevant
Youth Development Index

India Youth Development Report 20�0 ���
modern amenities (information, communication and technology). The dimensions of communication, information and technology are considered in the National Youth Policy as key sectors for youth development. However, the higher values found for basic Amenities Index are not surprising as the primary aim of the government developmental efforts has been to provide the basic facilities. However, since this is an attempt to construct a YDI, it was necessary to include facilities which are considered important for youth development.
BOX 4.5 Amenities
Basic Amenities Index (1/2 weight)• Access to safe water• Type of house• Access to electricity• Toilet facility
Youth Amenities Index (1/2 weight)• Information• Communication• Technology
In terms of YAI, the highest ranking state is Delhi (0.611) followed by Goa (0.580) and Kerala (0.518). The lowest ranking state is Bihar (0.272). Other states having a low Amenities index are Orissa, Jharkhand and Chattisgarh. Eleven states are below the national average of 0.381. The range of variation in Amenity Index is 0.339 which is high. A comparison of YDI and YAI in Indian states is provided in Figure 4.12. Except for Delhi, in all other states the YAI value is lower than the YDI value.
Since both Basic and Youth Amenities are largely household based facilities, the gender differences are minimal. When Youth Amenities Index is calculated for males and females separately, the values for national level are 0.389 for males and 0.373 for females.

���
TABLE 4.8 Youth Amenities Index across Indian States
States YDI YDI Rank YAI YAI RankIndia 0.453 0.295
AndhraPradesh 0.514 13 0.382 17
ArunachalPradesh 0.482 19 0.375 19
Assam 0.430 25 0.319 25
Bihar 0.383 29 0.272 29
Chattisgarh 0.457 21 0.295 26
Delhi 0.587 3 0.611 1
Goa 0.588 2 0.580 2
Gujarat 0.510 14 0.430 12
Haryana 0.506 15 0.447 10
HimachalPradesh 0.590 1 0.475 6
Jammu&Kashmir 0.490 17 0.446 11
Jharkhand 0.410 28 0.283 27
Karnataka 0.525 12 0.421 13
Kerala 0.579 4 0.547 3
MadhyaPradesh 0.467 20 0.319 24
Maharashtra 0.555 5 0.451 9
Manipur 0.503 16 0.382 18
Meghalaya 0.532 9 0.388 15
Mizoram 0.553 6 0.463 7
Nagaland 0.487 18 0.385 16
Orissa 0.435 24 0.282 28
Punjab 0.527 11 0.518 4
Rajasthan 0.452 22 0.361 20
Sikkim 0.540 8 0.481 5
TamilNadu 0.549 7 0.410 14
Tripura 0.428 26 0.341 22
UttarPradesh 0.424 27 0.320 23
Uttaranchal 0.527 10 0.457 8
WestBengal 0.441 23 0.342 21
Note: YAIYouthAmenitiesIndex
Youth Development Index

India Youth Development Report 20�0 ���
FIGURE 4.12 Comparison of YDI and YAI across Indian States

���
4.7 Inter Correlations between YDI and its DimensionsTable 4.9 presents the correlations between YDI and the sub-indexes. All the dimensions, except work, show a very high correlation with the YDI. An increase in the value of a sub-index is expected to bring an increase in the level of the YDI. The low level of correlation between the Work Index and YDI is due to the wide inter-state variations and because a certain percentage of youth may not be working.
BOX 4.6 Youth Participation Index (From Primary Research)
• Percentage of youth aged 18 and above who have enrolled as a voter (1/2 weight)
• Percentage of those voted in the last election among those enrolled as a voter (1/2 weight)
The relationship between Education Index and Work Index can be seen from Figure 4.13. As one may expect, there is a negative correlation between Education Index and Work Index. States having a high Education Index tend to have a low Work Index as many of those in the youth age group are still in the education system, thus not working. Yet, it may be noted that the correlation coefficient is not high.
Pearson Correlation ** Significant at 0.01 level
TABLE 4.9 Correlation between YDI and Sub indexes
YDI YHI YEI YWI YAI
YDI 1 .861(**) .857(**) .180 .894(**)
YHI .861(**) 1 .684(**) .060 .817(**)
YEI .857(**) .684(**) 1 -.218 .823(**)
YWI .180 .060 -.218 1 -.180
YAI .894(**) .817(**) .823(**) -.180 1
Youth Development Index

India Youth Development Report 20�0 ���
FIGURE 4.13 Scatter Plot: Education Index and Work Index
4.8 Youth Participation Index
TABLE 4.10 Participation Index in Selected Indian States (From Primary Research)
States YPIf YPIm YPI YGPI YGPISR
A&Nislands 0.646 0.793 0.716 0.709 0.682
Assam 0.722 0.726 0.724 0.724 0.709
Delhi 0.313 0.629 0.488 0.434 0.387
Jammu&Kashmir 0.624 0.744 0.687 0.681 0.647
Maharashtra 0.703 0.730 0.717 0.717 0.672
Nagaland 0.661 0.691 0.677 0.676 0.652
Rajasthan 0.673 0.773 0.726 0.722 0.685
TamilNadu 0.646 0.687 0.666 0.666 0.665
UttarPradesh 0.582 0.900 0.752 0.717 0.670
WestBengal 0.659 0.801 0.732 0.725 0.705
Kerala 0.812 0.765 0.789 0.788 0.770
India 0.545 0.692 0.622 0.613 0.588

���
FIGURE 4.14Comparison of Youth Participation Index and Youth Development Index
The Participation Index (Table 4. 10 and figure 4.14) based on data from 10 states is 0.622 with Kerala having the highest value 0.788. In the selected states, the Participation Index is generally high with the exception of Delhi where the value is 0.488. In all the selected states, the Participation Index for male youth is higher than that of the female youth. The difference between males and females is particularly striking for Jammu and Kashmir and West Bengal. While in Jammu and Kashmir the Participation Index for females is 0.313 as compared to 0.629 for males, in West Bengal participation of females is 0.582 as compared to 0.900 for males. When the Participation Index is corrected for gender differences, the value becomes 0.613. If the sex ratio is also considered, it becomes 0.588. Tamil Nadu is the only state where the Participation Index does not change when corrected for gender differences.
4.9 ConclusionA YDI with a value of 0.453 is low, and it is important to note that this value gives the level of development of the entire youth population which forms 41% of the total population of the country. When gender disparities in the YDI are considered, the
Youth Development Index

India Youth Development Report 20�0 ��0
value is reduced further. Among the five dimensions of the YDI, India as a whole has a relatively low value for the Education Index and Youth Amenities Index, with some states showing a dismal performance.
The Health Index value, derived from a set of outcome- and access-related indicators gives a value of 0.580 and can be considered above average. But keeping in mind that in general youth are considered to be the healthiest section in the population, this value indicates the issues related to both nutritional status and access to services. Also, the male–female difference in the Health Index is considerable for some of the states.
The Education Index for India is 0.413. Considering that the YEI is low, there is still a long way to go in achieving the targets of VISION 2020 in terms of producing a youth force which is ready for the challenges of a globalized world.
The YWI in India is 0.636 with considerable inter-state variations. It is necessary to increase work participation among youth, especially female youth, for ensuring appropriate utilisation of the demographic window of opportunities. The negative correlation between Education Index and Work Index emphasizes the need for planned synchronisation between the two sectors.
The YAI, which is a combination of basic amenities and youth-specific amenities, has a value of 0.38. This has resulted from a relatively high value for the basic amenities and a very low value for youth-specific amenities. Given the current understanding that improvement in access related to these dimensions is crucial in the development of a nation, special attention needs to be given to these aspects.
The theme of ‘Citizenship’ is emphasized in the National Youth Policy, UNWAPY, and the WDR. The UNWPAY describes this as ‘the full and effective participation of youth in the life of society and in decision-making’. The value of Participation Index, computed using enrolment as a voter and voting behaviour was 0.622. This situation can be enhanced further with appropriate interventions to increase youth participation in various dimensions of development.
Thus, the YDI provides us with an opportunity to comprehensively assess the situation of youth and the differentials. Though the YDI was computed based on available data for the period 2004–05 or 2005–06, it can be stated that the situation of youth development in India would not have changed substantially.

���
TABLE 4:11 YDI and Sub-indexes across Indian States
States YHI YEI YWI YAI YDI
India 0.580 0.413 0.636 0.295 0.453
AndhraPradesh 0.643 0.408 0.747 0.382 0.514 13
ArunachalPradesh 0.585 0.354 0.711 0.375 0.482 19
Assam 0.518 0.417 0.557 0.319 0.430 25
Bihar 0.523 0.298 0.558 0.272 0.383 29
Chattisgarh 0.566 0.350 0.754 0.295 0.457 21
Delhi 0.691 0.603 0.526 0.611 0.587 3
Goa 0.728 0.548 0.561 0.580 0.588 2
Gujarat 0.612 0.429 0.667 0.430 0.510 14
Haryana 0.626 0.462 0.574 0.447 0.506 15
HimachalPradesh 0.628 0.611 0.688 0.475 0.590 1
Jammu&Kashmir 0.653 0.421 0.519 0.446 0.490 17
Jharkhand 0.515 0.315 0.633 0.283 0.410 28
Karnataka 0.643 0.419 0.726 0.421 0.525 12
Kerala 0.749 0.575 0.531 0.547 0.579 4
MadhyaPradesh 0.621 0.363 0.706 0.319 0.467 20
Maharashtra 0.639 0.509 0.695 0.451 0.555 5
Manipur 0.625 0.515 0.539 0.382 0.503 16
Meghalaya 0.688 0.402 0.804 0.388 0.532 9
Mizoram 0.638 0.481 0.695 0.463 0.553 6
Nagaland 0.575 0.441 0.585 0.385 0.487 18
Orissa 0.565 0.391 0.617 0.282 0.435 24
Punjab 0.682 0.481 0.549 0.518 0.527 11
Rajasthan 0.564 0.325 0.671 0.361 0.452 22
Sikkim 0.658 0.424 0.666 0.481 0.540 8
TamilNadu 0.681 0.496 0.711 0.410 0.549 7
Tripura 0.571 0.399 0.486 0.341 0.428 26
UttarPradesh 0.543 0.372 0.571 0.320 0.424 27
Uttaranchal 0.567 0.501 0.625 0.457 0.527 10
WestBengal 0.568 0.399 0.556 0.342 0.441 23
Youth Development Index

India Youth Development Report 20�0 ��2
5.1 IntroductionThis chapter examines the state of Youth Health in the nation by taking into consideration the various dimensions of health included in the construction of the Youth Health Index (YHI). Subsequently, this chapter examines the situation with respect to some of the other aspects of youth health that were not included in the construction of the YHI.
WHO defines health as “… a state of complete physical, mental and social well-being and not merely the absence of disease or infirmity.” In 1986, at the Ottawa Charter for Health Promotion, the WHO stated:
“Health promotion is the process of enabling people to increase control over, and to improve, their health. To reach a state of complete physical, mental and social well-being, an individual or group must be able to identify and to realize aspirations, to satisfy needs, and to change or cope with the environment. Health is, therefore, seen as a resource for everyday life, not the objective of living. Health is a positive concept emphasizing social and personal resources, as well as physical capacities. Therefore, health
Youth Health
Tolerance, co-existence, interaction, enrichment are what will give our system strength.
–RajivGandhi
CH
AP
TE
R
V
Youth Health Index: 0.580
Youth Health Outcome Index: 0.609
Youth Health Access Index: 0.482
Youth Life Expectancy Index: 0.654
Youth non-Anaemia Index: 0. 613
Youth BMI Index: 0.547
Youth Nutrition Index: 0.570

���
promotion is not just the responsibility of the health sector, but goes beyond healthy lifestyles to well-being.”
In India, there are three policies at the national level, which have direct relevance to youth health. These are: the National Youth Policy of 2003, the National Health Policy of 2002, and the National Population Policy of 2000. While identifying health as a thematic area important for youth development, the National Youth Policy “recognizes that a holistic approach towards health, mental, physical and spiritual, needs to be adopted after careful assessment of the health needs of the youth”. Therefore, the policy identified five sub-areas under youth health: General Health; Mental Health, Spiritual Health, AIDS, Sexually Transmitted Diseases, Substance Abuse and Population Education.
Based on these considerations, the National Youth Policy suggests interventions with effective collaborations involving various stakeholders. The policy also underlines the importance of access to quality health services in the following manner:
“This Policy urges upon universal accessibility of an acceptable, affordable and quality health care service to the youth throughout the length and breadth of this country to be made available in close proximity to their places of residence. The youth should have this accessibility for themselves as well as for other vulnerable age groups whom they could help out.”
The National Health Policy is a broad statement of health-related issues in the nation in the changing contexts. It does not mention youth as a category deserving special attention to health. However, mention is made on broader aspects of equity in health, women’s health and mental health. It reiterates that the efforts to improve the health situation would be carried out based on two policies: the National Health Policy and the National Population Policy. The National Population Policy is concerned with both the stabilization of the population and also with ensuring reproductive and child health services to all population sections. Some of the health concerns expressed in the National Health Policy are actually covered in more detail by the National Population Policy.
Concerning aspects related to Youth Health, the National Population Policy, in addition to underlining the importance of accessible reproductive and child health services, focuses on empowerment of women on health and nutrition and also identifies adolescents and an under-served population group. The policy also suggests a number of strategies to be adopted to achieve the stated goals. The policy states that:
“The needs of adolescents, including protection from unwanted pregnancies and sexually transmitted diseases (STD), have not been specifically addressed in the past. Programmes should encourage delayed marriage and child-bearing, and education of adolescents about the risks of unprotected sex. Reproductive health services for adolescent girls and boys are especially significant in rural India, where adolescent marriage and pregnancy are widely prevalent. Their special requirements comprise information, counselling, population education, and making contraceptive services accessible and affordable, providing food supplements and nutritional services through the ICDS, and enforcing the Child Marriage Restraint Act, 1976”.
Youth Health

India Youth Development Report 20�0 ���
5.2 Youth Health Index (YHI)Table 5.1 recapitulates the values of the (YHI) across Indian States. As noted in Chapter 4, the value of YHI varies across states despite the fact that the value is above 0.5 in all Indian States. For constructing Health Index, the dimensions of outcome and access were used. The sub-dimension health outcome was measured considering mortality and nutritional
BOX 5.1 Youth Health Index
India: 0.580Highest: 0.749 (Kerala)Lowest: 0.515 (Jharkhand) and 0.518 (Assam)
status. For mortality, expectation of life in the age group 10-14 years was considered and thus a Life Expectancy Index was first constructed. For measuring the nutritional status, anaemia and BMI were taken. Thus the Youth Nutrition Index was computed. Combining the Life Expectancy Index and Youth Nutrition Index, the Youth Health Outcome Index was computed. Youth Health Access Index was identified as access to safe delivery. Youth Health Outcome Index and Youth Health Access Index were then combined to construct the YHI.
TABLE 5.1 Youth Health Index (YHI) across Indian States
State YHI State YHI
India 0.580 MadhyaPradesh 0.621
AndhraPradesh 0.643 Maharashtra 0.639
ArunachalPradesh 0.585 Manipur 0.625
Assam 0.518 Meghalaya 0.688
Bihar 0.523 Mizoram 0.638
Chhattisgarh 0.566 Nagaland 0.575
Delhi 0.691 Orissa 0.565
Goa 0.728 Punjab 0.682
Gujarat 0.612 Rajasthan 0.564
Haryana 0.626 Sikkim 0.658
HimachalPradesh 0.628 TamilNadu 0.681
Jammu&Kashmir 0.653 Tripura 0.571
Jharkhand 0.515 UttarPradesh 0.543
Karnataka 0.643 Uttaranchal 0.567
Kerala 0.749 WestBengal 0.568

���
Table 5.2 presents the levels of health outcome and access sub-indexes across Indian states. A comparison between Health Outcome Index and Health Access Index is made in Figure 5.1. At the national level, the outcome index for Youth Health is 0.609. Considering that the index value can vary between 0 and 1, this is well above average though there is scope for further improvement. Inter-state variation in outcome index is substantial. At the one end is Manipur (0.757) followed closely by Mizoram (0.747) and Kerala (0.719). At the lower end are the north-eastern States of Arunachal Pradesh (0.516), Assam (0.586) and Tripura (0.591).The Health Outcome Index was computed separately for males and females. In India, Youth Health Outcome Index is 0.562 for females and 0.652 for males. In most of the states, the value of the index is higher for males by about 0.06 to 0.09 points; Nagaland, Sikkim and West Bengal show a greater difference. As shown in Table 5.2, when adjusted for gender differences and sex ratio, the value of Health outcome Index decreases though not very much; Delhi registers the highest decline from 0.703 to 0. 624.
FIGURE 5.1 Health Outcome and Health Access Indexes across Indian States
Youth Health

India Youth Development Report 20�0 ���
TABLE 5.2 Health Outcome and Access Sub-indexes
YHOIf YHOIm YHOI YGHOI YGHOISR YGHAI YGHAISR
India 0.562 0.652 0.609 0.605 0.581 0.482 0.462AndhraPradesh 0.562 0.681 0.622 0.617 0.609 0.742 0.733ArunachalPradesh 0.639 0.714 0.677 0.675 0.663 0.334 0.328Assam 0.533 0.636 0.586 0.581 0.569 0.312 0.306Bihar 0.535 0.651 0.596 0.590 0.564 0.309 0.295Chhattisgarh 0.560 0.646 0.604 0.601 0.592 0.443 0.437Delhi 0.653 0.743 0.703 0.700 0.624 0.651 0.580Goa 0.666 0.727 0.697 0.696 0.678 0.943 0.919Gujarat 0.556 0.647 0.604 0.601 0.568 0.647 0.612Haryana 0.593 0.701 0.652 0.647 0.592 0.542 0.496HimachalPradesh 0.637 0.695 0.667 0.666 0.651 0.502 0.491Jammu&Kashmir 0.617 0.712 0.667 0.664 0.631 0.605 0.575Jharkhand 0.536 0.647 0.593 0.588 0.567 0.287 0.277Karnataka 0.585 0.668 0.628 0.625 0.609 0.713 0.695Kerala 0.696 0.743 0.719 0.718 0.702 0.997 0.974MadhyaPradesh 0.563 0.637 0.602 0.600 0.566 0.707 0.667Maharashtra 0.605 0.681 0.646 0.643 0.603 0.617 0.578Manipur 0.732 0.783 0.757 0.757 0.750 0.317 0.314Meghalaya 0.669 0.704 0.686 0.686 0.677 0.694 0.685Mizoram 0.715 0.777 0.747 0.745 0.728 0.371 0.362Nagaland 0.642 0.765 0.706 0.700 0.675 0.259 0.250Orissa 0.550 0.640 0.595 0.592 0.591 0.464 0.463Punjab 0.647 0.710 0.681 0.679 0.630 0.686 0.636Rajasthan 0.570 0.635 0.604 0.602 0.571 0.432 0.409Sikkim 0.625 0.748 0.690 0.685 0.642 0.558 0.523TamilNadu 0.593 0.697 0.645 0.641 0.640 0.932 0.931Tripura 0.557 0.624 0.591 0.589 0.583 0.500 0.495UttarPradesh 0.602 0.658 0.632 0.631 0.590 0.292 0.273Uttaranchal 0.571 0.657 0.615 0.612 0.600 0.415 0.407WestBengal 0.545 0.656 0.602 0.596 0.580 0.457 0.444Note:YHOIf:YouthHealthOutcomeIndexFemales;YHOIm:YouthHealthOutcomeIndexMales;YHOI:YouthHealthOutcomeIndex;YGHOI:YouthGenderHealthOutcomeIndex;YGHOISR:YouthGenderHealthOutcomeIndexCorrectedforSexRatio;YGHAI:YouthGenderHealthAccessIndex;YGHAISRYouthGenderHealthAccessIndexCorrectedforSexRatio

���
Health access was measured by indirectly using the extent of safe delivery among youth. The premise was that a major reason for not opting for safe delivery is the absence of services or lack of accessibility. If accessibility is improved, the chance of people utilizing the services of trained health personnel is high. The health access index is thus computed from the proportion of deliveries among youth that were attended by trained health personnel. In India, only 48 percent of deliveries among youth are attended by health personnel; this extent is very low. Inter-state variation in access is quite considerable. The percentage of deliveries attended by health personnel is the highest in Kerala (99.7), followed by Goa (94.3) and Tamil Nadu (93.2) and the lowest in Nagaland (0.259), Jharkhand (0.287) and Uttar Pradesh (0.292).
5.3 Health Outcome Measures5.3.1 Mortality
Selection of sub-dimension of health to be included in the index was made after several consultations. Mortality was always considered important in measuring health status of youth. Subsequent consultations and analysis identified life expectancy as the most appropriate indicator. Since we are dealing with the youth population in the age group 13-35 years, life expectancy in the age group 10-14 years was finally taken as the indicator related to mortality (measuring the absence of mortality). Table 5.3 provides information on life expectancy in the age group 10-14 years in India and the States. It also provides the values of the life expectancy indices. Classification of States according to the level of Youth Life Expectancy Index can be seen from Figure 5.2.
Life Expectancy in the age group 10-14 years in India is 62.3 years for females and 59.0 years for males. Female Life Expectancy varies from 68 years and above in Kerala and Goa to 62.2 years in Uttaranchal. Male Life Expectancy is also the highest in Kerala (63.8 years) and the lowest in Orissa (58.5 years) and Uttaranchal (58.7 years). The difference between female and male Life Expectancies ranges from 3-6 years across States. Using normalization method, the values of Life Expectancy were converted to obtain Female and Male Youth Life Expectancy Indexes. Again, the values are the highest for Kerala and Goa and the lowest for Uttaranchal. The Gender Life Expectancy Index and Life Expectancy Index adjusted for sex ratio show a marginal decrease in the value of the index.
Figure 5.2 shows that 15 states have a Youth Life Expectancy Index value higher than 0.70. It also shows that the relative disadvantage in the States located at the centre of the map and also in Assam and Uttaranchal.
Youth Health

India Youth Development Report 20�0 ���
TABLE 5.3 Life Expectancy and Life Expectancy Indexes
States Life Exp (yr) YLEIf YLEIm YLEI YGLEI YGLEISR
Female Male India 62.32 59.02 0.649 0.659 0.654 0.654 0.627AndhraPradesh 65.80 60.97 0.737 0.717 0.727 0.726 0.718ArunachalPradesh 63.59 59.68 0.681 0.679 0.680 0.680 0.667Assam 63.10 59.05 0.668 0.660 0.664 0.664 0.650Bihar 63.69 60.28 0.683 0.696 0.690 0.690 0.659Chhattisgarh 63.18 59.21 0.670 0.665 0.668 0.668 0.658Delhi 65.80 61.47 0.737 0.731 0.734 0.734 0.654Goa 68.07 62.48 0.794 0.761 0.777 0.777 0.757Gujarat 63.69 59.94 0.683 0.686 0.685 0.685 0.648Haryana 65.94 61.38 0.740 0.729 0.734 0.734 0.672HimachalPradesh 65.38 60.89 0.726 0.714 0.720 0.720 0.704Jammu&Kashmir 64.87 60.81 0.713 0.712 0.713 0.713 0.677Jharkhand 64.75 60.50 0.710 0.703 0.706 0.706 0.682Karnataka 64.40 60.14 0.701 0.692 0.697 0.697 0.679Kerala 68.72 63.84 0.811 0.801 0.806 0.806 0.788MadhyaPradesh 62.47 59.01 0.652 0.659 0.656 0.656 0.619Maharashtra 65.80 60.97 0.737 0.717 0.726 0.726 0.680Manipur 67.19 62.29 0.772 0.756 0.764 0.764 0.757Meghalaya 64.18 60.35 0.696 0.699 0.697 0.697 0.688Mizoram 66.39 61.92 0.752 0.745 0.748 0.748 0.731Nagaland 65.52 61.82 0.730 0.742 0.736 0.736 0.709Orissa 62.32 58.47 0.649 0.643 0.646 0.646 0.645Punjab 65.25 61.21 0.723 0.724 0.723 0.723 0.671Rajasthan 62.26 58.86 0.647 0.655 0.651 0.651 0.617Sikkim 65.99 61.13 0.742 0.721 0.731 0.731 0.685TamilNadu 65.38 61.13 0.726 0.721 0.724 0.724 0.723Tripura 63.26 59.56 0.672 0.675 0.674 0.674 0.667UttarPradesh 63.42 59.68 0.676 0.679 0.678 0.678 0.634Uttaranchal 62.18 58.72 0.645 0.651 0.648 0.648 0.635WestBengal 63.88 59.81 0.688 0.683 0.685 0.685 0.666
Note: YLEIf::YouthLifeExpectancyIndexfemales;YLEIm::YouthLifeExpectancyIndexmales;YLEI:YouthLifeExpectancyIndex;YGLEI:YouthGenderLifeExpectancyIndex;YGLEISR:YouthGenderLifeExpectancyIndexCorrectedforSexRatio

���
FIGURE 5.2 Youth Life Expectancy Index across Indian States
Youth Life Expectance Index
An analysis of National Family Health Survey data NFHS 3 (2005-06) shows that the overall level of Anaemia among persons aged 15-34 years is higher among females as compared to males. While about 1.1 percent of the men aged 15-34 years have severe Anaemia, the corresponding percent for women is 1.7 percent. The percentage of men and women with severe Anaemia is higher in rural areas as compared to urban areas. The rural-urban difference is more for male youth. The percentage of both men and women who are severely anaemic is relatively higher among those who are in younger
Youth Health

India Youth Development Report 20�0 ��0
TABLE 5.4 Youth Non-anaemic Index in India and States
States Population prop. YNAIf YNAIm YNAI YGNAI YGNAISR
Non-Anaemic (%) Female MaleIndia 44.5 76.8 0.445 0.768 0.613 0.519 0.498AndhraPradesh 36.6 77.9 0.366 0.779 0.575 0.448 0.443ArunachalPradesh 49.0 71.7 0.490 0.717 0.606 0.543 0.533Assam 31.1 64.8 0.311 0.648 0.483 0.380 0.372Bihar 33.5 68.0 0.335 0.680 0.515 0.410 0.392Chhattisgarh 43.2 74.8 0.432 0.748 0.592 0.501 0.493Delhi 54.5 83.2 0.545 0.832 0.704 0.623 0.555Goa 61.8 90.3 0.618 0.903 0.764 0.685 0.668Gujarat 42.9 78.5 0.429 0.785 0.617 0.511 0.483Haryana 43.5 80.3 0.435 0.803 0.635 0.524 0.480HimachalPradesh 56.6 80.6 0.566 0.806 0.689 0.623 0.609Jammu&Kashmir 47.8 81.0 0.478 0.810 0.652 0.556 0.528Jharkhand 31.3 65.3 0.313 0.653 0.489 0.385 0.371Karnataka 47.9 81.2 0.479 0.812 0.650 0.554 0.540Kerala 66.9 91.8 0.669 0.918 0.791 0.723 0.707MadhyaPradesh 44.6 74.8 0.446 0.748 0.606 0.518 0.489
age group, less educated and whose standard of living is lower. Among religion and caste groups, more Hindus and Scheduled Caste/ Tribe men and women suffer from severe Anaemia as compared to their counterparts.
Table 5.4 presents information on anaemia levels among youth, the second health outcome indicator used in the construction of Youth Health Index. As noted earlier, anaemia is high even among the youth population which indicates that the health status of young people can be adversely affected. For the construction of the index, the percentage of youth not suffering from anaemia was used in combination with Body Mass Index (BMI), another indicator of nutritional status in a population. In India, 77 percent of male youth and 45 percent of female youth are not anaemic. Conversely, 23 percent male youth and 55 percent of female youth suffer from anaemia.
Inter-state variation in the prevalence of anaemia is considerable. For male youth, the highest extent of anaemia is in Meghalaya (35.9 percent), followed by Assam (35.2 percent) and Jharkhand (34.7 percent). The lowest prevalence of anaemia among male youth is in Kerala (8.2 percent) followed by Goa (9.7 percent) and Manipur (9.7 percent).

���
Note: YNAIf:YouthNonAnaemicIndexfemales;YNAIm:YouthNonAnaemicIndexmales;YNAI:YouthNonAnaemicIndex;YGNAIf:YouthGenderNonanaemicIndex;YGNAISR:YouthNonAnaemicIndexadjustedforSexRatio.
States Population prop. YNAIf YNAIm YNAI YGNAI YGNAISR
Non-Anaemic (%) Female MaleMaharashtra 50.9 83.4 0.509 0.834 0.682 0.588 0.551Manipur 64.9 90.3 0.649 0.903 0.775 0.706 0.699Meghalaya 53.2 64.1 0.532 0.641 0.586 0.557 0.550Mizoram 60.8 81.4 0.608 0.814 0.713 0.658 0.643Nagaland 44.5 76.8 0.445 0.768 0.612 0.518 0.500Orissa 40.6 70.4 0.406 0.704 0.555 0.469 0.468Punjab 60.9 86.3 0.609 0.863 0.745 0.675 0.626Rajasthan 45.9 76.5 0.459 0.765 0.620 0.532 0.504Sikkim 39.3 77.4 0.393 0.774 0.595 0.480 0.450TamilNadu 47.7 85.2 0.477 0.852 0.664 0.555 0.555Tripura 37.5 68.7 0.375 0.687 0.532 0.441 0.437UttarPradesh 50.3 76.7 0.503 0.767 0.644 0.569 0.532Uttaranchal 43.1 71.0 0.431 0.710 0.573 0.493 0.484WestBengal 37.3 68.9 0.373 0.689 0.535 0.442 0.430
Among female youth, highest Anaemia prevalence is in Arunachal Pradesh (68.9 percent) and Jharkhand (68.7 percent). Lowest Anaemia prevalence among female youth is in Kerala (33.1 percent), Manipur (35.1 percent) and Goa (38.2 percent). Male-female difference in Anaemia prevalence is quite high in all the States. In 17 states, Anaemia prevalence among female youth is greater than 50 percent.
FIGURE 5.3 Percentage of Youth having at least two meals per day, 2009
Youth Health

India Youth Development Report 20�0 ��2
Figure 5.3 presents information on the share of youth having at least two meals per day which indirectly indicates the nutritional and possible health situation of youth in a population. This information was gathered from the 11 states/ UT where the primary research was carried out. When the data from individual states/ UT were combined, about 88 percent of Indian youth have at least two meals a day. Male-female, rural-urban and age differences are not substantial.
At the national level, the youth non-anaemic index is 0.613 with a wide range of inter-state variation (Table 5.4). The index value varies from 0.791 in Kerala, 0.775 in Manipur and 0.764 in Goa to 0.483 in Assam and 0.489 in Jharkhand. When corrected for gender differences, the youth non-anaemic index comes down from 0.613 to 0.519, a difference of 0.094, as a result of the high extent of male-female difference in the prevalence of Anaemia. The gender adjusted index is the highest in Kerala (0.723) followed by Goa (0.685), Punjab (0.675) and Delhi (0.623). When corrected for sex ratio, the value of the index decreases marginally.
5.3.2 Youth BMI Index
An analysis of NFHS 3 data shows that the Body Mass Index (BMI) of females aged 15-34 years is higher as compared to males (Table 5.5). BMI is relatively higher in urban areas, in higher age groups, among better educated, those who belong to other religious groups (other than Hindus and Muslims) and upper caste groups and those who are with higher standard of living.
TABLE 5.5 Mean Body Mass Index (BMI) level among Men and Women aged 15-34 years by Demographic Variables, NFHS, India, 2005-06
Mean Body Mass Index (BMI) in Kg/m2
Variables Men Women
Total Rural Urban Total Rural Urban
Age-group
15-19 18.3 18.1 18.8 19.0 18.8 19.3
20-24 19.7 19.4 20.2 19.6 19.3 20.4
25-29 20.4 19.9 21.3 20.3 19.7 21.7
30-34 20.9 20.3 22.1 20.9 20.0 22.8
Educational status
Noeducation,pre-school 19.4 19.3 20.3 19.7 19.4 21.2
Primary 19.8 19.5 20.6 20.5 20.0 21.8
Secondary 20.3 19.8 21.0 20.9 20.1 22.0
Higher 22.4 21.4 23.0 22.5 21.1 23.0

���
Mean Body Mass Index (BMI) in Kg/m2
Variables Men Women
Total Rural Urban Total Rural Urban
Religion
Muslim 20.2 19.7 20.9 20.6 19.8 21.9
Hindu 20.2 19.7 21.3 20.4 19.7 21.9
Others 21.4 20.9 22.3 21.7 21.1 22.6
Social-group
Scheduledtribe 19.3 19.2 20.4 19.1 18.9 20.6
Scheduledcaste 19.7 19.3 20.6 19.9 19.4 21.0
OBC 20.2 19.7 21.1 20.4 19.8 21.8
Others 21.0 20.3 21.8 21.3 20.3 22.6
Nocaste/tribe 20.2 19.8 21.2 20.7 20.1 22.7
Standard of living
Low 19.0 18.9 19.4 19.0 18.9 19.7
Medium 19.6 19.4 20.1 19.7 19.5 20.7
High 21.4 20.9 21.9 21.9 21.0 22.7
Total 21.2 20.4 22.7 21.7 20.6 24.0
Source: ComputedfromNFHS3(2005-06)Data
The BMI level of about 40 percent of the youth is between 18.5 and 24.9 (the normal BMI range); this percentage is relatively higher in rural areas. Percentage of those that are underweight is higher among youth aged 15-19 years, those who are less educated, Hindus, Scheduled Tribes, and those with low standard of living. Table 5.6 presents information on the share of male and female youth having normal BMI range and also the values of Youth Nutrition Index. In India, among female youth, 53.9 percent have a normal BMI, indicating that the remaining 46.1 percent female youth are malnourished in some way. Among male youth, 44.6 percent are undernourished at the national level. A comparison of the percentages of male and female youth having normal BMI is provided in Figure 5.4.
Among females the highest percentage having normal BMI is in the north-eastern states of Meghalaya (81.8 percent), Mizoram (78.2 percent), Arunachal Pradesh (76.3 percent), Nagaland (75.8 percent), Manipur (75.7 percent) and Sikkim (75.4 percent). However, the State of Assam, the most populated among the North-eastern states shows a different situation with only 58 per cent of female youth having a normal
Youth Health

India Youth Development Report 20�0 ���
BMI. On the other side of the spectrum, West Bengal (50.8 percent), Tamil Nadu (51.0 percent), Karnataka (51.1 percent) and Chhattisgarh (51.7 percent) have the lowest share of female youth with normal BMI.
Among male youth also a similar pattern of inter-state variation in the BMI level exists. The information presented shows that the male-female difference in the extent of malnutrition is not substantial even though the percentage of youth having normal BMI is slightly higher among males for most of the States. In contrast, in Madhya Pradesh, Rajasthan, Manipur, Meghalaya, Tripura and Uttar Pradesh, the percentage of male youth having normal BMI is lower than female youth. The marginal gender difference is reflected in the values of youth BMI index and the youth gender BMI index adjusted for sex ratio.

���
States Population prop. YBMIIf YBMIIm YBMII YGBMII YGBMIISR
Normal BMI (%) Female MaleIndia 53.9 55.4 0.539 0.554 0.547 0.547 0.524AndhraPradesh 52.5 55.5 0.525 0.555 0.540 0.540 0.533ArunachalPradesh 76.3 79.7 0.763 0.797 0.780 0.780 0.766Assam 58.0 58.2 0.580 0.582 0.581 0.581 0.569Bihar 53.0 55.3 0.530 0.553 0.542 0.542 0.517Chhattisgarh 51.7 53.7 0.517 0.537 0.527 0.527 0.519Delhi 63.0 69.8 0.630 0.698 0.668 0.666 0.594Goa 53.5 58.1 0.535 0.581 0.559 0.558 0.543Gujarat 48.9 49.5 0.489 0.495 0.492 0.492 0.465Haryana 54.3 58.6 0.543 0.586 0.566 0.565 0.518HimachalPradesh 56.7 58.7 0.567 0.587 0.577 0.577 0.564Jammu&Kashmir 61.4 64.0 0.614 0.640 0.628 0.627 0.596Jharkhand 52.8 55.1 0.528 0.551 0.540 0.540 0.521Karnataka 51.1 53.6 0.511 0.536 0.524 0.524 0.510Kerala 56.6 57.8 0.566 0.578 0.572 0.572 0.559MadhyaPradesh 53.6 52.0 0.536 0.520 0.528 0.527 0.498Maharashtra 50.6 53.3 0.506 0.533 0.520 0.520 0.487Manipur 75.7 75.5 0.757 0.755 0.756 0.756 0.749Meghalaya 81.8 79.8 0.818 0.798 0.808 0.808 0.797Mizoram 78.2 81.4 0.782 0.814 0.798 0.798 0.780Nagaland 75.8 81.8 0.758 0.818 0.789 0.788 0.759Orissa 54.1 58.1 0.541 0.581 0.561 0.560 0.559Punjab 56.2 59.4 0.562 0.594 0.579 0.579 0.537Rajasthan 55.4 51.2 0.554 0.512 0.532 0.531 0.503Sikkim 75.4 78.1 0.754 0.781 0.768 0.768 0.720TamilNadu 51.0 56.5 0.510 0.565 0.537 0.536 0.536Tripura 57.5 49.4 0.575 0.494 0.534 0.531 0.526UttarPradesh 57.8 54.6 0.578 0.546 0.561 0.561 0.524Uttaranchal 60.1 62.1 0.601 0.621 0.611 0.611 0.599WestBengal 50.8 58.0 0.508 0.580 0.545 0.543 0.527
TABLE 5.6 Youth Body Mass Index in India and States
Note: YBMIIf:YouthBMIIndexFemales;YBMIIm:YouthBMIIndexMales;YBMIIYouthBMIIndex;YGBMIIYouthGenderBMIIndex;YGBMIISRYouthGenderBMIIndexAdjustedforSexratio
Youth Health

India Youth Development Report 20�0 ���
FIGURE 5.4 Percentage of Male and Female Youth with Normal BMI

���
Status of Nutrition Index among youth in India is presented in Table 5.7 and Figure 5.5. The Youth Nutrition Index is derived by combining Youth Non-anaemic Index and Youth Body Mass Index giving equal weight to these components. The Youth Nutrition Index for India is 0.570 with the lowest value observed in Jharkhand (0.508) followed by Bihar (0.522), Assam (0.523), and Tripura (0.523). The highest values are in Manipur (0.755) followed by Mizoram (0.0.750) and Nagaland (0.686). The States which have a high value of Youth Health Index such as Kerala, Goa and Delhi have slightly lower Nutrition Index (0.654, 0.637 and 0.680 respectively).
FIGURE 5.5 Youth Nutrition Index across Indian States
Youth Health

India Youth Development Report 20�0 ���
TABLE 5.7 Youth Nutrition Index in India and States
States YNIf YNIm YNI YGNI YGNISR India 0.490 0.645 0.570 0.560 0.537AndhraPradesh 0.440 0.649 0.546 0.525 0.519ArunachalPradesh 0.602 0.754 0.679 0.671 0.659Assam 0.429 0.614 0.523 0.507 0.497Bihar 0.424 0.611 0.522 0.505 0.482Chhattisgarh 0.473 0.627 0.551 0.540 0.532Delhi 0.585 0.756 0.680 0.669 0.596Goa 0.574 0.696 0.637 0.631 0.615Gujarat 0.458 0.612 0.539 0.528 0.499Haryana 0.486 0.676 0.589 0.573 0.525HimachalPradesh 0.566 0.677 0.623 0.618 0.604Jammu&Kashmir 0.541 0.712 0.631 0.619 0.588Jharkhand 0.411 0.599 0.508 0.490 0.473Karnataka 0.495 0.646 0.572 0.562 0.548Kerala 0.614 0.696 0.654 0.652 0.637MadhyaPradesh 0.489 0.617 0.556 0.549 0.518Maharashtra 0.507 0.650 0.583 0.574 0.538Manipur 0.698 0.814 0.755 0.751 0.744Meghalaya 0.645 0.709 0.676 0.675 0.666Mizoram 0.683 0.814 0.750 0.744 0.727Nagaland 0.572 0.791 0.686 0.668 0.644Orissa 0.469 0.637 0.553 0.541 0.540Punjab 0.585 0.697 0.645 0.640 0.594Rajasthan 0.504 0.617 0.564 0.558 0.529Sikkim 0.537 0.777 0.665 0.642 0.603TamilNadu 0.493 0.675 0.584 0.570 0.570Tripura 0.466 0.579 0.523 0.517 0.512UttarPradesh 0.539 0.639 0.592 0.588 0.550Uttaranchal 0.509 0.663 0.587 0.577 0.565WestBengal 0.436 0.630 0.536 0.518 0.504
Note: YNIf:YouthNutritionIndexfemales;YNIm:YouthNutritionIndexmales;YNI:YouthNutritionIndex;YGNI:YouthGenderNutritionIndex;YGNISR:YouthNutritionIndexadjustedforSexratio.

���
5.4 Access to Health In section 5.2, we considered the access aspect by examining the Access Index that was derived from the percentage of deliveries among youth that were attended by health personnel, as reported in the National Family Health Survey (2005-06). Though this indicator has significant influence on the health outcome of child survival in the construction of YHI, it is considered as an access indicator.
At the national level, only 48.2 percent of deliveries among youth are attended by health personnel with considerable variation across States. Trained attendance at birth considerably varies across the States with Kerala (99.7 percent), Goa (94.3 percent) and Tamil Nadu (93.2 percent) showing the highest extent of assisted delivery. Nagaland (25.9 percent) and Uttar Pradesh (29.2 percent) have the lowest percentages of births assisted by trained health personnel. In 12 of the 29 States, the share of deliveries assisted by trained health personnel is below 50 percent. (Only slightly higher than one-third of last births to women in the past five years were followed by a post natal check of the mother within two days of delivery.) It is seen that neither pregnant adolescents nor older youth who are having higher order pregnancies are receiving adequate antenatal, natal and post natal care services. Thus, reaching young mothers would help substantially in improving child survival and maternal health situation.
In the primary research, we examined the accessibility to health services by gathering information on institutional deliveries among youth and also by asking direct questions whether health facilities were available if and when required. Figure 5.6 depicts the inter-state variations in the extent of institutional deliveries. Figures 5.7 and 5.8 present the extent of institutional deliveries according the demographic variables.
FIGURE 5.6Percentage of Institutional Deliveries among Youth in Selected Indian States, 2009
Youth Health

India Youth Development Report 20�0 ��0
There are considerable variations across states in the extent of institutional deliveries among youth. The extent of accessibility is low in States that have high extent of maternal, infant and child mortality rates. The extent is 50 percent or below in Nagaland, Rajasthan, Uttar Pradesh and Assam. On the other hand, Tamil Nadu, Kerala and A&N Islands have greater than 90 percent institutional deliveries.
FIGURE 5.7Percentage of Institutional Delivery by Age & Residence in India
(Based on Primary Data from 11 states/UT), 2009
The extent of institutional deliveries varies according to age, place of residence, religion, caste and standard of living. Younger youth are more likely to opt for institutional deliveries and so are the urban youth; yet these differences are not substantial. While 70 percent of youth belonging to Hindu or Muslim religious groups reported institutional delivery, the extent is a low 44 percent in the ‘other’ religious groups. Among caste groups, the extent of institutional deliveries is the lowest among Scheduled Tribes (53 percent) followed by Scheduled Castes (58 percent).
FIGURE 5.8Percentage of Institutional Delivery by Religion, Caste and Standard of Living
Index in India (based on Primary Data from 11 states/ UT), 2009

���
There is a clear difference across the standard of living categories in the extent of institutional delivery. While in the lowest SLI group it is 56 percent, in the second it is 78 percent and among the richest group, the extent of institutional delivery is 83 percent.
FIGURE 5.9Percentage of Youth Reporting Availability of Health Services
in Indian States, 2009
About three-fourth of youth in selected States reported that health facility (public or private) was available if and when needed (Figure 5.9). The inter-state variation is substantial; on the one end of the spectrum are A&N Islands, Delhi and Uttar Pradesh, reporting high extent of availability of facilities; and on the other end are Jammu & Kashmir, West Bengal and Maharashtra where the proportion of youth reporting availability of health facilities is quite low.
5.5 Perceived Health StatusIn the primary research, youth were asked to rate their health status. Table 5.8 presents the perceived status of health by selected background characteristics. As may be expected, only 5.7 percent youth perceived their health status as very poor or poor. A majority of the youth reported that their health status was either good or very good (70.8 percent). While age difference in perceived health is only marginal, sex difference shows that a larger proportion of male youth perceive their health as good / very good (75.5 percent) as compared to female youth (64.7 percent). Rural-urban difference shows that more urban youth perceive their health as good or very good (84.2 percent) as compared to rural youth (68.7 percent).
Youth Health

India Youth Development Report 20�0 ��2
TABLE 5.8 Perceived Health Status of Indian Youth by Demographic Variables, 2009
Perceived Age (years) Sex Place of TotalHealth Status Residence
<18 18-25 25+ Male Female Rural Urban
VeryPoor 55 96 144 129 166 208 86 294/Poor (4.8) (5.4) (6.4) (4.5) (7.2) (6.0) (5.0) (5.7)
Average 246 432 546 567 651 868 356 1224 (21.5) (24.3) (24.4) (20.0) (28.2) (25.2) (20.8) (23.7)
Good 942 942 1193 1497 1231 1743 989 2732 (53.0) (53.0) (53.4) (52.8) (53.3) (50.6) (57.7) (53.0)
VeryGood 352 308 352 643 263 625 283 908 (15.7) (17.3) (15.7) (22.7) (11.4) (18.1) (16.5) (17.6)
Perceived Religion Caste Standard of LivingHealth Status Hindu Muslim Other SC ST OBC Other Low Medium HighVeryPoor 196 75 24 68 43 55 128 137 55 70/Poor (5.3) (10.1) (3.3) (6.8) (5.3) (3.9) (6.6) (7.5) (6.0) (3.9)
Average 928 202 94 312 170 291 446 538 211 331 (25.2) (27.2) (12.9) (31.2)(20.9) (20.8) (23.1) (29.5) (23.2) (18.4)
Good 1854 380 496 451 504 708 1066 878 515 1018 (50.3) (51.2) (68.3) (45.1)(61.8) (50.5) (55.2) (48.2) (56.5) (56.6)
VeryGood 711 85 112 170 98 347 292 269 130 378 (19.3) (11.5) (15.4) (17.0)(12.0) (24.8) (15.1) (14.8) (16.7) (21.0)
Source: PrimaryResearchinTenStatesandaUnionTerritory
While among Hindu youth and youth from ‘other’ religious groups, the proportion of youth reporting very poor / poor health is quite low, about one-tenth of Muslim youth perceived their health status as very poor / poor. The share of youth perceiving their health as good/ very good is lowest among Muslim youth (62.7 percent) as compared to Hindu youth (69.6 percent) and youth from ‘other’ religious groups (83.7 percent). Among the caste groups, the percentage of youth perceiving their health as good/ very good is the lowest among SC youth (62.1 percent) as compared to 70 percent or higher among other caste groups. Standard of living tends to influence perceived health in a positive way; the percentage of youth who perceive their health as good/ very good increases with improvement in standard of living.

���
Figure 5.10Perceived Health Status of Youth in Selected Indian States/UT, 2009
Figure 5.10 clearly points to the large inter-state differences in perceived health status among youth. The share of youth reporting that their health status is very poor / poor is the highest in Jammu and Kashmir (14.9 percent) and the lowest in Uttar Pradesh (1.5 percent) and Tamil Nadu (1.7 percent). The percentage of youth who perceive that their health status is good/ very good is the highest in A&N islands (91.2 percent), Delhi (85.7 percent) and Tamil Nadu (85.4 percent).
5.6 MorbidityAs per the National Family Health Survey 2005-06, which collected information on the prevalence of some of the diseases, the number of persons per 100,000 among household resident youth who were suffering from tuberculosis is 373 per 100,000 youth. (The prevalence in rural areas is much higher (473) as compared to urban areas (243) [Table 5.9].) It can be seen that the prevalence increases with age, both in rural and urban areas.
Further exploration shows that the number of youth suffering from TB is higher among those who do not have any education, who are Muslims, who belong to Scheduled Tribes and whose standard of living is low. Awareness about tuberculosis is almost universal and is slightly higher in urban areas and among males. Similarly, awareness about Tuberculosis increases with increase in age, educational status and standard of living.
Youth Health
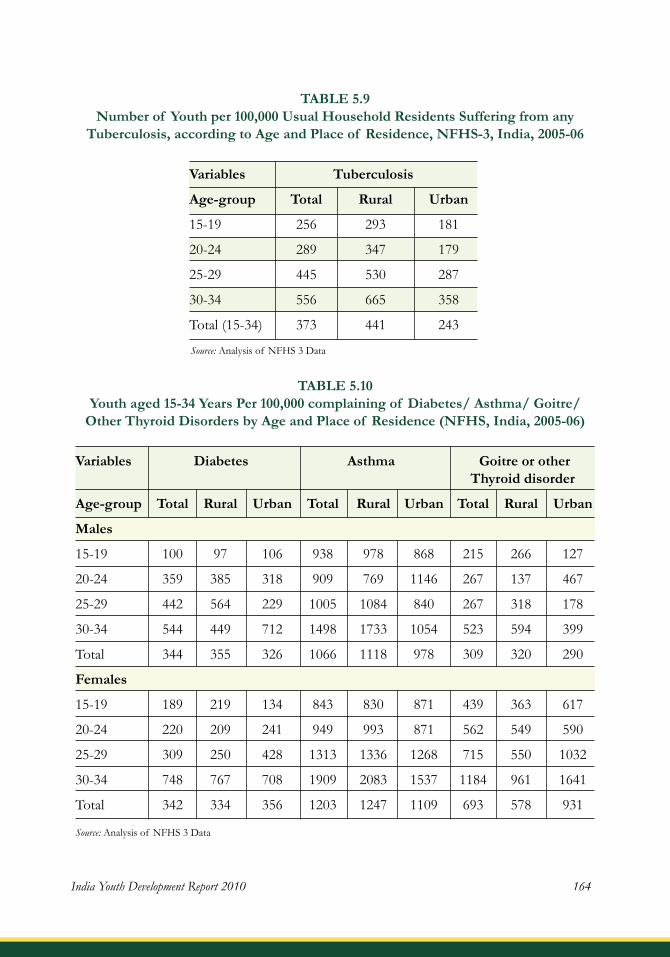
India Youth Development Report 20�0 ���
TABLE 5.9Number of Youth per 100,000 Usual Household Residents Suffering from any
Tuberculosis, according to Age and Place of Residence, NFHS-3, India, 2005-06
Variables Tuberculosis
Age-group Total Rural Urban
15-19 256 293 181
20-24 289 347 179
25-29 445 530 287
30-34 556 665 358
Total(15-34) 373 441 243
Source: Analysisof NFHS3Data
TABLE 5.10Youth aged 15-34 Years Per 100,000 complaining of Diabetes/ Asthma/ Goitre/
Other Thyroid Disorders by Age and Place of Residence (NFHS, India, 2005-06)
Variables Diabetes Asthma Goitre or other Thyroid disorder
Age-group Total Rural Urban Total Rural Urban Total Rural Urban
Males
15-19 100 97 106 938 978 868 215 266 127
20-24 359 385 318 909 769 1146 267 137 467
25-29 442 564 229 1005 1084 840 267 318 178
30-34 544 449 712 1498 1733 1054 523 594 399
Total 344 355 326 1066 1118 978 309 320 290
Females
15-19 189 219 134 843 830 871 439 363 617
20-24 220 209 241 949 993 871 562 549 590
25-29 309 250 428 1313 1336 1268 715 550 1032
30-34 748 767 708 1909 2083 1537 1184 961 1641
Total 342 334 356 1203 1247 1109 693 578 931
Source: Analysisof NFHS3Data

���
According to NFHS-3, 344 out of 100,000 male youth and 342 out of 100,000 female youth reported that they have diabetes; 1066 out of 100,000 men and 1203 out of 100,000 women reported that they suffer from Asthma; and 309 out of 100,000 men and 693 out of 100,000 women reported that they have Goitre or other thyroid disorder (Table 5.10). The number of male youth who suffer from Diabetes, Asthma and Goitre or other thyroid disorders is relatively high in rural areas while the number of female youth who suffer from Diabetes and Goitre or other thyroid disorders is higher in urban areas.
Among male youth, the number of Diabetes, Asthma and Goitre cases is the highest among those aged 30-34 years, those who do not have any education, those who are Muslims, those who belong to upper castes and those with a low standard of living. But, in the case of Diabetes the number is the highest among those with a high standard of living. Similar pattern is seen for women except in cases of Goitre or other thyroid disorders. The number of women with Goitre or other thyroid disorders is the highest among those with a high standard of living.
TABLE 5.11Morbidity among Youth in selected Indian States/ UT, 2009
State Age Sex Type of place Total
<18 18-24 25-35 Male Female Rural Urban
Acute 127 189 256 232 340 394 177 572Illness (10.9) (10.4) (11.3) (8.1) (14.3) (11.2) (10.2) (10.9)
Chronic 24 40 66 51 79 90 40 130Illness (2.1) (2.2) (2.9) (1.7) (3.3) (2.5) (2.3) (2.5)
Dental 135 241 351 325 401 485 242 727Problems (11.8) (13.5) (15.7) (11.5) (17.3) (14) (14.2) (14.1)
Suffered Religion Caste Standard of Totalfrom living index
Hindu Muslim Others SC ST OBC Others Low Middle High
Acute 399 90 83 95 81 164 231 239 106 159 572Illness (10.6) (12) (11.4) (8.9) (9.8) (11.8) (11.7) (12.9) (11.4) (8.7) (10.9)
Chronic 90 27 13 27 11 34 58 61 22 31 130Illness (2.4) (3.6) (1.8) (2.5) (1.3) (2.5) (2.9) (3.3) (2.4) (1.7) (2.5)
Dental 487 125 115 142 121 176 286 262 159 238 727Problems (13.1) (17.1) (16.2) (13.8) (15.6) (12.8) (14.5) (14.4) (17.9) (13.1) (14.1)
Source: PrimaryDatafrom11States/UT
Youth Health

India Youth Development Report 20�0 ���
In the primary research conducted in 10 States and one Union Territory of Andaman & Nicobar Islands, the youth were asked whether they suffered from any acute illness during the one month prior to the survey. Information was also collected about prevalence of chronic illness and dental problems. The results are presented in Table 5.11 and Figures 5.11, 5.12 and 5.13. About 11 percent of the youth reported that they suffered from acute illness while 2.5% reported suffering from chronic illness. The percentage of youth suffering from dental problems (at the time of survey) was considerably high (14%).
The morbidity pattern among youth varies according to background characteristics. The reported morbidity is higher among females for acute illness, chronic illness as well as dental problems. Reported morbidity increases with age. Though morbidity is slightly higher in rural areas for acute and chronic illness, the rural-urban difference is marginal.
Among the religious groups, morbidity is higher among Muslims as compared to Hindus and ‘other’ religious groups. For acute and chronic illnesses, the highest extent is reported by youth belonging to OBC and upper caste groups whereas for dental problems the highest extent is reported by ST youth followed by upper caste youth. Reported morbidity varies inversely with improvement in standard of living, both acute and chronic illness being higher among the lower standard of living category.
FIGURE 5.11Percentage of Youth who suffered Acute Illness in Selected Indian States/UT, 2009
As seen from Figure 5.11, there are inter-state differences in the prevalence of acute illnesses. Less than 5% of youth from Kerala and Tamil Nadu reported acute illness. The extent of acute illness reported is high in Jammu and Kashmir, Rajasthan, Andaman and Nicobar Islands and particularly in Maharashtra where close to one-third of youth reported having suffered from acute illness.

���
FIGURE 5.12Percentage of Youth who suffered Chronic Illness
in Selected Indian States/UT, 2009
The share of youth suffering from chronic illness varies from close to 0% in Tamil Nadu to 6% in Rajasthan (Figure 5.12). While Nagaland, Delhi, Uttar Pradesh and Assam reported 1% prevalence of chronic illnesses, the extent reported in Jammu and Kashmir, Maharashtra and Rajasthan is quite high (4 to 6%).
FIGURE 5.13Percentage of Youth who suffered Dental Problems
in Selected Indian States/UT, 2009
Figure 5.13 shows the inter-state differences in the prevalence of dental problems. Combined data from different locations revealed that 14% of Indian youth suffer from dental problems. The lowest extent reported is in Rajasthan where 6% reported that they suffer from dental problems. At the other end of the spectrum is Maharashtra where 26% of youth reported that they suffer from dental problems at the time of the survey. In addition to Maharashtra, 15% or more young people from Uttar Pradesh, Jammu and Kashmir and Nagaland reported that they suffer from dental problems.
Youth Health

India Youth Development Report 20�0 ���
5.7 DisabilityThe number of youth out of 100,000 persons who have at least one disability in India is about 1400, with the prevalence being higher among rural youth (Table 5.12). The number of persons with at least one disability is the highest among those who are aged 15 to 19 years and those who belong to rural areas. It can be seen that both in rural and urban areas, the extent of disability decreases with increasing age. Among various forms of disability, loco motor disability is the most common with about 950 youth per 100,000 suffering from this form of disability. The other most prevalent type of disability is speech and hearing-related. The prevalence of blindness among youth is around 60 per 100,000.
TABLE 5.12 Number of Disabled per 100,000 in age group 15-34 years and Type of Disability, India 2002
Other important form of disability prevalent among youth is mental retardation and mental illness. About 120 youth per 100,000 suffer from mental retardation while another 120 suffer from mental illness. While the extent of mental retardation decreases with age, the number of youth who are mentally ill increases with age. Though the extent of mental retardation and mental illness among youth is lower compared to older persons, the extent reported by the survey shows a high prevalence.
Age Mental Mental Blind- Low Hearing Speech Hearing Loco At least group retar- illness ness vision & speech motor one dis- dation ability
Total
15-19 170 86 53 19 180 238 194 1095 1633
20-24 140 105 62 21 175 236 218 972 1510
25-29 100 139 60 18 180 190 178 814 1343
30-34 90 153 64 17 186 154 154 801 1337
Rural
15-19 172 91 56 21 193 243 208 1181 1748
20-24 141 111 65 23 200 263 245 1039 1627
25-29 105 155 68 17 205 207 198 895 1487
30-34 91 173 77 16 207 169 175 852 1448
Urban
15-19 164 73 44 13 145 223 158 875 1337
20-24 137 92 56 18 118 175 158 819 1242
25-29 87 100 43 20 120 149 129 620 1000
30-34 86 102 30 19 134 116 101 669 1054Source: NSSO(2003)

���
TABLE 5.13 Number of disabled persons per 1000 in age group 15-34 years in each household social group, India 2002
Age-group Scheduled tribes Scheduled castes OBC Others
Total
15-19 89 93 94 92
20-24 75 75 76 78
25-29 51 59 60 65
30-34 60 54 52 56
Rural
15-19 112 101 98 91
20-24 116 90 91 76
25-29 35 65 61 59
30-34 59 54 54 54
Urban
15-19 87 91 93 93
20-24 72 72 72 79
25-29 53 57 60 67
30-34 60 54 51 57
Source: NSSO(2003)
The differentials by age and caste group show that the number of disabled persons per 1000 disabled persons in urban areas is relatively lower among Scheduled Castes and Scheduled Tribes in all the youth age groups except in the age group of 30-34 years (Table 5.13). But, in the rural areas, the number is much higher among Scheduled Tribes.
Among males, the highest number of disabled persons is among Scheduled Castes while among females the highest number is among those who belong to other caste groups. There are considerable caste differentials in the number of disabled persons according to place of residence. The number of cases of blindness, hearing disability, speech disability and locomotor disability are the highest among those aged 30-34 years and those who live in rural areas. The number of blindness cases and hearing disability is relatively high among males while the number of cases of speech disability is higher among females.
Youth Health

India Youth Development Report 20�0 ��0
5.8 Sexual and Reproductive HealthThe total fertility rate in India has come down from 3.6 in 1992 to 2.8 in 2006 (Table 5.14). Fertility in rural areas was always higher than that in the urban areas. Though over the years there has been some reduction in the rural-urban difference in TFR, even now the total fertility in rural areas is higher by 1.1 children per woman. The age pattern of fertility among youth shows two interesting features. One, close to one-tenth of the fertility in the 15-34 years age group occurs in the 15-19 years age group. Two, most of the fertility is concentrated in the 20-29 years age group with the fertility being higher in the 20-24 years age group; women in this age group account for about 42 percent of the total fertility among youth. Parasuraman et al (2009) while analyzing the youth situation (in the 15-24 years age group) using NFHS 3 data, observed that early childbearing defines India’s fertility pattern. By the time an Indian Woman completes 24 years of age, she on an average has 1.5 children. Fertility among youth aged 15-24 years accounts for more than half of total fertility in India.A compression in the effective reproductive span in some of the Indian States has been reported and has become an important concern. As the age at marriage increases in all the States, the pattern found is that the waiting time for conceiving the first child is reducing. And the effective reproductive span comes down to less than 10 years in many States. This clearly shows the need to focus on younger women both for providing services and for delaying marriage and first conception among the younger youth.
TABLE 5.14 Age-specific fertility rate per 1000 population by sex and place of residence in India, 1991-92, 1997-98 and 2005-06
Variables 1992* 1998 2006
Age Group Total Rural Urban Total Rural Urban Total Rural Urban
15-19 74.4 83.3 42.4 54.0 61.1 31.0 45.2 52.6 25.7
20-24 235.2 249.4 189.6 220.3 234.3 176.9 208.1 227.7 159.7
25-29 189.6 200.8 155.5 182.8 192.4 151.6 168.0 180.9 138.2
30-34 113.0 125.1 75.8 104.2 114.1 72.0 79.1 87.5 58.2
Crude 29.2 30.9 23.1 26.5 28.0 21.1 23.5 25.2 18.8birthrate
General 118.6 127.6 89.1 106.5 115.2 79.2 93.3 103.4 69.1fertilityrate
Total 3.6 3.9 2.6 3.2 3.5 2.4 2.8 3.1 2.0fertilityrate
Grossrepro- 1.7 1.8 1.2 1.5 1.7 1.1 1.3 1.5 1.0ductionrate
Note: *ExcludedJammu&KashmirSource: SampleRegistrationSystem,VariousYears

���
FIGURE 5.14 Mean Number of Children among Youth in Selected Indian States/UT, 2009
The primary research gathered information on the number of children ever born to married youth. It can be seen that there are inter-state differences in fertility among the youth. For example, the lowest fertility is in West Bengal, Tamil Nadu and Kerala where the average number of children ever born varies from 1.6 to 1.9. When the data from the various states are combined, the fertility among youth is 2.3 children. The states that reported high fertility are Rajasthan and Jammu & Kashmir where the mean number of children ever born is 3.0 and 3.2 respectively.
Evidence shows that the relatively lower age at marriage in India results in early initiation of sexual activity and childbearing. The NFHS (2005-06) data reveals that more than half of female youth have had sexual intercourse before the age of 18 years while about one fifth of the females had sexual intercourse before the age of 15 years (Table 5.15). The percentage of men who had sexual intercourse at earlier ages is much less as compared to women. The proportion of men and women who had sexual intercourse at an earlier age is higher in rural areas than in urban areas. The percentage is higher among men and women in the older age groups, less educated, Hindus, Scheduled Tribes, and those with a low standard of living. Among youth aged 15-24 years who had sexual intercourse, males on average had 1.8 partners and females had more than one partner. Among the 22 percent males (15-24 years) who had sexual intercourse during the 12 months preceding the survey, one-fourth had high-risk intercourse (with a partner who was neither spouse nor lived with them) [Parasuraman et al 2009].
Youth Health

India Youth Development Report 20�0 ��2
TABLE 5.15Percentage of Women aged 15-34 years experienced sexual intercourse
before age 15 and before age 18 by place of residence, NFHS, India, 2005-06
Sexual intercourse before age 15 Sexual intercourse before age 18
Total Rural Urban Total Rural Urban
Males
14.0 17.1 7.6 41.3 48.1 27.0
Females
2.4 3.2 1.1 11.7 14.6 6.6
Source: Analysisof NFHS3Data
Tables 5.16 and 5.17 present information on contraceptive use among youth. With regard to the current use of contraceptives, more than one-fourth of the women in the age group 15-34 years are currently using modern limiting methods, more than one-tenth of them are using modern spacing methods and about 8 percent of them are using traditional methods. The percentage of youth using modern spacing methods is much higher in urban areas and the proportion using modern limiting methods is slightly higher in rural areas as compared to urban areas. The percentage using any modern spacing method is the highest in the age group 25-29 years while about half of the women in the age group 30-34 years use some modern limiting method. Those using some modern spacing method and some modern limiting method proportionately increase with an increase in education. The percentage of people using some modern spacing method is higher among Muslims, OBCs and those with a higher standard of living; however, the proportion using any limiting method is higher among Hindus, OBCs and those with a medium standard of living.
TABLE 5.16 Percentage Distribution of Married Women aged 15-34 years currently using Contraceptive Methods, NFHS 3 India, 2005-06
Current use of contraceptives TotalVariables Modern spacing Modern limiting Traditional method method methodAge-group 15-19 5.8 1.1 6.120-24 12.4 13.6 7.325-29 14.4 33.9 8.030-34 13.1 48.0 9.2Total(15-34) 12.5 28.3 7.9
Source: Analysisof NFHS3Data

���
The pattern of contraceptive use among youth reveals the preference of a male child in India. As Parsuraman et al (2009) noted, among women (aged 15-24 years) with two children, only 31 percent of those not having a son use contraception as against 50 percent having one son and 58 percent having two sons using contraception.
TABLE 5.17 Percentage of currently Married Women aged 15-34 years with unmet needs for Family Planning, India 2005-06
Age For spacing For limiting Total
15-19 25.1 2.0 27.1
20-24 14.9 6.2 21.1
25-29 6.0 9.9 16.0
30-34 2.1 9.0 11.0Source: Analysisof NFHS3Data
More than one-fourth of the currently married women aged 15-19 years are having unmet need for family planning and the percentage decreases with an increase in age (Table 5.17). Unmet need for spacing is much higher than the unmet need for limiting. The unmet need for spacing among women in the age group 15-19 years is 25.1 percent whereas the unmet need for limiting among women in the age group 15-19 years is only 2 per cent.
FIGURE 5.15 Perceived Importance of Contraception among Indian Youth by age, sex and place of residence, 2009
Youth Health

India Youth Development Report 20�0 ���
FIGURE 5.16 Perceived importance of Contraception among Youth by Religion, Caste and Standard of Living, 2009
The primary research studied youth perceptions about the importance of contraception. Information related to this aspect is presented in Figures 5.15, 5.16 and 5.17. About 90 percent of the youth perceive that use of contraception is important or very important. The perceived level of importance varies with background characteristics. More male youth perceive that contraception is important as compared to female youth. Also, the extent of importance given to contraception is greater among urban youth. The extent of perceived importance is a little lower among Muslim Youth as compared to other religious groups.
FIGURE 5.17 Perceived importance of Contraception among Indian Youth in selected Indian States/UT, 2009

���
There are inter-state differences in perceived importance of contraception among youth. The states where the greatest proportion of youth perceive that contraception is very important are Andaman & Nicobar Islands (74%) followed by West Bengal (58%). The states where the least percentage of youth perceive that contraception is very important is Jammu & Kashmir (25%). While only 1% of youth from A&N Islands and 3 percent of youth from West Bengal perceived that contraception is not at all important, their share is the highest Tamil Nadu (18%), followed by Jammu & Kashmir (17%).
TABLE 5.18 Percentage of currently Married Indian Women aged 15-34 years who have heard about RTI/ STI
Age group (years) % who have heard about RTI/ STI
15-19 38.5
20-24 42.2
25-29 45.0
30-34 46.2
Source: RCHDLHS-2India,2002-04
About half of the women in the age group 30-34 years have heard about RTI/ STI and the percentage is a low 38.5% in the age group 15-19 years (Table 5.18). As one may expect, awareness about STI/ RTI increases with age. About one in 10 youth (15-24 years) who had sexual intercourse preceding the survey reported an STI or STI (RTI) symptom during the 12 months prior to the survey.
5.9 HIV/AIDSThe number of AIDS cases in India among youth has increased considerably over the years. Poverty, migration, low status of women and stigma are some factors that have led to the spread of this virus in a short span of time (CARAT, 2007). The spread of the virus is largely through sexual transmission (85.7%), and the majority of the HIV infections (87.7%) are in the age group of 15-44 years (CARAT, 2007). Over the years, the virus has moved from urban to rural areas and from high risk to the general population disproportionately affecting women, youth and children.
The number is much higher among males as compared to females during all the periods. The sex-wise differences in the number of AIDS cases also have increased overtime. Among males, the highest number of AIDS cases is in the age group 30-44 years while in the case of females the highest number of AIDS cases is found in the age group 15-29 years.
Table 5.19 presents information on the status of HIV prevalence among youth in the age group 15-24 years based on NFHS 3 data. The highest prevalence among male youth can be seen in Andhra Pradesh (0.48% or 4.8 per 1000 youth) followed
Youth Health

India Youth Development Report 20�0 ���
by Manipur (3.8 per 1000) and Maharashtra (3.1 per 1000). Among female youth the highest HIV prevalence is in Manipur (3.9 per 1000) followed by Karnataka (3.3 per 1000) and Andhra Pradesh (2.9 per 1000).
TABLE 5.19 Prevalence (percent) of HIV among Indian Youth aged 15-24 years
Source: S. Parasuraman, Sunita Kishor, Shri Kant Singh, and Y. Vaidehi. 2009. A profile of YouthinIndia.NationalFamilyHealthSurvey(NFHS-3),India2005-06
State Men Women
UtterPradesh 0.00 0.03
AllOtherStates1 0.02 0.06
Maharashtra 0.31 0.18
TamilNadu 0.00 0.24
AndhraPradesh 0.48 0.29
Karnataka 0.14 0.33
Manipur 0.38 0.391IncludingUttarPradeshandExcludingNagaland
TABLE 5.20 Percentage of Indian Youth aged 15-34 years with Comprehensive Knowledge of HIV/AIDS, by Age and Place of Residence, NFHS, India, 2005-06
Percentage of men who say that HIV/AIDS cannot be transmitted by Variables Ever heard of HIV/AIDS any of three specified methodsAge-group Total Rural Urban Total Rural UrbanMales15-19 86.4 82.6 93.1 50.7 44.6 61.3
20-24 89.8 85.0 97.1 51.4 43.2 64.0
25-29 87.7 82.9 96.2 49.1 41.1 63.1
30-34 84.1 77.6 95.5 43.3 33.9 59.9
Total(15-34) 87.1 82.2 95.5 48.9 41.1 62.2
Females 15-19 64.3 55.3 85.4 36.3 28.3 54.9
20-24 66.5 56.5 87.2 36.7 27.4 55.7
25-29 62.6 51.1 85.8 32.6 22.5 52.7
30-34 58.8 47.3 82.3 28.9 19.4 48.3
Total(15-34) 63.4 53.0 85.3 34.0 24.9 53.2Source: Analysisof NFHS3Data

���
With regard to the knowledge of HIV/AIDS, about 87% men and 63% women aged 15-34 years have ever heard of HIV/AIDS (Table 5.20). Among both males and females, the percentage of youth who ever heard of HIV/AIDS is higher in urban areas. Compared to rural areas, almost all the men and women in urban areas have a comprehensive knowledge about HIV/AIDS.
In the primary research, a question was asked about awareness of AIDS. Overall 76% of the youth reported that they have heard about AIDS. While more than 80% of male youth have heard about AIDS, 70% of female youth have heard about it. The percentage of youth ever heard of AIDS is higher in urban areas (80.3%) as compared to rural areas (74.2%).
FIGURE 5.18 Percentage of Youth who have ‘ever heard about AIDS’ by Religion, Caste, SLI
Figure 5.18 presents the variation in awareness of HIV across religious, caste and SLI categories. The highest awareness is among other religious groups followed by Hindus (77%) while only 65% of Muslim Youth were aware of AIDS. High extent of awareness is found among ST and OBC youth as compared to others. There is a clear association between SLI and the extent of AIDS awareness. While in the lowest SLI category the extent of awareness is 65%, in highest category it is 86%.
FIGURE 5.19 Percentage of Youth who ‘ever heard about AIDS’ in selected Indian States, 2009
Youth Health

India Youth Development Report 20�0 ���
Figure 5.19 shows the variation in AIDS awareness across the selected states. The extent of awareness is the highest in A&N Islands (98%) followed by Kerala (89%) and Assam (89%). Other states with a high level of awareness are Tamil Nadu, Maharashtra and Nagaland. Lowest level of awareness is among youth from Rajasthan (60%) followed by West Bengal (57%) .
5.10 Substance UseTobacco use and alcohol consumption among youth are matters of concern (Parasuraman et al 2009). More than one-fourth of the men aged 15-34 years smoke while the corresponding percentage for women is negligible (Table 5.21). The proportion of men and women who smoke is relatively higher in rural areas as compared to urban areas. While more than one-third of the men aged 15-34 years use tobacco, the corresponding proportion for women is only six percent. Similarly, about one-third of men aged 15-34 years drink alcohol whereas the corresponding proportion for women is only 2 percent.
TABLE 5.21 Percentage of Youth aged 15-34 years who consume Tobacco and Alcohol by age and place of residence NFHS, India, 2005-06
Variables Smoke Tobacco Drink alcohol
Age-group Total Rural Urban Total Rural Urban Total Rural Urban
Men
15-19 12.3 13.2 10.6 22.0 24.3 18.0 11.0 11.8 9.5
20-24 26.7 28.4 24.2 38.6 43.6 30.9 28.8 29.6 27.5
25-29 35.0 36.7 32.0 42.2 45.7 35.9 37.6 38.6 35.9
30-34 37.6 40.5 32.5 42.3 45.2 37.0 39.4 39.2 39.9
Total 26.91 28.7 24.0 35.5 38.9 29.8 28.1 28.7 27.0
Women
15-19 0.1 0.2 0.04 3.0 3.4 1.9 1.0 1.3 0.2
20-24 0.4 0.5 0.2 4.6 5.5 2.9 1.4 1.9 0.5
25-29 1.0 1.3 0.3 7.5 8.8 4.7 2.3 3.1 0.6
30-34 1.7 2.2 0.7 10.4 12.3 6.4 2.6 3.7 0.5
Total 0.7 1.0 0.3 6.0 7.0 3.8 1.7 2.3 0.5
Note: (I)Smokeincludessmokingcigarettesandbidisorcigarpipe.(II)Tobaccoincludeschewingpanmasala,gutkhaorothertobacco.Source: Analysisof NFHS3Data

���
The percentage of men and women who smoke, use tobacco and drink alcohol varies according to background characteristics. Substance use is higher among those in the age group 30-34 years with poor education and low standard of living. There is considerable religion and caste differentials in the percentage of men and women who smoke, use tobacco and drink alcohol. For instance, the percentage of men and women who smoke is the highest among Muslims, while in the case of tobacco use, the percentage is highest among Hindu men; and among women, it is highest among those who belong to other religious groups.
5.11 Suicide among YouthAt one level, the present generation has more opportunities and spaces to make their lives meaningful. However, it is seen that they also face the pressures of survival in a competitive environment.
Partly due to poverty, many young people are forced to endure situations – including discrimination, exploitation and social isolation – that render them vulnerable to unprotected sex, and drug and alcohol use (Burns et al, 2004, cited in Aggleton pg 15)
Mental health problems such as acute stress, depression, anxiety attacks and lack of self confidence and esteem are on the increase as the youth get overwhelmed by the problems faced as a consequence of poverty, competition and the rat race for survival. Low self-esteem, desperation and complete hopelessness lead to a high incidence of suicides among the youth.
Of the total number of suicides in India during 2006, 35.7% were among youth aged 15-29 years (Table 5.22). The number of suicides is higher among male youth, the sex ratio being 1.17 (117 males to 100 females). Table 5.23 presents the distribution of suicides among youth by causes of suicide. Family problems are the cause of suicide for 11022 suicides, accounting for 26% of suicides among youth. Other important causes of suicide among youth are illness (17%), love affairs (7.1%), dowry (4.2%) and unemployment (2.1%).
TABLE 5.22Distribution of Suicidal Deaths in age group 15-29 years, India, 2006
Male Female Total Percentage of Total Suicides
22757 19459 42216 35.7
Source: NationalCrimeRecordsBureau,2008
Youth Health
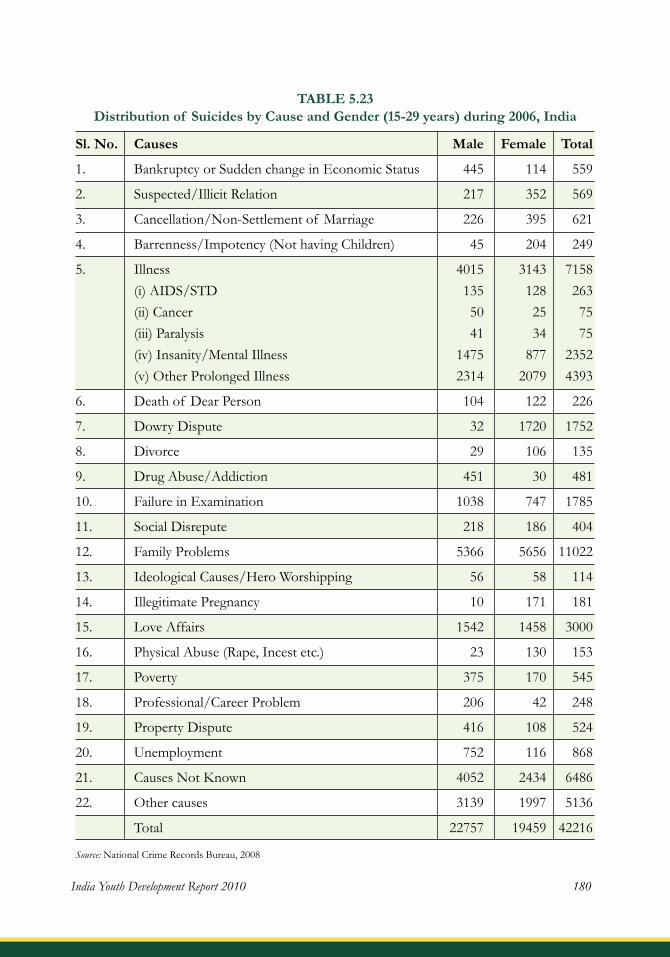
India Youth Development Report 20�0 ��0
TABLE 5.23Distribution of Suicides by Cause and Gender (15-29 years) during 2006, India
Sl. No. Causes Male Female Total
1. BankruptcyorSuddenchangeinEconomicStatus 445 114 559
2. Suspected/IllicitRelation 217 352 569
3. Cancellation/Non-Settlementof Marriage 226 395 621
4. Barrenness/Impotency(NothavingChildren) 45 204 249
5. Illness 4015 3143 7158 (i)AIDS/STD 135 128 263 (ii)Cancer 50 25 75 (iii)Paralysis 41 34 75 (iv)Insanity/MentalIllness 1475 877 2352 (v)OtherProlongedIllness 2314 2079 4393
6. Deathof DearPerson 104 122 226
7. DowryDispute 32 1720 1752
8. Divorce 29 106 135
9. DrugAbuse/Addiction 451 30 481
10. FailureinExamination 1038 747 1785
11. SocialDisrepute 218 186 404
12. FamilyProblems 5366 5656 11022
13. IdeologicalCauses/HeroWorshipping 56 58 114
14. IllegitimatePregnancy 10 171 181
15. LoveAffairs 1542 1458 3000
16. PhysicalAbuse(Rape,Incestetc.) 23 130 153
17. Poverty 375 170 545
18. Professional/CareerProblem 206 42 248
19. PropertyDispute 416 108 524
20. Unemployment 752 116 868
21. CausesNotKnown 4052 2434 6486
22. Othercauses 3139 1997 5136
Total 22757 19459 42216
Source: NationalCrimeRecordsBureau,2008

���
If we combine all the economic reasons (poverty, unemployment, property dispute, change in economic status), these contribute to about 6% of suicides among youth in the age group 15-29 years. Failure in examination is a cause of suicide and accounts for 4.2% of youth suicides.
TABLE 5.24 Student Suicides in Selected Indian States and Cities, 2006
State Male Female Total
WestBengal 639 502 1141
Maharashtra 444 438 882
AP 287 225 512
Karnataka 230 217 447
MP 198 167 365
Total(AllIndia) 3123 2734 5857
Source: NationalCrimeRecordsBureauquotedinAnahitaMukherji,Timesof India,Mumbai,February22,2008,Pg.5.
Table 5.24 provides further information on student suicides in selected States and cities. The highest number of student suicides is reported in West Bengal followed by Maharashtra. These two States together contribute to about 35 percent of student suicides in India. About 12 percent of all student suicides in Maharashtra during 2006 were from Mumbai, according to the National Crime Records Bureau (NCRB) statistics. While pressure to excel has reached a high level in cities like Mumbai, academic pressure is less in small cities and rural areas.
5.12 Preferences for Health Facilities and Quality of Care In the primary research, young people were asked about their preferred source for treatment in case of illness. This was to understand what they think of various kinds of facilities. The information on this aspect and the variations according to background characteristics are provided in Table 5.25. When data from all locations are combined, 62% of youth preferred to go to a government facility while 29.2% said that they would go to a private doctor or a private hospital. Others reported that they would go to indigenous practitioners, other systems of medicine or a pharmacy. The share of youth preferring government facility is higher in rural as compared to urban areas. While two-thirds of rural youth prefer government facility, only 53% of urban youth prefer to go to a government facility for illness treatment.
Youth Health

India Youth Development Report 20�0 ��2
TABLE 5.25 Preferred Type of Health Facility for Treatment of Illness among Youth in Selected Indian States, 2009
Age Sex Type of place
India <18 18-24 25-35 Male Female Rural Urban Total
Privatefacility 344 526 648 741 773 847 672 1517 (30.1) (29.3) (28.6) (25.8) (33.3) (24.3) (39.3) (29.2)
Govtfacility 692 1095 1436 1925 1291 2305 917 3223 (60.6) (61) (63.5) (67.1) (55.6) (66.1) (53.6) (62)
Other 106 175 178 201 258 336 123 459 (9.3) (9.7) (7.9) (7) (11.1) (9.6) (7.2) (8.8)
Religion Caste Standard of Living
Hindu Muslim Others SC ST OBC Others Low Middle High Total
Private 1200 153 164 278 126 394 717 369 245 738 1517facility (32) (20.8) (23.1) (27) (15.5) (28.3) (36.7) (20.3) (26.7) (40.1) (29.2)
Govt 2219 500 504 677 636 854 1053 1269 609 951 3223facility (59.1) (68) (70.9) (65.7) (78.4) (61.3) (53.8) (69.8) (66.3) (51.7) (62)
Other 334 82 43 76 49 145 186 180 65 151 459 (8.9) (11.2) (6) (7.4) (6) (10.4) (9.5) (9.9) (7.1) (8.2) (8.8)
The percentage of youth preferring government facility is higher among males (67.1%) as compared to females (55.6%). However, age difference in preferred illness treatment facility is minimal. While more Muslim youth (68%) and youth from other religious groups (71%) prefer government facility, the share of Hindu youth preferring government facility is 60%. Caste differences in preferred treatment facility are substantial; a higher percentage of youth belonging to ST and SC categories prefer government facility as compared to other groups. As the standard of living increases, the preference shifts from government to private facility among youth.

���
FIGURE 5.20 Preferred Type of Health Facility for Illness Treatment Source among Youth in the Selected Indian States/UT, 2009
Figure 5.20 presents the inter-state variation in preferred type of health facility in the case of illness. It can be seen that the highest percentage of youth preferring government health facility is in Jammu & Kashmir (89%) followed by Nagaland (79 %) and Tamil Nadu (79%). On the other hand, the highest share of youth preferring private facility can be found in Maharashtra (65%) followed by Delhi (62%). A considerable proportion of youth from A&N Islands (46%) reported that they would prefer other health facilities such as indigenous practitioners or obtaining medicine from a pharmacy.
TABLE 5.26 Quality of Care Received from Health Facility Last Visited, Selected Indian States 2009 by Age, Sex and Place of Residence, 2009
Age Sex Place of residence
India <18 18-24 25+ Male Female Rural Urban Total
Verypoor/ 103 181 239 342 179 384 139 523poor (11.2) (11.7) (12.3) (13.9) (9.2) (12.8) (9.9) (11.9)
Average 341 589 698 874 750 1198 429 1628 (37) (38.2) (35.9) (35.6) (38.6) (39.8) (30.7) (37)
Good/ 477 771 1006 1236 1015 1425 830 2254verygood (51.8) (50) (51.8) (50.4) (52.2) (47.4) (59.4) (51.2)
Youth Health

India Youth Development Report 20�0 ���
Table 5.26 provides information on the quality of services received from the last visited health facility by age, sex and place of residence. More than half the youth who visited a health facility during the six month period prior to the study rated the quality of services received as good or very good. The share of youth reporting poor or very poor quality of services is 12% while the remaining 37% said that the quality is average. There are no substantial age and male-female differences in the rating of quality of health services.
However, the rating of quality of health services differs considerably between rural and urban youth. While 47% of rural youth rated the quality of services as good or very good, the percentage of youth in urban areas giving such a rating is much higher (59.4%). While 40% of rural youth rated the quality as average, the corresponding proportion in urban areas is 31%.
TABLE 5.27 Quality of Care Received from Health Facility Last Visited, Selected Indian States 2009 by Religion, Caste and Standard of Living, 2009
Religion Caste Standard of Living
Hindu Muslim Others SC ST OBC Others Low Middle High Total
VeryPoor 360 104 59 134 121 102 165 242 96 118 523/Poor (11.4) (15.6) (10.2) (14.8) (17.5) (8.8) (10.1) (16) (11.7) (7.6) (11.9)
Average 1112 318 198 387 282 349 607 679 302 439 1628 (35.2) (47.7) (34.3) (42.7) (40.8) (30) (37.1) (44.8) (36.7) (28.3) (37)
Good/ 1689 245 320 385 288 712 866 596 426 993 2254VeryGood (53.4) (36.7) (55.5) (42.5) (41.7) (61.2) (52.9) (39.3) (51.7) (64.1) (51.2)
The variations in rating health services received according to religion, caste and SLI groups are given in Table 5.27. The rating varies widely across religious groups. While youth belonging to ‘Hindu’ and ‘Others’ show a similar pattern of rating with close to 55% rating the quality of services received as good or very good, among Muslim youth only 37% gave a similar rating. The percentage of youth reporting that the quality of health services they received was poor or very poor is the highest among youth belonging to ST category (17.5) followed by SC (14.8). Conversely, the share of youth reporting the quality of services as good or very good is high among OBC youth (61.2%) and upper caste youth (53%).

���
FIGURE 5.21 Quality of Healthcare received by Youth from Last Visited Health Facility, Selected Indian States/UT, 2009
Inter-state variations in the rating of quality of healthcare received are presented in Figure 5.21. The share of youth reporting that they received high quality services is the highest in Kerala (84%) followed by Maharashtra (77%), A&N Island (75%), Assam (73%) and Tamil Nadu (71%). On the other hand, the highest percentage of youth reporting that the quality of services received is poor or very poor can be found in Jammu & Kashmir (21%), West Bengal (18%) and Rajasthan (17%).
5.13 ConclusionThe analysis shows that while the Overall Health index in India is above average, the inter-state differences imply that the states with very low Youth Health Index (YHI) value should get adequate attention. Similarly, access to health and improved nutritional status of youth should be in the agenda for health interventions. In most of the sub-dimensions of health, the situation of female youth requires greater attention. The extent of morbidity among youth especially the extent of mental problems reported in primary research indicates the need for appropriate programmes in this direction. The status of mental health as seen from mental illnesses and the extent of suicides among youth requires urgent consideration. As the analysis shows, sexual and reproductive health status of youth should remain an important area of concern. Special attention needs to be given to youth living with HIV/AIDS and for prevention of HIV among young people.
Youth Health

India Youth Development Report 20�0 ���
6.1 Introduction Next to the family as an informal system for inculcating education for life and living, the formal education system is a major socializing agent in the life of children and youth. It is a key agent for political, social, cultural and economic change. The India HDI report (2005) mentions education as the single most important means for individuals to improve personal endowments, build capability levels, overcome constraints and in the process, enlarge their available set of opportunities and choices for a sustained improvement. The 11th Five Year Plan (2007-12) gives high priority to education as a key instrument to achieve rapid and inclusive growth.
A situational analysis of the Indian education scenario has shown that there are differences in education within the various Indian states, gender differences that impact the education of the girl child, income disparity and other such factors that reflect education in a polarized country. As per the Millennium Development Goals, the youth literacy rate (age group 15-24 years) in 2005 was 76.4%; school enrolment for primary education was 89% (net) in the same year; in 2000, the school enrolment for
Youth and Education
Education cannot be limited to literacy. It must be much broader and go into building the character and personality of the child.
–RajivGandhi
CH
AP
TE
R
VI
Youth Education Index: 0.413
Youth Education Outcome Index: 0.472
Youth Education Access Index: 0.223

���
secondary education was 6.2% (net); school enrolment for tertiary education (5 gross) 10.9%; and MDG children reaching grade 5 (% of grade 1 students) in 2004 was 73%.
As per the 2001 census data, the all-India literacy rate was only 65.38%, (males: 75.85%, females: 54.16%). As per the NSS 2006, the literacy rate was 77% for males and 57% for females, showing a gender gap of 20 percentage points. Though the literacy rates have gone up, there are still 468 million illiterates, of whom 101 million are in the age group of 15-34 years (Saraswati, 2009).
In spite of an explosion of primary, secondary and even college education in the Post Independence Era, a significant number of youth are out of school and college. The dropout rate between Classes I and X is around 70% and only 40 – 60% clear the Class X and XII examinations (GOI, Planning Commission Report of Working Group on Adolescents, 2001:8). One also finds that there are issues related to the quality of education received at the primary, secondary and tertiary levels.
6.1.1 Government Initiatives
The government is committed to the Movement of Education for All (EFA) which covers the six goals of Early Childhood Care and Education, Universal Elementary Education, Adult Literacy, Adolescent and Life Skill Education, Gender Equality and Emphasis on Quality Education.
The key policies influencing education in the country are: • The National Education Policy (1986,
1992)• The National Youth Policy (2003)• The Right of Children to Free and
Compulsory Education Act, 2009
The Right of Children to Free and Compulsory Education Act, 2009, which came into force from April 1st 2010, has been one of the most significant steps taken by the government to ensure education for all at the elementary level.
The National Knowledge Commission (NKC) Report (2006-2009) is also a landmark document which provides a comprehensive situational analysis of education in our country. The five key areas included in the report are related to Access to Knowledge;
The National Youth Policy 2003acknowledges that the youth havethe ‘privilege to receive appropriateeducationandtrainingwhichenablesthem to render themselves sociallyusefulandeconomicallyproductive’.
TheNKCreport,2009,studiessubjectsrelatedtoEducation,NationalKnowledgeNetwork,SchoolEducation,VocationalEducationandTraining,HigherEducation,MoreStudentsinMathsandScience,ProfessionalEducation,MoreQualityPhDs,Open and Distance Education, Open Education Resources, National ScienceandSocialScienceFoundation,HealthInformationNetwork,TraditionalHealthSystems,Innovation,EntrepreneurshipandAgriculture.
Youth and Education

India Youth Development Report 20�0 ���
Concepts (reinvigorating institutions where knowledge concepts are imparted); Creation (world-class environment for creation of knowledge); promoting Applications of Knowledge for sustained and inclusive growth; and using knowledge applications in efficient delivery of Public Services.
There are several schemes related to the policies and some of these are mentioned in the relevant sections later in this Chapter.
6.2 The Youth Education Index (YEI)The Human Development Index has been successful in indicating the extent to which a nation prioritizes education. This can be seen through the example of Brazil and its increased priorities for education and consequent development. Brazil went from ranking 69th to 64th among 175 countries in the world. Credit for this progress has been given to several factors, the chief one being the increase in registration rates in the educational field, to the increase in the longevity of the population due to advances in the area of health and to the progress, however moderate, made in terms of overcoming illiteracy1. The HDI value for India in 2005 was 0.619; in 2007, it was 0.612 (ranked 134 out of 182); and the Education Index was 0.645 in 2005 and 0.643 in 2007, which according to the UNDP is ‘Medium Human Development’ as compared to other countries.2
There are challenges incurred in categorizing data related to youth enrolment and attainment in education. The data varies throughout the country in relation to several factors including gender, region, caste and language. There are also gaps in studies on enrolment of people with psychiatric problems, disabilities, migration for higher education and employment (Megivern, Pellerito, Mowbray, 2003).
Youth Education Index for India : 0.413
Highest : 0.611 (Himachal Pradesh)
Lowest : 0.298 (Bihar)
1Appendix3of theLondonCommonwealthreport,‘TheUNESCOYouthDevelopmentIndex2 http://hdrstats.undp.org/countries/data_sheets/cty -ds -IND.html. also see Asia Pacific Human Development Report, 2006.http://www.undprcc.lk/rdhr2006/rdhr2006_report.asp

���
TABLE: 6.1Youth Education Index (YEI) of Indian States in Descending Order of Values
Table 6.1 shows that India’s YEI score is 0.413 which is low. As the data shows, the first five States were Himachal Pradesh, Delhi, Kerala, Goa and Manipur; and the poorest States were Bihar, Jharkhand, Rajasthan, Chhattisgarh and Arunachal Pradesh. There are 17 States above the India average of 0.413; and 12 States below this average. The difference between the highest (0. 611 - Himachal Pradesh) and the lowest is 0.313 (0.298 - Bihar), which shows a high disparity between the States.
6.2.1 Components of YEI
As a stage of development, youth are on the brink of seeking self-sufficiency in terms of livelihood and hence, an independent income. Such a person needs to be equipped with knowledge and relevant skills to be productive as an individual and for growth in society. In computing YEI for HDI-India, data was based on a 7+ literacy rate and mean
India: 0.413
YEI States above India value YEI States below India value
0.611 HimachalPradesh 0.408 AndhraPradesh
0.603 Delhi 0.402 Meghalaya
0.575 Kerala 0.399 Tripura
0.548 Goa 0.399 WestBengal
0.515 Manipur 0.391 Orissa
0.509 Maharashtra 0.372 UttarPradesh
0.501 Uttaranchal 0.363 MadhyaPradesh
0.496 TamilNadu 0.354 ArunachalPradesh
0.481 Mizoram 0.350 Chhattisgarh
0.481 Punjab 0.325 Rajasthan
0.462 Haryana 0.315 Jharkhand
0.441 Nagaland 0.298 Bihar
0.429 Gujarat
0.424 Sikkim
0.421 Jammu&Kashmir
0.419 Karnataka
0.417 Assam
Youth and Education

India Youth Development Report 20�0 ��0
years of education for 15+ years age group; and weighted to give adult literacy more significance in the statistic. The importance of literacy is well recognized for basic abilities such as reading newspapers, addresses, signs and the sense of confidence it instils in a person. However, though it provides the foundation for becoming a productive citizen, in today’s context of globalization and modernization, basic literacy is often highly inadequate. The feedback through the regional workshops clearly showed that both youth and experts felt that the minimum levels of education should be the Secondary School Certificate (SSC)/XII along with Vocational Skills. Hence, for the current YDI, greater significance and hence weightage was given to secondary, tertiary and vocational education. The relative weight of the educational dimension in the YDI has been theoretically and empirically assessed and detailed out in the Methodology Chapter.
Components of YEI are:• Educational Attainment: For measuring Outcome• Gross Enrolment Ratio (GER) for measuring Access to Education
Data from primary research will also be included in relevant sections.
Education Outcome (Attainment): Taking into consideration the feedback from the regional workshops and the specific needs of the youth, this index considers literacy, primary, secondary, tertiary and vocational education with differential weightage as outcomes of education.
Access to Education: It is understood that just taking the GER ignores the aspects of quality, context, culture, infrastructure, etc. However, it does indicate the extent of outreach of education, irrespective of these factors in different parts of the country. Since the YDI is concerned about the status of youth, only access to secondary and tertiary education was considered.
The sources of data have been mentioned in the Methodology Chapter. The educational components of the YDI will aim to understand the status of education amongst the youth and outline some of the causal factors for the levels of enrolment and education attainment. Since both outcome and access are very closely related, analysis of literacy and primary education is discussed in detail in the section on YEOI, while secondary and tertiary education will be studied in depth in the section on YEAI.

���
FIGURE 6.1 Youth Education Outcome Index (YEOI) and Youth Education Access Index (YEAI) across Indian States
Youth and Education

India Youth Development Report 20�0 ��2
TABLE 6.2 Youth Education Outcome Index (YEOI) and Youth Education Access Index (YEAI) across Indian States
States YEI YEOI YEOf YEOm YGEOI YGEOISR YEAI YGEAI YGEAISR
India 0.413 0.472 0.409 0.530 0.464 0.445 0.223 0.219 0.210AndhraPradesh 0.408 0.454 0.379 0.526 0.442 0.436 0.255 0.249 0.246Arunachal 0.354 0.393 0.353 0.432 0.389 0.382 0.216 0.211 0.207PradeshAssam 0.417 0.496 0.459 0.531 0.493 0.483 0.176 0.173 0.170Bihar 0.298 0.355 0.254 0.448 0.328 0.314 0.107 0.090 0.086Chhattisgarh 0.350 0.392 0.311 0.470 0.376 0.370 0.206 0.197 0.195Delhi 0.603 0.661 0.605 0.707 0.657 0.586 0.434 0.430 0.383Goa 0.548 0.640 0.623 0.658 0.640 0.624 0.289 0.288 0.280Gujarat 0.429 0.498 0.424 0.564 0.488 0.462 0.213 0.210 0.199Haryana 0.462 0.534 0.463 0.594 0.526 0.482 0.243 0.242 0.222Himachal 0.611 0.611 0.573 0.647 0.608 0.595 0.614 0.614 0.600PradeshJammu& 0.421 0.496 0.424 0.561 0.486 0.462 0.191 0.190 0.180KashmirJharkhand 0.315 0.380 0.286 0.468 0.358 0.345 0.104 0.099 0.096Karnataka 0.419 0.471 0.422 0.518 0.466 0.455 0.247 0.246 0.240Kerala 0.575 0.694 0.684 0.704 0.694 0.678 0.275 0.275 0.268MadhyaPradesh 0.363 0.406 0.333 0.471 0.394 0.371 0.216 0.203 0.191Maharashtra 0.509 0.577 0.536 0.613 0.574 0.538 0.301 0.300 0.281Manipur 0.515 0.601 0.579 0.622 0.600 0.594 0.269 0.268 0.265Meghalaya 0.402 0.460 0.452 0.469 0.460 0.454 0.209 0.208 0.206Mizoram 0.481 0.564 0.561 0.567 0.564 0.551 0.235 0.234 0.229Nagaland 0.441 0.559 0.544 0.573 0.559 0.538 0.115 0.115 0.111Orissa 0.391 0.439 0.376 0.501 0.430 0.429 0.228 0.210 0.209Punjab 0.481 0.568 0.551 0.583 0.568 0.526 0.224 0.224 0.208Rajasthan 0.325 0.367 0.271 0.453 0.344 0.326 0.178 0.158 0.150Sikkim 0.424 0.499 0.452 0.541 0.495 0.465 0.191 0.191 0.179TamilNadu 0.496 0.561 0.520 0.602 0.558 0.558 0.294 0.293 0.293Tripura 0.399 0.458 0.436 0.480 0.457 0.453 0.205 0.203 0.201UttarPradesh 0.372 0.421 0.345 0.488 0.409 0.382 0.207 0.200 0.187Uttaranchal 0.501 0.557 0.547 0.566 0.556 0.545 0.322 0.320 0.314WestBengal 0.399 0.470 0.413 0.523 0.463 0.450 0.176 0.172 0.167
Note : YEOI-YouthEducationOutcomeIndex;YGEOI-YouthGenderOutcomeIndex;YGEOI SR-YouthGenderEducationOutcomeIndex,adjustedforSexRatio;YEAI-YouthEducationAccessIndex;YGEAI-YouthGenderEducationAccessIndex;YGEAI SR-YouthGenderEducationAccessIndexadjustedforSexRatio.

���
As Figure 6.1 and Table 6.2 indicate, Himachal Pradesh had a high score for both the YEO and the YEA. Delhi and Uttaranchal had a difference in value between the YEO and the YEA of 0.227 and 0.235 respectively while in all the other States the difference was much higher. This shows that access to secondary and tertiary education is not available to a large number of youth. It is generally understood that those in urban areas have a higher level of education than rural areas (Parasuraman et al 2009). In this index, it is true of Delhi which is the most urbanized state in the country (94.05%), but Himachal Pradesh that ranks first in education, has one of the lowest levels of urbanization (10.17%). Over the years, Kerala and Himachal Pradesh have emerged as leaders amongst Indian States in education and literacy initiatives3. Though Kerala has for long had the distinction of being ahead of others in terms of literacy and universalizing elementary education (HDI, Kerala, 2005), it ranks third in the YEI. The State gets a low score for the Access Index and a high score for the Outcome Index.
When computed for gender differentials and sex ratio, the values of the YEI further decrease progressively. It is only in Himachal Pradesh that the values are nearly the same for the YEI and the sub-indexes of education.
6.3 Youth Outcome Index - Educational AttainmentFor the computation of YEO India, the NSS Data, 62nd round, 2005-06 (age group 13-35 years) was used. Differential weightage was given for the different levels of education. The data on vocational training was included for the final computation. The original data from the NSSO 2005-06 are given in Volume 2.
In terms of the YEO in the Index (Table 6.2), the India average was 0.472, wherein Kerala (0.694) ranks the highest followed by Delhi (0.661), Goa (0.640) and Himachal Pradesh (0.611). The YEO is higher than the YEAI due to the high performance of literacy and primary education in nearly all the States. The States which had a very low YEO were Bihar (0.355), Rajasthan (0.367); Jharkhand (0.380), Arunachal Pradesh (0.393) and Chhattisgarh (0.392).
3ForeducationalinitiativesinHimachalPradesh,seeDrezeandSen2002:177-184
Youth and Education

India Youth Development Report 20�0 ���
FIGURE 6.2 Youth Education Outcome Index (YEOI) by Indian States

���
FIGURE 6.3 Youth Education Outcome Index (Educational Attainment) for Indian Males
Youth and Education

India Youth Development Report 20�0 ���
TABLE 6.3 Proportion of Population at Different Levels in Education in Indian States
Proportion of Population at Different Levels in Education (%) Illiterate Just Primary Secondary Tertiary Vocational literateStates F M F M F M F M F M F MIndia 32.5 15.0 8.3 9.0 33.4 40.3 14.8 20.4 4.3 5.5 6.9 9.7AndhraPradesh 40.6 20.5 7.5 7.9 25.1 30.6 13.6 22.7 2.6 6.9 10.7 11.5Arunachal 36.7 23.6 13.2 13.6 30.8 35.7 10.6 20.9 3.0 3.4 5.6 2 . 9PradeshAssam 15.7 7.7 14.6 10.9 47.4 52.4 15.9 19.7 1.8 5.3 4.8 4.1Bihar 52.7 25.9 11.5 13.1 21.6 30.3 9.5 18.1 0.9 3.1 3.7 9.7Chattisgarh 40.7 18.5 15.3 14.9 30.7 39.2 6.3 14.8 2.5 2.6 4.7 10.0Delhi 7.5 1.7 11.9 4.4 36.4 32.2 20.0 32.8 18.0 21.6 6.3 7.3Goa 9.4 4.2 4.4 1.6 38.5 40.7 23.2 33.9 14.6 9.2 9.9 10.4Gujarat 29.0 9.8 8.9 9.4 36.7 43.4 14.6 19.5 4.2 4.4 6.7 13.3Haryana 24.9 10.0 6.1 6.6 39.1 38.2 18.8 26.2 4.1 6.1 7.0 13.0Himachal 12.7 3.8 7.1 4.2 35.1 38.2 28.7 36.5 6.2 6.0 10.2 11.2PradeshJammu& 31.7 13.5 5.5 4.5 35.1 41.5 17.3 24.8 2.8 3.9 7.7 11.7KashmirJharkhand 48.0 21.2 9.4 10.4 28.1 39.8 9.8 16.8 3.3 6.0 1.5 5.7Karnataka 29.4 13.8 6.6 8.6 37.6 44.3 18.7 23.1 3.3 4.8 4.5 5.4Kerala 2.5 1.3 2.2 2.2 39.8 41.1 29.7 24.5 8.4 5.1 17.2 25.8MadhyaPradesh 40.6 18.1 14.3 14.8 26.3 40.7 9.0 13.5 4.0 5.4 5.8 7.5Maharashtra 15.5 5.8 5.7 4.6 42.0 44.4 23.0 29.0 6.2 6.7 7.6 9.5Manipur 5.6 2.5 7.7 3.5 48.2 49.7 26.1 31.1 2.8 7.5 9.5 5.6Meghalaya 10.5 7.5 21.6 24.1 49.7 49.2 12.9 11.7 3.1 4.6 2.2 2.9Mizoram 3.1 2.0 5.1 7.6 62.5 60.0 22.9 22.1 3.4 4.9 3.0 3.3Nagaland 10.3 7.5 7.8 1.8 48.9 55.4 20.0 24.5 3.6 8.1 9.3 2.7Orissa 35.4 17.4 10.8 13.4 31.5 36.9 12.2 15.9 3.7 5.7 6.3 10.8Punjab 18.9 15.0 4.7 5.4 32.0 31.9 25.9 27.2 7.1 4.4 11.4 16.2Rajasthan 52.1 21.3 7.5 10.1 26.8 43.4 7.6 16.3 2.6 4.8 3.6 4.1Sikkim 11.9 3.0 15.3 15.3 56.5 54.3 12.3 17.4 2.1 1.6 1.8 8.5TamilNadu 15.6 7.8 8.1 6.0 42.4 42.0 20.0 25.7 6.3 6.7 7.5 11.7Tripura 10.6 5.9 23.0 20.4 52.6 55.2 9.3 13.4 3.3 4.0 1.3 1.2UttarPradesh 44.6 19.3 4.9 8.0 28.3 42.2 12.3 18.7 4.2 5.6 5.7 6.1Uttaranchal 15.4 7.7 7.7 2.7 37.3 51.4 21.7 31.8 14.7 6.1 3.2 0.3WestBengal 28.1 15.8 11.0 12.6 40.4 39.0 8.6 11.7 3.4 4.4 8.4 16.5
F-FemaleM-MaleEO-EducationOutcome

���
Figures 6.2, 6.3, and 6.4, and Table 6.3 show the data related to Educational Outcome when computing the YEI. When comparing the YEO (female) to YEO (male), the difference was highest in Bihar (0.191) followed by Jharkhand and Rajasthan (0.182 for both States). It is seen that the percentage of educational attainment decreases with higher levels of education. The least percent attain tertiary education and a very small percent experience vocational training of any kind.
Figure 6.2 shows the YEOI values of the States in ascending order. Kerala which has the highest is followed by Delhi, Goa and Himachal Pradesh. All these States have a value above 0.6. The States with the lowest values (less than 0.4) are Bihar, Rajasthan, Jharkhand, Chhattisgarh and Arunachal Pradesh.
FIGURE 6.4 Youth Education Outcome Index
(Educational Attainment) for Indian Females
Youth and Education

India Youth Development Report 20�0 ���
FIGURE 6.5 Educational Attainment of Respondents in Primary Research
Note : ‘India’pertainstotheaverageof allthe11locationsinthestudy
The data in the primary research (Figure 6.5) showed that except for West Bengal (58%), all the other States had more than 70% youth who had studied beyond primary education. The India average was 84%. However, those who have studied up to SSC and above are much fewer as shown in the box below.
Youth studying above SSCKerala:88%Delhi:76%Maharashtra:62%UttarPradesh:62%A&NIslands:52%JammuandKashmir:41%
(primary data)Rajasthan:40%Nagaland:33%TamilNadu:33%Assam:24%WestBengal:19%India : 45%
FIGURE 6.6 Educational Status by Religion, Caste and Standard of Living
Note : ‘Others’includereligionsotherthanHindusandMuslims

���
Figure 6.6 shows that caste and standard of living are two dimensions which have influenced the level of educational attainment. The lowest percent of those in higher education was from the SC group, followed by the ST and OBC; and the highest percent was from the ‘others’ category. Similarly, the data shows that the highest percent of those in tertiary education are from the ‘high’ category of the SLI. In terms of religion, the least percent in tertiary education is from Muslims. These are similar to the trends of the secondary data.
6. 3.1. Primary Education and Literacy
‘Literacy is an essential tool of self-defence in a society where social interactions include the written media. An illiterate person is significantly less equipped to defend herself in court, to obtain a bank loan, to enforce her inheritance rights, to take advantage of new technology, to compete for a secure employment, to get on the right bus, to take part in political activity – in short, to participate successfully in the modern economy and society. Similar things can be said about numeracy and other skills acquired in the process of basic education.’ (Dreze and Sen 2002:140)
The government has always considered literacy and primary education as major indicators of development. The literacy rates as per the 2001 census also differ from one Indian State to the other and this variation takes place for the different age groups between 15 and 34 years. States such as Uttar Pradesh and Bihar had total illiteracy for youth shown as 19.34% and 11.09% respectively whereas in comparison, Himachal Pradesh and Kerala were much lower at 0.44% and 1.36% respectively.
Figures 6.3 and 6.4 and Table 6.3 of the YEO show a high percent of illiteracy among females and a wide gap in gender differentials. For India, the illiteracy rates are 32.5% for females and 15% for males. There are seven states where female illiteracy is above 40% and five States where male illiteracy is above 20%. The states with an illiteracy rate of more than 40% for females were Bihar (52.7%), Rajasthan (52.1%), Jharkhand (48%), Chhattisgarh (40.7%), Andhra Pradesh (40.6%) and Madhya Pradesh (40.6%). The highest rate for male illiteracy is 25.9% in Bihar and no state has a male illiteracy rate above 25%. The largest gap between the percent of males and females in relation to illiteracy is in Bihar (57.7% females, 25.9% males), followed by Rajasthan (52.1% females, 21.3% males).
The data related to primary education shows that for India, the attainment levels are low with 33.4% for females and 40.3% for males (for India). The gap in male attainment and female attainment is 6.9%. According to the 2001 census, the literacy rate of SCs was 54.69% and that of STs was 47.10% as against the national average of 64.84%. Overall in literacy, the gap between STs and “Others” has reduced between 1991 and 2001. Further, the decrease in dropout ratios over this period shows an improvement in completion in all categories of school education. However, in the important area of secondary school education, the gap between STs and ‘others’ has gone up from 14.2
Youth and Education

India Youth Development Report 20�0 200
to 17.7 percentage points, while the Dalits (SCs) are closing this gap (Sarkar, S., & Mishra, S. et al, 2006).
The National Policy on Education (1986 modified in 1992) emphasizes the eradication of illiteracy especially for the age group of 15-35 years, and the universalization of primary education. Schemes such as the Sarva Shiksha Abhiyan (SSA) (for those in the age group of 6-14years) are expected to provide supportive measures to ensure that children and adolescents remain in the education system.
A reminder needs to be made here to the importance of each young person’s development. Although the literacy rate has been increasing, we cannot be satisfied until there is 100% literacy and 0% dropout rate, with support given to the youth who need a ‘second chance’ and those that have taken a break in education. Around 30% of those in the age group of 15-35 years are functionally illiterate, as they are too old to benefit from SSA and also not the primary target group in literacy programmes (NKC, 2009).
The present scenario in India is quite poor compared to the international scene. Economic competitors like China have shown a much stronger commitment to raising literacy rates in their country. Whereas the GDP per capita (constant 2000 US$) in the year 2002 is 477.4 in India, it is 1106 in China (Asia Pacific Human Development Report 2006). Consequently (taking other factors into account as well), HDI trends show China ranking 85th amongst 177 countries and India as 127th. The Youth Literacy of India (% aged 15-24 years) as compared to other countries is very poor indeed – latest figure for India (1995-2005) is 76.4 which is very low compared to the youth literacy rates in most European, East-Asian, as well as many African countries.4
At far as adult literacy is concerned, about 40 million adult illiterates are estimated to become literate through adult literacy programmes during 2001-11. With this achievement, the literacy rate for age group 15 years and over will be around 73% by 2011 (Prem Chand, 2007).
6.3.2 Secondary Education
Figure 6.7 pertains to the data related to secondary education. Here again, it is clear that only 14.8% females and 20.4% males attain secondary education. In all the States except Meghalaya, the percent of females who attain secondary level of education is lower than that of males. It is seen that out of 100 entering Std. I, less than 50 continue till secondary level of education.5
4Comparativechartof youthliteracyrateacrosscountries,http://hdrstats.undp.org/indicators/112,html5SeeKinBingWuandDar,A,http://info.worldbank.org/etools/docs/library/235784/2Amit%20Darsecondary.pdf

20�
FIGURE 6.7 Attainment of Secondary Education by Sex
6.3.3 Tertiary Education
Figure 6.8 clearly shows that a very small proportion of Indian youth reach the tertiary levels of education (4.3% for females, 5.5% for males). It is significant to note that the percentage of females (14.7%) is higher than males (6.1%) only in the State of Uttaranchal.
In the present context, data across the country shows that once girls do have access to higher education, their performance is on par with that of boys. Performance related data show that in recent years girls have been performing better than boys in most competitive examinations.
Youth and Education

India Youth Development Report 20�0 202
HSC results of 2006 2007 Maharashtra Girls : 77.15% Girls: 77.15% Boys : 68.02% Boys: 70.07%‘Girlsoutshoneboysatthisyear’sconvocationattheUniversityof Mumbai,bygrabbing40of the71goldmedals’TOI,Mumbai,Feb.13th2008,pg.11
FIGURE 6.8 Attainment of Tertiary Education by Sex
Series 2-males; series1-females
20�
There are a few instances where research has shown that when girls do access higher education, they perform better than their male counterparts. One such research shows how a group of English-speaking girls have an advantage over boys from lower class jatis. The findings reveal that:
…male working class networks, organized at the level of the sub-caste or jati, continue to channel boys into traditional occupations despite the fact that returns to non-traditional (white collar) occupations have risen substantially during the post-1990s reform period. In contrast, girls who have had historically low labour-market participation rates and few network ties to constrain them, appear to be taking full advantage of the opportunities that have become available in the new economy. It is generally believed that the benefits of globalization have accrued disproportionately to the elite in developing countries. In this setting, we instead find that a previously disadvantaged group (girls) might surpass boys in educational attainment and employment outcomes in the future in the most heavily networked jatis. (Munshi and Rosenzweig, 2005: 30)
The trend of girls going for higher education as compared to boys is seen in other communities too where the traditional occupation has been trade/ business or a particular skill-based work which is male-dominated. In such communities, when educational opportunities are opened up for girls, they have opted for higher education to seek other careers, as there are no openings in their community occupation eg in Punjab, where agriculture is largely conducted by males, girls are going in for higher education and seeking other careers. Similar trends are being observed in some pockets of the Muslim community where the predominant occupation is artisans and craftsmanship; and the girls are slowly opting for higher education. This trend is observed in the Parsi community also (Narayan, 2008).
6.3.4 Vocational Training
The part of education which does not contribute to the process of economic development may be considered ineffective as human capital… that part of expenditure on education which is spent on students who do not complete the course and cannot join the labour market may be considered as a wastage of human capital (Upadhyay, 2007).
The need for lifelong learning opportunities is also well-recognized especially in the era of rapid technological changes. Transitions between education and work are no longer linear; regularly expanding one’s basket of skills and upgrading specific
Theyouthfeelthattheneedof thehouristogetawideskillsbaskettoequipthemfortheglobalized,technology-drivenmarket.Thiswasstronglyendorsedbytheyouthandexpertsinalltheregionalworkshopsheldinthesecondphaseof thisproject(RGNIYD,2009).
Youth and Education

India Youth Development Report 20�0 20�
work skills are the need of the day, and it is necessary to understand whether such opportunities exist.
Figure 6.9 shows the percentage of youth who had undergone some form of vocational training. In terms of state performance, Kerala is the highest at 21.48% while Tripura is the lowest at 1.26%. More than 90% of the youth in the country did not receive any kind of vocational training either through formal or non-formal means (including family occupations). The NSS (2005-06) data also showed that only 6.9% females and 9.7% males had got some form of vocational training. The Kothari Commission on Educational Reforms, 1966 had visualized that 25 percent of the students at the secondary stage would go for the vocational stream. At present, only about 5 percent of children in the age group of 16-18 years are in the vocational stream.
FIGURE 6.9 Vocational Training in Indian States

20�
FIGURE 6.10 Status of Vocational Training in Indian States/UT(Primary Research)
As per the primary research, only 12.9% (672) had received some form of vocational/ technical education. Figure 6.10 shows the data related to the 672 youth who had undergone training ranges from 42% in A&N to 7% in Uttar Pradesh and West Bengal. Except for A&N, all the other States were 20 % and below. Data indicate a higher percentage of youth in the age group of 18-24 years, which could be expected as those are the years during which many youth choose to undergo vocational training and are eligible for many courses.
Of those who had undergone vocational/ technical education, the percentage was slightly higher in urban areas (15.5%: 263) as compared to those in rural areas (11.6%: 406). It was interesting to note that the percentage of females was slightly higher (13.5%: 313) than that of males (12.4%: 357). In terms of religion and caste, it was the ‘others’ category which had the highest ‘percent’ of those who had undergone vocational training, while there was a higher percent of those with a ‘high’ SLI who had undergone vocational training.
Skills education is being given greatest emphasis through both government initiatives as well as the private sector, given the economic competitiveness in which India has begun to play a significant role, but faces severe shortages. Several references are made to skills education and vocationalization ( vocational education/ training) in policies such as the National Youth Policy 2003.
�0th or �2th standard education can be considered as the minimum level required but we wondered what one really stands to gain. In many cases, vocational training to support employability proves to be a more significant form of education...AyouthfromDelhi
Youth and Education

India Youth Development Report 20�0 20�
The 11th Five Year Plan (section 1.6.13) states:
“At the present pace of economic development, the country cannot train everyone to become skilled professionals. Even university level education to all cannot be ensured. But our industries require skills in specific trades, and India has historically lagged behind in the area of technical/ vocational training. Even today, enrolment rates in Industrial Training Institutes (ITIs) and other vocational institutions, including nursing and computer training schools, are only about a third of that in higher education. This is quite the opposite of other Asian countries which have performed better than us in labour intensive manufacturing. Vocational training institutes need to be substantially expanded not only in terms of the persons they train but also in the number of different skills and trades for meeting industry requirements as well as creating opportunities for self-employment.”
In order to meet the great demand and need for vocational training, The NKC, 2009 proposes a New Skill Development Mission (2008) with an outlay of Rs 31,200 crore with the goal of more polytechnics, vocational schools and skill development centres.
6.4. Youth Education Access Index - Gross Enrolment RatioA significant percentage of the youth in India do not have access to education. Andre Beteille traces its historical roots as follows:
Indian society had a deeply hierarchical structure in which life chances were most unequally distributed than perhaps in any other society in the world. Even after the adoption of a modern system of education with its schools, colleges and universities in the middle of the 19th century, access to education remained highly restricted for a 100 years, not only on account of severe economic inequalities but also because of strong and deeply-rooted social prejudices against women and against disadvantaged castes and communities. Colonial rule served to ease some of the social prejudices but did little to address existing inequalities in the distribution of material resources. (Beteille 2008: 40)
Though the enrolment in secondary and higher secondary education is rising, the enrolment ratio as per the 2003 statistics is still under 40% (Kin Bing Wu, Dar,A)6
It is also to be noted that secondary education is governed by the State policies, within a larger national framework.
6SecondaryEducationin.India–Investinginthe.Future.KinBingWuandAmitDar.(WorldBank).Page2.2.SystemDescription...info.worldbank.org/etools/docs/library/.../2Amit%20Darsecondary.pdf -Similar

20�
TABLE 6 .4 Youth Education Access Index (YEAI) across Indian States
Gross Gross Enrolment Enrolment Rate at Rate atStates Secondary Tertiary YEAIf YEAIm YEAI YGEAI YGEAISR Level Level Female Male Female Male India 0.342 0.434 0.079 0.109 0.193 0.250 0.223 0.219 0.210Andhra 0.423 0.515 0.081 0.133 0.218 0.290 0.255 0.249 0.246PradeshArunachal 0.358 0.468 0.043 0.066 0.184 0.246 0.216 0.211 0.207PradeshAssam 0.276 0.350 0.056 0.078 0.152 0.200 0.176 0.173 0.170Bihar 0.098 0.208 0.032 0.089 0.063 0.147 0.107 0.090 0.086Chhattisgarh 0.292 0.430 0.054 0.090 0.163 0.248 0.206 0.197 0.195Delhi 0.537 0.484 0.437 0.338 0.480 0.396 0.434 0.430 0.383Goa 0.572 0.584 0.148 0.094 0.311 0.269 0.289 0.288 0.280Gujarat 0.331 0.428 0.089 0.107 0.187 0.237 0.213 0.210 0.199Haryana 0.395 0.455 0.098 0.101 0.231 0.253 0.243 0.242 0.222Himachal 1.276 1.352 0.131 0.139 0.594 0.633 0.614 0.614 0.600PradeshJammu& 0.312 0.384 0.061 0.066 0.175 0.206 0.191 0.190 0.180KashmirJharkhand 0.113 0.170 0.053 0.085 0.081 0.125 0.104 0.099 0.096Karnataka 0.446 0.475 0.095 0.110 0.237 0.256 0.247 0.246 0.240Kerala 0.622 0.595 0.092 0.068 0.283 0.267 0.275 0.275 0.268Madhya 0.267 0.418 0.073 0.138 0.161 0.264 0.216 0.203 0.191PradeshMaharashtra 0.520 0.575 0.105 0.145 0.280 0.320 0.301 0.300 0.281Manipur 0.463 0.495 0.115 0.142 0.253 0.285 0.269 0.268 0.265Meghalaya 0.336 0.321 0.102 0.120 0.206 0.212 0.209 0.208 0.206Mizoram 0.441 0.432 0.071 0.123 0.222 0.247 0.235 0.234 0.229Nagaland 0.209 0.211 0.042 0.047 0.114 0.116 0.115 0.115 0.111Orissa 0.342 0.509 0.033 0.131 0.163 0.292 0.228 0.210 0.209Punjab 0.399 0.389 0.107 0.088 0.232 0.218 0.224 0.224 0.208Rajasthan 0.203 0.423 0.043 0.075 0.117 0.234 0.178 0.158 0.150Sikkim 0.335 0.331 0.077 0.097 0.190 0.191 0.191 0.191 0.179TamilNadu 0.622 0.630 0.094 0.106 0.285 0.302 0.294 0.293 0.293Tripura 0.363 0.407 0.049 0.068 0.187 0.223 0.205 0.203 0.201UttarPradesh 0.277 0.413 0.068 0.089 0.168 0.241 0.207 0.200 0.187Uttaranchal 0.517 0.620 0.123 0.129 0.296 0.348 0.322 0.320 0.314WestBengal 0.267 0.346 0.059 0.096 0.147 0.204 0.176 0.172 0.167
Youth and Education

India Youth Development Report 20�0 20�
FIGURE 6.11 Youth Education Access Index (YEAI) by Sex across Indian States
As Table 6.4 shows, the YEAI was based on the GER for secondary and tertiary education and the score for India is a very low 0.223. The overall GER for India as per the HDI Index, 2007 was 61% – ranking 134 out of the total. The expected trend is that the GER is (will be) lower than the Educational Attainment, especially as the YEAI only considers the secondary and tertiary education enrolments. This was the case in all the States, except for Himachal Pradesh which has a GER higher than the Educational Attainment. The Education Index clearly indicates that in most States the GER is low. The highest rank was 0.614 (Himachal Pradesh), and the lowest 0.107 (Bihar) – the range between the highest and the lowest being 0.508. Fifteen States had a rank below the India score, and 14 above. Only four States had a score above 0.3 (Himachal Pradesh, Delhi, Maharashtra and Uttaranchal).

20�
Kerala’s YEAI is only 0.275 which is largely due to the fact that the State has a high dropout rate at the secondary and tertiary levels of education. The Kerala Education Commission puts the figure at 15% of youth entering colleges, while Tilak (2001) puts the enrolment rate in higher education at about 3.7% (HDI Report, Kerala, 2005). This is generally the situation across the country whereby there is a high dropout rate at the secondary and tertiary levels of education.
The essence of human resource development is that education must play a significant and interventionist role in remedying imbalances in the socio-economic fabric of the country
FIGURE 6.12 Youth Education Access Index (YEAI) (State-wise)
Figure 6.12 shows the YEAI by States in ascending order of values. Himachal Pradesh, Delhi, Uttaranchal, and Maharashtra have values above 0.3; while Jharkhand, Bihar, Nagaland, West Bengal, Assam, Rajasthan, Sikkim and Jammu & Kashmir have values below 0.2.
Youth and Education

India Youth Development Report 20�0 2�0
However, thesuccessof achievingan increase in literacyandschoolenrolment ratesis counteracted by the high dropout rates. In some Indian states, the Elementaryschooldropoutrate(GradeI-VIII)fortheyear2004-2005isashighas74.7inBiharand Jharkhand combined. (Ministry of HRD, 2007). Primary school dropout rate(GradeI-V)forthesameyearwashighestinRajasthanat56.6%andtheprimaryschooldropoutsforthecountryasawholein2003-2004wasashighas31%.Variousfactorsneedtobeconsideredwithregardtothesehighratesincludingtheroleof teachersandtheteacher-studentratiowhichforinstanceinprimaryeducation(2004-05)isBihar,is104,inJharkhand81andinRajasthan49.(http://youthportal.gov.in)
FIGURE 6.13 GER for Secondary Education by Sex (State-wise)

2��
The GER for secondary education given in Table 6.4 and Figure 6.13 shows that for India, the values are 0.342 for females and 0.434 for males. The percentages for males and females are nearly the same in the North East States of Manipur, Meghalaya, Mizoram and Nagaland, Punjab, Kerala and Tamil Nadu. There are stark differences in the male-female values of the GER in the States of Rajasthan, Madhya Pradesh, Uttar Pradesh, Chhattisgarh and Bihar.
15yearoldNazneenisfromKargildistrict.Shestartsherdayveryearlyinthemorning,andcanonlyrestlateevening.Shejoinedthehandicraftsworkwhenshewas12yearsold,whichisfarawayfromhome.Heparentsforciblypushedhertowork,asitisatraditionheretosendoneof thechildrentowork.Herparentsthinkthatthereisnootheroptionheretosendhertoworkastheschoolsarenotgoodandnotaccessible.Nazneenhastoshoulderresponsibilityinthehouseholdwork,fetchwaterfordomesticpurposes,cookforthefamilyandthencompleteherwork.Allherearningsaretakenbyherparents.Shewouldhavelikedtocontinueherstudiesratherthanwork,buttheconditionsathomeandtheneedtosupplementthefamilyincomestopherfromdoingso.Whenshewasaskedif shewouldliketojoinschoolagainshesaid“NO”,asshehadlostinterest,andasmostof thestudentsof heragewouldbeintheseniorclasses.Sheisalsoawarethatworkingatthisstagewillnotonlyaffectherpresentbutalsothefuture.Shealsonowworkswiththeintentionof supportinghersiblings’educationandensuringthattheydonotdropoutof school.Shedreamsof becomingarichpersoninfuturesothatshecanhelpbreakthiscycleof femalelabouratayoungage...submittedbyBilalAhmadBhatKargilCentreforCentralAsianstudies,Universityof Kashmir,J&K.
TABLE: 6.5 Enrolment Data for India, Covering Primary, Middle and Secondary Education (2004-2005)
Source: Selectededucationalstatistics2004-2005,Governmentof India;Ministryof HumanResourceDevelopment,NewDelhi(CitedinWankhede,2010).
Enrolment Total Scheduled castes Scheduled tribes (figures in millions) (in thousands) (in thousands)
Male Female Total Male Female Total Male Female Total
Primary(1-5) 69.7 61.1 130.8 13762 10995 24757 7367 6369 13737
Middle/upper 28.5 22.7 51.2 5100 3597 3597 2395 1776 4171primary(6-8)
Sec./Sr.Sec./ 21.7 15.4 37.1 3228 3228 5218 1290 795 2085Inter/Predegree(9-12)
Youth and Education

India Youth Development Report 20�0 2�2
TABLE 6.6 Dropout Rate in India Covering Primary, Elementary and Secondary Education
Source: FromSelectededucationalstatistics2004-2005,Governmentof India;Ministryof HumanResourceDevelopment,NewDelhi.(CitedinWankhede,2010)
Dropout rate Total Scheduled castes Scheduled tribes(%) Male Female Total Male Female Total Male Female Total
Primary(1-5) 31.81 25.42 29 32.7 36.1 34.2 42.6 42 42.3
Elementary(1-8) 50.49 51.28 50.84 55.2 60 57.3 65 67.1 65.9
Secondary(1-10) 60.41 63.88 61.92 69.1 74.2 71.3 77.8 80.7 79
Tables 6.5 and 6.6 depict the status of the SC and ST groups in terms of enrolment and dropout rates. It is clear that about 29% drop out at the primary stage itself, with a high rate of 42% for the ST group.
FIGURE 6.14 GER for Tertiary Education by Sex
(State-wise)

2��
The level of higher education is determined by the size of institutional capacity of higher education system in the country. The size of higher education system in turn, is determined by three indicators: the number of educational institutions (universities and colleges), number of teachers and number of students. (UGC, 2008: 2).
In terms of institutional capacity, since 1950, there has been a phenomenal increase in the number of universities (20 to 431); colleges (500 to 20,677); and teachers (15,000 to nearly 5.05 lakhs). However, the number of students enrolled has increased only from 1 lakh in 1950 to 116.12 lakh in 2008 (UGC, 2008).
Yet Table 6.4 and map 6.6 show that the approximate GER for tertiary education is 0.94. As per the UGC data, the GER at the tertiary level (graduates) based on Selected Education Statistics (SES) was about 11% in 2007, while the GER based on NSS 2004-05 is 12.59%; census data 2001, 13.6%. The 11% GER is very low as compared to the world average of 23% or 36.5% for countries in transition. (Thorat, 2008). The GER is much lower in the States of Arunachal Pradesh, Bihar, M.P., Meghalaya, Mizoram, Rajasthan, Sikkim, Tripura, and Jharkhand. (Thorat, 2008).
In the YEAI, GER scores for males (0.109) and females (0.079) are very low for India. In nearly all the States, the GER for females is lower than for males with the exception of Uttaranchal, Kerala and Goa where a higher percentage of females are enrolled at the tertiary education level.
However, the growth rate in higher education has been 8.77% for women and 5.22% for men (based on census-adjusted figures for two rounds – 1993-94 and 1999-2000), though the rate is much lower for females than for men. (Raju, S,2008).
It isobservedthatusuallyparentsaredecision-makersregardingeducationof minorgirls; when economics take precedence, girls are the first casualty. However, when girls reachanageof decision-making,theytaketheirstudentrolemoreseriouslythanboys.Girls are alsonot seen asprimarybreadwinners and, hence, theyhave the choice tocontinueeducationonlytilltheygetmarriedorwork.Thereasonsforboysdroppingoutof highereducationareoftenthattheyprefertogetjobsratherthanpursuehighereducationwhichhasnovalue. Inspiteof all the limitationsof the formaleducationsystem, thepositivecorrelationbetweenwomen’seducationand lower fertility,betterhealth, intergenerational mobility and other social development indicators have beenwell-established.
Youth and Education

India Youth Development Report 20�0 2��
Source: MHRD (N. Knowledge Commission Report, 200�, Pg. ���-���)
TABLE 6.7 Status in Colleges of Higher Education in India (2005)
Details Number
Totalnumberof colleges 17,625
Numberof collegesunderUGCpurview 14,000
Numberof collegesrecognized 5,589(40percent)underSection2(f)of UGCAct
Numberof collegesrecognized 5,273(38percent)underSection12(B)of UGCAct
Numberof collegesactually 4,870(35percent)fundedbytheUGC
Numberof collegesaccreditedby 2,780(20percent)theNAAC
Numberof collegesaccreditedby 2,506(17.9)theNAACandscoringabove60percent
The distribution of colleges across the country also shows pockets of high density while there are others with very few colleges. This has resulted in high migration of youth from the North-East States to other cities such as Delhi, Bangalore and Pune.
Table 6.7 depicts the number of colleges for 100,000 youth population (age group 15-34 years) and shows the inequitable distribution across the country. This is an indicator of access to tertiary education for the youth in a particular State. For India, it is a low 1.92%; the highest is Manipur (6.51%); while Bihar and Jharkhand have the lowest access for college education for their youth. One sees the disproportionate ratio of youth in tertiary education and access to colleges. When looking at the growth rate of colleges from 2000-01 to 2004-05, it was seen that one-third of the colleges were located in the four States of the South; followed by the Central region (22%); Western (19%); and Eastern (11.5%). The North-East region had only 3.5% of the colleges. The highest growth rate occurred in the Central region – largely Uttarakhand (30.3%) and Uttar Pradesh (13.8%). Of the Southern States, Kerala witnessed the highest growth rate of 17.3%. (Duraiswamy, 2008)

2��
TABLE 6.8 Accessibility of Colleges and Percentage of Indian Youth in Tertiary Education
*Calculated from the number of colleges in a state and the total youth population of that state
Youth in Tertiary Number of Colleges for 100,000 States Education (%) Youth Population (15-34 years)*
India 6.22 1.92AndhraPradesh 6.26 9.44ArunachalPradesh 3.97 1.63Assam 4.11 4.20Bihar 2.65 1.29Chhattisgarh 3.21 2.10Delhi 23.27 1.49Goa 14.67 4.96Gujarat 5.49 2.04Haryana 6.67 2.11HimachalPradesh 7.86 2.26Jammu&Kashmir 4.46 2.78Jharkhand 5.72 1.08Karnataka 4.82 3.09Kerala 9.56 1.98MadhyaPradesh 6.09 2.19Maharashtra 7.97 2.59Manipur 6.25 6.51Meghalaya 4.48 3.99Mizoram 4.82 6.02Nagaland 7.12 1.83Orissa 5.97 2.84Punjab 7.52 2.49Rajasthan 4.53 1.29Sikkim 2.2 1.18TamilNadu 8.18 1.48Tripura 4.24 1.40UttarPradesh 6.2 2.52Uttaranchal 12.29 1.58WestBengal 5.35 1.38
Youth and Education

India Youth Development Report 20�0 2��
The Central Advisory Board for Education concluded on the basis of international experience that an enrolment rate of 20 percent or more is consistent with a turnaround in economic performance. If India has to achieve the target soon, it would imply more than doubling the scale and size of the higher education system within the next 5 - 7 years. The challenge is great, as with the existing high disparities, inclusive education has remained an elusive target. Inter-caste, male-female and regional disparities in enrolment still remain prominent.
6.5 Science and Technology EducationUnfortunately, the quality of research at the higher levels of education is dismal, largely due to the lack of quality infrastructure and the inability to recruit good young faculty and gifted students. (NKC, 2009: 111). The National Youth Policy (2003) and the NKC, 2009 emphasise the need to provide opportunities to youth for education in science and technology. The NKC, 2009 recommends the creation of a National Science and Social Science Foundation to look at all knowledge as one seamless activity.
The takers for pure science are fewer than those who aspire to become engineers and doctors. In order to encourage youth to engage in mainstream research, the government has the following schemes (Sabherwal, 2010):1. Ramanujan Fellowships: for meritorious researchers and engineers (in India
and abroad) who wish to take up pure research studies in India. 2. Fast Track Scheme for Young Scientists (FAST): Started in 2000, this
scheme provides quick support to young scientists to pursue research in existing realms of science and engineering. This scheme also encourages the Science and Technology institutions and agencies to begin some youth-oriented programmes and engage young scientists.
3. DST’s Scholarship scheme for Women Scientists and Technologists: This scheme provides help to women scientists between the ages of 30 and 50 years, who have taken a break due to familial responsibilities and wish to return to mainstream science. Here, women scientists are encouraged to pursue research in the main areas of science, on problems of societal relevance and to take up S&T-based internships followed by self-employment.
4. Sophisticated Analytical Instrument Facilities (SAIF): This scheme makes available sophisticated analytical instruments to the researchers in order to ensure quality work. These instruments are made available to many of the IITs, IISCs and universities such as Nagpur University and Punjab University. About 8000 scientists avail of this facility and they are trained to use and maintain these instruments.
5. Better Opportunities to Young Scientists in Chosen Areas of Science and Technology (BOYSCAST): In this scheme, young scientists are offered a fellowship (3-12 months) which provides an opportunity to interact and work with international level researchers and international institutes. Annually, around 40 young scientists below 30 years are selected.

2��
The M. S. Swaminathan Research Foundation (MSSRF) in Chennai, India, has piloted a path-breaking project, in the tiny coastal State of Pondicherry. The project, being run by the foundation’s Rural Technology Centre, has helped local women become computer-literate and in the process, empowered them. The programme has taught them how to download the latest weather reports from the US Oceanographic department on the Net. The women broadcast these reports on the public address system – information that is often crucial to their husbands out fishing on the high seas. They have earned respect from the community that once looked down upon them. Encouraged by this, the women have also started accessing information on issues crucial to them - reproductive health, basic education and so on. And this is just the beginning.GeetaSharmaEditor,LearningChannel.org
Environmental Education and Training is another area which is gaining recognition through the Ministry of Environment and Forests. Among other programmes, Environment Education in the school system is one initiative whereby the textbooks in science, social sciences and languages of middle-school level were modified and introduced in 2002-03 in the selected states of Andhra Pradesh, Assam, Goa, Jammu and Kashmir, Maharashtra, Orissa, Punjab and Uttaranchal. The success of the modules in these states would decide the future course of action in the other states. Other programmes include Environmental Appreciation Courses, Introduction of Environmental Concepts in Management and Business Studies, Initiating Eco Clubs, and Several Other Awareness Programmes for Children and Youth.
There is little or no data at the national level on youth access and participation in such programmes.
6.6 Open and Distance EducationThe government has provided another mechanism for access to higher education through the open and distance mode of education. These Courses are implemented through correspondence and the online Courses through the Distance Education Institutions (DEIs) and open universities such as the Indira Gandhi National Open University (IGNOU). These provide youth an opportunity to upgrade their education throughout their lives and in situations where they need to work, and hence, cannot be a fulltime student. About one-fifth of students who are in higher education receive their education through the distance mode. In 2004-05, around 11 million people were enrolled in higher education in India, of which the open and distance education system (including correspondence courses offered by distance educational institutions (DEIs) of conventional colleges) served roughly 20 percent. In 2000-01, only 4 percent of the higher education need was served by open universities, but in 2003-04 the figure was around 10 percent, while the overall distance education contribution is around 19 percent (NYK, 2009: 203).
However, like the quality of other formal systems of education, there is a criticism that the quality of distance education leaves much to be desired.
Youth and Education

India Youth Development Report 20�0 2��
The quality and delivery mechanisms of distance education provided by correspondence courses are relatively poor. Most correspondence courses are instituted as a mode of resource generation in view of the unmet demand for higher education... (NYK, 2009: 204)
6.7 Life Skills EducationToday, it is recognized that a stable Emotional Quotient is as important as a person’s Intelligence Quotient. So far, socialization processes in the family were expected to provide the skills and attitudes to cope with the changes in the environment. However, because of the stresses and strains on the family as a unit, these skills are no longer learnt at home. In order to educate youth on this aspect, Life Skills education is increasingly been introduced at the University level. This has been defined by the WHO as:
‘the abilities for adaptive and positive behaviour that enable individuals to deal effectively with the demand and changes of everyday life’.
The content includes personal skills; learning skills; awareness of the world; and livelihood skills (Robinson, 2004). The Report on the Working Group on Adolescents for the 10th Five Year Plan (2002-2007) also emphasizes the need for Life Skills Education in the curriculum.
6.8 Value Education An educational agenda found in all the policies and commissions irrespective of the changes in the central government has been the inclusion of spiritual values in education. This was first reflected in the Radhakrishan Commission (1948) which strongly recommended ‘spiritual training’ in educational institutions. The Kothari Commission (1964-66) reiterated this stating: “A serious defect in the school system is the absence of provision for education in social, moral and spiritual values”. The 2003 National Youth Policy recognizes the need for the educational system “to instil, in the youth, an abiding sense of patriotism and values oriented towards the unity and integrity of the country, equally calls for the elimination of violence in all forms, adherence to good moral and ethical values and respect and reverence for India’s composite culture and national heritage”.
This is an area which is considered vital for character- building and yet, it is one where there is no consensus about the perspective and content.
Intheregionalworkshops,theparticipantsclearlydelinkedvaluesandspiritualityfromreligionandstatedthatthisaspectshouldnotbeincludedintheindex,andaspectssuchasspiritualityareverypersonalandindividual-based.Desiredvalues:love, respect, non-violence, humanity, fraternity, tolerance, democracy, service to self and society, courage, dignity. ‘Nationalism’ is highly debatable.Spiritual health is very difficult to define and measure...Ayouthinregionalworkshop

2��
6.9 Other Barriers to Education Gender and caste have been long considered two major factors which have negatively affected female and Dalit youth. Their status in terms of education has been mentioned in the various sections of this Chapter. In addition to these two key dimensions impacting the socialization processes of youth in India, there are other barriers which prevent optimum educational attainment and access of children and youth. Some of these are mentioned below:
In terms of religion, Muslims had the lowest GER. Those who never attended school are higher among the Muslims than Hindus and other women belonging to other religions. (Parasuraman et al 2009) .There have been several recent studies that point out the need for increasing literacy levels amongst the Muslim community which is the major segment of India’s largest minority group. Non-formal education through madrasas has been the traditional form of education for a significant percentage of Muslims. There have been differing views on the issue of modernisation of madrasa education as one mechanism by which more of the population would become formally educated (Bandhyopadhyay, 2002; Ara, 2004).
Returning to the above point on inequalities, apart from social and structural inequalities in access to education, there are language barriers to include subordinate groups whose languages are not part of the mainstream curriculum recognized by the Indian state. The eighth schedule of the Indian Constitution recognizes 22 scheduled languages and there are over 200 languages with almost 1,600 dialects that exist in the country. Further, Article 350a provides for facilities for instruction through the mother tongue at the primary stage of education. However, as Virginius Xaxa (2005) points out:
Yet, no efforts whatsoever have been made so far by the federal state or the provincial states towards safeguarding tribal languages, let alone promoting them. Education in all provinces/ states, even at the primary level, has been imparted in the language of the dominant community. There were, of course, instances in states like undivided Bihar where primers were prepared in some tribal languages for pedagogic purposes [in the mother tongues] but these were allowed to rot in government godowns.
The language barrier not only poses problems in relation to access to education but also raises questions on how (if so) the knowledge of subordinate groups is represented in the mainstream curriculum.
The NKC document (2009) strongly recommends the translation of materials to different Indian languages. Thus, today, we have a National Translation Mission whose sole task is to achieve this. The report also accepts the fact that today English language is an important factor for access to higher education, employment possibilities and social opportunities. Hence the report recommends the introduction of English as a language along with the first language.
Youth and Education

India Youth Development Report 20�0 220
Other common barriers to access in the Indian sub-continent are factors like poverty, migration and displacement due to man-made disasters (evictions for development projects, riots, war); natural disasters (tsunami, earthquakes), seasonal migration due to nature of occupation of family/ self (landless labourers, construction workers), disability and disease, household duties, child labour and paid work, early marriage, and other related social and cultural pressures. Also, self-image was shown as a factor: “In India, some girls dropped out of school because they cannot face the shame of admitting to an alcoholic father or domestic violence”. Similarly, ‘mobility or security’ was seen to be a problem: “In India, Nepal and Pakistan, girls are exposed to the danger of harassment on way to school, or are stared at by men and boys” (Robinson, 2004 : 21).
The above mentioned situations were the major reason that forced youth to drop out of education and training; also the fact that there are few accessible systemic provisions for getting back into formal education. The World Development Report, 2007 mentions the provision of ‘second chances’ as one strategic direction for empowering youth.
Provide an effective system of second chances through targeted programs that give young people the hope and the incentive to catch up from bad luck – or bad choices. (World Bank 2007: 2)
The 11th Five Year Plan proposes to support institutions and colleges with a lower GER; special support to those colleges and universities located in rural, hilly, remote, tribal and border areas; 90 districts have been identified for central support. Increase in the number of scholarships is the proposed measure to ensure affordability for those who cannot pursue higher education due to economic reasons. The NKC Report, 2009, also states that all deserving students should have access to higher education, irrespective of their socio-economic background.
The 11th Five Year plan recommends that ‘efforts must be made to mainstream differently-abled and other disadvantaged children and to provide them access to education, like other children their age. The most vulnerable, such as street children, trafficked children, children affected by conflict or calamities, children of sex workers, child labourers, children with HIV/AIDS, victims of child sex abuse, differently-abled children and juvenile delinquents need special attention. Adoption, rescue and rehabilitation, juvenile police units, shelter homes, counselling and medical aid, etc., also need attention as they contribute to ensuring a secure childhood’. (GOI, 11th Five Year Plan:57)
Recommendations of the NKC Report, 2009- IncreaseGERinhighereducationto15andaboveby2015.- Creation of 1500 universities by 2015, partly by restructuring
existingones.- Createmodelsforcommunitycolleges.

22�
6.10 Quality of Education The type of schools and colleges is one indicator to assess the quality of education provided to students. It is well-accepted that the quality of education received at the primary, secondary and tertiary levels differs tremendously and the standards are just not comparable. The general perception is that private schools which cater to the upper middle and the higher classes of society provide better quality of education while government schools do not offer satisfactory education.
Official statistics show the number of schools and the enrolment figures but not the disparities in the quality of education provided by schools of different kinds. These disparities are very large and probably increasing (Beteille, A, 2008).
The disparity between the middle-class and lower income class is substantial. Middle class youth living in cities for example, are much better prepared to move on from elementary level upwards, as compared to those who belong to lower income classes in remote villages and city slums. Research shows that “more serious than the shortages of buildings, blackboards and books is the negligence of teachers. On an average, on any working day, 25 percent of teachers in elementary schools remain absent from work (Kremer et al 2006 from Beteille 2008: 44). The disparities and gaps as well as issues adversely affecting the quality of education continue from elementary to higher education and research” (see Beteille 2008: 44-48).
In 2007-08, there were more than 51% vacancies in universities which were not filled. A significant percent of these were in State universities, where 90% of students of university departments are enrolled. (Chadha, Bhushuan, Murlidhar, 2008). One needs to explain the consequences of such a dismal situation on the quality of tertiary education.
The quality of education is also an area of concern for the government ,which is stated in the 11th Five Year Plan of the Planning Commission of India:
The most difficult task is to ensure good quality of instruction. A recent study7 has found that 38% of the children who have completed four years of schooling cannot read a small paragraph with short sentences meant to be read by a student of Class II. About 55% of such children cannot divide a three digit number by a one digit number. These are indicators of serious learning problems which must be addressed. (Government of India 2006: 58)
The NSS 64th Round, 2007-08 shows that the proportion of students in private institutions (general education at all levels) has increased, but these institutions remain accessible only to the upper classes. The proportion of students rose from 28.2% in 1995-96 (NSS 52nd Round) to 30.8% in 2007-08. For urban areas, the proportion of students in private schools has crossed 50% at the primary, secondary and higher education levels. Families in urban areas spend more than twice what those in rural
7AnnualStatusof Education(ASAR)-Rural2005facilitatedbyPratham
Youth and Education
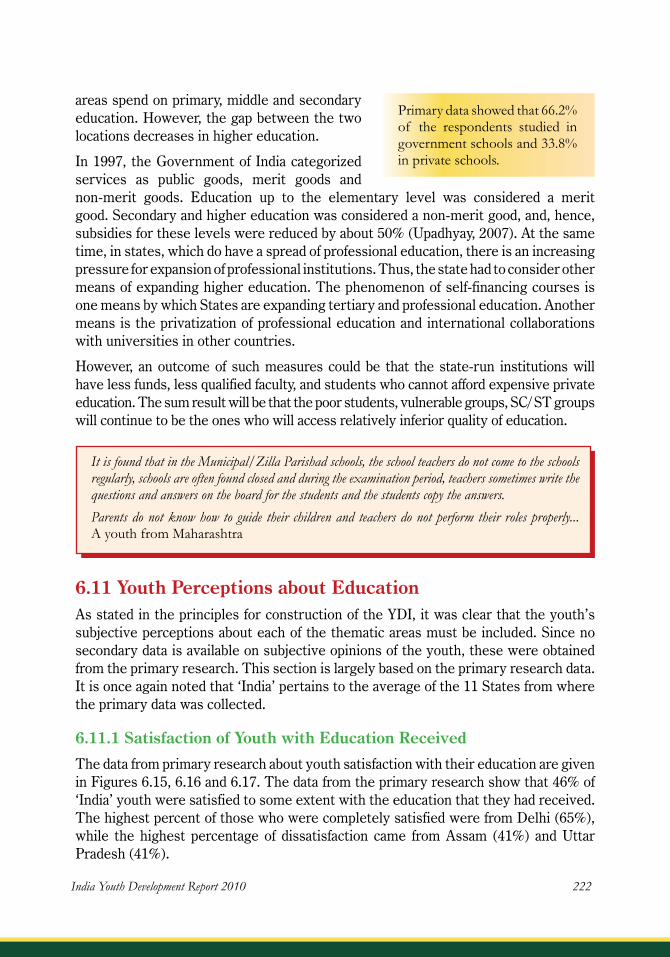
India Youth Development Report 20�0 222
areas spend on primary, middle and secondary education. However, the gap between the two locations decreases in higher education.
In 1997, the Government of India categorized services as public goods, merit goods and non-merit goods. Education up to the elementary level was considered a merit good. Secondary and higher education was considered a non-merit good, and, hence, subsidies for these levels were reduced by about 50% (Upadhyay, 2007). At the same time, in states, which do have a spread of professional education, there is an increasing pressure for expansion of professional institutions. Thus, the state had to consider other means of expanding higher education. The phenomenon of self-financing courses is one means by which States are expanding tertiary and professional education. Another means is the privatization of professional education and international collaborations with universities in other countries.
However, an outcome of such measures could be that the state-run institutions will have less funds, less qualified faculty, and students who cannot afford expensive private education. The sum result will be that the poor students, vulnerable groups, SC/ ST groups will continue to be the ones who will access relatively inferior quality of education.
6.11 Youth Perceptions about Education As stated in the principles for construction of the YDI, it was clear that the youth’s subjective perceptions about each of the thematic areas must be included. Since no secondary data is available on subjective opinions of the youth, these were obtained from the primary research. This section is largely based on the primary research data. It is once again noted that ‘India’ pertains to the average of the 11 States from where the primary data was collected.
6.11.1 Satisfaction of Youth with Education Received
The data from primary research about youth satisfaction with their education are given in Figures 6.15, 6.16 and 6.17. The data from the primary research show that 46% of ‘India’ youth were satisfied to some extent with the education that they had received. The highest percent of those who were completely satisfied were from Delhi (65%), while the highest percentage of dissatisfaction came from Assam (41%) and Uttar Pradesh (41%).
Primarydatashowedthat66.2%of the respondents studied ingovernmentschoolsand33.8%inprivateschools.
It is found that in the Municipal/Zilla Parishad schools, the school teachers do not come to the schools regularly, schools are often found closed and during the examination period, teachers sometimes write the questions and answers on the board for the students and the students copy the answers.Parents do not know how to guide their children and teachers do not perform their roles properly... AyouthfromMaharashtra

22�
FIGURE 6.15 Youth Satisfaction about Education by Indian States
FIGURE 6.16 Level of Satisfaction by Religion, Caste and Standard of Living
FIGURE 6.17 Level of Satisfaction by Age, Sex and Type of Place
Youth and Education

India Youth Development Report 20�0 22�
Data show that there were a higher percent of Muslims, SCs and those in the low ‘SLI’ who were not satisfied with the level of education they had received. These are the groups which have less access to quality education and whose attainment levels are also lower than other sections of the population. This clearly reinforced the fact that minority groups (Muslims, SCs and STs) and those in the low ‘SLI’ are the ones who need focussed attention and greater inputs to ensure that they are empowered to their full potential.
6.11.2 Satisfaction Regarding Level of Education Achieved
Youth were also asked whether they were able to study to the extent they wished; Figure 6.18 shows their responses:
FIGURE 6.18 Satisfaction Regarding Level of Education in Indin States
FIGURE 6.19 Satisfaction Regarding Level of Education by Religion, Caste and SLI

22�
FIGURE 6.20 Satisfaction Regarding Level of Education by Age, Sex and Place of Residence
FIGURE 6.21 Aspirations of
Youth by Indian States
When asked whether they were satisfied with the extent of education they had received, 2068 (42%) of the youth responded in the negative. There were only 19% of the total youth who said that they could study to the extent that they wished. The percentage of youth who felt that they had studied to the level which they aspired was highest in A&N Islands and Maharashtra. The A&N Islands are relatively cut off from the rest of India and it could be that their awareness and access to higher levels of education may be limited. The highest percentage of those who said that they were not satisfied were from Rajasthan and Tamil Nadu. Rajasthan had the least literates (46%), and Tamil Nadu, the third lowest (81%). West Bengal, that had the highest percentage of dissatisfied youth, also had the second lowest percentage of literates in the sample.
Here again the data showed (Figures 6.19, 6.20) that the Muslim youth, the SC group and the low SLI group were the highest percentage of those who said that they had not been educated to the extent that they wished. The percentage of youth who were dissatisfied were slightly higher in those who resided in rural areas as compared to urban areas.
6.11.3 Aspirations Related To Educational Attainment
Youth and Education

India Youth Development Report 20�0 22�
FIGURE 6.22 Aspirations of Youth by Religion, Caste and SLI
Figures 6.21 and 6.22 clearly show that most youth in the primary research aspired for a higher degree (3051: 76.6%). There were more than 90% of the youth of A&N who aspired for a higher degree. In the sample, there were 1216 (24.8%) who were still studying and hence, could still work towards the degree they aspired for. However, for the rest of the youth it is most likely that their aspirations would not be met. About 740 youth (18.6%) wished for a change in vocation and this was slightly higher in the States of Maharashtra and Rajasthan.
6.11.4 Parental Aspirations
FIGURE 6. 23 Parental Aspirations by India States
The data (Figure 6.23) showed that 38% of the total youth felt that their parents wished that they would graduate and work. The highest percentage was in Assam (61%) followed by Maharashtra (56%) and A&N Islands (51%). Parental preference of higher degree for their wards was the highest in Jammu & Kashmir (50%), followed

22�
by Uttar Pradesh (41%). Parental aspirations for a higher degree for their wards were lowest in Tamil Nadu (5%), followed by Maharashtra (6%), A&N Islands (6%) and West Bengal (7%). In Tamil Nadu, 61% of the youth felt that their parents had no particular aspirations for them.
FIGURE 6.24 Parental Aspirations by Age, Sex and Type of Place
In terms of parental aspirations, it is clearly seen that parents expect their children to work by the time they turn 25 years to 35 years (Figure 24). There is a higher percent who expect their sons to work than their daughters. Literacy and marriage are the two expectations of their daughters; it is heartening to note that a small but significant percentage (16.8%: 791) said that their parents left the decision to them; and this response is across age, sex and location.
The primary data clearly corroborates the findings of Dreze and Sen (2002) which expose some of the ‘myths’ that they find have ‘tended to cloud official thinking and public debates’ on ‘why so many Indian children are out of school’. One of the ‘myths’ surrounding the ‘discouragement effect’ for youth is identified as the fallacy in the belief that Indian parents have little interest in education. Citing the PROBE survey (1999) as an example, Dreze and Sen (2002) point out that in India’s most educationally backward States, the proportion of parents who considered it ‘important’ for a child to be educated was as high as 98% for boys and 89% for girls. Further, educational aspirations were highly consistent with the constitutional goal of universal elementary education: only a small minority of respondents, for instance, aspired to fewer than eight years of education for their sons and daughters, and only 3% of parents were opposed to compulsory education at the primary level. This study also shows that today a significant percent of parents do aspire for their children having a graduate degree.
Youth and Education

India Youth Development Report 20�0 22�
Parents often put pressure on their children to pursue education or a profession of the parents’ choice. Sometimes youth do not perform as per the expectations of their parents and then they run away from home out of fear and anger, come to big cities like Mumbai and join the population of street youth. AyouthduringaregionalworkshopinMumbai
6.11.5 Sources of Support for Youth in Education
FIGURE 6.25 Support Received by Youth for Education in selected Indian States
FIGURE 6.26 Support for Education by Religion, Caste and Standard of Living

22�
Figures 6.25 and 6.26 clearly show that the family continues to be the major support for the youth to pursue their educational aspirations. This was highest in the SC group and the ‘low standard of living’ youth. These are the groups where families have to struggle hard to see their children through education. The youth, in all probability, understand and witness the hardships that the elders put themselves to ensure that their children can pursue their education. Those who were ‘self-motivated’ were highest in the Muslim youth, probably as they had to overcome cultural barriers to pursue their education.
In terms of the states, A&N had the highest percentage of self-motivated youth, while Tamil Nadu and West Bengal had the highest percentage of those who felt that their family was their strongest support.
It is to be noted that the percentage of youth who said that their teachers were a source of support was only 18.2% (819). Apart from parents, teachers are supposed to be the key role models and support to their students in the educational process. Various studies have shown that the poor quality of teachers is one factor which impacts enrolment and performance of students at all levels of education.
6.11.6 Utilization of Government Schemes
TABLE 6.9 Utilization of Government Schemes by Indian Youth
Age Sex Place of Residence
India < 18 18 to 24 25 to 35 Male Female Rural Urban Total
Utilized 385 655 751 993 788 1158 630 1791somescheme (33.2) (36.6) (33.8) (35.0) (34.1) (33.5) (36.9) (34.6)
Nutritional 188 326 318 452 380 571 259 832status (16.2) (18.0) (14.2) (15.9) (16.2) 16.4) (15.0) (16.0)
Career 8 22 39 38 31 41 28 69counselling (0.7) (1.2) (1.8) (1.3) (1.4) (1.2) (1.6) (1.3)
Table 6.9 shows that 1791 youth (34.6%) in the sample said that they had utilized at least one government scheme. Of these 16% (832) mentioned that they had received nutrition which could be related to the mid-day meal scheme at the primary level which is implemented in several States. The Table also shows that only 69 youth (1.3%) had availed of career counselling. This is a service which is vital for youth to guide them to make choices related to their education and career.
The youth in the regional workshops had strongly expressed that this was a service sadly non-existent, and that there is a strong need for such a service.
Youth and Education

India Youth Development Report 20�0 2�0
Overall, the data in this section clearly show that the youth are not satisfied with the education that they receive; they do have aspirations for accessing tertiary education; and their parents also hope that their children will graduate and get employment.
The Commonwealth Plan of Action for Youth Empowerment (PAYE) emphazisesprovidingqualityeducationforallasunder:1. Prioritize basic education and literacy programmes,ensuringtheparticipation
of ruralyouthandthoseinspecialcircumstances.2. Review educational curricula to include components of enterprise, life skills,
conflict resolution, culture, human rights and the environment, as appropriate.3. Broaden access to secondary and higher education,makinguseof cost-effective
meanssuchasdistancelearning.4. Promote knowledge transfer through volunteering and mentoring
opportunities,includingpromotionof indigenousknowledge.
6.12 ConclusionThe YEI shows that India as a whole has performed poorly in the Education Index, with some states showing a dismal performance. The factor which is of great concern is the low GER which conveys poor access and wastage at the primary, secondary and tertiary levels of education. India still has a long way to go in achieving the targets of VISION 2020 in terms of producing a youth force which is ready for the challenges of a globalized world. The country needs to now move beyond the parameters of literacy and primary education as yardsticks of educational achievement for youth. For this, mere expansion of colleges and universities will not achieve the required results unless there is value addition in terms of quality and relevance.
Issues of quality in education call for discussions on access to education, and the knowledge represented in the curriculum. Several other factors as well need to be considered. For instance, today’s livelihood programmes must take account of adolescent-headed households, out-of-school youth, economic migrants, internally displaced persons and refugees.
Providing quality education for the youth is a sure way of guiding them towards creating an independent mind capable of critically understanding and synthesizing various issues and challenges that present before them and whose sensitivity is attuned towards desiring to help their community. We need to ensure that we create supportive, enabling conditions for youth to become self-directive and empowered to take charge of their own growth and contribute to society.

2��
Impression of Student Youth Pursuing Higher EducationGunj Ashram School is located in the lap of a green mountain, at the end of the Gunj Budhawali village in Jawahar subdivision of Thane district. As we approached the school, we saw farmers sowing seeds for the new season. The village was small, with a cluster of ��-20 houses. Most of the houses were kachha and a few had concrete walls with thatched roof. The beautiful location, the very simple lifestyle of the people and the pristine nature all around, made me think. I was confused about what constitutes leading a happy life. Many of these people do not have access to the so-called ‘modern’ facilities but this does not seem to hinder their happiness and they don’t seem to be bothered by the lack of such amenities. Even if they were bothered and wanted access to the facilities of the modern world, they would not be able to use these facilities as they lack the capability and opportunities to gain the required facilities. This situation reminded me of Aesop’s story of the fox and the stork. I was a child when I first heard the story, but the relevance is felt even more today. My own interpretation of the story has also changed over time. The story is as follows. The fox and the stork became friends and once the fox invited the stork over for lunch. The fox served the stork, soup, in a very shallow bowl. The stork could not have the soup as the bowl was too shallow for her long beak. The clever fox licked up his own soup as well as the stork’s soup. Though the moral of the story says something else, I could connect this story to modern development practice that is happening in India and elsewhere, especially in the developing countries. In the story we can see that, though the food has been served in front of the stork yet she can’t have it as she does not have the capability to exploit the opportunity. On the other hand, the fox has both the capability and opportunity. In a similar fashion, development is taking place in India. Claims are made that jobs are being created through these development programmes, but in actuality, very few people have the capability to enjoy the fruits of development. In this scenario, tribals are the most deprived and vulnerable. They face double jeopardy – on one hand, in the name of development we have encroached onto their land and taken away their opportunities to use their skills; and, on the other hand, they are not capacitated to participate in the development process and gain the benefits of the same .
Youth and Education

India Youth Development Report 20�0 2�2
7.1 IntroductionA major landmark in the transition to adulthood is when a person is meaningfully engaged in some work and becomes financially independent. Earlier, work was just a part of the individual’s overall social role; but today, the modern ethos gives self the central meaning through work. A person’s social identity is acquired by mobility and social reward for his/ her work. Employment provides time structure, social contact, activity, status, purpose and control. Unemployment results in economic implications, physiological and psychological effects. Women’s participation in the workforce is interwoven with caste, class and gender hierarchies.
The World Development Report 2007 mentions certain key issues which need to be kept in mind when managing the transition from education to work. These are:• Starting work too early• Breaking into the job market “Employment rates
for youth are systematically higher than for older generations” pg. 7.
• Moving to new jobs and up the skills ladder; especially in poor countries, young people are working very hard, but earning very little.
Youth and Work
Our Youth have to be trained to use new technology in all areas especially agriculture where it matters most.
–RajivGandhi
CH
AP
TE
R
VII
Youth Work Index: 0.636
Youth Work Index females: 0384
Youth Work Index Males: 0.868
Youth Work Outcome Index: 0.594
Youth Work Access Index: 0.957

2��
The conventional route to getting gainfully employed was through school and then some training. People were stable and secure in one job for the rest of their lives. Today, this trajectory is not so linear. Education does not necessarily prepare one for the next step which is vocational/ professional training. The resources are few, competition is high and hence, there is only a small proportion of youth who can achieve what they set out to do. Thus, the irony of the Indian situation is that there are young people desperately looking for work and there are employers who are equally desperate looking for suitably skilled candidates to fill up the large number of vacancies.
It is well-known that in spite of constitutional and legal provisions [Child Labour (Prohibition and Regulation), 1986], in India, children and adolescents continue to be part of the workforce and many of them work in the informal sector. The initiatives by the Government over a period of time to promote employment opportunities include:• Employment Guarantee Scheme of Maharashtra, 1972-73: To assist the
economically weaker sections of rural society. • The 20-Point Programme, 1975: Poverty eradication and raising the standard of
living. • Food for Work Programme, 1977-78: Providing food grains to labour for the work
of development. • National Rural Employment Programme, 1980: To provide profitable employment
opportunities to the rural poor. • Development of Women & Children in Rural Areas, 1982: To provide suitable
opportunities of self-employment to women belonging to rural families who are living below the poverty line.
• Rural Landless Employment Guarantee Programme, 1983: For providing employment to landless farmers & labourers.
• Self-employment of the Educated Unemployed Youth, 1983-84: To provide financial and technical assistance for self-employment.
• Self-Employment Programme for the Urban Poor, 1986: To provide self-employment to urban poor through provision of subsidiaries and bank credit.
• Jawahar Rozgar Yojana, 1989: To provide employment to rural unemployed. • Nehru Rozgar Yojana, 1989: To provide employment to urban unemployed. • Scheme for Urban Micro Enterprises, 1990: To assist the urban poor for small
enterprises. • Scheme for Urban Wage Employment, 1990: To provide wages employment after
arranging the basic facilities for poor people in the urban areas where population is less than one lakh.
• Scheme for Housing and Shelter Upgradation, 1990: To provide employment by means of shelter up-gradation in the urban areas where population is between 1-20 lakhs.
• Employment Assurance Scheme, 1993: To provide employment of at least 100 days in a year in villages.
Youth and Work

India Youth Development Report 20�0 2��
• Swaran Jayanti Shahri Rozgar Yojana, 1997: To provide gainful employment to urban unemployed and under employed poor through self employment or wage employment.
• Swarna Jayanti Gram Swarozgar Yojana, 1999: For eliminating rural poverty and unemployment and promoting self employment.
• Pradhan Mantri Gram Sadak Yojana, 2000: To line all villages with pucca roads. • Sampurna Gramin Rojgar Yojana, 2001: Providing employment and food security. • Jai Prakash Narain Rozgar Guarantee Yojana, 2002-3: Employment guarantee in
most poor districts. • National Rural Employment Guarantee Scheme, 2005-6: 100 days assured
employment.
7.2 Youth Work Index (YWI)As noted in Chapter 4, the YWI was calculated using the extent of work participation among youth aged 18 years and above and the intensity of employment for those who are working. A recapitulation of the YWI in India and states is provided in Table 7.1. At the national level, the YWI is 0.636, with substantial inter-state variations. The highest YWI is for Meghalaya (0.804) followed by Chhattisgarh (0.754) and Andhra Pradesh (0.747) while the lowest value is for Jammu & Kashmir (0.516) followed by Delhi (0.526) and Kerala (0.531).
Youth Work IndexHigh Values: Meghalaya (0.804);Chhattisgarh(0.754)Low Values: Jammu & Kashmir(0.516),Delhi(0.526),Kerala(0.531)
TABLE 7.1 Youth Work Index (YWI) in Indian States
States YWI YWI Rank States YWI YWI RankIndia 0.636 MadhyaPradesh 0.706 7AndhraPradesh 0.747 3 Maharashtra 0.695 8ArunachalPradesh 0.711 6 Manipur 0.539 25Assam 0.557 22 Meghalaya 0.804 1Bihar 0.558 21 Mizoram 0.695 9Chhattisgarh 0.754 2 Nagaland 0.585 17Delhi 0.526 27 Orissa 0.617 16Goa 0.561 20 Punjab 0.549 24Gujarat 0.667 12 Rajasthan 0.671 11Haryana 0.574 18 Sikkim 0.666 13HimachalPradesh 0.688 10 TamilNadu 0.711 5Jammu&Kashmir 0.519 28 Tripura 0.486 29Jharkhand 0.633 14 UttarPradesh 0.571 19Karnataka 0.726 4 Uttaranchal 0.625 15Kerala 0.531 26 WestBengal 0.556 23Note: YWIYouthWorkIndex

2��
A comparison of YWI for males and females across Indian states can be made from Figure 7.1. It is clear that work index for male youth is much higher as compared to that for female youth in all the states. In some of the states, the difference in YWI is striking. The reason for a lower work participation rate among female youth can vary across states.
FIGURE 7.1 Youth Work Index (YWI) for Males and Females in Indian States
7.2.1 Youth Work Outcome Index (YWOI)
Youth work outcome index is defined as the work participation rate among male and female youth weighted by the proportion of males and females. From Table 7.2 it can be seen that the work outcome index for Indian youth is 0.594 which varies from 0.781 in Meghalaya to 0.425 in Tripura. The states with high a level of youth work outcome index are Meghalaya, Chhattisgarh and Andhra Pradesh whereas Tripura, Jammu & Kashmir, Delhi and Kerala are at the other end with very low youth work outcome index. However, the lower extent of work outcome index does not always imply lesser
Youth and Work

India Youth Development Report 20�0 2��
opportunities as such a situation can also be a result of a greater extent of youth pursuing higher education and therefore not engaged in economic activity. Similarly, a high value of youth work outcome index need not necessarily imply a better situation if many of them are working in unorganized sector and the income obtained is meagre.
Note: YWOIf :YouthWorkOutcomeIndexFemale;YWOIm:YouthWorkOutcomeIndexMale;YWOI:YouthWorkOutcomeIndex;YWOISR:YouthWorkOutcomeIndexCorrectedforSexRatio.
TABLE 7.2 Youth Work Outcome Index (YWOI) in Indian States
Work Participation Rate (WPR)(%)States Female Male YWOIf YWOIm YWOI YGWOI YGWOISR
India 31.3 85.3 0.313 0.853 0.594 0.467 0.448AndhraPradesh 55.1 87.9 0.551 0.879 0.717 0.679 0.671ArunachalPradesh 55.3 79.6 0.553 0.796 0.677 0.655 0.643Assam 16.8 83.0 0.168 0.830 0.506 0.283 0.277Bihar 12.9 85.3 0.129 0.853 0.507 0.232 0.221Chhattisgarh 59.2 85.6 0.592 0.856 0.726 0.702 0.692Delhi 10.1 76.7 0.101 0.767 0.470 0.195 0.174Goa 26.3 74.4 0.263 0.744 0.510 0.393 0.383Gujarat 33.9 88.9 0.339 0.889 0.629 0.503 0.476Haryana 16.6 82.8 0.166 0.828 0.525 0.293 0.268HimachalPradesh 51.8 78.1 0.518 0.781 0.652 0.626 0.612Jammu&Kashmir 15.0 74.9 0.150 0.749 0.464 0.259 0.246Jharkhand 33.1 83.4 0.331 0.834 0.591 0.481 0.464Karnataka 48.5 89.2 0.485 0.892 0.694 0.633 0.617Kerala 20.4 76.0 0.204 0.760 0.476 0.318 0.310MadhyaPradesh 42.8 89.0 0.428 0.890 0.672 0.590 0.556Maharashtra 44.6 84.7 0.446 0.847 0.659 0.596 0.558Manipur 31.7 65.6 0.317 0.656 0.485 0.426 0.422Meghalaya 68.2 88.2 0.682 0.882 0.781 0.768 0.758Mizoram 50.0 81.2 0.500 0.812 0.660 0.622 0.608Nagaland 42.4 64.4 0.424 0.644 0.538 0.515 0.496Orissa 27.4 87.0 0.274 0.870 0.572 0.417 0.416Punjab 8.2 85.5 0.082 0.855 0.496 0.159 0.148Rajasthan 37.2 86.8 0.372 0.868 0.633 0.532 0.504Sikkim 45.8 77.7 0.458 0.777 0.627 0.586 0.549TamilNadu 48.3 87.1 0.483 0.871 0.677 0.621 0.621Tripura 9.1 75.3 0.091 0.753 0.425 0.164 0.162UttarPradesh 14.8 85.0 0.148 0.850 0.522 0.264 0.247Uttaranchal 38.7 76.7 0.387 0.767 0.581 0.518 0.507WestBengal 14.8 84.3 0.148 0.843 0.505 0.257 0.250

2��
As can be seen from the Table 7.2, the work outcome index for male youth is much higher than that for female youth. At the national level, the youth work outcome index for males is 0.853 as against the very low value of 0.313 for female youth. The difference between the index for males and females is 0.540. Among females the lowest value of work outcome index is in Punjab (0.082). Other states that have a very low value of youth work outcome index for females are Tripura (0.091), Delhi (0.101), Bihar (0.129), Uttar Pradesh (0.148) and West Bengal (0.148). The highest value for youth work outcome index for females is in Meghalaya (0.682).
For male youth, the highest value of youth work outcome index is in Karnataka (0.892) closely followed by Madhya Pradesh (0.890), and Gujarat (0.889). The lowest youth work outcome index for males is in Nagaland (0.644) and Manipur (0.656). While for female youth the difference between the lowest and the highest values of youth work outcome index among Indian states is as high as 0.600, the corresponding difference for males is only 0.248 points. As can be seen from the Table, youth work outcome index reduces substantially when adjusted for gender differences in work outcome measure; the youth work outcome index decreases from its original value of 0.594 to 0.467 as a result of the huge male-female differences noted above.
7.2.2 Youth Work Access Index
Youth work access index was derived from the intensity of employment (number of days worked in a week). The information for this was taken from the NSS 62nd round dataset. Differential weights were given for the different ranges in the number of days worked. The objective in considering this indicator was to find out to what extent those who reported as working were getting work. However, as can be seen from Table 7.3, the youth work access index as measured above is high in all the states as most of those who were working reported that they get work for at least five days in a week.
Youth and Work

India Youth Development Report 20�0 2��
Note: YWAIf : Youth Work Access Index Female; YWAIm : Youth Work Access Index Male; YWAI : Youth Work Access Index; YGWAI: Youth Gender Access Index Corrected for Sex Ratio; YGWAI: SR Youth Work Access Index Corrected for Sex Ratio.
TABLE 7.3 Youth Work Access Index (YEAI) in Indian States
States YWAIf YWAIm YWAI YGWAI YGWAISR
India 0.919 0.992 0.957 0.955 0.916AndhraPradesh 0.962 0.991 0.977 0.976 0.965ArunachalPradesh 0.985 0.994 0.990 0.990 0.972Assam 0.876 0.995 0.937 0.933 0.914Bihar 0.857 0.988 0.925 0.921 0.880Chhattisgarh 0.936 0.992 0.964 0.963 0.949Delhi 0.940 1.000 0.973 0.972 0.867Goa 0.993 1.000 0.997 0.997 0.971Gujarat 0.887 0.996 0.945 0.941 0.890Haryana 0.874 0.996 0.940 0.936 0.857HimachalPradesh 0.886 0.986 0.937 0.935 0.913Jammu&Kashmir 0.840 0.996 0.922 0.916 0.870Jharkhand 0.862 0.983 0.924 0.920 0.888Karnataka 0.939 0.991 0.966 0.965 0.941Kerala 0.960 0.991 0.976 0.975 0.953MadhyaPradesh 0.936 0.994 0.966 0.965 0.911Maharashtra 0.955 0.996 0.977 0.977 0.915Manipur 0.937 0.995 0.966 0.965 0.956Meghalaya 0.970 0.998 0.983 0.983 0.970Mizoram 0.928 0.977 0.953 0.952 0.931Nagaland 0.879 0.960 0.921 0.919 0.886Orissa 0.918 0.981 0.950 0.949 0.947Punjab 0.859 0.995 0.932 0.927 0.859Rajasthan 0.928 0.999 0.965 0.964 0.913Sikkim 0.924 1.000 0.964 0.963 0.903TamilNadu 0.974 0.996 0.985 0.985 0.984Tripura 0.983 1.000 0.992 0.992 0.982UttarPradesh 0.847 0.994 0.925 0.919 0.859Uttaranchal 0.994 0.996 0.995 0.995 0.975WestBengal 0.861 0.986 0.925 0.921 0.895

2��
At the national level, the Youth Work Access Index value is 0.957 indicating a high extent of access for those who are working. It may be noted that this index does not include those who are not working for one reason or the other. Other dimensions of access may be evident from subsequent sections where we deal with wage patterns and unemployment. Inter-state variations in the value of work access index are not substantial. The lowest value is for Bihar and Nagaland (both having a value of 0.921), and Uttar Pradesh and West Bengal (both having a value of 0.925). The highest Youth Work Access Index is in Goa (0.997), followed by Tripura (0.992) and Arunachal Pradesh (0.990).
When computed for males and females separately, it can be found that the value of Youth Work Access Index is lower for females (0.919) as compared to males (0.992). There are inter-state variations in the difference between the values for males and females, though they are not substantial. Since the male-female difference in access is not very high, the value is only marginally affected when adjusted for gender difference in access (the value decreases from 0.957 to 0.955). When adjusted further for sex ratio, the value of youth work access index becomes 0.916.
A comparison between Youth Work Outcome and Youth Work Access Indexes across Indian states is provided in Figure 7.2. As can be seen in all the states the value of the access index is much higher than the outcome index.
We have noted in Chapter 4 that there is a low negative correlation (-0.218) between youth education index and YWI; the correlation was statistically insignificant. we try to further explore (refer Figure 7.3) the pattern of this association in an attempt to understand the absence of a strong relationship. When we look at the quadrangles within the graph, we have ten states having a low education index and a low work index. These states also have low values for other dimensions of youth development. The states that need special attention in terms of development interventions are Assam, Bihar, Jharkhand, Jammu & Kashmir, Orissa, Uttar Pradesh, Tripura and West Bengal.
Youth and Work

India Youth Development Report 20�0 2�0
FIGURE 7.2 Comparison of Youth Work Outcome and Youth Work Access Indexes across Indian States

2��
FIGURE 7.3 Relationship between Youth Education and Youth Work Indexes
Youth and Work

India Youth Development Report 20�0 2�2
On the other side, there are four states that have high values of both youth education index and Youth Work Index (Tamil Nadu, Maharashtra, Mizoram and Himachal Pradesh). The remaining states having strikingly different values for education and work indexes. Nine states have a low value (0.45 or b for low) for education index but have a high value (0.65 or above) for work index. Among them are the relatively less developed states of Rajasthan and Madhya Pradesh. Andhra Pradesh, a state known for high level of child labour, is also in this group. For seven states, the values of both education and work indexes are very low. Most of these states are relatively well-developed in all the dimensions related to youth development.
7.3 Some Aspects of Work Participation Table 7.4 shows the work participation rates for main and marginal youth workers. It is evident from the Table that about 45 percent of the males were main workers while the corresponding percentage for females was only 15 percent. There was slight variation in the percentages of males who were classified under main workers in rural and urban areas. However, there were substantial rural-urban differentials in the proportion of females who were main workers. Among different age groups, the proportion of main workers was lowest among 5-14 age groups (2.72 percent) and highest among youth in the age group 30-39 years (87.19 years). This was true for both males as well as females.
TABLE 7.4 Work Participation Rates for Main and Marginal Indian Youth Workers, 2001 (%)
Age-group Type of All Areas Rural Urban
Workers Males Females Males Females Males Females
AllAges A 45.13 14.68 44.31 16.65 47.19 9.42
B 6.55 10.95 7.79 14.14 3.41 2.46
5-14 A 2.72 1.81 2.94 2.08 2.05 0.97
B 2.42 3.05 3.01 3.87 0.64 0.52
15-19 A 28.12 11.83 30.89 14.65 21.67 5.31
B 10.79 12.8 13.67 17.37 4.09 2.24
20-24 A 58.54 19.17 61.75 23.25 51.95 9.8
B 12.15 16.44 15.12 22.23 6.06 3.12
25-29 A 77.8 23.74 78.12 28 77.12 13.79
B 10.88 17.63 13.12 23.63 6.06 3.62
30-39 A 87.19 28.19 86.19 32.53 89.41 17.91
B 8.73 18.36 10.41 24.31 5.01 4.27Note: A–MainWorkers,B–MarginalWorkers Source: Censusof India-2001-B-SeriesTables

2��
Further, the rural-urban differentials in the proportion of male main workers were more substantial in the age groups 15-19 years and 20-24 years than in other age groups. But, the proportion of main workers was considerably higher among females in rural areas in all the age group as compared to their urban counterparts.
About 7 percent of the males and more than one-tenth of the females were marginal workers. The proportion of marginal workers among males is the highest in the age group 20-24 years whereas the corresponding percentage among females was highest in the age group 30-39 years. While the proportion of marginal workers is considerably higher among females in rural areas, the proportion was slightly higher among males in urban areas.
TABLE 7.5 Work Participation Rates (percent) for Indian Youth Main Workers, 1991 and 2001
Age-group 1991 2001 Males Females Males FemalesAllAges 50.93 15.93 51.68 25.635-14 5.18 3.4 5.14 4.8515-19 42.57 18.44 38.91 24.6320-24 73.68 23.46 70.69 35.6125-29 90.5 26.33 88.68 41.3630-39 96.14 29.05 95.92 46.54Source: Censusof India-2001-B-SeriesTables
Table 7.5 shows the work participation rates for youth main workers during 1991 and 2001. More than half the males and one-fourth females were working during 2001. While there was a slight decrease in the percentage of male main workers from the year 1991 to 2001, there was considerable increase in the proportion of female main workers during the same period. Regarding age-wise variation, it is clear from the Table that more than 95 percent of the males aged 30 years and above were main workers during both the time period. However, there was substantial increase in the proportion of main workers among females from 1991 to 2001.
Source: NationalSampleSurvey62ndround
TABLE 7.6 Worker Population Ratio (WPR) among Indian Youth 2005-06
Age-group Rural Urban Male Female Total Male Female Total15-19 42 17.7 31.1 28.7 8.8 19.6
20-24 80 25.5 53.4 65.3 14.3 41
25-29 94.2 34.6 64 89 18.7 53.9
30-34 97.8 39.8 66.9 96.1 18.6 57.9
15-34 82 33.1 57.9 74.5 16.4 46.4
Youth and Work

India Youth Development Report 20�0 2��
Table 7.6 presents the worker population ratio by usual principal activity. The ratio was relatively higher in the rural areas as compared to urban areas. This was similar for all age groups. The worker population ratio increases with an increase in age group. Work participation rate in urban areas is lower than that in rural areas for both males and females. Work participation for female youth in urban areas is only half of that for females in rural areas.
TABLE 7.7 Percentage of Employed Indian Youth by Usual Principal Activity 2005-06
Age group
Occupation 15-19 20-24 25-29 30-34 Total
Scientific/technical work 0.6 2.8 4.7 4.8 3.5
Managerial 1.9 2.8 3.6 4.2 3.3
Clerical/supervisoryworkers 8.2 10.7 10.5 11.5 10.4
Serviceworkers 3.7 3.5 4 3.9 3.8
Agricultureandrelatedwork 56.2 51.1 50 51.8 51.8
Production&operationrelatedwork 29.1 28.8 26.6 23.3 26.7
Total 100 100 100 100 100Source: NationalSampleSurvey62ndround
The distribution of employed youth according to principal activity across age groups is given in Table 7.7. More than 50 percent of youth work in agriculture and related areas while a little over a quarter work in production and allied activities. Other activities such as service work, scientific or technical work, clerical and supervisory work, and managerial activities employ about a little over one-fifth of the youth in India. Though there are differences across age groups, these are not substantial. The percentage engaged in agriculture and production activities decline slightly with age; consequently those in service, clerical and other activities increase as age increases.
TABLE 7.8 Distribution of Employed Indian Youth across Sectors according to Age Group (%), 2005-06
Age group Agriculture Industry Service
15-19 55.80 26.40 17.80
20-24 51.30 23.60 25.20
25-29 50.00 22.30 27.80
30-34 51.70 20.50 27.80
All 51.80 22.80 25.40Source: NSSO62ndRound

2��
Table 7.8 presents the distribution of youth who are working across various sectors in each age group. Among the youth who are employed, 52 percent work in the agriculture sector, 23 percent in industries and 25 percent in the service sector. The distribution across age group varies, but the differences are not substantial.
TABLE 7.9 Employment Status of Indian Youth by Usual Principal Activity, 2005-06
Age group Self Regular Casual Unemployed Not in Employed Wage/Salary Labour Labour Force15-19 12.70 3.60 11.80 3.20 68.60
20-24 23.80 9.30 16.90 4.80 45.20
25-29 29.60 11.20 20.50 2.70 36.00
30-34 31.70 12.10 20.70 1.20 34.30
All 23.60 8.70 17.10 3.10 47.60
Source: NationalSampleSurvey62ndRound
Table 7.9 presents work participation among youth according to wage pattern. While being employed is important, the classification presented in the Table enables us to see the possibilities of seasonality in employment, the permanency of employment and also the extent of income earned from work. Among youth, 47.6 percent are not in the labour force. While 23.6 percent of youth are self-employed (forming about 45 percent of total employed youth), 17 percent are casual labourers (forming 32 percent of the employed youth). Only 8.7 percent of the youth (or 17 percent of the employed youth) earn regular income. The remaining 3.1 percent of Indian youth are unemployed.
There are age-wise variations in the pattern of employment among young people. The number of youth engaged in all these categories increases with age as a consequence of the overall increase in work participation with age.
TABLE 7.10 Employment Status of Indian Youth (Usual Principal Activity) by Sector and Wage Pattern
Self Employed Regular Wage/ Salary Casual Labour
Agriculture 56.00 1.40 42.60
Industry 29.60 26.50 43.80
Service 47.50 42.50 10.00
All 47.80 17.60 34.60
Source: NationalSampleSurvey62ndRound
Youth and Work

India Youth Development Report 20�0 2��
Table 7.10 presents the distribution of youth employed in various sectors according to wage pattern. The highest extent of youth who work as casual labour is in Industry (43.8 percent) closely followed by Agricultural (42.6 percent). In the service sector, only 10 percent of youth work as casual labour. As one would expect, the share of regular salaried youth is the highest in the service sector (42.5) while Industry has a little over one-fourth of its young employees earning regular wages/ salaries. Regular employment is very low in the agriculture sector with only 1.4 percent of youth employed in this sector earning regular salary or wage. The proportion of self-employed youth is the highest in the agricultural sector; it may be noted that the extent of self-employed youth is high in the service sector also.
In Madhya Pradesh, women from the Valmiki and Haila communities are still compelled to clean latrines manually. There are still certain pockets in India, where manual scavenging exists and those unwilling to practise the trade are compelled to continue with the profession against their will. Everybody knows that manual scavenging has been banned in India. But that has not made much of a difference to many Hindu women from the Valmiki community and their Muslim counterparts from the Haila community in Madhya Pradesh (MP), who are still compelled to clean dry latrines for a living.
Known as manual scavengers, these women manually remove human excreta from dry latrines – toilets with not more than a small cubicle in which a hole in the ground opens on to a receptacle in a partitioned off space. The Valmikis and Hailas are deemed the lowliest of the low. The Valmikis, who are a Scheduled Caste (SC), are looked down upon by other SC communities, too. As for the Hailas, although they fall in the Other Backward Class (OBC) category, their lot is the worst. Victims of extreme exploitation, deprivation and marginalization, local custom still forbids the Hailas from using public facilities like a teashop and their children are harassed even if they are granted admission in a school.
The government offers financial assistance to those among these communities who break away and take up other jobs. They can start any alternative work after they quit manual scavenging.
BOX 7.1 The Shocking Plight of Manual Scavengers
Contd...

2��
What is surprising though is that this benefit is sanctioned only for men, although it is the women who largely dominate this demeaning ‘profession’ – in MP, 90 percent of those who still engage in scavenging are women. The loan probably benefits the men folk more because the money is given for agriculture and allied services or trade, which are largely considered to be male dominated jobs.
The story of Sumitra Bai, 52, of Barotha village in Dewas district, is emblematic of the challenges that face those who try to leave this ugly legacy behind. A Valmiki, Sumitra Bai was encouraged by her children to give up manual scavenging after decades of cleaning lavatories. Despite the hostility she faced, Sumitra Bai took a loan of Rs 20,000 from a cooperative bank to open a cloth shop in her village. Sumitra burnt her scavenger’s basket to symbolize the end to a degrading past. Six months after she had set up shop, pricing her goods – saris, blouses and petticoats – according to the purchasing power of the neighbourhood, she still had not sold a single item!
The villagers – both from the upper castes and the Dalit communities – had decided to punish her for daring to step beyond her caste by boycotting her goods. “The influential people of the village issued a diktat against me and therefore no one bought anything from my shop. My shop had saris, with prices ranging from Rs 100-300. The village people could have easily afforded them. There are about 50 houses belonging to the Valmiki community in my village. But the fact that not a single piece of cloth was sold proves that not only members of the upper castes and the gentry, but even those in the Valmiki community considered me guilty,” says a heartbroken Sumitra.
With no option left, Sumitra Bai returned to manual scavenging after returning her stock of unsold goods at a loss of 20 percent.
According to statistics available, a total of 2,274 persons in the rural and urban areas of Madhya Pradesh continue to be engaged in carrying excreta. It is interesting to note though that only 112 of this number are male. In Dewas district, for instance, among 129 manual scavengers, only two are men.
(New Woman, April 2009, pg 113-115).
BOX 7.1 The Shocking Plight of ...... Contd...
Youth and Work

India Youth Development Report 20�0 2��
TABLE 7.11 Percentage of Employed Indian Youth in Various Occupations by Type of Employment, 2005-06
Self Regular Wage Casual Employed Salary Labour
Scientific/Technical work 20.20 79.10 0.60
Managerial 89.30 9.90 0.80
Clerical/SupervisoryWorkers 57.10 39.60 3.40
ServiceWorkers 34.90 52.00 13.10
AgricultureandRelatedWork 55.90 1.50 42.70
Production&OperationRelatedWork 28.90 27.60 43.60
All 47.80 17.60 34.60
Source: NationalSampleSurvey62ndRound
The extent of employment according to wage pattern in certain types of occupations can be seen from Table 7.11. The extent of casual labour is the highest in agriculture-related work and also in production and allied activities. Casual labour prevalence is the lowest in scientific/technical work and in managerial work. In scientific/ technical work, most youth are salaried (79 percent). Interestingly, the occupations categorized as managerial, have only 9.9 percent salaried employees while 89.3 percent are self-employed. Scientific/technical work, clerical and supervisory work and service work have the highest extent of youth earning regular salary/wages.
The National Family Health Survey 2005-06 also collected data on work from men and women across Indian states. The following paragraphs highlight some of the salient aspects captured by NFHS regarding work participation among youth (15-34 years).

2��
FIGURE 7.4 Percentage of Indian Youth worked during 12 month period preceding survey by Age Groups, NFHS 3 (2005-06), India
Figure 7.4 shows the percentage worked in the last 12 months by age groups. The highest proportion of men who were currently working was in the age group 30-34 years followed by men in 20-24 years and lowest among men in the 15-19 years. However, among women the proportion of those currently working was highest in the age group 30-34 years and lowest in the age group 15-19 years. The proportion who has worked in the past one year among women was almost the same for all the age groups.
FIGURE 7.5 Work Status in last 12 months by Type of Place of Residence, NFHS 3 2005-06, India
Youth and Work

India Youth Development Report 20�0 2�0
FIGURE 7.6 Work Status in last 12 months by Sex and Place of Residence, NFHS 3 2005-06, India
Figure 7.6 shows the percentage of youth who have worked in the past 12 months by sex and type of place of residence. Overall, the proportion of youth who were currently working was relatively higher in the rural areas as compared to urban areas. This variation was more substantial among women as compared to men. Likewise, the percentage of men and women who have worked in the past year was relatively higher in rural areas and this variation was more visible among women.
Figure 7.5 presents the percentage of youth who have worked in the past 12 months by type of place of residence. Overall, the proportion of youth who were currently working was relatively higher in the rural areas as compared to urban areas. This variation was more substantial among women as compared to men. Likewise, the percentage of men and women who have worked in the past year was relatively higher in rural areas and this variation was more visible among women.

2��
Figure 7.7 depicts work participation by educational status of the youth. A vast majority of the men and women who do not have any education were currently working. The proportion of those who have worked in the past year was almost the same for males in all the educational groups whereas there was considerable variation in the proportion who have worked in the past year among women according to educational status. For instance, the percentage of women who worked in the past year was highest among women having no education.
FIGURE 7.8 Work Status in last 12 months by Sex and Caste, NFHS 3 2005-06, India
FIGURE 7.7 Work Status in last 12 months by Sex and Education, NFHS 3 2005-06, India
Youth and Work

India Youth Development Report 20�0 2�2
Figure 7.9 gives information about those youth who have worked in the last 12 months, by standard of living. Overall, the proportion who did not work during the past one year was higher among women. While about one-fifth of the men did not work during the past one year, the corresponding percentage for women was around 60 percent. Similarly, more than three- forth of the men were currently working whereas only 30 percent of the women were currently working. With regard to the standard of living, the percentage of both men and women who did not work during the past one year was relatively higher among those who were having higher standard of living. In addition, the proportion of men and women who were currently working was higher among those with lower standard of living. Although the variation in the proportion was not much significant among youth in the low and medium standard of living categories, there was considerable variation in the proportion when we consider medium to higher standard of living.
Figure 7.8 shows the information about youth who have worked in the last 12 months by caste. It is clear from the graph that among different caste groups, the proportion who was working was highest among Scheduled Tribes. This was true of both men and women. In the case of those who have worked in the past year, the proportion was highest among Scheduled Tribe Women followed by Scheduled Caste and Others.
FIGURE 7.9 Work Status in last 12 months by Standard of Living, NFHS 3 2005-06, India

2��
FIGURE 7.10 Median Age at First Employment, Selected Indian States/UT, 2009
The primary research gathered information on the employment status of youth in the selected states. From Figure 7.10 it can be seen that the median age at first employment is 18 in most of the States. Age at first employment is the highest in Andaman and Nicobar Islands (24.5) closely followed by Nagaland (24 years).
FIGURE 7.11 Percentage of Youth Ever Worked, Selected Indian States/UT, 2009
Figure 7.11 presents information on the percentage of youth who have ever worked in the selected states. When the data from all States are combined, 31 percent of youth said that they have ever worked. The share of youth stating that they have ever worked ranges from 8 % in Jammu and Kashmir to 81 % in Tamil Nadu and 80 % in Kerala. The wide inter-state variation in employment among youth needs to be taken into account in interventions aimed at creating work opportunities for youth.
Youth and Work

India Youth Development Report 20�0 2��
FIGURE 7.12 Perception of Fulfilment Regarding Employment Aspirations, Selected Indian States, 2009
Figure 7.12 presents information on the perceived fulfilment of employment aspirations. Respondents were asked whether they were able to obtain a job they aspired for. It can be seen that close to half of the youth said that their aspiration is not at all fulfilled while 41 percent said that aspiration was achieved to some extent and 12 percent said that they were able to completely achieve their employment aspirations. There are inter-state variations in the level of fulfilment of employment aspirations.
The extent of youth reporting that their aspirations are not at all satisfied is the highest in Uttar Pradesh, followed by Andaman and Nicobar islands. The greatest extent of fulfilment of aspirations is reported in Delhi (33 percent) followed by Kerala (23 percent).
7.3 Unemployment among YouthJoblessness and underemployment are challenging economic and social problems in developing countries. In most countries, young people are the majority of the jobless and are 2-3 times more likely to be unemployed than adults (World Bank, 2006). Whenever there is a discussion of the Indian economy, a common topic that comes up is that of unemployment which has been plaguing the nation. Unemployment refers to a situation in which people who are able and willing to work do not get employment opportunities and jobs that match their capabilities and skills. (Demand of skilled workers in the knowledge economy has created hindrance for a large portion of world youth, especially in developing countries, where higher education system has not been able to realize sufficient ‘value addition’ in terms of enhancing the employability in the new age labour market.) Indian labour market has been marked by the dominance of informal, unorganized sectors, high labour involvement in low-productivity agricultural services, and largely poor working conditions (Sarkar, 2007).

2��
“The report, ‘Global Employment Trends for Youth’, says that at the end of 2009, there were an estimated 81 million unemployed young people in the world. This was 7.8 million more than the number in 2007 at the start of the global crisis. The youth unemployment rate rose sharply during the economic crisis – more sharply than ever before – from 11.9 to 13.0 percent. The report forecasts a continued increase in the youth unemployment rate in 2010 to 13.1 percent, followed by a moderate decline in 2011.” {http://www.indiaedunews.net/Today/’Indian_youth_not_educated_enough_for_employment’_10717/)
According to the Global Entrepreneurship Monitor (2007) report, India’s High-Growth Expectation Early-Stage Entrepreneurship (HEA) rate is only one-fifth that of China. Five States viz. Tamil Nadu (10.60 percent), Maharashtra (10.10 per cent), West Bengal (10.05 percent), Uttar Pradesh (9.61 percent) and Andhra Pradesh (9.56 percent) together account for about 50 percent of the total establishments in the country. The same five states also have the combined share of about 50 percent of total employment.
Unfortunately, a major demoralizing factor is the ever-looming spectra of unemployment after completion of higher education. The incidence of unemployment in 1999-00 was 2.5 percent for males and 1.8 percent for females (Table 7.12). According the 62nd round of National Sample Survey (2005-06), the extent of unemployment among youth is 1.4 percent in rural areas and 2.6 percent in urban areas. Unemployment rate is higher among males (2.0 percent in rural and 3.7 percent in urban areas) as compared to females (0.7 percent in rural and 1.4 percent in urban areas). Though globalization and modernization processes have created opportunities for widening the scope of work and enhancing lifestyles (especially in urban middle class), it has also been instrumental in creating in some a sense of humiliation and low self-esteem. In India, these processes have thrown a significant number out of their traditional niches of occupation, lifestyles (e.g., development projects such as big dams, SEZs). Migrations to urban pockets have increased, leading to overcrowding, lack of adequate infrastructure and assimilation of urban lifestyles. Such processes have also made many of the existing strengths seem irrelevant or outdated (computer, skills, projects which displace people into another world where a new set of skills required). The Indian diaspora youth, very often the middle class or the elite, also have to face increasingly a sense of humiliation in their status of second class citizens in the new locations. They take recourse in their religious identities with a passion not seen in India (Kakar, 1996).
Unemployment can be defined as a state of worklessness for a man fit and willing to work. It is a condition of involuntary and not voluntary idleness. Some features of unemployment have been identified as follows:
1. The incidence of unemployment is much higher in urban areas than in rural areas.
2. Unemployment rates for women are higher than those for men.
Youth and Work

India Youth Development Report 20�0 2��
3. The incidence of unemployment among the educated is much higher than the overall unemployment.
4. There is greater unemployment in the agricultural sector than in industrial and other major sectors.
Even as economists and social thinkers have classified unemployment into various types, unemployment can be broadly classified into two types:
(1) Voluntary unemployment
In this type of unemployment, a person out of job, out of his own choice doesn’t work on the prevalent or prescribed wages. Either he wants higher wages or doesn’t want to work at all. It is in fact a social problem leading to social disorganization. Social problems and forces such as a revolution, social upheaval, class struggle, financial or economic crisis, a war between nations, mental illness, political corruption, mounting unemployment and crime etc. threaten the smooth working of society. Social values are often regarded as the sustaining force of society. They contribute to the strength and stability of social order. But due to rapid social change, new values come up and some of the old values decline. At the same time, people are not is a position to reject the old completely and accept the new altogether. Here, conflict between the old and the new is an inevitable result which leads to social disorganization in an imposed situation. In economic terminology, this situation is voluntary unemployment.
(2) Involuntary unemployment
In this type of situation, the person who is unemployed has no say in the matter. It means that a person is separated from remunerative work and is devoid of wages although he is capable of earning his wages and is also anxious to earn them. Forms and types of unemployment according to Hock are:
a. Cyclical unemployment: This is the result of the trade cycle which is a part of the capitalist system. In such a system, there is greater unemployment and when there is depression, a large number of people are rendered unemployed. Since such an economic crisis is the result of trade cycle, unemployment is a part of it.
b. Sudden unemployment: When at the place where workers have been employed there is some change, a large number of persons are unemployed. It all happens in the industries, trades and business where people are employed for a job and suddenly when the job has ended they are asked to go.
c. Unemployment caused by failure of industries: In many cases, a business, a factory or an industry has to close down. There may be various factors responsible for it, there may be dispute amongst the partners, the business may incur a huge loss or the business may not turn out to be useful and so on.

2��
d. Unemployment caused by deterioration in industry and business: In various industries, trades or business, sometimes, there is deterioration. This deterioration may be due to various factors. Inefficiency of the employers, keen competition, less profit etc. are some of the factors responsible for deterioration in industry and business.
e. Seasonal unemployment: Certain industries and traders engage workers for a particular season. When the season ends, the workers are rendered unemployed. The sugar industry is an example of this type of seasonal unemployment.
The problem of unemployment is becoming colossal. The extent of unemployment differs according to location as well as social status. In urban areas, the unemployment rate is much higher. As per NSSO’s 61st round, the unemployment rate among urban males aged 15 years and above is 3.7 percent as compared to 6.9 percent among females. This indicates that many women in urban areas are willing to work but fail to get opportunities. Caste-wise variations in unemployment are also substantial and can lead to communal tensions in some cases. Various problems have caused this situation. There are individual factors like age, vocational unfitness and physical disabilities which restrict the people. External factors include technological and economic factors. There is an enormous increase in the population. Every year, India adds to her population afresh. In addition, every year about 5 million people become eligible for securing jobs. The business field is subject to the ups and downs of trade cycle and globalization. Sick industries often close down compelling their employees to become unemployed. Technological advancement contributes to economic development. But unplanned and uncontrolled growth of technology is causing havoc in job opportunities. Computerization and automation has led to technological unemployment. Strikes and lockouts have become an inseparable aspect of the industrial world today. Due to this, industries often face economic losses and production comes down. Since workers do not get any salary or wages during the strike period, they suffer from economic hardships. They become permanently or temporarily unemployed. Today, young people are not ready to take jobs which are considered to be socially degrading or lowly. Our educational system has its own irreparable defects and its contribution to unemployment is an open truth. Our education does not prepare the minds of the young generation to become self-employed; on the contrary it makes them dependent on government vacancies which are hard to come. Our state, right from the beginning of the Five year plans, has introduced several employment generating schemes and programmes over the years; but, in the absence of proper implementation and monitoring, they have failed to achieve the required targets. Recently, the UPA government introduced the National Rural Employment Guarantee (NREGA) programme which aims to provide minimum days of employment to people living in the villages. This is a laudable programme if implemented sincerely because it will provide employment to people during natural calamities like drought, floods, etc. The remedial measures for reducing unemployment may lay greater emphasis on creation
Youth and Work

India Youth Development Report 20�0 2��
of opportunities for self-employment, augmentation of productivity and income levels of the working poor, shift in emphasis from creation of relief type of employment to the building up of durable productive assets in the rural areas; and, instead of attempting to revert to protectionist policies, the pace of privatization may be accelerated [Azad India Foundation: www.azadindia.org].
Estimates of the absolute number of unemployed youth show that about 58 million youth are unemployed in any particular day – which has serious implications. The possibility of a large youth population missing the windows of opportunity provided is quite high, if we do not find employment opportunities for them. If the economy does not generate adequate employment of sufficiently attractive nature, the demographics would not deliver a dividend.
The National Sample Survey provides information on the number of days worked during the past seven days for those who are employed. This information is converted to indicate intensity of employment, which indirectly indicates access to work. It can be seen that most of the working youth are able to find work for five or more days in a week.
Table 7.12 provides information on the activity status of youth in the 1990s. It can be seen that the percentage of unemployed in India increased slightly from 2.27 to 2.49 percent between 1993-94 and 1999-2000. The extent of unemployment among males has remained much higher than among females. Urban unemployment (4.17 percent) has been much higher than rural unemployment (1.54 percent). An encouraging change has been the increase during the period in the share of students among youth, particularly among females.
AmitabhYadav,a22-year-oldyouthwhohadgraduatedfromthelocalcollege,expressedhisviewsonmigrationfromhisdistrictinUttarPradesh.“There are no factories & industries to create work opportunities, due to existingcorruptionandmalpracticesinthejoballocationsinthegovernment&non-governmentsector.Employmentisnottheonlyproblem–itstartsearlieratthelevelof education.Intheabsenceof education,workispossibleonlyintheunorganizedsectoranddailywages.Duetothis,povertycontinues.Peopleinthisareaareverypoorandhavetochoosebetweeneducationandworkforthesakeof sustenance.Thosewhocanaffordeducation,migratetourbancentresinsearchof betterpayingjobs.Facilitiesintheurbanareas,moreopportunitiesforeducationandwork,andlifestyleincitiesattractyouthandtheywanttosettledowninurbansetupsinanticipationof goodfacilitiesfortheirchildren.Agriculturethesedaysisdependentontheweatherandthusisnotasustainablesourceof employment.Source: Primary research in Uttar Pradesh

2��
Note: Figureswithinparenthesesaretheunemploymentrateswithrespectof labourforce;‘Others’includedomesticduties,retiredpersons,disabled,beggars,etc.Source: India Yearbook 2002, Manpower Profile
TABLE 7.12 Activity Status of Indian Youth (15 – 34 years) in the 1990s
Activity All areas Urban Rural Status Year Male Female Total Male Female Total Male Female Total
Employed 1993-94 78.35 40.62 59.91 69.04 19.95 46.04 81.9 47.7 64.94
1999-2000 75.55 36.28 56.08 66.83 16.83 42.38 79.07 43.43 61.17
Un- 1993-94 3.27 1.22 2.27 5.63 2.72 4.27 2.37 0.7 1.54employed (4.01) (2.91) (3.65) (7.54) (11.99) (8.48) (2.82) (1.45) (2.36)
1999-2000 3.72 1.23 2.49 6.09 2.08 4.17 2.76 0.93 1.84 (4.67) (3.29) (4.25) (8.36) (10.98) (8.86) (3.37) (2.09) (2.92)
Students 1993-94 16.33 8.66 12.58 23.02 17.65 20.5 13.78 5.58 9.71
1999-2000 17.77 10.64 14.23 24.09 18.73 21.52 15.22 7.66 11.42
Others 1993-94 2.05 49.51 25.24 2.31 59.68 29.19 1.95 46.02 23.81
1999-2000 2.96 51.85 27.2 2.99 62.36 31.43 2.95 47.98 25.57
Total 100 100 100 100 100 100 100 100 100
Figure 7.13 presents the unemployment situation among youth by place of residence and age groups. As per the 62nd round of the NSS, about 4 percent of youth in urban and about 2.3 percent of youth in rural areas are unemployed. The unemployment rate among male youth is above 6 percent in urban and about 4 percent in rural India. Among males the highest level of unemployment is reported in the 20-24 years age group both in rural and urban areas with the urban level being much higher (7.5 percent). Among females, the percentage of unemployed youth is about 1.8 percent in rural and a little higher in urban areas.
Youth and Work

India Youth Development Report 20�0 2�0
FIGURE 7.13 Percentage of Unemployed Population in Rural & Urban India (by usual principal activity) 2005-06 (NSS 62nd round)
Figure 7.14 presents the percentage of youth who ever sought employment in the states where primary research was conducted. When the data from the states are combined, 36 percent of the youth said that they had never sought employment whereas 24 percent said that they had sought any type of employment (full time or part time) and 40 percent said that they had sought full time employment.
There are inter-state variations in employment- seeking. Whereas 98 percent of Delhi youth reported that they had ever sought full time employment, employment- seeking is the lowest in Assam (66 percent) and Andaman & Nicobar Islands (63 percent).
FIGURE 7.14 Percentage of Youth Ever Sought Employment in Selected Indian States/UT, 2009

2��
Figures 7.15 and 7.16 present information on the perceived situation regarding employment opportunities for males and females respectively. It can be seen that above 60 percent of the youth perceive that the chance of gaining employment for males is very poor/poor. The extent varies substantially across states with only 3 percent of youth from Andaman and Nicobar Islands saying that the situation is bad. In comparison, 86 percent of youth from Uttar Pradesh and 68 percent from Jammu and Kashmir reported that the employment opportunities for males are very poor or poor.
FIGURE 7.15 Perceived Rating of Employment Opportunities for Males in Selected Indian States/UT, 2009
FIGURE 7.16 Perceived Rating of Employment Opportunities for Females in Selected Indian States/UT, 2009
Perceptions about employment opportunities for females indicate that 65 percent of youth perceive that the opportunities are minimal (as compared to 61 percent for males). As in the case of males, youth from Andaman & Nicobar Islands perceive that the situation is good while youth from Uttar Pradesh, Delhi, Rajasthan and West Bengal perceive that opportunities for female youth for employment are very poor or poor.
Youth and Work

India Youth Development Report 20�0 2�2
Some of the critical problems in this area are: mismatch between skills requirement and employment opportunities, low wages and low productivity; occupational shift in employment; under-employment due to seasonal factors and excess labour supply vis-à-vis the demand; migration of labour force from rural areas to urban areas; and very low participation of women in the work force, especially in the organized sector.
Employment is a social institution with latent and manifest consequences; apart from earning a living, employment also provides time structure, social contact, activity, status, purpose and control. Thus unemployment does not just have economic implications, but also wide ranging physiological and psychological effects, leading to frustration, deviant behaviour and even suicide. In India, reflecting the social and cultural diversity, male youth response to unemployment is also diverse. For instance in Kerala the growth of unemployment has resulted in migration. In many other states (eg Punjab, Gujarat and some North-eastern states), youth were mobilized into anti-national activities.
Singh et al [1996] showed greater vulnerability to the feeling of alienation and its dimensions among unemployed subjects compared to employed subjects, with technically educated unemployed subjects being most vulnerable and their non-technical, educated, employed counterparts being least vulnerable. Unemployment and financial difficulties have often been the cause of suicides, including the farmers’ suicides which continue unabated in the Vidarbha region of Maharashtra.
Statistics also show that, with regard to males and females in urban areas, the proportion of unemployed increased with increasing level of education (Parasuraman, 1989). More than any other group, youth have to pay the social cost of globalization. The rate of unemployment of youth is at least two times that for the adult population worldwide (World Youth Report 2003).
According to a study carried out by the ILO, [quoted in Sriram] youth unemployment :• Has far reaching implications on the labour market and the society at large;• Has contributed to economic exclusion and poverty;• Increases the probability of future joblessness [in adulthood];• Results in the loss of a valuable contribution to economic activity and
growth;• Is a major cause of crime and drug abuse;• Leads to alienation from society and a distrust of democratic political
processes.
Globalization and liberalization of the Indian economy and their consequences on market forces like recession, government’s downsizing mantra, and the shrinking job market have had a negative influence by throwing out the work- force from employment, thus affecting the public sector the most. The growth rate of employment in the organized private sector has experienced a major jump from 0.45 percent during 1983-94 to 1.87 percent during 1994-2000 (Sriram, 2003). However, the growth rates in rural and urban

2��
employment during 1993-94 to 2000 were 0.66 percent and 2.27 percent respectively. During the next five years, the employment growth rate registered an increase to reach close to the level prior to 1993-94. It was estimated that the government’s economic policy would result in additional unemployment of 1 to 3 million during 1992-93 and 4.8 million in 1993-94 [Naidu, 1996]. In Maharashtra, 43 lakh unemployed people registered with the State government’s employment bureau. The employment picture reflects the deliberate government policy of cutting down jobs in the public sector along with market-driven growth in the private sector (Sriram, 2003). Due to lack of jobs to offer, the government’s emphasis now is on encouraging people for self-employment [TOI, September 18, 2000, pg.1]. These processes have pushed out youth from their traditional occupations and reduced them to contract workers/ casual labourers. In 2005, 27.8 million young people who had at least 10 years of education were seeking jobs; of them 5.4 million were graduates. Despite the fact that labour force participation stagnated during the past few years, open unemployment rates have increased. Youth unemployment rates are substantially higher than overall unemployment rate, and have increased over the years (Chandrasekhar et al 2006). As many as 6-8 percent of young rural males and 12-14 percent of urban male youth describe themselves as available for work and seeking but not finding work. It is estimated that 36 million young people between 15-29 years were ‘usually unemployed’ at the start of 1995, and as many as 58 million young people were unemployed on any particular day.
The following is a news report based on the study carried out by the PopulationCouncil and the International Institute for Population Sciences in 2009 in selectedIndianstates.“Just two in every five young men (40 percent) and one in every three young women (33 percent) had completed secondary education... (and) one in every �2 young men and one in four young women had never been to school at all in the country,” said the study conducted under the aegis of the Ministry of Health and Family Welfare. The study titled ‘Youth in India: Situation and Needs’ assessed the situation of youth in six states - Andhra Pradesh, Bihar, Jharkhand, Maharashtra, Rajasthan and Tamil Nadu - between 200� and 200�, involving over ��,000 youths in the age group of ��-2� years. Around ��-�2 percent of men and ��-�� percent of women in Maharashtra and the southern states of Andhra Pradesh and Tamil Nadu had completed �0 or more years of education, compared to �0-�� percent of men and ��-�� percent of women from the other states. “Basic education can be very important in helping people to get jobs and gainful employment. This connection, while always present, is particularly critical in a rapidly globalizing world in which quality control and production according to strict specification can be crucial,” Nobel laureate Amartya Sen said at the release of the study. Around 56 percent of men and 68 percent of women surveyed were interested in acquiring vocational skills to help employability”. (http://www.indiaedunews.net/Today/’Indian_youth_not_educated_enough_for_employment’_10717/)
Youth and Work

India Youth Development Report 20�0 2��
Reservation policies have also made jobs an increasingly remote possibility. The problem of unemployment has been accentuated by advances in technology and communications. To meet this problem, opportunities for self-employment need to be encouraged to enable the young people to exploit the benefits of the advances in technology. It has been found that caste, class, culture, gender hierarchies, are all interwoven in decisions regarding women’s participation in the work- force. It has been observed that often women withdraw from work when the family income improves, largely due to status considerations and concentration on family needs. About 40% of urban female youth with a degree in medicine and engineering do not work (Parasuraman, 1989).
In spite of a significant rise in new vocations and careers, students still opt for jobs and careers which have a status and standing in society. There is not much consideration given to aptitude or social sensitivity. Gangrade’s (1975) study showed that youth were more inclined towards occupations which offered adventure, challenge and better monetary prospects, while parents were more concerned with the security offered by any occupation.
One finds that skilled workers like carpenters, farmers and blacksmiths prefer their children to take up white collar jobs rather than continue their trade. The number of youth involved in the task of social reconstruction is very small. The phenomenon of many students chasing a few career choices, vis-a–vis other employment opportunities is linked to the approach to development chosen by the country, i.e. the type of modernization based exclusively on an industrial urban model.
Today, expectations and aspirations for a consumerist lifestyle makes youth more ambitious and aggressive in career advancement. According to a MARG survey of school and college- going youth across the country in 1995, it was seen that money mattered most to 32 percent of the youth. Only 5 percent cherished freedom of the country. Values like honesty, hard work and courage were considered important by only a few. The survey covered 6,088 students across 31 cities. The private sector outranked all other career options. These views were shared by parents and teachers also. The armed forces ranked at the bottom.
“The youth see the private sector as modern, wealthy and professional; the civil service as highly social, classy, arrogant and corrupt; and the armed forces as macho, brave, caring, committed but leading an unsettled life.” [The Times of India, May 27, 1995, pg.11]
The concept of choice is so limited to many due to limited opportunities and socio-economic conditions. A large number think in terms of jobs rather than careers, considering the bleak employment scene. When choices are minimal or absent, attitudes and perceptions related to work are affected. Commitment to the goals of the organization is often lacking; a sense of drudgery and monotony creeps in; others who show interest are ridiculed, leading to gradual demoralization of the whole team.

2��
Another phenomenon observed in this era of quick changes, is that the youth want maximum rewards with minimum efforts. Thus, the work culture further propagates the competitive, self-oriented, myopic outlook, while concerns related to society and nation- building are sadly lacking. The messages related to co-operation, national integration and team effort, seem very alien to the youth, and they accommodate quickly to the ‘make hay while the sun shines’ idiom.
The stage of transition from school to work and, hence, unemployment is viewed as a serious problem. Migration for employment is on the rise; increased migration to urban locations leads to overcrowding, lack of adequate infrastructure and creation of identity issues [insider and outsider]. Globalization and modernization have widened the scope of work and enhancing lifestyles (especially the urban middle class) Many existing crafts and skills are becoming outdated or irrelevant (computer skills, artisans [kanjeevaram] etc).
TABLE 7.13 India’s Ranking in Doing Business 2008
StartingaBusiness 111
DealingwithLicenses 134
EmployingWorkers 85
RegisteringProperty 112
PayingTaxes 165
TradingAcrossBorders 79
EnforcingContracts 177
ClosingaBusiness 137
Source: DoingBusiness,WorldBank,2008(NationalKnowledgeCommissionReport,2009,Pg.212-213)
Another aspect of potential for providing employment for youth can be seen from Table 7.13 which presents information on India’s ranking in various processes associated with doing business in a country. It is observed that in many aspects, it ranks very low. This indicates that the possibility of organizations considering India as a potential place for establishing a business is bleak. This situation has implications for employment of Indian youth in the future.
Table 7.14 presents the results from a recent survey that examined the job prospects across States. The first three States in terms of job prospects are Andhra Pradesh, Karnataka and Maharashtra.
Youth and Work

India Youth Development Report 20�0 2��
TABLE 7.14 Indian States with the Best Job Prospects
States Job Prospects Labour laws Labour supply Labour demand Rank 2009 rank rank rank
AndhraPradesh 1 2 3 2
Karnataka 2 3 1 10
Maharashtra 3 1 7 13
Delhi 4 8 2 1
Gujarat 5 4 4 6
Kerala 6 10 6 5
TamilNadu 7 6 8 7
Haryana 8 7 12 12
Rajasthan 9 11 13 3
Goa 10 9 5 14
Punjab 11 12 11 9
HimachalPradesh 12 13 16 4
MadhyaPradesh 13 5 17 16
Orissa 14 14 15 15
WestBengal 15 19 10 8
UttarPradesh 16 15 14 18
Bihar 17 17 9 17
Assam 18 16 18 11
Jammu&Kashmir 19 18 19 19
(OUTLOOK,June28,2010,Pg.64)
7.4 Conclusion The YWI value indicates a relatively better position of youth work in India with an overall work index value of 0.636. The pattern of work participation among youth indicates a mixed association of work with educational development. The large inter-state variation in work participation among youth is a matter of concern. Both high level of participation in the absence of much improvement in education and low participation despite educational advancement are to be examined in detail.
Especially notable is the low extent of work participation among female youth despite the attempts to empower women. The improvements in female work

2��
participation are not on a par with the improvements in the educational attainment of females.
Though the work access index indicates that work is available for those who are already working, the extent of unemployment among youth is high. Also, data indicates that a large section of youth perceive the employment opportunities as minimal. The extent of youth employed as casual labourers in agriculture and industry should be a matter of concern.
Appendix Tables: (Based on Primary Data)
Age Sex Type of place
India <18 18-24 25-35 Male Female Rural Urban Total
Ever 88 401 838 920 404 824 504 1327employed (10.3) (27.8) (46.3) (39.1) (23.1) (30.4) (36.1) (32.3)Have ever Sought WorkFulltime 73 396 885 971 382 879 476 1354 (11.8) (33.7) (53.3) (47.3) (27.5) (36.9) (44.4) (39.2)Full/ 197 357 397 481 467 669 282 951Parttime (31.8) (30.4) (23.90 (23.4) (33.6) (28.1) (26.3) (27.5)Not 349 423 378 601 542 837 313 1150Seeking (56.4) (36) (22.8) (29.3) (390) (35.1) (29.2) (33.3)Employed 48 255 669 735 234 632 340 972inparwith (26.2) (51) (61.5) (60.9) (41.9) (55) (54.7) (54.9)education
Religion Caste Standard of Living
Hindu Muslim Others SC ST OBC Others Low Middle High Total
Ever 1039 141 146 319 174 332 502 494 170 484 1326employed (36.9) (21) (23.5) (38.2)(22.6)(35.8) (32) (34.6) (24.3) (34.1) (32.6)
Have ever sought work
Fulltime 1055 165 133 317 180 346 511 5089 195 498 1353 (44.4) (38.6) (20.5) (47.8)(24.1)(38.4) (44.9) (39.2) (32.4) (44.4) (39.2)
Full/ 694 96 161 178 150 330 290 319 180 341 951Parttime (29.2) (22.5) (24.8) (26.8)(20.1)(36.6) (25.5) (24.6) (29.9) 30.4) (27.5)
Not 629 166 355 168 417 226 338 469 227 283 1150Seeking (26.5) (38.9) (54.7) (25.3)(55.8)(25.1) (29.7) (36.2) (37.7) 2(25.2)(33.3)
Employed 757 1126 98 199 124 233 415 337 133 387 971inparwith (53.1) (61.7) (63.2) (48) (62.9)(54.6) (56.8) (48.4) (50.6) (66.4) (54.9)education
Youth and Work

India Youth Development Report 20�0 2��
Age Sex Type of place
India <18 18-24 25-35 Male Female Rural Urban Total
Fulfilled aspiration with job
Completely 75 143 268 350 135 289 197 486 (11.1) (11.2) (14.5) (16) (8.4) (11.2) (16.1) (12.8)
Some 200 511 838 1018 531 1097 453 1549extent (29.7) (39.9) (45.3) (46.5) (33) (42.6) (37) (40.7)
Not 399 626 742 821) 941 1192 575 1767atall (59.2) (48.9) (40.2) (37.5) (58.6) (46.2) (46.9) (46.5)
Religion Caste Standard of Living
Hindu Muslim Others SC ST OBC Others Low Middle High Total
Fulfilled aspiration with job
Completely 3897 57 42 79 66 124 216 110 67 249 486 (13.9) (12.2) (7.7) (10.4)(10.1)(12.4) (15.5) (8) (9.8) (19.4) (12.8)
Some 1134 148 267 349 300 375 526 552 259 537 1549extent (40.6) (31.6) (49.2) (46) (45.9) (37.7) (37.8) (40.3) (37.8) (41.8) (40.8)
Notatall 1269 263 234 331 287 497 649 708 359 499 1766 (45.5) (56.2) (43.1) (43.6) (44) (49.9) (46.7) (51.7) (52.4) (38.8) (46.5)
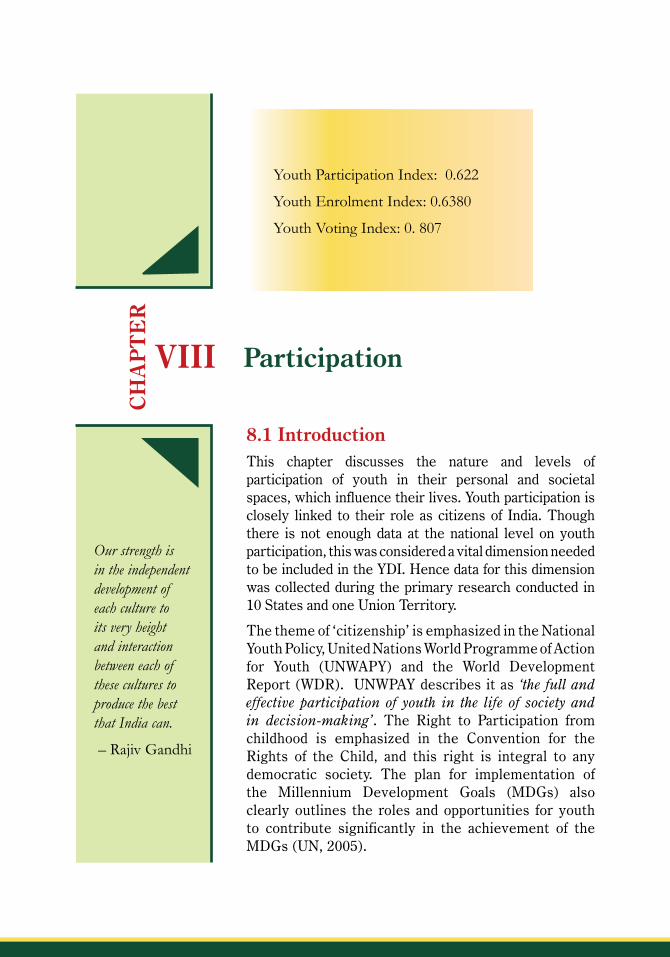
2��
8.1 IntroductionThis chapter discusses the nature and levels of participation of youth in their personal and societal spaces, which influence their lives. Youth participation is closely linked to their role as citizens of India. Though there is not enough data at the national level on youth participation, this was considered a vital dimension needed to be included in the YDI. Hence data for this dimension was collected during the primary research conducted in 10 States and one Union Territory.
The theme of ‘citizenship’ is emphasized in the National Youth Policy, United Nations World Programme of Action for Youth (UNWAPY) and the World Development Report (WDR). UNWPAY describes it as ‘the full and effective participation of youth in the life of society and in decision-making’. The Right to Participation from childhood is emphasized in the Convention for the Rights of the Child, and this right is integral to any democratic society. The plan for implementation of the Millennium Development Goals (MDGs) also clearly outlines the roles and opportunities for youth to contribute significantly in the achievement of the MDGs (UN, 2005).
Participation
Our strength is in the independent development of each culture to its very height and interaction between each of these cultures to produce the best that India can.
–RajivGandhi
CH
AP
TE
R
VIII
YouthParticipationIndex:0.622
YouthEnrolmentIndex:0.6380
YouthVotingIndex:0.807

India Youth Development Report 20�0 2�0
Participation may be defined as purposive interaction that helps primary stakeholders at the grassroots level gain access to decision-making processes whether directly or through legitimate institutionalized bodies such as community-based organizations and/ or non-government organizations that happen to represent their interests and define their stakes in development projects. (Maiti, Prasenjit, 2006)
The responsibility of civil society in taking a more proactive role in strengthening democracy, promoting rights and developing civil institutions to act as interfacing systems between the state and the people is considered vital. It is important for citizens, especially youth, to have a say in matters that affect their life, and this necessitates that the youth are also socialized for constructive engagement in the delivery of schemes. Youth have been frontrunners of several campaigns viz. National Literacy Campaign, Prevention of Child Labour in the M.V. Foundation, A.P. Youth power has always been available for revolutionary or rebellious activities and for social movements and protests. Youth are also known to be loyal and committed to the cause they believe in. Thus, they can be mobilized for collective action and movements. This can also lead to over-identification with ideologies and idolization of heroes which can be exploited by vested interests.
Dreze and Sen, (2002, pg.9-10) emphasize the equations between opportunities, power, equality and participation.
“… Participation is intimately connected with demands of equality. At the most immediate level, democratic participation requires the sharing and symmetry of basic political rights – to vote, to propagate and to criticize…
Divisions of power and influence related to caste, gender and even education can, in many situations, make the socially underprivileged also politically marginalized.”
Government reports also accede that youth participation is very limited.
Development programmes in our country are handed down by government, external agencies, NGOs and older people. Seldom are opportunities and enabling environments available for programmes based on local initiatives… in the long run it is essential to enable adolescents and youth to become the drivers of development – to assess development needs, prepare plans to meet them, undertake implementation and monitor them. They would thus be both the participants and the beneficiaries of the programmes (Planning Commission, GOI, 2001).
Youth participation can be gauged at several levels. Participation in the schemes offered by the government such as the National Service Scheme (NSS), Nehru Yuva Kendra Sangathan (NYK), Bharat Scouts and Guides, sports and adventures programmes etc that can meaningfully engage the youth in constructive activities and influence values as expected in the National Youth Policy. As a category, youth can be represented on the panchayat and ward-level committees and play an important role in local governance.

2��
Political participation is another important form of youth participation in the country. The UNWAPY categorizes participation at five levels. • Level 1 : Providing Information• Level 2 : Consulting, adult-initiated• Level 3 : Consulting, youth-initiated, but no decision-making powers• Level 4 : Shared decision-making; adults and youth share power• Level 5: Autonomy. Young people take initiative and conduct projects themselves
Rationale:An important indicator of the success of such programmes being the stake of the beneficiaries in the results of the same, this Policy also stresses that the youth of the country should enjoy greater participation in the processes of decision-making and execution at local and higher levels. Such participation would be facilitated by identifiable structures, transparent procedures and wider representation of the youth in appropriate bodies, with the emphasis being more on working with the youth than for the youth.
Objectives:
• to develop qualities of citizenship and dedication to community service amongst all sections of the youth;
• to sustain and reinforce the spirit of volunteerism amongst the youth in order to build up individual character and generate a sense of commitment to the goals of developmental programmes;
• to develop youth leadership in various socio-economic and cultural spheres and to encourage the involvement of Non-Governmental Organizations, Co-operatives and Non-formal groups of young people.
BOX 8.1 The National Youth Policy, 2003
8.2 Youth Participation IndexMoller (1968, p. 234) writes,
“In any community, the presence of a large number of adolescents and young adults influences the temper of life and the greater the proportion of young people, the greater the likelihood of cultural and social change.”
Participation

India Youth Development Report 20�0 2�2
As stated earlier, the political arena is one where youth power has been used significantly. The Naxalites, ULFA, groups in Jammu & Kashmir are political formations led by the youth. Irrespective of political inclinations, a basic political right available to every youth is the right to vote and influence change in governance at the local, state and centre levels. Thus, the two dimensions taken for calculation of the index were related to the youth’s political participation as citizens of the country. These were ‘enrolment as a voter’ and ‘actual voting behaviour’. Their voting behaviour in the last local elections was considered for calculation of the index. The details of the calculation are given in Chapter 3. The average of all the 11 locations is taken as the ‘India’ value.
The Youth Participation Index was 0.622. The values for each state are given in Figure 8.1 and Table 8.1.
Youth Participation Index:0.622
Highest value :Kerala(0.789)Lowest value : Delhi(0.488)
TABLE 8.1 Participation Index in Selected Indian States
States YPIf YPIm YPI YGPI YGPISR
A&Nisland 0.646 0.793 0.716 0.709 0.682
Assam 0.722 0.726 0.724 0.724 0.709
Delhi 0.313 0.629 0.488 0.434 0.387
Jammu&Kashmir 0.624 0.744 0.687 0.681 0.647
Maharashtra 0.703 0.730 0.717 0.717 0.672
Nagaland 0.661 0.691 0.677 0.676 0.652
Rajasthan 0.673 0.773 0.726 0.722 0.685
TamilNadu 0.646 0.687 0.666 0.666 0.665
UttarPradesh 0.582 0.900 0.752 0.717 0.670
WestBengal 0.659 0.801 0.732 0.725 0.705
Kerala 0.812 0.765 0.789 0.788 0.770
India 0.545 0.692 0.622 0.613 0.588
Source: Primaryresearch,2009

2��
The overall YPI suggests that more than 60% of the youth participate in the election process, either by enrolling and/ or actually voting. If one considers the difference in the male and female participation (Table 7.1), it is clear that in all states except Kerala, the involvement of males in voting is much higher than that of females. For India, the difference in the male and female values is 0.147. The largest gap was seen in Delhi and Uttar Pradesh where the value difference was 0.316 and 0. 312.
As seen in the other dimensions, when calculated for gender differentials and sex ratio, the values of the YPI decreased incrementally. Tamil Nadu was an exception where all the three values of the YPI, YGPI and YGPI SR were nearly equal. Figure 8.1 gives the position of the states in descending order of the YPI values.
FIGURE: 8.1 Youth Participation Index YGPR and YGPI SR across Indian States
The data values on the bars indicate the YPI values
Participation

India Youth Development Report 20�0 2��
8.3 Youth Enrolment
Table 8.2 Percentage of Indian Youth Who Were Enrolled as Voters by State, Age, Sex and Location
Age Sex Type of place
State 18-24 25-34 Male Female Rural Urban Total
A&N 43(71.7) 45(97.8) 44(86.3) 44(80) 69(83.1) 19(82.6) 88(83)Islands
Assam 98(64.5) 233(98.3) 198(90.8) 133(77.8) 181(83) 150(87.7) 331(85.1)
Delhi 115(64.2) 197(86) 172(83.5) 139(69.2) 122(74.8) 190(77.6) 312(76.5)
Jammu& 181(84.2) 229(95) 239(93) 171(85.9) 351(90.5) 59(86.8) 410(89.9)Kashmir
Kerala 56(68.3) 128(87.7) 105(80.2) 79(81.4) 149(79.3) 35(87.5) 184(80.7)
Maharashtra 109(71.2) 229(93.9) 182(87.9) 156(82.1) 192(85) 146(85.4) 338(85.1)
Nagaland 127(75.6) 176(94.1) 177(88.1) 123(81.5) 192(82.8) 111(90.2) 303(85.4)
Rajasthan 122(72.2) 251(91.3) 297(88.1) 75(72.1) 256(86.5) 117(79.1) 373(84)
TamilNadu 99(48.8) 241(91.3) 182(75.2) 158(70.2) 290(74) 50(66.7) 340(72.8)
Uttar 107(44.4) 166(84.7) 179(86.1) 94(41) 190(60.9) 83(66.4) 273(62.5)Pradesh
WestBengal 130(65.7) 196(85.2) 185(84.1) 140(68) 220(76.7) 106(75.2) 326(76.2)
India 1187 2091 2012 1356 2281 1093 3374 (65.21) (91.11) (69.18) (57.19) (64.10) (63.06 (63.80)
As shown in Table 8.2, in terms of youth enrolment for voting, Jammu & Kashmir had the highest where 90% of the youth were enrolled and Uttar Pradesh the lowest with an enrolment of 62.5%. The percentage of those enrolled was much higher in the older age group of 25-34 years. In the younger age group, Uttar Pradesh (44.4%) and Tamil Nadu (48.8%) had less than 50% of the youth enrolled. One possible factor is that those in the age group of 18-24 years are largely caught up in the education-employment nexus which ensures that youth energies are largely spent in the ‘self-survival’ process, rather than perceiving their role in contribution to society.
It was observed that in all the states except Kerala, female enrolment was lower than that of males. The difference between male and female enrolments was the highest in Uttar Pradesh (45.1 percentage points) whereas in Kerala, female enrolment was slightly higher by 1.2 percentage points. In terms of location, there were 2281 (64.10%) rural youth who were enrolled as compared to 1093 (63.06%) urban youth. There were five States where enrolment was higher in rural areas and these were A&N, J&K, Rajasthan, Tamil Nadu and West Bengal.

2��
Youth energies are focused on getting a good job and then getting married. Once these goals are achieved, very few youth think of contributing to the larger society; in cities like Mumbai, factors such as distance and lack of time are blocks for participation in larger social issues… Regionalyouthworkshop,Mumbai
8.3.1 Voting Pattern of Youth
Those youth who said that they were enrolled in the voting list were asked whether they had voted in the previous national, state and local elections. Their responses across states and by age, sex and location are given in Tables 8.3, 8.4 and 8.5.
TABLE 8.3 Percentage of Indian Youth who Voted in the last Local Elections by Age, Sex and Type of Place
Age Sex Type of place
State 18-24 25-34 Male Female Rural Urban Total
A&N 34(79.1) 40(88.9) 40(90.9) 34(77.3) 55(79.7) 19(100) 74(84.1)Islands
Assam 86(87.8) 185(83.7) 149(80.1) 122(91.7) 147(86.5) 124(83.2) 271(85)
Delhi 50(43.5) 100(50.8) 128(74.4) 21(15.1) 63(51.6) 87(45.8) 150(48.1)
Jammu& 104(60.1) 156(69.3) 160(70.5) 100(58.5) 220(64.9) 40(67.8) 260(65.3)Kashmir
Kerala 29(51.8) 112(87.5) 77(73.3) 64(81) 112(75.2) 29(82.9) 141(76.6)
Maharashtra 92(84.4) 215(93.9) 163(89.6) 144(92.3) 170(88.5) 137(93.8) 307(90.8)
Nagaland 89(72.4) 146(85.9) 140(80) 93(80.9) 154(84.2) 81(73.6) 235(80.2)
Rajasthan 100(83.3) 236(94.4) 262(89.1) 73(97.3) 234(91.4) 102(89.5) 336(90.8)
TamilNadu 72(75) 236(98.3) 159(88.8) 149(94.9) 262(91.6) 46(92) 308(91.7)
Uttar 101(94.4) 164(99.4) 175(97.8) 90(96.8) 185(97.4) 80(97.6) 265(97.4)Pradesh
WestBengal 97(74.6) 166(84.7) 152(82.2) 110(78.6) 185(84.1) 78(73.6) 263(80.7)
India 854 1756 1605 1000 1787 823 2610 (73) (85) (83.2) (76.8) (82.1) (77.6) (80.7)
Participation

India Youth Development Report 20�0 2��
TABLE 8.4 Percentage of Indian Youth who Voted in the last National Elections by Age, Sex and Type of Place
Age Sex Type of place
State 18-24 25-34 Male Female Rural Urban Total
A&N 3(7) 19(42.2) 11(25) 11(25) 22(31.9) 0(0) 22(25)Islands
Assam 67(68.4) 152(68.8) 122(65.6) 97(72.9) 115(67.6) 104(69.8) 219(68.7)
Delhi 97(84.3) 169(85.8) 159(92.4) 106(76.3) 101(82.8) 165(86.8) 266(85.3)
Jammu& 10(6) 45(20.5) 46(20.4) 9(5.5) 46(13.9) 9(15.8) 55(14.2)Kashmir
Kerala 19(33.9) 102(79.7) 57(54.3) 64(81) 99(66.4) 22(62.9) 121(65.8)
Maharashtra 51(46.8) 139(60.7) 108(59.3) 82(52.6) 108(56.3) 82(56.2) 190(56.2)
Nagaland 27(22) 46(27.9) 45(26.3) 28(24.6) 36(20.2) 37(33.6) 73(25.3)
Rajasthan 78(65) 198(80.2) 216(74) 59(79.7) 198(78.3) 78(68.4) 276(75.2)
TamilNadu 66(68.8) 219(91.3) 157(87.7) 128(81.5) 240(83.9) 45(90) 285(84.8)
Uttar 84(79.2) 157(95.2) 154(86.5) 87(93.5) 168(88.4) 73(90.1) 241(88.9)Pradesh
WestBengal 16(12.3) 72(36.7) 49(26.5) 39(27.9) 41(18.6) 47(44.3) 88(27)
India 518 1318 1124 710 1174 662 1836 (44.5) (64.2) (58.6) (55) (54.4) (62.6) (57.1)
Source: Primaryresearch,TISS,2009

2��
TABLE 8.5 Percentage of Indian Youth who Voted in the last State Elections by Age, Sex and Type of Place
Age Sex Type of place
State 18-24 25-34 Male Female Rural Urban Total
A&N 13(30.2) 34(75.6) 26(59.1) 21(47.7) 38(55.1) 9(47.4) 47(53.4)Islands
Assam 76(77.6) 171(77.4) 133(71.5) 114(85.7) 142(83.5) 105(70.5) 247(77.4)
Delhi 90(78.3) 167(84.8) 151(87.8) 105(75.5) 98(80.3) 159(83.7) 257(82.4)
Jammu& 135(76.7) 193(85) 193(82.1) 135(80.4) 282(82) 46(78) 328(81.4)Kashmir
Kerala 28(50) 114(89.1) 77(73.3) 65(82.3) 113(75.8) 29(82.9) 142(77.2)
Maharashtra 63(57.8) 164(71.6) 133(73.1) 94(60.3) 132(68.8) 95(65.1) 227(67.2)
Nagaland 62(50) 98(58) 96(56.5) 62(51.7) 95(51.1) 65(60.7) 160(54.6)
Rajasthan 90(75) 215(86.3) 237(80.9) 67(89.3) 217(85.4) 88(76.5) 305(82.7)
TamilNadu 67(69.8) 232(96.7) 159(88.8) 140(89.2) 253(88.5) 46(92) 299(89)
Uttar 88(82.2) 159(96.4) 160(89.4) 87(93.5) 172(90.5) 75(91.5) 247(90.8)Pradesh
WestBengal 27(20.8) 88(44.9) 68(36.8) 47(33.6) 68(30.9) 47(44.3) 115(35.3)
India 739 1635 1433 937 1610 764 2374 (62.9) (79.1) (74.2) (71.9) (73.8) (72.2) (73.3)
Source: Primaryresearch,TISS,2009
TABLE 8.6 Comparison of Indian Youth Voting Patterns in India by Age, Sex and Location
Age Sex Type of place
State 18-24 25-34 Male Female Rural Urban Total
Local 854(73) 1756(85) 1605(83.2) 1000(76.8)1787(82.1) 823(77.6) 2610(80.7)
State 739(62.9) 1635(79.1) 1433(74.2) 937(71.9) 1610(73.8) 764(72.2) 2374(73.3)
National 518(44.5) 1318(64.2) 1124(58.6) 710(55) 1174(54.4) 662(62.6) 1836(57.1)
Table 8.6 shows that there was a higher percentage of youth in the older age group (25-34 years) who voted in all the elections. The percentage of males who voted was also higher than the females. It was interesting to note that a higher percentage of rural youth than urban youth voted at the local and state elections; however, the reverse was observed during the national elections where a higher percentage of urban youth voted as compared to rural youth.
Source: Primaryresearch,TISS,2009
Participation

India Youth Development Report 20�0 2��
State Local elections State elections National elections Total Total Total
A&NIslands 74(84.1) 47(53.4) 22(25)
Assam 271(85) 247(77.4) 219(68.7)
Delhi 150(48.1) 257(82.4) 266(85.3)
Jammu&Kashmir 260(65.3) 328(81.4) 55(14.2)
Kerala 141(76.6) 142(77.2) 121(65.8)
Maharashtra 307(90.8) 227(67.2) 190(56.2)
Nagaland 235(80.2) 160(54.6) 73(25.3)
Rajasthan 336(90.8) 305(82.7) 276(75.2)
TamilNadu 308(91.7) 299(89) 285(84.8)
UttarPradesh 265(97.4) 247(90.8) 241(88.9)
WestBengal 263(80.7) 115(35.3) 88(27)
India 2610(80.7) 2374(73.3) 1836(57.1)
Past studies have shown that a large proportion of the urban student youth are apolitical as there has been an alienation of the educated classes from the main political process. In this study, in terms of enrolment, Table 8.2 showed that there was a slightly higher percent of rural youth who were enrolled as compared to the urban youth. Table 8.6 suggests that urban youth are more interested in national and state elections as compared to the local elections. Thus, if the voting pattern is considered one aspect of the political process, then this primary data does not suggest a significant difference in rural and urban youth.
A study by the Centre for Studies on Developing Societies (CSDS) in 200� showed that ��% of the youth said that they were interested in politics had voted in every election. (ed.D’Souza.P.R.,KumarS,ShastriS.)
TABLE 8.7 Comparison of Indian Youth Voting Patterns across Indian States/UT at the National, State and Local Levels
Highestvalueforthestate
Mediumvalueforthestate
Lowestvalueforthestate
Source: Primaryresearch,TISS,2009
2��
It is to be noted that the timeframe of elections at different levels and in different locations varied, and hence, the responses could be influenced by that factor. However, the data across states and different levels of elections do suggest trends in voting patterns of the youth.
Table 8.7 shows the comparison of voting patterns at different levels of governance across states. The data clearly show that in most states, the highest percentage of youth voted in the local elections. It was significant that the lowest percentage of youth voters was in the national elections. It was only in Delhi that had the highest percentage of voting in the national level, though it had the lowest percentage in the country for voting in the local elections. There was a large difference in the percentage of youth in Delhi who voted in the national and the local elections. West Bengal also had a big difference in the percentage of youth who voted in the local elections (80.7%) and those who voted in the national elections (27%).
The data also show that J &K and Kerala had the highest percentage of youth voters in the state elections. 65.3% of the youth in J&K voted in the state elections, while only 14.2% voted in the national elections. The voting pattern in J&K is indicative of the youth’s opinions about governance at the Centre and their feelings about increased State autonomy.
The data is indicative of youth perceptions about their relative sphere of influence in Local, State and Central governance. This is related to their perceptions about the level of governance where responses to problems and actions are more visible. They may feel distanced from the national seats of power such as the Lok Sabha and their local MP, while it is their local MLA or Corporator who is seen as being more proactive in meeting their demands.
Palshikar and Kumar’s (2004) study on people’s participation in the electoral process during the period 1989-2004 shows the following trends: 1. There has been an overall increase in the turnout of voters.2. There has been a change in the composition of voters. “The
1990s saw women, dalits, adivasis and OBCs relying more and more on the vote as an instrument of democratic assertion.”
3. More in rural constituencies than urban (Yadav 2000: 125-126 in Palshikar and Kumar, 2004)
4. The participatory trend is showing a significant increase. From 1996-2004, more and more citizens are getting interested in elections and participating in campaign activity (at least at the minimum level).
BOX 8.2
Participation

India Youth Development Report 20�0 2�0
8.4 Politics Voting patterns of youth is just one indicator of political participation of youth in local, state or national governance. However, it is a significant indicator as this is one right available to every Indian citizen who is 18 years and above.
President A.P.J.Abdul Kalam, in his address to the nation on the eve of Republic Day 2007, urged the youth to make a meaningful contribution to the development of the nation by taking up politics as their career in large numbers. “Political science should form part of the curriculum from the secondary to college level for all students with development politics as the focus.”
Politics is unfortunately often equated with electoral activity or unfair power games, and hence, there are many who prefer to stay away from politics. Although youth power has always been mobilized for revolutionary or rebellious activities, past studies have shown that most of the urban student youth are apolitical as there has been an alienation of the educated classes from the main political process. The youth in small towns have a greater affiliation to organizations and parties based on ethnicity and religion (Narayan, 2006: 25).
However, youth do get involved in political activities which have some meaning to their own existence. There are those who are willing to follow those who promise them a decent living – whether in the name of religion, caste or ideology.
Moller (1968) writes that a high proportion of adolescents and youth in a population have implications also for the incidence of violent behaviour. One finds this true in the Indian context, where increasing frustration is being manifested through violent forms like riots, self-immolation and terrorism.
Student bodies in colleges and universities are often a breeding ground for youth leaders who may wish to enter party politics. In universities like JNU, student bodies are often affiliated to political parties, and often student elections are conflict-ridden and turn violent.
The Lyngdoh Committee Report (2006) clearly specifies norms of the student body and student union elections in colleges and universities. Among other clauses, it emphasizes the conduct of democratic peaceful elections without appealing to communal and caste sentiments; the minimum academic requirements and minimum percentage of attendance required for candidates; and grievance mechanisms for any complaints of candidates.
However, there are also sections of students who do not identify with these party affiliations.
Usually activism, whether social or cultural, brings together individuals who not only want to be recognized by their surroundings but also have the instinct to gain political power out of activism. The individuals interested in politics start searching for their political identity. This brings into conflict

2��
individuals who work unitedly at the socio-cultural level and others working on political lines due to their own personal interests, into two groups. One starts identifying with the well-established political outfits within the surroundings and the other creates a new political structure having no connection with the established political outfits (Narendra Kumar, 1999:40).
Though participation in party politics is not appreciated by many youth, movements such as the Naxalite movement, ULFA, groups in the J&K, the Narmada Bachao Andolan and the Chipko movement largely comprise youth uprisings which question the nature of development and seek structural changes in governance, and in the political and economic systems. Youth activism is also seen nationally and internationally in networks related to issues of sustainable development such as World Social Forum, Greenpeace etc. In such movements, it is seen that education has an effect on youth participation.
In spite of different ideologies and perspectives, the young population still believes in India being a democracy. This view was expressed at all the regional workshops which were held as part of this project. Yet, it can be said that the youth, by and large, have opted to compromise, rather than fight injustice. This is due to the lack of a credible youth movement, and, thus, the politicization of youth is very ad hoc and fragmented.
8.5 Youth Participation in Government Programmes The government has instituted certain significant programmes for eliciting youth volunteerism for nation-building. These include the National Service Volunteer Scheme (NSVS), the Rashtra Sadbhavana Yojana, the National Integration Scheme and the Bharat Scouts and Guides. The two most important schemes for youth are the National Service Scheme (NSS) for student youth and the Nehru Yuva Kendra Sangathan (NYKS) for the rural non-student youth.
8.5.1 Nehru Yuva Kendra Sangathan (NYKS)
The NYKS was initiated in 1972 and is today, the largest non-political youth organization of its kind in the world. It caters to the needs of more than 80 lakh non-student rural youth in the age group of 13-35 years. The main activities include:
• Voluntary village level youth organizations affiliated to NYKS;• 2551 Youth Development Centres (YDCs);• 139 Rural Information Technology Youth Development Centres (RITYDCs);• 17,000 trained volunteers enrolled every year.
During college union elections, it is seen that the participation of the Arts students are higher than that of other streams like Science. Women participation is also poor... YouthWorkshop,Bhubaneswar
Participation

India Youth Development Report 20�0 2�2
Through its 501 offices all over the country at district headquarters, the NYKS reaches out to each and every part of India [through its wide network in villages.] (Ministry of Youth Affairs and Sports; http://yas.nic.in/index.asp?layid=1)
TABLE 8.8 Proportion of Rural Youth in Youth Clubs of NYKS
Statisticscalculatedfromdataof NYKSandGovt.of Indiaforpurposesof thisreport.
Total Membership of Regd Youth Population Participation Clubs & Total Membership of of Youth in NYKS Un-Regd Youth Clubs (2007-2008) 2007 (%)States Male Female Total Total India 5922356 2271683 8194039 323216830.2 2.53AndhraPradesh 744842 450886 1195728 24702159.27 4.84ArunachalPradesh 17518 10110 27628 364474.3354 7.58Assam 280108 144933 425041 10309216.07 4.12Bihar 306731 119565 426296 26484384.08 1.60Chhattisgarh 99055 53216 152271 5848094.135 2.60Delhi 1952 735 2687 427686.9756 0.62Goa 2580 900 3480 292557.7567 1.18Gujarat 100765 10462 111227 14134857.74 0.78Haryana 100014 10552 110566 7080055.94 1.56HimachalPradesh 149772 31371 181143 2510260.51 7.21J&K 63929 15103 79032 3523390.222 2.24Jharkhand 23819 16332 40151 7683644.388 0.52Karnataka 214087 96112 310199 15296197.8 2.02Kerala 501298 185973 687271 9863037.208 6.96MadhyaPradesh 354924 93865 448789 15763420.68 2.84Maharashtra 551026 264086 815112 24204211.08 3.36Manipur 157575 121568 279143 784862.0813 35.56Meghalaya 51053 26139 77192 866152.3557 8.91Mizoram 2100 480 2580 206530.2432 1.24Nagaland 110558 69852 180410 1078140.676 16.73Orissa 234160 74359 308519 13552612.84 2.27Punjab 168656 4278 172934 7021778.044 2.46Rajasthan 201462 36840 238302 18835199.9 1.26Sikkim 11860 5530 17390 258771.5762 6.72TamilNadu 422231 129255 551486 13683400.84 4.03Tripura 9537 3993 13530 1243460.276 1.08UttarPradesh 483687 65167 548854 53646785.04 1.02Uttaranchal 31604 12482 44086 2715728.777 1.62WestBengal 491749 186422 678171 26161579.14 2.59

2��
FIGURE 8.2 Proportion of Rural Youth in Youth Clubs of NYKS across Indian States in an Ascending Order
Table 8.8 and Figure 8.2 show the proportion of rural youth who were enrolled in the Youth Clubs of the NYKS. The overall ‘India’ participation is a low 2.53%. The highest enrolment was in Manipur (35.56%) and the lowest was in Jharkhand (0.52%). Though in terms of number of youth, the outreach seems to be tremendous, it is to be noted that there is a significant percent that does not access the scheme.
“India needs a national movement of young people engaged actively in social development, sports and the development of personal character. Values like discipline, comradeship, loyalty, dedication to the nation and the cause of social equality are built through such movements,” Dr.ManmohanSingh,PrimeMinisterof India
Participation

India Youth Development Report 20�0 2��
I joined the NSS to do whatever little I can, for the community; and in turn, I would also learn what is happening in society... YouthatworkshopinDelhi
TABLE 8. 9 Proportion of Indian Youth from Tertiary Education who Participated in NSS
Total no. of students 11th, 12th, Graduation Participation States/ UTs 2003-04 Boys Girls Total in NSSIndia 2014412 12119781 8306330 20426111 9.862AndhraPradesh 203955 1334256 837894 2172150 9.390ArunachalPradesh 3200 12413 7723 20136 15.892Assam 21000 222925 143956 366881 5.724Bihar 39553 638656 208079 846735 4.671Chhattisgarh 31036 248493 154273 402766 7.706Delhi 47052 226175 206304 432479 10.880Goa 20000 19945 22574 42519 47.038Gujarat 105190 508224 382782 891006 11.806Haryana 58121 324658 234343 559001 10.397HimachalPradesh 29164 220933 201834 422767 6.898Jammu&Kashmir 16126 118725 94104 212829 7.577Jharkhand 19150 135750 79233 214983 8.908Karnataka 123746 632340 532061 1164401 10.627Kerala 100000 226898 284253 511151 19.564MadhyaPradesh 91680 581325 361893 943218 9.720Maharashtra 210970 1613209 1150404 2763613 7.634Manipur 9700 21140 15544 36684 26.442Meghalaya 12000 23591 21936 45527 26.358Mizoram 21000 8627 7879 16506 127.226Nagaland 4400 15852 12997 28849 15.252Orissa 122716 513435 207879 721314 17.013Punjab 8550 260790 240534 501324 1.705Rajasthan 119800 582541 267465 850006 14.094Sikkim 61141 7172 5893 13065 467.976TamilNadu 229616 782023 757221 1539244 14.917Tripura 16659 29620 21411 51031 32.645UttarPradesh 148641 1809637 1179645 2989282 4.972Uttaranchal 34655 126698 112757 239455 14.472WestBengal 85650 826072 503238 1329310 6.443Source: RajyaSabhaUnstarredQuestionNo.2203,dated22.12.2004,quotedinindiastat.com

2��
FIGURE 8.3 Participation in NSS across Indian States
Participation in NSS
Table 8.10 and Figure 8.3 show that the proportion of student youth who enrol for the NSS programme is 9.86% for India which is again low. The highest enrolment was in Goa (47%) and the lowest in Punjab (1.7%). There were 13 States where youth enrolment was less than 10% and 11 States where the enrolment was between 10-20%. Though it’s a very significant programme for youth involvement in development activities, its outreach is very small.
Table 8.3 shows that as per the calculations, Sikkim had a NSS participation of 467% and Mizoram had 127% participation. This shows that there were some errors in the data provided by the government records.
A study conducted by TISS (2008-09) on NSS in five States and one Union Territory showed:
Participation

India Youth Development Report 20�0 2��
• Regular activities were found to be very conventional, routine and thrust on colleges.
• In almost all the states, NSS volunteers played an important role in rescue and relief activities in disaster situations.
• The students gained significantly through their involvement in NSS programmes as it helped build their confidence and enhanced their skills in communication when working with communities.
• Though the programme is working well in a few places, sustainability of impact depended on factors like continuity of work in one location; strong institutional support from principals and programme officers.
In the NYKS as well as the NSS programmes, the quality varies according to the state and district depending on the leadership in that location.
Agochiya, D (2005) writes:The manner in which youth programmes have developed in the country over the last two decades is a matter of despair and disillusionment to professionals and practitioners in this country. It is an irony that though we were first out of the blocks (in South and Southeast Asian countries) when we launched two unique and innovative schemes in the early seventies – NSS and NYKS – we have allowed ourselves to get fettered and as a result there has been stagnation.
8.6 Youth Perception on Participation As mentioned in the earlier sections, youth volunteerism has been significant in social movements and below average in government programmes for youth. This section looks at youth’s perceptions related to their participation in various forums. The respondents of the primary research were asked for their views about their nature of participation and experiences of volunteering.
8.6.1 Level of participation
The youth were asked whether they had participated in any activity at the college, political or non-political level. The data showed (Figures 8.4, 8.5) that only 14% said that they had participated in at least one activity. This is a low percent as it included their participation in at least one activity. The data also showed that the level of participation was slightly higher in the age group of 25-35 years, among males and among urban youth. The participation was also highest in the ST group of youth, those with a high SLI and those belonging to ‘other’ religions.

2��
FIGURE 8.4 Participation of Indian Youth in any Activity across Indian States
Source: Primaryresearch,TISS,2009
FIGURE 8.5 Participation of Indian Youth in any Activity by Age, Sex, Location
Source: Primaryresearch,TISS,2009
8.6.2 Sustainability of Youth Participation over Time
The youth who had participated in some activity were asked whether their level of involvement in social/political/voluntary activities had changed over time. It was encouraging to note that 47.5% (474) said that their participation had increased over time. 24.3% (244) said that their involvement had decreased over the years, while the remaining 28.1% (283) said that they had sustained their involvement at the same level throughout. The data suggest that once youth participate in some activity or programme, most of them (75.6%) see the value of such involvement and do continue their involvement in the social spaces available for participation.
Participation

India Youth Development Report 20�0 2��
FIGURE 8.6 Sustainability of Indian Youth Participation over Time by Religion, Caste and SLI
FIGURE 8.7 Sustainability of Indian Youth Participation over Time by Age, Sex and Location
Source: Primaryresearch,TISS,2009
Source: Primaryresearch,TISS,2009
Figures 8.6 and 8.7 show the sustainability of youth participation by religion, caste, SLI, location, age and sex. The data showed that participation had decreased among the Muslims, ‘other’ castes and those with a medium SLI.

2��
FIGURE 8.8 Satisfaction of Indian Youth about Experiences of Participation
8.6.3 Satisfaction Related To Participation
Source: Primaryresearch,TISS,2009
When asked about their level of satisfaction with their contribution to development activities, 24.4% said that they were not satisfied; 38.3% said that they were satisfied to some extent; and 12% felt that they had contributed adequately and were very satisfied (Figure 8.8). The variables such as sex, age, religion, caste and location did not make a difference in their responses. The responses suggest that the youth do experience discomfort about their contribution to society and wish to do more.
8.6.4 Opportunities for Decision-Making
One of the factors which influence the quality of participation of youth is their capability for independent decision-making, in matters pertaining to their own lives. Though we claim to be a democracy, Indian society is by and large hierarchical and feudal in nature, with little scope for members to be involved in democratic decision-making processes. This characteristic is evident in the family, education, work, and governance systems (as stated in earlier chapters). The youth in the primary research were asked whether they had opportunities for decisions which were directly connected with their lives viz education, marriage, career etc.
Participation

India Youth Development Report 20�0 2�0
FIGURE 8.9 Perceptions of Indian Youth about Opportunities for Independent Decision-Making
The data in Figure 8.9 is very revealing and shows that 68% (2811) of the youth were never involved in decision-making in those issues linked with their own lives. Only 10.2% (422) of the youth stated that they were completely involved in making decisions about their own lives, while 21.8% (901) youth stated that they were occasionally involved in the decision-making process. The data shows that the youth are still bound by hierarchical structures, and do not have much say in the choices related to their own lives.
The majority of the youth in Delhi (96%) and the A&N Islands (91%) perceived that they had no choice at all regarding the decisions related to their lives. Kerala (7%) and West Bengal (20%) had the lowest percentages of youth sensing that they had no decision-making power.
Source: Primaryresearch,TISS,2009
AccordingtotheNFHS-3(2005-06),mostmenstatedthatwivesshouldhaveanequalsayindecisionsrelatedtothehousehold.Majorhouseholdpurchasesandvisitstothewife’sfamilywereareaswheremenfeltthatwomenshouldhavealessersay.

2��
FIGURE 8.10 Opportunities for Decision-Making by Indian Youth by Age, Sex and Place of Residence
Figure 8.10 shows that opportunities for decision-making were slightly lower for those below 18 years, males and from urban areas. Those below 18 years would be adoles-cents, and still be expected to listen to their elders for all decisions related to their lives. It is surprising that males and urban youth felt that they had no decision-making spaces. It is possible that this is directly related to the expectations of youth in relation to age, sex and location. Adolescence is characterized by rebellion and a strong need for freedom and, hence, any suppression of choice could be strongly opposed. Females are socialized into being submissive to their parents’ instructions and societal norms and, hence, do not expect choice in decision-making. Urban youth do expect greater decision-making powers, but may be they are still expected to obey elders in matters related to career, marriage, mobility for work and education and so on.
The data also showed that 450 youth (9%) said that their spaces for decision-making had increased after marriage or gaining financial independence. There were 881 (17.5%) youth who said that their freedom to make choices increased with age.
8.7 Conclusion A YPI of 0.622 shows that more than 50% of the youth do participate in the electoral process. However, their participation in other forums in college and NGOs is relatively low.
We have a society based on inequalities. This gives rise to discontent, frustration, and also apathy (psyche of the powerless). There is also an increasing awareness of rights in civil society. In this scenario, the participation of youth in social development takes on different hues, from party politics, social movements, volunteerism in civil society organizations and through government programmes. There are also certain sections of youth who are unmoved, or do not want to get involved. The challenge is to foster the youth of this large democracy and motivate them to contribute in their own way for social development towards building an equitable social order.
Participation

India Youth Development Report 20�0 2�2
9.1 Introduction Youth culture generally refers to the ways adolescents and teenagers differentiate themselves from the parent culture of their community. Since it is a unique identifying characteristic of the youth population, there was speculation whether it should be included as one dimension of the YDI. During the regional workshops, the unanimous response was that ‘identity’ is too personal and subjective, and cannot be standardized in any index. However, since identity forms a very important part of one’s personality, especially in the context of youth in India, this chapter describes the factors influencing youth identity. This chapter is largely based on data collected during the primary research study.
Apart from personal and cultural factors, identity is also influenced by the relations a person has with societal systems such as education, work, health and leisure; a person’s equations with these systems determine his/ her ‘performance’ and ‘success’ in society, which in turn influence the way he/she defines himself/ herself.
Youth popular culture is simply defined as that which is “in,” contemporary and has the approval of young people. It is that which has mass appeal. The culture dictates the shared norms that provide young people with a deep sense of belonging and often with a strong preference for behaving in certain ways. It is the amalgamation of family upbringing, educational inputs, socio-economic and political influences which create a certain kind of youth force or culture. Youth are not just enacting culture but are also participating in re-creating culture, especially youth culture.
We find that there is no generalized, broad-based, cohesive youth culture in India. This is largely because the youth is divided on class, caste, regional and political affiliation, language and gender. Television and films are perhaps two
Youth Culture – Identity and Lifestyle
We see India; we see the strength of India in its many cultures, in its diversity. It is in developing these separate cultures, to their individual heights, that will strengthen India.
–RajivGandhi
CH
AP
TE
R
IX

2��
sources of common messages through which youth get connected across the country. Thanks to the media hype and the skewed financial investments made, cricket has become a sport which, intermittently unites and divides the youth population.
There are, however, several sub-cultures that contextualize young people’s lives based on ethnicity, gender and location. These sub-cultures have often emerged as a form of resistance to authoritarian and repressive social forces. This includes youth uprisings and also language, music, dress styles, drugs, rave parties, etc. Youth culture also determines the values and behaviours of youth; social controls would be stronger in smaller populations and hence youth would adapt or turn against expected forms of behaviour, while the anomie of large metros permits a more liberal outlook on social norms. The larger society is also raising several value-based issues which have a direct bearing on the youth viz inter-community marriages, sex education in schools, etc.
There are some who believe that the actions of the young have attained the lowest ebb today and that they will destroy the fine fabric of morality through irresponsible thought and action. There are others who hold the other extreme view that the young are the only hope for the future – that they are today more public-spirited, socially-conscious and will transform society. In a study on youth, 65% said that the best thing about India was its culture. That included factors like India’s diversity and multiculturalism, its long tradition and so on (The Times of India, 14th Aug, 2007).
Whatever the attitudes (positive and negative) about youth culture, a working knowledge of this culture is important, if we are to effectively predict behavioural choices and determine strategies for communicating with them. For the purpose of the Youth Development Report, youth culture has been divided into two major areas:
• Identity • Lifestyle
Identity is closely linked to the lifestyle a youth chooses, and a person’s lifestyle in turn affects his/ her identity.
Objectives of the National Youth Policy include:
To instil in the youth, at large, an abiding awareness of, and adherence to, the secular principles and values enshrined in the Constitution of India, with unswerving commitment to Patriotism, National Security, National Integration, Non-violence and Social Justice
BOX 9.1
Youth Culture - Identity and Lifestyle

India Youth Development Report 20�0 2��
9.2 IdentityAs the individual progresses from infancy to old age and experiences complex and large scale life changes, his personality shapes itself into an organized form. The central principle which is responsible for an organization of personality is known as the concept of identity (Paranjpe, 1975:36).
Though identity formation begins at birth, formation of one’s identity is one dimension of adolescence and youthhood. Each person has an individual identity (individuality, sense of uniqueness) and a social identity (sameness, sense of belonging). It is a dynamic concept, which is affected by time and space. A strong sense of identity is said to lend meaning to life. A weak sense of identity leads to feelings of rootlessness and perhaps a fear of one’s mortality (Buss, 2001). Baumann (2005a.19) talks about identity as ‘a battleground of interminable struggle, between desire for freedom and the need for security.’
Today, a person’s identity can be a source of conflict, embarrassment or pride. Religious minority groups, dalits, scheduled tribes and other such populations have felt oppressed due to their identity, and have had to struggle to prove themselves in every sphere, including their loyalty to India. Narrow parochial identifications create divisive forces, which are destructive to unifying society.
In their study on youth, Garg and Parikh, 1995 mention four areas of conflict which adolescents and youth go through in their search for identity:1. The primary source of conflict was between familial interpersonal interdependence
and conformity-based traditional ethos and the individualistic, achievement-oriented stance from the western ethos.
2. Conflict between location of identity and choice of lifestyle: e.g. western trappings of lifestyle but traditional rituals, choice of spouse etc.
3. Conflict in relation to authority – whether as equals or hierarchy – as in traditional.
4. Realm of relationships: weightage to those born into and those one chooses.
9.2.1 Social Identity
A person’s socialization processes enable him to define the “boundaries” of his social self – the groups he/she belongs to by virtue of birth, location, member of an ethnic/ religious/cultural collective. Beyond these boundaries, a person may be neutral or negative to the ‘other’ or ‘outsider’. These may also change with life experiences. Social identity can be seen at two levels – in relation to face-to-face groups (wife, brother, employee), and at a larger level (religion, caste, gender, age) (Buss, 2001).
The collective identity or social identity plays a very important role in a youth’s life, especially today in India. There are several factors of difference but the major ones are gender, caste, class, religion and region. Identity is also determined by cultural factors: for women it is still largely defined by marriage and for men by work.

2��
Group or social identity is transmitted down the generations through history, values and shared cultural symbols. It is an extended part of the individual’s self-experience and the intensity of this experience varies across individuals and with time. It can range from feelings of nominal affiliation with the group to a deep identification or even to feelings of fusion, where any perceived harm to the group’s interests or threats to its ‘honour’ are reacted to as strongly as damage to one’s own self. (Kakar, 1996). Categories are perpetuated by minimizing differences between categories through assimilation or exaggerating differences between categories. In India, this is done through jokes and comments on the language accent, type of dress, food, etc.
Youth as a population group is an identity and in the primary research, the respondents were asked to describe society’s perceptions about ‘youth’. Figures 9.1, 9.2 and 9.3 show the responses of youth about their views on how society views them.
FIGURE 9.1 Society’s Perception of Youth across Indian States/UT
*Positivetradesincludes-Honest/truthful,Respectful,Helpful,Hardworking,*Negativetradesincludes-Lazy,Feelingof alienation,Associatedwithpoliticalpower,Rebelliousandfrustrated,VulnerabletosubstanceabuseSource:Primaryresearch,TISS,2009
Data shows that 50% of youth in India think that society has a positive attitude towards youth. This response was highest in Uttar Pradesh (79%) followed by A&N Islands (76%). The lowest response was in J&K (60%) followed by Rajasthan (51%). The positive traits were related to personal characteristics such as being honest, helpful, hardworking and respectful. In terms of sex, Figure 9.2 shows a higher percentage of females (56%) who gave this response as compared to the males (47%). This correlates to the general perception that females are more honest, helpful, and the males are more rebellious, participate in politics and indulge in substance use.
The perception that youth contribute to society was very low in all the States with only 9% in India giving this response; 19% in Nagaland, followed by 16% in Maharashtra and 11% in Kerala. This perception correlates with the YPI (refer Chapter 7) where
Youth Culture - Identity and Lifestyle

India Youth Development Report 20�0 2��
participation on social issues was low. It is also possible that society does not expect youth to contribute to social issues, but wants them to spend this phase of life in stabilizing their career and financial capacities.
In terms of religion, it was interesting to note that there was a higher percentage of Muslims (56%) who perceived society as viewing them in a positive light. In terms of caste, youth from the OBC group (57%) had the highest response for the ‘positive’ perception of youth.
FIGURE 9.2 Society’s Perception of Indian Youth across Age, Sex and Location
Source: Primaryresearch,TISS,2009
FIGURE 9.3 Society’s Perception of Indian Youth across Religion, Caste and SLI
Source: Primaryresearch,TISS,2009
9.2.2 Identity and Change
Cultural identity is a dynamic process and is influenced by political and social processes. It is not something that people think about on a daily basis but is enhanced when that identity is in threat and this could lead to anger, humiliation and insecurity.

2��
It is seen that there has been a rapid social transition experienced by the Indians where the old, traditional social institutions and support systems of caste, joint family, village and urban neighbourhood – have been breaking down. Old values and social mores which cemented together different segments of society have been disappearing under the hammer blows of profit motive, capitalist competitiveness and careerism, resulting in a moral and cultural vacuum which is highly conducive to ideologies based on fear and hate (Gupta. et al. 1990: 437).
Globalization and technology have further influenced cultural identities by breaking national boundaries and permitting greater exposure to other cultures and identities. International migration, tourism and international networks have helped youth to interact with others across nations and understand cultures. However, this has not necessarily broken narrow identities and expanded to create a more global inclusive identity. Those who are fortunate to be net savvy find themselves creating virtual identities, breaking geographical boundaries.
9.2.3 Factors Influencing Identity – Subculture Identities
FIGURE: 9.4 Factors which Influence Indian Youth Identity and Culture
There are several factors which influence one’s identity. Figure 9.4 depicts the major factors which determine youth identity and culture. Some of these factors have been described in greater detail in Chapter 1.
Age: The very definition of youth by age divides youth into three groups. Does society consider a person of 13 years or 35 years as youth As stated earlier, the identity-related
Youth Culture - Identity and Lifestyle

India Youth Development Report 20�0 2��
issues are different for the three sub-groups within the age group of 13 - 35 years. A 13-year-old person is considered a child and in need of protection. An adult of 35 years is expected to be mature, financially independent and a productive member of society.
Family: As stated in Chapter 1, youth are not only a part of the family, but they are also in the process of forming their own family. The primary site of regulation of behaviour according to strict norms was the joint family. The Indian family’s stability is explained by its patriarchal ideology based on hierarchy, whereby authority is usually determined by age, gender and generation status. Decision-making is by and large, still authoritative, rather than democratic or participative. Youth face a sense of conflict polarized between ‘living for oneself’ and ‘living for others’ (Garg and Parikh, 1976).
The conformist attitude has more to do with youngsters wanting to play safe… Indian kids are not individualized, they don’t want to break away from family ties. They fear taking risks and responsibility, so the majority want parents’ involvement in marriage. (Renuka Singh, TOI, 20th November, 2001).
India has chosen a path of urbanization and modernisation for development. More families are opting for an urban lifestyle which demands greater initiative, a certain aggressiveness, a capacity to make choices, cope with tensions and take responsibility for one’s actions.
A study commissioned by the Hindustan Times (26th January, 2003, pg 6) in five metros (Delhi, Mumbai, Bengaluru, Kolkata and Chandigarh) and one rural area, among young Indians in the age group of 16 - 24 years showed that young Indians think very highly of their parents and see them as role models. When asked whom they considered their role model, 30% of the urban youth voted for their parents.
In the primary research, a similar question was posed to the youth about the role models who had influenced their lives. Their responses are shown in Figures 9.5, 9.6 and 9.7.
FIGURE 9.5 Role Models of Indian Youth by Indian States/UT
‘Others’ includes film star, sportsperson, current political leader, spiritual leader, social reformer or national heroSource: Primary research, TISS, 200�
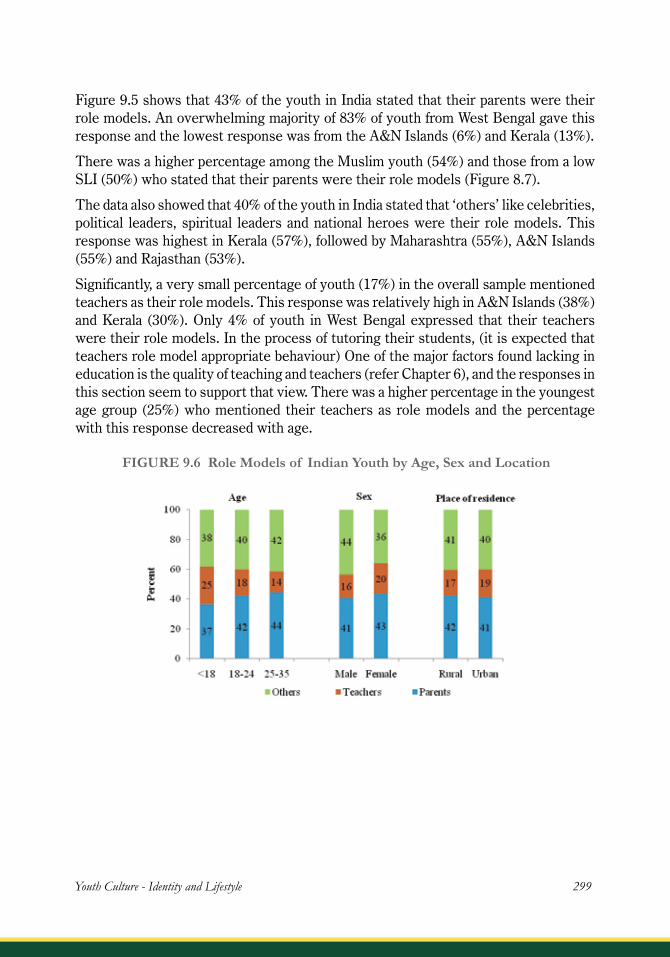
2��
Figure 9.5 shows that 43% of the youth in India stated that their parents were their role models. An overwhelming majority of 83% of youth from West Bengal gave this response and the lowest response was from the A&N Islands (6%) and Kerala (13%).
There was a higher percentage among the Muslim youth (54%) and those from a low SLI (50%) who stated that their parents were their role models (Figure 8.7).
The data also showed that 40% of the youth in India stated that ‘others’ like celebrities, political leaders, spiritual leaders and national heroes were their role models. This response was highest in Kerala (57%), followed by Maharashtra (55%), A&N Islands (55%) and Rajasthan (53%).
Significantly, a very small percentage of youth (17%) in the overall sample mentioned teachers as their role models. This response was relatively high in A&N Islands (38%) and Kerala (30%). Only 4% of youth in West Bengal expressed that their teachers were their role models. In the process of tutoring their students, (it is expected that teachers role model appropriate behaviour) One of the major factors found lacking in education is the quality of teaching and teachers (refer Chapter 6), and the responses in this section seem to support that view. There was a higher percentage in the youngest age group (25%) who mentioned their teachers as role models and the percentage with this response decreased with age.
FIGURE 9.6 Role Models of Indian Youth by Age, Sex and Location
Youth Culture - Identity and Lifestyle

India Youth Development Report 20�0 �00
FIGURE 9.7 Role Models of Indian Youth by Religion, Caste and SLI
Source: Primaryresearch,TISS,2009
Gender: The earlier chapters have clearly shown the gender inequality in all dimensions of the YDI. Among young women, there are those who face further isolation due to circumstances or choices that they have made. For example, women who decided to remain single, walked away from a marriage or were widowed at a young age face stigma and non-acceptance. In the wake of several disasters, one of the consequences has been an increase in the number of young widows. Mandar’s (2008) study of deprivation in the three states of Orissa, Rajasthan and Andhra Pradesh highlighted the plight of single women, the aged and disabled. About single women he writes:
In all villages in all states, we found widows of all castes and communities face continuous prejudice, and almost none continue to live in their husband’s home, because of physical and psychological abuse and efforts to deprive them of their rights to property. ...it is considered inauspicious to see their faces in the morning or in any celebration; their plain and coarse clothes are desexualized and also serve to identify them as inauspicious widows at all times… even more despised are separated women – in a twilight zone of neither being respectably married or widowed – especially those who have themselves left their partners… Mandar, 2008.
In terms of gender, it is said that fluidity of gender is the next big wave in terms of adolescent development. Youth are testing the boundaries of gender and challenging social standards in the process. The social stigma around those who profess a different sexual orientation other than heterosexuality is enormous. They face abuse, ridicule and even physical assault. Today, they are slowly coming out in the open, with NGOs and self-supportive groups being set up. A few celebrities have also helped their cause by claiming their own transgender identity. The Tamil Nadu State Commission for women has taken the positive step by recommending that all cases pertaining to transgenders should be handled only in women-led police stations. The State Government is doing away with terms like eunuchs and using words which denote ‘respectful woman’.

�0�
Location: With increasing urbanization, more and more families are adopting an urban lifestyle. The culture of cities breeds individualism, competition, consumerism and increases economic strains. In this changed scenario, the youth and their families also have to make changes and adapt to this new lifestyle. Urban youth are indoctrinated in the values of materialism and consumerism to a greater extent than the rural youth. Urban youth definitely feel superior and more confident than rural youth, especially those that have had an English medium education.
Class: Class is the basis of inequalities – of opportunities, deprivation, social isolation, and insecurity. The earlier presentation of the profile highlighted the differentials based on income and class.
High levels of deprivation among youth lends itself to the creation of a psyche of powerlessness, hopelessness and fatalism. If exposed to glimmers of hope through education, media exposure, etc, such youth take the risk of aspiring for and dreaming of a humane existence. However, if these hopes are shattered, it could lead to depression, anger, hate and violent reactions.
Religion: The multi-faceted character in India is also determined by the presence of many religions in India. However, today, we see that religion, which is supposedly a unifying force is the most divisive factor in Indian polity. In fact, religion and caste, cut across other identities and across the country.
Assertion of one’s religious identity has gained prominence over the last two decades. It has become a major factor for determining values, the political agenda and citizenship. Simultaneously, there is a surge of spirituality amongst a minority where religious dogmas are rejected and the ‘spirit’ or ‘oneness’ is celebrated. There is also a band of secular humanists, liberals, atheists, rationalists, etc. This is not an Indian phenomenon but it is seen that there is a worldwide wave of religious revival. There is an increase in forging cultural identities based on religion – the ‘us’ and the ‘them’ identity.
Thameem, a 2�-year-old youth, a non-practicing Muslim who completed schooling till �0th class works as a flower vendor in Chennai. The only son of his parents, he comes from a poor financial background and hence was unable to continue his education. He realized his feminine side at the age of �� but could not be open about it due to fear and shyness. Due to social stigma and discrimination, he doesn’t want to undergo emasculation and behave as a female. So he continues to live with the family in the male dress and attire. His mother is the only person in this world who understands his femininity and predicaments. He can barely survive on his income. He wants to live as a proper woman but he thinks that it is not possible. He feels that the transgender should be considered as a third sex by society and government. He is in need of a ration card, voters ID, shelter and job from government. Sexual harassment, stigma and discrimination are his day-to-day problems. He loves watching TV and is addicted to tobacco.
There is a remarkable universality of human experience in the context of people who live in hunger, insecurity and prolonged, profound and usually hopeless deprivation, born out of or associated with social devaluation and isolation (Mandar,2008).
Youth Culture - Identity and Lifestyle

India Youth Development Report 20�0 �02
In India, the Hindus consider themselves the majority and like any other majority religion or community or country across the world, feel superior to the others. Those of other religions are termed minority groups, a concept which is not clearly defined.
Minority as a concept has not been adequately defined in the Indian Constitution. Although mentioning the cultural attributes of religion and language, the Constitution does not provide details on the geographical and numerical specification of the concept. Even the specifics of language and religion are not mentioned (Jain, R. 2005).
Muslims all over the world today face the common stigma of being ‘fundamentalists’. They face a persecution anxiety in which they perceive great threat to their survival and collective identity. By now, because of cumulated experience, the Muslims of India are… mentally fatigued and distrustful Ashraf (2004). The Christian community is largely perceived as a peace-loving one but accused by some factions of forceful conversion. Statistics prove the myth of conversions is not true as the number of Christians is decreasing. The 1991 census shows Christians at 2.5% of population against 2.6% of 1981.
The rise of religious fundamentalism is also a reality and this exists across all religions. Many adherents of these fundamentalist groups are youth who are educated and from the urban middle class.
The primary research attempted to study youth behaviour related to religious practices.
Figures 9.8, 9.9 and 9.10 show the percentage of youth who do follow a religion.
Religious fundamentalism is described as a phenomenon which is an attempt by a religious community to preserve its identity by a selective retrieval of doctrines, beliefs and practices from a sacred past (Kakar,1996:170).
FIGURE 9.8 Percentage of Indian Youth who Follow Religion in Indian States
Source: Primaryresearch,TISS,2009

�0�
Figure 9.8 shows that 79% of the youth in India do believe in a religion and follow it. The highest was Uttar Pradesh (92%) and the lowest, A&N islands (27%). Except for A&N Islands, in all the other states, more than 60% youth said that they were religious.
FIGURE 9.9 Percentage of Indian Youth who Follow Religion by Age, Sex, Location
Source: Primaryresearch,TISS,2009
Figure 9.9 shows that there are a higher percentage of females (83%) and youth in rural areas (80%) who believe in a religion. The age of the youth did not make a difference in their beliefs.
FIGURE 9.10 Percentage of Indian Youth who Follow Religion by Religion, Caste and SLI
Source: Primaryresearch,TISS,2009
Figure 9.10 shows that the highest percentage of youth who followed a religion were among Muslims (91%), STs (88%) and those belonging to the low (80%) and high (82%) SLI groups.
Youth Culture - Identity and Lifestyle

India Youth Development Report 20�0 �0�
FIGURE 9.11 Frequency of Religious Practices by Youth across Indian States
Source: Primaryresearch,TISS,2009
FIGURE 9.12 Frequency of Religious Practices by Indian Youth across Religion, Caste and SLI
Source: Primaryresearch,TISS,2009
The youth were also asked about how often they practiced the rituals related to their religion. Their responses are given in Figures 9.11 and 9.12. Figure 9.11 shows that 50% of the youth in India performed their religious practices on special occasions such as festivals and religious days. A significant percentage of youth (41%) said that they practice their religion rarely, and this was highest from the youth in West Bengal (61%). Seventy two percent of the youth in J&K said that they practise their religion on special occasions. The percentage of youth who regularly performed religious practices was very small and the highest response was from Maharashtra (24%). The responses suggest that youth do believe in their religion and hence, their religious identity, but do not consider it necessary to show their faith through regularly performing rituals.

�0�
Surveyssuggestthatyoutharereligiousandconservative.AstudybytheTimes of Indiain 2001 in five metros covering the age group of 15-19 years and representing the top60%of thesocio-economicstratashowedthat53%of theDelhiyouthsaidthatreligionwasanimportantpartof theirlives.30%of youthfromChennai,KolkataandBengalurugavethisresponse,whilethelowestwasfromMumbai(21%).Itsaidthatthereisapositivecorrelationbetweenfamilytiesandreligion.
Tribe: The term ‘ tribe’ is defined as those people who are different from those of the mainstream civilization, and this seen as a colonial construction (Beteille, A. 1995).
Increasing interactions with mainstream society and access to education have been vehicles for acculturation with the larger society. For example, the tsunami necessitated increased interaction between the tribes in the Andaman & Nicobar Islands and those on the ‘mainland’. In the process of interaction with the mainstream, many lose their distinct identity and space. Today, in the State’s administrative practices, there is no choice of using tribal religions and they can only identify with the major religions.
Often the tribes are denied the status of tribes if they have converted to other religions like Christianity, even though these groups belong to their ethnic group, share the same social organization, language and culture. This is a group which needs to preserve and promote its unique identity but if it needs to develop or access education or work opportunities, then it needs to absorb the regional language and culture for assimilation.
Caste: Caste has always been seen as a major indicator of deprivation in the country.
For the Dalits, their identity is linked to the context of caste and social hierarchy. As a group, they have internalized the beliefs, perceptions and attitudes ascribed to them because of this identity.
Actually not only is caste used as virtually the sole criterion in public policy oriented towards positive discrimination but categories like OBCs and SCs are treated as essentially homogeneous groups. In the absence of requisite data, it is simply assumed that almost the entire population of each of the categories suffers from a uniformly high degree of deprivation. Even within caste, there are attempts to arrange the OBCs and SCs according to the degree of backwardness, and split into sub-groups such as ‘more backward’ and ‘most backward’. (Chaudhary, 2004)
Figure 9.12 shows that among those who practiced their religion on special occasions, the highest was from Muslim youth (55%); ‘Others’ (55%); and youth from a high SLI (58%).
If at all they have an identity, then they have an identity only as a caste within the overall organizational and hierarchical structure of the caste system (Xaxa,2005).
Youth Culture - Identity and Lifestyle

India Youth Development Report 20�0 �0�
However, changes are taking place in India concerning how people view the caste system and how it shapes their lives. Hence, while the influence of the Indian caste system may seemingly be disappearing in India, many inequalities still persist in the light of changing attitudes. Newer forms of caste discrimination appear in terms of heightened resistance to inter-caste marriages in the form of honour killings; in cities, housing societies allow membership only to certain communities; and in the matrimonial advertisements in leading newspapers, caste specifications are clearly mentioned.
There is a caste system in the Muslim and Christian community also.
Today, in post-independence India, the notions of identity related to caste and tribe have come to acquire several connotations. In recent decades, in the context of reservations being held up as a palliative for community backwardness, categories of caste and tribe, and indeed the very notion of ‘backwardness’, have become tools to ensure community advancement. (Economic and Political Weekly, 9th June, 2007, pgs 2132-2133). There is an increase in the number of castes, sub-castes and OBCs which are clamouring for privileges such as reservations in educational institutions. There was a time when Maratha was a language identity. It has been turned into a caste identity (GPD, Economic and Political Weekly, 26th January, 2008).
Disability: Apart from the physiological handicaps faced by the differently-abled, there is a social construction of disability, which impairs the identity even more. A disabled person can be a man, woman, breadwinner, dependant with family or destitute. Each of these is primarily socially constructed and the social disabilities they face are more of social construction rather than physiology (physiological). The nature and extent of disability also influences the extent of isolation and stigma.
Migrants/Regional Identity: Today’s youth are more mobile, and migration across cities, States and regions for work or education is an increasing phenomenon. Some migrations happen out of choice and others out of compulsion in search of livelihoods. It also needs to be understood that urbanization happens due to migration.
Today, it is said that there are about a hundred million migrant workers. The most numerous are Biharis. The nature of governance in the State has forced an entire generation of Biharis to look for jobs outside their State (Jha, 2008).
Though globalization and modernization processes have created opportunities for widening the scope of work and enhancing lifestyles (especially in urban middle class), it has also been instrumental in creating in some a sense of humiliation and low self-esteem. Such processes have made many of the existing strengths and skills of youth seem irrelevant or outdated (local artisans, handicrafts, handlooms, etc).
Today, there are political parties who are actively promoting a revival of the ‘sons of the soil’ slogan, which argues for maximal allocation of resources and opportunities to the ‘natives’ of that location. Such movements have a large proportion of youth lending its support, as they view the ‘outsider’ as depriving them of opportunities, especially livelihoods. In terms of identity, the question is what constitutes the ‘insider’ and the

�0�
‘outsider’. There can be no clear demarcation as there are thousands of families who are no longer migrants in their new locations but have amalgamated their old and new identities of region or location.
No Identity: There are youth populations who have no identity as citizens of a particular location to access any service such as a bank account or rations. Refugees, street dwellers, transgenders and homeless are some groups who face abuse and rejection by virtue of their status. Very often, they themselves do not realize the implications due to poor education and exploitation.
Other Socially Marginalized GroupsInstitutionalized adolescents can be classified into four groups:
Who is the outsider then? Identity is a tricky work as everyone belongs here and somewhere else… Ranjona Banerji, DNA, 6thApril,2008,pg10
Youth Culture - Identity and Lifestyle
Sanjay’s story truly reflects how youth are being forced to move out of their native place tolookforlivelihoodandarethencriminalizedfortheirconditionSanjay is a 2�-year-old boy from a small village in Uttar Pradesh. He lost his mother when he was a child. His father married thrice due to which there were frequent fights at home. His family comprised his father, stepmother, two brothers and a sister. He and his brothers left home and migrated to different cities in search of work due to lack of work opportunities. One of his brothers got settled in Delhi and Sanjay stayed with him. Due to some differences, the brothers could not get along with each other and Sanjay came to Mumbai nine months back to look for work. He is in touch with his brother on phone but doesn’t want to live with him. Once in Mumbai he worked as a casual labourer with a catering contractor. He earned Rs 200 a day whenever he got work. The nature of the work compelled him to work at odd hours, sometimes even late nights. Since he had no shelter in Mumbai, he slept on streets or in public gardens.On a hot afternoon, he was taking rest in a public garden after working till late in the night when he was woken up by a few policemen. He was told to sit in the van and told that they would release him after an enquiry. He did not resist fearing police action. In the van, he saw nearly 20-25 people, some of them migrants like him doing odd jobs. He was processed under the Bombay Prevention of Beggary Act ���� and taken to court which sent him on remand to the Beggars Home for a period of seven days. The probation officer didn’t have enough time to verify his details. However, during his remand period, a Koshish social worker interviewed him and realized that Sanjay was not a beggar but arrested on suspicion. After building a good rapport with the social worker, Sanjay expressed his need to get stable work. The social worker felt that Sanjay’s chances of getting rearrested were high if he was found sleeping on streets again; so he offered to look for a job in a hotel where Sanjay could work during the day and also sleep at night.Today, after � months Sanjay continues to work in the same hotel in which the social worker had placed him. His salary has increased as a result of the hard work that he has put in and he has even saved money with his employer. But the hope of going back to the family, working in one’s own hometown and living a settled life is long lost… Koshish, a field action project of TISS

India Youth Development Report 20�0 �0�
• Those who are orphaned and without any family (destitute)• Those who are institutionalized due to the parents’ inability to look after them
due to poverty, ill health, etc.• Those who are in conflict with the law• Adolescents with special problems such as disability and need special care.
There are some studies on this group but the data is inadequate. The studies largely concentrate on the facilities available. It is seen that the facilities are very inadequate, personnel are few and untrained; the environment is not conducive for healthy growth (abuse, no care, learn anti-social behaviour), there is no preparation for the world outside after they turn 18 years. They live within closed doors with very little interaction with the outside world.
Street youth: While on the street, certain values such as sobriety, conformity and ambition are replaced by hedonism, defiance of authority and a quest for adventure and experimentation. They are exploited, abused and rejected by society and labelled as ‘bad influences’. Their plight has been highlighted over the years by several NGOs and today Childline India Foundation is a government scheme which includes provisions for street children and youth.
Media
Media and the Internet have revolutionized the pace and quality of communication the world over. Media is a very effective means of empowerment by transmitting education and reflective messages. But these can also be a means for spreading propaganda, reinforcing stereotypes. Through its ‘multiplier effect’ it can incite violence and hatred too. The information highway is becoming cheaper and more accessible.
The mass media, namely, the television has also contributed to changes in family norms. Gender-sensitive messages are attempted at one level (education of the girl child; gender equality), while at another level, the audience is also sold high profile living and gender stereotypes through commercial advertising. Some TV serials portray extra-marital relationships and power games within families. The increasing publicity and investments made in beauty pageants for both girls and boys have influenced the notion of good looks and the portrayal of confidence based on western standards. The youth are caught up in this phase of transient value changes.

�0�
9.2.4 Identity as a Citizen of the Country
The respondents of the primary research were asked about how they perceived their primary identity as a citizen of the country. Their responses are given in Figure 9.13.
FIGURE 9.13 Primary Identity of Indian Youth as a Citizen of India
Source: Primaryresearch,TISS,2009
Figure 9.13 and Table 9.1 show the three main identities related to citizenship among the youth – national, State and local. The data showed that among the total number of youth (India), 44% (2190) said that they perceived their primary identity as ‘Indian’; 11% (555) said that their State identity was primary; and 7% (338) stated that their local identity was primary. It was encouraging to note that the Indian identity was highest in all the States.The other ‘identities’ mentioned by some youth are given below in Table 9.1. There were 498 (9%) youth who predominantly identified with their religion. It was heartening to know that 16.5% (892) youth perceived their identity beyond national boundaries and said that their identity was ‘human/ global citizens’. Thus, in spite of regional and ethnic divisions and conflicts, the data in the primary research suggest that a significant percentage of youth identify themselves with their nation.
Youth Culture - Identity and Lifestyle
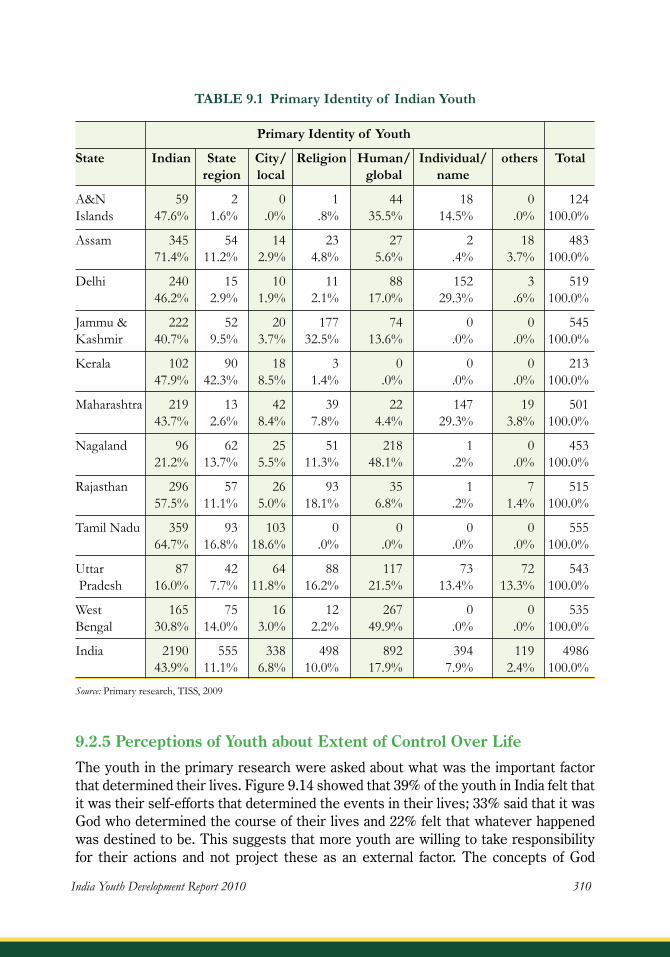
India Youth Development Report 20�0 ��0
Primary Identity of Youth
State Indian State City/ Religion Human/ Individual/ others Total region local global name
A&N 59 2 0 1 44 18 0 124Islands 47.6% 1.6% .0% .8% 35.5% 14.5% .0% 100.0%
Assam 345 54 14 23 27 2 18 483 71.4% 11.2% 2.9% 4.8% 5.6% .4% 3.7% 100.0%
Delhi 240 15 10 11 88 152 3 519 46.2% 2.9% 1.9% 2.1% 17.0% 29.3% .6% 100.0%
Jammu& 222 52 20 177 74 0 0 545Kashmir 40.7% 9.5% 3.7% 32.5% 13.6% .0% .0% 100.0%
Kerala 102 90 18 3 0 0 0 213 47.9% 42.3% 8.5% 1.4% .0% .0% .0% 100.0%
Maharashtra 219 13 42 39 22 147 19 501 43.7% 2.6% 8.4% 7.8% 4.4% 29.3% 3.8% 100.0%
Nagaland 96 62 25 51 218 1 0 453 21.2% 13.7% 5.5% 11.3% 48.1% .2% .0% 100.0%
Rajasthan 296 57 26 93 35 1 7 515 57.5% 11.1% 5.0% 18.1% 6.8% .2% 1.4% 100.0%
TamilNadu 359 93 103 0 0 0 0 555 64.7% 16.8% 18.6% .0% .0% .0% .0% 100.0%
Uttar 87 42 64 88 117 73 72 543Pradesh 16.0% 7.7% 11.8% 16.2% 21.5% 13.4% 13.3% 100.0%
West 165 75 16 12 267 0 0 535Bengal 30.8% 14.0% 3.0% 2.2% 49.9% .0% .0% 100.0%
India 2190 555 338 498 892 394 119 4986 43.9% 11.1% 6.8% 10.0% 17.9% 7.9% 2.4% 100.0%
TABLE 9.1 Primary Identity of Indian Youth
Source: Primaryresearch,TISS,2009
9.2.5 Perceptions of Youth about Extent of Control Over Life
The youth in the primary research were asked about what was the important factor that determined their lives. Figure 9.14 showed that 39% of the youth in India felt that it was their self-efforts that determined the events in their lives; 33% said that it was God who determined the course of their lives and 22% felt that whatever happened was destined to be. This suggests that more youth are willing to take responsibility for their actions and not project these as an external factor. The concepts of God

���
and destiny do overlap, but God was perceived as a clear definite identity (based on religion) and destiny was seen as more ambiguous, overarching, and in some ways, suggestive of fatalism.
Source: Primaryresearch,TISS,2009
Assam had the highest percentage of youth (57%) who said that it was their self-efforts that determined their lives; the least was from Rajasthan (16%) and Jammu & Kashmir (17%) where the highest percentage of youth stated that it was destiny that guided their lives. Kerala had nearly an equal distribution of youth who gave all three responses.
9.3 LifestyleIdentity is not just about cultural heritage. It is also about what you wear, who you are seen with, what music you hear. Identity is also defined by lifestyle, wealth and social status. Social identity and individual confidence (as well as social acceptability) is often gained through wearing appropriate bra nd names or ‘class’ items of clothing (Miles, S. 2000).
What are today’s youth like What do they want, what do they like, who do they liberal, or don’t they? Ogilvy & Mather did an attitudinal study of the current generation by getting college students in various cities across the country, from metros to small towns like Indore and Patiala, to write in about the trends, dreams, fads and beliefs that made them tick. O & M also spoke to people who interacted with the young for their impressions. The findings:
“There is no notion of a universal human nature in the Indian culture and thus we cannot deduce ethical rules… what a person should do or not do depends on the context.” Kakar,S.andKakar,K.(2007)
Youth Culture - Identity and Lifestyle
FIGURE 9.14 Perceptions of Indian Youth about Primary Locus of Control Over One’s Life

India Youth Development Report 20�0 ��2
For all the posturing, the majority of youth are like `reverse coconuts’, white and Western outside, brown and Indian at the core. Psychiatrist Achal Bhagat observes, “There is often an oscillation between extremes – the need to seek approval from the herd as well as the need for individual expression, between Western and Indian attitudes.” Hence, most experimentation with identity is superficial. Part of the behaviour can be attributed to the fear of permanent commitments at this early stage of life; part to the need to conform to a disparate set of values. So you have the same person being the cool dude at college and the good, responsible boy at home, the low-waist jeans wearing girl who can make great tasting aloo-puri. They desire transience and reversibility in their experiences... – Vice President, O&M (2008).
The indicators for measuring status include the level of techno-savvyism and the number of gadgets determine whether one has ‘arrived’. It is no surprise that the cell phone is the lifeline of communication for youth and no longer a luxury, as the survey indicates. India with 261.09 million subscribers has the second largest wireless network after China (TOI, 26th April, 2008). The two-wheeler has replaced the cycle age, with personal car gradually catching on in the metros, especially in the North. (Narayan, 2007)
With greater purchasing power and easy loans available for maintaining a comfortable lifestyle, young couples are no longer afraid of living off credit, which was unthinkable a decade ago. An India Today survey showed that the youth are positively inclined to take loans for needs such as a house as the market provides the opportunities. They are also more money savvy and willing to take risks with readiness to play the stock markets and invest in real estate. Females seem more conservative, however. The level of awareness of small town youth in this regard is not clear (Narayan, 2007).
Urban areas are experiencing the first generation of ‘liberal parents’. They have less ‘expectations’ of their children, who are now receivers of material gifts and goods rather than givers – a trait of a consumerist society.
A survey by the Hindustan Times (2003) showed that of the youth icons, parents topped the list, followed by Sachin Tendulkar (6%), Amitabh Bachchan (5%) and Swami Vivekananda (3%). The lure of the TV and Bollywood is very strong and these also define styles, language, and at times even influence values and behaviour.

���
9.3.1 Choice of Dress
Source: PrimaryDatafrom11states/UT,TISS,2009
As shown in Figure 9.15, 42% of the youth in India predominantly wore Indian clothes ie sari and/ or salwar-kameez, kurta-pyjama; and 26% said they mainly wore western clothes. However, there is a growing number of youth who are comfortable in both Indian and Western dress styles as 13% of the youth stated that they wore western clothes and Indian dresses equally. The highest percentage who said that they wore both western and Indian clothes were from Delhi (40%) which is a highly urbanized location. Interestingly, 20% of the youth wore their regional dress most of the time.
FIGURE 9.16 Predominant Form of Dress across Indian States
Source: Primaryresearch,TISS,2009
Youth Culture - Identity and Lifestyle
FIGURE 9.15 Predominant Dress Style of Indian Youth

India Youth Development Report 20�0 ���
Figure 9.16 depicts the dress patterns across States. The Figure shows that the majority of the youth in A&N Islands and West Bengal usually wore Indian dresses. The majority of youth in Nagaland said that they wore western clothes. Rajasthan, Tamil Nadu and Jammu & Kashmir had more than 40% of their youth stating that they wore regional dresses.
Figure 9.16 gives the data by age, sex and location. There is a gender dimension which is clearly seen here, where the percentage of females who wore Indian dress is nearly double than that of males wearing the same. Males have adopted the western style of dressing (trousers and shirt) much earlier than females – one factor being that males have migrated to urban locations much before females, and the change to western dress patterns are linked to urbanization. However, today it is not only in urban areas that youth wear trousers and shirts, but it is increasingly worn in rural areas too. In comparison, young females wearing western clothes are not yet fully accepted in all locations. In fact, the mode of dressing has always been a form of patriarchal control on women (dupatta/ veil/ ghunghat). Traditionally, Indian films have also portrayed women wearing pants as vamps, seducers and manipulators. This has changed to some extent in the last decade and yet, the stereotype of the heroine is a young woman dressed in a sari/ salwar kameez, is ‘homely’ and innocent.
In terms of age, there are more in the younger age group who wear western clothes, and the percentage decreases with age; and in terms of location, the percentage is higher in urban areas (Figure 9.17) .
Figure 9.17 Predominant Form of Dress by Age, Sex and Location
Source: PrimaryDatafrom11States/UT,2009

���
Figure 9.18 Predominant Form of Dress by Religion, Caste and SLI
PrimaryDatafrom11States/UT,TISS,2009
Figure 9.18 shows the influence of religion, caste and SLI on the mode of dressing among youth. In terms of religion, there were 53% of the youth belonging to ‘other’ religions, who wore western clothes. These youth were largely Christian youth; those belonging to the ST group had the highest percentage of youth who wore western clothes. Many of these youth were from the state of Nagaland.
9.3.2 Choice of Food
Food forms a very important part of Indian culture, and hence, also youth. Figures 9.19, 9. 20 and 9.21 show the youth’s preferences for food.
FIGURE 9.19 Food Preferences of Indian Youth
*Othersincludefoodtypeslikecokes,pizza/burgersSource:Primaryresearch,TISS,2009
Youth Culture - Identity and Lifestyle

India Youth Development Report 20�0 ���
Figure 9.19 shows that 56% of the youth in India have highest preference for Indian food; 36% prefer ‘Others’ which consists largely of the category termed ‘fast foods’ like pizza, burger and drinks such as Coca Cola and Pepsi; 9% mentioned that they preferred international cuisine like Chinese, Thai or Continental. West Bengal, Tamil Nadu and Kerala had the highest percentage of youth who mentioned that Indian food was their favourite cuisine. Jammu & Kashmir had the highest percentage who mentioned ‘other foods’ as their favourite food; 60% of the youth in A&N Islands also mentioned ‘other foods’ as their food preference.Figures 9.20 and 9.21 show the food preferences by age, sex, location, religion, caste and standard of living. The figures show that more youth in the higher age group of 25-35 years, males and those staying in rural areas mentioned Indian food as their first preference. There were also more Hindus and more from the SC group who preferred Indian food. It was interesting to note that the percentage of those who mentioned ‘other foods’ as their first preference increased with the standard of living.
FIGURE 9. 20 Perceived Current Status of Food Habits by Age, Sex and Type of Place
Source: Primaryresearch,TISS,2009
Source: Primaryresearch,TISS,2009
FIGURE 9.21 Food Habits by Religion, Caste and SLI

���
FIGURE 9.22 Substance use by Indian Youth across Indian States/UT
9.3.3 Substance Use
Youth is a stage of experimentation, where young persons often do not consider the long term risks of behaviour such as substance abuse, sexual experimentation and rash driving. It has been generally seen that student youth glamorize tobacco and alcohol consumption, while non-student youth use tobacco and alcohol out of frustration and poverty. The role of advertising in promoting these products as part of a successful lifestyle is much more than the media campaigns for their prevention. Smoking and drinking by girls has increased in India and the age for smoking gone down to 12 years. The major reasons are related to economic independence, social acceptance and breaking-down of taboos.
Incidence of Substance Abuse
Figures 9.22, 9.23 and 9.24 provide the data from the primary research related to substance use by the youth. This includes use of tobacco in any form, alcohol, drugs and other addictives.
Figure 9.22 shows the incidence of any substance use by the youth. 30% stated that they did indulge in substance use. The highest percentage was in Assam while the lowest in Tamil Nadu. In terms of religion, (Figure 9.23) the percentage in the ‘Others’ category, the ST group and those in the middle SLI were higher than the other groups in their particular category.
Source: Primaryresearch,TISS,2009
Youth Culture - Identity and Lifestyle

India Youth Development Report 20�0 ���
FIGURE 9.23 Substance use by
Indian Youth by Religion,
Caste and SLI
Source: Primaryresearch,TISS,2009
FIGURE 9.24 Substance use by Indian Youth by
Age, Sex and Type of Place
As expected, the percentage of males who indulged in substance use was much higher than that of females, and those in the higher age groups. Interestingly, the percentage was the same in both rural and urban locations (Figure 9.24).
FIGURE 9.25 Frequency of Substance Use by Youth across States
FIGURE 9.25 Frequency of Substance use by Youth across Indian States
Source: Primaryresearch,TISS,200�Primaryresearch,TISS,2009
Source: Primaryresearch,TISS,2009

���
Figures 9.25 and 9.26 show the frequency of substance use among the youth where 29% of the youth in India said that they often indulged in substance use, while 46% mentioned that they sometimes used tobacco/ alcohol/ drugs/ addictives. There was a higher percentage of youth among Muslims, ST groups and the low SLI who indulged in substance use.(Figure 9.26).
9.3.4 Television Viewing
Figure 9.27 Television Viewing Patterns among Indian Youth
FIGURE 9.26 Frequency of Substance use by Religion, Caste & SLI among Indian Youth
Source: Primaryresearch,TISS,2009
Source: Primaryresearch,TISS,2009
Youth Culture - Identity and Lifestyle

India Youth Development Report 20�0 �20
Figure 9.27 shows the type of programmes that youth like to watch on television. An overwhelming majority of the youth predominantly watch ‘other’ programmes which includes serials, reality shows, religious programmes and sports. A small percentage watch the news and educational programmes have a miniscule percent as audience. The data clearly reveals the impact of TV entertainment programmes on the youth. The National Family Health Survey (NFHS-3) India 2005-06, shows that women (35%) have less access to media as compared to only 18% of men who do not have access.
9.4 The Global IndiansThere is a small percentage of youth who may live in India or elsewhere but whose lifestyles, interests, attitudes and aspirations are truly global in nature.Their ideology is practical liberalism and they have a global mind-set. This is a generation exposed to Internet, satellite TV, opportunities to study and work abroad and experience other cultures through travel.
9.5 ConclusionIndia’s youth have an enormous impact on the media and on the culture of the country. The data shows that the youth still identify with the country in terms of their primary identity and are Indian in relation to tastes in dressing styles and food preferences. They are comfortable in mixing western and eastern styles with ease, especially the urban youth. One can look forward to a more cosmopolitan culture in some ways, if the youth do not identify with narrow parochial, fundamentalist identities.
AccordingtoGore,(1977:43),thetypeof personweneedtoday...….must be capable of innovation and adaptability to new situations: he would need to be individualized and autonomous so that he judges issues on their respective merits and independent criteria, rather than in the context of tradition. But he must maintain a group orientation and a commitment to the larger society so that his individualism does not degenerate either into mere eccentricity or self-aggrandizement.

�2�
Definition of Youth The age range of 13-35 years as the defining factor for youth has been highly debated during the regional workshops with both youth and experts. Several suggestions about potential age categories were made. The general thinking was that the age group of 13-17 years should be considered only as children and adolescents. Youth should be defined as those who are aged 18-29 years. This would ensure that the programmes and schemes focus on these youth and their requirements for higher education, work and health. However, it is acknowledged that there are some who are marginalized and cannot access the facilities available, e.g. seasonal migrants and those affected by disasters. For these youth, the age limit for utilizing the schemes and facilities may be extended to 35 years.
Attitude towards Youth Youth as a constituency is often perceived as a group who are troublemakers and hence need to be controlled, or as a group whose growth is measured in terms of involvement in recreation and adventure. This attitude needs to change whereby youth are to be considered partners in development and involved actively in the different forums pertaining to youth.
Youth Development Index (YDI) The value of YDI at 0.453 is low; this is because the indicators selected were ‘youth sensitive’. It is most
Recommendations
CH
AP
TE
R
X
Our national goal is progress of a kind which looks ahead with confidence to the future and back with pride to the past.
–RajivGandhi

India Youth Development Report 20�0 �22
likely that India would rank very low if we compute and compare youth development index for other nations using the same indicators and methodology. This highlights the fact that youth are a neglected section of our society.
Among the sub-indexes, the amenities index (0.380) has the lowest value. This is because the modern amenities index which had components that were youth- specific (communication, information, technology) was very low. If youth are to be equipped to face the challenges of modernization and use the emerging opportunities, then they need to be provided with the appropriate facilities.
Education index (0.413) is also low and reveals the status of secondary and tertiary education in India. Though efforts should continue to ensure universal literacy and primary education, we can no longer ignore secondary and higher education. It is very clear that primary education alone does not satisfy or equip youth for constructive engagement in personal and social spheres. The State needs to give priority to these areas.
The need to address gender inequality is evident from the YDI adjusted for gender differences in youth development.
There are a few states which have performed poorly in all or most of the dimensions of youth development. First and foremost, it needs to be acknowledged that there are states with poor performance. Special attention and support should be provided such that the youth in these states do not become marginalized from the fruits of development. These are the groups who become disgruntled and tend to alienate themselves from the mainstream development processes.
Data Base for Youth Development The process of doing this report clearly showed that there is no data specifically collected for the purpose of assessing youth development situation in the country. Data collected for other purposes had to be used to examine the various dimensions of youth development. The lack of specific data on youth in many aspects of development (e.g. dimensions on access and quality pertaining to the youth; participation of youth; youth- specific amenities; lifestyles) results in an insufficient understanding of youth. If the YDI is to be computed periodically in order to monitor youth development, there is a need to create systems for regularly providing youth-specific data. These systems could be developed at the state, district and sub-district levels. This could be one of the action points in implementing the National Youth Policy.
Research on Youth There is a need for a national centre for youth research which can initiate, coordinate and conduct studies on specific themes related to youth. Some thematic areas for research could include youth culture, attitudes and values of youth, youth perceptions

�2�
about development, youth vision for India, mental health of youth, status of marginalized youth, youth perceptions and recommendations for curricula, migratory patterns and consequences. More data is needed to show the correlation of qualitative leading to quantitative results and vice-versa.
Policy for Youth The National Youth Policy, 2003 has been in effect for the past seven years. It is now time that it is reviewed and the findings of the YDI are considered in this process. Some states have formulated State-level youth policies. This needs to be encouraged, so that the diversity in state-level of youth can be recognized and acted upon.
Budget Allocations for Youth Youth form a considerable percentage of the Indian population. By and large, budgetary allocations are not made based on the size of youth population. It is recommended that this aspect is taken into account while planning financial allocations.
Health The findings of the YHI show that States with very low YHI value should get adequate attention. Similarly, access to health and improved nutritional status of youth should be in the agenda for health interventions. Health issues such as morbidity including oral health, mental health status, sexual and reproductive health should be important concerns in youth health interventions. Special attention needs to be given to youth living with HIV/ AIDS and for prevention of HIV among young people. Spiritual health is mentioned in the Youth Policy, 2003. This term needs greater discussion and definition and there is a need for caution in the kind of activities conducted in the name of spiritual health.
Education The recommendations of the National Knowledge Commission should be taken seriously and implemented within the time frame suggested. School and college curricula should be gender-sensitive in terms of the language, perspective and messages conveyed. The suggestions made by earlier committees and reports related to improving quality of schools, quality of teachers, reduction of dropout rates and education of girls should be implemented.
There is a need to reiterate the recommendation of the NKC for a central legislation affirming the Right to Education. The report makes specific mention of SC/ ST groups, backward regions, remote and difficult terrains, Muslim children, children of seasonal migrants, child labourers and the disabled. The curriculum needs to be formulated
Recommendations

India Youth Development Report 20�0 �2�
keeping in mind the specific needs of marginalized groups mentioned in this report, e.g. support needs to be given to the youth who require a ‘second chance’ to pursue their education.
There is an increasing demand for youth to interface with financial institutions such as banks, insurance, etc. Thus, there is an immediate requirement to include financial education in the curriculum at the secondary and tertiary levels of education. Career counselling is another service which needs area which needs to be provided at all levels of education.
Work Providing employment is the biggest challenge for the country, and this needs to be tackled with urgency if we want to benefit from the demographic windows. High rates of unemployment and underemployment are the major causes of youth unrest. It is important to ensure that employment is available in all the regions and states for the youth. The present disparities in employment opportunities compel youth from certain regions to migrate in search of livelihood. This increase in migration has its own consequences. Work participation, especially among female youth, is low and it is imperative that more opportunities are created to ensure that the youth are a productive force in the country.
It is essential that entrepreneurship education is introduced in phases in secondary and tertiary education levels. As stated in the Knowledge Commission Report (2009), the inputs should include information about opportunities, practical exposure, developing skills of critical analysis, mentoring of youth and creating industry-institution linkages.
Entrepreneurship education should be linked to institutions which facilitate easy access to finance and other requirements.
As the share of youth engaged in the organized sector is very low, there is a need to introduce training options for the unorganized and informal sector with certification of vocational education and training.
Participation Primary research clearly showed that the majority of the youth stated that they had never been provided opportunities to be part of decision-making processes in matters pertaining to their own lives. Youth should be provided with more space for participation in societal issues. There should be youth representation on government committees pertaining to youth concerns.
The YPI showed that the enrolment as a voter and voting were reasonably high. However, youth participation in other forums was very poor. There must be greater monitoring of the NSS and the NYKS, as these are excellent programmes to mobilize youth for social development. The NYKS should be expanded to include urban non-student youth.

�2�
IdentityIt is essential to have a collective youth identity which focuses on the growth of the country as a whole. However, unless the basic requirement of health, education and work are satisfactorily met, the youth will remain polarized and fragmented.
Amenities The YAI shows that though the basic amenities scores are high, there are pockets of deprivation where housing, electricity, sanitation facilities and drinking water are absent. As stated earlier, the amenities pertaining specifically to youth are accessible only to a few. If it is understood that technology, communication and information are crucial in the development of a nation, special attention needs to be given to these aspects. It is necessary that all youth have access to these amenities.
Recommendations
When we talk of science and technology, our objective is to bring it within the reach of the poor people in our villages.
–RajivGandhi

India Youth Development Report 20�0 �2�
References
Aggleton, P, Ball, A, Mane, P (Eds.), (2006)
Agochiya , D (2005)
Ambulgekar, K.G (1999)
Anand, S. and Sen, A.K. (1993)
Anand, S. and Sen, A.K. (1995)
Anand, S. and Sen, A.K. (1997)
Anand, S. and Sen, A.K. (2000)
Anil Kumar K (2000)
Ara, A. (2004)
Atul Sethi, Divya, A. (2010)
Bandyopadhyay, D. (2002)
Bansal, R (1998)
Sex, Drugs and Young People – International Perspectives, Great Britain: Routledge.
‘Youth Development Programs in India at the Crossroads: Agenda for Choosing the Right Path, Endeavor, Vol 1: 35-49; Sriperumbudur : RGNIYD
Varna and Oppresssion, Dalits: Assertion for Identity, ed. Pinto, A, New Delhi: Indian Social Institute: 34-37
‘Human Development Index: Methodology and Measurement’, Human Development Report Office Occasional Paper 12, UNDP, New York.
‘Gender Inequality in Human Development: Theories and Measurement’, Human Development Report Office Occasional Paper 19, UNDP, New York.
‘Concepts of Human Development and Poverty: A Multidimensional Perspective’, Human Development Papers, United Nations Publications, New York.
‘The Income Component of the Human Development Index’, Journal of Human Development, 1: 83-106.
Health of Indian Youth, Tata Institute of Social Sciences, Mumbai (Mimeo)
‘Madrasas and Making of Muslim Identity in India’, Economic and Political Weekly, January 3rd: 34-38
Times of India, pg. 22, May 16th 2010, ‘A gene called caste’,
‘Madrasa Education and the Conditions of Indian Muslims’, Economic and Political Weekly, April 20th : 1481-1484
‘The Years of Living Dangerously’, Times of India, September 8th: pg. 15

�2�
Baumann, Z (2005) Beteille, A (1995)
Beteille, A. (2008)
Biswas’s study (1988)
Boer L. and Koekkoek A
Bourn Douglas (2008)
Buss, A (2001)
Cell for AIDS Research, Action and Training (CARAT), (2007)
Centre for Development studies, Thiruvananthapuram, Government of Kerala, (2006)
Chadha,G.K, Bhushuan,S, Murlidhar, (2008)
Chakravarty, S. R. (2003)
Chaudhury, P (2004)
Liquid Life, Cambridge, Polity Press
‘Construction of tribes’, The Times of India , June 19, 1960
‘Access to Education’. Economic and Political Weekly, May 17th, pp. 40-48. http://www.epw.org.in/epw/uploads/articles/12262.pdf
‘Relationship between Family Structure and Reactions to Frustration of School going Adolescents’, Indian Journal of Social Work, 49[4]: 359-365
‘Human Development Report: Fad or Fixture’ Development Policy Review. 11 : 427-438.
Young People, Identity and Living in a Global Society , Development Education Research Centre, unpublished
Psychological Dimensions of the Self. New Delhi : Sage Publications
Concept note, Mumbai: TISS, unpublished.
Kerala- Human Development Report, 2005, State Planning Board, Government of Kerala.
‘Teachers in Universities and Colleges –Current Status Regarding Availability and Service Conditions’ in Higher Education in India - issues related to Expansion, Inclusiveness, Quality and Finance, New Delhi: University Grants Commission : 203-213
“A Generalized Human Development Index”, Review of Development Economics, Vol. 7(1), 99-114.
‘The ‘Creamy Layer’- Political Economy of Reservations”, EPW, May 15th ,pg. 1989 – 1991
References

India Youth Development Report 20�0 �2�
Chetan Chauhan (2010)
Comim, F. (2001)
D’Souza B, Sonavat, R and Madangopal, D. (2004)
D’Souza, B. (2008)
D’Souza,P.R., Kumar, S and Shastri,S [Ed.][2009]
Dasgupta P. and Weale M. (1992)
DEAT (Department of Environmental Affairs and Tourism) (2001)
Desai, M. (1991)
Dreze, S and Sen, A, (2002)
Duraiswamy,P (2008)
Dutta, B., Panda, M. and Wadhwa, W (1997)
Fakuda-Parr, (2003)
Hindustan Times, Mumbai, Friday, May 21, Pg. 9
“Operationalizing Sen’s Capability Approach”, Paper presented at Conference Justice and Poverty: examining Sen’s Capability Approach, Cambridge, June, 2001.
Understanding Adolescents at Risk, Mumbai: Multi – tech Publishing Company
Children in Adult Garb – The street children’s reality, : Mumbai : Tej Prasarini, Don Bosco Communications
Indian Youth in a Transforming World: attitudes and perceptions ;CSDS and Sage, 2009
On measuring the quality of life. World Development 20 (1), 119–131.
“National Core Set of Environmental Indicators”, For State of Environment Reporting in South Africa, Phase I, Scoping Report, DEAT.
‘Human Developments – Concepts and measurement’, European Economic Review, 35, 350-57.
India - Development and Participation, New Delhi: Oxford University Press.
‘Enrolment Forecast of Higher Education for Inclusive Growth in the 11th Five Year Plan’, Higher Education in India-issues related to Expansion, Inclusiveness, Quality and Finance, New Delhi: University Grants Commission: 27-50.
Human Development in India. In S. Subramanian (Ed.), Measurement of Inequality and Poverty. New Delhi: Oxford University Press. (1997)
The Human Development Paradigm: Operationalizing Sen’s Ideas on Capabilities Feminist Economics, 9(2-3), 301-317.

�2�
Fakuda-Parr, S., Raworth, K., and Shiva Kumar, A. K. (2003)
Fernandes W, (1999)
Foster, J. E., López-Calva L., F. and Székely M. (2003)
Garg and Parikh, (1995)
Gore, M.S. (1977)
Government of India
Government of India (1992)
Government of India (2000)
Government of India (2001)
Government of India (2009)
Government of India Ministry of Youth Affairs and Sports. (2003)
Government of India, Ministry of Human Resource Development (2006)
‘Using the HDI for Policy Analysis’, in S. Fukuda-Parr and A. K. Shiva Kumar (eds) Readings in Human Development, Oxford University Press, New York.
‘Attacks on Minorities and a national debate on Conversions, EPW, Jan 16-23, , pg. 81-84
‘Measuring the Distribution of Human Development: Methodology and an Application to Mexico’, Human Development Study Report, 2003-04, UNDP, Mexico.
Crossroads of Culture: A Study in Culture of Transience, New Delhi, Sage Publications
Indian Youth: Processes of Socialization, New Delhi: Vishwa Yuvak Kendra
Eleventh Five Year Plan
National Policy on Education 1986 (with modifications undertaken in 1992). New Delhi: Ministry of Human Resource Development.
Selected Educational Statistics 1998-99, New Delhi: Ministry of Human Resource Development
Report of Working Group on Adolescents, 10th Five Year Plan (2002-2007). New Delhi: Planning Commission.
National Knowledge Commission Report
National Youth Policy 2003
The Lyngdoh Committee Report
References

India Youth Development Report 20�0 ��0
Government of India, Ministry of Human Resource Development (2007)
Government of India, Planning Commission (2002)
Grimm, H., Harttgen, K., Klasen, S., and Misselhorn, M. (2008)
Han, J. and M. Kamber, (2001)
Haq, M. (1995)
Harding, T.W.,(2000)
Hensman, Rohini, (2004)
Hicks, D. (1997)
Hopkins, M. (1991)
Hopkins, M. (1993)
Human Rights Law Network (2007)
International Institute for Population Sciences (IIPS) and Macro International (2007)
IND-SESO4, Selected Educational Statistics 2004-05, Dept. Of Higher Education, Statistics Division, New Delhi.
Report of the Committee on India Vision 2020, New Delhi
‘A Human Development Index by Income Groups’, World Development, 36, 2527-46.
Data Mining: Concepts and Techniques, Morgan Kaufmann, USA.
Reflections of Human Development, Oxford University Press, New York.
‘Mental Health and Human Rights’, in Mental Health in India – 1950-2000, Ed. Murthy, R.S., Bangalore: People’s Action for Mental Health, (241-251).
‘Globalization, Women and Work – What are we Talking About?], Economic and Political Weekly, March 6th: 1030- 1034
‘The Inequality-Adjusted Human Development Index’: A Constructive Proposal, World Development, 25, 1283-1298.
‘Human Development Revisited’: A New UNDP Report, World Development, 19(10), 1461-1468.
‘A Note on Adding Components (Dimensions) to the HDI.’ Human Development Report Office, UNDP, New York.
Report of Refugee Populations in India
National Family Health Survey (NFHS 3), 2005-06: India: Volume 1.

���
Ivanova, I. (1994)
Jahan, S. (2003)
Jahoda, M ,(1974)
Jain, R (2005)
Jha, Prem Shankar (2008)
Joseph, A, (2005)
Joseph, E. Davis Editor (2000)
Ashraf, K.M. (2004)
Kakar, S and Choudhary, K. (1970)
Kakar, S. (1996)
Kakar, S and Kakar, K (2007)
Kakkar, S . (1978)
Kakkar, (2006)
‘A Quantitative Measure of the Comparative Advantage of Nations.’ Paper presented at the Atlantic Schools of Business Conference, 1994, Nova Scotia.
‘Evolution of the Human Development Index’, in S. Fukuda-Parr and A. K. Shiva Kumar (eds.) Readings in Human Development, Oxford University Press, New York.
‘The Impact of Unemployment in the 1930s and in the 1970s’, Bulletin of the British Psychological Society, 32: 309-314.
Minority Rights in Education: Reflections on Article 30 of the Indian Constitution, EPW, June 11th, pgs. 2430-2437
‘The Diaspora is Inside’, Outlook, 25th February, pg. 32
‘Gender, media and Tsunamis’, India Together, http://www.indiatogether.org/2005/feb/ajo-genmedia.htm
Identity and Social Change by Joseph E. Davis Editor (2000)
An overview of Muslim politics in India , Manak Publications, New Delhi, 2001, pg. 143 cited in Ara, Arjumand, ‘Madrasas and Making of Muslim Identity in India’, EPW, Jan. 3rd, 34-38.
Conflict and Choice – Indian Youth in a Changing Society, Bombay: Somaiya Publications.
The Colors of Violence, London: University of Chicago Press
The Indian Identity, Penguin Books India
The Inner World: A Psychoanalytic Study of Childhood and Society in India, Oxford University Press, New Delhi
‘The elastic Indian’, India Today, Aug. 21, 2006: 90- 96
References

India Youth Development Report 20�0 ��2
Kanbur, R. (1990)
Karollil, M (2006)
Kashyap, L [Ed.] (2009)
Kelley, A. C. (1991)
Khatib, H. (1994)
Kishor Bhanushali (2006)
Kishore, Sunita and Kamla Gupta (2009)
Kodoth, P and Eapen, M (2005)
Kothari commission reportKothari, D. S. (1966) Kothari, A (1998)
Kulhara, P, (2000)
Kumar, Narendra (1999)
‘Poverty and Development: the Human Development Report and the World Development Report 1990’, Discussion paper 103, University of Warwick, Coventry, England.
Youth, Choice and Subjective Well being : 5 pre – doctoral papers, unpublished, Mumbai : TISS
‘Training Family Counsellors in Contemporary India’, IJSW, Vol.70, [2], 133-144
‘The Human Development Index: handle with care’’, Population and Development Review 17(2):315-324.
‘The HDI as a Policy and Planning Tool’, A paper prepared for Human Development Office, UNDP, New York.
‘Dimensions of Disability in India’ Disability India Network
Gender Equality and Women’s Empowerment in India, National Family Health Survey (NFHS 3), India 2005-06, Mumbai, IIPS, Calverton, Maryland, USA, ICF Macro.
‘Looking beyond Gender Parity – Gender Inequities of Some Dimensions of Well-Being in Kerala’, EPW, July 23rd: 3278-3286.
Report of the Education Commission (1964-66) - Education and National Development. New Delhi: University Grants Commission.
Communities and Conservation: Natural Resource Management in South and Central Asia
‘Course and Outcome of Schizophrenia in India: Reflection of Indian Research’, in Mental Health in India – 1950-2000, Ed. Murthy, R.S., Bangalore: People’s Action for Mental Health, (10-16).
Dalit Identity and Student Politics in JNU, Dalits: Assertion for Identity, ed. Pinto, A, New Delhi: Indian Social Institute, 40-47

���
Kumar, S (2008)
Lefrancois,G.R. (1990)
Lüchters, G and Menkhoff, L. (1996).
Manchanda, Rita (2010)
Manchanda, Rita (2004)
Mandar, H (2008)
Manjrekar, N (2003)
McGillivray, M. and White, H. (1993)
Miles, S. (2000)
Ministry of Human Resource Development (2007)
Mishra, A.K, and Gupta, R (2006)
Mishra, S. and Nathan, H.S.K. (2008)
‘Dalit Women at the Intersections: Voices from the Margins’, IJSW, Vol.69 [2]: 159-178
The Life Span [3rd edition], California: Wadsworth Publishing.
Human development as statistical artifact, World Development, 24(8), 1385-1392.
‘Media-Mediated Public Discourse on ‘Terrorism’ and Suspect Communities’, EPW, Vol. XLV no. 15, April 10th, pgs. 43-50.
‘Gender Conflict and Displacement’ – Contesting ‘Infantilization of Forced Migrant Women’; Economic and Political Weekly, September 11th: 4179- 4186
‘Living with Hunger: Deprivation among the Aged, Single Women and People with Disability’, EPW, April 26th: 87-98
‘Contemporary Challenges to Women’s Education: Towards an Elusive Goal?’, Economic and Political Weekly, Oct. 25.
“Measuring Development? The UNDP’s Human Development Index,” Journal of International Development, 5(2), 183-192.
Youth Lifestyles in a Changing World, Maidenhead, Open University Press
IND-SESO4, Selected Educational Statistics 2004-05, Department of Higher Education Statistics Division, New Delhi
‘Disability Index – A Measure of Deprivation among Disabled’, EPW, Sept. 23rd: 4026-4029
‘On a class of Human Development Index Measures’, WP-2008-020, Working Paper Series, Indira Gandhi Institute of Development Research (IGIDR), Mumbai.
References

India Youth Development Report 20�0 ���
Misra, D.K., Jain, C.M., Doshi, S.L. (Eds.), (1975)
Moller ,H , (1968)
Moorcroft, S, (1997)
Munshi, K and Rosenzweig, M (2005)
Murray, C., (1993)
Narayan, L (2008)
Narayan, L (2006)
Narayan, L and Anil Kumar, K (2008)
Nathan, H. S. K., (2008)
Nathan, H. S. K., and Mishra S., (2010)
Youth, University and Community, New Delhi: S. Chand and Co.
‘Youth as a Force in the Modern World’, Comparative Study in Society and History, Vol.3.
‘The values gap: young people living in the future, today’, Business Futures, London. www.businessfutures.com/youth.htm
‘Traditional Institutions Meet the Modern World: Caste, Gender and Schooling Choice in a Globalizing Economy’. The American Economic Review, 96, 4, 1225-1252.
Development data constraints and the Human Development Index. In: Westendorff, D. and Ghai, D., Editors, Monitoring Social Progress in the 1990s, Data Constraints, Concerns and Priorities. Aldershot: Avebury.
Study of Parsi Youth in India, New Delhi: PARZOR Foundation, mimeo
‘In Stride with the Times’, in India Today, Feb. 20th, pg. 24-25
Regional Workshop Reports on the Construction of Youth Development Index and Youth Development Report, TISS and RGNIYD : 2008 [mimeo]
Gender-based Indicators in Human Development: Correcting for Missing Women, IGIDR WP-2008-018. Indira Gandhi Institute of Development Research (GIDR), Mumbai. http://www.igidr.ac.in/pdf/publication/WP-2008-018.
Progress in human development: Are we on the right path?, International Journal of Economic Policy in Emerging Economies, Vol. 3, No.3 pp.199–221. An earlier version of the paper is available as WP 2010-010, Working Paper Series, Indira Gandhi Institute of Development Research (GIDR), Mumbai. http://www.igidr.ac.in/pdf/publication/WP-2010-010.

���
Nathan, H. S. K. and Reddy S., (2010)
Nathan, H. S. K., Mishra S., Rampal P., (2009)
Nathan, H. S. K., Mishra S., Reddy S. (2008)
Nathan, H. S. K. and Reddy S., (2011)
Nayar Usha S. and Parasuraman S (1982)
Noorbakhsh, F. (1998)
NSSO (2003)
O’Donnell, C (1983)
OECD (Organization of Economic Co-operation and Development), (2003)
Osama, O. M. (1994)
Selection Criteria for Sustainable Development Indicators, Working Paper Series (forthcoming), Indira Gandhi Institute of Development Research (GIDR), Mumbai, (obtained from the author).
Gender Development Index: Two Corrections, PP-062-19, Proceedings/Project Reports Series, Indira Gandhi Institute of Development Research (GIDR), Mumbai.
An alternative approach to measure HDI, WP-2008-002, Working Paper Series, Indira Gandhi Institute of Development Research (GIDR), Mumbai.
Criteria Selection for Sustainable Development Indicators, International Journal of Multicriteria Decision Making Vol 1, No. 3, pp. 257–279. An earlier version of the paper is available as WP-2010-013, Working Paper Series, Indira Gandhi Institute of Development Research (GIDR), Mumbai. http://www.igidr.ac.in/pdf/publication/WP-2010-013.
Health Situation of Youth in India, TISS Series 51, Tata Institute of Social Sciences, Mumbai
‘A Modified Human Development Index’, World Development, 26, 517-28.
Disabled Persons in India (NSS 58th Round), Ministry of Statistics and Programme Implementation, Government of India, New Delhi.
‘Neo-Pentecostalism in North America and Europe’, Concilium, January, pg.35-41, cited in Fernandes, 1999.
“OECD Environmental Indicators: Development, Measurement and Use”, Reference paper, Environmental Performance and Information Division, OECD, Paris.
The Use of HDI as a Statistical Tool for Policy Programming Tool’, A paper prepared for Human Development Office, UNDP, New York.
References

India Youth Development Report 20�0 ���
Osler A, and Starkey, H (2005)
Pal, S. P. and Pant D. K. (1992)
Paranjpe, A.C. (1975)
Parasuraman Sulabha, Sunita Kishore, S.K. Singh and Y. Yaidehi (2009)
Parasuraman, S et al (2008)
Parekh, K.S., and Radhakrishnan, R, (2005)
Park, C. B., and Cho, N., 1995.
PAYE (2007-2015)
Planning Commission, Govt. of India, (2001)
Prem Chand (2007)
PROBE TEAM (1999)
Pyatt, G. (1992)
Changing citizenship, Maidenhead: Open University Press, U.K.
An Alternative Human Development Index’, National Council for Applied Economic Research, India.
In Search of Identity, Mumbai: Macmillan Company
A Profile of Youth in India, National Family Health Survey (NFHS 3), India 2005-06, Mumbai, IIPS, Calverton, Maryland, USA, ICF Macro.
Youth In India: Situation and Needs 2006-07. Mumbai: I.I.P.S.
India Development Report 2004-05, New Delhi: Oxford University Press.
Consequences of Son Preference in a Low- Fertility Society: Imbalance of the Sex Ratio at Birth. Population and Development Review 21 (1), 59 - 84.
The Commonwealth Plan of Action for Youth Empowerment 2007-2015. Commonwealth Youth Programme. Commonwealth Youth Secretariat. http://www.thecommonwealth.org/shared_asp_files/GFSR.asp?NodeID=169313 Last accessed 26th May 2008
Report of the ‘The Working Group on Adolescents for the Tenth Five Year Plan [2002-2007]
‘Status of Adult Literacy in India: A Database for Literacy Programmes’, National Literacy Mission, Directorate of Adult Education, Dept. of School Education and Literacy.
Public Report on Basic Education in India. New Delhi: Oxford University Press.
‘There is Nothing Wrong with the HDI but…’, mimeo, University of Warwick, Coventry, England.

���
Rajendran, V, Balamurugan G, Paul P.D (2006)
Ramkrishna , J, Karott, M, Murthy, R.S, Chandran, V and Pelto, P.J., (2004)
Rao, V.V. B. (1991)
Raworth, K. (2001)
Raworth, K. and Stewart, D. (2003)
Robinson, C (2004)
Rosenmayr, L (1972)
Ryten, J. (2000)
Saaty, T.L. (1980)
Sabherwal, P (2010)
Sandip Sarkar, Sunil Mishra, Harishwar Dayal, Dev Nathan (2006)
Globalization and Youth – A Background Paper,Youth and Globalisation, ed. Rajendran,V and Paul, D ,RGNIYD: Sriperumbudur, 1-14.
‘Sexual behaviours of Street Boys and Male Sex Workers in Bangalore’, in R.K.Verma, P.J.Pelto, S.L.Schensul and A.Joshi (Eds.) Sexuality in the Time of AIDS, New Delhi: Sage.
‘Human Development Report 1990: Review and Assessment’, World Development, Vol. 19, No. 10, 1451-1460.
‘Measuring Human Rights’, Journal of Ethics and International Affair, 15(1), 111-131.
‘Critiques of the Human Development Index: A Review’, in S. Fukuda-Parr and A. K. Shiva Kumar, (eds) Readings in Human Development, Oxford University Press, New York.
Out-of-School Adolescents in South Asia: A Cross-National Study. UNESCO Literacy and Non-Formal Education Section, Cross-cutting project- empowering adolescent girls to become agents of social transformation. ‘Introduction: New Theoretical Approaches to the Sociological Study of Young People’, International Social Science Journal, , 24[2], pp.216-56.
‘Should there be a Human Development Index’, Paper presented at the International Association for Official Statistics Meeting, Montreux, September.
The Analytic Hierarchy Process: Planning, Priority Setting, Resource Allocation. McGraw-Hill, New York.
‘Developing science and technology in India’, Youth ki Awaaz’, April 4th http//www.youthkiawaaz.com/2010/04
Economic and Political Weekly, Nov 18, Pg. 4824-4827).
References

India Youth Development Report 20�0 ���
Saraswati, S (2009)
Saraswati, (2007)
Saraswati, S (1998)
Sen A.K. (2000)
Sen, A.K. (1989)
Sen, A.K. (1997)
Sen, A.K. (1999)
Shalabi L.A., Shaaban Z., Kasasbeh B (2006).
Sharma, M. (2008)
Sharma, N. (2008).
Srinivasan, T. N. (1994)
Stokes, B (2010)
Streeten, P. (1994)
Streeten, P., Burki, J. S., Haq, M. U., Hicks, N., and Stewart, F. (1981)
‘Indian Youth in the New Millennium ’ , Rajiv Gandhi National Institute for Youth Development : Sriperumbudur
Youth in India, RGNIYD, Sriperumbudur.
Youth in India, New Delhi: Indian Council of Social Science Research.
A Decade of Human Development’, Journal of Human Development, 1, 17-23.
‘Development as Capability Expansion’, Journal of Development Planning, 19, 41-58.
‘Human Capital and Human Capability’, World Development, 25, 1959-1961.
Development as Freedom, Oxford University Press, Oxford.
Data Mining: A Preprocessing Engine’, Journal of Computer Science 2 (9): 735-739.
‘Index of Financial Inclusion’ Working Paper No. 215, Indian Council for Research on International Economic Relations (ICRIER), New Delhi.
Makiguchi and Gandhi: Their Educational Relevance for the 21st Century. Maryland: University Press of America.
Human Development: A New Paradigm or Reinvention of the Wheel? American Economic Review, 1994, 84 (2), 238-43.
‘Sidewalk Squatters’, in National Journal, Washington, 27/3/2010.
‘Human development: means and ends’, The American Economic Review, Papers and Proceedings, 84, 232-37.
First Things First: Meeting Basic Human Needs in Developing Countries, Oxford University Press, New York.

���
Suhas Palshikar, Sanjay Kumar (2004)
Sulabha P., Sunita K., Shri. Kant Singh., Vaidehi Y. (2009)
Sundar Nandini (1999)
Taylor,C. (2006)
Thorat (2008)
Thorat, S & Newman, Katherine S.(ed.) (2009)
Trabold-Nubler H. (1991)
U. N.(2005)
UNDP (1990)
UNDP (2001)
UNDP (2004-05)
UNDP, (2004)
UNDP (2005)
‘Participatory Norm: How Broad-based is it?; Economic and Political Weekly, Dec. 18th: 5412-5417.
A Profile of Youth in India. NFHS-3, India, 2005-06. Mumbai: IIPS; Calverton, Maryland, USA: ICF Macro.
‘The Indian Census, Identity and Inequality’ in Ramchandra Guha and J.P.Parry [eds.] Institutions and Inequalities. Essays in honour of Andre Beteille, Oxford University Press, New Delhi. Cited in Xaxa 2005.
Multiculturalism: Examining the politics of recognition, quoted in Ajegbo, pg. 29.
‘Emerging Issues in Higher Education - Approach and Strategy of 11th Plan’, Higher Education in India- issues related to Expansion, Inclusiveness, Quality and Finance, New Delhi: University Grants Commission : 1-26 .
Blocked By Caste: Economic Discrimination In Modern India. New Delhi. Oxford University Press.
“The Human Development Index-A New Development Indicator?” Inter Economics September/October: 236-243.
Youth and the MDGs: Challenges and Opportunities for Implementation, The Adhoc working group for youth and the MDGs, April, 2005.
Human Development Report 1990. New York: Oxford University Press.
Human Development Report. New York: Oxford University Press.
Human Development Report
Human Development Report. Croatia 2004 - Youth.
Human Development Report 2005 – International Cooperation at a crossroads – Aids, trade and security in an unequal world, UNDP, New York.
References

India Youth Development Report 20�0 ��0
UNDP, (2006)
UNDP (2006)
UNDP (2007)
UNDP, (2008)
UNDP, University of Nicosia, KADEM. (2009)
University Grants Commission. (2008)
Upadhyay, S (2007)
Visalakshi N.K., and Thangavel K. (2009)
Vivek Kumar (2003)
Wankhede, G.G. (2002)
Wankhede, G.G. (2010)
Women’s Aid (2009)
Human Development Report 2006 – Beyond scarcity: Power, Poverty And The Global Water Crisis.
Asia-Pacific Human Development Report 2006, Trade on Human Terms – Transforming Trade for Human Development in Asia and the Pacific, Macmillan India Ltd, New Delhi. http://www.pcij.org/blog/wp-docs/HDR2006/Prelim.pdf Last accessed May 26th 2008.
Human Development Report, 2007/2008, Oxford University Press, New York.
Human Development Report - Turkey 2008 - Youth in Turkey.
Cyprus Human Development Report 2009 - Youth in Cyprus: Aspirations, Lifestyles & Empowerment.
Higher Education in India, Issues Related to Expansion, Inclusiveness, Quality and Finance. University Grants Commission, New Delhi.
‘Wastage in Higher Education, ‘EPW’, January 13th, : 161-168.
‘Impact of Normalization in Distributed K-Means Clustering’, International Journal of Soft Computing 4 (4): 168-172.
‘Dalit Movement and Dalit International Conferences’, Economic and Political Weekly, July 5th: 2799.
‘Dalits In India – A Critique Of The Issues And Challenges’, Think India, Vol. 5 [4]: 38-55.
‘Caste and Education in India’, in Penelope Peterson, Eva Baker, Barry McGraw [ed.], International Encyclopedia of Education Vol 1, pp. 589-594, Oxford: Elsevier
‘Domestic Violence: Frequently Asked Questions Factsheet 2009’ www.womensaid.org.uk

���
World Bank (September 16, 2006)
World Bank, (2007)
Xaxa, V (2005)
Yadav, Yogendra (2000)
Zeleny, M. A. (1974)
Zeng, Y., Tu P., Gu, B., Xu, Y, Li, B., Li, Y., 1993.
World Development Report: Development and the Next Generation. http://siteresources.worldbank.org INTWDR2007/Resources/1489782-1158107976655/overview.pdf Last accessed 26th May 2008.
World Development Report [2007]: Development and the Next Generation.http://siteresources.worldbank.org/INTWDR2007/Resources/1489782-1158107976655/overview.pdf
‘Politics of Language, Religion and Identity: Tribes in India’, EPW, March 26th, Pg. 1363-1370
‘Understanding the Second Democratic Upsurge: Trends of Bahujan Participation in Electoral politics in the 1990s’ in Frankel Francine R, Zoya Hasan, Rajeev Bhargava and Balveer Arora [eds], Transforming India, OUP, New Delhi: 120-145.
Concept of Compromise Solutions and Method of Displaced Ideal, Computational Operation Research, 1: 479-496.
Causes and Implications of the Recent Increase in the Reported Sex Ratio at Birth in China. Population and Development Review 19 (2), 283–302.
http://hdr.undp.org/en/statistics/indices/hdi/
http://youthportal.gov.in/
References