Environmental Monitoring of Fish Farming
24
Environment Agency· Traðagøta 38 · Postboks 2048 · FO-165 Argir · Tel: +298 34 24 00 · [email protected] · www.us.fo Guidance document 19/2018 Environmental Monitoring of Fish Farming The purpose of this guidance document is to describe and structure seabed studies at sites and fjords where fish farming takes place. UNOFFICIAL TRANSLATION June 2020
-
Upload
khangminh22 -
Category
Documents
-
view
2 -
download
0
Transcript of Environmental Monitoring of Fish Farming
Environment Agency· Traðagøta 38 · Postboks 2048 · FO-165 Argir · Tel: +298 34 24 00 · [email protected] · www.us.fo
Guidance document 19/2018
Environmental Monitoring of Fish Farming The purpose of this guidance document is to describe and structure
seabed studies at sites and fjords where fish farming takes place.
UNOFFICIAL TRANSLATION June 2020

page 2 of 24

page 3 of 24
Contents 1. Introduction .................................................................................................................................................................. 4
2. Description of farming sites, fjords, etc. ............................................................................................................ 5
2.1 Information about the natural environmental characteristics .............................................................. 5
2.2 Site descriptions ........................................................................................................................................................ 5
3. Seabed surveys ............................................................................................................................................................. 6
3.1 Number, type and location of samples ............................................................................................................ 6
3.2 Timing and frequency ............................................................................................................................................. 8
3.3 Cages moved during a production cycle ......................................................................................................... 8
3.4 Lack of seabed material ......................................................................................................................................... 8
4. Sampling and testing ................................................................................................................................................. 9
4.1 Simple assessment ................................................................................................................................................... 9
4.2 Chemical analyses .................................................................................................................................................... 9
4.3 Type of testing ........................................................................................................................................................... 9
4.4 Fauna assessments ............................................................................................................................................... 10
5. Assessment plan ....................................................................................................................................................... 10
6. New and moved farming sites ............................................................................................................................ 10
7. Management of environmental monitoring .................................................................................................. 11
7.1 Lacking seabed surveys ...................................................................................................................................... 11
7.2 Guideline limit value ............................................................................................................................................ 11
8. Submission of results and reporting ................................................................................................................ 12
Overview of international standards applicable to specific assessments ................................................. 14
Glossary ................................................................................................................................................................................. 14
Environmental assessment based on Form B ....................................................................................................... 19
Sampling procedure ......................................................................................................................................................... 22
Decision tree ....................................................................................................................................................................... 24
First edition: 12-03-2018

page 4 of 24
1. Introduction This guidance is an updated version of the document: Environmental Monitoring of Fish Farm Sites, published in June 2003.
The purpose of these guidelines, as of the previous version, is to describe and structure seabed studies in areas and fjords where fish is farmed. Seabed surveys are a key element of how the Environment Agency monitors the environmental impact of fish farming. The environmental monitoring programme has to be adapted continuously to take into account lessons learned from the current programme, as well as the most recent developments in aquaculture.
Fish farming is a highly polluting activity, which, pursuant to the Faroese Parliamentary Act on Environmental Protection, is subject to environmental licensing. The Environment Agency sets out conditions for specific farming activities in the environmental licenses it issues. A key requirement is that fish farm operators closely monitor levels of pollution at and around farming sites.
This document sets out guidelines for the location and frequency of sampling, what samples should be tested for, guideline limit values for pollution and the potential consequences of exceeding pollution thresholds. It also contains guidelines detailing how to describe the natural environmental conditions of fjords, such as seabed and current characteristics.
In order to monitor how aquaculture affects the environment and ecosystems in fjords and straits, fish farm operators must carry out tests both inside and outside farming sites.
The most significant change in this new guidance document is the timing of surveys. Previously, surveys were carried out in late summer every year. Tests will now always have to be carried out when fish stocks peak and pollution therefore peaks.
In addition, the frequency of surveys is now determined by the environmental condition during the previous production cycle. This means that if an impact is detected in or outside the farming site, more frequent surveys are required.
If tests during previous production cycles determined that a site was affected, then testing is also required prior to releasing fish. If the site remains affected when fish is due for release, then tests are also required halfway through the production cycle.
Farming sites differ, as do aquaculture methods. This guide should therefore not be interpreted as a document describing every last detail of sampling, testing, etc. for all farming sites. The provisions in this guide on sampling, frequency, testing, etc. are guidelines applicable to ‘ordinary’ circumstances.
Fish farm operators are required to submit draft assessment plans for the approval of the Environmental Agency prior to every round of sampling, testing and surveys. In the case of ‘extraordinary’ circumstances, for example if cages are moved frequently during a production cycle or the seabed has special characteristics, then fish farm operators are required to explain why they are choosing each sampling station etc. in relation to the local characteristics and how their aquaculture is managed.

page 5 of 24
2. Description of farming sites, fjords, etc.
2.1 Information about the natural environmental characteristics
The most significant effluents from aquaculture are faeces and residual feed. Feed is relatively heavy and sediments quickly, while faeces are lighter and move further before sedimenting. This means that the impact of effluents differs according to the seabed’s characteristics and local currents. In some places feed and faeces sediment directly below cages, while in others they deposit in depressions away from the cages. In other cases they are carried away by the current and not seen again. In depth knowledge about farm sites, fjords and straits is therefore a fundamental precondition for structuring environmental monitoring of aquaculture. This includes knowledge about seabed topography, bathymetry and material, as well as local currents. This knowledge must underpin all assessment plans for farming sites and fjords.
2.2 Site descriptions
Fish farm operators are required to draw up separate site descriptions for each farming site and farming fjord. Site descriptions must include at least the following:
• outline map/drawing of the farming fjord and sites clearly indicating the location and size of the farming site.
• 2D and 3D map/drawing of farming sites showing seabed topography and type of seabed.
• 2D and 3D map/drawing of farming fjords indicating seabed topography and type of seabed. For example whether there is a shallow at the mouth of the fjord, depth of the shallow and inside the shallow and any depressions inside the shallow.
• Minimum, average and maximum current velocity and main direction of current for the farming site and farming fjord from sea level to seabed. Describe whether the drift is driven by tide, wind or other factors. Any seasonal changes must also be described.
If a farming site is changed or expanded, maps and drawings must be updated accordingly. Farming fjords and farming sites can be found at www.kortal.fo under the heading Fish farming. For an example of a map indicating seabed topography, please see Annex 1.

page 6 of 24
3. Seabed surveys
Seabed surveys are the basis for environmental monitoring of fish farming.
3.1 Number, type and location of samples
The sample types required are: cage samples (RS), site samples (ØS), fjord samples (FS) and reference samples (SS) [abbreviations in Faroese].
Site samples, fjord samples and reference samples should be drawn from the same location every time, while cage samples may vary annually depending on the location of cages. All sample types mentioned are samples of collected material (soft seabed).
Cage sample (RS) must be at the individual cages/units. If the seabed slopes and it is impossible to collect material, samples should be taken from the deepest location by the cage in the direction of the current. Site samples (ØS) must be collected from the part of the farming site where no farming is taking place in order to monitor the overall level of pollution in the farming site. The number of site samples is determined by the size of the farming site. At least four site samples are required. For each 0.2 km2 the farming area exceeds ½ km2 one additional site sample is required. (For example: if the farming area is 0.5 km2, then 4 site samples are required, if it is 0.8 km2, 5 site samples are required).
Figure 1, number of site samples per farming site size
0
1
2
3
4
5
6
7
8
9
10
11
12
13
14
15
0,1 0,2 0,3 0,4 0,5 0,6 0,7 0,8 0,9 1,0 1,1 1,2 1,3 1,4 1,5 1,6 1,7 1,8 1,9 2,0 2,1 2,2 2,3 2,4 2,5 2,6
Nu
mb
er o
f si
te s
amp
les
Size of farming site in km2

page 7 of 24
Site samples must, to the greatest extent possible, be representative of the part of the farming site with soft seabed that represents the type of seabed, depth and drift. Site samples must not be taken closer than 50 metres from farming cages/units. At least one site sample must be collected from the deepest part of the farming area. Site samples must, to the greatest possible extent, be the same year on year. If farming cages/units are moved it may, in certain circumstances, become necessary to adjust the location of site samples. Any such adjustment requires approval from the Environment Agency. Fjord samples (FS) must be taken outside the farming site. Fjord samples should indicate how aquaculture is impacting the environment beyond the farming site. The placement of samples should take into account prevailing currents and seabed topography. At least four fjord samples are required for each farming site, and they must represent areas of the fjords that are susceptible to the impact of aquaculture. Farm operators are required to state in the assessment plans why they have chosen the specific location and number of samples.
• One fjord sample (FS1) is required from a location representative of most of the farming fjord.
• One fjord sample (FS2) is required from a location in the direction of the current 20 to 30 metres outside the farming site where the environmental impact is likely to be the highest.
• One fjord sample (FS3) is required from the deepest location outside the farming site in the direction of the current, i.e. in a depression where material is likely to deposit.
• Other fjord samples (FS4, FS5 etc.) should be taken from depressions or other deep locations in the fjord.
Reference samples (SS) are required from a fixed location outside the farming site. One reference sample is required for each farming site. Reference samples should be as representative of the natural unpolluted farming fjord seabed as possible. Reference samples sites should not be moved unnecessarily. It may become necessary to move a reference samples site, for example if it does not represent the most common type of seabed in the farming fjord or if material from farming ends up in the location. In such cases, any changes should be addressed in the assessment plan.

page 8 of 24
3.2 Timing and frequency
Seabed surveys should always be carried out when the volume of fish is the greatest1, i.e. when feed consumption and thereby pollution peaks, or within one month after the peak in fish volume. The average environmental condition indicated by RS, according to sampling at peak biomass, will determine when the next seabed survey is required. The greater the impact of farming on a farming site, the more frequently seabed surveys are required. The frequency of seabed surveys is indicated in Table 1.
Environmental condition c.f. most recent survey at peak biomass
Next survey is due:
1 – Unpolluted At peak biomass
2 – Some pollution Before fish is released at the site and at peak biomass.
3 – Polluted a. Before fish is released and b. If the survey prior to release indicated:
- Condition 1: at peak biomass - Condition 2 or 3: when biomass is 50% of peak biomass and at
peak biomass - Condition 4: The Environment Agency will determine sampling
requirements
4 – Highly polluted The Environment Agency will determine sampling requirements.
Table 1, frequency of seabed surveys
A decision tree indicating which tests should be carried out is included in Annex 7. How to determine the level of pollution is outlined in Annex 5. If no aquaculture has taken place at a farming site for 3 years a seabed survey is required before any fish may be released. An assessment plan is required and must be submitted to the Environment Agency for approval.
3.3 Cages moved during a production cycle
If farming cages containing fish are moved within the farming site during a production cycle, this must be taken into account in the farming plan and surveys.
3.4 Lack of seabed material
Two attempts to retrieve material from the seabed are always required. If no material is retrieved in more than 80% of samples it is likely that the material is sedimenting in another location. Based on seabed topography and prevailing currents, samples must be taken where material is likely to deposit. Under such circumstances a new assessment plan is
1 It is estimated that farming sites suffer the greateest impact at peak biomass or when 75% to 90% of the feed used during a production cycle has been given to the fish, NS 9419:2016 point 7.9 Undersøkelsesfrekvens (Survey frequency).
page 9 of 24
required. It must include an explanation of why the plan has been amended and it has to be submitted to the Environment Agency for approval.
4. Sampling and testing Sampling procedures are set out in Annex 6. Testing carried out on samples collected includes three types of tests, i.e. simple assessments, chemical analyses and fauna assessment.
4.1 Simple assessment
An assessment of the seabed condition carried out immediately after sampling. It encompasses four assessment categories:
I. simple fauna assessment: are animals larger than 1 mm present in sample? II. pH and redox test of the top cm of the sample,
III. sensory assessment: evaluation of bubbles, colour, odour, texture and sludge thickness.
IV. photos of all samples
Seabed survey reports should be submitted accompanied by duly filled sample forms, see annexes 2, 3 and 4.
4.2 Chemical analyses
The chemical analyses required include testing for copper and zinc contents in sediment, as well as for organic material measured as loss on ignition. Chemical analyses are required for all ØS, FS and SS samples, as well as three of the RS samples found to be most polluted in the simple assessment.
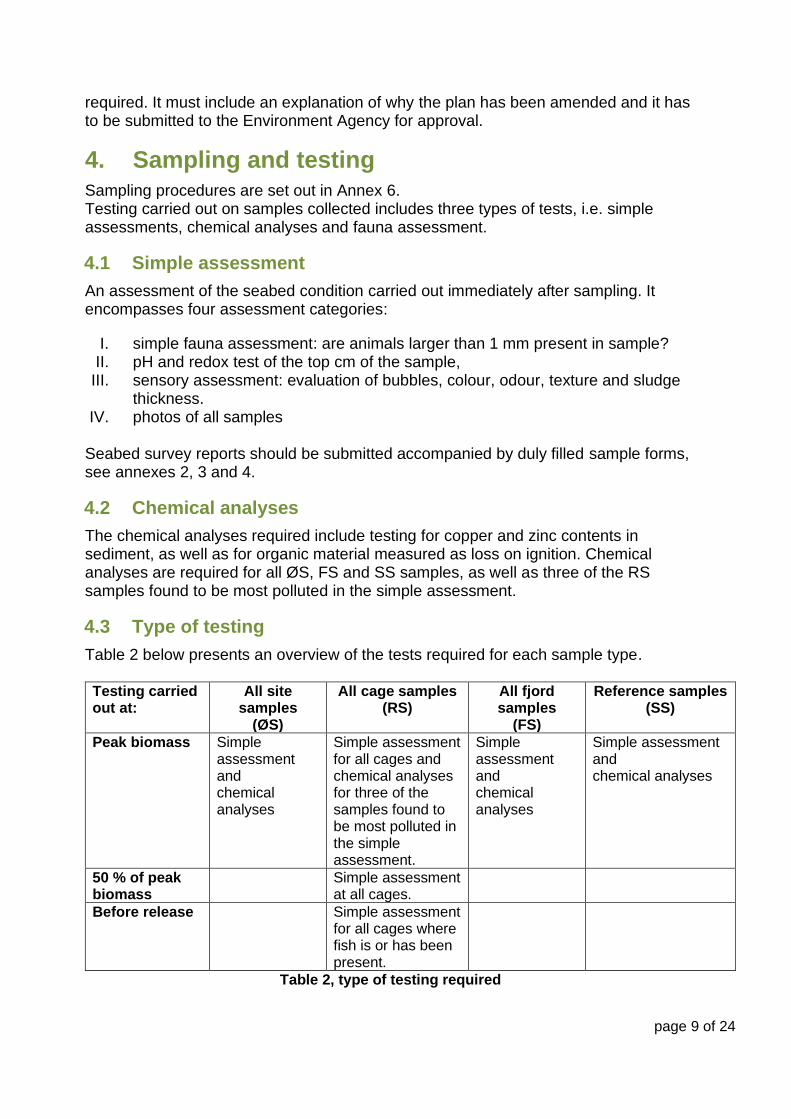
4.3 Type of testing
Table 2 below presents an overview of the tests required for each sample type. Testing carried out at:
All site samples
(ØS)
All cage samples (RS)
All fjord samples
(FS)
Reference samples (SS)
Peak biomass Simple assessment and chemical analyses
Simple assessment for all cages and chemical analyses for three of the samples found to be most polluted in the simple assessment.
Simple assessment and chemical analyses
Simple assessment and chemical analyses
50 % of peak biomass
Simple assessment at all cages.
Before release
Simple assessment for all cages where fish is or has been present.
Table 2, type of testing required

page 10 of 24
4.4 Fauna assessments
Fauna assessments are required every third year at peak biomass in line with NS
16665-20132. Analyses must be carried out by a laboratory with a documented quality
assurance programme.
5. Assessment plan Fish farm operators are required to submit assessment plans to the Environment Agency for approval no later than 4 weeks before sampling is due. The assessment plan must indicate where samples will be taken based on the area description as defined in point 2.2. The location of samples must be shown both on a map and in a table listing position (dd 0 mm, mmm) and depth for each sample. The map must show the farming site, cages with moorings and positions for all samples (RS, ØS, FS and SS). Farm operators are required to explain why each sampling station was chosen. Precise positions should be entered into a table for each sample and submitted in a format loadable to the GIS system. They must be submitted as geographic positions in WGS84 longitude and latitude or in UTM29/WGS84 eastings and northings.3
6. New and moved farming sites
Baseline surveys are required before using a new farming site or moving a farming site. Baseline surveys must provide detailed information about the condition of the farming site and fjord area. Area descriptions are required as defined in Section 2, as well as proposals for sampling stations. Baseline surveys must include 10 site samples for each 0.5 km2 of the size of the farming site. Based on prevailing current, seabed topography, bathymetry and seabed material reference samples and four fjord samples are required. Fauna assessments are always required as part of baseline surveys. The assessment plan for the baseline survey, along with a report setting out the reason for the choice of sampling stations, must be submitted to the Environment Agency for approval no later than 4 weeks before sampling is due.
2 NS-EN ISO 16665:2013: Water quality – Guidelines for quantitative sampling and sample processing of marine soft-bottom macrofauna. 3 NS-EN ISO 16665-2013, part 4.2.2 Defining the position of sampling stations.

page 11 of 24
7. Management of environmental monitoring The purpose of environmental monitoring is to prevent pollution from reaching unacceptable levels. A measure of pollution is allowed under cages, while less pollution is allowed in areas without farming cages. Outside fish farming sites there should be no traces of pollution from aquaculture.
Regardless of the fact that some pollution is permitted under cages and at farm sites, rising levels of pollution will not be accepted. It is therefore a requirement that farming sites should recover between each production cycle.
Significant levels of pollution detected at farming sites or signs of pollution outside farming sites are indications that pollution levels are higher than the farming site tolerates.
Fish farm operators are required to manage aquaculture in a manner that prevents pollution from reaching unacceptable levels. If significant levels of pollution are detected, fish farm operators must adapt their practices to ensure that pollution returns to acceptable levels.
The Environment Agency has put in place guideline warning and limit values for pollution within and outside farm sites. Guideline thresholds have been fixed for copper, zinc and organic material, as well as for overall level of pollution. These thresholds are in place to protect benthic fauna and have been fixed based on equivalent limits in neighbouring countries. In its review of survey results, the Environment Agency takes into account current results for the different parameters, as well as how they compare to previous surveys. If the level of pollution is above the guide warning values and steadily rising, the Environment Agency may order aquaculture practices to be adapted and the Environment Agency may order the implementation of necessary measures.
7.1 Lacking seabed surveys
If no seabed surveys have been carried out as described in sections 3 and 4, then there is no information available on the environmental condition of the farming site. This means that it is not possible to determine how aquaculture should be managed. The Environment Agency cannot approve any aquaculture programme while the environmental condition remains unknown. This means that no fish can be released until the aquaculture programme has been approved by the Environment Agency.
7.2 Guide limit value
Table 3 shows an overview of average Faroese background values and guideline warning and limit values for copper, zinc and loss-on-ignition for farming sites in the Faroe Islands.

page 12 of 24
Average Faroese background values
Warning values Limit values
Copper 58 ±14 mg/kg t.e. 170 mg/kg t.e. 270 mg/kg t.e.
Zinc 53 ±11 mg/kg t.e. 270 mg/kg t.e. 410 mg/kg t.e.
Loss-on-ignition 57 ±20 mg/kg t.e. 170 mg/kg t.e. 270 mg/kg t.e.
Overall assessment of seabed parameters
>Condition 2
Table 3
8. Submission of results and reporting Farm operators are required to submit a report to the Environment Agency after each seabed survey. The report should contain all the information and data required to enable others to replicate exactly the same tests. The survey findings must be analysed and discussed in a manner that clearly sets out what the survey shows and how pollution compares to previous surveys and biomass of farmed fish. A separate overall conclusion is required for each farm site. In addition, if any sections of the site are in particularly poor condition this should be commented on in the report. Reports must, as a minimum, consist of:
• Concise overview with information about the farm operator, farming site, biomass, etc.
• Concise site description as well as a report on how the release was managed, where farming units were located throughout the release, along with information about whether the nets were impregnated, feed usage, biomass at the time of survey and other details relevant to the environment.
• A summary of the results with clearly worded conclusions.
• 2d maps of the fjord area and farming site. The maps must show the location of cages and sampling stations and any other information.
• Current roses presenting the drift in the farming area.
• 3d map of the farming site including bathymetry, location of cages as well as the assessed condition at each sampling station. Pollution levels should be indicated using colour coding (condition 1 = blue, condition 2 = green, condition 3 = yellow, condition 4 = red).
• The forms in annexes 2,3 and 4 must all be duly filled in.
• All raw date, including test results, must be included as annexes.
• Photos of all samples are required.
• A table with historical figures for biomass, feed usage, number of fish, impregnation of nets, as well as the average environmental condition at the farming site and other relevant environmental monitoring data.
• Line graph or bar chart indicating the relation between biomass, feed usage and average environmental condition at the farming site for at least three releases. If cages/units have been moved this should also be indicated in the line graph.
• Line graph of the average redox potential in ØS, FS and SS from the last five surveys.
• Line graph of the average figures for copper, zinc and Loi in ØS, FS and SS over time.

page 13 of 24
All data must be entered into the Environment Agency’s excel spreadsheet4 and submitted with the report. The spreadsheet is available at the Environment Agency’s website www.us.fo/botnkanning Reports must be submitted to the Environment Agency in PDF format within six weeks of surveys taking place.
4 Forms may be amended or updated. New forms should always be downloaded for each data entry.

page 14 of 24
Overview of international standards applicable to specific assessments
Unless otherwise stipulated in these guidelines, the quality requirements stipulated in the standards listed below shall apply. If a standard is no longer in force, the most recent version is always applicable. Farming site maps IHO 1a (international hydrographic organization) Fjord area maps IHO 1b (international hydrographic organization) Sampling ISO 12878:2012 Environmental monitoring of the impact from
marine finfish farms on soft bottom Simple assessment NS 9410:2016 Environmental monitoring of seabed impact from
marine aquaculture installations Chemical analyses NS 9410:2016 Environmental monitoring of seabed impact from
marine aquaculture installations Annex C Fauna assessment ISO 16665:2013 Water quality - Guidelines for quantitative
sampling and sample processing of marine soft - bottom macrofauna
All chemical analyses must be carried out by laboratories with an approved quality control system using accredited methods of analysis.
Glossary
In this guidance document the following terms mean: Farming unit: fish-farming pen, fish-farming cage and similar installations used for aquaculture.
Farming site: a delimited area where a marine fish farm, in line with its fish farming licence, is authorised to install a farming array to farm fish for human consumption.
Farming array: several units, pens or cages placed together in a section of the farming site.
Biomass: total weight of live fish.
A release or production cycle: a period ranging from when fish is released into a farming site until all the fish has been captured.

page 15 of 24
Annex 1
Sample seabed topography map
page 16 of 24
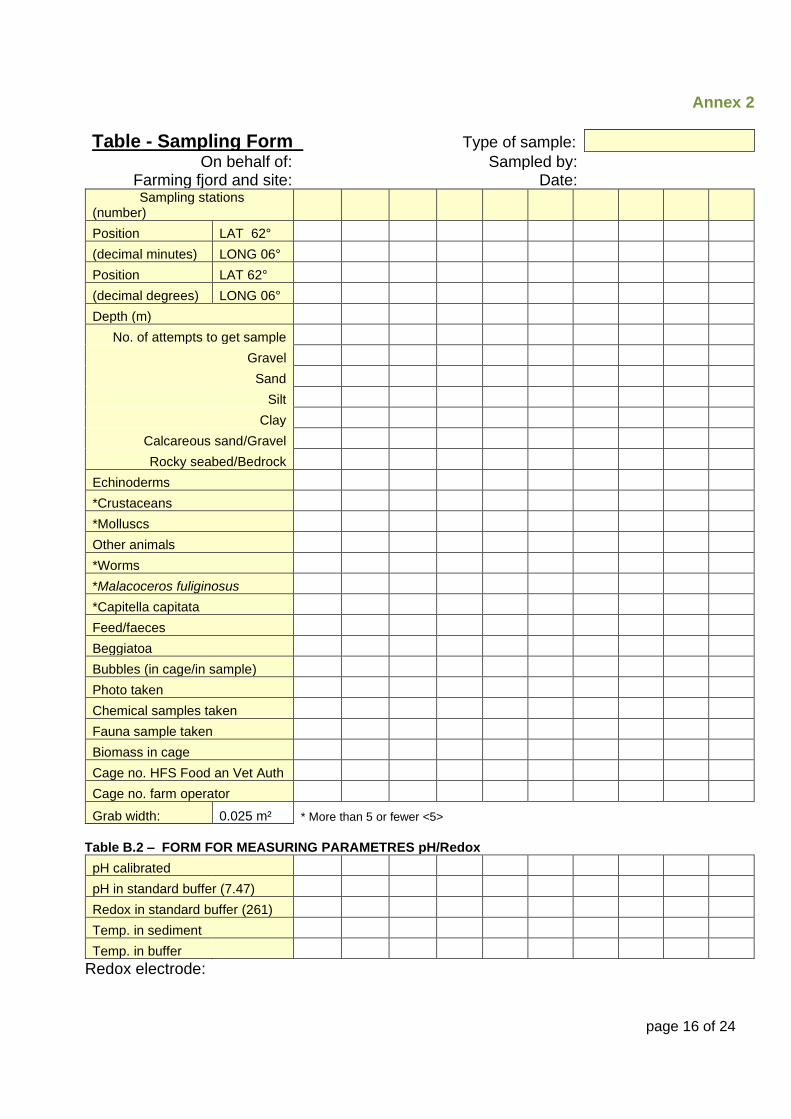
Annex 2
Table - Sampling Form Type of sample:
On behalf of: Sampled by: Farming fjord and site: Date:
Sampling stations (number)
Position LAT 62°
(decimal minutes) LONG 06°
Position LAT 62°
(decimal degrees) LONG 06°
Depth (m)
No. of attempts to get sample
Gravel
Sand
Silt
Clay
Calcareous sand/Gravel
Rocky seabed/Bedrock
Echinoderms
*Crustaceans
*Molluscs
Other animals
*Worms
*Malacoceros fuliginosus
*Capitella capitata
Feed/faeces
Beggiatoa
Bubbles (in cage/in sample)
Photo taken
Chemical samples taken
Fauna sample taken
Biomass in cage
Cage no. HFS Food an Vet Auth
Cage no. farm operator
Grab width: 0.025 m² * More than 5 or fewer <5> Table B.2 – FORM FOR MEASURING PARAMETRES pH/Redox
pH calibrated
pH in standard buffer (7.47)
Redox in standard buffer (261)
Temp. in sediment
Temp. in buffer
Redox electrode:
page 17 of 24
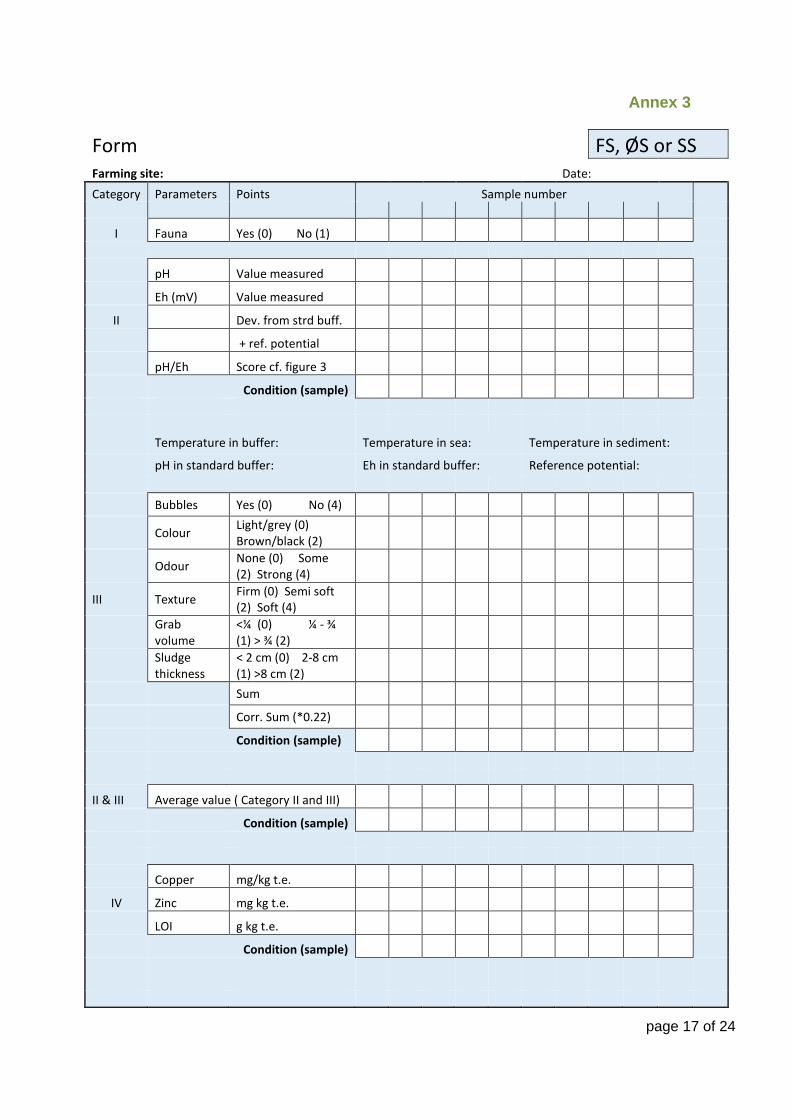
Annex 3
Form FS, ØS or SS Farming site: Date:
Category Parameters Points Sample number
I Fauna Yes (0) No (1)
pH Value measured
Eh (mV) Value measured
II Dev. from strd buff.
+ ref. potential
pH/Eh Score cf. figure 3
Condition (sample)
Temperature in buffer: Temperature in sea: Temperature in sediment:
pH in standard buffer: Eh in standard buffer: Reference potential:
Bubbles Yes (0) No (4)
Colour Light/grey (0) Brown/black (2)
Odour None (0) Some (2) Strong (4)
III Texture Firm (0) Semi soft (2) Soft (4)
Grab volume
<¼ (0) ¼ - ¾ (1) > ¾ (2)
Sludge thickness
< 2 cm (0) 2-8 cm (1) >8 cm (2)
Sum
Corr. Sum (*0.22)
Condition (sample)
II & III Average value ( Category II and III)
Condition (sample)
Copper mg/kg t.e.
IV Zinc mg kg t.e.
LOI g kg t.e.
Condition (sample)
page 18 of 24
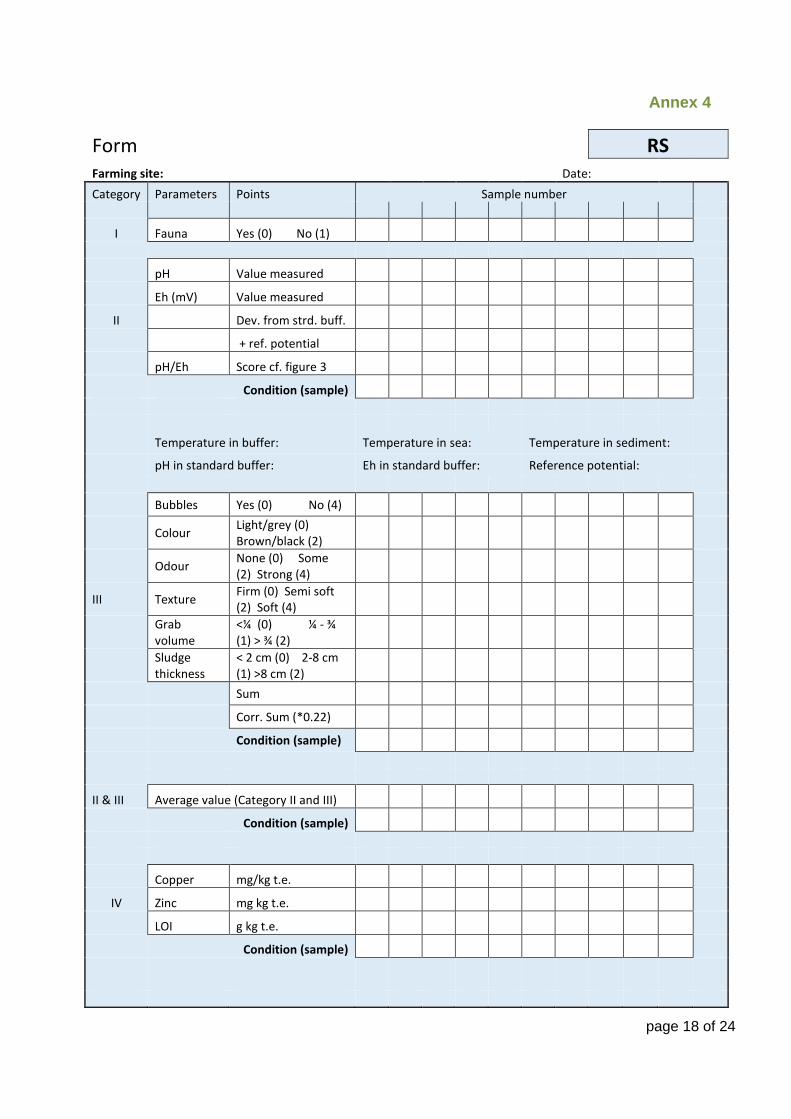
Annex 4
Form RS Farming site: Date:
Category Parameters Points Sample number
I Fauna Yes (0) No (1)
pH Value measured
Eh (mV) Value measured
II Dev. from strd. buff.
+ ref. potential
pH/Eh Score cf. figure 3
Condition (sample)
Temperature in buffer: Temperature in sea: Temperature in sediment:
pH in standard buffer: Eh in standard buffer: Reference potential:
Bubbles Yes (0) No (4)
Colour Light/grey (0) Brown/black (2)
Odour None (0) Some (2) Strong (4)
III Texture Firm (0) Semi soft (2) Soft (4)
Grab volume
<¼ (0) ¼ - ¾ (1) > ¾ (2)
Sludge thickness
< 2 cm (0) 2-8 cm (1) >8 cm (2)
Sum
Corr. Sum (*0.22)
Condition (sample)
II & III Average value (Category II and III)
Condition (sample)
Copper mg/kg t.e.
IV Zinc mg kg t.e.
LOI g kg t.e.
Condition (sample)

page 19 of 24
Annex 5
Environmental assessment based on Form B A score system has been devised to assess the condition of the environment based on surveys. Points are allocated to each sample and the level of pollution of the overall farming site is also determined. The level of pollution is determined and grouped in four categories.
• Condition 1 = unpolluted
• Condition 2 = some pollution
• Condition 3 = polluted
• Condition 4 = highly polluted
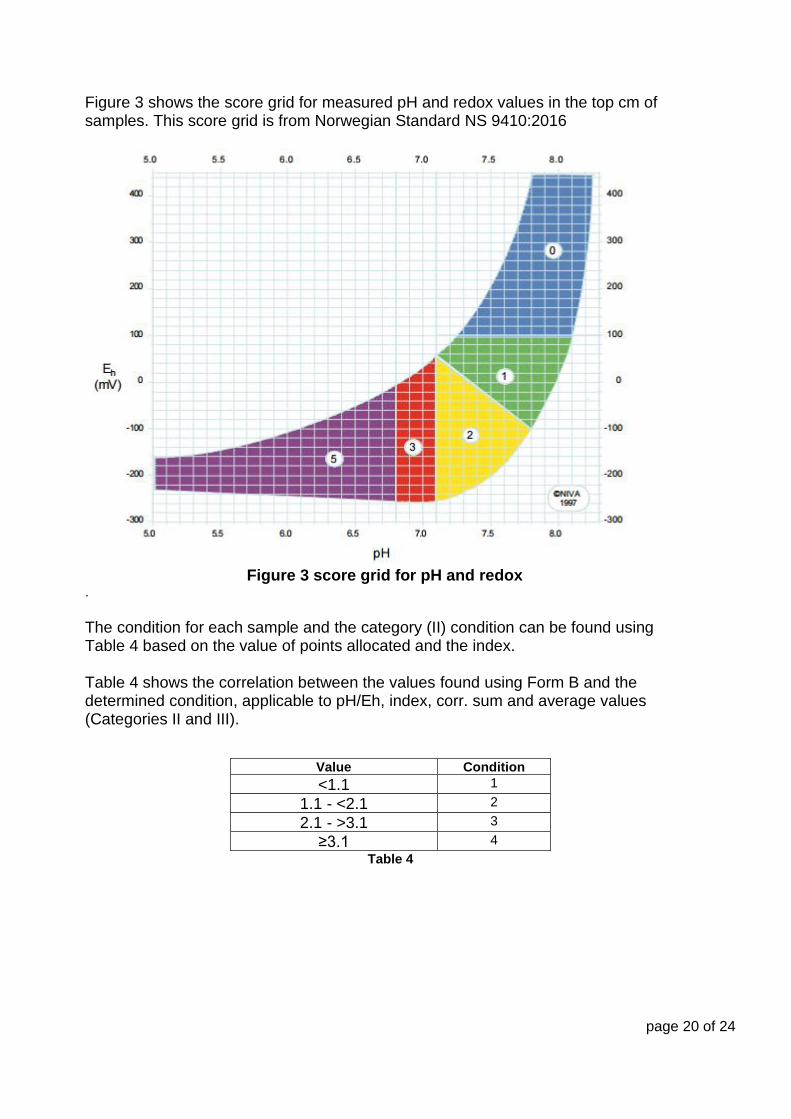
An assessment of the condition is carried out for each individual sample. The overall condition is assessed for each farming array based on the average condition of cage samples from that farming array. Grouping of samples: Environmental monitoring requires different samples from areas where the expected impact differs greatly. Furthermore, farming arrays are regularly moved within farming sites. It is therefore vital to keep samples separated; this also applies to RS representing different sites or conditions. It is crucial that surveys from several farming arrays are not grouped in the same form. In addition, surveys from areas where fish is present and surveys where there is no fish present should not be grouped together. Category I Fauna: In this category operators should note whether benthos larger than 1 mm are present in the sample or not. This category is not used directly to assess the condition of the environment. If the sample contains benthos, then the sample is allocated a condition assessment of 0. If there are no benthos the sample is allocated a condition assessment of 1. Category II pH and redox potential (Eh): The pair of figures for measured pH and Eh (corrected for deviations from standard buffer and reference potential) should be plotted against Figure 3. Find the score allocated and enter this in the pH/Eh field. The average for the farming array should be placed under index.
page 20 of 24
Figure 3 shows the score grid for measured pH and redox values in the top cm of samples. This score grid is from Norwegian Standard NS 9410:2016
Figure 3 score grid for pH and redox
.
The condition for each sample and the category (II) condition can be found using Table 4 based on the value of points allocated and the index. Table 4 shows the correlation between the values found using Form B and the determined condition, applicable to pH/Eh, index, corr. sum and average values (Categories II and III).
Value Condition
<1.1 1
1.1 - <2.1 2
2.1 - >3.1 3
≥3.1 4
Table 4
page 21 of 24
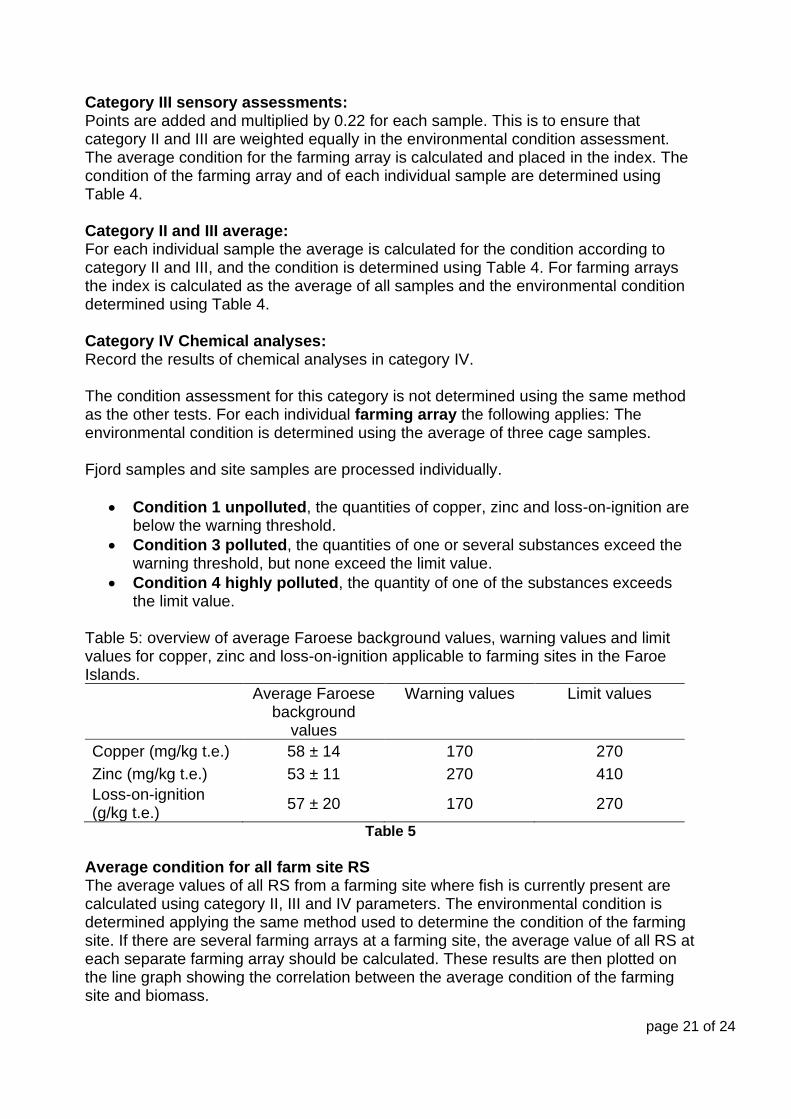
Category III sensory assessments: Points are added and multiplied by 0.22 for each sample. This is to ensure that category II and III are weighted equally in the environmental condition assessment. The average condition for the farming array is calculated and placed in the index. The condition of the farming array and of each individual sample are determined using Table 4. Category II and III average: For each individual sample the average is calculated for the condition according to category II and III, and the condition is determined using Table 4. For farming arrays the index is calculated as the average of all samples and the environmental condition determined using Table 4. Category IV Chemical analyses: Record the results of chemical analyses in category IV. The condition assessment for this category is not determined using the same method as the other tests. For each individual farming array the following applies: The environmental condition is determined using the average of three cage samples. Fjord samples and site samples are processed individually.
• Condition 1 unpolluted, the quantities of copper, zinc and loss-on-ignition are below the warning threshold.
• Condition 3 polluted, the quantities of one or several substances exceed the warning threshold, but none exceed the limit value.
• Condition 4 highly polluted, the quantity of one of the substances exceeds the limit value.
Table 5: overview of average Faroese background values, warning values and limit values for copper, zinc and loss-on-ignition applicable to farming sites in the Faroe Islands.
Average Faroese background
values
Warning values Limit values
Copper (mg/kg t.e.) 58 ± 14 170 270
Zinc (mg/kg t.e.) 53 ± 11 270 410
Loss-on-ignition (g/kg t.e.)
57 ± 20 170 270
Table 5
Average condition for all farm site RS The average values of all RS from a farming site where fish is currently present are calculated using category II, III and IV parameters. The environmental condition is determined applying the same method used to determine the condition of the farming site. If there are several farming arrays at a farming site, the average value of all RS at each separate farming array should be calculated. These results are then plotted on the line graph showing the correlation between the average condition of the farming site and biomass.

page 22 of 24
Annex 6
Sampling procedure Sample collector Samples must be collected by a company that carries out seabed surveys and is approved by the Environment Agency. Companies carrying out surveys are required to ensure that the persons collecting the samples are duly qualified and trained to collect and analyse samples, so that all samples are assessed using the same method, regardless of who collected the samples. Equipment
• Grabber with the capacity to take seabed surveys with a surface width of at
least 250cm2. The grabber must be equipped with flaps for pH and redox
measurements.
• Equipment for pH measurements: field-pH metre, pH-electrode, buffer with pH
4.0 and 7.0 and distilled water.
• Equipment for measuring redox potential: field-pH metre, redox electrode,
reference electrode and buffer.
• Strainer with holes of 1 mm in diameter.
• White plastic tub of a suitable size for emptying the grabber.
• Equipment for lifting surface water from the grabber.
• Electrode holder for holding electrodes in the top cm of the sediment?
• Equipment for noting down the position where samples are collected,
corresponding to DGPS accuracy (3-5m).
• Photo camera
• Ruler
• Sterilising liquid
• Magnifying glass
• Containers for chemical analyses
• Spoon (large)
Analysing samples Before sampling calibrate the electrodes using buffers that are the same temperature as the sea, then place the electrodes in a container with seawater. Once the electrodes are giving stable values, they are ready to use for measuring. For a more detailed description of pH and Redox measurements, please see Annex C in NS 9410:2016. Read the exact position of samples and seabed depth once the grabber is at seabed level, enter the measurements in Form A. When the grabber reaches deck, place the closed grabber in a tub. Open the flaps on the grabber bucket and lift off surface water. Both pH and redox potential must be measured in sediment that is as untouched as possible. Introduce the electrodes into the sediment so that they are placed 1 cm below the surface of the sediment. Hold the electrodes as still as possible (e.g. using electrode holders),and record the pH and

page 23 of 24
redox readings once values have stabilised. Record the measured values in Category II in Form B. When calculating the redox potential in sediment, add any buffer deviation plus the half-cell potential of the reference electrode. Rinse the electrodes and place them in seawater at the same temperature as the samples. Regularly check if the electrodes are giving accurate readings. Take samples for chemical analyses from the top two cm of sediment. A ¼ pot sample (size?) is sufficient if the material is fine sand or clay, but if there are many larger particles present, such as gravel, shells or pebbles, then the sample must be larger in order to ensure that there is sufficient sediment of grain size < 500 µm. Send the samples for analysis at an approved laboratory. Carefully open the grabber and empty the content into the tub so that the sediment stratification remains as undisturbed as possible. Take a photo of the sediment. Assess the sediment according to the parameters for Category III in form B. Subsequently, take note of any fauna in the Category I sample in Form B. If it is difficult to see fauna in the sample, the sediment may be filtered using a strainer with holes measuring 1 mm in diameter. Also fill in Form A. Record in Form A what type of seabed has been sampled as well as more detailed information about the composition of fauna. Sediment samples may be harmful to farmed fish. Dispose of samples in a manner that ensure that the sediment does not reach farming cages with fish.

page 24 of 24
Annex 7
Decision tree
Which survey to carry out: