Precision Farming Business
88
Precision Farming Industry Structure Rodrigo Suzacq, Research Assistant Department of Agricultural and Consumer Economics University of Illinois at Urbana-Champaign Mumford Hall 1301 W Gregory Drive Urbana, IL 61801 Mobile: (598) 99 704 604 Email: [email protected] Peter D. Goldsmith, Associate Professor and Interim Director, Food & Agribusiness Management Program Department of Agricultural and Consumer Economics University of Illinois at Urbana-Champaign 318 Mumford Hall 1301 W Gregory Drive Urbana, IL 61801 Office: (217) 333-5131 Email: [email protected] Associate Director Leonardo J. Cristalli, CEO at OKARA LTDA. J. P. Sotura 1268, Dolores, CP75100, Soriano, Uruguay Web: www.okara.com.uy Mobile: (598) 93 381 318 Email: [email protected] 1
-
Upload
independent -
Category
Documents
-
view
1 -
download
0
Transcript of Precision Farming Business
Precision Farming Industry Structure
Rodrigo Suzacq, Research AssistantDepartment of Agricultural and Consumer Economics
University of Illinois at Urbana-ChampaignMumford Hall 1301 W Gregory Drive
Urbana, IL 61801Mobile: (598) 99 704 604
Email: [email protected]
Peter D. Goldsmith, Associate Professor andInterim Director, Food & Agribusiness Management
ProgramDepartment of Agricultural and Consumer Economics
University of Illinois at Urbana-Champaign318 Mumford Hall
1301 W Gregory DriveUrbana, IL 61801
Office: (217) 333-5131Email: [email protected]
Associate DirectorLeonardo J. Cristalli, CEO at OKARA LTDA.
J. P. Sotura 1268, Dolores, CP75100, Soriano,Uruguay
Web: www.okara.com.uy Mobile: (598) 93 381 318
Email: [email protected]
1
Precision Farming Industry Structure
Abstract
Precision farming means collecting data and makingagricultural management decisions based on that data. Thepresent report summarizes literature information foundconcerning precision farming evolutionary phases,profitability, business structure, and data collaborationamong different agents in the agriculture sector for eachof the precision farming technologies. Furthermore, thegaps found concerning precision farming businessstructure is filled analyzing data from semi-structuredinterviews and web-based surveys. Results indicatedifferent scenarios of business structures possible, withdifferent arrangements between farmers, serviceproviders, software developers, machinery manufacturers,sensors providers, input providers, traders, banks, andinsurance agencies. Moreover, survey results provideunprecedented information about the precision farmingindustry companies offering type, market penetration,number of employees, and annual turnover. Finally,insights on the future of precision agriculture arepresented as results of discussion with many leaders ofthis industry.
2

Keywords: precision farming, big data, profitability,adoption, structure
JEL Classification: Q1, O3
1. INTRODUCTION
Several definitions for precision farming are found inthe literature. A definition that includes any otherdescription is that precision farming means collectingdata and making agricultural management decisions basedon that data (Hague, 2014). The objective of precisionfarming is to help farmers to apply the right amounts ofinputs, on the right place, and at right time (Pandit,2012).
The concept of precision farming emerged in the 1980s(Herring, 2001). However, this notion went throughdifferent phases over the last four decades (Hague,2014). To fully understand and precision farming industry
3

structure and taxonomy, it is important to differentiatethese phases one another.
Even though it’s been more than 30 years since precisionfarming emerged, NASA’s specialist Susan Moran statesthat these technologies are still in the experimentalphase (Herring, 2001). Some researchers strengthenMoran’s statement indicating that adoption rates vary alot among the set of technologies known as precisionfarming. Indeed, adoption rates range from 75-80% for GPSand Guidance systems to less than 2% for remote sensing(Griffin et al., 2004; Schimmelpfennig and Ebel, 2011;Cox and Wong, 2013). Thus, the need to differentiatebetween technologies with defined costs benefits ratioand easy-to-measure benefits from those technologies thatdo not have those same characteristics.
In addition to this, during the last five years,precision farming saw an increase in the number oftechnologies, products, companies, investments, andacquisitions (Cox and Wong, 2013; Oganesoff and Howard,2014). Therefore, the business structure of eachtechnology needs to be studied. On one hand, sometechnologies come standard in original equipment, or canbe purchased in the after-market. On the other hand, thedynamics for some technologies have not yet been defined.
What is more, data now plays an increasing role in manybusinesses (Kolb, J. 2012; Mayer-Schonberger, V andCukier, K. 2013). However, in agriculture there is stilla whole unknown space of opportunities. As a matter offact, different agents of the industry can benefit fromthe data. Thus, there is a particular interest incharacterizing the role of data for different agents andat the different levels of the agriculture and foodsupply chain.
4

2. LITERATURE REVIEW
2.1. GLOBAL POSITIONING SYSTEM AND GUIDANCE SYSTEMS
2.1.1. Global Positioning System (GPS)
GPS can be simply defined as a navigation system based ona network of earth-orbiting satellites that lets usersrecord near-instantaneous positional information(latitude, longitude, and elevation) with accuracyranging from 100 m to 0.01 m (Batte, 2000). GPS becameessential in many businesses, and agriculture is becomingmore and more dependent on it. Indeed, GPS is the basisfor many others precision farming technologies.
Standard GPS provides accurate worldwide positioningservices within 10-15 meters, but these systems cannot beany more precise than this because of timing andsatellite orbit errors (Cox and Wong, 2013). For manybusinesses, this kind of accuracy may be enough, but forprecision agriculture, where the idea is to manage eachsquare meter of a farm differently, standard GPS systemsare not accurate enough. There are some ways of improvingstandard accuracy.
Differential Global Positioning System (DGPS):
GPS receivers that are compatible can receive DGPScorrections for free (Cox and Wong, 2013). DGPS is asystem providing a very accurate position (accuracy rangefrom 1 to 10 m), by calculating the difference betweenthe actual locations of a fixed-position ground stationandthe satellite-located position of the station, andproviding a correction signal to a mobile user (HCGA,2009).
Space-based augmentation systems (SBAS):
Another way to improve accuracy is SBAS. These are
5
networks of stations on the ground that correct GPSsignals received from the 24 GPS satellites and send themback up to their proprietary satellites (Cox and Wong,2013).
Privately owned L-band satellite:
The next most accurate technique for GPS correction issubscription to privately owned L-band satellite. Thesesignals virtually cover the whole world and provideaccuracy from eight to two inches (5 – 20 cm) (Cox andWong, 2013).
Real-time kinematic (RTK) positioning:
However, according to the same authors, the most accurate(and expensive) correction solution to date is real-timekinematic (RTK) positioning (accuracy is usually lessthan 1 cm.). RTK is a processor that makes GPS signalcorrections that are transmitted to a satellite andsubsequently stored in real time (Schimmelpfennig andEbel, 2011). Indeed, it is a system that uses a fixedground station to measure satellite drift and send acorrection signal by radio directly to GPS equippedvehicles. The main advantage, besides a better accuracy,is that RTK is not affected by atmospheric interference(HGCA, 2009).
2.1.2. Guidance systems
Guidance systems show a driver where to steer to coverthe field at the spacing required for the implement beingused without overlapping or under lapping (HCGA, 2009).Guidance systems can be as simple as a mechanical markeron a planter or foam marker on a sprayer, and assophisticated as GPS-based auto-steering (Smith et al.,2013). Nowadays, the vast majority of farmers rely onGPS-based guidance systems (
Without guidance systems, every application has highchances of overlap or under lap. Overlapping refers toapplying the product more than once in a certain area,while under lapping means unintentionally not applyingthe product in a certain an area. Overlapping has
6

negative impact in the environment and increasesapplication costs, it can even reduce yield by toxiceffects of the chemical in some cases. On the other hand,under lapping can have negative effects on yield in theareas where fertilizer was not applied, or seed was notplaced.
Auto guidance
Auto guidance systems have an auto steer componentsynchronized with the guidance system to automaticallyand precisely steer the machinery (Smith et al., 2013).By this mean, operators to focus on other tasks such aswatching over seeding monitor or yield variation. Autoguidance systems can be more or less accurate dependingif they rely on standard GPS or in more sophisticatedsystems such as real-time kinematics.
GPS technology has been used in precision industry sinceits origin. Indeed, in the 1980s GPS was used forconnecting grid soil sampling and variable rateapplication of a few inputs. However, the accuracyachieved by GPS technology differs in the differentphases early mentioned. Whereas in the 1980s standard GPSwas the only solution available, in 1990s DGPS wasavailable, and by the 2000s RTK was also available forfarmers. This means that, in the origins of precisionfarming farmers worked with a 15 meters precision,nowadays farmers work with a precision of 1 centimeter.This means that every single process that uses GPStechnology- such as guidance systems, yield monitoring,soil mapping, or VRAs- is more accurate.
Guidance systems have also been through an evolution inthe last decades. In the early 1920s, systems that canfollow furrows guided the machines across the field. Inthe 1970s, wire carrying low current, low frequencysignal was used to guide machines. In the mid-1990s,researchers were studying GPS guidance systems (Reid etal, 2000). In the mid 2000s, auto steering was madecommercially available (Griffin et al, 2004).
7
According to Schimmelpfennig and Ebel (2011), in the US,guidance systems have an adoption rate of 75-80% and autosteering has an adoption rate of 50-60%. These highlevels of adoption can be explained to the perceived costbenefit relation and the measurability of the benefitsfrom adopting a guidance system. Several authors havefocused their research into studying the economics of GPSguidance systems.
Smith et al. (2013), set a range in savings of 2-7% ininput cost in farmers that adopted GPS guidance.Moreover, the same authors point out studies conducted inAuburn University that indicated input savings from 1-12%for each pass across a field when using automatic sectioncontrol.
In addition to this, a study by Iowa State University in2011 revealed that the cost of a GPS planting system withRTK (USD 10,000-20,000) can be returned within 3 yearsfor the medium scale growers based on seed cost alone.
Table 1. Savings from GPS/RTK planting
Acres farmed Assumed overlap(%)
Reduced overlap(acres)
Savings(USD)
500 6 30 3,6001000 5.25 53 6,3001500 4.5 68 8,1002000 3.75 75 9,0002500 3 75 9,000
Source: Purdue University crop cost study, USDA, Cox and Wong (2013)
Also, a Purdue University study of fertilizer saving whenusing a GPS+RTK system demonstrated that GPS fertilizingwith RTK can also be returned within 3 years for mediumscale growers based on fertilizer cost alone.
Table 2. Savings from GPS/RTK fertilization
Acresfarmed
Assumed overlap(%)
Reduced overlap(acres)
Savings(USD)
8
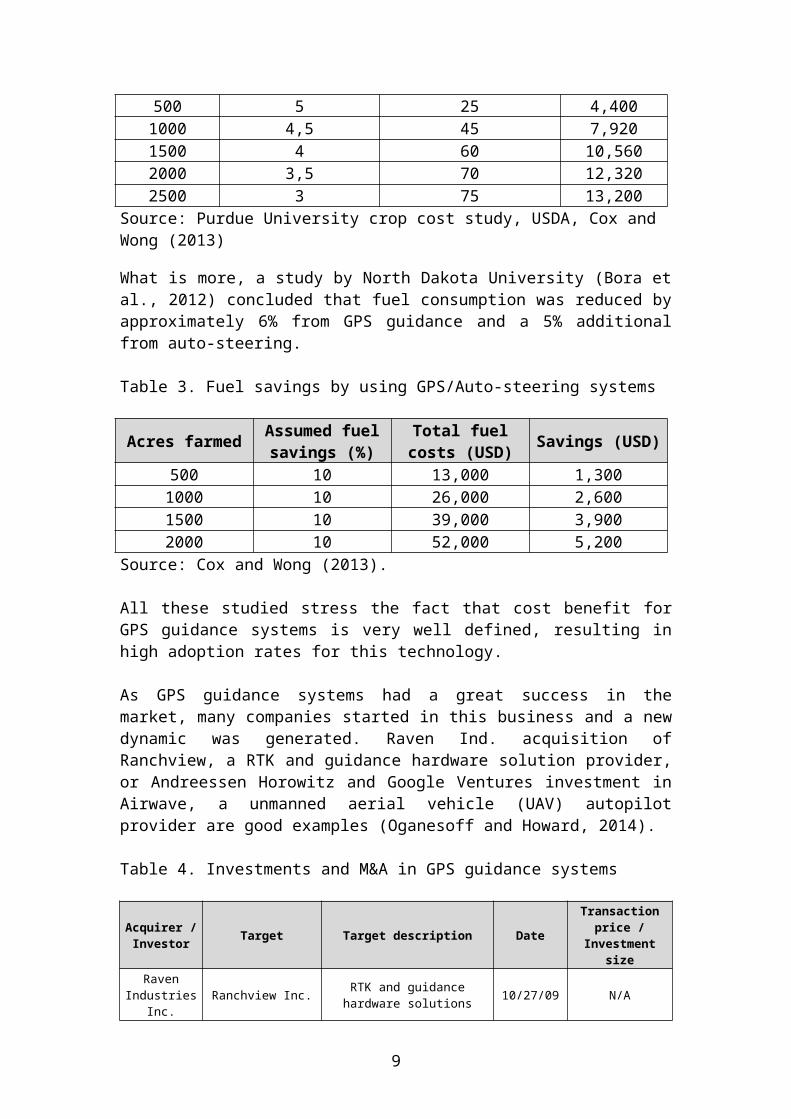
500 5 25 4,4001000 4,5 45 7,9201500 4 60 10,5602000 3,5 70 12,3202500 3 75 13,200
Source: Purdue University crop cost study, USDA, Cox and Wong (2013)
What is more, a study by North Dakota University (Bora etal., 2012) concluded that fuel consumption was reduced byapproximately 6% from GPS guidance and a 5% additionalfrom auto-steering.
Table 3. Fuel savings by using GPS/Auto-steering systems
Acres farmed Assumed fuelsavings (%)
Total fuelcosts (USD) Savings (USD)
500 10 13,000 1,3001000 10 26,000 2,6001500 10 39,000 3,9002000 10 52,000 5,200
Source: Cox and Wong (2013).
All these studied stress the fact that cost benefit forGPS guidance systems is very well defined, resulting inhigh adoption rates for this technology.
As GPS guidance systems had a great success in themarket, many companies started in this business and a newdynamic was generated. Raven Ind. acquisition ofRanchview, a RTK and guidance hardware solution provider,or Andreessen Horowitz and Google Ventures investment inAirwave, a unmanned aerial vehicle (UAV) autopilotprovider are good examples (Oganesoff and Howard, 2014).
Table 4. Investments and M&A in GPS guidance systems
Acquirer /Investor Target Target description Date
Transactionprice /
Investmentsize
RavenIndustries
Inc.Ranchview Inc. RTK and guidance
hardware solutions 10/27/09 N/A
9
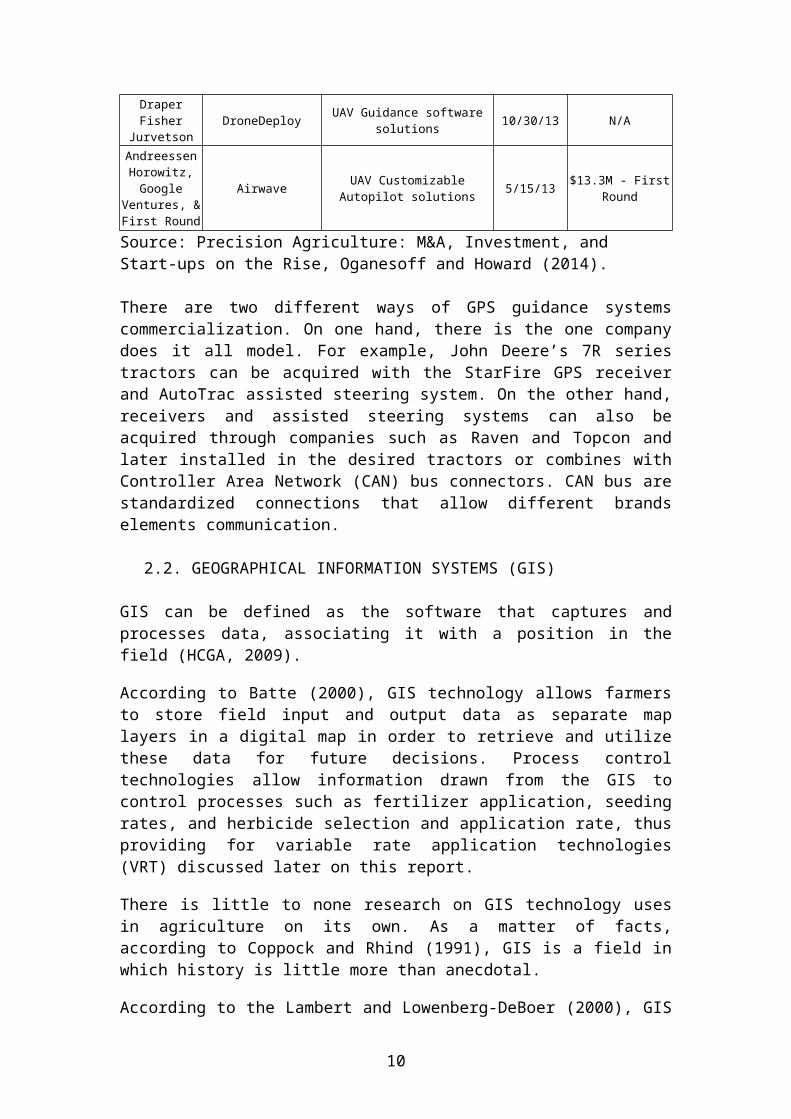
DraperFisher
JurvetsonDroneDeploy UAV Guidance software
solutions 10/30/13 N/A
AndreessenHorowitz,Google
Ventures, &First Round
Airwave UAV CustomizableAutopilot solutions 5/15/13 $13.3M - First
Round
Source: Precision Agriculture: M&A, Investment, and Start-ups on the Rise, Oganesoff and Howard (2014).
There are two different ways of GPS guidance systemscommercialization. On one hand, there is the one companydoes it all model. For example, John Deere’s 7R seriestractors can be acquired with the StarFire GPS receiverand AutoTrac assisted steering system. On the other hand,receivers and assisted steering systems can also beacquired through companies such as Raven and Topcon andlater installed in the desired tractors or combines withController Area Network (CAN) bus connectors. CAN bus arestandardized connections that allow different brandselements communication.
2.2. GEOGRAPHICAL INFORMATION SYSTEMS (GIS) GIS can be defined as the software that captures andprocesses data, associating it with a position in thefield (HCGA, 2009).
According to Batte (2000), GIS technology allows farmersto store field input and output data as separate maplayers in a digital map in order to retrieve and utilizethese data for future decisions. Process controltechnologies allow information drawn from the GIS tocontrol processes such as fertilizer application, seedingrates, and herbicide selection and application rate, thusproviding for variable rate application technologies(VRT) discussed later on this report.
There is little to none research on GIS technology usesin agriculture on its own. As a matter of facts,according to Coppock and Rhind (1991), GIS is a field inwhich history is little more than anecdotal.
According to the Lambert and Lowenberg-DeBoer (2000), GIS
10

is used in combination with other technologies such asvariable rate application (discussed later in thisreport). Thus, examining GIS phases and cost benefitrelation the same way it was analyzed for GPS guidancesystems is not possible with the available literature.
In addition to this, GIS business dynamic has not changedsignificantly over the last years. As a matter of fact,according to the market analysis firm Daratech, onecompany, ESRI, holds approximately 40% of GIS marketshare. This has led users to rely on ESRI’ shapefiles asthe standard file extension for GIS.
2.3. SENSORS AND REMOTE SENSING
Sensors are devices that are capture environmental andnon-environmental factors such as light, temperature,radiation level, pressure, engine use, and transmits asignal to a measuring instrument. Data loggers then storethe data and can wirelessly send that data via cellularor satellite.
Sensors can be mounted on different vehicles for remotesensing, or be stationary such as weather stations.
Remote sensing can be defined as the process of detectinginformation about a field, soil or crop from a distance,using sensors mounted on satellites, aircraft or othermachinery (HGCA, 2009). Remote sensing has been veryuseful over the years, especially for large-scale growersas it isn’t always possible for them to survey all oftheir lands every week (Herring, 2001). Most importantly,according to the same author, remote sensing data cantell the farmers not only where their crops are understress but also why.
Satellite sensing
Landsat TM satellite image data are an alternative toyield monitor data and enable farmers to identify regionsor management zones (Herring, 2001). Satellite imagerycan have many uses, for example:
Oklahoma State University researchers have been able
11
to calibrate these data to wheat yield (Solie, 2000) Creation on false-color images to differentiate bare
fields (blue), while soils that have recently beenleveled in preparation for planting appears whiteand dark red areas show flood irrigation (Herring,2001).
Elaboration of false-color maps representingmeasurements made at thermal infrared wavelengths,to represent surface temperatures. Cool temperatures(blue and green) are associated with vegetation andhot temperatures (yellow and red) with bare soil(Herring, 2001).
Elaboration of maps with color variations determinedby crop density (also referred to as "NormalizedDifference Vegetation Index," or NDVI), where darkblues and greens indicate lush vegetation and redsshow areas of bare soil (Herring, 2001).
Creation of water deficit maps (Herring, 2001).
Aircraft and Unmanned Aerial System (UAS) sensing
Aircraft and UAS can be equipped with many types ofcameras such as visible light, infrared, LIDAR (lightdetection and ranging), multispectral or hyper spectral.The images recovered later can be used to scout the fieldand identify damage and crop stress, create normalizeddifference vegetation index (NDVI) maps, and identifymachine issues among many other tasks (Everaerts, 2008).
NDVI is defined by the following ratio, with VIS and NIRbeing the spectral reflectance measurements acquired fromthe visible and the near infrared. This ratio correlateswith leaf are index, vegetation condition, and biomass(Carlson and Ripley, 1997).
From the three sensing methods described, aircraftsensing is the least used because of its costs. However,satellite and UAS sensing are being used more and moreoften. Nonetheless, the greatest difference betweensatellite and UAS resides in the resolution achieved.
12

Whether satellite imagery such as Landsat has 30 metersper pixel resolution (Solie, 2000), UAS imageryresolution goes from 4 to 10 centimeters per pixel.
The use of sensors varied a lot through the last decades.Sensors were first used for farming in the 1990s whenNASA’s aircraft equipped with sensors started being usedin agriculture (Herring, 2001). Moreover, according tothe same author, in the late 1990s high-resolutionsatellite imagery became commercially available and cropand soil conditions start being diagnosed usingsatellite-based remote sensors. Nevertheless, there islittle information on the literature about the use ofstationary sensors such as soil moisture sensors orweather stations throughout this last three decades.
In addition to this, existing literature has mainlyfocused on the use of sensors for irrigation systems(Hedley et al., 2013; Lichtenberg, 2013; Lichtenberg etal., 2014). However, sensors are being used in many non-irrigated fields. This few information on cost benefits,can be explained to the difficulty on measuring it. As amatter of facts, sensors are used with othertechnologies, such as variable rate application, and itis difficult to separate benefits from one or the othertechnology on its own.
What is more, there is a wide range of market structurein this industry. On one hand, there are companies- suchas Davis Instruments, Spectrum, and Decagon- that providethe whole hardware package (sensors, data loggers, remotecommunication) with specific software to assist in thedecision-making. On the other hand, some companies- suchas Ranch Systems- partner with sensor manufacturers andsoftware makers providing the entire solution to the end-user. Finally, companies- such as AgSense and iLinc-develop software for integrating the sensor’s data whilepartnering with sensors manufacturers.
Finally, there is very no previous research about how touse sensor’s data for different agents and steps of thesupply chain.
2.4. YIELD MONITOR AND YIELD MAPPING
13

Yield monitoring can be defined as "the measurement ofthe harvested portion of a crop over space and time andthe summation of those measurements in graphical form"(Pierce, 1997).
It allows farmers to use GPS maps to pinpoint yieldvariation within their fields (Gebbers and Adamchuck,2010). Yield data from 5-7 years allow growers toelaborate yield maps from a GIS software package. Thesemaps are useful to divide the field into differentmanagement zones according to potential yield, andtherefore chose different crops, varieties, fertilizerrate and any other input according to the zone (Solie,2000).
Yield monitors have been in use since the mid 1990s forsoybeans and corn, and since the late 1990s for cotton(Griffin, 2004; Ping and Dobermann, 2005). Since then,adoption rates grew very fast, reaching more than 65% ofadoption in US grain crop acres (Schimmelpfennig andEbel, 2001; Griffin et al., 2004). Some authors explainthis high level of adoption because yield monitorsprovide an easy mean to develop strategic site-specificmanagement decisions (Ping and Dobermann, 2005).
In addition to this, yield monitors are perceived to havehigh relation between cost and benefits. Many combinescome equipped with yield monitors from factory, providingusers with a technology at virtually no extra cost. Thebenefits are those perceived by site-specific management,which range from seed and fertilizer saving environmentalsustainability (analyzed later in this report).Nonetheless, some authors state that analyzing yield datarequires a level of commitment of time and resources,which can be limiting adoption rate (Lotz, 1997).
What is more, structure for yield monitors business isvery concise. On one hand, companies such as John Deere,AGCO, and CNH provide this technology default fromfactory. On the other hand, companies like LoupElectronics, Trimble, Precision Planting, and AgLeaderprovide the yield monitors straight to the end-user. To
14

differentiate themselves from the OEMs, the lattercompanies usually provide yield analysis softwarepackages as well.
Despite the high adoption rate of yield monitors, noprevious research has focused on the different uses ofthe data gathered with yield monitors. The potential usesfor yield data go from: real-time yield data analysis bytraders when speculating with commodity prices tohistorical yield data for differential land valuemanagement. The business opportunities in this matterneed to be evaluated by the academia.
2.5. SOIL MAPPING
Soil mapping can be simply defined as the production of aplan that defines areas in a field (HGCA, 2009). Thecreation of soil maps is very useful to run site-specificfarming as different soils may be handled separately.There are many ways of creating soil maps.
For example, some soils data are available from the USDANatural Resources Conservation Service’s NationalCartography and Geospatial Center. This information is inthe form of soil boundaries and could be augmented payingonsite sampling services, testing, and detailed study ofspecific sites for intensive cropping uses(Schimmelpfennig and Ebel, 2011). Also, as stressedbefore, different kind of soil maps can be made fromremote sensing.
Logically, the more data a soil map contains, the moreprecise the farm will be managed. For example, combiningyield-variation factors such as topography, pH, and soildepth can be very useful when prescribing inputs rates.These maps can be used as prescription maps for variablerate applications (Grisso et al., 2011).
Soil mapping was one of the first precision technologiesthat emerged. Indeed, according to Herring (2001), in the1980s precision farming meant grid sampling for variablefertilizer input and pH correction. Understanding soiltypes, and its interaction with yield and its variationshas been important throughout the last three decades.
15

According to a dealers survey carried out by Holland etal. (2013), 66% of respondents offered soil-samplingservices.
However, measuring the cost benefit relation from usingsoil samples to perform variable rate applications isvery difficult. It seems difficult to separate thebenefit from a variable rate prescription map that comesfrom soil sample, than a prescription that comes fromyield maps and management zones.
Moreover, there is no previous research on how farmer’saggregated soil maps can benefit different agents in theagribusiness industry. It is a fact, for example, thatinsurance services vary insurance fee according to soiltype. These benefits should be taken into account infuture research.
2.6. VARIABLE RATE APPLICATION (VRAs)
The variable rate technologies (VRTs) are devices thatcan be mounted on tractors and programmed to control thedispersion of seeds and chemicals based upon theinformation gained from the remote sensors orprescription maps (Grisso et al. 2011; Herring, 2001).
First it allows farmers to tailor their input applicationrates to the varying yield response characteristics indifferent parts of a field. Second, it allows forinexpensive gathering of site-specific data, which canprovide the farmer desiring to farm using VRA withvaluable information (Bullock et al., 2002).
Map-based VRA
Map-based VRA can be implemented using a number ofdifferent strategies such as soil type, soil color andtexture, topography, crop yield or field scouting data(Grisso et al., 2011). Whether some strategies are basedon single information, combining the data should performa better prescription map.
These maps can be created by the grid sampling method orzone management method. According to Fleming et al.
16
(2000), grid soil sampling at a density of 1 per ha orlarger has conventionally been used in the US. On theother hand, according to the same authors, a managementzone can be defined as a sub-region of a field thatexpresses a homogeneous combination of yield limitingfactors.
Sensor-based VRA
On the other hand, optical crop sensing requires no mapor positioning system. As a matter of fact, sensor-basedVRA varies the application rate of inputs with no priormapping or data collection. Real-time sensors measure thedesired properties such as soil properties or cropcharacteristics in real time and a control systemcalculates the input needs and transfer the informationto a controller requires no map or positioning systemwhich delivers the input to the location measured by thesensor (Grisso et al., 2011).
VRA sub-technologies
Variable rate technologies can be divided into:fertilizer VRA, seeding VRA, weed control VRA, lime VRAand variable rate irrigation (Grisso et al., 2011; Coxand Wong, 2013).
The objective is the same for all of these subtechnologies. VRA increases growers’ economic return byoptimizing inputs allowing farmers to focus inputs onzones of higher yield potential, while reducing inputs inlower productivity zones or where previous managementresulted in reduced input need (Grisso et al. 2011). Forexample, in variable rate irrigation (VRI), sensors areplaced in the field and the amount of water each nozzlespreads depend on water level in the soil, thus avoidingover-watering (Cox and Wong, 2013).
Variable rate application has been the objective ofprecision farming since the 1980s. As stated before,according to Herring (2001), in the 1980s grid samplingwas used for varied fertilizer input and pH corrections.According to the same author, in the 2000s, variable rate
17
technologies (VRT) start to being used more frequently.According to different researchers, VRT adoption rate is8-12% of US grain crop acres (Schimmelpfennig and Ebel,2011; Griffin et al., 2004).
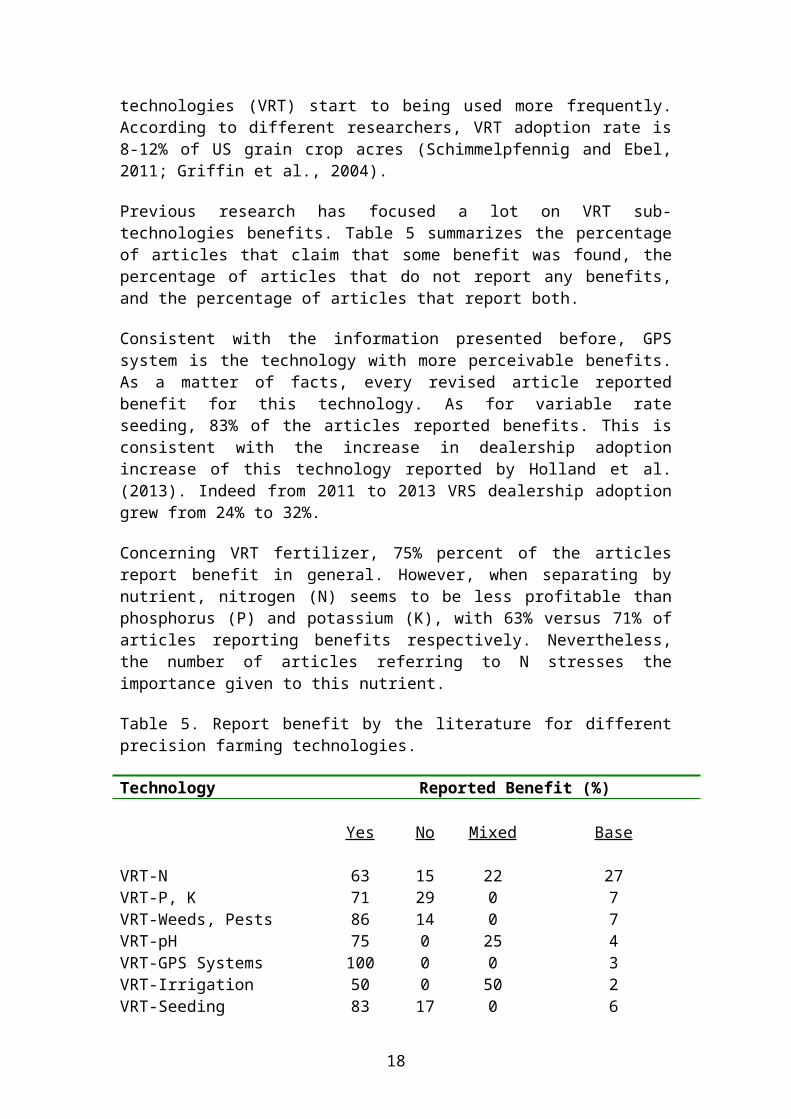
Previous research has focused a lot on VRT sub-technologies benefits. Table 5 summarizes the percentageof articles that claim that some benefit was found, thepercentage of articles that do not report any benefits,and the percentage of articles that report both.
Consistent with the information presented before, GPSsystem is the technology with more perceivable benefits.As a matter of facts, every revised article reportedbenefit for this technology. As for variable rateseeding, 83% of the articles reported benefits. This isconsistent with the increase in dealership adoptionincrease of this technology reported by Holland et al.(2013). Indeed from 2011 to 2013 VRS dealership adoptiongrew from 24% to 32%.
Concerning VRT fertilizer, 75% percent of the articlesreport benefit in general. However, when separating bynutrient, nitrogen (N) seems to be less profitable thanphosphorus (P) and potassium (K), with 63% versus 71% ofarticles reporting benefits respectively. Nevertheless,the number of articles referring to N stresses theimportance given to this nutrient.
Table 5. Report benefit by the literature for differentprecision farming technologies.
Technology Reported Benefit (%)
Yes No Mixed Base
VRT-N 63 15 22 27VRT-P, K 71 29 0 7VRT-Weeds, Pests 86 14 0 7VRT-pH 75 0 25 4VRT-GPS Systems 100 0 0 3VRT-Irrigation 50 0 50 2VRT-Seeding 83 17 0 6
18
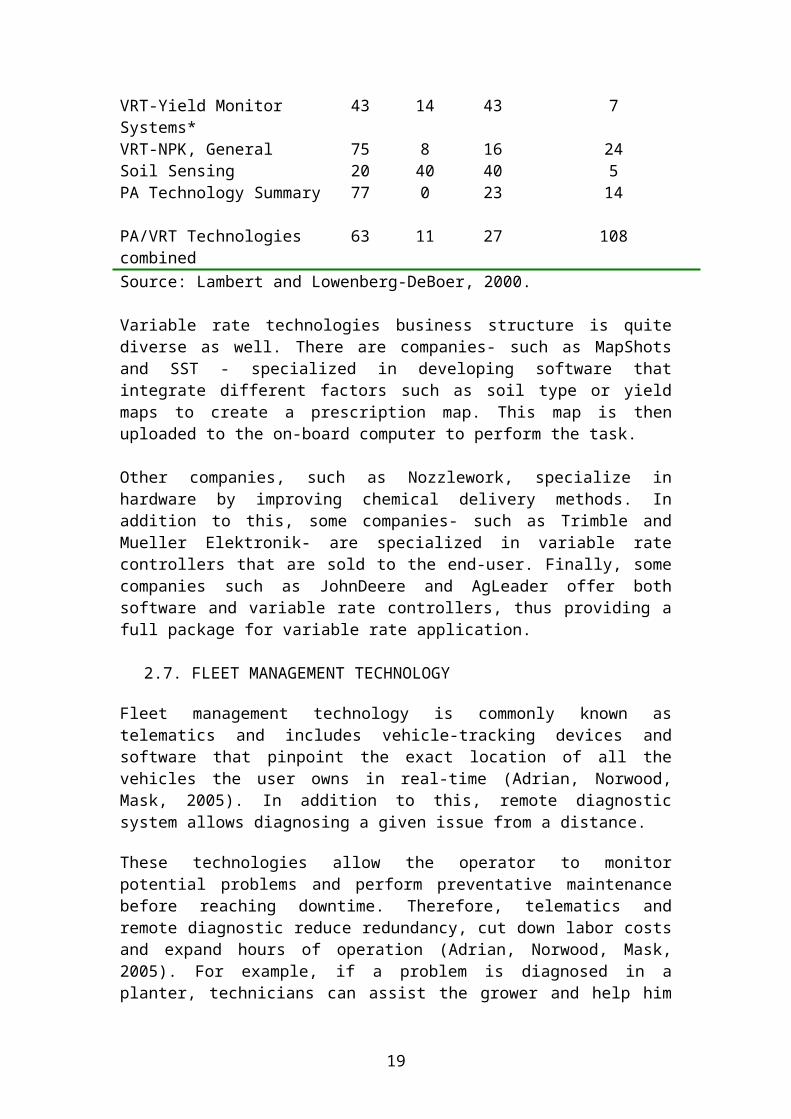
VRT-Yield Monitor Systems*
43 14 43 7
VRT-NPK, General 75 8 16 24Soil Sensing 20 40 40 5PA Technology Summary 77 0 23 14
PA/VRT Technologies combined
63 11 27 108
Source: Lambert and Lowenberg-DeBoer, 2000.
Variable rate technologies business structure is quitediverse as well. There are companies- such as MapShotsand SST - specialized in developing software thatintegrate different factors such as soil type or yieldmaps to create a prescription map. This map is thenuploaded to the on-board computer to perform the task.
Other companies, such as Nozzlework, specialize inhardware by improving chemical delivery methods. Inaddition to this, some companies- such as Trimble andMueller Elektronik- are specialized in variable ratecontrollers that are sold to the end-user. Finally, somecompanies such as JohnDeere and AgLeader offer bothsoftware and variable rate controllers, thus providing afull package for variable rate application.
2.7. FLEET MANAGEMENT TECHNOLOGY
Fleet management technology is commonly known astelematics and includes vehicle-tracking devices andsoftware that pinpoint the exact location of all thevehicles the user owns in real-time (Adrian, Norwood,Mask, 2005). In addition to this, remote diagnosticsystem allows diagnosing a given issue from a distance.
These technologies allow the operator to monitorpotential problems and perform preventative maintenancebefore reaching downtime. Therefore, telematics andremote diagnostic reduce redundancy, cut down labor costsand expand hours of operation (Adrian, Norwood, Mask,2005). For example, if a problem is diagnosed in aplanter, technicians can assist the grower and help him
19

to figure out whether this can be solved the next day orit must be solved immediately (Cox and Wong, 2013).Remote monitoring and diagnostics take significantimportance during short window period such as plantingand harvesting, where machinery must be used in the mosteffective way
Telematics and remote diagnostics are a new technology inagriculture. According to Gartner, these technologieswere first used in automobiles. Professor Kelly Rainerfrom Auburn University states that General Motors firstused telematics in the late 1990s. Even though there isno research analyzing the evolution of these technologiesin agriculture, we can place telematics and remotediagnostic as a technology of the last decade. Indeed,one of the fist companies to offer such technologies wasLeica Geosystems through its Virtual Wrench, which waslaunched in 2007.
Moreover, very little research report cost benefits fromthe adoption of telematics and remote diagnostic. As amatter of facts, Professor Terry Kastens from KansasState University states that it is too early to pretendwe know the economics of telematics. However, Gartnerplaces telematics as entering the plateau of productivityon its hype cycle.
What is more, business structure for telematics is quitesimpler than for most of the already revisedtechnologies. Indeed, telematics devices are installed bydefault or as after-factory boxes that collect andtransmit data (Gartner IT Glossary). Many OEM such asJohn Deere, AGCO and CNHI provide new machinery withtelematics featuring by default. Other companies, such asLeica Geosystems, Trimble, and Raven, provide the servicedirectly to the end-user. Leica Geosystems, for example,added built-in GPS in their displays to providetelematics services. Raven, on the other hand, providetelematics through their Slingshot hub. There is lessinformation on this matter for remote diagnostic. Somecompanies, such as Leica Geosystems, provide this servicethrough their Virtual Wrench portal.
20
In addition to this, there is no previous research on howtelematics in agriculture is changing the way fleet datacan be used among different agents in this business. Forexample, insurance agents could benefit from assettracking but no economic research evaluates its impact.
2.8. FARM MANAGEMENT SYSTEMS (FMS)
FMS are management systems which purpose is to assistagricultural farmers to perform various tasks such asoperational planning, implementation, and documentationin order to evaluate the performed work (Teye, 2011). FMSis part of a wider concept- Decision Support Systems(DSS)- used in many businesses since the 1980s. For somewriters, decision support systems simply mean interactivesystems for use by managers (Keen, 1980). Inagribusiness, DSS rely on: Business Intelligence (BI),Massive Data Management (Big Data), and EnterpriseResource Management (ERM).
Business Intelligence (BI)
BI is defined by Kolb (2012) as the methods and toolsused to analyze and understand important data- both frominternal and external sources. BI uses data analysis tospot patterns, trends, and correlations within data tohelp decision-makers make data-driven decisions.
Massive Data Management (Big Data)
According to Gartner’s IT Glossary, massive datamanagement can be defined as high-volume, high-velocityand high-variety information assets that demand cost-effective, innovative forms of information processing forenhanced insight and decision making.Enterprise Resource Management (ERM)
Al-Mashari et al. (2002) state that Rosemann (1999)defined ERM system as customizable software that includesintegrated business solutions for the core processes(e.g. production planning and control, warehouse
21

management) and the main administrative functions (e.g.accounting, human resource management) of an enterprise.
Moreover, according to Markus et al. (2000), ERP systemswork essentially at integrating inventory data withfinancial, sales, and human resources data, allowingorganizations to price their products, produce financialstatements, and manage effectively their resources ofpeople, materials and money (Al-Mashari et al., 2002).
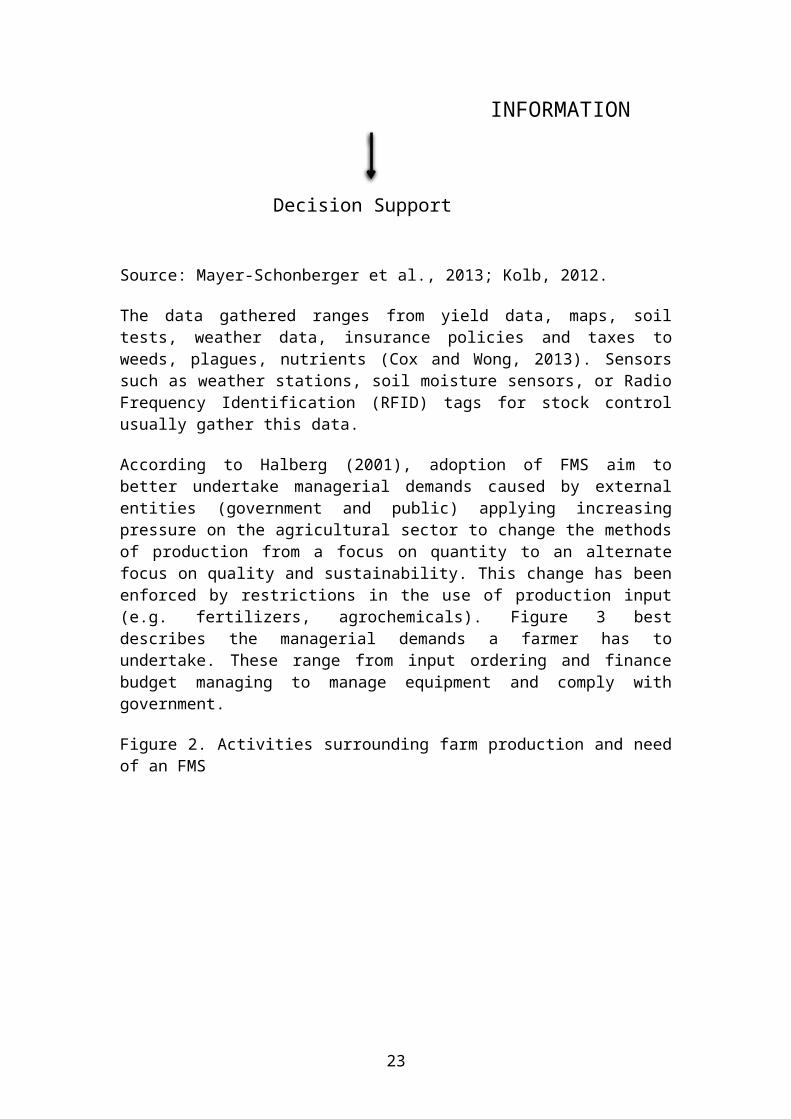
Figure 1 is a very simple example of the steps requiredto develop a FMS. First, raw data has to be collected-with sensors when possible- and stored. Once the amountof data is significant, it has to be analyzed in order togive sense to all this data (Kolb, 2012). Once the datais analyzed, a decision support system helps the user totake data driven decisions.
Analytics play a key role into transforming raw data intouseful information. Indeed, Kolb (2012) defines analyticsas he collection of technologies and processes that turnsraw data into usable knowledge in order to informdecisions and drive action.
Figure 1. Simplified steps for developing an FMS
Sowing Fertilization Plant height Soil pH DensityGrains/m Grain weight
Soil nutrients Plagues Soil moistureTemperature Humidity yield
DATA
Sensors
Analyt
22
INFORMATION
Source: Mayer-Schonberger et al., 2013; Kolb, 2012.
The data gathered ranges from yield data, maps, soiltests, weather data, insurance policies and taxes toweeds, plagues, nutrients (Cox and Wong, 2013). Sensorssuch as weather stations, soil moisture sensors, or RadioFrequency Identification (RFID) tags for stock controlusually gather this data.
According to Halberg (2001), adoption of FMS aim tobetter undertake managerial demands caused by externalentities (government and public) applying increasingpressure on the agricultural sector to change the methodsof production from a focus on quantity to an alternatefocus on quality and sustainability. This change has beenenforced by restrictions in the use of production input(e.g. fertilizers, agrochemicals). Figure 3 bestdescribes the managerial demands a farmer has toundertake. These range from input ordering and financebudget managing to manage equipment and comply withgovernment.
Figure 2. Activities surrounding farm production and needof an FMS
Decision Support Systems
23
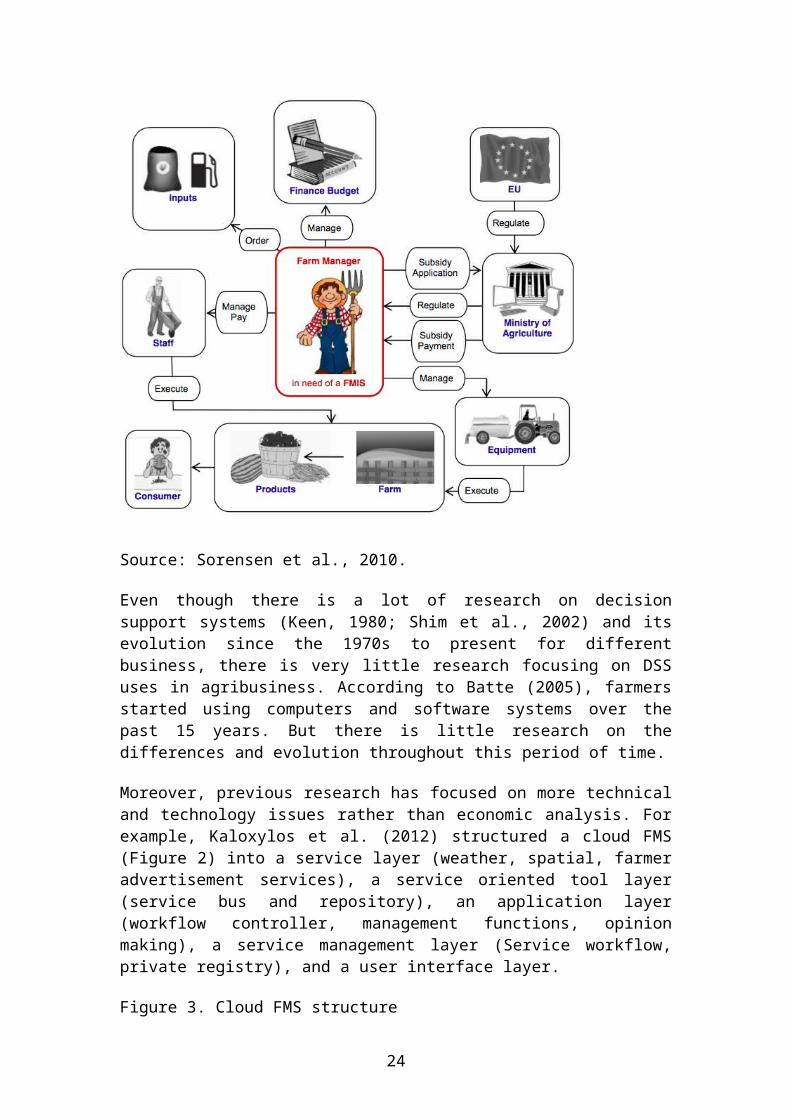
Source: Sorensen et al., 2010.
Even though there is a lot of research on decisionsupport systems (Keen, 1980; Shim et al., 2002) and itsevolution since the 1970s to present for differentbusiness, there is very little research focusing on DSSuses in agribusiness. According to Batte (2005), farmersstarted using computers and software systems over thepast 15 years. But there is little research on thedifferences and evolution throughout this period of time.
Moreover, previous research has focused on more technicaland technology issues rather than economic analysis. Forexample, Kaloxylos et al. (2012) structured a cloud FMS(Figure 2) into a service layer (weather, spatial, farmeradvertisement services), a service oriented tool layer(service bus and repository), an application layer(workflow controller, management functions, opinionmaking), a service management layer (Service workflow,private registry), and a user interface layer.
Figure 3. Cloud FMS structure
24
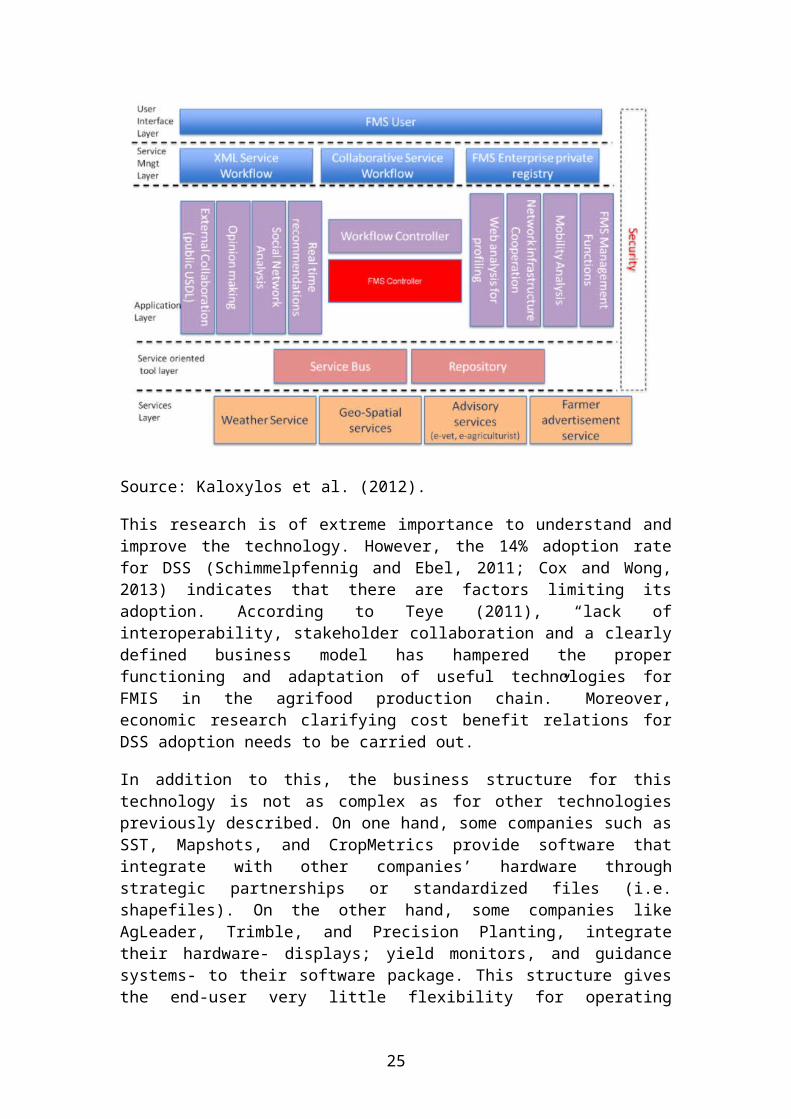
Source: Kaloxylos et al. (2012).
This research is of extreme importance to understand andimprove the technology. However, the 14% adoption ratefor DSS (Schimmelpfennig and Ebel, 2011; Cox and Wong,2013) indicates that there are factors limiting itsadoption. According to Teye (2011), “lack ofinteroperability, stakeholder collaboration and a clearlydefined business model has hampered the properfunctioning and adaptation of useful technologies forFMIS in the agrifood production chain.” Moreover,economic research clarifying cost benefit relations forDSS adoption needs to be carried out.
In addition to this, the business structure for thistechnology is not as complex as for other technologiespreviously described. On one hand, some companies such asSST, Mapshots, and CropMetrics provide software thatintegrate with other companies’ hardware throughstrategic partnerships or standardized files (i.e.shapefiles). On the other hand, some companies likeAgLeader, Trimble, and Precision Planting, integratetheir hardware- displays; yield monitors, and guidancesystems- to their software package. This structure givesthe end-user very little flexibility for operating
25
different brands.
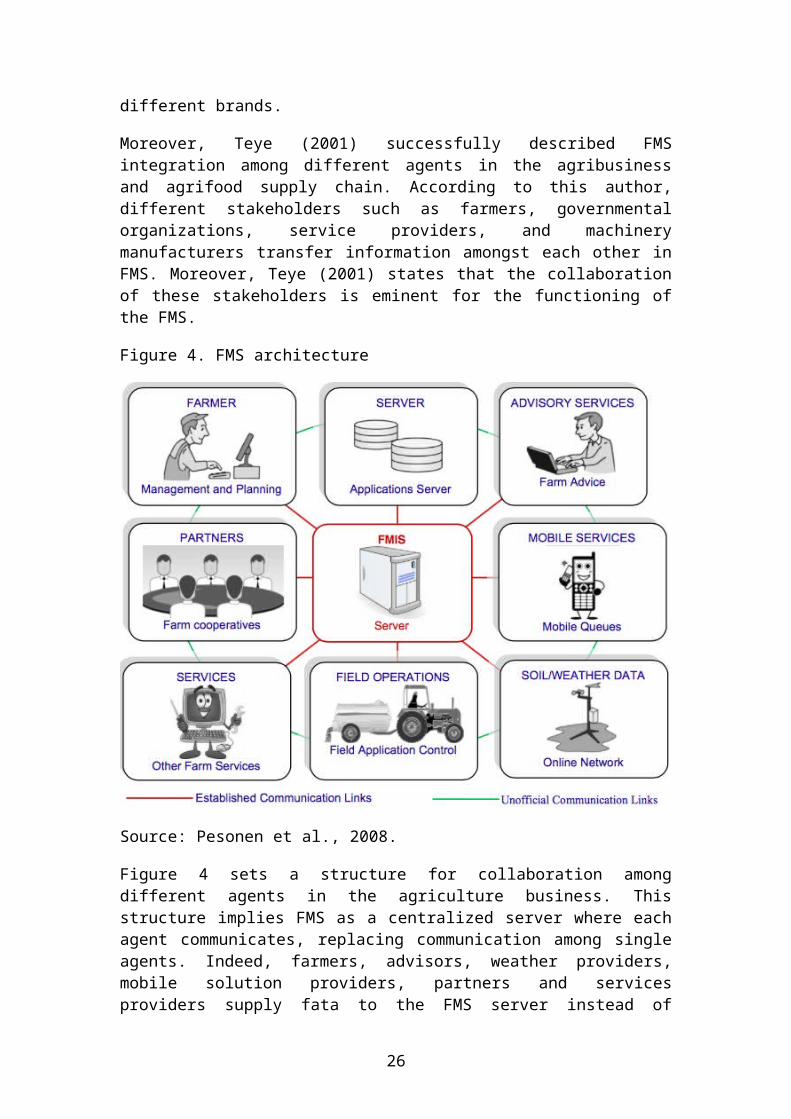
Moreover, Teye (2001) successfully described FMSintegration among different agents in the agribusinessand agrifood supply chain. According to this author,different stakeholders such as farmers, governmentalorganizations, service providers, and machinerymanufacturers transfer information amongst each other inFMS. Moreover, Teye (2001) states that the collaborationof these stakeholders is eminent for the functioning ofthe FMS.
Figure 4. FMS architecture
Source: Pesonen et al., 2008.
Figure 4 sets a structure for collaboration amongdifferent agents in the agriculture business. Thisstructure implies FMS as a centralized server where eachagent communicates, replacing communication among singleagents. Indeed, farmers, advisors, weather providers,mobile solution providers, partners and servicesproviders supply fata to the FMS server instead of
26
sharing data among each other.
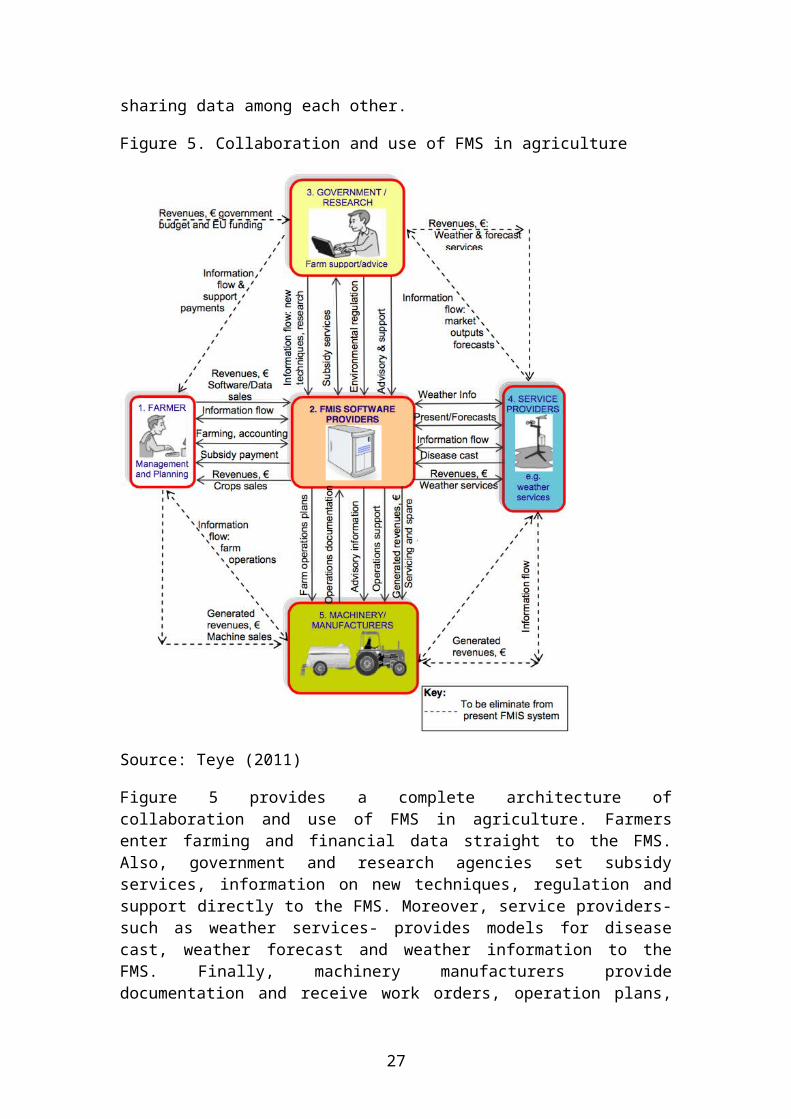
Figure 5. Collaboration and use of FMS in agriculture
Source: Teye (2011)
Figure 5 provides a complete architecture ofcollaboration and use of FMS in agriculture. Farmersenter farming and financial data straight to the FMS.Also, government and research agencies set subsidyservices, information on new techniques, regulation andsupport directly to the FMS. Moreover, service providers-such as weather services- provides models for diseasecast, weather forecast and weather information to theFMS. Finally, machinery manufacturers providedocumentation and receive work orders, operation plans,
27
and operation support straight from the FMS. Figure 5also indicates the steps to be eliminated in the futurefrom adopting FMS. Information flow between farmers,government, service providers and machinery manufacturersis likely to diminish over time, centralizing the data onthe FMS provider.
2.9. MOBILE APPLICATIONS AND CLOUB-BASED INFRASTRUCTURE
According to the National Institute of Standards andTechnology, cloud computing can be defined as a “modelfor enabling ubiquitous, convenient, on-demand networkaccess to a shared pool of configurable computingresources (e.g., networks, servers, storage,applications, and services) that can be rapidlyprovisioned and released with minimal management effortor service provider interaction”.
Murazzo and Rodríguez (2010) define mobile solutions asthe cloud computing availability in mobile devices. Thesesolutions create a platform to deploy web-based contentsinto mobile devices in a high-speed and low-cost way.
There are several mobile solutions that allow fieldscouting, boundary mapping, hyper-local weather forecast,and on foot VRA control among many others (Cox and Wong,2013). What is more, mobile solutions allow growers tocontact advisors and technicians everywhere in the field,and show them in site issues concerning their crops ormachinery.
In addition to this, mobile solutions are also startingto grow in the irrigation industry. Growers can monitormultiple irrigation systems from their mobile phones ortablets and make adjustments to application rates andsystem movement as needed (Cox and Wong, 2013).
On the other hand, cloud-based computing connectsmonitors, mobile devices, and office computers. This is ahuge benefit to the growers as they can make changes,record data, take pictures and not worry about having toupload them to each of their systems by physical USBtransfer (Cox and Wong, 2013). Cloud-based computinggenerates more and more data to be analyzed and
28

integrated in farm management software.
Even though there is not much information in theliterature about mobile application adoption inagriculture over the last decades, the InternationalTelecommunication Union (ITU) has monitored the telephoneand broadband subscription rates in industrialized andnon-industrialized countries (Figure 6). On average,since 2012, each inhabitant in the planet is subscribedto a mobile cellular plan, even in non-industrializedcountries. This statistic reveals the potential formobile applications in agriculture. Moreover, mobilebroadband Internet subscriptions support this claim(Figure 7). Some regions in Africa and the Middle East,however, are still far below average of mobile Internetsubscriptions despite the potential and needs in thesezones to adopt the technology (Baumuller, 2013).
Figure 6. Telephone and broadband subscription rates(2000-2012)
Source: International Telecommunication Union website
Figure 7. Mobile broadband Internet subscriptions as apercentage of country population in 2012
29

Source: International Telecommunication Union website
In addition to this, there is still no research foundabout the cost benefit ratio from adopting mobile andcloud-based technologies. This is probably because it issuch a new technology that business structure has not yetbeen defined. Moreover, the apparent lack of easiness tomeasure benefits from adopting a mobile application isprobably contributing as well. For example, there is noliterature on how to measure benefits from adoptingweather or scouting applications. The number of variablesaffecting agriculture is making economists’ work evenharder.
What is more, the business model for mobile applicationsis still being structured. On one hand, many companiesoffer mobile solutions as part as their complete package.This is especially true for software companies such asSST and Mapshots. These companies’ mobile applicationsusually complement their computer-based software withfunctions such as GPS-tagged observations, images, andfield boundary delimitation. On the other hand, companiesnot traditionally involved in mobile offerings haverecently started to develop mobile solutions as well.Some fine examples of this are Cargill’s NextField orDupont’s Encirca, the latter also being developed forwearable technologies such as Google Glass. Moreover,companies allied with sensors developers provide mobileapplications as part of their service package. Some fine
30

examples are AgSense, i-Linc Technologies, andRanchSystems. Finally, machinery manufacturers likeJohnDeere, AGCO, and CNH provide mobile solutions as atool for fleet and data management.
Even though there is no literature on how differentagents of the agriculture sector can benefit from mobileapplications data, it can be expected to suffer a similarstructure as Teye (2011) proposed for FMS. The potentialfor mobile and cloud-based computing data use needs to beexamined for different agents and at different levels ofthe supply chain network.
31
3. METHODOLOGY
To carry out this research, three different steps werefollowed.
First, it was necessary to collect and analyze secondarymarket information and previous research on this subjectin order to formulate and underlie the structure andtaxonomy of precision agriculture market.
Second, semi-structured interviews took place to test thepreviously formulated structure. These interviews werecarried out face to face or by phone call if distanceswere too large.
Finally, a web-based survey was sent to all the companiessomehow involved in one of the precision farming industrykey roles: hardware, software, and sensors developers.The survey was sent to a total of 216, receiving a 17% ofresponses. The results of the “2014 Precision agriculturecompanies survey” are summarized and presented in thisreport.
The next considerations were taken into account whencompiling the companies’ and technologies’ list.
Dealers and services providers that did not developtheir own product were excluded from the list asthis report aims to describe technologies and thecompanies developing those technologies.
In addition to this, the surveys were not sent tocompanies that are directly in the agricultureindustry but are somehow related (i.e. Insurances,Banks, Brokers)
32
4. RESULTS
4.1. PRECISION AG COMPANIES DESCRIPTION
Throughout this section, a brief overall precisionfarming industry characterization will be made. Inaddition to this, precision Ag industry companies will belisted in different categories.
The first distinction to be made is between public andprivates companies. Public companies are, usually, biggercompanies with larger revenues and resources (number ofemployees, R&D investment, facilities). Thus, comparingprivate vs. public companies is not adequate.
In addition to this, private companies will be dividedaccording to their offering type and the marketreached/expected by separating multinational companiesfrom national ones. Within each category, a generalmarket characterization will be made.
4.1.1. General description
33

Precision farming industry has seen over the last fewyears a huge outbreak in the number of companies funded.As stressed in the lit review section, this has led to asignificant business-to-business enhancement throughmergers and acquisitions (M&A) and venture capital (VC)financing.
It is of common knowledge that companies with greatpotential rapidly become VC-backed companies. Thisincludes many private companies such as aWhere,Meteologic, Aquaspy, Farmeron or Granular.
Therefore, it is to be expected that private companieslargely surpass public companies in precision farmingindustry (82% vs. 18%). Moreover, it is likely to see anincrease in this private/public companies ratio over thenext few years as Big Data in agriculture moves towardsthe plateau of productivity on Gartner’s hype cycle.
Figure 8. Public companies / private companies inprecision Ag industry
34

Public companies
18%
Private companies
82%
Public companies / private companies in precision Ag industry
Source: 2014 Precision agriculture companies survey
What is more, around 70% of companies are from the US (orat least headquartered in the US), beating by far thesecond on the list, Canada with 10%.
35
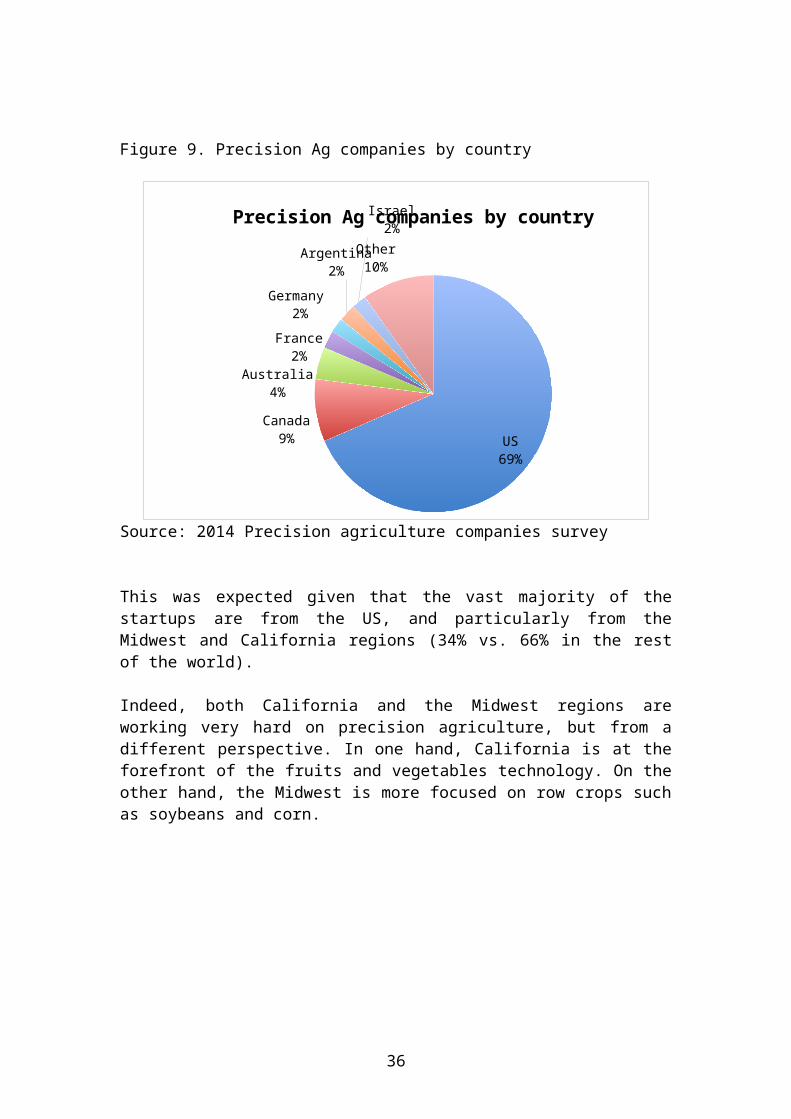
Figure 9. Precision Ag companies by country
US69%
Canada9%
Australia4%
France2%
Germany 2%
Argentina2%
Israel2%
Other10%
Precision Ag companies by country
Source: 2014 Precision agriculture companies survey
This was expected given that the vast majority of thestartups are from the US, and particularly from theMidwest and California regions (34% vs. 66% in the restof the world).
Indeed, both California and the Midwest regions areworking very hard on precision agriculture, but from adifferent perspective. In one hand, California is at theforefront of the fruits and vegetables technology. On theother hand, the Midwest is more focused on row crops suchas soybeans and corn.
36
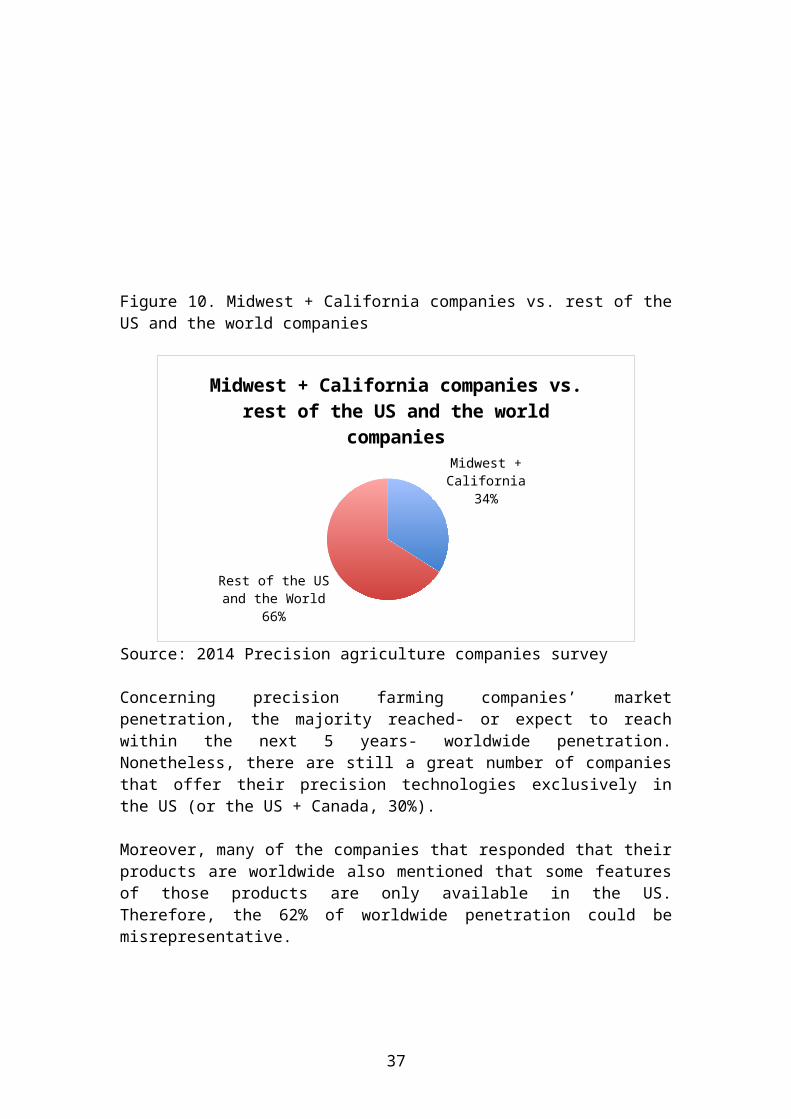
Figure 10. Midwest + California companies vs. rest of theUS and the world companies
Midwest + California
34%
Rest of the US and the World
66%
Midwest + California companies vs. rest of the US and the world
companies
Source: 2014 Precision agriculture companies survey
Concerning precision farming companies’ marketpenetration, the majority reached- or expect to reachwithin the next 5 years- worldwide penetration.Nonetheless, there are still a great number of companiesthat offer their precision technologies exclusively inthe US (or the US + Canada, 30%).
Moreover, many of the companies that responded that theirproducts are worldwide also mentioned that some featuresof those products are only available in the US.Therefore, the 62% of worldwide penetration could bemisrepresentative.
37
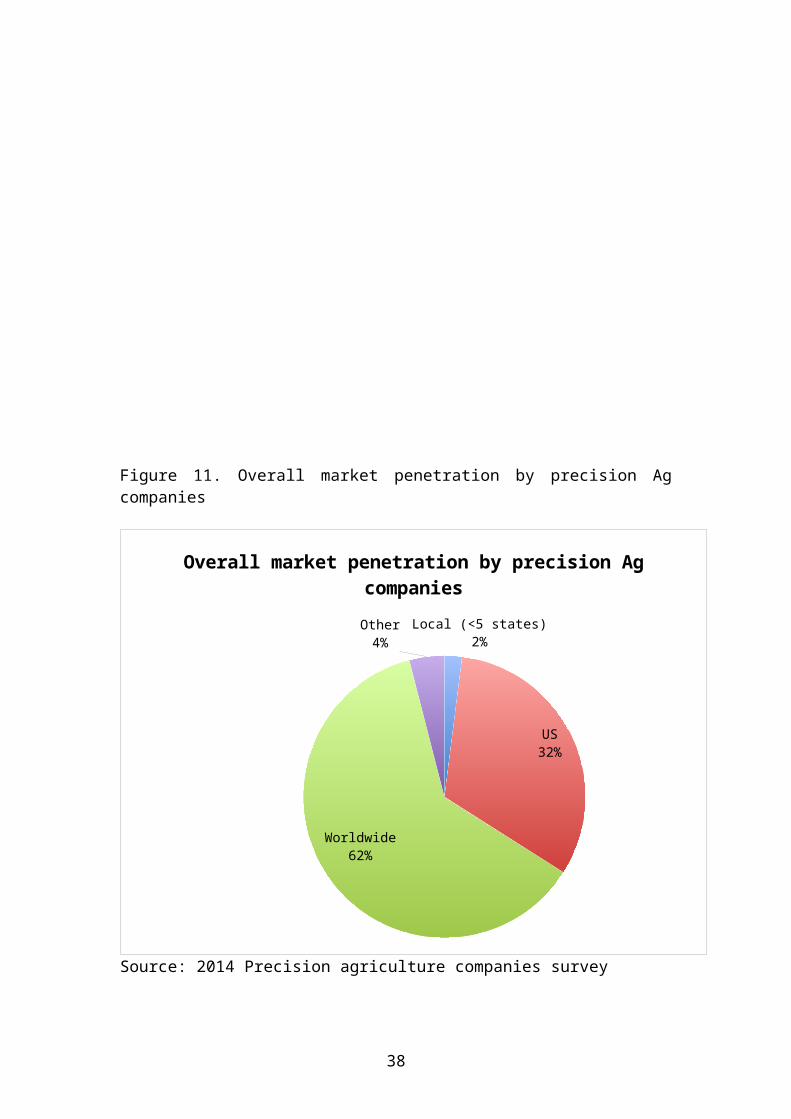
Figure 11. Overall market penetration by precision Agcompanies
Local (<5 states)2%
US32%
Worldwide62%
Other4%
Overall market penetration by precision Ag companies
Source: 2014 Precision agriculture companies survey
38
4.1.2. Public companies
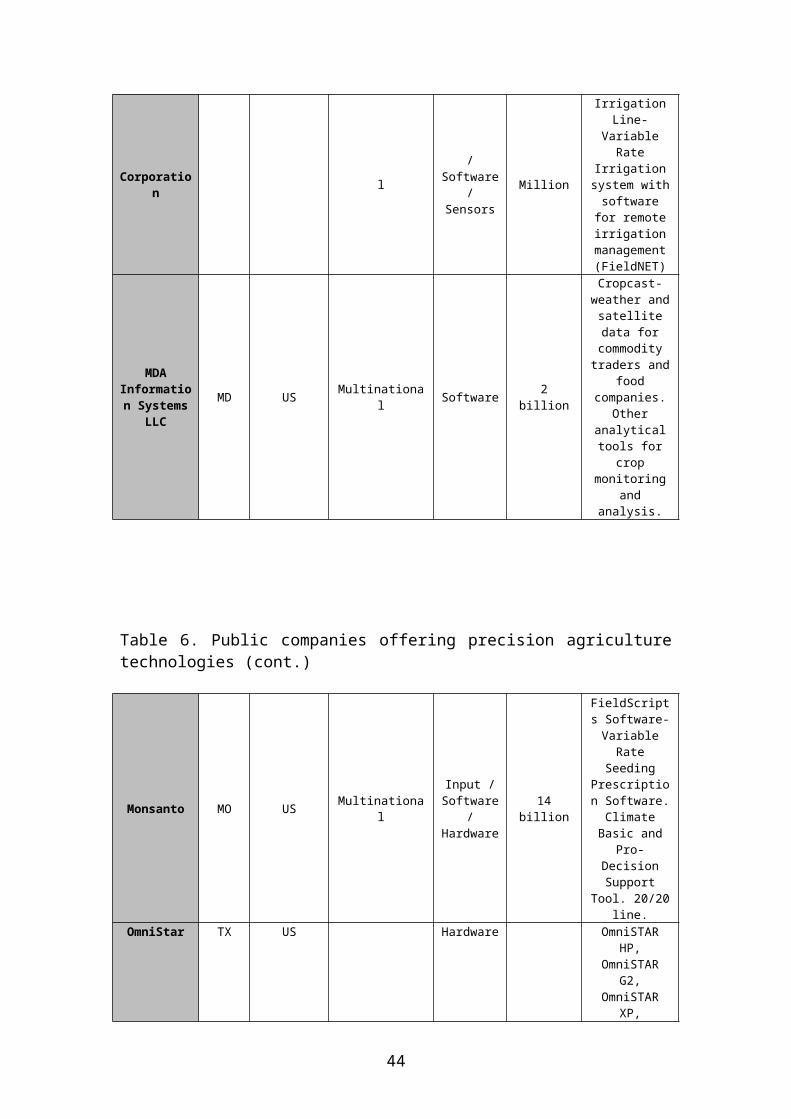
Table 6. Public companies offering precision agriculturetechnologies
CompanyHQState
HQCountr
y
National /Multinatio
nal
Offeringtype
Annualturnover
(USD)
Precision AgProducts
AGCO Corp. GA US Multinational
Hardware
10billion
AgCommand-fleet
management app.VarioDoc,
TaskDoc- fielddocumentationsystems. Auto-Guide 3000-assisted-steeringsolution.VarioGuide-automaticsteering
solution. Fuse
39
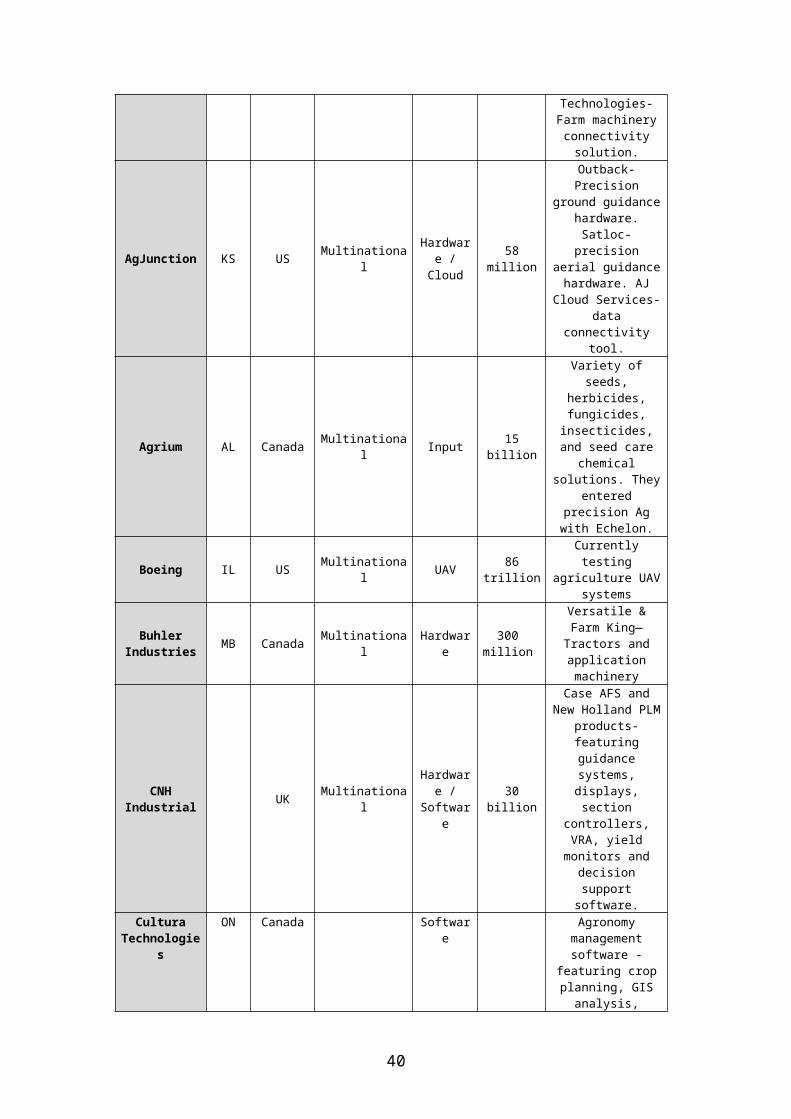
Technologies-Farm machineryconnectivitysolution.
AgJunction KS US Multinational
Hardware /Cloud
58million
Outback-Precision
ground guidancehardware.Satloc-
precisionaerial guidancehardware. AJ
Cloud Services-data
connectivitytool.
Agrium AL Canada Multinational Input 15
billion
Variety ofseeds,
herbicides,fungicides,insecticides,and seed care
chemicalsolutions. They
enteredprecision Agwith Echelon.
Boeing IL US Multinational UAV 86
trillion
Currentlytesting
agriculture UAVsystems
BuhlerIndustries MB Canada Multinationa
lHardwar
e 300 million
Versatile &Farm King—Tractors andapplicationmachinery
CNHIndustrial UK Multinationa
l
Hardware /
Software
30billion
Case AFS andNew Holland PLM
products-featuringguidancesystems,displays,section
controllers,VRA, yieldmonitors anddecisionsupport
software.Cultura
Technologies
ON Canada Software
Agronomymanagementsoftware -
featuring cropplanning, GISanalysis,
40

Reporting andfield history
tools.Financial andAccountingsoftware.
Table 6. Public companies offering precision agriculturetechnologies (cont.)
41

42
CompanyHQState
HQCountry
National /Multinationa
l
Offering type
Annualturnover(USD)
PrecisionAg Products
Deere &Co. IL US Multinationa
l
Hardware /
Software /
Cloud /Sensors
37billion
Completeline ofdisplays,reveivers,guidance,controllers, and datamanagementsolutions.
DigiInternatio
nalMN US Multinationa
l
Hardware /
Software /Cloud
Etherios- acloud
solution.Social
machine-software
applicationto connect
everydevice- Canbe usefulfor fleetmanagement
DowAgroScienc
esIN US Multinationa
l
Input /Softwar
e
57billion
Enlist &Enlist app-
weedmanagementcontrol
system andapp.
Dupont DE US Multinational
Software /
Cloud /Sensors
34billion
EncircaView- an
informationrecord/shar
ingsoftwarebetweenusers andhyper-localweatherprovider.EncircaYield
NitrogenManagementService-allows tomanageinput
accordingto datagatheredfrom thefield
(weather,soil, etc.)
E-Markets CO US Software
CINCH &Intellego-agribusines
saccountingsolutions
ExelIndustries France Multinationa
lHardwar
e900
million
Spreaders,tractors,harvesters
andseeders.

Table 6. Public companies offering precision agriculturetechnologies (cont.)
CompanyHQ
State
HQCountry
National /Multinatio
nal
Offering
type
Annualturnov
er(USD)
PrecisionAg
Products
HardiInternatio
nalDenmark Multinationa
l Hardware
VR sprayersand
controllers. Nozzleselectorapp.
HexagonGeospatial AL US Multinationa
l Software 14billion
GeoMedia-GIS
Managementsoftware.ERDAS-remote
sensing andimage
analysis.LiDAR-high-
accuracyelevationdata.
MapWorks-field datacaptureapp.
IBM NY US Multinational
Software/ Cloud
99billion
DeepThunder-hyper-local,
short-term,customizedweatherforecast
foragriculture
.
Iteris CA US Software/ Cloud
> 60Million
ClearPathAG-
hyperlocalcustomizedweather foragribusines
s.
Kuhn France Multinational Hardware > 50
Million
Precisionseeding andfertilizermachinery
Lindsay NE US Multinationa Hardware 400 Zimmatic
43
Corporation l
/Software
/Sensors
Million
IrrigationLine-
VariableRate
Irrigationsystem withsoftware
for remoteirrigationmanagement(FieldNET)
MDAInformation Systems
LLC
MD US Multinational Software 2
billion
Cropcast-weather andsatellitedata forcommoditytraders and
foodcompanies.
Otheranalyticaltools for
cropmonitoring
andanalysis.
Table 6. Public companies offering precision agriculturetechnologies (cont.)
Monsanto MO US Multinational
Input /Software
/Hardware
14billion
FieldScripts Software-VariableRate
SeedingPrescription Software.ClimateBasic and
Pro-DecisionSupport
Tool. 20/20line.
OmniStar TX US Hardware OmniSTARHP,
OmniSTARG2,
OmniSTARXP,
44
OmniSTARVBS-
Satelliteguidancenetworks
andsolutions
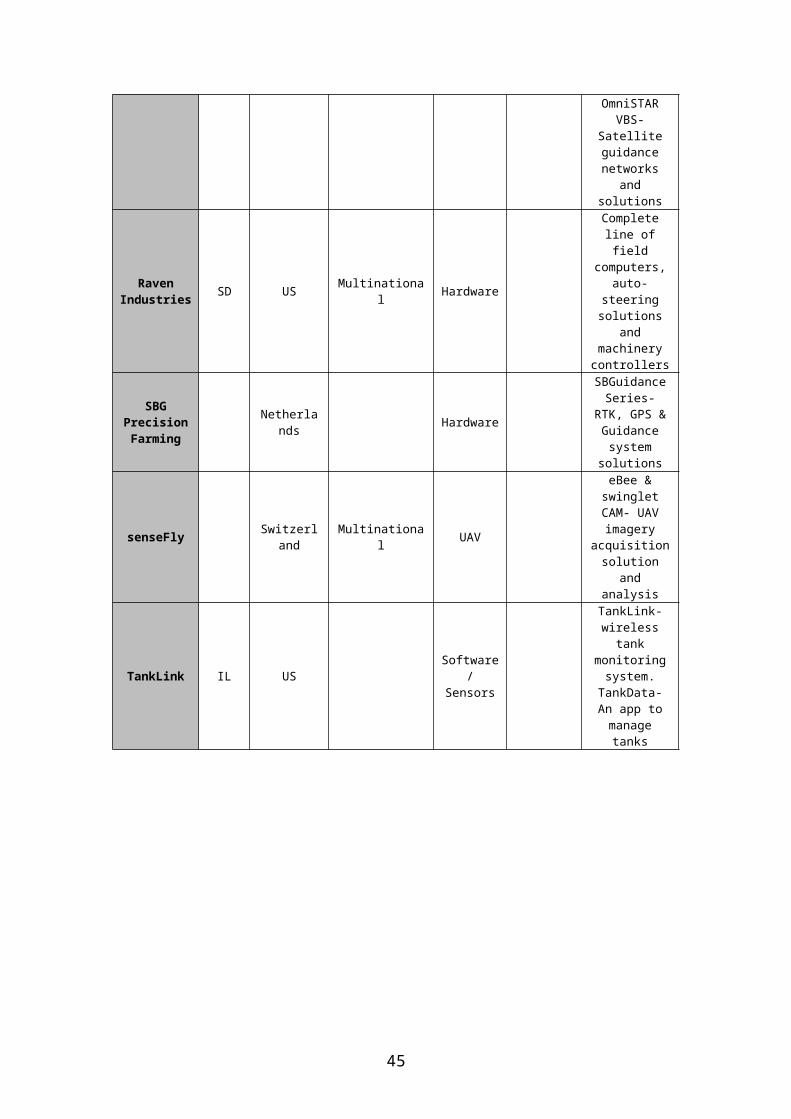
RavenIndustries SD US Multinationa
l Hardware
Completeline offield
computers,auto-
steeringsolutions
andmachinerycontrollers
SBGPrecisionFarming
Netherlands Hardware
SBGuidanceSeries-
RTK, GPS &Guidancesystem
solutions
senseFly Switzerland
Multinational UAV
eBee &swingletCAM- UAVimagery
acquisitionsolution
andanalysis
TankLink IL USSoftware
/Sensors
TankLink-wirelesstank
monitoringsystem.TankData-An app tomanagetanks
45

Table 6. Public companies offering precision agriculturetechnologies (cont.)
CompanyHQ
State
HQCountry
National /Multinational
Offering
type
Annualturnover
(USD)
PrecisionAg
Products
Topcon Japan Multinational
Hardware/
Software/
Cloud /Sensors
6trillion(Toshiba
)
Guidancesystems,
applicationcontrolsystems,field datacollectors,
GPSreceivers,crop canopysensors,SGIS
Farm&Pro-data
managementand analysissoftware
TrimbleNavigation CA US Multinational
Software/
Cloud /Sensors
2billion
GreenSeeker—Crop healthassessmentsensor,
ConnectedFarm—FieldManagementsoftwaresolution &
datamanagement.FarmWorks-mappingsoftware
ublox Switzerland Multinational Hardware 240
million
Positioningdevices &Fastrax
software-positioningsoftware
ValleyIrrigation
NE US Multinational Hardware/
Software
3billion
Variablerate
irrigationequipment.BaseStation
3-Irrigationsystemsremote
46
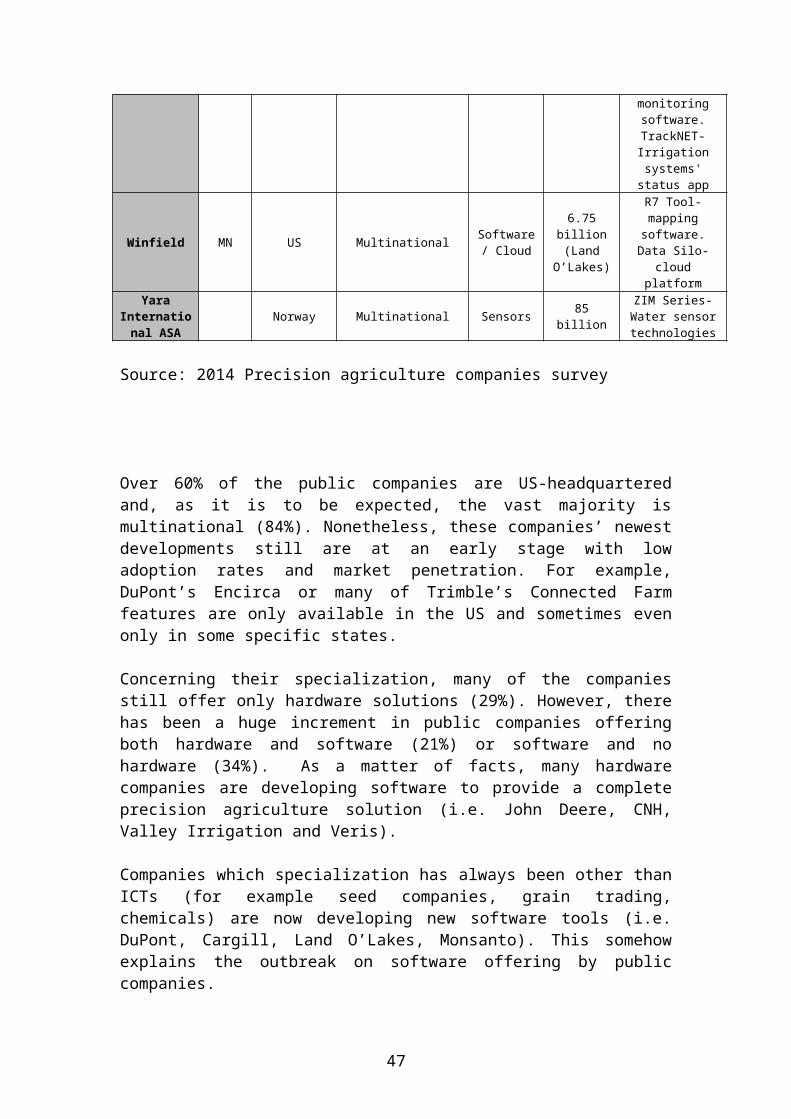
monitoringsoftware.TrackNET-Irrigationsystems'status app
Winfield MN US Multinational Software/ Cloud
6.75billion(Land
O’Lakes)
R7 Tool-mapping
software.Data Silo-
cloudplatform
YaraInternational ASA
Norway Multinational Sensors 85billion
ZIM Series-Water sensortechnologies
Source: 2014 Precision agriculture companies survey
Over 60% of the public companies are US-headquarteredand, as it is to be expected, the vast majority ismultinational (84%). Nonetheless, these companies’ newestdevelopments still are at an early stage with lowadoption rates and market penetration. For example,DuPont’s Encirca or many of Trimble’s Connected Farmfeatures are only available in the US and sometimes evenonly in some specific states.
Concerning their specialization, many of the companiesstill offer only hardware solutions (29%). However, therehas been a huge increment in public companies offeringboth hardware and software (21%) or software and nohardware (34%). As a matter of facts, many hardwarecompanies are developing software to provide a completeprecision agriculture solution (i.e. John Deere, CNH,Valley Irrigation and Veris).
Companies which specialization has always been other thanICTs (for example seed companies, grain trading,chemicals) are now developing new software tools (i.e.DuPont, Cargill, Land O’Lakes, Monsanto). This somehowexplains the outbreak on software offering by publiccompanies.
47

This is a clear example that large companies are enteringthe precision farming software race.
Figure 12. Offering type among public companies
Hardware29%
Hardware / Software
21%
Software*34%
Other (UAV, Sensors)
16%
Offering type among public companies
*These companies do not develop only softwareSource: 2014 Precision agriculture companies survey
4.1.3. Private companies
Country ratios’ for private companies is very similar tothe one for total companies (public + private). This is afurther aspect proving that the US is leading inprecision farming industry, with 70% of the privatecompanies, followed by far by Canada with only 9% ofthem. Once again, the Midwest and California regionsconcentration- 30% of private companies in the world-partially explains this ratio.Figure 13. Private companies by country
48
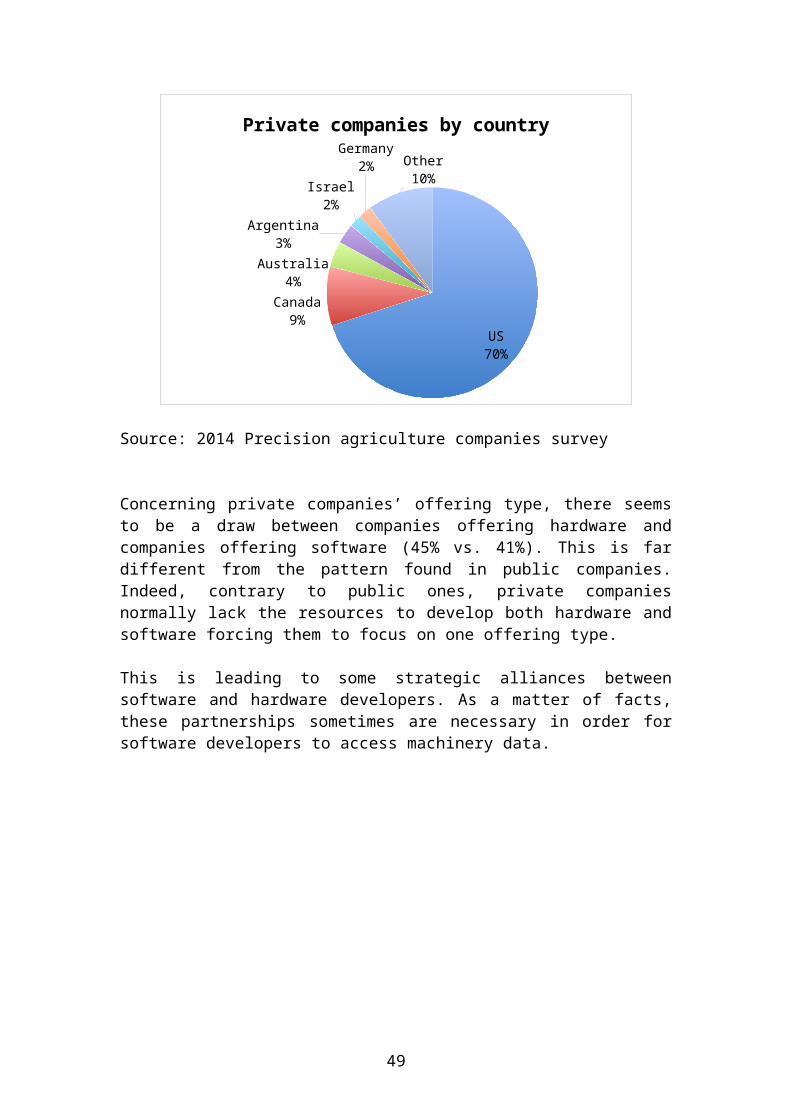
US70%
Canada9%
Australia4%
Argentina3%
Israel2%
Germany2% Other
10%
Private companies by country
Source: 2014 Precision agriculture companies survey
Concerning private companies’ offering type, there seemsto be a draw between companies offering hardware andcompanies offering software (45% vs. 41%). This is fardifferent from the pattern found in public companies.Indeed, contrary to public ones, private companiesnormally lack the resources to develop both hardware andsoftware forcing them to focus on one offering type.
This is leading to some strategic alliances betweensoftware and hardware developers. As a matter of facts,these partnerships sometimes are necessary in order forsoftware developers to access machinery data.
49

Figure 14. Offering type among private companies
Hardware45%
Hardware / Software11%
Software41%
Other3%
Offering type among private companies
Source: 2014 Precision agriculture companies survey
Concerning multinational / national percentages byoffering type, it seems that software companies arecatching up with hardware companies. Indeed, thepercentage of multinational software companies isslightly fewer than that of hardware companies (25% vs.31%).
As for companies offering hardware and software, themulti / national ratio is more equilibrated, near 50 –50. This stresses that these kinds of companies are ingeneral larger companies with more resources.
50

Figure 15. Multinational and national companies byoffering type
Hardware Hardware & Software
Software
31%48%
25%
69%52%
75%
Multinational and national companies by offering type
Multinational National
Source: 2014 Precision agriculture companies survey
The next two figures summarize the respondent annualturnover and number of employees by offering type inorder to have an idea of the different companies’ size inthe precision agriculture industry.
Both charts seem to indicate a tendency where privatesoftware companies are mostly at early stages. As a
51
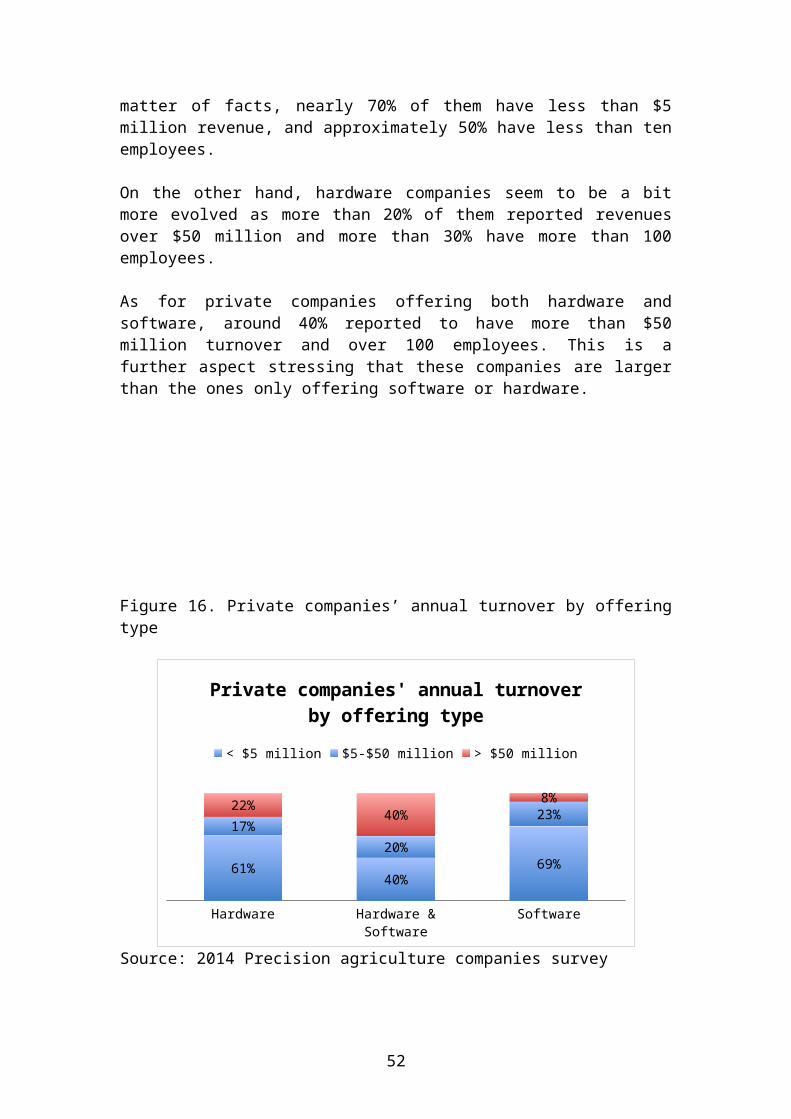
matter of facts, nearly 70% of them have less than $5million revenue, and approximately 50% have less than tenemployees.
On the other hand, hardware companies seem to be a bitmore evolved as more than 20% of them reported revenuesover $50 million and more than 30% have more than 100employees.
As for private companies offering both hardware andsoftware, around 40% reported to have more than $50million turnover and over 100 employees. This is afurther aspect stressing that these companies are largerthan the ones only offering software or hardware.
Figure 16. Private companies’ annual turnover by offeringtype
Hardware Hardware & Software
Software
61%40%
69%
17%20%
23%22% 40%8%
Private companies' annual turnover by offering type
< $5 million $5-$50 million > $50 million
Source: 2014 Precision agriculture companies survey
52
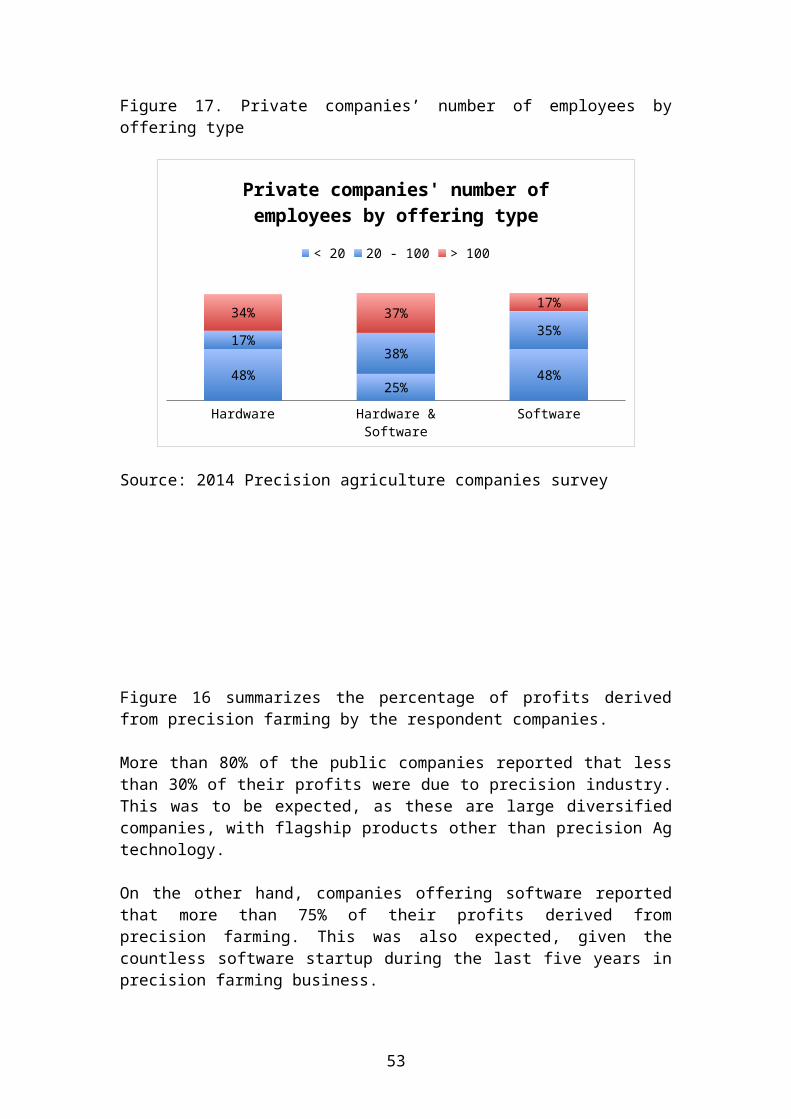
Figure 17. Private companies’ number of employees byoffering type
Hardware Hardware & Software
Software
48%25%
48%
17%38%
35%34% 37% 17%
Private companies' number of employees by offering type
< 20 20 - 100 > 100
Source: 2014 Precision agriculture companies survey
Figure 16 summarizes the percentage of profits derivedfrom precision farming by the respondent companies.
More than 80% of the public companies reported that lessthan 30% of their profits were due to precision industry.This was to be expected, as these are large diversifiedcompanies, with flagship products other than precision Agtechnology.
On the other hand, companies offering software reportedthat more than 75% of their profits derived fromprecision farming. This was also expected, given thecountless software startup during the last five years inprecision farming business.
53
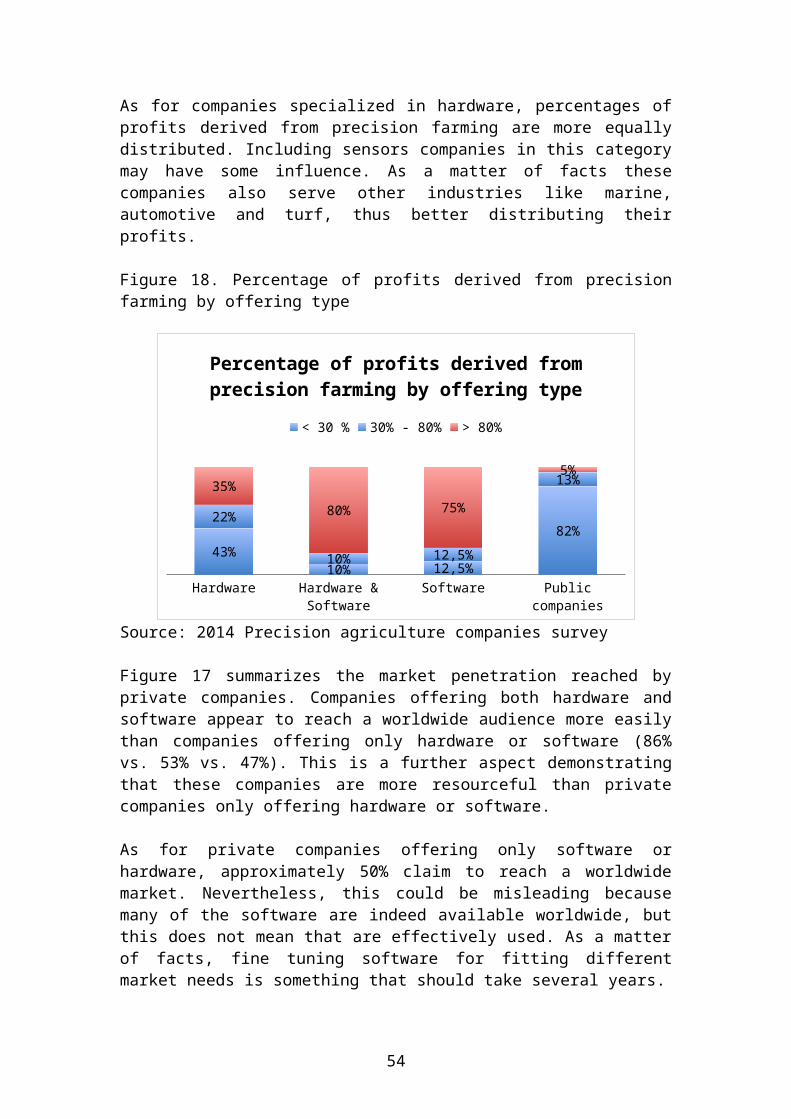
As for companies specialized in hardware, percentages ofprofits derived from precision farming are more equallydistributed. Including sensors companies in this categorymay have some influence. As a matter of facts thesecompanies also serve other industries like marine,automotive and turf, thus better distributing theirprofits.
Figure 18. Percentage of profits derived from precisionfarming by offering type
Hardware Hardware & Software
Software Public companies
43%10% 12,5%
82%22%
10% 12,5%
13%35%80% 75%
5%
Percentage of profits derived from precision farming by offering type
< 30 % 30% - 80% > 80%
Source: 2014 Precision agriculture companies survey
Figure 17 summarizes the market penetration reached byprivate companies. Companies offering both hardware andsoftware appear to reach a worldwide audience more easilythan companies offering only hardware or software (86%vs. 53% vs. 47%). This is a further aspect demonstratingthat these companies are more resourceful than privatecompanies only offering hardware or software.
As for private companies offering only software orhardware, approximately 50% claim to reach a worldwidemarket. Nevertheless, this could be misleading becausemany of the software are indeed available worldwide, butthis does not mean that are effectively used. As a matterof facts, fine tuning software for fitting differentmarket needs is something that should take several years.
54
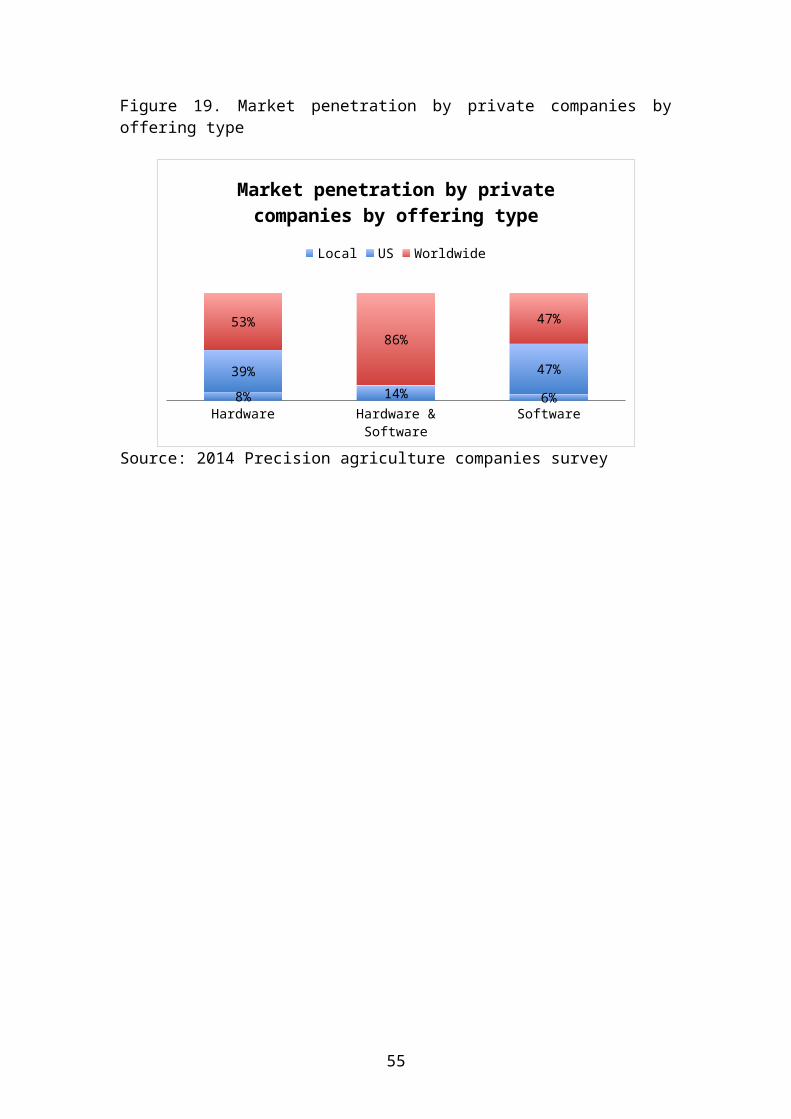
Figure 19. Market penetration by private companies byoffering type
Hardware Hardware & Software
Software8% 6%39%
14%47%
53%86%
47%
Market penetration by private companies by offering type
Local US Worldwide
Source: 2014 Precision agriculture companies survey
55
4.1.3.1. Companies specialized in hardware
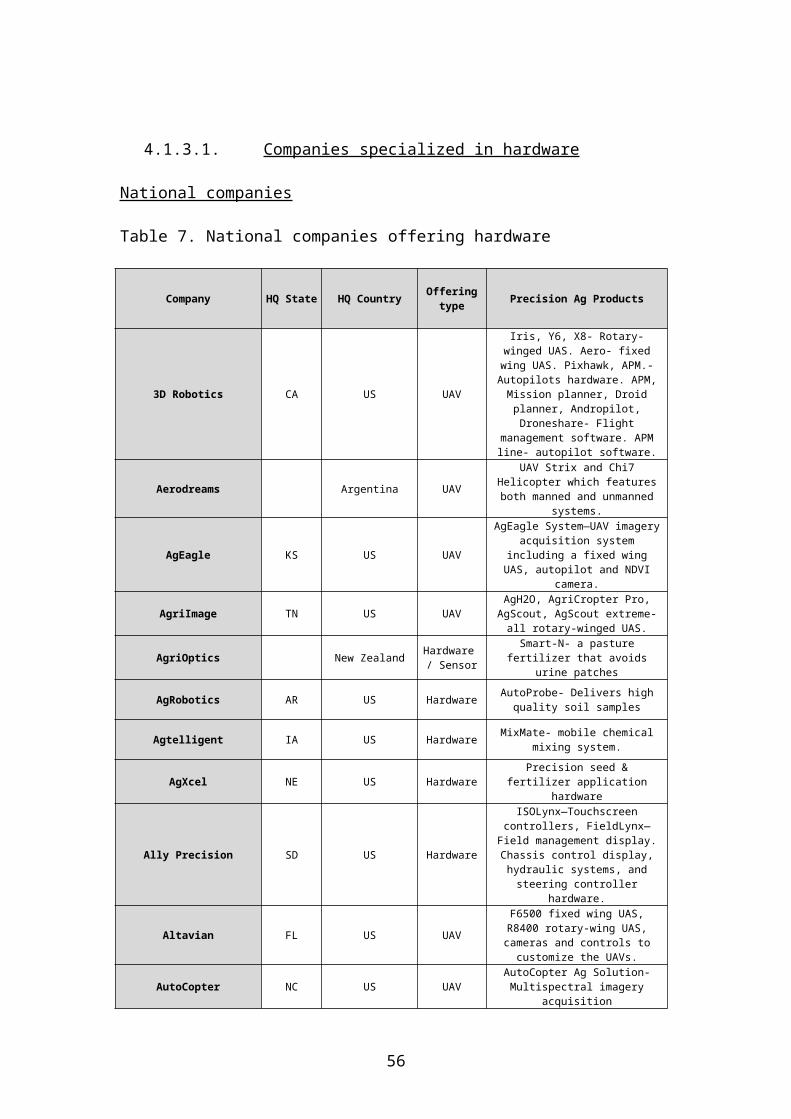
National companies
Table 7. National companies offering hardware
Company HQ State HQ Country Offeringtype Precision Ag Products
3D Robotics CA US UAV
Iris, Y6, X8- Rotary-winged UAS. Aero- fixedwing UAS. Pixhawk, APM.-Autopilots hardware. APM,Mission planner, Droidplanner, Andropilot,Droneshare- Flight
management software. APMline- autopilot software.
Aerodreams Argentina UAV
UAV Strix and Chi7Helicopter which featuresboth manned and unmanned
systems.
AgEagle KS US UAV
AgEagle System—UAV imageryacquisition system
including a fixed wingUAS, autopilot and NDVI
camera.
AgriImage TN US UAVAgH2O, AgriCropter Pro,
AgScout, AgScout extreme-all rotary-winged UAS.
AgriOptics New Zealand Hardware / Sensor
Smart-N- a pasturefertilizer that avoids
urine patches
AgRobotics AR US Hardware AutoProbe- Delivers highquality soil samples
Agtelligent IA US Hardware MixMate- mobile chemicalmixing system.
AgXcel NE US HardwarePrecision seed &
fertilizer applicationhardware
Ally Precision SD US Hardware
ISOLynx—Touchscreencontrollers, FieldLynx—
Field management display.Chassis control display,hydraulic systems, andsteering controller
hardware.
Altavian FL US UAV
F6500 fixed wing UAS,R8400 rotary-wing UAS,cameras and controls to
customize the UAVs.
AutoCopter NC US UAVAutoCopter Ag Solution-Multispectral imagery
acquisition
56
Back40 Precision IL US Hardware / UAV
GNSS / GPS Receivers withSBAS correction optional.Currently working on an
UAV for agriculture
Barron BrothersInternational GA US Hardware
BBI line of fertilizer andlime spreaders for
Variable Rate Application.Task Command System—New
Guidance system featuringVariable Rate Application
Bestway KS US Hardware / Sensor
AutoGlide—Auto Boom HeightControl System
Blue RiverTechnologies CA US Hardware
/ Sensors
LettuceBot- Automated weedelimination solution inlettuce crops. Currently
working on the samesolution for corn and
soybeans
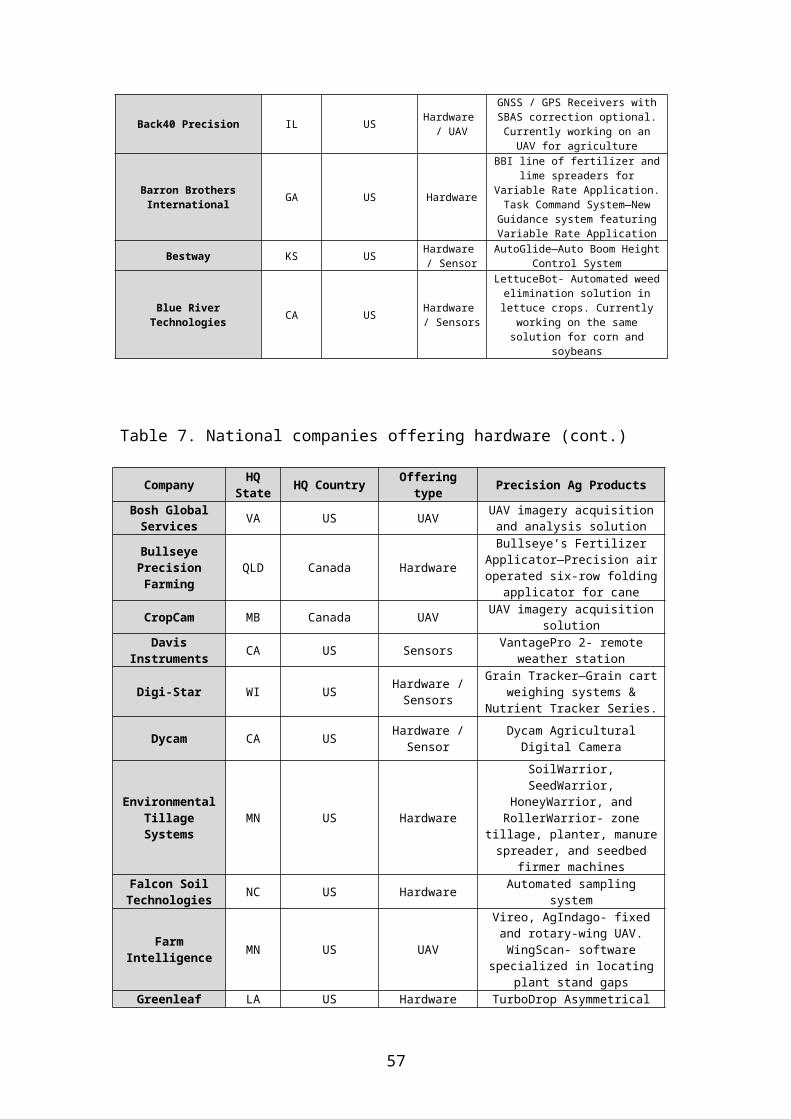
Table 7. National companies offering hardware (cont.)
Company HQState HQ Country Offering
type Precision Ag Products
Bosh GlobalServices VA US UAV UAV imagery acquisition
and analysis solution
BullseyePrecisionFarming
QLD Canada Hardware
Bullseye’s FertilizerApplicator—Precision airoperated six-row folding
applicator for cane
CropCam MB Canada UAV UAV imagery acquisitionsolution
DavisInstruments CA US Sensors VantagePro 2- remote
weather station
Digi-Star WI US Hardware /Sensors
Grain Tracker—Grain cartweighing systems &
Nutrient Tracker Series.
Dycam CA US Hardware /Sensor
Dycam AgriculturalDigital Camera
EnvironmentalTillageSystems
MN US Hardware
SoilWarrior,SeedWarrior,
HoneyWarrior, andRollerWarrior- zone
tillage, planter, manurespreader, and seedbed
firmer machinesFalcon SoilTechnologies NC US Hardware Automated sampling
system
FarmIntelligence MN US UAV
Vireo, AgIndago- fixedand rotary-wing UAV.WingScan- software
specialized in locatingplant stand gaps
Greenleaf LA US Hardware TurboDrop Asymmetrical
57

TechnologiesDualFan- lower drift andmore efficiency in each
pass.
Hawkeye UAV New Zealand UAV
RQ-84Z & RQ-84Z2- fixed-wing UAV with
multispectral cameraoption.
Headsight IN US Hardware /Sensors
Headsight Sensors-Height control systems.Truesight- Row guidance
system.
Honey Comb. OR US UAV AgDrone UAS- a fixedwing drone.
IntelligentAgriculturalSolutions
ND US Hardware /Sensor
Wireless BlockageMonitor & Active Depth
Controller.
ISISGeomatics AB Canada UAV /
Satellite
Pix4D- aerial imageprocessing software.EnsoMOSAIC UAV- readsUAV images. Tetracam-multispectral camera.
Jacto SP Brazil HardwareBoom height & Section
control, Guidancesystems, Ag Cameras
Junge Control IA US Hardware
Automated chemical andfertilizer mixing for
ground and aerialapplication
LoupElectronics NE US Hardware /
SensorsYield & drill monitorsand various sensors
Magictec MI US HardwareAutomatic Soil Probe- a
high accuracy soilsampling system
Metos Austria Sensors iMETOS- Weather stationsMicrodrones
GmbH Germany UAV md4- rotary-wing UAVs
Micro TrakSystems MN US Hardware /
Sensors
DrillMaster—AutomaticRate Controller, Calc-An-Acre II—Speed and
area monitor, Flow- TrakII & FlowMate—Flowmonitors, hydrauliccontrol valves andmotors, and speed
sensorsTable 7. National companies offering hardware (cont.)
Company HQState
HQCountry
Offeringtype Precision Ag Products
MyWay RTK IL US HardwareAgriculture customized RTK
system to assist in auto-steerand field mgmt.
NozzleworksInc. WA US Hardware Variable Orifice Nozzle- VRA
nozzleOptima France Hardware Genius Series- Electronic
58
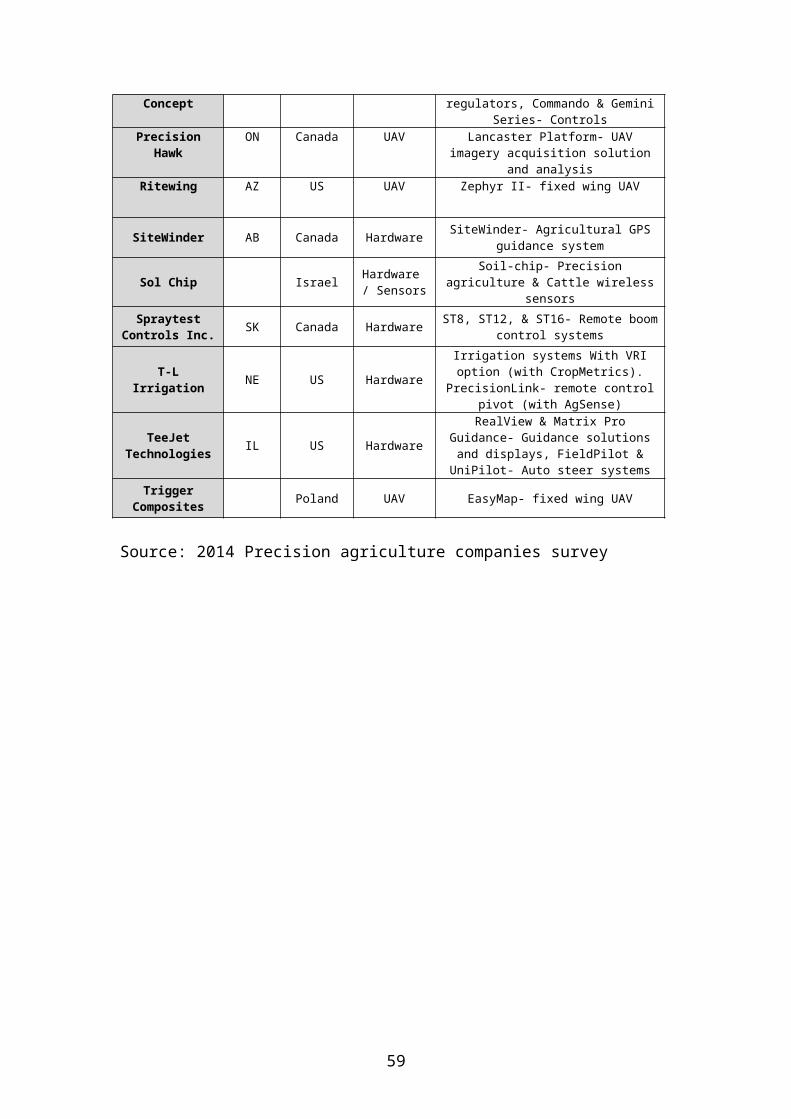
Concept regulators, Commando & GeminiSeries- Controls
PrecisionHawk
ON Canada UAV Lancaster Platform- UAVimagery acquisition solution
and analysisRitewing AZ US UAV Zephyr II- fixed wing UAV
SiteWinder AB Canada Hardware SiteWinder- Agricultural GPSguidance system
Sol Chip Israel Hardware / Sensors
Soil-chip- Precisionagriculture & Cattle wireless
sensorsSpraytest
Controls Inc. SK Canada Hardware ST8, ST12, & ST16- Remote boomcontrol systems
T-LIrrigation NE US Hardware
Irrigation systems With VRIoption (with CropMetrics).
PrecisionLink- remote controlpivot (with AgSense)
TeeJetTechnologies IL US Hardware
RealView & Matrix ProGuidance- Guidance solutionsand displays, FieldPilot &UniPilot- Auto steer systems
TriggerComposites Poland UAV EasyMap- fixed wing UAV
Source: 2014 Precision agriculture companies survey
59

Multinational companies
Table 8. Multinational companies offering hardware
Company HQState HQ Country Offering
type Precision Ag Products
Airware CA US UAV
osFlex Pilot—UAV customizableautopilot. In addition,
currently working on a aerialinformation platform
connectingsensors/cloud/software.
Amazone GmbH Germany Hardware
Comprehensive variety ofhardware and heavy equipment,
including precisionspreaders, tillage, rollers,
and seed drills
ARAG Italy Hardware Precision Ag sprayingproducts
Capstan KS US Hardware
Pinpoint, SharpShooter, N-Ject, Synchro- Variable Rate
Application hardware,specialized in liquid
fertilizers.
CLAAS Germany Hardware
Efficient Agriculture Systems(E.A.S.Y) products: auto-steering, guidance systems,remote monitoring and online
telematics systems.
DICKEY-johnCorporation AL US Hardware /
Sensors
Precision plantinghardware/sensors, autosteer,autosection control, groundspeed adapters and sensors
solutions.
Force IA US Hardware VRA hardware
Greentronics ON US Hardware
RiteHeight- Boom spray heighcontrol. RiteDepth- plantingdepth control. Rite yield-
yield monitors.
Hiniker MN US Hardware
Cultivators, Sprayers,Controllers, Shredders, &
Hiniker VOD- Variable orificedistributor.
IDETEC Chile UAV StarDust & Sirol- fixed wingUAV. iMK8- rotary-wing UAV.
Juniper Systems UT US Hardware /Sensors
Mirus- Harvest datacollection software. Field
Research Software- field datacollection software.
Kinze IA US Hardware
Kinze Variable Rate Planters& Currently working on and
electric multi-hybridplanter.
60
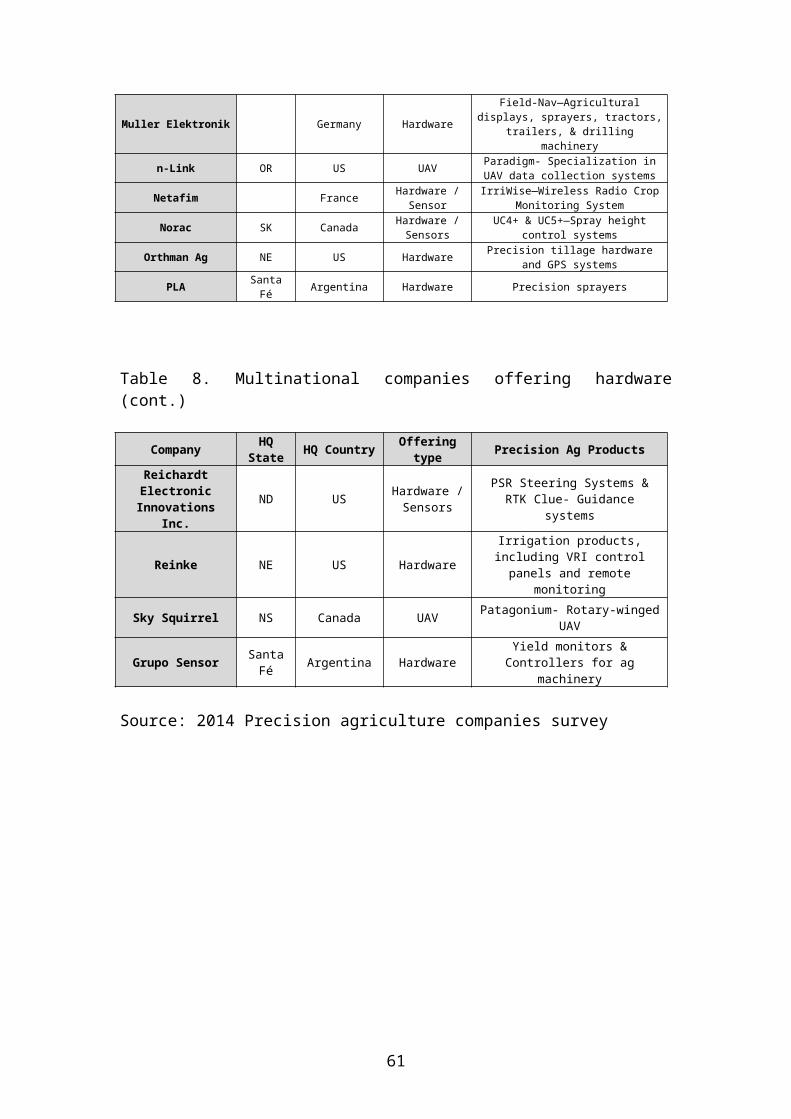
Muller Elektronik Germany Hardware
Field-Nav—Agriculturaldisplays, sprayers, tractors,
trailers, & drillingmachinery
n-Link OR US UAV Paradigm- Specialization inUAV data collection systems
Netafim France Hardware /Sensor
IrriWise—Wireless Radio CropMonitoring System
Norac SK Canada Hardware /Sensors
UC4+ & UC5+—Spray heightcontrol systems
Orthman Ag NE US Hardware Precision tillage hardwareand GPS systems
PLA SantaFé Argentina Hardware Precision sprayers
Table 8. Multinational companies offering hardware(cont.)
Company HQState HQ Country Offering
type Precision Ag Products
ReichardtElectronicInnovations
Inc.
ND US Hardware /Sensors
PSR Steering Systems &RTK Clue- Guidance
systems
Reinke NE US Hardware
Irrigation products,including VRI controlpanels and remote
monitoring
Sky Squirrel NS Canada UAV Patagonium- Rotary-wingedUAV
Grupo Sensor SantaFé Argentina Hardware
Yield monitors &Controllers for ag
machinery
Source: 2014 Precision agriculture companies survey
61

4.1.3.2. Companies specialized in software
National companies
Table 9. National companies offering software
Company HQState HQ Country Offering
type Precision Ag Products
Advanced AgSolutions IN US Software /
Cloud
Optimizer- Decision Supporttool, for creating VR
recommendations, crop scouting,and crop planning.
AdvancedReconnaissance
Corp.NY US Software /
Sensors
Airborne and ground sensorssystems. AgVu- crop analysis &
mapping tool.
Ag Connections KY US Software /Cloud
Land.db- Farm managementsoftware. Land.db Viewer-
Information display software.AgC Mobile- Mobile database
access for Land.db users. Farmby Phone- Remote repportingtool. Map.db- field mapping
application.
62

Ag Integrated PA US Software /Cloud
Onsite App- collection of as-applied and yield files, aswell as prescription filestransfer to major OEMs.
AgData Autralia QLD Australia Software /Cloud
Phoenix Production Software—Suite of modules for
agribusiness management.Phoenix Live—Cloud storagesystem. Phoenix Financials-financial management software
for farmers.
AgDNA QLD Australia Software /Cloud
Mobile Farm Management servicesincluding mobile record
keeping, GPS mapping, Scoutingobservations, Fleet Tracking
AgNition ON Canada Software /Cloud
ScoutDoc—Mobile field scoutingmobile application
Agrian CA US SoftwareAdvisor, Grower, Applicator,Retail and Mobile- Decision
Support Tools.
AgriApps South Africa Software /Cloud
Currently working on FleetManager- a fleet management
software
AgriData ND US SoftwareSurety Online Mapping—Mappingsoftware (with FSA, soil and
topography maps).
Agri-Trend AB Canada Software /Cloud
AgriData- a cloud-basedsolution for field processes
data storage.
AgriculturalInformatics IL US Software It's a startup providing data
for developers (via APIs).
AgriSolutions IL US SoftwareAgManager- A financial
management system. AgIQ- dataaccess software
Agri-vision MO US SoftwareAgVision Grain Software-Accounting and inventory
management suite.
AgSmart UK Software /Cloud
Cloud-based services. Datareports from UK farms. Imagery
for UK.
AgSquared NY US Software /Cloud
AgSquared—Field planning,management and record keepingsoftware for small farms.
Table 9. National companies offering software (cont.)
Company HQState HQ Country Offering
type Precision Ag Products
AgSync IN US Software /Cloud
AgriSite- Scouting application.AgSync Logistics- logisticsoftware. AgSync Operator-employees tracking app.
AgWorks IA US Software /Cloud
AgOS software- featuringscouting, compliancy, mapping,crop planning and precision
63

agronomy tool (w/ VR Rxincluded).
Appareo Hardware /Software
Wireless Blockage Monitor-blockage monitoring system forair-seeding implements. ActiveDepth Controller- for sugar beetharvest. Custom Ag Solutions
aWhere CO US Software /Cloud
aWhere Platform- softwareincorporating weather, long-term
climate scenarios, markets,trials and global research data.
CrescoAg TN US Software Currently working on a suite forfarm data management
Conservis MN US Software /Cloud
Conservis- Farm managementsoftware
Crop DataManagementServices
CA US Software
Advisor- Decision Support Systemfeaturing mapping, scouting,sampling, crop protection and
planning tools.
CropMetrics NE US Software
Virtual Agronomist—Fieldmanagement software for
irrigated and non-irrigatedareas
dataTRESH IA US Software
Farmer Community- a forum wherefarmers can learn and discuss
data/precision ag issues.Currently working on a precision
ag software.
Decisive Farming AB Canada Software /Cloud
My Farm Manager—Field managementsoftware. Optimize RX- VR
Recommendations software. Know-Risk- risk management solution.
DN2K CO US Software /Cloud
DN2K- Cloud storage solution.MyAgCentral- Decision Support
Tool.
E4 CropIntelligence IA US Software
E4 Software- featuring tenmodules including mapping,
planning, budgeting, VR Recs,and weather tools.
Echelon SK Canada Software
EchelonConnect, LevelONE, &PrecisionVRT- Field managementsoftware and Decision Support
Tool
eLEAF Netherlands Software PiMapping—Vegetation remotesensing and analysis system
Fairport FarmSoftware Australia Software
PAM-a Decision Support Toolfeaturing mapping, VR Recs,asset tracking, livestockmanagement, irrigation, andaccounting. PocketPAM2- themobile app for PAM users.
Table 9. National companies offering software (cont.)
64

Company HQState HQ Country Offering
type Precision Ag Products
Farmade Mgmt.Systems Ltd. UK Software
Gatekeeper- a suite ofdesktop and mobile app forfarmers and agronomists
Farmeron CA US Software / Cloud
Farmeron- Dairy farmmanagement and analysis
software. Currently workingon crop analysis software.
FarmersEdge KS US Software / Cloud
Precision Edge- web-basedGIS software and decision
support tool
FarmLink MO US Software / Sensors
TrueHarvest- a tool forsetting yield potential in
small areas
FarmLogs MI US Software / Cloud
FarmLogs- Field managementsoftware.
iCropTrak AZ US Software / Cloud
iCropTrak Soil- soilsampling app. iCropTrakScout- scouting app.
iCropTrak complete- farmmanagement app.
iLincTechnologies GA US
Software / Cloud /Sensors
FarmLinc- Decision supporttool integrating weatherstations and sensors
connected to a software viawireless base station.
TrackLinc- Asset trackingand management solution.
Libera Systems ND US Software / Cloud
Currently working onZoneMap- Variable Rate Map
software
MapShots Inc GA US Software
AgStudio & AgStudio Select-Precision soil fertility,variable rate irrigation &seeding management software
Meteo-Logic Israel Software Wind and Solar powerforecasting
MZB Technologies SD US SoftwareMZB Tools- a software forcreating zone management
maps
Observant Australia Software / Sensors
Solutions for livestockwater, soil moisture andweather monitoring. A web-based platform enables tomanage the system remotely.
OkaraTech Uruguay Software
OKT Recorridas- a scoutingsoftware. OKT Clima- a
hyperlocal weathersoftware.
OnFarm CA US Software OnFARM- Fixed asset andfarm decision management
65

software
Plantium SantaFé Argentina Hardware
/ Cloud
Platinum- display, SteerH &Steer DD- guidance and autosteer systems. SBOX Hub-RTK solution. SBOX Cloud-web-based remote monitoring
tool
Ranch Systems CA USSoftware / Cloud /Sensors
Weather, Soil moisturesensors, weather stations &Farm management software
ScoutPro IA US Software / Cloud
ScoutPro—Corn and Soymanagement app
Table 9. National companies offering software (cont.)
Company HQState HQ Country Offering
type Precision Ag Products
SoftwareSolutions
Integrated (SSI)IL US Software
AgVance- a financialmanagement softwarefeaturing agronomy,
accounting, energy andgrain modules
SoilIQ CA USSoftware / Cloud /Sensors
SoilIQ—Smartphonemanagement app and wirelesssensors for small farmers
and gardens
Soil MAP IA US Software
SoilMap- a decision supporttool including datamanagement, fleet
management, automaticblenders, VR Recs and anaccounting interface.
SpectrumTechnologies IL US Sensors
Weather monitoring,Nutrient management,
Integrated Pest Management,and soil moisture
measurement equipment
TapLogic KY US SoftwareFarmLogic- farm managementsoftware, Soil Test Pro-
soil sampling app, FarmPAD-
TenaciousSystems LLC NY US Software
FarmSoft- Fruit andvegetables farm management
software
United Soils IL US Software IFARM- software focused onsoil sampling
VerisTechnologies KS US Software
/ Sensors
Soil EC, OM and pH- Sensorsfor creating maps.
FieldFusion- software forVRS and VR lime application
Weather TrendsInternational PA US Software
/ Cloudw360- Predictive weather
tool
Wilbur-Ellis CA US Input /Software
AgVerdict- A completedecision support platform
66
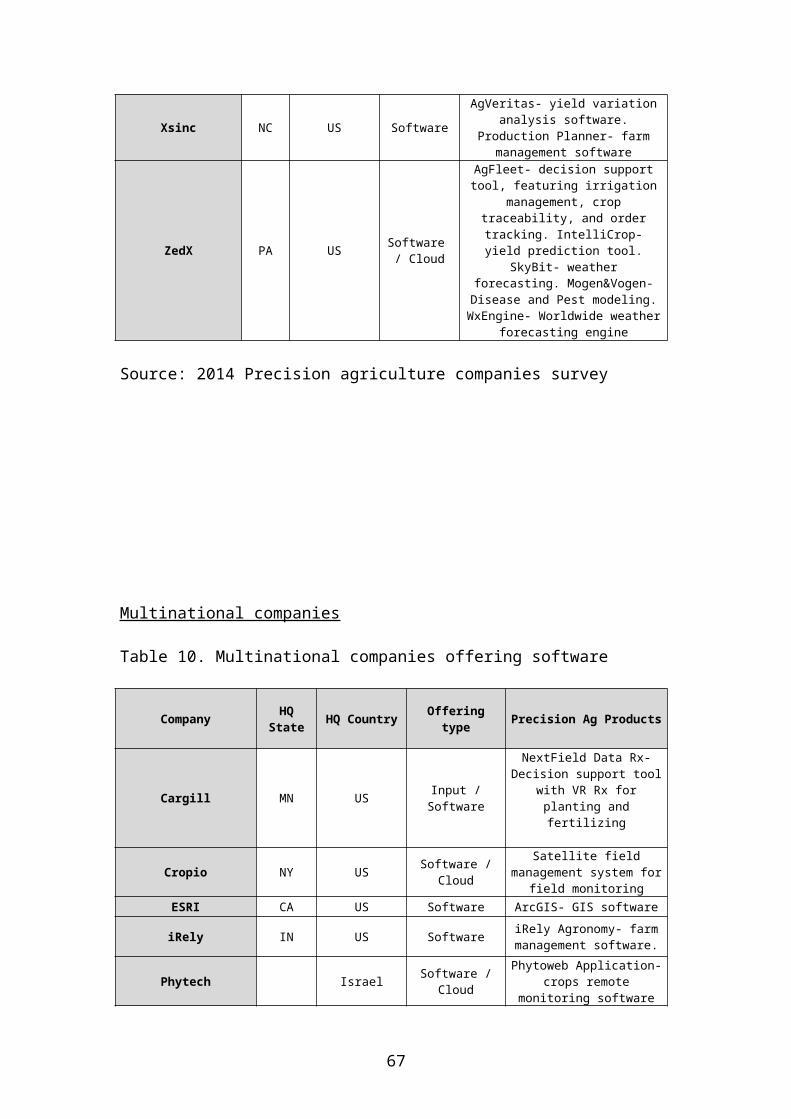
Xsinc NC US Software
AgVeritas- yield variationanalysis software.
Production Planner- farmmanagement software
ZedX PA US Software / Cloud
AgFleet- decision supporttool, featuring irrigation
management, croptraceability, and ordertracking. IntelliCrop-yield prediction tool.
SkyBit- weatherforecasting. Mogen&Vogen-Disease and Pest modeling.WxEngine- Worldwide weather
forecasting engine
Source: 2014 Precision agriculture companies survey
Multinational companies
Table 10. Multinational companies offering software
Company HQState HQ Country Offering
type Precision Ag Products
Cargill MN US Input /Software
NextField Data Rx-Decision support tool
with VR Rx forplanting andfertilizing
Cropio NY US Software /Cloud
Satellite fieldmanagement system for
field monitoringESRI CA US Software ArcGIS- GIS software
iRely IN US Software iRely Agronomy- farmmanagement software.
Phytech Israel Software /Cloud
Phytoweb Application-crops remote
monitoring software
67
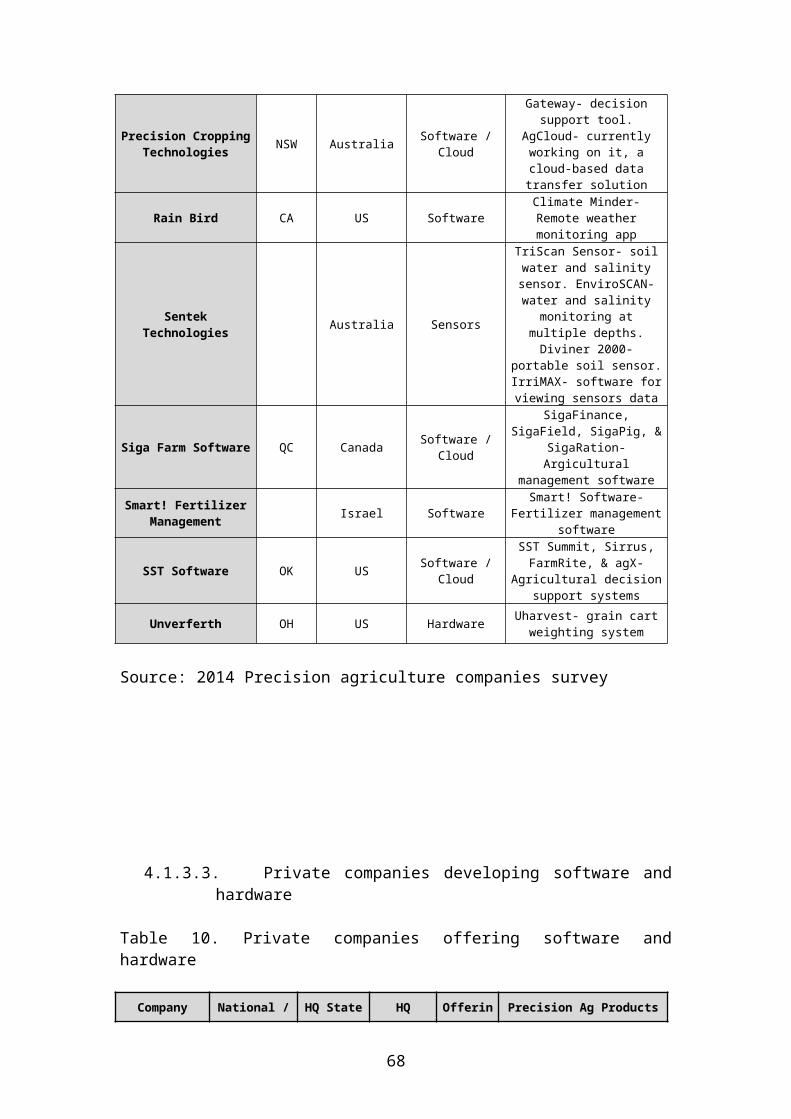
Precision CroppingTechnologies NSW Australia Software /
Cloud
Gateway- decisionsupport tool.
AgCloud- currentlyworking on it, acloud-based datatransfer solution
Rain Bird CA US SoftwareClimate Minder-Remote weathermonitoring app
SentekTechnologies Australia Sensors
TriScan Sensor- soilwater and salinitysensor. EnviroSCAN-water and salinity
monitoring atmultiple depths.Diviner 2000-
portable soil sensor.IrriMAX- software forviewing sensors data
Siga Farm Software QC Canada Software /Cloud
SigaFinance,SigaField, SigaPig, &
SigaRation-Argicultural
management software
Smart! FertilizerManagement Israel Software
Smart! Software-Fertilizer management
software
SST Software OK US Software /Cloud
SST Summit, Sirrus,FarmRite, & agX-
Agricultural decisionsupport systems
Unverferth OH US Hardware Uharvest- grain cartweighting system
Source: 2014 Precision agriculture companies survey
4.1.3.3. Private companies developing software andhardware
Table 10. Private companies offering software andhardware
Company National / HQ State HQ Offerin Precision Ag Products
68

Multinational Country g type
360 YieldCenter National IL US
Hardware /
Software
360 Soil Scan- Infield nitrate,
ammonium and potassiumreadings. 360
Commander- Agronomicdecision-making tool.360 Y Drop- liquid
fertilizer applicator.360 Undercover- inner
canopy spraying.
Ag Leader Multinational IA US
Hardware /
Software /Cloud
SMS / SMS AdvancedSoftware- Completeagronomic decision
support tool. AgFiniti—Cloud storage
solution. Hardware:Displays, guidance,and yield monitoring
solutions.SeedCommand,DirectCommand,
Intelliscope—VariableRate Control systems
Table 10. Private companies offering software andhardware (cont.)
69
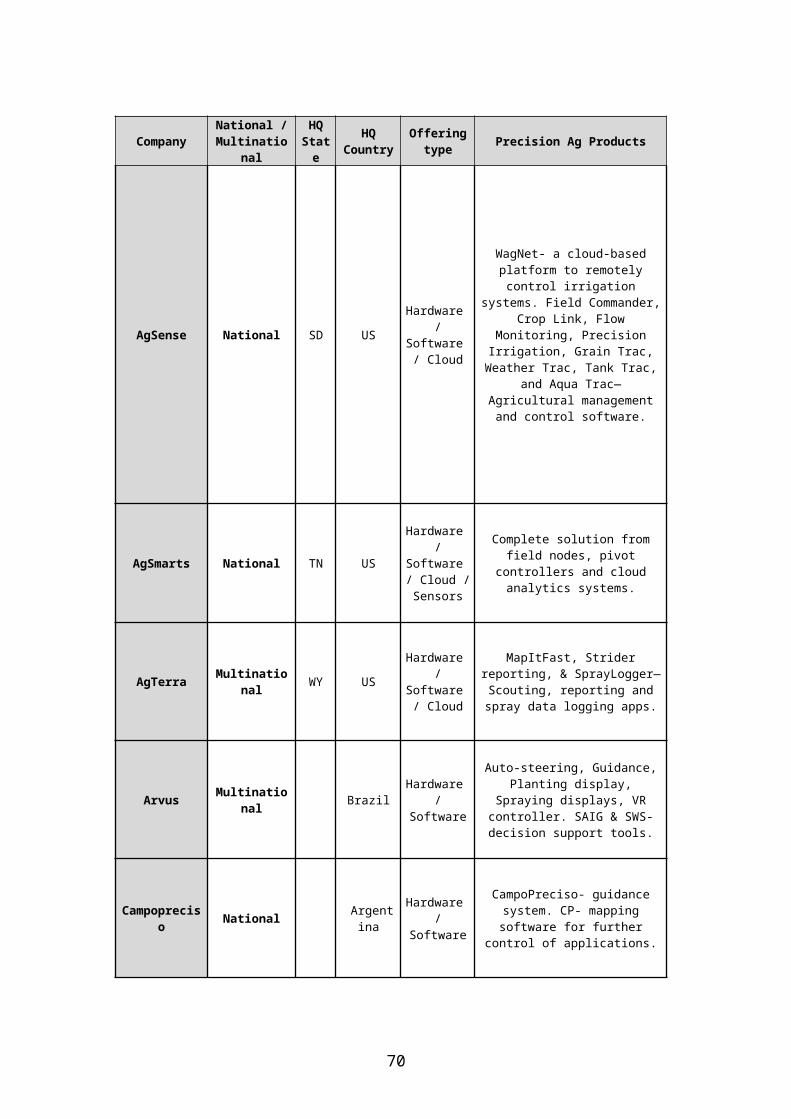
CompanyNational /Multinatio
nal
HQState
HQCountry
Offeringtype Precision Ag Products
AgSense National SD US
Hardware /
Software / Cloud
WagNet- a cloud-basedplatform to remotelycontrol irrigation
systems. Field Commander,Crop Link, Flow
Monitoring, PrecisionIrrigation, Grain Trac,Weather Trac, Tank Trac,
and Aqua Trac—Agricultural managementand control software.
AgSmarts National TN US
Hardware /
Software / Cloud /Sensors
Complete solution fromfield nodes, pivot
controllers and cloudanalytics systems.
AgTerra Multinational WY US
Hardware /
Software / Cloud
MapItFast, Striderreporting, & SprayLogger—Scouting, reporting andspray data logging apps.
Arvus Multinational Brazil
Hardware /
Software
Auto-steering, Guidance,Planting display,
Spraying displays, VRcontroller. SAIG & SWS-decision support tools.
Campopreciso National Argent
ina
Hardware /
Software
CampoPreciso- guidancesystem. CP- mappingsoftware for further
control of applications.
70

Table 10. Private companies offering software andhardware (cont.)
CompanyNational /Multination
al
HQState
HQCountr
y
Offeringtype Precision Ag Products
DroneDeploy National CA US
Hardware /Software /
Cloud
CoPilot- cellular telemetryradio for UAV. And a web-based control softwarefeaturing mapping tools
(i.e.:NDVI)
Farmscan National QLD Australia
Hardware /Software /Sensors
Variety of hardwareincluding guidance, spray
and variable ratecontrollers, camera andsensory equipment, and
LevelGuide (Laser sensor).AgDroid- farm management
mobile app.
Hortau National QC Canada
Hardware /Software /Cloud /Sensors
TX3—Wireless fieldmonitoring station. Weather
Hub- complete weatherstation. Field ControlUnit- remote engines'
control. Irrolis- web-basedirrigation management
software.
71

Table 10. Private companies offering software andhardware (cont.)
CompanyNational /Multination
al
HQState
HQCountr
y
Offeringtype Precision Ag Products
MosaicMill National Finlan
d
Hardware/
Software
EnsoMOSAIC- imageryprocessing software. UAV
cameras
Netirrigate National IN US
Hardware/
Software
PivotProxy- center pivotmonitoring solution.
PumpProxy- wells remotemonitoring solution.
Netirrigate software- forremote monitoring of theentire irrigation system
72
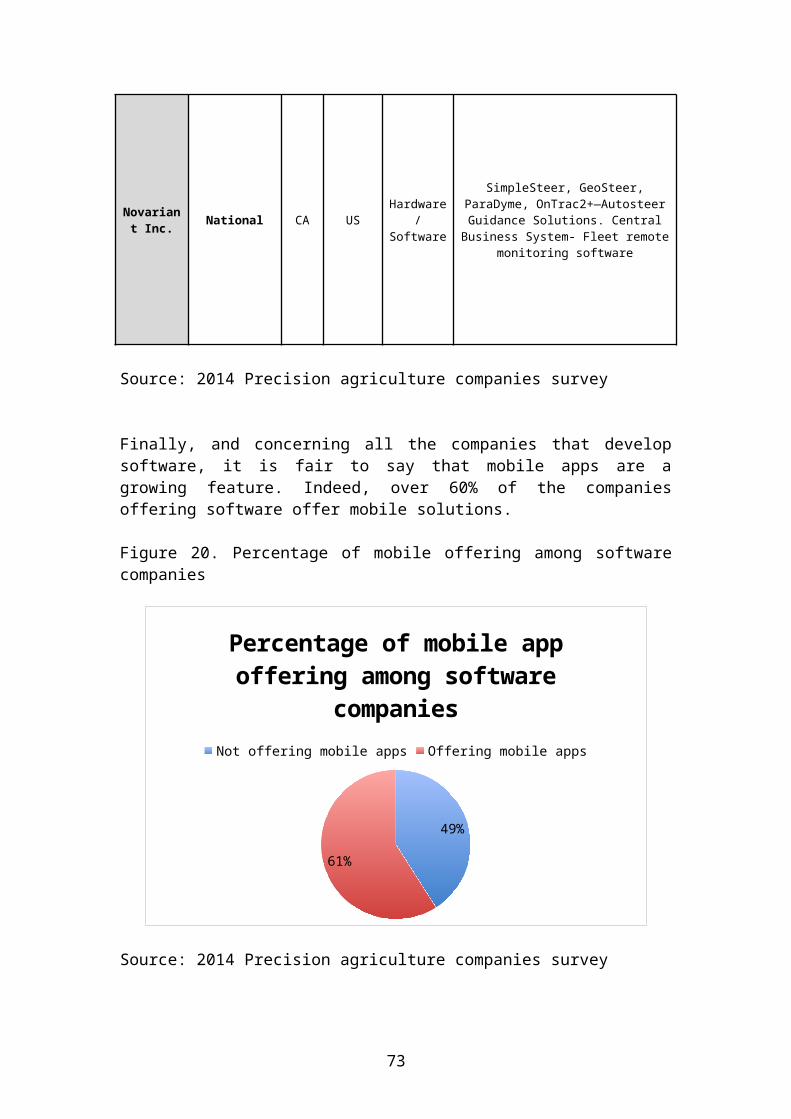
Novariant Inc. National CA US
Hardware/
Software
SimpleSteer, GeoSteer,ParaDyme, OnTrac2+—AutosteerGuidance Solutions. CentralBusiness System- Fleet remote
monitoring software
Source: 2014 Precision agriculture companies survey
Finally, and concerning all the companies that developsoftware, it is fair to say that mobile apps are agrowing feature. Indeed, over 60% of the companiesoffering software offer mobile solutions.
Figure 20. Percentage of mobile offering among softwarecompanies
49%
61%
Percentage of mobile app offering among software
companiesNot offering mobile apps Offering mobile apps
Source: 2014 Precision agriculture companies survey
73

4.2. PRECISION AG INDUSTRY STRUCTURE
The next table represents the different technologies andagents on the precision farming business, stressing whichagent could directly benefit from the differenttechnologies.
Table 11. Agents and technologies in the precisionfarming business
Technologies GPS GI
S GS1YM&
YMa2RS3 SM4 VRTs
5 RM&D6 FMS7Agronomi
csoftware
Sensors
BigData
Mobile &cloudAgents
Farmers X X X X X X X X X X X X XBuyers X X X X X X X XInputseller X X X X X X X X X X
OriginalEquipmentManufacturer (OEM)
X X X X X X X X X
Non-OEM X X X X X X X XConsultanc
ies X X X X X X X X X X X X
Insurers X X X X X X X X XBanks X X X X X X X X
1GS: Guidance Systems2YM & YMa: Yield monitor and yield mapping3RS: Remote Sensing4SM: Soil Mapping5VRTs: Variable Rate Technologies (either map-based or sensor-based)6RM&D: Remote monitoring and diagnostics7FMS: Farm management System
Table 9 demonstrates that there are plenty of businessopportunities in the precision agriculture industry, andthat research need to further explore these opportunitiesbetween agents and technologies.
For example, banks could benefit from their lenders soilmaps and yield maps to diminish risk associated to theircredit lines. Or, as stressed in chapter 2.3.3.,different agents of the supply chain can also benefitfrom the data gathered. For example, a potash seller canbenefit from weather and soil data to predict the higherneed of fertilizer.
74

The next figure is a possible precision agricultureindustry structure. Not only it summarizes their mainactors such as precision service provider and softwaredevelopers, but also includes the secondary agents whoare taking profit of this industry, such as banks andinsurance services.
Figure 21. Precision agriculture general structure
75
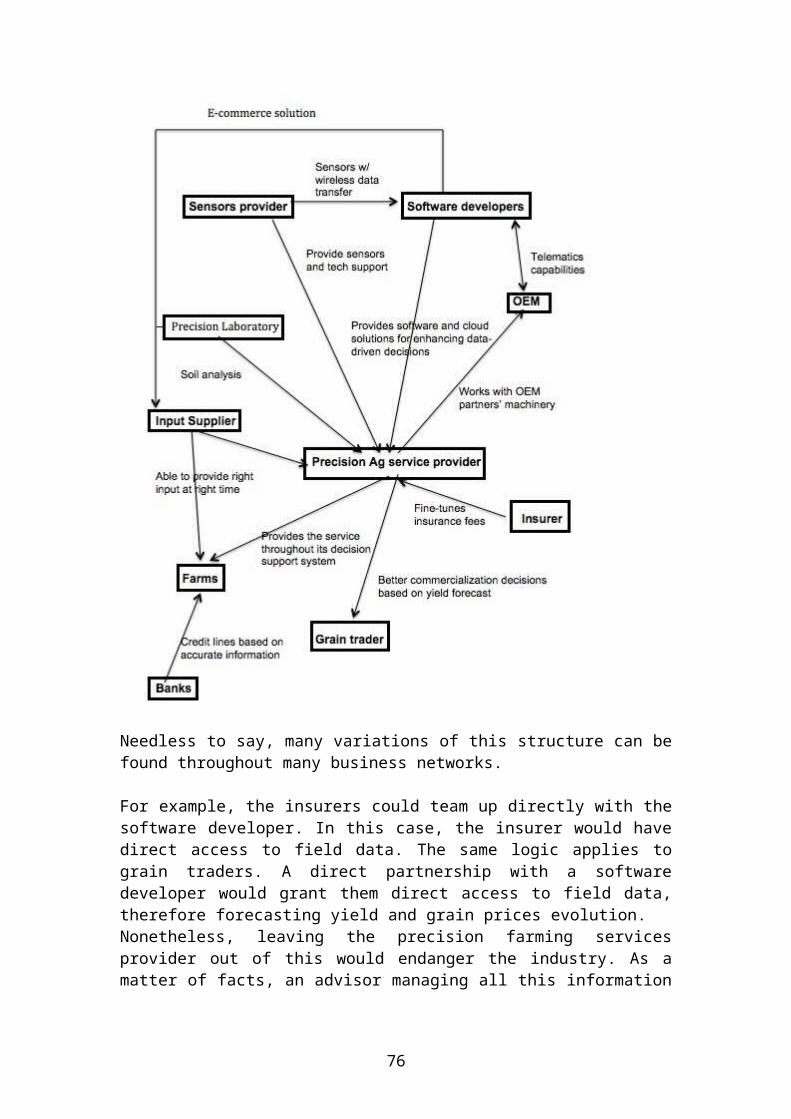
Needless to say, many variations of this structure can befound throughout many business networks.
For example, the insurers could team up directly with thesoftware developer. In this case, the insurer would havedirect access to field data. The same logic applies tograin traders. A direct partnership with a softwaredeveloper would grant them direct access to field data,therefore forecasting yield and grain prices evolution.Nonetheless, leaving the precision farming servicesprovider out of this would endanger the industry. As amatter of facts, an advisor managing all this information
76
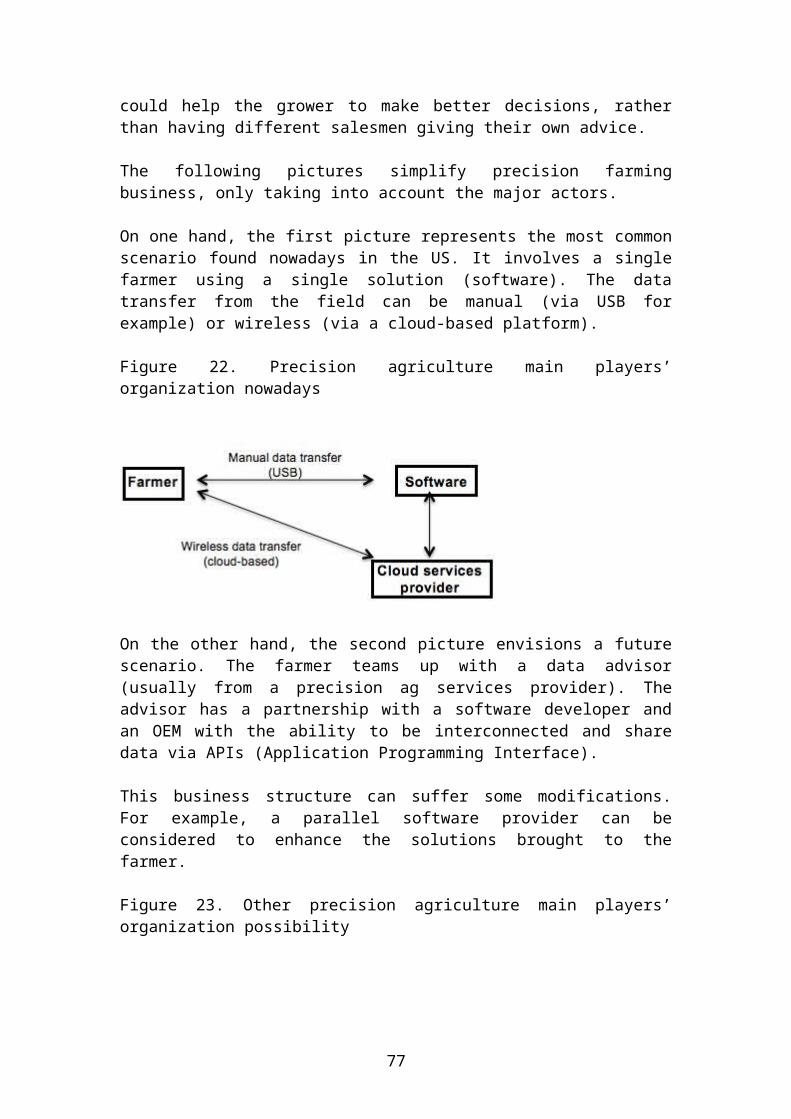
could help the grower to make better decisions, ratherthan having different salesmen giving their own advice.
The following pictures simplify precision farmingbusiness, only taking into account the major actors.
On one hand, the first picture represents the most commonscenario found nowadays in the US. It involves a singlefarmer using a single solution (software). The datatransfer from the field can be manual (via USB forexample) or wireless (via a cloud-based platform).
Figure 22. Precision agriculture main players’organization nowadays
On the other hand, the second picture envisions a futurescenario. The farmer teams up with a data advisor(usually from a precision ag services provider). Theadvisor has a partnership with a software developer andan OEM with the ability to be interconnected and sharedata via APIs (Application Programming Interface).
This business structure can suffer some modifications.For example, a parallel software provider can beconsidered to enhance the solutions brought to thefarmer.
Figure 23. Other precision agriculture main players’organization possibility
77
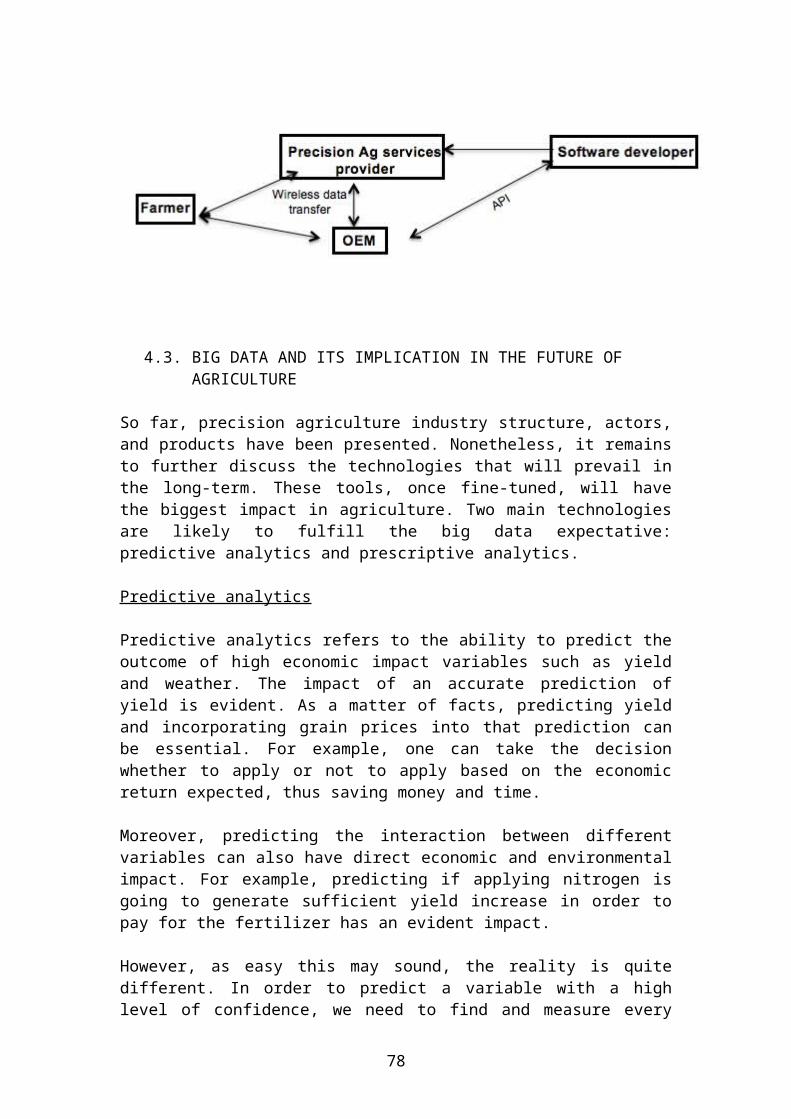
4.3. BIG DATA AND ITS IMPLICATION IN THE FUTURE OF AGRICULTURE
So far, precision agriculture industry structure, actors,and products have been presented. Nonetheless, it remainsto further discuss the technologies that will prevail inthe long-term. These tools, once fine-tuned, will havethe biggest impact in agriculture. Two main technologiesare likely to fulfill the big data expectative:predictive analytics and prescriptive analytics.
Predictive analytics
Predictive analytics refers to the ability to predict theoutcome of high economic impact variables such as yieldand weather. The impact of an accurate prediction ofyield is evident. As a matter of facts, predicting yieldand incorporating grain prices into that prediction canbe essential. For example, one can take the decisionwhether to apply or not to apply based on the economicreturn expected, thus saving money and time.
Moreover, predicting the interaction between differentvariables can also have direct economic and environmentalimpact. For example, predicting if applying nitrogen isgoing to generate sufficient yield increase in order topay for the fertilizer has an evident impact.
However, as easy this may sound, the reality is quitedifferent. In order to predict a variable with a highlevel of confidence, we need to find and measure every
78

data somehow related to this value and which has thehighest impact on it. What is more, these measurementsmust be cheap and accurate.
In order to achieve this, a fully integration betweenresearch and development must be structured. The smalldata has to go hand-by-hand with the big data. Trialswill determine the variables with the highest impact,engineers will determine the cheapest way to measure orestimate them in each part of the field, and the IT techswill have the computer power to fully integrate anddevelop a big data application.
Prescriptive analytics
Even though prescriptive analytics is still in earlystages comparing to predictive analytics, its potentialshouldn’t be underestimated. In fact, once predictiveanalytics of production variables and its interactionwith input and grain prices are set, a whole new kind oftools can be put in order by prescriptive analytics.
For example, the decision support tool will be able toprovide us with the best seed variety according to fieldcharacteristics, field history, predicted weather andprice ratios. Nevertheless, once again, in order toachieve this we need to set a system where small data isconnected to big data. As a matter of facts, we needevaluations to determine and understand what are thefactors that most affect the variable studied and thenintegrate that with a big data application.
Agriculture is an industry affected by too manyvariables. Thus, the traditional approach of not knowingthe why but only the what does not necessarily works inthis business. We need to understand what is makingthings change, in order to anticipate that in the futureand make better decisions because of that.
Moreover, many of the current technologies will beboosted by predictive and prescriptive analytics. Indeed,predictions and prescriptions will be capable of fine-
79
tuning variable rate technologies, and vice versa.Variable rate is in fact a technology with high potentialeconomic impact.
Traditionally, we did not have the potential computerskills and power to take into account all the variablesfor a good VR prescription. That leaded to make VR mapstaking into account only one or two variables (such ashistorical yields or soil sampling). That is one of thereasons VR seeding has failed in the past. Nonetheless,we are now able to change this both biologically andeconomically.
5. CONCLUSIONS
In this paper, we analyzed secondary market informationand previous research articles to formulate the actualstructure and taxonomy of precision farming market.Several gaps were found between current information andneeded information to effectively set the precisionfarming business structure. To close the gap anddetermine a precise structure of the precision farmingbusiness, semi-structured interviews took place withmajor players of the precision agriculture industry, anda web-based survey was sent to over 200 companies.
We found that many stakeholders in agriculture can profitfrom precision agriculture and data management. Insuranceagencies, traders, government, and banks are fineexamples. Use of passive data by insurers- withoutinvolving the farmer- to differentiate high and low riskzones constitutes a perfect example. Moreover, banks canprofit by better managing risk when providing creditlines. In addition to this, use of active data- involvingfarmers- such as real-time yield data can assist traderswhen speculating commodity prices.
The results from this paper also indicate that moreresearch needs to be done, specifying cost benefitrelations for many of the precision technologies. Indeed,literature basically focused on GPS Guidance and VRA.Finally, business interaction and proprietary rights of
80

agribusiness stakeholders and data sharing policies needto be further analyzed.
References
ADRIAN, A.M.; NORWOOD, S.H.; MASK, P.L. 2005. “Producers’perceptions and attitudes toward precision agriculture technologies”. Computers and Electronicsin Agriculture, 48, p. 256–271.
AL-MASHARI, M.; AL-MUDIMIGH, A.; ZAIRI, M. 2002. “Enterprise resource planning: A taxonomy of critical factors”. European Journal of Operational Research 146: 352-364. Available in: http://down.cenet.org.cn/upfile/94/200526163530140.pdf
BAUMULLER, H. 2013. “Mobile technology trends and their potential for agricultural development”. Center for Development Research, University of Bonn.
BATTE, M.T. 2000. “Factors Influencing the Profitability of Precision Farming Systems”. Journal of soil and water conservation. p.12-18
BATTE, M. 2005. “Changing computer use in agriculture: evidence from Ohio”. Comput. Electron. Agric. 47 (1), 1–13.
BATTE, M.T.; DIEKMANN, F. 2010. “Ohio farming practices survey: Adoption and use of precision farming technology in Ohio”. Available in: http://greatlakeswater.uwex.edu/sites/default/files/library/research-projects/2010-precision-farming-practices-survey-executive-summary08-27-2010.pdf
81
BERDAGUE, J.A.; FUENTEALBA, R. 2011. “Latin America: The State of Smallholders in Agriculture”. Available in:http://www.ifad.org/events/agriculture/doc/papers/berdegue.pdf
BORA, G.C.; NOWATZKI, J.F.; ROBERTS, D.C. 2012. “Energy savings by adopting precision agriculture in rural USA”. Available in: http://download.springer.com/static/pdf/994/art%253A10.1186%252F2192-0567-2-22.pdf?auth66=1405700473_fa949663f732448f45e5f7b58adabb69&ext=.pdf
BULLOCK, D.S.; LOWEMBERG-DEBOER, J.; SWINTON, S.M. 2002. “Adding value to spatially managed inputs by understanding site-specific yield response”. Agricultural Economics 27 (2002) 233-245.
CAMBERATO, J.; NIELSEN, R.L.; JOEL, B. 2011. “Nitrogen management guidelines for corn in Indiana”. Available in: http://www.agry.purdue.edu/ext/corn/news/timeless/nitrogenmgmt.html
CARLSON, T.N.; RIPLEY, D.A. 1997. “On the relation between NDVI, fractional vegetation cover, and leaf area index”. Available in: http://cursosihlla.bdh.org.ar/curso%20posgrado-tdi1/3_Bibliografia/1997%20-%20RSE_Pv%20Carlson.pdf
COCHRAN, R.L.; LARSON J.A., ROBERTS, R.L., ENGLISH, B.C. 2004. “Will variable rate application technology payin Tennessee?” Southern agricultural economics association annual meeting.
COPPOCK, J. T. & RHIND, D. W. (1991). The history of GIS.Geographical information systems: Principles and applications, 1(1), 21-43.COX, M.E.; WONG, B. 2013. “Agriculture: Precision Farming Primer; Big Data Theme Emerges in Agriculture”. Industry note.
D’ANTONI, J.M.; MISHRA, A.K.; POWELL, R.; MARTIN, S. 2012. “Farmers’ Perception of Precision Technology:
82
The Case of Autosteer Adoption by Cotton Farmers”. Southern Agricultural Economics Association Annual Meeting
DUFFY, M. 2014. “Crops- Cost and Returns”. Iowa State University Extension and Outreach. Available in: http://www.extension.iastate.edu/agdm/cdcostsreturns.html
DOBBINS, C.L.; LANGEMEIER, M.R.; MILLER, W.A.; NIELSEN, B.; VYN, T.J.; CASTEEL, S.; JOHNSON, B.; WISE, K. 2012. “2013 Purdue Crop Cost & Return Guide”. Available in: http://www.agecon.purdue.edu/extension/pubs/id166_2013%20_novembe.pdf
EVERAERTS, J. 2008. “The use of unmanned aerial vehicles (UAVS) for remote sensing and mapping”. Available in: http://www.isprs.org/proceedings/XXXVII/congress/1_pdf/203.pdf
FLEMING, K.L.; WESTFALL, D.G.; WIENS, D.W.; BRODAHL, M.C.2000. “Evaluating farmer defined management zone maps for variable rate fertilizer application”. Available in: http://link.springer.com/article/10.1023/A:1011481832064#page-1
FOUNTAS, S.; PEDERSEN, M.; BLACKMORE, S. 2003. “ICT in Precision Agriculture – diffusion of technology”. Available in: http://departments.agri.huji.ac.il/economics/gelb-pedersen-5.pdf
FRANZEN, D. 2008. “What is site-specific farming?”. Available in: http://www.ag.ndsu.edu/pubs/plantsci/soilfert/sf1176-1.pdf
GEBBERS, R.; ADAMCHUK, V.I. 2010. “Precision agriculture and food security”. Available in: http://www.sciencemag.org/content/327/5967/828.full
83

GRIFFIN, T.W.; LOWENBERG-DEBOER, J.; LAMBERT, D.M.; PEONE, J. PAYNE, T.; DABERKOW, S.G. 2004. “Adoption,Profitability, and making better use of Precision Farming Data”. Department of Agricultural Economics,Purdue University.
GRISSO, R.; ALLEY, M.; THOMASON, W.; HOLSHOUSER, D.; ROBERSON, G.T. 2011. “Precision farming tools: Variable-rate application”. Available in: http://pubs.ext.vt.edu/442/442-505/442-505_PDF.pdf
HALBERG, N. 2001. “Indicators of resource use and environmental impact for use in a decision aid for Danish livestock farmers.” In: Agriculture, Ecosystems and Environment. Volume 76, 17–30.
HCGA, 2009. “Precision Farming Glossary”. Available in: http://www.hgca.com/media/185207/pf_gls1-precision_farming_glossary_2009.pdf
HOLLAND, J.K.; ERICKSON, B.; WIDMAR, D. 2013. “2013 Precision agricultural services dealership survey results”. Dept. of Agricultural Economics, Purdue University West Lafayette, Indiana.
HERRING, D. 2001. "Precision Farming”. Available in: http://earthobservatory.nasa.gov/Features/PrecisionFarming/precision_farming.php
JONES, B. and BEST, F. 2003. “Potential costs savings from variable rate technology in site specific crop management in the Victorian Mallee”. Available in: http://www.regional.org.au/au/asa/2003/c/15/jones.htm
KALOXYLOS, A.; EIGENMANN, R.; TEYE, F.; POLITOPOULOU, Z.;WOLFERT, S.; SHRANK, C.; DILLINGER, M.; LAMPROPOULOU, I.; ANTONIOU, E.; PESONEN, L.; NICOLE,H.; THOMAS, F.; ALONISTIOTI, N.; KORMENTZAS, G. 2012. “Computers and electronics in agriculture”. Available: http://www.smartagrifood.eu/sites/default/files/cont
84

ent-files/downloads/Farm%20management%20systems%20and%20the%20Future%20Internet%20era.pdf
KNIGHT, B.; MALCOLM, B. 2007. “A whole-farm investment analysis of some precision agriculture technologies”. Faculty of land and food resources, University of Melbourne.
KEEN, P.G.W. 1980. “Decision Support Systems: a research perspective”. Available: http://dspace.mit.edu/bitstream/handle/1721.1/47172/decisionsupports1980keen.pdf
KOLB, J. 2012. “Business Intelligence In Plain Language: A practical guide to data mining and business analytics”.
LAMBERT, D.; LOWENBERG-DEBOER, J, 2000. Precision FarmingProfitability Review. Site-Specific Management Center, Purdue University, West Lafayette, IN, USA (http://www.purdue.edu/ ssmc).
LICHTEMBERG, E. 2013. “Optimal investment in precision irrigation systems: a dynamic intraseasonal approach”. Available in: http://purl.umn.edu/149920
LICHTEMBERG, E.; MAJSZTRIK, J; SAAVOSS, M. 2014. “Willingness to pay for sensor-controlled irrigation”. Available in: http://purl.umn.edu/168211
LOTZ, L. 1997. “Yield monitors and maps: making decisions”. Available: http://ohioline.osu.edu/aex-fact/0550.html
MAYER-SCHONBERGER, V.; CUKIER, K. 2013. “Big Data: A Revolution That Will Transform How We Live, Work andThink”.
MELL, P.; GRANCE, T. 2011. “The NIST definition of cloud computing”. Available at: http://faculty.winthrop.edu/domanm/csci411/Handouts/NIST.pdf
85

MURAZZO, M.A.; RODRIGUEZ, N.R. 2010. “Mobile cloud computing”. Available at: http://sedici.unlp.edu.ar/bitstream/handle/10915/19570/Documento_completo.pdf?sequence=1
OGANESOFF, E.M. and HOWARD, R.D. 2014. “Precision Agriculture: M&A, Investment, and Start-ups on the Rise”. Available in: http://www.focusbankers.com/publications/pdfs/FOCUS_Precision_Agriculture.pdf
PANDIT, M.; PAUDEL, K.P.; MISHRA, A.K.; SEGARRA, E. 2012.“Adoption and Nonadoption of Precision Farming Technologies by Cotton Farmers”. Department of Agricultural Economics and Agribusiness, Louisiana State University. Available in: http://ageconsearch.umn.edu/bitstream/125004/2/nested_main%20(1).pdf
PARCEL, J.; MASSEY, R. 2000. “Use and Perceptions of Precision Agriculture Technologies by Professional Chemical Services”. Available in: http://agebb.missouri.edu/mgt/agtech.htm
PESONEN, L.; KOSKINEN, H. 2008. InfoXT - User-centric Mobile Information Management in Automated Plant Production. Norway: Publication of the Nordic Innovation Centre.
PIERCE, F.J.; ANDERSON, N.W.; COLVIN, T.S.; SCHUELLER, J.K.; HUMBURG, D.S.; MCLAUGHLIN, N.B. 1997. “Yield Mapping”. Available: https://dl.sciencesocieties.org/publications/books/abstracts/acsesspublicati/thestateofsites/211?show-t-%20%20f=tables&wrapper=no?access=0&view=article
PING, J.L.; DOBERMANN, A.R. 2005. “Processing of yield map data”. Precision Agriculture 6 (2005), pp. 193–212.
PLUME, K. 2014. “High-tech U.S. farm machines harvest BigData, reap privacy worries”. Available in:
86

http://www.reuters.com/article/2014/04/09/us-usa-farming-data-idUSBREA3826220140409
REID, J.F.; ZHANG, Q.; NOGUCHI, N.; DICKSON, M. 2000. “Agricultural automatic guidance research in North America”. Available in: http://age-web.age.uiuc.edu/faculty/qzhang/Publications/2000CEA25(1)Reid.pdf
REINBOTT, D. 2013. “SEMO individual crop budgets”. University of Missouri Extension. Available at: http://extension.missouri.edu/scott/crop-budgets.aspx
RINDFLEISCH, A.; HEIDE, J.A. 1997. Available in: https://faculty.fuqua.duke.edu/~moorman/Marketing-Strategy-Seminar-2013/Session%206/Rindfleisch,%20Heide%201997.PDF
RULAND, S. 2014. “AgGetaway Tests Precision Ag ConversionToolbox”. Available in: http://www.aggateway.org/eConnectivity/Projects/CurrentOngoing/SPADE.aspx
SCHIMMELPFENNIG, D.; EBEL, R. 2011. “On the Doorstep of the Information Age: Recent Adoption of Precision Agriculture”. USDA ERS Economic Information Bulletin80.
SCHRIMPF, P. 2008. “Precision Ag Works: Reaping the benefits”. Available in: http://www.gpsfarm.com/LinkClick.aspx?fileticket=NdNZXB4L0RI%3D&tabid=97
SHIM, J.P.; WARKENTIN, M.; COURTNEY, J.F.; POWER, D.J.; SHARDA, R.; CARLSSON, C. 2002. “Past, present, and future of decision support technology”. Available in: http://www.researchgate.net/publication/222402824_Past_present_and_future_of_decision_support_technology
SMITH, C.M; DHUYVETTER, K.C.; KASTENS, T.L.; KASTENS, D.L.; SMITH, L.M. 2013. “Economics of Precision
87
Agricultural Technologies Across the Great Plains”. Journal of the ASFMRA. 185-206.
SOLIE, J.B. 2000. “The Impact of Precision Farming Strategies on Profitability”. Presented during the Agricultural Outlook Forum.
SONKA, S. 2013. “Beyond Precision Ag: If Big Data is the answer, what’s the question?” Center for Food and Agricultural Business, Purdue University.
SONKA, S. 2014. “Big Data and the Ag Sector: More thanLots of numbers”.
SORENSEN, C.; FOUNTAS, S.; NASH, E.; PESONEN, L.; BOCHTIS, D.; PEDERSEN, S.; BASSO, B.; BLACKMORE, S. 2010.”Conceptual model of a future farm management information system.” In: Computers and Electronics in Agriculture. Volume 72, 37-47.
SRIVASTAVA, S. 2002. “Space Inputs for Precision Agriculture: Scope for Prototype Experiments in the Diverse Indian Agro-Ecosystems.” In: Map Asia 2002, Report, 7 - 9 August 2002, Bangkok, Thailand, 1-4. www.gisdevelopment.net/application/agriculture/overview /agrio01.htm (Assessed February 4, 2011)
TEYE, F. 2011. “A conceptual model for collaboration-based farm management information systems”. HelsinkiMetropolia University of Applied Sciences. Availablein: http://www.theseus.fi/bitstream/handle/10024/29111/Teye_Masters%20Thesis_FMIS%20Business%20Model.pdf?sequence=1
88