Integrated Farming System - Worcester Polytechnic Institute
74
Integrated Farming System Advisor: Prof. Michael Ciaraldi Major Qualifying Project Submitted to the faculty of Worcester Polytechnic Institute In partial fulfillment of the requirements for the Degree of Bachelor of Science Respectfully Submitted By: Alex Becker – CS 2012 Daniel Caddell – RBE 2012 Reuben Gutierrez – RBE 2012 April 26, 2012 MXC - 0353
-
Upload
khangminh22 -
Category
Documents
-
view
1 -
download
0
Transcript of Integrated Farming System - Worcester Polytechnic Institute

0Fa
Integrated Farming System
Advisor:
Prof. Michael Ciaraldi
Major Qualifying Project Submitted to the faculty of
Worcester Polytechnic Institute In partial fulfillment of the
requirements for the Degree of Bachelor of Science
Respectfully Submitted By: Alex Becker – CS 2012
Daniel Caddell – RBE 2012 Reuben Gutierrez – RBE 2012
April 26, 2012
MXC - 0353
i
Abstract
People heavily rely on large-scale farms to grow and ship produce to their local markets.
This has become an issue today due to the high transportation costs associated with bringing
copious amounts of produce to crowded urban areas. The goal was to design an automated
farming system that alleviates these issues. The constructed model focused on the caring aspects
of the overall system. This prototype has proven the feasibility of the system’s design to save
space while reducing crop costs.

ii
Acknowledgements
We would like to acknowledge the people and following organization for their valuable
input towards this project.
1. Prof. Michael Ciaraldi
2. Prof. Pam Weathers
3. Prof. Luis Vidali
4. Worm’s Way
iii
Executive Summary
People heavily rely on large-scale farms to grow and ship produce to their local grocery
stores. These farms are not always domestic and can be located on the other side of the world.
This has become an issue today due to the high transportation costs associated with bringing
copious amounts of produce to crowded urban areas as well as to areas that cannot sustain
themselves with the local land. Furthermore, the preservatives that are required to allow produce
to make it to market inflate this cost. In addition to these economic costs, there are the
environmental impacts associated with transporting across these distances. Our goal is to solve
these issues by bringing the farms to these areas through an automated farming system. This
system will be enclosed either in its own facility or housed within another existing building. The
key is to minimize the amount of real estate required for these systems relative to how much land
would be needed by a comparable farm.
During the project, we identified and researched key areas of development that would
help us achieve our goal. During the research process we determined the project was too broad
for our group to accomplish within our time constraints, so we decided to focus on the caring
aspect of the design because it is the root of the system.
With a much more focused idea in mind we went through several conceptual designs.
The final design was a horizontal carousel system as shown in Figure 1. The key advantages of
this design are the all-in-one panels, the dedicated areas for peripherals, and the single reservoir.
The all-in-one panels allow for plants to be seeded, cared for, and harvested without the need of
transplanting. With the dedicated areas on the ends, the peripherals such as the seeder and

iv
harvester are allowed to work without affecting the other plants. The single reservoir removes
the need to have every nutrient solution available for every type of plant that exist.
Figure 1: Horizontal Carousel System
To test this design, we constructed a prototype that simulates two panels as well as an
application that can manage multiple systems. Once assembled, we experimented with this setup,
which ultimately demonstrated the ability to care for plants by successfully cultivating healthy
looking plants as shown in Figure 2. It also brought to light aspects of the design that required
more thought than anticipated. After analyzing our results we compiled a list of issues to fix and
work that can be done.
v
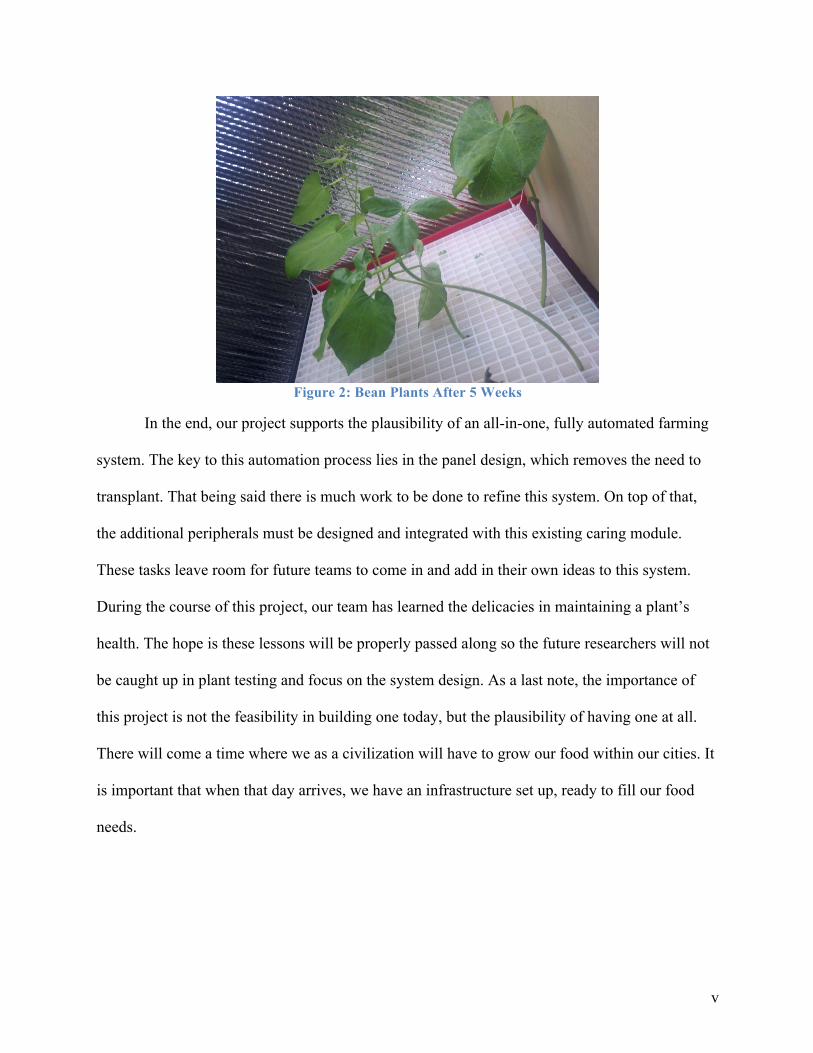
Figure 2: Bean Plants After 5 Weeks
In the end, our project supports the plausibility of an all-in-one, fully automated farming
system. The key to this automation process lies in the panel design, which removes the need to
transplant. That being said there is much work to be done to refine this system. On top of that,
the additional peripherals must be designed and integrated with this existing caring module.
These tasks leave room for future teams to come in and add in their own ideas to this system.
During the course of this project, our team has learned the delicacies in maintaining a plant’s
health. The hope is these lessons will be properly passed along so the future researchers will not
be caught up in plant testing and focus on the system design. As a last note, the importance of
this project is not the feasibility in building one today, but the plausibility of having one at all.
There will come a time where we as a civilization will have to grow our food within our cities. It
is important that when that day arrives, we have an infrastructure set up, ready to fill our food
needs.

vi
Table Of Contents
Abstract ...................................................................................................................................................... i
Acknowledgements .............................................................................................................................. ii
Executive Summary ............................................................................................................................. iii
Table Of Contents ................................................................................................................................. vi
Table Of Figures ................................................................................................................................... vii
Table of Tables ..................................................................................................................................... vii
Chapter 1 -‐ Introduction ..................................................................................................................... 1
Chapter 2 -‐ Background ....................................................................................................................... 4 2.1 -‐ Transportation ........................................................................................................................................ 4 2.2 -‐ Plant Anatomy ........................................................................................................................................ 5 2.3 -‐ Lighting ................................................................................................................................................... 7 2.4 -‐ Crop Systems .......................................................................................................................................... 9 2.5 -‐ Harvesting Technologies ....................................................................................................................... 12 2.6 -‐ Microcontrollers ................................................................................................................................... 13 2.7 -‐ Sensors ................................................................................................................................................. 14
Chapter 3 – Methodology .................................................................................................................. 17 3.1 -‐ Project Goal .......................................................................................................................................... 17 3.2 -‐ System Design ....................................................................................................................................... 18 3.3 -‐ Prototype Design .................................................................................................................................. 25 3.4 – Software Design ................................................................................................................................... 40 3.5 – Tasks .................................................................................................................................................... 46
Chapter 4 -‐ Results .............................................................................................................................. 48 4.1 -‐ Prototype Results ................................................................................................................................. 48
Chapter 5 – Recommendations ....................................................................................................... 52
Chapter 6 – Conclusion ...................................................................................................................... 55
References ............................................................................................................................................. 56
Appendix A: UML Diagram ............................................................................................................... 59
Appendix B: Additional Conceptual Sketches ............................................................................ 60
Appendix D: Electrical Box ............................................................................................................... 62
Appendix E: Prototype Budget ........................................................................................................ 63
Appendix F: Prototype Images ........................................................................................................ 64

vii
Table Of Figures Figure 1: Horizontal Carousel System ______________________________________________________________ iv Figure 2: Bean Plants After 5 Weeks _______________________________________________________________ v Figure 3: Box Concept Sketch ___________________________________________________________________ 20 Figure 4: Pivoting Panel Sketch __________________________________________________________________ 21 Figure 5: Continuous Conveyor Sketch ____________________________________________________________ 22 Figure 6: Horizontal Carousel Sketch _____________________________________________________________ 23 Figure 7: Side Frame __________________________________________________________________________ 27 Figure 8: Wooden Frame _______________________________________________________________________ 27 Figure 9: Wooden Frame Hole Spacing ____________________________________________________________ 28 Figure 10: Completed Wooden Frame ____________________________________________________________ 29 Figure 11: 4' x 6' Acrylic Sheet Cut Specifications ____________________________________________________ 30 Figure 12: Enclosure in Construction ______________________________________________________________ 31 Figure 13: Enclosure Back Door and Sealant Placement ______________________________________________ 32 Figure 14: Piping System Block Diagram __________________________________________________________ 33 Figure 15: Sprayers Attached to Back Door ________________________________________________________ 34 Figure 16: Electrical Box Circuits _________________________________________________________________ 37 Figure 17: Electrical Box _______________________________________________________________________ 38 Figure 18: Sensor waterproofing, from left to right, pH and E.C. sensors _________________________________ 40 Figure 19: Plant Manager Window _______________________________________________________________ 44 Figure 20: System Controller Interface ____________________________________________________________ 45 Figure 21: 2nd Week Mark: Green Bean Seedling ___________________________________________________ 50 Figure 22: 5th Week Mark: Green Bean and Basil Plants ______________________________________________ 50 Figure 23: 2nd Week Mark: Carrots ______________________________________________________________ 51
Table of Tables Table 1: Wooden Frame Materials _______________________________________________________________ 26 Table 2: Wooden Frame Cuts ___________________________________________________________________ 26 Table 3: Enclosure Materials ____________________________________________________________________ 30 Table 4: Piping Materials ______________________________________________________________________ 33 Table 5: Electrical Box Materials _________________________________________________________________ 36 Table 6: Sensors Information ___________________________________________________________________ 39 Table 7: Waterproofing Sensor Materials __________________________________________________________ 39

1
Chapter 1 -‐ Introduction
People heavily rely on large-scale farms to grow and ship produce to their local grocery
stores. These farms are not always domestic and can be located on the other side of the world.
This has become an issue today due to the high transportation costs associated with bringing
copious amounts of produce to crowded urban areas as well as to areas that cannot sustain
themselves with the local land. Furthermore, the preservatives that are required to allow produce
to make it to market inflate this cost. In addition to these economic costs, there are the
environmental impacts associated with transporting across these distances. Our goal is to solve
these issues by bringing the farms to these areas through an automated farming system. This
system will be enclosed either in its own facility or housed within another existing building. The
key is to minimize the amount of real estate required for these systems relative to how much land
would be needed by a comparable farm.
Within the United States, the two main providers of produce are farms that are located
relatively distant from urban areas, and imports from other countries. In both cases transportation
costs are added onto the value of the crop being delivered. In recent years the number of farms
across the nation has decreased which can contribute to some of the increasing costs of domestic
produce. This can also be the cause of it being cheaper to import produce; however, the cost that
is paid is on the environment. By bringing the farms into urban areas, the transportation costs are
effectively rendered negligible. This allows for more affordable produce as well as less impact
on the environment.
Today there are multiple groups working to solve the issues involved with today’s
farming situation. Two key figures are Dickson Despommier and Richard Stoner. Both of these
2
men advocate the idea that the cities should house the farms that provide for them. The
difference is the techniques that they utilize to achieve this goal. Despommier proposes to use a
hydroponics system to feed and care for crops within large vertical farms. Hydroponics is a
soilless growing method that has the plants’ roots sitting in a running stream of nutrient solution.
These vertical farms call for whole buildings to be used to grow enough produce to support the
entire city. Stoner decided to utilize an aeroponics system to feed his crops that sit on top of
growing panels. Aeroponics is similar to hydroponics; however, instead of the roots sitting in the
solution, the nutrients are delivered through a fine mist that is sprayed directly onto the roots.
Overall, both of these ideas are examples of high density farming, which is ideal for growing
crops in urban areas.
Given that alternative farming methods are already available and methods have been
formulated to implement them, what further research is necessary? The techniques that are
available solve the issue that conventional farming poses. However, they require the users to
understand the intricacies of plant care. Our solution eliminates that need by automating the
whole process. By turning to automation, the amount of human labor required to tend to this
system is greatly reduced. This is crucial for urban areas since city-dwellers do not want to
become farmers. Automating alternative farming methods is equivalent to bringing tractors and
harvesters to traditional farms. This is a delicate area considering previous attempts to automate
the farming process have not produced promising results. In contrast to the work done towards
moving farms into cities that center on hydroponics, our project attempts to utilize the benefits of
aeroponics. Aeroponics is a fairly new field compared to the alternatives, which made this
project risky; however, the benefits of being easier to automate certainly justify that decision.
3
The aim of this project was to design an Integrated Farming System (IFS) that would be
able to automatically seed, care for and harvest crops without any user assistance. The idea is the
user inputs what type of crop they desire, how much of that crop they want and by what date they
wish the produce to be ready. Our team designed the full system, but focused primarily on the
caring aspects of the design. We felt the rest of the design decisions would be dependent upon
the caring module and indeed this was the case. The design was made so that later groups that
work on this project will be able to implement their own ideas when it comes to the harvesting
and seeding operations. We constructed a prototype with most of the environmental controls, as
well as all of the core nutrient controls implemented for the purposes of proof of concept, as well
as a template for future teams. Although not large, the prototype shows that this overall system is
plausible as well as expandable due to its modular design.

4
Chapter 2 -‐ Background
Background research was conducted in order to identify key areas of development that
would help us achieve our goal. This chapter will discuss the two main problems motivating this
project. Furthermore, we discuss basic plant information, primary farming methods, and
technologies needed to implement our solution.
2.1 -‐ Transportation
It can be seen that the market values of crops have been steadily increasing in recent
years (USDA). Although there are many factors that contribute to this rising cost, one of the
most influential is the transportation costs involved in bringing the crops to market.
Transportation costs can be broken down into two categories: economic costs and environmental
costs. The economic costs are highly influenced by the mode of transportation chosen. On top of
that, if these crops are from foreign countries there are tariffs, which further inflate the cost.
Finally the distance these crops must travel adds specifically to the fuel costs associated with the
corresponding transportation method. The environmental costs are constantly increasing the
more we must ship our food. This not only comes from the cost of transportation itself, but also
the use of pesticides and fertilizers polluting the land for years.
The transportation method used to move the crop has the most impact on the crop’s
overall market value. Domestic goods are dominated by land travel and increase in price the
further the market is from the farm that grew the plant. Occasionally these goods are flown in by
air, which is one of the most expensive methods of transportation. Not only is this method
expensive, but according to the Food Miles report (2007), the imports by airplanes have a
5
substantial impact on global warming pollution. Finally transporting goods by sea, although
cheaper due to the bulk of products on board, is actually much more “expensive” when it comes
to our environment. It is estimated that fifteen of the world’s largest container ships emit as
much pollution as all of the world’s 760 million cars (Evans, 2009).
2.2 -‐ Plant Anatomy
Plants have complex systems that help them grow. It is important to know what these
systems are, how they work, and how they react to their environment. This information is
especially important when the goal is to automate the growing process.
Plant growth
Plants have several requirements to achieve growth (Schmidt, n.d.). These requirements
are: physical support, adequate temperature, oxygen, water, mineral nutrients and lighting. Plants
need a good physical support system to help them grow vertically and get their leaves in position
to obtain sunlight. Plants usually use their roots to do this. The system works well in soil but
causes problems in soilless growing methods, which will be discussed later. Adequate
temperature is a big requirement, because plants only grow well within a restricted range and this
range varies depending on the season. When temperatures are too high or too low it can cause
abnormalities and reduce crop yields. Plants acquire the oxygen they need for transpiration
through their roots. The transpiration process allows the plants to uptake the water and nutrients
that they need.
Water is required by many of the systems within a plant (Schmidt, n.d.). For this reason
plants consume significant amounts of water. However the quality of the water also affects the
process, for example, water with salt concentrations greater than 320 parts per million will cause

6
an imbalance of nutrients, which leads to poor plant growth. The essential elements that the
plants absorb through the roots are: nitrogen, phosphorus, potassium, calcium, magnesium and
sulfur. Depending on the type, the plant will require a balanced amount of these nutrients to grow
properly. They also need light to hit their leaves in order to achieve photosynthesis.
Photosynthesis
Photosynthesis is the process in which the plant converts the energy in the sunlight into
chemical energy that the plant can use (Vermaas, 1998). In this process pigments called
chlorophylls absorb the blue and red spectrum of the light and carotenoids absorb the blue-green
spectrum. The light energy captured by these pigments is used to break down water (H2O) and
other elements obtained from the roots, returning oxygen (O2), Adenosine Triphosphate (ATP)
and Nicotinamide Adenine Dinucleotide Phosphate (NADPH). Then the plant, through a light
independent reaction, uses ATP and NADPH to reduce carbon dioxide (CO2) to glucose, which
the plant can use and store.
Plant Cycles
Plant cycles can be simplified to the following seven stages: Pollination, Fertilization,
Seed Formation, Seed dispersal, Germination, Continued growth and back to Pollination (“7-
Stage Explanation”, 2010). Pollination starts with an insect, animal, the wind or the plant itself
by carrying the pollen grains to the female’s plant ovule. Once the pollen grain reaches the ovule
fertilization begins. The seed starts forming inside the mother plant and it then continues to
grow either inside a fruit if the plant type is angiosperm or it can grow outside in the bracts of
cones if it is gymnosperm. Seed dispersal starts when the fruit is ripened or the cone had dropped.
Wind, animal or insects spread the seeds. When the conditions are right, the germination process
begins. During germination the seed produces parts such as the roots, stem and leaves, which are

7
required for it to grow. The plant will continue to gather nutrients and create new cells and parts
until it reaches maturity. After it reaches maturity the plant will produce its own flowers to begin
pollination and the cycle starts over.
2.3 -‐ Lighting
Light is an important aspect of the plant’s life cycle. Plants use light to break down water
and nutrients to form energy that they have use and store. The sun usually provides the necessary
light that the plants need. When the goal is to have a controlled environment, this does not work
to well since the sun is hard to control. For that reason it is important to know how to artificially
create light and how this light affects the plants.
Incandescent and Fluorescent
For plants to grow properly, the light received must mimic natural sunlight (“Artificial
Lights”, 2012). Sunlight contains the entire spectrum of light that the plants need for
photosynthesis. The phosphor coating inside the bulb of incandescent and fluorescent lights
determine the spectrum. This layer generates a focused set of colors, which is why a two-bulb
fixture is recommended to ensure that the plants receive the required spectrum. With artificial
lighting, it is important to know the correct dosage of light per day. The amount varies per plant,
but if they don’t receive enough light they will not grow quickly enough. Conversely, if they
receive too much light they will wilt.
Two of the main differences between incandescent and fluorescent lights are their
efficiency and cost (“Artificial Lights”, 2012). Incandescents are inexpensive in comparison to
fluorescents but they are also highly inefficient since they need more energy to produce the same
amount of light. Incandescent lights also tend to produce significant amounts of heat, which can
8
endanger the plant, while fluorescent lights hardly emit any heat. Furthermore, the color ranges
produced by these two types of lights very greatly. Incandescents produce mostly red light
whereas fluorescents produce mostly blue light. However, there are many different variants of
fluorescent lights, some of which are able to produce near full spectrum.
High Pressure Sodium
High Pressure Sodium (HPS) lights produce light mostly on the orange color spectrum
(The Gain, 2011). This type of lighting is mostly used for flowering plants, but it lacks blue hues,
which plants require for vegetation. HPS lights are usually used in tandem with metal halide
lamps. Metal Halide lamps focus more on the blue spectrum. This combination accounts for both
of the necessary spectrums to stimulate plant growth. HPS lights are durable, last as long as
eighteen months, and produce six times as much light as incandescents. However, they also run
at higher temperatures requiring cooling systems.
Light-‐Emitting Diode for growing
Using Light-Emitting Diodes (LED) for growing is one of the newest ideas in this field
(Nate, 2012). The concept behind using LEDs for growing is that they only focus on the color
spectrums required to stimulate plant growth. The key is that LEDs emit extremely focused
colors, enabling higher customizability when combined with other colored LEDs.
Currently there are many disadvantages for using this technology (Nate, 2012). One of
the most important is the quality of the crops. The crops grown with LEDs tend to be lower
quality than the crops grown using other lighting technologies mainly because most LEDs aren’t
powerful enough to produce the lumens necessary for plant growth. Another great disadvantage
of LEDs is the initial cost, which compared to other technologies is simply too high.
9
The main advantage of LEDs is that the technology is improving rapidly (Nate, 2012).
Historically speaking, if we compare the timelines of LEDs to any of the other lighting
technologies, we can see that LEDs show great promise. Currently LED prices are high but they
are rapidly dropping and soon will be within reasonable levels. Additional advantages of LEDs
are the reduction in power consumption, lack of heat generation, and significantly longer
lifespans.
2.4 -‐ Crop Systems
In order to improve plant growth and reliability, research needs to be done in what
environments plants can be grown in. This section delves into the details of soil–based and
hydroponic systems.
Soil
Soil is a naturally occurring medium that normally contains nutrients needed to grow
plants (“Agricultural Technology”, 2012). It is also the most commonly used medium. Also, this
is the most natural method to grow crops. However, current farming techniques abuse this
medium. One downfall is that soil is slow to replenish its nutrients because it relies on biological
decay and rocks. So to fix this, fertilizers are commonly used. Furthermore, since crops grown in
soil tend to be exposed to the surrounding elements, pests have the potential to run rampant in
not only the air but the soil as well. Farmers also use pesticides to counter this issue. These
pesticides contain various substances, the most disturbing being toxic elements such as lead,
mercury, and arsenic.
To make matters worse, there tends to be a lot of water runoff since soil only retains so
much water. Although containment basins solve the water shortage problem (Hong, 2009), they
10
create many new ones. The most notable issues are that over time the acidity, temperature, and
concentration of the water can vary greatly. To top that off, these areas can be great breeding
grounds for plant pathogens.
To make matters even worse, the water that runs off tends to contain leftover fertilizer
and pesticide, which can pollute other ecosystems. Runoff fertilizer can promote the growth of
unwanted organisms, which have the potential to clog irrigation plumbing and invade other
ecosystems. Furthermore, the excess pesticides also pollute the surrounding land with toxic
inorganic substances. However, not all hope is lost because green houses can help alleviate many
of these issues by creating a more enclosed system that regulates the temperature, humidity, and
water. Regardless, soil is still very messy to work with.
Hydroponics
Hydroponics not only solves the messiness of soil but also increases yields by adding
more control of the environment. This method uses just a nutrient solution to feed the plants. To
suspend the plants and create a water buffer, processed mediums tend to be used. The primary
types are: clay pebbles (commonly known as hydroton), rock wool, mined minerals (perlite and
vermiculite), coconut fiber, and even more organic mixes that look like but are not considered
soil (“Growing Medium”, 2008). Each of these mediums have their own advantages and
disadvantages, but the most notable medium as of today is coconut fiber. This byproduct of the
manufacturing processes of coconuts has great water retention while also maintaining a larger
oxygen capacity.
The key to hydroponics is the method of surrounding the roots with this nutrient solution
(“Basic Hydroponic Systems”, 2008). The most notable techniques are: water culture, ebb and
11
flow, drip, and nutrient film technique (N.F.T). The simplest form of hydroponics is a water
culture system. This technique floods the roots all the time with oxygen enriched nutrient
solution. Although some plants thrive in the system such as lettuce, most other plants don't grow
well. Ebb and flow operates on a cycle where the roots are flooded with nutrient solution in a
basin for a period of time and then left suspended in the air by draining the basin for another
period of time. The drip system uses lines from a pump that travels to every plant on a tray or
basin. Lastly, the nutrient film technique pumps nutrient solution into a declining rail of plants,
which uses gravity to direct a thin film of nutrient solution over suspended roots. Although drip
systems are the most common today, there is no winning technique.
Aeroponics
A more recent variant of hydroponics is Aeroponics, which was developed by Dr. Hillel
Soffer back in the early 1980s (“Aero Hydroponics The Way of The Future”, 2008). This
technique offers even more control over plant growth. Instead of constantly flooding the roots of
the crops, Aeroponics uses a fine mist of nutrient solution with an approximate diameter of
around 10 microns per droplet (Weathers; Zobel 1992). The key to the success of this technique
revolves around increasing the level of dissolved oxygen around the roots.
Unfortunately, it is not that simple. Since the mist is thinly coating the roots, the
Aeroponic system now relies on how fast the plants can absorb the nutrients. If too much nutrient
solution coats the roots, the plant absorbs the nutrients in the coating, but it leaves a shield of
nutrient-depleted water, which inhibits the ability to provide more nutrients to the roots.
Essentially, it boils down to determining how long the on/off spray cycle lasts for every plant in
the system, which can be very tedious and error-prone. Regardless of the sensitivity, this
technique is still used today because of its increased product yields when done correctly.
12
There are three types of systems used: low-pressure, high-pressure, and Fogponics. Low-
pressure systems are not true Aeroponics solutions since the droplet size is too large and can run
into issues like the water shield mentioned above. High-pressure Aeroponics uses water systems
that operate at around 40 to 100 psi. These commercially available systems, such as AgriHouse’s
Genesis series, generate droplets with diameters of around 10 to 50 microns (“Hydro-Atomizing
Spray Jets & Fittings”, 2011). Lastly, the most effective Aeroponics system, known as Fogponics,
uses ultrasonic vibrations of piezoelectric crystals to generate a nutrient enriched fog (Weathers;
Zobel, 1992). This technique has the potential to solve the issue of water coating the roots. Since
the droplet size is so tiny, the boundary effect is reduced significantly. Unfortunately, the system
not only has higher initial costs due to how expensive fog emitters are, but also requires extra
energy to vibrate the crystals. Overall Aeroponics is a fairly new technique and still has a ways
to go, but the results seem very promising.
2.5 -‐ Harvesting Technologies
In order for any farming system to be useful there must be a way to harvest the crops that
it produces. At first, harvesting crops was all done by hand. When the world became more
industrialized and the need for manpower in other sectors was prevalent, more mechanized
harvesters were invented. For example, during the American Civil War, it was estimated that
each of Cyrus McCormick’s horse-pulled reapers, which freed up five men for military service
(Hounshell, 1984). As time progressed more complex machines, such as combine harvesters
were created. They began to run off of other power sources besides mules and horses. The
introduction of steam engines and later the internal combustion engine, paved the way for the
first modern tractors. From here self-propelled combines made their debut in the 1930s
(Constable, Somerville, 2003). These advances not only made the harvesting process more

13
efficient, they freed up land otherwise used to support the animals previously needed to move
these machines.
Today, crops are mainly harvested using the brute force approach that mechanization
brought to agriculture. A somewhat recent development is the John Deere Power Source Tomato
Harvester (High-Tech Tomato Harvesting). This unit is specialized for tomatoes similar to how
combines of the past were designed for wheat crop. These brute force methods are not restricted
to their original application of harvesting from giant fields. The same design can be brought to a
more precise level to accommodate much smaller plots. An overlooked example is the cylinder
(reel) lawn mower. This device utilizes the same principle combine heads use to keep cut
material within the desired area. In both cases a fixed cutting blade cuts the plant and the rotating
reel keeps the product from slipping back onto the ground.
Beyond the brute force methods employed today is a more surgical route that could
precisely pick each crop individually. Although time consuming, this would allow for a much
more delicate process as well as ensure each crop was properly harvested. There is only a
handful of precision harvesting units such as the unit developed by Robotic Harvesting (Robotic
Harvesting, 2011). Beyond these current designs there are technologies that can be applied to
harvesting. These include electrostatic adhesion and a beanbag grabber.
2.6 -‐ Microcontrollers
To controls these apparatuses, some form of a processing unit is necessary.
Microcontrollers are an important aspect of robotics applications. They are the brains of the
operation that listen to the sensors and activate the actuators. It is important to know what types
of microcontroller there exist and what their functionalities are.

14
Arduino
Arduino is an open-source prototyping platform that geared towards anyone interested in
creating an interactive environment (Arduino, 2012). Arduino has its own programming
language and its own development environment. This microcontroller has the capability to be
stand-alone but it can also communicate with a computer through software. This microcontroller
architecture has many different boards that are readily available. Some of the well-known models
are the Arduino Uno, the Mega2560 and the Nano. The boards can also be expanded with a vast
assortment of shields that serve other functions such as an Ethernet shield and even a wireless
shield.
DyIO
The Dynamic Input / Output (DyIO) from Neuron Robotics is a piece of hardware that
allows users to quickly connect peripherals to a computer (Neuron Robotics, 2012). These
peripherals can be sensors, LEDs and servos. Essentially, the DyIO acts as an IO relay. It also
uses Java as its programing language and has been tested to work on all major operating systems.
2.7 -‐ Sensors
Sensors are also an important aspect of any robotic system. They are the feedback
mechanisms that allow the system to properly interact with its environment. It is important to
have a good understanding of what these sensors are and how they work.
Temperature Sensors
There are two main types of temperature sensors - contact and non-contact sensors
(Smith, 2008). Furthermore, contact temperature sensors can be divided into thermocouples and
thermistors. Thermocouples sensors use the Seebeck effect, which has to do with temperature

15
changes affecting the output voltage of electrical circuits to determine the temperature.
Thermistor sensors are the most commonly used. They have a predictable resistance that is
affected by temperature. Resistance changes can easily be determined using electrical laws. On
the other hand, non-contact sensors can sense the temperature of an object at a distance. These
sensors use Planck’s Law, which has to do with the thermal radiation released by an object. By
knowing the thermal radiation of the object the temperature can be determined.
Humidity Sensors
The main principle that most humidity sensors use to detect humidity is to track the
changes of electrical properties of semiconductor materials (Adrian, 2007). In a capacitor-based
system the semiconductor material will absorb or release water depending on the relative
humidity and will affect the charge in the capacitor. Similarly, in resistive-base systems the
change in the material will affect the resistances of the system. Based on this change the relative
humidity can be calculated.
pH Sensors
A pH sensor indicates how acidic or basic a solution is (Anthoni, 2005). There is a scale
that ranges from 0 to 14, where lower values indicate acidity whereas high values indicate how
basic a solution is. Seven is considered neutral. Water tends to fluxuate around this number.
The underlying value behind this scale is the hydrogen ion concentration. This is
measured using a measuring and a reference electrode. The measuring electrode is sensitive to
the hydrogen ions, which develops a voltage that is directly related to the hydrogen ion
concentration of the solution. The reference electrode provides a stable differential and is used to
compare against the measuring electrode.

16
Electrical Conductivity Sensor
Electrical Conductivity (E.C.) is defined as the ability of a substance to conduct
electricity. This reading is measured in Siemens per meter (“Water Conductivity”, 2011). The
more conductive the solution is, the higher the ion concentration. The concept of testing
conductivity is similar to the pH measurement. There is the anode (positive terminal), and a
cathode (a negative terminal). When both of these are placed into the solution and a voltage is
applied on the anode, a current would establish between the nodes. The current will vary
depending on the concentration. Higher current values indicate higher conductivity and vice-
versa. This value also is used to approximate parts per million within a solution. This value is
crucial to know when caring for plants since drastic levels of concentration can kill the plant.
17
Chapter 3 – Methodology
Now that we understand plant needs, and know about necessary hardware to implement a
solution, we can now compile a design that solves our initial problem. This chapter describes the
steps involved in creating our design and implementing a prototype of that design.
3.1 -‐ Project Goal
This project started with the grand ambition of having a fully realized system that would
be able to accomplish the three aspects of farming: seeding, caring and harvesting. The designs
revolved primarily around having an all-in-one caring module that would be visited by seeding
and harvesting units. However, as we delved further into the caring conditions for this design we
realized that having a fully operational unit was overzealous. Considering the seeding and
harvesting units were dependent on the caring module we focused our efforts on designing the
module and ensuring the plants would be able to survive within its closed environment.
The caring system that the team envisioned would be able to provide various degrees of
nutrition as well as environmental conditions for any type of crop the user requested. In order to
achieve this level of variability and accuracy, it was necessary to understand all of the elements
involved with a plant’s nutrition as well as environment. The team discovered that nutrient
solutions already existed for various categories of plants. This made it simple to design a system
that would maintain a solution concentration for the type of plant it was growing. Similarly, ideal
environmental conditions were already known for various crops with elements such as day and
night cycles, temperature and humidity. For these variables the team needed to design
environmental controls such that the ideal levels were maintained within certain thresholds.
18
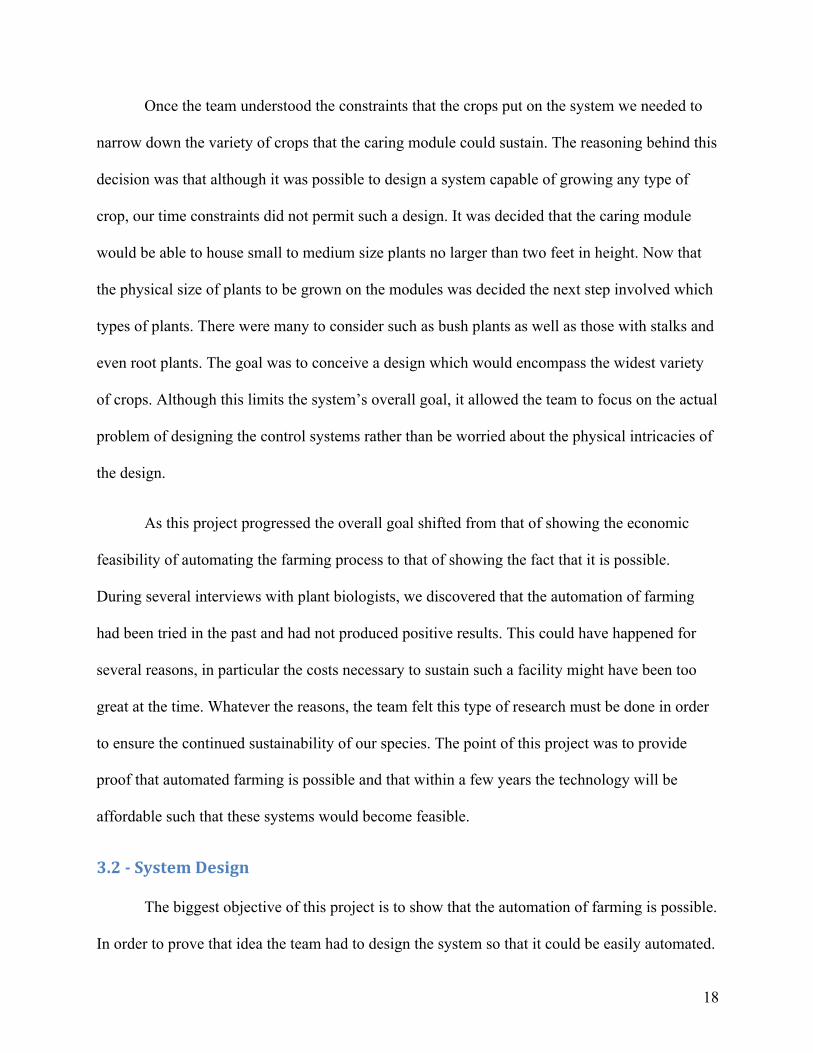
Once the team understood the constraints that the crops put on the system we needed to
narrow down the variety of crops that the caring module could sustain. The reasoning behind this
decision was that although it was possible to design a system capable of growing any type of
crop, our time constraints did not permit such a design. It was decided that the caring module
would be able to house small to medium size plants no larger than two feet in height. Now that
the physical size of plants to be grown on the modules was decided the next step involved which
types of plants. There were many to consider such as bush plants as well as those with stalks and
even root plants. The goal was to conceive a design which would encompass the widest variety
of crops. Although this limits the system’s overall goal, it allowed the team to focus on the actual
problem of designing the control systems rather than be worried about the physical intricacies of
the design.
As this project progressed the overall goal shifted from that of showing the economic
feasibility of automating the farming process to that of showing the fact that it is possible.
During several interviews with plant biologists, we discovered that the automation of farming
had been tried in the past and had not produced positive results. This could have happened for
several reasons, in particular the costs necessary to sustain such a facility might have been too
great at the time. Whatever the reasons, the team felt this type of research must be done in order
to ensure the continued sustainability of our species. The point of this project was to provide
proof that automated farming is possible and that within a few years the technology will be
affordable such that these systems would become feasible.
3.2 -‐ System Design
The biggest objective of this project is to show that the automation of farming is possible.
In order to prove that idea the team had to design the system so that it could be easily automated.

19
This required the engineering thought of how to accomplish different tasks such as seeding and
harvesting from the same module without disturbing the other crops. It also became important
for the caring module to be an all-in-one system, which is without the need to transplant
seedlings to a maturing area. After the physical system is decided upon it is just as important to
generate a comparable software application. Considering the outlook that the users do not need
to become farmers, the application was designed in a way that would be quick to learn as well as
have little room for human error. Finally considering the team was focused on the caring aspect,
it was essential to leave room for additional peripherals to interact with the module.
Nutrition Method
Figuring out which growing method would be used was the first decision made by the
team. This set the stage for the rest of the design and would influence our further decisions. The
three methods to choose from were traditional farming, hydroponics and aeroponics. Traditional
farming, although known to work, would be too messy and cumbersome for an automated
system to be effective. The decision quickly fell between hydroponics and aeroponics. These two
methods are fairly similar; they do not require soil and they utilize nutrient solutions to feed their
plants. The key difference was the ease in which aeroponics could be automated. Despite both
methods being automatable, currently hydroponics requires the transplanting of seedlings.
Although transplanting is recommended for aeroponics as well, the team decided to use
aeroponics as an all-in-one solution.
Design Concepts
There were several conceptual designs the team went through before the final design was
decided upon. The first was a box design similar to small plant enclosures that can be bought
today. In order to be more space and energy efficient the team came up with a pivoting panels

20
design. This system would have panels like those used by Richard Stoner. The design that would
lead up to the actual system would be the continuous conveyor. This idea scrapped the panels
approach but kept with the Ferris wheel idea, depicted in Figure 4, so that crops could still be
seeded in one area and harvested in a separate one.
Box Concept
Figure 3: Box Concept Sketch
The team’s original idea stemmed from growing boxes that can be bought in plant stores.
These boxes would originally have been utilizing a hydroponics approach. Later on it was
discovered that Aeroponics best fit the automation requirements. Once aeroponics was chosen
the decision was between ordinary mist heads and an ultrasonic method. We had found a lot of
research concerning ultrasonic misting methods and decided they would be the best fit. Despite
the change the box still remained a plausible idea. These containers would be fitted to rails that
could slide out so the unit was movable throughout the entire system through a series of rail lines.
The disadvantage came from having to disengage the electrical and plumbing lines every time
the unit needed to be moved. The lighting scheme was also rather expensive considering every
unit needed its own light source.
21
Pivoting Panels
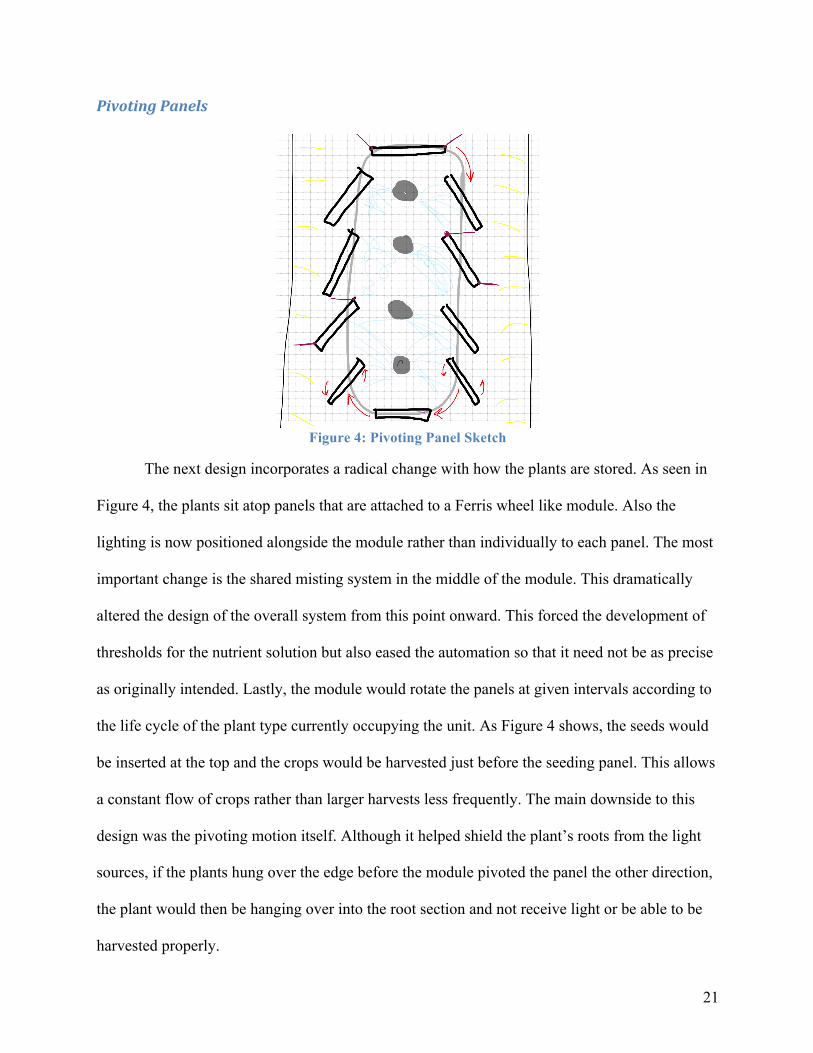
Figure 4: Pivoting Panel Sketch
The next design incorporates a radical change with how the plants are stored. As seen in
Figure 4, the plants sit atop panels that are attached to a Ferris wheel like module. Also the
lighting is now positioned alongside the module rather than individually to each panel. The most
important change is the shared misting system in the middle of the module. This dramatically
altered the design of the overall system from this point onward. This forced the development of
thresholds for the nutrient solution but also eased the automation so that it need not be as precise
as originally intended. Lastly, the module would rotate the panels at given intervals according to
the life cycle of the plant type currently occupying the unit. As Figure 4 shows, the seeds would
be inserted at the top and the crops would be harvested just before the seeding panel. This allows
a constant flow of crops rather than larger harvests less frequently. The main downside to this
design was the pivoting motion itself. Although it helped shield the plant’s roots from the light
sources, if the plants hung over the edge before the module pivoted the panel the other direction,
the plant would then be hanging over into the root section and not receive light or be able to be
harvested properly.
22
Continuous conveyor
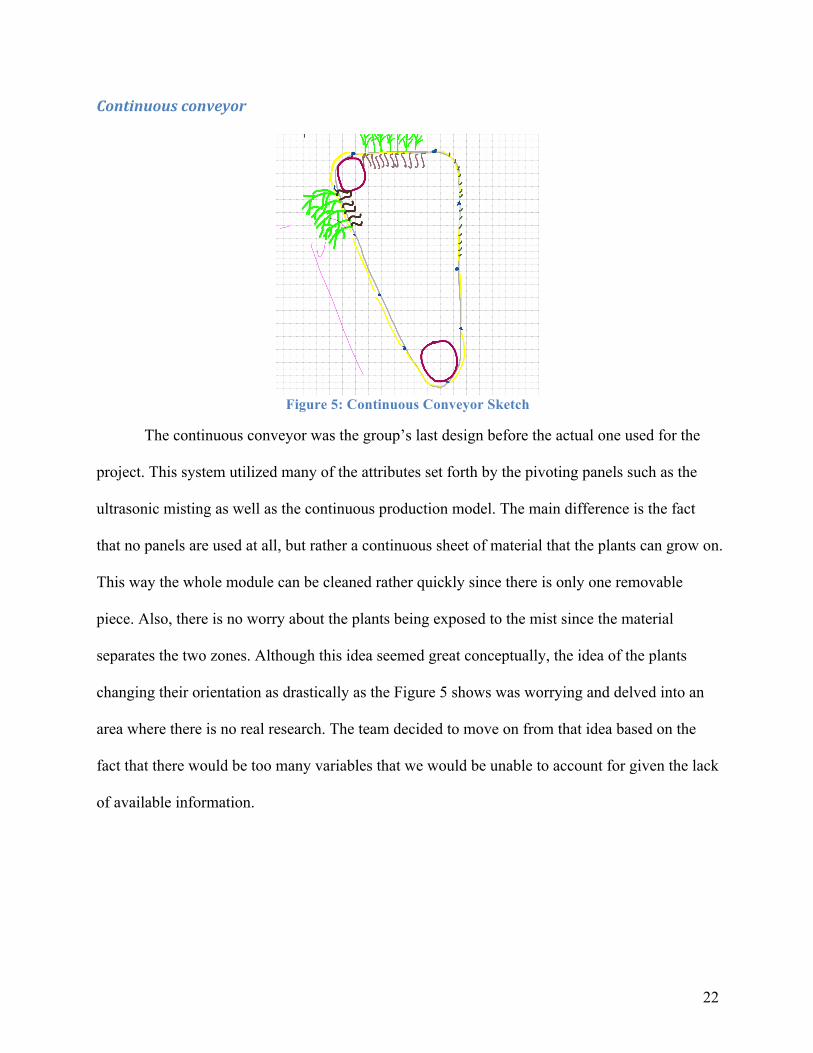
Figure 5: Continuous Conveyor Sketch
The continuous conveyor was the group’s last design before the actual one used for the
project. This system utilized many of the attributes set forth by the pivoting panels such as the
ultrasonic misting as well as the continuous production model. The main difference is the fact
that no panels are used at all, but rather a continuous sheet of material that the plants can grow on.
This way the whole module can be cleaned rather quickly since there is only one removable
piece. Also, there is no worry about the plants being exposed to the mist since the material
separates the two zones. Although this idea seemed great conceptually, the idea of the plants
changing their orientation as drastically as the Figure 5 shows was worrying and delved into an
area where there is no real research. The team decided to move on from that idea based on the
fact that there would be too many variables that we would be unable to account for given the lack
of available information.

23
Carousel System Design
Figure 6: Horizontal Carousel Sketch
The final concept for the caring system was an elongated horizontal carousel design. This
unit would have multiple modules going around its perimeter as shown in Figure 6. Each of these
modules would contain four panels stacked vertically in a column where crops would be grown.
On each stretched side of the carousel there would be lighting fixtures. Within the center of the
carousel would be the misters that provide the nutrients to the plants roots, similar to the
continuous conveyor design. The ends of the carousel are designated for peripherals that the
team did not design. For example, when the system is further developed and a harvester and
seeder are added they will need easy access to the modules in a space efficient manner. In order
to keep the footprint for each carousel to a minimum the columns will be able to be rotated
around the carousel along a rail. Once the requested column is at one of the two end areas the
carousel stops and the peripherals perform their tasks. After they are finished the columns return
24
to their original orientation so that each panel is receiving the proper nutrients. While the
carousel is shifting the modules, the misters are inactive. The key to this design is the reservoir
system implemented into each carousel.
Each carousel will have a single reservoir that will contain the nutrient solution used by
every panel. In order for this to be a possibility, plants with similar nutrient needs will be placed
together on the same carousel. Although each plant’s ideal conditions might not be met, there
will be thresholds for how much their specific constraints may vary. This helps automate the
process considering that the system will not need to have every concentration of solution
available for every type of plant that exists. This is where the control systems come into play.
The reservoir’s solution will have two requirements: pH and nutrient concentration thresholds.
These levels will be monitored with the use of a pH sensor and an EC (electric conductivity)
sensor respectively. In terms of the environmental controls, temperature and humidity are
concrete values that must be maintained. Less intuitive is the fact that there must be constant
airflow so that no bacteria or fungi are allowed to settle on the plants and infect the entire module.
This design goes further than a single carousel that can only grow plants with similar
nutrient needs. Each carousel will have its own microcontroller that will act as an I/O relay.
None of the control system’s calculations will be done locally. Instead, each carousel will be
connected to a centralized server that will simultaneously maintain each carousel. With this
highly centralized design, it will be easier to locate problems should any arise. More importantly,
all the automation is written into one program rather than multiple systems that must constantly
communicate. By having each device accounted for by the server this allows room for future
additions such as the harvester and seeder directly into the scheduler.
25
Application Goals
As for the server application, the design should be more generic to increase flexibility
such as handling modules other than the carousel design. Furthermore, the user should be able to
easily manage an entire system of farming modules. To accomplish this task the application must
be flexible enough to handle different types of module designs, varying plant needs, and user
input efficiently. Essentially many of these requirements point towards a network of simple
controllers that act as the arms and legs of a server in a star topology. These simple controllers
send sensory data to the server, and enable or disable actuators such as fans, lights, and pumps
based on feedback from the server. The server analyzes the sensory data from these controllers,
determines the most efficient actions, and commands the controllers to act on its schedule.
3.3 -‐ Prototype Design
Using the carousel design and application requirements, the team created a prototype to
prove that it was possible. It contained all the main concepts of the system design but
simplifications were made to allow its construction within the team’s limited time and budget.
The prototype design includes a full implementation of the spray system, the pump system,
control of the reservoir’s solution and server-to-unit communication. It also included limited
implementation of the environmental controls, panel design and application design. The
construction of the prototype can be divided into seven sections.
Wooden Frame
The group started with the construction of a wooden frame that supported a single
column from the system design. This frame was also used to enclose the location of the plants,
which allowed the group to have an approximation of a controlled environment. The materials

26
needed to build the frame are shown in Table 1. The materials needed to be cut to the dimensions
shown in Table 2.
Table 1: Wooden Frame Materials
Wooden Frame 2’’x 4’’x 10’ Wood 10
2-½’’ Exterior Grade Screw 40 Roll of Reflective Insolation 1 ⅜-16 Hex Head Bolt 2’’ Long 6
3/8-16 Washer 6 ⅜’’ T50 Staples As needed
Table 2: Wooden Frame Cuts
Wood 6’ Segment 4
32’’ Segment 4 25-½’’ Segment 3 7-½’’ Segment 2 22-½’’ Segment 1
Reflective Insolation 32’’ x 32’’ Sheet 2 25’’ x 6’ Sheet 1 32’’ x 6’ Sheet 1 6’’ x 6’ Sheet 1
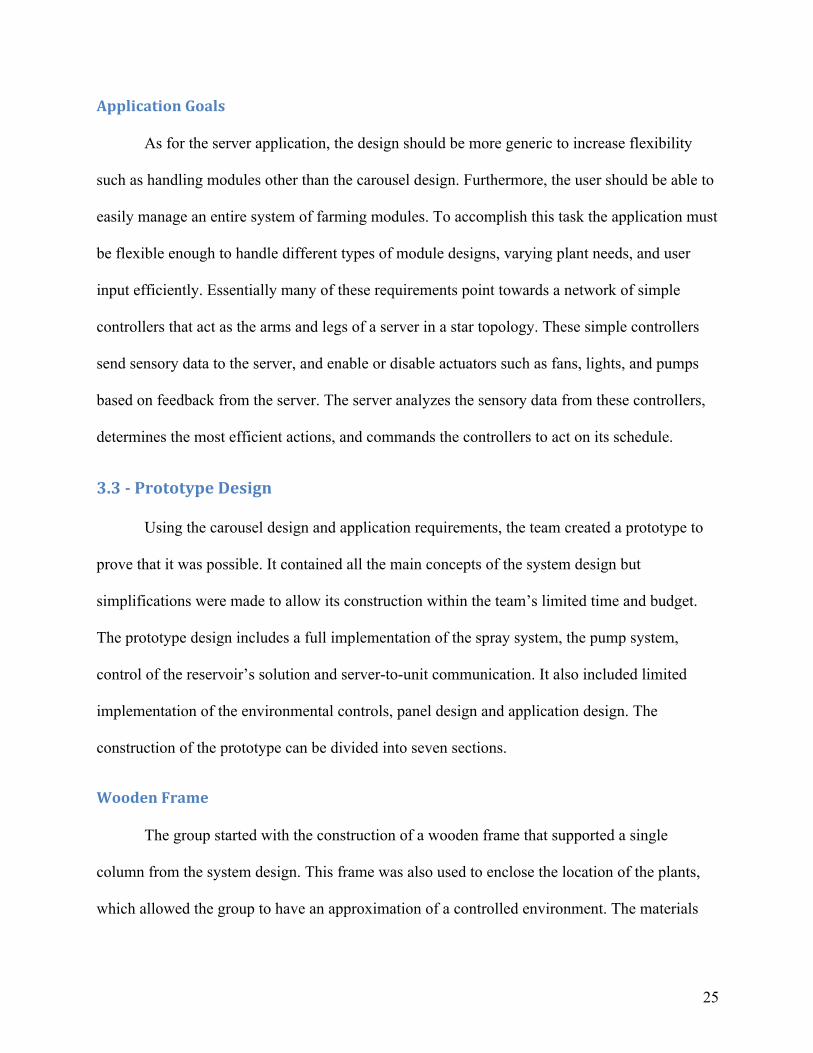
The team started by putting the side frames together using two of the 32’’ and 6’ wood
segments. The group used two screws per connection. To complete the frame, the team
constructed two side frames that are shown in Figure 7. Then the team completed the frame by
using the three 25-½’’ segments to attach the two side frames as shown in Figure 8. Additionally
the group added the 7-½’’ segments, twelve inches apart, which hold the electrical box.
27
Figure 7: Side Frame
Figure 8: Wooden Frame
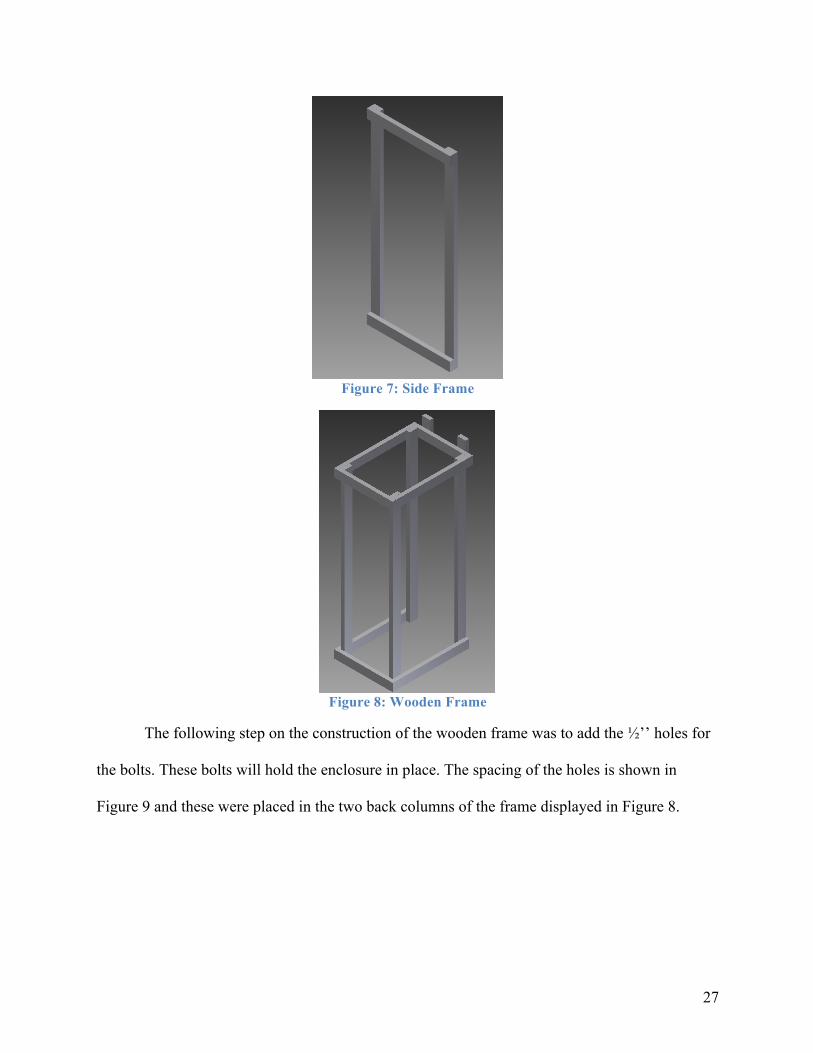
The following step on the construction of the wooden frame was to add the ½’’ holes for
the bolts. These bolts will hold the enclosure in place. The spacing of the holes is shown in
Figure 9 and these were placed in the two back columns of the frame displayed in Figure 8.
28
Figure 9: Wooden Frame Hole Spacing
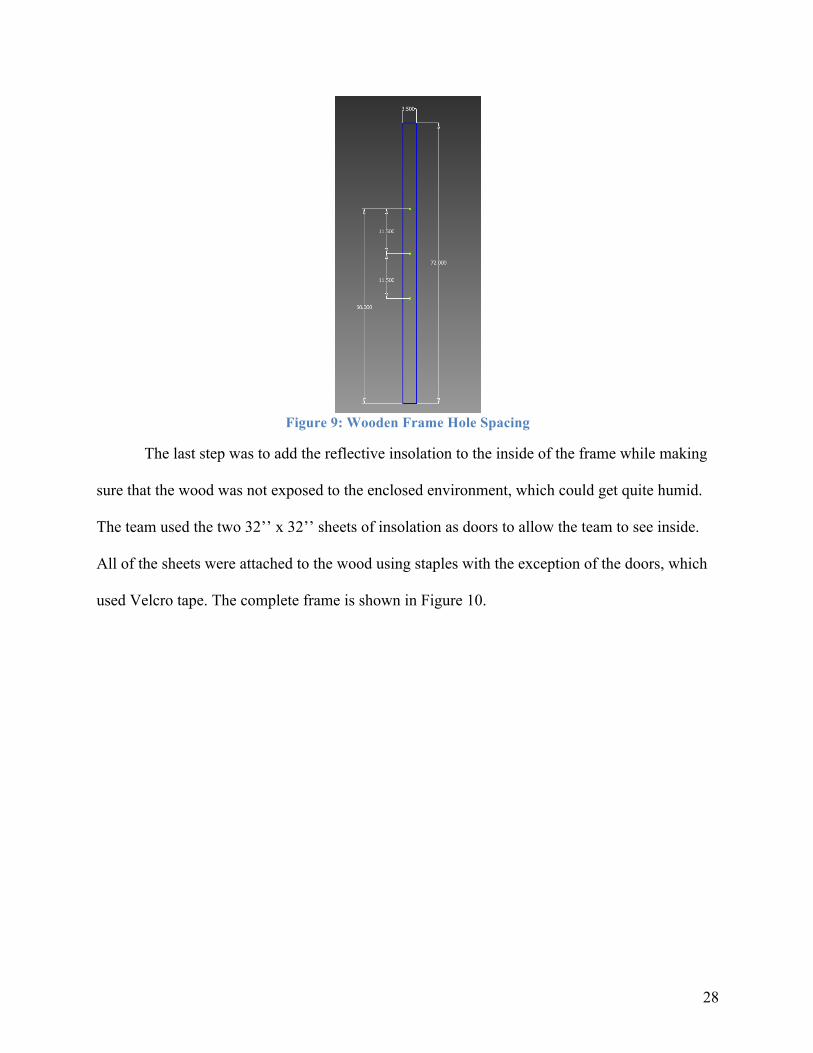
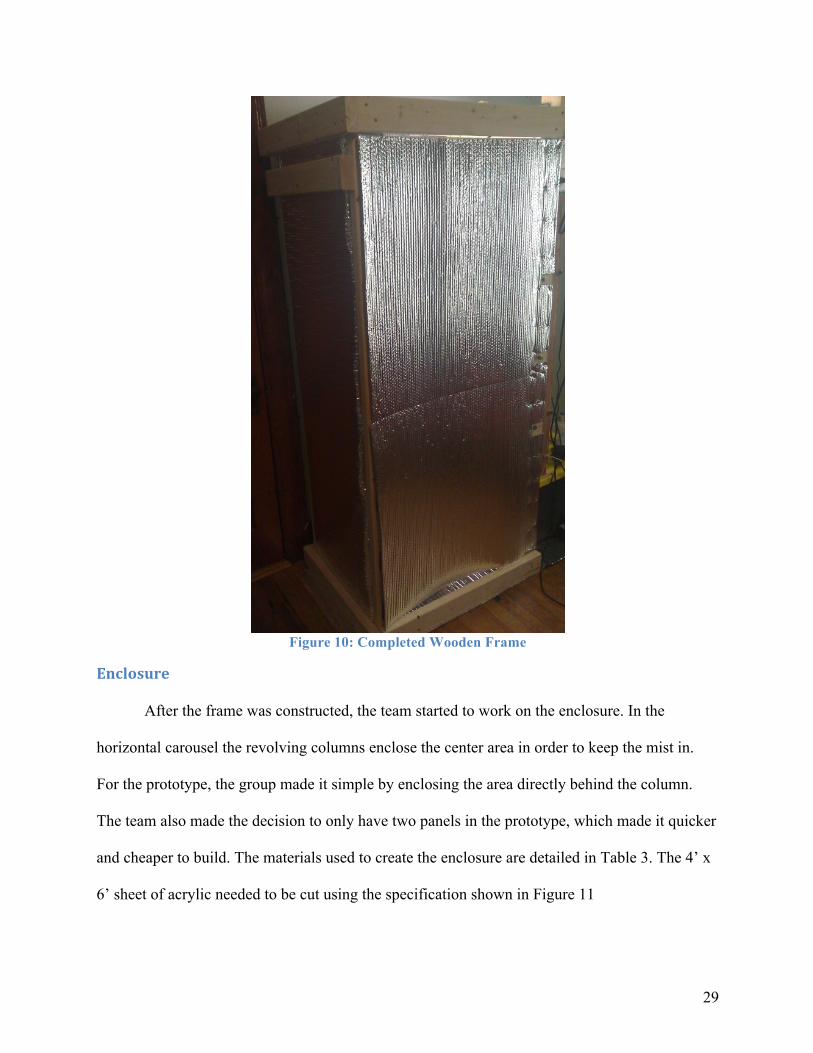
The last step was to add the reflective insolation to the inside of the frame while making
sure that the wood was not exposed to the enclosed environment, which could get quite humid.
The team used the two 32’’ x 32’’ sheets of insolation as doors to allow the team to see inside.
All of the sheets were attached to the wood using staples with the exception of the doors, which
used Velcro tape. The complete frame is shown in Figure 10.
29
Figure 10: Completed Wooden Frame
Enclosure
After the frame was constructed, the team started to work on the enclosure. In the
horizontal carousel the revolving columns enclose the center area in order to keep the mist in.
For the prototype, the group made it simple by enclosing the area directly behind the column.
The team also made the decision to only have two panels in the prototype, which made it quicker
and cheaper to build. The materials used to create the enclosure are detailed in Table 3. The 4’ x
6’ sheet of acrylic needed to be cut using the specification shown in Figure 11

30
Table 3: Enclosure Materials
Enclosure 4’x6’ Sheet of Acrylic 1
9-½’’x 16-½’’Sheet of Acrylic 2 16-½’’ x 16-½’’ Sheet of Acrylic 2
90° Door Locks 4 ⅜-16 Hex Head Bolt 1’’ Long 6
⅜-16 Bolt Coupler 6 ⅜-16 Washer 12
Figure 11: 4' x 6' Acrylic Sheet Cut Specifications
Having all of the pieces needed, the group proceeded with assembling the enclosure. The
team used a bonding agent specifically designed to adhere the acrylic pieces together. Figure 12
shows the pieces glued together.
31
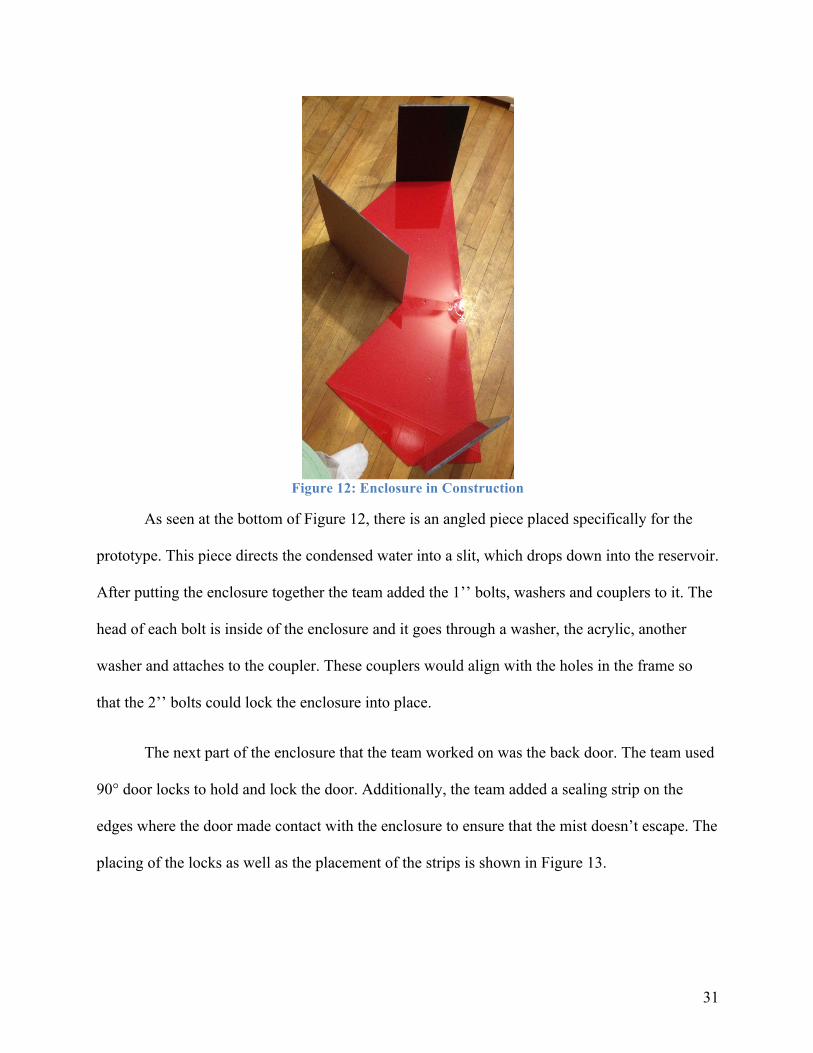
Figure 12: Enclosure in Construction
As seen at the bottom of Figure 12, there is an angled piece placed specifically for the
prototype. This piece directs the condensed water into a slit, which drops down into the reservoir.
After putting the enclosure together the team added the 1’’ bolts, washers and couplers to it. The
head of each bolt is inside of the enclosure and it goes through a washer, the acrylic, another
washer and attaches to the coupler. These couplers would align with the holes in the frame so
that the 2’’ bolts could lock the enclosure into place.
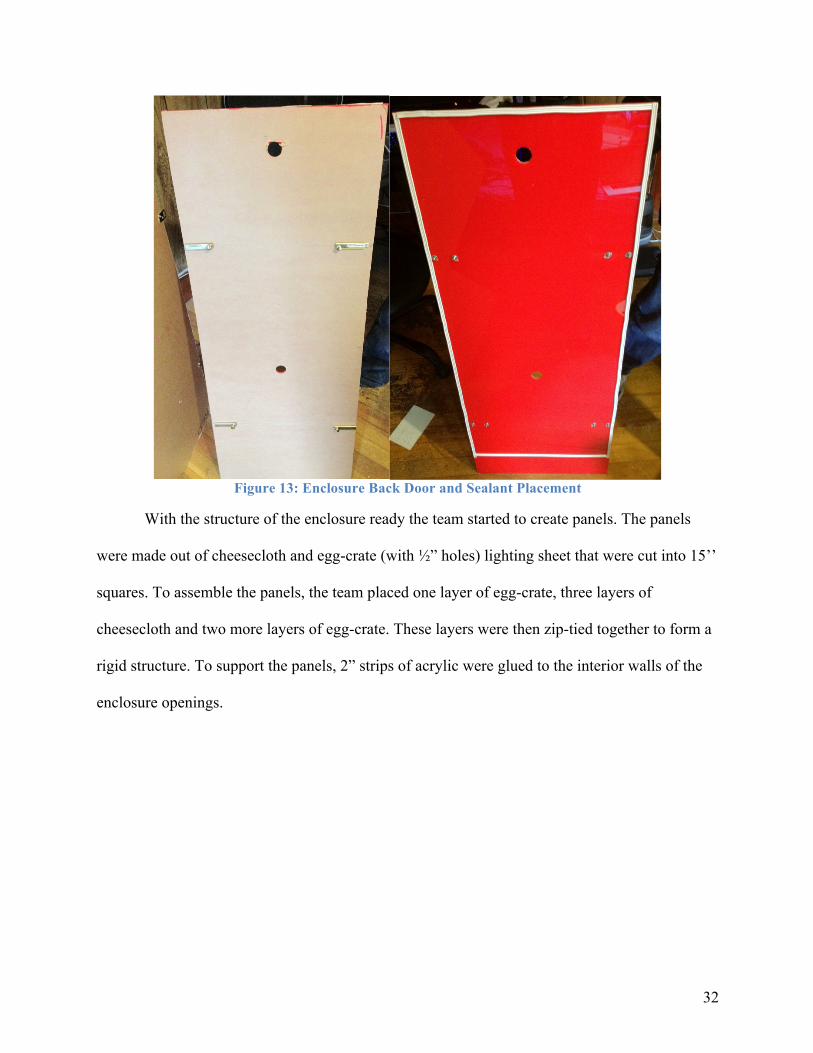
The next part of the enclosure that the team worked on was the back door. The team used
90° door locks to hold and lock the door. Additionally, the team added a sealing strip on the
edges where the door made contact with the enclosure to ensure that the mist doesn’t escape. The
placing of the locks as well as the placement of the strips is shown in Figure 13.
32
Figure 13: Enclosure Back Door and Sealant Placement
With the structure of the enclosure ready the team started to create panels. The panels
were made out of cheesecloth and egg-crate (with ½” holes) lighting sheet that were cut into 15’’
squares. To assemble the panels, the team placed one layer of egg-crate, three layers of
cheesecloth and two more layers of egg-crate. These layers were then zip-tied together to form a
rigid structure. To support the panels, 2” strips of acrylic were glued to the interior walls of the
enclosure openings.

33
Plumbing
The plumbing system is the part of the prototype that delivers the mist of nutrients to the
roots. This system involves the sprayers, the pump, and the recycling of water. The materials
needed to construct this system are detailed in Table 4.
Table 4: Piping Materials
Piping System Aquatec Pressure Boost Pump CDP 6800 1
24 VAC 1000mA Transformer 1 1-½ Gallon Accumulator Tank 1
12 VAC ¼’’ Solenoid 2 80 psi Pressure Switch 1 ½’’ PVC Mist Head 8
27 Gallon Strong Box 1 Quick Connect ¼’’ Tee Splitter 1 Quick Connect ¼’’ Y Splitter 1
Quick Connect ¼’’ Valve 2 Quick Connect ¼’’ to ½’’ PVC converter 2
½’’ PVC Tee Splitter 2 ½’’ PVC 90° Elbow 4 ½’’ PVC 45°Elbow 4 ½’’ PVC Cap 4 ¼’’ Tubing As needed
½’’ PVC Piping As needed Zip Ties As needed
Figure 14: Piping System Block Diagram

34
The system can be explained in the block diagram described in Figure 14. It explains how
the components are connected to one another and how the system recycles the water.
In this system, the pump is on until the switch detects that the accumulator tank is at 80
pounds per square inch (psi) of pressure. Once the pressure is settled the pump will turn off but
when the switch detects a loss in pressure the pump will turn on again. This will occur whenever
the solenoids are turned on, which is determined by the software. Once the solenoids are on, the
mist will hit the panels and the excess will fall down to the reservoir where the pump can reuse it.
The system primarily uses ¼’’ flexible tubing to connect the components. However, the
sprayers are made of ½’’ PVC piping because the team decided that the sprayers needed to have
a rigid structure, which flexible tubing cannot provide. Figure 15 shows the shape of the sprayers
and how they are attached to the back door. The layout, depicted in Figure 15, was chosen so that
the mist could be properly distributed to the panels.
Figure 15: Sprayers Attached to Back Door

35
Lighting and Ventilation
The lighting and ventilation aspects of the prototype are simple. The team did a
considerable amount of research related to artificial lighting but the only option that seemed to
be possible and affordable at the time was fluorescent lighting. Fixtures for this type of lighting
were easily available. To add this fixture a quick modification to the frame was done to allow the
team to attach a hook where the light was suspended. The ventilation was simple as well; the
team added a fan at the bottom of the enclosed area of the frame. This fan allowed air circulation
and acted as a temperature and humidity controller.
Nutrient Solution
For the reservoir control the team was able to control the concentration and the pH levels
of the nutrient solution. The way to change the concentration and pH levels is through four
different mixtures. The pH is changed through adding commercially available pH up and pH
down solutions depending on the situation. The concentration is changed through adding more
concentrated nutrient solution if the concentration is low or adding water to dilute the
concentration. The team accomplished this goal by having submersible pumps in the solution
containers. The system would then determine which mixture to add and activate the appropriate
pump.
Electrical Box
The electrical box protects the power supplies, microcontroller, and associated circuitry.
All of the sensors and actuators of the prototype were connected to this box through easily
accessible terminals. The materials needed to construct the box are detailed in Table 5.
36
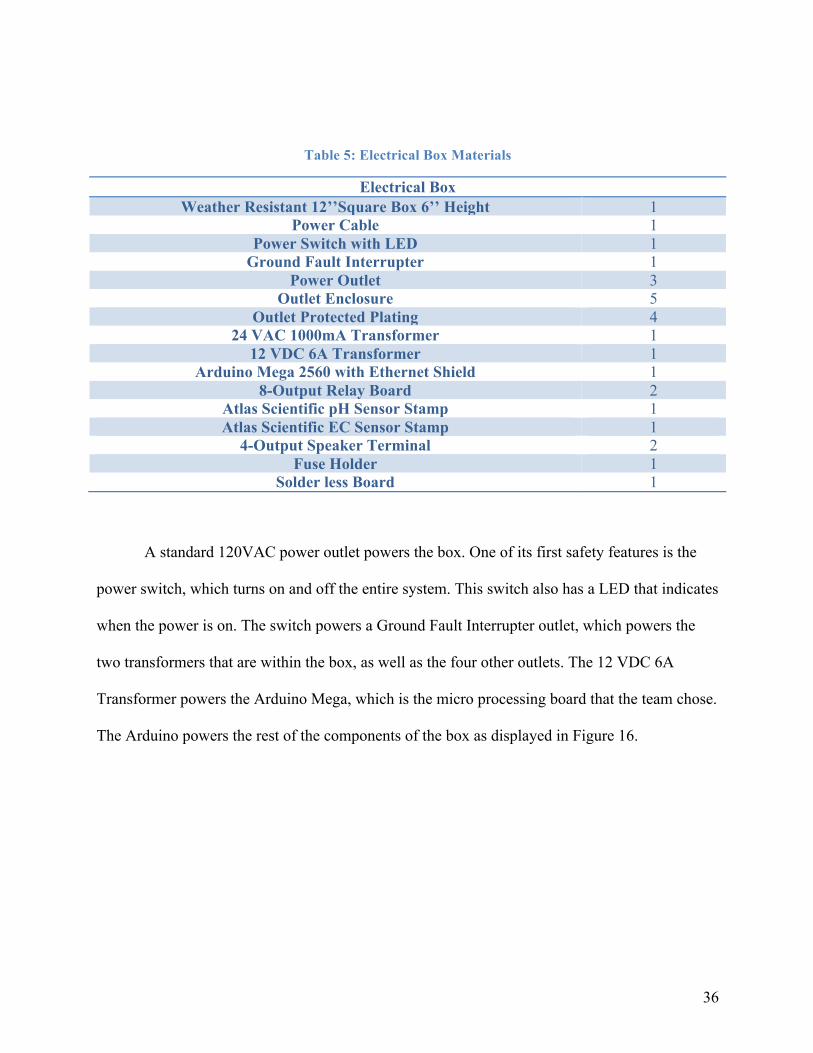
Table 5: Electrical Box Materials
Electrical Box Weather Resistant 12’’Square Box 6’’ Height 1
Power Cable 1 Power Switch with LED 1
Ground Fault Interrupter 1 Power Outlet 3
Outlet Enclosure 5 Outlet Protected Plating 4
24 VAC 1000mA Transformer 1 12 VDC 6A Transformer 1
Arduino Mega 2560 with Ethernet Shield 1 8-Output Relay Board 2
Atlas Scientific pH Sensor Stamp 1 Atlas Scientific EC Sensor Stamp 1
4-Output Speaker Terminal 2 Fuse Holder 1
Solder less Board 1
A standard 120VAC power outlet powers the box. One of its first safety features is the
power switch, which turns on and off the entire system. This switch also has a LED that indicates
when the power is on. The switch powers a Ground Fault Interrupter outlet, which powers the
two transformers that are within the box, as well as the four other outlets. The 12 VDC 6A
Transformer powers the Arduino Mega, which is the micro processing board that the team chose.
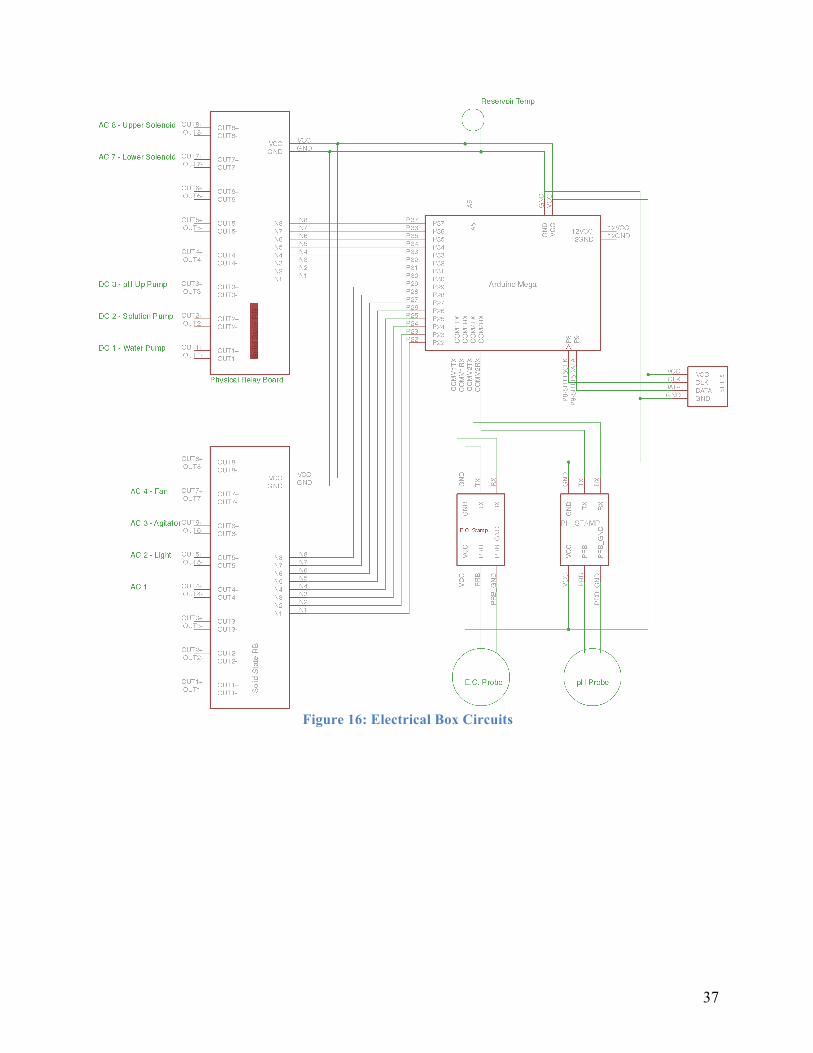
The Arduino powers the rest of the components of the box as displayed in Figure 16.
37
Figure 16: Electrical Box Circuits

38
Figure 17: Electrical Box
All of the elements of the box are attached to a false bottom. This allowed the team to
remove the main components if there was a need to. The layout of the box is simple; the Arduino
is on the top of Figure 17 underneath the power switch enclosure. In the middle, are the two relay
boards stacked vertically (which can’t be seen) and on top there is a layer of solderless board that
allowed the team to attach the fuse holders. On the right of the figure there is a board that
corresponds to the circuitry of the sensor probes. On the bottom the transformers are located and
were attached to one another using Velcro.
39
Sensors
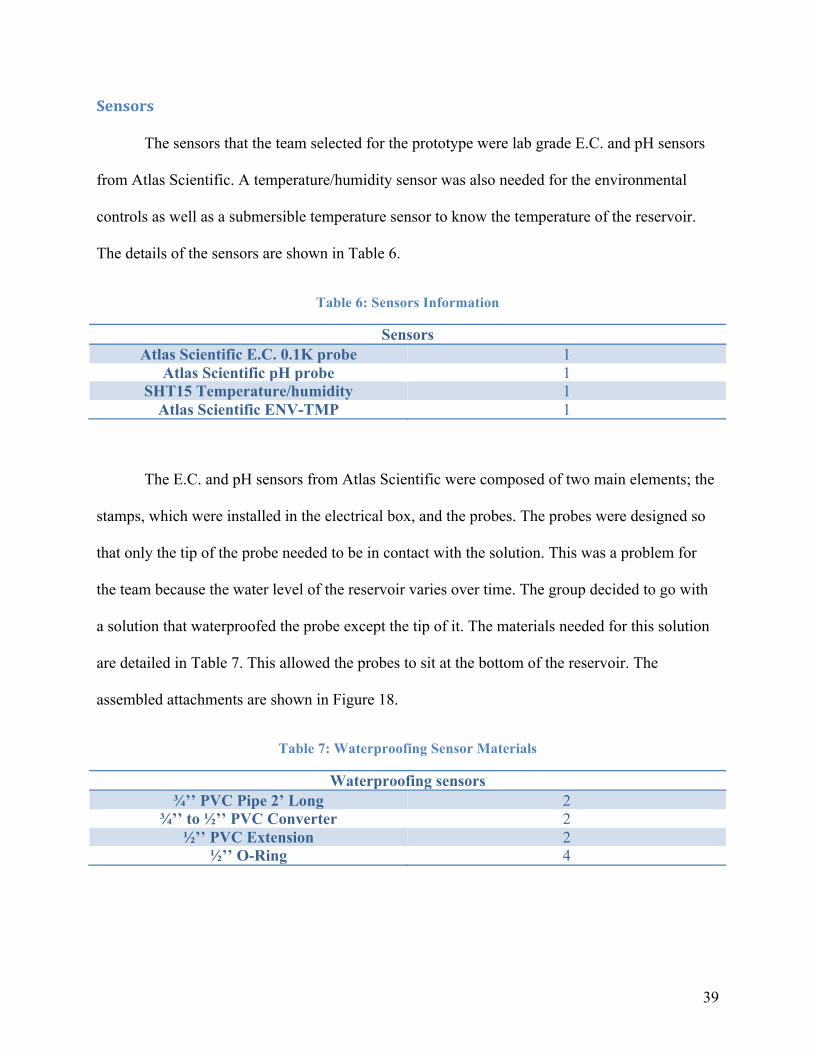
The sensors that the team selected for the prototype were lab grade E.C. and pH sensors
from Atlas Scientific. A temperature/humidity sensor was also needed for the environmental
controls as well as a submersible temperature sensor to know the temperature of the reservoir.
The details of the sensors are shown in Table 6.
Table 6: Sensors Information
Sensors Atlas Scientific E.C. 0.1K probe 1
Atlas Scientific pH probe 1 SHT15 Temperature/humidity 1
Atlas Scientific ENV-TMP 1
The E.C. and pH sensors from Atlas Scientific were composed of two main elements; the
stamps, which were installed in the electrical box, and the probes. The probes were designed so
that only the tip of the probe needed to be in contact with the solution. This was a problem for
the team because the water level of the reservoir varies over time. The group decided to go with
a solution that waterproofed the probe except the tip of it. The materials needed for this solution
are detailed in Table 7. This allowed the probes to sit at the bottom of the reservoir. The
assembled attachments are shown in Figure 18.
Table 7: Waterproofing Sensor Materials
Waterproofing sensors ¾’’ PVC Pipe 2’ Long 2
¾’’ to ½’’ PVC Converter 2 ½’’ PVC Extension 2
½’’ O-Ring 4

40
Figure 18: Sensor waterproofing, from left to right, pH and E.C. sensors
3.4 – Software Design
Now we had to implement the software behind the control systems. This involves finding
the right tools to develop with, what hardware to use, and how to structure the system virtually.
Tools
To fulfill our application goals, we needed to find hardware that can be easily networked
and software that is open enough to operate on most platforms while maintaining a persistent
environment state. For our prototype, we chose Java because it is cross-platform compatible,
supports networking, and provides many tools/libraries.
Database Management
Among the tools provided with Java is the Java persistence API. This framework
manages relational data and maps it to objects. This enables the developer to easily manage
virtual representations in this farming system. However, there is a small performance cost for
maintaining reliability. To minimize this issue, we selected eclipselink as our persistence
41
provider that utilizes an embedded H2 database. This combination is great because it uses open
source technologies and according to “JPA performance benchmark” is one of the best
performing JPA/DBMS combinations (“Eclipselink Performance Summary”, 2012).
To help speed up the development process, we chose to work in the NetBeans IDE. This
development environment contains an easy-to-use debugger and a great user interface builder. In
addition, the H2 database plug-in and auto complete of syntax help with the learning of the JPA
language and structure. As for code management, we set up a git server to track changes and
synchronize development machines.
Hardware
As for hardware, we chose the Arduino as our embedded platform because it is a very
expandable and inexpensive microcontroller. The Arduino Mega 2560 has 16 analog inputs, and
54 I/O pins of which 14 provide PWM output and 8 provide 4 UART serial communication lines
(Arduino, 2012). In addition, this platform also has an Ethernet Shield, which enables the
microcontroller to handle network communication via TCP or UDP easily. This feature is crucial
because it allows multiple controllers to be connected to a server. Furthermore, it is simpler to
develop a device since the Arduino Ethernet Library already handles packet transport and a stack.
Neuron Robotics
In order to send remote procedure calls, we needed a compact and reliable messaging
protocol. Instead of creating our own we found Neuron Robotics’ bowler communications
system to fit these requirements. This protocol is intended for embedded systems with various
methods of communicating with a host (Neuron Robotics, 2012). Each bowler packet can
contain a maximum of 256 bytes of data, 4 of which identify the remote procedure call. These
42
bowler packets make up a bowler transaction, which defines how a bowler host and device
communicate. The most common type of transaction is a synchronous transaction where a host
sends a remote procedure call to a device and waits for a packet with the same identifier from the
device. This redundancy ensures a more reliable connection, which is absolutely crucial in the
system. On the other hand asynchronous transactions involve only one device sending a packet.
Although this is less reliable, it enables the device to send status updates that are less important.
This method of communication is very helpful for certain sensors such as the pH and E.C.
sensors because you don't want to interrupt the device when waiting for readings that take time
on the order of seconds. In addition to the structure of the bowler communications system,
Neuron Robotics also provides an SDK for the Java platform that encapsulates connecting to a
device, and transactions between the host and the device.
Design
With all the tools in place we are able to design a Java application that can control
multiple devices easily and reliably while maintaining persistent storage of user settings and
system status. In our prototype Java application, a framework has been created for a more
expandable system but for the moment it only controls the prototype.
Physical versus Virtual systems
One of the issues we needed to overcome was the separation of the physical device and
the virtual system. Generating entities/objects that map directly to elements in the physical
system solved this problem. When put together, these objects create a virtual model of the
system.
43
Model
The model is split up into five entities. The IFS Module entity tracks unique attributes
such as its name, a list of columns (panels), the associated device entity as well as the current
tasks. The device entity handles the hardware identifier (MAC address) and a virtual instance of
the physical device. This instance uses NeuronRobotics’ SDK to connect to the bowler device,
which in the prototype is the Arduino.
As for the column entities (panels), each one tracks what plant is currently on it, and
when it was planted. The plant entity tracks the name and cycles of the plant such as initial
seeding, week 1, week 2, and harvest. Each plant cycle contains all the environment settings
necessary to care for the plants during a given period of time.

44
Figure 19: Plant Manager Window
Some of the settings as shown in Figure 19 are: a user readable name, how long the cycle
lasts, how long the spray nozzles should remain on and off, when to turn the lights on and off,
thresholds for environmental sensors, thresholds for reservoir sensors, and nutrient information
ideal for the plant.

45
Controller
Figure 20: System Controller Interface
To further increase flexibility, we implemented the model-view-controller pattern. Here's
a walk-through the program. The main application first creates a system controller and a plant
manager. Once the plant manager is initialized, it retrieves all of the plants in the database. This
is then rendered in the main window. On the other hand, the system controller generates the
system model by looking up what modules are connected to the system, what devices are
connected to those modules, and attempts to connect to those devices. Once the devices are
connected, the controller then looks up the panels that are associated to that device and schedules
maintenance tasks such as the spray cycle and reservoir calibration. Once initialized, the main
window then looks up the modules and displays them as a list in the system manager. Figure 20
illustrates the monitoring functionality of the application and Appendix A contains a simplified
diagram of this structure.
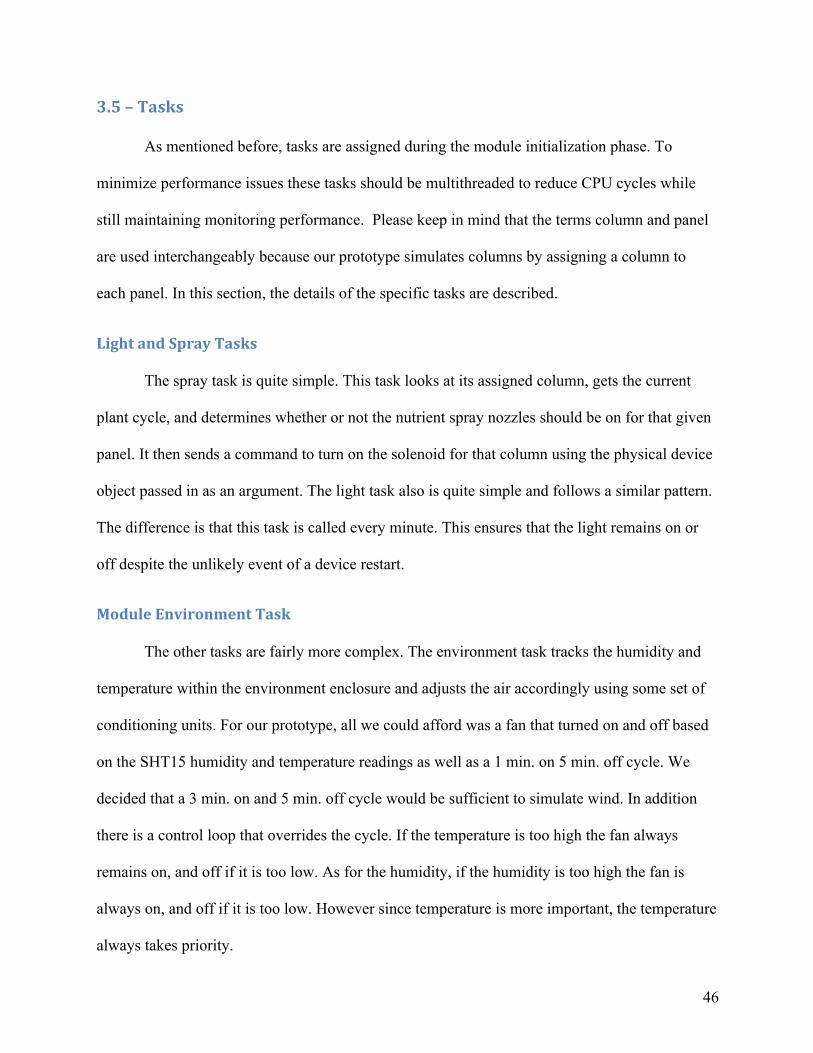
46
3.5 – Tasks
As mentioned before, tasks are assigned during the module initialization phase. To
minimize performance issues these tasks should be multithreaded to reduce CPU cycles while
still maintaining monitoring performance. Please keep in mind that the terms column and panel
are used interchangeably because our prototype simulates columns by assigning a column to
each panel. In this section, the details of the specific tasks are described.
Light and Spray Tasks
The spray task is quite simple. This task looks at its assigned column, gets the current
plant cycle, and determines whether or not the nutrient spray nozzles should be on for that given
panel. It then sends a command to turn on the solenoid for that column using the physical device
object passed in as an argument. The light task also is quite simple and follows a similar pattern.
The difference is that this task is called every minute. This ensures that the light remains on or
off despite the unlikely event of a device restart.
Module Environment Task
The other tasks are fairly more complex. The environment task tracks the humidity and
temperature within the environment enclosure and adjusts the air accordingly using some set of
conditioning units. For our prototype, all we could afford was a fan that turned on and off based
on the SHT15 humidity and temperature readings as well as a 1 min. on 5 min. off cycle. We
decided that a 3 min. on and 5 min. off cycle would be sufficient to simulate wind. In addition
there is a control loop that overrides the cycle. If the temperature is too high the fan always
remains on, and off if it is too low. As for the humidity, if the humidity is too high the fan is
always on, and off if it is too low. However since temperature is more important, the temperature
always takes priority.

47
Reservoir Calibration Task
The last task that needs to be performed is maintaining the nutrient solution, which we
call the reservoir calibration task. This task checks the reservoir sensors, the EC and pH, every
hour. If the threshold on either of these sensors is exceeded, the calibration cycle begins.
First the E.C. is calibrated. If the E.C. is too high water is selected. If the E.C. is too low,
the solution is selected. After the E.C. is calibrated, the pH is calibrated. If the pH is too low, the
water is selected, and if the pH is too high, the solution is selected. Once the solution is selected,
the control loop begins.
There are five variables in this loop: xprevious, xmeasured. xdesired, tprevious, and tnew. The loop is
first initialized with xp set to the current sensor measurement, xd set to an average of the
thresholds of the selected sensor, and tp set to 3 seconds. Now the calibration loop begins. The
pump for the solution is then turned on for tp seconds. Then the control waits for 30 minutes with
the agitator pump on. After the settling, xmeasured is then set to the current sensor reading. The
amount of time needed to turn on the pump again is then calculated using the following formula:
𝑡! = 𝑡!(𝑥! − 𝑥!)(𝑥! − 𝑥!)
This equation essentially calculates the rate of change in the sensor reading and
determines how much more time it would take to reach the desired level based on the difference
between the desired reading and the current measurement. The variables tp and xp are then set to
tn and xm and the loop repeats. To prevent the unit from overshooting too many times, this loop is
only allowed to run a maximum of two times before stopping indefinitely while sending warning
signs to the user until the readings come back to normal.
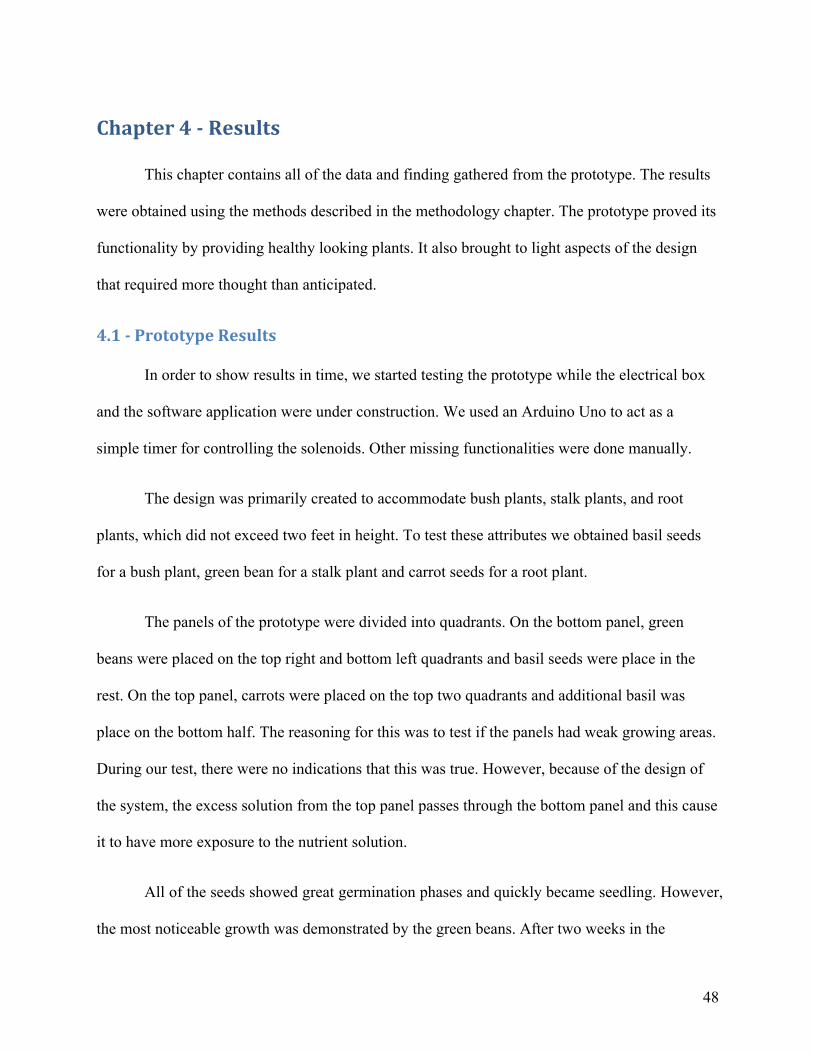
48
Chapter 4 -‐ Results
This chapter contains all of the data and finding gathered from the prototype. The results
were obtained using the methods described in the methodology chapter. The prototype proved its
functionality by providing healthy looking plants. It also brought to light aspects of the design
that required more thought than anticipated.
4.1 -‐ Prototype Results
In order to show results in time, we started testing the prototype while the electrical box
and the software application were under construction. We used an Arduino Uno to act as a
simple timer for controlling the solenoids. Other missing functionalities were done manually.
The design was primarily created to accommodate bush plants, stalk plants, and root
plants, which did not exceed two feet in height. To test these attributes we obtained basil seeds
for a bush plant, green bean for a stalk plant and carrot seeds for a root plant.
The panels of the prototype were divided into quadrants. On the bottom panel, green
beans were placed on the top right and bottom left quadrants and basil seeds were place in the
rest. On the top panel, carrots were placed on the top two quadrants and additional basil was
place on the bottom half. The reasoning for this was to test if the panels had weak growing areas.
During our test, there were no indications that this was true. However, because of the design of
the system, the excess solution from the top panel passes through the bottom panel and this cause
it to have more exposure to the nutrient solution.
All of the seeds showed great germination phases and quickly became seedling. However,
the most noticeable growth was demonstrated by the green beans. After two weeks in the

49
prototype, the bean looks as shown in Figure 21. The carrots were introduced to the system
sometime after this point because we wanted to system to be more stable. At the five-week mark
the beans and the basil look great as displayed in Figure 22. The carrots also look healthy at their
two-week mark as shown in Figure 23.
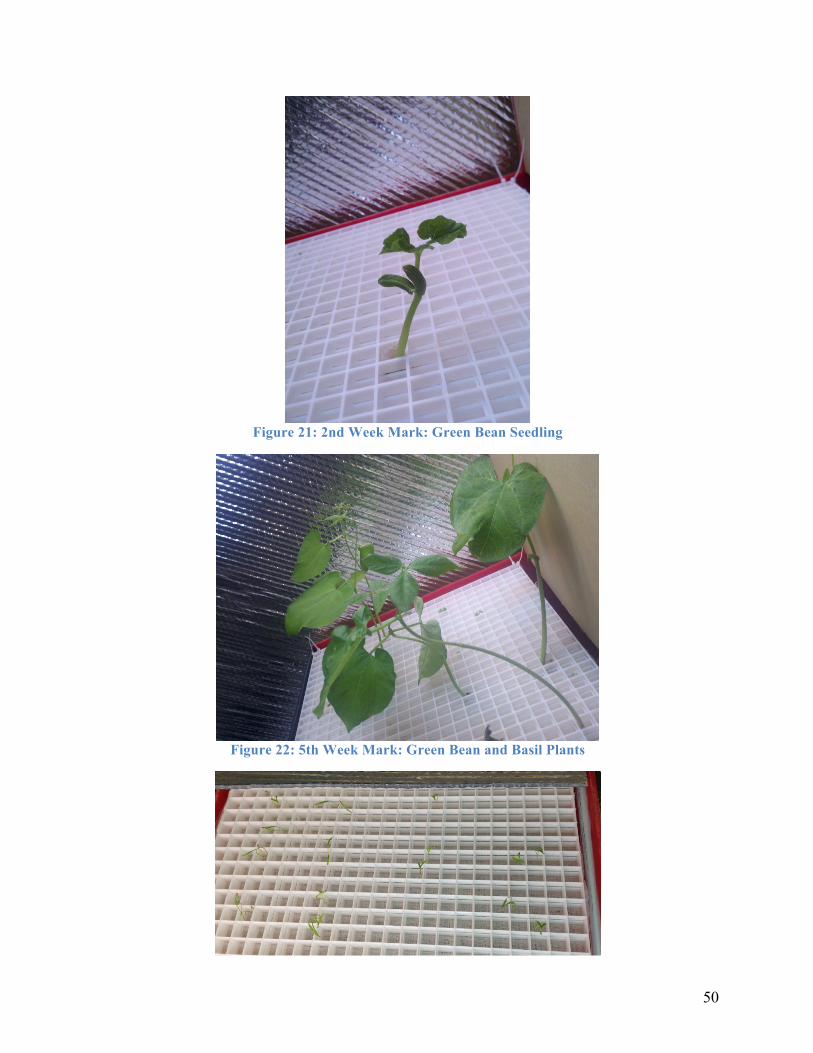
50
Figure 21: 2nd Week Mark: Green Bean Seedling
Figure 22: 5th Week Mark: Green Bean and Basil Plants
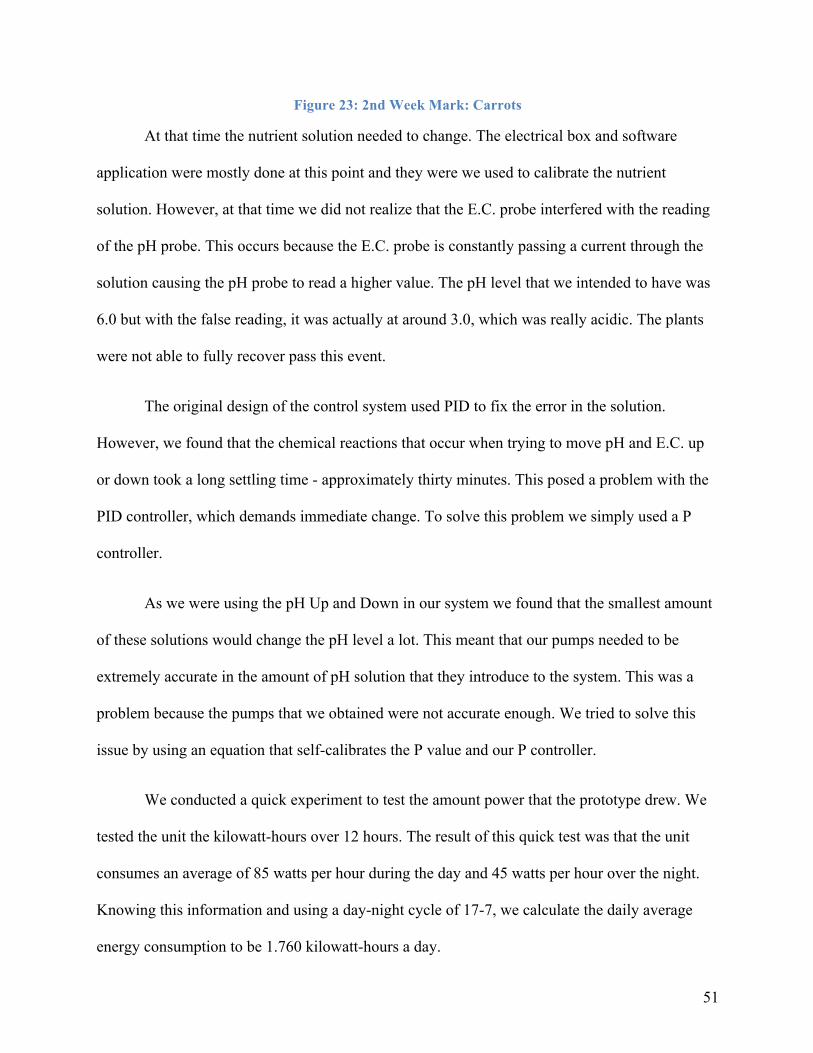
51
Figure 23: 2nd Week Mark: Carrots
At that time the nutrient solution needed to change. The electrical box and software
application were mostly done at this point and they were we used to calibrate the nutrient
solution. However, at that time we did not realize that the E.C. probe interfered with the reading
of the pH probe. This occurs because the E.C. probe is constantly passing a current through the
solution causing the pH probe to read a higher value. The pH level that we intended to have was
6.0 but with the false reading, it was actually at around 3.0, which was really acidic. The plants
were not able to fully recover pass this event.
The original design of the control system used PID to fix the error in the solution.
However, we found that the chemical reactions that occur when trying to move pH and E.C. up
or down took a long settling time - approximately thirty minutes. This posed a problem with the
PID controller, which demands immediate change. To solve this problem we simply used a P
controller.
As we were using the pH Up and Down in our system we found that the smallest amount
of these solutions would change the pH level a lot. This meant that our pumps needed to be
extremely accurate in the amount of pH solution that they introduce to the system. This was a
problem because the pumps that we obtained were not accurate enough. We tried to solve this
issue by using an equation that self-calibrates the P value and our P controller.
We conducted a quick experiment to test the amount power that the prototype drew. We
tested the unit the kilowatt-hours over 12 hours. The result of this quick test was that the unit
consumes an average of 85 watts per hour during the day and 45 watts per hour over the night.
Knowing this information and using a day-night cycle of 17-7, we calculate the daily average
energy consumption to be 1.760 kilowatt-hours a day.
52
Chapter 5 – Recommendations
After analyzing our results we compiled a list of issues to fix and work that can be done.
1. Fixes
a. Prevent dripping on the sides of the reservoir
b. Use peristaltic pumps for the concentrated nutrient solutions
i. Variable output
ii. Unit is not submerged
c. Reservoir calibration
i. Account for the pH logarithmic scale in the equation
ii. Insert ability to add pH up and down
d. Ethernet library on Arduino has difficulty with DHCP
i. No more than 1 hop or else the device can’t be seen
e. Implement detection of loss of host to stop sending asynchronous responses on
the bowler device end because If it is left on, causes inability to connect to the
device
f. Refine bowler device firmware
i. Currently only supports UDP
ii. Make connection more reliable
iii. Improve the structure
g. Implement detection of a device restart
h. Redefine server and bowler device roles

53
i. Server sends changes of settings to device rather than sending every
command over the network
1. More reliable in case of a server crash or device restart
ii. Bowler device saves changes onto micro SD card slot on Ethernet shield
1. Not EEPROM because it is not replaceable and has limited number
of writing cycles. Micro SD is replaceable
i. Control the power of the E.C. probe since it affects the pH reading drastically
j. Add in a bypass line the accumulator to the reservoir to purge the accumulator on
occasion
i. Even though the reservoir might be calibrated the accumulator is not
ii. It may take a lot of time to see changes depending on how many plants are
being fed
k. Add method of detecting water level of the reservoir
l. Add in a pH probe buffer cycle
2. Future Work
a. Build a functional horizontal carousel module
b. Implement a harvester
c. Implement a seeder
d. Devise method of intercommunication between devices for harvester and seeder
e. Implement an efficient planner for creating a steady flow of crops
i. Also determines scheduling of tasks for harvester and seeders
f. Research more into lights
i. LEDs

54
ii. HFS (high pressure sodium lights)
iii. Ratios
iv. Cost analysis
g. Research into better environment settings for other plants
h. Implement other types of caring systems to account for larger plants
i. Obtain and experiment with Arabidopsis (common test plant)
j. Experiment with a sturdier underlying plastic mesh instead of just the water-
soaking medium, such as cheesecloth to support the plant
k. Add cleaning cycle of spray nozzles to prevent clogging
55
Chapter 6 – Conclusion
In the end, our project opens up the plausibility of an all-in-one, fully automated farming
system. The key to this automation process lies in the panel design, which removes the need to
transplant. That being said there is much work to be done to refine this system. On top of that,
the additional peripherals must be designed and integrated with this existing caring module.
These tasks leave room for future teams to come in and add in their own ideas to this system.
During the course of this project, our team has learned the delicacies in maintaining a plant’s
health. The hope is these lessons will be properly passed along so the future researchers will not
be caught up in plant testing and focus on the system design.
To help future teams we have left starting points for them to develop their own ideas. Our
overall design allows free creation for the remaining aspects of the IFS. Given the extensive
research put into this project by our team, any incoming team starting to develop this system
further would have resources to guide them through the ideas that have already been put forth.
Finally the application itself allows for the insertion of different devices, so implementing the
new peripherals should be easier.
Even if future teams are not able to create a cost-effective solution for our initial problem
within a few iterations, which is expected. The goal of this project in the long term is to show
that a fully realized automated farming system is possible. If they are able to make it affordable
that is a great step forward. The importance of this project is not the feasibility in building one
today, but the plausibility of having one at all. There will come a time where we as a civilization
will have to grow our food within our cities. It is important that when that day arrives, we have
an infrastructure set up, ready to fill our food needs.
56
References
Adrian, P. (2007). A Novel Conductive Humidity Sensor. Retrieved 04/25, 2012, from http://www.sensorsmag.com/sensors-mag/a-novel-conductive-humidity-sensor-1336 Aero Hydroponics The Way of The Future. (2008). Retrieved 12/05, 2011, from http://simplyhydro.com/aero_hydro.htm Agricultural Technology. (2011). EncyclopÊdia Britannica Online Academic Edition: EncyclopÊdia Britannica Inc. Alterieri, M. A. (2000). Modern Agriculture: Ecological impacts and the possibilities for truly sustainable farming. Retrieved Dec 12, 2011, from http://nature.berkeley.edu/~agroeco3/modern_agriculture.html Anthoni, J. F. (2005). pH Meter Principles. Retrieved 04/25, 2012, from http://www.seafriends.org.nz/dda/ph.htm Arduino. (2012). Retrieved 04/25, 2012, from http://arduino.cc/en/ Basic Hydroponic Systems. (2008). 2011, from http://simplyhydro.com/system.htm Converting Pump to Pressure. Retrieved 02/04, 2012, from http://www.engineeringtoolbox.com/pump-head-pressure-d_663.html Deyle, T. (2009). Electroadhesive Robot Climbers. Retrieved 11/14, 2011, from http://www.hizook.com/blog/2009/08/06/electroadhesive-robot-climbers Deyle, T. (2010a). Electroadhesive Robot Grippers from SRI International. Retrieved 11/14, 2011, from http://www.hizook.com/blog/2010/10/28/electroadhesive-robot-grippers-sri-international Deyle, T. (2010b). "Jamming" Robot Gripper Gets Official: Article Published in PNAS. Retrieved 11/14, 2011, from http://www.hizook.com/blog/2010/10/25/jamming-robot-gripper-gets-official-article-published-pnas EC/TDS/PPM Meter On Limited Budget. (2006). from http://blea.ch/wiki/index.php/PPM_Meter Eclipselink Performance Summary. (2012). Retrieved 03/04, 2012, from http://www.jpab.org/EclipseLink.html Fears, S. (2008a). Monoculture vs Polyculture Farming Methods. Retrieved 04/22, 2012, from http://true-progress.com/monoculture-vs-polyculture-farming-methods-84.htm Fears, S. (2008b). Monoculture vs. Polyculture Farming Methods. Retrieved 12-12, 2011, from http://true-progress.com/monoculture-vs-polyculture-farming-methods-84.htm

57
Food miles: How far your food travels has serious consequences for your health and the climate. Natural Resources Defense Council. Gardening in a bucket, growing plants upside-down. 9 Plants to plant in it. Retrieved 12-12, 2011, from http://www.juicymaters.com/2011/07/gardening-in-a-bucket-growing-plants-upside-down-9-plants-to-plant-in-it/ Gregory, M. (2010). Photosynthesis. Retrieved 4/22, 2012, from http://faculty.clintoncc.suny.edu/faculty/michael.gregory/files/bio%20101/bio%20101%20lectures/photosynthesis/photosyn.htm Growing Mediums. (2008). Retrieved 09/15, 2011, from http://simplyhydro.com/growing1.htm Growing Plant under Artificial Lights. Retrieved 04/25, 2012, from http://primexgardencenter.com/wp-content/uploads/2011/03/caresheets_ArtificialLight.pdf Hounshell, D. A. (1984). From the American System to Mass Production, 1800-1932: The Development of Manufacturing Technology in the United States. Baltimore, Maryland: Johns Hopkins University Press. How Do Plants Grow? A 7-Stage Explanation of What Makes Plants Grow. (2010). GrowingAnything.com. Hydro-Atomizing Spray Jets & Fittings. (2011). Retrieved 12/05, 2011, from http://www.aeroponics.com/aero6j.htm Hydroponic Plants - What To Grow? (2009-2011). Retrieved 11/08, 2011, from http://www.hydroponics-simplified.com/hydroponic-plants.html Lab, B. (2007). Nominal EC Values for Hydroponic Crops. Retrieved 2/12, 2012, from http://www.getbluelab.com/Articles/Nominal+EC+Values+for+Hydroponic+Crops.html Lipstein, D. Don's LED Faq. Nate. (2011). LED Grow Lights Review. Retrieved 04/25, 2012, from http://ledgrowlightsreview.org/the-quick-guide-to-led-grow-lights/ Paxton, A. The Food Miles Report. PH Meter. (2010). Retrieved 11/07, 2011, from http://blea.ch/wiki/index.php/PH_Meter Plant List - Grown in Genesis Series Aeroponics System. from http://www.biocontrols.com/aero20.htm Plant Parts. (2009). Retrieved 4/22, 2012, from http://www.mbgnet.net/bioplants/parts.html , PPMs/EC for various plants. (2007). PPMs/EC for various plants. http://forums.bghydro.com/showthread.php?167-PPM-Guide
58
Robotics, N. (2012). DyIO. Retrieved 04/25, 2012, from http://neuronrobotics.com/neuronrobotics/store/dyio/ Scientific, A. Retrieved 2/12, 2012, from http://www.atlas-scientific.com Smith, S. (2008). How Does a Temperature Sensor Work? Retrieved 04/25, 2012, from http://www.ehow.com/how-does_4928076_temperature-sensor-work.html The Gain, P. (2011). Grow Light Reviews - The High Pressure Sodium (HPS) Light. Types of Plants: Seed Bearing Plants. (2010). Retrieved 12-12, 2011, from http://plantspages.com/seedbearingplants.htm Urban Hydroponic Growers Union. Retrieved 12-12, 2012 USDA: FRUIT AND VEGETABLE MARKET NEWS PORTAL. (2011). Retrieved 11/14, 2011, from http://marketnews.usda.gov/portal/fv?paf_dm=full&paf_gear_id=1200002&startIndex=1&dr=1&shipHighLow=true Vermaas, W. (1998). An Introduction to Photosynthesis and Its Applications. Retrieved 04/22, 2012, from http://bioenergy.asu.edu/photosyn/education/photointro.html Water Conductivity. (2011). Retrieved 04/25, 2012, from http://www.lenntech.com/applications/ultrapure/conductivity/water-conductivity.htm Weathers, P. J., & Zobel, R. W. (1992). Aeroponics For the Culture of Organisms, Tissues, and Cells. Pergamon Press plc.
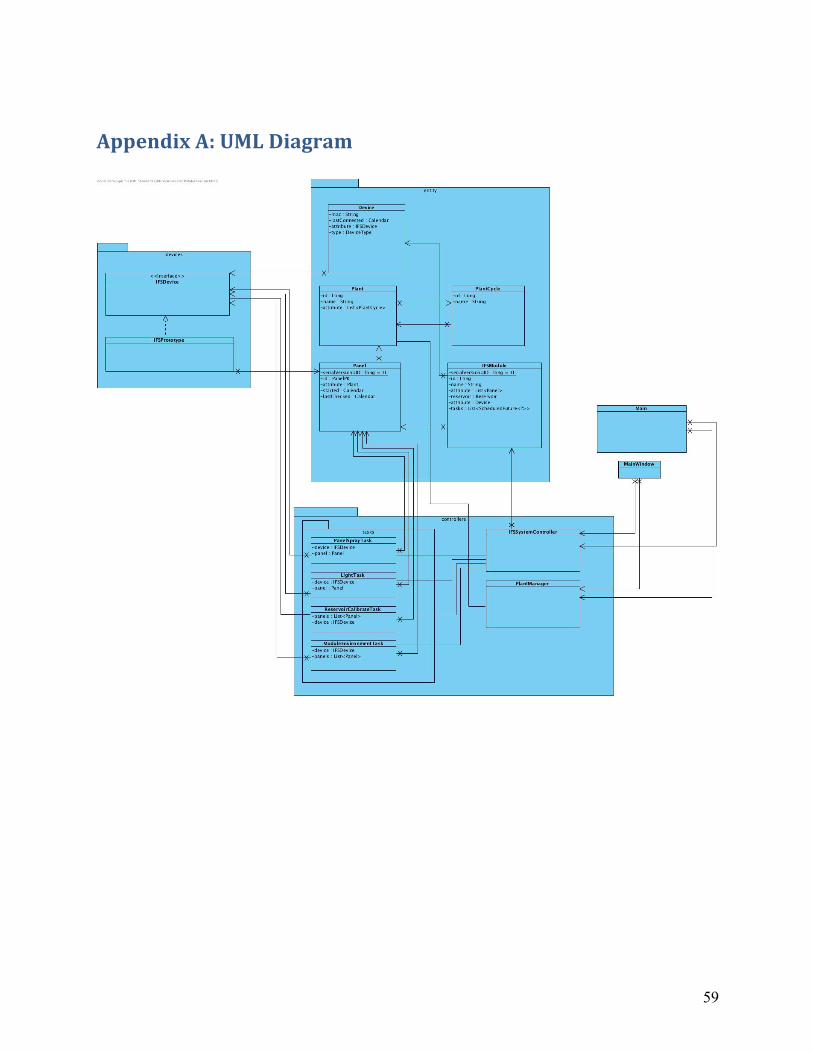
59
Appendix A: UML Diagram

60
Appendix B: Additional Conceptual Sketches
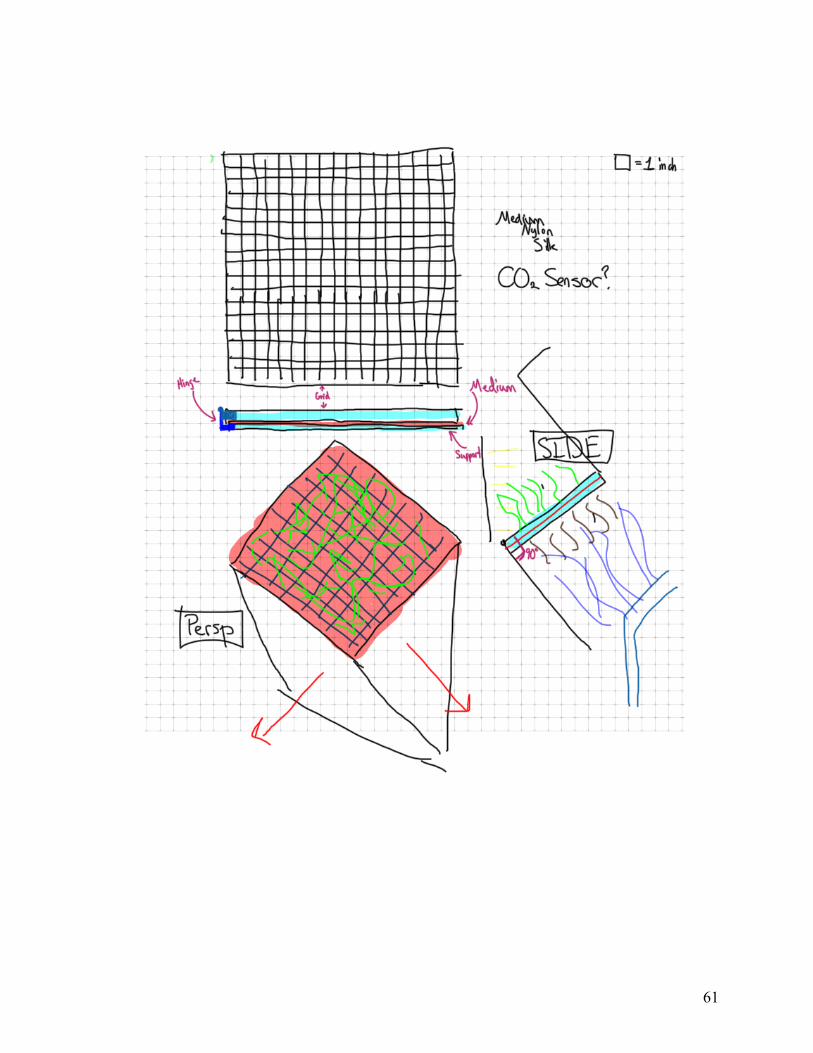
61

62
Appendix D: Electrical Box

63
Appendix E: Prototype Budget
26%
24% 30%
13%
7%
Budget (Total: $1200)
Sensors
Electrical
Building Supplies
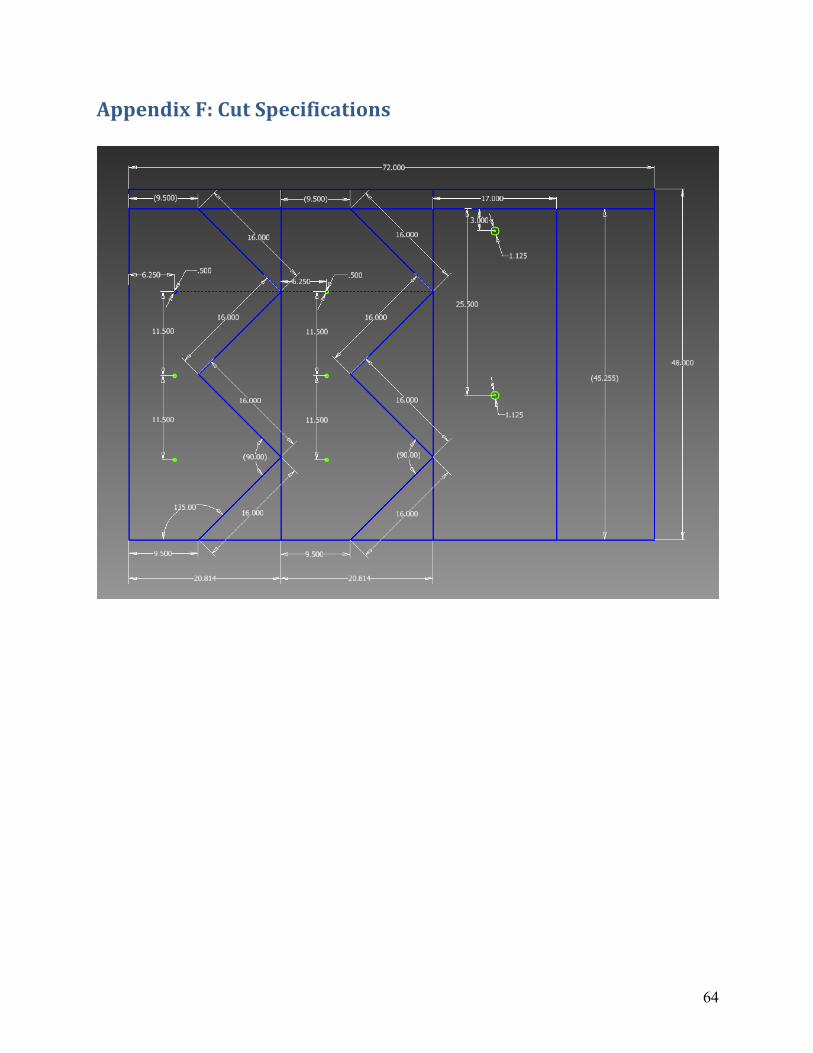
64
Appendix F: Cut Specifications
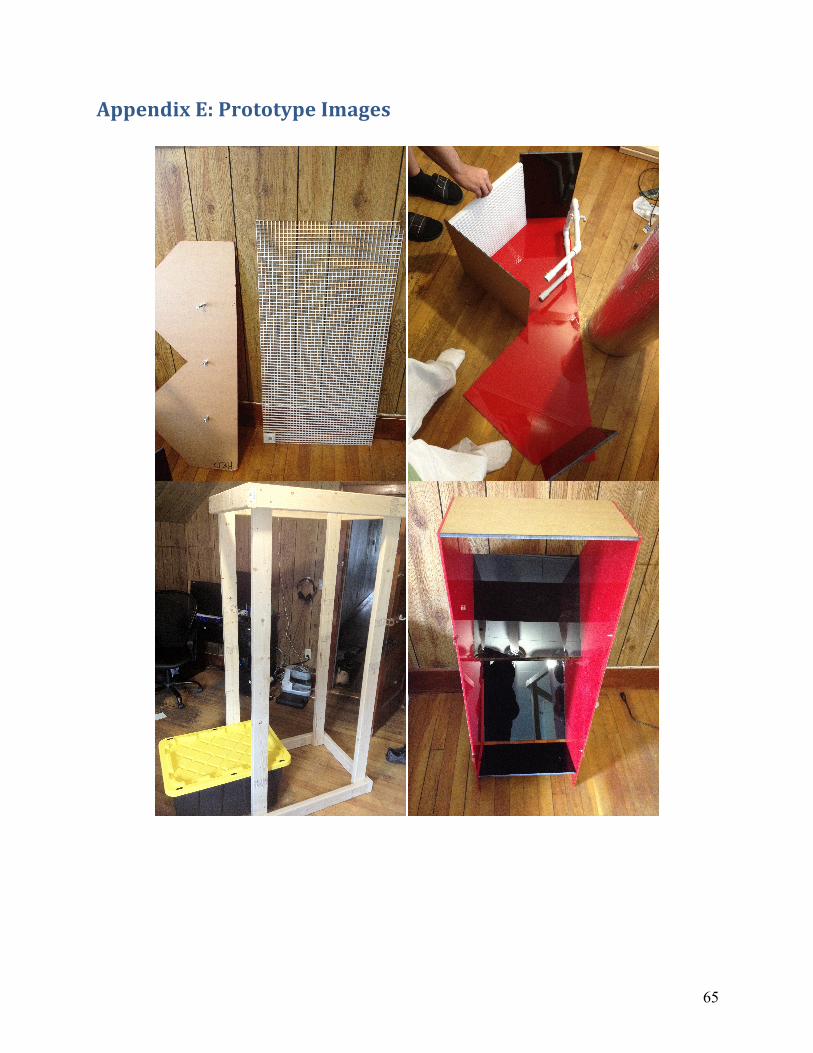
65
Appendix E: Prototype Images

66