
2014_MAV1_Final_Report.pdf - Worcester Polytechnic Institute
74
-
Upload
khangminh22 -
Category
Documents
-
view
1 -
download
0
Transcript of 2014_MAV1_Final_Report.pdf - Worcester Polytechnic Institute


i
Abstract
This project involved the analysis, design, and fabrication of an aircraft meeting the
requirements of the 2014 SAE Aero Design Competition, Micro-Class. Best competition scoring
favored an aircraft of maximum payload that could be loaded into a 24”x18”x8” box. The team
used various tools including wind tunnel and mathematical modeling to determine the Micro’s
aerodynamics and power characteristics. Final design used a combination of conventional and high
performance materials, balsa, carbon fiber, and UltraCote wing covering. Configuration was
conventional with 4 wing panels totaling 90” span using an 1100 W motor. Outer wing panels
were given +8 degrees of dihedral to permit two-axis control. The Micro is expected to carry 5-10
pounds of payload at speeds of 25-35 ft. /sec.
“Certain materials are included under the fair use exemption of the US Copyright Law and have been prepared
according to the fair use guidelines and are restricted from further use.”

ii
Acknowledgements
We would like to thank the following people and companies for their support throughout
the project. Without them, the aircraft never would have left the ground.
Project Advisors Professor Anthony B. Linn and Professor David J. Olinger for their
advice, encouragement, and constructive criticism
Financial Sponsor UTC Aerospace Systems for their generous financial support
Hobby Shop Turn4Hobbies of West Boylston, Massachusetts for their
recommendations and help with supplies
ME/AE Department Staff Gloria Boudreau and Barbara Fuhrman for their processing and
purchasing assistance
WPI Facilities Carpentry shop for building the carrying box
WPI Baseball Team For allowing us to borrow their radar gun for launch velocity tests

iii
Table of Contents Abstract ................................................................................................................................ i
Acknowledgements ............................................................................................................. ii
Table of Figures .................................................................................................................. v
List of Tables ..................................................................................................................... vi
Table of Authorship .......................................................................................................... vii
List of Symbols and Acronyms........................................................................................ viii
1. Introduction ................................................................................................................. 1
2. Literature Review........................................................................................................ 2
3. SAE Rule Changes ...................................................................................................... 3
4. Aircraft Mission .......................................................................................................... 5
5. Conceptual Designs .................................................................................................... 6
5.1. Flying Wing ........................................................................................................ 7
5.2. Powered Glider ................................................................................................... 8
6. Design Philosophy ...................................................................................................... 8
7. Airfoil Analysis & Selection ....................................................................................... 9
7.1 XFLR5 Analysis ..................................................................................................... 10
7.2 Trailing Edge Modifications ................................................................................... 11
8. Aerodynamic Analysis .................................................................................................. 12
8.1. Lift Analysis........................................................................................................... 13
8.2. Stability Analysis ................................................................................................... 16
8.3. Trim Analysis......................................................................................................... 17
8.4. Initial Wind Tunnel Models ................................................................................... 18
8.4.1 Slant Tube Manometer ..................................................................................... 19
8.5. Throw Tests ........................................................................................................... 21
9. Control Configuration ................................................................................................... 22
10. Foam Model ................................................................................................................ 24
10.1. Hot-Wire Foam Cutter ......................................................................................... 24
10.2. Foam Model ......................................................................................................... 25
11. Thrust Testing ............................................................................................................. 27
11.1. Thrust Stand ......................................................................................................... 28

iv
11.2. Thrust Tests .......................................................................................................... 29
12. Wing Design and Structure ......................................................................................... 33
12.1. Initial Wing Design .............................................................................................. 34
12.2. Initial Test Construction ...................................................................................... 39
12.2.1. Balsa Construction ........................................................................................ 39
12.2.2. Connection Fabrication ................................................................................. 40
12.2.3. Applying the Final Skin ................................................................................ 41
12.3. Wing Load-to-Failure Test .................................................................................. 42
12.4. Wing redesign ...................................................................................................... 44
12.5. Flying Wire .......................................................................................................... 45
13. Fuselage Design .......................................................................................................... 47
13.1. Payload ................................................................................................................. 48
14. Tail Design .................................................................................................................. 50
15. Final Assembly ........................................................................................................... 54
16. First Flight ................................................................................................................... 55
17. Post Flight Design Modifications ............................................................................... 56
18. Second Flight Test ...................................................................................................... 57
19. Potential future work................................................................................................... 58
19.1 Longitudinal Stability and Trim............................................................................ 58
19.2 Lateral Control and Stability ................................................................................. 58
21. Conclusion .................................................................................................................. 60
References ......................................................................................................................... 62
I. Appendix A-Full Scale Picture ...................................................................................... 63
II. Appendix B-Sample XFLR5 Output Data ................................................................... 65

v
Table of Figures
Figure 1-Final aircraft ......................................................................................................... 1
Figure 2-Predicted scores for the 2013 Aero Design Competition ..................................... 4
Figure 3-Flight scores for initial flight per given payload .................................................. 5
Figure 4-2014 Aero Design Micro-Class flight course....................................................... 6
Figure 5-Original powered glider concept .......................................................................... 8
Figure 6-XFLR5 analysis for the Selig 1223 airfoil ......................................................... 11
Figure 7-Airfoil Comparison; TOP: Unmodified S1223 Airfoil; CENTER: Airfoil required
by 1/16th balsa wrap; BOTTOM: Raw modified airfoil shape ............................ 11
Figure 8-Excel data flowchart ........................................................................................... 12
Figure 9-Lift profile over length of wing sections ............................................................ 14
Figure 10-Static Margin with various payload plates loaded ........................................... 17
Figure 11-Aircraft trim diagram for various payloads ...................................................... 18
Figure 12-Modified Selig 1223 airfoil in the 8"X8" wind tunnel ..................................... 19
Figure 13-The radar gun used to measure expected launch velocity. ............................... 22
Figure 14-The hot-wire foam cutter and spring modification .......................................... 25
Figure 15-First foam flight test model .............................................................................. 26
Figure 16-Required thrust vs. aircraft payload ................................................................. 28
Figure 17-Early SolidWorks model of the thrust stand. It has a 2:1 moment reduction .. 29
Figure 18-Test motor mounted on the thrust stand in the wind tunnel ............................. 30
Figure 19-Average thrust of various propellers vs. flight velocity for the test motor ...... 30
Figure 20-Effect of battery discharge on thrust for the test motor ................................... 31
Figure 21-Maximum average thrust for 5 cell battery with 18X8 propeller and 6 cell battery
with 16x8 and 15x10 propellers using Hacker A40-12L motor ........................... 32
Figure 22-Discharge thrust test for the final motor .......................................................... 33
Figure 23-Top: the Selig 1223 airfoil trailing edge. Bottom: the modified converging balsa
wraps of the constructed wing airfoil .................................................................... 36
Figure 24-Side view of the rib construction and a cutout of the dihedral connection ...... 38
Figure 25-Internal structure of the load-to-failure test wing ............................................ 39
Figure 26-View of the dihedral joint sleeve embedded in the balsa spar ......................... 40
Figure 27-Turned aluminum rod showing the low precision............................................ 41
Figure 28-Wing covering application with the hot iron .................................................... 41
Figure 29-Setup of the structural load-to-failure test. Double sided tape was used to secure
the sand and a protractor was used to measure the twist. ..................................... 43
Figure 30-The bent aluminum rod and tube following the failure test ............................. 44
Figure 31-The Three Types of Spar Webs Used in Wing; TOP: Solid spar web used in
majority of wing; CENTER: Lightened Spar web used in center of outer wing
section; BOTTOM: Further lightened spar web used in tip of outer wing section.
............................................................................................................................... 45

vi
Figure 32-Flying wire wing attachment ............................................................................ 46
Figure 33-Flying wire wing attachment detail .................................................................. 46
Figure 34-Flying wire fuselage interface .......................................................................... 47
Figure 35-Payload plates. LEFT: Half-sized plates used for CG adjustment. RIGHT: Full
payload plates........................................................................................................ 48
Figure 36-Payload attachment bolts inside the aircraft with a sample payload installed . 49
Figure 37-Side view of the fuselage assembly ................................................................. 50
Figure 38-Tail boom deflection test results ...................................................................... 51
Figure 39-Tail boom interlocking key system. Not pictured is the U-shaped basswood
block that secures the tail boom longitudinally. ................................................... 52
Figure 40-Final tail configuration detail ........................................................................... 53
Figure 41-CAD model of the tail assembly ...................................................................... 53
Figure 42-Final aircraft detail drawing (Note: Not to original scale. See I. Appendix A-Full
Scale Picture for larger view) ............................................................................... 54
Figure 43-The group with the final aircraft prior to its maiden flight .............................. 61
List of Tables
Table 1-Some appropriate airfoils for low-Reynolds Number aircraft ............................. 10
Table 2: Sample Vertical Rise for Free Stream Velocities in Wind Tunnel ..................... 20

vii
Table of Authorship
Section Author
1. Introduction DL, EM
2. Literature Review DL
3. SAE Rule Changes DL, EM
4. Aircraft Mission EM
5. Conceptual Designs EM
5.1 Flying Wing EM
5.2 Powered Glider EM
6. Design Philosophy GF, DL, EM
7. Airfoil Analysis & Selection DL, EM
7.1 XFLR5 Analysis DL, EM
7.2 Trailing Edge Modifications EM, ES
8. Aerodynamic Analysis EM
8.1 Lift Analysis EM
8.2 Stability Analysis EM
8.3 Trim Analysis EM
8.4 Initial Wind Tunnel Models DL, NR
8.4.1 Slant Tube Manometer EM
8.5 Throw Tests DL, NR
9. Control Configuration EB, EM
10. Foam Model EB
10.1 Hot-Wire Foam Cutter EM
10.2 Foam Model EB, GF, EM
11. Thrust Testing EB, GF
11.1 Thrust Stand EB, GF
11.2 Thrust Tests EB, GF
12. Wing Design and Structure EB, ES
12.1 Initial Wing Design EB, ES
12.2 Initial Test Construction EB, ES, NR
12.2.1 Balsa Construction EB, ES, NR
12.2.2 Connection Fabrication EB, ES
12.2.3 Applying the Final Skin NR
12.3 Wing Load-to Failure Test GF, NR
12.4 Wing Redesign EB
12.5 Flying Wire EB
13. Fuselage Design EB, GF
14. Tail Design GF, EM
15. Final Assembly GF, DL
16. First Flight ES
17. Post Flight Design Modifications ES
18. Second Flight Test ES
19. Potential Future Work ES

viii
21. Conclusion DL, EM, NR
References EB, GF, DL, EM, NR, ES
Appendix EB, GF, DL, EM, NR, ES
3D Modeling EB, GF, EM, ES
2D CAD/Laser Cutter Templates ES
2D Graphics ES
Editing/Revising EB, GF, DL, EM, NR, ES
Final Formatting GF
List of Symbols and Acronyms
AGL = Above Ground Level
AR = Aspect Ratio
d = Distance water travels along slant tube monometer
dL = Span wise length of subsection being analyzed on wing section
dS = Planform Area of Subsection being analyzed
EW = Empty Weight
g = Acceleration due to Gravity
H = Wing Thickness
h = Vertical rise of water drawn in monometer
L = Length of wing section
MAV = Micro Aerial Vehicle
MQP = Major Qualifying Project (Senior Capstone Project)
n = Flight Number
𝑃𝑛 = Payload for the nth Flight
𝑃𝐹𝑛 = Payload Fraction for the nth Flight
RC = Remote Control
S = Wing Planform Area
SAE = Society of Automotive Engineers
𝑉∞ = Free stream velocity
WPI = Worcester Polytechnic Institute
XFLR5 = XFoil Low Reynolds Number v5
𝜌∞ = Density of Air
𝜌𝑚 = Density of monometer fluid

1
1. Introduction
Figure 1-Final aircraft
Every year the Society of Automotive Engineers (SAE) hosts an Aero Design competition
with three classes. This project used the Micro-Class rules and was performed as a capstone design
project known as the Major Qualifying Project (MQP) at Worcester Polytechnic Institute (WPI).
It ran from September 2013 to April 2014, spanning the majority of the 2013-2014 academic year.
The design process can be loosely approximated to match WPI’s seven week academic terms. A-
Term focused on conceptual design and development of construction methods. The majority of
testing was done in B-Term, while C- and D-Terms were used for final construction, re-design,
and flight operations.
The optimum design for the Micro-Class competition is one in which two conflicting
parameters, highest payload and lowest empty weight, can be achieved. The objective of the
Micro-Class is to design a system containing a portable (modular based) unmanned aerial vehicle
and launching system within specified packaging requirements. Aircraft will be launched either

2
by hand, or by use of an engineered launching system without the use of a runway for takeoff. In
either case, the entire system must be contained within the specified packaging requirements.
Restrictions: 1. No lighter-than-air or rotary wing aircraft 2. Electric motor propulsion only 3. All aircraft components must fit into a foam lined box with interior dimensions 24”x18”x8” 4. Must be capable of carrying and fully enclosing a rectangular block with the dimensions
2”x2”x5” that represents the minimal size of the payload bay
Requirements: 1. The aircraft must either be hand launched or elastic launched 2. The aircraft must be assembled from the carrying case within 3 minutes by two people 3. Fly closed circuit and land structurally intact. Only the propeller may break.
2. Literature Review
The design process began with a literature review of past WPI MQP reports that were
entered into past Micro-Class competitions, along with flight videos from the 2012 SAE Aero
West Design Competition. The past three MQP projects provided a starting point as to what type
of design configuration, construction techniques, and material selection proved to be beneficial in
the competition.
WPI's 2012 entry was a powered aircraft that placed sixth overall in the SAE competition.
The aircraft was constructed out of balsa wood cut from the laser cutter, assembled on a jig, and
coated in Mylar. The finished design had an empty weight of 0.80 lbs and a maximum payload of
2.17 lbs, which meant their payload fraction was 0.71.1
WPI's 2013 entry was a Flying Wing design based off of Georgia Tech's winning design.
The final design had a swept wing with varying taper, constructed of laser cut balsa wood ribs
using a jig and coated in Mylar. The idea of the Flying Wing showed a promising, simple,
1 (Andrews, et al. 2012)

3
lightweight design that was reliable for carrying a heavy payload. The lack of a fuselage allowed
for the center body to act as a high lift section. The aircraft's empty weight was 0.39 lbs and their
payload fraction during one round at the SAE Aero West Competition was 0.7172. This team
placed fourth overall in the 2013 SAE competition.2
Low-speed flight at low Reynolds numbers required research to determine which airfoils
are best suited for the task at hand. Several papers found on the University of Illinois at Urbana-
Champaign (UIUC) website proved useful in determining several airfoils to investigate further.3
The airfoil shape coordinates from the UIUC airfoil database and Airfoil Tools were downloaded
and prepared for analysis.4 In addition, several RC Aircraft Hobby websites were visited to
research what airfoils were commonly used for RC airplanes. These airfoils were typically flat-
bottomed for easy construction, which was interesting to note, however they did not have as high
a lift coefficient as other airfoils researched, and therefore dropped from further consideration.
3. SAE Rule Changes
Every three years, one class of the Aero Design competition is updated. This year the
Micro-Class rules were changed, with the most important difference in the calculation of the flight
scores. The flight score for the SAE Aero Design Competition is based off of the aircraft's empty
weight and payload fraction, which is the payload divided by the sum of the payload and empty
weight. For the past competitions, the scoring formula is as follows:
2013 𝐹𝑖𝑛𝑎𝑙 𝐹𝑙𝑖𝑔ℎ𝑡 𝑆𝑐𝑜𝑟𝑒 = (2 − 𝐸𝑊) ∙ 𝑃𝐹𝑛 ∙ 120 (1)
2 (Crathern, et al. 2013) 3 (UIUC Applied Aerodynamics Group 2014) 4 (Airfoil Tools 2014)

4
Figure 2-Predicted scores for the 2013 Aero Design Competition
A higher the empty weight of the aircraft results in a decrease in flight score. Any aircraft
that has an empty weight of two pounds will score a zero. These competitions focused on reducing
the empty weight of the aircraft, rather than increasing the payload.
The change in flight scoring formula alters the equation to favor a heavier payload and
minimizes the penalty for an empty weight above two pounds. Instead of focusing on empty weight
fraction as in previous years, this year’s flight scoring formula focused more heavily on payload
capacity.
To highlight the changes between the 2013 and 2014 rules, the 2013 WPI MQP Flying
Wing aircraft was used as a benchmark. Under the 2013 rules, the Flying Wing had a total flight
score of 147.8, whereas under the 2014 rules, assuming the aircraft carried the maximum payload
of 1.2 pounds for all three flights, the total flight score would be 12.3. This difference is directly a
result of the total payload carried.

5
While any aircraft over two pounds of empty weight would still be penalized under the
2014 rules, any additional weight the aircraft could carry as a result significantly outweighed the
penalty as shown in Figure 3. To maximize the flight score, the payload carried in each flight
needed to be maximized. The new flight scoring calculation heavily influenced the design, which
radically departed from the designs of previous years.
2014 𝐹𝑖𝑛𝑎𝑙 𝐹𝑙𝑖𝑔ℎ𝑡 𝑆𝑐𝑜𝑟𝑒 = ∑(2 − 𝐸𝑊̅̅ ̅̅ ̅) ∙ 𝑃𝐹𝑛 + (𝑃𝑛 ∙ ∑ 𝑃𝑛)
𝑛
1
𝑛
1
(2)
Figure 3-Flight scores for initial flight per given payload
4. Aircraft Mission
The SAE Rules dictate what mission the aircraft must perform during the
competition, which for the Micro-Class is a simple lap. Figure 4 shows the course the aircraft must
fly. The aircraft must fly one lap around a 300 foot by 50 foot rectangle, making two 180 degree
turns. The takeoff would be into the wind, and the landing zone would be a grassy stretch of open

6
ground on the same side of the course as the takeoff zone. The aircraft may be launched either by
hand, or with the use of an elastic system that must also fit in the carrying box with the aircraft.
Figure 4-2014 Aero Design Micro-Class flight course
Additionally, Micro-Class aircraft were forbidden from performing acrobatic maneuvers during
their flights. This mission and flight regime specifications influenced the aircraft’s final design.
5. Conceptual Designs
As the group read the rules and began to understand the mission requirements, several
conceptual designs were proposed. Two options quickly became forerunners, a flying wing design
and a powered glider or sailplane design. While these designs were considered, initial research and
analysis was performed simultaneously.

7
5.1. Flying Wing
The flying wing design sought to reduce the empty weight of the aircraft to minimize the
total lifting surface, while keeping the payload constant. This was influenced by the 2012-2013
WPI Flying Wing MQP team, but was dropped due to several important factors. The packing
efficiency in the carrying case limited how much wing area could be included. The swept wing
necessary for a flying wing’s stability limited how the wings could be cut as to fit in the box.
Additionally, the wingtip washout and reflexed airfoil reduced the wing’s lift coefficient by nearly
a factor of two, as many high-lift airfoils were eliminated as options. In order to maintain the same
payload a higher wing area would be needed, once again reducing packing efficiency and creating
a highly segmented wing that would have strength issues at all the joints. In the end the flying
wing design would be much larger than a conventional layout and push the aircraft volume to the
limit of the box.
A secondary concern with the flying wing was stability and controllability. Even with the
inclusion of several vertical stabilizers, to help with yaw stability, the aircraft would barely be
stable in pitch, one of the most important control axes. Without an elevator, the allowable CG
range of the aircraft would be very small, placing significant restrictions on the internal layout of
the aircraft and possibly reducing the amount of payload that could be carried.

8
5.2. Powered Glider
Figure 5-Original powered glider concept
The powered glider or sailplane conceptual design proved to be the starting point for the
final aircraft design, and many characteristics remained, including thin tail boom, dihedral, and
rudder and elevator control setup. The high-aspect ratio wing would be broken up into several
sections, allowing a longer wing to fit in the box and could serve as natural points for dihedral to
start in the wing. Initially the concept called for three wing sections, however this was later
increased to four sections. The efficiencies of a glider or sailplane design would eventually be
traded out in favor for overall aircraft performance over the course of this project, keeping with
the top down design philosophy the group adopted.
6. Design Philosophy
With a high payload, the aircraft must be large to support the gross aircraft weight. This
aircraft would inherently take longer to build due to its size and involve more complicated
construction techniques than smaller aircraft. As a result, if a catastrophic crash occurred during
flight tests in April, there would not have been enough time to rebuild the aircraft in time for the
competition. Additionally, the SAE Rules stipulate that only the propeller may break for the flight

9
to count. The benefits of a stronger, heavier aircraft with less payload outweighed the slight score
increase a lighter plane of the same size would have. Therefore stronger construction techniques
and materials were chosen. Despite this decision, steps were taken to reduce the aircraft’s empty
weight whenever possible as long as it did not negatively affect the structural integrity of the
aircraft. In many places, a composite of several materials provided a stronger result.
Another philosophy the group had was to ensure the aircraft would have more than enough
power. An aircraft in straight and level flight requires only enough thrust to overcome its drag.
This aircraft would need to be capable of extreme acceleration on takeoff to ensure that it could
reach flight velocity before hitting the ground. Therefore, the group selected a motor that would
give ample power despite the extra weight.
7. Airfoil Analysis & Selection
Lift is the most important parameter of any aircraft and the mission specifications for this
aircraft required the maximum lift from the wing. More lift allows for a heavier payload and thus
higher flight score. As with any aircraft, higher airspeeds provide greater lift. In the case of this
remotely controlled aircraft, however, the competition course limits the aircraft’s maximum speed
so that it can make two 180 degree turns. A predicted maximum flight speed of 40 feet per second
was used as an upper bound for initial aerodynamic considerations. A lower bound was established
to be approximately 10 to 15 feet per second, but was not as important to the airfoil selection as
maximum lift. At lower flight speeds a powerful enough motor would enable the aircraft to gain
the altitude and speed required to obtain steady level flight. Thus the wing was aerodynamically
optimized for cruise conditions.

10
7.1 XFLR5 Analysis
The flight speeds chosen and a chord length of ten inches determined the aircraft would
operate in a Reynolds number range from 50,000 to 200,000. This significantly impacted the airfoil
selection, since some airfoils work better at lower Reynolds numbers than others. An initial round
of research led to many airfoil choices. Some airfoils that operate in the Reynolds number
calculated are in the table below. To narrow these down, an airfoil analysis program, XFLR5, was
used to evaluate the performance of each airfoil at various angles of attack and Reynolds numbers.
XFLR5 is a GUI front end for XFOIL and renders polars for many important relations such as
Angle of Attack, Lift Coefficient, and Drag Coefficient. It is only capable of analyzing two-
dimensional flows and is of limited use at higher Mach numbers.
Table 1-Some appropriate airfoils for low-Reynolds Number aircraft5
Liebeck L1003 Selig 1210
Chen High Lift Airfoil Selig 1223
Chuch Hollinger CH 10-48-13 High Lift, Low
Reynolds Number Airfoil
Eppler E420, E421, E422, E423
The result of this analysis showed the Selig 1210, 1221, and 1223 performed the best at
higher speeds and angles of attack, with XFLR5 predicting a maximum lift coefficient of
approximately 2.2 from the Selig 1223. The next best lift coefficients were significantly lower and
fell between 1.4 and 1.9. From this analysis, the Selig 1223 was selected to be the airfoil for the
wing.
5 (UIUC Applied Aerodynamics Group 2014)

11
Figure 6-XFLR5 analysis for the Selig 1223 airfoil
7.2 Trailing Edge Modifications
Both initial and final construction methods required that the trailing edge of the Selig 1223
airfoil be thickened to ensure two properties: first, that the geometry could be constructed out of
balsa wood, and second, that it could be made strong enough to survive landing. Figure 7 shows a
comparison between the Selig 1223 and the modified airfoil.
Figure 7-Airfoil Comparison; TOP: Unmodified S1223 Airfoil; CENTER: Airfoil required by 1/16th balsa wrap;
BOTTOM: Raw modified airfoil shape

12
8. Aerodynamic Analysis
XFLR5, like XFOIL, only analyzes the flow in two dimensions, and therefore could not be
the only step taken for analysis of the wing. Changes in the wing geometry, lift distribution, and
the effects of wing tip vortices needed to be accounted for to more accurately predict the lift on
the wing. To integrate these factors, a calculation program was developed in Microsoft Excel to
make lift, drag, and moment predictions for the main wing. This tool also integrated the weight
and balance and a basic stability analysis of the aircraft into one tool.
For the majority of calculations done in the Excel Tool, VBA macros were written to handle
the numerical integration and complex data gathering. The rest of the calculations, the majority
being for the center of gravity calculation, were done with in-cell functions. This allowed for the
different scripts to automatically update in-cell calculations, simplifying the overall flow of data
throughout the tool.
Figure 8-Excel data flowchart

13
8.1. Lift Analysis
The first goal was to more accurately predict the wing performance using a database of lift
and drag coefficients as a function of airfoil angle of attack at various Reynolds numbers. This was
done to calculate the characteristics of 10, 9, 5, and 4.5-inch chord airfoils at 30 to 40 feet per
second. This database setup was done to allow for several wing geometries to be analyzed,
including a tapered outer wingtip section and a root chord length of 9 or 10 inches, depending on
the projected fit into the competition box. More conventional airfoils like the WASP and NACA
4414 airfoil were run through these trials with the Selig 1223. This offered a comparison between
the high-lift, low-Reynolds number airfoils found during research.
The transition from two-dimensional data to three-dimensional predictions was based upon
two very important assumptions. First, the outer cross section of the inner wing section matched
the inner cross section of the outer wing. This allowed for three stations to be setup at the root,
mid-span, and the wingtip. Second, the change between cross section values for lift, drag, and
moment coefficients were linear and a function of the distance from the wing section root. This
allowed for the two-dimensional data to translate to the entire wing. The major difference was on
the outer wing section, where the lift produced needed to go to zero following the elliptical lift
distribution. In this instance, the lift was assumed to follow the same linear pattern until halfway
along the outer section. From that value, it would linearly fall to zero at the wing tip. This crude
approximation of an elliptical distribution allowed for some of the major three-dimensional effects
to be considered. The change in root and tip wing section lift coefficients are described by the two
equations below:
𝐶𝐿𝑖𝑟𝑜𝑜𝑡
= (𝐶𝐿𝑡𝑖𝑝
𝑑𝐿
𝐿) + 𝐶𝐿𝑟𝑜𝑜𝑡
(1 −𝑑𝐿
𝐿) (3)

14
𝐶𝐿𝑖𝑡𝑖𝑝
= − (𝑑𝐿
𝐿− 1) (𝐶𝐿𝑡𝑖𝑝
+ 𝐶𝐿𝑟𝑜𝑜𝑡) (4)
The lift calculation on each wing section was performed with a numeric integration of the
following equation, where dSi is the small planform area being analyzed:
𝑑𝑆𝑖 =
𝐿
2𝑛(2 ∗ 𝐶𝑟𝑜𝑜𝑡 +
𝑑𝐿(𝐶𝑡𝑖𝑝 − 𝐶𝑟𝑜𝑜𝑡)
𝐿) (5)
The wing sections were subdivided into between 10 and 100 sections depending on user
specifications to control calculation runtime. Therefore the length dL is simply the total length of
each wing section divided by the number of subsections. The lift, drag, and moment calculations
for each subsection were done using the values calculated following the midpoint numerical
integration method as to minimize errors at the root and tip of each wing section.
𝐿𝑖𝑓𝑡𝑟𝑜𝑜𝑡 =
1
2𝜌𝑣2 ∑ 𝐶𝐿𝑖𝑟𝑜𝑜𝑡
𝑑𝑆𝑖
𝑛
𝑖=1
(6)
𝐿𝑖𝑓𝑡𝑡𝑖𝑝 =
1
2𝜌𝑣2 ∑ 𝐶𝐿𝑖𝑡𝑖𝑝
𝑑𝑆𝑖
𝑛
𝑖=1
(7)
Figure 9-Lift profile over length of wing sections

15
Figure 9 shows the lift distribution on the inner and outer wing sections. These graphs and
the remaining graphs in this section are the result of a 30 sub-section analysis of a wing with a 10,
9, and 4.5 inch chord length at the root, mid, and tip positions respectively. While not the final
wing geometry, this arrangement highlights the effect of the assumptions made and how they
affected the predictions.
Both the drag and pitch moment generated by the wing were calculated in a very similar
manner to the lift, except the values were not altered for the outer section. This was done to
simplify the scripting, as well as overestimate both values. The team decided that it would be better
to use this more conservative estimate to ensure that thrust requirements would be met or exceeded.
The drag was calculated keeping the frontal cross-sectional area of the wing section in
mind. The height of the wing was taken to be the vertical distance between the lower-most and
upper-most point of the airfoil at the input angle of attack. Using the chord length, angle of attack,
and geometric coordinates of the airfoil, each of the three cross-sections were calculated. The
height at an arbitrary distance from the wing-section root chord is found using the following
equation:
𝐻𝑖 =
𝑑𝐿
𝐿(𝐻2 − 𝐻1) + 𝐻1 (8)
This leads to the drag being calculated as:
𝐷𝑟𝑎𝑔 =
1
2𝜌𝑣2 ∑ 𝐶𝐷𝑖
𝐻𝑖
𝑛
𝑖=1
(9)
Where the coefficient of drag is calculated as:
𝐶𝐷𝑖
=𝑑𝐿
𝐿(𝐶𝑑𝑡𝑖𝑝
− 𝐶𝑑𝑟𝑜𝑜𝑡) + 𝐶𝑑𝑟𝑜𝑜𝑡
(10)

16
The bending moment due to the lift was calculated from the lift values at each sub-section
of the wing and included the effect of the outer wing section dihedral. This explains the jump in
the graph between the wing sections.
As a result of this analysis, and the imperative for a high-lift wing, the final geometry of
the wing featured a constant 10-inch chord. The outer wing sections were canted 8 degrees above
the horizontal to create the dihedral needed for creating roll. This arrangement resulted in a
prediction of 13 pounds of lift at a steady flight speed of 35 feet per second.
8.2. Stability Analysis
Static stability is critical to a successful aircraft. To determine the pitch stability of the
aircraft, the Excel Tool was employed using a component buildup method. Using the quarter-chord
point as a reference, the mass and location of every major component was calculated and accounted
for to get an accurate center of gravity location. The team began with initial weight estimates based
on the initial design requirements and parameters, and then systematically replaced the
components with the real weights as the final components were purchased and built. The center
of gravity was calculated using the basic equation below:
𝑥𝐶𝐺 =
1
∑ 𝑚𝑖𝑛𝑖=1
∑ 𝑚𝑖𝑥𝑖
𝑛
𝑖=1
(11)
An equally important component to finding stability is the neutral point or aerodynamic
center. This parameter was found using standard stability equations through the use of a VBA
script following the methods and graphs found in Napolitano’s Aircraft Dynamics: From Modeling
to Simulation. Using this point, stability of the aircraft was determined in combination with the
center of gravity. Due to the static margin reference point being the leading edge of the wing, the
center of gravity’s reference point was transformed to match the aerodynamic center.

17
The center of gravity calculations were done in-cell while the static margin calculation was
done as a script to de-clutter the Excel sheet and improve its readability. This allowed for a simple
script to generate a graph of the static margin as a function of payload weight shown below. To
help the pilot prepare for each flight, the graph is in terms of the number of payload plates. The
payload plates were steel bars cut into 2” x 5” x ⅛” sections each weighing 0.352 pounds.
Figure 10-Static Margin with various payload plates loaded
8.3. Trim Analysis
As a result of the stability analysis, the effect of various horizontal tail alignments were
considered, and found to be relatively minimal to the overall performance of the aircraft. First, the
overall pitching moment was examined and the difference between a zero incidence angle tail and
a zero angle of attack of the tail was found to be less than 3 percent. Second, the trim-out force
required from the deflection of the elevator differed by 0.03 pounds between the two extremes for
the tail orientation. This analysis influenced the decision to keep the tail simple and minimize
weight by not including a mechanism to adjust the tail’s incidence angle.

18
Figure 11-Aircraft trim diagram for various payloads
8.4. Initial Wind Tunnel Models
In order to verify the Excel Tool’s theoretical calculations were correct, a scale model of
the wing was constructed. This also helped to practice construction techniques for the final aircraft.
The group’s first attempt at the scale model resulted in a crude approximation to the WASP airfoil
shape. This airfoil was chosen initially for simple construction only. Paper templates of the airfoil
were attached to the balsa wood and cut out and sanded to the correct shape. When testing this
model in the 8 inch wind tunnel, issues quickly arose from the model’s design and the inaccuracy
of the equipment. The model showed fluttering at higher free-stream velocities and did not produce
accurate results. A second model, with the Selig 1223 airfoil, was constructed with the use of the
laser cutter and ⅛ inch balsa wood. The spacing of the ribs were placed closed together and the
force balance attachment was placed towards the trailing edge between two of the ribs. The
19
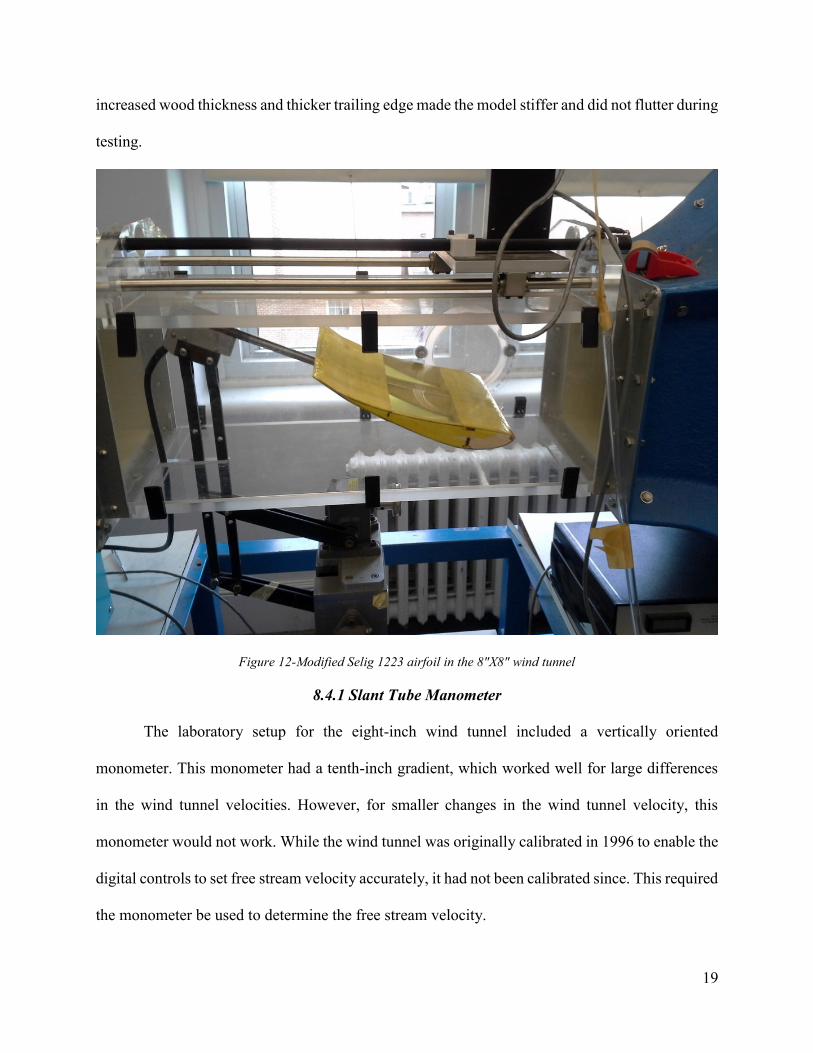
increased wood thickness and thicker trailing edge made the model stiffer and did not flutter during
testing.
Figure 12-Modified Selig 1223 airfoil in the 8"X8" wind tunnel
8.4.1 Slant Tube Manometer
The laboratory setup for the eight-inch wind tunnel included a vertically oriented
monometer. This monometer had a tenth-inch gradient, which worked well for large differences
in the wind tunnel velocities. However, for smaller changes in the wind tunnel velocity, this
monometer would not work. While the wind tunnel was originally calibrated in 1996 to enable the
digital controls to set free stream velocity accurately, it had not been calibrated since. This required
the monometer be used to determine the free stream velocity.
20
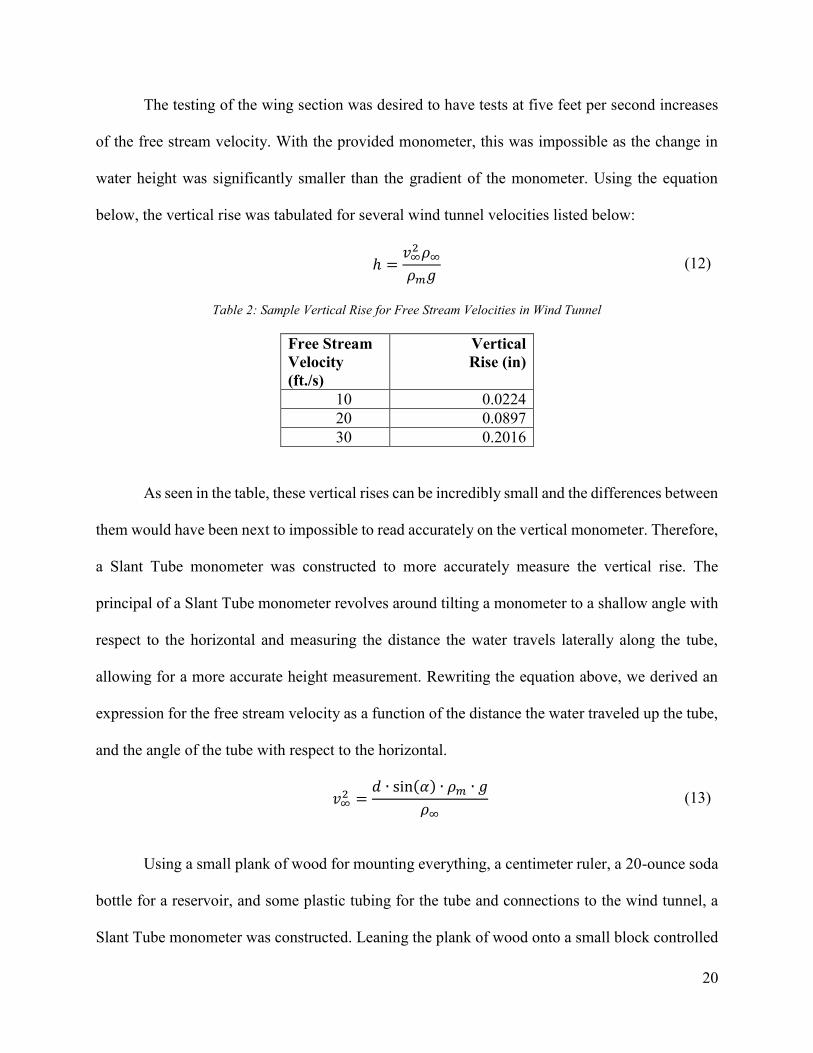
The testing of the wing section was desired to have tests at five feet per second increases
of the free stream velocity. With the provided monometer, this was impossible as the change in
water height was significantly smaller than the gradient of the monometer. Using the equation
below, the vertical rise was tabulated for several wind tunnel velocities listed below:
ℎ =
𝑣∞2 𝜌∞
𝜌𝑚𝑔 (12)
Table 2: Sample Vertical Rise for Free Stream Velocities in Wind Tunnel
Free Stream
Velocity
(ft./s)
Vertical
Rise (in)
10 0.0224
20 0.0897
30 0.2016
As seen in the table, these vertical rises can be incredibly small and the differences between
them would have been next to impossible to read accurately on the vertical monometer. Therefore,
a Slant Tube monometer was constructed to more accurately measure the vertical rise. The
principal of a Slant Tube monometer revolves around tilting a monometer to a shallow angle with
respect to the horizontal and measuring the distance the water travels laterally along the tube,
allowing for a more accurate height measurement. Rewriting the equation above, we derived an
expression for the free stream velocity as a function of the distance the water traveled up the tube,
and the angle of the tube with respect to the horizontal.
𝑣∞2 =
𝑑 ∙ sin(𝛼) ∙ 𝜌𝑚 ∙ 𝑔
𝜌∞ (13)
Using a small plank of wood for mounting everything, a centimeter ruler, a 20-ounce soda
bottle for a reservoir, and some plastic tubing for the tube and connections to the wind tunnel, a
Slant Tube monometer was constructed. Leaning the plank of wood onto a small block controlled

21
the tilt angle of the monometer. The further the small block was from where the plank touched the
table, the shallower the angle. An angle of approximately four degrees was used for the initial
testing of the system. This testing revealed several issues with the monometer, including
inconsistent measurements.
Several steps were taken to improve the setup. First the 20-ounce soda bottle was replaced
with a three-liter bottle with a larger diameter. If the volume of water traveling up through the tube
drained a significant amount of water from the reservoir, then the height lost in the reservoir would
adversely affect the reading from the tube. The larger diameter three-liter bottle was the best
replacement, as it was nearly twice the diameter. Additionally it was observed that taking the wind
tunnel from rest to the test speed, brought to rest and then brought back up to speed, the water in
the monometer reached two different points along the tube. This was thought to be the result of
friction in the system, and was significantly reduced by mixing a small amount of dish soap into
the water used in the monometer.
These changes significantly improved the monometer, however it did not improve the
system enough obtain perfectly repeatable results. However, it allowed the group to obtain
reasonable ballpark numbers for the lift and drag forces on the wing section at different speeds,
showing that the wing would produce an approximate maximum of 1.5 pounds of lift per eight
inches of span.
8.5. Throw Tests
With a conceptual design and a rough estimation of geometric parameters, the group
needed to determine the viability of throwing an aircraft with a payload of five pounds, totaling
ten pounds, and a wingspan of 90 inches. In order to simulate the weight and the wings of the
aircraft, a ten pound dumbbell was lashed to PVC piping in a cross pattern. The overall goal of
22
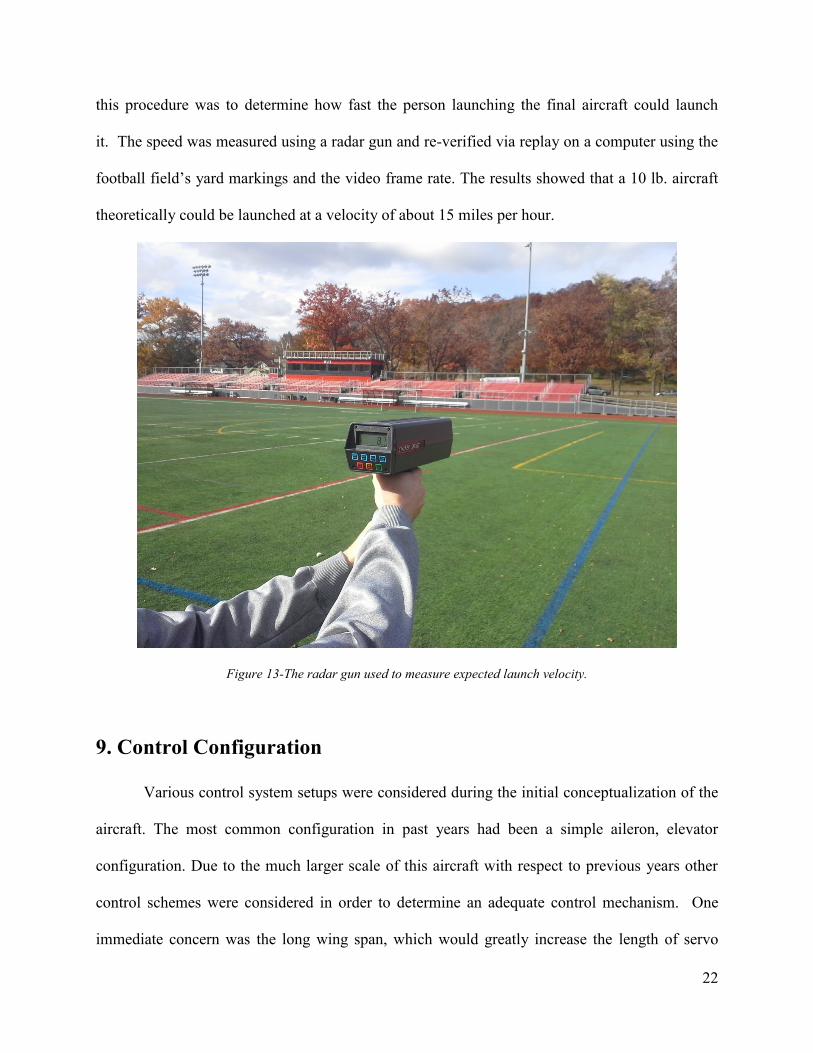
this procedure was to determine how fast the person launching the final aircraft could launch
it. The speed was measured using a radar gun and re-verified via replay on a computer using the
football field’s yard markings and the video frame rate. The results showed that a 10 lb. aircraft
theoretically could be launched at a velocity of about 15 miles per hour.
Figure 13-The radar gun used to measure expected launch velocity.
9. Control Configuration
Various control system setups were considered during the initial conceptualization of the
aircraft. The most common configuration in past years had been a simple aileron, elevator
configuration. Due to the much larger scale of this aircraft with respect to previous years other
control schemes were considered in order to determine an adequate control mechanism. One
immediate concern was the long wing span, which would greatly increase the length of servo

23
wiring required and would require either large servos mounted near the wing tips, or a bar-linkage
system. Either setup would require complexity not seen in previous years as neither task was
insurmountable. One advantage to a large wing span was the flexibility of creating significant and
useful dihedral in the wings. One such use is through a banking force that is created during an
aircraft yaw. This control setup is quite common amongst RC aircraft, and with adequate dihedral
and rudder moment, could effectively turn the aircraft around the required course. This
configuration also reduced complexity, as all electronics and control mechanisms could be easily
laid out and secured on the tail. The most significant and obvious negative was a substantial
increase in tail weight which would need to be countered in order to ensure a statically stable
aircraft.
After deliberating the various control schemes, the aircraft was designed to use a three-
channel rudder-elevator-throttle system to keep the total aircraft complexity low for easy assembly.
With the wing dihedral, the rudder would yaw the wings through the air, causing the aircraft to
roll into and out of a turn. This setup is common amongst beginner to intermediate RC aircraft and
was a good fit for the aircraft because it did not require wiring to be threaded through the wings
during assembly. The lack of ailerons in the outer wing section helped keep the weight and
complexity low. One significant driver for a rudder-elevator setup was the thin and highly
cambered trailing edge of the modified Selig 1223. While this airfoil was desirable for its high lift
characteristics, the airfoil’s thin trailing edge did not lend itself well to being used as an aileron.
This setup was tested in the second iteration of the foam model and the initial flight of the
final aircraft and proved to be successful. The dihedral of the wing, combined with the large rudder
and high power of the motor, allowed for adequate turning of the aircraft.

24
10. Foam Model
A full-scale foam model was constructed to test initial glide stability, control surfaces, and
the electrical setup. The model was primarily constructed out of sturdy insulation foam and shaped
with a hot-wire foam cutter. Most of the team’s time was spent on cutting the wings with the
correct airfoil and attaching the wings to the fuselage with wooden dowels. Acrylic templates of
the modified Selig 1223 airfoil were cut out using a laser cutter, which allowed for accurate
representation of the shape. The templates provided a contour over which the hot-wire could run
to ensure a consistent shape for each panel. The tail was constructed out of three wooden dowels
for the tail boom and cardboard for the tail and control surfaces.
10.1. Hot-Wire Foam Cutter
Initial testing of the hot-wire foam cutter showed that it did not provide enough tension to
keep the wire straight for the simplest of cuts. The thermal expansion and aging of the wire was
suspected to be the primary cause of this issue and therefore modifications were made to make the
cutter useful. The WPI MAV Team 2 provided a new wire, while the group mounted a strong
spring on one end of the cutter. To prevent permanent bending in the arm of the cutter, parachute
cord was used to create a way to adjust the tension. Using a purchase system, the cutter could be
tensioned for use and de-tensioned for storage. Both upgrades improved how well the cutter shaped
the foam and allowed for a good approximation of the Selig airfoil in the foam mockup.

25
Figure 14-The hot-wire foam cutter and spring modification
10.2. Foam Model
Two variations of the foam model were constructed iteratively. The first model saw the
construction of the wings and a tail with no control surfaces. This model served as a method for
analyzing glide stability and wing lift capability. Steel plates were taped to the nose to bring the
center of gravity forward to offset to the center of gravity shift due to the wood dowel tail boom.
The center of gravity was moved to the quarter chord of the wing.
The second model saw the inclusion of control surfaces, wing dihedral, and the full
electrical setup. This model underwent a powered flight test, which resulted in a successful
validation of the control scheme and general flight capabilities. The flight was conducted in the
manner of the competition with a correct launch and landing. The third iteration saw structural
improvements, mainly ensuring that the tail boom was more rigid which would ensure better
control surface performance. Due to higher than expected wind after launch, the pilot had difficulty

26
controlling the relatively light aircraft and the aircraft crashed during an attempt to land. The crash
destroyed the front end of the foam model and snapped the motor shaft, however the flight tests
gave the team valuable data on how the aircraft would fly. The crash was determined to be due to
windy conditions and not due to the aircraft design itself.
Additionally, the aircraft’s large wings and tail structure made it very difficult to reliably
launch the aircraft in a consistent manner. The group therefore proceeded with the assumption that
initial flight velocity would be minimal. For calculation purposes it was assumed to be zero. This
assumption was made to ensure that the aircraft would have enough thrust at launch regardless of
it actual launch velocity.
Due to these flight tests, the final model saw a few design improvements. Most importantly,
because it is the only lateral control on the aircraft, the rudder saw a significant increase in size.
At one point, due to wind, the pilot had difficulty turning the foam aircraft without additional
throttle. With additional rudder surface area, this problem was reduced.
Figure 15-First foam flight test model

27
11. Thrust Testing
The group needed to determine which size motor would ideally fit the requirements of the
aircraft. Aerodynamic calculations and physical throw tests indicated that hand-launch takeoff
speed would be minimal. Therefore, the group determined that the launch flight regime was the
most critical, as it put the most significant limitations on the performance of the aircraft. It was
determined that having the highest possible thrust would be advantageous to a successful aircraft.
Having high thrust at launch helped avoid the problems with low launch velocities and did not
impact cruise performance. The group calculated that the aircraft would need to accelerate to flight
velocity within 2 seconds or it would hit the ground after being thrown. Basic physics equations
indicate that the aircraft, at a gross weight of 12 pounds, would require about 7.5 net pounds of
thrust to attain steady flight. Since maximum drag was expected not to exceed two pounds, the
group decided that 10 pounds of thrust would be ideal. Additional research suggested that remote
control aircraft require approximately 75 Watts of electrical power per pound of aircraft weight.
For a maximum weight of 10-15 pounds, the aircraft would require 750-900 Watts of electrical
power for optimal takeoff performance. The group discovered an online calculation tool, which
could calculate the thrust and power produced by various electrical setups. Naturally, the group
was skeptical about using an untested tool to calculate important information. Upon conferring
with the advisors, the group decided that the tool could be used as long as it was verified with
empirical data.

28
Figure 16-Required thrust vs. aircraft payload
After research, the group purchased a Turnigy G46 420 kV test motor. This motor was
selected because it was an inexpensive fit within the power and size expected for the aircraft.
Research suggested that propellers ranging from 16 to 18 inches in diameter would produce
maximal thrust for the selected motor. The group then decided to test the motor to ensure it
performed to the expected specifications.
11.1. Thrust Stand
In order to accurately measure the thrust generated by the test motor, a custom thrust stand
was needed. The completed design, pictured below, is made of 1” square aluminum tubing. The
motor, propeller, and electronics are attached at the top of the vertical piece. The short side of the
horizontal bar allows the user to counterweight the arm to better zero the scale. The long side of
the horizontal bar provides for a mechanical disadvantage of about 2:1 to reduce the total force

29
imparted to a scale. The scale is placed under the bolt that protrudes from the end of the long part
of the horizontal bar. The total system has one degree of freedom and any inaccuracies brought on
by the fact that the motor and propeller deviate from the horizontal are negligible compared to the
natural vibrations induced by the motor.
Figure 17-Early SolidWorks model of the thrust stand. It has a 2:1 moment reduction
11.2. Thrust Tests
Thrust tests were conducted to determine several important sets of data. All tests were
conducted with the thrust stand in the 2’X2’ closed-circuit wind tunnel in Higgins 016 to ensure
that any potential hazards were mitigated. This was a wise decision because during one of the tests,
the wooden motor mount failed due to excessive vibrations. The wind tunnel contained all of the
shrapnel and residual energy.
30
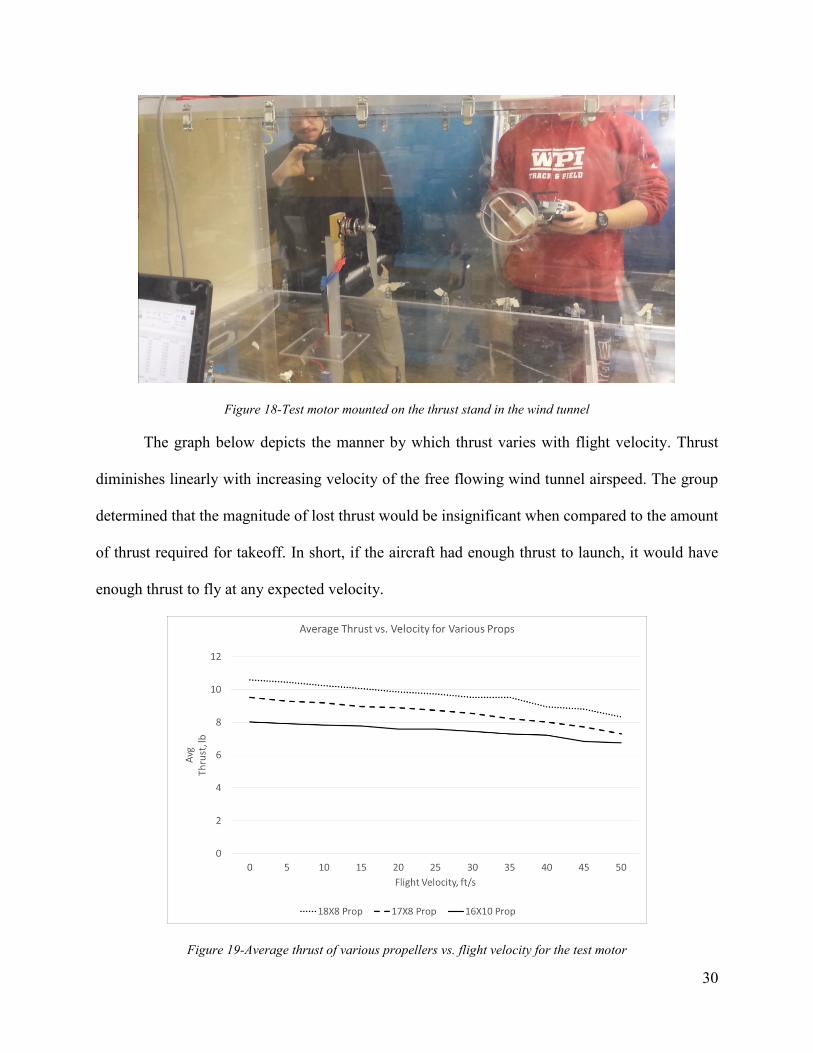
Figure 18-Test motor mounted on the thrust stand in the wind tunnel
The graph below depicts the manner by which thrust varies with flight velocity. Thrust
diminishes linearly with increasing velocity of the free flowing wind tunnel airspeed. The group
determined that the magnitude of lost thrust would be insignificant when compared to the amount
of thrust required for takeoff. In short, if the aircraft had enough thrust to launch, it would have
enough thrust to fly at any expected velocity.
Figure 19-Average thrust of various propellers vs. flight velocity for the test motor

31
Then, the group tested the motor to determine how its discharge affected thrust. To do this
test, the motor was set to 50% throttle and the thrust was measured every 10 seconds for a total
duration of 2 minutes.
Figure 20-Effect of battery discharge on thrust for the test motor
After initial thrust testing was concluded, the test motor was installed in the foam flight
test model where it was subsequently destroyed in a crash. The group decided to search for a
superior motor if possible. After utilizing the online tool, a Hacker A40-12L was selected. Upon
receiving the motor, new tests were conducted to verify that it would produce adequate thrust and
that the selected 6 Cell battery would last long enough for a flight test.
Testing of the new motor only involved two tests. The first test was to determine which
motor/battery/propeller combination yielded the highest thrust. Flight velocity was omitted from
this test because previous testing indicated that flight velocity does not significantly affect the
motor thrust. Additionally, the group did not want to risk damaging the new motor by pushing it
beyond its limits. Based on the eCalc website, all expected motor/battery/propeller combinations
should have been safe at full power, but they were all very close to the motor’s maximal

32
performance. Additionally, testing time was limited. The 16X8 propeller with a 6 cell LiPo battery
produced the highest thrust as shown below.
Figure 21-Maximum average thrust for 5 cell battery with 18X8 propeller and 6 cell battery with 16x8 and 15x10
propellers using Hacker A40-12L motor
As before, the group wanted to ensure that the new battery would provide enough power
after running for a simulated flight. The motor was set to 50% throttle and the thrust was measured
every 10 seconds for a total duration of 2 minutes. The results are shown below. Additionally, a
maximum throttle burst was conducted after the discharge test. The post-discharge thrust was 138
oz., which corresponds to a drop of 9.21%

33
Figure 22-Discharge thrust test for the final motor
12. Wing Design and Structure
The main focus for the team was to maximize the payload, while still maintaining a
reasonable empty weight in order to score the most points. The scoring formula is still affected by
empty weight, and is therefore it was important to utilize lightweight and durable material for the
construction of the aircraft. Based on typical construction materials for remote controlled model
aircraft, Balsa wood was utilized for the aircraft structure. For the internal ribs of the wing sections,
where the most moment would be concentrated, a stronger basswood was used along with
aluminum sleeves and rods for the connections. The ribs of the wing sections had cutouts to also
contribute to reducing the empty weight.

34
All of the pieces used in the construction of the aircraft required accurate, tight tolerances,
requiring the use of the laser cutter. The laser cutter allowed for the precise lengths and overall
dimensions of each individual piece.
The laser cut parts of Balsa wood were assembled with CA glue. This type of glue allowed
for rapid dry times and is the typical glue used in model making. Once assembled, the aircraft was
covered in a layer of UltraCote. UltraCote is very lightweight and is also typically used for aircraft
model’s wings and control surfaces. UltraCote to the aircraft skeleton and provides a smooth
surface that also adds strength to the aircraft.
Because of the relaxed empty weight penalty, a much larger aircraft became a design
necessity to ensure a maximum payload and score. As a result, the aircraft required a large, high
aspect ratio wing. The required storage box was also a significant consideration, and the wing
needed to be quickly and safely reassembled. One notable simplification is the lack of ailerons,
however the consequence was added dihedral.
A four-panel main wing was decided upon, with a length of 22 inches for each section,
resulting in a total wingspan of 90 inches. A constant chord length of 10 inches was chosen to
simplify construction and maximize wing the area we could reliably package in the box. To
simplify attachment to the fuselage, the inboard wing sections have no dihedral. However, some
dihedral was necessary to allow the aircraft to have lateral control using only a rudder. Therefore,
the wing has 8 degrees of dihedral in the outer wing sections.
12.1. Initial Wing Design
The wing went through several design iterations with the goal to improve strength and
reduce weight. However, because of the utilitarian nature of the aircraft as a whole, the entire
design revolved around ease of construction and assembly. This forced a design that avoided

35
unnecessary complications. After considering the consequences and determining that they would
be negligible for the scales of this aircraft, no wing taper and no wing tip devices were designed.
These design considerations were decided upon because of the relatively low flight speeds, and
the drag at cruise being an overall negligible component of flight (maximum power was paired to
takeoff conditions).
There were several driving factors regarding the wing’s internal structure. The first was
ease of construction. The wing had to be simple enough to manufacture that anyone in the group
could easily help build the wings. The second factor was that the wing sections had to assemble
quickly to ensure that the whole aircraft could be assembled in three minutes. The final factor was
strength. The wing had to be strong enough to resist hard landings and repeated flights.
Additionally, most of the wing parts were designed so that they could easily be laser cut for
precision and accuracy. The selected wing structure was a balsa I-beam connecting balsa ribs.
Secondary, but equally important, was the consideration of sizing. A large wing area was
desired due to the heavy lifting capabilities required, but structural and rule limits put hard
constraints on the absolute size of the wing. Four wing panels were agreed on due to limits in wing
flexure and vertical space limits in the box. This would overall simplify the number and rigidity
of wing panel connections. In a similar fashion, a ten inch wing chord was settled on. After creating
a mock up box in SolidWorks, the team laid out the size-estimated components and determined a
max chord length that would allow for safe but compact box packing and still maximize wing area
up to structural limits. One simplifying factor was the lack of a wing taper or sweep. With no taper
a constant chord length of ten inches provided adequate lifting area, numerically validated through
the Excel tool (this lifting area was later empirically validated through the foam model tests). Major
concerns limiting further increases in wing area revolved mainly around concerns with wing flex
36
and stresses at the wing root. Overcoming the stresses, not only in steady flight but also during
unexpected hard maneuvering and potential rough landings, was a significant design concern. This
concern was addressed both through wing shape and sizing as well as through sturdy internal
design/construction.
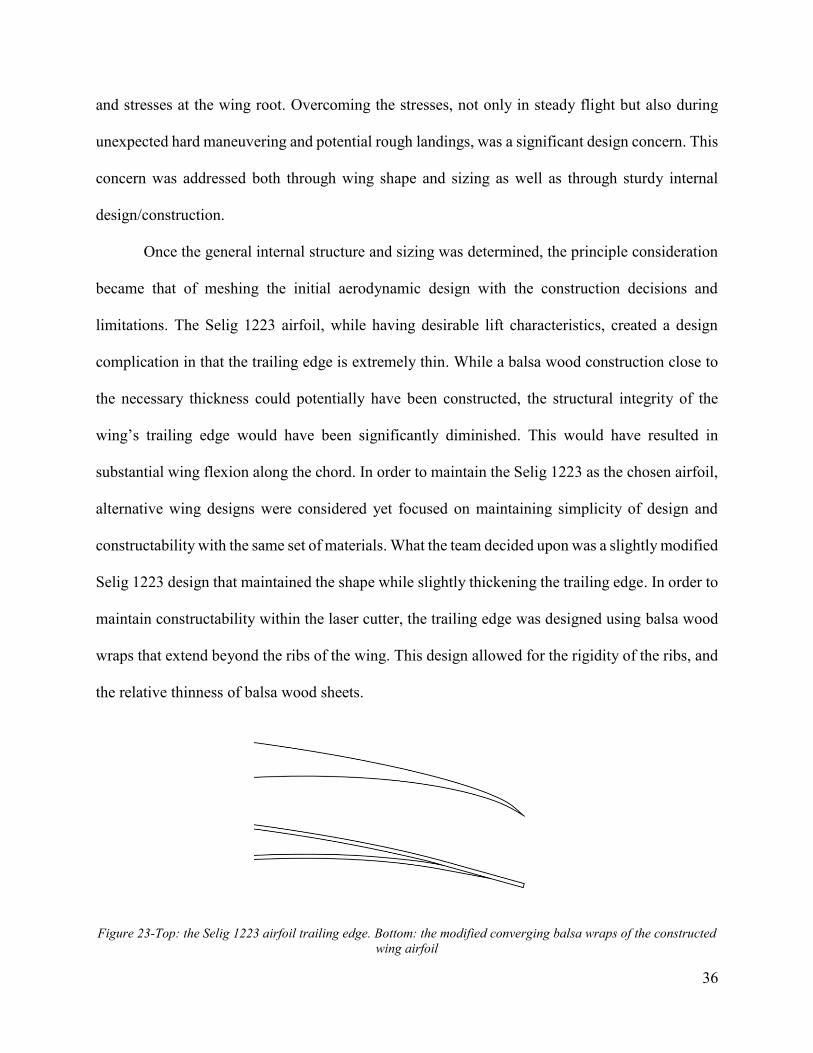
Once the general internal structure and sizing was determined, the principle consideration
became that of meshing the initial aerodynamic design with the construction decisions and
limitations. The Selig 1223 airfoil, while having desirable lift characteristics, created a design
complication in that the trailing edge is extremely thin. While a balsa wood construction close to
the necessary thickness could potentially have been constructed, the structural integrity of the
wing’s trailing edge would have been significantly diminished. This would have resulted in
substantial wing flexion along the chord. In order to maintain the Selig 1223 as the chosen airfoil,
alternative wing designs were considered yet focused on maintaining simplicity of design and
constructability with the same set of materials. What the team decided upon was a slightly modified
Selig 1223 design that maintained the shape while slightly thickening the trailing edge. In order to
maintain constructability within the laser cutter, the trailing edge was designed using balsa wood
wraps that extend beyond the ribs of the wing. This design allowed for the rigidity of the ribs, and
the relative thinness of balsa wood sheets.
Figure 23-Top: the Selig 1223 airfoil trailing edge. Bottom: the modified converging balsa wraps of the constructed
wing airfoil
37
With few exceptions, the wing was designed to use balsa and basswood of 1/8” and 1/16”
thicknesses. This allowed for a consistent airfoil cross-section over the entire wing and allowed
for the parts to be made quickly. These materials could also be easily and consistently cut in the
laser cutter. It also ensured that materials could quickly be purchased and recut in the event of a
crash or design changes.
In tandem to the internal structure was the macro wing design and the connections between
panels and the fuselage. With the mission of the aircraft being to carry the most payload, it quickly
became apparent that while a balsa wood spar would be sufficient for the wing panels, it would
not sufficiently hold the loads induced at the wing roots, and would not solve the problem of how
to securely add dihedral to the wing. These problems were solved in a similar fashion. For
structural integrity, each rib in the wing had the exact same layout with the exception of the two
basswood ribs on each side of each joint in the wing. The dihedral joint featured off-center holes,
allowing for a straight aluminum tube to be inserted between the two wing sections, while the wing
root featured centered holes for the aluminum rod connecting the wings to the fuselage. Each joint
featured an aluminum sleeve to prevent crushing the wood, and guide the connecting rods.
With the aluminum rods becoming the main structural elements, their connection to the
main wooden spar needed to be reconsidered. A simple I-beam construction did not provide
sufficient area to securely encompass any aluminum spar. Another structural consideration was
the physical limitations of wood grain orientation and purchasable materials. No balsa wood
existed that allowed for a single panel-length spar web with vertical grain. Shear stresses were a
concern with respect to potential wing twist as well as torques due to crashes or rough landings.
As a result, the I-beam construction was scrapped in favor of a box spar design. One significant
advantage to this design other than connection feasibility, was a slightly heavier but overall

38
stronger design which allowed for the orientation of wood grain to be manually selected at each
segment between ribs. The box-shaped spar would be connected by a joiner slotted into the ribs.
This allowed for the spar to be capped on both the top and bottom by a piece of 1/8” by 3/8” balsa
strip running the length of an entire wing section. A piece of carbon fiber thread would then be
glued to the top and bottom of the wing along the spar cap, resisting wing flex.
Figure 24-Side view of the rib construction and a cutout of the dihedral connection
The final structural components of the wing were the wraps made from two 1/16” thick
balsa panels. These wraps were designed to cover the leading edge and trailing edge in order to
maintain the shape of the Selig 1223 as well as add significant structural integrity to the wing. The
leading edge rap consisted of a D-shaped structure along the leading edge of the wing, which
significantly increased the wing’s torsional rigidity. The trailing edge wrap consisted of two wraps,
extending from the top and bottom on the wing respectively, past the ribs in order to simulate the
thin Selig 1223 trailing edge. The two wraps would be blended together through glue and sanding
in order to maintain a consistent shape.
In order to cover the wing and continue to maintain a low weight, a lightweight, transparent
heat shrinking covering called MonoKote was considered. This covering, proven extremely

39
effective in previous MQP competitions, not only provided a quality cover for the wing, but also
further added to the structural integrity of the wing by increasing its rigidity and resistance to shear
due to wing flex.
12.2. Initial Test Construction
Initial construction and material purchase began shortly after initial wing design was
complete. The purpose of this (half) wing was to test the physical characteristics of the designed
wing as well as practice invaluable construction methods for the final aircraft. The ultimate goal
of the half wing was to use it in a break test to test the mounting method and overall strength of
the wing.
12.2.1. Balsa Construction
The wing construction was primarily designed using laser-cut balsa wood. The components
were designed and assembled within SolidWorks and then exported into DraftSight in order to
then send the designs to the laser-cutter. All balsa wood components were cut within the laser-
cutter in order to ensure consistency and a high tolerance. Once cut, the parts were assembled in
the lab and glued using hobby grade CA glue.
Figure 25-Internal structure of the load-to-failure test wing

40
12.2.2. Connection Fabrication
The design of the panel connections was centered on aluminum rods and tubes fitted into
sleeves within the panels themselves. A friction fit of these components was essential to ensure
that the wing panels did not disassemble during flight, however purchasing aluminum rods and
tubes with inner and outer diameters within the required tolerances to do so was impossible.
Therefore in order to acquire the correct diameters the team planned to manually mill down the
aluminum rod in order to fit it within the tube.
Figure 26-View of the dihedral joint sleeve embedded in the balsa spar
The team purchased an aluminum sleeve of inner diameter .305 inches and a rod of outer
diameter 5/16 (.3125) inches. The rod was subsequently turned in a manual lathe with the goal of
a final outer diameter of .300 inches. The result was not consistent, and while adequate for the
break test, did not provide the tolerances required to reliably friction fit the components in the final
model.

41
Figure 27-Turned aluminum rod showing the low precision
12.2.3. Applying the Final Skin
MonoKote and similar products are heat-shrink plastics that adhere to themselves and most
other materials, allowing for a smooth finish to be uniformly applied to an entire section. The
covering process required a minimum of two members except for some more difficult sections
which required three people to properly apply the covering. One or two people hold the plastic
taunt over the wooden frame, while another applies heat and pressure with a hobby iron.
Figure 28-Wing covering application with the hot iron

42
It took approximately one hour to apply the UltraCote to each wing section.6 To begin the
process, a section of the covering was cut from the roll that was slightly larger than the wing
section it was being applied to. After aligning the plastic and taping it to the wing section, a
protective lining was removed. Using the iron, the plastic was heated and pressed into the wood
from the inside to outer edges, pushing any wrinkles to the edge. Keeping the covering taunt during
this process proved critical for a smooth final surface, free of major wrinkles. Minor wrinkles could
be removed from sections between ribs and the leading and trailing edge wraps by applying more
heat after an initial pass of the iron.
Once the major surfaces were coated, which took approximately 45 minutes, the edges
were trimmed and cut to allow for easy wrapping around the sidewalls of each wing section and
ironed into place to anchor the upper and lower surfaces and prevent slippage.
12.3. Wing Load-to-Failure Test
Due to the composite nature of the wing design, where several features significantly
contributed to the strength of the wing, it was determined that the wing needed to be loaded to
failure in order to determine how strong it was and determine the failure mode. A test wing was
constructed and mounted to a vice upside down and at the nominal cruise angle of attack. The
aircraft’s mission did not specify acrobatic maneuvers and only required simple turns. Therefore
the aircraft was not expected to exceed 1.5 g’s in normal flight (as a reference, an aircraft will pull
2g’s at 60 degrees of bank in a level turn). However, in the case of an unintended dive, the aircraft
will experience increased load in the pull-up. A 3g load-factor was determined to be an appropriate
margin for safety, and is comparable to the requirement of utility category aircraft. In an effort to
6 https://www.youtube.com/watch?v=mSgqPbu0No8

43
simulate the distributed lift and achieve the predicted moments, various bags of sand were taped
to the wing over each rib in order to achieve different total lift and bending moment objectives.
Figure 29-Setup of the structural load-to-failure test. Double sided tape was used to secure the sand and a
protractor was used to measure the twist.
The wing ultimately failed at the root, plastically deforming the main aluminum rod that
mounts the wing to the fuselage. The rod failed with approximately 13.5 pounds of sand on the
wing generating a bending moment of 20.76 foot-pounds at the root. This does not take into
account the weight of the wing itself, which must be added twice to account for the orientation of
the test. With the anticipated gross weight of the aircraft being 12 pounds, the wing should have
held 18 pounds during the test, which it did not. Failure to support the applied load lead to a
material change in the wing root. The 1/4” aluminum rod was replaced with a similarly sized rod
made of 1141 extra strength carbon steel. This added approximately 50 grams to the empty weight

44
of the aircraft, but it was deemed a worthwhile trade off to improve survivability in the event of a
crash.
Figure 30-The bent aluminum rod and tube following the failure test
12.4. Wing redesign
The wing break tests resulted in a re-design of some aspects of the wing. The most notable
was a replacement of the aluminum root with a steel rod as a result of the wing break test. Since
the .300” (turned down from 5/16”) aluminum rod was not strong enough, the group examined
several options. The first option was to get a larger diameter aluminum rod. This course of action
would have required significant redesign of the wing structure to accommodate at least a ½” sleeve
because the next size rod was ⅜”. Another option was to use some form of carbon fiber or
composite. This idea was eliminated because it would involve higher costs and higher chance of
brittle failure. The final option was to use a ¼” high strength steel rod with a thicker walled
aluminum sleeve. Both materials were easily sourced through McMaster-Carr and were
sufficiently strong enough to take the load from the wing. The wing was also lightened
significantly at the tips by transitioning the spar webs from a solid piece to a truss structure at the

45
wing tip. As seen in the figure below, the outermost webs only have a single cross piece.
Additionally, lighter UltraCote was selected to coat the wing. This resulted in a wing about 20%
lighter than the test wing.
Figure 31-The Three Types of Spar Webs Used in Wing; TOP: Solid spar web used in majority of wing; CENTER:
Lightened Spar web used in center of outer wing section; BOTTOM: Further lightened spar web used in tip of outer
wing section.
12.5. Flying Wire
In an attempt to further reduce the moments experienced by the wing root attachment, a
flying wire was added to the main wing. The flying wire was made out of a single length of
Kevlar thread with loops on both ends. These loops were looped around the mid-wing
attachment rods, up against a thin plate made from an aluminum can to protect the more delicate
wooden wing structure. A small slot was cut into the bottom of the fuselage through which the
chord passes through, keeping it centered along the wing spar and securing it for landing so it
doesn’t move. When on the ground, the flying wire is, snug but not considerably tight. This
allows the wings to flex slightly when in the air, allowing the flying wire to take the majority of

46
the initial load during flight and reliving the main wing root attachment rod from taking all of the
force.
Figure 32-Flying wire wing attachment
Figure 33-Flying wire wing attachment detail

47
Figure 34-Flying wire fuselage interface
13. Fuselage Design
The fuselage was a critical part of the aircraft because it had to carry the payload and act
as a central hub for the wings, motor, and tail boom. As such, it was going to be subjected to some
substantial forces during any given flight regime. The main structure of the fuselage comes from
two parallel sidewalls cut from 1/4” birch plywood. These two side plates were spaced by the
plywood motor mount, plywood top payload bay mount, and basswood tail mounting pieces. Each
of these were similarly laser cut, fitted into slots cut into the main wall, and glued in place with
wood.
The large belly of the fuselage housed the payload and electronics and is rounded to reduce
the chance of an unexpected bounce upon landing. The high wing mount serves several purposes.
Firstly, it allows the fuselage to land first in a wings-level landing. This prevents the wings from

48
hitting first. Secondly, placing the bulk of the aircraft’s weight below the wing helps ensure lateral
stability by causing the aircraft to tend to fly level. Finally, rounded bottom allows the tail boom
attachment to be as high as possible to keep the tail as far out of the downwash as possible.
13.1. Payload
The payload bay is centered underneath the wing spar inside the fuselage and the payload
plates are held in place by two quarter-inch diameter, four-inch long bolts and four nuts. The bolts
are held to the fuselage by a wooden cross-brace and supported with three-quarter inch washers
on the top to distribute the load. Each bolt has a nut directly underneath the wooden cross-brace,
clamping it in, to make loading the payload plates easier. The bolts are separated longitudinally by
2.5 inches and centered in the payload bay.
Each payload plate has two holes spaced to match the bolts, and needs to be carefully fitted
into the payload bay to avoid binding on either the sidewalls or the threads of the payload bolts.
These plates are cut from a two-inch wide, 1/8th inch thick steel bar, to be five inches long. Each
plate nominally weighed 0.358 pounds. While the payload could be moved vertically through the
payload bay for CG adjustment, it was only flown as far into the payload bay as possible to keep
the center of gravity as close to the thrust line as possible.
Figure 35-Payload plates. LEFT: Half-sized plates used for CG adjustment. RIGHT: Full payload plates

49
One other possible variation of the payload compartment that was considered was smaller
bolts for the flights where less than half payload capacity was carried. These three-inch bolts could
have been inserted, but for simplicity all test flights were conducted with the four-inch bolts to
facilitate inserting the bolts into the payload compartment and offer the most flexibility for test
loading different payloads.
Figure 36-Payload attachment bolts inside the aircraft with a sample payload installed
Each sidewall extends slightly beyond the interior components to transmit the landing
forces through the sidewalls rather than the cross braces. The sidewalls were lightened
significantly by cutting as much material as possible, while at the same time maintaining its
structure and strength. No cut was made within half an inch from the bottom edge to prevent
structural damage to the walls during a hard landing. A cross structure was kept in all locations
where material was removed to maintain a rigid shape and transmit the forces through the rest of
the fuselage. The payload was secured to a single plywood top section from which two ¼ inch-20

50
X 4 inch bolts hold the plates in place with spacers and washers. This setup allowed for plates to
be added or subtracted easily.
To test the fuselage’s strength, it was secured, inverted, in a vice and a load was applied at
the wing spar. The fuselage held over 45 pounds before slipping in the vice, with no visual or
auditory indication of cracks. The fuselage also held up to a rudimentary impulse test wherein the
load was allowed to drop slightly before catching the full load. Again, there were no signs of
failure. The rigidity of the tail boom interface and tail boom showed that under 3g loading
conditions, the tip deflection was less than 1/4”, small enough to prevent elevator control loss.
Figure 37-Side view of the fuselage assembly
14. Tail Design
As emphasized by the foam flight test model, a rigid and strong tail was necessary to ensure
that the aircraft would be controllable in flight. Rigidity, strength, assembly time, and lightweight
materials were key requirements for the tail. A combination of 3D printed parts, carbon fiber thread
and tubes, balsa wood, and assorted hardware allowed the tail to meet or exceed these constraints.
A 28-inch, 0.645-inch diameter carbon fiber tube formed the tail boom.

51
In order to ensure that the tail boom was sufficiently rigid, it was secured into a mockup of
the fuselage and loaded at the tip. Five different loads were applied so the boom’s stiffness could
be verified. With a load of 5.8 lb., the total deflection was 1.5 in, which is less than the length of
the aircraft’s elevator. The maximal expected force applied to the aircraft’s tail in flight was
expected to be no more than 5 pounds. Additionally, the aircraft would not be rigidly fixed in
space; the aircraft would rotate in the air, thereby lessening the apparent tail force. Therefore, the
group determined that the boom was sufficiently rigid and proceeded with the design.
Figure 38-Tail boom deflection test results
At each end, plastic parts were glued on to prevent movement under control-surface
loading. The fuselage interface utilized a key system, which required the tail to be rotated a couple
of times on assembly and breakdown. This system prevented the tail from rotating or moving
forward or aft inflight. The keys were made of rigid 3-D printed plastic and they were epoxied to
the tail boom to prevent slipping. To insert the tail boom, it must be rotated ninety degrees two
times to interlock the three keys with the fuselage. The boom is axially secured by a permanent

52
basswood plate at the front and by a removable basswood plate at the rear. These plates effectively
sandwich the keys into the aircraft and ensure that the tail boom did not pull out of the aircraft.
Figure 39-Tail boom interlocking key system. Not pictured is the U-shaped basswood block that secures the tail
boom longitudinally.
At the tip of the tail boom, tube clamps were used to transition from a circular cross section
to the horizontal and vertical stabilizers. Initial considerations of tail aerodynamics revolved
around symmetrical or slightly cambered airfoils. However the use of balsa wood as the main
building material in this aircraft prevented the extremely thin elevator trailing edges from being
manufactured in the laser cutter. To keep construction simple, a flat plate with a rounded leading
edge was used for both the vertical and horizontal components.

53
Figure 40-Final tail configuration detail
The horizontal stabilizer and elevator were laser cut from 1/4” thick balsa into a truss shape.
Carbon fiber threads and tubing were used to reinforce the wood perpendicular to the grain. The
vertical stabilizer and rudder were cut from a larger piece of 3/16” thick balsa and reinforced in a
similar manner. Finally, UltraCote was applied to the surfaces to create the final shape.
Figure 41-CAD model of the tail assembly

54
15. Final Assembly
When finally assembled, the aircraft’s dimensions are very close to the predicted and
designed values as seen below. The group would like to note that while there is a three minute
assembly requirement, the assembly of this aircraft was never timed. Some time-saving measures,
such as permanently affixing much of the hardware to various airframe components was never
complete. As such, the group cannot speak with certainty regarding the aircraft’s actual assembly
time. During flight testing, however, it was cautiously assembled with no practice or prior
coordination in less than ten minutes. The group feels that the three minute limit would be an
achievable albeit very difficult benchmark.
Figure 42-Final aircraft detail drawing (Note: Not to original scale. See I. Appendix A-Full Scale Picture for larger
view)

55
16. First Flight
The aircraft’s maiden flight was performed on April 11th 2014 at Moore State Park in
Paxton, Massachusetts, and was flown by group member Erik Scott, who had previous experience
flying RC aircraft. Flight conditions were marginal with winds of about 10 miles per hour gusting
to 15 at a relatively constant heading. The sky was overcast with occasional drizzle. Despite this,
the decision was made to go ahead with what was intended to be a short flight to test aircraft
control response and power. After assembly, the aircraft was armed and a brief power check was
performed where the throttle was brought up to about one third maximum power. Erik McCaffrey,
who was holding the aircraft for the hand launch, reported he felt ample power, saying “It nearly
pulled it out of my hands.” With 4 cameras rolling, the pilot waited for a slight break in the wind
and then advanced the throttle for takeoff. The aircraft was launched and immediately pitched up
into an almost completely vertical climb. The pilot recovered the aircraft at what is estimated to
be between 100 and 200 feet AGL by inputting strong forward stick/downward elevator deflection.
The remainder of the flight was spent attempting to land the plane intact while fighting its strong
pitch-up tendency. Despite lowering the throttle, the aircraft retained its strong pitch up behavior
and stalled several times during the flight. The aircraft was eventually landed, breaking only the
propeller, despite the pilot losing sight of the aircraft during the landing. This flight lead to
significant additional trim and moment analysis and a slight design modification to the tail.7
7 https://www.youtube.com/watch?v=-HZ2moqayHU

56
17. Post Flight Design Modifications
The aircraft’s performance came as a surprise and 2 suspected sources of this pitch up
behavior were investigated: the CG located aft of the aircraft’s neutral point, and insufficient
horizontal tail incidence. A longitudinal static stability test was re-run and the aircraft was once
again determined to have a sufficient static margin. Additionally, to combat the small static margin
which made pitch control difficult during flight, several payload plates were cut in half. This
allowed more payload to be loaded on the forward bolt of the payload bay rather than spread evenly
between the two, shifting the center of gravity forward slightly.
The pilot reported that, despite the short time he spent piloting the aircraft and fighting the
pitch up tendency, the aircraft behavior was consistent with one severely out of trim. The plane
never appeared to want to pitch down uncontrollably; a statically unstable aircraft would depart in
either direction. As a result, trim was determined to be the primary concern and the tail incidence
was increased to +6 degrees to bring it more in line with the 8 degree main wing incidence.
Additional trim requirements were to be determined experimentally during future flight tests.

57
18. Second Flight Test
On Friday April 17, 2014, the group flew the second, and final, test flight of the aircraft at
Moore State Park in Paxton, Massachusetts and was again piloted by Erik Scott. The wind was
from 070 ranging from 5-12 miles per hour, with periodic gusts up to 16 miles per hour. While
conditions were not ideal for a second flight due to the gusts, the decision was made to go ahead
with the flight. Despite the increased tail incidence, the aircraft again pitched up initially, but was
quickly recovered. Once stabilized, the aircraft flew in a very controlled and predictable manner
with the exception of one sudden pitch up when attempting to turn upwind. The pilot decided to
cut the flight short to adjust control throws. During landing however, the aircraft was in a slight
nose-down and right-wing low attitude when a sudden gust pushed the aircraft down. There was
insufficient altitude to recover and the aircraft landed right wingtip first. The majority of the
damage occurred at the right wing root where the steel rod and aluminum sleeve ripped itself out
of the spar, splitting the inboard half of the wing section into upper and lower halves around the
spar. Additional damage included a snapped fly-wire, bent control rods, sand slight damage to the
fuselage. The propeller once again snapped as in the first flight, though this is allowed by SAE
rules.
If the plane were to fly again, the inner right wing section would have to be completely
rebuilt, a new fly-wire would have to be made, small repairs would have to be made to the fuselage,
and tail and the propeller would have to be replaced. Due to the time required to re-build the wing
section, the aircraft was retired and the practical aspect of the project was declared completed.
Remaining time would be spent documenting and presenting the findings of the project.8
8 https://www.youtube.com/watch?v=kTfTKCu8DcY

58
19. Potential future work
With more time and work, the aircraft could be rebuilt and significantly improved. While
structurally the aircraft is sound, modifications to improve controllability, especially during
landing, need to be considered. Several areas are detailed as follows.
19.1 Longitudinal Stability and Trim
While the current aircraft design is statically stable, the current 15% static margin proved
to result in an aircraft that was more responsive in pitch than desirable. Any future design iterations
should include a way to adjust the location of the CG before flight to ensure consistent pitch
response across different payloads. This was already partially accomplished with the ability to load
half-plates on the forward bolt of the payload bay. Additional options include an entire payload
bay that could be shifted forward and aft, and a way to change the longitudinal location of the
battery before flight.
Longitudinal trim proved to be the biggest issue during the aircraft’s maiden flight, where
the aircraft unexpectedly pitched up dramatically upon launch. This was adjusted for the final
flight by increasing the horizontal tail incidence. Further time would allow for the design of a
simple mechanism to easily adjust the incidence of the tail in the field. Such a device might include
a simple screw turned with an Alan-Wrench that would raise and lower the horizontal tail’s leading
edge.
19.2 Lateral Control and Stability
During the final moments of the second and final flight, the plane encountered a gust in a
right-wing-low pitch-down attitude. While time did not allow for a pull-up in time, had the aircraft
been wings level it would have likely survived intact with only damage to the prop. Additional roll

59
authority could have helped avoid the crash. Lateral control authority could be accomplished in
several ways.
The first and simplest improvement would be to increase the size of the vertical tail. Ideally,
a good rule-of-thumb should be size the vertical tail’s height to be approximately equal to the semi-
span of the horizontal tail. This was not the case with the final aircraft and should be modified.
With a final configuration in place, tail volume coefficients could be used to settle on proper tail
sizing for both the horizontal and vertical tails. A larger vertical surface would allow for a larger
rudder, allowing more yaw authority. Because the aircraft derives its rolling moment through yaw
and the dihedral effect, this would offer more responsive roll and lateral control authority.
The three axis rudder-elevator-throttle configuration is however notoriously less precise
when it comes to roll, and the addition of rolling devices on the wings would improve rolling
authority dramatically. There are two main options for this: roll spoilers and, more conventionally,
ailerons. Rolling spoilers would act to reduce lift on one wing inducing a rolling moment.
However, this is undesirable, especially considering the aircraft’s primary purpose is to be a high
lift aircraft. Because this would act to reduce overall lift of the aircraft, rolling spoilers would be
undesirable. The alternative would be the addition of ailerons. However, this brings complications
of its own. With the highly cambered trailing edge of the S1223 airfoil, the ailerons would
experience high static loads. Because the wing would have to be disassembled, these loads would
be taken directly by the servos as balancing control runs would not be able to be run through the
aircraft. As a result, the servo required to take these loads would have to be strong. Stronger servos
are generally larger and heavier, adding to the empty weight of the aircraft. Additionally, servos
located on the wings would require significant lengths of servo wires to be strung through the wing
sections, complicating an already lengthy assembly process. The tailing edge itself also poses

60
additional design challenges when it comes to ailerons. Creating strong and effective ailerons
would be difficult while attempting to maintain the thin trailing edge of the s1223 airfoil.
Additional analysis and trade studies would have to be performed to determine if the addition of
ailerons would be a worth-while endeavor.
21. Conclusion
The group successfully designed, built, and flew an aircraft that met the initial design
requirements and goals. Despite not competing in the SAE Aero Design East competition, the
design aspects of the project were achieved and resulted in an aircraft capable of carrying a
significant payload. In order to achieve this, the group had to creatively blend the design methods
required for both full size and remote control aircraft.
Through analysis and testing, the group was able to validate the design philosophy. A
simple and conservative design proved pivotal to the success of the aircraft. While the specific
aircraft parameters evolved over the course of the project, the overall aircraft design remained
consistent. During the design and testing phase of the project, experimentation like wind tunnel
and structural tests resulted in tangible data that had real application to the physical aircraft. The
flight of the foam model and final aircraft proved that the selected control configuration was a
valid approach.
The final construction and flights of the aircraft were the culmination of a lengthy design
process. While the full potential of the aircraft was never realized, the flights that were completed
showed an aircraft that was more than capable of fulfilling the carrying capacity and exceeding the
design goals set by the team.

61
Figure 43-The group with the final aircraft prior to its maiden flight

62
References
2014. Airfoil Tools. http://airfoiltools.com/.
Andrews, Steven M., Benjamin Efram Grossman-Ponemon, Shauna-Marie Dian Hendricks,
Geoffrey Alexander Hong, Christopher McKenzie, and Kyle Andrew Morette. 2012.
Design of a Micro-Class Aicraft. Major Qualifying Project, Worcester Polytechnic
Institute.
Blair, James Allen, Ethan A. Connors, Paul Stephen Crosby, David William Irwin, Keegan N.
Mehrtens, and Carlos Javier Sarria-Pardo. 2012. Design of a Micro Class Aircraft for the
2012 SAE Aero Design East Competition. Major Qualifying Project, Worcester
Polytechnic Institute.
Crathern, Kyle Davis, Reinaldo Ross Fonseca Viera Lopes, Timothy C. Momose, and Niel Cruz
Pomerleau. 2013. Micro Aircraft Competition Design -- Flying Wing. Major Qualifying
Project, Worcester Polytechnic Institute.
Muler, Markus. 2014. eCalc Propeller Calculator.
http://www.ecalc.ch/motorcalc.php?ecalc&lang=en.
Napolitano, Marcello R. 2012. Aircraft Dynamics: From Modeling to Simulation. Hoboken:
Wiley.
Raymer, Daniel P. 2012. Aircraft Design: A Conceptual Approach 5th Edition. Reston: AIAA.
2014. "SAE Aero Design." SAE International 2014 Collegiate Design Series.
http://students.sae.org/cds/aerodesign/rules/2014_aero_rules.pdf.
2014. SAE Collegiate Design Series. http://students.sae.org/cds/aerodesign/.
2014. UIUC Applied Aerodynamics Group. http://aerospace.illinois.edu/m-selig/ads.html.

63
I. Appendix A-Full Scale Picture
The following is a 12:1 scale drawing of the final aircraft and captures all the major
dimensions and geometric parameters. The drawing omits the addition of the flying wire and the
increased tail incidence, as the former was an informal addition done by hand without the
assistance of CAD tools, and the latter was an improvised design fix made after the maiden flight.
As a result, it should be noted that a tail incidence of approximately 6 degrees was added to the
horizontal tail. This also resulted in an added 6 degree sweep (for a total of 13 degrees) on the
leading edge of the vertical tail.

64

65
II. Appendix B-Sample XFLR5 Output Data
Airfoil S1223
Velocity 40
Re 20600
alpha CL CD CDp Cm
Top
Xtr
Bot
Xtr Cpmin Change XCp
------- -------- --------- --------- -------- ------- ------- -------- --------- ---------
-4.9 0.268 0.07536 0.06714 -0.111 0.005 0.0016 -0.973 0 0.6753
-4.8 0.2662 0.07486 0.06667 -0.1098 0.005 0.0016 -0.9794 0 0.6735
-4.7 0.2641 0.07437 0.0662 -0.1086 0.005 0.0016 -0.986 0 0.6717
-4.6 0.2623 0.07386 0.06571 -0.1075 0.005 0.0016 -0.9926 0 0.6698
-4.5 0.2613 0.07328 0.06515 -0.1065 0.005 0.0016 -0.9991 0 0.6674
-4.4 0.2614 0.07261 0.0645 -0.1059 0.005 0.0016 -1.0054 0 0.6644
-4.3 0.2617 0.07192 0.06383 -0.1053 0.005 0.0016 -1.0119 0 0.6613
-4.2 0.2623 0.07122 0.06314 -0.1048 0.005 0.0016 -1.0185 0 0.6581
-4.1 0.2631 0.0705 0.06244 -0.1043 0.005 0.0016 -1.0253 0 0.6549
-4 0.2641 0.06976 0.06172 -0.1039 0.005 0.0016 -1.0323 0 0.6516
-3.9 0.2652 0.06903 0.06099 -0.1036 0.005 0.0016 -1.0396 0 0.6483
-3.8 0.2667 0.06827 0.06025 -0.1034 0.005 0.0016 -1.0472 0 0.645
-3.7 0.2685 0.06749 0.05949 -0.1033 0.005 0.0016 -1.055 0 0.6416
-3.6 0.2706 0.06669 0.0587 -0.1032 0.005 0.0016 -1.0632 0 0.6381
-3.5 0.2731 0.06585 0.05787 -0.1033 0.005 0.0016 -1.0718 0 0.6345