Variation in isotopologues of atmospheric nitric acid in passively collected samples along an air...
10
Variation in isotopologues of atmospheric nitric acid in passively collected samples along an air pollution gradient in southern California Michael D. Bell a, * , James O. Sickman b , Andrzej Bytnerowicz c , Pamela E. Padgett c , Edith B. Allen a a University of California, Riverside, Department of Botany and Plant Sciences, 900 University Avenue, Riverside, CA 92521, United States b University of California, Riverside, Department of Environmental Science, 900 University Avenue, Riverside, CA 92521, United States c USDA Forest Service, Pacific Southwest Research Station, 4955 Canyon Crest Drive, Riverside, CA 92507, United States highlights In a stable environment Nylasorb nylon filters collect unbiased HNO 3 d 15 N and d 18 O. Isotopologues of HNO 3 are depleted at the low end the atm. nitrogen gradient. Lightning creates pulses of HNO 3 with a distinctive isotopic signature. Patterns in HNO 3 isotopes result from the mixing of HNO 3 sources. article info Article history: Received 1 November 2013 Received in revised form 6 May 2014 Accepted 9 May 2014 Available online 13 May 2014 Keywords: Nylasorb nylon filter Atmospheric deposition Passive sampler Nitric acid d 15 N d 18 O Lightning abstract The sources and oxidation pathways of atmospheric nitric acid (HNO 3 ) can be evaluated using the iso- topic signatures of oxygen (O) and nitrogen (N). This study evaluated the ability of Nylasorb nylon filters to passively collect unbiased isotopologues of atmospheric HNO 3 under controlled and field conditions. Filters contained in passive samplers were exposed in continuous stirred tank reactors (CSTRs) at high (16 mg/m 3 ) and moderate (8 mg/m 3 ) HNO 3 concentrations during 1e4 week deployment times. Filters were concurrently exposed at high and low N deposition sites along a gradient in the Sonoran Desert. Filters deployed in CSTRs at moderate HNO 3 concentrations for 1e2 weeks had greater variation of d 18 O relative to the 3e4 week deployments, while high concentration samples were consistent across weeks. All deployment means were within 2& of the source solution. The d 15 N of all weekly samples were within 0.5& of the source solution. Thus, when deployed for longer than 3 weeks, Nylasorb filters collected an isotopically unbiased sample of atmospheric HNO 3 . The initial HNO 3 samples at the high deposition field sites had higher d 15 N and d 18 O values than the low deposition sites, suggesting either two independent sources of HNO 3 were mixing or that heavier isotopologues of HNO 3 were preferentially lost from the gas phase through physical deposition or equilibrium chemical reactions. Subsequent HNO 3 samples were subject to summer monsoon conditions leading to variation of isotopic signatures of N and O following 2-source mixing dynamics. Both sites mixed with a source that dominated during the two discrete precipitation events. The high number of lightning strikes near the samplers during the monsoon events suggested that lightning-created HNO 3 was one of the dominant mixing sources with an approximate isotopic signature of 21.6& and 0.6& for d 18 O and d 15 N respectively. Two-source mixing models suggest that lightning-created HNO 3 made up between 40 and 42% of atmospheric HNO 3 at the high deposition sites and 59e63% at the low deposition during the 4 week exposure. Ó 2014 Elsevier Ltd. All rights reserved. 1. Introduction Nitrogen emissions from anthropogenic sources (e.g. fertilizers, domestic animal wastes, and internal combustion engines) contribute to the formation of photochemical smog and * Corresponding author. University of California, Irvine, Center for Environmental Biology, 243 Steinhaus Hall, Irvine, CA 92697, United States. E-mail address: [email protected] (M.D. Bell). Contents lists available at ScienceDirect Atmospheric Environment journal homepage: www.elsevier.com/locate/atmosenv http://dx.doi.org/10.1016/j.atmosenv.2014.05.031 1352-2310/Ó 2014 Elsevier Ltd. All rights reserved. Atmospheric Environment 94 (2014) 287e296
Transcript of Variation in isotopologues of atmospheric nitric acid in passively collected samples along an air...
lable at ScienceDirect
Atmospheric Environment 94 (2014) 287e296
Contents lists avai
Atmospheric Environment
journal homepage: www.elsevier .com/locate/atmosenv
Variation in isotopologues of atmospheric nitric acid in passivelycollected samples along an air pollution gradient in southernCalifornia
Michael D. Bell a,*, James O. Sickman b, Andrzej Bytnerowicz c, Pamela E. Padgett c,Edith B. Allen a
aUniversity of California, Riverside, Department of Botany and Plant Sciences, 900 University Avenue, Riverside, CA 92521, United StatesbUniversity of California, Riverside, Department of Environmental Science, 900 University Avenue, Riverside, CA 92521, United StatescUSDA Forest Service, Pacific Southwest Research Station, 4955 Canyon Crest Drive, Riverside, CA 92507, United States
h i g h l i g h t s
� In a stable environment Nylasorb nylon filters collect unbiased HNO3 d15N and d18O.� Isotopologues of HNO3 are depleted at the low end the atm. nitrogen gradient.� Lightning creates pulses of HNO3 with a distinctive isotopic signature.� Patterns in HNO3 isotopes result from the mixing of HNO3 sources.
a r t i c l e i n f o
Article history:Received 1 November 2013Received in revised form6 May 2014Accepted 9 May 2014Available online 13 May 2014
Keywords:Nylasorb nylon filterAtmospheric depositionPassive samplerNitric acidd15Nd18OLightning
* Corresponding author. University of California, IrvBiology, 243 Steinhaus Hall, Irvine, CA 92697, United
E-mail address: [email protected] (M.D. Bell).
http://dx.doi.org/10.1016/j.atmosenv.2014.05.0311352-2310/� 2014 Elsevier Ltd. All rights reserved.
a b s t r a c t
The sources and oxidation pathways of atmospheric nitric acid (HNO3) can be evaluated using the iso-topic signatures of oxygen (O) and nitrogen (N). This study evaluated the ability of Nylasorb nylon filtersto passively collect unbiased isotopologues of atmospheric HNO3 under controlled and field conditions.Filters contained in passive samplers were exposed in continuous stirred tank reactors (CSTRs) at high(16 mg/m3) and moderate (8 mg/m3) HNO3 concentrations during 1e4 week deployment times. Filterswere concurrently exposed at high and low N deposition sites along a gradient in the Sonoran Desert.Filters deployed in CSTRs at moderate HNO3 concentrations for 1e2 weeks had greater variation of d18Orelative to the 3e4 week deployments, while high concentration samples were consistent across weeks.All deployment means were within 2& of the source solution. The d15N of all weekly samples werewithin 0.5& of the source solution. Thus, when deployed for longer than 3 weeks, Nylasorb filterscollected an isotopically unbiased sample of atmospheric HNO3. The initial HNO3 samples at the highdeposition field sites had higher d15N and d18O values than the low deposition sites, suggesting either twoindependent sources of HNO3 were mixing or that heavier isotopologues of HNO3 were preferentially lostfrom the gas phase through physical deposition or equilibrium chemical reactions. Subsequent HNO3
samples were subject to summer monsoon conditions leading to variation of isotopic signatures of N andO following 2-source mixing dynamics. Both sites mixed with a source that dominated during the twodiscrete precipitation events. The high number of lightning strikes near the samplers during themonsoon events suggested that lightning-created HNO3 was one of the dominant mixing sources with anapproximate isotopic signature of 21.6& and �0.6& for d18O and d15N respectively. Two-source mixingmodels suggest that lightning-created HNO3 made up between 40 and 42% of atmospheric HNO3 at thehigh deposition sites and 59e63% at the low deposition during the 4 week exposure.
� 2014 Elsevier Ltd. All rights reserved.
ine, Center for EnvironmentalStates.
1. Introduction
Nitrogen emissions from anthropogenic sources (e.g. fertilizers,domestic animal wastes, and internal combustion engines)contribute to the formation of photochemical smog and
M.D. Bell et al. / Atmospheric Environment 94 (2014) 287e296288
atmospheric particulates leading to the long distance transport ofreactive nitrogen (N) (Fenn et al., 2003; Galloway et al., 2003;Vitousek et al., 1997). Advances in stable isotopic analysis of Nand O within atmospheric pollution are increasing our ability todifferentiate these sources of N and the formation pathway of nitricacid (HNO3) (Elliott et al., 2009; Hastings et al., 2003; Templer andWeathers, 2011). The dominant forms of anthropogenic N inSouthern California are ammonia (NH3), nitric oxide (NO), nitrogendioxide (NO2), and HNO3. HNO3makes up a small component of thetotal N, but is a sink of NOx that is readily deposited to the sur-rounding ecosystem (Bytnerowicz and Fenn, 1996; Hanson andLindberg, 1991). The timing of peak atmospheric reactive N con-centration coincides with the dry season in southern California, dueto dependence of HNO3 production on photochemical reactions(Calvert et al., 1985), leading to a predominance of dry N deposition(Fenn et al., 2003). Once deposited, the N can alter ecosystem Ncycling (Goulding et al., 1998) and affect competitive interactionsamong plants leading to vegetation type conversion (Allen et al.,2009; Padgett and Allen, 1999).
Once NOx molecules are released to the atmosphere they un-dergo a series of photolytic reactions with ozone (O3), peroxyradicals (ReO2), and hydroxyl radicals to produce HNO3 (Calvertet al., 1985). Industrial combustion releases NOx with a positived15N value (þ3.8 to þ20&; Elliott et al., 2009; Felix et al., 2012),while vehicle emissions have been measured as both negative(�13& to �2&; Heaton, 1990) or positive (þ3.8& to þ9&;Ammann et al., 1999; Moore, 1977). The contradictory values haveled to speculation that there may be secondary fractionation duringthe photolytic reactions leading to HNO3 formation (Vicars et al.,2013). Atmospheric HNO3 originating from natural processes,such as biogenic NOx emissions (�27&; Felix and Elliott, 2013) andlightning (0&; Hoering, 1957), generally have lower d15N valuesrelative to anthropogenic sources. While the HNO3 d15N can beattributed to the source, the HNO3 d18O is linked to the oxidationpathway leading to the production of HNO3 (Hastings et al., 2003,2004; Vicars et al., 2013). HNO3 formed through ‘nighttime’ re-actions with O3 (d18O ¼ 90e100&) are more enriched in 18O thanHNO3 molecules formed during ‘daytime’ reactions dominated byNO2 reacting with OH radicals (Elliott et al., 2009; Jarvis et al.,2008).
Recent work by Vicars et al. (2013) has identified strong diurnalpatterns in d15N values of atmospheric NOx in the Los Angeles Basin.While some of this variation is due to changes in the relative con-tributions of HNO3 sources, kinetic and equilibrium reactions(including gaseaerosol phase equilibria) involving NOx, O3, HNO3,NH3 and water vapor can potentially fractionate isotopes (Freyer,1991; Freyer et al., 1993). The thermodynamics of these reactionsis well established (Seinfeld and Pandis, 2006), but much less isknown about their impact on the isotopic composition of HNO3 inthe atmosphere and how this will impact passive collection efforts.Measurements of temporal and spatial variation of the isotopicsignature of HNO3 can improve the understanding of varyingsources and oxidation pathways of NOx.
A national scale N deposition monitoring network run by theNational Atmospheric Deposition Program (NADP) measures wetdeposition across the continental US (NADP, 2012), while drydeposition of N in monitored by the US EPA’s CASTNET monitoringnetwork. (CASTNet, 2013). Dry deposition monitoring sites areconcentrated in the eastern US, with relatively coarse coverage inthe West (CASTNet, 2013). These gaps are filled for local analysis bysimple, inexpensive passive sampling systems containing Nylasorbnylon filters (Bytnerowicz et al., 2005). These samplers allowmonitoring of atmospheric HNO3 concentration in specific areas ofinterest and can be used to calculate dry deposition rates throughinferential methods (Clarke et al., 1997; Hanson and Lindberg,
1991). Isotopic analysis of collected HNO3 may expand our under-standing of N sources in the western US, but few studies haveaddressed the accuracy of the technique. Elliott et al. (2009)observed an offset (þ6.4&) in HNO3 d18O values between activelyand passively collected samples, suggesting that the passive sam-plers may be collecting biased isotopic measurements. This offsetmay have been associated with kinetic fractionation when HNO3adsorbs to the filters, fractionation of HNO3 during extraction, orthe co-collection of nitrous acid (HONO) on the filters (Bytnerowiczet al., 2005), but more study is needed.
The first objective of our study was to evaluate if passive sam-plers collect unbiased isotopologues of atmospheric HNO3 underexperimentally controlled HNO3 concentrations. We hypothesizedthat the previously noted bias in isotopic measurements ofpassively collected HNO3 will not occur under controlled laboratoryconditions where the source isotopic signature can be held con-stant. The second questionwas whether sources of HNO3 remainedconstant through space and time along a transect from the easternportion of the highly polluted Los Angeles Air Basin eastward intothe Sonoran Desert. We hypothesized that anthropogenic sourcesof NOx would decline eastward toward the low deposition sites.Anthropogenic sources of NOx are expected to be relatively weak atthe low deposition sites, so we hypothesized that natural sources ofNOx, including lightning and soil emissions, would contribute ahigher proportion of atmospheric HNO3.
2. Methods
2.1. Continuously stirred tank reactors
Nylasorb filters (Pall Corporation, Port Washington, NY) wereexposed to atmospheric HNO3 with known concentrations andisotopic composition in continuously stirred tank reactors (CSTRs)to determine if isotopic fractionation of atmospheric HNO3 occursupon adsorption. Ambient air was pumped through an activatedcharcoal canister and a HEPA filter capsule (model 12144, GelmanSciences, Ann Arbor, MI, U.S.A.) to remove background atmosphericcontaminants before a concentrated HNO3 solution (ofd15N ¼ 0.6 � 0.2& and d18O ¼ 26.0 � 0.2&) was volatilized andmixed with the airstream and pumped into the sealed chambers.For details of construction and operation of CSTRs, please refer toPadgett et al. (2004). The flow of the HNO3 enhanced air simulatedambient conditions by creating daily peaks in HNO3 values (high:100 mg/m3; moderate: 50 mg/m3) in the mid-afternoon and thendropping back down near zero in the evening. The average 24 hconcentrations in each chamber were 16 mg/m3 and 8 mg/m3
respectively, which bracketed measured field concentrations (4e12 mg/m3). The concentration of the moderate chamber wasdetermined based on the minimum flow rate at which the systemproduced consistent daily HNO3 peaks while also maintainingconsistent HNO3 peaks in the high chamber.
HNO3 within the chambers was measured with passive sam-plers of the Bytnerowicz et al. (2005) design. Ambient air diffusesthrough a 47 mm Zefluor PTFE Membrane filter of 2 mm pore-size(Pall Corporation) to a 47 mm Nylasorb nylon filter (HNO3 collect-ing medium). All filters were loaded into passive samplers made ofa 50 mm diameter Petri dish and capped with Petri dish lids toprevent any contamination prior to their deployment. Uponcollection from the chambers, the filters were capped and storedat �20 �C.
Passive samplers were first deployed in September 2011 in foursets of three replicates. After the first week, one set of filters wascollected while three additional sets continued to be exposed andthree additional sets of filters were deployed. This patterncontinued until four 1-week, three 2-week, two 3-week, and one 4-
M.D. Bell et al. / Atmospheric Environment 94 (2014) 287e296 289
week deployments were collected. Two filters were combined foreach sample in the 1- and 2-week deployments for both chambers.
2.2. Field survey
2.2.1. Study siteThe field sites were located in Riverside County, California,
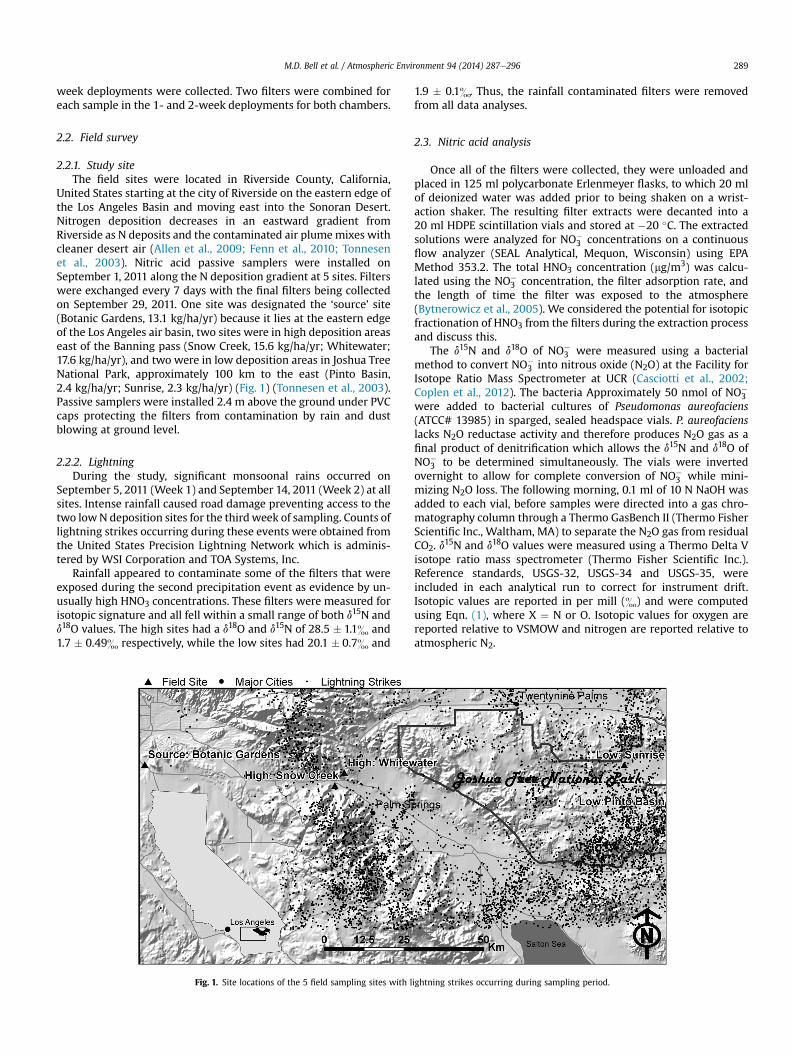
United States starting at the city of Riverside on the eastern edge ofthe Los Angeles Basin and moving east into the Sonoran Desert.Nitrogen deposition decreases in an eastward gradient fromRiverside as N deposits and the contaminated air plumemixes withcleaner desert air (Allen et al., 2009; Fenn et al., 2010; Tonnesenet al., 2003). Nitric acid passive samplers were installed onSeptember 1, 2011 along the N deposition gradient at 5 sites. Filterswere exchanged every 7 days with the final filters being collectedon September 29, 2011. One site was designated the ‘source’ site(Botanic Gardens, 13.1 kg/ha/yr) because it lies at the eastern edgeof the Los Angeles air basin, two sites were in high deposition areaseast of the Banning pass (Snow Creek, 15.6 kg/ha/yr; Whitewater;17.6 kg/ha/yr), and two were in low deposition areas in Joshua TreeNational Park, approximately 100 km to the east (Pinto Basin,2.4 kg/ha/yr; Sunrise, 2.3 kg/ha/yr) (Fig. 1) (Tonnesen et al., 2003).Passive samplers were installed 2.4 m above the ground under PVCcaps protecting the filters from contamination by rain and dustblowing at ground level.
2.2.2. LightningDuring the study, significant monsoonal rains occurred on
September 5, 2011 (Week 1) and September 14, 2011 (Week 2) at allsites. Intense rainfall caused road damage preventing access to thetwo lowN deposition sites for the thirdweek of sampling. Counts oflightning strikes occurring during these events were obtained fromthe United States Precision Lightning Network which is adminis-tered by WSI Corporation and TOA Systems, Inc.
Rainfall appeared to contaminate some of the filters that wereexposed during the second precipitation event as evidence by un-usually high HNO3 concentrations. These filters were measured forisotopic signature and all fell within a small range of both d15N andd18O values. The high sites had a d18O and d15N of 28.5 � 1.1& and1.7 � 0.49& respectively, while the low sites had 20.1 � 0.7& and
Fig. 1. Site locations of the 5 field sampling sites with l
1.9 � 0.1&. Thus, the rainfall contaminated filters were removedfrom all data analyses.
2.3. Nitric acid analysis
Once all of the filters were collected, they were unloaded andplaced in 125 ml polycarbonate Erlenmeyer flasks, to which 20 mlof deionized water was added prior to being shaken on a wrist-action shaker. The resulting filter extracts were decanted into a20 ml HDPE scintillation vials and stored at �20 �C. The extractedsolutions were analyzed for NO�
3 concentrations on a continuousflow analyzer (SEAL Analytical, Mequon, Wisconsin) using EPAMethod 353.2. The total HNO3 concentration (mg/m3) was calcu-lated using the NO�
3 concentration, the filter adsorption rate, andthe length of time the filter was exposed to the atmosphere(Bytnerowicz et al., 2005). We considered the potential for isotopicfractionation of HNO3 from the filters during the extraction processand discuss this.
The d15N and d18O of NO�3 were measured using a bacterial
method to convert NO�3 into nitrous oxide (N2O) at the Facility for
Isotope Ratio Mass Spectrometer at UCR (Casciotti et al., 2002;Coplen et al., 2012). The bacteria Approximately 50 nmol of NO�
3were added to bacterial cultures of Pseudomonas aureofaciens(ATCC# 13985) in sparged, sealed headspace vials. P. aureofacienslacks N2O reductase activity and therefore produces N2O gas as afinal product of denitrification which allows the d15N and d18O ofNO�
3 to be determined simultaneously. The vials were invertedovernight to allow for complete conversion of NO�
3 while mini-mizing N2O loss. The following morning, 0.1 ml of 10 N NaOH wasadded to each vial, before samples were directed into a gas chro-matography column through a Thermo GasBench II (Thermo FisherScientific Inc., Waltham, MA) to separate the N2O gas from residualCO2. d15N and d18O values were measured using a Thermo Delta Visotope ratio mass spectrometer (Thermo Fisher Scientific Inc.).Reference standards, USGS-32, USGS-34 and USGS-35, wereincluded in each analytical run to correct for instrument drift.Isotopic values are reported in per mill (&) and were computedusing Eqn. (1), where X ¼ N or O. Isotopic values for oxygen arereported relative to VSMOW and nitrogen are reported relative toatmospheric N2.
ightning strikes occurring during sampling period.
M.D. Bell et al. / Atmospheric Environment 94 (2014) 287e296290
X ¼�
RSample
RStandard
�� 1 (1)
2.4. Statistical analysis
The rate of HNO3 collection in each chamber was determined byregressing the average dose of HNO3 to the amount of HNO3collected by the filters. The slopes of the high and moderatechambers were compared by ANCOVA using HNO3 dose as a co-variate to determine if the concentration of atmospheric HNO3affected the rate of adsorption to the filters. A two-way ANOVAwasused to test for the effects of site and deployment length on theamount of HNO3 collected, and the d15N and d18O values of theextracted NO�
3 .For the field samples, ANOVA was used to compare the effect of
site location and timing of filter deployment and collection on at-mospheric variables. A correlation analysis was conducted tomeasure the covariance between d18O and d15N on a single filter aswell as the correlation between HNO3 concentration and its iso-topes. HNO3 concentration data were inverse-transformed to ach-ieve normality for among site analyses. An analysis of covarianceeffects test was then run for each site to evaluate difference in thecorrelation based on location. Data were analyzed using JMP soft-ware (Version 9.0 SAS Institute Inc.).
3. Results
3.1. Continuously stirred tank reactors
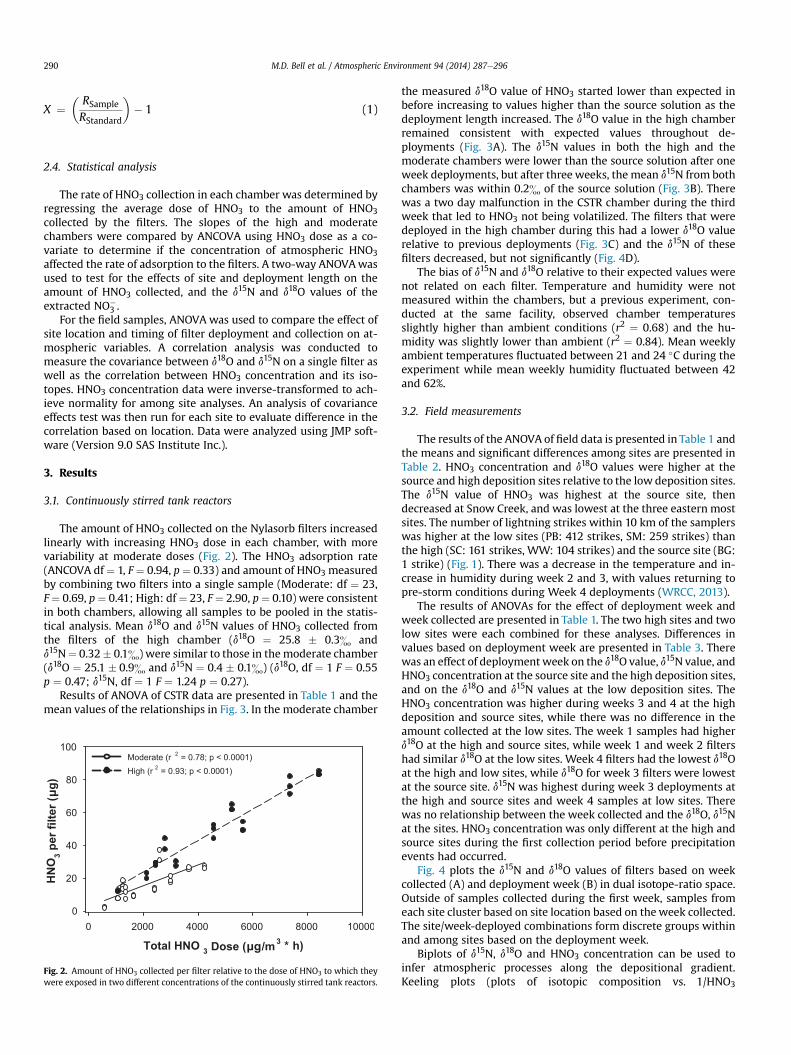
The amount of HNO3 collected on the Nylasorb filters increasedlinearly with increasing HNO3 dose in each chamber, with morevariability at moderate doses (Fig. 2). The HNO3 adsorption rate(ANCOVA df ¼ 1, F ¼ 0.94, p ¼ 0.33) and amount of HNO3 measuredby combining two filters into a single sample (Moderate: df ¼ 23,F¼ 0.69, p¼ 0.41; High: df ¼ 23, F¼ 2.90, p¼ 0.10) were consistentin both chambers, allowing all samples to be pooled in the statis-tical analysis. Mean d18O and d15N values of HNO3 collected fromthe filters of the high chamber (d18O ¼ 25.8 � 0.3& andd15N¼ 0.32� 0.1&) were similar to those in themoderate chamber(d18O ¼ 25.1 � 0.9& and d15N ¼ 0.4 � 0.1&) (d18O, df ¼ 1 F ¼ 0.55p ¼ 0.47; d15N, df ¼ 1 F ¼ 1.24 p ¼ 0.27).
Results of ANOVA of CSTR data are presented in Table 1 and themean values of the relationships in Fig. 3. In the moderate chamber
Fig. 2. Amount of HNO3 collected per filter relative to the dose of HNO3 to which theywere exposed in two different concentrations of the continuously stirred tank reactors.
the measured d18O value of HNO3 started lower than expected inbefore increasing to values higher than the source solution as thedeployment length increased. The d18O value in the high chamberremained consistent with expected values throughout de-ployments (Fig. 3A). The d15N values in both the high and themoderate chambers were lower than the source solution after oneweek deployments, but after three weeks, the mean d15N from bothchambers was within 0.2& of the source solution (Fig. 3B). Therewas a two day malfunction in the CSTR chamber during the thirdweek that led to HNO3 not being volatilized. The filters that weredeployed in the high chamber during this had a lower d18O valuerelative to previous deployments (Fig. 3C) and the d15N of thesefilters decreased, but not significantly (Fig. 4D).
The bias of d15N and d18O relative to their expected values werenot related on each filter. Temperature and humidity were notmeasured within the chambers, but a previous experiment, con-ducted at the same facility, observed chamber temperaturesslightly higher than ambient conditions (r2 ¼ 0.68) and the hu-midity was slightly lower than ambient (r2 ¼ 0.84). Mean weeklyambient temperatures fluctuated between 21 and 24 �C during theexperiment while mean weekly humidity fluctuated between 42and 62%.
3.2. Field measurements
The results of the ANOVA of field data is presented in Table 1 andthe means and significant differences among sites are presented inTable 2. HNO3 concentration and d18O values were higher at thesource and high deposition sites relative to the low deposition sites.The d15N value of HNO3 was highest at the source site, thendecreased at Snow Creek, and was lowest at the three eastern mostsites. The number of lightning strikes within 10 km of the samplerswas higher at the low sites (PB: 412 strikes, SM: 259 strikes) thanthe high (SC: 161 strikes, WW: 104 strikes) and the source site (BG:1 strike) (Fig. 1). There was a decrease in the temperature and in-crease in humidity during week 2 and 3, with values returning topre-storm conditions during Week 4 deployments (WRCC, 2013).
The results of ANOVAs for the effect of deployment week andweek collected are presented in Table 1. The two high sites and twolow sites were each combined for these analyses. Differences invalues based on deployment week are presented in Table 3. Therewas an effect of deployment week on the d18O value, d15N value, andHNO3 concentration at the source site and the high deposition sites,and on the d18O and d15N values at the low deposition sites. TheHNO3 concentration was higher during weeks 3 and 4 at the highdeposition and source sites, while there was no difference in theamount collected at the low sites. The week 1 samples had higherd18O at the high and source sites, while week 1 and week 2 filtershad similar d18O at the low sites. Week 4 filters had the lowest d18Oat the high and low sites, while d18O for week 3 filters were lowestat the source site. d15N was highest during week 3 deployments atthe high and source sites and week 4 samples at low sites. Therewas no relationship between the week collected and the d18O, d15Nat the sites. HNO3 concentration was only different at the high andsource sites during the first collection period before precipitationevents had occurred.
Fig. 4 plots the d15N and d18O values of filters based on weekcollected (A) and deployment week (B) in dual isotope-ratio space.Outside of samples collected during the first week, samples fromeach site cluster based on site location based on the week collected.The site/week-deployed combinations form discrete groups withinand among sites based on the deployment week.
Biplots of d15N, d18O and HNO3 concentration can be used toinfer atmospheric processes along the depositional gradient.Keeling plots (plots of isotopic composition vs. 1/HNO3
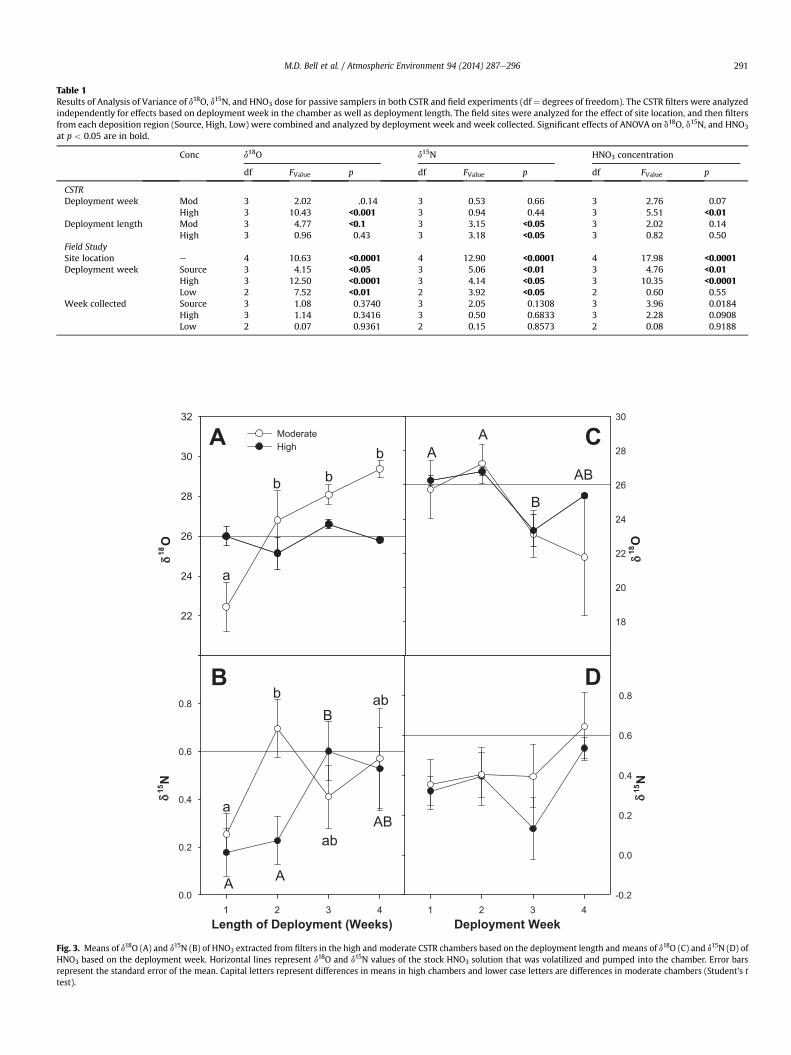
Table 1Results of Analysis of Variance of d18O, d15N, and HNO3 dose for passive samplers in both CSTR and field experiments (df ¼ degrees of freedom). The CSTR filters were analyzedindependently for effects based on deployment week in the chamber as well as deployment length. The field sites were analyzed for the effect of site location, and then filtersfrom each deposition region (Source, High, Low) were combined and analyzed by deployment week and week collected. Significant effects of ANOVA on d18O, d15N, and HNO3
at p < 0.05 are in bold.
Conc d18O d15N HNO3 concentration
df FValue p df FValue p df FValue p
CSTRDeployment week Mod 3 2.02 .0.14 3 0.53 0.66 3 2.76 0.07
High 3 10.43 <0.001 3 0.94 0.44 3 5.51 <0.01Deployment length Mod 3 4.77 <0.1 3 3.15 <0.05 3 2.02 0.14
High 3 0.96 0.43 3 3.18 <0.05 3 0.82 0.50Field StudySite location e 4 10.63 <0.0001 4 12.90 <0.0001 4 17.98 <0.0001Deployment week Source 3 4.15 <0.05 3 5.06 <0.01 3 4.76 <0.01
High 3 12.50 <0.0001 3 4.14 <0.05 3 10.35 <0.0001Low 2 7.52 <0.01 2 3.92 <0.05 2 0.60 0.55
Week collected Source 3 1.08 0.3740 3 2.05 0.1308 3 3.96 0.0184High 3 1.14 0.3416 3 0.50 0.6833 3 2.28 0.0908Low 2 0.07 0.9361 2 0.15 0.8573 2 0.08 0.9188
Fig. 3. Means of d18O (A) and d15N (B) of HNO3 extracted from filters in the high and moderate CSTR chambers based on the deployment length and means of d18O (C) and d15N (D) ofHNO3 based on the deployment week. Horizontal lines represent d18O and d15N values of the stock HNO3 solution that was volatilized and pumped into the chamber. Error barsrepresent the standard error of the mean. Capital letters represent differences in means in high chambers and lower case letters are differences in moderate chambers (Student’s ttest).
M.D. Bell et al. / Atmospheric Environment 94 (2014) 287e296 291
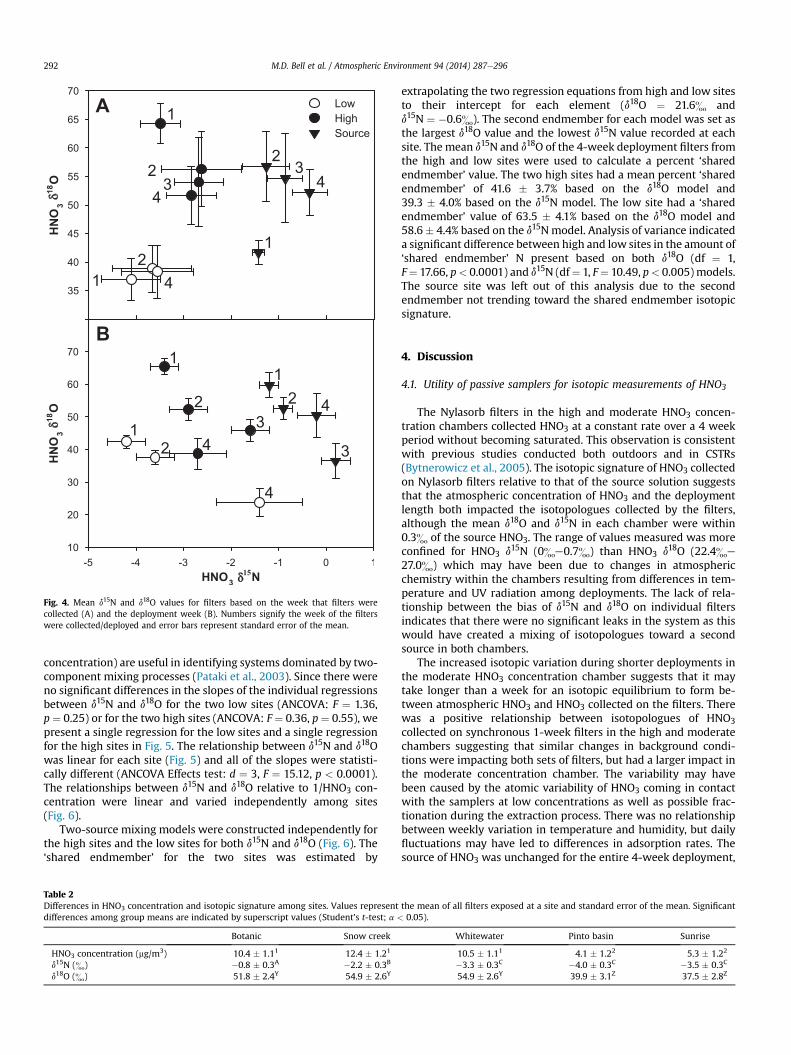
Fig. 4. Mean d15N and d18O values for filters based on the week that filters werecollected (A) and the deployment week (B). Numbers signify the week of the filterswere collected/deployed and error bars represent standard error of the mean.
M.D. Bell et al. / Atmospheric Environment 94 (2014) 287e296292
concentration) are useful in identifying systems dominated by two-component mixing processes (Pataki et al., 2003). Since there wereno significant differences in the slopes of the individual regressionsbetween d15N and d18O for the two low sites (ANCOVA: F ¼ 1.36,p ¼ 0.25) or for the two high sites (ANCOVA: F ¼ 0.36, p ¼ 0.55), wepresent a single regression for the low sites and a single regressionfor the high sites in Fig. 5. The relationship between d15N and d18Owas linear for each site (Fig. 5) and all of the slopes were statisti-cally different (ANCOVA Effects test: d ¼ 3, F ¼ 15.12, p < 0.0001).The relationships between d15N and d18O relative to 1/HNO3 con-centration were linear and varied independently among sites(Fig. 6).
Two-source mixing models were constructed independently forthe high sites and the low sites for both d15N and d18O (Fig. 6). The‘shared endmember’ for the two sites was estimated by
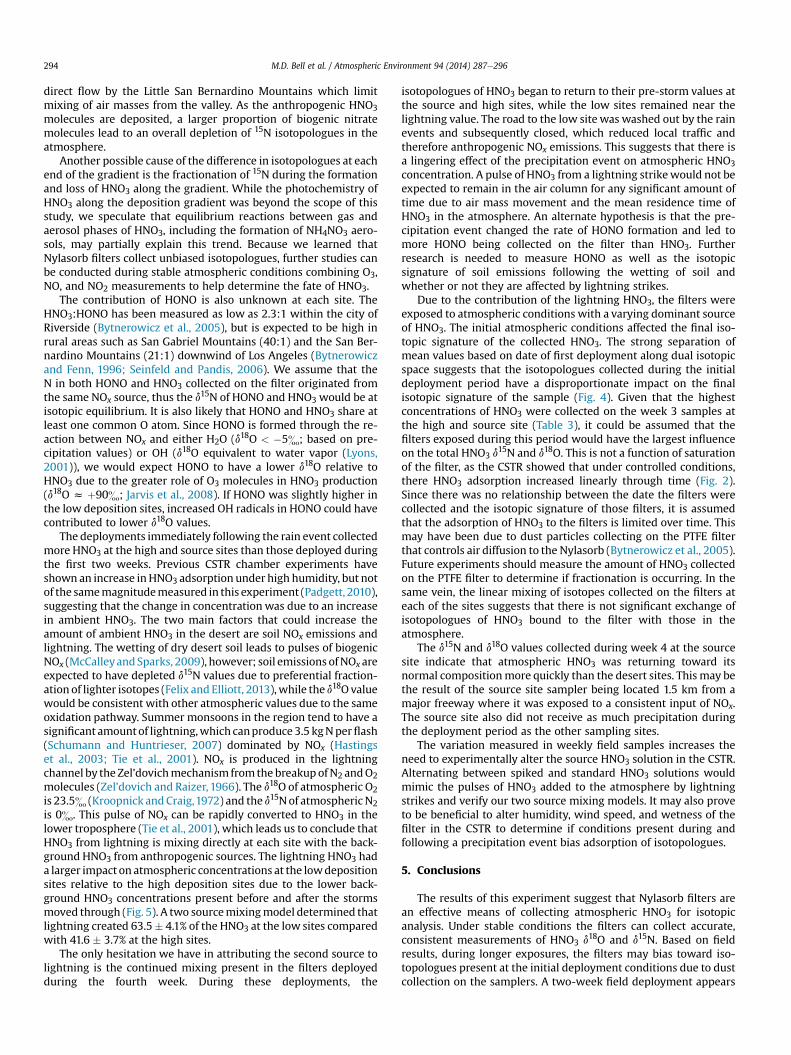
Table 2Differences in HNO3 concentration and isotopic signature among sites. Values representdifferences among group means are indicated by superscript values (Student's t-test; a <
Botanic Snow creek
HNO3 concentration (mg/m3) 10.4 � 1.11 12.4 � 1.21
d15N (&) �0.8 � 0.3A �2.2 � 0.3B
d18O (&) 51.8 � 2.4Y 54.9 � 2.6Y
extrapolating the two regression equations from high and low sitesto their intercept for each element (d18O ¼ 21.6& andd15N ¼ �0.6&). The second endmember for each model was set asthe largest d18O value and the lowest d15N value recorded at eachsite. The mean d15N and d18O of the 4-week deployment filters fromthe high and low sites were used to calculate a percent ‘sharedendmember’ value. The two high sites had a mean percent ‘sharedendmember’ of 41.6 � 3.7% based on the d18O model and39.3 � 4.0% based on the d15N model. The low site had a ‘sharedendmember’ value of 63.5 � 4.1% based on the d18O model and58.6� 4.4% based on the d15N model. Analysis of variance indicateda significant difference between high and low sites in the amount of‘shared endmember’ N present based on both d18O (df ¼ 1,F¼ 17.66, p< 0.0001) and d15N (df¼ 1, F¼ 10.49, p< 0.005)models.The source site was left out of this analysis due to the secondendmember not trending toward the shared endmember isotopicsignature.
4. Discussion
4.1. Utility of passive samplers for isotopic measurements of HNO3
The Nylasorb filters in the high and moderate HNO3 concen-tration chambers collected HNO3 at a constant rate over a 4 weekperiod without becoming saturated. This observation is consistentwith previous studies conducted both outdoors and in CSTRs(Bytnerowicz et al., 2005). The isotopic signature of HNO3 collectedon Nylasorb filters relative to that of the source solution suggeststhat the atmospheric concentration of HNO3 and the deploymentlength both impacted the isotopologues collected by the filters,although the mean d18O and d15N in each chamber were within0.3& of the source HNO3. The range of values measured was moreconfined for HNO3 d15N (0&e0.7&) than HNO3 d18O (22.4&e
27.0&) which may have been due to changes in atmosphericchemistry within the chambers resulting from differences in tem-perature and UV radiation among deployments. The lack of rela-tionship between the bias of d15N and d18O on individual filtersindicates that there were no significant leaks in the system as thiswould have created a mixing of isotopologues toward a secondsource in both chambers.
The increased isotopic variation during shorter deployments inthe moderate HNO3 concentration chamber suggests that it maytake longer than a week for an isotopic equilibrium to form be-tween atmospheric HNO3 and HNO3 collected on the filters. Therewas a positive relationship between isotopologues of HNO3collected on synchronous 1-week filters in the high and moderatechambers suggesting that similar changes in background condi-tions were impacting both sets of filters, but had a larger impact inthe moderate concentration chamber. The variability may havebeen caused by the atomic variability of HNO3 coming in contactwith the samplers at low concentrations as well as possible frac-tionation during the extraction process. There was no relationshipbetween weekly variation in temperature and humidity, but dailyfluctuations may have led to differences in adsorption rates. Thesource of HNO3 was unchanged for the entire 4-week deployment,
the mean of all filters exposed at a site and standard error of the mean. Significant0.05).
Whitewater Pinto basin Sunrise
10.5 � 1.11 4.1 � 1.22 5.3 � 1.22
�3.3 � 0.3C �4.0 � 0.3C �3.5 � 0.3C
54.9 � 2.6Y 39.9 � 3.1Z 37.5 � 2.8Z

Table 3Changes in HNO3 concentration and HNO3 isotopic signature along the N deposition gradient based on the deployment week. Analyses are among weeks and within sites.ANOVA was performed on inverse (1/HNO3 concentration) values to normalize the data. Significant differences among group means are indicated by superscript values(Student’s t-test; a < 0.05).
Week 1 Week 2 Week 3 Week 4
Source HNO3 concentration (mg/m3) 10.2 � 1.21 7.0 � 1.11 17.0 � 3.42 10.0 � 1.612
d15N (&) �0.9 � 0.2AB �1.2 � 0.2B 0.2 � 0.3C �0.2 � 0.4AC
d18O (&) 52.5 � 3.3YZ 59.7 � 3.9Y 36.5 � 5.3Z 50.4 � 6.8High HNO3 concentration 8.0 � 0.41 9.5 � 1.01 19.7 � 3.42 11.8 � 2.11
d15N �3.4 � 0.3A �2.9 � 0.4A �1.6 � 0.4B �2.7 � 0.6AB
d18O 65.4 � 2.4x 52.3 � 3.3Y 45.9 � 3.4YZ 38.7 � 4.8Z
Low HNO3 concentration 4.8 � 0.61 4.3 � 0.51 6.4 � 2.41
d15N �4.2 � 0.4A �3.6 � 0.4A �1.4 � 0.9B
d18O 42.4 � 2.0Y 37.6 � 2.1Y 23.8 � 4.4Z
M.D. Bell et al. / Atmospheric Environment 94 (2014) 287e296 293
limiting our ability to determine if there is any post adsorptionexchange with atmospheric HNO3.
The results of the CSTR portion of the experiment demonstratedthat the Nylasorb filters effectively capture unbiased isotopologuesof atmospheric HNO3 in controlled atmospheric conditions if givensufficient time to equilibrate. Filters deployed in the moderatechambers for one week had a lower d18O value than the sourcesolution, so a two week exposure is recommended to obtain anaccurate measurement. While rates of dry deposition of atmo-spheric HNO3 to soil and plant surfaces are affected by changes intemperature and humidity (Brook et al., 1999), variations in tem-perature and humidity in the CSTRs did not have an effect onchanges in isotopologue accumulation on the filter. This findingsuggests that changes in accumulation that occurred in the fieldwere the result of changes in atmospheric concentrations associ-ated with changing sources of HNO3.
4.2. Field measurements
The HNO3 concentrations recorded at the high field sites weresimilar to previously measured levels, while the low sites increasedfrom 2.5 to 3.5 mg/m3 (Allen et al., 2009; Rao et al., 2009). The in-crease may have been related to the precipitation events which didnot occur during previous deployments. The baseline isotopicsignature of atmospheric HNO3 (Week 1 deployment, 1-weekexposure) was unique at the source, high, and low sites. The d15Nvalues of all samples were negative (�1.1& to �5.6&) suggesting
Fig. 5. The relationship between the d18O value and d15N value of passively collectedHNO3 on individual filters separated by deposition intensity.
that the main source of anthropogenic HNO3 was automotive(Heaton, 1990). This is consistent with emissions data from LosAngeles where over 50% of NOx comes from automotive combus-tion (CARB, 2009). The largest d18O values recorded at each set ofsites were consistent with previously measured atmospheric values(Elliott et al., 2009; Hastings et al., 2004). The d15N and d18O valuesboth decreased from west to east. The depletion of heavy iso-topologues from the LA Basin eastward could be caused by pref-erential loss of heavier isotopologues along the gradient. The highdeposition sites are directly in the path of air moving out of the LosAngeles Air Basin, while the low deposition sites are protected from
Fig. 6. The d18O (A) and d15N (B) values of passively collected HNO3 are correlated withthe amount of HNO3 collected on each filter.
M.D. Bell et al. / Atmospheric Environment 94 (2014) 287e296294
direct flow by the Little San Bernardino Mountains which limitmixing of air masses from the valley. As the anthropogenic HNO3molecules are deposited, a larger proportion of biogenic nitratemolecules lead to an overall depletion of 15N isotopologues in theatmosphere.
Another possible cause of the difference in isotopologues at eachend of the gradient is the fractionation of 15N during the formationand loss of HNO3 along the gradient. While the photochemistry ofHNO3 along the deposition gradient was beyond the scope of thisstudy, we speculate that equilibrium reactions between gas andaerosol phases of HNO3, including the formation of NH4NO3 aero-sols, may partially explain this trend. Because we learned thatNylasorb filters collect unbiased isotopologues, further studies canbe conducted during stable atmospheric conditions combining O3,NO, and NO2 measurements to help determine the fate of HNO3.
The contribution of HONO is also unknown at each site. TheHNO3:HONO has been measured as low as 2.3:1 within the city ofRiverside (Bytnerowicz et al., 2005), but is expected to be high inrural areas such as San Gabriel Mountains (40:1) and the San Ber-nardino Mountains (21:1) downwind of Los Angeles (Bytnerowiczand Fenn, 1996; Seinfeld and Pandis, 2006). We assume that theN in both HONO and HNO3 collected on the filter originated fromthe same NOx source, thus the d15N of HONO and HNO3 would be atisotopic equilibrium. It is also likely that HONO and HNO3 share atleast one common O atom. Since HONO is formed through the re-action between NOx and either H2O (d18O < �5&; based on pre-cipitation values) or OH (d18O equivalent to water vapor (Lyons,2001)), we would expect HONO to have a lower d18O relative toHNO3 due to the greater role of O3 molecules in HNO3 production(d18O z þ90&; Jarvis et al., 2008). If HONO was slightly higher inthe low deposition sites, increased OH radicals in HONO could havecontributed to lower d18O values.
The deployments immediately following the rain event collectedmore HNO3 at the high and source sites than those deployed duringthe first two weeks. Previous CSTR chamber experiments haveshown an increase inHNO3 adsorption under high humidity, but notof the samemagnitudemeasured in this experiment (Padgett, 2010),suggesting that the change in concentration was due to an increasein ambient HNO3. The two main factors that could increase theamount of ambient HNO3 in the desert are soil NOx emissions andlightning. The wetting of dry desert soil leads to pulses of biogenicNOx (McCalleyandSparks, 2009), however; soil emissions ofNOx areexpected to have depleted d15N values due to preferential fraction-ation of lighter isotopes (Felix and Elliott, 2013),while the d18O valuewould be consistent with other atmospheric values due to the sameoxidation pathway. Summer monsoons in the region tend to have asignificant amountof lightning,which canproduce 3.5 kgNperflash(Schumann and Huntrieser, 2007) dominated by NOx (Hastingset al., 2003; Tie et al., 2001). NOx is produced in the lightningchannel by the Zel’dovichmechanism fromthe breakup ofN2 andO2molecules (Zel’dovich and Raizer, 1966). The d18O of atmospheric O2is 23.5& (Kroopnick andCraig,1972) and the d15Nof atmospheric N2is 0&. This pulse of NOx can be rapidly converted to HNO3 in thelower troposphere (Tie et al., 2001), which leads us to conclude thatHNO3 from lightning is mixing directly at each site with the back-ground HNO3 from anthropogenic sources. The lightning HNO3 hada larger impact on atmospheric concentrations at the lowdepositionsites relative to the high deposition sites due to the lower back-ground HNO3 concentrations present before and after the stormsmoved through (Fig. 5). A two sourcemixingmodel determined thatlightning created 63.5� 4.1% of the HNO3 at the low sites comparedwith 41.6 � 3.7% at the high sites.
The only hesitation we have in attributing the second source tolightning is the continued mixing present in the filters deployedduring the fourth week. During these deployments, the
isotopologues of HNO3 began to return to their pre-storm values atthe source and high sites, while the low sites remained near thelightning value. The road to the low site was washed out by the rainevents and subsequently closed, which reduced local traffic andtherefore anthropogenic NOx emissions. This suggests that there isa lingering effect of the precipitation event on atmospheric HNO3concentration. A pulse of HNO3 from a lightning strikewould not beexpected to remain in the air column for any significant amount oftime due to air mass movement and the mean residence time ofHNO3 in the atmosphere. An alternate hypothesis is that the pre-cipitation event changed the rate of HONO formation and led tomore HONO being collected on the filter than HNO3. Furtherresearch is needed to measure HONO as well as the isotopicsignature of soil emissions following the wetting of soil andwhether or not they are affected by lightning strikes.
Due to the contribution of the lightning HNO3, the filters wereexposed to atmospheric conditions with a varying dominant sourceof HNO3. The initial atmospheric conditions affected the final iso-topic signature of the collected HNO3. The strong separation ofmean values based on date of first deployment along dual isotopicspace suggests that the isotopologues collected during the initialdeployment period have a disproportionate impact on the finalisotopic signature of the sample (Fig. 4). Given that the highestconcentrations of HNO3 were collected on the week 3 samples atthe high and source site (Table 3), it could be assumed that thefilters exposed during this period would have the largest influenceon the total HNO3 d
15N and d18O. This is not a function of saturationof the filter, as the CSTR showed that under controlled conditions,there HNO3 adsorption increased linearly through time (Fig. 2).Since there was no relationship between the date the filters werecollected and the isotopic signature of those filters, it is assumedthat the adsorption of HNO3 to the filters is limited over time. Thismay have been due to dust particles collecting on the PTFE filterthat controls air diffusion to the Nylasorb (Bytnerowicz et al., 2005).Future experiments should measure the amount of HNO3 collectedon the PTFE filter to determine if fractionation is occurring. In thesame vein, the linear mixing of isotopes collected on the filters ateach of the sites suggests that there is not significant exchange ofisotopologues of HNO3 bound to the filter with those in theatmosphere.
The d15N and d18O values collected during week 4 at the sourcesite indicate that atmospheric HNO3 was returning toward itsnormal compositionmore quickly than the desert sites. This may bethe result of the source site sampler being located 1.5 km from amajor freeway where it was exposed to a consistent input of NOx.The source site also did not receive as much precipitation duringthe deployment period as the other sampling sites.
The variation measured in weekly field samples increases theneed to experimentally alter the source HNO3 solution in the CSTR.Alternating between spiked and standard HNO3 solutions wouldmimic the pulses of HNO3 added to the atmosphere by lightningstrikes and verify our two source mixing models. It may also proveto be beneficial to alter humidity, wind speed, and wetness of thefilter in the CSTR to determine if conditions present during andfollowing a precipitation event bias adsorption of isotopologues.
5. Conclusions
The results of this experiment suggest that Nylasorb filters arean effective means of collecting atmospheric HNO3 for isotopicanalysis. Under stable conditions the filters can collect accurate,consistent measurements of HNO3 d18O and d15N. Based on fieldresults, during longer exposures, the filters may bias toward iso-topologues present at the initial deployment conditions due to dustcollection on the samplers. A two-week field deployment appears
M.D. Bell et al. / Atmospheric Environment 94 (2014) 287e296 295
to be themost effective timing to gather accurate isotopic data. Thisdeployment length in the CSTRs produced average isotopic ratioswithin 0.5& of the true value for both d18O and d15N. Using a two-week deployment minimizes the amount of variability in the iso-topic ratios data for both elements while increasing the ability toplan the deployment around variable weather patterns. This alsolimits the impact that dust accumulation could have air diffusion tothe filter surface.
The storms with lightning events that occurred during the studyperiod created variable isotopic ratios of HNO3 during the multipledeployment periods. The mixing of isotopologues was indicative ofa two-sourcemixingmodel with a shared second source among thehigh and low deposition sites. We attributed this shared source toHNO3 created by lightning strikes based on the similarity of N and Oisotopic signatures of N and O with their atmospheric constituents.Future CSTR chamber studies should use an HNO3 isotope tracer tosimulate a pulse of a second HNO3 source into a stable atmosphereto verify how the filters adsorb isotopologues of two sources ofHNO3.
Acknowledgments
This research was made possible by grants from the NationalScience Foundation (DEB-1110832) and the San BernardinoCommunity Foundation Desert Research Fund. The authors wouldlike to thank Josh Hoines and Katie Kain from Joshua Tree Na-tional Park and Katie O’Conner from the Friends of the DesertMountains for assistance with site access and Delores Lucero,Diane Alexander, Elizabeth Hessom, Ben Wissinger, and TaahiraMajor for field and lab assistance. We would also like to thank thetwo anonymous reviewers for their comments on the initialsubmission.
References
Allen, E.B., Rao, L.E., Steers, R.J., Bytnerowitcz, A., Fenn, M.E., 2009. Impacts of at-mospheric nitrogen deposition on vegetation and soils in Joshua Tree NationalPark. In: Webb, R.H., Fenstermaker, L.F., Heaton, J.S., Hughson, D.L.,McDonald, E.V., Miller, D.M. (Eds.), The Mojave Desert: Ecosystem Processes andSustainability. University of Nevada Press, Las Vegas, pp. 78e100.
Ammann, M., Siegwolf, R., Pichlmayer, F., Suter, M., Saurer, M., Brunold, C., 1999.Estimating the uptake of traffic-derived NO2 from N-15 abundance in Norwayspruce needles. Oecologia 118, 124e131.
Brook, J.R., Zhang, L., Li, Y., Johnson, D., 1999. Description and evaluation of a modelof deposition velocities for routine estimates of dry deposition over NorthAmerica. Part II: review of past measurements and model results. Atmos. En-viron. 33, 5053e5070.
Bytnerowicz, A., Fenn, M.E., 1996. Nitrogen deposition in California forests: a re-view. Environ. Pollut. 92, 127e146.
Bytnerowicz, A., Sanz, M.J., Arbaugh, M.J., Padgett, P.E., Jones, D.P., Davila, A., 2005.Passive sampler for monitoring ambient nitric acid (HNO3) and nitrous acid(HNO2) concentrations. Atmos. Environ. 39, 2655e2660.
Calvert, J.G., Lazrus, A., Kok, G.L., Heikes, B.G., Walega, J.G., Lind, J., Cantrell, C.A.,1985. Chemical mechanisms of acid generation in the troposphere. Nature 317,27e35.
California Air Resources Board (CARB), 2009. Emission Data by Region (Statewide),California Air Resources Board. Retrieved from: http://www.arb.ca.gov/ei/emissiondata.htm.
Casciotti, K.L., Sigman, D.M., Hastings, M.G., Böhlke, J.K., Hilkert, A., 2002. Mea-surement of the oxygen isotopic composition of nitrate in Seawater andfreshwater using the denitrifier method. Anal. Chem. 74, 4905e4912.
CASTNet (Clean Air Status and Trends Network), 2013. Annual Report, p. 2011.Retrieved from: http://epa.gov/castnet/javaweb/docs/annual_report_2011.pdf.
Clarke, J.F., Edgerton, E.S., Martin, B.E., 1997. Dry deposition calculations for theclean air status and trends network. Atmos. Environ. 31, 3667e3678.
Coplen, T.B., Qi, H., Révész, K., Casciotti, K., Hannon, J.E., 2012. Determination of thed15N and d18O of nitrate in water; RSIL lab code 2900. Chap. 17. In:Révész, Kinga, Coplen, T.B. (Eds.), Stable Isotope-Ratio Methods, Sec. C,Methods of the Reston Stable Isotope Laboratory: U.S. Geological SurveyTechniques and Methods, Book 10, p. 35. Available only at: http://pubs.usgs.gov/tm/2006/tm10c17/.
Elliott, E.M., Kendall, C., Boyer, E.B., Burns, D.A., Lear, G., Golden, H.E., Harlin, K.,Bytnerowicz, A., Butler, T.J., Glatz, R., 2009. Dual nitrate isotopes in dry
deposition: utility for partitioning NOx source contributions to landscape ni-trogen deposition. J. Geophys. Res. Biogeosci. 114, G04020.
Felix, J.D., Elliott, E.M., 2013. The agricultural history of human-nitrogen interactionsas recorded in ice core d15N-NO3�. Geophys. Res. Lett. 40, 1642e1646.
Felix, J.D., Elliott, E.M., Shaw, S.L., 2012. Nitrogen isotopic composition of coal-firedpower plant NOx: influence of emission controls and implications for globalemission inventories. Environ. Sci. Technol. 46, 3528e3535.
Fenn, M.E., Allen, E.B., Weiss, S.B., Jovan, S., Geiser, L.H., Tonnesen, G.S., Johnson, R.F.,Rao, L.E., Gimeno, B.S., Yuan, F., Meixner, T., Bytnerowicz, A., 2010. Nitrogencritical loads and management alternatives for N-impacted ecosystems inCalifornia. J. Environ. Manag. 91, 2404e2423.
Fenn, M.E., Haeuber, R., Tonnesen, G.S., Baron, J.S., Grossman-Clarke, S., Hope, D.,Jaffe, D.A., Copeland, S., Geiser, L., Rueth, H.M., Sickman, J.O., 2003. Nitrogenemissions, deposition, and monitoring in the western United States. Bioscience53, 391e403.
Freyer, H.D., 1991. Seasonal-variation of N15/N14 ratios in atmospheric nitratespecies. Tellus Ser. B Chem. Phys. Meteorol. 43, 30e44.
Freyer, H.D., Kley, D., Volzthomas, A., Kobel, K., 1993. On the interaction of isotopicexchange processes with photochemical-reactions in atmospheric oxides ofnitrogen. J. Geophys. Res. Atmos. 98, 14791e14796.
Galloway, J.N., Aber, J.D., Erisman, J.W., Seitzinger, S.P., Howarth, R.W., Cowling, E.B.,Cosby, B.J., 2003. The nitrogen cascade. Bioscience 53, 341e356.
Goulding, K.W.T., Bailey, N.J., Bradbury, N.J., Hargreaves, P., Howe, M., Murphy, D.V.,Poulton, P.R., Willison, T.W., 1998. Nitrogen deposition and its contribution tonitrogen cycling and associated soil processes. New. Phytol. 139, 49e58.
Hanson, P.J., Lindberg, S.E., 1991. Dry deposition of reactive nitrogen compounds: areview of leaf, canopy and non-foliar measurements. Atmos. Environ. Part AGeneral Top. 25, 1615e1634.
Hastings, M.G., Sigman, D.M., Lipschultz, F., 2003. Isotopic evidence for sourcechanges of nitrate in rain at Bermuda. J. Geophys. Res. 108, 4790.
Hastings, M.G., Steig, E.J., Sigman, D.M., 2004. Seasonal variations in N and O iso-topes of nitrate in snow at Summit, Greenland: implications for the study ofnitrate in snow and ice cores. J. Geophys. Res. 109, D20306.
Heaton, T.H.E., 1990. 15N/14N ratios of NOx from vehicle engines and coal-firedpower stations. Tellus B 42, 304e307.
Hoering, T., 1957. The isotopic composition of the ammonia and the nitrate ion inrain. Geochim. Et. Cosmochim. Acta 12, 97e102.
Jarvis, J.C., Steig, E.J., Hastings, M.G., Kunasek, S.A., 2008. Influence of local photo-chemistry on isotopes of nitrate in Greenland snow. Geophys. Res. Lett. 35,L21804.
Kroopnick, P., Craig, H., 1972. Atmospheric oxygen: isotopic composition and sol-ubility fractionation. Science 175, 54e55.
Lyons, J.R., 2001. Transfer of mass-independent fractionation in ozone to otheroxygen-containing radicals in the atmosphere. Geophys. Res. Lett. 28, 3231e3234.
McCalley, C.K., Sparks, J.P., 2009. Abiotic gas formation drives nitrogen loss from adesert ecosystem. Science 326, 837e840.
Moore, H., 1977. Isotopic composition of ammonia, nitrogen-dioxide, and nitrate inatmosphere. Atmos. Environ. 11, 1239e1243.
NADP, 2012. National Atmospheric Deposition Program 2011 Annual Summary,NADP Data Report 2012-01. Illinois State Water Survey.
Padgett, P.E., 2010. The effect of ambient ozone and humidity on the performance ofnylon and Teflon filters used in ambient air monitoring filter-pack systems.Atmos. Pollut. Res. 1, 23e29.
Padgett, P.E., Allen, E.B., 1999. Differential responses to nitrogen fertilization innative shrubs and exotic annuals common to Mediterranean coastal sage scrubof California. Plant Ecol. 144, 93e101.
Padgett, P.E., Bytnerowicz, A., Dawson, P.J., Riechers, G.H., Fitz, D.R., 2004. Design,evaluation and application of a continuously stirred tank reactor system for usein nitric acid air pollutant studies. Water Air Soil Pollut. 151, 35e51.
Pataki, D.E., Ehleringer, J.R., Flanagan, L.B., Yakir, D., Bowling, D.R., Still, C.J.,Buchmann, N., Kaplan, J.O., Berry, J.A., 2003. The application and interpretationof keeling plots in terrestrial carbon cycle research. Glob. Biogeochem. Cycles 17.
Rao, L.E., Parker, D.R., Bytnerowicz, A., Allen, E.B., 2009. Nitrogen mineralizationacross an atmospheric nitrogen deposition gradient in Southern Californiadeserts. J. Arid Environ. 73, 920e930.
Schumann, U., Huntrieser, H., 2007. The global lightning-induced nitrogen oxidessource. Atmos. Chem. Phys. 7, 3823e3907.
Seinfeld, J.H., Pandis, S.N., 2006. Atmospheric Chemistry and Physics: from AirPollution to Climate Change, second ed. John Wiley & Sons, Inc., New York.
Templer, P.H., Weathers, K.C., 2011. Use of mixed ion exchange resin and thedenitrifier method to determine isotopic values of nitrate in atmosphericdeposition and canopy throughfall. Atmos. Environ. 45, 2017e2020.
Tie, X., Zhang, R., Brasseur, G., Emmons, L., Lei, W., 2001. Effects of lightning onreactive nitrogen and nitrogen reservoir species in the troposphere. J. Geophys.Res. Atmos. 106, 3167e3178.
Tonnesen, G.S., Wang, Z.S., Omary, M., Chien, C.J., 2003. Model simulations of for-mation, transport and deposition of ozone, fine particulates and nitrates in theSierra Nevada. In: Bytnerowicz, A., Arbaugh, M., Alonso, R. (Eds.), Ozone AirPollution in the Sierra Nevada e Distribution and Effects on Forests. De-velopments in Environmental Sciences. Elsevier Press, Amsterdam,Netherlands.
Vicars, W.C., Morin, S., Savarino, J., Wagner, N.L., Erbland, J., Vince, E., Martins, J.M.F.,Lerner, B.M., Quinn, P.K., Coffman, D.J., Williams, E.J., Brown, S.S., 2013. Spatialand diurnal variability in reactive nitrogen oxide chemistry as reflected in the

M.D. Bell et al. / Atmospheric Environment 94 (2014) 287e296296
isotopic composition of atmospheric nitrate: results from the CalNex 2010 fieldstudy. J. Geophys. Res. Atmos. 118, 10,567e10,588.
Vitousek, P.M., Aber, J.D., Howarth, R.W., Likens, G.E., Matson, P.A., Schindler, D.W.,Schlesinger, W.H., Tilman, D.G., 1997. Human alteration of the global nitrogencycle: sources and consequences. Ecol. Appl. 7, 737e750.
WRCC (Western Regional Climate Center), 2013. Palm Springs, CA (046635),Monthly Climate Summary, 9/1/2011 to 9/28/2011. Website: http://www.wrcc.dri.edu.
Zel’dovich, Y.B., Raizer, Y.P., 1966. Physics of Shock Waves and High-temperatureHydrodynamic Phenomena. Academic Press, New York.