Response of Passively-Controlled Tall Buildings in Tokyo ...
10
Response of Passively-Controlled Tall Buildings in Tokyo during 2011 Great East Japan Earthquake K. Kasai Tokyo Institute of Technology, Japan W.C. Pu Wuhan University of Technology,China A. Wada Tokyo Institute of Technology, Japan SUMMARY: Many tall buildings in Tokyo metropolitan area were strongly shaken during the East Japan Earthquake, March 11, 2011. Most of them are less than 40 years old, and have not experienced such strong shaking. This paper discusses some of the tall buildings that have passive control dampers and are instrumented with sensors. The buildings have steel dampers, oil dampers, viscous dampers, or combination of some of these, and showed distinct responses depending on dampers. The building with steel dampers showed high floor accelerations, since dampers remained elastic due to the level of shaking below their yield limit. In contrast, the velocity-dependent dampers such as oil and viscous dampers dissipated seismic energy, and raised the damping ratio. Hundreds of dampers are used for each tall building, but the damping ratio was 3.5 to 5% typically. The moderate damping, however, was effective in reducing responses, compared with the undamped tall building. Keywords: 2011 Great East Japan Earthquake, response records, passively-controlled building, dampers 1. INTRODUCTION 1.1. Full-Scale Building Tests Conducted before The Earthquake Significant change has taken place in the past three years, regarding recognition of effectiveness in the response-control technology for seismic protection of buildings and their contents. Although this new technology, increasingly used in Japan, still had no conclusive evidence of its superior performance due to its short history, comprehensive results from full-scale shake table tests of buildings with various dampers have been disseminated since 2009 (Kasai et al. 2009-2012). The shake-table, the largest in the world, is called as E-Defense facility, and was used to test a full-scale 5–story buildings with different dampers and without dampers, respectively, applying the ground motion recorded during the 1995 Great Hanshin Earthquake in the small scale to real (catastrophic) level. Figure 1 shows the building specimen in which 12 dampers were instrumented with more than 1,350 sensors, and local responses of member forces and deformations to global responses such as story drifts and accelerations were obtained under the small to catastrophic table motions. As shown in Figure 2, the test used 4 types of dampers, steel, oil, viscous, and viscoelastic dampers in the order. These dampers represent four of major five types of dampers in Japan, and their characteristics are summarized in Figure 2: Steel damper utilizes yielding of steel material for energy dissipation. It shows a round curve bounded by bi-linear lines, and can be analytically modeled by using readily available constitutive rules for steel materials. Viscous damper utilizes flow resistance of the polymer liquid. Its force is proportional to the fractional power of velocity, leading to the hysteresis loop of combined ellipse and rectangle. Oil damper utilizes flow resistance of the oil with low viscosity.
-
Upload
khangminh22 -
Category
Documents
-
view
1 -
download
0
Transcript of Response of Passively-Controlled Tall Buildings in Tokyo ...

Response of Passively-Controlled Tall Buildings in Tokyo during 2011 Great East Japan Earthquake K. Kasai Tokyo Institute of Technology, Japan W.C. Pu Wuhan University of Technology,China A. Wada Tokyo Institute of Technology, Japan
SUMMARY: Many tall buildings in Tokyo metropolitan area were strongly shaken during the East Japan Earthquake, March 11, 2011. Most of them are less than 40 years old, and have not experienced such strong shaking. This paper discusses some of the tall buildings that have passive control dampers and are instrumented with sensors. The buildings have steel dampers, oil dampers, viscous dampers, or combination of some of these, and showed distinct responses depending on dampers. The building with steel dampers showed high floor accelerations, since dampers remained elastic due to the level of shaking below their yield limit. In contrast, the velocity-dependent dampers such as oil and viscous dampers dissipated seismic energy, and raised the damping ratio. Hundreds of dampers are used for each tall building, but the damping ratio was 3.5 to 5% typically. The moderate damping, however, was effective in reducing responses, compared with the undamped tall building. Keywords: 2011 Great East Japan Earthquake, response records, passively-controlled building, dampers 1. INTRODUCTION
1.1. Full-Scale Building Tests Conducted before The Earthquake
Significant change has taken place in the past three years, regarding recognition of effectiveness in the response-control technology for seismic protection of buildings and their contents. Although this new technology, increasingly used in Japan, still had no conclusive evidence of its superior performance due to its short history, comprehensive results from full-scale shake table tests of buildings with various dampers have been disseminated since 2009 (Kasai et al. 2009-2012).
The shake-table, the largest in the world, is called as E-Defense facility, and was used to test a full-scale 5–story buildings with different dampers and without dampers, respectively, applying the ground motion recorded during the 1995 Great Hanshin Earthquake in the small scale to real (catastrophic) level. Figure 1 shows the building specimen in which 12 dampers were instrumented with more than 1,350 sensors, and local responses of member forces and deformations to global responses such as story drifts and accelerations were obtained under the small to catastrophic table motions. As shown in Figure 2, the test used 4 types of dampers, steel, oil, viscous, and viscoelastic dampers in the order.
These dampers represent four of major five types of dampers in Japan, and their characteristics are summarized in Figure 2: Steel damper utilizes yielding of steel material for energy dissipation. It shows a round curve bounded by bi-linear lines, and can be analytically modeled by using readily available constitutive rules for steel materials. Viscous damper utilizes flow resistance of the polymer liquid. Its force is proportional to the fractional power of velocity, leading to the hysteresis loop of combined ellipse and rectangle. Oil damper utilizes flow resistance of the oil with low viscosity.

Figure 1. Full-scale building with dampers Figure 2. Four types of dampers used for full-scale building tests
The damper typically has a relief mechanism to switch viscous coefficient to a small value when subjected to a large velocity, making the hysteresis to switch from an elliptical shape to a rectangle shape. Viscoelastic damper utilizes molecular motion of a polymer for energy dissipation. Hysteresis loop is an inclined ellipse, and the inclination angle and the fatness of the loop depend on the excitation frequency and the temperature.
The laboratory tests have given detailed information on behavior of the above-mentioned dampers, frames, components, and distribution of forces and deformations on these elements, which are essential for rational control design, and their relations with the seismic input have been studied in details.
1.2. Response Records of Actual Buildings with Dampers
As another important data base on the other hand, many acceleration records were obtained during the 2011 Great East Japan Earthquake from the existing buildings (e.g., Kasai, 2011c,d, Kasai et al., 2012c, Hisada et al., 2011, 2012, Koyama and Kashima 2011, Maseki et al., 2011, Pu and Kasai 2012, Matsuda et al. 2012). The monitored existing buildings with dampers were up to 54-story. Obviously, such buildings can never be tested by using the table and imposing the catastrophic ground motions, and only the minor shaking tests had been performed previously. The 2011 quake caused much stronger shaking than ever for such buildings.
In contrast to the shake-table tests using numerous sensors, actual buildings typically have limited number of accelerometers only, from which only the global responses can be estimated. Nevertheless, the data is obviously significant, since it most realistically represents true behavior of the buildings whose gigantic sizes prohibit laboratory test. Follow-up studies on the monitored responses are being performed, and have already provided for the first time the realistic information validating effects of the response control.
The present paper, therefore, attempt to provide the most significant evidence of response-control effectiveness, mainly discussing results from monitoring and system identification of the actual response-controlled buildings shaken due to the Great East Japan Earthquake, by combining some observations gained from the laboratory tests as well.
2. SHAKING IN TOKYO DURING 2011 GREAT EAST JAPAN EARTHQUAKE
2.1. The Great East Japan Earthquake
At 14:46 on March 11, 2011, the Great East Japan Earthquake of magnitude 9.0 occurred off Sanriku coast of Japan. It caused tremendous tsunami hazard in the pacific coast of eastern Japan, killing more
than 15,000 people, destroying and washing away cities. Where ground acceleration was large, except for some areas of soft ground, the response spectrum indicates short dominant period, which was probably the main reason for relatively small seismic damage.
On the other hand, Tokyo relatively far from the epicenter was subjected to the ground motion of short to long period components. Many tall buildings have been constructed for the last 40 years in Tokyo, and the shaking they experienced is much stronger than those in the past. Therefore, the response observed are believed to be the precursors for the performance of the tall buildings against the stronger shaking that will definitely occur in future. Since some tall buildings were instrumented with accelerometers, acceleration records obtained during the earthquake would be one of the best resources to study the building responses.
2.2. Sample Buildings with Recorded Accelerations
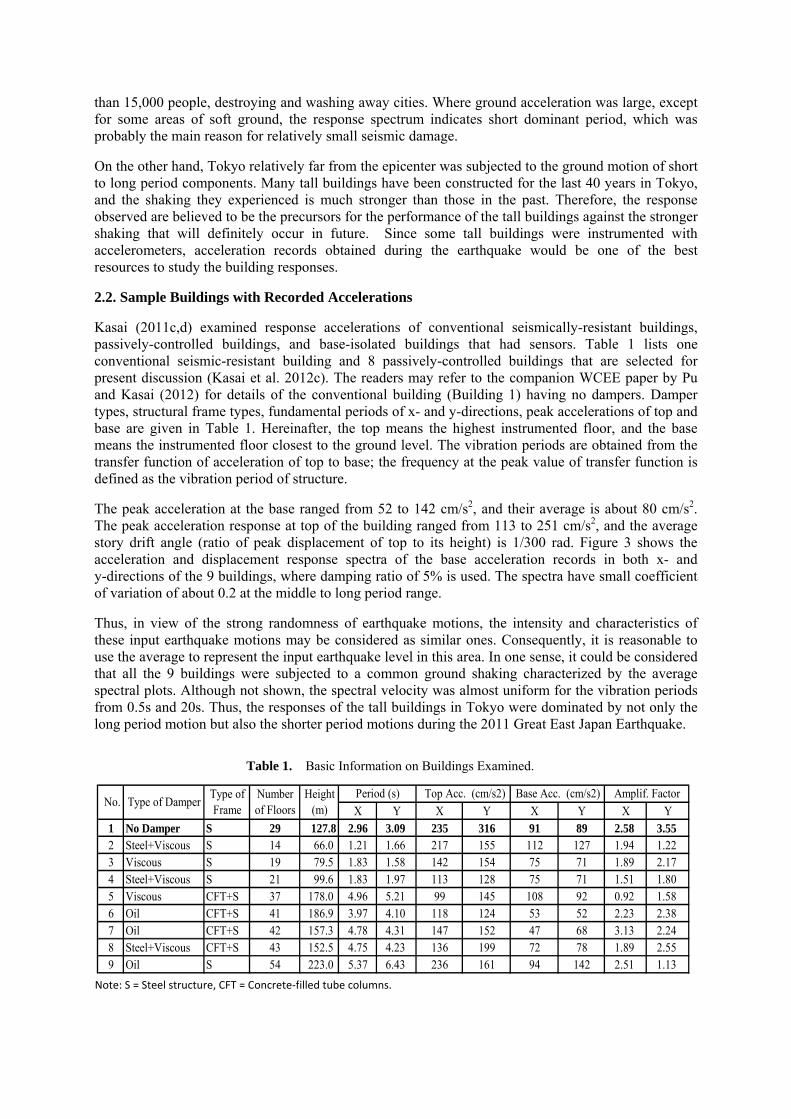
Kasai (2011c,d) examined response accelerations of conventional seismically-resistant buildings, passively-controlled buildings, and base-isolated buildings that had sensors. Table 1 lists one conventional seismic-resistant building and 8 passively-controlled buildings that are selected for present discussion (Kasai et al. 2012c). The readers may refer to the companion WCEE paper by Pu and Kasai (2012) for details of the conventional building (Building 1) having no dampers. Damper types, structural frame types, fundamental periods of x- and y-directions, peak accelerations of top and base are given in Table 1. Hereinafter, the top means the highest instrumented floor, and the base means the instrumented floor closest to the ground level. The vibration periods are obtained from the transfer function of acceleration of top to base; the frequency at the peak value of transfer function is defined as the vibration period of structure.
The peak acceleration at the base ranged from 52 to 142 cm/s2, and their average is about 80 cm/s2. The peak acceleration response at top of the building ranged from 113 to 251 cm/s2, and the average story drift angle (ratio of peak displacement of top to its height) is 1/300 rad. Figure 3 shows the acceleration and displacement response spectra of the base acceleration records in both x- and y-directions of the 9 buildings, where damping ratio of 5% is used. The spectra have small coefficient of variation of about 0.2 at the middle to long period range.
Thus, in view of the strong randomness of earthquake motions, the intensity and characteristics of these input earthquake motions may be considered as similar ones. Consequently, it is reasonable to use the average to represent the input earthquake level in this area. In one sense, it could be considered that all the 9 buildings were subjected to a common ground shaking characterized by the average spectral plots. Although not shown, the spectral velocity was almost uniform for the vibration periods from 0.5s and 20s. Thus, the responses of the tall buildings in Tokyo were dominated by not only the long period motion but also the shorter period motions during the 2011 Great East Japan Earthquake.
Table 1. Basic Information on Buildings Examined.
Note: S = Steel structure, CFT = Concrete‐filled tube columns.
X Y X Y X Y X Y1 No Damper S 29 127.8 2.96 3.09 235 316 91 89 2.58 3.552 Steel+Viscous S 14 66.0 1.21 1.66 217 155 112 127 1.94 1.223 Viscous S 19 79.5 1.83 1.58 142 154 75 71 1.89 2.174 Steel+Viscous S 21 99.6 1.83 1.97 113 128 75 71 1.51 1.805 Viscous CFT+S 37 178.0 4.96 5.21 99 145 108 92 0.92 1.586 Oil CFT+S 41 186.9 3.97 4.10 118 124 53 52 2.23 2.387 Oil CFT+S 42 157.3 4.78 4.31 147 152 47 68 3.13 2.248 Steel+Viscous CFT+S 43 152.5 4.75 4.23 136 199 72 78 1.89 2.559 Oil S 54 223.0 5.37 6.43 236 161 94 142 2.51 1.13
Amplif. FactorHeight(m)
Period (s) Top Acc. (cm/s2) Base Acc. (cm/s2) No. Type of Damper Type of
FrameNumberof Floors

Figure 3. Response spectra generated from the base x- and y-motions of nine buildings (damping ratio 5%).
2.3. Acceleration Amplification
The ratio of accelerations of top to base will be named as “acceleration amplification ratio”. As stated above, the response spectra for the buildings are similar, and the vibration period of the building is well correlated to its height. However, acceleration amplification ratio did not follow the trend of acceleration spectra in Figure 3a. As can be understood by comparing the values in Table 1 to the trends of Figure 3a, the ratio appears to be very high for taller buildings (Kasai, 2011c,d, Kasai et al., 2012c).
This is due to significant contribution of higher modes to be discussed later, and, in case of seismic-resistant buildings, their low damping ratios. Note also that even the passively-controlled buildings with steel dampers showed similar trend, since damper was elastic or yielding little for the level of the ground shaking in Tokyo.
In Japanese practice to-date, design criteria for passively-controlled buildings have been set for displacement control, and rarely for acceleration control. In spite, excessive accelerations have been found to cause large economic loss by damaging non-structural components and facilities. Thus, acceleration amplification should be taken in structural design more seriously. By this reason, the following discussion will refer to both displacement and acceleration.
2.4. Verification of Modal Properties
By using the following two different methods, the displacements of structure are calculated from the recorded accelerations. The results are compared with each other in order to confirm their reliability (Kasai, 2011c).
Method 1 performs double integration together with hi-pass filtering in frequency domain. The cut-off frequency is typically 0.05 or 0.1Hz. Method 2 first obtains modal properties such as vibration period, damping ratio, and participation vector, by applying a basic system identification technique of fitting a theoretical transfer function to the spectral ratio between accelerations recorded at a selected story and building base, respectively. Then, the time histories of acceleration and displacement of each mode are calculated by using the base acceleration recorded, and those for modes typically 1 to 3 are added together. This modal superposition analysis is conducted easily, without modeling numerous structural elements of the building.
For all the nine buildings considered, the displacements from method 2 agreed well with those from method 1, and accelerations from method 2 agreed with those recorded. In such cases, the modal properties obtained are considered valid, and the contribution of each mode as well as the effect of damping can be examined. Method 2 is based on the assumption of linear response, proportional damping, and real number mode. The agreement between the two methods suggests that the buildings had linear or slightly nonlinear behavior during the earthquake as well as moderate amount of damping. In the next sections, selected buildings will be considered to describe in detail typical responses and modal contributions.
0
100
200
300
400
500
0 1 2 3 4 5
T(s)
Pseu
do-a
ccel
erat
ion(
cm/s
/s)
Average Average ± Standard deviation Individual motion
Pseu
do-A
cc. (
cm/s2 )
(a)
0
5
10
15
20
25
30
35
0 1 2 3 4 5
T(s)
Dis
plac
emen
t (cm
)Di
splac
emen
t (cm
)
(b)
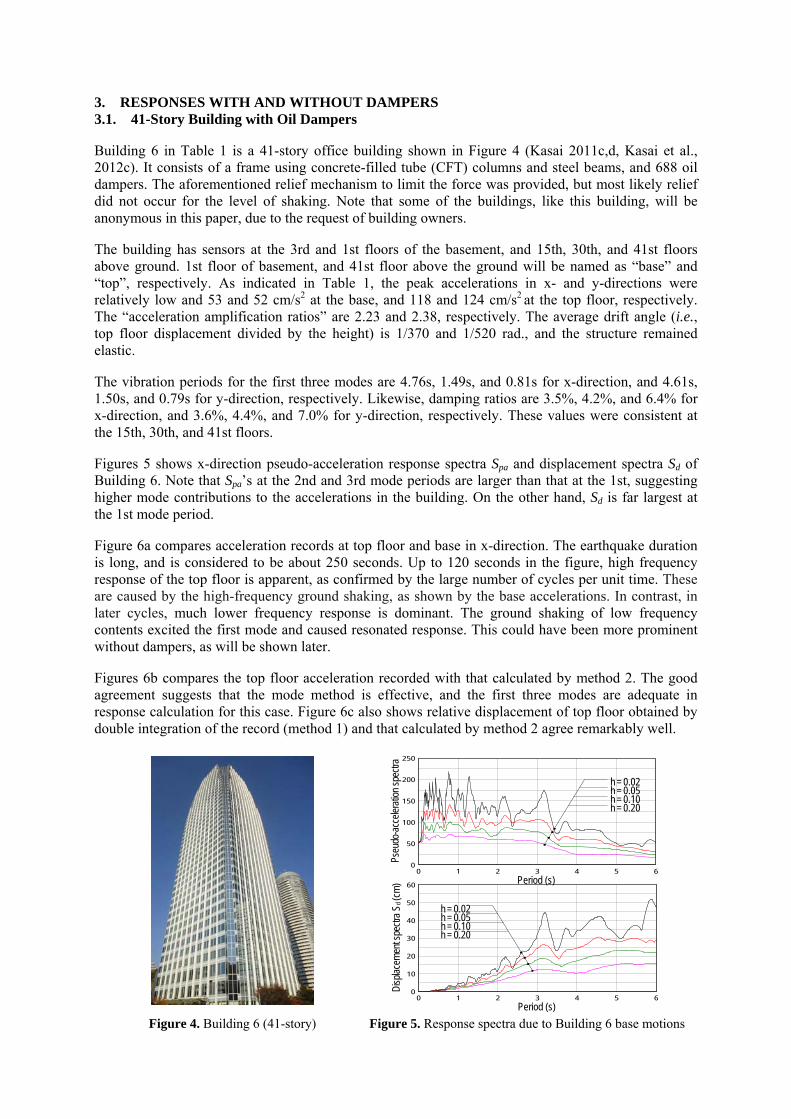
3. RESPONSES WITH AND WITHOUT DAMPERS 3.1. 41-Story Building with Oil Dampers
Building 6 in Table 1 is a 41-story office building shown in Figure 4 (Kasai 2011c,d, Kasai et al., 2012c). It consists of a frame using concrete-filled tube (CFT) columns and steel beams, and 688 oil dampers. The aforementioned relief mechanism to limit the force was provided, but most likely relief did not occur for the level of shaking. Note that some of the buildings, like this building, will be anonymous in this paper, due to the request of building owners.
The building has sensors at the 3rd and 1st floors of the basement, and 15th, 30th, and 41st floors above ground. 1st floor of basement, and 41st floor above the ground will be named as “base” and “top”, respectively. As indicated in Table 1, the peak accelerations in x- and y-directions were relatively low and 53 and 52 cm/s2 at the base, and 118 and 124 cm/s2 at the top floor, respectively. The “acceleration amplification ratios” are 2.23 and 2.38, respectively. The average drift angle (i.e., top floor displacement divided by the height) is 1/370 and 1/520 rad., and the structure remained elastic.
The vibration periods for the first three modes are 4.76s, 1.49s, and 0.81s for x-direction, and 4.61s, 1.50s, and 0.79s for y-direction, respectively. Likewise, damping ratios are 3.5%, 4.2%, and 6.4% for x-direction, and 3.6%, 4.4%, and 7.0% for y-direction, respectively. These values were consistent at the 15th, 30th, and 41st floors.
Figures 5 shows x-direction pseudo-acceleration response spectra Spa and displacement spectra Sd of Building 6. Note that Spa’s at the 2nd and 3rd mode periods are larger than that at the 1st, suggesting higher mode contributions to the accelerations in the building. On the other hand, Sd is far largest at the 1st mode period.
Figure 6a compares acceleration records at top floor and base in x-direction. The earthquake duration is long, and is considered to be about 250 seconds. Up to 120 seconds in the figure, high frequency response of the top floor is apparent, as confirmed by the large number of cycles per unit time. These are caused by the high-frequency ground shaking, as shown by the base accelerations. In contrast, in later cycles, much lower frequency response is dominant. The ground shaking of low frequency contents excited the first mode and caused resonated response. This could have been more prominent without dampers, as will be shown later.
Figures 6b compares the top floor acceleration recorded with that calculated by method 2. The good agreement suggests that the mode method is effective, and the first three modes are adequate in response calculation for this case. Figure 6c also shows relative displacement of top floor obtained by double integration of the record (method 1) and that calculated by method 2 agree remarkably well.
0 1 2 3 4 5 60
50
100
150
200
250
Pseu
do-ac
celer
ation
spec
tra
S(
l)
Period (s)
h = 0.02 h = 0.05 h = 0.10 h = 0.20
0 1 2 3 4 5 60
10
20
30
40
50
60
Disp
lacem
ent s
pectr
a Sd (
cm)
Period (s)
h = 0.05 h = 0.10 h = 0.20
h = 0.02
Figure 4. Building 6 (41-story) Figure 5. Response spectra due to Building 6 base motions

As is known, the contribution of each vibration mode depends on the type of response as well as the story level determining participation vector. Since the properties and responses of each vibration mode identified seem reasonably accurate, it is possible to discuss such contributions:
Figure 7a shows the acceleration of each mode at the top floor. As mentioned earlier, it is dominated by the 2nd, 3rd, and 1st modes in the order of weight for the first 120 seconds. For the later cycles, the 1st mode response increases and become dominant, with slight contribution from the 2nd and 3rd modes. As for the displacement at top floor (Figure 7b), the 1st mode dominates throughout the entire duration.
3.2. Three (21-, 41-, and 54-Story) Buildings with/without Dampers
In addition to Building 6 discussed above, Buildings 4 and 9 are also considered (Figure 8). Building 4 is a 21-story government office building (Koyoma and Kashima 2011, Kasai 2011c,d, Kasai et al., 2012c). It consists of a steel frame and 336 low yield point steel (wall) dampers and 284 viscous (wall) dampers (Figure 8a). As found from the full-scale laboratory test mentioned earlier (Kasai et al.
Figure 7. Contributions of the first three modes to acceleration and displacement
(a) Modal contributions to top floor acceleration
(b) Modal contributions to top floor displacement
80 90 100 110 120 130 140 150 160 170 180-120
-60
0
60
120
t (s)
1st mode 2nd mode 3rd mode
Acc.
(gal)
41th Floor Acceleration
80 90 100 110 120 130 140 150 160 170 180-60
-30
0
30
60
t (s)
1st mode 2nd mode 3rd mode
Disp
. (cm
)
41th Floor Displacement
Figure 6. Acceleration records and accuracy of mode superposition method
High Frequency Low Frequency
80 90 100 110 120 130 140 150 160 170 180-120
-60
0
60
120Ac
c. (g
al)
t (s)
Top acceleration Base acceleration
(a) Accelerations recorded at top and base
(b) Comparison: acceleration obtained by mode superposition vs. actual recorded 80 90 100 110 120 130 140 150 160 170 180
-120
-60
0
60
120
Acc.
(gal)
Mode superposition Actual Acc.
t (s)
(c) Comparison: dispt. Obtained by mode superposition vs. dispt. From double integral of recorded acceleration80 90 100 110 120 130 140 150 160 170 180
-60
-30
0
30
60
Disp
. (cm
)
t (s)
Mode superposition Double integral of actual acc.

2011b, 2012a), a contrasting case of using only steel dampers lead to large accelerations, since the dampers remained elastic for the level of shaking in Tokyo (Kasai 2011c,d, Kasai et al., 2012c). Building 4 had been designed to avoid such a situation, expecting that viscous damper would dissipate energy from a small earthquake, and steel damper, the most economical among all types, would dissipate considerable amount of energy at a large quake, respectively.
Building 9 is a 54-story office steel building constructed in 1979. It was retrofitted in 2009 (Maseki et al. 2011, Kasai et al. 2011c,d) by attaching 288 oil dampers (Figure 8c). 12 dampers per floor were attached to middle 24 stories of the building. The oil damper is similar to those used for Building 6, except that its relief mechanism is modified to reduce forces near peak responses. This aims to reduce the axial force of the column transmitting the damper force, and consequently uplift force of foundation. Most likely, however, the relief did not occur for the level of shaking.
As indicated in Table 1, average of acceleration amplification ratios of Buildings 4, 6, and 9 is less than 2, well below those of the conventional seismic-resistant Building 1 having no dampers. Modal properties are obtained from method 2, and estimated 1st mode damping ratios are about 4%, and those of the 2nd and 3rd modes are almost equal or larger. The 1st mode vibration periods are indicated in Table 1, and those up to the 3rd mode will be shown in later Figure 12.
For all the three buildings, their accelerations and displacements are obtained from superposition up to the 3rd mode, and accuracies are confirmed like those shown in Figures 6b and c shown earlier. Such responses at top floor are shown by black lines in Figures 9, 10, and 11 for buildings 4, 6, and 9, respectively.
In these three buildings, the acceleration (Figures 9 to 11) is dominated by the 2nd and 3rd modes for about 100 seconds, and by the 1st mode for later 200 seconds. Whereas, the displacement (Figures 9 to 11) is dominated by the 1st mode throughout the shaking. This trend is like that of seismically-resistant Building 1 (Pu and Kasai 2012), but the amplitudes are believed to be smaller due
Viscous Damper
Steel Damper
(a)
Oil Damper
(c)
Oil Damper
(b) X Y
99.6m
21-story Building:
Steel Frame + 336 Steel Dampers + 284 Viscous Dampers
41-story Building:
Steel Frame + 688 Oil Dampers
223m
54-story Building: Steel Frame + 288 Oil Dampers
186.9m
X Y X Y
52m 96m
45.4m 45.4m
42m 63m
Figure 8. Buildings 4, 6, and 9

to the supplemental damping. Thus, the responses are compared with those of lower but possible damping ratio representing a hypothetical case of not using the dampers. The modal period is unchanged, assuming small stiffness of the damper. The 1st to 3rd mode damping ratios are uniformly set to 1% and superposition is repeated. The results are shown by gray lines in Figures 9, 10, and 11 for Buildings 4, 6, and 9, respectively.
In all the three buildings, their responses are considerably smaller (black lines) than those with low damping (gray line). The peak accelerations and displacements are about 0.5 and 0.7 times those of the low damping case. Moreover, between significant ground shakings, the responses decay much faster, and number of large cycles is reduced considerably. These help reducing damage and fatigue of structural and non-structural component as well as fear or discomfort of the occupants. In order to quantify such an effect, root mean square of the acceleration and displacement at top are calculated, and their values appear to be about 0.4 and 0.5 times those with low damping, respectively.
Figure 9. Building 4 with different damping ratios (y-dir.).
Original damping Decreased damping (1%)
Decreased damping (1%) (a) Acceleration of top floor
(b) Displacement of top floor
Original damping
Original damping
Decreased damping (1%)
Decreased damping (1%) (a) Acceleration of top floor
(b) Displacement of top floor
Original damping
Figure 10. Building 6 with different damping ratios (x-dir.).
Original damping Decreased damping (1%)
Original damping Decreased damping (1%) (a) Acceleration of top floor
(b) Displacement of top floor
Figure 11. Building 9 with different damping ratios (y-dir.).

3.3. Component Responses in Controlled Building
Inertia forces against structural and non-structural components including equipment and building content are produced by accelerations in the building. Large accelerations typically developed at upper stories cause falling, overturning, shifting, crashing, rapture, and excessive vibration of a variety of non-structural components. As a matter of fact, economic loss due to damage of non-structural components is much more than that of structural damage. Falling of ceilings and other components may also cause death of occupants. Such failures due to the 2011 Great East Japan Earthquake were enormous.
Figure 12 shows component acceleration spectra for the top floors of the four buildings 1, 4, 6, and 9. Damping ratio of the component is assumed to be 3%. The value attached to “original damping” is the first mode damping ratio. For Building 1 (Figure 12a) that is seismically resistant, the broken line is based on the recorded top floor acceleration of the original building having low damping ratios as mentioned earlier, and solid line shows a case where the building damping ratios of the first three modes are increased to 4%. In contrast, for Buildings 4, 6, and 9 (Figures 12b-d) that are response-controlled, the solid line is based on recorded top floor acceleration of the original building (Figures 10 to 11), and the broken line shows when the first three modal damping ratios of the building are reduced to 1%. These examine a merit of increasing building modal damping ratios for protecting the acceleration-sensitive components.
According to Figure 12, the past belief that short-period components are safer in a tall building is incorrect. They are as vulnerable as the long-period components due to multiple resonance peaks created by different modes of the building. The peaks are extremely high, even greater than 2,000 cm/s2 (≈2G). Thus, the resonant acceleration of the components may be greater than 8G at a so-called major quake 4 times or stronger. The problem may become more serious when damage and softening of components cause period shifting from one resonance peak to others. Note that three peaks for each building are shown in Figure 12, since the first three modes were identified. But more peaks may emerge in an actual low damping case.
As a rule of thumb, facilities may overturn when floor acceleration exceeds 0.3G, and ceiling whose vibration period typically ranges from 0.3s to 1s may fall when its acceleration response exceeds 1G. These indicate the needs for an immediate attention to component responses at a major quake that will occur in Tokyo. Figure 12 also clearly indicates that even moderately increasing the building damping ratio by 3% or so would reduce the component acceleration considerably.
4. CONCLUSIONS
This paper has discussed responses of various Japanese passively-controlled tall buildings in Tokyo, based on their motions recorded during the 2011 East Japan Earthquake. The buildings have steel dampers, oil dampers, viscous dampers, or combination of some of these.
Spa (
cm/s2 )
Spa
(cm/
s2 )
Spa (
cm/s2 )
Spa (
cm/s2 )
Decreased Bldg.Damping (1%)
T(s)
(a) Bldg. 1
(b) Bldg. 4
(c) Bldg. 6
(d) Bldg. 9
T(s)
T(s)
T(s)
Decreased Bldg. Damping (1%) Decreased Bldg.
Original Bldg.
Damping (2.1%) Increased Bldg. Damping (4%)
Original Bldg.
Damping (3.7%)
Original Bldg.
Damping (3.4%)
Original Bldg.
Damping (3.9%)
Figure 12. Component response spectra (component damping ratio = 3%).

The building with steel dampers showed high floor accelerations, since dampers remained elastic due to the level of shaking below their yield limit. In contrast, the velocity-dependent dampers such as oil and viscous dampers dissipated seismic energy, and raised the damping ratio of the buildings. Hundreds of dampers are used for each tall building, but the damping ratio was 3.5 to 5% typically. The moderate damping, however, was effective in reducing responses, compared with the undamped tall building.
For each building, modal properties of vibration period, damping ratio, and participation vectors are identified, and they are used to re-construct the recorded responses and their accuracies validated. Based on these, effects of the damping on responses are quantified, and necessity for using the supplemental damping systems to existing conventional tall buildings is discussed.
REFERENCES Kasai, K., Motoyui, S., Ozaki, H., Ishii, M., Ito, H., Kajiwara, K., and Hikino, T. (2009a): Full-Scale Tests
of Passively-Controlled 5-Story Steel Building Using E-Defense Shake Table, Part 1 (pp. 11-17), Part 2 (pp. 87-92), Part 3 (pp. 93-99), Proc. of STESSA 2009 (Behaviour of steel structures in seismic areas), Keynote Paper, Philadelphia.
Kasai, K., Hikino, T., Ito, H., Ooki, Y., Motoyui, S., Kato, F., and Baba, Y. (2011a): Overall Test Outline and Response of Building without Dampers, Part 1: 3D Shake Table Tests on Full Scale 5-Story Steel Building with Dampers, J. Struct. Constr. Eng., AIJ, Vol. 76, No. 663, pp.997-1006. (in Japanese).
Kasai, K., Murata, S., Kato, F., Hikino, T., and Ooki, Y. (2011b): Evaluation Rule for Vibration Period, Damping, and Mode Vector of Buildings Tested by A Shake Table with Inevitable Rocking Motions, J. Struct. Constr. Eng., AIJ, Vol. 76, No. 670, pp.2031-2040. (in Japanese).
Kasai, K., Baba, Y., Nishizawa, K., Hikino, T., Ito, H., Ooki, Y., and Motoyui, S. (2012a): Test Results for Building with Steel Dampers, Part 2: 3D Shake Table Tests on Full Scale 5-Story Steel Building with Dampers, J. Struct. Constr. Eng., AIJ, Vol. 77, No. 673, pp.499-508. (in Japanese).
Kasai, K., Baba, Y., Ito, H., Tokoro, K., Hikino, T., Ooki, Y., and Murai, R. (2012b): 3-D Shake Table Tests on Full-Scale 5-Story Steel Building with Viscoelastic Dampers, J. Struct. Constr. Eng., AIJ, Vol. 77, No. 676, (In Print), (in Japanese).
Kasai, K. (2011c): 4.2.3 Acceleration Records of Buildings, 4.4.5. Behavior of Response Controlled Buildings, Preliminary Reconnaissance Report of the 2011 Tohoku-Chiho Taiheiyo-Oki Earthquake, Architectural Institute of Japan, pp.280-284, pp.345-347 (in Japanese).
Kasai, K. (2011d): Chapter 4. Performance of Response-Controlled Buildings, The Kenchiku Gijutsu, No.741, pp.118-123. (in Japanese).
Hisada, Y., Kubo, T., and Yamashita, T. (2011): Shaking and Damage of the Shinjuku Campus Building and Shinjuku Campus Report from Kougakuin University, Internet Access (in Japanese): http://kouzou.cc.kogakuin.ac.jp/Open/20110420Event/20Apr11_Kogakuin01.pdf
Hisada, Y., Yamashita, T., Murakami, M., Kubo, T., Shindo, J., Aizawa K., and Arata T. (2012): Sesimic Response and Damage of High-Rise Buildings in Tokyo, Japan During the Great East Japan Earthquake, Proceedings, International Symposium on Engineering Lessons Learned from the Giant Earthquake, Tokyo, Japan, March 3 -4.
Koyama, S., and Kashima, T. (2011): Prompt Report on Strong Motions Recorded during the 2011 Tohoku Pacific Ocean Earthquake, Report 5, Building Research Institute (BRI).
Maseki, R., Nii, A., Nagashima, I., Aono, H., Kimura, Y., and Hosozawa, O. (2011): Performance of Seismic Retrofitting of Suoer High-Rise Building Based on Earthquake Observation Records, International Symposium on Disaster Simulation and Structural Safety in the Next Generation (DS’11), Japan
Kasai, K., Pu, W., and Wada, A. (2012c): Responses of Tall Buildings in Tokyo during the 2011 Great East Japan Earthquake, Proc. of STESSA 2012 (Behaviour of steel structures in seismic areas), Keynote Paper, pp.25-35, Santiago, Chile, 9-11 January.
Pu, W. and Kasai, K. (2012): Responses of Conventional Seismic-Resistant Tall Buildings in Tokyo During 2011 Great East Japan Earthquake, Proc. 15WCEE, Lisbon, 24-28, Sep.
Matsuda, K., Kasai, K., Yamagiwa, H., and Sato, D (2012). Responses of Base-Isolated Buildings in Tokyo During the 2011 Great East Japan Earthquake, Proc. 15WCEE, Lisbon, 24-28, Sep.