Atm spheric Pollution Research - Semantic Scholar
12
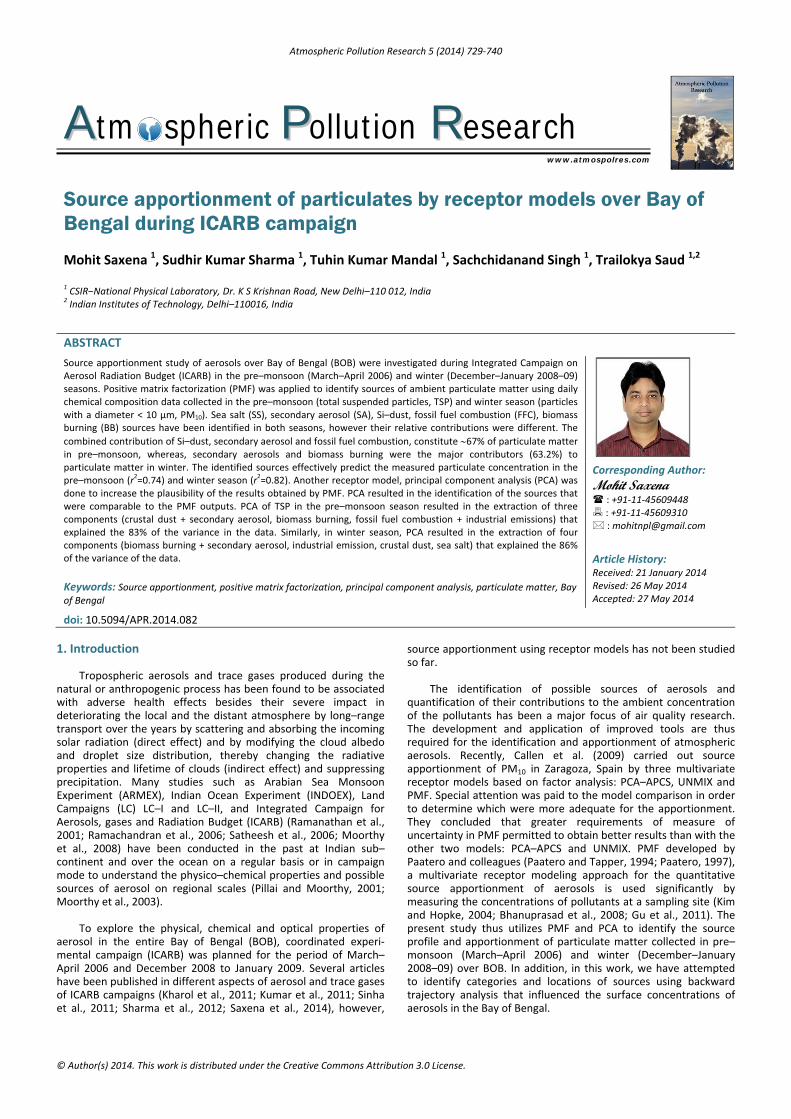
Atmospheric Pollution Research 5 (2014) 729‐740 © Author(s) 2014. This work is distributed under the Creative Commons Attribution 3.0 License. A Atm spheric P Pollution R Research www.atmospolres.com Source apportionment of particulates by receptor models over Bay of Bengal during ICARB campaign Mohit Saxena 1 , Sudhir Kumar Sharma 1 , Tuhin Kumar Mandal 1 , Sachchidanand Singh 1 , Trailokya Saud 1,2 1 CSIR–National Physical Laboratory, Dr. K S Krishnan Road, New Delhi–110 012, India 2 Indian Institutes of Technology, Delhi–110016, India ABSTRACT Source apportionment study of aerosols over Bay of Bengal (BOB) were investigated during Integrated Campaign on Aerosol Radiation Budget (ICARB) in the pre–monsoon (March–April 2006) and winter (December–January 2008–09) seasons. Positive matrix factorization (PMF) was applied to identify sources of ambient particulate matter using daily chemical composition data collected in the pre–monsoon (total suspended particles, TSP) and winter season (particles with a diameter < 10 μm, PM 10 ). Sea salt (SS), secondary aerosol (SA), Si–dust, fossil fuel combustion (FFC), biomass burning (BB) sources have been identified in both seasons, however their relative contributions were different. The combined contribution of Si–dust, secondary aerosol and fossil fuel combustion, constitute 67% of particulate matter in pre–monsoon, whereas, secondary aerosols and biomass burning were the major contributors (63.2%) to particulate matter in winter. The identified sources effectively predict the measured particulate concentration in the pre–monsoon (r 2 =0.74) and winter season (r 2 =0.82). Another receptor model, principal component analysis (PCA) was done to increase the plausibility of the results obtained by PMF. PCA resulted in the identification of the sources that were comparable to the PMF outputs. PCA of TSP in the pre–monsoon season resulted in the extraction of three components (crustal dust + secondary aerosol, biomass burning, fossil fuel combustion + industrial emissions) that explained the 83% of the variance in the data. Similarly, in winter season, PCA resulted in the extraction of four components (biomass burning + secondary aerosol, industrial emission, crustal dust, sea salt) that explained the 86% of the variance of the data. Keywords: Source apportionment, positive matrix factorization, principal component analysis, particulate matter, Bay of Bengal Corresponding Author: Mohit Saxena : +91‐11‐45609448 : +91‐11‐45609310 : [email protected] Article History: Received: 21 January 2014 Revised: 26 May 2014 Accepted: 27 May 2014 doi: 10.5094/APR.2014.082 1. Introduction Tropospheric aerosols and trace gases produced during the natural or anthropogenic process has been found to be associated with adverse health effects besides their severe impact in deteriorating the local and the distant atmosphere by long–range transport over the years by scattering and absorbing the incoming solar radiation (direct effect) and by modifying the cloud albedo and droplet size distribution, thereby changing the radiative properties and lifetime of clouds (indirect effect) and suppressing precipitation. Many studies such as Arabian Sea Monsoon Experiment (ARMEX), Indian Ocean Experiment (INDOEX), Land Campaigns (LC) LC–I and LC–II, and Integrated Campaign for Aerosols, gases and Radiation Budget (ICARB) (Ramanathan et al., 2001; Ramachandran et al., 2006; Satheesh et al., 2006; Moorthy et al., 2008) have been conducted in the past at Indian sub– continent and over the ocean on a regular basis or in campaign mode to understand the physico–chemical properties and possible sources of aerosol on regional scales (Pillai and Moorthy, 2001; Moorthy et al., 2003). To explore the physical, chemical and optical properties of aerosol in the entire Bay of Bengal (BOB), coordinated experi‐ mental campaign (ICARB) was planned for the period of March– April 2006 and December 2008 to January 2009. Several articles have been published in different aspects of aerosol and trace gases of ICARB campaigns (Kharol et al., 2011; Kumar et al., 2011; Sinha et al., 2011; Sharma et al., 2012; Saxena et al., 2014), however, source apportionment using receptor models has not been studied so far. The identification of possible sources of aerosols and quantification of their contributions to the ambient concentration of the pollutants has been a major focus of air quality research. The development and application of improved tools are thus required for the identification and apportionment of atmospheric aerosols. Recently, Callen et al. (2009) carried out source apportionment of PM 10 in Zaragoza, Spain by three multivariate receptor models based on factor analysis: PCA–APCS, UNMIX and PMF. Special attention was paid to the model comparison in order to determine which were more adequate for the apportionment. They concluded that greater requirements of measure of uncertainty in PMF permitted to obtain better results than with the other two models: PCA–APCS and UNMIX. PMF developed by Paatero and colleagues (Paatero and Tapper, 1994; Paatero, 1997), a multivariate receptor modeling approach for the quantitative source apportionment of aerosols is used significantly by measuring the concentrations of pollutants at a sampling site (Kim and Hopke, 2004; Bhanuprasad et al., 2008; Gu et al., 2011). The present study thus utilizes PMF and PCA to identify the source profile and apportionment of particulate matter collected in pre– monsoon (March–April 2006) and winter (December–January 2008–09) over BOB. In addition, in this work, we have attempted to identify categories and locations of sources using backward trajectory analysis that influenced the surface concentrations of aerosols in the Bay of Bengal.
-
Upload
khangminh22 -
Category
Documents
-
view
3 -
download
0
Transcript of Atm spheric Pollution Research - Semantic Scholar
Atmospheric Pollution Research 5 (2014) 729‐740
© Author(s) 2014. This work is distributed under the Creative Commons Attribution 3.0 License.
AAtm spheric PPollution RResearch www.atmospolres.com
Source apportionment of particulates by receptor models over Bay of Bengal during ICARB campaign
Mohit Saxena 1, Sudhir Kumar Sharma 1, Tuhin Kumar Mandal 1, Sachchidanand Singh 1, Trailokya Saud 1,2
1 CSIR–National Physical Laboratory, Dr. K S Krishnan Road, New Delhi–110 012, India2 Indian Institutes of Technology, Delhi–110016, India
ABSTRACT Source apportionment study of aerosols over Bay of Bengal (BOB) were investigated during Integrated Campaign on Aerosol Radiation Budget (ICARB) in the pre–monsoon (March–April 2006) and winter (December–January 2008–09) seasons. Positive matrix factorization (PMF) was applied to identify sources of ambient particulate matter using daily chemical composition data collected in the pre–monsoon (total suspended particles, TSP) and winter season (particles with a diameter < 10 µm, PM10). Sea salt (SS), secondary aerosol (SA), Si–dust, fossil fuel combustion (FFC), biomass burning (BB) sources have been identified in both seasons, however their relative contributions were different. The
combined contribution of Si–dust, secondary aerosol and fossil fuel combustion, constitute 67% of particulate matter in pre–monsoon, whereas, secondary aerosols and biomass burning were the major contributors (63.2%) to particulate matter in winter. The identified sources effectively predict the measured particulate concentration in the pre–monsoon (r
2=0.74) and winter season (r
2=0.82). Another receptor model, principal component analysis (PCA) was
done to increase the plausibility of the results obtained by PMF. PCA resulted in the identification of the sources that were comparable to the PMF outputs. PCA of TSP in the pre–monsoon season resulted in the extraction of three components (crustal dust + secondary aerosol, biomass burning, fossil fuel combustion + industrial emissions) that explained the 83% of the variance in the data. Similarly, in winter season, PCA resulted in the extraction of four components (biomass burning + secondary aerosol, industrial emission, crustal dust, sea salt) that explained the 86% of the variance of the data.
Keywords: Source apportionment, positive matrix factorization, principal component analysis, particulate matter, Bay of Bengal
Corresponding Author:
Mohit Saxena : +91‐11‐45609448 : +91‐11‐45609310 : [email protected]
Article History: Received: 21 January 2014 Revised: 26 May 2014 Accepted: 27 May 2014
doi: 10.5094/APR.2014.082
1. Introduction
Tropospheric aerosols and trace gases produced during the
natural or anthropogenic process has been found to be associated with adverse health effects besides their severe impact in deteriorating the local and the distant atmosphere by long–range transport over the years by scattering and absorbing the incoming solar radiation (direct effect) and by modifying the cloud albedo and droplet size distribution, thereby changing the radiative properties and lifetime of clouds (indirect effect) and suppressing precipitation. Many studies such as Arabian Sea Monsoon Experiment (ARMEX), Indian Ocean Experiment (INDOEX), Land Campaigns (LC) LC–I and LC–II, and Integrated Campaign for Aerosols, gases and Radiation Budget (ICARB) (Ramanathan et al., 2001; Ramachandran et al., 2006; Satheesh et al., 2006; Moorthy et al., 2008) have been conducted in the past at Indian sub–continent and over the ocean on a regular basis or in campaign mode to understand the physico–chemical properties and possible sources of aerosol on regional scales (Pillai and Moorthy, 2001; Moorthy et al., 2003).
To explore the physical, chemical and optical properties of
aerosol in the entire Bay of Bengal (BOB), coordinated experi‐mental campaign (ICARB) was planned for the period of March–April 2006 and December 2008 to January 2009. Several articles have been published in different aspects of aerosol and trace gases of ICARB campaigns (Kharol et al., 2011; Kumar et al., 2011; Sinha et al., 2011; Sharma et al., 2012; Saxena et al., 2014), however,
source apportionment using receptor models has not been studied so far.
The identification of possible sources of aerosols and
quantification of their contributions to the ambient concentration of the pollutants has been a major focus of air quality research. The development and application of improved tools are thus required for the identification and apportionment of atmospheric aerosols. Recently, Callen et al. (2009) carried out source apportionment of PM10 in Zaragoza, Spain by three multivariate receptor models based on factor analysis: PCA–APCS, UNMIX and PMF. Special attention was paid to the model comparison in order to determine which were more adequate for the apportionment. They concluded that greater requirements of measure of uncertainty in PMF permitted to obtain better results than with the other two models: PCA–APCS and UNMIX. PMF developed by Paatero and colleagues (Paatero and Tapper, 1994; Paatero, 1997), a multivariate receptor modeling approach for the quantitative source apportionment of aerosols is used significantly by measuring the concentrations of pollutants at a sampling site (Kim and Hopke, 2004; Bhanuprasad et al., 2008; Gu et al., 2011). The present study thus utilizes PMF and PCA to identify the source profile and apportionment of particulate matter collected in pre–monsoon (March–April 2006) and winter (December–January 2008–09) over BOB. In addition, in this work, we have attempted to identify categories and locations of sources using backward trajectory analysis that influenced the surface concentrations of aerosols in the Bay of Bengal.
Saxena et al. – Atmospheric Pollution Research (APR) 730
2. Methodology 2.1. Sampling site
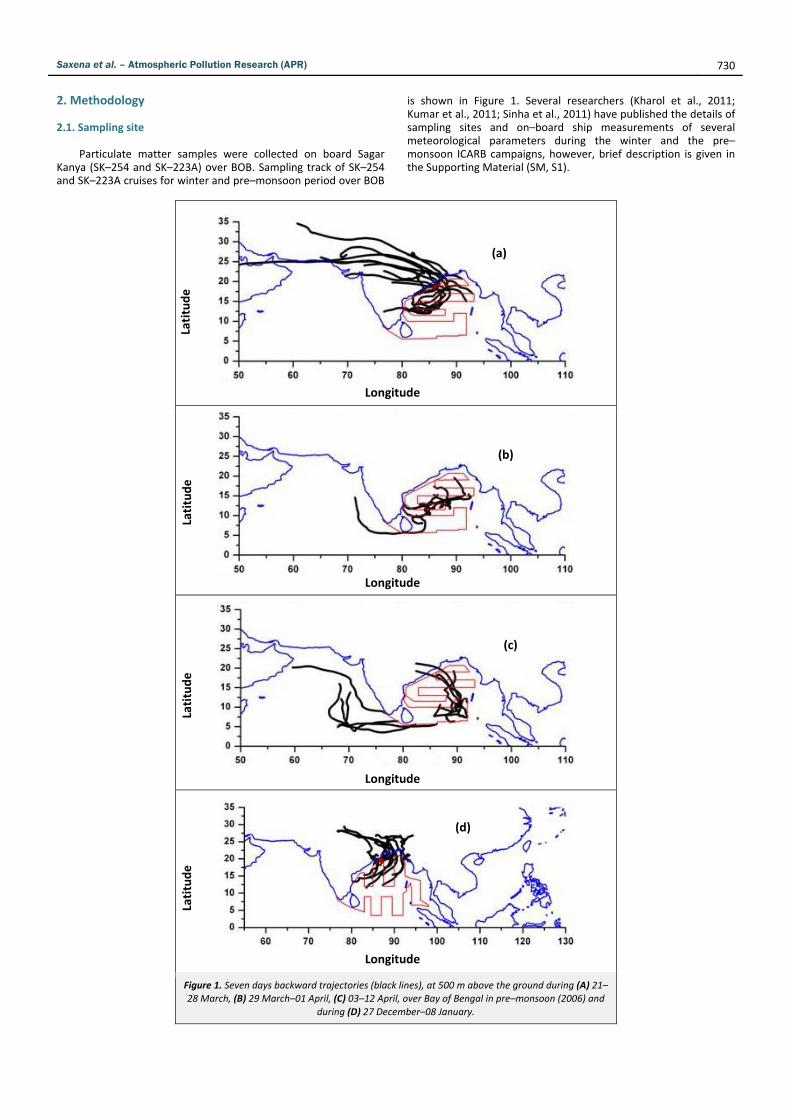
Particulate matter samples were collected on board Sagar
Kanya (SK–254 and SK–223A) over BOB. Sampling track of SK–254 and SK–223A cruises for winter and pre–monsoon period over BOB
is shown in Figure 1. Several researchers (Kharol et al., 2011; Kumar et al., 2011; Sinha et al., 2011) have published the details of sampling sites and on–board ship measurements of several meteorological parameters during the winter and the pre–monsoon ICARB campaigns, however, brief description is given in the Supporting Material (SM, S1).
Figure 1. Seven days backward trajectories (black lines), at 500 m above the ground during (A) 21–28 March, (B) 29 March–01 April, (C) 03–12 April, over Bay of Bengal in pre–monsoon (2006) and
during (D) 27 December–08 January.
Longitude
Latitude
Longitude
Latitude
Longitude
Latitude
Longitude
Latitude
(a)
(b)
(c)
(d)

Saxena et al. – Atmospheric Pollution Research (APR) 731
Figure 1. Continued. (E) 09–15 January (F) 15–22 January over BOB in winter season (2008–09)
and cruise path (red line).
2.2. Sample collection and analysis
Aerosol samples were collected on pre–heated (550 °C for
about 5 h) Whatman quartz microfiber filter paper (QMA: 20.3 × 25.4 cm2), using Respirable Dust Sampler (RDS, Envirotech 460 NL for PM10) in winter (December 2008 to January 2009) and High Volume Sampler (HVS for TSP) in pre–monsoon period (March–May, 2006), respectively. The total number of 40 samples were collected from 19th March to 12th April, 2006 (pre–monsoon period) and 27
th December 2008 to 22nd January 2009 (winter season). One sample collected daily, having sampled period of around 18 h over the span of 24 h. The collected samples were kept in polythene bags and stored in refrigerator till analysis. Details for the analysis of chemical constituents of particulates have been described in supporting material (see the SM, S2).
3. Receptor Model Description 3.1. EPA–Positive Matrix Factorization (PMF)
PMF is a widely used multivariate factor analysis tool,
developed by Paatero (1997, 1999) to apportion the source contribution to the ambient particulate matter (Song et al., 2006a; Pitz et al., 2011). The detailed information on the principles and usage of the model can be found in the user manual (Paatero, 1997; U.S. EPA, 2008). PMF decomposes speciated data matrix X of i by j dimensions (i number of samples and j chemical species) into two sub–data matrixes, the factor profiles and factor contributions based on the correlation between the different components. Briefly, the goal of multivariate receptor modeling with a PMF is to identify a number of factors (p), the species profile (f) of each source, and the amount of mass (g) contributed by each factor to each individual sample [Equation (1)] without detailed prior information on source inventories.
(1)
PMF v3.0 needs two input files: one for the measured concentrations of the species and other for the estimated uncertainties of the concentrations. Uncertainty in the data above the method detection limit was calculated using the Equation (2) where error fraction is the percentage of uncertainty and MDL is the method detection limit.
error fraction x concentration (2)
EPA–PMF 3.0 (http://www.epa.gov/heasd/products/pmf/pmf.
html) model was utilized in the present study for source apportionment of TSP and PM10 collected over BOB during pre–monsoon and winter seasons in extensive and co–ordinated ICARB campaign. Speciation data set consist of total number of 18 and 19 chemical species in pre–monsoon and winter seasons, respectively. Quality of data was categorized on the basis of signal to noise ratio. Species having S/N≥2 were categorized as strong while those with S/N 0.2 to 2 were categorized as weak data as these species do not provide adequate variability in the concentration. Those species with S/N less than 0.2 were classified as bad values. TSP and PM10 mass concentrations were also included in PMF, but categorized as weak, to reduce the influence of particulate matter on PMF solution.
The Q values are goodness of fit calculated using Equation (3),
where Xij is the measured concentration (in µg/m3), µij is the estimated uncertainty (in µg/m3), n is the number of samples, m is the number of species and p is the number of sources included in the analysis.
∑ (3)
Q values indicate how well the model fit the input data,
excluding the outliers for which the scaled residuals are greater than 4. Qtrue should be less than 1.5 times of Qrobust vice versa of which indicates that peak events may be disproportionately
Longitude
Latitude
Longitude
Latitude
(e)
(f)
Saxena et al. – Atmospheric Pollution Research (APR) 732
influencing the model (Gugamsetty et al., 2012; Kaul et al., 2014; Sharma et al., 2014). Only the converged solution should be investigated. Non converged solution indicates that the model did not find any minima; this could be due to very low uncertainties or in appropriate input data. Number of factors selected for base model run should sufficiently describe the total PM. In fact the selection of factor is subjective that requires the knowledge of the possible sources in the area. Evaluating multiple solutions within the range of Fpeak values that yield an acceptable Q value and assessing the edge plots are more objective ways to evaluate the model results. Several Fpeak values were explored to determine which solutions are reasonable. To examine this, G space plots for all the factors were evaluated to ensure whether the factors were not correlated with each other and hence that they represented the distinctive sources.
3.2. Principal component analysis
To identify the possible sources of particles in both pre‐
monsoon and winter, principal component analysis (PCA) was performed using the SPSS software. The orthogonal transformation method with Varimax rotation was employed. The lowest eigenvalue for extracted factors was restricted to more than 1.0. Total fifteen constituents of TSP and eighteen constituents of PM10 were used as variables in the data set. In PCA, the chemical data are transformed into a dimensionless standardized form:
(4)
where, i=1,…,n samples; j=1,…m elements; Cij is the concentration of element j in sample i; and and are the arithmetic mean concentration and the standard deviation for element j, respect‐tively. The PCA model is expressed as:
(5)
where, k=1,…,p are the sources, and gik and hkj are the factor loadings and the factor scores, respectively. This equation is solved by eigenvector decomposition (Song et al., 2006b)
4. Results and Discussion
Aerosol samples collected during the pre–monsoon (n=20,
TSP) and winter seasons (n=20, PM10) were characterized for 18 species (OC, OM, EC, Al, Si, Ti, Mn, Fe, Cu, Zn, W, Na+, K+, Mg++,
Ca++, NO3–, Cl–, nss–SO4
2–) and 19 species (OC, OM, EC, Al, Si, Ti, Mn, Fe, Cu, Zn, Zr, Na+, NH4
+, K+, Mg++, Ca++, NO3–, Cl–, nss–SO4
2–) respectively. Average mass concentration of OC, EC, WSIC, major and minor elements are given in Table 1. The average concentration of TSP during the pre–monsoon season was 249.4±131.3 µg/m3, similarly during winter average PM10 mass concentration was 52.8± 26.01 µg/m
3 (see the SM, Figure S1). Enrichment factors (EFs) of Si, Ti, Fe, Mg calculated during the pre–monsoon season were <1, which suggest that these elements may have a crustal origin, whereas EF of elements Na+, K+ Ca++, Cu, Zn were >1.0, indicating that they are mostly affected by anthropogenic sources. Similarly, in winter EFs were calculated for the elements (Na+, K+, Mg++, Ca++, Ti, Fe, Zn, Si, Cu, Zr and Mn) ranged from 0.36 to 414, suggesting that the emissions of these elements from both crust and non crustal sources (see the SM, Figure S2). Non–crustal sources could be traffic, fossil fuel combustion, industry, biomass burning etc. PMF and PCA, receptor models were employed and discussed in subsequent sections to evaluate the contribution of different sources over BOB.
4.1. Identification of emission sources by PMF
In this study, aerosol samples with 18 species and 19 species
in the pre–monsoon (n=20) and winter (n=20), respectively, and signal to noise ratios greater than 0.2 were considered for input files. PMF was run multiple times randomly, with varying number of factors, bootstrap and Fpeak to identify optimal factor resolution and factor composition. Five sources were resolved with a resultant Fpeak of 0.1. Qrobust (378.76) and Qtrue (366.46) were almost equal to Qtheory (20x18=360) in pre–monsoon. Similarly, Qrobust (388.3) and Qtrue (376.3) were almost equal to Qtheory (20x19=380) in winter. The correlation between measured and model predicted species concentrations was determined to examine the model goodness fit. The coefficient of determination (r2=0.74, pre–monsoon; r2=0.82, winter) suggested that reconstructed mass concentrations were consistent with the measured mass concentrations. TSP and PM10 mass concentrations were also included in PMF to apportion factor mass concentration but categorized as weak, to reduce the influence of PM on PMF solution.
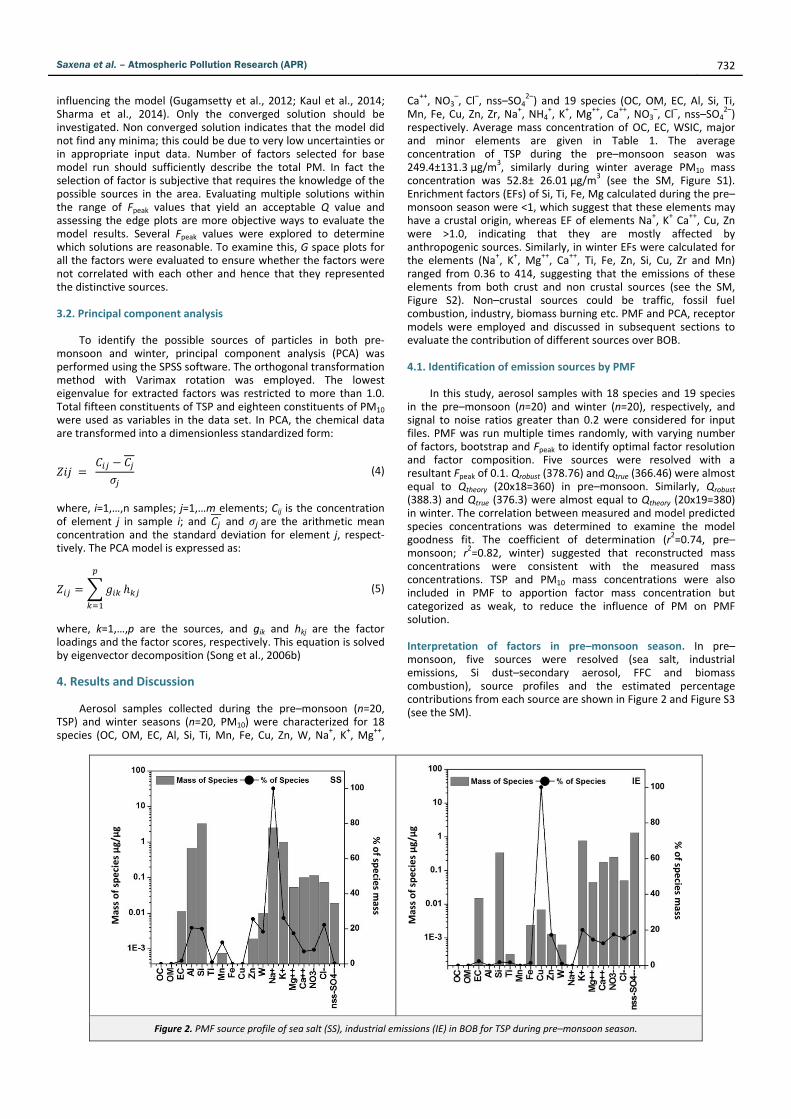
Interpretation of factors in pre–monsoon season. In pre–monsoon, five sources were resolved (sea salt, industrial emissions, Si dust–secondary aerosol, FFC and biomass combustion), source profiles and the estimated percentage contributions from each source are shown in Figure 2 and Figure S3 (see the SM).
Figure 2. PMF source profile of sea salt (SS), industrial emissions (IE) in BOB for TSP during pre–monsoon season.
Mass of species µg/µg
Mass of species µg/µg
% of sp
ecie
s mass
% of sp
ecie
s mass
Saxena et al. – Atmospheric Pollution Research (APR) 733
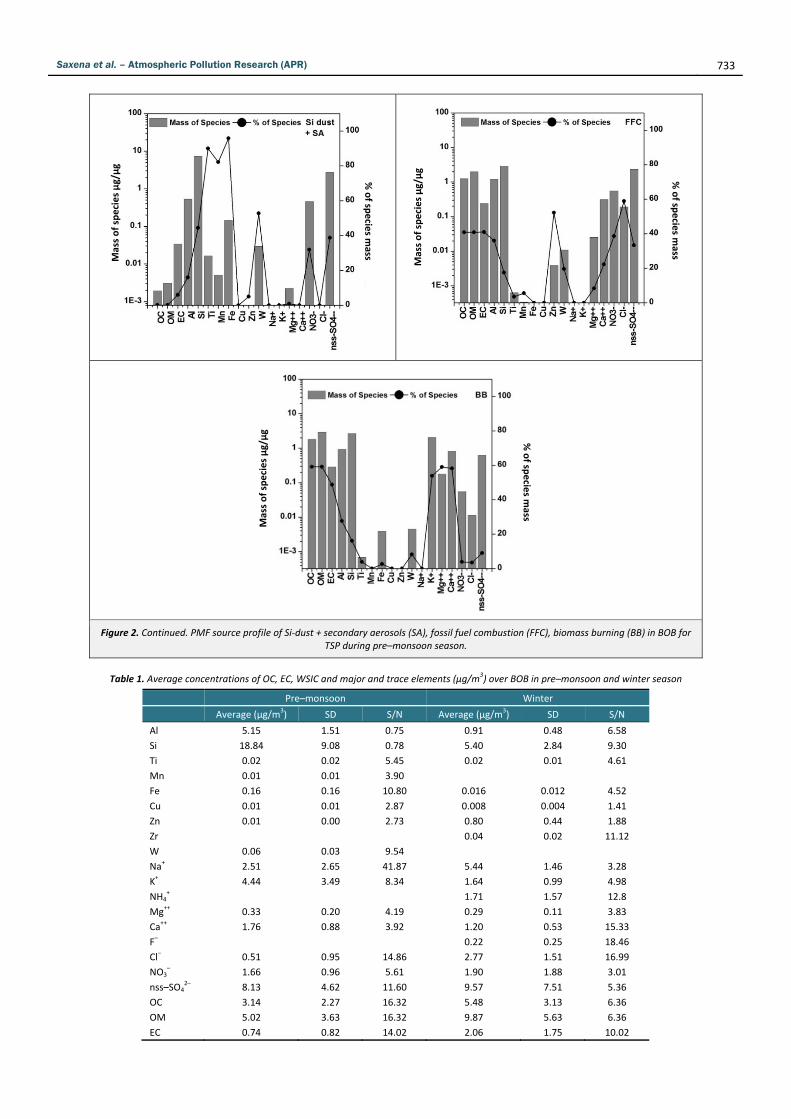
Figure 2. Continued. PMF source profile of Si‐dust + secondary aerosols (SA), fossil fuel combustion (FFC), biomass burning (BB) in BOB for TSP during pre–monsoon season.
Table 1. Average concentrations of OC, EC, WSIC and major and trace elements (µg/m
3) over BOB in pre–monsoon and winter season
Pre–monsoon Winter
Average (µg/m3) SD S/N Average (µg/m
3) SD S/N
Al 5.15 1.51 0.75 0.91 0.48 6.58
Si 18.84 9.08 0.78 5.40 2.84 9.30
Ti 0.02 0.02 5.45 0.02 0.01 4.61
Mn 0.01 0.01 3.90
Fe 0.16 0.16 10.80 0.016 0.012 4.52
Cu 0.01 0.01 2.87 0.008 0.004 1.41
Zn 0.01 0.00 2.73 0.80 0.44 1.88
Zr 0.04 0.02 11.12
W 0.06 0.03 9.54
Na+ 2.51 2.65 41.87 5.44 1.46 3.28
K+ 4.44 3.49 8.34 1.64 0.99 4.98
NH4+
1.71 1.57 12.8
Mg++ 0.33 0.20 4.19 0.29 0.11 3.83
Ca++ 1.76 0.88 3.92 1.20 0.53 15.33
F– 0.22 0.25 18.46
Cl– 0.51 0.95 14.86 2.77 1.51 16.99
NO3– 1.66 0.96 5.61 1.90 1.88 3.01
nss–SO42– 8.13 4.62 11.60 9.57 7.51 5.36
OC 3.14 2.27 16.32 5.48 3.13 6.36
OM 5.02 3.63 16.32 9.87 5.63 6.36
EC 0.74 0.82 14.02 2.06 1.75 10.02
Mass of species µg/µg
Mass of species µg/µg
Mass of species µg/µg
% of sp
ecie
s mass
% of sp
ecie
s mass
% of sp
ecie
s mass
Saxena et al. – Atmospheric Pollution Research (APR) 734
The first factor contributes 14.5% of TSP mass, dominated by
the presence of Na+, K+, Mg++, and Cl–. These tracers are mainly associated with the sea salt particles (SS) (Mooibroek et al., 2011). Since the sampling has been carried out in the marine atmosphere, it is very much obvious to get the sea salt fraction in the samples. It is very important to mention here that this factor 1 was devoid of nss–SO4
2–, NO3–, OC, EC tracers which further affirms the
contribution of marine source towards particulate loading over BOB.
PMF results revealed that second factor accounted for 6.8% of
TSP. High percentage of metals in the profile attributed to industrial emissions (IE). A considerable percentage of copper, zinc and sulfur appear to be associated with coal combustion and steel processing sources (Lee et al., 1999; Salminen et al., 2005, Song et al., 2006a, Shridhar et al., 2010). Further, this profile also exhibited calcium, which could be due to the dust from the cement factories. Potassium and magnesium in this factor may be attributed to the fertilizer industry (Salminen et al., 2005). To summarize, this factor profile may be because of the mixture of different industrial activities around the sampling area.
Third factor is the largest contributor of TSP, accounted for
almost 44%. This factor typically contains elements of crustal material (CRM). These are particularly silicon, aluminum, titanium, and iron (Khillare et al., 2004; Begum et al., 2011). This factor does not contain calcium and therefore dust over BOB may be characterized as Si–dust, probably originated from the desert regions. Ca++ dust is a predominantly soil component in western India (Rastogi and Sarin, 2005). This observation is consistent with the previous study over the Indian Ocean by Bhanuprasad et al. (2008). This factor also contains a substantial percentage of secondary sulfate (38.7%) and nitrate (31.9%) that imply secondary aerosol (SA) components in the marine atmosphere. Sulfur dioxide and nitrogen dioxide derived from the combustion processes are oxidized to sulfate and nitrate that along with the wind may have transported to the study area, adding to secondary aerosol component in the marine atmosphere.
Fourth factor is the second major contributor to the total
loading of particulates, accounting 23.2% of TSP. It was characterized by high loadings of OC, EC, NO3
–, nss–SO42–, Al, Zn,
Ca++, and Cl–. All these tracers signalize towards fossil fuel combustion that could be attributed to coal combustion. Coal combustion had high loading of chloride followed by OC, nss–SO4
2–
, NO3– and Fe (Song et al., 2006a). The significant contribution of
chloride (58%), Zn (52.18%), OC (40%), nss–SO42– (33%) and NO3
– (38%) suggested that factor 4 was associated with coal combustion (Gupta et al., 2007). Activity of coal combustion in the Indian subcontinent and South East Asia is very common as most of the power production in both the continents comes from the coal based thermal power plants. In the eastern coastal states of India (West Bengal, Orissa, and Jharkhand) and South China, Thailand, and Myanmar there are more than thirty thermal power plants.
The fifth factor accounting for 11.5% of TSP, characterized by
high loading of K+ that primarily comes from the stalk burning, along with the OC, EC, Ca++, Mg++ appeared to be closely associated with biomass burning. PMF does not differentiate between the residential biomass combustion for cooking and open burning of forests and agricultural residues (Venkataraman et al., 2005, Venkataraman et al., 2006). However Andreae and Merlet (2001) explained that OC predominates in the emissions from the open biomass burning, whereas, BC constitutes more than 50% in residential biomass burning (Venkataraman et al., 2005).
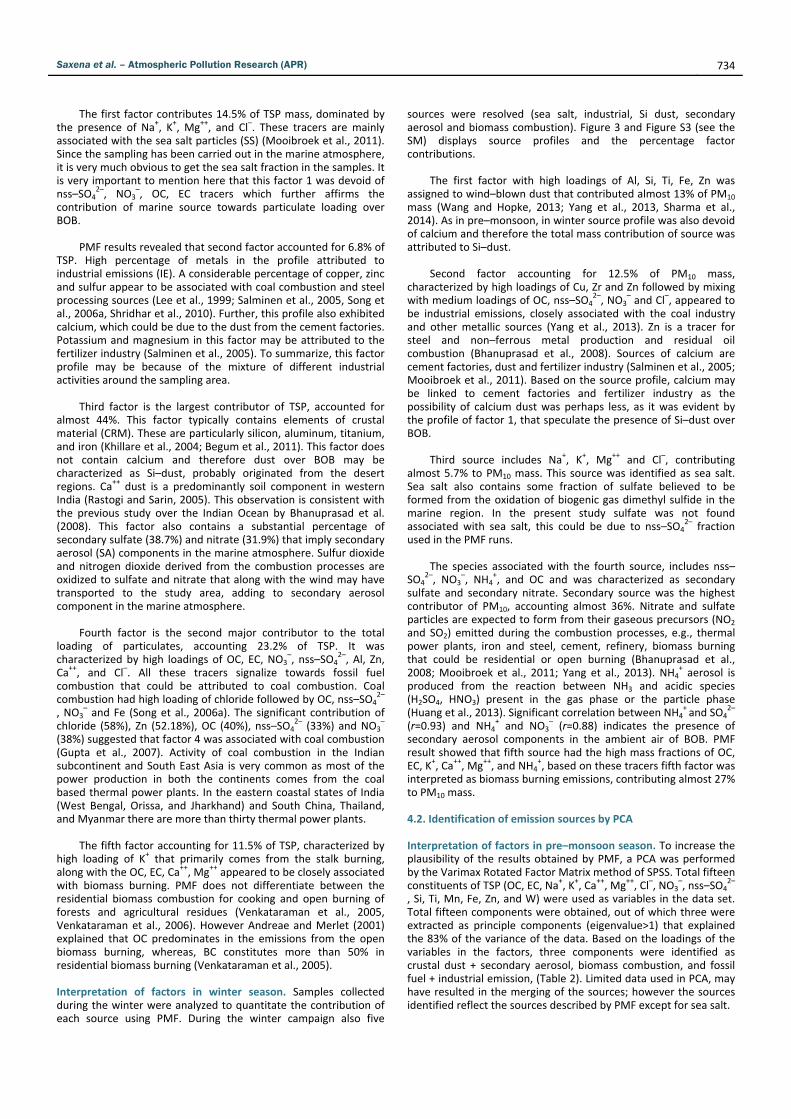
Interpretation of factors in winter season. Samples collected during the winter were analyzed to quantitate the contribution of each source using PMF. During the winter campaign also five
sources were resolved (sea salt, industrial, Si dust, secondary aerosol and biomass combustion). Figure 3 and Figure S3 (see the SM) displays source profiles and the percentage factor contributions.
The first factor with high loadings of Al, Si, Ti, Fe, Zn was
assigned to wind–blown dust that contributed almost 13% of PM10 mass (Wang and Hopke, 2013; Yang et al., 2013, Sharma et al., 2014). As in pre–monsoon, in winter source profile was also devoid of calcium and therefore the total mass contribution of source was attributed to Si–dust.
Second factor accounting for 12.5% of PM10 mass,
characterized by high loadings of Cu, Zr and Zn followed by mixing with medium loadings of OC, nss–SO4
2–, NO3– and Cl–, appeared to
be industrial emissions, closely associated with the coal industry and other metallic sources (Yang et al., 2013). Zn is a tracer for steel and non–ferrous metal production and residual oil combustion (Bhanuprasad et al., 2008). Sources of calcium are cement factories, dust and fertilizer industry (Salminen et al., 2005; Mooibroek et al., 2011). Based on the source profile, calcium may be linked to cement factories and fertilizer industry as the possibility of calcium dust was perhaps less, as it was evident by the profile of factor 1, that speculate the presence of Si–dust over BOB.
Third source includes Na+, K+, Mg++ and Cl–, contributing
almost 5.7% to PM10 mass. This source was identified as sea salt. Sea salt also contains some fraction of sulfate believed to be formed from the oxidation of biogenic gas dimethyl sulfide in the marine region. In the present study sulfate was not found associated with sea salt, this could be due to nss–SO4
2– fraction used in the PMF runs.
The species associated with the fourth source, includes nss–
SO42–, NO3
–, NH4+, and OC and was characterized as secondary
sulfate and secondary nitrate. Secondary source was the highest contributor of PM10, accounting almost 36%. Nitrate and sulfate particles are expected to form from their gaseous precursors (NO2 and SO2) emitted during the combustion processes, e.g., thermal power plants, iron and steel, cement, refinery, biomass burning that could be residential or open burning (Bhanuprasad et al., 2008; Mooibroek et al., 2011; Yang et al., 2013). NH4
+ aerosol is produced from the reaction between NH3 and acidic species (H2SO4, HNO3) present in the gas phase or the particle phase (Huang et al., 2013). Significant correlation between NH4
+ and SO42–
(r=0.93) and NH4+ and NO3
– (r=0.88) indicates the presence of secondary aerosol components in the ambient air of BOB. PMF result showed that fifth source had the high mass fractions of OC, EC, K+, Ca++, Mg++, and NH4
+, based on these tracers fifth factor was interpreted as biomass burning emissions, contributing almost 27% to PM10 mass.
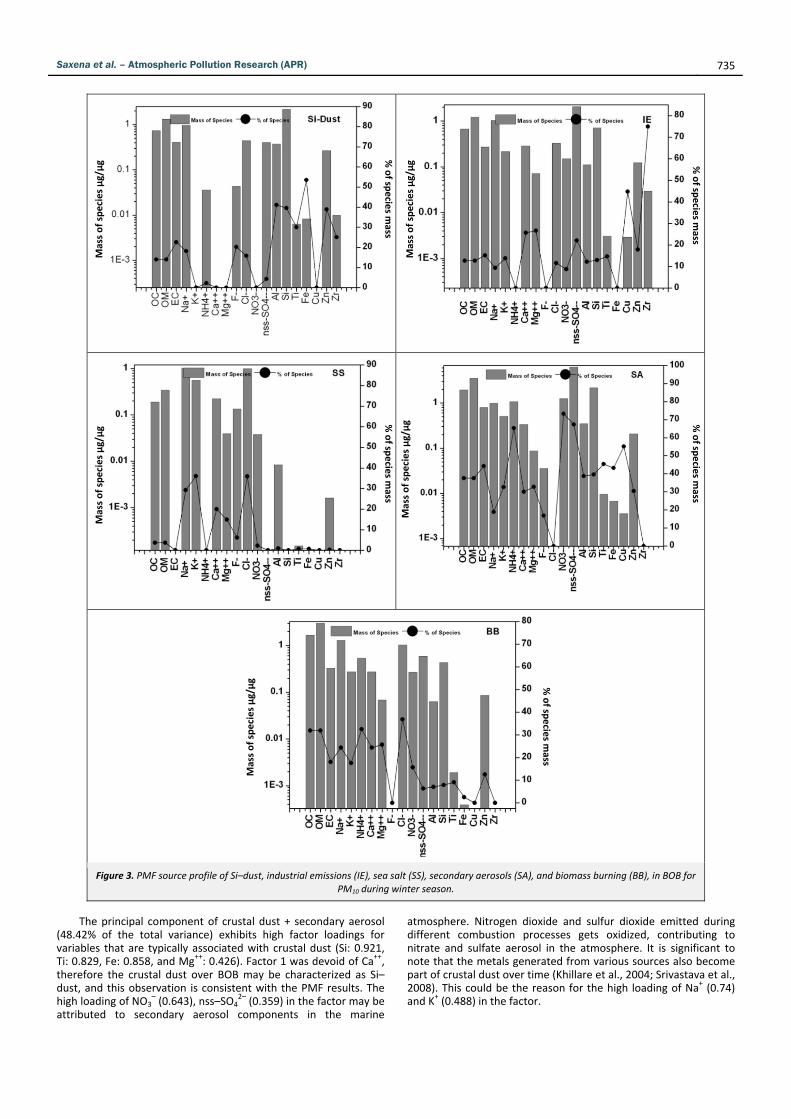
4.2. Identification of emission sources by PCA Interpretation of factors in pre–monsoon season. To increase the plausibility of the results obtained by PMF, a PCA was performed by the Varimax Rotated Factor Matrix method of SPSS. Total fifteen constituents of TSP (OC, EC, Na+, K+, Ca++, Mg++, Cl–, NO3
–, nss–SO42–
, Si, Ti, Mn, Fe, Zn, and W) were used as variables in the data set. Total fifteen components were obtained, out of which three were extracted as principle components (eigenvalue>1) that explained the 83% of the variance of the data. Based on the loadings of the variables in the factors, three components were identified as crustal dust + secondary aerosol, biomass combustion, and fossil fuel + industrial emission, (Table 2). Limited data used in PCA, may have resulted in the merging of the sources; however the sources identified reflect the sources described by PMF except for sea salt.
Saxena et al. – Atmospheric Pollution Research (APR) 735
Figure 3. PMF source profile of Si–dust, industrial emissions (IE), sea salt (SS), secondary aerosols (SA), and biomass burning (BB), in BOB for
PM10 during winter season.
The principal component of crustal dust + secondary aerosol
(48.42% of the total variance) exhibits high factor loadings for variables that are typically associated with crustal dust (Si: 0.921, Ti: 0.829, Fe: 0.858, and Mg++: 0.426). Factor 1 was devoid of Ca++, therefore the crustal dust over BOB may be characterized as Si–dust, and this observation is consistent with the PMF results. The high loading of NO3
– (0.643), nss–SO42– (0.359) in the factor may be
attributed to secondary aerosol components in the marine
atmosphere. Nitrogen dioxide and sulfur dioxide emitted during different combustion processes gets oxidized, contributing to nitrate and sulfate aerosol in the atmosphere. It is significant to note that the metals generated from various sources also become part of crustal dust over time (Khillare et al., 2004; Srivastava et al., 2008). This could be the reason for the high loading of Na+ (0.74) and K
+ (0.488) in the factor.
Mass of species µg/µg
Mass of species µg/µg
Mass of species µg/µg
Mass of species µg/µg
Mass of species µg/µg
% of sp
ecie
s mass
% of sp
ecie
s mass
% of sp
ecie
s mass
% of sp
ecie
s mass
% of sp
ecie
s mass
Saxena et al. – Atmospheric Pollution Research (APR) 736
Table 2. PCA factor loadings for TSP collected during pre–monsoon season over BOB
TSP Constituents Factor 1 Factor 2 Factor 3
OC 0.838 0.441
EC 0.349 0.916
Na+ 0.740
K+ 0.488 0.714
Ca++ 0.804
Mg++ 0.426 0.833
Cl– 0.912
NO3–
0.643 0.385 0.426
nss–SO42– 0.359 0.756
Si 0.921
Ti 0.829
Mn 0.883
Fe
0.858 0.462
Zn
0.305 0.832
W 0.924
Eigenvalues 7.263 3.359 1.957
Variance (%) 48.421 22.391 13.044
Cumulative (%) 48.421 70.812 83.856
Source Crustal dust +
secondary aerosolBiomass combustion
Fossil fuel combustion + industrial emission
Extraction method: principal component analysis, Rotation method: Varimax with Kaiser normalization, Eigenvalues>1.0, Factor loading≥0.30
The second factor was responsible for 22.39% of the total
variance and consisted of OC (0.838), K+ (0.714), Ca++ (0.804) and Mg++ (0.833) components which are typically responsible for biomass combustion. High loading of Ca++ (0.804) in the factor suggested its emission from the anthropogenic activities. Third factor was characterized by high loadings of nss–SO4
2– (0.756), Zn (0.832), Mn (0.883), OC (0.441), and EC (0.916). All these tracers indicate towards the fossil fuel combustion that most likely originated from the coal combustion in the thermal power and metal manufacturing industry.
On comparing, PMF results with those of PCA for pre–
monsoon season, it has been observed that both the model predicted the crustal dust, secondary aerosol, biomass com‐bustion, fossil fuel combustion sources, responsible for particulates in ambient air of BOB. However, because of the loadings of Na+ and Cl
– in separate factors, sea salt component was not identified by PCA.
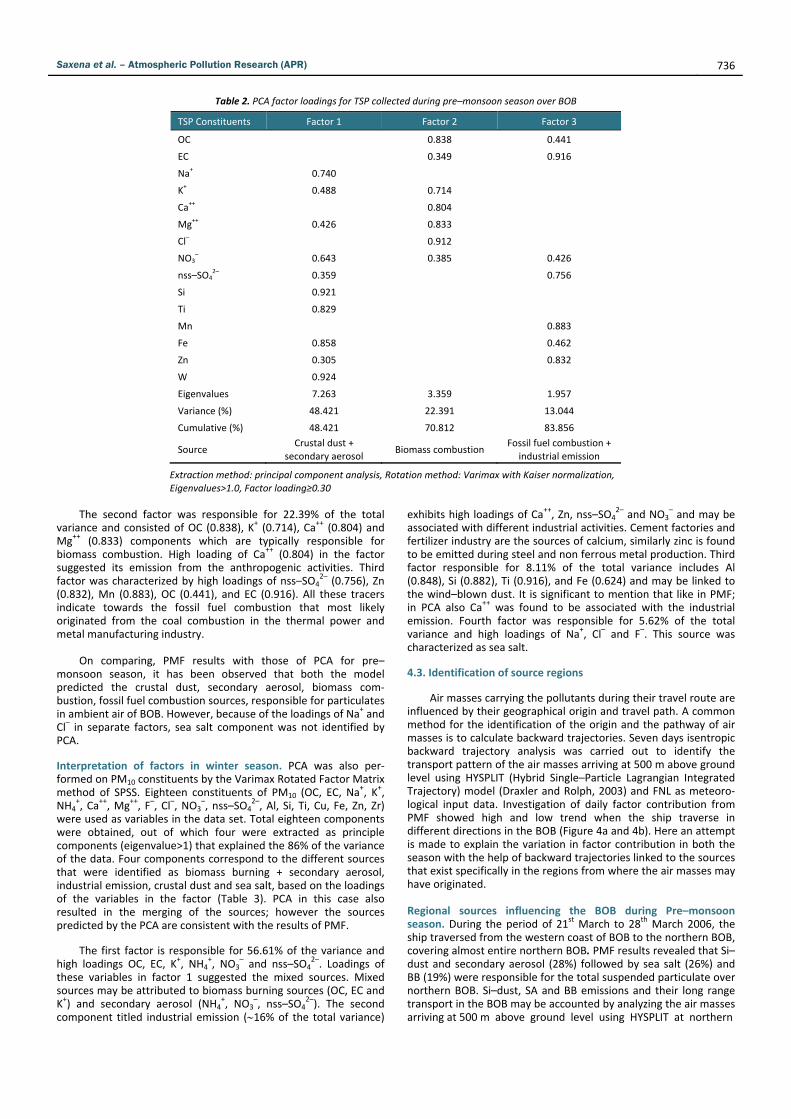
Interpretation of factors in winter season. PCA was also per‐formed on PM10 constituents by the Varimax Rotated Factor Matrix method of SPSS. Eighteen constituents of PM10 (OC, EC, Na
+, K+, NH4
+, Ca++, Mg++, F–, Cl–, NO3–, nss–SO4
2–, Al, Si, Ti, Cu, Fe, Zn, Zr) were used as variables in the data set. Total eighteen components were obtained, out of which four were extracted as principle components (eigenvalue>1) that explained the 86% of the variance of the data. Four components correspond to the different sources that were identified as biomass burning + secondary aerosol, industrial emission, crustal dust and sea salt, based on the loadings of the variables in the factor (Table 3). PCA in this case also resulted in the merging of the sources; however the sources predicted by the PCA are consistent with the results of PMF.
The first factor is responsible for 56.61% of the variance and high loadings OC, EC, K
+, NH4+, NO3
– and nss–SO42–. Loadings of
these variables in factor 1 suggested the mixed sources. Mixed sources may be attributed to biomass burning sources (OC, EC and K+) and secondary aerosol (NH4
+, NO3–, nss–SO4
2–). The second component titled industrial emission (16% of the total variance)
exhibits high loadings of Ca++, Zn, nss–SO42– and NO3
– and may be associated with different industrial activities. Cement factories and fertilizer industry are the sources of calcium, similarly zinc is found to be emitted during steel and non ferrous metal production. Third factor responsible for 8.11% of the total variance includes Al (0.848), Si (0.882), Ti (0.916), and Fe (0.624) and may be linked to the wind–blown dust. It is significant to mention that like in PMF; in PCA also Ca++ was found to be associated with the industrial emission. Fourth factor was responsible for 5.62% of the total variance and high loadings of Na+, Cl– and F–. This source was characterized as sea salt. 4.3. Identification of source regions
Air masses carrying the pollutants during their travel route are
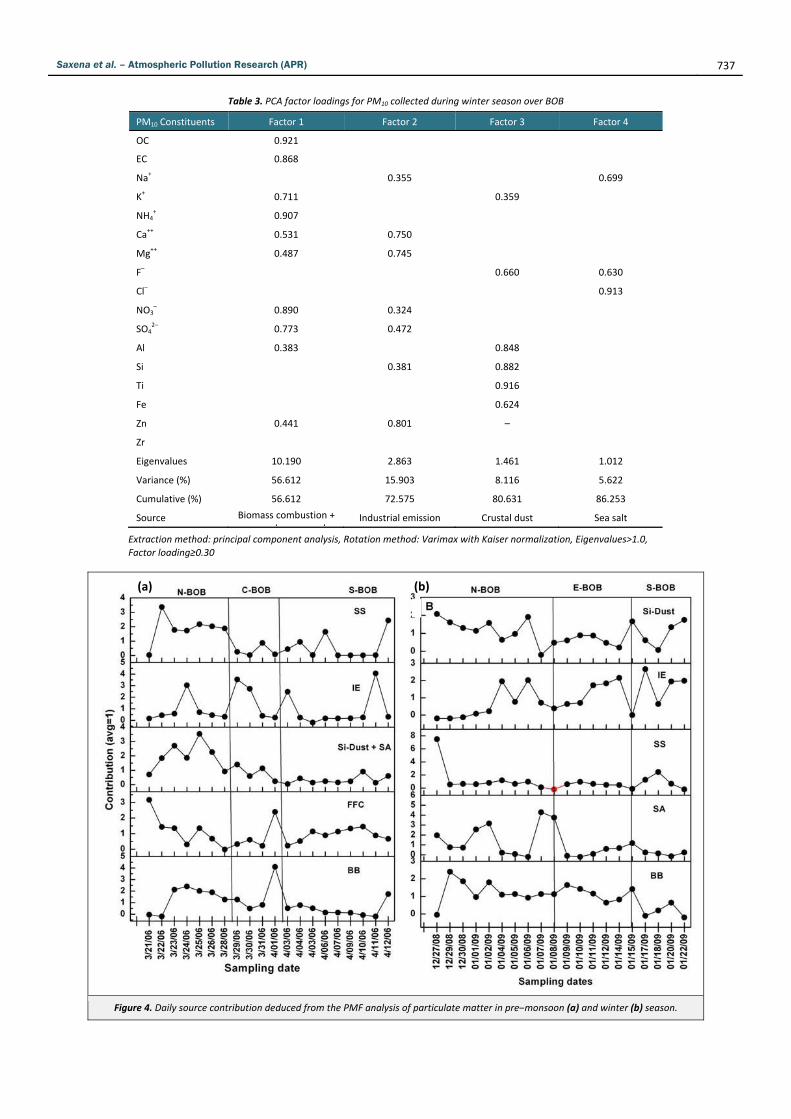
influenced by their geographical origin and travel path. A common method for the identification of the origin and the pathway of air masses is to calculate backward trajectories. Seven days isentropic backward trajectory analysis was carried out to identify the transport pattern of the air masses arriving at 500 m above ground level using HYSPLIT (Hybrid Single–Particle Lagrangian Integrated Trajectory) model (Draxler and Rolph, 2003) and FNL as meteoro‐logical input data. Investigation of daily factor contribution from PMF showed high and low trend when the ship traverse in different directions in the BOB (Figure 4a and 4b). Here an attempt is made to explain the variation in factor contribution in both the season with the help of backward trajectories linked to the sources that exist specifically in the regions from where the air masses may have originated.
Regional sources influencing the BOB during Pre–monsoon season. During the period of 21st March to 28th March 2006, the ship traversed from the western coast of BOB to the northern BOB, covering almost entire northern BOB. PMF results revealed that Si–dust and secondary aerosol (28%) followed by sea salt (26%) and BB (19%) were responsible for the total suspended particulate over northern BOB. Si–dust, SA and BB emissions and their long range transport in the BOB may be accounted by analyzing the air masses arriving at 500 m above ground level using HYSPLIT at northern
Saxena et al. – Atmospheric Pollution Research (APR) 737
Table 3. PCA factor loadings for PM10 collected during winter season over BOB
PM10 Constituents Factor 1 Factor 2 Factor 3 Factor 4
OC 0.921
EC 0.868
Na+ 0.355 0.699
K+ 0.711 0.359
NH4+
0.907
Ca++ 0.531 0.750
Mg++ 0.487 0.745
F– 0.660 0.630
Cl– 0.913
NO3–
0.890 0.324
SO42– 0.773 0.472
Al 0.383 0.848
Si 0.381 0.882
Ti 0.916
Fe
0.624
Zn
0.441 0.801 –
Zr
Eigenvalues 10.190 2.863 1.461 1.012
Variance (%) 56.612 15.903 8.116 5.622
Cumulative (%) 56.612 72.575 80.631 86.253
Source Biomass combustion +
d lIndustrial emission Crustal dust Sea salt
Extraction method: principal component analysis, Rotation method: Varimax with Kaiser normalization, Eigenvalues>1.0,
Factor loading≥0.30
Figure 4. Daily source contribution deduced from the PMF analysis of particulate matter in pre–monsoon (a) and winter (b) season.
(a) (b)
Saxena et al. – Atmospheric Pollution Research (APR) 738
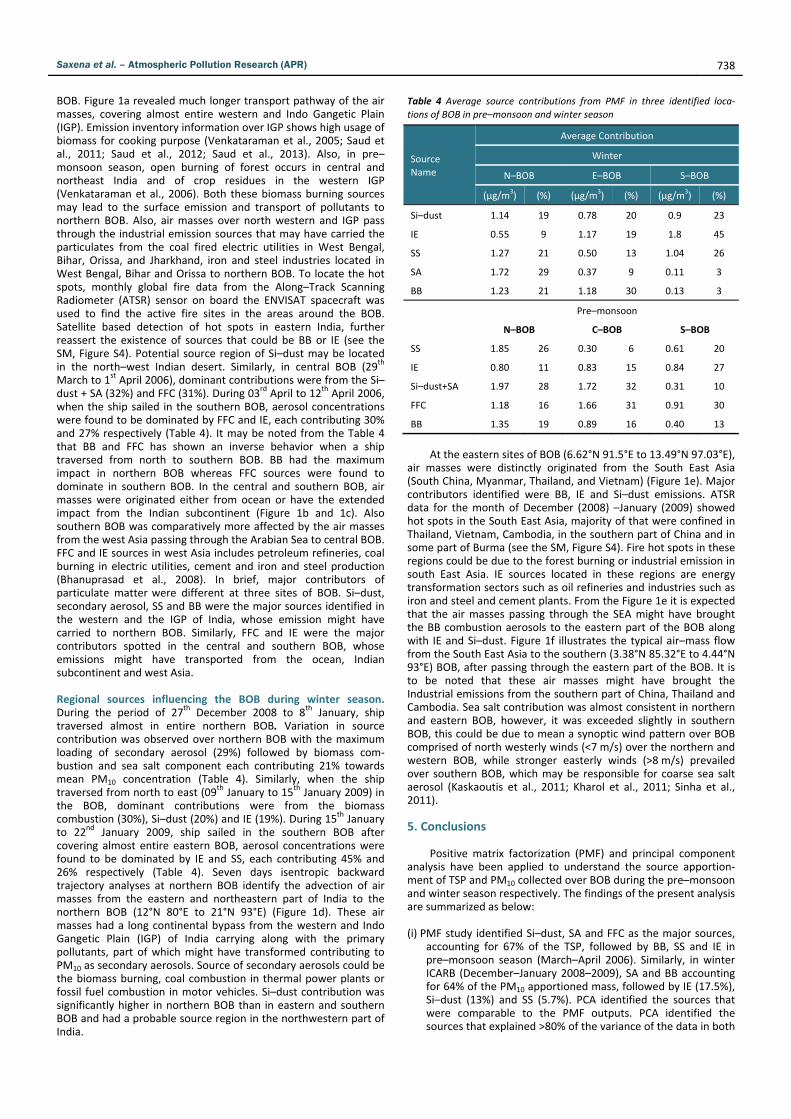
BOB. Figure 1a revealed much longer transport pathway of the air masses, covering almost entire western and Indo Gangetic Plain (IGP). Emission inventory information over IGP shows high usage of biomass for cooking purpose (Venkataraman et al., 2005; Saud et al., 2011; Saud et al., 2012; Saud et al., 2013). Also, in pre–monsoon season, open burning of forest occurs in central and northeast India and of crop residues in the western IGP (Venkataraman et al., 2006). Both these biomass burning sources may lead to the surface emission and transport of pollutants to northern BOB. Also, air masses over north western and IGP pass through the industrial emission sources that may have carried the particulates from the coal fired electric utilities in West Bengal, Bihar, Orissa, and Jharkhand, iron and steel industries located in West Bengal, Bihar and Orissa to northern BOB. To locate the hot spots, monthly global fire data from the Along–Track Scanning Radiometer (ATSR) sensor on board the ENVISAT spacecraft was used to find the active fire sites in the areas around the BOB. Satellite based detection of hot spots in eastern India, further reassert the existence of sources that could be BB or IE (see the SM, Figure S4). Potential source region of Si–dust may be located in the north–west Indian desert. Similarly, in central BOB (29th March to 1
st April 2006), dominant contributions were from the Si–dust + SA (32%) and FFC (31%). During 03rd April to 12th April 2006, when the ship sailed in the southern BOB, aerosol concentrations were found to be dominated by FFC and IE, each contributing 30% and 27% respectively (Table 4). It may be noted from the Table 4 that BB and FFC has shown an inverse behavior when a ship traversed from north to southern BOB. BB had the maximum impact in northern BOB whereas FFC sources were found to dominate in southern BOB. In the central and southern BOB, air masses were originated either from ocean or have the extended impact from the Indian subcontinent (Figure 1b and 1c). Also southern BOB was comparatively more affected by the air masses from the west Asia passing through the Arabian Sea to central BOB. FFC and IE sources in west Asia includes petroleum refineries, coal burning in electric utilities, cement and iron and steel production (Bhanuprasad et al., 2008). In brief, major contributors of particulate matter were different at three sites of BOB. Si–dust, secondary aerosol, SS and BB were the major sources identified in the western and the IGP of India, whose emission might have carried to northern BOB. Similarly, FFC and IE were the major contributors spotted in the central and southern BOB, whose emissions might have transported from the ocean, Indian subcontinent and west Asia.
Regional sources influencing the BOB during winter season. During the period of 27th December 2008 to 8th January, ship traversed almost in entire northern BOB. Variation in source contribution was observed over northern BOB with the maximum loading of secondary aerosol (29%) followed by biomass com‐bustion and sea salt component each contributing 21% towards mean PM10 concentration (Table 4). Similarly, when the ship traversed from north to east (09th January to 15th January 2009) in the BOB, dominant contributions were from the biomass combustion (30%), Si–dust (20%) and IE (19%). During 15th January to 22nd January 2009, ship sailed in the southern BOB after covering almost entire eastern BOB, aerosol concentrations were found to be dominated by IE and SS, each contributing 45% and 26% respectively (Table 4). Seven days isentropic backward trajectory analyses at northern BOB identify the advection of air masses from the eastern and northeastern part of India to the northern BOB (12°N 80°E to 21°N 93°E) (Figure 1d). These air masses had a long continental bypass from the western and Indo Gangetic Plain (IGP) of India carrying along with the primary pollutants, part of which might have transformed contributing to PM10 as secondary aerosols. Source of secondary aerosols could be the biomass burning, coal combustion in thermal power plants or fossil fuel combustion in motor vehicles. Si–dust contribution was significantly higher in northern BOB than in eastern and southern BOB and had a probable source region in the northwestern part of India.
Table 4 Average source contributions from PMF in three identified loca‐
tions of BOB in pre–monsoon and winter season
Source Name
Average Contribution
Winter
N–BOB E–BOB S–BOB
(µg/m3) (%) (µg/m
3) (%) (µg/m
3) (%)
Si–dust 1.14 19 0.78 20 0.9 23
IE 0.55 9 1.17 19 1.8 45
SS 1.27 21 0.50 13 1.04 26
SA 1.72 29 0.37 9 0.11 3
BB 1.23 21 1.18 30 0.13 3
Pre–monsoon
N–BOB C–BOB S–BOB
SS 1.85 26 0.30 6 0.61 20
IE 0.80 11 0.83 15 0.84 27
Si–dust+SA 1.97 28 1.72 32 0.31 10
FFC 1.18 16 1.66 31 0.91 30
BB 1.35 19 0.89 16 0.40 13
At the eastern sites of BOB (6.62°N 91.5°E to 13.49°N 97.03°E),
air masses were distinctly originated from the South East Asia (South China, Myanmar, Thailand, and Vietnam) (Figure 1e). Major contributors identified were BB, IE and Si–dust emissions. ATSR data for the month of December (2008) –January (2009) showed hot spots in the South East Asia, majority of that were confined in Thailand, Vietnam, Cambodia, in the southern part of China and in some part of Burma (see the SM, Figure S4). Fire hot spots in these regions could be due to the forest burning or industrial emission in south East Asia. IE sources located in these regions are energy transformation sectors such as oil refineries and industries such as iron and steel and cement plants. From the Figure 1e it is expected that the air masses passing through the SEA might have brought the BB combustion aerosols to the eastern part of the BOB along with IE and Si–dust. Figure 1f illustrates the typical air–mass flow from the South East Asia to the southern (3.38°N 85.32°E to 4.44°N 93°E) BOB, after passing through the eastern part of the BOB. It is to be noted that these air masses might have brought the Industrial emissions from the southern part of China, Thailand and Cambodia. Sea salt contribution was almost consistent in northern and eastern BOB, however, it was exceeded slightly in southern BOB, this could be due to mean a synoptic wind pattern over BOB comprised of north westerly winds (<7 m/s) over the northern and western BOB, while stronger easterly winds (>8 m/s) prevailed over southern BOB, which may be responsible for coarse sea salt aerosol (Kaskaoutis et al., 2011; Kharol et al., 2011; Sinha et al., 2011).
5. Conclusions
Positive matrix factorization (PMF) and principal component
analysis have been applied to understand the source apportion‐ment of TSP and PM10 collected over BOB during the pre–monsoon and winter season respectively. The findings of the present analysis are summarized as below:
(i) PMF study identified Si–dust, SA and FFC as the major sources,
accounting for 67% of the TSP, followed by BB, SS and IE in pre–monsoon season (March–April 2006). Similarly, in winter ICARB (December–January 2008–2009), SA and BB accounting for 64% of the PM10 apportioned mass, followed by IE (17.5%), Si–dust (13%) and SS (5.7%). PCA identified the sources that were comparable to the PMF outputs. PCA identified the sources that explained >80% of the variance of the data in both

Saxena et al. – Atmospheric Pollution Research (APR) 739
pre–monsoon and winter season. Crustal dust + secondary aerosol (48% variance) and biomass burning + secondary aerosol (56.61% variance) were identified as the principal components in pre–monsoon and winter season, respectively.
(ii) PMF results revealed the spatial variability in source contri‐bution along the cruise path in both seasons. In pre–monsoon, a sharp contrast has been noticed in type of sources over the northern and southern BOB. Si–dust + secondary aerosol (average 28%), sea salt (average 26%) and biomass burning (average 19%) were the major contributors in northern BOB, whereas, fossil fuel combustion (average 30%) and industrial emission (average 27%) sources caused the major influence in southern BOB. Similarly, in winter, secondary aerosol (average 29%) was the major contributor in northern BOB. The average contribution of secondary aerosol decreased, when cruise traversed in the eastern (9%) and southern BOB (3%). Biomass burning contribution (average 30%) in eastern BOB was higher than in northern (average 21%) and southern (average 3%) BOB.
(iii) Observed variability in sources over BOB might be because of the air masses that have commenced from different continents (IGP of India, West Asia and SEA). In pre–monsoon, air masses originated from the western and the IGP of India causing aeolian input over northern BOB. Air masses commenced from west Asia, which has passed through the Arabian Sea reached into southern BOB. Similarly, in winter season, advection of air masses from the eastern and northeastern part of Indian sub–continent to the northern region of BOB was observed. At the eastern and southern sites of BOB, air masses were distinctly originated from the South East Asia.
Acknowledgment
Authors are thankful to Director and Head, Radio and Atmos‐
pheric Sciences Division, National Physical Laboratory, New Delhi, India for their constant encouragement and support. The authors acknowledge Indian Space Research Organization, Department of Space (ISRO/DOS), for financial support for participation in ICARB. Authors are thankful to NCAOR for providing opportunity for performing the experiment on board ship.
Supporting Material Available
Sampling site description (S1), Analysis for the chemical
constituents (S2), Enrichment factor calculation (S3), Concentration of TSP and PM10 (µg/m
3) over entire BOB and at different sites of BOB (Figure S1), Enrichment factors of elements in TSP and PM10 mass over BOB (Figure S2), Percentage factor contribution to particulate mass concentration in pre–monsoon (A) and winter (B) season (Figure S3), ATSR fire data during the pre–monsoon and winter season (Figure S4). This information is available free of charge via the Internet at http://www.atmospolres.com.
References
Andreae, M.O., Merlet, P., 2001. Emission of trace gases and aerosols from
biomass burning. Global Biogeochemical Cycles 15, 955–966.
Begum, B.A., Biswas, S.K., Hopke, P.K., 2011. Key issues in controlling air
pollutants in Dhaka, Bangladesh. Atmospheric Environment 45, 7705–
7713.
Bhanuprasad, S.G., Venkataraman, C., Bhushan, M., 2008. Positive matrix
factorization and trajectory modelling for source identification: A new
look at Indian Ocean Experiment ship observations. Atmospheric Environment 42, 4836–4852.
Callen, M.S., de la Cruz, M.T., Lopez, J.M., Navarro, M.V., Mastral, A.M.,
2009. Comparison of receptor models for source apportionment of the PM10 in Zaragoza (Spain). Chemosphere 76, 1120–1129.
Draxler, R.R., Rolph, G.D., 2003. HYSPLIT (Hybrid Single–Particle Lagrangian
Integrated Trajectory), http://www.arl.noaa.gov/ready/hysplit4.html, accessed in June 2014.
Gu, J.W., Pitz, M., Schnelle–Kreis, J., Diemer, J., Reller, A., Zimmermann, R.,
Soentgen, J., Stoelzel, M., Wichmann, H.E., Peters, A., Cyrys, J., 2011.
Source apportionment of ambient particles: Comparison of positive matrix factorization analysis applied to particle size distribution and
chemical composition data. Atmospheric Environment 45, 1849–1857.
Gugamsetty, B., Wei, H., Liu, C.N., Awasthi, A., Hsu, S.C., Tsai, C.J., Roam, G.D., Wu, Y.C., Chen, C.F., 2012. Source characterization and
apportionment of PM10, PM2.5 and PM0.1 by using Positive Matrix
Factorization. Aerosol and Air Quality Research 12, 476–491.
Gupta, A.K., Karar, K., Srivastava, A., 2007. Chemical mass balance source
apportionment of PM10 and TSP in residential and industrial sites of an
urban region of Kolkata, India. Journal of Hazardous Materials 142, 279–287.
Huang, B., Liu, M., Ren, Z.F., Bi, X.H., Zhang, G.H., Sheng, G.Y., Fu, J.M.,
2013. Chemical composition, diurnal variation and sources of PM2.5 at two industrial sites of South China. Atmospheric Pollution Research 4,
298–305.
Kaskaoutis, D.G., Kharol, S.K., Sinha, P.R., Singh, R.P., Kambezidis, H.D., Sharma, A.R., Badarinath, K.V.S., 2011. Extremely large anthropogenic–
aerosol contribution to total aerosol load over the Bay of Bengal during
winter season. Atmospheric Chemistry and Physics 11, 7097–7117.
Kaul, D.S., Gupta, T., Tripathi, S.N., 2014. Source apportionment for water
soluble organic matter of submicron aerosol: A comparison between
foggy and nonfoggy episodes. Aerosol and Air Quality Research 14, 1527–1533.
Kharol, S.K., Badarinath, K.V.S., Kaskaoutis, D.G., Sharma, A.R., Gharai, B.,
2011. Influence of continental advection on aerosol characteristics over Bay of Bengal (BoB) in winter: Results from W–ICARB cruise
experiment. Annales Geophysicae 29, 1423–1438.
Khillare, P.S., Balachandran, S., Meena, B., 2004. Spatial and temporal variation of heavy metals in atmospheric aerosol of Delhi.
Environmental Monitoring and Assessment 90, 1–21.
Kim, E., Hopke, P.K., 2004. Improving source identification of fine particles in a rural northeastern US area utilizing temperature–resolved carbon
fractions. Journal of Geophysical Research–Atmospheres 109, art. no.
D09204.
Kumar, K.R., Narasimhulu, K., Balakrishnaiah, G., Reddy, B.S.K., Gopal, K.R.,
Reddy, R.R., Reddy, L.S.S., Moorthy, K.K., Babu, S.S., Dutt, C.B.S., 2011.
Spatial heterogeneities in aerosol properties over Bay of Bengal inferred from ship–borne and MODIS observations during ICARB–W
cruise campaign: Implications to radiative forcing. Atmospheric
Environment 45, 404–412.
Lee, E., Chan, C.K., Paatero, P., 1999. Application of positive matrix
factorization in source apportionment of particulate pollutants in Hong
Kong. Atmospheric Environment 33, 3201–3212.
Mooibroek, D., Schaap, M., Weijers, E.P., Hoogerbrugge, R., 2011. Source
apportionment and spatial variability of PM2.5 using measurements at
five sites in the Netherlands. Atmospheric Environment 45, 4180–4191.
Moorthy, K.K., Satheesh, S.K., Babu, S.S., Dutt, C.B.S., 2008. Integrated
campaign for aerosols, gases and radiation budget (ICARB): An
overview. Journal of Earth System Science 117, 243–262.
Moorthy, K.K., Babu, S.S., Satheesh, S.K., 2003. Aerosol spectral optical
depths over the Bay of Bengal: Role of transport. Geophysical Research
Letters 30, art. no. 1249.
Paatero, P., 1999. The multilinear engine – a table–driven, least squares
program for solving multilinear problems, including the n–way parallel
factor analysis model. Journal of Computational and Graphical Statistics 8, 854–888.
Paatero, P., 1997. Least squares formulation of robust non–negative factor
analysis. Chemometrics and Intelligent Laboratory Systems 37, 23–35.
Paatero, P., Tapper, U., 1994. Positive matrix factorization: A non–negative
factor model with optimal utilization of error estimates of data values.
Environmetrics 5, 111–126.
Pillai, P.S., Moorthy, K.K., 2001. Aerosol mass–size distributions at a tropical
coastal environment: Response to mesoscale and synoptic processes.
Atmospheric Environment 35, 4099–4112.

Saxena et al. – Atmospheric Pollution Research (APR) 740
Pitz, M., Gu, J., Soentgen, J., Peters, A., Cyrys, J., 2011. Particle size
distribution factor as an indicator for the impact of the Eyjafjallajokull
ash plume at ground level in Augsburg, Germany. Atmospheric Chemistry and Physics 11, 9367–9374.
Ramachandran, S., Rengarajan, R., Jayaraman, A., Sarin, M.M., Das, S.K.,
2006. Aerosol radiative forcing during clear, hazy, and foggy conditions over a continental polluted location in north India. Journal of
Geophysical Research: Atmospheres 111, art. no. D20214.
Ramanathan, V., Crutzen, P.J., Lelieveld, J., Mitra, A.P., Althausen, D., Anderson, J., Andreae, M.O., Cantrell, W., Cass, G.R., Chung, C.E.,
Clarke, A.D., Coakley, J.A., Collins, W.D., Conant, W.C., Dulac, F.,
Heintzenberg, J., Heymsfield, A.J., Holben, B., Howell, S., Hudson, J., Jayaraman, A., Kiehl, J.T., Krishnamurti, T.N., Lubin, D., McFarquhar, G.,
Novakov, T., Ogren, J.A., Podgorny, I.A., Prather, K., Priestley, K.,
Prospero, J.M., Quinn, P.K., Rajeev, K., Rasch, P., Rupert, S., Sadourny, R., Satheesh, S.K., Shaw, G.E., Sheridan, P., Valero, F.P.J., 2001. Indian
Ocean Experiment: An integrated analysis of the climate forcing and
effects of the great Indo–Asian haze. Journal of Geophysical Research–Atmospheres 106, 28371–28398.
Rastogi, N., Sarin, M.M., 2005. Long–term characterization of ionic species
in aerosols from urban and high–altitude sites in western India: Role of mineral dust and anthropogenic sources. Atmospheric Environment 39,
5541–5554.
Salminen, R., Batista, M.J., Bidovec, M., Demetriades, A., 2005. Geochemical Atlas of Europe. Part 1: Background Information,
Methodology and Maps, Electronic Version, 525 pages.
Satheesh, S.K., Srinivasan, J., Moorthy, K.K., 2006. Spatial and temporal heterogeneity in aerosol properties and radiative forcing over Bay of
Bengal: Sources and role of aerosol transport. Journal of Geophysical
Research–Atmospheres 111, art. no. D08202.
Saud, T., Saxena, M., Singh, D.P., Saraswati, Dahiya, M., Sharma, S.K., Datta,
A., Gadi, R., Mandal, T.K., 2013. Spatial variation of chemical
constituents from the burning of commonly used biomass fuels in rural areas of the Indo–Gangetic Plain (IGP), India. Atmospheric Environment
71, 158–169.
Saud, T., Gautam, R., Mandal, T.K., Gadi, R., Singh, D.P., Sharma, S.K., Dahiya, M., Saxena, M., 2012. Emission estimates of organic and
elemental carbon from household biomass fuel used over the Indo–
Gangetic Plain (IGP), India. Atmospheric Environment 61, 212–220.
Saud, T., Mandal, T.K., Gadi, R., Singh, D.P., Sharma, S.K., Saxena, M.,
Mukherjee, A., 2011. Emission estimates of particulate matter (PM)
and trace gases (SO2, NO and NO2) from biomass fuels used in rural sector of Indo–Gangetic Plain, India. Atmospheric Environment 45,
5913–5923.
Saxena, M., Singh, D.P., Saud, T., Gadi, R., Singh, S., Sharma, S.K., Mandal, T.K., 2014. Study on particulate polycyclic aromatic hydrocarbons over
Bay of Bengal in winter season. Atmospheric Research 145–146, 205–
213.
Sharma, S.K., Mandal, T.K., Saxena, M., Rashmi, Sharma, A., Datta, A., Saud,
T., 2014. Variation of OC, EC, WSIC and trace metals of PM10 in Delhi,
India. Journal of Atmospheric and Solar–Terrestrial Physics 113, 10–22.
Sharma, S.K., Singh, A.K., Saud, T., Mandal, T.K., Saxena, M., Singh, S.,
Ghosh, S.K., Raha, S., 2012. Study on water–soluble ionic composition
of PM10 and related trace gases over Bay of Bengal during W_ICARB campaign. Meteorology and Atmospheric Physics 118, 37–51.
Shridhar, V., Khillare, P.S., Agarwal, T., Ray, S., 2010. Metallic species in
ambient particulate matter at rural and urban location of Delhi. Journal of Hazardous Materials 175, 600–607.
Sinha, P.R., Manchanda, R.K., Kaskaoutis, D.G., Sreenivasan, S., Moorthy,
K.K., Babu, S.S., 2011. Spatial heterogeneities in aerosol size distribution over Bay of Bengal during Winter–ICARB Experiment.
Atmospheric Environment 45, 4695–4706.
Song, Y., Zhang, Y.H., Xie, S.D., Zeng, L.M., Zheng, M., Salmon, L.G., Shao, M., Slanina, S., 2006a. Source apportionment of PM2.5 in Beijing by
positive matrix factorization. Atmospheric Environment 40, 1526–1537.
Song, Y., Xie, S.D., Zhang, Y.H., Zeng, L.M., Salmon, L.G., Zheng, M., 2006b. Source apportionment of PM2.5 in Beijing using principal component
analysis/absolute principal component scores and UNMIX. Science of
the Total Environment 372, 278–286.
Srivastava, A., Gupta, S., Jain, V.K., 2008. Source apportionment of total
suspended particulate matter in coarse and fine size ranges over Delhi.
Aerosol and Air Quality Research 8, 188–200.
U.S. EPA (U.S. Environmental Protection Agency), 2008. Positive Matrix
Factorization (PMF) 3.0 Fundamentals and User Guide, USEPA Office of
Research and Development.
Venkataraman, C., Habib, G., Kadamba, D., Shrivastava, M., Leon, J.F.,
Crouzille, B., Boucher, O., Streets, D.G., 2006. Emissions from open
biomass burning in India: Integrating the inventory approach with high–resolution Moderate Resolution Imaging Spectroradiometer
(MODIS) active–fire and land cover data. Global Biogeochemical Cycles
20, art. no. GB2013.
Venkataraman, C., Habib, G., Eiguren–Fernandez, A., Miguel, A.H.,
Friedlander, S.K., 2005. Residential biofuels in South Asia:
Carbonaceous aerosol emissions and climate impacts. Science 307, 1454–1456.
Wang, Y.G., Hopke, P.K., 2013. A ten–year source apportionment study of
ambient fine particulate matter in San Jose, California. Atmospheric Pollution Research 4, 398–404.
Yang, L.X., Cheng, S.H., Wang, X.F., Nie, W., Xu, P.J., Gao, X.M., Yuan, C.,
Wang, W.X., 2013. Source identification and health impact of PM2.5 in a heavily polluted urban atmosphere in China. Atmospheric Environment
75, 265–269.