cancers - Semantic Scholar
18
cancers Article Blood Flow Measurements Enable Optimization of Light Delivery for Personalized Photodynamic Therapy Yi Hong Ong 1,2 , Joann Miller 1 , Min Yuan 1 , Malavika Chandra 2 , Mirna El Khatib 3,4 , Sergei A. Vinogradov 3,4 , Mary E. Putt 5 , Timothy C. Zhu 1 , Keith A. Cengel 1 , Arjun G. Yodh 2 and Theresa M. Busch 1, * 1 Department of Radiation Oncology, Perelman School of Medicine, University of Pennsylvania, Philadelphia, PA 19104, USA; [email protected] (Y.H.O.); [email protected] (J.M.); [email protected] (M.Y.); [email protected] (T.C.Z.); [email protected] (K.A.C.) 2 Department of Physics and Astronomy, School of Arts and Sciences, University of Pennsylvania, Philadelphia, PA 19104, USA; [email protected] (M.C.); [email protected] (A.G.Y.) 3 Department of Biochemistry and Biophysics, Perelman School of Medicine, University of Pennsylvania, Philadelphia, PA 19104, USA; [email protected] (M.E.K.); [email protected] (S.A.V.) 4 Department of Chemistry, School of Arts and Sciences, University of Pennsylvania, Philadelphia, PA 19104, USA 5 Department of Biostatistics, Epidemiology & Informatics, Perelman School of Medicine, University of Pennsylvania, Philadelphia, PA 19104, USA; [email protected] * Correspondence: [email protected] Received: 30 April 2020; Accepted: 11 June 2020; Published: 15 June 2020 Abstract: Fluence rate is an effector of photodynamic therapy (PDT) outcome. Lower light fluence rates can conserve tumor perfusion during some illumination protocols for PDT, but then treatment times are proportionally longer to deliver equivalent fluence. Likewise, higher fluence rates can shorten treatment time but may compromise treatment efficacy by inducing blood flow stasis during illumination. We developed blood-flow-informed PDT (BFI-PDT) to balance these effects. BFI-PDT uses real-time noninvasive monitoring of tumor blood flow to inform selection of irradiance, i.e., incident fluence rate, on the treated surface. BFI-PDT thus aims to conserve tumor perfusion during PDT while minimizing treatment time. Pre-clinical studies in murine tumors of radiation-induced fibrosarcoma (RIF) and a mesothelioma cell line (AB12) show that BFI-PDT preserves tumor blood flow during illumination better than standard PDT with continuous light delivery at high irradiance. Compared to standard high irradiance PDT, BFI-PDT maintains better tumor oxygenation during illumination and increases direct tumor cell kill in a manner consistent with known oxygen dependencies in PDT-mediated cytotoxicity. BFI-PDT promotes vascular shutdown after PDT, thereby depriving remaining tumor cells of oxygen and nutrients. Collectively, these benefits of BFI-PDT produce a significantly better therapeutic outcome than standard high irradiance PDT. Moreover, BFI-PDT requires ~40% less time on average to achieve outcomes that are modestly better than those with standard low irradiance treatment. This contribution introduces BFI-PDT as a platform for personalized light delivery in PDT, documents the design of a clinically-relevant instrument, and establishes the benefits of BFI-PDT with respect to treatment outcome and duration. Keywords: photodynamic therapy; vascular response; Photofrin ® ; hemodynamic; perfusion; blood flow monitoring; light modulation; diffuse correlation spectroscopy; phosphorescence quenching; Oxyphor Cancers 2020, 12, 1584; doi:10.3390/cancers12061584 www.mdpi.com/journal/cancers
-
Upload
khangminh22 -
Category
Documents
-
view
4 -
download
0
Transcript of cancers - Semantic Scholar

cancers
Article
Blood Flow Measurements Enable Optimization ofLight Delivery for PersonalizedPhotodynamic Therapy
Yi Hong Ong 1,2 , Joann Miller 1, Min Yuan 1, Malavika Chandra 2, Mirna El Khatib 3,4,Sergei A. Vinogradov 3,4, Mary E. Putt 5, Timothy C. Zhu 1 , Keith A. Cengel 1, Arjun G. Yodh 2
and Theresa M. Busch 1,*1 Department of Radiation Oncology, Perelman School of Medicine, University of Pennsylvania, Philadelphia,
PA 19104, USA; [email protected] (Y.H.O.);[email protected] (J.M.); [email protected] (M.Y.);[email protected] (T.C.Z.); [email protected] (K.A.C.)
2 Department of Physics and Astronomy, School of Arts and Sciences, University of Pennsylvania,Philadelphia, PA 19104, USA; [email protected] (M.C.); [email protected] (A.G.Y.)
3 Department of Biochemistry and Biophysics, Perelman School of Medicine, University of Pennsylvania,Philadelphia, PA 19104, USA; [email protected] (M.E.K.);[email protected] (S.A.V.)
4 Department of Chemistry, School of Arts and Sciences, University of Pennsylvania, Philadelphia, PA 19104, USA5 Department of Biostatistics, Epidemiology & Informatics, Perelman School of Medicine,
University of Pennsylvania, Philadelphia, PA 19104, USA; [email protected]* Correspondence: [email protected]
Received: 30 April 2020; Accepted: 11 June 2020; Published: 15 June 2020�����������������
Abstract: Fluence rate is an effector of photodynamic therapy (PDT) outcome. Lower light fluencerates can conserve tumor perfusion during some illumination protocols for PDT, but then treatmenttimes are proportionally longer to deliver equivalent fluence. Likewise, higher fluence rates canshorten treatment time but may compromise treatment efficacy by inducing blood flow stasis duringillumination. We developed blood-flow-informed PDT (BFI-PDT) to balance these effects. BFI-PDTuses real-time noninvasive monitoring of tumor blood flow to inform selection of irradiance, i.e.,incident fluence rate, on the treated surface. BFI-PDT thus aims to conserve tumor perfusion duringPDT while minimizing treatment time. Pre-clinical studies in murine tumors of radiation-inducedfibrosarcoma (RIF) and a mesothelioma cell line (AB12) show that BFI-PDT preserves tumor bloodflow during illumination better than standard PDT with continuous light delivery at high irradiance.Compared to standard high irradiance PDT, BFI-PDT maintains better tumor oxygenation duringillumination and increases direct tumor cell kill in a manner consistent with known oxygendependencies in PDT-mediated cytotoxicity. BFI-PDT promotes vascular shutdown after PDT,thereby depriving remaining tumor cells of oxygen and nutrients. Collectively, these benefits ofBFI-PDT produce a significantly better therapeutic outcome than standard high irradiance PDT.Moreover, BFI-PDT requires ~40% less time on average to achieve outcomes that are modestlybetter than those with standard low irradiance treatment. This contribution introduces BFI-PDTas a platform for personalized light delivery in PDT, documents the design of a clinically-relevantinstrument, and establishes the benefits of BFI-PDT with respect to treatment outcome and duration.
Keywords: photodynamic therapy; vascular response; Photofrin®; hemodynamic; perfusion;blood flow monitoring; light modulation; diffuse correlation spectroscopy; phosphorescencequenching; Oxyphor
Cancers 2020, 12, 1584; doi:10.3390/cancers12061584 www.mdpi.com/journal/cancers

Cancers 2020, 12, 1584 2 of 18
1. Introduction
In photodynamic therapy (PDT), light, photosensitizer and oxygen interact to producetissue-damaging reactive oxygen species (ROS). PDT is directly cytotoxic to treated cells; moreover,it can promote antitumor immunity and damage tumor vasculature [1,2]. Vascular damage is oftenbeneficial to achieving a complete response, but the timing of vascular damage relative to the period oflight delivery is critical [3,4]. Functional deterioration of tumor blood vessels after light delivery isfavorable when it deprives remaining tumor cells of oxygen and nutrients. Conversely, therapeuticeffects can be compromised when vascular damage manifests as temporary ischemia during lightdelivery; under these circumstances, a resultant decrease in oxygen supply during PDT can reduceROS generation and limit cell kill. Subsequently, when tumor blood flow recovers after PDT, thesurviving treatment-spared tumor cells can proliferate to result in tumor regrowth. For these reasons,the extent and time-course of PDT-induced vascular damage can critically impact therapeutic effect.
The ability to monitor and modulate tumor blood flow during illumination offers a means forreal-time optimization of PDT delivery. PDT is well known to induce fluctuations in tumor bloodflow during illumination across various treatment protocols [4–11]. Khurana et al. [5] used Doppleroptical coherence tomography to observe a marked increase in blood flow velocity at the start ofillumination and, attributed this to a narrowing of blood vessel lumens. Similarly at the start ofillumination, Yu et al. [11] observed an increase and then a sharp decline in blood flow using opticaldiffuse correlation spectroscopy. The rate of this decline correlated strongly with treatment outcome.Specifically, tumors with rapid decrease in blood flow experienced shorter regrowth delays. The relativechanges in blood flow and the tissue hemoglobin oxygen saturation of tumors after PDT were alsopredictive of outcome. Nevertheless, blood flow during PDT is a more appealing clinical metric,because it enables outcome to be predicted using data obtained during treatment.
Vascular and cytotoxic responses to PDT are affected by fluence rate in the treated tissue, whichis controlled by the choice of irradiance, i.e., the incident light fluence rate on the tissue in the caseof surface illumination [12–14]. In protocols dominated by anti-vascular mechanisms, nonreversibleischemia may build within the tumor over the course of illumination. Yet, for other PDT protocols,efficacy is determined by the combined effects of vascular damage and direct tumor cell damage.Lower irradiances are beneficial under these circumstances, and this benefit is often attributed to theconservation of blood flow during illumination and a reduction in the rate of oxygen consumptionby PDT. Consequently, longer illumination times at low irradiance can favor long term outcomes byenhancing direct PDT cytotoxicity and vascular damage after light delivery [10,12,15–19]. By contrast,higher irradiances may compromise direct tumor cell kill by inducing reversible blood flow stasisduring light delivery and lowering ROS production as a result of tissue hypoxia, [20,21]. Fractionatedillumination with short on-off cycles or two-fold illumination with a single long dark interval alsoappears to improve PDT effectiveness [22–31]. In this case, treatment efficacy varies with the lengths ofdark intervals and first light fraction, as well as the irradiance level. Unfortunately, despite evidencethat low irradiance and light fractionation improve PDT outcomes, such approaches can be clinicallyundesirable due to lengthy treatment times.
Here we introduce a novel scheme, blood-flow-informed PDT (BFI-PDT), to personalize PDTdelivery. BFI-PDT dynamically adjusts the length of light/dark fractions and/or choice of irradiancebased on real-time measurement of PDT-induced vascular response. We hypothesize that BFImodulation of light delivery improves PDT efficacy compared to standard treatment with continuoushigh irradiance, while limiting treatment times to less than those needed for continuous illumination atlow irradiance. We explore these ideas using two preclinical murine tumor models, radiation-inducedfibrosarcoma (RIF) and malignant mesothelioma (AB12). The hemodynamic characteristics and tumorresponses achieved by three standard and two BFI-PDT treatment schemes are studied. Noninvasivemeasurement of relative blood flow (rBF) in tumor is measured by diffuse correlation spectroscopy(DCS). This technology has been validated and employed for monitoring of blood flow in brain [32–34],skeletal muscle [35,36], and tumors [37,38], as well as for determination of vascular response during
Cancers 2020, 12, 1584 3 of 18
PDT [1,7,9,11,39,40]. DCS is sensitive to flow in tumor microvasculature, i.e., tumor arterioles,capillaries, and venules, and it can be used in a noncontact configuration that permits continuousmonitoring during PDT without interfering with treatment light delivery. In the preclinical murinemodels, we demonstrate the ability to measure and modulate tumor blood flow via real-time BFIlight delivery. For these tumors BFI-PDT minimizes the duration of illumination and is both safeand effective.
2. Materials and Methods
2.1. Tumor Models/PDT
RIF and AB12 tumors were grown in C3H or BALB/c mice (Charles River Laboratories, Wilmington,MA, USA), respectively. A total of 3 × 10⁵ RIF or 1 × 10⁶ AB12 cells were injected intradermally overthe right shoulder or the flank of the mice, respectively. The animals were entered in studies ~one weeklater with tumor diameters of ~5 mm. The treatment area was depilated (Nair hair removal lotion,Church & Dwight Co., Inc., Ewing, NJ, USA), and Photofrin® was injected 20–24 h before illumination(tail vein, 5 mg/kg) to allow for its accumulation in tumor tissues [41]. Photofrin® distributes toboth malignant cells and blood vessels in tumors, and with longer incubations it localizes mainly toorganelle membranes such as the mitochondria, endoplasmic reticulum and Golgi complex [42,43].
Treatment light from a 630-nm laser (Biolitec AG., A-1030, Vienna, Austria) was collimated usinga microlens-tipped fiber (CardioFocus, Norton, MA, USA). It was delivered over a 1 cm diameterfield centered on the tumor to a total fluence of 135 Jcm−2, at a high irradiance of 150 mWcm−2, a lowirradiance of 25 mWcm−2, or a combination of these irradiances as a function of the treatment scheme.It should be noted that external beam PDT induces no to minimal tissue heating (2–3 ◦C) at irradiances≤150 mWcm−2 [44]. Mice were anesthetized using ~1.5% isoflurane, while a heating pad maintainedbody temperature.
Tumor response was quantified as the number of days after PDT for tumor regrowth to a volumeof 400 mm3 (i.e., time-to-400mm3). Tumor volume (V) was calculated as V = π/6 × width2
× length.An absence of tumor burden at 90 days after PDT was defined as a complete response. Animal studieswere approved by the IACUC of the University of Pennsylvania and animal facilities accredited byAAALAC under protocol #803526 (approved on 3/24/2011, latest renewal 2/12/2020).
2.2. Diffuse Correlation Spectroscopy
Diffuse correlation spectroscopy (DCS) derives information about tissue blood flow by quantifyingthe temporal intensity fluctuation of multiple scattered light. It employs coherent near-infrared(NIR) light that travels diffusively and scatters within tissue before emerging from the tissue surface.Each scattering event alters the phase of the scattered light field; eventually, multiple light fieldstravel from the light source to the tissue surface, each with different phases. These fields interfereconstructively or destructively to create a speckle pattern. The movements of red blood cells in tissuesalter the scattered light phases and cause the speckle pattern to vary in time. Thus, the temporalintensity fluctuations of the detected light are sensitive to the motions of red blood cells in the tissuemicrovasculature. The temporal decay of the autocorrelation function (the DCS signal) thereforeprovides a direct measure of blood flow. A tumor blood-flow index (BFi) is obtained by fitting themeasured intensity autocorrelation function to the solution of the correlation diffuse equation in thesemi-infinite homogeneous medium geometry [45,46].
2.2.1. DCS Instrumentation
The DCS instrumentation includes a coherent laser source (785 nm, 80 mW, CrystaLaser Inc., Reno,NV, USA) operating in continuous mode, and a fiber bundle consisting of 4 single mode detector fiberslocated at 0.2 cm around a central multimode source fiber. The fibers were placed at the detector planeat the back of a camera while the camera lens delivered excitation light and collected reflected diffuse
Cancers 2020, 12, 1584 4 of 18
light from the tumor surface. Four single photon-counting avalanche photodiodes (SPCM-4AQC,Excelitas, Waltham, MA, USA) were employed in parallel for detection of the diffuse light. Typically,average photon penetration depth into tissue is one-third to one-half of the source-detector separation.Therefore, when the excitation light was focused onto the center of tumor surface, light detected by thedetector fibers is primarily sensitive to superficial tumor tissue (~0.7–1 mm depth) spanned betweenthe source-detector pairs and not the underlying normal tissue. Bandpass optical filters are usedto attenuate the treatment light and prevent the detectors from saturation. The detected intensityautocorrelation functions were computed using a four-channel autocorrelator board (Correlator.com,Bridgewater, NJ, USA) at ~0.34 Hz measurement rates. DCS data for one frame were averaged over allfour detector channels to represent the rBF in the bulk tumor tissue. This setup enabled us to monitorblood flow during PDT by permitting unobstructed illumination with the treatment light at a smallangle to the tissue surface.
2.2.2. Tumor Blood Flow Monitoring
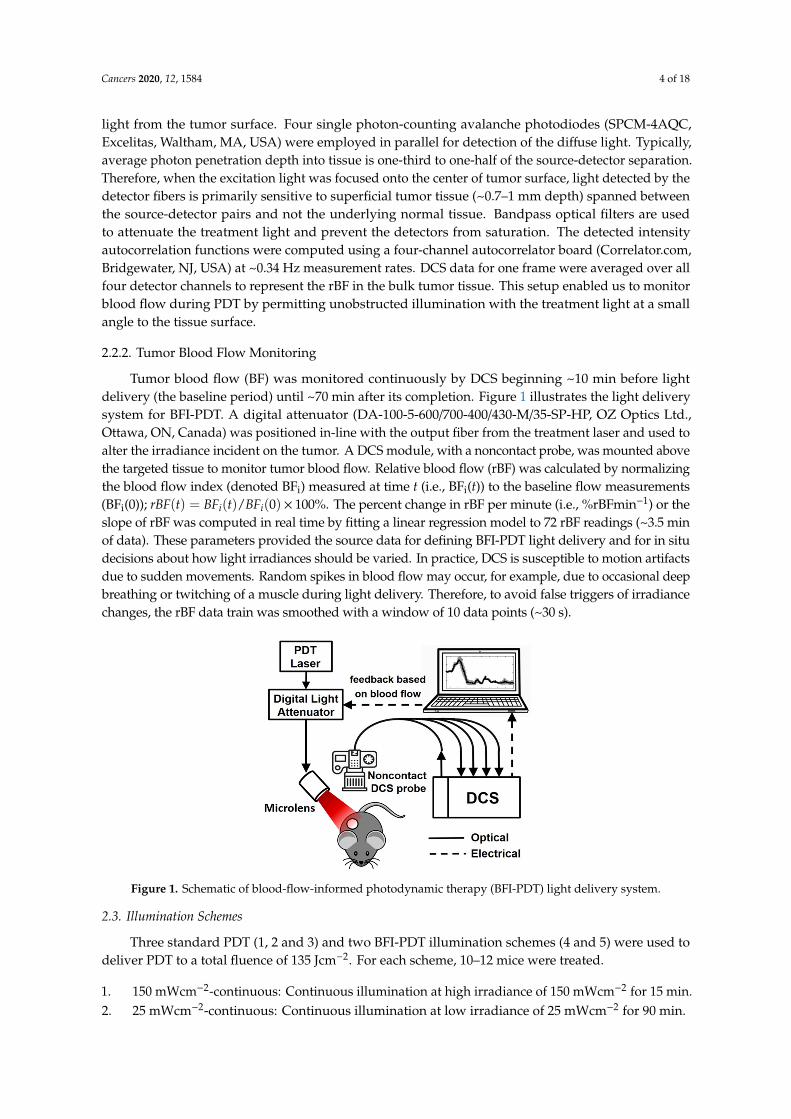
Tumor blood flow (BF) was monitored continuously by DCS beginning ~10 min before lightdelivery (the baseline period) until ~70 min after its completion. Figure 1 illustrates the light deliverysystem for BFI-PDT. A digital attenuator (DA-100-5-600/700-400/430-M/35-SP-HP, OZ Optics Ltd.,Ottawa, ON, Canada) was positioned in-line with the output fiber from the treatment laser and used toalter the irradiance incident on the tumor. A DCS module, with a noncontact probe, was mounted abovethe targeted tissue to monitor tumor blood flow. Relative blood flow (rBF) was calculated by normalizingthe blood flow index (denoted BFi) measured at time t (i.e., BFi(t)) to the baseline flow measurements(BFi(0)); rBF(t) = BFi(t)/BFi(0)× 100%. The percent change in rBF per minute (i.e., %rBFmin−1) or theslope of rBF was computed in real time by fitting a linear regression model to 72 rBF readings (~3.5 minof data). These parameters provided the source data for defining BFI-PDT light delivery and for in situdecisions about how light irradiances should be varied. In practice, DCS is susceptible to motion artifactsdue to sudden movements. Random spikes in blood flow may occur, for example, due to occasional deepbreathing or twitching of a muscle during light delivery. Therefore, to avoid false triggers of irradiancechanges, the rBF data train was smoothed with a window of 10 data points (~30 s).
Cancers 2020, 12, x 4 of 19
2.2.1. DCS Instrumentation
The DCS instrumentation includes a coherent laser source (785 nm, 80 mW, CrystaLaser Inc., Reno, NV, USA) operating in continuous mode, and a fiber bundle consisting of 4 single mode detector fibers located at 0.2 cm around a central multimode source fiber. The fibers were placed at the detector plane at the back of a camera while the camera lens delivered excitation light and collected reflected diffuse light from the tumor surface. Four single photon-counting avalanche photodiodes (SPCM-4AQC, Excelitas, Waltham, MA, USA) were employed in parallel for detection of the diffuse light. Typically, average photon penetration depth into tissue is one-third to one-half of the source-detector separation. Therefore, when the excitation light was focused onto the center of tumor surface, light detected by the detector fibers is primarily sensitive to superficial tumor tissue (~0.7–1 mm depth) spanned between the source-detector pairs and not the underlying normal tissue. Bandpass optical filters are used to attenuate the treatment light and prevent the detectors from saturation. The detected intensity autocorrelation functions were computed using a four-channel autocorrelator board (Correlator.com, Bridgewater, NJ, USA) at ~0.34 Hz measurement rates. DCS data for one frame were averaged over all four detector channels to represent the rBF in the bulk tumor tissue. This setup enabled us to monitor blood flow during PDT by permitting unobstructed illumination with the treatment light at a small angle to the tissue surface.
2.2.2. Tumor Blood Flow Monitoring
Tumor blood flow (BF) was monitored continuously by DCS beginning ~10 minutes before light delivery (the baseline period) until ~70 minutes after its completion. Figure 1 illustrates the light delivery system for BFI-PDT. A digital attenuator (DA-100-5-600/700-400/430-M/35-SP-HP, OZ Optics Ltd., Ottawa, ON, Canada) was positioned in-line with the output fiber from the treatment laser and used to alter the irradiance incident on the tumor. A DCS module, with a noncontact probe, was mounted above the targeted tissue to monitor tumor blood flow. Relative blood flow (rBF) was calculated by normalizing the blood flow index (denoted BFi) measured at time t (i.e., BFi(t)) to the baseline flow measurements (BFi(0)); 0 100%⁄ . The percent change in rBF per minute (i.e., %rBFmin-1) or the slope of rBF was computed in real time by fitting a linear regression model to 72 rBF readings (~3.5 minutes of data). These parameters provided the source data for defining BFI-PDT light delivery and for in situ decisions about how light irradiances should be varied. In practice, DCS is susceptible to motion artifacts due to sudden movements. Random spikes in blood flow may occur, for example, due to occasional deep breathing or twitching of a muscle during light delivery. Therefore, to avoid false triggers of irradiance changes, the rBF data train was smoothed with a window of 10 data points (~30 s).
Figure 1. Schematic of blood-flow-informed photodynamic therapy (BFI-PDT) light delivery system. Figure 1. Schematic of blood-flow-informed photodynamic therapy (BFI-PDT) light delivery system.
2.3. Illumination Schemes
Three standard PDT (1, 2 and 3) and two BFI-PDT illumination schemes (4 and 5) were used todeliver PDT to a total fluence of 135 Jcm−2. For each scheme, 10–12 mice were treated.
1. 150 mWcm−2-continuous: Continuous illumination at high irradiance of 150 mWcm−2 for 15 min.2. 25 mWcm−2-continuous: Continuous illumination at low irradiance of 25 mWcm−2 for 90 min.

Cancers 2020, 12, 1584 5 of 18
3. 150 mWcm−2-fractionated: 150 mWcm−2 in equal intermittent intervals of 30 s light-on and 30 slight-off for a total of 30 min.
4. Blood-flow-informed-irradiance (BFI-Irrad): Continuous illumination was initially 150 mWcm−2,but illumination was cyclically decreased to 25 mWcm−2 and returned to 150 mWcm−2 in responseto the blood flow monitoring parameters. Treatment time was adjusted to deliver a total fluenceof 135 Jcm−2 (between 15 and 90 min).
5. Blood-flow-informed-fractionated (BFI-Frac): Fractionated illumination was initiated at150 mWcm−2, but illumination was intermittently discontinued (light-off, 0 mWcm−2) in responseto blood flow monitoring. Treatment time was adjusted to deliver a total fluence of 135 Jcm−2,which was reached within 90 min in the current investigations. Note, this guidance platformrequires a maximum treatment time to be established irrespective of whether or not a total fluenceof 135 Jcm−2 is achieved because the light can remain “off” for extended periods of time if bloodflow recovery is slow.
2.4. In Vivo/In Vitro Clonogenic Assay
Tumor-bearing animals were treated with PDT or as controls. At the indicated timepoints, animalswere euthanized, and tumors were excised, weighed, minced and enzymatically digested using atechnique described previously [19,47]. In brief, the minced tumor was suspended in a trypsinizingflask containing 3000 units deoxyribonuclease (Sigma-Aldrich, St. Louis, MO, USA), 2000 unitscollagenase (Sigma-Aldrich), and 3 mg protease (Sigma-Aldrich) dissolved in 12 mL of Hanks’ balancedsalt solution. After digestion, cells were plated on 100 mm tissue culture dishes in triplicate, and after a~10-day incubation (37 ◦C in 95% air/5% CO2) colonies were fixed, stained (2.5 mg/mL methylene blue in30% alcohol), and counted. The number of clonogenic cells per gram was calculated as the number ofcells per gram of tumor multiplied by the ratio of the number of colonies to the number of cells plated.
2.5. Tumor Oxygenation Measurements
Phosphorescence lifetime-based measurements of tumor oxygenation were performed as describedpreviously [39,48,49]. Oxyphor R4 (30 µL, 20 mM), whose absorption spectrum does not overlap withthe emission band of the treatment laser, was injected intra-tumorally ~24 h prior to measurement.Excitation of the phosphorescence was performed using a light-emitting diode (λmax = 523 nm),and the phosphorescence was detected using an avalanche photodiode (APD) through a long-passfilter (710 nm). Phosphorescence lifetime oximetry permits absolute measurement of tumor oxygenpartial pressure. The technique is based on variations in the probe phosphorescence decay time dueto quenching of the probe triplet state by oxygen. The measurements are thus unaffected by theconcentration of the probe, the excitation light intensity, and signal collection efficiency.
2.6. Statistical Analysis
Differences in the distribution of flow reduction between each of the modalities were comparedusing a Kruskall Wallis test, followed by pairwise Wilcoxon Rank Sum tests. Differences inlog-transformed tumor clonogenicity and ∆rBF were assessed using a one-way ANOVA. To accountfor repeated measurements on the same animal, differences between mean pO2 were analyzed using amixed effects model. Median time-to-400 mm3 was estimated using the Kaplan-Meier method. In orderto weight earlier failure times more strongly, differences in the time-to-400 mm3 among groups wereassessed using Gehan-Wilcoxon tests [50]. The proportion of animals with a complete response wasestimated and the exact 95% confidence interval (CI) reported. The association between regrowth andeither treatment group or flow reduction rate was assessed using a Cox model. Statistical analyseswere carried out in R (3.6.1) with the package survminer for pairwise comparisons of the time-to-eventdata. The family-wise error rate was maintained at 0.05 using either a Holm-Bonferroni correction formultiplicity (flow reduction rate, pO2, or time-to-400 mm3) or Tukey’s Honest Significance Difference(clonogenicity, ∆rBF).

Cancers 2020, 12, 1584 6 of 18
3. Results
3.1. Irradiance Alters Tumor Blood Flow During PDT
Initial studies characterized rBF in tumors treated with standard PDT. Figure 2 depictsrepresentative traces of rBF during light delivery for PDT with (a) high irradiance-continuous(150 mWcm−2 in red), (b) low irradiance-continuous (25 mWcm−2 in yellow) and (c) highirradiance-fractionated illumination (150 mWcm−2 light-on intervals in red).
Cancers 2020, 12, x 6 of 19
2.6. Statistical Analysis
Differences in the distribution of flow reduction between each of the modalities were compared using a Kruskall Wallis test, followed by pairwise Wilcoxon Rank Sum tests. Differences in log-transformed tumor clonogenicity and ΔrBF were assessed using a one-way ANOVA. To account for repeated measurements on the same animal, differences between mean pO2 were analyzed using a mixed effects model. Median time-to-400 mm3 was estimated using the Kaplan-Meier method. In order to weight earlier failure times more strongly, differences in the time-to-400 mm3 among groups were assessed using Gehan-Wilcoxon tests.[50] The proportion of animals with a complete response was estimated and the exact 95% confidence interval (CI) reported. The association between regrowth and either treatment group or flow reduction rate was assessed using a Cox model. Statistical analyses were carried out in R (3.6.1) with the package survminer for pairwise comparisons of the time-to-event data. The family-wise error rate was maintained at 0.05 using either a Holm-Bonferroni correction for multiplicity (flow reduction rate, pO2, or time-to-400 mm3) or Tukey’s Honest Significance Difference (clonogenicity, ΔrBF).
3. Results
3.1. Irradiance Alters Tumor Blood Flow During PDT
Initial studies characterized rBF in tumors treated with standard PDT. Figure 2 depicts representative traces of rBF during light delivery for PDT with (a) high irradiance-continuous (150 mWcm−2 in red), (b) low irradiance-continuous (25 mWcm−2 in yellow) and (c) high irradiance-fractionated illumination (150 mWcm−2 light-on intervals in red).
Figure 2. Representative blood flow traces during standard light delivery to radiation-inducedfibrosarcoma (RIF) tumors using (a) 150 mWcm−2-continuous; (b) 25 mWcm−2-continuous; and(c) 150 mWcm−2 standard fractionated illumination with 30 second light-on/light-off intervals. Lightdelivery is shaded in red or yellow for illumination at 150 mWcm−2 or 25 mWcm−2, respectively. · and� indicate the initiation and completion of light delivery, respectively. rBFmax(initial) and rBFmin(initial)
are the maximum and minimum that define the initial peak and trough in relative blood flow (rBF)during photodynamic therapy (PDT). A dotted bracket on each plot represents the slope of rBF decrease,i.e., flow reduction rate. (d) Box plots of blood flow reduction rate for standard PDT treatments (opencircles indicate means; n = 10–11 mice per group). Statistical differences between groups by Wilcoxonrank-sum tests with Holm-Bonferroni adjustment are indicated. * represents groups with statisticallysignificant different flow reduction rates. (e) Kaplan-Meier survival curves for mice treated usingstandard PDT defined by tertiles of flow reduction rate (n = 10–11 mice per group). P < 0.001 for globalGehan Wilcoxon test of differences between irradiance levels; p < 0.001 for the 25.5–100% rBFmin−1
group versus each lower group and p = 0.027 for 0–12.4% rBFmin−1 versus 12.4–25.5% rBFmin−1.

Cancers 2020, 12, 1584 7 of 18
For all standard illumination schemes, rBF increased at the start of light delivery (Figure 2a–c).At high irradiance, after a rapid increase, rBF declined steeply. By contrast, at low irradiance, aftera more gradual initial increase, rBF declined more slowly. These changes in rBF during PDT arecharacterized by rBFmax(initial) and rBFmin(initial), defined as the respective maximum and minimumflow associated with this first rise and fall (Figure 2a–c). A flow reduction rate was calculated foreach mouse as the slope of the line segment between rBFmax(initial) and rBFmin(initial) (depicted bythe dotted line). During continuous irradiance at 25 mWcm−2 the median flow reduction rate was9.3 %rBFmin−1, a value significantly smaller than the median flow reduction rate of 23 %rBFmin−1
for 150 mWcm−2-continuous (p < 0.001) and 25 %rBFmin−1 for 150 mWcm−2-fractionated (p = 0.0016)(Figure 2d and Table 1).
Figure 2e shows a Kaplan-Meier curve for time-to-400 mm3 with groups defined by tertiles offlow-reduction. As in previous studies [11], larger flow reduction rates were associated with worsetreatment outcome (p < 0.001 ). In a Cox model, the instantaneous ‘risk’ of regrowth to 400 mm3
increased by a factor of 2.1 (95% confidence interval, 1.6, 2.7) per 10% increase in flow reduction rate(p < 0.001). In a Cox model including only the treatment groups, there was a significant associationwith time time-to-400 mm3 (p = 0.05), but once flow reduction rate was added to the model, treatmentgroup was no longer statistically significant (p = 0.87). This suggests that a considerable portion of thetreatment effect was mediated through flow reduction rate.
The above results suggest irradiance affects flow reduction rate, and that a larger flow reductionrate is associated with poorer response across a range of standard treatment conditions (i.e., high andlow irradiance, continuous and fractionated illumination). Furthermore, these findings suggest flowreduction rate could serve as an optimization criterion to personalize PDT for individual animals.Our approach proposed monitoring blood flow during PDT and altering irradiance in real time inresponse to changes in blood flow. With this scheme, we hoped to maintain favorable flow reductionrates during light delivery and thus improve PDT outcomes.

Cancers 2020, 12, 1584 8 of 18
Table 1. For RIF tumors, flow reduction rate (overall flow reduction rate for BFI-Irrad and BFI-Frac), treatment length (segregated by time spent at each irradiance),and ∆rBF at 1 h after illumination with standard or BFI-PDT.
Type of PDT GroupFlow Reduction Rate
(%rBFmin−1)Median (IQR)
Treatment Length in mMminutesMedian (IQR)
∆rBF(%) at 1 hafter PDTMean (SD)150 mWcm−2 25 mWcm−2 0 mWcm−2 Total
Standard
150 mWcm−2
continuous23.0 (21.4, 49.8) 15 0 0 15 24.8 (67.3)
25 mWcm−2
continuous9.3 (7.8, 11.6)(p < 0.0011) 0 90 0 90 −46.2 (23.7)
(p = 0.001 1)
150 mWcm−2
fractionated25.0 (14.9 34,6)
(p = 0.0022) 15 0 15 30 −32.2 (31.3)(p = 0.018 1)
Blood-flowinformed
BFI-Irrad 5.2 (4.6, 5.4)(p < 0.001 1,3, p = 0.0012)
8(7, 9)
45(39, 50) 0 53
(48, 57)−31.4 (19.7)(p = 0.016 1)
BFI-Frac 10.0 (6.7, 10.2)(p < 0.001 1,3) 15 0 46
(34, 55)61
(49, 70)−43.6 (29.0)(p = 0.002 1)
All p-values for pairwise comparisons are adjusted using Tukey’s Honest Significant Difference in determinations 1 for comparison to 150 mWcm−2-continuous; 2 for comparisonto 25 mWcm−2-continuous; 3 for comparison to 150 mWcm−2-fractionated. RIF: radiation-induced fibrosarcoma; PDT: photodynamic therapy; rBF: relative blood flow; BFI-Irrad:blood-flow-informed irradiance; BFI-Frac: blood-flow-informed fractionated; IQR: interquartile range; SD: standard deviation.

Cancers 2020, 12, 1584 9 of 18
3.2. BFI-PDT Alters Flow Dynamics during Illumination Compared to Standard PDT
BFI-PDT was studied with schemes of either BFI-Irrad or BFI-Frac as defined in Figure 3a.The delivered light fluence, accumulated treatment time, relative tumor blood flow, and flow reductionrate were monitored continuously throughout light delivery. BFI-Irrad utilized either a time-conservingirradiance of 150 mWcm−2 or flow-conserving 25 mWcm−2. BFI-Frac employed either an irradiance of150 mWcm−2, or when the laser was paused, an irradiance of 0 mWcm−2.
Cancers 2020, 12, x 8 of 19
regrowth after PDT (time-to-400 mm3 of <10 days) when flow reduction rate was higher than 10
%rBFmin-1, and substantial delay in tumor regrowth when flow reduction rate was less than or equal
to 10 %rBFmin-1. If rBF(t) recovered to a value above its level during the baseline period (rBFbaseline),
then the irradiance returned to 150 mWcm−2. At each subsequent instance of a flow decrease of more
than 10% rBFmin-1, the irradiance was again attenuated to 25 mWcm−2 (BFI-Irrad) or 0 mWcm−2 (BFI-
Frac), and then, the irradiance was returned to 150 mWcm−2 when rBF(t) recovered to above rBFbaseline.
Light was delivered until a total fluence of 135 Jcm−2 was reached, or, in the case of BFI-Frac, until a
maximum treatment time of 90 minutes (including light-off time). Figure S1a,b additionally
illustrates how temporal fluctuations in rBF (Figure S1a) associate with the slope of its change (Figure
S1b); BFI-PDT attenuated the irradiance of light delivery when this slope decreased at a rate greater
than 10% rBFmin−1.
Figure 3. (a) Flow chart of the process for blood-flow-informed (BFI) light delivery. Irradiances are
either 150 mWcm−2 or 25 mWcm−2 for BFI-Irrad PDT; and 150 mWcm−2 or 0 mWcm−2 for BFI-Frac
photodynamic therapy (PDT). Representative blood flow traces for (b) blood-flow-informed
irradiance light delivery (BFI-Irrad) and (c) blood-flow-informed fractionated light delivery (BFI-Frac)
of radiation-induced fibrosarcoma (RIF) tumors. Light delivery is shaded in red or yellow for
illumination at 150 mWcm−2 or 25 mWcm−2, respectively. ► and ■ indicate the initiation and
completion of light delivery, respectively. rBFmax(initial) and rBFmin(global) are the respective first peak and
global minimum of tumor blood flow during light delivery. Dashed red lines in each plot represents
the slope of the decrease in rBF between rBFmax(initial) and the rBFmin(global), described as the overall flow
reduction rate.
Several features distinguish the flow reduction rate for BFI-PDT compared to standard PDT. As
shown in Figure 2a–c, rBFmin(initial) for standard PDT generally represents the global minimum in rBF
(rBFmin(global)) for the entire treatment. By contrast, during BFI-PDT, modulation of light delivery
interrupts and reverses PDT-induced decreases in rBF. Consequently, rBFmin(global) rarely corresponds
with rBFmin(initial) for BFI-PDT. The rBFmin(global) during BFI-PDT often occurs later during treatment, i.e.,
after illumination has been attenuated or paused at least once per the rules of the BFI platform.
Furthermore, maximum rBF during standard PDT is generally the first peak in rBF after the start of
illumination (i.e., rBFmax(initial)), which differs from BFI-PDT because the BFI platform promotes blood
flow recovery that may lead to subsequent peaks higher than rBFmax(initial). These differences in blood
flow trends during BFI-PDT versus standard PDT provide hemodynamic evidence of a modified
vascular response during illumination.3.3. BFI-PDT Decreases Blood Flow Reduction Rate During
Light Delivery, While Shortening Treatment Time
Table 1 summarizes the hemodynamic effect (flow reduction rate) and treatment parameters
(duration of exposure to each fluence rate) for RIF tumors treated with standard PDT or BFI-PDT.
We note that BFI-Irrad and BFI-Frac induced multiple peaks and troughs in rBF during treatment;
the hemodynamic effect was quantified as a single overall flow reduction rate, calculated from the
slope of decrease between rBFmax(initial) and rBFmin(global), as depicted by the red dotted lines in Figure
3b,c. Median overall flow reduction rate for BFI-Irrad was 5.2% rBFmin-1 and for BFI-Frac was 10%
Figure 3. (a) Flow chart of the process for blood-flow-informed (BFI) light delivery. Irradiancesare either 150 mWcm−2 or 25 mWcm−2 for BFI-Irrad PDT; and 150 mWcm−2 or 0 mWcm−2 forBFI-Frac photodynamic therapy (PDT). Representative blood flow traces for (b) blood-flow-informedirradiance light delivery (BFI-Irrad) and (c) blood-flow-informed fractionated light delivery (BFI-Frac) ofradiation-induced fibrosarcoma (RIF) tumors. Light delivery is shaded in red or yellow for illuminationat 150 mWcm−2 or 25 mWcm−2, respectively. · and � indicate the initiation and completion of lightdelivery, respectively. rBFmax(initial) and rBFmin(global) are the respective first peak and global minimumof tumor blood flow during light delivery. Dashed red lines in each plot represents the slope of thedecrease in rBF between rBFmax(initial) and the rBFmin(global), described as the overall flow reduction rate.
During PDT, relative blood flow (rBF(t)) and rBF slope were collected as a function of time. For bothtreatment schemes, PDT commenced with light delivery at 150 mWcm−2. Irradiance was attenuatedto 25 mWcm−2 for BFI-Irrad (exemplified in Figure 3b), or to 0 mWcm−2 for BFI-Frac (exemplifiedin Figure 3c), when the reduction in rBF during PDT was more rapid than a cutoff value of 10% perminute (i.e., when the “time-derivative” of rBF(t) was less than or equal to −10% rBFmin−1). This cutoff
value was selected based on our previous work [11] where we observed rapid tumor regrowth afterPDT (time-to-400 mm3 of <10 days) when flow reduction rate was higher than 10 %rBFmin−1, andsubstantial delay in tumor regrowth when flow reduction rate was less than or equal to 10 %rBFmin−1.If rBF(t) recovered to a value above its level during the baseline period (rBFbaseline), then the irradiancereturned to 150 mWcm−2. At each subsequent instance of a flow decrease of more than 10% rBFmin−1,the irradiance was again attenuated to 25 mWcm−2 (BFI-Irrad) or 0 mWcm−2 (BFI-Frac), and then,the irradiance was returned to 150 mWcm−2 when rBF(t) recovered to above rBFbaseline. Light wasdelivered until a total fluence of 135 Jcm−2 was reached, or, in the case of BFI-Frac, until a maximumtreatment time of 90 min (including light-off time). Figure S1a,b additionally illustrates how temporalfluctuations in rBF (Figure S1a) associate with the slope of its change (Figure S1b); BFI-PDT attenuatedthe irradiance of light delivery when this slope decreased at a rate greater than 10% rBFmin−1.
Several features distinguish the flow reduction rate for BFI-PDT compared to standard PDT.As shown in Figure 2a–c, rBFmin(initial) for standard PDT generally represents the global minimum inrBF (rBFmin(global)) for the entire treatment. By contrast, during BFI-PDT, modulation of light deliveryinterrupts and reverses PDT-induced decreases in rBF. Consequently, rBFmin(global) rarely correspondswith rBFmin(initial) for BFI-PDT. The rBFmin(global) during BFI-PDT often occurs later during treatment,i.e., after illumination has been attenuated or paused at least once per the rules of the BFI platform.

Cancers 2020, 12, 1584 10 of 18
Furthermore, maximum rBF during standard PDT is generally the first peak in rBF after the startof illumination (i.e., rBFmax(initial)), which differs from BFI-PDT because the BFI platform promotesblood flow recovery that may lead to subsequent peaks higher than rBFmax(initial). These differences inblood flow trends during BFI-PDT versus standard PDT provide hemodynamic evidence of a modifiedvascular response during illumination.
3.3. BFI-PDT Decreases Blood Flow Reduction Rate during Light Delivery, While Shortening Treatment Time
Table 1 summarizes the hemodynamic effect (flow reduction rate) and treatment parameters(duration of exposure to each fluence rate) for RIF tumors treated with standard PDT or BFI-PDT.We note that BFI-Irrad and BFI-Frac induced multiple peaks and troughs in rBF during treatment;the hemodynamic effect was quantified as a single overall flow reduction rate, calculated from theslope of decrease between rBFmax(initial) and rBFmin(global), as depicted by the red dotted lines inFigure 3b,c. Median overall flow reduction rate for BFI-Irrad was 5.2% rBFmin−1 and for BFI-Frac was10% rBFmin−1. These values were compared to those of standard conditions. Overall flow reductionrates for BFI-Irrad were lower than those for each of the standard PDT conditions with continuousillumination (p ≤ 0.001). Overall flow reduction rates for BFI-Frac were lower than for 150 mWcm−2
using either continuous or fractionated light (p < 0.001 in each case) but did not differ from 25 mWcm−2
continuous (p = 0.63).We next investigated how BFI-PDT affects treatment length. A total of 90 min was required to
deliver 135 Jcm−2 at 25 mWcm−2-continuous. Median treatment length for BFI-Irrad was 53 min, about59% of the time required for 25 mWcm−2-continuous. During BFI-Irrad, total fluence was dividedabout equally between 150 mWcm−2 and 25 mWcm−2, corresponding to ~15% of the illuminationtime at 150 mWcm−2 and ~85% of the time at 25 mWcm−2. With a median treatment time of 61 min,BFI-Frac took twice as long as for treatment with standard 150 mW/cm2-fractionated (30 min), but lesstime than treatment with 25 mWcm−2-continuous (90 min). Unlike BFI-Irrad, BFI-Frac incorporateslight-off periods. For BFI-Frac, there is no pre-specified maximum time for completion of treatment; ifrBF remains below the pre-PDT baseline value for extensive periods, the desired fluence cannot bedelivered in a reasonable time. For these reasons, BFI-Irrad is more clinically relevant than BFI-Frac.
3.4. BFI-PDT Alters Mechanisms of PDT Effect on Vascular Damage
Tumor vascular perfusion has been studied using techniques such as laser Doppler [5], powerDoppler ultrasound imaging [11] and various histological and other assays [20,51,52]. Here, themechanistic effect of BFI-PDT on vascular damage was studied by assessing ∆rBF at 1 h after PDTmeasured by DCS. We have previously shown that DCS measurements after PDT aligned with thosemeasured by power Doppler [11]. This demonstrates that we are measuring decreases in perfusion as anindication of vascular damage. Vascular congestion develops within 3 h after treatment of RIF tumorswith PDT [51], suggesting that this congestion contributes to the detected decreases in blood flow.
Representative traces show rBF through 1 h after PDT for each treatment scheme (Figure S2a–e).∆rBF was defined as the calculated difference between rBF at 1 h after PDT and rBF at baseline,representing the change in vascular function between these two timepoints. As previouslyshown [53], lower irradiance led to more vascular damage after PDT than did higher irradiance.Among the standard conditions, 25 mWcm−2-continuous (mean ∆rBF of −46%; p < 0.001 and150 mWcm−2-fractionated (−32%; p = 0.018) both resulted in substantially more damage to tumorvasculature than 150 mWcm−2-continuous (+25%). For BFI-PDT, both BFI-Irrad (mean −31%; p = 0.016)and BFI-Frac (−44%; p = 0.002) led to more vascular damage after PDT than 150 mWcm−2-continuous.In contrast, each BFI-PDT scheme resulted in similar mean ∆rBF compared to 25 mWcm−2-continuousor 150 mWcm−2-fractionated PDT (p > 0.05 in each comparison). Thus, PDT produces more vasculardamage than the comparative standard treatment with 150 mWcm−2-continuous.
The effect of BFI-PDT on direct cytotoxicity was assessed by clonogenic assay. Mice wereeuthanized for tumor excisions at timepoints A-E as indicated in Figure 4a. Tumor clonogenicity (log

Cancers 2020, 12, 1584 11 of 18
transformed) for each treatment condition/timepoint is presented in Figure 4b. Compared to control(timepoint A), PDT with 150 mWcm−2-continuous did not reduce tumor clonogenicity. The numberof clonogenic cells/g (mean ± SD) was 1.16 ± 0.35 × 10⁸ for controls and 1.06 ± 0.63 × 10⁸ at theconclusion PDT (timepoint B). Even when tumors were left for an additional 45 min (a time lapse of60 min from the start of illumination; timepoint C), treatment with 150 mWcm−2-continuous did notyield cytotoxicity (mean = 1.61 ± 1.4 × 10⁸). In contrast, compared to controls, both BFI-Irrad andBFI-Frac dramatically reduced the number of clonogenic cells/g to 0.18 ± 0.15 × 10⁸ (p < 0.001) and0.13 ± 0.11 × 10⁸ (p < 0.001), respectively, for tumor assayed immediately upon treatment conclusion(timepoints D and E for BFI-Irrad and BFI-Frac, respectively). Because treatment with BFI-Irrad andBFI-Frac required 53 to 61 min, tumor clonogenicity was compared to that at 60 min after the startof 150 mWcm−2-continuous (timepoint C). At this timepoint, both BFI-Irrad (p < 0.001) and BFI-Frac(p < 0.001) created an additional ~1 log10 of cell kill compared to 150 mWcm−2-continuous. Thus,BFI-PDT was consistently more cytotoxic to tumor cells than 150 mWcm−2-continuous standard PDT.Cancers 2020, 12, x 12 of 19
Figure 4. Tumor clonogenicity and oxygenation for standard photodynamic therapy (PDT) with 150
mWcm−2-continuous or BFI-PDT (BFI-Irradiance or BFI-Fractionated). (a) Timeline of tumor oxygen
tension (pO2) measurement and excision for clonogenic assay. Dark bands indicate periods of 1-
minute phosphorescence lifetime measurements of tumor pO2; labels A-E indicate timepoints at
which mice were euthanized for tumor excision. (b) Tumor clonogenicity for each treatment
condition/timepoint, 6–7 mice per group. Controls (A) received 15 minutes of illumination with 150
mWcm−2-continuous in the absence of photosensitizer administration; this value was similar to that
found for tumors unexposed to light and photosensitizer (log transformed value of 7.9 (0.87 ± 0.3 ×
108) clonogenic cells/g) (c) Tumor oxygenation for each treatment condition/timepoint, 5 mice per
group. Baseline represents the overall pre-PDT tumor pO2 for all mice in conditions A-E (n = 20 mice).
A-E are post-PDT tumor pO2 for each control or treatment scheme. For mice that received
150mWcm−2-continuous illumination, pO2 measurements were taken twice at different timepoints, B
and C, post-PDT as indicated in (a). Statistical differences in log-transformed tumor clonogenicity
were assessed using a one-way ANOVA and in tumor oxygenation by a mixed effects model to
account for repeated measurements on the same animal. The mean for each dataset is indicated by
open circles. * represents groups with statistically significant difference.
Conservation of tumor blood flow by BFI-PDT is expected to maintain tumor oxygenation
during light delivery and thus induce more cytotoxicity compared to standard PDT. To understand
the effect of BFI-PDT on tumor oxygenation, partial oxygen tension was assessed by phosphorescence
lifetime oximetry for 1-minute periods before and after PDT (indicated by the dark bands on Figure
4a). Across all animals, mean tumor oxygenation at baseline was 32.8 mmHg (Figure 4c). After control
(light only) treatment, mean oxygenation levels (32.6 mmHg) were indistinguishable from baseline
values. Compared to control, mean pO2 declined in all experimental groups immediately after
illumination (p < 0.001 for each group). At the conclusion of 150 mWcm−2-continuous illumination,
Figure 4. Tumor clonogenicity and oxygenation for standard photodynamic therapy (PDT) with150 mWcm−2-continuous or BFI-PDT (BFI-Irradiance or BFI-Fractionated). (a) Timeline of tumor oxygentension (pO2) measurement and excision for clonogenic assay. Dark bands indicate periods of 1-minphosphorescence lifetime measurements of tumor pO2; labels A-E indicate timepoints at which micewere euthanized for tumor excision. (b) Tumor clonogenicity for each treatment condition/timepoint,6–7 mice per group. Controls (A) received 15 min of illumination with 150 mWcm−2-continuous in theabsence of photosensitizer administration; this value was similar to that found for tumors unexposedto light and photosensitizer (log transformed value of 7.9 (0.87 ± 0.3 × 10⁸) clonogenic cells/g) (c) Tumoroxygenation for each treatment condition/timepoint, 5 mice per group. Baseline represents the overallpre-PDT tumor pO2 for all mice in conditions A-E (n = 20 mice). A-E are post-PDT tumor pO2 foreach control or treatment scheme. For mice that received 150 mWcm−2-continuous illumination, pO2
measurements were taken twice at different timepoints, B and C, post-PDT as indicated in (a). Statisticaldifferences in log-transformed tumor clonogenicity were assessed using a one-way ANOVA and intumor oxygenation by a mixed effects model to account for repeated measurements on the sameanimal. The mean for each dataset is indicated by open circles. * represents groups with statisticallysignificant difference.

Cancers 2020, 12, 1584 12 of 18
Conservation of tumor blood flow by BFI-PDT is expected to maintain tumor oxygenation duringlight delivery and thus induce more cytotoxicity compared to standard PDT. To understand theeffect of BFI-PDT on tumor oxygenation, partial oxygen tension was assessed by phosphorescencelifetime oximetry for 1-min periods before and after PDT (indicated by the dark bands on Figure 4a).Across all animals, mean tumor oxygenation at baseline was 32.8 mmHg (Figure 4c). After control (lightonly) treatment, mean oxygenation levels (32.6 mmHg) were indistinguishable from baseline values.Compared to control, mean pO2 declined in all experimental groups immediately after illumination(p < 0.001 for each group). At the conclusion of 150 mWcm−2-continuous illumination, mean tumoroxygenation decreased sharply to a mean of 13.3 mmHg, in contrast to more modest declines tomeans of 26.7 mmHg and 25.5 mmHg respectively for BFI-Irrad and BFI-Frac (p < 001 for eachcompared to 150 mW cm−2-continuous). Interestingly, tumor oxygenation recovered over the 45 minafter 150 mWcm−2-continuous to a mean pO2 of 26.2 mmHg at timepoint C (p < 0.001 compared totimepoint B). This reoxygenation likely reflected recovery of tumor blood flow after PDT, as shown inFigure S2a. The acute hypoxia induced by illumination with 150 mWcm−2-continuous could thereforelimit direct cytotoxicity to tumor cells, and spare tumor vasculature.
3.5. BFI-PDT Improves Therapeutic Outcome
Tumor response studies were performed to assess the overall therapeutic value ofBFI-PDT (Figure 5). For RIF-bearing mice treated with 150 mWcm−2-continuous, the mediantime-to-400 mm3 was 11.0 days compared to 19.6 days for 25 mWcm−2-continuous (p = 0.031versus 150 mWcm−2-continuous) and 18 days for 150 mWcm−2-fractionated (p = 0.048 versus150 mWcm−2-continuous (Figure 5a and Table S1)). No animals at 150 mWcm−2-continuous achieved acomplete response compared to 30% (95% confidence interval (CI) of 7–65%) at 25 mWcm−2-continuousand 22% (95% CI of 2–48%) at 150 mWcm−2-fractionated. Importantly, however, standard fractionationwas also associated with morbidity that was not found with either of the continuous treatment schemes.Fractionation promoted high levels of edema and culminated in mortality within several days of PDTfor 25% (95% CI of 5–57%) of animals.
Cancers 2020, 12, x 13 of 19
mean tumor oxygenation decreased sharply to a mean of 13.3 mmHg, in contrast to more modest
declines to means of 26.7 mmHg and 25.5 mmHg respectively for BFI-Irrad and BFI-Frac (p < 001 for
each compared to 150 mW cm−2-continuous). Interestingly, tumor oxygenation recovered over the 45
minutes after 150 mWcm−2-continuous to a mean pO2 of 26.2 mmHg at timepoint C (p < 0.001
compared to timepoint B). This reoxygenation likely reflected recovery of tumor blood flow after
PDT, as shown in Figure S2a. The acute hypoxia induced by illumination with 150 mWcm−2-
continuous could therefore limit direct cytotoxicity to tumor cells, and spare tumor vasculature.
3.5. BFI-PDT Improves Therapeutic Outcome
Tumor response studies were performed to assess the overall therapeutic value of BFI-PDT
(Figure 5). For RIF-bearing mice treated with 150 mWcm−2-continuous, the median time-to-400 mm3
was 11.0 days compared to 19.6 days for 25 mWcm−2-continuous (p = 0.031 versus 150 mWcm−2-
continuous) and 18 days for 150 mWcm−2-fractionated (p = 0.048 versus 150 mWcm−2-continuous
(Figure 5a and Table S1)). No animals at 150 mWcm−2-continuous achieved a complete response
compared to 30% (95% confidence interval (CI) of 7–65%) at 25 mWcm−2-continuous and 22% (95%
CI of 2–48%) at 150 mWcm−2-fractionated. Importantly, however, standard fractionation was also
associated with morbidity that was not found with either of the continuous treatment schemes.
Fractionation promoted high levels of edema and culminated in mortality within several days of PDT
for 25% (95% CI of 5–57%) of animals.
Figure 5. Kaplan Meier survival curves for radiation-induced fibrosarcoma (RIF)-bearing mice treated
using (a) 150 mWcm−2-continuous, 25 mWcm−2-continuous, and standard 150 mWcm−2-fractionated
illumination; (b) BFI-Irradiance and BFI-Fractionated illumination, and for comparison purposes, 150
mWcm−2-continuous is repeated as a solid line on panel b. (c) Kaplan Meier survival curves for murine
mesothelioma tumors (AB12) treated using 150 mWcm−2-continuous, 25 mWcm−2-continuous and BFI-
Irradiance illumination. n = 9–12 mice per group. Differences in the time-to-400 mm3 among groups
were assessed using Gehan-Wilcoxon tests for comparisons to 150 mWcm−2-continuous for RIF tumors
treated with (a) 25 mWcm−2-continuous (p = 0.031) and standard fractionated (p = 0.048) or (b) BFI-Irrad
(p = 0.006) and BFI-Frac (p < 0.002), and for AB12 tumors (c) treated with 25 mWcm−2-continuous (p =
0.021) and BFI-Irrad (p = 0.007).
Both BFI-Irrad and BFI-Frac were more effective than 150 mWcm−2-continuous at inducing a
tumor response. For BFI-Irrad, the median time-to-400 mm3 was 29 days (p = 0.006 versus 150
mWcm−2-continuous) and 40% (95% CI of 12–74.5%) of animals exhibited a complete response (Figure
5b and Table S1). No differences in tumor response were observed for BFI-Irrad versus 25 mWcm−2-
continuous (p = 0.88), but the required treatment time was ~40% shorter for BFI-Irrad than 25
mWcm−2-continuous (see Table 1).
Figure 5. Kaplan Meier survival curves for radiation-induced fibrosarcoma (RIF)-bearing mice treatedusing (a) 150 mWcm−2-continuous, 25 mWcm−2-continuous, and standard 150 mWcm−2-fractionatedillumination; (b) BFI-Irradiance and BFI-Fractionated illumination, and for comparison purposes,150 mWcm−2-continuous is repeated as a solid line on panel b. (c) Kaplan Meier survival curves formurine mesothelioma tumors (AB12) treated using 150 mWcm−2-continuous, 25 mWcm−2-continuousand BFI-Irradiance illumination. n = 9–12 mice per group. Differences in the time-to-400 mm3 amonggroups were assessed using Gehan-Wilcoxon tests for comparisons to 150 mWcm−2-continuousfor RIF tumors treated with (a) 25 mWcm−2-continuous (p = 0.031) and standard fractionated(p = 0.048) or (b) BFI-Irrad (p = 0.006) and BFI-Frac (p < 0.002), and for AB12 tumors (c) treatedwith 25 mWcm−2-continuous (p = 0.021) and BFI-Irrad (p = 0.007).
Both BFI-Irrad and BFI-Frac were more effective than 150 mWcm−2-continuous at inducinga tumor response. For BFI-Irrad, the median time-to-400 mm3 was 29 days (p = 0.006 versus

Cancers 2020, 12, 1584 13 of 18
150 mWcm−2-continuous) and 40% (95% CI of 12–74.5%) of animals exhibited a complete response(Figure 5b and Table S1). No differences in tumor response were observed for BFI-Irrad versus25 mWcm−2-continuous (p = 0.88), but the required treatment time was ~40% shorter for BFI-Irradthan 25 mWcm−2-continuous (see Table 1).
For BFI-Frac, the median time-to-400 mm3 was 39 days and 56% (95% CI of 18–91%) achieveda complete response (p < 0.002 versus 150 mWcm−2-continuous). No differences in tumor responsewere observed for BFI-Frac versus 25 mWcm−2-continuous (p = 0.45). BFI-Frac appeared less acutelytoxic than standard 150 mWcm−2-fractionated illumination. With BFI-Frac, 10% (95% CI of 0–45%) ofanimals experienced a non-acute death (>1 week after PDT), compared to 25% (95% CI of 5–57%) acutedeaths within a week of standard 150 mWcm−2-fractionation.
The benefit of PDT with BFI-PDT was confirmed in the AB12 tumor model (Figure 5c and Table S2).In this model, complete response occurred in 33% (95% CI of 7–71%) for 150 mWcm−2-continuous,89% (95% CI of 52–100%) for 25 mWcm−2-continuous and in 100% (95% CI of 69–100%) for BFI-Irrad.The median survival time was 20 days for 150 mWcm−2-continuous and exceeded 90 days forboth 25 mWcm−2-continuous (p = 0.021) and BFI-Irrad (p = 0.007). Survival times did not differsignificantly for 25 mWcm−2-continuous versus BFI-Irrad (p = 0.29). The median length of treatmentwith BFI-Irrad was ~60% shorter than that required for 25 mWcm−2-continuous. Table 2 summarizesillumination duration and other treatment parameters for AB12 tumors. The median overall flowreduction rate for BFI-Irrad was significantly slower at 6% rBFmin−1 compared to 21% rBFmin−1
for 150 mWcm−2-continuous (p = 0.004) or 13% rBFmin−1 at 25 mWcm−2-continuous (p = 0.04).BFI-Irrad also produced more vascular shutdown at 1 h after PDT (−59% ∆rBF) compared to150 mWcm−2-continuous (−11% ∆rBF) (p = 0.001). Thus, BFI-Irrad PDT produced similar benefit totumor vascular damage, complete response, and treatment length in both RIF and AB12 tumors.
Table 2. For AB12 tumors, flow reduction rate (overall flow reduction rate for BFI-Irrad), treatment length(segregated by time spent at each irradiance), and ∆rBF at 1 h after PDT with 150 mWcm−2-continuous,25 mWcm−2-continuous or BFI-Irrad.
GroupFlow Reduction Rate
(%rBFmin−1)Median (IQR)
Treatment Length in MinutesMedian (IQR)
∆rBF(%) at 1 hafter PDTMean (SD)150 mWcm−2 25 mWcm−2 0 mWcm−2 Total
150 mWcm−2-continuous
20.7 (15.5, 32.6) 15 0 0 15 −10.7 (21.6)
25 mWcm−2-continuous
13.4 (11.9, 16.8) 0 90 0 90 −56.6 (18.6)(p = 0.001 1)
BFI-Irrad 6.0 (3.7, 12.1)(p = 0.004 1, p = 0.04 2)
11(9, 14)
27(9, 36) 0 37
(23, 45)−58.5 (15.3)(p = 0.001 1)
All p-values for pairwise comparisons are adjusted using Tukey’s Honest Significant Difference in determinations 1 forcomparison to 150 mWcm−2-continuous; 2 for comparison to 25 mWcm−2-continuous. AB12: mouse mesotheliomacell line; PDT: photodynamic therapy; rBF: relative blood flow; BFI-Irrad: blood-flow-informed irradiance; BFI-Frac:blood-flow-informed fractionated; IQR: interquartile range; SD: standard deviation.
4. Discussion
The therapeutic effect of PDT depends on the availability of photosensitizer, light and oxygen inthe targeted tissue. Besides total fluence-dependency, irradiance or the incident fluence rate in tissuealso determines treatment efficacy. Foster et al. [16] demonstrated irradiance effects in PDT of tumorspheroids that were subject to equivalent fluences, delivered at different irradiances. These data foundgreater cytotoxicity after PDT at lower irradiances. In murine models, lower irradiances are moreefficient, requiring lower fluence to achieve the same tumor responses than higher irradiances [53].Moreover, other in vivo studies [54,55] also demonstrated that lower irradiances improve PDT outcome.
In the present report we observed continuous illumination with 25 mWcm−2 to be more effectivethan 150 mWcm−2; however, treatment to a therapeutically relevant fluence of 135 Jcm−2 requiressubstantially longer time at 25 mWcm−2 (90 min) than at 150 mWcm−2 (15 min). Initially upon

Cancers 2020, 12, 1584 14 of 18
illumination, tumor blood flow decreased rapidly at high irradiance, in contrast to more gradualchanges at lower irradiance. Rapid decreases could promote hypoxia limiting the therapeutic effect.From these observations, we posited that an interactive approach to light delivery could be guidedin real-time by tumor blood flow, utilizing high irradiance during periods of stable blood flow toprovide time-efficient light delivery, coupled with low irradiance during periods of declining bloodflow to facilitate its recovery. Indeed, results demonstrate that when compared to high irradiancetreatment, BFI-PDT interrupts the PDT-induced decrease in blood flow during illumination, conservestumor oxygenation, increases direct tumor cytotoxicity, and promotes vascular damage after treatment.The tumor damage inflicted by BFI-PDT contributes to significant improvement in long-term therapeuticoutcome compared to high irradiance treatment.
BFI-PDT appears to improve outcome by generating a vascular response similar to that associatedwith low irradiance PDT. Low irradiance is known to promote vascular shutdown after PDT [10,18].Additionally, BFI-PDT improves PDT outcome is through an effect on the direct cytotoxicity ofPDT to tumor cells. Both BFI-Irrad and BFI-Frac are significantly more cytotoxic to tumor cellsthan 150 mWcm−2-continuous, both immediately after illumination and ~60 min after the start ofillumination. Both BFI-PDT conditions preserve tumor oxygenation during treatment comparedto 150 mWcm−2-continuous. Maintenance of tumor blood flow during light delivery appears toensure better supply of oxygen, which, in turn, could contribute to production of more cytotoxic ROSand greater tumor damage. Lower irradiance or light-off cycles during BFI-PDT may also reducephotochemical oxygen consumption, further preserving tumor oxygenation during these treatments.
In studies of fractionated PDT, 150 mWcm−2 illumination was divided into equal 30- second light-onand light-off intervals, producing treatment outcome similar to that achieved by 25 mWcm−2-continuous.However, the benefit of fractionated illumination has been inconsistently demonstrated, with othersfailing to reveal a treatment benefit [56]. These discrepancies may reflect the lack of an informedapproach for fractionation. Choice of irradiance, frequency of light fractions and duration of eachpause could each affect treatment efficacy. Moreover, the tumor control provided by fractionatedillumination in the present study was accompanied by morbidity, resulting in a 25% acute death rate.This is not unexpected, as others have reported high fluence rate illumination could lead to significantmorbidity from the inflammation that it may induce [57,58]. In this study, BFI-Frac guided the insertionof pauses in illumination after rapid decreases in blood flow, allowing treated tissue to re-perfusebefore resuming illumination. The observed complete response rate was better in BFI-Frac comparedto standard fractionated PDT, and importantly, BFI-Frac did not lead to any acute morbidity. BFI-Frachad one delayed morbidity (4 weeks post-PDT) of unknown cause, whereas no morbidities of anykind were associated with BFI-Irrad.
BFI-Frac however does not appear practical in clinical situations. A rapid decline in tumor bloodflow triggers a stop to illumination and thus a pause in treatment. A maximum treatment lengthcannot be defined in advance and treatment may not even be completed if blood flow remains low fora prolonged period. Based on the currently defined parameters for BFI-PDT, BFI-Irrad appears to bethe more valuable treatment platform. However, continued refinement of treatment parameters, suchas the choice of treatment irradiances and the threshold rBF slopes that trigger change in irradiancesemployed for BFI-PDT, are very likely to provide further improvements in response. In this regard,we note that as it is presently applied, the BFI treatment platform demonstrated a capability both totransform noncurative PDT into a treatment with curative potential (in RIF tumors) and to move apotentially curative treatment into a completely curative regimen (in AB12 tumors).
In the present study, we carefully looked at the effect of BFI protocols on major PDT endpointsincluding tumor oxygenation, vascular damage and tumor regrowth. Future work should look atother subtle changes at the vascular and cellular level, such as the effect of BFI-PDT on vascularpermeability. It has been shown that vascular permeability in tumors can be affected by fluence ratemodification, for which it peaked at intermediate to low fluence rates and diminished toward veryhigh and very low fluence rates [13]. The enhancement of tumor permeability can be used to increase

Cancers 2020, 12, 1584 15 of 18
the deposition and accumulation of drugs into tumors. Understanding how PDT treatments withvarying irradiances affect vascular permeability in tumors would be helpful for the optimization ofBFI protocols to enhance these effects. Improving PDT-mediated vascular permeabilization couldpotentially enhance the delivery of chemotherapeutic agents to the tumor, thereby offering addedadvantage to combination strategies.
5. Conclusions
In conclusion, a noninvasive system for real-time monitoring of tumor blood flow during PDTdemonstrated personalized light delivery in an automated fashion. In two murine models, PDT withBFI-Irrad achieved a significantly better treatment outcome than PDT using continuous high irradiance.BFI-PDT provided the desired benefit of achieving a therapeutic response that was similar to that oflow irradiance PDT but required a much shorter treatment time. Ultimately, this research suggests thatthe ability to measure and modulate tumor physiologic properties during illumination for PDT willprovide a means for personalized delivery in clinical applications.
Supplementary Materials: The following are available online at http://www.mdpi.com/2072-6694/12/6/1584/s1,Figure S1: (a) Representative relative blood flow traces of RIF tumor for BFI-Irrad, and (b) the corresponding timederivative/slope of rBF computed in real-time from data in (a), Figure S2: Representative blood flow traces of RIFtumors for the pre-PDT through post-PDT timeframe: (a) 150 mWcm−2 -continuous; (b) 25 mWcm−2-continuous;(c) standard 150 mWcm−2- fractionated illumination; (d) BFI-Irrad; (e) BFI-Frac., Table S1: Summary of median(95% confidence interval) percent of complete response and time-to-400 mm3 for treatments of RIF tumors usingeach of the standard and BFI-PDT illumination schemes., Table S2: Summary of median (95% confidence interval)percent of complete response and time-to-400 mm3 for treatments of AB12 tumors using 150 mWcm−2-continuous,25 mWcm−2-continuous and BFI-Irrad illumination schemes.
Author Contributions: Conceptualization, Y.H.O., A.G.Y., and T.M.B.; methodology, Y.H.O., J.M., M.Y., M.C.,M.E.K., and S.A.V.; software, Y.H.O., and M.C.; formal analysis, Y.H.O., and T.M.B.; validation, M.E.P.; fundingacquisition, T.C.Z., K.A.C., A.G.Y., and T.M.B.; writing—original draft preparation, Y.H.O.; writing—review andediting, All; supervision, T.M.B., A.G.Y., and T.C.Z.; All authors have read and agreed to the published version ofthe manuscript.
Funding: This research was funded by NIH grants R01 CA085831, P01 CA087971, R01 CA236362, R01 NS060653,U24 EB028941 and P41 EB015893. M.E.K acknowledges the support of NIH grant K25 HL145092.
Conflicts of Interest: T.M.B., K.A.C., and T.C.Z. declare roles on the Advisory Board for Simphotek, Inc. The otherauthors declare no conflict of interest.
References
1. Thong, P.; Lee, K.; Toh, H.J.; Dong, J.; Tee, C.S.; Low, K.P.; Chang, P.H.; Bhuvaneswari, R.; Tan, N.C.; Soo, K.C.Early assessment of tumor response to photodynamic therapy using combined diffuse optical and diffusecorrelation spectroscopy to predict treatment outcome. Oncotarget 2017, 8, 19902–19913. [CrossRef] [PubMed]
2. Mroz, P.; Hashmi, J.T.; Huang, Y.Y.; Lange, N.; Hamblin, M.R. Stimulation of anti-tumor immunity byphotodynamic therapy. Expert Rev. Clin. Immunol. 2011, 7, 75–91. [CrossRef] [PubMed]
3. Fingar, V.H.; Wieman, T.J.; Wiehle, S.A.; Cerrito, P.B. The role of microvascular damage in photodynamictherapy: The effect of treatment on vessel constriction, permeability, and leukocyte adhesion. Cancer Res.1992, 52, 4914–4921.
4. Busch, T.M. Local physiological changes during photodynamic therapy. Lasers Surg. Med. 2006, 38, 494–499.[CrossRef] [PubMed]
5. Khurana, M.; Moriyama, E.H.; Mariampillai, A.; Wilson, B.C. Intravital high-resolution optical imaging ofindividual vessel response to photodynamic treatment. J. Biomed. Opt. 2008, 13, 040502. [CrossRef]
6. Wang, W.; Moriyama, L.T.; Bagnato, V.S. Photodynamic therapy induced vascular damage: An overview ofexperimental PDT. Laser Phys. Lett. 2013, 10, 023001. [CrossRef]
7. Rohrbach, D.J.; Tracy, E.C.; Walker, J.; Baumann, H.; Sunar, U. Blood flow dynamics during local photoreactionin a head and neck tumor model. Front. Phys. 2015, 3, 13. [CrossRef]

Cancers 2020, 12, 1584 16 of 18
8. Yu, G.; Durduran, T.; Zhou, C.; Zhu, T.C.; Finlay, J.C.; Busch, T.M.; Malkowicz, S.B.; Hahn, S.M.; Yodh, A.G.Real-time in situ monitoring of human prostate photodynamic therapy with diffuse light. Photochem. Photobiol.2006, 82, 1279–1284. [CrossRef] [PubMed]
9. Becker, T.L.; Paquette, A.D.; Keymel, K.R.; Henderson, B.W.; Sunar, U. Monitoring blood flow responsesduring topical ALA-PDT. Biomed. Opt. Express 2010, 2, 123–130. [CrossRef] [PubMed]
10. Busch, T.M.; Xing, X.; Yu, G.; Yodh, A.; Wileyto, E.P.; Wang, H.W.; Durduran, T.; Zhu, T.C.; Wang, K.K. Fluencerate-dependent intratumor heterogeneity in physiologic and cytotoxic responses to Photofrin photodynamictherapy. Photochem. Photobiol. Sci. 2009, 8, 1683–1693. [CrossRef]
11. Yu, G.; Durduran, T.; Zhou, C.; Wang, H.W.; Putt, M.E.; Saunders, H.M.; Sehgal, C.M.; Glatstein, E.; Yodh, A.G.;Busch, T.M. Noninvasive monitoring of murine tumor blood flow during and after photodynamic therapyprovides early assessment of therapeutic efficacy. Clin. Cancer Res. 2005, 11, 3543–3552. [CrossRef]
12. Busch, T.M.; Wileyto, E.P.; Emanuele, M.J.; Del Piero, F.; Marconato, L.; Glatstein, E.; Koch, C.J. PhotodynamicTherapy Creates Fluence Rate-dependent Gradients in the Intratumoral Spatial Distribution of Oxygen.Cancer Res. 2002, 62, 7273. [PubMed]
13. Henderson, B.W.; Busch, T.M.; Snyder, J.W. Fluence rate as a modulator of PDT mechanisms. Lasers Surg.Med. 2006, 38, 489–493. [CrossRef] [PubMed]
14. Angell-Petersen, E.; Spetalen, S.; Madsen, S.J.; Sun, C.-H.; Peng, Q.; Carper, S.W.; Sioud, M.; Hirschberg, H.Influence of light fluence rate on the effects of photodynamic therapy in an orthotopic rat glioma model.J. Neurosurg. 2006, 104, 109–117. [CrossRef] [PubMed]
15. Rizvi, I.; Anbil, S.; Alagic, N.; Celli, J.; Zheng, L.Z.; Palanisami, A.; Glidden, M.D.; Pogue, B.W.; Hasan, T.PDT dose parameters impact tumoricidal durability and cell death pathways in a 3D ovarian cancer model.Photochem. Photobiol. 2013, 89, 942–952. [CrossRef]
16. Foster, T.H.; Hartley, D.F.; Nichols, M.G.; Hilf, R. Fluence rate effects in photodynamic therapy of multicelltumor spheroids. Cancer Res. 1993, 53, 1249–1254.
17. Guo, H.W.; Lin, L.T.; Chen, P.H.; Ho, M.H.; Huang, W.T.; Lee, Y.J.; Chiou, S.H.; Hsieh, Y.S.; Dong, C.Y.;Wang, H.W. Low-fluence rate, long duration photodynamic therapy in glioma mouse model using organiclight emitting diode (OLED). Photodiagnosis Photodyn. Ther. 2015, 12, 504–510. [CrossRef]
18. Seshadri, M.; Bellnier, D.A.; Vaughan, L.A.; Spernyak, J.A.; Mazurchuk, R.; Foster, T.H.; Henderson, B.W. Lightdelivery over extended time periods enhances the effectiveness of photodynamic therapy. Clin. Cancer Res. 2008,14, 2796–2805. [CrossRef]
19. Busch, T.M.; Wang, H.W.; Wileyto, E.P.; Yu, G.; Bunte, R.M. Increasing damage to tumor blood vessels duringmotexafin lutetium-PDT through use of low fluence rate. Radiat. Res. 2010, 174, 331–340. [CrossRef]
20. Sitnik, T.M.; Hampton, J.A.; Henderson, B.W. Reduction of tumour oxygenation during and afterphotodynamic therapy in vivo: Effects of fluence rate. Br. J. Cancer 1998, 77, 1386–1394. [CrossRef]
21. Iinuma, S.; Schomacker, K.T.; Wagnieres, G.; Rajadhyaksha, M.; Bamberg, M.; Momma, T.; Hasan, T. In vivofluence rate and fractionation effects on tumor response and photobleaching: Photodynamic therapy withtwo photosensitizers in an orthotopic rat tumor model. Cancer Res. 1999, 59, 6164–6170. [PubMed]
22. de Bruijn, H.S.; Brooks, S.; van der Ploeg-van den Heuvel, A.; Ten Hagen, T.L.; de Haas, E.R.; Robinson, D.J.Light Fractionation Significantly Increases the Efficacy of Photodynamic Therapy Using BF-200 ALA inNormal Mouse Skin. PLoS ONE 2016, 11, e0148850. [CrossRef] [PubMed]
23. de Bruijn, H.S.; van der Veen, N.; Robinson, D.J.; Star, W.M. Improvement of systemic 5-aminolevulinicacid-based photodynamic therapy in vivo using light fractionation with a 75-min interval. Cancer Res. 1999,59, 901–904. [PubMed]
24. de Haas, E.R.; Kruijt, B.; Sterenborg, H.J.; Martino Neumann, H.A.; Robinson, D.J. Fractionated illuminationsignificantly improves the response of superficial basal cell carcinoma to aminolevulinic acid photodynamictherapy. J. Investig. Dermatol. 2006, 126, 2679–2686. [CrossRef]
25. de Vijlder, H.C.; Sterenborg, H.J.; Neumann, H.A.; Robinson, D.J.; de Haas, E.R. Light fractionationsignificantly improves the response of superficial basal cell carcinoma to aminolaevulinic acid photodynamictherapy: Five-year follow-up of a randomized, prospective trial. Acta Derm. Venereol. 2012, 92, 641–647.[CrossRef]
26. van der Veen, N.; Hebeda, K.M.; de Bruijn, H.S.; Star, W.M. Photodynamic effectiveness andvasoconstriction in hairless mouse skin after topical 5-aminolevulinic acid and single- or two-fold illumination.Photochem. Photobiol. 1999, 70, 921–929. [CrossRef]

Cancers 2020, 12, 1584 17 of 18
27. Pogue, B.W.; Hasan, T. A theoretical study of light fractionation and dose-rate effects in photodynamictherapy. Radiat. Res. 1997, 147, 551–559. [CrossRef]
28. Muller, S.; Walt, H.; Dobler-Girdziunaite, D.; Fiedler, D.; Haller, U. Enhanced photodynamic effects usingfractionated laser light. J. Photochem. Photobiol. B 1998, 42, 67–70. [CrossRef]
29. Estevez, J.P.; Ascencio, M.; Colin, P.; Farine, M.O.; Collinet, P.; Mordon, S. Continuous or fractionatedphotodynamic therapy? Comparison of three PDT schemes for ovarian peritoneal micrometastasis treatmentin a rat model. Photodiagnosis Photodyn. Ther. 2010, 7, 251–257. [CrossRef]
30. Ascencio, M.; Estevez, J.P.; Delemer, M.; Farine, M.O.; Collinet, P.; Mordon, S. Comparison of continuous andfractionated illumination during hexaminolaevulinate-photodynamic therapy. Photodiagnosis Photodyn. Ther.2008, 5, 210–216. [CrossRef]
31. Xiao, Z.; Halls, S.; Dickey, D.; Tulip, J.; Moore, R.B. Fractionated versus standard continuous light delivery ininterstitial photodynamic therapy of dunning prostate carcinomas. Clin. Cancer Res. 2007, 13, 7496–7505.[CrossRef]
32. Durduran, T.; Yodh, A.G. Diffuse correlation spectroscopy for non-invasive, micro-vascular cerebral bloodflow measurement. Neuroimage 2014, 85, 51–63. [CrossRef]
33. Favilla, C.G.; Mesquita, R.C.; Mullen, M.; Durduran, T.; Lu, X.; Kim, M.N.; Minkoff, D.L.; Kasner, S.E.;Greenberg, J.H.; Yodh, A.G.; et al. Optical bedside monitoring of cerebral blood flow in acute ischemic strokepatients during head-of-bed manipulation. Stroke 2014, 45, 1269–1274. [CrossRef]
34. Busch, D.R.; Rusin, C.G.; Miller-Hance, W.; Kibler, K.; Baker, W.B.; Heinle, J.S.; Fraser, C.D.; Yodh, A.G.;Licht, D.J.; Brady, K.M. Continuous cerebral hemodynamic measurement during deep hypothermic circulatoryarrest. Biomed. Opt. Express 2016, 7, 3461–3470. [CrossRef]
35. Shang, Y.; Gurley, K.; Yu, G. Diffuse Correlation Spectroscopy (DCS) for Assessment of Tissue Blood Flow inSkeletal Muscle: Recent Progress. Anat. Physiol. 2013, 3, 128.
36. Yu, G.; Floyd, T.F.; Durduran, T.; Zhou, C.; Wang, J.; Detre, J.A.; Yodh, A.G. Validation of diffuse correlationspectroscopy for muscle blood flow with concurrent arterial spin labeled perfusion MRI. Opt. Express 2007,15, 1064–1075. [CrossRef]
37. Cochran, J.M.; Chung, S.H.; Leproux, A.; Baker, W.B.; Busch, D.R.; DeMichele, A.M.; Tchou, J.; Tromberg, B.J.;Yodh, A.G. Longitudinal optical monitoring of blood flow in breast tumors during neoadjuvant chemotherapy.Phys. Med. Biol. 2017, 62, 4637–4653. [CrossRef]
38. Dong, L.; Kudrimoti, M.; Cheng, R.; Shang, Y.; Johnson, E.L.; Stevens, S.D.; Shelton, B.J.; Yu, G. Noninvasivediffuse optical monitoring of head and neck tumor blood flow and oxygenation during radiation delivery.Biomed. Opt. Express 2012, 3, 259–272. [CrossRef]
39. Mesquita, R.C.; Han, S.W.; Miller, J.; Schenkel, S.S.; Pole, A.; Esipova, T.V.; Vinogradov, S.A.; Putt, M.E.;Yodh, A.G.; Busch, T.M. Tumor blood flow differs between mouse strains: Consequences for vasoresponse tophotodynamic therapy. PLoS ONE 2012, 7, e37322. [CrossRef]
40. Ong, Y.H.; Dimofte, A.; Kim, M.M.; Finlay, J.C.; Sheng, T.; Singhal, S.; Cengel, K.A.; Yodh, A.G.; Busch, T.M.;Zhu, T.C. Reactive Oxygen Species Explicit Dosimetry for Photofrin-mediated Pleural Photodynamic Therapy.Photochem. Photobiol. 2020, 96, 340–348. [CrossRef]
41. Li, L.B.; Luo, R.C. Effect of drug-light interval on the mode of action of Photofrin photodynamic therapy in amouse tumor model. Lasers Med. Sci. 2009, 24, 597–603. [CrossRef]
42. Allison, R.R.; Moghissi, K. Photodynamic Therapy (PDT): PDT Mechanisms. Clin. Endosc. 2013, 46, 24–29.[CrossRef]
43. Hsieh, Y.J.; Yu, J.S.; Lyu, P.C. Characterization of photodynamic therapy responses elicited in A431 cellscontaining intracellular organelle-localized photofrin. J. Cell. Biochem. 2010, 111, 821–833. [CrossRef]
44. Shafirstein, G.; Bellnier, D.A.; Oakley, E.; Hamilton, S.; Habitzruther, M.; Tworek, L.; Hutson, A.; Spernyak, J.A.;Sexton, S.; Curtin, L.; et al. Irradiance controls photodynamic efficacy and tissue heating in experimentaltumours: Implication for interstitial PDT of locally advanced cancer. Br. J. Cancer 2018, 119, 1191–1199.[CrossRef]
45. Buckley, E.M.; Parthasarathy, A.B.; Grant, P.E.; Yodh, A.G.; Franceschini, M.A. Diffuse correlation spectroscopyfor measurement of cerebral blood flow: Future prospects. Neurophotonics 2014, 1, 011009. [CrossRef]
46. Durduran, T.; Choe, R.; Baker, W.B.; Yodh, A.G. Diffuse optics for tissue monitoring and tomography.Rep. Prog. Phys. 2010, 73, 076701. [CrossRef]

Cancers 2020, 12, 1584 18 of 18
47. Wang, H.-W.; Rickter, E.; Yuan, M.; Wileyto, E.P.; Glatstein, E.; Yodh, A.; Busch*, T.M. Effect of PhotosensitizerDose on Fluence Rate Responses to Photodynamic Therapy. Photochem. Photobiol. 2007, 83, 1040–1048.[CrossRef]
48. Esipova, T.V.; Karagodov, A.; Miller, J.; Wilson, D.F.; Busch, T.M.; Vinogradov, S.A. Two New “Protected”Oxyphors for Biological Oximetry: Properties and Application in Tumor Imaging. Anal. Chem. 2011, 83,8756–8765. [CrossRef]
49. Gallagher-Colombo, S.M.; Miller, J.; Cengel, K.A.; Putt, M.E.; Vinogradov, S.A.; Busch, T.M. ErlotinibPretreatment Improves Photodynamic Therapy of Non–Small Cell Lung Carcinoma Xenografts via MultipleMechanisms. Cancer Res. 2015, 75, 3118–3126. [CrossRef]
50. Harrington, D.P.; Fleming, T.R. A Class of Rank Test Procedures for Censored Survival Data. Biometrika 1982,69, 553–566. [CrossRef]
51. Maas, A.L.; Carter, S.L.; Wileyto, E.P.; Miller, J.; Yuan, M.; Yu, G.; Durham, A.C.; Busch, T.M. Tumor VascularMicroenvironment Determines Responsiveness to Photodynamic Therapy. Cancer Res. 2012, 72, 2079.[CrossRef]
52. Engbrecht, B.W.; Menon, C.; Kachur, A.V.; Hahn, S.M.; Fraker, D.L. Photofrin-mediated PhotodynamicTherapy Induces Vascular Occlusion and Apoptosis in a Human Sarcoma Xenograft Model. Cancer Res. 1999,59, 4334. [PubMed]
53. Sitnik, T.M.; Henderson, B.W. The effect of fluence rate on tumor and normal tissue responses to photodynamictherapy. Photochem. Photobiol. 1998, 67, 462–466. [CrossRef]
54. Feins, R.H.; Hilf, R.; Ross, H.; Gibson, S.L. Photodynamic therapy for human malignant mesothelioma in thenude mouse. J. Surg. Res. 1990, 49, 311–314. [CrossRef]
55. Gibson, S.L.; Foster, T.H.; Feins, R.H.; Raubertas, R.F.; Fallon, M.A.; Hilf, R. Effects of photodynamic therapyon xenografts of human mesothelioma and rat mammary carcinoma in nude mice. Br. J. Cancer 1994, 69,473–481. [CrossRef]
56. Babilas, P.; Schacht, V.; Liebsch, G.; Wolfbeis, O.S.; Landthaler, M.; Szeimies, R.M.; Abels, C. Effects of lightfractionation and different fluence rates on photodynamic therapy with 5-aminolaevulinic acid in vivo.Br. J. Cancer 2003, 88, 1462–1469. [CrossRef]
57. Francois, A.; Salvadori, A.; Bressenot, A.; Bezdetnaya, L.; Guillemin, F.; D’Hallewin, M.A. How to avoidlocal side effects of bladder photodynamic therapy: Impact of the fluence rate. J. Urol. 2013, 190, 731–736.[CrossRef]
58. Tetard, M.C.; Vermandel, M.; Leroy, H.A.; Leroux, B.; Maurage, C.A.; Lejeune, J.P.; Mordon, S.; Reyns, N.Interstitial 5-ALA photodynamic therapy and glioblastoma: Preclinical model development and preliminaryresults. Photodiagnosis Photodyn. Ther. 2016, 13, 218–224. [CrossRef]
© 2020 by the authors. Licensee MDPI, Basel, Switzerland. This article is an open accessarticle distributed under the terms and conditions of the Creative Commons Attribution(CC BY) license (http://creativecommons.org/licenses/by/4.0/).