Conference series - Semantic Scholar
12
International Journal of Science and Applied Science: Conference Series P-ISSN: 2549-4635 Int. J. Sci. Appl. Sci.: Conf. Ser., Vol. 2 No. 1 (2017) E-ISSN: 2549-4627 International Conference on Science and Applied Science 2017 doi: 10.20961/ijsascs.v2i1.16680 60 Analytical Hierarchy Process (AHP), Fuzzy AHP, and TOPSIS for Determining Bridge Maintenance Priority Scale in Banjarsari, Surakarta Ayu Intan Nurani 1 , Astri Tamara Pramudyaningrum 2 , Shofie Rizqi Fadhila 3 , Senot Sangadji 4 , Widi Hartono 5 Civil Engineering Program Sebelas Maret University, Jl. Ir. Sutami 36A Kentingan Jebres Surakarta 57126, INDONESIA [email protected] Abstract. Data on 2015 [9] show that less than 50 percent of provincial and local level bridges in Central Java are in good condition. In the other hand, it has been reported that local bridges in the city of Surakarta have been deteriorated and damaged. The maintenance and rehabilitation action often done based solely on incidental reports without systematic planning. Analytical Hierarchy Process, Fuzzy Analytical Hierarchy Process, and Technique for Order Preference by Similarity to Ideal Solution (TOPSIS) were used to compare the priority scale of bridge management in Kecamatan (District) Banjarsari, Surakarta. Bridge Management System 1993 (BMS 1993) standard was used to quantify bridge damage condition by means of direct visual observation. Scores used in this 3 different analysis were determined by comparing aforementioned 2 criteria and 9 sub criteria. Accordingly, criteria and subcriteria defined in this paper were based on the standard. The criteria employed were bridge damage condition and average daily traffic (ADT). Bridge condition criteria were then divided further into sub criteria; i.e. river stream, safety support building, foundation, pier, girder system, parapet, floor system, expansion joint, and other property. From 11 bridges considered in this study, Maris Bridge has the highest pirority determined in 3 different methods. AHP and TOPSIS methods show Ringin Semar Bridge the lowest priority to maintain. On the other hand, Fuzzy AHP determines Balapan Bridge as the lowest order. Keyword: Bridge Management, BMS 1993, AHP, FAHP, TOPSIS. 1. Introduction Bridge examination and maintenance is a process of Bridge Management System which includes routine maintenance intervals to give a better monitoring system and control maintenance. Data on 2015 [9] show that less than 50 percent of provincial and local level bridges in Central Java are in good condition. In the other hand, it has been reported that local bridges in the city of Surakarta have been deteriorated and damaged. Yet, there is no effective and efficient maintenance program handling the problem. The condition limit of the bridge can be exceeded early due to damage of main elements. Unplanned and insindental maintenance has the potential to disrupt the flow of traffic and significantly increase the cost of road users. By studying the method of bridge management for the assessment of the condition of the bridge it is expected to assist in developing a good bridge management system. [13]. The maintenance and rehabilitation action in Surakarta often done based solely on incidental reports without
-
Upload
khangminh22 -
Category
Documents
-
view
0 -
download
0
Transcript of Conference series - Semantic Scholar

International Journal of Science and Applied Science: Conference Series P-ISSN: 2549-4635
Int. J. Sci. Appl. Sci.: Conf. Ser., Vol. 2 No. 1 (2017) E-ISSN: 2549-4627
International Conference on Science and Applied Science 2017 doi: 10.20961/ijsascs.v2i1.16680
60
Analytical Hierarchy Process (AHP), Fuzzy AHP, and
TOPSIS for Determining Bridge Maintenance Priority
Scale in Banjarsari, Surakarta
Ayu Intan Nurani1, Astri Tamara Pramudyaningrum
2, Shofie Rizqi Fadhila
3,
Senot Sangadji4, Widi Hartono
5
Civil Engineering Program Sebelas Maret University,
Jl. Ir. Sutami 36A Kentingan Jebres Surakarta 57126, INDONESIA
Abstract. Data on 2015 [9] show that less than 50 percent of provincial and local
level bridges in Central Java are in good condition. In the other hand, it has been
reported that local bridges in the city of Surakarta have been deteriorated and
damaged. The maintenance and rehabilitation action often done based solely on
incidental reports without systematic planning. Analytical Hierarchy Process,
Fuzzy Analytical Hierarchy Process, and Technique for Order Preference by
Similarity to Ideal Solution (TOPSIS) were used to compare the priority scale of
bridge management in Kecamatan (District) Banjarsari, Surakarta. Bridge
Management System 1993 (BMS 1993) standard was used to quantify bridge
damage condition by means of direct visual observation. Scores used in this 3
different analysis were determined by comparing aforementioned 2 criteria and 9
sub criteria. Accordingly, criteria and subcriteria defined in this paper were based
on the standard. The criteria employed were bridge damage condition and average
daily traffic (ADT). Bridge condition criteria were then divided further into sub
criteria; i.e. river stream, safety support building, foundation, pier, girder system,
parapet, floor system, expansion joint, and other property. From 11 bridges
considered in this study, Maris Bridge has the highest pirority determined in 3
different methods. AHP and TOPSIS methods show Ringin Semar Bridge the
lowest priority to maintain. On the other hand, Fuzzy AHP determines Balapan
Bridge as the lowest order. Keyword: Bridge Management, BMS 1993, AHP,
FAHP, TOPSIS.
1. Introduction
Bridge examination and maintenance is a process of Bridge Management System which
includes routine maintenance intervals to give a better monitoring system and control
maintenance. Data on 2015 [9] show that less than 50 percent of provincial and local
level bridges in Central Java are in good condition. In the other hand, it has been
reported that local bridges in the city of Surakarta have been deteriorated and damaged.
Yet, there is no effective and efficient maintenance program handling the problem.
The condition limit of the bridge can be exceeded early due to damage of main
elements. Unplanned and insindental maintenance has the potential to disrupt the flow
of traffic and significantly increase the cost of road users. By studying the method of
bridge management for the assessment of the condition of the bridge it is expected to
assist in developing a good bridge management system. [13]. The maintenance and
rehabilitation action in Surakarta often done based solely on incidental reports without

International Journal of Science and Applied Science: Conference Series http://jurnal.uns.ac.id/ijsascs
Int. J. Sci. Appl. Sci.: Conf. Ser., Vol. 2 No. 1 (2017) doi: 10.20961/ijsascs.v2i1.16680
61
systematic planning. Further, data inaccuracies make the bridge maintenance at local
level even ineffective without appropriate resources allocation. The government of the
city of Surakarta was fully aware of the problem and needs decision making support
system for systematic and rational maintenance and rehabilitation program of local
bridges. Maintenance done be gave a hope that all the in Indonesia will be effective and
the purpose of an examination this Bridge was to convince that bridges are working
safely and the need for held a certain action to the maintenance and repair of
periodically of maintenance in bridge any very important to therefore condition bridge
is staying on its function [5].
This study investigates condition assessment on 11 bridges in Banjarsari, owned by
Surakarta City Government as starting point to set priority for their efficient
maintenance. Condition assessment was performed by means of the Bridge
Management System (BMS) standard while priority analysis utilized the Analytical
Hierarchy Process (AHP) method, fuzzy logic (Fuzzy AHP), and TOPSIS.
Bridge Management System 1993 (BMS 1993) standard was used to quantify bridge
damage condition by means of direct visual observation. Accordingly, criteria and
subcriteria defined in this paper were based on the standard. In this study, only
comparisons of priority scale compilations between AHP, Fuzzy AHP, and TOPSIS
were then compared
2. Methodology
2.1. Research Object
There are 11 bridges chosen in Banjarsari, Surakarta for analysis. These bridges were
recapitulated in table 1.
Table 1. Bridges List
No. Street Bridge Name
1 Jl. Walanda Maramis Maris
2 Jl. Adi Sumarmo Komplang
3 Jl. Letjen S. Parman Pasar Legi
4 Jl. Monginsidi Ringin Semar
5 Jl. Sutan Syahrir Ngebrusan
6 Jl. Letjen Sutoyo Ngemplak
7 Jl. Kusumoyudan Setabelan
8 Jl. D.I. Panjaitan Rejosari
9 Jl. Dr. Setia Budi Munggung
10 Jl. Gadjah Mada Balapan
11 Jl. Letjen Sutoyo Nayu Ngemplak
2.2. Data Collection
Primary data is data obtained from direct observation from the field. In this study,
primary data consists of two types: primary data for analysis with BMS method and data
for analysis of AHP and FAHP methods. Primary data for BMS analysis were obtained
from the assessment of the condition of bridge elements and components visually in the
study sites. Assessment refers to the bridge inspection form based on BMS standards.
International Journal of Science and Applied Science: Conference Series http://jurnal.uns.ac.id/ijsascs
Int. J. Sci. Appl. Sci.: Conf. Ser., Vol. 2 No. 1 (2017) doi: 10.20961/ijsascs.v2i1.16680
62
For analysis, AHP and FAHP method required data from purposive questionnaires
given to respondents. Target respondents are stakeholders who have work experience in
the field of bridge maintenance. The respondents were ten officers and engineers from
the Department of Public Works Surakarta and the Technical Executing Agency of Bina
Marga Surakarta. Scores given by respondents are recapitulated on table 2.
Secondary data is supporting data obtained from an intermediate medium or
reference. These data were obtained from Public Works Department of Central Java
Province, namely road map and daily traffic data report. Saaty (2008) assigns a
quantitative scale of 1 (one) to 9 (nine) to assess the comparative importance of an
element to another.
Tabl 2. Scale of Relatives Importances [12]
Importance Scale Definition
1 Equal importance
3 Weak importance of one over another
5 Essential or strong importance
7 Demonstrated importance
9 Absolute importance
2,4,6,8 Intermediate values between two adjacent judgments
Reciprocals
If activity i has one of the above nonzero numbers assigned to it
when compared with activity j, then j has the reciprocal value when
compared with i.
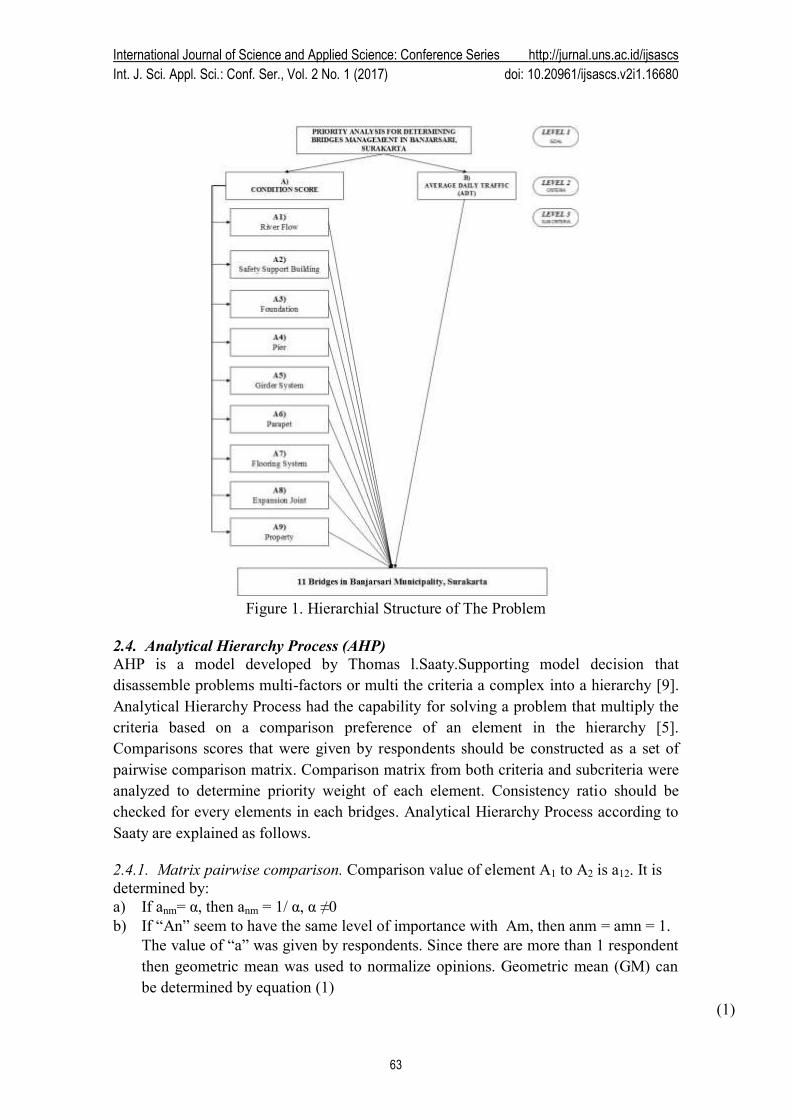
2.3. Hierarchy Structure
Criteria and subcriteria defined in this paper were based on BMS 1993 standard. The
criteria employed were bridge damage condition (A) and average daily traffic (ADT)
(B). Bridge condition criteria were then divided further into sub criteria; i.e. river stream
(A1), safety support building (A2), foundation (A3), pier (A4), girder system (A5),
parapet (A6), floor system (A7), expansion joint (A8), and other property (A9). The
hierarchy structure consists of criteria and subcriteria of this problem is shown in Figure
1.
International Journal of Science and Applied Science: Conference Series http://jurnal.uns.ac.id/ijsascs
Int. J. Sci. Appl. Sci.: Conf. Ser., Vol. 2 No. 1 (2017) doi: 10.20961/ijsascs.v2i1.16680
63
Figure 1. Hierarchial Structure of The Problem
2.4. Analytical Hierarchy Process (AHP)
AHP is a model developed by Thomas l.Saaty.Supporting model decision that
disassemble problems multi-factors or multi the criteria a complex into a hierarchy [9].
Analytical Hierarchy Process had the capability for solving a problem that multiply the
criteria based on a comparison preference of an element in the hierarchy [5].
Comparisons scores that were given by respondents should be constructed as a set of
pairwise comparison matrix. Comparison matrix from both criteria and subcriteria were
analyzed to determine priority weight of each element. Consistency ratio should be
checked for every elements in each bridges. Analytical Hierarchy Process according to
Saaty are explained as follows.
2.4.1. Matrix pairwise comparison. Comparison value of element A1 to A2 is a12. It is
determined by:
a) If anm= α, then anm = 1/ α, α ≠0
b) If “An” seem to have the same level of importance with Am, then anm = amn = 1.
The value of “a” was given by respondents. Since there are more than 1 respondent
then geometric mean was used to normalize opinions. Geometric mean (GM) can
be determined by equation (1)
(1)
International Journal of Science and Applied Science: Conference Series http://jurnal.uns.ac.id/ijsascs
Int. J. Sci. Appl. Sci.: Conf. Ser., Vol. 2 No. 1 (2017) doi: 10.20961/ijsascs.v2i1.16680
64
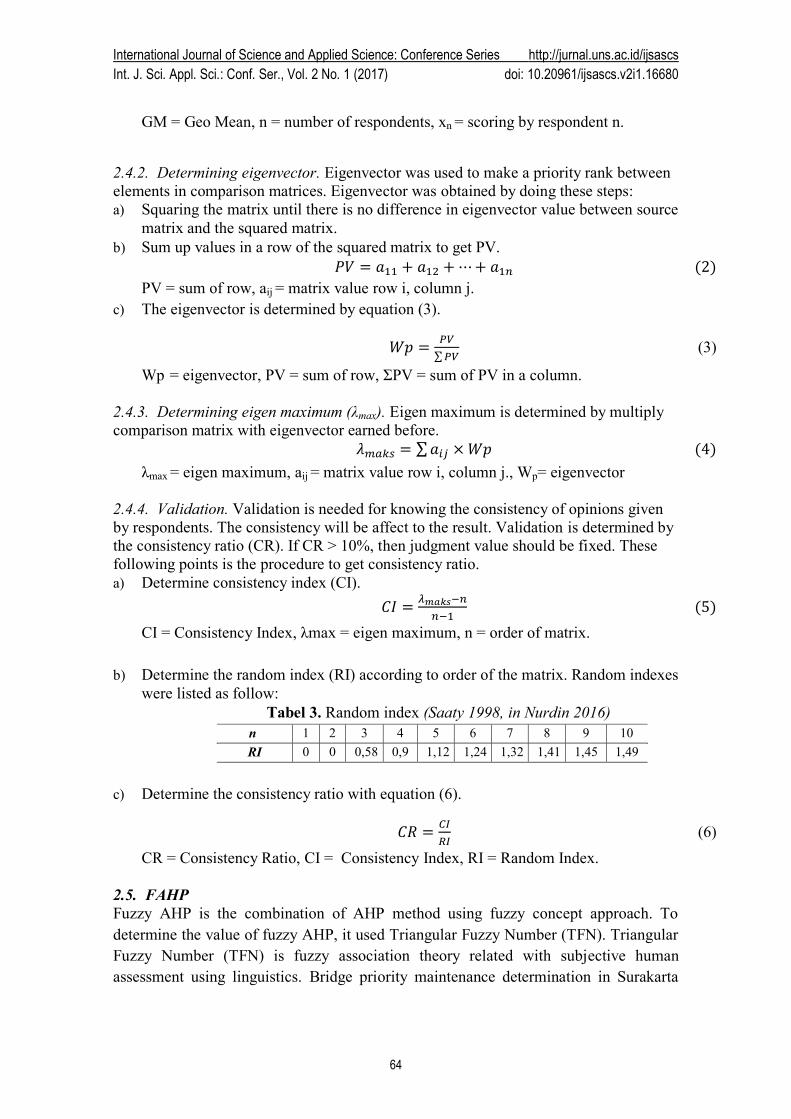
GM = Geo Mean, n = number of respondents, xn = scoring by respondent n.
2.4.2. Determining eigenvector. Eigenvector was used to make a priority rank between
elements in comparison matrices. Eigenvector was obtained by doing these steps:
a) Squaring the matrix until there is no difference in eigenvector value between source
matrix and the squared matrix.
b) Sum up values in a row of the squared matrix to get PV.
𝑃𝑉 = 𝑎11 + 𝑎12 + ⋯+ 𝑎1𝑛 (2)
PV = sum of row, aij = matrix value row i, column j.
c) The eigenvector is determined by equation (3).
𝑊𝑝 =𝑃𝑉
∑𝑃𝑉 (3)
Wp = eigenvector, PV = sum of row, ΣPV = sum of PV in a column.
2.4.3. Determining eigen maximum (λmax). Eigen maximum is determined by multiply
comparison matrix with eigenvector earned before.
𝜆𝑚𝑎𝑘𝑠 = ∑𝑎𝑖𝑗 × 𝑊𝑝 (4)
λmax = eigen maximum, aij = matrix value row i, column j., Wp= eigenvector
2.4.4. Validation. Validation is needed for knowing the consistency of opinions given
by respondents. The consistency will be affect to the result. Validation is determined by
the consistency ratio (CR). If CR > 10%, then judgment value should be fixed. These
following points is the procedure to get consistency ratio.
a) Determine consistency index (CI).
𝐶𝐼 =𝜆𝑚𝑎𝑘𝑠−𝑛
𝑛−1 (5)
CI = Consistency Index, λmax = eigen maximum, n = order of matrix.
b) Determine the random index (RI) according to order of the matrix. Random indexes
were listed as follow:
Tabel 3. Random index (Saaty 1998, in Nurdin 2016)
n 1 2 3 4 5 6 7 8 9 10
RI 0 0 0,58 0,9 1,12 1,24 1,32 1,41 1,45 1,49
c) Determine the consistency ratio with equation (6).
𝐶𝑅 =𝐶𝐼
𝑅𝐼 (6)
CR = Consistency Ratio, CI = Consistency Index, RI = Random Index.
2.5. FAHP
Fuzzy AHP is the combination of AHP method using fuzzy concept approach. To
determine the value of fuzzy AHP, it used Triangular Fuzzy Number (TFN). Triangular
Fuzzy Number (TFN) is fuzzy association theory related with subjective human
assessment using linguistics. Bridge priority maintenance determination in Surakarta
International Journal of Science and Applied Science: Conference Series http://jurnal.uns.ac.id/ijsascs
Int. J. Sci. Appl. Sci.: Conf. Ser., Vol. 2 No. 1 (2017) doi: 10.20961/ijsascs.v2i1.16680
65
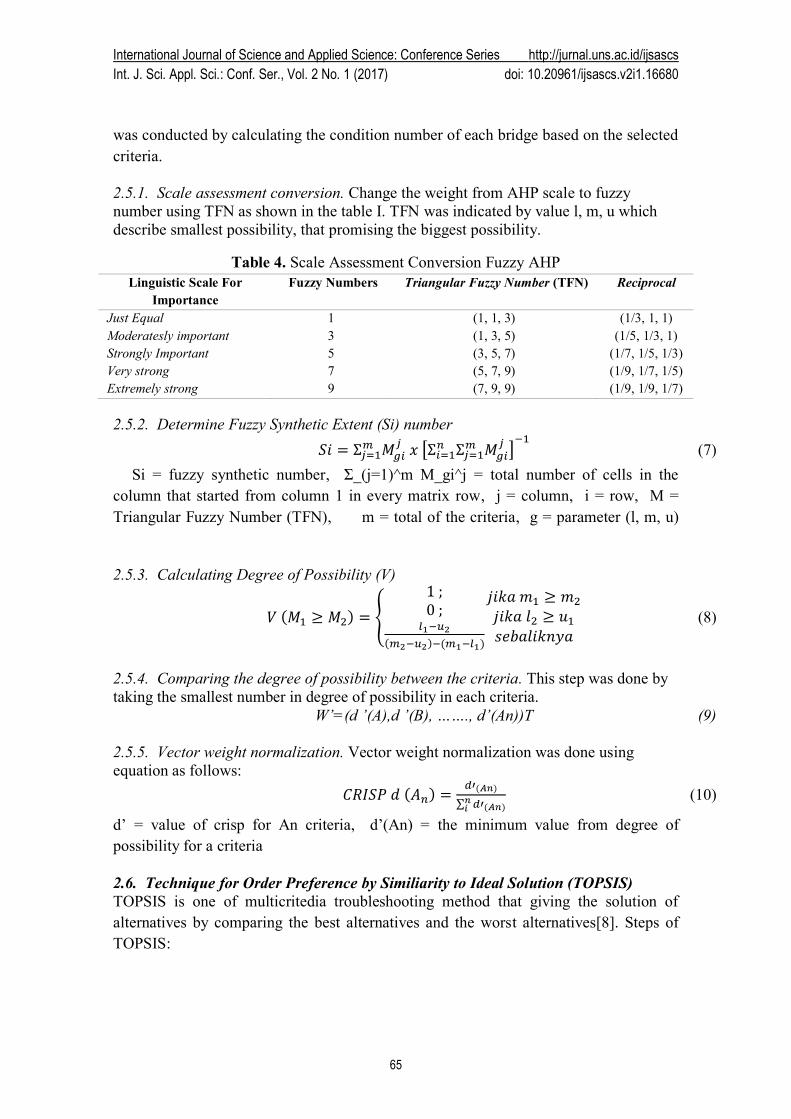
was conducted by calculating the condition number of each bridge based on the selected
criteria.
2.5.1. Scale assessment conversion. Change the weight from AHP scale to fuzzy
number using TFN as shown in the table I. TFN was indicated by value l, m, u which
describe smallest possibility, that promising the biggest possibility.
Table 4. Scale Assessment Conversion Fuzzy AHP
Linguistic Scale For
Importance
Fuzzy Numbers Triangular Fuzzy Number (TFN) Reciprocal
Just Equal 1 (1, 1, 3) (1/3, 1, 1)
Moderatesly important 3 (1, 3, 5) (1/5, 1/3, 1)
Strongly Important 5 (3, 5, 7) (1/7, 1/5, 1/3)
Very strong 7 (5, 7, 9) (1/9, 1/7, 1/5)
Extremely strong 9 (7, 9, 9) (1/9, 1/9, 1/7)
2.5.2. Determine Fuzzy Synthetic Extent (Si) number
𝑆𝑖 = Σ𝑗=1𝑚 𝑀𝑔𝑖
𝑗 𝑥 [Σ𝑖=1𝑛 Σ𝑗=1
𝑚 𝑀𝑔𝑖𝑗 ]
−1 (7)
Si = fuzzy synthetic number, Σ_(j=1)^m M_gi^j = total number of cells in the
column that started from column 1 in every matrix row, j = column, i = row, M =
Triangular Fuzzy Number (TFN), m = total of the criteria, g = parameter (l, m, u)
2.5.3. Calculating Degree of Possibility (V)
𝑉 (𝑀1 ≥ 𝑀2) = {
1 ;0 ;
𝑙1−𝑢2
(𝑚2−𝑢2)−(𝑚1−𝑙1)
𝑗𝑖𝑘𝑎 𝑚1 ≥ 𝑚2
𝑗𝑖𝑘𝑎 𝑙2 ≥ 𝑢1
𝑠𝑒𝑏𝑎𝑙𝑖𝑘𝑛𝑦𝑎 (8)
2.5.4. Comparing the degree of possibility between the criteria. This step was done by
taking the smallest number in degree of possibility in each criteria.
W’=(d ’(A),d ’(B), ……., d’(An))T (9)
2.5.5. Vector weight normalization. Vector weight normalization was done using
equation as follows:
𝐶𝑅𝐼𝑆𝑃 𝑑 (𝐴𝑛) =𝑑′(𝐴𝑛)
∑ 𝑑′(𝐴𝑛)𝑛𝑖
(10)
d’ = value of crisp for An criteria, d’(An) = the minimum value from degree of
possibility for a criteria
2.6. Technique for Order Preference by Similiarity to Ideal Solution (TOPSIS)
TOPSIS is one of multicritedia troubleshooting method that giving the solution of
alternatives by comparing the best alternatives and the worst alternatives[8]. Steps of
TOPSIS:

International Journal of Science and Applied Science: Conference Series http://jurnal.uns.ac.id/ijsascs
Int. J. Sci. Appl. Sci.: Conf. Ser., Vol. 2 No. 1 (2017) doi: 10.20961/ijsascs.v2i1.16680
66
2.6.1. Create a decision matrix.
𝑋 =
𝑎1
𝑎2
𝑎3
⋮𝑎𝑚 [
𝑥1 𝑥2 𝑥3 … 𝑥𝑛
𝑥11 𝑥12 𝑥13 … 𝑥1𝑛
𝑥21 𝑥22 𝑥23 … 𝑥2𝑛
𝑥31 𝑥32 𝑥33 … 𝑥3𝑛
⋮ ⋮ ⋮ ⋮𝑥𝑚1 𝑥𝑚2 𝑥𝑚3 … 𝑥𝑚𝑛]
2.6.2. Create a normalized decision matrix
𝑟𝑖𝑗 =𝑥𝑖𝑗
√∑ 𝑥𝑖𝑗2𝑚
𝑖=1
(11)
2.6.3. Determine positive ideal solution matrix and negative ideal solution matrix.
Positive ideal solution matrix is the maximum value for each criterion from all
alternatives, on the other hand negative ideal solution is the minimum value for each
criterion from all alternatives.
2.6.4. Calculate separation measure. Separation measure is a measurement of distance
from an alternative by using a positive ideal solution and negative ideal solution.
𝐷𝑖
+ = √∑ (𝑌𝑖𝑗 − 𝑌𝑗+)2𝑛
𝑖=1 (12)
𝐷𝑖
− = √∑ (𝑌𝑖𝑗 − 𝑌𝑗−)2𝑛
𝑖=1 (13)
2.6.5. Calculate the preference value for each alternatives
𝑉𝑖+ =
𝐷𝑖−
(𝐷𝑖++𝐷𝑖
−), 0 ≤ 𝑉𝑖
+ ≤ 1 (14)
2.6.6. Rank the alternatives. The alternatives be sorted from the greatest V to the
samllest V.
3. Results and Discussion
The number of respondents who gave the assessment was ten people, so the weight of
group assessment is stated by looking for the geometric mean value (Geometric Mean)
of the assessment given by all respondents. This geometric mean value is then compiled
into a comparison matrix and a weighted analysis is performed between criteria.
Tabel 5. Matrix Comparison (Criteria)
Bridge
Condition
Average Daily
Traffic (ADT)
Bridge Condition 1 4,9294
Average Daily Traffic (ADT) 0,2029 1
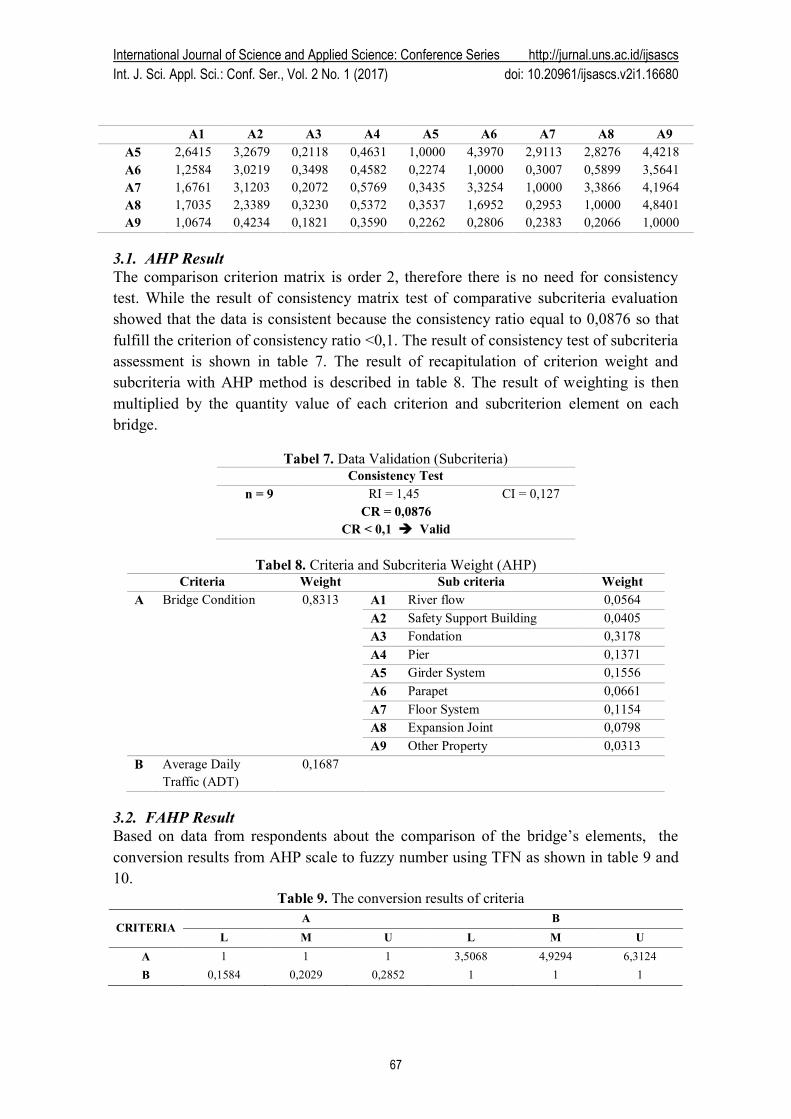
Tabel 6. Matriks Comparison (Subcriteria)
A1 A2 A3 A4 A5 A6 A7 A8 A9
A1 1,0000 0,7762 0,3066 0,8960 0,3786 0,7947 0,5966 0,5870 0,9368
A2 1,2884 1,0000 0,1418 0,2389 0,3060 0,3309 0,3205 0,4275 2,3618
A3 3,2612 7,0511 1,0000 3,6224 4,7220 2,8587 4,8264 3,0963 5,4929
A4 1,1161 4,1864 0,2761 1,0000 2,1594 2,1823 1,7335 1,8616 2,7855
International Journal of Science and Applied Science: Conference Series http://jurnal.uns.ac.id/ijsascs
Int. J. Sci. Appl. Sci.: Conf. Ser., Vol. 2 No. 1 (2017) doi: 10.20961/ijsascs.v2i1.16680
67
A1 A2 A3 A4 A5 A6 A7 A8 A9
A5 2,6415 3,2679 0,2118 0,4631 1,0000 4,3970 2,9113 2,8276 4,4218
A6 1,2584 3,0219 0,3498 0,4582 0,2274 1,0000 0,3007 0,5899 3,5641
A7 1,6761 3,1203 0,2072 0,5769 0,3435 3,3254 1,0000 3,3866 4,1964
A8 1,7035 2,3389 0,3230 0,5372 0,3537 1,6952 0,2953 1,0000 4,8401
A9 1,0674 0,4234 0,1821 0,3590 0,2262 0,2806 0,2383 0,2066 1,0000
3.1. AHP Result
The comparison criterion matrix is order 2, therefore there is no need for consistency
test. While the result of consistency matrix test of comparative subcriteria evaluation
showed that the data is consistent because the consistency ratio equal to 0,0876 so that
fulfill the criterion of consistency ratio <0,1. The result of consistency test of subcriteria
assessment is shown in table 7. The result of recapitulation of criterion weight and
subcriteria with AHP method is described in table 8. The result of weighting is then
multiplied by the quantity value of each criterion and subcriterion element on each
bridge.
Tabel 7. Data Validation (Subcriteria) Consistency Test
n = 9 RI = 1,45 CI = 0,127
CR = 0,0876
CR < 0,1 Valid
Tabel 8. Criteria and Subcriteria Weight (AHP) Criteria Weight Sub criteria Weight
A Bridge Condition 0,8313 A1 River flow 0,0564
A2 Safety Support Building 0,0405
A3 Fondation 0,3178
A4 Pier 0,1371
A5 Girder System 0,1556
A6 Parapet 0,0661
A7 Floor System 0,1154
A8 Expansion Joint 0,0798
A9 Other Property 0,0313
B Average Daily
Traffic (ADT)
0,1687
3.2. FAHP Result
Based on data from respondents about the comparison of the bridge’s elements, the
conversion results from AHP scale to fuzzy number using TFN as shown in table 9 and
10.
Table 9. The conversion results of criteria
CRITERIA A B
L M U L M U
A 1 1 1 3,5068 4,9294 6,3124
B 0,1584 0,2029 0,2852 1 1 1
International Journal of Science and Applied Science: Conference Series http://jurnal.uns.ac.id/ijsascs
Int. J. Sci. Appl. Sci.: Conf. Ser., Vol. 2 No. 1 (2017) doi: 10.20961/ijsascs.v2i1.16680
68
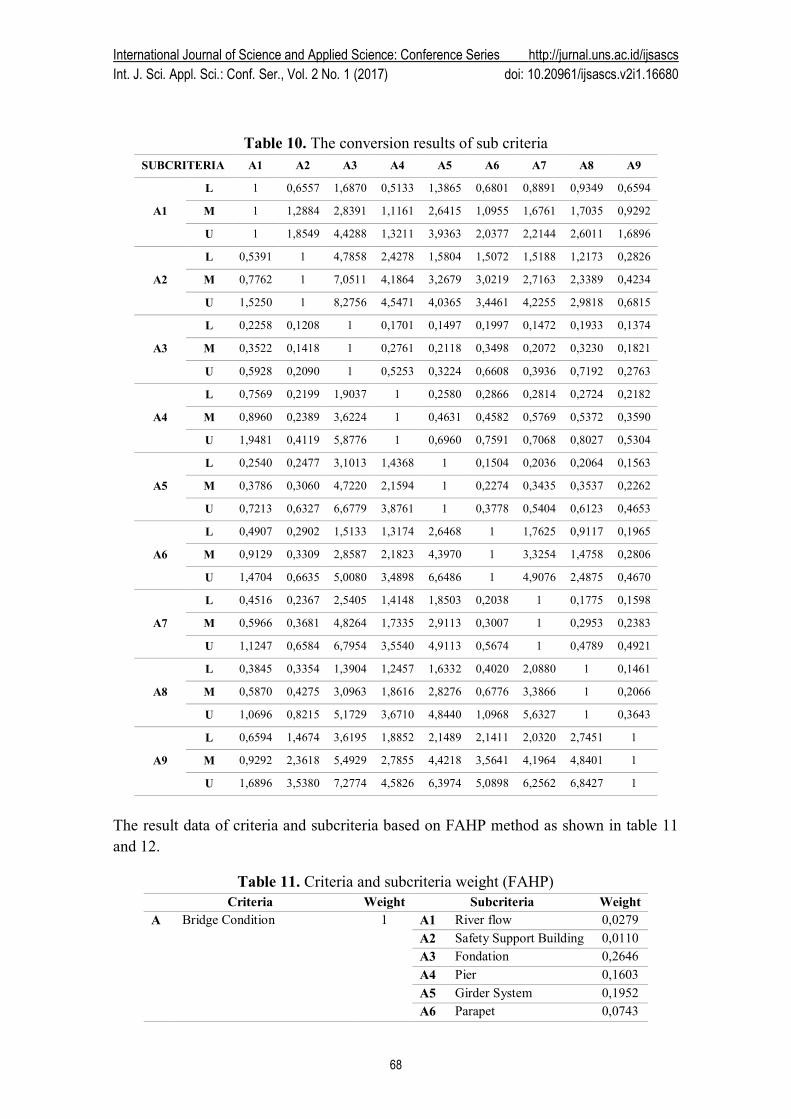
Table 10. The conversion results of sub criteria
SUBCRITERIA A1 A2 A3 A4 A5 A6 A7 A8 A9
A1
L 1 0,6557 1,6870 0,5133 1,3865 0,6801 0,8891 0,9349 0,6594
M 1 1,2884 2,8391 1,1161 2,6415 1,0955 1,6761 1,7035 0,9292
U 1 1,8549 4,4288 1,3211 3,9363 2,0377 2,2144 2,6011 1,6896
A2
L 0,5391 1 4,7858 2,4278 1,5804 1,5072 1,5188 1,2173 0,2826
M 0,7762 1 7,0511 4,1864 3,2679 3,0219 2,7163 2,3389 0,4234
U 1,5250 1 8,2756 4,5471 4,0365 3,4461 4,2255 2,9818 0,6815
A3
L 0,2258 0,1208 1 0,1701 0,1497 0,1997 0,1472 0,1933 0,1374
M 0,3522 0,1418 1 0,2761 0,2118 0,3498 0,2072 0,3230 0,1821
U 0,5928 0,2090 1 0,5253 0,3224 0,6608 0,3936 0,7192 0,2763
A4
L 0,7569 0,2199 1,9037 1 0,2580 0,2866 0,2814 0,2724 0,2182
M 0,8960 0,2389 3,6224 1 0,4631 0,4582 0,5769 0,5372 0,3590
U 1,9481 0,4119 5,8776 1 0,6960 0,7591 0,7068 0,8027 0,5304
A5
L 0,2540 0,2477 3,1013 1,4368 1 0,1504 0,2036 0,2064 0,1563
M 0,3786 0,3060 4,7220 2,1594 1 0,2274 0,3435 0,3537 0,2262
U 0,7213 0,6327 6,6779 3,8761 1 0,3778 0,5404 0,6123 0,4653
A6
L 0,4907 0,2902 1,5133 1,3174 2,6468 1 1,7625 0,9117 0,1965
M 0,9129 0,3309 2,8587 2,1823 4,3970 1 3,3254 1,4758 0,2806
U 1,4704 0,6635 5,0080 3,4898 6,6486 1 4,9076 2,4875 0,4670
A7
L 0,4516 0,2367 2,5405 1,4148 1,8503 0,2038 1 0,1775 0,1598
M 0,5966 0,3681 4,8264 1,7335 2,9113 0,3007 1 0,2953 0,2383
U 1,1247 0,6584 6,7954 3,5540 4,9113 0,5674 1 0,4789 0,4921
A8
L 0,3845 0,3354 1,3904 1,2457 1,6332 0,4020 2,0880 1 0,1461
M 0,5870 0,4275 3,0963 1,8616 2,8276 0,6776 3,3866 1 0,2066
U 1,0696 0,8215 5,1729 3,6710 4,8440 1,0968 5,6327 1 0,3643
A9
L 0,6594 1,4674 3,6195 1,8852 2,1489 2,1411 2,0320 2,7451 1
M 0,9292 2,3618 5,4929 2,7855 4,4218 3,5641 4,1964 4,8401 1
U 1,6896 3,5380 7,2774 4,5826 6,3974 5,0898 6,2562 6,8427 1
The result data of criteria and subcriteria based on FAHP method as shown in table 11
and 12.
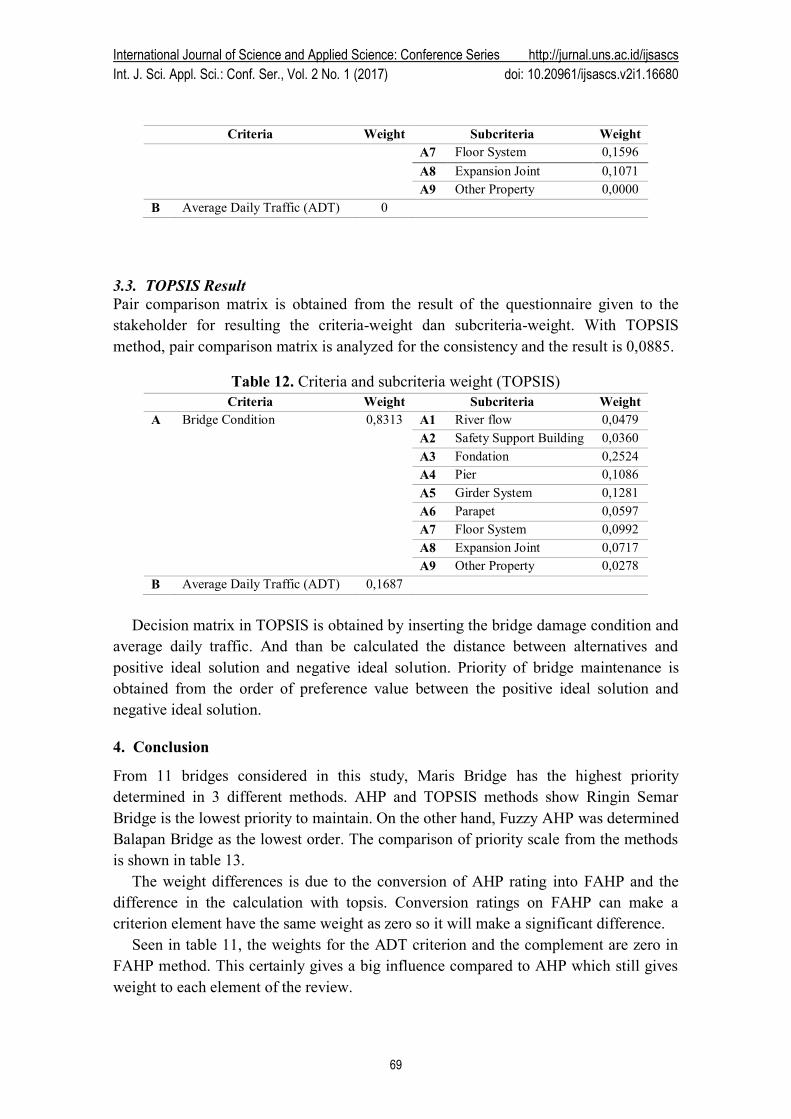
Table 11. Criteria and subcriteria weight (FAHP)
Criteria Weight Subcriteria Weight
A Bridge Condition 1 A1 River flow 0,0279
A2 Safety Support Building 0,0110
A3 Fondation 0,2646
A4 Pier 0,1603
A5 Girder System 0,1952
A6 Parapet 0,0743
International Journal of Science and Applied Science: Conference Series http://jurnal.uns.ac.id/ijsascs
Int. J. Sci. Appl. Sci.: Conf. Ser., Vol. 2 No. 1 (2017) doi: 10.20961/ijsascs.v2i1.16680
69
Criteria Weight Subcriteria Weight
A7 Floor System 0,1596
A8 Expansion Joint 0,1071
A9 Other Property 0,0000
B Average Daily Traffic (ADT) 0
3.3. TOPSIS Result
Pair comparison matrix is obtained from the result of the questionnaire given to the
stakeholder for resulting the criteria-weight dan subcriteria-weight. With TOPSIS
method, pair comparison matrix is analyzed for the consistency and the result is 0,0885.
Table 12. Criteria and subcriteria weight (TOPSIS)
Criteria Weight Subcriteria Weight
A Bridge Condition 0,8313 A1 River flow 0,0479
A2 Safety Support Building 0,0360
A3 Fondation 0,2524
A4 Pier 0,1086
A5 Girder System 0,1281
A6 Parapet 0,0597
A7 Floor System 0,0992
A8 Expansion Joint 0,0717
A9 Other Property 0,0278
B Average Daily Traffic (ADT) 0,1687
Decision matrix in TOPSIS is obtained by inserting the bridge damage condition and
average daily traffic. And than be calculated the distance between alternatives and
positive ideal solution and negative ideal solution. Priority of bridge maintenance is
obtained from the order of preference value between the positive ideal solution and
negative ideal solution.
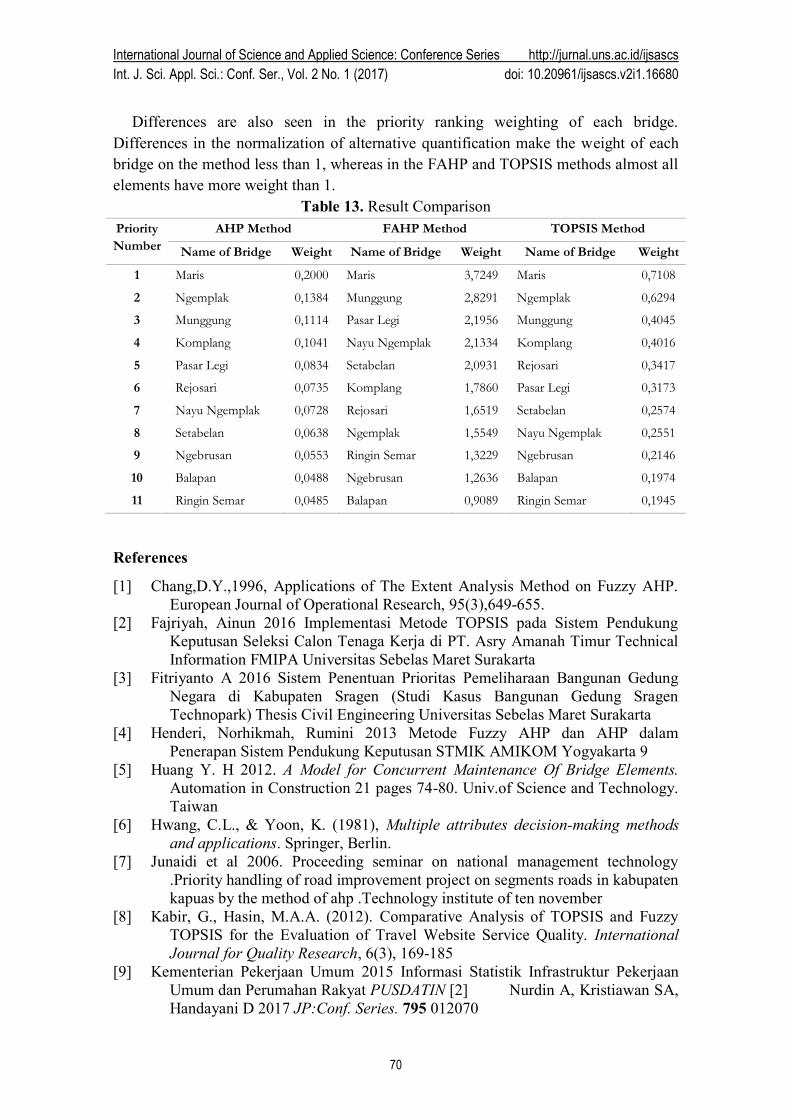
4. Conclusion
From 11 bridges considered in this study, Maris Bridge has the highest priority
determined in 3 different methods. AHP and TOPSIS methods show Ringin Semar
Bridge is the lowest priority to maintain. On the other hand, Fuzzy AHP was determined
Balapan Bridge as the lowest order. The comparison of priority scale from the methods
is shown in table 13.
The weight differences is due to the conversion of AHP rating into FAHP and the
difference in the calculation with topsis. Conversion ratings on FAHP can make a
criterion element have the same weight as zero so it will make a significant difference.
Seen in table 11, the weights for the ADT criterion and the complement are zero in
FAHP method. This certainly gives a big influence compared to AHP which still gives
weight to each element of the review.
International Journal of Science and Applied Science: Conference Series http://jurnal.uns.ac.id/ijsascs
Int. J. Sci. Appl. Sci.: Conf. Ser., Vol. 2 No. 1 (2017) doi: 10.20961/ijsascs.v2i1.16680
70
Differences are also seen in the priority ranking weighting of each bridge.
Differences in the normalization of alternative quantification make the weight of each
bridge on the method less than 1, whereas in the FAHP and TOPSIS methods almost all
elements have more weight than 1.
Table 13. Result Comparison
Priority
Number
AHP Method FAHP Method TOPSIS Method
Name of Bridge Weight Name of Bridge Weight Name of Bridge Weight
1 Maris 0,2000 Maris 3,7249 Maris 0,7108
2 Ngemplak 0,1384 Munggung 2,8291 Ngemplak 0,6294
3 Munggung 0,1114 Pasar Legi 2,1956 Munggung 0,4045
4 Komplang 0,1041 Nayu Ngemplak 2,1334 Komplang 0,4016
5 Pasar Legi 0,0834 Setabelan 2,0931 Rejosari 0,3417
6 Rejosari 0,0735 Komplang 1,7860 Pasar Legi 0,3173
7 Nayu Ngemplak 0,0728 Rejosari 1,6519 Setabelan 0,2574
8 Setabelan 0,0638 Ngemplak 1,5549 Nayu Ngemplak 0,2551
9 Ngebrusan 0,0553 Ringin Semar 1,3229 Ngebrusan 0,2146
10 Balapan 0,0488 Ngebrusan 1,2636 Balapan 0,1974
11 Ringin Semar 0,0485 Balapan 0,9089 Ringin Semar 0,1945
References
[1] Chang,D.Y.,1996, Applications of The Extent Analysis Method on Fuzzy AHP.
European Journal of Operational Research, 95(3),649-655.
[2] Fajriyah, Ainun 2016 Implementasi Metode TOPSIS pada Sistem Pendukung
Keputusan Seleksi Calon Tenaga Kerja di PT. Asry Amanah Timur Technical
Information FMIPA Universitas Sebelas Maret Surakarta
[3] Fitriyanto A 2016 Sistem Penentuan Prioritas Pemeliharaan Bangunan Gedung
Negara di Kabupaten Sragen (Studi Kasus Bangunan Gedung Sragen
Technopark) Thesis Civil Engineering Universitas Sebelas Maret Surakarta
[4] Henderi, Norhikmah, Rumini 2013 Metode Fuzzy AHP dan AHP dalam
Penerapan Sistem Pendukung Keputusan STMIK AMIKOM Yogyakarta 9
[5] Huang Y. H 2012. A Model for Concurrent Maintenance Of Bridge Elements.
Automation in Construction 21 pages 74-80. Univ.of Science and Technology.
Taiwan
[6] Hwang, C.L., & Yoon, K. (1981), Multiple attributes decision-making methods
and applications. Springer, Berlin.
[7] Junaidi et al 2006. Proceeding seminar on national management technology
.Priority handling of road improvement project on segments roads in kabupaten
kapuas by the method of ahp .Technology institute of ten november
[8] Kabir, G., Hasin, M.A.A. (2012). Comparative Analysis of TOPSIS and Fuzzy
TOPSIS for the Evaluation of Travel Website Service Quality. International
Journal for Quality Research, 6(3), 169-185
[9] Kementerian Pekerjaan Umum 2015 Informasi Statistik Infrastruktur Pekerjaan
Umum dan Perumahan Rakyat PUSDATIN [2] Nurdin A, Kristiawan SA,
Handayani D 2017 JP:Conf. Series. 795 012070
International Journal of Science and Applied Science: Conference Series http://jurnal.uns.ac.id/ijsascs
Int. J. Sci. Appl. Sci.: Conf. Ser., Vol. 2 No. 1 (2017) doi: 10.20961/ijsascs.v2i1.16680
71
[10] Kilang C 2016 Evaluasi Kerusakan dan Prioritas Pemeliharaan (Studi Kasus di
Kabupaten Sragen) Thesis Civil Engineering Universitas Sebelas Maret
Surakarta
[11] Saaty TL 1988 What Is the Analytic Hierarchy Process. Berlin: Conference Paper,
Mathematical Models for Decision Support. Vol 01, No 48
[12] Saaty TL 2008 Decision Making with the Analytical Hierarchy Process.
Pitsburgh: International Journal Science Services. Vol 1, No 1:83-97
[13] Stratt RW 2010 Bridge Management a System Approach for Decision Making.
Brussel: School of Doctoral Studies (European Union) Journal. Vol 11,No
4:67-108.