nanomaterials - Semantic Scholar
14
nanomaterials Article The Effect of Precursor Concentration on the Particle Size, Crystal Size, and Optical Energy Gap of Ce x Sn 1-x O 2 Nanofabrication Naif Mohammed Al-Hada 1,2,3, * , Rafiziana Md. Kasmani 2 , Hairoladenan Kasim 4, *, Abbas M. Al-Ghaili 5, *, Muneer Aziz Saleh 2 , Essam M. Banoqitah 6 , Abdulsalam M. Alhawsawi 6,7 , Anwar Ali Baqer 8 , Jian Liu 1 , Shicai Xu 1 , Qiang Li 1 , Azlan Muhammad Noorazlan 9 , Abdullah A. A. Ahmed 3,10 , Moayad Husein Flaifel 11,12 , Suriati Paiman 13 , Nazirul Nazrin 13 , Bandar Ali Al-Asbahi 14 and Jihua Wang 1, * Citation: Al-Hada, N.M.; Md. Kasmani, R.; Kasim, H.; Al-Ghaili, A.M.; Saleh, M.A.; Banoqitah, E.M.; Alhawsawi, A.M.; Baqer, A.A.; Liu, J.; Xu, S.; et al. The Effect of Precursor Concentration on the Particle Size, Crystal Size, and Optical Energy Gap of Ce x Sn 1-x O 2 Nanofabrication. Nanomaterials 2021, 11, 2143. https:// doi.org/10.3390/nano11082143 Academic Editor: Sotirios Baskoutas Received: 15 July 2021 Accepted: 14 August 2021 Published: 22 August 2021 Publisher’s Note: MDPI stays neutral with regard to jurisdictional claims in published maps and institutional affil- iations. Copyright: © 2021 by the authors. Licensee MDPI, Basel, Switzerland. This article is an open access article distributed under the terms and conditions of the Creative Commons Attribution (CC BY) license (https:// creativecommons.org/licenses/by/ 4.0/). 1 Shandong Key Laboratory of Biophysics, Institute of Biophysics, Dezhou University, Dezhou 253023, China; [email protected] (J.L.); [email protected] (S.X.); [email protected] (Q.L.) 2 School of Chemical and Energy Engineering, Universiti Teknologi Malaysia, Skudai, Johor Bahru 81310, Malaysia; rafi[email protected] (R.M.K.); [email protected] (M.A.S.) 3 Department of Physics, Faculty of Applied Science, Thamar University, Dhamar 87246, Yemen; [email protected] 4 College of Computing & Informatics (CCI), Universiti Tenaga Nasional (UNITEN), Kajang 43000, Malaysia 5 Institute of Informatics and Computing in Energy (IICE), Universiti Tenaga Nasional (UNITEN), Kajang 43000, Malaysia 6 Department of Nuclear Engineering, Faculty of Engineering, K. A. CARE Energy Research and Innovation Center, King Abdulaziz University, P.O. Box 80204, Jeddah 21589, Saudi Arabia; [email protected] (E.M.B.); [email protected] (A.M.A.) 7 Center for Training & Radiation Prevention, King Abdulaziz University, P.O. Box 80204, Jeddah 21589, Saudi Arabia 8 Department of Physics, Faculty of Science for Women, University of Baghdad, Baghdad 10071, Iraq; [email protected] 9 Physics Department, Faculty of Science and Mathematics, University Pendidikan Sultan Idris, Tanjong Malim 35900, Malaysia; [email protected] 10 Fachbereich Physik, Center for Hybrid Nanostructures (CHyN), Universität Hamburg, 20146 Hamburg, Germany 11 Department of Physics, College of Science, Imam Abdulrahman Bin Faisal University, P.O. Box 1982, Dammam 31441, Saudi Arabia; [email protected] 12 Basic and Applied Scientific Research Center, College of Science, Imam Abdulrahman Bin Faisal University, P.O. Box 1982, Dammam 31441, Saudi Arabia 13 Department of Physics, Faculty of Science, University Putra Malaysia, Serdang 43400, Malaysia; [email protected] (S.P.); [email protected] (N.N.) 14 Department of Physics & Astronomy, College of Science, King Saud University, P.O. Box 2455, Riyadh 11451, Saudi Arabia; [email protected] * Correspondence: [email protected] (N.M.A.-H.); [email protected] (H.K.); [email protected] (A.M.A.-G.); [email protected] (J.W.) Abstract: In the present work, a thermal treatment technique is applied for the synthesis of Ce x Sn 1-x O 2 nanoparticles. Using this method has developed understanding of how lower and higher precur- sor values affect the morphology, structure, and optical properties of Ce x Sn 1-x O 2 nanoparticles. Ce x Sn 1-x O 2 nanoparticle synthesis involves a reaction between cerium and tin sources, namely, cerium nitrate hexahydrate and tin (II) chloride dihydrate, respectively, and the capping agent, polyvinylpyrrolidone (PVP). The findings indicate that lower x values yield smaller particle size with a higher energy band gap, while higher x values yield a larger particle size with a smaller energy band gap. Thus, products with lower x values may be suitable for antibacterial activity applications as smaller particles can diffuse through the cell wall faster, while products with higher x values may be suitable for solar cell energy applications as more electrons can be generated at larger particle sizes. The synthesized samples were profiled via a number of methods, such as scanning electron microscopy (SEM), transmission electron microscopy (TEM), X-ray diffraction (XRD), and Fourier transform infrared spectroscopy (FT-IR). As revealed by the XRD pattern analysis, the Ce x Sn 1-x O 2 Nanomaterials 2021, 11, 2143. https://doi.org/10.3390/nano11082143 https://www.mdpi.com/journal/nanomaterials
-
Upload
khangminh22 -
Category
Documents
-
view
3 -
download
0
Transcript of nanomaterials - Semantic Scholar

nanomaterials
Article
The Effect of Precursor Concentration on the Particle Size,Crystal Size, and Optical Energy Gap of CexSn1−xO2Nanofabrication
Naif Mohammed Al-Hada 1,2,3,* , Rafiziana Md. Kasmani 2, Hairoladenan Kasim 4,*, Abbas M. Al-Ghaili 5,*,Muneer Aziz Saleh 2, Essam M. Banoqitah 6, Abdulsalam M. Alhawsawi 6,7 , Anwar Ali Baqer 8, Jian Liu 1,Shicai Xu 1, Qiang Li 1, Azlan Muhammad Noorazlan 9, Abdullah A. A. Ahmed 3,10, Moayad Husein Flaifel 11,12,Suriati Paiman 13 , Nazirul Nazrin 13, Bandar Ali Al-Asbahi 14 and Jihua Wang 1,*
�����������������
Citation: Al-Hada, N.M.; Md.
Kasmani, R.; Kasim, H.; Al-Ghaili,
A.M.; Saleh, M.A.; Banoqitah, E.M.;
Alhawsawi, A.M.; Baqer, A.A.; Liu, J.;
Xu, S.; et al. The Effect of Precursor
Concentration on the Particle Size,
Crystal Size, and Optical Energy Gap
of CexSn1−xO2 Nanofabrication.
Nanomaterials 2021, 11, 2143. https://
doi.org/10.3390/nano11082143
Academic Editor: Sotirios Baskoutas
Received: 15 July 2021
Accepted: 14 August 2021
Published: 22 August 2021
Publisher’s Note: MDPI stays neutral
with regard to jurisdictional claims in
published maps and institutional affil-
iations.
Copyright: © 2021 by the authors.
Licensee MDPI, Basel, Switzerland.
This article is an open access article
distributed under the terms and
conditions of the Creative Commons
Attribution (CC BY) license (https://
creativecommons.org/licenses/by/
4.0/).
1 Shandong Key Laboratory of Biophysics, Institute of Biophysics, Dezhou University, Dezhou 253023, China;[email protected] (J.L.); [email protected] (S.X.); [email protected] (Q.L.)
2 School of Chemical and Energy Engineering, Universiti Teknologi Malaysia, Skudai,Johor Bahru 81310, Malaysia; [email protected] (R.M.K.); [email protected] (M.A.S.)
3 Department of Physics, Faculty of Applied Science, Thamar University, Dhamar 87246, Yemen;[email protected]
4 College of Computing & Informatics (CCI), Universiti Tenaga Nasional (UNITEN), Kajang 43000, Malaysia5 Institute of Informatics and Computing in Energy (IICE), Universiti Tenaga Nasional (UNITEN),
Kajang 43000, Malaysia6 Department of Nuclear Engineering, Faculty of Engineering, K. A. CARE Energy Research and Innovation
Center, King Abdulaziz University, P.O. Box 80204, Jeddah 21589, Saudi Arabia;[email protected] (E.M.B.); [email protected] (A.M.A.)
7 Center for Training & Radiation Prevention, King Abdulaziz University, P.O. Box 80204,Jeddah 21589, Saudi Arabia
8 Department of Physics, Faculty of Science for Women, University of Baghdad, Baghdad 10071, Iraq;[email protected]
9 Physics Department, Faculty of Science and Mathematics, University Pendidikan Sultan Idris,Tanjong Malim 35900, Malaysia; [email protected]
10 Fachbereich Physik, Center for Hybrid Nanostructures (CHyN), Universität Hamburg,20146 Hamburg, Germany
11 Department of Physics, College of Science, Imam Abdulrahman Bin Faisal University, P.O. Box 1982,Dammam 31441, Saudi Arabia; [email protected]
12 Basic and Applied Scientific Research Center, College of Science, Imam Abdulrahman Bin Faisal University,P.O. Box 1982, Dammam 31441, Saudi Arabia
13 Department of Physics, Faculty of Science, University Putra Malaysia, Serdang 43400, Malaysia;[email protected] (S.P.); [email protected] (N.N.)
14 Department of Physics & Astronomy, College of Science, King Saud University, P.O. Box 2455,Riyadh 11451, Saudi Arabia; [email protected]
* Correspondence: [email protected] (N.M.A.-H.); [email protected] (H.K.); [email protected](A.M.A.-G.); [email protected] (J.W.)
Abstract: In the present work, a thermal treatment technique is applied for the synthesis of CexSn1−xO2
nanoparticles. Using this method has developed understanding of how lower and higher precur-sor values affect the morphology, structure, and optical properties of CexSn1−xO2 nanoparticles.CexSn1−xO2 nanoparticle synthesis involves a reaction between cerium and tin sources, namely,cerium nitrate hexahydrate and tin (II) chloride dihydrate, respectively, and the capping agent,polyvinylpyrrolidone (PVP). The findings indicate that lower x values yield smaller particle size witha higher energy band gap, while higher x values yield a larger particle size with a smaller energyband gap. Thus, products with lower x values may be suitable for antibacterial activity applicationsas smaller particles can diffuse through the cell wall faster, while products with higher x values maybe suitable for solar cell energy applications as more electrons can be generated at larger particlesizes. The synthesized samples were profiled via a number of methods, such as scanning electronmicroscopy (SEM), transmission electron microscopy (TEM), X-ray diffraction (XRD), and Fouriertransform infrared spectroscopy (FT-IR). As revealed by the XRD pattern analysis, the CexSn1−xO2
Nanomaterials 2021, 11, 2143. https://doi.org/10.3390/nano11082143 https://www.mdpi.com/journal/nanomaterials

Nanomaterials 2021, 11, 2143 2 of 14
nanoparticles formed after calcination reflect the cubic fluorite structure and cassiterite-type tetrago-nal structure of CexSn1−xO2 nanoparticles. Meanwhile, using FT-IR analysis, Ce-O and Sn-O wereconfirmed as the primary bonds of ready CexSn1−xO2 nanoparticle samples, whilst TEM analysishighlighted that the average particle size was in the range 6−21 nm as the precursor concentration(Ce(NO3)3·6H2O) increased from 0.00 to 1.00. Moreover, the diffuse UV-visible reflectance spectraused to determine the optical band gap based on the Kubelka–Munk equation showed that anincrease in x value has caused a decrease in the energy band gap and vice versa.
Keywords: CexSn1−xO2 nanoparticles; thermal treatment technique; polyvinylpyrrolidone; energyband gap
1. Introduction
Recently, nanomaterials have been the focus of extensive research studies, with theirunique physiochemical properties attracting particular attention [1–6]. As a result of suchstudies, new systems, nanoplatforms, devices, and structures applicable to various do-mains have been developed [7–10]. The proliferation of related work makes nanomaterialapplications demonstrating biodegradability, biocompatibility, and functionalization espe-cially advantageous [11,12]. Empirical research has been significantly concerned with theuse of cubic fluorite structures (CeO2) and cassiterite-type tetragonal structures of (SnO2)semiconductors nanomaterials [4,13,14]. Both group II and group IV elements are includedin the CeO2 cubic fluorite structure, since it is classified as II-IV composite semiconduc-tor [14]. There are various applications intended to exploit the singular structural featuresof nanomaterials on the basis of the useful chemical and physical properties [15]. It has anotable structure with a cubic fluorite structure crystalline, along with energy band gapsamounting to 3.0–3.6 eV [16]. CeO2 semiconductor nanostructures have wide applications,such as in photovoltaic and solar cells [17,18]. Further significant applications includediodes, clear electrodes, gas sensors, as well as antibacterial activity [19]. CeO2 nanostruc-tures have been prepared in different shapes, such as nanoparticles [16], nanocrystals [20],nanoclusters [21], nanowires [22], nanotubes [23], and nanoflowers.
Similarly, the composite semiconductor (II-VI) SnO2-type tetragonal structure is madeup of the metal Sn (II) and non-metallic elemental oxygen (VI) [4,13]. Important applicationshave been devised based on the remarkable properties presented by various SnO2 semi-conductor materials [24]. Used as the archetypal tetragonal crystal structure, this materialis categorized as an n-type semiconductor with 3.6 eV band gaps [25]. Research and appli-cations have sought to exploit the characteristic properties of SnO2 nanomaterials rooted intheir singular crystal structure and nano-sized dimensions. Thus, applications are exempli-fied by solar cells due to their tunable physical and chemical properties, with enhancedperformance over their bulk counterparts [26,27], and optoelectronic devices [28], withapplications geared towards leveraging the pellucidity occurring in the visible solar spec-trum zone, as well as catalysis [29], diodes [30], gas sensors [31], and biomedical tools [32].Furthermore, nanocrystals [33], nanoclusters [34], nanotubes [35], and nanorods [36] areamong the wide range of SnO2 nanomaterials produced via different approaches, such assonochemical [37], solvothermal [26], co-precipitation [38], microwave hydrothermal [39],and sol-gel treatment [40] approaches.
The complementary features are indicated by the distinguishing composition ofCexSn1−xO2 with regard to the bandgaps and sizes that grow from both oxide semi-conductors. It is also probable that it has characteristics that set it apart from singularsemiconductor constituents. The use of CexSn1−xO2 for various purposes, including bio-cides and disinfectants is a matter that warrants attention in relation to the particularCexSn1−xO2 nanocomposite composition. The composition displays better stability anda lengthier life than organic-based materials, not to mention the fact that it has been thefocus of more extensive study with regard to biological activity [41,42]. Precipitation meth-

Nanomaterials 2021, 11, 2143 3 of 14
ods [43], co-precipitation methods [44], and the hydrothermal strategies [45] are among thetechniques through which it is possible to produce CexSn1−xO2 nanostructures. Neverthe-less, due to the complexity of the process of synthesis, which involves extensive reactiontimes, toxic reagents, and effluent byproducts, such techniques are not highly effective forthe industrial-scale production of CexSn1−xO2 nanoparticles. Moreover, the synthesis ofCexSn1−xO2 nanoparticles at various x values has not been investigated. More specifically,an uncomplicated heat treatment technique may be adopted to avoid waste CexSn1−xO2nanoparticle products. The significance of this work stems from the fact that it proposesa production method compatible with industrial applications that is capable of yieldingproducts defined by basic handling, particle size regulation (smaller and larger sizes arerespectively suitable for antibacterial activity due to the smaller particle can diffuse throughthe cell wall faster, and energy applications due to more electrons can be generated atthe bigger particle size [6]), inexpensiveness, high quality, high adaptability, a powderedform, and effective band gap. The chosen approach is also advantageous because it doesnot generate toxic byproducts and does not require extra chemical reagents. On the basisof this approach, this work seeks to determine how precursor values affect CexSn1−xO2nanoparticles.
CexSn1−xO2 samples have been synthesized in this work utilizing a thermal-basedtreatment process and the effects of Ce and Sn contents on the morphological, structural,and optical properties of CexSn1−xO2 nanoparticles have also been analyzed. The approachhas involved the use of a solution with a content of metal ions and polyvinylpyrrolidoneacting as precursor and capping agents, respectively. Furthermore, to obtain the desiredpure nanoparticles, a calcination technique has been adopted, while various methods areapplied to investigate morphology and crystallinity. The effect of x value variation isinvestigated as well.
2. Materials and Methods2.1. Materials
Cerium nitrate hexahydrate with a purity of more than 99% (Ce(NO3)3·6H2O) and tin(II) chloride dihydrate (SnCl2·2H2O), both in concentrations of 0.00, 0.20, 0.40, 0.60, 0.80,and 1.00 mmol, were employed as the metal precursors, while polyvinylpyrrolidone anddeionized water served as a capping agent, which mediated the spread of particles, andas solvent, respectively. All the chemicals were acquired from Sigma-Aldrich (US), theirquality was research-grade, and none were purified further.
2.2. Synthesis of Samples
The preparation of the CexSn1−xO2 nanoparticle product involved the dissolutionof 4.5 g of polyvinylpyrrolidone into 100 mL of deionized water, followed by energeticstirring for 120 min at a temperature of 70 ◦C. The next step was the dissolution of Ce(NO3)3·6H2O into amounts of 0.00, 0.20, 0.40, 0.60, 0.80, and 1.00 mmol. A homogeneoussolution was obtained by adding and energetically mixing SnCl2·2H2O in amounts of 1.00,0.80, 0.60, 0.40, 0.20, and 0.00 mmol. The combined solution was placed on a petri dish andsubjected to drying in an oven for one day at 80 ◦C. In this way, a solid was attained whichwas then rendered into a powdered form through crushing for half an hour in a mortar. Abox furnace was subsequently employed to subject the powder to calcination at 650 ◦C foran hour and a half. Once the synthesized and calcined oxide nanoparticle samples wereobtained, their profiling could be initiated.
3. Results and Discussion3.1. Mechanism of the Formation of the Nanoparticle
Figure 1a presents the chemical structure of the amphiphilic PVP, in which the headgroup is the pyrrolidone part (hydrophilic) while the tail group is the polyvinyl part (hy-drophobic); however, when the PVP molecules are in an aqueous solution, the structuremay transform to a resonance structure as illustrated in Figure 1b [46]. Figure 2 schemati-

Nanomaterials 2021, 11, 2143 4 of 14
cally shows the process of interaction between the capping agent PVP and the metal ions.The cerium and tin are bound by strong ionic bonds between the metallic ions and theamide groups of the polymer chains. At the same time, cerium and tin ions are alreadybound to nitrate ions (NO3
−) and the propane-2-olate ions (OC3H7−), respectively, via
a strong ionic bond. Eventually, the metal cations are immobile in the cavities of thepolymer chains, which leads to the formation of uniformly distributed metal oxides in asolid solution in the drying and calcination process [47].
Nanomaterials 2021, 11, x FOR PEER REVIEW 4 of 14
3. Results and Discussion
3.1. Mechanism of the Formation of the Nanoparticle
Figure 1a presents the chemical structure of the amphiphilic PVP, in which the head
group is the pyrrolidone part (hydrophilic) while the tail group is the polyvinyl part (hy-
drophobic); however, when the PVP molecules are in an aqueous solution, the structure
may transform to a resonance structure as illustrated in Figure 1b [46]. Figure 2 schemat-
ically shows the process of interaction between the capping agent PVP and the metal ions.
The cerium and tin are bound by strong ionic bonds between the metallic ions and the
amide groups of the polymer chains. At the same time, cerium and tin ions are already
bound to nitrate ions (NO3−) and the propane-2-olate ions (OC3H7−), respectively, via a
strong ionic bond. Eventually, the metal cations are immobile in the cavities of the poly-
mer chains, which leads to the formation of uniformly distributed metal oxides in a solid
solution in the drying and calcination process [47].
Figure 1. (a) PVP chemical structure; (b) formation of the resonance structure of the pyrene ring of
PVP.
Figure 2. Schematic illustration of the proposed mechanism of interaction between metal ions and PVP.
PVP’s main role in the employed method is to control the growth of the particles by
forming passivation layers around the metal. In addition, the functions of PVP during the
preparation of CexSn1−xO2 nanoparticles are to regulate the expansion nucleation of
Figure 1. (a) PVP chemical structure; (b) formation of the resonance structure of the pyrene ring of PVP.
Nanomaterials 2021, 11, x FOR PEER REVIEW 4 of 14
3. Results and Discussion
3.1. Mechanism of the Formation of the Nanoparticle
Figure 1a presents the chemical structure of the amphiphilic PVP, in which the head
group is the pyrrolidone part (hydrophilic) while the tail group is the polyvinyl part (hy-
drophobic); however, when the PVP molecules are in an aqueous solution, the structure
may transform to a resonance structure as illustrated in Figure 1b [46]. Figure 2 schemat-
ically shows the process of interaction between the capping agent PVP and the metal ions.
The cerium and tin are bound by strong ionic bonds between the metallic ions and the
amide groups of the polymer chains. At the same time, cerium and tin ions are already
bound to nitrate ions (NO3−) and the propane-2-olate ions (OC3H7−), respectively, via a
strong ionic bond. Eventually, the metal cations are immobile in the cavities of the poly-
mer chains, which leads to the formation of uniformly distributed metal oxides in a solid
solution in the drying and calcination process [47].
Figure 1. (a) PVP chemical structure; (b) formation of the resonance structure of the pyrene ring of
PVP.
Figure 2. Schematic illustration of the proposed mechanism of interaction between metal ions and PVP.
PVP’s main role in the employed method is to control the growth of the particles by
forming passivation layers around the metal. In addition, the functions of PVP during the
preparation of CexSn1−xO2 nanoparticles are to regulate the expansion nucleation of
Figure 2. Schematic illustration of the proposed mechanism of interaction between metal ions and PVP.
PVP’s main role in the employed method is to control the growth of the particles byforming passivation layers around the metal. In addition, the functions of PVP duringthe preparation of CexSn1−xO2 nanoparticles are to regulate the expansion nucleation ofnanoparticles, limit the accretion of the nanoparticles, improve the degree of crystallinityof the nanoparticles, create a restricted environment around the CexSn1−xO2 nanoparticles,and facilitate the development of nanoparticles with a homogenous dispersal of both sizeand form [47,48]. The drying process may decompose the PVP partly to feature shorterpolymer chains [49,50]. The shortening of polymer chains causes the metallic ions to be welldispersed throughout the PVP cavities and a reduction in the number of metal ions that

Nanomaterials 2021, 11, 2143 5 of 14
are being capped. The effect of PVP is not restricted only to the solution and drying steps,but also the formation of CexSn1−xO2 nanoparticles in the calcination process through thenucleation, solid-state reaction, and the oxidization of Ce3+ and Sn2+ ions. In addition,during the calcination process, organic materials (PVP) are being eliminated, which causessteric hindrance disruption.
3.2. TEM Analysis
Transmission electron microscopy (TEM) was the basis for profiling the nanoparticlesamples. This method is particularly useful because it ensures that the generated nanopar-ticles have a homogeneous round shape and size. Samples typically display uniformity interm of morphological features (x0.00–x1.00). CexSn1−xO2 nanoparticles were subjected tocalcination at 650 ◦C and their TEM images and particle size distributions are illustratedin Figures 3 and 4, respectively. These images indicate that the existence of direct propor-tionality between the x values and particle size, with the increase in particle size beingdetermined by contiguous particle aggregation, which in turn is caused by surface meltingat elevated calcination temperature and x values.
Nanomaterials 2021, 11, x FOR PEER REVIEW 5 of 14
nanoparticles, limit the accretion of the nanoparticles, improve the degree of crystallinity
of the nanoparticles, create a restricted environment around the CexSn1−xO2 nanoparticles,
and facilitate the development of nanoparticles with a homogenous dispersal of both size
and form [47,48]. The drying process may decompose the PVP partly to feature shorter
polymer chains [49,50]. The shortening of polymer chains causes the metallic ions to be
well dispersed throughout the PVP cavities and a reduction in the number of metal ions
that are being capped. The effect of PVP is not restricted only to the solution and drying
steps, but also the formation of CexSn1−xO2 nanoparticles in the calcination process through
the nucleation, solid-state reaction, and the oxidization of Ce3+ and Sn2+ ions. In addition,
during the calcination process, organic materials (PVP) are being eliminated, which causes
steric hindrance disruption.
3.2. TEM Analysis
Transmission electron microscopy (TEM) was the basis for profiling the nanoparticle
samples. This method is particularly useful because it ensures that the generated nano-
particles have a homogeneous round shape and size. Samples typically display uniformity
in term of morphological features (x0.00–x1.00). CexSn1−xO2 nanoparticles were subjected to
calcination at 650 °C and their TEM images and particle size distributions are illustrated
in Figures 3 and 4, respectively. These images indicate that the existence of direct propor-
tionality between the x values and particle size, with the increase in particle size being
determined by contiguous particle aggregation, which in turn is caused by surface melting
at elevated calcination temperature and x values.
Figure 3. TEM images of (x0.00) Ce0.00Sn1.00O2, (x0.20) Ce0.20Sn0.80O2, (x0.40) Ce0.40Sn0.60O2, (x0.06) Ce0.60Sn0.40O2, (x0.08) Ce0.80Sn0.20O2
and (x1.00) Ce1.00Sn0.00O2) nanoparticles calcined at 650 °C. Figure 3. TEM images of (x0.00) Ce0.00Sn1.00O2, (x0.20) Ce0.20Sn0.80O2, (x0.40) Ce0.40Sn0.60O2, (x0.06) Ce0.60Sn0.40O2, (x0.08)Ce0.80Sn0.20O2 and (x1.00) Ce1.00Sn0.00O2) nanoparticles calcined at 650 ◦C.
The size uniformity and round shape of the CexSn1−xO2 nanoparticles were confirmedby the results obtained. The standard process of nanoparticle sample production wasestablished to be effective, with the sizes of the nanoparticles being influenced by thepresence of PVP in a considerable amount based on the agglomeration and suppressionmechanism [51]. The outcomes of the XRD and TEM analyses, obtained from the differentlysized nanoparticles (from 6 nm to 21 nm), synthesized at 650 ◦C by increasing the xvalue, are outlined in Table 1. PVP is used as a stabilizer for particles and mediatesnanoparticle nucleation and formation while also contributing to homogeneity [52–55]. Assuch, it is useful for restricting nanoparticle size, as well as for preventing nanoparticleaggregation [13,56–59]. Consequently, the particles increased in size when CeO2 wasused in the sample (x = 0.20–1.00) due to the intensified agglomeration. Meanwhile, the

Nanomaterials 2021, 11, 2143 6 of 14
reduction trend could be attributed to the fact that Ce3+ and Sn2+ have different ioniccrystal radii.
Nanomaterials 2021, 11, x FOR PEER REVIEW 6 of 14
Figure 4. Particle size distribution of (x/0.00) Ce0.00Sn1.00O2, (x/0.20) Ce0.20Sn0.80O2, (x/0.40) Ce0.40Sn0.60O2, (x/0.06) Ce0.60Sn0.40O2, (x/0.08)
Ce0.80Sn0.20O2, and (x/1.00) Ce1.00Sn0.00O2) nanoparticles calcined at 650 °C.
The size uniformity and round shape of the CexSn1−xO2 nanoparticles were confirmed
by the results obtained. The standard process of nanoparticle sample production was es-
tablished to be effective, with the sizes of the nanoparticles being influenced by the pres-
ence of PVP in a considerable amount based on the agglomeration and suppression mech-
anism [51]. The outcomes of the XRD and TEM analyses, obtained from the differently
sized nanoparticles (from 6 nm to 21 nm), synthesized at 650 °C by increasing the x value,
are outlined in Table 1. PVP is used as a stabilizer for particles and mediates nanoparticle
nucleation and formation while also contributing to homogeneity [52–55]. As such, it is
useful for restricting nanoparticle size, as well as for preventing nanoparticle aggregation
[13,56–59]. Consequently, the particles increased in size when CeO2 was used in the sam-
ple (x = 0.20–1.00) due to the intensified agglomeration. Meanwhile, the reduction trend
could be attributed to the fact that Ce3+ and Sn2+ have different ionic crystal radii.
3.3. SEM Analysis
The morphologies of CexSn1−xO2 nanoparticles have been analyzed using scanning
electron microscopy (SEM). Figure 5 illustrates micrographs associated with the
CexSn1−xO2 nanoparticles at every x value. The shapes of the prepared samples were almost
spherical with regularities at x = 1.00, while the samples featured small grains and were
spherical at x = 0.00. This finding was consistent with those reported in earlier studies
[13,60]. In Figure 5, the images for x = 0.20 and x = 0.80 show samples of clusters formed
with a round shape due to the fusion, breakdown, and overlapping of grains caused by
the reduction in x value. Small particles agglomerated on large particles as shown in im-
ages where x = 0.60 and x = 0.80, due to the decreased amount of SnO2 that caused an
agglomeration of SnO2 on CeO2.
Figure 4. Particle size distribution of (x/0.00) Ce0.00Sn1.00O2, (x/
0.20) Ce0.20Sn0.80O2, (x/0.40) Ce0.40Sn0.60O2, (x/
0.06)Ce0.60Sn0.40O2, (x/
0.08) Ce0.80Sn0.20O2, and (x/1.00) Ce1.00Sn0.00O2) nanoparticles calcined at 650 ◦C.
Table 1. XRD and TEM results for CexSn1−xO2 nanoparticles of various x values when synthesized at 650 ◦C.
x Values Sample Concentrations CexSn1−xO2 At650 ◦C and 4.5 gm of PVP
Particle Sizeby TEM (nm)
Crystallite Sizeby XRD (nm)
Energy Bandgap(eV)
0.00 Ce0.00Sn1.00 O2 6 ± 2 6 3.970.20 Ce0.20Sn0.80 O2 8 ± 3 7 3.860.40 Ce0.40Sn0.60 O2 10 ± 2 9 3.720.60 Ce0.60Sn0.40 O2 12 ± 4 10 3.640.80 Ce0.80Sn0.20 O2 16 ± 3 14 3.561.00 Ce1.00Sn0.00 O2 21 ± 2 19 3.40
3.3. SEM Analysis
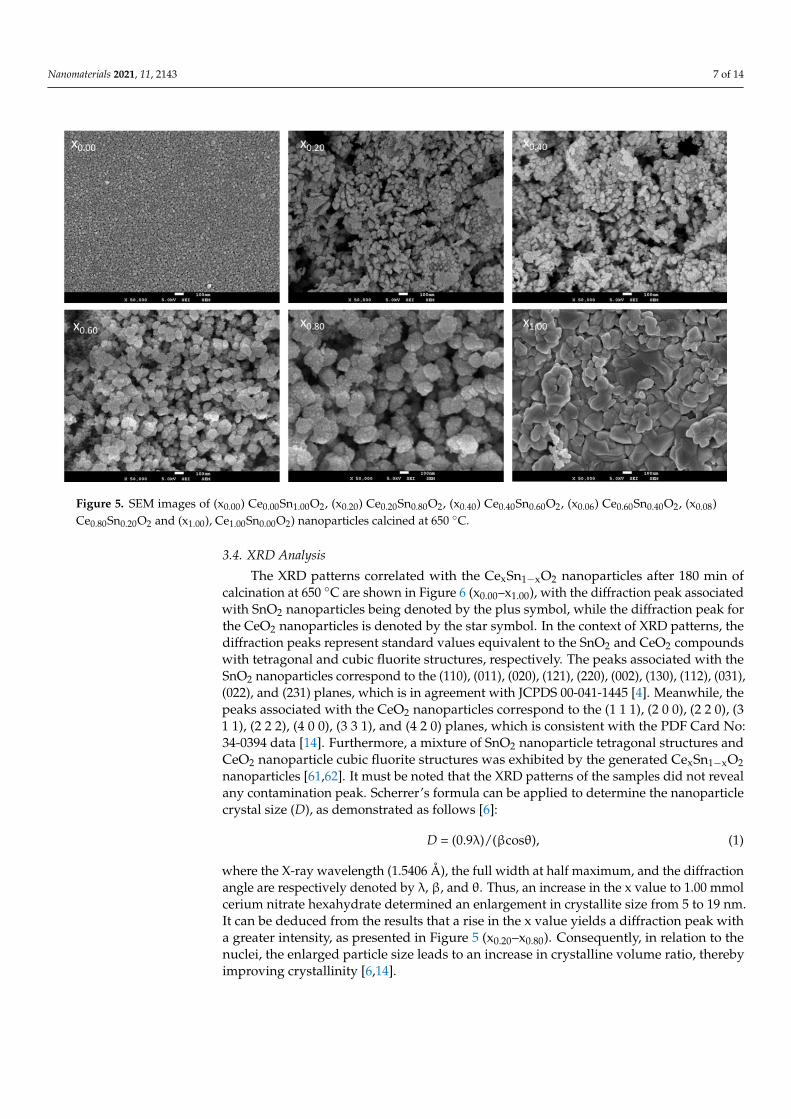
The morphologies of CexSn1−xO2 nanoparticles have been analyzed using scan-ning electron microscopy (SEM). Figure 5 illustrates micrographs associated with theCexSn1−xO2 nanoparticles at every x value. The shapes of the prepared samples werealmost spherical with regularities at x = 1.00, while the samples featured small grainsand were spherical at x = 0.00. This finding was consistent with those reported in earlierstudies [13,60]. In Figure 5, the images for x = 0.20 and x = 0.80 show samples of clustersformed with a round shape due to the fusion, breakdown, and overlapping of grains causedby the reduction in x value. Small particles agglomerated on large particles as shown inimages where x = 0.60 and x = 0.80, due to the decreased amount of SnO2 that caused anagglomeration of SnO2 on CeO2.
Nanomaterials 2021, 11, 2143 7 of 14Nanomaterials 2021, 11, x FOR PEER REVIEW 7 of 14
Figure 5. SEM images of (x0.00) Ce0.00Sn1.00O2, (x0.20) Ce0.20Sn0.80O2, (x0.40) Ce0.40Sn0.60O2, (x0.06) Ce0.60Sn0.40O2, (x0.08) Ce0.80Sn0.20O2
and (x1.00), Ce1.00Sn0.00O2) nanoparticles calcined at 650 °C.
3.4. XRD Analysis
The XRD patterns correlated with the CexSn1−xO2 nanoparticles after 180 min of calci-
nation at 650 °C are shown in Figure 6 (x0.00–x1.00), with the diffraction peak associated with
SnO2 nanoparticles being denoted by the plus symbol, while the diffraction peak for the
CeO2 nanoparticles is denoted by the star symbol. In the context of XRD patterns, the dif-
fraction peaks represent standard values equivalent to the SnO2 and CeO2 compounds
with tetragonal and cubic fluorite structures, respectively. The peaks associated with the
SnO2 nanoparticles correspond to the (110), (011), (020), (121), (220), (002), (130), (112),
(031), (022), and (231) planes, which is in agreement with JCPDS 00-041-1445 [4]. Mean-
while, the peaks associated with the CeO2 nanoparticles correspond to the (1 1 1), (2 0 0),
(2 2 0), (3 1 1), (2 2 2), (4 0 0), (3 3 1), and (4 2 0) planes, which is consistent with the PDF
Card No: 34-0394 data [14]. Furthermore, a mixture of SnO2 nanoparticle tetragonal struc-
tures and CeO2 nanoparticle cubic fluorite structures was exhibited by the generated
CexSn1−xO2 nanoparticles [61,62]. It must be noted that the XRD patterns of the samples
did not reveal any contamination peak. Scherrer’s formula can be applied to determine
the nanoparticle crystal size (D), as demonstrated as follows [6]:
D = (0.9λ)/(βcosθ), (1)
20 30 40 50 60 70 800
500
1000
1500
Inte
nsity
(a.
u.)
2Theta (degree)
x1.00
Figure 5. SEM images of (x0.00) Ce0.00Sn1.00O2, (x0.20) Ce0.20Sn0.80O2, (x0.40) Ce0.40Sn0.60O2, (x0.06) Ce0.60Sn0.40O2, (x0.08)Ce0.80Sn0.20O2 and (x1.00), Ce1.00Sn0.00O2) nanoparticles calcined at 650 ◦C.
3.4. XRD Analysis
The XRD patterns correlated with the CexSn1−xO2 nanoparticles after 180 min ofcalcination at 650 ◦C are shown in Figure 6 (x0.00–x1.00), with the diffraction peak associatedwith SnO2 nanoparticles being denoted by the plus symbol, while the diffraction peak forthe CeO2 nanoparticles is denoted by the star symbol. In the context of XRD patterns, thediffraction peaks represent standard values equivalent to the SnO2 and CeO2 compoundswith tetragonal and cubic fluorite structures, respectively. The peaks associated with theSnO2 nanoparticles correspond to the (110), (011), (020), (121), (220), (002), (130), (112), (031),(022), and (231) planes, which is in agreement with JCPDS 00-041-1445 [4]. Meanwhile, thepeaks associated with the CeO2 nanoparticles correspond to the (1 1 1), (2 0 0), (2 2 0), (31 1), (2 2 2), (4 0 0), (3 3 1), and (4 2 0) planes, which is consistent with the PDF Card No:34-0394 data [14]. Furthermore, a mixture of SnO2 nanoparticle tetragonal structures andCeO2 nanoparticle cubic fluorite structures was exhibited by the generated CexSn1−xO2nanoparticles [61,62]. It must be noted that the XRD patterns of the samples did not revealany contamination peak. Scherrer’s formula can be applied to determine the nanoparticlecrystal size (D), as demonstrated as follows [6]:
D = (0.9λ)/(βcosθ), (1)
where the X-ray wavelength (1.5406 Å), the full width at half maximum, and the diffractionangle are respectively denoted by λ, β, and θ. Thus, an increase in the x value to 1.00 mmolcerium nitrate hexahydrate determined an enlargement in crystallite size from 5 to 19 nm.It can be deduced from the results that a rise in the x value yields a diffraction peak witha greater intensity, as presented in Figure 5 (x0.20–x0.80). Consequently, in relation to thenuclei, the enlarged particle size leads to an increase in crystalline volume ratio, therebyimproving crystallinity [6,14].

Nanomaterials 2021, 11, 2143 8 of 14
Nanomaterials 2021, 11, x FOR PEER REVIEW 7 of 14
Figure 5. SEM images of (x0.00) Ce0.00Sn1.00O2, (x0.20) Ce0.20Sn0.80O2, (x0.40) Ce0.40Sn0.60O2, (x0.06) Ce0.60Sn0.40O2, (x0.08) Ce0.80Sn0.20O2
and (x1.00), Ce1.00Sn0.00O2) nanoparticles calcined at 650 °C.
3.4. XRD Analysis
The XRD patterns correlated with the CexSn1−xO2 nanoparticles after 180 min of calci-
nation at 650 °C are shown in Figure 6 (x0.00–x1.00), with the diffraction peak associated with
SnO2 nanoparticles being denoted by the plus symbol, while the diffraction peak for the
CeO2 nanoparticles is denoted by the star symbol. In the context of XRD patterns, the dif-
fraction peaks represent standard values equivalent to the SnO2 and CeO2 compounds
with tetragonal and cubic fluorite structures, respectively. The peaks associated with the
SnO2 nanoparticles correspond to the (110), (011), (020), (121), (220), (002), (130), (112),
(031), (022), and (231) planes, which is in agreement with JCPDS 00-041-1445 [4]. Mean-
while, the peaks associated with the CeO2 nanoparticles correspond to the (1 1 1), (2 0 0),
(2 2 0), (3 1 1), (2 2 2), (4 0 0), (3 3 1), and (4 2 0) planes, which is consistent with the PDF
Card No: 34-0394 data [14]. Furthermore, a mixture of SnO2 nanoparticle tetragonal struc-
tures and CeO2 nanoparticle cubic fluorite structures was exhibited by the generated
CexSn1−xO2 nanoparticles [61,62]. It must be noted that the XRD patterns of the samples
did not reveal any contamination peak. Scherrer’s formula can be applied to determine
the nanoparticle crystal size (D), as demonstrated as follows [6]:
D = (0.9λ)/(βcosθ), (1)
20 30 40 50 60 70 800
500
1000
1500
Inte
nsity
(a.
u.)
2Theta (degree)
x1.00
Nanomaterials 2021, 11, x FOR PEER REVIEW 8 of 14
Figure 6. XRD patterns of (x0.00) Ce0.00Sn1.00O2, (x0.20) Ce0.20Sn0.80O2, (x0.40) Ce0.40Sn0.60O2, (x0.06) Ce0.60Sn0.40O2, (x0.08) Ce0.80Sn0.20O2
and (x1.00) Ce1.00Sn0.00O2) nanoparticles calcined at 650 °C.
where the X-ray wavelength (1.5406 Å), the full width at half maximum, and the diffrac-
tion angle are respectively denoted by λ, β, and θ. Thus, an increase in the x value to 1.00
Figure 6. XRD patterns of (x0.00) Ce0.00Sn1.00O2, (x0.20) Ce0.20Sn0.80O2, (x0.40) Ce0.40Sn0.60O2, (x0.06) Ce0.60Sn0.40O2, (x0.08)Ce0.80Sn0.20O2 and (x1.00) Ce1.00Sn0.00O2) nanoparticles calcined at 650 ◦C.

Nanomaterials 2021, 11, 2143 9 of 14
3.5. FT-IR Analysis
The FT-IR spectrum related to the CexSn1−xO2 samples has been studied in the rangeof 80–4000 cm−1. Figure 7a–g shows FT-IR spectra for the samples with different x valuesafter drying at 80 ◦C and being calcined at 650 ◦C. In Figure 7a (sample after drying at 80 ◦Conly) the absorption bands at wavenumbers 3433, 2954, and 1673 cm−1 were attributedto N–H, C–H, and C = O stretching vibrations [63]. The absorption band at 1418 cm−1
was attributed to C–H bending vibration initiated in the methylene group, and the peakat 1272 cm−1 was assigned to the C–N stretching vibration. The bands at 833, 731, and620 cm−1 were mapped to NO3- groups, with the vibrations generated by C–C ring andC–N=O bending [64,65]. The absorption bands at 421 and 540 cm−1 were assigned toCe–OH band Sn–OH vibrations. Figure 7b–g show the disappearance of these peaks dueto broadband absorption for the samples calcinated at 650 ◦C. The single absorption peakat 385 cm−1 in Figure 7b was attributed to Ce–O, and the other single absorption peakat 491 cm−1 in Figure 6g was attributed Sn–O. The double absorption peaks at 382, 373,370, 368 cm−1, and 487 cm−1 in Figure 7c–f were attributed to Ce–O, and Sn–O, where thewavenumber values for the sample spectra changed when the x values were increased.In regard to the x value increase, this was proved by the variable crystallinity exhibitedby the generated CexSn1−xO2 nanoparticles. All the bands characterizing the samples(i.e., x = 0.20–0.80) were included in the range of the Ce-O and Sn-O stretching vibrations,confirming the purity of the synthesized CexSn1−xO2 nanoparticles. Thus, the sampleswere free of additional impurities [4,60].
Nanomaterials 2021, 11, x FOR PEER REVIEW 9 of 14
mmol cerium nitrate hexahydrate determined an enlargement in crystallite size from 5 to
19 nm. It can be deduced from the results that a rise in the x value yields a diffraction peak
with a greater intensity, as presented in Figure 5 (x0.20–x0.80). Consequently, in relation to
the nuclei, the enlarged particle size leads to an increase in crystalline volume ratio,
thereby improving crystallinity [6,14].
3.5. FT-IR Analysis
The FT-IR spectrum related to the CexSn1−xO2 samples has been studied in the range
of 80–4000 cm−1. Figure 7a–g shows FT-IR spectra for the samples with different x values
after drying at 80 °C and being calcined at 650 °C. In Figure 7a (sample after drying at 80
°C only) the absorption bands at wavenumbers 3433, 2954, and 1673 cm−1 were attributed
to N–H, C–H, and C = O stretching vibrations [63]. The absorption band at 1418 cm−1 was
attributed to C–H bending vibration initiated in the methylene group, and the peak at
1272 cm−1 was assigned to the C–N stretching vibration. The bands at 833, 731, and 620 cm−1
were mapped to NO3- groups, with the vibrations generated by C–C ring and C–N=O bending
[64,65]. The absorption bands at 421 and 540 cm−1 were assigned to Ce–OH band Sn–OH vi-
brations. Figures 6b–g show the disappearance of these peaks due to broadband absorption
for the samples calcinated at 650 °C. The single absorption peak at 385 cm−1 in Figure 7b was
attributed to Ce–O, and the other single absorption peak at 491 cm−1 in Figure 6(g) was at-
tributed Sn–O. The double absorption peaks at 382, 373, 370, 368 cm−1, and 487 cm−1 in Figure
7c–f were attributed to Ce–O, and Sn–O, where the wavenumber values for the sample spectra
changed when the x values were increased. In regard to the x value increase, this was proved
by the variable crystallinity exhibited by the generated CexSn1−xO2 nanoparticles. All the bands
characterizing the samples (i.e., x = 0.20–0.80) were included in the range of the Ce-O and Sn-
O stretching vibrations, confirming the purity of the synthesized CexSn1−xO2 nanoparticles.
Thus, the samples were free of additional impurities [4,60].
Figure 7. FTIR spectra of (a) the sample after drying at 80 °C ((b), x1.00) Ce1.00Sn0.00O2, ((c), x0.20)
Ce0.20Sn0.80O2 ((d), x0.40) Ce0.40Sn0.60O2, ((e), x0.60) Ce0.60Sn0.40O2, ((f), x0.80) Ce0.80Sn0.20O2 and ((g), x0.00)
Ce0.00Sn1.00O2 nanoparticles calcined at 650 °C.
0 1000 2000 3000 4000
620731
x0.0
x0.80
x0.60
x0.40
sample after 80 oC drying
x0.20
SnO2
x1.00
g
T
ran
sm
itta
nce
(a
. u
)
Wavenumber (cm-1)
475
477
481
487
368
370
373
382
f
e
d
c
491
385a
b
CeO2
421540
833
12721418
1673
29543433
Figure 7. FTIR spectra of (a) the sample after drying at 80 ◦C ((b), x1.00) Ce1.00Sn0.00O2, ((c), x0.20)Ce0.20Sn0.80O2 ((d), x0.40) Ce0.40Sn0.60O2, ((e), x0.60) Ce0.60Sn0.40O2, ((f), x0.80) Ce0.80Sn0.20O2 and ((g),x0.00) Ce0.00Sn1.00O2 nanoparticles calcined at 650 ◦C.
3.6. Bandgap Analysis
The procedure underpinning the Kubelka–Munk function consists of mapping thesquare of this function, namely, (F(R∞)hv)2, in relation to the energy and extension of thelinear portion of the curve to F(R)2 = 0. As shown in Figure 8 (x0.00–x1.00), the Kubelka–

Nanomaterials 2021, 11, 2143 10 of 14
Munk function facilitates the calculation of energy bandgaps for nanoparticles accordingto the diffuse reflectance spectra associated with samples exposed to a temperature of650 ◦C. In this way, the band gap energy was generated for the oxide nanoparticles, withthe energy bandgap values and x values being inversely correlated. Quantum size effectsexplained the rise in the bandgap energy value, whereas the transitions among the partiallysuitable valance and conduction bands for Ce3+ ion d-shell electrons explained the decreasein the band gap energy. Given the aspects addressed above, it is a complicated matterto eliminate the effect of particle size with regard to the band gap. Indeed, the materialproperties and band structure can be altered, where, owing to a particle size decrease,bandgap reduction is directly related to size enlargement. Disruption in the s-electron andp-electron conduction bands occurs at higher energy levels, leading to the possibility ofsuperimposition when the particles are of a small size. In term of the Fermi-level distance,the larger the distance from the particle center, the lower the nuclear potential for electronconduction is. Hence, the absorption energy is equivalent to the conduction band energy inthe case of transitions with permissible quantum numbers. In this work, band gap valueswere reduced whilst x values were increased to make it easier to conduct a comparativeanalysis, as shown in Table 1; however, flawed states may be enhanced at elevated x values,resulting in a higher absorption coefficient. Furthermore, the characteristics of the opticalnanomaterial and related electronic structures can be modified by the fields of the electronhole pairs generated by photon absorption.
Nanomaterials 2021, 11, x FOR PEER REVIEW 11 of 14
Figure 8. The energy bandgap of (x0.00) Ce0.00Sn1.00O2, (x0.20) Ce0.20Sn0.80O2, (x0.40) Ce0.40Sn0.60O2, (x0.06)
Ce0.60Sn0.40O2, (x0.08) Ce0.80Sn0.20O2, and (x1.00) Ce1.00Sn0.00O2) nanoparticles calcined at 650 °C.
4. Conclusions
The results obtained in this paper have proven that calcination is an effective tech-
nique for the synthesis of CexSn1−xO2 nanoparticles. In addition, X-ray diffraction analysis
revealed that, at every x value, the CexSn1−xO2 nanoparticles exhibited a cubic fluorite
structure for CeO2 and a tetragonal structure for SnO2. A direct correlation was established
between the nanoparticle size and the x value, with sizes ranging between 6 and 21 nm at
x values between 0.00 and 1.00. The double absorption peaks were attributed to Ce–O and
Sn–O and confirmed the purity of the CexSn1−xO2 nanoparticles. A shift in the wavenumber
for the sample’s nanoparticles spectra at increasing x values was documented. The novel
thermal treatment method confirmed that the crystallinity of the CexSn1−xO2 nanoparticles
has been produced. Furthermore, the major vibrational modes displayed by Ce-O and Sn-
O were identified via FT-IR analysis, while UV-vis absorption analysis revealed that, as
the x value increased, the energy band gap diminished. Moreover, the smaller particle size
was derived from a lower x value and the smaller energy band gap was derived from a
higher x value. It can thus be concluded that products at lower x values can have antibac-
terial activity applications as the smaller particles can diffuse through the cell wall faster,
while the products at higher x values can have solar cell energy applications due to more
electrons can be generated at the bigger particle size.
Author Contributions: N.M.A.-H. conceived and designed the experiments; N.M.A.-H., A.M.A.-G.,
M.A.S., and M.A.S. performed the experiments; N.M.A.-H., A.M.A.-G., M.A.S., M.H.F., and A.A.B.,
analyzed the data; H.K., E.M.B., Q.L., A.M.A., R.M.K., A.A.A.A., J.L., S.X., A.M.N., S.P., N.N.,
B.A.A.-A. and J.W., contributed rea-gents/materials/analysis tools; N.M.A., A.M.A.-G., and M.A.S.
wrote the paper. All authors have read and agreed to the published version of the manuscript.
Funding: This research was supported in part by the Research Foundation for Advanced Talents of
Dezhou University, in part by the Universiti Tenaga Nasional with Fund: Internal Research Grant
Opex under grant RJO10517919/iRMC/Publication, in part by Taishan Scholars Program of Shan-
dong Province (tsqn201812104), the Qingchuang Science and Technology Plan of Shandong Prov-
ince (2019KJJ017), in part by researchers with supporting project number (RSP-2021/348), King Saud
2.8 3.2 3.6 4.0 4.40
100
200
300
400
500
600
700
2 3 4 5 60
500
1000
1500
2000
[F(R
)hv]
2(e
V/m
)2
E (eV)
[F(R
)hv]
2(e
V/m
)2
E (eV)
x0.00
x0.20
x0.40
X0.60
x1.00
x0.80
Figure 8. The energy bandgap of (x0.00) Ce0.00Sn1.00O2, (x0.20) Ce0.20Sn0.80O2, (x0.40) Ce0.40Sn0.60O2, (x0.06) Ce0.60Sn0.40O2,(x0.08) Ce0.80Sn0.20O2, and (x1.00) Ce1.00Sn0.00O2) nanoparticles calcined at 650 ◦C.
4. Conclusions
The results obtained in this paper have proven that calcination is an effective techniquefor the synthesis of CexSn1−xO2 nanoparticles. In addition, X-ray diffraction analysisrevealed that, at every x value, the CexSn1−xO2 nanoparticles exhibited a cubic fluoritestructure for CeO2 and a tetragonal structure for SnO2. A direct correlation was establishedbetween the nanoparticle size and the x value, with sizes ranging between 6 and 21 nmat x values between 0.00 and 1.00. The double absorption peaks were attributed to Ce–

Nanomaterials 2021, 11, 2143 11 of 14
O and Sn–O and confirmed the purity of the CexSn1−xO2 nanoparticles. A shift in thewavenumber for the sample’s nanoparticles spectra at increasing x values was documented.The novel thermal treatment method confirmed that the crystallinity of the CexSn1−xO2nanoparticles has been produced. Furthermore, the major vibrational modes displayedby Ce-O and Sn-O were identified via FT-IR analysis, while UV-vis absorption analysisrevealed that, as the x value increased, the energy band gap diminished. Moreover, thesmaller particle size was derived from a lower x value and the smaller energy band gapwas derived from a higher x value. It can thus be concluded that products at lower x valuescan have antibacterial activity applications as the smaller particles can diffuse through thecell wall faster, while the products at higher x values can have solar cell energy applicationsdue to more electrons can be generated at the bigger particle size.
Author Contributions: N.M.A.-H. conceived and designed the experiments; N.M.A.-H., A.M.A.-G.,M.A.S., and M.A.S. performed the experiments; N.M.A.-H., A.M.A.-G., M.A.S., M.H.F., and A.A.B.,analyzed the data; H.K., E.M.B., Q.L., A.M.A., R.M.K., A.A.A.A., J.L., S.X., A.M.N., S.P., N.N., B.A.A.-A. and J.W., contributed rea-gents/materials/analysis tools; N.M.A.-H., A.M.A.-G., and M.A.S. wrotethe paper. All authors have read and agreed to the published version of the manuscript.
Funding: This research was supported in part by the Research Foundation for Advanced Talentsof Dezhou University, in part by the Universiti Tenaga Nasional with Fund: Internal ResearchGrant Opex under grant RJO10517919/iRMC/Publication, in part by Taishan Scholars Program ofShandong Province (tsqn201812104), the Qingchuang Science and Technology Plan of ShandongProvince (2019KJJ017), in part by researchers supporting project number (RSP-2021/348), King SaudUniversity, Riyadh, Saudi Arabia, and in part by Universiti Teknologi Malaysia (UTM), FellowResearch Grant, Q.J130000.21A6.00P19.
Acknowledgments: This work was supported in part by the Research Foundation for AdvancedTalents of Dezhou University, in part by the Universiti Tenaga Nasional with Fund: Internal ResearchGrant Opex under grant RJO10517919/iRMC/Publication, in part by Taishan Scholars Program ofShandong Province (tsqn201812104), the Qingchuang Science and Technology Plan of ShandongProvince (2019KJJ017), in part by researchers supporting project number (RSP-2021/348), King SaudUniversity, Riyadh, Saudi Arabia, and in part by Universiti Teknologi Malaysia (UTM), FellowResearch Grant, Q.J130000.21A6.00P19.
Conflicts of Interest: The authors declare no conflict of interest.
References1. Yao, J.; Yang, M.; Duan, Y. Chemistry, biology, and medicine of fluorescent nanomaterials and related systems: New insights into
biosensing, bioimaging, genomics, diagnostics, and therapy. Chem. Rev. 2014, 114, 6130–6178. [CrossRef]2. Aziz, N.; Pandey, R.; Barman, I.; Prasad, R. Leveraging the attributes of mucor hiemalis-derived silver nanoparticles for a
synergistic broad-spectrum antimicrobial platform. Front. Microbiol. 2016, 7, 1984. [CrossRef]3. Marpu, S.B.; Benton, E.N. Shining light on chitosan: A review on the usage of chitosan for photonics and nanomaterials research.
Int. J. Mol. Sci. 2018, 19, 1795. [CrossRef] [PubMed]4. Al-Hada, N.M.; Al-Ghaili, A.M.; Kasim, H.; Saleh, M.A.; Flaifel, M.H.; Kamari, H.M.; Baqiah, H.; Liu, J.; Jihua, W. The effect
of PVP concentration on particle size, morphological and optical properties of cassiterite nanoparticles. IEEE Access 2020, 8,93444–93454. [CrossRef]
5. Al-Hada, N.M.; Kamari, H.M.; Saleh, M.A.; Flaifel, M.H.; Al-Ghaili, A.M.; Kasim, H.; Baqer, A.A.; Saion, E.; Jihua, W. Morpholog-ical, structural and optical behaviour of PVA capped binary (NiO)0.5(Cr2O3)0.5 nanoparticles produced via single step basedthermal technique. Results Phys. 2020, 17, 103059. [CrossRef]
6. Al-Hada, N.M.; Kamari, H.M.; Abdullah, C.A.C.; Saion, E.; Shaari, A.H.; Talib, Z.A.; Matori, K.A. Down-top nanofabrication ofbinary (CdO)x (ZnO)1−x nanoparticles and their antibacterial activity. Int. J. Nanomed. 2017, 12, 8309. [CrossRef]
7. Khan, I.; Saeed, K.; Khan, I. Nanoparticles: Properties, applications and toxicities. Arab. J. Chem. 2019, 12, 908–931. [CrossRef]8. Han, Y.-H.; Kankala, R.K.; Wang, S.-B.; Chen, A.-Z. Leveraging engineering of indocyanine green-encapsulated polymeric
nanocomposites for biomedical applications. Nanomaterials 2018, 8, 360. [CrossRef]9. Veiseh, O.; Gunn, J.W.; Zhang, M. Design and fabrication of magnetic nanoparticles for targeted drug delivery and imaging. Adv.
Drug Deliv. Rev. 2010, 62, 284–304. [CrossRef]10. Kumar, K.S.; Choudhary, N.; Jung, Y.; Thomas, J. Recent advances in two-dimensional nanomaterials for supercapacitor electrode
applications. ACS Energy Lett. 2018, 3, 482–495. [CrossRef]

Nanomaterials 2021, 11, 2143 12 of 14
11. Ahmed, N.; Fessi, H.; Elaissari, A. Theranostic applications of nanoparticles in cancer. Drug Discov. Today 2012, 17, 928–934.[CrossRef] [PubMed]
12. Kabashin, A.V.; Singh, A.; Swihart, M.T.; Zavestovskaya, I.N.; Prasad, P.N. Laser-processed nanosilicon: A multifunctionalnanomaterial for energy and healthcare. ACS Nano 2019, 13, 9841–9867. [CrossRef] [PubMed]
13. Al-Hada, N.M.; Kamari, H.M.; Baqer, A.A.; Shaari, A.H.; Saion, E. Thermal calcination-based production of SnO2 nanopowder:An analysis of SnO2 nanoparticle characteristics and antibacterial activities. Nanomaterials 2018, 8, 250. [CrossRef]
14. Baqer, A.A.; Matori, K.A.; Al-Hada, N.M.; Shaari, A.H.; Saion, E.; Chyi, J.L.Y. Effect of polyvinylpyrrolidone on cerium oxidenanoparticle characteristics prepared by a facile heat treatment technique. Results Phys. 2017, 7, 611–619. [CrossRef]
15. Arabaci, A. Ceria-based solid electrolytes for IT-SOFC applications. Acta Phys. Pol. A 2020, 137, 530–534. [CrossRef]16. Nithya, P.; Sundrarajan, M. Ionic liquid functionalized biogenic synthesis of AgAu bimetal doped CeO2 nanoparticles from
justicia adhatoda for pharmaceutical applications: Antibacterial and anti-cancer activities. J. Photochem. Photobiol. B Biol. 2020,202, 111706. [CrossRef]
17. Liu, Y.; Yang, J.; Wu, B.; Zhang, W.; Zhang, X.; Shan, C.; Liu, Q. CeO2/Co3O4 hollow microsphere: Pollen-biotemplatedpreparation and application in photo-catalytic degradation. Colloids Surf. A Physicochem. Eng. Asp. 2020, 586, 124193. [CrossRef]
18. Mohanty, B.; Chattopadhyay, A.; Nayak, J. Band gap engineering and enhancement of electrical conductivity in hydrothermallysynthesized CeO2-PbS nanocomposites for solar cell applications. J. Alloys Compd. 2021, 850, 156735. [CrossRef]
19. Basavaraj, R.; Navami, D.; Deepthi, N.; Venkataravanappa, M.; Lokesh, R.; Kumar, K.S.; Sreelakshmi, T. Novel orange-redemitting Pr3+ doped CeO2 nanopowders for white light emitting diode applications. Inorg. Chem. Commun. 2020, 120, 108164.[CrossRef]
20. Xia, W.; Mao, J.; Xu, F.; Gong, M.; Tan, X.; Shen, Y.; Sun, L.; Xin, H.L. Atomic modulation engineering of hexagon-shaped CeO2nanocrystals by in situ sculpturing of an electron beam. J. Phys. Chem. C 2020, 124, 17006–17014. [CrossRef]
21. Pollitt, S.; Truttmann, V.; Haunold, T.; Garcia, C.; Olszewski, W.; Llorca, J.; Barrabes, N.; Rupprechter, G. The dynamic structure ofAu38 (SR) 24 nanoclusters supported on CeO2 upon pretreatment and CO oxidation. ACS Catal. 2020, 10, 6144–6148. [CrossRef]
22. Dong, T.; Liu, W.; Ma, M.; Peng, H.; Yang, S.; Tao, J.; He, C.; Wang, L.; Wu, P.; An, T. Hierarchical zeolite enveloping Pd-CeO2nanowires: An efficient adsorption/catalysis bifunctional catalyst for low temperature propane total degradation. Chem. Eng. J.2020, 393, 124717. [CrossRef]
23. dos Santos, A.; Dantas, T.; Costa, J.; Souza, L.; Soares, J.; Caldeira, V.; Araújo, A.; Santos, A. Formation of CeO2 nanotubes throughdifferent conditions of hydrothermal synthesis. Surf. Interfaces 2020, 21, 100746. [CrossRef]
24. Matussin, S.; Harunsani, M.H.; Tan, A.L.; Khan, M.M. Plant-extract-mediated SnO2 nanoparticles: Synthesis and applications.ACS Sustain. Chem. Eng. 2020, 8, 3040–3054. [CrossRef]
25. Habte, A.G.; Hone, F.G.; Dejene, F.B. Effect of solution pH on structural, optical and morphological properties of SnO2 nanoparti-cles. Phys. B Condens. Matter 2020, 580, 411832. [CrossRef]
26. Xie, H.; Yin, X.; Chen, P.; Liu, J.; Yang, C.; Que, W.; Wang, G. Solvothermal synthesis of highly crystalline SnO2 nanoparticles forflexible perovskite solar cells application. Mater. Lett. 2019, 234, 311–314. [CrossRef]
27. Yun, A.J.; Kim, J.; Hwang, T.; Park, B. Origins of efficient perovskite solar cells with low-temperature processed SnO2 electrontransport layer. ACS Appl. Energy Mater. 2019, 2, 3554–3560. [CrossRef]
28. Kumar, P.; Khadtare, S.; Park, J.; Yadav, B. Fabrication of leaf shaped SnO2 nanoparticles via sol-gel route and its application forthe optoelectronic humidity sensor. Mater. Lett. 2020, 278, 128451. [CrossRef]
29. Letifi, H.; Litaiem, Y.; Dridi, D.; Ammar, S.; Chtourou, R. Enhanced photocatalytic activity of vanadium-doped SnO2 nanoparticlesin rhodamine B degradation. Adv. Condens. Matter Phys. 2019, 2019, 2157428. [CrossRef]
30. Ravikumar, K.; Agilan, S.; Raja, M.; Marnadu, R.; Alshahrani, T.; Shkir, M.; Balaji, M.; Ganesh, R. Investigation on microstructuraland opto-electrical properties of Zr-doped SnO2 thin films for Al/Zr: SnO2/p-Si Schottky barrier diode application. Phys. BCondens. Matter 2020, 599, 412452. [CrossRef]
31. Chen, K.; Chen, S.; Pi, M.; Zhang, D. SnO2 nanoparticles/TiO2 nanofibers heterostructures: In situ fabrication and enhanced gassensing performance. Solid-State Electron. 2019, 157, 42–47. [CrossRef]
32. Caldas, M.; Santos, A.C.; Veiga, F.; Rebelo, R.; Reis, R.L.; Correlo, V.M. Melanin nanoparticles as a promising tool for biomedicalapplications—A review. Acta Biomater. 2020, 105, 26–43. [CrossRef]
33. Kong, Z.; Liu, D.; Liu, X.; Fu, A.; Wang, Y.; Guo, P.; Li, H. One-pot decoration of graphene with SnO2 nanocrystals by an elevatedhydrothermal process and their application as anode materials for lithium ion batteries. J. Nanosci. Nanotechnol. 2019, 19, 850–858.[CrossRef] [PubMed]
34. Hong, X.; Li, S.; Wang, R.; Fu, J. Hierarchical SnO2 nanoclusters wrapped functionalized carbonized cotton cloth for symmetricalsupercapacitor. J. Alloys Compd. 2019, 775, 15–21. [CrossRef]
35. Reddy, C.S.; Murali, G.; Reddy, A.S.; Park, S.; In, I. GO incorporated SnO2 nanotubes as fast response sensors for ethanol vapor indifferent atmospheres. J. Alloys Compd. 2020, 813, 152251. [CrossRef]
36. Sun, L.; Wang, B.; Wang, Y. High-temperature gas sensor based on novel Pt single atoms@SnO2 nanorods@SiC nanosheetsmulti-heterojunctions. ACS Appl. Mater. Interfaces 2020, 12, 21808–21817. [CrossRef] [PubMed]
37. Choudhari, A.; Bhanvase, B.A.; Saharan, V.K.; Salame, P.H.; Hunge, Y. Sonochemical preparation and characterization ofrGO/SnO2 nanocomposite: Electrochemical and gas sensing performance. Ceram. Int. 2020, 46, 11290–11296. [CrossRef]

Nanomaterials 2021, 11, 2143 13 of 14
38. Sagadevan, S.; Johan, M.; Bin, R.; Aziz, F.A.; Hsu, H.-L.; Selvin, R.; Hegazy, H.; Umar, A.; Algarni, H.; Roselin, S.L. Influence ofMn doping on the properties of Tin oxide nanoparticles prepared by Co-precipitation method. J. Nanoelectron. Optoelectron. 2019,14, 583–592. [CrossRef]
39. Mamakhel, A.; Søndergaard, M.; Borup, K.; Iversen, B.B. Continuous flow hydrothermal synthesis of rutile SnO2 nanoparticles:Exploration of pH and temperature effects. J. Supercrit. Fluids 2020, 166, 105029. [CrossRef]
40. Lemarchand, A.; Rémondière, F.; Jouin, J.; Thomas, P.; Masson, O. Crystallization pathway of size-controlled SnO2 nanoparticlessynthesized via a nonaqueous sol–gel route. Cryst. Growth Des. 2020, 20, 1110–1118. [CrossRef]
41. Ali Baig, A.B.; Rathinam, V.; Ramya, V. Synthesis and investigation of Fe doped SnO2 nanoparticles for improved photocatalyticactivity under visible light and antibacterial performances. Mater. Technol. 2020, 36, 623–635. [CrossRef]
42. Nurhasanah, I.; Safitri, W.; Windarti, T.; Subagio, A. The calcination temperature effect on the antioxidant and radioprotectionproperties of CeO2 nanoparticles. Reaktor 2018, 18, 22–26. [CrossRef]
43. Slavinskaya, E.; Zadesenets, A.; Stonkus, O.; Stadnichenko, A.; Shchukarev, A.; Shubin, Y.V.; Korenev, S.; Boronin, A. Thermalactivation of Pd/CeO2-SnO2 catalysts for low-temperature CO oxidation. Appl. Catal. B Environ. 2020, 277, 119275. [CrossRef]
44. Hassan, S.S.; Kamel, A.H.; Hassan, A.A.; Amr, A.E.-G.E.; El-Naby, H.A.; Elsayed, E.A. A SnO2/CeO2 nano-composite catalyst foralizarin dye removal from aqueous solutions. Nanomaterials 2020, 10, 254. [CrossRef] [PubMed]
45. Liu, J.; Dai, M.; Wang, T.; Sun, P.; Liang, X.; Lu, G.; Shimanoe, K.; Yamazoe, N. Enhanced gas sensing properties of SnO2 hollowspheres decorated with CeO2 nanoparticles heterostructure composite materials. ACS Appl. Mater. Interfaces 2016, 8, 6669–6677.[CrossRef] [PubMed]
46. Pattanaik, M.; Bhaumik, S.K. Adsorption behaviour of polyvinyl pyrrolidone on oxide surfaces. Mater. Lett. 2000, 44, 352–360.[CrossRef]
47. Al-Hada, N.M.; Saion, E.; Kamari, H.M.; Flaifel, M.H.; Shaari, A.H.; Talib, Z.A.; Abdullahi, N.; Baqer, A.A.; Kharazmi, A.Structural, morphological and optical behaviour of PVP capped binary (ZnO)0.4(CdO)0.6 nanoparticles synthesised by a facilethermal route. Mater. Sci. Semicond. Process. 2016, 53, 56–65. [CrossRef]
48. Muhamad, S.; Kamari, H.M.; Al-Hada, N.M.; Abdullah, C.A.C.; Nidzam, N.N.S. Fabrication of binary (ZnO)x (TiO2)1−xnanoparticles via thermal treatment route and evaluating the impact of various molar concentrations on the structure and opticalbehaviors. Appl. Phys. A 2020, 126, 1–15. [CrossRef]
49. Ghosh, G.; Naskar, M.K.; Patra, A.; Chatterjee, M. Synthesis and characterization of PVP-encapsulated ZnS nanoparticles. Opt.Mater. 2006, 28, 1047–1053. [CrossRef]
50. Koebel, M.M.; Jones, L.C.; Somorjai, G.A. Preparation of size-tunable, highly monodisperse PVP-protected Pt-nanoparticles byseed-mediated growth. J. Nanoparticle Res. 2008, 10, 1063–1069. [CrossRef]
51. Absi, E.; Saleh, M.A.; Al-Hada, N.M.; Hamzah, K.; Alhawsawi, A.M.; Banoqitah, E.M. Binary nickel and silver oxides by thermalroute: Preparation and characterization. Appl. Phys. A 2021, 127, 606. [CrossRef]
52. Al-Hada, N.M.; Al-Ghaili, A.M.; Kasim, H.; Saleh, M.A.; Baqiah, H.; Liu, J.; Wang, J. Nanofabrication of (Cr2O3)x (NiO)1−x andthe impact of precursor concentrations on nanoparticles conduct. J. Mater. Res. Technol. 2021, 11, 252–263. [CrossRef]
53. Hashem, M.; Saion, E.; Al-Hada, N.M.; Kamari, H.M.; Shaari, A.H.; Talib, Z.A.; Paiman, S.B.; Kamarudeen, M.A. Fabrication andcharacterization of semiconductor nickel oxide (NiO) nanoparticles manufactured using a facile thermal treatment. Results Phys.2016, 6, 1024–1030. [CrossRef]
54. Gene, S.A.; Saion, E.B.; Shaari, A.H.; Kamarudeen, M.A.; Al-Hada, N.M. Fabrication and characterization of nanospinel ZnCr2O4using thermal treatement method. In Advanced Materials Research; Trans Tech Publications Ltd.: Stafa-Zurich, Switzerland, 2015;pp. 301–307.
55. Baqer, A.A.; Matori, K.A.; Al-Hada, N.M.; Kamari, H.M.; Shaari, A.H.; Saion, E.; Chyi, J.L.Y. Copper oxide nanoparticlessynthesized by a heat treatment approach with structural, morphological and optical characteristics. J. Mater. Sci. Mater. Electron.2018, 29, 1025–1033. [CrossRef]
56. Al-Hada, N.M.; Kamari, H.M.; Shaari, A.H.; Saion, E. Fabrication and characterization of manganese-Zinc ferrite nanoparticlesproduced utilizing heat treatment technique. Results Phys. 2019, 12, 1821–1825. [CrossRef]
57. Al-Hada, N.M.; Saion, E.B.; Shaari, A.H.; Kamarudin, M.A.; Flaifel, M.H.; Ahmad, S.H.; Gene, A. A facile thermal-treatment routeto synthesize the semiconductor CdO nanoparticles and effect of calcination. Mater. Sci. Semicond. Process. 2014, 26, 460–466.[CrossRef]
58. Kamari, H.M.; Al-Hada, N.M.; Saion, E.; Shaari, A.H.; Talib, Z.A.; Flaifel, M.H.; Ahmed, A.A.A. Calcined solution-based PVPinfluence on ZnO semiconductor nanoparticle properties. Crystals 2017, 7, 2. [CrossRef]
59. Lee, P.J.; Saion, E.; Al-Hada, N.M.; Soltani, N. A simple up-scalable thermal treatment method for synthesis of ZnO nanoparticles.Metals 2015, 5, 2383–2392. [CrossRef]
60. Baqer, A.A.; Matori, K.A.; Al-Hada, N.M.; Shaari, A.H.; Kamari, H.M.; Saion, E.; Chyi, J.L.Y.; Abdullah, C.A.C. Synthesis andcharacterization of binary (CuO)0.6(CeO2)0.4 nanoparticles via a simple heat treatment method. Results Phys. 2018, 9, 471–478.[CrossRef]
61. Lin, R.; Zhong, Y.-J.; Luo, M.-F.; Liu, W.-P. Structure and Redox Properties of CexSn1−xO2 Mixed Oxides. Indian J. Chem. 2001, 40,36–40.
62. Cao, J.-L.; Wang, Y.; Sun, G.; Zhang, Z.-Y. CuO/CexSn1−xO2 catalysts: Synthesis, characterization, and catalytic performance forlow-temperature CO oxidation. Transit. Metal. Chem. 2011, 36, 107–112. [CrossRef]

Nanomaterials 2021, 11, 2143 14 of 14
63. Zakiyah, L.B.; Saion, E.; Al-Hada, N.M.; Gharibshahi, E.; Salem, A.; Soltani, N.; Gene, S. Up-scalable synthesis of size-controlledcopper ferrite nanocrystals by thermal treatment method. Mater. Sci. Semicond. Process. 2015, 40, 564–569. [CrossRef]
64. Gene, S.A.; Saion, E.; Shaari, A.H.; Kamarudin, M.A.; Al-Hada, N.M.; Kharazmi, A. Structural, optical, and magnetic char-acterization of spinel Zinc chromite nanocrystallines synthesised by thermal treatment method. J. Nanomater. 2014, 2014, 15.[CrossRef]
65. Midala, I.H.; Kamari, H.M.; Al-Hada, N.M.; Tim, C.K.; Muhamad, S.; Hamza, A.M.; Abubakar, T.R.; Nuhu, I.M. Structural,morphological and optical properties of (ZnO)0.2 (ZrO2)0.8 nanoparticles. Appl. Phys. A 2019, 125, 668. [CrossRef]