metals - Semantic Scholar
17
metals Article Comparison between Shot Peening, Cavitation Peening, and Laser Peening by Observation of Crack Initiation and Crack Growth in Stainless Steel Hitoshi Soyama Department of Finemechanics, Tohoku University, Sendai 980-8579, Japan; [email protected]; Tel.: +81-22-795-6891; Fax: +81-22-795-3758 Received: 24 November 2019; Accepted: 26 December 2019; Published: 31 December 2019 Abstract: The traditional technique used to modify the surface of a metallic material is shot peening; however, cavitation peening, a more recent technique in which shot is not used, was developed, and improvements in the fatigue strength of metallic materials were demonstrated. In order to compare the fatigue properties introduced by shot peening with those introduced by cavitation peening, crack initiation and crack growth in specimens of austenitic stainless steel (Japanese Industrial Standards JIS SUS316L) treated using these techniques were investigated. With conventional cavitation peening, cavitation is produced by injecting a high speed water jet into water. In the case of submerged laser peening, bubbles are generated using a pulsed laser after laser ablation, and the impact produced when the bubbles collapse is larger than that due to laser ablation. Thus, in this study, cavitation peening using a water jet and submerged laser peening were investigated. To clarify the mechanisms whereby the fatigue strength is improved by these peening techniques, crack initiation and crack growth in specimens with and without treatment were examined by means of a K-decreasing test, where K is the stress intensity factor, and using a constant applied stress test using a load controlled plane bending fatigue tester. It was found that the improvement in crack initiation and the reduction in crack growth were roughly in a linear relationship, even though the specimens were treated using different peening methods. The results presented here show that the fatigue strength of SUS316L treated by these peening techniques is closely related to the reduction in crack growth, rather than crack initiation. Keywords: cavitation peening; shot peening; crack; fatigue; stainless steel 1. Introduction Austenitic stainless steel is a bioinert material commonly used for implants [1,2]; unfortunately, this type of steel has insufficient fatigue resistance [2]. One of the best ways to enhance the fatigue life and/or strength of a metal is by shot peening, which introduces compressive residual stress into the sub-surface and work hardening. However, a disadvantage of shot peening is that there is an increase in surface roughness due to the physical collision with the shot. Recently, cavitation peening, in which shot is not used, has been developed [3,4]. To clarify the mechanism through which the fatigue characteristics are improved by peening, crack initiation and crack growth in peened specimens are usually investigated. This has been done for shot peened austenitic stainless steel [5]; however, it has not been done for cavitation peened stainless steel. To improve the fatigue properties of stainless steel in order to be able to use it for medical implants, the effect of shot peening on the fatigue properties has been investigated by examining the corrosion behavior in Ringer’s solution [6]. The effect of the shot peening conditions on the surface properties and the corrosion behavior of medical grade 316L stainless steel has also been examined [7]. Moreover, Metals 2020, 10, 63; doi:10.3390/met10010063 www.mdpi.com/journal/metals
-
Upload
khangminh22 -
Category
Documents
-
view
2 -
download
0
Transcript of metals - Semantic Scholar

metals
Article
Comparison between Shot Peening, CavitationPeening, and Laser Peening by Observation of CrackInitiation and Crack Growth in Stainless Steel
Hitoshi Soyama
Department of Finemechanics, Tohoku University, Sendai 980-8579, Japan; [email protected];Tel.: +81-22-795-6891; Fax: +81-22-795-3758
Received: 24 November 2019; Accepted: 26 December 2019; Published: 31 December 2019 �����������������
Abstract: The traditional technique used to modify the surface of a metallic material is shot peening;however, cavitation peening, a more recent technique in which shot is not used, was developed, andimprovements in the fatigue strength of metallic materials were demonstrated. In order to comparethe fatigue properties introduced by shot peening with those introduced by cavitation peening, crackinitiation and crack growth in specimens of austenitic stainless steel (Japanese Industrial StandardsJIS SUS316L) treated using these techniques were investigated. With conventional cavitation peening,cavitation is produced by injecting a high speed water jet into water. In the case of submerged laserpeening, bubbles are generated using a pulsed laser after laser ablation, and the impact producedwhen the bubbles collapse is larger than that due to laser ablation. Thus, in this study, cavitationpeening using a water jet and submerged laser peening were investigated. To clarify the mechanismswhereby the fatigue strength is improved by these peening techniques, crack initiation and crackgrowth in specimens with and without treatment were examined by means of a K-decreasing test,where K is the stress intensity factor, and using a constant applied stress test using a load controlledplane bending fatigue tester. It was found that the improvement in crack initiation and the reductionin crack growth were roughly in a linear relationship, even though the specimens were treated usingdifferent peening methods. The results presented here show that the fatigue strength of SUS316Ltreated by these peening techniques is closely related to the reduction in crack growth, rather thancrack initiation.
Keywords: cavitation peening; shot peening; crack; fatigue; stainless steel
1. Introduction
Austenitic stainless steel is a bioinert material commonly used for implants [1,2]; unfortunately,this type of steel has insufficient fatigue resistance [2]. One of the best ways to enhance the fatiguelife and/or strength of a metal is by shot peening, which introduces compressive residual stress intothe sub-surface and work hardening. However, a disadvantage of shot peening is that there is anincrease in surface roughness due to the physical collision with the shot. Recently, cavitation peening,in which shot is not used, has been developed [3,4]. To clarify the mechanism through which thefatigue characteristics are improved by peening, crack initiation and crack growth in peened specimensare usually investigated. This has been done for shot peened austenitic stainless steel [5]; however, ithas not been done for cavitation peened stainless steel.
To improve the fatigue properties of stainless steel in order to be able to use it for medical implants,the effect of shot peening on the fatigue properties has been investigated by examining the corrosionbehavior in Ringer’s solution [6]. The effect of the shot peening conditions on the surface propertiesand the corrosion behavior of medical grade 316L stainless steel has also been examined [7]. Moreover,
Metals 2020, 10, 63; doi:10.3390/met10010063 www.mdpi.com/journal/metals

Metals 2020, 10, 63 2 of 17
the effect of the surface roughness of shot peened stainless steel 316L has been investigated for thepurpose of modulating the interaction between the biological environment and the material [8].
Cavitation peening is a shotless peening method, in which the impact is produced by bubblescollapsing. In the case of conventional cavitation peening, cavitation is produced by injecting ahigh speed water jet into a water filled chamber, and the cavitation is generated inside and/or nearthe nozzle [9]. A water jet with cavitation is called a cavitating jet. In the case of a cavitating jet,cavitation clouds shed periodically from the nozzle, develop on the target, then collapse, generatingthe impacts [9]. On the other hand, in the case of water jet peening, the impact of the water column atthe center of the jet is used. Please note that the water column at the center of the jet can also peen themetal; however, the peened area is very limited and the peening intensity is smaller than that dueto cavitation [10]. Soyama proposed a classification map to distinguish between cavitation peeningand water jet peening using the distance between the nozzle and the target, the injection pressure, thenozzle diameter, and the cavitation number [3].
In the case of laser peening, there are two methods. One is laser peening using a water film onthe target [11–13], and the other method is submerged laser peening, in which the target is placed inwater [14]. In the case of submerged laser peening, bubbles generated after laser ablation develop,then collapse. As the behavior of these bubbles is similar to that of cavitation bubbles, this is calledlaser cavitation. It has been believed that the peening effect is due to laser ablation, as the amplitude ofthe shock wave induced by laser ablation is larger than that due to laser cavitation; however, when theimpact through the target was measured using a Polyvinylidene Fluoride (PVDF) sensor [15,16], theimpact due to laser cavitation collapse was found to be larger than that due to laser ablation [3,17].Soyama proposed a technique for cavitation peening using a pulsed laser without laser ablation byfocusing the laser in the water [18].
Another common method used to generate cavitation is ultrasonic cavitation. For example, avibratory erosion test is commonly used to evaluate the cavitation erosion resistance of materials, i.e.,ASTM G32 [19]. Please note that an erosion test using a cavitating jet has been standardized as ASTMG134 [20]. A vibratory horn is placed close to the surface of the material to be treated. It was foundthat at submillmeter horn to target distances the aggressive intensity changed drastically [21], andthis was confirmed experimentally and theoretically by Bai et al. [22]. As the sensitivity to distanceof ultrasonic cavitation limits its applications, it was not examined in this paper, and only cavitationinduced by a submerged water jet and using a submerged pulsed laser were investigated. Generally,peening using a submerged water jet is called cavitation peening (CP), and peening using a submergedlaser is called laser peening (LP). These are the terms used in this paper.
In a study done to compare the effects of different peening methods on austenitic stainless steelSUS304, it was found that grain boundary hardening and dislocation hardening are the most importantmechanisms [23]. Moreover, it was reported that fatigue loading reduces the compressive residualstress introduced by peening and that the reduction depends on the particular surface treatmentemployed [24–26].
Although an energy-based parameter to describe shot peening was proposed [27], this is notpossible in the case of cavitation peening, since, at present, the intensity of the impact at a particularenergy cannot be simulated theoretically; therefore, experimental studies of cavitation peening arerequired. The fatigue life and strength of austenitic stainless steel JIS SUS316L treated by severalpeening methods were investigated using a displacement controlled fatigue test [17], and it was shownthat the fatigue strength of cavitation peening was larger than that of shot peening, although thefatigue life at relatively high applied stress for shot peened specimens was larger than that of cavitationpeened specimens. As mentioned above, as crack initiation and growth affect the fatigue properties,these need to be investigated.
To investigate crack growth rates, a compact tension specimen is commonly used [28]. However,it is difficult to evaluate the crack growth in the modified surface layer, as the effect of the underlyingmaterial is much larger than that of the modified layer. As the maximum tensile stress is applied at

Metals 2020, 10, 63 3 of 17
the surface, i.e., in the surface modified layer, a plane bending fatigue test is suitable for evaluatingthe crack growth of peened materials. However, the plane bending fatigue testers currently availablecannot be used, because these are displacement controlled machines. With a displacement controlledplane bending fatigue tester, the applied stress decreases as the crack area increases. Thus, a loadcontrolled plane bending fatigue tester was developed [29], and using this, it was demonstrated thatthe threshold stress intensity factor range ∆Kth and the stress intensity factor range increment ∆(∆K)were improved by cavitation peening [30]. The load controlled plane bending fatigue tester was usedin these experiments to evaluate crack initiation and growth in surface layers treated by shot peening,cavitation peening, and laser peening. Please note that K-decreasing test was carried out in order todetermine whether crack initiation or crack growth is important, and also the improvement of thefatigue life within short crack by cavitation peening was dominant [31].
In this paper, the fatigue properties of austenitic stainless steel after treatment by cavitationpeening, laser peening and shot peening were compared. To make this comparison, crack initiationand growth in steel specimens were evaluated by a K-decreasing test and a constant applied stress testusing a load controlled plane bending fatigue tester, respectively.
2. Experimental Apparatus and Procedure
2.1. Crack Growth Test
The material under test was austenitic stainless steel JIS SUS316L. Tables 1 and 2 show the chemicalcomposition and mechanical properties of tested steel. The geometry of the specimens for the fatiguetest is shown in Figure 1. The thickness of the specimens was 4 mm. To investigate the growth of thecrack, a notch was introduced by milling using a 0.5 mm diameter end mill. The width and depthof the notch was 0.5 mm and 0.25 mm, respectively. The length was 2 mm for the K-decreasing testand 5 mm for the constant applied stress test. A pre-crack was developed from the notch using thehandmade plane bending fatigue tester. The lengths of the pre-crack before the respective tests were2.4 mm and 5.4 mm. Figures 2 and 3 show a schematic illustration and a photograph of the loadcontrolled plane bending fatigue tester [29]. The load is applied to the specimen using a servomotor(Harmonic Drive Systems Inc., Tokyo, Japan) which has a feedback system that detects the appliedload via a load sensor. The test frequency was 5 Hz and the stress ratio R was −1. The details of thebending fatigue test were shown in the references [29,30,32].
Table 1. Chemical composition of the stainless steel used in the tests (mass %).
C Si Mn P S Ni Cr Mo
0.014 0.63 0.97 0.030 0.004 12.03 17.45 2.05
Table 2. Mechanical properties of the stainless steel used in the tests.
Yield Strength (0.2%) Tensile Strength Elongation
304 MPa 576 MPa 52%Metals 2020, 10, x FOR PEER REVIEW 4 of 16
Figure 1. Dimensions of plane bending fatigue specimens (thickness: 4 mm).
Figure 2. Schematic diagram of load controlled plane bending fatigue tester (side view).
Figure 3. Photograph of load controlled plane bending fatigue tester (front view).
At the surface. Specimens were tested at certain number of cycles, and put into the furnace to oxidize the crack propagation area, i.e., half elliptic region, and fractured (see Figure 6 in the reference [30]). The length of the crack 2a was measured by a digital microscope at 1000× magnification. Under the present conditions, the relationships between 2a and b for the peened and non-peened specimens were the same [30]. The following relationship between 2a and b was obtained by observation of the crack shape, enabling b to be estimated by measuring 2a on the surface (see Figure 7 in the reference [30]). = 1 2 2 (3)
where 2a0 and b0 are the length and the depth of the notch, and C1 and C2 are constants obtained from experimental data using the least squares method. For the present experiments, 2a0, b0, C1 and C2 were
Figure 1. Dimensions of plane bending fatigue specimens (thickness: 4 mm).

Metals 2020, 10, 63 4 of 17
Metals 2020, 10, x FOR PEER REVIEW 4 of 16
Figure 1. Dimensions of plane bending fatigue specimens (thickness: 4 mm).
Figure 2. Schematic diagram of load controlled plane bending fatigue tester (side view).
Figure 3. Photograph of load controlled plane bending fatigue tester (front view).
At the surface. Specimens were tested at certain number of cycles, and put into the furnace to oxidize the crack propagation area, i.e., half elliptic region, and fractured (see Figure 6 in the reference [30]). The length of the crack 2a was measured by a digital microscope at 1000× magnification. Under the present conditions, the relationships between 2a and b for the peened and non-peened specimens were the same [30]. The following relationship between 2a and b was obtained by observation of the crack shape, enabling b to be estimated by measuring 2a on the surface (see Figure 7 in the reference [30]). = 1 2 2 (3)
where 2a0 and b0 are the length and the depth of the notch, and C1 and C2 are constants obtained from experimental data using the least squares method. For the present experiments, 2a0, b0, C1 and C2 were
Figure 2. Schematic diagram of load controlled plane bending fatigue tester (side view).
Metals 2020, 10, x FOR PEER REVIEW 4 of 16
Figure 1. Dimensions of plane bending fatigue specimens (thickness: 4 mm).
Figure 2. Schematic diagram of load controlled plane bending fatigue tester (side view).
Figure 3. Photograph of load controlled plane bending fatigue tester (front view).
At the surface. Specimens were tested at certain number of cycles, and put into the furnace to oxidize the crack propagation area, i.e., half elliptic region, and fractured (see Figure 6 in the reference [30]). The length of the crack 2a was measured by a digital microscope at 1000× magnification. Under the present conditions, the relationships between 2a and b for the peened and non-peened specimens were the same [30]. The following relationship between 2a and b was obtained by observation of the crack shape, enabling b to be estimated by measuring 2a on the surface (see Figure 7 in the reference [30]). = 1 2 2 (3)
where 2a0 and b0 are the length and the depth of the notch, and C1 and C2 are constants obtained from experimental data using the least squares method. For the present experiments, 2a0, b0, C1 and C2 were
Figure 3. Photograph of load controlled plane bending fatigue tester (front view).
To investigate crack initiation and growth in the surface layer, the stress intensity factor range ∆Kand the crack growth rate da/dn were evaluated using the plane bending fatigue tester. The appliedbending stress σa was calculated from the bending moment M, the width of the specimen W and thethickness of the specimen t using the following equation:
σa =6 MW t2 (1)
∆K was calculated using the Newman-Raju equation [33], as follows:
∆K = ∆σa√
π bJφ
S H (2)
where b is the depth of the crack, ∆σa is 2 σa, and J, φ, S and H are shape factors. Although the crackpropagates in three dimensions, the depth of the crack b is estimated from the length of the crack 2a.
At the surface. Specimens were tested at certain number of cycles, and put into the furnaceto oxidize the crack propagation area, i.e., half elliptic region, and fractured (see Figure 6 in thereference [30]). The length of the crack 2a was measured by a digital microscope at 1000×magnification.Under the present conditions, the relationships between 2a and b for the peened and non-peenedspecimens were the same [30]. The following relationship between 2a and b was obtained by observationof the crack shape, enabling b to be estimated by measuring 2a on the surface (see Figure 7 in thereference [30]).
b = b0 + C1[1− exp{C2(2a− 2a0)
}] (3)

Metals 2020, 10, 63 5 of 17
where 2a0 and b0 are the length and the depth of the notch, and C1 and C2 are constants obtained fromexperimental data using the least squares method. For the present experiments, 2a0, b0, C1 and C2 were2, 0.25, 2.51 and −0.51 for the K-decreasing test and 5, 0.25, 2.26 and −0.28 for the crack growth test atconstant applied stress, respectively.
The effect of peening on crack initiation was examined by determining the threshold stressintensity factor range, ∆Kth. The crack length was measured after each 105 cycles using an opticalmicroscope, then da/dn and ∆K were calculated. Please note that the secant method [28] was used forcomputing the crack growth rate da/dn. A K-decreasing test was carried out, and ∆Kth is given by thevalue of ∆K at da/dn = 10−10 m/cycle.
The stress intensity factor range increment, ∆(∆K), was used in order to investigate the effect ofpeening on crack growth, considering a previous report [30]. Larger values of ∆(∆K) signify greaterreductions in crack growth. In the present study, the domain for Paris’ law is from da/dn = 10−9 m/cycleto da/dn = 10−8 m/cycle. da/dn is plotted against ∆K on a log-log scale in this domain in Figure 4 [30].The intercepts A and B at da/dn = 10−8 m/cycle, and C and D at da/dn = 10−9 m/cycle were obtained fornon-peened and peened specimens, respectively. The average value m of the values of AC and BD wasdetermined. ∆(∆K) is defined as 10m. For the crack growth test at constant applied load, the appliedstress was 160 MPa for the non-peened specimen and 200 MPa for the peened specimen.
Metals 2020, 10, x FOR PEER REVIEW 5 of 16
2, 0.25, 2.51 and −0.51 for the K-decreasing test and 5, 0.25, 2.26 and −0.28 for the crack growth test at constant applied stress, respectively.
The effect of peening on crack initiation was examined by determining the threshold stress intensity factor range, ∆Kth. The crack length was measured after each 105 cycles using an optical microscope, then da/dn and ∆K were calculated. Please note that the secant method [28] was used for computing the crack growth rate da/dn. A K-decreasing test was carried out, and ∆Kth is given by the value of ∆K at da/dn = 10−10 m/cycle.
The stress intensity factor range increment, ∆(∆K), was used in order to investigate the effect of peening on crack growth, considering a previous report [30]. Larger values of ∆(∆K) signify greater reductions in crack growth. In the present study, the domain for Paris’ law is from da/dn = 10−9 m/cycle to da/dn = 10−8 m/cycle. da/dn is plotted against ∆K on a log-log scale in this domain in Figure 4 [30]. The intercepts A and B at da/dn = 10−8 m/cycle, and C and D at da/dn = 10−9 m/cycle were obtained for non-peened and peened specimens, respectively. The average value m of the values of AC and BD was determined. ∆(∆K) is defined as 10m. For the crack growth test at constant applied load, the applied stress was 160 MPa for the non-peened specimen and 200 MPa for the peened specimen.
Figure 4. Schematic diagram illustrating the definition of the stress intensity factor range increment, ∆(∆K) = 10m.
To confirm repeatability and reproducibility, two sets of non-peened, cavitation peening, laser peening and shot peening at tp = 0.88 s/mm were tested at the K-decreasing test and the constant applied stress test. In Section 3. Result, the averaged value and error bar, which show the maximum value and minimum value, were shown.
The surface residual stress, surface Vickers hardness and surface roughness of the peened surfaces were measured. The residual stress in the longitudinal direction was measured by a 2D X-ray diffraction method using Kα X-rays from a Cr-tube operating at 35 kV and 40 mA [34]. The X-rays passed through a 0.8 mm diameter collimator and a monochromator, and the X-ray diffraction patterns obtained. The diffraction angle from the γ-Fe (2 2 0) plane without strain was 128 degrees. Twenty-four diffraction rings were detected from the specimens at various angles using a two-dimensional detector (Bruker Japan Co., Ltd., Yokohama, Japan), considering the conditions used in a previous report [35]. The load used in measuring the Vickers hardness was 0.2 kgf, i.e., 1.96 N. The surface roughness was evaluated using a stylus type profilometer (Mitutoyo Corporation, Kawasaki, Japan).
2.2. Submerged Water Jet System
Figure 5 shows an illustration of a submerged water jet system for cavitation peening. Water, pressurized by a plunger pump, is injected into a water filled stainless steel tank through a test nozzle. The test nozzle has a cavitator and a guide pipe which were optimized to enhance the aggressive intensity of the cavitating jet [36]. As the length L and diameter D of the outlet bore at the nozzle exit also affect the aggressive intensity of the jet, L and D were optimized experimentally [37]. The nozzle
Figure 4. Schematic diagram illustrating the definition of the stress intensity factor range increment,∆(∆K) = 10m.
To confirm repeatability and reproducibility, two sets of non-peened, cavitation peening, laserpeening and shot peening at tp = 0.88 s/mm were tested at the K-decreasing test and the constantapplied stress test. In Section 3. Result, the averaged value and error bar, which show the maximumvalue and minimum value, were shown.
The surface residual stress, surface Vickers hardness and surface roughness of the peened surfaceswere measured. The residual stress in the longitudinal direction was measured by a 2D X-ray diffractionmethod using Kα X-rays from a Cr-tube operating at 35 kV and 40 mA [34]. The X-rays passed througha 0.8 mm diameter collimator and a monochromator, and the X-ray diffraction patterns obtained. Thediffraction angle from the γ-Fe (2 2 0) plane without strain was 128 degrees. Twenty-four diffractionrings were detected from the specimens at various angles using a two-dimensional detector (BrukerJapan Co., Ltd., Yokohama, Japan), considering the conditions used in a previous report [35]. The loadused in measuring the Vickers hardness was 0.2 kgf, i.e., 1.96 N. The surface roughness was evaluatedusing a stylus type profilometer (Mitutoyo Corporation, Kawasaki, Japan).
2.2. Submerged Water Jet System
Figure 5 shows an illustration of a submerged water jet system for cavitation peening. Water,pressurized by a plunger pump, is injected into a water filled stainless steel tank through a test nozzle.The test nozzle has a cavitator and a guide pipe which were optimized to enhance the aggressive

Metals 2020, 10, 63 6 of 17
intensity of the cavitating jet [36]. As the length L and diameter D of the outlet bore at the nozzle exitalso affect the aggressive intensity of the jet, L and D were optimized experimentally [37]. The nozzlethroat diameter d was 2 mm, the diameter of the cavitator dc was 3 mm, the injection pressure was 30MPa and the standoff distance was 222 mm, the same as used in a previous study [17]. Cavitationdevelops as cloud cavitation, and becomes ring vortex cavitation at the surface, before collapsing.Thus, the specimens were placed in a recess so that the whole surface was flat.
Metals 2020, 10, x FOR PEER REVIEW 6 of 16
throat diameter d was 2 mm, the diameter of the cavitator dc was 3 mm, the injection pressure was 30 MPa and the standoff distance was 222 mm, the same as used in a previous study [17]. Cavitation develops as cloud cavitation, and becomes ring vortex cavitation at the surface, before collapsing. Thus, the specimens were placed in a recess so that the whole surface was flat.
The processing time per unit length, tp is defined as follows. = (4)
where n and v are the number of passes and the scanning speed of the nozzle, respectively. For these experiments, the processing time per unit length was chosen to be tp = 8 s/mm, the same as in the previous study [17].
Figure 5. Schematic illustration of the set up for cavitation peeing using a submerged water jet.
2.3. Submerged Pulse Laser System
Figure 6 shows the set up for submerged laser peening. The specimen is placed on a stage in a water filled glass chamber, and the stage is moved horizontally and vertically by stepping motors. The chamber walls are 3 mm thick. The laser pulses are generated by a Q-switched Nd:YAG laser (Continuum Inc., San Jose, CA, USA) with a fundamental wavelength of 1064 nm. The optimum standoff distance is partly in air sa and partly in water sw. The maximum energy, the beam diameter, the pulse width, and the repetition frequency of the laser pulses used in the experiments for this study were 0.35 J, 6 mm, 6 ns and 10 Hz, respectively. The focal length of the final convex lens was 100 mm and the spot size of the laser on the target was about 0.8 mm in diameter in these experiments, the laser pulse density was chosen to be 4 pulse/mm2, the same as in the previous study [17].
2.4. Recirculating Shot Peening Accelerated by Water Jet System
Shot peening was carried out using recirculating shot accelerated by a water jet system, which was developed by Naito et al. [38], and was used by us in the previous study [17]. Figure 7 shows a schematic diagram of the shot peening system. The conditions were chosen to be the same as those used in the previous work [17]. The shot, made of stainless steel JIS SUS440C, were installed in the chamber and accelerated by pressurized water coming through three 0.8 mm diameter holes. The diameter and the number of shot were 3.2 mm and 500, respectively. The standoff distance and the injection pressure were 50 mm and 12 MPa, respectively. Please note that no compressive residual stress was introduced into the stainless steel by the water jet alone under the same conditions. To avoid loose shot, the specimen was placed in a recess to make the surface flat, and the chamber was scanned across the surface. The processing time per unit length is defined in the same way as for cavitation peening (Equation (4)). In the case of shot peening, tp was chosen to be 0.18, 0.29, 0.58 and 0.88 s/mm considering the results obtained and presented in the previous report [17].
Figure 5. Schematic illustration of the set up for cavitation peeing using a submerged water jet.
The processing time per unit length, tp is defined as follows.
tp =nv
(4)
where n and v are the number of passes and the scanning speed of the nozzle, respectively. For theseexperiments, the processing time per unit length was chosen to be tp = 8 s/mm, the same as in theprevious study [17].
2.3. Submerged Pulse Laser System
Figure 6 shows the set up for submerged laser peening. The specimen is placed on a stage in awater filled glass chamber, and the stage is moved horizontally and vertically by stepping motors.The chamber walls are 3 mm thick. The laser pulses are generated by a Q-switched Nd:YAG laser(Continuum Inc., San Jose, CA, USA) with a fundamental wavelength of 1064 nm. The optimumstandoff distance is partly in air sa and partly in water sw. The maximum energy, the beam diameter,the pulse width, and the repetition frequency of the laser pulses used in the experiments for this studywere 0.35 J, 6 mm, 6 ns and 10 Hz, respectively. The focal length of the final convex lens was 100 mmand the spot size of the laser on the target was about 0.8 mm in diameter in these experiments, thelaser pulse density was chosen to be 4 pulse/mm2, the same as in the previous study [17].Metals 2020, 10, x FOR PEER REVIEW 7 of 16
Figure 6. Schematic illustration of the set up for cavitation peeing using a submerged laser.
Figure 7. Schematic illustration of the set up for peeing using recirculating shot.
3. Results
3.1. Improvement of ∆Kth and ∆(∆K) by Peening
To compare the effect of the peening methods on crack initiation, Figure 8 shows the relationship between the stress intensity factor range ∆K and the crack growth rate da/dn obtained by the K-decreasing test. In Figure 8, in the case of non-peened, cavitation peening, laser peening and shot peening at tp = 0.88 s/mm, the 1st set was shown by closed symbols and the 2nd set was shown by open symbols. In Figure 8, the number after “Shot peening (SP)” shows the processing time per unit length. For example, “SP0.18” means shot peened at tp = 0.18 s/mm. As shown in Figure 8, the ∆K-da/dn curves of the peened specimens have shifted to the right. ∆Kth was calculated from these curve at da/dn = 1010 m/cycle, and the values are 3.71 ± 0.11 MPa√m for the non-peened specimen, 6.33 ± 0.20 MPa√m for the laser peened specimen, 6.46 ± 0.25 MPa√m for the cavitation peened specimen and 6.52 ± 0.17 MPa√m for the shot peened specimen at 0.88 s/mm, as shown in Table 3. In the case of shot peening with short processing times per unit length, tp = 0.18, 0.29 and 0.58 s/mm, ∆Kth is 5.51, 5.74 and 6.49 MPa√m, respectively. As reported in the previous reference [17], the optimum value of tp is 0.88 s/mm, thus ∆Kth cannot be improved by reducing tp. Thus, it can be concluded that peening at the optimum value of tp increases ∆Kth by more than 70%.
Figure 9 shows the crack length changing with number of cycle obtained by the constant applied stress test. In Figure 9, in the case of non-peened, cavitation peening, laser peening and shot peening at tp = 0.88 s/mm, the 1st set was shown by closed symbols and the 2nd set was shown by open symbols. As shown in Figure 9, the number of cycles to fracture was extended by peening. The longest number of cycle to fracture was obtained with cavitation peening, followed by shot peening at tp = 0.88 s/mm.
Figure 6. Schematic illustration of the set up for cavitation peeing using a submerged laser.

Metals 2020, 10, 63 7 of 17
2.4. Recirculating Shot Peening Accelerated by Water Jet System
Shot peening was carried out using recirculating shot accelerated by a water jet system, whichwas developed by Naito et al. [38], and was used by us in the previous study [17]. Figure 7 shows aschematic diagram of the shot peening system. The conditions were chosen to be the same as thoseused in the previous work [17]. The shot, made of stainless steel JIS SUS440C, were installed in thechamber and accelerated by pressurized water coming through three 0.8 mm diameter holes. Thediameter and the number of shot were 3.2 mm and 500, respectively. The standoff distance and theinjection pressure were 50 mm and 12 MPa, respectively. Please note that no compressive residualstress was introduced into the stainless steel by the water jet alone under the same conditions. To avoidloose shot, the specimen was placed in a recess to make the surface flat, and the chamber was scannedacross the surface. The processing time per unit length is defined in the same way as for cavitationpeening (Equation (4)). In the case of shot peening, tp was chosen to be 0.18, 0.29, 0.58 and 0.88 s/mmconsidering the results obtained and presented in the previous report [17].
Metals 2020, 10, x FOR PEER REVIEW 7 of 16
Figure 6. Schematic illustration of the set up for cavitation peeing using a submerged laser.
Figure 7. Schematic illustration of the set up for peeing using recirculating shot.
3. Results
3.1. Improvement of ∆Kth and ∆(∆K) by Peening
To compare the effect of the peening methods on crack initiation, Figure 8 shows the relationship between the stress intensity factor range ∆K and the crack growth rate da/dn obtained by the K-decreasing test. In Figure 8, in the case of non-peened, cavitation peening, laser peening and shot peening at tp = 0.88 s/mm, the 1st set was shown by closed symbols and the 2nd set was shown by open symbols. In Figure 8, the number after “Shot peening (SP)” shows the processing time per unit length. For example, “SP0.18” means shot peened at tp = 0.18 s/mm. As shown in Figure 8, the ∆K-da/dn curves of the peened specimens have shifted to the right. ∆Kth was calculated from these curve at da/dn = 1010 m/cycle, and the values are 3.71 ± 0.11 MPa√m for the non-peened specimen, 6.33 ± 0.20 MPa√m for the laser peened specimen, 6.46 ± 0.25 MPa√m for the cavitation peened specimen and 6.52 ± 0.17 MPa√m for the shot peened specimen at 0.88 s/mm, as shown in Table 3. In the case of shot peening with short processing times per unit length, tp = 0.18, 0.29 and 0.58 s/mm, ∆Kth is 5.51, 5.74 and 6.49 MPa√m, respectively. As reported in the previous reference [17], the optimum value of tp is 0.88 s/mm, thus ∆Kth cannot be improved by reducing tp. Thus, it can be concluded that peening at the optimum value of tp increases ∆Kth by more than 70%.
Figure 9 shows the crack length changing with number of cycle obtained by the constant applied stress test. In Figure 9, in the case of non-peened, cavitation peening, laser peening and shot peening at tp = 0.88 s/mm, the 1st set was shown by closed symbols and the 2nd set was shown by open symbols. As shown in Figure 9, the number of cycles to fracture was extended by peening. The longest number of cycle to fracture was obtained with cavitation peening, followed by shot peening at tp = 0.88 s/mm.
Figure 7. Schematic illustration of the set up for peeing using recirculating shot.
3. Results
3.1. Improvement of ∆Kth and ∆(∆K) by Peening
To compare the effect of the peening methods on crack initiation, Figure 8 shows the relationshipbetween the stress intensity factor range ∆K and the crack growth rate da/dn obtained by the K-decreasingtest. In Figure 8, in the case of non-peened, cavitation peening, laser peening and shot peening at tp
= 0.88 s/mm, the 1st set was shown by closed symbols and the 2nd set was shown by open symbols.In Figure 8, the number after “Shot peening (SP)” shows the processing time per unit length. Forexample, “SP0.18” means shot peened at tp = 0.18 s/mm. As shown in Figure 8, the ∆K-da/dn curves ofthe peened specimens have shifted to the right. ∆Kth was calculated from these curve at da/dn = 1010
m/cycle, and the values are 3.71 ± 0.11 MPa√
m for the non-peened specimen, 6.33 ± 0.20 MPa√
m forthe laser peened specimen, 6.46 ± 0.25 MPa
√m for the cavitation peened specimen and 6.52 ± 0.17
MPa√
m for the shot peened specimen at 0.88 s/mm, as shown in Table 3. In the case of shot peeningwith short processing times per unit length, tp = 0.18, 0.29 and 0.58 s/mm, ∆Kth is 5.51, 5.74 and 6.49MPa
√m, respectively. As reported in the previous reference [17], the optimum value of tp is 0.88 s/mm,
thus ∆Kth cannot be improved by reducing tp. Thus, it can be concluded that peening at the optimumvalue of tp increases ∆Kth by more than 70%.

Metals 2020, 10, 63 8 of 17
Metals 2020, 10, x FOR PEER REVIEW 8 of 16
Figure 10 shows the fractured surface after the constant applied stress test. As shown in Figure 10, the crack propagated in a semi-elliptical shape from the notch, then fractured. The steps near the surface was generated by the secondary cracks.
Table 3. Threshold stress intensity factor range ∆Kth, stress intensity factor range increment ∆(∆K) and fatigue strength σfs.
Process ∆Kth MPa√ ∆Kth’ ∆(∆K)
Fatigue Strength σfs MPa σfs’
Non-peened 3.71 ± 0.11 1.00 ± 0.03 1.00 ± 0.05 278.9 ± 5.2 1.00 ± 0.02 Shot peening 6.52 ± 0.17 1.76 ± 0.07 2.21 ± 0.05 325.0 ± 8.7 1.17 ± 0.04
Cavitation peening 6.46 ± 0.25 1.74 ± 0.09 2.32 ± 0.05 348.1 ± 8.4 1.25 ± 0.04
Laser peening 6.33 ± 0.20 1.71 ± 0.07 2.05 ± 0.23 303.2 ± 8.4 1.09 ± 0.04
Figure 8. Relationship between the stress intensity factor range ∆K and the crack growth rate da/dn obtained by the K-decreasing test.
Figure 8. Relationship between the stress intensity factor range ∆K and the crack growth rate da/dnobtained by the K-decreasing test.
Table 3. Threshold stress intensity factor range ∆Kth, stress intensity factor range increment ∆(∆K) andfatigue strength σfs.
Process ∆Kth MPa√
m ∆Kth’ ∆(∆K)Fatigue
Strength σfsMPa
σfs’
Non-peened 3.71 ± 0.11 1.00 ± 0.03 1.00 ± 0.05 278.9 ± 5.2 1.00 ± 0.02Shot peening 6.52 ± 0.17 1.76 ± 0.07 2.21 ± 0.05 325.0 ± 8.7 1.17 ± 0.04
Cavitation peening 6.46 ± 0.25 1.74 ± 0.09 2.32 ± 0.05 348.1 ± 8.4 1.25 ± 0.04Laser peening 6.33 ± 0.20 1.71 ± 0.07 2.05 ± 0.23 303.2 ± 8.4 1.09 ± 0.04
Figure 9 shows the crack length changing with number of cycle obtained by the constant appliedstress test. In Figure 9, in the case of non-peened, cavitation peening, laser peening and shot peening attp = 0.88 s/mm, the 1st set was shown by closed symbols and the 2nd set was shown by open symbols.As shown in Figure 9, the number of cycles to fracture was extended by peening. The longest numberof cycle to fracture was obtained with cavitation peening, followed by shot peening at tp = 0.88 s/mm.
Figure 10 shows the fractured surface after the constant applied stress test. As shown in Figure 10,the crack propagated in a semi-elliptical shape from the notch, then fractured. The steps near thesurface was generated by the secondary cracks.
To compare the effect of the peening methods on crack growth, Figure 11 shows the relationshipbetween the stress intensity factor range ∆K and the crack growth rate da/dn obtained by the constantapplied stress test. Figure 11a,c show the complete data range and Figure 11b.

Metals 2020, 10, 63 9 of 17Metals 2020, 10, x FOR PEER REVIEW 9 of 16
Figure 9. Crack length as a function of number of cycle obtained by the constant applied stress test.
Figure 10. Aspect of fractured surface after the constant applied stress test of specimens of (a) non-peened, (b) shot peening, (c) cavitation peening and (d) laser peening.
5 mm
Figure 9. Crack length as a function of number of cycle obtained by the constant applied stress test.
Metals 2020, 10, x FOR PEER REVIEW 9 of 16
Figure 9. Crack length as a function of number of cycle obtained by the constant applied stress test.
Figure 10. Aspect of fractured surface after the constant applied stress test of specimens of (a) non-peened, (b) shot peening, (c) cavitation peening and (d) laser peening.
5 mm
Figure 10. Aspect of fractured surface after the constant applied stress test of specimens of(a) non-peened, (b) shot peening, (c) cavitation peening and (d) laser peening.

Metals 2020, 10, 63 10 of 17
Metals 2020, 10, x FOR PEER REVIEW 10 of 16
To compare the effect of the peening methods on crack growth, Figure 11 shows the relationship between the stress intensity factor range ∆K and the crack growth rate da/dn obtained by the constant applied stress test. Figure 11a,c show the complete data range and Figure 11b.
(a) Complete data range (1st set) (b) Paris’ law domain (1st set)
(c) Complete data range (2nd set) (d) Paris’ law domain (2nd set)
Figure 11. Relationship between the stress intensity factor range ∆K and the crack growth rate da/dn obtained by the constant applied stress test (continued).
And (d) show the data in the Paris’ law domain, i.e., da/dn = 10−9 m/cycle to da/dn = 10−8 m/cycle. The constants of Paris’ law and correlation coefficient of the data in Figure 11b,d are shown in Table 4. The number of data points and the probability of non-correlation were also shown in Table 4. The probability of non-correlation was less than 1% except shot peening at tp = 0.18 s/mm. Namely the relationship in Figure 11 is worth to discussing. The constant C was reduced by shot peening, cavitation peening and laser peening remarkably. In addition, the constant m of cavitation peening and laser peening increased. This result suggested that the crack growth at initial stage was reduced by cavitation peening and laser peening. As shown in Figure 11a–d, the ∆K-da/dn curves shift to the right and down after peening. This means that at equivalent values of ∆K, da/dn decreases after peening. If equivalent values of da/dn are compared, ∆K increases after peening. ∆(∆K) was calculated
Figure 11. Relationship between the stress intensity factor range ∆K and the crack growth rate da/dnobtained by the constant applied stress test (continued).
And (d) show the data in the Paris’ law domain, i.e., da/dn = 10−9 m/cycle to da/dn = 10−8 m/cycle.The constants of Paris’ law and correlation coefficient of the data in Figure 11b,d are shown in Table 4.The number of data points and the probability of non-correlation were also shown in Table 4. Theprobability of non-correlation was less than 1% except shot peening at tp = 0.18 s/mm. Namelythe relationship in Figure 11 is worth to discussing. The constant C was reduced by shot peening,cavitation peening and laser peening remarkably. In addition, the constant m of cavitation peeningand laser peening increased. This result suggested that the crack growth at initial stage was reducedby cavitation peening and laser peening. As shown in Figure 11a–d, the ∆K-da/dn curves shift tothe right and down after peening. This means that at equivalent values of ∆K, da/dn decreases afterpeening. If equivalent values of da/dn are compared, ∆K increases after peening. ∆(∆K) was calculatedas described in Section 2.1, and is 2.05 ± 0.23 for laser peening, 2.21 ± 0.05 for shot peening at tp = 0.88s/mm, and 2.32 ± 0.05 for cavitation peening. These values are also shown in Table 3. At the present

Metals 2020, 10, 63 11 of 17
condition base on the longer fatigue test changing with processing time per unit length and pulsedensity [17], both ∆Kth and ∆(∆K) of laser peening were slightly smaller than those of shot peeningat tp = 0.88 s/mm, as shown in Table 3. If the laser peening condition was changed, the result wouldbe changed. In the case of shot peening at shorter tp, ∆(∆K) is 1.68 ± 0.32 for tp = 0.18 s/mm, 1.69 ±0.10 for tp = 0.29 s/mm and 1.99 ± 0.11 for tp = 0.58 s/mm. As with ∆Kth, ∆(∆K) does not improve withshorter tp. Thus, both ∆Kth and ∆(∆K) increase with tp under the conditions used here.
Table 4. Paris’ law constants and correlation coefficient.
Heading Paris’ Law Constants CorrelationCoefficient
Number ofData Points
Probability ofNon-Correlation
(%)C m/cycle m
Non-peened 3.8 × 10⁻¹⁰ 1.4 ± 0.4 0.67 18 0.23
Shot peening(tp = 0.18 s/mm) 6.5 × 10⁻¹⁰ 1.1 ± 1.5 0.38 5 53
Shot peening(tp = 0.29 s/mm) 5.5 × 10⁻¹¹ 2.0 ± 0.4 0.80 19 0.004
Shot peening(tp = 0.58 s/mm) 1.2 × 10⁻¹⁰ 1.4 ± 0.4 0.55 29 0.2
Shot peening(tp = 0.88 s/mm) 7.6 × 10⁻¹¹ 1.6 ± 0.3 0.66 52 0.001
Cavitationpeening 3.7 × 10⁻¹¹ 1.8 ± 0.4 0.66 33 0.3
Laser peening 5.3 × 10⁻¹¹ 1.8 ± 0.3 0.71 36 0.013
As shown in Figure 11, the data scatter for SP0.18 was higher than the others. To clarify thereason, Figure 12 shows the aspect of shot peened surface at tp = 0.18 and 0.29 s/mm. Please note thataspects of the peened surface treated by cavitation peening, laser peening and shot peening at tp =
0.88 s/mm were shown in the reference [17]. As shown in Figure 12, in the case of SP0.18 and SP0.29,plastic deformation pits introduced by the shots did not cover whole area, and not-peened surface wasobserved. This is one of reasons why data of SP0.18 was more scattered compared to the others.
Metals 2020, 10, x FOR PEER REVIEW 11 of 16
as described in Section 2.1, and is 2.05 ± 0.23 for laser peening, 2.21 ± 0.05 for shot peening at tp = 0.88 s/mm, and 2.32 ± 0.05 for cavitation peening. These values are also shown in Table 3. At the present condition base on the longer fatigue test changing with processing time per unit length and pulse density [17], both ∆Kth and ∆(∆K) of laser peening were slightly smaller than those of shot peening at tp = 0.88 s/mm, as shown in Table 3. If the laser peening condition was changed, the result would be changed. In the case of shot peening at shorter tp, ∆(∆K) is 1.68 ± 0.32 for tp = 0.18 s/mm, 1.69 ± 0.10 for tp = 0.29 s/mm and 1.99 ± 0.11 for tp = 0.58 s/mm. As with ∆Kth, ∆(∆K) does not improve with shorter tp. Thus, both ∆Kth and ∆(∆K) increase with tp under the conditions used here.
As shown in Figure 11, the data scatter for SP0.18 was higher than the others. To clarify the reason, Figure 12 shows the aspect of shot peened surface at tp = 0.18 and 0.29 s/mm. Please note that aspects of the peened surface treated by cavitation peening, laser peening and shot peening at tp = 0.88 s/mm were shown in the reference [17]. As shown in Figure 12, in the case of SP0.18 and SP0.29, plastic deformation pits introduced by the shots did not cover whole area, and not-peened surface was observed. This is one of reasons why data of SP0.18 was more scattered compared to the others.
Table 4. Paris’ law constants and correlation coefficient.
Heading Paris’ Law Constants Correlation
Coefficient Number of Data
Points
Probability of Non-Correlation
(%) C m/cycle m
Non-peened 3.8 × 10⁻¹⁰ 1.4 ± 0.4 0.67 18 0.23 Shot peening
(tp = 0.18 s/mm) 6.5 × 10⁻¹⁰ 1.1 ± 1.5 0.38 5 53
Shot peening (tp = 0.29 s/mm)
5.5 × 10⁻¹¹ 2.0 ± 0.4 0.80 19 0.004
Shot peening (tp = 0.58 s/mm)
1.2 × 10⁻¹⁰ 1.4 ± 0.4 0.55 29 0.2
Shot peening (tp = 0.88 s/mm)
7.6 × 10⁻¹¹ 1.6 ± 0.3 0.66 52 0.001
Cavitation peening 3.7 × 10⁻¹¹ 1.8 ± 0.4 0.66 33 0.3 Laser peening 5.3 × 10⁻¹¹ 1.8 ± 0.3 0.71 36 0.013
(a) Shot peening tp = 0.18 s/mm (b) Shot peening tp = 0.29 s/mm
Figure 12. Aspect of shot peened surface at tp = 0.18 and 0.29 s/mm.
Figure 13 shows the relationship between ∆Kth and ∆(∆K). As ∆(∆K) is an improvement ratio against non-peened specimen, ∆Kth is revealed by ∆Kth’ which is normalized by non-peened one. As shown in Figure 13, ∆Kth’ and ∆(∆K) are roughly in a linear relationship. Please note that the correlation coefficient for the 7 points is 0.963. This means that the probability of non-correlation is less than 0.05%. Thus, it can be said that the relationship between ∆Kth’ and ∆(∆K) is highly significant. The values of ∆Kth’ for cavitation peening and shot peening are similar. On the other hand, in the case of ∆(∆K), this is slightly larger for cavitation peening than for shot peening as shown in Table 3. This suggests that the effect on reducing crack growth is slightly larger for cavitation peening than for shot peening.
1 mm
Figure 12. Aspect of shot peened surface at tp = 0.18 and 0.29 s/mm.
Figure 13 shows the relationship between ∆Kth and ∆(∆K). As ∆(∆K) is an improvement ratioagainst non-peened specimen, ∆Kth is revealed by ∆Kth’ which is normalized by non-peened one.As shown in Figure 13, ∆Kth’ and ∆(∆K) are roughly in a linear relationship. Please note that thecorrelation coefficient for the 7 points is 0.963. This means that the probability of non-correlation is lessthan 0.05%. Thus, it can be said that the relationship between ∆Kth’ and ∆(∆K) is highly significant.The values of ∆Kth’ for cavitation peening and shot peening are similar. On the other hand, in thecase of ∆(∆K), this is slightly larger for cavitation peening than for shot peening as shown in Table 3.

Metals 2020, 10, 63 12 of 17
This suggests that the effect on reducing crack growth is slightly larger for cavitation peening than forshot peening.Metals 2020, 10, x FOR PEER REVIEW 12 of 16
Figure 13. Relationship between the stress intensity factor range increment ∆(∆K) and the normalized threshold stress intensity factor range ∆Kth’.
3.2. Effect of the Mechanical Properties on ∆Kth and ∆(∆K)
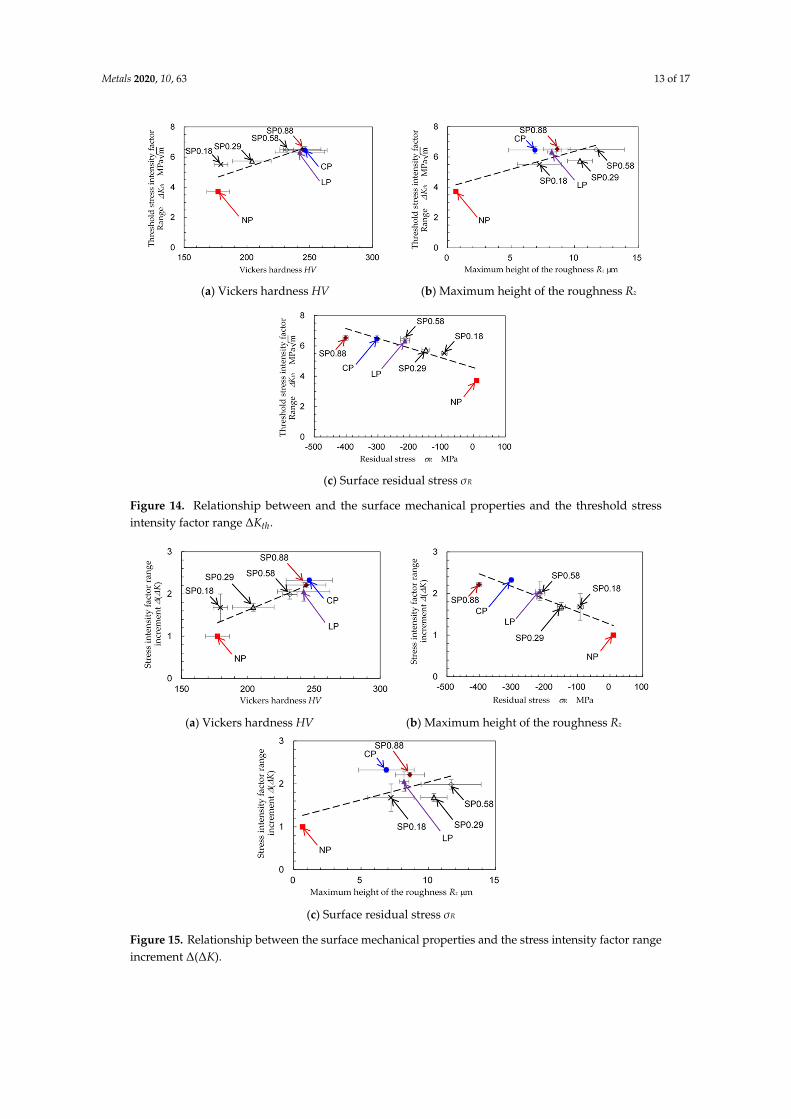
To investigate the effect of the mechanical properties on ∆Kth and ∆(∆K), Figures 14 and 15 show ∆Kth and ∆(∆K) as functions of the mechanical properties, including (a) the Vickers hardness HV, (b) the maximum height of the roughness Rz and (c) the surface residual stress σR. The correlation coefficients for each of these curves are 0.855 for Figure 14a, 0.830 for Figure 14b, 0.924 for Figure 14c, 0.912 for Figure 15a, 0.658 for Figure 15b and 0.930 for Figure 15c. These results show that both ∆Kth and ∆(∆K) increase with increasing Vickers hardness and compressive residuals stress. As is well known, peening is a mechanical surface treatment used for work hardening and introducing compressive residual stress by generating local plastic deformation. The surface roughness is increased by shot peening, laser peening and cavitation peening. This is why ∆Kth and ∆(∆K) increase with increasing Rz. However, the increase in roughness also increases crack initiation. Thus, a small increase in surface roughness by peening is best for improving the fatigue properties.
When the different peening methods are compared, ∆Kth and ∆(∆K) are similar to each other as shown in Table 3. As shown in Figures 14a and 15a, the Vickers hardness after shot peening, laser peening and cavitation peening are very close to each other. On the other hand, the surface roughness after cavitation peening is smoother than that after shot peening and laser peening, as shown in Figures 14b and 15b. This shows that ∆Kth and ∆(∆K) can be improved by cavitation peening with a smaller increase in surface roughness compared with shot peening and laser peening. When the compressive residual stress at the surface is compared as shown in Figures 14c and 15c, the largest value is for shot peening, with cavitation peening second and laser peening the smallest. It can be concluded that the smallest possible surface roughness is obtained with cavitation peening, and that shot peening introduces the largest compressive residual stress, but with the greatest increase in surface roughness.
(a) Vickers hardness HV (b) Maximum height of the roughness Rz
Figure 13. Relationship between the stress intensity factor range increment ∆(∆K) and the normalizedthreshold stress intensity factor range ∆Kth’.
3.2. Effect of the Mechanical Properties on ∆Kth and ∆(∆K)
To investigate the effect of the mechanical properties on ∆Kth and ∆(∆K), Figures 14 and 15 show∆Kth and ∆(∆K) as functions of the mechanical properties, including (a) the Vickers hardness HV,(b) the maximum height of the roughness Rz and (c) the surface residual stress σR. The correlationcoefficients for each of these curves are 0.855 for Figure 14a, 0.830 for Figure 14b, 0.924 for Figure 14c,0.912 for Figure 15a, 0.658 for Figure 15b and 0.930 for Figure 15c. These results show that both ∆Kth and∆(∆K) increase with increasing Vickers hardness and compressive residuals stress. As is well known,peening is a mechanical surface treatment used for work hardening and introducing compressiveresidual stress by generating local plastic deformation. The surface roughness is increased by shotpeening, laser peening and cavitation peening. This is why ∆Kth and ∆(∆K) increase with increasingRz. However, the increase in roughness also increases crack initiation. Thus, a small increase in surfaceroughness by peening is best for improving the fatigue properties.
When the different peening methods are compared, ∆Kth and ∆(∆K) are similar to each other asshown in Table 3. As shown in Figures 14a and 15a, the Vickers hardness after shot peening, laserpeening and cavitation peening are very close to each other. On the other hand, the surface roughnessafter cavitation peening is smoother than that after shot peening and laser peening, as shown in Figures14b and 15b. This shows that ∆Kth and ∆(∆K) can be improved by cavitation peening with a smallerincrease in surface roughness compared with shot peening and laser peening. When the compressiveresidual stress at the surface is compared as shown in Figures 14c and 15c, the largest value is forshot peening, with cavitation peening second and laser peening the smallest. It can be concluded thatthe smallest possible surface roughness is obtained with cavitation peening, and that shot peeningintroduces the largest compressive residual stress, but with the greatest increase in surface roughness.
Metals 2020, 10, 63 13 of 17
Metals 2020, 10, x FOR PEER REVIEW 12 of 16
Figure 13. Relationship between the stress intensity factor range increment ∆(∆K) and the normalized threshold stress intensity factor range ∆Kth’.
3.2. Effect of the Mechanical Properties on ∆Kth and ∆(∆K)
To investigate the effect of the mechanical properties on ∆Kth and ∆(∆K), Figures 14 and 15 show ∆Kth and ∆(∆K) as functions of the mechanical properties, including (a) the Vickers hardness HV, (b) the maximum height of the roughness Rz and (c) the surface residual stress σR. The correlation coefficients for each of these curves are 0.855 for Figure 14a, 0.830 for Figure 14b, 0.924 for Figure 14c, 0.912 for Figure 15a, 0.658 for Figure 15b and 0.930 for Figure 15c. These results show that both ∆Kth and ∆(∆K) increase with increasing Vickers hardness and compressive residuals stress. As is well known, peening is a mechanical surface treatment used for work hardening and introducing compressive residual stress by generating local plastic deformation. The surface roughness is increased by shot peening, laser peening and cavitation peening. This is why ∆Kth and ∆(∆K) increase with increasing Rz. However, the increase in roughness also increases crack initiation. Thus, a small increase in surface roughness by peening is best for improving the fatigue properties.
When the different peening methods are compared, ∆Kth and ∆(∆K) are similar to each other as shown in Table 3. As shown in Figures 14a and 15a, the Vickers hardness after shot peening, laser peening and cavitation peening are very close to each other. On the other hand, the surface roughness after cavitation peening is smoother than that after shot peening and laser peening, as shown in Figures 14b and 15b. This shows that ∆Kth and ∆(∆K) can be improved by cavitation peening with a smaller increase in surface roughness compared with shot peening and laser peening. When the compressive residual stress at the surface is compared as shown in Figures 14c and 15c, the largest value is for shot peening, with cavitation peening second and laser peening the smallest. It can be concluded that the smallest possible surface roughness is obtained with cavitation peening, and that shot peening introduces the largest compressive residual stress, but with the greatest increase in surface roughness.
(a) Vickers hardness HV (b) Maximum height of the roughness Rz Metals 2020, 10, x FOR PEER REVIEW 13 of 16
(c) Surface residual stress σR
Figure 14. Relationship between and the surface mechanical properties and the threshold stress intensity factor range ∆Kth.
(a) Vickers hardness HV (b) Maximum height of the roughness Rz
(c) Surface residual stress σR
Figure 15. Relationship between the surface mechanical properties and the stress intensity factor range increment ∆(∆K).
4. Discussions
To investigate the relationship between the fatigue strength and crack growth, Figures 16 and 17 show the fatigue strength σfs as a function of ∆Kth and ∆(∆K), respectively. The value of the fatigue strength of austenitic stainless JIS SUS316L was obtained from reference [17], and is shown in Table 3. In Figures 16 and 17, σfs is revealed by σfs’ which is normalized by non-peened one. As mentioned above, there are no big differences between the values of ∆Kth’. The correlation coefficient between σfs’ and ∆Kth’ is 0.806. This means that the probability of non-correlation is larger than 20%. On the other hand, the correlation coefficient between σfs’ and ∆(∆K) is 0.884, and the probability of non-correlation is about 12%. Thus, it can be concluded that the decrease in the crack growth rate rather than in crack initiation is the main reason for the improvement in fatigue strength.
Figure 14. Relationship between and the surface mechanical properties and the threshold stressintensity factor range ∆Kth.
Metals 2020, 10, x FOR PEER REVIEW 13 of 16
(c) Surface residual stress σR
Figure 14. Relationship between and the surface mechanical properties and the threshold stress intensity factor range ∆Kth.
(a) Vickers hardness HV (b) Maximum height of the roughness Rz
(c) Surface residual stress σR
Figure 15. Relationship between the surface mechanical properties and the stress intensity factor range increment ∆(∆K).
4. Discussions
To investigate the relationship between the fatigue strength and crack growth, Figures 16 and 17 show the fatigue strength σfs as a function of ∆Kth and ∆(∆K), respectively. The value of the fatigue strength of austenitic stainless JIS SUS316L was obtained from reference [17], and is shown in Table 3. In Figures 16 and 17, σfs is revealed by σfs’ which is normalized by non-peened one. As mentioned above, there are no big differences between the values of ∆Kth’. The correlation coefficient between σfs’ and ∆Kth’ is 0.806. This means that the probability of non-correlation is larger than 20%. On the other hand, the correlation coefficient between σfs’ and ∆(∆K) is 0.884, and the probability of non-correlation is about 12%. Thus, it can be concluded that the decrease in the crack growth rate rather than in crack initiation is the main reason for the improvement in fatigue strength.
Figure 15. Relationship between the surface mechanical properties and the stress intensity factor rangeincrement ∆(∆K).

Metals 2020, 10, 63 14 of 17
4. Discussions
To investigate the relationship between the fatigue strength and crack growth, Figures 16 and 17show the fatigue strength σfs as a function of ∆Kth and ∆(∆K), respectively. The value of the fatiguestrength of austenitic stainless JIS SUS316L was obtained from reference [17], and is shown in Table 3.In Figures 16 and 17, σfs is revealed by σfs’ which is normalized by non-peened one. As mentionedabove, there are no big differences between the values of ∆Kth’. The correlation coefficient between σfs’and ∆Kth’ is 0.806. This means that the probability of non-correlation is larger than 20%. On the otherhand, the correlation coefficient between σfs’ and ∆(∆K) is 0.884, and the probability of non-correlationis about 12%. Thus, it can be concluded that the decrease in the crack growth rate rather than in crackinitiation is the main reason for the improvement in fatigue strength.Metals 2020, 10, x FOR PEER REVIEW 14 of 16
Figure 16. Relationship between the normalized threshold stress intensity factor range ∆Kth’ and the normalized fatigue strength σfs’.
Figure 17. Relationship between the stress intensity factor range increment ∆(∆K) and the normalized fatigue strength σfs’.
5. Conclusions
To clarify the mechanism by which the mechanical properties of austenitic stainless steel is improved by mechanical surface treatments, austenitic stainless steel JIS SUS316L was treated by shot peening, cavitation peening using a submerged water jet and cavitation peening using a submerged pulsed laser. To avoid confusion, these latter two are referred to as cavitation peening and laser peening, respectively. Comparisons between crack initiation and growth in the surface layer after being subjected to these different peening processes was investigated by determining the threshold stress intensity factor range ∆Kth and the stress intensity factor range increment ∆(∆K) obtained by means of a K-decreasing test and a constant applied stress test, respectively. Please note that in the present experiments, a load controlled plane bending fatigue tester was used. The results obtained for the material under test, JIS SUS316L, which were treated by shot peening, cavitation peening and laser peening, can be summarized as follows.
(1) The values of ∆Kth’ and ∆(∆K) are roughly in a linear relationship, even though the specimens were treated using different peening methods. Please note that ∆Kth’ is ∆Kth normalized by non-peened one. The reduction in crack growth after cavitation peening is larger than that after the other peening methods at equivalent values of ∆Kth’.
Figure 16. Relationship between the normalized threshold stress intensity factor range ∆Kth’ and thenormalized fatigue strength σfs’.
Metals 2020, 10, x FOR PEER REVIEW 14 of 16
Figure 16. Relationship between the normalized threshold stress intensity factor range ∆Kth’ and the normalized fatigue strength σfs’.
Figure 17. Relationship between the stress intensity factor range increment ∆(∆K) and the normalized fatigue strength σfs’.
5. Conclusions
To clarify the mechanism by which the mechanical properties of austenitic stainless steel is improved by mechanical surface treatments, austenitic stainless steel JIS SUS316L was treated by shot peening, cavitation peening using a submerged water jet and cavitation peening using a submerged pulsed laser. To avoid confusion, these latter two are referred to as cavitation peening and laser peening, respectively. Comparisons between crack initiation and growth in the surface layer after being subjected to these different peening processes was investigated by determining the threshold stress intensity factor range ∆Kth and the stress intensity factor range increment ∆(∆K) obtained by means of a K-decreasing test and a constant applied stress test, respectively. Please note that in the present experiments, a load controlled plane bending fatigue tester was used. The results obtained for the material under test, JIS SUS316L, which were treated by shot peening, cavitation peening and laser peening, can be summarized as follows.
(1) The values of ∆Kth’ and ∆(∆K) are roughly in a linear relationship, even though the specimens were treated using different peening methods. Please note that ∆Kth’ is ∆Kth normalized by non-peened one. The reduction in crack growth after cavitation peening is larger than that after the other peening methods at equivalent values of ∆Kth’.
Figure 17. Relationship between the stress intensity factor range increment ∆(∆K) and the normalizedfatigue strength σfs’.
5. Conclusions
To clarify the mechanism by which the mechanical properties of austenitic stainless steel isimproved by mechanical surface treatments, austenitic stainless steel JIS SUS316L was treated by shotpeening, cavitation peening using a submerged water jet and cavitation peening using a submergedpulsed laser. To avoid confusion, these latter two are referred to as cavitation peening and laserpeening, respectively. Comparisons between crack initiation and growth in the surface layer afterbeing subjected to these different peening processes was investigated by determining the threshold

Metals 2020, 10, 63 15 of 17
stress intensity factor range ∆Kth and the stress intensity factor range increment ∆(∆K) obtained bymeans of a K-decreasing test and a constant applied stress test, respectively. Please note that in thepresent experiments, a load controlled plane bending fatigue tester was used. The results obtained forthe material under test, JIS SUS316L, which were treated by shot peening, cavitation peening and laserpeening, can be summarized as follows.
(1) The values of ∆Kth’ and ∆(∆K) are roughly in a linear relationship, even though the specimenswere treated using different peening methods. Please note that ∆Kth’ is ∆Kth normalized bynon-peened one. The reduction in crack growth after cavitation peening is larger than that afterthe other peening methods at equivalent values of ∆Kth’.
(2) The correlation between ∆(∆K) and the fatigue strength of the stainless steel specimens treated bythe various peening processes is better than that between ∆Kth’ and the fatigue strength.
(3) ∆Kth and ∆(∆K) are increased with increasing surface hardness and compressive residual stress.(4) The values of ∆Kth and values of ∆(∆K) of the specimens after treatment by the different peening
methods are each roughly the same. When the mechanical properties of the peened specimenswere compared, it was found that the cavitation peened specimen was smoother than the others.The compressive residual stress at the surface introduced by shot peening was larger than thatintroduced by the other peening methods.
Funding: This research was partly supported by JSPS KAKENHI Grant Number 17H03138 and 18KK0103.
Acknowledgments: The author wishes to thank Kazumasa Sanada and Ryosuke Hori, Ex-students of theDepartment of Finemechanics, Tohoku University for their help in the experiments.
Conflicts of Interest: The author declares no conflict of interest.
References
1. Disegi, J.A.; Eschbach, L. Stainless steel in bone surgery. Inj. Int. J. Care Inj. 2000, 31, S2–S6. [CrossRef]2. Asri, R.I.M.; Harun, W.S.W.; Samykano, M.; Lah, N.A.C.; Ghani, S.A.C.; Tarlochan, F.; Raza, M.R. Corrosion
and surface modification on biocompatible metals: A review. Mater. Sci. Eng. C Mater. Biol. Appl. 2017, 77,1261–1274. [CrossRef] [PubMed]
3. Soyama, H. Key factors and applications of cavitation peening. Inter. J. Peen. Sci. Technol. 2017, 1, 3–60.4. Soyama, H. Fundamentals and applications of cavitation peening comparing with shot peening and laser
peening. In Proceedings of the Advanced Surface Enhancement, INCASE 2019, Lecture Notes in MechanicalEngineering, Singapore, 10–12 September 2020; pp. 76–87.
5. Delosrios, E.R.; Walley, A.; Milan, M.T.; Hammersley, G. Fatigue-crack initiation and propagation onshot-peened surfaces in A316 stainless-steel. Int. J. Fatigue 1995, 17, 493–499. [CrossRef]
6. Azar, V.; Hashemi, B.; Yazdi, M.R. The effect of shot peening on fatigue and corrosion behavior of 316Lstainless steel in ringer’s solution. Surf. Coat. Technol. 2010, 204, 3546–3551. [CrossRef]
7. Ahmed, A.A.; Mhaede, M.; Basha, M.; Wollmann, M.; Wagner, L. The effect of shot peening parameters andhydroxyapatite coating on surface properties and corrosion behavior of medical grade AISI 316L stainlesssteel. Surf. Coat. Technol. 2015, 280, 347–358. [CrossRef]
8. Bagherifard, S.; Slawik, S.; Fernandez-Pariente, I.; Pauly, C.; Mucklich, F.; Guagliano, M. Nanoscale surfacemodification of AISI 316L stainless steel by severe shot peening. Mater. Des. 2016, 102, 68–77. [CrossRef]
9. Soyama, H.; Yamauchi, Y.; Adachi, Y.; Sato, K.; Shindo, T.; Oba, R. High-speed observations of the cavitationcloud around a high-speed submerged water-jet. JSME Int. J. 1995, 38, 245–251. [CrossRef]
10. Kamisaka, H.; Soyama, H. Effect of injection pressure on mechanical surface treatment using a submergedwater jet. J. Jet Flow Eng. 2018, 33, 4–10.
11. Peyre, P.; Fabbro, R.; Merrien, P.; Lieurade, H.P. Laser shock processing of aluminium alloys. Application tohigh cycle fatigue behaviour. Mater. Sci. Eng. A Struct. Mater. Prop. Microstruct. Process. 1996, 210, 102–113.[CrossRef]
12. Hatamleh, O.; Rivero, I.V.; Lyons, J. Evaluation of surface residual stresses in friction stir welds due to laserand shot peening. J. Mater. Eng. Perform. 2007, 16, 549–553. [CrossRef]

Metals 2020, 10, 63 16 of 17
13. Telang, A.; Gili, A.S.; Mannava, S.R.; Qian, D.; Vasudevan, V.K. Effect of temperature on microstructure andresidual stresses induced by surface treatments in inconel 718 SPF. Surf. Coat. Technol. 2018, 344, 93–101.[CrossRef]
14. Sano, Y.; Obata, M.; Kubo, T.; Mukai, N.; Yoda, M.; Masaki, K.; Ochi, Y. Retardation of crack initiation andgrowth in austenitic stainless steels by laser peening without protective coating. Mater. Sci. Eng. A 2006, 417,334–340. [CrossRef]
15. Soyama, H.; Lichtarowicz, A.; Momma, T.; Williams, E.J. A new calibration method for dynamically loadedtransducers and its application to cavitation impact measurement. J. Fluids Eng. 1998, 120, 712–718.[CrossRef]
16. Soyama, H.; Sekine, Y.; Saito, K. Evaluation of the enhanced cavitation impact energy using a PVDF transducerwith an acrylic resin backing. Measurement 2011, 44, 1279–1283. [CrossRef]
17. Soyama, H. Comparison between the improvements made to the fatigue strength of stainless steel bycavitation peening, water jet peening, shot peening and laser peening. J. Mater. Process. Technol. 2019, 269,65–78. [CrossRef]
18. Soyama, H. Surface mechanics design by cavitation peening using submerged pulse laser. In Proceedings ofthe Abstracts of 7th International Conference on Laser Peening and Related Phenomena, Singapore, 17–22June 2018; p. 57.
19. G32-16 Standard test method for cavitation erosion using vibratory apparatus1. ASTM Stand. 2016, 3, 1–20.20. G134-17 Standard test method for erosion of solid materials by a cavitating liquid jet. ASTM Stand. 2017, 3,
1–17.21. Kikuchi, K.; Ahmed, S.M.; Hiraiwa, T.; Ito, Y.; Oba, R. An indirect vibratory method capable of simulating
several cavitating states. JSME Int. J. Ser. B Fluids Therm. Eng. 1991, 34, 1–8. [CrossRef]22. Bai, F.; Long, Y.Y.; Saalbach, K.A.; Twiefel, J. Theoretical and experimental investigations of ultrasonic sound
fields in thin bubbly liquid layers for ultrasonic cavitation peening. Ultrasonics 2019, 93, 130–138. [CrossRef]23. Lesyk, D.A.; Soyama, H.; Mordyuk, B.N.; Dzhemelinskyi, V.V.; Martinez, S.; Khripta, N.I.; Lamikiz, A.
Mechanical surface treatments of AISI 304 stainless steel: Effects on surface microrelief, residual stress, andmicrostructure. J. Mater. Eng. Perform. 2019, 28, 5307–5322. [CrossRef]
24. Munoz-Cubillos, J.; Coronado, J.J.; Rodriguez, S.A. Deep rolling effect on fatigue behavior of austeniticstainless steels. Int. J. Fatigue 2017, 95, 120–131. [CrossRef]
25. Zhou, J.; Retraint, D.; Sun, Z.; Kanoute, P. Comparative study of the effects of surface mechanical attritiontreatment and conventional shot peening on low cycle fatigue of a 316L stainless steel. Surf. Coat. Technol.2018, 349, 556–566. [CrossRef]
26. Ben Moussa, N.; Gharbi, K.; Chaieb, I.; Ben Fredj, N. Improvement of AISI 304 austenitic stainless steellow-cycle fatigue life by initial and intermittent deep rolling. Int. J. Adv. Manuf. Technol. 2019, 101, 435–449.[CrossRef]
27. Ghelichi, R.; Crispiatico, G.; Guagliano, M.; Bagherifard, S. An energetic approach to predict the effect ofshot peening-based surface treatments. Metals 2018, 8, 190. [CrossRef]
28. E647-13 Standard test method for measurement of fatigue crack growth rates. ASTM Stand. 2013, 3, 1–48.29. Soyama, H. Evaluation of crack initiation and propagation of stainless steel treated by cavitating peening
using a load controlled plate bending fatigue tester. Met. Finish. News 2014, 15, 60–62.30. Takakuwa, O.; Sanada, K.; Soyama, H. Evaluation of fatigue crack propagation in surface modification layer
by a load-controlled plate bending fatigue tester. Trans. JSME 2014, 80, 1–17. [CrossRef]31. Masaki, K.; Ochi, Y.; Soyama, H. Fatigue property improvement of type 316L steel by cavitation shotless
peening. In Proceedings of the 10th International Conference on Shot Peening, Tokyo, Japan, 15–18 September2008; p. 53.
32. Soyama, H. Improvement of threshold stress intensity factor range of stainless steel by cavitation peening.In Proceedings of the 12th International Conference on Shot Peening, Goslar, Germany, 15–18 September2014; pp. 55–60.
33. Raju, I.S.; Newman, J.C. Stress-intensity factors for a wide-range of semi-elliptical surface cracks infinite-thickness plates. Eng. Fract. Mech. 1979, 11, 817–829. [CrossRef]
34. He, B.B. Two-Dimensional X-Ray Diffraction; John Wiley & Sons, Inc.: Hoboken, NJ, USA, 2009; pp. 249–328.

Metals 2020, 10, 63 17 of 17
35. Takakuwa, O.; Soyama, H. Optimizing the conditions for residual stress measurement using atwo-dimensional XRD method with specimen oscillation. Adv. Mater. Phys. Chem. 2013, 3, 8–18.[CrossRef]
36. Soyama, H. Enhancing the aggressive intensity of a cavitating jet by introducing a cavitator and a guide pipe.J. Fluid Sci. Technol. 2014, 9, 1–12. [CrossRef]
37. Soyama, H. Enhancing the aggressive intensity of a cavitating jet by means of the nozzle outlet geometry. J.Fluids Eng. 2011, 133, 1–11. [CrossRef]
38. Naito, A.; Takakuwa, O.; Soyama, H. Development of peening technique using recirculating shot acceleratedby water jet. Mater. Sci. Technol. 2012, 28, 234–239. [CrossRef]
© 2019 by the author. Licensee MDPI, Basel, Switzerland. This article is an open accessarticle distributed under the terms and conditions of the Creative Commons Attribution(CC BY) license (http://creativecommons.org/licenses/by/4.0/).