antibiotics - Semantic Scholar
37
Antibiotics 2015, 4, 76-112; doi:10.3390/antibiotics4010076 antibiotics ISSN 2079-6382 www.mdpi.com/journal/antibiotics Article Genomic, Transcriptomic and Metabolomic Studies of Two Well-Characterized, Laboratory-Derived Vancomycin-Intermediate Staphylococcus aureus Strains Derived from the Same Parent Strain Dipti S. Hattangady 1 , Atul K. Singh 1 , Arun Muthaiyan 1 , Radheshyam K. Jayaswal 1 , John E. Gustafson 2 Alexander V. Ulanov 3 , Zhong Li 3 , Brian J. Wilkinson 1, * and Richard F. Pfeltz 4 1 School of Biological Sciences, Illinois State University, Normal, IL 61790, USA; E-Mails: [email protected] (D.S.H.); [email protected] (A.K.S.); [email protected] (A.M.); [email protected] (R.K.J.) 2 Department of Biochemistry and Molecular Biology, Oklahoma State University, Stillwater, OK 74078, USA; E-Mail: [email protected] 3 Roy J. Carver Biotechnology Center, University of Illinois at Urbana-Champaign, Urbana, IL 61807, USA; E-Mails: [email protected] (A.V.U.); [email protected] (Z.L.) 4 BD Diagnostic Systems, Microbiology Research and Development, Sparks, MD 21152, USA; E-Mail: [email protected] * Author to whom correspondence should be addressed; E-Mail: [email protected]; Tel.: +1-309-438-7244; Fax: +1-309-438-3722. Academic Editor: Dr. Sergei Vakulenko Received: 28 October 2014 / Accepted: 10 December 2014 / Published: 4 February 2015 Abstract: Complete genome comparisons, transcriptomic and metabolomic studies were performed on two laboratory-selected, well-characterized vancomycin-intermediate Staphylococcus aureus (VISA) derived from the same parent MRSA that have changes in cell wall composition and decreased autolysis. A variety of mutations were found in the VISA, with more in strain 13136p − m + V20 (vancomycin MIC = 16 μg/mL) than strain 13136p − m + V5 (MIC = 8 μg/mL). Most of the mutations have not previously been associated with the VISA phenotype; some were associated with cell wall metabolism and many with stress responses, notably relating to DNA damage. The genomes and transcriptomes of the two VISA support the importance of gene expression regulation to the VISA phenotype. Similarities in overall transcriptomic and metabolomic data indicated that the VISA OPEN ACCESS
-
Upload
khangminh22 -
Category
Documents
-
view
0 -
download
0
Transcript of antibiotics - Semantic Scholar

Antibiotics 2015, 4, 76-112; doi:10.3390/antibiotics4010076
antibiotics ISSN 2079-6382
www.mdpi.com/journal/antibiotics
Article
Genomic, Transcriptomic and Metabolomic Studies of Two Well-Characterized, Laboratory-Derived Vancomycin-Intermediate Staphylococcus aureus Strains Derived from the Same Parent Strain
Dipti S. Hattangady 1, Atul K. Singh 1, Arun Muthaiyan 1, Radheshyam K. Jayaswal 1,
John E. Gustafson 2 Alexander V. Ulanov 3, Zhong Li 3, Brian J. Wilkinson 1,* and
Richard F. Pfeltz 4
1 School of Biological Sciences, Illinois State University, Normal, IL 61790, USA;
E-Mails: [email protected] (D.S.H.); [email protected] (A.K.S.); [email protected] (A.M.);
[email protected] (R.K.J.) 2 Department of Biochemistry and Molecular Biology, Oklahoma State University, Stillwater,
OK 74078, USA; E-Mail: [email protected] 3 Roy J. Carver Biotechnology Center, University of Illinois at Urbana-Champaign, Urbana,
IL 61807, USA; E-Mails: [email protected] (A.V.U.); [email protected] (Z.L.) 4 BD Diagnostic Systems, Microbiology Research and Development, Sparks, MD 21152, USA;
E-Mail: [email protected]
* Author to whom correspondence should be addressed; E-Mail: [email protected];
Tel.: +1-309-438-7244; Fax: +1-309-438-3722.
Academic Editor: Dr. Sergei Vakulenko
Received: 28 October 2014 / Accepted: 10 December 2014 / Published: 4 February 2015
Abstract: Complete genome comparisons, transcriptomic and metabolomic studies
were performed on two laboratory-selected, well-characterized vancomycin-intermediate
Staphylococcus aureus (VISA) derived from the same parent MRSA that have changes in
cell wall composition and decreased autolysis. A variety of mutations were found in the
VISA, with more in strain 13136p−m+V20 (vancomycin MIC = 16 µg/mL) than strain
13136p−m+V5 (MIC = 8 µg/mL). Most of the mutations have not previously been associated
with the VISA phenotype; some were associated with cell wall metabolism and many with
stress responses, notably relating to DNA damage. The genomes and transcriptomes of the
two VISA support the importance of gene expression regulation to the VISA phenotype.
Similarities in overall transcriptomic and metabolomic data indicated that the VISA
OPEN ACCESS

Antibiotics 2015, 4
77
physiologic state includes elements of the stringent response, such as downregulation of
protein and nucleotide synthesis, the pentose phosphate pathway and nutrient transport
systems. Gene expression for secreted virulence determinants was generally downregulated,
but was more variable for surface-associated virulence determinants, although capsule
formation was clearly inhibited. The importance of activated stress response elements could
be seen across all three analyses, as in the accumulation of osmoprotectant metabolites such
as proline and glutamate. Concentrations of potential cell wall precursor amino acids and
glucosamine were increased in the VISA strains. Polyamines were decreased in the VISA,
which may facilitate the accrual of mutations. Overall, the studies confirm the wide
variability in mutations and gene expression patterns that can lead to the VISA phenotype.
Keywords: Staphylococcus aureus; VISA; genomics; transcriptomics; metabolomics
1. Introduction
The first report of a clinical isolate of Staphylococcus aureus showing decreased susceptibility to
vancomycin, minimum inhibitory concentration (MIC) 8 μg/mL, appeared in 1997 [1]. Since that time
there have been many reports of laboratory-derived and clinically-isolated vancomycin-intermediate
S. aureus (VISA), and these have been reviewed [2–4]. Despite considerable effort, the mechanism(s)
underlying decreased vancomycin susceptibility is not entirely clear. Although VISA typically show a
number of phenotypic traits in common, such as increased cell wall thickness, decreased autolysis and
alterations in peptidoglycan structure, a wide variety of mutations and transcriptomes have been found
in VISA [2–4]. Exposure of S. aureus to cell wall-active antibiotics induces the expression of a set of
genes that comprises a cell wall stress stimulon [5]. Altered stress response gene expression without
antimicrobial exposure, including members of the cell wall stress stimulon, is characteristic of VISA [6].
In 2000, Pfeltz et al. [7] reported on the characteristics of a number of VISA strains generated by
in vitro step selection from vancomycin-susceptible S. aureus (VSSA) in the presence of increasing
concentrations of vancomycin. Among these VSSA was heterogeneously methicillin-resistant S. aureus
(MRSA) strain 13136p−m+ (penicillinase-negative, mecA-positive). This strain was originally isolated
in 1960 as MRSA 13136, one of the handful of MRSA among several thousand clinical S. aureus isolates
surveyed [8]. Strain 13136p−m+ is a penicillinase-negative derivative selected from 13136 [9]. Like the
well-studied penicillinase-negative, homogeneous MRSA strain Colindale 9204 (COL), the 13136
lineage is lysogenized by prophage L54a inserted near the 3' end of the glycerol ester hydrolase gene
(geh). The result is a truncated, inactive gene product (lipase) [10]. L54a, also known as ϕCOL, was only
present in COL in a comparison of six staphylococcal genome sequences [11]. Although COL and 13136
were isolated in the same time period (1960–1964) by the Cross-infection Reference Laboratory,
Colindale, London, a comparison of genome sequences between the two strains is not available.
COL was isolated from a hospital in Colindale, whereas the separate survey identifying 13136 drew
isolates from hospitals primarily in southeastern England, but also elsewhere within and outside of that
country [8,12].

Antibiotics 2015, 4
78
MRSA 13136p−m+ was the parent strain from which VISA 13136p−m+V5 was derived, and
subsequently VISA 13136p−m+V20 was then derived from 13136p−m+V5. The MICs of the VISA strains
were 8 and 16 μg/mL for 13136p−m+V5 and 13136p−m+V20, respectively [7]. Strain 13136p−m+V5 was
isolated after two selection cycles in one week and strain 13136p−m+V20 after a total of five cycles of
selection across five weeks. Each selection cycle consisted of growth in liquid medium that was
inoculated onto solid medium containing the same concentration of vancomycin. The 64 µg/mL
minimum bactericidal concentration (MBC) of strain 13136p−m+V20 was significantly higher than that
of 13136p−m+V5 (16 µg/mL) or the parent strain (8 µg/mL). These strains have been extensively studied
for their cell wall-related properties [7,13]. The VISA strains grew slower than the VSSA parent [7].
Muropeptide analysis showed an increase in muropeptides with a single L-alanine residue in the
interpeptide bridge in the two VISA strains compared to the VSSA parent strain. Cell wall teichoic acid
content was significantly decreased in the VISA strains, in strain 13136p−m+V20 in particular, as judged
by cell wall phosphorus content. The VISA strains showed decreased whole cell autolysis, decreased
lysostaphin susceptibility and decreased isolated crude cell wall autolytic activity. Differences were
noted in the amount and profile of peptidoglycan hydrolase activities in the VISA strains [13]. atl, the
gene encoding two major S. aureus autolysins [14], showed significantly reduced expression in
13136p−m+V20 compared to 13136p−m+.
We have used these strains to further probe the mechanism(s) of decreased vancomycin susceptibility
by a combination of genomic, transcriptomic and metabolomic approaches. Metabolomics typically
involves the comparative analysis of small, cellular organic compounds of a molecular weight less than
1000 daltons [15]. A metabolome is a direct reflection of the physiological status of a cell and thus is
another approach to understanding cell function. VISA strains are believed to be activated for cell wall
synthesis [16] and to display impaired acetate catabolism [17]. A recent metabolomic analysis of two
series of VISA isolates indicated alterations to a wide range of central metabolic pathway intermediates,
but did not elucidate the underlying mechanism of decreased vancomycin susceptibility [18].
2. Results
2.1. Mutations in Strains 13136p−m+V5 and 13136p−m+V20 Compared to 13136p−m+
The mutations present in the two VISA strains are summarized in Table 1. A total of nine
single-nucleotide polymorphisms (SNPs) across eight genes that resulted in protein amino acid changes
were detected in strain 13136p−m+V5 and 16 SNPs across nine genes in 13136p−m+V20, relative to
VSSA parent strain 13136p−m+. Although the MIC of 13136p−m+V20 was only double that of
13136p−m+V5, strain 13136p−m+V20 was subjected to three more selection cycles than 13136p−m+V5,
and this was reflected in the higher number of SNPs. Six of the nine 13136p−m+V5 SNPs were also
present in 13136p−m+V20, but three were not.
Antibiotics 2015, 4
79
Table 1. Mutations resulting in protein amino acid changes present in VISA strains 13136p−m+V5 and 13136p−m+V20 (yellow cells) following
in-vitro passage-selection from VSSA parent 13136p−m+.
SNP
Amino
acid
change
Locus Gene
Name
Known or Predicted
Gene Product
Mutation Present In: Function of Predicted Gene Product Based on Published Studies and
Similarities to Other Proteins, and Known Stress-Response
Associations [references] 13136p−m+V5 13136p−m+V20
223 GG KE SACOL1005 pepF Oligoendopeptidase F + - Cytoplasmic endopeptidase releasing amino acids from internalized
peptides; involved in protein turnover [19]
143 CT AV SACOL1231 stp1 Eukaryotic-like serine /
threonine phosphatase + -
Influences the regulation of virulence, cell wall structure, autolysis, and
susceptibility to some cell wall-active antibiotics [20]
554 GA SF SACOL1600 comGB ComGB, competence
protein + -
A membrane protein associated with the SOS response that transports
exogenous DNA into the Gram-positive cell [21]
126 AC ED SACOL0593 fusA
Translation elongation
factor G
- + Protein synthesis roles in tRNA translocation during elongation and post-
termination ribosome dissociation; upregulated by acid adaptation [22,23] 121 GT GC SACOL0593 + +
6596 GA AV SACOL2150 fmtB FmtB protein + +
β-lactam resistance-related surface protein with cell wall anchoring and
spanning domains, putatively involved in cell wall biosynthesis, cell
adhesion, biofilms [6]
171 CA MI SACOL2217 infA Translation initiation
factor IF-1 + +
RNA-binding protein that binds the 30S ribosomal subunit, required for
correct translation initiation, and downregulated by cell wall-active
antibiotics [5,24]
311 AT YF SACOL1319 glpF Glycerol uptake
facilitator protein + +
Housekeeping gene product that transports glycerol or small uncharged
molecules into the cell; down-regulated by oxidative stress [25]
353 GC GP SACOL0339
ssb1
Prophage L54a single-
stranded DNA-binding
protein
+ +
One of a family of proteins that bind with high affinity to ssDNA
intermediates during DNA replication, recombination and repair [26–28]
352 GC GP SACOL0339 + +
350 AC NP SACOL0339 - +
349 AC NP SACOL0339 - +
345 AC QP SACOL0339 - +
344 AC QP SACOL0339 - +
329 AC KT SACOL0339 - +

Antibiotics 2015, 4
80
Table 1. Cont.
SNP
Amino
acid
change
Locus Gene
Name
Known or Predicted
Gene Product
Mutation Present In: Function of Predicted Gene Product Based on Published Studies and
Similarities to Other Proteins, and Known Stress-Response
Associations [references] 13136p−m+V5 13136p−m+V20
670 CT LF SACOL0810 tarO
glycosyl transferase,
group 4 family protein
(TarO)
- +
Teichoic acid synthesis enzyme; inactivation increases autolysis rates,
reduces β-lactam resistance, and disrupts sepatation and cell separation
[29]
11 GA AV SACOL1495 dinG Damage inducible gene
G (DinG) - +
3'→5' ssDNA and ssRNA exonuclease; proposed functions: R-loop
resolution, other unspecified recombination repair systems, anitviral
defense [30]
191 CT CY SACOL1690 apt Adenine phosphoribosyl
transferase - +
Enzyme in an adenine recycling pathway upregulated by acid adaptation,
the stringent response, and in some organisms polyamine metabolism
[23,31]
574 AC FV SACOL2451 none
Amino acid ABC
transporter binding
protein
- + Homolog of OpuBC, the glycine betaine/choline binding lipoprotein of an
osmoprotectant uptake system [32]

Antibiotics 2015, 4
81
A total of 12 genes were associated with 19 protein amino acid changes in one or both VISA
(Table 1). Five of these genes encode products that interact with nucleic acids in protein synthesis or are
associated with DNA damage/SOS responses: comGB, fusA, infA, ssb1 and dinG [21–24,26–28,30].
Three more are housekeeping genes encoding products involved in central intermediary metabolism:
pepF encodes an endopeptidase that hydrolyzes internalized peptides to provide nutrients or endogenous
peptides for protein turnover [19]; glpF encodes a glycerol transporter (carbon and energy acquisition) [25];
and apt encodes an enzyme in a purine salvage pathway catalyzing the production of AMP from adenine
and phosphoribosyl pyrophosphate [23,31]. apt is associated with the stringent response in other
Gram-positive bacteria [29,33–35]. The fmtB and tarO gene products are cell envelope proteins involved
in cell wall biosynthesis, β-lactam resistance and virulence [6,29]. fmtB is located downstream of glmM
and is also known as mrp and sasB [36]. FmtB has a C-terminal LPXTG cell wall anchoring motif [37].
The indirect effect of FmtB on methicillin resistance can be relieved by increasing the production of the
cell wall precursor glucosamine-l-phosphate [38]. tarO, also known as tagO, llm and farO, catalyzes the
initial step of cell wall teichoic acid synthesis. Locus SACOL2451 encodes a putative membrane protein,
a homolog of OpuBC, the permease component of an ABC-type osmoprotectant transport system [32].
The final mutated gene, stp1, encodes a eukaryotic-like serine-threonine phosphatase and is located
in tandem with its cognate serine-threonine kinase gene, stk1 [39]. These two enzymes comprise a
two-component regulatory system that plays important roles in bacterial signal transduction [20], in
addition to roles in cell wall structure and autolysis [39,40]. Mutations in stp1 have previously been
associated with laboratory-selected glycopeptide resistance, along with cell wall alterations characteristic
of the VISA phenotype [40–43]. Passalacqua et al. [42] reported reduced autolytic activity in addition
to decreased susceptibility to vancomycin, daptomycin and linezolid due to an stp1 mutation.
Additionally, Cameron et al. [43] demonstrated that the deletion of this gene alone is sufficient to slightly
reduce vancomycin susceptibility. A eukaryotic-like serine-threonine phosphatase-kinase pair regulates
an osmotic stress sensory system in Mycobacterium tuberculosis that leads to an adaptive response
involving modifications to cell wall structure and virulence factor production [44]. Eleven of the 12
genes listed in Table 1, all except pepF, can be linked to stress response either by expression change or
gene product function.
2.2. Comparison of Transcriptional Profiles between 13136p−m+, 13136p−m+V5 and 13136p−m+V20
Gene expression differences in VISA 13136p−m+V5 and 13136p−m+V20 relative to VSSA progenitor
strain 13136p−m+ are listed in Supplementary Tables S1 and S2. These changes are presented graphically
by gene functional groupings in Figure 1. Supplementary Table S3 contains the data used to generate
Figure 1. For both VISA, approximately twice as many gene expression differences versus VSSA
13136p−m+ were downregulated as were upregulated. Unfortunately, but not unexpectedly, the gene
functional group with the largest number of changes was hypothetical functions, and along with the
unclassified and unknown function categories accounted for 91 of the 338 genes (27%) with expression
changes in VISA strains. Among genes with assigned functions, seven functional groups each had at
least 5% of the genes each with expression changes in VISA vs. VSSA 13136p−m+: cell envelope
(48 genes, or 14%), transport and binding proteins (39 genes, or 12%), purines, pyrimidines, nucleosides
and nucleotides (28 genes, or 8%), protein synthesis (27 genes, or 8%), regulatory functions (24 genes,

Antibiotics 2015, 4
82
or 7%), and biosynthesis of cofactors, prosthetic groups and carriers (18 genes) and central intermediary
metabolism (16 genes) with 5% each. Together these eight functional groups accounted for 86% of
the genes represented in Figure 1. Downregulation was the clear trend for all of these functional
groups, except biosynthesis of cofactors, prosthetic groups and carriers, where the numbers of down- and
up-regulation were comparable.
Figure 1. Gene expression patterns. The number of genes by functional group upregulated
(green bars) and downregulated (red bars) at least two-fold in VISA 13136p−m+V5 (A) and
13136p−m−V20 (B) relative to gene expression in vancomycin-susceptible S. aureus (VSSA)
parent 13136p−m+.
Supplementary Table S3 presents the gene expression change concordance between VISA13136p−m+V5
and 13136p−m+V20. Approximately the same number of genes were upregulated in each VISA strain,
83 in VISA13136p−m+V5 and 80 13136p−m+V20. Of these, 53%–55% of those upregulated in one VISA
were also upregulated in the other VISA strain. Approximately the same number of genes were also
downregulated in each VISA strain, 187 in VISA13136p−m+V5 and 177 in 13136p−m+V20. Expression
concordance was greater for underexpression patterns, as 70%–73% of genes downregulated in one VISA
were also downregulated in the other VISA strain. As shown in Figure 1, VISA 13136p−m+V5 had
noticeably more expression changes than 13136p−m+V20 among the cell envelope (41 vs. 29) and
transport and binding protein (11 vs. 20) genes and fewer than 13136p−m+V20 among protein fate
(two vs. six) and protein synthesis (11 vs. 20) genes, with downregulated genes outnumbering
upregulated genes at least 2:1 for each VISA and these functional groups, except the 1:1 ratio for the
two 13136p−m+V5 protein fate expression changes. Total numbers of regulatory function gene
expression changes were comparable between the two VISA, at 19 for VISA13136p−m+V5 and 17 for
13136p−m+V20, but the ratio of the number of upregulated to downregulated genes varied between the
strains at 4:15 and 6:11, respectively.

Antibiotics 2015, 4
83
Although overall gene expression trends were similar between the two VISA versus their progenitor
VSSA, specific patterns within these data were not consistent between the two comparisons. For
example, 13 of the 16 ribosomal proteins listed in Supplementary Table S1 were downregulated for
13136p−m+V20, with three unchanged, compared to 13136p−m+. In contrast, four were downregulated
and 12 unchanged for the 13136p−m+V5 to 13136p−m+ comparison. However, for the expression of 18
pur and pyr genes associated with central intermediary biosynthetic pathways, 12 were downregulated
and six unchanged in 13136p−m+V5, and 15 were downregulated and three unchanged in 13136p−m+V20.
For either ribosomal protein or pur and pyr genes, when expression was unchanged in one VISA, it was
always downregulated in the other VISA versus 13136p−m+. Genes encoding secreted proteases were
generally downregulated in both VISA (sec3, sspA, sspB2 and sspC), as were cap genes encoding
capsular polysaccharide biosynthesis, but the pattern of expression changes was inconsistent between
the two VISA. The expression of genes encoding cell surface protein, regulatory, biofilm-related and
cell wall metabolism gene products was more variable, with more frequent upregulation and greater
ranges of expression fold-change values. A large number of genes previously identified as associated
with the VISA strain, including members of the cell wall stress stimulon, showed expression changes
in one or both VISA versus 13136p−m+. These include vraR and prsA, which are overexpressed in
both VISA and are part of the cell wall stress stimulon [5], as well as penicillin binding proteins.
McAleese et al. [6] previously reported overexpression of the cell wall stress stimulon in VISA.
Three genes, which were altered in expression, as determined by microarray analysis, were validated
using qRT-PCR. The expression ratios of cmk, agrA and ddh were shown to be in good agreement with
microarray results (data not shown).
2.3. Genes with at Least One Eight-Fold Expression Change among VISA and VSSA
Table 2 is the subset of genes from Supplementary Table S1 with large expression differences among
the three strains, as defined by at least one expression change eight-fold or greater in magnitude
(≥8-fold) between either VISA and the progenitor VSSA. Supplementary Figure S1 is a graphical
representation of the data in Table 2. In Table 2 genes are sorted by attributes related to the VISA
phenotype instead of generic functional groupings. Additionally, the Table 2 V20-V5 column indicates
fold-change expression differences between VISA 13136p−m+V20 and 13136p−m+V5. A total of 60
changes >8-fold were present between the three strains across 52 different genes. The hypothetical/
unclassified/unknown function gene functional group accounted for 21 (40%) of the 52 genes with
>8-fold changes, followed by 11 cell envelope genes (21%), four genes each (8%) in regulatory functions
and biosynthesis of cofactors, prosthetic groups and carriers and three genes each (6%) for purines,
pyrimidines, nucleosides, nucleotides and transport and binding proteins; together, these groups
accounted for 89% of the >8-fold change gene subset. This pattern differed from that in Figure 1 and
Supplementary Table S2 in that some functional groups had no genes among the >8-fold change gene
subset, including the amino acid biosynthesis, transcription and, most notably, the protein synthesis
groups. The general central intermediary metabolism functional group had two genes in the >8-fold
change gene subset, just below 4%, but comparable to the total in Supplementary Table S1.

Antibiotics 2015, 4
84
Table 2. Expression patterns and assigned functional roles for genes with at least one > 8-fold expression increase or decrease (yellow cells)
between VSSA 13136p-m+ and VISA or VISA 13136p−m+V5 and 13136p−m+V20.
Locus ID Gene Protein 13136p−m+V
5 vs. VSSA
13136p−m+V2
0 vs. VSSA
VISA V20 vs.
VISA V5
VISA-
Related
Categories
Stress
Response
Association
Gene and Protein Functional Role Comments
[references]
SAV2009 sec3 enterotoxin typeC3 −24.4 −21.5 2.9
Virulence
Factor-
Associated
Secreted exotoxin, same as gene sea in MRSA strain
COL [11]
SACOL0907 seb staphylococcal enterotoxin B −17.2 −18.3 −1.1 Nutritional Secreted cytotoxin upregulated during the stringent
response [45]
SACOL1871 epiG epidermin immunity protein F −11.2 11.2 Nutritional Virulence factor upregulated during the stringent
response [45]
SAV2472 NA short chain dehydrogenase −8.5 −5.2 3.3 Capsular biosynthesis enzyme from the SDR protein
super-family [46]
SAV0372 NA
predicted PepSY family
membrane peptidase
propeptide
−4.1 −10.5 −6.4
Unknown function but likely to have a protease
inhibitory function based on homology to peptidase
propeptides
SAV1046 sspC cysteine protease −3.4 −8.6 −5.2
Secreted virulence factor Staphostatin B that inhibits
sspB2-encoded serine protease Staphopain B activity
[47]
SACOL2026 agrA accessory gene regulator
protein A −2.8 −9 −6.2
Response regulator of the agr operon which generally
upregulates secreted proteins and downregulates cell
surface proteins [48]
SACOL0096 sarS staphylococcal accessory
regulator S 8.9 8.9 Nutritional
SarA global regulator family that generally upregulates
virulence factor genes; sarS is downregulated by agr and
upregulated by Rot and during the stringent response
[45,48,49]
SAV0111 spa Immunoglobulin G binding
protein A precursor 11.5 11.5 General
Cell surface adhesion protein upregulated by heat shock
and downregulated by cell wall-active antibiotics
[5,47,50]

Antibiotics 2015, 4
85
Table 2. Cont.
Locus ID Gene Protein 13136p−m+V
5 vs. VSSA
13136p−m+V2
0 vs. VSSA
VISA V20 vs.
VISA V5
VISA-
Related
Categories
Stress
Response
Association
Gene and Protein Functional Role Comments
[references]
SAV1764 rot repressor of toxins Rot 12.6 12.6
Virulence
Factor-
Associated
Homolog of the SarA transcriptional regulator that often
exerts effects opposite of agr [48]
SAV0320 geh glycerol ester hydrolase 2.7 12 9.3 rot-regulated lipase translated as an inactive, truncated
form due bacteriophage L54a integration [10,49]
SAV2637 aur zinc metalloproteinase
aureolysin 8.2 −8.2 Secreted virulence factor [51]
SAV2667 icaD intercellular adhesion protein
D 15.9 −15.9 Oxidative
Cell surface virulence factor downregulated by oxidative
stress [25]
SACOL2689 icaA intercellular adhesion protein
A 25.2 −25.2 Oxidative
Cell surface virulence factor downregulated by oxidative
stress [25]
SAS0236 scdA cell wall metabolism protein
ScdA −2 9.5 11.5
Cell Wall
Metabolism
Oxidative ScdA is involved in peptidoglycan cross-linking and cell
division, and upregulated by oxidative stress [25]
SACOL0034 mecR1 methicillin-resistance MecR1
regulatory protein 38.5 −38.5
Cell Wall-
Active
Antibiotics
Integral membrane metalloprotease acting as a
beta-lactam sensing signal transducer [52]
SAV0041 mecA penicillin binding protein 2A 48.5 −48.5
Nutritional
& Cell
Wall-Active
Antibiotics
Alternative PBP imparting mec-mediated resistance to
beta-lactam antibiotics

Antibiotics 2015, 4
86
Table 2. Cont.
Locus ID Gene Protein 13136p−m+V
5 vs. VSSA
13136p−m+V2
0 vs. VSSA
VISA V20 vs.
VISA V5
VISA-
Related
Categories
Stress
Response
Association
Gene and Protein Functional Role Comments
[references]
SACOL2147 NA
transcriptional antiterminator,
BglG family/DNA-binding
protein
−12 −4.4 7.6
Central
Intermediary
Metabolism
Oxidative Regulatory functions; downregulated by oxidative stress
[25]
SACOL1573 NA integrase/recombinase, core
domain family −10.6 −12.1 −1.5
DNA
Damage
Pseudogene not located within a prophage or
pathogenicity island
SAV2328 NA dehydrogenase −9.9 −4.4 5.5 Unknown function; from the SDR protein super-family [53]
SAV2182 asp23 alkaline shock protein 23 −9.8 −19.7 −9.9 Nutritional
& General
σB-regulated general stress response gene upregulated in
VISA, by alkaline or heat shock, and during the stringent
response [45,50,54]
SACOL1114 NA Mn2+/Fe2+ transporter,
NRAMP family −9.5 −9.4 0.1
Oxidative &
Nutritional
Gene upregulated by oxidative stress - Mn2+ and Fe2+
are important for oxidative stress resistance, and Mn may
have a role in virulence related competition with hosts
for limited nutrient [25,55]
SAV1074 purD phosphoribosylamine-glycine
ligase −9.5 −2.3 7.2 Nutritional
Purine ribonucleotide biosynthesis gene downregulated
during the stringent response [45]
SAV1072 purN phosphoribosylglycinamide
formyltransferase −9.5 −2.5 7 Purine ribonucleotide biosynthesis gene [56]
SAV2185 NA glycine betaine transporter
opuD homolog −9.2 −14.5 −5.3
Osmotic &
General
The opuCABCD operon is upregulated by osmotic stress
and part of the general stress response [57]
SAS0678 NA glutamine amidotransferase
class-I protein −8.6 −5.4 3.2
Subunit of anthranilate synthase, an enzyme from the
glutamate-consuming folate biosynthetic pathway
SACOL0872 NA OsmC/Ohr family protein −8.5 −5.7 2.8 Osmotic Membrane protein of unknown function induced by
osmotic stress
SAV1071 purM phosphoribosylaminoimidazole
synthetase −8.4 −2.2 6.2 Nutritional
Purine ribonucleotide biosynthesis gene downregulated
during the stringent response [45]
SACOL0630 NA amino acid permease −6 −9.5 −3.5 Transmembrane amino acid transporter protein
SACOL2428 bioD dethiobiotin synthase 8.7 8.7 Biotin biosynthesis enzyme; competition for biotin may
play an important role in phagosome escape [58]
SACOL0032 maoC (R)-specific enoyl-CoA
hydratase 23.7 −23.7
Amino acid degradation enzyme in aerobic
phenylalanine/phenylacetate catabolism [59]

Antibiotics 2015, 4
87
Table 2. Cont.
Locus ID Gene Protein 13136p−m+V
5 vs. VSSA
13136p−m+V2
0 vs. VSSA
VISA V20 vs.
VISA V5
VISA-
Related
Categories
Stress
Response
Association
Gene and Protein Functional Role Comments
[references]
SACOL0866 NA hypothetical protein −12.9 −3.8 9.1
Hypothetical
Proteins
SAR0592 NA hypothetical protein −12.3 −15.8 −3.5
SAV0823 NA hypothetical protein −11.3 −3.1 8.2
SAR2275 NA hypothetical protein −9.8 −20.4 −10.6
SACOL2547 NA hypothetical protein −9.5 4.2 13.7
SACOL2720 NA hypothetical protein −9.4 −7 2.4
SAS2396a NA hypothetical protein −8.3 −6.4 1.9
SAV2565 NA hypothetical protein −8.2 −2.3 5.9
SAS2047 NA hypothetical protein −8.1 −3.9 4.2
SACOL2174 NA hypothetical protein −7.4 −20.2 −12.8
SACOL1679 NA hypothetical protein −7.3 −10.3 −3
SACOL2175 NA hypothetical protein −6.8 −17.3 −10.5
SACOL1680 NA hypothetical protein −6.3 −8.4 −2.1
SAV2474 NA hypothetical protein −5.5 −10.8 −5.3
SACOL0912 NA hypothetical protein −5.4 −8.3 −2.9
SACOL1574 NA hypothetical protein −5.4 −8.6 −3.2
SACOL0908 NA hypothetical protein −3.8 −8.8 −5
SAS0281 NA hypothetical protein 10 3.6 −6.4
SACOL0625 NA hypothetical protein 11.2 2.5 −8.7
SACOL0067 NA hypothetical protein 12.6 5 −7.6
SAV2556 NA hypothetical protein 12.8 3.6 −9.2
Antibiotics 2015, 4
88
Five genes in the >8-fold change subset that encode regulatory proteins (agrA, sarS, rot, mecR1 and
locus SACOL2147) all had very different expression patterns between the two VISA versus parent
VSSA3136p−m+. The only two genes with >8-fold expression changes between both VISA and the
parent VSSA and between the two VISA themselves were locus SAR2275, which encodes a hypothetical
protein, and asp23, whose gene product is the σB-regulated alkaline shock protein 23. This gene is
downregulated by cell wall-active antibiotics and often upregulated during the general stress response
and many specific stress responses, but its function is not known [5].
Genes with >8-fold expression changes were grouped into four VISA-related categories in Table 2:
virulence factor-associated (14 genes, 12 up- and 12 down-regulated changes), cell wall metabolism
(three genes, four up- and two down-regulated changes), central intermediary metabolism (14 genes,
three up- and 18 down-regulated changes) and hypothetical proteins (21 genes, seven up- and 25
down-regulated changes). Of the 31 genes that did not encode hypothetical functions, 17 have one or
more known stress response associations that are listed in the Table 2 Stress Response Association
column. Eight genes were associated with nutritional stress (stringent response), five with oxidative
stress, three with the general stress response, two each with osmotic and cell wall-active antibiotic
stresses, and one with DNA damage response (recombination repair function and/or SOS response).
Ten of the >8-fold expression changes were upregulations (29%), and 24 were downregulations
(71%) for the 13136p−m+V5 versus VSSA 13136p−m+ comparison. These figures were six and 20 (23%
and 77%) and 10 and 13 (43% and 57%) for the 13136p−m+V20 versus VSSA 13136p−m+ and
13136p−m+V20 versus 13136p−m+V5 comparisons, respectively.
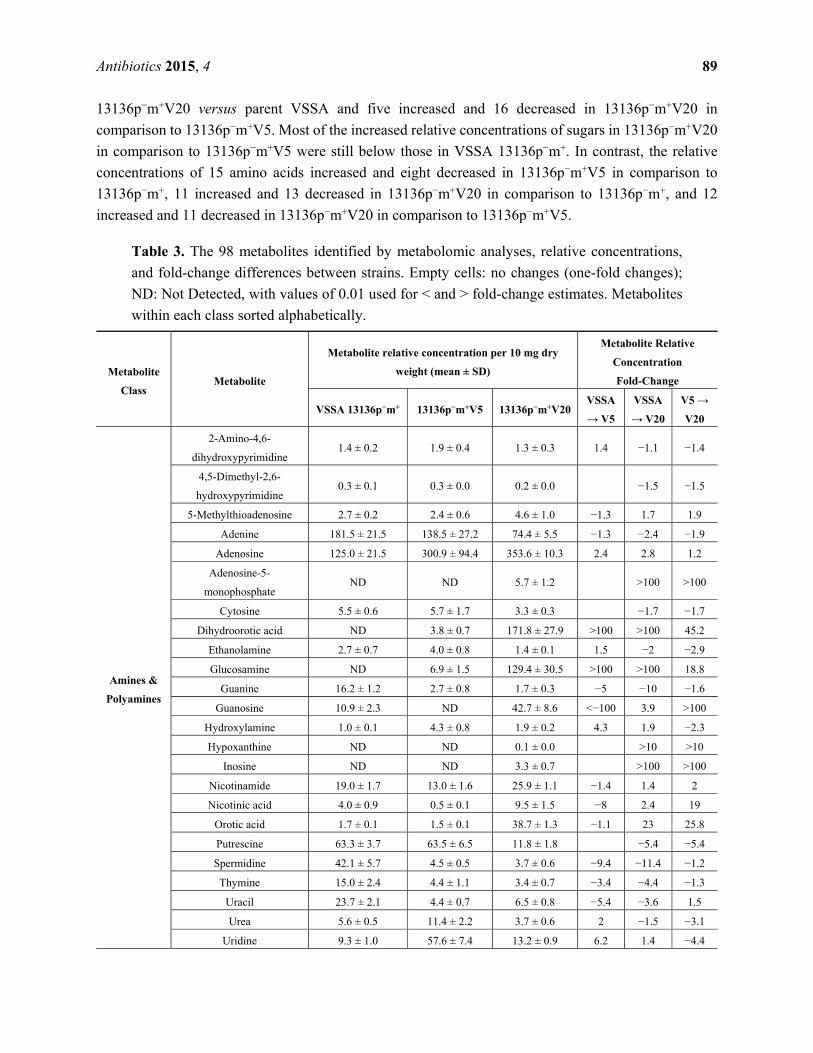
2.4. Metabolomics
Ninety-eight total metabolites were identified in VSSA 13136p−m+ and its two VISA derivatives,
13136p−m+V5 and 13136p−m+V20. Twenty-four were in the amines and polyamines metabolite class,
25 were amino acids, 26 were polar organic acids and the remaining 23 were sugars. The concentrations
of 43 metabolites were increased and 42 were decreased in 13136p−m+V5 cells compared to the parent
strain 13136p−m+ (12 were unchanged). In 13136p−m+V20 cells, the concentrations of 47 metabolites
were increased and 48 were decreased compared to their concentrations in the parent strain 13136p−m+
(only two were unchanged). Thirteen metabolites were increased in both VISA and twelve others were
decreased in both VISA compared to the parent VSSA. The relative concentrations of the identified
metabolites in the three strains are shown in Table 3, which also contains calculated fold-changes for
both VISA versus parent VSSA relative concentrations, as well as fold-changes for 13136p−m+V20
compared to its immediate passage-selection predecessor, 13136p−m+V5. In 13136p−m+V20 cells, the
concentrations of 46 metabolites were increased, and 48 were decreased compared to their concentrations
in predecessor 13136p−m+V5 13136p−m+ (four relative concentrations were unchanged).
Supplementary Figure S2 is a graphical presentation by metabolite class of the fold-change of all 98
detected metabolites’ relative concentrations for 13136p−m+V5 in comparison to the parent VSSA,
13136p−m+V20 in comparison to the parent VSSA, and 13136p−m+V20 in comparison to 13136p−m+V5.
In general, a decrease in sugars was evident in strain 13136p−m+V20 versus its VISA predecessor
13136p−m+V5. Relative concentrations of 10 sugars increased and 12 decreased (one unchanged) in
13136p−m+V5 versus the parent VSSA, but the tallies were only five increased and 18 decreased for the
Antibiotics 2015, 4
89
13136p−m+V20 versus parent VSSA and five increased and 16 decreased in 13136p−m+V20 in
comparison to 13136p−m+V5. Most of the increased relative concentrations of sugars in 13136p−m+V20
in comparison to 13136p−m+V5 were still below those in VSSA 13136p−m+. In contrast, the relative
concentrations of 15 amino acids increased and eight decreased in 13136p−m+V5 in comparison to
13136p−m+, 11 increased and 13 decreased in 13136p−m+V20 in comparison to 13136p−m+, and 12
increased and 11 decreased in 13136p−m+V20 in comparison to 13136p−m+V5.
Table 3. The 98 metabolites identified by metabolomic analyses, relative concentrations,
and fold-change differences between strains. Empty cells: no changes (one-fold changes);
ND: Not Detected, with values of 0.01 used for < and > fold-change estimates. Metabolites
within each class sorted alphabetically.
Metabolite
Class Metabolite
Metabolite relative concentration per 10 mg dry
weight (mean ± SD)
Metabolite Relative
Concentration
Fold-Change
VSSA 13136p−m+ 13136p−m+V5 13136p−m+V20 VSSA
→ V5
VSSA
→ V20
V5 →
V20
Amines &
Polyamines
2-Amino-4,6-
dihydroxypyrimidine 1.4 ± 0.2 1.9 ± 0.4 1.3 ± 0.3 1.4 −1.1 −1.4
4,5-Dimethyl-2,6-
hydroxypyrimidine 0.3 ± 0.1 0.3 ± 0.0 0.2 ± 0.0 −1.5 −1.5
5-Methylthioadenosine 2.7 ± 0.2 2.4 ± 0.6 4.6 ± 1.0 −1.3 1.7 1.9
Adenine 181.5 ± 21.5 138.5 ± 27.2 74.4 ± 5.5 −1.3 −2.4 −1.9
Adenosine 125.0 ± 21.5 300.9 ± 94.4 353.6 ± 10.3 2.4 2.8 1.2
Adenosine-5-
monophosphate ND ND 5.7 ± 1.2 >100 >100
Cytosine 5.5 ± 0.6 5.7 ± 1.7 3.3 ± 0.3 −1.7 −1.7
Dihydroorotic acid ND 3.8 ± 0.7 171.8 ± 27.9 >100 >100 45.2
Ethanolamine 2.7 ± 0.7 4.0 ± 0.8 1.4 ± 0.1 1.5 −2 −2.9
Glucosamine ND 6.9 ± 1.5 129.4 ± 30.5 >100 >100 18.8
Guanine 16.2 ± 1.2 2.7 ± 0.8 1.7 ± 0.3 −5 −10 −1.6
Guanosine 10.9 ± 2.3 ND 42.7 ± 8.6 <−100 3.9 >100
Hydroxylamine 1.0 ± 0.1 4.3 ± 0.8 1.9 ± 0.2 4.3 1.9 −2.3
Hypoxanthine ND ND 0.1 ± 0.0 >10 >10
Inosine ND ND 3.3 ± 0.7 >100 >100
Nicotinamide 19.0 ± 1.7 13.0 ± 1.6 25.9 ± 1.1 −1.4 1.4 2
Nicotinic acid 4.0 ± 0.9 0.5 ± 0.1 9.5 ± 1.5 −8 2.4 19
Orotic acid 1.7 ± 0.1 1.5 ± 0.1 38.7 ± 1.3 −1.1 23 25.8
Putrescine 63.3 ± 3.7 63.5 ± 6.5 11.8 ± 1.8 −5.4 −5.4
Spermidine 42.1 ± 5.7 4.5 ± 0.5 3.7 ± 0.6 −9.4 −11.4 −1.2
Thymine 15.0 ± 2.4 4.4 ± 1.1 3.4 ± 0.7 −3.4 −4.4 −1.3
Uracil 23.7 ± 2.1 4.4 ± 0.7 6.5 ± 0.8 −5.4 −3.6 1.5
Urea 5.6 ± 0.5 11.4 ± 2.2 3.7 ± 0.6 2 −1.5 −3.1
Uridine 9.3 ± 1.0 57.6 ± 7.4 13.2 ± 0.9 6.2 1.4 −4.4

Antibiotics 2015, 4
90
Table 3. Cont.
Metabolite
Class Metabolite
Metabolite relative concentration per 10 mg dry
weight (mean ± SD)
Metabolite Relative
Concentration
Fold-Change
VSSA 13136p−m+ 13136p−m+V5 13136p−m+V20 VSSA
→ V5
VSSA
→ V20
V5 →
V20
Amino
Acids
4-hydroxyproline 5.5 ± 0.6 6.3 ± 1.7 3.9 ± 1.1 1.1 −1.4 −1.6
Alanine 498.0 ± 47.1 525.3 ± 67.1 493.2 ± 41.0 1.1 −1.1
Asparagine 18.9 ± 3.0 36.8 ± 4.5 14.7 ± 2.5 1.1 −1.3 −2.5
Aspartic acid 975.4 ± 127.0 2203.8 ± 446.5 2303.0 ± 397.1 2.3 2.4
Cystathionine 4.5 ± 0.8 ND ND <−100 <−100
Glutamic acid 20.5 ± 4.0 284.7 ± 76.8 308.5 ± 36.4 14 15 1.1
Glycine 33.8 ± 10.3 45.7 ± 6.2 109.5 ± 9.8 1.4 3.2 2.4
Homocysteine 1.5 ± 0.3 3.7 ± 0.8 5.7 ± 1.0 2.5 3.8 1.5
Homoserine 1.0 ± 0.2 ND 0.6 ± 0.1 <−100 −1.7 >100
Isoleucine 26.5 ± 3.5 36.0 ± 7.1 88.9 ± 9.9 1.4 3.4 2.4
Leucine 118.1 ± 24.2 330.4 ± 40.9 451.9 ± 68.2 2.8 3.8 1.4
Lysine 354.5 ± 39.9 276.8 ± 20.6 121.9 ± 27.5 −1.3 −2.9 −2.3
Methionine 10.4 ± 2.1 11.7 ± 2.8 8.5 ± 1.2 1.1 −1.2 −1.4
N-Acetylglutamic acid ND ND 25.6 ± 1.5 >100 >100
O-Acetyl-serine 5.4 ± 1.3 1.0 ± 0.2 ND −5.4 <−100 <−100
Ornithine 30.8 ± 4.8 16.6 ± 3.1 1.2 ± 0.2 −2 −26 −13.8
Phenylalanine 165.9 ± 29.1 237.0 ± 30.3 116.5 ± 9.3 1.4 −1.4 −2
Proline 10.9 ± 1.5 154.6 ± 30.0 239.8 ± 8.0 14 22 1.6
Pyroglutamic acid 1017.3 ± 159.3 1017.6 ± 136.4 1659.0 ± 164.2 1.6 1.6
Serine 11.5 ± 1.3 7.2 ± 1.4 9.5 ± 2.9 −1.6 −1.2 1.3
Threonine 52.8 ± 10.6 20.0 ± 8.5 7.8 ± 1.2 −2.6 −6.8 −2.6
Tryptophan 29.7 ± 4.8 8.5 ± 1.3 11.9 ± 3.0 −3.5 −2.5 1.4
Tyrosine 33.6 ± 7.4 40.8 ± 5.7 26.3 ± 2.2 1.2 −1.3 −1.6
Valine 63.1 ± 14.3 152.9 ± 25.8 170.6 ± 35.3 2.4 2.7 1.1
β-Alanine 57.4 ± 7.6 272.3 ± 42.6 95.1 ± 12.9 4.7 1.7 −2.9
Polar
Organic
Acids
2-Hydroxyglutaric acid 6.1 ± 0.4 2.5 ± 0.3 2.8 ± 0.2 −2.4 −2.2 1.1
2-Phosphoglycerate 14.6 ± 2.0 7.5 ± 1.9 3.0 ± 0.6 −2 −5 −2.5
3-Hydroxybenzoic acid 0.3 ± 0.0 0.4 ± 0.1 0.5 ± 0.0 1.3 1.7 1.3
3-Phosphoglycerate 242.6 ± 45.1 62.7 ± 10.9 40.1 ± 7.5 −3.9 −6 −1.6
Aminomalonic acid 0.6 ± 0.1 0.21 ± 0.1 0.7 ± 0.1 2.9 1.2 3.3
Benzoic acid 1.6 ± 0.1 1.9 ± 0.2 1.6 ± 0.4 1.2 −1.2
cis-Aconitic acid ND 2.1 ± 0.2 ND >100 <−100
Citramalic acid 14.8 ± 2.7 19.1 ± 4.1 27.3 ± 5.4 1.3 1.8 1.4
Citric acid 15.6 ± 2.0 243.7 ± 22.6 35.1 ± 8.4 16 2.3 −6.9
Fumaric acid 19.8 ± 4.5 1.5 ± 0.4 28.6 ± 4.0 −12.5 1.4 19.1
Glucaric acid 1.2 ± 0.3 2.7 ± 0.4 3.0 ± 0.1 2.3 2.6 1.1
Gluconic acid 0.6 ± 0.1 11.8 ± 2.2 5.8 ± 2.1 20 10 −2
Glyceric acid 7.0 ± 0.9 6.9 ± 1.3 3.7 ± 0.2 −2 −1.9
Glycolic acid 5.2 ± 0.6 5.1 ± 0.9 20.2 ± 1.8 3.9 4
Lactic acid 358.9 ± 52.4 320.6 ± 36.2 682.9 ± 60.6 −1.1 1.9 2.1
Malic acid 3.4 ± 0.6 ND 12.9 ± 2.3 <−100 3.7 >100
Monomethylphosphate 104.8 ± 24.0 161.3 ± 2.0 258.1 ± 17.9 1.5 2.5 1.6

Antibiotics 2015, 4
91
Table 3. Cont.
Metabolite
Class Metabolite
Metabolite relative concentration per 10 mg dry
weight (mean ± SD)
Metabolite Relative
Concentration
Fold-Change
VSSA 13136p−m+ 13136p−m+V5 13136p−m+V20 VSSA
→ V5
VSSA
→ V20
V5 →
V20
Polar
Organic
Acids
Oxyphosphinyloxyacetate 3.8 ± 0.1 3.4 ± 0.3 6.6 ± 1.0 −1.1 1.7 1.9
Pantothenate ND ND 2.2 ± 0.0 >100 >100
Phenylpyruvic acid ND ND 3.4 ± 0.4 >100 >100
Pyruvic acid 58.1 ± 10.5 38.9 ± 15.8 31.4 ± 4.8 −1.4 −2 −1.2
Succinic acid 36.1 ± 8.7 31.6 ± 8.2 42.9 ± 9.6 −1.1 1.2 1.4
α-Glycerophosphate 824.3 ± 131.3 1487.9 ± 121.8 920.7 ± 76.9 1.8 1.1 −1.6
α-Ketoglutaric acid 30.7 ± 6.9 11.1 ± 2.1 18.2 ± 2.7 −2.8 −1.7 1.6
β-Lactate 3.6 ± 0.8 2.0 ± 0.2 8.5 ± 1.7 −1.7 2.3 4.3
β-Phenyllactic acid 3.0 ± 0.6 1.7 ± 0.2 7.3 ± 0.7 −1.7 2.4 4.3
Sugars
Arabitol 6.3 ± 1.3 12.0 ± 2.3 4.8 ± 0.7 1.9 −1.3 −2.5
Fructose 40.5 ± 7.5 4.0 ± 0.8 1.8 ± 0.2 −10 −23 −2.2
Fructose-6-P 6.7 ± 2.0 5.2 ± 1.0 3.0 ± 0.7 −1.3 −2.5 −1.7
Galactitol ND 2.1 ± 0.2 2.0 ± 0.3 >100 >100 −1.1
Galactopyranose 2.2 ± 0.5 3.4 ± 0.7 2.0 ± 0.1 1.5 −1.1 −1.7
Galactose 5.1 ± 1.3 7.9 ± 0.8 1.5 ± 0.3 1.5 −3.3 −5.3
Glucose-1-P 20.3 ± 5.2 13.8 ± 3.4 2.3 ± 0.6 −1.4 −10 −6
Glucose-6-P 13.6 ± 0.7 1.6 ± 0.3 0.5 ± 0.1 −8.5 −27.2 −3.2
Glycerol 569.8 ± 71.4 668.7 ± 76.0 611.0 ± 103.9 1.2 1.1 −1.1
Glycerol-2-P 28.2 ± 7.4 12.1 ± 3.0 7.6 ± 1.5 −2.5 −3.3 −1.6
Inositol 3.1 ± 1.0 12.8 ± 1.1 0.1 ± 0.0 4.1 −31 −128
Inositol, -chiro- 0.8 ± 0.1 1.5 ± 0.3 1.9 ± 0.1 1.8 2.2 1.3
Mannitol 178.1 ± 15.6 29.5 ± 7.2 32.3 ± 3.1 −6 −5.5 1.1
Mannitol-P 36.6 ± 3.2 9.0 ± 1.3 14.3 ± 2.8 −4.1 −2.6 1.6
Mannose 7.2 ± 1.0 12.8 ± 2.4 1.2 ± 0.2 1.8 −6 −10.7
Mannose-6-P 13.2 ± 2.9 ND ND <−100 <−100
Ribitol 122.9 ± 22.0 24.2 ± 4.4 76.2 ± 15.4 −5 −1.6 3.1
Ribose 47.9 ± 9.4 42.0 ± 7.1 25.0 ± 3.3 −1.1 −2 −1.7
Ribose-5-P 4.3 ± 0.5 30.6 ± 1.8 12.5 ± 2.0 7.2 2.9 −2.4
Sedoheptulose 2.3 ± 0.7 2.2 ± 0.0 ND <−100 <−100
Sedoheptulose-7-P 1.0 ± 0.0 ND ND <−100 <−100
Sucrose 14.5 ± 2.5 1.4 ± 0.7 6.4 ± 0.2 −10 −2.3 4.6
Trehalose 2.5 ± 0.3 17.6 ± 0.7 3.4 ± 0.8 7 1.4 −5.2
Figure 2 is a set of diagrams of central intermediary metabolic pathways with detected metabolites
indicated along with increases and decreases in concentration for all three comparisons of relative
concentrations (each VISA versus the parent VSSA and VISA 13136p−m+V20 vs. VSSA 3136p−m+V5).
For clarity, only metabolite relative concentration changes of five-fold or greater are presented. Forty
five of the 98 metabolites identified had at least one relative concentration change of five-fold or greater
among the three strain comparisons. By metabolite class, these were: 13 amines and polyamines, eight
amino acids, nine polar organic acids and 15 sugars. These 45 metabolites, their relative concentrations
per strain, and relative concentration fold-changes for all three strain comparisons are listed in

Antibiotics 2015, 4
92
Supplementary Table S4. The Figure 2 diagrams are not intended to be complete pathways, and many
metabolites are involved in numerous metabolic processes; and for some, such as polyamines and
unphosphorylated sugars, there is uncertainty around their metabolic roles. The pathways presented
represent those that seem relevant given the context of the other metabolites identified and the results of
the genomic and transcriptomic analyses.
Figure 2. Cont.

Antibiotics 2015, 4
93
Figure 2. Cont.

Antibiotics 2015, 4
94
Figure 2. Metabolites with at least one five-fold relative concentration difference between
(A) VISA 13136p−m+V5 relative to VSSA 13136p−m+, (B) VISA 13136p−m+V20 relative
to VSSA 13136p−m+ and (C) VISA 13136p−m+V20 relative to VISA 13136p−m+V5, as well
as their positions in metabolic pathways. Bordered terms: metabolites identified by
metabolomic analyses; green shading: five-fold or greater relative concentration increases;
red shading: five-fold or greater relative concentration decreases.

Antibiotics 2015, 4
95
A number of metabolites were only detected in one or two of the three strains employed in this study.
Particularly striking were the absence of guanosine from 13136p−m+V5 and the accumulation of AMP,
N-acetylglutamic acid, pantothenate and phenylpyruvic acid in 13136p−m+V20. Polyamine relative
concentrations were sequentially diminished as greater vancomycin tolerance accrued over the course
of VISA selection. Initially, the spermidine relative concentration was reduced 9.4-fold by the selection
of 13136p−m+V5 from VSSA 13136p−m+, while putrescine’s was unchanged; then the selection of
13136p−m+V20 from 13136p−m+V5 led to a 5.4-fold reduction in putrescine that was accompanied by a
further, small reduction in spermidine. Several sugars were sequentially diminished in a similar fashion,
notably glucose-1-phosphate, glucose-6-phosphate, and fructose.
The amino acids consistently present in the highest concentrations were alanine, aspartic acid,
glutamic acid, leucine, lysine, proline and pyroglutamic acid. In general, the concentrations of these
amino acids were increased in strains 13136p−m+V5 and 13136p−m+V20 compared to the parent strain.
Aspartic acid was increased 2.3- and 2.4-fold, respectively, in the two VISA strains, glutamic acid
14- and 15-fold, leucine 2.8- and 3.8-fold and proline 14- and 22-fold.
There were high concentrations at a similar level in all three strains of pyroglutamate, which is the
cyclic lactam of glutamic acid [60]. Although pyroglutamic acid is almost ubiquitously present in cells
from Archaea to humans, it is a neglected metabolite. Pyroglutamate is formed by a number of different
routes, including from the degradation of glutathione, spontaneous cyclization of glutamate phosphate
and non-enzymatically from glutamate and glutamine. We are unaware of previous reports of its
occurrence in S. aureus.
Glycerol was present at similar high levels in all three strains. Alpha glycerophosphate was present
in all three strains. Mannitol relative concentration was significantly decreased in the VISA strains. Acid
production from mannitol is a species characteristic of S. aureus. Lactic acid was present at high levels
in all three strains.
3. Discussion
It has become apparent that the stress response network and virulence are intrinsically interwoven
with central intermediary metabolism. Figure 3 is a diagram of the relationships between these three
aspects of bacterial physiology. Secreted virulence factors, such as proteases and hemolysins, destroy
host tissue in order to generate nutrients for growing pathogen populations. The released nutrients are
transported into the S. aureus cell to serve as substrates for central intermediary metabolic pathways.
Metabolic pathways are modulated to minimize damage from host immune response oxidative and
nitrosative assaults [61]. Cell surface associated virulence factors, such as adhesions, promote host tissue
colonization and aid in the evasion of host immune responses that are triggered by the activities of the
secreted proteins. The production of virulence factors in S. aureus is density-dependent and regulated
by a complicated network of global regulatory loci, but also by stress-related adjustments of central
metabolic pathways, including the tricarboxylic acid (TCA) cycle. Some TCA cycle enzymes are
upregulated in biofilm-associated cells versus planktonic culture [62,63]. Many of these global regulators,
such as alternative sigma factor σB and members of the staphylococcal accessory regulator (Sar) family,
exert regulatory influence over not only virulence factors, but the S. aureus general stress response and
expression of antimicrobial resistances, including vancomycin intermediate susceptibility [64].

Antibiotics 2015, 4
96
Figure 3. Conceptual diagram of the relationship between central intermediary metabolism,
virulence factors, and the stress response network. Virulence is related to central
intermediary metabolism through the production of soluble exoprotein virulence factors,
regulated in a cell density-dependent fashion, which destroy host tissue in order to make
nutrients available to a growing bacterial population. Cell-associated virulence factors are
primarily defenses against host immune responses, working in conjunction with stress
responses to immune system oxidative insults and damage sensing and responses to cell
wall-active antibiotics. The stringent response is a stress response that coordinates a
downregulation of central intermediary metabolism, and protein and nucleic acid synthesis,
in order to conserve resources during periods of nutritional scarcity.
The alarmone-mediated nutritional stress response, known as the stringent response, has been linked
to activated stress responses and methicillin resistance [45]. The S. aureus starvation response involves
expression changes to genes associated with DNA repair and oxidative stress resistance [65].
rpoB mutations associated with conversion from VSSA to VISA also impart characteristics of the
stringent response, reduced expression of genes encoding ribosomal proteins and upregulation of genes
encoding amino acid biosynthesis enzymes, in addition to a slowed growth rate [66]. RNA polymerase
subunit encoding genes rpoB and rpoC were downregulated 3.1- and 2.1-fold in 13136p−m+V20,
respectively, but expression was unchanged in 13136p−m+V5. The stringent response is activated in
MRSA in response to β-lactam antibiotics and leads to intermediary metabolic pathways optimized for
energy production [67,68]. Stringent response induction by mupirocin in a heterogeneous MRSA
dramatically increased the production of PBP2A and resulted in homogenous methicillin resistance
expression [69]. Additionally, the link between virulence and the stringent response has been described
for S. aureus and other bacteria [70]. Despite a dramatic upregulation of the mecA gene in VISA

Antibiotics 2015, 4
97
13136p−m+V5 (48.5-fold vs. parent VSSA or 13136p−m+ V20), the oxacillin MIC of 13136p−m+V5 was
comparable to those of the other two strains. Expression of two other genes encoding penicillin-binding
proteins changed only slightly, pbp2 down 2.3-fold in 13136p−m+V20 and pbp3 down 2.5-fold
in13136p−m+V5, despite the reported importance of PBP2 to laboratory-selected VISA [71].
Multiple studies have identified genes associated with decreased susceptibility to vancomycin.
These studies have been summarized by Howden et al. [3,4], who have attempted to make some
generalizations. Mutations in the regulatory genes, walKR, vraRS and graRS, and the gene encoding
RNA polymerase subunit (rpoB) have been most frequently associated with the VISA phenotype.
WalKR is an essential two-component system involved in the control of cell wall metabolism,
particularly in controlling the expression of peptidoglycan hydrolases [72]. VraSR controls the cell wall
stress stimulon [5,73]. GraSR is a two-component system associated with vancomycin resistance [74]
and more generally with sensing antimicrobial peptides [75]. We did not detect mutations in any of these
genes in our VISA strains. However, mutations were detected in stp1, fmtB and tarO, which are all
involved in cell wall metabolism. Matsuo et al. [76] have identified mutations associated with the
transition from hVISA to VISA. These authors have suggested that mutations in genes involved in
protein synthesis, such as translation elongation factor G and translation initiation factor IF-1, in our
case, may reduce protein synthesis and allow more use of amino acids for peptidoglycan synthesis.
Indeed, the levels of several peptidoglycan precursor amino acids were elevated in our VISA strains.
Many of the mutations we encountered in our VISA strains have either not been or have only been
rarely associated with the VISA phenotype. Five of the 12 13136p−m+ VISA mutations are in genes
encoding products that interact with nucleic acids in protein synthesis or are associated with DNA
damage/SOS responses: comGB, fusA, infA, ssb1 and dinG. Often, a single stress will activate
components from multiple stress responses. Oxidative stress and heat shock are known to elicit very
broad stress responses [25]. However, SOS responses, such as recombination repair and competence
mechanisms, are not commonly listed among the stress response alterations associated with the
VISA phenotype.
That seven of the nineteen mutant loci identified in this study were in L54a prophage gene ssb1 is
intriguing. Single-stranded DNA binding proteins of L54a and similar prophages are thought to function
as positive transcriptional regulators of integrase and perhaps other recombination-related phage
genes [28,77]. Prophage genomes are known to harbor bacterial virulence determinants that can be
regulated by global regulatory elements, such as the agr system [78], and cases have been reported of
phage proteins exerting regulatory influence over host gene expression [79,80]. Cell wall biosynthesis
disruption in MRSA COL results in downregulation of 33 L54a genes and upregulation of only two
(none were ssb1), interpreted as a reinforcement of the lysogenic state, because stress is known to
activate the SOS system and thereby the entry of the prophage into the lytic cycle [27]. The fact that
mutations were identified in three L54a loci in VISA 13136p−m+V5 and additional mutations accumulated
during the selection of increased resistance in VISA 13136p−m+V20, and that there were no mutations
in other L54a genes such as those encoding the excisionase, suggests that ssb1 may have a regulatory
function that was the target of VISA selection. It seems unlikely that so many mutations in one gene
would be necessary to simply disable lytic cycle capabilities. Likewise, mutations in fusA, infA and stp1
may serve to modulate regulatory functions. Competence damage-inducible protein CinA, with
functional similarities to both the comGB and dinG gene products, was identified as a member of the
Antibiotics 2015, 4
98
cell wall stress stimulon by Utaida et al. [5]. Interestingly, in relation to comGB, L54a itself cannot
induce competence as a prophage [81].
Matsuo et al. [66] described the importance of regulation to the VISA resistance mechanism.
The greater ratio of up- to down-regulated regulatory function genes for VISA 13136p−m+V20 (6:11)
than 13136p−m+V5 (4:15) supports this observation. This is also true for the stp1 SNP reversion when
VISA 13136p−m+V20 was selected from VISA 13136p−m+V5. Several regulatory genes showed modest
downregulation in 13136p−m+V5: arlSR, glnR, pyrR, rsbU, agrA, agrB, agrC2 (but not agrD), icaR,
sarA, sarV, rpoF (encodes stress response RNA polymerase sigma factor σB) and rsbV (encodes an anti-
anti-sigma factor). However, saeS, sarR and vraR showed modest upregulation in 13136p−m+V5, and
the downregulation of both rpoF and rsbV together was unusual in that this would have opposite effects
relative to σB-mediated regulation. In 13136p−m+V20, sarA homologs sarS and rot (repressor of toxins)
were highly upregulated at 8.9- and 12-fold versus parent VSSA, respectively. agrA, agrB, agrC2 and
agrD genes, as well as saeS, sarA and rsbW were downregulated in 13136p−m+V20, while arlSR, glnR,
pyrR, rpoF, rsbV, sarR, sarV and vraR had no expression change versus the progenitor 13136p−m+. saeS
is the sensor histidine kinase gene of a two-component regulation system that is upregulated by β-lactams
and vancomycin in some other strains [82], and sarA is important for intrinsic antimicrobial resistance [83].
The complexity of the network of regulatory elements that controls virulence factor expression also
extends to capsules and biofilms. The general downregulation of capsular polysaccharide biosynthesis
genes can be directly interpreted as capsule production inhibition, although typically cap genes have
been found to be overexpressed in VISA strains [3,4]. Whether or not biofilm formation was favored or
inhibited in the two VISA cannot be discerned from the pattern of expression changes among regulatory
loci, although the general downregulation of the protease-encoding genes is favorable to biofilm
formation [84].
Secreted and cell surface-associated virulence factor gene expression patterns were similarly
complicated. aur, encoding the zinc metalloproteinase aureolysin, was overexpressed 8.2-fold in
13136p−m+V5. Aureolysin has been shown to cleave complement component C3 and is proposed to
mediate immune evasion [85]. Gene sspB encodes a cysteine protease precursor and was upregulated
3.7-fold in 13136p−m+V5, but unchanged in 13136p−m+V20. This gene was reported as downregulated
in another VISA strain, JH9 [6]. Genes sspC and sspA, encoding a cysteine protease and V8 serine
protease, respectively, were downregulated in both 13136p−m+V5 and 13136p−m+V20. Ingavale et al. [86]
suggested that decreased levels of SspA may affect the processing of autolysins, such as Atl, resulting
in altered autolytic activity, a characteristic displayed by our VISA strains. Serine protease loss may also
affect other proteases, specifically cysteine protease proteolytic maturation [87]. The spa gene, encoding
protein A, had no expression change in 13136p−m+V5 but surprisingly was upregulated 11.5-fold in
13136p−m+V20. Downregulation of this gene is the typical observation in VISA strains [3,4].
All 16 SNPs in VISA 13136p−m+V20 were in genes with known associations to stress responses,
primarily to cell wall antibiotics and DNA damage. The tarO gene product is a membrane-associated
protein that catalyzes the initial step in the biosynthesis of cell wall teichoic acid, a polymer of ribitol
phosphate subunits [13]. The functions of teichoic acid are not fully understood, but it has roles in VISA
characteristics such as cell wall structure, cell separation, autolysis and β-lactam susceptibility. Teichoic
acid D-alanylation, mediated by dlt gene products, promotes biofilm formation and cell adhesion and
is associated with the regulation of autolysis and virulence [88]. Both dlt genes were downregulated

Antibiotics 2015, 4
99
three-fold, but only in VISA 13136p−m+V5. Only VISA 13136p−m+V5 had the mutation in tarO, and it
had the largest decrease in the metabolite ribitol relative concentration (five-fold, versus only 1.6-fold
in VISA 13136p−m+V20). VISA 13136p−m+V20 has only 70% of the cell wall phosphorus of the parent
VSSA, whereas VISA 13136p−m+V5 has 92% of the parent level [13]. Reductions in ribitol
concentration did not correlate with lower phosphorus levels in VISA purified cell walls, which is
indicative of lower teichoic acid content.
Fructose levels were 10- and 23-fold lower in 13136p−m+V5 and 13136p−m+V20, respectively,
versus the relative concentration in the parent VSSA. Fructose phosphate levels were slightly lower in
the two VISA than the parent. Expression of locus SAV0698, encoding a putative fructose utilization
(fru) operon repressor, was upregulated 2.3- and 4.3-fold in 13136p−m+V5 and 13136p−m+V20,
respectively. Factors contributing to the diminished fructose pool could be the repression of genes
encoding enzymes required for uptake and utilization or the diversion of available fructose toward
upregulated peptidoglycan synthesis. There are problems with both of these hypotheses, however. The
uptake mechanism encoded by the fru operon is a phosphotransferase system, but it was unphosphorylated
fructose whose relative concentrations changed dramatically. Furthermore, the thickened cell walls
characteristic of the VISA phenotype are generally only produced in the presence of glycopeptides.
Analyses in this study were performed on cells grown in antibiotic-free medium. Additionally, in
13136p−m+V5, the glmS gene is downregulated, but not in 13136p−m+V20. GlmS catalyzes the initial
step in UDP-N-acetylglucosamine biosynthesis, in which fructose as fructose-6-phosphate is
incorporated into the cell wall biosynthetic pathway.
Components of the S. aureus general stress response network were selectively deployed in the two
VISA, as three of the eight genes whose expression was highly downregulated (>8-fold versus parent
VSSA) were associated with stress responses. These were asp23, encoding alkaline shock protein 23,
locus SAV2185, encoding a putative transporter of osmoprotectant glycine betaine, and SACOL1114,
encoding a putative Mn2+/Fe2+ transporter associated with oxidative stress management. The remaining
five genes encoded two enterotoxins (sec, seb), a pseudogene with homology to integrase/recombinase
proteins and two hypothetical proteins. No genes were upregulated >8-fold in both VISA.
There was evidence of stress response activation or modification in metabolomic data. The ica
operon was strongly upregulated in VISA 13136p−m+V5, but not VISA 13136p−m+V20. Production of
a number of virulence factors, including the intercellular adhesin proteins encoded by the ica operon,
are regulated by TCA cycle changes in response to stress. An increase in ribose concentration has been
linked to TCA cycle stress and an accompanying pentose phosphate pathway regulation modulation [63].
Ribose-5-phosphate concentration was 7.2-fold greater in VISA 13136p−m+V5 than the parent VSSA,
although only up 2.9-fold in VISA 13136p−m+V20, while concentrations of ribose itself were
comparable in VISA 13136p−m+V5 and the parent VSSA but two-fold lower in VISA 13136p−m+V20
than the parent strain.
Alcohol dehydrogenase is a fermentation pathway enzyme encoded by the adh1 gene, whose
expression was decreased 7.8-fold in VISA 13136p−m+V5 versus the parent VSSA, representing a
reduced potential for fermentation, while expression was increased 4.7-fold in VISA 13136p−m+V5
versus the parent VSSA, representing an increased potential for fermentation. The pdhC gene encodes a
component of the pyruvate dehydrogenase complex, which converts pyruvate to acetate. Expression of
pdhC versus the parent 13136p−m+ was unchanged in 13136p−m+V5 and downregulated 3.1-fold in
Antibiotics 2015, 4
100
13136p−m+V20, indicating that fermentation to acetate was not occurring. A shift away from anaerobic
growth is consistent with the fact that acetate was not detected by the metabolomic analysis, pyruvic
acid levels declined only slightly in the two VISA in comparison to the VSSA parent, and nitrate
extrusion protein gene narK was downregulated in 13136p−m+V5.
Adenosine monophosphate (AMP) was not detected in 13136p−m+ or 13136p−m+V5, but was at
detectable levels in 13136p−m+V20. In S. aureus, the PurA protein is a substrate for phosphorylation by
Stk1, the cognate serine threonine phosphatase to the Stp1 serine threonine kinase encoded by the stp1
gene [20] containing an SNP in 13136p−m+V5 that reverted during selection of 13136p−m+V20. The
purA gene encodes adenylosuccinate synthase, which catalyzes the final step in AMP biosynthesis.
However, purA was downregulated 2.4-fold in 13136p−m+V20, but unchanged in 13136p−m+V5, so the
mutant Stp1 protein was not responsible for the increased AMP level in 13136p−m+V20. Therefore, the
accumulation of AMP and downregulation of a gene encoding its biosynthesis may be due to a reduced
demand for ATP in 13136p−m+V20. Energy conservation is a stringent response characteristic, as is the
general downregulation of purine and pyrimidine metabolism genes observed in both VISA.
The major proline biosynthetic pathway in S. aureus is through arginine and ornithine via the urea
cycle, not from glutamate [89]. Accumulation of osmoprotectants, including trehalose and especially
proline, is an important osmotic stress countermeasure employed by S. aureus. Trehalose was present
in 13136p−m+V5 and 13136p−m+V20 at relative concentrations seven- and 1.4-fold higher than in the
parent strain. This is consistent with an activated stress response network in VISA, but not with the gene
expression data for the trehalose-specific phosphotransferase system encoded by treP (downregulated
4.2-fold and upregulated 5.3-fold in 13136p−m+V5 and 13136p−m+V20, respectively). The TreP system
is phosphoenolpyruvate (PEP) dependent, however, and PEP was not among the identified metabolites,
suggesting that other uptake systems may have been utilized for trehalose and indicating that no
significant gluconeogenesis was occurring in any of the three strains.
Proline relative concentrations were extremely elevated versus the parent VSSA in both
13136p−m+V5 (14-fold) and 13136p−m+V20 (22-fold). Citrate, cis-aconitate and glutamate, metabolites
prior to the urea cycle branch point in the TCA cycle, all accumulated in 13136p−m+V5, while fumarate
and malate concentrations, which are at or after the urea cycle branch point, were reduced. TCA cycle
intermediate cis-aconitate was not detected in parent VSSA or 13136p−m+V20, only in 13136p−m+V5.
In 13136p−m+V20, the identified TCA cycle intermediates, except cis-aconitate, were all within five-
fold of parent strain relative concentrations, but many intermediates in glycolysis were reduced at least
five-fold versus the parent. This suggests elevated flux through glycolysis to allow the TCA cycle to
maintain such high proline levels. However, S. aureus also imports proline via the ProP low-affinity
transport system in response to osmotic stress or a high-affinity PutP transport system in response to
nutrient limitation [90]. Gene expression for locus SAV0573, encoding a ProP proline/betaine
transporter homolog, was upregulated 3.7-fold in 13136p−m+V5 versus the parent strain, consistent with
elevated proline concentrations and an activated stress response network. Data were not available for
13136p−m+V20 proP expression. Overall, the results suggest that 13136p−m+V5 was more reliant on
transport into the cell via ProP to accumulate proline than 13136p−m+V20, which, in turn, relied more
on proline biosynthesis from arginine via the urea cycle. Osmoprotectant uptake from the environment
is a more rapid response to osmotic stress than de novo biosynthesis. However, that becomes irrelevant
if proline biosynthesis is an aspect of the stress response network in VISA 13136p−m+V20 that is

Antibiotics 2015, 4
101
permanently activated to maintain high proline concentrations. Glutamate accumulation may have been
due to reduced demand from nucleotide biosynthesis pathways.
Nelson et al. [17] have suggested that there is decreased flow through the TCA cycle in VISA strains
and that this is associated with decreased aconitase activity; however, no expression changes were
identified for any of the genes in the cit operon. Of seven pyrimidine ribonucleotide biosynthetic
pathway genes with expression changes in this study, two were downregulated and five unchanged in
13136p−m+V5 and six downregulated and one unchanged in 13136p−m+V20. The relative concentrations
of pyrimidines, as well as purines, did not correlate well with biosynthetic gene expression patterns.
McAleese et al. [6] reported pyr gene downregulation in VISA, and Reiss et al. [45] reported pur gene
downregulation in MRSA COL during a mupirocin-induced stringent response. Hypoxanthine and
inosine were detected in 13136p−m+V20, but not in 13136p−m+V5 or the parent 13136p−m+. These are
purine salvage pathway substrates either taken up from the growth medium, perhaps due to activated
elements of the starvation response, or are degradation products from excess adenine and adenosine after
downregulated purine biosynthesis [65]. Likewise, the accumulation of pyrimidine biosynthetic
intermediates, dihydroorotate and orotate, was consistent with a downregulated pyrimidine biosynthetic
pathway. Their accumulation was sequential, as dihydroorotate but not orotate relative concentrations
were dramatically increased versus the parent VSSA in 13136p−m+V5 and were substantially elevated
again in 13136p−m+V20. Orotate levels were comparable in parent and 13136p−m+V5, with substantial
accumulation only in 13136p−m+V20.
There were significant decreases in the polyamines putrescine (strain 13136p−m+V20) and spermidine
(both strains). Polyamines play important roles in many cellular processes [91,92]. Joshi et al. [93] found
polyamines to exhibit a strong antimutagenic effect on several strains of S. aureus. Lower levels of
polyamines in VISA strains may facilitate the development of the VISA phenotype by increasing the
frequency of mutations. Within the cell polyamines are often complexed with nucleic acids, where they
are thought to serve a protective function against stress and possibly participate in the regulation of
protein synthesis and DNA-binding protein interactions. Polyamines protect E. coli against oxidative
stress and are a component of the acid stress response. On the cell surface polyamines have been
shown to influence biofilm formation in Bacillus subtilis and a number of Gram-negative pathogens.
Spermidine biosynthesis exerts a regulatory influence on Streptococcus pneumoniae autolytic activity,
possibly through cell wall structural interactions [93,94].
Polyamine functions are generally poorly understood [94]. A complication to the assessment of this
study’s polyamine data is the unique hypersensitivity of S. aureus to these molecules. It is questionable
whether S. aureus is capable of synthesizing these polyamines [93]. Adenine phosphoribosyltransferase,
encoded by the apt gene mutated in 13136p−m+V20 but not 13136p−m+V5, is involved in recycling
polyamine biosynthesis byproducts in E. coli. Furthermore, in at least some Gram-positives, including
S. aureus, the relA gene encoding an alarmone biosynthesis activity that mediates the stringent response
is downstream of apt. Streptomyces coelicolor relA is transcribed from transcriptional read-through of
apt, linking regulation of the stringent response and that of purine metabolism [31,34,35].
Glutamic acid is known to have roles in the osmoregulatory and stress physiology of S. aureus [89,95].
Alanine and glutamic acid are precursors of the L- and D-alanine, D-glutamic acid, and D-isoglutamine
residues found in peptidoglycan. Their presence in increased concentrations in the VISA strains might
be related to modifications in peptidoglycan structure and cell wall thickening in VISA strains [7,13,96–98].

Antibiotics 2015, 4
102
However, levels of lysine, which is also found in S. aureus peptidoglycan, were decreased in the VISA
strains. Possibly also related to peptidoglycan synthesis, glucosamine was undetectable in the parent
strain but was present at 6.9/10mg dry weight in 13136p−m+V5 and 129.4/10mg dry weight in
13136p−m+V20. Peptidoglycan biosynthesis has been shown to be activated in some VISA strains [16],
with an increased flow of glucose into the cell wall [74]. The levels of glycolytic pathway intermediates
generally decreased sequentially from parent to 13136p−m+V5 and again from 13136p−m+V5 to
13136p−m+V20, suggesting an increasing reliance on the high flux of glucose through glycolysis as
susceptibility to vancomycin increases during selection.
Mannitol is suspected of playing a role in osmoregulation in S. aureus [99]. Relative concentrations
versus parent VSSA of mannitol and mannitol-6-phosphate decreased in 13136p−m+V5 (six- and
4.1-fold, respectively) and 13136p−m+V20 (5.5- and 2.6-fold, respectively). In the parent 13136p−m+,
there was almost five-times the relative concentration of the unphosphorylated mannitol as in its VISA
derivatives. The lower concentrations in the VISA can be explained by downregulated mtlA expression,
which encodes a mannitol phosphotransferase system component, by 2.9- and 4.5-fold in 13136p−m+V5
and 13136p−m+V20, respectively. One reason for the dramatic proline accumulation in the VISA might
have been to compensate for the unavailability of mannitol for service in osmoprotection.
Ideally, it would be possible to reveal elements of the VISA resistance mechanism by working
backwards from phenotypic characteristics through metabolomic, then transcriptomic, and finally
genomic data. However, interpretation of the omics data from this study presents several challenges.
In-depth knowledge of the function of the gene products of many of the genes with SNPs is lacking,
profoundly so for some of them (e.g., ssb1, dinG and stp1). A large proportion of gene expression
changes identified by transcriptome analysis encode products in the hypothetical protein, unclassified,
and unknown function gene functional groups (27% overall, rising to 40% of the high fold-change
subset). This is not a novel observation [45]. As mentioned previously, metabolite relative concentration
changes do not always correlate with the expression changes of genes encoding their biosynthetic
enzymes and regulatory elements. This may be due in part to the fact that gene expression data do not
provide information on gene product activity, and many enzymes and regulatory proteins engage in
interactions with other regulatory molecules in ways that are not evident to broad analyses. For example,
the alarmone synthetase and hydrolase activities are combined in a single, bifunctional protein in Gram-
positive bacteria [45], and gene expression data on relA up- or down-regulation give no guidance on
which activities are active at the time of sample processing. Furthermore, the single gene expression
change in the mobile and extrachromosomal element functions gene functional group identified by the
transcriptional analysis does not reflect the dominant position of the L54a prophage mutations within
the genomic analysis.
4. Experimental Section
4.1. Strains and Growth Conditions
S. aureus strains 13136p−m+, 13136p−m+V5 and 13136p−m+V20 were studied [7]. They were
grown in Tryptic Soy Broth (Becton Dickinson and Company, Cockeysville, MD, USA) at 37 °C with

Antibiotics 2015, 4
103
shaking at 200 rpm. Mid-exponential phase cells (OD600nm 0.5) were used for transcriptional profiling
and metabolomics analysis.
4.2. Complete-Genome Comparisons
These were performed with an array-based service provided by Nimblegen Systems Inc. (Madison,
WI, USA) [100,101]. The reference genome was strain 13136p−m+ to which the genomes of
13136p−m+V5 and 13136p−m+V20 were compared.
4.3. Transcriptional Profiling
This was carried out as described in previous publications from this laboratory [102,103]. S. aureus
genome microarrays version 6.0, provided by the Pathogen Functional Genomics Resource Center of
the National Institutes of Allergy and Infectious Diseases, were used.
4.4. Microarray Validation by Real-Time Reverse Transcription-PCR (RT-PCR)
This was carried out as described by Song et al. [103] on selected genes.
4.5. Metabolomic Analysis
This was carried out as described by Singh et al. [104]. Briefly, 500 mL of mid-exponential phase
cells growing in a 2-liter flask with shaking (200 rpm) at 37 °C were harvested, washed and extracted
with 40% (vol/vol) methanol. The extracts were analyzed by liquid chromatography/mass spectroscopy
and gas chromatography/mass spectroscopy. Data from each chromatogram were normalized to an
internal standard of 10 mg/mL hentriacontanoic acid to allow dry weight comparisons between samples.
Relative concentrations were calculated as metabolite peak area divided by internal standard peak area.
These analyses were carried out at the Roy J. Carver Biotechnology Center, University of Illinois at
Urbana-Champaign, Urbana, IL, USA. Three separate batches of each strain were analyzed, and the data
were combined.
5. Conclusions
This study added new members to the lists of mutations and transcriptomes that are associated with
the VISA phenotype. Overall trends in VISA characteristics were consistent with previous studies,
including a great variability in the mutations and gene expression patterns among VISA of different
lineages. This variability has been noted previously by Howden et al. [3,4,105]. Those authors and
Gardete et al. [106] also confirm that VISA transcriptomes are generally consistent with decreased
virulence. Parent VSSA 13136p−m+ in this study had been laboratory-propagated for decades, although
for much of that time it was in frozen storage, and its VISA derivatives were selected in vitro and have
never been passaged through animals. The extensive modulation of virulence determinants in these and
other in vitro-selected and -propagated VISA demonstrates that virulence and central intermediary
metabolism are inextricably intertwined. Extended in vitro passage has been shown to change the
expression pattern of virulence determinants, but it does not eliminate them [107,108].

Antibiotics 2015, 4
104
The importance of activated elements of the stress response network was reinforced by the results
from this study. Stress response modulation in the VISA phenotype was evident across all three omics
analyses, from mutations and expression changes with genes known to respond to stresses or encode
stress-related products, to modulation of stress-protection metabolites, such as proline and polyamines.
It was surprising how many mutations were identified in the two VISA strains that were associated with
stress related to DNA damage and the SOS response, especially so for the strain with the higher
vancomycin MIC (13136p−m+V20). The pattern of downregulation of central metabolic processes
related to protein synthesis and purine and pyrimidine biosynthetic pathways indicates a stringent
response-like state for the two VISA, as has been reported for both MRSA and VISA [45,66].
Downregulation of these processes was not simply a component of the slowed growth rates of these
VISA versus their VSSA parent, for while central metabolism in VISA 13136p−m+V20 was clearly less
active than that in 13136p−m+V5, their doubling times are very similar [7].
The greatest value derived from the metabolomics analysis was in providing physiologic evidence
supporting the association of stress response activation and stringent response characteristics with the
VISA phenotype. This was evident in progressive changes in metabolite relative concentrations that
paralleled the selection of greater vancomycin resistance between VSSA 13136p−m+ and 13136p−m+V5,
and then between 13136p−m+V5 and 13136p−m+V20. Numbers of stress response-related mutations
consistently changed in this fashion, as did broad expression patterns for genes associated with aspects
of metabolism related to the stress response network and central intermediary metabolism. This pattern
was also evident in metabolite levels of osmoprotectants, polyamines, and intermediates in nucleotide
biosynthesis and central carbon and energy utilization pathways.
Supplementary Tables and Figures
1. Supplementary Table S1. Two-fold or greater gene expression changes in VISA 13136p−m+V5
and 13136p−m+V20 versus parent VSSA 13136p−m+.
2. Supplementary Table S2. Expression patterns by gene functional group in VISA 13136p−m+V5
and 13136p−m+V20 as number of genes upregulated and downregulated at least two-fold relative
to gene expression in VSSA 13136p−m+.
3. Supplementary Table S3. Concordance of expression patterns vs. parent VSSA 13136p−m+
between 13136p−m+V5 and 13136p−m+V20 for the 335 genes with expression data for both VISA.
4. Supplementary Table S4. The 45 metabolites with at least one five-fold change among
comparisons between 13136p−m+, 13136p−m+V5 and 13136p−m+V20.
5. Supplementary Figure S1. Number of genes by functional group upregulated and
downregulated at least eight-fold in VISA 13136p−m+V5 (A) and 13136p−m+V20 (B) relative to
gene expression in VSSA parent 13136p−m+.
6. Supplementary Figure S2. Metabolomic profiles by metabolite class (A–D).
7. Supplementary File S1. Metabolomic analysis background information.
Acknowledgments
The DNA microarrays were obtained through National Institutes of Allergy and Infectious Diseases
(NIAID) Pathogen Functional Genomics Resource Center, Division of Microbiology and Infectious

Antibiotics 2015, 4
105
Disease, NIAID, NIH. This work was funded by NIH Grant 1R15AI084006 to BJW. We are grateful to
Zhong Li and Alexander Ulanov for the metabolomics results.
Conflicts of Interest
The authors declare no conflict of interest.
References
1. Hiramatsu, K.; Aritaka, N.; Hanaki, H.; Kawasaki, S.; Hosoda, Y.; Hori, S.; Fukuchi, Y.;
Kobayashi, I. Dissemination in Japanese hospitals of strains of Staphylococcus aureus
heterogeneously resistant to vancomycin. Lancet 1997, 350, 1670–1673.
2. Pfeltz, R.F.; Wilkinson, B.J. The escalating challenge of vancomycin resistance in Staphylococcus
aureus. Curr. Drug Targets Infect. Disord. 2004, 4, 273–294.
3. Howden, B.P.; Davies, J.K.; Johnson, P.D.; Stinear, T.P.; Grayson, M.L. Reduced vancomycin
susceptibility in Staphylococcus aureus, including vancomycin-intermediate and heterogeneous
vancomycin-intermediate strains: resistance mechanisms, laboratory detection, and clinical
implications. Clin. Microbiol. Rev. 2010, 23, 99–139.
4. Howden, B.P.; Peleg, A.Y.; Stinear, T.P. The evolution of vancomycin intermediate Staphylococcus
aureus (VISA) and heterogenous-VISA. Infect. Genet. Evol. 2013, 13, S1567–S1348.
5. Utaida, S.; Dunman, P.M.; Macapagal, D.; Murphy, E.; Projan, S.J.; Singh, V.K.; Jayaswal, R.K.;
Wilkinson, B.J. Genome-wide transcriptional profiling of the response of Staphylococcus aureus
to cell-wall-active antibiotics reveals a cell-wall-stress stimulon. Microbiology 2003, 149, 2719–2732.
6. McAleese, F.; Wu, S.W.; Sieradzki, K.; Dunman, P.; Murphy, E.; Projan, S.; Tomasz, A.
Overexpression of genes of the cell wall stimulon in clinical isolates of Staphylococcus aureus
Exhibiting vancomycin-intermediate-S. aureus-type resistance to vancomycin. J. Bacteriol. 2006,
188, 1120–1133.
7. Pfeltz, R.F.; Singh, V.K.; Schmidt, J.L.; Batten, M.A.; Baranyk, C.S.; Nadakavukaren, M.J.;
Jayaswal, R.K.; Wilkinson, B.J. Characterization of passage-selected vancomycin-resistant
Staphylococcus aureus strains of diverse parental backgrounds. Antimicrob. Agents Chemother.
2000, 44, 294–303.
8. Jevons, M.P. “Celbenin”—Resistant Staphylococci. Br. Med. J. 1961, 1, 124–125.
9. Dyke, K.G. Penicillinase production and intrinsic resistance to penicillins in methicillin-resistant
cultures of Staphylococcus aureus. J. Med. Microbiol. 1969, 3, 261–278.
10. Lee, C.Y.; Iandolo, J.J. Integration of staphylococcal phage L54a occurs by site-specific
recombination: Structural analysis of the attachment sites. Proc. Natl. Acad. Sci. USA 1986, 83,
5474–5478.
11. Gill, S.R.; Fouts, D.E.; Archer, G.L.; Mongodin, E.F.; Deboy, R.T.; Ravel, J.; Paulsen, I.T.;
Kolonay, J.F.; Brinkac, L.; Beanan, M.; et al. Insights on evolution of virulence and resistance
from the complete genome analysis of an early methicillin-resistant Staphylococcus aureus strain
and a biofilm-producing methicillin-resistant Staphylococcus epidermidis strain. J. Bacteriol.
2005, 187, 2426–2438.
Antibiotics 2015, 4
106
12. Parker, M.T.; Jevons, M.P. A survey of methicillin resistance in Staphylococcus. Postgrad. Med. J.
1964, 40 (Suppl), 170–178.
13. Koehl, J.L.; Muthaiyan, A.; Jayaswal, R.K.; Ehlert, K.; Labischinski, H.; Wilkinson, B.J. Cell wall
composition and decreased autolytic activity and lysostaphin susceptibility of glycopeptide-
intermediate Staphylococcus aureus. Antimicrob. Agents Chemother. 2004, 48, 3749–3757.
14. Oshida, T.; Sugai, M.; Komatsuzawa, H.; Hong, Y.M.; Suginaka, H.; Tomasz, A.
A Staphylococcus aureus autolysin that has an N-acetylmuramoyl-L-alanine amidase domain and
an endo-β-N-acetylglucosaminidase domain. Cloning, sequence analysis, and characterization.
Proc. Natl. Acad. Sci. USA 1995, 92, 285–289.
15. Fiehn, O. Metabolomics—The link between genotypes and phenotypes. Plant. Mol. Biol. 2002,
48, 155–171.
16. Hanaki, H.; Labischinski, H.; Inaba, Y.; Kondo, N.; Murakami, H.; Hiramatsu, K. Increase
in glutamine-non-amidated muropeptides in the peptidoglycan of vancomycin-resistant
Staphylococcus aureus strain Mu50. J. Antimicrob. Chemother. 1998, 42, 315–320.
17. Nelson, J.L.; Rice, K.C.; Slater, S.R.; Fox, P.M.; Archer, G.L.; Bayles, K.W.; Fey, P.D.;
Kreiswirth, B.N.; Somerville, G.A. Vancomycin-intermediate Staphylococcus aureus strains have
impaired acetate catabolism: Implications for polysaccharide intercellular adhesin synthesis and
autolysis. Antimicrob. Agents Chemother. 2007, 51, 616–622.
18. Alexander, E.L.; Gardete, S.; Bar, H.Y.; Wells, M.T.; Tomasz, A.; Rhee, K.Y. Intermediate-type
vancomycin resistance (VISA) in genetically-distinct Staphylococcus aureus isolates is linked to
specific, reversible metabolic alterations. PLOS ONE 2014, 9, e97137.
19. Kanamaru, K.; Stephenson, S.; Perego, M. Overexpression of the PepF oligopeptidase inhibits
sporulation initiation in Bacillus subtilis. J. Bacteriol. 2002, 184, 43–50.
20. Pereira, S.F., Goss, L.; Dworkin, J. Eukaryote-like serine/threonine kinases and phosphatases in
bacteria. Microbiol. Mol. Biol. Rev. 2011, 75, 192–212.
21. Ogura, M.; Tanaka, T. Bacillus subtilis comZ (yjzA) negatively affects expression of comG but not
comK. J. Bacteriol. 2000, 182, 4992–4994.
22. Suematsu, T.; Yokobori, S.; Morita, H.; Yoshinari, S.; Ueda, T.; Kita, K.; Takeuchi, N.;
Watanabe, Y. A bacterial elongation factor G homologue exclusively functions in ribosome
recycling in the spirochaete Borrelia burgdorferi. Mol. Microbiol. 2010, 75, 1445–1454.
23. Huang, Y.J.; Tsai, T.Y.; Pan, T.M. Physiological response and protein expression under acid stress
of Escherichia coli O157:H7 TWC01 isolated from Taiwan. J. Agric. Food Chem. 2007, 5,
7182–7191.
24. Kapralou, S.; Fabbretti, A.; Garulli, C.; Spurio, R.; Gualerzi, C.O.; Dahlberg, A.E.; Pon, C.L.
Translation initiation factor IF1 of Bacillus stearothermophilus and Thermus thermophilus
substitute for Escherichia coli IF1 in vivo and in vitro without a direct IF1-IF2 interaction.
Mol. Microbiol. 2008, 70, 1368–1377.
25. Chang, W.; Small, D.A.; Toghrol, F.; Bentley, W.E. Global transcriptome analysis of
Staphylococcus aureus response to hydrogen peroxide. J. Bacteriol. 2006, 188, 1648–1659.
26. Maul, R.W.; Sanders, L.H.; Lim, J.B.; Benitez, R.; Sutton, M.D. Role of Escherichia coli DNA
polymerase I in conferring viability upon the dnaN159 mutant strain. J. Bacteriol. 2007, 189,
4688–4695.

Antibiotics 2015, 4
107
27. Sobral, R.G.; Jones, A.E.; Des Etages, S.G.; Dougherty, T.J.; Peitzsch, R.M.; Gaasterland, T.;
Ludovice, A.M.; de Lencastre, H.; Tomasz, A. Extensive and genome-wide changes in the
transcription profile of Staphylococcus aureus induced by modulating the transcription of the cell
wall synthesis gene murF. J. Bacteriol. 2007, 189, 2376–2391.
28. Ye, Z.H.; Lee, C.Y. Nucleotide sequence and genetic characterization of staphylococcal
bacteriophage L54a int and xis genes. J. Bacteriol. 1989, 171, 4146–4153.
29. Campbell, J.; Singh, A.K.; Santa Maria, J.P., Jr.; Kim, Y.; Brown, S.; Swoboda, J.G.;
Mylonakis, E.; Wilkinson, B.J.; Walker, S. Synthetic lethal compound combinations reveal a
fundamental connection between wall teichoic acid and peptidoglycan biosynthesis in
Staphylococcus aureus. ACS Chem. Biol. 2011, 6, 106–116.
30. McRobbie, A.M.; Meyer, B.; Rouillon, C.; Petrovic-Stojanovska, B.; Liu, H.; White, M.F.
Staphylococcus aureus DinG, a helicase that has evolved into a nuclease. Biochem. J. 2012, 442,
77–84.
31. Singh, V.; Evans, G.B.; Lenz, D.H.; Mason, J.M.; Clinch, K.; Mee, S.; Painter, G.F.;
Tyler, P.C.; Furneaux, R.H.; Lee, J.E.; et al. Femtomolar transition state analogue inhibitors of
5'-methylthioadenosine/S-adenosylhomocysteine nucleosidase from Escherichia coli. J. Biol.
Chem. 2005, 280, 18265–18273.
32. Kappes, R.M.; Kempf, B.; Kneip, S.; Boch, J.; Gade, J.; Meier-Wagner, J.; Bremer, E. Two
evolutionarily closely related ABC transporters mediate the uptake of choline for synthesis of the
osmoprotectant glycine betaine in Bacillus subtilis. Mol. Microbiol. 1999, 32, 203–216.
33. Wehmeier, L.; Schäfer, A.; Burkovski, A.; Krämer, R.; Mechold, U.; Malke, H.; Pühler, A.;
Kalinowski, J. The role of the Corynebacterium glutamicum rel gene in (p)ppGpp metabolism.
Microbiology 1998, 144, 1853–1862.
34. Wendrich, T.M.; Marahiel, M.A. Cloning and characterization of a relA/spoT homologue from
Bacillus subtilis. Mol. Microbiol. 1997, 26, 65–79.
35. Chakraburtty, R.; White, J.; Takano, E.; Bibb, M. Cloning, characterization and disruption of a
(p)ppGpp synthetase gene (relA) of Streptomyces coelicolor A3(2). Mol. Microbiol. 1996, 19,
357–368.
36. McCarthy, A.J.; Lindsay, J.A. Genetic variation in Staphylococcus aureus surface and immune
evasion genes is lineage associated: Implications for vaccine design and host-pathogen
interactions. BMC Microbiol. 2010, 10, e173.
37. Ythier, M.; Resch, G.; Waridel, P.; Panchaud, A.; Gfeller, A.; Majcherczyk, P.; Quadroni, M.;
Moreillon, P. Proteomic and transcriptomic profiling of Staphylococcus aureus surface
LPXTG-proteins: Correlation with agr genotypes and adherence phenotypes. Mol. Cell Proteomics
2012, 11, 1123–1139.
38. Komatsuzawa, H.; Ohta, K.; Sugai, M.; Fujiwara, T.; Glanzmann, P.; Berger-Bachi, B.; Suginaka, H.
Tn551-mediated insertional inactivation of the fmtB gene encoding a cell wall-associated protein
abolishes methicillin resistance in Staphylococcus aureus. J. Antimicrob. Chemother. 2000, 45,
421–431.
39. Ohlsen, K.; Donat, S. The impact of serine/threonine phosphorylation in Staphylococcus aureus.
Int. J. Med. Microbiol. 2010, 300, 137–141.

Antibiotics 2015, 4
108
40. Beltramini, A.M.; Mukhopadhyay, C.D.; Pancholi, V. Modulation of cell wall structure and
antimicrobial susceptibility by a Staphylococcus aureus eukaryote-like serine/threonine kinase and
phosphatase. Infect. Immun. 2009, 77, 1406–1416.
41. Renzoni, A.; Andrey, D.O.; Jousselin, A.; Barras, C.; Monod, A.; Vaudaux, P.; Lew, D.;
Kelley, W.L. Whole genome sequencing and complete genetic analysis reveals novel pathways to
glycopeptide resistance in Staphylococcus aureus. PLOS ONE 2011, 6, e21577.
42. Passalacqua, K.D.; Satola, S.W.; Crispell, E.K.; Read, T.D. A mutation in the PP2C phosphatase
gene in a Staphylococcus aureus USA300 clinical isolate with reduced susceptibility to vancomycin
and daptomycin. Antimicrob. Agents Chemother. 2012, 13, 5212–5223.
43. Cameron, D.R.; Ward, D.V.; Kostoulias, X.; Howden, B.P.; Moellering, R.C.J.; Eliopoulos, G.;
Peleg, A.Y. The serine/threonine phosphatase Stp1 contributes to reduced susceptibility to
vancomycin and virulence in Staphylococcus aureus. J. Infect. Dis. 2012, 205, 1677–1687.
44. Hatzios, S.K.; Baer, C.E.; Rustad, T.R.; Siegrist, M.S.; Pang, J.M.; Ortega, C.; Alber, T.;
Grundner, C.; Sherman, D.R.; Bertozzi, C.R. Osmosensory signaling in Mycobacterium tuberculosis
mediated by a eukaryotic-like Ser/Thr protein kinase. Proc. Natl. Acad. Sci. USA 2013, 110,
E5069–E5077.
45. Reiss, S.; Pané-Farré, J.; Fuchs, S.; François, P.; Liebeke, M.; Schrenzel, J.; Lindequist, U.;
Lalk, M.; Wolz, C.; Hecker, M.; et al. Global analysis of the Staphylococcus aureus response to
mupirocin. Antimicrob. Agents Chemother. 2012, 56, 787–804.
46. Miyafusa, T.; Caaveiro, J.M.; Tanaka, Y.; Tsumoto, K. Crystal structure of the enzyme CapF of
Staphylococcus aureus reveals a unique architecture composed of two functional domains.
Biochem. J. 2012, 443, 671–680.
47. Lamamy, C.; Berthelot, A.; Bertrand, X.; Valentin, A.S.; Dos Santos, S.; Thiais, S.; Morange, V.;
Girard, N.; Donnio, P.Y.; Quentin, R.; et al. Bloodstream Infection Study Group of the Réseau des
Hygiénistes du Centre. CC9 livestock-associated Staphylococcus aureus emerges in bloodstream
infections in French patients unconnected with animal farming. Clin. Infect. Dis. 2013, 56, e83–e86.
48. Nielsen, A.; Månsson, M.; Bojer, M.S.; Gram, L.; Larsen, T.O.; Novick, R.P.; Frees, D.;
Frøkiær, H.; Ingmer, H. Solonamide B inhibits quorum sensing and reduces Staphylococcus aureus
mediated killing of human neutrophils. PLOS ONE 2014, 9, e84992.
49. Saïd-Salim, B.; Dunman, P.M.; McAleese, F.M.; Macapagal, D.; Murphy, E.; McNamara, P.J.;
Arvidson, S.; Foster, T.J.; Projan, S.J.; Kreiswirth, B.N. Global regulation of Staphylococcus
aureus genes by Rot. J. Bacteriol. 2003, 185, 610–619.
50. Shrihari, R.Y.; Singh, N.P. Multiplex reverse transcription polymerase chain reaction to study the
expression of virulence and stress response genes in Staphylococcus aureus. J. Food Sci. 2012, 77,
M95–M101.
51. Banbula, A.; Potempa, J.; Travis, J.; Fernandez-Catalán, C.; Mann, K.; Huber, R.; Bode, W.;
Medrano, F. Amino-acid sequence and three-dimensional structure of the Staphylococcus aureus
metalloproteinase at 1.72 A resolution. Structure 1998, 6, 1185–1193.
52. Arêde, P.; Botelho, T.; Guevara, T.; Usón, I.; Oliveira, D.C.; Gomis-Rüth, F.X. Structure-function
studies of the staphylococcal methicillin resistance antirepressor MecR2. J. Biol. Chem. 2013, 288,
21267–21278.

Antibiotics 2015, 4
109
53. Kavanagh, K.L.; Jörnvall, H.; Persson, B.; Oppermann, U. Medium- and short-chain
dehydrogenase/reductase gene and protein families: The SDR superfamily: Functional and
structural diversity within a family of metabolic and regulatory enzymes. Cell. Mol. Life Sci. 2008,
65, 3895–3906.
54. Chen, H.; Liu, Y.; Zhao, C.; Xiao, D.; Zhang, J.; Zhang, F.; Chen, M.; Wang, H. Comparative
proteomics-based identification of genes associated with glycopeptide resistance in clinically
derived heterogeneous vancomycin-intermediate Staphylococcus aureus strains. PLOS ONE 2013,
8, e66880.
55. Haemig, H.A.; Moen, P.J.; Brooker, R.J. Evidence that highly conserved residues of
transmembrane segment 6 of Escherichia coli MntH are important for transport activity.
Biochemistry 2010, 49, 4662–4671.
56. Mongodin, E.; Finan, J.; Climo, M.W.; Rosato, A.; Gill, S.; Archer, G.L. Microarray transcription
analysis of clinical Staphylococcus aureus isolates resistant to vancomycin. J. Bacteriol. 2003,
185, 4638–4643.
57. Yan, M.; Hall, J.W.; Yang, J.; Ji, Y. The essential yhcSR two-component signal transduction
system directly regulates the lac and opuCABCD operons of Staphylococcus aureus. PLOS ONE
2012, 7, e50608.
58. Napier, B.A.; Meyer, L.; Bina, J.E.; Miller, M.A.; Sjöstedt, A.; Weiss, D.S. Link between
intraphagosomal biotin and rapid phagosomal escape in Francisella. Proc. Natl. Acad. Sci. USA
2012, 109, 18084–18089.
59. Teufel, R.; Gantert, C.; Voss, M.; Eisenreich, W.; Haehnel, W.; Fuchs, G. Studies on the
mechanism of ring hydrolysis in phenylacetate degradation: A metabolic branching point.
J. Biol. Chem. 2011, 286, 11021–11034.
60. Kumar, A.; Bachhawat, A.K. Pyroglutamic acid: Throwing light on a lightly studied metabolite.
Curr. Sci. 2012, 102, 288–297.
61. Ledala, N.; Zhang, B.; Seravalli, J.; Powers, R.; Somerville, G.A. The influence of iron and
aeration on Staphylococcus aureus growth, metabolism, and transcription. J. Bacteriol. 2014, 196,
2178–2189.
62. Liebeke, M.; Meyer, H.; Donat, S.; Ohlsen, K.; Lalk, M. A metabolomic view of Staphylococcus
aureus and its ser/thr kinase and phosphatase deletion mutants: involvement in cell wall
biosynthesis. Chem. Biol. 2010, 17, 820–830.
63. Zhu, Y.; Nandakumar, R.; Sadykov, M.R.; Madayiputhiya, N.; Luong, T.T.; Gaupp, R.; Lee, C.Y.
RpiR homologues may link Staphylococcus aureus RNAIII synthesis and pentose phosphate
pathway regulation. J. Bacteriol. 2011, 193, 6187–6196.
64. Lamichhane-Khadka, R.; Cantore, S.A.; Riordan, J.T.; Delgado, A.; Norman, A.E.; Dueñas, S.;
Zaman, S.; Horan, S.; Wilkinson, B.J.; Gustafson, J.E. sarA inactivation reduces vancomycin-
intermediate and ciprofloxacin resistance expression by Staphylococcus aureus. Int. J. Antimicrob.
Agents 2009, 34, 136–141.
65. Lithgow, J.K.; Ingham, E.; Foster, S.J. Role of the hprT-ftsH locus in Staphylococcus aureus.
Microbiology 2004, 150, 373–381.

Antibiotics 2015, 4
110
66. Matsuo, M.; Hishinuma, T.; Katayama, Y.; Cui, L.; Kapi, M.; Hiramatsu, K. Mutation of
RNApolymerase beta subunit (rpoB) promotes hVISA-to-VISA phenotypic conversion of strain
Mu3. Antimicrob. Agents Chemother. 2011, 55, 4188–4195.
67. Keaton, M.A.; Rosato, R.R.; Plata, K.B.; Singh, C.R.; Rosato, A.E. Exposure of clinical MRSA
heterogeneous strains to β-lactams redirects metabolism to optimize energy production through the
TCA cycle. PLOS ONE 2013, 8, e71025.
68. Dordel, J.; Kim, C.; Chung, M.; Pardos de la Gándara, M.; Holden, M.T.; Parkhill, J.;
de Lencastre, H.; Bentley, S.D.; Tomasz, A. Novel determinants of antibiotic resistance:
Identification of mutated loci in highly methicillin-resistant subpopulations of methicillin-resistant
Staphylococcus aureus. MBio 2014, 5, doi:10.1128/mBio.01000-13.
69. Kim, C.; Mwangi, M.; Chung, M.; Milheiriço, C.; de Lencastre, H.; Tomasz, A. The mechanism
of heterogeneous beta-lactam resistance in MRSA: Key role of the stringent stress response.
PLOS ONE 2013, 8, e82814.
70. Dalebroux, Z.D.; Svensson, S.L.; Gaynor, E.C.; Swanson, M.S. ppGpp Conjures bacterial
virulence. Microbiol. Mol. Biol. Rev. 2010, 74, 171–199.
71. Moreira, B.; Boyle-Vavra, S.; deJonge, B.L.; Daum, R.S. Increased production of penicillin-
binding protein 2, increased detection of other penicillin-binding proteins, and decreased coagulase
activity associated with glycopeptide resistance in Staphylococcus aureus. Antimicrob. Agents
Chemother. 1997, 41, 1788–1793.
72. Delaune, A.; Poupel, O.; Mallet, A.; Coic, Y.M.; Msadek, T.; Dubrac, S. Peptidoglycan
crosslinking relaxation plays an important role in Staphylococcus aureus WalKR-dependent cell
viability. PLOS ONE 2011, 6, e17054.
73. Kuroda, M.; Kuroda, H.; Oshima, T.; Takeuchi, F.; Mori, H.; Hiramatsu, K. Two-component
system VraSR positively modulates the regulation of cell-wall biosynthesis pathway in
Staphylococcus aureus. Mol. Microbiol. 2003, 49, 807–821.
74. Cui, L.; Lian, J.Q.; Neoh, H.M.; Reyes, E.; Hiramatsu, K. DNA microarray-based identification of
genes associated with glycopeptide resistance in Staphylococcus aureus. Antimicrob. Agents
Chemother. 2005, 49, 3404–3413.
75. Li, M.; Cha, D.J.; Lai, Y.; Villaruz, A.E.; Sturdevant, D.E.; Otto, M. The antimicrobial
peptide-sensing system aps of Staphylococcus aureus. Mol. Microbiol. 2007, 66, 1136–1147.
76. Matsuo, M.; Cui, L.; Kim, J.; Hiramatsu, K. Comprehensive identification of mutations responsible
for heterogeneous vancomycin-intermediate Staphylococcus aureus (hVISA)-to-VISA conversion
in laboratory-generated VISA strains derived from hVISA clinical strain Mu3. Antimicrob. Agents
Chemother. 2013, 12, 5843–5853.
77. Ye, Z.H.; Buranen, S.L.; Lee, C.Y. Sequence analysis and comparison of int and xis genes from
staphylococcal bacteriophages L54a and phi 11. J. Bacteriol. 1990, 172, 2568–2575.
78. Novick, R.P.; Christie, G.E.; Penadés, J.R. The phage-related chromosomal islands of
Gram-positive bacteria. Nat. Rev. Microbiol. 2010, 8, 541–551.
79. Ranjan, A.; Banerjee, R.; Pani, B.; Sen, U.; Sen, R. The moonlighting function of bacteriophage
P4 capsid protein, Psu, as a transcription antiterminator. Bacteriophage 2013, 3, e25657.

Antibiotics 2015, 4
111
80. Bae, B.; Davis, E.; Brown, D.; Campbell, E.A.; Wigneshweraraj, S.; Darst, S.A. Phage T7 Gp2
inhibition of Escherichia coli RNA polymerase involves misappropriation of σ70 domain 1.1.
Proc. Natl. Acad. Sci. USA 2013, 110, 19772–19777.
81. Sjöström, J.E.; Philipson, L. Role of the phi 11 phage genome in competence of Staphylococcus
aureus. J. Bacteriol. 1974, 119, 19–32.
82. Kuroda, H.; Kuroda, M.; Cui, L.; Hiramatsu, K. Subinhibitory concentrations of beta-lactam
induce haemolytic activity in Staphylococcus aureus through the SaeRS two-component system.
FEMS Microbiol. Lett. 2007, 268, 98–105.
83. O’Leary, J.O.; Langevin, M.J.; Price, C.T.; Blevins, J.S.; Smeltzer, M.S.; Gustafson, J.E. Effects
of sarA inactivation on the intrinsic multidrug resistance mechanism of Staphylococcus aureus.
FEMS Microbiol. Lett. 2004, 237, 297–302.
84. Tang, J.; Chen, J.; Li, H.; Zeng, P.; Li, J. Characterization of adhesin genes, staphylococcal
nuclease, hemolysis, and biofilm formation among Staphylococcus aureus strains isolated from
different sources. Foodborne Pathog. Dis. 2013, 10, 757–763.
85. Laarman, A.J.; Ruyken, M.; Malone, C.L.; van Strijp, J.A.; Horswill, A.R.; Rooijakkers, S.H.
Staphylococcus aureus metalloprotease aureolysin cleaves complement C3 to mediate immune
evasion. J. Immunol. 2011, 186, 6445–6453.
86. Ingavale, S.S.; van Wamel, W.; Cheung, A.L. Characterization of RAT, an autolysis regulator in
Staphylococcus aureus. Mol. Microbiol. 2003, 48, 1451–1466.
87. Komatsuzawa, H.; Ohta, K.; Fujiwara, T.; Choi, G.H.; Labischinski, H.; Sugai, M. Cloning and
sequencing of the gene, fmtC, which affects oxacillin resistance in methicillin-resistant
Staphylococcus aureus. FEMS Microbiol. Lett. 2001, 203, 49–54.
88. Koprivnjak, T.; Mlakar, V.; Swanson, L.; Fournier, B.; Peschel, A.; Weiss, J.P. Cation-induced
transcriptional regulation of the dlt operon of Staphylococcus aureus. J. Bacteriol. 2006, 188,
3622–3630.
89. Townsend, D.E.; Wilkinson, B.J. Proline transport in Staphylococcus aureus: A high affinity
system and a low affinity system involved in osmoregulation. J. Bacteriol. 1992, 174, 2702–2710.
90. Li, C.; Sun, F.; Cho, H.; Yelavarthi, V.; Sohn, C.; He, C.; Schneewind, O.; Bae, T. CcpA mediates
proline auxotrophy and is required for Staphylococcus aureus pathogenesis. J. Bacteriol. 2010,
192, 3883–3892.
91. Bouchereau, A.; Aziz, A.; Larher, F.; Martin-Tanguy, J. Polyamines and environmental challenges:
Recent developments. Plant Sci. 1999, 140, 103–125.
92. Thomas, T.; Thomas, T.J. Polyamine in cell growth and cell death: Molecular mechanisms and
therapeutic applications. Cell. Mol. Life Sci. 2001, 58, 244–258.
93. Joshi, G.S.; Spontak, J.S.; Klapper, D.G.; Richardson, A.R. Arginine catabolic mobile element
encoded speG abrogates the unique hypersensitivity of Staphylococcus aureus to exogenous
polyamines. Mol. Microbiol. 2011, 82, 9–20.
94. Potter, A.J.; Paton, J.C. Spermidine biosynthesis and transport modulates pneumococcal autolysis.
J. Bacteriol. 2014, doi:10.1128/JB.01981-14.
95. Graham, J.E.; Wilkinson, B.J. Staphylococcus aureus osmoregulation: Roles for choline, glycine
betaine, proline, and taurine. J. Bacteriol. 1992, 174, 2711–2716.

Antibiotics 2015, 4
112
96. Hiramatsu, K. Vancomycin-resistant Staphylococcus aureus: A new model of antibiotic resistance.
Lancet Infect. Dis. 2001, 1, 147–155.
97. Sieradzki, K.; Tomasz, A. Inhibition of cell wall turnover and autolysis by vancomycin in a highly
vancomycin-resistant mutant of Staphylococcus aureus. J. Bacteriol. 1997, 179, 2557–2566.
98. Cui, L.; Murakami, H.; Kuwahara-Arai, K.; Hanaki, H.; Hiramatsu, K. Contribution of a thickened
cell wall and its glutamine nonamidated component to the vancomycin resistance expressed by
Staphylococcus aureus Mu50. Antimicrob. Agents Chemother. 2000, 44, 2276–2285.
99. Ferreira, M.T.; Manso, A.S.; Gaspar, P.; Pinho, M.G.; Neves, A.R. Effect of oxygen on glucose
metabolism: Utilization of lactate in Staphylococcus aureus as revealed by in vivo NMR studies.
PLOS ONE 2013, 8, e58277.
100. Friedman, L.; Alder, J.D.; Silverman, J.A. Genetic changes that correlate with reduced
susceptibility to daptomycin in Staphylococcus aureus. Antimicrob. Agents Chemother. 2006, 50,
2137–2145.
101. Albert, T.J.; Dailidiene, D.; Dailide, G.; Norton, J.E.; Kalia, A.; Richmond, T.A.; Molla, M.;
Singh, J.; Green, R.D.; Berg, D.E. Mutation discovery in bacterial genomes: Metronidazole
resistance in Helicobacter pylori. Nat. Meth. 2005, 2, 951–953.
102. Muthaiyan, A.; Silverman, J.A.; Jayaswal, R.K.; Wilkinson, B.J. Transcriptional profiling reveals
that daptomycin induces the Staphylococcus aureus cell wall stress stimulon and genes responsive
to membrane depolarization. Antimicrob. Agents Chemother. 2008, 52, 980–990.
103. Song, Y.; Rubio, A.; Jayaswal, R.K.; Silverman, J.A.; Wilkinson, B.J. Additional routes to
Staphylococcus aureus daptomycin resistance as revealed by comparative genome sequencing,
transcriptional profiling, and phenotypic studies. PLOS ONE 2013, 8, e58469.
104. Singh, A.K.; Ulanov, A.V.; Li, Z.; Jayaswal, R.K.; Wilkinson, B.J. Metabolomes of the
psychrotolerant bacterium Listeria monocytogenes 10403S grown at 37 °C and 8 °C. Int. J. Food
Microbiol. 2011, 148, 107–114.
105. Howden, B.P.; McEvoy, C.E.; Allen, D.L.; Chua, K.; Gao, W.; Harrison, P.F.; Bell, J.;
Coombs, G.; Wood, V.B.; Porter, J.L.; et al. Evolution of multidrug resistance during
Staphylococcus aureus infection involves mutation of the essential two component regulator
WalKR. PLOS Pathog. 2011, 7, e1002359.
106. Gardete, S.; Kim, C.; Hartmann, B.M.; Mwangi, M.; Roux, C.M.; Dunman, P.M.; Chambers, H.F.;
Tomasz, A. Genetic pathway in acquisition and loss of vancomycin resistance in a methicillin
resistant Staphylococcus aureus (MRSA) strain of clonal type USA300. PLOS Pathog. 2012,
13, e1002505.
107. Pandya, U.; Sinha, M.; Luxon, B.A.; Watson, D.A.; Niesel, D.W. Global transcription profiling
and virulence potential of Streptococcus pneumoniae after serial passage. Gene 2009, 443, 22–31.
108. Somerville, G.A.; Beres, S.B.; Fitzgerald, J.R.; DeLeo, F.R.; Cole, R.L.; Hoff, J.S.; Musser, J.M.
In vitro serial passage of Staphylococcus aureus: Changes in physiology, virulence factor
production, and agr nucleotide sequence. J. Bacteriol. 2002, 184, 1430–1437.
© 2015 by the authors; licensee MDPI, Basel, Switzerland. This article is an open access article
distributed under the terms and conditions of the Creative Commons Attribution license
(http://creativecommons.org/licenses/by/4.0/).