
Neural networks in BISDN flow control: ATM traffic prediction or network modeling
Upload
independentCategory
view
1download
0
~
1_-
-~-=
ELSEVIER
Abstract
COMPUTERNETWORKSandISDN SYSTEMS
Computer Networks and ISDN Systems 27 (1994) 85-100
Traffic control in ATM networks 1
Irfan Khan a,*, Victor O.K. Li b
a SRI International, 333 Ravenswood Avenue. Menlo Park. CA 94025. USAb Communication Sciences Institute, University of Southern California. Los Angeles, CA 90089-2565, USA
This paper presents a framework to study the problem of traffic control in ATM networks. Bursty traffic sources aremodelled by Interrupted Bernoulli Processes. Probability of violation and dimensioning issues are adr.lressed for the leakybucket mechanism and the (L, M, T) mechanism, proposed by the authors. We present two schemes to demonstrate thatimproved statistical multiplexing can be achieved if the traffic control mechanisms are not used in isolation for each session,rather theyare used on groupsof sessions. In the first scheme, traffic control is performed on the aggregate traffic of a group.In the secondscheme, traffic control is performed on single sessions with Information about the status of all the sessions ofthe groupbeingavailable andused at each traffic control mechanism. Numerical examples that illustrate the improvementinstatistical multiplexing as a result of the aboveschemes are presented.
Keywords: ATM;Congestion control; Traffic control; (L, M, T) mechanism; Leaky bucket
1. Introduction
In ATM networks, during the call set-up phase, theuser declares its traffic characteristics to the networkin the form of traffic descriptors and requests a certainquality of service (QOS). The network, based uponthe current calls in progress, their traffic characteristics and their QOS requirements decides whether ornot to accept the new call. The call acceptance control(CAC) function could be made simple by allocatingbandwidth corresponding to the peak rate of a call to
• Corresponding author. This research was carried out while Irfan Khan was with the Communication Sciences Institute at theUniversity of Southern California.
1 This research was supported in part by the National ScienceFoundation under grant No. NCR-9016348, by the Departmentof Defense Joint Services Electronics Program under contract no.F49620·91-0028, and by the Pacific Bell External TechnologyProgram.
every call and byrejecting a new can if the sum of theallocated bandwidths (if this call were accepted) exceeds some pre-defined threshold. Under this scheme,the network would be severely under-utilized. Thus,more sophisticated CAC schemes that utilize additional traffic characteristics of the calls other than justthe peak rate information so as to reflect the statisticalmultiplexing of various calls are desired. Of course,this statistical multiplexing has to be performed insuch a manner that the QOS requirements of the various calls are met. The traffic descriptors used must besuch that they help the CAe function to be performedin real time. ccm and a number of researchers [14] have suggested that the following traffic descriptorsbe used:
• An estimated peak cell rate, P, measured over ashort interval.
• An estimated mean cell rate, .A, measured overa longer interval.
OI69·7552/94/~7.00 © 1994 Elsevier Science B.Y. All rights reservedSSDl 0169-7552 (93) EO l07-P

86 I. Khan, V.O.K. Li/Computer Networks and ISDN Systems 27 (1994) 85-JOO
• The maximum duration at which the source cantransmit atpeak, or in other words, the maximumnumber of cells that arrive in a burst, M.
The advantage of using the above trafficdescriptors todescribe the characteristics of a call is that the CAefunction can be considerably simplified by assuminga worst case trafficpattern corresponding to the abovetraffic descriptors. The worst case traffic pattern beinga periodic ON/OFF process in which the source istransmitting at its peak rate as long as allowed andthen turns silent until it is able to transmit a maximumburst at peak rate again [4].
Once a call is accepted, there is a need to monitor each call to make sure that it conforms to itsdeclared traffic descriptors. This way the networkcan be prevented from getting congested. Trafficcontrol/policing mechanisms have to be devised forthis purpose. In Section 2, we present a frameworkto study the problem of traffic control in ATM networks. We also describe the traffic model used for ouranalysis. A drawback with currently proposed trafficcontrol mechanisms like the leaky bucket is that inorder to keep the probability of violation for a wellbehaved bursty source low, a tradeoff exists betweenthe policed values of A and M. By well behaved, wemean that the traffic source conforms to the trafficcontract. Thus, probability of violation at the trafficcontrol mechanism is the probability that an arbitrarycell belonging to a well behaved traffic source will bedeemed to be in violation of the traffic contract. Theabove mentioned tradeoff between A and M is notdesirable. We will elaborate more on this in Section 3using the leaky bucket as an example. In that sectionwe conclude that the above drawback is a consequenceof the fact that the traffic control mechanisms arenot synchronized with the traffic source. Motivatedby this conclusion, in Section 4, we propose a newtraffic control mechanism, termed (L, M, T) mechanism that is synchronized with the traffic source. Thismechanism uses information from a few previousbursts to control the average rate and consequentlyremoves the tradeoff between the policed values of Aand M. We also present an analytic model to determine the probability of violation for our mechanism.In Section 5, we propose a scheme where traffic control is performed on groups of sessions as opposedto a single session. This scheme leads to improvedstatistical multiplexing due to the smoother traffic
that results from combining bursty traffic streams. InSection 6, we propose yet another scheme in whichtraffic control is performed on each session as before.However, the probability that a traffic violating cell isallowed to enter the network is made dependent uponthe number of sessions (bound for the same virtualpath, for instance) that are ON at that particular instant. Improved statistical multiplexing is achievedon account of the dynamic nature of the scheme. Although the above scheme can be used with any trafficcontrol mechanism, in Sections 5 and 6, we presentanalytic models for schemes that use the (L , M, T)mechanism as the traffic control mechanism. Finally,in Section 7 we present our conclusions.
In this paper, we assume a discrete time scenariowhere time is divided into equal size slots, the durationof a slot being such that a cell can be transmittedduring a slot.
2. Framework for traffic control
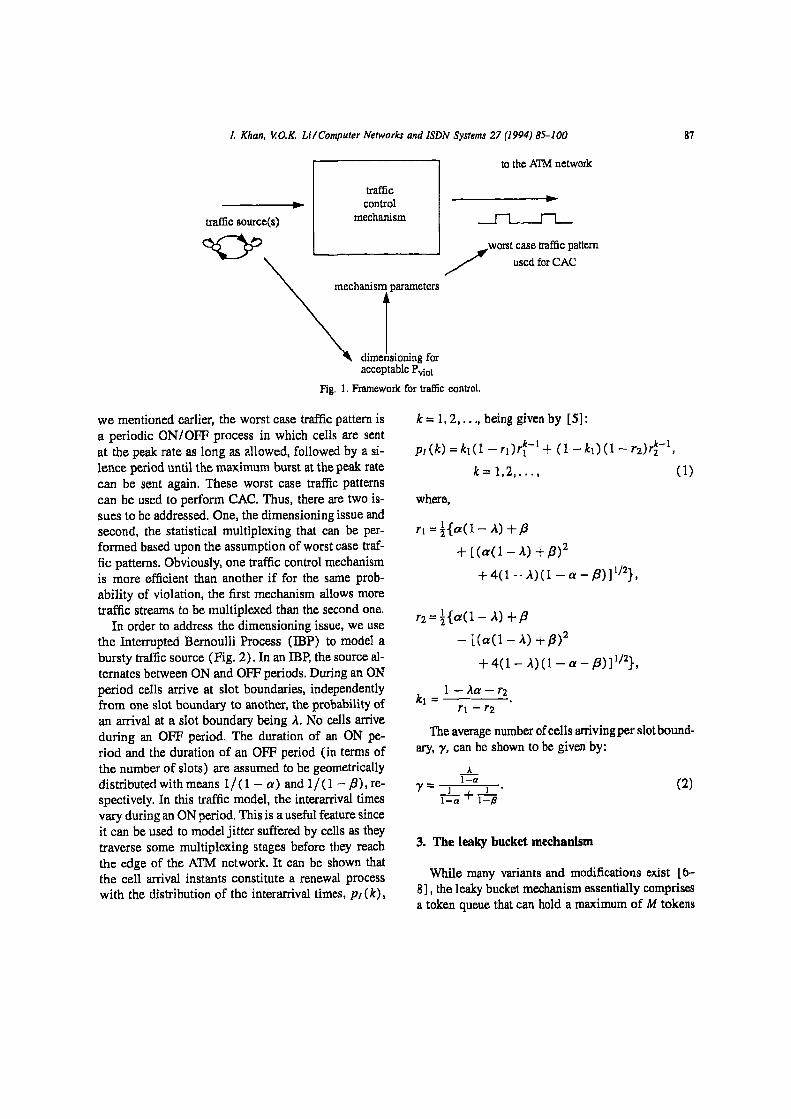
Fig. I illustrates a framework to study the problemof traffic control in ATM networks. This frameworkcan be used to compare the effectiveness of varioustraffic control mechanisms. As we mentioned earlier,the users and the ATM network enter into a contractwhereby it is agreed that certain characteristics of incoming traffic, e.g. mean rate, peak rate, maximumburst length, etc., have to be within acceptable limits and that the user will be provided with a certainQOS. The users access the ATM network via a trafficcontrol mechanism. Ideally, the traffic control mechanism should be transparent to well behaved sourcesand at the same time guard the network against trafficcontrol violations. Since we are dealing with statistical quantities, a well behaved source will always suffer a probability of violation. The objective is to keepthis probability of violation within acceptable limits.This can be accomplished by suitably dimensioningthe traffic control mechanism. Dimensioning the traffic control mechanism involves modelling the trafficcontrol mechanism using a traffic model to determinethe probability of violation. This enables us to chooseparameters of the traffic control mechanism so as toachieve a tolerable probability of violation. Once theparameters of the traffic control mechanism are chosen, the worst case trafficpattern can be predicted. As
I. Khan, v.O.K. LitComputer Networks and ISDN Systems 27 (1994) 85-100 87
to the ATM network
traffic source(s)
trafficcontrol
mechanism
/worst case traffic pattern
,,/" used forCAe
mechanism parameters
d,ml"m,. foracceptable Pviol
Fig. 1. Framework for traffic control.
where,
3. The leaky bucket mechanism
While many variants and modifications exist L()8] , the leaky bucket mechanism essentially comprisesa token queue that can hold a maximum of M tokens
TI =H a(l - ,,\) + f3+ [(a(l- A) +f3)2
+4(I-A)(1-a-{3)]1/2},
(2)
r2 =Ha(l-"\) +{3
- [(a(l- A) + (3)2
+4(1 - A)( 1 - a - {3)] 1/2},
l-Aa- r2kl = --_---=.
TI - r2
The average number of cells arriving per slot boundary, 'Y, can be shown to be given by:
AI-a
k =1,2, ..., being given by [5]:
PI (k) =kl (l - r!lrt- t + (1 - k\)(1 - T2)r~-1 ,
k=l,2,,,., (1)
'Y = J J'r=; + J-19
we mentioned earlier, the worst case traffic pattern isa periodic ON/OFF process in which cells are sentat the peak rate as long as allowed, followed by a silence period until the maximum burst at the peak ratecan be sent again. These worst case traffic patternscan be used to perform CAC. Thus, there are two issues to be addressed. One, the dimensioning issue andsecond, the statistical multiplexing that can be performed based upon the assumption of worst case traffic patterns. Obviously, one traffic control mechanismis more efficient than another if for the same probability of violation, the first mechanism allows moretraffic streams to be multiplexed than the second one.
In order to address the dimensioning issue, we usethe Interrupted Bernoulli Process (mp) to model abursty traffic source (Fig. 2). In an mP,the source alternates between ON and OFF periods. During an ONperiod cells arrive at slot boundaries, independentlyfrom one slot boundary to another, the probability ofan arrival at a slot boundary being A. No cells arriveduring an OFF period. The duration of an ON period and the duration of an OFF period (in terms ofthe number of slots) are assumed to be geometricallydistributed with means 1/(l - a) and 1/(l - {3), respectively. In this traffic model, the interarrival timesvary during an ON period. This is a useful feature sinceit can be used to model jitter suffered by cells as theytraverse some multiplexing stages before they reachthe edge of the A1M network. It can be shown thatthe cell arrival instants constitute a renewal processwith the distribution of the interarrival times, PI (k),

88 I. Khan. V.O.K. LilComputer Networks and ISDN Systems 27 (1994) 85-100
contractviolating cells (ifno tokenis found in the tokenqueue)
n token queueIsizeM)
1 token generator (rate lid)
Fig. 3. The leaky bucket mechanism.
Frob of arrival/slot=).
i-«
Fig. 2. IBP traffic model.
arrivingcells
t~O
1departingcells (to the network)
(3)
and a token generation mechanism [9] (Fig. 3). Tokens arrive deterministically spaced apart in time by dslots. To enter the network, an arriving cell must obtain a token from the token queue. If there is no tokenavailable, an arriving cell is deemed to be in violationof the traffic contract. In Section 3.1, we outline theanalytic model for determining the probability of violation for a well behaved source being policed by aleaky bucket mechanism and in Section 3.2 we discuss the tradeoff between the policed values of A andM that we mentioned earlier.
3.1. Analytic model
the steady-state probability that the unfinished work(number of customers X D) in the queuing system isequal to i. The following equation holds among 'TT'/ insteady state.
sD
71"i = L 'TT'jp/(D + j - i)j.,fJ
(HI)D
+ L 71"jp/U - i),j=sD+]
i=l, ... ,(s+l)D.
Another equation is simply the normalization condition for probability distributions:
3.2. Traffic control using the leaky bucket
As we mentioned earlier, we are interested in policing the peak rate 'P, mean rate A and the maximum
(4)
(5)
CHI)D
E 71"i =1.j.,fJ
Eqs. (3) and (4) give us (s+ 1)D independent equations in (s + 1)D unknowns. Thus 7Ti, i =0, ... , (s +l)D, can be determined. The probability of violationPvlol can be computed as:
(HI)D
Pvlol = L 71"i·
i=sD+l
It is well known that the loss probability of theGID/lls system is the same as the violationprobability of a leaky bucket mechanism [10-12]. For the discrete time case, this queuing model consists of a single server with deterministic service time of D slots,a finite capacity queue with s waiting places, and ageneral arrival process G. The service time D of themodel is chosen to be equal to the deterministic distance, d, between the interarrival times of two tokensand the number of customers in the system (includingthe one in service) directly represents the state of thetoken queue. Therefore, the size of the token queue,M I is equal to s+1. Weproceed in a similar manner asin Ref. [10]. We embed a Markov Chain an infinitesimal amount of time before those slot boundaries withcell arrivals. Define 'TT'i, i =0, ... , (s + l)D, to be

I. Khan, V.O.K. Li I Computer Networks and ISDN Systems 27 (1994) 85-100 89
number of cells in a burst M for the call. Here we address the issue of policing A and M and assume thatpeak rate violations do not occur. Policing 'P can beaccomplished by using another leaky bucket dimensioned to police P. A is simply given by lid. For agiven A, M, the maximum number of cells in a burstwill be produced by a traffic source that waits untilthe token queue is full, then transmits at the peak rateuntil it no longer finds tokens in the queue and thenremains silent till the token pool is full again. Undersuch a scenario, M is given by the following equation:
(6)
where rxl is the smallest integer greater than or equalto x. The term within r1in the right hand side of theabove equation is the number of tokens that arrive intothe token queue while the traffic source is transmittingat its peak rate. The above equation does not have aunique solution. The smallest integer value for M thatsatisfies the above equation is the maximum burst sizepermitted by the leaky bucket mechanism. We assumethe following parameters for the traffic source: a =0.9, f3 = 0.99 and A = 0.9. With these parameters,we have a bursty traffic source characterized by a fewcells (average =9) arriving during a burst followedby a relatively long silent period (average = 100).Ideally, we would like to dimension the leaky bucketmechanism in such a way that the policed average rate,A, is close to the average rate of the traffic source givenby (2) to be equal to 0.0818/s10t boundary. In Fig. 4,we show how PYla! varies with A for varying values ofM. We see that for values of A close to the mean rateof the traffic source, P ylol is large. Pv\ol can be madesmall by increasing the value of M. Unfortunately, thishas the side effect of increasing M as can be seen[10m (6) and is not desirable. If we wish to sacrificestatistical multiplexing somewhat by policing closerto the peak rate, we can perhaps do with a smallervalue for M to achieve a tolerable P1os.s' But again from(6), we see that a larger A (implying a smaller d),again results in a larger M. This dependence betweenA and M is fundamental to all the existing trafficcontrol mechanisms and is undesirable. Some thoughtreveals that the reason for this dependence is that thetraffic control mechanisms are not synchronized withthe traffic source, thus controlling the average rate (ata reasonable Pylo1) is accomplished by using both the
pcllced meanrate
Fig. 4. Effect of varying policed mean rate and M.
token generation rate and the bucket size. Motivated bythis argument, we present the (L, M, T) traffic controlmechanism (in the next section) that is synchronizedwith the traffic source. The average rate is controlledusing information from a few previous bursts.
4. (L, M, T) mechanism
In the (L, M, T) mechanism, L is the minimuminter-cell distance (in terms of the number of slots)that is allowed within a burst, M is the maximumnumber of cells that are allowed in a burst and T is theminimum distance (in terms of the number of slots)that is allowed between two adjacent ON periods.
The mechanism, shown in Fig. 5, consists of twoparts, one a burst stretcher and the other an (M, T)enforcer. The burst stretcher merely ensures that theinter-cell distance in a burst is at least L slots. Thisfeature can be used to reduce the peak rate of the traffic stearn if cells arrive deterministically spaced apartin time during the ON period. Since we are includingjitter in our traffic model, this feature of the (L, M, T)mechanism cannot be used. In order to police P, another (L, M, T) dimensioned for that purpose can beused. As in the leaky bucket case, we assume that peakrate violations do not occur and concern ourselves withpolicing A and M. The (M, T) enforcer ensures thatthe maximum number of cells in a burst does not exceed M =M and that the minimum distance betweentwo ON periods is T slots 2. The value for T fluctuates
2 This assumes that we are able to distinguish between ON and

90 I. Khan. V.O.K. LitComputer Networks and ISDN Systems 27 (1994) 85-100
;
M (maximumnumberof cells permitted per burst)
T=I or Tmaxdependingupon information collectedover the previous1C burstsL (policed peak rate : IlL)
~Incomingcells
BurstStretcher
(M,1') enforcer
departing cells(to the network)
contractviolating cells(thosethat anive at a rategreater than IlL)
contract vlolaUng cells(those that violate the (M,T) condition)
Fig. S. (L, M, T) mechanism.
OFF periods. We can assume, for example, that any idle periodbetween two cells which is bigger than x corresponds to an OFFperiod.
dynamically between T = 1 and T =Tmax dependingupon information that is collected from a few, say K,
previous bursts. More specifically, we collect a running average rate, n, from K previous bursts and usethat to determine whether or not the traffic source istransmitting at the negotiated average rate A. If n ~
A, then we use T = I, otherwise we use T =Tmax.
Tmax is chosen to protect the network against the worstpossible behavior, i.e. a source transmitting M cellsat its peak rate, followed by a silence period. Thus,in order that the policed average rate A is respected,Tmax is given by:
where rxl is the smallest integer ~ x. The value forT depends on K and can be determined by trial anderror. On the one hand, we would like to use a largevalue for K, because by doing so the probability ofusing Tmax for a well behaved source will be verysmall. On the other hand, using a large value for K
also makes the system somewhat sluggish, in that itmay take I< bursts to inform the mechanism about acontract violating source. In our numerical examples,we see that using a small value of K suffices to obtainperformance better than the leaky bucket mechanism.Finally, n could be determined via a number of ways.For instance, exponential averaging could be used tomake the system more sensitive to recent bursts. In this
M M-lTmax~ rA --pl, (7)
paper, we use a moving average rate calculated for K
previous bursts. With such a dimensioning, Pviol for awell behaved source can be made low and at the sametime, the worst case traffic emerging from the trafficcontrol mechanism can be predicted, which in tumcan be used for call admission control and bandwidthallocation.
We note an interesting property of our traffic control mechanism. Cells are more likely to be dropped ifthey are either at the start of the burst or at the end ofthe burst. The former happens if a burst starts beforethe T slots after the previous ON period is over andthe latter happens due to restriction on the maximumburst length. Thus, cells are less likely to be droppedif they are in the middle of a burst. This could haveimplications on how cells are packed in a burst. Thus,cells carrying more significant information could bepacked in between cells carrying less significant information. This feature of our traffic control mechanismrequires further study. In the next section, we presentan analytic model for the (L, M. T) mechanism.
4.1. Analytic model
In Section 4.1.1, we outline a derivation for Prllthe probability of using T =1 after any burst. In Section 4.1.2. we present an expression for PylalIT=I andPvlol IT..T..... the conditional probabilities of violationgiven that T = 1 and T = Tmu respectively. FromPylaIIT:I, Pvial IT=T1I\Il and Prl' the unconditional probability of violation Pyjal can be obtained as:

I. Khan, V.O.K. Li/Computer Networks and ISDN Systems 27 (1994) 85-100 91
P viol =PYiQ1IT=1(PTI) + PYiaIIT=T....(1 - PT1) . (8)
4.1.1. Prl
Prl is the probability that we will use T =1 after aburst for the inter-burst distance. This probability depends upon the averaging scheme used, In this paper,we use, n, the moving average rate over the previousIe bursts. Thus PTJ is given by:
(15)
1,2, . ' " the probability distribution of the number ofslots in a single OFF period. R; the moving averagerate collected from Ie previous bursts is simply equalto Bit/ (Vit +FK). Thus,
Bitp(n~A)=p(V :F ~A)
It+ It
00 00 mln(i,l(i+j)AJl
=2:L: L1=1 j=1 m=O
P(VIt =i,FK =j,BIt =m)
00 00 min{I,L(i+}MJl
=L:L: Lr..1 j=1 m=O
00 00
+ L:~P(olt =i)P(FIt =j)1=1 j=j,
X (~) Ant (1 - t\)I-m. (16)
Closed form expression, albeit tedious, can be obtained for the above equation.
00 j,-I
pen ~ A) =I:I:P(VIt =i)P(FIt =j)1=1 }=I
Thus, the summation in (12) can be written as:
P(VK =i)P(FIt =j)
x (~)t\mO-t\)i-m. (12)
The 4th and 5th lines of the above equation are derived from the fact that ON and OFF periods are independent, and because of Bernoulli arrivals per slotduring an ON period. Vi and Ft, the probability distributions for O" and :FK
, respectively, can be easilyobtained as:
V~ = (1 - alt)(i -1) (i - 2) ' .. (i + 1- K) (13)I alt-I(K-l)! '
(1-f3It )( i - l )( i - 2) ... (i+ l-K)Ft = f3K-I (K _ 1)! . (14)
For each i, a value for j, h, such that i ~ L(i +j) AJis given by:
(9)
(11 )
(0)
b(i) =
B(z) = (1- a)(t\z + 1- A).1 - a(t\z + 1 - A)
The above pgf can be inverted to yield b(i),
(l - a) (l - A), i =0,1- £1'(1 - A)
{1 - a + (l-a)(I-A)}
a 1- a(l- A)
x( aA )1, i~1.1 - a(l - A)
Let Bj, j =1, ' .. , be the random variable that represents the number of cells in i bursts taken together.Let !Ji (i), j = 1" . " i = J, . , .,be the probability thatj bursts, taken together, have i cells, b l (i) simply being b(i), the probability distribution of the number ofcells in a single burst. Similarly, let oi, i = 1•.. "be the random variable that represents the number ofslots in j ON periods taken together, Let Qi(i), i =1, ' . " i = i", ., be the probability that j ON periods, taken together, have i slots, 0 1(i) simply beingO(i) =(1 - a) ai-I, i =1,2, . , ., the probability distribution of the number of slots in a single ON period. Again, let Fj, i =1, .. " be the random variablethat represents the number of slots in i OFF periodstaken together. Let Fj ei), j =1" , " i = i. ... , be theprobability that j OFF periods, taken together, have islots, FI(O simply being F(i) = (1- f3)f3 i- I , i =
Let b(i), i =0, 1, ..., denote the probability of i cellarrivals during an ON period and let B (z ) denote thecorresponding probability generating function. Sinceduring an ON period, cells arrive with probability Aata slot boundary, independently from one slot boundaryto another, B(z) is given by B(z) =OeAz +1- A),where Oez) =(l - a)z/(l- £liZ) is the probabilitygenerating function (pgf) of the duration of the ONperiod. Thus,

92 l. Khan, V.O.K. Li/Computer Networks and ISDN Systems 27 (1994) 85-100
to the cells that get dropped from the back of a burstif the number of cells in the burst exceeds M. In theAppendix, we prove that m(k) is given by:
PI =71 - k1rl + k lr2,
ml =-(PI - 71 + kl71 - klPlrl - ksr:
- PI72 + klPlr2 + rlr2)/
(l - 2pI +PI2),
-1 + rl + r2 - 71r2m2=
-1 +PI
m3 = -( _P12 +Plrl - klPlrl + klPI2rl + klPlr2
+PI 2r2 - klPl272
- PI 71 72) /
(1- 2pI +PI 2).
4.1.2. PyfolIT=1 and Pvlo1IT=T....
On account of the memoryless property of geometric distributions, there is an embedded regenerativeprocess in our traffic control mechanism. It starts eachtime we reset a counter and start counting how manycells are arriving in a particular burst. The counteris reset after either the previous burst passes or thecounter value becomes M. It ends when the minimumnumber of slots, Truax or 1, between this particular ONperiod and the next are over. We can visualize this regenerative process by means of a regenerative windowthat moves along the time axis. Pvio11T=Tmax is given by:
PyfoIIT=T""", =
{E [No. of cells dropped during
a regenerative window]} /
{E [Total No. of cells that arrive
during this regenerative windowl}. ( 17)
Let us represent the numerator and the denominatorof the above equation by Num and Den respectively.In what follows, we shall outline methods to determine Num and Den. Num can be represented by thefollowing equation:
Tmax-I
Num= L O(Tmax-k)m(k)k=1
k= 2,3, ... ,
=A, k= 1,
where,
Thus, Num can be obtained from (18).Den is given by:
T....-l 00
Den = L O(Tmax - k)m(k) + Libi •
k=1 i=O
(19)
(20)
J This includes the situation where multiple subsequent burstsare present within the next k slots.
where 00) =(1-{3) f3H, i =1, ..., is the probabilitydistribution of the number of slots in the OFF period.The first term in the RHS of the above equation refersto the cells that get dropped from the front of theburst where k = 1, ... , (Tmax - 1) is the number ofslots that this regenerative window intrudes into thenext ON period. The probability that the regenerativewindow intrudes into the next ON period by k slotsis given by the probability that the OFF period is ofduration (Tmax - k) slots, given by (1 - {3) {3Tmax-k-l.
In the above, m( k) refers to the mean number of cellsof the next burst 3 that are present in the k slots. Thesecond term in the RHS of the above equation refers
00
+ L (i-M)b(i),i=M+I
(18)As before, the first term in the RHS of the above equation refers to the cells that get dropped from the frontof the burst. The second term is the mean number ofcells that arrive in a burst. All the terms in the aboveequation are known. Hence, PyfOljT=Tmax can be obtainedfrom (17). P"iOlIT=1 is simply
L::M+I (i - M)b(i)
L:~ibi
since no cell gets dropped from the front of the nextburst. Thus the unconditional Pv101 can be determinedfrom (8).
4.2. Comparison between leaky bucket and (L, M, T)
We assume the following parameters for the burstyON/OFF source: a. = 0.9, f3 = 0.99 and A = 0.9.These are the same parameters used for the leaky

I. Khan, V.O.K. Li I Computer Networks and ISDN Svstems 27 (1994) 85-100
Poli.czd Polie;ed Probofvio- Probability of violation with (L,M.T)
avc:n&ll Muim\llll Wioa "'1° IC~S 'loa. lC-6 .....lC-4raIe buntlia wilhLeaky illIpIQWdIC ~ imptvvaDa
Buc:b:t at_LB Dl_UI =_IJI
0.1667 49 0.0689 0.G1.25 67.34 0.0142 79.39 O.OO:n 86.79
0.1429 43 0.0904 0.0499 44.80 0.0365 59.62 0.0271 70.02
0.1250 39 0.1130 0.0865 23.45 0.0698 38.23 0.0.570 40.7
0.1111 37 0.1369 0.130"1 4.82 0.1125 17.82 0.0980 28.41
0.1000 35 0.1617 0.1768 -9.34 0.1603 0.86 0.1463 9.52
0.0909 34- 0.1875 0.2257 -20.37 0.2119 -12.8 0.1999 -6.61
Fig. 6. Performance comparison with leaky bucket, ex =0.9, f3 =0.99, A= 0.9.
93
bucket mechanism in Section 3.2. Thus, as we mentioned before, we have a bursty traffic source characterized by a few cells (average = 9) arriving during aburst followed by a relatively long silence period (average = 100). The average rate of the traffic sourceas determined from (2) is 0.0818 per slot boundary.We vary the policed average rate from 0.0909, a valueclose to the average rate of the source, to 0.1667. Inorder that we may compare the performance with theleaky bucket mechanism, the values for M are theones obtained from (6) using token pool size of 25,with a value of 0.33 assumed for P. The probabilityof violation obtained using the leaky bucket and the(L, M, T) mechanism for values of K = 4, 5, 6 are tabulated in Fig. 6. A number of interesting conclusionscan be drawn. If the policed average rate is closerto the peak rate, relatively fewer bursts (K = 4) areneeded in the (L, M, T) mechanism to obtain performance better than the leaky bucket. Of course, increasing K improves performance still further. If the policedaverage rate is closer to the mean rate of the trafficsource, for smaller values of K, the leaky bucket mayperform better than the (L, M, T) mechanism. How-
ever, we can always outperform the leaky bucket byusing larger values of K. This is due to the fact that theprobability that the running average rate for the previous K bursts will exceed A is larger if A is closerto the average rate of the traffic source. For a givenvalue of K, the probability of violation increases as Adecreases. This is on account of the burstiness of thetraffic source and is a common feature of all trafficcontrol mechanisms.
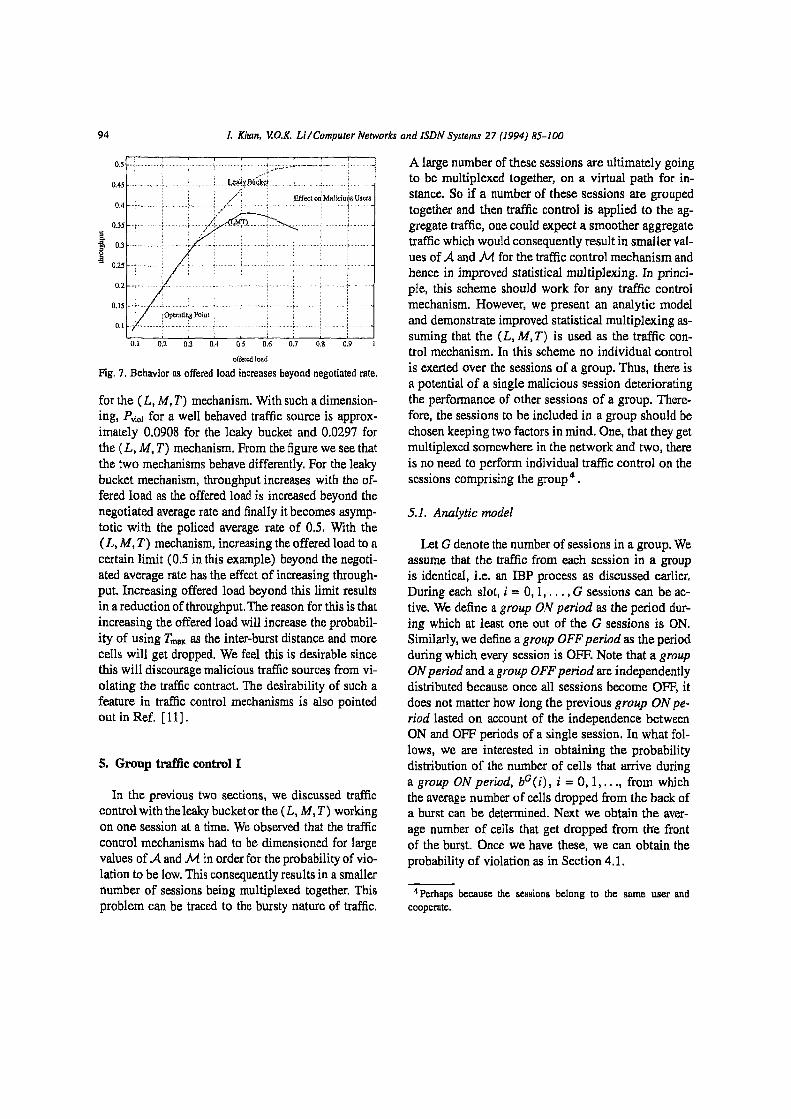
In Fig. 7, we investigate how the (L, M, T) mechanism and the leaky bucket mechanism behave as theaverage rate of the traffic source increases beyond theaverage rate in the traffic contract. In particular, weplot the offered load vs throughput curve in the figure. We increase the offered load by increasing theaverage ON period, 1/( I - a), while keeping the average OFF period, 1/0- {3), constant. In this example the values for a, {3, A and K are taken to be0.9, 0.99, 0.99 and 4, respectively. We dimension theleaky bucket mechanism so that the policed values forA and Mare 0.5 (d =2) and 29, respectively. The(L, M, T) mechanism is dimensioned for the same Mas above. However, using d =2 results in A =0.38
94 I. Khan, V.O.K. Li t Computer Networks and ISDN Systems 27 (1994) 85-100
5. Group traffic control I
offered load
Fig. 7. Behavior as offered load increases beyond negotiated rate.
In the previous two sections, we discussed trafficcontrol with theleaky bucket or the (L, M, T) workingon one session at a time. We observed that the trafficcontrol mechanisms had to be dimensioned for largevalues of A and M in order for the probability of violation to be low.This consequently results in a smallernumber of sessions being multiplexed together. Thisproblem can be traced to the bursty nature of traffic.
Let G denote the number of sessions in a group. Weassume that the traffic from each session in a groupis identical, i.e, an ffiP process as discussed earlier.During each slot, i = 0, 1, .. . , G sessions can be active. We define a group ON period as the period during which at least one out of the G sessions is ON.Similarly, we define a group OFF period as the periodduring which every session is OFF. Note that a groupONperiod and a group OFF period are independentlydistributed because once all sessions become OFF, itdoes not matter how long the previous group ON period lasted on account of the independence betweenON and OFF periods of a single session . In what follows, we are interested in obtaining the probabilitydistribution of the number of cells that arrive duringa group ON period, bG(i), i =0, 1, ..., from whichthe average number of cells dropped from the back ofa burst can be determined. Next we obtain the average number of cells that get dropped from the frontof the burst. Once we have these, we can obtain theprobability of violation as in Section 4.1.
4 Perhaps because the sessions belong to the same user andcooperate.
A large number of these sessions are ultimately goingto be multiplexed together, on a virtual path for instance. So if a number of these sessions are groupedtogether and then traffic control is applied to the aggregate traffic, one could expect a smoother aggregatetraffic which would consequently result in smaller values of A and M for the traffic control mechanism andhence in improved statistical multiplexing. In principle, this scheme should work for any traffic controlmechanism. However, we present an analytic modeland demonstrate improved statistical multiplexing assuming that the (L, M, T) is used as the traffic control mechanism. In this scheme no individual controlis exerted over the sessions of a group. Thus, there isa potential of a single malicious session deterioratingthe performance of other sessions of a group. Therefore, the sessions to be included in a group should bechosen keeping two factors in mind. One, that they getmultiplexed somewhere in the network and two, thereis no need to perform individual traffic control on thesessions comprising the group 4 •
5.1. Analytic model
. ~::' ".... ".
......
"'4 ;;--<,
// :
" ... , .
/ ...... ..... . ......
I/ : . ..•0.1
0.45
0.5
0.15
0.2
for the (L, M, T) mechanism. With such a dimensioning, Py10l for a well behaved traffic source is approximately 0.0908 for the leaky bucket and 0.0297 forthe (L, M, T) mechanism. From the figure we see thatthe two mechanisms behave differently. For the leakybucket mechanism, throughput increases with the offered load as the offered load is increased beyond thenegotiated average rate and finally it becomes asymptotic with the policed average rate of 0.5. With the(L, M ,T) mechanism, increasing the offered load to acertain limit (0.5 in this example) beyond the negotiated average rate has the effect of increasing throughput. Increasing offered load beyond this limit resultsin a reduction of throughput. The reason for this is thatincreasing the offered load will increase the probability of using Tmax as the inter-burst distance and morecells will get dropped. We feel this is desirable sincethis will discourage malicious traffic sources from violating the traffic contract. The desirability of such afeature in traffic control mechanisms is also pointedout in Ref. [11].
0.4
0.35t OJ
0.25

L Khan, V.O.K. LilCompliter Networks and ISDN Systems 27 (1994) 85-100 95
During any group ON period, each slot can havej, j =1,2, ... , G, ON sessions. Any of these j ONsessions can contribute a cell arrival with probability A,independently from one another. Let the total numberof sessions that are ON at the start of the group ONperiod be Sj. Similarly, let Sk, k =2,3, ... .l, be thetotal number of sessions that are ON during the kth slotof the group ON period, l being the length of the groupON period. If we know the probability distribution ofS = SI + S2 + .,. + SI, we can determine bG(i), i =0, 1, ..., the probability distribution of the number ofcells that arrive during a group ON period, since theabove sum gives us the number ofBernoulli trials eachof which contributes a cell arrival with probability A.
A little reflection reveals that the above sum can beobtained in a manner analogous to that used for obtaining first passage times in Markov chains, first passage time being defined as the number of transitions ittakes to reach state j for the first time if the system isin state i at time zero. We construct a Markov Chainwi th G + 1 states (0 through G). The state of theMarkov chain indicates the number of sessions that areON during a slot. The transition probabilities for thisMarkov Chain, Plj, i = 0,1, ... , G, j = 0,1, ... , G,defined as the probability of moving to state j duringthe next slot, given that we are presently in state i, aregiven by:
Pij =t; {(i) ci( 1 - a)l-k }
x { (J~~) (1 - !3)j-k!3G-i-U-k) } ,
i < j,
eu =t{(~) ak(l - a)l-k}
x { (J~~) (1 - !3)j-k f3G- 1- U- k) } ,
i ~ j.
The term within the first pair of curly brackets is theprobability that k out of the i ON sessions will remainON during the next slot. The term within the secondpair of curly brackets is the probability that j - k outof the G - i OFF sessions will turn ON at the next slotboundary.
Similar to the first passage time definition, let usdefine the first passage sum as the state sum that getsaccumulated by the time the system reaches state j forthe first time if the system is in state i at time zero. Tostart with, the state sum is initialized to zero. At eachtransition from state k, k is added to the state sum.Let us define ()Ij(n) to be the probability that the firstpassage sum (from i to j) is n, n =1,2, .... It can beobtained recursively as follows:
G
()lj(n)=pIjB(n-i)+ L: Plk()kj(n-i). (21)k=O.k~j
In the above, if n = i, the underlying event could onlybe accomplished if the process made its first transitionto state i, an event with probability plj.lf n > i, however, the process must have made its first transition tosome state k, k "1= j, and then must have accumulatedthe remaining state sum of n - i during a first passagefrom state k to state [,
Thus the probability distribution of the sum S, referred to above, say sen), can be obtained as:
G
sen) =L ()iQ(n)qi,1",1
where ql, i =1,2, ... , G, the probability that a groupON period starts with i ON sessions, is simply theprobability that i out of G sessions turn ON during aslot, given that all G sessions were OFF during theprevious slot. The probability that a session turns ONduring a slot given that it was OFF during the previousslot is simply 1 - 13. The probability that at least onesession will tum ON during a slot, given that all Gsessions were OFF in the previous slot is 1- f3G. Thus,ql is given by:
ql = (~) (1- f3)lf3G-i I _1130,
Thus sen) can be obtained. As mentioned earlier, wecan obtain bG(i) from sen) because sen) gives us thedistribution of the number of Bernoulli trials each ofwhich contributes a cell arrival with probability A.
bG(i) =t (1) A1(1 - A)j-Is(j).
In practice, the infinite sums in the above equations canbe truncated after further contributions become negli-

96 I. TUum. V.O.K. Lir Computer Networks and ISDN Systems 27 (1994) 85-100
gible. From bG(i) obtained above, the mean numberof cells arriving during a burst and the mean number of cells truncated from the back of a burst (if thenumber in the burst exceeds M) can be obtained. Theonly remaining quantity needed to obtain the probability of violation as in Section 4.1.2 is the mean number of cells dropped from the front of the next burst5 (because of the requirement that at least Trnax slotsbe provided between two consecutive ON periods, inthis case the group ON periods). We determine thisquantity next.
Let the joint probability of group OFFperiod beingof duration k slots and i, i = 1,2, ... , G, sessionsbeing ON at the start of the next group ON period bedenoted by 'TIki. This probability is the probability thati out of G sessions have an OFF period equal to k slots(probability equal to /3k-1 (l - 13) for each session)and 0 - i sessions each have an OFF period greaterthan k slots (probability equal to 13k for each session) .Thus,
nu» (~) (f3k- l(l_f3»i(f3k)G-i.
The mean number of cells dropped from the front ofthe next burst given that the group OFF period consistsof k, k: =1,2, ..., slots and the number of ON sessionsat the start of the next group ON period is equal to i,is equal to
1/
im(Tmnx - k) + (G - i)m (Tmax - k»,
where m(k) is as in (19) andm" (k) is the mean number of cells that arrive from a session in k slots, giventhat we start counting from a slot where the session isOFF and can be obtained in a manner similar to m( k).Tmax - k is the number of slots that intrude into thenext group ON period because of the requirement thatat least Tmw< slots be provided in between two adjacentON periods (group ON periods in this case). Giventhat i sessions are ON at the beginning of the groupON period, G - i are OFF at the beginning of the OFFperiod. Thus, the above expression for the conditionalmean number of cells that get dropped from the frontof the next burst. Thus the unconditional mean number of cells dropped from the front of the next burst is
5 As before, this includes the situation where multiple subsequentbursts are present within the next k slots .
G T.... - I
l: E 'TIki(im(Tmnx - k)1=1 ""'1
+(0- i) mil (Tmnx - k»).
All the terms in this expression are known. Hencethe mean number of cells dropped from the front ofthe next burst can be determined. P(R ~ A) canbe determined as in Section 4.1.1. Thus PYlal can bedetermined,
5.2. Numerical results
In this section we investigate the improvement instatistical multiplexing due to group traffic control. Weassume that each session is identically distributed asan IBP process, each with the following parameters:a =0.9, f3 =0.99, A=0.99. The value for I( is takento be equal to 4. This translates to an average arrivalrate of 0.0908 cell arrivals/slot boundary. M = 15 isassumed for each session. Thus, when two sessionsare taken together in a group, M becomes 30 and soon. Instead of determining how many sessions can bemultiplexed together at an acceptable PYloh in Fig. 8,we plot PYlol as a function of the policed per sessionaverage rate for group size values of 1 (single sessian), 2 and 3. Clearly, the lower the PYiol the largerwill be the number of sessions that can be multiplexedand vice-versa. We observe three facts from the figure.First, PYlol decreases as G increases. This is expectedsince combining more sessions will result in smootheraggregate traffic. Second, the improvement in performance decreases as G increases. Third, the knee inthe plot for each session moves towards a lower policed rate as G increases. This is useful information,since now for larger G, we can dimension the trafficcontrol mechanism to control a small A and yet sufferacceptable Pviol '
6. Group traffic control n
In the scheme presented in the previous section,a malicious session in a group can seriously affectthe performance of other sessions. Sometimes, it maynot be possible to ensure that all the sessions in agroup will cooperate. Our next scheme again works ongroups of sessions (those that get multiplexed some-

I. Khan. V.O.K. LiIComputer Networks and ISDN Systems 27 (1994) 85-100 97
0.04
0.035
0.03 .....
'""! 0.025
!e.c 0.02~
0.015
0.01
0.006.250.5 0.6 0.6
0.25r-".,....-.,....--.,....---.,....---.,....---~-~
s 0.15s~'ll
i 0.1
0.05
policed meanrate
Fig. 8. Improvement in performance due to group traffic control 1.policed mean rate
Fig. 9. Improvement in performance due to group traffic controlII.
where in the network) but does not rely on any suchcooperation among sessions of a group.
In this scheme, traffic control is carried out on eachsession as before. However, the probability that a traffic violating cell is dropped, PD, is made dependentupon the number of other sessions that are ON atthat particular instant. More specifically, the larger thenumber of other sessions that are ON, the larger theprobability a violating cell will be dropped. The dependence between the number of other sessions thatare ON and PD could be implemented in a number ofways. For instance, this dependence could be made linear by setting the conditional probability of dropping acontract violating cell given that i, i =0, 1, ...• G - 1,other sessions are ON at that particular instant, PDli'equal to i/CG-I). With this scheme, the probability of violation decreases to Pv!o!PD. This decrease inprobability of violation is accompanied by an increasein the policed average traffic rate of the traffic controlmechanism because of the extra cells admitted. In thenext section, we shall quantify this increase in policedaverage traffic rate. Improved statistical multiplexingis expected, because of the adaptive way in which excess traffic is admitted, i.e. more traffic is admittedwhen more sessions are OFF.
6.1. Analytic model
Po can be determined as follows: Since each sessionis assumed to be independent from one another andidentically distributed as an mp with parameters cr,/3 and A, the probability that at any arbitrary instanti, i =0,1, ... ,G - 1, other sessions are ON, y( i), isgiven by:
yO) = (G~ 1) aiO- CT)G-I-i,
where, (T, the probability that a single session is ONat an arbitrary instant, can be shown to be equal to(1 - /3) 1(2 - a - f3). Thus, the unconditional probability PD is given by:
G-I
PD =L PDj;'Yi =a:I=(J
The second line of the above equation can be obtainedby substituting the expressions for PDII ::: if (G - 1)and YI.
In what follows, we quantify the increase in policed average traffic rate in this scheme. We considerthe worst case scenario. As we mentioned earlier, theworst case traffic from a traffic control mechanismis one where M cells are transmitted at the peakrate, 'P (the duration of the ON period is given by(M - 1) /P), followed by a silence period of duration, say S slots (8 is the actual value ofTmllX in (7)).The worst case traffic patterns from the G sessions areassumed to have a uniformly distributed skew with respect to one another.
In order to quantify the increase in policed trafficrate, we assume a fictitious, malicious source that triesto send cells into the network, at peak rate, wheneverit can, subject to the policy outlined above about dropping contract violating cells. Let 7Ji denote the probability that a contract violating cell will be allowedinto the network during slot i. Since we are assumingidentical sessions and hence identical worst case traf-

98 1. Khan, V.O.K. Li/Computer Networks and ISDN Systems 27 (1994) 85-100
fie patterns and a uniformly distributed skew amongthe worst case traffic patterns, the value of ""I will beperiodic with period eM - 1) /P +S. So we needto concentrate only on (M - I) /P +S slots. Out ofthese (M - 1) /P + S slots, the value for ""I will remain the same for (M - 1) /P slots. say.,,;, andthenattain another value, say",,;', for the next S slots.Thus,the average number of cells admitted into the networkfrom the malicious source, .Ae'lI1I' is given by:
Next, we determine T/; and ",,;'. Wetag a worst casepattern and examine how many other worst case patterns are ON during a particular slot:
I 0-1 ( j + 1)""t =~ 1 - a- r/Jj,
where r/lj is the probability that during the ith slotj out of the other G - 1 worst case traffic patternsare ON. Given that j out of G - lather worst casetraffic patterns are ON, we know that during theseslots, j + lout of the G traffic patterns are ON. Thusthe probability that a contract violating cell will beallowedinto the network during such a slot is givenby(l - (j + 1) / G). The above equation simplifies to:
where Vi is the average of {r/lj} and is simply G - Itimes the fraction of time that one worst case trafficpattern remains ON. Hence, it is given by:
iff =(G-l) (M -l)/P .(M -l)/P+S
In a manner similar to above, it can be argued that T/;'is given by:
6.2. Numerical results
We assume the same parameters as in Section 5.2.As before, we plot Pyjol as a function of policed persession average rate (Fig. 9). PvlOlo determined as before, is decreased in valueby multiplying it with PD.Ae.lraIG is added to the policed average rate of a session. In Fig. 9, PYiol is plotted against the policed persessionaverage rate for G = 2- -4. The improvementin performance as G increases is evident. A comparison of Figs. 8 and 9 shows that, as compared withschemeI, the rangeof policed averagetraffic rates decreases with group control scheme II. We are able topolice higheraverage traffic rates only. This is due tothe fact that a lower policed average traffic rate implies a large OFF periodfor the worst case traffic pattern, which in tum results in more extra cells beingadmitted whichconsequently increases the policedaverage traffic rate. From Fig. 9, we see that this rangeincreases as G increases.
7. Conclusions
Thispaperpresentedaframeworkto studythe problem of traffic control in ATM networks. A new trafficcontrolmechanism termed (L, M, T) was introduced.A performancecomparison between this mechanismand the leaky bucketwasprovided.Twonew schemeswereproposed, one thatimproves uponstatisticalmultiplexing by controlling groups of sessions togetherand another that improves statistical multiplexing byadmittingmorecellswhenmore sessionsare OFFthanwhen fewer are OFF. Analyticmodels and numericalexamples were providedfor all of the schemes.
Acknowledgements
The authors gratefully acknowledge the helpfulcomments of the anonymous reviewers. Their comments were incorporated and improved the clarity ofthe paper.

I. Khan. V.O.K. LilComputer Networks and ISDN Systems 27 (1994) 85-100 99
Appendix A
m(k) =A(1 +m' (k» + (1- A)m' (k)
=A+m'(k). (A.l)
In this appendix, we prove that m(k), the meannumber of cell arrivals during k slots starting fromthe beginning of an ON period, is given by (19). Anarrival will occur at the slot boundary that marks thebeginning of an ON period with probability A. Ignoring this arrival for the moment,let us find m' (k), themean number of cell arrivals that occur in subsequentslot boundaries in k slots. Thereafter,
(A.5)
=~ zl,,(z)61-z,,"'I
00 k-I
= 2: z k2::fnCi)
k=1 1=0
00
M' (z) := 2: F,,(z),,"'I
00 00
=2:fn(i) L Zk
i=O k=1+1
00
=_z_ " (f(z) )tll-z6
"",J
z fez):=-- ,
l-z1-f(z)
where fez), the Z-transform of a single interarrivaltime distribution, is given by
00 Zi+l
=2:fnCO-1_1=0 Z
zfn(z) (A,4)=1=Z""'
Taking Z-transform on both sides of (24) I we get:
(A,2)k = 1,2, ... ,
Let p" (k) denote the probability distribution of n arrivals in k slots, starting from the beginning of an ONperiod and ignoring any arrival that may occur at thefirst slot boundary. A little reflection reveals that thetime until the first arrival, ignoring any arrival thatmayhave occurred at the first slot boundary, has the samedistribution as the interarrival time distribution. Usingthis fact and standard arguments in renewal theory, wecan writep,,(k) as:
where Fn (k) is the cumulative distribution function(CDF) of the sum of n interarrival times. Then,
00
m' (k) =L:np,,(k)n=O00
=:L>(Fn(k-l) -F"+I(k-l)n=O
fez) := kj(l- rl)z + (1- kl) (1- 72)Z.1 - rrz 1 - 72Z
The justification for the last step in the above equationis the independence among interarrival time distributions. Inverting the Z-transform in (26), using partialfraction expansion, we obtain (19).
References
00
Fn(z) =LzkFnCk - 1)k=1
Denote the Z-transform of the sequence m~ by M' (z )and of the CDF Fn(k - 1) by Fn(z ). The Z-transformFn(z) can be related to fn(z), the Z-transform ofthe probability distribution of the sum of n interarrivaltimes, in(k) as follows:
00
=LFn(k-l)."",1
(A.3) [1] ccrrr SG XVIII, Contribution D.1021, Geneva, November1990.
[2] ccm SG XVIII, Draft recommendation 1.311, Geneva,May 1990.
[3] K. Kvols and S. Blaabjerg, Bounds and approximations forthe periodic ON/OFF queue with applications to ATM trafficcontrol, in: Proc, INFOCOM 1992, pp. 487-494, 1992,
[4] C. Rasmussen, J. Sorenson, KS. Kvels and S.B. Jacobsen,Source-independent call acceptance procedures in ATMnetworks, IEEE J. Selected Areas Comm. 9 (3) (1991)351-358.
[5] M. Murata, Y, Die, T. Suda and H. Miyahara, Analysis of aDiscrete-Time Single-Server Queue with Bursty Inputs for

100 1. Khan, V.O.K. LiIComputer Networks and ISDN Systems 27 (1994) 85-100
Traffic Control in ATM Networks, IEEE J. Selected Area.~
Comm. SAC-8 (3) (1990) 447-458.[6] X. Chen and LM. Leslie, Performance evaluation of input
traffic control, in: Proc. INFOCOM 1992, pp. 552-561,1992.
(7] 1. Cidon, I.S. Gopal and H. Melies, Paris: an approach tointegrated private networks, in: Proc. lCC 1987, pp. 764768, 1989.
[8] H. Ahmadi, R. Guerin and K. Sohraby, Analysis of leakybucket access control mechanism with batch arrival process,in: Proc. GLOBECOM 1990, pp. 344-349, 1990.
[9] L Turner, New directions in communications (or which wayto the information age), IEEE Comm. Mag. 24 (l0) (1986)8-15.
[10] E. P. Rathgeb, Modelling and performance comparison ofpolicing mechanisms for ATM networks, lEEE J. SelectedAreas Comm. 9 (3) (1991) 325-334.
[11] B. Lague, C, Rosenberg and F. Guillemin, A generalizationof some policing mechanisms, in: Proc. 1NFOCOM 1992,pp. 767-775, 1992.
[12] M. Sidi, W. Lin, 1. Cidon and I. Gopal, Congestion controlthrough input rate regulation, in: Proc. GLOBECOM 1989,pp. 1764--1768,1989.
Irfan Khan obtained a B.E. (withhonors) in electrical and electronicsengineering from the Birla Institute ofTechnology and Science, Pilani, India,in 1986; an M.S. in electrical engineering from George Washington University,Washington, D.C., in 1988; an M.S. incomputer science in 1991 and a Ph.D.in electrical engineering in 1993, fromthe University of Southern California,Los Angeles, California. His Ph.D. thesis was on teletraffic analysis and traffic
control in asynchronous transfer mode (ATM) networks. Duringthe summer of 1989, Dr. Khan worked for Digital EquipmentCorporation at Littleton, Massachusetts, on performance analysisof a fast packet switch and on congestion control. During thesummers of 1990 and 1991 he worked for BeU CommunicationsResearch at Red Bank, New Jersey, on alternate routing for congestion control and on internetworking protocols for SwitchedMultimegabit Data Service (SMDS). Since 1993, he has workedin the Information and Telecommunication Sciences Center at SRIInternational, Menlo Park, California, on multicasting, on trafficcontrol in high-speed multi-media networks, and an network control using Artificial Intelligence techniques. His research interestsinclude performance analysis and design of communication network protocols, ne twork architectures andprotocols for broadbandand personal communication services, MANs, LANs, fast-packetswitches, network control using Artificial Intelligence techniquesand queuing theory. Dr. Khan is a member of IEEE and the honorsocieties Eta Kappa Nu, Tau Beta Pi and Phi Kappa Phi.
V.O.K. Li (S'BO-M'81-SM'86-F'92)was born in Hong Kong in 1954. Hereceived his SB, SM, and ScD degreesin Electrical Engineering and ComputerScience from the Massachusetts Institute of Technology, Cambridge, Massachusetts, in 1977, 1979, and 19BI,respectively. Since February 19B1 hehas been with the University of Southern California (UCS), Los Angeles,California, where he is Professor ofElectrical Engineering and Director of
the USC Communication Sciences Institute. He has published150 technical papers and has lectured and consulted extensivelyaround the world. His research interests include high speedcommunication networks, personal communication networks, intelligent networks, distributed databases, queueing theory, graphtheory, and applied probability.
Dr. Li is very active in the Institute of Electrical and Electronic Engineers (IEEE), having been a member of the ComputerCommunications Technical Committee since 1983, and havingserved as Chairman from 1987-1989. He served as a Chairman ofthe Los Angeles Chapter of the IEEE Information Theory Groupfrom 1983-1985. He is the Steering Committee Chair of theInternational Conference on Computer Communications and Networks (lC3N), General Chair of the 1st Annual lC 3N, held inSan Diego, California in June 1992, General Chair and TechnicalProgram Chair of the 4th IEEE Workshop on Computer Communications held in California in 1989. A member of ACM andORSA, Dr. Li has served 118an editor of IEEE Network, guest editor of IEEE lSAC and of Computer Networks and ISDN Systems,and is now serving as an editor of Telecommunication Systemsand of ACM Wireless Networks. He serves on the InternationalAdvisory Board of IEEE TENCON'90, IEEE TENCON'94, IEEESICON'91, IEEE SICON'93, IEEE SICON/ICm'95, the International Conference on Microwaves and Communications '92, andthe International Symposium on Communications '91. He is anIEEE Fellow, an lAE Fellow, D. New York City Urban Fellow,and is listed in Marquis' Who's Who in Frontier Science andTechnology, and Who's Who in California.
Copyright © 2022 FDOKUMEN