Military Voice Services over Wireless ATM Networks - Defense ...
103
DEFENCE I C m J DEFENSE Military Voice Services over Wireless ATM Networks: Performance Analysis of FEC Schemes for ATM Transport Over Wireless Links Sophia Tsakiridou Communications Research Centre Canada DISTRIBUTION STATEMENT A Approved for Public Release Distribution Unlimited Communications Research Centre Centre de recherches sur lea communications The work described in this document was sponsored by the Department of National Defence under Work Unit 5CB17 Defence R&D Canada DEFENCE RESEARCH ESTABLISHMENT OTTAWA TECHNICAL REPORT DREOTR 2001-058 CRC Report No. 2001-003 March 2001 ,*. National Defense f QTlQflSl " Defence nationale V_y<Xl ICtVAd. 20011105 015
-
Upload
khangminh22 -
Category
Documents
-
view
1 -
download
0
Transcript of Military Voice Services over Wireless ATM Networks - Defense ...

DEFENCE I C m J DEFENSE
Military Voice Services over Wireless ATM Networks: Performance Analysis of FEC Schemes for ATM Transport Over Wireless Links
Sophia Tsakiridou Communications Research Centre Canada
DISTRIBUTION STATEMENT A Approved for Public Release
Distribution Unlimited
Communications Research Centre Centre de recherches sur lea communications
The work described in this document was sponsored by the Department of National Defence under Work Unit 5CB17
Defence R&D Canada DEFENCE RESEARCH ESTABLISHMENT OTTAWA
TECHNICAL REPORT DREOTR 2001-058
CRC Report No. 2001-003 March 2001
■ ,*.■ National Defense f QTlQflSl ■ "■ Defence nationale V_y<Xl ICtVAd.
20011105 015

H
f\L Ru DEFENCE I ^M 1 DEFENSE
Military Voice Services over Wireless ATM Networks: Performance Analysis of FEC Schemes for ATM Transport Over Wireless Links
Sophia Tsakiridou Broadband Network Technologies Communications Research Centre Canada
Communloaelona Raaaareh Cantra Cantri da raoharohaa aur laa oommunleafelona
The work described in this document was sponsored by the Department of National Defence under Work Unit 5CB17
DEFENCE RESEARCH ESTABLISHMENT OTTAWA
TECHNICAL REPORT DREOTR 2001-058
CRC Report No. 2001-003 March 2001

Abstract
Wireless ATM was designed to extend the support of broadband, multimedia services pro- vided in fixed ATM networks to the wireless/mobile environment in a seamless and efficient manner. It is a candidate wireless networking technology for future tactical military networks which have adopted ATM in the core network. The bandwidth-limited, error-prone nature of wireless links poses significant challenges in the design of wireless ATM.
This report is part of a study on the feasibility of military digital voice services over wireless ATM networks and is concerned with the impact of wireless link errors on the performance of ATM. The work presents a review of various error-control schemes proposed for the efficient transport of ATM over point-to-point wireless links. Due to the strict latency requirements of voice applications, only error-control schemes based on Forward Error Correction are considered. The performance of these schemes is analyzed for the random-error channel and for the Gilbert- Elliott burst-error channel.
in
Resume
Le mode de transfert asynchrone (MTA) sans fil a ete mis au point pour etendre les services multimedias ä large bände assures par des reseaux MTA fixes au milieu des communications mobiles et sans fil de maniere efficace et transparente. C'est un choix approprie de mise en reseau sans fil qui pourrait etre employee dans l'avenir pour les reseaux militaires tactiques dont le reseau federateur fonctionne dejä en MTA. La faible largeur de bände et la probabilite d'erreurs associees aux liaisons sans fil opposent toutefois de serieux obstacles ä la conception de reseaux MTA sans fil.
Le present rapport fait partie d'une etude de la faisabilite de services vocales ä usage militaire empruntant des reseaux MTA sans fil. II porte sur l'incidence des erreurs survenant au niveau de la liaison sans fil sur la qualite de transmission assuree par le MTA. L'auteure y passe en revue diverses methodes de detection d'erreurs proposees pour le transport efficace des cellules MTA par l'intermediairc de liaisons sans fil point ä point. Vu l'extreme brievcte des retards admissibles dans le contextc d'applications vocales, les seules methodes dc detection d'erreurs examinees sont celles qui se fondent sur la correction d'erreur sans voie de retour (aussi dite correction d'erreur directe ou CED). L'auteure analyse l'efficacite de ces methodes ä l'egard d'un canal ou les erreurs sont aleatoires et d'un canal faconne sur le modele Gilbert-Elliott, ou les erreurs se produisent par paquets.
IV

Executive Summary
The adoption of ATM-based wireless transport architectures in future broadband wireless networks facilitates the seamless extension of fixed ATM network capabilities to the wireless environment. For this reason, wireless ATM is an attractive candidate technology for tactical networks which have adopted ATM in the core network. At the same time, the transport of ATM cells over wireless links raises challenging performance issues due to incompatibilities of the ATM technology and the wireless medium transmission characteristics.
ATM technology was originally designed for transport over high-speed, fiber-optic links, with low bit-error rates—typically of the order of 10~10—and has, therefore, limited error- control capabilities. Wireless links have limited bandwidth and are characterized by high error rates—with errors occurring both in a random and burst manner—and time-varying behavior. Wireless link errors can severely degrade the performance of ATM and the Quality of Service (QoS) provided to ATM applications.
This work investigates the effect of bit errors on the transport of ATM over point-to-point wireless links. Of particular interest are Line-of-Sight (LOS) microwave links which are preva- lent in tactical communications. The study analyzes the performance of mechanisms proposed for error control over the random-error channel and over a burst-error channel modeled by the Gilbert-Elliott channel model. The error-control mechanisms are based on Forward Error Cor- rection (FEC) and more specifically on block codes such as the Reed-Solomon (RS) and the Bose-Chaudhuri-Hocquenghem (BCH) codes.
Block codes are applied to standard ATM cells to form wireless ATM cells which are trans- mitted over the radio channel. The error-control schemes under consideration are distinguished into three categories: i) schemes where a block code is applied to the entire standard ATM cell, ii) schemes where the ATM cell header and payload are protected individually by different block codes, iii) schemes which make use of duplicate cell headers.
Key performance measures of interest for the evaluation of these schemes are the Cell Loss Ratio and the error rate of the information delivered to the ATM layer which capture the Quality of Service (QoS) provided to the ATM applications. The work herein is primarily concerned with the performance of voice applications which are quite tolerant to loss but sensitive to delays.
Most of the performance results were derived by using analytical methods based on prob- ability theory. The complexity associated with obtaining simulation results for low bit-error rates is prohibitively high. However, some simulation results were obtained by using a modified version of CRC LINKSIM with a simplified channel model.
Numerical results indicate that an error-control scheme that uses a (56,32) BCH code for the header and a (429,384) BCH code for the payload can adequately meet the performance requirements of voice over the random-error channel. In the case of the burst-error channel, the best performance with respect to Cell Loss Ratio was exhibited by a duplicate-header scheme which uses compressed headers encoded by using a (51,24) BCH code.
DREO-TR-2001-058, CRC-RP-2001-03, Performance Analysis of FEC Schemes for ATM Transport over Wireless Links, Sophia Tsakiridou, CRC, VPNT-RNS, Ottawa

Sommaire L'utilisation d'architectures de transport sans fil reposant sur le mode de transfert asyn-
chrone (MTA) dans les reseaux sans fil ä large bände facilite l'extension homogene des capacites des reseaux MTA fixes au milieu des communications sans fil. Le MTA sans fil constitue pour cette raison une technique attrayante pour les reseaux tactiques dont le reseau federateur fonc- tionne dejä en MTA. L'incompatibilite du MTA et des caracteristiques de transmission du sans-fil pose toutefois de serieux points d'interrogation quant ä l'efficacite du transport de cellules MTA par 1'intermediaire de liaisons sans fil.
Le MTA a ete mis au point pour le transport par liaisons optiques ä grande vitesse et faible taux d'erreur sur les bits—typiquement de l'ordre de 10-10—, et ses capacites de correction d'erreurs sont done limitees. Or, les liaisons sans fil occupent une faible largeur de bände et se caracterisent par un taux d'erreur eleve et un comportement qui varie selon le moment. Les erreurs survenant au niveau de la liaison sans fil, qui peuvent se produire de fagon aleatoire ou par paquets, peuvent entrainer une deterioration considerable de la transmission MTA et de la qualite de service assuree aux applications MTA.
L'auteure examine l'effet des erreurs sur le transport de cellules MTA par 1'intermediaire de liaisons sans fil,point ä point. Elle se penche en particulier sur les liaisons hertziennes en visibilite directe, qui sont les plus employees pour les communications tactiques. Elle analyse Fefficacite de methodes proposees pour la detection d'erreurs dans un canal ou les erreurs sont aleatoires et dans un canal fagonne sur le modele Gilbert-Elliott, ou les erreurs viennent par paquets. Les methodes examinees reposent sur la correction d'erreurs sans voie de retour (aussi dite correction d'erreur directe ou CED) et, plus precisement, sur des codes de blocs, tels les codes Reed-Solomon et Bose-Chaudhuri-Hocquenghem (BCH).
Les codes de blocs sont appliques aux cellules MTA standard pour former des cellules MTA sans fil, qui sont transmises dans le canal radio. Les methodes de detection d'erreurs analysees se repartissent en trois categories : i) celles ou l'on applique un code de blocs ä la cellule MTA standard entiere; ii) celles ou l'en-tete de la. cellule et les donnees utiles qu'elle renferme sont protegees par des codes de blocs distincts; iii) celles qui utilisent le dedoublement des en-tetes de cellules.
Les mesures de la qualite de transmission presentant le plus d'interet pour revaluation de ces methodes sont le taux de suppression de cellules et le taux d'erreurs de l'information livree ä la couche MTA, qui exprime la qualite de service assuree aux applications MTA. L'auteure s'est arretee surtout ä la qualite de transmission des applications vocales qui supportent assez bien les suppressions, mais sont tres sensibles aux retards.
Les resultats dont il est fait etat sont pour la plupart issus de l'application de methodes analytiques fondees sur la theorie des probabilites. La simulation de faibles taux d'erreur sur les bits est en effet trop complexe pour etre realisable. L'auteure est neanmoins parvenue ä obtenir certains resultats de simulation en utilisant une version modifiee du Systeme LINKSIM du CRC et un modele de canal simplifie.
D'apres les chiffres obtenus, l'utilisation d'une methode de detection d'erreurs employant un code BCH (56,32) pour l'en-tete et un autre code BCH (429,384) pour les donnees utiles serait adequate pour assurer la qualite de transmission vocale requise dans le canal ou les erreurs sont aleatoires. Dans le canal ou les erreurs surviennent par paquets, la methode ayant donne les meilleurs resultats du point de vue de la suppression de cellules etait celle qui supposait le dedoublement de l'en-tete et le codage des en-tetes comprimes ä l'aide d'un code BCH (51,24).
DREO-TR-2001-058, CRC-RP-2001-03, Performance Analysis of FEC Schemes for ATM Transport over Wireless Links, Sophia Tsakiridou, CRC, VPNT-RNS, Ottawa
VI

Acknowledgements
The contributions of all the members of the Wireless ATM project at CRC to this work are gratefully acknowledged.
The author would like to thank Louise Lamont for her valuable suggestions, guidance and support, and Luis Villasenor-Gonzalez for his insightful comments and assistance.
The assistance of the CRC Communications Signal Processing group in providing the LinkSim software package has been greatly appreciated. Francois Patenaude, has generously offered his expertise and guidance throughout the course of this work.
This work has been funded by the Department of National Defence, Canada.
Remer elements
L'auteure a grandement appreciee 1'assistance technique regu des membres du projet MTA sans fil.
L'auteure remercie Louise Lamont pour ses nombreuses suggestions, sa supervision et sou- tien tout au long du projet, ainsi que Luis Villasenor pour ses commentaires perspicaces et pour son aide.
Le groupe de traitement de signaux de telecommunications du CRC a egalement contribue au projet en fournissant le logiciel LinkSim ainsi que leur experience avec ce dernier. Frangois Patenaude a genereusement offert son expertise tout au long du projet.
Les travaux faisant l'objet du present rapport ont ete finances par le ministere de la Defense nationale, Canada.
vn

Contents
1 Effect of Channel Errors on ATM Performance 1 1.1 Introduction 1 1.2 Header Error Control 2
1.2.1 Header Error Control (HEC) Mechanism 2 1.2.2 Effect of Channel Errors on the HEC Mechanism 3
1.3 Cell Delineation 5 1.3.1 Cell Delineation Mechanism 5 1.3.2 Effect of Channel Errors on the Cell Delineation Mechanism 6
2 FEC-Based Error Control for Wireless ATM 9 2.1 Introduction 9 2.2 NATO PG/6 Proposal 10
2.2.1 System Description 10 2.2.2 Performance Over the Random-Error Channel 11
2.3 NTT Proposal 14 2.3.1 System Description 14 2.3.2 Performance Over the Random-Error Channel 14
2.4 DERA Proposal 18 2.4.1 System Description 18 2.4.2 Performance Over the Random-Error Channel 18
3 Approaches for Adapting ATM to the Wireless Medium 22 3.1 Yurie Approach 22
3.1.1 LANET Frame Structure 22 3.1.2 Cell Delineation Mechanism 23 3.1.3 Multiple Redundancy Addressing 24 3.1.4 Payload Encoding 25 3.1.5 Comments 25
3.2 GTE Tactical ATM 26 3.2.1 Wireless Environment/System Characteristics 26 3.2.2 Key Features 26 3.2.3 Tactical ATM Frame Structure 27 3.2.4 Error-Control Coding 28
4 Recommendations for Error Control Over the Random-Error Channel 31
5 Performance Over the Markov Channel 32 5.1 Introduction 32
5.1.1 Channel Model Description 32 5.1.2 Performance Analysis 33 5.1.3 Performance Measures 36 5.1.4 Performance Over the Gilbert-Elliott Channel 38
5.2 Standard ATM 40 5.2.1 Error-Detection Mode 40 5.2.2 Error-Correction Mode 43
5.3 NATO PG/6 Proposal 45
ix

5.3.1 Performance of Cell RS Codes 45 5.3.2 Performance of Cell BCH Codes 48 5.3.3 Performance Comparison of RS and BCH Codes 53
5.4 Combination Header/Payload FEC 56 5.4.1 Performance of (50,32) BCH Header/(420,384) BCH Payload Codes ... 57 5.4.2 Performance of (56,32) BCH Header/(429,384) BCH Payload Codes ... 58 5.4.3 Performance of (82,40) BCH Header/(421,376) BCH Payload Codes ... 59 5.4.4 Performance of (56,32) BCH Header/(224,192) BCH Payload Codes ... 60 5.4.5 Performance Comparison of Combination Hcadcr/Payload FEC 62
5.5 Duplicate-Header Scheme 67 5.5.1 Performance of DERA Scheme in Error-Detection Mode 67 5.5.2 Performance of DERA Scheme in Error-Correction Mode 74 5.5.3 Performance of DERA Scheme with Compressed Headers 75 5.5.4 Performance of Duplicate-Header Scheme with BCH-Encoded Headers . . 77 5.5.5 Performance of Duplicate-Header Scheme with BCH-Encoded Compressed
Headers 78 5.5.6 Performance Comparison of Duplicate-Header Schemes 80
6 Recommendations for Error Control Over the Markov Error Channel 83
A Derivation of probabilities Pdis and Pund 87
References 88
List of Figures
1 HEC operation state transition diagram 2 2 HEC verification flow diagram 3 3 HEC performance in mixed and detection modes 4 4 CLR performance in mixed and detection modes 4 5 Cell delineation state diagram 5 6 Tsync and Tacq for the ITU-T recommended cell delineation mechanism 7 7 Frame structure for Synchronous Transport Signal Level 1 (STS-1) 8 8 Block structure of wireless ATM cell for the PG/6 proposal 10 9 PG/6 error-control scheme performance 12 10 BCH code performance 13 11 Block structure of wireless ATM cell for the NTT proposal 14 12 Header BCH code CLR performance 15 13 Payload BCH code Residual BER performance 16 14 DERA link hardening scheme 18 15 Wireless ATM cell structure proposed for voice transmissions 18 16 Duplicate-header scheme performance - Header-error detection case 19 17 Duplicate-header scheme performance - Header-error correction case 20 18 LANET frame structure 22 19 LANET cell delineation state diagram 23 20 LANET cell delineation algorithm performance 24 21 Tactical ATM frame structure 27 22 Channel model 34 23 Data block structure for performance analysis 35 24 State transition diagram of Gilbert-Elliott channel model 38 25 Sample realization of process {en}n>i 38 26 Analytical results for standard ATM over the GE channel in HEC detection mode. 40 21 Analytical results for standard ATM over the GE channel in HEC detection mode. 42 28 Analytical results for standard ATM over the GE channel in HEC correction mode. 42 29 Analytical results for standard ATM over the GE channel in HEC detection and
correction modes 43 30 Analytical results for the PG/6 error-control scheme over the GE channel. ... 46 31 Analytical and simulation results for the (59,53) RS code over the GE channel. 47 32 Analytical results for the (469,424) BCH and (478,424) BCH codes over the GE
channel 49 33 Comparison of analytical results for the (469,424) BCH and (478,424) BCH codes
over the GE channel 50 34 Analytical and simulation results for the (469,424) BCH code over the GE channel. 51 35 Analytical and simulation results for the (478,424) BCH code over the GE channel. 51 36 Analytical and simulation results for the (469,424) BCH and (478,424) BCH
codes over the GE channel 52 37 Comparison of analytical results for the RS and BCH codes over the GE channel. 53 38 Comparison of simulation results for the RS and BCH codes over the GE channel. 55 39 Analytical results for the (50,32) BCH header/(420,384) BCH payload codes over
the GE channel 57
xi

40 Analytical results for the (56,32) BCH header/(429,384) BCH payload codes over the GE channel 58
41 Analytical results for the (82,40) BCH headery'(421,376) BCH payload codes over the GE channel 59
42 Analytical results for the combination (56,32) BCH header code and (224,192) BCH payload code over the GE channel 61
43 Performance comparison of CLR for combination header/payload BCH codes. . 62 44 Performance comparison of CER for combination header/payload BCH codes. . 63 45 Performance comparison of PER for combination header/payload BCH codes. . 63 46 Performance comparison of PBER for combination header/payload BCH codes. 64 41 Performance comparison of CLR for combination header/payload BCH codes. . 65 48 Performance comparison of CER for combination header/payload BCH codes. . 65 49 Performance comparison of PER for combination header/payload BCH codes. . 66 50 Performance comparison of PBER for combination header/payload BCH codes. 66 51 Wireless ATM cell structure for the DER A error-control proposal 67 52 Analytical results for the DERA duplicate-header scheme over the GE channel in
HEC detection mode (payload size = 384) 68 53 Analytical results for the DERA duplicate-header scheme over the GE channel in
HEC detection mode for different values of payload size Nx 71 54 Wireless ATM cell structure for the duplicate-header control scheme (scenario 2). 72 55 Analytical results for different scenarios of the duplicate-header scheme over the
GE channel in HEC detection mode (payload size = 384) 72 56 Analytical results for the duplicate-header scheme (scenario 2) over the GE chan-
nel in HEC detection mode for different values of payload size N\ 73 51 Analytical results for the DERA duplicate-header scheme over the GE channel in
HEC correction mode (payload size = 384) 74 58 Analytical results for the DERA duplicate-header scheme over the GE channel in
HEC detection mode (compressed headers) 75 59 Analytical results for the DERA duplicate-header scheme over the GE channel in
HEC correction mode (compressed headers) 76 60 Analytical results for the duplicate-header scheme over the GE channel with (56,32)
BCH header code 77 61 Analytical results for the duplicate-header scheme over the GE channel with (48,24)
BCH header code 78 62 Analytical results for the duplicate-header scheme over the GE channel with (51,24)
BCH header code 79 63 Performance comparison of CLR for duplicate-header schemes 80 64 Performance comparison of CER for duplicate-header schemes 81 65 Performance comparison of PER for duplicate-header schemes 81 66 Performance comparison of PBER for duplicate-header schemes 82 61 CLR. performance comparison 83 68 CER. performance comparison 84 69 PER performance comparison 84 10 PBER performance comparison 85 11 Performance comparison 86
xii

List of Tables
1 Block code performance 13 2 Header BCH code performance 15 3 Payload BCH code performance 16 4 Separate header and payload encoding - BCH code performance 17 5 BCH header and payload code performance 30 6 Block code performance over the random-error channel 31 7 Comparison of analytical results for the RS and BCH codes over the GE channel. 54
xni

1 Effect of Channel Errors on ATM Performance
1.1 Introduction
ATM was designed for high-speed, highly reliable fiber-optic links. Wireless links, however, are typically characterized by limited bandwidth, high error rates—with errors occurring both in a random and burst manner—and time-varying behavior. The impact of transmission link errors on the performance of ATM is addressed in this section with focus on high error rates which are typical of wireless links.
The adaptation of ATM to the physical transmission medium is performed by the physical layer interface. ATM physical layer standards exist for media such as optical fiber and coaxial cable, while protocols for lower rate, unreliable media are currently under development. In prin- ciple, existing physical layer protocols can be used for transmission over wireless links provided that adequate bandwidth is available. However, the protocol performance and consequently the performance of ATM may be significantly impaired by high error rates.
Key physical layer functions affected by errors are Header Error Control and Cell Delin- eation, as well as Frame Synchronization, whenever a frame-based transmission format is used. These functions are provided for by the Transmission Convergence (TC) sublayer of the physical layer interface. Header error control protects the ATM cell against errors in the header. It is also used in the cell delineation process. Cell delineation and frame synchronization are responsible for identifying cell and frame boundaries, respectively.
The ATM header error control and cell delineation mechanisms, which have been designed for low-error-rate transmission media, are susceptible to transmission errors. Bit errors in the ATM cell header may result in the loss of ATM cells, either directly due to the HEC mechanism, or indirectly due to the loss of cell synchronization by the cell delineation process which relies strongly on the integrity of the cell header. Cell synchronization fails when an adequate number of consecutive corrupted headers is detected. The loss of cell synchronization results in the discarding of consecutive ATM cells during the process of acquiring synchronization.
Transmission errors degrade the ability of the cell delineation process to maintain and acquire cell synchronization by inducing false loss of synchronization and by increasing the acquisition time required to regain synchronization following a loss-of-synchronization event.
When ATM cells are transported by using frame-based transmission formats such as the Synchronous Digital Hierarchy (SDH) or the Plesiochronous Digital Hierarchy (PDH), the per- formance of the frame synchronization mechanism may be affected by errors in the frame struc- ture. Much as in the case of the cell delineation process, transmission errors affect the ability of the framing process to maintain and acquire frame synchronization. The loss of frame synchro- nization causes the loss of information bits for the duration of the frame acquisition time and may, therefore, result in the discarding of successive ATM cells, which, in turn, may affect the cell delineation process.
The impact of transmission errors on the HEC and cell delineation mechanisms is addressed in detail in the following subsections.
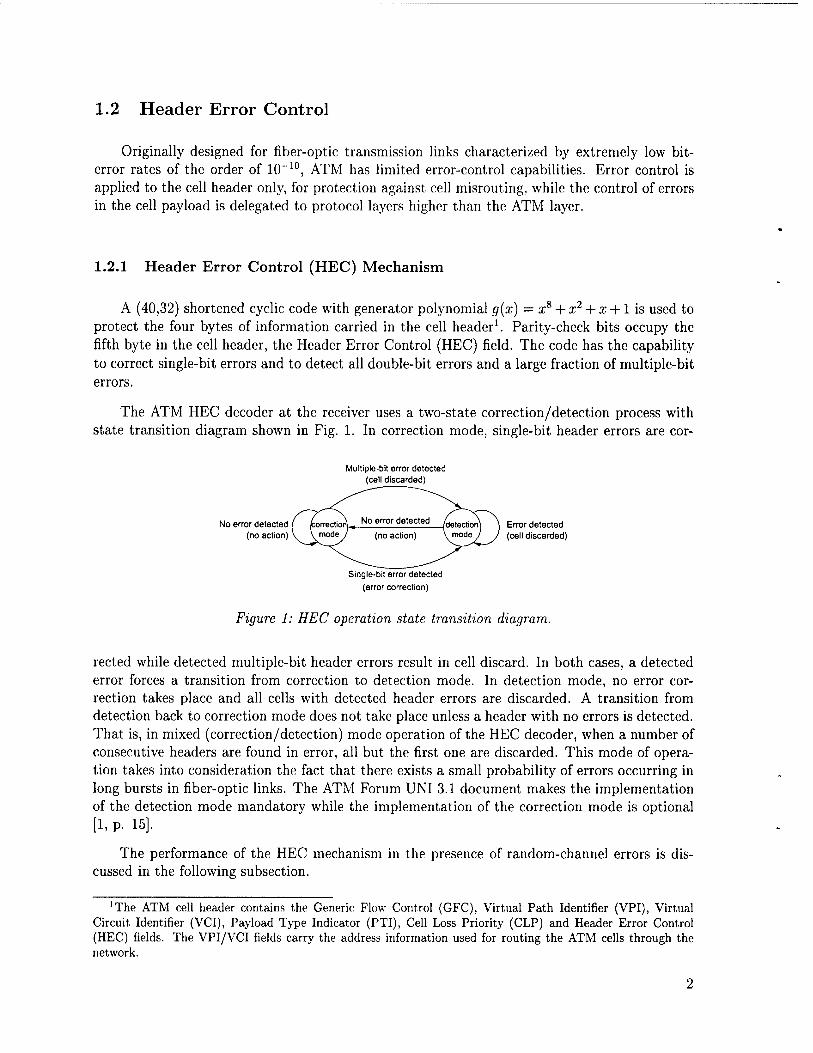
1.2 Header Error Control
Originally designed for fiber-optic transmission links characterized by extremely low bit- error rates of the order of 10~"10, ATM has limited error-control capabilities. Error control is applied to the cell header only, for protection against cell misrouting, while the control of errors in the cell payload is delegated to protocol layers higher than the ATM layer.
1.2.1 Header Error Control (HEC) Mechanism
A (40,32) shortened cyclic code with generator polynomial g(x) = xs + x2 + x + 1 is used to protect the four bytes of information carried in the cell header1. Parity-check bits occupy the fifth byte in the cell header, the Header Error Control (HEC) field. The code has the capability to correct single-bit errors and to detect all double-bit errors and a large fraction of multiple-bit errors.
The ATM HEC decoder at the receiver uses a two-state correction/detection process with state transition diagram shown in Fig. 1. In correction mode, single-bit header errors are cor-
Multiple-bit error detected (cell discarded)
No error detected I fcnrrArtinnj . NO error aeteciea /Hp)ar.iinn'j \ Error detected (no action) y \modeJ (no action) x^modey J (cell discarded)
Single-bit error detected (error correction)
Figure 1: HEC operation state transition diagram.
rected while detected multiple-bit header errors result in cell discard. In both cases, a detected error forces a transition from correction to detection mode. In detection mode, no error cor- rection takes place and all cells with detected header errors are discarded. A transition from detection back to correction mode does not take place unless a header with no errors is detected. That is, in mixed (correction/detection) mode operation of the HEC decoder, when a number of consecutive headers are found in error, all but the first one are discarded. This mode of opera- tion takes into consideration the fact that there exists a small probability of errors occurring in long bursts in fiber-optic links. The ATM Forum UNI 3.1 document makes the implementation of the detection mode mandatory while the implementation of the correction mode is optional [1, p. 15].
The performance of the HEC mechanism in the presence of random-channel errors is dis- cussed in the following subsection.
'The ATM cell header contains the Generic Flow Control (GFC), Virtual Path Identifier (VPI), Virtual Circuit Identifier (VCI), Payload Type Indicator (PTI), Cell Loss Priority (CLP) and Header Error Control (HEC) fields. The VPI/VCI fields carry the address information used for routing the ATM cells through the network.

1.2.2 Effect of Channel Errors on the HEC Mechanism
According to the HEC operation, there are three possible outcomes of a HEC check when a cell with header errors is received:
• the cell may be discarded,
• the cell may be forwarded to the ATM layer with no header errors following successful error correction, and,
• the cell may be forwarded to the ATM layer with undetected header errors, including errors due to incorrect correction in mixed mode.
These three possible outcomes are depicted in Fig. 2.
No error in header
Error(s) in header
delivered iA layer
"
Valid cells toATf
1 1 Discarded Cells delivered to ATM
cells layer with errored headers
Figure 2: HEC verification flow diagram.
Cells with undetected header errors in the VPI/VCI fields will be misrouted and eventually lost. In addition, these cells may affect the integrity of other connections. For example, the undetected change of the VPI/VCI fields to the address of another connection will result in cell misinsertion.
The performance of ATM HEC mechanism with respect to cell loss in the presence of link errors can be captured by
• the probability that a cell is discarded, Pdis, and,
• the probability that a cell header error is undetected, Pund.
Numerical results for Pdis and Pund versus the channel Bit-Error Rate (BER) p in mixed and pure detection modes are presented in Fig. 3. Channel errors are assumed to be randomly distributed. These results have been obtained by applying the methodology described in [2, p. 18]; the codeword weight distribution for the HEC CRC code is provided in [3]. Note that the probability of cell discard Pdis is lower in mixed than in detection mode, due to single-bit error correction in mixed mode. This, however, is achieved at the expense of a higher undetected error rate Pund in mixed mode, caused by incorrect error corrections, as shown in Fig. 3.
The Cell Loss Ratio (CLR) QoS parameter is easily obtained from
CLR = Pr{cell is lost} Lost Cells
Total Transmitted Cells *dis t -*i undt (1)

BER p
Figure 3: EEC performance in mixed and detection modes.
Figure 4: CLR performance in mixed and detection modes.
it is plotted as a function of the BER in Fig. 4 for the two modes of operation. For small values of BER p, the CLR in mixed mode is lower than the CLR in pure detection mode by several orders of magnitude. For fiber-optic links where typically p < 10~9, the CLR in pure detection mode is less than 10~7 and, therefore, sufficiently low to support ATM applications. This explains why the implementation of mixed mode in ATM switches is optional. Furthermore, mixed mode results in a higher probability of undetected header errors than does detection mode, as illustrated in Fig. 3 and, in consequence, in higher Cell Misinsertion Rate (CMR). For BERs in the range of 10~6-10~3, which is typical of wireless links, the CLR ranges from 4 x 10"5 to 3.9 x 1CT2 in detection mode and from 2.4 x 10"9 to 2.3 x 10"3 in mixed mode. The CLR performance of the HEC mechanism at BER p = 1CT3 is inadequate for most ATM applications in both operation modes.

1.3 Cell Delineation
The Cell Delineation process of the transmission convergence sublayer is responsible for the identification of cell boundaries in a stream of ATM cells [4].
1.3.1 Cell Delineation Mechanism
Cell delineation is based on the validity of the Header Error Control (HEC) check. If the process finds the correlation between the header bits to be protected (the first 4 bytes of the cell header) and the relevant control bits (the 5th byte of the cell header, which is the HEC field) correct, then it searches for the next header after 48 bytes.
Cell delineation is performed according to the state transition diagram shown in Fig. 5. The
Correct HEC
Bit-by-bit ( HUNT 1 ( PRE; j Ce||.by.ce||
search search
a consecutive' incorrect HECs
SYNC , 8 consecutive
. „. „ - correct HECs Cell-by-cell
search
Figure 5: Cell delineation state diagram.
process is in the SYNC state when the receiver is synchronized at cell boundaries. Synchroniza- tion is assumed to be lost if an incorrect HEC is obtained a times consecutively. In this case, the process makes a transition from the SYNC to the HUNT state.
In the HUNT state, the delineation process performs a bit-by-bit search for the correct HEC. Once a match has been found, it is assumed that one header has been found and the process makes a transition to the PRESYNC state.
In the PRESYNC state, the process performs a cell-by-cell search for the correct HEC. The process repeats until the correct HEC has been confirmed 5 times consecutively, at which point the process moves to the SYNC state. If an incorrect HEC is found, the process returns to the HUNT state.
Cells with correct HECs (or cell headers with single-bit errors which are corrected) that are processed while in the SYNC state are passed to the ATM layer. Any cells received while the process is in the HUNT or PRESYNC state are discarded.
Parameters a and Ö are associated with the declaration of loss of synchronization and the declaration of acquisition of synchronization by the cell delineation process, respectively. The larger the value of a, the longer the time required for the process to declare loss of synchroniza-

tion. Similarly, the larger the value of 5, the longer the time required to declare acquisition of synchronization.
The choice of values for a and S is subject to conflicting performance requirements. More specifically, small values of a will reduce the response time of the cell delineation process in the event of true loss of synchronization, but will also increase the probability of "false" declaration of loss of synchronization, caused inadvertently by transmission errors. In the case of 6, small values will reduce the time required to acquire synchronization at the expense of increasing the probability of falsely declaring synchronization, due to random bit sequences passing the HEC check. The values a = 7 and 6 = 6 are recommended by ITU-T specification 1.432 [4].
1.3.2 Effect of Channel Errors on the Cell Delineation Mechanism
Cell delineation relies on the correctness of ATM cell headers for maintaining and acquiring synchronization; it is therefore impaired by high link-error rates. Errors affect cell delineation by falsely declaring loss of synchronization and by increasing the time required to acquire syn- chronization. These effects are addressed in the following subsections.
Loss of Cell Synchronization The failure of a consecutive HEC checks, caused by errors in the ATM cell headers, is perceived by the delineation process as loss of synchronization when in fact the receiver is synchronized at cell boundaries. In consequence, the length of time during which the process perceives to be synchronized to the received cell stream decreases in the presence of errors.
The average time spent in the SYNC state before a transition to the HUNT state is forced by bit errors, denoted by Tsync, is a measure of the effect of errors on the loss of synchronization. Tsync can be easily obtained as a function of the BER, for errors that occur independently, based on the theory of Bernoulli trials. The average number of trials until the first occurrence of m consecutive successes in a sequence of Bernoulli trials with probability of success ps is given by [5, p. 117]
£ i=1 sPsJ (l-Ps)P? ' V '
Based on the cell delineation algorithm, a transition from the SYNC to the HUNT state takes place whenever a consecutive cells fail the HEC check. The probability of HEC check failure Pj can be expressed in terms of the BER p as
Pj = Pr{errored cell header}
= 1-(1-P)n,
where n is the length of the cell header.
TSync, measured in cell time units, is obtained from Eq. 2 by substituting a for m and Pf for ps:
l-Pf Tsync = n _ pf)p<* - (3)

For p < IQ-3, Ts sync
For
Results for Tsync as a function of p for a = 7 are shown in Fig. 6
is dominated by the term — « -—— and, therefore, varies exponentially with \jp
p = 10-3, Tsync = 7.28 x 10⁹ cell time units, the equivalent of 4.82 x 10⁷ seconds or 18.6 months for transmission rate of 64 kb/s. For transmission rate of 2,048 kb/s, Tsync is 1.51 x 10⁶ seconds or 17.4 days. Therefore, the performance of the cell delineation process with respect to loss of synchronization is satisfactory for BERs up to 10~3 and transmission rates between 64 and 2,048 kb/s. As the BER increases beyond 10-3 the performance degrades beyond acceptable levels for the same transmission rate range. For example, for p = 10-2, Tsync = 3.43 x 10³ cell time units which translates into 22.73 seconds for 64 kb/s and 0.71 seconds for 2,048 kb/s.
Figure 6: Tsync and Tacq for the ITU-T recommended cell delineation mechanism.
Acquisition of Cell Synchronization When synchronization is lost, the cell delineation state machine makes a transition to the HUNT state and searches every bit position in the cell for a correct header. A successful HEC check does not necessarily imply that a correct header has been found; a random pattern may match the header with probability Ps — (1/2)8. Synchronization is acquired after 5 consecutive correct headers have been confirmed at the same position in the cell in the PRESYNC state. That is, a minimum of 6 + 1 header checks— corresponding to, roughly, 6 + 1 cell time units—is required to acquire synchronization.
The maximum average synchronization acquisition time, Tacq, defined as the average time required for the delineation process to make a transition from the HUNT to the SYNC state when the maximum number of bit positions is tested, can be obtained as a function of the BER, for random errors, from the formula derived in [6]:
Lacq p6+ ± c ?+1l (N-l)
l-Ps + 1 - p*+1
(4)
where Pc — (1 - p)n is the probability of a header without errors and iV = 424 is the cell length. Tacq is measured in cell time units. Results for Tacq as a function of p for 5 — 6 are shown in Fig. 6. For p < 10-3, Tacq takes values close to the minimum value of 7 cell time units

(Tacq < 10.44). Thus, the performance of the cell delineation process with respect to acquisition remains satisfactory up to p = 10~3. As the value of p increases beyond 10~3, the value of Tt
grows rapidly to levels that are unacceptably high. For example, for p = 10 -2 acq
Tacq = 65.87 cell time units.
Remark A continuous stream of ATM cells has been assumed in the derivation of Tsync (Eq. 3) and Tacq (Eq. 4), whereas in practice a frame overhead may interrupt the flow of cells whenever a frame structure is used for cell transport. The Synchronous Optical Network (SONET) and the Plesiochronous Digital Hierarchy (PDH) are examples of frame-based interfaces for ATM cell transport. In the SONET Synchronous Transport Signal Level 1 (STS-1) frame, overhead and payload bytes are transmitted (received) in an alternating fashion; four overhead bytes followed by 86 payload bytes as shown in Fig. 7 [7, p. 329]. Given the relatively low percentage of overhead per frame, the effect of the overhead on Tsync and Tacq can be ignored.
-3 octets- - 90 octets -
- 86 octets"
Figure 7: Frame structure for Synchronous Transport Signal Level 1 (STS-1).

2 FEC-Based Error Control for Wireless ATM
2.1 Introduction
Prom the discussion on the effect of channel errors on the performance of standard ATM in Section 1, it becomes clear that the CLR performance of standard ATM is severely degraded in the presence of wireless-link errors. In consequence, the use of error-control mechanisms is necessary to enable the effective transport of ATM over wireless links and the support of the QoS requirements of the ATM service classes.
Error-control mechanisms applied to communication networks are distinguished in three categories: mechanisms based on Forward Error Correction (FEC), mechanisms based on Auto- matic Repeat Request (ARQ) and hybrid mechanisms that combine FEC and ARQ. ARQ-based error-control mechanisms may introduce long and unpredictable delays due to retransmissions and are not well-suited for delay-sensitive, constant-bit-rate applications such as voice. This study is focused on the use of FEC for the support of voice services over wireless ATM.
The issue of error control in wireless communication networks is addressed in [8], where alternative general approaches to error control are reviewed and proposals for error control in Wireless ATM are summarized. Some aspects of FEC control in the wireless ATM environment are discussed in [9]. General considerations on the optimization and adaptation of FEC and other error-control algorithms for application to Wireless ATM are also presented in [10].
Error-control mechanisms that have been proposed for the transport of ATM cells over point-to-point wireless links, and which are based on FEC, can be classified into three groups:
a. mechanisms where FEC is applied to the ATM cell stream and all bits are treated identically,
b. mechanisms where FEC is applied independently to the header and payload of the ATM cell and where all cells are treated identically irrespective of the QoS requirements of the connection they belong to, and,
c. mechanisms where FEC is applied independently to the header and payload of the ATM cell and where, moreover, payload FEC is applied on a per Virtual Circuit (VC) basis according to the service class QoS requirements.
The first group includes the Reed-Solomon encoding scheme proposed in the Phase 2 Re- port of the NATO Project Group 6 (PG/6) [11, 12]. It also includes the concatenated Reed- Solomon/Convolutional code approach adopted in the error-control architecture presented in [2,13] and considered in [14]. The concatenated RS/convolutional code scheme has been adopted as the baseline FEC algorithm in the Transmission Error Control System of the Survivable ATM architecture [15].
In the first group of mechanisms, header and payload bits in an ATM cell stream are treated identically and protected equally against errors. However, for a given application, the tolerance of the ATM header to errors may differ significantly from the tolerance of the payload. This is true in particular for error-tolerant applications such as voice. The encoding of the cell header and payload by separate codes provides flexibility in choosing the codes that satisfy the application requirements for cell loss and cell errors in the most efficient manner. In contrast,
9

a mechanism where error correction is applied to the ATM bit stream indiscriminately must satisfy the application requirements on both Cell Loss Ratio and Cell Error Rate and must, therefore, be designed to satisfy the most stringent of the two constraints.
The approach of applying FEC separately to the header and payload has been adopted in the error-control scheme for tactical ATM proposed by GTE Government Systems [16, 17]. The same principle is the basis for the approach presented in [18, 19], although the work is not intended specifically for tactical ATM.
The error-control approach proposed for tactical ATM by the Defence Evaluation and Re- search Agency (DERA) [20, 21] is different from the above in that it recommends applying FEC to the ATM bit stream (channel encoding) as well as increasing header protection by duplicating the header of the standard ATM cell for transmission over the wireless link.
In the second group of mechanisms, encoding is applied to every cell in the stream of mul- tiplexed ATM connections in an identical manner at the TC sublayer. In standard ATM, cells belonging to different ATM connections are not distinguishable at the TC sublayer. Conse- quently, error control cannot be applied on the basis of the QoS requirements of the individual service classes but rather has to be performed on the basis of the least error-tolerant service class using the link. Applications with less stringent requirements will be protected with encoding schemes more powerful than necessary with the potential of wasted bandwidth. Alternatively, FEC can be applied to the ATM cell payload on a per-VC basis at the AAL layer [22, 23, 24].
The performance of the error-control mechanisms for ATM transport over wireless point-to- point links proposed by the NATO PG/6 group, NTT and DERA is addressed in the following.
2.2 NATO PG/6 Proposal
2.2.1 System Description
The NATO PG/6 group has proposed a simple FEC scheme based on Reed-Solomon codes for the TACOMS Post-2000 project [11, 12]. In the proposed scheme, the standard ATM cell is encoded using a (59,53) shortened RS code defined over GF(28) (Fig. 8). The code has
Standard ATM cell FEC
Wireless A TM cell
Figure 8: Block structure of wireless ATM cell for the PG/6 proposal.
error-correcting capability t = 3 bytes and code rate r = 0.90.
In the following subsection it is shown that the code achieves CLR < 1.3 x 10"3 and Residual BERpreSi6 < 8 x 10~5 for BER p < 10~3 over the random-error (Additive White Gaussian Noise - AWGN) channel.
10

2.2.2 Performance Over the Random-Error Channel
Given an (n,k) RS code with m-bit symbols and symbol-correcting capability t and consid- ering bounded-distance decoding, the probability of incorrect decoding of a received codeword is given by the probability that the number of errored codeword symbols exceeds t [25, p. 219]:
A" = E ("W - *•)""' = l ~ E ("W - Ps)n~j. (5)
Probability ps denotes the symbol-error probability and is given by:
p* = E mW -p)m~j =1 - (i -p)m>
for m-bit symbols and random-error channel BER p. The quantity pw includes contributions due both to undetected and detected errors.
Under the assumption that all incorrect decoding events result in codeword (cell) discard, the probability of incorrect decoding pw is equal to the CLR. Therefore, pw is an upper bound for CLR.
Results for pw for shortened RS codes defined over GF(28) with k = 53 information symbols (the size of an ATM cell), derived by means of Eq. 5, are shown in Fig. 9(a) for different values of code error-correction capability t (1 < t < 6).
The residual BER (or post-decoding bit-error probability) bounded by [25, p. 333]:
2m-i » j +1 (n
j=t+i *-* = ^n £J-^ Qrfd - ?■)->, «o
can also be useful in evaluating the performance of the proposed scheme. The residual BER cannot be directly associated with performance measures of interest like the payload bit-error rate by analytical means. However, it is expected in general that the lower the value of pres,b, the better the performance of the encoding scheme. Results for pres,b are shown in Fig. 9(b). Note that for random BER p = 10"3, the (59,53) RS code achieves CLR = 1.3 x 1CT3 and Pres,b — 7.8 x 1CT5. The CLR achieved by this encoding scheme for p — 10-3 is almost the same as the CLR achieved by using traditional HEC in mixed mode (2.3 x 10⁻³).
The CLR and residual BER performance for p < 10-3 will improve by increasing the number of information symbols per codeword from k = 53 to k = 106 (two ATM cells per codeword) and maintaining the same code rate r = 0.90 as illustrated by the results of Figs. 9(c) and 9(d), respectively. In this case, the CLR is given by CLR = 2pw, since the discard of a single codeword results in the discard of two successive ATM cells. More specifically, the (118,106) code with rate r = 0.90 and t = 6 symbols achieves, for p = 10~3, CLR = 5 x 10~5 and pres>b = 2.8 x 10⁻⁶ compared to 1.3 x 10⁻³ and 7.8 x 10⁻⁵, respectively, achieved by the (59,53) code. This performance improvement is achieved at the expense of increased encoding delay introduced by the processing of ATM cells in pairs.
For completeness, the performance of the (59,53) RS code is compared to that of shortened BCH codes from the class of original BCH codes with block size equal to 511. For an (n,k) BCH
11

(n,53) Reed-Solomon code performance (n,53) Reed-Solomon code performance
„ =-=-*■"~Z^*^-^^y^
: RStsSjS^ .-J*'— ̂ y^ySyY'y'
1 _ , S&WSÖ^^^ ^^*^y.
;.—--''RS(59,53ir----^^ y^ j^ /
*^*s($\sa\, y^ s*
*sfet)s$s,%\S /
J^(65.53L/
•*- RS(55,53)t=1,r=0.96 -♦- RS(57,53) t=2, r=0.93 -•- RS(59,53) 1=3, r=0.90 - RS(61,53)t=4, r=0.87 -*- RS(63,53) t=5, r=0.84 -r- RS(65,53) 1=6, r=0.82 - - CRC(40.32) detection mode - - CRC(40,32) mixed mode
„10"
RSi5543*-"— \*^**\^^
V.Sl^Sl^'^ ^ _^\/ / r^"^ VSIfIZßOir S's'
■^^^RS(61^3K y/yS ■
^/H&faspr yS
' •*- RS(55,53)t=1,r=0.96 -»- RS(57,53) t=2, r=0.93 ■*- RS(59,53) 1=3, r=0.90 " — RS(61,53)t=4, r=0.87 -*- RS(63,53) 1=5, r=0.84 -T- RS(65,53) 1=6, r=0.82
10 BER p
10 BER p
(a) CLR (b) Residual BER
(n,106) Reed-Solomon code performance (n,106) Reed-Solomon code performance
• RS(108,106)t=1,r=0,98 ■ RS(110.106)t=2, r=0.96
RS(112.106)t=3, r=0.95 • RS(114,106)t=4, r=0.93
RS(116,106)t=5, r=0 91 ■ RS(118,106) t=6, r=0.90
RSflOSJDSt» \-^~^Z^^y
1 " RS(110JDSf ^^^^^/^
r-—^RS(112JQ6f^ ^^y'y'
^^RS(114,1(Jßp— s^ yS
^^«S(116.106r yS
Rg(\w.i<x>ir
-*- RS(108,106)l=1,r=0.98 -♦- RS(110,106)t=2, r=0,96 -«- RS(112,106)t=3, r=0.95 " — RS(114,106)t=4, r=0.93 -»- RS( 116,106)1=5,1=0.91 -r- RS(118,106)t=6, r=0.90
10 BER p
10 ' 10- BER p
(c) CLR (d) Residual BER
Figure 9: PG/6 error-control scheme performance.
code, pw and pres,b are obtained from Eqs. 5 and 6, respectively, for m — 1. Results for the two quantities for different values of bit-error-correcting capability t are shown in Fig. 10.
Note that for p = 10~3 the (469,424) BCH code with rate r = 0.90 and t = 5-bit error- correcting capability outperforms both the (59,53) RS code and the (118,106) RS code by achiev- ing CLR = 9.6 x 10⁻⁶ and preSjb = 2.1 x 10"7. For p = 10-5, the (59,53) RS code is outperformed by the BCH code, which in turn is outperformed by the (118,106) RS code. These performance comparison results are tabulated in Table 1.
Pr
Furthermore, the (487,424) BCH code (r = 0.87, * = 7) achieves CLR < 4.84 x 10" < 1.5 x 10~9 for p < 10~3.
and
Remarks The (469,424) BCH code outperforms the (59,53) RS code of equal code rate 0.90 over the random-error rates of interest (10-6 < p < 10~3). It should be pointed out,
12

■ BCH(460,424) t=4, r=0.92 ■ BCH(469,424) 1=5, r=0.90 ■ BCH(478,424) t=6, r=0.89 • BCH(487,424) t=7, n=0.87
BCH(496,424) t=8, r=0.85 ■ BCH(505,424) t=9, F0.84
CRC(40,32) detection mode CRC(40,32) mixed mode
10 BER p
10"'
10"s
io-10
/^JT^
JO"" BCH(460,424^-^^\^^V^«^/ yS
*«-, -
io-25
^^BCH[4«<424) yr ■
10"3" ■ ^^CH(505.424i/ -
10"35
10""
,n"45
-*- BCH(460,424) t=4, r=0.92 -»- BCH(469,424)t=5,p=0.90 -»- BCH(478,424) t=8, r=0.89 •— BCH(487,424) (=7,1=0.87
BCH(496,424) 1=8, (=0.85 -T- BCH(505,424) t=9, r=0.84
1<T BER p
(a) CLR (b) Residual BER
Figure 10: BCH code performance.
Code rate t (symbols) Channel BER (p) CLR Pres,b
RS (59,53) 0.90 3 AWGN 10"3 1.3 x IO-3 7.8 x IO"5
RS (118,106) 0.90 6 AWGN io-3 5.0 x IO"5 2.8 x IO-6
BCH (469,424) 0.90 5 AWGN 10~3 9.6 x IO"6 2.1 x IO"7
RS (59,53) 0.90 3 AWGN IO"5 1.9 x IO"11 1.1 x IO"12
RS (118,106) 0.90 6 AWGN IO"5 1.1 x IO"18 6.1 x IO"20
BCH (469,424) 0.90 5 AWGN 10~5 1.4 x IO"17 3.3 x IO"19
Table 1: Block code performance.
however, that in the burst-error environment RS codes have the advantage of being inherently resistant to burst errors of length less than or equal to the symbol size.
13

2.3 NTT Proposal
2.3.1 System Description
In the approach presented in [19], BCH codes are considered for header and payload error control. A wireless ATM cell for transmission over the radio link is formed from the standard ATM cell by removing the HEC byte and replacing it with the parity-check bits of a BCH code stronger than the 8-bit HEC CRC. Moreover, the parity-check bits used for the protection of the payload are appended to the standard cell. The structure of the wireless ATM cell for this proposal is illustrated in Fig. 11; fields FECQ and FECi indicate the parity-check bits for the header and payload codes, respectively. At the receiving end, the wireless ATM cell header
Header FECo Payload FECj
H Wireless ATM cell H
Figure 11: Block structure of wireless ATM cell for the NTT proposal.
is checked for correctness. Wireless ATM cells with detected uncorrectable header errors are discarded, while cells with no detected header errors are reverted to standard ATM cells by removing the header parity-check bits and reintroducing the HEC byte as well as decoding the payload FEC. Note that an undetected error in the ATM cell header will result in cell misrouting and, eventually, in cell discarding.
The performance of the NTT proposal with respect to the CLR and the Residual BER over the random-error channel are investigated in the following subsection.
2.3.2 Performance Over the Random-Error Channel
Header BCH Code The CLR performance of the scheme is determined by the probability of incorrect codeword decoding for the header BCH code, given by Eq. 5 for m = 1:
^=E("V(I-P)B-'. i=t+i w
where t is the bit-error-correcting capability and n the block size of the code.
CLR results for shortened BCH codes obtained from the original codes of block size 63 bits are shown in Fig. 12(a) for different values of t (1 < t < 5).
The (56,32) code with t = 4 and the (59,32) code with t = 5 achieve CLR < 10-7 for p < 10-3. The (63 - £,k - £) shortened BCH codes from the class of original (63,*;) BCH codes, where k - t = 32, can provide error-correcting capability t of up to 5 bits only. Shortened BCH codes with error-correcting capability higher than 5 bits and up to 15 bits, must be sought from the class of (127,*) codes. CLR results for some of these codes (1 < t < 7) are shown in Fig. 12(b). For t < 5, the codes from the (63,*) class achieve CLR values that are slightly better (within the same order of magnitude) than those obtained from the (127,*) class for the same value of t. In addition, the former are more efficient than the latter as they are higher rate codes. Unless the desired CLR value over the random-error channel is less than 10~n for
14

(a) BGH (63,n) codes (b) BCH (127,n) codes
Figure 12: Header BCH code CLR performance.
p < 10"3 (or less than IO-5 for p < IO-2), it is preferable to use codes of the (63,A;) class. These points become evident from the performance results of Table 2.
Code rate t (symbols) Channel BER (p) CLR BCH (44,32) 0.73 2 AWGN io-3 1.3 x IO"5
BCH (50,32) 0.64 3 AWGN io-3 2.2 x IO"7
BCH (56,32) 0.57 4 AWGN io-3 3.7 x 10⁻⁹
BCH (59,32) 0.54 5 AWGN io-3 4.3 x 10~n
BCH (46,32) 0.70 2 AWGN io-3 1.5 x 10"5
BCH (53,32) 0.60 3 AWGN io-3 2.8 x IO"7
BCH (60,32) 0.53 4 AWGN io-3 5.2 x IO"9
BCH (67,32) 0.47 5 AWGN io-3 9.5 x 10⁻¹¹
BCH (74,32) 0.43 6 AWGN io-3 1.7 x IO"12
BCH (81,32) 0.40 7 AWGN 10"3 3.0 x 10"14
Table 2: Header BCH code performance.
Payload BCH Code The payload BER performance of the scheme is given by the residual BER of the payload BCH code, obtained from Eq. 6 for m = 1:
Pres,b — / j
j=t+l
j + t (n n
\p>(l-p)n->. (7)
The NTT approach recommends breaking the payload into two segments of 192 bits each and applying the same BCH code of appropriate error-correcting capability t to each segment. The codes under consideration are obtained from the class of BCH codes with block size equal to 255 through shortening; results for the residual BER for different values of t are shown in
15

10"s
BCH(200,192^- ' ^^^ ^^^^^
JWia BCH(208.192^--^'^ ^^ S
a: UJ
w r-"'BCH(216,192i^^ -^
110-" © a. ^^BCH(224,192|/^
■
BtfH(232,192) 10 !°
in"'5
-*- BCH(200,192)t=1, r=0.96 \ -♦- BCH(208,192)t=2, r=0.92 -*- BCH(216,192)t=3, r=0.89 — BCH(224,192)I=4, r=0.86
BCH(232,192)I=5, r=0.83 I
cflo-"
BCH(393.384^_- -"""""^ JT^
I""BCH(402.384^-^"^ --"^ * // ^-^KH(411.38«^X^ -/^ ,
■ ^^BCH(420.384v/^ y^ //
BI2ft(429,384) y/ y'
BCH(438,384l/ /
BC(j(447,3841/
■
■*• BCH(393,384)t=1,[=0.98 -*- BCH(402,384) 1=2, 1=0.96 -«- BCH(411,384) 1=3, r=0.93 ■ — BCH(420,384) 1=4, r=0.91
BCH(429,384) 1=5, r=0.90 -T- BCH(438,384) 1=6. r=0.88 -*- BCH(447,384) t=7, r=0.86
10 BER p
10 BER p
(a) BCH (255,n) codes (b) BCH (511,n) codes
Figure 13: Payload BCH code Residual BER performance.
Fig. 13(a). The (224,192) BCH code with t = 4 and all the codes from the same class with higher error-correcting capability achieve residual BER < 10"6 for p < IO"3.
For p < 10~3 and the same code rate r, better residual BER values are achieved when the 384 payload bits are encoded in a single codeword by using shortened BCH codes from the original class with block size 511, as illustrated by the results in Fig. 13 and Table 3.
A residual BER value of less than 10~6 is obtained for p < IO"3 by applying the (224,192) BCH code with t = 4 or the (429,384) BCH code with t = 5 and the higher error-correcting capability codes.
Code rate t (symbols) Channel BER (p) Pres,b
BCH (200,192) 0.96 1 AWGN io-3 2.7 x 10~4
BCH (208,192) 0.92 2 AWGN io-3 3.1 x IO"5
BCH (216,192) 0.89 3 AWGN 10"3 2.4 x IO"6
BCH (224,192) 0.86 4 AWGN io-3 1.5 x IO"7
BCH (402,384) 0.96 2 AWGN io-3 1.0 x IO"4
BCH (411,384) 0.93 3 AWGN io-3 1.5 x IO"5
BCH (420,384) 0.91 4 AWGN IO"3 1.6 x IO-6
BCH (429,384) 0.90 5 AWGN io-3 1.5 x 10~7
BCH (438,384) 0.88 6 AWGN 10"3 1.2 x 10~8
BCH (447,384) 0.86 7 AWGN 10"3 8.5 x IO"10
Table 3: Payload BCH code performance.
The combination of the (56,32) BCH code for the header and the (224,192) BCH code for the payload, satisfies the constraints CLR < IO"7 and Residual BER < IO"6 for p < 10~3 over the random-error channel. The total overhead required due to coding is 88 bits, resulting in a code rate r = 416/504 = 0.83 for the entire cell. The combination of the (56,32) BCH code and
16
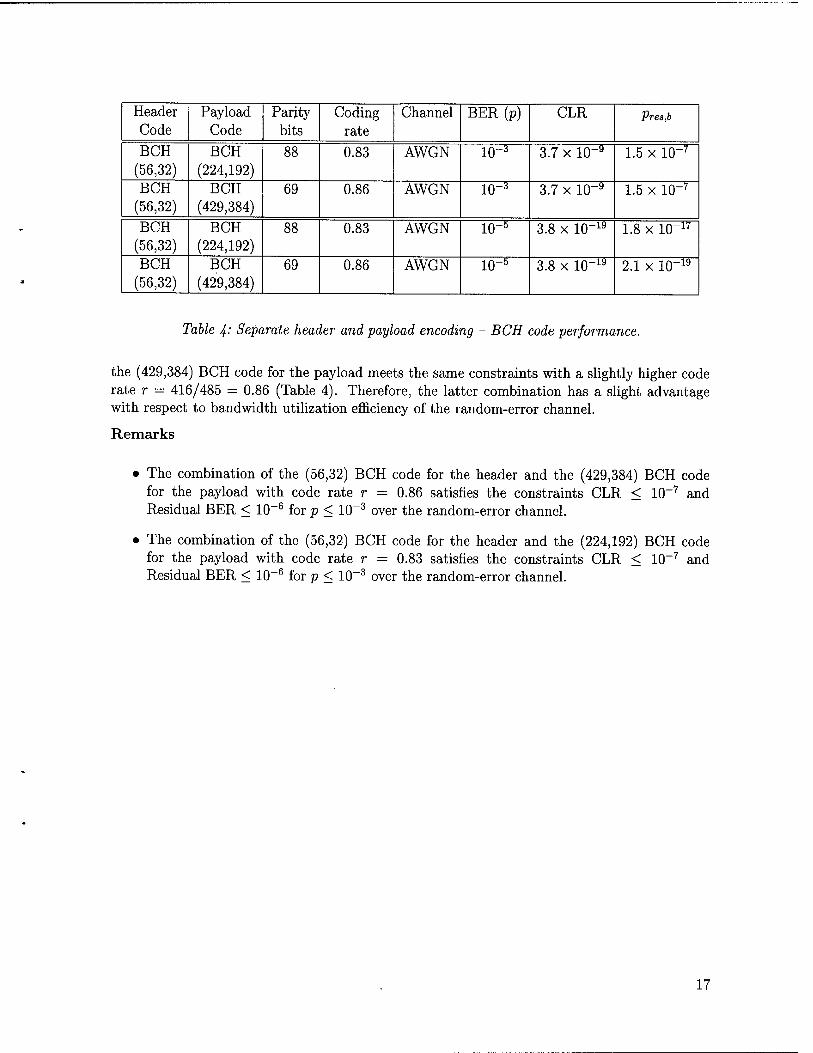
Header Code
Payload Code
Parity bits
Coding rate
Channel BER (p) CLR Pres,b
BCH (56,32)
BCH (224,192)
88 0.83 AWGN io-3 3.7 x 10~9 1.5 x IO"7
BCH (56,32)
BCH (429,384)
69 0.86 AWGN io-3 3.7 x IO"9 1.5 x IO"7
BCH (56,32)
BCH (224,192)
88 0.83 AWGN 10~5 3.8 x IO"19 1.8 x IO"17
BCH (56,32)
BCH (429,384)
69 0.86 AWGN io-5 3.8 x IO"19 2.1 x IO-19
Table 4-' Separate header and payload encoding - BCH code performance.
the (429,384) BCH code for the payload meets the same constraints with a slightly higher code rate r = 416/485 = 0.86 (Table 4). Therefore, the latter combination has a slight advantage with respect to bandwidth utilization efficiency of the random-error channel.
Remarks
• The combination of the (56,32) BCH code for the header and the (429,384) BCH code for the payload with code rate r = 0.86 satisfies the constraints CLR < 10-7 and Residual BER < 10~6 for p < IO-3 over the random-error channel.
• The combination of the (56,32) BCH code for the header and the (224,192) BCH code for the payload with code rate r = 0.83 satisfies the constraints CLR < IO-7 and Residual BER < IO-6 for p < IO-3 over the random-error channel.
17

2.4 DERA Proposal
2.4.1 System Description
An approach based on a Link Hardening Applique (LHA), that sits between a Commercial- Off-The-Shelf (COTS) ATM switch and a radio modem, has been adopted by (DERA) [20]. The purpose of the LHA is to interface to a standard ATM switch and suitably process the ATM cell stream. The processing of a standard ATM cell by the LHA at the transmitting end results in a "hardened" wireless ATM cell which is passed to a radio modem for transmission across the error-prone link (Fig. 14). The LHA at the receiving end is responsible for error recovery and for reproducing a cell with standard ATM structure from the wireless ATM cell and passing it on to the wired network. The function of the LHA is to protect ATM mechanisms against the
X LHA
t Radio Radio LHA X
Standart ATM cell
Wireless ATM cell
Wireless ATM cell
Standard ATM cell
Figure 14-' DERA link hardening scheme.
high radio-link error rates and so should be distinguished from that of a modem which merely improves the radio-link error rates to very low values comparable to those of fiber-optic links.
The structure of the wireless ATM cell is shown in Fig. 15. In this approach, the error control applied to ATM cells for protection of voice transmissions includes the use of a duplicate cell header as well as optional FEC control [21]. Note that the second cell header is placed after
Header ü Hi Payload (48 bytes) Header
o tu X
FEC (45) (optional)
Figure 15: Wireless ATM cell structure proposed for voice transmissions.
the payload, and is separated from the FEC field of length 45 by two bits. FEC is applied to the entire standard ATM cell including the duplicate cell header.
The performance of this approach when FEC is applied in addition to the duplicate header cannot be evaluated by using analytical means. The effect of the combined use of FEC and duplicate HEC check on the performance of the scheme, while of interest due to the concatenation of codes, must be addressed through simulation.
2.4.2 Performance Over the Random-Error Channel
The performance of the duplicate-header scheme in terms of CLR when FEC is not applied can be easily determined from the performance of the HEC mechanism (Section 1.2.2).
The performance of the scheme is investigated for two cases:
18

(a) header-error detection without error correction, and,
(b) header-error detection and single-bit error correction.
(a) Header-Error Detection When header-error correction is not performed, the cell discard and undetected error proba- bilities for the duplicate-header scheme, denoted by P^f and P%% respectively, can be easily derived in terms of the respective probabilities for the traditional single header HEC scheme in detection mode, P^s and Pund (Appendix A).
Under the assumptions that:
a) a cell is discarded whenever both cell headers have detected errors, and,
b) when no errors are detected in any of the two headers, one of the headers is removed in a random fashion,
Pff and P** are given by:
r>dup dis
pdup und
= P2 ± disi
= *und\l i Pdis)
(8)
(9)
Results for both quantities are shown in Fig. 16(a). The cell header duplication results in cell discard probability that is approximately the same to that achieved by the single-header scheme in mixed mode. Furthermore, it results in undetected error probability that is almost identical to that achieved by the single-header scheme in detection mode. Therefore, cell header duplication has a clear advantage over the single header scheme in both detection and mixed operation modes at the expense of increased overhead.
10' 10 BER p
10 10 BER p
(a) Cell discard and undetected error performance (b) CLR performance
Figure 16: Duplicate-header scheme performance - Header-error detection case.
■jdup ■jdup The CLR performance under the duplicate-header scheme, CLRdup = P^f + P^d, is com- pared to the CLR performance under the traditional HEC mechanism in Fig. 16(b). The
19

duplicate-header scheme achieves slightly improved performance compared to that of the single- header scheme in mixed mode. For p < 10~3, a CLR value of less than 1.5 x 10~3 is achieved.
(b) Header-Error Correction When the single-bit error-correcting capability of the HEC CRC code is applied, the cell discard probability, (P^/)', and the undetected error probability, (P^)1, are derived in terms of the probabilities of detected and undetected header error events in correction mode, denoted by P'dis
and P'und (Appendix A), respectively:
tf£7 (pdupy \rund!
\Pdis)
-*imd(l + Pdis
(10)
(11)
In correction mode, the probability of a detected error event P'dis decreases compared to Pdis in detection mode due to single-bit-error correction, P'dis < Pdis. Furthermore, the undetected error probability P'und increases compared to Pund, due to incorrect correction of multiple-bit errors, P'und > Pund. In consequence, header-error correction results in improved cell discard probability compared to case (a) where only header-error detection is applied:
(P'c dup\ dis ) (Pdi, dis )2 < Pj _ pdup
dis dis ' (12)
On the other hand, the undetected error probability (P^d)' increases compared to P^d. More specifically, the duplicate-header scheme with header-error correction has the highest undetected error probability amongst the single-header and duplicate-header schemes. In addition, it is the only scheme with cell discard probability lower than the undetected error probability (except for high channel-error rates p > 10~3), resulting in more cells being misrouted than discarded. For example, for p = 1(T3, (P%*)' = 2.8 x 1CT6 and (P*|p)' = 5.7 x 1(T7. These observations can be verified from the results for (P£p)' and (pw)' shown in Fig. 17(a).
10"' 10"J
BER p
-•- CLR (single header, detection mode) -•- CLR (single header, mixed mode) * CLR (double header, detection mode)
-*• CLR (double header, correction mode)
10 10 BER p
(a) Cell discard and undetected error performance (b) CLR performance
Figure 17: Duplicate-header scheme performance - Header-error correction case.
The cell discard probability in this case is significantly lower than the cell discard probability when no error correction is attempted (Figs. 16(a), 17(a)). At the same time, the probability of
20

undetected error for this range of BERs is almost identical to that obtained if a single header is used in mixed mode. It is this quantity (P***)' that dominates the Cell Loss Ratio results shown in Fig. 17(b).
Nevertheless, the CLR is lower than the CLR obtained when no error correction is applied by at least three orders of magnitude for p < 10~3. For p < 10-3, a CLR value of less than 3.4 x 10⁻⁶ is achieved. Even though the duplicate-header scheme with header-error correction provides for low CLR values, it is considered ineffective due to the high undetected error rates.
21

3 Approaches for Adapting ATM to the Wireless Medium
The error-control mechanisms discussed in Section 2 address the protection of the ATM cell against errors by using FEC without consideration to the effect of errors on the Wireless ATM frame/cell synchronization processes.
The two approaches presented in this section propose complete solutions for the transport of ATM cells over point-to-point wireless transmission links.
3.1 Yurie Approach
A solution for the adaptation of ATM to low-speed, error-prone environments has been developed by Yurie Systems (acquired by Lucent Technologies in May 1998) and implemented in the ATM access concentrators LDR100 and LDR200 (predecessors to Lucent's PacketStar Access Concentrators 60 and 120, respectively). The solution is based on a multi-layered error- correction approach with key features [22]:
• LANET, a physical layer protocol with enhanced cell delineation capabilities,
• an error-tolerant addressing scheme to enhance header protection against errors, and,
• application-dependent payload encoding on a per-virtual-circuit basis at the Service Spe- cific Convergence Sublayer (SSCS) of the ATM Adapatation Layer (AAL).
3.1.1 LANET Frame Structure
LANET uses a frame-based transmission format with frame structure as shown in Fig. 18 [23]. The frame has length 2400 bytes and includes 45 ATM cells, a total of 2385 bytes, and
53 bytes bytes »--*—»- — /
F C D D T B B CelM Cell 2 Cell 3 Cell 4 Cell 5
S Cell 6
S
S
S
S
S
S
S Cell 45
(fl a E
3 W
_F
DTD
One-byte LANET Frame Header (Hex 96) [7] One-byte Transport Layer Control Channel
One-byte BIP-8 | B | B | Two-byte Byte Stuffing Control (Hex F628)
Two-byte Data Communication Channel S One-byte Subframe Header (Hex E8)
Figure 18: LANET frame structure.
22
15 bytes of overhead which accounts for 0.625% of the transmission bandwidth. ATM cells are accommodated in nine subframes, each of which carries five ATM cells as shown in Fig. 18. The first LANET subframe starts with a one-byte frame header field F followed by a one-byte bit interleaved parity (BIP-8) field C, where the checksum is computed over the previous frame, excluding the frame header. A two-byte Data Communication Channel field DD is used to provide for the operation, administration and maintenance of the communication link. A single- byte field T is reserved for the Transport Layer Control Channel. A two-byte field BB has been included for the purpose of byte-stuffing control and has been assigned the hexadecimal value F628. In the rest of the subframes, ATM cells are preceded by identical single-byte subframe headers S with hexadecimal value E8.
3.1.2 Cell Delineation Mechanism
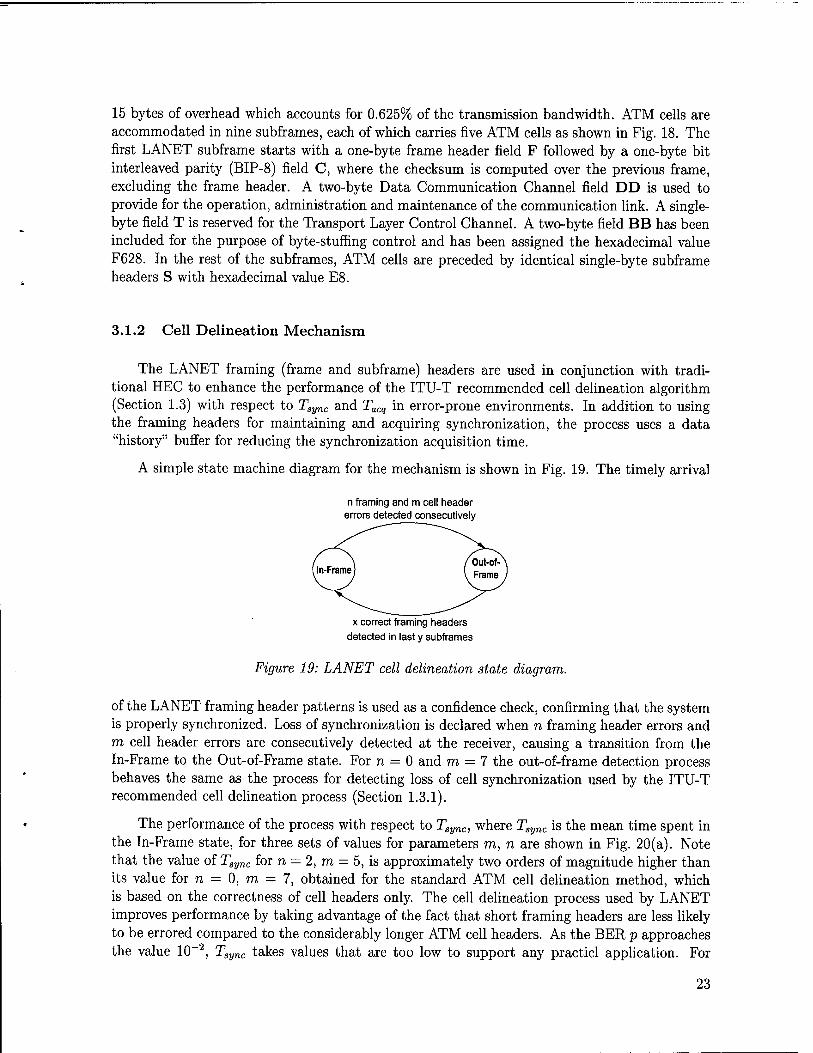
The LANET framing (frame and subframe) headers are used in conjunction with tradi- tional HEC to enhance the performance of the ITU-T recommended cell delineation algorithm (Section 1.3) with respect to Tsync and Tacq in error-prone environments. In addition to using the framing headers for maintaining and acquiring synchronization, the process uses a data "history" buffer for reducing the synchronization acquisition time.
A simple state machine diagram for the mechanism is shown in Fig. 19. The timely arrival
n framing and m cell header errors detected consecutively
x correct framing headers detected in last y subframes
Figure 19: LANET cell delineation state diagram.
of the LANET framing header patterns is used as a confidence check, confirming that the system is properly synchronized. Loss of synchronization is declared when n framing header errors and m cell header errors are consecutively detected at the receiver, causing a transition from the In-Frame to the Out-of-Frame state. For n = 0 and m = 7 the out-of-frame detection process behaves the same as the process for detecting loss of cell synchronization used by the ITU-T recommended cell delineation process (Section 1.3.1).
The performance of the process with respect to Tsync, where Tsync is the mean time spent in the In-Frame state, for three sets of values for parameters m, n are shown in Fig. 20(a). Note that the value of Tsync for n = 2, m = 5, is approximately two orders of magnitude higher than its value for n - 0, m — 7, obtained for the standard ATM cell delineation method, which is based on the correctness of cell headers only. The cell delineation process used by LANET improves performance by taking advantage of the fact that short framing headers are less likely to be errored compared to the considerably longer ATM cell headers. As the BER p approaches the value 10-2, Tsync takes values that are too low to support any practicl application. For
23

10 BER p
(a) Tsync (b) Tacq
Figure 20: LANET cell delineation algorithm performance.
example, for p = 10 2, T, r = 64 kb/s.
> x sync is in the order of minutes only for transmission rates as low as
The process declares acquisition of synchronization when x correct framing headers are identified in the last y subframes of past data (the history buffer is assumed to hold at least y subframes of data). More specifically, the process performs a bit-by-bit backward search for a correct subframe in the buffer and, when this is found, it continues searching for (x — l)-out-of-a; correct framing headers. The parameter settings x = 3, y = 4 have been used in implementations of the process. Results for the mean synchronization acquisition time Tacq, as derived in [22], are presented in Fig. 20(b).
The process for acquiring cell synchronization used by the LANET cell delineation mech- anism relies on the correctness of the framing headers only, rather than on the correctness of ATM cell headers as is the case with the ITU-T recommended cell delineation algorithm. The periodic occurrence of predictable framing header patterns, which are short enough to have a reasonable chance of surviving errors, allows for the quick sorting of the data stored in the history buffer. This results in the significant reduction of Tacq compared to standard ATM cell delineation, especially as the BER approaches 10"2, as shown in Fig. 20(b).
3.1.3 Multiple Redundancy Addressing
A nontraditional approach has been implemented for the protection of the cell header and, more specifically, the header VPI/VCI fields, against errors. In this approach, multiple virtual circuits are established to the same destination. The addresses for the circuits are within the error space of the principal address used for the actual transmission. Thus, the most probable error patterns occurring in the address field will simply change the address to another valid one. In practice, tolerance of 2-bit random errors or 5-bit burst errors requires setting up N = 526
24

addresses2 per virtual channel [22]. This implementation requires no special hardware and no modifications to the current standard. It encodes the header address within the same 40-bit header space of standard ATM cells, as opposed to header error protection schemes based on error correction. The latter may require additional header space to accommodate parity-check bits and may introduce delay due to encoding.
Due to the addressing redundancy, this scheme limits the number of users that can be supported. This is not considered a serious constraint in the wireless environment where the links will likely be used to support a small number of users due to bandwidth limitations. A serious drawback of this approach is that the address of the signaling channel, VPI=0, VCI=5, is within 2 bit errors of the idle cell address VPI=0, VCI=0; therefore, signaling will be inhibited in high-error conditions. It must also be noted that the approach does not protect the GFC, PTI and CLP fields of the header, which need to be separately protected with the payload.
3.1.4 Payload Encoding
The approach developed by Yurie provides the flexibility of using application-dependent payload error correction schemes depending on the error tolerance of the application at the SSCS.
3.1.5 Comments
Test results reported by Yurie claim that the combination of LANET, the 2-bit random/o- bit burst-error-tolerant addressing scheme and a software Reed-Solomon (9 bytes into 15 bytes) encoded payload can reliably transmit ATM cells over a noisy medium at random BER up to 10~3 and 5-bit burst errors at BER up to 10-2.
2The size of the address field is 24 bits, that is, the size of the VPI/VCI fields at the UNI. The number of addresses iV that must be set up in addition to the principal address, is given by the number of 2-bit random-error patterns in a sequence of 24 bits, Nr, and the number of error patterns with one or more (up to four) 5-bit burst
/24\ errors, Ny. N — NT + Nb- There are Nr = I 1 = 276 error patterns of weight 2 in a sequence of 24 bits. JV(,
can be expressed as Nb = N1+N2 + NZ + N4, where iV; is the number of error patterns with i 5-bit error bursts. By use of combinatorics, it can be shown that Ni = 20, N2 = 105, JV3 = 120, N4 = 5, and thus, Nb = 250 and N = Nr + Nb = 526.
25

3.2 GTE Tactical ATM
An approach for ATM transmission over tactical communication links and, in particular, US Army LOS microwave links, has been developed by GTE Government Systems Corporation. The design provides distinct solutions for voice and data; the solution applied to data uses the solution proposed for voice enhanced by payload error-control encoding.
3.2.1 Wireless Environment/System Characteristics
The approach has been developed for LOS microwave links, the most prevalent links used for tactical communications. The data rates supported by these tactical links include 256, 512, 1024 and 2048 kb/s. The links are characterized by long-term average bit-error rates in the range of 10~610~3.
Tactical LOS microwave links can sometimes be accurately characterized as AWGN chan- nels, when the terrain between the receiver and the transmitter does not support signal reflec- tions and all received energy is associated with the direct path. When there is a significant amount of reflected energy in addition to the direct path, tactical LOS links are characterized as slow Rician fading channels [17].
Both the AWGN and Rician fading channel models have been used for the performance evaluation of the design. The parameters K = 20 dB and K = 10 dB have been considered for the Rician channel model, where K is the ratio of the energy received along the direct path to the total reflected energy. The K = 20 dB model is considered the most representative channel model and the K — 10 dB model the worst-case model.
Furthermore, the design assumes binary Frequency-Shift-Keying (FSK) modulation with noncoherent detection and hard-decision decoding, which is implemented in the tactical radios of interest to the GTE work, and the choice of error-control codes has been based on this assumption.
3.2.2 Key Features
The key features of the error-control approach for ATM transmission over tactical commu- nication links presented in [16] are:
• BCH error-control coding is applied for header error control of both voice and data trans- missions.
• BCH error-control coding is applied for payload-error control of data transmissions. Pay- load error-control coding is applied in the case of data transmissions in order to limit the number of retransmissions required by traditional ARQ at the Transport Layer.
• Information is transported in tactical ATM frames, where each frame is associated with a single standard ATM cell.
26

3.2.3 Tactical ATM Frame Structure
The transmission format used for the transport of ATM cells is different from the frame- based approach used by LANET. In the GTE tactical ATM approach, ATM cells are transmitted individually (much like the standard ATM cell-based transmission format) rather than being packed in a frame container (frame-based transmission format). Alternatively, one may consider this as a simplified frame-based format where the frame consists of a single cell. It is in this context that the term "frame" will be used in the remainder of this section.
The standard 424-bit ATM cell is converted into a 503-bit tactical ATM cell, with the header and payload separately encoded with BCH codes. A 5-bit synchronization character is added to the beginning of the tactical ATM cell to produce a 508-bit frame. The detailed structure of the frame is shown in Fig. 21.
8 bits
VPI/LM
Sync
VPI
VPI VCI
VCI
VCI PTI CLP
Payload or AAL1 Header
Header Error Contol (42 bits)
Remaining ATM payload (376 bits)
Payload Error Control (45 bits)
Figure 21: Tactical ATM frame structure.
The header of the tactical ATM cell consists of 40 header bits and 42 header parity-check bits. The header bits include the VPI3, VCI, PTI and CLP fields (a total of 32 bits), as well as the first eight payload bits of the standard ATM cell. A (82,40) BCH code with 6-bit error-correcting capability is used for error encoding of the header bits. The remaining 376 payload bits are encoded using a (421,376) BCH code with 5-bit error-correcting capability. Thus, 45 payload parity-check bits are included in the tactical ATM cell payload. The choice and performance of the header and payload codes will be discussed in a later subsection.
The reason for protecting the first eight payload bits with the header, separately from the rest of the payload, is that when AAL Type 1 (AAL1) is used for the transport of voice, these
3The first three bits of the VPI field may be optionally allocated to Link Management (LM) information.
27

bits correspond to the AAL1 header. The AAL1 header is important for the processing of the voice payload and is therefore protected with the more powerful header code rather than the payload code.
The overhead due to the frame synchronization character, header, header-error control and payload-error control—excluding the first eight bits of the standard ATM cell which have been incorporated in the header of the tactical ATM cell—accounts for 124/508 = 24.4% of the frame, compared to 40/424 = 9.4% overhead of a standard ATM cell. In the case where payload-error control is not applied, the overhead reduces to 79/463 = 17.1%.
The framing character is used for faster cell synchronization/delineation under all channel conditions. Details regarding the framing procedure and its performance arc unavailable; it has been stated, however, that frame acquisition/cell delineation processing is typically less than one cell and that the average frame acquisition time is less than three cells for BER p = 10~3.
3.2.4 Error-Control Coding
Performance requirements Voice and data applications have different degrees of tolerance to errors and therefore the requirements of each service type are addressed separately.
Continuously Variable Slope Delta (CVSD) modulated voice, commonly used in military applications, is the voice service paradigm considered in the GTE work. CVSD voice at either 16 or 32 kb/s is transmitted with acceptable quality over tactical, non-ATM, LOS links throughout the 10-6-10-3 BER range [16]. It is then argued that CVSD voice can be transmitted with acceptable quality over tactical ATM LOS links provided that the error rate delivered to the ATM layer remains in the 10"6-10-3 range. This implies that voice can tolerate payload errors in this range without significant quality degradation, provided that cells are not lost due to errors in the header, that is, provided that the CLR is maintained low enough. Therefore, the transmission of CVSD voice with acceptable quality over such links can be achieved without the use of payload-error control but requires header-error control to improve the CLR which can take high values as the BER approaches the value 10~2 as has been shown in Fig. 4.
Data applications, in general, have more stringent requirements against errors than voice applications. For the efficient bandwidth utilization in the presence of packet retransmissions, it is important that a sufficiently low end-to-end packet-error rate is provided for this type of service. Data packets are segmented into ATM cells for transmission over ATM links and, in order to ensure the desired packet-error rate, both the payload-error rate and the CLR must be maintained sufficiently low. Thus, in the case of data applications, both payload- and header- error control are recommended.
The design provides distinct solutions for voice and data applications. In the case of voice, error control is applied to the header only. The solution proposed for voice, enhanced by payload- error control, is used for data applications. Since the header and payload may have different degrees of tolerance to errors, given the application's QoS requirements, the separate encoding of header and payload provides flexibility and efficiency in the design.
The FEC requirements for the header are determined by the CLR requirements for voice (or other real-time applications), while the FEC requirements for the payload are determined by the end-to-end packet-error rate requirements for data applications.
28

To maintain high throughput efficiency, close to 100%, for window sizes up to 10 packets, the end-to-end packet-error rate must be no higher than 10~2 under all conditions. For packet sizes up to 1060 bytes (or 20 standard ATM cells) and window sizes up to 10 packets, an uncoded throughput efficiency—excluding TCP/IP and ATM overhead—of at least 95% is obtained for channel BERs up to 10"6 in the case of the AWGN channel. For larger packet sizes, high throughput efficiency is obtained for lower BERs. For the same packet and window size ranges, an uncoded throughput efficiency above 95% is obtained for channel BERs up to 10~5 in the case of the K — 10 dB Rician channel. Therefore, the payload code design objective for data transmission is a decoded BER < 10~6 over the AWGN channel and a decoded BER < 10-5
over K — 10 dB Rician channel.
Error-Control Codes A variety of candidate codes were considered in the GTE study, in- cluding punctured convolutional codes, RS codes and BCH codes.
Convolutional Codes The effectiveness of any convolutional code candidate is limited by the requirement for hard-decision decoding. The shortcomings of high-rate, short-constraint-length convolutional codes for tactical ATM applications are briefly discussed in [17]. It is pointed out that a rate-7/8 code obtained by puncturing the rate-1/2, constraint length K = 7 code provides a post-decoding BER of 10"6 when the channel BER is 1.6 x 10⁻³. This performance satisfies the design objective that the delivered BER be less than 10~6 for channel BERs up to 10~3, set for tactical ATM applications in [17]. However, short-constraint-length convolutional codes require a significant amount of data interleaving in order to be effective in slow Rician fading and are not considered for tactical ATM as they would violate the latency requirements of voice users.
Reed-Solomon Codes Reed-Solomon codes were also found ineffective for the tactical ATM application. A (64,48) RS code defined on a 6-bit alphabet (6-bit symbols) with error-correcting capability t = 7 symbols and code rate r — 3/4 will deliver a decoded BER significantly less than the target 10-6 for BER 10-3 over the AWGN channel. This is, however, achieved at the expense of high overhead. The (64,56) RS code with error-correcting capability t = 3 symbols and rate r — 7/8 does not meet the target decoded BER. The flexibility in choosing a Reed-Solomon code with optimum trade-off between error-correcting capability and code overhead for given performance requirements is limited by the encoder/decoder sets available by vendors (Reed- Solomon codes with rates r = 7/8,3/4 and 1/2 are implemented most commonly). Furthermore, a (469,424) binary BCH code with t = 5-bit error-correcting capability meets the target decoded BER with code rate r = 424/469 = 0.9 which is significantly higher than the rate of (64,48) RS code (r = 0.75).
The more fundamental problem with the Reed-Solomon codes is the performance in slow Rician fading. Similarly to the convolutional codes, to make the Reed-Solomon codes effective on this channel would require applying symbol interleaving.
BCH Codes BCH codes provide the best combination of low CLR, low payload-error prob- ability and low overhead for the LOS channel. For relatively short block lengths and moderate error rates, binary BCH codes provide good performance. An important advantage of these
29

codes is that there exists a wide range of block lengths available for short to moderate length messages and, therefore, the block length can be easily adjusted to match the ATM cell size. The availability of a wide range of block lengths, code rates and error-correcting power for binary BCH codes, as well as the availability of efficient encoding and decoding algorithms, support their use for tactical ATM applications.
Following the testing of binary BCH codes with different error-correcting capabilities,
• a (82,40) code with t — 6-bit error-correcting capability was selected for the header, and,
• a (421,376) BCH code with t = 5-bit error-correcting capability was selected for the pay load.
The performance of the header code with respect to CLR and the performance of the payload code, in terms of the probability Pe that the number of errors in the payload exceeds five, is shown in Table 5 for different channels.
BER Channel CLR Pe io-3 AWGN 3.6 x IO"12 5.2 x IO"6
io-3 Rician {K = 20 dB) 1.14 x IO"7 1.1 x IO-3
10"3 Rician (K = 10 dB) 2.2 x IO'3 1.7 x IO"3
io-5 AWGN 3.8 x IO"26 7.4 x IO"18
IO-5 Rician {K = 20 dB) 1.0 x IO"13 5.5 x 10-y
10~6 Rician (K = 10 dB) 3.2 x IO"5 1.2 x IO"4
Table 5: BCH header and payload code performance.
Bit interleaving Interleaving is applied to spread the header bits—with the exception of the synchronization pattern—throughout the cell, and hence, to mitigate the effect of burst errors on the header. It is implemented by placing four payload bits before every header bit, thus creating the following pattern within each frame:
SSSSS-PPPP-H-PPPP-H-PPPP-H PPPP-H-PPPPP- • • PPPP
where S represents a sync bit, P represents a payload bit and H represents a header bit. This results in spreading the header bits throughout 82 x 4 = 328 payload bits and having 421-328 = 93 payload bits at the end of the cell following the last header bit. By choosing a spreading distance of four payload bits (instead of five), the same implementation becomes applicable in the case where payload-error control is not employed. In this case, the final header bit is followed by 376 - 328 = 48 payload bits instead of 93.
30

Recommendations for Error Control Over the Random- Error Channel
The results of the analysis of the FEC-based error-control approaches over the random-error channel presented in Sections 2 and 3.2 are summarized in Table 6 for comparison. In this table, Bandwidth (BW) efficiency rj is a measure of the overhead due to header information and error control and is defined as the ratio:
V number of information bits in wireless ATM cell
total number of bits in wireless ATM cell
Code code rate
n BER (p) CLR Pres,b
RS (59,53) 0.90 0.81 io-3
10~5 1.3 x IO"3
1.9 x IO-5 7.8 x IO"5
1.1 x IO"12
BCH (469,424) 0.90 0.82 io~3
10~5 9.6 x 10~6
1.4 x IO"17 2.1 x IO"7
3.3 x IO"19
BCH (478,424) 0.89 0.80 io-3
IO"5 7.2 x 10~7
1.1 x IO-20 2.0 x 10-" 2.9 x IO"22
BCH (50,32) k BCH (420,384)
0.89 0.82 10~3
io-5 2.2 x IO"7
2.3 x IO"20 1.6 x 10⁻⁶
2.3 x IO"16
BCH (56,32) k BCH (429,384)
0.86 0.79 io-3
io-5 3.7 x IO"9
3.8 x IO"19 1.5 x IO"7
2.1 x IO"19
DERA (detection)
0.83 io-3
io-5 1.5 x IO"3
1.6 x IO-7
DERA (correction)
0.83 io-3
io-5 3.4 x IO"6
2.9 x IO-12
BCH (82,40) k BCH (421,376)
0.83 0.76 io-3
IO"5 3.6 x IO"12
3.8 x IO"26
Table 6: Block code performance over the random-error channel.
Based on the recommendations in [16], the following performance requirements must be satisfied for the transport of voice over tactical ATM LOS links with acceptable quality:
• the CLR must be of the same order of magnitude as the CLR achieved with standard ATM for BERs that are typical of wireline links. For fiber-optic links where, typically, p < 10~9, CLR < IO-7 in pure detection mode. Similarly, for coaxial cable with p < IO-7, CLR < IO-5 (Fig. 4). Therefore, CLR must be less than at least 10~5 and, preferably, less than IO-7.
• the error rate delivered to the ATM layer must be less than IO-3.
The above conditions are easily met by the (50,32) BCH header/(420,384) BCH payload code and the (82,40) BCH header/(421,376) BCH payload code schemes. The former combination of header/payload codes with the higher BW efficiency 77 = 0.79 is the error-control scheme recommended for the random-error channel.
31

5 Performance Over the Markov Channel
Section 2 addressed the performance of FEC-based error-control schemes over the random- error channel. The performance of these error-control schemes over the burst-error channel is investigated in this section.
5.1 Introduction
The burst-error channel is modeled using a simple Markov Chain model. Due to their analytical tractability, Markov Chain (MC) models have been used extensively to capture the behavior of the wireless channel and to model the associated error process.
5.1.1 Channel Model Description
In the general form, a MC-based model for the channel is associated with an underlying discrete-time Markov chain {cn}„>0, where c„ is the state of the channel at time instant n. {cn}n>o is defined on an iV-dimensional state space S = {0,... , N - 1}, N > 2. The time unit associated with the Markov chain is the bit transmission time, although other time units, such as packet transmission time, can be used depending on the channel modeling assumptions and the time scale of interest.
The channel bit-error process {en}„>i defined by
{1 if n-th bit in error, (13)
0 otherwise,
depends, in general, on the state of the channel at time instants n — 1 and n. That is, the value of the error process at the end of a transition of {cn}„>0 from state i to state j (i —> j) depends on both states i and j according to the probability distributions
phij = Pr{en = 1, c = j\cn-i = i}, (14)
Po,ij = Pr{e„ = 0, c„ = j\cn-i = i} = 1 - phij, (15)
where i,j € S.
The special case where e„ depends solely on cn or cn_! is most commonly used in practice because it is easier in this case to associate the parameters of the analytical model to the parameters of the physical channel. The case where en depends on cn only is considered in this work. Then,
puij = Pr{e71 = 1, c„ = j|c„_i = i)
= Pr{e„ = l|cn = j} Pr{c„ = j|cn_i = i}
= pe{j) Pr{c„ = j\cn-i = i}, (16)
where pe{j) = Pr{en = l|c„ = j}, 0 < pe(j) < 1. That is, given that the state of the channel during the transmission of the n-th bit is j, cn = j, the n-th bit in the bitstream of information is in error with probability pe(j).
32

Matrix Px with elements pltij, i,j € S, can be expressed by the matrix product
Pi = PPe (17)
where P is the transition probability matrix of {c„}„>o and Pe is the diagonal matrix given by Pe = diag{pe(Q),... ,pe{N - 1)}. Similarly, the matrix with elements p0,ij, i,j € S, Po, can be expressed as
P0 = P(I-Pe), (18)
where I is the identity matrix of dimension N. Note that the finite state Markov Chain channel model is in this case completely defined in terms of the transition probability matrix P and the error-rate matrix Pe. The channel BER p is given by
P = 7rPee, (19)
where ir is the stationary probability row vector of {cn}„>0, ff = TTP, 7re = 1, and e is the unit column vector of appropriate dimensionality.
5.1.2 Performance Analysis
The cell loss and error performance over the Finite State Markov Channel of some of the FEC schemes considered in Section 2 can be analyzed by using Markov Chain theory. Such are the schemes where the ATM cell header is encoded separately from the payload, for reasons that will become obvious from the development of the analysis. Performance bounds can be obtained analytically for schemes such as the NATO PG/6 scheme where header and payload are encoded as a single information block. Simulation results can be obtained in all cases, but for low-error rates these can be computationally intensive and require prohibitively long runtimes.
Fig. 22(a) shows a simple block diagram for the channel where {x„}n>i is the sequence of information bits transmitted over the channel (channel input) and {yn}n>i is the original bit sequence altered by channel errors (channel output). The error process {e„}„>i is illustrated in Fig. 22(b).
n
Let un denote the number of errors in a block of n bits, un = 2_^ei an(* ^et <Atj(^)n) be
defined as the conditional probability
<j>ij(k, n) = Pr{cn = j, un = k\c0 = i}.
That is, (j>ij(k,n) is the probability that the state of the channel during the transmission of the n-th bit is j, cn = j, and that k out of the sequence of n bits y^ • • • Vn are in error, given that the state of the channel before the transmission of the first bit is i, c0 = i. Probabilities ^{k, n)
33

input channel output
\Xnlnz 1 \Cnln^O {y*)«z\
y n ~JyXn,>Cn)
(a) Block diagram
m \ XUn J *"
(b) Error process
Figure 22: Channel model.
can be easily obtained for n > 0, 0 < k < n, in a recursive manner:
<ßij{k, n) = Pr{c„ = j, un - k\c0 = i} l
= ^ Y2 Pr{°n - 3-,cn-i =m,un = k,en = k'\c0 = i} meS k'=0
1
= 5Z 5Z Pr{c" = ■?' c"~1 = m'w"-' = k - k',en = k'\c0 = i] meS k'=0
1
= ^2 ^Pr{c„_i = m,un-i = k - fc'|c0 = i) Pr{en = A;',cn = i|c„_i = m} m6Sfc'=0
1
= 5Z 5Z ^""^ ~ k',n- !) Prlen = &',c„ = i|cn_! = m} m€S/fc'=0
]T] {^m(^,n - l)P0,mj + <t>im(k - 1,71 - l)pi,mj} (20) mGS
where po,mj and Pi.mj are given by Eqs. 14 and 15, respectively. Based on Eq. 20, the matrix with elements <f>ij(k,n), i,j G 5, denoted by &(k,n), n > 0, 0 < k < n, can be expressed by the following recursive relationship
&(k,n) *(fc,n-l)P0, k = 0,
${k, n - 1)P„ + #(fc - 1, n - l)Pi, 0 < k < n,
k*(Ä-l,n-l)Pi, k = n,
(21)
with*(0,0) = I.
Probabilities &(k,n) are useful in deriving performance metrics of interest in different sce- narios where forward error correction codes arc applied. For example, if information is trans- mitted over the Markov channel in blocks of size Ar, then the probability of k errors in the block
34

is given by n$(k, JV)e, 0 < k < N. If the information transmitted over the channel is encoded in code blocks of size N, then the probability that the number of errors in the block, U, exceeds the code error-correcting capability t is given by
N
Pr{U>t}= Y^ T*(fc',iV)e.
The impact of a channel error on a standard ATM cell and the ATM performance, varies depending on whether the corrupted bit is in the cell header or payload, as has been discussed in Section 1. Recall that the header is protected by a CRC code with single-bit-error-correcting capability while the payload is not protected against errors. Therefore, the analytical study of the performance of ATM over the Markov channel is facilitated by considering the header and payload as two separate fields, F0 and F\, respectively, as shown in Fig. 23(a). The size of Fj in bits is denoted by N{, i = 0,1. For the standard ATM cell, N0 = 40 and ATX = 384.
Header Payload Fo F,
Fo F, F2 ... F
m ... FM
(a) Standard ATM cell (b) Generic Wireless ATM cell
Figure 28: Data block structure for performance analysis.
Let Ui be defined as the number of errors in i*1,, i = 0,1:
Ni
Ui= Yl ee>
where 0 < Ui < Ni and JV_i = 0. Then, the conditional probability
Xij(h, fci) - ^{CNQ+N! = j,Ui = kuU0 = k0\c0 = i}
i,j <ES, 0<k0< NQ, 0 < ki < Ni,
is given by
Xij(h, h) = Y PT{
CNO+NI = 3, Ui = ki\cNo = m} PT{CNO =m,U0 = k0\c0 = i}
meS
= Y <l>irn(ko, N0)(j)mj{ki, Ni) meS
[«(Äo.iVo)*^!,^)]«,
(22)
(23)
where [A]y denotes the (i,j) element of matrix A. Equation 23 can be expressed in matrix form as
X(Ä0>fc1) = *(fco,iVo)#(Äi,iV1)> (24)
35

where X.(ko,ki) is the matrix with elements Xij(ko,ki), i,j £ 5. Matrices X(fc0, &i) are used to obtain the probabilities:
Pr{C/i = kuU0 = k0} = JT53Pr{cW>+N» = J.^i = fci.^o = h\co = «} Pr(^o = *} ies jes
ies jes
= nX(k0,k1)e (25)
- V>(*o,fci)
which, in turn, are used to derive the performance measures of interest.
The results obtained for the standard ATM cell in Eqs. 23 and 25 can be generalized for a data block with the structure shown in Fig. 23(b) which could represent the structure of a generic wireless ATM cell with M fields. The different fields in this generic structure identify cell segments that are encoded using different FEC codes, including no encoding.
In this case, it can be easily shown that,
Xijih, fci. • ■ • . kM) — PT{CNO+NI+...+NM = j,UM = kM,... ,Ui = ki,UQ = k0\c0 = i}
i,J€S, 0<km<Nm,0<m<M
= [*(Ä0) N0)*(ku yVO^M, NM)]tj , (26)
or equivalently, that
X(k0, k1,...,kM) = *(*„, N0)*(ku N,)... *(fcM, NM). (27)
It follows that
Pr{C/i = ku U0 = k0,... , UM = kM] = TrX(k0, ku... , kM)e (28)
= ip{k0,ki,... ,kM).
5.1.3 Performance Measures
ATM performance measures of interest can be obtained from the analysis in a straightfor- ward manner. Note that the only type of errors considered in this work are the errors introduced by the wireless channel. The performance measures under consideration are:
• Cell Loss Ratio (CLR) defined here as the ratio of lost to total transmitted cells:
^ „ T ^ • l°st ceHs
Cell Loss Ratio = ——. total transmitted cells
Lost cells are cells that are not delivered to the ATM layer by the TC sublayer.
In the case of standard ATM, lost cells are cells with uncorrectable errors in the header and the CLR is given by:
No N\ to Wj
CLR= Y, E*'^ = 1"EE*'^ (2Q) ko=to+lki=0 ko=0ki=0
where t0 is the error correcting capability of the header CRC (to — 1).
36

• Cell Error Ratio (CER) defined here as the ratio of errored to total transmitted cells:
errored cells Cell Error Ratio =
successfully transmitted cells + errored cells
A received cell is errored if it has an invalid header after header error control procedures have been completed or if the payload is different from the transmitted payload.
For standard ATM cells,
N0 Ni to JVi
CER- Y, E^^ + EE^^) fco=to+lfci=0 k0=0ki=1
to Ni to
= CLR+££tf(Äo,A;i) = l-J^(fc0,0). (30) Jbo=0fci=l ko=0
• Payload Error Ratio (PER) defined here as the ratio of errored payload bits to total transmitted payload bits:
errored payload bits Payload Error Ratio = : : :—r-r-.—.
total transmitted payload bits
A received payload bit is errored if it is different from the transmitted payload bit or if it belongs to a cell with an invalid header after header error control procedures. That is, all payload bits of lost cells are considered errored payload bits.
For standard ATM, PER can be expressed as:
N0 Ni to JVi , to Ni ,
PER= Y, E ^(fc»' ^) + E E #^^> ^) = CLR + E E ^^(^'fci)' (31) fco=to+l*i=0 ko=0ki=\ 1 k0=0k\=l l
• Payload Bit Error Ratio (PBER) defined here as the ratio of errored payload bits delivered to the ATM layer to the total payload bits delivered to the ATM layer:
errored payload bits delivered to the ATM layer Payload Bit Error Ratio = - :——— — : :—._,,. .. . .
total payload bits delivered to the AIM layer
The PBER is the BER of the payload of the cells that are delivered to the ATM layer.
For standard ATM, the PBER is expressed as:
EE>^) PBER = fc0=°fcl=^ . (32)
£5~>(*b,*i) k0=0ki=0
The performance measures defined above and evaluated in the case of standard ATM can also be evaluated in the case where other FEC schemes are applied for error control as discussed later in this section.
The performance measures of greatest interest in the case of the loss tolerant voice applica- tions are the CLR and the PER.
37

5.1.4 Performance Over the Gilbert-Elliott Channel
The most simple finite state Markov chain model for the burst-error channel is the Gilbert- Elliott (GE) model which is based on a two-state (N = 2) Markov chain {cn}n>0 with state transition diagram as shown in Fig. 24. The transition probability matrix of {c„}n>o is denoted
Figure 24: State transition diagram of Gilbert-Elliott channel model.
by
P = Poo Poi PlO Pll
and the stationary probability vector is given by
7T = [71-Q 7Ti] PlO P01
LPOl + PlO POI + PlO
(33)
(34)
The bit-error process {e„}n>i is determined by the underlying Markov chain {cn}„>o as follows: an error in the bit stream occurs with probability pe(0) whenever {cn}n>o is in state '0' and with probability pe(l) whenever {c„}n>o is in state '1'. Typically, one state is associated with low bit-error rates (state 0 or good state) and the other with high bit-error rates (state 1 or bad state), pe(0) << pe(l). The channel BER is then given by
p = 7rPee = 7TüPe(0) + 7ripe(l), pe(0) < p < pe(l). (35)
According to Markov chain theory, the sojourn time in state 1 (0) is geometrically distributed with mean 1/pio (1/poi) time units. Consequently, the bit-error process {en}n>i for the GE channel model consists of geometrically distributed ' error-free'' (or low-error rate) periods during which errors are generated randomly with probability pe(0) followed by geometrically distributed error-burst periods with mean r = 1/pio during which errors are generated randomly with probability pe(l). A sample realization of process {e„}„>i is shown in Fig. 25.
H low error rate period (mean x /a) -
0 12 3 4
"error burst (mean T)"
_p 3?
£-th bit without error ( ek = 0) |||| k-th bit in error ( ek = 1 )
k k+1 k k+l
Figure 25: Sample realization of process {e„}„>i.
38

For a given BER p, and selected values for pe(0) and pe(l), matrix P can be expressed in terms of the mean burst length r as follows:
1 — a/r a/r 1/r 1-1/r
[1 0] 1 a —a 0 1 r -1 1 _ (36)
p — p (0) where a = —,.s . The stationary probability vector 7r is independent of r and given by
Pe(l)-p'
■K a
1+a 1+a Pe(l)-P P-Pe(0)
.pe(l)-pe(0) pe(l)-pe(0) (37)
The GE model can be further simplified in terms of the number of parameters involved by considering state 0 to be error-free, i.e., by setting pe(0) = 0.
39

5.2 Standard ATM
Analytical results for the performance measures discussed in Section 5.1.3 for standard ATM over the GE channel are obtained from Eqs. 29-32. The channel is characterized by an error-rate matrix Pe = diag{0,1} and transition probability matrix P given by Eq. 36.
5.2.1 Error-Detection Mode
The performance of standard ATM with Header Error Check (HEC) in detection mode (no header-error correction) is shown in Fig. 26 for different values of BER p. For all measures of
Mean Burst Length T
(a) BER = 10-e
Mean Burst Length t
- in-s (b) BER = 10
Mean Burst Length T
(c) BER = 10-5
Figure 26: Analytical results for standard ATM over the GE channel in HEC detection mode.
interest, the performance over the GE channel is improved compared to that over the random- error channel (dashed lines).
40

More specifically, for standard ATM in detection mode, the CLR is given by
CLR = 1 - TrPo^e. (38)
Equation 38 is obtained by applying the following relationships to Eqs. 24 and 25:
Y,$(h,N1) = PN\ $(0,N0)=PoNo. (39) fci=0
As T —> 1, CLR approaches its value obtained over the random-error channel. From Eq. 36,
P-» 1 — a a
1 0 as T -> 1. (40)
Consequently, CLR ->■ CLRi = 1 - TT0(1 - a)"0'1 = 1 - (1 - p)(l - a)*0"1. When p < 1, a fa p and CLRX wl- (1 — p)N°, the CLR value over the random-error channel. It can be easily shown that as r -» oo, P -> I and CLR -> CLR«, = 7Ti = p. That is, for the GE channel with Pe = diag{0,1}, CLR approaches the link BER as the mean burst length r increases.
The improvement of CLR performance with respect to the random-error channel can intu- itively be explained as follows. In the random-error channel, all cells have the same probability of being discarded due to errors. This is not the case for the GE channel, where errors are grouped in bursts. The error-free time interval between error-bursts in the GE channel is longer than the time interval between errors in the random-error channel, for the same link BER. These longer intervals result in fewer cells being discarded in the GE channel than in the random-error channel for the same BER.
Following arguments similar to those used above to establish the CLR behavior for limiting values of r, it can be shown that for p <C 1:
lim CER = 1 - (1 - p)(l - a)No+Nl-1 fa 1 - (1 - p)No+N\
lim PER tu CLR + p(l - CLR) w CLR,
lim PBER « p. T->1
It can also be shown that
lim CER = CLR = p, lim PER = CLR = p, lim PBER = 0. (41) T-¥CO T->00 T—>00
For large values of r the main contribution to CER comes from the CLR; that is, for large error-bursts, cells with no errors in the header are most likely to have no errors in the payload. However, the key contributing factor to CER for small values of r, are cells with error-free header and errored payload.
PER takes values that are slightly higher than CLR, implying that CLR is the dominant factor of PER. This highlights the significance of payload bits lost due errors in the header and the need to avoid cell discarding.
For small values of r, the payload BER of undiscarded cells (PBER) is equal to the link BER p. As the burst length increases, undiscarded cells tend to have error-free payload and the PBER decreases to zero.
41

Note that, for each performance measure, the results obtained for two values of p that differ by some order of magnitude are also different by approximately that same order of magnitude. That is,
CLR(Pl) _ Pl
CLR(p2) ~ p2
where CLR(pj) denotes the CLR value evaluated at p = pit i = 1,2. In other words, the results for a given performance measure for different values of p are represented by parallel lines on a logarithmic scale, as illustrated in Fig. 27.
''*-CLR(p=i<r") *-CER(p=10"*)
■■!■; ■,»■■■■«,, ,71.,, .-,»■■ 10'
Mean Burst Length T 10' 10
Mean Burst Length T
(a) Results for CLR and CER (b) Results for PER and PBER
Figure 27: Analytical results for standard ATM over the GE channel in EEC detection mode.
i^-ziü..^-,,
*-CE{t (p=10"°) »....» ..ft...... ,..«......,
10*
A 4-PEB (p^b"5) T~-,. A ' * ■A ■ k ~''
■\....T....T.,..T.,..T.,..T..,T..,,T. ,T ■* * -A...*-
*,P,BER(p=10"°)
Mean Burst Length i 101 10'
Mean Burst Length t
(a) Results for CLR and CER (b) Results for PER and PBER
Figure 28: Analytical results for standard ATM over the GE channel in EEC correction mode.
42

5.2.2 Error-Correction Mode
A performance behavior similar to the one exhibited in detection mode (Fig. 27) is observed when HEC is in correction mode for r > 2 (Fig. 28).
The performance of standard ATM with respect to CLR and PER for small values of r improves when HEC is used in correction mode (dotted lines in Fig. 29), most noticeably for T — 1. For large error-bursts, the single-bit error-correcting capability of the header is ineffective.
-•- CLR (detection mode) ■ ■•' CLR (correction mode) -•- CER (detection mode) ■ «■ CER (correction mode) -*- PER (detection mode) * PER (correction mode)
-T- PBER (detection mode) • T ■ PBER (correction mode)
Mean Burst Length x 10' 10'
Mean Burst Length T
(a) BER = 10- (b) BER = 10 -3
Mean Burst Length T
— m-s (c) BER = 10
Figure 29: Analytical results for standard ATM over the GE channel in HEC detection and correction modes.
Note that CLR is the dominant factor of PER as discussed in the case of HEC detection mode (Section 5.2.1), as long as the CLR value remains above BER p. When CLR < p, the PER value is dominated by p, as is the case for p — 10-5, r = 1 in correction mode (Fig. 29(c)).
43

The CER and PBER measures remain largely unaffected by the error-correcting capability of the header. In the case of CER, this is due to the fact that CLR is not the dominant factor of CER for small values of r. In the case of PBER, header-error correction results in fewer cells being discarded, but does not affect the payload BER of the cells.
44

5.3 NATO PG/6 Proposal
5.3.1 Performance of Cell RS Codes
Analytical results for the performance metrics of interest (CLR,CER,PER and PBER) can- not be obtained in the case of the NATO PG/6 proposal, which uses a (59,53) RS code to protect the entire ATM cell. An upperbound for the CER, and consequently for the CLR, is found in the probability that the number of errored symbols per codeword (coded ATM cell) exceeds the code error-correcting capability t:
CLR < CER < CLR„ = Pr{number of errored codeword symbols > t},
where
N
CLRU= Y^ nV(k,N)e, N = 59, (42) k=t+l
fV(fc,n-l)V0, k = 0, V(fc,n) = I V(Jfeln-l)Vo + V(fc-l,n-l)Vi) 0 < k < n, (43)
(v(fc-l,n-l)Vi, k = n,
m
with Vo = *(0, m), Vi = 5^ *(Jfe,m) (m = 8) and V(0,0) = I. jfe=i
In addition, the residual BER is a lowerbound for the PER:
BERres < PER,
where
2™-1 v^ k + t BER, res ^E^*'^ (44)
fc=t+i
Analytical results for CLR„ and BERres for the (59,53) RS code as obtained from Eqs. 42 and 44 are shown in Figs. 30(a), 30(c) and 30(e) for different values of p, p = 10~2, 10~3, 10~5. The corresponding results for the (118,106) RS code are shown in Figs. 30(b), 30(d) and 30(f). The dashed lines in Fig. 30 correspond to the results for the random-error channel.
From the analytical results presented in Fig. 30 it is observed that for r ^ 20 and p < 10-3
the (118,106) RS code gives significantly improved results compared to the (59,53) RS code, especially as r —>■ 1.
Simulation results for CLR, CER, PER and PBER for the (59,53) RS code at p = 10~3
are shown in Fig. 31(b) for HEC operation in detection mode (dm - solid curves) and in mixed mode (mm - dashed curves). Note that for large values of r there is little improvement in using mixed mode instead of detection mode.
45

■ ' ' '
JS10"'
E \ ^\ \ ^». F \ *\ CLR \ ^^u
Q-10
\ . BER
V__^ -*- CLR — BER
BER
Mean Burst Length T
(a) (59,53) RS - BER = 10~
10' Mean Burst Length T
(b) (118,106) RS- BER = 10 -2
Mean Burst Length t Mean Burst Length T
(c) (59,53) RS - BER = 10~3 (d) (118,106) RS - BER = 10~3
Mean Burst Length t Mean Burst Length x
(e) (59,53) RS - BER = 10~5 (f) (118,106) RS - BER = 10~5
Figure SO: Analytical results for the PG/6 error-control scheme over the GE channel.
46

10' 10' Mean Burst Length t
10' 10' Mean Burst Length x
(a) Analytical results - BER = 10 3 (b) Simulation results - BER = 10 3
Figure 31: Analytical and simulation results for the (59,53) RS code over the GE channel.
The results for the analytical bounds are presented for comparison purposes in Fig. 31(a). Note that CLR„ is a tight bound for CER but quite loose for CLR. Furthermore, the simulation results for CLR, CER and PER in detection mode take values that lie between the curves for the analytical bounds.
The dotted lines in Fig. 31(b) represent the results for standard ATM in detection mode. The effect of the RS code on the performance decreases with the increase of r and is most significant for r < 20. For values of r sufficiently large, the use of coding becomes ineffective, with performance deteriorating to levels below those achieved when no coding is used. For example, in the case of CLR shown in Fig. 31(b), this takes place for r < 200. The fact that, for large error-bursts, there are fewer cells discarded when no error coding is used can be explained as follows. In the case of the RS code, a wireless ATM cell corrupted by a sufficiently long error-burst will always be discarded regardless of the location of the errored bits in the cell. This is due to the error-correcting capability of the code being exceeded. In the case where no coding is used, the same error burst will result in a discarded cell only when the burst corrupts the standard ATM cell header.
The performance of a code with given error-correcting capability over a channel with fixed BER depends on the way errors are "distributed" among the wireless ATM cells (codewords). For a given BER, performance is best over the channel where the distribution of errors is such that the code error-correcting capability is reached but not exceeded for the largest possible number of cells. If the BER is high enough that the error-correcting capability has to be exceeded, then, performance is best if errors are clustered within a cell so that a discarded cell carries as many corrupted bits as possible.
In the case of the (59,53) RS code, for small values of p, such as p = 10-5, performance is better over the random-error channel than over the GE channel for the entire range of r (Fig. 30(e)). For large values of p, such as p = 10-2, performance over the GE channel is better than over the random-error channel for the entire range of r (Fig. 30(a)). For p — 10-3, performance is better over the GE channel for small values of r and better over the random-error channel for large values of r (Fig. 30(c)).
47

5.3.2 Performance of Cell BCH Codes
The performance of BCH codes when applied to the entire ATM cell is considered in this subsection. The message block subject to encoding is the standard ATM cell of length 424 bits. In the case of an (N, K) BCH code with error-correcting capability t, CLR^ and BERj.ea are given by Eqs. 45 and 46, respectively:
N
CLRu = Y^ *"*(*> W)e, (45) k=t+l
N k + t BER,.68= £ -^^(k,N)e. (46)
k=t+l
Analytical results for CLRu and BER^ for the (469,424) BCH code (t = 5) are shown in Figs. 32(a), 32(c) and 32(e) for different values of p, p = 1(T2, 1(T3, 1(T5. The corresponding results for the (478,424) BCH code (t = 6) are shown in Figs. 32(b), 32(d) and 32(f). The dashed lines in Fig. 32 correspond to the results for the random-error channel.
48

10' 10" Mean Burst Length T
10 10 10" Mean Burst Length T
(a) (469,424) BCH - BER = 10~ (b) (478J24) BCH - BER = 10~
Mean Burst Length T 10' 10'
Mean Burst Length t
(c) (469,424) BCH - BER = W (d) (478,424) BCH - BER = 10'
Mean Burst Length % Mean Burst Length T
(e) (469,424) BCH - BER = 10 -5 (f) (478,424) BCH - BER = 10'
Figure 32: Analytical results for the (469,424) BCH and (478,424) BCH codes over the GE channel. 4g

The performance of these two codes which is compared directly in Fig. 33, identifies the shortcomings of BCH codes in the burst-error environment: the performance improvement achieved by increasing the error correcting capability of the code by one bit is insignificant over the entire range of r with the exception of r = 1. For r = 1, the (478,424) BCH code outperforms the (469,424) BCH code and the performance improvement increases with the de- crease of the BER, a behavior well-anticipated in view of the performance of BCH codes over the random-error channel.
-+- (469,424) BCH CLRu — (469,424) BCH BER"t
-J- (478,424) BCH CLR™ -T- (478,424) BCH BER^
BER
10' Mean Burst Length T
10 104
S io E
110
CLR
BER * — ■" -
"
f •■
I -*- (469,424) BCH CLRu
— (469,424) BCH BERrM
-A- (478,424) BCH CLR™' -T- (478,424) BCH BER"(J
BER , J 10'
Mean Burst Length i
(a) BER = 10- (b) BER = 10-
iio-'
-»- (469,424) BCH CLRa — (469,424) BCH BER"B
-*- (478,424) BCH CLR™ -T- (478,424) BCH BER"e
BER
10' 10* Mean Burst Length x
(c) BER = 10~5
Figure 33: Comparison of analytical results for the (469,424) BCH and (478,424) BCH codes over the GE channel.
50

Simulation results for the CLR, CER, PER and PBER for the (469,424) BCH code are shown in Fig. 34(b) next to the analytical results for the CLRU and BER^ shown in Fig. 34(a). The results shown in Fig. 34 are for p = 10~3. The solid curves in Fig. 34(b) represent the results for detection mode HEC operation while the dashed curves the results for mixed mode. Note that, similarly to the case of RS codes, there is little improvement in using mixed mode for values of r greater than one.
— BER" res
^"\f:LRu
BER
:
BER
\f
-♦- CLR - detection -*■ CLR-mixed -*- CER - detection -*- CER-mixed -*- PER - detection -*- PER-mixed -*- PBER - detection -m- PBER-mixed
10 10' Mean Burst Length x
10' 10' Mean Burst Length T
(a) Analytical results - BER = 10 3 (b) Simulation results - BER - 10 3
Figure 84>' Analytical and simulation results for the (469,424) BCH code over the GE channel
Similar observations can be made in the case of the (478,424) BCH code. Analytical and simulation results for the (478,424) BCH code for p = 10~3 are shown in Figs. 35(a) and 35(b), respectively.
-"■ BERL
/ ^FLRu
BER
-
I BER_.
V 10' 10'
Mean Burst Length t
-♦* CLR - detection -*- CLR-mixed -♦- CER - detection -♦- CER-mixed -»- PER - detection -»- PER-mixed -*- PBER - detection -m- PBER-mixed
10' 10' Mean Burst Length t
(a) Analytical results - BER = 10~3 (b) Simulation results - BER - 10~3
Figure 35: Analytical and simulation results for the (478,4%4) BCH code over the GE channel.
51

Simulation results for the (469,424) BCH code in detection mode are shown in Fig. 36(b) (solid lines). The corresponding results for the (478,424) BCH code are shown in the same figure in dashed lines. The comparison of these results confirms the performance behavior observed based on the analytical bounds: for r > 1, the increase of the code error-correcting capability yields small improvement in the performance measures under consideration.
-•- (469,424) BCH CLR^ -*- (478,424) BCH CLR" — (469,424) BCH BER"O
-T- (478,424) BCH BER™ BER
10 10 Mean Burst Length T
10' 10' Mean Burst Length T
(a) Analytical results - BER = 10~ (b) Simulation results - BER = 10 3
Figure 36: Analytical and simulation results for the (469,424) BCH and (478,424) BCH codes over the GE channel.
For T roughly greater than 200, the BCH codes, much like the RS codes considered in the previous section, become ineffective, resulting in performance that is worse than that when no encoding is used. The effect of the codes is most significant for r less than approximately 20 and increases with decreasing values of r. For r < 20, all performance measures decrease monotonically for decreasing values of r. It is worthwhile mentioning that this is not always the case with RS codes where some of the measures may decrease and then increase with decreasing r, as shown in Fig. 31(b). This difference in performance behavior is attributed to the nonbinary nature of Reed-Solomon codes and is exhibited for r less than the code symbol length m (m = 8).
52

5.3.3 Performance Comparison of RS and BCH Codes
The analytical results for the RS and BCH codes considered in Sections 5.3.1 and 5.3.2, respectively, are compared in Fig. 37. For convenience, the performance comparison results for the RS and BCH codes with respect to the CLR^ and the BER^,, bounds are also tabulated in Table 7.
i io ■ r
Jp' '' —-a^CLR : : 1
1\Y /'' /'' itlt /' ' /// ' /// / in / ill '
1
-•- (469,424) BCH CLRu i -— (469,424) BCH BER^ : -nt- (478,424) BCH CLR™' -T- (478.424) BCH BER^s |
BER . . (59,53) RS CLRu
.. (59,53) RS BER"M
__ (118,106) RSCLRu
_. (118,106) RSBER°es
Mean Burst Length x Mean Burst Length t
(a) BER = 10- (b) BER = 10-
Mean Burst Length x
(c) BER = 10~5
Figure 37: Comparison of analytical results for the RS and BCH codes over the GE channel.
In this table, the relation x -< y, where x, y are codes and m is a performance metric, m
m e {CLRU, BER,.,,,,}, is used to indicate that code x is outperformed by code y with respect to metric m:
x -< y = {code x outperformed by code y with respect to metric m}. m
For example, (118,106) RS ~< (59,53) RS indicates that (118,106) RS is outperformed by (59,53)
53

RS with respect to CLR„, i.e., the value of CLR„ for (118,106) RS is higher than that for (59,53) RS.
The key code performance observations with respect to CLRU and BERres from Fig. 37 are captured in Table 7 and summarized as follows:
• The performance with respect to CLR„ and BERres does not differ significantly for r greater than approximately 30 (r ^ 30), with the most significant differences between RS and BCH codes appearing in the range of r for less than approximately 30 (r ^ 30).
• For r = 1 and p = IO-2, BCH codes and RS codes, in particular, perform extremely poorly. For r = 1, the best choice of code for both CLR„ and BER^,, is the (478,424) BCH code.
• For 2 ^ r ^ 30, RS codes outperform BCH codes and the best choice for both CLR„ and BERre7is the (118,106) RS code.
BER r CLR^
1(H r = l (118,106) RS -< (59,53) RS -< (469,424) BCH -< (478,424) BCH CLRu CLRu CLRu
l(H 2 < T < 30 (469,424) BCH -< (478,424) BCH -< (59,53) RS -< (118,106) RS CLRU CLRU CLRu
i(H 100 <T (118,106) RS -< (478,424) BCH -< (469,424) BCH -< (59,53) RS CLRu CLRu CLRu
io~3 T = l (59,53) RS -< (118,106) RS -< (469,424) BCH -< (478,424) BCH
CLRu CLRU CLRU
io-3 2 < r < 30 (469,424) BCH -< (478,424) BCH -< (59,53) RS ■< (118,106) RS CLRu CLRu CLRu
IO"3 100 <r (118,106) RS -< (478,424) BCH -< (469,424) BCH -< (59,53) RS CLRu CLRu CLRu
10~5 r = l (59,53) RS -< (469,424) BCH -< (118,106) RS < (478,424) BCH CLRu CLRu CLRu
io-5 2 < r < 30 (469,424) BCH -< (478,424) BCH -< (59,53) RS -< (118,106) RS CLRu CLRu CLRu
10~5 100 <r (118,106) RS -< (478,424) BCH ~< (469,424) BCH -< (59,53) RS CLRu CLRu CLRu
BER r BERres
IO"2 r = l same as for CLR„ io-* 2 < T < 30 same as for CLRU
io-2 100 <r (478,424) BCH -< (469,424) BCH -< (118,106) RS -< (59,53) RS BERrcs BERrcs BERrcs
io-3 r = l same as for CLR„
io-3 2 < r < 30 same as for CLR„ io-3 100 <r (478,424) BCH -< (469,424) BCH -< (118,106) RS -< (59,53) RS
BERres BERres BERres
io-5 r = 1 same as for CLRU
10~5 2 < r < 30 same as for CLR„ io-5 100 <r (478,424) BCH -< (469,424) BCH -< (118,106) RS -< (59,53) RS
BERres BERres BERres
Table 7: Comparison of analytical results for the RS and BCH codes over the GE channel.
54

The comparison of the simulation results for the (59,53) RS and the (469,424) BCH codes for p = 10~3 and HEC operation in detection mode is shown in Fig. 38. These results are shown for r > 2 as it is computationally prohibitive to obtain simulation results for the low probabilities occurring at r = 1. Summarizing the performance observations for the (59,53) RS
-•- CLR - BCH (469,424) -+■ CLR - RS (59,53) -*- CER-BCH (469,424) -*- CER - RS (59,53) -•- PER - BCH (469,424) -«- PER - RS (59,53) -•- PBER - BCH (469,424) —- PBER - RS (59,53)
10' Mean Burst Length x
Figure 38: Comparison of simulation results for the RS and BCH codes over the GE channel.
code and the (469,424) BCH code over the GE channel from the simulation results, the RS code performs better over the entire range of r where the use of coding is effective except for r = 1. The RS and BCH codes have approximately the same bandwidth efficiency rj\
VRS 384
59x8 = 0.814, rjBCH
384 469
= 0.819.
55

5.4 Combination Header/Payload FEC
Analytical results for the CLR, CER, PER and PBER for error-control schemes where FEC is applied independently to the header and payload can be easily obtained based on the analysis presented in Section 5.1.2. If an (N0,K0) BCH code with error-correcting capability to is used for the header and an (N\,Ki) BCH code with error-correcting capability £1 is used for the payload, the performance measures of interest are obtained from the following expressions:
N0 Ni t0 JVi
CLR = Y, E^o,£i) = l-$3 J>^>fci) (47a) ko=tQ+lki=0 ko=0 ki=0
No ATi to JVi
CER = £ ^^0,^) + Y, E M^h) fc0=t0+l fci=0 ka=0ki=ti+\
to Ni to ti
= CLR+J] £ #o,*i) = l-£2^'fci) (47b) fco=0fc1=ti+l jfco=0fci=0
N0 Ni to Ni ,
PER = Y, $>(*°>*i) + E E W^ki) Ni
A;0=to + l fci=0 fc0=o fcl=t1 + l
to Ni h = CLR+5^ J2 ^(fco.fci) (47c)
Ao=0 fei=«i+l 1
to Ni
E E w^ko>k lj
PBER = fc°-Qfc'-tl+1 (47d) to Ni v '
E E^^0'^1 A:0=0fci=0
where i>(k0, hi) = 7r$(A;o, iV0)*(A;1, iV^e.
56
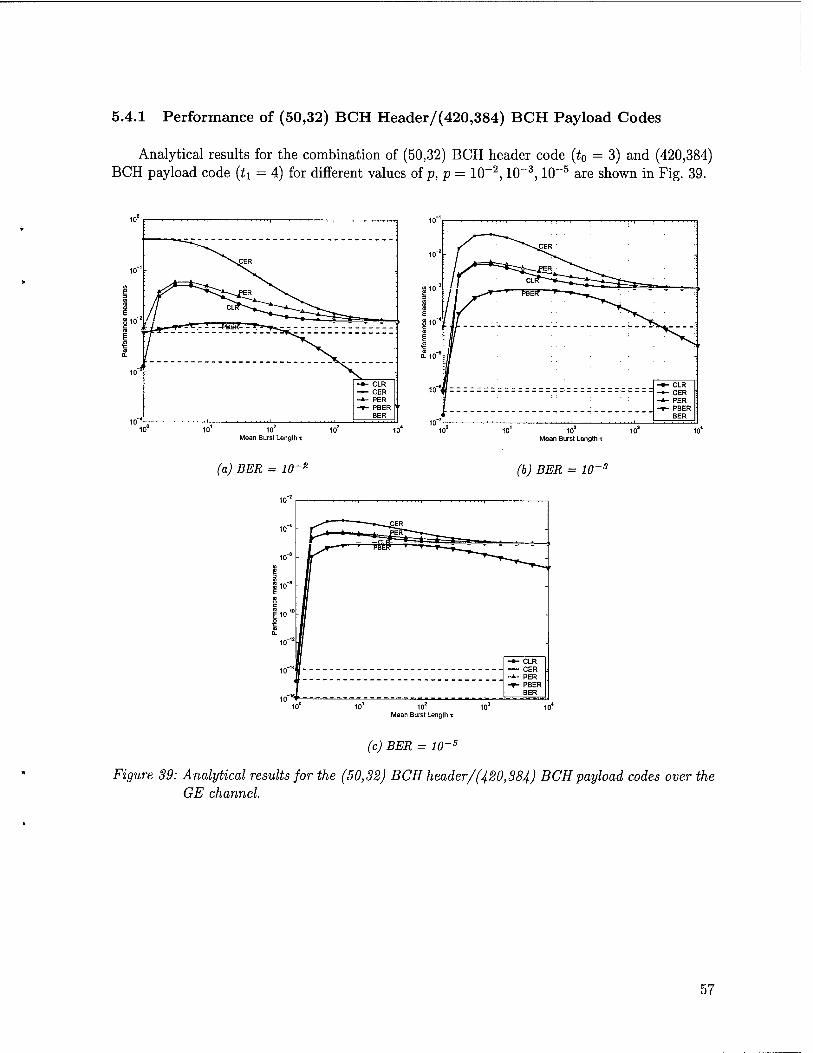
5.4.1 Performance of (50,32) BCH Header/(420,384) BCH Payload Codes
Analytical results for the combination of (50,32) BCH header code (t0 = 3) and (420,384) BCH payload code (*i = 4) for different values of p, p = 10-2,10~3,10~5 are shown in Fig. 39.
g 10' c ra E
I £io"°
;/r^^_J /1 ;r-*"
T~'r" -hE* ~^ ~*--.^.^ '• •" " " " ::
7/ -
-+■ CLR —- CER -*- PER -T- PBER
BER , ' , Mean Burst Length x
10' Mean Burst Length x
(a) BER = 10 - m-s (b) BER = 10 -s
■ CLR • CER - PER ■ PBER
BER
10 10 Mean Burst Length i
(c) BER = 10 -5
Figure 39: Analytical results for the (50,32) BCH header/'(420,384) BCH payload codes over the GE channel.
57

5.4.2 Performance of (56,32) BCH Header/(429,384) BCH Payload Codes
Fig. 40 shows analytical results for the combination of (56,32) BCH header code (to = 4) and (429,384) BCH payload code (U = 5) for BER p = 1CT2, 1CT3, 1(T5.
E 810'
^\XER
1 Ä t~--^=»» ^
/ />T--*-* 'fett" T~~F^^ ^ = = = = = -
-•- CLR — CER -*- PER ; T- PBER '
BER '
Mean Burst Length T 101 10'
Mean Burst Length T
(a) BER = 10- (b) BER = 10-
Mean Burst Length x
(c) BER = 10-5
Figure 40: Analytical results for the (56,32) BCH header/'(429,384) BCH payload codes over the GE channel.
58

5.4.3 Performance of (82,40) BCH Header/(421,376) BCH Payload Codes
Analytical results for the FEC scheme adopted for tactical ATM in the GTE proposal are shown in Fig. 41 for different values of BER p.
Mean Burst Length x 10' 10'
Mean Burst Length i
(a) BER = 10 - m-e (b) BER = 10-
10' 10° Mean Burst Length x
(c) BER = 10-5
Figure 4.1: Analytical results for the (82,40) BCH header/(421,376) BCH payload codes over the GE channel.
59
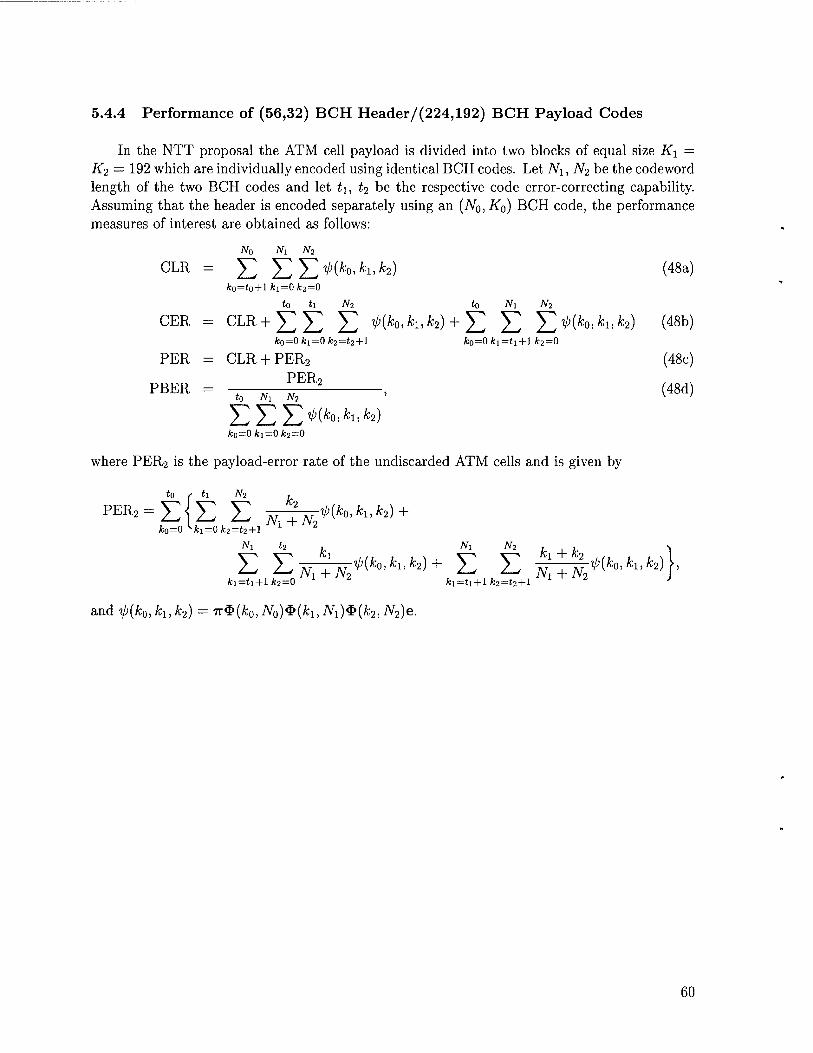
5.4.4 Performance of (56,32) BCH Header/(224,192) BCH Payload Codes
In the NTT proposal the ATM cell payload is divided into two blocks of equal size K\ = K2 — 192 which are individually encoded using identical BCH codes. Let N\, N2 be the codeword length of the two BCH codes and let t\, t2 be the respective code error-correcting capability. Assuming that the header is encoded separately using an (An, K0) BCH code, the performance measures of interest are obtained as follows:
N0 Ni N2
CLR = J2 EX>(^*4,A;2) (48a) k0=t0+l fci=0k2=0
to ti W2 to Ni N2
CER = CLR+EE E il>(h,ki,k2) + J2 E X^*"'*1'*2) (48b) fc0=0fci=0*:2=t2+l fco=0*i=ti+l fc2=0
PER = CLR + PER2 (48c) PERo
PBER = -1^-1^ > (48d)
/c0=0/ci=0*:2=0
where PER2 is the payload-error rate of the undiscarded ATM cells and is given by
to ( ti N2
PEK2 = E E E äTTä^^O^^2) + fco=0 vAn=0fc2=t2+l
Ni t2 , Ni N2 , ,
E EA7-nv:^^'^'A;2)+ E E ATT^:^0'*1'^ fci=ti + l*2=0 2 Jfci=ti+l/fc2=t2 + l
and il>(k0,k1,k2) = TT^{k0,N0)^(kuN^{k2,N2)e.
60

Analytical results for the combination of (56,32) BCH header code (N0 — 56, t0 = 4) and the (224,192) BCH payload code (TVi = N2 = 224, h = t2 = 4) for BER p = 1(T2, 1(T3, 10"5
are shown in Fig. 42.
Mean Burst Length x Mean Burst Length T
(a) BER = 10~s (b) BER = 10~
Mean Burst Length x
(c) BER = 10~5
Figure 42: Analytical results for the combination (56,32) BCH header code and (224,192) BCH payload code over the GE channel.
61
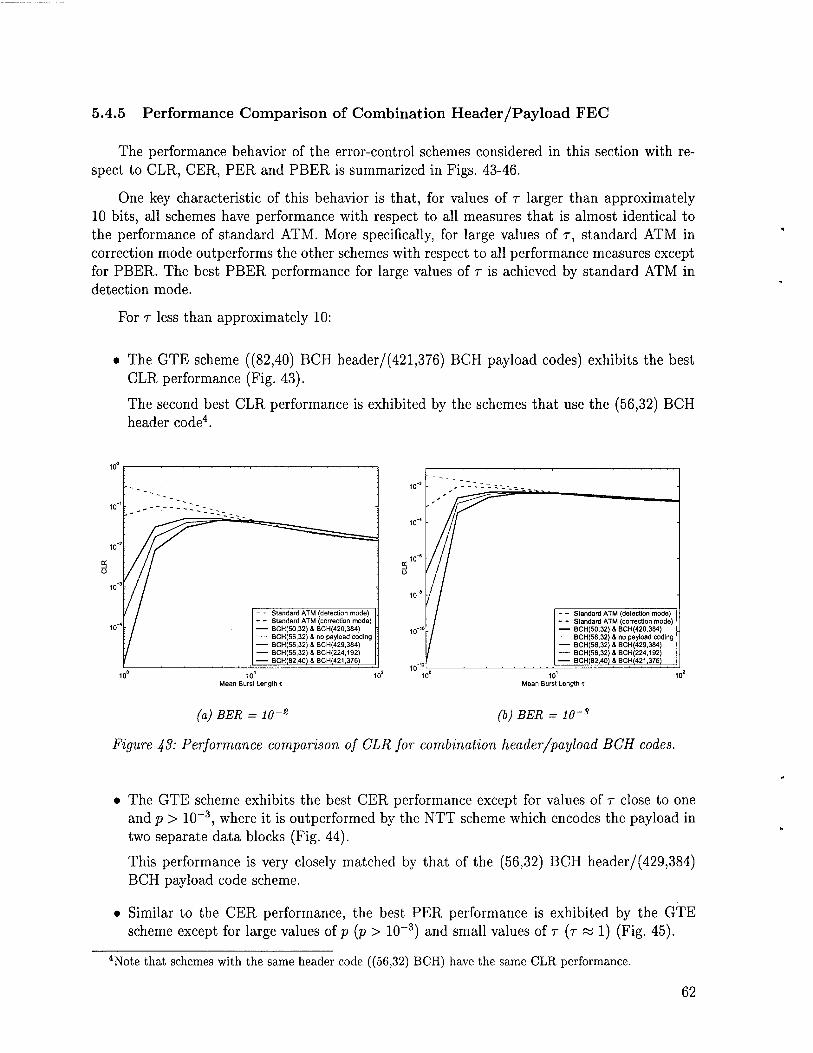
5.4.5 Performance Comparison of Combination Header/Payload FEC
The performance behavior of the error-control schemes considered in this section with re- spect to CLR, CER, PER and PBER is summarized in Figs. 43-46.
One key characteristic of this behavior is that, for values of r larger than approximately 10 bits, all schemes have performance with respect to all measures that is almost identical to the performance of standard ATM. More specifically, for large values of r, standard ATM in correction mode outperforms the other schemes with respect to all performance measures except for PBER. The best PBER performance for large values of r is achieved by standard ATM in detection mode.
For r less than approximately 10:
• The GTE scheme ((82,40) BCH header/(421,376) BCH payload codes) exhibits the best CLR performance (Fig. 43).
The second best CLR performance is exhibited by the schemes that use the (56,32) BCH header code4.
~~~---^
7*~ -
■
- Standard ATM (detection mode) - Standard ATM (correction mode) BCH(50,32) & BCH(420,384)
■ ■ ■ BCH(56,32) & no payload coding BCH(56,32) S BCH(429,384) BCH(56,32) & BCH(224,192) BCH(82,40)&BCH(421,376)
"""-------.
T -
■
- Standard ATM (detection mode) - Standard ATM (correction mode) BCH(50,32) 1 BCH(420,384)
BCH(56,32) & no payload coding BCH(58,32) & BCH(429,384) BCH(56,32)&BOH(224,192) BCH(82,40) & BCH(421,376)
101
Mean Burst Length x 10
Mean Burst Length t
(a) BER = 10~e (b) BER = 10~s
Figure 43: Performance comparison of CLR for combination header/payload BCH codes.
• The GTE scheme exhibits the best CER performance except for values of r close to one and p > 10~~3, where it is outperformed by the NTT scheme which encodes the payload in two separate data blocks (Fig. 44).
This performance is very closely matched by that of the (56,32) BCH header/(429,384) BCH payload code scheme.
• Similar to the CER performance, the best PER performance is exhibited by the GTE scheme except for large values of p (p > 10~~3) and small values of r (r s=s 1) (Fig. 45).
4Note that schemes with the same header code ((56,32) BCH) have the same CLR performance.
62

■s
-
- - Standard ATM (detection mode) - - Standard ATM (correction mode) BCH(50,32) & BCH(420,384) " BCH(56,32) & no payload coding BCH(56,32) & BCH(429,384) BCH(56,32)&BCH(224,192) BCH(82,40)&BCH(421,376)
"—■--..
.
■ / .•
- Standard ATM (detection mode) - Standard ATM {correction mode) BCH(50,32) & BCH(420,384) BCH(56,32) & no payload coding BCH(56,32) & BCH(429,384) BCH(56,32)&BCH(224,192) BCH(82,40) & BCH(421,376)
Mean Burst Length T 10'
Mean Burst Length T
(a) BER = 10~2 (b) BER = 10~3
Figure 44'- Performance comparison of CER for combination header/payload BCH codes.
The PER performance of the (56,32) BCH/(429,384) BCH scheme is comparable to that of the NTT scheme except for values of r close to one. In this case, the former scheme performs better for small values of p, while the latter performs better for large values of P-
"N-s
- Standard ATM (detection mode) ; - Standard ATM (correction mode) BCH(50,32) & BCH(420,384) - - - - BCH(56,32) & no payload coding BCH(56,32) & BCH(429,384) BCH(56,32)&BCH(224,192) BCH(82,40)&BCH(421,376)
. •* *" ** ■" »."V" - :
f -.- - 1 "Z " -. -
- III
■
- Standard ATM (detection mode) : - Standard ATM (correction mode) BCH(50,32) & BCH(420,384) BCH(56,32) & no payload coding . BCH(56,32) & BCH(429,384) BCH(56,32)&BCH(224,192) BCH(82,40)8iBCH(421,376)
10' Mean Burst Length i Mean Burst Length T
(a) BER = 10~s (b) BER = 10~3
Figure 45: Performance comparison of PER for combination header/payload BCH codes.
The GTE scheme exhibits the best PBER performance (Fig. 46) except for large values of p where it is outperformed by the NTT scheme.
The PBER performance of the (56,32) BCH/(429,384) BCH scheme is very close to that of the GTE scheme.
63

Standard ATM Standard ATM
■ BCH(50,32) & BCH(56,32) &
■ BCH(56,32) S ■ BCH(56,32) & ■ BCH(82,40) &
(detection mode) (correction mode) BCH(420,384) no payload coding BCH(429,384) BCH(224,192) BCH(421,376)
101
Mean Burst Length T
10 10' 10'
- Standard ATM (detection mode) - Standard ATM (correction mode) BCH(50,32) & BCH(420,384)
BCH(56,32) & no payload coding BCH(56,32) S BCH(429,384) •— BCH(56,32) & BCH(224,192) BCH(82,40)8,BCH(421,376)
10' Mean Burst Length t
(a) BER = 10~e (b) BER = 10~s
Figure 46: Performance comparison of PBER for combination header/payload BCH codes.
• Note that the CER performance of the (56,32) BCH header code with no payload coding is identical to that of standard ATM. The same for the PBER performance.
The PER performance improves if payload coding is combined with the (56,32) BCH code of the header. The improvement is most significant for small values of p (p < 10~3) and r (r fa 1). For r > 2 payload coding does not improve the PER performance significantly.
In summary, for p < 1(T3, the GTE scheme with BW efficiency 77 = 384/503 = 0.763 has the best overall performance, followed by the combination (56,32) BCH header/(429,384) BCH payload code scheme with efficiency n = 384/485 = 0.792.
Recall that the GTE scheme uses a header code with error-correcting capability to = 6 and a payload code with error-correcting capability t\ = 5. The (56,32) BCH header/(429,384) BCH payload code scheme has t0 = 4 and t\ = 5. The strength of the header code is increased to t0 = 5 for the (59,32) BCH code and to t0 = 6 for the (74,32) BCH code. These codes combined with the (429,384) BCH code for the payload result in schemes with BW efficiency 77 = 384/488 = 0.789 and 77 = 384/503 = 0.763, respectively.
The relative performance of these schemes as the strength of the header code increases while the strength of the payload code is maintained the same is shown in Figs. 47- 50 for different values of p. The figure also show the performance of the GTE scheme for comparison purposes. It is worthwhile noting that, for values of r close to one, the CLR, CER and PER performance improves with t0. The opposite is true for the PBER performance. These fine details are indistinguishable in the figures as the performance of all schemes is comparable for all measures except for the CLR and small values of r. Furthermore, the effect of the header code on the CER and PBER performance is insignificant for all practical purposes.
Note that the GTE scheme and the (74,32) BCH header/(429,384) BCH payload code scheme have identical BW efficiencies. While the performance of the two schemes is almost identical, the GTE scheme with the shortest payload has the best CER and PBER performance and the (74,32) BCH header/(429,384) BCH payload code scheme with the shortest header has
64

the best CLR and PER performance.
■
■:
■*- BCH(56,32) & BCH(429,384) ; -~- BCH(59,32) & BCH(429,384) -r- BCH(74,32) & BCH(429,384) -<- BCH(82,40)&BCH(421,376)
10 Mean Burst Length x
-•- BCH(56,32) & BCH(429,384) — BCH(59,32)&BCH(429,384) -7- BCH(74,32) & BCH(429,384) -— BCH(82,40)&BCH(421,376)
10' Mean Burst Length T
(a) CLR - BER = 10~z (b) CLR - BER = 10~s
Figure 47: Performance comparison of CLR for combination header/payload BCH codes.
■
-*- BCH(56,32) & BCH(429,384) —- BCH(59,32) & BCH(429,384) -f- BCH(74,32) & BCH(429,384) -•- BCH(82,40)&BCH(421,376)
Mean Burst Length x Mean Burst Length T
(a) CER - BER = 10~* (b) CER - BER = 10~3
Figure 48: Performance comparison of CER for combination header/payload BCH codes.
65

10"'
-*- BCH(56,32)&BCH(429,384) — BCH(59,32) S BCH(429,384) -f- BCH(74,32) & BCH(429,384) — BCH(82,40)&BCH(421,376)
- :
. /A
io"2 .
10-' • f^ "—-
10"' 7 ■
io-s
/
10-
/
-
-•- BCH(56,32) & BCH(429,384) . — BCH(59,32) & BCH(429,384) -T- BCH(74,32) & BCH(429,384) -•- BCH(82,40)&BCH(421,376)
10 Mean Burst Length T
10 Mean Burst Length t
(a) PER - BER = 10~s (b) PER - BER = W'3
Figure 49: Performance comparison of PER for combination header/payload BCH codes.
■ BCH(56,32) 4 BCH(429,384) ■ BCH(59,32) S BCH(429,384)
BCH(74,32) S BCH(429,384) ■ BCH(82,40)SBCH(421,376)
101
Mean Burst Length T 10'
Mean Burst Length T
(a) PBER - BER = 10~s (b) PBER - BER = 10~3
Figure 50: Performance comparison of PBER for combination header/payload BCH codes.
66

5.5 Duplicate-Header Scheme
The DERA proposal uses duplicate headers for protection against errors with the second header being appended at the end of the standard ATM cell. In the most simple case, the second header is an exact duplicate of the standard ATM cell header. The resulting wireless ATM cell structure is shown in Fig. 51, where field F0 represents the first header (JVo = 40, to), Fi represents the cell payload (Nx = 384, tx — 0) and F2 represents the second header (JV2 = No, h = to)- The error-correcting capability of the CRC header code used in standard ATM is t0 = t2 = 1 if HEC is used in correction mode, or t0 — t2 = 0 if HEC applies error detection only. Assuming that a cell with duplicate headers is dropped (lost) when the number
Header Payload Header
Fo Fl F2
r*-tf0-H<- N, -*H-*T
Figure 51: Wireless ATM cell structure for the DERA error-control proposal.
of errors exceeds the code error-correcting capability for both headers, i.e., when {Uo > to} and {£/2 > t2}, the performance metrics of interest are given by:
N0 Ni N2
CLR - Pr{C/0> t0, U2>t2} = E E E i>(hMM) (49a)
CER = CLR + Pr{t/0 <t0,C/i >ti} + Pr{[/0>io,t/i >*i,^2 <t2} to JVi N2 No Ni t2
= CLR+J] £ J^^(k0,h,k2)+ Yl E J>(fco,Äi,*2) (49b) feo=0 fci=ti+l fc2=0 fc0=to+l fei=ti+l fc2=0
PER = CLR + PER2 (49c) PER2 PBER
Pr{?7o < to} + Pr{C/0 > k, U2 < t2} PER2
to Ni N2 No Ni t2 '
EEE^*0'*1'*2^ E EE^*0'*1'*2) fc0=0 fci=0 fc2=0 &0=to+lfci=0fc2=0
where PER2 is the payload-error rate of the undiscarded ATM cells and is given by
Ni
PER2 = Yl fci=ti+i
to JVi N2
Pr{U0 < t0, Ux = h} + Pr{[/0 > t0, Ux = h, U2 < t2}
No Ni t2
ko=0 ki=h+l k2=0
kx
Nx
kx
fco=t0+lfci=ti+l*;2=0
(49d)
= EE E ^(*o» *!•*»)+ E E E^^o,^,^). (49e
5,5.1 Performance of DERA Scheme in Error-Detection Mode
Analytical results for the duplicate-header scheme when the HEC operates in detection mode (no header-error correction) are shown in Fig. 52 for different values of BER. The dotted lines in
67

the figure correspond to the performance measures for standard ATM with error detection. As can be seen from the figure, compared to standard ATM, the DERA scheme provides improved performance with respect to CLR and PER, no significant improvement with respect to CER and a slight degradation with respect to PBER.
Mean Burst Length i Mean Burst Length T
(a) BER = 10- (b) BER = 10-
Mean Burst Length x
(c) BER = 10~5
Figure 52: Analytical results for the DERA duplicate-header scheme over the GE channel in EEC detection mode (payload size = 384).
Note that the performance behavior of the CLR as a function of the mean burst length r for this scheme is distinctly different from that for standard ATM and the other FEC schemes considered so far. In the previous schemes, for values of r large enough, CLR takes values higher than the BER to which it converges in the limit as r —> oo. In the DERA scheme, the CLR also converges to the BER as r increases but in this' case, the limit is approached from values that are lower than the BER.
An expression for the CLR in the case of standard ATM cell headers with error detection
68

can be easily obtained from Eq. 49a. Let Hi denote the event that the first header of the wireless ATM cell (field Fi) is not corrupted by errors:
Hi = {i*\ free of errors}.
Then, H[ = {Fi in error} and Pr(i7f) = 1 - Pr(ifi). Similarly, for the second header,
H2 = {F2 free of errors}, H% = {F2 in error}
and Pr(#2c) = 1 - Pr(tf2). CLR is given by
CLR = Pr(#ffif) = 1 - Pi(HfH2) - Pr(tfiff2c) - Pr(#iH2),
where
and
No Ni
Pv(HciH2) = nJ2 *(*b, Wo) E *(ki,Ni)$(0,NQ)e fco=l A;i=0
= TT[PNO
- *(0,N0)]PNl§(Q,N0)e
= 7r[I-*(0,Ar0)]PWl$(0,iVo)e
= TT$(0, N0)e - TT*(0, N0)PN^(0, N0)e
= Pr(#iff2c)
Pr^ffe) = 7r*(0,iVo)PJVl*(0,Aro)e.
(50)
(51)
(52)
For the GE channel with transition probability matrix P and error-rate matrix Pe given by
P = 1 — ajr ajr
1/r 1-1/r and PG =
1 0 0 1
the quantities Pr(#i) = Pr(if2) and Pr(HiH2) are expressed in terms of p, r, N0 and Nt as follows:
Pr(F1) = 7r*(0,iV0)e = (1 - q/r)^"1
1 + a
Pr(ffiiT2) = TT*(0, iY0)PJVl*(0, iV0)e =
(1 - a/r)^-1
1 + a -4-^) Ni+l'
(53)
, (54)
where a = p/(l —p). An explicit expression for CLR in terms of p, r, iVo and iVi can be obtained by substituting for TT$(0, iV0)e and TT$(0, A^0)P
iVl*(0, AT0)e from Eqs. 53 and 54 in Eqs. 51, 52 and 50:
CLR = 1 - 2TT$(0, N0)e + TT$(0, N0)PNl&{0, N0)e
'(l-a/T)N°-^2 " 1 + a 1 + a 1 + a 1
l + a\ Ni+l'
-;
= a (1 - a/r)^-1
1 + a 1 + a' nJVi+l
+ ! (1 ~ «A) 1 + a
JVo-l
(55)
(56)
69

Initially, CLR decreases with r, it achieves a minimum value CLR^n for some value r = rc/r
and increases with r for large values of r. This can be explained as follows. A cell is lost whenever both headers are corrupted by errors. For error-bursts that are short compared to the cell size (r << iVi), the two headers in a cell can be corrupted simultaneously by separate bursts only. For a fixed BER, as the burst length increases, the gap between bursts also increases and, therefore, the probability of both headers in a cell being corrupted by errors, i.e., the CLR, decreases. This trend of the CLR performance, that is, the decrease with burst length, is present for burst lengths up to the threshold value Tcir. Any further increase of the burst length to values high enough to have both headers in a cell corrupted by a single burst (r >> Ni), will result in the increase of the CLR. In this case, the longer the error-burst, the higher the probability of both headers in a cell being corrupted by errors and the higher the CLR. Summarizing, CLR decreases with r for small values of the ratio T/NI and increases with r for large values of T/NI.
In mathematical terms, the CLR performance is dominated by the second term in Eq. 56 for T < Tdr,
CLR = PT(H^) 1- (1 - a/r)"»-1
1 + 0!
H2
= Pr(tf1c)Pr(#2
c), (57)
and dominated by the first term in Eq. 56 for r > rc;r,
"(l-a/r)JV°-n2r
CLR = Pi(HZH%) « a 1 + a
1- l + o JVi+l
(58)
The CER, PER and PBER are monotone decreasing functions of r.
Performance depends on the size of the payload Ni as shown in the results presented in Fig. 53 for different values of Nu 7VX = 192,384,768. The solid curves in Fig. 53 are for the results obtained for JVi = 384, the dashed curves for the results obtained for JVi = 192 and the dotted curves for the results obtained for JVi = 768.
More specifically, for values of r sufficiently small, the value of CLR does not vary with payload size Nt. In this range of r, CLR is given by Eq. 57 and is clearly independent of N\. For large values of r, the value of CLR decreases with the increase of payload size JVi. For a given value of r, the increase of payload size results in the increase of the separation between the two headers. This, in turn, results in the decrease of the probability that a single burst will corrupt both headers in a cell, i.e., it results in the decrease of the CLR. This is also evident from Eq. 58, since 0 < 1 — (1 + a)/r < 1 in this range of r. Clearly, rc/r increases with N\. In addition, CLR^^ decreases with Nx. In other words, the use of larger payload size is preferable with respect to CLR performance. However, larger payload size results in higher CER and PBER over the entire range of r. The PER remains unaffected by the payload size for the values of N\ under consideration.
The CLR performance depends on the separation between the two headers. If the second header follows directly after the first header instead of being appended at the end of the payload (Fig. 54) the performance of the duplicate-header scheme may differ significantly as shown in Fig. 55 where the results obtained for the DERA proposal (dashed lines) are compared to those obtained for the scenario shown in Fig. 54 (solid lines). In this case, the CLR is identical to
70

Mean Burst Length t
' -%- CLR (N(=384)
"NJ"''-. -». CLR(N1=192) . V^*1',^ .... CLR (^=768)
"""v ^*s, ■--..
*^ J^sJIEK," ■ ■
V k**--*. f ER , """'r::^r^{i^....,
4 >i
• J *T» .' r ■ *•
\» . /. OLFT^J
« i
'■•
10' Mean Burst Length i
(a) BER = 10- (b) BER = 10-
E
m E
>S^---. -m- CLR (^=384) _»- CLR(Nt=192) ... CLR (1^=768)
-•» ■ ■■■■■ -
^ / / * : ^v / /
^L # /
^v / / •
10' 10' Mean Burst Length x
— m-5 (c) BER = 10
Figure 53: Analytical results for the DERA duplicate-header scheme over the GE channel in EEC detection mode for different values of payload size Ni.
that obtained for the DERA proposal (Fig. 51) if the payload size is considered to be iVi = 0
CLR = 1 - 2TT$(0, iV0)e + TT$(0, NQ)&(0, N0)e
\ + a 1 + a d + «)(i-7) (59)
71

Header Header Payload
Fo Fl F2
\<-N0-*\*-NJ^\<- K
Figure 54: Wireless ATM cell structure for the duplicate-header control scheme (scenario 2).
10 10' Mean Burst Length x Mean Burst Length t
(a) BER = 10 -s (b) BER = 10~
Mean Burst Length T
(c) BER = 10~5
Figure 55: Analytical results for different scenarios of the duplicate-header scheme over the GE channel in EEC detection mode (payload size — 384)-
72

The performance behavior of scenario 2 for the duplicate-header scheme with increasing payload size iV-. illustrated in Fig. 56 is similar to that observed for the DERA scheme (Fig. 53).
Mean Burst Length x Mean Burst Length x
(a) BER = 10~ (b) BER = 10-
. CER (N(=384) CER(N,=192) CER {N =768)
10' 10* Mean Burst Length t
(c) BER = 10~5
Figure 56: Analytical results for the duplicate-header scheme (scenario 2) over the GE channel in EEC detection mode for different values of payload size N±.
73

5.5.2 Performance of DERA Scheine in Error-Correction Mode
The effect of using HEC in correction rather than detection mode on the performance of the DERA scheme is illustrated in Fig. 57. The use of the single-error-correcting capability of the standard ATM HEC results mainly in improved CLR performance for small values of r. It also results in slightly improved PER performance for high BERs. The other performance metrics remain unaffected by the use of correction mode.
-*- CLR (detection mode) •■•■ CLR (correction mode) —- CER (detection mode) ■ ■ ■ CER (correction mode) -±- PER (detection mode) * PER (correction mode)
•T- PBER (detection mode) ■-T- PBER (correction mode)
-♦- CLR (detection mode) ■■•■ CLR (correction mode) — CER (detection mode)
■■■■ CER (correction mode) -*- PER (detection mode) •*■ PER (correction mode) -T- PBER (detection mode) [ ■ T ■ PBER (correction mode)
Mean Burst Length t Mean Burst Length i
(a) BER = 10~2 (b) BER = 10 -s
im
-
CL?
Z-^***-^»PBER
i
-•- CLR (detection mode) ■ ■• CLR (correction mode) — CER (detection mode)
■ ■ CER (correction mode) •*- PER (detection mode)
■■* PER (correction mode) -T- PBER (detection mode) ■ T PBER (correction mode)
10' 10* Mean Burst Length t
(c) BER = 10~5
Figure 57: Analytical results for the DERA duplicate-header scheme over the GE channel in HEC correction mode (payload size — 384).
74

5.5.3 Performance of DERA Scheine with Compressed Headers
It can be easily proven that the CLR (Eq. 56) is an increasing function of the header size N0. Therefore, improved CLR performance can be achieved by reducing the size of the cell headers. Specifically, the standard ATM cell header can be compressed by reducing the size of the VPI/VCI fields, which implies the reduction of the maximum number of ATM connections supported over radio links. Due to the bandwidth-limited nature of the wireless medium, the compression of the VPI/VCI fields has no significant practical implications; the number of ATM connections carried over radio links will be much smaller than the number of connections carried over fixed, high-bandwidth links.
• CLR (compressed) CLR (uncompressed)
- CER (compressed) CER (uncompressed)
■ PER (compressed) PER (uncompressed)
• PBER (compressed) PBER (uncompressed) BER
Mean Burst Length T Mean Burst Length t
(a) BER = 10 -s (b) BER = 10~s
^■""^-^gER -
cuff
. PBER*^>,,
-•- CLR (compressed) — CLR (uncompressed) -"- CER (compressed) — CER (uncompressed) -*- PER (compressed) — - PER (uncompressed) -T- PBER (compressed) — PBER (uncompressed)
BER
10' Mean Burst Length x
-5 (c) BER = 10
Figure 58: Analytical results for the DERA duplicate-header scheme over the GE channel in EEC detection mode (compressed headers).
Analytical results for such a scheme, where the VPI/VCI field size has been byte compared to standard ATM, are shown in Figs. 58 and 59 for operation in
reduced by one HEC detection
75

and correction mode, respectively. The compressed header (24 bytes) is encoded using the standard ATM CRC-8 code.
■ CLR (compressed) CLR (uncompressed)
■ CER (compressed) CER (uncompressed)
■ PER (compressed) PER (uncompressed)
• PBER (compressed) PBER (uncompressed) BER
1 ' -*- CLR (compressed) — CLR (uncompressed)
-1 -*- CER (compressed) - - CER (uncompressed) -*- PER (compressed) - - PER (uncompressed)
Iff' -T- PBER (compressed) - - PBER (uncompressed)
§ BER
£ s « _i jf PBEBSNW 1=1"
•e- / ^^ y ^^ a 10 J
y CL?~^
It)"8 A
*«-T i ■ >
10' 10' Mean Burst Length x
10' Mean Burst Length T
(a) BER = 10- (b) BER = IQ'3
-*- CLR (compressed) — CLR (uncompressed) — CER (compressed) — CER (uncompressed) -*- PER (compressed) — - PER (uncompressed) -T- PBER (compressed) — PBER (uncompressed)
BER
Mean Burst Length T 10*
(c) BER = 10 -5
Figure 59: Analytical results for the DERA duplicate-header scheme over the GE channel in HEC correction mode (compressed headers).
A slight improvement in CLR and PER performance, due to header compression, can be observed in the lower range of values of r for both HEC operation modes. The CER and PBER performance remains unaffected by header compression.
76

5.5.4 Performance of Duplicate-Header Scheme with BCH-Encoded Headers
A variant of the DERA scheme where ATM headers are encoded using BCH codes rather than the standard ATM CRC-8 code is considered in this section. The performance of a scheme that uses a (56,32) BCH header code is shown in Fig. 60. The results for the DERA variant with BCH-encoded headers are indicated by solid lines, whereas the results for the DERA scheme with error correction are indicated by dashed lines.
Mean Burst Length x 10 10"
Mean Burst Length i
(a) BER = 10- (b) BER = 10-
■ CLR ■ CER ■ PER ■ PBER
BER
10* Mean Buret Length T
(c) BER = 10~5
Figure 60: Analytical results for the duplicate-header scheme over the GE channel with (56,32) BCH header code.
The use of BCH header codes improves the CLR performance for small values of r (r < 10) but has no significant impact on the rest of the performance measures.
77
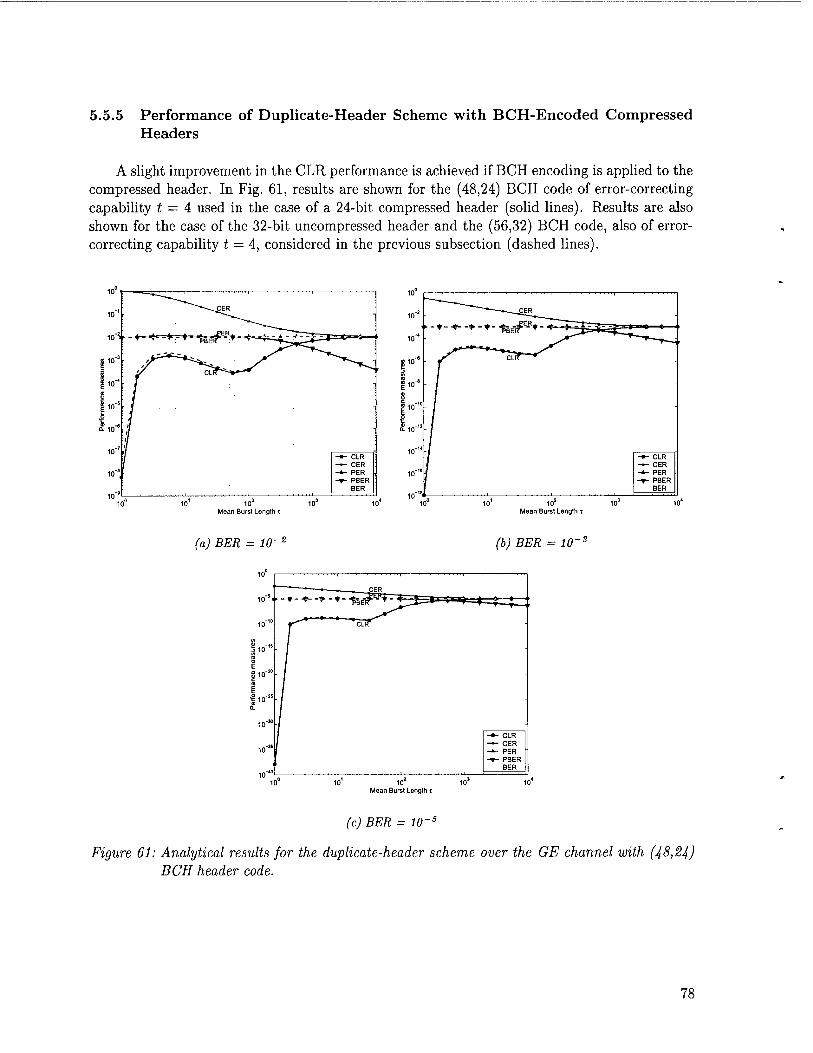
5.5.5 Performance of Duplicate-Header Scheme with BCH-Encoded Compressed Headers
A slight improvement in the CLR performance is achieved if BCH encoding is applied to the compressed header. In Fig. 61, results are shown for the (48,24) BCH code of error-correcting capability t = 4 used in the case of a 24-bit compressed header (solid lines). Results are also shown for the case of the 32-bit uncompressed header and the (56,32) BCH code, also of error- correcting capability t = 4, considered in the previous subsection (dashed lines).
10
10"' ^~"-»--^£ER -
10-S A- -J---EER± - i— -<■ -^T-^-TTT^T
„ - - _ |10J ,jF
CL^"^»*-"' ^*^^,^"
^10"4 - 8 |10"S
€ <■> -A Q- 10
-
10"7 i/ /
-»- CLR — CER
10"* -*~ PER -T- PBER
BER
e
| 10'
S 110'
I £ io'
10'
10'
10'
Mean Burst Length T Mean Burst Length x
(a) BER = 10' (b) BER = 10 - m-s
Mean Burst Length T
-»- CLR — CER -»- PER T- PBER
BER
(c) BER = 10~5
Figure 61: Analytical results for the duplicate-header scheme over the GE channel with (48,24) BCH header code.
78

An additional slight improvement in CLR and PER performance is achieved by increasing the error-correcting capability of the BCH code applied to the compressed header. For example, the results for the (51,24) BCH code with error-correcting capability t = 5 are shown in Fig. 62 (solid lines). The results for the (48,24) BCH code with error-correcting capability t = 4 are also shown in the same figure for comparison purposes (dashed lines).
——^£|R ► -*- ■*- -*■ -*• •W**- ~ * '~fr "^
if - a
it if
ti if
i\ u
CLFf *
-
i
-*- CLR -^ CER -*- PER -T- PBER
BER
Mean Burst Length T
(a) BER = 10- (b) BER = 10-
Mean Burst Length x
■ CLR ■ CER
PER ■ PBER
BER
(c) BER = 10~5
Figure 62: Analytical results for the duplicate-header scheme over the GE channel with (51,24) BCH header code.
79

5.5.6 Performance Comparison of Duplicate-Header Schemes
The performance behavior of the duplicate-header schemes with respect to the CLR, CER, PER and PBER performance measures is summarized in Figs. 63-66. Results are shown for BER values p = 1(T2,10~3. The results for p = 10"5 follow a trend similar to that displayed by the results for p = 10-3.
The following characteristics can be observed with respect to the different measures: - CLR (Fig. 63)
• The schemes with BCH-encoded headers have improved CLR performance compared to the schemes with CRC encoded headers for small values of r (r < 10).
• The schemes with compressed headers perform better than the schemes with full length headers, the improvement being most noticeable for small values of r.
• The duplicate-header scheme with (51,24) BCH header code outperforms the other schemes with BCH-encoded headers over the entire range of r. It is outperformed only by the schemes with CRC encoded compressed headers for r > 10, yet the difference in perfor- mance is very small.
;:;;.__
<s-~~ ;=::Üi<ii.
'if ■
— DERA (detection mode) — DERA (correction mode) — DERA compressed (detection mode) DERA compressed (correction mode) — duplicate BCH(56,32) duplicate BCH(48,24) duplicate BCH(51,24)
10
io-'°
io-,s
/; /^ ■
— DERA (detection mode) DERA (correction mode) — DERA compressed (detection mode) " — DERA compressed (correction mode) — duplicate BCH(56,32) duplicate BCH(48,24) — duplicate BCH(51,24)
10 Mean Burst Length x
10' Mean Burst Length i
(a) BER = 10~s (b) BER = 10~3
Figure 63: Performance comparison of CLR for duplicate-header schemes.
- CER (Fig. 64) All duplicate-header schemes under consideration have identical CER performance.
- PER (Fig. 65) The PER performance of the schemes exhibits the same behavior described for the CLR.
- PBER (Fig. 66) Similar to CER, all schemes yield almost identical PBER performance results.
80
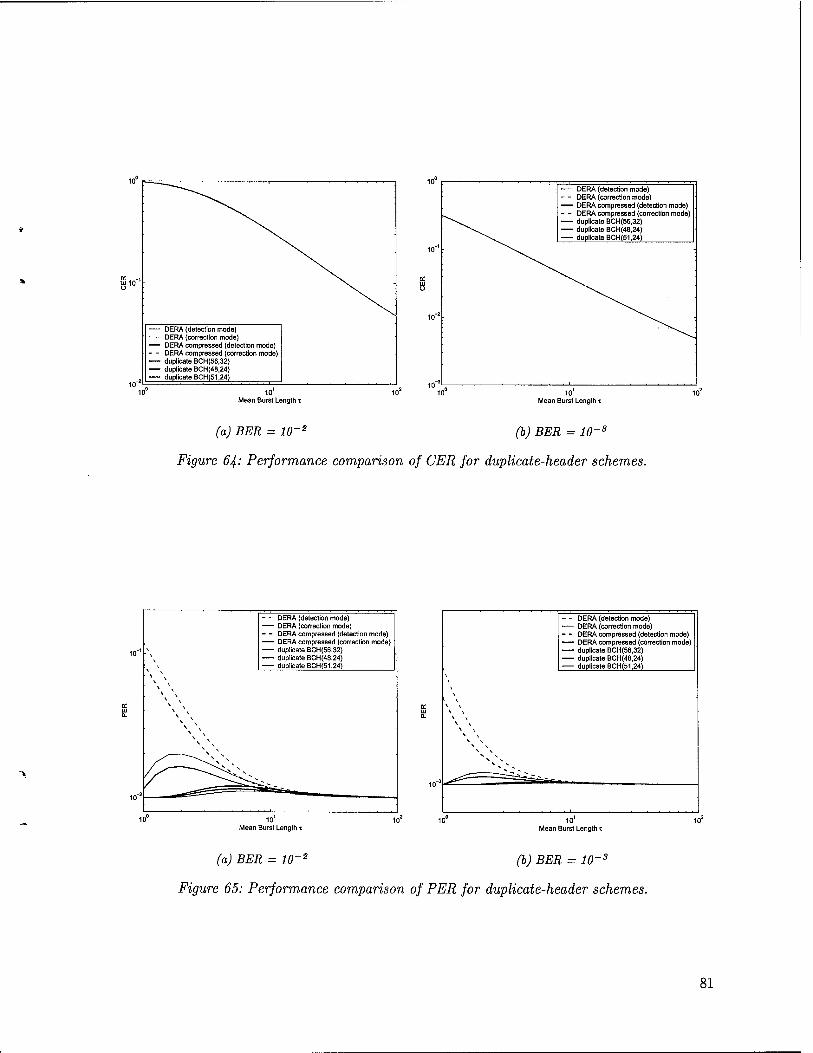
- \.
DERA (detection mode) — DERA (correction mode) — DERA compressed (detection mode) — DERA compressed (correction mode) — duplicate BCH(56,32) — duplicate BCH(48,24) duplicate BCH(51,24)
■—■ DERA (detection mode) — - DERA (correction mode) — DERA compressed (detection mode) — DERA compressed (correction mode) duplicate BCH(56,32) duplicate BCH(48,24) — duplicate BCH(51,24)
r ^^\^
10' Mean Burst Length x
10 Mean Burst Length x
(a) BER = 10~s (b) BER = 10~3
Figure 64-' Performance comparison of CER for duplicate-header schemes.
DERA (detection mode) ■ DERA (correction mode)
DERA compressed (detection mode) ■ DERA compressed (correction mode) ■ duplicate BCH(56,32) • duplicate BCH(48,24) • duplicate BCH(51,24)
— - DERA (detection mode) ■— DERA (correction mode) — DERA compressed (detection mode) —— DERA compressed (correction mode) duplicate BCH(56,32) duplicate BCH(48,24) — duplicate BCH(51,24)
10' Mean Burst Length x
10' Mean Burst Length x
(a) BER = 10~s (b) BER = 10~3
Figure 65: Performance comparison of PER for duplicate-header schemes.
81

- DERA (detection mode) - DERA (correction mode) - DERA compressed (detection mode) DERA compressed (correction mode) duplicate BCH(56,32) duplicate BCH{48,24) duplicate BCH(51,24)
1
— - DERA (detection mode) — DERA (correction mode) — DERA compressed (detection mode) — DERA compressed (correction mode) duplicate BCH(56,32) — duplicate BCH(48,24) -— duplicate BCH(51,24)
10 Mean Burst Length T Mean Burst Length T
(a) BER = 10~e (b) BER = 10~s
Figure 66: Performance comparison of PBER for duplicate-header schemes.
82

6 Recommendations for Error Control Over the Markov Error Channel
The performance results for the combination header/payload FEC schemes (Section 5.4.5) and the duplicate-header schemes (Section 5.5.6) are compared in this section. The (82,40) BCH header/(421,376) BCH payload code (GTE scheme) and the (74,32) BCH header/(429,384) BCH payload code were the two schemes that exhibited the best performance in the former category. The two schemes are of equal bandwidth efficiency r\ — 0.763 and have comparable performance. The duplicate-header scheme with compressed headers encoded using a (51,24) BCH header code had the best performance in the latter category. The BW efficiency of this scheme is 77 = 384/(2 x 51 + 384) = 0.79.
Based on the results obtained for the three schemes, shown in Figs. 67-70, the following observations can be made regarding their relative performance:
• The duplicate-header scheme outperforms the header/payload FEC schemes with respect to CLR. This difference can be as large as several orders of magnitude for r < 100.
BCH(74,32) & BCH(429,384) BCH(82,40)&BCH(421,376) - duplicate header BCH(51,24)
10' 10' Mean Burst Length T Mean Burst Length i
(a) BER = 10~z (b) BER = 10~3
Figure 67: CLR performance comparison.
• The duplicate-header scheme is outperformed by the other schemes with respect to CER. The CER of the duplicate-header scheme is almost the same as that of standard ATM where no payload error control is applied. This is anticipated in view of the fact that no payload error control is used in the case of the duplicate-header scheme and because the CER is more sensitive to the encoding of the payload rather than of the header.
• The PER of the duplicate-header scheme is almost constant over the entire range of r and equal to the BER p. The duplicate-header scheme outperforms the other schemes over the entire range of r with the exception of very small values close to one.
• The PBER performance of the duplicate-header scheme is worse than that of the other schemes. In fact, it is worse than the performance of standard ATM. For small values of r,
83

BCH(74,32) S BCH(429,384) BCH(82,40)SBCH(421,376) - duplicate headerBCH(51,24)
\ -
BCH(74,32) S BCH(429,384) BCH(82.40)&BCH(421,376) ■— duplicate header BCH(51,24)
10' 10' Mean Burst Length x
10 10 Mean Burst Length t
(a) BER = 10-e (b) BER = 10~s
Figure 68: CER performance comparison.
BCH(74,32) & BCH(429,384) BCH(82,40)SBCH(421,376) - duplicate header BCH(51,24)
Mean Burst Length T Mean Burst Length T
(a) BER = 10-& (b) BER = 10~s
Figure 69: PER performance comparison.
the PBER performance of the combination schemes has a trend that is distinctly different from that of the duplicate-header scheme or of standard ATM. This is attributed to the effect of payload-error correction which prevails for small values of r and p.
84

• BCH(74,32) & BCH(429,384) ■ BCH<82,40)&BCH(421,376) • duplicate header BCH(51,24)
BCH(74,32) & BCH{429,384) BCH(82,40)&BCH{421,376) — duplicate header BCH(51,24)
Mean Burst Length T Mean Burst Length t
(a) BER = 10~2 (b) BER = lO'3
Figure 70: PBER performance comparison.
Finally, the performance results for the three schemes considered above are compared to the results for the (59,53) RS code in Fig. 71 for BER p = 1(T3. It is observed that:
• The duplicate-header scheme outperforms all other schemes with respect to CLR.
• The RS code exhibits the best CER performance over the entire range of r except for r = 1 where it is outperfored by the combination header/payload FEC schemes. Similarly for the PBER performance.
• With respect to PER, the header/payload FEC schemes exhibit the best performance for r = 1, the RS code exhibits the best performance in the range between r = 2 and r = 8 and the duplicate-header scheme exhibits the best performance for r > 8.
The duplicate-header scheme with the best CLR performance is a good candidate for voice transport over the GE channel. Recall that this scheme does not apply payload-error control, and therefore, has a poor CER and PBER performance compared to the other schemes. However, given the voice tolerance to errors, it is preferable to have cells delivered with errors than to have a large number of lost cells. In addition, a payload-error control scheme could be used in combination with the duplicate-header scheme to improve the CER, PER and PBER performance at the expense of decreasing the code rate.
The RS code has some inherent desirable performance characteristics with respect to CER, PER and PBER for values of r less than the code symbol length, but does not perform as well as the header/payload FEC schemes over the random-error channel (r = 1).
85
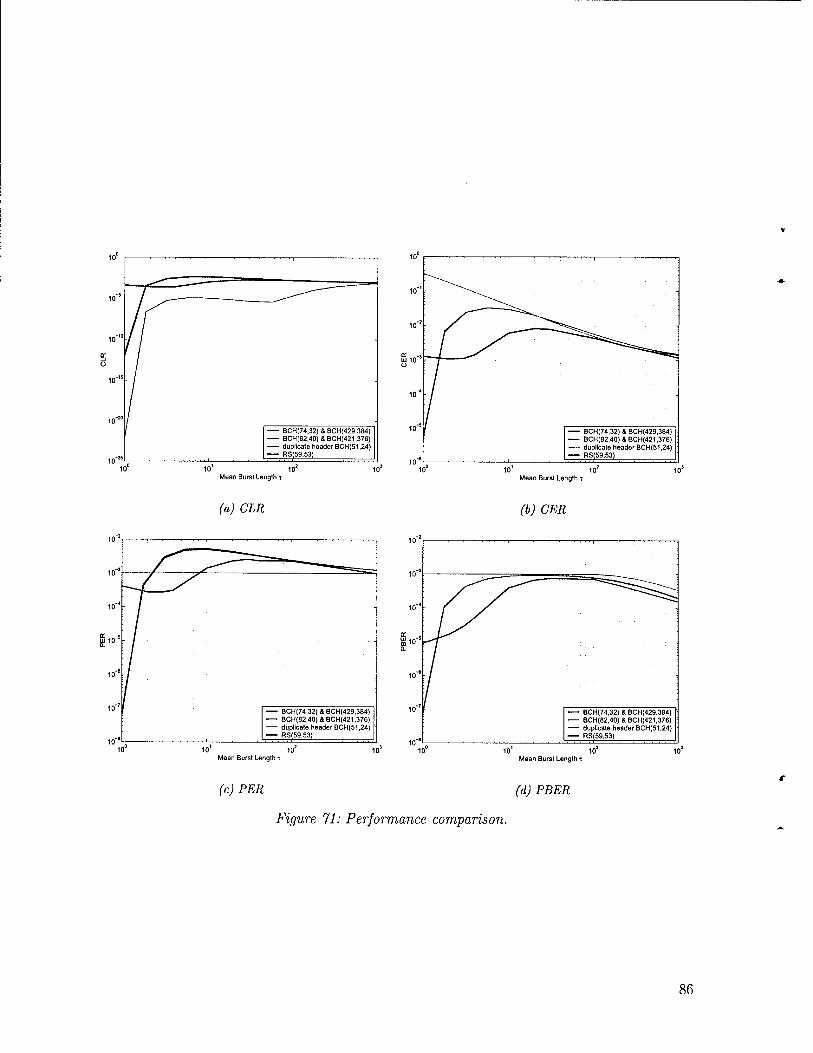
101 10' Mean Burst Length T
(a) CLR
10"'
1 ^^^=
BCH(74,32) 4 BCH(429,384) BCH(82,40)SBCH(421,376) - duplicate header BCH(51,24) RS(59.53)
10 10' Mean Burst Length t
10 10' Mean Burst Length t
10°
(b) CER
BCH(74,32) & BCH(429,384) BCH(82,40)&BCH(421,376) -— duplicate headerBCH(51,24) RS(59,53)
10' 10* Mean Burst Length T
(c) PER (d) PBER
Figure 71: Performance comparison.
86

A Derivation of probabilities PdiS and Pund
Detection Mode
In detection mode, the probability of an undetected error event in a header, Pund, and the probability of a detected error event in a header (or cell discard probability), Pdis, can be expressed in terms of the codeword weight distribution, Ai,i = 0,l,...,n [3] as follows:
(60)
(61)
Pund — Pr{undetected error in detection mode} n
= £V(I-P)B-<
, »=1
Pdis = Pr{detected error in detection mode}
= 1 — Pr{no errors detected in detection mode}
= 1 — Pr{no errors incurred in detection mode}
— Pr{undetected errors in detection mode} n
= l-(i - P)B-53^(1-p)*-«
= I-^V(I-P)B
-*- »=0
Correction Mode
When the single-bit error-correcting capability of the HEC CRC code is applied, i.e., in correction mode, the probability of an undetected error event in a header, Pund, and the probability of a detected error event in a header (or cell discard probability), Pdis, are given by:
P'und — Pr {undetected error in correction mode}
= Pr{undetected error in detection mode}
+ Pr{incorrect correction in correction mode} (62) n
= Pund + X> + 1) [Ai+i + (n-i + 1)A^}p'(l -p)n-\ i=2
P'dis — Pr{detected error in correction mode}
= 1 — Pr{no errors detected in correction mode}
= 1 — Pr{no errors detected in detection mode} (63)
— Pr{corrected errors in correction mode}
= Pdis - np(l - p)n-\
87

References
1] ATM Forum, ATM User-Network Interface Specification, Version 3.1, Sept. 1994.
2] Harris Government Aerospace Systems Division, "Performance analysis of ATM networks with wireless links," tech. rep., Melbourne, Fl, May 1995.
3] S.-M. Lei, "The syndrome distribution of m-bit error patterns and the analysis of ATM forward error correction codes," IEEE Transactions on Communications, vol. 43, pp. 1392 1399, Feb./Mar./Apr. 1995.
4] ITU-T Recommendation 1.432, Integrated Services Digital Network (ISDN) - B-ISDN User- Network Interface - Physical Layer Specification. ITU-T SG XVIII, Helsinki, Sweden, Mar. 1993.
5] J. J. Hunter, Mathematical Techniques of Applied Probability, vol. 1. New York: Academic Press, 1983.
6] D. W. Choi, "Frame alignment in a digital carrier system-a tutorial," IEEE Communica- tions Magazine, vol. 28, pp. 47 54, Feb. 1990.
7] U. Black, ATM: Foundation for Broadband Networks. Englewood Cliffs, N.J.: Prentice Hall, 1995.
8] H. Liu, H. Ma, M. El Zarki, and S. Gupta, "Error control schemes for networks: An overview," ACM/Baltzer Journal of Mobile Networks and Applications, vol. 2, pp. 167 182, Apr. 1997.
9] C. Schüler, "Error correction strategies for wireless ATM," in Proceedings of the 1997 IEEE Workshop on the Architecture and Implementation of High Performance Communication Systems, Chalkidiki, Greece, pp. 204-213, June 23-25, 1997.
[10] C. Schüler, "Optimization and adaptation of error control algorithms for wireless ATM," International Journal of Wireless Information Networks, vol. 5, no. 2, pp. 173-185, 1998.
[11] J. P. Hergott, "Using ATM switching in post-2000 tactical networks," technical report, Thomson-CSF, July 1993.
[12] Tri-service Group for Communications and Electronics (TSGCE), Sub-Group on Commu- nications (SG/11), "Phase 2 report of project group on tactical communications in the land combat zone post-2000," technical report, January 1995.
[13] J. B. Cain and D. N. McGregor, "A recommended error control architecture for ATM networks with wireless links," IEEE Journal on Selected Areas in Communications, vol. 15, pp. 16 28, Jan. 1997.
[14] Y. A. Tcsfai and S. G. Wilson, "FEC schemes for ATM traffic over wireless links," in Proceedings of the 1996 IEEE Military Communications Conference ,McLean, VA, pp. 948 953, Oct. 21-24, 1996.

[15] J. F. Durkin and A. J. Akins, "An emerging wireless ATM architecture: Survivable ATM," in Proceedings of the 1997 IEEE Military Communications Conference, Monterey, CA, pp. 498-500, Nov. 3-7, 1997.
[16] S. Pizzi, A. Michelson, D. Freeman, J. Sanford, J. Pope, Frank, L. Wetmore, R. Nagle, and J. Simonelli, "Error-control for tactical ATM," in Proceedings of the 1998 IEEE Military Communications Conference, Bedford, MA, pp. 397-408, Oct. 18-21, 1998.
[17] A. H. Levesque, B. E. Basch, R. R. Voruganti, and A. M. Michelson, "Reliable ATM trans- mission in tactical networks," in Proceedings of the Second Annual FEDLAB Symposium, pp. 246-250, Feb. 1998.
[18] S. Aikawa, Y. Motoyama, and M. Umehira, "Error correction and error detection techniques for wireless ATM systems," ACM Wireless Networks, vol. 3, pp. 285-290, Sept. 1997.
[19] Y. Nakayama and S. Aikawa, "Cell discard and TDMA synchronization using FEC in wire- less ATM systems," IEEE Journal on Selected Areas in Communications, vol. 15, pp. 29-34, Jan. 1997.
[20] R. Barfoot, D. Camm, J. Daniell, and P. Thorlby, "Mapping commercial ATM to the tactical radio environment," in Proceedings of the 1998 IEEE Military Communications Conference, Bedford, MA, pp. 1055-1059, Oct. 18-21, 1998.
[21] D. A. Camm, I. Ali, P. S. Pardoe, and F. T. Bell, "Schemes and protocols for tactical ATM transmission," in Proceedings of the Workshop on ACCORD, the Collaborative ATM Network, (Defense Science and Technology Organisation, Canberra, Australia), Feb. 12-15, 1996.
[22] K. L. Li, J. K. Kim, and Y. L. Ho, Adapting ATM in Low Speed Environments. White paper, Yurie Systems, Inc., Landham, MD.
[23] I. Akyildiz, I. Joe, H. Driver, and Y. L. Ho, "A new adaptive FEC scheme for wireless ATM networks," in Proceedings of the 1998 IEEE Military Communications Conference, Bedford, MA, pp. 277-281, Oct. 18-21, 1998.
[24] J. X. Qiu and J. W. Mark, "Error control for integrated wireless and wireline networks," in Proceedings of the 1998 Conference on Information Sciences and Systems, (Princeton, NJ), Mar. 18-20, 1998.
[25] G. C. Clark and J. B. Cain, Error-correction coding for digital communications. New York: Plenum Press, 1981.
89

UNCLASSIFIED SECURITY CLASSIFICATION OF FORM
(highest classification of Title, Abstract, Keywords)
DOCUMENT CONTROL DATA (Security classification of title, body of abstract and indexing annotation must be entered when the overall document is classified)
1. ORIGINATOR (the name and address of the organization preparing the document. Organizations for whom the document was prepared, e.g. Establishment sponsoring a contractor's report, or tasking agency, are entered in section 8.)
COMMUNICATIONS RESEARCH CENTRE CANADA 3701 CARLING AVENUE, PO BOX 11490, STATION H OTTAWA, ONTARIO, CANADA, K2H 8S2
SECURITY CLASSIFICATION (overall security classification of the document, including special warning terms if applicable)
UNCLASSIFIED
3. TITLE (the complete document title as indicated on the title page. Its classification should be indicated by the appropriate abbreviation (S,C or U) in parentheses after the title.)
MILITARY VOICE SERVICES OVER WIRELESS ATM NETWORKS: PERFORMANCE ANALYSIS OF FEC SCHEMES FOR ATM TRANSPORT OVER WIRELESS LINKS (U)
4. AUTHORS (Last name, first name, middle initial)
TSAKIRIDOU, SOPHIA
DATE OF PUBLICATION document)
MARCH, 2001
(month and year of publication of 6a. NO. OF PAGES (total containing information. Include Annexes, Appendices, etc.)
xiii + 89
6b. NO. OF REFS (total cited in document)
25
7. DESCRIPTIVE NOTES (the category of the document, e.g. technical report, technical note or memorandum. If appropriate, enter the type of report, e.g. interim, progress, summary, annual or final. Give the inclusive dates when a specific reporting period is covered.)
TECHNICAL REPORT
8. SPONSORING ACTIVITY (the name of the department project office or laboratory sponsoring the research and development. Include the
DEFENCE RESEARCH ESTABLISHMENT OTTAWA (DREO) NATIONAL DEFENCE HEADQUARTERS, OTTAWA, ONTARIO, CANADA K2H8S2
9a. PROJECT OR GRANT NO. (if appropriate, the applicable research and development project or grant number under which the document was written. Please specify whether project or grant)
5cbl7
9b. CONTRACT NO. (if appropriate, the applicable number under which the document was written)
10a. ORIGINATOR'S DOCUMENT NUMBER (the official document number by which the document is identified by the originating activity. This number must be unique to this document.)
CRC-RP-2001-03
10b. OTHER DOCUMENT NOS. (Any other numbers which may be assigned this document either by the originator or by the sponsor)
DREO TR 2001-058
11. DOCUMENT AVAILABILITY (any limitations on further dissemination of the document, other than those imposed by security classification)
X) Unlimited distribution ) Distribution limited to defence departments and defence contractors; further distribution only as approved ) Distribution limited to defence departments and Canadian defence contractors; further distribution only as approved ) Distribution limited to government departments and agencies; further distribution only as approved ) Distribution limited to defence departments; further distribution only as approved ) Other (please specify):
12. DOCUMENT ANNOUNCEMENT (any limitation to the bibliographic announcement of this document. This will normally correspond to the Document Availability (11). However, where further distribution (beyond the audience specified in 11) is possible, a wider announcement audience may be selected.)
UNLIMITED
UNCLASSIFIED SECURITY CLASSIFICATION OF FORM DCD03 2/06/87
90

UNCLASSIFIED SECURITY CLASSIFICATION OF FORM
13. ABSTRACT (a brief and factual summary of the document. It may also appear elsewhere in the body of the document itself. It is highly desirable that the abstract of classified documents be unclassified. Each paragraph of the abstract shall begin with an indication of the security classification of the information in the paragraph (unless the document itself is unclassified) represented as (S), (C), or (U). It is not necessary to include here abstracts in both official languages unless the text is bilingual).
(U) Wireless ATM was designed to extend the support of broadband, multimedia services provided in fixed ATM networks to the wireless/mobile environment in a seamless and efficient manner. It is a candidate wireless networking technology for future tactical military networks which have adopted ATM in the core network. The bandwidth-limited, error-prone nature of wireless links poses significant challenges in the design of wireless ATM.
(U) This report is part of a study on the feasibility of military voice services over wireless ATM networks and is concerned with the impact of wireless link errors on the performance of ATM. The work presents a review of various error control schemes proposed for the efficient transport of ATM over point-to-point wireless links. Due to the strict latency requirements of voice applications, only error control schemes based on Forward Error Correction are considered. The performance of these schemes is analyzed for the random-error channel and for the Gilbert-Elliott burst-error channel.
14. KEYWORDS, DESCRIPTORS or IDENTIFIERS (technically meaningful terms or short phrases that characterize a document and could be helpful in cataloguing the document. They should be selected so that no security classification is required. Identifiers such as equipment model designation, trade name, military project code name, geographic location may also be included. If possible keywords should be selected from a published thesaurus, e.g. Thesaurus of Engineering and Scientific Terms (TEST) and that thesaurus-identified. If it is not possible to select indexing terms which are Unclassified, the classification of each should be indicated as with the title.)
WIRELESS ATM VOICE OVER ATM FORWARD ERROR CORRECTION SCHEMES WIRELESS COMMUNICATIONS
UNCLASSIFIED SECURITY CLASSIFICATION OF FORM
91