Regional transport and dilution during high-pollution episodes in southern France: Summary of...
26
Regional transport and dilution during high-pollution episodes in southern France: Summary of findings from the Field Experiment to Constraint Models of Atmospheric Pollution and Emissions Transport (ESCOMPTE) P. Drobinski, 1 F. Saı ¨d, 2 G. Ancellet, 1 J. Arteta, 3 P. Augustin, 4 S. Bastin, 1 A. Brut, 2 J. L. Caccia, 5 B. Campistron, 2 S. Cautenet, 3 A. Colette, 1 I. Coll, 6 U. Corsmeier, 7 B. Cros, 2 A. Dabas, 8 H. Delbarre, 4 A. Dufour, 8 P. Durand, 2 V. Gue ´nard, 5 M. Hasel, 7 N. Kalthoff, 7 C. Kottmeier, 7 F. Lasry, 6 A. Lemonsu, 8 F. Lohou, 2 V. Masson, 8 L. Menut, 9 C. Moppert, 2 V. H. Peuch, 8 V. Puygrenier, 2 O. Reitebuch, 10 and R. Vautard 11 Received 9 May 2006; revised 30 September 2006; accepted 15 December 2006; published 4 July 2007. [1] In the French Mediterranean basin the large city of Marseille and its industrialized suburbs (oil plants in the Fos-Berre area) are major pollutant sources that cause frequent and hazardous pollution episodes, especially in summer when intense solar heating enhances the photochemical activity and when the sea breeze circulation redistributes pollutants farther north in the countryside. This paper summarizes the findings of 5 years of research on the sea breeze in southern France and related mesoscale transport and dilution of pollutants within the Field Experiment to Constraint Models of Atmospheric Pollution and Emissions Transport (ESCOMPTE) program held in June and July 2001. This paper provides an overview of the experimental and numerical challenges identified before the ESCOMPTE field experiment and summarizes the key findings made in observation, simulation, and theory. We specifically address the role of large-scale atmospheric circulation to local ozone vertical distribution and the mesoscale processes driving horizontal advection of pollutants and vertical transport and mixing via entrainment at the top of the sea breeze or at the front and venting along the sloped terrain. The crucial importance of the interactions between processes of various spatial and temporal scales is thus highlighted. The advances in numerical modeling and forecasting of sea breeze events and ozone pollution episodes in southern France are also underlined. Finally, we conclude and point out some open research questions needing further investigation. Citation: Drobinski, P., et al. (2007), Regional transport and dilution during high-pollution episodes in southern France: Summary of findings from the Field Experiment to Constraint Models of Atmospheric Pollution and Emissions Transport (ESCOMPTE), J. Geophys. Res., 112, D13105, doi:10.1029/2006JD007494. 1. Introduction [2] Summer atmospheric stagnant air episodes in coastal areas, leading to land/sea breeze flows and associated recirculations of air, have long been recognized as a major factor of development of severe photo-oxidant episodes. Those movements of air masses result from a complex combination of local and mesoscale winds that transport and redistribute pollutants across the air basins, generating exceedances of ozone regulatory thresholds that may recur for several consecutive days when ozone is retained in reservoir at high altitudes. Fast transport of high ozone JOURNAL OF GEOPHYSICAL RESEARCH, VOL. 112, D13105, doi:10.1029/2006JD007494, 2007 Click Here for Full Articl e 1 Institut Pierre-Simon Laplace, Service d’Ae ´ronomie, Universite ´ Pierre et Marie Curie, Paris, France. 2 Laboratoire d’Ae ´rologie, Universite ´ Paul Sabatier, Toulouse, France. 3 Laboratoire de Me ´te ´orologie Physique, Universite ´ Blaise Pascal, Aubie `re, France. 4 Laboratoire de Physico-Chimie de l’Atmosphe `re, Universite ´ du Littoral-Co ˆte d’Opale, Dunkerque, France. 5 Laboratoire de Sondages Electromagne ´tiques de l’Environnement Terrestre, Universite ´ du Sud Toulon-Var, Toulon, France. Copyright 2007 by the American Geophysical Union. 0148-0227/07/2006JD007494$09.00 D13105 6 Faculte ´ des Sciences et Technologie, Laboratoire Inter-Universitaire des Syste `mes Atmosphe ´riques, Cre ´teil, France. 7 Institut fu ¨r Meteorologie und Klimaforschung, Forschungszentrum Karlsruhe, Universita ¨t Karlsruhe, Karlsruhe, Germany. 8 Centre National de Recherches Me ´te ´orologiques, Me ´te ´o-France, Toulouse, France. 9 Laboratoire de Me ´te ´orologie Dynamique, Institut Pierre-Simon Laplace, E ´ cole Polytechnique, Palaiseau, France. 10 Institut fu ¨r Physik der Atmospha ¨re, Deutsches Zentrum fu ¨r Luft- und Raumfahrt, Oberpfaffenhofen, Germany. 11 Laboratoire des Sciences du Climat et de l’Environnement, Institut Pierre Simon Laplace, Commisariat a ` l’E ´ nergie Atomique, Gif-sur-Yvette, France. 1 of 26
-
Upload
independent -
Category
Documents
-
view
0 -
download
0
Transcript of Regional transport and dilution during high-pollution episodes in southern France: Summary of...

Regional transport and dilution during high-pollution episodes
in southern France: Summary of findings from the Field
Experiment to Constraint Models of Atmospheric Pollution
and Emissions Transport (ESCOMPTE)
P. Drobinski,1 F. Saıd,2 G. Ancellet,1 J. Arteta,3 P. Augustin,4 S. Bastin,1 A. Brut,2
J. L. Caccia,5 B. Campistron,2 S. Cautenet,3 A. Colette,1 I. Coll,6 U. Corsmeier,7 B. Cros,2
A. Dabas,8 H. Delbarre,4 A. Dufour,8 P. Durand,2 V. Guenard,5 M. Hasel,7 N. Kalthoff,7
C. Kottmeier,7 F. Lasry,6 A. Lemonsu,8 F. Lohou,2 V. Masson,8 L. Menut,9 C. Moppert,2
V. H. Peuch,8 V. Puygrenier,2 O. Reitebuch,10 and R. Vautard11
Received 9 May 2006; revised 30 September 2006; accepted 15 December 2006; published 4 July 2007.
[1] In the French Mediterranean basin the large city of Marseille and its industrializedsuburbs (oil plants in the Fos-Berre area) are major pollutant sources that cause frequentand hazardous pollution episodes, especially in summer when intense solar heatingenhances the photochemical activity and when the sea breeze circulation redistributespollutants farther north in the countryside. This paper summarizes the findings of 5 yearsof research on the sea breeze in southern France and related mesoscale transport anddilution of pollutants within the Field Experiment to Constraint Models of AtmosphericPollution and Emissions Transport (ESCOMPTE) program held in June and July 2001.This paper provides an overview of the experimental and numerical challenges identifiedbefore the ESCOMPTE field experiment and summarizes the key findings made inobservation, simulation, and theory. We specifically address the role of large-scaleatmospheric circulation to local ozone vertical distribution and the mesoscale processesdriving horizontal advection of pollutants and vertical transport and mixing viaentrainment at the top of the sea breeze or at the front and venting along the sloped terrain.The crucial importance of the interactions between processes of various spatial andtemporal scales is thus highlighted. The advances in numerical modeling and forecastingof sea breeze events and ozone pollution episodes in southern France are also underlined.Finally, we conclude and point out some open research questions needing furtherinvestigation.
Citation: Drobinski, P., et al. (2007), Regional transport and dilution during high-pollution episodes in southern France:
Summary of findings from the Field Experiment to Constraint Models of Atmospheric Pollution and Emissions Transport
(ESCOMPTE), J. Geophys. Res., 112, D13105, doi:10.1029/2006JD007494.
1. Introduction
[2] Summer atmospheric stagnant air episodes in coastalareas, leading to land/sea breeze flows and associatedrecirculations of air, have long been recognized as a majorfactor of development of severe photo-oxidant episodes.
Those movements of air masses result from a complexcombination of local and mesoscale winds that transportand redistribute pollutants across the air basins, generatingexceedances of ozone regulatory thresholds that may recurfor several consecutive days when ozone is retained inreservoir at high altitudes. Fast transport of high ozone
JOURNAL OF GEOPHYSICAL RESEARCH, VOL. 112, D13105, doi:10.1029/2006JD007494, 2007ClickHere
for
FullArticle
1Institut Pierre-Simon Laplace, Service d’Aeronomie, Universite Pierreet Marie Curie, Paris, France.
2Laboratoire d’Aerologie, Universite Paul Sabatier, Toulouse, France.3Laboratoire de Meteorologie Physique, Universite Blaise Pascal,
Aubiere, France.4Laboratoire de Physico-Chimie de l’Atmosphere, Universite du
Littoral-Cote d’Opale, Dunkerque, France.5Laboratoire de Sondages Electromagnetiques de l’Environnement
Terrestre, Universite du Sud Toulon-Var, Toulon, France.
Copyright 2007 by the American Geophysical Union.0148-0227/07/2006JD007494$09.00
D13105
6Faculte des Sciences et Technologie, Laboratoire Inter-Universitairedes Systemes Atmospheriques, Creteil, France.
7Institut fur Meteorologie und Klimaforschung, ForschungszentrumKarlsruhe, Universitat Karlsruhe, Karlsruhe, Germany.
8Centre National de Recherches Meteorologiques, Meteo-France,Toulouse, France.
9Laboratoire de Meteorologie Dynamique, Institut Pierre-SimonLaplace, Ecole Polytechnique, Palaiseau, France.
10Institut fur Physik der Atmosphare, Deutsches Zentrum fur Luft- undRaumfahrt, Oberpfaffenhofen, Germany.
11Laboratoire des Sciences duClimat et de l’Environnement, Institut PierreSimon Laplace, Commisariat a l’Energie Atomique, Gif-sur-Yvette, France.
1 of 26

concentration to the midtroposphere even frequently occurswhen these recirculations are combined with upslope windsin the presence of mountains. Experimental evidence forsuch phenomena has been reported for large cities of NorthAmerica [Rosenthal et al., 2003; Hastie et al., 1999] and inMediterranean areas where strong insolation and low windspeeds provide a favorable environment [Millan et al.,1996; Ziomas et al., 1998], and also on the highly pollutedcoasts of Asia [Cheng, 2002; Liu et al., 2002; Wang et al.,2001].[3] The study of air quality along the coast of the
Provence region (in southern France, see Figure 1) is ofparticularly interest because of the sea breeze circulationand the presence of the large city of Marseille and itsindustrialized suburbs (oil refineries in the Fos-Berre area),which emit huge amounts of pollutants into the atmosphere.Subsequent degradation of air quality causes numerous andmajor pollution episodes especially during summer.This region witnesses a high frequency of photochemicalpollution events compared to other French regions withinlarge urban areas, with up to 6 days per month of surface
ozone concentrations exceeding 90 ppb during one hour onaverage.[4] The other peculiarity of this coastal area is the
complexity of topography, combining the coast and thepresence of two mountain barriers of different heights(the French Alps to the east that culminates at 4807 m andthe Massif Central to the west that culminates at 1885 m),separated by the Rhone valley, a gap of 200 km length and60 km width. On a southwestern-northeastern axis alsolies the Durance valley with a fairly constant width ofabout 10 km and a length of about 60 km. These topo-graphical features perturb the main sea breeze flow [e.g.,Kusuda and Alpert, 1983], and put major limitations fornumerical weather simulation models with coarse resolu-tion (10–30 km horizontal resolution).[5] On dynamical aspects, there is a long history of
scientific research on the impact of local atmosphere circu-lations in coastal areas (see, e.g., Atkinson [1981] andSimpson [1994] for reviews). The land/sea breeze phenom-enon is first mentioned in the literature in the 17th centurywith the work of Halley [1686]. The first motivations to the
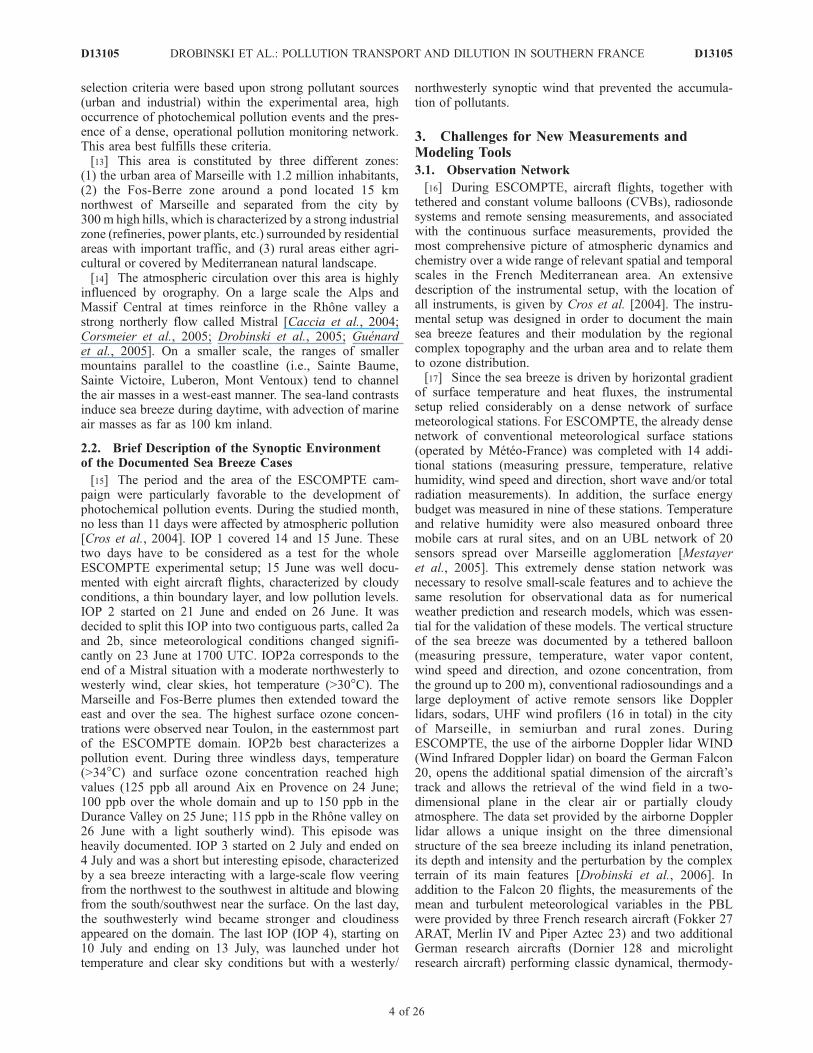
Figure 1. Map of southern France with the topography shaded in grey when higher than 500 m abovesea level. The 200 m height isocontour as well as the coastline are shown with thin and thick lines,respectively. Dots indicate the locations of the operational meteorological surface stations operated byMeteo-France. The large dots and triangles indicate the locations of cities and of mountain ranges orpeaks, respectively. The inset in the upper left corner indicates the region of France shown in the mainpanel in a square.
D13105 DROBINSKI ET AL.: POLLUTION TRANSPORT AND DILUTION IN SOUTHERN FRANCE
2 of 26
D13105

good understanding of land/sea breeze and its relatedprocesses mainly include interests to the fundamentalmeteorology and its influence on various recreational activi-ties. The first analytical models including Earth rotation effectare developed in 1947 [Haurwitz, 1947; Schmidt, 1947].Linear models are then used for analyzing the response ofthe atmosphere to a differential surface heating [e.g., Walsh,1974; Rotunno, 1983] and for scaling the vertical structureof the sea breeze flow [Steyn, 1998, 2003] and its horizontalto vertical aspect ratio [Rotunno, 1983; Niino, 1987; Daluand Pielke, 1989]. The major limit of linear models is theabsence of feedback between temperature and wind fields,causing a maximum perturbation at the shoreline. This limitis stepped over by the use of two-dimensional non linearnumerical models [e.g., Estoque, 1962; Feliks, 1993, 2004]followed by their three-dimensional version [e.g., Bechtoldet al., 1991]. The initial academic motivation is thenprogressively replaced by economic and public healthinterests since breeze circulations are known to contributeto matter and energy transport, and to affect pollutionventilation, species concentration and inland pollutant trans-port [e.g., Lyons and Olsson, 1973]. As an example, Kolevet al. [1998, 2000],Murayama et al. [1999], and Vijayakumaret al. [1998] assess the influence of the sea breeze on theproperties of aerosols in coastal regions while Klemm et al.[1998] show that in the Athens region, sea breeze air massesentering the city can carry some aged pollution havingundergone at least several hours of photochemical process-ing in the atmosphere. Schultz and Warner [1982] find thatthe ventilation of pollution across the domain of the LosAngeles Basin in the absence of a synoptic-scale wind isstrongly influenced by the location of the sea breeze frontand the particular stage of the sea breeze life cycle. Externalprocesses such as synoptic forcing or orography are shownto affect the dynamics of the sea breeze [Kitada et al.,1986]. Thus Wakimoto and McElroy [1986] show that thecombination of upper level winds, orographic effects andthermally induced changes in the depth of the planetaryboundary layer (PBL) leads to the formation of elevatedpollution layers and possible incorporation of pollutants intolong-range transport.[6] On air quality aspects, several coastal cities have been
studied, Tokyo, Los Angeles, and Athens in Europe. Themain air pollution crossroads over the Mediterraneanhave also been investigated in the frameworks of severalEuropean projects like Meso-meteorological Cycles of AirPollution in the Iberian Peninsula (MECAPIP) in Spain[Millan et al., 1996], Photochemical Activity and SolarUltraviolet Radiation (PAUR) in Italy and Greece [Zerefoset al., 2002], or Mediterranean Intensive Oxidant Study(MINOS) in Crete [Lelieveld et al., 2002]. However, thespecificity of these sites make it difficult to generalize themajor findings of each study. In France, major investiga-tions of air quality in continental cities have also beencarried out, such as for Paris in the framework of the Etudeet Simulation de la Qualite de l’air en Ile-de-France(ESQUIF) experiment held between 1998 and 2000 [Menutet al., 2000; Vautard et al., 2003a] where it was found thatozone episodes are largely due to large-scale advection fromNorthern Europe regions, and that local dynamical forcingdoes not play a major role. In the case of the Marseille areait is not expected that such a transport dominates.
[7] During summer 2001, meteorological and chemicalmeasurements were taken in southern France in theframework of the Field Experiment to Constraint Modelsof Atmospheric Pollution and Emissions Transport(ESCOMPTE) [Cros et al., 2004] and its urban boundarylayer (UBL) subprogram UBL/ESCOMPTE dedicated to thestudy of the urban boundary layer in the Marseille area(Figure 1) [Mestayer et al., 2005]. This campaign lastednearly 6 weeks from 7 June to 16 July 2001 and aimed atcollecting a large amount of measurements from in situ,passive, and active remote sensors to document the four-dimensional state of the atmosphere over both meteorolog-ical and chemical aspects, and understand the precursors ofphotochemical pollution in the region. Among theESCOMPTE objectives [Cros et al. 2004], the mesoscaletransport and dilution (MTD) program was designed toimprove the understanding and forecasting of the life cycleof the sea breeze, including its three-dimensional structureand associated contribution to transport and mixing ofpollutants emitted from the Marseille and Fos-Berre areas.The questions addressed within the MTD working groupwere sorted as a function of the temporal and spatial scales.[8] 1. At synoptic scale, can a part of the temporal and
spatial variability of pollutants in the ESCOMPTE targetarea be attributed to large-scale transport?[9] 2. At the mesoscale, how do land and sea breezes
affect the diurnal redistribution of pollutants? Can theRhone and Durance valleys modify the sea breeze charac-teristics and consequently the pollutant distribution? Doslope winds (anabatic and katabatic winds) contributesignificantly to pollutant ventilation?[10] 3. At local scale, does the coastline shape have an
impact on sea/land breeze circulation and transport? Doesthe urban area contribute to local-scale circulations (e.g.,urban breezes) or/and disrupts the mesoscale land and seabreeze circulations?[11] The objective of this paper is to give an overview of
the key findings, after five years of research, on the physicaland chemical processes leading to summertime atmosphericpollution episodes in southern France, in the light of theinnovative measurements collected during the campaignand the use of fine-scale numerical mesoscale and chemistrytransport models. After this introduction, section 2 lists thepros for selecting the region of Marseille/Fos-Berre as atarget area for pollution studies during ESCOMPTE andthe main scientific objectives. It also gives a summary ofthe ESCOMPTE intensive observation periods (IOPs).Section 3 presents the main challenges identified beforethe field experiment to be addressed in terms of observationand modeling. Section 4 synthesizes the main findings interms of observation, numerical simulation and theory of seabreeze and related pollution transport and dilution. Finally,section 5 concludes this overview of results and points outsome open research questions needing further investigation.
2. Southern France as a Target Area forPollution Studies
2.1. Scientific Motivation
[12] A 120 � 120 km2 area around the city of Marseilleand the Berre pond, in southern France, has been selected tohost the ESCOMPTE field campaign (Figure 1). The
D13105 DROBINSKI ET AL.: POLLUTION TRANSPORT AND DILUTION IN SOUTHERN FRANCE
3 of 26
D13105
selection criteria were based upon strong pollutant sources(urban and industrial) within the experimental area, highoccurrence of photochemical pollution events and the pres-ence of a dense, operational pollution monitoring network.This area best fulfills these criteria.[13] This area is constituted by three different zones:
(1) the urban area of Marseille with 1.2 million inhabitants,(2) the Fos-Berre zone around a pond located 15 kmnorthwest of Marseille and separated from the city by300 m high hills, which is characterized by a strong industrialzone (refineries, power plants, etc.) surrounded by residentialareas with important traffic, and (3) rural areas either agri-cultural or covered by Mediterranean natural landscape.[14] The atmospheric circulation over this area is highly
influenced by orography. On a large scale the Alps andMassif Central at times reinforce in the Rhone valley astrong northerly flow called Mistral [Caccia et al., 2004;Corsmeier et al., 2005; Drobinski et al., 2005; Guenardet al., 2005]. On a smaller scale, the ranges of smallermountains parallel to the coastline (i.e., Sainte Baume,Sainte Victoire, Luberon, Mont Ventoux) tend to channelthe air masses in a west-east manner. The sea-land contrastsinduce sea breeze during daytime, with advection of marineair masses as far as 100 km inland.
2.2. Brief Description of the Synoptic Environmentof the Documented Sea Breeze Cases
[15] The period and the area of the ESCOMPTE cam-paign were particularly favorable to the development ofphotochemical pollution events. During the studied month,no less than 11 days were affected by atmospheric pollution[Cros et al., 2004]. IOP 1 covered 14 and 15 June. Thesetwo days have to be considered as a test for the wholeESCOMPTE experimental setup; 15 June was well docu-mented with eight aircraft flights, characterized by cloudyconditions, a thin boundary layer, and low pollution levels.IOP 2 started on 21 June and ended on 26 June. It wasdecided to split this IOP into two contiguous parts, called 2aand 2b, since meteorological conditions changed signifi-cantly on 23 June at 1700 UTC. IOP2a corresponds to theend of a Mistral situation with a moderate northwesterly towesterly wind, clear skies, hot temperature (>30�C). TheMarseille and Fos-Berre plumes then extended toward theeast and over the sea. The highest surface ozone concen-trations were observed near Toulon, in the easternmost partof the ESCOMPTE domain. IOP2b best characterizes apollution event. During three windless days, temperature(>34�C) and surface ozone concentration reached highvalues (125 ppb all around Aix en Provence on 24 June;100 ppb over the whole domain and up to 150 ppb in theDurance Valley on 25 June; 115 ppb in the Rhone valley on26 June with a light southerly wind). This episode washeavily documented. IOP 3 started on 2 July and ended on4 July and was a short but interesting episode, characterizedby a sea breeze interacting with a large-scale flow veeringfrom the northwest to the southwest in altitude and blowingfrom the south/southwest near the surface. On the last day,the southwesterly wind became stronger and cloudinessappeared on the domain. The last IOP (IOP 4), starting on10 July and ending on 13 July, was launched under hottemperature and clear sky conditions but with a westerly/
northwesterly synoptic wind that prevented the accumula-tion of pollutants.
3. Challenges for New Measurements andModeling Tools
3.1. Observation Network
[16] During ESCOMPTE, aircraft flights, together withtethered and constant volume balloons (CVBs), radiosondesystems and remote sensing measurements, and associatedwith the continuous surface measurements, provided themost comprehensive picture of atmospheric dynamics andchemistry over a wide range of relevant spatial and temporalscales in the French Mediterranean area. An extensivedescription of the instrumental setup, with the location ofall instruments, is given by Cros et al. [2004]. The instru-mental setup was designed in order to document the mainsea breeze features and their modulation by the regionalcomplex topography and the urban area and to relate themto ozone distribution.[17] Since the sea breeze is driven by horizontal gradient
of surface temperature and heat fluxes, the instrumentalsetup relied considerably on a dense network of surfacemeteorological stations. For ESCOMPTE, the already densenetwork of conventional meteorological surface stations(operated by Meteo-France) was completed with 14 addi-tional stations (measuring pressure, temperature, relativehumidity, wind speed and direction, short wave and/or totalradiation measurements). In addition, the surface energybudget was measured in nine of these stations. Temperatureand relative humidity were also measured onboard threemobile cars at rural sites, and on an UBL network of 20sensors spread over Marseille agglomeration [Mestayeret al., 2005]. This extremely dense station network wasnecessary to resolve small-scale features and to achieve thesame resolution for observational data as for numericalweather prediction and research models, which was essen-tial for the validation of these models. The vertical structureof the sea breeze was documented by a tethered balloon(measuring pressure, temperature, water vapor content,wind speed and direction, and ozone concentration, fromthe ground up to 200 m), conventional radiosoundings and alarge deployment of active remote sensors like Dopplerlidars, sodars, UHF wind profilers (16 in total) in the cityof Marseille, in semiurban and rural zones. DuringESCOMPTE, the use of the airborne Doppler lidar WIND(Wind Infrared Doppler lidar) on board the German Falcon20, opens the additional spatial dimension of the aircraft’strack and allows the retrieval of the wind field in a two-dimensional plane in the clear air or partially cloudyatmosphere. The data set provided by the airborne Dopplerlidar allows a unique insight on the three dimensionalstructure of the sea breeze including its inland penetration,its depth and intensity and the perturbation by the complexterrain of its main features [Drobinski et al., 2006]. Inaddition to the Falcon 20 flights, the measurements of themean and turbulent meteorological variables in the PBLwere provided by three French research aircraft (Fokker 27ARAT, Merlin IV and Piper Aztec 23) and two additionalGerman research aircrafts (Dornier 128 and microlightresearch aircraft) performing classic dynamical, thermody-
D13105 DROBINSKI ET AL.: POLLUTION TRANSPORT AND DILUTION IN SOUTHERN FRANCE
4 of 26
D13105
namical and air chemical slow and fast measurements[Saıd et al., 2005].[18] The surface ozone concentration was documented by
the stations operated by the local air quality networksAIRMARAIX and AIRFOBEP completed by 18 continentalsurface stations used to follow the pollutant plumes and2 stations onboard of ships used to obtain information onthe chemical conditions at the outskirts of the ESCOMPTEregion and monitor atmospheric chemistry over the sea. Thevertical profiles of ozone concentration were observed by 4ground-based ozone lidars. Several precise locations weredefined, combining a wind profiler (Doppler lidar, radar, orsodar) with an ozone lidar, in order to create a multiscale(local and regional) remote sensing network on emissionzones where photochemical processes are dominant, onintermediate zones where ozone is mainly generated bytransport processes, and on rural zones in order to giveinformation on the domain limits. Intercomparison of ozonemeasurements was performed at the beginning of the fieldcampaign to assess the global measurement uncertainties[Frejafon et al., 2005]. The measurements of the meteoro-logical and chemical variables within the PBL were alsoprovided by the aircrafts (except the Falcon 20) equippedfor chemical measurements such as NOx, NOy, O3, CO, orCO2, radiation measurements including the NO2 photolysisrate JNO2. Some of these aircrafts measured chemicalspecies fluxes. CVBs were also used to follow pollutantplumes, and to investigate the evolution of the plumethermodynamics and chemical properties in a ‘‘Lagrangianmode’’.
3.2. Numerical Modeling
[19] The main objectives of the numerical modelingefforts made in the context of ESCOMPTE were (1) todocument the capability of state-of-the-art meso-g-scalenumerical models to simulate air flow and of chemistry-transport models to predict chemical species fields incomplex terrain and (2) to improve the process understand-ing of the underlying interactions between atmosphericprocesses and pollutant distribution. The specific researchchallenges were (1) to simulate the detailed characteristicsand evolution of the sea breeze flow in complex orographyand to better understand the underlying flow dynamics,(2) to diagnose accurately the PBL depth at the transitionbetween land and sea where it evolves sharply over a smallhorizontal range and affects the estimation of the pollutantdilution, (3) to determine the complex interactions betweensurface emissions and ozone production with respect to themeteorological conditions, and (4) to quantify the impact ofsimulated meteorological field inaccuracies on the produc-tion rate and concentration of ozone. Necessary ingredientsfor a high forecasting skill of high-resolution numericalmodels for weather and air quality are expected to be (1) anaccurate simulation of larger-scale aspects (the sensitivity ofthe local response of the sea breeze to any uncertainty in thelarge-scale analysis is large because of the weakness of thesea breeze intensity), (2) a good initial analysis of the low-level atmospheric state (to account for small-scale surfaceheterogeneities), and (3) a high-resolution model with aproper representation of orography and urban area andsophisticated parameterizations for physical processes likeradiation and turbulence. Moreover, the uniquely dense data
set collected during ESCOMPTE was expected to offer oneof the first opportunities to clearly demonstrate the possiblebenefits of future real-time meso-g-scale numerical predic-tion of the weather and air quality.[20] Different dynamical and chemical models have been
used to analyze the ESCOMPTE database. The maindynamical models are the nonhydrostatic mesoscale modelsMeso-NH [Lafore et al., 1998], MM5 [Dudhia, 1993] andRAMS (Regional Atmospheric Modeling System) [Cottonet al., 2003]. Some of these models are coupled online withchemistry models. This is the case of Meso-NH (also calledMeso-NHC) which includes a chemistry module andRAMS which is coupled online with a condensed chemistrymodel (MOCA) including 29 species [Aumont et al., 1996].All these models have been run with horizontal scalespanning from 250 m to 5 km and several nested grids.The MM5 model has also been used to force the chemistrytransport model CHIMERE [Schmidt et al., 2001; Vautardet al., 2003b]. The operational weather forecast models ofMeteo-France ARPEGE (typical mesh size of 30 km) andALADIN (typical mesh size of 10 km) have been used toforce the chemistry transport model MOCAGE [Dufouret al., 2005; Michou et al., 2005]. All these models usean emission inventory which was designed for the purposeof the ESCOMPTE program and built following a bottom-up approach with a 1 km resolution [Franois et al., 2005]. Itnotably describes the emissions of 95 gaseous compoundsinvolved in ozone production, while biogenic emissions,including isoprene and alpha-pinene, have been hourlycalculated using meteorological ambient parameters. Thecomparison of the dynamical and chemical models with theextensive ESCOMPTE database has been the subject of aninternational modeling exercise between 2004 and 2006.The results of this intercomparison are available on http://medias.obs-mip.fr/escompte/exercice/HTML/exe.html.
4. Key Findings
4.1. Large-Scale Contribution to Local OzoneDistribution
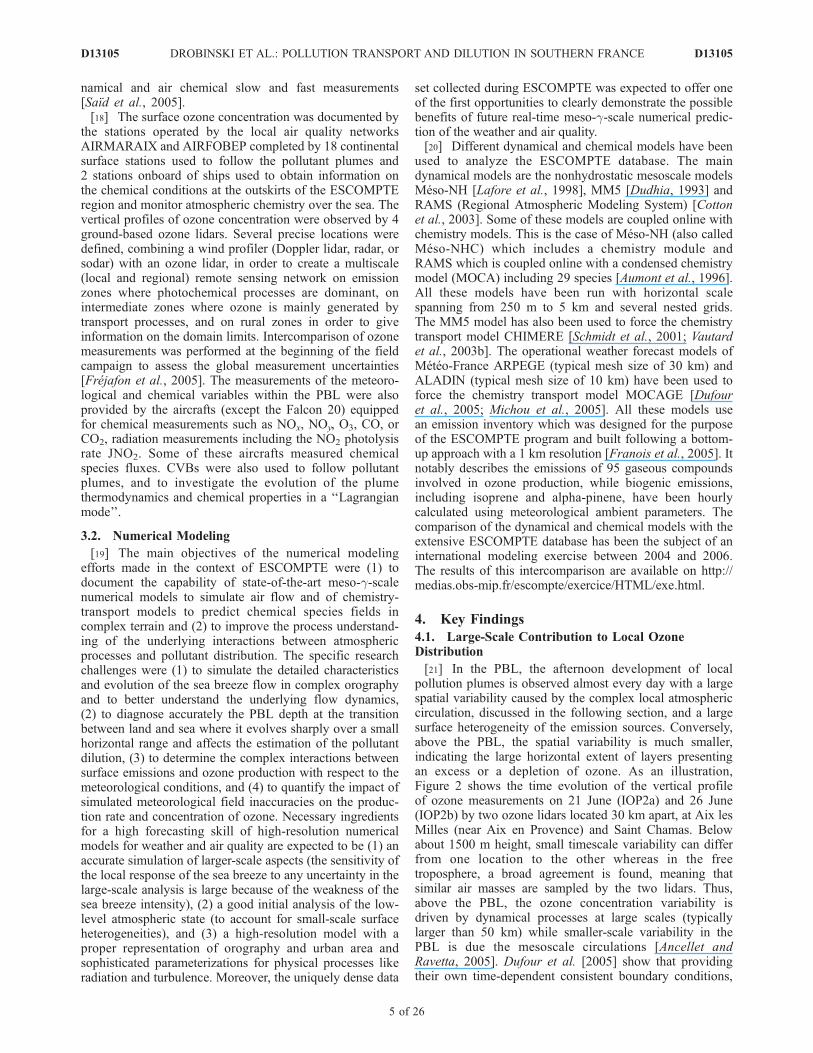
[21] In the PBL, the afternoon development of localpollution plumes is observed almost every day with a largespatial variability caused by the complex local atmosphericcirculation, discussed in the following section, and a largesurface heterogeneity of the emission sources. Conversely,above the PBL, the spatial variability is much smaller,indicating the large horizontal extent of layers presentingan excess or a depletion of ozone. As an illustration,Figure 2 shows the time evolution of the vertical profileof ozone measurements on 21 June (IOP2a) and 26 June(IOP2b) by two ozone lidars located 30 km apart, at Aix lesMilles (near Aix en Provence) and Saint Chamas. Belowabout 1500 m height, small timescale variability can differfrom one location to the other whereas in the freetroposphere, a broad agreement is found, meaning thatsimilar air masses are sampled by the two lidars. Thus,above the PBL, the ozone concentration variability isdriven by dynamical processes at large scales (typicallylarger than 50 km) while smaller-scale variability in thePBL is due the mesoscale circulations [Ancellet andRavetta, 2005]. Dufour et al. [2005] show that providingtheir own time-dependent consistent boundary conditions,
D13105 DROBINSKI ET AL.: POLLUTION TRANSPORT AND DILUTION IN SOUTHERN FRANCE
5 of 26
D13105

chemistry transport models are able to account for most ofthe complex vertical and horizontal structures documentedduring ESCOMPTE.[22] In order to assess the dynamical processes responsi-
ble for the ozone variability in the free troposphere, numer-ical modeling and lagrangian studies were conducted byDufour et al. [2005], Cousin et al. [2005], and Colette et al.[2006] for IOP2, during which typical types of weatherwere observed. These studies showed that during IOP2,long-range transport but also stratospheric intrusions con-tribute to the high variability over the whole troposphericcolumn, consistent with results from PAUR and MINOSprojects [Lelieveld et al., 2002; Zerefos et al., 2002; Traubet al., 2003]. In detail, back trajectories were computedfrom the location of the ozone lidar located at Aix les Millesusing the FLEXPART lagrangian particle dispersion modelfor synoptic-scale processes, and the nonhydrostatic modelMeso-NH for mesoscale processes [Colette et al., 2006].For IOP2a (21 and 22 June), synoptic-scale processes abovethe Northern Atlantic region drive the observed ozonevariability whereas during IOP2b (23–26 June), most freetropospheric air masses come from the PBL of the Iberianpeninsula.
[23] To analyze the synoptic-scale processes above theAtlantic Ocean during IOP2a, air masses following similartrajectories were clustered in different groups. Consistenceis found between these coherent ensembles of trajectoriesand the observed ozone variability. So each ozone anomaly(see ellipses in Figures 2a and 2c) can be assign to a specifictransport pathway. The ozone depleted layer indicated by(1) corresponds to air masses transported in a warm con-veyor belt (WCB) on 17 June associated with a surface lowcentered at (32�W, 50�N). Its low ozone content is in goodagreement with an origin above the marine PBL. The airmasses indicated by (2) and (4) are advected in the vicinityof a deep cutoff low active on 19 June in the Azores region(25�W, 42�N). The potential vorticity along the mesoscaletrajectories corresponding to these air masses, is higher thanthe surrounding potential vorticity suggesting that theycorrespond to stratospheric streamer. The high ozone levelsmeasured for these air masses is thus of stratospheric origin.The rich ozone layer (3) is associated with a WCB activeabove the northeastern USA. However, after having under-gone a strong ascent, these air masses are advected in thetropopause region before reaching the measurement site.Consequently, it is not clear whether these high ozone
Figure 2. Vertical profiles of ozone concentration as a function of time measured by two DIAL ozonelidars during (a and c) IOP 2a and (b and d) IOP 2b: the ALTO ozone lidar located at Aix les Milles(Figures 2a and Figures 2b) and the EPFL ozone lidar located at Saint Chamas, 30 km west of Aix lesMilles (Figures 2c and 2d). Adapted from Ancellet and Ravetta [2005] and Simeonov et al. [2004].
D13105 DROBINSKI ET AL.: POLLUTION TRANSPORT AND DILUTION IN SOUTHERN FRANCE
6 of 26
D13105

concentrations are related to an anthropogenic or strato-spheric source. Finally, the stratospheric origin of theobserved high ozone concentrations indicated by (5) isrelated to a strong subsidence in a trough off the shore of
Portugal on 19 and 20 June. These air masses are thuscoming from the tropopause region.[24] After 23 June, the ozone variability in the free tropo-
sphere above the ESCOMPTE region is driven by transport
Figure 3
D13105 DROBINSKI ET AL.: POLLUTION TRANSPORT AND DILUTION IN SOUTHERN FRANCE
7 of 26
D13105

processes above the European continent. A thermal lowdevelops every day above the Iberian Peninsula whichfavors the onset of orographic and sea breezes and shallowconvection. A trough stagnates above southwestern Europeso that air masses exported from the Iberian PBL canbe advected to the ESCOMPTE area. The lagrangiantrajectories suggest that between 23 and 26 June, 33% ofthe air masses arriving between 2000 m and 5000 m asl inthe ESCOMPTE region come from the Iberian PBL, whichis slightly more than during MINOS (23%) [Traub et al.,2003] but still consistent considering the small number ofdays analyzed during ESCOMPTE and MINOS. Air massesremaining in the free troposphere during the three dayspreceding their arrival in the ESCOMPTE area, are associ-ated with low ozone content in the free troposphere,especially in the morning of 23 June, around 2000 m on24 June, and above 3500m on 25 and 26 June (see Figures 2band 2d). The ozone rich air masses having left the PBL lessthan 5 hours before being observed by the lidar at Aix lesMilles come from the ESCOMPTE area. Their time andaltitude of arrival above the lidar are consistent with thoseexpected for the Marseille and Fos-Berre pollution plumes,lifted above the PBL. The other air masses leaving the PBLseveral hours before arriving in the ESCOMPTE region,come from the PBL of the Iberian peninsula. The patternof these air masses is strongly correlated with the highozone values measured by the lidar in the free troposphere.This finding illustrates how thermal and convective pro-cesses in the Iberian peninsula followed by intra-Europeantransport can explain tropospheric ozone variability in theESCOMPTE region.[25] These tropospheric ozone layers in the ESCOMPTE
region are not expected to be reintegrated in the southerly/southwesterly near-surface sea breeze flow blowing withinthe PBL via the upper level return flow of the sea breeze(expected to blow from the north). Indeed, as illustrated inFigure 3, showing the wind field below the Falcon 20 flighttrack along the Rhone valley, one key feature found duringESCOMPTE is that the return flow of the textbooks on seabreeze circulation is very seldom seen in this area [Drobinskiet al., 2006]. This is due to (1) the presence of a systematicnon zero background wind which prevails over the returnflow which is expected to be much weaker than the seabreeze flow [see Rotunno, 1983, Figure 2] and (2) the three-dimensional structure of the sea breeze caused by complexcoastline shape. The absence of a marked return flow in thisarea can question the reentry of the pollutants with the seabreeze few days later as suggested by Millan et al. [1996]from the analysis of the measurements collected duringMECAPIP project in the eastern coast of the Iberian penin-sula (mechanism called ‘‘photochemical reactor’’).
4.2. Mesoscale Horizontal Transport by the Sea Breezein the PBL
[26] Studies of PBL transport processes show that duringpollution episodes, the sea breeze can export inland thepollutants emitted from the Marseille urban area and theFos-Berre plants, and that the countryside is often morepolluted than the area immediately surrounding the pollut-ant sources. Table 1 illustrates this point. It shows thatozone concentration is low at Marseille and higher at Aix enProvence (30 km north of Marseille, see Figure 1) underpure sea breeze conditions (25 and 26 June, i.e., IOP2b, and3 and 4 July, i.e., IOP3), leading to photochemical pollution.Ozone builds up from morning emissions the plume whilebeing advected inland by the afternoon sea breeze. InProvence, the sea breeze shares its occurrence with theMistral which is frequently observed to extend as far as afew hundreds of kilometers from the coast and is thusassociated with low pollution levels in Provence as theMistral advects the pollutants away from their sources ofemission over the Mediterranean. Table 1 shows that theESCOMPTE Mistral events correspond to low ozone con-centration over the region, with one exception on 1 Julywhen the ozone concentration is higher than usual becausehigh-level tropospheric ozone is incorporated within theMistral flow [Corsmeier et al., 2005]. During IOP2a, aMistral event occurs, but its weak intensity allows the seabreeze to break through during daytime. Because of theadverse Mistral flow, the sea breeze cannot penetrate farinland making the pollutants accumulate close to the coast-line near the emission sources [Bastin et al., 2006] (Table 1).The dilution of ozone during its transport inland ismodulated by the variation of the PBL depth along thepolluted air mass trajectory. The observations and simu-lations of all ESCOMPTE IOPs allow to draw some robustconclusions on the structure of the PBL in the ESCOMPTEtarget area for the different synoptic conditions encounteredduring the field campaign. The sea breeze penetrates inlandassociated with the development of an internal PBL at thetransition between sea and land. The advection of coldmarine air by the sea breeze maintains a shallow PBL (about0.5 km depth) close to the shore while farther inland the PBLdepth can reach typical values of summer continental PBL inthe plain (i.e., about 1.5–2 km) and sometimes even largervalues over the mountains where anabatic slope windscontribute to the PBL vertical extension [Kalthoff et al.,2005; Saıd et al., 2007].4.2.1. Near-Surface Ozone Transport[27] A detailed description of the sea breeze evolution
and the associated ozone transport is shown in Figures 4 and 5for the two typical days of the ESCOMPTE campaign(22 June, i.e., IOP2a, and 25 June, i.e., IOP2b). Theimpact of the sea breeze on ozone concentration is clearly
Figure 3. (a, c, e, g, and i) Topography of the ESCOMPTE area. The thin and thick lines indicate the 500-m isoline andthe coastline, respectively. The thick segment represents the flight track of the DLR Falcon 20 along which the vertical crosssection of the horizontal wind field from the WIND data is extracted and shown in Figures 3b, 3d, 3f, 3h, and 3j. (b, d, f, h,and j) Vertical cross section of the horizontal wind field from the WIND data along the leg shown in Figures 3a, 3c, 3e, 3g,and 3i on 22, 25, and 26 June 2001 and 3 and 4 July 2001. Arrows indicate the horizontal wind speed and direction as afunction of height, and the superimposed color indicates the wind speed. The absence of data corresponds to discardedunreliable data. The dark thick tick mark indicates the location of the coast. Adapted from Drobinski et al. [2006].
D13105 DROBINSKI ET AL.: POLLUTION TRANSPORT AND DILUTION IN SOUTHERN FRANCE
8 of 26
D13105

visible in Figures 4 and 5 which display the surface ozoneconcentration and 10 m wind speed and direction on 22 and25 June at 0600, 0900, 1200, 1500 and 1800 UTC simulatedusing the MM5 mesoscale model coupled with the chemistrytransport model CHIMERE.[28] CHIMERE outputs were carefully compared with
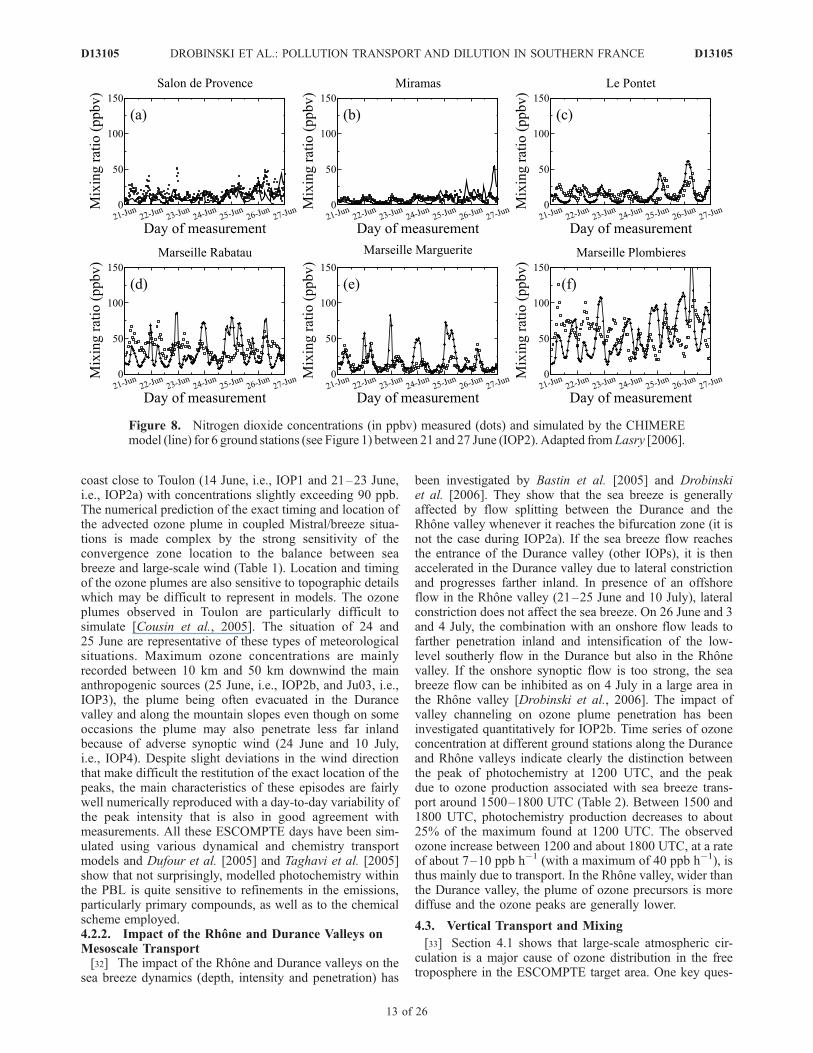
observations of CO, O3 and NO2, at the ground level and inaltitude [Lasry, 2006]. Comparison of modeled values withairborne measurements indicate that the CO regional back-ground is accurately reproduced by CHIMERE, as well asthe location and amplitude of local peaks, while only minordisagreements are observed (Figure 6). Ozone time series(Figure 7) reveal that CHIMERE is able to reproduce thechange in the ozone behavior inland between IOP2a andIOP2b (Le Pontet, close to Avignon), the modeled ruralbackground, and the intensity and shape of the peaks inland(Salon de Provence). Nocturnal ozone titration is lessaccurately predicted since it is often of very local origin.Figure 7 also illustrates the overestimation in urban areas(Marseille), the underestimation of the ozone maximum atAix on 24 June (observed for many models during theESCOMPTE modeling exercise), and the missed peaks atthe northernmost sites (Mourre Negre) which result fromslight deviations of the direction of the wind that transportstoo far to the east the secondary plume. Because of its shortlifetime, NO2 is difficult to reproduce in Eulerian models.Nevertheless, time series in Figure 8 indicate that the orderof magnitude of the modeled NO2 mixing ratios is correct,as well as the evolution in concentrations from urban torural sites, and from IOP2a to IOP2b in inland sites due tothe presence of the see breeze.[29] Just after sunrise on 22 June, the Mistral transports
the primary pollutants, emitted near the coast, over the sea(Figures 4a and 4b). Before sunrise, ozone concentrationfields show strong ozone titration at ground level due to thepresence of NO, in a plume which extends on the coast fromMarseille to Fos-Berre and is transported over the sea up tothe southeastern end of the domain. After 1000 UTC, thesea breeze develops over the sea with the wind veering tothe west/southwest [Bastin et al., 2006] (Figure 4c). Theanthropogenic plumes are redirected toward the coast
mainly between Fos-Berre and Marseille, and are finallytransported back toward the coast and are stretched along aband extending from Fos-Berre to Toulon. This returntransport combines with fresh coastal pollutant emissions,amplifying ozone concentrations along the coast (Figures 4b,4c, and 4d). On that day the ozone concentrations over thewhole domain remain moderate (<90 ppb threshold value,corresponding to the first level of public alert) except nearToulon where observed concentrations reach about 100 ppb,values which are underestimated by the simulation. Efficientdispersion due to moderate Mistral and strong mixing leadsto low ozone production on that day, despite the limitedinland penetration of the sea breeze (about 20–30 km;see Table 1). After 1800 UTC (Figure 4e), whereas ozoneconcentrations over the sea are still high, ozone is titratedinland in the largest areas with anthropogenic emissions. Atnight, the wind at ground level becomes weaker withchanging direction. It is the time of the onset of the landbreeze which brings back pollutants over the sea.[30] On 25 June, the meteorological situation is mostly
influenced by local-scale phenomena. During nighttime(Figure 5a), the wind is weak (land breeze and katabaticwinds), and surface ozone concentrations are low due tonighttime titration by NO in the large anthropogenic emis-sion zones and dry deposition. Over the sea, the wind blowsfrom the north/northwest direction on the central part of thedomain, whereas it is openly westerly on the area of Toulon,generating a recirculation of the industrial nighttime plumesover the city. This phenomenon can be observed through thetrail of an anthropogenic plume (with low ozone concen-trations) extending from Fos-Berre to Toulon and spreadingup to about 50 km over the sea. After 0900 UTC (Figure 5b),surface ozone concentrations increase. This increase can berelated both to the development of the PBL and the recoveryof high ozone concentrations in altitude and to local ozoneproduction, as the simulation indicates ozone productionrates exceeding 10 ppb h�1 downwind the largest anthro-pogenic areas. At the sea breeze onset, the wind veers to thesouth/southwest, with a more pronounced westerly compo-nent in the region of Toulon [Bastin et al., 2005], whichpushes back the primary pollutant plumes toward the coast
Table 1. Ozone Concentration Measured and Simulated With CHIMERE at Marseille and Aix en Provence and
Averaged Between 1000 and 1600 UTC, as a Function of the Type of Atmospheric Circulation Regimea
DateFlow
RegimeMeasured OzoneConcentration, ppb
Simulated OzoneConcentration, ppb
Sea Breeze InlandPenetration, km
17 Jun M 38.0/41.2 —/— —18 Jun M 40.5/42.2 —/— —19 Jun M 42.0/43 —/— —21 Jun (IOP2a) M + SB 70.0/49.8 69.6/63.8 2022 Jun (IOP2a) M + SB 57.5/55.0 74.9/62.1 3023 Jun (IOP2a) M + SB 60.0/42.2 67.2/60.4 3024 Jun (IOP2b) M (end) + SB 50.0/95.9 71.9/81.1 8025 Jun (IOP2b) SB 31.0/74.3 74.3/91.2 10026 Jun (IOP2b) SB 46.0/75.5 81.6/80.3 12028 Jun M 44.0/43.8 —/— —1 Jul (IOP3) M 50.5/49.8 60.8/59.7 —3 Jul (IOP3) SB 50.0/75.6 77.2/74.6 1104 Jul (IOP3) SB 45.5/67.8 65.8/72.8 150
aThe left number is Marseille, and the right number is Aix en Provence. M stands for ‘‘mistral,’’ and SB stands for ‘‘seabreeze’’. The sea breeze inland penetration in the Rhone valley, when it exists, is indicated in the last column. The CHIMEREsimulations were conducted for the IOPs only.
D13105 DROBINSKI ET AL.: POLLUTION TRANSPORT AND DILUTION IN SOUTHERN FRANCE
9 of 26
D13105

where they dilute in a deeper PBL and combine with freshcoastal emissions. Just downwind of Toulon, Marseille andthe industrial Fos-Berre complex, fast ozone production isfound (from 20 to 35 ppb h�1). After 1100 UTC (Figure 5c),the production rates can reach amaximumof 35 to 50 ppb h�1.Such values, which correspond to the highest range ofozone production rates found in the literature [e.g., Baumann
et al., 2000; Daum et al., 2000], are consistent with theexperimental calculations made for this period [Coll et al.,2005]. After 1100 UTC, ozone concentration exceeds thethreshold value of 90 ppb. Contrary to 22 June, the seabreeze penetrates inland, advects the plume of ozone withvalues exceeding 90 ppb and forms a band of highconcentration extending from Avignon to Toulon. Under
Figure 4. Surface ozone concentration (color coded) and 10 m wind speed and direction (arrows) on22 June (IOP 2a) at (a) 0600 UTC, (b) 0900 UTC, (c) 1200 UTC, (d) 1500 UTC and (e) 1800 UTCsimulated using the MM5 mesoscale model coupled with the chemistry transport model CHIMERE.
D13105 DROBINSKI ET AL.: POLLUTION TRANSPORT AND DILUTION IN SOUTHERN FRANCE
10 of 26
D13105

the influence of a well-established sea breeze, this high-ozone plume progresses toward the north of theESCOMPTE domain, its northern end being delimited bythe sea breeze front [Menut et al., 2005] (Figures 5d and 5e;it must be noted that in the middle of the Rhone valley, notshown, the sea breeze front penetrates farther inland; seeTable 1). Thus most of the ozone is actually producedwithin the sea breeze which mixes and transports anthro-pogenic pollutants inland toward the Durance and Rhone
valleys. At 1500 UTC (Figure 5d), the local ozone maximahave merged into a single plume which amplitude increaseswith time and which extreme values, east of Aix enProvence, exceed the 120 ppb threshold at 1600 UTC.On 25 June the simulated ozone concentrations, although alittle shifted toward the south compared to measurements,are in good agreement with the maximum of 120 ppbmeasured at the same time in Cadarache, east of Aix enProvence. After 1500 UTC, ozone production rates fall
Figure 5. Same as Figure 4 on 25 June (IOP 2b).
D13105 DROBINSKI ET AL.: POLLUTION TRANSPORT AND DILUTION IN SOUTHERN FRANCE
11 of 26
D13105

appreciably, and from 1600 UTC the plume does no longerproduce ozone. It is evacuated toward the northeastern partof the domain along the Durance valley. After 1900 UTC(Figure 5e), ozone deposition is simulated downwind themain traffic, urban and industrial centers.
[31] These days are representative of the different types ofepisodes encountered in the ESCOMPTE region. Days withmoderate ozone production are characterized by a seabreeze coupled with moderate synoptic wind like Mistral.Mistral leads to the formation of an ozone plume along the
Figure 6. Carbon monoxide concentrations (in ppbv) measured (dots) and simulated by the CHIMEREmodel (line) onboard the DORNIER, MERLIN, and ARAT aircrafts on 22, 25, and 26 June, respectively.Adapted from Lasry [2006].
Figure 7. (a–c) Ozone concentrations (in ppbv) measured (dots) and simulated by the CHIMEREmodel (line) on 22 June onboard the MERLIN aircraft and on 25 and 26 June onboard the ARAT aircraft.(d–i) Ozone concentrations (in ppbv) measured (dots) and simulated by the CHIMERE model (line) for 6ground stations (see Figure 1) between 21 and 27 June (IOP2). Adapted from Lasry [2006].
D13105 DROBINSKI ET AL.: POLLUTION TRANSPORT AND DILUTION IN SOUTHERN FRANCE
12 of 26
D13105
coast close to Toulon (14 June, i.e., IOP1 and 21–23 June,i.e., IOP2a) with concentrations slightly exceeding 90 ppb.The numerical prediction of the exact timing and location ofthe advected ozone plume in coupled Mistral/breeze situa-tions is made complex by the strong sensitivity of theconvergence zone location to the balance between seabreeze and large-scale wind (Table 1). Location and timingof the ozone plumes are also sensitive to topographic detailswhich may be difficult to represent in models. The ozoneplumes observed in Toulon are particularly difficult tosimulate [Cousin et al., 2005]. The situation of 24 and25 June are representative of these types of meteorologicalsituations. Maximum ozone concentrations are mainlyrecorded between 10 km and 50 km downwind the mainanthropogenic sources (25 June, i.e., IOP2b, and Ju03, i.e.,IOP3), the plume being often evacuated in the Durancevalley and along the mountain slopes even though on someoccasions the plume may also penetrate less far inlandbecause of adverse synoptic wind (24 June and 10 July,i.e., IOP4). Despite slight deviations in the wind directionthat make difficult the restitution of the exact location of thepeaks, the main characteristics of these episodes are fairlywell numerically reproduced with a day-to-day variability ofthe peak intensity that is also in good agreement withmeasurements. All these ESCOMPTE days have been sim-ulated using various dynamical and chemistry transportmodels and Dufour et al. [2005] and Taghavi et al. [2005]show that not surprisingly, modelled photochemistry withinthe PBL is quite sensitive to refinements in the emissions,particularly primary compounds, as well as to the chemicalscheme employed.4.2.2. Impact of the Rhone and Durance Valleys onMesoscale Transport[32] The impact of the Rhone and Durance valleys on the
sea breeze dynamics (depth, intensity and penetration) has
been investigated by Bastin et al. [2005] and Drobinskiet al. [2006]. They show that the sea breeze is generallyaffected by flow splitting between the Durance and theRhone valley whenever it reaches the bifurcation zone (it isnot the case during IOP2a). If the sea breeze flow reachesthe entrance of the Durance valley (other IOPs), it is thenaccelerated in the Durance valley due to lateral constrictionand progresses farther inland. In presence of an offshoreflow in the Rhone valley (21–25 June and 10 July), lateralconstriction does not affect the sea breeze. On 26 June and 3and 4 July, the combination with an onshore flow leads tofarther penetration inland and intensification of the low-level southerly flow in the Durance but also in the Rhonevalley. If the onshore synoptic flow is too strong, the seabreeze flow can be inhibited as on 4 July in a large area inthe Rhone valley [Drobinski et al., 2006]. The impact ofvalley channeling on ozone plume penetration has beeninvestigated quantitatively for IOP2b. Time series of ozoneconcentration at different ground stations along the Duranceand Rhone valleys indicate clearly the distinction betweenthe peak of photochemistry at 1200 UTC, and the peakdue to ozone production associated with sea breeze trans-port around 1500–1800 UTC (Table 2). Between 1500 and1800 UTC, photochemistry production decreases to about25% of the maximum found at 1200 UTC. The observedozone increase between 1200 and about 1800 UTC, at a rateof about 7–10 ppb h�1 (with a maximum of 40 ppb h�1), isthus mainly due to transport. In the Rhone valley, wider thanthe Durance valley, the plume of ozone precursors is morediffuse and the ozone peaks are generally lower.
4.3. Vertical Transport and Mixing
[33] Section 4.1 shows that large-scale atmospheric cir-culation is a major cause of ozone distribution in the freetroposphere in the ESCOMPTE target area. One key ques-
Figure 8. Nitrogen dioxide concentrations (in ppbv) measured (dots) and simulated by the CHIMEREmodel (line) for 6 ground stations (see Figure 1) between 21 and 27 June (IOP2). Adapted from Lasry [2006].
D13105 DROBINSKI ET AL.: POLLUTION TRANSPORT AND DILUTION IN SOUTHERN FRANCE
13 of 26
D13105

tion is the estimation of the air mass exchanges between thePBL and the free troposphere which can contribute toventilate the PBL or to import fresh ozone from the freetroposphere down to the PBL, enhancing the contribution oflocal emission sources. In the ESCOMPTE region, thedynamical processes that contribute to vertical exchangesand mixing consist of (1) the vertical mixing at the seabreeze front, (2) the entrainement/detrainement processesat the convective PBL top in the following sea breeze, and(3) the contribution of the slopes to venting/accumulationprocesses by anabatic/katabatic flows.4.3.1. Vertical Mixing at the Sea Breeze Front[34] The leading edge of the sea breeze forms in general a
typical frontal zone with intense turbulence mixing while asharp dividing line is maintained between the sea breezeflow and the environmental flow. Figure 9 shows thepassage of the sea breeze front above the UHF wind profiler
Table 2. Ozone Concentration at Different Ground Stations
Located Along the Rhone and Durance Valleys at About 1200
UTC and Between 1500 and 1800 UTC (Maximum Ozone Value)a
Distance Fromthe Coast 24 Jun 25 Jun 26 Jun
Alpilles (Rhonevalley)
35 km 72.3/85.4 100.2/111.7 80.5/57.5
Le Pontet (Rhonevalley)
50 km 65.7/78.9 78.9/94.0 85.4/111.7
Bollene (Rhonevalley)
90 km 63.4/71.6 75.1/78.6 65.7/91.5
Meyrargues (Durancevalley)
45 km 79.3/114.1 96.7/106.4 81.2/98.6
Vinon (Durance valley) 60 km 55.8/91.7 71.9/124.0 62.6/119.7Les Mees (Durancevalley)
80 km 57.3/87.8 72.5/135.9 71.0/109.2
aLeft number is 1200 UTC, and right number is between 1500 and1800 UTC. Values are in ppb.
Figure 9. Time-height sections of meridian wind speed (i.e., the south-north wind component v),vertical wind components, and dissipation rate measured with Saint Chamas UHF wind profiler on24 June, with superimposed (v, w) wind vectors. Adapted from Puygrenier [2006].
D13105 DROBINSKI ET AL.: POLLUTION TRANSPORT AND DILUTION IN SOUTHERN FRANCE
14 of 26
D13105

on 24 June (IOP2b) at Saint Chamas [Puygrenier, 2006].This unique data set perfectly illustrates the dynamics of thesea breeze front. The sea breeze starts blowing at SaintChamas (very close to the shore) at about 0900 UTC whenthe wind takes a southerly component. The passage of thesea breeze is materialized by strong updraft (>1 m s�1) andlarge dissipation rate (about 45 � 10�4 m2 s�3 maximum)up to about 0.5 km. Maximum turbulence is found up toabout 0.3 km within the sea breeze head due to largegradient of horizontal wind speed through the sea breezefront generating shear induced turbulence. After the passageof the front, the sea breeze is only 0.3 km deep with stilllarge dissipation rate (about 30 � 10�4 m2 s�3 maximum)due to near-surface shear and buoyancy production ofturbulence by convection. One can note the weak down-ward motion following the passage of the sea breeze frontassociated with detrainment in the wake of the sea breezefront. The UHF observations can be compared qualitativelyto the numerical simulations by Bastin et al. [2006] andBastin and Drobinski [2006] for 22 June and 25 June,respectively. Figure 10 shows a vertical cross section ofv � w wind vectors (v is the meridian wind component),dissipation and potential temperature at 1600 UTC along
the Rhone valley (4.5�E longitude) on 22 June (IOP2a) and25 June (IOP2b) as simulated with the Meso-NH model. Itclearly evidences a maximum updraft (0.5–1 m s�1) and asea breeze ‘‘head’’ extending up to about 1 to 2 km asl.Bastin et al. [2006] show that the speed of the sea breezeflow (about 5 m s�1) is faster than the speed of the seebreeze front (about 1–2 m s�1), so when the sea breezeflow reaches the front, convergence results in a rapidupdraft flow and a characteristic ‘‘head’’ forms at the seabreeze front, typical of a gravity current and deeper than thefollowing sea breeze flow. This raised head is a zone ofintense mixing as indicated by the large values of dissipa-tion rate. One can note that the simulated values of verticalvelocity and dissipation rate are of the same order thanthose measured by the UHF wind profiler (Figure 9).[35] Bastin and Drobinski [2006] computed mass flux at
the sea breeze front. They show that the vertical mass fluxescan take values half as large as the sea breeze inducedhorizontal air mass flux in the Rhone valley. Detrainment inthe wake of the sea breeze front does not compensate forthis net upward export of air mass from the PBL to the freetroposphere. This is visible in Figures 9 and 10 with upwardmotion penetrating deeply in the free troposphere. Bastin
Figure 10. Vertical cross section at 4.5�E longitude of v � w wind vectors (arrows, with v the meridianwind component and w the vertical wind component), potential temperature (isocontours ranging from294 K to 310 K with a 2 K interval), and turbulent kinetic energy dissipation rate (shaded area) at1600 UTC on (a) 22 June 2001 and (b) 25 June 2001 along the Rhone valley, as simulated by theMeso-NH model. The vertical and horizontal arrows indicate the scale for w and v, respectively.Adapted from Bastin and Drobinski [2006] and Bastin et al. [2006].
D13105 DROBINSKI ET AL.: POLLUTION TRANSPORT AND DILUTION IN SOUTHERN FRANCE
15 of 26
D13105

and Drobinski [2006] conclude that the most efficienttransport from the PBL to the free troposphere is found atthe sea breeze front especially in situations of moderateoffshore synoptic flow. Since the sea breeze front propaga-tion speed is lower than the sea breeze intensity, andbecause the vertical mass flux at the front is smaller thanthe horizontal mass flux in the sea breeze, the pollutantsaccumulate just behind the front (Figures 4 and 5), part ofthem being exported upward at the sea breeze front [Cousinet al., 2005]. This is illustrated in Figure 11, which showsthe three-dimensional structure of the ozone field along asouth-north cross section intersecting the coast line nearMarseille, characterized by a typical pattern where theozone maximum is found along the sea breeze front, trans-ported and lifted at upper levels in the convergence line.Figure 11 shows the progression of the ‘‘ozone front’’: inthe late morning the plume develops near the coast in aweakly polluted background air, is farther advected inland,lifted and recirculated by both the weak Mistral and theupper sea breeze branch. At the end of the afternoon thiscoupling between mesoscale transport and photochemistryleaves an ozone layer that fills the residual layer as alsosuggested by Millan et al. [1996] from the MECAPIP data.This phenomenon can be substantially attenuated in themorning and in the evening (at the onset and breakdown ofthe sea breeze when the front is smooth, see Figures 11a and11e) and in situations of onshore synoptic prevailing wind[Estoque, 1962]. The tropospheric rich-ozone air massesdocumented by the ozone lidars at Aix les Milles (Figure 2)and originating from the PBL have thus most probably beenlifted above the PBL at the passage of the sea breeze frontthat has transported upward the polluted air of the Marseilleand Fos-Berre plumes (see section 4.1).[36] More locally, in the Marseille area which displays a
step like coastline, a shallow sea breeze (about 300 m depth)driven by the local coastal temperature gradient, blowsperpendicular to the coastline below the main southerlysea breeze, forced by the regional temperature contrastbetween land and the Mediterranean sea (also called deepsea breeze). Because of the shape of the Marseille coastline(the city faces the sea both to the east and to the south), theshallow sea breeze blows from the south-southeast south ofMarseille, and from the west over the northern districts[Bastin and Drobinski, 2006; Lemonsu et al., 2006a].Lemonsu et al. [2006a] show that the southerly shallowsea breeze south of Marseille and the westerly shallow seabreeze north of Marseille converge and form a marked frontover the city center forcing updrafts which export urbanozone at higher vertical levels as discussed by Delbarreet al. [2005]. Frontogenesis associated with the sea breeze(both shallow and deep) thus appears to be a very efficientway to export pollutants from the surface to the upperlevels.4.3.2. Turbulent Vertical Transport in the PBL[37] During ESCOMPTE, the impact of convective
motions within the PBL on vertical exchanges of tempera-ture, humidity, ozone and nitric oxides has been quantified[Kalthoff et al., 2005] because entrainment and detrainmentat the PBL top may contribute to downward mixing of airpollutants from elevated layers into the PBL, increasesurface concentrations and initiate chemical transformationprocesses. Because NO and NO2 sources reside near the
Earth’s surface, nitrogen oxides deviate positively in theconvective updrafts throughout the PBL and thereforethe turbulent flux of NOx, w0NO0
x (where w0 and NOx
0 are theturbulent fluctuations of the vertical velocity and NOx
concentration, respectively) is positive in general both overthe Rhone valley and the mountainous terrain (Figure 12).However, the flux data over the mountainous terrain show amuch higher variability and sometimes are even twice ashigh as over the Rhone valley. This may be attributed to localsources and secondary circulations, such as anabatic slopewinds.[38] In contrast to nitric oxides, ozone is both produced
locally by photochemical reactions involving anthropogenicproduced precursors and transported into the region overquite long distances [e.g., Corsmeier et al., 2005]. Therelation between ozone production and destruction dependson the concentration of precursor gases, radiation, humidityand temperature [Klonecki and Levy, 1997]. Transport ofstratospheric ozone into the troposphere takes place too[Colette et al., 2006], but is not a major factor [Hasel et al.,2005]. Figure 12 shows that the vertical ozone fluxes in thePBL over the Rhone valley are slightly negative with valuesof about 0.15 ppb m s�1. Ozone is transported toward thesurface where deposition takes place. Much more variabilityoccurs over the mountainous areas, w0O0
3 (where O30 is the
turbulent fluctuation of O3 concentration) varying between±0.5 ppb m s�1 with a mean value of about zero. Thehighest values of w0O0
3 occur at the PBL top, with in averagenegative sign over the mountainous sites and positive overthe Rhone valley. However, high variability at the PBL topindicates entrainment and detrainment processes with thefree atmosphere. The negative covariance over the moun-tains results from the ozone profile, which shows a maxi-mum at the PBL top due to ozone transport along themountain slopes (except on 26 June, not shown, when thePBL is highly polluted, resulting in a significant ozonegradient toward lower concentrations in the free troposphereduring daytime associated with positive covariance and aneffective transport of ozone from the PBL to the freetroposphere). This downward flux over the mountainsassociated with detrainment at the leading edge of theupslope winds validates qualitatively the numerical resultsof Bastin and Drobinski [2006] for 25 June and is consistentwith the experimental and numerical findings by Saıd et al.[2007]. However, the mass flux budget by Bastin andDrobinski [2006] also shows that this detrainment withinthe PBL does not compensate the vertical export in the freetroposphere by the combination of upslope winds and thesea breeze.[39] It has thus been shown during ESCOMPTE that
ozone transport is mainly directed toward the sink regionat the earth and vegetation surfaces. Since O3 is controlledby radiation, concentration of precursors and temperature,the ozone concentration in the PBL is characterized by ahigh variability in cases of high air pollution. In mountain-ous regions, fluxes are mainly negative. Entrainment anddetrainment at the PBL top may critically affect exchangewith the free troposphere.4.3.3. Vertical Venting Along the Slopes[40] Finally, the ESCOMPTE target area is featured by
many massifs surrounding the city of Marseille and in thecountryside and the foothills of the western Alps. The
D13105 DROBINSKI ET AL.: POLLUTION TRANSPORT AND DILUTION IN SOUTHERN FRANCE
16 of 26
D13105

Figure 11. South-north cross section the ozone concentration field (ppb) simulated by the CHIMEREchemistry transport model on 24 June. The cross section is taken at 5.65�E. In this simulation the modelis run at a resolution of 2 km, has 16 layers between ground level and 500 hPa, and is driven by the MM5model, itself forced at the boundaries by the ECMWF analyzes. The model topography is represented.Abscissa represents the latitude.
D13105 DROBINSKI ET AL.: POLLUTION TRANSPORT AND DILUTION IN SOUTHERN FRANCE
17 of 26
D13105

Figure 12. Vertical profiles of turbulent ozone fluxes and nitric oxide fluxes (left) over the Rhone valleyand (right) over the mountain ranges. Adapted from Kalthoff et al. [2005].
D13105 DROBINSKI ET AL.: POLLUTION TRANSPORT AND DILUTION IN SOUTHERN FRANCE
18 of 26
D13105

orography affects the low-level atmospheric circulation asan obstacle but also can generate slope winds that contributeto pollution venting during daytime by anabatic upslopeflows and by pollution accumulation during nighttime bythe katabatic winds. Using numerical simulations, Bastinand Drobinski [2006] showed that slope wind contribute toexport air mass from the PBL into the troposphere. Thecombination of the sea breeze with the slope wind tend toincrease the vertical mass flux along the slope by at least afactor of two. From an observational point of view, thedense observation network near Marseille allowed thedocumentation of the slope winds and their impact onozone distribution. The works conducted by Bastin andDrobinski [2005] and Puygrenier et al. [2005] show thatland and sea breezes flowing along the nearshore slopedterrain oscillate with time with a period of 45 to 90 minduring nighttime, and 2 to 3 hours during daytime. Theseoscillations are visible in surface temperature and windvelocity, PBL depth but also in ozone and nitrogen oxide.The most striking example is on 25 June. Figure 13 displaysthe time series of measurements of temperature, winddirection and speed by the surface station at Vallon d’Ol,north of Marseille on a hill flank with a gentle slope of 3�.Figure 13 shows a 180� rotation of the wind directionbetween 0600 and 0900 UTC (from the northeast to thesouthwest) and at 1900 UTC (from the southwest to thenortheast) associated with the sea breeze and land breezeonsets. During nighttime (2200–0600 UTC), the wind isvery weak (about 1 m s�1) with a mean direction of about
70� (northeast direction). Figure 14 shows a nighttimetemperature oscillations with a period of about 1 and a1.5 hour modulation. The northeast component of theoscillating katabatic flow indicates that the air drains offthe mountain along the maximum slope direction at Vallond’Ol. During daytime, the wind direction is about 250�,corresponding to the sea breeze and maximum slope direc-tions at Vallon d’Ol. Figures 13 and 14 reveal the existenceof daytime oscillations in temperature and velocity with aperiod of nearly 3 hours. Puygrenier et al. [2005] showedthat the oscillation of the wind speed is visible up to thePBL top which also oscillates with an amplitude of about200 m. Figure 13 shows that at Barben (30 km northwest ofVallon d’Ol) on a flat terrain area affected by land and seabreezes, no oscillation is visible during both nighttime anddaytime. For katabatic winds, Fleagle [1950, p. 230]explains the oscillating phenomenon simply: ‘‘as the airaccelerates down the slope, adiabatic heating results in areverse pressure gradient which retards the flow. As the airdecelerates, friction decreases, radiative cooling increasesthe pressure gradient and the cycle is repeated.’’ Compar-atively to katabatic winds, no daytime observations ofoscillating anabatic upslope flows have ever been pub-lished, probably because of temperature inversion breakupthat inhibits upslope winds [Whiteman and McKee, 1982a,1982b]. During ESCOMPTE, the existence of such oscilla-tion is attributed by Bastin and Drobinski [2005] to the seabreeze which advects cold air and thus imposes a mesoscaletemperature gradient that forces the baroclinicity of the
Figure 13. (a) Time evolution of 2 m surface temperature, (b) 10 m wind direction, and (c) speed atVallon d’Ol (solid line) and Barben (dashed line) (see Figure 1) on 25 June. The dotted lines inFigure 13b indicate the upslope (240�) and downslope (50�) directions. Adapted from Bastin andDrobinski [2005], with kind permission of Springer Science and Business Media.
D13105 DROBINSKI ET AL.: POLLUTION TRANSPORT AND DILUTION IN SOUTHERN FRANCE
19 of 26
D13105

atmosphere all day long. The mechanism of the observedoscillations is thus very similar to low-frequency oscilla-tions of katabatic flows: (1) the isentrope inclination allowsthe sea breeze flow to run along the slope; (2) the adiabaticcooling due to the air ascension retards the flow; (3) theradiative heating near the surface allows the flow toaccelerate.[41] By simplifying and combining the equations of
motion and heat, Bastin and Drobinski [2005] derived adifferential equation which describes a harmonic oscillationof wind and temperature with the following pulsationfrequency:
w ¼
ffiffiffiffiffiffiffiffiffiffiffiffiffiffiffiffiffiffiffiffiffiffiffiffiffiffiffiffiffiffiffiffiffiffiffiffiffiffiffiffiffiffiffiffiffiffiffiffiffiffiffiffiffiffiffiffiffiffiffiffiffiffiffiffiffiffiffiffiffiffiffiffiffig
q0sina
@ �qþ q?� �@x
cosaþ G sina� �s
ð1Þ
where g is the gravity acceleration, q0 is a referencepotential temperature, �q(x, z, t) the mesoscale potentialtemperature field, q?(x, z, t) is the perturbation with regardsto the mesoscale field due to the existence of the gravityflow. @�q/@x is the horizontal gradient of potential tempera-ture due to the existence of the sea breeze flow, G = @q/@z isthe vertical lapse rate of the atmosphere, and a is the slopeangle. Table 3 gives additional details about the date, theaverage wind direction as well as the observed and
predicted oscillation period for the nights and days showingevidence of temperature and velocity oscillations.Theoscillation time period varies between 45 and 90 min at nightwhereas during daytime it varies between 100 and 180 min.[42] The agreement between the observed nighttime oscil-
lation periods and the predictions using equation (1) wasfound for the whole campaign (Table 3). The absence of windand temperature oscillations during IOP 2a along the slopesurrounding the city of Marseille is mainly due to the fact thatthe sea breeze hardly reached the sloped terrain region asshown by Bastin et al. [2006].[43] The impact of such oscillations on ozone concentra-
tion is discussed by Puygrenier et al. [2005] and Augustinet al. [2006]. Figure 15 displays NO2 and O3 concentrationsmeasured in the Marseille city center between 0900 and1900 UTC. Figure 15 shows that NO2 concentration fallsperiodically from 30–35 to 15–20 ppb simultaneouslywith the maxima of the sea breeze intensity (indicated withthe black arrows) at 1215–1230, 1400–1500, and 1800–1830 UTC (see Figure 13), whereas O3 concentration isnearly constant (30–40 ppb) during the day and also fallsperiodically to 20–25 ppb observed simultaneously withNO2 concentration maxima. Puygrenier et al. [2005] showedthat during sea breeze, advected marine air is poor in NO2
Figure 14. (a) Time series of the temperature oscillations on the night of 25 June at Vallon d’Olbetween 2200 and 0600 UTC (b) with its corresponding power spectrum (obtained using a Bayesianspectral estimator). (c and d) Same as Figures 14a and 14b except for the time series between 0600 and1900 UTC. Adapted from Bastin and Drobinski [2005], with kind permission of Springer Science andBusiness Media.
D13105 DROBINSKI ET AL.: POLLUTION TRANSPORT AND DILUTION IN SOUTHERN FRANCE
20 of 26
D13105

and that the NO2 concentration of the marine air increases asit travels over Marseille. The enrichment in NO2 increaseswith the residential time of the marine air over the city. Thereason why NO2 and O3 concentrations oscillate with thewind speed is the following: (1) when the wind speed isweak and the PBL deep, the concentration of NO2 increasesover Marseille whereas the concentration of O3 remains lowbecause of dilution; (2) when the wind speed increases, theconcentration of NO2 decreases because the residential timeover the city decreases and the concentration of O3 increasesbecause the PBL depth decreases. However, the competitionbetween three processes (ozone production along the airmass trajectory, residential time over the urban area and PBLdepth) can differ from one site to the other in some areas inMarseille [Augustin et al., 2006]. For instance, air masstrajectory, and so ozone loading, differ when the area is on
the path of the southerly shallow sea breeze (south ofMarseille) or of the westerly shallow sea breeze (north ofMarseille) (see section 4.3.1) inducing different correlationbetween ozone concentration and PBL depth.[44] So the combination of slope winds with the sea
breeze enhances the vertical export along the slopes byabout a factor of two with respect to the action of slopewinds only. The combination of slope winds with the seabreeze generate oscillating motions along the slopes similarto gravity waves. The oscillating motions is associated withperiodic variation of pollutants concentrations due to themodulation of the residential time over the emission sourcesand by dilution caused by PBL depth oscillation. Ventingalong the slope thus appears to be a non negligible processin the ESCOMPTE target area.
4.4. Advances in Physical and Chemical NumericalModeling During ESCOMPTE
[45] One major objective of ESCOMPTE was to improvethe performance of high-resolution numerical weather pre-diction, chemical and coupled models in a complex coastalarea. Some limits appeared with respect to the representa-tion of the town energy budget and its impact on thesimulated low-level thermodynamical field over Marseillemainly, and grid resolution (since a grid size of a fewkilometers is not fine enough to reproduce the fine complexterrain in the region of Marseille and orography of theRhone and Durance valleys). Most of these problems couldbe solved using the ESCOMPTE data set, allowing moreaccurate and reliable numerical modeling and forecasting ofthe three-dimensional structure of sea breeze and its timeevolution, and of the ozone and nitric oxide concentrations.4.4.1. Town Energy Budget Scheme[46] In the ESCOMPTE region, the reliable and accurate
modeling of the atmospheric in the vicinity and over a largecity such as Marseille requires an improved parametrizationof energy exchanges between the town and the atmosphere.Numerical simulations performed by Lemonsu et al.[2006b] with the Meso-NH model and the town energybudget (TEB) scheme [Masson, 2000] for IOP2a and IOP2bdemonstrate that a proper treatment of the town energybudget is of crucial importance to simulate accurate surfaceheat fluxes and temperature in the urban area. Beforehand,the ESCOMPTE database allowed to improve the initial
Table 3. Nighttime and Daytime (shaded) Oscillation Periods
When the Surface Measurements at Vallon d’Ol Show Evidence of
Temperature and Wind Speed Oscillations on June and July 2001a
Date(2001)
Wind Oscillation Periodobs./Equation (1)Direction Speed
7 Jun W/SW 6 m s�1 100 min/-7–8 Jun E 2 m s�1 60 min/-11–12Jun E 4 m s�1 70–90 min/-13 Jun SW 6 m s�1 180 min/-14–15 Jun E 2 m s�1 70 min/80 min15–16 Jun E 3–4 m s�1 60 min/75 min19–20 Jun NE 2 m s�1 60 min/70 min20 Jun SW 5 m s�1 120–140 min/23 Jun W/SW 5 m s�1 180 min/170 min24–25 Jun NE 1 m s�1 60 min/70 min25 Jun W/SW 4 m s�1 180 min/170 min25–26 Jun E 2 m s�1 80 min/90 min26 Jun W/SW 4 m s�1 120 min/140 min26–27 Jun NE 2 m s�1 50 min/70 min29–30 Jun N 4–5 m s�1 90 min/90 min7–8 Jul N/NW 4 m s�1 60 min/-8 Jul SW 7 m s�1 120 min/-9–10 Jul NE 2 m s�1 45 min/-13 Jul SW 5 m s�1 150 min/-
aDaytime periods are indicated in bold. Comparison is made withtheoretical prediction given by equation (1) (except from 7 to 13 June andfor July 2001 when no vertical profiles of virtual potential temperature weremeasured). The abbreviation obs. stands for ‘‘observations.’’
Figure 15. Nitrogen dioxide (NO2) and ozone (O3) concentrations measured on 25 June in the Marseillecity center (arrows indicate westerly wind maxima). Adapted from Puygrenier et al. [2005], copyright2005, with permission from Elsevier.
D13105 DROBINSKI ET AL.: POLLUTION TRANSPORT AND DILUTION IN SOUTHERN FRANCE
21 of 26
D13105

version of the TEB scheme [Lemonsu et al., 2004]. Indeed,air temperature measured within urban canyons of Marseilleallowed modeled and observed canyon air temperatures tobe compared for the first time. The results show that TEB inits original form does not simulate sufficiently rapid venti-lation of the air from the canyon. Indeed, the Marseilleregion is characterized by the presence of strong winds andlarge net radiative fluxes during summer. When mixing isenhanced (for instance, by modifying canyon aerodynamicresistance), the simulated canyon air temperature is im-proved. Under sea breeze conditions, cold air advectionfrom the sea increases the temperature gradient between theground and the atmosphere. As a consequence, the parti-tioning between sensible heat flux and storage favors theturbulent sensible heat flux, contrary to the results from theMexico City core, where TEB was initially evaluated[Masson et al., 2002]. Nevertheless, the Marseille citycenter required specific attention, because their urbanparameters are totally different than those usually appliedto dense city centers.4.4.2. Model Validation[47] The deployment of innovative remote sensors to
document at high temporal and spatial resolutions thethree-dimensional flow structure was the instrumental corefor new methods of validation of high resolution modeling,especially for weak flow dynamics (at most 5–6 m s�1)which has never been done before. Lemonsu et al. [2006a]simulated the fine-scale flow with Meso-NH model usingnested domains with 250 m horizontal resolution for thefinest domain and TEB scheme, similar to the radialresolution of a ground based Doppler (called TWL fortransportable wind lidar) deployed at Vallon d’Ol. To doso, similar simulated radial velocity fields are computedfrom the simulated flow using the relation between theradial velocity and the three components of the wind:
vr ¼ U cosf sinyþ V cosf cosy� w sinf ð2Þ
where U is the zonal wind component, V the meridionalwind component, w the vertical wind speed, f the elevationangle and y the azimuth angle. Figure 16 shows thecomparison between the radial velocities from the TWL(Figure 16, left) and from the model (Figure 16, right) forone vertical scan across the northern district of Marseille, at190� from the north on 26 June 1001 at 1400 UTC. TheTWL data indicate the superimposition of 4 layers (labeledA, B, C, and D in Figure 16). In layers B, C and D, the radialvelocities are globally negative. Near the surface, the TWLmeasures positive radial velocities up to 600–700 m asl to adistance of 4.7 km away from the TWL. This layercorresponds to layer A. Beyond 4.7 km to the south ofVallon d’Ol, the TWL records negative velocities near thesurface. This change of sign of the radial velocity illustratesthe convergence between a flow with a northerly componentand a flow with a southerly component above the city core[Delbarre et al., 2005; Augustin et al., 2006]. Despite somediscrepancies (location of the convergence zone, depth oflayer A), the numerical model is able for this particular caseto reproduce the very fine scale structure of the sea breezeabove the city of Marseille, both qualitatively andquantitatively.[48] Ozone lidars also proved to be an extremely relevant
tool to validate chemistry transport models, allowing a newinsight on ozone mesoscale variability in the free tropo-sphere. Figure 17 shows the time series of observed ozonevalues during IOP2 at 1500 m and 3100 m above groundlevel and the corresponding simulated values obtained withMOCAGE chemistry transport model. Indeed, MOCAGE isthe only model used for the ESCOMPTE database analysiswhich is able to reproducing the observed signal aboveabout 2500 m. Most of the other models are ‘‘PBL chem-istry models’’, dedicated to the numerical simulation of airpollution at the surface and within the PBL. Part of thesignal observed with the lidars is due to a tropopause foldevent that occurred on the Atlantic and that travels up to the
Figure 16. Vertical cross sections of (left) observed (right) and modeled radial velocities along theground-based Doppler lidar line of sight on 26 June 2001 at 1400 UTC. The solid and the dashed isolinesdistinguish the positive and the negative radial velocities, respectively. The model outputs correspond tothe 250 m domain grid size, which is similar to the radial resolution of the ground-based Doppler lidarmeasurements. Adapted from Lemonsu et al. [2006a], with kind permission of Springer Science andBusiness Media.
D13105 DROBINSKI ET AL.: POLLUTION TRANSPORT AND DILUTION IN SOUTHERN FRANCE
22 of 26
D13105

ESCOMPTE area. Small-scale spatial and temporal varia-bilities are related to the actual positions of the instrumentsregarding local emissions and recirculations [Ancellet andRavetta, 2005] and present a diurnal variability that themodels can generally quite well capture [Dufour et al.,2005; Cousin et al., 2005]. Interestingly, differences alsoappear between the two lidars above 2500 m. Such differ-ences, that last over a few days, are rather unexpected atsuch altitudes given the proximity of the two sites, onlylocated 30 km apart. The model used here is not capable ofcapturing these differences (the chemistry transport modelresolution being approximately 10 km). At 3100 m, thesimulated ozone levels are comparable with those measuredat Aix les Milles, but with a temporal variability closer to
that at Saint Chamas. A much better agreement is observedjust above the PBL (1500 m) between the observations atthe two sites and between the observations and the model.The differences observed at the mesoscale in the freetroposphere requires further investigation, as the 2500–4000 m altitude range is the one where residual pollutionlayers and upper tropospheric and stratospheric air massescome in contact.
5. Concluding Remarks
[49] Looking back from some distance, the design of thecomposite observing network may be assessed as quitepositive, even though lessons can always be learned. The
Figure 17. Lidar observations (Saint Chamas (EPFL), crosses, and Aix en Provence (ALTO), triangles)and numerical simulations (MOCAGE chemistry transport model) of ozone time series at Saint Chamas(black) and Aix les Milles (gray), (top) 3100 m and (bottom) 1500 m above ground level. Adapted fromDufour et al. [2005].
D13105 DROBINSKI ET AL.: POLLUTION TRANSPORT AND DILUTION IN SOUTHERN FRANCE
23 of 26
D13105

composite observing system and the combination of remotesensing and in situ systems produced a wealth of data whichallows unprecedented insight into the structure of the seabreeze flow and its contribution to ozone redistribution. Thecombination of established and novel and highly sophisti-cated remote sensing instruments with conventional in situmeasurements (dense surface network and radiosondes)allowed to capture previously unseen details of the finestructure of the sea breeze and allowed the validation ofultrahigh-resolution numerical research and weather predic-tion models as well as chemistry transport models. Fromthis work, an operational numerical platform for air qualityforecast at fine-scale called AIRES (kilometer-scale resolu-tion, combining the mesoscale model MM5 and the chem-istry transport model CHIMERE), has been developed andis currently used by the air quality network AIRMARAIX.[50] The main findings are that despite the complexity of
the terrain, the horizontal transport is mainly driven by thesea breeze and its inland extent by the location of the seabreeze front. The pollutant dilution along its horizontaltransport is modulated by the PBL depth which remainsshallow near the coast (and thus can contribute to highprimary and secondary compound concentrations) andbecomes deeper farther inland. The vertical exchanges arepredominantly directed from the PBL into the free tropo-sphere, even though entrainment of ozone-rich air within thePBL can be found at sunrise and over the mountains insome occasions. Most of the vertical air mass flux occurs atthe sea breeze front, however remaining smaller than the seabreeze induced horizontal mass flux, thus contributing topollution accumulation just upstream of the sea breeze front.Detrainment at the top of the following breeze within thePBL can not compensate for the upward export. Pollutionventing along the slopes is the second contribution to the netvertical export into the free troposphere. It is enhanced bythe combination with the sea breeze flow which induces agravity wave-like oscillatory motion along the slope whichaffects the time evolution of ozone and nitric oxide con-centration. Comparatively to the significant verticalexchanges at the the sea breeze front and along the slopes,entrainment/detrainment at the PBL top is an order ofmagnitude weaker especially when exchanges of ozoneare considered. So, aged tropospheric polluted air massesare not substantially incorporated into the PBL.[51] Finally, despite the significant progress made in sea
breeze understanding, modeling and forecasting thanks tothe ESCOMPTE programme, several key issues are still atbest partly understood. Among those are mainly the fol-lowing: (1) A quantitative experimental estimation of theexchanges of pollutant between the PBL and the freetroposphere along the mountain slopes has not been con-ducted during ESCOMPTE because the instrumental setupdid not initially aimed at quantifying this contribution,especially in the countryside. (2) The simulation of thepolluted ESCOMPTE days with very fine scale numericalmodels did not succeed in reproducing the oscillating natureof the combined sea breeze and anabatic flow, and itsimpact on ozone variability along the mountain slope andin the urban area (maybe caused by too coarse resolution ofthe models or unsuited numerical diffusion scheme incomplex terrain, as suggested by Zangl [2002]). (3) Themodel initialization proved to be in some occasions prob-
lematic because of a lack representativity of the measure-ments in the valleys, at hill tops or over very heterogeneousterrain (e.g., near the sea, the Berre pond, the urban zones,etc.) especially during anticyclonic conditions. (4) Thenumerical simulation of small-scale tropospheric ozonevariability, well above the PBL, is currently very challeng-ing as the accurate simulation of these features requires thatboth long-range transport and detailed local circulations andphotochemistry are well accounted for. Further modelingwork, involving a hierarchy of coupled chemistry andtransport modeling systems that allows to cover the impor-tant range of time and spatial scales involved, as well asfuture observing efforts in the Mediterranean area areneeded to further investigate such small-scale variabilityof free tropospheric ozone.
[52] Acknowledgments. The authors would like to thank the threeanonymous referees who contributed to improve the manuscript signifi-cantly and B. Cros and P. Durand for the coordination of the experiment. Inthe framework of the French programs PNCA and PRIMEQUAL-PREDIT,ESCOMPTE was performed thanks to funding from the Ministere del’Ecologie et du Developpement Durable (MEDD), the Agence de l’Envi-ronnement et de la Maıtrise de l’Energie (ADEME), the Institut Nationaldes Sciences de l’Univers (INSU), Meteo-France, the Institut National del’Environnement Industriel et des Risques (INERIS), the German fundingagency (BMBF), the Institute for Meteorology and Climate Research (IMK-Karlsruhe), the Joint Research Center (JRC-Ispra), the Swiss FederalInstitute of Technology (EPFL-Lausanne), the Centre National d’EtudesSpatiales (CNES), Electricite de France (EDF), the air quality agenciesAirmaraix and Airfobep, the cities of Marseille and Aix en Provence, andthe county council of the Bouches-du-Rhone. The flights of the DLRFalcon were funded partly by the CAATER (Co-ordinated Accessto Aircraft for Transnational Environmental Research) program of theEuropean Commission. We particularly thank M. P. Lefebvre, who playeda crucial role in the delicate organization of the flights.
ReferencesAncellet, G., and F. Ravetta (2005), Analysis and validation of ozonevariability observed by lidar during the ESCOMPTE-2001 campaign,Atmos. Res., 74, 435–459.
Atkinson, B. W. (1981), Mesoscale Atmospheric Circulations, 495 pp.,Academic, London.
Augustin, P., H. Delbarre, F. Lohou, B. Campistron, V. Puygrenier,H. Cachier, and T. Lombardo (2006), Investigation of local meteorologicalevents and their relationship with ozone and aerosols during anESCOMPTE photochemical episode, Ann. Geophys., 24, 2809–2822.
Aumont, B., A. Jaeker-Voirol, M. Martin, and G. Toupance (1996), Tests ofsome reduction hypotheses made in photochemical mechanisms, Atmos.Environ., 30, 2061–2077.
Bastin, S., and P. Drobinski (2005), Temperature, and wind velocity oscil-lations along a gentle slope during sea-breeze events, Boundary LayerMeteorol., 114, 573–594.
Bastin, S., and P. Drobinski (2006), Sea breeze induced mass transport overcomplex terrain in southeastern France: A case study, Q. J. R. Meteorol.Soc., 132, 405–423.
Bastin, S., P. Drobinski, A. M. Dabas, P. Delville, O. Reitebuch, andC. Werner (2005), Impact of the Rhone and Durance valleys on sea-breezecirculation in the Marseille area, Atmos. Res., 74, 303–328.
Bastin, S., P. Drobinski, V. Guenard, J. L. Caccia, B. Campistron, A. M.Dabas, P. Delville, O. Reitebuch, and C. Werner (2006), On the interac-tion between sea-breeze and summer mistral at the exit of the Rhonevalley, Mon. Weather Rev., 134, 1647–1668.
Baumann, K., et al. (2000), Ozone production and transport near Nashville,Tennessee: Results from the 1994 study at New Hendersonville, J. Geo-phys. Res., 105, 9137–9151.
Bechtold, P., J. P. Pinty, and P. Mascart (1991), A numerical investigation ofthe influence of large-scale winds on sea-breeze and inland-breeze-typecirculations, J. Appl. Meteorol., 30, 1268–1279.
Caccia, J. L., V. Guenard, B. Benech, B. Campistron, and P. Drobinski(2004), Vertical velocity and turbulence aspects during Mistral eventsas observed by UHF wind profilers, Ann. Geophys., 22, 3927–3936.
Cheng, W. L. (2002), Ozone distribution in coastal central Taiwan undersea-breeze conditions, Atmos. Environ., 36, 3445–3459.
Colette, A., G. Ancellet, L. Menut, and S. R. Arnold (2006), A Lagrangiananalysis of the impact of transport and transformation on the ozone
D13105 DROBINSKI ET AL.: POLLUTION TRANSPORT AND DILUTION IN SOUTHERN FRANCE
24 of 26
D13105

stratification observed in the free troposphere during the ESCOMPTEcampaign, Atmos. Chem. Phys., 6, 3487–3503.
Coll, I., S. Pinceloup, P. E. Perros, G. Laverdet, and G. Le Bras (2005), 3Danalysis of high ozone production rates observed during the ESCOMPTEcampaign, Atmos. Res., 74, 477–505.
Corsmeier, U., R. Behrendt, P. Drobinski, and C. Kottmeier (2005), Themistral and its effect on air pollution transport and vertical mixing, Atmos.Res., 74, 275–302.
Cotton, W. R., et al. (2003), RAMS 2001: Current status and future direc-tions, Meteorol. Atmos. Phys., 82, 5–29.
Cousin, F., P. Tullet, and R. Rosset (2005), Interaction between local andregional pollution during ESCOMPTE 2001: Impact on surface ozoneconcentration (IOP2a and 2b), Atmos. Res., 74, 275–302.
Cros, B., et al. (2004), The ESCOMPTE program: An overview, Atmos.Res., 69, 241–279.
Dalu, G. A., and R. A. Pielke (1989), An analytical study of the sea-breeze,J. Atmos. Sci., 46, 1815–1825.
Daum, P. H., L. I. Kleinman, D. Imre, L. J. Nunnermacker, Y. N. Lee, S. R.Springston, and L. Newman (2000), Analysis of ozone formation duringa stagnation episode in central Tennessee in summer 1995, J. Geophys.Res., 105, 9107–9119.
Delbarre, H., et al. (2005), Ground-based remote sensing observation of thecomplex behaviour of the Marseille boundary layer during ESCOMPTE,Atmos. Res., 74, 403–433.
Drobinski, P., S. Bastin, V. Guenard, J. L. Caccia, A. M. Dabas, P. Delville,A. Protat, O. Reitebuch, and C. Werner (2005), Summer mistral at theexit of the Rhone valley, Q. J. R. Meteorol. Soc., 131, 353–375.
Drobinski, P., S. Bastin, A. M. Dabas, P. Delville, and O. Reitebuch (2006),Variability of the three-dimensional sea-breeze structure in southeasternFrance: Observations and evaluation of empirical scaling laws, Ann.Geophys., 24, 1783–1799.
Dudhia, J. A. (1993), Nonhydrostatic version of the Penn State-NCARmesoscale model: Validation tests and simulation of an Atlantic cycloneand cold front, Mon. Weather Rev., 121, 1493–1513.
Dufour, A., M. Amodei, G. Ancellet, and V. H. Peuch (2005), Observed andmodelled ‘‘chemical weather’’ during ESCOMPTE, Atmos. Res., 74,275–302.
Estoque, M. A. (1962), The sea-breeze as a function of the prevailingsynoptic situation, J. Atmos. Sci., 19, 244–250.
Feliks, Y. (1993), A numerical model for estimation of the diurnal fluc-tuation of the inversion height due to a sea-breeze, Boundary LayerMeteorol., 62, 151–161.
Feliks, Y. (2004), Nonlinear dynamics and chaos in the sea and land breeze,J. Atmos. Sci., 61, 2169–2187.
Fleagle, R. G. (1950), A theory of air drainage, J. Meteorol., 7, 227–232.Franois, S., S. Fayet, E. Grondin, and J. L. Ponche (2005), Establishment ofthe atmospheric emission inventories of the ESCOMPTE program, Atmos.Res., 74, 5–35.
Frejafon, E., A. Brut, J. L. Caccia, H. Cachier, C. Jambert, P. Laj, P. Perros,and F. Lohou (2005), Global uncertainties of the 2001 ESCOMPTE fieldcampaign database expected confidence intervals, paper presented at 6thESCOMPTE Workshop, Marseille, France.
Guenard, V., P. Drobinski, J. L. Caccia, B. Campistron, and B. Benech(2005), An observational study of the mesoscale mistral dynamics,Boundary Layer Meteorol., 115, 263–288.
Halley, E. (1686), An historical account of trade winds, and monsoons,observable in the seas between and near the tropics, with an attempt toassign physical cause of said winds, Philos. Trans. R. Soc., 16, 153–168.
Hasel, M., C. Kottmeier, U. Corsmeier, and A. Wieser (2005), Airbornemeasurements of turbulent trace gas fluxes and analysis of eddy structurein the convective boundary layer over complex terrain, Atmos. Res., 74,381–402.
Hastie, D. R., et al. (1999), Observational evidence for the impact of thelake breeze circulation on ozone concentrations in southern Ontario,Atmos. Environ., 33, 323–335.
Haurwitz, B. (1947), Comments on the sea-breeze circulation, J. Meteorol.,4, 1–8.
Kalthoff, N., C. Kottmeier, J. Thurauf, U. Corsmeier, F. Saıd, and E. Frejafon(2005), Mesoscale circulation systems and ozone concentrations duringESCOMPTE: A case study from IOP 2b, Atmos. Res., 74, 355–380.
Kitada, T., K. Igarashi, and M. Owada (1986), Numerical analysis of airpollution in a combined field of land/sea-breeze and mountain/valleywind, J. Clim. Appl. Meteorol., 25, 767–784.
Klemm, O., I. C. Ziomas, D. Balis, P. Suppan, J. Slemr, R. Romero, andL. G. Vyras (1998), A summer air-pollution study in Athens, Greece,Atmos. Environ., 32, 2071–2087.
Klonecki, A., and H. Levy II (1997), Tropospheric chemical ozone tenden-cies in CO-CH4-NOy-H2O system: Their sensitivity to variations in en-vironmental parameters and their application to a global chemistrytransport model study, J. Geophys. Res., 102, 21,221–21,237.
Kolev, I., O. Parvanov, B. Kaprielov, E. Doney, and D. Ivanov (1998),Lidar observations of sea-breeze and land-breeze aerosol structure onthe Black Sea, J. Appl. Meteorol., 37, 982–995.
Kolev, I., T. Skakalova, and I. Grigorov (2000), Lidar measurement ofaerosol extinction profile in Black Sea coastal zone, Atmos. Environ.,34, 3813–3822.
Kusuda, M., and P. Alpert (1983), Anti-clockwise rotation of the windhodograph. Part I: Theoretical study, Atmos. Environ., 32, 2071–2087.
Lafore, J. P., et al. (1998), The meso-Nh atmospheric simulation system.Part I: Adiabatic formulation and control simulation, Ann. Geophys., 16,90–109.
Lasry, F. (2006), Analyse par modelisation tridimensionnelle des processusphysico-chimiques determinant la production d’ozone. Evaluationde l’impact de scenarios d’emissions prospectifs. Application au siteESCOMPTE, Ph.D. thesis, 294 pp., Univ. Paris 12, Creteil, France.
Lelieveld, J., et al. (2002),Global air pollution crossroads over theMediterranean,Science, 298, 794–799.
Lemonsu, A., C. S. B. Grimmond, and V. Masson (2004), Modelling of thesurface energy budget of an old Mediterranean city core: Marseille,J. Appl. Meteorol., 43, 312–327.
Lemonsu, A., S. Bastin, V. Masson, and P. Drobinski (2006a), Verticalstructure of the urban boundary layer over Marseille under sea-breezecondition, Boundary Layer Meteorol., 118, 477–501.
Lemonsu, A., G. Pigeon, V. Masson, and C. Moppert (2006b), Sea-towninteractions over Marseille: 3D urban boundary layer and thermodynamicfields near the surface, Theor. Appl. Climatol., 84, 171–178.
Liu, K. Y., Z. Wang, and L. F. Hsiao (2002), A modeling of the sea breezeand its impacts on ozone distribution in northern Taiwan, Environ. Modell.Software, 17, 21–27.
Lyons, W. A., and L. E. Olsson (1973), Detailed mesometeorological stu-dies of air pollution dispersion in the Chicago lake breeze, Mon. WeatherRev., 101, 387–403.
Masson, V. (2000), A physically-based scheme for the urban energy budgetin atmospheric models, Boundary Layer Meteorol., 94, 357–397.
Masson, V., C. S. B. Grimmond, and T. R. Oke (2002), Evaluation of thetown energy balance (TEB) scheme with direct measurements from drydistricts in two cities, J. Appl. Meteorol., 41, 1011–1026.
Menut, L., et al. (2000), Measurements and modelling of atmosphericpollution over the Paris area: An overview of the ESQUIF project,Ann. Geophys., 18, 1467–1481.
Menut, L., I. Coll, and S. Cautenet (2005), Impact of meteorological dataresolution on the forecasted ozone concentrations during ESCOMPTEIOP2a and IOP2b, Atmos. Res., 74, 139–159.
Mestayer, P., et al. (2005), The urban boundary layer field experiment overMarseille UBL/CLU-ESCOMPTE: Experimental set-up and first results,Boundary Layer Meteorol., 114, 315–365.
Michou, M., P. Laville, D. Sera, A. Fotiadi, P. Bouchou, and V. H. Peuch(2005), Measured and modeled dry deposition velocities over theESCOMPTE area, Atmos. Res., 74, 89–116.
Millan, M., R. Salvador, E. Mantilla, and B. Artinano (1996), Meteorologyand photochemical air pollution in southern Europe: Experimental resultsfrom EC research projects, Atmos. Environ., 30, 1909–1924.
Murayama, T., H. Okamoto, N. Kaneyasu, H. Kamataki, and K. Miura(1999), Application of lidar depolarization measurement in the atmo-spheric boundary layer: Effects of dust and sea-salt particles, J. Geophys.Res., 104, 31,781–31,792.
Niino, H. (1987), The linear theory of land and sea-breeze circulation,J. Meteorol. Soc. Jpn., 65, 901–920.
Puygrenier, V. (2006), Etude de la couche limite atmospherique cotieredurant ESCOMPTE 2001: Evaluation et amelioration des performancesd’un radar UHF, Ph.D. thesis, 200 pp., Univ. Paul Sabatier, Toulouse,France.
Puygrenier, V., F. Lohou, B. Campistron, F. Saıd, G. Pigeon, B. Benech,and D. Serca (2005), Investigation on the fine structure of sea-breezeduring ESCOMPTE experiment, Atmos. Res., 74, 329–353.
Rosenthal, J. S., R. A. Helvey, T. E. Battalino, C. Fisk, and P. W. Greiman(2003), Ozone transport by mesoscale and diurnal wind circulationsacross southern California, Atmos. Environ., 37, 51–71.
Rotunno, R. (1983), On the linear theory of the land and sea-breeze,J. Atmos. Sci., 40, 1999–2009.
Saıd, F., U. Corsmeier, N. Kalthoff, C. Kottmeier, M. Lothon, A. Wieser,T. Hofherr, and P. Perros (2005), ESCOMPTE experiment: intercompar-ison of four aircraft dynamical, thermodynamical, radiative and chemicalmeasurements, Atmos. Res., 74, 217–252.
Saıd, F., A. Brut, B. Campistron, and F. Cousin (2007), Investigation of theatmospheric boundary layer dynamics during the ESCOMPTE campaign,Ann. Geophys., 25, 597–622.
Schmidt, F. H. (1947), An elementary theory of the land and sea-breezecirculation, J. Meteorol., 4, 9–15.
D13105 DROBINSKI ET AL.: POLLUTION TRANSPORT AND DILUTION IN SOUTHERN FRANCE
25 of 26
D13105

Schmidt, H., C. Derognat, R. Vautard, and M. Beekmann (2001), A com-parison of simulated and observed ozone mixing ratios for the summer of1998 in western Europe, Atmos. Environ., 36, 6277–6297.
Schultz, P., and T. T. Warner (1982), Characteristics of summertime circu-lations and pollutant ventilation in the Los Angeles basin, J. Appl.Meteorol., 21, 672–682.
Simeonov, P., P. Ristori, I. Balin, B. Calpini, and H. Van Den Bergh (2004),A new DIAL based on a N2 Raman converter for ozone monitoring:Design and application during the ESCOMPTE Campaign, paper pre-sented at XX Quadrennial Ozone Symposium, Int. Ozone Comm., Kos,Greece.
Simpson, J. E. (1994), Sea Breeze and Local Winds, 234 pp., CambridgeUniv. Press, New York.
Steyn, D. G. (1998), Scaling the vertical structure of sea breezes, BoundaryLayer Meteorol., 86, 505–524.
Steyn, D. G. (2003), Scaling the vertical structure of sea breezes revisited,Boundary Layer Meteorol., 107, 177–188.
Taghavi, M., S. Cautenet, and J. Arteta (2005), Impact of a highly detailedemission inventory on modeling accuracy, Atmos. Res., 74, 65–88.
Traub, M., et al. (2003), Chemical characteristics assigned to trajectoryclusters during the MINOS campaign, Atmos. Chem. Phys., 3, 459–468.
Vautard, R., et al. (2003a), A synthesis of the air pollution over the Parisregion (ESQUIF) field campaign, J. Geophys. Res., 108(D17), 8558,doi:10.1029/2003JD003380.
Vautard, R., et al. (2003b), Paris emission inventory diagnostics from theESQUIF airborne measurements and a chemistry-transport model,J. Geophys. Res., 108(D17), 8564, doi:10.1029/2002JD002797.
Vijayakumar, G., K. Parameswaran, and R. Rajan (1998), Aerosols in theatmospheric boundary layer and its association with surface wind speedat a coastal area, J. Atmos. Sol. Terr. Phys., 60, 1531–1542.
Wakimoto, R. M., and J. L. McElroy (1986), Lidar observations of elevatedpollution layers over Los Angeles, J. Clim. Appl. Meteorol., 25, 1583–1599.
Walsh, J. E. (1974), Sea-breeze theory and applications, J. Atmos. Sci., 31,2012–2026.
Wang, T., Y. Y. Wu, T. F. Cheung, and K. S. Lam (2001), A study of surfaceozone and the relation to complex wind flow in Hong Kong, Atmos.Environ., 35, 3203–3215.
Whiteman, C. D., and T. B. McKee (1982a), Breakup of temperatureinversions in deepmountain valleys: Part 1.Observations, J. Appl.Meteorol.,21, 270–289.
Whiteman, C. D., and T. B. McKee (1982b), Breakup of temperature in-versions in deep mountain valleys: Part 2. Thermodynamic model,J. Appl. Meteorol., 21, 290–302.
Zangl, G. (2002), An improved method for computing horizontal diffusionin a sigma-coordinate model and its application to simulations overmountainous topography, Mon. Weather Rev., 130, 1423–1432.
Zerefos, C. S., et al. (2002), Photochemical activity and solar ultravioletradiation (PAUR) modulation factors: An overview of the project,J. Geophys. Res., 107(D18), 8134, doi:10.1029/2000JD000134.
Ziomas, I. C., P. Tzoumaka, D. Balis, D. Melas, C. S. Zerefos, andO. Klemm (1998), Ozone episodes in Athens, Greece: A modellingapproach using data from the MEDCAPHOT-TRACE, Atmos. Environ.,32, 2313–2321.
�����������������������G. Ancellet, S. Bastin, and A. Colette, Institut Pierre-Simon Laplace,
Service d’Aeronomie, Universite Pierre et Marie Curie, 4 place Jussieu,F-75252 Paris, France.P. Drobinski and L. Menut, Laboratoire de Meteorologie Dynamique,
Institut Pierre-Simon Laplace, Ecole Polytechnique, F-91128 PalaiseauCedex, France. ([email protected])A. Brut, B. Campistron, B. Cros, P. Durand, F. Lohou, C. Moppert,
V. Puygrenier, and F. Saıd, Laboratoire d’Aerologie, Universite Paul Sabatier,14 avenue E. Belin, F-31400 Toulouse, France.J. Arteta and S. Cautenet, Laboratoire de Meteorologie Physique,
Universite Blaise Pascal, 24 Avenue des Landais, F-63174 Aubiere, France.P. Augustin and H. Delbarre, Laboratoire de Physico-Chimie de
l’Atmosphere, Universite du Littoral-Cote d’Opale, 189A avenue MauriceSchumann, F-59140 Dunkerque, France.J. L. Caccia and V. Guenard, Laboratoire de Sondages Electromagne-
tiques de l’Environnement Terrestre, Universite du Sud Toulon-Var,F-83957 La Garde Cedex, France.I. Coll and F. Lasry, Faculte des Sciences et Technologie, Laboratoire
Inter-Universitaire des Systemes Atmospheriques, F-94010 Creteil, France.U. Corsmeier, M. Hasel, N. Kalthoff, and C. Kottmeier, Institut
fur Meteorologie und Klimaforschung, Forschungszentrum Karlsruhe,Universitat Karlsruhe, D-76133 Karlsruhe, Germany.A. Dabas, A. Dufour, A. Lemonsu, V. Masson, and V. H. Peuch, Centre
National de Recherches Meteorologiques, Meteo-France, 42 avenueG. Coriolis, F-31057 Toulouse, France.O. Reitebuch, Institut fur Physik der Atmosphare, Deutsches Zentrum fur
Luft- und Raumfahrt, D-82234 Weßling, Germany.R. Vautard, Laboratoire des Sciences du Climat et de l’Environnement,
Institut Pierre-Simon Laplace, Commisariat a l’Energie Atomique, F-91191Gif-sur-Yvette cedex, France.
D13105 DROBINSKI ET AL.: POLLUTION TRANSPORT AND DILUTION IN SOUTHERN FRANCE
26 of 26
D13105