Artificial Neural Networks for the Diagnosis and Prediction of Desert Dust Transport Episodes
ARTICLE IN PRESS
1352-2310/$ - se
doi:10.1016/j.at
�CorrespondE-mail addr
Atmospheric Environment 39 (2005) 39–50
www.elsevier.com/locate/atmosenv
Aerosol optical, chemical and physical properties at Gosan,Korea during Asian dust and pollution episodes in 2001
Sang-Woo Kima,b, Soon-Chang Yoona, Anne Jeffersonb,�, John A. Ogrenb,Ellsworth G. Duttonb, Jae-Gwang Wona, Young Sung Ghimc,
Byung-Il Leea, Jin-Seok Hand
aSchool of Earth and Environmental Sciences, Seoul National University, Seoul, KoreabNOAA Climate Monitoring and Diagnostics Laboratory, R/CMDL1, 325 Broadway, Boulder, CO 80305, USA
cAir Resource Research Center, Korea Institute of Science and Technology, Seoul, KoreadAtmospheric Chemistry Division, National Institute of Environmental Research, Incheon, Korea
Received 28 June 2004; accepted 24 September 2004
Abstract
In order to understand the influence of dust and anthropogenic pollution aerosols on regional climate in East Asia,
we analyzed the aerosol optical, chemical and physical properties for two cases with high aerosol loading and assessed
the radiative forcing of these cases. The 1st case study is a heavy dust episode (DE) in April (during ACE-Asia) 2001
and the 2nd case is a regional-scale pollution event in November 2001. The Angstrom exponent (A) for DE was 0.38
from sunphotometer measurements. The mean single scattering albedo (550 nm) at the surface reported during the
pollution episode (PE, 0.88) was lower than that of DE (0.91). The concentrations of organic (OC) and elemental
carbon (EC) measured during the PE were about 90% and 30% higher than DE. The aerosol mass scattering efficiency
(as) of PE is a factor of about 2 higher than that of the DE. The difference in the mass absorption efficiency (aa) of ECduring DE and PE is small and within the measurement uncertainty. The diurnally averaged aerosol radiative forcing
efficiency (DDFE, Wm�2 t�1) during DE is similar to results of other studies at Gosan.
r 2004 Elsevier Ltd. All rights reserved.
Keywords: Asian dust and pollution; Light scattering; Light absorption; Aerosol radiative forcing; Gosan
1. Introduction
Eastern Asia is a major source region of combustion-
related anthropogenic pollutants as well as wind-blown
mineral dust aerosols. These aerosols have drawn much
attention in recent years from the climate research
groups in the context of the aerosol radiative effects
(The Intergovernmental Panel on Climate Change
e front matter r 2004 Elsevier Ltd. All rights reserve
mosenv.2004.09.056
ing author. Tel.: +1303 497 6493
ess: [email protected] (A. Jefferson).
(IPCC), 2001), because of their large but uncertain
climate forcing. The regional climate effects of these
aerosols are predicted to increase in the near future
(Takemura et al., 2001).
According to results from the Asian Pacific Regional
Aerosol Characterization Experiment (ACE-Asia) (Hue-
bert et al., 2003), mineral dust aerosols had complex,
highly varied chemical and optical properties (Anderson
et al., 2003). Dust from East Asia was mixed with
pollutants, creating a multi-component aerosol of great
complexity and variability (Clark et al., 2004), causing a
d.

ARTICLE IN PRESSS.-W. Kim et al. / Atmospheric Environment 39 (2005) 39–5040
significant perturbation to the radiation budget (e.g.,
Conant et al., 2003; Nakajima et al., 2003). The
properties of pollution aerosols, not associated with
dust, were poorly characterized during the ACE-Asia
campaign. In order to better understand the influence of
two aerosol types, dust and anthropogenic pollutant, on
the regional climate environment in East Asia, we need
to investigate the aerosol properties for both regional-
scale pollution and dust storm cases. This study focuses
on two case studies with high aerosol loading, where the
1st case study is a heavy dust episode (DE) in April 2001
(during ACE-Asia campaign) and the 2nd case is a
regional-scale pollution event in November 2001. The
objectives of these case studies are to characterize and
compare the meteorological fields as well as the aerosol
optical, chemical, and physical properties measured at
Gosan, Korea during dust and pollution episodic
periods and to investigate their radiative forcing.
2. Measurements
Aerosol characterization measurements were made at
Gosan (33.291N, 126.161E, 72m), Korea in the spring
(April) and autumn (November) of 2001. A summary of
Table 1
Measurements made at Gosan that are related to this study
Institute Instrument Measured/deriv
(a) Aerosol chemical and physical properties
KME Various PM2.5/PM10—m
PM2.5—EC an
HKUST Sampler PM2.5—mass, E
UW Sampler PM2.5—mass, E
CMDL CN counter Condensation
(b) Aerosol optical properties
CMDL Nephelometer ssp, ACMDL PSAP sap, oCMDL Sunphotometer t, ASNU MPL sep
(c) Solar radiations
CMDL Pyrheliometer Direct irradian
CMDL Pyranometer Diffuse irradia
(d) Gas phase concentrations
UMIST Various O3, CO, NO2,
KME Various O3, CO, NO2,
(e) Meteorological parameters
KMA Various Surface T, RH
KMA Radiosonde Upper air T, R
aJ: sample available, X: no sample available.
the instrumentation used in this study is given in
Table 1.
2.1. Aerosol optical properties
The aerosol scattering coefficients (ssp) were measured
at three wavelengths (450, 550 and 700 nm) with a
nephelometer (TSI model 3563), as a function of
scattering angle (7–1701) and RH (50–95%) for aerosol
particles, having diameterso10mm. The aerosol absorp-
tion coefficients (sap) were measured with a Radiance
Research Particle Soot Absorption Photometer at
550 nm. The data were corrected for sample area, flow
rate and non-idealities. Detailed descriptions of these
instruments, their operation, associated uncertainties
and variability appear in Delene and Ogren (2002).
A Carter–Scott sunphotometer (model SP02),
mounted on a Sci-Tech solar tracker, made measure-
ments of aerosol optical depth (t) at 412, 500, 675 and
862 nm wavelengths. Calibration of the sunphotometer
was performed at the NOAA CMDL facilities (39.991N,
105.261W, 1700m) using a Langley plot approach
before, during and after the field campaign. The
reported accuracy of the spectral t is approximately
70.02.
ed properties Episodic periodsa
Dust Pollution
ass, ionic comp. J J
d OC conc.
C and OC conc. X J
C and OC conc. J X
nuclei conc. J J
J J
J J
J J
J J
ce J J
nce J J
SO2 J X
SO2 X J
, WS, WD J J
H, WS, WD J J

ARTICLE IN PRESSS.-W. Kim et al. / Atmospheric Environment 39 (2005) 39–50 41
Vertical profiles of the aerosol extinction coefficient
(sep) were measured by a single-channel micropulse lidar
(MPL; 523 nm). The vertical resolution was adjusted to
30m, and the MPL was set to average and analyzed the
backscattered signal every 10min. Detailed descriptions
of basic design and background of this instrument, its
operation and sep retrieval processes appear in Won
et al. (2004).
2.2. Aerosol chemical and physical properties
Daily filter samples of o2.5mm (PM2.5) and 10mm(PM10) particle diameter (Dp) were collected and
analyzed for mass, elemental carbon (EC), organic
carbon (OC) as well as major ionic compounds
concentrations by three research groups:
(a) Hong Kong University of Science and Technology
(HKUST): Aerosols were collected on a 24-h schedule
using a d-IAS sampler with a 2.5 mm cut size cyclone.
OC and EC concentrations were measured using a
thermal/optical carbon analyzer (Sunset Lab.). Com-
plete descriptions are given in Yang et al. (2004).
(b) University of Wisconsin-Madison (UW): Samples
were collected each day for 24-h using a low volume
sampler. Mass was measured at a temperature of 70 1C
and RH of 35%. EC and OC were measured by the
ACE-Asia EC/OC method based on NIOSH 5040, as
detailed by Schauer et al. (2003).
(c) Korea Ministry of Environment (KME): Daily
filter samplings were conducted for the PM2.5 and PM10
size fractions. The concentrations of OC, EC and ionic
compounds were analyzed using a thermal/optical
carbon analyzer (DRI, model 2001), ion chromatogra-
phy (Dionex), atomic absorption spectroscopy (AAna-
lyst 800, Perkin-Elmer) and a UV spectrometer (Lamdar
20, Perkin-Elmer). Detailed descriptions of the instru-
ments as well as the analytical methods and associated
uncertainties appear in Ghim et al. (2003).
In addition, O3, SO2, NO2 and CO measurements
were made by the University of Manchester Institute of
Science and Technology (UMIST) in April 2001 and by
KME in November 2001.
2.3. Shortwave flux
The direct normal irradiance was measured by an
Eppley normal incidence pyrheliometer and the diffuse
irradiance was measured by an Eppley 8–48 black and
white pyranometer, whose dome and receiver was
shaded from the direct solar beam by a tracking disk
in the short-wave regime (0.28–3.0 mm).
2.4. Meteorological parameters
Meteorological measurements, including temperature,
relative humidity, wind speed (WS), and direction at the
ground level were continuously measured at Gosan
weather station, maintained by the Korea Meteorologi-
cal Administration (KMA). Also, upper air radiosonde
data of these quantities at the site were measured twice a
day, on 00 and 12 UTC, respectively.
3. Results and discussions
3.1. Designation of Asian dust and pollution episodes
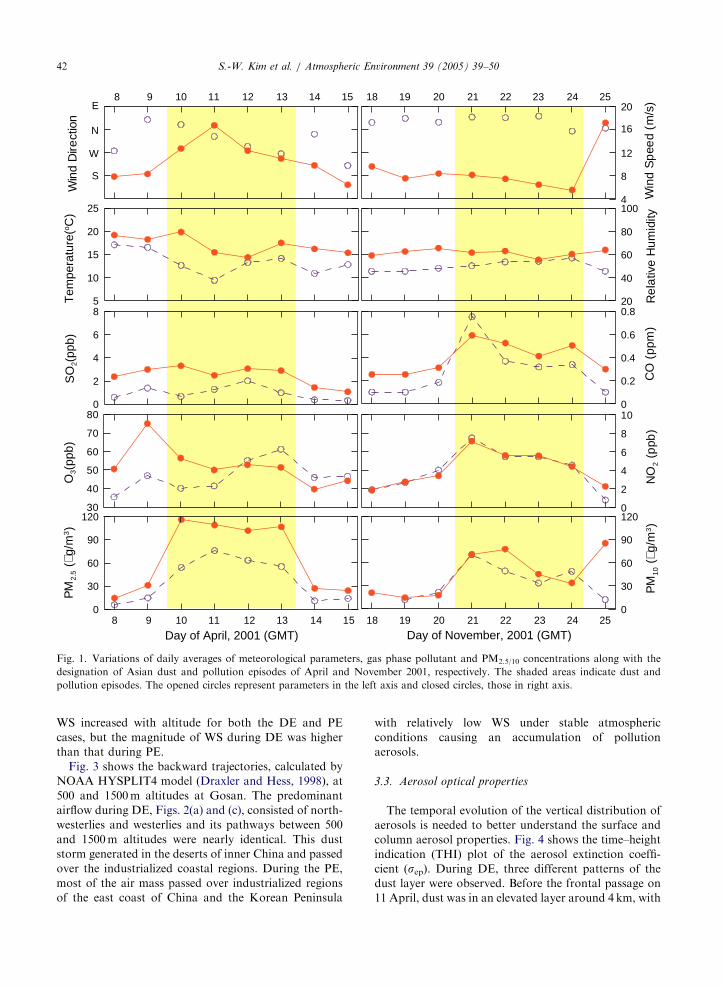
Fig. 1 shows variations of daily averages of the
meteorological parameters and gas phase and particu-
late matter concentrations in April and November 2001.
According to the MPL observations, a large Asian
dust storm swept over the Gosan site from 10 to 14
April, with a column Angstrom exponent (A) of 0.38.
This dust event is easily recognized by an increase in the
coarse particle mass concentrations, when the ratio of
PM2.5 to PM10 decreased to 0.57. These 4 days, when
dust was the dominant aerosol, were designated as the
‘‘dust episode’’ (DE) in this study.
In November 2001, instead of a strong continental
high-pressure system, a stagnant anti-cyclone overlay
East Asia due to the atmospheric blocking by a low-
pressure system over the Sea of Okhotsk. The same
weather pattern repeated from 21 to 24 November and
caused a build-up of pollutants in this region. In
contrast to the DE these 4 days, when fine-mode
pollutants were the dominant aerosol (ratio of PM2.5
to PM10 of 0.89 and A of 1.29), were designated as the
‘‘pollution episode’’ (PE) (Ghim et al., 2003).
We note that the dust particles were also mixed with
pollution aerosols during DE (e.g., Huebert et al., 2003;
Clark et al., 2004) and that local pollution aerosols also
likely contribute to the aerosol high loadings during PE.
3.2. Meteorological conditions
The aerosol properties at Gosan were strongly
influenced by meteorological conditions (Jefferson et
al., 2004). The synoptic weather patterns during DE and
PE were characterized by a fast moving cyclone system
associated with a strong cold front and a stagnant anti-
cyclone system, respectively. As shown in Fig. 1, the
wind direction (WD) at the surface was north to
southwest during the DE with a high WS
(�13.1m s�1). During PE, WD was continuously from
north to east with a relatively low WS (�7.5m s�1). For
reference, the average WS for the last 30 years at Gosan
has been 6.9m s�1.
Vertical profiles of WD and WS shown in Fig. 2 verify
these characteristics. During DE, WD was from the
north to southwest below 6km, consistent with the
results of the surface observations. During PE, the
prevailing WD in the boundary layer was north to east.
ARTICLE IN PRESS
Win
d D
irect
ion
8 10 11 12 13 14 15
4
8
12
16
20
Win
dS
pee
d(m
/s)18 19 20 21 22 23 24 25
E
N
W
S
5
10
15
20
25
Tem
pera
ture
(o C)
20
40
60
80
100
Rel
ativ
eH
umid
ity
0
2
4
6
8
SO
2(pp
b)
0
0.2
0.4
0.6
0.8
CO
(ppm
)
30
40
50
60
70
80
O3(
ppb)
0
2
4
6
8
10
NO
2(p
pb)
8 10 11 12 13 14 15
Day of April, 2001 (GMT)
0
30
60
90
120
PM
2.5
(µg/
m3)
18 19 20 21 22 23 24 25
Day of November, 2001 (GMT)
0
30
60
90
120
PM
10( µ
g/m
3)
9
9
Fig. 1. Variations of daily averages of meteorological parameters, gas phase pollutant and PM2.5/10 concentrations along with the
designation of Asian dust and pollution episodes of April and November 2001, respectively. The shaded areas indicate dust and
pollution episodes. The opened circles represent parameters in the left axis and closed circles, those in right axis.
S.-W. Kim et al. / Atmospheric Environment 39 (2005) 39–5042
WS increased with altitude for both the DE and PE
cases, but the magnitude of WS during DE was higher
than that during PE.
Fig. 3 shows the backward trajectories, calculated by
NOAA HYSPLIT4 model (Draxler and Hess, 1998), at
500 and 1500m altitudes at Gosan. The predominant
airflow during DE, Figs. 2(a) and (c), consisted of north-
westerlies and westerlies and its pathways between 500
and 1500m altitudes were nearly identical. This dust
storm generated in the deserts of inner China and passed
over the industrialized coastal regions. During the PE,
most of the air mass passed over industrialized regions
of the east coast of China and the Korean Peninsula
with relatively low WS under stable atmospheric
conditions causing an accumulation of pollution
aerosols.
3.3. Aerosol optical properties
The temporal evolution of the vertical distribution of
aerosols is needed to better understand the surface and
column aerosol properties. Fig. 4 shows the time–height
indication (THI) plot of the aerosol extinction coeffi-
cient (sep). During DE, three different patterns of the
dust layer were observed. Before the frontal passage on
11 April, dust was in an elevated layer around 4 km, with

ARTICLE IN PRESS
Wind Direction
0.0
0.5
1.0
1.5
2.0
2.5
3.0
3.5
4.0
4.5
5.0
5.5
6.0
0.0
0.5
1.0
1.5
2.0
2.5
3.0
3.5
4.0
4.5
5.0
5.5
6.0
Alti
tude
(km
)
NWS SW NW NE 0 10 15 20 25 30 35 40
Wind Speed (m/s)(b)(a)
E 5
Fig. 2. Vertical profiles of (a) WD and (b) WS were taken from radiosonde measurements at twice a day, on 00 and 12 UTC during
Asian dust (opened) and pollution (closed) periods. Symbols with error bars in (b) represent the average WS and its standard deviation
for every kilometer.
90 100 110 120 130 140 150
Longtitude (E)
20
30
40
50
60
Latit
ude
(N)
Triangle: 11 AprilSquare: 12 AprilCircle : 13 April
110 115 120 125 130
Longtitude (E)
30
35
40
45
Latit
ude
(N)
Triangle: 21 NovemberSquare: 22 NovemberCircle : 23 NovemberDiamond: 24 November
0
1500
3000
4500
6000
Hei
ght a
bove
gro
und
(m)
0 12 24 36 48 60 720 12 24 36 48 60 72
Hours to GosanHours to Gosan
0
1500
3000
4500
6000
Hei
ght a
bove
gro
und
(m)
(a) (b)
(c) (d)
Fig. 3. Three days’ backward trajectories at 500m (closed) and 1500m (opened) altitudes from Gosan during Asian dust (a and c) and
pollution (b and d) episodes. The trajectory location was calculated at 6-h intervals: (a) and (b) on the horizontal plane, (c) and (d) on
the vertical plane.
S.-W. Kim et al. / Atmospheric Environment 39 (2005) 39–50 43

ARTICLE IN PRESS
Fig. 4. Micropulse lidar measurements of aerosol extinction coefficient (523 nm) during Asian dust (top) and pollution (bottom)
episodes at Gosan. The local time is UTC+09h.
Table 2
Comparison of means and standard deviations of aerosol optical properties measured by the in situ measurements during Asian dust
and pollution episodic periods
Period Parameters CN (cm�3) Extensive properties Intensive properties
sap (Mm�1, 550) ssp (Mm�1, 550) A (450/700) o (550)
Dust Mean 4833.6 22.8 239.8 0.66 0.912
S.D. 2954.5 10.4 64.2 0.40 0.027
Pollution Mean 3508.1 25.4 244.2 1.40 0.880
S.D. 883.2 12.5 123.3 0.16 0.017
S.-W. Kim et al. / Atmospheric Environment 39 (2005) 39–5044
sep of 0.15–0.2 km�1, and after the frontal passage, dust
was observed below 3 km. On the afternoon of 13 April,
an isolated dust layer appeared near 4 km with sep of
about 0.5 km�1. This layer gradually thickened and
continued until 21 UTC on April 13, when it rained. The
THI plot of sep during the PE shows that the aerosol
layer existed below 2 km from 21 November to 12 UTC
on 22 November with sepo0.2 km�1. The maximum in
the aerosol loading at 1 km was during the daytime, with
sep of 0.05–0.12 km�1. On 24 November, an aerosol
layer appeared below 3 km, followed by low-level clouds
after 12 UTC.
Table 2 shows the means and standard deviations of
the aerosol extensive and intensive properties during DE
and PE. We performed a T-test to compare the means of
the two groups. The variables in the shaded areas
represent a significant difference. Particle number
concentrations during DE were �37% higher than that
reported for PE. The means of ssp and sap at 550 nm
during PE were slightly higher than those of DE, but not
statistically different. The mean single-scattering albedo
(o) at 550 nm reported during PE (0.88) was lower than
that of DE (0.91) in a significance level of 0.05.
In spite of similar values of ssp at 550 nm, one
distinguishing optical feature between the dust and
pollution aerosols is the wavelength-dependent light
scattering characteristics. Fig. 5 shows the wavelength
dependence of the aerosol optical depth (t) from the
four-channel sunphotometer and ssp from a three-
wavelength nephelometer. A, negative of the slope of
ln t (or ssp) versus ln l, from all wavelengths (l) for DE
(t at 500 nm�0.618) was 0.38 and 0.61 from the
sunphotometer and the nephelometer, respectively. A
for PE (t at 500 nm�0.172) was roughly 2–3 times larger

ARTICLE IN PRESS
1000900800700600500400
1000900800700600500400
Wavelength (nm)
0.1
1
0.2
0.3
0.4
0.5
0.6
0.7
0.80.9
0.090.08
0.07
0.06
Aer
osol
Opt
ical
Dep
th
100
200
300
400
500
Aer
osol
Sca
tterin
g C
oeffi
cien
t (M
m-1)
DustSunphotometer = 0.38
PollutionSunphotometer = 1.29
PollutionNephelometer = 1.39
DustNephelometer = 0.61
Fig. 5. The spectral variations of aerosol optical depth (t; closed) from the sunphotometer and aerosol scattering coefficient (ssp;opened) from the nephelometer during the Asian dust (circle) and pollution (square) episodes. The standard deviation of t is also
plotted as error bars, but that of ssp is given in Table 2.
Table 3
Comparison of aerosol optical properties with those measured in worldwide locations
Location sap ssp o Sample duration (date/mon/yr)
Linan, China 23714 3537202 0.9370.04 28/10/1999–01/12/1999
Beijing, China 83740 4887370 0.8170.08 11/06/1999–16/06/1999
Yulin, China 6710 1607196 0.9570.05 31/03/2001–01/05/2001
Kaashidhoo, Maldives 1679 73728 0.8270.03 15/02/1999–30/04/1999
Bondville, USA 572 57718 0.9270.03 19/09/1996–26/09/2000
Lamont, USA 371 47717 0.9570.03 06/04/1997–26/09/2000
Ship R/B Dust 1276 181782 0.9470.02 ACE-Asia campaign
Pollution 774 64730 0.9470.03 (April, 2001)
Gosan, Korea 1078 89746 0.8870.06 02/04/2001–28/02/2002
Aircraft C-130 Dust 972 135723 0.9570.02 ACE-Asia Campaign
Pollution 975 55734 0.8870.03 (April, 2001)
This study Dust 22711 240764 0.9170.03 10/04/2001–13/04/2001
Pollution 25713 2447123 0.8870.02 21/11/2001–24/11/2001
S.-W. Kim et al. / Atmospheric Environment 39 (2005) 39–50 45
than those of DE, with values of 1.29 and 1.39
from sunphotometer and nephelometer measurements,
respectively.
The aerosol optical properties in this study are
compared with those at other clean or polluted areas
in Table 3. ssp and sap of this study are roughly a factor
of 2–3 higher than those of the average year-round
measurements at Gosan (Jefferson et al., 2004) and
those from the NOAA research vessel Ronald H. Brown
(Carrico et al., 2003) and aircraft C-130 (Anderson et
al., 2003) during the ACE-Asia campaign. sap is similar
to values measured at Linan, China (rural, but affected
by large city; Xu et al., 2002) and is more than a factor
of 3 lower than the mean values from Beijing, China
(polluted urban; Bergin et al., 2001). sap of this study is
roughly a factor of 4 higher than at the rural location

ARTICLE IN PRESSS.-W. Kim et al. / Atmospheric Environment 39 (2005) 39–5046
(Bondville, IL and Lamont, OK; Delene and Ogren,
2002) in the US and 1.5 times higher than the INDOEX
results at Kaashidhoo (Andrews et al., 2001). Particu-
larly, the mean sap is 3 times higher than the values
observed at Yulin, China, which is located near the dust
source region (Xu et al., 2004). Similar to sap, the mean
ssp is also lower than that from Beijing and Linan, but
higher than those from the other locations. Based on
these measurements, the mean o of the PE is similar to
the year-round mean of o at Gosan (0.8870.06,
Jefferson et al., 2004), whereas the mean o of DE is
higher by 0.03. The value of o during the DE is higher
than the values at Beijing (0.81) and Kaashidhoo (0.82),
but is lower than those at the other sites. From
comparisons of sap and o between Yulin and Gosan,
we deduce that large amounts of light-absorbing
anthropogenic pollutants were added to the dust plume
during transport. Namely, the reduction in o as the air
mass moves from the dust source region to Gosan is due
to the addition of fine pollution particles to the mineral
dust (Holler et al., 2003; Clark et al., 2004).
Fig. 6 shows the relationship between sep and oduring DE and PE. Similar to other polluted regions, oincreased with increases in ssp or sep during the PE (e.g.
Andrews et al., 2001). However, o decreased with an
increase in sep during the DE. Here, the data points in
the afternoon on 11 April, given in the dashed circle,
were not considered due to the aerosol scavenging by
light rain (o0.4mm). This result implies that as the total
mass concentration of the dust particles increased, so did
the light-absorbing aerosol concentration, most likely
0 100 200 300 400 500
Aerosol Extinction Coefficient (550nm,Mm-1)
0.80
0.82
0.84
0.86
0.88
0.90
0.92
0.94
0.96
0.98
1.00
Sin
gle
Sca
tterin
g A
lbed
o
Fig. 6. Relationships between single scattering albedo and
aerosol extinction coefficient during Asian dust (closed) and
pollution (opened) episodes. Plots are based on all valid hourly
averaged aerosol in situ measurements.
through coagulation of black carbon containing aerosol
during long-range transport.
In general, the aerosol optical properties at Gosan
during the DE and PE are more representative of prior
measurements in urban rather than rural areas and are
largely affected by light-absorbing aerosols, which can
increase the aerosol forcing and forcing efficiency.
3.4. Aerosol chemical and physical properties
Integrated PM2.5 and PM10 filter samples for mass,
OC and EC, and major ionic concentrations during DE
and PE are presented in Table 4. The majority of the
aerosol mass during DE was in the coarse mode, as
reflected in the 0.57 ratio of PM2.5 to PM10, whereas the
aerosol was dominated by fine particles during PE, with
a PM2.5 to PM10 of 0.89.
For carbonaceous species, OC and EC concentrations
measured during PE were about 90% and 30% higher
than those of DE, respectively. Fig. 7 shows a
comparison of OC and EC concentrations of this study
with results from other studies at Gosan. The OC
concentration for DE is within the range of previous
results. However, the mean OC value during PE is
nearly a factor of 2 greater than the other results (Kim
et al., 2000). The EC concentrations are considerably
higher than the results of other studies at Gosan. The
source of high OC and EC concentrations during the PE
are likely from the rice harvest and the burning of
biomass after the harvest in China and Korea.
The mean ratios of OC and EC (OC/EC) are 2.7 and
3.8 for DE and PE, respectively. The greater value of PE
is due to a larger increase of OC. These ratios of OC to
EC are greater than the values from Seoul (o2; Kim et
al., 1999), and are lower than the values from Beijing
(�11.6; Bergin et al., 2001) and Linan (�11.0; Xu et al.,
2002).
The increase in crustal elements (e.g. nss-calcium) was
obvious during the DE. During the PE nss-sulfate,
ammonium and nitrate, species that originated from
anthropogenic sources rather than soil particles, formed
59% of PM2.5 mass. During PE, the nss-potassium,
which is a product of biomass burning, increased. These
results compare well with those of Park et al. (2004) and
Lee et al. (2001) at Gosan in Fig. 8. Park et al. (2004)
analyzed 10 years of data from 1992 to 2002 for total
suspended particles and Lee et al. (2001) studied PM2.5
composition from 1996 to 1997. The concentrations of
nss-sulfate, ammonium, and nitrate during the DE are
similar to the above studies. However, those concentra-
tions during PE were higher, by a factor of 2.2, 3.8 and
4.0 for PM2.5, respectively. During DE only 42%, 70%
and 21% of the sulfate, ammonium and nitrate were in
particles smaller than PM2.5 (J. Schauer, 2004, private
communication). Most of the sulfate and nitrate resided
in coarse mode particles.

ARTICLE IN PRESS
Table 4
Comparison of PM10 and PM2.5 mass, organic and elemental carbon, and major ionic aerosol concentrations during Asian dust and
pollution periods (unit: mgm�3)a
Species Dust Pollution Measurement
PM10 mass 107.975.9 56.9720.7 KME
PM2.5 mass 62.3710.1 50.4715.2 KME
66.5720.1 N/Ab UW
58.8713.6 N/A HKUST
PM2.5 organic carbon N/A 6.972.1 KME
3.670.4 N/A UW
3.670.3 N/A HKUST
PM2.5 elemental carbon N/A 1.870.8 KME
1.470.5 N/A UW
1.370.4 N/A HKUST
PM2.5 ionic compounds
nss-SO42� 7.0 7 2.2 (11.2) 15.975.4 (31.5)
nss-Ca2+ 1.270.3 (1.9) 0.270.1 (0.4)
nss-K+ 0.870.2 (1.3) 1.170.3 (2.2)
NH4+ 1.370.8 (2.1) 5.071.0 (9.9) KME
NO3� 2.271.2 (3.5) 8.973.7 (17.7)
Na+ 1.470.4 (2.2) 0.270.1 (0.4)
Cl� 0.871.1 (1.3) 0.370.1 (0.6)
Mg2+ 0.370.0 (0.5) 0.170.0 (0.2)
aThe percentage of each ionic component relative to the PM2.5 total mass of KME in parentheses.bN/A: No sample available.
0
3
6
9
Org
anic
Car
bon
(µg/
m3 )
0
1
2
3
Ele
men
tal C
arbo
n (µ
g/m
3 )
Jul-1
994
Aug-1
994
Jul-1
995
Mar
-199
6Dec
-199
6Ja
n-19
97Sep
-199
7Dec
-199
7Nov
-199
8Ap
r-199
9Apr
-200
1Nov
-200
1Ap
r-200
2Feb
-200
3Th
is st
udy
(Dus
t)Thi
s st
udy
(Pol
lutio
n)
Fig. 7. Comparison of the organic (opened) and elemental carbon (closed) concentrations of this study with results from other studies
at Gosan. The circle and bar represent mean and its standard deviation, respectively. Aerosol size cuts at all measurements were PM2.5.
The values from July 1994 to April 1999 are from Kim et al. (2000), April 2001; Yang et al. (2004), November 2001 to February 2003;
Ghim et al. (2003) andGhim (2003).
S.-W. Kim et al. / Atmospheric Environment 39 (2005) 39–50 47
3.5. Aerosol mass scattering and absorption efficiencies
The measurements of aerosol optical and chemical
properties allow estimates of the aerosol mass scattering
(as, m2 g�1) and absorption efficiencies (aa, m2 g�1)
shown in Table 5. as was estimated from the ratio of
ssp (Dpo10 mm and 550 nm) and PM10 mass concentra-
tion. as of the PE is a factor of 2 higher than that of DE.
Lower as for dust may be due to the large particle size,
non-spherical shape or lower refractive index of dust

ARTICLE IN PRESS
Fig. 8. Comparison of mean concentrations of the major ionic compounds of this study with results from other studies at Gosan.
Table 5
Comparison of aerosol mass scattering and absorption efficiencies during Asian dust and pollution periods (unit: m2 g�1)
Species Dust Pollution Measurement
Scattering efficiency, as (PM10) 2.270.1 4.571.3 KME
Absorption efficiency, aa, (PM2.5) N/A 13.874.6 KME
17.071.5 N/A UW
16.970.7 N/A HKUST
S.-W. Kim et al. / Atmospheric Environment 39 (2005) 39–5048
compared to the pollution particles. Similar estimates of
as have been founded in other studies for both urban
and rural areas, 2.3–4.4m2 g�1 (Bergin et al., 2001; Xu et
al., 2002). as of PE is slightly higher than the upper end
of this range.
aa was estimated from the ratio of average sap(Dpo10 mm and 550 nm) and EC concentration from
PM2.5 measurements. For this estimate of aa, we assume
that the absorption and EC present in particles larger
than 2.5mm is negligible. The values of aa for both DE
and PE are larger than the range of values, 5–11m2 g�1,
reported for the US by Waggoner et al. (1981) as well as
the values of 8.677.0m2 g�1 in Linan (Xu et al., 2002).
The sources of EC during DE and PE are likely from the
burning of biomass associated with the harvest, emission
of automobile exhaust and residential coal use. The
contribution of mineral dust to sap is expected to be
small because the imaginary part of refractive index of
the mineral dust particle is more than two orders of
magnitude smaller than that of EC (Tegen et al., 1996).
Thus, the aa of the dust aerosol could be higher than the
pollution aerosol due to the absorption of dust.
However, aa of DE falls within one standard deviation
of that of PE and the difference between these values is
not significant and could be due to the different EC
measurement techniques.
3.6. Determination of aerosol radiative forcing
Based on this analysis of aerosol properties for high
dust and pollutant loading episodes, we assess their
relevance to the aerosol radiative forcing.
Clear-sky aerosol radiative forcing (ARF) in the
short-wave regime (0.28–3.0 mm) is calculated by the
hybrid method (Bush and Valero, 2003), which com-
bines solar flux measurements under an aerosol-present
atmosphere and model calculations for pristine atmo-
sphere. Unlike the slope method, the advantage of the
hybrid method is that it does not require measurements
of the aerosol optical depth. Here, we use SBDART
(Santa Barbara DISORT atmospheric radiative transfer;
Ricchiazzi et al., 1998).
The diurnally averaged ARF (DDF, Wm�2) and
forcing efficiency (DDFE, Wm�2 t�1) at the surface for
the predominantly cloud-free days during DE and PE
are given in Table 6. DDF is the averaged DF over 24-h
calculated by the following two steps: all data are cloud-
screened for clear sky, and then interpolated or

ARTICLE IN PRESS
Table 6
Diurnally averaged aerosol radiative forcing at the surface and aerosol optical properties during Asian dust and pollution episodes
Period (Day/Month) Radiative forcing at the surface Column properties Surface properties
DDF DDFE t500 A ssp sap o OC EC as aa(Wm�2) (Wm�2 t�1
500) (412/675) (Mm�1) (Mm�1) (mgm�3) (mgm�3) (m2 g�1) (m2 g�1)
Dust 12/04 �29.1 �77.5 0.375 0.672 243.8 28.8 0.90 3.8 1.0 3.8 17.4
13/04 �56.5 �75.9 0.744 0.377 243.2 27.9 0.90 1.7 1.6 4.3 17.4
Pollution 21/11 �24.6 �86.9 0.283 1.308 264.8 40.8 0.89 9.9 3.0 4.9 13.7
23/11 �16.4 �73.5 0.224 1.303 211.2 19.3 0.88 4.9 1.0 4.8 18.5
24/11 �9.1 �76.0 0.120 1.350 211.0 13.7 0.87 6.4 1.8 4.3 9.4
S.-W. Kim et al. / Atmospheric Environment 39 (2005) 39–50 49
extrapolated to fill in the missing periods. DDF is
directly proportional to column aerosol amount, repre-
sented as t. The largest DDF was estimated on the dust-
dominated days, especially 13 April. However, DDFE,
defined, as the DDF divided by the daily mean t,depends on the aerosol upscatter fraction as well as the
aerosol single scattering albedo. DDFEs during DE are
expected to be lower than those of the mean PE values
due to the weak absorption of dust particles (Tegen et
al., 1996). However, DDFEs for DE are similar to those
calculated for PE as well as the results of other studies at
Gosan (Bush and Valero, 2003; Won et al., 2004) and
suggest that either the dust is strongly absorbing or that
a considerable amount of absorbing black carbon
aerosol is associated with the dust. Variations in DDFEs
with the surface single-scattering albedo or aerosol size
(A) are unclear. Day-to-day variations in the column
water vapor may also affect the estimates of DDF and
DDFE. The lower amount of water vapor observed by
radiosonde on 23 and 24 November, compared to the
other days may lead toward smaller estimates of surface
DDF and DDFE.
4. Summary and conclusion
We analyzed measurement data for aerosol optical,
chemical and physical properties at Gosan, Korea
during heavy dust (DE, April 2001) and regional-scale
pollution (PE, November 2001) episodes, and investi-
gated their relevance for radiative forcing. The principle
findings of our analysis are summarized below:
1.
The meteorological fields were characterized by (a)long-range transport of dust by a fast moving
cyclonic system associated with a strong cold front
and short-range transportation by a stagnant anti-
cyclonic system, and (b) northwesterly and north–-
northeasterly prevailing winds in the boundary layer
for DE and PE, respectively.
2.
The ratio of PM2.5 to PM10 mass is 0.57 and 0.89 forDE and PE, respectively. A values for the DE were
0.38 and 0.61 from the sunphotometer and the
nephelometer, respectively. The single-scattering al-
bedo reported during the PE (0.88) was lower than
that of DE (0.91). However, the mineral dusts were
also mixed with light-absorbing aerosols.
3.
The OC and EC concentrations for the PE are �90%and �30% higher than those of the DE.
4.
The increase in crustal elements (e.g., nss-calcium)was obvious during DE, whereas nss-sulfate, ammo-
nium and nitrate dominated during the PE.
5.
The aerosol mass scattering efficiency of PE is afactor of about 2 higher than those of DE. The
difference in mass absorption efficiency of EC during
DE and PE is small and within the instrument
uncertainties.
6.
The diurnally averaged aerosol radiative forcingefficiencies (DDFE) during DE and PE are similar
and may reflect the association of light-absorbing
aerosols with the dust.
The results of this study for high regional-scale dust
and pollution aerosol loading conditions may be an
indicator of future aerosol properties and emission levels
if we assume that anthropogenic emissions and dust will
continue to increase from China and all of East Asia.
Acknowledgements
We are grateful to the Gosan weather station staff,
Dr. K. Bower (UMIST), Dr. J. Schauer (University of
Wisconsin) and Dr. J. Z. Yu (HKUST) for providing
data. This research was supported by the BK21 program
and by the Climate Environment System Research
Center and by the Korea Ministry of Environment as
an Eco-technopia 21 project under grant 2001-44001-8.
We thank the NOAA Office Global Programs for
support of the CMDL measurements.
References
Anderson, T., et al., 2003. Variability of aerosol optical
properties derived from in situ aircraft measurements during

ARTICLE IN PRESSS.-W. Kim et al. / Atmospheric Environment 39 (2005) 39–5050
ACE-Asia. Journal of Geophysical Research 108 (D23),
8647.
Andrews, E., et al., 2001. NOAA climate monitoring and
diagnostics laboratory. Summ. Report 26, 60–79.
Bergin, M., et al., 2001. Aerosol radiative, physical, and
chemical properties in Beijing during June 1999. Journal
of Geophysical Research 106(D16), 17,969–17,980.
Bush, B.C., Valero, F.P.J., 2003. Aerosol radiative forcing at
Gosan during the ACE-Asia Campaign. Journal of Geo-
physical Research 108 (D23), 8660.
Carrico, C.M., Kus, P., Rood, M.J., Quinn, P.K., Bates, T.S.,
2003. Mixtures of pollution, dust, sea salt and volcanic
aerosol during ACE-Asia: aerosol radiative properties as a
function of relative humidity. Journal of Geophysical
Research 108 (D23), 8650.
Clark, A., et al., 2004. Size distribution and mixture of dust and
black carbon aerosol in Asian outflow: physiochemistry and
optical properties. Journal of Geophysical Research 109,
D15S09.
Conant, W., et al., 2003. A model for the radiative forcing
during ACE-Asia derived from CIRPAS Twin Otter and R/
V Ronald H. Brown data and comparison with observa-
tions. Journal Geophysical Research 108 (D23), 8661.
Delene, D.J., Ogren, J.A., 2002. Variability of aerosol optical
properties at four North American surface monitoring sites.
Journal of Atmospheric Science 59, 1135–1150.
Draxler, R.R., Hess, G.D., 1998. An overview of the
HYSPLIT_4 modeling system for trajectories, dispersion,
and deposition. Australian Meteorological Magazine 47,
295–308.
Ghim, Y., et al., 2003. Concentration variations of persistent
organic pollutants in Gosan, Jeju during the polluted period
in November 2001 and the yellow sand period in spring 2002
(in Korean). Journal of Korean Society of Atmospheric
Enviornment 19, 469–490.
Holler, R., Ito, K., Tohno, S., kasahara, M., 2003. Wavelength-
dependent aerosol single-scattering albedo: measurements
and model calculations for a coastal site near the Sea of
Japan during ACE-Asia. Journal of Geophysical Research
108 (D23), 8648.
Huebert, B.J., Bates, T., Russell, P.B., Shi, G., Kim, Y.J.,
Kawamura, K., Carmichael, G., Nakajima, T., 2003. An
overview of ACE-Asia: strategies for quantifying the
relationships between Asian aerosols and their climatic
impacts. Journal of Geophysical Research 108 (D23), 8633.
IPCC (The Intergovernmental Panel on Climate Change), 2001.
Climate Change 2001: The Scientific Basis. Cambridge
University Press, Cambridge. 896pp.
Jefferson, A., Kim, S.-W., Kim, J., Ogren, J., Dutton, E., 2004.
Source characterization of Asian aerosol at Gosan. South
Korea. Proceedings of the International Radiation Sympo-
sium 2004, Busan, Korea, pp. 128.
Kim, Y.P., Moon, K.-C., Lee, J.H., Baik, N.J., 1999.
Concentrations of carbonaceous species in particles at Seoul
and Cheju in Korea. Atmospheric Environment 33,
2751–2758.
Kim, Y.P., Moon, K.-C., Lee, J.H., 2000. Organic and
elemental carbon in fine particles at Kosan, Korea. Atmo-
spheric Environment 34, 3309–3317.
Lee, J.H., Kim, Y.P., Moon, K.-C., Kim, H.-K., Lee, J.B.,
2001. Fine particles measurement at two background sites in
Korea between 1996 and 1997. Atmospheric Environment
35, 635–643.
Nakajima, T., et al., 2003. Significance of direct and
indirect radiative forcings of aerosols in the East China
Sea region. Journal of Geophysical Research 108 (D23),
8658.
Park, M.H., Kim, Y.P., Kang, C.H., 2004. Aerosol composi-
tion change between 1992 and 2002 at Gosan, Korea.
Journal of Geophysical Research 109, D19S13.
Ricchiazzi, P., Yang, S., Gautier, C., Sowie, D., 1998.
SBDART: a research and teaching software tool for
plane-parallel radiative transfer in the Earth’s atmosphere.
Bulletin of the American Meteorological Society 79,
2102–2114.
Schauer et al., 2003. ACE-Asia intercomparison of a thermal-
optical method for the determination of particle-phase
organic and elemental carbon. Environmental Science and
Technology 37, 993–1001, 10.1021/es020622f.
Takemura, T., Nakajima, T., Nozawa, T., Aoki, K., 2001.
Simulation of future aerosol distribution, radiative forcing,
and long-range transportation in East Asia. Journal of the
Meteorological Socity of Japan 79, 1139–1155.
Tegen, I., Lacis, A.A., Fung, I., 1996. The influence on climate
forcing of mineral aerosols from distributed soils. Nature
381, 681–683.
Waggoner, A.P., Weiss, R.E., Ahlquist, N.C., Covert, D.S.,
Will, S., Charlson, R.J., 1981. Optical characteristics of
atmospheric aerosols. Atmospheric Environment 15,
1891–1909.
Won, J.-G., Yoon, S.-C., Kim, S.-W., Jefferson, A., Dutton,
E.G., Holben, B., 2004. Estimation of direct radiative
forcing of Asian dust aerosols with sun/sky radiometer and
lidar measurement at Gosan, Korea. Journal of the
Meteorological Society of Japan 82, 115–130.
Xu, J., Bergin, M.H., Yu, X., Liu, G., Zhao, J., Carrico,
C.M., Baumann, K., 2002. Measurement of aerosol
chemical, physical and radiative properties in the Yangtze
delta region of China. Atmospheric Environment 36,
161–173.
Xu, J., et al., 2004. Aerosol chemical, physical, and radiative
characteristics near a desert source region or northwest
China during ACE-Asia. Journal of Geophysical Research
109, D19S03.
Yang, Xu, J., Wu, W.-S., Wan, C.H., Yu, J.Z., 2004. Chemical
characterization of water-soluble organic aerosols at Juju
Island collected during ACE-Asia. Environmental Chem-
istry 1, doi:10.1071/EN04006.
Copyright © 2022 FDOKUMEN