Properties of dust aerosol particles transported to Portugal from the Sahara desert
10
Tellus (2009), 61B, 297–306 C 2008 Centro de Geof´ ısica de ´ Evora Journal compilation C 2008 Blackwell Munksgaard Printed in Singapore. All rights reserved TELLUS Properties of dust aerosol particles transported to Portugal from the Sahara desert FRANK WAGNER 1, ∗ ,DANIELE BORTOLI 1 ,S ´ ERGIO PEREIRA 1 ,MARIA JO ˜ AO COSTA 1,2 , ANA MARIA SILVA 1,2 ,BERNADETT WEINZIERL 3 ,MICHAEL ESSELBORN 3 ,ANDREAS PETZOLD 3 ,KATHI RASP 3 ,BERND HEINOLD 4 andINA TEGEN 4 , 1 Centro de Geof´ ısica, Rua Rom˜ ao Ramalho 59, 7000 ´ Evora, Portugal; 2 University of ´ Evora, Physics Department, Rua Rom˜ ao Ramalho 59, 7000 ´ Evora, Portugal; 3 Deutsches Zentrum f¨ ur Luft- und Raumfahrt, Institut f ¨ ur Physik der Atmosph ¨ are, Oberpfaffenhofen, 82234 Wessling, Germany; 4 Leibniz Institute for Tropospheric Research, Leipzig, Germany (Manuscript received 7 February 2008; in final form 14 August 2008) ABSTRACT Aerosol properties of mineral particles in the far field of an African desert dust outbreak were investigated that brought Saharan dust over the Mediterranean in different layers to Portugal. The measurements were performed inside the project Desert Aerosols over Portugal (DARPO) which was linked to the Saharan Mineral Dust Experiment (SAMUM). The maximum particle mass concentration was about 150 μgm −3 and the corresponding scattering coefficient was 130 M m −1 which results in a mass scattering efficiency of 0.87 m 2 g −1 . The aerosol optical depth reached values up to 0.53 and the lidar ratio was between 45 and 50 in the whole dust loaded column. A comparison between particle size distributions and refractive indices derived from different instruments and models showed a general good agreement but some minor differences could also be observed. Measurements as well as calculations with a particle transport model suggest that there is a relatively higher concentration of very large particles in the upper region of the dust layer than on the surface which is likely connected with meteorological conditions at the observational site ( ´ Evora, Portugal). 1. Introduction Desert dust is one of the major constituents of natural aerosol particles in the atmosphere and the African Sahara is the largest desert area and also the primary dust source on Earth (Washington et al., 2003). Particles originating from there are transported over several thousands of kilometres over the At- lantic Ocean as far as North America (see e.g. Prospero, 1999), and over Europe reaching northern latitudes as far as England, Northern Germany and Denmark (Ansmann et al., 2003). A desert dust outbreak is also one of the main causes, which leads high PM10 particle mass concentrations in Southern Europe (see e.g. Rodr´ ıguez et al., 2001; Borge et al., 2007). Mineral dust particles scatter and absorb radiation. Due to the significant portion of larger particles, desert dust not only influ- ences the short-wave (or solar) radiation but also the long-wave (terrestrial) radiation. In terms of an energy balance the short- and long-wave radiative effects have different signs and there- ∗ Corresponding author. e-mail: [email protected] DOI: 10.1111/j.1600-0889.2008.00393.x fore they partially cancel out (see e.g. Haywood et al., 2001). At the surface the incoming solar energy is reduced due to scattering and absorption of dust particles. This loss is in part compensated by an increase in long-wave radiation due to emission of radi- ation by dust (Claquin et al., 1998). The vertical distribution of mineral particles influences the top-of-the-atmosphere radia- tive flux and hence the radiative forcing both at the top-of-the- atmosphere and at the surface. Moreover atmospheric heating rates are altered (see e.g. Carlson and Benjamin, 1980). Besides routine measurements in various places on the world several experiments have already been conducted to determine properties and effects of desert dust. Recently the experiments Saharan Dust Experiment (SHADE, 2000, Cape Verde, see e.g. Tanr´ e et al., 2003), Puerto Rico Dust Experiment (PRIDE, 2001, Puerto Rico, see e.g. Reid et al., 2003) and African Monsoon Multidisciplinary Analyses (AMMA, 2006, West Africa, see e.g. Redelsperger et al., 2006) were performed. The experiment Saharan Mineral Dust Experiment (SA- MUM) took place in May/June 2006 in Morocco and aimed at characterizing the properties and assessing the effects of desert dust close to the source regions. At the same time the project Desert Aerosols over Portugal (DARPO) was conducted over Tellus 61B (2009), 1 297 PUBLISHED BY THE INTERNATIONAL METEOROLOGICAL INSTITUTE IN STOCKHOLM SERIES B CHEMICAL AND PHYSICAL METEOROLOGY
-
Upload
independent -
Category
Documents
-
view
1 -
download
0
Transcript of Properties of dust aerosol particles transported to Portugal from the Sahara desert
Tellus (2009), 61B, 297–306 C© 2008 Centro de Geofısica de EvoraJournal compilation C© 2008 Blackwell Munksgaard
Printed in Singapore. All rights reserved
T E L L U S
Properties of dust aerosol particles transported toPortugal from the Sahara desert
FR A N K WAG N ER 1,∗, DA N IELE B O RTO LI1, SER G IO PER EIR A 1, M A R IA JO A O C O STA 1,2,A NA M A R IA SILVA 1,2, B ER NA D ETT W EIN ZIER L 3, M IC H A EL ESSELB O R N 3, A N D R EA S
PETZO LD 3, K ATH I R A SP 3, B ER N D H EIN O LD 4 and INA TEG EN 4, 1Centro de Geofısica, RuaRomao Ramalho 59, 7000 Evora, Portugal; 2University of Evora, Physics Department, Rua Romao Ramalho 59, 7000Evora, Portugal; 3Deutsches Zentrum fur Luft- und Raumfahrt, Institut fur Physik der Atmosphare, Oberpfaffenhofen,
82234 Wessling, Germany; 4Leibniz Institute for Tropospheric Research, Leipzig, Germany
(Manuscript received 7 February 2008; in final form 14 August 2008)
A B S T R A C TAerosol properties of mineral particles in the far field of an African desert dust outbreak were investigated that broughtSaharan dust over the Mediterranean in different layers to Portugal. The measurements were performed inside theproject Desert Aerosols over Portugal (DARPO) which was linked to the Saharan Mineral Dust Experiment (SAMUM).The maximum particle mass concentration was about 150 μg m−3 and the corresponding scattering coefficient was130 M m−1 which results in a mass scattering efficiency of 0.87 m2 g−1. The aerosol optical depth reached values up to0.53 and the lidar ratio was between 45 and 50 in the whole dust loaded column. A comparison between particle sizedistributions and refractive indices derived from different instruments and models showed a general good agreementbut some minor differences could also be observed. Measurements as well as calculations with a particle transportmodel suggest that there is a relatively higher concentration of very large particles in the upper region of the dustlayer than on the surface which is likely connected with meteorological conditions at the observational site (Evora,Portugal).
1. Introduction
Desert dust is one of the major constituents of natural aerosolparticles in the atmosphere and the African Sahara is thelargest desert area and also the primary dust source on Earth(Washington et al., 2003). Particles originating from there aretransported over several thousands of kilometres over the At-lantic Ocean as far as North America (see e.g. Prospero, 1999),and over Europe reaching northern latitudes as far as England,Northern Germany and Denmark (Ansmann et al., 2003). Adesert dust outbreak is also one of the main causes, which leadshigh PM10 particle mass concentrations in Southern Europe (seee.g. Rodrıguez et al., 2001; Borge et al., 2007).
Mineral dust particles scatter and absorb radiation. Due to thesignificant portion of larger particles, desert dust not only influ-ences the short-wave (or solar) radiation but also the long-wave(terrestrial) radiation. In terms of an energy balance the short-and long-wave radiative effects have different signs and there-
∗Corresponding author.e-mail: [email protected]: 10.1111/j.1600-0889.2008.00393.x
fore they partially cancel out (see e.g. Haywood et al., 2001). Atthe surface the incoming solar energy is reduced due to scatteringand absorption of dust particles. This loss is in part compensatedby an increase in long-wave radiation due to emission of radi-ation by dust (Claquin et al., 1998). The vertical distributionof mineral particles influences the top-of-the-atmosphere radia-tive flux and hence the radiative forcing both at the top-of-the-atmosphere and at the surface. Moreover atmospheric heatingrates are altered (see e.g. Carlson and Benjamin, 1980).
Besides routine measurements in various places on the worldseveral experiments have already been conducted to determineproperties and effects of desert dust. Recently the experimentsSaharan Dust Experiment (SHADE, 2000, Cape Verde, see e.g.Tanre et al., 2003), Puerto Rico Dust Experiment (PRIDE, 2001,Puerto Rico, see e.g. Reid et al., 2003) and African MonsoonMultidisciplinary Analyses (AMMA, 2006, West Africa, see e.g.Redelsperger et al., 2006) were performed.
The experiment Saharan Mineral Dust Experiment (SA-MUM) took place in May/June 2006 in Morocco and aimed atcharacterizing the properties and assessing the effects of desertdust close to the source regions. At the same time the projectDesert Aerosols over Portugal (DARPO) was conducted over
Tellus 61B (2009), 1 297
P U B L I S H E D B Y T H E I N T E R N A T I O N A L M E T E O R O L O G I C A L I N S T I T U T E I N S T O C K H O L M
SERIES BCHEMICALAND PHYSICAL METEOROLOGY
298 F. WAGNER ET AL.
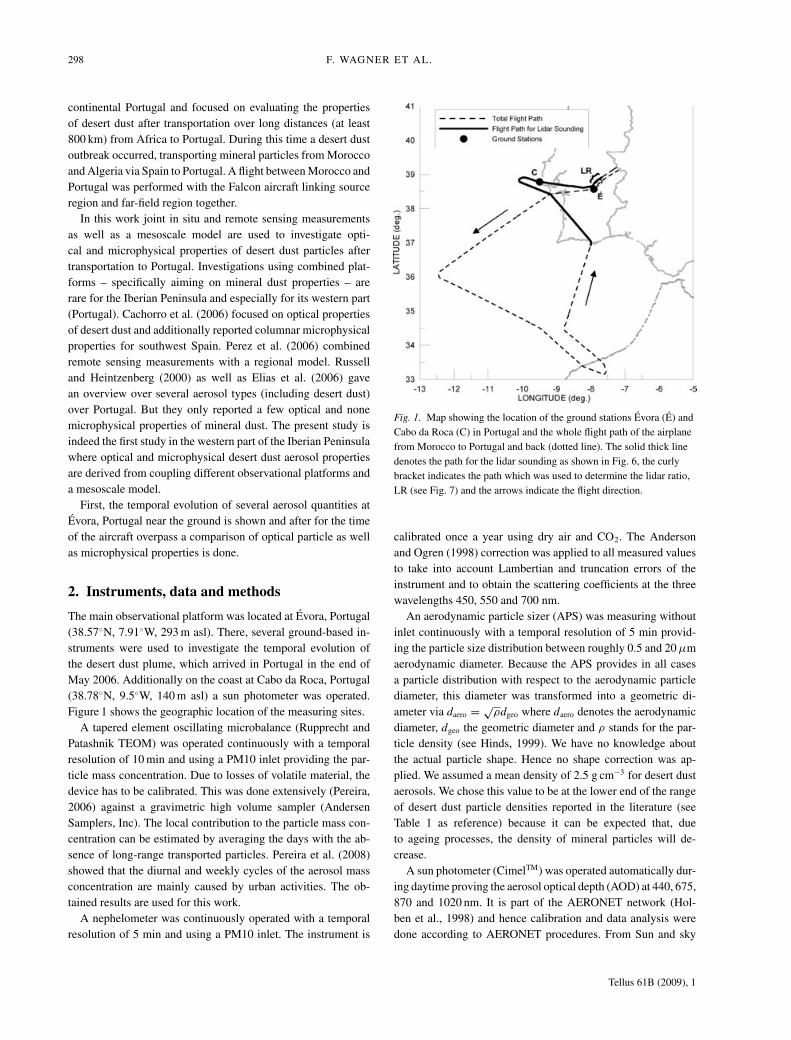
continental Portugal and focused on evaluating the propertiesof desert dust after transportation over long distances (at least800 km) from Africa to Portugal. During this time a desert dustoutbreak occurred, transporting mineral particles from Moroccoand Algeria via Spain to Portugal. A flight between Morocco andPortugal was performed with the Falcon aircraft linking sourceregion and far-field region together.
In this work joint in situ and remote sensing measurementsas well as a mesoscale model are used to investigate opti-cal and microphysical properties of desert dust particles aftertransportation to Portugal. Investigations using combined plat-forms – specifically aiming on mineral dust properties – arerare for the Iberian Peninsula and especially for its western part(Portugal). Cachorro et al. (2006) focused on optical propertiesof desert dust and additionally reported columnar microphysicalproperties for southwest Spain. Perez et al. (2006) combinedremote sensing measurements with a regional model. Russelland Heintzenberg (2000) as well as Elias et al. (2006) gavean overview over several aerosol types (including desert dust)over Portugal. But they only reported a few optical and nonemicrophysical properties of mineral dust. The present study isindeed the first study in the western part of the Iberian Peninsulawhere optical and microphysical desert dust aerosol propertiesare derived from coupling different observational platforms anda mesoscale model.
First, the temporal evolution of several aerosol quantities atEvora, Portugal near the ground is shown and after for the timeof the aircraft overpass a comparison of optical particle as wellas microphysical properties is done.
2. Instruments, data and methods
The main observational platform was located at Evora, Portugal(38.57◦N, 7.91◦W, 293 m asl). There, several ground-based in-struments were used to investigate the temporal evolution ofthe desert dust plume, which arrived in Portugal in the end ofMay 2006. Additionally on the coast at Cabo da Roca, Portugal(38.78◦N, 9.5◦W, 140 m asl) a sun photometer was operated.Figure 1 shows the geographic location of the measuring sites.
A tapered element oscillating microbalance (Rupprecht andPatashnik TEOM) was operated continuously with a temporalresolution of 10 min and using a PM10 inlet providing the par-ticle mass concentration. Due to losses of volatile material, thedevice has to be calibrated. This was done extensively (Pereira,2006) against a gravimetric high volume sampler (AndersenSamplers, Inc). The local contribution to the particle mass con-centration can be estimated by averaging the days with the ab-sence of long-range transported particles. Pereira et al. (2008)showed that the diurnal and weekly cycles of the aerosol massconcentration are mainly caused by urban activities. The ob-tained results are used for this work.
A nephelometer was continuously operated with a temporalresolution of 5 min and using a PM10 inlet. The instrument is
Fig. 1. Map showing the location of the ground stations Evora (E) andCabo da Roca (C) in Portugal and the whole flight path of the airplanefrom Morocco to Portugal and back (dotted line). The solid thick linedenotes the path for the lidar sounding as shown in Fig. 6, the curlybracket indicates the path which was used to determine the lidar ratio,LR (see Fig. 7) and the arrows indicate the flight direction.
calibrated once a year using dry air and CO2. The Andersonand Ogren (1998) correction was applied to all measured valuesto take into account Lambertian and truncation errors of theinstrument and to obtain the scattering coefficients at the threewavelengths 450, 550 and 700 nm.
An aerodynamic particle sizer (APS) was measuring withoutinlet continuously with a temporal resolution of 5 min provid-ing the particle size distribution between roughly 0.5 and 20 μmaerodynamic diameter. Because the APS provides in all casesa particle distribution with respect to the aerodynamic particlediameter, this diameter was transformed into a geometric di-ameter via daero = √
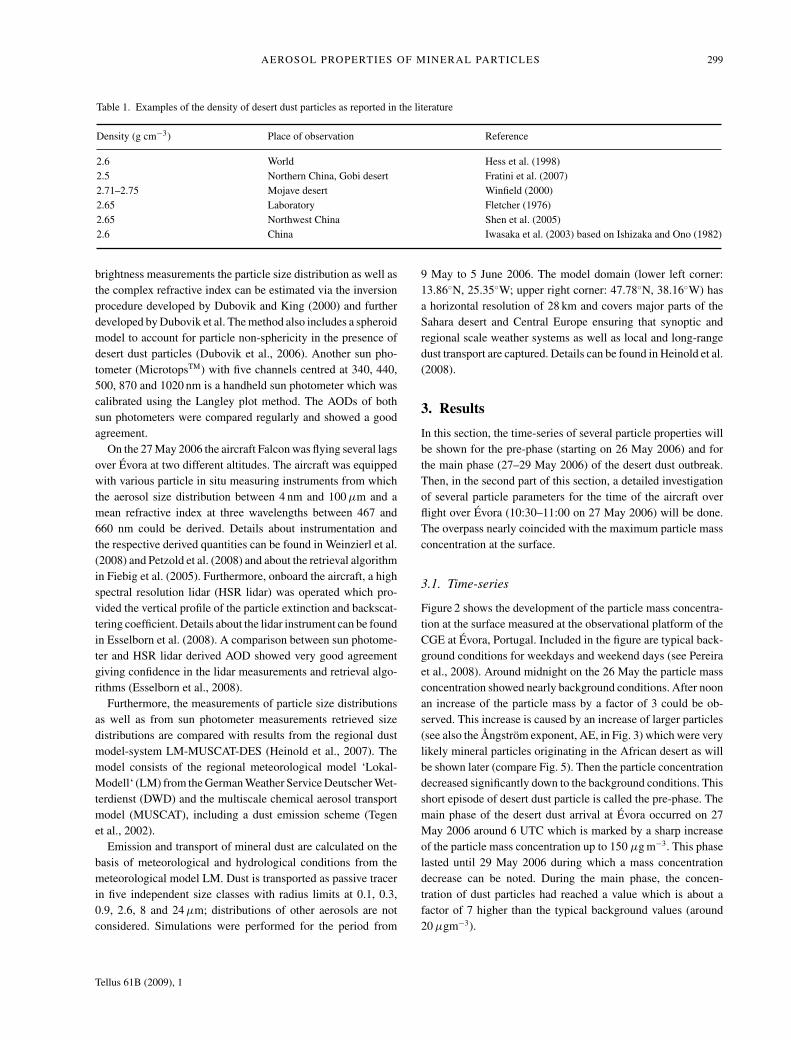
ρdgeo where daero denotes the aerodynamicdiameter, dgeo the geometric diameter and ρ stands for the par-ticle density (see Hinds, 1999). We have no knowledge aboutthe actual particle shape. Hence no shape correction was ap-plied. We assumed a mean density of 2.5 g cm−3 for desert dustaerosols. We chose this value to be at the lower end of the rangeof desert dust particle densities reported in the literature (seeTable 1 as reference) because it can be expected that, dueto ageing processes, the density of mineral particles will de-crease.
A sun photometer (CimelTM) was operated automatically dur-ing daytime proving the aerosol optical depth (AOD) at 440, 675,870 and 1020 nm. It is part of the AERONET network (Hol-ben et al., 1998) and hence calibration and data analysis weredone according to AERONET procedures. From Sun and sky
Tellus 61B (2009), 1
AEROSOL PROPERTIES OF MINERAL PARTICLES 299
Table 1. Examples of the density of desert dust particles as reported in the literature
Density (g cm−3) Place of observation Reference
2.6 World Hess et al. (1998)2.5 Northern China, Gobi desert Fratini et al. (2007)2.71–2.75 Mojave desert Winfield (2000)2.65 Laboratory Fletcher (1976)2.65 Northwest China Shen et al. (2005)2.6 China Iwasaka et al. (2003) based on Ishizaka and Ono (1982)
brightness measurements the particle size distribution as well asthe complex refractive index can be estimated via the inversionprocedure developed by Dubovik and King (2000) and furtherdeveloped by Dubovik et al. The method also includes a spheroidmodel to account for particle non-sphericity in the presence ofdesert dust particles (Dubovik et al., 2006). Another sun pho-tometer (MicrotopsTM) with five channels centred at 340, 440,500, 870 and 1020 nm is a handheld sun photometer which wascalibrated using the Langley plot method. The AODs of bothsun photometers were compared regularly and showed a goodagreement.
On the 27 May 2006 the aircraft Falcon was flying several lagsover Evora at two different altitudes. The aircraft was equippedwith various particle in situ measuring instruments from whichthe aerosol size distribution between 4 nm and 100 μm and amean refractive index at three wavelengths between 467 and660 nm could be derived. Details about instrumentation andthe respective derived quantities can be found in Weinzierl et al.(2008) and Petzold et al. (2008) and about the retrieval algorithmin Fiebig et al. (2005). Furthermore, onboard the aircraft, a highspectral resolution lidar (HSR lidar) was operated which pro-vided the vertical profile of the particle extinction and backscat-tering coefficient. Details about the lidar instrument can be foundin Esselborn et al. (2008). A comparison between sun photome-ter and HSR lidar derived AOD showed very good agreementgiving confidence in the lidar measurements and retrieval algo-rithms (Esselborn et al., 2008).
Furthermore, the measurements of particle size distributionsas well as from sun photometer measurements retrieved sizedistributions are compared with results from the regional dustmodel-system LM-MUSCAT-DES (Heinold et al., 2007). Themodel consists of the regional meteorological model ‘Lokal-Modell‘ (LM) from the German Weather Service Deutscher Wet-terdienst (DWD) and the multiscale chemical aerosol transportmodel (MUSCAT), including a dust emission scheme (Tegenet al., 2002).
Emission and transport of mineral dust are calculated on thebasis of meteorological and hydrological conditions from themeteorological model LM. Dust is transported as passive tracerin five independent size classes with radius limits at 0.1, 0.3,0.9, 2.6, 8 and 24 μm; distributions of other aerosols are notconsidered. Simulations were performed for the period from
9 May to 5 June 2006. The model domain (lower left corner:13.86◦N, 25.35◦W; upper right corner: 47.78◦N, 38.16◦W) hasa horizontal resolution of 28 km and covers major parts of theSahara desert and Central Europe ensuring that synoptic andregional scale weather systems as well as local and long-rangedust transport are captured. Details can be found in Heinold et al.(2008).
3. Results
In this section, the time-series of several particle properties willbe shown for the pre-phase (starting on 26 May 2006) and forthe main phase (27–29 May 2006) of the desert dust outbreak.Then, in the second part of this section, a detailed investigationof several particle parameters for the time of the aircraft overflight over Evora (10:30–11:00 on 27 May 2006) will be done.The overpass nearly coincided with the maximum particle massconcentration at the surface.
3.1. Time-series
Figure 2 shows the development of the particle mass concentra-tion at the surface measured at the observational platform of theCGE at Evora, Portugal. Included in the figure are typical back-ground conditions for weekdays and weekend days (see Pereiraet al., 2008). Around midnight on the 26 May the particle massconcentration showed nearly background conditions. After noonan increase of the particle mass by a factor of 3 could be ob-served. This increase is caused by an increase of larger particles(see also the Ångstrom exponent, AE, in Fig. 3) which were verylikely mineral particles originating in the African desert as willbe shown later (compare Fig. 5). Then the particle concentrationdecreased significantly down to the background conditions. Thisshort episode of desert dust particle is called the pre-phase. Themain phase of the desert dust arrival at Evora occurred on 27May 2006 around 6 UTC which is marked by a sharp increaseof the particle mass concentration up to 150 μg m−3. This phaselasted until 29 May 2006 during which a mass concentrationdecrease can be noted. During the main phase, the concen-tration of dust particles had reached a value which is about afactor of 7 higher than the typical background values (around20 μgm−3).
Tellus 61B (2009), 1
300 F. WAGNER ET AL.
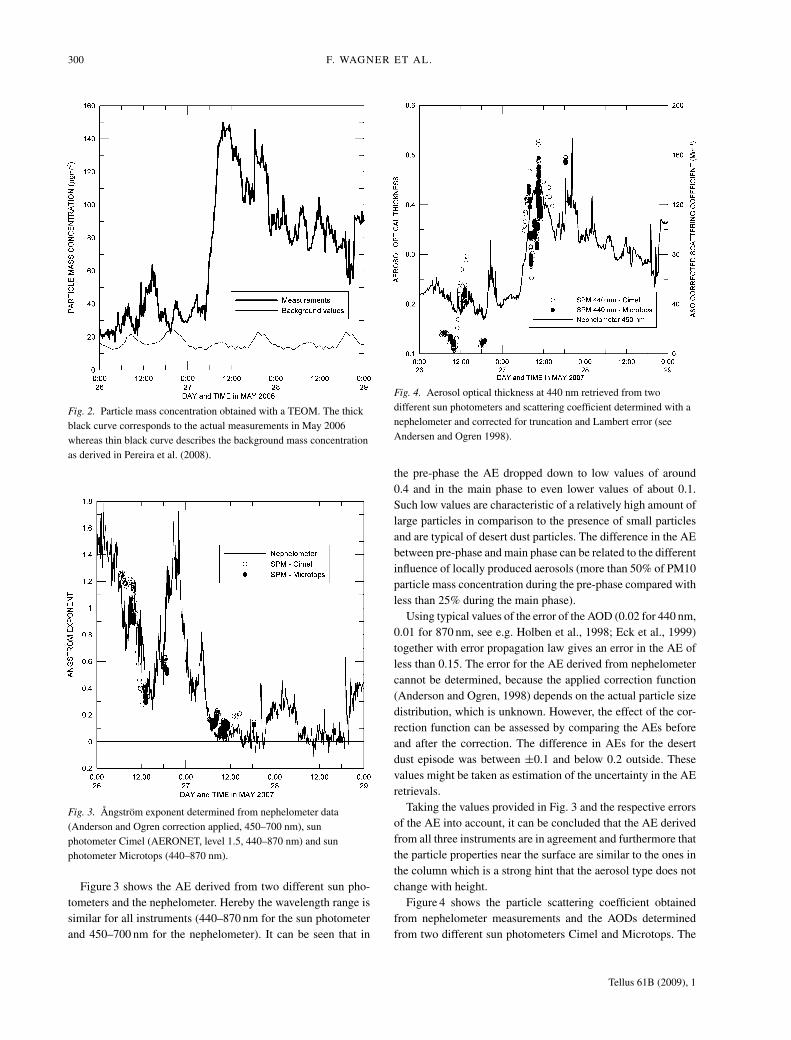
Fig. 2. Particle mass concentration obtained with a TEOM. The thickblack curve corresponds to the actual measurements in May 2006whereas thin black curve describes the background mass concentrationas derived in Pereira et al. (2008).
Fig. 3. Ångstrom exponent determined from nephelometer data(Anderson and Ogren correction applied, 450–700 nm), sunphotometer Cimel (AERONET, level 1.5, 440–870 nm) and sunphotometer Microtops (440–870 nm).
Figure 3 shows the AE derived from two different sun pho-tometers and the nephelometer. Hereby the wavelength range issimilar for all instruments (440–870 nm for the sun photometerand 450–700 nm for the nephelometer). It can be seen that in
Fig. 4. Aerosol optical thickness at 440 nm retrieved from twodifferent sun photometers and scattering coefficient determined with anephelometer and corrected for truncation and Lambert error (seeAndersen and Ogren 1998).
the pre-phase the AE dropped down to low values of around0.4 and in the main phase to even lower values of about 0.1.Such low values are characteristic of a relatively high amount oflarge particles in comparison to the presence of small particlesand are typical of desert dust particles. The difference in the AEbetween pre-phase and main phase can be related to the differentinfluence of locally produced aerosols (more than 50% of PM10particle mass concentration during the pre-phase compared withless than 25% during the main phase).
Using typical values of the error of the AOD (0.02 for 440 nm,0.01 for 870 nm, see e.g. Holben et al., 1998; Eck et al., 1999)together with error propagation law gives an error in the AE ofless than 0.15. The error for the AE derived from nephelometercannot be determined, because the applied correction function(Anderson and Ogren, 1998) depends on the actual particle sizedistribution, which is unknown. However, the effect of the cor-rection function can be assessed by comparing the AEs beforeand after the correction. The difference in AEs for the desertdust episode was between ±0.1 and below 0.2 outside. Thesevalues might be taken as estimation of the uncertainty in the AEretrievals.
Taking the values provided in Fig. 3 and the respective errorsof the AE into account, it can be concluded that the AE derivedfrom all three instruments are in agreement and furthermore thatthe particle properties near the surface are similar to the ones inthe column which is a strong hint that the aerosol type does notchange with height.
Figure 4 shows the particle scattering coefficient obtainedfrom nephelometer measurements and the AODs determinedfrom two different sun photometers Cimel and Microtops. The
Tellus 61B (2009), 1

AEROSOL PROPERTIES OF MINERAL PARTICLES 301
AOD derived with the Cimel instrument was automatically cloudscreened according to AERONET routines (see Smirnov et al.,2000). The other sun photometer (Microtops) is a handheld de-vice and was operated manually. It was only measuring whenno clouds were visible in the path between the instrument andthe Sun. Hence the cloud screening is intrinsically done duringmeasurement procedure. Note that the different number of mea-surements between the two sun photometers is rather caused dueto the frequency of manual operations and not due to a more orless effective cloud screening procedure.
It is obvious from the figure that the AOD and hence theparticle concentration in the atmospheric column vary muchmore than the scattering coefficient obtained at ground level.This is likely due to particle transport processes above the mixinglayer causing horizontal inhomogeneities together with differentpointing paths of the sun photometers due to the movement ofthe Sun.
Fig. 5. (a) 120 h-back trajectories arriving at 3000 m asl at Evora, Portugal. (b) 120 h back trajectories arriving at 500 m asl at Evora, Portugal.
The relatively high scattering coefficient (Fig. 4) and the rel-atively low particle mass concentration (Fig. 2) about 9 pm be-tween pre-phase and main phase were caused by local, urbanparticle production, which is characterized by small particles(high scattering coefficient and low particle mass concentra-tion). At this time desert dust was absent near the ground as canbe concluded from the AE value of about 1.6 (Fig. 3).
From the scattering coefficient and the particle mass concen-tration the mass scattering efficiency of aerosols can be derived.For the main phase of the desert dust outbreak this quantity wasabout 1 or slightly below 1 m2 g−1 independently of particle con-centration. Such values lie within the range of mass scatteringefficiencies reported in the literature (see Hand and Malm, 2007for a review).
Figure 5a shows 120 h back trajectories arriving at Evoraat 3 km altitude. They were calculated with the HYSPLITmodel (Draxler and Rolph, 2003; Rolph, 2003). The trajectories
Tellus 61B (2009), 1
302 F. WAGNER ET AL.
support the previous mentioned classification in pre-phase andmain phase of the desert dust outbreak. Furthermore (Fig. 5b),trajectories arriving at 500 m asl (200 m above ground) nevertouched the African continent neither in the pre-phase nor dur-ing the main phase. This suggests that the transport of mineralparticles occur essentially at higher altitudes and vertical mixingas well as gravitational settling processes are responsible for thepresence of desert dust particles near surface.
Figure 5 also shows that the particles for this desert dust out-break travelled from east before arriving in Portugal. The secondmeasurement station at Cabo da Roca is located on the coastnearly 150 km west of Evora at nearly the same geographicallatitude. The desert dust plume as observed with sun photometermeasurements arrived at the coast slightly more than 4 h later(not shown) than at Evora which corresponds to a mean particleplume speed of less than 40 km h–1. The retrieved columnar par-ticle size distributions and refractive indices were very similar atboth stations. Consequently in terms of microphysical particleproperties the desert dust plume was homogeneous.
3.2. Detailed analysis of particle parameters duringaircraft over flight
On 27 May 2006 the aircraft Falcon was flying from the basein Casablanca, Morocco to Portugal and back. The aircraft flewover Evora between 10:30 and 11:00 UTC which coincidedclosely with the time of the maximum particle concentration atthe surface.
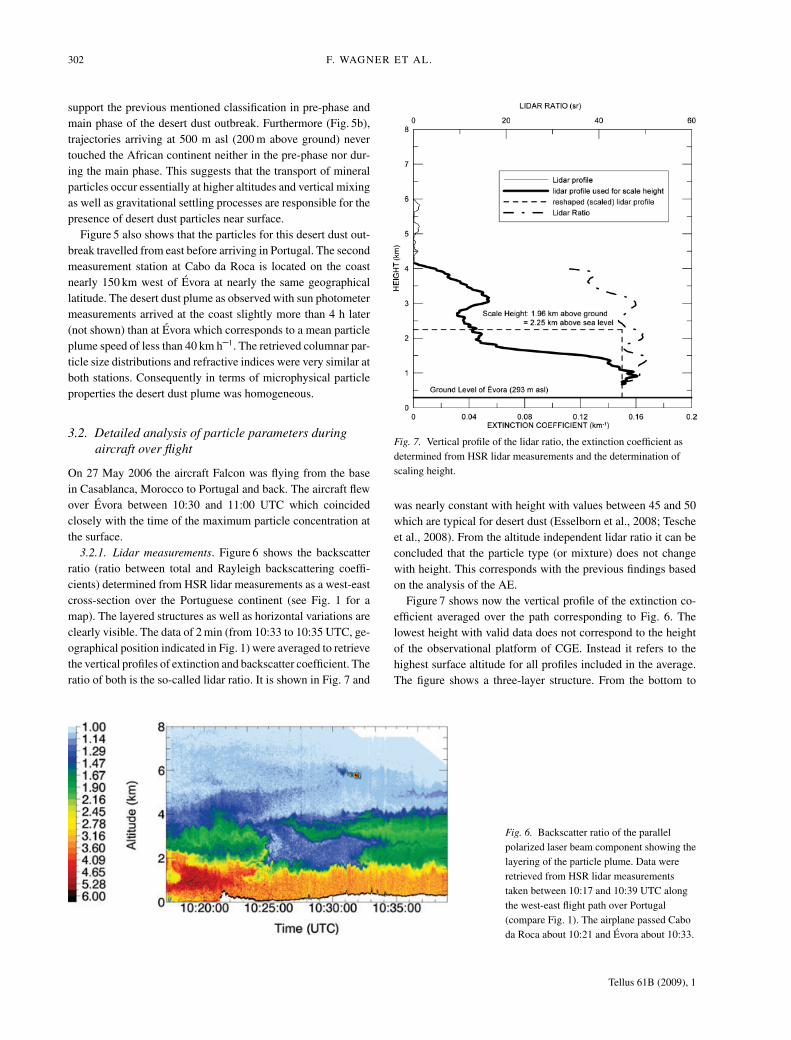
3.2.1. Lidar measurements. Figure 6 shows the backscatterratio (ratio between total and Rayleigh backscattering coeffi-cients) determined from HSR lidar measurements as a west-eastcross-section over the Portuguese continent (see Fig. 1 for amap). The layered structures as well as horizontal variations areclearly visible. The data of 2 min (from 10:33 to 10:35 UTC, ge-ographical position indicated in Fig. 1) were averaged to retrievethe vertical profiles of extinction and backscatter coefficient. Theratio of both is the so-called lidar ratio. It is shown in Fig. 7 and
Fig. 6. Backscatter ratio of the parallelpolarized laser beam component showing thelayering of the particle plume. Data wereretrieved from HSR lidar measurementstaken between 10:17 and 10:39 UTC alongthe west-east flight path over Portugal(compare Fig. 1). The airplane passed Caboda Roca about 10:21 and Evora about 10:33.
Fig. 7. Vertical profile of the lidar ratio, the extinction coefficient asdetermined from HSR lidar measurements and the determination ofscaling height.
was nearly constant with height with values between 45 and 50which are typical for desert dust (Esselborn et al., 2008; Tescheet al., 2008). From the altitude independent lidar ratio it can beconcluded that the particle type (or mixture) does not changewith height. This corresponds with the previous findings basedon the analysis of the AE.
Figure 7 shows now the vertical profile of the extinction co-efficient averaged over the path corresponding to Fig. 6. Thelowest height with valid data does not correspond to the heightof the observational platform of CGE. Instead it refers to thehighest surface altitude for all profiles included in the average.The figure shows a three-layer structure. From the bottom to
Tellus 61B (2009), 1
AEROSOL PROPERTIES OF MINERAL PARTICLES 303
about 1.5 km stretches the mixing layer. On top there is an in-termediate layer with decreasing extinction coefficient. Finallythere is clear distinct particle layer on top between about 2.7 and4 km. The aircraft took in situ measurements inside the top andintermediate layer.
This profile was rescaled in a way that the extinction coeffi-cient is constant over height and equal to the value at the lowestheight of the actual profile. The corresponding layer thickness is1.96 km and this value is later needed to transform the columnarparticle size distribution determined from sun photometry into avolume size distribution.
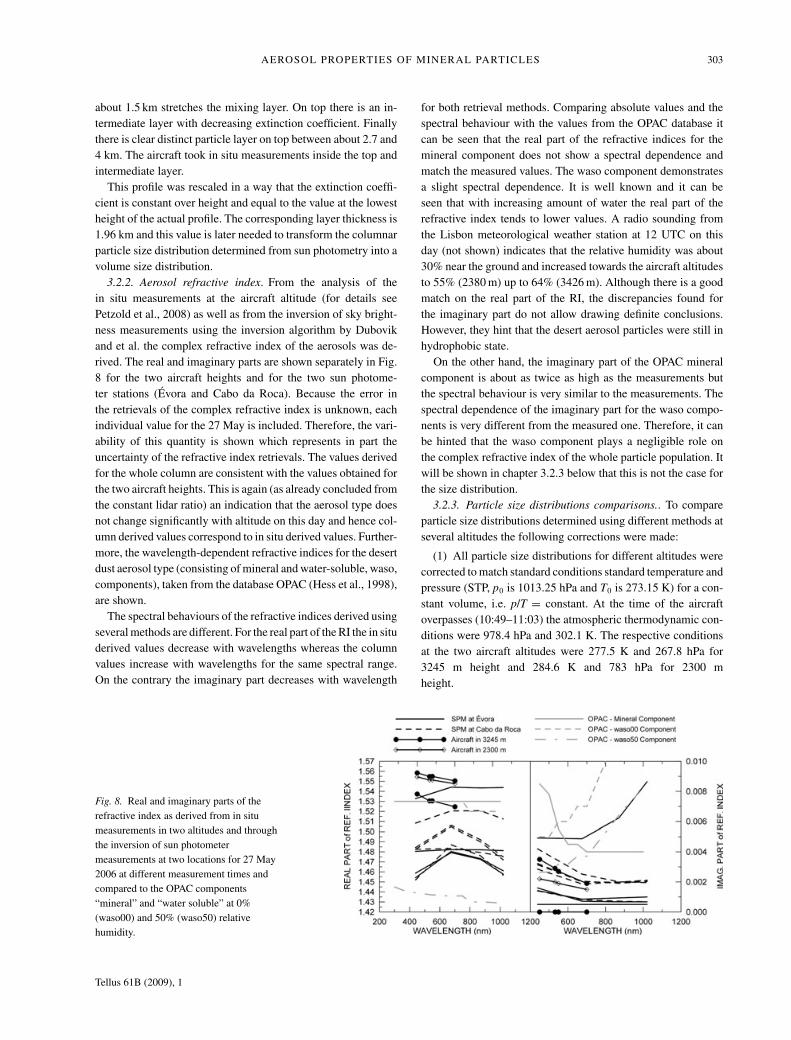
3.2.2. Aerosol refractive index. From the analysis of thein situ measurements at the aircraft altitude (for details seePetzold et al., 2008) as well as from the inversion of sky bright-ness measurements using the inversion algorithm by Dubovikand et al. the complex refractive index of the aerosols was de-rived. The real and imaginary parts are shown separately in Fig.8 for the two aircraft heights and for the two sun photome-ter stations (Evora and Cabo da Roca). Because the error inthe retrievals of the complex refractive index is unknown, eachindividual value for the 27 May is included. Therefore, the vari-ability of this quantity is shown which represents in part theuncertainty of the refractive index retrievals. The values derivedfor the whole column are consistent with the values obtained forthe two aircraft heights. This is again (as already concluded fromthe constant lidar ratio) an indication that the aerosol type doesnot change significantly with altitude on this day and hence col-umn derived values correspond to in situ derived values. Further-more, the wavelength-dependent refractive indices for the desertdust aerosol type (consisting of mineral and water-soluble, waso,components), taken from the database OPAC (Hess et al., 1998),are shown.
The spectral behaviours of the refractive indices derived usingseveral methods are different. For the real part of the RI the in situderived values decrease with wavelengths whereas the columnvalues increase with wavelengths for the same spectral range.On the contrary the imaginary part decreases with wavelength
Fig. 8. Real and imaginary parts of therefractive index as derived from in situmeasurements in two altitudes and throughthe inversion of sun photometermeasurements at two locations for 27 May2006 at different measurement times andcompared to the OPAC components“mineral” and “water soluble” at 0%(waso00) and 50% (waso50) relativehumidity.
for both retrieval methods. Comparing absolute values and thespectral behaviour with the values from the OPAC database itcan be seen that the real part of the refractive indices for themineral component does not show a spectral dependence andmatch the measured values. The waso component demonstratesa slight spectral dependence. It is well known and it can beseen that with increasing amount of water the real part of therefractive index tends to lower values. A radio sounding fromthe Lisbon meteorological weather station at 12 UTC on thisday (not shown) indicates that the relative humidity was about30% near the ground and increased towards the aircraft altitudesto 55% (2380 m) up to 64% (3426 m). Although there is a goodmatch on the real part of the RI, the discrepancies found forthe imaginary part do not allow drawing definite conclusions.However, they hint that the desert aerosol particles were still inhydrophobic state.
On the other hand, the imaginary part of the OPAC mineralcomponent is about as twice as high as the measurements butthe spectral behaviour is very similar to the measurements. Thespectral dependence of the imaginary part for the waso compo-nents is very different from the measured one. Therefore, it canbe hinted that the waso component plays a negligible role onthe complex refractive index of the whole particle population. Itwill be shown in chapter 3.2.3 below that this is not the case forthe size distribution.
3.2.3. Particle size distributions comparisons.. To compareparticle size distributions determined using different methods atseveral altitudes the following corrections were made:
(1) All particle size distributions for different altitudes werecorrected to match standard conditions standard temperature andpressure (STP, p0 is 1013.25 hPa and T0 is 273.15 K) for a con-stant volume, i.e. p/T = constant. At the time of the aircraftoverpasses (10:49–11:03) the atmospheric thermodynamic con-ditions were 978.4 hPa and 302.1 K. The respective conditionsat the two aircraft altitudes were 277.5 K and 267.8 hPa for3245 m height and 284.6 K and 783 hPa for 2300 mheight.
Tellus 61B (2009), 1
304 F. WAGNER ET AL.
(2) Because there was no sun photometer inversion data avail-able during the flight of the aircraft over Evora the followingprocedure was applied to include the sun photometer derivedaerosol size distribution in the comparison.
(a) Averaging of the four available aerosol size distribu-tions obtained from Cimel sun photometer measurements atEvora for 27 May; averaging of the corresponding AODs andcalculating the AOD at 532 nm through AE approach. Herebyonly particle size distributions retrieved for Evora were used.
(b) Change the aerosol number concentration of the sunphotometer derived particle size distribution in such a waythat the AOD obtained from the sun photometer measurementsmatches the lidar integrated AOD. Note that a closure study(Esselborn et al., 2008) was successfully performed for AODderived from sun photometer and HSR lidar.
(c) Use the scale height (see Fig. 7) to convert columnar(cm−2) into volume aerosol size distribution (cm−3). Herebythe scale height has to be constant for the times of the sunphotometer measurements as well as for the times of the lidarmeasurements. Note that this condition is less strong thandemanding identical vertical profiles.
(d) Correct for STP conditions because the sun photometerwas operated at the Evora observational platform and not atsea level.
(3) As already mentioned in Section 2, the aerodynamicaldiameter provided by the APS system was corrected to a geo-metrical diameter using a density of 2.5 gcm−3.
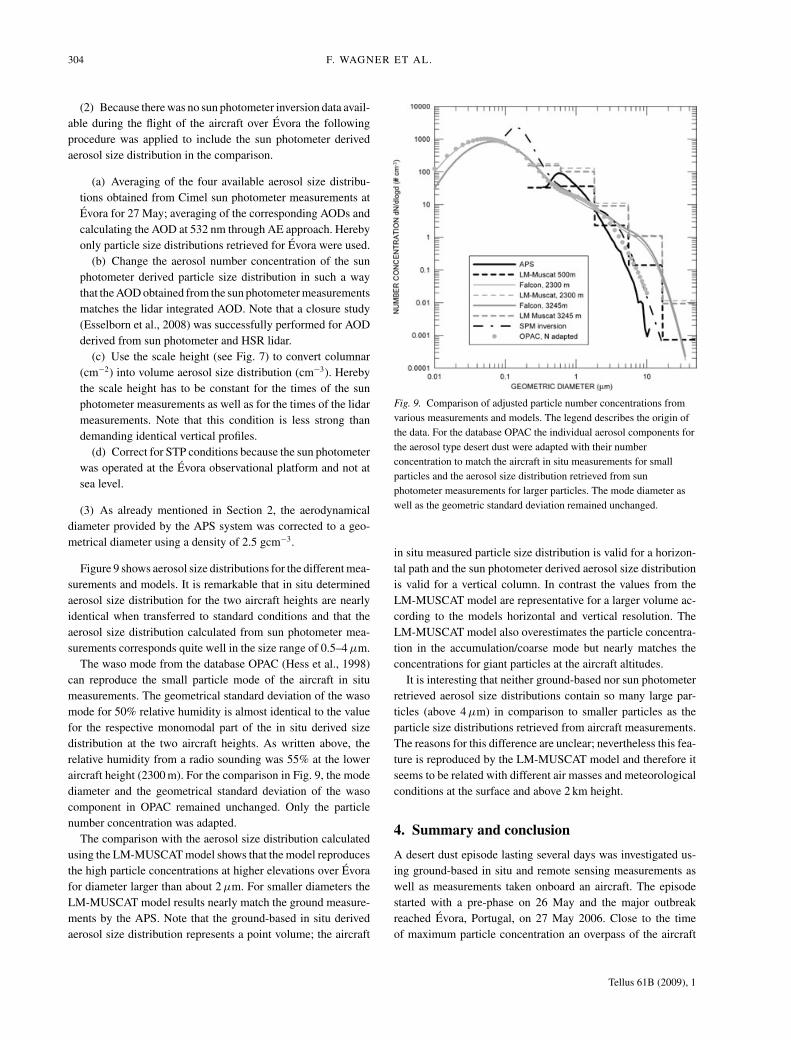
Figure 9 shows aerosol size distributions for the different mea-surements and models. It is remarkable that in situ determinedaerosol size distribution for the two aircraft heights are nearlyidentical when transferred to standard conditions and that theaerosol size distribution calculated from sun photometer mea-surements corresponds quite well in the size range of 0.5–4 μm.
The waso mode from the database OPAC (Hess et al., 1998)can reproduce the small particle mode of the aircraft in situmeasurements. The geometrical standard deviation of the wasomode for 50% relative humidity is almost identical to the valuefor the respective monomodal part of the in situ derived sizedistribution at the two aircraft heights. As written above, therelative humidity from a radio sounding was 55% at the loweraircraft height (2300 m). For the comparison in Fig. 9, the modediameter and the geometrical standard deviation of the wasocomponent in OPAC remained unchanged. Only the particlenumber concentration was adapted.
The comparison with the aerosol size distribution calculatedusing the LM-MUSCAT model shows that the model reproducesthe high particle concentrations at higher elevations over Evorafor diameter larger than about 2 μm. For smaller diameters theLM-MUSCAT model results nearly match the ground measure-ments by the APS. Note that the ground-based in situ derivedaerosol size distribution represents a point volume; the aircraft
Fig. 9. Comparison of adjusted particle number concentrations fromvarious measurements and models. The legend describes the origin ofthe data. For the database OPAC the individual aerosol components forthe aerosol type desert dust were adapted with their numberconcentration to match the aircraft in situ measurements for smallparticles and the aerosol size distribution retrieved from sunphotometer measurements for larger particles. The mode diameter aswell as the geometric standard deviation remained unchanged.
in situ measured particle size distribution is valid for a horizon-tal path and the sun photometer derived aerosol size distributionis valid for a vertical column. In contrast the values from theLM-MUSCAT model are representative for a larger volume ac-cording to the models horizontal and vertical resolution. TheLM-MUSCAT model also overestimates the particle concentra-tion in the accumulation/coarse mode but nearly matches theconcentrations for giant particles at the aircraft altitudes.
It is interesting that neither ground-based nor sun photometerretrieved aerosol size distributions contain so many large par-ticles (above 4 μm) in comparison to smaller particles as theparticle size distributions retrieved from aircraft measurements.The reasons for this difference are unclear; nevertheless this fea-ture is reproduced by the LM-MUSCAT model and therefore itseems to be related with different air masses and meteorologicalconditions at the surface and above 2 km height.
4. Summary and conclusion
A desert dust episode lasting several days was investigated us-ing ground-based in situ and remote sensing measurements aswell as measurements taken onboard an aircraft. The episodestarted with a pre-phase on 26 May and the major outbreakreached Evora, Portugal, on 27 May 2006. Close to the timeof maximum particle concentration an overpass of the aircraft
Tellus 61B (2009), 1
AEROSOL PROPERTIES OF MINERAL PARTICLES 305
Falcon took place over Evora. HSR lidar measurements showedthat there was only one aerosol type predominant in the wholecolumn with a corresponding lidar ratio of about 45–50 whichis typical for desert dust. The lidar measurements also showeda certain horizontal and vertical variability of aerosol particles.Surface measurements at the time of maximum particle con-centrations reached values of about 150 μg m−3 for the particlemass concentration and 130 M m−1 for the green scattering co-efficient. The AOD at 440 nm was as high as 0.53 and thecorresponding AE was nearly 0. A comparison between particlesize distributions and refractive indices derived from differentinstruments and models showed in general good agreement butsome minor differences could also be observed.
The high frequency of occurrence of such dust outbreaks tocontinental Portugal and the large uncertainties on their radiativeeffects emphasize the importance of having multiplatform mea-surements preferably combined with modelling. Measurementsas well as calculations with a particle transport model suggestthat there is a relatively higher concentration of very large par-ticles in the upper region of the dust layer than on the surfacewhich is likely connected with meteorological conditions at theobservation site (Evora). A higher concentration of larger par-ticles in the free troposphere than near the ground might haveimplications for the long-wave radiative forcing due to desertdust, because the trapping of thermal radiation depends on thealtitude of desert dust.
Furthermore, the use of the measurements of this paper to-gether with the measurements near the source region in Morocco(see various SAMUM papers) enables to link source region andfar field together and to investigate altered desert dust propertiesdue to ageing processes during transportation. But this is beyondthe scope of this work.
5. Acknowledgments
The project DARPO was funded by the European Commis-sion under the 6th Framework Program within the EUFARIntegrated Infrastructure Initiative. This work was sup-ported by Fundacao para a Ciencia e Technologia un-der grants SFRH/BPD/14508/2003, SFRH/BPD/22160/2005,SFRH/BPD/29687/2006 and SFRH/BD/29008/2006 and by theGerman Research Foundation within the Research Group SA-MUM. The authors gratefully acknowledge the NOAA AirResources Laboratory (ARL) for the provision of the HYS-PLIT transport and dispersion model and/or READY website(http://www.arl.noaa.gov/ready.html) used in this publicationand they wish to thank Nuno Belo for providing the nephelome-ter data.
References
Ansmann, A., Bosenberg, J., Chaikovsky, A., Comeron,A., Eckhardt, S.and co-authors. 2003. Long-range transport of Saharan dust to north-
ern Europe: the 11–16 October 2001 outbreak observed with EAR-LINET. J. Geophys. Res. 108, 4783, doi: 10.1029/2003JD003757.
Anderson, T. L. and Ogren, J. A. 1998. Determining aerosol radiativeproperties using the TSI 3563 integrating nephelometer. Aerosol Sci.
Technol. 29, 57–69.Borge, R., Lumbreras, J., Vardoulakis, S., Kassomenos, P. and
Rodrıguez, E. 2007. Analysis of long-range transport influences onurban PM10 using two-stage atmospheric trajectory clusters. Atmos.Environ. 41, 4434–4450.
Cachorro, V. E., Vergaz, R., de Frutos, A. M., Vilaplana, J. M., Hen-riques, D., and co-authors. 2006. Study of desert dust events overthe southwestern Iberian Peninsula in year 2000: two case studies.Annales Geophysicae 24, 1493–1510.
Carlson, T. N. and Benjamin, S. G. 1980. Radiative heating rates forSaharan dust. J. Atmos. Sci. 37, 193–213.
Claquin, T., Schulz, M., Balkanski, Y. and Boucher O. 1998. Uncer-tainties in assessing radiative forcing by mineral dust. Tellus 50B,491–505.
Draxler, R. R. and Rolph, G. D. 2003. HYSPLIT (HYbrid Single-ParticleLagrangian Integrated Trajectory) Model access via NOAA ARLREADY Website (http://www.arl.noaa.gov/ready/hysplit4.html).NOAA Air Resources Laboratory, Silver Spring, MD.
Dubovik, O. and King M. D. 2000. A flexible inversion algorithm forretrieval of aerosol optical properties from Sun and sky radiance mea-surements. J. Geophys. Res. 105, 20673–20696.
Dubovik, O., Sinyuk, A., Lapyonok, T., Holben, B. N., Mishchenko,M. and co-authors. 2006. Application of light scattering by spheroidsfor accounting for particle non-sphericity in remote sensing of desertdust. J. Geophys. Res. 111, D11208, doi: 10.1029/2005JD006619.
Eck, T. F., Holben, B. N., Reid, J. S., Dubovik, O., Smirnov, A. andco-authors. 1999. Wavelength dependence of the optical depth ofbiomass burning, urban, and desert dust aerosols. J. Geophys. Res.104, 31 333–31 349.
Elias, T., Silva, A. M., Belo, N., Pereira, S., Formenti, P. and co-authors. 2006. Aerosol extinction in a remote continental region ofthe Iberian Peninsula during summer. J. Geophys. Res, 111, D14204,doi: 10.1029/2005JD006610.
Esselborn, M., Wirth, M., Fix, A., Tesche, M. and Ehret, G. 2008. Air-borne high spectral resolution lidar for measuring aerosol extinctionand backscatter coefficients. Appl. Opt. 47, 346–358.
Esselborn, M., Wirth, M., Fix, A., Weinzierl, B., Rasp, K. and co-authors.2008. Spatial distribution and optical properties of Saharan dust ob-served by airborne high spectral resolution lidar during SAMUM2006, Tellus 61B, doi: 10.1111/j.1600-0889.2008.00394.x.
Fiebig, M., Stein, C., Schroder, F. Feldpausch, P. and A. Petzold 2005.Inversion of data containing information on the aerosol particle sizedistribution usingmultiple instruments. J. Aerosol Sci. 36, 1353–1372.
Fletcher, B. 1976. The incipient motion of granular materials. J. Phys.
D: Appl. Phys. 9, 2471–2478.Fratini, G., Ciccioli, P., Febo, A., Forgione, A. and Valentini, R. 2007.
Size-segregated fluxes of mineral dust from a desert area of northernChina by eddy covariance, Atmos. Chem. Phys. 7, 2839–2854.
Hand, J. L. and Malm, W. C. 2007. Review of aerosol mass scatteringefficiencies from ground-based measurements since 1990. J. Geophys.
Res. 112, D16203, doi: 10.1029/2007JD008484.Haywood, J.M., Francis, P. N., Geogdzhayev, I., Mishchenko, M. and
Frey, R. 2001. Comparison of Saharan dust aerosol optical depths
Tellus 61B (2009), 1
306 F. WAGNER ET AL.
retrieved using aircraft mounted pyranometers and 2-channel AVHRRalgorithms, Geophys. Res. Lett. 28, 2393–2396.
Heinold, B., Helmert, J., Hellmuth, O., Wolke, R., Ansmann, A. andco-authors. 2007. Regional modeling of Saharan dust events usingLM-MUSCAT: model description and case studies, J. Geophys. Res.112, D11204, doi: 10.1029/2006JD007443.
Heinold, B., Tegen, I., Knippertz, P., Laurent, B., Schepanski, K. and co-authors. 2008. Regional Saharan dust modelling during the SAMUM2006 campaign. Tellus 61B, doi: 10.1111/j.1600-0889.2008.00387.x.
Hess, M., Koepke, P. and Schult, I. 1998. Optical properties of aerosolsand clouds: the software package OPAC. Bull. Am. Meteorol. Soc. 79,831–844.
Hinds, W.C. 1999. Aerosol Technology: Properties, behaviour, and Mea-
surements of Airborne Particles 2nd Edition. John Wiley & Sons, NewYork, 483 pp.
Holben, B. N., Eck, T. F., Slutsker, I., Tanre, D. Buis, J. P. and co-authors.1998. AERONET—a federated instrument network and data archivefor aerosol characterization. Remote Sens. Environ. 66, 1–16.
Ishizaka, Y. and Ono, A. 1982. Mass-size distribution of the principalminerals of yellow sand dust in the air over Japan, Idojaras 86, 249–253.
Iwasaka, Y., Shi, G.-Y. Shen, Z., Kim, S., Trochkin, D., and co-authors.2003. Nature of atmospheric aerosols over the desert area in the Asiancontinent: chemical state and number concentration of particles mea-sured at Dunhuang, China. Water, Air Soil Pollut.: Focus 3, 129–145.
Pereira, S.N. 2006. Utilization of a Particle Monitor for the Determina-
tion of the Aerosol Mass Concentration at the Surface and Validation
of the Measurements (in Portuguese), Master thesis. University ofEvora, Portugal, 90 pp.
Pereira, S., Wagner, F. and Silva, A.M. 2008. PM10 air quality as-sessment at a Portuguese rural city using a TEOM instrument. In:Proceedings of European Aerosol Conference 9–14 September 2007,Salzburg, Austria.
Perez, C., Nickovic, S., Baldasano, J. M., Sicard, M., Rocaden-bosch, F. and co-authors. 2006. A long Saharan dust eventover the western Mediterranean: Lidar, Sun photometer observa-tions, and regional dust modeling. J. Geophys Res. 111, D15214,doi: 10.1029/2005JD006579.
Petzold, A., Rasp, K., Weinzierl, B., Esselborn, M., Hamburger, T. andco-authors. 2008. Saharan dust absorption and refractive index fromaircraft-based observations during SAMUM 2006. Tellus 61B, doi:10.1111/j.1600-0889.2008.00383.x.
Prospero, J.M. 1999. Long-term measurements of the transport ofAfrican mineral dust to the southeastern United States: implicationsfor regional air quality. J. Geophys. Res. 104, 15 917–15 927.
Redelsperger, J.-L., Thorncroft, C. D., Diedhiou, A., Lebel, T., Parker,D. J. and co-authors. 2006. African monsoon multidisciplinary anal-ysis: an international research project and field campaign. Bull. Am.
Meteorol. Soc. 87, 1739–1746.Reid, J.S., Kinney, J. E., Westphal, D. L., Holben, B. N., Welton, E. J.,
and co-authors. 2003. Analysis of measurements of Saharan dust byairborne and groundbased remote sensing methods during the PuertoRico Dust Experiment (PRIDE). J. Geophys. Res. 108, 8586, doi:10.1029/2002JD002493.
Rodrıguez, S., Querol, X., Alastuey, A., Kallos, G. and Kakaliagou, O.2001. Saharan dust contribution to PM10 and TSP levels in Southernand eastern Spain. Atmos. Environ. 35, 2433–2447.
Rolph, G.D. 2003. Real-time Environmental Applications and Display
sYstem (READY). NOAA Air Resources Laboratory, Silver Spring,MD . Available at: http://www.arl.noaa.gov/ready/hysplit4.html.
Russell, P.B. and Heintzenberg, J. 2000. An overview of the ACE-2 clearsky column closure experiment (Clearcolumn). Tellus 52B, 463–483.
Shen, Y., Shen, Z., Du, M. and Wang, W. 2005. Dust emission over dif-ferent land surface in the arid region of northwest China. J. Meteorol.
Soc. Jpn. 83, 935–942.Smirnov, A., Holben, B. N., Eck, T. F., Dubovik, O. and Slutsker, I. 2000.
Cloud-screening and quality control algorithms for the AERONETdatabase. Remote Sens. Environ. 73, 337–349.
Tanre, D., Haywood, J., Pelon, J., Leon, J.F., Chatenet, B. and co-authors.2003. Measurement and modeling of the Saharan dust radiative im-pact: overview of the Saharan Dust Experiment (SHADE). J. Geophys.Res. 108, 8574, doi: 10.1029/2002JD003273.
Tegen, I., Harrison, S. P., Kohfeld, K., Prentice, I. C., Coe, M. and co-authors. 2002. Impact of vegetation and preferential source areas onglobal dust aerosol: results from a model study. J. Geophys. Res. 107,4576, doi: 10.1029/2001JD000963.
Tesche, M., Ansmann, A., Muller, D., Althausen, D., Heese, B. and co-authors. 2008. Vertical profiling of Saharan dust with Raman lidarsand airborne HSRL in southern Morocco during SAMUM. Tellus61B, doi: 10.1111/j.1600-0889.2008.00390.x.
Washington, R., Todd, M., Middleton, N. J. and Goudie, A.S. 2003.Dust-storm source areas determined by the total ozone monitoringspectrometer and surface observations. Ann. Assoc. Am. Geogr. 93,297–313.
Weinzierl, B., Petzold, A., Esselborn, M., Wirth, M. and co-authors.2008. Airborne measurements of dust layer properties, particle sizedistribution and mixing state of Saharan dust during SAMUM 2006.Tellus 61B, doi: 10.1111/j.1600-0889.2008.00392.x.
Winfield, K.A. .2000. Factors controlling water retention of alluvialdeposits. Western Mojave Desert, available at http://wwwrcamnl.wr.usgs.gov/uzf/winfield.thesis.pdf.
Tellus 61B (2009), 1