AEROSOL COMPOSITION AND HYGROSCOPICITY STUDIES
546
AEROSOL COMPOSITION AND HYGROSCOPICITY STUDIES: INSTRUMENT DEVELOPMENT/CHARACTERIZATION, AMBIENT AND LABORATORY MEASUREMENTS, AND MODELING Thesis by Armin Sorooshian In Partial Fulfillment of the Requirements for the Degree of Doctor of Philosophy California Institute of Technology Pasadena, California 2008 (Defended May 5, 2008)
-
Upload
khangminh22 -
Category
Documents
-
view
1 -
download
0
Transcript of AEROSOL COMPOSITION AND HYGROSCOPICITY STUDIES

AEROSOL COMPOSITION AND HYGROSCOPICITY STUDIES:
INSTRUMENT DEVELOPMENT/CHARACTERIZATION, AMBIENT AND
LABORATORY MEASUREMENTS, AND MODELING
Thesis by
Armin Sorooshian
In Partial Fulfillment of the Requirements for the
Degree of Doctor of Philosophy
California Institute of Technology
Pasadena, California
2008
(Defended May 5, 2008)

ii
© 2008
Armin Sorooshian
All Rights Reserved

iii
To Shirin, Soroosh, and Jamshid

iv
Acknowledgements Because of two people I came to Caltech for graduate school. My father inspired
me to pursue a career in academia. From Jost O. L. Wendt, my undergraduate research
advisor at the University of Arizona, I first heard the names John Seinfeld and Rick
Flagan.
John and Rick have been two amazing advisors. They provided me with abundant
resources and opportunities, including flying in the back of a research aircraft to navigate
pilots and be responsible for keeping a payload of instruments functional. I appreciate
them for trusting me with this duty; this experience stands out as one of the most exciting
and educational parts of my research at Caltech. John has been a role model because of
his ability to effectively manage time, advise students, and be organized in all aspects of
the academic profession. He usually responded to emails within minutes, was always
available for meetings, edited papers immediately, and provided excellent advice. Rick
was a constant source of creativity. He helped me with instrumentation, provided ideas
for experiments, and would sit with me in his office, with great patience, providing
advice and teaching me how to be a better technical writer.
I worked most closely with Fred Brechtel. He has helped me in a countless
number of ways, including teaching me about instrumentation. I thank him for his calm
demeanor and patience in training me. Not only is he a gifted engineer and terrific
colleague, but a genuinely warm friend. I also thank Andy Corless at BMI for his help
with learning how to use various instruments.
I have worked with many wonderful people in the Seinfeld/Flagan research group.
I want to thank Tracey and Tomtor, who brought me under their wings in the field. I have

v
shared some of my most memorable moments with these two wonderful people.
Harmony was very helpful during our first year, as we both tried to maintain a strong
sense of humor during some tough times. Shane and I spent a great amount of time
together in various field studies. I want to thank him for asking insightful questions and
providing excellent feedback whenever I had questions. Maybe someday we will both be
able to go back to the Barking Spider together. I was very delighted to be able to work
closely with Scott in the last year and a half. We overlapped on a project together and I
am grateful for his maturity, assistance, and ideas. He is not only a very intelligent
person, but also a great friend. He was the one person that could keep up with me in the
buffet lines at the Ath. Some of my most memorable moments were working in the
laboratory at very late hours across from Jason. I also thank Andrew M., whom I have
been absolutely delighted to get to know and spend time with in the field. I want to thank
Sally, Jesse, and Arthur for their help with chamber experiments, and for being awesome
people. It was a fantastic experience mentoring Rebecca Simpson as part of a summer
MURF project; I thank her for having been so motivated and pleasurable to interact with.
Others I wish to thank include Roya, Puneet, Xerxes, Bill, Daven, Julia, Havala, Anne,
Song, Amir, Adam, Dean, Andreas, Philip, Candy, and Andrea.
I want to thank Patrick Chuang and Thanos Nenes who I have had the pleasure of
interacting with in various field studies and conferences. Both have provided me with
valuable support. I also had the pleasure of collaborating closely with both Graham
Feingold and Barbara Ervens. They were both very energetic during our interactions.
Graham’s passion about the science of clouds has certainly rubbed off on me. I give
thanks to Michael Hoffmann, who I have had memorable discussions with in my last year

vi
at Caltech. Nathan Dalleska provided valuable technical support whenever I experienced
problems in the lab. I extend thanks to staff members who have helped me along the way:
Ann Hilgenfeldt, Marcy Fowler, Yvette Grant, and Kathy Bubash.
I want to thank everyone at CIRPAS: Haf Jonsson, Roy Woods, Mike Hubbell,
Chris Maguire, Greg Cooper, Gintas Buzorius, Nava Roy, Bob Bluth, Richard Boyd,
Dennis Hamaker, Reggie Burch, and Sara Moore. Haf has not only been a team player in
the field, but also a wonderful person to interact with on a personal level. Our time
together in the field and on the Quintescence allowed for meaningful discussions about
science, family, and life. Roy was always willing to help and I am still in awe at how he
could fasten down that double rack in the Twin Otter. As flight scientist, I was able to
spend many hours on the Twin Otter with Mike and Chris. I am in deep admiration of
their talent as pilots (and Roy, although I never had the pleasure of flying with him), and
their ability to carry out the glorious Charlie Bravo Flight. I also thank them for not
beating me up after the infamous Cow Flight.
I would like to thank the Betty and Gordon Moore Foundation for providing
funding for my first four years at Caltech. I thank the funding agencies that supported my
research: the Office of Naval Research, the National Science Foundation, and the
National Oceanic and Atmospheric Administration.
I want to thank my following friends: Andrew B. for six stitches and being a loyal
friend and roommate for four years; Arian and Parvin for unique support and lengthy
discussions about Arizona basketball; Win for making me laugh; Ubaldo for his vision
and Magic Time; Marc for always being solid; Edgardo for his spirit; Stephanie for her
good taste in wine and music; Ali for allowing me to practice my Farsi with someone;

vii
BOB for our legendary tailgating parties, kicking field goals late at night, and being solid;
Danielle for laughter; Chip for his trust in me; and BUND for meaningful conversations.
The glowing light in my life during the last half of my time at Caltech has been an
angel named Atria. She has had an unmeasurable effect on me. Thank you.
Finally, I wish to thank my family. My brother, Jamshid, has always been a great
role model and I have followed his footsteps in several ways. He has made sacrifices that
have directly resulted in my well-being and I am always thankful for that. I am
appreciative for him trying to make me not take life and work so seriously and to relax
and take a deep breath sometimes. I am grateful for the constant love and support from
my parents, Shirin and Soroosh. Amongst so many other things, I thank them for teaching
me the value of family, education, working hard, and enjoying life.

viii
Abstract
Aerosols influence climate by altering the global energy balance via scattering
and absorbing solar radiation (direct effects), and by their effect on the reflectance of
clouds and occurrence of precipitation (indirect effects). Aerosols also influence
biogeochemical cycles, lead to diminished environmental visibility, and harm human
health. This thesis focuses on advancing knowledge of critical properties, specifically
composition and hygroscopicity, which govern the role of aerosols in climatic and
environmental change. The methods used in this work include a combination of
instrument development/characterization, ambient and laboratory measurements, and
modeling.
An instrument was developed to quantify the water-soluble composition of
aerosols. The particle-into-liquid sampler (PILS) grows ambient particles into droplets
that grow sufficiently large to be collected by inertial impaction. After being collected in
vials, the liquid sample can be analyzed with a variety of analytical methods including
ion chromatography. Results from characterization tests are presented, which summarize
instrument accuracy, precision, size and time resolution, and uncertainties. An instrument
model was developed to simulate operation of the PILS; the model considers plumbing
transmission efficiencies, droplet growth, mixing effects, and volatilization losses. Model
predictions and measurements are compared and are shown to exhibit good agreement.
A second instrument, termed the differential aerosol sizing and hygroscopicity
spectrometer probe (DASH-SP), was developed to quantify aerosol hygroscopic growth
and refractive index. This technique employs size classification of dry aerosol particles,
equilibrates the classified particles to multiple relative humidities, and then measures the

ix
sizes of the grown particles using optical particle counters. Similar to the PILS, results
from an extensive set of characterization test are presented. DASH-SP measurements of
growth factor for various inorganic and organic acid salts are reported and compared to
thermodynamic predictions.
Airborne aerosol measurements from four separate field campaigns are presented.
The main topics of investigation from the ambient experiments include the following: (1)
in-cloud production of secondary organic aerosol; (2) a characterization of the sources
and character of water-soluble aerosol composition during the 2006 Gulf of Mexico
Atmospheric Composition and Climate Study (GoMACCS); and (3) a comprehensive
airborne characterization of aerosol from a massive bovine source.

x
Table of Contents Dedication iii
Acknowledgements iv
Abstract viii
List of Tables xviii
List of Figures xx
1 Introduction 1
1.1 Background and Motivation……………………………………………………….2
1.2 Organization of Thesis……………………………………………………….…….3
1.3 References……………………………………….…………………………………5
2 Modeling and Characterization of a Particle-into-liquid Sampler (PILS) 8
2.1 Abstract..............................................................................................................9
2.2 Introduction......................................................................................................10
2.3 Modified PILS.................................................................................................11
2.4 PILS Model ……………………………………………………………….…15
2.4.1 Model Equations...............................................................................16
2.4.2 Model Predictions.…………………………………………………17
2.5 PILS-IC Detection Levels……………………………………………………19
2.5.1 Ion Chromatography (IC) System…………….……………………19
2.5.2 PILS-IC Technique Background Levels….………………………..20
2.6 Evaluation of Model With Laboratory Data……...………………………….22
2.6.1 PILS Collection Efficiency for Different Aerosol Seeds…………..25

xi
2.6.2 Tip Temperature Sensitivity Tests……...………………………….27
2.7 Field Data………………………………………………………………...…..30
2.8 Future Work………………………………………………………………….30
2.9 Conclusions…………………………………………………………………..31
2.10 Acknowledgements……………………………………………………..…..34
2.11 References……………………………………………………...……….…..34
3 Rapid Size-resolved Aerosol Hygroscopic Growth Measurements: Differential
Aerosol Sizing and Hygroscopicity Spectrometer Probe (DASH-SP) 53
3.1 Abstract………………………………………………………………………54
3.2 Introduction…………………………………………………………………..55
3.3 DASH-SP Description……………………………………………………….58
3.4 Experimental Methods……………………………………………………….63
3.5 Instrument Characterization………………………………………………….64
3.5.1 Size Limits of OPC Detection……………………………………...64
3.5.2 Time Resolution……………………………………………………64
3.5.3 DASH-SP Accuracy, Precision, and Uncertainties……………...…66
3.5.4 Stability…………………………………………………………….69
3.6 Data Analysis………………………………………………………………...69
3.7 Growth Factor Measurements………………………………………………..73
3.7.1 Inorganic Salts……………………………………………………..73
3.7.2 Organic Acids……………………………………………………...74
3.8 Validation of Iterative Data Processing Code………………………………..77
3.9 Field Implementation of DASH-SP………………………………………….79

xii
3.10 Conclusions…………………………………………………………………81
3.11 Acknowledgements…………………………………………………………83
3.12 References…………………………………………………………………..84
4 Oxalic Acid in Clear and Cloudy Atmospheres: Analysis of Data from
International Consortium for Atmospheric Research on Transport and
Transformation 2004 104
4.1 Abstract……………………………………………………………………..105
4.2. Introduction………………………………………………………………...106
4.3. Twin Otter (TO) Research Aircraft………………………………………...108
4.4. PILS-IC Measurements…………………………………………………….110
4.5. Field Measurements………………………………………………………..112
4.5.1. Field Data Summary……………………………………………..112
4.5.2. Case Study: Power Plant Plume in Cloud (Flight 5 on 9 August
2004)……………………………………………………………116
4.6. Cloud Parcel Model………………………………………………………..119
4.6.1. Description and Modifications…………………………………...119
4.6.2. Sensitivity Analysis……………………………………………...123
4.7. Comparison of Model Predictions to Field Measurements………………...126
4.7.1. Case Study: Power Plant Plume in Cloud………………………..127
4.7.2. Case Study: Clouds Uninfluenced by Local Pollution Sources….131
4.7.3. Comparison of Predictions From Both Cases to all In-Cloud Field
Measurements………………………………………………..…132

xiii
4.7.4. Contribution of Different Aqueous-Phase Pathways to Production
of Oxalic Acid…………...……………………………..…….…134
4.8. Conclusions………………………………………………………………...136
4.9. Acknowledgments………………………………………………………….137
4.10. References………………………………………………………………...137
5 On the Source of Organic Acid Aerosol Layers Above Clouds 159
5.1 Abstract……………………………………………………………………..160
5.2 Introduction…………………………………………………………………160
5.3 Aircraft Measurements……………………………………………………...162
5.4 Sources of Oxalate above Cloud……………………………………………165
5.5 Physical Processes at the Cloudtop Interface (Large Eddy Simulations)…..167
5.6 Oxalic Acid Chemistry……………………………………………………..170
5.7 Methanesulfonate…………………………………………………………...173
5.8 Acknowledgements…………………………………………………………174
5.9 References…………………………………………………………………..174
6 Particulate Organic Acids and Overall Water-soluble Aerosol Composition
Measurements from the 2006 Gulf of Mexico Atmospheric Composition and
Climate Study (GoMACCS) 188
6.1 Abstract……………………………………………………………………..189
6.2 Introduction…………………………………………………………………190
6.3 Twin Otter (TO) Research Aircraft…………………………………………193
6.4 Water-soluble Chemical Characterization of Southeastern Texas Aerosol...194
6.5 Sources and Character of Organic Acids…………………………………...198

xiv
6.5.1 Saturated Dicarboxylic Acids…………………………………….198
6.5.2 Unsaturated and Hydroxylated Dicarboxylic Acids……………...201
6.5.3 Saturated Monocarboxylic Acids…………………………………202
6.5.4 Unsaturated Monocarboxylic Acids……………………………...204
6.6 Role of Organic Acids in Cloud Droplet Chemistry………………………..206
6.6.1 Oxalic Acid as a Reaction Product in Clouds…………………….206
6.6.2 High Nitrate Episodes: Methacrylic Acid in Cloud Droplets and
Suppressed Organic Acid Formation…………………………….210
6.7 Organic Acids Downwind of the Houston Ship Channel…………………..212
6.8 Evaluation of Ambient Data Relative to Laboratory Chamber Experiments of
m-xylene Photooxidation………………………………………….……….214
6.9 Conclusions…………………………………………………………………216
6.10 Acknowledgements………………………………………………………..218
6.11 References…………………………………………………………………218
7 Comprehensive Airborne Characterization of Aerosol From a Major Bovine
Source 238
7.1 Abstract……………………………………………………………………..239
7.2 Introduction…………………………………………………………………240
7.3 Experimental Methods……………………………………………………...243
7.3.1 Aerosol Chemical Composition (PILS)…………………………..243
7.3.2 Aerosol Chemical Composition (Aerodyne cToF-AMS)………...245
7.3.3 Aerosol Hygroscopicity and Refractive Index (DASH-SP)……...247
7.3.4 Cloud Condensation Nuclei Counter (CCNc)…………………….248

xv
7.3.5 Size Distributions and Particle Number Concentration…………..248
7.3.6 Flight Strategy…………………………………………………….249
7.4 Results………………………………………………………………………250
7.4.1 Meteorology………………………………………………………250
7.4.2 Particle Number Concentrations and Size Distributions…………251
7.4.3 Submicrometer Aerosol Chemical Composition…………………252
7.4.3.1 Total Aerosol Mass and Major Components…………...253
7.4.3.2 Inorganic Aerosol……………………………………….254
7.4.3.3 Organic Aerosol………………………………………...254
7.4.4 Aerosol Mixing State……………………………………………..256
7.4.5 Refractive Index…………………………………………………..257
7.4.6 Hygroscopic Properties of the Aerosol…………………………...258
7.4.6.1 Subsaturated Water Uptake……………………………..258
7.4.6.2 CCN…………………………………………………….259
7.5 Discussion………………………………………………………….……….261
7.5.1 Enhancements in Mass Production and Water Uptake in the Plume
Aerosol…………………………………………………..…………..261
7.5.2 Amines as an Atmospheric Base………………………………….262
7.5.2.1 Is Nitric Acid or Ammonia the Limiting Reactant?.........262
7.5.2.2 Sources and Character of Amines………………………264
7.5.2.3 Total Amine Mass Calculations………………………...266
7.5.3 Degree of Oxidation and Volatility in the Aerosol……………….267
7.5.4 Factors Influencing Aerosol Number/Mass Concentrations……...268

xvi
7.5.5 Estimated Subsaturated Hygroscopic Growth Factors for the Organic
Fraction………………………………………………...…………..269
7.5.6 Relationship Between Sub- and Supersaturated Water Uptake…..272
7.5.7 Parameterization for Sub- and Supersaturated Water Uptake……273
7.6. Conclusions………………………………………………………………...275
7.7 Acknowledgements…………………………………………………………277
7.8 References…………………………………………………………………..277
8 Conclusions 311
Appendices 316
Appendix A Chemical Composition of Secondary Organic Aerosol Formed from
the Photooxidation of Isoprene 317
Appendix B Evidence for Organosulfates in Secondary Organic Aerosol 344
Appendix C Characterization of 2-Methylglyceric Acid Oligomers in Secondary
Organic Aerosol Formed from the Photooxidation of Isoprene Using
Trimethylsilylation and Gas Chromatography/Ion Trap Mass
Spectrometry 356
Appendix D Aerosol-Cloud Drop Concentration Closure for Clouds Sampled
During the International Consortium for Atmospheric Research on
Transport and Transformation 2004 Campaign 373
Appendix E Secondary Aerosol Formation from Atmospheric Reactions of
Aliphatic Amines 386
Appendix F Regional Variation of Organic Functional Groups in Aerosol Particles
on Four U.S. East Coast Platforms during ICARTT 2004 412
xvii
Appendix G Effect of NOx Level on Secondary Organic Aerosol (SOA) Formation
from the Photooxidation of Terpenes 424
Appendix H Secondary Organic Aerosol (SOA) Formation from Reaction of
Isoprene with Nitrate Radicals (NO3) 441
Appendix I Molar Mass, Surface Tension, and Droplet Growth Kinetics of Marine
Organics from Measurements of CCN Activity 515

xviii
List of Tables
Table 2.1 Equations for Droplet Growth and Transmission Efficiency in Different
Stages of the PILS………………………………………………………………..37
Table 2.2 Filter Mode Background Levels……………………………………………..39
Table 2.3 Effect of Using (NH4)2SO4 and NH4NO3 Independently as Wash-flow
Solutions…………………………………………………………………………40
Table 2.4 Minimum Time Response to Step Changes in Concentration for the Original
and Modified PILS Designs as a Function of the Debubbler Residence Time….41
Table 2.5 PILS Collection Efficiency for Anions and Cations Compared to the DMA..42
Table 2.6 Molar Ratios for Different Aerosols Tested by the PILS……………………43
Table 3.1. Aerosol Hygroscopicity Measurement Techniques………….……………...93
Table 4.1. Twin Otter Payload Description…………………………………………...143
Table 4.2. Comparison of PILS Original (Old) and Re-Analyzed (New) Vials from
Flight 5 on 9 August 2004……………………………………………………...144
Table 4.3. Molar Ratio of Oxalate Relative to Sulfate, Nitrate, and Ammonium…….145
Table 4.4. Initial Conditions for Two Simulations……………………………………146
Table 5.1. Summary of Lagrangian Trajectory Results……………………………….182
Table 6.1. Selected Organic Acid Measurements in Urban Atmospheres…………….226
Table 6.2. Chemical Formulas and Structures for the Organic Acids Studied………..227
Table 6.3. Organic Acid Product Distribution for a Series of m-xylene Laboratory
Chamber Photooxidation Experiments…………...…………………………….228

xix
Table 7.1. Summary of In-plume and Out-of-plume Measurements of Composition and
Particle Number and Mass Concentration……………………….……………..288
Table 7.2. DASH-SP Hygroscopicity and Dry Particle Refractive Index Data
Categorized by the Time of Flight as Shown in Figure 1. Data at RH = 85% are
not available for Flight A………………….………………………………..…..289
Table 7.3. Summary of CCN Data for Flights A and B…………………..…………...290
Table 7.4. Summary of κ Values (Petters and Kreidenweis, 2007) Derived from
Subsaturated Hygroscopic Growth Factor Data at RHs of 85%, and 92%. Data at
RH = 85% are not available for Flight A………………………………….……291

xx
List of Figures
Figure 1.1. Earth’s annual global mean energy budget (Kiehl and Trenberth, 1997)…….7
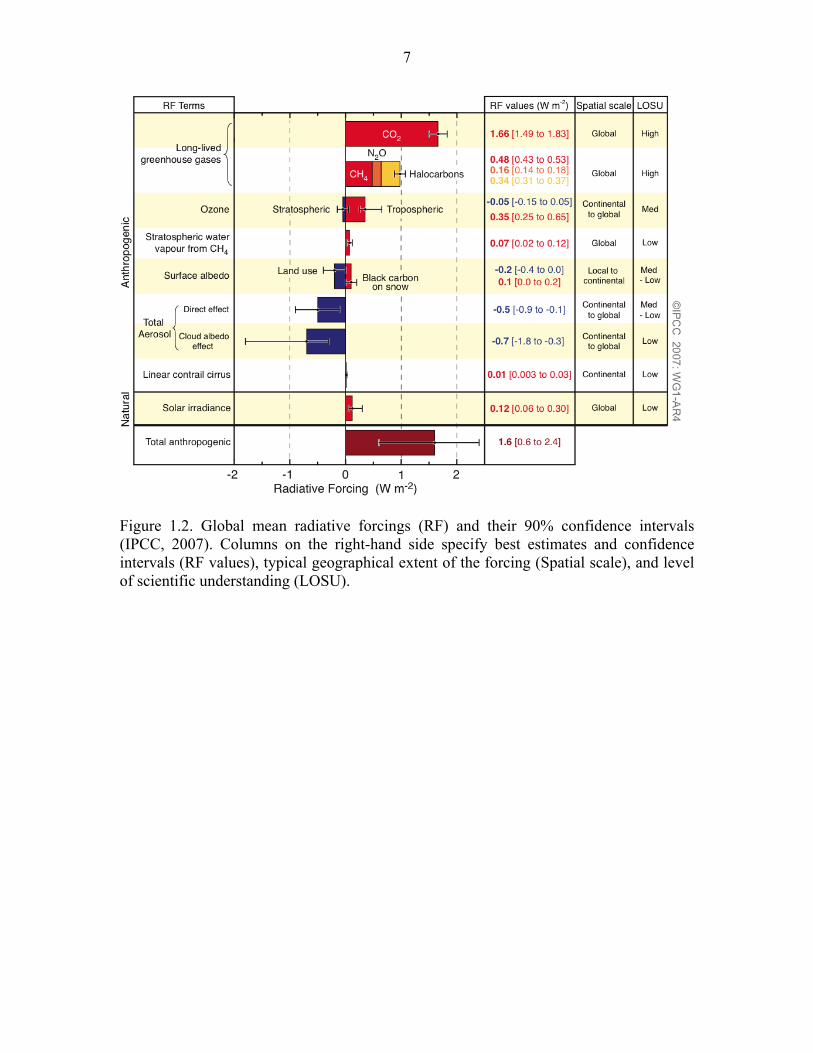
Figure 1.2. Global mean radiative forcings (RF) and their 90% confidence interval
(IPCC, 2007)....…………………………………………………...……………….8
Figure 2.1. Schematic diagram of the modified PILS…………………………………...44
Figure 2.2. Modeled stages of the modified PILS……………………………………….45
Figure 2.3. Temperature dependence of the equilibrium constants for three reactions….46
Figure 2.4. Transmission efficiency in the PILS as a function of particle diameter for all
plumbing prior to droplet growth in the condensation chamber, and the relative
contribution of diffusion and inertial deposition to the total
losses…………………………………………………………………………......47
Figure 2.5. Final droplet diameters after growth in the condensation chamber (τ = 1 s) as
a function of the initial particle diameters for different (a) accommodation
coefficients (b) and tip temperatures…………………………………...………...48
Figure 2.6. Percentage of NH4+ remaining in the particle phase after the 1 s residence
time in the condensation chamber as a function of particle surface temperature,
acidity, and the amount of water (which is related to the dilution
factor)………………………………………………………………………….....49
Figure 2.7. Comparison of experimental and theoretical mass concentrations in the
modified PILS…………………………………………………………................50
Figure 2.8. Tip temperature sensitivity results for a test where the modified PILS sampled
(NH4)2SO4 aerosol…………………………………………………...…………..51

xxi
Figure 2.9. (a) Flight tracks; (b) Time series of the mass concentrations of various
inorganic and organic acid ions measured during one ICARTT flight that was
marked by the presence of clouds………………………………...……………...52
Figure 3.1. Schematic of DASH-SP……………………………………………………..94
Figure 3.2. Time required as a function of particle number concentration to obtain
sufficient pulses for the modal pulse height to be within 1% of the mode that
would be obtained when counting at least 10,000 particles at constant particle
composition. Also shown is the time needed for the standard deviation to be
within 1%, 5%, and 10% of the standard deviation that would be obtained when
counting at least 10,000 particles at constant particle
composition……………........................................................................................95
Figure 3.3. Stability statistics for different species and sizes over a time span of four
months……………………………………………………………...…………….96
Figure 3.4. OPC response as a function of dry particle size for salts of different refractive
index…………………………………………………………………...…………97
Figure 3.5. Data processing procedure from DASH-SP raw pulse height data to growth
(GFs) for both laboratory-generated aerosol, for which the composition and
refractive index (n) of the dry particles are known, and for ambient aerosol, where
the composition and refractive index of the dry particles are
unknown…………………………………………………………………...……..98
Figure 3.6. Experimentally determined growth factor curves for inorganic and organic
acid species………………………………………………………………………99

xxii
Figure 3.7. Comparison between two thermodynamic models and DASH-SP data for
ammonium sulfate particles…………………………………………………….100
Figure 3.8. Size distributions from wet ammonium sulfate and dry PSL aerosol laboratory
tests………………………………………………………………………….….101
Figure 3.9. Panel A) Flight tracks during a MASE II flight (July 16, 2007) during which
the Twin Otter aircraft sampled emissions from a large cargo ship off the central
coast of California………………………………………………………………102
Figure 4.1. Twin Otter flight tracks during the ICARTT field study…………………..147
Figure 4.2. Simplified illustration of how the Twin Otter flew when it encountered two
specific atmospheric conditions: (a) Power plant plume in cloud; (b) Power plant
plume in cloud-free air with precipitation from scattered clouds overhead……148
Figure 4.3. Vertical distribution of ions measured by the PILS during ICARTT……...149
Figure 4.4. Oxalate and SO42- molar concentrations for each atmospheric condition
encountered……………………………………………………………………..150
Figure 4.5. Flight 5 (9 August 2004): (a) Flight tracks; (b) Time series of altitude, LWC,
and aerosol number concentration; (c) Time series of SO42-, organic ions, and the
aerosol volume concentration………………………………………………..…151
Figure 4.6. Evolution of the DACAD aerosol size distribution (dry: < 20%) for Flight 5
on 9 August 2004……………………………………………………………….152
Figure 4.7. Multiphase organic chemistry……………………………………………...153
Figure 4.8. Model predictions for the power plant plume in cloud case (simulation of
Flight 5 on 9 August 2004)……………………………………………………..154

xxiii
Figure 4.9. Comparison of Flight 5 (9 August 2004) field data and model predictions for
SO42- and oxalate growth……………………………………………………….155
Figure 4.10. Model predictions for the case of clouds uninfluenced by local pollution
sources…………………………………………………………………………..156
Figure 4.11. Comparison of oxalate and SO42- molar concentrations between model
predictions and field data for clouds with and without power plant plume
influence...............................................................................................................157
Figure 4.12. Contribution of different aqueous-phase pathways to production of oxalic
acid……………………………………………………………………………...158
Figure 5.1. Schematic of physical processes leading to an organic acid aerosol layer
above clouds…………………………………………………………………….183
Figure 5.2. Particulate oxalate concentrations below and above 14 different cloud fields
probed during MASE…………………………………………………………...184
Figure 5.3. Particulate organic acid concentrations below and above 22 different cloud
systems probed during GoMACCS…………………………………………….185
Figure 5.4. A-C: Example of the temporal evolution of trajectories from a 2D slice of the
3D LES simulation. D: Temporal evolution of cloudtop from the LES simulation
of the stratocumulus cloud observed July 5, 2005, which was influenced by ship
emissions corresponds to 7/5 in Figure 5.2)……………………………………186
Figure 5.5. Droplet residual particle data from two different GoMACCS cloud profiling
events…………………………………………………………………………...187
Figure 6.1. Spatial distribution of the PILS water-soluble mass concentration during
GoMACCS……………………………………………………………………...229

xxiv
Figure 6.2. Total water-soluble charge balance for all samples collected during
GoMACCS……………………………………………………………………...230
Figure 6.3. Comparison between the water-soluble mass concentration and DMA volume
concentration in different regions of the lower troposphere……………………231
Figure 6.4. Vertical distribution of the total water-soluble mass and different ionic
components……………………………………………………………………..232
Figure 6.5. Vertical distribution of the different organic acids and diethylamine……..233
Figure 6.6. Contribution of individual organic acids to the total organic acid mass in
different regions of the lower troposphere……………………………………...234
Figure 6.7. Comparison of the oxalate:glyoxylate mass ratio between ambient
measurements of cloud droplet residual particles and model predictions for clouds
influenced by pollution sources (”polluted”) and those that are not (“clean”)…235
Figure 6.8. Flight tracks during a study aimed at analyzing the evolution of aerosol
properties in three major plumes originating in the Houston Ship Channel……236
Figure 6.9. Organic acid product evolution from a photooxidation experiment with the
following conditions: 75 ppb m-xylene/low NOx/non-acid ammonium sulfate seed
aerosol…………………………………………………………………………..237
Figure 7.1. A) Complete flight tracks for the two flights in the San Joaquin Valley of
California. The shaded mountain areas are meant to provide a relative view of
how the San Joaquin Valley is bordered by major topographical features. B/C)
Detailed tracks for flights A (12 July 2007) and B (30 July 2007) with a step-by-
step description of the aircraft maneuvers……………………………………...292

xxv
Figure 7.2. Upper panel) Time series of particle number concentration and
meteorological data for flight A. Lower panel) Time series of aerosol size
distribution……………………………………………………………………...293
Figure 7.3. Upper panel) Time series of particle number concentration and
meteorological data for flight B. Lower panel) Time series of aerosol size
distribution……………………………………………………………………...294
Figure 7.4. Vertical profiles of particle number concentration and meteorological data for
flights A (upper panel) and B (lower panel)....…………………………………295
Figure 7.5. HYSPLIT five-day backward trajectory analysis for flights A (panel A) and B
(panel B)………………………………………………………………………...296
Figure 7.6. Time series of PILS water-soluble aerosol composition and cToF-AMS
composition for flights A (upper panel) and B (lower panel)…………………..297
Figure 7.7. Spatial distribution of various aerosol species during flight A. A) Nitrate and
diethylamine; B) Excess nitrate remaining after both sulfate and nitrate have been
neutralized by ammonium (see Section 7.3.2 for further explanation); C)
ammonium; D) organics………………………………..………………………298
Figure 7.8. Spatial distribution of various aerosol species during flight B. A) Nitrate and
diethylamine; B) Excess nitrate remaining after both sulfate and nitrate have been
neutralized by ammonium (see Section 7.3.2 for further explanation); C)
ammonium; D) organics………………………………………………………..299
Figure 7.9. Vertical distribution of total submicrometer particulate mass and species
concentrations from both the PILS and cTOF-AMS, for flights A (upper panel) and B
(lower panel)……………………………………………………………………………300

xxvi
Figure 7.10. Aerosol mass spectra from the cToF-AMS in the background aerosol and in
the plume at various downwind distances from the feedlot for flight B………..301
Figure 7.11. A comparison of the plume organic mass spectra versus the background
aerosol organic mass spectra for flights A (upper panel) and B (lower panel)...302
Figure 7.12. Speciated size distributions as determined by the cToF-AMS for flights A
(panel A) and B (panel B)………………………………………………………303
Figure 7.13. Growth factor data from flight A at RHs of 74% (upper panel) and 92%
(lower panel)……………………………………………………………………304
Figure 7.14. Growth factor data from flight B at RHs of 74% (A), 85% (B), and 92%
(C)………………………………………………………………………………305
Figure 7.15. Relationship between the hygroscopic growth factor at 92% RH and mass
fractions of nitrate and organics during flight B………………………………..306
Figure 7.16. Time series of activated fraction of aerosol (CCN/CN), and total CCN
concentration during flights A (upper panel) and B (lower panel)……………..307
Figure 7.17. Normalized CCN activation ratio, (CCN/CN)measured:(CCN/CN)ammonium sulfate,
as a function of hygroscopic growth factors for flight B……………………….308
Figure 7.18. The relationship between the m/z 57:44 ratio, the organic mass fraction, the
CCN fraction with less droplet growth than ammonium sulfate (Di < DAS), and the
hygroscopic growth factor at RH = 92%.............................................................309
Figure 7.19. Spatial distribution of the calculated organic growth factors, using the ZSR
mixing rule, for flights A (upper panel) and B (lower panel)…………………..310

1
Chapter 1
Introduction

2
1.1 Background and Motivation
Aerosols, defined here as suspended particulate matter, influence climate by altering
the global radiative balance (Figure 1.1). The climatic effects associated with aerosols
include their ability to scatter and absorb solar radiation (direct effects) and their effect on
the reflectance of clouds and occurrence of precipitation (indirect effects) (IPCC, 2007).
It is understood that aerosols exhibit a negative net anthropogenic radiative forcing
globally, but the current level of scientific understanding of the forcing magnitude is low
(Figure 1.2; IPCC, 2007). This poses a major obstacle when trying to predict future
climate change. Of particular interest are aerosol-cloud interactions because the
uncertainty associated with these interactions is the highest of all forcings. Aerosols also
influence biogeochemical cycles, lead to diminished environmental visibility, and harm
human health (EPA, 2004).
To understand the relationship between aerosols and climate, it is necessary to
perform measurements of key aerosol properties, which include the following: size
distribution, number concentration, composition, hygroscopicity, and refractive index.
When the former four measurements are combined with knowledge of key cloud
properties, such as liquid water content, drop number concentration, and drop size, it is
possible to investigate aerosol–cloud interactions. One way to reduce uncertainties in the
radiative forcing associated with aerosol effects is to perform ambient in-situ
measurements of atmospheric aerosols. Instrumentation needs to be designed to make
rapid measurements suitable for aircraft deployment, such that short time-scale events
can be resolved. Airborne aerosol measurements can then be used to validate and
improve atmospheric models.

3
1.2 Organization of Thesis
This thesis is devoted to the development and characterization of aerosol
instrumentation, the application of these instruments in field and laboratory studies, and
evaluating models with measurements. Chapters 2 and 3 focus on the development and
characterization of two novel aerosol instruments, which were designed for aircraft
deployment. Chapter 2 introduces the particle-into-liquid sampler (PILS), which when
coupled to ion chromatography, can quantify water-soluble aerosol composition. Chapter
3 introduces the differential aerosol sizing and hygroscopicity spectrometer probe
(DASH-SP), which employs differential mobility analysis in-concert with multiple
humidification and optical sizing steps to determine dry optical size and hygroscopic
growth factors for size-selected aerosols.
Chapters 4-7 discuss measurements carried out on the Center for Interdisciplinary
Remotely-Piloted Aircraft Studies (CIRPAS) Twin Otter in the following four different
field studies: International Consortium for Atmospheric Research on Transport and
Transformation (ICARTT 2004), Marine Stratus/Stratocumulus Experiment I and II
(MASE 2005, 2007), Gulf of Mexico Atmospheric Composition and Climate Study
(GoMACCS 2006). The aircraft payload consisted of a suite of aerosol instruments, but
specific attention is given to PILS and DASH-SP measurements.
Chapters 4-5 specifically focus on the production of secondary organic aerosol in
clouds. Owing to the low volatility and water-soluble nature of organic acids, these
species constitute a significant fraction of SOA mass. Chapter 4 explores the production
of oxalic acid in clouds during the 2004 ICARTT study. ICARTT measurements of

4
sulfate, oxalate, and oxalate’s aqueous-phase precursors are presented in both clear air
and clouds. Predictions from a state-of-the-art chemical/microphysical cloud parcel
model show good agreement with ambient data for the relative magnitude of sulfate and
organic acid growth in clouds. Clear evidence is presented for aqueous-phase oxalic acid
production as the primary mechanism for oxalic acid formation in ambient aerosols.
Chapter 5 explores the sources of enhanced organic acid aerosol layers that were
observed directly above cloudtops in measurements from MASE I and GoMACCS. As
derived from large eddy simulations of stratocumulus under the conditions of MASE,
both Lagrangian trajectory analysis and diurnal cloudtop evolution provide evidence that
a significant fraction of the aerosol mass concentration above cloud can be accounted for
by evaporated droplet residual particles. In addition, entrainment of free tropospheric
aerosol is also argued to lead to enhanced organic acid levels above clouds.
Chapter 6 presents a thorough characterization of the water-soluble aerosol
composition during the 2006 GoMACCS study in southeastern Texas. Special attention is
given to the sources and character of organic acids (C2–C9). The organic acid mass
composition in the Houston Ship Channel, an area emitting large amounts of aromatic
hydrocarbons, is compared to measurements from laboratory studies of m-xylene
photooxidation. Chapter 7 reports an extensive airborne characterization of aerosol
downwind of a massive bovine source in the San Joaquin Valley (California) on two
flights during the MASE II study. Measurements are presented for chemical composition,
particle size distribution, mixing state, sub- and supersaturated water uptake behavior,
light scattering properties, and the interrelationship between these parameters and
meteorology.

5
Chapter 8 presents the main conclusions of this thesis. Appendices A-I present
results from studies devoted to aerosol composition, aerosol formation, and aerosol-cloud
interactions.
1.3 References
1. Intergovernmental Panel on Climate Change (IPCC) (2007). Climate Change 2007,
Cambridge, UK: Cambridge Univ. Press, Cambridge and New York.
2. U.S. Environmental Protection Agency (2004). Air Quality Criteria for Particulate
Matter, EPA 600/P-99/002aF-bF, Washington, DC: EPA.
3. Kiehl, J. T., and Trenberth, K. E. (1997). Earth's Annual Global Mean Energy Budget,
Bull. Amer. Meteor. Soc., 78, 197-208.

6
Figure 1.1. Earth’s annual global mean energy budget (Kiehl and Trenberth, 1997).
7
Figure 1.2. Global mean radiative forcings (RF) and their 90% confidence intervals (IPCC, 2007). Columns on the right-hand side specify best estimates and confidence intervals (RF values), typical geographical extent of the forcing (Spatial scale), and level of scientific understanding (LOSU).

8
Chapter 2
Modeling and Characterization of a Particle-Into-
Liquid Sampler (PILS)∗
∗This chapter is reproduced by permission from “Modeling and Characterization of a Particle-Into-Liquid Sampler (PILS)” by A. Sorooshian, F. J. Brechtel, Y. L. Ma, R. J. Weber, A. Corless, R. C. Flagan, and J. H. Seinfeld, Aerosol Sci. Tech., 40, 396-409, 2006. Copyright 2006. American Association for Aerosol Research.

9
2.1 Abstract
A modified particle-into-liquid sampler (PILS), based on the original design of
Weber et al. (2001), is presented. The principal modification in this design is that
collected liquid sample is delivered to vials held on a rotating carousel as opposed to an
on-line analytical detector. A model is developed to predict aerosol mass concentrations
measured by a PILS based on operating parameters and characteristics of the sampled
aerosol. A backward model predicts the concentrations of the sampled aerosol based on
operating parameters and concentrations measured by the PILS. Both models, which
consider plumbing transmission efficiencies, droplet growth, mixing effects, and
volatilization losses, predict mass concentrations that are consistent with laboratory tests
for step changes in concentration. The average collection efficiency for species (Na+, K+,
SO42-, Cl-, NO3
-) from a variety of aerosols compared to simultaneous measurements with
a differential mobility analyzer (DMA) exceeded 96% except for NH4+ (88%); NH4
+ is
theoretically shown to be the most vulnerable to volatilization, followed by Cl- and then
NO3-, with greater losses caused by increasing droplet pH and temperature. The
characterization tests highlight the importance of reducing NH4+ volatilization by keeping
a stable tip temperature of 100°C at the point where steam and ambient air mix in the
condensation chamber. Maintaining a stable tip temperature also avoids fluctuations in
supersaturations that lead to increased deposition losses of larger droplets. Sample data
from the 2004 International Consortium for Atmospheric Research on Transport and
Transformation (ICARTT) field campaign are presented.

10
2.2 Introduction
Instrumental methods for quantifying atmospheric aerosol chemical composition
have evolved from filter-based sampling to devices that provide real-time measurements
(Buhr et al., 1995; Simon and Dasgupta, 1995; Zellweger et al., 1999; Stolzenburg and
Hering, 2000; Slanina et al., 2001; Weber et al., 2001; Orsini et al., 2003). Real-time
measurements avoid both the potential sampling artifacts and long turn-around time for
processed results associated with filter sampling. Weber et al. (2001) developed the
original particle-into-liquid sampler (PILS), which grows particles in supersaturated
water vapor, thereby creating droplets sufficiently large to be collected by inertial
impaction and then chemically analyzed in real-time. The liquid sample can be
partitioned into fractions and analyzed by different analytical techniques, such as ion
chromatography (IC) and total organic carbon (TOC) analysis.
We report here on a PILS, developed by Brechtel Manufacturing Inc.
(www.brechtel.com), which is based on a modification of the original design of Weber et
al. (2001). The principal modification in this design is that two syringe pumps drive the
liquid sample from the impaction plate at the end of the condensation chamber to vials
held on a rotating carousel; in the original PILS design, liquid sample is driven directly
from the impaction plate to an analytical detector with either a peristaltic pump or two
syringe pumps downstream of the analytical device. Benefits of syringe pumps over
peristaltic pumps include steadier flow rates and less degradation in pump tubing over
time. The sampling rate of this modified PILS is not limited by the duty cycle time of
any on-line analytical detector, which is advantageous for airborne sampling.

11
A model is needed to predict sample behavior in both the original and modified
PILS in order to quantify effects such as volatilization losses and mixing. We present
here a mathematical model to simulate the major processes affecting the aerosol sample
within the PILS. A model of the instrument is developed that, given the input aerosol
concentration, predicts the mass concentration in successive vials collected; the model
incorporates plumbing efficiencies, droplet growth, evaporation of semi-volatile species,
and the residence time distribution in the debubbler and two syringes that drive the liquid
sample to vials. These same processes are considered in a backward model, intended to
predict the aerosol mass concentration entering the inlet based on observed
concentrations within vials. The two models are used to simulate operation of both the
modified and the original PILS, where the step involving the syringes is eliminated when
considering the original PILS. Model predictions are compared to data obtained from
characterization tests with the original and modified PILS, which include evaluation of
the PILS collection efficiency using a differential mobility analyzer (DMA) while
sampling a variety of different laboratory aerosols. Sample data from the 2004
International Consortium for Atmospheric Research on Transport and Transformation
(ICARTT) field campaign are presented to show that the modified PILS can successfully
quantify ambient concentrations of inorganic and organic acid ions with time resolution
appropriate for aircraft sampling.
2.3 Modified PILS The basic principle of the PILS instrument is to grow aerosol particles into
droplets sufficiently large to be collected by inertial impaction for subsequent chemical

12
analysis (Weber et al., 2001). Many of the instrumental features of the modified PILS
design presented here are the same as those described by Orsini et al. (2003). As shown
in Figure 2.1, the modified PILS samples ambient air at approximately 12.5 L min-1, with
a critical orifice maintaining a constant volumetric flow rate. A single-stage pre-impactor
(D50 = 1 μm) removes super-micrometer sized particles. An automated three-way valve
(Swagelok) either directs flow through (filter mode) or bypasses (sample mode) a high-
efficiency particulate air (HEPA) filter to allow for background level testing during
experiments. A series of three denuders remove gases that can bias aerosol
measurements; inorganic vapors are removed by two denuders with annular glass
surfaces (URG-2000-30x242-3CSS), and a third denuder (Sunset Laboratory Inc.),
composed of 15 thin carbon filter paper sheets (3.15 cm x 20.32 cm x 0.04 cm thick) with
0.2 cm gaps between them, removes organic gases. The glass denuders are placed
upstream of the carbon denuder so that detailed extraction tests can be carried out
following operation.
The ambient air mixes with steam that is introduced through a tube (0.04 cm ID),
the tip of which has a thermocouple attached to provide accurate steam injection tip
temperature readings. An algorithm is used to account for pressure fluctuations
(specifically for airborne operation) and air flow over the tip, to provide real-time control
of the steam injection tip temperature at 100 + 2°C. Rapid adiabatic mixing of the steam
and the cooler ambient air produces a high supersaturation of water vapor that allows
droplets to grow large enough (Dp > 1 μm) to be collected by inertial impaction onto a
wettable quartz or polycarbonate impactor plate. The condensation chamber is kept at a
slight angle (15°) to allow wall condensate to be removed by a drain line at the end of the

13
chamber’s main body. Those particles too small (< 1 μm) to be collected by inertial
impaction leave the system with the exhausted air flow.
Impacted droplets are transported down the impactor by a wash-flow (0.15 to 0.20
mL min-1) supplied by two syringe pumps with 250 μL syringes (Kloehn Ltd. Model V3),
which work together using a “handshaking” technique. Using this technique, one syringe
aspirates sample from a wash-flow stock bottle in a downward stroke, while the other is
dispensing already-collected wash-flow to the top of the impactor plate in an upward
stroke. A stainless steel mesh wick on the perimeter aids in drawing the liquid down the
impactor plate. Two syringes use the “handshaking” technique to extract the liquid
sample from the bottom of the impactor plate (0.13 mL min-1) and deliver it to a
debubbler; volumes of 250 and 50 μL were used for these syringes (these syringes,
regardless of volume, are operated at the same speed, 2.17 μL s-1), with the lower volume
reducing the mean liquid residence time in the PILS. The liquid flow rates are controlled
by the programmed syringe pump speeds. After air bubbles are removed by the
debubbler, the liquid sample is drawn into one of two syringes (at any one time, one
syringe aspirates liquid from the debubbler and the other dispenses liquid to the vials);
the debubbler and each syringe behave like two continuously stirred tank reactors
(CSTRs) in series. These types of vessels are characterized by perfect mixing, such that
the concentration is uniform throughout the vessel. The sample then travels to a
computer-controlled injection needle that is inserted into individual vials, the caps of
which have septa to minimize contamination. Seventy-two vials are held on a rotating
carousel; typically 0.65 mL of sample was collected over a 5-min period in each vial for
results presented here. The sample volume and filling time for each vial can be adjusted

14
to optimize the level of dilution and time resolution needed. The addition of syringe
pumps and the vial collection technique are beneficial for aircraft sampling since the
liquid sample in each vial can be partitioned into fractions for different analytical tests
after each flight. Furthermore, the use of a vial collection system avoids the space,
power, weight, and down-time of an analytical device while promoting autonomous
operation.
Dilution occurs when the impacted droplets are washed from the impactor plate.
In addition to the wash-flow, dilution takes place as a result of water vapor condensation
on the impactor wall. The dilution factor is determined by spiking the wash-flow of
Milli-Q water with non-interfering ions (LiF and LiBr were used for this study); this
factor, which typically ranges from 1.1 to 1.4 during airborne flights, is calculated by
taking the ratio of the Li+ concentration in the wash-flow supply bottle to the Li+
concentration in each vial. The pressure changes that occur during aircraft flights have
been shown to have no influence on the dilution factor since the syringe pumps allow for
precise liquid sample flow control.
To make meaningful intercomparisons with other instruments sampling the same
air stream simultaneously, it is necessary to know the residence time of an air parcel and
liquid sample inside the PILS system (Figure 2.2). The debubbler and the syringes
complicate this measurement since they act as CSTRs and mix each incoming liquid
parcel with their entire liquid volume. An estimate of the residence time in the mixing
vessels is made by observing the time needed to empty them when they are completely
filled with liquid. All other plumbing residence times are calculated using measured tube
volumes and flow rates. The time elapsed from the moment a parcel of air enters the inlet

15
until it impacts onto the droplet impactor plate is estimated to be 3.6 s; this time will vary
between different designs based on the plumbing length between the inlet and the droplet
impactor (combined 3 m in this design with tube IDs varying between 0.35 and 1.65 cm).
The time for each syringe to complete a full round-trip (downward stroke followed by an
upward stroke) is measured to be 46 and 230 s using 50 and 250 μL syringes,
respectively. The last liquid parcel to enter a syringe at the end of a downward stroke
exits the syringe at the beginning of the next upward stroke, which results in very little
time spent in the syringe. As will be shown later, model predictions show that there is a
minimum time delay of 301 s and 304-313 s to overcome a step change in concentration
for the original and modified PILS (assuming a 66 s debubbler liquid residence time),
respectively; the time delays for the modified PILS are used here as a time-offset to
intercompare with DMA measurements. The time-offset can be reduced by lowering the
debubbler residence time; this involves optimizing the ratio between the flow rate of the
wash-flow at the top of the droplet impactor and the speed of the syringes aspirating
liquid from the debubbler.
2.4 PILS Model
A model is developed that predicts the mass of solutes in the PILS vials. The
model accounts for plumbing transmission efficiencies, droplet growth, loss processes in
the condensation chamber including volatilization and droplet deposition, mixing
behavior in the debubbler and the syringes, and the “handshaking” behavior of the
syringes. This model also predicts the transition time resulting from a step change in
concentration for different operating parameters, such as vial-filling time, mixing vessel
volumes, and the round-trip time for the syringes. The inverse model starts from
16
measurements of concentration in vials to back-calculate the actual mass concentrations
in the sampled aerosol and to properly adjust the PILS measurements for instrument time
response. Both models are also used to simulate sample behavior in the original PILS,
with the only difference being that the syringes were not considered.
The important flow elements of the modified PILS are the impactors, the
plumbing leading to the condensation chamber, the condensation chamber itself, and the
plumbing leading from the droplet impactor to the dispensing needle, which includes the
debubbler and two syringes (Figure 2.2). During sample transport within the instrument,
plumbing-related particle losses can occur by gravitational settling, diffusional
deposition, turbulent inertial deposition, and inertial deposition at bends and flow
constrictions. The model considers these processes as a function of particle size for all
stages up to the droplet impactor, at which point the masses in each particle size bin are
added into a cumulative liquid parcel. Predictions can be used to assess the sensitivity of
the droplet size distribution to different initial conditions for the air and water vapor
streams.
2.4.1 Model Equations
The basic equations of the PILS model are given in Table 2.1 (Figure 2.2
indicates which equations are applied when modeling specific stages of the instrument).
Semi-volatile species in the sampled particles can evaporate as a result of the release of
latent heat of condensation and convective heating of the air sample. Ma (2004) reports a
13 to 16% loss (by mass) of NH4+ based on PILS (original design) intercomparisons with
filter samples obtained during four selected ground-based and airborne studies. For the

17
range of particle surface temperatures examined (25–130°C), NH4+ is the most volatile,
followed by Cl-, and then NO3- (Figure 2.3). To estimate the volatilization of these three
species during PILS operation, we calculate the quantity of particle-phase NH4+, Cl-, and
NO3- that will be converted to the gas phase in the condensation chamber. It is assumed
that before the sampled aerosol reaches the condensation chamber, the denuders remove
all of the gas-phase species (NH3, HCl, HNO3). The general assumption is made for the
equilibria represented in Figure 2.3 that ambient volatile species are in equilibrium
between the gas and particle phase, which has been argued to be especially valid for sub-
micrometer particles (Pilinis and Seinfeld, 1987; Zhang et al., 2002); however, this
assumption has been shown not to hold under all ambient conditions (Hildemann et al.,
1984; Quinn et al., 1992; Parmar et al., 2001; Trebs et al., 2005).
After the condensation chamber and the droplet impactor, the liquid sample
travels through the debubbler, syringes, and 0.5 mm ID PEEK tubing prior to reaching
the dispensing needle. Although no aerosol mass is expected to be lost in these final flow
components, mixing occurs in the debubbler and syringes. It is assumed that each liquid
parcel drawn into a mixing vessel immediately mixes with the bulk liquid volume and
that the mass concentration of the effluent is equal to the uniform concentration inside the
vessel.
2.4.2 Model Predictions
Since the PILS operates with an upstream impactor to remove super-micrometer
particles, we examine theoretical losses for sub-micrometer particles in the plumbing up
to the condensation chamber (Figure 2.4). Losses are predicted to decrease from 2.21 to

18
0.42% for particles with diameters ranging from 0.01 to 0.08 μm, respectively. Losses
subsequently increase from 0.42 to 8.58% for diameters increasing from 0.08 to 1.0 μm,
respectively. Diffusional losses dominate the total losses for the smaller particle range,
ranging from 95 to 57% of the total losses, whereas inertial deposition dominates for the
larger particle range, ranging from 43 to 98% of the total losses. Inertial deposition at
bends, of which 12 are present in this modified PILS design, dominate the inertial losses.
Losses in the condensation chamber are predicted as a function of particle size
entering the chamber (Figure 2.5). As the steam temperature increases, the
supersaturation increases, resulting in larger final droplet diameters in the condensation
chamber. The final droplet size is more sensitive to the supersaturation ratio achieved by
having higher tip temperatures than to the initial particle size entering the condensation
chamber. The value of the water condensation mass accommodation coefficient (α) is
shown to have a significant impact on the predicted final size of the droplets; as this value
increases, water vapor is more effectively scavenged during condensational growth.
There is considerable scatter in experimental measurements for this parameter; values
ranging from 0.04 to 1 are applied in current cloud model studies (Kreidenweis et al.,
2003). Weber et al. (2001) report that particles in the condenser reach final diameters of
nominally 2 to 3 μm, while Orsini et al. (2003) measured a typical droplet size
distribution from sampling room air and observed the range of droplet diameters to be
between 1 and 5 μm (with the majority of the droplets between 2 and 3 μm). Sullivan et
al. (2004) report that droplet diameters within the PILS can reach up to between 3 and 5
μm, which is consistent with previous studies. The droplet diameters reported in the
three aforementioned studies, the two most recent of which used the same steam

19
condensation chamber as our PILS, are consistent with model predictions assuming an
accommodation coefficient between 0.01 and 0.05 and a tip temperature of 100°C (Figure
2.5a).
Losses during the droplet growth stage are dominated by gravitational settling and
inertial deposition in the main body of the condensation chamber and in the conical
section at the end of the chamber (these regions are defined in Figure 2.2). The losses
exceed 1 and 10% when droplets reach sizes of 3 and 8 μm, respectively (Figure 2.5a).
Figure 2.5b shows that losses in the conical section exceed those in the main body when
droplets grow larger than 2 μm. These results emphasize the importance of keeping the
PILS tip temperature close to 100°C to minimize the growth of larger droplets that are
more effectively lost by deposition prior to reaching the droplet impactor.
Calculations indicate that volatilization effects are most sensitive to temperature
and the acidity of the sampled particles. Figure 2.6 shows the amount of NH4+ expected
to remain in the particle phase at the end of the condensation chamber as a function of
temperature and acidity. Ammonium is the sole ion vulnerable to volatilization over the
span of temperatures, acidity, and dilution factors shown, whereas Cl- and NO3- losses are
predicted to be less than 1%. Ammonium losses are higher as the temperature increases
and as the droplet acidity decreases.
2.5 PILS-IC Detection Levels
2.5.1 Ion Chromatography (IC) System
The technique of choice for analyzing the liquid sample is IC. Two Dionex ICS-
2000 systems (25 μL sample loops) are used for performing off-line quantitative

20
speciated inorganic and organic analysis. A Dionex AS-40 Autosampler feeds samples,
which are in 0.5 mL vials with filter-caps, to the anion system (AS-11 column 2 x 250
mm, ASRS Ultra II 2-mm suppressor, potassium hydroxide eluent) first, which is
equipped with a de-gas unit to rid the injected sample of any air bubbles that can amplify
baseline noise. The anion unit has a 6-port injection valve that splits off part of the
sample to the cation system (CS12A column 2 x 250 mm, CSRS Ultra II 2-mm
suppressor, methanesulfonic acid eluent).
2.5.2 PILS-IC Technique Background Levels
The additional steps required in the off-line analysis of samples in this design
require background-level testing to check for contamination; sources of contamination
include the Milli-Q water used in the wash-flow, plumbing in the PILS, the PILS and IC
vials, including sample transfer between them, and the IC system itself. The background
levels of individual species concentrations for analyzed filter samples (n > 300),
presented as the average concentration plus three times the standard deviation (σ), are
between 0.02 and 0.28 μg m-3 (Table 2.2). It should be noted that the contribution from
the IC alone to these background levels (calculated as the average concentration plus
three times σ of the smallest detectable peak for each ion in the IC baseline noise and
then converted to air-equivalent units) is less than 0.05 μg m-3 for all major inorganic
ions (NH4+, K+, Mg2+, SO4
2-, Cl-, NO2-, NO3
-) except Na+ and Ca2+, which have IC
background levels of 0.10 μg m-3. To minimize background levels, the droplet impactor
plate must be continuously cleaned (between each use of the system), the denuders

21
should be frequently recoated, and the plumbing between the droplet impactor and
dispensing needle should be periodically replaced.
Tests were performed to examine if any sinks or sources exist for different species
(NH4+, SO4
2-, or NO3-) in the plumbing between the impactor plate and the dispensing
needle. A wash-flow solution with known concentrations of either (NH4)2SO4 or
NH4NO3 in water was used in place of the standard Milli-Q water solution spiked with
LiBr or LiF. For each solution, several vials were collected while no steam was being
generated (no droplets made) followed by steam generation. The tip temperature was
controlled between 100 + 2°C during steam production. This test would also reveal if
heating of the impactor plate due to deposition of warm droplets and convective heating
leads to volatility losses for any of the species in the wash-flow solutions. The collection
efficiency in these tests is defined as the ratio of ion concentrations in liquid collected
into vials to those in the wash-flow stock solution. The results in Table 2.3 show that
neither NH4+, SO4
2-, or NO3- is preferentially lost on the impactor plate, within the
debubbler and syringes, or in the liquid lines before steam production, as the collection
efficiency of each ion is approximately unity. During steam generation, volatility losses
from the heated impactor plate are negligible since the molar ratios are within the
measurement uncertainty (one σ) of the expected values of two and one for (NH4)2SO4
and NH4NO3, respectively. However, the one hour duration of these tests leaves open the
possibility that higher tip temperatures and longer periods of heating may lead to
increased volatilization losses due to heating of the impactor plate.

22
2.6 Evaluation of Model With Laboratory Data
Figure 2.7 compares observed and model-predicted normalized mass
concentrations from tests in which the PILS was cycled between sample and filter mode,
thereby inducing a step change in mass concentration in the sampled air. The sampled
particles were composed of Na2SO4 with a unimodal size distribution (number
concentration mode at 70 nm with a geometric σ of 1.6). Losses due to volatility were
not expected since SO42- and Na+ represent relatively non-volatile species. The forward
model simulated the operation of the modified PILS for 50 and 250 μL syringes, in
addition to the original PILS, which does not employ syringes. For a specific debubbler
residence time, the predicted time delay between when a step change is made and when
the modified PILS reaches stable concentrations (defined as less than a 1% change by
mass between two successive vials) varies according to the syringe round-trip time; for a
debubbler residence time of 66 s, the minimum time delays for 50 and 250 μL syringes
are predicted to be 304 and 313 s, respectively (Table 2.4). Variations in the minimum
time delays predicted are seen for single simulations considering successive step changes
due to the position of the two syringes when one of them draws in the first liquid parcel
following the step change in concentration; variations ranged between 10 and 60 s for
simulations with the 50 and 250 μL syringes, respectively. Data and predictions indicate
that it usually takes two “transition vials” (at 5 min each with a debubbler residence time
of 66 s) using 50 and 250 μL syringes, during which the concentration gradually
increases or decreases depending on the direction of the step change, before stable mass
concentrations are reached (Figure 2.7); however, predictions and observations
occasionally show that only one transition vial is needed for 50 μL syringes. The

23
minimum time delay for the original PILS, assuming the same characteristic residence
time in the debubbler, is predicted to be 301 s (Table 2.4). The minimum time delays
predicted for the original and modified PILS designs are within 12 s of each other,
indicating that mixing in the debubbler has a dominant effect on the time response of
each design to a step change in concentration. Thus, the addition of syringes in the liquid
flow path of the modified design does not significantly increase the minimum time
response to concentration changes; however, the syringes have a broadening effect on the
range of the time delay during each successive step change in concentration. To decrease
the time response, the residence time needs to be minimized in the mixing vessels. Table
2.4 shows that as the debubbler mixing volume is reduced, resulting in lower residence
times, the minimum time response also drops substantially. Figure 2.7 also shows
modified PILS observations and predictions from a step change test where 1-min vials
were collected and the debubbler residence time was reduced to 15 s (using 50 μL
syringes with a 15 s round-trip time); one or two 1-min vials are needed prior to
stabilization with good agreement between observations and predictions. Predictions for
the original PILS show that for an assumed 1-min duty cycle time for an on-line
analytical detector and a debubbler residence time of 15 s, one transition vial is needed
prior to stabilization during step changes.
After a step increase in concentration, the normalized PILS levels observed
indicate that mass losses are less than 1%. This is consistent with mass losses predicted
by the forward model for droplet diameters up to 3 μm. Mass losses of less than 3.5%
are predicted for droplets with diameters between 3 and 5 μm. Orsini et al. (2003) report
that the overall collection efficiency for operation at 15 L min-1 is better than 95% for

24
particles with diameters between 0.03 and 6.0 μm, which is consistent with our model
predictions.
The experimental PILS mass measurements from the step change tests are now
used as inputs to the inversion model to back-calculate the time-adjusted mass
concentrations of the sampled aerosol (predicted mass measurements from the forward
model are used as the input for the original PILS). The goal of the inverse model is to
accurately predict the maximum and minimum concentrations attained during the step
changes and to minimize the transition time during step changes by effectively
deconvoluting mixing effects. The results of the inverse model are reported either as 1 or
4-min scans, where these times represent a broad range of representative DMA scanning
times. This allows model predictions to be compared to DMA mass concentrations for
experiments where the aerosol density is known. For 50 and 250 μL syringes (assuming
a debubbler residence time of 66 s), between two and four 4-min transition scans are
needed before the PILS-measured concentrations stabilize and match the step function
concentration change. Fewer scans are usually needed prior to stabilization for the 50 μL
syringes compared to 250 μL syringes because fewer experimental transition vials are
considered, and the mixing time is significantly shorter in the 50 μL syringes (46 s round-
trip versus 230 s for 50 and 250 μL syringes, respectively). For the modified PILS test
with 1-min vials and the shorter debubbler residence time (15 s), predictions showed that
two or three 1-min scans are needed prior to stabilization. It is predicted that only one 1-
min scan is needed for the original PILS to reach stable concentrations with a 15 s
debubbler residence time and a 1-min duty cycle time. After the period of transition, the

25
model accurately predicts the minimum and maximum concentrations associated with the
step changes to within 1% for both the modified and original PILS.
2.6.1 PILS Collection Efficiency for Different Aerosol Seeds To determine the PILS collection efficiency for aerosols of different composition
and to compare the model with experimental results, the modified PILS sampled a variety
of laboratory aerosols in parallel with a DMA. The aerosols studied include (NH4)2SO4,
NH4NO3, NaCl, Na2SO4, K2SO4, and KNO3. A constant rate atomizer generated particles
that were dried before reaching two 210Po neutralizers and then injected into a 28 m3
teflon chamber. A source of constant concentration aerosol allowed for direct
comparison between the PILS, DMA, and model predictions. The relative humidity (RH)
inside the chamber was maintained at less than 6% and the temperature was kept at 20oC
(Vaisala HMP230 series transmitters). The PILS tip temperature was maintained at 100
+ 2°C for these tests. Complete number distributions (10-800 nm) were provided with 4-
min frequency by a cylindrical scanning electrical mobility spectrometer, connected to a
TSI model 3760 condensation nuclei counter. On average, the size distribution of the
atomized seed aerosol particles was unimodal, with a number concentration mode
centered between 70 and 100 nm and a geometric σ between 1.5 and 1.7. Using
appropriate corrections for particle charging, DMA transfer function, and other scanning
voltage correction factors, data from the DMA can be used to calculate a total aerosol
volume concentration in the aerosol flow. Because the RH was less than 6% for all tests,
the pure seed aerosol densities could be used to convert from volume to mass
concentration. The DMA-derived masses were used to determine the relative

26
contributions of cations and anions present based on the measured anion-to-cation ratios
in the atomized solutions. The aerosols listed above were used to study the volatilization
effects for NH4+, Cl-, and NO3
-. The collection efficiency of two of the aerosols tested,
(NH4)2SO4 and Na2SO4, were also measured by Ma (2004) in a laboratory setting using a
similar approach with the original PILS.
The collection efficiency of the PILS compared to the DMA and the molar ratios
measured in the PILS vials, as total averages, are shown in Tables 2.5 and 2.6,
respectively. The total aerosol mass loadings for these tests ranged between 1 and 140
μg m-3, with no significant variation in the collection efficiency as a function of mass
loading for all ions studied. The PILS measurements are within 4% of the DMA-derived
mass concentrations for K+, Na+, SO42-, Cl-, and NO3
-. The collection efficiency of NH4+,
however, is approximately 88% for the two ammonium-containing aerosols studied. The
measured molar ratios are near the expected values for each seed aerosol tested, with the
exception of ammonium-containing aerosols, where the ratio is lower than expected,
confirming that NH4+ is vulnerable to volatilization loss within the PILS system.
Measured collection efficiencies of Cl- and NO3- were on the order of 96 to 97%,
suggesting that they are less susceptible to volatilization losses as compared to NH4+.
These results are consistent with thermodynamic data shown earlier (Figure 2.3),
indicating that over the temperature span of PILS operation, NH4+ is the ion most
susceptible to volatilization.
Ma (2004) reports that when (NH4)2SO4 was generated and sampled by a PILS in
laboratory tests, the mean NH4+:SO4
2- molar ratio showed that NH4+ was undermeasured
by approximately 10 + 10%. When Na2SO4, a relatively non-volatile compound, was

27
tested, the mean Na+:SO42- ratio was 2.03 + 0.06. A comparison of the results from these
two tests provides further evidence that NH4+ volatilization occurs in the PILS.
Furthermore, the observed molar ratios from the Na2SO4 and (NH4)2SO4 laboratory tests
show agreement between this study and that of Ma (2004).
Theoretical calculations for NH4+ losses in the PILS in Figure 2.6 show
consistency with the experimental observations. Ma (2004) showed that the pH for PILS-
collected liquid with dissolved particle sample can be 5.6, which is consistent with
measurements obtained with the current PILS. Assuming a pH of 5.6 as an average for
droplets composed of ammonium-containing aerosol particles, calculations predict that 5
to 15% and 7 to 20% of the total NH4+ is lost by volatilization for particle surface
temperatures between 30 and 40°C, respectively, for a range of dilution factors between
1.1 and 1.4 (this range is representative of field and laboratory test conditions). These
two particle surface temperatures represent a range of values predicted by the PILS
model for the operating conditions in these tests. Therefore, the bars shown in Figure 2.6
should be used as a range for the predicted NH4+ loss. The experimentally determined
12% loss of NH4+ is in the range of the predicted values for the expected operating
conditions in the condensation chamber.
2.6.2 Tip Temperature Sensitivity Tests
Several tests were performed to determine the influence of the tip temperature on
the sampling efficiency of aerosols composed of (NH4)2SO4, NH4NO3, NaCl, Na2SO4,
K2SO4, and KNO3. Vials were collected while the tip temperature was maintained at 100
+ 2°C. The tip temperature was then allowed to increase to between 120 and 150°C for at

28
least 20 min before decreasing and restabilizing at 100 + 2°C, during which time vials
were continuously being collected.
Figure 2.8 shows results from a representative test performed using (NH4)2SO4
aerosol. Prior to the intense heating, the collection efficiency of NH4+ and SO4
2- are 90
and 100%, respectively. When the tip temperature was increased to 147°C, the collection
efficiency for both species dropped to between 30 and 35% before returning to their
original values when the tip temperature was reduced to 100°C. During the period after
the tip returned to 100 + 2°C, NH4+ initially exhibited a collection efficiency between 86
and 91% (between 0 and 35 min after the tip returned to 100 + 2°C), but stabilized at 91%
for the last two vials collected 70 and 75 min after the tip returned to 100 + 2°C. The
collection efficiency of SO42- was consistently between 98 and 101% after the intense
heating. The increased sensitivity of NH4+
to the intense heating immediately after the tip
temperature was lowered to 100 + 2°C is due to the heated condensation chamber and
impactor plate, leading to additional volatilization losses before the temperature
decreased. The general response of NH4+ to the excessive heating shown in Figure 2.8 is
consistent with that observed for the other five aerosols listed above.
These results show that as the tip temperature is increased, particles grow to a
sufficiently large size that deposition results in substantial droplet losses in the
condensation chamber, specifically in the conical reduction region leading to the
impactor jet. The initial decrease in species concentrations may, to a lesser extent, be
partly associated with increased condensation of water vapor onto the droplet impactor
and resultant dilution, since the temperature difference between the impactor plate and
the mixed flow of steam and air is higher just after the tip temperature increases. During

29
the intense heating, the increased deposition losses explain the observed decreases in
collection efficiency of non-volatile species such as Na+, K+, and SO42-. Also, intense
heating in the condensation chamber was shown to lead to additional volatilization losses
for NH4+ (exceeding those shown in Table 2.5) even when the tip temperature was
allowed to return to normal operating values, since the chamber and the impactor plate
remained at elevated temperatures over one hour after the intense heating tests were
completed. These results emphasize the importance of maintaining the tip temperature at
100°C to minimize volatilization and deposition in the condensation chamber.
The PILS model developed here underestimates losses in the condensation
chamber if deposition is primarily responsible for increased losses during the intense
heating periods. The model predicts collection efficiencies of 84 and 66% for droplet
diameters of 10 and 15 μm, respectively. The droplet diameters predicted for tip
temperatures ranging from 93 to 150°C in Figure 2.5b are all less than 6 μm, assuming an
accommodation coefficient of 0.01. Larger droplet sizes would be predicted with larger
values of the accommodation coefficient, yielding better agreement between
measurements and predictions for particle losses; droplets are predicted to grow to 11 μm
at a tip temperature of 150°C and assuming an accommodation coefficient of 1. If the
accommodation coefficient has a temperature dependence, this could explain both the
increased droplet growth at higher tip temperatures and the significant droplet losses
predicted. The equations used to predict droplet losses in the PILS, particularly the
conical reduction section, are likely underpredicting the losses for the larger droplets.

30
2.7 Field Data
A modified PILS has been successfully deployed in two field missions and the
reader is referred to Sorooshian et al. (2006) for an in-depth analysis of data collected
during the 2004 ICARTT field campaign. Flight tracks and data from one flight during
ICARTT are shown in Figure 2.9 where the Center for Interdisciplinary Remotely-Piloted
Aircraft Studies (CIRPAS) Twin Otter research aircraft flew transect legs downwind of
the Conesville Power Plant (Coshocton County, Ohio) in clouds. There was significant
SO42- growth with increasing distance downwind of the plant due to conversion of SO2 to
SO42-. The ammonium-to-sulfate molar ratio was between 1.1 and 1.6 for most of the
flight downwind of the plant, indicating that there was insufficient ammonia to neutralize
the relatively high level of sulfuric acid. The high level of acidity can also explain why
virtually no NO3- was detected (< 0.3 μg/m3). Oxalate and SO4
2- are strongly correlated
and aqueous-phase precursors to oxalic acid, including glyoxylate, were detected
indicating that aqueous-phase processing in cloud led to the elevated levels of oxalate
measured during this flight. The results show that the modified PILS design is effective
at quantifying ambient mass concentrations of both inorganic and organic acid ions with
5-min time resolution.
2.8 Future Work
There are several ways to improve the design of the PILS. The time response of
the instrument to concentration changes can be improved by minimizing the liquid
residence time in mixing vessels, primarily the debubbler and the syringes (only used in
the modified design). With the modified PILS, syringe volumes can be reduced and they

31
can be driven at higher speeds to minimize both the unpumped liquid volume in the
debubbler and the residence time in the syringes. PILS users can correct for
volatilization losses with correction factors (error bars) based on experimental results,
such as those presented here for NH4+. The instrument can also be optimized with
respect to sampling organic aerosol both in laboratory tests and ambient field studies.
Longer IC programs can be used to improve resolution of organic peaks by storing liquid
samples in vials for subsequent off-line chemical analysis vs. the limited time for
chromatographic separations of the on-line systems (Weber et al., 2001). It should be
noted that the original PILS can perform longer IC programs as well, however, this is
only practical for ground-based sampling since users must sacrifice time resolution
during airborne flights. The PILS can also be coupled to other analytical detectors to
quantify organics other than the organic acids that the IC can detect. A new technique
described by Sullivan et al. (2004) couples the PILS to a TOC analyzer in order to
quantify water-soluble organic carbon (WSOC). Techniques such as this increase the
fraction of the total particulate organic mass that the PILS can speciate and quantify.
2.9 Conclusions
This study has introduced a modified PILS, as well as a model of the PILS
sampling behavior. The main modification in this PILS is the implementation of syringe
pumps to drive the liquid sample flow from the impactor to vials held on a rotating
carousel. The instrument’s time resolution is not limited by the duty cycle time of any
on-line analytical technique, which is advantageous for airborne studies; this allows for a
variety of analytical tests to be performed on an individual liquid sample, including

32
longer IC gradient programs to resolve more organic peaks. This design of the PILS is
also well-suited for remote ground-based operation as it requires less monitoring
compared to a PILS connected to an analytical instrument.
An instrument model is developed that takes into account mixing effects,
plumbing efficiencies, droplet growth, evaporation of semi-volatile species, and the
“handshaking” technique of the syringes. When considering multiple step changes in the
aerosol sample, the model accurately predicts experimentally measured concentrations in
PILS vials. It was shown that for the modified PILS configurations used in this study (50
and 250 μL syringes with a debubbler residence time of 66 s) that one or two 5-min
transition vials are needed before stable concentrations (+ 1% by mass) are reached in
successive vials. However, when the debubbler residence time is reduced to 15 s and 1-
min vials are collected using 50 μL syringes, only one transition vial is needed. The
minimum predicted time delay prior to reaching stabilization after a step change is
between 301 and 313 s for two modified PILS configurations and the original PILS
(assuming a debubbler residence time of 66 s), suggesting that mixing in the debubbler is
mainly responsible for the time delay. An inverse model is also developed to back-
calculate the actual time-history of aerosol concentrations entering the PILS based on the
measured concentrations. The predictions show intermediate agreement with
experimental data from the modified PILS, with the main issue being that the model
cannot completely deconvolute the mixing effects within the PILS during the transition
between step changes. However, after the transition period in the forward and inversion
models, predictions and experimental data for the aerosol mass concentrations agree
within 1%.

33
Results from laboratory characterization tests of the sampling efficiency and
volatilization losses within the PILS have been compared to model predictions and good
agreement has been found. Characterization tests show that the average modified PILS
mass collection efficiency, as compared to the DMA-derived mass for a variety of
aerosols exceeds 96% with the exception of NH4+, which exhibits a collection efficiency
of 88% (n = 369) for (NH4)2SO4 and NH4NO3. Results from similar tests conducted with
an original PILS for (NH4)2SO4 and Na2SO4 aerosols agree with those observed with the
modified PILS. When considering the operating conditions in the condensation chamber,
it is predicted that between 5 and 20% of the particle-phase NH4+ is converted to gas-
phase NH3, which is consistent with experimental results. The temperature at the point
where steam and the aerosol sample mix is an important parameter that must be properly
controlled to prevent significant particle losses. If the tip temperature is too high, the
increase in supersaturation produces larger droplets that are more effectively lost by
deposition in the condensation chamber. Volatilization losses of NH4+ are also increased
under high tip temperature conditions. Data from 369 samples of laboratory-generated
(NH4)2SO4 at different mass loadings suggest that PILS users should apply a correction
factor of 1.14 (1/0.88) to their NH4+ results to account for volatility losses (when the tip is
in the operating range of 100 + 2°C). However, this factor should be used with caution
since NH4+ volatilization is theoretically shown to be sensitive to droplet pH and ambient
samples do not necessarily behave like laboratory-generated (NH4)2SO4 samples. Field
data from ICARTT 2004 show that the modified PILS is successful at quantifying
ambient concentrations of inorganic and organic acid ions with 5-min time resolution.

34
2.10 Acknowledgements This work was supported by the National Science Foundation grant ATM-0340832
and the Office of Naval Research.
2.11 References Buhr, S. M., Buhr, M. P., Fehsenfeld, F. C., Holloway, J. S., Karst, U., Norton, R. B., Parrish, D. D., and Sievers, R. E. (1995). Development of a Semicontinuous Method for the Measurement of Nitric-Acid Vapor and Particulate Nitrate and Sulfate, Atmos. Environ., 29(19): 2609-2624. Crane, R. L., and Evans, R. L. (1977). Inertial Deposition of Particles in a Bent Pipe, J. Aerosol Sci., 8: 161-170. Fuchs, N. A. (1964). The Mechanics of Aerosols, Pergamon, Oxford. Gormley, P. G., and Kennedy, M. (1949). Diffusion from a Stream Flowing Through a Cylindrical Tube. Proc. R. Irish Acad., 52A: 163-169. Hameri, K., Laaksonen, A., Vakeva, M., and Suni, T. (2001). Hygroscopic Growth of Ultrafine Sodium Chloride Particles, J. Geophys. Res., 106(D18): 20749-20757. Hangal, S., and Willeke, K. (1990). Overall Efficiency of Tubular Inlets Sampling at 0-90 Degrees from Horizontal Aerosol Flows, Atmos. Environ., 24A: 2379-2386. Hildemann, L. M., Russell, A. G., and Cass, G. R. (1984). Ammonia and Nitric-Acid Concentrations in Equilibrium with Atmospheric Aerosols - Experiment Vs Theory, Atmos. Environ., 18(9): 1737-1750. Kreidenweis, S. M., Walcek, C. J., Feingold, G., Gong, W., Jacobson, M. Z., Kim, C.-H., Liu, X., Penner, J. E., Nenes, A., and Seinfeld, J. H. (2003). Modification of Aerosol Mass and Size Distribution due to Aqueous-phase SO2 Oxidation in Clouds: Comparison of Several Models, J. Geophys. Res., 108 (D7), 4213, doi:10.1029/2002JD002697. Ma, Y. (2004). Developments and Improvements to the Particle-Into-Liquid Sampler (PILS) and its Application to Asian Outflow Studies, Ph.D. Dissertation, Georgia Institute of Technology, Atlanta, GA. Muyshondt, A., McFarland, A. R., and Anand, N. K. (1996). Deposition of Aerosol Particles in Contraction Fittings, Aerosol Sci. Technol., 24: 205-216.

35
Orsini, D. A., Ma, Y., Sullivan, A., Sierau, B., Baumann, K., and Weber, R. J. (2003). Refinements to the Particle-Into-Liquid Sampler (PILS) for Ground and Airborne Measurements of Water Soluble Aerosol Composition, Atmos. Environ., 37: 1243-1259. Parmar, R. S., Satsangi, G. S., Lakhani, A., Srivastava, S. S., and Prakash, S. (2001). Simultaneous Measurements of Ammonia and Nitric Acid in Ambient Air at Agra (27 degrees 10' N and 78 degrees 05' E) (India), Atmos. Environ., 35(34): 5979-5988. Pilinis, C., and Seinfeld, J. H. (1987). Continued Development of a General Equilibrium-Model for Inorganic Multicomponent Atmospheric Aerosols, Atmos. Environ., 21: 2453-2466. Pui, D. Y. H, Romay-Novas, F., and Liu, B. Y. H. (1987). Experimental Study of Particle Deposition in Bends of Circular Cross Section, Aerosol Sci. Technol., 7: 301-315. Quinn, P. K., Asher, W. E., and Charlson, R. J. (1992). Equilibria of the Marine Multiphase Ammonia System, J. Atmos. Chem., 14(1-4): 11-30. Schwendiman, L. C., Stegen, G. E., and Glissmeyer, J. A. (1975). Report BNWL-SA-5138, Battelle Pacific Northwest Laboratory, Richland, Washington. Seinfeld, J. H., and Pandis, S. N. (1998). Atmospheric Chemistry and Physics, Wiley-Interscience, New York. Simon, P. K. and Dasgupta, P. K. (1995). Continuous Automated Measurement of the Soluble Fraction of Atmospheric Particulate Matter, Anal Chem., 67(1): 71-78. Slanina, J., ten Brink, H. M., Otjes, R. P., Even, A., Jongejan, P., Khlystov, A., Waijers-Ijpelaan, A., and Hu, M. (2001). The Continuous Analysis of Nitrate and Ammonium in Aerosols by the Steam Jet Aerosol Collector (SJAC): Extension and Validation of the Methodology, Atmos. Environ., 35(13): 2319-2330. Sorooshian, A., Varutbangkul, V., Brechtel, F. J., Ervens, B., Feingold, G., Bahreini, R., Murphy, S. M., Holloway, J. S., Atlas, E. L., Buzorius, G., Jonsson, H., Flagan, R. C., and Seinfeld, J. H. (2006). Oxalic Acid in Clear and Cloudy Atmospheres: Analysis of Data from ICARTT 2004, J. Geophys. Res., 111, D23S45, doi:10.1029/2005JD006880. Stolzenburg, M. R. and Hering, S. V. (2000). Method for the Automated Measurement of Fine Particle Nitrate in the Atmosphere, Environ. Sci. Technol., 34(5): 907-914. Sullivan, A. P., Weber, R. J., Clements, A. L., Turner, J. R., Bae, M. S., and Schauer, J. J. (2004). A Method for On-Line Measurement of Water-Soluble Organic Carbon in Ambient Aerosol Particles: Results from an Urban Site, Geophys. Res. Lett., 31:L13105. Thomas, J. W. (1958). J. Air Pollut. Control Assoc., 8:32.

36
Trebs, I., Metzger, S., Meixner, F. X., Helas, G. N., Hoffer, A., Rudich, Y., Falkovich, A. H., Moura, M. A. L., da Silva, R. S., Artaxo, P., Slanina, J., and Andreae, M. O. (2005). The NH4+-NO3--Cl--SO42--H2O Aerosol System and its Gas Phase Precursors at a Pasture Site in the Amazon Basin: How relevant are Mineral Cations and Soluble Organic Acids?, J. Geophys. Res., 110(D7), doi:10.1029/2004JD005478. Wang, J., McNeill, V. F., Collins, D. R., and Flagan, R. C. (2002). Fast Mixing Condensation Nucleus Counter: Application to Rapid Scanning Differential Mobility Analyzer Measurements, Aerosol Sci. Technol., 36: 678-689. Weber, R. J., Orsini, D., Daun, Y., Lee, Y. N., Klotz, P. J., and Brechtel, F. J. (2001). A Particle-Into-Liquid Collector for Rapid Measurement of Aerosol Bulk Chemical Composition, Aerosol Sci. Technol., 35:718-727. Willeke, K., and Baron, P. A. (2001). Aerosol Measurement: Principles, Techniques, and Applications, Wiley-Interscience, New York. Zellweger, C., Ammann, M., Hofer, P., and Baltensperger, U. (1999). NOy Speciation with a Combined Wet Effluent Diffusion Denuder-aerosol Collector Coupled to Ion Chromatography, Atmos. Environ., 33(7): 1131-1140. Zhang, J., Chameides, W. L., Weber, R. J., Cass, G., Orsini, D., Edgerton, E., Jongejan, P., and Slanina, J. (2002). An Evaluation of the Thermodynamic Equilibrium Assumption for Fine Particulate Composition: Nitrate and Ammonium During the 1999 Atlanta Supersite Experiment, J. Geophys. Res., 108(D7), 8414, doi:10.1029/2001JD001592.

37
Table 2.1. Equations for Droplet Growth and Transmission Efficiency in Different Stages of the PILSa
aLaminar and turbulent flow are distinguished by calculating the Reynolds number (Re = ρggUd/η), where ρg, η, U, and d are the density and viscosity of the gas, characteristic gas velocity, and tubing dimension, respectively. The transmission efficiency of the two impactors, which are obtained from theoretical impactor efficiency curves, depend on the jet Reynolds number, the ratio of the jet-to-plate distance and the nozzle diameter (values are given in Figure 2.1), and the Stokes number, Stk = ρpCcD2
pU/9ηW, where ρp and Dp
38
are the particle density and diameter, respectively. The slip correction factor, Cc, accounts for noncontinuum effects, η is the air viscosity, W is the nozzle diameter, and U is the average air velocity at the nozzle exiting point. It is assumed that the droplets that do impact on the second impactor are collected. Hangal and Willeke (1990) argue that there are no inertial transmission losses for sub-isokinetic isoaxial sampling; no losses are assumed to occur in the conical expansion at the beginning of the condensation chamber. bThe labels under this column are shown as markers on Figure 2.2 to indicate which equations are applied when modeling specific stages of the PILS. “P” denotes a plumbing transmission efficiency equation and “D” denotes a droplet growth equation.

39
Table 2.2. Filter Mode Background Levels (n > 300) Air-equivalent concentration (μg m-3) Na+ NH4
+ K+ Mg2+ Ca2+ Average + 3 * σ 0.11 0.27 0.17 0.19 0.28 Cl- NO2
- NO3- SO4
2- Oxalate Average + 3 * σ 0.09 0.10 0.11 0.10 0.02

40
Table 2.3. Effect of Using (NH4)2SO4 and NH4NO3 Independently as Wash-flow Solutions (NH4
+ Collection Efficiency is the Total Average of Both Wash Solution Tests)
Collection efficiency with no steam production SO4
2- (n = 25) NH4+ (n = 45) NO3
- (n = 20) Average 0.99 1.01 0.99 σ 0.02 0.04 0.02
Before steam production [NH4
+]:[SO42-] (n = 25) [NH4
+]:[NO3-] (n = 20)
Average 1.97 0.99 σ 0.04 0.04
During steam production [NH4
+]:[SO42-] (n = 39) [NH4
+]:[NO3-] (n = 23)
Average 1.98 0.98
σ 0.03 0.04

41
Table 2.4. Minimum Time Response (Defined as the Minimum Time Before Successive Mass Concentrations Vary by Less than 1%) to Step Changes in Concentration for the Original and Modified PILS Designs as a Function of the Debubbler Residence Time Minimum Time Response (s) Debubbler Residence Timea (s)
Syringe Volume (μL)/Round-trip Time (s) 66 50 33 10
Original PILS NA 301 227 149 43 50 / 46 304 229 155 45 Modified PILS
250 / 230 313 233 158 48
aThe debubbler residence time is taken to be the time required to empty it when it is completely filled with liquid during normal operation.

42
Table 2.5. PILS Collection Efficiency for Anions and Cations Compared to the DMA; a Shape Factor of 1.08 was Applied to the DMA Data for NaCl (Hameri et al. 2001) Anion SO4
2- NO3- Cl-
Seed aerosol (NH4)2SO4 (n = 283)
K2SO4 (n = 11)
Na2SO4
(n = 19) NH4NO3 (n = 86)
KNO3 (n = 5)
NaCl (n = 16)
PILS [x]/DMA [x] 0.99 0.99 0.97 0.97 0.96 0.96 σ 0.06 0.07 0.05 0.11 0.04 0.04 Cation NH4
+ Na+ K+ Seed aerosol (NH4)2SO4
(n = 283) NH4NO3 (n = 86)
NaCl (n = 16)
Na2SO4 (n = 19)
KNO3 (n = 5)
K2SO4 (n = 11)
PILS [x]/DMA [x] 0.88 0.88 1.01 0.99 0.99 0.98 σ 0.08 0.11 0.07 0.06 0.02 0.05

43
Table 2.6. Molar Ratios for Different Aerosols Tested by the PILS
[NH4+]:
[SO42-]
(n = 476)
[NH4+]:
[NO3-]
(n = 91)
[Na+]: [Cl-]
(n = 16)
[Na+]: [SO4
2-] (n = 22)
[K+]: [SO4
2-] (n = 11)
[K+]: [NO3
-] (n = 5)
Average 1.82 0.92 1.04 2.02 1.97 1.03 σ 0.13 0.09 0.07 0.06 0.10 0.04

44
Figure 2.1. Schematic diagram of the modified PILS.
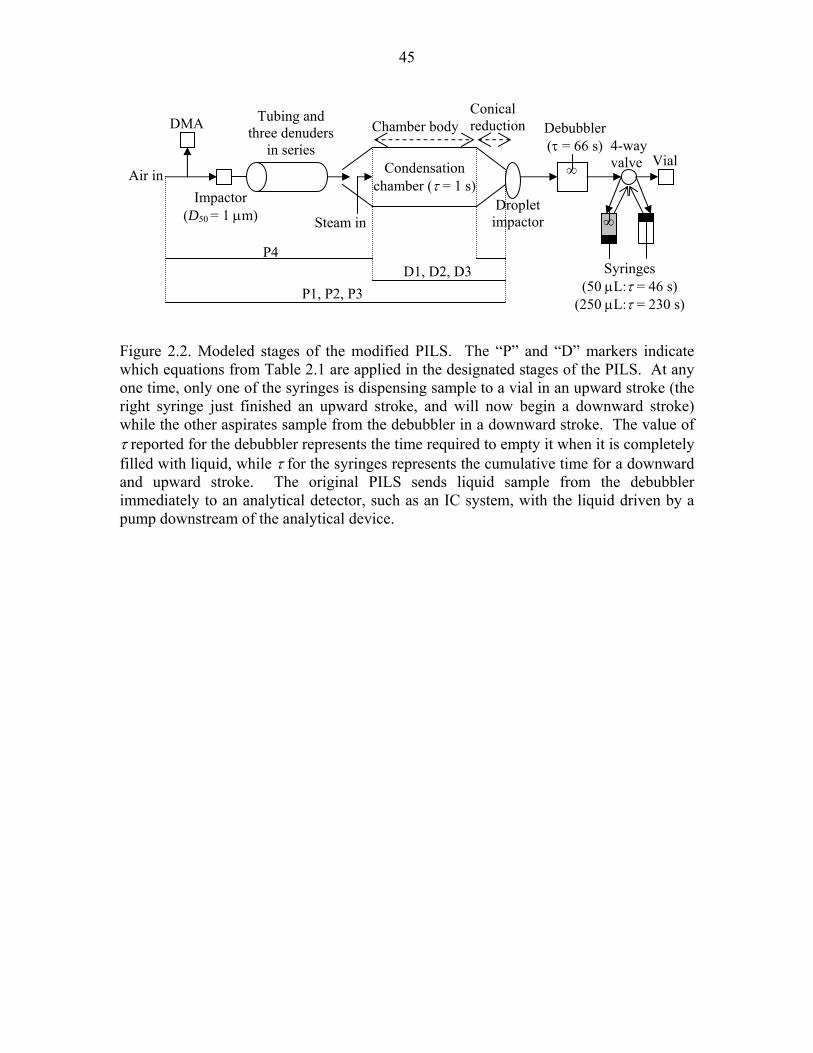
45
Figure 2.2. Modeled stages of the modified PILS. The “P” and “D” markers indicate which equations from Table 2.1 are applied in the designated stages of the PILS. At any one time, only one of the syringes is dispensing sample to a vial in an upward stroke (the right syringe just finished an upward stroke, and will now begin a downward stroke) while the other aspirates sample from the debubbler in a downward stroke. The value of τ reported for the debubbler represents the time required to empty it when it is completely filled with liquid, while τ for the syringes represents the cumulative time for a downward and upward stroke. The original PILS sends liquid sample from the debubbler immediately to an analytical detector, such as an IC system, with the liquid driven by a pump downstream of the analytical device.
Impactor (D50 = 1 μm)
Air in
Tubing and three denuders
in series
Steam in
Condensation chamber (τ = 1 s)
Droplet impactor
Debubbler (τ = 66 s)
Vial ∞
Syringes (50 μL:τ = 46 s)
(250 μL:τ = 230 s)
DMA Chamber bodyConical reduction
4-way valve
P4 D1, D2, D3
P1, P2, P3
∞
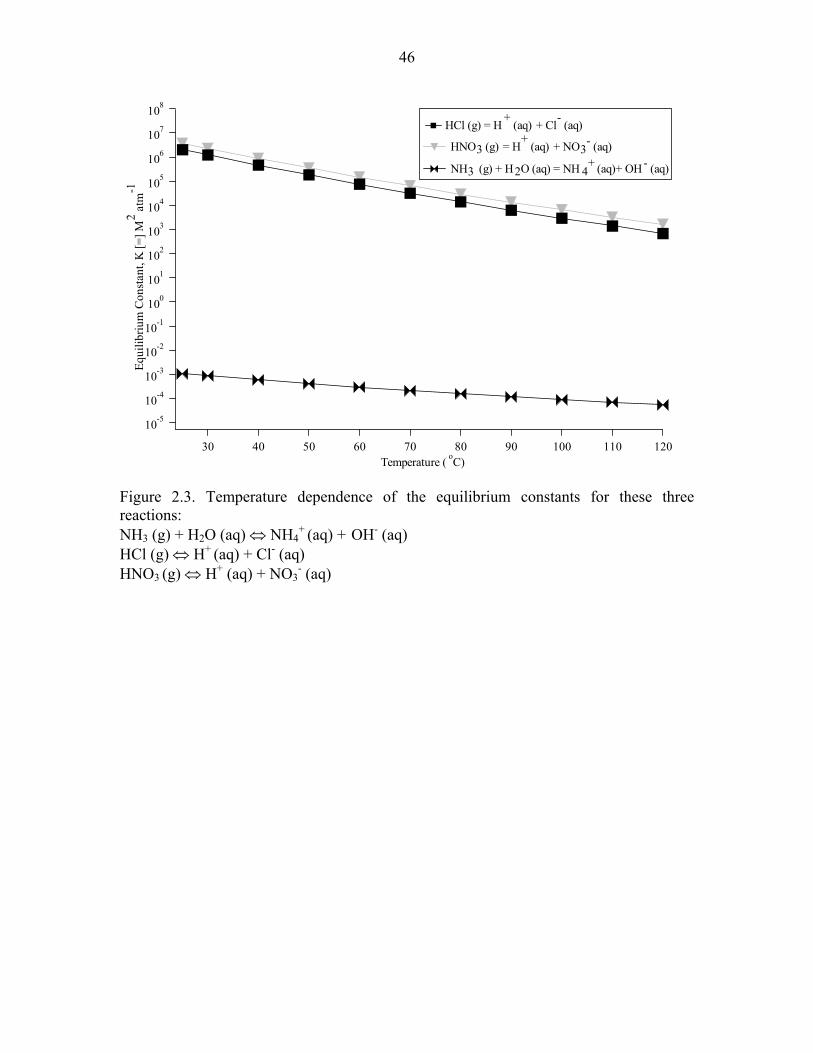
46
10-5
10-4
10-3
10-2
10-1
100
101
102
103
104
105
106
107
108
Equi
libriu
m C
onst
ant,
K [=
] M2 a
tm-1
12011010090807060504030Temperature ( oC)
HCl (g) = H+
(aq) + Cl- (aq)
HNO3 (g) = H+
(aq) + NO3- (aq)
NH3 (g) + H2O (aq) = NH 4+
(aq)+ OH- (aq)
Figure 2.3. Temperature dependence of the equilibrium constants for these three reactions: NH3 (g) + H2O (aq) ⇔ NH4
+ (aq) + OH- (aq) HCl (g) ⇔ H+ (aq) + Cl- (aq) HNO3 (g) ⇔ H+ (aq) + NO3
- (aq)

47
100
90
80
70
60
50
40
30
20
10
0
%
0.012 3 4 5 6 7 8 9
0.12 3 4 5 6 7 8 9
1Incoming Dp (μm)
Transmission Efficiency Relative Contribution of Diffusion to Total Losses Relative Contribution of Inertial Deposition
to Total Losses
Figure 2.4. Transmission efficiency in the PILS as a function of particle diameter for all plumbing prior to droplet growth in the condensation chamber, and the relative contribution of diffusion and inertial deposition to the total losses.

48
100
Figure 2.5. Final droplet diameters after growth in the condensation chamber (τ = 1 s) as a function of the initial particle diameters for different (a) accommodation coefficients (b) and tip temperatures. The (a) total transmission efficiency in the chamber is shown in addition to the (b) relative contribution of different parts of the chamber to the total losses. The final droplet size is more sensitive to both the tip temperature and accommodation coefficient compared to the initial particle size entering the condensation chamber.
a)
b)
4
68
0.1
2
4
68
1
Initi
al D
p (μ
m)
12 3 4 5 6 7 8 9
10Dp after 1 s of growth (μm)
4
68
0.1
1
Initi
al D
p (μ
m)
2
4
68
12 3 4 5 6 7 8 9
10
80
60
40
20
0
% of Total Losses
100
80
60
40
20
0
Transmission Efficiency (%
) Ttip=100oC
α=0.01 α=0.05α=0.1 α=1.0
Transmission Efficiency (Total)
α=0.01Ttip= 93oC Ttip=100oC
Ttip=110oC Ttip=125oC
Ttip=150oC
Losses in chamber body (gravitational settling and inertial deposition) Losses in conical reduction

49
100
Figure 2.6. Percentage of NH4
+ remaining in the particle phase after the 1 s residence time in the condensation chamber as a function of particle surface temperature, acidity, and the amount of water (which is related to the dilution factor). Each marker reflects a dilution factor of 1.25 where the upper and lower bounds reflect dilution factors of 1.4 and 1.1, respectively. Nitrate and chloride results are not shown since they are predicted to stay completely (100%) in the particle phase for all temperatures, acidities, and dilution factors considered here.
90
80
70
60
50
40
30
20
10
% o
f par
ticle
-pha
se N
H4+ R
emai
ning
at t
he E
nd o
f the
Con
dens
atio
n C
ham
ber
140120100806040
pH = 7.0 pH = 5.6 pH = 4.0
20
Particle Surface Temperature o
C)(

50
1.00.80.60.40.20.0
120100806040200Time (min)
1.00.80.60.40.20.0
Nor
mal
ized
Mas
s Con
cent
ratio
n
120100806040200Time (min)
1.00.80.60.40.20.0
35302520151050Time (min)
1.00.80.60.40.20.0
35302520151050Time (min)
Measured PILS results Step change applied Inversion model results Forward model results
Modified PILS, 50 μL syringes, 5-min vials, debubbler residence time = 66 s, 4-min inversion scans
Modified PILS, 250 μL syringes, 5-min vials, debubbler residence time = 66 s, 4-min inversion scans
Original PILS without syringes, 1-min duty cycle time, assumed debubbler residence time = 15 s, 1-min inversion scans
Modified PILS, 50 μL syringes, 1-min vials, debubbler residence time = 15 s, 1-min inversion scans
Figure 2.7. Comparison of experimental and theoretical mass concentrations in the modified PILS. Model predictions are also shown for the original PILS, which does not include syringes in the liquid sample’s path from the debubbler to the analytical detector. All concentrations have been normalized to the maximum concentration applied during the step changes. The time response is shown to be dramatically improved with shorter debubbler residence times (top right), where the residence time is taken to be the time required to empty the vessel when it is completely filled with liquid during normal operation; the 50 μL syringes were set to operate at three times their usual speed (15 s round-trip) and the flow rate ratio between the wash-flow at the top of the droplet impactor and the liquid being aspirated into the syringes from the debubbler was reduced to 1.01, resulting in less liquid volume being held in the debubbler.

51
2.2
2.0
1.8
1.6
[NH
4]:[S
O4]
1.00.80.60.40.20.0
[PIL
S SO
4]:[D
MA
SO
4]
1.00.80.60.40.20.0
[PIL
S N
H4]
:[DM
A N
H4]
1301201101009080706050403020100
Time (min)
150140130120110100
Tip
Tem
pera
ture
(o C
)
Figure 2.8. Tip temperature sensitivity results for a test where the modified PILS sampled (NH4)2SO4 aerosol. During the intense heating (from 10 to 45 min), the tip reaches up to 147°C and the NH4
+ and SO42- mass collection efficiency levels drop significantly. The
molar ratio is slightly less than two whenever the tip temperature is held at 100 + 2°C, mainly due to NH4
+ volatilization.
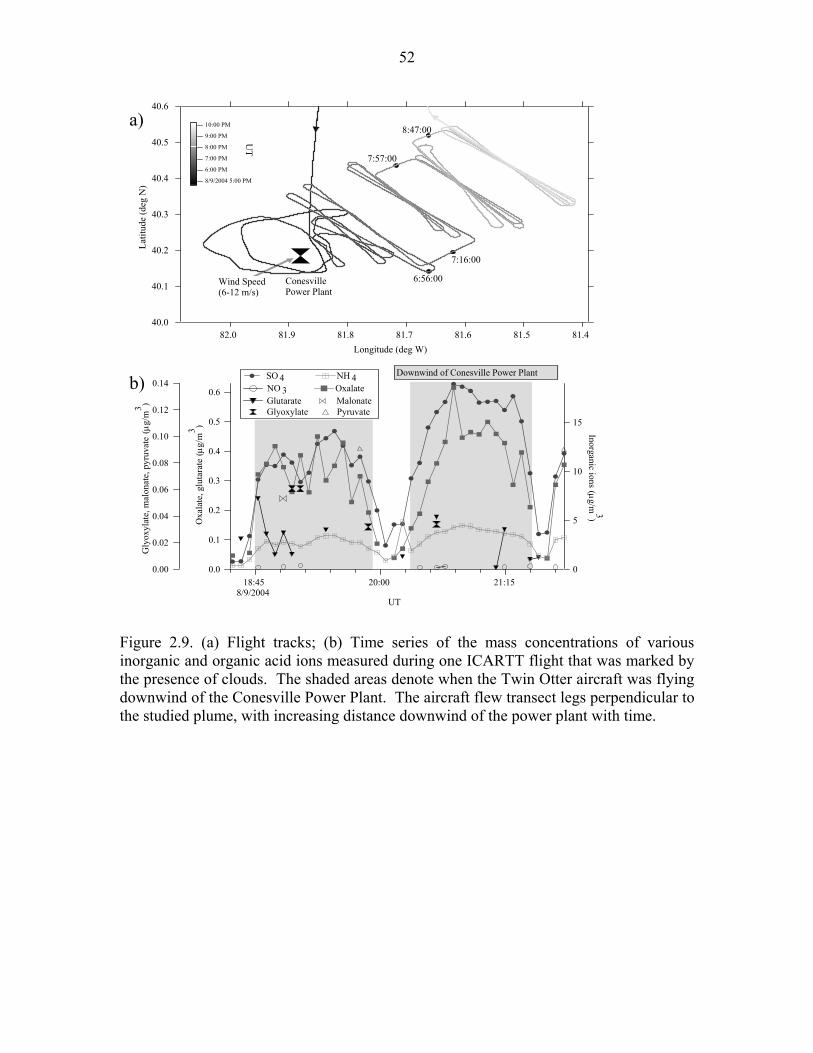
52
40.6
Figure 2.9. (a) Flight tracks; (b) Time series of the mass concentrations of various inorganic and organic acid ions measured during one ICARTT flight that was marked by the presence of clouds. The shaded areas denote when the Twin Otter aircraft was flying downwind of the Conesville Power Plant. The aircraft flew transect legs perpendicular to the studied plume, with increasing distance downwind of the power plant with time.
b)
a)
15
10
5
0
Inorganic ions (μg/m3)
18:458/9/2004
20:00 21:15
UT
0.6
0.5
0.4
0.3
0.2
0.1
0.0
Oxa
late
, glu
tara
te (μ
g/m
3 )
0.14
0.12
0.10
0.08
0.06
0.04
0.02
0.00
Gly
oxyl
ate,
mal
onat
e, p
yruv
ate
(μg/
m3 )
SO 4 NH 4 NO 3 Oxalate Glutarate Malonate Glyoxylate Pyruvate
Downwind of Conesville Power Plant
40.5
40.4
40.3
40.2
40.1
40.0
Latit
ude
(deg
N)
82.0 81.9 81.8 81.7 81.6 81.5 81.4Longitude (deg W)
10:00 PM
ConesvillePower Plant
8/9/2004 5:00 PM
6:00 PM
7:00 PM
8:00 PM
9:00 PM
Wind Speed(6-12 m/s)
UT
7:16:00
7:57:00
8:47:00
6:56:00

53
Chapter 3
Rapid Size-Resolved Aerosol Hygroscopic Growth
Measurements: Differential Aerosol Sizing and
Hygroscopicity Spectrometer Probe (DASH-SP)∗
∗This chapter is reproduced by permission from “Rapid Size-Resolved Aerosol Hygroscopic Growth Measurements: Differential Aerosol Sizing and Hygroscopicity Spectrometer Probe (DASH-SP)” by A. Sorooshian, S. Hersey, F. J. Brechtel, A. Corless, R. C. Flagan, and J. H. Seinfeld, Aerosol Sci. Tech., 2008. Copyright 2008. American Association for Aerosol Research.

54
3.1 Abstract
We report on a new instrument developed to perform rapid, size-resolved aerosol
hygroscopicity measurements. The differential aerosol sizing and hygroscopicity
spectrometer probe (DASH-SP) employs differential mobility analysis in-concert with
multiple humidification and optical sizing steps to determine dry optical size and
hygroscopic growth factors for size-selected aerosols simultaneously at three elevated
relative humidities. The DASH-SP has been designed especially for aircraft-based
measurements, with time resolution as short as a few seconds. The minimum particle
diameter detected with 50% efficiency in the optical particle counters (OPCs) is 135 + 8
nm, while the maximum detectable particle diameter is in excess of 1 μm. An iterative
data processing algorithm quantifies growth factors and “effective” refractive indices for
humidified particles using an empirically-derived three-dimensional surface (OPC pulse
height - refractive index – particle size), based on a calculated value of the “effective” dry
particle refractive index. Excellent agreement is obtained between DASH-SP laboratory
data and thermodynamic model predictions for growth factor dependence on relative
humidity for various inorganic salts. Growth factor data are also presented for several
organic acids. Oxalic, malonic, glutaric, and glyoxylic acids grow gradually with
increasing relative humidity up to 94%, while succinic and adipic acids show no growth.
Airborne measurements of hygroscopic growth factors of ship exhaust aerosol during the
2007 Marine Stratus/Stratocumulus Experiment (MASE II) field campaign off the central
coast of California are presented as the first report of the aircraft integration of the
DASH-SP.

55
3.2 Introduction
Uptake of water by atmospheric aerosols is important in a variety of phenomena:
light scattering, ability to act as cloud condensation nuclei, and deposition within the
human respiratory system. Aerosol hygroscopicity measurements have been made with a
variety of systems (Table 3.1). The parameter normally quantified is the diameter growth
factor (GF = Dp,wet/Dp,dry). Laboratory growth factor measurements are commonly
performed by levitating a particle in an electrodynamic balance (Cohen et al., 1987a,
1987b; Tang and Munkelwitz, 1993, 1994a, 1994b; Chan et al., 1997; Peng et al., 2001;
Peng and Chan, 2001). This method probes single, laboratory-generated particles,
directly measuring the mass change in response to humidity variation. The need to
directly measure the growth factor of ambient aerosols led to the development of the
hygroscopicity tandem differential mobility analyzer (HTDMA) (Liu et al., 1978;
Sekigawa, 1983; Rader and McMurry, 1986), in which dry particles of a selected size are
exposed to a specific relative humidity (RH), after which the wet size is measured by
classifying the grown particles with a second DMA, and counting with a condensation
particle counter (CPC). Owing to the long duration of time required to measure the size
distribution of the grown particles using a DMA, the HTDMA technique is relatively
slow. However, both techniques above enable high-precision measurements of the
growth factor.
While these methods have produced important insights into the hygroscopic
behavior of atmospheric aerosols, the long time required to determine growth factors for
different particle sizes and RHs makes them impractical in a number of important
measurement scenarios in which the properties of sampled particles vary rapidly,

56
especially during airborne measurements. A number of alternate methods, which are
described in detail in Table 3.1, have been employed to probe the hygroscopic properties
of the atmospheric aerosol more rapidly than is possible with the HTDMA. Several of
these methods probe the entire aerosol as measured at different humidities, using
nephelometers to probe ensemble light scattering (Rood et al., 1985; Dougle et al., 1998;
Carrico et al., 1998, 2000; Sheridan et al., 2002; Magi and Hobbs, 2003; Kim et al.,
2006), or measuring aerosol size distributions with optical particle sizing instruments in
parallel (Kotchenruther and Hobbs, 1998; Hegg et al., 2006, 2007; Snider and Petters,
2007), or multiple DMAs operated in parallel (Wang et al., 2003). The use of an optical
particle counter (OPC) in place of a DMA detector is not new, as several investigators
(Covert et al. 1990; Hering and McMurry 1991; Brand et al. 1992) used OPC detection of
mobility-classified particles to gain insight into the mixing state of atmospheric aerosol
and to determine their optical properties. One approach that attempts to provide the
resolution of the HTDMA without the response time limitations is to classify particles
with a DMA operated at one RH, equilibrate the classified particles at a second RH, and
then measure the resulting size distribution using a fast particle sizer such as an OPC.
Kreisberg et al. (2001) classified particles at a high RH, dried the classified particles, and
measured the dry particle size using an OPC in an instrument they called the relative
humidity-moderated differential mobility optical particle size spectrometer (RH-
DMOPSS). The RH-DMOPSS, which is an extension of the DMOPSS design of
Stolzenburg et al. (1998), measures shrinkage by drying rather than growth upon
humidification like most other hygroscopic growth instruments. The RH-DMOPSS is an
improvement upon the HTDMA in that it is faster and can measure a larger range of

57
particle sizes (0.1 – 1.1 μm). However, this instrument provides a growth factor at only
one RH at any given time.
In this paper, we describe a new instrument that enables simultaneous
determination of growth factors at several RHs, and that overcomes the challenges of
determining the size of dry particles with unknown composition. The instrument has
been designed especially for aircraft-based measurements. The differential aerosol sizing
and hygroscopicity spectrometer probe (DASH-SP), developed by Brechtel
Manufacturing Inc. (http://www.brechtel.com/), employs DMA classification of dry
aerosol particles, equilibrates the classified particles to a new RH, and then measures the
sizes of the grown particles using an OPC. An iterative data processing algorithm
quantifies growth factors and “effective” refractive indices (n) for wet particles based on
a calculated “effective” dry particle refractive index; iterations are performed on a three-
dimensional surface (pulse height – n – Dp) based on dry particle calibration data from
several salts with known refractive indices. By operating four controlled-RH channels in
parallel and equipping each of the humidified channels with a separate OPC, hygroscopic
growth factors can rapidly be determined at a number of particle sizes without having to
incur the time delays required to stabilize a humidification column to a new RH.
Depending upon the concentration and size distribution of the aerosol sampled, the
growth factors of particles at any selected size within the size resolution of the instrument
can be determined in as little as a few seconds.
We present first an overview of the design of the DASH-SP instrument. Results
from laboratory characterization tests illustrate the performance of the instrument,
including size detection limits, time resolution, stability, accuracy, and inherent

58
uncertainties. The data processing algorithm is subsequently described, which is used to
convert pulse height data to growth factors. Hygroscopicity measurements for various
inorganic salts and organic acids are compared to theoretical predictions for growth factor
dependence on RH. Finally, airborne field measurements establish that the DASH-SP is
capable of measuring growth factors at multiple sizes and RHs with a time resolution as
much as two orders of magnitude shorter than that of the HTDMA.
3.3 DASH-SP Description
The DASH-SP, illustrated in Figure 3.1, couples a single classification DMA
system with a set of growth factor measurement systems that are operated in parallel. The
modules that comprise the instrument are, in the order in which the aerosol experiences
them: (1) an aerosol drier; (2) an aerosol neutralizer; (3) a classification DMA that selects
the dry mobility size range for which growth factor measurements are made; (4) a set of
parallel aerosol conditioning modules in which the aerosol is brought to equilibrium at
controlled RHs; and (5) a detector at the outlet end that determines the total particle
concentration leaving the DMA, and the size distributions of the particles after RH
equilibration. The aerosol path through the instrument will now be described in detail.
A 0.5 LPM aerosol sample flow first passes through a Nafion drier (described
below), and then passes through a 210Po neutralizer that brings the dried particles to a
stable, steady-state charge distribution. The aerosol then enters a cylindrical DMA with a
33.9-cm-long classification column, and inner and outer radii of 62.4 mm and 72.3 mm,
respectively. The DMA sheath flow rate is 5 LPM. The DMA selects particles in a
narrow interval of mobility-equivalent diameters in the 0.1 to 1.0 μm range. The

59
minimum voltage at which particles are classified is 281 V (to select 150 nm diameter
particles), so Brownian diffusion does not significantly broaden the DMA transfer
function (Flagan 1999), and the transmission characteristics of the DMA closely
approach the ideal, nondiffusion transfer function of Knutson and Whitby (1974).
Particles larger than 1 μm can be classified by operating the DMA at lower flowrates,
although the fraction of particles that carry multiple charges will become significant,
making data analysis more difficult. For the present purposes, we shall limit discussion to
measurement of growth factors of particles with dry diameters of 1 μm or smaller. The
classified aerosol leaving the DMA is split into five separate flows. The total
concentration of classified particles is determined, without further conditioning of one of
the five flows, by measuring the dry, classified particles using an integral TSI Model
3781 water-based condensation particle counter (CPC). The CPC serves as a redundant
particle number concentration measurement against which data from the OPCs, to be
described below, can be compared.
The remaining four classified aerosol flows are used to measure growth factors.
They first pass through a Perma Pure, LLP, Nafion humidifier (Model MD-070-24FS-4)
that consists of a Nafion membrane tube that is enclosed in a coaxial tube. The Nafion
efficiently transmits water through the membrane, enabling the small aerosol flow
through the center tube to equilibrate with the RH of the larger flow between the
membrane and the outer shell. The RH of that larger flow is adjusted by mixing of dry air
with air that has been saturated with water vapor by passage through a Nafion tube coil
that is immersed in a warm water bath. Feedback control using an RH sensor (Model
HMP50YCC1A2X, Vaisala) ensures that a constant, predetermined RH is achieved in

60
both the conditioned aerosol flow, and the outer flow. One humidifier is kept dry (< 8%
RH), while the other three are operated at higher and different RHs. The maximum RH is
typically below 94% in order to prevent condensation within the instrument, although
higher RH can be used for short periods of time.
The aerosol growth factor is measured as a surrogate for particle growth in
response to humidity changes in the atmosphere where sufficient time is generally
available for the droplets to fully equilibrate with atmospheric water vapor. To simulate
the atmospheric response effectively, the time in the conditioning columns must be
sufficient to ensure full equilibration. The characteristic time for a droplet to reach
thermodynamic equilibrium with water vapor in unsaturated conditions (RH < 100%) is
estimated to be on the order of microseconds (Pilinis et al., 1989). The ~ 4 s residence
time within each conditioning column is sufficient to ensure equilibration. Moreover, as
described below, the outer flow from the Nafion humidifier is used as a sheath flow
within the OPC to ensure that the equilibrium is maintained to the point of measurement.
The four conditioned aerosol flows pass directly to dedicated, custom-built OPCs,
designed to detect particles in the 100 nm to 3 µm diameter size range. To ensure that
particles pass through the 1.4 x 10⁻³ mm3 view volume of the collection optics, the
aerosol (0.06 LPM) and a coaxial sheath flow (4 LPM) are focused by acceleration
through a nozzle. Laboratory tests have shown that the sheath and aerosol streams do not
mix. The view volume of the OPCs is determined by calculating the intersection volume
of the cylindrical particle beam and the laser light sheet through which particles pass. The
design of the laser light sheet is such that all particles that enter the OPC optical cavity
pass through the light. The thickness of the laser light sheet is measured in two ways: 1)

61
projecting the laser against a distant surface and then measuring the projected width with
a vernier caliper while using a light meter to define the edges of the light; and 2) by using
an oscilloscope to measure the pulse width and, therefore, the transit time of individual
particles through the light sheet. The particle velocity is calculated using the known flow
rate through the accelerating nozzle. By multiplying the velocity by the transit time, the
thickness of the laser light sheet is determined. The two methods for measuring the light
sheet thickness agree to within 15% and found a thickness of 0.015 mm. However, the
light sheet does not have perfect edges. Therefore, larger particles are observed above
the comparator threshold for slightly longer pulse widths.
To minimize size changes during measurements, the OPCs measure scattering of
light from single particles as they pass through the laser light sheet originating from the
diode laser (λ = 532 nm, World Star Technologies, Model TECGL-30). Scattered light is
collected using an elliptical mirror from a wide angle ( +64°/-50° in vertical plane and
+/-74° in horizontal plane) in the near forward direction to integrate over the Mie
resonances, thereby minimizing intensity oscillations that might otherwise lead to
ambiguity in size determination. A cone of scattered light (+/-22°) emanating from the
view volume along the axis of the laser is not collected due to a pass-thru hole in the
elliptical mirror that is needed to allow the laser to exit the optical cavity. The mirror
focuses the scattered light onto a photomultiplier tube (PMT, Hamamatsu Model H6779-
02). RH, temperature (T), flow, and pressure (P) sensors monitor conditions of all flows,
both upstream and downstream (except flow) of each OPC.
The DASH-SP employs two data acquisition systems: a high-speed system to
acquire the pulse data produced by the photomultipliers, and a second system to monitor

62
signals from the slower sensors used to record T, RH, DMA size selection, DMA voltage,
OPC gain settings, etc. The signal from the PMT is processed through two gain stages,
low gain for measurement of particles larger than about 450 nm, and high gain for
particles in the 135 < Dp < 450 nm size range. The instrument automatically selects the
appropriate gain stage according to the size expected for that channel. A four-channel
high-speed digitizer (National Instruments™, Model PCI-6132) accumulates the
logarithmically amplified, detected peak PMT signals from individual particles for count
rates up to 2.5 x 10⁶ s-1, corresponding to a concentration of 2.5 x 106 cm-3. Particle
coincidence, which occurs when multiple particles are simultaneously in the OPC view
volume, is a function of particle number concentration, view volume, and particle size.
The coincidence performance of the OPC was validated by simultaneously sampling the
same DMA-selected particles with two CPCs and the OPC. One CPC sampled upstream
of the OPC, while the second CPC sampled downstream of the OPC. The maximum
coincidence error associated with the laboratory and field measurements during this study
is 3%, while the 1% particle coincidence concentration limit is approximately 5000 cm-3
and 350 cm-3 for the smallest (~ 135 nm for high gain) and largest (~ 450 nm for high
gain) detectable particles, respectively, in the OPCs.
The DASH-SP can be operated manually or autonomously. In manual operation,
the user specifies the RH for each humidifier, the size of particles to be selected by the
DMA, and the number of particles to be sized by the OPC for each RH channel. The
autonomous mode can step through a number of particle sizes and RHs, measuring a
specified number of particles for each Dp/RH combination. Changing the RH on any
conditioning column slows the measurements due to the time required for the RH to

63
stabilize after such a change. The typical RH equilibration time needed after a step
change in RH from < 10% to be within + 1% of 74%, 85%, and 92% was determined to
be 236 + 61 s, 372 + 106 s, and 569 + 97 s, respectively (n = 11); these equilibration
times represent an upper limit since smaller changes in RH within these broad ranges
would ideally be carried out during experiments.
3.4 Experimental Methods
A series of laboratory experiments were conducted to characterize the DASH-SP
while it operated in the manual mode. For all characterization tests described below, test
salt aerosols were employed. Salt solutions were prepared by mixing a known amount of
salt with Milli-Q water, usually resulting in 0.2% (by mass) solutions. A compressed air
source, with a downstream high-efficiency particulate air (HEPA) filter to remove
particulate contaminants, supplied flow to a stainless steel, constant-rate atomizer (Liu
and Lee 1975) and sheath air flows for the DMA and OPCs. A dilution flow system was
used to maintain atomizer output particle number concentrations below 1000 cm-3 at a
DMA-selected size.
The DASH-SP was also deployed on the Center for Interdisciplinary Remotely-
Piloted Aircraft Studies (CIRPAS) Twin Otter aircraft in the July 2007 Marine
Stratus/Stratocumulus Experiment (MASE II) campaign, in which airborne aerosol and
cloud measurements were carried out off the central coast of California. For the duration
of the field study, the instrument operated in the autonomous mode where the scan sizes
and minimum OPC pulse count quantities were pre-programmed. We briefly present
data from one particular flight to report the first airborne deployment of the DASH-SP; a

64
more comprehensive analysis of data from this entire campaign will be presented in
subsequent work.
3.5 Instrument Characterization
3.5.1 Size Limits of OPC Detection
The range of particle sizes in which characterization experiments are carried out
depends on the OPC size detection limits. The optical properties of salts vary, so the size
detection limit of the OPCs is a function of the composition of an aerosol sample. By
sampling a set of 16 different species (10 inorganic, 6 organic), the minimum particle
diameters detected with 50% efficiency in the OPCs were found to be 135 + 8 nm and
234 + 16 nm for high- and low-gain settings, respectively. The variation in OPC
response as a function of refractive index is contained within the standard deviations,
which reflect the variability among the ensemble of salts tested. The maximum size that
can be detected accurately by the OPC is approximately 450 + 30 nm with the high-gain
setting, and beyond 1 μm with the low-gain setting. However, uncertainties associated
with multiply charged particles are enhanced when detecting particles of increasing size,
especially near 1 μm. Also, electrical saturation of the OPCs results in enhanced
uncertainties starting at Dp > 450 nm (high gain) and Dp > 700 nm (low gain).
3.5.2 Time Resolution
The time resolution of the instrument is determined by three factors: 1) the
transport delays between the point where particles enter the DASH-SP or, for a steady
aerosol, where they enter the DMA, and the OPC detectors; 2) delays associated with
programmed changes in the sampled particle size; and 3) the time required to obtain

65
statistically significant counts in each OPC channel. A maximum transition time of 17 s
is needed when switching between different DMA-selected sizes for normal operating
conditions in order to ensure particles of the previous size have exited the system; this
addresses the first two factors governing time resolution. The tubing length of each
stream from the 5-way splitter (see Figure 3.1) to each humidification chamber and OPC
is equivalent, which results in the same particle transit time in each channel. Tests were
performed to estimate the minimum number of particles at a given size required to obtain
a response with varying degrees of statistical significance. These tests indicate the length
of time the instrument should sample at a given set of operating conditions to obtain
representative growth factors. Sample sets of over 10,000 pulses were obtained for a
selected particle size for different salts (Dp = 150 – 404 nm). Pulses were randomly
removed from each data file in a way to determine the variation of the modal pulse height
and standard deviation as a function of decreasing counts at a fixed particle size. The
ratio of standard deviation to modal pulse height is usually within 10% for pulse numbers
ranging from 50 to 10,000. The variation of the modal pulse height is + 1% when
comparing pulse counts of over 10,000 to any number of counts down to 50, below which
the difference increases relatively quickly. In order for the standard deviation of
observed pulse heights to be within 10%, 5%, and 1% of the original standard deviation
calculated for a population of over 10,000 particles, an average of 60, 220, and 530
pulses are required, respectively. Figure 3.2 displays the time required to satisfy these
different limits of the original modal pulse height and standard deviation for a wide range
of particle number concentrations at a selected dry diameter. For example, for 10
particles cm-3 at a DMA-selected size, a minimum of 5 s is needed to be within 1% of the

66
modal pulse height had over 10,000 particles of the same composition been sampled. An
additional order of magnitude of time is required to be within 1% of the original standard
deviation as compared to 1% of the original mode. As will be shown subsequently, the
mode is the critical parameter in quantifying growth factors via the iterative data
processing technique. Assuming a pulse height distribution with a distinct and dominant
mode (there are often less dominant modes due to multiply-charged particles), the data
processing algorithm will determine the correct pulse height distribution mode regardless
of the variance in the distribution. Thus, sampling time at a given Dp/RH combination
should be reduced to improve time resolution at the expense of variance, which
ultimately has no effect on the accuracy of quantified growth factors.
3.5.3 DASH-SP Accuracy, Precision, and Uncertainties
The uncertainty of the DASH-SP measurement of growth factor depends on the
uncertainties in the RH and sizing (DMA and OPC) measurements. Critical to the
accuracy of the RH measurements is the calibration procedure. One “reference” RH
sensor (Model HMP50YCC1A2X, Vaisala) was initially calibrated over six saturated salt
solutions within the 8 – 97% RH range. The remaining 12 RH sensors were then
calibrated as an ensemble against the “reference” sensor in a temperature-controlled
chamber through which a controlled mixture of dry and humid air was circulated. The
accuracy of the RH measurements was evaluated by comparing theoretical deliquescence
RH (DRH) for multiple salts with measurements. The DRHs of ammonium sulfate,
sodium sulfate, and potassium chloride aerosols agreed with literature values (Seinfeld
and Pandis 2006) to within + 1.0%, while sodium chloride aerosols agreed to within +
67
1.6%. The overall RH measurement uncertainty was calculated by taking the summed
root mean square errors of the measured OPC sample and sheath flow RHs, and
combining this with the uncertainty associated with the RH sensors. The overall
uncertainty was usually + 1.5%, while the RH sensor precision was + 0.7%.
Temperature fluctuations and gradients within each of the four humidification
chamber-OPC units can lead to uncertainties due to the RH changing. Temperature
sensors monitoring the sheath, sample, and exit flows of each OPC exhibited no
significant change (∆T < 1° C) during laboratory scans that lasted as long as ~ 10 min, but
temperatures did show a systematic increase (∆T > 1° C) over longer periods of time.
During aircraft flights lasting 5 h in which the DASH-SP was deployed, the twelve
temperature sensors recorded the same level of variation. For example, the twelve sensors
during one representative flight exhibited averages between 24.0 – 25.0° C and standard
deviations between 3.0 – 3.5° C. However, the RH sensors exhibited significantly less
variation due to the feedback control of the humidification by the instrument software:
the RH standard deviation ranged between 0.1 – 1.8% for OPCs with upstream
humidification chambers equilibrated at RHs of 74%, 85%, and 92%. Therefore, the RH
variation resulting from temperature fluctuations in the humidification chamber-OPC
units is normally within the uncertainty of the RH sensor measurements.
The instrument software calculates the DMA voltage required to classify a
selected dry size for the specific geometry and operating parameters (T, P, flow rates) of
the DMA. Since the DMA sheath flow rate is usually 10 times larger than the aerosol
flow rate and relatively large particles are studied, the width of the sampled electrical
mobility window is + 10%. DMA performance was frequently evaluated with calibrated

68
PSL particles ranging in diameter between 152 - 1101 nm. Accurate DMA operation is
exhibited when the maximum particle concentration is observed at the DMA-selected
size that matches the actual size of the PSL particles, rather than a smaller or larger size.
The maximum particle concentration was observed to occur at DMA-selected sizes
within + 3% of the actual size of the PSL particles tested. It should be noted that the PSL
particles studied have a reported size uncertainty ranging from + 1 - 3%. The average
uncertainty associated with growth factor measurements is calculated to be + 4.3%, with
an uncertainty as high as 8% at a dry size of 150 nm at lower RHs (< 80%).
Tests were done to check for contamination both in the form of leaks and in the
source of Milli-Q water used in atomizing solutions. When feeding filtered air into the
DASH-SP frequently over a period longer than 30 days, no particles were detected by the
CPC and fewer than 1 cm-3 were detected by the OPC (high gain). Particles detected by
the OPC corresponded to sizes below the 50% detection limit of the OPC (Dp < 135 nm).
Pure Milli-Q water was atomized into the DASH-SP system; no particles were detected
by the CPC beyond 135 nm, and < 1 cm-3 were detected by the OPC (high gain). Below
135 nm, background particle concentrations measured by the CPC reached a value as
high as 30 cm-3 at 5 nm; the OPC response at these lower sizes remained at < 1 cm-3. No
background particle signals were observed using the low-gain OPC configuration for
these tests. Since the experiments conducted with salts usually involved OPC number
concentrations between 100 - 1000 cm-3 at a specific size, any background particles from
the water source and inside the system itself are deemed negligible. Moreover, since no
particles larger than 135 nm were observed by the OPC for these tests, contamination is

69
negligible for ambient sampling, as the system is designed to sample at minimum dry Dp
exceeding 135 nm (150 nm for this study).
3.5.4 Stability
The stability in dry and wet particle data was studied. For dry data, stability was
quantified over a time span of four months by calculating pulse height standard deviation
relative to pulse height average ( x/σ ) for both gain settings and different particle sizes
(Figure 3.3). Above 200 nm, at the high-gain OPC setting, x/σ is < 10%, with the
species of greatest atmospheric relevance (ammonium sulfate, ammonium nitrate, sodium
chloride) being < 3%. For the low-gain setting, x/σ is < 10% at 350 nm and < 5%
beyond 350 nm for all species studied. For wet studies, the stability in growth factor at
different initial dry sizes and RHs between 30 – 92% was quantified for several species,
where x/σ was usually < 3% for all species studied. In summary, the stability of the
DASH-SP improves for both dry and wet particles with increasing size above the 50%
detection limit of the OPC.
3.6 Data Analysis
Data resulting from the collection of scattered light from individual particles are
returned by the OPCs as pulse heights, the amplitudes of which depend on particle size,
shape, and refractive index, the latter depending on particle composition. For the
purposes of pulse height data interpretation, the following assumptions are made: (1)
purely scattering, spherical particles (one exception to the sphericity assumption for
growth factor calculations is that a shape factor of 1.08 was assumed for dry sodium

70
chloride particles, thought to be cubic, prior to humidification (Hinds, 1999; Hameri et
al., 2001)); (2) the DMA-selected particle size corresponds to the mode of the true
particle size distribution, and therefore, the mode of the OPC pulse height distribution;
and (3) for particles that undergo humidification, the mode of the OPC pulse height
distribution represents the true wet particle size. The first assumption is an
approximation for ambient particles, but has been commonly made in previous DMA-
OPC studies (Stolzenburg et al., 1998; Hand et al., 2000; Ames et al., 2000; Kreisberg et
al., 2001; Hand and Kreidenweis, 2002). Growth factors are calculated using the
volume-equivalent diameter (Dp), while the DMA classifies particles based on their
mobility-equivalent diameter (Dp,mob), the two diameters of which are only equivalent for
spherical particles. Following the methodology of Gysel et al. (2002), employing a shape
factor of 1.08 for dry sodium chloride particles results in a value of 0.96 for the ratio
Dp:Dp,mob. This provides a representative indication of the sensitivity of growth factor
measurements to particles with one type of shape effect (cubic rather than spherical);
without the shape factor correction, growth factors for sodium chloride particles would be
underestimated by 4%. The volume of water in particles after humidification is often
substantial; the assumption that particles are spherical and scatter, but do not absorb, light
is generally valid for those particles for which growth is significant.
Before the pulse height distribution modes can be used to determine the particle
size and refractive index, dry particle calibrations must be performed to accumulate
sufficient data relating pulse height, particle size, and refractive index. OPC calibrations
were carried out for a set of six salts of known refractive index (1.39, 1.47, 1.50, 1.52,
1.54, and 1.60; salts listed in Figure 3.4) (Weast, 1987; Lide, 2005) by measuring OPC

71
pulse height response to a range of DMA-selected diameters (150, 175, 200, 225, 250,
300, 350, 375, 404, and 415 nm) without humidification. Figure 3.4 summarizes the
OPC response as a function of dry particle size for salts of different refractive index from
one set of calibrations. For each OPC, high-order polynomial equations accurately
represent the relationship between OPC pulse height and particle dry diameter for
different refractive indices (R2 > 0.995), allowing calculation of size from a given
refractive index and OPC pulse height:
Dp,dry = a5 x5 + a4 x4 + a3 x3 + a2 x2 + a1 x + a0 [1]
where x = OPC pulse height and constants a0 – a5 are determined using calibration data.
The relationship between OPC pulse height and refractive index for specific particle dry
diameters can be modeled as a cubic polynomial (R2 > 0.996), allowing calculation of
refractive index from OPC pulse height at a given dry particle size:
Refractive index = b3 x3 + b2 x2 + b1 x + b0 [2]
where x = OPC pulse height and constants b0 – b3 are determined using calibration data.
Using equation 2, OPC response curves for different dry particle sizes were extrapolated
to calculate pulse heights for refractive indices between 1.33 and 1.39 for which
calibration salts were not tested (water has a refractive index of 1.33). A three-
dimensional surface can now be generated with the following equation, which is derived
from multiple regression analysis:
Pulse height = c5 + c4 Dp + c3 n + c2 Dp2 + c1 n2 + c0 Dp n [3]
where n is refractive index and Dp corresponds to particles in their dry or wet state.
Figure 3.5 summarizes the algorithm used to calculate “effective” refractive index
and growth factor from the dry and wet pulse height distribution modes. Initially, the dry

72
pulse height distribution mode is used to iterate on a two-dimensional surface (n vs pulse
height, fixed Dp) to determine the dry particle “effective” refractive index. After guessing
a value for the wet particle diameter, a volume-weighted refractive index is calculated to
account for the refractive index of both water and the dry particle. Using the wet particle
pulse height data, iterations are carried out on the three-dimensional surface to converge
on a value for the humidified particle’s “effective” refractive index, which is
subsequently used to determine the wet particle diameter and growth factor. This
iterative process is not possible without a priori knowledge of the dry particle refractive
index, which requires one of the four humidification chambers to be operated in the dry
state. This algorithm assumes that particles are internally mixed and that particulate
matter is completely dissolved in humidified particles.
One exception to the iterative procedure for humidified particles is when testing
laboratory-generated aerosols with known dry-particle refractive indices; a
thermodynamic model of particle water uptake (Brechtel and Kreidenweis, 2000a, 2000b)
can predict the refractive index for a specific salt at a given RH. Only one step is then
needed to interpolate on the three-dimensional surface (Dp vs. pulse height, fixed n) to
determine the true wet particle size. The modified Köhler model used includes a
parameterization for the solution osmotic coefficient that approaches the correct
thermodynamic limit as the solution becomes infinitely dilute (Brechtel and Kreidenweis,
2000a, 2000b). Predictions from both this model and the Aerosol Inorganics Model
(AIM) (Clegg et al., 1998; http://www.aim.env.uea.ac.uk/aim/aim.html) are used below
for comparison with laboratory data for a number of salts.

73
3.7 Growth Factor Measurements 3.7.1 Inorganic Salts Experiments were carried out to determine growth factor values as a function of
RH, from 10% to 94%, for different inorganic species (ammonium nitrate, ammonium
sulfate, ammonium nitrate, sodium chloride, potassium chloride, and sodium sulfate) and
organic acid species (oxalic, glyoxylic, malonic, succinic, glutaric, and adipic acids). The
growth factors for these species are either known or can be calculated theoretically to
assess the accuracy of the DASH-SP measurements. However, only the inorganics
provide a firm comparison between theory and/or laboratory measurements with those of
the DASH-SP since growth factors for organic acids are not as well established as those
for inorganic salts.
Figure 3.6 shows the measured hygroscopic growth curves for various inorganic
and organic acid species. With the exception of the organic acids and ammonium nitrate,
a sharp increase in growth factor is observed at the DRH, providing evidence for the
homogeneity of the humidity field experienced by the particles. The measured growth
factors of the inorganic species agree well with thermodynamic theory for RH values
above the DRH (+ 1%). For ammonium sulfate at an RH of 92% the discrepancy is + 4%
based on the Brechtel and Kreidenweis (2000a, 2000b) model, and + 1% based on the
Clegg et al. (1998) model. Growth factor measurements at RH values above the DRH
show the following levels of agreement with thermodynamic theory: sodium chloride
(1.0% above theory, σ = 2.3%, n > 50), ammonium sulfate (1.5% above theory, σ =
1.7%, n > 50), sodium sulfate (2.0% below theory, σ = 2.4%, n > 50). Ammonium
nitrate particles have been shown to remain “wet” at RHs as low as 8% (Dougle et al.,

74
1998; Lightstone et al., 2000), which explains why the observed growth factors exceed
unity for RHs below the DRH. Multiple growth factor curves are reported for
ammonium nitrate in Figure 3.6 to show that at sizes near 250 nm, the growth factors
increase with higher dry particle sizes.
3.7.2 Organic Acids
In contrast to inorganic species, the hygroscopic properties of organic aerosol
species are not as well known. Organic acids are an important component of atmospheric
aerosols (Kawamura and Ikushima, 1993; Khwaja, 1995; Chebbi and Carlier, 1996;
Saxena and Hildemann, 1996; Kawamura and Sakaguchi, 1999; Kerminen et al., 2000;
Yao et al., 2004; Huang et al., 2005; Fisseha et al., 2006; Sorooshian et al., 2007a), the
presence of which can affect the hygroscopicity of ambient particles (Saxena et al., 1995;
Hansson et al., 1998; Li et al., 1998; Ansari and Pandis, 2000; Cruz and Pandis, 2000;
Peng et al., 2001; Peng and Chan, 2001; Prenni et al., 2001, 2003; Wise et al., 2003).
Two- to six-carbon dicarboxylic acids are investigated here, in addition to glyoxylic acid,
which is a direct precursor to oxalic acid, the most abundant particulate dicarboxylic acid
in the atmosphere (Kawamura and Ikushima, 1993; Kawamura and Sakaguchi, 1999;
Kerminen et al., 2000; Poore, 2000; Yao et al., 2004; Crahan et al., 2004; Yu et al., 2005;
Huang et al., 2005, 2006; Sorooshian et al., 2006a, 2007a, 2007b).
Oxalic (C2), malonic (C3), glyoxylic (C2), and glutaric (C5) acids do not exhibit a
DRH, but rather grow gradually with increasing RH (Figure 3.6). This result is
consistent with previous studies which showed that organic acids absorb water at all RHs
(Saxena and Hildemann, 1997; Dougle et al., 1998). Unlike the other organic acids

75
studied, succinic (C4) and adipic (C6) acids exhibited no hygroscopic growth over the RH
range studied, which is consistent with the HTDMA results of Prenni et al. (2001). With
the exception of glyoxylic acid, previous studies have either measured or calculated
DRHs for these organic acids; only malonic (DRH = 74 - 91%) and glutaric (DRH = 84 -
99%) acids exhibit DRHs in the range of RHs tested in this study, while the rest of the
organic acids exhibit DRHs exceeding 97% (Saxena and Hildemann 1997; Peng et al.
2001).
Excluding oxalic and glyoxylic acids, the experimental data in Figure 3.6 indicate
a clear odd-even carbon number effect, where the odd-carbon number organic acids
(malonic and glutaric acids) exhibit relatively more hygroscopic growth as compared to
the even-carbon number acids (succinic and adipic acids). This behavior is consistent
with the literature (Saxena and Hildemann 1996; Prenni et al. 2001); solubility alternates
with the number of carbon atoms in the organic acid molecule up to C10. Oxalic acid is
significantly more hygroscopic than succinic and adipic acids, the other two even carbon-
number dicarboxylic acids.
Growth factor values for dicarboxylic acids measured in this study tend to be
lower than those predicted by the Brechtel and Kreidenweis model (2000a, 2000b). The
growth factors for malonic acid showed the best agreement with predictions as compared
to the other organic acids, with a growth factor that is at most 6% below that predicted.
The measured growth factor for glutaric acid was at most 17% below predictions.
Malonic and oxalic acids exhibited relatively similar growth factors up to an RH of 92%
(1.53 + 0.07, 8% below theory, and 1.58 + 0.07, 26% below theory, respectively), while
glutaric acid showed less growth (1.27 + 0.05, 19% below theory). Because
76
thermodynamic parameters are not available for glyoxylic acid, only experimental results
are shown; glyoxylic acid exhibits similar hygroscopic behavior when compared to
oxalic, malonic, and glutaric acids. Glyoxylic acid has a measured growth factor of 1.44
+ 0.06 at an RH of 92%.
Five potential explanations for the disagreement between measurements and
predictions for the dicarboxylic acid growth factors include: (1) uncertainties in the
model parameters used for each dicarboxylic acid (osmotic coefficient, surface tension,
solution density); (2) particles did not crystallize during drying prior to size-selection by
the DMA and, therefore, do not properly reflect the quantity of solute; (3) particles were
non-spherical; (4) volatilization of the organic acids occurred; and (5) the dicarboxylic
acid particles exhibit slower water uptake than the inorganic species studied and did not
have enough time to reach equilibrium at a given wet RH. The extent to which each of
the five aforementioned explanations leads to the discrepancy between predictions and
measurements is not known. It is noted that the second, third, and fifth explanations
would ideally lead to an underestimate of the growth factor. In particular, there is less
known about the morphology of organics as compared to inorganic species, therefore, if
the organic acid particles were not spherical or compact, then the experimentally
determined growth factors are less than their actual values from a morphology standpoint.
The measurements do provide evidence that ambient particles that contain organic acids,
specifically oxalic, malonic, glutaric, and glyoxylic acids, experience growth at low RHs
(< 65%).

77
3.8 Validation of Iterative Data Processing Code
In order to assess the validity of the data processing technique for interpreting
ambient data, the iterative procedure outlined in Figure 3.5 was applied to data collected
from wet ammonium sulfate experiments to quantify “effective” refractive index and
growth factor as a function of RH. The three wet RHs used in the field study
subsequently discussed, 74%, 85%, and 92%, were also applied in these wet ammonium
sulfate tests (n > 15 at each RH). The measurements that have been processed with the
iterative code are compared to predictions of the Brechtel and Kreidenweis (2000a,
2000b) and Clegg et al. (1998) models. Figure 3.7 shows that, although the calculated
“effective” refractive index at an RH of 74% agrees perfectly with the literature (Weast
1987), the DASH-derived average growth factors exceed theory at this RH by as much as
8%. The measured growth factors at RHs of 85% and 92% lie within one standard
deviation of the model predictions, whereas the “effective” refractive indices agree to
within 1%. This is a result of the fact that the calculation of growth factor in the iterative
data processing code is more sensitive to DMA, OPC, and RH uncertainties as compared
to calculation of refractive indices.
Figure 3.8 (A-C) shows examples of the dry and wet size distributions from wet
ammonium sulfate data processed with the iterative code. Size distribution data are
presented at four RHs (one dry, and three wet RHs) for each of three initial dry sizes
(150, 175, and 200 nm). The size distributions for dry particles and those at an RH value
of 74% should be identical since ammonium sulfate particles deliquesce at an RH of 79.9
+ 0.5% (Seinfeld and Pandis 2006). However, the mode diameters of the size
distributions at RH = 74% slightly exceed those of the dry size distributions. The dry and

78
RH = 74% size distributions are broader at a dry size of 150 nm than at the two larger
sizes; this broadening behavior is normally observed when the particle size is close to the
minimum OPC detection limit. There is variation in the growth factors at constant RH,
as the range in values at RHs of 74%, 85%, and 92% is 0.04 (average GF = 1.06), 0.08
(average GF = 1.59), and 0.16 (average GF = 1.80), respectively. The differences in
growth factor at constant RH for various dry sizes is attributable to uncertainties in the
measurements and the iterative data processing procedure, particularly the cubic and
high-order polynomial equations. However, all of the growth factors reported in Figure
3.8 are within 10% of predictions from the Brechtel and Kreidenweis (2000a, 2000b) and
Clegg et al. (1998) models.
One would expect narrower size distributions for the dry ammonium sulfate
results in Figure 3.8 since the DMA is selecting one size. To determine whether the
broadness of the dry ammonium sulfate size distributions is caused by an instrument
issue or by impurities and morphology issues associated with ammonium sulfate
particles, dry PSL size distributions were also computed since PSL particles are spherical
(Figure 3.8D). The PSL size distributions are considerably narrower than those of dry
ammonium sulfate particles, suggesting that the latter aerosol likely consisted of non-
spherical particles that affect the final optical sizing; particle shape variations can
significantly influence their scattering and absorption properties (Chylek et al., 1984;
Videen et al., 1997). The PSL size distributions for particle diameters of 152 nm and 404
nm were slightly broader than distributions at diameters of 199 nm and 300 nm,
providing further evidence that the OPCs have somewhat lower size resolution near their
minimum and maximum size detection limits. It is unlikely that particle coincidence

79
plays a role in the broadening behavior apparent in Figure 3.8. If this were the case, the
same shape would be observed in the dry PSL distributions for all sizes shown. It is
possible, however, that some of the broadening is also due to the particles experiencing a
range of RHs.
These results suggest that the iterative procedure is capable of accurately
determining refractive indices and providing dry and wet size distributions. Although the
distributions may be broader close to the OPC size detection limits, the modes of these
distributions can still be used to accurately calculate growth factors.
3.9 Field Implementation of DASH-SP On July 16, 2007, by prior arrangement, the Twin Otter intercepted and
repeatedly sampled the exhaust plume of a large PANAMAX container ship with a 55
MW main engine operating on heavy fuel oil. Figure 3.9A shows the flight tracks during
the ship experiment. The aircraft first flew up the plume toward the ship, which was
steaming directly into the wind, at an altitude of 30 m; this procedure was repeated three
more times. The aircraft also performed several cross-wind transects of the plume at
various altitudes in the marine boundary layer (< 250 m), which was clear on this day.
Inside the plume, submicrometer particle number concentrations reached as high as
365,000 cm-3, as determined with a differential mobility analyzer with a time resolution
of ~ 73 s, whereas the background aerosol concentration outside of the plume was < 500
cm-3. The plume was ~ 0.4 km wide during the first downwind transect at an altitude of
30 m and it was 2 km wide during the second to last transect at an altitude of 150 m (the
plume was not detected in the last transect at 210 m).

80
Figure 3.9B displays the water-soluble aerosol composition inside the plume as
measured every 4.5 min (equivalent to a flown distance of ~ 13.5 km) by a particle-into-
liquid sampler (PILS; Brechtel Manufacturing Inc.) (Sorooshian et al., 2006b). The
water-soluble aerosol mass, which reached values as high 93 μg m-3 just behind the ship,
was composed mainly of sulfate (96.2% + 4.0% of water-soluble mass; n = 15). Other
water-soluble components of the aerosol included Na+ (1.0% + 2.4%), NO3- (1.0% +
0.6%), organic acids (0.6% + 0.3%), Cl- (0.6% + 0.9%), and NH4+ (0.5% + 0.4%). The
aerosol was highly acidic, as the ammonium-to-sulfate molar ratio was, on average, 0.03.
The ratio of water-soluble mass to the DMA-observed volume concentration of the
aerosol was 1.13 g cm-3 + 0.30 g cm-3, suggesting that a significant fraction of the aerosol
was accounted for by the PILS data, assuming that the ambient aerosol density was close
to that of sulfuric acid (1.84 g cm-3). As observed by an Aerodyne time-of-flight aerosol
mass spectrometer, the aerosol contained a large proportion of hydrophobic organic
species that were not detected by the PILS. It is likely that some of the hydrophobic
species were light-absorbing, like soot, which introduces error in the iterative data
processing algorithm because of non-zero imaginary components of the refractive index.
DASH-SP data are presented for the following dry diameters: 150, 175, 200, and
250 nm. The instrument was pre-programmed to detect a minimum of 300 pulses in each
OPC channel for this flight. For 150 and 175 nm particles, 1 s and 10 s were usually
required before all OPCs detected at least 300 pulses inside and outside of the ship
plume, respectively. For 200 and 250 nm particles, 10 - 30 s and 10 – 60 s were required
inside and outside of the plume, respectively.

81
The average dry “effective” refractive index of aerosol in the ship plume was
determined to be 1.53 + 0.04, while the “effective” refractive index in the background
aerosol outside of the plume was 1.49 + 0.04. It should be noted that the refractive
indices of sulfuric acid, ammonium bisulfate, and ammonium sulfate are 1.41, 1.48, and
1.52, respectively (Weast, 1987; Ames et al., 2000). The time resolution of the DASH-
SP is evident in Figure 3.9C, which shows the spatial distribution of growth factors at an
RH of 92%. In the ship plume, the average growth factors at RHs of 74%, 85%, and 92%
were 1.11 + 0.04, 1.46 + 0.09, and 1.53 + 0.10, respectively. The corresponding growth
factors in the background aerosol were 1.19 + 0.09 (RH = 74%), 1.54 + 0.05 (RH =
85%), and 1.63 + 0.08 (RH = 92%). Therefore, the overall averages suggest that there
was a decrease in hygroscopicity inside the ship plume as compared to the background
marine aerosol at RHs > 74%. There was no significant difference in growth factor as the
plane flew closer to the ship in its plume from a downwind distance greater than 30 km.
We hypothesize that this occurred because the relative mass fractions of acidic sulfate
and hydrocarbon-like organic species did not vary appreciably over the range of
timescales of transport between the ship and aircraft. The observed growth factors in the
plume are lower than what would be expected for pure sulfuric acid, and this is likely a
result of the presence of other species, such as hydrophobic organics, in the particles that
reduced the hygroscopicity.
3.10 Conclusions
This study introduces a new instrument, termed the differential aerosol sizing and
hygroscopicity spectrometer probe (DASH-SP). In the instrument, a DMA-selected

82
monodisperse aerosol flow is split into five flows, one to each of four OPCs with its own
upstream humidification column, and one to a CPC. The DASH-SP has been designed
for aircraft operation and other applications where hygroscopic growth observations are
required at multiple sizes and RHs with high time resolution. An iterative data
processing algorithm calculates growth factors and “effective” refractive indices for
humidified particles based on a calculated value of the “effective” dry particle refractive
index; iterations are performed on a three-dimensional surface (pulse height – refractive
index – Dp) based on dry particle calibration data from several salts with known
refractive indices.
Laboratory tests were performed to characterize the instrument’s performance.
The minimum particle diameter detected with 50% efficiency in the OPCs is 135 + 8 nm;
particles with diameters > 1 μm are detected by the OPCs using the low-gain setting,
subject to increasing uncertainty as a function of growing size due to multiply charged
particles and electrical saturation of the OPCs. Estimates for the time required to obtain
statistically significant counts in each OPC channel were reported for a wide range of
particle number concentrations. The RH uncertainty is + 1.5% with an average
uncertainty of + 4.3% for growth factor measurements. Measured DRHs of ammonium
sulfate, sodium sulfate, and potassium chloride aerosols agree with literature values to
within + 1%, while that for sodium chloride aerosols agrees to within + 1.6%. A high
level of stability exists in the dry salt calibrations and growth factors for various salts at
RHs up to 92%, especially at particle diameters larger than the 50% detection limit of the
OPCs.

83
Excellent agreement exists between growth factor data for several inorganic salts
and predictions from a thermodynamic model. Growth factor data for organic acids show
that, with the exception of oxalic and glyoxylic acids (both C2 acids), the organic acids
with an odd number of carbons (malonic and glutaric acids) exhibit greater hygroscopic
growth than those with an even number (succinic and adipic acids). Succinic and adipic
acids exhibit no hygroscopic growth up to an RH of 94%, while the other organic acids
show gradual growth starting at low RHs (< 65%). Oxalic acid, the most abundant
organic acid in ambient aerosols, exhibits the greatest hygroscopic growth among all of
the organic acids studied.
The DASH-SP was successfully deployed in the 2007 Marine
Stratus/Stratocumulus Experiment (MASE II) campaign on board the CIRPAS Twin
Otter aircraft. Results are presented here for one flight during this study in which the
plume from a large container ship was sampled. Growth factors of the exhaust plume
aerosol downwind of this ship at RHs of 74%, 85%, and 92% were 1.11 + 0.04, 1.46 +
0.09, and 1.53 + 0.10, respectively. The field data demonstrate that the DASH-SP is
capable of providing first-of-a-kind, rapid, simultaneous, size-resolved aerosol
hygroscopic growth measurements at multiple RHs. Future work will address the
instrument response to non-spherical and light-absorbing particles.
3.11 Acknowledgements
Brechtel Manufacturing Inc. acknowledges the support of Dr. Ronald Ferek and
the ONR SBIR Program under grant N00014-05-C-0016. This work was also supported

84
by the Office of Naval Research grant N00014-04-1-0118. We appreciate valuable
comments and suggestions by Jeff Snider.
3.12 References Aklilu, Y., Mozurkewich, M., Prenni, A. J., Kreidenweis, S. M., Alfarra, M. R., Allan, J. D., Anlauf, K., Brook, J., Leaitch, W. R., Sharma, S., Boudries, H., and Worsnop, D. R. (2006). Hygroscopicity of Particles at Two Rural, Urban Influenced Sites During Pacific 2001: Comparison with Estimates of Water Uptake from Particle Composition, Atmos. Environ., 40:2650-2661. Ames, R. B., Hand, J. L., Kreidenweis, S. M., Day, D. E., and Malm, W. C. (2000). Optical Measurements of Aerosol Size Distributions in Great Smoky Mountains National Park: Dry Aerosol Characterization, J. Air Waste Manage., 50:665-676. Ansari, A. S., and Pandis, S. N. (2000). Water Absorption by Secondary Organic Aerosol and its Effect an Inorganic Aerosol Behavior, Environ. Sci. Technol., 34:71-77. Baltensperger, U., Streit, N., Weingartner, E., Nyeki, S., Prevot, A. S. H., Van Dingenen, R., Virkkula, A., Putaud, J. P., Even, A., ten Brink, H., Blatter, A., Neftel, A., and Gaggeler, H. W. (2002). Urban and Rural Aerosol Characterization of Summer Smog Events During the PIPAPO Field Campaign in Milan, Italy, J. Geophys. Res., 107(D22), doi:10.1029/2001JD001292. Berg, O. H., Swietlicki, E., and Krejci, R. (1998). Hygroscopic Growth of Aerosol Particles in the Marine Boundary Layer Over the Pacific and Southern Oceans During the First Aerosol Characterization Experiment (ACE 1), J. Geophys. Res., 103(D13):16535-16545. Brand, P., Ruoss, K., and Gebhart, J. (1992). Performance of a Mobile Aerosol Spectrometer for an Insitu Characterization of Environmental Aerosols in Frankfurt City, Atmos. Environ., 26:2451-2457. Brechtel, F. J., and Kreidenweis, S. M. (2000a). Predicting Particle Critical Supersaturation from Hygroscopic Growth Measurements in the Humidified TDMA. Part I: Theory and Sensitivity Studies, J. Atmos. Sci., 57:1854-1871. Brechtel, F. J., and Kreidenweis, S. M. (2000b). Predicting Particle Critical Supersaturation from Hygroscopic Growth Measurements in the Humidified TDMA. Part II: Laboratory and Ambient Studies, J. Atmos. Sci., 57:1872-1887. Busch, B., Kandler, K., Schutz, L., and Neususs, C. (2002). Hygroscopic Properties and Water-Soluble Volume Fraction of Atmospheric Particles in the Diameter Range from 50

85
nm to 3.8 μm During LACE 98, J. Geophys. Res., 107(D21), doi:10.1029/2000JD000228. Carrico, C. M., Rood, M. J., and Ogren, J. A. (1998). Aerosol Light Scattering Properties at Cape Grim, Tasmania, During the First Aerosol Characterization Experiment (ACE 1), J. Geophys. Res., 103(D13):16565-16574. Carrico, C. M., Rood, M. J., Ogren, J. A., Neususs, C., Wiedensohler, A., and Heintzenberg, J. (2000). Aerosol Optical Properties at Sagres, Portugal During ACE-2, Tellus B., 52:694-715. Carrico, C. M., Kreidenweis, S. M., Malm, W. C., Day, D. E., Lee, T., Carrillo, J., McMeeking, G. R., and Collett, J. L. (2005). Hygroscopic Growth Behavior of a Carbon-Dominated Aerosol in Yosemite National Park, Atmos. Environ., 39:1393-1404. Chan, C. K., Kwok, C. S., and Chow, A. H. L. (1997). Study of Hygroscopic Properties of Aqueous Mixtures of Disodium Fluorescein and Sodium Chloride Using an Electrodynamic Balance, Pharmaceut. Res., 14:1171-1175. Chebbi, A., and Carlier, P. (1996). Carboxylic Acids in the Troposphere, Occurrence, Sources, and Sinks: A Review, Atmos. Environ., 30:4233-4249. Chylek, P., Ramaswamy, V., and Cheng, R. J. (1984). Effect of Graphitic Carbon on the Albedo of Clouds, J. Atmos. Sci., 41:3076-3084. Clegg, S. L., Brimblecombe, P., and Wexler, A. S. (1998). A Thermodynamic Model of the System H+ - NH4+ - Na+ - SO42- - NO3- - Cl- - H2O at 298.15 K, J. Phys. Chem. A., 102:2155-2171. Cocker, D. R., Whitlock, N. E., Flagan, R. C., and Seinfeld, J. H. (2001). Hygroscopic Properties of Pasadena, California Aerosol, Aerosol Sci. Tech., 35:637-647. Cohen, M. D., Flagan, R. C., and Seinfeld, J. H. (1987a). Studies of Concentrated Electrolyte-Solutions Using the Electrodynamic Balance .1. Water Activities for Single-Electrolyte Solutions, J. Phys. Chem., 91:4563-4574. Cohen, M. D., Flagan, R. C., and Seinfeld, J. H. (1987b). Studies of Concentrated Electrolyte-Solutions Using the Electrodynamic Balance .2. Water Activities for Mixed-Electrolyte Solutions, J. Phys. Chem., 91:4575-4582. Covert, D. S., Heintzenberg, J., and Hansson, H. C. (1990). Electrooptical Detection of External Mixtures in Aerosols, Aerosol Sci. Tech., 12:446-456. Covert, D. S., Hansson, H.-C., Winkler, P., and Heintzenberg, J. (1991). The Degree of Mixing of Hygroscopic Properties in Source and Receptor Locations in Northern Europe, Proceedings of AAAR 1991, 7-11 October 1991, Travers City, Michigan, USA.

86
Covert, D. S., and Heintzenberg, J. (1993). Size Distributions and Chemical-Properties of Aerosol at Ny Alesund, Svalbard, Atmos. Environ., 27:2989-2997. Crahan, K. K., Hegg, D., Covert, D. S., and Jonsson, H. (2004). An Exploration of Aqueous Oxalic Acid Production in the Coastal Marine Atmosphere, Atmos. Environ., 38:3757-3764. Cruz, C. N., and Pandis, S. N. (2000). Deliquescence and hygroscopic growth of mixed inorganic-organic atmospheric aerosol, Environ. Sci. Technol., 34:4313-4319. Dougle, P. G., Veefkind, J. P., and ten Brink, H. M. (1998). Crystallisation of Mixtures of Ammonium Nitrate, Ammonium Sulphate and Soot, J. Aerosol Sci., 29:375-386. Ferron, G. A., Karg, E., Busch, B., and Heyder, J. (2005). Ambient Particles at an Urban, Semi-Urban and Rural Site in Central Europe: Hygroscopic Properties, Atmos. Environ., 39:343-352. Fisseha, R., Dommen, J., Gaeggeler, K., Weingartner, E., Samburova, V., Kalberer, M., and Baltensperger, U. (2006). Online Gas and Aerosol Measurement of Water Soluble Carboxylic Acids in Zurich, J. Geophys. Res., 111(D12316), doi:10.1029/2005JD006782. Flagan, R. C. (1999). On Differential Mobility Analyzer Resolution, Aerosol Sci. Tech., 30:556-570. Gasparini, R., Li, R. J., Collins, D. R., Ferrare, R. A., and Brackett, V. G. (2006). Application of Aerosol Hygroscopicity Measured at the Atmospheric Radiation Measurement Program's Southern Great Plains Site to Examine Composition and Evolution, J. Geophys. Res., 111(D5), doi:10.1029/2004JD005448. Gysel, M., Weingartner, E., and Baltensperger, U. (2002): Hygroscopicity of Aerosol Particles at Low Temperatures. 2. Theoretical and Experimental Hygroscopic Properties of Laboratory Generated Aerosols, Environ. Sci. Technol., 36:63–68. Gysel, M., Weingartner, E., Nyeki, S., Paulsen, D., Baltensperger, U., Galambos, I., and Kiss, G. (2004). Hygroscopic Properties of Water-Soluble Matter and Humic-like Organics in Atmospheric Fine Aerosol, Atmos. Chem. Phys., 4:35-50. Hameri, K., Laaksonen, A., Vakeva, M., and Suni, T. (2001). Hygroscopic Growth of Ultrafine Sodium Chloride Particles, J. Geophys. Res., 106(D18):20749-20757. Hameri, K., Vakeva, M., Hansson, H. C., and Laaksonen, A. (2000). Hygroscopic Growth of Ultrafine Ammonium Sulphate Aerosol Measured Using an Ultrafine Tandem Differential Mobility Analyzer, J. Geophys. Res., 105(D17):22231-22242.

87
Hand, J. L., Ames, R. B., Kreidenweis, S. M., Day, D. E., and Malm, W. C. (2000). Estimates of Particle Hygroscopicity During the Southeastern Aerosol and Visibility Study, J. Air Waste Manage., 50:677-685. Hand, J. L., and Kreidenweis, S. M. (2002). A New Method for Retrieving Particle Refractive Index and Effective Density from Aerosol Size Distribution Data, Aerosol Sci. Tech., 36:1012-1026. Hansson, H. C., Rood, M. J., Koloutsou-Vakakis, S., Hameri, K., Orsini, D., and Wiedensohler, A. (1998). NaCl aerosol particle hygroscopicity dependence on mixing with organic compounds, J. Atmos. Chem., 31:321-346. Hegg, D. A., Covert, D. S., Crahan, K. K., Jonsson, H., and Liu, Y. (2006). Measurements of Aerosol Size-Resolved Hygroscopicity at Sub and Supermicron Sizes, Geophys. Res. Lett., 33, doi:10.1029/2006GL026747. Hegg, D. A., Covert, D. S., Jonsson, H., and Covert, P. A. (2007). An Instrument for Measuring Size-Resolved Aerosol Hygroscopicity at Both Sub- and Super-Micron Sizes, Aerosol Sci. Tech., 41:873-883. Hering, S. V., and McMurry, P. H. (1991). Optical Counter Response to Monodisperse Atmospheric Aerosols, Atmos. Environ., 25:463-468. Hinds, W. C. (1999). Aerosol Technology: Properties, Behavior,and Measurement of Airborne Particles, Second Edition, John Wiley & Sons, New York. Huang, X. F., Hu, M., He, L. Y., and Tang, X. Y. (2005). Chemical Characterization of Water-Soluble Organic Acids in PM2.5 in Beijing, China, Atmos. Environ., 39:2819-2827. Huang, X. F., Yu, J. Z., He, L. Y., and Yuan, Z. B. (2006). Water-Soluble Organic Carbon and Oxalate in Aerosols at a Coastal Urban Site in China: Size Distribution Characteristics, Sources, and Formation Mechanisms, J. Geophys. Res., 111, D22212, doi:10.1029/2006JD007408. Kawamura, K., and Ikushima, K. (1993). Seasonal-Changes in the Distribution of Dicarboxylic-Acids in the Urban Atmosphere, Environ. Sci. Technol., 27:2227-2235. Kawamura, K., and Sakaguchi, F. (1999). Molecular Distributions of Water Soluble Dicarboxylic Acids in Marine Aerosols Over the Pacific Ocean Including Tropics, J. Geophys. Res., 104(D3):3501-3509. Kerminen, V. M., Ojanen, C., Pakkanen, T., Hillamo, R., Aurela, M., and Merilainen, J. (2000). Low-Molecular-Weight Dicarboxylic Acids in an Urban and Rural Atmosphere, J. Aerosol Sci., 31:349-362.
88
Khwaja, H. A. (1995). Atmospheric Concentrations of Carboxylic-Acids and Related-Compounds at a Semiurban Site, Atmos. Environ., 29:127-139. Kim, J., Yoon, S. C., Jefferson, A., and Kim, S. W. (2006). Aerosol Hygroscopic Properties During Asian Dust, Pollution, and Biomass Burning Episodes at Gosan, Korea in April 2001, Atmos. Environ., 40:1550-1560. Knutson, E. O., and Whitby, K. T. (1975). Aerosol Classification by Electric Mobility: Apparatus, Theory, and Applications, J. Aerosol Sci., 6:443-451. Kotchenruther, R. A., and Hobbs, P. V. (1998). Humidification Factors of Aerosols from Biomass Burning in Brazil, J. Geophys. Res., 103(D24):32081-32089. Kreisberg, N. M., Stolzenburg, M. R., Hering, S. V., Dick, W. D., and McMurry, P. H. (2001). A New Method for Measuring the Dependence of Particle Size Distributions on Relative Humidity, with Application to the Southeastern Aerosol and Visibility Study, J. Geophys. Res., 106(D14):14935-14949. Li, Z. D., Williams, A. L., and Rood, M. J. (1998). Influence of Soluble Surfactant Properties on the Activation of Aerosol Particles Containing Inorganic Solute, J. Atmos. Sci., 55:1859-1866. Lide, D. R. (2005). CRC Handbook of Chemistry and Physics, 86th Edition, CRC Press, Florida. Lightstone, J. M., Onasch, T. B., Imre, D., and Oatis, S. (2000). Deliquescence, Efflorescence, and Water Activity in Ammonium Nitrate and Mixed Ammonium Nitrate/Succinic Acid Microparticles, J. Phys. Chem. A., 104:9337-9346. Liu, B. Y. H., and Lee, K. W. (1975). Aerosol Generator of High Stability, Am. Ind. Hyg. Assoc. J., 36:861-865. Liu, B. Y. H., Pui, D. Y. H., Whitby, K. T., Kittelson, D. B., Kousaka, Y., and Mckenzie, R. L. (1978). Aerosol Mobility Chromatograph - New Detector for Sulfuric-Acid Aerosols, Atmos. Environ., 12:99-104. Magi, B. I., and Hobbs. P. V. (2003). Effects of Humidity on Aerosols in Southern Africa During the Biomass Burning Season, J. Geophys. Res., 108(D13), doi:10.1029/2002JD002144. Malm, W. C., Day, D. E., Kreidenweis, S. M., Collett, J. L., Carrico, C., McMeeking, G., and Lee, T. (2005). Hygroscopic Properties of an Organic-Laden Aerosol, Atmos. Environ., 39:4969-4982.

89
Massling, A., Wiedensohler, A., Busch, B., Neususs, C., Quinn, P., Bates, T., and Covert, D. (2003). Hygroscopic Properties of Different Aerosol Types Over the Atlantic and Indian Oceans, Atmos. Chem. Phys., 3:1377-1397. Massling, A., Leinert, S., Wiedensohler, A., and Covert, D. (2007). Hygroscopic Growth of Sub-Micrometer and One-Micrometer Aerosol Particles Measured During ACE-Asia, Atmos. Chem. Phys., 7:3249-3259. McMurry, P. H., and Stolzenburg, M. R. (1989). On the Sensitivity of Particle-Size to Relative-Humidity for Los-Angeles Aerosols, Atmos. Environ., 23:497-507. Peng, C., Chan, M. N., and Chan, C. K. (2001). The Hygroscopic Properties of Dicarboxylic and Multifunctional Acids: Measurements and UNIFAC Predictions, Environ. Sci. Technol., 35:4495-4501. Peng, C. G., and Chan, C. K. (2001). The Water Cycles of Water-Soluble Organic Salts of Atmospheric Importance, Atmos. Environ., 35:1183-1192. Pilinis, C., Seinfeld, J. H., and Grosjean, D. (1989). Water-Content of Atmospheric Aerosols, Atmos. Environ., 23:1601-1606. Poore, M. W. (2000). Oxalic Acid in PM2.5 Particulate Matter in California, J. Air Waste Manage., 50:1874-1875. Prenni, A. J., DeMott, P. J., Kreidenweis, S. M., Sherman, D. E., Russell, L. M., and Ming, Y. (2001). The Effects of Low Molecular Weight Dicarboxylic Acids on Cloud Formation, J. Phys. Chem. A., 105:11240-11248. Prenni, A. J., De Mott, P. J., and Kreidenweis, S. M. (2003). Water Uptake of Internally Mixed Particles Containing Ammonium Sulfate and Dicarboxylic Acids, Atmos. Environ., 37:4243-4251. Rader, D. J., and McMurry, P. H. (1986). Application of the Tandem Differential Mobility Analyzer to Studies of Droplet Growth or Evaporation, J. Aerosol Sci., 17:771-787. Rood, M. J., Larson, T. V., Covert, D. S., and Ahlquist, N. C. (1985). Measurement of Laboratory and Ambient Aerosols with Temperature and Humidity Controlled Nephelometry, Atmos. Environ., 19:1181-1190. Saxena, P., Hildemann, L. M., McMurry, P. H., and Seinfeld, J. H. (1995). Organics Alter Hygroscopic Behavior of Atmospheric Particles, J. Geophys. Res., 100(D9):18755-18770.

90
Saxena, P., and Hildemann, L. M. (1996). Water-Soluble Organics in Atmospheric Particles: A Critical Review of the Literature and Application of Thermodynamics to Identify Candidate Compounds, J. Atmos. Chem., 24:57-109. Saxena, P., and Hildemann, L. M. (1997). Water Absorption by Organics: Survey of Laboratory Evidence and Evaluation of UNIFAC for Estimating Water Activity, Environ. Sci. Technol., 31:3318-3324. Seinfeld, J. H., and Pandis, S. N. (2006). Atmospheric Chemistry and Physics, Second Edition, Wiley-Interscience, New York. Sekigawa, K. (1983). Estimation of the Volume Fraction of Water-Soluble Material in Sub-Micron Aerosols in the Atmosphere, J. Meteorol. Soc. Jpn., 61:359-367. Sheridan, P. J., Jefferson, A., and Ogren, J. A. (2002). Spatial Variability of Submicrometer Aerosol Radiative Properties Over the Indian Ocean During INDOEX, J. Geophys. Res., 107(D19), doi:10.1029/2000JD000166. Snider, J. R., and Petters, M. D. (2007). Optical Particle Counter Measurement of Marine Aerosol Hygroscopic Growth, Atmos. Chem. Phys. Disc., 7:12381-12415.
Sorooshian, A., Varutbangkul, V., Brechtel, F. J., Ervens, B., Feingold, G., Bahreini, R., Murphy, S. M., Holloway, J. S., Atlas, E. L., Buzorius, G., Jonsson, H., Flagan, R. C., and Seinfeld, J. H. (2006a). Oxalic Acid in Clear and Cloudy Atmospheres: Analysis of Data from International Consortium for Atmospheric Research on Transport and Transformation 2004, J. Geophys. Res., 111, D23S45, doi:10.1029/2005JD006880. Sorooshian, A., Brechtel, F. J., Ma, Y. L., Weber, R. J., Corless, A., Flagan, R. C., and Seinfeld, J. H. (2006b). Modeling and Characterization of a Particle-into-Liquid Sampler (PILS), Aerosol Sci. Tech., 40:396-409. Sorooshian, A., Ng, N. L., Chan, A. W. H., Feingold, G., Flagan, R. C., and Seinfeld, J. H. (2007a). Particulate Organic Acids and Overall Water-Soluble Aerosol Composition Measurements from the 2006 Gulf of Mexico Atmospheric Composition and Climate Study (GoMACCS), J. Geophys. Res., 112, D13201, doi:10.1029/2007JD008537.
Sorooshian, A., Lu, M. –L., Brechtel, F. J., Jonsson, H., Feingold, G., Flagan, R. C., and Seinfeld, J. H. (2007b). On the Source of Organic Acid Aerosol Layers Above Clouds, Environ. Sci. Technol. 41:4647-4654. Stolzenburg, M., Kreisberg, N., and Hering, S. (1998). Atmospheric Size Distributions Measured by Differential Mobility Optical Particle Size Spectrometry, Aerosol Sci. Tech., 29:402-418.

91
Svenningsson, I. B., Hansson, H. C., Wiedensohler, A., Ogren, J. A., Noone, K. J., and Hallberg, A. (1992). Hygroscopic Growth of Aerosol-Particles in the Po Valley, Tellus B., 44:556-569. Svenningsson, B., Hansson, H. C., Wiedensohler, A., Noone, K., Ogren, J., Hallberg, A., and Colvile, R. (1994). Hygroscopic Growth of Aerosol-Particles and its Influence on Nucleation Scavenging In-Cloud - Experimental Results from Kleiner-Feldberg, J. Atmos. Chem., 19:129-152. Svenningsson, B., Hansson, H. C., Martinsson, B., Wiedensohler, A., Swietlicki, E., Cederfelt, S. I., Wendisch, M., Bower, K. N., Choularton, T. W., and Colvile, R. N. (1997). Cloud Droplet Nucleation Scavenging in Relation to the Size and Hygroscopic Behaviour of Aerosol Particles, Atmos. Environ., 31:2463-2475. Swietlicki, E., Zhou, J. C., Berg, O. H., Martinsson, B. G., Frank, G., Cederfelt, S. I., Dusek, U., Berner, A., Birmili, W., Wiedensohler, A., Yuskiewicz, B., and Bower, K. N. (1999). A Closure Study of Sub-Micrometer Aerosol Particle Hygroscopic Behaviour, Atmos. Res., 50:205-240. Swietlicki, E., Zhou, J. C., Covert, D. S., Hameri, K., Busch, B., Vakeva, M., Dusek, U., Berg, O. H., Wiedensohler, A., Aalto, P., Makela, J., Martinsson, B. G., Papaspiropoulos, G., Mentes, B., Frank, G., and Stratmann, F. (2000). Hygroscopic Properties of Aerosol Particles in the Northeastern Atlantic During ACE-2, Tellus B., 52:201-227. Tang, I. N., and Munkelwitz, H. R. (1993). Composition and Temperature-Dependence of the Deliquescence Properties of Hygroscopic Aerosols, Atmos. Environ., 27:467-473. Tang, I. N., and Munkelwitz, H. R. (1994a). Water Activities, Densities, and Refractive-Indexes of Aqueous Sulfates and Sodium-Nitrate Droplets of Atmospheric Importance, J. Geophys. Res., 99:18801-18808. Tang, I. N., and Munkelwitz, H. R. (1994b). Aerosol Phase-Transformation and Growth in the Atmosphere, J. Appl. Meteorol., 33:791-796. Videen, G., Pellegrino, P., Ngo, D., Videen, J. S., and Pinnick, R. G. (1997). Light-Scattering Intensity Fluctuations in Microdroplets Containing Inclusions, Appl. Optics., 36:6115-6118. Wang, J., Flagan, R. C., and J. H. Seinfeld (2003). A Differential Mobility Analyzer (DMA) System for Submicron Aerosol Measurements at Ambient Relative Humidity, Aerosol Sci. Tech., 37:46-52. Weast, R. C. (1987). CRC Handbook of Chemistry and Physics, 68th Edition, CRC Press, Florida.

92
Wise, M. E., Surratt, J. D., Curtis, D. B., Shilling, J. E., and Tolbert, M. A. (2003). Hygroscopic Growth of Ammonium Sulfate/Dicarboxylic Acids, J. Geophys. Res., 108(D20), doi:10/1029/2003JD003775. Yao, X. H., Fang, M., Chan, C. K., Ho, K. F., and Lee, S. C. (2004). Characterization of Dicarboxylic Acids in PM2.5 in Hong Kong, Atmos. Environ., 38:963-970. Yu, J. Z., Huang, S. F., Xu, J. H., and Hu, M. (2005). When Aerosol Sulfate Goes Up, so does Oxalate: Implication for the Formation Mechanisms of Oxalate, Environ. Sci. Technol., 39:128-133. Zhang, X. Q., McMurry, P. H., Hering, S. V., and Casuccio, G. S. (1993). Mixing Characteristics and Water-Content of Submicron Aerosols Measured in Los-Angeles and at the Grand-Canyon, Atmos. Environ., 27:1593-1607.

93
Table 3.1. Aerosol Hygroscopicity Measurement Techniques

94
Figure 3.1. Schematic of DASH-SP.

95
Figure 3.2. Time required as a function of particle number concentration to obtain sufficient pulses for the modal pulse height to be within 1% of the mode that would be obtained when counting at least 10,000 particles at constant particle composition. Also shown is the time needed for the standard deviation to be within 1%, 5%, and 10% of the standard deviation that would be obtained when counting at least 10,000 particles at constant particle composition.

96
Figure 3.3. Stability statistics for different species and sizes over a time span of four months. Panel A corresponds to the high-gain OPC setting, and Panel B represents the low-gain setting for dry tests. Panel C represents stability statistics for growth factor during wet studies using the high-gain OPC configuration (n > 20 for each salt in the bottom panel).

97
Figure 3.4. OPC response as a function of dry particle size for salts of different refractive index. These results are from one OPC for a single set of calibrations performed for each salt. All OPCs show the same general behavior.
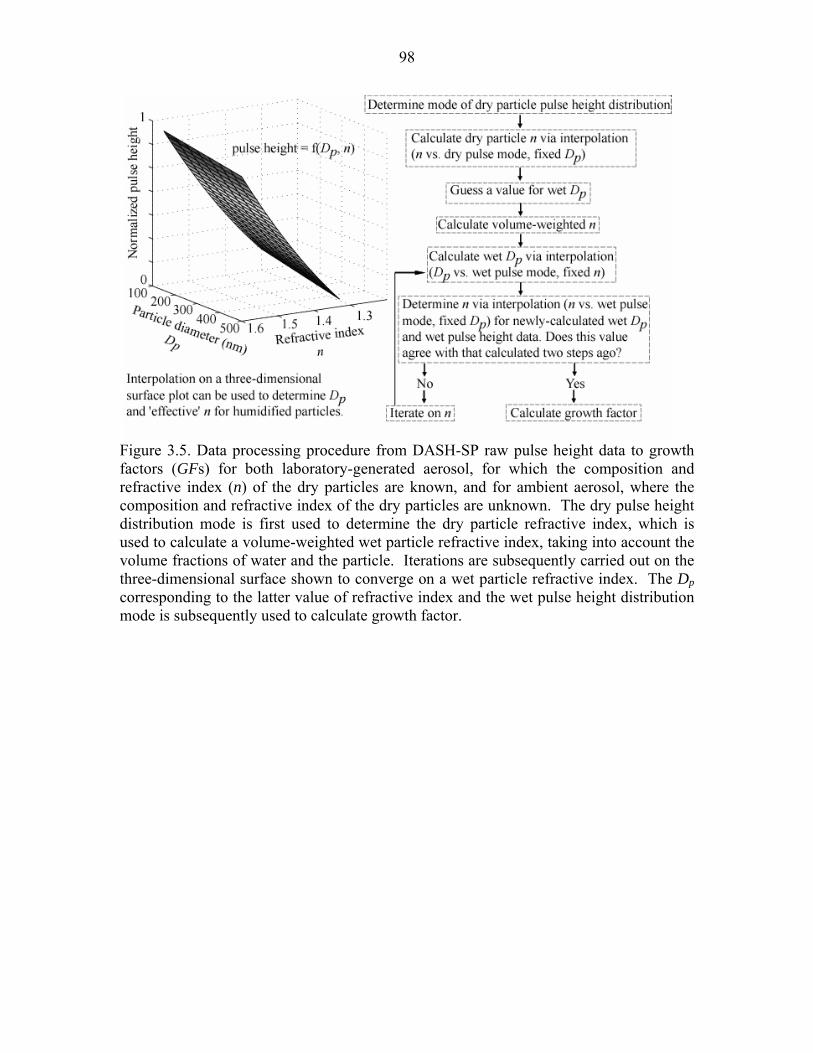
98
Figure 3.5. Data processing procedure from DASH-SP raw pulse height data to growth factors (GFs) for both laboratory-generated aerosol, for which the composition and refractive index (n) of the dry particles are known, and for ambient aerosol, where the composition and refractive index of the dry particles are unknown. The dry pulse height distribution mode is first used to determine the dry particle refractive index, which is used to calculate a volume-weighted wet particle refractive index, taking into account the volume fractions of water and the particle. Iterations are subsequently carried out on the three-dimensional surface shown to converge on a wet particle refractive index. The Dp corresponding to the latter value of refractive index and the wet pulse height distribution mode is subsequently used to calculate growth factor.

99
Figure 3.6. Experimentally determined growth factor curves for inorganic and organic acid species. Predictions from the Brechtel and Kreidenweis (2000a, 2000b) model are shown for all salts except for glyoxylic acid and potassium chloride, while predictions from the Clegg et al. (1998) model are also shown for ammonium sulfate. It should be noted that these two models differ in that the Brechtel and Kreidenweis (2000a, 2000b) model includes the Kelvin term to account for droplet curvature. Sampled particles within the size range of the DASH-SP are sufficiently large so that the Kelvin effect correction is relatively small. The error bars reflect uncertainties associated with the RH and sizing (DMA and OPC) measurements. The reported deliquescence RH (DRH) and efflorescence RH (ERH) values are from the following references: Saxena and Hildemann (1997) and Peng et al. (2001) for organic acids, and Seinfeld and Pandis (2006) for the inorganic species.
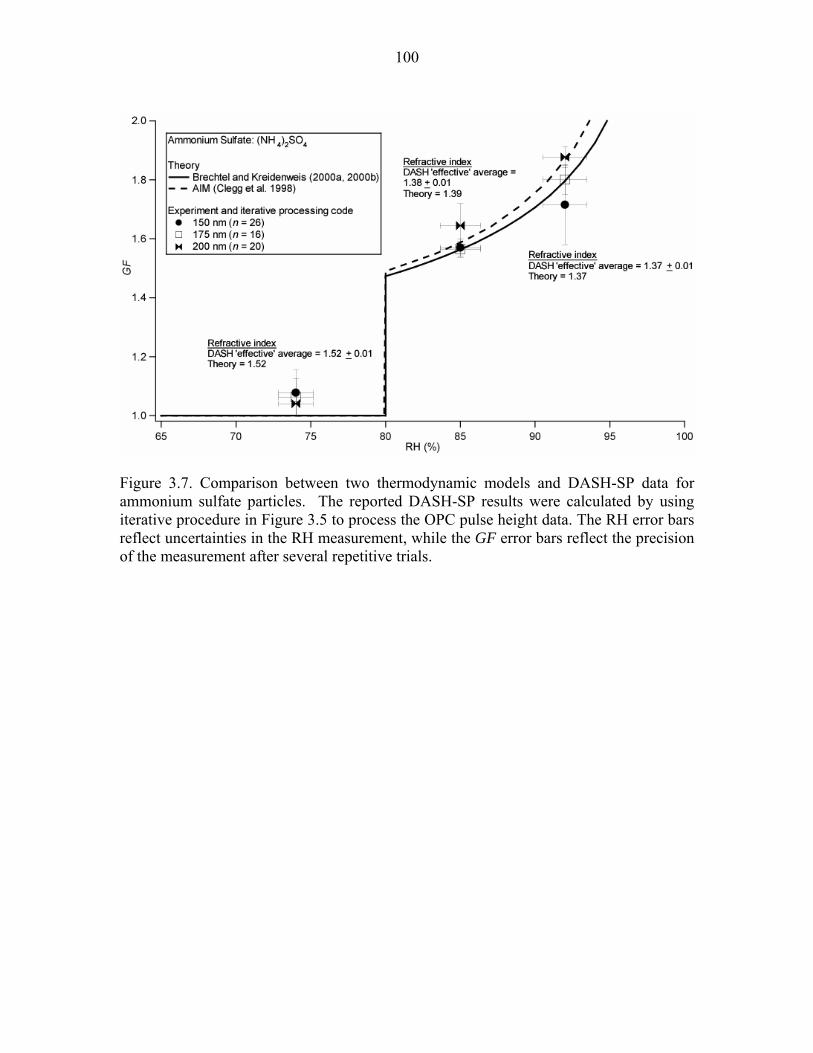
100
Figure 3.7. Comparison between two thermodynamic models and DASH-SP data for ammonium sulfate particles. The reported DASH-SP results were calculated by using iterative procedure in Figure 3.5 to process the OPC pulse height data. The RH error bars reflect uncertainties in the RH measurement, while the GF error bars reflect the precision of the measurement after several repetitive trials.

101
Figure 3.8. Size distributions from wet ammonium sulfate and dry PSL aerosol laboratory tests. Panels A, B, and C correspond to ammonium sulfate tests in which DMA-selected dry particle sizes of 150, 175, and 200 nm, respectively, were exposed to RHs of < 8% (dry), 74%, 85%, and 92%. Each curve is labeled with its calculated growth factor and “effective” refractive index (n), as calculated from the iterative data processing procedure in Figure 3.5. Panel D corresponds to dry PSL size distributions to show that for spherical particles the distributions are narrower than those for salts that may not be perfectly spherical. The size distributions tend to be broader near the minimum and maximum size detection limits of the OPCs.
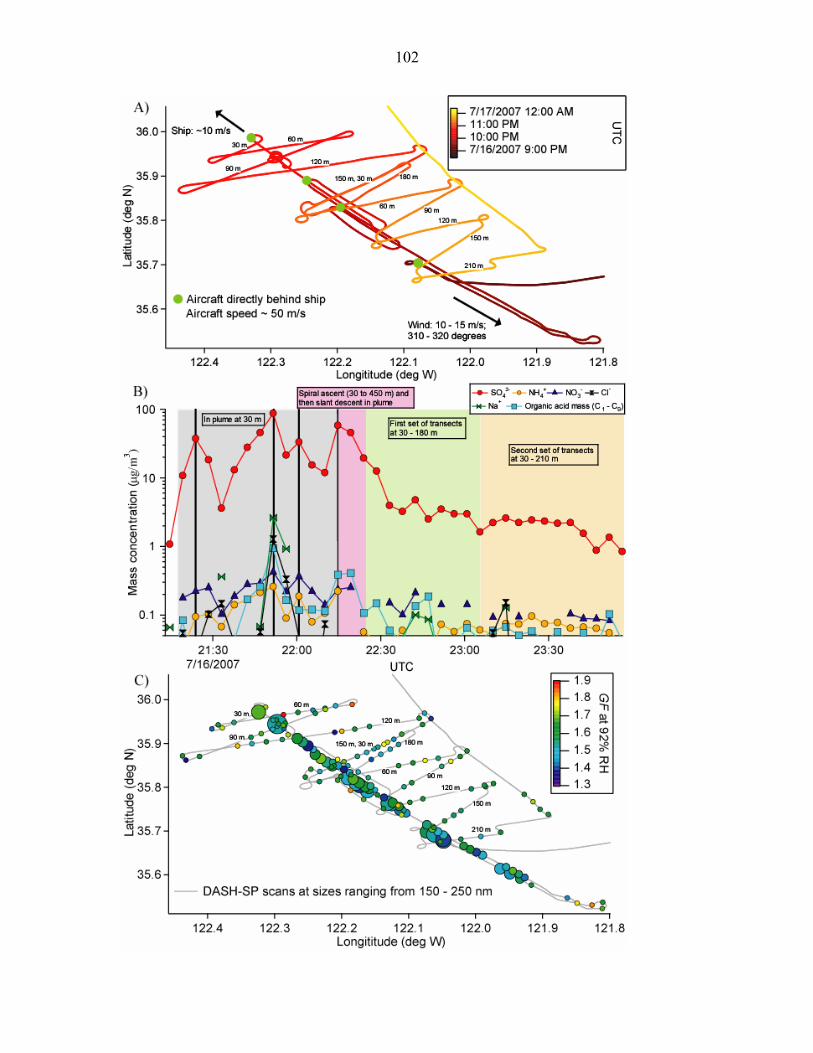
102

103
Figure 3.9. Panel A) Flight tracks during a MASE II flight (July 16, 2007) during which the Twin Otter aircraft sampled emissions from a large cargo ship off the central coast of California. The duration of the ship exhaust plume measurements was approximately 2.5 h. The plane flew at an altitude of 30 m in the ship’s plume, before performing multiple cross-wind transects of the plume at the labeled altitudes. Panel B) Water-soluble species concentrations as measured by a PILS onboard the Twin Otter. The four, black vertical lines indicate when the aircraft was immediately behind the ship. Panel C) Growth factors at an RH of 92%. Marker sizes are proportional to the submicrometer particle number concentration (range = 50 – 365,000 cm-3), as determined by a DMA.

104
Chapter 4
Oxalic Acid in Clear and Cloudy Atmospheres:
Analysis of Data from International Consortium for
Atmospheric Research on Transport and
Transformation 2004∗
∗This chapter is reproduced by permission from “Oxalic Acid in Clear and Cloudy Atmospheres: Analysis of Data from International Consortium for Atmospheric Research on Transport and Transformation 2004” by A. Sorooshian, V. Varutbangkul, F. J. Brechtel, B. Ervens, G. Feingold, R. Bahreini, S. M. Murphy, J. S. Holloway, E. L. Atlas, G. Buzorius, H. Jonsson, R. C. Flagan, and J. H. Seinfeld, J. Geophys. Res., 111, D23S45, doi:10.1029/2005JD006880, 2006. Copyright 2006. American Geophysical Union.

105
4.1 Abstract
Oxalic acid is often the leading contributor to the total dicarboxylic acid mass in
ambient organic aerosol particles. During the 2004 International Consortium for
Atmospheric Research on Transport and Transformation (ICARTT) field campaign, nine
inorganic ions (including SO42-) and five organic acid ions (including oxalate) were
measured onboard the Center for Interdisciplinary Remotely-Piloted Aircraft Studies
(CIRPAS) Twin Otter research aircraft by a particle-into-liquid sampler (PILS) during
flights over Ohio and surrounding areas. Five local atmospheric conditions were studied:
(1) cloud-free air, (2) power plant plume in cloud-free air with precipitation from
scattered clouds overhead, (3) power plant plume in cloud-free air, (4) power plant plume
in cloud, and (5) clouds uninfluenced by local pollution sources. The aircraft sampled
from two inlets: a counterflow virtual impactor (CVI) to isolate droplet residuals in
clouds and a second inlet for sampling total aerosol. A strong correlation was observed
between oxalate and SO42- when sampling through both inlets in clouds. Predictions
from a chemical cloud parcel model considering the aqueous-phase production of
dicarboxylic acids and SO42- show good agreement for the relative magnitude of SO4
2-
and oxalate growth for two scenarios: power plant plume in clouds and clouds
uninfluenced by local pollution sources. The relative contributions of the two aqueous-
phase routes responsible for oxalic acid formation were examined; the oxidation of
glyoxylic acid was predicted to dominate over the decay of longer-chain dicarboxylic
acids. Clear evidence is presented for aqueous-phase oxalic acid production as the
primary mechanism for oxalic acid formation in ambient aerosols.

106
4.2. Introduction
Dicarboxylic acids are ubiquitous in atmospheric aerosols (Norton et al., 1983;
Kawamura and Kaplan, 1987; Kawamura and Ikushima, 1993; Khwaja et al., 1995;
Kawamura et al., 1995, 1996, 2003, 2005; Liu et al., 1996; Kawamura and Sakaguchi,
1999; Limbeck and Puxbaum, 1999; Kerminen et al., 2000; Poore, 2000; Puxbaum et al.,
2000; Pakkanen et al., 2001; Rohrl and Lammel, 2001; Yao et al., 2002a, 2004; Salam et
al., 2003a, 2003b; Crahan et al., 2004; Shantz et al., 2004; Yu et al., 2005) and cloud
droplets (Weathers et al., 1988; Limbeck and Puxbaum, 2000; Hegg et al., 2002; Loflund
et al., 2002; Crahan et al., 2004); however, the physical and chemical routes by which
these compounds form and are sequestered in particulate matter are not fully understood.
The presence of dicarboxylic acids in pure and mixed aerosols may affect both
deliquescence relative humidity and hygroscopic behavior (Cruz and Pandis, 1998;
Brooks et al., 2002; Kumar et al., 2003); the radiative impact of particles containing
dicarboxylic acids depends on their effectiveness in absorbing water as a function of
relative humidity.
Oxalic acid, (COOH)2, a by-product of fossil fuel combustion, biomass burning,
and biogenic activity, has been shown in many studies to be the most abundant
dicarboxylic acid in tropospheric aerosols (Kawamura and Kaplan, 1987; Kawamura and
Ikushima, 1993; Kawamura et al., 1995, 1996, 2003, 2005; Liu et al., 1996; Kawamura
and Sakaguchi, 1999; Kerminen et al., 2000; Poore, 2000; Loflund et al., 2002; Yao et
al., 2002a, 2004; Salam et al., 2003a, 2003b; Crahan et al., 2004; Yu et al., 2005).
Studies have suggested, however, that primary sources of particulate oxalic acid cannot

107
account for ambient levels that have been measured globally (Poore, 2000; Warneck,
2003; Yao et al., 2004; Yu et al., 2005).
Oxalate, the anion of oxalic acid, is typically detected by analytical techniques
such as ion chromatography (IC). In some observations, oxalate-containing particles
show two distinct accumulation modes at 0.2 + 0.1 μm and 0.7 + 0.2 μm, with the larger
mode being associated with SO42- (Kerminen et al., 1999, 2000; Kalberer et al., 2000;
Yao et al., 2002b, 2003; Crahan et al., 2004). Suggested oxalate formation mechanisms
in the fine particulate mode include in-cloud processing, oxidation of gaseous species
followed by condensation, and aerosol surface reactions (Kawamura and Ikushima, 1993;
Faust, 1994; Chebbi and Carlier, 1996; Blando and Turpin, 2000; Yao et al., 2002b,
2003; Mochida et al., 2003; Turekian et al., 2003). Crahan et al. (2004) measured in a
coastal marine environment the air-equivalent concentrations of SO42- and oxalate in
cloudwater as approximately two and three times greater, respectively, than
concentrations measured below cloud. They also detected glyoxylic acid, an intermediate
in aqueous-phase oxalate production (Leitner and Dore, 1997), in cloudwater samples.
Based on data from the literature and results from their own study, Yu et al. (2005) argue
that a dominant in-cloud pathway can explain the close correlation between SO42- and
oxalate.
During the 2004 International Consortium for Atmospheric Research on
Transport and Transformation (ICARTT) study, measurements made by surface,
airborne, and satellite platforms focused on examining the nature of air masses in the
northeastern United States, the western Atlantic Ocean, and the Maritime Provinces of
Canada. In August 2004, the Center for Interdisciplinary Remotely-Piloted Aircraft

108
Studies (CIRPAS) Twin Otter (TO), based at Hopkins International Airport in Cleveland,
Ohio, participated in the ICARTT field campaign. The focus of the CIRPAS
participation was to study aerosol and cloud condensation nuclei (CCN) physics and
chemistry.
The goal of the present work is to elucidate oxalic acid formation in the
atmosphere. We analyze airborne measurements of SO42- and oxalate in different
conditions in the atmosphere around Ohio during ICARTT. The majority of the oxalate
measurements were made while sampling either droplet residuals (the particle remaining
after a cloud droplet has evaporated) or the total aerosol in clouds (the sum of interstitial
aerosol and droplet residuals). We investigate the correlation between SO42- and oxalate,
and the role of other organic acids in aqueous-phase production of oxalate. The relative
contributions of different aqueous-phase reactions are examined, as well as the magnitude
of SO42- and oxalate mass production rates in cloud-processed air. Finally, we assess the
extent to which these rates agree with those predicted by a cloud parcel model containing
a state-of-the-art mechanism for aqueous-phase production of SO42- and oxalate.
4.3. Twin Otter (TO) Research Aircraft
Table 4.1 summarizes the instruments that were operated on the TO. Chemical
composition data analyzed here were obtained by a particle-into-liquid sampler (PILS),
which will be described below. A quadropole Aerodyne Aerosol Mass Spectrometer
(AMS) (Jayne et al., 2000) provided chemical composition data for non-refractory
aerosol species. Aerosol size distribution data (10 - 800 nm diameter) were obtained by a
Caltech dual differential mobility analyzer (DMA) system (Wang et al., 2003), also

109
called the Dual Automated Classified Aerosol Detector (DACAD). An external Passive
Cavity Aerosol Spectrometer Probe (PCASP, PMS, modified by DMT Inc.) and an
external Forward Scattering Spectrometer Probe (FSSP, PMS, modified by DMT Inc.)
provided cloud and aerosol size distributions for the following particle diameter ranges,
respectively: 0.1 to 2.0 μm and 2.0 to 40.0 μm.
The main inlet was the primary inlet supplying sample flow to all instruments
anytime the TO was outside of clouds and sometimes when it was inside clouds. The
main inlet of the TO uses two diffusers to decelerate air by a factor of ten before it is sent
to the sampling instruments. Hegg et al. (2005) characterized the behavior of the TO
inlet; they report that the transmission efficiency of the inlet under standard flight
conditions for particle diameters less than 3.5 μm is near unity, decreasing for larger
particles until 5.5 μm and above, where the transmission efficiency remains slightly in
excess of 60%. This transmission efficiency persists for particle diameters up to 9 μm,
the upper limit of the characterization tests. When used in clouds, the main inlet sampled
the total aerosol, which included interstitial aerosol and residual particles from
evaporated cloud droplets. Evidence that droplet residuals were being sampled through
the main inlet during ICARTT included the detection of aqueous-phase precursors to
oxalic acid.
A counterflow virtual impactor (CVI) inlet was employed only in clouds. The
CVI selectively samples cloud droplets larger than a cut-off diameter of 10 (+ 20%) μm
by isolating them from the interstitial aerosol, by means of inertial impaction. During the
time the CVI was used, sample flow was diluted and divided for supply only to the PILS,
AMS, a particle soot absorption photometer (PSAP, Radiance Research Inc.), and a

110
condensation particle counter (TSI CPC 3010), during which time, all other instruments
still sampled air entering through the main inlet. The instruments behind the CVI
sampled residual particles from evaporated cloud droplets. PILS concentrations reported
during CVI sampling should be considered as the lower limit to their true value due to
uncertainties in the CVI transmission efficiency.
4.4. PILS-IC Measurements
The PILS-IC is a quantitative technique for measuring water-soluble ions,
including inorganic and organic acid ions in aerosol particles. The PILS developed and
used in this study (Brechtel Manufacturing Inc., www.brechtel.com) is based on the
prototype design (Weber et al., 2001) with key modifications, including integration of a
liquid sample fraction collector and real-time control of the steam injection tip
temperature (Sorooshian et al., 2006). Ambient air is sampled through a 1 - micrometer
cut-size impactor and a set of three denuders (URG and Sunset Laboratories) to remove
inorganic and organic gases that may bias aerosol measurements. The two annular glass
denuders (URG-2000-30x242-3CSS) used for removal of inorganic gases are coated with
solutions of either 2% sodium carbonate or 2% phosphoric acid (for removal of acidic
and basic gases, respectively) in a solution of 100 mL of Milli Q water, 80 mL of
methanol, and 2 g of glycerol. The third denuder (Sunset Laboratory Inc.), composed of
15 thin carbon filter paper sheets (3.15 cm x 20.32 cm x 0.04 cm thick) with 0.2 cm gaps
between them, removes organic gases. Sample air mixes with steam in a condensation
chamber where rapid adiabatic mixing produces a high water supersaturation. Droplets
grow sufficiently large to be collected by inertial impaction before being delivered to

111
vials held on a rotating carousel. The contents of the vials are subsequently analyzed off-
line using a dual IC system (ICS-2000 with 25 μL sample loop, Dionex Inc.) for
simultaneous anion and cation analysis. A fraction of each liquid sample was frozen for
future re-analysis with a longer IC program capable of better detection of organic acid
ions.
Nine inorganic ions (Na+, NH4+, K+, Mg2+, Ca2+, Cl-, NO2
-, NO3-, and SO4
2-) and
five organic acid ions (oxalate, malonate, glutarate, pyruvate, and glyoxylate) were
measured during the field campaign. The limit of detection (LOD) for each ion was
determined by running the lowest concentration standard detectable by the IC and using
the average concentration plus three times the standard deviation (n = 50) to calculate the
air-equivalent concentration of each ion. The LODs for the ions measured using the
PILS-IC technique for this study are all below 0.1 μg/m3, with the organic anions and
SO42- exhibiting LOD’s below 0.03 μg/m3.
Measurements presented for glyoxylate, pyruvate, and glutarate are derived from
re-analyzing the stored liquid volumes (they were frozen for 13 months). It should be
noted that all vials were spiked with 5 μL of dichloromethane prior to storage to prevent
biological processing. The mass concentrations of SO42-, NH4
+, and oxalate from the
original and re-analyzed vials were compared for Flight 5 on 9 August 2004 to determine
the magnitude of variability between the two batches (Table 4.2). The concentrations
measured in the original vials for the three ions exceeded the re-analyzed concentrations
by factors between 1.54 and 1.83, indicating that there was degradation of ion levels
during storage; potential explanations for degradation include the freezing and thawing
process, the interaction of the sample with the vial surface, and the effect of

112
dichloromethane. The reported concentrations of glyoxylate, pyruvate, and glutarate
should be viewed as a lower limit, assuming that their degradation rates were similar to
those measured for SO42-, NH4
+, and oxalate.
4.5. Field Measurements 4.5.1. Field Data Summary The TO flight tracks for all twelve flights between 1 and 21 August 2004 are
shown in Figure 4.1. Several flights focused on areas downwind of the Monroe Power
Plant (Monroe County, Michigan) and the Conesville Power Plant (Coshocton County,
Ohio), both of which are coal-burning plants. The following types of atmospheric
conditions were encountered over the entire 12-flight mission: (1) cloud-free air, (2)
power plant plume in cloud-free air with precipitation from scattered clouds overhead, (3)
power plant plume in cloud-free air, (4) power plant plume in cloud, and (5) clouds
uninfluenced by local pollution sources. Figure 4.2 illustrates the sampling strategy used
by the TO during flights when atmospheric condition types 2 and 4 were encountered; the
TO flew a number of horizontal transect legs perpendicular to the studied plume. Figure
4.2b represents the case of type 3 as well, but in the absence of precipitation. Data
grouped in the two cloud cases were identified by elevated relative humidities (RH >
100%) and high liquid water content (LWC > 0.1 g/m3). Plumes were identified by a
dramatic increase in aerosol number concentration. It should be noted that the clouds
uninfluenced by local pollution sources may have still been influenced by long-range
transport of urban pollution.
Characteristics of the clouds observed during Flights 5 and 12 (9 and 21 August
2004, respectively), which are flights that will be examined in detail subsequently, are

113
representative of the clouds encountered over the entire mission. The clouds were
typically cumulus, which broadly encompasses stratocumulus, fair-weather cumulus, and
cumulus congestus clouds, with thicknesses between 500 to 700 m. Cloud bases stayed
on the order of 1500 m, and as the day proceeded, the tops grew from around 2000 m to
between 2300 and 2700 m. Typical LWC vertical profiles indicate that there were
slightly variable cloud base altitudes, and some entrainment drying. The LWC in clouds
typically ranged from 0.1 to 1.0 g/m3. The lower troposphere in the sampling region was
marked by turbulence and convective instability. Soundings obtained on the ascents out
of Cleveland show ambient and dew point temperatures tracing nearly straight lines to
cloud base altitudes, reflecting instability and vigorous mixing. On average, vertical
velocities near the cloud bases tended to be 1 m/s, increasing to 2 m/s during passes at
higher levels in cloud.
Figure 4.3 displays the vertical distribution of specific ions and the total mass
measured through both inlets for the entire 12-flight mission. The mass concentrations of
oxalate and SO42- were evenly scattered at all altitudes up to about 2250 m, where they
start to decrease, indicating the beginning of the free troposphere. Oxalate constituted up
to 6.3% of the total water-soluble ionic mass as measured by the PILS. Table 4.3 shows
the variation of the molar ratio of oxalate relative to three of the major inorganic ions for
each atmospheric condition encountered and each inlet used. Overall, oxalate exhibits
the strongest correlation with SO42-, followed by NH4
+ and then NO3-. Ammonium is
correlated with SO42-, since acidic sulfate-containing particles absorb ammonia. Oxalate
and NO3- show a poor correlation, suggesting that these ions arise from different
processes.
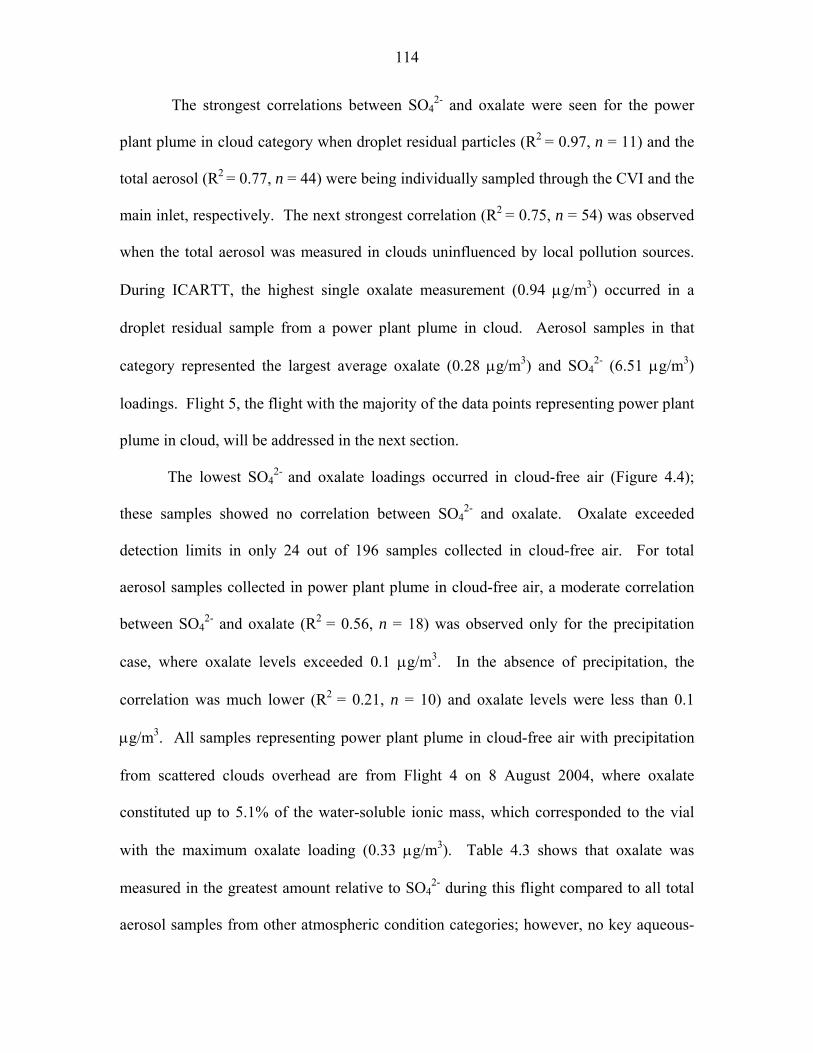
114
The strongest correlations between SO42- and oxalate were seen for the power
plant plume in cloud category when droplet residual particles (R2 = 0.97, n = 11) and the
total aerosol (R2 = 0.77, n = 44) were being individually sampled through the CVI and the
main inlet, respectively. The next strongest correlation (R2 = 0.75, n = 54) was observed
when the total aerosol was measured in clouds uninfluenced by local pollution sources.
During ICARTT, the highest single oxalate measurement (0.94 μg/m3) occurred in a
droplet residual sample from a power plant plume in cloud. Aerosol samples in that
category represented the largest average oxalate (0.28 μg/m3) and SO42- (6.51 μg/m3)
loadings. Flight 5, the flight with the majority of the data points representing power plant
plume in cloud, will be addressed in the next section.
The lowest SO42- and oxalate loadings occurred in cloud-free air (Figure 4.4);
these samples showed no correlation between SO42- and oxalate. Oxalate exceeded
detection limits in only 24 out of 196 samples collected in cloud-free air. For total
aerosol samples collected in power plant plume in cloud-free air, a moderate correlation
between SO42- and oxalate (R2 = 0.56, n = 18) was observed only for the precipitation
case, where oxalate levels exceeded 0.1 μg/m3. In the absence of precipitation, the
correlation was much lower (R2 = 0.21, n = 10) and oxalate levels were less than 0.1
μg/m3. All samples representing power plant plume in cloud-free air with precipitation
from scattered clouds overhead are from Flight 4 on 8 August 2004, where oxalate
constituted up to 5.1% of the water-soluble ionic mass, which corresponded to the vial
with the maximum oxalate loading (0.33 μg/m3). Table 4.3 shows that oxalate was
measured in the greatest amount relative to SO42- during this flight compared to all total
aerosol samples from other atmospheric condition categories; however, no key aqueous-

115
phase intermediates in oxalic acid formation were detected. Therefore, we cannot
preclude sources of oxalic acid other than cloud processing, such as gas-phase oxidation
of parent organic species followed by condensation.
As noted in the Introduction, previous studies have ruled out primary sources as
the main formation mechanism for oxalic acid based on spatial and temporal
characteristics (Poore, 2000; Yao et al., 2004; Yu et al., 2005). If primary sources were
responsible for observed oxalate levels, then comparable levels should have been
measured in all of the aforementioned atmospheric conditions encountered. That the
oxalate-to-sulfate molar ratios in the two cloud categories (power plant plume in cloud
and clouds uninfluenced by local pollution sources) show consistency and that the oxalate
mass concentrations in cloud-free air were significantly lower is consistent with the
hypothesis of an in-cloud production pathway for oxalate. Although SO42- and oxalate
are not directly linked chemically, the correlation between their levels is a result of the
fact that both formation mechanisms require the aqueous medium. While information
regarding the size distribution of oxalate and SO42- is not available from the PILS
measurements, past studies have noted similar size distributions of these two species,
suggesting a common source (Yao et al., 2003; Crahan et al., 2004). Further evidence for
aqueous oxalate production is provided by the detection of aqueous intermediates in
oxalate formation, including glyoxylate, which was measured in 6 CVI samples (clouds
uninfluenced by local pollution sources) and 13 total aerosol samples (9 in clouds
uninfluenced by local pollution sources and 4 in clouds influenced by power plant
plumes).

116
4.5.2. Case Study: Power Plant Plume in Cloud (Flight 5 on 9 August 2004) On 9 August 2004 (1709–2216 UT), the TO sampled the Conesville Power Plant
plume in cloud (Figure 4.5a). Located south of Cleveland, this plant emits SO2 and NOx
at rates of 1.31x10⁸ kg/yr and 2.16x10⁷ kg/yr, respectively, and VOCs at 1.21x10⁵ kg/yr
(http://www.emissionsonline.org/nei99v3/plant/pl44374x.htm, 1999). The plume was
transported northeast (~ 230°) at wind speeds between 6 and 12 m/s. Figure 4.5b shows
the TO altitude, LWC, and aerosol number concentration. The TO flew a stair-step
pattern between altitudes of 1500 and 2200 m downwind of the plant between 1815 and
2140 UT. LWC measurements reached values as high as 0.94 g/m3.
Typical FSSP cloud droplet size distributions showed a number concentration
mode ranging from 7.7 to 9.0 μm with a geometric standard deviation ranging between
1.2 and 1.5. All instruments were sampling the total aerosol through the main inlet,
which when used in cloud, as noted earlier, contained a mixture of interstitial aerosol,
particles that contain significant amounts of water but are not activated (usually < 2 μm),
and droplet residuals. The DACAD measured a consistent bimodal size distribution with
increasing distance downwind of the power plant in cloud, with a smaller mode that grew
from 25 to 42 nm (Figure 4.6). The aerosol number concentration outside of cloud and
close to the power plant was dominated by particles with Dp < 40 nm. A cloud-
processing mode in the range between 100 and 200 nm was measured throughout the
flight. The hygroscopic growth factor for the larger mode ranged between 1.16 and 1.20
at the relative humidities shown in Figure 4.6. The growth factors are low relative to that
for pure ammonium sulfate particles (1.17 compared to 1.44 for pure ammonium sulfate

117
at 77% RH), suggesting that the sampled aerosol was composed of less hygroscopic
components.
Figure 4.5c shows a time series of SO42-, various organic ions, and the volume
concentration, from the DACAD, of the total aerosol sampled (Dp < 1 μm). There is
significant growth in SO42-, oxalate, and the aerosol volume concentration in the plume
proceeding downwind of the power plant. The aerosol volume concentration and the
SO42- loadings are correlated and close in magnitude, suggesting that most of the volume
growth was a result of the conversion of SO2 to SO42-. The ammonium-to-sulfate molar
ratio was between 1.1 and 1.6 for most of the flight downwind of the plant, indicating
that there was insufficient ammonia to neutralize the relatively high level of sulfuric acid.
This high level of acidity can also explain why virtually no NO3- was detected (< 0.3
μg/m3). The aerosol volume concentration reached a maximum close to 40 km
downwind of the plant (2043 UT), the point at which the highest SO42- and oxalate
loadings occurred (18.90 and 0.61 μg/m3, respectively). Oxalate grew with increasing
distance from the plant as well, representing between 0.5 and 3.1% of the total water-
soluble mass for the majority of the flight and 2.6% in the vial with its maximum mass.
Out-of-plume, oxalate concentrations dropped below 0.1 μg/m3, and SO42- dropped to
between 1 and 5 μg/m3.
Aqueous-phase precursors to oxalate were only identified in cloud, offering
support to the hypothesis of an aqueous formation pathway. Glyoxylate, the anion of
glyoxylic acid, was measured in two successive vials, at a level on the order of 0.06
μg/m3, while oxalate was measured as 0.26 μg/m3 and 0.39 μg/m3 in these two vials.
Two other vials contained 0.03 μg/m3 glyoxylate, while oxalate was at 0.19 μg/m3 and

118
0.36 μg/m3. Pyruvate, the anion of pyruvic acid, which is thought to be a precursor of
glyoxylic acid (Lim et al., 2005), was measured at a level between 0.09 and 0.10 μg/m3.
Glutarate, the anion of the glutaric acid (C5 dicarboxylic acid), reached a maximum level
of 0.24 μg/m3. One vial contained 0.05 μg/m3 of malonate, the anion of malonic acid (C3
dicarboxylic acid). Longer-chain dicarboxylic acids such as glutaric acid are oxidized in
the aqueous phase leading to smaller dicarboxylic acids, ultimately reaching oxalic acid
(Kawamura and Sakaguchi, 1999). The aforementioned data alone do not reveal the
relative contribution from the decay of longer-chain acids such as glutarate and the
oxidation of glyoxylate to the production of oxalate mass; this will be explored
subsequently.
Since the concentrations of SO42- and oxalate are correlated and they are both
typically found in the same mode in the submicrometer aerosol size range, it is
hypothesized that oxalate is formed in the aqueous phase, for which the presence of key
aqueous intermediates to oxalic acid provides evidence. The mass concentrations of
SO42- and oxalate were higher in the Flight 5 total aerosol samples as compared to the
total aerosol and droplet residual measurements in clouds uninfluenced by local pollution
sources from other flights. This is hypothesized to be a result of longer cloud processing
times for sampled particles during Flight 5 since the clouds were more abundant and
closely packed. Also, some of the highest LWC values from the entire mission were
observed, leading to increased partitioning of gases (specifically SO2, organic precursors
to oxalic acid, and oxidants) into the droplets, yielding higher mass production rates of
SO42- and oxalate. The highly turbulent nature of the lower atmosphere on 9 August
2004 may have also promoted the re-activation of evaporated droplets, via cycling in- and
119
out-of-cloud, to produce increasing amounts of SO42- and oxalate. We note that although
the SO2 concentrations were measured to be higher in plume compared to non-plume
conditions, the concentrations of volatile organic carbon (VOC) species were essentially
similar, which highlights the importance of non-VOC factors in oxalic acid production.
4.6. Cloud Parcel Model 4.6.1. Description and Modifications The overall goal of this study is to understand the mechanism of occurrence of
oxalic acid in atmospheric aerosols. The hypothesis is that aqueous-phase chemistry
provides the dominant route for oxalic acid formation. To evaluate the extent to which
the data support this hypothesis, we compare ambient oxalate measurements to
predictions of a state-of-the-art microphysical/chemical cloud parcel model (Ervens et al.,
2004) that simulates the activation of a population of aerosol particles. The model also
simulates cloud cycles that are intended to represent the trajectory of a typical air parcel
in a cloudy atmosphere, including gas and aqueous-phase chemical reactions. Four gas-
phase VOC precursors of dicarboxylic acids are included; toluene and ethene represent
anthropogenic emissions, isoprene represents biogenic emissions, and cyclohexene serves
as a model compound for symmetrical alkenes similar to monoterpenes emitted by
biogenic sources. The oxidation products of these species in the gas phase (glyoxal,
glyoxylic acid, glycolic acid, hydroxyacetaldehyde, methylglyoxal, pyruvic acid, acetic
acid, adipic acid, and glutaric acid) can transfer to the aqueous phase. Key multiphase
organic reactions leading to the formation and depletion of oxalic acid are shown in
Figure 4.7, whereas SO42- production in the model is simply governed by SO2 oxidation

120
with H2O2 and O3 (Seinfeld and Pandis, 1998). The model does not consider the
volatilization of particulate dicarboxylic acids as their vapor pressures are sufficiently
low (< 10-5 mm Hg) (Saxena and Hildemann, 1996; Tong et al., 2004).
Oxalic acid has two sources and one sink in the aqueous phase; it is consumed by
OH oxidation to yield CO2, and it is formed by OH oxidation of longer-chain
dicarboxylic acids and glyoxylic acid (including its anion, glyoxylate). The formation
route arising from the decay of longer dicarboxylic acids begins with adipic acid, which
is formed primarily by the aqueous uptake of gas-phase products from cyclohexene
oxidation by ozone and OH. Glutaric acid is formed by the aqueous oxidation of adipic
acid and by the aqueous uptake of gas-phase products from the ozonolysis of
cyclohexene. A series of oxidation steps leads, in order, from glutaric acid to succinic,
malonic, and oxalic acids. The second formation route considers the oxidation of
glyoxylic acid, which is formed by the OH oxidation of glyoxal, glycolate,
methylglyoxal, and acetic acid. These intermediates are formed in the mechanisms
associated with toluene, isoprene, and ethene. Lim et al. (2005) have proposed that
methylglyoxal yields low volatility organic acids through oxidation to glyoxylic acid, via
intermediate steps involving pyruvic and acetic acids, and finally to oxalic acid. The
Ervens et al. (2004) aqueous-phase mechanism for isoprene oxidation has been modified
to account for these reactions (Figure 4.7).
The model was applied to match the conditions encountered in the ICARTT
flights. To estimate the soluble aerosol fraction (by mass), the total PILS water-soluble
mass (inorganic and organic acid species) was divided by the sum of the PILS inorganic
water-soluble mass and the organic mass measured by the AMS. The AMS organic

121
measurement includes both water-soluble and non-water soluble species. The model was
also modified to incorporate measured ambient particle size distributions.
Since measurements were carried out in plumes, it is necessary to account for
plume dispersion. Using measurements and estimates for various properties in the
background air (including concentrations of SO2, H2O2, O3, gas-phase organic precursors,
and the mixing ratio of water), the following parameterized factor, which will be called
the entrainment rate, is applied to simultaneously simulate open system conditions and
plume dilution,
( )ecc
btφφηφ
−−=∂
∂
where φc and φe are the values of a property in the moving parcels and in the entrained
air, respectively. As will be discussed later, a constant measured value representative of
background air in the ambient Ohio atmosphere was used for properties represented by
φe, while φc was initialized with measured values at the source of the ambient process
being simulated (one simulation to be addressed in a later section begins near a power
plant stack) and subsequently calculated after each time step by the model. The equation
above is analogous to the plume entrainment rate presented by Squires and Turner
(1962), where a value of η = 0.2 is based on their laboratory experiments. The parameter
b is defined as the characteristic length scale for the entrainment process at time t, and
taken here as 500 m, the typical depth of the clouds sampled. It is emphasized that the
entrainment rate represents a simplified ad hoc factor.
The model simulates one - hour cloud cycles that are intended to represent the
trajectory of a typical air parcel in a cloudy atmosphere. Twelve cloud cycles, limited by
the prescribed trajectory used, are simulated for each experiment. One cloud cycle
122
begins with a parcel of air ascending from near the ground up through the mixed layer
until activation in cloud. The parcel continues to rise and then descends through the
cloud back to the mixed layer. During each cycle, a parcel is in-cloud for approximately
800 s; the same trajectory is then repeated with the number concentration remaining the
same, but with particle sizes altered due to mass addition after each cycle. The LWC
time evolution in the prescribed thermodynamic trajectory represents mixing and drying
by entrained air, based on the host model from which it is derived. A rough estimate of
the in-cloud residence time can be estimated by calculating the volume fraction of the
boundary layer (BL) occupied by cloud (Feingold et al., 1998); typical volume fractions
observed were between 20 and 25% suggesting that the hourly cloud contact time was
between 720 and 900 s for a well-mixed BL, a range that is consistent with the cloud
contact time of 800 s assumed in the cloud cycles. Photolysis rates are calculated for
40°N on June 21 at a height of 1 km for 12 hours starting at 6 am. The photolysis rates
are time dependent and uninfluenced by the presence of clouds. Gas uptake and chemical
aqueous-phase processes during each cycle occur only if the LWC exceeds 1 mg/kg and
for each particle size bin if the sum of the ammonium and sulfate concentrations does not
exceed 1 M. The model neglects aqueous-phase chemical processes when the ionic
strength exceeds 1 M. This assumption is the result of a lack of data for the estimation of
rate coefficients and because the solubility of organic gases typically decreases with
increasing ionic strength. The model also does not consider aerosol loss by wet and dry
deposition. Predictions for SO42- and oxalate levels are presented here at the end of each
cloud cycle. The comparison between field data and predictions should be viewed as
semi-quantitative; for instance, the actual trajectories of air parcels are not known. Our

123
goal is to determine the extent to which the levels of SO42- and oxalate measured are
generally consistent with those predicted by a model that is based on cloud processing
and aqueous-phase chemistry.
4.6.2. Sensitivity Analysis
Prior to actually simulating the field data, we explore the sensitivity of the model
to key parameters and initial conditions related to the initial particle population and the
ambient atmosphere which include meteorological conditions and concentrations of
gaseous species. Ervens et al. (2004) simulated generic “clean continental” and
“polluted” cases, in which for a closed system (without entrainment of background air)
SO42- reached its ultimate level by the end of the third cloud cycle. With continuous
replenishment of SO2, on the other hand, SO42- is predicted to form continuously.
Oxidation of all organic species in the aqueous phase yields HO2 which replenishes the
H2O2 supply, also promoting SO42- production. Sulfate production is controlled mainly
by the initial concentrations of SO2 and H2O2; a set of simulations show that the
percentage change in SO42- mass depends almost linearly on the percentage change in the
initial SO2 concentration, while an increase in H2O2 yields a less than proportional
increase in SO42-. The initial value of SO4
2- is governed by the size distribution and
soluble fraction of the initial particle population, where the initial soluble portion is
assumed to be pure ammonium sulfate.
Ervens et al. (2004) showed that approximately eight cloud cycles are required
for aqueous-phase organic oxidation to be completed in “clean continental” and
“polluted” cases (since organics are involved in more oxidation steps than SO42-). As

124
with sulfur, with continued replenishment of organic precursor gases, organics continue
reacting in the aqueous phase. Oxalic acid production does not exhibit the same degree
of sensitivity to its precursor concentrations as does SO42- to SO2. In some cases, even
less oxalic acid was produced when its gaseous precursor concentrations were increased.
One explanation is that oxalic acid does not form in direct proportion to its parent
precursor VOC (toluene, ethene, isoprene, cyclohexene) levels because of subsequent
steps required in its formation and competing reactions that deplete OH, the primary
oxidant in the aqueous-phase organic reactions. Examples of such competing reactions
include the OH oxidation of hydrogen peroxide, formic acid, formate, and hydrated
formaldehyde. In addition, several volatile organic species, including HCHO and CO2,
are produced as side-products in the aqueous-phase mechanism and do not contribute to
oxalic acid production.
The base value of 500 m used for b in the entrainment rate was doubled and
halved to explore the sensitivity of the production rates of SO42- and oxalic acid to this
parameterized factor. For these sensitivity tests, the concentrations of gas-phase species
in the moving parcels (φc) and in the entrained air (φe) were identical and equal to the
initial conditions for the case of clouds uninfluenced by local pollution sources in Table
4.4. As will be discussed later, these conditions are taken from field measurements made
at 1000 m in the ambient Ohio atmosphere. With higher entrainment rates, the simulated
particles are more effectively replenished with oxidants, SO2, and organic precursors.
Sulfate steadily changed to reach a final mass 28.3% greater and 27.2% lower when the
entrainment rate was doubled and halved, respectively. Doubling and halving the base
entrainment rate yielded 11% more and 3% less oxalic acid, respectively, at the end of

125
the simulation. Although less oxalic acid was formed in the case with the lowest
replenishment rate of oxidants and precursors, oxalic acid was produced more efficiently
relative to the total organic mass compared to simulations with higher entrainment rates;
the oxalic acid predicted contribution to the total organic aerosol mass in the case with
the lowest entrainment rate exceeded that of the other two cases by a minimum of 40%
after the second cloud cycle. Concentrations of the first-generation aqueous-phase
organic products, like adipic acid, showed the most proportional response to changes in
the entrainment rate (they grew with increasing entrainment rate) followed by products in
subsequent generations. Thus, the nonlinear response of oxalic acid to the entrainment
rate compared to SO42- can be explained by the multiple steps required in oxalic acid
formation and the complex feedbacks of reaction chains in the chemical mechanism,
specifically with the oxidant cycles (including HOx, NOx, O3, and H2O2). Also, the
production of oxalic acid from glyoxylic acid oxidation is less efficient as the pH
decreases, with the lowest pH values predicted in the simulation with the highest
entrainment rate, because the rate constant of the oxidation of glyoxylic acid is an order
of magnitude lower than that of its anion, glyoxylate.
The results of these sensitivity tests emphasize the critical nature of allowing for
an open system with entrainment as opposed to a closed system when simulating the
production rates of SO42- and oxalic acid. Sulfate was shown to be the most sensitive to
its precursor concentrations (SO2). Although the total organic aerosol mass and SO42- are
comparably sensitive to their precursor concentrations, oxalic acid is not. This is because
the total organic mass is dominated by first-generation products in the aqueous phase,
mainly adipic acid. Several oxidation steps are required to form oxalic acid, which

126
allows for the depletion of OH, the primary oxidant for organic compounds, and the
production of volatile organic side-products that do not contribute to the production of
oxalic acid.
4.7. Comparison of Model Predictions to Field Measurements Measured ambient conditions from two specific flights (Table 4.4) are used here
to initialize individual simulations to represent the two types of clouds that were studied;
Flights 5 (9 August 2004) and 12 (21 August 2004) represent power plant plume in cloud
and clouds uninfluenced by local pollution sources, respectively. The representative
measurements from Flight 5 were made directly downwind of the Conesville Power Plant
outside of cloud in its plume at 1000 m, whereas the Flight 12 measurements were made
at the same altitude at a location in the Ohio atmosphere unaffected by local pollution
sources. Gas-phase measurements were not carried out on the TO; estimates of the
gaseous precursor concentrations were obtained from the WP-3D and Convair, operated
by the National Oceanic and Atmospheric Administration (NOAA) and the
Meteorological Service of Canada (MSC), respectively, which flew in the same areas as
the TO, but at different times. In both simulations, concentrations of gas-phase species in
the entrained air were set equal to those in the case of clouds uninfluenced by local
pollution sources (Table 4.4), which represent background air conditions. Two key
differences in the plume case are the higher SO2 and aerosol number concentrations.
Although the ethene and toluene levels are each below 0.15 ppb for both cases, they are
nearly twice as large in the plume case suggesting that anthropogenic emissions were
stronger directly downwind of the Conesville plant compared to a nearby location in the

127
Ohio atmosphere unaffected by local pollution sources. The soluble fraction of the initial
particle population in the plume case is calculated to be 0.45 as opposed to 0.60 for
clouds uninfluenced by local pollution sources. These two values agree with an alternate
calculation of the soluble fraction by dividing the total PILS water-soluble mass by the
DACAD-derived mass concentration assuming a total aerosol density of 1.3 g/cm3 in
both cases. Measurements show that the sampled particles from the plume flight were
composed of less hygroscopic components; the accumulation mode (100 to 200 nm)
growth factors for the representative measurements during Flight 5 and 12 were 1.15
(77% RH) and 1.20 (75% RH), respectively. For the aerosol microphysics, it is assumed
that the soluble fraction is entirely ammonium sulfate. The measured contribution of
ammonium and sulfate to the total water-soluble mass measured by the PILS was on the
order of 90% for the representative data for both flights; thus, the predicted SO42-
concentrations are adjusted, accounting for the 10% deficit in the initial water-soluble
ammonium sulfate mass.
4.7.1. Case Study: Power Plant Plume in Cloud
Figure 4.8 shows predictions for the growth rate of SO42- and various organic
ions in the particle phase immediately downwind of the Conesville Power Plant. Sulfate
is predicted to continuously increase, reaching a total submicrometer mass of 31.4 μg/m3,
with its sharpest increase predicted during cloud cycles 4 and 5. The predicted total
organic mass, which grows to 0.82 μg/m3 by the end of the simulation, is dominated by
oxalic and adipic acids (the model treats the oxidation of cyclohexene as a one-step
process leading immediately to adipic acid). Ervens et al. (2004) state that the

128
cyclohexene mechanism provides an upper estimate for its contribution to the predicted
dicarboxylic acid mass due to the simplified (one-step) chemistry in the model. The
background concentration of cyclohexene is assumed to be 0.01 ppb, which was chosen
to stay consistent with previous measurements showing that its emission rate is an order
of magnitude less than that of toluene (Grosjean and Fung, 1984). Even though the
background concentration of cyclohexene, which was not measured by the WP-3D or
Convair, in the atmosphere above Ohio may have been lower since adipate was not
measured by the PILS, cyclohexene can be considered to serve as a surrogate compound
for all symmetrical alkenes similar to monoterpenes.
Adipic and glutaric acids are oxidized, forming the shorter-chain acids starting
with succinic acid, which then fuels malonic acid production. Succinic and malonic acids
are each predicted to remain below 0.01 μg/m3 and 0.3% of the total organic mass
throughout the simulation. The oxidation of malonic acid leads to oxalic acid, which is
predicted to grow to levels comparable to those of adipic acid (0.27 μg/m3 and 0.24
μg/m3, respectively) after three cloud cycles, since it is also produced by glyoxylic acid
oxidation. Oxalic acid reaches a peak mass of 0.38 μg/m3 after the sixth cloud cycle
before steadily decreasing to 0.17 μg/m3 by the end of the simulation. It grows the most
during the third and fourth cloud cycles, which correspond to the two cycles with the
highest average droplet pH values (2.61 and 2.46, respectively) and when glyoxylic acid
and its precursors reached their highest concentrations (droplet pH values from the
simulations will be displayed subsequently).
Figure 4.9 compares predictions to field measurements from Flight 5, where first-
order plume age is based on the distance away from the power plant and the wind speed.

129
Selected measurements from the field data were taken to represent different distances
downwind of the Conesville Power Plant where transects were made. The field
measurements for SO42- show continuous growth until the last transect, where plume
dilution may have dominated. The initial SO42- mass predicted prior to the first cloud
cycle (cloud cycle 0 in Figure 4.9) is highly dependent on the assumed particle size
distribution and soluble fraction of the particles used to initialize the simulation. Using
the measured values for these two parameters, the initial SO42- predicted (7.37 μg/m3) is
already more than 2 μg/m3 greater than that measured in the first transect downwind of
the Conesville Power Plant (5.00 μg/m3 at a plume age of 0.6 hours). The model
predicted that 3.46 μg/m3 of SO42- grew after the first cloud cycle, while the most growth
occurs in the fourth and fifth cloud cycles (4.83 μg/m3 and 5.42 μg/m3, respectively).
Sulfate grows between 0.5 and 2 μg/m3 in each of the other cloud cycles. It is
hypothesized that SO42- increased the most during cloud cycles 4 and 5 because the
average cloud cycle droplet pH value experienced its largest decline in the simulation
from 2.61 in the third cycle to 1.95 in the fifth cycle, which enhanced SO42- production.
Oxalic acid first increases and eventually decreases slightly with downwind
distance in both the field data and the predictions. The decrease in oxalic acid is
predicted to be due to its oxidation in the particle phase to CO2. The predicted oxalate-
to-sulfate molar ratio agrees with the field data points (between 0.01 and 0.05) from the
third cloud cycle until the end of the eighth cloud cycle.
As mentioned earlier, it is difficult to compare plume age, as measured by the
aircraft, to a specific cloud cycle, as represented by the model. A tracer species such as
SO2 can give an indication of the comparison of field data at different transects to

130
predictions from specific cloud cycles. The NOAA WP-3D made measurements of SO2
on 6 August 2004 in the Conesville plume at distances corresponding to plume ages of
1.1 hours (51 ppb) and 1.8 hours (36 ppb), which occur during the second cloud cycle.
Figure 4.9 shows how the predicted SO2 concentration changes at one-half the base
entrainment rate. At this lower rate, the second measured point for SO2 is predicted to
occur during the third cloud cycle. The oxalate measurement between plume ages of 1.1
and 1.8 hours (0.45 μg/m3) substantially exceeds predictions between the first and second
cloud cycles (9x10⁻⁵ – 0.01 μg/m3); it does, however, agree within an order of a
magnitude with the predictions starting from the third cloud cycle until the last cycle,
ranging between 0.17 and 0.38 μg/m3. The ambient SO42- measurement (12.8 μg/m3) lies
between the values predicted between the second and third cloud cycles (12.68 – 14.55
μg/m3). Thus, measurements and predictions for the relative levels of SO42- and oxalate
agree to within one cloud cycle when considering the same amount of SO2 measured and
predicted.
The measured glyoxylate concentrations during Flight 5 ranged between 0.03 and
0.06 μg/m3 (Figure 4.5c), which exceed the predicted values by an order of magnitude.
The model predicted up to 0.08 μg/m3 of pyruvic acid, which is close to that observed
Flight 5 (0.09 - 0.10 μg/m3). Glutaric acid, measured at levels between 0.02 and 0.24
μg/m3 during Flight 5, is predicted to reach a peak of 0.03 μg/m3 after the second cloud
cycle. Malonic acid (0.05 μg/m3) was measured as an order of magnitude larger than
predictions, which were stable after the fourth cloud cycle at 0.001 μg/m3. In summary,
measured and predicted mass concentrations of organic acids other than oxalic acid in the

131
particle phase show general agreement, providing support for the aqueous-phase
chemical mechanism used to predict oxalic acid formation.
4.7.2. Case Study: Clouds Uninfluenced by Local Pollution Sources
Figure 4.10 shows predictions from a simulation initialized with conditions
representative of the absence of local pollution sources, including power plant plumes.
Sulfate is predicted to grow almost linearly with each successive cloud cycle from 1.4 to
12.5 μg/m3. The total organic mass, which is predicted to grow to 3.06 μg/m3 at the end
of the simulation, once again has its largest dicarboxylic acid mass contributions from
oxalic and adipic acids. Oxalic acid is predicted to achieve its peak concentration after
the fourth cloud cycle (0.61 μg/m3), which corresponds to the cycle with the highest
average droplet pH value (3.28), before steadily decreasing to 0.35 μg/m3 at the end of
the simulation. Glyoxylic acid is predicted to increase in concentration with each
successive cloud cycle, in contrast to its behavior in the power plant plume in cloud case.
Glyoxylic acid is also predicted to attain higher concentrations in this case as compared
to the previous case study (0.2 μg/m3 versus 0.002 μg/m3). The concentrations of the
precursors to glyoxylic acid (including acetic, pyruvic, and glycolic acids) are also
predicted to be greater in this case, suggesting that the mechanisms associated with
toluene, ethene, and isoprene (only these three parent organic species produce glyoxylic
acid) are more efficient at producing oxalic acid. The pathway associated with
cyclohexene, which consists of the decay of dicarboxylic acids (from C6 to C2) by OH
oxidation and does not involve any other aqueous-phase intermediate species, is more

132
efficient in the previous case at producing oxalic acid since a greater amount of the C3-C6
acids were produced.
That more oxalic acid is predicted to form in this case as compared to that of the
power plant plume in cloud case is a result of the predicted relative effectiveness of
glyoxylic acid oxidation vs. the decay of longer-chain dicarboxylic acids. The production
of glyoxylic acid was less efficient in the previous simulation due partly to the lower
soluble fraction of the initial particle population (0.45 versus 0.60 for plume and non-
plume cases, respectively). The partitioning of gas-phase species into droplets was
reduced in the plume simulation since the LWC was lower. Also, the effective Henry’s
Law coefficients are a function of pH; the more acidic particles in the plume simulation
(total simulation pH average of 1.88 versus 2.46 for plume and non-plume cases,
respectively) resulted in a reduction of the droplets’ uptake efficiency for some aqueous-
phase precursors to oxalic acid, including acetic and pyruvic acids. As stated before,
although sulfate production is enhanced at lower pH, the production of oxalic acid from
glyoxylic acid is slower at lower pH because the rate constant of the oxidation of
glyoxylic acid is an order of magnitude lower than that of its anion, glyoxylate.
4.7.3. Comparison of Predictions From Both Cases to all In-Cloud Field
Measurements
Figure 4.11 compares all of the measured oxalate and SO42- data from total
aerosol and droplet residual samples to the predictions of the two previous case studies.
Predictions of the relative growth of SO42- vs. oxalate from the first three cloud cycles,
corresponding to up to 40 minutes of cloud contact time, agree most closely with ambient

133
measurements for clouds uninfluenced by local pollution sources. The high droplet pH
values during the fourth and fifth cloud cycles yielded greater predicted oxalate growth
relative to SO42- compared to observations; however, the relative amounts of the two
species are again predicted to come close to agreement with observations after the fifth
cycle. Predictions during the third and fourth cloud cycles (between 40 and 55 minutes
of cloud contact time) agree with the power plant plume in cloud measurements.
Cumulatively, for both cloud types studied, the relative loadings of SO42- and oxalate
predicted during the third cloud cycle agree the best with observations, suggesting that
the average air parcel experienced nearly 40 minutes of cloud contact time. In addition,
the ranges of SO42- and oxalate measured agree with those predicted for both cloud types,
with the exception of the large amount of SO42- predicted after the fourth cloud cycle for
the case of power plant plume in cloud.
As noted earlier, the measured amounts of oxalate relative to SO42- downwind of
the Conesville plant exceeded those predicted, indicating that the model overestimated
SO42- production relative to oxalate in the case of power plant plume in cloud. If the
aerosol number concentration or the soluble fraction used to initialize the particle
population in the power plant plume in cloud simulation were slightly lower, the SO42-
levels would be reduced to a greater extent compared to oxalate, yielding better
agreement between measurements and predictions. Even though these two values were
derived from measurements, any error in the determination of these initial values could
have led to inaccurate predicted SO42- levels. Also, the overestimate in SO4
2- may be due
to the actual plume dilution in Flight 5 being higher than assumed. Excess SO42- and
oxalate predicted in the latter cloud cycles for clouds uninfluenced by local pollution

134
sources may have resulted from a replenishment rate of oxidants, organic precursors, and
SO2 that is too high. However, the latter cloud cycles that predicted excessive SO42- and
oxalate in both simulations may also represent particles that were processed longer
compared to the sampled particles.
The model predicts a range of particulate oxalic acid levels that are consistent
with measurements of both total aerosol and droplet residuals in clouds. The predicted
growth of oxalate relative to SO42- is most consistent with measurements assuming that
the sampled particles experienced an average of 40 minutes of cloud contact time.
However, if the sampled particles had been processed longer, the predicted replenishment
of gaseous species in the entrained air may have been too high, leading to an overestimate
in the latter cloud cycles for SO42- (both simulations) and oxalate (only in the case of
clouds uninfluenced by local pollution sources). Also, uncertainties in the characteristics
of the initial particle population may have led to inaccurate predicted SO42- growth
relative to oxalate.
4.7.4. Contribution of Different Aqueous-Phase Pathways to Production of Oxalic
Acid
Comparison of observations and predictions can help address the relative
importance of different aqueous-phase oxalic acid formation pathways. Three
simulations were performed, using the conditions from the case of clouds uninfluenced
by local pollution sources in Table 4.4 (the initial concentration of cyclohexene was set to
0.05 ppb instead of 0.01 ppb to compare the predicted oxalic acid growth to the
simulation presented in Section 6.2), to analyze the effect of the two pathways, decay of
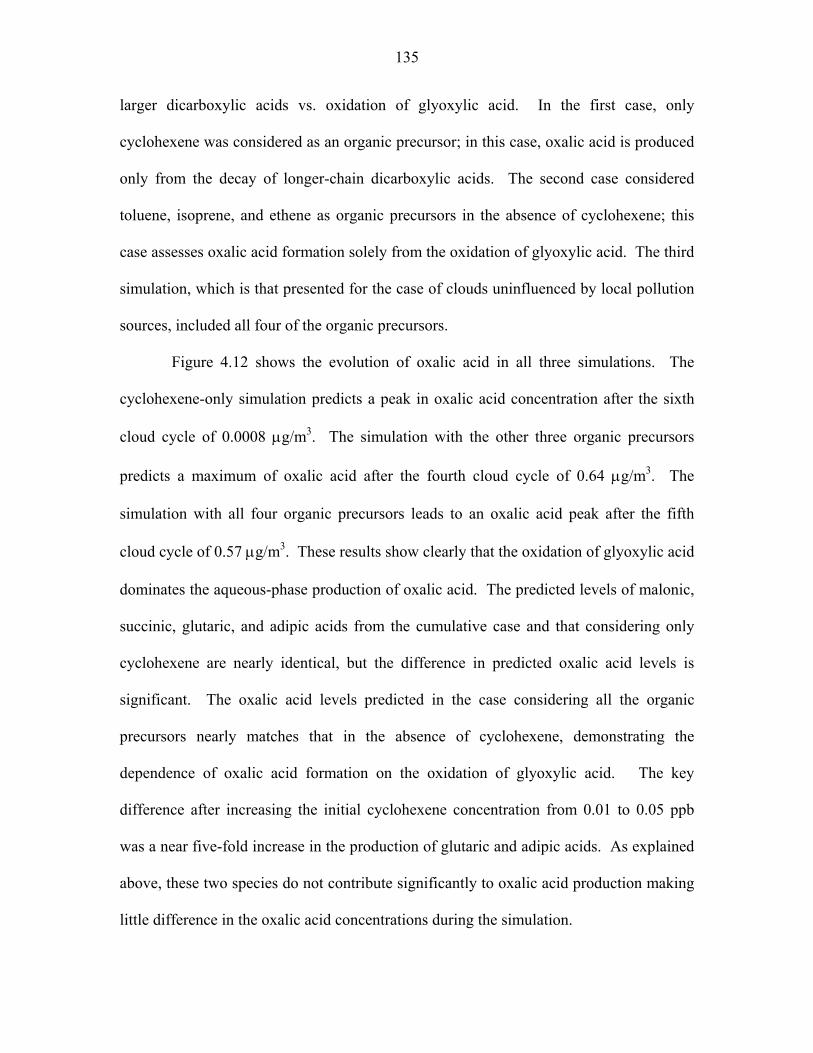
135
larger dicarboxylic acids vs. oxidation of glyoxylic acid. In the first case, only
cyclohexene was considered as an organic precursor; in this case, oxalic acid is produced
only from the decay of longer-chain dicarboxylic acids. The second case considered
toluene, isoprene, and ethene as organic precursors in the absence of cyclohexene; this
case assesses oxalic acid formation solely from the oxidation of glyoxylic acid. The third
simulation, which is that presented for the case of clouds uninfluenced by local pollution
sources, included all four of the organic precursors.
Figure 4.12 shows the evolution of oxalic acid in all three simulations. The
cyclohexene-only simulation predicts a peak in oxalic acid concentration after the sixth
cloud cycle of 0.0008 μg/m3. The simulation with the other three organic precursors
predicts a maximum of oxalic acid after the fourth cloud cycle of 0.64 μg/m3. The
simulation with all four organic precursors leads to an oxalic acid peak after the fifth
cloud cycle of 0.57 μg/m3. These results show clearly that the oxidation of glyoxylic acid
dominates the aqueous-phase production of oxalic acid. The predicted levels of malonic,
succinic, glutaric, and adipic acids from the cumulative case and that considering only
cyclohexene are nearly identical, but the difference in predicted oxalic acid levels is
significant. The oxalic acid levels predicted in the case considering all the organic
precursors nearly matches that in the absence of cyclohexene, demonstrating the
dependence of oxalic acid formation on the oxidation of glyoxylic acid. The key
difference after increasing the initial cyclohexene concentration from 0.01 to 0.05 ppb
was a near five-fold increase in the production of glutaric and adipic acids. As explained
above, these two species do not contribute significantly to oxalic acid production making
little difference in the oxalic acid concentrations during the simulation.

136
4.8. Conclusions
Airborne measurements made during ICARTT 2004 in the vicinity of Ohio
provide clear evidence for aqueous-phase production of oxalic acid. In addition, a
correlation between measured oxalate and SO42- is indicative of common aqueous-phase
processing, as these two species are not directly linked in their production chemistry.
The highest mass loadings for oxalate were measured for total aerosol and droplet
residual samples in clouds influenced by power plant plumes. Virtually no oxalate was
measured in cloud-free air aerosols; however, values slightly higher than detection limits
were observed for aerosol samples in a power plant plume in cloud-free air. The
strongest correlation between SO42- and oxalate (R2 = 0.80, n = 40) is seen in Flight 5 (9
August 2004) where the aircraft was sampling the total aerosol downwind of a coal-fired
power plant in the presence of clouds. Both masses evolved chemically in clouds while
being transported away from the power plant. Oxalate reached some of its highest levels
on this particular flight presumably due to the elevated LWC in the clouds and abundance
of clouds in a stratified deck allowing for additional cloud processing time.
A chemical cloud parcel model, initialized with measured aerosol size
distributions, gas-phase concentrations, and meteorological conditions, predicted the
same relative magnitudes of oxalic acid and SO42- production as those measured in the
field. Agreement between measurements and predictions for the growth of glyoxylate,
malonate, pyruvate, and glutarate lends further support to the aqueous-phase mechanism.
The production of oxalic acid is less sensitive to the initial concentration of its gas-phase
precursors as compared to production of SO42-; this may be a result of the complex multi-

137
step nature of oxalic acid production, which leads to the production of volatile side-
product species and the depletion of its main aqueous-phase oxidant, OH, by competing
reactions. Oxalic acid production is shown to be enhanced with increasing amounts of
both LWC and pH in droplets. Based on a state-of-the-art aqueous-phase chemical
mechanism, the oxidation of glyoxylic acid dominates over that of longer-chain
dicarboxylic acids in the production of oxalic acid.
4.9. Acknowledgments
This work was supported by the National Science Foundation grant ATM-
0340832. Graham Feingold and Barbara Ervens were supported by NOAA’s Climate
Goal. Elliot L. Atlas acknowledges support from the NOAA Office of Global Programs
and NOAA Health of the Atmosphere Program. We thank Kurt Anlauf, Art Tham, and
Maurice Watt of the Meteorological Service of Canada for providing hydrogen peroxide
measurements. Appreciation is extended to William C. Conant for helpful discussions.
4.10. References Blando, J. D., and B. J. Turpin (2000), Secondary organic aerosol formation in cloud and fog droplets: a literature evaluation of plausibility, Atmos. Environ., 34, 1623-1632. Brooks, S. D., M.E. Wise, M. Cushing, and M.A. Tolbert (2002), Deliquescence behavior of organic/ammonium sulfate aerosol, Geophys. Res. Lett., 29(10), 1917, doi:10.1029/2002GL014733. Chebbi, A., and P. Carlier (1996), Carboxylic acids in the troposphere, occurrence, sources, and sinks: A review, Atmos. Environ., 30, 4233-4249. Crahan, K. K., D. Hegg, D. S. Covert, and H. Jonsson (2004), An exploration of aqueous oxalic acid production in the coastal marine atmosphere, Atmos. Environ., 38, 3757-3764.

138
Cruz, C. N., and S. N. Pandis (1998), The effect of organic coatings on the cloud condensation nuclei activation of inorganic atmospheric aerosol, J. Geophys. Res., 103(D11): 13111-13123. Ervens, B., G. Feingold, G. J. Frost, and S. M. Kreidenweis (2004), A modeling study of aqueous production of dicarboxylic acids: 1. Chemical pathways and speciated organic mass production, J. Geophys. Res., 109, D15205, doi:10.1029/2003JD004387. Faust, B. C. (1994), Photochemistry of clouds, fogs, and aerosols, Environ. Sci. Technol., 28, A217-A222. Feingold, G., S. M. Kreidenweis, and Y. Zhang (1998), Stratocumulus processing of gases and cloud condensation nuclei: 1. Trajectory ensemble model, J. Geophys. Res., 103(D16), 19,527– 19,542. Grosjean, D. and K. Fung (1984), Hydrocarbons and carbonyls in Los-Angeles air, J. Air Pollut. Control Assoc., 34, 537-543. Hegg, D. A., S. Gao, and H. Jonsson (2002), Measurements of selected dicarboxylic acids in marine cloud water, Atmos. Res., 62, 1-10. Hegg, D. A., D. S. Covert, P. A. Covert, and H. Jonsson (2005), Determination of the efficiency of an aircraft aerosol inlet. Aerosol Sci. Tech., 39, 966-971. Jayne, J. T., D. C. Leard, X. F. Zhang, P. Davidovits, K. A. Smith, C. E. Kolb, and D. R. Worsnop (2000), Development of an aerosol mass spectrometer for size and composition analysis of submicron particles, Aerosol Sci. Tech., 33, 49-70. Kalberer, M., J. Yu, D. R. Cocker, R. C. Flagan, and J. H. Seinfeld (2000), Aerosol formation in the cyclohexene-ozone system, Environ. Sci. Technol., 34, 4894-4901. Kawamura, K., and I. R. Kaplan (1987), Motor exhaust emissions as a primary source for dicarboxylic-acids in Los-Angeles ambient air, Environ. Sci. Technol., 21, 105-110. Kawamura, K., and K. Ikushima (1993), Seasonal-changes in the distribution of dicarboxylic-acids in the urban atmosphere, Environ. Sci. Technol., 27, 2227-2235. Kawamura, K., H. Kasukabe, O. Yasui, and L. A. Barrie (1995), Production of dicarboxylic-acids in the Arctic atmosphere at polar sunrise, Geophys. Res. Lett., 22, 1253-1256. Kawamura, K., R. Sempéré, Y. Imai, Y. Fujii, and M. Hayashi (1996), Water soluble dicarboxylic acids and related compounds in Antarctic aerosols, J. Geophys. Res., 101(D13), 18721-18728.

139
Kawamura, K., and F. Sakaguchi (1999), Molecular distributions of water soluble dicarboxylic acids in marine aerosols over the Pacific Ocean including tropics, J. Geophys. Res., 104(D3), 3501-3509. Kawamura, K., N., N. Umemoto, M. Mochida, T. Bertram, S. Howell, and B. J. Huebert (2003), Water-soluble dicarboxylic acids in the tropospheric aerosols collected over east Asia and western North Pacific by ACE-Asia C-130 aircraft, J. Geophys. Res., 108(D23), 8639, doi:10.1029/2002JD003256. Kawamura, K., Y. Imai, and L. A. Barrie (2005), Photochemical production and loss of organic acids in high Arctic aerosols during long-range transport and polar sunrise ozone depletion events, Atmos. Environ., 39, 599-614. Kerminen, V. M., K. Teinila, R. Hillamo, and T. Makela (1999), Size-segregated chemistry of particulate dicarboxylic acids in the Arctic atmosphere, Atmos. Environ., 33, 2089-2100. Kerminen, V. M., C. Ojanen, T. Pakkanen, R. Hillamo, M. Aurela, and J. Merilainen (2000), Low-molecular-weight dicarboxylic acids in an urban and rural atmosphere, J. Aerosol Sci., 31, 349-362. Khwaja, H. A., S. Brudnoy, and L. Husain (1995), Chemical characterization of 3 summer cloud episodes at Whiteface Mountain, Chemosphere, 31, 3357-3381. Kumar, P. P., K. Broekhuizen, and J. P. D. Abbatt (2003), Organic acids as cloud condensation nuclei: Laboratory studies of highly soluble and insoluble species, Atmos. Chem. Phys., 3, 509-520. Leitner, N. K. V., and M. Dore (1997), Mechanism of the reaction between hydroxyl radicals and glycolic, glyoxylic, acetic and oxalic acids in aqueous solution: Consequence on hydrogen peroxide consumption in the H2O2/UV and O3/H2O2 systems, Water Res., 31, 1383-1397. Lim, H. J., A. G. Carlton, and B. J. Turpin (2005), Isoprene forms secondary organic aerosol through cloud processing: Model simulations, Environ. Sci. Technol., 39, 4441-4446. Limbeck, A., and H. Puxbaum (1999), Organic acids in continental background aerosols, Atmos. Environ., 33, 1847-1852. Limbeck, A., and H. Puxbaum (2000), Dependence of in-cloud scavenging of polar organic aerosol compounds on the water solubility, J. Geophys. Res., 105(D15): 19857-19867. Liu, P. S. K., W. R. Leaitch, C. M. Banic, S. M. Li, D. Ngo, and J. W. Megaw (1996), Aerosol observations at Chebogue Point during the 1993 North Atlantic Regional

140
Experiment: Relationships among cloud condensation nuclei, size distribution, and chemistry, J. Geophys. Res., 101(D22), 28971-28990. Loflund, M., A. A. Kasper-Giebl, B. Schuster, H. Giebl, R. Hitzenberger, and H. Puxbaum (2002), Formic, acetic, oxalic, malonic and succinic acid concentrations and their contribution to organic carbon in cloud water, Atmos. Environ., 36, 1553-1558. Mochida, M., N. N. Umemoto, K. Kawamura, and M. Uematsu (2003), Bimodal size distribution of C2-C4 dicarboxylic acids in the marine aerosols, Geophys. Res. Lett., 30(13), 1672, doi:10.1029/2003GL017451. Norton, R. B., J. M. Roberts, and B. J. Huebert (1983), Tropospheric oxalate, Geophys. Res. Lett., 10(7), 517-520. Pakkanen, T. A., K. Loukkola, C. H. Korhonen, M. Aurela, T. Makela, R. E. Hillamo, P. Aarnio, T. Koskentalo, A. Kousa, and W. Maenhaut (2001), Sources and chemical composition of atmospheric fine and coarse particles in the Helsinki area, Atmos. Environ., 35, 5381-5391. Poore, M. W. (2000), Oxalic acid in PM2.5 particulate matter in California, J. Air Waste Manage., 50, 1874-1875. Puxbaum, H., J. Rendl, R. Allabashi, L. Otter, and M.C. Scholes (2000), Mass balance of the atmospheric aerosol in a South African subtropical savanna (Nylsvley, May 1997), J. Geophys. Res., 105(D16): 20697-20706. Rohrl, A., and G. Lammel (2001), Low molecular weight dicarboxylic acids and glyoxylic acid: Seasonal and air mass characteristics, Environ. Sci. Technol., 35, 95-101. Salam, A., H. Bauer, K. Kassin, S. M. Ullah, and H. Puxbaum (2003a), Aerosol chemical characteristics of a mega-city in Southeast Asia (Dhaka-Bangladesh), Atmos. Environ., 37, 2517-2528. Salam, A., H. Bauer, K. Kassin, S. M. Ullah, and H. Puxbaum (2003b), Aerosol chemical characteristics of an island site in the Bay of Bengal (Bhola-Bangladesh), J. Environ. Monitor., 5, 483-490. Saxena, P., and L. M. Hildemann (1996), Water-soluble organics in atmospheric particles: A critical review of the literature and application of thermodynamics to identify candidate compounds, J. Atmos. Chem., 24, 57–109. Seinfeld, J. H., and S. N. Pandis (1998), Atmospheric Chemistry and Physics, Wiley-Interscience, New York. Shantz, N. C., Y. A. Aklilu, N. Ivanis, W. R. Leaitch, P. C. Brickell, J. R. Brook, Y. Cheng, D. Halpin, S. M. Li, Y. A. Tham, D. Toom-Sauntry, A. J. Prenni, and L. Graham

141
(2004), Chemical and physical observations of particulate matter at Golden Ears Provincial Park from anthropogenic and biogenic sources, Atmos. Environ., 38, 5849-5860. Sorooshian, A., Brechtel, F. J., Ma, Y., Weber, R. J., Corless, A., Flagan, R. C., Seinfeld, J. H. (2006), Modeling and characterization of a particle-into-liquid sampler (PILS), Aerosol Sci. Tech., 40, 396-409. Squires, P., and J. S. Turner (1962), An entraining jet model for cumulo-nimbus updraughts, Tellus, 14, 422-434. Tong, C. H., M. Blanco, W. A. Goddard III, and J. H. Seinfeld (2004), Thermodynamic properties of multifunctional oxygenates in atmospheric aerosols from quantum mechanics and molecular dynamics: Dicarboxylic acids, Environ. Sci. Technol., 38, 3941-3949. Turekian, V. C., S. A. Macko, and W. C. Keene (2003), Concentrations, isotopic compositions, and sources of size-resolved, particulate organic carbon and oxalate in near-surface marine air at Bermuda during spring, J. Geophys. Res., 108(D5), 4157, doi:10.1029/2002JD002053. Wang, J., R. C. Flagan, and J. H. Seinfeld (2003), A differential mobility analyzer (DMA) system for submicron aerosol measurements at ambient relative humidity, Aerosol Sci. Tech., 37, 46-52. Warneck, P. (2003), In-cloud chemistry opens pathway to the formation of oxalic acid in the marine atmosphere, Atmos. Environ., 37, 2423-2427. Weathers, K. C., G. E. Likens, F. H. Bormann, S. H. Bicknell, B. T. Bormann, B. C. Daube, J. S. Eaton, J. N. Galloway, W. C. Keene, K. D. Kimball, W. H. Mcdowell, T. G. Siccama, D. Smiley, and R. A. Tarrant (1988), Cloudwater chemistry from 10 sites in North-America, Environ. Sci. Technol., 22, 1018-1026. Weber, R. J., D. Orsini, Y. Daun, Y. N. Lee, P. J. Klotz, and F. J. Brechtel (2001), A particle-into-liquid collector for rapid measurement of aerosol bulk chemical composition, Aerosol Sci. Tech., 35, 718-727. Yao, X. H., C. K. Chan, M. Fang, S. Cadle, T. Chan, P. Mulawa, K. B. He, and B. M. Ye (2002a), The water-soluble ionic composition of PM2.5 in Shanghai and Beijing, China, Atmos. Environ., 36, 4223-4234. Yao, X. H., M. Fang, and C. K. Chan (2002b), Size distributions and formation of dicarboxylic acids in atmospheric particles, Atmos. Environ., 36, 2099-2107.

142
Yao, X. H., A. P. S. Lau, M. Fang, C. K. Chan, and M. Hu (2003), Size distributions and formation of ionic species in atmospheric particulate pollutants in Beijing, China: 2-dicarboxylic acids, Atmos. Environ., 37, 3001-3007. Yao, X. H., M. Fang, C. K. Chan, K. F. Ho, and S. C. Lee (2004), Characterization of dicarboxylic acids in PM2.5 in Hong Kong, Atmos. Environ., 38, 963-970. Yu, J. Z., S. F. Huang, J. H. Xu, and M. Hu (2005), When aerosol sulfate goes up, so does oxalate: Implication for the formation mechanisms of oxalate, Environ. Sci. Technol., 39, 128-133.

143
Table 4.1. Twin Otter Payload Description
Instrument Data Condensation particle counter (CPC)a Aerosol number concentration Cloud condensation nucleus counter (CCN)
Cloud condensation nucleus number concentration at 3 supersaturations
Counterflow virtual impactor (CVI) Virtual impactor for isolating cloud droplets Dual automated classified aerosol detector (DACAD)
Submicrometer aerosol size distribution (10-800 nm) at low and high RH
Aerosol spectrometer probe (PCASP), aerodynamic particle sizer (APS), forward scattering spectrometer probe (FSSP), cloud and aerosol particle spectrometer (CAPS)
Aerosol/cloud droplet size distribution (120 nm-1.6 mm)
Aerodyne aerosol mass spectrometer (AMS)a
Non-refractory aerosol chemistry
Particle-into-liquid sampler (PILS)a Submicrometer aerosol chemistry (IC: inorganic and some organic acid ions)
Filters Bulk aerosol chemistry (FTIR: functional group analysis)
PSAPa, photoacoustic, SP2 Soot absorption (multi-wavelength/incandescence)
Miscellaneous navigational and meteorology probes
Navigational data, temperature, dew point, RH, pressure, liquid water content, wind direction/speed, updraft velocity, etc.
aThese are the only instruments that sampled air coming through the CVI inlet.

144
Table 4.2. Comparison of PILS Original (Old) and Re-Analyzed (New) Vials from Flight 5 on 9 August 2004 SO4
2- (n = 42) NH4+ (n = 38) Oxalate (n = 34)
Slope (R2) Slope (R2) Slope (R2) [Old]/[New] 1.66 (0.84) 1.54 (0.50) 1.83 (0.50)

145
Table 4.3. Molar Ratio of Oxalate Relative to Sulfate, Nitrate, and Ammoniuma
SO42- NO3
- NH4+
Atmospheric condition type
Inlet (# vials with oxalate
above detection
limits/total # vials)
Slope (R2) Slope (R2) Slope (R2)
Clouds uninfluenced by local pollution sources
CVI (34/131) 0.014 (0.37) 0.010 (0.15) 0.006 (0.24)
Main (54/92) 0.024 (0.75) -0.007 (0.01) 0.015 (0.59) Cumulative
(88/223) 0.023 (0.71) 0.000 (0.00) 0.013 (0.55)
Power plant plume in cloud
CVI (11/32) 0.083 (0.97) -0.009 (0.00) 0.073 (0.45)
Main (44/79) 0.028 (0.77) -0.110 (0.03) 0.026 (0.81) Cumulative
(55/111) 0.028 (0.82) -0.031 (0.04) 0.026 (0.84) Cloud-free air Main (24/196) 0.000 (0.00) 0.010 (0.08) 0.002 (0.17) Power plant plume in cloud-free air
Main (10/24) 0.015 (0.21) 0.011 (0.10) 0.011 (0.28)
Power plant plume in cloud-free air with precipitation from scattered clouds overhead
Main (18/21) 0.051 (0.56) 0.031 (0.09) 0.024 (0.52)
aCVI samples correspond to cloud droplet residual particles; Main inlet samples correspond to total aerosol, which includes a mixture of interstitial aerosol and droplet residuals in clouds.

146
Table 4.4. Initial Conditions for Two Simulationsa
aConditions for clouds uninfluenced by local pollution sources are also those representing the background air in the entrainment rate for both simulations.

147
42.5
42.0
41.5
41.0
40.5
40.0
39.5
Latit
ude
(deg
o N)
85.0 84.5 84.0 83.5 83.0 82.5 82.0 81.5 81.0 80.5
Longitude (deg oW)
RF 1 RF 7 RF 2 RF 8 RF 3 RF 9 RF 4 RF 10 RF 5 RF 11 RF 6 RF 12 Power plants studied Cleveland Airport
Detroit MonroePower Plant
ConesvillePower Plant
OHIO
MICHIGAN
WEST VIRGINIA
PENN
IND
LAKE ERIE
CLEVELAND
CANADA
Figure 4.1. Twin Otter flight tracks during the ICARTT field study. RF refers to Research Flight.

148
Figure 4.2. Simplified illustration of how the Twin Otter flew when it encountered two specific atmospheric conditions: (a) Power plant plume in cloud; (b) Power plant plume in cloud-free air with precipitation from scattered clouds overhead.

149
150
μg/m3
43210
μg/m3
2500
2000
1500
1000
500
Alti
tude
(m)
20100
μg/m3
2.50.0
μg/m3
0.80.40.0
μg/m3
6420
NH4Total PILS Mass OxalateSO4 NO3
% of Total PILS Mass from Oxalate
Figure 4.3. Vertical distribution of ions measured by the PILS during ICARTT.

150
10
8
6
4
2
Oxa
late
(nm
ol/m
3 )
150100500
SO4 (nmol/m3
)
Total aerosol (main inlet)Power plant plume in cloud ( n = 44)
Clouds uninfluenced by local pollution sources ( n = 54) Power plant plume in cloud-free air ( n = 10) Power plant plume in cloud-free air with precipitation from scattered clouds overhead (n = 18) Cloud-free air (n = 24)Droplet residuals (CVI inlet)
Power plant plume in cloud ( n = 11) Clouds uninfluenced by local pollution sources ( n = 34)
Figure 4.4. Oxalate and SO4
2- molar concentrations for each atmospheric condition encountered. The total aerosol samples collected in cloud consist of a mixture of interstitial aerosol and droplet residuals.

151
Figure 4.5. Flight 5 (9 August 2004): (a) Flight tracks; (b) Time series of altitude, LWC, and aerosol number concentration; (c) Time series of SO4
2-, organic ions, and the aerosol volume concentration.

152
20x103
15
10
5
0
dN/d
logD
p (c
m-3
)
102 3 4 5 6 7 8 9
1002 3 4 5 6 7 8
Particle diameter (nm)
First number in reported GF is that of the small mode; second number is that of the larger mode
Circling plant: GF = 1.173/1.165 @ 70% 8-km transect; GF = 1.179/1.152 @ 77% 16-km transect; GF = 1.172/1.154 @ 77% 32-km transect; GF = 1.239/1.204 @ 81%
Figure 4.6. Evolution of the DACAD aerosol size distribution (dry: < 20%) for Flight 5 on 9 August 2004. GF refers to the aerosol growth factor at the RH value given.

153
Figure 4.7. Multiphase organic chemistry (shadowed area: aqueous phase). References: Ervens et al. (2004) and Lim et al. (2005).

154
10-4
10-3
10-2
10-1
(μg/
m3 )
1211109876543210Cloud cycles
10-710-610-510-410-310-210-1100
Dic
arbo
xylic
aci
ds (μ
g/m
3 )
1211109876543210
30
25
20
15
10
SO4 (μg/m
3)
Glyoxylic acid Glycolic acid Formate Pyruvic acid Acetic acid
Oxalic acid (C 2) Malonic acid (C 3) Succinic acid (C 4) Glutaric acid (C 5) Adipic acid (C 6) Sulfate
Figure 4.8. Model predictions for the power plant plume in cloud case (simulation of Flight 5 on 9 August 2004).

155
40
30
20
10
0
SO4
2.01.81.61.41.21.00.80.6Plume age (h)
40
30
20
10
0
SO4
1211109876543210Cloud cycles
10-5
10-4
10-3
10-2
10-1
100
Oxalate, [O
xalate]:[SO4 ]
10-5
10-4
10-3
10-2
10-1
100 Oxalate, [O
xalate]:[SO4 ]
70605040302010
0
SO2
70
60
50
40
30
20
10
0
SO2
Field Data [Oxalate]:[ SO4] SO2 (ppb)
Oxalate ( μg/m3)
SO4 (μg/m3
)
Model Predictions [Oxalate]:[ SO4] SO2 (ppb) SO2 (ppb) with
one-half the base entrainment rate
Oxalate (μg/m3
)
SO4 (μg/m3)
Figure 4.9. Comparison of Flight 5 (9 August 2004) field data and model predictions for SO4
2- and oxalate growth.

156
4
0.012
4
0.12
4
1
(μg/
m3 )
1211109876543210Cloud cycles
10-6
10-5
10-4
10-3
10-2
10-1
100
Dic
arbo
xylic
aci
ds (μ
g/m
3 )
1211109876543210
12
10
8
6
4
2
SO4 (μg/m
3)
Glyoxylic acid Glycolic acid Formate Pyruvic acid Acetic acid
Oxalic acid (C 2) Malonic acid (C 3) Succinic acid (C 4) Glutaric acid (C 5) Adipic acid (C 6) Sulfate
Figure 4.10. Model predictions for the case of clouds uninfluenced by local pollution sources.

157
10
8
6
4
2
0
Oxa
late
(nm
ol/m
3 )
300250200150100500
SO4 (nmol/m3
)
Field DataTotal aerosol (main inlet) Flight 5 downwind of the Conesville plant (9 August 2004) Clouds uninfluenced by local pollution sources Droplet residuals (CVI inlet) Clouds uninfluenced by local pollution sources Model Predictions (Left to Right = Cloud Cycles 1-12)
Power plant plume in cloud (Flight 5 simulation) Clouds uninfluenced by local pollution sources
3.0
2.5
2.0
1.5
1.0
Average Cloud C
ycle Droplet pH
Figure 4.11. Comparison of oxalate and SO4
2- molar concentrations between model predictions and field data for clouds with and without power plant plume influence. The model prediction points are color coded to represent the average droplet pH during each cloud cycle.

158
10-6
10-5
10-4
10-3
10-2
10-1
100
Oxa
lic a
cid
(μg/
m3 )
1211109876543210
Cloud cycles
Organic precursors used to initialize simulation: cyclohexene toluene, ethene, and isoprene toluene, ethene, isoprene, and cyclohexene
Figure 4.12. Contribution of different aqueous-phase pathways to production of oxalic acid.

159
Chapter 5
On the Source of Organic Acid Aerosol Layers Above
Clouds∗
∗This chapter is reproduced by permission from “On the Source of Organic Acid Aerosol Layers Above Clouds” by A. Sorooshian, M. –L. Lu, F. J. Brechtel, H. Jonsson, G. Feingold, R. C. Flagan, and J. H. Seinfeld, Environ. Sci. Technol., 41(13), 4647-4654, 2007. Copyright 2007. American Chemical Society.

160
5.1 Abstract
During the July 2005 Marine Stratus/Stratocumulus Experiment (MASE) and the
August-September 2006 Gulf of Mexico Atmospheric Composition and Climate Study
(GoMACCS), the Center for Interdisciplinary Remotely-Piloted Aircraft Studies
(CIRPAS) Twin Otter probed aerosols and cumulus clouds in the eastern Pacific Ocean
off the coast of northern California and in southeastern Texas, respectively. An on-board
particle-into-liquid sampler (PILS) quantified inorganic and organic acid species with <
5-min time resolution. Ubiquitous organic aerosol layers above cloud with enhanced
organic acid levels were observed in both locations. The data suggest that aqueous-phase
reactions to produce organic acids, mainly oxalic acid, followed by droplet evaporation is
a source of elevated organic acid aerosol levels above cloud. Oxalic acid is observed to
be produced more efficiently relative to sulfate as the cloud liquid water content
increases, corresponding to larger and less acidic droplets. As derived from large eddy
simulations of stratocumulus under the conditions of MASE, both Lagrangian trajectory
analysis and diurnal cloudtop evolution provide evidence that a significant fraction of the
aerosol mass concentration above cloud can be accounted for by evaporated droplet
residual particles. Methanesulfonate data suggest that entrainment of free tropospheric
aerosol can also be a source of organic acids above boundary layer clouds.
5.2 Introduction
Organic carbon (OC) is a major component of atmospheric particulate matter (1-
7). Organic acids constitute a significant fraction of particulate organic carbon (1, 8-11).
Dicarboxylic acids, the most abundant of which in the troposphere is oxalic acid
161
[(COOH)2], contributed as much as 50% to particulate organic aerosol mass in at least
one study in central Japan (8). Primary emissions from fossil fuel combustion, biomass
burning, and biogenic activity are sources of particulate oxalic acid (12-14);
photooxidation of volatile organic compounds (VOCs), particularly aromatic
hydrocarbons, followed by condensation onto preexisting aerosols is also a source (15,
16). Blando and Turpin (17) suggested that organic acids are likely particle-phase
compounds formed by cloud and fog processing. Oxalic acid, which has also been shown
to be formed by aqueous-phase chemistry in cloud droplets, remains in the aerosol phase
after subsequent droplet evaporation (18-28). In the aqueous phase, oxalic acid is formed
by oxidation of either glyoxylic acid or by the oxidative decay of malonic acid, which, in
turn, is formed by the oxidation of higher-order dicarboxylic acids (18-19, 21-28).
Sorooshian et al. (21) showed that the glyoxylic acid oxidation pathway is significantly
more efficient at producing oxalic acid, as compared to malonic acid oxidation.
Aqueous-phase intermediates to glyoxylic acid include glyoxal, methylglyoxal, glycolic
acid, pyruvic acid, and acetic acid (18, 19, 21-28).
In July 2005, the Center for Interdisciplinary Remotely-Piloted Aircraft Studies
(CIRPAS) Twin Otter (TO), based at Marina, CA, participated in the Marine
Stratus/Stratocumulus Experiment (MASE), focused on probing aerosols and
stratocumulus clouds over the eastern Pacific Ocean off the coast of northern California
(29; http://www.cirpas.org). During August - September 2006, the CIRPAS TO also
participated in the Gulf of Mexico Atmospheric Composition and Climate Study (25;
GoMACCS; http://esrl.noaa.gov/csd/2006/), in which 22 flights were devoted largely to
probing aerosol-cloud relationships over the Gulf of Mexico and the inland Houston area.

162
In both MASE and GoMACCS, a ubiquitous layer of organic aerosol was found above
cloud. These observations in the MASE experiment have been noted by Alexander et al.
(30). At present, there is uncertainty as to what mechanism(s) can explain these
observations. It should be noted that Heald et al. (31, 32) also observed a layer of
enhanced organic aerosol levels, but in the free troposphere (FT), and argued that likely
explanations include the formation of secondary organic aerosol (SOA) following the
venting of insoluble VOCs to the FT, and also cloud processing.
The goal of the present work is to evaluate, on the basis of the two field datasets,
evidence and possible mechanisms for the existence of pervasive organic aerosol layers
above clouds. We focus especially on organic acid levels in this work; particulate
concentrations of organic acids and sulfate, and their ratios to each other, are compared
above the boundary layer (BL) and below, inside, and above BL cumulus clouds. Results
from large eddy simulations (LES) are used to provide support for a source of organic
acid aerosols above cloud as residual particles from evaporated droplets.
5.3 Aircraft Measurements
The instrument payload on the TO aircraft is described elsewhere (29
http://www.cirpas.org). In both field experiments, two different inlets were employed for
sampling clear air and clouds. A counterflow virtual impactor (CVI) inlet was used in
cloud to isolate particles resulting from evaporation of cloud droplets (so-called residual
particles). The transmission efficiency of the total aerosol inlet under standard flight
conditions for particle diameters less than 3.5 μm is near unity (33). Submicrometer
aerosol chemical composition measurements were carried out by a particle-into-liquid

163
sampler (PILS, Brechtel Manufacturing Inc.) (34). In the PILS, submicrometer-sized
ambient particles are grown into droplets sufficiently large to be collected by inertial
impaction, allowing subsequent chemical analysis by ion chromatography (IC, Dionex).
A series of three denuders immediately downstream of the PILS inlet removes inorganic
and organic gases that may bias aerosol measurements. Samples are deposited in vials
held on a rotating carousel, where each vial contains material representing a period of
time between 3.5 and 5 min of flight. IC analysis quantified the ambient air
concentrations of water-soluble ions, including inorganic and organic acid ions.
The PILS-IC instrument uncertainty is calculated to be +7% and the detection
limit (calculated as the average concentration plus three standard deviations of the
smallest detectable peak for each ion in the IC baseline noise and then converted to air-
equivalent units) is < 0.04 μg/m3 for the inorganic ions (NH4+, SO4
2-, and NO3-) and <
0.01 μg/m3 for the organic acid ions (dicarboxylic acids C2 - C9, acetate, formate,
pyruvate, glyoxylate, maleate, malate, methacrylate, benzoate, and methanesulfonate)
pertinent to this study. Methanesulfonate (MSA-) was detected during MASE and
GoMACCS, but was only quantified for GoMACCS flights because of uncertainties in its
measurement during MASE; therefore, only the presence of MSA- in MASE samples is
reported, not its concentration. Oxalate is the only organic acid ion for which
quantitative data are shown from MASE, as it was the only organic acid observed above
detection limits.
The aircraft flight strategy consisted of probing either cloud fields (MASE and
GoMACCS) or a single growing cumulus cloud (GoMACCS). The flight path generally
comprised multiple level legs below cloud, at different altitudes in cloud, and above
164
cloud. The cloud field legs were usually sufficiently long for at least two PILS samples
to be collected, while individual samples collected during shorter single cloud profiling
legs combined residual particles from up to three different altitude transects. Relative
ratios of species in individual droplet residual particle samples are reported in this study,
as opposed to absolute concentrations, to account for the variable amount of time the
aircraft spent in cloud when collecting a particular sample.
During MASE, stratocumulus cloud bases typically ranged between 100 and 400
m, with tops between 350 and 700 m. Cumulus cloud bases during GoMACCS ranged
between 500 and 800 m, with tops between 800 and 3000 m. Typical stratocumulus
liquid water content (LWC) values ranged between 0.1 and 0.5 g/m3, with a maximum of
0.7 g/m3, during MASE; cumulus LWC values between 0.1 and 1 g/m3 were typically
observed during GoMACCS, with a maximum of 2.1 g/m3. Sounding profiles up to
cloud bases indicate that the BL tended to be well-mixed during both field campaigns.
An estimate of the in-cloud residence time of an air parcel in a well-mixed BL can be
obtained from the cloud volume fraction of the BL (35), values of which for both field
studies were usually between 20 - 50%. The volume fraction was calculated by dividing
the average cloud depth observed during cloud field legs by the BL height; uncertainties
in this calculation include the assumption that there was a continuous cloud deck of the
same depth everywhere in the BL and that there was no deviation in cloud thickness. For
GoMACCS, this likely represents an upper bound since cloud fractions were on the order
of 10%. Organic acids constituted a significant portion of the above-cloud aerosol mass
during both campaigns; on average, organic acid mass above cloud during MASE and

165
GoMACCS was 0.07+0.04 μg/m3 (4.9+3.6% of PILS mass) and 0.14+0.14 μg/m3
(6.5+5.1% of PILS mass), respectively.
5.4 Sources of Oxalate above Cloud
Figure 5.1 is a schematic of processes that can lead to enhanced organic acid
levels above cloud. Gases such as SO2 and VOCs ascend into cloud and partition into
droplets before participating in aqueous-phase chemistry to form SO42- and organic
species (such as oxalic acid), respectively (18-28). At the same time, ambient particles
already containing SO42- and organic acids are lofted into cloud. Above cloudtop,
droplets evaporate leaving residual particles, which contain newly-formed species such as
sulfate and oxalic acid. Also, aerosol containing organic acids can be entrained into the
BL from the FT. Although not discussed here, new particle formation can also occur
above cloud (36).
Oxalate was consistently the dominant organic acid species measured in both field
experiments; during GoMACCS, for example, the largest contributor to above-cloud
organic acids was oxalate, on average 87+17% by mass (Figure 5.1). Less abundant
species included acetate (7+13%), formate (2+8%), malonate (1+6%), glutarate (1+7%),
MSA- (1+5%), succinate (0.5+3%), and glyoxylate (0.5+2%). During both MASE and
GoMACCS, the oxalate concentration, on average, increased from below to above cloud
by between 25 - 30%, then decreased above the BL to it lowest values in the FT (Figure
5.1).
Of 14 cloud field profiling events during MASE, oxalate concentration was higher
above cloud as compared to below in 12 events (Figure 5.2). Sulfate was greater above

166
cloud as compared to below in three of these 14 events (7/16a, 7/13b, 7/17), two of which
were influenced by ship emissions; there was usually slightly less sulfate above cloud as
compared to below. Situations in which the increase in NH4+:SO4
2- from below to above
cloud was largest tended to exhibit the greatest amount of oxalate growth as well (7/16a-
c). The greatest increase in both oxalate concentration and the relative amount of oxalate
to sulfate from below to above cloud was usually associated with higher in-cloud LWC
values and larger BL cloud volume fractions. Four out of nine cloud events, in which at
least four droplet residual samples were collected, exhibited a strong correlation between
sulfate and oxalate (R2 > 0.5); this is consistent with in-cloud production of oxalic acid
(19, 21, 25, 26).
During GoMACCS, higher organic acid and oxalate mass concentrations were
observed above cloud as compared to below in 13 and 16 out of 22 cloud profiling
events, respectively (Figure 5.3). Only one event (8/23b), which was directly influenced
by the plume from the W.A. Parish Power Plant, exhibited a higher sulfate concentration
above cloud; sulfate was usually more abundant below cloud due to the high background
levels at lower altitudes from local SO2 sources. When BL cloud volume fractions
exceeded 55% in GoMACCS, the contribution of oxalate to organic acid mass in aerosol
below and above cloud always exceeded 85% and 90%, respectively; these values were
lower when the BL cloud volume fraction was smaller, presumably because the cloud
droplet medium in which organic acids are converted to oxalic acid was less abundant.
Similar to MASE, oxalate was well-correlated with sulfate in cloud (R2 > 0.5 in 14 out of
the 22 events). It should be noted that in cloud events from both field campaigns where

167
oxalate increased from below to above cloud, the increases were significant beyond the
PILS-IC measurement uncertainty.
During strong GoMACCS pollution events (> 8000 particles/cm3 below cloud)
the contribution of oxalate to the total organic acid mass increased from below to above
cloud even though the total organic acid mass itself decreased (8/23b, 9/2b). Under more
polluted conditions, photooxidation of primary VOCs may have led to lower volatility
organic acids that could have partitioned into below-cloud aerosols. It is hypothesized
that subsequent cloud processing increased the oxalate mass above these polluted clouds,
with simultaneous depletion of the other organic acids by deposition, reaction to form
volatile organic side-products, or further oxidation to produce oxalic acid.
5.5 Physical Processes at the Cloudtop Interface (Large Eddy Simulations)
In order to assess the likelihood of there being evaporated droplet residual
particles above cloud, we report on LES results for the stratocumulus cloud observed July
5, 2005, which was influenced by ship emissions. For vertical resolution, we use Δz = 5
m near the cloudtop interface (z = 630−730 m); outside that range, a resolution of 15 m is
employed, giving a total of 94 vertical grid cells. The horizontal resolution is 55 m with
60 grid cells in each horizontal direction. Periodic boundary conditions are specified (37).
The sea surface temperature is taken to be 287 K. The large scale divergence estimated
from the National Centers for Environmental Prediction (NCEP) reanalysis is set at 10-
5/s. The initial wind field is assumed to be constant with u = 5.75 m/s and v = -9.96 m/s,
as derived from the aircraft measurements. The initial sounding profiles are based on the
smoothed vertical profiles of potential temperature and total liquid water mixing ratio

168
sampled by the aircraft. The model is spun up at 4 AM local time with random noise on
temperature over the initially assumed well-mixed sounding profile. The model used is
the LES version of RAMS coupled with bin microphysics, a detailed description of which
is given by Lu and Seinfeld (37).
The dry aerosol size distribution obtained by the differential mobility analyzer in
the sub-cloud region (~ 227 m) is fitted with a trimodal log-normal distribution: rg [nm] =
(56, 65, 175), σg = (1.24, 2.43, 1.31), and N [cm-3] = (140, 513, 81). Based on aircraft
measurements, the simulated CCN is largely ammonium bisulfate with dry density of
1.79 g/cm3 and soluble fraction of 1. Organic carbon is not considered as an aerosol
component in the LES simulations.
Lagrangian air parcel trajectories from the LES simulations are derived following
the methodology of Stevens et al. (38). The parcels are released at 10 AM local time and
tracked for three hours; 3600 parcels are released at each altitude. The integration time
interval for parcel trajectories is 10 s. Parcels initialized just below cloudtop have the
highest probability of ascending above cloud (Figure 5.4A-C); at least 10% of cloud
parcels that originate within the 10 m-layer below cloudtop can ascend above cloud
(Table 5.1). These above-cloud parcels can be recycled back into cloud or remain above
cloud. Cloudtop residence times of simulated trajectories in nonprecipitating
stratocumulus have been shown to be on the order of 10 min or longer (38); a significant
portion of droplets near cloudtop, as represented by trajectories in the present
simulations, are likely to undergo evaporation once they are out of cloud.
Stratocumulus clouds typically exhibit a clear diurnal evolution in cloud top and
base (37, 39), and the cloud layer is thinner during daytime as compared to nighttime.

169
LES results in Figure 5.4D show that the simulated cloudtop drops by about 15 m from 8
to 10 AM. Extrapolating these results to the actual measurements suggests that the thin
layer above cloud sampled by the aircraft possibly contained droplet residual particles
from evaporated cloudtops during the day. Moreover, modeling studies of marine
stratocumulus clouds have shown that cloudtops are not the limit of mixing of BL air and
that turbulence and mixing tend to exist up to tens of meters above cloud (40, 41). Hegg
et al. (42) reported measurements directly above stratocumulus off the coast of
California, as in the present experiment; their measurements also indicate that cloud-
processed aerosol detraining from the marine cloud layer were being sampled. In
summary, both Lagrangian trajectory analysis and diurnal cloudtop evolution provide
evidence that a significant fraction of aerosol particles above cloud are likely residual
particles from evaporated cloud droplets. Both mechanisms work concomitantly and
continuously during the day, as the resultant residual particle layer thickens. This
conceptual model provides support for physical mechanisms leading to a residual organic
acid aerosol layer above clouds.
We utilize the results from the trajectory analysis to assess the amount of organic
acid mass measured above cloud. Using results from Table 5.1, specifically that 56% of
159 droplets/cm3 ascend above cloudtop, and assuming that residual particles from these
evaporated droplets have diameters of 150 nm, the density of ammonium bisulfate (1.79
g/cm3), and an organic acid mass fraction of 5% (based on measurements), the particulate
organic acid concentration calculated (~0.01 μg/m3) is less than those measured. An
increase in any of the input variables will increase this value, and this calculation still
does not account for the thickening of the residual particle layer during the day.

170
Assuming that all the aerosol above cloud consisted of evaporated droplets at 1000
particles/cm3, 0.16 μg/m3 of organic acids is predicted to be present, which approaches
the highest measurement made above cloud during MASE (Figure 5.2: 7/16c = 0.14
μg/m3). The more convective clouds encountered during GoMACCS, as compared to the
stratocumulus clouds in MASE, would have been more effective at pumping cloud-
processed aerosol above their tops. Vigorous mixing and transient cloud evolution
(clouds grow and dissipate rapidly during the day) during GoMACCS likely contributed
to the observed organic acid aerosol layer above cloud; during above-cloud legs, the
aircraft was frequently sampling in areas that were recently occupied by the top portions
of a cloud that evaporated.
5.6 Oxalic Acid Chemistry
Detection of aqueous-phase intermediates to oxalic acid in several cloud events
provides evidence for a cloud processing mechanism. Glyoxylate was detected in droplet
residual particles in six GoMACCS cloud events. Typically, the glyoxylate concentration
in total aerosol samples was an order of magnitude lower than that of oxalate, with
glyoxylate peaking at 0.03 μg/m3. Acetic acid, an aqueous precursor to glyoxylic acid,
was measured during the same six events as well. The six cloud events were marked by
higher LWC values as compared to others, which may explain why aqueous oxalic acid
precursors reached measurable concentrations. Higher LWC values increase partitioning
of gases (including organic precursors to oxalic acid) into droplets, which promotes
enhanced production of oxalic acid from oxidation of intermediates such as glyoxylic and
acetic acids.

171
It has been shown that glyoxylic acid produces oxalic acid more efficiently at
higher droplet pH values, because the rate constant of the oxidation of glyoxylic acid is
an order of magnitude lower than that of its anion, glyoxylate (43). Also, effective
Henry’s Law coefficients are a function of pH; higher acidity reduces droplet uptake
efficiency for aqueous-phase precursors to oxalic acid. Similarly, the solubility of sulfate
precursors and the aqueous oxidation of these precursors both have pH dependence.
However, the production rate of oxalic acid is greater than that of sulfate at pH levels
expected in cloud droplets; the Henry’s Law coefficients for oxalic acid VOC precursors
(for example, glyoxal = 3 x 10⁵ M/atm; acetic acid = 5500 M/atm, pyruvic acid = 3.11 x
105 M/atm; glycolic and glyoxylic acids = 9000 M/atm) exceed that of SO2 (1.24 M/atm)
(1, 44). In addition, at higher droplet pH conditions, the reaction rate constant for oxalic
acid production from OH oxidation of glyoxylate, 2.9 x 10⁹ M-1 s-1 (OH oxidation of
glyoxylic acid = 3.6 x 10⁸ M-1 s-1), exceeds that of sulfate-producing reactions (SO2 + O3
= 2.4 x 10⁴ M-1 s-1; HSO3- + O3 = 3.7 x 10⁵ M-1 s-1; SO3
2- + O3 = 1.5 x 10⁹ M-1 s-1; H2O2 +
HSO3- + H+ = 7.2 x 10⁷ M-2 s-1) (43, 44).
GoMACCS cloud data are consistent with a role of acidity in in-cloud processes.
The oxalate:SO42- ratio increased when ascending from below to above cloud in all
MASE and GoMACCS cloud events, before decreasing above the BL. The below- to
above-cloud ratio of oxalate to sulfate exhibited the largest increase when BL cloud
volume fractions exceeded 55%; these cases also included cloud fields with some of the
highest LWC values. During a single cloud profiling event (Figure 5.5: bottom), seven
residual particle samples were collected with ascending altitude in a growing cumulus
cloud, and the oxalate:SO42- ratio increased in strong correlation with the maximum LWC

172
amount. The greatest increases in the oxalate:SO42- ratio occurred in the fourth and sixth
sample when the greatest increases in the maximum LWC occurred. Cloud LWC
increased with altitude, but decreased near cloudtop due to entrainment drying. In
another cloud profiling event where two adjacent growing cumulus clouds were probed
(Figure 5.5: top), the same trends were observed for six residual particle samples
collected. The oxalate:SO42- ratio grew with altitude as the maximum LWC increased,
with the sharpest increases occurring with the maximum LWC increase. The cumuli in
the two events were almost the same depth and exhibited similar oxalate:SO42- mass
ratios with altitude (0.10-0.40); the highest ratios were observed in the top half of the
clouds. Observations from these cloud profiling events show that higher altitudes in
cloud have increased LWC (with the exception of near the top due to entrainment drying)
and as a result, higher droplet pH; the rate of oxalic acid production is enhanced relative
to sulfate with increasing LWC in cloud. Also, higher oxalic acid concentrations relative
to sulfate in the upper levels of clouds are a consequence of multi-step aqueous-phase
oxalic acid production (several subsequent oxidation steps are necessary before oxalic
acid is formed from VOC precursors, whereas fewer steps are required for sulfate
production; 18-28), which is facilitated by more time in cloud. The oxalate:SO42- ratio
showed no increasing trend with altitude on clear days; most of the higher clear air ratios
were observed during flights when the plane was performing a spiral ascent or descent in
an area near clouds. These results offer an explanation of high ratios of oxalate to sulfate
above cloud.
Of 22 flights during GoMACCS, only two showed consistent particulate nitrate
levels above 0.5 μg/m3 in the BL. In these, the sampled particles exhibited NH4+:SO4
2-

173
molar ratios above two, indicating that there was sufficient NH3 to neutralize SO42-,
thereby allowing HNO3 to partition into the particle phase, forming NO3-. Four total
cloud profiling events were carried out during these two flights (Figure 5.3: 8/29a-c,
8/31) in the high-nitrate area. Three of these events exhibited lower particulate oxalate
and organic acid concentrations above cloud as compared to below. The oxalate:SO42-
ratio showed either no change or only a small increase from below to above cloud. In the
presence of high HNO3 levels and relatively lower LWC values, the droplets are more
acidic, presumably suppressing organic acid formation. That the in-cloud production rate
of oxalate seemed to be reduced during these cloud events suggests again that FT
entrainment is not the dominant source of above-cloud oxalate levels.
5.7 Methanesulfonate
Methanesulfonate data from both campaigns show that the aerosol both above the
BL and below clouds can be a source for this species above clouds. Methanesulfonic
acid is formed by dimethylsulfide (DMS) oxidation by free radicals such as OH, where
DMS is excreted by phytoplankton in sea water (45). Data from MASE and GoMACCS
show that, on average, oxalate increased in concentration with altitude from below to
above cloud; MSA- exhibited the opposite behavior (Figure 5.1). MSA- was most
frequently detected below cloud; its frequency of detection decreased with altitude until
eventually increasing above cloud. Since the occurrence of MSA- was not observed to be
enhanced in cloud, its source above cloud is more likely to be from above the BL. Most
of the GoMACCS MSA- measurements occurred over the Gulf of Mexico; although not
reflected in the average concentrations in Figure 5.1, comparable levels of MSA- were

174
measured above cloud and in the FT over the Gulf (0.02 - 0.05 μg/m3), with a decrease
observed in cloud.
Five-day back-trajectories computed from the NOAA HYSPLIT model (46) for
MASE indicate that the air tended to originate from areas over the Pacific Ocean farther
north up the coast of the US and from farther west over the ocean. Five-day back-
trajectories indicate that air parcels in the GoMACCS flights with MSA- detected
originated farther southeast over the Gulf of Mexico. Vertical transport from the marine
BL injects MSA- or its precursors, such as DMS, into the lower FT. It is hypothesized
that the MASE marine BL, which exhibited continuous decks of stratocumulus clouds,
was more effective at entraining MSA--enriched aerosol above clouds. The data indicate
that the FT is a source of above-cloud MSA- in both regions studied, and organic acids
other than MSA- may also be contained within these entraining aerosol particles.
5.8 Acknowledgements
This work was supported by NOAA grant NA06OAR4310082 and Office of
Naval Research grant N00014-04-1-0118. The authors gratefully acknowledge the
NOAA Air Resources Laboratory (ARL) for the provision of the HYSPLIT transport and
dispersion model.
5.9 References
(1) Saxena, P.; Hildemann, L. M. Water-soluble organics in atmospheric particles: A
critical review of the literature and application of thermodynamics to identify candidate
compounds. J. Atmos. Chem. 1996, 24, 57–109.

175
(2) Kanakidou, M.; Seinfeld, J. H.; Pandis, S. N.; Barnes, I.; Dentener, F. J.; Facchini, M.
C.; Van Dingenen, R.; Ervens, B.; Nenes, A.; Nielsen, C. J.; Swietlicki, E.; Putaud, J. P.;
Balkanski, Y.; Fuzzi, S.; Horth, J.; Moortgat, G. K.; Winterhalter, R.; Myhre, C. E. L.;
Tsigaridis, K.; Vignati, E.; Stephanou, E. G.; Wilson, J. Organic aerosol and global
climate modelling: a review. Atmos. Chem. Phys. 2005, 5, 1053-1123.
(3) Lim, H. J.; Turpin, B. J. Origins of primary and secondary organic aerosol in Atlanta:
Results of time-resolved measurements during the Atlanta supersite experiment. Environ.
Sci. Technol. 2002, 36, 4489-4496.
(4) Balasubramanian, R.; Qian, W. B.; Decesari, S.; Facchini, M. C.; Fuzzi, S.
Comprehensive characterization of PM2.5 aerosols in Singapore. J. Geophys. Res. 2003,
108, D16, 4523, doi:10.1029/2002JD002517.
(5) Putaud, J. P.; Raes, F.; Van Dingenen, R.; Bruggemann, E.; Facchini, M. C.;
Decesari, S.; Fuzzi, S.; Gehrig, R.; Huglin, C.; Laj, P.; Lorbeer, G.; Maenhaut, W.;
Mihalopoulos, N.; Mulller, K.; Querol, X.; Rodriguez, S.; Schneider, J.; Spindler, G.; ten
Brink, H.; Torseth, K.; Wiedensohler, A. European aerosol phenomenology-2: chemical
characteristics of particulate matter at kerbside, urban, rural and background sites in
Europe. Atmos. Environ. 2004, 38, 2579-2595.
(6) Russell, M.; Allen, D. T.; Collins, D. R.; Fraser, M. P. Daily, seasonal, and spatial
trends in PM2.5 mass and composition in Southeast Texas. Aerosol Sci. Tech. 2004, 38,
14-26.
(7) Murphy, D. M.; Cziczo, D. J.; Froyd, K. D.; Hudson, P. K.; Matthew, B. M.;
Middlebrook, A. M.; Peltier, R. E.; Sullivan, A.; Thomson, D. S.; Weber, R. J. Single-

176
particle mass spectrometry of tropospheric aerosol particles. J. Geophys. Res. 2006, 111,
D23S32, doi:10.1029/2006JD007340.
(8) Satsumabayashi, H.; Kurita, H.; Yokouchi, Y.; Ueda, H. Photochemical formation of
particulate dicarboxylic-acids under long-range transport in central Japan. Atmos.
Environ. 1990, 24, 1443-1450.
(9) Kavouras, I. G.; Mihalopoulos, N.; Stephanou, E. G. Formation of atmospheric
particles from organic acids produced by forests. Nature, 1998, 395, 683-686.
(10) Kawamura, K.; Sakaguchi, F. Molecular distributions of water soluble dicarboxylic
acids in marine aerosols over the Pacific Ocean including tropics. J. Geophys. Res. 1999,
104, D3, 3501-3509.
(11) Raman, R. S.; Hopke, P. K. An ion chromatographic analysis of water-soluble,
short-chain organic acids in ambient particulate matter. Int. J. Environ. An. Ch. 2006, 86,
767-777.
(12) Kawamura, K.; Kaplan, I. R. Motor exhaust emissions as a primary source for
dicarboxylic-acids in Los-Angeles ambient air. Environ. Sci. Technol. 1987, 21, 105-110.
(13) Narukawa, M.; Kawamura, K.; Takeuchi, N.; Nakajima, T. Distribution of
dicarboxylic acids and carbon isotopic compositions in aerosols from 1997 Indonesian
forest fires. Geophys. Res. Lett. 1999, 26, 3101-3104.
(14) Yamasoe, M. A.; Artaxo, P.; Miguel, A. H.; Allen, A. G. Chemical composition of
aerosol particles from direct emissions of vegetation fires in the Amazon Basin: water-
soluble species and trace elements. Atmos. Environ. 2000, 34, 1641-1653.
(15) Kleindienst, T. E.; Smith, D. F.; Li, W.; Edney, E. O.; Driscoll, D. J.; Speer, R. E.;
Weathers, W. S. Secondary organic aerosol formation from the oxidation of aromatic

177
hydrocarbons in the presence of dry submicron ammonium sulfate aerosol. Atmos.
Environ. 1999, 33, 3669-3681.
(16) Kalberer, M.; Yu, J.; Cocker, D. R.; Flagan, R. C.; Seinfeld, J. H. Aerosol formation
in the cyclohexene-ozone system. Environ. Sci. Technol. 2000, 34, 4894-4901.
(17) Blando, J. D.; Turpin, B. J. Secondary organic aerosol formation in cloud and fog
droplets: a literature evaluation of plausibility. Atmos. Environ. 2000, 34, 1623-1632.
(18) Warneck, P. In-cloud chemistry opens pathway to the formation of oxalic acid in the
marine atmosphere. Atmos. Environ. 2003, 37, 2423-2427.
(19) Crahan, K. K.; Hegg, D.; Covert, D. S.; Jonsson, H. An exploration of aqueous
oxalic acid production in the coastal marine atmosphere. Atmos. Environ. 2004, 38, 3757-
3764.
(20) Gelencser, A.; Varga, Z. Evaluation of the atmospheric significance of multiphase
reactions in atmospheric secondary organic aerosol formation. Atmos. Chem. Phys. 2005,
5, 2823-2831.
(21) Sorooshian, A.; Varutbangkul, V.; Brechtel, F. J.; Ervens, B.; Feingold, G.; Bahreini,
R.; Murphy, S. M.; Holloway, J. S.; Atlas, E. L.; Buzorius, G.; Jonsson, H.; Flagan, R.
C.; Seinfeld, J. H. Oxalic acid in clear and cloudy atmospheres: Analysis of data from
International Consortium for Atmospheric Research on Transport and Transformation
2004. J. Geophys. Res. 2006, 111, D23S45, doi:10.1029/2005JD006880.
(22) Ervens, B.; Feingold, G.; Frost, G. J.; Kreidenweis, S. M. A modeling study of
aqueous production of dicarboxylic acids: 1. Chemical pathways and speciated organic
mass production. J. Geophys. Res. 2004, 109, D15205, doi:10.1029/2003JD004387.

178
(23) Lim, H. J.; Carlton, A. G.; Turpin, B. J. Isoprene forms secondary organic aerosol
through cloud processing: Model simulations. Environ. Sci. Technol. 2005, 39, 4441-
4446.
(24) Carlton, A. G.; Turpin, B. J.; Lim, H. J.; Altieri, K. E.; Seitzinger, S. Link between
isoprene and secondary organic aerosol (SOA): Pyruvic acid oxidation yields low
volatility organic acids in clouds. Geophys. Res. Lett. 2006, 33, L06822,
doi:10.1029/2005GL025374.
(25) Sorooshian, A.; Ng, N. L.; Chan, A. W. H.; Feingold, G.; Flagan, R. C.; Seinfeld, J.
H. Particulate organic acids and overall water-soluble aerosol composition measurements
from the 2006 Gulf of Mexico Atmospheric Composition and Climate Study
(GoMACCS). J. Geophys. Res., 2007, 112, D13201, doi:10.1029/2007JD008537.
(26) Yu, J. Z.; Huang, S. F.; Xu, J. H.; Hu, M. When aerosol sulfate goes up, so does
oxalate: Implication for the formation mechanisms of oxalate. Environ. Sci. Technol.
2005, 39, 128-133.
(27) Altieri, K. E.; Carlton, A. G.; Lim, H. J.; Turpin, B. J.; Seitzinger, S. P. Evidence for
oligomer formation in clouds: Reactions of isoprene oxidation products. Environ. Sci.
Technol. 2006, 40, 4956-4960.
(28) Carlton, A. G.; Turpin, B. J.; Altieri, K. E.; Seitzinger, S.; Reff, A.; Lim, H. J.;
Ervens, B. Atmospheric oxalic acid and SOA production from glyoxal: results of aqueous
photooxidation experiments. Atmos. Environ. 2007, 41:7588-7602.
(29) Lu, M.-L.; Conant, W. C.; Jonsson, H.; Varutbangkul, V.; Flagan, R. C.; Seinfeld, J.
H. The Marine Stratus/Stratocumulus Experiment (MASE): Aerosol-cloud relationships

179
in marine stratocumulus. J. Geophys. Res. 2007, 112, D10209,
doi:10.1029/2006JD007985.
(30) Alexander, M.; Hubbe, J.; Lee, Y.; Daum, P.; Senum, G.; Wang, J.; Flagan, R. C.;
Varutbangkul, V.; Murphy, S. M.; Rissman, T. A.; Sorooshian, A.; Seinfeld, J. H.;
Hudson, J.; Jayne, J. Observation of persistent layer of enhanced organic aerosol
concentrations above cloudtops off the Northern California Coast. 2006, Seventh
International Aerosol Conference, American Association for Aerosol Research, St. Paul,
Minnesota, USA, September 10-15.
(31) Heald, C. L.; Jacob, D. J.; Park, R. J.; Russell, L. M.; Huebert, B. J.; Seinfeld, J. H.;
Liao, H.; Weber, R. J. A large organic aerosol source in the free troposphere missing
from current models. Geophys. Res. Lett. 2005, 32, L18809, doi:10.1029/2005GL023831.
(32) Heald, C. L.; Jacob, D. J.; Turquety, S.; Hudman, R. C.; Weber, R. J.; Sullivan, A.
P.; Peltier, R. E.; Atlas, E. L.; de Gouw, J. A.; Warneke, C.; Holloway, J. S.; Neuman, J.
A.; Flocke, F. M.; Seinfeld, J. H. Concentrations and sources of organic carbon aerosols
in the free troposphere over North America. J. Geophys. Res. 2006, 111, D23S47,
doi:10.1029/2006JD007705.
(33) Hegg, D. A.; Covert, D. S.; Covert, P. A.; Jonsson, H. Determination of the
efficiency of an aircraft aerosol inlet. Aerosol Sci. Tech. 2005, 39, 966– 971.
(34) Sorooshian, A.; Brechtel, F. J.; Ma, Y. L.; Weber, R. J.; Corless, A.; Flagan, R. C.;
Seinfeld, J. H. Modeling and characterization of a particle-into-liquid sampler (PILS).
Aerosol Sci. Tech. 2006, 40, 396-409.
180
(35) Feingold, G.; Kreidenweis, S. M.; Zhang, Y. Stratocumulus processing of gases and
cloud condensation nuclei: 1. Trajectory ensemble model. J. Geophys. Res. 1998, 103,
D16, 19527–19542.
(36) Hegg, D. A.; Radke, L. F.; Hobbs, P. V. Particle-production associated with marine
clouds. J. Geophys. Res. 1990, 95, D9, 13917-13926.
(37) Lu, M. -L.; Seinfeld, J. H. Study of the aerosol indirect effect by large-eddy
simulation of marine stratocumulus. J. Atmos. Sci. 2005, 62, 3909-3932.
(38) Stevens, B.; Feingold, G.; Cotton, W. R.; Walko, R. L. Elements of the
microphysical structure of numerically simulated nonprecipitating stratocumulus. J.
Atmos. Sci. 1996, 53, 980-1006.
(39) Duynkerke, P. G.; de Roode, S. R.; van Zanten, M. C.; Calvo, J.; Cuxart, J.; Cheinet,
S.; Chlond, A.; Grenier, H.; Jonker, P. J.; Kohler, M.; Lenderink, G.; Lewellen, D.;
Lappen, C. L.; Lock, A. P.; Moeng, C. H.; Muller, F.; Olmeda, D.; Piriou, J. M.; Sanchez,
E.; Sednev, I. Observations and numerical simulations of the diurnal cycle of the
EUROCS stratocumulus case. Q. J. Roy. Meteor. Soc. 2004, 130, 3269-3296.
(40) Moeng, C. H.; Stevens, B.; Sullivan, P. P. Where is the interface of the
stratocumulus-topped PBL?. J. Atmos. Sci. 2005, 62, 2626-2631.
(41) Lenschow, D. H.; Zhou, M. Y.; Zeng, X. B.; Chen, L. S.; Xu, X. D. Measurements
of fine-scale structure at the top of Marine Stratocumulus. Bound-Lay. Meteorol. 2000,
97, 331-357.
(42) Hegg, D. A.; Covert, D. S.; Jonsson, H.; Khelif, D.; Friehe, C. A. Observations of
the impact of cloud processing on aerosol light-scattering efficiency. Tellus B. 2004, 56,
285-293.

181
(43) Ervens, B.; Gligorovski, S.; Herrmann, H. Temperature-dependent rate constants for
hydroxyl radical reactions with organic compounds in aqueous solutions. Phys. Chem.
Chem. Phys. 2003, 5, 1811-1824.
(44) Ervens, B.; George, C.; Williams, J. E.; Buxton, G. V.; Salmon, G. A.; Bydder, M.;
Wilkinson, F.; Dentener, F.; Mirabel, P.; Wolke, R.; Herrmann, H. CAPRAM 2.4
(MODAC mechanism): An extended and condensed tropospheric aqueous phase
mechanism and its application. J. Geophys. Res. 2003, 108, D14, 4426,
doi:10.1029/2002JD002202.
(45) Charlson, R. J.; Lovelock, J. E.; Andreae, M. O.; Warren, S. G. Oceanic
phytoplankton, atmospheric sulphur, cloud albedo and climate. Nature. 1987, 326, 655–
661.
(46) Draxler, R. R.; Rolph, G. D. HYSPLIT (HYbrid Single-Particle Lagrangian
Integrated Trajectory) Model access via NOAA ARL READY Website
(http://www.arl.noaa.gov/ready/hysplit4.html). 2003, NOAA Air Resources Laboratory,
Silver Spring, MD.

182
Table 5.1. Summary of Lagrangian Trajectory Results
Initial trajectory altitude (m)
(Cloudtop = 675 m)
Fraction of trajectories penetrating above cloudtop at
least once (%)
Mean cloud droplet number concentration
(#/cm3) 672.5 56 159+67 667.5 13 303+112 662.5 4 284+185

183
Figure 5.1. Schematic of physical processes leading to an organic acid aerosol layer above clouds. Average oxalate, sulfate, and methanesulfonate data are shown next to the respective region of the atmosphere where they were measured (below cloud, in cloud, above cloud, and the FT) for MASE and GoMACCS. During MASE, oxalate represented the entire organic acid mass (mass fraction is not shown) and absolute concentrations of MSA- were not measured. In addition, only species ratios are reported for the in-cloud category since absolute concentrations were not measured (NA).
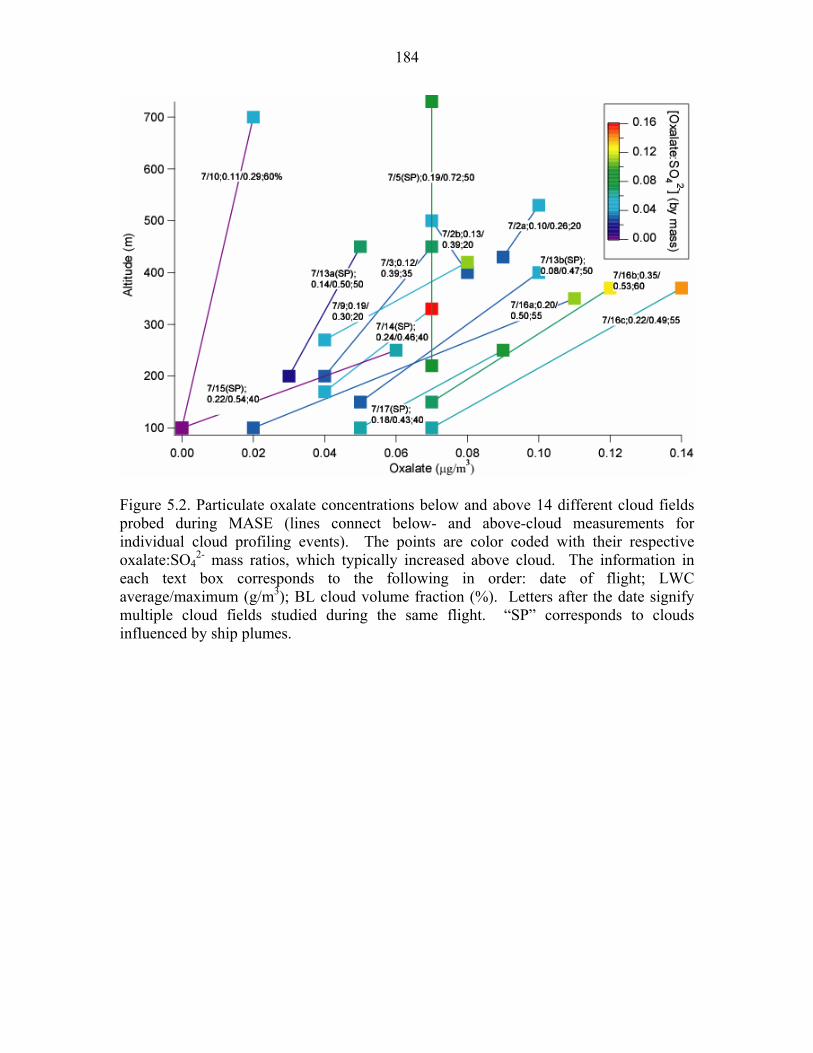
184
Figure 5.2. Particulate oxalate concentrations below and above 14 different cloud fields probed during MASE (lines connect below- and above-cloud measurements for individual cloud profiling events). The points are color coded with their respective oxalate:SO4
2- mass ratios, which typically increased above cloud. The information in each text box corresponds to the following in order: date of flight; LWC average/maximum (g/m3); BL cloud volume fraction (%). Letters after the date signify multiple cloud fields studied during the same flight. “SP” corresponds to clouds influenced by ship plumes.

185
Figure 5.3. Particulate organic acid concentrations below and above 22 different cloud systems probed during GoMACCS (lines connect below- and above-cloud measurements for individual cloud profiling events). The points are color coded with their respective oxalate:SO4
2- mass ratios, which typically increased above cloud. Larger marker sizes, usually above cloud, also denote that oxalate contributed relatively more to the total organic acid mass. The information in each text box corresponds to the following in order: date of flight; LWC average/maximum (g/m3); BL cloud volume fraction (%). Letters after the date signify multiple cloud fields studied during the same flight. “PP” corresponds to clouds influenced by the Parish Plant plume.

186
Figure 5.4. A-C: Example of the temporal evolution of trajectories from a 2D slice of the 3D LES simulation. Trajectories are initialized at various altitudes (z) near cloudtop. Trajectories that always stay inside cloud are shown as gray lines; those that penetrate above cloud at least once are represented by black lines. The thick red horizontal line marks the cloudtop (675 m). D: Temporal evolution of cloudtop from the LES simulation of the stratocumulus cloud observed July 5, 2005, which was influenced by ship emissions (corresponds to 7/5 in Figure 5.2). Detailed discussion of this cloud can be found in Lu et al. (29).

187
Figure 5.5. Droplet residual particle data from two different GoMACCS cloud profiling events. (Top) The TO probed two adjacent cumuli (corresponds to 9/10 in Figure 5.3); (Bottom) the TO probed one cumulus cloud (corresponds to 9/7b in Figure 5.3). The mass ratio of oxalate to sulfate usually increased with increasing LWC.
188
Chapter 6
Particulate Organic Acids and Overall Water-Soluble
Aerosol Composition Measurements from the 2006 Gulf
of Mexico Atmospheric Composition and Climate Study
(GoMACCS)∗
∗This chapter is reproduced by permission from “Particulate Organic Acids and Overall Water-Soluble Aerosol Composition Measurements from the 2006 Gulf of Mexico Atmospheric Composition and Climate Study (GoMACCS)” by A. Sorooshian, N. L. Ng, A. W. H. Chan, G. Feingold, R. C. Flagan, and J. H. Seinfeld, J. Geophys. Res., 112, D13201, doi:10.1029/2007JD008537, 2007. Copyright 2007. American Geophysical Union.
189
6.1 Abstract
The Center for Interdisciplinary Remotely-Piloted Aircraft Studies (CIRPAS)
Twin Otter participated in the Gulf of Mexico Atmospheric Composition and Climate
Study (GoMACCS) mission during August - September 2006. A particle-into-liquid
sampler (PILS) coupled to ion chromatography was used to characterize the water-
soluble ion composition of aerosol and cloud droplet residual particles (976 5-min PM1.0
samples in total). Sulfate and ammonium dominated the water-soluble mass
(NH4++SO4
2- = 84+14%), while organic acids contributed 3.4+3.7%. The average
NH4+:SO4
2- molar ratio was 1.77+0.85. Particulate concentrations of organic acids
increased with decreasing carbon number from C9 to C2. Organic acids were most
abundant above cloud, presumably as a result of aqueous-phase chemistry in cloud
droplets, followed by subsequent droplet evaporation above cloudtops; the main product
of this chemistry was oxalic acid. The evolution of organic acids with increasing altitude
in cloud provides evidence for the multi-step nature of oxalic acid production; predictions
from a cloud parcel model are consistent with the observed oxalate:glyoxylate ratio as a
function of altitude in GoMACCS cumuli. Suppressed organic acid formation was
observed in clouds with relatively acidic droplets, as determined by high particulate
nitrate concentrations (presumably high HNO3 levels too) and lower liquid water content,
as compared to other cloud fields probed. In the Houston Ship Channel region, an area
with significant volatile organic compound emissions, oxalate, acetate, formate, benzoate,
and pyruvate, in decreasing order, were the most abundant organic acids. Photooxidation
of m-xylene in laboratory chamber experiments leads to a particulate organic acid product
distribution consistent with the Ship Channel area observations.

190
6.2 Introduction
Organic acids are ubiquitous in atmospheric aerosols (Kawamura and Ikushima,
1993; Stephanou and Stratigakis, 1993; Khwaja, 1995; Chebbi and Carlier, 1996;
Kerminen et al., 2000; Yao et al., 2004); however, their formation mechanisms are not
entirely understood. Dicarboxylic acids have much lower vapor pressures (factor of 2 to
4) compared to monocarboxylic acids, which allows them to partition more easily into the
aerosol phase (Ludwig and Klemm, 1988; Chebbi and Carlier, 1996). Studies have
shown that the particulate mass concentration of dicarboxylic acids tends to increase with
decreasing carbon number (Kawamura and Ikushima, 1993; Sempere and Kawamura,
1994; Kawamura et al., 1995; Kawamura and Sakaguchi, 1999; Limbeck and Puxbaum,
1999; Kerminen et al., 2000; Neususs et al., 2000); consequently, oxalic acid [(COOH)2]
is the dominant particulate dicarboxylic acid. Oxalic acid occurs both in primary
emissions from fossil fuel combustion, biomass burning, and biogenic activity, as well as
from photooxidation of volatile organic compounds (VOCs) and aqueous-phase
chemistry in cloud droplets (Norton et al., 1983; Kawamura and Kaplan, 1987;
Kawamura and Ikushima, 1993; Faust, 1994; Chebbi and Carlier, 1996; Kerminen et al.,
1999; Narukawa et al., 1999; Blando and Turpin, 2000; Yamasoe et al., 2000; Yao et al.,
2002, 2003; Mochida et al., 2003; Turekian et al., 2003; Crahan et al., 2004; Yu et al.,
2005; Sorooshian et al., 2006a). (Huang and Yu (2007) recently showed that vehicle
exhaust is not a significant primary source for oxalate.) Sources of longer chain
dicarboxylic acids (C9 is the longest acid detected in the present study) include pyrolysis
of vegetative material, vehicular emissions, photooxidation of aromatic hydrocarbons,
and the oxidative decay of higher carbon number organic acids (Pereira et al., 1982;

191
Rogge et al., 1991; Kawamura and Sakaguchi, 1999). A major source of > C9 organic
acids includes the oxidation of unsaturated n-fatty acids, which are emitted from
microbial sources and the processing of plant and animal constituents (Rogge et al., 1993;
Kawamura et al., 2005); meat cooking is an especially significant source of fatty acid
emissions (Rogge et al., 1991). Lower carbon number dicarboxylic acids have been more
frequently detected and at higher concentrations. The decrease in concentration of
dicarboxylic acids with increasing carbon number, especially at higher altitudes, is
suggestive of an oxidative decay mechanism; it is not certain, however, whether the
lower carbon number acids are more abundant at lower altitudes simply as a result of
larger primary emission rates.
The monocarboxylic acids, of which formic and acetic acids are the most
dominant in the gas phase, usually exhibit concentrations one to two orders of magnitude
lower in the aerosol phase as compared to the gas phase (Chebbi and Carlier, 1996).
Formation mechanisms for these and other monocarboxylic acids include reactions of
precursors in gas, aqueous, and particulate phases, and primary biogenic and
anthropogenic emissions (Simoneit and Mazurek, 1982; Simoneit, 1986; Talbot et al.,
1988; Rogge et al., 1991; Khwaja, 1995; Chebbi and Carlier, 1996; Souza et al., 1999;
Kanakidou et al., 2005). Although exceptions such as formic acid exist, monocarboxylic
acids are generally thought to be oxidized to form dicarboxylic acids via intermediates
such as hydroxyacids and ketocarboxylic acids (Kawamura and Ikushima, 1993).
During August - September 2006, the Center for Interdisciplinary Remotely-
Piloted Aircraft Studies (CIRPAS) Twin Otter (TO), based at Houston, Texas,
participated in the Gulf of Mexico Atmospheric Composition and Climate Study

192
(GoMACCS; http://www.esrl.noaa.gov/csd/2006/); 22 flights were devoted largely to
probing aerosol-cloud relationships over the Gulf of Mexico and the inland Houston area.
Previous field campaigns in southeastern Texas have addressed chemical characterization
of aerosol in the Houston area (2000 Texas Air Quality Study (TexAQS;
www.utexas.edu/research/ceer/texaqs); 2000 - 2001 Gulf Coast Aerosol Research and
Characterization Study (GC-ARCH; Russell and Allen, 2004)); absent in those studies
were rapid (< 5 min) airborne measurements of speciated organic acids, in addition to
inorganic species, in aerosol and cloud droplet residual particles. Table 6.1 provides a
summary of reported urban organic aerosol measurements, with an emphasis on organic
acids. These past measurements provide a body of urban data to which data from the
Houston area during GoMACCS can be compared.
The goal of the present work is twofold: (1) to provide a chemical
characterization of inorganic and organic acid ions in southeastern Texas aerosol,
including cloud droplet residual particles; and (2) to gain insight into formation
mechanisms for organic acids and their role in cloud droplet chemistry. Measurements of
inorganic and organic acid species are first presented to gain insight into the spatial
distribution of their mass concentrations, ionic charge balance closure, mass and volume
concentration ratios in different air categories, and cross-correlations between the
different species. An in-depth analysis of each organic acid follows. The evolution of
organic acids with increasing altitude in cloud is examined, and cloud parcel model
predictions are compared to measurements to explain trends in the oxalate:glyoxylate
ratio observed. Unique findings from cloud field measurements in high-nitrate areas are
reported. Special attention is given to evidence of secondary organic aerosol (SOA)

193
formed from aromatic VOCs, in which airborne data in the Houston Ship Channel area
are compared to those from laboratory chamber photooxidation of m-xylene.
6.3 Twin Otter (TO) Research Aircraft
The instrument payload on the TO aircraft is described elsewhere
(http://www.cirpas.org). Two different inlets were employed for sampling clear air and
clouds. A counterflow virtual impactor (CVI) inlet was used in cloud to isolate particles
resulting from evaporation of cloud droplets (so-called residual particles). The main
aircraft inlet sampled total aerosol outside of clouds and occasionally inside clouds,
where the total aerosol consisted of interstitial aerosol and some evaporated droplet
residual particles. Submicrometer aerosol chemical composition was measured by a
particle-into-liquid sampler (PILS, Brechtel Manufacturing Inc.) (Sorooshian et al.,
2006b). In the PILS, submicrometer-sized ambient particles are grown into droplets
sufficiently large to be collected by inertial impaction, allowing subsequent chemical
analysis by ion chromatography (IC, Dionex). Samples are deposited in vials held on a
rotating carousel, with each vial containing material representing a period of 5 min of
flight, or alternatively, 62.5 L of sampled air (PILS sample flow rate = 12.5 L/min). IC
analysis quantified the ambient air concentrations of water-soluble ions, including
inorganic and organic acid ions.
The detection limit (calculated as the average concentration plus three standard
deviations of the smallest detectable peak for each ion in the IC baseline noise, converted
to air-equivalent units) is < 0.1 μg/m3 for the inorganic ions (Na+, NH4+, K+, Mg2+, Ca2+,
Cl-, NO2-, NO3
-, and SO42-), < 0.01 μg/m3 for the organic acid ions (saturated
194
dicarboxylic acids C2-C9, acetic, formic, pyruvic, glyoxylic, maleic, malic, methacrylic,
benzoic, and methanesulfonic acids), and 0.06 μg/m3 for the one amine measured,
diethylamine. Since acetate, lactate, and glycolate co-elute, these three are reported as a
collective mass using the calibration equation of acetate; therefore, the contribution of
acetate reported is likely an overestimate. Compared to acetate, using the calibration
equation of glycolate would yield values lower by < 10%, with increasing peak area
allowing for better agreement between the two calibration equations. A list of all organic
acids studied with their respective structures and chemical formulas is given in Table 6.2.
6.4 Water-soluble Chemical Characterization of Southeastern Texas Aerosol The PILS collected 976 samples up to an altitude of 5 km over 22 flights during
GoMACCS. Data were collected in the following regions of the atmosphere: free
troposphere (called “FT”; determined by meteorological sounding profiles), above cloud,
inside cloud, below cloud, and in clear air in the boundary layer (BL) away from the
vicinity of clouds (called “clear air”).
Figure 6.1 displays the spatial distribution of total water-soluble mass
concentrations; the highest water-soluble mass concentrations (reported here with
respective mass fraction of sulfate) in the BL occurred downwind of the W.A. Parish
Power Plant (8.9+3.7 μg/m3; SO42- = 76+6%), followed by the urban core of Houston
(7.7+3.4 μg/m3; SO42- = 69+10%), the Beaumont-Port Arthur area (7.1+4.5 μg/m3; SO4
2-
= 66+12%), the Houston Ship Channel (6.3+3.9 μg/m3; SO42- = 69+8%), and over the
Gulf of Mexico (2.9+1.4 μg/m3; SO42- = 56+10%). The maximum mass concentration

195
during the entire study (25.74 μg/m3; SO42- = 79%) was observed downwind of the Parish
Plant.
The overall water-soluble aerosol charge balance, as shown in Figure 6.2, has a
slope of 0.80, indicating that there were unmeasured cations. The zero y-intercept
indicates the absence of high background levels of anions and cations. Since sulfate and
ammonium were the dominant species in aerosol sampled, the NH4+:SO4
2- molar ratio is a
reliable indicator of the overall aerosol acidity in the region; Figure 6.2 shows that ratios
< 2 usually are associated with a negative charge balance. On average, the NH4+:SO4
2-
molar ratio was 1.77+0.85 during GoMACCS, indicating that ammonia (NH3) was
generally prevalent in the region. The vertical distribution of the charge balance shows
that the most acidic aerosol occurred in clear air and at low altitudes close to SO2 sources;
the NH4+:SO4
2- molar ratio was close to unity downwind of the Parish Plant.
The PILS mass concentrations were reasonably correlated with DMA volume
concentrations for aerosol in different vertical layers of the troposphere (R2 > 0.5) with
the exception of the FT (R2 = 0.19) (Figure 6.3). The highest correlation (R2 = 0.64) was
observed above cloud where the slope (aerosol density) was 1.46 g/cm3 (density of pure
ammonium sulfate = 1.769 g/cm3). The slopes for other regions of the atmosphere in
Figure 6.3 are less than unity. Many of the points exhibiting a higher volume
concentration as compared to mass concentration (indicative of an aerosol density < 1
g/cm3), especially in clear air, are downwind of major VOC sources. These samples may
have contained organic species not detectable by the PILS-IC technique owing to
insufficient water solubility and polarity. The FT data exhibited the lowest slope,
suggesting that much of the mass was organic aerosol not quantifiable by the PILS-IC

196
technique. The greatest mass fraction of organic acids occurred in above-cloud aerosol
particles, as this layer has been shown to be enriched in water-soluble organic acids
(Sorooshian et al., submitted). A significant fraction of the organic acids above cloud
may have been produced by in-cloud oxidation of less-polar below-cloud species not able
to be detected by the PILS-IC technique.
The vertical mass distribution of the major inorganic species and total organic
acids is shown in Figure 6.4. The total mass concentration usually peaked near 1 km, and
was lowest (< 5 μg/m3) above 3 km, an approximate altitude indicating the division
between the BL and the FT. For all of the five air categories shown in Figure 6.4, the
total mass was dominated by sulfate (55 - 68%), followed by ammonium (16 - 22%), and
then nitrate (5 - 12%). The mass fraction of organic acids increased with altitude from
below cloud (2%) to above cloud (7%), while an intermediate mass fraction was observed
in cloud droplet residual particles (6%). The total organic acid mass did not decrease
above cloud. Sulfate was highly correlated with ammonium (R2 = 0.84), followed by
oxalate (R2 = 0.33), which dominated the total organic acid mass. Cloud chemistry is
likely the explanation for the observed correlation between sulfate and oxalic acid
(Sorooshian et al., 2006a; Sorooshian et al., submitted). Although sulfate and oxalic acid
are known to be produced by in-cloud oxidation of their gaseous precursors, sulfate
typically decreased from below to above cloud while the sum of all organic acids, which
was dominated by oxalic acid, exhibited the opposite behavior. This can be explained by
the high background levels of sulfate at lower altitudes from local SO2 sources. Although
there were local VOC sources as well, more lengthy chemistry, and consequently more

197
time, is required to form oxalic acid from its parent gas-phase precursors as compared to
sulfate production from SO2.
The mass fractions of the other inorganic species measured (Na+, K+, Ca2+, Mg2+,
Cl-, NO2-, NO3
-) were highest in the FT (cumulative = 13%), presumably from long-range
transport, and then above cloud (cumulative = 3%). Sodium and chloride are best
correlated with each other (R2 = 0.45), likely owing to sea salt from the Gulf of Mexico.
Nitrate shows poor correlation (R2 < 0.1) with all other species except diethylamine (R2 =
0.53), suggesting the presence of diethylamine nitrate in the atmosphere. Previous
studies provide experimental and theoretical evidence for diethylamine nitrate being
present in atmospheric aerosol (Angelino et al., 2001; Murphy et al., 2007).
Diethylamine reached levels as high as 0.08 μg/m3 (n = 4; Figure 6.5). When nitrite was
measured (n = 4), it was best-correlated with calcium (R2 = 0.85); this suggests that
nitrite was formed heterogeneously on the surface of calcium-containing particles in
these samples. The heterogeneous uptake and reactions of nitrogen oxides on the surface
of calcium-containing particles have been well-characterized (Grassian, 2001).
Two flights over the Gulf of Mexico addressed cloud-processed and clear air
aerosol. When comparing measurements at the same altitude range below 1100 m on
these two days, the clear day was characterized by an average concentration of 0.05
μg/m3 and 0.02 μg/m3 for organic acids and oxalate, respectively, while the cloudy day
yielded respective averages of 0.11 μg/m3 and 0.09 μg/m3. Cloud processing is
hypothesized to have led to higher organic acid levels, especially oxalic acid, on the
cloudy day. It is uncertain though the extent to which other conditions differed between
the two days, such as VOC and oxidant levels. Methanesulfonate (MSA) was measured

198
during these two Gulf flights, exhibiting its highest organic acid mass fractions below
cloud (5%) and in the FT (11%), as compared to other data categories in Figure 6.6.
6.5 Sources and Character of Organic Acids As an average over 22 flights, the total concentration of the nine dicarboxylic
acids measured (C2 - C9; includes saturated and unsaturated acids) was larger than those
of seven monocarboxylic acids (C1 - C7; includes saturated and unsaturated acids)
(0.09+0.10 μg/m3 vs. 0.03+0.05 μg/m3). Secondary organic carbon (SOC) measurements
(difference between total OC and primary OC, averaged over two years) at urban sites in
southeastern Texas during the 2000 - 2001 GC-ARCH study ranged from 0.65+1.11 to
1.15+1.52 μg C/m3 (Table 6.1) (Russell and Allen, 2004); the total organic acids
measured in GoMACCS account for an estimated 5 - 10% of the SOC reported in this
prior study.
6.5.1 Saturated Dicarboxylic Acids Oxalate was the most abundant organic acid anion measured in GoMACCS. It
exhibited higher organic acid mass fractions below (0.08+0.10 μg/m3; 68%), inside
(0.09+0.07 μg/m3; 80%), and above clouds (0.11+0.11 μg/m3; 85%), as compared to in
clear air (0.09+0.09 μg/m3; 64%) and the FT (0.03+0.05 μg/m3; 52%) (Figures 6.5, 6.6).
These values tend to be less than those measured in other polluted urban atmospheres (as
shown in Table 6.1, the measurements, the majority of which are from ground sites, are
reported for different particle size ranges); oxalic acid exhibited a mean concentration of
1.14 μg/m3 in Sao Paulo, Brazil (Souza et al., 1999), 0.27 μg/m3 (Kawamura and

199
Ikushima, 1993) and 1.35 μg/m3 (Sempere and Kawamura, 1994) in Tokyo, 0.22 μg/m3
in Beijing (Huang et al., 2005), 0.21 μg/m3 (Grosjean, 1988) and 0.06 - 0.36 μg/m3
(semiurban site; Khwaja, 1995) in New York, 0.49 μg/m3 in Los Angeles (Kawamura et
al., 1985), 0.35 - 0.37 μg/m3 in Hong Kong during the winter (0.09 - 0.17 μg/m3 during
summer) (Yao et al., 2004), 0.23 μg/m3 in Leipzig, Germany (Rohrl and Lammel, 2001),
and 0.34 μg/m3 in Vienna, Austria (Limbeck and Puxbaum, 1999).
In cloud droplets, oxalic acid is formed by oxidation of glyoxylic acid, the
precursors of which include glyoxal, methylglyoxal, glycolic acid, pyruvic acid, and
acetic acid (Warneck, 2003; Ervens et al., 2004; Lim et al., 2005; Carlton et al., 2006).
Elevated organic acid layers above clouds, dominated by oxalic acid, can be explained, in
part, by two likely mechanisms: evaporation of droplets near cloudtops, leaving residual
particles that have newly formed oxalic acid, and entrainment from the FT above BL
clouds (Sorooshian et al., submitted). Oxalate is the most abundant organic acid in the
FT, as it is a product of the oxidation of higher carbon number organic acids. For
example, malonic acid is oxidized to form oxalic acid via intermediates such as
hydroxymalonic acid or ketomalonic acid (Kawamura and Ikushima, 1993; Kawamura et
al., 1996a; Kawamura and Sakaguchi, 1999). Mainly because of the double bond,
unsaturated dicarboxylic acids are oxidized to produce oxalic acid (Kawamura and
Ikushima, 1993).
The organic acid mass fractions of malonate (C3), succinate (C4), glutarate (C5),
and adipate (C6) were greater in the FT (3.4%, 2.2%, 2.7%, and 1.6%, respectively), as
compared to below in the BL (Figure 6.6). Malonic acid is thought to be formed by
oxidative decay of larger acids like succinic acid (Kawamura and Ikushima, 1993;

200
Kawamura and Sakaguchi, 1999). (Measurements, however, made in the Helsinki
metropolitan area are not consistent with major malonic acid production from succinic
acid (Kerminen et al., 2000).) A source of C4-C6 dicarboxylic acids is the ozonolysis of
cyclic alkenes, such as cyclohexene, which are emitted by vehicles and have been
reported to be present in urban atmospheres (Grosjean et al., 1978; Grosjean and Fung,
1984; Hatakeyama et al., 1985, 1987).
Kawamura and Ikushima (1993) suggested that the C3:C4 ratio can be used as an
indicator of enhanced photochemical production of dicarboxylic acids; they showed that
malonate is less abundant than succinate in automobile exhaust, yet more abundant in
Tokyo aerosol, presumably owing to secondary atmospheric production. In the present
study, the C3:C4 ratio increased with increasing altitude up to 4 km (average C3:C4 up to
500 m = 0.05; C3:C4 > 1 from 500 - 4000 m), above which no malonate was detected. At
a ground sampling site in Los Angeles in 1984, an average C3:C4 ratio of 0.35 was
reported for direct primary emissions from vehicular exhaust (Kawamura and Kaplan,
1987), while ratios > 1 were reported for atmospheric aerosol in other studies (Kawamura
and Ikushima, 1993; Kawamura et al., 1996b; Kawamura and Sakaguchi, 1999; Yao et
al., 2002; Huang et al., 2005); these values are consistent with the measurements in the
present study. Because of oxidative decay, the Cn and Cn+1 dicarboxylic acid pairs were
usually well-correlated [oxalate:malonate (R2 = 0.72); succinate:glutarate (R2 = 0.47);
glutarate:adipate (R2 = 0.67)].
The fraction of organic acid mass contributed by suberate peaked below cloud
(1.3%), with a clear air value of 0.7%. Azelate was detected only in one clear air sample
at ~ 600 m (~ 0.01 μg/m3). Azelaic acid is known to be an oxidation product from

201
biogenic unsaturated fatty acids, mainly those containing a double bond at the C-9
position (Yokouchi and Ambe; 1986; Kawamura and Gagosian, 1987; Kawamura and
Kaplan, 1987; Narukawa et al., 1999). C8 and C9 dicarboxylic acids decreased in
concentration rapidly with increasing altitude, presumably because the aged aerosol has
undergone oxidative decay of these and other longer-chain acids.
6.5.2 Unsaturated and Hydroxylated Dicarboxylic Acids Photooxidation of aromatic hydrocarbons is known to lead to ring-cleavage
reactions and produce C2 - C5 dicarbonyls that are subsequently oxidized to form
dicarboxylic acids (Kawamura and Ikushima, 1993; Calvert et al., 2002). Maleic acid, an
unsaturated dicarboxylic acid, is produced by photooxidation of benzene (Kawamura and
Ikushima, 1993; Kawamura et al., 1996a) and is emitted from diesel and gasoline engines
(Rogge et al., 1993). The organic acid mass fraction of maleate was highest in the FT
(3.2%) (Figure 6.6). It was correlated most closely with benzoate (R2 = 1, n = 3),
followed by glutarate (R2 = 0.52), formate (R2 = 0.39), succinate (R2 = 0.16), and acetate
(R2 = 0.15). Maleic and succinic acids exhibit similar vertical distributions; the most
direct link between these two species is formation of succinic acid by hydrogenation of
maleic acid, although there is no clear evidence from the present data to support this
mechanism. Benzoic acid, like maleic acid, is also produced by the oxidation of aromatic
hydrocarbons, specifically toluene (Forstner et al., 1997; Jang and Kamens, 2001).
Maleic acid is expected to be further oxidized to produce malonic and oxalic acids, or
transformed to fumaric acid, an isomer of maleic acid (Kawamura et al., 2005).

202
Kawamura and Ikushima (1993) reported that the cis-configuration (maleic acid) is
generally more abundant than the trans-configuration (fumaric acid).
Malic acid, whose anion (malate) was detected in only four samples, is a
hydroxylated dicarboxylic acid that can be formed by hydration of maleic acid and
hydroxylation of succinic acid (Kawamura and Ikushima, 1993; Kawamura and
Sakaguchi, 1999; Kawamura et al., 2005). Evidence for the hydroxylation reaction is
based on detection of C5 and C6 hydroxyacids (Appel et al., 1979). It has been proposed
that the oxidation of succinic acid can form malonic acid with malic acid acting as an
intermediate (Kawamura and Ikushima, 1993). Succinate was not measured in the same
samples as malic acid, but it was twice measured in samples collected immediately after a
sample containing malate. Malate and maleate were measured together in one sample.
Malate was best-correlated with acetate (R2 = 0.89) and oxalate (R2 = 0.77); oxalic and
malonic acids are known oxidation products of malic acid (Kawamura and Ikushima,
1993), but it is uncertain as to whether acetic acid is also an oxidative product. Malate
exhibited low concentrations (maximum of 0.02 μg/m3) and was detected only below 2
km.
6.5.3 Saturated Monocarboxylic Acids
After oxalate, the next most abundant particulate organic acid measured in
GoMACCS was acetate, with formate and several other acids with similar concentrations
following. Acetate was measured more frequently than formate; acetic acid has a higher
Henry’s Law coefficient and a lower vapor pressure as compared to formic acid, which
allows it to partition more easily into the aerosol phase (Saxena and Hildemann, 1996).

203
The organic acid mass fraction of acetate peaked in the FT (20+28%) (Figure 6.6).
Acetate and formate were the most abundant organic acids in droplet residual particles
after oxalate, contributing 13% and 3% to the total organic acid mass, respectively. This
suggests that acetate and formate are active components in droplet chemistry; acetic acid
is further oxidized in the aqueous phase to yield oxalic (with glyoxylic acid as an
intermediate) and formic acids (Lim et al., 2005; Carlton et al., 2006). Some of the
highest acetate concentrations (maximum of 0.6 μg/m3) occurred in the Houston Ship
Channel area. As will be discussed later, the oxidation of aromatic VOCs leads
preferentially to acetate and formate, as compared to other organic acids studied.
Pyruvic acid, the main oxidation product of methylglyoxal, has been shown to
originate from biogenic sources such as isoprene (Talbot et al. 1995); it is also a
precursor to oxalic acid in the aqueous phase (Lim et al., 2005; Carlton et al., 2006).
Pyruvate was detected only in clear air and below cloud, suggesting that it is rapidly
oxidized in the condensed phase to form products of higher polarity such as acetic and
oxalic acids (Lim et al., 2005; Carlton et al., 2006). Pyruvate has been reported in other
urban areas (Table 6.1); pyruvic acid concentrations ranged between 0.06 - 1.15 μg/m3 in
Sao Paulo (Souza et al., 1999), between 0.04 - 0.10 μg/m3 in Schenectady, New York
(Khwaja, 1995), and exhibited an average of 0.03 μg/m3 in Beijing (Huang et al., 2005)
and 0.06 μg/m3 in Vienna (Limbeck and Puxbaum, 1999). In the present study, pyruvate
is most closely correlated with benzoate (R2 = 0.42) and methacrylate (R2 = 0.26). Souza
et al. (1999) showed that oxalic and pyruvic acids were well-correlated (R2 = 0.67) in Sao
Paulo. As will be discussed, pyruvate is a product in the photooxidation of aromatic
VOCs, similar to benzoate, acetate, and oxalate.

204
The fraction of organic acid mass contributed by glyoxylate was a maximum in
droplet residual samples (1.1%), because it is likely an immediate precursor to oxalic acid
in the aqueous phase (Sorooshian et al., 2006a). As evidenced by its vertical distribution,
glyoxylate was usually detected at altitudes corresponding to those where clouds were
present. Glyoxylic acid is produced by the oxidation of glyoxal and glycolic acid
(Kawamura et al., 1996a; Ervens et al., 2004). Glyoxylate exhibited its strongest
correlation with formate (R2 = 0.91), followed by benzoate (R2 = 0.58). As will be
discussed, glyoxylate is an oxidative product, similar to formic and benzoic acids, from
the photooxidation of aromatic VOCs.
6.5.4 Unsaturated Monocarboxylic Acids
Methacrylic acid is a second-generation gas-phase oxidation product of isoprene,
formed from methacrolein (C4H6O) oxidation (Claeys et al., 2004). The methacrolein
Henry’s Law constant, 6.5 M/atm, is too low for it to participate directly in SOA
formation (Iraci et al., 1999; Gelencser and Varga, 2005). Methacrylic acid has a
Henry’s Law constant of 2 x 10³ M/atm; this value is such that it is a possible precursor
for other organic acids in the aqueous phase (Meylan and Howard, 1991; Gelencser and
Varga, 2005). (Assuming a pH range of 2–5 for cloud droplets, the effective Henry’s
Law constant, KH,eff = KH *(1 + Ka/[H+]), is calculated to be between 2 x 10³ M/atm and
6.4 x 10³ M/atm.) An IC peak corresponding to that at which methacrylate normally
elutes was detected in both clear air and cloud droplet residual samples. Tests were done
to see if another anion, 2-methylglycerate, elutes at the same time as methacrylate;
methacrylic acid is thought to form 2-methylglyceric acid (C3H7O2COOH; also called

205
2,3-dihydroxy-2-methylpropanoic acid) via oxidation (Claeys et al., 2004). After
synthesizing standards for 2-methylglyceric acid and analyzing them by IC, no
conclusive evidence was found that 2-methylglycerate co-elutes with methacrylate. In
addition, field samples were too dilute to give any signal by LC/ESI-MS (liquid
chromatography/electrospray ionization-mass spectrometry) in the negative ion mode for
methacrylic and 2-methylglyceric acids. It is also unclear as to whether methacrylic acid
was formed in the droplet growth chamber of the PILS as a decomposition product of
larger species such as polymers. This species, measured to be < 0.04 μg/m3, will be
termed methacrylate henceforth; it was best-correlated with pyruvate (R2 = 0.26) and
glyoxylate (R2 = 0.15), two other species active in the aqueous-phase chemistry of
isoprene oxidation products (Lim et al., 2005; Carlton et al., 2006). Methacrylate will be
discussed in more detail subsequently.
Benzoate was measured most frequently in clear air and in the vicinity of the
Houston Ship Channel and urban core area. Benzoate was detected only below 1 km,
suggesting that it is likely oxidized rapidly. Aromatic hydrocarbons are emitted by
numerous point sources in the Houston area, with a high density of sources in the Ship
Channel area (http://www.esrl.noaa.gov/csd/2006/fieldops/emission.html). Toluene
constitutes one of these species emitted, and its gas-phase oxidation leads to benzoic acid
as a product (Forstner et al., 1997; Jang and Kamens, 2001; Hamilton et al., 2005). Jang
and Kamens (2001) showed that in the presence of NOx and 1-propene, 7-12% of the
toluene-OH radical reaction yields benzaldehyde after H-abstraction from the methyl
group. Based on data from five different studies, Calvert et al. [2002] suggested an
average yield of 6+1% for the same reaction pathway. After subsequent oxidation of
206
benzaldehyde, benzoic acid is produced from the benzoylperoxy radical - HO2 reaction.
It should be noted, however, that Kleindienst et al. (2004) did not detect particulate
benzoic acid in toluene photooxidations and attributed its detection in the previous
studies of Forstner et al. (1997) and Jang and Kamens (2001) to be a result of high initial
concentrations of aromatic and NOx gases, which lead to significant levels of ring-
retaining products. When detected during GoMACCS, benzoate was well-correlated with
glutarate and succinate (R2 = 0.98 and 0.63, respectively), which represent ring-opening
products from the oxidation of C5-C7 cycloalkenes (Hatakeyama et al., 1985; Kalberer et
al., 2000). Benzoate was highly correlated with maleate (R2 = 1, n = 3), glyoxylate (R2 =
0.58), and pyruvate (R2 = 0.42), all of which will be shown later to be products from the
photooxidation of aromatic VOCs.
6.6 Role of Organic Acids in Cloud Droplet Chemistry
6.6.1 Oxalic Acid as a Reaction Product in Clouds
The below-cloud organic acid product distribution was dominated by oxalate
(69%), followed by acetate (10%), formate (9%), and MSA (6%) (Figure 6.6). In cloud
droplet residual particles, the distribution of organic acids changed as a result of cloud-
phase reactions forming oxalic acid through its main intermediate, glyoxylic acid
(Sorooshian et al., 2006a; Sorooshian et al., submitted). Glyoxylate, which contributed
an average of 0.2% to the organic acid mass below cloud, accounted for 1.1% in droplet
residual particles. Oxalic acid can also be produced by malonic acid oxidation (Ervens et
al., 2004; Sorooshian et al., 2006a), and malonate contributed 1.7% to the organic acid
mass in droplet residual particles, as compared to a 0.3% contribution to below-cloud

207
aerosol. The source of malonic acid was most likely the decarboxylation of larger
dicarboxylic acids such as succinic acid (Ervens et al., 2004). Acetic acid is an aqueous-
phase precursor to glyoxylic acid (Lim et al., 2005; Carlton et al., 2006), and it
contributed 12.6% to the organic acid mass in droplet residual particles as opposed to
9.9% in below-cloud aerosol. The oxalate contribution to the organic acid mass
increased to 77% in cloud droplet residual particles as a result of aqueous-phase reactions
(Ervens et al., 2004; Sorooshian et al., 2006a). As the droplets above cloud evaporated,
the organic acid product distribution was shifted even more towards oxalic acid, as it
contributed 87% to the organic acid mass, while acetate, glyoxylate, and malonate
decreased to 7%, 1%, and 0.7%, respectively.
Droplet residual particle composition was studied as a function of altitude in
cloud. With increasing altitude in cloud, the cumulative average of the
oxalate:glyoxylate ratio in all clouds studied decreased and then increased (just above
base = 78; mid-level = 19; just below top = 232); this behavior suggests that glyoxylic
acid is produced most rapidly in the bottom half of clouds, while oxalic acid is produced
most efficiently in the top half of the clouds by glyoxylic acid oxidation. An average is
reported here since glyoxylate did not achieve sufficiently high concentrations at multiple
heights in more than a couple individual cloud fields. In-cloud data from all samples
containing both oxalate and glyoxylate from different flights are shown together in Figure
6.7 as a function of normalized height in cloud (height above cloud base/cloud thickness).
The oxalate:glyoxylate ratio decreases from the lower portions of clouds to the mid-point,
at which point the ratio increases with increasing altitude.

208
Ambient measurements of the oxalate:glyoxylate ratio are compared to
predictions of a state-of-the-art microphysical/chemical cloud parcel model [Ervens et al.,
2004] that simulates the activation of a population of aerosol particles. The model
simulates cloud cycles that are intended to represent the trajectory of a typical air parcel
in a cloudy atmosphere, including gas and aqueous-phase chemical reactions. The parcel
follows a prescribed trajectory that encounters a cloud for a fixed period of time (~ 850 s
each cycle). During a cloud cycle, a parcel ascends from the base of a cloud to its top
and then descends back down. Four gas-phase VOC precursors of dicarboxylic acids are
included in the model chemistry; toluene and ethene represent anthropogenic emissions,
isoprene represents biogenic emissions, and cyclohexene serves as a model compound for
symmetrical alkenes similar to monoterpenes emitted by biogenic sources. Oxidation
products of these species in the gas phase (glyoxal, glyoxylic acid, glycolic acid,
hydroxyacetaldehyde, methylglyoxal, pyruvic acid, acetic acid, adipic acid, and glutaric
acid) can transfer to the aqueous phase to undergo reactions to form lower-volatility
products. The same initial conditions used by Sorooshian et al. (2006a) are used to
simulate two conditions: clouds uninfluenced by local pollution sources (“clean” initial
concentrations: 1755 particles/cm3, 0.5 ppb SO2, 40 ppb O3, 1 ppb H2O2, 0.04 - 0.06 ppb
each for isoprene, toluene, cyclohexene, ethene) and clouds immediately impacted by
pollution sources (“polluted” initial concentrations: 4890 particles/cm3, 69.5 ppb SO2, 40
ppb O3, 1 ppb H2O2, 0.04 - 0.11 ppb each for isoprene, toluene, cyclohexene, ethene).
In order to evaluate the comparison between the predicted and observed
oxalate:glyoxylate ratio, it is necessary to compare cloud-contact times in the model and
in the Houston cumulus clouds studied. Ervens et al. (2004) used trajectories derived

209
from modeling of stratocumulus clouds and showed mean contact times with cloud on the
order of ~ 850 s (14 min). For the current study we use model trajectories for shallow
cumulus clouds based on model simulations of GoMACCS cases as well as simple
calculations based on updraft velocities and cloud depth. The stratocumulus clouds in the
previous work were shallower (< 200 m) as compared to GoMACCS clouds (average
depth ~ 1100 m), but the more convective clouds in GoMACCS exhibited higher updraft
velocities (1.2+1.3 m/s). Using the average GoMACCS cloud depth and updraft velocity
measured, an estimate of the cloud-contact time for one cloud cycle is ~ 900 s (15 min).
There are obvious uncertainties in this estimate such as the assumption of no variability
in cloud depth or updraft velocity during the time the aircraft was probing a single cloud
field. Model simulations of air parcel trajectories in cumulus clouds in the Houston area
show that among 500 parcels initialized in the BL, approximately 30% spent more than 6
min in cloud, and some parcels spent up to 21 min in cloud. Since the oxalate:glyoxylate
data are reported from some of the largest clouds studied, it is likely that many of the
parcels were in contact with these large clouds for times in the order of 10 - 20 min.
Therefore, the predicted trend of the ratio of oxalate:glyoxylate as a function of in-cloud
time should provide a meaningful comparison to GoMACCS measurements.
The general trend predicted for a typical cloud cycle is that the ratio of
oxalate:glyoxylate decreases and then increases with increasing cloud-contact time
(Figure 6.7). The trend and absolute values of the oxalate:glyoxylate ratio predicted were
similar for the “clean” and “polluted” simulations. The range of values predicted agree
with ambient GoMACCS measurements; thus, the residence times of parcels in
GoMACCS clouds are consistent with that needed for the observed chemical changes in

210
the oxalate:glyoxylate ratio in cloud. The multi-step nature of oxalic acid production
leads to more efficient production in the upper portions of clouds; in addition, the upper
portions of clouds usually exhibit higher liquid water content (LWC) values, which
increases droplet pH, a condition favorable for oxalic acid production from glyoxylate
oxidation (Sorooshian et al., submitted).
It should also be noted that some of the highest oxalate levels were observed
during spirals performed in clear air with clouds nearby. For instance, after profiling a
single growing cumulus cloud, the aircraft performed a spiral descent from 3400 m to
700 m between the profiled cloud and other deep cumuli. Three total PILS samples were
collected, where each sample represents aerosol over a third of the height range during
the descent; the oxalate concentration increased with increasing altitude (0.23, 0.34, 0.41
μg/m3). This suggests that significant amounts of cloud-processed aerosol containing
organic acids might exist outside the edges of these deep cumuli. Sources of cloud-
processed aerosol around the edges of cumulus clouds include detrainment out of the
sides of clouds and transport from the cloudtop region by downdrafts.
6.6.2 High Nitrate Episodes: Methacrylic Acid in Cloud Droplets and Suppressed
Organic Acid Formation
During two flights, the TO probed cloud fields above agricultural areas west of
Houston where elevated levels of particulate nitrate (> 0.6 μg/m3; up to 40% of total
PILS mass) were observed. The TO also probed cloud fields within this same vicinity
during three other flights when there were lower nitrate levels. During the five flights,
the TO flew within the same altitude range (1000 - 3000 m). The below-cloud aerosol

211
during high-nitrate flights exhibited higher NH4+:SO4
2- molar ratios (usually > 2) as
opposed to low-nitrate flights, indicating that there was enough NH3 to neutralize the
SO42-, thereby allowing NO3
- to form in the particle phase from gaseous nitric acid
(HNO3) condensation with available NH3.
During the flight with the largest average nitrate levels, the frequency of detection
of methacrylate was relatively high compared to other flights, and was the only flight in
which methacrylate was detected in droplet residual particle samples. Glyoxylic acid was
also measured in the droplet residual samples. These data are consistent with the
multiphase mechanism proposed by Claeys et al. (2004); they observed that the ambient
concentrations of 2-methyltetrols and 2-3 dihydroxymethacrylic acid, the latter of which
is proposed to have methacrylic acid as an intermediate, were enhanced under high-NOx
conditions and that they could be formed by acid-catalyzed oxidation with hydrogen
peroxide. Owing to the high particulate nitrate levels, both in and out of cloud, it is
thought that high-NOx conditions existed and that the droplets were relatively acidic since
the cloud LWC values were lower this flight compared to other flights. Methacrolein
could have produced methacrylate in these acidic droplets, which could have been further
oxidized to form 2-methylglyceric acid.
Unlike the majority of the other cloud fields sampled during GoMACCS, the
cloud fields experienced during the high-nitrate flights exhibited lower organic acid
levels above cloud as compared to below (Sorooshian et al., submitted). In the presence
of high HNO3 levels and relatively lower LWC values, the droplets are more acidic
(larger droplets would be more dilute), presumably suppressing organic acid formation.
For example, the net production rate of oxalic acid in acidic droplets is suppressed

212
because the rate constant of glyoxylic acid oxidation is an order of magnitude lower than
that of glyoxylate (Ervens et al., 2003; Sorooshian et al., 2006a).
6.7 Organic Acids Downwind of the Houston Ship Channel
One flight (Flight 7; 28 August 2006) was devoted to studying the evolution of
three different plumes from sources on the Houston Ship Channel (Figure 6.8), an area
emitting a significant amount of VOCs, including aromatic hydrocarbons
(http://www.esrl.noaa.gov/csd/2006/fieldops/emission.html). Several crosswind transects
were made to identify the largest plumes and then the plane flew 10 - 15 min legs at ~
500 m going downwind inside three separate plumes. The fine particle number
concentration was strongest at the source of plume B (37,000 cm-3), followed by plume A
(14,000 cm-3), and then plume C (8000 cm-3). At a plume age of 1.5 h (plume ages
calculated with distance from source and wind speed), plumes A and B were diluted to
approximately 8000 cm-3, while plume C decreased to 1000 cm-3. On the other hand, the
PCASP (0.1 - 2.5 μm) number concentrations grew with plume age in plumes A, B, and
C, reaching more than 20,000 cm-3 at plume ages of 1.5 h; the majority of the particles in
these plumes exceeded 1 μm in diameter.
The mass fractions of sulfate and ammonium together exceeded 80% in all three
plumes from the source to a corresponding plume age of 1.5 h. On average, the mass
fraction of organic acids was greatest in plume A (2.7%), followed by plumes B (1%) and
C (0.5%). Plume C exhibited the lowest volume (2 - 2.5 μm3/cm3) and PILS mass (2.5 -
3.5 μg/m3) concentrations both at the source and downwind up to 40 km, with little
variation in the aerosol composition. Plumes A and B showed an increase in aerosol

213
volume (~ 3 to 4 μm3/cm3) and mass concentration (~ 4 to 6 μg/m3) from the source to a
plume age of 1.5 h. Sulfate continuously increased with downwind distance in both
plume A and B. Between a plume age of 0.5 to 1.5 h, the total organic acid concentration
in plume A was stable at approximately 0.09 μg/m3, unlike plume B, where it grew from
0.03 to 0.12 μg/m3. Of the total organic acid mass, acetate and formate collectively
accounted for ~ 5% and oxalate contributed ~ 55% upwind of the three plumes, while
downwind, acetate and formate accounted for 29 - 77% and oxalate contributed 6 - 56%.
During the early stages of the plumes (< 0.5 h), the organic acid mass fraction of
benzoate reached up to 9% and 25% in plumes A and B, respectively. It is likely that the
SOA formed by gas-to-particle conversion from aromatic emissions initially contained
species such as benzoic acid, that were subsequently oxidized to form lower molecular
weight organic acids (that were less volatile and more polar), dominated by acetic and
formic acids and followed by oxalic acid. Plume C was composed entirely of acetate
among all of the organic acids. An average of all clear air Ship Channel samples during
the campaign show that the most abundant organic acids in decreasing order of their
organic acid mass fractions are as follows: oxalate (37%), acetate (36%), formate (9%),
benzoate (9%), and pyruvate (4%); these results differ from other areas sampled because
benzoate was actually detected, and oxalate contributed the least to the organic acid mass
in this area, while acetate, formate, and pyruvate contributed relatively more.

214
6.8 Evaluation of Ambient Data Relative to Laboratory Chamber Experiments of m-
xylene Photooxidation
The GoMACCS observations prompt the question of the extent to which
particulate products measured in the Houston atmosphere match those of aromatic
oxidation in a laboratory chamber. Laboratory tests in the dual 28 m3 Teflon chambers at
Caltech were performed to study the organic acid product distribution from the
photooxidation of a model aromatic hydrocarbon, m-xylene. A detailed description of
these experiments and SOA yield are addressed elsewhere (Ng et al., 2007), but selected
results are briefly discussed here in relation to the field measurements. The chambers are
surrounded by banks of black lights that are turned on after the injection of seed aerosol
and gas-phase reactants to initiate photooxidation. Seed aerosol, produced by atomizing
a solution of ammonium sulfate, was first introduced into the chambers in these
experiments. Sulfuric acid was added to the atomizing solution when studying the effects
of acidic seed aerosol. For nucleation experiments, no seed was added. Nitrous acid
(HONO) was introduced as a source of OH and NOx for a series of high-NOx tests; extra
NO was added to ensure a NOx level near ~ 1 ppm. For the low-NOx experiments, H2O2
served as the OH source. The range of initial VOC:NOx ratios during the experiments,
0.3 – 2500 (Table 6.3), encompasses values expected in the Houston atmosphere.
For the experiments conducted with m-xylene and the different NOx and seed
conditions, the SOA mass fraction of organic acids was between 17% and 41% (Table
6.3); SOA mass was determined by multiplying the DMA volume concentration by a
calculated SOA density (as determined by comparing DMA size distribution to the AMS
size distribution; error = + 0.10 g/cm3). Higher organic acid mass fractions were

215
exhibited during the low-NOx experiments (35 - 41%), as compared to high-NOx
conditions (17 - 26%); however, the high-NOx organic acid mass fractions are likely an
underestimate due to observed nitrate contamination in the laboratory chambers (5 - 10
μg/m3), which increased the volume concentration. The organic acid product distribution
was similar for all the experiments; acetate (22 - 45%) and formate (28 - 37%) were the
dominant products, followed by pyruvate (15 - 28%), oxalate (5 - 8%), and a set of other
acids (malonate, succinate, glutarate, glyoxylate, and maleate were each < 4%). As stated
earlier, acetate, lactate, and glycolate co-elute, so it is likely that the contribution of
acetate reported is an overestimate, while glycolate and lactate could have been products.
Figure 6.9 shows the time evolution of all organic acids during one
photooxidation experiment (75 ppb m-xylene/low NOX/non-acidic ammonium sulfate
seed aerosol). The first organic acid products formed are acetate/glycolate/lactate,
formate, pyruvate, and oxalate, in decreasing level of concentration. Less abundant
products included malonate, succinate, glutarate, maleate, and glyoxylate. All species
stabilize in concentration within approximately four hours with the exception of oxalate,
malonate, succinate, and glutarate, which continue to grow until the end of the
experiment. For the first two hours of irradiation, the oxalate:malonate mass ratio
increases from 2 to 4, and then decreases steadily to 1.7 by the end of the experiment (9 h
of irradiation). The malonate:succinate and succinate:glutarate ratios do not show such a
trend over the duration of the experiment. One possibility is that the in the first two
hours, malonic acid was more efficiently being photooxidized to form oxalic acid, and
then in the final hours, malonate was being formed more efficiently. It has been
suggested that some of the dicarboxylic acids from the photooxidation of aromatic VOCs

216
could be dimers of monocarboxylic acids (Fisseha et al., 2004), which is consistent with
the first step of polymerization as reported by Kalberer et al. (2004). This could explain
why oxalate, malonate, succinate, and glutarate were still increasing in concentration
until the end of the experiment. Pyruvic acid, which exhibited most of its growth in the
first two hours after lights were turned on, may be a compound involved in
polymerization processes (Kalberer et al., 2004).
Fisseha et al. (2004) also reported higher particulate concentrations of
monocarboxylic acids as compared to dicarboxylic acids in their study of the
photooxidation of 1,3,5 trimethylbenzene in the presence of 300 ppb propene and 300
ppb NOx; they reported that organic acids accounted for 20 - 45% of the aerosol mass
formed, similar to results in this study. However, it should be noted that the aerosol
sampling techniques used both in this study and that of Fisseha et al. (2004) rely on steam
condensation, which may break down polymers to their monomers resulting in higher
concentrations of organic acids such as acetic, formic, and pyruvic acids.
These laboratory chamber results are consistent with acetate, formate, and
pyruvate contributing more to the organic acid mass in the Ship Channel area compared
to all other locations during GoMACCS. The higher contribution of oxalate in the Ship
Channel area as compared to the laboratory chamber may be a result of a higher
background level of oxalate in the area.
6.9 Conclusions
Ambient measurements of water-soluble aerosol species were made on board the
CIRPAS Twin Otter during the 2006 GoMACCS field campaign in southeastern Texas.

217
Sulfate and ammonium dominated the water-soluble mass (NH4++SO4
2- = 84+14%). The
average NH4+:SO4
2- molar ratio was 1.77+0.85. The most acidic samples and highest
sulfate loadings occurred downwind of the W. A. Parish Power Plant. The mass fraction
of nitrate was usually less than 10%, but elevated levels were observed west of Houston
during two particular flights (> 0.6 μg/m3; up to 40% of total PILS mass). The cloud
fields in these areas were unique in that the droplet residual particles contained
methacrylate, which is known to be formed under high-NOx conditions by the acid-
catalyzed reaction of isoprene with hydrogen peroxide. Suppressed organic acid
formation was also observed in the high nitrate-containing clouds since they were
suspected of containing relatively acidic droplets.
The average particulate water-soluble mass fraction of organic acids measured
was 3.4+3.7%; concentrations of organic acids increased with decreasing carbon number
from C9 to C2. The organic acid mass fraction of oxalate, the most abundant organic acid
measured, was greatest above cloud as a result of aqueous-phase chemistry in cloud
droplets followed by subsequent droplet evaporation above cloudtops. The observed
distribution of organic acids as a function of altitude in cloud is consistent with the multi-
step nature of liquid-phase oxalic acid production; predictions from a cloud parcel model
agree with measurements that show that the oxalate:glyoxylate ratio decreases and then
increases as a function of altitude in GoMACCS cumuli. Glyoxylate is likely formed
rapidly with increasing altitude in the lower portion of clouds, which then allows it to
efficiently produce oxalic acid in the upper portion.
Oxalate, acetate, formate, benzoate, and pyruvate, in decreasing order, contributed
the most to the organic acid mass in the Houston Ship Channel region, an area with
218
significant VOC emissions. The chemical composition of the aerosol in this region was
different from that in other areas around Houston in that benzoate was detected, oxalate
contributed the least to the organic acid mass, while acetate, formate, and pyruvate
contributed relatively more. In laboratory chamber experiments, the photooxidation of
m-xylene, a model aromatic VOC, leads to a particulate organic acid product distribution
consistent with Ship Channel observations. The chamber SOA mass fraction accounted
for by organic acids ranged from 17-41%, with higher values observed under low-NOx
conditions, as compared to high-NOx conditions. Acetate/glycolate/lactate, formate, and
pyruvate were the dominant products, accounting for 22-45%, 28-37%, and 15-28% of
the total organic acid mass, respectively.
Atmospheric measurements of water-soluble aerosol species, especially organic
acids, provide valuable data to constrain gas- and particle/droplet-phase chemistry.
Organic acids identified in the Houston atmosphere give important clues as to the sources
of the atmospheric organic aerosol in that region and in urban atmospheres in general.
6.10 Acknowledgements
This work was supported by National Oceanic and Atmospheric Administration
grant NA06OAR4310082.
6.11 References
Angelino, S., D. T. Suess, and K. A. Prather (2001), Formation of aerosol particles from reactions of secondary and tertiary alkylamines: Characterization by aerosol time-of-flight mass spectrometry, Environ. Sci. Technol., 35, 3130-3138.

219
Appel, B. R., E. M. Hoffer, E. L. Kothny, S. M. Wall, M. Haik, and R. L. Knights (1979), Analysis of carbonaceous material in Southern-California atmospheric aerosols. 2., Environ. Sci. Technol., 13, 98-104. Blando, J. D., and B. J. Turpin (2000), Secondary organic aerosol formation in cloud and fog droplets: a literature evaluation of plausibility, Atmos. Environ., 34, 1623-1632. Calvert, J. G., R. Atkinson, K. H. Becker, R. M. Kamens, J. H. Seinfeld, T. J. Wallington, and G. Yarwood (2002), The Mechanisms of Atmospheric Oxidation of Aromatic Hydrocarbons, Oxford University Press, New York, N. Y. Carlton, A. G., B. J. Turpin, H. J. Lim, K. E. Altieri, and S. Seitzinger (2006), Link between isoprene and secondary organic aerosol (SOA): Pyruvic acid oxidation yields low volatility organic acids in clouds, Geophys. Res. Lett., 33, L06822, doi:10.1029/2005GL025374. Chebbi, A., and P. Carlier (1996), Carboxylic acids in the troposphere, occurrence, sources, and sinks: A review, Atmos. Environ., 30, 4233-4249. Claeys, M., W. Wang, A. C. Ion, I. Kourtchev, A. Gelencser, and W. Maenhaut (2004), Formation of secondary organic aerosols from isoprene and its gas-phase oxidation products through reaction with hydrogen peroxide, Atmos. Environ., 38, 4093-4098. Crahan, K. K., D. Hegg, D. S. Covert, and H. Jonsson (2004), An exploration of aqueous oxalic acid production in the coastal marine atmosphere, Atmos. Environ., 38, 3757-3764. Ervens, B., S. Gligorovski, and H. Herrmann (2003), Temperature-dependent rate constants for hydroxyl radical reactions with organic compounds in aqueous solutions, Phys. Chem. Chem. Phys., 5, 1811-1824. Ervens, B., G. Feingold, G. J. Frost, and S. M. Kreidenweis (2004), A modeling study of aqueous production of dicarboxylic acids: 1. Chemical pathways and speciated organic mass production, J. Geophys. Res., 109, D15205, doi:10.1029/2003JD004387. Faust, B. C. (1994), Photochemistry of clouds, fogs, and aerosols, Environ. Sci. Technol., 28, A217-A222. Fisseha, R., J. Dommen, M. Sax, D. Paulsen, M. Kalberer, R. Maurer, F. Hofler, E. Weingartner, and U. Baltensperger (2004), Identification of organic aerosol and the acids in secondary corresponding gas phase from chamber experiments, Anal. Chem., 76, 6535-6540. Forstner, H. J. L., R. C. Flagan, and J. H. Seinfeld (1997), Secondary organic aerosol from the photooxidation of aromatic hydrocarbons: Molecular composition, Environ. Sci. Technol., 31, 1345-1358.

220
Gelencser, A., and Z. Varga (2005), Evaluation of the atmospheric significance of multiphase reactions in atmospheric secondary organic aerosol formation, Atmos. Chem. Phys., 5, 2823-2831. Grassian, V. H. (2001), Heterogeneous uptake and reaction of nitrogen oxides and volatile organic compounds on the surface of atmospheric particles including oxides, carbonates, soot and mineral dust: implications for the chemical balance of the troposphere, Int. Rev. Phys. Chem., 20, 467-548. Grosjean, D., K. Vancauwenberghe, J. P. Schmid, P. E. Kelley, and J. N. Pitts (1978), Identification of C3-C10 aliphatic dicarboxylic-acids in airborne particulate matter, Environ. Sci. Technol., 12, 313-317. Grosjean, D., and K. Fung (1984), Hydrocarbons and carbonyls in Los-Angeles air, Japca. J. Air Waste Ma., 34, 537-543. Grosjean, D. (1988), Aldehydes, carboxylic-acids and inorganic nitrate during NSMCS, Atmos. Environ., 22, 1637-1648. Hamilton, J. F., P. J. Webb, A. C. Lewis, and M. M. Reviejo (2005), Quantifying small molecules in secondary organic aerosol formed during the photo-oxidation of toluene with hydroxyl radicals, Atmos. Environ., 39, 7263-7275. Hatakeyama, S., T. Tanonaka, J. H. Weng, H. Bandow, H. Takagi, and H. Akimoto (1985), Ozone cyclohexene reaction in air - quantitative-analysis of particulate products and the reaction-mechanism, Environ. Sci. Technol., 19, 935-942. Hatakeyama, S., M. Ohno, J. H. Weng, H. Takagi, and H. Akimoto (1987), Mechanism for the formation of gaseous and particulate products from ozone-cycloalkene reactions in air, Environ. Sci. Technol., 21, 52-57. Huang, X. F., M. Hu, L. Y. He, and X. Y. Tang (2005), Chemical characterization of water-soluble organic acids in PM2.5 in Beijing, China, Atmos. Environ., 39, 2819-2827. Huang, X. F., J. Z. Yu, L. Y. He, and Z. B. Yuan (2006), Water-soluble organic carbon and oxalate in aerosols at a coastal urban site in China: Size distribution characteristics, sources, and formation mechanisms, J. Geophys. Res., 111, D22212, doi:10.1029/2006JD007408. Huang, X. F., and J. Z. Yu (2007), Is vehicle exhaust a significant primary source of oxalic acid in ambient aerosols?, Geophys. Res. Lett., 34, L02808, doi.10.1029/2006GLO28457. Iraci, L. T., B. M. Baker, G. S. Tyndall, and J. J. Orlando (1999), Measurements of the Henry's law coefficients of 2-methyl-3-buten-2-ol, methacrolein, and methylvinyl ketone, J. Atmos. Chem., 33, 321-330.

221
Jang, M. S., and R. M. Kamens (2001), Characterization of secondary aerosol from the photooxidation of toluene in the presence of NOx and 1-propene, Environ. Sci. Technol., 35, 3626-3639. Kalberer, M., J. Yu, D. R. Cocker, R. C. Flagan, and J. H. Seinfeld (2000), Aerosol formation in the cyclohexene-ozone system, Environ. Sci. Technol., 34, 4894-4901. Kalberer, M., D. Paulsen, M. Sax, M. Steinbacher, J. Dommen, A. S. H. Prevot, R. Fisseha, E. Weingartner, V. Frankevich, R. Zenobi, and U. Baltensperger (2004), Identification of polymers as major components of atmospheric organic aerosols, Science, 303, 1659-1662. Kanakidou, M., J. H. Seinfeld, S. N. Pandis, I. Barnes, F. J. Dentener, M. C. Facchini, R. Van Dingenen, B. Ervens, A. Nenes, C. J. Nielsen, E. Swietlicki, J. P. Putaud, Y. Balkanski, S. Fuzzi, J. Horth, G. K. Moortgat, R. Winterhalter, C. E. L. Myhre, K. Tsigaridis, E. Vignati, E. G. Stephanou, and J. Wilson (2005), Organic aerosol and global climate modelling: a review, Atmos. Chem. Phys., 5, 1053-1123. Kawamura, K., L. L. Ng, and I. R. Kaplan (1985), Determination of organic-acids (C1-C10) in the atmosphere, motor exhausts, and engine oils, Environ. Sci. Technol., 19, 1082-1086. Kawamura, K., and R. B. Gagosian (1987), Implications of omega-oxocarboxylic acids in the remote marine atmosphere for photooxidation of unsaturated fatty-acids, Nature, 325, 330-332. Kawamura, K., and I. R. Kaplan (1987), Motor exhaust emissions as a primary source for dicarboxylic-acids in Los-Angeles ambient air, Environ. Sci. Technol., 21, 105-110. Kawamura, K., and K. Ikushima (1993), Seasonal-changes in the distribution of dicarboxylic-acids in the urban atmosphere, Environ. Sci. Technol., 27, 2227-2235. Kawamura, K., H. Kasukabe, O. Yasui, and L. A. Barrie (1995), Production of dicarboxylic-acids in the Arctic atmosphere at polar sunrise, Geophys. Res. Lett., 22, 1253-1256. Kawamura, K., H. Kasukabe, and L. A. Barrie (1996a), Source and reaction pathways of dicarboxylic acids, ketoacids and dicarbonyls in Arctic aerosols: one year of observations, Atmos. Environ., 30, 1709–1722. Kawamura, K., R. Semere, Y. Imai, Y. Fujii, and M. Hayashi (1996b), Water soluble dicarboxylic acids and related compounds in Antarctic aerosols, J. Geophys. Res., 101(D13), 18721-18728.

222
Kawamura, K., and F. Sakaguchi (1999), Molecular distributions of water soluble dicarboxylic acids in marine aerosols over the Pacific Ocean including tropics, J. Geophys. Res., 104(D3), 3501-3509. Kawamura, K., Y. Imai, and L. A. Barrie (2005), Photochemical production and loss of organic acids in high Arctic aerosols during long-range transport and polar sunrise ozone depletion events, Atmos. Environ., 39, 599-614. Kerminen, V. M., K. Teinila, R. Hillamo, and T. Makela (1999), Size-segregated chemistry of particulate dicarboxylic acids in the Arctic atmosphere, Atmos. Environ., 33, 2089-2100. Kerminen, V. M., C. Ojanen, T. Pakkanen, R. Hillamo, M. Aurela, and J. Merilainen (2000), Low-molecular-weight dicarboxylic acids in an urban and rural atmosphere, J. Aerosol Sci., 31, 349-362. Khwaja, H. A. (1995), Atmospheric concentrations of carboxylic-acids and related-compounds at a semiurban site, Atmos. Environ., 29, 127-139. Kleindienst, T. E., T. S. Conver, C. D. McIver, and E. O. Edney (2004), Determination of secondary organic aerosol products from the photooxidation of toluene and their implications in ambient PM2.5, J. Atmos. Chem., 47, 79-100. Kondo, Y., Y. Miyazaki, N. Takegawa, T. Miyakawa, R. J. Weber, J. L. Jimenez, Q. Zhang, and D. R. Worsnop (2007), Oxygenated and water-soluble organic aerosols in Tokyo, J. Geophys. Res., 112, D01203, doi:10.1029/2006JD007056. Lim, H. J., A. G. Carlton, and B. J. Turpin (2005), Isoprene forms secondary organic aerosol through cloud processing: Model simulations, Environ. Sci. Technol., 39, 4441-4446. Limbeck, A., and H. Puxbaum (1999), Organic acids in continental background aerosols, Atmos. Environ., 33, 1847-1852. Ludwig J., and O. Klemm (1988), Organic acids in different classes of atmospheric particulate material, Tellus, 4013, 340-347. Meylan, W. M., and P. H. Howard (1991), Bond contribution method for estimating Henry’s law constants, Environ. Toxicol. Chem., 10, 1283–1293. Mochida, M., N. N. Umemoto, K. Kawamura, and M. Uematsu (2003), Bimodal size distribution of C-2-C-4 dicarboxylic acids in the marine aerosols, Geophys. Res. Lett., 30(13), 1672, doi:10.1029/2003GL017451.

223
Murphy, S. M., A. Sorooshian, J. H. Kroll, N. L. Ng, P. Chhabra, C. Tong, J. D. Surratt, E. Knipping, R. C. Flagan, and J. H. Seinfeld (2007), Secondary aerosol formation from atmospheric reactions of aliphatic amines, Atmos. Chem. Phys. Disc., 7, 289–349. Narukawa, M., K. Kawamura, N. Takeuchi, and T. Nakajima (1999), Distribution of dicarboxylic acids and carbon isotopic compositions in aerosols from 1997 Indonesian forest fires, Geophys. Res. Lett., 26, 3101-3104. Neususs, C., M. Pelzing, A. Plewka, and H. Herrmann (2000), A new analytical approach for size-resolved speciation of organic compounds in atmospheric aerosol particles: Methods and first results, J. Geophys. Res., 105(D4), 4513-4527. Ng, N. L., J. H. Kroll, A. W. H. Chan, P. S. Chhabra, R. C. Flagan, and J. H. Seinfeld (2007), Secondary organic aerosol formation from m-xylene, toluene, and benzene, Atmos. Chem. Phys. Disc., 7, 4085–4126. Norton, R. B., J. M. Roberts, and B. J. Huebert (1983), Tropospheric oxalate, Geophys. Res. Lett., 10(7), 517-520. Peltier, R. E., A. P. Sullivan, R. J. Weber, A. G. Wollny, J. S. Holloway, C. A. Brock, J. A. de Gouw, and E. L. Atlas (2007), No evidence for acid-catalyzed secondary organic aerosol formation in power plant plumes over metropolitan Atlanta, Georgia, Geophys. Res. Lett., 34(6), L06801, doi:10.1029/2006GL028780. Pereira, W. E., C. E. Rostad, H. E. Taylor, and J. M. Klein (1982), Characterization of Organic Contaminants in Environmental-Samples Associated with Mount St-Helens 1980 Volcanic-Eruption, Environ. Sci. Technol., 16, 387-396. Rogge, W. F., L. M. Hildemann, M. A. Mazurek, G. R. Cass, and B. R. T. Simoneit (1991), Sources of fine organic aerosol .1. Charbroilers and meat cooking operations, Environ. Sci. Technol., 25, 1112-1125. Rogge, W. F., M. A. Mazurek, L. M. Hildemann, G. R. Cass, and B. R. T. Simoneit (1993), Quantification of urban organic aerosols at a molecular-level - identification, abundance and seasonal-variation, Atmos. Environ., 27, 1309-1330. Rohrl, A., and G. Lammel (2001). Low molecular weight dicarboxylic acids and glyoxylic acid: Seasonal and air mass characteristics. Environ. Sci. Technol., 35, 95-101. Russell, M., and D. T. Allen (2004), Seasonal and spatial trends in primary and secondary organic carbon concentrations in southeast Texas, Atmos. Environ., 38, 3225-3239. Salam, A., H. Bauer, K. Kassin, S. M. Ullah, and H. Puxbaum (2003), Aerosol chemical characteristics of a mega-city in Southeast Asia (Dhaka-Bangladesh), Atmos. Environ., 37, 2517-2528.

224
Satsumabayashi, H., H. Kurita,Y. Yokouchi, and H. Ueda (1989), Mono- and di-carboxylic acids under long-range transport of air pollution in central Japan, Tellus, 41B, 219-229. Saxena, P., and L. M. Hildemann (1996), Water-soluble organics in atmospheric particles: A critical review of the literature and application of thermodynamics to identify candidate compounds, J. Atmos. Chem., 24, 57–109. Sempere, R., and K. Kawamura (1994), Comparative distributions of dicarboxylic-acids and related polar compounds in snow rain and aerosols from urban atmosphere. Atmos. Environ., 28, 449-459. Simoneit, B. R. T., and M. A. Mazurek (1982), Organic-matter of the troposphere .2. Natural background of biogenic lipid matter in aerosols over the rural Western United-States, Atmos. Environ., 16, 2139-2159. Simoneit, B. R. T. (1986), Characterization of organic-constituents in aerosols in relation to their origin and transport - a review, Int. J. Environ. An. Ch., 23, 207-237. Sorooshian, A., V. Varutbangkul, F. J. Brechtel, B. Ervens, G. Feingold, R. Bahreini, S. M. Murphy, J. S. Holloway, E. L. Atlas, G. Buzorius, H. Jonsson, R. C. Flagan, and J. H. Seinfeld (2006a), Oxalic acid in clear and cloudy atmospheres: Analysis of data from International Consortium for Atmospheric Research on Transport and Transformation 2004, J. Geophys. Res. 111, D23S45, doi:10.1029/2005JD006880. Sorooshian, A., F. J. Brechtel, Y. L. Ma, R. J. Weber, A. Corless, R. C. Flagan, and J. H. Seinfeld (2006b), Modeling and characterization of a particle-into-liquid sampler (PILS), Aerosol Sci. Tech., 40, 396-409. Sorooshian, A., M. –L. Lu, F. J. Brechtel, H. Jonsson, G. Feingold, R. C. Flagan, and J. H. Seinfeld (2007), On the source of organic acid aerosol layers above clouds, Environ. Sci. Technol., 41, 4647-4654. Souza, S. R., P. C. Vasconcellos, and L. R. F. Carvalho (1999), Low molecular weight carboxylic acids in an urban atmosphere: Winter measurements in Sao Paulo City, Brazil, Atmos. Environ., 33, 2563-2574. Stephanou, E. G., and N. Stratigakis (1993), Oxocarboxylic and alpha,omega-dicarboxylic acids - photooxidation products of biogenic unsaturated fatty-acids present in urban aerosols, Environ. Sci. Technol., 27, 1403-1407. Sullivan, A. P., R. E. Peltier, C. A. Brock, J. A. de Gouw, J. S. Holloway, C. Warneke, A. G. Wollny, and R. J. Weber (2006), Airborne measurements of carbonaceous aerosol soluble in water over northeastern United States: Method development and an investigation into water-soluble organic carbon sources, J. Geophys. Res., 111, D23S46, doi:10.1029/2006JD007072.

225
Talbot, R. W., K. M. Beecher, R. C. Harriss, and W. R. Cofer (1988), Atmospheric geochemistry of formic and acetic-acids at a mid-latitude temperate site, J. Geophys. Res., 93(D2), 1638-1652. Talbot, R. W., B. W. Mosher, B. G. Heikes, D. J. Jacob, J. W. Munger, B. C. Daube, W. C. Keene, J. R. Maben, and R. S. Artz (1995), Carboxylic-acids in the rural continental atmosphere over the Eastern United-States during the Shenandoah Cloud and Photochemistry Experiment, J. Geophys. Res., 100(D5), 9335-9343. Turekian, V. C., S. A. Macko, and W. C. Keene (2003), Concentrations, isotopic compositions, and sources of size-resolved, particulate organic carbon and oxalate in near-surface marine air at Bermuda during spring, J. Geophys. Res., 108(D5), 4157, doi:10.1029/2002JD002053. Warneck, P. (2003), In-cloud chemistry opens pathway to the formation of oxalic acid in the marine atmosphere, Atmos. Environ., 37, 2423-2427. Yamasoe, M. A., P. Artaxo, A. H. Miguel, and A. G. Allen (2000), Chemical composition of aerosol particles from direct emissions of vegetation fires in the Amazon Basin: water-soluble species and trace elements, Atmos. Environ., 34, 1641-1653. Yao, X. H., M. Fang, and C. K. Chan (2002), Size distributions and formation of dicarboxylic acids in atmospheric particles, Atmos. Environ., 36, 2099-2107. Yao, X. H., A. P. S. Lau, M. Fang, C. K. Chan, and M. Hu (2003), Size distributions and formation of ionic species in atmospheric particulate pollutants in Beijing, China: 2-dicarboxylic acids, Atmos. Environ., 37, 3001-3007. Yao, X. H., M. Fang, C. K. Chan, K. F. Ho, and S. C. Lee (2004), Characterization of dicarboxylic acids in PM2.5 in Hong Kong, Atmos. Environ., 38, 963-970. Yokouchi, Y., and Y. Ambe (1986), Characterization of polar organics in airborne particulate matter, Atmos. Environ., 20, 1727-1734. Yu, J. Z., S. F. Huang, J. H. Xu, and M. Hu (2005), When aerosol sulfate goes up, so does oxalate: Implication for the formation mechanisms of oxalate, Environ. Sci. Technol., 39, 128-133.

226
Table 6.1. Selected Organic Acid Measurements in Urban Atmospheres
aGround site measurements made by Russell and Allen (2004) were in the same area as the GoMACCS measurements.

227
Table 6.2. Chemical Formulas and Structures for the Organic Acids Studied

228
Table 6.3. Organic Acid Product Distribution for a Series of m-xylene Laboratory Chamber Photooxidation Experiments. (C2-C5 = dicarboxylic acids; For=formate; Ace=acetate; Pyr=pyruvate; Gly=glyoxylate; Mle=maleate; Glyc=glycolate; Lac=lactate). Those labels with “Det” indicate that glyoxylate exceeded detection limits during the experiment, but not in the sample representing the maximum organic acid mass observed.

229
Figure 6.1. Spatial distribution of the PILS water-soluble mass concentration during GoMACCS. Marker sizes are proportional to sulfate concentration, where larger markers represent higher concentrations (range = 0.2–23.3 μg/m3).

230
Figure 6.2. (Left) Total water-soluble charge balance for all samples collected during GoMACCS. Markers are color coded with their respective NH4
+:SO42-
molar ratios. (Right) Vertical distribution of the charge balance for samples categorized by the region of the lower troposphere they were collected in. Main inlet data in cloud refer to total aerosol samples, which contain interstitial aerosol and evaporated droplet residual particles. CVI data represent only evaporated droplet residual particles in cloud.
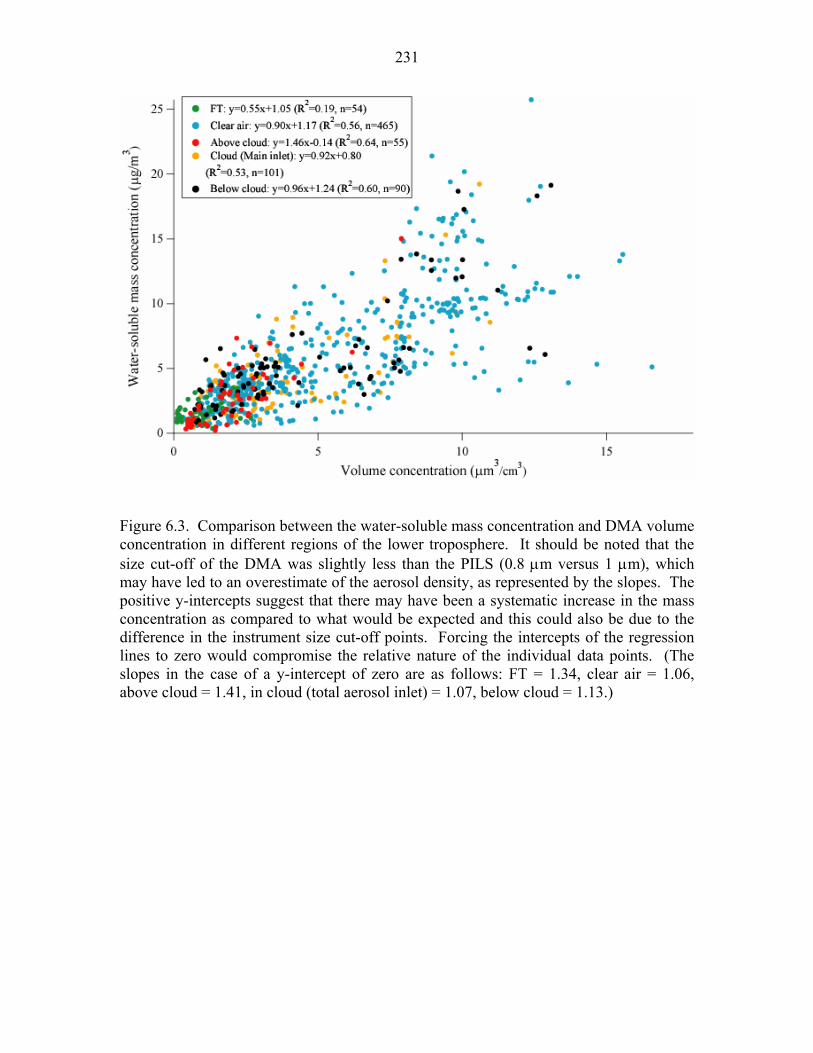
231
Figure 6.3. Comparison between the water-soluble mass concentration and DMA volume concentration in different regions of the lower troposphere. It should be noted that the size cut-off of the DMA was slightly less than the PILS (0.8 μm versus 1 μm), which may have led to an overestimate of the aerosol density, as represented by the slopes. The positive y-intercepts suggest that there may have been a systematic increase in the mass concentration as compared to what would be expected and this could also be due to the difference in the instrument size cut-off points. Forcing the intercepts of the regression lines to zero would compromise the relative nature of the individual data points. (The slopes in the case of a y-intercept of zero are as follows: FT = 1.34, clear air = 1.06, above cloud = 1.41, in cloud (total aerosol inlet) = 1.07, below cloud = 1.13.)

232
Figure 6.4. Vertical distribution of the total water-soluble mass and different ionic components. The data are categorized by what region of the lower troposphere the samples were collected in. Main inlet data in cloud refer to total aerosol samples, which contain interstitial aerosol and evaporated droplet residual particles.

233
Figure 6.5. Vertical distribution of the different organic acids and diethylamine.
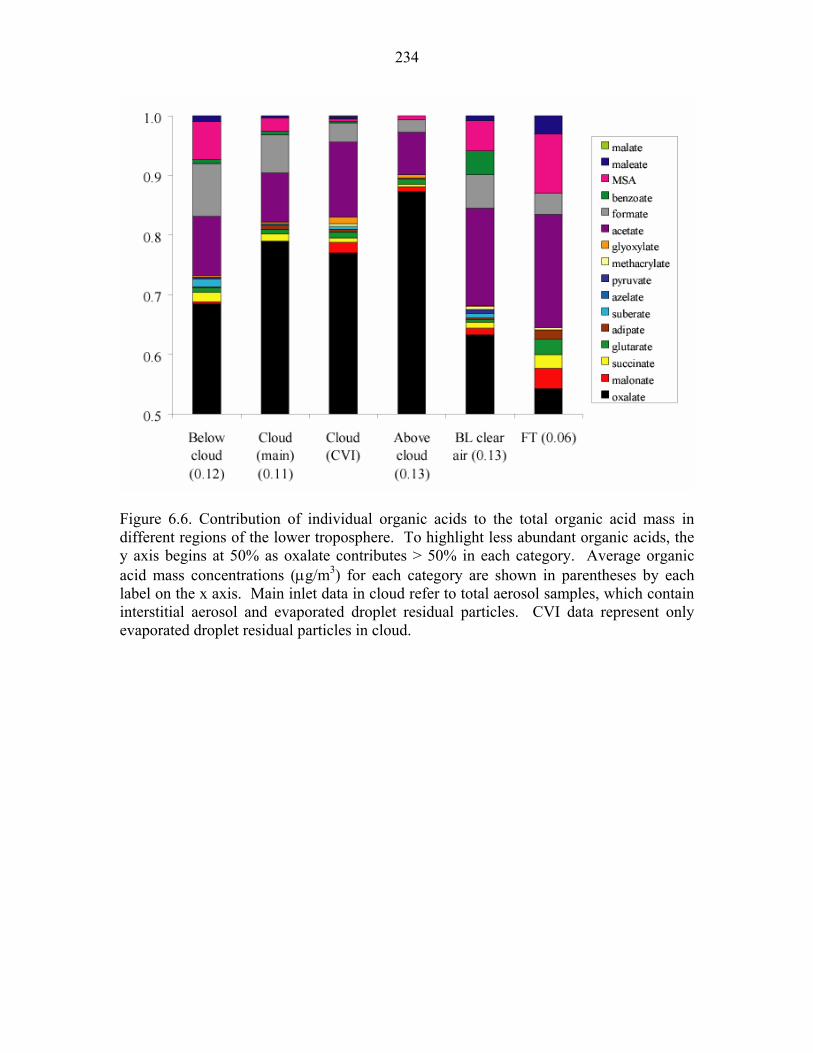
234
Figure 6.6. Contribution of individual organic acids to the total organic acid mass in different regions of the lower troposphere. To highlight less abundant organic acids, the y axis begins at 50% as oxalate contributes > 50% in each category. Average organic acid mass concentrations (μg/m3) for each category are shown in parentheses by each label on the x axis. Main inlet data in cloud refer to total aerosol samples, which contain interstitial aerosol and evaporated droplet residual particles. CVI data represent only evaporated droplet residual particles in cloud.

235
Figure 6.7. Comparison of the oxalate:glyoxylate mass ratio between ambient measurements of cloud droplet residual particles and model predictions for clouds influenced by pollution sources (“polluted”) and those that are not (“clean”). The chemical cloud parcel model considers mean cloud-contact times on the order of ~ 850 s, while the estimated value for the ambient case, using average cloud depth and updraft velocity, is ~ 900 s.

236
Figure 6.8. Flight tracks during a study aimed at analyzing the evolution of aerosol properties in three major plumes originating in the Houston Ship Channel. Markers are color-coded to represent fine particle (< 1 μm) number concentration, while marker sizes are proportional to PCASP (0.1 - 2.5 μm) number concentration (range = 0 – 29,000 cm-
3). There were southwesterly winds (205 - 230°; 5 - 10 m/s).

237
Figure 6.9. Organic acid product evolution from a photooxidation experiment with the following conditions: 75 ppb m-xylene/low NOx/non-acid ammonium sulfate seed aerosol. The organic acid mass fraction of the DMA-derived SOA mass was estimated to be approximately 39% at the time the sample with the maximum mass concentration was collected.

238
Chapter 7
Comprehensive Airborne Characterization of Aerosol
From a Major Bovine Source∗
∗This chapter is prepared for journal submission as “Comprehensive Airborne Characterization of Aerosol From a Major Bovine Source” by A. Sorooshian, S. Hersey, S. M. Murphy, H. Gates, L. Padro, A. Nenes, F. J. Brechtel, H. Jonsson, R. C. Flagan, and J. H. Seinfeld.

239
7.1 Abstract
We report an extensive airborne characterization of aerosol downwind of a
massive bovine source in the San Joaquin Valley (California) on two flights during July
2007. The Center for Interdisciplinary Remotely-Piloted Aircraft Studies (CIRPAS) Twin
Otter probed chemical composition, particle size distribution, mixing state, sub- and
supersaturated water uptake behavior, light scattering properties, and the interrelationship
between these parameters and meteorology. Total PM1.0 levels and concentrations of
organics, nitrate, and ammonium were enhanced in the plume from the source as
compared to the background aerosol. Organics dominated the plume aerosol mass (~ 56 -
64%), followed either by sulfate or nitrate, and then ammonium. Particulate amines were
detected in the plume aerosol by a particle-into-liquid sampler (PILS) and via mass
spectral markers in the Aerodyne cToF-AMS. Amines were found to be a significant
atmospheric base even in the presence of ammonia; particulate amine concentrations are
estimated as at least 14 – 23% of that of ammonium in the plume. Enhanced sub- and
supersaturated water uptake and reduced refractive indices were coincident with lower
organic mass fractions, higher nitrate mass fractions, and the detection of amines. Kinetic
limitations due to hydrophobic organic material are shown to have likely suppressed
droplet growth. After removing effects associated with size distribution and mixing state,
the normalized activated fraction of cloud condensation nuclei (CCN) increased as a
function of the subsaturated hygroscopic growth factor, with the highest activated
fractions being consistent with relatively lower organic mass fractions and higher nitrate
mass fractions. Subsaturated hygroscopic growth factors for the organic fraction of the
aerosol are estimated based on employing the Zdanovskii-Stokes Robinson (ZSR) mixing

240
rule. Representative values for a parameterization treating particle water uptake in both
the sub- and supersaturated regimes are reported for incorporation into atmospheric
models.
7.2 Introduction
Bovine emissions are major sources of methane (CH4), nitrous oxide (N2O), and
ammonia (NH3); they are also the dominant anthropogenic source for amines (Schade and
Crutzen, 1995). Ammonia is the dominant base in the atmosphere, efficiently neutralizing
acidic substances. The main global sources of ammonia are from livestock waste,
fertilizer applications, biomass burning, motor vehicle emissions, and coal combustion
(Apsimon et al., 1987; Asman and Janssen, 1987; Kleeman et al., 1999; Anderson et al.,
2003; Battye et al., 2003). Typical ammonia mixing ratios over continents range between
0.1 and 10 ppb (Edgerton et al., 2007, and references therein), while levels as high as a
few ppm have been reported near areas of extensive livestock operations (Rumburg et al.,
2006).
The principal inorganic aerosol components involving ammonia are ammonium
nitrate and ammonium sulfate. The formation of these inorganic salts depends on
temperature, relative humidity (RH), and concentrations of NH3, nitric acid (HNO3) and
sulfur dioxide (SO2). Ammonium nitrate tends to form after sulfuric acid is completely
neutralized. Atmospheric ammonium nitrate generally obeys thermodynamic equilibrium
with gaseous nitric acid and ammonia (Stelson et al., 1979; Doyle et al., 1979; Stelson
and Seinfeld, 1982a, 1982b; Russell et al., 1983; Hildemann et al., 1984; Zhang et al.,
2002; Takahama et al., 2004; Yu et al., 2005), although some studies have pointed out
that factors such as mass transport limitations can, at times, result in departures from

241
equilibrium (Wexler and Seinfeld, 1992; Meng and Seinfeld, 1996; Fridlind and
Jacobson, 2000; Fridlind et al., 2000). The equilibrium between particulate ammonium
nitrate and gaseous nitric acid and ammonia shifts to the gas phase as ambient
temperature increases, and RH decreases. Similar to ammonia, amines undergo
neutralization reactions with nitric and sulfuric acids to form amine salts (Mozurkewich,
1993; Stelson and Seinfeld, 1982a; Angelino et al., 2001; Murphy et al., 2007). The
photooxidation of gas-phase amines has been shown to form aerosol based on recent
laboratory experiments (Angelino et al., 2001; Murphy et al., 2007).
Gaseous amines, including methylamine, dimethylamine, trimethylamine,
ethylamine, diethylamine, triethylamine, ethanoloamine, n-butylamine, amylamine, 1,4-
butanediamine, isobutylamine, and isopropylamine, have been identified in emissions
from bovine sources (Mosier et al., 1973; Hutchinson et al., 1982; Schade and Crutzen,
1995; Rabaud et al., 2003; Ngwabie et al., 2005). Amine emission rates from animal
husbandry sources are typically two to three orders of magnitude lower than those of
ammonia (Schade and Crutzen, 1995; Ngwabie et al., 2005). Gaseous amines are also
present in vehicular exhaust (Cadle and Mulawa, 1980; Westerholm et al., 1993), the
marine atmosphere (Vanneste et al., 1987), biomass burning plumes (Lobert et al., 1991),
as well as emissions from decaying organic matter, waste incineration, and sewage
treatment plants (Manahan, 2005). Amine salts have sufficiently low vapor pressures to
partition to the aerosol phase; moreover, they exhibit greater water-solubility as
compared to other particulate organic nitrogen species (Milne and Zika, 1993; Gorzelska
et al., 1994; Murphy and Thomson, 1997; Glagolenko and Phares, 1994; Abalos et al.,
1999; Angelino et al., 2001; Makela et al., 2001; Tan et al., 2002; Zhang et al., 2002;

242
Zhang and Anastasio, 2003; Maria et al., 2003; Beddows et al., 2004; Denkenberger et
al., 2007; Murphy et al., 2007; Sorooshian et al., 2007a).
The availability of a massive, concentrated source of ammonia and amines offers
a unique opportunity to probe the response of the resulting aerosol. During July 2007, the
Center for Interdisciplinary Remotely Piloted Aircraft Studies (CIRPAS) Twin Otter
probed the aerosol downwind of a major cattle feedlot in the San Joaquin Valley in
California. The San Joaquin Valley, the major geographical feature in central California,
is bordered on its west and east sides by mountain ranges and is characterized by
relatively stagnant air circulation (Figure 7.1A). Consequently, this region is one of the
largest nonattainment areas for ozone and particulate matter in the United States (Chow
et al., 2006). The San Joaquin Valley contains numerous animal husbandry operations,
the largest of which is the focus of this study. This feedlot operation covers several
hundred acres and contains up to 100,000 head of cattle at any one time. Although gas-
phase measurements were not carried out, the presence of ammonia and amines is
inferred from established emissions inventories from animal husbandry sources and from
measurements of the ammonium and amine content of the aerosol downwind of the
plume source.
The goal of the present study is to provide a comprehensive airborne
characterization of the aerosol downwind of a major bovine source. First, the aircraft
instrument payload and flight path strategy are presented. Detailed measurements were
obtained for: meteorology, aerosol size distributions and number concentrations, aerosol
composition, mixing state, refractive index, hygroscopic growth factors at three different
relative humidities, and cloud condensation nucleus (CCN) behavior. Special attention is

243
given to the sub- and supersaturated water uptake properties of the aerosol, and how these
relate to chemical composition. Subsaturated hygroscopic growth factors for the organic
fraction of the aerosol are reported based on a closure analysis employing the
Zdanovskii-Stokes Robinson mixing rule. Subsaturated hygroscopic growth data are then
compared to measured supersaturated CCN activity to evaluate the level of consistency
between observed water uptake in the two regimes.
7.3 Experimental Methods
The data on which the present study is based were aquired during two clear air
flights in the San Joaquin Valley on 12 July 2007 and 30 July 2007. Henceforth, these
two flights will be termed flight A (12 July 2007) and flight B (30 July 2007). The
aircraft total aerosol inlet, characterized by Hegg et al. (2005), provided sample air to
instruments on the aircraft. The instrument payload on the Twin Otter aircraft is
described elsewhere (http://www.cirpas.org), however, attention is given below to those
instruments the data from which will be discussed in detail.
7.3.1. Aerosol Chemical Composition (PILS)
Water-soluble aerosol chemical composition was measured by a particle-into-
liquid sampler (PILS, Brechtel Mfg Inc.; Sorooshian et al., 2006a). In the PILS,
submicrometer ambient particles are grown into droplets sufficiently large to be collected
by inertial impaction for subsequent chemical analysis. At the entrance to the instrument
a series of three denuders (URG and Sunset Laboratories) remove inorganic (basic and
acidic) and organic gases that would otherwise bias aerosol measurements. The denuders

244
have been shown to successfully remove gaseous amine species (Murphy et al., 2007).
The impacted droplets are delivered to a rotating carousel containing 72 vials, with each
vial containing material representing a period of ~ 5 min of flight, or alternatively, a
distance of 15 km in flight (aircraft speed ~ 50 m/s). The contents of the vials are
subsequently analyzed off-line using a dual ion chromatography (IC) system (ICS-2000,
Dionex Inc.) for simultaneous anion and cation analysis.
The PILS-IC instrument uncertainty has been established as + 7%, and the
detection limit (calculated as air-equivalent concentration of the lowest concentration
standard that is distinct from baseline noise in the IC plus three times the standard
deviation of this measurement) is < 0.1 μg/m3 for the inorganic ions (Na+, NH4+, K+,
Mg2+, Ca2+, Cl-, NO2-, NO3
-, and SO42-) and < 0.01 μg/m3 for the organic acid ions
(carboxylic acids with one to nine carbon atoms) (Sorooshian et al., 2007b). The PILS-
IC technique has been demonstrated to speciate amines, including ethylamine,
diethylamine, triethylamine, methylamine, dimethylamine, and trimethylamine
(Sorooshian et al., 2007a); however, only ethylamine and diethylamine were measured
above detection limits (0.01 μg/m3) in the present study. It should be noted that
ammonium and ethylamine co-elute in the IC cation column; however, ethylamine was
detected at sufficiently high concentrations for its peak to be distinguishable from that of
ammonium. The reported concentrations of ethylamine represent a lower limit due to this
co-elution effect. Since acetate, lactate, and glycolate also co-elute, these three species
are reported as a collective mass using the calibration equation of acetate; therefore, the
contribution of acetate reported is likely an overestimate. As compared to acetate, using
the calibration equation of glycolate would reduce the estimates by < 10%.

245
7.3.2. Aerosol Chemical Composition (Aerodyne cToF-AMS)
Chemical composition measurements for non-refractory aerosol species (sulfate,
nitrate, ammonium, and organics) were performed using an Aerodyne compact Time of
Flight Aerosol Mass Spectrometer (cToF-AMS; Drewnick et al., 2004a, 2004b). At the
entrance to the instrument, an aerodynamic lens focuses particles with vacuum
aerodynamic diameters between approximately 50 nm and 800 nm through a 3.5%
chopper and onto a tungsten vaporizer (~ 550° C) (Murphy et al., 2007). The chopper can
be operated in three modes to gather either background mass spectra, ensemble average
mass spectra over all particle sizes, or size-resolved mass spectra. Once vaporized,
molecules undergo electron impact ionization and travel through a time of flight mass
analyzer. The cToF-AMS detects the presence of amines in the form of characteristic
amine peaks at m/z 30, 56, 58, 73, and 86 (McClafferty and Turecek, 1993; Angelino et
al., 2001; Murphy et al., 2007). The detection limit, calculated as three times the standard
deviation of the noise for filtered air, is < 0.05 μg/m3 for all species measured.
The cToF-AMS can be used to calculate a quantity that will be referred to
subsequently as excess nitrate. Excess nitrate is defined as the nitrate mass, derived from
cToF-AMS spectra, remaining after both sulfate and nitrate have been fully neutralized
by ammonium. A zero or slightly negative value indicates that sufficient ammonia exists
to neutralize both sulfate and nitrate, while a positive value indicates that some nitrate is
associated with other cations besides ammonium. cToF-AMS calibrations allow an
assessment of the error associated with the excess nitrate calculation; introducing pure
ammonium nitrate into the instrument should result in an excess nitrate value of zero.
After flight A, calibrations were conducted with monodisperse ammonium nitrate

246
particles ranging from 50 nm to 400 nm and mass concentrations ranging from 1.5 μg/m3
to 7.0 μg/m3, similar to concentrations in flight. Thirty-three calibration points were
collected that exhibited an average excess nitrate of 0.08 + 0.31 μg/m3. Similarly during
a calibration on the day of flight B, 350 and 400 nm ammonium nitrate particles were
introduced into the instrument at levels near ~ 3 μg/m3, which exceeds the peak nitrate
concentration observed during the flight. The average excess nitrate was - 0.014 + 0.095
μg/m3 (n = 17). As will be shown, ambient excess nitrate concentrations in the plume
aerosol significantly exceeded the background values for pure ammonium nitrate.
Nitrate species can be detected by peaks at m/z 30 and 46. A problem innate to
cToF-AMS unit mass-resolution spectra is differentiating between NO+, CH2O+, and
C2H6+, all of which give peaks at m/z 30. If the contribution of organic fragments to the
signal at m/z 30 is not correctly accounted for, the mass of nitrate, as inferred from NO+,
can be overestimated. A relatively conservative approach is to calculate nitrate mass
using the peak intensity at m/z 46 (NO2+), which rarely corresponds to an organic
fragment (McClafferty and Turecek, 1993). Calibration of the instrument with pure
ammonium nitrate allows observation of the ratio of the peak intensities at m/z 30 and 46
when NO+ and NO2+ are present without organic interference. During such a calibration
conducted after flight A, the peak at m/z 30 was observed to be 2.2 times that at m/z 46.
Thus, for this flight, nitrate mass at m/z 30 was calculated to be 2.2 times the mass at m/z
46. Based on calibrations on the day of flight B, the peak at m/z 30 was observed to be
2.8 times that at m/z 46. The two calibrations were seventeen days apart, and instrumental
drift is responsible for the difference in the m/z 30:46 ratio between the two days; typical
values observed with this instrument range between two and three. The mass remaining at

247
m/z 30 after the nitrate contribution is subtracted is assumed to be organic, including
amine species, which often exhibit a major peak here.
7.3.3. Aerosol Hygroscopicity and Refractive Index (DASH-SP)
A differential aerosol sizing and hygroscopicity spectrometer probe (DASH-SP;
Brechtel Mfg Inc.; Sorooshian et al., 2008) was included in the instrument payload on the
aircraft. The DASH-SP consists of a single classification differential mobility analyzer
(DMA) followed by a set of parallel hygroscopic growth chambers operated at different
relative humidities. A ~ 0.5 LPM aerosol sample flow passes first through a Nafion drier,
and then through a 210Po neutralizer that brings the dried particles to a stable, steady-state
charge distribution. A cylindrical DMA selects particles in a narrow interval of mobility-
equivalent diameters in the 0.1 to 1.0 μm range. The classified aerosol leaving the DMA
is split into five separate flows. In one of the five streams, the total concentration of
classified particles is determined using an integral TSI Model 3831 water-based
condensation particle counter (CPC). The remaining four classified aerosol flows pass
through a Nafion humidifier (Perma Pure, LLP, Model MD-070-24FS-4) to achieve
thermodynamic equilibrium with water vapor at a constant, predetermined RH. The four
conditioned aerosol flows pass directly to dedicated, custom-built OPCs (λ = 532 nm,
World Star Technologies, Model TECGL-30) designed to size particles in the 100 nm to
3 µm diameter size range. An iterative data processing algorithm quantifies an “effective”
aerosol refractive index that is used to calculate hygroscopic growth factors (GF =
Dp,wet/Dp,dry) corrected for the refractive-index dependence of the OPC response
(Sorooshian et al., 2008). During this study, the DASH-SP provided simultaneous

248
measurements of GFs at different RHs for dry DMA-selected particle diameters between
Dp = 150 – 200 nm. One humidifier was operated dry (RH < 8%), and the other three
were at RHs of 74%, 85%, and 92%. (No data from the RH = 85% channel were
available during flight A.) The uncertainty associated with growth factor measurements is
~ + 4.5%, and the uncertainty in the RH is + 1.5%.
7.3.4. Cloud Condensation Nuclei Counter (CCNc)
A continuous flow thermal gradient cloud condensation nuclei counter (CCNc,
Droplet Measurement Technologies Inc.; Roberts and Nenes, 2005; Lance et al., 2006)
was used to quantify the number of particles that activate at supersaturations ranging
from 0.1% to 0.6%. In the instrument a supersaturation is generated in an axisymmetric
flow by applying a constant streamwise temperature gradient, using three sets of thermal
electric coolers across a wetted column. At the exit of the CCNc column, those particles
that activate and grow sufficiently large (Dp > 0.75 μm) for detection by an OPC were
quantified. The activated fraction is determined as the ratio of the CCN number
concentration to the total particle (CN) number concentration.
7.3.5. Size Distributions and Particle Number Concentration
Aerosol size distribution data were obtained by a DMA (Dp = 10 – 800 nm) and
an external passive cavity aerosol spectrometer probe (0.1 – 3 μm) (PCASP, PMS Inc.,
modified by DMT Inc.). Particle number concentrations were quantified with two
condensation particle counters (CPC Model 3010, TSI Inc., Dp > 10 nm; UFCPC Model
3025, TSI Inc., Dp > 3 nm). When the two CPCs experienced electrical saturation,

249
particle number concentrations from the DMA are reported. The DMA time resolution is
74 s as opposed to 1 s for the CPCs.
7.3.6. Flight Strategy
Complete flight tracks from flights A and B are shown in Figure 7.1A. Both
flights were intended to resemble each other in the time of the day and flight path.
Starting from the Marina, CA airport, the aircraft transited east before descending to 50 m
above the surface of the San Joaquin Valley. Then the aircraft flew southeast directly
towards the feedlot, approaching to within one kilometer of the feedlot. A close-up of the
flight tracks near the plume source with step-by-step details of the flight strategy is
shown in Fig. 7.1B/C. In each flight, the Twin Otter circled above the perimeter of the
source several times, performed a spiral ascent to characterize the meteorological profile,
performed several downwind transects of the plume at various altitudes below the
boundary layer top, flew directly in the plume for several legs (only flight B), and
transited northwest back up the valley. Sampling lasted for more than three hours starting
just before noon during both flights. The feedlot operation is slightly larger than 3 km2 in
area (~ 800 acres). The feedlot is bordered on the west side by the Interstate 5 roadway,
which is a major transportation route and source of vehicular emissions, connecting
northern and southern California.

250
7.4 Results
7.4.1 Meteorology
Figures 7.2 (flight A) and 7.3 (flight B) display the time evolution of
meteorological and particle number concentration data, while Figure 7.4 presents vertical
profiles. During flight B, ambient temperatures (27.5 + 2.4° C) were higher and RHs
(25.8 + 5.9%) were lower than observed in flight A (21.8 + 2.3° C; 49.0 + 7.8%). During
both flights, the aircraft performed three vertical profiles of the boundary layer. The
temperature inversions were weak (< 1° C), so decreases in RH and particle number
concentrations, as quantified by the DMA and PCASP, are used as indicators for
inversion layers. The boundary layer exhibited multiple inversions, the highest of which
was observed at the end of the flights (~ 3 PM local time) at ~ 630 m. The depth of the
inversion layers increased with time as the surface warmed. The vertical temperature and
RH profiles, and the relatively uniform particle concentrations with altitude (Fig. 7.4)
provide evidence for a vigorously-mixed boundary layer, as was previously observed by
Neuman et al. (2003) in the San Joaquin Valley in May 2002.
Five-day back-trajectories, computed using the NOAA HYSPLIT model (Draxler
and Rolph, 2003), show that the background air during flight A originated over the
Pacific Ocean, whereas the background air during flight B was transported over land
from the north (Fig. 7.5). This suggests that the background aerosol in flight A may have
carried the signature of cleaner marine air, while that measured during flight B was more
exposed to urban and agricultural emissions.

251
7.4.2 Particle Number Concentrations and Size Distributions
Average submicrometer particle number concentrations in the plume were 30,528
+ 8,987 cm-3 (flight A) and 16,606 + 4,286 cm-3 (flight B) (Table 7.1). Particle number
concentrations in and out of the plume were similar, indicating the absence of significant
emissions of particles from the source. (As noted in Section 7.4.3, nitrate enhancement is
used to identify the location of the plume.) During the downwind plume transects,
number concentrations decreased slightly with increasing altitude until a sharp decrease
near the top of the boundary layer to below 300 cm-3 (flight A) and 800 cm-3 (flight B) at
altitudes of 550 m and 400 m, respectively. The ratio of the number concentration of
particles with Dp > 3 nm to the number concentration of particles with Dp > 10 nm was
1.1 + 0.1 and 1.2 + 0.1 for flights A and B, respectively. This ratio showed no difference
in and out of the plume and decreased with altitude.
The vertical structure of the PCASP (Dp = 0.1 – 3 μm) and CPC number
concentrations were similar. Average PCASP concentrations in the plume for flights A
and B were 1,065 + 330 and 675 + 220 cm-3, respectively, indicating that most of the
particles were smaller than 100 nm in diameter. The number of 0.1 to 3 μm diameter
particles in the plume was enhanced by a factor of 2.5 - 3 times as much over that in the
background aerosol. This is especially evident by the increase in number concentration
(Dp > 100 nm) observed when passing through the beginning of the plume over the
perimeter of the source (upper panels of Figure 7.2/7.3; see the flight segments labeled
“2” when the aircraft was circling the perimeter of the plume source); this likely is a
result of smaller particles growing into this size range. However, the increase in number
concentration for particles with Dp = 0.1 – 3 μm was not sufficiently large to result in a

252
significant difference in the submicrometer number concentration (Dp = 0.01 – 1 μm) in
and out of the plume.
Aerosol number and volume distributions were similar both between the two
flights, and in and out of the plume. Multiple modes normally existed in the number and
volume distributions. A number concentration mode was generally present between Dp =
20 – 60 nm, with a weaker mode between Dp = 60 – 100 nm (lower panels of Fig.
7.2/7.3). There was also a dominant number concentration mode, which will be referred
to as the nucleation mode, at sizes smaller than the detection limit of the DMA (10 nm);
this mode is evident from the difference in number concentration measured by the DMA
and the UFCPC 3025. Volume concentration modes existed at Dp = 30 – 60 nm, Dp ~ 100
nm, and frequently at Dp > 100 nm. The number and volume distributions in the plume
shifted slightly to larger sizes with downwind distance from the plume source.
7.4.3 Submicrometer Aerosol Chemical Composition
Figures 7.6 (time series), 7.7/7.8 (spatial distribution), and 7.9 (vertical
distribution) summarize the submicrometer aerosol composition data, in addition to Table
7.1, which reports the background and in-plume composition for both flights. The
reported total organic mass is non-refractory organic mass that was measured by the
cToF-AMS. The total aerosol mass is determined as the sum of inorganic mass, as
determined by the PILS and cToF-AMS, and non-refractory organic mass from the cToF-
AMS. Nitrate enhancement is used to define the location of the plume. Then, knowing
where the plume is, local enhancements in other species concentrations and aerosol
properties can be determined. Plume ages are noted on the spatial plots in Fig. 7.1B/C

253
and were calculated using downwind distance and average wind speed in the vicinity of
the source. The highest plume age encountered in flights A and B was 0.9 h and 1.2 h,
respectively.
7.4.3.1 Total Aerosol Mass and Major Components
The average total aerosol mass in the boundary layer was 8.85 + 1.79 μg/m3 and
3.40 + 0.98 μg/m3 during flights A and B, respectively, with significant enhancements in
the plume (Table 7.1). The highest concentrations, 17.07 μg/m3 (flight A) and 6.27 μg/m3
(flight B), occurred in the plume while the lowest concentrations were observed at the
highest altitudes when the aircraft performed spiral ascents (flight A = 1.40 μg/m3; flight
B = 0.24 μg/m3).
Overall, organic species dominated the total mass. Organics accounted for 61.9%
+ 2.6% (flight A) and 55.5% + 6.4% (flight B) of the plume aerosol mass, and 63.5% +
3.3% (flight A) and 63.1% + 11.9% (flight B) of the background aerosol mass. The
organic mass concentration in the plume was 6.48 + 0.98 μg/m3 (flight A) and 2.46 +
0.29 μg/m3 (flight B), and in the background aerosol was 5.10 + 1.07 μg/m3 (flight A)
and 1.73 + 0.70 μg/m3 (flight B). The next largest contributor to the particulate mass was
either sulfate or nitrate, depending on the day and aerosol type, followed by either
ammonium or nitrate (see Table 7.1). The ratio of organic mass to inorganic mass in the
plume was 1.64 + 0.19 (flight A) and 1.30 + 0.39 (flight B), while the ratio in the
background aerosol was 1.77 + 0.29 (flight A) and 1.92 + 0.68 (flight B). Previous
measurements in the San Joaquin Valley have also shown that organic aerosol contributes
significantly to the fine particle mass (Chow et al., 1996; Neuman et al., 2003).

254
7.4.3.2 Inorganic Aerosol
Within the source plume, the levels of nitrate and ammonium increased
significantly above their respective values in the background valley aerosol (Fig. 7.6 –
7.8). The ammonium-to-sulfate molar ratio is an important indicator of the level of
partitioning of ammonium nitrate between the gas and aerosol phases. Since this ratio
usually exceeded two, ammonia was available to foster partitioning of nitrate to the
aerosol phase in the plume. The vertical distribution of nitrate and ammonium exhibited
similar trends in each flight, unlike sulfate, which did not increase in concentration at
plume altitudes (~ 100 – 300 m) (Fig. 7.9).
Generally, other inorganic species, including chloride, sodium, potassium,
calcium, magnesium, and nitrite, did not contribute significantly (> 0.1 μg/m3) to the
aerosol mass. Many of these species are expected to be found primarily in the coarse
particle fraction (Dp > 1 μm), owing to their origins in sea salt (Na+, Cl-) and dust and soil
(Ca2+, Mg2+, Na+, K+). Magnesium, calcium, and potassium concentrations were all
below detection limits (< 0.05 μg/m3). Sodium and chloride were sparsely detected in
both flights, usually in the background aerosol during the transits, with concentrations
near ~ 0.1 μg/m3. Nitrite above detection limits was found in only one PILS sample
(0.10 μg/m3) during flight A while circling the feedlot near the beginning of the flight
(UT ~ 19:00).
7.4.3.3 Organic Aerosol
The concentration of total organics, as determined by the cToF-AMS, in the
plume aerosol significantly exceeded those in the background valley aerosol (Figure 7.6 –

255
7.8). The vertical distribution of total organic concentrations was somewhat similar to
those of nitrate and ammonium, with the exception that there was not as sharp an
enhancement in concentration at plume altitudes, as was especially evident in flight B
(Fig. 7.9).
Figure 7.10 shows the representative mass spectra of the organic fragments
detected by the cToF-AMS in the background valley aerosol, the plume aerosol close to
the source, and farther downwind. All non-organic contributions to the mass spectra
have been removed using the methodology described in Allan et al. (2004);
fragmentation at m/z 30 was further modified as described in Section 7.3.2. Figure 7.11
indicates that the signal at m/z 30 represents a large fragment for organics, including
amines. The chemical signatures of the organic aerosol in the three categories appear to
be quite similar. One difference, which is highlighted also in Figure 7.11, is that the m/z
30 (common amine marker) peak intensity is enhanced by ~ 150% at the closest point to
the plume source as compared to background aerosol, and decreases by ~ 25% at the
farthest downwind distance. Figure 7.11 shows comparisons of the plume aerosol organic
mass spectra to the background spectra for both flights. The overall organic aerosol
appears to be similar in and out of the plume; however, peak intensities at m/z 30, 56, 74,
and 86 are enhanced in plume. These are all peaks in the electron impact mass spectrum
of amines, including diethylamine and triethylamine (McClafferty and Turecek, 1993;
Angelino et al., 2001; Murphy et al., 2007). A similar analysis for plume organics close
to the feedlot and farther downwind reveals no significant difference in most peaks,
although the intensity of the m/z 30 peak decreases with increasing plume age; as will be
discussed subsequently, this is likely attributed to increased partitioning of particulate

256
amines to the gas phase to maintain thermodynamic equilibrium as the plume dilutes with
background air. An analysis of the background valley aerosol spectra during the transit
portions of the flights indicates that the organic aerosol composition was similar
throughout the valley.
Two amines were detected by the PILS, diethylamine and ethylamine; these were
found only in the plume (Fig. 7.6 – 7.8). Diethylamine reached higher concentrations (up
to 0.18 μg/m3 and 6.0% of the organic mass) and was more abundant farther downwind
of the feedlot as compared to ethylamine; diethylamine was observed at plume ages up to
0.9 h (flight A) and 0.7 h (flight B). Ethylamine was detected by the PILS only in three
samples collected during the two flights. It was found immediately downwind of the
feedlot up to plume ages of 0.7 h (flight A) and 0.3 h (flight B) at concentrations near
0.02 μg/m3, which corresponds to 0.8% of the total organic mass, as inferred from the
cToF-AMS data.
The collective organic acid concentration, as determined by the PILS, reached
levels of up to 0.23 μg/m3 (flight A) and 0.41 μg/m3 (flight B), accounting for 0.4% (+
0.8%) and 0.4% (+ 0.6%) of the cToF-AMS total organic mass during flights A and B,
respectively. Oxalate was the most abundant organic acid, followed by succinate,
formate, and acetate. The concentration of the organic acids (C1 – C9) were not found to
be correlated with those of total organics, amines, or any inorganic species.
7.4.4 Aerosol Mixing State
Figure 7.12 shows speciated size distributions for the background and in-plume
aerosol at various downwind distances for both flights. Organics, nitrate, and sulfate all

257
appear to be externally mixed to some extent. This is especially clear when examining the
plume aerosol at various downwind distances in flight B; the distribution of nitrate
aerosol grows in diameter, while the organic distribution shows relatively less growth and
the sulfate distribution does not exhibit any corresponding shift in size. Speciated size
distributions for the valley aerosol during transit are similar to the background aerosol in
the vicinity of the feedlot, indicating chemically similar particles.
7.4.5 Refractive Index
The background aerosol exhibited a consistent average dry-particle refractive
index of 1.54 + 0.07 and 1.54 + 0.04 for flights A and B, respectively (Table 7.2). Since
these values are close to those of ammonium nitrate (1.55) and ammonium sulfate (1.52 –
1.53) (Weast, 1987; Tang, 1996), which are the dominant inorganic components of the
aerosol, assuming a volume-weighted overall refractive index, the organic component
refractive index is calculated also to be 1.54. Notably, Zhang et al. (1994) reported a
similar refractive index of 1.55 for particulate organic compounds in Grand Canyon
aerosol. The overall aerosol refractive indices were slightly lower in the plume, with the
lowest values observed closest to the feedlot during the aircraft circling maneuvers (1.48
+ 0.09 and 1.51 + 0.01 for flights A and B, respectively). Organic species, such as
amines, may be responsible for this decrease as the organic mass fraction dominated the
total mass; ethylamine and diethylamine have refractive indices of 1.37 and 1.39,
respectively (Dean, 1999). Although only two particulate amines were speciated at low
concentrations (< 4% of total mass), other amine compounds may well have existed in
the total organic mass with comparable refractive indices.

258
7.4.6 Hygroscopic Properties of the Aerosol
7.4.6.1 Subsaturated Water Uptake
Figures 7.13 and 7.14 present the spatial distribution of hygroscopic growth
factors at the RHs studied for flights A and B, respectively. Aerosol growth factors
ranged from 1.00 to 1.27 at 74% RH, 1.21 to 1.62 at 85% RH, and 1.30 to 2.04 at 92%
RH (Table 7.2), depending on location, altitude, and proximity to the plume source. For
reference, growth factors for pure ammonium nitrate (Dp,dry = 150 nm) at RHs of 74%,
85%, and 92% are 1.37, 1.60, and 1.94, respectively (deliquescence RH = 61.8%;
Brechtel and Kreidenweis, 2000). Growth factors for pure ammonium sulfate (Dp,dry =
150 nm) at RHs of 85% and 92% are 1.56 and 1.80, respectively (deliquescence RH =
79.9%; Brechtel and Kreidenweis, 2000). Overall, the plume aerosol exhibited higher
hygroscopic growth factors as compared to the background aerosol. Hygroscopic growth
factors in the immediate vicinity of the source were usually between 1.75 – 1.90 at RH =
92%.
Hygroscopic growth factors are now related to the mass fractions of the aerosol
components. Figure 7.15 shows the dependence of growth factors at an RH of 92% on
mass fractions of nitrate and organics measured for flight B. (Similar effects occur at the
other RHs.) Increasing growth factors coincide with higher nitrate mass fractions. This
effect is most evident during flight B, in terms of slope (0.31) and correlation (R2 = 0.43),
partly because of the larger range of nitrate mass fractions observed. In addition, growth
factors exhibited a negative correlation (R2 = 0.46, slope = -0.28) with organic mass
fractions. Less correlation exists between observed growth factors and mass fractions of
ammonium and sulfate (R2 < 0.21). The data show that subsaturated hygroscopicity

259
increases as a function of increasing fraction of ammonium nitrate, a highly hygroscopic
salt, and decreasing fraction of organics, the growth factor of which will be explored
subsequently.
7.4.6.2 CCN
The CCN data acquired are summarized in Table 7.3 and Figure 7.16. Owing to
the large number of particles with diameters below about 60 nm, in the background
atmosphere as well as in the plume, the activated fractions were quite small. An
enhancement in activated fraction was observed in the plume, which is consistent with
the observed behavior of subsaturated hygroscopic growth factors.
An important issue is the extent to which aerosol composition influences CCN
behavior. This can be manifested in two ways: (1) by affecting the critical supersaturation
of the particles; and (2) by influencing the growth rate once the particle activates. Figure
7.17 shows the normalized activation fraction as a function of hygroscopic growth factor
for flight B. The normalization is done by computing the activation fraction assuming the
CCN are composed of pure ammonium sulfate. The normalization removes any
variations due to shifts in the shape of the size distribution. It is noted that, in general,
higher supersaturations are required to activate particles composed of less hygroscopic
material.
Regarding the effect of particle composition on growth rate, consider two
particles each having the same critical supersaturation. If the ambient supersaturation
exceeds the critical supersaturation, then each particle will activate. The subsequent rate
of growth by water condensation depends on the uptake of water molecules. If the two

260
particles have different composition, then the uptake coefficients for water vapor can be
different; the particle with the smaller water uptake coefficient will exhibit a slower rate
of growth after activation. In a CCN instrument, like the CCNc employed here, the more
slowly growing particle may not reach its ultimate size before it exits the growth chamber
of the instrument and is detected by the OPC. The growth rate of pure ammonium sulfate
particles of the same critical supersaturation as that of the particle in question can be
taken as the standard against which particle growth rates can be compared. Since an
entire distribution of particles enter the CCNc, with different critical supersaturations (as
a result of size and composition), the standard used is ammonium sulfate with a critical
supersaturation equal to the supersaturation of the instrument. Based on this standard, if
all particles grow as quickly as those composed entirely of ammonium sulfate, all
particles will have droplet sizes equal to or larger than the standard. Hence, at a given
supersaturation, the presence of droplets with a size less than that of the standard
indicates retarded growth. We express this effect in terms of the fraction of droplets less
than the standard at the supersaturation of the instrument.
Figure 7.18 shows the cToF-AMS – derived ratio of m/z 57:44 as a function of
organic mass fraction. (A larger m/z 57:44 ratio is correlated with the organic material
being less oxidized, and hence more hydrophobic.) The color coding of the data points
corresponds to the fraction of droplets that have a size (Di) less than the ammonium
sulfate standard (DAS), as described above. The size of the symbols reflects the
hygroscopic growth factor at 92% RH. The data indicate that at high organic mass
fractions when the particles are composed of less oxidized material, there is a tendency,

261
although weak, towards retardation of growth. The growth factor exhibits a clear anti-
correlation with organic mass fraction.
7.5 Discussion
In this section we explore key findings in this study. The observations reveal
significant differences in aerosol properties in and out of the plume, and as a function of
plume age. Significant enhancements in nitrate, ammonium, and organic levels in the
plume were observed; this coincided with an increased potential for water uptake in both
the sub- and supersaturated regimes. While trends in the data from the two flights were
similar, particle number and mass concentrations were larger in flight A. Explanations for
this discrepancy will be pursued.
Owing to the range of organic fractions observed, the present study provides an
opportunity to evaluate the sensitivity of mixed inorganic/organic particle hygroscopicity
to the organic fraction. Subsaturated hygroscopic growth factors are calculated for the
organic fraction based on a closure analysis using the Zdanovskii-Stokes Robinson (ZSR)
mixing rule. Measurement of CCN activity in this study also presents an opportunity to
assess the consistency of observed supersaturated water uptake with the subsaturated
water uptake measurements.
7.5.1 Enhancements in Mass Production and Water Uptake in the Plume Aerosol
Significant production of ammonium nitrate and organic mass in the plume
occurred during both flights. Ammonium nitrate production is expected due to the high
ammonia levels and the presumed abundance of nitric acid from the daytime

262
photochemistry. Organic aerosol mass production results from both condensation of
semi-volatile organic species and acid – base chemistry of amines, followed by
condensation of low-volatility products onto pre-existing aerosols.
Enhanced sub- and supersaturated water uptake coincides with greater fractions of
ammonium, nitrate, and amines. Dinar et al. (2008) have shown, for example, that the
reactive uptake of ammonia by aerosols containing slightly soluble organics leads to
substantial increases in hygroscopic growth and CCN activity. This observation appears
to be consistent with the present measurements. Speciated size distributions show that the
aerosol is, in part, externally mixed, with different species growing independently during
plume aging (Fig. 7.12). The high organic fractions, particularly during flight A, may
have masked the expected and significant growth exhibited by pure ammonium nitrate
and ammonium sulfate salts; however, amines, which represent one class of organic
species in the plume, are thought to be highly hygroscopic. Aklilu et al. (2006) also
suggested that the organic fraction of the aerosol can suppress the growth normally
associated with nitrate based on ambient measurements at two rural, urban-influenced
sites.
7.5.2 Amines as an Atmospheric Base
7.5.2.1 Is Nitric Acid or Ammonia the Limiting Reactant?
Previous studies of particulate ammonium nitrate formation in the San Joaquin
Valley suggest that the limiting reactant is nitric acid because of abundant ammonia
emissions (Blanchard et al., 2000; Pun and Seigneur, 1999). During an aircraft study in
the San Joaquin Valley in May 2002, Neuman et al. (2003) reported simultaneous nitric

263
acid depletion and aerosol mass enhancements when the aircraft either encountered large
ammonia sources or reached lower temperatures at higher altitudes in the boundary layer.
Ammonia is emitted from the ground, whereas nitric acid is efficiently produced
photochemically throughout the entire boundary layer, especially during the summer in
the daytime San Joaquin Valley atmosphere.
Since gas-phase ammonia and nitric acid were not measured in the present study,
observed particulate levels of ammonium, nitrate, sulfate, and amines can help determine
the limiting reactant in chemical processing inside the plume. Excess nitrate is most
abundant within the plume, reaching levels as high as 1.72 μg/m3 (flight A) and 0.89
μg/m3 (flight B). (As defined in Section 7.3.2, excess nitrate is the amount of nitrate
remaining after both sulfate and nitrate have been fully neutralized by ammonium.) The
greatest excess nitrate values coincide with relatively lower ambient temperatures, higher
altitudes, the presence of diethylamine and ethylamine, and are correlated with amine
markers in the cToF-AMS spectra (m/z 58, 73, 86) (Figure 7.7B/7.8B/7.9). The
background aerosol tends to exhibit excess nitrate values close to zero, indicating that
just enough ammonia was present, on average, to neutralize both sulfate and nitrate. The
data suggest either of two conclusions: (1) insufficient ammonia was present to neutralize
both sulfate and nitrate within the plume, thereby distinguishing ammonia as the limiting
reactant; or (2) sufficient ammonia was present, but a significant amount of nitric acid
formed salts preferentially with amines rather than ammonia. The detection of amines by
the PILS and the large amount of organic mass, with representative amine markers
detected by the cToF-AMS, suggests that the second explanation may be more plausible.
This is a significant finding in the atmosphere that is consistent with laboratory

264
observations made in photooxidation experiments of aliphatic amines (Angelino et al.,
2001; Murphy et al., 2007). The affinity of inorganic acids for amines in the presence of
ammonia has even greater implications during the winter and at night, when lower
temperatures and higher RHs enable increasing partitioning of both ammonium nitrate
and amine salts into the aerosol phase.
7.5.2.2 Sources and Character of Amines
The formation of particulate amine salts depends on temperature, the identity and
concentrations of the amine and acidic species present, and the concentration of ammonia
that competes with amines for the acidic species. Once the particulate amine salts are
formed, they may revolatilize, undergo subsequent particle-phase reactions including
oxidation, or serve as a site for the condensation of other organic compounds. Chamber
experiments performed by Murphy et al. (2007) showed that the dominant formation
mechanism for amines is that of acid-base reactions (amine + nitric acid) rather than from
photooxidation to form non-salt condensable organics. These experiments showed that
nitric acid preferentially reacts with amines, depending on the species, rather than
ammonia. It is expected that particulate amines should be prevalent close to the source of
amine emissions where gaseous amine concentrations are highest. If the temperature
dependence of amine salt equilibria resembles that of ammonium nitrate, then amines
should partition more favorably to the aerosol phase at lower temperature (higher
altitudes) within the plume. Of the six amines studied by Murphy et al. (2007),
diethylamine was shown to have the most favorable equilibrium constant for salt
formation in the presence of ammonia, an observation that is consistent with the present

265
field measurements since diethylamine was the most abundant amine detected in the
aerosol. The amine salts produced in the laboratory chamber experiments eventually
repartitioned back to the gas phase. In the present study, amine concentrations decreased
as a function of plume age, as evident in the ethylamine and diethylamine data and the
m/z 30 peak intensity data from the cToF-AMS. The decreasing amine levels in the
aerosol phase presumably occur because of two reasons: (1) amine concentrations, like
those of ammonium and nitrate, decrease due to dilution as a function of plume age; and
(2) amines partition back to the gas phase to maintain thermodynamic equilibrium due to
the decreasing gas-phase concentrations owing to dilution.
Diethylamine, measured exclusively in the plume, exhibited a strong and positive
correlation with nitrate, ammonium, sulfate, and total organics during flight A (n = 8, R2:
nitrate = 0.65, ammonium = 0.73, sulfate = 0.72, organics = 0.68), but showed a weaker
correlation with the same species during flight B (n = 7, R2: nitrate = 0.35, ammonium =
0.04, sulfate = 0.13, total organics = 0.40). The positive correlation between diethylamine
and nitrate suggests that nitric acid exhibits an affinity for amines as an atmospheric base,
even in the presence of ammonia. Diethylamine concentrations correlated more weakly
with sulfate than to nitrate during flight B, possibly because nitric acid levels were higher
than those of to sulfuric acid causing the formation of particulate amines to proceed only
through the amine + HNO3 acid - base reaction. When diethylamine was detected, its
average mass ratio relative to nitrate was 0.31 (flight A) and 0.36 (flight B); relative to
sulfate it was 0.16 (flight A) and 0.36 (flight B), and relative to ammonium it was 0.31
(flight A) and 0.17 (flight B).

266
7.5.2.3 Total Amine Mass Calculations
One can estimate the total mass of amines present in the plume. This calculation
assumes that excess nitrate is in a 1:1 molar ratio with amines. Amine mass is then
determined by assuming a representative molecular weight for the amine population. We
choose to use methylamine and triethylamine as lower and upper limits, respectively,
since these species represent the smallest and largest amines that can be speciated using
the PILS-IC technique (Murphy et al., 2007); the molecular weight of the two amines
detected in this study, ethylamine and diethylamine, fall within the range of those of
methylamine and triethylamine.
On the basis of the molecular weight of methylamine (31.1 g/mol), average amine
concentrations in the plume are calculated to have been 0.23 + 0.13 μg/m3 (4% of total
organic mass) (flight A) and 0.06 + 0.10 μg/m3 (2% of total organic mass) (flight B),
while maximum plume concentrations were 0.86 μg/m3 (13% of total organic mass)
(flight A) and 0.44 μg/m3 (19% of total organic mass) (flight B). On the basis of the
molecular weight of triethylamine (101.1 g/mol), average amine concentrations are
calculated to have been 0.76 + 0.43 μg/m3 (12% of total organic mass) (flight A) and 0.20
+ 0.32 μg/m3 (8% of total organic mass) (flight B), while maximum levels were 2.81
μg/m3 (43% of total organic mass) (flight A) and 1.45 μg/m3 (63% of total organic mass)
(flight B). Using the conservative molecular weight of methylamine, amine mass was at
least 23% (flight A) and 14% (flight B) of ammonium mass in this plume. In addition,
speciated amines (ethylamine and diethylamine via the PILS) accounted for at least 25%
(flight A) and 45% (flight B) of the estimated total amine mass (via the excess nitrate
calculation from the cToF-AMS).

267
7.5.3 Degree of Oxidation and Volatility in the Aerosol
In the absence of strong signals in the data representing primary particulate
emission sources, the submicrometer aerosol in the sampling region is presumed to
originate mainly from secondary production. No obvious signs of primary aerosol
vehicular emissions existed based on organic markers in the cToF-AMS spectra. The
ratio of m/z 57:44 peak intensities from the cToF-AMS can provide some insight into the
relative ratio of hydrocarbon-like (HOA) and oxygenated organic (OOA) aerosols (Zhang
et al., 2005). This ratio was ~ 0.07 + 0.01 during both flights, with no major changes
during the flights, nor between plume and background aerosol (Table 7.1). Based on this
ratio, it appears that the aerosol was highly oxygenated with relatively little hydrocarbon-
like organic aerosol (HOA). The ratio of the peak intensity between m/z 44 and total
organics was, on average, 0.10 + 0.01 in the plume aerosol and 0.11 + 0.02 in the
background aerosol (Table 7.1). Peak intensities at m/z 44 (and 29 for flight A) are
slightly greater in the background aerosol relative to plume aerosol, indicating a greater
degree of oxidation out of the plume than within it (Fig. 7.11). This is presumably
because the background aerosol had aged longer than the fresh emissions in the plume.
Organic acids represent a pool of organic species that are water-soluble and
highly oxidized. In previous aircraft measurements, organic acids (C1 – C9) contributed
3.4 + 3.7% to the total PILS mass in an urban atmosphere (Houston, Texas; Sorooshian et
al., 2007a) and 3.5 + 3.1% in a marine atmosphere (Eastern Pacific Ocean; Sorooshian et
al., 2007b). In the present study, organic acids contributed 2.4 + 5.5% to the total PILS
mass, indicating greater variability and a lower average mass fraction of organic acids
than seen in the other field data. Since the lower organic acid contributions are likely not

268
a result of less photochemical processing, gas-particle partitioning of these water-soluble
organic species may have been affected by the high ambient temperatures in the present
flights. In addition, the relatively low humidities and lack of clouds prevented organic
acid production via aqueous-phase processing during the measurement period
(Sorooshian et al., 2006b). Organic acid concentrations were not correlated with
ammonium or nitrate, which represent semi-volatile species, during the present flights.
The ammonium nitrate levels varied significantly in the plume, but concentrations of the
organic acids were relatively stable. Thus, the data do not allow one to conclude whether
volatility or RH was the dominant factor controlling organic acid levels.
7.5.4 Factors Influencing Aerosol Number/Mass Concentrations
Particle number and mass concentrations were significantly higher during flight A
than in flight B. The presence of nucleation cannot explain this discrepancy, especially in
terms of mass concentration (Table 7.1). The background aerosol concentration in the
valley was also higher during flight A than in flight B. Since there are no significant
sources of SO2 in the sampling region, sulfate can be employed as a tracer for
accumulated aerosol originating from long-range transport. It should be noted that
comparable levels of vehicular emissions could be expected both days as both flights
occurred on weekdays. Sulfate concentrations were significantly higher during flight A.
The lower temperatures and higher RH during flight A favored partitioning of semi-
volatile species, such as ammonium nitrate and organics, to the aerosol phase. The back-
trajectory analysis indicates that the sampled air mass during flight A originated three
days previously over the Pacific Ocean, while the air sampled in flight B originated in a

269
more polluted inland area. We conclude that ventilation of the valley during flight B was
more effective than in flight A, reducing aerosol number and mass concentrations.
Over the flight durations, aerosol concentrations were influenced by competition
between a growing boundary layer, decreasing RH, and increasing temperatures.
Although the aerosol was well-mixed locally in the valley, the timescale for equilibration
between the gas and particle phases is shorter than the boundary layer mixing time
(Neuman et al., 2003); this may explain fluctuations in the concentrations of aerosol
species at various altitudes and distances downwind of the plume source. The topography
of the sampling region downwind of the source and general buoyancy in the boundary
layer facilitated vertical transport of emissions to lower temperature regions, reducing the
dissociation constant of ammonium nitrate aerosol and, presumably, semi-volatile
organics. This might explain why the concentrations of organics (diethylamine in
particular), nitrate, and ammonium peaked at the highest altitude and farthest downwind
distance from the plume source in flight A.
7.5.5 Estimated Subsaturated Hygroscopic Growth Factors for the Organic Fraction
Calculations were carried out to determine the effective growth factor for the
organic fraction needed to achieve composition – hygroscopicity closure. Due to its
simplicity and frequent application (Cruz and Pandis, 2000; Dick et al., 2000; Choi and
Chan, 2002a, 2002b; Prenni et al., 2003; Wise et al., 2003; Clegg et al., 2003; Clegg and
Seinfeld, 2004, 2006a, 2006b; Khlystov et al., 2005; Rissler et al., 2005; Aklilu et al.,
2006; Svenningsson et al., 2006; Varutbangkul et al., 2006; Gysel et al., 2007; Sjogren et
al., 2007; Dinar et al., 2008), the Zdanovskii-Stokes Robinson (ZSR) (Zdanovskii, 1948;

270
Stokes and Robinson, 1966) mixing rule is employed to predict hygroscopic growth
factors. This procedure of estimating hygroscopic growth based on specified composition
is based on the assumption that water uptake by each individual component of a particle
is independent and additive. We use the following form of the ZSR mixing rule (Aklilu
et al., 2006; Gysel et al., 2007):
31
3)()( ⎟⎠
⎞⎜⎝
⎛≈ ∑
iwiiwmixed aGFaGF ε (1)
where GFmixed is the hygroscopic growth factor of the mixed particle, GFi is the
hygroscopic growth factor of pure compound i, aw is the activity coefficient of water, and
εi is the volume fraction of pure compound i in the dry particle. aw = RH in equation (1)
(Seinfeld and Pandis, 2006). Growth factors for the pure inorganic components were
obtained from the Aerosol Inorganics Model (AIM;
http://mae.ucdavis.edu/~sclegg/aim.html; Clegg et al., 1998). At an RH of 74%, a
growth factor of unity is employed for ammonium sulfate rather than the predicted value
of 1.40 on its metastable branch of the hygroscopic hysteresis. It is reasonable to assume
that the sampled aerosol did not have sufficient time to be processed in the atmosphere at
high RHs. A growth factor of unity is also assumed for EC, as suggested by Aklilu et al.
(2006).
Calculating the individual volume fractions requires an estimate of the organic
density. If it is assumed that the aerosol is composed of ammonium sulfate (AS),
ammonium nitrate (AN), organic carbon (OC), and elemental carbon (EC), then total
aerosol density can be expressed as:
ECECECANANANASASASOCOCOC mxmxmxmx ρρρρρ +++= (2)

271
where xi are mass fractions, mi are mass concentrations, and ρ is density of the
multicomponent particle, as determined by the ratio of aerosol volume (via the DMA) to
the aerosol mass (via the PILS and cToF-AMS); in equation (2), ρOC is the unknown
quantity that we desire to determine. Elemental carbon was not quantified in the present
study; however, based on extensive chemical characterization of San Joaquin Valley
PM2.5 by Chow et al. (2006), the mass fraction of EC tends to be ~ 5 – 10% near the
present sampling site. In the absence of a quantitative measure of EC, it is assumed that
5% of the total submicrometer mass is composed of EC. It is assumed for the purpose of
this calculation that all of the sulfate is neutralized by ammonium, and the remaining
ammonium occurs as ammonium nitrate. Densities of 1.725, 1.769, and 1.9 g/cm3 are
used for AN, AS, and EC respectively. A wide range of densities are reported for EC
(0.625 – 2.25 g/cm3) (Fuller et al., 1999); here we assume a value of 1.9 g/cm3, similar to
that employed by Dillner et al. (2001). From the mass concentrations and respective
densities of AN, AS, OC, and OC, the volume fraction of each component can be
calculated.
On average, the in-plume organic growth factors needed to match the data (flight
A/B) are 1.07/1.02 (74% RH), NA/1.28 (85% RH), and 1.49/1.53 (92% RH) (Figure
7.19). The background aerosol organic growth factors (flight A/B) are 1.08/1.03 (74%
RH), NA/1.21 (85% RH), and 1.29/1.24 (92% RH). Flight B is characterized by a wider
range in the mass fractions of organics, thus this flight presents a better indication of
trends in organic growth factor with changing mass fractions. During this flight, inferred
organic growth factors increase in the plume as a function of decreasing organic fraction.
The lowest organic fractions in flight B coincide with the detection of amines, which
272
likely enhance the hygroscopicity of the organic fraction. There is a significant amount
of variation in predicted growth factors at constant organic mass fractions and the
absolute values of some of the predicted organic growth factors (< 1 and > 2) are
unrealistic. Possible explanations for the unrealistic organic hygroscopic growth factors
include: (1) complex particle morphology; (2) complex interactions between the
components in the particles leading to non-additive water uptake among the individual
components; and (3) errors associated with the calculation of the volume fractions and
uncertainties in the measurements.
7.5.6 Relationship Between Sub- and Supersaturated Water Uptake
One anticipates a direct correspondence between subsaturated hygroscopic
behavior and supersaturated CCN activity. For example, Mochida et al. (2006) explored
the relationship between hygroscopicity and CCN activity for urban aerosols using a
hygroscopic tandem DMA (HTDMA) coupled in series to a CCNc; enhanced CCN
activity coincided with higher subsaturated growth factors. A similar analysis for the
present data (Figure 7.17) shows that the normalized CCN activation ratio is generally
consistent with water uptake in the subsaturated regime. Also, higher activated fractions
are consistent with smaller markers, which represent lower organic mass fractions and
higher nitrate mass fractions. Enhancements in water uptake for aerosols with lower
organic content are likely due to increasing dissolution of water-soluble species,
including ammonium nitrate and amine salts, and the possible reduction in surface
tension by surface-active species. Organics have previously been shown to influence

273
CCN activity by adding solute and suppressing surface tension (Shulman et al., 1996;
Facchini et al., 1999; Feingold and Chuang, 2002; Nenes et al., 2002).
Recent work has shown that kinetic limitations, including surface films and slow
dissolution of particulate substances, can suppress droplet growth (Asa-Awuku and
Nenes, 2007; Ruehl et al., 2008). With few exceptions including solute being physically
“trapped” within some type of waxy material, dissolution kinetics is governed by
diffusion of solute from the solid “core” at the center of a droplet to the growing droplet.
It has been argued that the latter process is slow enough for compounds with high
molecular weights to influence droplet growth kinetics and the Köhler curve (Asa-Awuku
and Nenes, 2007; Taraniuk et al., 2007; Moore et al., 2008). According to Figure 7.18,
droplet growth was at times less than that expected for pure ammonium sulfate. In
addition, it is shown to some extent that the droplet growth was suppressed for CCN with
relatively greater amounts of hydrophobic organic material This suggests kinetic
limitations may have played a role in suppressing water uptake. This issue will be
revisited in subsequent work that will address size-resolved CCN data from this
experiment.
7.5.7 Parameterization for Sub- and Supersaturated Water Uptake
To effectively represent the process of water uptake by multicomponent particles
in atmospheric models, parameterizations are used. A number of investigators have
attempted to introduce parameters to describe water uptake in both the sub- and
supersaturated regimes. Expanding upon the earlier work of Fitzgerald et al. (1982),
Svenningsson et al. (1992) used a parameter termed ε to link subsaturated water uptake to

274
cloud and fog activation. Subsequent work introduced closely related parameters for sub-
and supersaturated regimes (Kreidenweis et al., 2005; Rissler et al., 2006; Petters and
Kreidenweis, 2007). A recently introduced parameter, κ (Petters and Kreidenweis,
2007), can be calculated without knowledge of the particle properties such as density,
molecular weight, and surface tension.
Kappa can be determined from either CCN activity data or subsaturated
hygroscopic growth data. Since the subsaturated DASH-SP growth factors are measured
for size-resolved particles, we use the subsaturated hygroscopicity data to predict the
value of κ with the following equation (Petters and Kreidenweis, 2007):
)1(1
exp3
3
κ−−−
=
⎟⎟⎠
⎞⎜⎜⎝
⎛ GFGF
GFDA
RH
d
(3)
where W
Was
RTM
Aρ
σ /4= , Dd is the dry particle diameter, GF is the growth factor at the
corresponding RH, Mw is the molecular weight of water, ρw is the density of water, R is
the universal gas constant, T is temperature, and σs/a is the surface tension at the air/water
interface. The water surface tension of 0.072 J/m2 is assumed, as in the analysis of
Petters and Kreidenweis (2007). Briefly, κ values of 0.5 to 1.4 represent highly
hygroscopic salts such as sodium chloride, values of 0.01 to 0.5 represent slightly to very
hygroscopic organics, and a value of 0 represents a non-hygroscopic component (Petters
and Kreidenweis, 2007; see Table 7.1). κ values representative of urban, maritime,
continental, and remote areas, as derived by Petters and Kreidenweis (2007) using data

275
from previous ambient studies (Fitzgerald and Hoppel, 1982; Hudson and Da, 1996;
Dusek et al., 2006), have been reported to range from 0.1 to 0.94.
Table 7.4 summarizes the values of κ derived in the present study. A noticeable
enhancement in κ occurs within the plume as compared to the background aerosol, which
is consistent with the enhancement in subsaturated growth factors. κ is enhanced by
between 21% and 67% in the plume, with typical values being between 0.36 – 0.44. The
range of κ values, based on DASH-SP data at RHs of 85% and 92%, is 0.11 – 0.87. The
correlation between κ values and the mass fraction of organics is more pronounced for
flight B; κ increases as the mass fraction of organics decreases and that of nitrate
increases. Representative κ values are assigned to two categories: aerosol from the strong
bovine source (κ = 0.40) and aerosol in an agricultural area (κ = 0.30). Values of κ
determined here fall within the range of those derived from previous ambient studies.
7.6 Conclusions
An extensive set of airborne aerosol and meteorological measurements were
performed downwind of a massive bovine source in the San Joaquin Valley of California
during two flights in July 2007; these include meteorology, particle size distributions,
aerosol composition and mixing state, sub- and supersaturated water uptake behavior,
aerosol refractive index, and interrelationships between these properties.
Concentrations of total mass, organics, nitrate, and ammonium were elevated
within the plume as compared to the background aerosol during both flights. Evidence
exists of some degree of external mixing of particles in the plume. Organics constituted
the dominant fraction of the total mass in the plume and background aerosol (~ 56 –
276
64%), followed either by sulfate or nitrate, and then ammonium. Particulate amines were
detected in the plume and are shown to be a significant atmospheric base even in the
presence of ammonia; the total amine concentration accounted for at least 23% (flight A)
and 14% (flight B) of that of ammonium.
The refractive index of the background aerosol in the valley was on average 1.54,
but reductions were observed in the plume, especially in the immediate vicinity of the
plume source (flight A ~ 1.48; flight B ~ 1.51). Measurements indicate that increasing
uptake of ammonia by aerosols, in the form of ammonium nitrate and ammonium sulfate,
relative to the organic fraction, results in an enhancement in particle water uptake and a
reduction in refractive index. Amine salts are also hypothesized to have contributed to
significant hygroscopic growth in the plume. Hygroscopic growth factors in the
immediate vicinity of the source were generally between 1.75 – 1.90 at RH = 92%.
Estimated hygroscopic growth factors (RH = 92%) for the organic fraction on average
were 1.49 – 1.53 in the plume and 1.24 – 1.29 in the background aerosol. It is shown that
kinetic limitations associated with hydrophobic organic species likely suppressed droplet
growth. After removing effects associated with size distribution and mixing state,
enhanced CCN activated fractions were generally observed as a function of increasing
subsaturated growth factors, with the highest activated fractions being consistent with the
lowest organic mass fractions. Representative κ values (Petters and Kreidenweis, 2007)
are assigned to two categories: aerosol from the bovine source (κ = 0.40) and aerosol in
an agricultural area (κ = 0.30). Since organics dominated the particle mass, these values
of κ are indicative of fairly hygroscopic organics.

277
7.7 Acknowledgements
This work was supported, in part, by NOAA grant NA06OAR4310082. A. N.
acknowledges support from an NSF CAREER award, NOAA, and NASA. L. T. P.
acknowledges support from a NASA Earth System Science Fellowship. The authors
gratefully acknowledge the NOAA Air Resources Laboratory (ARL) for provision of the
HYSPLIT transport and dispersion model.
7.8 References Abalos, M., Bayona, J. M., and Ventura, F.: Development of a solid-phase microextraction GC-NPD procedure for the determination of free volatile amines in wastewater and sewage-polluted waters, Anal. Chem., 71, 3531-3537, 1999. Aklilu, Y., Mozurkewich, M., Prenni, A. J., Kreidenweis, S. M., Alfarra, M. R., Allan, J. D., Anlauf, K., Brook, J., Leaitch, W. R., Sharma, S., Boudries, H., and Worsnop, D. R.: Hygroscopicity of particles at two rural, urban influenced sites during Pacific 2001: Comparison with estimates of water uptake from particle composition, Atmos. Environ., 40, 2650-2661, 2006. Allan, J. D., Delia, A. E., Coe, H., Bower, K. N., Alfarra, M. R., Jimenez, J. L., Middlebrook, A. M., Drewnick, F., Onasch, T. B., Canagaratna, M. R., Jayne, J. T., and Worsnop, D. R.: A generalised method for the extraction of chemically resolved mass spectra from aerodyne aerosol mass spectrometer data, J. Aerosol Sci., 35, 909-922, 2004. Anderson, N., Strader, R., and Davidson, C.: Airborne reduced nitrogen: ammonia emissions from agriculture and other sources, Environ. Int., 29, 277-286, 2003. Angelino, S., Suess, D. T., and Prather, K. A.: Formation of aerosol particles from reactions of secondary and tertiary alkylamines: Characterization by aerosol time-of-flight mass spectrometry, Environ. Sci. Technol., 35, 3130-3138, 2001. Apsimon, H. M., Kruse, M., and Bell, J. N. B.: Ammonia emissions and their role in acid deposition, Atmos. Environ., 21, 1939-1946, 1987. Asa-Awuku, A. and Nenes, A.: Effect of solute dissolution kinetics on cloud droplet formation: Extended Kohler theory, J. Geophys. Res., 112, D22201, doi:10.1029/2005JD006934, 2007.

278
Asman, W. A. H. and Janssen, A. J.: A long-range transport model for ammonia and ammonium for Europe, Atmos. Environ., 21, 2099-2119, 1987. Battye, W., Aneja, V. P., and Roelle, P. A.: Evaluation and improvement of ammonia emissions inventories, Atmos. Environ., 37, 3873-3883, 2003. Beddows, D. C. S., Donovan, R. J., Harrison, R. M., Heal, M. R., Kinnersley, R. P., King, M. D., Nicholson, D. H., and Thompson, K. C.: Correlations in the chemical composition of rural background atmospheric aerosol in the UK determined in real time using time-of-flight mass spectrometry, J. Environ. Monitor., 6, 124-133, 2004. Blanchard, C. L., Roth, P. M., Tanenbaum, S. J., Ziman, S. D., and Seinfeld, J. H.: The use of ambient measurements to identify which precursor species limit aerosol nitrate formation, J. Air Waste Manage., 50, 2073-2084, 2000. Brechtel, F. J. and Kreidenweis, S. M.: Predicting particle critical supersaturation from hygroscopic growth measurements in the humidified TDMA. part I: Theory and sensitivity studies, J. Atmos. Sci., 57, 1854-1871, 2000. Cadle, S. H. and Mulawa, P. A.: Low-molecular weight aliphatic-amines in exhaust from catalyst-equipped cars, Environ. Sci. Technol., 14, 718-723, 1980. Choi, M. Y. and Chan, C. K.: The effects of organic species on the hygroscopic behaviors of inorganic aerosols, Environ. Sci. Technol., 36, 2422-2428, 2002a. Choi, M. Y. and Chan, C. K.: Continuous measurements of the water activities of aqueous droplets of water-soluble organic compounds, J. Phys. Chem. A, 106, 4566-4572, 2002b. Chow, J. C., Watson, J. G., Lu, Z. Q., Lowenthal, D. H., Frazier, C. A., Solomon, P. A., Thuillier, R. H., and K. Magliano (1996), Descriptive analysis of PM(2.5) and PM(10) at regionally representative locations during SJVAQS/AUSPEX, Atmos. Environ., 30, 2079-2112. Chow, J. C., Chen, L. W. A., Watson, J. G., Lowenthal, D. H., Magliano, K. A. Turkiewicz, K., and Lehrman, D. E.: PM2.5 chemical composition and spatiotemporal variability during the California Regional PM10/PM2.5 Air Quality Study (CRPAQS), J. Geophys. Res., 111, D10S04, doi:10.1029/2005JD006457, 2006. Chuang, P. Y.: Measurement of the timescale of hygroscopic growth for atmospheric aerosols, J. Geophys. Res., 108, 4282, doi:10.1029/2002JD002757, 2003. Clegg, S. L., Brimblecombe, P., and Wexler, A. S.: Thermodynamic model of the system H+-NH4
+-Na+-SO42--NO3
--Cl--H2O at 298.15 K, J. Phys. Chem. A, 102, 2155-2171, 1998.

279
Clegg, S. L., Seinfeld, J. H., and Edney, E. O.: Thermodynamic modelling of aqueous aerosols containing electrolytes and dissolved organic compounds. II. An extended Zdanovskii-Stokes-Robinson approach, J. Aerosol Sci., 34, 667-690, 2003. Clegg, S. L. and Seinfeld, J. H.: Improvement of the Zdanovskii-Stokes-Robinson model for mixtures containing solutes of different charge types, J. Phys. Chem. A, 108, 1008-1017, 2004. Clegg, S. L. and Seinfeld, J. H.: Thermodynamic models of aqueous solutions containing inorganic electrolytes and dicarboxylic acids at 298.15 K. 1. The acids as nondissociating components, J. Phys. Chem. A, 110, 5692-5717, 2006a. Clegg, S. L. and Seinfeld, J. H.: Thermodynamic models of aqueous solutions containing inorganic electrolytes and dicarboxylic acids at 298.15 K. 2. Systems including dissociation equilibria, J. Phys. Chem. A, 110, 5718-5734, 2006b. Cruz, C. N. and Pandis, S. N.: Deliquescence and hygroscopic growth of mixed inorganic-organic atmospheric aerosol, Environ. Sci. Technol., 34, 4313-4319, 2000. Dean, J. A.: Lange's Handbook of Chemistry, Fifteenth Edition, McGraw-Hill, 1999. Denkenberger, K. A., Moffet, R. C., Holecek, J. C., Rebotier, T. P., and Prather, K. A.: Real-time, single-particle measurements of oligomers in aged ambient aerosol particles, Environ. Sci. Technol., 41, 5439-5446, 2007. Dick, W. D., Saxena, P., and McMurry, P. H.: Estimation of water uptake by organic compounds in submicron aerosols measured during the Southeastern Aerosol and Visibility Study, J. Geophys. Res., 105, 1471-1479, 2000. Dillner, A. M., Stein, C., Larson, S. M., and Hitzenberger, R.: Measuring the mass extinction efficiency of elemental carbon in rural aerosol, Aerosol Sci. Tech., 35, 1009-1021, 2001. Dinar, E., Anttila, T., and Rudich, Y.: CCN activity and hygroscopic growth of organic aerosols following reactive uptake of ammonia, Environ. Sci. Technol., 42, 793-799, 2008. Doyle, G. J., Tuazon, E. C., Graham, R. A., Mischke, T. M., Winer, A. M., and Pitts, J. N.: Simultaneous concentrations of ammonia and nitric-acid in a polluted atmosphere and their equilibrium relationship to particulate ammonium-nitrate, Environ. Sci. Technol., 13, 1416-1419, 1979. Draxler, R. R. and Rolph, G. D.: HYSPLIT (HYbrid Single-Particle Lagrangian Integrated Trajectory) Model access via NOAA ARL READY Website (http://www.arl.noaa.gov/ready/hysplit4.html), NOAA Air Resources Laboratory, Silver Spring, MD, 2003.

280
Drewnick, F., Schwab, J. J., Jayne, J. T., Canagaratna, M., Worsnop, D. R., and Demerjian, K. L.: Measurement of ambient aerosol composition during the PMTACS-NY 2001 using an aerosol mass spectrometer. Part I: Mass concentrations, Aerosol Sci. Tech., 38, 92-103, 2004a. Drewnick, F., Jayne, J. T., Canagaratna, M., Worsnop, D. R., and Demerjian, K. L.: Measurement of ambient aerosol composition during the PMTACS-NY 2001 using an aerosol mass spectrometer. Part II: Chemically speciated mass distributions, Aerosol Sci. Tech., 38, 104-117, 2004b. Dusek, U., Frank, G. P., Hildebrandt, L., Curtius, J., Schneider, J., Walter, S., Chand, D., Drewnick, F., Hings, S., Jung, D., Borrmann, S., and Andreae, M. O.: Size matters more than chemistry for cloud-nucleating ability of aerosol particles, Science, 312, 1375-1378, 2006. Edgerton, E. S., Saylor, R. D., Hartsell, B. E., Jansen, J. J., and Hansen, D. A.: Ammonia and ammonium measurements from the southeastern United States, Atmos. Environ., 41, 3339-3351, 2007. Facchini, M. C., Mircea, M., Fuzzi, S., and Charlson, R. J.: Cloud albedo enhancement by surface-active organic solutes in growing droplets, Nature, 401, 257-259, 1999. Feingold, G. and Chuang, P. Y.: Analysis of the influence of film-forming compounds on droplet growth: Implications for cloud microphysical processes and climate, J. Atmos. Sci., 59, 2006-2018, 2002. Fitzgerald, J. W., Hoppel, W. A., and Vietti, M. A.: The size and scattering coefficient of urban aerosol-particles at Washington, DC as a function of relative-humidity, J. Atmos. Sci., 39, 1838-1852, 1982. Fitzgerald, J. W. and Hoppel, W. A.: Measurement of the relationship between the dry size and critical supersaturation of natural aerosol particles, J. Hung. Meteorol. Serv., 86, 242-248, 1982. Fridlind, A. M. and Jacobson, M. Z.: A study of gas-aerosol equilibrium and aerosol pH in the remote marine boundary layer during the First Aerosol Characterization Experiment (ACE 1), J. Geophys. Res., 105, 17325-17340, 2000. Fridlind, A. M., Jacobson, M. Z., Kerminen, V. M., Hillamo, R. E., Ricard, V., and Jaffrezo, J. L.: Analysis of gas-aerosol partitioning in the Arctic: Comparison of size-resolved equilibrium model results with field data, J. Geophys. Res., 105, 19891-19903, 2000. Fuller, K. A., Malm, W. C., and Kreidenweis, S. M.: Effects of mixing on extinction by carbonaceous particles, J. Geophys. Res., 104, 15941-15954, 1999.

281
Glagolenko, S. and Phares, D. J.: Single-particle analysis of ultrafine aerosol in College Station, Texas. J. Geophys. Res., 109, D18205, doi:10.1029/2004JD004621, 2004. Gorzelska, K., Talbot, R. W., Klemm, K., Lefer, B., Klemm, O., Gregory, G. L., Anderson, B., and Barrie, L. A.: Chemical-composition of the atmospheric aerosol in the troposphere over the Hudson-Bay Lowlands and Quebec-Labrador Regions of Canada. J. Geophys. Res., 99, 1763-1779, 1994. Gysel, M., Crosier, J., Topping, D. O., Whitehead, J. D., Bower, K. N., Cubison, M. J., Williams, P. I., Flynn, M. J., McFiggans, G. B., and Coe, H.: Closure study between chemical composition and hygroscopic growth of aerosol particles during TORCH2, Atmos. Chem. Phys., 7, 6131-6144, 2007. Hegg, D. A., Covert, D. S., Jonsson, H., and Covert, P. A.: Determination of the transmission efficiency of an aircraft aerosol inlet, Aerosol Sci. Tech., 39, 966-971, 2005. Hildemann, L. M., Russell, A. G., and Cass, G. R.: Ammonia and nitric-acid concentrations in equilibrium with atmospheric aerosols - experiment vs theory, Atmos. Environ., 18, 1737-1750, 1984. Hudson, J. G. and Da, X. Y.: Volatility and size of cloud condensation nuclei, J. Geophys. Res., 101, 4435-4442, 1996. Hutchinson, G. L., Mosier, A. R., and Andre, C. E.: Ammonia and amine emissions from a large cattle feedlot, J. Environ. Qual., 11, 288-293, 1982. Khlystov, A., Stanier, C. O., Takahama, S., and Pandis, S. N.: Water content of ambient aerosol during the Pittsburgh air quality study, J. Geophys. Res., 110, D07S10, doi:10.1029/2004JD004651, 2005. Kleeman, M. J., Hughes, L. S., Allen, J. O., and Cass, G. R.: Source contributions to the size and composition distribution of atmospheric particles: Southern California in September 1996, Environ. Sci. Technol., 33, 4331-4341, 1999. Kreidenweis, S. M., Koehler, K., DeMott, P. J., Prenni, A. J., Carrico, C., and Ervens, B.: Water activity and activation diameters from hygroscopicity data - Part I: Theory and application to inorganic salts, Atmos. Chem. Phys., 5, 1357-1370, 2005. Lance, S., Medina, J., Smith, J. N., and Nenes, A.: Mapping the operation of the DMT Continuous Flow CCN counter, Aerosol Sci. Tech., 40, 242-254, 2006. Lobert, J. M., Scharffe, D. H., Hao, W. M., Kuhlbusch, T. A., Warneck, P., and Crutzen, P. J.: Experimental evaluation of biomass burning emissions: Nitrogen and carbon containing compounds, in J. S. Levine (ed.), Global Biomass Burning: Atmospheric, Climate and Biospheric Implications, MIT Press, Cambridge, MA, 1991.

282
Makela, J. M., Yli-Koivisto, S., Hiltunen, V., Seidl, W., Swietlicki, E., Teinila, K., Sillanpaa, M., Koponen, I. K., Paatero, J., Rosman, K., and Hameri, K.: Chemical composition of aerosol during particle formation events in boreal forest, Tellus B, 53, 380-393, 2001. Manahan, S. E.: Environmental Chemistry, Eighth Edition, CRC Press, Boca Raton, Florida, 2005. Maria, S. F., Russell, L. M., Turpin, B. J., Porcja, R. J., Campos, T. L., Weber, R. J., and Huebert, B. J.: Source signatures of carbon monoxide and organic functional groups in Asian Pacific Regional Aerosol Characterization Experiment (ACE-Asia) submicron aerosol types, J. Geophys. Res., 108, 8637, doi:10.1029/2003JD003703, 2003. McLafferty, F. W. and Turecek, F.: Interpretation of Mass Spectra, Fourth Edition, University Science Books, Mill Valley, California, 1993. Meng, Z. Y. and Seinfeld, J. H.: Time scales to achieve atmospheric gas-aerosol equilibrium for volatile species, Atmos Environ., 30, 2889-2900, 1996. Milne, P. J. and Zika, R. G.: Amino-acid nitrogen in atmospheric aerosols - occurrence, sources and photochemical modification, J. Atmos. Chem., 16, 361-398, 1993. Mochida, M., Kuwata, M., Miyakawa, T., Takegawa, N., Kawamura, K., and Kondo, Y.: Relationship between hygroscopicity and cloud condensation nuclei activity for urban aerosols in Tokyo, J. Geophys. Res., 111, D23204, doi:10.1029/2005JD006980, 2006. Moore, R. H., Ingall, E. D., Sorooshian, A., and Nenes, A.: Molar mass, surface tension, and droplet growth kinetics of marine organics from measurements of CCN activity, Geophys. Res. Lett., 35, L07801, doi:10.1029/2008GL033350, 2008. Mosier, A. R., Andre, C. E., and Viets, F. G.: Identification of Aliphatic-Amines Volatilized from Cattle Feedyard, Environ. Sci. Technol., 7, 642-644, 1973. Mozurkewich, M.: The dissociation-constant of ammonium-nitrate and Its dependence on temperature, relative-humidity and particle-size, Atmos Environ., 27, 261-270, 1993. Murphy, D. M. and Thomson, D. S.: Chemical composition of single aerosol particles at Idaho Hill: Positive ion measurements, J. Geophys. Res., 102, 6341-6352, 1997. Murphy, S. M., Sorooshian, A., Kroll, J. H., Ng, N. L., Chhabra, P., Tong, C., Surratt, J. D., Knipping, E., Flagan, R. C., and J. H. Seinfeld (2007), Secondary aerosol formation from atmospheric reactions of aliphatic amines, Atmos. Chem. Phys., 7, 2313-2337.

283
Nenes, A., Charlson, R. J., Facchini, M. C., Kulmala, M., Laaksonen, A., and Seinfeld, J. H.: Can chemical effects on cloud droplet number rival the first indirect effect?, Geophys. Res. Lett., 29, 1848, doi:10.1029/2002GL015295, 2002. Neuman, J. A., Nowak, J. B., Brock, C. A., Trainer, M., Fehsenfeld, F. C., Holloway, J. S., Hubler, G., Hudson, P. K., Murphy, D. M., Nicks, D. K., Orsini, D., Parrish, D. D., Ryerson, T. B., Sueper, D. T., Sullivan, A., and Weber, R.: Variability in ammonium nitrate formation and nitric acid depletion with altitude and location over California, J. Geophys. Res., 108, 4557, doi:10.1029/2003JD003616, 2003. Ngwabie, N. M., Custer, T. G., Schade, G. W., Linke, S., and Hinz, T.: Mixing ratio measurements and flux estimates of volatile organic compounds (VOC) from a cowshed with conventional manure treatment indicate significant emissions to the atmosphere, Geophys. Res. Abstr., 7(01175), 2005. Petters, M. D. and Kreidenweis, S. M.: A single parameter representation of hygroscopic growth and cloud condensation nucleus activity. Atmos. Chem. Phys., 7, 1961-1971, 2007. Prenni, A. J., De Mott, P. J., and Kreidenweis, S. M.: Water uptake of internally mixed particles containing ammonium sulfate and dicarboxylic acids, Atmos Environ., 37, 4243-4251, 2003. Pun, B. K. and Seigneur, C.: Understanding particulate matter formation in the California San Joaquin Valley: conceptual model and data needs, Atmos. Environ., 33, 4865-4875, 1999. Rabaud, N. E., Ebeler, S. E., Ashbaugh, L. L., and Flocchini, R. G.: Characterization and quantification of odorous and non-odorous volatile organic compounds near a commercial dairy in California, Atmos. Environ., 37, 933-940, 2003. Rissler, J., Pagels, J., Swietlicki, E., Wierzbicka, A., Strand, M., Lillieblad, L., Sanati, M., and Bohgard, M.: Hygroscopic behavior of aerosol particles emitted from biomass fired grate boilers, Aerosol Sci. Tech., 39, 919-930, 2005. Rissler, J., Vestin, A., Swietlicki, E., Fisch, G., Zhou, J., Artaxo, P., and Andreae, M. O.: Size distribution and hygroscopic properties of aerosol particles from dry-season biomass burning in Amazonia, Atmos. Chem. Phys., 6, 471-491, 2006. Roberts, G. C. and Nenes, A.: A continuous-flow streamwise thermal-gradient CCN chamber for atmospheric measurements, Aerosol Sci. Tech., 39, 206-221, 2005. Ruehl, C. R., Chuang, P. Y., and Nenes, A.: How quickly do cloud droplets form on atmospheric particles?, Atmos. Chem. Phys., 8, 1043-1055, 2008.

284
Rumburg, B., Mount, G. H., Yonge, D., Lamb, B., Westberg, H., Filipy, J., Bays, J., Kincaid, R., and Johnson, K.: Atmospheric flux of ammonia from sprinkler application of dairy waste, Atmos Environ., 40, 7246-7258, 2006. Russell, A. G., Mcrae, G. J., and Cass, G. R.: Mathematical-modeling of the formation and transport of ammonium-nitrate aerosol, Atmos. Environ., 17, 949-964, 1983. Schade, G. W. and Crutzen, P. J.: Emission of aliphatic-amines from animal husbandry and their reactions - potential source of N2O and HCN, J. Atmos. Chem., 22, 319-346, 1995. Seinfeld, J. H. and Pandis, S. N.: Atmospheric Chemistry and Physics, Second Edition, Wiley-Interscience, New York, 2006. Shulman, M. L., Jacobson, M. C., Carlson, R. J., Synovec, R. E., and Young, T. E.: Dissolution behavior and surface tension effects of organic compounds in nucleating cloud droplets, Geophys. Res. Lett., 23, 277-280, 1996. Sjogren, S., Gysel, M., Weingartner, E., Baltensperger, U., Cubison, M. J., Coe, H., Zardini, A. A., Marcolli, C., Krieger, U. K., and Peter, T.: Hygroscopic growth and water uptake kinetics of two-phase aerosol particles consisting of ammonium sulfate, adipic and humic acid mixtures, J. Aerosol Sci., 38, 157-171, 2007. Sorooshian, A., Brechtel, F. J., Ma, Y. L., Weber, R. J., Corless, A., Flagan, R. C., and Seinfeld, J. H.: Modeling and characterization of a particle-into-liquid sampler (PILS), Aerosol Sci. Tech., 40, 396-409, 2006a. Sorooshian, A., Varutbangkul, V., Brechtel, F. J., Ervens, B., Feingold, G., Bahreini, R., Murphy, S. M., Holloway, J. S., Atlas, E. L., Buzorius, G., Jonsson, H., Flagan, R. C., and Seinfeld, J. H.: Oxalic acid in clear and cloudy atmospheres: Analysis of data from International Consortium for Atmospheric Research on Transport and Transformation 2004, J. Geophys. Res., 111, D23S45, doi:10.1029/2005JD006880, 2006b. Sorooshian, A., Ng, N. L., Chan, A. W. H., Feingold, G., Flagan, R. C., and Seinfeld, J. H.: Particulate organic acids and overall water-soluble aerosol composition measurements from the 2006 Gulf of Mexico Atmospheric Composition and Climate Study (GoMACCS), J. Geophys. Res., 112, D13201, doi:10.1029/2007JD008537, 2007a. Sorooshian, A., Lu, M. L., Brechtel, F. J., Jonsson, H., Feingold, G., Flagan, R. C., and Seinfeld, J. H.: On the source of organic acid aerosol layers above clouds, Environ. Sci. Technol., 41, 4647-4654, 2007b. Sorooshian, A., S. Hersey, F. J. Brechtel, A. Corless, R. C. Flagan, and Seinfeld, J. H.: Rapid, size-resolved aerosol hygroscopic growth measurements: differential aerosol sizing and hygroscopicity spectrometer probe (DASH-SP), Aerosol Sci. Tech., (in press), 2008.

285
Stelson, A. W., Friedlander, S. K., and Seinfeld, J. H.: Note on the equilibrium relationship between ammonia and nitric-acid and particulate ammonium-nitrate, Atmos. Environ., 13, 369-371, 1979. Stelson, A. W. and Seinfeld, J. H.: Relative-humidity and temperature-dependence of the ammonium-nitrate dissociation-constant, Atmos. Environ., 16, 983-992, 1982a. Stelson, A. W. and Seinfeld, J. H.: Relative-humidity and Ph-dependence of the vapor-pressure of ammonium-nitrate nitric acid-solutions at 25 degrees C, Atmos. Environ., 16, 993-1000, 1982b. Stokes, R. H. and Robinson, R. A.: Interactions in aqueous nonelectrolyte solutions .I. Solute-solvent equilibria, J. Phys. Chem., 70, 2126-2130, 1966. Svenningsson, I. B., Hansson, H. C., Wiedensohler, A., Ogren, J. A., Noone, K. J., and Hallberg, A.: Hygroscopic growth of aerosol-particles in the Po Valley, Tellus B, 44, 556-569, 1992. Svenningsson, B., Rissler, J., Swietlicki, E., Mircea, M., Bilde, M., Facchini, M. C., Decesari, S., Fuzzi, S., Zhou, J., Monster, J., and Rosenorn, T.: Hygroscopic growth and critical supersaturations for mixed aerosol particles of inorganic and organic compounds of atmospheric relevance, Atmos. Chem. Phys., 6, 1937-1952, 2006. Takahama, S., Wittig, A. E., Vayenas, D. V., Davidson, C. I., and Pandis, S. N.: Modeling the diurnal variation of nitrate during the Pittsburgh Air Quality Study, J. Geophys. Res., 109, D16S06, doi:10.1029/2003JD004149, 2004. Tan, P. V., Evans, G. J., Tsai, J., Owega, S., Fila, M. S., and Malpica, O.: On-line analysis of urban particulate matter focusing on elevated wintertime aerosol concentrations, Environ. Sci. Technol., 36, 3512-3518, 2002. Tang, I. N.: Chemical and size effects of hygroscopic aerosols on light scattering coefficients, J. Geophys. Res., 101, 19245-19250, 1996. Taraniuk, I., Graber, E. R., Kostinski, A., and Rudich, Y.: Surfactant properties of atmospheric and model humic-like substances (HULIS), Geophys. Res. Lett., 34, L16807, doi:10.1029/2007GL029576, 2007. Vanneste, A., Duce, R. A., and Lee, C.: Methylamines in the marine atmosphere, Geophys. Res. Lett., 14, 711-714, 1987. Varutbangkul, V., Brechtel, F. J., Bahreini, R., Ng, N. L., Keywood, M. D., Kroll, J. H., Flagan, R. C., Seinfeld, J. H., Lee, A., and Goldstein, A. H.: Hygroscopicity of secondary organic aerosols formed by oxidation of cycloalkenes, monoterpenes, sesquiterpenes, and related compounds, Atmos. Chem. Phys., 6, 2367-2388, 2006.

286
Weast, R. C.: CRC Handbook of Chemistry and Physics, Sixty Eighth Edition, CRC Press, Florida, 1987. Westerholm, R., Li, H., and Almen, J.: Estimation of aliphatic amine emissions in automobile exhausts, Chemosphere, 27, 1381-1384, 1993. Wexler, A. S. and Seinfeld, J. H.: Analysis of aerosol ammonium-nitrate - departures from equilibrium during Scaqs, Atmos. Environ., 26, 579-591, 1992. Wise, M. E., Surratt, J. D., Curtis, D. B., Shilling, J. E., and Tolbert, M. A.: Hygroscopic growth of ammonium sulfate/dicarboxylic acids, J. Geophys. Res., 108, 4638, doi:10.1029/2003JD003775, 2003. Xiong, J. Q., Zhong, M. H., Fang, C. P., Chen, L. C., and Lippmann, M.: Influence of organic films on the hygroscopicity of ultrafine sulfuric acid aerosol, Environ. Sci. Technol., 32, 3536-3541, 1998. Yu, S. C., Dennis, R., Roselle, S., Nenes, A., Walker, J., Eder, B., Schere, K., Swall, J., and Robarge, W.: An assessment of the ability of three-dimensional air quality models with current thermodynamic equilibrium models to predict aerosol NO3
-, J. Geophys. Res., 110, D07S13, doi:10.1029/2004JD004718, 2005. Zdanovskii, A.: New methods for calculating solubilities of electrolytes in multicomponent systems, Zhur. Fiz. Khim., 22, 1475–1485, 1948. Zhang, J., Chameides, W. L., Weber, R., Cass, G., Orsini, D., Edgerton, E., Jongejan, P., and Slanina, J.: An evaluation of the thermodynamic equilibrium assumption for fine particulate composition: Nitrate and ammonium during the 1999 Atlanta Supersite Experiment, J. Geophys. Res., 108, 8414, doi:10.1029/2001JD001592, 2002. Zhang, X. Q., Turpin, B. J., McMurry, P. H., Hering, S. V., and Stolzenburg, M. R.: Mie theory evaluation of species contributions to 1990 wintertime visibility reduction in the Grand-Canyon, J. Air Waste Manage., 44, 153-162, 1994. Zhang, Q., Anastasio, C., and Jimenez-Cruz, M.: Water-soluble organic nitrogen in atmospheric fine particles (PM2.5) from northern California, J. Geophys. Res., 107, 4112, doi:10.1029/2001JD000870, 2002. Zhang, Q. and Anastasio, C.: Free and combined amino compounds in atmospheric fine particles (PM2.5) and fog waters from Northern California, Atmos. Environ., 37, 2247-2258, 2003. Zhang, Q., Alfarra, M. R., Worsnop, D. R., Allan, J. D., Coe, H., Canagaratna, M. R., and Jimenez, J. L.: Deconvolution and quantification of hydrocarbon-like and oxygenated

287
organic aerosols based on aerosol mass spectrometry, Environ. Sci. Technol., 39, 4938-4952, 2005.

288
Table 7.1. Summary of In-plume and Out-of-plume Measurements of Composition and Particle Number and Mass Concentration.
aThe ratio of the particle number concentration for Dp > 3 nm (UFCPC 3025) to that for Dp > 10 nm (CPC 3010).

289
Table 7.2. DASH-SP Hygroscopicity and Dry Particle Refractive Index Data Categorized by the Time of Flight as Shown in Figure 7.1. Data at RH = 85% are not available for flight A.

290
Table 7.3. Summary of CCN Data for Flights A and B.

291
Table 7.4. Summary of κ Values (Petters and Kreidenweis, 2007) Derived From Subsaturated Hygroscopic Growth Factor Data at RHs of 85%, and 92%. Data at RH = 85% are not available for flight A.

292
Figure 7.1. A) Complete flight tracks for the two flights in the San Joaquin Valley of California. The shaded mountain areas are meant to provide a relative view of how the San Joaquin Valley is bordered by major topographical features. B/C) Detailed tracks for flights A (12 July 2007) and B (30 July 2007) with a step-by-step description of the aircraft maneuvers. Plume ages were calculated using downwind distance and average wind speed in the vicinity of the feedlot.

293
Figure 7.2. Upper panel) Time series of particle number concentration and meteorological data for flight A. Lower panel) Time series of aerosol size distribution. The number labels at the top of each shaded block correspond to the respective flight segment listed in Figure 7.1.

294
Figure 7.3. Upper panel) Time series of particle number concentration and meteorological data for flight B. Lower panel) Time series of aerosol size distribution. The number labels at the top of each shaded block correspond to the respective flight segment listed in Figure 7.1.

295
Figure 7.4. Vertical profiles of particle number concentration and meteorological data for flights A (upper panel) and B (lower panel). For the submicrometer particle concentration data (CPC 3010), it should be noted that the absolute concentrations are not accurate due to electrical saturation of the instrument; these data are plotted because of the 1 s time resolution of the data. The DMA and CPC 3010 number concentrations were proportional throughout both flights, therefore, the CPC 3010 values are useful for qualitative purposes to identify the mixing layer height. DMA number concentrations indicated are accurate.

296
Figure 7.5. HYSPLIT five-day backward trajectory analysis for flights A (panel A) and B (panel B). Six hours of time separate each marker on the trajectories.

297
Figure 7.6. Time series of PILS water-soluble aerosol composition and cToF-AMS composition for flights A (upper panel) and B (lower panel). The number labels for each shaded box correspond to the portion of each flight represented in Figure 7.1. The shaded areas representing the plume are characterized by significant increases in organics, ammonium, nitrate, and amines. The ammonium-to-sulfate molar ratio exceeds 2.0 in the plume, allowing nitrate to partition into the aerosol phase. The multiple cToF-AMS spikes in the species concentrations cannot be resolved by the PILS since the 5 - min time intervals for sample collection average out the quick plume passes with the longer legs outside of the plume. Agreement between the PILS and cToF-AMS is most evident for sulfate, since this species was relatively level in concentration during the flights.

298
Figure 7.7. Spatial distribution of various aerosol species during flight A. A) Nitrate and diethylamine; B) Excess nitrate remaining after both sulfate and nitrate have been neutralized by ammonium (see Section 7.3.2 for further explanation); C) ammonium; D) organics. The PILS markers are spatially placed wherever the aircraft was at the midpoint of the time when a particular sample was collected (after being corrected for liquid residence time in the instrument); therefore the amine markers are spatially distinct from the core of the plume (especially the two markers representing the highest plume ages).

299
Figure 7.8. Spatial distribution of various aerosol species during flight B. A) Nitrate and diethylamine; B) Excess nitrate remaining after both sulfate and nitrate have been neutralized by ammonium (see Section 7.3.2 for further explanation); C) ammonium; D) organics. The PILS markers are spatially placed wherever the aircraft was at the midpoint of the time when a particular sample was collected (after being corrected for liquid residence time in the instrument).

300
Figure 7.9. Vertical distribution of total submicrometer particulate mass and species concentrations from both the PILS and cToF-AMS, for flights A (upper panel) and B (lower panel). The cToF-AMS marker sizes for “Total mass” are proportional to the organic:inorganic ratio. Marker sizes for the individual cToF-AMS species are proportional to the respective mass fraction of that species. Marker sizes for PILS “Organic acids” are proportional to the relative contribution by oxalate. Marker sizes for PILS ammonium are proportional to the ammonium-to-sulfate molar ratio. Total mass, nitrate, ammonium, and organics increase in concentration with increasing altitude up to ~ 250 – 300 m, before decreasing in both flights. cToF-AMS concentrations exceed those of the PILS for commonly detected species in the plume, especially nitrate and ammonium, since the PILS averages 5 - min worth of aerosol composition whereas the cToF-AMS has a time resolution of ~ 20 – 30 s. Total PILS mass includes inorganics and organic acids, whereas total cToF-AMS mass includes inorganics and nonrefractory organic mass.

301
Figure 7.10. Aerosol mass spectra from the cToF-AMS in the background aerosol and in the plume at various downwind distances from the feedlot for flight B. There is no significant difference in the chemical signature of the aerosol in the three categories shown, with the notable exception of an enhancement in the m/z 30 peak, a common amine marker, at the closest point to the source. The flight A spectra are similar to those presented here.

302
Figure 7.11. A comparison of the plume organic mass spectra versus the background aerosol organic mass spectra for flights A (upper panel) and B (lower panel). All non-organic contributions to the mass spectra have been removed by fragmentation calculations described in Section 7.4.3.3. This means that the signal at m/z 30 represents a fragment of organics, including amines. The data on the y-axis were generated by taking the difference in the organic spectra in the plume and out of the plume. The organic aerosol appears to be very similar except this plot shows that there is an increase in peak intensities at m/z 30, 56, 74, and 86, common amine peaks, in the plume. The peak intensity at m/z 44 (and 29 in flight A) are greater in the background aerosol spectra indicating increased oxidation out of the plume as compared to inside the plume.

303
Figure 7.12. Speciated size distributions as determined by the cToF-AMS for flights A (panel A) and B (panel B). The x-axis is the vacuum aerodynamic diameter. There is evidence of externally mixed aerosols, evident by the independent shifts of various species as a function of increasing plume age. This is clearest in flight B where nitrate is shown to grow in size with plume age with less growth for organics and no growth for sulfate.

304
Figure 7.13. Growth factor data from flight A at RHs of 74% (upper panel) and 92% (lower panel). The markers represent individual DASH-SP scans at dry diameters between 150 and 200 nm. Marker sizes in upper panel are proportional to the ammonium nitrate:ammonium sulfate ratio, while marker sizes in the lower panel are proportional to the organic:inorganic ratio (inorganic = ammonium sulfate + ammonium nitrate).

305
Figure 7.14. Growth factor data from flight B at RHs of 74% (A), 85% (B), and 92% (C). The markers represent individual DASH-SP scans at dry diameters between 150 and 200 nm. A) Marker sizes are proportional to the organic:ammonium nitrate ratio; B) marker sizes are proportional to the ammonium nitrate:ammonium sulfate ratio; C) marker sizes are proportional to the organic:inorganic ratio (inorganic = ammonium sulfate + ammonium nitrate).

306
Figure 7.15. Relationship between the hygroscopic growth factor at 92% RH and mass fractions of nitrate and organics during flight B. Less correlation exists between the subsaturated hygroscopic growth factors and the mass fractions of ammonium (R2 = 0.19, slope = 0.07) and sulfate (R2 = 0.21, slope = -0.10).

307
Figure 7.16. Time series of activated fraction of aerosol (CCN/CN), and total CCN concentration during flights A (upper panel) and B (lower panel). Data points are color-coded with instrument supersaturation. The shaded gray boxes in the lower panel indicate portions of flight B when the CCNc was operating in an alternative mode and those data are not presented here.

308
Figure 7.17. Normalized CCN activation ratio, (CCN/CN)measured:(CCN/CN)ammonium sulfate, as a function of hygroscopic growth factors for flight B. The effects of size distribution and mixing state have been removed from the data and the calculated activation ratio to isolate the impact of composition on the relationship between water uptake in the sub- and supersaturated regimes (see Section 7.4.6.2).

309
Figure 7.18. The relationship between the m/z 57:44 ratio, the organic mass fraction, the CCN fraction with less droplet growth than ammonium sulfate (Di < DAS), and the hygroscopic growth factor at RH = 92%. The CCN fraction with Di < DAS is a qualitative measure of kinetic limitations to droplet growth. The majority of the markers representing the lowest values of Di < DAS occur at m/z 57:44 < 0.07, while most of the higher values of Di < DAS coincide with the highest organic mass fractions (> 0.6). The highest growth factors at RH = 92% occur at the lowest organic mass fractions and m/z 57/44 ratios.

310
Figure 7.19. Spatial distribution of the calculated organic growth factors, using the ZSR mixing rule, for flights A (upper panel) and B (lower panel). Marker sizes are proportional to the mass fraction of nitrate.

311
Chapter 8
Conclusions

312
This thesis has focused on the development and characterization of aerosol
instrumentation, the application of these instruments in field and laboratory studies, and
the evaluation models and parameterizations with measurements. In order to reduce
uncertainties associated with aerosol radiative forcing, rapid measurements of key aerosol
properties, including composition and hygroscopicity, are needed. Two novel aerosol
instruments have been designed specifically for aircraft operation.
Chapter 2 introduces the particle-into-liquid sampler (PILS), which grows
particles into droplets sufficiently large to be collected by inertial impaction. The
collected liquid sample can be analyzed using a variety of analytical techniques,
including ion chromatography to quantify water-soluble aerosol composition. Forward
and backward instruments models, which consider plumbing transmission efficiencies,
droplet growth, mixing effects, and volatilization losses, were developed to predict mass
concentrations that are consistent with laboratory tests for step changes in concentration.
Results from characterization experiments summarize the overall performance of the
instrument, including uncertainties, volatilization effects, and time resolution. Sample
data from the 2004 International Consortium for Atmospheric Research on Transport and
Transformation (ICARTT) field campaign show that this instrument is suitable for
aircraft deployment and can quantify ambient mass concentrations of both inorganic and
organic acid ions with 5 - min time resolution.
Chapter 3 reports on a new instrument developed to perform rapid, size-resolved
aerosol hygroscopicity measurements. The differential aerosol sizing and hygroscopicity
spectrometer probe (DASH-SP) employs differential mobility analysis in-concert with
multiple humidification and optical sizing steps to determine dry optical size and

313
hygroscopic growth factors for size-selected aerosols simultaneously at three elevated
RHs. Results from an extensive set of characterization tests summarize the time and size
resolution, accuracy, precision, stability, and uncertainties associated with the instrument.
An iterative data processing algorithm is introduced that quantifies growth factors and
“effective: refractive indices for humidified particles using an empirically-derived three-
dimensional surface (OPC pulse height - refractive index – particle size), based on a
calculated value of the “effective” dry particle refractive index. Growth factor data are
presented for several inorganic and organic acid salts and compared to thermodynamic
predictions. Oxalic, malonic, glutaric, and glyoxylic acids grow gradually with
increasing relative humidity up to 94%, while succinic and adipic acids show no growth.
Airborne measurements of hygroscopic growth factors of ship exhaust aerosol during the
2007 Marine Stratus/Stratocumulus Experiment (MASE II) field campaign off the central
coast of California are presented as the first report of the aircraft integration of the
DASH-SP.
In-cloud production of secondary organic aerosol is discussed in Chapters 4 - 6.
Airborne PILS measurements carried out on the CIRPAS Twin Otter from three field
campaigns (ICARTT, MASE I, GoMACCS) are presented and show that sulfate and
oxalate are strongly correlated in ambient aerosols, including evaporated cloud droplet
residual particles. Since their chemical formation mechanisms are not directly linked,
this correlation can be explained by a common medium necessary for production:
droplets. Enhanced organic acid aerosol layers have been observed directly above
cloudtops in both marine and urban atmospheres; as derived from large eddy simulations
of stratocumulus under the conditions of MASE I, both Lagrangian trajectory analysis

314
and diurnal cloudtop evolution provide evidence that a significant fraction of the aerosol
mass concentration above cloud can be accounted for by evaporated droplet residual
particles. Predictions from a chemical cloud parcel model considering the aqueous-phase
production of organic acids and sulfate show good agreement with ambient data for the
relative magnitude of sulfate and organic acid growth in clouds and also the evolution of
oxalic acid and its aqueous-phase precursors with increasing altitude in cloud. Aircraft
measurements show that cloud processing is a significant source for organic acids,
especially oxalic acid, in the ambient aerosols.
Chapter 6 additionally discusses the sources and character of water-soluble
aerosol species, including both inorganic and organic acid species, during the 2006
GoMACCS campaign. Sulfate and ammonium dominated the water-soluble mass, with
the most acidic samples and highest sulfate loadings observed downwind of the W. A.
Parish Power Plant. The average particulate water-soluble mass fraction of organic acids
measured was 3.4 + 3.7%; concentrations of organic acids increased with decreasing
carbon number from C9 to C2. Specific attention was given to the sources and character
of various organic acids in both clear and cloudy conditions; organic acids identified in
the Houston atmosphere give important clues as to the sources of the atmospheric organic
aerosol in that region and in urban atmospheres in general.
Chapter 7 reports an extensive airborne characterization of aerosol downwind of a
massive bovine source in the San Joaquin Valley (California) on two flights during July
2007. Total submicrometer aerosol levels and concentrations of organics, nitrate, and
ammonium were enhanced in the plume from the source as compared to the background
aerosol. Amines were found to be a significant atmospheric base even in the presence of

315
ammonia; particulate amine concentrations are estimated as at least 14 – 23% of that of
ammonium in the plume. Enhanced sub- and supersaturated water uptake and reduced
refractive indices were coincident with lower organic volume fractions, higher
ammonium nitrate volume fractions, and the detection of amines. Kinetic limitations due
to hydrophobic organic material are shown to have likely suppressed droplet growth.
After removing effects associated with size distribution and mixing state, the normalized
activated fraction of CCN increased as a function of the subsaturated hygroscopic growth
factor, with the highest activated fractions being consistent with relatively lower organic
mass fractions and higher nitrate mass fractions.
Looking ahead to the future, it is necessary to continue to make ambient aerosol
measurements in order to advance knowledge of the climatic and environmental effects
associated with aerosols, and to assess the level of accuracy of atmospheric models.
Since discrepancies invariably exist, models need to be improved in order to increase the
accuracy of future climate change predictions. To increase understanding and predictive
capabilities of global climate change, it is also imperative to monitor and analyze changes
in properties that alter the radiative budget, such as trace gases, aerosols, and cloud cover,
with large-scale systematic measurements. Remote sensing of aerosols and other
components of the atmosphere, such as water vapor, are needed to understand the
relationship between aerosols, clouds, and the hydrological cycle. The synergism of
remote sensing data analysis, in-situ observations, and modeling provides a solid
framework to study causal relationships between aerosols, clouds, and precipitation, and
their resulting climatic implications.

316
Appendices

Appendix A
Chemical Composition of Secondary Organic Aerosol
Formed from the Photooxidation of Isoprene∗
∗This chapter is reproduced by permission from “Chemical Composition of Secondary Organic Aerosol Formed from the Photooxidation of Isoprene” by J. D. Surratt, S. M. Murphy, J. H. Kroll, N. L. Ng, L. Hildebrandt, A. Sorooshian, R. Szmigielski, R. Vermeylen, W. Maenhaut, M. Claeys, R. C. Flagan, and J. H. Seinfeld, J. Phys. Chem. A, 110, 9665-9690, 2006. Copyright 2006. American Chemical Society.
317

Chemical Composition of Secondary Organic Aerosol Formed from the Photooxidation ofIsoprene
Jason D. Surratt,† Shane M. Murphy,‡ Jesse H. Kroll,§ Nga L. Ng,‡ Lea Hildebrandt,‡
Armin Sorooshian,‡ Rafal Szmigielski,| Reinhilde Vermeylen,| Willy Maenhaut, ⊥
Magda Claeys,| Richard C. Flagan,§ and John H. Seinfeld*,§
Department of Chemistry, California Institute of Technology, Pasadena, California 91125, Department ofChemical Engineering, California Institute of Technology, Pasadena, California 91125, Departments ofEnVironmental Science and Engineering and Chemical Engineering, California Institute of Technology,Pasadena, California 91125, Department of Pharmaceutical Sciences, UniVersity of Antwerp (Campus DrieEiken), UniVersiteitsplein 1, BE-2610 Antwerp, Belgium, and Department of Analytical Chemistry,Institute for Nuclear Sciences, Ghent UniVersity, Proeftuinstraat 86, BE-9000 Gent, Belgium
ReceiVed: March 20, 2006; In Final Form: June 15, 2006
Recent work in our laboratory has shown that the photooxidation of isoprene (2-methyl-1,3-butadiene, C5H8)leads to the formation of secondary organic aerosol (SOA). In the current study, the chemical composition ofSOA from the photooxidation of isoprene over the full range of NOx conditions is investigated through aseries of controlled laboratory chamber experiments. SOA composition is studied using a wide range ofexperimental techniques: electrospray ionization-mass spectrometry, matrix-assisted laser desorptionionization-mass spectrometry, high-resolution mass spectrometry, online aerosol mass spectrometry, gaschromatography/mass spectrometry, and an iodometric-spectroscopic method. Oligomerization was observedto be an important SOA formation pathway in all cases; however, the nature of the oligomers depends stronglyon the NOx level, with acidic products formed under high-NOx conditions only. We present, to our knowledge,the first evidence of particle-phase esterification reactions in SOA, where the further oxidation of the isopreneoxidation product methacrolein under high-NOx conditions produces polyesters involving 2-methylglycericacid as a key monomeric unit. These oligomers comprise∼22-34% of the high-NOx SOA mass. Underlow-NOx conditions, organic peroxides contribute significantly to the low-NOx SOA mass (∼61% when SOAforms by nucleation and∼25-30% in the presence of seed particles). The contribution of organic peroxidesin the SOA decreases with time, indicating photochemical aging. Hemiacetal dimers are found to form fromC5 alkene triols and 2-methyltetrols under low-NOx conditions; these compounds are also found in aerosolcollected from the Amazonian rainforest, demonstrating the atmospheric relevance of these low-NOx chamberexperiments.
1. Introduction
Secondary organic aerosol (SOA) is formed in the tropospherefrom the oxidation of volatile organic compounds (VOCs),where the resultant low-vapor-pressure oxidation productspartition between the gas and aerosol phases. Recent laboratoryexperiments have established that SOA formation can also resultfrom the heterogeneous reactions between particle-associatedsubstances and relatively volatile species resulting in theformation of high-molecular-weight (MW) products via oligo-merization (polymerization).1-5 Until recently, the formation ofSOA from the photooxidation of isoprene, the atmosphere’smost abundant nonmethane hydrocarbon, was considered in-significant.6,7 This was largely due to the known volatility offirst-generation gas-phase oxidation products, such as meth-
acrolein (MACR), methyl vinyl ketone (MVK), and formalde-hyde, from isoprene oxidation in the presence of NOx, and aprevious chamber study that concluded that isoprene oxidationdoes not lead to SOA formation.8 Recent field observations ofcertain organic aerosol compounds, diastereoisomeric 2-meth-yltetrols (2-methylerythritol and 2-methylthreitol), and 2-me-thylglyceric acid, attributable to isoprene oxidation, and theexperimental observation that isoprene under highly acidicconditions can lead to the formation of polymeric, humic-likesubstances through heterogeneous reactions, re-opened the issueof SOA formation from isoprene.7,9-13 After their ambientidentification, Edney et al.14 and Boge et al.15 detected 2-me-thyltetrols in SOA formed from laboratory chamber studies ofisoprene.
Recent work in our laboratory has shown that SOA formationfrom isoprene oxidation can be significant.16,17 Extensiveexperiments were carried out under both low- and high-NOx
conditions using either nitrous acid (HONO) or hydrogenperoxide (H2O2) as the OH radical source. Photooxidationexperiments were also conducted using isoprene first-generationgas-phase oxidation products as the VOC precursor. Althoughno aerosol growth was observed from MVK oxidation, SOA
* To whom correspondence should be addressed. Phone: (626) 395-4635. Fax: (626) 796-2591. E-mail [email protected].
† Department of Chemistry, California Institute of Technology.‡ Department of Chemical Engineering, California Institute of Technol-
ogy.§ Departments of Environmental Science and Engineering and Chemical
Engineering, California Institute of Technology.| University of Antwerp.⊥ Ghent University.
9665J. Phys. Chem. A2006,110,9665-9690
10.1021/jp061734m CCC: $33.50 © 2006 American Chemical SocietyPublished on Web 07/19/2006
318

formation was observed from MACR at high-NOx conditions.High-molecular-weight (MW) species were observed to formfrom isoprene oxidation under both low- and high-NOx condi-tions.17 Moreover, SOA yields were observed to exhibit adependence on the NOx level. This dependence appears to beattributed to differences in organic peroxy radical (RO2)chemistry. At high [NO] (i.e., high-NOx conditions), RO2radicals react mainly with NO to produce small alkoxy radicals(RO) that likely fragment into smaller organics, which areexpected to be too volatile to partition appreciably to the aerosolphase, or form organic nitrate species (RONO2). In the absenceof NOx (i.e., low-NOx conditions), RO2 radicals instead reactwith HO2 radicals (present in the chamber experiments in largequantities from the OH+ H2O2 reaction) to form organichydroperoxides, which have been experimentally shown to beimportant SOA components from other VOC precursors.18,19
Hydroperoxides have been suggested to be involved in polym-erization in the aerosol phase via reactions with aldehydes toform peroxyhemiacetals.18,19
Although it is now established that OH-initiated oxidationof isoprene leads to SOA, a detailed understanding of thechemical reaction pathways leading to the production of isopreneSOA is lacking. Results from chamber studies have elucidatedthe importance of the further oxidation of MACR as a primaryroute for SOA formation from isoprene under high-NOx
conditions. Known RO2 chemistry at low-NOx conditions leadsto the initial gas-phase oxidation products, likely hydroxyhy-droperoxides, of isoprene, which upon further oxidation leadsto SOA production. Nonetheless, detailed evaluation of themechanism of SOA formation from the oxidation of isoprenehas not yet been carried out.
In the present work, a suite of offline analytical techniquesis used in conjunction with online aerosol mass spectrometryto investigate the detailed chemical composition of SOA fromisoprene oxidation. SOA is produced from the photooxidationof isoprene under varying NOx conditions and is collected ontofilters for offline chemical analyses. Offline mass spectrometry(MS) techniques are used to detect organic species from aerosolfilter samples, including oligomeric components of isopreneSOA (as detected in prior studies only by online time-of-flightaerosol mass spectrometry (TOF-AMS) measurements). TandemMS and gas chromatography (GC)/MS derivatization techniquesare employed to structurally elucidate oligomeric components.Organic peroxides are detected and quantified from low-NOx
isoprene SOA using a conventional iodometric-spectroscopicmethod. Tracer compounds for isoprene oxidation in the ambientatmosphere, as found in the Amazonian rainforest, are detectedhere for the first time in the low-NOx chamber experiments.The low-NOx conditions are most relevant to understanding SOAformation in highly vegetated, remote regions.7 In some cases,such as the southeastern U.S., where atmospheric transport ofpollutants from urban areas can influence SOA formation,20
conditions closer to those of the high-NOx experiments may beapplicable.
2. Experimental Section
2.1. Chamber Experiments.Experiments were carried outin Caltech’s dual indoor 28 m3 Teflon smog chambers.21,22
Experimental protocols are similar to those described previ-ously,16,17 so they will be described only briefly here. Mostexperiments were carried out with hydrogen peroxide (H2O2)as the hydroxyl radical (OH) precursor; in some cases, HONOwas used instead to demonstrate that the particular OH sourcehas no effect on the outcome of the experiments. For some
experiments, ammonium sulfate seed particles were introducedinto the chamber (at volume concentrations of 20-30µm3/cm3)by atomization of a 0.015 M ammonium sulfate solution. Aknown concentration of isoprene (or any other precursor, suchas MACR) was then introduced by sending air over a measuredvolume of the pure compound (Aldrich, 99.8%) into thechamber. For H2O2/high-NOx experiments, NO was also intro-duced into the chamber from a gas mixture (500 ppm gascylinder in N2, Scott Specialty Gases). In low-NOx experiments,NO was not added and NOx concentrations were<1 ppb. Whenthe isoprene (monitored by gas chromatography-flame ioniza-tion detection (GC-FID)), NOx, and seed concentrations becameconstant inside the chamber, irradiation by UV lights (centeredat 354 nm) was started, initiating the reaction.
SOA volume growth (µm3/cm3) was monitored with adifferential mobility analyzer (DMA). For quantification of SOAproducts collected on filter samples, the DMA volumes wereused for each experiment to determine the total SOA masscollected. Filter sampling commenced when the particle growthhad terminated, that is, when the aerosol volume had reachedits maximum value. Depending on the total volume concentra-tion of aerosol in the chamber, the filter sampling time was2-4 h, which typically resulted in 3-7 m3 of total chamber airsampled.
2.2. Filter Extractions. Collected Teflon filters (PALL LifeSciences, 47-mm diameter, 1.0-µm pore size, teflo membrane)were extracted in 5 mL of HPLC-grade methanol by 40 min ofsonication. The filters were then removed from the methanolsample extracts and archived at-20°C. Each extract was blowndry under a gentle N2 stream (without added heat) and thenreconstituted with 1 mL of a 50:50 (v/v) solvent mixture ofHPLC-grade methanol and 0.1% aqueous acetic acid solution.The reconstituted extracts were then stored at-20 °C untilanalysis was performed. In most cases, filter extracts werechemically analyzed within 1-2 days after filter extraction. Labcontrol filters were extracted and treated in the same manneras the samples. Aliquots of each of these filter extracts wereanalyzed by the four mass spectrometry techniques to follow.
To ensure that H2O2 was not condensing onto filter mediaand introducing artifacts in the chemical analyses, we collectedseveral blank filters under dark conditions from the chambercontaining typical experimental well-mixed concentrations ofisoprene, NO, and ammonium sulfate seed aerosol, sampled forthe same duration (∼2-4 h) as a sample filter. No significantchemical artifacts or contaminants were observed in the analyti-cal techniques from these blank filters, consistent with the lackof observed aerosol growth under dark conditions.
2.3. Liquid Chromatography/Electrospray Ionization-Mass Spectrometry (LC/ESI-MS). A Hewlett-Packard 1100Series HPLC instrument, coupled with a single quadrupole massanalyzer and equipped with an electrospray ionization (ESI)source, was used to identify and quantify relatively polar, acidicSOA components. Data were collected in both positive (+) andnegative (-) ionization modes; the quantitative analysis pre-sented here is limited to the negative ionization mode. AnAgilent Eclipse C18 column (3.0× 250 mm) was used toseparate the organic species before detection. The eluents usedwere 0.1% aqueous acetic acid (A) and methanol (B). In the40-min gradient elution program used, the concentration ofeluent B increased from 5% to 90% in 35 min, and thendecreased to 5% in 5 min. The total flow rate of the eluentused in the LC/MS analysis was 0.8 mL min-1. Optimumelectrospray conditions were found using a 60 psig nebulizingpressure, 3.5 kV capillary voltage, 13 L min-1 drying gas
9666 J. Phys. Chem. A, Vol. 110, No. 31, 2006 Surratt et al.
319

flowrate, and a 330°C drying gas temperature. During the fullscan mode of analysis, the cone voltage was set at 60 V,avoiding fragmentation of most species and allowing theirdetection as deprotonated molecules ([M - H]-). During theupfront collision-induced dissociation (CID) mode of analysis,the cone voltage was set to 110 V, resulting in partialfragmentation of the [M- H]- ions. By comparing these twosets of MS data (upfront CID mode to the full scan mode ofanalysis) and by examining the fragmentation patterns of thespecies, some structural information on the analyzed specieswas obtained. This was particularly useful in confirming resultsfrom other MS/MS techniques used and for the identificationof oligomeric components.
Using a set of six acidic species (meso-erythritol, citramalicacid, 2-hydroxy-3-methylbutyric acid, pimelic acid, pinic acid,and suberic acid monomethyl ester) as surrogate standards, thismethod was also used to quantify the amount of polar acidicspecies. Filter extraction efficiency was established by standardadditions of these surrogate standards to blank filters. Onaverage, the extraction efficiency for each standard was∼60%with an estimated error bar of ca.(15% over the concentrationrange used to generate the LC/MS calibration curves. Thisaverage extraction efficiency was included in the calculationsto quantify identified isoprene SOA products.
As we will note shortly, to investigate the probable impor-tance of a C4 hydroxy dialdehyde species formed under high-NOx conditions, we derivatized selected sample extracts usingGirard Reagent P (1-(carboxymethyl)pyridium chloride hy-drazide, MW) 187) to increase sensitivity for aldehydic speciesin the (+)LC/MS mode. Girard Reagent P (GirP) reacts withaldehydes and ketones to form water-soluble hydrazones witha permanently charged pyridine moiety, and water is eliminatedin this reaction.23 The organic unit that adds to aldehydes andketones has a mass of 152 Da. A series of aldehyde standards,glyoxal (MW ) 58), succinic semialdehyde (MW) 102), andglutaraldehyde (MW) 100), were derivatized using the GirPand analyzed with (+)LC/MS. These small polar aldehydestandards typically go undetected using (+)ESI techniques suchas in LC/MS; however, upon derivatization they were detectedas the singly charged [M - H2O + 152(GirP)]+ ions (glyoxalwas also detected as doubly charged [M - 2H2O + 152(GirP)]2+
ion), where M is the MW of the aldehyde species. Thesecompounds eluted between 1 and 2 min from the LC column,including a derivatized compound corresponding to the proposedC4 hydroxy dialdehyde species (MW) 102 and [M- H2O +152(GirP)]+ ) 236).
2.4. ESI-Ion Trap Mass Spectrometry (ESI-ITMS).Aliquots of the filter extracts were also analyzed by a Ther-moElectron LCQ ion trap mass spectrometer equipped with anESI source, via direct infusion. This instrument does not providechromatographic separation, precluding quantification. Instead,the instrument was used for the qualitative detection of productspecies. In addition, specific ions of interest were isolated fromthe rest of the sample ion matrix and further fragmented toproduce product ion mass spectra, aiding in structural elucida-tion.
Data were collected in both positive and negative ionizationmodes. Because the same species were detected in both modes([M - H]- and [M+ Na]+ ions), we only present here the datacollected under negative ionization; the data collected underpositive ionization serve as confirmation of the negativeionization data.
2.5. Matrix-Assisted Laser Desorption Ionization-Time-of-Flight Mass Spectrometer (MALDI-TOFMS). Another
aliquot of the filter extract was analyzed on an AppliedBiosystems Voyager-DE Pro MALDI-TOFMS instrument. After6 µL of each extract had been dried on the steel target plate,the plate was gently brushed with graphite particles, whichserved as the matrix. The samples were analyzed in the linearmode, in both positive and negative ionization modes. 400-500 laser shots were summed to obtain a representative massspectrum of each sample. This method was mainly used to assessthe molecular weight (MW) range of the aerosol, to detectoligomeric signatures, and to confirm the MWs of speciesidentified by the ESI techniques.
2.6. High-Resolution ESI-MS.Extracts were also analyzedby a Waters LCT Premier Electrospray time-of-flight massspectrometer with W geometry in the Department of Chemistryat the University of California, Irvine, operated in the negativeionization mode. Samples were analyzed by flow injection. Thecalibration was carried out using sodium formate clusters withco-injection of fmoc-amino acids of appropriate mass spikedinto the analytical sample for lock-mass corrections to obtainaccurate mass for the oligomeric ions withm/z266, 323, 365,368, 467, and 470. These ions were only detected in the high-NOx experiments, and elemental compositions were determinedwith reasonable accuracy (within(5 ppm) and were consistentwith other analytical observations (such as ESI-MS/MS and GC/MS derivatization data).
2.7. Aerodyne Time-of-Flight Aerosol Mass Spectrometer(TOF-AMS). During most chamber experiments, real-timeparticle mass spectra were collected continuously by an Aero-dyne Time-of-Flight Aerosol Mass Spectrometer (TOF-AMS),and averaged spectra were saved every 5 min. The design andcapabilities of the TOF-AMS instrument are described in detailelsewhere.24 Briefly, chamber air enters the instrument througha 100-µm critical orifice at a flowrate of 1.4 cm3/s. Particleswith vacuum aerodynamic diameters between 50 and 800 nmare efficiently focused by an aerodynamic lens, passed througha chopper, and then impacted onto a tungsten vaporizer. Thechopper can be operated in three modes: (1) completelyblocking the beam to gather background mass spectra; (2) outof the beam’s path to collect ensemble average mass spectraover all particles sizes; and (3) chopping the beam to createsize-resolved mass spectra. The vaporizer is typically run at∼550°C to ensure complete volatilization of the SOA and theinorganic seed; during several runs the vaporizer temperaturewas lowered to∼160°C to reduce thermally induced fragmen-tation of oligomers. Once vaporized, molecules undergo electronionization at 70 eV and are orthogonally pulsed every 19µsinto the time-of-flight mass analyzer.
2.8. Gas Chromatography/Mass Spectrometry (GC/MS).Extracts of selected filters were analyzed for polar organiccompounds by GC/MS using a method that was adapted fromthat reported by Pashynska et al.25 The sample workup consistedof extraction of all or half of the filter with methanol underultrasonic agitation and derivatization of carboxyl and hydroxylfunctions into trimethylsilyl (TMS) derivatives. The extract wasdivided into two parts; one part was trimethylsilylated whilethe other part was stored in a refrigerator at 4°C for eventualfurther analysis. GC/MS analyses were performed with a systemcomprising a TRACE GC2000 gas chromatograph, which wascoupled to a Polaris Q ion trap mass spectrometer equippedwith an external ionization source (ThermoElectron, San Jose,CA). A Heliflex AT-5MS fused-silica capillary column (5%phenyl, 95% methylpolysiloxane, 0.25µm film thickness, 30m × 0.25 mm i.d.) preceded by a deactivated fused-silicaprecolumn (2 m× 0.25 mm i.d.) (Alltech, Deerfield, IL) was
Composition of Isoprene Secondary Organic Aerosol J. Phys. Chem. A, Vol. 110, No. 31, 20069667
320

used to separate the derivatized extracts. Helium was used ascarrier gas at a flow rate of 1.2 mL min-1. The temperatureprogram was as follows: isothermal hold at 50°C for 5 min,temperature ramp of 3°C min-1 up to 200°C, isothermal holdat 200°C for 2 min, temperature ramp of 30°C min-1 up to310°C; and isothermal hold at 310°C for 2 min. The analyseswere performed in the full scan mode (mass range:m/z50-800), and were first carried out in the electron ionization (EI)mode and subsequently in the chemical ionization (CI) mode.The ion source was operated at an electron energy of 70 eVand temperatures of 200°C and 140°C in the EI and CI modes,respectively. The temperatures of the GC injector and the GC/MS transfer line were 250°C and 280°C, respectively. Forchemical ionization, methane was introduced as reagent gas ata flow rate of 1.8 mL min-1. We present here mainly the datacollected in the EI mode; the data collected in the CI mode areused if insufficient MW information is obtained in the EI mode.
Selected extracts were also subjected to a hydrolysis/ethylation and/or a methoximation procedure prior to trimeth-ylsilylation. The purpose of the hydrolysis/ethylation procedurewas to confirm the presence of ester linkages, while that of themethoximation procedure was to evaluate the presence ofaldehyde/keto groups, in oligomeric SOA. The hydrolysis/ethylation procedure involved reaction of the extract residueswith 40 µL of analytical-grade ethanol and 8µL of trimethyl-chlorosilane (Supelco, Bellafonte, PA) for 1 h at 60 °C. Detailsabout the methoximation procedure can be found in Wang etal.12
2.9. Gas Chromatography-Flame Ionization Detection(GC-FID). Quantitative determination of the 2-methyltetrols(i.e., 2-methylthreitol and 2-methylerythritol), the C5 alkenetriols [i.e., 2-methyl-1,3,4-trihydroxy-1-butene (cis and trans)and 3-methyl-2,3,4-trihydroxy-1-butene], and 2-methylglycericacid, in selected filters, was performed by GC-FID with a GC8000 Top instrument (Carlo Erba, Milan, Italy). The sampleworkup was the same as that for GC/MS analysis except thatfilter parts were spiked with a known amount of erythritol(Sigma, St. Louis, MO) as an internal recovery standard; it wasassumed that the GC-FID responses of the trimethylsilylderivatives of the analytes and the internal recovery standardwere similar. The GC column and conditions were comparablewith those used for GC/MS; the column was a CP-Sil 8 CBcapillary column (5% diphenyl, 95% methylpolysiloxane, 0.25µm film thickness, 30 m× 0.25 mm i.d.) (Chrompack,Middelburg, The Netherlands) and the temperature program wasas follows: isothermal hold at 45°C for 3 min, temperatureramp of 20°C min-1 up to 100°C, isothermal hold at 100°Cfor 10 min, temperature ramp of 5°C min-1 up to 315°C, andisothermal hold at 315°C for 20 min. Measurement of the2-methyltetrols in the low-NOx SOA samples was performedafter the unstable products tentatively characterized as 2-me-thyltetrol performate derivatives had decayed to 2-methyltetrols,that is, after leaving the reaction mixture for 2 days at roomtemperature.
2.10. Total Aerosol Peroxide Analysis.The total amountof peroxides in the low-NOx isoprene SOA was quantified usingan iodometric-spectrophotometric method adapted from thatused by Docherty et al.18 to analyze peroxides formed byR-pinene-ozonolysis. The method employed here differed onlyin the choice of extraction solvent: we used a 50:50 (v/v)mixture of methanol and ethyl acetate, rather than pure ethylacetate. Calibration and measurements were performed at 470nm on a Hewlett-Packard 8452A diode array spectrophotometer.A standard calibration curve was obtained from a series of
benzoyl peroxide solutions. Benzoyl peroxide was the standardused for quantification of organic peroxides formed from low-NOx experiments, because its MW is close to the average MWdetermined from the mass spectrometry techniques, in particularthe MALDI-TOFMS measurements. The molar absorptivitydetermined from the standard curve was∼852, in excellentagreement with that determined by Docherty et al. and withthe value of 845 determined with the original method develop-ment paper.18,26 As a confirmation that the technique wasreproducible, we extracted and analyzed in the same fashion,threeR-pinene-ozonolysis filters collected from our laboratorychambers. We measured∼49% of the SOA mass, producedfrom R-pinene ozonolysis, to be organic peroxides, in excellentagreement to that of Docherty et al.’s measurement of∼47%for the same system. A few high-NOx isoprene filter sampleswere also analyzed by this method, but resulted in the detectionof no organic peroxides (below detection limits of this tech-nique).
2.11. Particle-Into-Liquid Sampler Coupled to Ion Chro-matography (PILS/IC). The PILS/IC (particle-into-liquidsampler coupled to ion chromatography) is a quantitativetechnique for measuring water-soluble ions in aerosol particles.The PILS developed and used in this study27 is based on theprototype design28 with key modifications, including integrationof a liquid sample fraction collector and real-time control ofthe steam injection tip temperature. Chamber air is sampledthrough a 1-µm cut-size impactor and a set of three denuders(URG and Sunset Laboratories) to remove inorganic and organicgases that may bias aerosol measurements. Sample air mixeswith steam in a condensation chamber where rapid adiabaticmixing produces a high water supersaturation. Droplets growsufficiently large to be collected by inertial impaction beforebeing delivered to vials held on a rotating carousel. The contentsof the vials are subsequently analyzed off-line using a dual ICsystem (ICS-2000 with 25µL sample loop, Dionex Inc.) forsimultaneous anion and cation analysis. The background levelsof individual species (Na+, NH4
+, K+, Mg2+, Ca2+, SO42-, Cl-,
NO2-, NO3
-, oxalate, acetate, formate, methacrylate, pyruvate)concentrations for analyzed filter samples, presented as theaverage concentration plus three times the standard deviation(σ), are less than 0.28µg m-3.
3. Results
As noted, experiments were conducted at high- and low-NOx
conditions. High-NOx conditions were achieved through theaddition of substantial NOx (∼800 to 900 ppb NOx) to thereaction chamber, leading to isoprene/NOx molar ratios of∼0.56to 0.63. Under low-NOx conditions no NOx is added to thechamber, where NOx mixing ratios of<1 ppb (small amountsof NOx likely desorb from chamber walls) were observed. Thelow-NOx condition simulates a remote (NOx-free) atmosphere;for example, at typical isoprene and NOx mixing ratios observedin the Amazonian rainforest (∼4 to 10 ppb and 0.02 to 0.08ppb, respectively),7,29 the isoprene/NOx ratios that result are∼50to 500, comparable to the isoprene/NOx ratio of the presentexperiments (∼500).
3.1. High-NOx Condition. Table 1 lists nine high-NOxchamber experiments that were conducted to generate SOA foraerosol filter sampling. All experiments were conducted with500 ppb of isoprene or MACR in order to produce sufficientaerosol mass for all offline analytical measurements. In mostof the experiments conducted, H2O2 served as the OH radicalprecursor; in this manner, initial oxidation of isoprene isdominated by OH. It is estimated that∼3-5 ppm of H2O2 was
9668 J. Phys. Chem. A, Vol. 110, No. 31, 2006 Surratt et al.
321
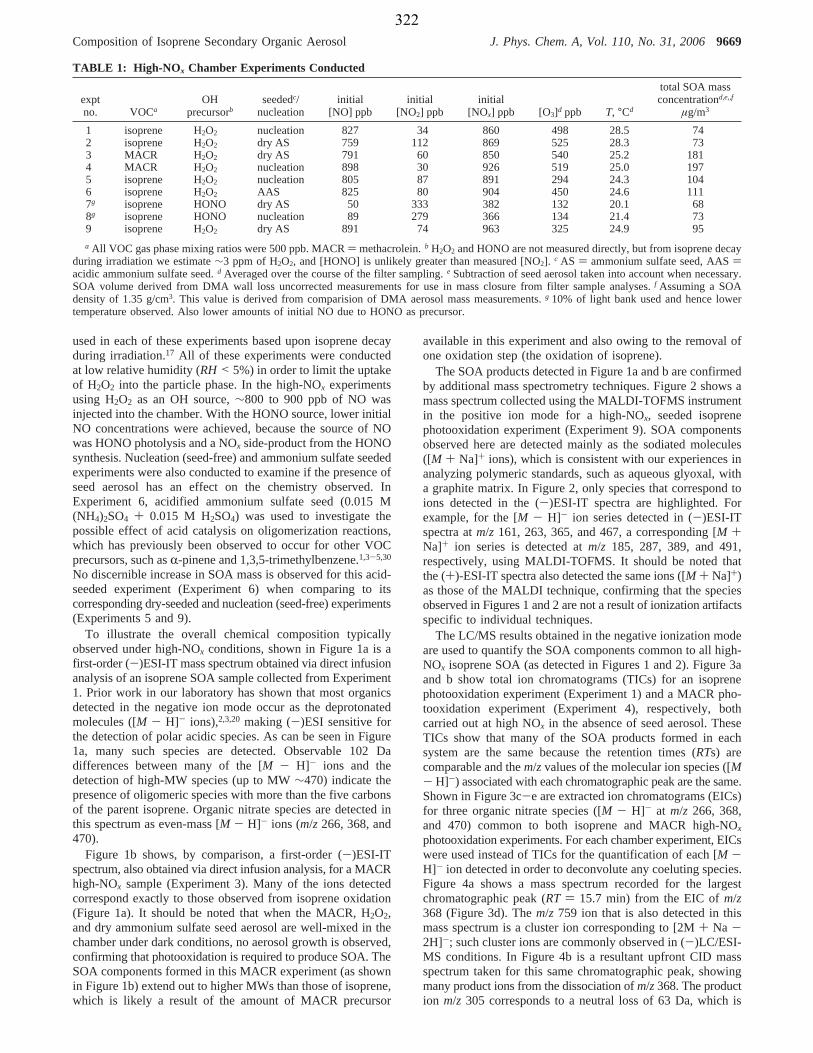
used in each of these experiments based upon isoprene decayduring irradiation.17 All of these experiments were conductedat low relative humidity (RH < 5%) in order to limit the uptakeof H2O2 into the particle phase. In the high-NOx experimentsusing H2O2 as an OH source,∼800 to 900 ppb of NO wasinjected into the chamber. With the HONO source, lower initialNO concentrations were achieved, because the source of NOwas HONO photolysis and a NOx side-product from the HONOsynthesis. Nucleation (seed-free) and ammonium sulfate seededexperiments were also conducted to examine if the presence ofseed aerosol has an effect on the chemistry observed. InExperiment 6, acidified ammonium sulfate seed (0.015 M(NH4)2SO4 + 0.015 M H2SO4) was used to investigate thepossible effect of acid catalysis on oligomerization reactions,which has previously been observed to occur for other VOCprecursors, such asR-pinene and 1,3,5-trimethylbenzene.1,3-5,30
No discernible increase in SOA mass is observed for this acid-seeded experiment (Experiment 6) when comparing to itscorresponding dry-seeded and nucleation (seed-free) experiments(Experiments 5 and 9).
To illustrate the overall chemical composition typicallyobserved under high-NOx conditions, shown in Figure 1a is afirst-order (-)ESI-IT mass spectrum obtained via direct infusionanalysis of an isoprene SOA sample collected from Experiment1. Prior work in our laboratory has shown that most organicsdetected in the negative ion mode occur as the deprotonatedmolecules ([M- H]- ions),2,3,20 making (-)ESI sensitive forthe detection of polar acidic species. As can be seen in Figure1a, many such species are detected. Observable 102 Dadifferences between many of the [M - H]- ions and thedetection of high-MW species (up to MW∼470) indicate thepresence of oligomeric species with more than the five carbonsof the parent isoprene. Organic nitrate species are detected inthis spectrum as even-mass [M- H]- ions (m/z266, 368, and470).
Figure 1b shows, by comparison, a first-order (-)ESI-ITspectrum, also obtained via direct infusion analysis, for a MACRhigh-NOx sample (Experiment 3). Many of the ions detectedcorrespond exactly to those observed from isoprene oxidation(Figure 1a). It should be noted that when the MACR, H2O2,and dry ammonium sulfate seed aerosol are well-mixed in thechamber under dark conditions, no aerosol growth is observed,confirming that photooxidation is required to produce SOA. TheSOA components formed in this MACR experiment (as shownin Figure 1b) extend out to higher MWs than those of isoprene,which is likely a result of the amount of MACR precursor
available in this experiment and also owing to the removal ofone oxidation step (the oxidation of isoprene).
The SOA products detected in Figure 1a and b are confirmedby additional mass spectrometry techniques. Figure 2 shows amass spectrum collected using the MALDI-TOFMS instrumentin the positive ion mode for a high-NOx, seeded isoprenephotooxidation experiment (Experiment 9). SOA componentsobserved here are detected mainly as the sodiated molecules([M + Na]+ ions), which is consistent with our experiences inanalyzing polymeric standards, such as aqueous glyoxal, witha graphite matrix. In Figure 2, only species that correspond toions detected in the (-)ESI-IT spectra are highlighted. Forexample, for the [M - H]- ion series detected in (-)ESI-ITspectra atm/z161, 263, 365, and 467, a corresponding [M +Na]+ ion series is detected atm/z 185, 287, 389, and 491,respectively, using MALDI-TOFMS. It should be noted thatthe (+)-ESI-IT spectra also detected the same ions ([M + Na]+)as those of the MALDI technique, confirming that the speciesobserved in Figures 1 and 2 are not a result of ionization artifactsspecific to individual techniques.
The LC/MS results obtained in the negative ionization modeare used to quantify the SOA components common to all high-NOx isoprene SOA (as detected in Figures 1 and 2). Figure 3aand b show total ion chromatograms (TICs) for an isoprenephotooxidation experiment (Experiment 1) and a MACR pho-tooxidation experiment (Experiment 4), respectively, bothcarried out at high NOx in the absence of seed aerosol. TheseTICs show that many of the SOA products formed in eachsystem are the same because the retention times (RTs) arecomparable and them/zvalues of the molecular ion species ([M- H]-) associated with each chromatographic peak are the same.Shown in Figure 3c-e are extracted ion chromatograms (EICs)for three organic nitrate species ([M - H]- at m/z 266, 368,and 470) common to both isoprene and MACR high-NOx
photooxidation experiments. For each chamber experiment, EICswere used instead of TICs for the quantification of each [M -H]- ion detected in order to deconvolute any coeluting species.Figure 4a shows a mass spectrum recorded for the largestchromatographic peak (RT ) 15.7 min) from the EIC ofm/z368 (Figure 3d). Them/z759 ion that is also detected in thismass spectrum is a cluster ion corresponding to [2M+ Na -2H]-; such cluster ions are commonly observed in (-)LC/ESI-MS conditions. In Figure 4b is a resultant upfront CID massspectrum taken for this same chromatographic peak, showingmany product ions from the dissociation ofm/z368. The production m/z 305 corresponds to a neutral loss of 63 Da, which is
TABLE 1: High-NO x Chamber Experiments Conducted
exptno. VOCa
OHprecursorb
seededc/nucleation
initial[NO] ppb
initial[NO2] ppb
initial[NOx] ppb [O3]d ppb T, °Cd
total SOA massconcentrationd,e,,f
µg/m3
1 isoprene H2O2 nucleation 827 34 860 498 28.5 742 isoprene H2O2 dry AS 759 112 869 525 28.3 733 MACR H2O2 dry AS 791 60 850 540 25.2 1814 MACR H2O2 nucleation 898 30 926 519 25.0 1975 isoprene H2O2 nucleation 805 87 891 294 24.3 1046 isoprene H2O2 AAS 825 80 904 450 24.6 1117g isoprene HONO dry AS 50 333 382 132 20.1 688g isoprene HONO nucleation 89 279 366 134 21.4 739 isoprene H2O2 dry AS 891 74 963 325 24.9 95
a All VOC gas phase mixing ratios were 500 ppb. MACR) methacrolein.b H2O2 and HONO are not measured directly, but from isoprene decayduring irradiation we estimate∼3 ppm of H2O2, and [HONO] is unlikely greater than measured [NO2]. c AS ) ammonium sulfate seed, AAS)acidic ammonium sulfate seed.d Averaged over the course of the filter sampling.e Subtraction of seed aerosol taken into account when necessary.SOA volume derived from DMA wall loss uncorrected measurements for use in mass closure from filter sample analyses.f Assuming a SOAdensity of 1.35 g/cm3. This value is derived from comparision of DMA aerosol mass measurements.g 10% of light bank used and hence lowertemperature observed. Also lower amounts of initial NO due to HONO as precursor.
Composition of Isoprene Secondary Organic Aerosol J. Phys. Chem. A, Vol. 110, No. 31, 20069669
322

likely nitric acid (HNO3). Another product ionm/z 291corresponds to neutral loss of 77 Da, likely from the combinedlosses of a methyl (CH3) radical and a nitrate (NO3) radical (orCH3ONO2). The neutral loss of 102 Da results in the production m/z266; these types of product ions are used to aid in thestructural elucidation of SOA components and will be discussedsubsequently. Owing to the lack of available authentic oligo-meric standards, quantification was carried out by using a seriesof calibration curves generated from surrogate standards (listedin the Experimental Section) covering the wide range ofRTsfor all detected species. Each surrogate standard contained acarboxylic acid group, the likely site of ionization for detectedSOA components, except for themeso-erythritol standard.Because of the initial high percentage of aqueous buffer presentin the LC/MS gradient, we were able to detect small polar
organics, such as 2-methylglyceric acid. To quantify thiscompound, the polyolmeso-erythritol, detected as the [M- H+ acetic acid]- ion, was used. Unlikemeso-erythritol, 2-meth-yltetrols (and other polyols) were not detected using the (-)-LC/MS technique. All surrogate standards were within ca.(1.5min of theRTs of the detected SOA components. Table 2 showsthe LC/MS quantification results for high-NOx SOA. Four typesof oligomers are quantified here. For ease of comparison,experiments corresponding to the same VOC and OH precursortype are grouped together under the same column heading.
SOA components observed thus far are not artifacts formedon filters and are observed over varying isoprene concentrations,as confirmed by online particle mass spectrometry. Figure 5shows mass spectra collected from three high-NOx chamberexperiments using the Aerodyne TOF-AMS instrument. In these
Figure 1. ESI-ITMS negative mode spectra collected via direct infusion analyses. (a) MS scan of a filter extract obtained from a 500 ppb isoprene,high-NOx, seeded experiment. (b) MS scan of a filter extract obtained from a 500 ppb MACR, high-NOx, seeded experiment. These mass spectrashow that MACR oxidation produces many of the same SOA products as that of isoprene oxidation under high-NOx conditions. Common 102 Dadifferences between ions in both spectra are observed indicating the presence of oligomers.
9670 J. Phys. Chem. A, Vol. 110, No. 31, 2006 Surratt et al.
323

experiments, the TOF-AMS instrument was operated at∼160°C to lessen the degree of thermal fragmentation of the high-MW SOA components. Figure 5a shows a TOF-AMS spectrumcollected for a 50 ppb isoprene, high-NOx nucleation experiment(not included in Table 1 because of insufficient aerosol massfor offline chemical analysis techniques). Even at these isopreneconcentrations, high-MW species are detected in the SOAproduced. Differences of 102 Da are noted in this spectrum,again indicating the presence of oligomers. The oligomerspresent here confirm the species detected by the (-)ESI and(+)MALDI techniques (Figures 1 and 2, respectively), wherethe observed TOF-AMS ions result from a loss of a hydroxyl(OH) radical from the molecular ion (i.e.,R-cleavage of ahydroxyl radical from a carboxylic acid group). ESI detects theseoligomers as the [M - H]- ion and MALDI as the [M + Na]+
ion, so ions measured in the TOF-AMS instrument are lowerby 16 and 40 units, respectively. For example, ions ofm/z145,187, 247, and 289 measured by the TOF-AMS instrument(Figure 5), correspond tom/z161, 203, 263, and 305, respec-tively, using (-)ESI (Figure 1). Four different series ofoligomers are highlighted in this spectrum, where ions of thesame oligomeric series are indicated in a common color. Figure5b corresponds to a MACR high-NOx, dry seeded experiment,in which a filter sample was collected (Experiment 3), showingthe same oligomeric signature to that of the low concentration(50 ppb) isoprene experiment. Figure 5c corresponds to anisoprene high-NOx, HONO experiment (Experiment 8). Again,many ions at the samem/z values are detected, as those ofFigures 5a and 5b, suggesting the chemical components of theSOA are the same in these samples. Though probably present,oligomeric compounds formed under conditions similar to thoseof Figure 5c were not detected in the original study of SOAformation from this laboratory16 because a less-sensitive quad-rupole AMS was used; such high-MW species were reported
in a subsequent study using the TOF-AMS.17 These onlinechemical results confirm that the 102 Da differences observedin the offline analytical techniques (ESI and MALDI) are not aresult of sample workup or ionization artifacts. Also, these onlinechemical results suggest that seeded versus nucleation experi-ments do not lead to significant differences in the chemistryobserved, in agreement with the ESI analyses. The OH precursor(HONO or H2O2) also does not have a substantial effect on thechemistry observed (i.e., similar products formed, however,abundances may vary), an observation that is also consistentwith the offline mass spectrometry analyses.
PILS/IC measurements were carried out for Experiments 1(nucleation) and 2 (dry seeded). In both experiments, the acetateanion was the most abundant organic anion detected (14.72µg/m3 in Experiment 1 and 23.47µg/m3 in Experiment 2) followedby the formate anion (1.18µg/m3 in Experiment 1 and 2.90µg/m3 in Experiment 2). It should be noted that these two ionselute off the IC column immediately after sample injection, andthere is a possibility that other early-eluting monocarboxylicacid species coeluted with these two species leading to anoverestimate of their mass. In addition, the extent to which theacetate and formate levels quantified here represent decayproducts from oligomers detected in the particle phase isuncertain. It is likely that a significant fraction of this massresults from the decomposition of oligomers at the samplecollection conditions (high water concentrations and tempera-tures) in the PILS instrument and possibly by the use ofpotassium hydroxide (KOH) as the eluent for anion analyses inthe IC instrument.
GC/MS with TMS derivatization (restricted to carboxyl andhydroxyl groups) was employed to determine the functionalgroups present within SOA components formed under high-NOx conditions. Figure 6a shows a GC/MS TIC of a high-NOx
isoprene nucleation experiment (Experiment 5). 2-methylglyceric
Figure 2. MALDI positive mode spectrum obtained with a graphite matrix for a 500 ppb isoprene, high-NOx, dry seeded experiment (Experiment9). Highlighted Na+ adduct ions confirm the existence of the species detected by ESI.
Composition of Isoprene Secondary Organic Aerosol J. Phys. Chem. A, Vol. 110, No. 31, 20069671
324

acid (2-MG), detected previously in ambient and laboratory filtersamples,10,11,13,14was found to elute from the GC column at29.08 min. The corresponding EI mass spectrum for this peakis shown in Figure 6b. The chemical structure of trimethylsi-lylated 2-MG, along with its respective MS fragmentation, isalso shown in this mass spectrum. Using GC-FID to quantifythe amount of 2-MG present in this same sample, it was foundthat 3.8µg/m3 was formed, which accounted for∼3.7% of theSOA mass. This was consistent with LC/MS measurements of2-MG from other high-NOx isoprene nucleation experiments
(such as 2.7% of the SOA mass for Experiment 1). Adi-esterpeak was observed to elute from the GC column at 51.59 min.The corresponding EI mass spectrum for this chromatographicpeak is shown in Figure 6c along with its proposed chemicalstructure and MS fragmentation pattern.
3.2. Low-NOx Condition. Table 3 lists nine low-NOxchamber experiments. All experiments were conducted withH2O2 as the OH radical precursor with no added NOx. Ozoneformation is attributed mainly to residual NOx emitted by thechamber walls; these O3 concentrations observed likely have a
Figure 3. (a) LC/MS TIC of a filter extract from a 500 ppb isoprene, high-NOx, nucleation experiment. (b) LC/MS TIC of a filter extract from a500 ppb MACR, high-NOx, nucleation experiment. The similar retention times and mass spectra associated with each chromatographic peak inthese two TICs indicate that MACR is an important SOA precursor from isoprene oxidation under high-NOx conditions. c-e are LC/MS EICs oforganic nitrate species common to both MACR and isoprene high-NOx samples. These organic nitrate ions are a part of the same oligomeric seriesconfirmed by MS/MS analyses.
9672 J. Phys. Chem. A, Vol. 110, No. 31, 2006 Surratt et al.
325

negligible effect on the gas-phase chemistry because of the slowreactivity of O3 toward isoprene. Experiments were conductedwith 50% of the light banks in the chamber except forExperiments 10 and 11, in which 100% of the light banks wereused and resulted in the higher temperatures observed. Allexperiments were conducted with 500 ppb of isoprene exceptfor Experiment 17, in which 100 ppb of isoprene was used. Asin the high-NOx experiments, these experiments were conductedat low relative humidity (RH < 9%) in order to limit the uptakeof H2O2 into the particle phase. Nucleation (seed-free) andseeded (ammonium sulfate and acidified ammonium sulfate)experiments were conducted in order to examine if the presenceof seed aerosol has an effect on the chemistry observed.Assuming a density of∼1.25 g/cm3 (derived from the com-parison of DMA aerosol volume and TOF-AMS aerosol massmeasurements), acid seeded (0.015 M (NH4)2SO4 + 0.015 MH2SO4) experiments formed the largest amounts of SOA mass(∼259µg/m3 for Experiment 14) compared to the correspondingnucleation (∼72.5µg/m3 for Experiment 12) and ammoniumsulfate seeded experiments (∼72.8µg/m3 for Experiment 15).Lower mixing ratios of isoprene (Experiment 17) in the presenceof acid seed also resulted in larger amounts of SOA whencompared to the nucleation and ammonium sulfate seededexperiments.
No particle-phase organics were detected using (-) and (+)-ESI techniques. Analysis of filter sample extracts using thesetechniques were nearly identical to the blank and control filters.This shows that SOA components at low-NOx conditions arenot acidic in nature like those of the high-NOx SOA. Becauseof the expected presence of hydroperoxides and polyols, otheranalytical techniques, such as the iodometric-spectrophotometricmethod and GC/MS with TMS derivatization, were employedto understand the chemical nature of low-NOx SOA. Theperoxide aerosol mass concentration was measured for allexperiments except for Experiments 12, 13, and 16. The
iodometric-spectrophotometric method measures the total per-oxide content (sum of ROOH, ROOR, and H2O2) of the aerosol,but because no peroxides were measured from filters collectedfrom air mixtures containing isoprene, H2O2, and seed aerosol,it is assumed that the peroxides measured are organic peroxides.The nucleation experiments (Experiments 10 and 18a) had thehighest contribution of peroxides (∼61% on average) to the SOAmass observed. Dry ammonium sulfate (Experiments 11 and15) and acidified ammonium sulfate seeded experiments (Ex-periments 14 and 17) led to comparable contributions of organicperoxides to the overall SOA mass (∼25 and 30%, respectively).Quality control tests were conducted by the addition ofammonium sulfate to standard solutions of benzoyl peroxideto test if the seed had an effect on the UV-vis measurement oftotal peroxides. The amount of ammonium sulfate added to thebenzoyl peroxide standards was determined by the ratio of SOAvolume growth to the typical ammonium sulfate seed volumeemployed (∼3:1) as determined from the DMA. Little differencewas observed (∼0.6%), showing that ammonium sulfate seedhas a negligible effect on the measurement of peroxide contentfrom seeded experiments. As observed previously,17 the SOAmass was found to decrease rapidly in nucleation experimentsafter reaching peak growth, and as a result, the peroxide contentof the SOA was measured at different times in Experiment 18.The iodometric-spectrophotometric measurement made at thepeak growth in the aerosol volume, as determined from theDMA, for Experiment 18, showed that the peroxides accountedfor ∼59% of the total SOA mass. Twelve hours later, once theaerosol volume decay reached its constant value, the peroxidecontribution to the SOA mass was found to have dropped to26%.
Figure 7 shows a (+)MALDI mass spectrum for a low-NOxacid-seed experiment (Experiment 14). Them/z range (49-620)of ion species observed was not significantly different from (+)-MALDI results obtained for nonacid-seeded experiments. Theabundances of these ions were higher for the acid experiments,but quantification of these species is not possible because ofuncertainties in the ionization efficiencies. In the absence ofseed MALDI signal was low or nonexistent, likely due to verylow ionization efficiencies in the absence of a sulfate matrix.Quantification is also difficult with MALDI because of incon-sistencies and inhomogeneities of sample preparation and lackof understanding of sample matrix effects.31 It is clear, however,that oligomerization occurs in low-NOx SOA. Common 14, 16,and 18 Da differences are observed between many peaksthroughout this spectrum. Structural elucidation of these peaksin Figure 7 was not possible using the (+)MALDI techniqueowing to the inability of performing MS/MS experiments onselected ions from the sample matrix.
Figure 8 shows two TOF-AMS mass spectra for a 500 ppb,low-NOx nucleation experiment (Experiment 12) in them/zrange of 200-450. These mass spectra also indicate theexistence of oligomeric components for low-NOx SOA. Themass spectrum in Figure 8a was collected at a low vaporizertemperature (∼150°C) while that in Figure 8b was collectedat a higher temperature (∼600°C). The presence of more higher-mass peaks at high vaporizer temperatures (Figure 8b) mayindicate that the low-NOx oligomers are heterogeneous, withsome series of oligomers being easily volatilized below 200°Cwhile others are not volatile at these temperatures.
The chemical composition of the SOA formed under low-NOx conditions was found to change over the course of theexperiment. The evolution of selected ions and of the totalorganic mass measured by the TOF-AMS instrument is shown
Figure 4. (a) Mass spectrum for the largest chromatgraphic peak (RT) 15.7 min) from Figure 3d (EIC ofm/z368 ion). (b) Upfront CIDmass spectrum for the same chromatographic peak in Figure 3d (EICof m/z368 ion). The neutral losses observed in the upfront CID massspectrum are associated with a trimeric organic nitrate species. Thisfragmentation pattern ofm/z 368 is consistent with ion trap MS/MSresults. The product ionm/z266 corresponds to a neutral loss of 102Da (common to all MS techniques), the product ionm/z291 correspondsto a neutral loss of 77 Da (likely CH3 radical and NO3 radical, CH3-NO3), the product ionm/z305 corresponds to a neutral loss of 63 Da(likely HNO3), the product ionm/z203 corresponds to a neutral lossof 165 Da, and the product ionm/z164 corresponds to a neutral lossof 204 Da (two losses of common monomer).
Composition of Isoprene Secondary Organic Aerosol J. Phys. Chem. A, Vol. 110, No. 31, 20069673
326

in Figure 9. All ion signal intensities shown here are dividedby the signal intensity of sulfate to correct for loss of particlemass to the chamber walls. Figure 9a shows the evolution oftwo prominent high-mass fragment ionsm/z247 and 327. Thesehigh-mass fragment ions increase in abundance with time, withthe increase inm/z327 being more significant. This increase isobserved for all high-mass (m/z> 200) fragment ions. Figure9b shows the change in the intensity of the fragment ionm/z91, which is proposed to serve as a tracer ion for peroxidesformed under low-NOx conditions, where the proposed formulafor this fragment ion is C3H7O3, and the structure for one of itsisomers is shown in Figure 9b. This peroxide tracer ion reachesits maximum signal after 7 h have elapsed in the experiment.Over the next 6 h, this ion decreases to a lower constant value;such a loss cannot be attributed to wall loss processes becausethe m/z 91 signal has already been normalized to the sulfatesignal. Figure 9c shows the time evolution of the organic massfrom Experiment 13. The organic mass also decreases slightlyafter reaching its peak value; however, the decrease observedfor the organic mass is much lower than that of the peroxidetracer ion (m/z91).
PILS/IC data were collected for some low-NOx experiments.Aerosol mass concentrations of acetate were much lower thanthose in the high-NOx case. For example, for Experiment 12,the acetate anion accounted for only 1.67µg/m3, ∼14-22 timeslower than that of high-NOx levels. Formate anion was detected
at comparable mass concentrations to that of the high-NOx
experiments (∼1.51µg/m3). Again, it should be noted that thesetwo ions elute off the IC column immediately after sampleinjection and there is a possibility that other early-elutingmonocarboxylic acid species coeluted with these two species,leading to an overestimate of their mass. No other organic anionswere detected at significant levels from these low-NOx experi-ments.
Figure 10a shows a GC/MS TIC of a low-NOx, dry am-monium sulfate seeded experiment (Experiment 13). Thechromatographic peaks atRT ) 31.21, 32.25, and 32.61 mincorrespond to isomeric C5 alkene triol species (cis-2-methyl-1,3,4-trihydroxy-1-butene, 3-methyl-2,3,4-trihydroxy-1-butene,trans-2-methyl-1,3,4-trihydroxy-1-butene, respectively), whichhave been measured previously in ambient aerosol from theAmazonian rainforest and Finnish boreal forests.11,12This is thefirst detection of these species in a controlled laboratory chamberexperiment. The chromatographic peaks atRTs 38.22 and 38.97min correspond to the 2-methyltetrols (2-methylthreitol and2-methylerythritol, respectively), which also have been detectedin ambient aerosol studies,7,10,11,13as well as in one previousphotooxidation chamber study.14 The C5 alkene triols and2-methyltetrols have received much attention in prior studies;the corresponding mass spectra for their respective chromato-graphic peaks can be found in Figure 1S (Supporting Informa-tion). GC-FID measurements were made to quantify the
TABLE 2: Quantified SOA Products (in ng/m3) from High-NO x Chamber Experiments
isoprene/high NOx/H2O2 MACR/high NOx/H2O2 isoprene/HONO
[M - H]- ionsurrogate standard used for
quantificationa expt 1 expt 2 expt 6 expt 9 expt 3 expt 4 expt 7 expt 8
mono-nitrate 266 pimelic acid 1970 4170 3890 3910 9360 3860 1470 830oligomers 368 pinic acid 1350 2450 3700 4440 20600 10100 830 750
470 pinic acid 2330 2930 2300 2640 28900 16700 210572 pinic acid b 2960 6810674 suberic acid monomethyl ester 670 710776 suberic acid monomethyl ester 220 450878 suberic acid monomethyl ester 210
total mass frommono-nitrate oligomers (µg/m3) 5.65 9.55 9.89 11.0 62.7 38.8 2.30 1.79% contribution to the total SOA mass 8 13 9 12 35 20 3 2
2-MGc 119 meso-erythritol 2050 3170 9680 4500 1240 460 4170 11600oligomers 221 citramalic acid 1170 2590 2330 2110 3840 1720 550 1000
323 2-hydroxy-3-methylbutyric acid 630 970 430 470 2740 1320 70 160425 pimelic acid 280 290 260 1650 680 130527 pimelic acid 720 480
total mass from 2-MG oligomers (µg/m3) 3.85 7.01 12.7 7.34 10.2 4.66 4.79 12.9% contribution to the total SOA mass 5 10 11 8 6 2 7 18
mono-acetate 161 citramalic acid 40 100 90 110 70oligomers 263 2-hydroxy-3-methylbutyric acid 680 1720 600 670 4070 1300 360 160
365 pimelic acid 770 1890 820 1240 4830 1760 250 290467 pinic acid 340 450 180 420 3750 1310 130569 pinic acid 790 8600 2960671 suberic acid monomethyl ester 450 360
total mass frommono-acetate oligomers (µg/m3) 1.79 4.89 1.70 2.33 21.8 7.69 0.72 0.65% contribution to the total SOA mass 2 7 2 2 12 4 1 1
mono-formate 147 meso-erythritol 200 380 11300 200 1370oligomers 249 2-hydroxy-3-methylbutyric acid 460 1340 40 1970 810 60
351 2-hydroxy-3-methylbutyric acid 370 1000 60 2880 1390 30453 pimelic acid 290 380 1800 710
total mass frommono-formate oligomers (µg/m3) 1.32 3.10 11.3 0.10 6.85 2.91 0.09 1.37% contribution to the total SOA mass 2 4 10 0.1 4 1 0.1 2
total mass identified (g/m3) 12.6 24.6 35.6 20.8 102 54.1 7.90 16.7% of SOA identified 17 34 32 22 56 27 12 23
a Surrogate standards used covered the range of retention times for detected [M-H]- ions. All standards used were within( 1.5 minutes ofretention times for sample [M-H]- ions. b A blank cell indicates that the corresponding species was below the detection limit.c 2-MG )2-methylglyceric acid.
9674 J. Phys. Chem. A, Vol. 110, No. 31, 2006 Surratt et al.
327

2-methyltetrols and C5 alkene triols for a low-NOx dry seededexperiment (Experiment 13-peaks in Figure 10a) and a low-NOx acid seeded experiment (Experiment 14). It was found thatthe 2-methyltetrols and C5 alkene triols accounted for 3.91%and 0.60% of the SOA mass, respectively, for the dry seededexperiment (Experiment 13), and decreased to 0.46% and 0.06%of the SOA mass, respectively, for the acid seeded experiment(Experiment 14). The inset shown in Figure 10a is them/z219EIC for six isomeric dimers (MW) 254) eluting between 58.8and 59.2 min. The corresponding averaged EI mass spectrumfor these chromatographic peaks is shown in Figure 10b. Thegeneral chemical structure of the trimethylsilylated dimer, alongwith its respective MS fragmentation, is also shown in this massspectrum. The fragmentation pattern shown here indicates thatthe dimer forms by the reaction of a C5 alkene triol (indicatedby them/z335 fragment ion) with a 2-methyltetrol (indicatedby the m/z 219 fragment ion) to form the hemiacetal dimershown. To confirm the MW of the isomeric hemiacetal dimerseluting between 58.8 and 59.2 min, an averaged CI(CH4) massspectrum was also collected and is shown in Figure 10c. TheMW of the trimethylsilylated dimer (derivatized MW) 686)is confirmed by the [M + H - CH4]+ ion atm/z671. The SOAproducts that elute at 34.91 and 35.47 min were tentativelycharacterized as diastereoisomeric 2-methyltetrol performatederivatives, which are unstable and upon reaction in thetrimethylsilylation reagent mixture are converted into 2-meth-yltetrols. Their corresponding EI mass spectra can also be foundin Figure 1S (Supporting Information). It should be noted thatthe peaks labeled *1, *2, and *3 in the GC/MS TIC (Figure
10a) were also present in the laboratory controls and wereidentified as palmitic acid, stearic acid, and palmitoyl monoglyc-eride, respectively. Table 4 summarizes all low-NOx SOAcomponents elucidated by GC/MS.
4. Discussion
4.1. Gas-Phase Chemistry.Gas-phase oxidation of isopreneis dominated by the reaction with OH.16,17 Under high-NOx
conditions, O3 and NO3 radicals play only a minor role in theinitial oxidation of isoprene because they form only once [NO]approaches zero, by which time most of the isoprene isconsumed. Under low-NOx conditions, O3 and NO3 radicals alsocontribute negligibly to isoprene oxidation. Figure 11 showsthe initial gas-phase reactions that occur under both low- andhigh-NOx conditions. In both cases, the initial oxidation ofisoprene occurs by reaction with OH, followed by the immediateaddition of O2 to form eight possible isomeric isoprenehydroxyperoxy (RO2) radicals (for simplicity, only three areshown).
Under high-NOx conditions, the isoprene hydroxyperoxyradicals react predominantly with NO; however, they may alsoreact with NO2 to form peroxynitrates (ROONO2, not shownin Figure 11), but these are likely unimportant to the formationof isoprene SOA because of their thermal instability. RO2 +NO reactions result in the formation of either hydroxynitratesor hydroxyalkoxy (RO) radicals. Our observations of organicnitrates in high-NOx SOA as observed in Figure 1 ([M- H]-
ions with evenm/zvalues) indicate that these hydroxynitrates
Figure 5. TOF-AMS spectra collected at low vaporizer temperatures for the following high-NOx chamber experiments: (a) 50 ppb isoprene, 250ppb NOx, H2O2 as the OH precursor, no seed; (b) 500 ppb MACR, 800 ppb NOx, H2O2 as the OH precursor, with seed; and (c) 500 ppb isoprene,HONO as the OH precursor, no seed. These spectra indicate that the OH precursor does not have a substantial effect on the chemistry observed,that MACR is an important SOA precursor from isoprene oxidation, and that the 102 Da differences observed in the offline mass spectrometry dataare not a result of sample workup or ionization artifacts.
Composition of Isoprene Secondary Organic Aerosol J. Phys. Chem. A, Vol. 110, No. 31, 20069675
328

are likely SOA precursors. Two of the hydroxyalkoxy radicalsdecompose into MVK and MACR, where their yields are 32-44% and 22-28%, respectively.32-35 The remaining hydroxy-alkoxy radical forms a 1,4-hydroxycarbonyl, which may isomer-ize and dehydrate to form 3-methylfuran.36 SOA formation hasbeen observed from the photooxidation of MACR and 3-me-thylfuran, indicating that these are SOA precursors (indicatedby black boxes in Figure 11).17 However, 3-methylfuran is notexpected to contribute greatly to the SOA formed by isopreneoxidation because of its low gas-phase product yield (<2-5%).33-35 The higher gas-phase product yields observed forMACR suggest that it is the most important SOA precursor fromisoprene oxidation under high-NOx conditions; this is consistentwith the similarities of the chemical products observed inisoprene and MACR SOA (Figure 1 and Table 2). Even though
MVK typically has the highest gas-phase product yield observed,it is not a contributor to SOA formation under high-NOx
conditions because negligible amounts of aerosol were producedfrom the high-NOx photooxidation of 500 ppb MVK. Otherproducts of isoprene oxidation under high-NOx conditions (notshown in Figure 11) include C5 hydroxycarbonyls, C4 hydroxy-carbonyls, and C5 carbonyls; these may contribute to SOAformation, but experimental evidence is currently lacking.
Under low-NOx conditions, the isoprene hydroxyperoxyradicals react predominantly with HO2. These reactions resultin the formation of hydroxy hydroperoxides, which are high-lighted in dotted boxes to indicate that these species are possibleSOA precursors. Under similar reaction conditions, Miyoshi etal.32 observed by IR spectroscopy that hydroperoxides are majorgas-phase products from isoprene oxidation under NOx-
Figure 6. (a) TIC of a high-NOx isoprene nucleation experiment (Experiment 5) collected using GC/MS in the EI mode. (b) EI mass spectrum forthe 2-MG residue (RT ) 29.08 min). (c) EI mass spectrum for a linear dimer made up of two 2-MG residues (RT ) 51.59 min). These two massspectra confirm that 2-MG is present in high-NOx SOA and that it is involved in particle-phase esterification reactions resulting in polyesters (asshown by the dimer structure above).
9676 J. Phys. Chem. A, Vol. 110, No. 31, 2006 Surratt et al.
329

free conditions. Aerosol formation was also observed; how-ever, the composition of the resultant aerosol was not investi-gated.
In contrast to Kroll et al.,16 under the present conditions theremay be some contribution (∼10-30%) of RO2 + RO2 reactionsunder low-NOx conditions owing to the higher [isoprene]o/[H2O2] ratios used in the current study.32 For simplicity, onlythe RO2 + RO2 reactions that lead to hydroxyalkoxy radicalsare shown in Figure 11. As in the high-NOx case, thesehydroxyalkoxy radicals will likely form MVK, MACR, andhydroxycarbonyls. The RO2 + RO2 reactions not shown canlead to the formation of diols and other isomeric hydroxycar-bonyls. As will be discussed subsequently, the diols that resultfrom RO2 + RO2 reactions (not shown) may form SOA aswell.15
4.2. High-NOx SOA. 4.2.1. Importance of MACR Oxidation.MACR oxidation under high-NOx conditions produces signifi-cant amounts of SOA (Experiments 3 and 4). When comparingthe SOA products from isoprene and MACR oxidation at high-NOx conditions, many of the same products are observed (Figure1). Tandem MS data obtained for selected ions common to bothisoprene and MACR samples, like them/z 368 ion shown inFigure 4, produced similar product ion spectra, further indicatingthat these species are indeed the same. This observation isconsistent with our previous proton-transfer reaction-massspectrometry (PTR-MS) studies of isoprene oxidation, whichdemonstrate a strong correlation between the amount of SOAformed and the MACR reacted in the gas phase.37,38 In thesestudies, aerosol growth continued well after isoprene was fullyconsumed, indicating the likely importance of second- (or later-)
TABLE 3: Low-NO x Chamber Experiments Conducted
exptno.a,b
seededc/nucleation [O3]d ppb T, °Cd
total SOA massconcentrationd,e,fµg/m3
peroxide aerosol massconcentrationµg/m3
% contribution ofperoxides to the SOA
mass concentration observed
10g nucleation 32 29.1 186 116 6211g dry AS 36 28.7 282 97 3412 nucleation b.d.l. 23.7 73 h h
13 dry AS 12 24.1 69 h h
14 AAS b.d.l. 23.8 259 67 2615 dry AS 11 23.9 73 19 2516i dry AS 2 25.6 24 h h
17 AAS b.d.l. 23.6 93 23 2418a nucleation 7 26.2 55 32 5918bj nucleation 37 27.0 22 6 26
a All VOC gas-phase mixing ratios were 500 ppb, except for Experiment 17 (100 ppb).b H2O2 was the OH precursor used for each low NOx
isoprene experiment. H2O2 is not measured directly, but from isoprene decay during irradiation we estimate∼3 ppm of H2O2. c AS ) ammoniumsulfate seed, AAS) acidic ammonium sulfate seed.d Averaged over the course of filter sampling.e Subtraction of seed aerosol taken into accountwhen necessary. SOA volume derived from DMA wall loss uncorrected measurements for use in mass closure from filter sample analyses.f Assuminga SOA density of 1.25 g/cm3. This value is derived from comparison of DMA aerosol volume and AMS aerosol mass measurements.g 100% oflight bank used and hence higher temperatures in chamber observed during sampling.h No peroxide measurement made for this sample.f Half ofthe typical [H2O2] used∼1.5 ppm.j Late sampling, after peak growth, during the rapid decay of the aerosol mass/volume typical of low NOx
experiments.
Figure 7. MALDI positive mode spectrum obtained with a graphite matrix for a 500 ppb isoprene, low-NOx, acid seeded experiment (Experiment14). High-molecular mass species formed up to∼620 Da.
Composition of Isoprene Secondary Organic Aerosol J. Phys. Chem. A, Vol. 110, No. 31, 20069677
330

generation gas-phase products and/or heterogeneous (particle-phase) reactions. It should be noted that when the MACR, H2O2,and dry ammonium sulfate seed aerosol are well mixed in thechamber before irradiation begins, no aerosol growth is ob-served. This rules out the possibility of reactive uptake ofMACR into the particle phase; instead the oxidation of MACRis a necessary step in SOA formation from the photooxidationof isoprene.
4.2.2. Oligomers.Oligomerization occurs in SOA formedunder high-NOx conditions, where both offline and online massspectrometry techniques (Figures 1, 2, and 5) measure specieswith much higher MWs than those of the parent isoprene, withcharacteristic 102 Da differences. Tandem MS techniques, suchas upfront CID on the LC/MS instrument, confirm that oligo-mers are indeed formed from a common 102 Da monomericunit. For example, when isolating them/z368 ion from the restof the sample matrix and further fragmenting it to generate aproduct ion spectrum, two successive neutral losses of 102 Dawere observed atm/z266 and 164 (Figure 4b). Two isomericcompounds withm/z266 in Figure 3c were found to elute offthe LC column at∼2.5-3 min earlier than the compound withm/z 368 studied here. The fact that the compounds withm/z266 ions elute off the LC column at earlierRTs, and thatm/z266 is a product ion ofm/z 368, strongly suggests that thesetwo ions are characteristic of the same oligomeric series. Thecompounds characterized bym/z368 and 266 are likely a trimerand dimer, respectively. The other series of oligomers quantifiedin Table 2 also had 102 Da differences observed and similarLC/MS behaviors, with ions with lower mass eluting from theLC column at earlierRTs.
4.2.3. Organic Nitrates.Organic nitrates, detected as even-mass [M- H]- ions in (-)ESI spectra, were measured in allhigh-NOx experiments. All organic nitrates detected in high-NOx SOA samples had similar product ion spectra asm/z368
(Figure 4b), with neutral losses of 63 (HNO3), 77 (CH3 radical+ NO3 radical, possibly CH3NO3), and 102 Da, suggesting thatall even-mass [M- H]- ions are oligomeric organic nitratespecies. Unlike the (-)ESI techniques (Figures 1 and 3), theGC/MS technique did not allow for the detection of organicnitrate species, likely a result of their instability at the hightemperature of the GC injector and/or derivatization techniquesused during sample workup. Organic nitrates were also notclearly detected in the MALDI-TOFMS (Figure 2) and TOF-AMS (Figure 5) instruments. This is likely a result of the harshionization techniques employed by these instruments. Even with(-)ESI, these organic nitrates were not completely stable, asshown in Figure 4a for them/z368 ion. Organic nitrates foundin the high-NOx SOA likely form from the further oxidation ofthe hydroxynitrate species found in the gas phase from RO2 +NO reactions.
4.2.4. 2-MG as Monomeric Units.As shown in Table 2, othervarieties of oligomers were observed as well. From further useof tandem MS techniques, it was found that one of these seriesof oligomers likely involved 2-MG (2-methylglyceric acid), arecently discovered SOA tracer compound for isoprene oxidationin the ambient atmosphere,10,13,14 as an important monomer.Confirmation of the 2-MG monomer in high-NOx SOA wasprovided by GC/MS with TMS derivatization (Figure 6a andb). Because monomeric 2-MG is small and polar, it was notretained effectively by the LC reverse phase column (RT≈ 1.3min) and was detected in its deprotonated form atm/z 119.Figure 12 shows product ion spectra obtained with (-)ESI-ITMS for Experiment 9. In Figure 12a, them/z 323 ion isisolated in the ion trap from the rest of the ion matrix and iscollisionally activated to produce the MS2 spectrum shown here.Them/z221 ion is the base peak in this spectrum, and them/z119 ion also detected as the result of further fragmentation ofthe m/z 221 product ion. The fact that them/z 119 ion was
Figure 8. TOF-AMS spectra for a 500 ppb isoprene low-NOx experiment (Experiment 12). (a) Mass spectrum obtained with a low temperaturevaporizer (∼150°C). (b) Mass spectrum obtained with a high temperature vaporizer (∼600°C). The spectrum is richer at higher temperature withsome prominent peaks at higherm/z, indicating that the high- MW oligmers that are not easily volatilized at<200 °C.
9678 J. Phys. Chem. A, Vol. 110, No. 31, 2006 Surratt et al.
331

detected as a product ion in the MS2 and MS3 spectra shown inFigure 12 strongly suggests that 2-MG is a monomer in thisoligomeric series. It is important to note thatm/z119 was alsoa fragment ion produced in the upfront CID spectrum for them/z 368 ion in Figure 4b. It was found thatm/z 119 was acommon product ion to each oligomeric series, suggesting theimportance of 2-MG in oligomerization reactions.
4.2.5. Mono-Acetate and Mono-Formate Oligomers.ThePILS/IC measurements of high levels of particulate acetate andformate anions in both the seeded (Experiment 1) and nucleation(Experiment 2) experiments, coupled with the high volatilitiesof their acid forms produced in the gas phase from the oxidationof isoprene, suggests that these compounds resulted from thedecomposition of oligomeric SOA. The formation ofmono-acetate andmono-formate oligomers was observed by tandem(-)ESI-MS measurements. Figure 13 shows two product ionspectra for amono-acetate dimer ([M- H]- at m/z161) andmono-formate trimer ([M- H]- at m/z249), respectively. Theobservation of a neutral loss of 42 Da (ketene, H2CdCdO)and a dominant product ionm/z59 (acetate anion) in the MS2
spectrum of them/z 161 ion (Figure 13a), provides strongevidence for acetylation. In the MS2 spectrum of them/z249ion (Figure 13b), the major product ionm/z 147 results fromthe common neutral loss of 102 Da. The product ionm/z221results from a neutral loss of 28 Da (CO), a rearrangementreaction that is characteristic of formates. The product ionm/z119 (deprotonated 2-MG) resulting from the combined neutrallosses of 102 and 28 Da is also observed.Mono-acetate
oligomers were also detected by the GC/MS TMS derivatizationmethod; the details of these findings will be discussed in aforthcoming GC/MS complementary paper.
4.2.6. Heterogeneous Esterification Reactions.Oligomerspecies containing them/z119, 221, and 323 ions as detectedby the (-)ESI techniques were also observed by GC/MS astheir respective TMS derivatives as shown Figure 6a. As inprevious measurements of 2-MG,14 the EI mass spectrum shownin Figure 6b confirms the formation of monomeric 2-MG inhigh-NOx isoprene SOA. The dimer detected atm/z221 by (-)-ESI techniques (as shown in Figure 12b) involving 2-MG asan important monomer, is detected at 51.59 min in Figure 6a.The chemical structure of this species likely contains onecarboxyl and three hydroxyl groups, as shown in Figure 6c.The formation of an ester linkage is also denoted in thisstructure, which is the expected site of oligomerization. Theionsm/z583 ([M + TMS]+) andm/z495 ([M - CH3]+) confirmthat the MW of this dimer species is 222 (which is also inagreement with the ESI results). The ionm/z467 ([M - (CH3
+ CO)]+) is consistent with a terminal trimethylsilylatedcarboxylic group, while the ionm/z 480 ([M - CH2O]+) isexplained by a rearrangement of a trimethylsilyl group andpoints to a terminal trimethylsilylated hydroxymethyl group. Theelemental composition (C8H14O7) of the structure shown inFigure 6c was also confirmed by high-resolution ESI-TOFMSmeasurements. These results strongly suggest that particle-phaseesterification reactions occurred between 2-MG molecules,where a hydroxyl group of one 2-MG molecule reacted with a
Figure 9. Time evolution plots produced from the TOF-AMS instrument for selected fragment ions and the total organic mass observed from atypical low-NOx experiment (Experiment 13). All ion signal intensities are divided by the signal intensity of sulfate. Because sulfate concentrationis a tracer for wall loss (neither created nor removed during the run), the ratio of ion signal to sulfate signal should give an indication of thebehavior without wall loss. (a) Time evolution plot for high-mass fragment ionsm/z247 and 327. (b) Time evolution plot for the proposed peroxidefragment ionm/z91 (C3H7O3), where the structure of one isomer is shown. (c) Time evolution plot for the total organic mass. These plots indicatethat the chemical composition changes with experimental time, where the decomposition of organic peroxides correlates to oligomerization withinlow-NOx SOA. The missing data points (11:30 to 12:00 hours) in these plots are due to the vaporizer in the TOF-AMS instrument being turned off.
Composition of Isoprene Secondary Organic Aerosol J. Phys. Chem. A, Vol. 110, No. 31, 20069679
332

carboxylic acid group of another one. The products that resultfrom this reaction would be the ester compound shown in Figure6c and a water molecule. The neutral loss of 102 Da, likelycorresponding to dehydrated 2-MG or a 2-MG residue in theform of a lactone (i.e., 2-hydroxy-2-methylpropiolactone),observed from the ESI-MS/MS techniques can be explained bythe charge-directed nucleophilic reaction shown in Figure 14.To our knowledge, this is the first evidence of particle-phaseesterification reactions in SOA. It should be noted that the massspectra, not shown here, for the chromatographic peaks in Figure6a at 60.01 and 60.31 min, correspond to branched and linear2-MG acid trimers (corresponding to MW) 324), respectively.A detailed discussion of the EI mass spectral behavior of theTMS derivatives of 2-MG and 2-MG dimer and trimers will bepresented in a complimentary GC/MS study.
Figure 15a and b compares the GC/MS EICs, using them/z219 ion as the base peak, for a filter sample from Experiment5 treated with trimethylsilylation only to that of a filter sample(also from Experiment 5) treated by hydrolysis/ethylation+trimethylsilylation, respectively, to show further confirmationof polyesters formed via esterification reactions between 2-MGmolecules. When treating SOA from the same chamber experi-ment with the hydrolysis/ethylation procedure, a noticeabledecrease in 2-MG and 2-MG oligomers is observed. Forexample, the peaks at 29.08, 51.59, and 60.31 min (Figure 15a)observed after trimethylsilylation appear as smaller peaks uponthe hydrolysis/ethylation experiment, as shown in the secondchromatogram (Figure 15b). This decrease is a result of theformation of ethyl esters of 2-MG and of linear dimer (RTs)27.42 and 50.48 min, respectively). The mass spectra confirming
Figure 10. (a) GC/MS TIC of isoprene low-NOx SOA. The inset shows them/z219 EIC for the dimeric products eluting between 58.8 and 59.2min. Peak identifications:RTs 31.21, 32.25, and 32.61 min: C5 alkene triols;RTs 34.91 and 35.47 min: unstable products tentatively characterizedas 2-methyltetrol performate derivatives;RTs 38.22 and 38.97 min: 2-methyltetrols (2-methylthreitol and 2-methylerythritol, respectively). The EIspectra for the latter seven compounds are provided in Figure 1S (Supporting Information). The peaks labeled *1, *2, and *3 were also present inthe laboratory controls and were identified as palmitic acid, stearic acid, and palmitoyl monoglyceride, respectively. (b) Averaged EI spectrum forthe dimeric products eluting between 58.8 and 59.2 min and fragmentation scheme; and (c) averaged CI(CH4) spectrum for the latter products.
9680 J. Phys. Chem. A, Vol. 110, No. 31, 2006 Surratt et al.
333

the formation of these ethyl ester species are shown in Figure15c and d, respectively. Them/z 365 and 277 ions in Figure15c confirm the MW of the ethyl ester of 2-MG to be 148,where its formation is the result of polyesters decomposing intothis derivatized monomer. The detection ofm/z539 and 451 inFigure 15d confirm the MW of the ethyl ester of the linear 2-MGdimer, likely a result of the incomplete decomposition of largerpolyesters (i.e., trimers, tetramers, pentamers, etc.) in high-NOx
SOA.Figure 16 shows the overall proposed reaction mechanism
for SOA formation from the photooxidation of isoprene underhigh-NOx conditions. This figure denotes important initial gas-phase and particle-phase reactions that lead to the observed SOAproducts. As was discussed earlier, further gas-phase oxidationof MACR is required in order to form SOA from isoprene underhigh-NOx conditions. Oligomeric organic nitrates, such as them/z368 ion, are compromised of an organic nitrate monomer,which is detected as the deprotonatedm/z 164 product ion(Figure 4b); therefore, it is possible that one gas-phase productof MACR oxidation is its hydroxynitrate form, as shown inFigure 16. Through further oxidation of the aldehyde group inthis hydroxynitrate species, it is expected that the acid form of
this species results in the particle phase, thus being availablefor esterification reactions with 2-MG (Reaction 2 in Figure16). To our knowledge, no organic nitrates have been measuredin the gas phase from MACR oxidation (though nitrate formationhas been inferred from OH-methacrolein reaction kinetics39);however, the detection of organic nitrates in the particle phasesuggests that this is possibly a minor channel for SOA formation.However, the formation of 2-MG from the oxidation of MACRis still uncertain because of the unknown intermediates leadingto its formation. Recently, it was proposed that 2-MG formsfrom the reaction of methacrylic acid or MACR with H2O2 inthe liquid aerosol phase under acidic conditions.13 No aerosolgrowth was observed for MACR, H2O2, and dry ammoniumsulfate seed aerosol under dark conditions; however, it ispossible that other products such as formic and acetic acid, aswell as oxidants formed during isoprene photooxidation, maypromote the reactive uptake of MACR into the aerosol phase.Further measurements of MACR oxidation products are neededin order to better understand the formation of 2-MG, whichmight occur in either the particle or gas phase.
From our detailed analytical measurements discussed above,the importance of 2-MG to particle-phase reactions in high-
TABLE 4: Low-NO x Isoprene SOA Products Elucidated by GC/MS
Composition of Isoprene Secondary Organic Aerosol J. Phys. Chem. A, Vol. 110, No. 31, 20069681
334

NOx SOA is now well established. 2-MG monomers can reactintermolecularly via esterification to produce 2-MG oligomers(Reaction 1), or react withmono-nitrate monomers to producemono-nitrate oligomers (Reaction 2), or react with acetic orformic acid to producemono-acetate andmono-formate oligo-mers, respectively (Reactions 3 and 4). These proposed esteri-fication reactions are equilibrium reactions, and as a result, theaddition of an acid or removal of water could promote theformation of these esters. As stated earlier, the high-NOx
experiments were conducted at very low relative humidities (RH< 5%); therefore, this condition could allow for the esterformation we observe. We also observe high concentrations oforganic acids (2-methylglyceric, acetic, and formic acid) at high-NOx conditions, which could provide the acidity needed to drivethese reactions. It has been shown40 that heterogeneous esteri-fication of polyols by vapor-phase treatment with acetic acidand trifluoroacetic anhydride (used as an alternative to thesulfuric acid catalyst) will occur at room temperature withoutthe use of liquids. Thus, it is reasonable to infer that esterificationreactions may occur under the dry, room-temperature conditionsof our chamber experiments. It should be noted that there isalso evidence from the TOF-AMS that supports this reactionmechanism. The ratio of the TOF-AMS ion signals associatedwith the 2-MG dimer (m/z205) to that of the 2-MG monomer(m/z103) increases during the course of the high-NOx experi-ments, therefore providing additional confirmation of ourproposed reaction mechanism in Figure 16. These results fromthe TOF-AMS, however, are not quantitative because of themajority of these molecules being fragmented (thermally or bythe electron impact ionization) to smaller ions.
In comparison to MACR oxidation, the further oxidation ofMVK likely does not produce SOA under high-NOx conditionsbecause of its ketone moiety. The lack of an aldehydic hydrogenprecludes the formation of acidic products (like that of 2-MGfrom MACR oxidation), which are necessary componentsneeded for the particle-phase esterification reactions (Figure 16).One of the most abundant gas-phase products produced fromMVK oxidation under high-NOx conditions is methylglyoxal.It was shown in a prior chamber study by Kroll et al.41 thatmethylglyoxal does not reactively uptake onto inorganic seedaerosol; therefore, this could explain the lack of SOA growthfrom the further oxidation of MVK.
For the isoprene/H2O2 experiments, except for Experiment6, the most abundant oligomer series was themono-nitrateoligomers (Table 2). Themono-nitrate oligomers accounted for∼8-13% of the SOA mass formed in these experiments. Asfor the isoprene/H2O2 experiments, themono-nitrate oligomerswere the most abundant oligomers for the MACR/H2O2 experi-ments (∼35% of SOA mass for the seeded experiment versus∼20% for the nucleation experiment). Even though most of thechemical products are the same in the H2O2 and HONOexperiments, the abundances of these products are different. Incontrast to the H2O2 experiments, the 2-MG oligomers are themost abundant oligomers for the HONO experiments. Thesedifferences could be due to different NOx levels. SOA massclosure was observed to be the highest for the MACR/H2O2/seeded experiment (∼57% of SOA identified) and the isoprene/H2O2/seeded experiments (22-34% identified). It is importantto stress that the organic aerosol mass loadings formed in theseisoprene high-NOx chamber experiments (∼50-200µg m-3)
Figure 11. Reaction mechanism of isoprene oxidation under low- and high-NOx conditions. Dotted boxes indicate possible SOA precursors,whereas black boxes indicate known SOA precursors. For simplicity, only three of the eight initial isoprene hydroxyperoxy (RO2) radicals areshown. RO2 + RO2 reactions leading to diols and other hydroxycarbonyls have been omitted for simplicity.aMiyoshi et al.31 showed that [isoprene]o/[H2O2] determines molar yields of MVK, MACR, and formaldehyde under low-NOx conditions.bKroll et al.16 summarized molar yields of gas-phase products from isoprene oxidation under high-NOx conditions reported in the literature.
9682 J. Phys. Chem. A, Vol. 110, No. 31, 2006 Surratt et al.
335

are much higher than those found in ambient aerosol whereisoprene emissions are the highest (∼5µg m-3). The amountof organic aerosol mass controls the gas-particle partitioningof semi-volatile species produced from the oxidation of hydro-carbons because more organic aerosol mass allows for moreuptake of these species; therefore, the mass closure resultspresented apply only to the aerosol mass loadings produced inthis current study and are not absolute for the isoprene system.The key insight from our analysis is the detection of thesevarious oligomeric products formed from particle-phase esteri-fication reactions.
4.2.7. Additional Routes for SOA Formation.As shown inTable 2, the polyester products from oligomerization of 2-MGand related components account only for a portion (22-34%)of the SOA formed from isoprene oxidation under high-NOx
conditions. This lack of mass closure could result from the LC/MS technique underestimating the amount of polyesters, pos-sibly related to the use of a C18 reverse phase column and theunavailability of authentic standards. The C18 reverse phasecolumn could have degraded the oligomers into smaller unitsas they pass through the column, or very large oligomers couldhave permanently been retained onto the reverse phase material,and hence were not detected. Negative bias associated with filtersampling, such as evaporative losses during sampling or storage,could also be a source of incomplete mass closure. The presenceof acetic acid in eluent mixture used for the LC/MS runs couldalso have caused an underestimation of the oligomers formed
due to the possibility of acid-catalyzed hydrolysis during ESI,a process that would lead to a decrease in the detection ofoligomeric compounds. Besides possible errors associated withquantifying esterification products identified by the LC/MStechnique, the possibility still exists that other unidentifiedsecond- (or later-)-generation gas- or particle-phase productsfrom isoprene oxidation contribute to SOA formation, and as aresult, would increase the mass closure significantly.
Glyoxal, a C2 dialdehyde, has been recently shown to bereactively taken up into particulate matter,41,42 however, not atthe lowRHs employed in this study (RH < 5%). Theoretically,it has been shown that this reactive uptake of glyoxal resultsfrom thermodynamically favorable hydration and oligomeriza-tion.43,44When first interpreting the MS data from the ESI andMALDI techniques, it was considered that a dialdehyde speciespossibly corresponded to the 102 Da neutral losses observedfrom the oligomeric components. Figure 17 shows a proposedgas-phase reaction scheme for the formation of a C4 hydroxydialdehyde species (MW) 102) from the further oxidation ofMACR. In contrast to glyoxal, dissolution may not be required
Figure 12. ESI-ITMS negative mode product ion spectra from a high-NOx isoprene SOA sample (Experiment 9). (a) MS2 spectrum for anisolatedm/z 323 ion. Two neutral losses of 102 Da are observed asshown by the product ionsm/z221 and 119. (b) MS3 spectrum for anisolatedm/z323 ion generated from the further fragmentation of thedominant daughter ion () m/z221) in the MS2 spectrum. These spectraindicate that 2-MG ([M- H]- ion ) m/z119) is a monomer for theoligomericm/z323 ion.
Figure 13. ESI-ITMS negative mode product ion mass spectraproviding evidence formono-acetate andmono-formate oligomers inhigh-NOx SOA. (a) Product ion mass spectrum for amono-acetate dimer(m/z161). (b) Product ion mass spectrum for amono-formate trimer(m/z249).
Figure 14. Proposed charge-directed nucleophilic reaction occurringduring collisional activation in (-)ESI-ITMS, explaining the observationof 102 Da (2-hydroxy-2 methylpropiolactone) losses from oligomerichigh-NOx SOA.
Composition of Isoprene Secondary Organic Aerosol J. Phys. Chem. A, Vol. 110, No. 31, 20069683
336

for this proposed dialdehyde species to form SOA; therefore,other heterogeneous processes may occur. The detailed analysisof the GC/MS derivatization and the ESI tandem MS results,however, provides strong chemical evidence for the formation
of polyesters, where the neutral loss of 102 Da is explained bythe dehydrated lactone form of 2-MG (Figure 14). In addition,a GC/MS derivatization analysis made for MACR high-NOx
SOA (Experiment 3) that included a methoximation step prior
Figure 15. (a) GC/MS EIC ()m/z 219) for high-NOx isoprene nucleation sample (Experiment 5) treated only with TMS derivatization. (b)GC/MS EIC () m/z219) for a duplicate sample of the same experiment (Experiment 5) in part a, but treated this time by hydrolysis/ethylationfollowed by TMS derivatization. (c) EI mass spectrum for ethyl ester of 2-MG acid detected in part b (RT) 27.42 min). (d) EI mass spectrum forethyl ester of linear 2-MG acid dimer detected in part b (RT )50.48 min). The hydrolysis/ethylation followed by TMS derivatization resultspresented here confirm the existence of polyesters in high-NOx SOA.
9684 J. Phys. Chem. A, Vol. 110, No. 31, 2006 Surratt et al.
337

to trimethylsilylation to reveal aldehyde functions in the formedoligomers was negative.
To investigate further the probable importance of a C4
hydroxy dialdehyde species and its respective hemiacetaloligomers, selected sample extracts were derivatized usingGirard Reagent P to increase sensitivity for aldehydic speciesin the (+)ESI mode. A high-NOx isoprene and a MACR samplewere treated with this derivatizing agent, and as a result, thedetection of them/z236, 206, and 192 ions resulted for both
samples, which likely corresponds to the detection of theproposed C4 dialdehyde, glyoxal, and methylglyoxal, respec-tively. However, the proposed hemiacetal oligomers that wouldbe produced from this C4 dialdehyde were not detected,consistent with observations made in the methoximation GC/MS experiment. It is possible that the detection of the proposedC4 dialdehyde resulted from the decomposition of oligomersduring the derivatization step of the sample workup procedure(which is equivalent for the detection of glyoxal and methylg-
Figure 16. Proposed mechanism for SOA formation from isoprene photooxidation under high-NOx conditions. Symbol used: ?, further studyneeded in order to understand the formation (in gas/particle phase) of 2-MG.aElemental compositions confirmed by high-resolution ESI-MS.bElemental composition ofmono-nitrate tetramer (MW) 471) confirmed by high-resolution ESI-MS.cElemental compositions ofmono-acetatetetramer and pentamer (MW) 366 and 468, respectively) confirmed by high-resolution ESI-MS.
Figure 17. Proposed gas-phase formation mechanism for a C4 hydroxydialdehyde monomer, possibly accounting for a fraction of the unidentifiedSOA mass in high-NOx experiments.
Composition of Isoprene Secondary Organic Aerosol J. Phys. Chem. A, Vol. 110, No. 31, 20069685
338

lyoxal in the particle phase). As a confirmation that the observedions were derivatized species of the proposed C4 dialdehyde,glyoxal, and methylglyoxal, upfront CID LC/MS analysis wasused to detect common neutral mass losses and fragment ionsassociated with derivatized aldehydes and ketones. The commonneutral losses and fragment ions associated with the GirPderivatization detected were similar to those found by Lai etal.,23 providing further evidence of the detection of these smallaldehyde species in high-NOx isoprene and MACR SOA. Thedetection of these small dicarbonyls provides some evidencethat aldehydes may account for a fraction of the unquantified(unidentified) SOA mass (Table 2) produced from isopreneoxidation under high-NOx conditions. The mechanism (reactiveuptake and/or oligomerization) and the degree in which thesealdehydes form SOA, however, remains unclear and bearsfurther study.
4.3. Low-NOx SOA. 4.3.1. Hydroperoxides: Key Componentto SOA Formation.As discussed previously, in the absence ofNOx, the RO2 radical chemistry is dominated by RO2 + HO2
reactions, owing to the large amounts of HO2 formed from theOH + H2O2 reactions.17 RO2 + RO2 reactions are expected tobe less substantial (10-30% contribution) because of the highHO2/RO2 ratios in these experiments, and as a result, hydrop-eroxides are expected to be the dominant gas-phase products.Because of their expected low volatilities, hydroperoxide speciescan partition to the aerosol phase and likely form high-MWspecies via peroxyhemiacetal formation with aldehydic spe-cies.18,19 Hydroperoxides resulting from the oxidation of aro-matic and biogenic VOCs have been observed and calculatedto be important contributors to the overall SOA mass.18,45,46
Indeed, as shown in Table 3, organic peroxides (i.e., hydrop-eroxides or ROOR) are also a significant component (∼61%of the SOA mass for nucleation experiments and∼25% and30% of the SOA mass for dry seeded and acid seededexperiments, respectively) of the low-NOx isoprene SOA. Thelarge discrepancy in peroxide content observed between nucle-ation (seed-free) and seeded experiments is currently notunderstood. As discussed in the results section, there is noevidence of interference from ammonium sulfate on the peroxidecontent measurement. Owing to the neutral nature of thehydroperoxides (and ROOR) measured by the iodometric-spectrophotometric method, no tandem ESI-MS measurementscould be made to structurally elucidate this fraction. Thus, it isdifficult to explain the differences in the peroxide contentobserved between nucleation and seeded experiments. It ispossible that in the seeded cases the hydroperoxide species areheterogeneously converted into neutral species other thanperoxidic compounds, such as polyols. Further studies shouldbe conducted to investigate the role of inorganic seed on theamount of peroxides formed in the aerosol phase. As noted inthe high-NOx case, the mass closure results presented here applyonly to the aerosol mass loadings produced in this current studyand cannot be concluded as absolute for the isoprene system atlow-NOx conditions.
4.3.2 Oligomerization.Oligomers were found to form underlow-NOx conditions, as shown in the (+)MALDI (Figure 7),GC/MS with TMS derivatization (Figure 10), and TOF-AMS(Figures 8 and 9) data. In contrast to high-NOx conditions, nodistinct pattern or obvious monomeric unit, like the 102 Dadifferences observed in the high-NOx oligomeric SOA (Figures1, 2, and 5), was observed in the low-NOx oligomers. Theoligomers formed in the low-NOx case are not acidic in naturelike those in the high-NOx case. Structural elucidation of theseoligomers is limited because these neutral products are not
ionizable using ESI-MS. MALDI (Figure 7) was able to providesome indication of the MW ranges of the oligomeric SOA, butstructural elucidation was not possible. The large mass contribu-tion of organic peroxides to the low-NOx SOA (Table 3)provides some insight into the oligomerization reactions occur-ring. It is possible that some fraction of the oligomeric SOA isformed by peroxyhemiacetals, which result from heterogeneousreactions of hydroperoxides and aldehydes.
Because of the neutral nature of the oligomeric SOA producedunder low-NOx conditions, only the GC/MS derivatizationtechnique provides structural elucidation of the oligomersformed owing to the presence of polyols. Hemiacetal formationreactions between C5 alkene triols (Table 4) and 2-methyltetrols(Table 4) were found to occur using this technique (Figure 10b).The reaction involves a terminal hydroxyl group of a 2-meth-yltetrol, which serves as a nucleophile, reacting with thetautomeric keto form of one C5 alkene triol (Table 4) to formthe hemiacetal dimer shown in Figure 10b. As was observedby the GC/MS m/z 219 EIC, six isomeric forms of thishemiacetal dimer could be partially resolved. However, furtherelucidation of higher-order hemiacetal (acetal) oligomers couldnot be conducted owing to their likely thermal decompositionin the GC injector of the GC/MS instrument, their high MWpreventing their elution from the GC column, and lack ofionization when using ESI-MS techniques. As for the confirma-tion of peroxyhemiacetal oligomers, analytical techniques needto be developed in order to further elucidate the neutral higher-order hemiacetal (acetal) oligomers likely present in low-NOx
SOA.4.3.3. Acid Catalysis.The SOA mass for the acid seed
experiment (Experiment 14) is significantly larger (∼3.6 times)than that of the dry seeded/nucleation experiments (Experiments15/12), in contrast to high-NOx conditions, in which acid seedhad no such observable effect. Note that the SOA massconcentration was virtually identical in experiments using dry(nonacid) seed aerosol and in those in the absence of seedaerosol, where particle formation takes place by nucleation(Experiments 12, 13, and 15). GC-FID measurements made forselected low-NOx experiments also provide evidence for acid-catalyzed particle-phase reactions. The C5 alkene triols and2-methyltetrols decreased in their contributions to the overallSOA mass when acid seed was present. For example, the2-methyltetrols and C5 alkene triols contributed∼3.91% and0.6%, respectively, to the SOA mass for Experiment 13 (nonacidcase), whereas in Experiment 14 (acid case), the 2-methyltetrolsand C5 alkene triols were found to decrease to∼0.46% and0.06%, respectively, of the SOA mass. This result is in contrastto that observed by Edney et al.14 in which isoprene tracercompounds were observed to increase in concentration, and ispossibly due to the differing isoprene/NOx ratios employed. Inconjunction with the above GC-FID results, the fact that C5
alkene triols and 2-methyltetrols were found to form hemiacetaldimers (and likely higher order oligomers) suggests that thepresence of acidified aerosol catalyzes hemiacetal (and likelyacetal) oligomer formation under low-NOx conditions. The samemay be the case for peroxyhemiacetal formation reactions.
4.3.4. Formation Mechanism of Low-NOx SOA productsObserVed by GC/MS.The detection of organic peroxides in theparticle phase (Table 3) by the iodometric-spectrophotometricmethod provides strong evidence that the hydroperoxides thatresult from the gas-phase RO2 + HO2 reactions are sufficientlypolar (nonvolatile) to partition to the aerosol phase, therebyelucidating one major reaction pathway leading to SOA forma-tion under low-NOx conditions. The detection of 2-methyltetrols,
9686 J. Phys. Chem. A, Vol. 110, No. 31, 2006 Surratt et al.
339

C5 alkene triols, 2-methyltetrol performate derivatives, andhemiacetal dimers (Table 4) suggests that the RO2 radicals thatform from the initial oxidation (OH/O2) of isoprene follow someother route. The formation of 2-methyltetrols has been explainedby self- and cross-reactions of the RO2 radicals formed fromthe initial oxidation (OH/O2) of isoprene, leading to intermediate1,2-diols, which may undergo a second cycle of oxidation (OH/O2) reactions followed by self- and cross-reactions of the RO2
radicals.7
The detection of C5 alkene triols in ambient aerosol mayindicate the importance of intermediate epoxydiol derivativesof isoprene, which may also be intermediates in the formationof 2-methyltetrols.11,12 Wang et al.12 hypothesized from MSevidence that these epoxydiol intermediates could be trappedin the aerosol phase and subsequently converted into C5 alkenetriols and 2-methyltetrols through acid-catalyzed reactions. Acid-catatlyzed reactions of epoxydiols may be a formation pathwayfor 2-methyltetrols and C5 alkene triols, but these monomersmay also form from other pathways.
Shown in Figure 18 is a proposed mechanism for theformation of key SOA components from the oxidation ofisoprene under low-NOx conditions. As suggested by Bo¨ge etal.,15 2-methyltetrols may form by several possible pathways.The formation of the 2-methyltetrols through two cycles ofoxidation (OH/O2) reactions followed by self- and cross-reactions of the RO2 radicals is only briefly included in thisfigure. It is possible that epoxydiols may form from rearrange-ments of hydroxyhydroperoxides or hydroxyperoxy radicals.
Once formed, these epoxydiols could be taken up into theparticulate phase, and through hydrolysis form 2-methyltetrols.In addition, an alternative pathway leading to the formation of2-methyltetrols has been reported in a recent study by Bo¨ge etal.15 That study proposed that intermediates in the formation of2-methyltetrols (i.e., 2-methyl-3-butene-1,2-diol and 2-methyl-2-vinyloxirane) are converted to 2-methyltetrols through reactionwith hydrogen peroxide on acidic particles. The latter pathwayis also included in the scheme in Figure 18. Further gas andparticle-phase studies are needed in order to fully elucidate thepathways leading to the formation of 2-methyltetrols, the C5
alkene triols, and related dimeric products.4.3.5. EVolution of SOA Composition.As in Kroll et al.,17 a
rapid decay of the SOA mass was observed after the initial SOAgrowth reached its maximum for all low-NOx nucleationexperiments. This loss is not attributable to wall removalprocesses because the particles shrink in size rather than reducein number (as measured by the DMA). The loss of SOA masswas observed to stop immediately after chamber lights wereturned off, and resume once the lights were turned back on,indicating a photochemical effect.
Indeed, when comparing the peroxide measurements madeat (or around) the initial SOA growth maximum to some laterexperimental time after SOA mass decay, it was found thatthe organic peroxide content of the aerosol decreased signifi-cantly (∼59% to 26% of SOA mass, respectively, for Experi-ment 18). This observation provides strong evidence that organicperoxides decompose in the particle phase due to photolysis
Figure 18. Low-NOx SOA formation pathways as elucidated by GC/MS. Boxes indicate products detected in low-NOx SOA. Symbols used: &,further study needed for the formations of the hypothetical carbonyl diol and epoxydiol intermediates which may result from the rearrangementsof RO2 radicals and/or hydroperoxides; *, for details about this pathway leading to 2-methyltetrols and also holding for isomeric products, seereference 7; **, for details about this alternative pathway, see ref 14. 2-methyltetrol performate derivatives (shown in Table 4) were omitted forsimplicity; however, these could serve as precursors for 2-methyltetrols if in the presence of acid and water.
Composition of Isoprene Secondary Organic Aerosol J. Phys. Chem. A, Vol. 110, No. 31, 20069687
340

and/or subsequent particle-phase reactions, or they are drivenout of the particle as a result of gas-phase compounds beingreacted away, shifting the equilibrium back to the gas phase.TOF-AMS measurements also confirmed that the peroxidecontent of low-NOx SOA decreases with time as shown inFigure 9b. This decrease in peroxide content as a function oftime also coincided with high-mass fragment ions (m/z> 200)increasing in their abundance (in Figure 9a onlym/z247 and327 are shown), suggesting the possibility that peroxidedecomposition causes oligomerization reactions. These oligo-merization reactions likely lead to hemiacetals (as elucidatedby GC/MS).
4.3.6. Tracer Compounds for Isoprene Oxidation in theRemote Atmosphere.The low-NOx chamber experiments con-ducted in this study confirm that 2-methyltetrols indeed serveas tracer compounds for isoprene oxidation in the ambientatmosphere, especially in remote regions such as the Amazonianrainforest. The detection of C5 alkene triols and hemiacetaldimers in the present low-NOx experiments corresponds wellto their observation in ambient aerosol collected from theAmazonian rainforest12 and Finnish boreal forests (note thathemiacetal dimers in aerosol collected from the Finish borealforests is not yet confirmed).11 From these field studies, C5
alkene triols were postulated to form by acid-catalyzed ring-opening reactions of epoxydiol derivatives of isoprene in lowRH environments. However, hemiacetal dimers were notrecognized in ambient samples; this current study elucidates theirformation under low-NOx conditions. Once it was realized that
hemiacetal dimers form from C5 alkene triols and 2-meth-yltetrols, we referred back to data collected from the Amazonianrainforest.47 When investigating the GC/MS data carefully, itwas found that the hemiacetal dimers were indeed detected,suggesting the atmospheric relevance of these low-NOx chamberexperiments. Shown in Figure 19 is a GC/MS EIC of anAmazonian fine aerosol sample (i.e., PM2.5; particulate matterwith an aerodynamic diameter< 2.5 µm) collected during thewet season (low-NOx conditions) using multiple ions, that is,m/z 231 (to show the C5 alkene triols),m/z 219 (to show2-methyltetrols as well as the dimers), andm/z335 (character-istic of the dimers). An averaged EI mass spectrum for thehemiacetal dimers is also included in this Figure to furtherconfirm their presence in ambient aerosol.
5. Conclusions
The composition of SOA from the photooxidation of isopreneunder both high- and low-NOx conditions has been thoroughlyinvestigated through a series of controlled laboratory chamberexperiments. It is found that the chemical nature of the resultantSOA is significantly different in the two NOx regimes. Underhigh-NOx conditions, the SOA components are acidic and formupon the further oxidation of MACR. SOA components formedunder low-NOx conditions, by contrast, are not acidic, withprimary species identified being polyols and organic peroxides.On the basis of SOA growth, acid-catalysis seems to play alarger role under low-NOx conditions. Organic peroxides (likely
Figure 19. (a) GC/MS EIC using specific ions for the TMS derivatives of 2-methyltetrols (m/z219), C5 alkene triols (m/z231), and hemiacetaldimers (m/z219 and 335) for a PM2.5 aerosol sample collected in Rondonia, Brazil, during the onset of the wet season from 10-12 November2002 (39 h collection time). The inset shows a detail of the isomeric hemiacetal dimers, formed between 2-methyltetrols and C5 dihydroxycarbonyls,which elute between 57 and 59 min; (b) averaged EI mass spectrum (only limited mass rangem/z50-500 available) for the TMS derivatives ofthe isomeric hemiacetal dimers.
9688 J. Phys. Chem. A, Vol. 110, No. 31, 2006 Surratt et al.
341

dominated by hydroperoxides) contribute significantly to thelow-NOx SOA mass (∼61% for nucleation experiments and∼25% and 30% for dry seeded and acid seeded experiments,respectively). However, differences in the organic peroxidecontribution and the rate of loss in SOA mass for nucleation(seed-free) and seeded experiments are not well understood andrequire further investigation. The chemical composition changeswith time in the low-NOx case, showing evidence of chemicalaging.
Oligomerization is an important SOA formation pathway forboth low- and high-NOx conditions because oligomers wereobserved in both cases. The nature of the oligomers, however,is distinctly different in each NOx regime. Under high-NOxconditions, the oligomers have clear monomeric units, withobservable 102 Da differences using both online and offlinemass spectrometry techniques. Using tandem ESI-MS techniquesand GC/MS with trimethylsilylation, it is found that polyestersaccount for these high-NOx oligomers, with 2-MG as the keymonomeric unit. These polyesters account only for a fraction(∼22-34%) of the SOA mass formed from isoprene oxidation.This lack of mass closure could result from an underestimateof the amount of polyesters formed or additional, unidentifiedMACR or isoprene oxidation products that contribute to theSOA mass. One key unresolved question is the path by which2-MG is formed, which at present is not understood. Furthergas- and particle-phase studies on isoprene oxidation under high-NOx conditions are needed in order to elucidate the 2-MGformation pathway.
Previously detected tracer compounds for isoprene oxidationin the ambient atmosphere were detected in the low-NOx
experiments. C5 alkene triols and hemiacetal dimers are reportedhere for the first time in a controlled laboratory experiment,suggesting that the oxidative conditions used in these experi-ments are relevant to remote regions. The GC/MS results suggestthat hemiacetal dimers formed in these low-NOx chamberexperiments result from the reactions of 2-methyltetrols and C5
alkene triols (a reaction that is likely relevant to the realatmosphere). Besides the formation of hemiacetal (acetal)oligomers in low-NOx SOA, it is speculated that peroxyhemi-acetal oligomers could also form, because of the large amountsof peroxides measured in the particle phase. The formation oflow-NOx oligomers may correlate to the decomposition ofperoxides with experimental time, providing some insight intothe mechanism of oligomerization. Additional analytical tech-niques need to be developed in order to elucidate the neutral/unstable products found in SOA produced from the photooxi-dation of isoprene.
Acknowledgment. Research at Caltech was funded by theU.S. Environmental Protection Agency to Achieve Results(STAR) Program grant no. RD-83107501-0, managed by EPA’sOffice of Research and Development (ORD), National Centerfor Environmental Research (NCER), and by the U.S. Depart-ment of Energy, Biological, and Environmental ResearchProgram DE-FG02-05ER63983; this work has not been sub-jected to the EPA’s required peer and policy review andtherefore does not necessarily reflect the views of the Agencyand no official endorsement should be inferred. Jason Surrattwas supported in part by the United States EnvironmentalProtection Agency (EPA) under the Science to Achieve Results(STAR) Graduate Fellowship Program. Research at the Uni-versities of Antwerp and Ghent was supported by the BelgianFederal Science Policy Office through the BIOSOL project(contract SD/AT/02A) and a visiting postdoctoral fellowshipto Rafal Szmigielski, and by the Research Foundation-
Flanders (FWO). We would like to thank John Greaves at theUniversity of California, Irvine for the accurate mass measure-ments on the ESI-TOF instrument. We would like to also thankPaul Ziemann at the University of California, Riverside for hisuseful communications regarding peroxide measurements inSOA.
Supporting Information Available: Electron impact (EI)mass spectra for 2-methyltetrols, C5 alkene triols, and 2-meth-yltetrol performate derivatives for their respective chromato-graphic peaks found in Figure 10. This material is availablefree of charge via the Internet at http://pubs.acs.org.
References and Notes
(1) Iinuma, Y.; Boge, O.; Gnauk, T.; Herrmann, H.Atmos. EnViron.2004,38, 761.
(2) Gao, S.; Keywood, M.; Ng, N.; Surratt, J. D.; Varutbangkul, V.;Bahreini, R.; Flagan, R. C.; Seinfeld, J. H.J. Phys. Chem. A2004,108,10147.
(3) Gao, S.; Ng, N.; Keywood, M.; Varutbangkul, V.; Bahreini, R.;Nenes, A.; He, J.; Yoo, K.; Beauchamp, J.; Hodyss, R.; Flagan, R.; Seinfeld,J. EnViron. Sci. Technol.2004,38, 6582.
(4) Tolocka, M.; Jang, M.; Ginter, J.; Cox, F.; Kamens, R.; Johnston,M. EnViron. Sci. Technol.2004,38, 1428.
(5) Kalberer, M.; Paulsen, D.; Sax, M.; Steinbacher, M.; Dommen, J.;Prevot, A.; Fisseha, R.; Weingartner, E.; Frankevich, V.; Zenobi, R.;Baltensperger, U.Science2004,303, 1659.
(6) Kanakidou, M.; Seinfeld, J.; Pandis, S.; Barnes, I.; Dentener, F.;Facchini, M.; Van Dingenen, R.; Ervens, B.; Nenes, A.; Nielsen, C.;Swietlicki, E.; Putaud, J.; Balkanski, Y.; Fuzzi, S.; Horth, J.; Moortgat, G.;Winterhalter, R.; Myhre, C.; Tsigaridis, K.; Vignati, E.; Stephanou, E.;Wilson, J.Atmos. Chem. Phys.2005,5, 1053.
(7) Claeys, M.; Graham, B.; Vas, G.; Wang, W.; Vermeylen, R.;Pashynska, V.; Cafmeyer, J.; Guyon, P.; Andreae, M. O.; Artaxo, P.;Maenhaut, W.Science2004,303, 1173.
(8) Pandis, S.; Paulson, S.; Seinfeld, J. H.; Flagan, R. C.Atmos.EnViron. 1991,25, 997.
(9) Limbeck, A.; Kulmala, M.; Puxbaum, H.Geophys. Res. Lett.2003,30.
(10) Ion, A. C.; Vermeylen, R.; Kourtchev, I.; Cafmeyer, J.; Chi, X.;Gelencser, A.; Maenhaut, W.; Claeys, M.Atmos. Chem. Phys.2005, 5,1805.
(11) Kourtchev, I.; Ruuskanen, T.; Maenhaut, W.; Kulmala, M.; Claeys,M. Atmos. Chem. Phys.2005,5, 2761.
(12) Wang, W.; Kourtchev, I.; Graham, B.; Cafmeyer, J.; Maenhaut,W.; Claeys, M.Rapid Commun. Mass Spectrom.2005,19, 1343.
(13) Claeys, M.; Wang, W.; Ion, A.; Kourtchev, I.; Gelencser, A.;Maenhaut, W.Atmos. EnViron.2004,38, 4093.
(14) Edney, E. O.; Kleindienst, T. E.; Jaoui, M.; Lewandowski, M.;Offenberg, J. H.; Wang, W.; Claeys, M.Atmos. EnViron.2005,39, 5281.
(15) Boge, O.; Miao, Y.; Plewka, A.; Herrmann, H.Atmos. EnViron.2006,40, 2501.
(16) Kroll, J. H.; Ng, N. L.; Murphy, S. M.; Flagan, R. C.; Seinfeld, J.H. Geophys. Res. Lett.2005,32.
(17) Kroll, J. H.; Ng, N. L.; Murphy, S. M.; Flagan, R. C.; Seinfeld, J.H. EnViron. Sci. Technol.2006,40, 1869.
(18) Docherty, K.; Wu, W.; Lim, Y.; Ziemann, P.EnViron. Sci. Technol.2005,39, 4049.
(19) Johnson, D.; Jenkin, M. E.; Wirtz, K.; Martin-Reviejo, M.EnViron.Chem.2004,1, 150.
(20) Gao, S.; Surratt, J. D.; Knipping, E. M.; Edgerton, E. S.; Shahgholi,M.; Seinfeld, J. H.J. Geophys. Res., in press, 2006.
(21) Cocker, D.; Flagan, R. C.; Seinfeld, J. H.EnViron. Sci. Technol.2001,35, 2594.
(22) Keywood, M.; Varutbangkul, V.; Bahreini, R.; Flagan, R.; Seinfeld,J. EnViron. Sci. Technol.2004,38, 4157.
(23) Lai, C.; Tsai, C.; Tsai, F.; Lee, C.; Lin, W.Rapid Commun. MassSpectrom.2001,15, 2145.
(24) Drewnick, F.; Hings, S.; DeCarlo, P.; Jayne, J.; Gonin, M.; Fuhrer,K.; Weimer, S.; Jimenez, J.; Demerjian, K.; Borrmann, S.; Worsnop, D.Aerosol Sci. Technol.2005,39, 637.
(25) Pashynska, V.; Vermeylen, R.; Vas, G.; Maenhaut, W.; Claeys,M. J. Mass Spectrom.2002,37, 1249.
(26) Banerjee, D.; Budke, C.Anal. Chem.1964,36, 792.(27) Sorooshian, A.; Brechtel, F. J.; Ma, Y.; Weber, R. J.; Corless, A.;
Flagan, R. C.; Seinfeld, J. H.Aerosol Sci. Technol.2006,40, 396.(28) Weber, R.; Orsini, D.; Daun, Y.; Lee, Y.; Klotz, P.; Brechtel, F.
Aerosol Sci. Technol.2001,35, 718.
Composition of Isoprene Secondary Organic Aerosol J. Phys. Chem. A, Vol. 110, No. 31, 20069689
342

(29) Seinfeld, J. H.; Pandis, S. N.Atmospheric Chemistry and Physics:From Air Pollution to Climate Change; Wiley: New York, 1998.
(30) Iinuma, Y.; Boge, O.; Miao, Y.; Sierau, B.; Gnauk, T.; Herrmann,H. Faraday Discuss.2005,130, 279.
(31) Knochenmuss, R.; Zenobi, R.Chem. ReV.2003,103, 441.(32) Miyoshi, A.; Hatakeyama, S.; Washida, N.J. Geophys. Res.1994,
99, 18779.(33) Tuazon, E.; Atkinson, R.Int. J. Chem. Kinet.1990,22, 1221.(34) Paulson, S.; Flagan, R. C.; Seinfeld, J. H.Int. J. Chem. Kinet.1992,
24, 79.(35) Sprengnether, M.; Demerjian, K.; Donahue, N.; Anderson, J.J.
Geophys. Res.2002,107.(36) Baker, J.; Arey, J.; Atkinson, R.EnViron. Sci. Technol.2005,39,
4091.(37) Ng, N. L.; Kroll, J. H.; Keywood, M. D.; Bahreini, R.; Varut-
bangkul, V.; Lee, A.; Goldstein, A. H.; Flagan, R. C.; Seinfeld, J. H.EnViron. Sci. Technol.2006,40, 2283.
(38) Lee, A.; Goldstein, A. H.; Ng, N. L.; Kroll, J. H.; Varutbangkul,V.; Flagan, R. C.; Seinfeld, J. H.J. Geophys. Res.2006,111.
(39) Chuong, B.; Stevens, P. S.Int. J. Chem. Kinet.2004,36, 12.(40) Yuan, H.; Nishiyama, Y.; Kuga, S.Cellulose2005,12, 543.(41) Kroll, J. H.; Ng, N. L.; Murphy, S. M.; Varutbangkul, V.; Flagan,
R. C.; Seinfeld, J. H.J. Geophys. Res.2005,110.(42) Liggio, J.; Li, S.; McLaren, R.EnViron. Sci. Technol.2005,39,
1532.(43) Barsanti, K.; Pankow, J.Atmos. EnViron.2005,39, 6597.(44) Tong, C.; Blanco, M.; Goddard, W. A., III; Seinfeld, J. H.EnViron.
Sci. Technol.2006,40, 2333.(45) Johnson, D.; Jenkin, M. E.; Wirtz, K.; Martin-Reviejo, M.EnViron.
Chem.2005,2, 35.(46) Bonn, B.; von Kuhlmann, R.; Lawrence, M.Geophys. Res. Lett.
2004,31.(47) Decesari, S.; Fuzzi, S.; Facchini, M.; Mircea, M.; Emblico, L.;
Cavalli, F.; Maenhaut, W.; Chi, X.; Schkolnik, G.; Falkovich, A.; Rudich,Y.; Claeys, M.; Pashynska, V.; Vas, G.; Kourtchev, I.; Vermeylen, R.;Hoffer, A.; Andreae, M. O.; Tagliavini, E.; Moretti, F.; Artaxo, P.Atmos.Chem. Phys.2006,6, 375.
9690 J. Phys. Chem. A, Vol. 110, No. 31, 2006 Surratt et al.
343

Appendix B
Evidence for Organosulfates in Secondary Organic
Aerosol∗
∗This chapter is reproduced by permission from “Evidence for Organosulfates in Secondary Organic Aerosol” by J. D. Surratt, J. H. Kroll, T. E. Kleindienst, E. O. Edney, M. Claeys, A. Sorooshian, N. L. Ng, J. H. Offenberg, M. Lewandowski, M. Jaoui, R. C. Flagan, and J. H. Seinfeld, Environ. Sci. Technol., 41, 517-527, 2006. Copyright 2006. American Chemical Society.
344

Evidence for Organosulfates inSecondary Organic AerosolJ A S O N D . S U R R A T T , † J E S S E H . K R O L L , ‡ , X
T A D E U S Z E . K L E I N D I E N S T , §
E D W A R D O . E D N E Y , § M A G D A C L A E Y S , ⊥
A R M I N S O R O O S H I A N , | N G A L . N G , |
J O H N H . O F F E N B E R G , §
M I C H A E L L E W A N D O W S K I , §
M O H A M M E D J A O U I , #
R I C H A R D C . F L A G A N , ‡ A N DJ O H N H . S E I N F E L D * , ‡
Department of Chemistry, California Institute of Technology,Pasadena, California 91125, Departments of EnvironmentalScience and Engineering and Chemical Engineering,California Institute of Technology, Pasadena, California91125, National Exposure Laboratory, Office of Research andDevelopment, Environmental Protection Agency, ResearchTriangle Park, North Carolina 27711, Department ofPharmaceutical Sciences, University of Antwerp (Campus DrieEiken), Universiteitsplein 1, BE-2610 Antwerp, Belgium,Department of Chemical Engineering, California Institute ofTechnology, Pasadena, California 91125, and Alion Scienceand Technology, P.O. Box 12313, Research Triangle Park,North Carolina 27709
Recent work has shown that particle-phase reactionscontribute to the formation of secondary organic aerosol(SOA), with enhancements of SOA yields in the presence ofacidic seed aerosol. In this study, the chemical compositionof SOA from the photooxidations of R-pinene andisoprene, in the presence or absence of sulfate seedaerosol, is investigated through a series of controlledchamber experiments in two separate laboratories. By usingelectrospray ionization-mass spectrometry, sulfateesters in SOA produced in laboratory photooxidationexperiments are identified for the first time. Sulfate estersare found to account for a larger fraction of the SOAmass when the acidity of seed aerosol is increased, a resultconsistent with aerosol acidity increasing SOA formation.Many of the isoprene and R-pinene sulfate estersidentified in these chamber experiments are also found inambient aerosol collected at several locations in thesoutheastern U.S. It is likely that this pathway is importantfor other biogenic terpenes, and may be important in theformation of humic-like substances (HULIS) in ambient aerosol.
IntroductionParticle-phase reactions are now understood to play animportant role in secondary organic aerosol (SOA) formation
(1). Particle-phase oligomerization leads to the formation ofhigh-molecular-weight (MW) species (2-4); suggested oli-gomerization reactions include the reactive uptake of volatilealdehydes or ketones via peroxyhemiacetal formation (5, 6),hydration, hemiacetal/acetal formation, and aldol conden-sation (7, 8). Esterification in isoprene photooxidation (9,10) has also been reported in SOA formation. The role ofthese reactions remains in some doubt as some of theproposed reactions (e.g., hemiacetal/acetal formation andaldol condensation) are not thermodynamically favorable atambient conditions (11, 12).
Laboratory chamber studies have demonstrated that thepresence of acidic seed aerosol enhances the SOA yieldsobserved from the oxidation of various volatile organiccompounds (VOCs), such as R-pinene (2, 3, 13, 14), isoprene(8, 14, 15), and several model cycloalkenes (2) over thosewith a less acidic seed aerosol. Despite recent advances inunderstanding particle-phase SOA chemistry, the role ofparticle-phase acidity in enhancing SOA formation remainsessentially unexplained. Recent studies have presented massspectrometric evidence that the reactive uptake of glyoxaland pinonaldehyde (principal gas-phase oxidation productsfrom aromatics and R-pinene, respectively) on acidic aerosolinvolves organosulfate formation (sulfate esters or derivatives;for simplicity, we will use hereafter the term sulfate estersto also denote sulfate derivatives; i.e. sulfate derivativesformed from a carbonyl compound) (16-18). In addition,several field studies have reported sulfate ester signatures inaerosol collected on filters using Fourier transform infraredspectroscopy (19, 20) and electrospray ionization (ESI)-massspectrometry (MS) (21, 22). Nevertheless, the importance oforganosulfate formation to SOA remains unclear. Traditionalanalytical methods, such as gas chromatography/massspectrometry (GC/MS) with prior derivatization, may not bewell suited for identifying organosulfates. It is likely that singlederivatization protocols, such as trimethylsilylation, GCinjection and column temperatures could cause the degra-dation or misinterpretation of such species (23). On the otherhand, ESI-MS has been shown as an effective method forthe detection and quantification of organosulfate species(24, 25).
In the present study ESI-MS is used to detect andstructurally elucidate sulfate esters in SOA formed from thephotooxidations of isoprene and R-pinene under differingcombinations of NOx levels and seed aerosol acidities. As aresult, the formation of sulfate esters may be a majorcontributor to the observed enhancement in SOA yields inthe presence of acidic aerosol.
Experimental SectionIsoprene Chamber Experiments. A summary of experimentalconditions for all isoprene photooxidation experiments canbe found in Table 1. Isoprene photooxidation experimentswere conducted in Caltech’s dual indoor 28 m3 Teflonchambers (26, 27) and in EPA’s fixed volume 14.5 m3 indoorchamber (15). The temperatures, aerosol size distributions,and relative humidities, as well as the O3, nitric oxide (NO),NOx concentrations were continuously measured in bothfacilities. The isoprene concentrations in both facilities weremonitored by GC with flame ionization detection. The Caltechexperiments were conducted in the static mode (i.e., batchreactor) whereas the EPA experiments were conducted inthe dynamic mode (i.e., continuous stirred tank reactor) withthe exception of EPA-326 which was a static mode experiment.Hydroxyl radical (OH) precursors (H2O2 or HONO) wereemployed in the Caltech experiments (28, 29). For all Caltech
* Corresponding author phone: (626) 395-4635; fax: (626) 796-2591; e-mail: [email protected].
† Department of Chemistry, California Institute of Technology.‡ Departments of Environmental Science and Engineering and
Chemical Engineering, California Institute of Technology.§ Environmental Protection Agency.⊥ University of Antwerp.| Department of Chemical Engineering, California Institute of
Technology.# Alion Science and Technology.X Current address: Aerodyne Research, Inc., 45 Manning Road,
Billerica, MA 01281.
Environ. Sci. Technol. 2007, 41, 517-527
10.1021/es062081q CCC: $37.00 2007 American Chemical Society VOL. 41, NO. 2, 2007 / ENVIRONMENTAL SCIENCE & TECHNOLOGY 9 517Published on Web 12/07/2006
345

low-NOx experiments, only H2O2 was added, resulting in NOx
concentrations <1 ppb. Caltech high-NOx experiments eitherused H2O2 and an initial amount of NO (∼ 800 ppb), or withHONO and NOx as a side product. In the Caltech experiments,three initial inorganic seed aerosol conditions were used:(1) the absence of aerosol where SOA formation was initiatedby nucleation; (2) ammonium sulfate (AS) aerosol; and (3)acidified ammonium sulfate (AAS) aerosol. Concentrationsof the aqueous solutions that were introduced into thechambers by atomization are shown in Table 1. The initialseed aerosol concentrations that resulted ranged from ∼19-24 µg/m3. Teflon filters (PALL Life Sciences, 47-mm diameter,1.0-µm pore size, Teflon filters) were collected for offlinechemical analysis from the Caltech experiments at the pointat which the aerosol volume reached its maximum value, asdetermined by the differential mobility analyzer (DMA).All experiments were carried out at relative humidities(RHs) <9%.
In the dynamic experiments in the EPA chamber, reactantssuch as NO, SO2, and isoprene were continuously added fromhigh-pressure cylinders to the reaction chamber through amixing manifold. The steady-state nature of chamber opera-tion allows for filter sampling for extended periods fordetermining the composition of the resultant SOA. Oncesteady-state conditions were attained (∼24 h), samples fordetermining the composition of the SOA were collected onglass fiber filters preceded by a carbon strip denuder. Twosets of EPA experiments were conducted. In the first set, the
following aerosol conditions were used: AS, AAS, and sulfuricacid, with each of the aqueous solutions atomized into thechamber by atomization. The initial aerosol concentrationswere 0.1, 30.0, and 30.0 µg/m3, for EPA-299 stage 1, EPA-299stage 2, and EPA-299 stage 3, respectively. For the second setof EPA experiments, EPA-199 stage 1 and EPA-199 stage 2,acidic aerosol was generated by adding 60 and 200 ppb ofSO2, respectively to the reactant mixture. All EPA experimentswere conducted at a relative humidity of ∼30%. Results fromboth EPA experiments (i.e., SOA yields, gas-phase products,trends, etc.) will be discussed in more detail in forthcomingpublications; evidence for organosulfates is the focus here.
r-Pinene Chamber Experiments. All R-pinene experi-ments were conducted in the EPA dynamic chamber (15).Conditions for each experiment are listed in Table 2. TheEPA experiments consisted of one R-pinene/NOx irradiationexperiment along with a series of experiments where mixturesof hydrocarbons containing R-pinene were irradiated in thepresence of NOx. For some of these experiments, SO2 wasadded to the chamber to generate acidity in the aerosol. Thesame collection protocol was used here as that employed inthe EPA isoprene experiments.
Ambient Aerosol Collection. Ambient aerosol was col-lected from the Southeastern Aerosol Research and Char-acterization Study (SEARCH) network and analyzed for sulfateesters. This network comprises of four urban-rural (or urban-suburban) site pairs at locations across the southeast U.S.and was initiated in mid-1998 to carry out systematic
TABLE 1. Summary of Experimental Conditions and Sulfate Ester Formation from Isoprene Photooxidation
experimentinorganic seed
aerosolaOH
precursor
initialisoprene]
(ppb)
initial[NOx](ppb)
averageT (°C) [M-H]- detected sulfate ester ions (m/z)
Caltech low-NOx none added H2O2 500 none added 23.7 none detectedCaltech low-NOx AS H2O2 500 none added 23.9 215, 333Caltech low-NOx AAS H2O2 500 none added 23.8 153, 155, 169, 215, 333, 451Caltech high-NOx none added H2O2/NO 500 891 24.3 none detectedCaltech high-NOx AS H2O2/NO 500 963 24.9 199, 215, 244Caltech high-NOx AAS H2O2/NO 500 904 24.6 139, 153, 155, 197, 199, 215, 244, 260, 301, 346Caltech high-NOx none added HONO 500 382 20.1 none detectedCaltech high-NOx AS HONO 500 366 21.4 199, 215, 260, 333EPA-299 stage 1 ASb c 2500 200 29.0 none detectedEPA-299 stage 2 AAS c 2500 200 29.0 153, 155, 167, 169, 181, 197, 199, 215, 244,
260, 333EPA-299 stage 3 H2SO4 only c 2500 200 29.0 153, 155, 157, 167, 169, 181, 197, 199, 215, 244,
260, 333EPA-199 stage 1 60 ppb SO2
c 1598 475 24.6 197, 199, 215, 244, 260, 301, 317, 333EPA-199 stage 2 200 ppb SO2
c 1598 475 24.6 155, 169, 197, 199, 215, 244, 260, 301, 317,333, 346
a AS ) 15 mM (NH4)2SO4; AAS ) 15 mM (NH4)2SO4 + 15 mM H2SO4 for Caltech experiments and 0.31 mM (NH4)2SO4 + 0.612 mM H2SO4 forEPA-299 experiments; H2SO4 only ) 0.92 mM H2SO4; EPA-199 had no seed nebulized but instead used the photooxidation of SO2 to generatesulfuric acid aerosol. b Due to the low initial inorganic seed aerosol concentration, this condition is more conducive to nucleation. c No OH precursorwas used.
TABLE 2. Summary of Experimental Conditions and Sulfate Ester Formation from r-Pinene Photooxidation
experiment
initial[r-pinene]
(ppb)
initial[isoprene]
(ppb)
initial[toluene]
(ppm)
initial[NOx](ppb)
SO2(ppb)
average T(°C)
[M-H]- detected sulfateester ions (m/z)a
EPA-220 220 b b 450 b 25.5 none detectedEPA-326 186 1108 b 248 287 20.5 249, 265, 294, 310, 412, 426EPA-211 stage 1 105 b b 378 b 24.3 none detectedEPA-211 stage 2 105 b 1.59 378 b 24.3 none detectedEPA-211 stage 3 103 820 1.58 378 b 24.3 none detectedEPA-211 stage 4 117 854 1.57 378 275 24.3 265, 279, 294, 310, 326, 412, 426EPA-211 stage 5 115 b 1.59 378 275 24.3 249, 265, 279, 294, 310, 326EPA-211 stage 6 b 794 1.56 378 b 24.3 none detectedEPA-205 106 592 1.45 599 278 24.0 265, 294, 310, 412, 426
a Isoprene sulfate ester products like those in Table 2 were also detected only when SO2 and isoprene were copresent. No discernible toluenesulfate ester products were detected. b This compound was not present during the experiment.
518 9 ENVIRONMENTAL SCIENCE & TECHNOLOGY / VOL. 41, NO. 2, 2007
346

measurements of temporal and spatial variability of PM, inparticular PM2.5, gases relevant to secondary O3 formation,and surface meteorology (22). Twenty-four h compositequartz filters were taken on 4 days at four different sitesduring June 2004: Birmingham, AL (BHM, urban site),Centerville, AL (CTR, rural site outside of BHM), JeffersonStreet (JST, near downtown Atlanta, GA), and Pensacola, FL(PS, marine influenced urban site). Details of these sites(terrain, vegetation, transportation, and industrial sources),sample collection and handling procedures, and specificaerosol and gas-phase measurements obtained are givenelsewhere (22, 30).
Filter Extraction and Chemical Analyses. Detailed ex-traction procedures for Teflon and quartz filters are describedelsewhere (9, 22). Glass-fiber filters were extracted in thesame manner as Teflon filters (9), except resultant extractswere filtered through a PALL Life Sciences Acrodisc CR 25mm syringe filter (PTFE membrane, 0.2 µm pore size) toremove filter fibers. All sample extracts were analyzed by aHewlett-Packard 1100 series HPLC instrument, coupled witha quadrupole mass spectrometer, and by direct infusion ontoa ThermoElectron LCQ ion trap mass spectrometer (ITMS),both equipped with an ESI source operated in the negative(-) ionization mode. Details of the operating conditions forthese instruments are described elsewhere (9). Briefly, allsamples were analyzed on the LC/MS instrument in the fullscan mode and upfront collision-induced dissociation (CID)mode of analysis. Comparison of the resulting mass spectraproduced from these two modes of analyses on the LC/MSinstrument allows for some structural information to beobtained on the detected SOA components. Samples werealso analyzed on the ThermoElectron LCQ ITMS instrumentto confirm these results, and in some cases, provide furtherstructural elucidation. Sulfate standards of sodium propylsulfate (City Chemical, 98% purity), sodium lauryl sulfate(City Chemical, 98% purity), and 1-butyl-3-methylimidazo-
lium 2-(2-methoxyethoxy)ethyl sulfate (Sigma-Aldrich, 95%purity) were analyzed on the LC/MS instrument to determinecommon product ions associated with sulfate esters. Ad-ditional samples were collected with the particle-into-liquidsampler (PILS) with subsequent offline analysis by ionchromatography (IC) (31). The PILS/IC technique allows forthe quantitative measurement of water-soluble inorganic ionsin aerosol; no IC peaks could be attributed to organosulfates,so for these experiments only inorganic ions are measured.
ResultsSulfate Ester Standards. (-)ESI-MS studies have shown thatsulfate esters produce abundant [M-H]- ions, and uponcollisional activation of these ions, yield m/z 97 (HSO4
-) and80 (SO3
-‚) product ions (21, 24, 25). In conjunction with theknown isotopic distribution of sulfur, which contains 34S witha natural abundance of 4.2%, these product ions can be usedto identify sulfate esters. As confirmation, authentic standardsof sodium propyl sulfate (anionic mass ) 139 Da), sodiumlauryl sulfate (anionic mass ) 265 Da), and 1-butyl-3-methylimidazolium 2-(2-methoxyethoxy)ethyl sulfate (an-ionic mass ) 199 Da) were analyzed by the (-)LC/ESI-MStechnique in the full scan mode of analysis followed by theupfront CID mode of analysis to generate MS and MS/MSdata, respectively. As shown for the sodium propyl sulfateester standard in Figure 1A, these authentic standards yieldedm/z 97 and 80 product ions.
Sulfate Esters from Isoprene Oxidation. Previouslycharacterized (9, 10) isoprene SOA products were observedin these experiments and are shown in Table 3; however, thefocus here will be on the identification of sulfate esters.Comparison of (-)ESI-MS data collected from experimentsemploying no sulfate aerosol to those with sulfate aerosolshowed that numerous compounds were detected only whensulfate aerosol was present. To understand the nature of
FIGURE 1. (-)LC/ESI-MS upfront CID mass spectra for selected isoprene sulfate ester SOA products shown in Table 2. (A) Product ionmass spectrum for sodium propyl sulfate standard (anionic mass of intact propyl sulfate ester ) 139 Da). (B) Product ion mass spectrumfor a 2-methyltetrol sulfate ester detected in a Caltech high-NOx H2O2 AS seed photooxidation experiment. (C) Product ion massspectrum for a hemiacetal dimer sulfate ester detected in a Caltech low-NOx AAS seed photooxidation experiment. (D) Product ion massspectrum for a C5 trihydroxy nitrate sulfate ester detected in EPA-299 stage 2.
VOL. 41, NO. 2, 2007 / ENVIRONMENTAL SCIENCE & TECHNOLOGY 9 519
347

TABLE 3. Proposed Isoprene Sulfate Ester SOA Products
a Positional isomers containing nitrate or sulfate groups at other hydroxylated positions are likely. b Isoprene SOA products previously identifiedin prior studies by Surratt et al. (9) and/or Szmigielski et al. (10) and/or Edney et al. (15). cDetected in ambient aerosol collected from SEARCHnetwork (summer 2004) for first time. dConsidered major product due to large MS abundance in chamber studies. eCompounds listed in parenthesesare neutral losses observed upon (-)ESI-MS/MS. fInferred precursor due to the MS/MS fragmentation of its respective organosulfate product;this parent isoprene product goes undetected by (-)ESI-MS and GC/MS methods. gSome evidence for its existence in first-order mass spectra.hDetected in ambient aerosol by Matsunaga et al. (32).
520 9 ENVIRONMENTAL SCIENCE & TECHNOLOGY / VOL. 41, NO. 2, 2007
348
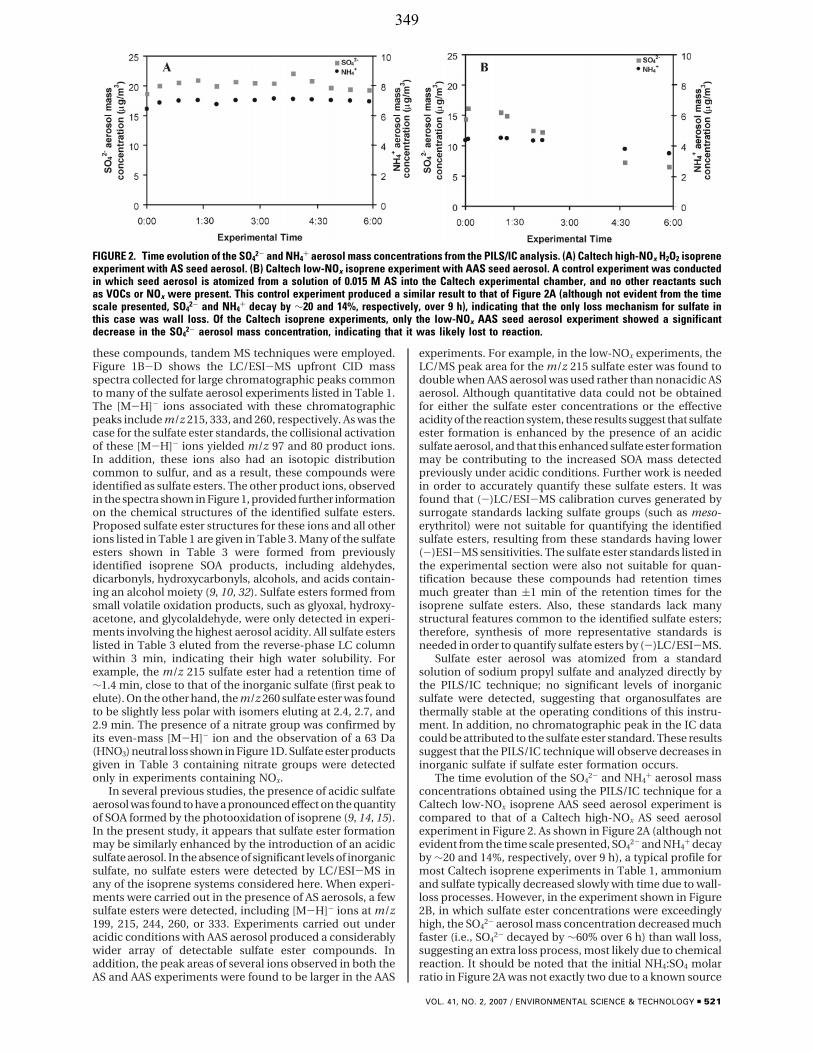
these compounds, tandem MS techniques were employed.Figure 1B-D shows the LC/ESI-MS upfront CID massspectra collected for large chromatographic peaks commonto many of the sulfate aerosol experiments listed in Table 1.The [M-H]- ions associated with these chromatographicpeaks include m/z 215, 333, and 260, respectively. As was thecase for the sulfate ester standards, the collisional activationof these [M-H]- ions yielded m/z 97 and 80 product ions.In addition, these ions also had an isotopic distributioncommon to sulfur, and as a result, these compounds wereidentified as sulfate esters. The other product ions, observedin the spectra shown in Figure 1, provided further informationon the chemical structures of the identified sulfate esters.Proposed sulfate ester structures for these ions and all otherions listed in Table 1 are given in Table 3. Many of the sulfateesters shown in Table 3 were formed from previouslyidentified isoprene SOA products, including aldehydes,dicarbonyls, hydroxycarbonyls, alcohols, and acids contain-ing an alcohol moiety (9, 10, 32). Sulfate esters formed fromsmall volatile oxidation products, such as glyoxal, hydroxy-acetone, and glycolaldehyde, were only detected in experi-ments involving the highest aerosol acidity. All sulfate esterslisted in Table 3 eluted from the reverse-phase LC columnwithin 3 min, indicating their high water solubility. Forexample, the m/z 215 sulfate ester had a retention time of∼1.4 min, close to that of the inorganic sulfate (first peak toelute). On the other hand, the m/z 260 sulfate ester was foundto be slightly less polar with isomers eluting at 2.4, 2.7, and2.9 min. The presence of a nitrate group was confirmed byits even-mass [M-H]- ion and the observation of a 63 Da(HNO3) neutral loss shown in Figure 1D. Sulfate ester productsgiven in Table 3 containing nitrate groups were detectedonly in experiments containing NOx.
In several previous studies, the presence of acidic sulfateaerosol was found to have a pronounced effect on the quantityof SOA formed by the photooxidation of isoprene (9, 14, 15).In the present study, it appears that sulfate ester formationmay be similarly enhanced by the introduction of an acidicsulfate aerosol. In the absence of significant levels of inorganicsulfate, no sulfate esters were detected by LC/ESI-MS inany of the isoprene systems considered here. When experi-ments were carried out in the presence of AS aerosols, a fewsulfate esters were detected, including [M-H]- ions at m/z199, 215, 244, 260, or 333. Experiments carried out underacidic conditions with AAS aerosol produced a considerablywider array of detectable sulfate ester compounds. Inaddition, the peak areas of several ions observed in both theAS and AAS experiments were found to be larger in the AAS
experiments. For example, in the low-NOx experiments, theLC/MS peak area for the m/z 215 sulfate ester was found todouble when AAS aerosol was used rather than nonacidic ASaerosol. Although quantitative data could not be obtainedfor either the sulfate ester concentrations or the effectiveacidity of the reaction system, these results suggest that sulfateester formation is enhanced by the presence of an acidicsulfate aerosol, and that this enhanced sulfate ester formationmay be contributing to the increased SOA mass detectedpreviously under acidic conditions. Further work is neededin order to accurately quantify these sulfate esters. It wasfound that (-)LC/ESI-MS calibration curves generated bysurrogate standards lacking sulfate groups (such as meso-erythritol) were not suitable for quantifying the identifiedsulfate esters, resulting from these standards having lower(-)ESI-MS sensitivities. The sulfate ester standards listed inthe experimental section were also not suitable for quan-tification because these compounds had retention timesmuch greater than (1 min of the retention times for theisoprene sulfate esters. Also, these standards lack manystructural features common to the identified sulfate esters;therefore, synthesis of more representative standards isneeded in order to quantify sulfate esters by (-)LC/ESI-MS.
Sulfate ester aerosol was atomized from a standardsolution of sodium propyl sulfate and analyzed directly bythe PILS/IC technique; no significant levels of inorganicsulfate were detected, suggesting that organosulfates arethermally stable at the operating conditions of this instru-ment. In addition, no chromatographic peak in the IC datacould be attributed to the sulfate ester standard. These resultssuggest that the PILS/IC technique will observe decreases ininorganic sulfate if sulfate ester formation occurs.
The time evolution of the SO42- and NH4
+ aerosol massconcentrations obtained using the PILS/IC technique for aCaltech low-NOx isoprene AAS seed aerosol experiment iscompared to that of a Caltech high-NOx AS seed aerosolexperiment in Figure 2. As shown in Figure 2A (although notevident from the time scale presented, SO4
2- and NH4+ decay
by ∼20 and 14%, respectively, over 9 h), a typical profile formost Caltech isoprene experiments in Table 1, ammoniumand sulfate typically decreased slowly with time due to wall-loss processes. However, in the experiment shown in Figure2B, in which sulfate ester concentrations were exceedinglyhigh, the SO4
2- aerosol mass concentration decreased muchfaster (i.e., SO4
2- decayed by ∼60% over 6 h) than wall loss,suggesting an extra loss process, most likely due to chemicalreaction. It should be noted that the initial NH4:SO4 molarratio in Figure 2A was not exactly two due to a known source
FIGURE 2. Time evolution of the SO42- and NH4
+ aerosol mass concentrations from the PILS/IC analysis. (A) Caltech high-NOx H2O2 isopreneexperiment with AS seed aerosol. (B) Caltech low-NOx isoprene experiment with AAS seed aerosol. A control experiment was conductedin which seed aerosol is atomized from a solution of 0.015 M AS into the Caltech experimental chamber, and no other reactants suchas VOCs or NOx were present. This control experiment produced a similar result to that of Figure 2A (although not evident from the timescale presented, SO4
2- and NH4+ decay by ∼20 and 14%, respectively, over 9 h), indicating that the only loss mechanism for sulfate in
this case was wall loss. Of the Caltech isoprene experiments, only the low-NOx AAS seed aerosol experiment showed a significantdecrease in the SO4
2- aerosol mass concentration, indicating that it was likely lost to reaction.
VOL. 41, NO. 2, 2007 / ENVIRONMENTAL SCIENCE & TECHNOLOGY 9 521
349

of ammonium volatilization previously characterized (31).The significant decrease in the SO4
2- mass concentrationobserved for the Caltech low-NOx AAS seed aerosol experi-ment is consistent with previously observed increases in SOAyields (9), strongly suggesting that particle-phase sulfateesterification is at least partly responsible for this “acid-effect.”Filter sampling for most Caltech isoprene experiments began∼5-7 h after the experiment was initiated; sulfate esters areformed by this point in the experiments as shown inFigure 2.
Sulfate Esters from r-Pinene Oxidation. As in theisoprene experiments, R-pinene sulfate esters were found toproduce abundant [M-H]- ions, corresponding 34S isotopicions, m/z 97 and 80 product ions, and were not observed inexperiments without SO2 (Table 2). Isoprene sulfate esterswere formed also in experiments involving isoprene and SO2
photooxidation; for simplicity, these esters are not listed inTable 2. Shown in Figure 3A-D are the (-)ESI-ITMS production spectra for representative R-pinene sulfate esters; theseinclude esters containing a [M-H]- ion at m/z 294, 265, 310,and 326, respectively. Analogous to some of the isoprenesulfate esters, the m/z 294, 310, and 326 R-pinene sulfateesters also contain nitrate groups as suggested by their even-mass [M-H]- ions and observed neutral losses of 63 (HNO3)and/or 47 Da (HONO). The MS/MS spectra of the [M-H]-
ions for the four R-pinene sulfate esters yielded m/z 97product ions. However, the m/z 80 product ion was observedonly for the m/z 265 ion due to mass range limits on themass spectrometer. It should be noted that the MS3 spectraof high-mass product ions shown in Figure 3 (e.g., m/z 250in Figure 1A) did yield the m/z 97 and m/z 80 product ions,
thus supporting that the [M-H]- ions at m/z 294, 310, and326 contain a sulfate group. These results were confirmedon the LC/MS instrument operated in the upfront CID modeof analysis.
Sulfate esters from R-pinene were found to elute from thereverse-phase LC column at much later RTs (∼10-26 min)than those formed in isoprene oxidation, indicating differ-ences in water solubility. Identified R-pinene sulfate esterslisted in Table 4 were formed from the reactive uptake ofpreviously identified gas-phase oxidation products (33, 34),consistent with previous work (17, 18). Except for pinonal-dehyde, no sulfate esters have been identified to form frompreviously identified R-pinene SOA products; however,further investigation is warranted. For quality control pur-poses, solid-phase extraction (SPE) was used on duplicatefilters collected from selected experiments (EPA-211) toremove excess inorganic sulfate; it was found that theR-pinene sulfate esters were still detected, and in some casesat higher [M-H]- ion abundances, indicating that thesesulfate esters are not a result of inorganic sulfate clusters inthe mass spectrometer.
Sulfate Esters in Ambient Aerosol. Figures 4A-C comparethe LC/MS extracted ion chromatograms (EICs) of m/z 215obtained from a Caltech low-NOx isoprene AAS experimentto that of two SEARCH field samples (JST and BHM,respectively). Both the RTs and mass spectra of the chro-matographic peaks shown in the EICs of m/z 215 are thesame in all samples, strongly suggesting that this isoprenesulfate ester is present in ambient aerosol. In addition,ambient aerosol recently collected at K-puszta, Hungaryindicates that the m/z 199 and 260 isoprene sulfate esters
FIGURE 3. (-)ESI-ITMS product ion mass spectra for sulfate esters of r-pinene oxidation products. (A) Product ion mass spectrum form/z 294 detected in EPA-211 stage 5. (B) Product ion mass spectrum for m/z 265 detected in EPA-211 stage 4. (C) Product ion mass spectrumfor m/z 310 detected in EPA-211 stage 5. (D) Product ion mass spectrum for m/z 326 detected in EPA-211 stage 5. These sulfate esters werealways present when r-pinene was photooxidized in the presence of SO2.
522 9 ENVIRONMENTAL SCIENCE & TECHNOLOGY / VOL. 41, NO. 2, 2007
350

are present (M. Claeys, unpublished results); however, thesecompounds are only weakly detected on some days analyzedfrom the SEARCH network.
Figure 5A-C compares the LC/MS EICs of m/z 294obtained from two R-pinene experiments (EPA-205 and EPA-326, respectively) and with a SEARCH field sample collectedat the BHM field site in June 2004. This figure indicates thatthe R-pinene m/z 294 sulfate ester is a constituent of ambientaerosol, consistent with previous work (22). Other R-pinenesulfate esters identified in this study have been observed inambient aerosol in the southeastern U.S (22). It is possiblethat the m/z 294 sulfate ester in the ambient aerosol couldalso result from the oxidation of other monoterpenes owing
to the lack of detailed connectivity of specific functionalgroups (e.g., sulfate esters and hydroxyls) provided by ESI-MS/MS methods.
The results above suggest that the chemistry occurring inour laboratory experiments are relevant to the conditions inthe southeastern U.S., even though the laboratory aerosolwas generated from much higher VOC mixing ratios, lowerRHs, and likely higher aerosol acidities observed in thesoutheastern U.S.
ESI-MS Quality Control Tests. To ensure that the sulfateesters elucidated in this study were formed only during SOAformation and not on the filter or during the ESI process,several quality control tests were conducted. First, a filter
TABLE 4. Proposed r-Pinene Sulfate Ester SOA Products
a Positional isomers containing nitrate or sulfate groups at other hydroxylated positions are possible. bCompounds listed in parentheses areneutral losses observed upon ESI-MS/MS. cPreviously detected R-pinene oxidation product by Aschmann et al. (33, 34). dProposed by Liggio etal. (17) to form from pinonaldehyde reactive uptake onto acidic seed particles; however, structure was not confirmed. In the current study, weconfirm its structure with (-)ESI-MS. eDetected in ambient aerosol collected from SEARCH network June 2004 for first time. fESI-MS cannotdifferentiate between which product is being detected; for completeness both structures are shown here. gObserved in an ambient study by Gaoet al. (22). hNo structural information was provided in the previous study by Gao et al. (22).
VOL. 41, NO. 2, 2007 / ENVIRONMENTAL SCIENCE & TECHNOLOGY 9 523
351

extract from a Caltech low-NOx isoprene nucleation (i.e., noinorganic seed aerosol present) experiment was divided intotwo parts. One part was spiked with a high concentration of(NH4)2SO4 and the other part was spiked with pure H2SO4.Both of these samples were analyzed by (-)LC/ESI-MS. Thesulfate esters listed in Table 1 were not detected in these twotest samples, demonstrating that the sulfate esters detectedin this study are likely not artifacts formed in the ESI interface.The use of reverse phase chromatography allowed forinorganic sulfate not to be confused with organosulfates,where inorganic sulfate was the very first peak to elute fromthe column. In the two test samples discussed above, theinorganic sulfate peak was found to have some tailing, whichwas very similar to the seeded experiments listed in Table1; however, this tailing seems to have no effect on theformation of sulfate esters.
As a second test, a meso-erythritol (a surrogate for the2-methyltetrols produced from isoprene oxidation) standardwas divided into two parts, where one was spiked with (NH4)2-SO4 and the other with pure H2SO4. As for the first qualitycontrol test above, these two samples produced no sulfateesters in (-)LC/ESI-MS.
Last, a filter extract from an EPA R-pinene experimentconducted without SO2 (thus no sulfate aerosol present) wasspiked with pure H2SO4. Again, no sulfate esters weredetected. These results strongly suggest the organosulfates(sulfate esters) were formed in the aerosol phase and are notan artifact of sampling or measurement.
DiscussionSulfate Esterification Reaction Mechanism. Reactive uptakeof gas-phase alcohols (e.g., methanol and ethanol) and
aldehydes (e.g., formaldehyde) in the upper troposphere andlower stratosphere have been suggested to occur in thepresence of sulfate aerosols (35-37), where increased aciditywas found to increase their uptake. Some of these studiesproposed that the observed uptake of the alcohols andaldehydes likely occurred by sulfate ester formation, althoughno product studies were conducted. It has also been shownthat reactive uptake of butanol and ethanol onto sulfateaerosols occurs at room temperature (38, 39). Esterificationwas recently shown to occur from the photooxidation ofisoprene in the presence of NOx from condensation reactionsof organic acids with alcohols (9, 10). The large amounts oforganic acids formed during the photooxidation wereproposed to drive these reactions.
Figure 6 shows the general reactions proposed for theformation of sulfate esters from alcohols (2-methyltetrol usedas model compound) and sulfate derivatives from carbonylcompounds (pinonaldehyde used as model compound). Inthe case of sulfate ester formation from alcohols, the proposedreactions likely involve nucleophilic substitution (SN1), wherethe sulfuric acid protonates the alcoholic group, making waterthe leaving group. The resulting carbocation becomes anucleophilic site for the unshared pair of electrons on oneof the oxygen atoms of the sulfate (40). Due to the low relativehumidities of these experiments, this likely shifts the equi-librium in favor of sulfate ester formation. In the case ofsulfate ester formation from aldehydes, the proposed reactionlikely involves the electron pair of the carbonyl oxygenaccepting a proton from sulfuric acid, producing the oxoniumion, and making it more susceptible to nucleophilic attackfrom an unshared pair of electrons from one of the oxygenatoms on sulfate. It should be stressed that other reaction
FIGURE 4. (-)LC/ESI-MS extracted ion chromatograms for m/z 215. The retention times of the m/z 215 EICs are the same as well as themass spectra associated with each chromatographic peak; therefore, the comparison of these EICs suggests that the photooxidation ofisoprene in the presence of acid seed produces these sulfate esters observed in the ambient aerosol. In all chamber experiments involvingisoprene in the presence of AS seed aerosol, AAS seed aerosol, or SO2, the m/z 215 ion was detected.
524 9 ENVIRONMENTAL SCIENCE & TECHNOLOGY / VOL. 41, NO. 2, 2007
352
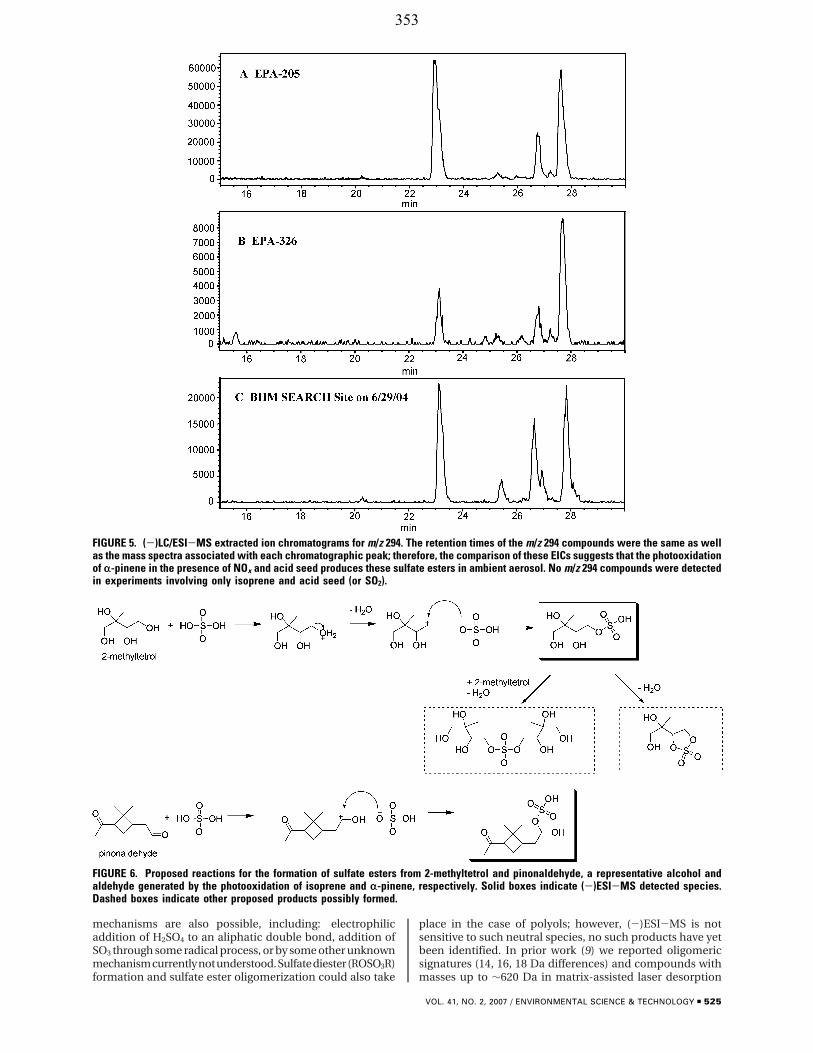
mechanisms are also possible, including: electrophilicaddition of H2SO4 to an aliphatic double bond, addition ofSO3 through some radical process, or by some other unknownmechanismcurrentlynotunderstood.Sulfatediester(ROSO3R)formation and sulfate ester oligomerization could also take
place in the case of polyols; however, (-)ESI-MS is notsensitive to such neutral species, no such products have yetbeen identified. In prior work (9) we reported oligomericsignatures (14, 16, 18 Da differences) and compounds withmasses up to ∼620 Da in matrix-assisted laser desorption
FIGURE 5. (-)LC/ESI-MS extracted ion chromatograms for m/z 294. The retention times of the m/z 294 compounds were the same as wellas the mass spectra associated with each chromatographic peak; therefore, the comparison of these EICs suggests that the photooxidationof r-pinene in the presence of NOx and acid seed produces these sulfate esters in ambient aerosol. No m/z 294 compounds were detectedin experiments involving only isoprene and acid seed (or SO2).
FIGURE 6. Proposed reactions for the formation of sulfate esters from 2-methyltetrol and pinonaldehyde, a representative alcohol andaldehyde generated by the photooxidation of isoprene and r-pinene, respectively. Solid boxes indicate (-)ESI-MS detected species.Dashed boxes indicate other proposed products possibly formed.
VOL. 41, NO. 2, 2007 / ENVIRONMENTAL SCIENCE & TECHNOLOGY 9 525
353

ionization (MALDI)-MS data collected for Caltech low-NOx
seeded experiments; AAS seed cases produced the mostprominent signals, possibly providing evidence for the sulfatediester or sulfate ester oligomerization reactions.
Isoprene Sulfate Esters and the role of NOx. Surratt etal. (9) observed a significant increase in the SOA yield in thelow-NOx AAS seed aerosol experiments, whereas very little(if any) increase in the SOA yield was observed in the high-NOx AAS seed aerosol experiments. This difference likelyoccurs because of the large abundance of organic acidsformed under high-NOx conditions competing with sulfuricacid (or sulfate) for esterification with alcohols. The low-NOx SOA was found to comprise largely of neutral polyols(e.g., 2-methyltetrols and hemiacetal dimers in Table 3) andhydroperoxides, which may react readily with sulfuric acidto produce sulfate esters. In previous work (9) we reporteddetecting no SOA components with (-)LC/ESI-MS for thelow-NOx seeded cases; reanalysis of that data indicates thatsulfate esters (m/z 215, 333, and 415) were in fact detected,but because they eluted very closely to inorganic sulfate(within 1-1.5 min), they were believed to be an artifact.
Atmospheric Implications. Sulfate esters identified pre-viously in ambient aerosol (21, 22) appear to be secondaryin nature, as demonstrated by the present study. Of particularsignificance is the detection of sulfate esters from isopreneand R-pinene in ambient aerosols, which could be indicatorsfor the acid induced reaction pathway. There is also thepossibility that oxidation of other hydrocarbons emitted intothe atmosphere in high abundances, including monoterpenesother than R-pinene as well as sesquiterpenes, could lead tothe formation of aerosol-bound sulfate esters. These esterscould contribute significantly to the HULIS fraction ofambient aerosol due to their high water-solubility, acidity,thermally stability, and high molecular weights, all of whichare common properties of HULIS (41). Strong chemicalevidence is presented here for the substantial occurrence ofsulfate esterification in both laboratory-generated and ambi-ent aerosols. This evidence provides one concrete explanationfor the observed increase in SOA yields in response toincreasing aerosol acidity. Additional studies are needed todetermine the mass fraction of sulfate esters in ambientaerosols and the factors that influence their formation, suchas relative humidity, temperature, and initial sulfate aerosolmass concentrations, in order to better understand and modelthis chemistry.
AcknowledgmentsResearch at Caltech was funded by the U.S. EnvironmentalProtection Agency Science to Achieve Results (STAR) programgrant no. RD-83107501-0, managed by EPA’s Office ofResearch and Development (ORD), National Center forEnvironmental Research (NCER) and Cooperative AgreementCR-831194001, and by the U.S. Department of Energy,Biological, and Environmental Research Program DE-FG02-05ER63983. This article has been jointly developed andpublished by EPA and the California Institute of Technology.ItwasproducedunderCooperativeAgreementno.CR83194001and is subject to 40 CFR 30.36. The article has been reviewedby EPA personnel under EPA scientific and technical peerreview procedures and approved for joint publication basedon its scientific merit, technical accuracy, or contribution toadvancing public understanding of environmental protection.However, the Agency’s decision to publish the article jointlywith Caltech is intended to further the public purposesupported by Cooperative Agreement no. CR83194001 andnot to establish an official EPA rule, regulation, guidance, orpolicy through the publication of this article. Further, EPAdoes not endorse any products or commerical servicesmentioned in this publication. J.D.S. was supported in partby the United States Environmental Protection Agency (EPA)
under the Science to Achieve Results (STAR) GraduateFellowship Program. Research at the University of Antwerpwas supported by the Belgian Federal Science Policy Officeand the Research Foundation-Flanders (FWO). The ElectricPower Research Institute provided support for the SEARCHnetwork. We thank Rafal Szmigielski for his discussions onsulfation reactions.
Literature Cited(1) Kanakidou, M.; Seinfeld, J. H.; Pandis, S. N.; Barnes, I.; Dentener,
F. J.; Facchini, M. C.; van Dingenen, R.; Ervens, B.; Nenes, A.;Nielsen, C. J.; Swietlicki, E.; Putaud, J. P.; Balkanski, Y.; Fuzzi,S.; Horth, J.; Moortgat, G. K.; Winterhalter, R.; Myhre, C. E. L.;Tsigardis, K.; Vignati, E.; Stephanou, E. G.; Wilson, J. Organicaerosol and global climate modeling: a review. Atmos. Chem.Phys. 2005, 5, 1053-1123.
(2) Gao, S.; Keywood, M.; Ng, N. L.; Surratt, J. D.; Varutbangkul, V.;Bahreini, R.; Flagan, R. C.; Seinfeld, J. H. Low-molecular-weightand oligomeric components in secondary organic aerosol fromthe ozonolysis of cycloalkenes and R-pinene. J. Phys. Chem. A2004, 108, 10147-10164.
(3) Gao, S.; Ng, N. L.; Keywood, M.; Varutbangkul, V.; Bahreini, R.;Nenes, A.; He, J.; Yoo, K. Y.; Beauchamp, J. L.; Hodyss, R. P.;Flagan, R. C.; Seinfeld, J. H. Particle phase acidity and oligomerformation in secondary organic aerosol. Environ. Sci. Technol.2004, 38, 6582-6589.
(4) Tolocka, M. P.; Jang, M.; Ginter, J. M.; Cox, F. J.; Kamens, R. M.;Johnston, M. V. Formation of oligomers in secondary organicaerosol. Environ. Sci. Technol. 2004, 38, 1428-1434.
(5) Tobias, H. J.; Ziemann, P. J. Thermal desorption mass spec-trometric analysis of organic aerosol formed from reactions of1-tetradecene and O3 in the presence of alcohols and carboxylicacids. Environ. Sci. Technol. 2000, 34, 2105-2115.
(6) Docherty, K. S.; Wu, W.; Lim, Y. B.; Ziemann, P. J. Contributionsof organic peroxides to secondary aerosol formed from reactionsof monoterpenes with O3. Environ. Sci. Technol. 2005, 39, 4049-4059.
(7) Jang, M.; Kamens, R. M. Atmospheric secondary aerosolformation by heterogeneous reactions of aldehydes in thepresence of sulfuric acid aerosol catalyst. Environ. Sci. Technol.2001, 35, 4758-4766.
(8) Jang, M.; Czoschke, N. M.; Lee, S.; Kamens, R. M. Heterogeneousatmospheric aerosol production by acid-catalyzed particle-phase reactions. Science 2002, 298, 814-817.
(9) Surratt, J. D.; Murphy, S. M.; Kroll, J. H.; Ng, N. L.; Hildebrandt,L.; Sorooshian, A.; Szmigielski, R.; Vermeylen, R.; Maenhaut,W.; Claeys, M.; Flagan, R. C.; Seinfeld, J. H. Chemical compositionof secondary organic aerosol formed from the photooxidationof isoprene. J. Phys. Chem. A 2006, 110, 9665-9690.
(10) Szmigielski, R.; Surratt, J. D.; Vermeylen, R.; Szmigielska, K.;Kroll, J. H.; Ng, N. L.; Murphy, S. M.; Sorooshian, A.; Seinfeld,J. H.; Claeys, M. Characterization of 2-methylglyceric acidoligomers in secondary organic aerosol formed from thephotooxidation of isoprene using trimethylsilyation and gaschromatography / ion trap mass spectrometry. J. Mass. Spectrom.2006, doi 10.1002/jms.1146.
(11) Barsanti, K. C.; Pankow, J. F. Thermodynamics of the formationof atmospheric organic particulate matter by accretionreactionsspart 1: aldehydes and ketones. Atmos. Environ. 2004,38, 4371-4282.
(12) Barsanti, K. C.; Pankow, J. F. Thermodynamics of the formationof atmospheric organic particulate matter by accretionreactionsspart 2: dialdehydes, methylglyoxal, and diketones.Atmos. Environ. 2005, 39, 6597-6607.
(13) Iinuma, Y.; Boge, O.; Gnauk, T.; Hermann, H. Aerosol-chamberstudy of the R-pinene/O3 reaction: influence of particle acidityon aerosol yields and products. Atmos. Environ. 2004, 38, 761-773.
(14) Kleindienst, T. E.; Edney, E. O.; Lewandowski, M.; Offenberg,J. H.; Jaoui, M. Secondary organic carbon and aerosol yieldsfrom the irradiations of isoprene and R-pinene in the presenceof NOx and SO2. Environ. Sci. Technol. 2006, 40, 3807-3812.
(15) Edney, E. O.; Kleindienst, T. E.; Jaoui, M.; Lewandowski, M.;Offenberg, J. H.; Wang, W.; Claeys, M. Formation of 2-methyltetrols and 2-methylglyceric acid in secondary organic aerosolfrom laboratory irradiated isoprene/NOx/SO2/air mixtures andtheir detection in ambient PM2.5 samples collected in the easternUnited States. Atmos. Environ. 2005, 39, 5281-5289.
526 9 ENVIRONMENTAL SCIENCE & TECHNOLOGY / VOL. 41, NO. 2, 2007
354

(16) Liggio, J.; Li, S.; McLaren, R. Heterogeneous reactions of glyoxalon particulate matter: identification of acetals and sulfate esters.Environ. Sci. Technol. 2005, 39, 1532-1541.
(17) Liggio, J.; Li, S. Organosulfate formation during the uptake ofpinonaldehyde on acidic sulfate aerosols. Geophys. Res. Lett.2006, 33, L13808, doi:10.1029/2006GL026079.
(18) Liggio, J.; Li, S. Reactive uptake of pinonaldehyde on acidicaerosols. J. Geophys. Res. 2006, in press.
(19) Blando, J. D.; Porcja, R. J.; Li, T.; Bowman, D.; Lioy, P. J.; Turpin,B. J. Secondary formation and the smoky mountain organicaerosol: an examination of aerosol polarity and functional groupcomposition during SEAVS. Environ. Sci. Technol. 1998, 32, 604-613.
(20) Maria, S. F.; Russell, L. M.; Turpin, B. J.; Porcja, R. J.; Campos,T. L.; Weber, R. J.; Huebert, B. J. Source signatures of carbonmonoxide and organic functional groups in Asian PacificRegional Characterization Experiment (ACE-Asia) submicronaerosol types. J. Geophys. Res. 2003, 108, 8637-8650.
(21) Romero, F.; Oehme, M. Organosulfatessa new component ofhumic-like substances in atmospheric aerosols? J. Atmos. Chem.2005, 52, 283-294.
(22) Gao, S.; Surratt, J. D.; Knipping, E. M.; Edgerton, E. S.; Shahgholi,M.; Seinfeld, J. H. Characterization of polar organic componentsin fine aerosols in the southeastern United States: identity,origin, and evolution. J. Geophys. Res. 2006, 111, D14314, doi:10.1029/2005JD006601.
(23) Murray, S.; Baillie, T. A. Direct derivatization of sulphate estersfor analysis by gas chromatography mass spectrometry. Biomed.Mass Spectrom. 1979, 6, 81-89.
(24) Boss, B.; Richling, E.; Herderich, M.; Schreier, P. HPLC-ESI-MS/MS analysis of sulfated flavor compounds in plants.Phytochemistry 1999, 50, 219-225.
(25) Metzger, K.; Rehberger, P. A.; Erben, G.; Lehmann, W. D.Identification and quantification of lipid sulfate esters byelectrospray ionization MS/MS techniques: cholesterol sulfate.Anal. Chem. 1995, 67, 4178-4183.
(26) Cocker, D.; Flagan, R. C.; Seinfeld, J. H. State-of-the-art chamberfacility for studying atmospheric aerosol chemistry. Environ.Sci. Technol. 2001, 35, 2594-2601.
(27) Keywood, M.; Varutbangkul, V.; Bahreini, R.; Flagan, R. C.;Seinfeld, J. H. Secondary organic aerosol formation from theozonolysis of cycloalkenes and related compounds. Environ.Sci. Technol. 2004, 38, 4157-4164.
(28) Kroll, J. H.; Ng, N. L.; Murphy, S. M.; Flagan, R. C.; Seinfeld, J.H. Secondary organic aerosol formation from isoprene pho-tooxidation under high-NOx conditions. Geophys. Res. Lett. 2005,32, L18808, doi:10.1029/2005GL023637.
(29) Kroll, J. H., Ng, N. L.; Murphy, S. M.; Flagan, R. C.; Seinfeld, J.H. Secondary organic aerosol formation from isoprene pho-tooxidation. Environ. Sci. Technol. 2006, 40, 1869-1877.
(30) Hansen, D.; Edgerton, E. S.; Hartsell, B. E.; Jansen, J. J.;Kandasamy, N.; Hidy, G. M.; Blanchard, C. L. The southeasternaerosol research and characterization study: Part 1-overview.J. Air Waste Manage. 2003, 53, 1460-1471.
(31) Sorooshian, A.; Brechtel, F. J.; Ma, Y.; Weber, R. J.; Corless, A.;Flagan, R. C.; Seinfeld, J. H. Modeling and characterization ofa particle-into-liquid sampler (PILS). Aerosol Sci. Technol. 2006,40, 396-409.
(32) Matsunaga, S. N.; Wiedinmyer, C.; Guenther, A. B.; Orlando, J.J.; Karl, T.; Toohey, D. W.; Greenberg, J. P.; Kajii, Y. Isopreneoxidation products are significant atmospheric aerosol com-ponents. Atmos. Chem. Phys. Discuss. 2005, 5, 11143-11156.
(33) Aschmann, S. M.; Reissell, A.; Atkinson, R.; Arey, J. Products ofthe gas phase reactions of the OH radical with R- and â-pinenein the presence of NO. J. Geophys. Res. 1998, 103, 25553-25561.
(34) Aschmann, S. M.; Atkinson, R.; Arey, J. Products of reaction ofOH radicals with R-pinene. J. Geophys. Res. 2002, 107, 4191-4197.
(35) Iraci, L. T.; Tolbert, M. A. Heterogeneous interaction offormaldehyde with cold sulfuric acid: Implications for the uppertroposphere and lower stratosphere. J. Geophys. Res. 1997, 102,16099-16107.
(36) Kane, S. M.; Leu, M. Uptake of methanol vapor in sulfuric acidsolutions. J. Phys. Chem. A 2001, 205, 1411-1415.
(37) Michelsen, R. R.; Staton, J. R.; Iraci, L. T. Uptake and dissolutionof gaseous ethanol in sulfuric acid. J. Phys. Chem. A 2006, 110,6711-6717.
(38) Hanson, D. R.; Eisele, F. L.; Ball, S. M.; McMurry, P. M. Sizingsmall sulfuric acid particles with an ultrafine particle conden-sation nucleus counter. Aerosol Sci. Technol. 2002, 36, 554-559.
(39) Joutsensaari, J.; Toivonen, T.; Vaattovaara, P.; Vesterinen, M.;Vepsalainen, J.; Laaksonen, A. Time-resolved growth behaviorof acid aerosols in ethanol vapor with a tandem-DMA technique.J. Aerosol Sci. 2004, 35, 851-867.
(40) Deno, N. C.; Newman, M. S. Mechanism of sulfation of alcohols.J. Am. Chem. Soc. 1950, 72, 3852-3856.
(41) Graber, E. R.; Rudich, Y. Atmospheric HULIS: how humic-likeare they? A comprehensive and critical review. Atmos. Chem.Phys. 2006, 6, 729-753.
Received for review August 30, 2006. Revised manuscriptreceived October 18, 2006. Accepted November 3, 2006.
ES062081Q
VOL. 41, NO. 2, 2007 / ENVIRONMENTAL SCIENCE & TECHNOLOGY 9 527
355

Appendix C
Characterization of 2-Methylglyceric Acid Oligomers in
Secondary Organic Aerosol Formed from the
Photooxidation of Isoprene Using Trimethylsilylation
and Gas Chromatography/Ion Trap Mass
Spectrometry∗
∗This chapter is reproduced by permission from “Characterization of 2-Methylglyceric Acid Oligomers in Secondary Organic Aerosol Formed from the Photooxidation of Isoprene Using Trimethylsilylation and Gas Chromatography/Ion Trap Mass Spectrometry” by R. Szmigielski, J. D. Surratt, R. Vermeylen, K. Szmigielska, J. H. Kroll, N. L. Ng, S. M. Murphy, A. Sorooshian, J. H. Seinfeld, and M. Claeys, J. Mass. Spectrom., 42, 101-116, 2007. Copyright 2007. John Wiley & Sons, Ltd.
356

JOURNAL OF MASS SPECTROMETRYJ. Mass Spectrom. 2007; 42: 101–116Published online 8 December 2006 in Wiley InterScience(www.interscience.wiley.com) DOI: 10.1002/jms.1146
Characterization of 2-methylglyceric acid oligomersin secondary organic aerosol formed from thephotooxidation of isoprene using trimethylsilylationand gas chromatography/ion trap mass spectrometry
Rafal Szmigielski,1 Jason D. Surratt,2 Reinhilde Vermeylen,1 Katarzyna Szmigielska,1
Jesse H. Kroll,3,4 Nga L. Ng,4 Shane M. Murphy,4 Armin Sorooshian,4 John H. Seinfeld3,4
and Magda Claeys1∗
1 Department of Pharmaceutical Sciences, University of Antwerp (Campus Drie Eiken), Universiteitsplein 1, BE-2610 Antwerp, Belgium2 Department of Chemistry, California Institute of Technology, Pasadena, CA 91125, USA3 Department of Environmental Science and Engineering, California Institute of Technology, Pasadena, CA 91125, USA4 Department of Chemical Engineering, California Institute of Technology, Pasadena, CA 91125, USA
Received 12 July 2006; Accepted 24 October 2006
In the present work, we have characterized in detail the chemical structures of secondary organic aerosol(SOA) components that were generated in a smog chamber and result from the photooxidation ofisoprene under high-NOx conditions typical for a polluted atmosphere. Isoprene high-NOx SOA contains2-methylglyceric acid (2-MG) and oligoester derivatives thereof. Trimethylsilylation, in combination withcapillary gas chromatography (GC)/ion trap mass spectrometry (MS) and detailed interpretation of the MSdata, allowed structural characterization the polar oxygenated compounds present in isoprene SOA up to2-MG trimers. GC separation was achieved between 2-MG linear and branched dimers or trimers, as well asbetween the 2-MG linear dimer and isomeric mono-acetate derivatives thereof. The electron ionization (EI)spectra of the trimethylsilyl derivatives contain a wealth of structural information, including informationabout the molecular weight (MW), oligoester linkages, terminal carboxylic and hydroxymethyl groups,and esterification sites. Only part of this information can be achieved with a soft ionization technique suchas electrospray (ESI) in combination with collision-induced dissociation (CID). The methane chemicalionization (CI) data were used to obtain supporting MW information. Interesting EI spectral differenceswere observed between the trimethylsilyl derivatives of 2-MG linear and branched dimers or trimers andbetween 2-MG linear dimer mono-acetate isomers. Copyright 2006 John Wiley & Sons, Ltd.
KEYWORDS: isoprene; 2-methylglyceric acid; oligomers; secondary organic aerosol; trimethylsilylation; gaschromatography/mass spectrometry; oligoesters
INTRODUCTION
Isoprene (2-methyl-1,3-butadiene, C5H8) is a volatile organiccompound (VOC) that is emitted in large amounts byterrestrial vegetation, estimated at about 500 Tg/yearworldwide.1 In the past, isoprene was assumed not tocontribute significantly to secondary organic aerosol (SOA)formation because of the high volatility of its first-generationoxidation products (i.e. methacrolein, methyl vinyl ketoneand formaldehyde).2 However, during the past 3 yearsevidence from both field3 – 7 and laboratory4,8 – 13 studieshas been obtained that isoprene is photooxidized to polaroxygenated products which are present in the aerosol phase.The aerosol yields from photooxidation of isoprene are rather
ŁCorrespondence to: Magda Claeys, Department of PharmaceuticalSciences, University of Antwerp (Campus Drie Eiken),Universiteitsplein 1, BE-2610 Antwerp, Belgium.E-mail: [email protected]
low (maximum about 3%);11,12 a recent modeling study,however, shows that this aerosol source is quite significanton a global scale.14 Knowledge of the detailed chemicalstructures of isoprene oxidation products is required in orderto gain insights into the underlying photochemical oxidationmechanisms of isoprene, which so far are only partiallyunderstood.
In a recent work,10 we characterized the chemical struc-tures of SOA components that were produced in a smogchamber from photooxidation of isoprene under both high-and low-NOx conditions. A combination of several massspectrometric techniques was used, including electrosprayionization (ESI), matrix-assisted laser desorption ionization(MALDI), aerosol mass spectrometry (MS), and derivatiza-tion gas chromatography (GC). It was shown in that studythat isoprene high-NOx SOA contains 2-methylglyceric acid(2-MG), formed by further photooxidation of methacrolein, a
Copyright 2006 John Wiley & Sons, Ltd.
357

102 R. Szmigielski et al.
first-generation oxidation product of isoprene, and oligoesterderivatives of 2-MG.
Soft ionization techniques such as ESI and MALDIare widely used currently in the analysis of oligomersand polymers, including oligomeric substances formedby photooxidation of biogenic and anthropogenic hydro-carbons such as isoprene,13 ˛-pinene,15 – 18 cycloalkenes16
and trimethylbenzene.19 Combination of these techniqueswith collision-induced dissociation (CID) and tandem MStechniques generally only partially provide the structuralinformation that is needed for elucidation of unknown multi-functional compounds. In the case of the oligomeric isopreneSOA compounds studied here, partial structural informationwas obtained by (�/C)ESI-ion trap MS and by upfront CIDmode of analysis on a LC/ESI-MS instrument.10 The majorfragmentation observed for 2-MG oligomers was loss of 102Da 2-MG residue(s), likely corresponding to 2-hydroxy-2-methylpropiolactone and formed through a nucleophilicreaction directed by the negative charge on the termi-nal ionized carboxylic acid function. In the present study,we demonstrate that additional structural information canbe achieved on oligomeric isoprene SOA compounds bytrimethylsilylation in combination with GC/ion trap MSand detailed interpretation of the electron ionization (EI)spectra.
A derivatization protocol based on methylation of car-boxylic acid functions prior to trimethylsilylation of neutralhydroxyl groups has been successfully applied in a previ-ous work20 to the analysis of polar oxygenated compoundspresent in organic aerosol. In the present work, preferencewas given to a one-step trimethylsilylation procedure thatconverts neutral and acidic hydroxyl functions to trimethylsi-lyl (TMS) ether or ester functions and allows the analysis ofpolar multifunctional compounds in the EI and/or chemicalionization (CI) mode. The EI mass spectra of trimethylsily-lated compounds generally contain a wealth of structuralinformation but often provide insufficient molecular weight(MW) information.6,20,21 The latter shortcoming can howeverbe overcome by recording spectra in the CI mode. In the EImode, information can be obtained on functional groups andtheir locations owing to the fragmentation-directing effect ofionized trimethylsilylated hydroxyl groups. Rearrangementreactions of the trimethylsilyl group may occur, renderingEI mass spectra quite complex and difficult to interpret, buthave the merit that they can yield structurally characteristicions.
The isoprene high-NOx SOA examined in the presentstudy contains 2-MG, 2-MG dimers, 2-MG dimer mono-acetate derivatives, and 2-MG trimers. We will first discussthe EI fragmentation behaviors of the 2-MG monomer andits oligomeric derivatives. In addition, we will examine thefragmentation behaviors of the ethyl ester derivatives thatare formed by subjecting isoprene high-NOx SOA to acidichydrolysis in ethanol. Part of this work has been brieflypresented in our previous study dealing with the overallchemical composition and mechanism of SOA formed fromthe photooxidation of isoprene under low- and high-NOx
conditions.10
EXPERIMENTAL
Aerosol samples and workupSOA was generated from isoprene (500 ppb) in Caltech’sindoor 28 m3 Teflon chambers using hydrogen peroxide asthe OH radical precursor and 800 ppb NO; the oxidationreaction was initiated by UV irradiation,11,12 and the SOA wascollected on Teflon filters. Full details about SOA generationfrom isoprene are given in our previous study.10 The SOAsample used in the present study was from a high-NOx
isoprene nucleation (seed-free) experiment (Experiment 5). 2-MG and a branched and linear dimer thereof were preparedby reacting methacrylic acid (250 µl; purity, 99%; Sigma,St. Louis, MI, USA) with hydrogen peroxide (250 µl; 50%aqueous solution) in the presence of formic acid (125 µl)for ten days at room temperature, following a procedureadapted from a previously reported one.4 The yield of 2-MG, as determined by trimethylsilylation GC with flameionization detection and using glyceric acid (Sigma) as aninternal recovery standard, was 222 mg; the 2-MG linear andbranched dimer were produced in small yield (combinedyield estimated at about 3.3 mg assuming a similar EIresponse as 2-MG), and the ratio branched/linear 2-MGdimer was 1 : 10.
The sample workup of the isoprene SOA sampleconsisted of extraction of the filter with methanolunder ultrasonic agitation and derivatization. Theextract was divided into two parts; one part wastrimethylsilylated, while the other part was subjected toa hydrolysis/ethylation procedure. For analysis of themethacrylic acid reaction products, 2 µl of the 30 timesdiluted reaction mixture (with methanol) was dried andtrimethylsilylated. Trimethylsilylation was performed byreacting the extract residue with 40 µl of a mixture containing1 ml N-methyl-N-trimethylsilyltrifluoroacetamide (C1%trimethylchlorosilane) (Pierce, Rockford, IL, USA) and 500 µlof dry pyridine (Merck) for an hour at 70 °C. The reagentemployed for deuterium labeling of the TMS methyl groups,N,O-bis(trimethyl-2H9-silyl)acetamide, was obtained fromCambridge Isotope Laboratories (Andover, MA, USA). Thehydrolysis/ethylation procedure involved reaction of theextract residue with 40 µl of analytical-grade ethanol and 8 µlof trimethylchlorosilane (Supelco, Bellafonte, PA, USA) for1 h at 60 °C. Aliquots of 1 µl were used for GC/MS analysisand were injected in the splitless mode.
GC/ion trap MSGC/MS analyses were performed with a system comprisinga TRACE GC2000 gas chromatograph, which was coupledto a Polaris Q ion trap mass spectrometer equipped withan external ionization source (ThermoElectron, San Jose,CA, USA). A Heliflex AT-5MS fused-silica capillary column(5% phenyl, 95% methylpolysiloxane, 0.25 µm film thickness,30 m ð 0.25 mm i.d.) preceded by a deactivated fused-silicaprecolumn (2 m ð 0.25 mm i.d.) (Alltech, Deerfield, IL, USA)was used to separate the derivatized extracts. Helium wasused as the carrier gas at a flow rate of 1.2 ml/min. Thetemperature program was as follows: isothermal hold at50 °C for 5 min, temperature ramp of 3 °C/min up to 200 °C,isothermal hold at 200 °C for 2 min, temperature ramp of
Copyright 2006 John Wiley & Sons, Ltd. J. Mass Spectrom. 2007; 42: 101–116DOI: 10.1002/jms
358

Isoprene oligomers in smog chamber aerosol 103
30 °C/min up to 310 °C; and isothermal hold at 310 °C for2 min. The analyses were performed in the full-scan mode(mass range: m/z 50–800), and were first carried out in the EImode and subsequently in the CI mode. The ion source wasoperated at an electron energy of 70 eV and temperatures of200 °C and 140 °C in the EI and CI modes, respectively. Thetemperatures of the GC injector and the GC/MS transfer linewere 250 °C and 280 °C, respectively. For CI, methane wasintroduced as the reagent gas at a flow rate of 1.8 ml/min.We present here mainly data collected in the EI mode; datacollected in the CI mode was used to obtain supporting MWinformation.
For CID experiments, the ions of interest were activatedby applying a percentage of a 5-V supplementary a.c.potential to the end-caps of the ion trap at the resonancefrequency of the selected ion [referred to as collisionenergy level (CEL)]. The CEL was 16%, while the excitationtime was 15 ms. Helium was introduced as dampingand collision gas at a flow rate of 1.1 ml/min. In somecases, MS/MS experiments were performed on severalmass-selected precursor ions sequentially during the samechromatographic run. For this purpose, the width of theisolation waveform at which the ion trap separation of theprecursor ions turned out to be the best was determined;the optimized value ranged between 3.5 and 5 a.m.u. Foreach precursor ion, the excitation time was 12 ms.
RESULTS AND DISCUSSION
Figure 1 shows a GC/MS total ion current chromatogram(TIC) obtained for SOA produced from the photooxida-tion of isoprene under high-NOx conditions. Compound 1was identified as the dihydroxymonocarboxylic acid, 2-MG(where 2-methylglyceric acid is its common name), which hasretained part of the isoprene skeleton. This compound wasreported for the first time in rural PM2.5 aerosol collected atK-puszta, Hungary, during a 2003 summer field campaign,4
and has since been reported in several field studies.5,7,8 Inaddition, it was shown in smog chamber studies that 2-MG is formed by photooxidation of isoprene8 and, morespecifically, by further oxidation of methacrolein, which is afirst-generation photooxidation product of isoprene.10 Com-pound 2a was characterized in our previous laboratory studyas a linear oligoester dimer of 2-MG (denoted as 2-MG lin-ear dimer), using a combination of several MS techniques,including ESI-MS, MALDI-MS, aerosol-MS, and trimethylsi-lylation GC/MS.10 In the present work, we discuss the EIbehavior of the TMS derivative of the 2-MG linear dimerin more detail and compare it with that of the brancheddimer (2b), which is not formed during photooxidation ofisoprene under high-NOx conditions (and therefore is notshown in Fig. 1) but which together with the 2-MG lineardimer is produced as a minor reaction product during theacid-catalyzed oxidation of methacrylic acid with hydrogenperoxide. The 2-MG branched dimer was found to elute atan earlier retention time (RT D 50.37 min) compared to thelinear dimer (RT D 51.59 min) (GC/MS TIC not shown). Noconclusions can be drawn about the relative amounts of 2-MGand its oligoester derivatives in the samples since it is pos-sible that 2-MG oligoester derivatives are partially degradedowing to hydrolysis during the trimethylsilylation procedurewhich uses an acidic catalyst (i.e. trimethylchlorosilane).Figure 2 shows the m/z 219 mass chromatogram obtainedafter subjecting the isoprene high-NOx SOA extract to acidichydrolysis in ethanol, an experiment that was performed toobtain evidence for ester linkages in the 2-MG oligomers.Compounds identified are the ethyl ester derivatives of 2-MG (1-Et), a branched (2b-Et) and linear 2-MG dimer (2a-Et),and a branched (3b-Et) and linear 2-MG trimer (3a-Et). In afollowing section, we will first discuss in detail the rathercomplex fragmentation behavior of the TMS derivatives of2-MG (1) and its ethyl derivative (1-Et) and will limit thediscussion to diagnostic ions with m/z values >140. In sub-sequent sections, we will then use this information to derive
Figure 1. GC/MS TIC obtained for a trimethylsilylated extract of isoprene high-NOx SOA. Peak identifications: 1, 2-MG; 2a, 2-MGlinear dimer; 2a-Ac1 and 2a-Ac2, 2-MG linear dimer mono-acetates; 3a, 2-MG linear trimer; 3b, 2-MG branched trimer. The peakeluting at 36.10 min is not discussed in the present work; it was found to correspond to an oxidation product of isoprene but not tobe related to 2-MG, and was tentatively identified as 2-hydroxymethyl-3-ketopropanoic acid. Other peaks not marked were alsofound in a control filter and were identified as fatty acids and monoglycerides thereof. Reprinted from J. Phys. Chem. A, 110, SurrattJD et al., Chemical composition of secondary organic aerosol formed from the photooxidation of isoprene, 9665, Copyright (2006),with permission from American Chemical Society.
Copyright 2006 John Wiley & Sons, Ltd. J. Mass Spectrom. 2007; 42: 101–116DOI: 10.1002/jms
359

104 R. Szmigielski et al.
Figure 2. GC/MS extracted ion chromatogram (m/z 219) obtained for an extract of isoprene high-NOx SOA subjected to ahydrolysis/ethylation procedure prior to trimethylsilylation. Reprinted from J. Phys. Chem. A, 110, Surratt JD et al., Chemicalcomposition of secondary organic aerosol formed from the photooxidation of isoprene, 9665, Copyright (2006), with permissionfrom American Chemical Society.
Figure 3. EI mass spectra for the TMS derivatives of (a) 2-MG (1) and (b) its ethyl ester derivative (1-Et). Part (a) reprinted from J.Phys. Chem. A, 110, Surratt JD et al., Chemical composition of secondary organic aerosol formed from the photooxidation ofisoprene, 9665, Copyright (2006), with permission from American Chemical Society.
structural information for 2-MG dimers (2a,b), 2-MG trimers(3a,b), the ethyl derivatives of 2-MG dimers (2a,b-Et), aswell as mono-acetate derivatives of the 2-MG linear dimer(2a-Ac1,2). In order to support fragmentation pathways, iontrap MS/MS experiments were used; only in the case of the2-MG monomer was deuterium labeling of the TMS groupscarried out.
Fragmentation behavior of 2-methylglyceric acidand its ethyl ester derivativeFigure 3 shows the EI mass spectra of the TMS derivativesof (a) 2-MG (1) and (b) its ethyl ester derivative (1-Et).The fragmentation pathways of the TMS derivative of 2-MG are summarized in Schemes 1 and 2; all pathwayssupported by an MS2 ion trap experiment are indicated
Copyright 2006 John Wiley & Sons, Ltd. J. Mass Spectrom. 2007; 42: 101–116DOI: 10.1002/jms
360

Isoprene oligomers in smog chamber aerosol 105
Figure 4. MS2 ion trap spectra for selected ions of the TMS derivative of 2-MG: (a) m/z 321, (b) m/z 219 and (c) m/z 293.
with an asterisk, while mass shifts obtained by introducing adeuterium labeled TMS group are given in parentheses. Themolecular ion (MCž; m/z 336) of the TMS derivative of 2-MGis very weak, as is generally the case for TMS derivativesof compounds containing multiple hydroxyl groups.6,21 Themolecular ion region has a signature that is characteristicof a trimethylsilylated carboxylic acid, i.e. the [M � CH3]C
ion (m/z 321) and the [M � �CH3 C CO�]C ion (m/z 293).Proof that m/z 321 is the precursor of m/z 293 was obtainedthrough an MS2 ion trap experiment on m/z 321 (Fig. 4(a)).Besides the MCž ion, other useful ions for inferring the MW
(336) are the [M � CH3]C ion (m/z 321) and the [M C TMS]C
ion (m/z 409). In addition, the molecular ion region containsa [M � CH2O]Cž ion (m/z 306), which is indicative of aterminal trimethylsilylated hydroxymethyl function and canbe explained via a rearrangement reaction of a TMS groupto the ionized ester function as outlined in Scheme 3.
The ion at m/z 219 is the base peak in the massspectrum and can be explained by a homolytic ˛-cleavage(Scheme 2). Fragmentation of m/z 219 (Fig. 4(b)) yieldsthe specific signature that was previously reported forthe m/z 219 ion of trimethylsilylated 2-methyltetrols,21
Copyright 2006 John Wiley & Sons, Ltd. J. Mass Spectrom. 2007; 42: 101–116DOI: 10.1002/jms
361

106 R. Szmigielski et al.
Scheme 1. Main fragmentation pathways for the TMS derivative of 2-methylglyceric acid. All pathways supported by an MS2 ion trapexperiment are indicated with an asterisk.
Scheme 2. Proposed pathways for m/z 233 and 219 formed from the TMS derivative of 2-MG and pathways for formation of m/z 219.
Scheme 3. Postulated gas-phase rearrangement process for the TMS derivative of 2-MG resulting in a resonance-stabilized m/z306 ion.
Copyright 2006 John Wiley & Sons, Ltd. J. Mass Spectrom. 2007; 42: 101–116DOI: 10.1002/jms
362

Isoprene oligomers in smog chamber aerosol 107
Scheme 4. Hydrogenation reaction of m/z 147 occurring in the ion trap resulting in m/z 149 and 133.
Figure 5. EI mass spectra of the TMS derivatives (a) 2-MG linear dimer (2a), (b) 2-MG branched dimer (2b), and (c) 2-MG linear dimerethyl ester (2a-Et). Part (a) reprinted from J. Phys. Chem. A, 110, Surratt JD et al., Chemical composition of secondary organicaerosol formed from the photooxidation of isoprene, 9665, Copyright (2006), with permission from American Chemical Society.
Copyright 2006 John Wiley & Sons, Ltd. J. Mass Spectrom. 2007; 42: 101–116DOI: 10.1002/jms
363

108 R. Szmigielski et al.
and is therefore consistent with a trimethylsilylated 1,2-dihydroxy-2-methylethyl group in the molecule. The m/z203 ion can be explained by loss of TMSOH from m/z 293(Scheme 1; Fig. 4(c)), while the m/z 147 ion correspondingto �CH3�2Si D OC � TMS is due to interaction between twoTMSO groups22 and indicates that the molecule contains atleast two TMSO groups. The m/z 147 ion is accompaniedby a m/z 149 ion which was shown to be formed from them/z 147 ion, and is explained by addition of hydrogen in theion trap, and fragments to m/z 133 through loss of methane(Scheme 4).
Comparison of the spectra of the TMS derivatives of2-MG (Fig. 3(a)) and its ethyl ester (Fig. 3(b)) shows thatethylation results in the expected mass shifts but has littleeffect on the fragmentation pathways. MW information isprovided by the MCž ion (m/z 292), the [M � CH3]C ion (m/z277), and the [M C TMS]C ion (m/z 365). It is worth notingthat the higher m/z region contains additional adduct ions atm/z 439 [M C 147]C and m/z 469 [M C 177]C. Of these ions,m/z 439 can be explained by adduct formation of the 2-MGethyl ester molecule with m/z 147, which is an abundant ionin the spectrum. The formation of m/z 177 likely involves thefurther addition of formaldehyde (30 Da), which is generatedin the formation of m/z 262 [M � CH2O]C. The latterion supports a terminal trimethylsilylated hydroxymethylfunction, while the base peak at m/z 219 is consistent with atrimethylsilylated 1,2-dihydroxy-2-methylethyl group.21
Fragmentation behavior of 2-MG dimers and theirethyl ester derivativesFigure 5 shows the EI mass spectra of the TMS derivatives of(a) the linear (2a) and (b) branched dimer of 2-MG (2b) and
(c) the ethyl ester derivative of the 2-MG linear dimer (2a-Et).Examination of the m/z range 450–600 provides informationabout the MW. In the case of the 2-MG linear dimer (Fig. 5(a);MW 510), these ions include m/z 583 [M C TMS]C, m/z 495[M � CH3]C, and m/z 467 [M � �CH3 C CO�]C. The latter ionsupports the presence of a terminal COOTMS group in themolecule as has been discussed above for 2-MG (Scheme 1).In the case of the 2-MG linear dimer ethyl ester (Fig. 5(c)),the MW (466) is supported by m/z 539 [M C TMS]C and m/z451 [M � CH3]C. The ion at m/z 393 detected for both of the2-MG linear and branched dimers and their ethyl esters canbe readily explained by a homolytic ˛-cleavage reaction asdepicted in Scheme 5.
The mass spectra of the TMS derivatives of the 2-MGlinear dimer as well as of its ethyl ester display an abundant[M � CH2O]Cž ion (m/z 480 and m/z 436, respectively),which is consistent with a terminal trimethylsilylatedhydroxymethyl function as has been discussed above forthe 2-MG monomer (Scheme 2). Subsequent elimination of aneutral (130 Da) through a rearrangement of a TMS groupleads to m/z 306, an ion that is also observed for the 2-MG monomer (Fig. 3(a)) and is stabilized by resonance(Scheme 6).
Comparison of the EI spectrum of the TMS derivative ofthe 2-MG linear dimer (Fig. 5(a)) with that of the brancheddimer (Fig. 5(b)) reveals some interesting differences. It canbe seen that the [M � CH2O]Cž ion (m/z 480) is absentin the case of the 2-MG branched dimer. However, it isnoted that a m/z 306 ion is also present in the 2-MGbranched dimer, suggesting that the internal TMS grouprearrangement (shown for 2a in Scheme 6) occurs prior to
Scheme 5. Formation of the m/z 393 characteristic of the 2-MG linear and branched dimers and their ethyl esters via a homolytic˛-cleavage reaction.
Scheme 6. Plausible mechanisms for the formation of m/z 436 and 306 from the TMS derivative of 2-MG linear dimer ethyl ester.
Copyright 2006 John Wiley & Sons, Ltd. J. Mass Spectrom. 2007; 42: 101–116DOI: 10.1002/jms
364
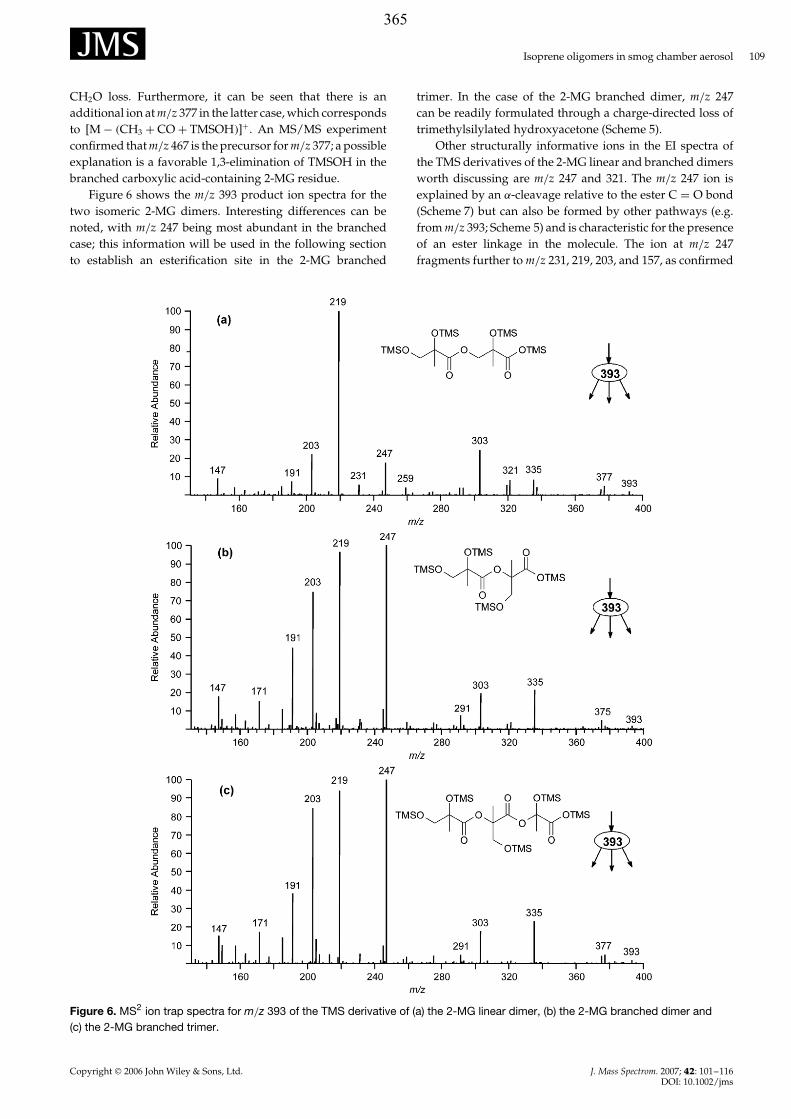
Isoprene oligomers in smog chamber aerosol 109
CH2O loss. Furthermore, it can be seen that there is anadditional ion at m/z 377 in the latter case, which correspondsto [M � �CH3 C CO C TMSOH�]C. An MS/MS experimentconfirmed that m/z 467 is the precursor for m/z 377; a possibleexplanation is a favorable 1,3-elimination of TMSOH in thebranched carboxylic acid-containing 2-MG residue.
Figure 6 shows the m/z 393 product ion spectra for thetwo isomeric 2-MG dimers. Interesting differences can benoted, with m/z 247 being most abundant in the branchedcase; this information will be used in the following sectionto establish an esterification site in the 2-MG branched
trimer. In the case of the 2-MG branched dimer, m/z 247can be readily formulated through a charge-directed loss oftrimethylsilylated hydroxyacetone (Scheme 5).
Other structurally informative ions in the EI spectra ofthe TMS derivatives of the 2-MG linear and branched dimersworth discussing are m/z 247 and 321. The m/z 247 ion isexplained by an ˛-cleavage relative to the ester C D O bond(Scheme 7) but can also be formed by other pathways (e.g.from m/z 393; Scheme 5) and is characteristic for the presenceof an ester linkage in the molecule. The ion at m/z 247fragments further to m/z 231, 219, 203, and 157, as confirmed
Figure 6. MS2 ion trap spectra for m/z 393 of the TMS derivative of (a) the 2-MG linear dimer, (b) the 2-MG branched dimer and(c) the 2-MG branched trimer.
Copyright 2006 John Wiley & Sons, Ltd. J. Mass Spectrom. 2007; 42: 101–116DOI: 10.1002/jms
365

110 R. Szmigielski et al.
Figure 7. MS2 ion trap spectra for selected ions of the TMS derivative of the 2-MG linear dimer: (a) m/z 247 and (b) m/z 219.
Scheme 7. A plausible formation mechanism for m/z 247 and its further fragmentation as confirmed by MS2 ion trap experiments.
by MS2 experiments (Fig. 7(a); Scheme 7). The MS2 ion trapspectrum of m/z 219 (Fig. 7(b)) unambiguously proves thatits structure is consistent with a trimethylsilylated 1,2-dihydroxy-2-methylethyl group,21 which has already beendiscussed above in the case of 2-MG and its ethyl esterderivative.
Fragmentation behavior of 2-MG trimers and theirethyl estersFigure 8(a) and (b) shows the EI mass spectra of the TMSderivatives of the two isomeric trimers of 2-MG that weredetected in the GC/MS TIC of high-NOx isoprene SOA(Fig. 1). Since both spectra display the same set of ions
Copyright 2006 John Wiley & Sons, Ltd. J. Mass Spectrom. 2007; 42: 101–116DOI: 10.1002/jms
366

Isoprene oligomers in smog chamber aerosol 111
Figure 8. EI mass spectra of the TMS derivatives of 2-MG (a) linear (3a) and (b) branched trimer (3b).
differing only in terms of their relative abundances, one canconclude that they represent isomeric compounds. The mostabundant compound which elutes at the latest retentiontime (RT D 60.31 min) is attributed to the linear trimer (3a),while the other one (RT D 60.01 min) is attributed to abranched trimer (3b), given that under the GC conditionsemploying a nonpolar stationary phase, branched isomers,which have a more compact structure than their linear forms,elute at an earlier retention time. As will be discussed below,evidence for a branched internal 2-MG residue was obtained.However, we have no evidence for the esterification site inthe terminal carboxylic acid-containing 2-MG residue andassume that after dimer formation, esterification proceedsby reaction with a terminal hydroxymethyl group of a 2-MGmolecule, thus resulting in a linear form, since the formationof linear forms is sterically less hindered.
As in the case of the 2-MG dimers, examination of the highm/z range enables us to infer the MW (684). Both isomersreveal a very weak [M C TMS]C adduct ion (m/z 757) aswell as [M � CH3]C ion (m/z 669) and [M � �CH3 C CO�]C
ions (m/z 641). The latter ion also supports a terminalcarboxyl group in the underivatized molecules. It can beseen that the abundance of the [M � CH2O]Cž ion (m/z 654)is strikingly different and is more abundant for the linear
system compared to the branched one. The same observationwas made for the [M � CH2O]Cž ion (m/z 610) in the massspectra of the 2-MG dimers and the ethyl derivatives of2-MG trimers (results not shown). A possible explanationfor this phenomenon is given in Scheme 8. A TMS grouptransfer may not only proceed from the terminal TMSOCH2
group but also from an internal TMSOCH2 group, involvedifferent geometries of the transition state, and take placeat a different rate. The interaction between the terminalTMSOCH2 group and a neighboring ester function involvesa 6-centered transition state, while that between the internalTMSOCH2 group of the branched isomer and a neighboringester function involves a 7-centered state which is lessfavorable but may be formed faster.
The m/z 393 ion can be explained by an ˛-cleavagedirected by the ionized internal TMSO group of the inner2-MG residue. Figure 6(c) shows that the m/z 393 production profile of the branched trimer is very similar to that ofthe branched dimer (Fig. 6(b)), suggesting that the branched2-MG trimer contains an inner branched 2-MG residue. In thefollowing discussion, attention will be given to structurallyinformative ions, which were not present in the case ofthe 2-MG dimers. Both the linear and branched 2-MGtrimer reveal an ion at m/z 495 which can be explained
Copyright 2006 John Wiley & Sons, Ltd. J. Mass Spectrom. 2007; 42: 101–116DOI: 10.1002/jms
367

112 R. Szmigielski et al.
Scheme 8. Differences in the geometry of the transition state providing a rational explanation for the more favorable loss offormaldehyde from the MCž ion of the TMS derivative of the 2-MG linear trimer compared to that of the branched form.
Scheme 9. Formation of m/z 495 in the case of the TMS derivative of the 2-MG linear trimer. The same mechanism can be proposedfor the 2-MG branched trimer.
Scheme 10. Pathway leading to m/z 409 in the TMS derivative of the 2-MG linear trimer.
from the [M � CH3]C ion by loss of a neutral (174 Da)from the terminal 2-MG residue through a rearrangementof a TMS group (Scheme 9). In addition, ions are present,which are isomer-specific. In the case of the 2-MG lineartrimer, an ion can be seen at m/z 409, while the 2-MGbranched trimer reveals an ion at m/z 596. The m/z 409ion can be generated from the [M C TMS]C adduct ion byan internal rearrangement of a TMS group resulting in the[2-MG C TMS]C adduct ion (Scheme 10). The m/z 596 ioncharacteristic of the 2-MG branched trimer is believed toresult from a favorable interaction in the MCž ion betweenthe trimethylsilylated hydroxymethyl group of the branchedunit and a trimethylsilylated hydroxyl group, leading to lossof �CH3�4Si (88 Da).
Fragmentation behavior of 2-MG linear dimermono-acetate derivativesThe two small peaks in the GC/MS TIC of high-NOx isopreneSOA (Fig. 1) eluting just after the 2-MG linear dimer (2a) were
identified as isomeric 2-MG linear dimer mono-acetates (2a-Ac1,2). These products were already partially characterizedin our previous study using (�) ESI-MS, and are formed byesterification between the 2-MG linear dimer and acetic acid,which is also generated from isoprene in the smog chamberunder high-NOx conditions.10 As will be discussed below, amore complete characterization of the isomeric 2-MG lineardimer mono-acetates was possible by detailed interpretationof the EI mass spectral data. The EI spectra of the TMS deriva-tives of the isomeric 2-MG linear dimer mono-acetates areshown in Fig. 9. The peak eluting at a RT of 52.3 min was char-acterized as the isomer containing an internal acetate group(2a-Ac1), while the peak at a RT of 52.6 min was attributed tothe isomer containing a terminal acetate group (2a-Ac2). Thepartial splitting noted in the latter chromatographic peak canbe explained by diastereoisomerism.
Examination of the high m/z range enables us to inferthe MW (480); the EI spectra of the TMS derivatives of both
Copyright 2006 John Wiley & Sons, Ltd. J. Mass Spectrom. 2007; 42: 101–116DOI: 10.1002/jms
368

Isoprene oligomers in smog chamber aerosol 113
Figure 9. EI mass spectra of the TMS derivatives of 2-MG linear dimer mono-acetates bearing the acetate group at (a) the terminalhydroxymethyl group (2a-Ac1) and (b) an internal hydroxyl group (2a-Ac2). Insets: CI (methane) data.
Scheme 11. Mechanisms proposed for the formation of m/z 450, 408, and 291 present in the EI spectrum of the TMS derivative ofthe 2-MG dimer mono-acetate isomer eluting at RT 52.3 min (2a-Ac1).
2-MG linear dimer mono-acetates show [M � CH3]C (m/z465) and [M � �CH3 C CO�]C ions (m/z 437). SupportingMW information was derived from the CI (methane)
spectra (insets in Fig. 9), which reveal [M C H]C (m/z481), [M C C2H5]C (m/z 509), and [M C C3H7]C (m/z 523)ions as well as [MH � CH4]C ions (m/z 465). It can be
Copyright 2006 John Wiley & Sons, Ltd. J. Mass Spectrom. 2007; 42: 101–116DOI: 10.1002/jms
369

114 R. Szmigielski et al.
Scheme 12. Possible formation pathways for m/z 291 in the TMS derivatives of both 2-MG dimer mono-acetate isomers throughcharge-remote fragmentation reactions.
Scheme 13. Mechanism proposed for the formation of m/z 420, an ion characteristic of the TMS derivative of the 2-MG dimermono-acetate bearing an acetyl group at the terminal hydroxymethyl group of the non-carboxylic acid-containing 2-MG residue(2a-Ac2). Parts of the molecule engaged in the elimination process are circled.
Scheme 14. Mechanisms proposed for formation of m/z 363, 217, 189, 157, and 131 in the TMS derivative of an 2-MG linear dimermono-acetate (2a-Ac2). The same mechanisms hold for the isomer 2a-Ac1.
seen that the spectrum of the first-eluting isomer (2a-Ac1) contains an ion at m/z 450, corresponding to the[M � CH2O]Cž ion formed through a rearrangement of a TMSgroup (Scheme 11). This ion firmly supports the presenceof a terminal trimethylsilylated hydroxymethyl group inthe non-carboxylic acid-containing 2-MG residue and isconsistent with a nonbranched carboxylic acid-containing
2-MG residue. Following the loss of formaldehyde, m/z450 fragments by loss of ketene (42 Da) from the acetategroup, resulting in m/z 408. Further fragmentation of m/z408 through loss of a TMSO(CO)ž radical leads to m/z 291.It can be seen that m/z 291 is also present in the case ofthe 2-MG dimer mono-acetate isomer eluting at a RT of52.6 min (2a-Ac2); an alternative explanation for m/z 291
Copyright 2006 John Wiley & Sons, Ltd. J. Mass Spectrom. 2007; 42: 101–116DOI: 10.1002/jms
370

Isoprene oligomers in smog chamber aerosol 115
in both 2-MG dimer mono-acetate isomers through charge-remote rearrangement reactions involving neutral loss ofboth ketene (42 Da) and formaldehyde (30 Da) is outlined inScheme 12.
The EI spectrum of the compound corresponding tothe 2-MG dimer mono-acetate isomer eluting at a RT of52.6 min (2a-Ac2) (Fig. 9(b)) shows a unique ion at m/z 420,which is explained by loss of acetic acid from the MCž
ion (Scheme 13). This favorable elimination of acetic acidinvolves a hydrogen at a 3-position relative to the acetategroup23 and does not occur in the other isomer (RT 52.3 min)in which only hydrogen atoms at the 2-position are available.
Ions present in the spectra of the TMS derivativesof both isomeric 2-MG linear dimer mono-acetates worthdiscussing are m/z 363, 217, 189, 157, and 131. Their formationmechanisms are given in Scheme 14. The formation of m/z217 and 189 in both isomers is consistent with the presenceof an acetate group in the non-carboxylic acid-containing2-MG residue. As expected, m/z 157 is more prominent inthe case of the 2-MG dimer mono-acetate bearing an acetylgroup at the terminal hydroxymethyl group because of thefavorable 1,3-elimination of acetic acid. On the other hand,the formation of m/z 131 due to loss of acetone from m/z 189seems to be a favored pathway in the case of the 2-MG dimermono-acetate bearing an internal acetyl group.
CONCLUSIONS
Detailed interpretation of the EI mass spectral data ofthe TMS derivatives of 2-MG and oligoester derivativesthereof allows one to obtain key structural features ofthe molecules and as such to elucidate their chemicalstructures and differentiate isomeric compounds. The m/z219 ion containing the trimethylsilylated 1,2-dihydroxy-2-methylethyl group is a characteristic ion of 2-MG and itsoligomers. Evidence for an ester function in the 2-MG dimersand trimers is indicated by the m/z 247 ion formed by an˛-cleavage in the ester group linking the non-carboxylicacid-containing 2-MG residue to the remaining part of themolecules. In addition, evidence for an inner branched 2-MG residue in the case of the 2-MG branched trimer wasobtained, while the 2-MG linear and branched dimers couldbe readily differentiated. Characteristic ions of the terminalcarboxyl group are the [M � CH3]C and [M � �CH3 C CO�]C
ions, while the terminal hydroxymethyl group was found togive rise to a [M � CH2O]Cž ion in linear 2-MG oligomers.Furthermore, it was possible to differentiate isomeric mono-acetates of the 2-MG linear dimer containing an acetyl groupin the non-carboxylic acid-containing 2-MG residue andlocate the position of the acetyl group. We can concludethat the EI spectra of the TMS derivatives contain a wealthof structural information, including information about theMW, ester linkages, terminal carboxylic and hydroxymethylgroups, and esterification sites.
AcknowledgementsResearch at the University of Antwerp was supported by theBelgian Federal Science Policy Office through the BIOSOL project(contract SD/AT/02A) and a visiting postdoctoral fellowship toRafal Szmigielski, and by the Research Foundation – Flanders (FWO)
(grant number G.0091.06). Research at Caltech was funded by theU.S. Environmental Protection Agency under the Science to AchieveResults (STAR) Program grant number RD-83107501-0, managed byEPA’s Office of Research and Development (ORD), National Centerfor Environmental Research (NCER), and by the U.S. Department ofEnergy, Biological, and Environmental Research Program DE-FG02-05ER63983; this work has not been subjected to the EPA’s requiredpeer and policy review and therefore does not necessarily reflectthe views of the Agency and no official endorsement should beinferred. Jason Surratt was supported in part by the United StatesEnvironmental Protection Agency (EPA) under the STAR GraduateFellowship Program.
REFERENCES1. Guenther A, Hewitt CN, Erickson D, Fall R, Geron C, Graedel T,
Harley P, Klinger L, Lerdau M, Mckay WA, Pierce T, Scholes B,Steinbrecher R, Tallamraju R, Taylor J, Zimmerman P. A globalmodel of natural volatile organic compound emissions.J. Geophys. Res. 1995; 100: 8873.
2. Pandis SN, Paulson SE, Seinfeld JH, Flagan RC. Aerosolformation in the photooxidation of isoprene and ˇ-pinene.Atmos. Environ. 1991; 25A: 997.
3. Claeys M, Graham B, Vas G, Wang W, Vermeylen R,Pashynska V, Cafmeyer J, Guyon P, Andreae MO, Artaxo P,Maenhaut W. Formation of secondary organic aerosols throughphotooxidation of isoprene. Science 2004; 303: 1173.
4. Claeys M, Wang W, Ion AC, Kourtchev I, Gelencser A,Maenhaut W. Formation of secondary organic aerosols fromisoprene and its gas-phase oxidation products through reactionwith hydrogen peroxide. Atmos. Environ. 2004; 38: 4093.
5. Ion AC, Vermeylen R, Kourtchev I, Cafmeyer J, Chi X,Gelencser A, Maenhaut W, Claeys M. Polar organic compoundsin rural PM2.5 aerosols from K-puszta, Hungary, during a 2003summer field campaign: sources and diel variations. Atmos.Chem. Phys. 2005; 5: 1805.
6. Wang W, Kourtchev I, Graham B, Cafmeyer J, Maenhaut W,Claeys M. Characterization of oxygenated derivatives ofisoprene related to 2-methyltetrols in Amazonian aerosols usingtrimethylsilylation and gas chromatography/ion trap massspectrometry. Rapid Commun. Mass Spectrom. 2005; 19: 1343.
7. Kourtchev I, Ruuskanen T, Maenhaut W, Kulmala M, Claeys M.Observation of 2-methyltetrols and related photo-oxidationproducts of isoprene in boreal forest aerosols from Hyytiala,Finland. Atmos. Chem. Phys. 2005; 5: 2761.
8. Edney EO, Kleindienst TE, Jaoui M, Lewandowski M, Offen-berg JH, Wang W, Claeys M. Formation of 2-methyl tetrols and2-methylglyceric acid in secondary organic aerosol from lab-oratory irradiated isoprene/NOx/SO2/air mixtures and theirdetection in ambient PM2.5 samples collected in the easternUnited States. Atmos. Environ. 2005; 39: 5281.
9. Boge O, Miao Y, Plewka A, Herrmann H. Formation ofsecondary organic particle phase compounds from isoprenegas-phase oxidation products: an aerosol chamber and fieldstudy. Atmos. Environ. 2006; 40: 2501.
10. Surratt JD, Murphy SM, Kroll JH, Ng NL, Hildebrandt L,Sorooshian A, Szmigielski R, Vermeylen R, Maenhaut W,Claeys M, Flagan RC, Seinfeld JH. Chemical composition ofsecondary organic aerosol formed from the photooxidation ofisoprene. J. Phys. Chem. A 2006; 110: 9665.
11. Kroll JH, Ng NL, Murphy SM, Flagan RC, Seinfeld JH.Secondary organic aerosol formation from isoprenephotooxidation under high-NOx conditions. Geophys. Res. Lett.2005; 32: L18808, Doi:10.1029/2005GL023637.
12. Kroll JH, Ng NL, Murphy SM, Flagan RC, Seinfeld JH.Secondary organic aerosol formation from isoprenephotooxidation. Environ. Sci. Technol. 2006; 40: 1867,Doi:10.1021/es054301.
13. Dommen J, Metzger A, Duplissy J, Kalberer M, Alfarra MR,Gascho A, Weingartner E, Prevot ASH, Verheggen B, Bal-tensperger U. Laboratory observation of oligomers in the aerosol
Copyright 2006 John Wiley & Sons, Ltd. J. Mass Spectrom. 2007; 42: 101–116DOI: 10.1002/jms
371

116 R. Szmigielski et al.
from isoprene/NOx photooxidation. Geophys. Res. Lett. 2006; 33:L13805, Doi:10.1029/2006GL026523.
14. Henze DK, Seinfeld JH. Global secondary organic aerosolfrom isoprene oxidation. Geophys. Res. Lett. 2006; 33: L09812,Doi:10.1029/2006GL025976.
15. Iinuma Y, Boge O, Gnauk T, Herrmann H. Aerosol-chamberstudy of the ˛-pinene/O3 reaction: influence of particle acidityon aerosol yields and products. Atmos. Environ. 2004; 38: 761.
16. Gao S, Keywood M, Ng NL, Surratt JD, Varutbangkul V,Bahreini R, Flagan RC, Seinfeld JH. Low-molecular-weight andoligomeric components in secondary organic aerosol from theozonolysis of cycloalkenes and alpha-pinene. J. Phys. Chem. A2004; 108: 10147.
17. Gao S, Ng NL, Keywood M, Varutbangkul V, Bahreini R,Nenes A, He J, Yoo KY, Beauchamp JL, Hodyss RP, Flagan RC,Seinfeld JH. Particle phase acidity and oligomer formation insecondary organic aerosol. Environ. Sci. Technol. 2004; 38: 6582.
18. Tolocka MP, Jang M, Ginter JM, Cox FJ, Kamens RM,Johnston MV. Formation of oligomers in secondary organicaerosol. Environ. Sci. Technol. 2004; 38: 1428.
19. Kalberer M, Paulsen D, Sax M, Steinbacher M, Dommen J,Prevot ASH, Fisseha R, Weingartner E, Frankevich V, Zenobi R,Baltensperger U. Identification of polymers as major compoundsof atmospheric organic aerosols. Science 2004; 308: 1659.
20. Jaoui M, Kleindienst TE, Lewandowski M, Edney EO. Identifica-tion and quantification of aerosol polar oxygenated compoundsbearing carboxylic acid or hydroxy groups. 1. Method develop-ment. Anal. Chem. 2004; 76: 4765.
21. Wang W, Vas G, Dommisse R, Loones K, Claeys M. Fragmen-tation study of diastereoisomeric 2-methyltetrols, oxidationproducts of isoprene, as their trimethylsilyl ethers, using gaschromatography/ion trap mass spectrometry. Rapid Commun.Mass Spectrom. 2004; 18: 1787.
22. Maenhaut-Claeys M, Vandewalle M. Studies in organic massspectrometry XIX. The fragmentation of the trimethylsilylderivatives of some 2,3-diakyl-1,4-cyclopentanediols. Bull. Soc.Chim. Belges 1974; 83: 343.
23. Liptak M, Heerma W. Fast atom bombardment massspectrometric study of some N-glycosides and S-glycosides ofacetylated hexose isomers. Rapid Commun. Mass Spectrom. 1993;7: 676.
Copyright 2006 John Wiley & Sons, Ltd. J. Mass Spectrom. 2007; 42: 101–116DOI: 10.1002/jms
372

Appendix D
Aerosol-Cloud Drop Concentration Closure for Clouds
Sampled during the International Consortium for
Atmospheric Research on Transport and
Transformation 2004 Campaign∗
∗This chapter is reproduced by permission from “Aerosol-Cloud Drop Concentration Closure for Clouds Sampled during the International Consortium for Atmospheric Research on Transport and Transformation 2004 Campaign” by C. Fountoukis, A. Nenes, N. Meskhidze, R. Bahreini, W. C. Conant, H. Jonsson, S. M. Murphy, A. Sorooshian, V. Varutbangkul, F. J. Brechtel, R. C. Flagan, and J. H. Seinfeld, J. Geophys. Res. 112, D10S30, doi:10.1029/2006JD007272, 2007. Copyright 2007. American Geophysical Union.
373

Aerosol–cloud drop concentration closure for clouds sampled during
the International Consortium for Atmospheric Research on Transport
and Transformation 2004 campaign
Christos Fountoukis,1 Athanasios Nenes,1,2 Nicholas Meskhidze,3,4 Roya Bahreini,5,6
William C. Conant,5,7 Haflidi Jonsson,8 Shane Murphy,9 Armin Sorooshian,9
Varuntida Varutbangkul,9 Fred Brechtel,5 Richard C. Flagan,5,10 and John H. Seinfeld,5,10
Received 8 March 2006; revised 19 November 2006; accepted 21 February 2007; published 26 April 2007.
[1] This study analyzes 27 cumuliform and stratiform clouds sampled aboard the CIRPASTwin Otter during the 2004 International Consortium for Atmospheric Research onTransport and Transformation (ICARTT) experiment. The data set was used toassess cloud droplet closure using (1) a detailed adiabatic cloud parcel model and(2) a state-of-the-art cloud droplet activation parameterization. A unique feature of the dataset is the sampling of highly polluted clouds within the vicinity of power plant plumes.Remarkable closure was achieved (much less than the 20% measurementuncertainty) for both parcel model and parameterization. The highly variable aerosol didnot complicate the cloud droplet closure, since the clouds had low maximumsupersaturation and were not sensitive to aerosol variations (which took place at smallparticle sizes). The error in predicted cloud droplet concentration was mostlysensitive to updraft velocity. Optimal closure is obtained if the water vapor uptakecoefficient is equal to 0.06, but can range between 0.03 and 1.0. The sensitivity of clouddroplet prediction error to changes in the uptake coefficient, organic solubility and surfacetension depression suggest that organics exhibit limited solubility. These findingscan serve as much needed constraints in modeling of aerosol-cloud interactions in theNorth America; future in situ studies will determine the robustness of our findings.
Citation: Fountoukis, C., et al. (2007), Aerosol–cloud drop concentration closure for clouds sampled during the International
Consortium for Atmospheric Research on Transport and Transformation 2004 campaign, J. Geophys. Res., 112, D10S30,
doi:10.1029/2006JD007272.
1. Introduction
[2] Most of the uncertainty in anthropogenic climatechange is associated with aerosol–cloud interactions[Lohmann and Feichter, 2004; Andreae et al., 2005].
Explicitly resolving cloud formation, microphysical evo-lution and aerosol-precipitation interactions in GlobalClimate Models (GCMs) is a challenging computationaltask [Khairoutdinov et al., 2005; Randall et al., 2003];parameterizations are used instead. In terms of predictingdroplet number, empirical correlations are often used[e.g., Jones et al., 1994; Gultepe and Isaac, 1996;Boucher and Lohmann, 1995; Lohmann and Feichter,1997; Kiehl et al., 2000; Menon et al., 2002; Brasseurand Roeckner, 2005], which relate an aerosol property(usually total number or mass) to cloud droplet numberconcentration, Nd. The data is usually obtained fromobservations. Although simple and easy to implement,correlations are subject to substantial uncertainty [Kiehl etal., 2000]. Prognostic parameterizations of aerosol–cloudinteractions have also been developed [Lohmann et al.,1999, 2000; Ghan et al., 2001a, 2001b; Rotstayn andPenner, 2001; Peng et al., 2002; Nenes and Seinfeld,2003; Fountoukis and Nenes, 2005] in which Nd iscalculated using cloud-scale updraft velocity, aerosol sizedistribution and composition. These approaches are basedon the ‘‘parcel’’ concept of 1-D Lagrangian numericalcloud models [e.g., Jensen and Charlson, 1984; Considineand Curry, 1998; Nenes et al., 2001]. Although inherently
JOURNAL OF GEOPHYSICAL RESEARCH, VOL. 112, D10S30, doi:10.1029/2006JD007272, 2007ClickHere
for
FullArticle
1School of Chemical and Biomolecular Engineering, Georgia Instituteof Technology, Atlanta, Georgia, USA.
2Also at School of Earth and Atmospheric Sciences, Georgia Institute ofTechnology, Atlanta, Georgia, USA.
3School of Earth and Atmospheric Sciences, Georgia Institute ofTechnology, Atlanta, Georgia, USA.
4Now at School of Marine, Earth, and Atmospheric Sciences, NorthCarolina State University, Raleigh, North Carolina, USA.
5Environmental Science and Engineering, California Institute ofTechnology, Pasadena, California, USA.
6Now at NOAA, Boulder, Colorado, USA.7Now at Department of Atmospheric Sciences, University of Arizona,
Tucson, Arizona, USA.8Center for Interdisciplinary Remotely-Piloted Aircraft Studies, Naval
Postgraduate School, Monterey, California, USA.9Department of Chemical Engineering, California Institute of Tech-
nology, Pasadena, California, USA.10Also at Department of Chemical Engineering, California Institute of
Technology, Pasadena, California, USA.
Copyright 2007 by the American Geophysical Union.0148-0227/07/2006JD007272$09.00
D10S30 1 of 12
374

better than correlations, prognostic parameterizations are stillsubject to uncertainties in the subgrid (i.e., cloud-scale)updraft velocity [e.g., Menon et al., 2002], aerosol sizedistribution and composition [e.g., Rissman et al., 2004],aerosol ‘‘chemical’’ effects and changes in droplet growthkinetics [e.g., Nenes et al., 2002].[3] The ultimate test for prognostic parameterizations and
cloud models is the comparison of their predictions againstcomprehensive in situ data. When done for cloud dropletnumber, this procedure is termed ‘‘cloud droplet closurestudy,’’ in which a discrepancy between Nd predicted bymodels and measured in situ is usually determined. Hallberget al. [1997] report �50% disagreement between predictedand observed Nd for continental stratocumulus clouds.Chuang et al. [2000] studied marine and continental stratusclouds sampled during the second Aerosol CharacterizationExperiment (ACE-2) and found a large discrepancy (about afactor of 3) between predictions and observations for updraftvelocity range expected for stratocumulus clouds. Snider andBrenguier [2000] and Snider et al. [2003] found up to 50%discrepancy between predicted and measured droplet con-centrations for ACE-2 and marine stratocumulus clouds. Partof this discrepancy was attributed to the usage of ground-based observations in the closure. Conant et al. [2004]achieved remarkable closure, to within 15%, for cumulusclouds of marine and continental origin sampled during theNASA Cirrus Regional Study of Tropical Anvils and CirrusLayers –Florida Area Cirrus Experiment (CRYSTAL-FACE). Meskhidze et al. [2005] also found excellent agree-ment between predicted and measured Nd (�30%) for thestratiform cloud data gathered during Coastal StratocumulusImposed Perturbation Experiment (CSTRIPE, Monterey,California, July 2003). In general, cloud droplet closure hasbeen successful for clouds formed in clean air masses, and toa lesser degree for polluted clouds. It is however unclear if thelatter results from limitations in the observations or in thetheory used for predicting cloud droplet number.[4] In this study we assess aerosol-cloud drop number
closure using (1) a detailed cloud parcel model [Nenes etal., 2001] and (2) the parameterization of Nenes andSeinfeld [2003] with recent extensions by Fountoukis and
Nenes [2005] (hereinafter referred to as ‘‘modified NS’’parameterization). The observations used in this study werecollected on board the Center for Interdisciplinary RemotelyPiloted Aircraft Studies (CIRPAS) Twin Otter aircraft(http://www.cirpas.org) during the NASA InternationalConsortium for Atmospheric Research on Transport andTransformation experiment (ICARTT). A unique feature ofthis data set is the sampling of highly polluted cloudy airwithin the vicinity of power plant plumes. Closure with theparcel model tests our predictive understanding of clouddroplet formation under extremely polluted conditions,while using the parameterization assesses its performanceand quantifies the uncertainty arising from its simplifiedphysics.
2. In Situ Observation Platform and AnalysisTools
[5] During ICARTT, the Twin Otter realized twelveresearch flights in the vicinity of Cleveland and Detroit(Figure 1), several of which sampled cumuliform andstratiform clouds. Seven flights are considered in this study.The cloud sampling strategy involves several under-cloud‘‘passes’’ to characterize the aerosol size distribution andchemical composition, followed by in-cloud ‘‘legs’’ tosample the cloud microphysics, chemistry and turbulence.
2.1. Description of Airborne Platform
[6] Table 1 summarizes the instruments and measuredquantities aboard the CIRPAS Twin Otter aircraft. A DualAutomatic Classifier Aerosol Detector (DACAD [Wang etal., 2003]) was used to measure dry aerosol size between10 and 800 nm. The DACAD consists of two scanningDifferential Mobility Analyzers (DMAs) operating in par-allel, one at a ‘‘dry’’ relative humidity (RH) less than 20%,and another at a ‘‘humid’’ RH of �75%. From the dry-wetsize distributions, the size-resolved hygroscopicity isobtained. Aerosol chemical composition (sulfate, nitrate,ammonium and organics) was measured in real time by anAerodyne Aerosol Mass Spectrometer (AMS [Bahreini etal., 2003; Jayne et al., 2000]). Concurrently, aerosol inor-ganics (NO3
�, SO42�, NH4
+) and some organics (oxalate)
Figure 1. (a) Map of the 12 Twin Otter research flight tracks during ICARTT. (b) Photograph ofConesville power plant plume affecting cloud depth (flight IC3; 6 August 2004).
D10S30 FOUNTOUKIS ET AL.: AEROSOL–CLOUD DROP CLOSURE
2 of 12
D10S30
375

were measured with a Particle-into-Liquid Sampler (PILS[Sorooshian et al., 2006a]). Updraft velocities were obtainedfrom a five-hole turbulence probe, a Pitot-static pressuretube, a C-MIGITS GPS/INS Tactical System, GPS/inertialnavigational system (INS), and the Novatel GPS system.[7] Droplet number concentrations were measured with a
Cloud and Aerosol Spectrometer (CAS) optical probe[Baumgardner et al., 2001], and the Forward ScatteringSpectrometer Probe (FSSP [Brenguier et al., 1998; Jaenickeand Hanusch, 1993]). The FSSP measures droplets rangingfrom 1.5 to 37 mm diameter. As with any optical counter, theFSSP is subject to numerous uncertainties such as variationsof the size calibration and of the instrument sampling section,nonuniformity in light intensity of the laser beam, probe deadtime and coincidence errors [Baumgardner and Spowart,1990; Brenguier, 1989]. The FSSP is most accurate formeasurements of Nd below 200 cm�3 [Burnet and Brenguier,2002]. At high droplet concentrations, Nd can be noticeablyunderestimated when measured with the Fast-FSSP [Burnetand Brenguier, 2002]. The CAS measures droplet sizes from0.4 to 50 mm in 20 size bins using a measurement principlesimilar to that of the FSSP, but improved electronics relaxesthe requirement for dead time and coincidence corrections[Burnet and Brenguier, 2002]. A Passive Cavity AerosolSpectrometer Probe (PCASP) was also flown, which is anoptical probe that measures particles between 100 and2500 nm.
2.2. Cloud Parcel Model
[8] The numerical cloud parcel model used in this study[Nenes et al., 2001, 2002] simulates the dynamical balancebetweenwater vapor availability from cooling of an ascendingair parcel and water vapor depletion from condensation ontoa growing droplet population. The model has successfullybeen used to assess cloud droplet closure in cumulus duringCRYSTAL-FACE [Conant et al., 2004] and has been used innumerous model assessments of aerosol-cloud interactions[e.g., Nenes et al., 2002; Rissman et al., 2004; Lance et al.,2004]. The model predicts cloud droplet number concentra-tion and size distribution using as input the cloud updraftvelocity, aerosol size distribution and chemical composition.‘‘Chemical effects,’’ such as surface tension depression[Shulman et al., 1996; Facchini et al., 1999], partial solu-bility or the presence of film-forming compounds [Feingoldand Chuang, 2002; Nenes et al., 2002; Rissman et al., 2004;Lance et al., 2004] can also be easily considered; their effecton droplet closure will be assessed through sensitivityanalysis.
2.3. Droplet Formation Parameterization
[9] The modified NS parameterization [Fountoukis andNenes, 2005] is one of the most comprehensive, robust andflexible formulations available for global models. Thecalculation of droplet number is based on the computationof maximum supersaturation, smax, within an ascending airparcel framework. The parameterization provides a compu-tationally inexpensive algorithm for computing dropletnumber and size distribution and can treat externally mixedaerosol subject to complex chemical effects (e.g., surfacetension effects, partial solubility, changes in water vaporuptake). The parameterization’s excellent performance hasbeen evaluated with detailed numerical cloud parcel model
Table
1.InstrumentationandMeasurementParam
etersDuringICARTT
Instrument
Measurement
MeasuredProperty
MeasurementPrinciple
Forw
ardscatteringspectrometer
probe(FSSP)
clouddropletnumber
distribution
geometricdiameter:1.5–37mm
opticalforw
ardscattering
Cloud,aerosol,andprecipitation
spectrometer
(CAS)
clouddropletnumber
distribution
geometricdiameter:0.5–50mm
opticalforw
ardscatteringand2-D
imaging
Condensationparticlecounter(CPC)
aerosolnumber
concentration
geometricdiameter
>(3
nm,7nm,13nm)
varyingsupersaturationsofbutanol
Dual
automated
classifier
aerosol
detector(D
ACAD)
aerosolsize
distribution
geometricdiameter:10–800nm
classificationbyelectrical
mobility
Passivecavityaerosolspectrometer
probe(PCASP)
aerosolsize
distribution
geometricdiameter:100–2500nm
opticalscattering
Aerodynam
icparticlesizer(A
PS)
aerosolsize
distribution
aerodynam
icdiameter:500–10,000nm
aerodynam
icclassification
Three-columncloudcondensation
nuclei
counter(CCN)
CCN
concentration
threesupersaturations
activationat
constantsupersaturation;opticaldetectionofdroplets
Aerodyneaerosolmass
spectrometer
(AMS)
aerosolchem
ical
composition
massconcentration:SO42�,NH4+,NO3�,OC
Flash
ionization;quadrapole
massspectrometer
Particle-into-liquid
sampler(PILS)
aerosolchem
ical
composition
massconcentration:SO42�,NH4+,NO3�,oxalate
ionchromatography
C-N
avigational
System
and
Novatel
GPS
updraftvelocity,windspeed
windvelocity;aircraftpositionandaltitude
windvelocity
=aircraftgroundvelocity
(C-M
IGITSIN
S/GPS)
�aircraftairvelocity
(turbulence
andPitot-static
probes)
D10S30 FOUNTOUKIS ET AL.: AEROSOL–CLOUD DROP CLOSURE
3 of 12
D10S30
376

simulations [Nenes and Seinfeld, 2003; Fountoukis andNenes, 2005] and in situ data for cumuliform and stratiformclouds of marine and continental origin [Meskhidze et al.,2005]. Formulations for sectional [Nenes and Seinfeld,2003] or lognormal [Fountoukis and Nenes, 2005] aerosolhave been developed. The latter (lognormal) formulation isused in this study.
3. Observations and Analysis
3.1. Description of Research Flights
[10] Seven flights are analyzed in this study, in which27 clouds are profiled (Table 2). The clouds formeddownwind of power plants, Cleveland and Detroit. Threeresearch flights (IC3,5 and 12) sampled clouds downwind ofthe Conesville power plant (Figure 1a), one flight (IC6)sampled clouds downwind of the Monroe power plant(Figure 1a), two flights (IC 9,10) sampled clouds southwestof Cleveland (Figure 1a) and one flight (IC11) sampledclouds southwest of Ontario (Figure 1a). Flight IC3 was thefirst to probe the Conesville power plant plume; its visibleimpact on local clouds (Figure 1b) motivated two moreresearch flights (IC5 and 12) that fully characterized theplume and its influence on clouds. Backward Lagrangiantrajectory analysis computed from the NOAA-HYSPLITmodel (http://www.arl.noaa.gov/ready/hysplit4.html) sug-gests that during flights IC3 and IC9, the air mass sampledwas transported by northerlies (Figure 2a). The air sampled inall other flights originated in the boundary layer and wastransported by westerly winds (Figure 2b). Prevailing winddirections, cloud types and other characteristics for eachcloud case are given in Table 2.
3.2. Cloud Droplet Number and Updraft VelocityMeasurements
[11] The observed cloud droplet spectra are carefullyscreened to eliminate biases in Nd. Dilution biases areavoided by considering only measurements with effectivedroplet diameter greater than 2.4 mm and geometric standarddeviation less than 1.5 [Conant et al., 2004]. A lack of adrizzle mode (liquid water) present, i.e., negligible concen-trations of droplets larger than 30 mm (typically 0–0.2 cm�3)suggest that collision-coalescence and drizzle formation werenot important for the clouds sampled. Particles below 1mmare either evaporating or unactivated haze and not counted asdroplets.[12] For flights before 13 August, the CAS suffered from
a saturation bias for concentrations above 1500 cm�3.About 3% of the data set was subject to this bias and wasdisregarded from this study. The CAS was also found toovercount droplets smaller than 6 mm but reliably counteddroplet larger than 6 mm. This problem is addressed bydisregarding the 1–6 mm CAS data and replacing them withFSSP data corrected for dead time and coincidence errors[Burnet and Brenguier, 2002]. Droplet concentration uncer-tainty was assessed by comparing FSSP and CAS concen-trations in the 6–10 mm range; the former was to be about40% lower than the latter. As all known sources of bias areaccounted for in the FSSP correction, we assume that thedifference between the two probes (40%) expresses anunbiased uncertainty (±20%) in observed droplet concen-tration for the whole data set and droplet size range.[13] The observed cloud droplet concentrations for each
flight are presented in Table 2. Average Nd varied from320 cm�3 to 1300 cm�3 and as expected, correlated with
Table 2. ICARTT Cloud Characteristics for the Flights Considered in This Study
Flight (Cloud)Number
FlightDate w+, ms�1 s+, ms�1
Observed Nd, cm�3
(±st.dev%)
Predicted Nd, cm�3
Parcel Model(Parameterization)
OriginatingAir Massa
(Cloud Type)Mission
DescriptionWind
Direction
IC3 (1) 6 Aug 1.67 0.868 1086 (15.9) 1046 (1066) clean (cumulus) Conesville PPb NIC3 (2) 6 Aug 0.39 1.732 354 (45.6) 321 (356) clean (stratocu) Conesville PPb NIC3 (3) 6 Aug 1.89 0.750 825 (44.5) 1109 (1116) clean (cumulus) Conesville PPb NIC3 (4) 6 Aug 1.18 0.619 828 (27.0) 980 (943) clean (cumulus) Conesville PPb NIC5 (1) 9 Aug 0.69 0.407 1293 (9) 1607 (1420) polluted (cumulus) Conesville PPb W-SWIC5 (2) 9 Aug 0.28 0.209 1160 (17) 1147 (1224) polluted (stratocu) Conesville PPb W-SWIC5 (3) 9 Aug 0.59 0.528 1045 (37.8) 1223 (1281) polluted (cumulus) Conesville PPb W-SWIC6 (1) 10 Aug 0.69 0.430 695 (14.7) 744 (813) polluted (stratocu) Monroe PPb W-SWIC6 (2) 10 Aug 0.35 0.283 415 (50.1) 508 (577) polluted (stratus) Monroe PPb NW-SWIC6 (3) 10 Aug 0.44 0.303 668 (28.4) 555 (636) polluted (stratus) Monroe PPb NW-SWIC6 (4) 10 Aug 0.69 0.375 808 (25.6) 745 (809) polluted (stratocu) Monroe PPb NW-SWIC6 (5) 10 Aug 0.57 0.477 700 (47.8) 649 (730) polluted (stratocu) Monroe PPb NW-SWIC6 (6) 10 Aug 1.07 0.819 1075 (15.7) 1008 (1073) polluted (stratocu) Monroe PPb NW-SWIC9 (1) 16 Aug 0.59 0.360 1012 (31.9) 1000 (1089) clean (stratocu) SW of Cleveland NW-SWIC9 (2) 16 Aug 0.17 0.131 540 (36) 487 (455) clean (stratus) SW of Cleveland NE-NIC9 (3) 16 Aug 0.15 0.170 524 (48.5) 413 (392) clean (stratus) SW of Cleveland NE-NIC9 (4) 16 Aug 0.72 0.727 1229 (8.7) 1507 (1384) clean (stratocu) SW of Cleveland NE-NIC10 (1) 17 Aug 0.69 0.401 1258 (6) 1306 (1367) polluted (cumulus) SW of Cleveland NE-NIC10 (2) 17 Aug 0.47 0.228 1040 (19.6) 1309 (1060) polluted (stratocu) SW of Cleveland S-SWIC10 (3) 17 Aug 0.17 0.212 811 (20.4) 718 (495) polluted (stratocu) SW of Cleveland S-SWIC11 (1) 18 Aug 0.35 0.313 963 (14.1) 803 (780) polluted (stratocu) SW of Ontario S-SWIC11 (2) 18 Aug 0.54 0.621 954 (32.1) 1056 (1054) polluted (stratocu) SW of Ontario S-SWIC11 (3) 18 Aug 0.62 0.428 965 (13.1) 1145 (1153) polluted (stratocu) SW of Ontario S-SWIC11 (4) 18 Aug 0.56 0.239 1141 (18.6) 1060 (1080) polluted (stratocu) SW of Ontario S-SWIC12 (1) 21 Aug 0.55 0.823 1314 (24.3) 1269 (1265) polluted (cumulus) Conesville PPb S-SWIC12 (2) 21 Aug 0.38 0.250 1016 (32.1) 783 (766) polluted (stratocu) Conesville PPb NW-SWIC12 (3) 21 Aug 0.12 0.134 322 (11.1) 287 (296) polluted (stratocu) Conesville PPb NaSee section 3.1 for characteristics of air mass types.bRead ‘‘PP’’ as ‘‘power plant.’’
D10S30 FOUNTOUKIS ET AL.: AEROSOL–CLOUD DROP CLOSURE
4 of 12
D10S30
377

cloud updraft velocity, w; clouds with Nd > 1000 cm�3
typically hadw > 1 m s�1,Nd� 500–1000 forw� 0.5 m s�1
and Nd � 300–500 for w � 0.25 m s�1. High dropletconcentration (even for clouds with low updraft velocity) isindicative of the high aerosol loading in almost all cloudsprofiled.[14] As expected, updraft velocity varied significantly in
each cloud (even at cloud base); we chose to fit observationsto a mass-flux-weighted Gaussian probability density func-tion (pdf), as discussed by Meskhidze et al. [2005] andConant et al. [2004]. Aircraft turns were eliminated fromour analysis and the pdf in the measurements were shifted tohave a mean of zero (consistent with the assumption of aslowly evolving boundary layer). Table 2 shows the valuesof average updraft velocity (closest to cloud base) and itsstandard deviation. Average cloud updraft velocity (at cloudbase), w+, varied between 0.12 (±0.13) and 1.89 (±0.73)m s�1. w+ and its standard deviation, s+, were highly corre-lated (Figure 3); typical of stratocumulus clouds, s+ issignificant and comparable to the mean updraft velocity.
3.3. Aerosol Size Distribution and Composition
[15] Flight legs were first conducted below cloud base tocharacterize aerosol composition and size distribution,followed by constant-altitude transects through the cloud; afinal pass was done at the cloud top (at 300–1000 m). Thevertical profiles and horizontal transects are used to deducecloud spatial extent and height. The under-cloud aerosol sizedistributions are averaged and fit to three (or four) lognormalmodes (depending on the observations) using least squaresminimization. Average total aerosol concentration rangedfrom 4200 cm�3 to 13300 cm�3; the distribution informationfor each cloud case is summarized in Table 3.
[16] Whenever available (flights IC3, IC5, IC6), AMSmeasurements were used to describe the dry aerosol compo-sition. The AMS always detected significant amounts oforganics, constituting 35–85% of the total aerosol mass.Highest organic mass fractions were observed outside ofpower plant plumes (Table 3). The ammonium-sulfate molarratio obtained both by the PILS and the AMS was larger than2 for most flights (ranging from 2.0 to 3.7), except for IC5,where the ratio was 1.75. This suggests that the aerosol was
Figure 2. HYSPLIT backward trajectory analysis for (a) flight IC3 and (b) flight IC6.
Figure 3. Correlation between average cloud base updraftvelocity and velocity standard deviation. All clouds listed inTable 2 are used.
D10S30 FOUNTOUKIS ET AL.: AEROSOL–CLOUD DROP CLOSURE
5 of 12
D10S30
378

neutralized in all flights except IC5. Lack of size-resolvedcomposition precludes the detection of acidity changesthroughout the aerosol distribution, but any gas phaseammonia (for all flights except IC5) would quickly condenseand neutralize acidic particles formed from in-cloud produc-tion of sulfate. The PILS analysis showed small amounts ofnitrate and oxalate, the latter being generated by in-cloudoxidation of organic precursors [Sorooshian et al., 2006b]. Itis unclear whether particulate nitrate is associated withaerosol phase organics. When combined, nitrates and oxalatedid not exceed 2% of the total (soluble + insoluble) aerosolmass and were excluded from our analysis; a small change inthe soluble fraction would not significantly impact dropletconcentrations [Rissman et al., 2004]. Table 3 presents theaerosol size distribution and composition for each cloud caseconsidered in this study.[17] Additional compositional insight (and its spatial
variability) can be obtained from the DACAD; the hygro-scopic growth factor (wet over dry aerosol diameter) duringflight IC3 was �1.17, (compared to 1.44 for pure ammo-nium sulfate at 77% relative humidity), characteristic ofcarbonaceous material with low sulfate content. Ageing ofthe plume downwind showed an increase in hygroscopicity,
consistent with condensation of sulfates on the aerosol. Theinfluence of the power plant plume could be detected formore than 20 miles downwind of the plant (Figure 4).Representative examples of measured and fitted size dis-tributions are shown in Figure 5; the discrepancy for CCN-relevant size range (larger than 30 nm) is generally small,less than 10%.
3.4. Cloud Droplet Closure: Parcel Model
[18] The average updraft velocity, w+, is used to computeNd; this was shown by Meskhidze et al. [2005] to giveoptimal closure for cumulus and stratocumulus clouds. w+ is
defined as, wþ ¼R10
wp wð Þdw=R10
p wð Þdw, where p(w) is
the vertical velocity probability density function (pdf). For aGaussian pdf with standard deviation yw and zero average
velocity, p wð Þ ¼ 1
2pð Þ1=2yw
exp � w2
2y2w
n o, and
wþ ¼� yw
2pð Þ1=2R10
exp �xð Þd �xð Þ
0:5¼ 2
p
� �1=2
yw ffi 0:8yw ð1Þ
Table 3. Aerosol Size Distribution and Chemical Composition for ICARTT Clouds
Flight Number (Date)AerosolMode
Modal Dpg,mm Modal s
Modal Nap,cm�3
(NH4)2SO4 MassFraction, %
IC3 (8/6/2004) nucleation 0.014 1.253 6667 40IC3 (8/6/2004) accumulation 0.024 1.222 2630 40IC3 (8/6/2004) coarse 0.064 1.720 1541 40IC5-a (8/9/2004) nucleation 0.027 1.477 2813 61IC5-a (8/9/2004) accumulation 0.112 1.638 3353 61IC5-a (8/9/2004) coarse 0.253 1.176 530 61IC5-b (8/9/2004) nucleation 0.030 1.330 2949 61IC5-b (8/9/2004) accumulation 0.051 1.121 486 61IC5-b (8/9/2004) coarse 0.124 1.712 3170 61IC5-c (8/9/2004) nucleation 0.013 1.066 163 66IC5-c (8/9/2004) accumulation 0.035 1.479 2578 66IC5-c (8/9/2004) coarse 0.138 1.708 2995 66IC6-a (8/10/2004) nucleation 0.015 1.336 2287 65IC6-a (8/10/2004) accumulation 0.042 1.400 3856 65IC6-a (8/10/2004) coarse 0.141 1.663 652 65IC6-b (8/10/2004) nucleation 0.014 1.230 1881 65IC6-b (8/10/2004) accumulation 0.040 1.496 4381 65IC6-b (8/10/2004) accumulation 0.163 1.534 533 65IC6-b (8/10/2004) coarse 0.738 1.027 0.1 65IC9-a (8/16/2004) nucleation 0.032 1.720 11890 15IC9-a (8/16/2004) accumulation 0.128 1.380 1310 15IC9-a (8/16/2004) coarse 0.274 1.150 420 15IC9-b (8/16/2004) nucleation 0.051 1.438 8491 70IC9-b (8/16/2004) accumulation 0.135 1.339 1365 70IC9-b (8/16/2004) coarse 0.249 1.161 289 70IC9-c (8/16/2004) nucleation 0.056 1.384 7959 50IC9-c (8/16/2004) accumulation 0.141 1.354 1300 50IC9-c (8/16/2004) coarse 0.260 1.140 244 50IC10-a (8/17/2004) nucleation 0.016 1.161 469 38IC10-a (8/17/2004) accumulation 0.037 1.360 4702 38IC10-a (8/17/2004) accumulation 0.077 1.060 243 38IC10-a (8/17/2004) coarse 0.143 1.581 1953 38IC10-b (8/17/2004) nucleation 0.024 1.269 3577 38IC10-b (8/17/2004) accumulation 0.042 1.123 355 38IC10-b (8/17/2004) coarse 0.112 1.841 2393 38IC11 (8/18/2004) nucleation 0.017 1.521 1322 15IC11 (8/18/2004) accumulation 0.098 1.676 2339 15IC11 (8/18/2004) coarse 0.237 1.289 587 15IC12 (8/21/2004) nucleation 0.013 1.117 133 36IC12 (8/21/2004) accumulation 0.096 1.296 206 36IC12 (8/21/2004) coarse 0.082 1.728 4336 36
D10S30 FOUNTOUKIS ET AL.: AEROSOL–CLOUD DROP CLOSURE
6 of 12
D10S30
379

w+, as calculated from equation (1), is identical to the‘‘characteristic’’ velocity found by Peng et al. [2005] usedfor assessing cloud droplet closure for stratocumulus cloudssampled in the North Atlantic Ocean. Equation (1) is alsoreflected in the updraft velocity observations (Figure 3); s+,which is roughly half of yw, yields after substitution intoequation (1) s+ ffi 0.63w+, which is consistent with the slopeof Figure 3.[19] The under-cloud temperature, pressure and relative
humidity describe the precloud thermodynamic state of theatmosphere and are used as initial conditions for the parcelmodel. Aerosol observations and cloud updraft velocity areobtained from Tables 2 and 3.[20] It is assumed that the aerosol is internally mixed
and composed of two compounds: ammonium sulfate(with density rsul = 1760 kg m�3) and organic (withdensity rorg = 1500 kg m�3). The ‘‘organic’’ density isslightly larger than the 1200–1250 kg m�3 value of Turpinand Lim [2001] proposed for Los Angeles to account forageing and the presence of some crustal species. For flightswhich AMS data were not available (i.e., IC9, IC10, IC11,IC12), the ‘‘insoluble’’ volume fraction, Vins, was inferred bysubtracting the ammonium sulfate volume, Vsul, (obtainedfrom PILS measurements) from the total aerosol volume,Vtotal (obtained from size distribution measurements). Themass fraction of the insoluble material, mins, is then calcu-lated as,
mins ¼rorgVins
rsulVsul þ rorgVins
ð2Þ
The assumption that only inorganics contribute solublemass relevant for CCN activation appears to be reasonablein CCN closure studies conducted in North America [e.g.,Medina et al., 2007; Broekhuizen et al., 2005]. Equation (2)assumes uniform composition with size; this can introduce asignificant amount of uncertainty in predicting CCN
concentrations [e.g., Medina et al., 2007; Broekhuizen etal., 2005]. The importance of both assumptions in clouddroplet number prediction is discussed in section 3.5.[21] The mass water vapor uptake (condensation) coeffi-
cient, ac, needed for computing the water vapor mass transfercoefficient [Fountoukis and Nenes, 2005] is currently subjectto considerable uncertainty. Li et al. [2001] have shown that ifuptake is controlled by the accommodation of water vapormolecules onto droplets, ac can range from 0.1 to 0.3 for purewater droplets, from 0.04 to 0.06 for aged atmospheric CCN[Shaw and Lamb, 1999; Pruppacher and Klett, 2000;Chuang, 2003; Conant et al., 2004], while a recent worksuggests that it should be close to unity for dilute droplets andpure water [Laaksonen et al., 2004]. However, ambient CCNat the point of activation are concentrated solutions com-posed of electrolytes and (potentially) organic surfactants,
Figure 4. Dry aerosol size distributions for flight IC5 (Conesville power plant). Distributions are shownfor plume transects downwind of the power plant.
Figure 5. Examples of observed size distributions andcorresponding lognormal fits.
D10S30 FOUNTOUKIS ET AL.: AEROSOL–CLOUD DROP CLOSURE
7 of 12
D10S30
380

which, together with other kinetic processes (e.g., solutedissolution [Asa-Awuku and Nenes, 2007]), can slow wateruptake and growth kinetics; this would give an apparentuptake coefficient much less than unity (even if ac wereunity). Because of this, and following the suggestions ofShaw and Lamb [1999] andConant et al. [2004], we considera ‘‘base case’’ value of ac equal to 0.06. The data set (Tables 2and 3) is used to determine a ‘‘best fit’’ value for ac andconstrain its uncertainty (section 3.5).[22] Figure 6 shows the cloud droplet number closure for
all 27 clouds analyzed in this study. The parcel modelpredictions ofNd are close to the 1:1 line of perfect agreementwith observations. In most cases, predictions are within 25%of the observations (average error 3.0 ± 15.4%; averageabsolute error 12.8 ± 8.7%), which is considerably less thanthe estimated Nd uncertainty of �20%.
3.5. Cloud Droplet Closure: Modified NSParameterization
[23] Evaluation of the modified NS parameterization iscarried out via a closure study, using the procedure outlinedin section 3.3. The results are shown in Figure 7; onaverage, the modified NS parameterization was found toreproduce observed Nd with the same accuracy as the parcelmodel (average error 1.5 ± 17.9%; average absolute error13.5 ± 11.5%). There is no systematic bias between themodeled and the observed Nd. This is remarkable, given thathighly polluted clouds formed from CCN containing largeamounts of organics have long been considered a challengefor any parameterization and parcel model [e.g., Conantet al., 2004]. This study, combined with the work ofMeskhidze et al. [2005] clearly show that the modified NSparameterization can accurately and robustly predict theprocess of cloud droplet activation and reliably be used inGCM assessments of the aerosol indirect effect.
3.6. Sources of Uncertainty and Sensitivity Analyses
[24] Despite the excellent closure, it is important to iden-tify key contributors to Nd error (defined as the differencebetween predicted and measured Nd normalized to measuredNd). This is done by examining the correlation of Nd errorwith key parameters affecting Nd, being (1) total aerosol
number, (2) accumulation mode aerosol number, (3) averagecloud base updraft velocity, (4) cloud base updraft velocityvariance, (5) observed cloud droplet number, and (6) aerosolsulfate mass fraction. The first two parameters are used as aproxy for pollution. The next two parameters are used as aproxy for cloud dynamics, which strongly impact clouddroplet number and its sensitivity to ‘‘chemical effects’’[e.g., Nenes et al., 2002; Rissman et al., 2004]. Sulfate massfraction itself is a proxy for ‘‘chemical effects,’’ as low sulfateis usually correlated with high organic content, which inturn may be water-soluble and contain surfactants. Finally,observed cloud droplet number is used to explore whetherthe Nd observations are subject to some concentration-dependant bias (section 3.2). Table 4 presents the resultsof the correlation analysis. When the whole data set isconsidered, Nd error only correlates significantly with w+
(R2 in Table 4 is for w+ < 1 m s�1) and its variance. There ispractically no correlation of droplet error with w+ when it isabove 1.0 m s�1 (roughly 50% of the data set). Thecorrelation of error with updraft is stronger as the w+
decreases; this is expected as vertical velocity uncertaintybecomes substantial for low updrafts. Lack of droplet errorcorrelation with chemical composition variations is consis-tent with Rissman et al. [2004], who show droplet numberis most sensitive to variations in updraft velocity underconditions of low supersaturation (i.e., strong competitionfor water vapor from high aerosol concentration and lowupdraft velocity). When considering subsets of data, updraftvelocity still correlates with droplet error (Table 4), moreweakly (R2 = 0.2) for power plant flights alone (IC3,5,6,12)and more strongly (R2 = 0.5) for non-power-plant plumeflights (IC9,10,11). The strength of correlation is expected,as power plant clouds are more vigorous (56% havew+ > 1.0,and only 6% with w+ < 0.25), than non-power-plant clouds(55% have w+ > 1.0, and 27% with w+ < 0.25).[25] For power plant flights alone, droplet error also
correlates with aerosol number. This is likely from thetemporal averaging of the aerosol size distribution; anaveraged distribution cannot account for the spatial hetero-geneity of the aerosol (hence droplet number) in the vicinityof power plant plumes. Therefore droplet error does not arise
Figure 6. Cloud droplet number closure using the parcelmodel. The conditions for predicting Nd are summarized inTables 2 and 3.
Figure 7. Same as Figure 3 but using the modified NSparameterization for predicting Nd.
D10S30 FOUNTOUKIS ET AL.: AEROSOL–CLOUD DROP CLOSURE
8 of 12
D10S30
381

from the presence of very high aerosol concentrations atcloud base, but variations thereof. The observations supportthis hypothesis; Nd error decreases as the plume ages anddilutes to the polluted (but homogeneous) backgroundaerosol. Despite the correlation, the droplet number vari-ability is still small compared to the highly variable aerosolnear the vicinity of a power plant plume (Figure 4) for tworeasons: droplet number variability is inherently less thanthe CCN variability [Sotiropoulou et al., 2006], and cloudsmay not respond to aerosol variations when they take placeat small particle sizes and smax is not sufficiently high toactivate them. The latter can be seen in Figure 4; most ofthe aerosol variability is seen in small diameters (<60 nm),while droplets formed upon CCN with diameter greater than70 nm (simulations suggest that smax � 0.085%). For non-power-plant plume flights (IC9,10,11), cloud droplet errorcorrelates with cloud droplet number (but not sulfatefraction or aerosol number), which suggests the presenceof minor biases in the Nd observations, which however arenot significant enough to affect closure.[26] Droplet number error also arises by assuming that
aerosol chemical composition is invariant with particle size(section 3.3). Broekhuizen et al. [2005],Medina et al. [2007]and Sotiropoulou et al. [2006] have shown that this assump-tion for polluted areas can result in up to 50% error in CCNpredictions. If our data set is subject to similar uncertainty,the resulting Nd error should range between 10 and 25%[Sotiropoulou et al., 2006], well within the observationaluncertainty. If organics partially dissolve and depress dropletsurface tension, Nd can become less sensitive to variations inchemical composition [Rissman et al., 2004].[27] Figure 8 presents the sensitivity of droplet number
prediction error, averaged over the data set, to the uptakecoefficient, ac. Figure 8 displays the Nd standard deviationonly for the parcel model, as the parameterization exhibitsroughly the same behavior. The sensitivity analysis was doneusing the parcel model and activation parameterization, andassuming that the organic fraction is insoluble. Assuming thatthe droplet number prediction error is random, our simula-tions indicate that the ‘‘best fit’’ value of ac (i.e., the valuewhich the average Nd error is minimal and its standarddeviation lies between the measured droplet uncertaintyrange) is 0.06, which is in agreement with values obtainedfrom the Conant et al. [2004] and Meskhidze et al.[2005] closure studies. Assuming a 20% uncertainty inobserved Nd (and neglecting the Nd error standard devi-ation) constrains ac between 0.03 and 1.0 (Figure 8).Peng et al. [2005] also obtain good closure using a muchdifferent ac (=1) in their analysis; this does not suggest
that the closure is insensitive to ac, but rather that updraftvelocity and droplet number measurements require reduc-tion in their uncertainty (Figure 8) to further constrain ac.[28] Finally, we assess the sensitivity of droplet closure to
‘‘chemical effects’’ (i.e., solubility of the organic fractionand depression of surface tension); the focus is to assesswhether different values of the uptake coefficient andorganic solubility (compared with the ‘‘base case’’ simu-lations for ac = 0.06) can yield good closure. In thesensitivity analysis, the dissolved organic was assumed tohave a molar volume of 66 cm3 mol�1 and a Van’t Hofffactor of 1, which is consistent with a lower limit ofproperties derived from the activation of water-solubleorganic carbon extracted from biomass burning samples(A. Asa-Awuku, Georgia Institute of Technology, personalcommunication, 2006). Organic solubility varied from 10�4
to 1 kg kg�1; when surface tension is allowed to decrease,we use the correlation of Facchini et al. [1999], assuming8 mols of carbon per mol of dissolved organic [Nenes et al.,2002]. We also consider two values of the uptake coeffi-cient, 0.06 and 1.0. Simulations indicate (Figure 9) thatorganic solubility less than 10�3 kg kg�1 is not enough toaffect CCN (thus droplet number) concentrations. All theorganic dissolves during activation when its solubility islarger than 10�2 kg kg�1; this leads to an average increase
Table 4. Correlation of Droplet Number Error With Important Aerosol-Cloud Interaction Propertiesa
Observed Property
Correlation Coefficient (R2)
Whole Data Set Non-Power-Plant Power Plant Only
Total aerosol number 0.002 0.018 0.111Accumulation mode aerosol number 0.002 0.043 0.198Cloud updraft velocity 0.358 0.500 0.209Updraft velocity standard deviation 0.150 0.383 0.066Cloud droplet number 0.067 0.343 0.014Aerosol sulfate mass fraction 0.025 0.036 0.014
aThe parcel model was used for computing cloud droplet number. Strongest correlations are shown in bold.
Figure 8. Sensitivity of droplet number error (betweenmodel and observations) to the value of the water vaporuptake coefficient.
D10S30 FOUNTOUKIS ET AL.: AEROSOL–CLOUD DROP CLOSURE
9 of 12
D10S30
382

in droplet number (error) by 10–15%, accompanied with asubstantial increase in droplet error variability. If surfacetension depression is included, droplet number (error) is onaverage increased by about 30% compared to the ‘‘basecase’’ simulation. Surface tension depression is consideredonly for simulations with ac = 1.0, as a lower value wouldyield droplet error outside of the uncertainty range. Using alarger organic molar volume (i.e., molecular weight) wouldjust decrease their effect on CCN activation; a lower molarvolume is unlikely, given that a lower estimate was alreadyused. The simulations suggest that combinations of organicsolubility, degree of surface tension depression and uptakecoefficient can give cloud droplet closure within experi-mental uncertainty. However, the ‘‘base case’’ conditionsgive by far the best closure since average droplet error andits variability are within measurement uncertainty (Figure 9).This suggests that ‘‘chemical effects’’ do not considerablyinfluence aerosol activation. The sensitivity analysis aboveillustrates the importance of reducing the droplet numbermeasurement uncertainty. On the basis of Figure 9, a 10%uncertainty would further constrain the extent of ‘‘chemicaleffects’’ on cloud droplet formation.
4. Summary
[29] This study analyzes 27 cumuliform and stratiformclouds sampled aboard the CIRPAS Twin Otter during the2004 ICARTT (International Consortium for AtmosphericResearch on Transport and Transformation). A uniquefeature of the data set is the sampling of highly pollutedclouds within the vicinity of power plant plumes. In situobservations of aerosol size distribution, chemical compo-sition and updraft velocity were input to (1) a detailedadiabatic cloud parcel model [Nenes et al., 2001, 2002] and(2) the modified NS parameterization [Fountoukis andNenes, 2005; Nenes and Seinfeld, 2003]; predicted dropletnumber is then compared with the observations. Remark-
able closure was achieved (on average to within 10%) forparcel model and parameterization. The error in predictedcloud droplet concentration was found to correlate mostlywith updraft velocity. Aerosol number also correlated withdroplet error for clouds affected by power plant plumes(which is thought to stem from spatial variability of theaerosol not considered in the closure). Finally, we assess thesensitivity of droplet closure to ‘‘chemical effects.’’ Anumber of important conclusions arise from this study:[30] 1. Cloud droplet number closure is excellent even for
the highly polluted clouds downwind of power plantplumes. Droplet number error does not correlate withbackground pollution level, only with updraft velocity andaerosol mixing state.[31] 2. A highly variable aerosol does not necessarily
imply a highly variable Nd concentration. The clouds in thisstudy often do not respond to aerosol variations becausethey take place primarily at small particle sizes, and cloudsmax is not high enough to activate them. Any dropletvariability that does arise is inherently less than the CCNvariability it originated from [Sotiropoulou et al., 2006].[32] 3. Usage of average updraft velocity is appropriate
for calculating cloud droplet number.[33] 4. The water vapor uptake coefficient ranges between
0.03 and 1.0. Optimum closure (for which average Nd erroris minimal and its standard deviation is within dropletmeasurement uncertainty) is obtained when the water vaporuptake coefficient is about 0.06. This agrees with valuesobtained from previous closure studies for polluted strato-cumulus [Meskhidze et al., 2005] and marine cumulusclouds [Conant et al., 2004].[34] 5. On average, organic species do not seem to influ-
ence activation through contribution of solute and surfacetension depression. Optimal cloud droplet closure is obtainedif the CCN are approximated by a combination of solubleinorganics and partially soluble organics (less than 1 g kg�1
water assuming a molar volume of 66 cm3 mol�1 and a Van’tHoff factor of 1).[35] 6. The cloud droplet activation parameterization used
in this study [Nenes and Seinfeld, 2003; Fountoukis andNenes, 2005] has performed as well as the detailed cloudparcel model. Excellent performance has also been reportedby Meskhidze et al. [2005]. Together, both studies suggestthat the parameterization can robustly be used in GCMassessments of the aerosol indirect effect.[36] 7. Distinguishing the ‘‘chemical effects’’ on the cloud
droplet spectrum requires the observational uncertainty to beof order 10%.[37] The above conclusions can serve as much needed
constraints for the parameterization of aerosol-cloud inter-actions in the North America. Future in situ studies willdetermine the robustness of our findings.
[38] Acknowledgments. We acknowledge the support of the NationalScience Foundation under award ATM-0340832. C.F., A.N. and N.M.acknowledge support from an NSF CAREER award, a NASA EOS-IDSand a NASA NIP. C.F. acknowledges support from a Gerondelis Founda-tion Fellowship.
ReferencesAndreae, O. M., C. D. Jones, and P. M. Cox (2005), Strong present-dayaerosol cooling implies a hot future, Nature, 435, 1187–1190.
Figure 9. Sensitivity of droplet number error (betweenmodel and observations) to the solubility of the aerosolorganic mass. The dissolved organic was assumed to have amolar volume of 66 g mol�1 and a Van’t Hoff factor of 1.
D10S30 FOUNTOUKIS ET AL.: AEROSOL–CLOUD DROP CLOSURE
10 of 12
D10S30
383

Asa-Awuku, A., and A. Nenes (2007), Effect of solute dissolution kineticson cloud droplet formation: 1. Extended Kohler theory, J. Geophys. Res.,doi:10.1029/2005JD006934, in press.
Bahreini, R., J. L. Jimenez, J. Wang, R. C. Flagan, J. H. Seinfeld, J. T. Jayne,and D. R. Worsnop (2003), Aircraft-based aerosol size and compositionmeasurements during ACE-Asia using an Aerodyne aerosol mass spectro-meter, J. Geophys. Res., 108(D23), 8645, doi:10.1029/2002JD003226.
Baumgardner, D., and M. Spowart (1990), Evaluation of the ForwardScattering Spectrometer Probe. Part III: Time response and laser inhomo-geneity limitations, J. Atmos. Oceanic Technol., 7, 666–672.
Baumgardner, D., H. Jonsson, W. Dawson, D. O’Connor, and R. Newton(2001), Cloud, aerosol and precipitation spectrometer: A new instrumentfor cloud investigations, Atmos. Res., 59–60, 251–264.
Boucher, O., and U. Lohmann (1995), The sulfate-CCN-cloud albedo effect:A sensitivity study with two general circulation models, Tellus, Ser. B, 47,281–300.
Brasseur, G. P., and E. Roeckner (2005), Impact of improved air quality onthe future evolution of climate, Geophys. Res. Lett., 32, L23704,doi:10.1029/2005GL023902.
Brenguier, J.-L. (1989), Coincidence and deadtime corrections for particlecounters. Part II: High concentration measurements with an FSSP,J. Atmos. Oceanic Technol., 6, 575–584.
Brenguier, J.-L., T. Bourrianne, A. Coelho, J. Isbert, R. Peytavi, D. Trevarin,and P. Weschler (1998), Improvements of droplet size distributionmeasurements with the Fast-FSSP (Forward Scattering SpectrometerProbe), J. Atmos. Oceanic Technol., 15, 1077–1090.
Broekhuizen, K., R. Y.-W. Chang, W. R. Leaitch, S.-M. Li, and J. P. D.Abbatt (2005), Closure between measured and modeled cloud condensa-tion nuclei (CCN) using size-resolved aerosol compositions in downtownToronto, Atmos. Chem. Phys. Disc., 5, 6263–6293.
Burnet, F., and J.-L. Brenguier (2002), Comparison between standard andmodified forward scattering spectrometer probes during the small cumu-lus microphysics study, J. Atmos. Oceanic Technol., 19, 1516–1531.
Chuang, P. (2003), Measurement of the timescale of hygroscopic growth foratmospheric aerosols, J. Geophys. Res., 108(D9), 4282, doi:10.1029/2002JD002757.
Chuang, P. Y., D. R. Collins, H. Pawlowska, J. R. Snider, H. H. Jonsson, J. L.Brenguier, R. C. Flagan, and J. H. Seinfeld (2000), CCN measurementsduring ACE-2 and their relationship to cloud microphysical properties,Tellus, Ser. B, 52, 843–867.
Conant,W.C., et al. (2004),Aerosol–clouddrop concentration closure inwarmcumulus, J. Geophys. Res., 109, D13204, doi:10.1029/2003JD004324.
Considine, G., and J. A. Curry (1998), Effects of entrainment and dropletsedimentation on the microphysical structure of stratus and stratocumulusclouds, Q. J. R. Meteorol. Soc., 124, 123–150.
Facchini, M., M. Mircea, S. Fuzzi, and R. Charlson (1999), Cloud albedoenhancement by surface-active organic solutes in growing droplets, Nature,401, 257–259.
Feingold, G., and P. Y. Chuang (2002), Analysis of the influence of film-forming compounds on droplet growth: Implications for cloud microphy-sical processes and climate, J. Atmos. Sci., 59, 2006–2018.
Fountoukis, C., and A. Nenes (2005), Continued development of a clouddroplet formation parameterization for global climate models,J. Geophys. Res., 110, D11212, doi:10.1029/2004JD005591.
Ghan, S. J., R. Easter, E. Chapman, H. Abdul-Razzak, Y. Zhang, L. Leung,N. Laulainen, R. Saylor, and R. Zaveri (2001a), A physically-basedestimate of radiative forcing by anthropogenic sulfate aerosol,J. Geophys. Res., 106, 5279–5293.
Ghan, S. J., N. Laulainen, R. Easter, R. Wagener, S. Nemesure, E. Chapman,Y. Zhang, and R. Leung (2001b), Evaluation of aerosol indirect forcing inMIRAGE, J. Geophys. Res., 106, 5317–5334.
Gultepe, I., and G. Isaac (1996), The relationship between cloud droplet andaerosol number concentrations for climate models, Int. J. Climatol., 16,941–946.
Hallberg, A., et al. (1997), Microphysics of clouds: Model versus measure-ments, Atmos. Environ., 31, 2453–2462.
Jaenicke, R., and T. Hanusch (1993), Simulation of the optical-particlecounter forward scattering spectrometer probe-100 (FSSP-100)—Conse-quences for size distribution measurements, Aerosol Sci. Technol., 18(4),309–322.
Jayne, J. T., D. C. Leard, X. Zhang, P. Davidovits, K. A. Smith, C. E. Kolb,and D. Worsnop (2000), Development of an aerosol mass spectrometerfor size and composition analysis of submicron particles, Aerosol Sci.Technol., 33, 49–70.
Jensen, J. B., and R. J. Charlson (1984), On the efficiency of nucleationscavenging, Tellus, Ser. B, 36, 367–375.
Jones, A., D. L. Roberts, and A. Slingo (1994), A climate model study ofindirect radiative forcing by anthropogenic sulphate aerosols, Nature,370, 450–453.
Khairoutdinov, M., D. Randall, and C. DeMott (2005), Simulations of theatmospheric general circulation using a cloud-resolving model as asuperparameterization of physical processes, J. Atmos. Sci., 62(7),2136–2154.
Kiehl, J. T., T. L. Schneider, P. J. Rasch, M. C. Barth, and J. Wong(2000), Radiative forcing due to sulfate aerosols from simulations withthe NCAR Community Climate Model, J. Geophys. Res., 105, 1441–1457.
Laaksonen, A., T. Vesala, M. Kulmala, P. M. Winkler, and P. E. Wagner(2004), On cloud modeling and the mass accommodation coefficient ofwater, Atmos. Chem. Phys. Disc., 4, 7281–7290.
Lance, S., A. Nenes, and T. Rissman (2004), Chemical and dynamicaleffects on cloud droplet number: Implications for estimates of theaerosol indirect effect, J. Geophys. Res., 109, D22208, doi:10.1029/2004JD004596.
Li, Y. Q., P. Davidovits, Q. Shi, J. T. Jayne, and D. R. Warsnop (2001),Mass and thermal accommodation coefficients of H2O(g) on liquidwater as a function of temperature, J. Phys. Chem. A, 105, 10,627–10,634.
Lohmann, U., and J. Feichter (1997), Impact of sulfate aerosols on albedoand lifetime of clouds: A sensitivity study with the ECHAM4 GCM,J. Geophys. Res., 102, 13,685–13,700.
Lohmann, U., and J. Feichter (2004), Global indirect aerosol effects: Areview, Atmos. Chem. Phys. Disc., 4, 7561–7614.
Lohmann, U., J. Feichter, C. C. Chuang, and J. E. Penner (1999), Predictingthe number of cloud droplets in the ECHAM GCM, J. Geophys. Res.,104, 9169–9198.
Lohmann, U., J. Feichter, J. E. Penner, and R. Leaitch (2000), Indirecteffect of sulfate and carbonaceous aerosols: A mechanistic treatment,J. Geophys. Res., 105, 12,193–12,206.
Medina, J., A. Nenes, R.-E. P. Sotiropoulou, L. D. Cottrell, L. D. Ziemba, P. J.Beckman, and R. J. Griffin (2007), Cloud condensation nuclei closureduring the International Consortium for Atmospheric Research on Trans-port and Transformation 2004 campaign: Effects of size-resolved compo-sition, J. Geophys. Res., 112, D10S31, doi:10.1029/2006JD007588.
Menon, S., A. D. DelGenio, D. Koch, and G. Tselioudis (2002), GCMsimulations of the aerosol indirect effect: Sensitivity to cloud parameter-ization and aerosol burden, J. Atmos. Sci., 59, 692–713.
Meskhidze, N., A. Nenes, W. C. Conant, and J. H. Seinfeld (2005), Evalua-tion of a new cloud droplet activation parameterization with in situ datafrom CRYSTAL-FACE and CSTRIPE, J. Geophys. Res., 110, D16202,doi:10.1029/2004JD005703.
Nenes, A., and J. H. Seinfeld (2003), Parameterization of cloud dropletformation in global climate models, J. Geophys. Res., 108(D14), 4415,doi:10.1029/2002JD002911.
Nenes, A., S. Ghan, H. Abdul-Razzak, P. Chuang, and J. Seinfeld (2001),Kinetic limitations on cloud droplet formation and impact on cloud albedo,Tellus, Ser. B, 53, 133–149.
Nenes, A., R. J. Charlson, M. C. Facchini, M. Kulmala, A. Laaksonen, andJ. H. Seinfeld (2002), Can chemical effects on cloud droplet number rivalthe first indirect effect?, Geophys. Res. Lett., 29(17), 1848, doi:10.1029/2002GL015295.
Peng, Y., U. Lohmann, R. Leaitch, C. Banic, and M. Couture (2002), Thecloud albedo-cloud droplet effective radius relationship for clean andpolluted clouds from RACE and FIRE.ACE, J. Geophys. Res.,107(D11), 4106, doi:10.1029/2000JD000281.
Peng, Y., U. Lohmann, and R. Leaitch (2005), Importance of vertical velo-city variations in the cloud droplet nucleation process of marine stratusclouds, J. Geophys. Res., 110, D21213, doi:10.1029/2004JD004922.
Pruppacher, H. R., and J. D. Klett (2000), Microphysics of Clouds andPrecipitation, Springer, New York.
Randall, D., M. Khairoutdinov, A. Arakawa, and W. Grabowski (2003),Breaking the cloud parameterization deadlock, Bull. Am. Meteorol. Soc.,84(11), 1547–1564.
Rissman, T., A. Nenes, and J. H. Seinfeld (2004), Chemical amplification(or dampening) of the Twomey effect: Conditions derived from dropletactivation theory, J. Atmos. Sci., 61(8), 919–930.
Rotstayn, L. D., and J. E. Penner (2001), Indirect aerosol forcing, quasi-forcing, climate response, J. Clim., 14, 2960–2975.
Shaw, R. A., and D. Lamb (1999), Experimental determination of thethermal accommodation and condensation coefficients of water, J. Chem.Phys., 111, 10,659–10,663.
Shulman, M. L., M. C. Jacobson, R. J. Charlson, R. E. Synovec, and T. E.Young (1996), Dissolution behavior and surface tension effects of organiccompounds in nucleating cloud droplets, Geophys. Res. Lett., 23, 277–280.
Snider, J. R., and J. L. Brenguier (2000), Cloud condensation nuclei andcloud droplet measurements during ACE-2, Tellus, Ser. B, 52, 827–841.
D10S30 FOUNTOUKIS ET AL.: AEROSOL–CLOUD DROP CLOSURE
11 of 12
D10S30
384

Snider, J. R., S. Guibert, J.-L. Brenguier, and J.-P. Putaud (2003), Aerosolactivation in marine stratocumulus clouds: 2. Kohler and parcel theoryclosure studies, J. Geophys. Res., 108(D15), 8629, doi:10.1029/2002JD002692.
Sorooshian, A., F. J. Brechtel, Y. Ma, R. J. Weber, A. Corless, R. C. Flagan,and J. H. Seinfeld (2006a), Modeling and characterization of a particle-into-liquid sampler (PILS), Aerosol Sci. Technol., 40, 396–409.
Sorooshian, A., et al. (2006b), Oxalic acid in clear and cloudy atmospheres:Analysis of data from International Consortium for Atmospheric Researchon Transport and Transformation 2004, J. Geophys. Res., 111, D23S45,doi:10.1029/2005JD006880.
Sotiropoulou, R. E. P., J. Medina, and A. Nenes (2006), CCN predictions:Is theory sufficient for assessments of the indirect effect?, Geophys. Res.Lett., 33, L05816, doi:10.1029/2005GL025148.
Turpin, B. J., and H. Lim (2001), Species contributions to PM2.5 massconcentrations: Revisiting common assumptions for estimating organicmass, Aerosol Sci. Technol., 35, 602–610.
Wang, J., R. C. Flagan, and J. H. Seinfeld (2003), A differential mobilityanalyzer (DMA) system for submicron aerosol measurements at ambientrelative humidity, Aerosol Sci. Technol., 37, 46–52.
�����������������������R. Bahreini, NOAA, Boulder, CO 80305, USA.F. Brechtel, R. C. Flagan, and J. H. Seinfeld, Environmental Science and
Engineering, California Institute of Technology, Pasadena, CA 91125, USA.W. C. Conant, Department of Atmospheric Sciences, University of
Arizona, Tucson, AZ 85721, USA.C. Fountoukis and A. Nenes, School of Chemical and Biomolecular
Engineering, Georgia Institute of Technology, Atlanta, GA 30332, USA.([email protected])H. Jonsson, Center for Interdisciplinary Remotely-Piloted Aircraft
Studies, Naval Postgraduate School, Monterey, CA 93933, USA.N. Meskhidze, School of Marine, Earth, and Atmospheric Sciences,
North Carolina State University, Raleigh, NC 27695, USA.S. Murphy, A. Sorooshian, and V. Varutbangkul, Department of Chemical
Engineering, California Institute of Technology, Pasadena, CA 91125, USA.
D10S30 FOUNTOUKIS ET AL.: AEROSOL–CLOUD DROP CLOSURE
12 of 12
D10S30
385

Appendix E
Secondary Aerosol Formation from Atmospheric
Reactions of Aliphatic Amines∗
∗This chapter is reproduced by permission from “Secondary Aerosol Formation from Atmospheric Reactions of Aliphatic Amines” by S. M. Murphy, A. Sorooshian, J. H. Kroll, N. L. Ng, P. Chhabra, C. Tong, J. D. Surratt, E. Knipping, R. C. Flagan, and J. H. Seinfeld, Atmos. Chem. Phys., 7(9), 2313–2337, 2007. © 2007 Author(s). This work is licensed under a Creative Commons License.
386

Atmos. Chem. Phys., 7, 2313–2337, 2007www.atmos-chem-phys.net/7/2313/2007/© Author(s) 2007. This work is licensedunder a Creative Commons License.
AtmosphericChemistry
and Physics
Secondaryaerosol formation from atmospheric reactions ofaliphatic amines
S. M. Murphy 1, A. Sorooshian1, J. H. Kroll 2, N. L. Ng1, P. Chhabra1, C. Tong1, J. D. Surratt1, E. Knipping3,R. C. Flagan1, and J. H. Seinfeld1
1Division of Chemistry and Chemical Engineering, California Institute of Technology, Pasadena, CA 91125, USA2Current Address: Aerodyne Research Inc., Billerica, MA, USA3Electric Power Research Institute, Palo Alto, CA, USA
Received: 17 December 2006 – Published in Atmos. Chem. Phys. Discuss.: 10 January 2007Revised: 13 April 2007 – Accepted: 13 April 2007 – Published: 8 May 2007
Abstract. Although aliphatic amines have been detected inboth urban and rural atmospheric aerosols, little is knownabout the chemistry leading to particle formation or the po-tential aerosol yields from reactions of gas-phase amines.We present here the first systematic study of aerosol forma-tion from the atmospheric reactions of amines. Based onlaboratory chamber experiments and theoretical calculations,we evaluate aerosol formation from reaction of OH, ozone,and nitric acid with trimethylamine, methylamine, triethy-lamine, diethylamine, ethylamine, and ethanolamine. En-tropies of formation for alkylammonium nitrate salts are es-timated by molecular dynamics calculations enabling us toestimate equilibrium constants for the reactions of amineswith nitric acid. Though subject to significant uncertainty,the calculated dissociation equilibrium constant for diethy-lammonium nitrate is found to be sufficiently small to allowfor its atmospheric formation, even in the presence of am-monia which competes for available nitric acid. Experimen-tal chamber studies indicate that the dissociation equilibriumconstant for triethylammonium nitrate is of the same orderof magnitude as that for ammonium nitrate. All amines stud-ied form aerosol when photooxidized in the presence of NOxwith the majority of the aerosol mass present at the peak ofaerosol growth consisting of aminium (R3NH+) nitrate salts,which repartition back to the gas phase as the parent amineis consumed. Only the two tertiary amines studied, trimethy-lamine and triethylamine, are found to form significant non-salt organic aerosol when oxidized by OH or ozone; calcu-lated organic mass yields for the experiments conducted aresimilar for ozonolysis (15% and 5% respectively) and pho-tooxidation (23% and 8% respectively). The non-salt organicaerosol formed appears to be more stable than the nitrate saltsand does not quickly repartition back to the gas phase.
Correspondence to:J. H. Seinfeld([email protected])
1 Introduction
Amines are emitted into the atmosphere from a variety ofsources including meat cooking, biomass burning, motor ve-hicle exhaust, industrial processes, and marine organisms.The dominant anthropogenic source is emissions from an-imal husbandry operations (Table 1). While amine emis-sions from animal husbandry are typically reported to betwo to three orders of magnitude less than those of ammo-nia (Ngwabie and Hintz, 2005; Schade and Crutzen, 1995),at least one study has reported gas-phase concentrations ofamines in the hundreds of ppb in areas of intense animalhusbandry (Rabaud et al., 2003). Though emission esti-mates vary widely, amines have been detected in marine, ru-ral, and urban atmospheres in the gas phase, particle phaseand within aqueous fog and rain drops (Zhang and Anas-tasio, 2003). Mass spectrometric studies by both Murphy(1997) and Angelino (2001) have shown that molecular ionstypically associated with amines are present in ambient par-ticles, especially in air masses from agricultural regions. Tanet al. (2002) identified particle phase amines during multiplesmog events in Toronto’s winter atmosphere. Recent fieldstudies suggest that organic nitrogen species could be an ap-preciable fraction of organic aerosol mass (Beddows et al.,2004; Mace et al., 2003; Makela et al., 2001; McGregor andAnastasio, 2001; Neff et al., 2002; Simoneit et al., 2003; Tanet al., 2002), although the relative importance of amines as asource of particulate organic nitrogen remains unclear.
During the 1970’s, interest in the gas-phase atmosphericchemistry of amines focused on carcinogenic nitrosaminesformed when amines are photooxidized (Pitts et al., 1978).It was subsequently determined that gas-phase nitrosaminesphotolyze rapidly in the troposphere and are believed to posea minimal threat to human health. More recently, toxicologystudies have demonstrated that particulate organic nitrogenspecies are associated with adverse health effects (Hamoir et
Published by Copernicus Publications on behalf of the European Geosciences Union.
387

2314 S. M. Murphy et al.: Secondary aerosol from atmospheric aliphatic amines
Table 1.Summary of structures of amines studied and estimated global emissions from animal husbandry.
Amine (abbrev) Formula Estimated Global Emissions, Gg N y−1
(Schade and Crutzen, 1995)
Ammonia NH3 23 300Methylamine (MA) CH3NH2 24±15Trimethylamine (TMA) (CH3)3N 108±30Diethylamine (DEA) (CH3CH2)2NH –Triethylamine (TEA) (CH3CH2)3N –Ethanolamine (MEA) (CH2OH)CH2NH2 –
al., 2003). Nemmar (2002) found that particles coated withamines produced a significant increase in the rate of bloodclots (by nearly 4 times) when installed in the trachea ofhamsters; in contrast, the effects of particles coated with car-boxylic acids and unmodified polystyrene particles were notstatistically significant when compared to the control groupof hamsters.
Amines are oxidized in the atmosphere by the hydroxylradical (OH), ozone (O3), and possibly by the nitrate radi-cal (NO3), with measured rate constants suggesting that thereaction rates of ozone and OH with amines are competitiveduring the day if ozone levels are in the tens to hundreds ofppb (Tuazon et al., 1994). The nitrate radical may play a sig-nificant role in amine oxidation at night, though very littleis known about this pathway. While many of the gas-phaseoxidation pathways involving OH and ozone have been elu-cidated, secondary aerosol formation resulting from the pho-tooxidation of amines has received limited attention. Also,because amines are basic compounds, they can form partic-ulate salts through reactions with gas-phase acids present inthe atmosphere (HNO3, H2SO4),
NR3(g)+ HNO3(g)�HNR3NO3(s) (R1)
2NR3(g)+ H2SO4(g)�(HNR3)2SO4(s) (R2)
Reactions(R1) and (R2) are analogous to those of ammoniato form ammonium sulfate and ammonium nitrate. Whilethe equilibria between gas-phase ammonia and nitric or sul-furic acid to form particle-phase salts have been thoroughlyinvestigated and the thermodynamic parameters governingthese reactions are well known (Mozurkewich, 1993; Stel-son and Seinfeld, 1982), similar thermodynamic parametersfor amine systems were not available prior to this study.
There have been a limited number of laboratory chamberexperiments in which aerosol resulting from amine photooxi-dation was observed (Angelino et al., 2001; Pitts et al., 1978).Aerosol yields, the relative importance of acid-base chem-istry, and the oxidative pathways leading to particle forma-tion remain poorly understood. The goal of the present workis to use controlled laboratory chamber studies to evaluatethe aerosol forming potential, by acid-base reactions, pho-tooxidation and ozonolysis, of aliphatic amines known to be
present in the atmosphere. The amines studied (with abbrevi-ation used) are: trimethylamine (TMA), methylamine (MA),triethylamine (TEA), diethylamine (DEA), ethylamine (EA),and monoethanolamine (MEA), which will be referred to asethanolamine in this paper.
2 Experimental
All experiments (Table 2) were carried out in the Caltechdual 28 m3 FEP Teflon chambers (Cocker et al., 2001; Key-wood et al., 2004). The chambers are surrounded by banksof black lights (276GE350BL) which output ultraviolet lightpredominantly between 300 and 400 nm, with a maximum at354 nm. Ports allow for the introduction of clean, dry (<10%RH) air, gas-phase reagents, inorganic seed aerosol, and formeasurement of NO, NOx, O3, RH, temperature, and partic-ulate mass, size, number concentration, and chemistry. Tem-perature is held at 20◦C, increasing to 25◦C during photooxi-dation experiments using the black lights. Commercial mon-itors (Horiba) are used to measure O3 (by UV absorption)and NO/NOx (NOx conversion to NO by activated carbon,followed by NO + O3 chemiluminescence). Both aminesand nitric acid (when added) were injected into the cham-ber by passing a stream of dry, clean air over a known vol-ume of high purity liquid phase compound. The purity andsource of the amines used in this study are: trimethylamine(45% solution in H2O, Fluka), methylamine (40 wt.% so-lution in H2O, Sigma-Aldrich ), triethylamine (>99.5% pu-rity, Sigma Aldrich), diethylamine (>99.5% purity, SigmaAldrich), ethylamine (70 wt.% solution in H2O, Aldrich),ethanolamine, (≥99% purity, Sigma Aldrich). Gas-phaseconcentrations of amines and nitric acid were not directlymeasured and were instead estimated based on the volume ofliquid phase amine injected; these concentrations representthe maximum possible within the chamber in the absence ofwall loss.
“Seed” aerosol was generated by atomizing a solu-tion of 0.015 M ammonium sulfate or 0.75 M ammo-nium nitrate. Particle-phase measurements were made byan Aerodyne Time of Flight Aerosol Mass Spectrometer(cToF-AMS), a Particle-Into-Liquid Sampler coupled to Ion
Atmos. Chem. Phys., 7, 2313–2337, 2007 www.atmos-chem-phys.net/7/2313/2007/
388

S. M. Murphy et al.: Secondary aerosol from atmospheric aliphatic amines 2315
Table 2. Initial conditions of all experiments conducted.
Exp. Amine Estimated Initial (ppb) Oxidant Initial NOx Mixing Ratios (ppb) HNO3 Injected (ppb) Atomized Seed AerosolMixing Ratios
1 Trimethylamine 100 NOx , Propene 100 (NO2) – –2 Trimethylamine 100 NOx , Propene 100 (NO2) 10 –3 Trimethylamine 100 H2O2 100 (NO2) 10 –4 Trimethylamine 100 Ozone – 18 –5 Methylamine 100 NOx 100 (NO2) 10 –6 Methylamine 100 H2O2 100 (NO) 10 –7 Methylamine 100 Ozone – – (NH4)2SO48 Triethylamine 500 H2O2 – – –9 Triethylamine 500 H2O2 400 (NO) – –10 Triethylamine 100 NOx 100 (NO) – –11 Triethylamine 100 NOx 100 (NO) 100 (NO2) – –12 Triethylamine 100 NOx 140 ( NO2) – –13 Triethylamine 100 NOx 100 ( NO2) – –14 Triethylamine 100 NOx 100 ( NO2) 10 –15 Triethylamine 50 NOx , Propene 100 (NO2) 100 –16 Triethylamine 100 O3 – 8 –17 Triethylamine 100 HNO3 – 100 –18 Triethylamine 20 ppb TEA aliquots – – – NH4NO319 Triethylamine 100 ppb NH3 inject TEA in aliquots – – 5 (twice) –20 Triethylamine 50 ppb TEA 50 ppb NH3 – – 8 –21 Diethylamine 100 H2O2 – – –22 Diethylamine 100 H2O2 80 (NO) – –23 Diethylamine 100 NOx , Propene 100 (NO) – –24 Diethylamine 100 NOx 100 (NO) – –25 Diethylamine 100 NOx 100 (NO2) – (NH4)2SO426 Diethylamine 100 NOx 100 ( NO2) 10 –27 Ethylamine 100 NOx 100 (NO2) 10 –28 Ethanolamine 100 NOx , Propene 140 NO 140 NO2 – –29 Ethanolamine 100 NOx , Propene 135 NO2 – –30 Ethanolamine 300 NOx , Propene 100 (NO2) – –31 Ethanolamine 100 – – – (NH4)2SO4mixed with H2SO4(aq)32 Ethanolamine 100 H2O2 100 100 –33 Ethanolamine 100 O3 – – –34 NH3 100 NOx , Propene 100 ( NO2) 10 –
Chromatography (PILS-IC), and a differential mobility ana-lyzer (DMA, TSI 3760). During experiment number 20 (Ta-ble 2), chamber particles were collected onto a Teflon (PALLLife Sciences, 47-mm diameter, 1.0-µm pore size) filter foranalysis by mass spectrometry using both Matrix AssistedLaser Desorption Ionization (MALDI) and electrospray ion-ization (ESI) to determine how spectra from these ionizationtechniques compared to the electron impact ionization spec-tra of the cToF-AMS. Details of the extraction and analysismethodology used for the Teflon filter are given in Surratt etal. (2006).
2.1 PILS-IC
The particle-into-liquid sampler coupled with ion chro-matography is a quantitative technique for measuring water-soluble ions, including inorganic, organic acid, and amineions in aerosol particles. The PILS-IC used in this study(Sorooshian et al., 2006) is based on the prototype design(Weber et al., 2001) with key modifications, including in-tegration of a liquid sample fraction collector and real-timecontrol of the steam injection tip temperature. Chamber airis sampled through a 1µm cut-size impactor and a set ofthree denuders (URG and Sunset Laboratories) to remove in-
organic (basic and acidic) and organic gases that would oth-erwise bias aerosol measurements. Sample air mixes withsteam in a condensation chamber where rapid adiabatic mix-ing produces a high water supersaturation. Droplets growsufficiently large to be collected by inertial impaction beforebeing delivered to vials held on a rotating carousel. The con-tents of the vials are subsequently analyzed off-line using adual IC system (ICS-2000 with 25µL sample loop, DionexInc.) for simultaneous anion and cation analysis.
Data for the following ions are reported: acetate, formate,nitrate, sulfate ammonium, methylammonium, dimethylam-monium, trimethylammonium, ethylammonium, diethylam-monium, and triethylammonium. The PILS-IC techniquecannot be used to speciate many of the organic compoundsthat make up the total aerosol mass since these are not suf-ficiently ionic in water to have affinity for the IC columnsused (anion: Dionex AS-11 column 2×250 mm, ASRS Ul-tra II 2-mm suppressor, potassium hydroxide eluent; cation:CS12A column 2×250 mm, CSRS Ultra II 2-mm suppres-sor, methanesulfonic acid eluent); nevertheless, all of theamine salts formed in the experiments reported here weresuccessfully speciated. It should be noted that ammonium,methylammonium, and ethylammonium co-elute; additionalco-eluting pairs are diethylammonium:trimethylammonium
www.atmos-chem-phys.net/7/2313/2007/ Atmos. Chem. Phys., 7, 2313–2337,2007
389

2316 S. M. Murphy et al.: Secondary aerosol from atmospheric aliphatic amines
and potassium:dimethylammonium. While potassium wasnever expected to be present and ammonium formation wasnot anticipated for many of the experiments, background lev-els of these species in the IC baseline noise did interfere withquantification of co-eluting species. The limit of detection(LOD) for each ion (NH+4 , NO−
3 , acetate, formate, and the sixaforementioned amine species) is defined in this study as theair-equivalent concentration of the lowest concentration stan-dard that is distinct from baseline noise in the IC plus threetimes the standard deviation (n=3) of this measurement. TheLOD’s for the ions measured using the PILS-IC technique forthis study are all below 0.1µg m−3, with the exceptions oftrimethylamine and triethylamine, which have LOD’s of 0.60and 0.89µg m−3, respectively. In all experiments, chamberair containing gas-phase amine and nitric acid (when added)was run through a particle filter and sampled by the PILS-IC;none of the amines was ever detected in these filtered vials,confirming that the carbon denuder was able to completelyremove gas-phase species and that the PILS-IC signal is en-tirely a result of aerosol-phase compounds.
2.2 Aerodyne cToF-AMS
The design parameters and capabilities of the cToF-AMS in-strument are described in detail elsewhere (Drewnick et al.,2004a, b). Briefly, chamber air enters the instrument througha 100µm critical orifice at a flowrate of 1.4 cm3 s−1. Parti-cles with a vacuum aerodynamic diameter between roughly50 and 800 nm are efficiently focused by an aerodynamiclens, passed through a 1% chopper, and then impacted ontoa tungsten vaporizer. The chopper can be operated in threemodes: (1) completely blocking the beam to gather back-ground mass spectra; (2) out of the beam’s path to collectensemble average mass spectra over all particles sizes; (3)chopping the beam to create size-resolved mass spectra. Thevaporizer is set at∼550◦C to ensure complete volatilizationof the aerosol. Once vaporized, molecules undergo electronimpact ionization at 70 eV and are orthogonally pulsed every19µs into the time of flight mass analyzer. The resolutionof the mass analyzer is∼800 (M/1M). For all mass spectrashown in this work the ion signal is represented as sticks, theheight of which represent the raw ion signal integrated over1 amu bins. These stick mass spectra are divided into dif-ferent chemical species based on the methodology of Allanet al. (2003), with exceptions noted in the text. The limitsof detection, calculated as three times the standard deviationof the noise for particle filtered air are<0.05µg m−3 for allspecies measured.
2.3 Effective density
Calculating the density of aerosol particles is important fortwo reasons. First, multiplying the aerosol volume measuredby the DMA by the material density allows one to calculateaerosol mass yields. (The cToF-AMS cannot be used to di-
rectly quantify aerosol mass because the fraction of particlesthat bounce off of the vaporizer is unknown and the PILS-IC does not measure the mass of non-ionic species) Second,changes in the density give an indication of alterations in par-ticle morphology during secondary aerosol formation.
The effective density (ρeff) is a function of the vacuumaerodynamic diameter (dva) measured by the cToF-AMS andthe mobility diameter (dm) measured by the DMA (DeCarloet al., 2004),
ρeff =dva
dmρo = ρm
Cc(dve)
δ3χtχvCc(dm)(1)
whereρo is unit density (1 g cm−3), ρm is the material den-sity, Cc is the slip correction factor,dve is the volume equiv-alent diameter,δ is a measure of the internal void space de-fined byδ=(ρm/ρp)1/3 whereρp is the particle density,χt isthe dynamic shape factor in the transition regime, andχv isthe dynamic shape factor in the free molecular regime.
As described in Bahreini et al. (2005) and Decarlo etal. (2004), the effective density is equivalent to the materialdensity if the shape factor and slip correction factor are unityand the internal void fraction is zero. These assumptions areprobably slightly incorrect for amine salts and amine oxida-tion products, given that ammonium nitrate particles have aneffective density 20 percent less than the material density ofammonium nitrate whenρeff is calculated using simultane-ous cToF-AMS and DMA measurements (Jayne et al., 2000).Indeed the effective densities calculated in this way for theaminium nitrates are less than the literature values. Whilethere is no need to use effective densities to calculate themass of pure salts (the PILS-IC is able quantitatively mea-sure these), it is necessary to use effective densities (as anapproximation of the material density) to calculate the massof aerosol formed during photooxidation and ozonolysis be-cause non-ionic species are present.
To calculate the effective density, one represents the DMAvolume distribution, normally expressed as dV/dlog(dm), asdV /dlog(ρeffdm) and adjustsρeff until this distribution (withpeak height normalized to 1) aligns in diameter space withthe mass distribution from the cToF-AMS, dM/dlog(dva)
(peak height also normalized to 1). The two distributionsalign when the correct effective density is used becauseρeffdm=dvaρo (if unity shape and slip correction factors andzero internal void fraction are assumed). Figure 1a showsthe calculated effective density of triethylammonium nitrate(TEAN) is 1.0±0.1 g cm−3 while the effective density of theaerosol formed from photolysis of TEA (mixed TEAN andproducts from TEA oxidation) has a slightly increased effec-tive density of 1.1±0.1 g cm−3.
2.4 Oxidation experiments
Three types of amine oxidation experiments were conductedin this study: (1) Photooxidation in the absence of NOx, (2)
Atmos. Chem. Phys., 7, 2313–2337, 2007 www.atmos-chem-phys.net/7/2313/2007/
390

S. M. Murphy et al.: Secondary aerosol from atmospheric aliphatic amines 2317
Photooxidation in the presence of NOx, and (3) dark ozonol-ysis. Hydrogen peroxide (H2O2) was used as the OH radicalprecursor for all of the NOx-free photooxidation experimentsand many of the high NOx experiments (see Table 2 for de-tails). H2O2 is introduced by bubbling 5 L min−1 of hu-midified room-temperature air for 2.5 h through a 50% H2O2solution (Aldrich), through a particle filter to avoid the in-troduction of droplets, and finally into the chamber. Themixing ratio of H2O2 achieved using this method has beenpreviously estimated to be between 3 and 5 ppm (Kroll et al.,2006). To minimize potential uptake of H2O2 by the aerosol,all experiments were carried out under dry (RH<10%) con-ditions. To determine if the presence of hydrogen peroxidesignificantly affected the particle-phase chemistry, numer-ous high NOx photooxidation experiments were conductedin the absence of H2O2, some with the gas-phase amine andNOx alone, and others where propene was added to gener-ate higher levels of OH in the chamber and increase the rateof oxidation (see Table 2 for details). For all photooxidationstudies, H2O2, NOx, propene, or a combination of these wasinjected first. For many experiments using NOx, this stepwas followed by the injection of nitric acid or, occasionally,ammonium sulfate (see Table 2 for details). After the HNO3or ammonium sulfate had mixed throughout the chamber, theamine was added. When nitric acid is present, formation ofaminium nitrate salt occurs once the amine is injected. Byusing a similar concentration of HNO3 in all experiments,we were able to roughly control the size distribution of theaerosol. Nucleating the aminium nitrate before the start ofoxidation also allowed us to measure the chemistry of puresalt particles in situ with the cToF-AMS and PILS-IC. Pho-tooxidation reactions were initiated by irradiation from theblack lights surrounding the chamber. Ozonolysis experi-ments were conducted in the dark in the absence of an OHscavenger. The order of reactant introduction for ozonolysisexperiments was: nitric acid, amine, and finally ozone. Be-tween experiments, the chamber was continuously flushedwith clean air and irradiated with UV light. Contaminationfrom previous experiments was occasionally observed andhas been accounted for in the analyses.
3 Atmospheric reaction pathways of amines
At the outset, it is useful to frame the results of this study byoutlining a hypothesis for the atmospheric reaction pathwaysof amines. Direct or indirect evidence of most of these path-ways has been observed during the chamber experiments inthis study.
Because amines are one of relatively few basic atmo-spheric compounds, they have the potential to undergo rapidacid-base reactions to form salt particles in the presence ofnitric or sulfuric acid. Formation of salt particles dependson temperature, the identity of the amine, and the concen-trations and identities of acidic species present. Formation
1002 3 4 5 6 7 8 9
1000Dva (nm)
Sig
nal I
nten
sity
(ar
bitr
ary
units
) dM/dlog(dva
) cToF-AMS dV/dlog(d
m ) DMA
dM/dlog(dva
) cToF-AMS dV/dlog(d
m ) DMA
dV/dlog(dm
*ρeff)
Fig. 1. Calculation of the effective density (data from exp. 14,Table 2). Panel (a) Volume distribution from the DMA(dV /dlog(dm), solid red line) and mass distribution from the cToF-AMS (dM/dlog(dva), solid green line) of triethylammonium nitrate(TEAN). The fact that the two distributions are aligned indicatesthe effective density of TEAN is∼1. The slight tailing of the cToF-AMS signal could be caused by slow vaporization or higher uncer-tainty in the size calibration for larger particles. Panel(b) The samedistributions shown in (a) after products from TEA photooxidationhave condensed onto the nitrate salt shown in (a) for 7 h. The parti-cles have grown larger from the condensation process. The dashedred line (dV/dlog(ρeff dm)) is created by adjusting the effective den-sity (ρeff) until the dotted red line aligns with the solid green line(ρeff=1.1 g cm−3).
of aminium salts also depends indirectly on the concentra-tion of ammonia, which will compete with amines for acidicmolecules. Once aminium-salt particles are formed, they canrevolatilize, undergo particle-phase reactions (including ox-idation), or serve as a site for condensation of other organicspecies. Condensation of organics onto the salts particlesmay form a barrier that prevents the salts from remaining atequilibrium with the gas phase.
Gas-phase amines can be oxidized by OH, O3 and pos-sibly NO3 (OH and O3 are known to be competitive oxida-tion agents of amines at atmospherically relevant concentra-tions while the rate of NO3 oxidation remains unexplored).Specifics of the known oxidation pathways will be discussedthoroughly in Sect. 5. Briefly, the products formed depend onthe oxidizing species and the NOx level. Many of the oxida-tion products of amines are themselves basic and can undergoreactions with atmospheric acids to form additional salts.Other oxidation products are sufficiently non-volatile to con-dense directly onto particles without forming salts. Finally,it is possible that certain amines, or their oxidation products,that are too volatile to condense onto dry particles will con-dense into, and ionize within, aqueous aerosols. Once con-densed, amines and their oxidation products may undergoparticle-phase reactions to form high molecular weight com-pounds, or they may be further oxidized into volatile species.
www.atmos-chem-phys.net/7/2313/2007/ Atmos. Chem. Phys., 7, 2313–2337,2007
391

2318 S. M. Murphy et al.: Secondary aerosol from atmospheric aliphatic amines
Table 3.Theoretically calculated dissociation constants for different nitrate systems. KP,298for ammonium nitrate=7.14E–7 Pa2.
KP,298(Pa2)Species 1H◦f from Cottrell and Gill (1951) 1H◦f from NBS (1982)
Methylammonium nitrate 7.90E-06 8.56E-09Dimethylammonium nitrate 1.01E-05 3.95E-09Trimethylammonium nitrate 2.27E+00 5.29E-07Ethylammonium nitrate 3.29E-06 9.56E-07Diethylammonium nitrate 3.11E-10 3.30E-11Triethylammonium nitrate 1.37E-05 1.18E-12
Theremainder of the paper is divided into two main sec-tions. In the first section, we investigate salt aerosol forma-tion from acid-base reactions of amines through both labo-ratory chamber experiments and theoretical estimates. In thesecond section, aerosol formation resulting from photooxida-tion and ozonolysis of amines under varying NOx conditionsis addressed.
4 Salt aerosol formation from acid-base reactions ofamines
4.1 Detection of aminium nitrate salts
As described in the Experimental section, nitrate salts wereformed by adding the amine of interest to a chamber contain-ing gaseous nitric acid (HNO3). In all cases, particle nucle-ation occurred within a few minutes of amine injection. Allof the aminium nitrate salts investigated were detected bythe cToF-AMS, PILS-IC, and DMA instruments. The massspectra for the nitrate salts of the amines studied are shownin Fig. 2. The spectra are similar to reference electron impactspectra in the NIST database for the gas-phase amines exceptfor additional intensity atm/z 30 andm/z 46 caused by NO+
and NO+
2 ion fragments from nitrate (Stein, 2005). The onlyprevious chamber study to focus on aerosol-phase amineswas conducted by Angelino et al. (2001) using a laser des-orption aerosol time of flight mass spectrometer (ATOFMS).In their study, the spectra of dialkyl ammonium salts exhib-ited prominent peaks (M+13)+, attributed to ion-moleculereactions within the ionization region of the instrument. Wedo not observe peaks larger than the molecular ion for any ofthe salts, indicating that ion-molecule reactions do not occurin the ionization region of the Aerodyne cToF-AMS; this ab-sence of ion-molecule reactions dramatically simplifies massspectral interpretation.
Though we did not observe ion-molecule reactions, it isimportant to note that we did observe a dramatic increasein the number of ions detected by the cToF-AMS when thevoltages that extract ions from the electron impact regioninto the flight chamber of the mass spectrometer were al-
tered by a few percent. When the voltages were in this al-tered state, we observed a further increase in both molecularand fragment amine ions with increasing vaporizer temper-ature above 550◦C. No such correlation between increasedvaporizer temperature and ion signal is observed when theextraction voltages are not in the altered state. Because al-tering the extraction voltages allows ions formed on the va-porizer surface to enter the mass spectrometer and becauseamines have low ionization potentials, we believe that theadditional ions are formed on the high temperature tungstensurface of the vaporizer. The artificial signal enhancement(increased ion rate) caused by this proposed surface ioniza-tion indicates that there is a potential for overestimates ofamine concentrations measured by the Aerodyne cToF-AMSif the instrument is not carefully callibrated and tuned. Sim-ilar effects caused by the unusually low ionization energy ofamines may also occur in other aerosol mass spectrometryinstruments. We observed enhancement of up to an order ofmagnitude by changing the voltages in the instrument a fewpercent. Them/z with the most prominent increase in ionrate was that corresponding to the molecular ion of the aminebeing studied. The fact that the molecular ion showed themost dramatic increase further supports the hypothesis thata non-electron impact surface ionization is occurring; 70 eVelectron impact ionization typically induces alpha cleavageof amines and little, non-fragmented, molecular ion signalis observed. It should be noted that we have not observedan increase in detected ions when the extraction voltages areshifted when studying aerosol that does not contain amines.Though not investigated further, these observations raise thepossibility that this type of tuning might be intentionally usedto detect the presence of molecular amine ions.
4.2 Atmospheric formation of aminium nitrate salts: theory
Having confirmed that aminium nitrate salts can be gener-ated and detected, we wish to estimate the potential atmo-spheric importance of aminium nitrate salts relative to am-monium nitrate (typically assumed to be the dominant at-mospheric nitrate salt in the fine mode). Based on theory,we estimate the dissociation constants (Kp=pHNO3 pamine)
Atmos. Chem. Phys., 7, 2313–2337, 2007 www.atmos-chem-phys.net/7/2313/2007/
392

S. M. Murphy et al.: Secondary aerosol from atmospheric aliphatic amines 2319
0.250.200.150.100.050.00
100908070605040302010m/z
0.250.200.150.100.050.00
0.250.200.150.100.050.00
Sig
nal I
nten
sity
Rel
ativ
e to
m/z
30
0.250.200.150.100.050.00
0.250.200.150.100.050.00
Triethylammonium nitrate
Diethylammonium nitrate
Trimethylammonium nitrate
Methylammonium nitrate
Monoethanolammonium nitrate
Fig. 2. Mass spectra for the nitrate salts of the amines studied. On the∼550◦C surface of the vaporizer, all nitrate salts decompose intonitric acid and the parent amine. Signals atm/z 30 and 46 are generated from the nitrate fragments NO+ and NO2
+ and are common toall spectra. Signal atm/z 30 is a combination of signal from NO+ and from amine fragments resulting from rearrangements after electronimpact ionization. For all spectra, molecular ions have significantly less signal intensity than the fragments resulting from the cleavage ofthe chemical group alpha to the nitrogen (alpha cleavage). For the ethyl amines, loss of methyl groups alpha to the nitrogen give fragmentsat [M-15]+ while for the methyl amines, loss of hydrogen atoms alpha to the nitrogen give fragments at [M-1]+.
for the gas-particle equilibrium of all amines studied ex-cept for ethanolamine, while noting that the estimates havelarge uncertainties resulting from discrepancies in the liter-ature values for the heats of formation of the aminium ni-trate salts. If the required thermodynamic parameters areknown, the dissociation constant for a given amine-nitricacid system can be obtained using the integrated form of theVan’t Hoff equation,
ln KP =1S◦
diss− 1CP,diss
R−
1H ◦
diss− T01CP,diss
RT
+1CP,diss
Rln
(T
T0
)(2)
Entropiesof formation for aminium nitrate salts have appar-ently not been reported in the literature; we estimate themusing a molecular dynamics approach described in the Ap-pendix. Also given in the Appendix are literature sources andvalues for the other thermodynamic parameters in Eq. (2).The calculated dissociation constants for all of the aminesstudied (except ethanolamine, for which the entropy was notestimated) are given in Table 3. Even if we assume that theestimated entropies are accurate, the results in Table 3 showthat discrepancies in the literature values for the heats of for-mation lead to significant uncertainty in the calculated disso-ciation constants. While this uncertainty precludes us fromgaining meaningful insight into how MA, DMA, or TEAmight compete with ammonia for HNO3 in the atmosphere,
we are able to draw conclusions about the other salts. Asmentioned earlier, most studies show that ambient ammoniaconcentrations tend to be an order of magnitude greater thanamine concentrations, except perhaps in the immediate vicin-ity of an amine emissions source. Given this, and assumingthat the calculated entropies are reasonable, it is improbablethat nitrate salts of TMA or EA would form in the presenceof typical ambient ammonia levels, because theKp valuesfor these two systems are greater than or equal to that of am-monium nitrate, independent of the precise value of the heatof formation. By contrast, the value of the dissociation con-stant for DEA is 2 to 3 orders of magnitude smaller than thatof ammonium nitrate (independent of the uncertainty in theheat of formation), indicating that formation of DEAN parti-cles under typical atmospheric mixing ratios is possible.
4.3 Atmospheric formation of aminium nitrate salts; exper-imental
We conducted chamber experiments to evaluate and con-strain the theoretical estimate for the dissociation constantof triethylammonium nitrate (TEAN), the highest molecularweight aminium nitrate studied.
The first experiment was carried out to study TEAN for-mation at atmospherically relevant ratios of ammonia:TEA(Fig. 3). Initially, 100 ppb of gas-phase ammonia was mixedin a chamber containing∼5 ppb of nitric acid, leading to
www.atmos-chem-phys.net/7/2313/2007/ Atmos. Chem. Phys., 7, 2313–2337,2007
393

2320 S. M. Murphy et al.: Secondary aerosol from atmospheric aliphatic amines
30
25
20
15
10
5
0
cToF
-AM
S
μg/
m3
00:00 01:00 02:00 03:00 04:00 05:00 06:00 07:00 Elapsed Time (Hours)
10
8
6
4
2
0
PIL
S
μg/
m3
Organic Nitrate Ammonium
NH4+
NO3-
TEA+
EA+
DEA+
Inject 5 ppb TEA Inject 5 ppb TEA
Inject 5 ppb HNO3 Inject 10 ppb
TEAInject 100 ppb NH3
Fig. 3. Time series from exp. 19 in Table 2 of the cToF-AMS (bottom) and the PILS-IC (top) showing rapid particle growth and evaporationafter TEA and nitric acid were added in small aliquots to a chamber containing equilibrated ammonium nitrate particles. The transient spikesin particle loading do not appear in the PILS-IC data because of the relatively long averaging time (5 min) of measurements and because thePILS-IC inlet is not in the path of the highly concentrated injection plume.
nucleation of ammonium nitrate particles. Once the ammo-nium nitrate particle concentration and mass had stabilized,aliquots of TEA were injected into the chamber. As can beseen in Fig. 3, the concentration of TEAN salt, indicatedby simultaneous shifts in the nitrate and organic signals, in-creased dramatically when TEA was added because the in-jection plume provided a high concentration region for parti-cle formation. As the amine mixed throughout the chamberand became more dilute, the equilibrium shifted back to thegas phase, the salt returned to pure ammonium nitrate, andthe organic signal =0. This sequence of events occurred aftereach injection, including a second addition of 5 ppb of nitricacid to the chamber.
After concluding that TEA would be unable to form nitratesalts at ratios of TEA:NH3 typically found in the atmosphere(except possibly near emissions sources), we developed anexperimental technique to estimate the gas-particle equilib-rium constant for TEAN. The procedure consists of addingan equimolar mixture of amine and ammonia to a chambercontaining nitric acid (it is necessary to inject both ammoniaand amine because we are unable to accurately measure gas-phase amine or nitric acid concentrations). Once ammonia,TEA, and nitric acid are injected, the following equilibria areestablished:
KP1 = pHNO3 pNH3 (3)
KP2 = pHNO3 pTEA (4)
wherepHNO3, pNH3, andpTEA are the partial pressures ofnitric acid, ammonia, and triethylamine, andKP1 andKP2
are the dissociation constants for ammonium nitrate and tri-ethylammonium nitrate, respectively. Using the values in Ta-ble A1 in Eq. (2),KP1 for the ammonium nitrate system iscalculated to be 1.916E-7 Pa2 at 293 K. The partial pressuresof NH3 and TEA can be determined by subtracting the mea-sured mass of each species in the aerosol phase from thatwhich was injected, assuming negligible wall loss. ThusKP2andpHNO3 are the two unknown quantities to be determined.Although the PILS-IC can measure the amount of nitrate inthe aerosol phase, this measurement was not used to calculatepHNO3, as nitric acid is subject to significant wall losses.
We report here an experiment in which 50 ppb of TEA and50 ppb of ammonia were added simultaneously to a cham-ber containing 8 ppb of nitric acid. Upon injection of theamine/ammonia mixture, a rapid particle nucleation eventwas detected by the cToF-AMS (similar to those shown inFig. 3). As the plume of ammonia and TEA mixed throughthe chamber, the mass loading of particles detected by thecToF-AMS decreased, and the other particle instruments(PILS-IC and DMA, which are not aligned with the injectionport) began to detect particle loadings consistent with thoseof the cToF-AMS. After all of the instruments gave consis-tent readings and the particle concentration was stable (otherthan a slow decrease from wall loss), the triethylammoniumand ammonium contents of the aerosol-phase were measuredby the PILS-IC, which unambiguously and quantitatively de-tects these two species. The dissociation constant of triethy-lammonium nitrate determined from this experiment, usingEq. (4), is 1.85E-7 Pa2. Although wall losses and slight
Atmos. Chem. Phys., 7, 2313–2337, 2007 www.atmos-chem-phys.net/7/2313/2007/
394

S. M. Murphy et al.: Secondary aerosol from atmospheric aliphatic amines 2321
8
6
4
2
0
µg m
-3
00:00 01:00 02:00 03:00 04:00 05:00 06:00 07:00 08:00 09:00 10:00 11:00 12:00Elapsed Time (Hours)
14
12
10
8
6
µg m
-3
00:00 01:00 02:00 03:00 04:00 05:00 06:00 07:00 08:00 09:00 10:00 11:00 12:00
20
15
10
5
0
µm3 c
m-3 20x10
3
15
10
5
0
Num
ber cm-3
Inject 100 ppb methylamine
Sulfate Ammonium Organic Nitrate
Volume Number
a
b
c
SO42-
Fig. 4. Time Series of data from the DMA Panel(a), PILS-IC Panel(b), and cToF-AMS Panel(c) showing rapid replacement of ammoniumsulfate by methylammonium sulfate during the injection of 100 ppb of methylamine into a chamber containing ammonium sulfate seedand ozone. The increase in the ratio of organic signal to sulfate signal near the end of the experiment results from the slow reaction ofmethylamine with ozone forming a small mass of organic aerosol.
contamination from other amine compounds from previousexperiments influenced this result, the likely effect of theseinfluences is judged to be too small to affect the conclusionthat the dissociation constant for TEAN is close to that ofammonium nitrate. This conclusion is consistent with theprevious experiment and the estimated dissociation constantfalls within the large range of values predicted theoretically.
The two chamber experiments described above confirmthat TEA does not form nitrate salts unless the ammonia con-centration is roughly equivalent to that of TEA or there is alarge excess of nitric acid. Experimental testing of all of theamines was beyond the scope of this study and further stud-ies of this type are warranted, but these initial results indicatethat the calculated dissociation constants, although subject toconsiderable uncertainty, are reasonable.
4.4 Aminium sulfate salts
Amines have the potential to form sulfate salts analogous toammonium sulfate. Although nitrate salts are probably morerelevant in agricultural settings, aminium sulfate salts mayform in the presence of high sulfate concentrations. Fig-ure 4 shows results from the addition of 100 ppb methy-lamine (MA) to pure ammonium sulfate seed in a dry (lessthan 10% RH) chamber (the chamber also contained ozonebecause the experiment was designed for MA ozonolysis).The DMA data show a 3µm3 cm−3 increase in particle vol-ume and new particle formation when methylamine is in-jected. The new particles are formed from the reaction ofmethylamine with residual nitric acid in the chamber.
Intriguingly, the mass of methylammonium (labeled “or-ganic” in Fig. 4) detected by the cToF-AMS is roughly 8times the mass needed to neutralize the nitrate. Addition-ally, the time series from the cToF-AMS also shows a sharpdecrease in the ammonium signal as the methylamine sig-nal increases. The effective density of the particles decreasesslightly (∼0.1±0.1 g cm−3) as the organic signal increases.All of these trends indicate that the methylamine is displac-ing ammonia and forming methylammonium sulfate. Oneoddity is the apparent increase in sulfate observed by thecToF-AMS. The sulfate time series from the PILS-IC showsthat there is no increase in sulfate loading after methylamineis injected (the growth of methylammonium cannot be fol-lowed by the PILS-IC because the IC column used is un-able to distinguish between ammonium and methylammo-nium cations). The increase in sulfate signal from the cToF-AMS can most easily be explained as an artifact, often seenin chamber studies, resulting from an increase in collectionefficiency as the physical properties of the aerosol change(Bahreini et al., 2005; Huffman et al., 2005). We hypoth-esize that replacement of the ammonium cation by methy-lammonium alters the physical characteristics of the particlewhich, in turn, causes fewer particles to bounce from the va-porizer surface, increasing collection efficiency. All of thesignals from the cToF-AMS (sulfate, organic, nitrate and am-monium) have been scaled by a factor that causes the cToF-AMS sulfate mass to match the PILS-IC sulfate mass afterthe increase in collection efficiency. Accordingly, the massesshown for the cToF-AMS before the collection efficiency in-crease are low.
www.atmos-chem-phys.net/7/2313/2007/ Atmos. Chem. Phys., 7, 2313–2337,2007
395

2322 S. M. Murphy et al.: Secondary aerosol from atmospheric aliphatic amines
Though the gas-phase concentration of methylamine inthis experiment is relatively large, a nearly complete con-version from ammonium sulfate to methylammonium sulfatewas observed. The extent of this type of displacement atlower gas-phase amine concentrations, for other amines, andas a function of RH all warrant further study.
5 Aerosol formation from photooxidation and ozonoly-sis of amines
We begin this section by describing common trends observedduring the oxidation experiments of all amines. The follow-ing subsections give the data and details for the oxidation ofindividual amines.
During all of the photooxidation experiments with NOx,we observed aerosol growth resulting from a combinationof aminium nitrate salt formation and condensation of non-volatile oxidized compounds (growth from the dissolutionof water soluble amines was limited by the low,<10%,RH of the chamber). For all of the amines studied, someof the aminium nitrate salt that was initially formed duringphotooxidation partitioned back into the gas-phase as moreof the parent amine was reacted away. The particle-phasesalt repartitions back to the gas phase because the continuedoxidation of the parent amine depletes its concentration inthe gas phase and drives the equilibrium back towards gas-phase amine and nitric acid. For methylamine, ethylamine,ethanolamine, and diethylamine nearly 100 percent of thenitrate salt revolatilized while for trimethylamine and tri-ethlyamine the nitrate salts appeared to be more stable anddid not return completely to the gas phase. All experimentswere carried out until the mass of aerosol was stable, no fur-ther growth or decay other than a slow decay caused by parti-cle loss to the walls. Based on estimates of the OH concentra-tion in our chamber (Kroll et al., 2006) and measured ozoneconcentrations, the cessation of aerosol growth is not causedby a depletion of oxidant. Typically, one defines a mass yieldof secondary organic aerosol (ratio of organic aerosol massto the mass of hydrocarbon reacted), but for the amines themass yield of aerosol depends on the concentration of ni-tric acid in the system. If ample nitric acid is formed duringphotooxidation, nearly all of the amine will form aminiumnitrate salts, while in the absence of nitric acid, nitrate saltsare not formed and the yield reflects the formation of non-volatile compounds from reaction of OH and O3 with theamine. Additional complexity arises because many of theoxidation products of amines are themselves basic and canform salts with nitric acid (e.g. amides and imines can allform salts with HNO3). These factors create a situation inwhich the yield of aerosol is related in a complex manner tothe rate of formation of nitric acid in the system.
If all of the nitrate salts return to the gas phase as theparent amine is reacted away, the final aerosol mass yieldwould be relatively independent of the nitric acid concentra-
tion. Intriguingly, this is not the case for experiments involv-ing TMA or TEA, as the PILS-IC detects significant load-ings of salt at the end of these experiments. As describedin detail later in this section, TMA and TEA are the onlytwo amines that formed significant non-salt organic aerosolduring oxidation. One explanation for the persistence of theaminium nitrate salts in these two systems is that the salt hasbeen “trapped” inside an external layer of oxidized aerosoland is no longer in equilibrium with the gas phase. However,the timescale for diffusion through the organic layers formedin these experiments, which are less than 200 nm thick, issmall and, unless the gas phase amine was completely insol-uble in the organic layer, it is improbable that this layer could“trap” the salt for any significant amount of time. It is possi-ble that mixing of organic material with the salt in the parti-cle phase somehow lowers the volatility of the salt. Anotherpossibility is that gas-phase concentrations of nitric acid aresufficiently high to force the equilibrium towards the parti-cle phase even when the concentration of the parent amine isvery low. Finally, given the large uncertainties in the calcu-lated gas-particle equilibrium constants for the amines, it ispossible that certain amines favor the particle phase even atvery low gas-phase concentrations.
Regardless of the mechanism by which the salts persist,the formation of nitrate salts biases the calculated mass yieldsof the photooxidation experiments to be higher than theywould be as a result of oxidation alone. In an attempt toestimate the purely oxidative yield in the absence of salt for-mation we conducted ozonolysis experiments and photooxi-dation experiments in the absence of NOx. The aerosol massyields for the different amines during photooxidation (withand without NOx) and ozonolysis are given in Table 4. Itis important to note that these yields are derived from ex-periments run under a single set of conditions and are givento show relative differences in the behavior of the differentamines; they are not quantitative yield estimates for the in-dividual amines. Indeed, runs conducted with higher ini-tial concentrations of amine give higher yields because ofthe increased particle-phase organic mass into which organ-ics can condense (Seinfeld and Pankow, 2003). It is evenpossible that the mass of salt formed can affect the yield ifthe condensable organics formed are soluble in the nitratesalts. Because of the exploratory nature of this study andbecause of the complex behavior of amines forming aerosolboth through salt formation and oxidation, we do not attemptto derive yield curves from these data.
The non-salt photooxidation yields given in Table 4 wereobtained using the following method: first, the aerosol vol-ume measured by the DMA was multiplied by the effectivedensity; second, the salt fraction of the aerosol mass was de-termined as (PILS-IC mass)/(DMA volume× effective den-sity). Finally, the wall-loss corrected DMA volume was mul-tiplied by the effective density and then by the fraction ofnon-salt aerosol mass to give the mass of non-salt secondaryorganic aerosol (SOA). The yields were calculated using data
Atmos. Chem. Phys., 7, 2313–2337, 2007 www.atmos-chem-phys.net/7/2313/2007/
396

S. M. Murphy et al.: Secondary aerosol from atmospheric aliphatic amines 2323
Table 4. Estimated percent mass yieldsa of non-salt aerosol during ozonolysis and photooxidation. All yields have an uncertainty of∼25%of their magnitude.
Amine Ozonolysis Yield High NOx Photooxidation Yield Zero NOxPhotooxidation Yield
Trimethylamine 15 23b –Methylamine <1 <1b –Triethylamine 5 8c 12b
Diethylamine <1 <1b <1b
Ethylamine – <1c –Ethanolamine 3 2c –
aAll yields for high NOx and ozonolysis are derived from experiments using 100 ppb initial concentrations of amine (high NOx photooxida-tions were run with 100 ppb of NOx). The zero NOx yields are from experiments using 500 ppb initial amine concentrations. These yieldsare given to demonstrate trends in the aerosol forming potential of the different amines and are not meant to represent definitive yields forthe systems shown.bH2O2 as OH precursor.c Photooxidation without H2O2. Photooxidation of 500 ppb TEA using H2O2 gave a mass yield of non-salt organic aerosol of> 20%.dThe effective densities used for the yield calculations are: TMA Ozonolysis: 1.4; TMA High NOx photox: 1.3; TEA Ozonolysis: 1.2; TEAHigh NOx photox: 1.1; TEA Low NOx photox: 1.1. All effective densities are given in g cm−3 with uncertainties of±0.1 g cm−3.
from the period after aerosol growth and decay appeared tohave ceased other than from loss to the chamber walls. Theseyield results will be discussed in detail later, although it isimmediately evident that while all of the amines can gener-ate aerosol mass by forming nitrate salts, several do not formaerosol mass through oxidation.
Before discussing results from individual photooxidationand ozonolysis experiments, it is useful to consider the gen-eral mechanisms by which OH and ozone oxidize aliphaticamines. The gas-phase chemistry of amine oxidation byOH (in the presence of NOx) and by ozone (without NOx)have been studied (Schade and Crutzen, 1995; Tuazon etal., 1994), and the major products formed by these reactionshave been identified. For many of the oxidation pathways,the products of OH and ozone oxidation are similar, if notidentical. The gas-phase products formed from oxidation ofaliphatic amines by OH in low NOx environments are un-known.
Figure 5a shows the most common oxidation pathways forOH attack of an aliphatic amine in the presence of NOx (An-gelino et al., 2001; Schade and Crutzen, 1995). Abstrac-tion of hydrogen from the secondary carbon is believed tobe the dominant pathway (Finlayson-Pitts and Pitts, 1986).Abstraction of a hydrogen atom bound directly to the nitro-gen in a primary or secondary amine is also possible but isbelieved to play a less significant role (Schade and Crutzen,1995). The gas-phase oxidation products formed are amides,nitramines, and imines. All of the products shown have thepotential to partition to the aerosol phase, although amidesare particularly water soluble and have the lowest vapor pres-sures. An unexpected product, alkylamine-N-oxide, was firstdetected by Angelino et al. (2001) in the aerosol phase andwas again detected in the particle phase during the currentstudy.
Figure 5b shows the pathways for ozone reaction with analiphatic amine. While the loss of an alkyl group from thehigh energy amine oxide generates products distinct fromthose generated by reaction with OH, rearrangement of theamine oxide and subsequent loss of OH leads to alkoxy radi-cals similar to those generated from hydrogen abstraction byOH followed by loss of an oxygen atom to NO. Followingthis branch of the reaction diagram leads to similar, and inmany cases identical, products as those formed by reactionwith OH.
Figure 5c shows the beginning of the reaction pathways foramine oxidation by OH in the absence of NOx. Presumably,a number of the condensable species in this system consist ofhydroperoxides and alkyl peroxides. Many of the same prod-ucts formed in the high NOx and ozone systems are formedif, rather than forming peroxides, RO2 + RO2 and RO2+HO2reactions form alkoxy radicals.
Many of the photooxidation experiments reported hereemployed hydrogen peroxide (H2O2) as an OH source.As detailed in the Experimental section, a relatively largeamount (3–5 ppm) of hydrogen peroxide must be introducedinto the chamber to achieve sufficient levels of OH for rapidreaction. Because the reaction between OH and H2O2 formsHO2 and because hydrogen peroxide itself may affect thechemistry of the aerosol formed, we conducted additionalphotooxidation experiments using mixtures of propene andNOx as well as NOx alone. We found no major differencesin chemistry between the systems with and without H2O2,although the reactions occurred much faster in the presenceof hydrogen peroxide, as expected. All of the ozonolysis re-actions were carried out in the absence of NOx.
www.atmos-chem-phys.net/7/2313/2007/ Atmos. Chem. Phys., 7, 2313–2337,2007
397

2324 S. M. Murphy et al.: Secondary aerosol from atmospheric aliphatic amines
(a)
Fig. 5a. Mechanism of amine oxidation by OH in the presence of NOx (Schade and Crutzen, 1995).
5.1 Experimental protocol
The same procedure was used for all photooxidation andozonolysis experiments. For photooxidation experiments,the first step is the injection of either: H2O2, a H2O2 andNOx mixture, a NOx and propene mixture, or NOx alone.Table 2 gives the oxidant used and NOx mixing ratio foreach photooxidation experiment. For all types of experi-ments, except NOx-free photooxidations, the next step wasto add a small amount (∼10 ppb) of HNO3. Once the HNO3had mixed, the amine was injected at a much higher con-centration than the nitric acid (typically∼100 ppb) causingnucleation of aminium nitrate salt while the vast majority ofthe amine remained in the gas phase. The concentration ofnucleated salt particles was always observed to peak soon af-ter the injection of the amine, followed by a sharp decreasein mass as mixing occurred and gas-particle equilibrium wasestablished.
After the concentration of the nucleated particles becamesteady and sufficient time had elapsed to collect compositiondata with the cToF-AMS and the PILS-IC, oxidation was ini-
tiated. For photooxidation experiments, oxidation was initi-ated by turning on the black lights surrounding the chamber,while for ozonolysis ozone was injected into the chamber.All experiments were continued until there were no furtherchanges in particle mass or volume, except for slow decayin mass and volume caused by particle loss to the chamberwalls.
5.2 Trimethylamine (TMA) photooxidation
Trimethylamine (TMA) is one of the more abundant ambi-ent alkyl amines near animal husbandry operations (Rabaudet al., 2003; Schade and Crutzen, 1995). Figure 6 shows thetime profiles for NOx, O3, particle volume (DMA), ionic par-ticle mass (PILS-IC), and particle mass (cToF-AMS) duringthe photooxidation of TMA. For this experiment (number 3,Table 2), 300 ppb of NO2, 10 ppb of HNO3 and 100 ppb ofTMA were used. As expected, trimethylammonium nitrate(TMAN) salt began to nucleate soon after the injection ofTMA. Approximately 30 min after the TMA injection theaerosol mass stabilized as the system reached gas-particle
Atmos. Chem. Phys., 7, 2313–2337,2007 www.atmos-chem-phys.net/7/2313/2007/
398

S. M. Murphy et al.: Secondary aerosol from atmospheric aliphatic amines 2325
(b)
N
R1
R3R2
N
R1OO
R3R2
peroxy radicalO2
HO 2 , R
O 2
N
R1
R3R2
OH
Peroxides, Alkyl Peroxides
HO
2 , RO
2
N
R1O
R3R2
alkoxy radical
(c)
Fig. 5b+c. Mechanism of amine oxidation by(b) Ozone, in the absence of NOx (Tuazon et al., 1994),(c) OH in the absence of NOx. A ?indicates an unknown oxidation mechanism to form the product shown.
equilibrium. The composition of the TMAN particles wasmeasured for an additional 30 min with the cToF-AMS andthe PILS-IC before the black lights surrounding the chamberwere turned on, initiating photooxidation.
When photooxidation begins, because of the large excessof TMA injected relative to HNO3, much of the nitric acidhas been converted into particle-phase nitrate. Assumingnegligible wall loss,∼90 ppb of TEA remains in the gas
phase at the time the lights are turned on. Upon irradiation,there is a brief spike in NO from the photolysis of NO2; as theTMA is oxidized by OH, RO2 radicals are formed that con-vert the NO back to NO2, and ozone formation begins. NOxgradually decreases throughout the course of the experimentas NO2 is converted to HNO3 by reaction with OH. Particleformation begins within∼10 min of the start of irradiation.
www.atmos-chem-phys.net/7/2313/2007/ Atmos. Chem. Phys., 7, 2313–2337,2007
399

2326 S. M. Murphy et al.: Secondary aerosol from atmospheric aliphatic amines
806040200
μm
3 cm
-3
00:00 01:00 02:00 03:00 04:00 05:00 06:00
Elapsed Time (hours)
3020100
μg
m-3
400300200100
Ozo
ne (
ppb) 100
50
0 N
Ox (ppb)
1.00.80.60.40.20.01.00.80.60.40.20.0 F
ract
ion
of m
axim
um
0.300.200.100.00
NO3-
TMA+
DMA+
MA+
Ozone NO NO2
a
b
c
d
e
sign
al a
t m/z
m/z 30 m/z 46 m/z 58
m/z 29 m/z 31 m/z 44
μg m
-3
Formate (right axis)
Lights On
Fig. 6. Photooxidation of trimethylamine (experiment 3 from Table 2). Panel (a) NOx and ozone concentrations. Panel (b) Particle volumemeasured by the DMA. Panel (c) Growth of ionic species measured by the PILS-IC. Panels (d) and (e) Fragment ions from the cToF-AMS.When injected, the TMA reacts with nitric acid in the chamber to form trimethylammonium nitrate. Upon activation of the black lights,there is an initial burst of particle growth followed by a rapid decay in particle mass and volume. The PILS-IC data show that much ofthe decay is a result of volatilization of the trimethylammonium nitrate salt. The cToF-AMS traces show that whilem/z’s correspondingto trimethylammonium nitrate salt fragments (30 NO+, 46 NO2
+, 58 ((CH3)2NCH2+) rapidly decrease after the peak in growth,m/z’s
corresponding to methylammonium nitrate (31 CH3NH2+) and oxidized fragments (29 HCO+, 44 CO2
+) are level or decrease much moregradually.
Figure 6c-e shows the particle composition as measured bythe cToF-AMS and the PILS-IC instruments. The PILS-ICdata show that at the peak of particle growth, 62µg m−3 ofthe particle mass consists of TMAN salt. The volume mea-sured by the DMA is 78µm3cm−3 at the peak of particlegrowth. Based on a calculated effective density of (1.3±0.2),nearly 80% of the particle mass is composed of the nitratesalt at the peak of particle growth. In addition to the saltpresent at the start of irradiation, additional salt is formedas TMA reacts with nitric acid formed as OH reacts withNO2. After the peak of particle growth, both the mass andvolume of aerosol drop dramatically. The drop in particlemass can be accounted for almost entirely by the volatiliza-tion of TMAN, and after 4.4 h of reaction TMAN salt ac-counts for less than 35% of the particle mass. Volatilizationof TMAN is a direct consequence of the gas-particle equilib-rium of the nitrate salt; as oxidation proceeds and gas-phaseTMA is reacted away (and as nitric acid is lost to the walls ofthe chamber), the equilibrium for the salt shifts back towardsthe gas phase. Figure 6d-e shows time traces of signals fromthe cToF-AMS associated with trimethylammonium (m/z58(CH3)2NCH+
2 ), methylammonium (m/z31 CH3NH+
2 ), ni-trate (m/z30 NO+, m/z 46 NO+
2 ) and oxidized fragments
(m/z 44 CO+
2 , m/z 29 CHO+). The signals associated withtrimethylammonium and nitrate all decrease quickly after thepeak of particle growth while those associated with oxidizedfragments and methylamine are relatively flat (some showslight decreases associated with the slow loss of particles tothe chamber walls). The time trends of these fragments lendsupport to the hypothesis that TMAN salt is repartitioning tothe gas phase while compounds formed from TMA oxidationare condensing.
Over the course of the reaction, both the cToF-AMS andthe PILS-IC detected signals consistent with the presenceof particle-phase methylammonium. Based on the PILS-ICdata, nearly 10% of the particle mass at the peak of aerosolgrowth is methylammonium. The most plausible explanationfor the detection of this species is that imines formed in thegas phase (see Fig. 5a) partition to the particle phase througheither nitrate salt formation or direct condensation. Iminesexposed to liquid water readily decompose into an amineand an aldehyde (Fig. 5a). It is possible that this reactionoccurs in the particle phase, though it is unclear if sufficientparticle-phase water existed to drive this reaction. The exper-iments are carried out at low RH (<10%) but both the TEAand nitric acid were bubbled into the chamber from aqueous
Atmos. Chem. Phys., 7, 2313–2337,2007 www.atmos-chem-phys.net/7/2313/2007/
400

S. M. Murphy et al.: Secondary aerosol from atmospheric aliphatic amines 2327
1.0
0.8
0.6
0.4
0.2
0.0
Rel
ativ
e In
tens
ity
8070605040302010
m/z
1.0
0.8
0.6
0.4
0.2
0.0
8070605040302010
10-5
10-4
10-3
10-2
10-1
20017515012510075
10-5
10-4
10-3
10-2
10-1
20017515012510075
1.0
0.8
0.6
0.4
0.2
0.0
8070605040302010
10-5
10-4
10-3
10-2
10-1
20018016014012010080
m/z 88
m/z 88 m/z 191m/z 145
m/z 104m/z 161
m/z 161
m/z 191m/z 145
m/z 104
m/z 76
m/z 76
m/z 86
m/z 100
m/z 29 m/z 44
m/z 44
m/z 44
m/z 29
m/z 29
Fig. 7. Aerosol mass spectra from the cToF-AMS during different stages of trimethylamine photooxidation (Fig. 6) and ozonolysis (Fig. 8).The top panel shows trimethylammonium nitrate before oxidation while the middle panel is from the end of the photooxidation experiment(8 h elapsed time). The bottom panel shows the spectra from aerosol formed from TMA after∼3 h of ozone exposure. The right and leftpanels show differentm/z ranges of the same spectra. The major peaks shift during the photooxidation from peaks corresponding to thetrimethylammonium nitrate salt to more oxidized peaks (29 HCO+, 44 CO2
+). There is also a significant increase in the fraction of highermolecular weight species.
solutions and the efflorescence behavior of aminium nitrateparticles is unknown (although if their behavior is similar tothat of ammonium nitrate, the particles may retain water atlow RH). Independent of the amount of particle water, be-cause the PILS-IC dissolves collected aerosol particles intowater droplets, the imines would almost certainly react withwater inside of the instrument if this reaction had not al-ready occurred in the chamber. The fact that more methy-lammonium nitrate is detected by the PILS-IC than dimethy-lammonium nitrate further supports the imine reaction path-way because this pathway does not lead to dimethylammo-nium nitrate. The PILS-IC data also show an increase inthe abundance of formate, which is a byproduct of hydrol-ysis of imines. While the cToF-AMS peak atm/z 31 couldbe a fragment from oxidized forms of TMA and not frommethylammonium, it is improbable that this peak is a frag-ment from TMAN itself because it does not follow the sametime profiles asm/z 58 (the dominant peak for TMAN). It isimprobable that this peak is a fragment from TMAN itself be-cause it does not follow the same time profiles asm/z 58 (thedominant peak for TMAN). The small amounts of dimethy-lammonium nitrate detected by the PILS-IC could be formedthrough hydrolysis of amides in the particle phase as shownin Fig. 5a.
Figure 7 shows the spectra from the cToF-AMS duringdifferent stages of the same photooxidation experiment dis-cussed above (experiment 3, Table 2). As in Fig. 6, the grow-ing importance of oxidized fragments relative to trimethy-lammonium nitrate fragments is evident. Of note is the rel-ative prominence ofm/z 88, which is the expected domi-nant peak (resulting from alpha-cleavage) of the carboxylicacid of TMA (shown in the bottom of Fig. 5a). Also ofnote is the increase in abundance of higher molecular weightspecies which could be the result of particle-phase reactionsor multiple oxidations in the gas phase. The gas-phase routeseems somewhat implausible for molecular weights above150 (RO2 + RO2=148 amu for TMA) because formation ofthese high molecular weight compounds would require mul-tiple RO2+RO2 or RO2+HO2 reactions.
5.3 Trimethylamine (TMA) ozonolysis
During the photooxidation of trimethylamine a large amountof ozone is formed, and, based on reported rate constants(Atkinson et al., 1978; Tuazon et al., 1994), ozone andOH reactions with TMA are competitive under these con-ditions. To determine if the products of the ozone reactionform aerosol, we conducted a TMA ozonolysis experiment.
www.atmos-chem-phys.net/7/2313/2007/ Atmos. Chem. Phys., 7, 2313–2337,2007
401

2328 S. M. Murphy et al.: Secondary aerosol from atmospheric aliphatic amines
1210
86420
μg3 m
-3
00:00 01:00 02:00 03:00 04:00 05:00 06:00 Elapsed Time (hours)
30
20
10
0
μm3 cm
-3
0.160.120.080.04
μg3 m
-3
400300200100
ppb
Trimethyammonium Dimethylammonium Methylammonium Nitrate
a
b
c
d
Fig. 8. Ozonolysis of trimethylamine (exp. 4, Table 2). Trimethylamine is injected into a chamber containing 18 ppb of nitric acid at time=0. The salt is allowed to decay away before 400 ppb of ozone is injected over∼1 h. Panel (a) Ozone concentration. Panel (b) DMAvolume showing significant aerosol growth as the TMA is oxidized. Panel (c) Formate concentration measured by the PILS-IC. Panel (d)Ions measured by the PILS-IC, showing that there is little increase in salt concentrations during the ozonolysis.
Figure 8 shows the time series of the DMA, cToF-AMS, andPILS-IC for this experiment. At time =0, 100 ppb of TMAwas added to16 ppb of HNO3 already in the chamber, form-ing trimethylammonium nitrate (TMAN). The TMAN saltremained in the chamber for∼3 h during which time nearlyall of it deposited on the chamber walls or volatilized. Oxida-tion was initiated by adding 200 ppb of ozone to the remain-ing gas-phase TMA in the system (∼85 ppb assuming negli-gible wall loss of gas phase TMA and assuming all of the par-ticulate TMAN was lost to the walls). During the ozonolysis,the vast majority (>90%) of the aerosol formed was non-ionic and accordingly was not detected by the PILS-IC. Af-ter 3 h of ozonolysis, aerosol growth had reached a peak. Atthis point, nitric acid was added (not shown in Fig. 8) to in-duce nitrate salt formation of gas-phase products too volatileto condense. The addition of nitric acid led to 9µm3 cm−3
of aerosol growth, which was predominantly TMAN with asmall contribution from methylammonium nitrate.
Though a large excess of ozone remained after the peakof aerosol growth, the aerosol formed appeared to be sta-ble towards further oxidation and did not rapidly revolatilize.The mass yield of non-salt aerosol (before additional nitricacid was injected) was∼15% (assuming 85 ppb as the start-ing concentration of amine). Interestingly, the yield from theozonolysis is similar to the 23% yield of oxidized (non-salt)SOA formed during photooxidation with NOx.
The bottom panel of Fig. 7 shows a spectrum from thecToF-AMS after three hours of ozone oxidation. The sim-ilarity between this spectrum and that in the middle panelof the figure (after photooxidation) is striking, with the one
obvious difference being that the nitrate fragments (m/z30and 46) are less prominent because nitrate salts represent asmaller fraction of the particulate mass in the ozonolysis ex-periment. The similarity of the spectra indicates that ozonol-ysis generates similar condensable compounds to those fromphotooxidation. It should be noted that OH can be createdduring ozonolyis (see Fig. 5) and some of the compoundsformed in ozonolyis could potentially be formed from aminereaction with OH.
5.4 Methylamine (MA) photooxidation
In addition to being formed through oxidation and hydrolysisof TMA, methylamine (MA) is itself a major emission fromanimal husbandry operations. In the study of Schade andCrutzen (1995) methylamine and trimethylamine were theonly two aliphatic amines detected near animal husbandryoperations. Figure 9 shows the time series for the photoox-idation of methylamine (experiment 6, Table 2) using H2O2as the OH precursor. Nitric acid, in the amount of 10 ppb,was added before methylamine was injected, and NOx wasadded as 100 ppb of NO, instead of as NO2. Injection of themethylamine caused the nucleation of methylammonium ni-trate, which was allowed to equilibrate and mix for approxi-mately two hours before the black lights were turned on 2.5 hafter injection of the amine. When irradiation began, NO wasquickly converted to NO2 through reactions with RO2 andHO2. As NO was removed, ozone formation began, NO2started to convert to HNO3, and aerosol formation began.The aerosol volume shows the same behavior as that during
Atmos. Chem. Phys., 7, 2313–2337, 2007 www.atmos-chem-phys.net/7/2313/2007/
402

S. M. Murphy et al.: Secondary aerosol from atmospheric aliphatic amines 2329
806040200
μg/m
3
01:00 03:30 06:00 08:30 11:00 Elapsed Time (h)
806040200
500400300200100
0O
zone
(pp
b)
80
60
40
20
0N
Ox (ppb)
20151050
μg/m
3
DMA volume
Ozone NO NO2
μm3 /c
m3
a
b
c
d ��� ��
��� ��
PILS trimethylammonium PILS dimethylammonium PILS methylammonium PILS NO3
-
PILS Total Mass
Fig. 9. Methylamine photooxidation (exp. 6, Table 2). Panel (a) Ozone and NOx concentrations. Panel (b) Time series for the DMA volumeshowing rapid decay after the peak of aerosol growth. Panel (c) Time series for the PILS-IC showing that most of the rapid mass decay is dueto vaporization of the methylammonium nitrate salt. Panel (d) Fragment ions from the cToF-AMS. Signal fromm/z 29 which is a mix ofoxidized organic fragments (CHO+) and salt fragments gradually grows more important than signal from from salt alone (m/z46 NO2
+).
the TMA photooxidation, growing to a peak as methylam-monium nitrate is formed then rapidly decaying as gas-phasemethylamine is oxidized. Subtracting the mass of all theionic species detected by the PILS-IC from the aerosol masscalculated by multiplying the DMA volume by the effectivedensity of 1.1±0.2, one finds that nearly 100% of the aerosolformed at the peak of aerosol growth is methylammoniumnitrate. There is a small signal in the PILS-IC from contami-nant TMA which decreases as the experiment progresses. Incontrast to the TMA photooxidation, there is little aerosol re-maining after the rapid decay of the salt;<1µg m−3 of non-salt organic aerosol is present in the system after 4 h of pho-tooxidation relative to more than 20µg m−3remaining for theTMA with similar starting concentrations of amine. Thoughthe mass of non-salt aerosol formed from the photooxida-tion was small, Panel (D) of Fig. 9 shows that the relativeimportance of non-salt organic aerosol increases throughoutthe experiment. Methanimine, one of the most abundant gas-phase products from methylamine photooxidation is knownto polymerize on surfaces and may be a source of the non-ionic aerosol detected (Schade and Crutzen, 1995).
5.5 Methylamine (MA) ozonolysis
Because the vast majority of the aerosol formed duringthe photooxidation of methylamine is methylammonium ni-trate, we performed an ozonolysis experiment to confirm thatmethylamine is unable to generate significant aerosol massthrough oxidative routes. Time series from the ozonolysis
have already been shown, though in the context of sulfate saltformation, in Fig. 4. Ammonium sulfate seed was added tothe methylamine-ozonolysis system to provide a surface forcondensation if the system did not generate enough condens-able products to induce nucleation. Ozone, in the amountof 200 ppb, was added to the chamber along with∼100 ppbof methylamine. As discussed previously, the methylaminereplaced the ammonium from the ammonium sulfate seed,but after this initial phase of growth by displacement, negli-gible further growth was observed, confirming the result ofnegligible non-salt organic mass yield observed during thephotooxidation.
5.6 Triethylamine (TEA) photooxidation
Results from the photooxidation of 500 ppb of triethylaminewith NOx using hydrogen peroxide as an OH precursor areshown in Fig. 10. For all TEA photooxidations, indepen-dent of OH source or starting concentration, rapid decay ofaerosol mass after the peak growth was not observed. Thereason for the observed stability of the salt formed is un-clear. It probably indicates that TEAN has a smaller dis-sociation constant than the other amines studied. It couldalso indicate that there is interaction between the organicmaterial and the salt lowering the volatility of the TEAN.Finally, it could be the result of salt formation by prod-ucts of TEA oxidation. During all TEA photooxidations,diethylammonium and ethylammonium were detected bythe PILS-IC with diethylammonium being formed at higher
www.atmos-chem-phys.net/7/2313/2007/ Atmos. Chem. Phys., 7, 2313–2337,2007
403

2330 S. M. Murphy et al.: Secondary aerosol from atmospheric aliphatic amines
500400300200100
0
μg m
-3
1000800600400200
0
μm3 c
m-3
00:00 01:00 02:00 03:00 04:00 05:00 06:00 07:00 08:00 09:00 10:00Elapsed Time (h)
1.00.80.60.40.20.0
Fra
ctio
n of
Pea
k S
igna
l
500400300200100
0
ppb
2.52.01.51.00.5
μg/m
3
mz 86 mz 132 mz 29 mz 58
Panel CLegend
NO3
-
NH4
+
TEA+
DEA+
EA+
PILS Total MassRight Axis
acetate formate
Ozone NO NO2
a
b
c
d
Fig. 10. Photooxidation of 500 ppb triethylamine (TEA) (exp. 9, Table 2). Irradiation is initiated at t=0. Panel (a) Evolution of ozoneand NOx. Panel (b) DMA volume. Panel (c) Time profile of species detected by the PILS-IC showing that diethylammonium and ethy-lammonium are formed during the photooxidation, with significantly more diethylammonium being formed. Panel (d) Fragments from thecToF-AMS. The most intense fragment of TEA (m/z86 N(CH2CH3)2CH2
+) grows in first followed by the major peak for DEA (m/z58NH(CH2CH3)CH2
+) and oxidized fragments (m/z29 CHO+). Higher molecular weight fragments (m/z132) grow in more slowly.
concentrations in the particle phase than ethylammonium.Based on our knowledge of the gas-phase oxidation reac-tions, it seems most plausible that the diethylammonium isformed by the particle-phase hydrolysis of N,N diethylac-etamide (the amide shown in Fig. 5a if all R groups are ethylgroups. As mentioned earlier, it is possible that hydrolysisof the amide occurs in the PILS-IC instrument itself ratherthan in the chamber.) The detection of acetate by the PILS-IC during the experiment is consistent with the proposedmechanism of diethylammonium formation from hydrolysisof N,N diethylacetamide . The ethylammonium detected bythe PILS-IC could be formed in two ways. First, it could re-sult from aqueous reaction of the imine as shown in Fig. 5a(if all R groups being ethyl). Second, it could be the resultof two successive amide hydrolysis reactions. The detectionof higher levels of diethylammonium than ethylammoniumcontrasts with the results from the oxidation of trimethy-lamine for which higher levels of methylamine were detectedthan for dimethylamine. This difference suggests that moreaerosol is formed through the imine route for trimethylaminewhereas more aerosol is formed through the amide route fortriethylamine.
During one photooxidation of TEA (experiment 20), a fil-ter of the aerosol was collected and analyzed by LC/MS withelectrospray ionization. All of the mass spectral peaks ob-served using LC/MS were consistent with the nitrate salt and
oxidation products already discussed, except for a peak atm/z 118 detected in the positive mode. Peaks detected inthe positive mode from electrospray ionization are typically[M+H] + ions, making the molecular weight of the speciesdetected 117 amu. This molecular weight is consistent withtriethylamine-N-oxide (shown in Figs. 5a and b with R=ethylgroup), a species that was previously detected by Angelinoet al. (2001). There is not a significant peak in the spectrumfrom the cToF-AMS atm/z 117 (orm/z 116 which wouldbe the expected largest fragment ion peak resulting from thealpha cleavage of a hydrogen from triethylamine-N-oxide);this is not particularly surprising because a high energy ox-ide of this type would be expected to fragment under electronimpact ionization if it had not already thermally fragmentedon the vaporizer. The extracted ion chromatogram (EIC) ofm/z 118 from the LC/MS system gives three distinct peakswith retention times of 1.38, 2.00, and 2.30 min, indicatingthe presence of three distinct isomers of this species. Thestructures of these isomers remain unknown.
5.7 Triethylamine (TEA) ozonolysis
Ozonolysis of TEA was conducted using the same proce-dure as for the ozonolysis of TMA and MA. First, nucle-ation of triethylammonium nitrate (TEAN) was initiated byadding 100 ppb of TEA to a chamber containing 8 ppb of ni-tric acid. After allowing the TEAN to equilibrate for 2 h,
Atmos. Chem. Phys., 7, 2313–2337,2007 www.atmos-chem-phys.net/7/2313/2007/
404

S. M. Murphy et al.: Secondary aerosol from atmospheric aliphatic amines 2331
400
300
200
100
0
ppb
02:00 03:00 04:00 05:00 06:00 07:00 08:00Elapsed Time (hours)
28
24
20
16
μm3
cm-3
15
10
5
μg m
-3
10
8
6
4
2
0
μg m
-3
6050403020
mz 46 mz 86 mz 58
TEA+
DEA+
EA+
NO3-
mz 44 mz 43 mz 29
a
b
c
d
Fig. 11. Ozonolysis of triethylamine (TEA) (exp. 16, Table 2). At t=0 (not shown)100 ppb of TEA is injected into a chamber containing8 ppb of nitric acid, nucleating triethylammonium nitrate (TEAN) particles, which are still present when ozone is injected at t=2 h 12 min.After growth of secondary aerosol formed through ozonolysis had ceased, an additional 8 ppb of nitric acid was injected at 5 h 31 min.Panel (a) Time series of ozone mixing ratio Panel (b) Aerosol volume as measured by the DMA (the time axis is coincident with all of theother panels, two y-axes have been used to show more precisely the growth resulting from ozonolysis). Panel (c) Ionic species measuredby the PILS-IC showing an increase in DEA throughout the reaction and condensation of EA when additional HNO3 is added Panel (d)Ion fragments detected by the cToF-AMS:m/z 46 NO2
+, m/z 86 N(CH2CH3)2CH2+ (largest peak from triethylammonium),m/z 58
NH(CH2CH3)CH2+ (largest peak from Diethylammonium),m/z 44 CO2
+, m/z 43 C2H3O+, m/z 29 CHO+.
350 ppb of ozone was slowly added to the chamber causingfurther aerosol growth that peaked, after∼3 h of ozone expo-sure, at a maximum of 15µm3 cm−3, or∼18µg3 m−3 (effec-tive density=1.2±0.2) of additional growth. The mass yieldfrom ozonolysis is 5%.
During ozonolysis, diethylammonium and ethylammo-nium were formed as they were during photooxidation, butthere was no corresponding growth in the nitrate signal (ei-ther on the cToF-AMS or the PILS-IC) indicating that thesecompounds condensed in the particle phase in a form otherthan nitrate salts. At the peak of aerosol growth (3 h of ox-idation), diethylammonium constituted 23% of the aerosolmass formed after ozone injection and ethylammonium ac-counted for 3% of the mass from ozonolysis. After theaerosol growth had peaked, an additional 8 ppb of nitric acidwas added causing a further 30µg m−3 of aerosol growth.The aerosol generated by this second addition of nitric acidwas a mix of diethylammonium (8.7µg m−3), ethylammo-nium (4.5µg m−3), triethylammonium (0.5µg m−3), and ni-trate (14.5µg m−3). The near perfect ion balance betweenthe positive amine ions and the negative nitrate ions (3%negative charge imbalance) substantiates that all of the ad-ditional growth was in the form of nitrate salts. The negli-gible increase in triethylammonium mass during the second
addition of nitric acid indicates that nearly all of the start-ing TEA had been oxidized. The final aerosol, composed ofnitrate salts and oxidized SOA, did not rapidly decay. ThePILS-IC data showed that nitrate decayed 7 percent fasterthan ethylammonium and 14 percent faster than diethylam-monium further supporting the idea that these species are notentirely nitrate salts and that nitrate salts decay more rapidlythan SOA formed through oxidation.
5.8 Diethylamine (DEA) photooxidation
Figure 12 shows the photooxidation of 100 ppb of diethy-lamine, conducted in the same manner as the previously dis-cussed photooxidations using hydrogen peroxide as an OHprecursor. Diethylammonium nitrate nucleates upon injec-tion of DEA followed by a burst of aerosol mass when thelights are turned on that quickly decays away. The rapiddecay is similar to the behavior of TMA and MA duringphotooxidation, with DEA being more similar to MA in thatnearly all of the aerosol formed is nitrate salt. Experimentsusing different OH sources also yielded negligible non-saltaerosol. This is an intriguing result, because by molecularweight alone, DEA would be predicted to form more sec-ondary organic aerosol when oxidized than TMA. Clearly,in this case, the chemical nature of the compound is more
www.atmos-chem-phys.net/7/2313/2007/ Atmos. Chem. Phys., 7, 2313–2337,2007
405

2332 S. M. Murphy et al.: Secondary aerosol from atmospheric aliphatic amines
120
80
40
0
μm3 c
m-3
00:00 02:00 04:00 06:00 08:00 10:00 12:00 14:00 16:00 Elapsed Time (Hours)
1.00.80.60.40.20.0
Rel
ativ
e In
tens
ity
90858075706560555045403530252015105
1.00.80.60.40.20.0
90858075706560555045403530252015105
1.00.80.60.40.20.0
90858075706560555045403530252015105
a
b
cm/z 44
m/z 44
m/z 44m/z 58
m/z 58
m/z 58
a b
c
Lights On
Fig. 12. Photooxidation of diethlyamine (exp. 22, Table 2). The volume trace from the DMA (bottom panel) shows that the aerosol formeddecays quickly back to the volume present before the irradiation. The prominent peaks in the cToF-AMS spectra (Panels a–c) show littlechange throughout the course of the experiment, except for a slight increase in the relative intensity of oxidized peaks atm/z 44 (CO2
+)andm/z43 (C2H3O+). There was also little change in the highm/z spectra indicating negligible growth of high molecular weight species.
important than molecular weight alone. Though the specificreactions that lead to the difference in yield between TEAand DEA remain unclear, Fig. 5 shows that there are severalcompounds that can be formed by tertiary amines through theloss of one of the alkyl groups, a reaction pathway that is notavailable for secondary or primary amines. Though believedto be a minor channel, OH can also extract a hydrogen atomdirectly from the nitrogen of primary and secondary amines;it is possible that this reaction pathway leads to more volatilecompounds. Because photooxidation yielded no non-salt or-ganic aerosol, an ozonolysis experiment was not conductedfor DEA.
5.9 Ethylamine (EA) photooxidation
One photooxidation of ethylamine was conducted andyielded negligible non-salt aerosol mass. Though there wascontamination from a previous DEA experiment, it is doubt-ful that this affected the amount of organic aerosol formed.Ethylamine ozonolysis was not pursued because of the neg-ligible non-salt yield during photooxidation.
5.10 Ethanolamine (MEA) photooxidation and ozonolysis
Figure 13 shows the photooxidation of ethanolamine.Aerosol growth follows the same pattern as for the otheramines with the majority of the initial growth being com-posed of nitrate salts that repartition back to the gas phaseas the amine reacts away. Non-salt organic aerosol forms
(∼2% mass yield), but the yield is small as it is for the othernon-tertiary amines studied. The cToF-AMS data show thatoxidized fragments (m/z 44, CO+
2 ) grow in more graduallyand decay less than fragments associated with ethanolammo-nium nitrate (m/z46 NO+
2 and m/z 30 NO+and the ma-jor ion fragment from ethanolammonium itself). The PILS-IC shows growth of diethylammonium though this is prob-ably a result of contamination because it is unclear howethanolamine could react to form diethylammonium. Theyield from ozonolysis of ethanolamine was small (∼3%), asexpected from the small yield observed during photooxida-tion.
5.11 Photooxidation in the absence of NOx
NOx-free photooxidation experiments were conducted forboth TEA and DEA. In both cases, negligible mass fromnitrate salts was detected by the PILS-IC. Following thetrends of the high NOx photooxidation and ozonolysis re-sults, 500 ppb of TEA formed 260µg m−3 of aerosol (massyield of ∼12%) while 500 ppb DEA formed less than 2µgm−3 (mass yield of∼0.1%). The cToF-AMS mass spec-trum from the NOx-free photooxidation of TEA is shown inFig. 14. No dramatic changes in the mass spectrum occurduring the course of the experiment.
Atmos. Chem. Phys., 7, 2313–2337, 2007 www.atmos-chem-phys.net/7/2313/2007/
406

S. M. Murphy et al.: Secondary aerosol from atmospheric aliphatic amines 2333
60
40
20
0
μg3 m
-3
00:00 01:00 02:00 03:00 04:00 05:00 06:00 07:00 08:00 09:00 Elapsed Time (hours)
806040200
μm3 cm
-3
1.00.80.60.40.20.0F
ract
ion
of P
eak
250200150100500
ppb
�� 46 �� 30 �� 44
PILS Total Mass
ethanolammonium triethylammoniumdiethylammoniumNitrate
Ozone NO NO2
Inte
nsity
a
b
c
d
Fig. 13. Photooxidation of 100 ppb of ethanolamine (MEA) (exp. 29, Table 2). Ethanolamine is injected at t=0 forming ethanolammoniumnitrate. Panel (a) Evolution of ozone and NOx mixing ratios. Panel (b) DMA volume. Panel (c) PILS-IC data. Panel (d) Fragments from thecToF-AMS. Oxidized fragment ions (m/z44 CO2
+) grow in slowly and decay less quickly than nitrate fragment ions (m/z46 NO2+ and
m/z 30 NO+) or ethanolammonium fragment ions (m/z30 is the base peak for ethanolammonium in the cToF-AMS).
1.00.80.60.40.20.0
10080604020m/z
1.00.80.60.40.20.0
10080604020
1.00.80.60.40.20.0
Rel
ativ
e In
tens
ity
10080604020
1.00.80.60.40.20.0
10080604020
1.00.80.60.40.20.0
10080604020
10-6
10-4
10-2
250225200175150125100
10-6
10-4
10-2
250225200175150125100
10-6
10-4
10-2
250225200175150125100
10-6
10-4
10-2
250225200175150125100
10-6
10-4
10-2 250225200175150125100
Nitrate Salt
PhotooxidationH2O2 without NOx
PhotooxidationH2O2 with NOx
PhotooxidationNOx without H2O2
Ozonolysiswithout NOx
Fig. 14. cToF-AMS spectra (normalized to the largest peak) of aerosol generated from TEA oxidation under various conditions. In all cases,except for hydrogen peroxide without NOx, the nitrate salt was intentionally formed by mixing TEA with nitric acid in the chamber beforethe start of oxidation. All spectra were collected after the peak of aerosol growth had been reached.
www.atmos-chem-phys.net/7/2313/2007/ Atmos. Chem. Phys., 7, 2313–2337,2007
407

2334 S. M. Murphy et al.: Secondary aerosol from atmospheric aliphatic amines
5.12 Effect of oxidation conditions on particle chemistry
Figure 14 shows cToF-AMS spectra from particles formedby oxidation of TEA using four different systems: (1) pho-tooxidation with NOx alone, (2) photooxidation with NOxusing H2O2 as an OH precursor, (3) ozonolysis in the ab-sence of NOx, and (4) photooxidation in the absence ofNOx using H2O2 as an OH precursor. Because the cToF-AMS uses electron impact ionization, differences in the peakheight ratios can be used to assess chemical similarity be-tween the systems even though the spectra are highly frag-mented. Aerosol formed in the two different photooxida-tion systems containing NOx have similar spectra with largepeaks corresponding to fragments from the nitrate salt mixedwith oxidized fragments (m/z29 HCO+, m/z 44 COO+,m/z 43 C2H3O+, etc.). The spectrum of aerosol generatedby photooxidation (using hydrogen peroxide as an OH pre-cursor) in the absence of NOx is the most distinct from allother spectra, with dramatically different peak height ratios(m/z 43 is the most intense signal) and more high molecularweight fragments than the other systems. The ozone spec-trum shows characteristics of both the high and low NOxspectra including a relatively large, yet not dominant,m/z
43 peak.
The spectra from different oxidation systems show that inaddition to affecting how much nitrate salt is formed, oxi-dant (OH, O3) and NOx levels also affect the chemical com-position of the oxidized aerosol. At the same time, the sim-ilarities between the spectra from high NOx photooxidationsystems with and without H2O2 indicate that similar speciescondense independent of the OH source. All of the aminesstudied formed aerosol with similar spectra during photooxi-dation whether or not hydrogen peroxide was used as an OHprecursor.
5.13 Effective density shifts
During the photooxidations of TEA and TMA the effectivedensity of the aerosol continually increased as non-salt or-ganic mass condensed. Figure 1 shows the increase observedduring the photooxidation of TEA. The effective density ofthe aerosol formed during ozonolysis was higher than that ofthe salt for both TEA and TMA. Additionally, TEA formedaerosol with a higher effective density than TEAN when pho-tooxidized in the absence of NOx. The increases in effec-tive densities observed in particles with a higher fraction ofnon-salt mass indicates that either: (1) the non-salt aerosolis more dense; or (2) the salt aerosol is either non-sphericalor has void volumes, and the condensation of organic aerosolonto the salt alters these physical characteristics. In eithercase, it is evident that the physical morphology of the parti-cles depends on the ratio of non-salt to salt mass.
6 Implications
Amines can undergo similar acid-base reactions as ammoniato form atmospheric nitrate and sulfate salts when in the pres-ence of HNO3 or H2SO4. Whether amines, in fact, will formsuch aminium salts depends not only on the concentrationof the amine and the acid, but also on the concentration ofammonia which competes for acidic molecules. Thermody-namic calculations using entropies estimated from quantummechanics and molecular dynamics indicate that diethylam-monium nitrate will be able to form when ammonia mixingratios are greater than those of diethylamine. Triethylaminewas shown experimentally to have a dissociation equilibriumconstant similar to that of ammonia. Ethylammonium nitrateand trimethylammonium nitrate are predicted to be unable toform unless their mixing ratios are near to or greater than thatof ammonia. We note that thermodynamic parameters for theaminium salts have large uncertainties that preclude us frommaking conclusions regarding the formation, in the presenceof ammonia, of the other aminium salts studied.
Gas-phase amines are subject to atmospheric oxidationby the OH radical and ozone, leading to secondary organicaerosol formation. If nitric or sulfuric acid is present duringthe oxidation, aminium salts of the parent amine can formsimultaneously with the SOA resulting from oxidation. Theproducts of amine oxidation can also be basic and form ad-ditional aminium salts. Aminium salts will most often formin source-rich areas. As the parent amine is reacted awayor as the air mass undergoes dilution, aminium salts can beexpected to repartition back to the gas phase. SOA result-ing from amine oxidation appears to be more stable in theparticle phase than the aminium salts.
Table 4 gives the non-salt organic aerosol yields for allof the amines studied under a number of different oxida-tive conditions. While the yields shown are only applicableto the amine:oxidant and oxidant:NOx ratios of the partic-ular experiments, we can draw the general conclusion thatthe tertiary amines (TMA and TEA) are able to form signifi-cant yields of non-salt SOA while the primary and secondaryamines studied are not. Ethanolamine showed a small growthduring ozonolysis which may be an indication that addingfunctional groups to the amines increases their organic (non-salt) aerosol yield.
Appendix A
Thermodynamic data for amine systems
Table A1 lists available thermodynamic data for commonamine systems. Multiple heats of formation values of alky-lammonium nitrates are listed to highlight their uncertainty.Data on entropy and heat capacities for alkylammonium ni-trates, with the exception of ammonium nitrate, do not appearto be available.
Atmos. Chem. Phys., 7, 2313–2337, 2007 www.atmos-chem-phys.net/7/2313/2007/
408

S. M. Murphy et al.: Secondary aerosol from atmospheric aliphatic amines 2335
Table A1. Thermodynamic data for various amine nitrate systems. Amines and nitric acid are in the gas phase and nitrates are solid.
Substance 1H ◦f
(kJ/mol) S◦(J/molK) CP (J/mol K)
ammonia –45.90d 192.77e 35.65d
methylamine –23.0f 243g 53g
dimethylamine –18.5f 273g 70.8g
trimethylamine –23.7f 287g 91.8g
ethylamine –47.5f 285g 72.7g
diethylamine –72.6f 352g 115.7g
triethylamine –92.4f 405g 160.9g
ethanolamine –210.2j 321j 85.3j
ammonium nitrate –365.61a 146.44b | 141.56* 140c
methylammonium nitrate –337h | –354.4k 194.7*dimethylammonium nitrate –331h | –350.2k 229.9*trimethylammonium nitrate –306h | –343.9k 243.5*ethylammonium nitrate –364h | –366.9k 237.2* 206i
diethylammonium nitrate –413h | –418.8k 299.9*triethylammonium nitrate –407h | –447.7k 350.3*ethanolammonium nitrate –576h
| –577k
nitric acid –134.31d 266.39d 53.31d
*values estimated from quantum mechanics/molecular dynamicsaCox et al. (1979),bEichenauer and Liebscher (1965),cWagman et al. (1968),dChase et al. (1998),eHaar (1968),fSchmitz et al. (2001),gPerry et al. (1997),hCottrell and Gill (1951),iAllen et al. (1985),jYaws (2003),kWagman et al. (1982)
One approach is to extract the entropy information fromatomistic classical and quantum simulation. Lin et al. (2003)developed a 2-phase thermodynamic approach for calculat-ing the thermodynamic properties of complex systems fromsingle molecular dynamics simulation trajectories. In generalthe Fourier transform of the velocity autocorrelation func-tion, obtained from a molecular dynamics trajectory is usedto obtain the vibrational density of states, which is then usedto calculate the thermodynamic properties by applying quan-tum statistics assuming each vibrational mode is a harmonicoscillator. This approach is quite accurate for solids, butleads to significant errors for liquids. Lin et al. (2003) ex-tend this approach to fluids by applying the 2-phase modelin which the density of states of the fluid systems are par-titioned into gas and solid like components. However, foraminium nitrates that are solids in ambient conditions, theharmonic approximation is sufficiently accurate for entropyestimation.
Of the alkylammonium nitrates, crystal structures wereonly found for ammonium nitrate (Herrmann et al., 1994)and methylammonium nitrate (Mylrajan et al., 1985). Forthe compounds with experimental crystal structures, the pe-riodic quantum mechanical (QM) Mulliken charge distribu-tion were determined by the SeqQuest program (Feibelman,1987; Verdozzi et al., 2002). For the compounds lackingexperimental crystal structure, the solid structures were es-
timated by modifying the methylammonium nitrate crystal.For instance, methyl groups were replaced by ethyl groupsin order to create the ethylammonium nitrate crystal struc-ture. The QM charges were obtained using Density Func-tional Theory (DFT), B3LYP (Becke, 1993) functions asimplemented in the Jaguar program (Jaguar, 2005) usingbasis sets aug-cc-pvtz (Kendall et al., 1992). Solid struc-tures were built using this method for di and trimethylam-monium nitrate, mono, di and triethylammonium nitrate inCERIUS2 (Cerius2, 1999). Molecular dynamic (MD) simu-lation at constant pressure, temperature and number of par-ticles (NPT) were performed to equilibrate these solid struc-tures. NVT simulations were then carried out for these ex-perimental crystals or equilibrated solids for a total of 50 ps.Long-range interactions are included using the Ewald summethod and the Nose-Hoover thermostat. Using the MD tra-jectories, the density of states can be obtained, and the en-tropies can then be determined from quantum statistics (Linet al., 2003).
The QM entropy is expected to be quite accurate forcrystalline systems. Indeed, the QM entropy agrees ratherwell with the experimental values for ammonium nitrate(141.56 J/molK vs. 146.44 J/molK). Unfortunately, experi-mental entropy is available only for ammonium nitrate sofurther comparison cannot be done. Since crystal structurewas also available for methylammonium nitrate, we expect
www.atmos-chem-phys.net/7/2313/2007/ Atmos. Chem. Phys., 7, 2313–2337,2007
409

2336 S. M. Murphy et al.: Secondary aerosol from atmospheric aliphatic amines
its QM entropy to be reasonably accurate. For other aminiumnitrates, the accuracy of the calculated entropies remains un-determined although we observed a sensible correlation be-tween the “flexibility” of the alkyl groups and the entropies.
Acknowledgements.This work was supported by the ElectricPower Research Institute.
Edited by: A. Laaksonen
References
Allan, J. D, Jimenez, J. L, Williams, P. I, Alfarra, M. R, Bower, K.N, Jayne, J. T, Coe, H., and Worsnop, D. R: Quantitative sam-pling using an Aerodyne aerosol mass spectrometer: 1. Tech-niques of data interpretation and error analysis, J. Geophys. Res.,108(D3), 4090, doi:10.1029/2002JD002358, 2003.
Allen, M., Evans, D. F., and Lumry, R.: Thermodynamic proper-ties of the ethylammonium nitrate + water-system – partial molarvolumes, heat-capacities, and expansivities, J. Solution. Chem.,14(8), 549–560, 1985.
Angelino, S., Suess, D. T., and Prather, K. A.: Formation of aerosolparticles from reactions of secondary and tertiary alkylamines:Characterization by aerosol time-of-flight mass spectrometry,Environ. Sci. Technol., 35(15), 3130–3138, 2001.
Atkinson, R., Perry, R. A., and Pitts, J. N.: Rate constants for reac-tions of OH radical with (CH3)2NH, (CH3)3N, and C2H5NH2over temperature range 298–426 degrees K, J. Chem. Phys.,68(4), 1850–1853, 1978.
Bahreini, R., Keywood, M. D., Ng, N. L., Varutbangkul, V., Gao, S.,Flagan, R. C., Seinfeld, J. H., Worsnop, D. R., and Jimenez, J. L.:Measurements of secondary organic aerosol from oxidation ofcycloalkenes, terpenes, and m-xylene using an Aerodyne aerosolmass spectrometer, Environ. Sci. Technol., 39(15), 5674–5688,2005.
Becke, A. D.: Density-functional thermochemistry III. The role ofexact exchange, J. Chem. Phys., 98(7), 5648–5652, 1993.
Beddows, D. C. S., Donovan, R. J., Harrison, R. M., Heal, M. R.,Kinnersley, R. P., King, M. D., Nicholson, D. H., and Thompson,K. C.: Correlations in the chemical composition of rural back-ground atmospheric aerosol in the UK determined in real timeusing time-of-flight mass spectrometry, J. Environ. Monit., 6(2),124–133, 2004.
Cerius2, v. 4.0, Accelrys, San Diego, CA, 1999.Chase, M. W.: NIST-JANAF themochemical tables, fourth edition,
J. Phys. Chem. Ref. Data, Monograph 9, 1343–1290, 1998.Cocker, D. R., Flagan, R. C., and Seinfeld, J. H.: State-of-the-art
chamber facility for studying atmospheric aerosol chemistry, En-viron. Sci. Technol., 35(12), 2594–2601, 2001.
Cottrell, T. L. and Gill, J. E.: The preparation and heats of com-bustion of some amine nitrates, J. Chem. Soc., (Jul), 1798–1800,1951.
Cox, J. D., Harrop, D., and Head, A. J.: Standard enthalpy of forma-tion of ammonium-nitrate and of the nitrate ion, J. Chem. Ther-modyn., 11(8), 811–814, 1979.
DeCarlo, P. F., Slowik, J. G., Worsnop, D. R., Davidovits, P., andJimenez, J. L.: Particle morphology and density characterizationby combined mobility and aerodynamic diameter measurements.Part 1: Theory, Aerosol Sci. Technol., 38(12), 1185–1205, 2004.
Drewnick, F., Jayne, J. T., Canagaratna, M., Worsnop, D. R., andDemerjian, K. L.: Measurement of ambient aerosol compositionduring the PMTACS-NY 2001 using an aerosol mass spectrome-ter. Part II: Chemically speciated mass distributions, Aerosol Sci.Technol., 38, 104–117, 2004a.
Drewnick, F., Schwab, J. J., Jayne, J. T., Canagaratna, M., Worsnop,D. R., and Demerjian, K. L.: Measurement of ambient aerosolcomposition during the PMTACS-NY 2001 using an aerosolmass spectrometer. Part I: Mass concentrations, Aerosol Sci.Technol., 38, 92–103, 2004b.
Eichenau,W. and Liebsche, D.: Die molwarme des ammonium-nitrats zwischen 11 und 280 degrees K, Zeitschrift fur Natur-forschung Part a-Astrophysik Physik und Physikalische Chemie,A 20(1), 160, 1965.
Feibelman,P. J.: Force and total-energy calculations for a spatiallycompact adsorbate on an extended, metallic crystal surface, Phys.Rev. B, 35(6), 2626–2646, 1987.
Finlayson-Pitts,B. J. and Pitts, J. N. J.: Atmospheric chemistry :Fundamentals and experimental techniques, Wiley, New York,1986.
Haar, L.: Thermodynamic properties of ammonia as an ideal gas, J.Res. Nbs. A. Phys. Ch., A 72(2), 207, 1968.
Hamoir, J., Nemmar, A., Halloy, D., Wirth, D., Vincke, G., Vander-plasschen, A., Nemery, B., and Gustin, P.: Effect of polystyreneparticles on lung microvascular permeability in isolated perfusedrabbit lungs: Role of size and surface properties, Toxicol. Appl.Pharmacol., 190(3), 278–285, 2003.
Herrmann,M., Engel, W., Schneider, J., and Goebel, H.: Rietveldrefinement of the phase of NH4NO3 measured in-situ underdifferent diffraction geometries, Materials Science Forum, 166,489–494, 1994.
Huffman, J. A., Jayne, J. T., Drewnick, F., Aiken, A. C., Onasch, T.,Worsnop, D. R., and Jimenez, J. L.: Design, modeling, optimiza-tion, and experimental tests of a particle beam width probe forthe Aerodyne aerosol mass spectrometer, Aerosol Sci. Technol.,39(12), 1143–1163, 2005.
Jaguar, v. 6.5, Schrodinger, LLC, New York, NY, 2005.Jayne,J. T., Leard, D. C., Zhang, X. F., Davidovits, P., Smith, K.
A., Kolb, C. E., and Worsnop, D. R.: Development of an aerosolmass spectrometer for size and composition analysis of submi-cron particles, Aerosol Sci. Technol., 33(1–2), 49–70, 2000.
Kendall, R. A., Dunning Jr., T. H., and Harrison, R. J.: Electronaffinities of the first-row atom revisited. Systematic basis sets andwave functions, J. Chem. Phys., 96(9), 6796–6806, 1992.
Keywood, M. D., Varutbangkul, V., Bahreini, R., Flagan, R. C.,and Seinfeld, J. H.: Secondary organic aerosol formation fromthe ozonolysis of cycloalkenes and related compounds, Environ.Sci. Technol., 38(15), 4157–4164, 2004.
Kroll, J. H., Ng, N. L., Murphy, S. M., Flagan, R. C., and Sein-feld, J. H.: Secondary organic aerosol formation from isoprenephotooxidation, Environ. Sci. Technol., 40(6), 1869–1877, 2006.
Lin, S.-T., Blanco, M., and Goddard III, W. A.: The two-phase model for calculating thermodynamic properties of liquidsfrom molecular dynamics: Validation for the phase diagram ofLennard-Jones fluids, J. Chem. Phys., 119(22), 11 792–11 805,2003.
Mace, K. A., Artaxo, P., and Duce, R. A.: Water-soluble or-ganic nitrogen in Amazon basin aerosols during the dry (biomassburning) and wet seasons, J. Geophys. Res., 108(D16), 4512,
Atmos. Chem. Phys., 7, 2313–2337, 2007 www.atmos-chem-phys.net/7/2313/2007/
410

S. M. Murphy et al.: Secondary aerosol from atmospheric aliphatic amines 2337
doi:10.1029/2003JD003557, 2003.Makela, J. M., Yli-Koivisto, S., Hiltunen, V., Seidl, W., Swietlicki,
E., Teinila, K., Sillanpaa, M., Koponen, I. K., Paatero, J., Ros-man, K., and Hameri, K.: Chemical composition of aerosol dur-ing particle formation events in boreal forest, Tellus B, 53(4),380–393, 2001.
McGregor, K. G. and Anastasio, C.: Chemistry of fog waters inCalifornia’s central valley: 2. Photochemical transformations ofamino acids and alkyl amines, Atmos. Environ., 35(6), 1091–1104, 2001.
Mozurkewich, M.: The dissociation-constant of ammonium-nitrate and its dependence on temperature, relative-humidity andparticle-size, Atmos. Environ. A-Gen., 27(2), 261–270, 1993.
Murphy, D. M. and Thomson, D. S.: Chemical composition of sin-gle aerosol particles at idaho hill: Positive ion measurements, J.Geophys. Res., 102(D5), 6341–6352, 1997.
Mylrajan, M., Srinivasan, T. K. K., and Sreenivasamurthy, G.: Crys-tal structure of monomethylammonium nitrate, J. Cryst. Spec-trosc., 15(5), 493–500, 1985.
Neff, J. C., Holland, E. A., Dentener, F. J., McDowell, W. H., andRussell, K. M.: The origin, composition and rates of organic ni-trogen deposition: A missing piece of the nitrogen cycle?, Bio-geochemistry, 57(1), 99–136, 2002.
Nemmar, A., Hoylaerts, M. F., Hoet, P. H. M., Dinsdale, D., Smith,T., Xu, H. Y., Vermylen, J., Nemery, B., and Nemery, B.: Ultra-fine particles affect experimental thrombosis in an in vivo ham-ster model, Am. J. Resp. Crit. Care., 166(7), 998–1004, 2002.
Ngwabie, N. M. and Hintz, T.: Mxing ratio measurements and fluxestimates of volatile organic compounds (voc) from a cowshedwith conventional manure treatment indicate significant emmis-sions to the atmosphere, Geograph. Res. Abstr., 7(01175), 2005.
Perry, R. H., Green, D. W., and Maloney, J. O.: Perry’s chemicalengineers’ handbook, McGraw-Hill, New York, 1997.
Pitts, J. N., Grosjean, D., Vancauwenberghe, K., Schmid, J. P., andFitz, D. R.: Photo-oxidation of aliphatic-amines under simulatedatmospheric conditions – formation of nitrosamines, nitramines,amides, and photo-chemical oxidant, Environ. Sci. Technol.,12(8), 946–953, 1978.
Rabaud, N. E., Ebeler, S. E., Ashbaugh, L. L., and Flocchini, R. G.:Characterization and quantification of odorous and non-odorousvolatile organic compounds near a commercial dairy in Califor-nia, Atmos. Environ., 37(7), 933–940, 2003.
Schade, G. W. and Crutzen, P. J.: Emission of aliphatic-amines fromanimal husbandry and their reactions – potential source of N2Oand HCN, J. Atmos. Chem., 22(3), 319–346, 1995.
Schmitz, L. R., Chen, K. H., Labanowski, J., and Allinger, N. L.:Heats of formation of organic molecules calculated by densityfunctional theory. III - amines, J. Phys. Org. Chem., 14(2), 90–96, 2001.
Seinfeld, J. H. and Pankow, J. F.: Organic atmospheric particulatematerial, Annu. Rev. Phys. Chem., 54, 121–140, 2003.
Simoneit,B. R. T., Rushdi, A. I., Bin Abas, M. R., and Didyk,B. M.: Alkyl amides and nitriles as novel tracers for biomassburning, Environ. Sci. Technol., 37(1), 16–21, 2003.
Sorooshian,A., Brechtel, F. J., Ma, Y. L., Weber, R. J., Corless,A., Flagan, R. C., and Seinfeld, J. H.: Modeling and characteri-zation of a particle-into-liquid sampler (pils), Aerosol Sci. Tech-nol., 40(6), 396–409, 2006.
Stein,S. E.: Mass spectra by NIST mass spec data center, NISTchemistry webbook, NIST standard reference database number69, Eds. Linstrom PJ, Mallard WG, National Institute of Stan-dards and Technology, Gaithersburg MD, (http://webbook.nist.gov), 2005.
Stelson, A. W. and Seinfeld, J. H.: Relative-humidity andtemperature-dependence of the ammonium-nitrate dissociation-constant, Atmos. Environ., 16(5), 983–992, 1982.
Surratt,J. D., Murphy, S. M., Kroll, J. H., Ng, N. L., Hildebrandt,L., Sorooshian, A., Szmigielski, R., Vermeylen, R., Maenhaut,W., Claeys, M., Flagan, R. C., and Seinfeld, J. H.: Chemicalcomposition of secondary organic aerosol formed from the pho-tooxidation of isoprene, J. Phys. Chem. A, 110(31), 9665–9690,2006.
Tan, P. V., Evans, G. J., Tsai, J., Owega, S., Fila, M. S., and Malpica,O.: On-line analysis of urban particulate matter focusing on ele-vated wintertime aerosol concentrations, Environ. Sci. Technol.,36(16), 3512–3518, 2002.
Tuazon, E. C., Atkinson, R., Aschmann, S. M., and Arey, J.: Ki-netics and products of the gas-phase reactions of O3 with aminesand related-compounds, Res. Chem. Intermed., 20(3–5), 303–320, 1994.
Verdozzi, C., Schultz, P. A., Wu, R., Edwards, A. H., and Kious-sis, N.: Layer intermixing during metal/metal oxide adsorption:Ti/sapphire(0001), Phys. Rev. B, 66, 125 408, 2002.
Wagman, D. D., Evans, W. H., Parker, V. B., Halow, I., Bailey, S.M., and Schumm, R. H.: Selected values of chemical thermo-dynamic properties; tables for the first thirty-four elements inthe standard order of arrangement, NBS Technical Note, 270(3),1968.
Wagman, D. D., Evans, W. H., Parker, V. B., Schumm, R. H.,Halow, I., Bailey, S. M., Churney, K. L., and Nuttall, R. L.: Thenbs tables of chemical thermodynamic properties – selected val-ues for inorganic and C-1 and C-2 organic-substances in si units,J. Phys. Chem. Ref. Data, 11(2), 91–110, 1982.
Weber, R. J., Orsini, D., Daun, Y., Lee, Y. N., Klotz, P. J., andBrechtel, F.: A particle-into-liquid collector for rapid measure-ment of aerosol bulk chemical composition, Aerosol Sci. Tech-nol., 35(3), 718–727, 2001.
Yaws, C. L.: Yaws’ handbook of thermodynamic and physical prop-erties of chemical compounds, Knovel, 2003.
Zhang,Q. and Anastasio, C.: Free and combined amino compoundsin atmospheric fine particles (pm2.5) and fog waters from north-ern California, Atmos. Environ., 37(16), 2247–2258, 2003.
www.atmos-chem-phys.net/7/2313/2007/ Atmos. Chem. Phys., 7, 2313–2337,2007
411
Appendix F
Regional Variation of Organic Functional Groups in
Aerosol Particles on Four U.S. East Coast Platforms
during ICARTT 2004∗
∗This chapter is reproduced by permission from “Regional Variation of Organic Functional Groups in Aerosol Particles on Four U.S. East Coast Platforms during ICARTT 2004” by S. Gilardoni, L. M. Russell, A. Sorooshian, R. C. Flagan, J. H. Seinfeld, T. S. Bates, P. K. Quinn, J. D. Allan, B. Williams, A. H. Goldstein, T. B. Onasch, and D.R. Worsnop, J. Geophys. Res., 112, D10S27, doi:10.1029/2006JD007737, 2007. Copyright 2007. American Geophysical Union.
412

Regional variation of organic functional groups in aerosol particles on
four U.S. east coast platforms during the International Consortium for
Atmospheric Research on Transport and Transformation 2004
campaign
S. Gilardoni,1 L. M. Russell,1 A. Sorooshian,2 R. C. Flagan,2 J. H. Seinfeld,2 T. S. Bates,3
P. K. Quinn,3 J. D. Allan,4 B. Williams,5 A. H. Goldstein,5 T. B. Onasch,6
and D. R. Worsnop6
Received 30 June 2006; revised 30 January 2007; accepted 2 April 2007; published 15 May 2007.
[1] Submicron atmospheric aerosol samples were collected during the InternationalConsortium for Atmospheric Research on Transport and Transformation (ICARTT) 2004campaign on four platforms: Chebogue Point (Nova Scotia, Canada), Appledore Island(Maine), the CIRPAS Twin Otter over Ohio, and the NOAA R/V Ronald H. Brownin the Gulf of Maine. Saturated aliphatic C-C-H, unsaturated aliphatic C=C�H, aromaticC=C�H, organosulfur C-O-S, carbonyl C=O, and organic hydroxyl C-OH functionalgroups were measured by calibrated Fourier Transform Infrared (FTIR) spectroscopy atall four sampling platforms. The ratio of molar concentrations of carbonyl C=O tosaturated aliphatic C-C-H groups was nearly constant at each sampling platform, with theTwin Otter samples having the lowest ratio at 0.1 and the three more coastal platformshaving ratios of 0.4 and 0.5. Organic mass (OM) to organic carbon (OC) ratiosfollow similar trends for the four platforms, with the Twin Otter having the lowest ratio of1.4 and the coastal platforms having slightly higher values typically between 1.5 and1.6. Organosulfur compounds were occasionally observed. Collocated organic aerosolsampling with two Aerodyne aerosol mass spectrometers for OM, a Sunset Laboratorythermo-optical analysis instrument for OC, and an ion chromatography-particle intoliquid sampler (IC-PILS) for speciated carboxylic acids provided comparable results formost of the project, tracking the time series of FTIR OM, OC, and carbonyl groups,respectively, and showing simultaneous peaks of similar magnitude during most of theproject. The FTIR/IC-PILS comparison suggests that about 9% of the carbonylgroups found in submicron organic particles on the Twin Otter are typically associatedwith low molecular weight carboxylic acids.
Citation: Gilardoni, S., et al. (2007), Regional variation of organic functional groups in aerosol particles on four U.S. east coast
platforms during the International Consortium for Atmospheric Research on Transport and Transformation 2004 campaign,
J. Geophys. Res., 112, D10S27, doi:10.1029/2006JD007737.
1. Introduction
[2] Organic matter constitutes an important fraction ofaerosol mass, both in remote and urban locations [Turpin
and Lim, 2001]. The presence of organic compounds inaerosol particles is due to primary emissions and secondaryorganic aerosol (SOA) formation. SOA can be formed bycondensation of species produced by gas phase oxidation ofvolatile compounds. The chemical composition of theorganic fraction affects the hygroscopicity of aerosol par-ticles which in turn affects the aerosol size distribution,residence time in the atmosphere and optical properties[Markowicz et al., 2003; Kim et al., 2006].[3] Although numerous studies have been performed to
characterize polar and nonpolar components of organicaerosols, only a small percentage of the organic mass hasbeen resolved by traditional analytical methods [Saxena andHildemann, 1996; Turpin et al., 2000]. Infrared spectroscopyhas been used to investigate the organic functional groupcomposition of atmospheric aerosol particles for more than30 years [Blanco and McIntyre, 1972; Dangler et al., 1987].
JOURNAL OF GEOPHYSICAL RESEARCH, VOL. 112, D10S27, doi:10.1029/2006JD007737, 2007ClickHere
for
FullArticle
1Scripps Institution of Oceanography, University of California, SanDiego, La Jolla, California, USA.
2Department of Chemical Engineering, California Institute of Technol-ogy, Pasadena, California, USA.
3PacificMarine Environmental Laboratory, NOAA, Seattle,Washington,USA.
4School of Earth, Atmospheric and Environmental Science, Universityof Manchester, Manchester, UK.
5Department of Environmental Sciences, Policy and Management,University of California, Berkeley, California, USA.
6Aerodyne Research, Inc., Billerica, Massachusetts, USA.
Copyright 2007 by the American Geophysical Union.0148-0227/07/2006JD007737$09.00
D10S27 1 of 11
413
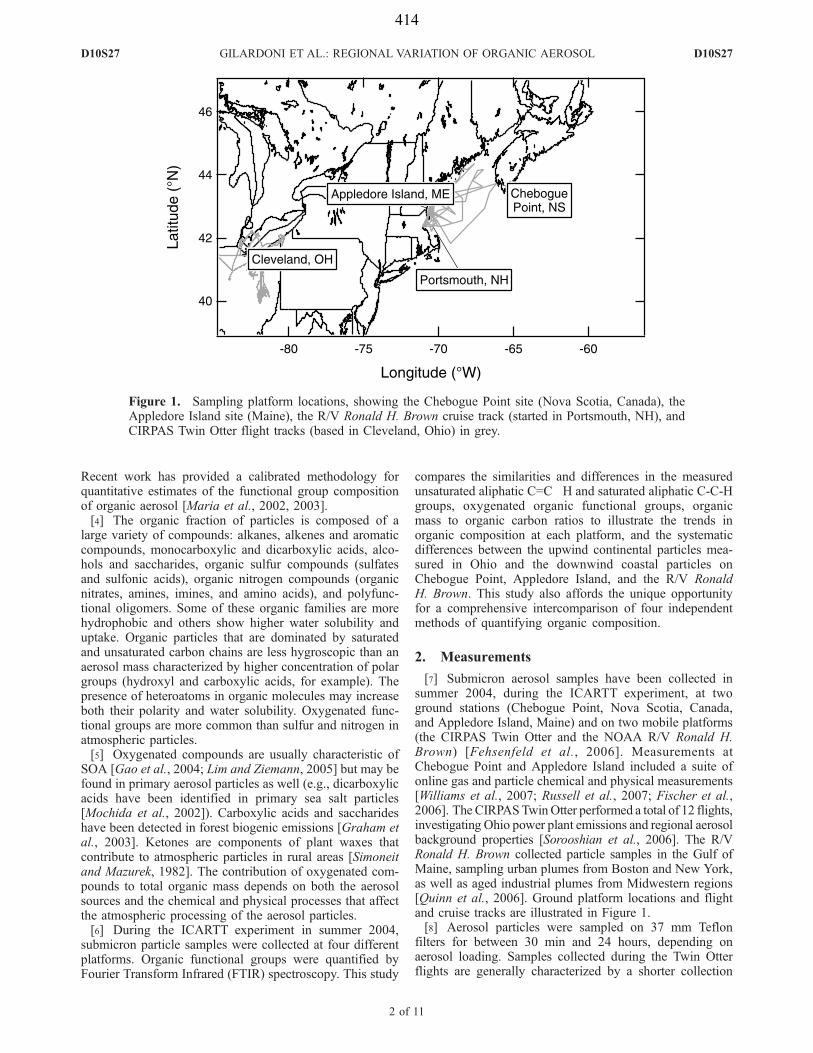
Recent work has provided a calibrated methodology forquantitative estimates of the functional group compositionof organic aerosol [Maria et al., 2002, 2003].[4] The organic fraction of particles is composed of a
large variety of compounds: alkanes, alkenes and aromaticcompounds, monocarboxylic and dicarboxylic acids, alco-hols and saccharides, organic sulfur compounds (sulfatesand sulfonic acids), organic nitrogen compounds (organicnitrates, amines, imines, and amino acids), and polyfunc-tional oligomers. Some of these organic families are morehydrophobic and others show higher water solubility anduptake. Organic particles that are dominated by saturatedand unsaturated carbon chains are less hygroscopic than anaerosol mass characterized by higher concentration of polargroups (hydroxyl and carboxylic acids, for example). Thepresence of heteroatoms in organic molecules may increaseboth their polarity and water solubility. Oxygenated func-tional groups are more common than sulfur and nitrogen inatmospheric particles.[5] Oxygenated compounds are usually characteristic of
SOA [Gao et al., 2004; Lim and Ziemann, 2005] but may befound in primary aerosol particles as well (e.g., dicarboxylicacids have been identified in primary sea salt particles[Mochida et al., 2002]). Carboxylic acids and saccharideshave been detected in forest biogenic emissions [Graham etal., 2003]. Ketones are components of plant waxes thatcontribute to atmospheric particles in rural areas [Simoneitand Mazurek, 1982]. The contribution of oxygenated com-pounds to total organic mass depends on both the aerosolsources and the chemical and physical processes that affectthe atmospheric processing of the aerosol particles.[6] During the ICARTT experiment in summer 2004,
submicron particle samples were collected at four differentplatforms. Organic functional groups were quantified byFourier Transform Infrared (FTIR) spectroscopy. This study
compares the similarities and differences in the measuredunsaturated aliphatic C=C�H and saturated aliphatic C-C-Hgroups, oxygenated organic functional groups, organicmass to organic carbon ratios to illustrate the trends inorganic composition at each platform, and the systematicdifferences between the upwind continental particles mea-sured in Ohio and the downwind coastal particles onChebogue Point, Appledore Island, and the R/V RonaldH. Brown. This study also affords the unique opportunityfor a comprehensive intercomparison of four independentmethods of quantifying organic composition.
2. Measurements
[7] Submicron aerosol samples have been collected insummer 2004, during the ICARTT experiment, at twoground stations (Chebogue Point, Nova Scotia, Canada,and Appledore Island, Maine) and on two mobile platforms(the CIRPAS Twin Otter and the NOAA R/V Ronald H.Brown) [Fehsenfeld et al., 2006]. Measurements atChebogue Point and Appledore Island included a suite ofonline gas and particle chemical and physical measurements[Williams et al., 2007; Russell et al., 2007; Fischer et al.,2006]. The CIRPASTwinOtter performed a total of 12 flights,investigating Ohio power plant emissions and regional aerosolbackground properties [Sorooshian et al., 2006]. The R/VRonald H. Brown collected particle samples in the Gulf ofMaine, sampling urban plumes from Boston and New York,as well as aged industrial plumes from Midwestern regions[Quinn et al., 2006]. Ground platform locations and flightand cruise tracks are illustrated in Figure 1.[8] Aerosol particles were sampled on 37 mm Teflon
filters for between 30 min and 24 hours, depending onaerosol loading. Samples collected during the Twin Otterflights are generally characterized by a shorter collection
Figure 1. Sampling platform locations, showing the Chebogue Point site (Nova Scotia, Canada), theAppledore Island site (Maine), the R/V Ronald H. Brown cruise track (started in Portsmouth, NH), andCIRPAS Twin Otter flight tracks (based in Cleveland, Ohio) in grey.
D10S27 GILARDONI ET AL.: REGIONAL VARIATION OF ORGANIC AEROSOL
2 of 11
D10S27
414

interval in order to collect two or more samples during the 4to 6 hour flights. Teflon filters were stored in polystyrenepetri dishes, sealed with Teflon tape and kept at approxi-mately �4�C for later analysis. Identification and quantifi-cation of organic and inorganic functional groups werecarried out by transmission FTIR spectroscopy. During theICARTT 2004 campaign more than 250 samples and anequal number of field blanks were collected and analyzedon the four platforms. None of the blanks showed detectablequantities of organic functional groups.
2.1. FTIR Spectroscopy
[9] FTIR analyses were completed with a Bruker Tensor27 FTIR Spectrometer with a DTGS detector. FTIR spectrawere measured in transmission mode in the range between400 and 4000 cm�1, with a spectral resolution of 4 cm�1
and 32 scans for each spectrum. Blank filters were scannedbefore sampling and aerosol spectra were obtained bysubtraction of the blank spectra from the correspondingsample spectra. Ambient aerosol spectra are usually char-acterized by broad double peaks in the absorption from2800 to 3400 cm�1 for ammonium. This interference wascorrected by subtracting a reference spectrum of ammoniumsulfate, normalized to the ammonium peak at 3200 cm�1.Table 1 lists the functional groups identified during theICARTT experiment and the location of the associated peakin absorbance. Here the terms ‘‘saturated aliphatic C-C-Hgroups’’ and ‘‘unsaturated aliphatic C=C�H groups’’ indi-cate C-H bonds typical of alkane and alkene molecules,respectively. ‘‘Aromatic C=C�H groups’’ refer to C-Hbonds from a benzenic ring structure. The identification offunctional groups used multiple absorption peaks, while thequantification was based on an absorption peak with neg-ligible interference. 1-docosanol, anthracene, sodium ben-zoate, 1-docosene, sodium ethyl-sulfate, citric acid andadipic acid have been employed as calibration standards[Maria et al., 2002, 2003]. The absorbance for the detectedspecies varies linearly with the number of moles of bondsand is independent of mixture composition [Maria et al.,2002, 2003]. The error associated with the calibration of asingle reference compound is typically 10% of the measuredconcentration for most functional groups, with the exceptionof organic hydroxyl C-OH groups for which interferencefrom water, ammonia, and amines increases the error to22%. The combined uncertainty of reference compounds,peak integration, and absorption artifacts is between 5% and22% [Russell, 2003].[10] Organic sulfur compounds have been identified in
aerosol particles by an absorption peak at 876 cm�1 [Maria
et al., 2003; Blando et al., 1998]. Carbonate and hydrogensulfate ions also absorb in the region between 850 and890 cm�1 (http://www.aist.go.jp/RIODB/SDBS/cgi-bin/cre_index.cgi). Reference samples of carbonates, hydrogensulfate, and sodium ethylsulfate were prepared using anatomizer (TSI Inc., model 3076) to collect deposits onTeflon filters, which were rinsed with hexane and acetoneto separate the organic sulfur compounds by dissolving inorganic solvents without removing the less soluble carbon-ate and hydrogen sulfate ions [Maria et al., 2002]. Thissequential rinsing with hexane and acetone was used forthose samples with an absorption peak located in the region850 cm�1 –890 cm�1 to distinguish organosulfur com-pounds from carbonate and hydrogen sulfate ions.[11] Amines are characterized by two absorption peaks
located at 3400 cm�1 and 1630 cm�1. Amines were presentbelow detectable amounts for all samples collected atChebogue Point, on the Twin Otter, and on the R/V RonaldH. Brown. Significant amine absorption signals wereobserved in a few samples collected at Appledore Island.Identification of amines is noted in Figure 2, although theirquantification was not possible during this project [Maria etal., 2003].[12] To convert calculated molar concentration to the
mass concentration of equivalent organic carbon (OC), weassume that saturated carbon chains are present mainly asCH2 groups [Maria et al., 2002]. The concentrationof saturated carbon was obtained by multiplying thesaturated aliphatic C-C-H bond molar concentration by6 (corresponding to carbon molecular mass divided by2 C-H bonds per CH2 unit). Contributions to organic carbonfrom unsaturated aliphatic C=C�H, aromatic C=C�H, andcarbonyl C=O groups were calculated by multiplying theC=C�H and C=O molar concentrations by 12. To calculateorganic mass (OM), the OC concentrations have been scaledto include the mass of associated hydrogen, sulfur, andoxygen atoms [Maria et al., 2002]. Organic mass (OM) isthe sum of both OC and associated heteroatoms in carbonylC=O groups, saturated and unsaturated aliphatic C-Hgroups, aromatic C=C�H groups, organic hydroxyl C-OHgroups, and sulfur from organosulfur C-O-S groups. OMvalues reported here neglect the contribution of organicnitrogen functional groups.
2.2. Air Mass Categorization
[13] Air masses sampled at Chebogue Point were catego-rized using the retroplume summaries calculated byFLEXPART (http://www.esrl.noaa.gov/csd/metproducts/icartt2004/). The FLEXPART model is run using two
Table 1. FTIR Absorption Characteristics for Organic Functional Groups
Functional Group Absorption Frequencies, cm�1 Quantified Peak, cm�1 Absorptivity, abs�1aDetection Limit,mmol of Bond
Saturated aliphatic C-C-H 1450, 2800–3000 2850–2920 0.895 0.013Unsaturated aliphatic C=C�H 2900–3100 2980 3.8 0.122Aromatic C=C�H 3000–3100 3050 8.7 0.035Carbonyl C=O 1640–1850 1720 0.062 0.009Organic hydroxyl C-OH 3100–3500 3350 0.057 0.006Organosulfur C-O-S 876 876 0.031 0.002Amines C-NH 3400, 1630 – – –
aAbsorptivity is the micromole of functional group per unit of peak area (in absorbance). The calibration of absorptivity may be instrument-specific withvalues that differ slightly on the basis of the detector used [cf. Maria et al., 2003].
D10S27 GILARDONI ET AL.: REGIONAL VARIATION OF ORGANIC AEROSOL
3 of 11
D10S27
415

Figure 2. Temporal trends of the measured functional group composition: (a and b) Twin Otter, (c and d)R/V Ronald H. Brown, (e and f) Chebogue Point, and (g and h) Appledore Island. For each platform, thelower plot (Figures 2b, 2d, 2f, and 2h) corresponds to functional group composition of cumulativesamples (12 or 24 hour collection time), and the upper plot (Figures 2a, 2c, 2e, and 2g) reportssimultaneous shorter time samples (3, 4, 6 or 8 hour collection time). All panels show saturated aliphaticC-C-H groups (blue), organic hydroxyl C-OH groups from alcohol and carboxylic acids (pink), aromaticC=C�H groups (light blue), unsaturated aliphatic C=C�H groups (red), carbonyl C=O groups (green),and organosulfur C-O-S groups (yellow) mass concentration. Samples marked by asterisks containedamine C-NH groups.
D10S27 GILARDONI ET AL.: REGIONAL VARIATION OF ORGANIC AEROSOL
4 of 11
D10S27
416

meteorological input data (Global Forecast System modeland ECMWF model) with a global resolution of 1 � 1� anda regional resolution of 0.36 � 0.36�. FLEXPART is aparticle dispersion model that uses the Frost and McKeeneinventory for North America with a spatial resolution of4 km. Air masses sampled at Chebogue Point andAppledore Island were categorized as ‘‘U.S.’’ or ‘‘Canada’’on the basis of visual inspection of retroplume calculationsof the most important emission sources. We consideredretroplume trajectories over the 5 days before reaching thesampling platform and their evolution during the samplinginterval, including 4 backward simulations during each12 hour sample. If all simulations for a sampling intervalshowed the same source locations, the sample was assignedto one of the two source categories. Air mass categoriza-tions for the R/V Ronald H. Brown showed that most ofthose samples were dominated by U.S. influenced airmasses [Quinn et al., 2006], whereas the coastal platformssampled several days that could be characterized by twodistinct types of air masses, those dominated by U.S.emissions and those dominated by Canada emissions.
3. Results and Discussion
[14] Saturated aliphatic C-C-H groups, unsaturatedaliphatic C=C�H groups, organic hydroxyl C-OH groupsfrom alcohols and carboxylic acids, carbonyl C=O groupsfrom carbonyl in ketones, aldehydes, and carboxylic acids,organosulfur C-O-S groups, ammonium, sulfate, and nitratewere detected during most of the ICARTT 2004 study on allsampling platforms. Figure 2 shows the temporal trend of OM
concentration. The average OM concentrations at CheboguePoint and Appledore Island were 1.7 and 1.4 mg m�3,respectively. Higher OM concentrations were observedduring the R/V Ronald H. Brown cruise (3.6 mg m�3)and during the CIRPAS Twin Otter flights (4.6 mg m�3).The maximum OM concentration measured on board theTwin Otter was 13 mg m�3. This high OM concentration isprobably a result of the proximity to large emission sources,such as coal burning power plants in Ohio [Sorooshian etal., 2006].[15] OM was dominated by saturated aliphatic C-C-H
groups (as shown in Figure 3). The Chebogue Point andAppledore Island platforms show average saturated aliphaticC-C-H concentration of 0.6 mg m�3. R/V Ronald H. Brownand Twin Otter saturated aliphatic C-C-H concentrationswere 1.4 and 2.9 mg m�3, respectively. The averagecarbonyl C=O group concentration ranged between 0.4 and0.5 mg m�3 on Chebogue Point, Appledore Island, and theTwin Otter and reached as high as 1.4 mgm�3 for R/V RonaldH. Brown.[16] Comparison of the time series of functional groups
on the four sampling platforms in Figure 2 shows eventsthat appear to be correlated at two or more differentsampling platforms. At Chebogue Point from 12 July(during the biomass burning event reported by Duck et al.[2007]), the contribution of carbonyl C=O groups to organicmass started rising. Similar trends in oxygenated functionalgroup composition occurred with a delay of about 12 hoursat Appledore Island and on the R/V Ronald H. Brown(during the biomass burning event reported by Quinn etal. [2006]). During the time period between 12 July and
Figure 3. Project average composition of organic mass for (a) Twin Otter, (b) R/V Ronald H. Brown,(c) Chebogue Point, and (d) Appledore Island. The color assignments for the organic functional groupmass fractions are the same as in Figure 2.
D10S27 GILARDONI ET AL.: REGIONAL VARIATION OF ORGANIC AEROSOL
5 of 11
D10S27
417

noon on 13 July, Appledore Island was subject to northerlywind. The R/V Ronald H. Brown measured along the coastof New England and sampled air masses coming from theNorth, as indicated by retroplume calculation. Figure 4reports the average composition of the organic mass duringthe event occurred on 12 July, for R/V Ronald H. Brown,Chebogue Point and Appledore Island samples. AtChebogue Point, for the time period that goes from 12 to13 July, 41% of organic mass is composed of saturatedaliphatic C-C-H groups, 39% of carbonyl C=O groups, and11% of organic hydroxyl C-OH groups. R/V Ronald H.Brown OM composition is characterized by a similar con-tribution of saturated aliphatic C-C-H groups (35%), organichydroxyl C-OH groups (10%) and carbonyl C=O groups(45%). Appledore Island organic mass composition is similarto Chebogue Point, although a smaller contribution fromorganic hydroxyl C-OH groups was observed. The averagefunctional group contribution to the total OM for 12–13 Julydiffers from the project average reported in Figure 3 by itshigher fraction of carbonyl C=O groups and lower fraction oforganic hydroxyl C-OH groups.[17] A second event observed at multiple platforms in the
ICARTT region took place from 17 to 18 July. On 18 July,R/V Ronald H. Brown and Chebogue Point measurementsshowed similar concentrations in carbonyl C=O groups andaromatic C=C�H groups. The maximum concentration ofaromatic C=C�H groups measured during this event was1 mgm�3 on the R/V Ronald H. Brown (project average equalto 0.1 mg m�3) and 0.8 mg m�3 at Chebogue Point (projectaverage equal to 0.05 mg m�3). From 16 to 19 July CheboguePoint was influenced by southerly wind, with retroplumecalculations indicating air masses coming from the Gulf ofMaine. The organic composition was similar to the projectaverage during the sample taken during 17–18 July, withthe single sample being insufficient to show any statisticallysignificant differences.
3.1. Saturated and Unsaturated Aliphatic OrganicFunctional Groups
[18] During most of the sampling period, the organicmass is dominated by the contribution of saturated aliphaticC-C-H and unsaturated aliphatic C=C�H groups. Bothsaturated and unsaturated organic compounds are releasedas primary emissions from both fossil fuel combustion and
biogenic emissions. Unsaturated aliphatic C=C�H groupscan be produced during the combustion processes by dehy-dration of alcohols or cracking of alkanes during incompletecombustion [Oros and Simoneit, 2000; Simoneit, 2002].Unsaturated aliphatic C=C�Hgroups are also produced fromoxidation of aromatic units [Johnson et al., 2005; Seinfeldand Pandis, 1998]. Figure 5 shows unsaturated aliphaticC=C–H relative to saturated aliphatic C-C-H concentrationfor the four sampling platforms.[19] Figure 5 shows four weak linear relationships in the
ratios of unsaturated to saturated organic compounds, indi-cating similar ratios during the sampling period with smallaverage differences for each of the four platforms. TwinOtter samples are characterized by unsaturated aliphaticC=C–H to saturated aliphatic C-C-H group ratios equalto 0.10 (n = 25); higher ratios were observed at the coastalplatforms for Appledore Island (0.2, n = 65), Chebogue
Figure 4. Project average OM composition on (a) the R/V Ronald H. Brown, (b) Chebogue Point, and(c) Appledore Island from 12 to 14 July. The color assignments for the organic functional group massfractions is the same as in Figure 2.
Figure 5. Ratios of saturated to unsaturated aliphatic C-Hgroup concentration for Appledore Island (pluses),Chebogue Point (circles), R/V Ronald H. Brown (squares),and Twin Otter (triangles). Line fits for the differentsampling sites are reported as solid line (Appledore Island),dotted line (Chebogue Point), dashed line (R/V Ronald H.Brown), and dot-dashed line (Twin Otter).
D10S27 GILARDONI ET AL.: REGIONAL VARIATION OF ORGANIC AEROSOL
6 of 11
D10S27
418

Point (0.2, n = 43), and the R/V Ronald H. Brown (0.2, n =52). These ratios are similar to the unsaturated to saturatedC-H group concentration ratios of 0.2 to 0.5 which weremeasured by H-NMR of water soluble organic carbon(WSOC) from urban polluted areas [Fuzzi et al., 2001;Decesari et al., 2000]. The similarity of the averageunsaturated to saturated aliphatic C-H group ratio observedat the three coastal sampling platforms suggests that thoseareas were often affected by air masses with similar sources.The higher average concentration of unsaturated com-pounds at the coastal platforms may indicate the largercontribution of biogenic sources or a lower contribution ofsaturated aliphatic C-C-H groups from unprocessed primarycombustion emissions.[20] Saturated aliphatic compounds dominate primary
coal burning emissions [Oros and Simoneit, 2000]. Forexample, the bituminous coal combustion emission ratioof unsaturated to saturated aliphatic C-H is 0.02.
3.2. Oxygenated Organic Carbon
[21] Oxygenated functional groups (carbonyl C=O andorganic hydroxyl C-OH) were observed on all platformswith concentrations that were often comparable to the
saturated aliphatic C-C-H group concentrations. Figure 6shows carbonyl C=O group concentration relative to satu-rated aliphatic C-C-H concentration, for each platform.These molar ratios and correlation coefficients are reportedin Table 2. The Twin Otter samples in Ohio were charac-terized by a lower molar ratio (0.1) compared to R/VRonald H. Brown (0.5), Chebogue Point (0.5), and Apple-dore Island (0.4). The carbonyl C=O to saturated aliphaticC-C-H group molar ratios recorded on the R/V Ronald H.Brown and at the two coastal platforms are similar to theratios measured by H-NMR on the WSOC of urban aerosolin the Po Valley, which ranged between 0.2 and 0.5 [Fuzzi etal., 2001]. Overall the lower average carbonyl C=O groupto saturated aliphatic C-C-H group ratio on the Twin Otter isconsistent with the less aged emissions observed over Ohio[Sorooshian et al., 2006] than those measured on the coastalplatforms, as prior work indicated more carboxylic acids(containing more carbonyl groups) were typically associatedwith aged and secondary aerosol [Rogge et al., 1993; Zhanget al., 2005].[22] The linear correlation between carbonyl C=O groups
and saturated aliphatic C-C-H groups for each platform wassignificant at the 99% confidence level. The variability of
Figure 6. Ratios of carbonyl C=O to saturated aliphatic C-C-H group concentrations on (a) the TwinOtter, (b) the R/V Ronald H. Brown, (c) Chebogue Point, and (d) Appledore Island, indicated as pluses.For Chebogue Point, different symbols are used to indicate samples affected by Canada (diamond), U.S.(squares), and other (pluses) air masses.
D10S27 GILARDONI ET AL.: REGIONAL VARIATION OF ORGANIC AEROSOL
7 of 11
D10S27
419

the ratio of carbonyl C=O groups to saturated aliphatic C-C-Hgroups indicates a range of oxygenated organic aerosolcompositions in the air masses sampled at each platformduring the course of the project. To study the variability inthe degree of oxidation of aerosol samples collected atChebogue Point, the air masses measured have been sepa-rated according to the retroplume calculations. ‘‘Canada’’and ‘‘U.S.’’ categories correspond to air masses affectedmainly by Canadian or U.S. emissions. Samples at Che-bogue Point associated with air masses from Canadaare characterized by a carbonyl C=O to saturated aliphaticC-C-H groups molar ratio equal to 0.5. These samples alsogenerally show a higher ratio of carbonyl C=O to saturatedaliphatic C-C-H groups compared to air masses from theUnited States which had a ratio of 0.3. Figure 7 reports thetemporal variation of carbonyl C=O to saturated aliphaticC-C-H groups molar ratio for Chebogue Point. Thermaldesorption aerosol GCMS-FID (TAG) data show that com-pounds associated with biogenic emissions are often presentin high concentrations in the air masses with retroplumesdominated by emission sources in Canada. For a detaileddescription of TAG measurements refer to Williams et al.[2007]. The FTIR functional group composition indicatesthat these aerosol particles associated with aged biogenicemissions are enriched in carbonyl C=O groups relative tosaturated aliphatic C-C-H groups.
3.3. OM/OC Ratios
[23] The ratio of organic mass to organic carbon (OM/OC) describes the overall organic composition of aerosolparticles, providing a distinction between organic com-pounds dominated by hydrocarbons with ratios rangingfrom 1 to 1.2 and OM containing a significant fraction ofoxygen, sulfur and nitrogen which have OM/OC from 1.3 tomore than 2 [Russell, 2003]. Ambient measurements oforganic mass are still scarce. In addition to the FTIRtechnique used here, OM can be estimated from AMSmeasurements of organic fragments [Allan et al., 2004;de Gouw et al., 2005] or determined by elemental analysisof organic fraction after extraction with water or organicsolvents [El-Zanan et al., 2005]. For the 4 different plat-forms and 2 different air mass categories, Table 2 lists theOM/OC ratios calculated from FTIR functional groupcomposition. Each sampling platform shows low variabilityin OM/OC, suggesting that organic composition during theICARTT experiment was fairly constant at each platform.OM/OC measured on the R/V Ronald H. Brown in the Gulfof Maine agrees with other reports of OM/OC for urban andpolluted continental locations, including a study performed
in the Gulf of Maine in 2002 in which OM/OC was equal to1.8 [de Gouw et al., 2005]. OM/OC reported for IMPROVEplatforms ranges between 1.6 and 2.6 [El-Zanan et al.,2005]. The lower OM/OC ratio recorded during the TwinOtter campaign can be explained by the observation thatfresh emissions contain lower concentrations of oxidizedfunctional groups which reduces the associated OM/OCratio [Turpin and Lim, 2001]. Table 2 shows that OM/OC atChebogue Point does not differ significantly for the two airmass retroplume emission categories.
3.4. Organosulfur Compounds
[24] Organosulfur compounds are a minor component oforganic aerosol mass. Organosulfur compounds weredetected at all four of the sampling platforms studied forICARTT 2004, with a higher frequency at Chebogue Point.The organosulfur C-O-S functional group absorbance canbe associated with either sulfuric or sulfonic esters. Theseclasses of compounds may be produced by addition ofsulfuric or sulfonic acid to alkenes or by esterification ofhydroxyl group promoted by the same acids [Romero andOehme, 2005]. In the aqueous aerosol particles, carbonyl
Table 2. Carbonyl C=O Group to Saturated Aliphatic C-C-H Group Molar and Average OM/OC Ratios for the Four Sampling Platforms
and Air Mass Categories
Platform C=O/C�H Molar Ratioa OM/OCb
Twin Otter 0.1 (90) 1.4 (0.12) n = 25R/V Ronald H. Brown 0.5 (99.9) 1.6 (0.14) n = 60Appledore Island 0.4 (99.9) 1.5 (0.16) n = 79Chebogue Point 0.5 (99.9) (Canada: 0.5 (99.9); United States: 0.3 (<75)) 1.6 (0.14), n = 74 (Canada: 1.6 (0.11),
n = 22; United States: 1.6 (0.18), n = 9)aThe significance of each linear regression was calculated by t-test and is reported in brackets.bStandard deviation is reported between brackets, where ‘‘n’’ indicates number of samples for each platform and category.
Figure 7. Time series of the ratio of carbonyl C=O groupsto saturated aliphatic C-C-H group concentration ratio atChebogue Point. The color of the symbols and the color barat the top of the graph identify samples associated with airmasses with emissions originating mostly from Canada(green) or the United States (red) (based on retroplumecalculations). TAG factor 1 is a marker of biogenicemissions [Williams et al., 2007] at Chebogue Point.
D10S27 GILARDONI ET AL.: REGIONAL VARIATION OF ORGANIC AEROSOL
8 of 11
D10S27
420

C=O functional groups may be converted into hydroxyl O-Hgroup by several mechanisms including hydration andpolymerization [Hastings et al., 2005]. Reaction with sul-furic or sulfonic acid would produce sulfuric or sulfonicesters and would shift the partitioning of the originalcarbonyl compounds from the gas phase toward the particlephase. In this scenario, organosulfur compounds formationwould explain the unusually high particle-to-gas phasedistribution coefficient observed for some volatile carbonylcompounds [Hastings et al., 2005]. Most of the samples inwhich organosulfur C-O-S groups were detected also hadhigh organic mass loadings. Organosulfur C-O-S groupswere detected only in samples that showed the simultaneouspresence of sulfate and carbonyl species, with relativehumidity higher than 80%.
3.5. Intercomparison of FTIR With AMS OM andTOA OC
[25] During the ICARTT experiment AMS measurementswere collected on Chebogue Point and the R/V Ronald H.Brown. AMS measurements were used to calculate OM ofaerosol samples by summing contributions from mass frag-ments containing carbon atoms [Allan et al., 2004; Quinn etal., 2006]. The Aerodyne AMS measurements used quad-rupole systems as described by Jayne et al. [2000] andJimenez et al. [2003]. The instrument is capable of mea-suring the submicron, nonrefractory component of theaerosols, using the data analysis techniques described byAllan et al. [2003, 2004]. For the Chebogue Point OMconcentration measurements, a collection efficiency of 0.5and relative ionization efficiency of 1.4 were used. Moredetails of the instruments and their results are published byWilliams et al. [2007]. Figure 8 shows a comparison of thetime series of AMS and FTIR organic mass concentrationsfor Chebogue Point and R/V Ronald H. Brown. The insetson Figures 8a and 8b show the quantitative correlationbetween the AMS and FTIR OM measurements, for whichthe AMS organic mass concentrations were integrated forthe filter sampling period. At Chebogue Point the averageFTIR to AMS ratio is 0.6 ± 0.1 with a correlation coefficientequal to 0.80. The comparison of organic mass on the R/VRonald H. Brown showed very similar trends in the timeseries in Figure 8a, and the inset shows that the ratio of theFTIR to AMS organic mass has a slope of 0.9 ± 0.1 and ahigh correlation coefficient (r2 = 0.87).[26] R/V Ronald H. Brown organic carbon (OC) was
monitored by two Thermo-Optical Analysis (TOA) instru-ments with fast (45 to 105 min) and slow (4 to 8 hours)
Figure 8. Comparison of AMS and FTIR OM on (a) theR/V Ronald H. Brown and (b) Chebogue Point. The timeseries of 5-min average AMS organic mass is shown as agrey line; FTIR organic mass is represented by blacktriangles. Horizontal error bars indicate the duration of thesampling time for each sample. Insets show scatterplots ofAMS average OM versus FTIR OM for the times whensampling largely overlapped. The dashed line indicates the1:1 ratio.
Figure 9. Comparison of TOA and FTIR OC for R/VRonald H. Brown measurements. Time series of high timeresolution online TOA OC is shown as a grey line, low timeresolution filter TOA OC is shown as circles, and FTIRorganic carbon is shown as black triangles. Horizontal errorbars indicate the duration of the sampling time for eachsample. Inset shows scatterplots of low time resolution TOAfilter sample OC versus simultaneous FTIR OC for thetimes when sampling largely overlapped. The dashed lineindicates the 1:1 ratio.
D10S27 GILARDONI ET AL.: REGIONAL VARIATION OF ORGANIC AEROSOL
9 of 11
D10S27
421

sampling times [Schauer et al., 2003; Quinn et al., 2006].The FTIR is lower than AMS OM on average at both sites,which may result from underprediction of heteroatoms inthe FTIR algorithm [Russell, 2003] or overprediction ofmass fragments by the AMS calibration [Quinn et al., 2006]for some organic compositions. Figure 9 shows the com-parison of TOA OC with FTIR OC for samples collectedsimultaneously, with a slope of 0.9 ± 0.1 and a correlationcoefficient of 0.67. The higher scatter associated with theOC measurements may be a result of the uncertaintyassociated with inferring OC from measured functionalgroups [Russell, 2003].
3.6. LMW Carboxylic Acids and Carbonyl Groupson CIRPAS Twin Otter
[27] Low molecular weight (LMW) carboxylic acids weremeasured by PILS and IC during the Twin Otter flights overOhio. The carboxylic acids measured were detected asoxalate, glyoxylate, glutarate, malonate, and pyruvate ions[Sorooshian et al., 2006]. Oxalate concentration rangedbetween 0.01 mg m�3 and 0.3 mg m�3 during the samplingperiod overlapping to filter collection. Concentrations ofglyoxylate, glutarate, malonate and pyruvate were generallyone or two orders of magnitude lower than oxalate. Thecarbonyl C=O group fraction of the total measured LMWcarboxylic acids was calculated for each FTIR samplingperiod and compared to the total carbonyl C=O groupconcentration determined by FTIR in Figure 10. Figure 10reports carbonyl C=O group concentration from LMWcarboxylic acid relative to total carbonyl C=O group con-centration measured by FTIR. The number of points avail-able for the comparison was limited but shows a linearcorrelation coefficient of 0.82 (n = 5). The slope of the fitshows that the LMW carboxylic acids represent 9% of thetotal carbonyl C=O groups detected by FTIR.
4. Conclusions
[28] Analysis by FTIR spectroscopy of aerosol particlesamples collected at four different locations in eastern North
America show high concentrations of saturated aliphaticC-C-H groups and carbonyl C=O groups. The functionalgroup composition shows significant differences across theICARTT region: The Twin Otter sampled near large sourcesof primary organic emissions (including several largeregional power plants) and measured lower unsaturated tosaturated aliphatic C-C-H groups and lower OM/OC ratioscompared to the coastal platforms (Chebogue Point, Apple-dore Island, and the R/V Ronald H. Brown). The averageOM/OC ranged between 1.4 (for Twin Otter in Ohio andChebogue Point) and 1.6 (for R/V Ronald H. Brown andChebogue Point). Organic particles collected during theTwin Otter flights over Ohio show a lower carbonyl C=Ogroup concentration relative to saturated aliphatic C-C-Hgroup concentration than samples collected at the coastallocations, suggesting that fresh emissions are predominantin those samples.[29] Some of the variability within the samples at each
platform can be attributed to changes in air masses, withthose air masses associated with similar regional sourcesalso having comparable functional group composition.Retroplume analysis for Chebogue Point samples suggestedthat air masses that reached this location from Canada andshowed TAG factors that were indicative of biogenicemissions, were characterized by higher carbonyl C=Ogroup concentration relative to saturated aliphatic C-C-Hgroups, compared to those air masses dominated by U.S.sources.[30] Intercomparison of independent techniques for mea-
suring the total OM and OC at two of the sampling locations(i.e., Chebogue Point and R/V Ronald H. Brown) showedthat the two techniques generally track each other with time(with slopes of 0.6 and 0.9, respectively) but the linearcorrelations show a high variability in the data, as is typicalfor intercomparisons of organic measurements [Turpin andLim, 2001]. Comparison of carbonyl C=O group concen-tration with LMW carboxylic acid concentration shows thatLMW carboxylic acids represented approximately 9% ofthe total observed carbonyl C=O groups for samples col-lected near plumes associated with coal power plants.
[31] Acknowledgments. This multiplatform research effort was madepossible by seed funding from the James S. McDonnell Foundation Awardfor 21st Century Science. Subsequent development, training, and analysiswere supported by NOAA grant NA17RJ1231. Additional support and fieldmeasurement opportunities were provided by National Science Foundationgrant ATM04-01611. We are grateful to Derek Coffman, Susanne Hering,Nathan Kreisberg, Roland von Glasow, Susanne Marquardt, CynthiaRandles, Kathryn Holderness, Alice Delia, Jennifer Ayers, Alex Pszenny,and William Keene for assistance in collecting samples and to AndreasStohl for compiling the FLEXPART analyses. This paper is also contribu-tion 138 to the Shoals Marine Laboratory.
ReferencesAllan, J. D., J. L. Jimenez, P. I. Williams, M. R. Alfarra, K. N. Bower, J. T.Jayne, H. Coe, and D. R. Worsnop (2003), Quantitative sampling usingan Aerodyne aerosol mass spectrometer: 1. Techniques of data interpreta-tion and error analysis, J. Geophys. Res., 108(D3), 4090, doi:10.1029/2002JD002358.
Allan, J. D., et al. (2004), A generalised method for the extraction ofchemically resolved mass spectra from Aerodyne aerosol mass spectro-meter data, J. Aerosol Sci., 35(7), 909–922.
Blanco, A. J., and R. G. McIntyre (1972), Infrared spectroscopic view ofatmospheric particulates over El Paso, Texas, Atmos. Environ., 6, 557–562.
Blando, J. D., R. J. Porcja, T. H. Li, D. Bowman, P. J. Lioy, and B. J. Turpin(1998), Secondary formation and the Smoky Mountain organic aerosol:
Figure 10. Carbonyl C=O group molar concentration ofPILS LMW carboxylic acids plotted as a function of totalFTIR carbonyl C=O group molar concentration.
D10S27 GILARDONI ET AL.: REGIONAL VARIATION OF ORGANIC AEROSOL
10 of 11
D10S27
422

An examination of aerosol polarity and functional group compositionduring SEAVS, Environ. Sci. Technol., 32, 604–613.
Dangler, M., S. Burke, S. V. Hering, and D. T. Allen (1987), A direct FTIRmethod for identifying functional-groups, in size segregated atmosphericaerosols, Atmos. Environ., 21, 1001–1004.
Decesari, S., M. C. Facchini, and S. Fuzzi (2000), Characterization of watersoluble organic compounds in atmospheric aerosol: A new approach,J. Geophys. Res., 105, 1481–1489.
de Gouw, J. A., et al. (2005), Budget of organic carbon in a pollutedatmosphere: Results from the New England Air Quality Study in 2002,J. Geophys. Res., 110, D16305, doi:10.1029/2004JD005623.
Duck, T. J., et al. (2007), Transport of forest fire emissions from Alaska andthe Yukon Territory to Nova Scotia during summer 2004, J. Geophys.Res., doi:10.1029/2006JD007716, in press.
El-Zanan, H. S., D. H. Lowenthal, B. Zielinska, J. C. Chow, and N. Kumar(2005), Determination of the organic aerosol mass to organic carbon ratioin IMPROVE samples, Chemosphere, 60, 485–496.
Fehsenfeld, F. C., et al. (2006), International Consortium for AtmosphericResearch on Transport and Transformation (ICARTT): North America toEurope—Overview of the 2004 summer field study, J. Geophys. Res.,111, D23S01, doi:10.1029/2006JD007829.
Fischer, E., A. Pszenny, W. Keene, J. Maben, A. Smith, A. Stohl, andR. Talbot (2006), Nitric acid phase partitioning and cycling in the NewEngland coastal atmosphere, J. Geophys. Res., 111, D23S09,doi:10.1029/2006JD007328.
Fuzzi, S., S. Decesari, M. C. Facchini, E. Matta, and M. Mircea (2001),A simplified model of the water soluble organic component of atmo-spheric aerosol, Geophys. Res. Lett., 20, 4079–4082.
Gao, S., M. Keywood, N. L. Ng, J. Suratt, V. Varutbangkul, R. Bahreini,R. C. Flagan, and J. H. Seinfeld (2004), Low-molecular-weight andoligomeric components in secondary organic aerosol from the ozonolysisof cycloalkenes and a-pinene, J. Phys. Chem. A, 108, 10,147–10,164.
Graham, B., et al. (2003), Composition and diurnal variability of the naturalAmazonian aerosol, J. Geophys. Res., 108(D24), 4765, doi:10.1029/2003JD004049.
Hastings, W. P., C. A. Koehler, E. L. Bailey, and D. O. De Hann (2005),Secondary organic aerosol formation by glyoxal hydration and oligomerformation: Humidity effects and equilibrium shifts during analysis,Environ. Sci. Technol., 39, 8728–8735.
Jayne, J. T., D. C. Leard, X. F. Zhang, P. Davidovits, K. A. Smith, C. E.Kolb, and D. R. Worsnop (2000), Development of an aerosol massspectrometer for size and composition analysis of submicron particles,Aerosol Sci. Technol., 33, 49–70.
Jimenez, J. L., et al. (2003), Ambient aerosol sampling using the AerodyneAerosol Mass Spectrometer, J. Geophys. Res., 108(D7), 8425,doi:10.1029/2001JD001213.
Johnson, D., M. C. Jenkin, K. Wirtz, and M. Martin-Reviejo (2005),Simulating the formation of secondary organic aerosol from the photo-oxidation of aromatic hydrocarbons, Environ. Chem., 2, 35–48.
Kim, J., S.-C. Yoon, A. Jefferson, and S.-W. Kim (2006), Aerosol hygroscopicproperties during Asian dust, pollution, and biomass burning episodes atGosan, Korea in April 2001, Atmos. Environ., 40, 1550–1560.
Lim, Y. B., and P. J. Ziemann (2005), Products and mechanism of secondaryorganic aerosol formation from reaction of n-alkanes with OH radicals inthe presence of NOx, Environ. Sci. Technol., 39, 9229–9236.
Maria, S. F., L. M. Russell, B. J. Turpin, and R. J. Porcja (2002), FTIRmeasurements of functional groups and organic mass in aerosol samplesover the Caribbean, Atmos. Environ., 36, 5185–5196.
Maria, S. F., L. M. Russell, B. J. Turpin, R. J. Porcja, T. L. Campos, R. J.Weber, and B. J. Huebert (2003), Source signature of carbon monoxideand organic functional groups in Asian Pacific Regional AerosolCharacterization Experiment (ACE-Asia) submicron aerosol types,J. Geophys. Res., 108(D23), 8637, doi:10.1029/2003JD003703.
Markowicz, K. M., P. J. Flatau, P. K. Quinn, C. M. Carrico, M. K. Flatau,A. M. Vogelmann, D. Bates, M. Liu, and M. J. Rood (2003), Influence ofrelative humidity on aerosol radiative forcing: An ACE-Asia experimentperspective, J. Geophys. Res., 108(D23), 8662, doi:10.1029/2002JD003066.
Mochida, M., Y. Kitamori, K. Kawamura, Y. Nojiri, S. Yukihiro, andK. Suzuki (2002), Fatty acids in the marine atmosphere: Factors governingtheir concentrations and evaluation or organic films on sea-salt particles,J. Geophys. Res., 107(D17), 4325, doi:10.1029/2001JD001278.
Oros, D. R., and B. R. T. Simoneit (2000), Identification and emission ratesof molecular tracers in coal smoke particulate matter, Fuel, 79, 515–536.
Quinn, P. K., et al. (2006), Impacts of sources and aging on submicrometeraerosol properties in the marine boundary layer across the Gulf of Maine,J. Geophys. Res., 111, D23S36, doi:10.1029/2006JD007582.
Rogge, W. F., M. A. Mazurek, L. M. Hildemann, G. R. Cass, and B. R. T.Simoneit (1993), Quantification of urban organic aerosols at a molecularlevel: Identification, abundance and seasonal variation, Atmos. Environ.,27, 1309–1330.
Romero, F., and M. Oehme (2005), Organosulfates—A new component ofhumic-like substances in atmospheric aerosols?, J. Atmos. Chem., 52,283–294.
Russell, L. M. (2003), Aerosol organic-mass-to-organic-carbon ratio mea-surements, Environ. Sci. Technol., 37, 2982–2987.
Russell, L. M., A. A. Mensah, E. V. Fischer, B. C. Sive, R. K. Varner, W. C.Keene, J. Stutz, and A. A. P. Pszenny (2007), Nanoparticle growth fol-lowing photochemical a- and b-pinene oxidation at Appledore Islandduring ICARTT/CHAiOS 2004, J. Geophys. Res., doi:10.1029/2006JD007736, in press.
Saxena, P., and L. M. Hildemann (1996), Water-soluble organics in atmo-spheric particles: A critical review of the literature and application ofthermodynamics to identify candidate compounds, J. Atmos. Chem.,24, 57–109.
Schauer, J. J., et al. (2003), ACE-Asia intercomparison of a thernal-opticalmethod for the determination of particle-phase organic and elementalcarbon, Environ. Sci. Technol., 37, 993–1001.
Seinfeld, J. H., and S. N. Pandis (1998),Atmospheric Chemistry and Physics,pp. 277–282, John Wiley, Hoboken, N. J.
Simoneit, R. B. T. (2002), Biomass burning—A review of organic tracersfor smoke from incomplete combustion, Appl. Geochem., 17, 129–162.
Simoneit, B. R. T., and M. A. Mazurek (1982), Organic matter of thetroposphere. II. Natural background of biogenic lipid matter in aerosolsover the rural western United States, Atmos. Environ., 16, 1967–1989.
Sorooshian, A., et al. (2006), Oxalic acid in clear and cloudy atmospheres:Analysis of data from International Consortium for AtmosphericResearch on Transport and Transformation 2004, J. Geophys. Res., 111,D23S45, doi:10.1029/2005JD006880.
Turpin, B. J., and H.-J. Lim (2001), Species contributions to PM2.5 massconcentrations: Revisiting common assumptions for estimating organicmass, Aerosol Sci. Technol., 35, 602–610.
Turpin, B. J., P. Saxena, and E. Andrews (2000), Measuring and simulatingparticulate organics in the atmosphere: Problems and prospects, Atmos.Environ., 34, 2983–3013.
Williams, B. J., A. H. Goldstein, D. B.Millet, R. Holzinger, N. M. Kreisberg,S. V. Hering, A. B. White, D. R. Worsnop, J. D. Allan, and J. L. Jimenez(2007), Chemical speciation of organic aerosol during the InternationalConsortium for Atmospheric Research on Transport and Transformation2004: Results from in situ measurements, J. Geophys. Res., 112, D10S26,doi:10.1029/2006JD007601.
Zhang, Q., D. R. Worsnop, M. R. Canagaratna, and J. L. Jimenez (2005),Hydrocarbon-like and oxygenated organic aerosol in Pittsburgh: Insightsinto sources and processes of organic aerosol, Atmos. Chem. Phys., 5,3289–3311.
�����������������������J. D. Allan, School of Earth, Atmospheric and Environmental Science,
University of Manchester, Manchester M13 9PL, UK.T. S. Bates and P. K. Quinn, Pacific Marine Environmental Laboratory,
NOAA, Seattle, WA 98115, USA.R. C. Flagan, J. H. Seinfeld, and A. Sorooshian, Department of Chemical
Engineering, California Institute of Technology, Pasadena, CA 91125,USA.S. Gilardoni and L. M. Russell, Scripps Institution of Oceanography,
University of California, San Diego, La Jolla, CA 92093, USA.([email protected])A. H. Goldstein and B. Williams, Department of Environmental Sciences,
Policy and Management, University of California, Berkeley, CA 94720,USA.T. B. Onasch and D. R. Worsnop, Aerodyne Research, Inc., 45 Manning
Road, Billerica, MA 01821-3976, USA.
D10S27 GILARDONI ET AL.: REGIONAL VARIATION OF ORGANIC AEROSOL
11 of 11
D10S27
423

Appendix G
Effect of NOx Level on Secondary Organic Aerosol
(SOA) Formation from the Photooxidation of Terpenes∗
∗This chapter is reproduced by permission from “Effect of NOx Level on Secondary Organic Aerosol (SOA) Formation from the Photooxidation of Terpenes” by N. L. Ng, P. S. Chhabra, A. W. H. Chan, J. D. Surratt, J. H. Kroll, A. J. Kwan, D. C. McCabe, P. O. Wennberg, A. Sorooshian, S. M. Murphy, N. F. Dalleska, R. C. Flagan, and J. H. Seinfeld, Atmos. Chem. Phys., 7, 5159-5174, 2007. © 2007 Author(s). This work is licensed under a Creative Commons License.
424

Atmos. Chem. Phys., 7, 5159–5174, 2007www.atmos-chem-phys.net/7/5159/2007/© Author(s) 2007. This work is licensedunder a Creative Commons License.
AtmosphericChemistry
and Physics
Effect of NOx level on secondary organic aerosol (SOA) formationfrom the photooxidation of terpenes
N. L. Ng1, P. S. Chhabra1, A. W. H. Chan1, J. D. Surratt2, J. H. Kroll 3, A. J. Kwan4, D. C. McCabe4, P. O. Wennberg4,A. Sorooshian1, S. M. Murphy 1, N. F. Dalleska4, R. C. Flagan1,4, and J. H. Seinfeld1,4
1Department of Chemical Engineering, California Institute of Technology, Pasadena, CA 91125, USA2Department of Chemistry, California Institute of Technology, Pasadena, CA 91125, USA3Aerodyne Research, Inc., Billerica, MA 01821, USA4Department of Environmental Science and Engineering, California Institute of Technology, Pasadena, CA 91125, USA
Received: 7 June 2007 – Published in Atmos. Chem. Phys. Discuss.: 12 July 2007Revised: 14 September 2007 – Accepted: 29 September 2007 – Published: 8 October 2007
Abstract. Secondary organic aerosol (SOA) formation fromthe photooxidation of one monoterpene (α-pinene) and twosesquiterpenes (longifolene and aromadendrene) is investi-gated in the Caltech environmental chambers. The effect ofNOx on SOA formation for these biogenic hydrocarbons isevaluated by performing photooxidation experiments undervarying NOx conditions. The NOx dependence ofα-pineneSOA formation follows the same trend as that observed pre-viously for a number of SOA precursors, including isoprene,in which SOA yield (defined as the ratio of the mass of or-ganic aerosol formed to the mass of parent hydrocarbon re-acted) decreases as NOx level increases. The NOx depen-dence of SOA yield for the sesquiterpenes, longifolene andaromadendrene, however, differs from that determined forisoprene andα-pinene; the aerosol yield under high-NOxconditions substantially exceeds that under low-NOx condi-tions. The reversal of the NOx dependence of SOA forma-tion for the sesquiterpenes is consistent with formation ofrelatively low-volatility organic nitrates, and/or the isomer-ization of large alkoxy radicals leading to less volatile prod-ucts. Analysis of the aerosol chemical composition for longi-folene confirms the presence of organic nitrates under high-NOx conditions. Consequently the formation of SOA fromcertain biogenic hydrocarbons such as sesquiterpenes (andpossibly large anthropogenic hydrocarbons as well) may bemore efficient in polluted air.
Correspondence to:J. H. Seinfeld([email protected])
1 Introduction
Atmospheric oxidation of certain volatile organic com-pounds (VOCs) leads to the formation of low volatilityspecies that partition into the condensed phase and form sec-ondary organic aerosol (SOA). Biogenic hydrocarbons, suchas isoprene (C5H8), monoterpenes (C10H16), and sesquiter-penes (C15H24), are important contributors to the total atmo-spheric burden of SOA owing to their large global emissionsand high reactivity with hydroxyl radicals (OH), ozone (O3),and nitrate radicals (NO3) (Guenther et al., 1995; Griffin etal., 1999a; Geron et al., 2000; Owen et al., 2001; Atkinsonand Arey, 2003; Seinfeld and Pankow, 2003; Kanakidou etal., 2005).
Over the last two decades, numerous laboratory chamberexperiments have been conducted to study aerosol formationfrom biogenic hydrocarbons. Level of odd nitrogen (NOx)
has been found to be highly influential in SOA production fora variety of compounds. Recent studies on isoprene photoox-idation,α-pinene ozonolysis, and benzene, toluene, andm-xylene photooxidation have demonstrated that aerosol yieldsare generally highest at low levels of NOx (Hatakeyama etal., 1991; Kroll et al., 2006; Presto et al., 2005; Song et al.,2005; Ng et al., 2007). These observations are consistentwith competitive chemistry of peroxy radicals between NOand HO2, with the RO2+HO2 reaction producing productsof lower volatility than the RO2+NO reaction (Hatakeyamaet al., 1991; Johnson et al., 2004, 2005; Kroll et al., 2005,2006; Presto et al., 2005; Ng et al., 2007). For example,in α-pinene ozonolysis, Presto et al. (2005) observed rela-tively volatile organic nitrates under high-NOx conditions,while less volatile products, such as 10-hydroxypinonic acid,were more abundant under low-NOx conditions. Although a
Published by Copernicus Publications on behalf of the European Geosciences Union.
425

5160 N. L. Ng et al.: NOx dependence of SOA formation from terpenes
decreasing SOA yield with increasing NOx level has beenestablished for relatively small hydrocarbons (10 carbonsor fewer), it is unknown whether larger molecules, such assesquiterpenes, exhibit a similar NOx dependence of SOAyield.
In the present study, we focus on two sesquiterpenes,longifolene and aromadendrene, and compare the NOx-dependence of their SOA formation with that ofα-pinene.Longifolene reacts very slowly with ozone (Atkinson andArey, 2003), making it ideal for the study of OH photooxi-dation. Moreover, both longifolene and aromadendrene haveonly one double bond, thus one can infer more easily thegeneral mechanisms of SOA formation than when multipledouble bonds are present (Ng et al., 2006). Experiments areconducted under limiting NOx conditions (high-NOx condi-tions in which HONO is used as the OH precursor, and low-NOx conditions in which H2O2 is used as the OH precursor),as well as with intermediate levels of NOx.
2 Experimental section
Experiments are performed in Caltech’s dual 28 m3 Teflonenvironmental chambers. Details of the facilities are givenelsewhere (Cocker et al., 2001; Keywood et al., 2004).Before each experiment, the chambers are flushed con-tinuously with dry purified air for∼24 h. Each cham-ber has a dedicated Differential Mobility Analyzer (DMA,TSI model 3081) coupled with a condensation nucleuscounter (TSI model 3760) for measuring aerosol size dis-tribution, number concentration, and volume concentration.All aerosol growth data are corrected for wall loss, in whichsize-dependent coefficients determined from inert particlewall loss experiments are applied to the aerosol volume data(Keywood et al., 2004). Temperature, relative humidity(RH), O3, NO, and NOx are continuously monitored. Theinitial temperature of the chamber is∼20◦C. Heating fromthe lights leads to a temperature increase of approximately5◦C inside the chamber over the course of the experiment.The analytical instruments are located outside the chamberenclosure and are at the temperature of the surrounding room(∼20–22◦C). The air may cool slightly as it is sampled fromthe chamber into the instruments, and the measured aerosollikely corresponds to the gas-particle partitioning at the tem-perature of the surrounding room rather than the chamberenclosure. Such small temperature differences are unlikelyto affect results significantly.
Seed particles are introduced into the chamber to act assubstrates onto which the gas-phase semivolatile productsmay condense. Seed aerosols are generated from a 0.015 Maqueous ammonium sulfate solution with a constant-rateatomizer, producing initial particle number concentrationsof ∼25 000 particles cm−3, with a geometric mean diame-ter of ∼50 nm, and an initial aerosol seed volume of∼10–15µm3 cm−3. After introduction of the seed aerosol, a
known volume of the parent hydrocarbon is injected intoa glass bulb, and then introduced into the chambers by anair stream. For experiments withα-pinene and longifo-lene, the concentration (mixing ratio) of the parent hydrocar-bon is monitored with a Hewlett Packard gas chromatograph(model 5890) with flame ionization detection (GC-FID). Theconcentration of longifolene in several experiments is alsomeasured with a Proton Transfer Reaction Mass Spectrome-ter (PTR-MS), a custom-modified Varian 1200 system (seeAppendix A). Owing to the difficulties in measuring aro-madendrene with GC-FID, its concentration is measuredsolely with the PTR-MS. The PTR-MS is calibrated only foraromadendrene.
In the high-NOx experiments nitrous acid (HONO) servesas the OH precursor. HONO is prepared by dropwise addi-tion of 15 mL of 1% NaNO2 into 30 mL of 10% H2SO4 ina glass bulb. After injection of the seed aerosol and parenthydrocarbon, the bulb is then attached to the chamber and astream of dry air is passed through the bulb, sending HONOinto the chamber. NO and NO2, formed as side products inthe preparation of HONO, are also introduced into the cham-ber, and are measured by a commercial NOx monitor (HoribaAPNA-360, Irvine, CA). Additional NO from a 500 ppm gascylinder (Scott Marrin, Inc.) is introduced into the chamberafter the addition of HONO to achieve a target NOx level inthe chamber of about 1 ppm (upper limit of the NOx moni-tor).
For low-NOx experiments, H2O2 serves as the OH precur-sor. The background NOx level in the chamber during suchexperiments is≤2 ppb. H2O2 is introduced into the chamber(prior to introduction of seed particles and parent hydrocar-bon) by bubbling air through a 50% H2O2 solution for 2.5 hat 5 L/min. The concentration of H2O2 in the chamber is notmeasured; based on the rate of hydrocarbon decay and liter-ature values ofσH2O2 andkH2O2, we estimate [H2O2] to be∼3–5 ppm (Kroll et al., 2006). The air stream then passesthrough a particle filter to remove any droplets. Variable NOexperiments are also carried out, in which a known concen-tration of NO is introduced into the chamber after the addi-tion of H2O2. This allows for the study of SOA formationunder intermediate NOx conditions. It is noted that for theseintermediate NOx experiments, NO goes to zero during theexperiment and so there is a switch from high- to low-NOxconditions over the course of the experiment.
Once the seed, parent hydrocarbon, and NOx concentra-tions stabilize, reaction is initiated by irradiating the cham-ber with blacklights. Output from the lights is between 300and 400 nm, with a maximum at 354 nm. Half of the avail-able black lights are used in the experiments. At these wave-lengths HONO efficiently photolyzes to OH and NO. By con-trast, H2O2 absorbs only weakly in this wavelength range,requiring the use of ppm mixing ratios of H2O2 to achievetarget levels of OH.
A comprehensive range of measurements are employedto study the chemical composition of the SOA formed.
Atmos. Chem. Phys., 7, 5159–5174, 2007 www.atmos-chem-phys.net/7/5159/2007/
426

N. L. Ng et al.: NOx dependence of SOA formation from terpenes 5161
Table 1.Parent hydrocarbons used in this study.
12 N. L. Ng et al.: NOx dependence of SOA formation from terpenes
Table 21. Parent hydrocarbons used in this study.
Parent Hydrocarbon Structure Formula (MW) kOH (cm3 molec-1 s-1)
α-pinene
C10H16 (136) 5.3 x 10⁻¹¹ a
longifolene
C15H24 (204) 4.8 x 10⁻¹¹ a
aromadendrene
C15H24 (204) 1.5 x 10⁻¹⁰ b
a Rate constants were obtained from Atkinson et al. (2003). b Rate constant was estimated from the rate of aromadendrene decay (experiment 1 in Table 4), assuming an OH concentration of 3 x 10⁶ molecule cm-3 and that aromadendrene reacts with OH only.
a Rate constants were obtained from Atkinson et al. (2003).b Rate constant was estimated from the rate of aromadendrenedecay (experiment 1 in Table 4), assuming an OH concentrationof 3×10⁶ molecule cm−3 and that aromadendrene reacts with OHonly.
Table 22. Initial conditions and results for α-pinene experiments.
Expt.No.
NOx Condition NO (ppb) NO2
(ppb)T (K) RH
(%)∆HC (ppb)a ∆Mo
(µg/m3)bSOA Yield(%)c
1 H2O2 0 0 298 5.3 13.8±0.2 29.3±2.4 37.9±3.22 H2O2 0 1 298 6.2 47.5±0.8 121.3±9.4 45.8±3.63 H2O2+NO 198 0 296 6.4 13.1±0.2 15.6±1.4 21.2±2.04 HONO 475 463 299 3.3 12.6±0.2 4.5±0.9 6.6±1.45 HONO 390 578 298 3.7 46.6±0.8 40.8±3.8 15.8±1.5
a Stated uncertainties (1σ) include scatter in GC measurements andGC calibration errors.b Stated uncertainties (1σ) are from scatter in particle volume mea-surements.c Stated uncertainties are propagated from errors in ∆HC and ∆Mo.
a Rateconstants were obtained from Atkinson et al. (2003).b Rate constant was estimated from the rate of aromadendrene decay (experiment 1 in Table 4), assuming an OH concentration of3×106 molecule cm−3 and that aromadendrene reacts with OH only.
Real-time particle mass spectra are obtained with an Aero-dyne quadrupole Aerosol Mass Spectrometer (Q-AMS)(Jayne et al., 2000). A particle-into-liquid sampler (PILS,Brechtel Manufacturing, Inc.) coupled with ion chromatog-raphy is employed for quantitative measurements of water-soluble ions in the aerosol phase (Sorooshian et al., 2006).For offline chemical analysis, aerosol samples are collectedon Teflon filters (PALL Life Sciences, 47-mm diameter, 1.0-µm pore size, Teflo membrane) starting at the point whenaerosol volume reaches its maximum value. Depending onthe total chamber volume concentration of aerosol, the fil-ter sampling time is 2–4 h, which results in∼1.5–6 m3 oftotal chamber air sampled. Teflon filter extraction proto-cols in HPLC-grade methanol have been described previ-ously (Surratt et al., 2006). The resultant filter extractsare then analyzed by high performance liquid chromatog-raphy/electrospray ionization-quadrupole mass spectrometry(HPLC/ESI-MS) and electrospray ionization-ion trap massspectrometry (ESI-ITMS); details of the protocols are de-scribed elsewhere (Surratt et al., 2006). Filter extracts arealso analyzed by a Waters ACQUITY ultra performance liq-uid chromatography (UPLC) system, coupled with a WatersLCT Premier time-of-flight (TOF) mass spectrometer (MS)equipped with an electrospray ionization (ESI) source (seeAppendix B), allowing for exact mass and tandem MS mea-surements.
The parent hydrocarbons studied and their stated puri-ties are as follows:α-pinene (Aldrich, 99+%), longifolene(Aldrich, >99%), and aromadendrene (Aldrich,>97%). Ta-
ble 1 lists the structures of the parent hydrocarbons and therate constants of the compounds for reaction with OH radi-cals (kOH). Experimental conditions and results for each ofthe parent hydrocarbons studied are given in Tables 2, 3, and4. In calculating SOA yield, knowledge of the SOA den-sity is required. By comparing volume distributions from theDMA and mass distributions from the Q-AMS, effective den-sities for the SOA formed can be estimated (Bahreini et al.,2005; Alfarra et al., 2006). The estimated densities of theSOA formed from different parent hydrocarbons are given inTable 5.
3 Aerosol yields
3.1 α-pinene photooxidation
Under high-NOx conditions, the efficient photolysis ofHONO generates relatively high concentrations of OH(∼2×10⁷ molecules cm−3 initially), leading to rapid α-pinene decay. Aerosol growth occurs essentially immedi-ately, even when [NO] is high (100’s of ppb). With the highNO concentration throughout the entire experiment, forma-tion of ozone and NO3 is suppressed.
Under low-NOx conditions, aerosol growth is alsoobserved immediately after initiation of irradiation. Theα-pinene decays at a slower rate than under high-NOxconditions, owing to the relatively slow production of OHradicals by H2O2 photolysis. Ozone formation is observed atan increasing concentration over time (∼30 ppb at the peak
www.atmos-chem-phys.net/7/5159/2007/ Atmos. Chem. Phys., 7, 5159–5174,2007
427
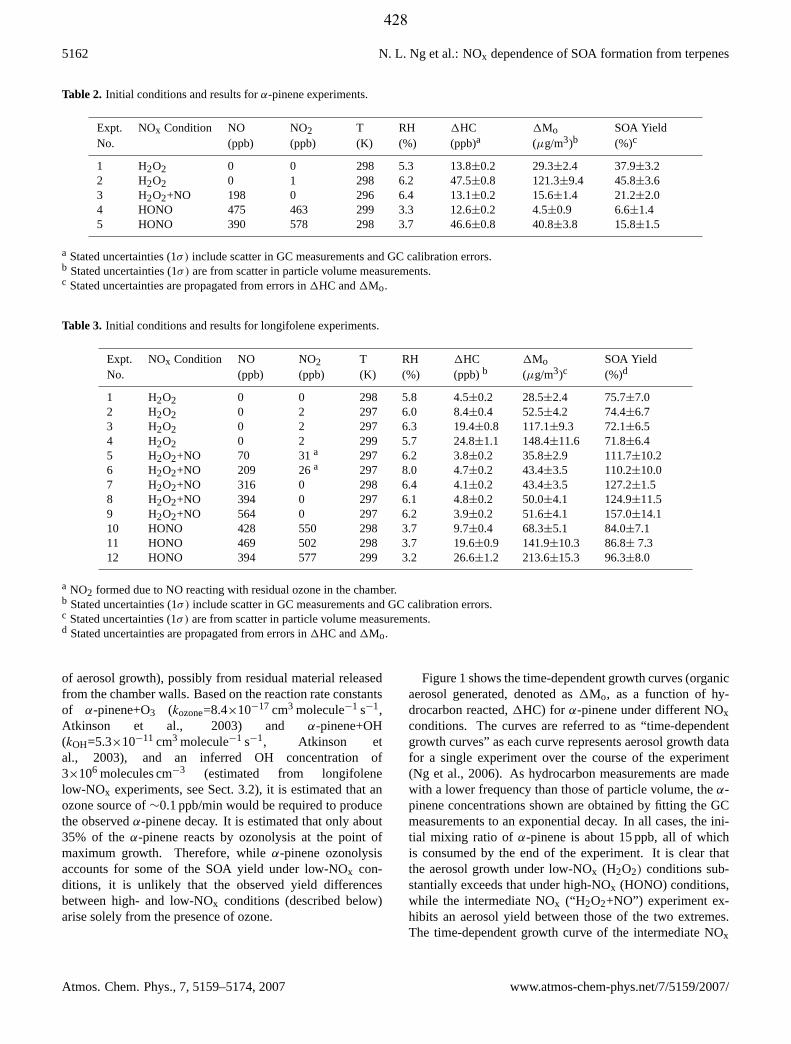
5162 N. L. Ng et al.: NOx dependence of SOA formation from terpenes
Table 2. Initial conditions and results forα-pinene experiments.
Expt. NOx Condition NO NO2 T RH 1HC 1Mo SOA YieldNo. (ppb) (ppb) (K) (%) (ppb)a (µg/m3)b (%)c
1 H2O2 0 0 298 5.3 13.8±0.2 29.3±2.4 37.9±3.22 H2O2 0 1 298 6.2 47.5±0.8 121.3±9.4 45.8±3.63 H2O2+NO 198 0 296 6.4 13.1±0.2 15.6±1.4 21.2±2.04 HONO 475 463 299 3.3 12.6±0.2 4.5±0.9 6.6±1.45 HONO 390 578 298 3.7 46.6±0.8 40.8±3.8 15.8±1.5
a Stateduncertainties (1σ)include scatter in GC measurements and GC calibration errors.b Stated uncertainties (1σ)are from scatter in particle volume measurements.c Stated uncertainties are propagated from errors in1HC and1Mo.
Table 3. Initial conditions and results for longifolene experiments.
Expt. NOx Condition NO NO2 T RH 1HC 1Mo SOA YieldNo. (ppb) (ppb) (K) (%) (ppb)b (µg/m3)c (%)d
1 H2O2 0 0 298 5.8 4.5±0.2 28.5±2.4 75.7±7.02 H2O2 0 2 297 6.0 8.4±0.4 52.5±4.2 74.4±6.73 H2O2 0 2 297 6.3 19.4±0.8 117.1±9.3 72.1±6.54 H2O2 0 2 299 5.7 24.8±1.1 148.4±11.6 71.8±6.45 H2O2+NO 70 31a 297 6.2 3.8±0.2 35.8±2.9 111.7±10.26 H2O2+NO 209 26a 297 8.0 4.7±0.2 43.4±3.5 110.2±10.07 H2O2+NO 316 0 298 6.4 4.1±0.2 43.4±3.5 127.2±1.58 H2O2+NO 394 0 297 6.1 4.8±0.2 50.0±4.1 124.9±11.59 H2O2+NO 564 0 297 6.2 3.9±0.2 51.6±4.1 157.0±14.110 HONO 428 550 298 3.7 9.7±0.4 68.3±5.1 84.0±7.111 HONO 469 502 298 3.7 19.6±0.9 141.9±10.3 86.8±7.312 HONO 394 577 299 3.2 26.6±1.2 213.6±15.3 96.3±8.0
a NO2 formeddue to NO reacting with residual ozone in the chamber.b Stated uncertainties (1σ)include scatter in GC measurements and GC calibration errors.c Stated uncertainties (1σ)are from scatter in particle volume measurements.d Stated uncertainties are propagated from errors in1HC and1Mo.
of aerosol growth), possibly from residual material releasedfrom the chamber walls. Based on the reaction rate constantsof α-pinene+O3 (kozone=8.4×10⁻¹⁷ cm3 molecule−1 s−1,Atkinson et al., 2003) and α-pinene+OH(kOH=5.3×10⁻¹¹ cm3 molecule−1 s−1, Atkinson etal., 2003), and an inferred OH concentration of3×106 molecules cm−3 (estimated from longifolenelow-NOx experiments, see Sect. 3.2), it is estimated that anozone source of∼0.1 ppb/min would be required to producethe observedα-pinene decay. It is estimated that only about35% of theα-pinene reacts by ozonolysis at the point ofmaximum growth. Therefore, whileα-pinene ozonolysisaccounts for some of the SOA yield under low-NOx con-ditions, it is unlikely that the observed yield differencesbetween high- and low-NOx conditions (described below)arise solely from the presence of ozone.
Figure 1 shows the time-dependent growth curves (organicaerosol generated, denoted as1Mo, as a function of hy-drocarbon reacted,1HC) for α-pinene under different NOxconditions. The curves are referred to as “time-dependentgrowth curves” as each curve represents aerosol growth datafor a single experiment over the course of the experiment(Ng et al., 2006). As hydrocarbon measurements are madewith a lower frequency than those of particle volume, theα-pinene concentrations shown are obtained by fitting the GCmeasurements to an exponential decay. In all cases, the ini-tial mixing ratio of α-pinene is about 15 ppb, all of whichis consumed by the end of the experiment. It is clear thatthe aerosol growth under low-NOx (H2O2) conditions sub-stantially exceeds that under high-NOx (HONO) conditions,while the intermediate NOx (“H2O2+NO”) experiment ex-hibits an aerosol yield between those of the two extremes.The time-dependent growth curve of the intermediate NOx
Atmos. Chem. Phys., 7, 5159–5174, 2007 www.atmos-chem-phys.net/7/5159/2007/
428

N. L. Ng et al.: NOx dependence of SOA formation from terpenes 5163
Table 4. Initial conditions and results for aromadendrene experiments.
Expt.No.
NOx Condition NO(ppb)
NO2(ppb)
T(K)
RH(%)
1HC(ppb)a
1Mo(µg/m3)b
SOA Yield(%)
1 H2O2 0 0 299 5.5 5.7±1.2 19.7±2.0 41.7±102 H2O2+NO 120 0 298 9.3 5.3±1.2 23.1±2.2 52.0±12.43 H2O2+NO 195 0 298 7.7 6.0±1.4 29.3±2.6 58.8±14.44 H2O2+NO 517 0 299 7.4 3.2±0.7 22.6±2.2 84.7±20.0
a Stateduncertainties (1σ)include scatter in PTR-MS measurements and PTR-MS calibration errors.b Stated uncertainties are derived from scatter in particle volume measurements.
Table 5. Estimated effective SOA densities.
Parent Hydrocarbon NOx Condition Effective Density (g cm−3)a
α-pinene Low-NOx 1.32±0.10α-pinene Intermediate NOx 1.32±0.10α-pinene High-NOx 1.33±0.10longifolene Low-NOx 1.29±0.10longifolene Intermediate NOx 1.30±0.10longifolene High-NOx 1.40±0.10aromadendrene Low-NOx 1.20±0.10aromadendrene Intermediate NOx 1.35±0.10
a Stateduncertainties (1σ)are from repeated measurement of am-monium sulfate seed densities.
experiment exhibits a vertical section at the end, indicatingthat further reactions are contributing to aerosol growth af-ter α-pinene is consumed. We return to this observation inSect. 5.2.2.
3.2 Longifolene photooxidation
For longifolene, a series of high-NOx (HONO) experimentsand low-NOx (H2O2) experiments with varying initial hydro-carbon concentrations are carried out. The time-dependentgrowth curves for 3 high-NOx and 3 low-NOx experiments,with initial longifolene mixing ratios ranging from∼10 to30 ppb, are shown in Fig. 2. In contrast toα-pinene photooxi-dation, longifolene aerosol yields under high-NOx conditionsexceed those under low-NOx conditions. Under high-NOxconditions, the maximum SOA yield is about∼100–130%and is reached in∼10 min after initiation of the experiments,with the yield decreasing after that point. It is noted that SOAyield is defined on a mass basis so oxidation (addition of Oor N atoms) can lead to yields larger than 100%. Under low-NOx conditions, SOA yield continues to increase over thecourse of the experiment, reaching a maximum when all thelongifolene is consumed. The final SOA yields of each longi-folene low-NOx experiment lie on a straight line that passesthrough the origin, indicating that under low-NOx conditionsSOA yield is constant (∼75%) under the range of1Mo stud-ied. It is possible that under lower SOA loadings the yields
Figure 1:
35
30
25
20
15
10
5
0
ΔMo
(μg/
m3 )
806040200
ΔHC (μg/m3)
H2 O2 H2 O2 + 198 ppb NO HONO (~1 ppm NOx)
Fig. 1. Time-dependent growth curves forα-pinene photooxidationunder different NOx conditions (Experiments 1, 3 and 4 in Table 2).
may decrease as some of the products partition back into thegas phase. Based on the observed longifolene decay andkOHfor longifolene, the chamber OH concentration under low-NOx conditions is estimated to be∼3×10⁶ molecules cm−3.
The effect of NOx on longifolene aerosol formation isfurther illustrated by the time-dependent growth curves inFig. 3. In both experiments H2O2 is used as the OH pre-cursor and the initial longifolene mixing ratio is 4–5 ppb; inone experiment no extra NO is added, while in the other ex-periment about 300 ppb of NO is introduced into the cham-ber after the addition of H2O2. Aerosol growth in the pres-ence of∼300 ppb NO is substantially higher. A series of ex-periments with the same initial longifolene concentration butdifferent initial NO concentrations (∼100–600 ppb) are alsocarried out. Figure 4 shows the final aerosol yield as a func-tion of the initial NOx concentration. The amount of aerosolformed is highly dependent on the level of NOx present ini-tially; with ∼600 ppb NO, the ultimate aerosol yield is twicethat at low-NOx conditions.
www.atmos-chem-phys.net/7/5159/2007/ Atmos. Chem. Phys., 7, 5159–5174, 2007
429

5164 N. L. Ng et al.: NOx dependence of SOA formation from terpenesFigure 2:
200
150
100
50
0
ΔMo
(μg/
m3 )
200150100500ΔHC (μg/m
3)
9.7 ppb (High NOx) 19.6 pbb (High NOx) 26.6 ppb (High NOx) 8.4 ppb (Low NOx) 19.4 ppb (Low NOx) 24.8 ppb (Low NOx)
Fig. 2. Time-dependent growth curves for longifolene photooxida-tion under high- and low-NOx conditions (Experiments 2, 3, 4, 10,11, and 12 in Table 3). The mixing ratios in the legend refer to theamount of longifolene reacted in each experiment. The final SOAyields of each low-NOx experiment lie on a straight line that passesthrough the origin, indicating that under low-NOx conditions SOAyield is constant, at∼75%.
Figure 3:
50
40
30
20
10
0
ΔMo
(μg/
m3 )
403020100
ΔHC (μg/m3)
H2O2 H2O2 + 316 ppb NO
Fig. 3. Time-dependent growth curves for longifolene photooxida-tion with H2O2 as the OH precursor. Aerosol growth in the presenceof ∼300 ppb NO (Experiment 7 in Table 3) significantly exceedsthat without NO (Experiment 1 in Table 3).
3.3 Aromadendrene photooxidation
Figure 5 shows the final aerosol yield as a function of ini-tial NOx concentration for aromadendrene photooxidation.The OH precursor used in these experiments is H2O2 andthe initial aromadendrene mixing ratio is∼5 ppb. It is clearthat aromadendrene aerosol yield also increases with NOxconcentration; as with longifolene, with∼500 ppb NO, theaerosol yield is approximately double that at low-NOx con-ditions.
Figure 4:
160
120
80
40
0
Yie
ld (
%)
6005004003002001000NOx (ppb)
Fig. 4. SOA growth as a function of initial NOx concentration, for afixed longifolene concentration (4–5 ppb). Results shown are fromTable 3.Figure 5:
100
80
60
40
20
0
Yie
ld (
%)
5004003002001000NOx (ppb)
Fig. 5. SOA growth as a function of initial NOx concentration, at afixed initial aromadendrene concentration (∼5 ppb). Results shownare given in Table 4.
4 Chemical composition of SOA
In this section, the measurements of the chemical composi-tion of α-pinene and longifolene SOA are presented. Thearomadendrene experiments are performed mainly to verifythe observed NOx dependence for longifolene, in which SOAyield is higher under high-NOx conditions, and so detailedanalysis of the chemical composition of aromadendrene SOAis not pursued.
4.1 Aerosol Mass Spectrometer (Q-AMS) measurements
Figures 6 and 7 show the AMS high-NOx versus low-NOxspectrum signal forα-pinene and longifolene photooxida-tion, respectively. Each mass fragment is normalized bythe total signal. For both hydrocarbons, SOA at high NOxconditions exhibit relatively strong signals atm/z 30 and
Atmos. Chem. Phys., 7, 5159–5174, 2007 www.atmos-chem-phys.net/7/5159/2007/
430

N. L. Ng et al.: NOx dependence of SOA formation from terpenes 5165Figure 6:
2
4
6
80.001
2
4
6
80.01
2
4
6
80.1
2
Hig
h N
Ox
Mas
s F
ract
ion
2 3 4 5 60.001
2 3 4 5 60.01
2 3 4 5 60.1
2
Low NOx Mass Fraction
12
13
14
15
16
17
18
24
25
26
2729
30
37
38
4142
43
44
4546
48
49
5051
52
53
54
55
5657
5859
60
6162
6364
65
66
67
68
69
7071
7273
74
75
77
78
79
80
81
82
83
8485
8687
89
90
91
92
9394
95
96
97
98
99
100101102 103
104
105
106
107108
109
110111
112113
114
115
117
119
120
121122
123
124
125127
128129
132133
134
135
136137
139
141
151
300
250
200
150
100
50
0
m/z
��������
Fig. 6. AMS high-NOx spectra signal versus low-NOx spectra sig-nal forα-pinene photooxidation. Each mass fragment is normalizedby the total signal. The solid black line is the 1:1 line. The spectraare taken when all hydrocarbon has been consumed.
46, and to a much smaller extentm/z 14. The signals atthese mass to charge ratios likely correspond to NO+
2 (46),NO+(30), and N+(14) fragments from nitrates in the aerosol.The significance of these fragments will be further discussedin Sect. 5.1.
Changes in AMS spectra over the course of the experi-ment for longifolene under high- and low-NOx conditionsare shown in Figs. 8 and 9, respectively. The correspondinggrowth curves for these experiments are shown in Fig. 2 (thepair of experiments with∼30 ppb of longifolene injected).The top panel shows the fractional contribution of each massfragment to the total organic and nitrate signal during thegrowth phase of the experiment (the first∼100µgm−3 longi-folene reacted); the middle panel shows the fractional contri-butions at the point when all of the hydrocarbon is consumed(1HC∼200µgm−3); the bottom panel shows the percentagechange of each mass fragment between these two phases.Under high-NOx conditions, changes in mass fractions ofdifferent fragments during aerosol growth are minimal, in-dicating that the aerosol composition is not changing signif-icantly over time. Under low-NOx conditions, however, themass fraction ofm/z 44 (corresponding to the CO+2 ion, in-dicative of highly oxidized organics) increases by 93% dur-ing the reaction, while those for higher mass to charge ratiosare observed to decrease. The mass fractions ofm/z 44 andhigher mass to charge ratios continue to change even after theaerosol growth levels off, suggesting the presence of furtherchemistry (either gas-phase or particle-phase) even after allthe initial hydrocarbon is consumed.
Figure 7:
2
3
456
0.001
2
3
456
0.01
2
3
456
0.1
Hig
h N
Ox
Sig
nal F
ract
ion
2 3 4 5 60.001
2 3 4 5 60.01
2 3 4 5 60.1
Low NOx Signal Fraction
12
13
14
15
16
17
18
24
25
26
272930
37
38
41
42
43
44
45
46
4849
50
51
52
53
54
55
5657
58
59
6061
62
6364
65
66
67
68
69
70
71
72
73747576
77
78
79
80
81
82
83
84
85
8687
88
89
90
91
92
93
94
95
9697
9899
100
101
102
103
104
105
106
107
108
109
110111
112113
114
115
116
117
118
119
120
121
122
123
124
125
126
127
128129
130
131
132
133
134
135
136
137
138
139
140
141
142
143
144
145
146
147
148150
151152153
154
155
156
157
158
159
160
161
162
163
164
165
166
167
168
169
170
171
172
173
174
175
176
177
178
179
181185187
189
191193
203205
207
300
250
200
150
100
50
0
m/z
�����������
Fig. 7. AMS high-NOx spectra signal versus low-NOx spectra sig-nal for longifolene photooxidation. Each mass fragment is normal-ized by the total signal. The solid black line is the 1:1 line. Thespectra are taken when all hydrocarbon has been consumed.
4.2 Offline chemical analysis
All ions detected by the UPLC/ESI-TOFMS instrument fromα-pinene and longifolene photooxidation are listed in Ta-bles 6 and 7, respectively. The tables list the exact massesand their likely molecular formulas corresponding to eachof the [M–H]− ions detected (in which M is the molecu-lar weight of the compound). The error between the mea-sured mass and theoretical mass is reported in two differentways, ppm and mDa. For most of the ions observed, theerror between the measured and theoretical masses is lessthan±2 mDa and±5 ppm, allowing for generally unambigu-ous identification of molecular formulae. Solvent blanks andcontrol filters are also run on the UPLC/ESI-TOFMS instru-ment; none of the listed ions is observed in these control sam-ples. The ions listed in Tables 6 and 7 are also detected byHPLC/ESI-MS and ESI-ITMS, confirming that these com-pounds are not the result of artifact formation in a specificmass spectrometer.
Acidic compounds, such as carboxylic acids and sulfateesters, readily ionize under (–)ESI-MS techniques (Gao etal., 2004; Surratt et al., 2006; Surratt et al., 2007). Hydroxy-lated compounds, as well as ketones and aldehydes, however,are generally not ionizable unless carboxylic acid and/or sul-fate ester moieties are also present within the same molecule.Therefore, it is expected that all ions listed in Tables 6 and 7are acidic compounds. For the SOA formed in the presenceof NOx (HONO and “H2O2+NO” experiments), even-mass
www.atmos-chem-phys.net/7/5159/2007/ Atmos. Chem. Phys., 7, 5159–5174, 2007
431

5166 N. L. Ng et al.: NOx dependence of SOA formation from terpenesFigure 8:
100
50
0
-50
Per
cent
age
Cha
nge
(%)
20018016014012010080604020m/z
0.10
0.08
0.06
0.04
0.02
0.00
Sig
nal F
ract
ion
0.100.080.060.040.020.00
Sig
nal F
ract
ion
����������� �� ��
growth
����������� �� ��
end
Fig. 8. Change in AMS spectrum over the course of longifolene photooxidation under high-NOx conditions. Top panel: Fractional con-tribution of each mass fragment to the total organic and nitrate signal during the growth phase of the experiment. Middle panel: fractionalcontribution of each mass fragment to the total organic and nitrate signal when all hydrocarbon is consumed. Bottom panel: Percentagechange of each mass fragment between the growth phase and the end of the experiment.
Figure 9:
100
50
0
-50
Per
cent
age
Cha
nge
(%)
20018016014012010080604020m/z
60x10-3
50
40
30
20
10
0
Sig
nal F
ract
ion
60x10-3
40
20
0
Sig
nal F
ract
ion
����������� �� ��
growth
����������� �� ��
end
Fig. 9. Change in AMS spectrum over the course of longifolene photooxidation under low-NOx conditions. Top panel: Fractional contri-bution of each mass fragment to the total organic and nitrate signal during the growth phase of the experiment. Middle panel: fractionalcontribution of each mass fragment to the total organic and nitrate signal when all hydrocarbon is consumed. Bottom panel: Percentagechange of each mass fragment between the growth phase and the end of the experiment.
Atmos. Chem. Phys., 7, 5159–5174, 2007 www.atmos-chem-phys.net/7/5159/2007/
432

N. L. Ng et al.: NOx dependence of SOA formation from terpenes 5167Figure 10:
7.80 8.00 8.20 8.40 8.60 8.80 9.00 9.20 9.40 9.60
374
374346
390 374390
374390
Longifolene (HONO)
Longifolene (H2O2 + NO)
Longifolene (H2O2)
Ab
so
lute
Ab
un
dan
ce
Time (min)
374
Fig. 10. UPLC/ESI-TOFMS extracted ion chromatograms (EICs) (=m/z346+374+390) for longifolene photooxidation. The even [M–H]−
ions listed above the chromatographic peaks correspond to organic nitrates detected in longifolene SOA. No organic nitrates are detected inthe H2O2 experiment (low-NOx condition). The HONO experiment (high-NOx condition) has the widest array of organic nitrates detected(as shown in Table 7), as well as the largest chromatographic peaks;m/z 372 is the only exception, and is most abundant in the intermediateNOx experiment. These EICs are directly comparable as the volume of chamber air sampled is approximately the same (2 m3).
[M–H]− ions are observed in ESI mass spectra, indicatingthe compound has an odd number of nitrogen atoms, likelywithin organic nitrate functional groups. Nitrated organicswere previously observed in isoprene SOA formed underhigh-NOx conditions (both HONO and H2O2+NO) (Surrattet al., 2006), and are further confirmed by the tandem MSdata, which reveals a loss of 63 Da (HNO3). For α-pinene,only one acidic organic nitrate (m/z322) is detected in theHONO experiment and none are detected in H2O2 and inter-mediate NOx experiments. Masses of many ions detectedin the α-pinene experiments have been observed in previ-ous laboratory work (Glasius et al., 1999, 2000; Larsen etal., 2001) and field studies (Gao et al., 2006). For longi-folene, a much wider array of acidic organic nitrates is de-tected by the UPLC/ESI-TOFMS instrument in both HONOand intermediate NOx experiments. For bothα-pinene andlongifolene, compounds with more carbons than the parenthydrocarbon are observed. Tandem MS data for these C12,C16, and C17 acidic organic nitrates reveal a common neutralloss of 60 Da, which possibly corresponds to an acetic acidmonomer. Surratt et al. (2006) and Szmigielski et al. (2007)recently showed that particle-phase esterification occurs inisoprene SOA formed under high-NOx conditions. The ob-served neutral loss of 60 Da for these acidic organic nitratessuggests that these compounds may be dimers formed byparticle-phase esterification.
Figure 10 shows the extracted ion chromatograms (EICs)of m/z 346, 374, and 390 from longifolene oxidation underdifferent NOx conditions. Thesem/z values correspond to
acidic organic nitrates, as confirmed by the exact mass data(Table 7) as well as the loss of 63 Da in the tandem MS data.The chromatographic peaks are much larger in the highestNOx experiment than those in the intermediate NOx exper-iment (exceptm/z 372, not shown); no chromatographicpeaks are observed under low-NOx (H2O2) conditions. Inaddition, for several [M–H]− ions (e.g.m/z 374 and 390)there are several structural isomers present. Additionally, theintensity of non-nitrogen-containing ions (e.g.m/z 223, 239,253, 255, 267, 269, and 283), are generally larger under low-NOx conditions.
5 Discussion
5.1 Effect of hydrocarbon size on NOx dependence
It has been established that NOx levels exert a major influ-ence on SOA formation (Hatakeyama et al., 1991; Pandiset al., 1991; Zhang et al., 1992, 2006; Hurley et al., 2001;Johnson et al., 2004, 2005; Song et al., 2005; Presto et al.,2005; Kroll et al., 2005, 2006; Ng et al., 2007). For pho-tooxidation of isoprene, SOA yields increase as the NOxlevel decreases (Kroll et al., 2006). The proposed mecha-nism for this observed NOx dependence is the competitivechemistry of organic peroxy radicals between NO and HO2,in which the semivolatile products formed via the RO2+HO2path are less volatile than those formed via the RO2+NOroute (Hatakeyama et al., 1991; Johnson et al., 2004, 2005;
www.atmos-chem-phys.net/7/5159/2007/ Atmos. Chem. Phys., 7, 5159–5174,2007
433

5168 N. L. Ng et al.: NOx dependence of SOA formation from terpenes
Table 6.α-Pinene acidic SOA components detected by UPLC/ESI-TOFMS.
Experiment Measured TOFMS suggested Error Error Retention[M - H] − ion (m/z) molecular formula (mDa) (ppm) Time (min)
H2O2
157.0497 C7H9O−
4 -0.4 -2.5 5.09169.0873 C9H13O−
3 0.8 4.7 6.89171.0654 C8H11O−
4 -0.3 -1.8 5.61183.1027 C10H15O−
3 0.6 3.3 7.50185.0821 C9H13O−
4 0.7 3.8 6.85199.0983 C10H15O−
4 1.3 6.5 6.17199.0982 C10H15O−
4 1.2 6.0 6.29199.0976 C10H15O−
4 0.6 3.0 6.34215.0923 C10H15O−
5 0.4 1.9 5.99215.0930 C10H15O−
5 1.1 5.1 7.18231.0885 C10H15O−
6 1.6 6.9 6.80
H2O2 + NO
157.0499 C7H9O−
4 -0.2 -1.3 5.08171.0655 C8H11O−
4 -0.2 -1.2 5.60183.1025 C10H15O−
3 0.4 2.2 7.49185.0812 C9H13O−
4 -0.2 -1.1 6.86197.0814 C10H13O−
4 0.0 0.0 8.09199.0971 C10H15O−
4 0.1 0.5 6.36203.0557 C8H11O−
6 0.1 0.5 5.50215.0925 C10H15O−
5 0.6 2.8 6.23229.0718 C10H13O−
6 0.6 2.6 6.17231.0856 C10H15O−
6 -1.3 -5.6 6.79
HONO
171.0649 C8H11O−
4 -0.8 -4.7 5.60183.1022 C10H15O−
3 0.1 0.5 7.49185.0457 C8H9O−
5 0.7 3.8 6.63187.0606 C8H11O−
5 0.0 0.0 5.65197.0819 C10H13O−
4 0.5 2.5 8.09203.0546 C8H11O−
6 -1.0 -4.9 5.50213.0781 C10H13O−
5 1.8 8.4 5.26231.0883 C10H15O−
6 1.4 6.1 6.80259.1182 C12H19O−
6 0.0 0.0 5.85322.1148 C12H20NO−
9 1.0 3.1 7.62
Prestoet al., 2005; Kroll et al., 2006; Zhang et al., 2006; Nget al., 2007). A similar yield dependence on NOx is observedhere for photooxidation ofα-pinene (Fig. 1). For an initialα-pinene concentration of∼15 ppb, the SOA yield under low-NOx conditions is about a factor of 3 higher than that un-der high-NOx conditions. The observed NOx dependence isconsistent with that of previous studies onα-pinene photoox-idation (Hatakeyama et al, 1991) andα-pinene ozonolysis(Presto et al., 2005).
The observed NOx dependence of SOA yield for thesesquiterpenes, however, is different from that of isopreneandα-pinene (as well as other hydrocarbons with 10 or fewercarbons, such as aromatic species). For longifolene and aro-madendrene, aerosol yield increases with increasing NOxconcentration (Figs. 2–5). This reversal of the NOx depen-dence of SOA formation could be the result of a number offactors. Figure 11 shows a simplified reaction mechanism in-volving peroxy radical chemistry. At the two limiting NOxconditions of this study, the peroxy radical chemistry is rela-tively well-defined; under high-NOx conditions, peroxy rad-icals react virtually entirely with NO, while under low-NOxconditions, RO2 reacts predominantly with HO2. One of thepossible explanations for the higher SOA yield under high-NOx conditions is the formation of large alkoxy radicals thatisomerize rather than fragment. Isomerization is plausible if
Table 7. Longifolene acidic SOA components detected byUPLC/ESI-TOFMS.
Experiment Measured TOFMS suggested Error Error Retention[M - H] − ion (m/z) molecular formula (mDa) (ppm) Time (min)
H2O2
223.1344 C13H19O−
3 1.0 4.5 8.92237.1500 C14H21O−
3 0.9 3.8 9.06239.1651 C14H23O−
3 0.4 1.7 10.50253.1445 C14H21O−
4 0.5 2.0 9.36249.1499 C15H21O−
4 0.8 3.2 9.25249.1501 C15H21O−
4 1.0 4.0 10.14255.1611 C14H23O−
4 1.5 5.9 9.88255.1622 C14H23O−
4 2.6 10.2 8.99267.1602 C15H23O−
4 0.6 2.2 8.88267.1606 C15H23O−
4 1.0 3.7 9.01267.1611 C15H23O−
4 1.5 5.6 9.28267.1601 C15H23O−
4 0.5 1.9 9.70269.1392 C14H21O−
5 0.3 1.1 7.71283.1561 C15H23O−
5 1.6 5.7 7.35313.2018 C17H29O−
5 0.3 1.0 9.20
H2O2 + NO
223.1337 C13H19O−
3 0.3 1.3 8.92239.1649 C14H23O−
3 0.2 0.8 10.49265.1442 C15H21O−
4 0.2 0.8 8.93269.1401 C14H21O−
5 1.2 4.5 7.72316.1396 C14H22NO−
7 0.0 0.0 9.88329.1972 C17H29O−
6 0.8 2.4 9.35372.1664 C17H26NO−
8 0.6 1.6 10.58374.1829 C17H28NO−
8 1.4 3.7 9.14374.1829 C17H28NO−
8 1.4 3.7 9.35390.1775 C17H28NO−
9 1.1 2.8 9.46
HONO
223.1334 C13H19O−
3 -0.1 -0.4 8.92241.1453 C13H21O−
4 1.3 5.4 7.55253.1431 C14H21O−
4 -0.9 -3.6 8.02269.1394 C14H21O−
5 0.5 1.9 7.18269.1408 C14H21O−
5 1.9 7.1 7.71342.1930 C17H28NO−
6 1.3 3.8 9.65344.1348 C15H22NO−
8 0.3 0.9 8.25346.1502 C15H24NO−
8 0.2 0.6 8.34360.1674 C16H26NO−
8 1.6 4.4 8.89372.1667 C17H26NO−
8 -0.6 -1.6 10.61374.1809 C17H28NO−
8 -0.6 -1.6 8.89374.1816 C17H28NO−
8 0.1 0.3 9.13374.1808 C17H28NO−
8 -0.7 -1.9 9.35390.1773 C17H28NO−
9 0.9 2.3 8.49390.1778 C17H28NO−
9 1.4 3.6 9.21435.1619 C17H27N2O−
11 0.4 0.9 9.56
the alkoxy radical has four or more carbon atoms and canform a 6-membered transition state (Baldwin et al., 1977;Carter and Atkinson, 1985). The isomerization pathwayleads to the formation of large hydroxycarbonyls, multifunc-tional products that are likely low in volatility. The relativeimportance of isomerization increases with the size of alkoxyradicals (Atkinson, 1994, 1997a, b; Atkinson et al., 1995,1999), and larger compounds could exhibit increasing SOAyields under high-NOx conditions as a consequence of thismechanism. For example, Lim and Ziemann (2005) mea-sured SOA yields up to∼50% for C15 alkanes in the presenceof ppm levels of NOx. They proposed multiple isomerizationsteps leading to the formation of multifunctional compoundsincluding nitrooxy, hydroxyl, and carbonyl groups, and it issuggested that the hydroxycarbonyls formed may isomerizeto form furan species that can undergo further reactions (Limand Ziemann, 2005). Gas-phase products that are consis-tent with the isomerization mechanism have been observed
Atmos. Chem. Phys., 7, 5159–5174, 2007 www.atmos-chem-phys.net/7/5159/2007/
434

N. L. Ng et al.: NOx dependence of SOA formation from terpenes 5169
in α-pinene photooxidation but this pathway does not appearto dominate SOA formation under high-NOx conditions (As-chmann et al., 1998, 2002), possibly due to the higher volatil-ity of these species.
Higher SOA yields observed under high-NOx conditionsfor sesquiterpenes may, secondly, be a result of the forma-tion of relatively nonvolatile organic nitrates, evidence forwhich appears in both Q-AMS data and filter sample data.In AMS data,m/z 30 (NO+) andm/z 46 (NO+
2 ) signals arecommonly associated with nitrate species (organic and inor-ganic nitrates). For bothα-pinene and longifolene, the ratioof the sum of the intensities of ions atm/z 30 andm/z 46 tothe total ion intensity is higher under high-NOx conditions:under low-NOx conditions, the ratio is very small (2%), un-der high-NOx conditions, the ratio is about 15–25%. Theratio of m/z 30 to total mass and the ratio ofm/z 46 to to-tal mass show the same trend, indicatingm/z 30 andm/z 46are correlated. It is possible that the signal atm/z 30 couldbe the result of a non-nitrogen containing organic fragmention; however, given the observed correlation betweenm/z
30 andm/z 46 and their small signals under low-NOx condi-tions, it appears that there is little interference from organicsat these signals. Under high-NOx conditions,∼10µgm−3 ofinorganic nitrates, as measured by the PILS/IC, are presentin the aerosol. Such nitrates may arise from the partitioningor reactive uptake of gas-phase HNO3 into the aerosol phase.Assuming no non-nitrate contribution tom/z 30 andm/z 46,the total nitrate content of the SOA is estimated as the sumof the signals at each fragment. It is found that the calcu-lated nitrate content (∼20µgm−3) exceeds that measured byPILS/IC, suggesting the presence of organic nitrates.
The filter sample data provide a more direct comparisonon the amount of organic nitrates formed inα-pinene andlongifolene photooxidation under different NOx conditions.For bothα-pinene and longifolene, no acidic nitrates are ob-served under low-NOx conditions, consistent with the lackof NOx and the prevailing RO2+HO2 reaction in this case.Organic nitrate yield from the RO2+NO reaction increaseswith increasing carbon number (Atkinson et al., 1987; Carterand Atkinson, 1989; O’Brien et al., 1998; Arey et al., 2001;Aschmann et al., 2001; Zhang et al., 2004), and with thelarger carbon skeleton the organic nitrates formed will beless volatile, this is consistent with the much wider arrayand larger quantities of acidic nitrates detected in longifolenephotooxidation under high-NOx conditions compared to theα-pinene experiments. Hence for photooxidation of largercompounds such as sesquiterpenes, the nitrate formationchannel may play an important role in SOA formation underhigh-NOx conditions. With the formation of large molecu-lar weight compounds with nitrate groups, mass-based SOAyields from longifolene photooxidation under high-NOx con-ditions actually exceed 100%.
Lacking appropriate analytical techniques for the detec-tion of non-acidic nitrates, the contribution of these speciesunder high-NOx conditions cannot be assessed. Inα-pinene
Figure 11:
Hydrocarbon
OH
RO2
RONO2
HO2 ROOH + O2
Fragments/
Carbonyls
Less volatile
products
Isomerization
Hydrocarbon
OH
RO2
RO RONO2
NO
HO2 ROOH + O2
Fragments/
Carbonyls
Less volatile
products
Isomerization
NO2
Fig. 11. General schematic of gas-phase peroxy radical chemistryin SOA formation.
photooxidation, hydroxynitrates have been identified in thegas phase using mass spectrometry (Aschmann et al., 1998,2002). In SOA formation from alkanes under high-NOx con-ditions, Lim and Ziemann (2005) found that, while SOAfrom oxidation of C10 alkane contains noδ-hydroxynitrates,nitrates contribute∼40% of the SOA mass for reactions ofthe C15 alkane. It seems likely that higher levels of hydrox-ynitrates are present in longifolene SOA than inα-pineneSOA.
5.2 General mechanisms of aerosol growth
5.2.1 Loss of semivolatiles
Substantial insight into the general mechanism of SOA for-mation and growth kinetics can be gained by examining“growth curves”, showing the amount of SOA formed perhydrocarbon reacted (Ng et al., 2006, 2007). Figure 2 showsthe time-dependent growth curves from longifolene photoox-idation under high- and low-NOx conditions. The high-NOxgrowth curves have a “convex” shape, indicating that aerosolgrowth slows down as longifolene approaches complete reac-tion. Similar behavior for longifolene growth was observedpreviously in our laboratory (Ng et al., 2006); the authorssuggested that this atypical growth behavior may have beenspurious, as a result of inaccuracies in PTR-MS measure-ments, owing to interference from product ions, or changes inthe aerosol density over the course of the experiment. In thisstudy, in those experiments in which the longifolene concen-tration is monitored by both GC-FID and PTR-MS, the shapeof PTR-MS hydrocarbon decay agrees with that measured byGC-FID. The density of the aerosol is estimated during oxi-dation by comparing Q-AMS and DMA data. It is found thatthe SOA density decreases slightly (<5%) over the course ofthe experiment, however, such a small decrease in density iswithin experimental uncertainty and cannot account for theobserved atypical growth behavior.
www.atmos-chem-phys.net/7/5159/2007/ Atmos. Chem. Phys., 7, 5159–5174,2007
435

5170 N. L. Ng et al.: NOx dependence of SOA formation from terpenesFigure 12:
HC Ag
Bp
Xkgk'OH
Cp
Fig. 12. A kinetic scheme depicting the competition be-tween gas-particle partitioning and irreversible loss of the gas-phase semivolatiles. X represents the product of generic lossof semivolatile species Ag by chemical reaction, and/or lossto chamber walls. k′
OH is the pseudo-first-order rate constant(k′
OH=kOH[OH]) for photooxidation of the parent hydrocarbon;kg
is the first-order rate constant of loss of semivolatiles.
Deceleration in SOA growth can arise from the loss ofsemivolatiles by photolysis, further reaction with OH toform volatile products, or irreversible loss to chamber walls.Such processes reduce the amount of gas-phase semivolatilesspecies that partition into the aerosol phase. The effect onSOA growth of gas-phase reaction forming more volatilespecies has been examined in a recent modeling study (Chanet al., 2007). Figure 12 shows a kinetic scheme depictingthe competition between gas-particle partitioning and irre-versible loss of the gas-phase semivolatiles. X represents theproduct of generic loss of semivolatile species Ag; k′
OH isthe pseudo-first-order rate constant (k′
OH=kOH[OH]) for re-action of the parent hydrocarbon; andkg is the first-order rateconstant of loss of semivolatiles. When fitting the observedaerosol growth with this simple kinetic model, it is estimatedthatkg is about 5 times larger thank′
OH. At the estimated OHconcentration of∼2×10⁷ molecules cm−3 under high-NOxconditions,k′
OH for longifolene is∼9.6×10⁻⁴ s−1. A ma-jor difference in SOA composition under high- and low-NOxconditions is the presence of organic nitrates under high-NOx conditions. Thus the loss of organic nitrates (amongother gas-phase species) may play a role in the observed de-celeration in aerosol growth. The reaction rate constants ofsmall alkyl nitrates with OH are generally of the order of10−13cm3 molecule−1 s−1 (hence pseudo-first-order reactionrate of∼10−6 s−1) and their photolysis rates have been mea-sured to be∼1×10⁻⁶ s−1 (Talukdar et al., 1997; Finlayson-Pitts and Pitts, 2000). Although the OH reaction rate andphotolysis rate of organic nitrates are much slower than theoxidation rate of longifolene, both rates are expected to in-crease with carbon number (Talukdar et al., 1997; Finlayson-Pitts and Pitts, 2000; Treves and Rudich, 2003). Hence, it ispossible that gas-phase reaction of C15 organic nitrates maybe occurring at an appreciable rate. Further study on the OHreaction rate constant and photolysis rate of larger nitrateswould be useful in evaluating the importance of gas-phasenitrate chemistry in aerosol formation.
Such a deceleration in SOA growth is not observed inlongifolene low-NOx experiments. This is in contrast to therapid decrease in aerosol volume observed in isoprene pho-tooxidation under low-NOx conditions, in which photolysisand/or further reactions of organic hydroperoxides may beoccurring (Kroll et al., 2006). There is evidence for furtherreactions with longifolene low-NOx SOA as well: the AMSm/z 44 (CO+
2 ) mass fraction increases over the course of theexperiment (Fig. 9), indicating the SOA is being further ox-idized. Unlike with isoprene photooxidation, however, thecompounds formed from the further oxidation of longifoleneproducts are likely sufficiently nonvolatile to remain in theparticle phase. The photochemistry of larger and more com-plex hydroperoxides merits further investigation.
5.2.2 SOA formation from higher generation products
In Figs. 1 and 3, the growth curves ofα-pinene and longi-folene photooxidation exhibit a “hook” at the end of the in-termediate NOx experiments, indicting that aerosol growthcontinues after the complete consumption of the parent hy-drocarbon. Organic mass measured by the Q-AMS increaseseven after all the hydrocarbon is consumed, indicating thatthis additional aerosol growth is not a result of condensationof inorganic nitrate. Continued aerosol growth can arise fromfurther gas-phase reactions of reactive oxidation products,such as aldehydes and furans, etc, or from further particle-phase reactions. In the intermediate NOx experiments, theNO concentration goes to zero within 20 min after the com-mencement of photooxidation, owing to the rapid reactionof NO and peroxy radicals (HO2 and other peroxy radicals).As a result, a transition from high-NOx to low-NOx condi-tions occurs over the course of the experiment, and the fi-nal aerosol formed is potentially a mixture of the productsformed under both conditions. It is possible that particle-phase reactions, such as the formation of peroxyhemiacetalsfrom hydroperoxides and aldehyde species, may be con-tributing to the further aerosol growth observed in the inter-mediate NOx experiments (Johnson et al., 2004, 2005).
6 Implications
A series of chamber experiments investigating the NOx de-pendence of SOA formation from the photooxidation of onemonoterpene and two sesquiterpenes is reported here. SOAformation from monoterpenes such asα-pinene is found tohave a similar NOx dependence as isoprene (as well as otherhydrocarbons with 10 or fewer carbons, such as aromaticspecies), in which the aerosol yields are substantially higherunder low-NOx conditions. The NOx dependence of SOAformation from the two sesquiterpenes is, however, markedlydifferent; for longifolene and aromadendrene, aerosol yieldsare at their maximum under high-NOx conditions. Thereason for this reversal of the NOx dependence, while not
Atmos. Chem. Phys., 7, 5159–5174,2007 www.atmos-chem-phys.net/7/5159/2007/
436

N. L. Ng et al.: NOx dependence of SOA formation from terpenes 5171
unequivocally established here, may be the result of produc-tion of highly nonvolatile organic nitrates, the existence ofwhich is suggested by both Q-AMS and filter sample data,and/or isomerization of alkoxy radicals to form low-volatilitymultifunctional organics.
The increase in SOA yield from photooxidation of thelarger biogenic hydrocarbons under high-NOx conditionscould have implications in terms of the effect of anthro-pogenically influenced air masses on biogenic SOA forma-tion. In the recent study of de Gouw et al. (2005), it issuggested that over the western Atlantic the majority of themeasured organic aerosol is from secondary anthropogenicsources, a conclusion that is somewhat at odds with the radio-carbon measurements that indicate high fractions of “mod-ern” (presumably biogenic) carbon (e.g. Klinedinst and Cur-rie, 1999; Weber et al., 2007). If the production of SOAfrom biogenic hydrocarbons is enhanced in the presence ofNOx, observations of enhanced SOA correlated with anthro-pogenic sources can occur, even for organic carbon of bio-genic origin. Large anthropogenic hydrocarbons may ex-hibit a similar NOx behavior as that of the sesquiterpenesstudied, as suggested by the substantial SOA yields from theOH-initiated reaction of large alkanes in the presence of ppmlevels of NOx (Lim and Ziemann, 2005). If the NOx behav-ior observed for longifolene and aromadendrene extends toother sesquiterpenes as well as larger alkanes, the contribu-tion to the total SOA from these compounds in polluted airmay actually be higher than previously estimated (Griffin etal., 1999a, b; Carreras-Sospedra et al., 2005; de Gouw et al.,2005).
In this study, we have investigated the NOx dependenceof SOA formation from photooxidation of only the monoter-peneα-pinene and two sesquiterpenes, each containing onedouble bond. SOA formation from compounds with two ormore double bonds can exhibit characteristics that suggestsignificant contributions from multiple generation products(Ng et al., 2006) and this may have impacts on the NOx de-pendence. It is clear that the effect of NOx on SOA yieldsfrom the complete suite of atmospherically relevant aerosol-forming hydrocarbons should be evaluated thoroughly.
Appendix A
Description of PTR-MS technique
For PTR-MS sampling, a constant flow of∼2.5 standardliters per minute (slm) is drawn from the chamber throughPFA tubing. The residence time in the inlet tubing is roughly1 s. A small portion of the flow, 93 standard cubic centime-ters per minute (sccm), is pulled through a glass critical ori-fice into a 2.54-cm diameter glass flow tube, in which thissample flow is diluted with dry N2 (1.6 slm) to maintain theflow tube pressure at 35 mbar. This dilution minimizes con-founding effects owing to large concentrations of hydrogen
peroxide and other compounds typically used or produced inchamber experiments.
In the flow tube, analyte ionization occurs in a mannersimilar to that described by Crounse et al. (2006) for neg-ative ionization. N2 (400 sccm) flows through an ion sourcecup composed of a cylindrical silver foil lined with210Po andsealed with gold.α bombardment from the210Po, coupledwith trace water present in the N2, leads to the formation ofpositively charged clusters, e.g. (H2O)nH+. The electric po-tentials of the ion source components are set such that thesepositively charged clusters then pass through a 6.35 mm aper-ture into the 35 mbar flow tube, flowing perpendicular to thesample flow. The clusters then react via proton transfer withthe analyte (e.g. aromadendrene) in the sample flow to formaromadendrene-H+ and higher order water clusters.
Across the flow tube from the ion source, a pinhole aper-ture (diameter 0.34 mm) allows a portion of the ions andneutral gas (∼30 sccm) to flow into the mass spectrometer,a Varian 1200 tandem mass spectrometer. The spectrometerwas modified by removing the electron impact source and ex-tending the hexapole ion guide that leads to the quadrupolemass analyzer to the pinhole aperture. For these measure-ments, the mass spectrometer was operated exclusively inone-dimensional mass spectrometry mode.
In order to simplify the mass spectra, a DC potential of−10 V (relative to the pinhole aperture) is applied to thehexapole. This offset pulls ions into the hexapole, wherethe pressure is relatively high owing to the neutral gas flow(chiefly N2) through the pinhole. The ions therefore undergohigh energy collisions with the neutral gas molecules whichdissociate water clusters of analyte A:
A · (H2O)n · H++N2 → A · H+
+nH2O+N2 (A1)
Thus, species are predominantly observed atm/z=M+1,where M is the molecular mass of the species. Hydrates,A·(H2O)m·H+, particularlym=1, are also observed for somespecies, though not for aromadendrene or longifolene.
Each day, the PTR-MS sensitivity towards aromadendrenewas determined by sampling standard mixtures of aromaden-drene in teflon bags filled with 50 L zero air. The sensitiv-ity was determined to be linear from 0 ppb to at least 5 ppb.Also, because of the large amounts of H2O2 utilized in theexperiments, the sensitivity as a function of H2O2 was de-termined, with [H2O2] measured by operating the Varian1200 in negative ionization mode, exploiting the reaction ofCF3O− with H2O2 (Crounse et al., 2006). Thus, the sen-sitivity determined from H2O2-free standards was correctedfor sampling from the chamber when H2O2 was present.
The uncertainty of aromadendrene measurements usingPTR-MS is estimated to be∼±22%, based on the scatter ofreplicate data and background measurements and uncertain-ties in the H2O2 correction.
www.atmos-chem-phys.net/7/5159/2007/ Atmos. Chem. Phys., 7, 5159–5174, 2007
437

5172 N. L. Ng et al.: NOx dependence of SOA formation from terpenes
Appendix B
Description of UPLC/ESI-TOFMS technique
Filter extracts (in 1:1 (v/v) solvent mixture of methanol and0.1% aqueous acetic acid solution) are analyzed by a Wa-ters ACQUITY ultra performance liquid chromatography(UPLC) system, coupled with a Waters LCT Premier time-of-flight (TOF) mass spectrometer (MS) equipped with anelectrospray ionization (ESI) source. The ESI source onthis instrument contains two individual sprays; one spray isfor the eluent and the other is for the lock-mass correction.Optimum ESI conditions are found using a 2.5 kV capillaryvoltage, 40 V sample cone voltage, 350◦C desolvation tem-perature, 130◦C source temperature, 20 L h−1 cone gas flowrate, and a 650 L h−1 desolvation gas flow rate. Data arecollected fromm/z 50–1000 in the negative (–) ionizationmode using the TOFMS operated in the W geometry reflec-tron mode. The W reflectron mode offers the highest massresolution, which is approximately 12 000, and allows for ex-act mass measurements to be conducted on detected SOAcomponents. The chromatographic separations are carriedout on a Waters ACQUITY HPLC HSS (high strength silica)column (2.1×100 mm, 1.8µm particle size) at 45◦C using agradient elution scheme. The eluent composition is (A) 0.1%acetic acid in water and (B) 0.1% acetic acid in methanol;both eluents are high purity solvents (LC-MS ChromaSolvGrade, Sigma-Aldrich). In the 12-min gradient elution pro-gram used, the concentration of eluent B is 0% for the first2 min, increased to 90% from 2 to 10 min, held at 90% from10 to 10.2 min; and then decreased back to 0% from 10.2to 12 min. The flow rate of the eluent is 0.3 mL min−1 andthe sample injection volume is 2µL. At the beginning ofeach analysis period, the TOFMS is calibrated using a 1:1(v/v) solvent mixture of acetonitrile and 0.1% phosphoricacid aqueous solution. During each chromatographic run,2 ng/µL of leucine enkphalin (MW=555) is used for thelock-mass spray for lock-mass correction to obtain accuratemasses for each SOA component eluting from the column.The lock-mass syringe pump is operated at 20 uL min−1. Inaddition to the lock-mass spray, the dynamic range enhance-ment feature of this mass spectrometer is applied to preventdead time, which affects mass accuracy, from occurring. Asconfirmation of the UPLC/ESI-TOFMS technique, a stan-dard sample containing known isoprene andα-pinene sulfateesters previously characterized by Surratt et al. (2007) areanalyzed. The known elemental compositions (i.e. molec-ular formulas) of the previously characterized sulfate esters(Surratt et al., 2007) are in excellent agreement with theirmeasured exact masses (i.e. within±2 mDa or±2 ppm). Inaddition to exact mass measurements, further insights intothe structures of the SOA components are obtained by gen-erating tandem MS data, which are generated by increasingthe first aperature voltage on the TOFMS from 10 V to 25 V.
Acknowledgements.This research was funded by U.S. Departmentof Energy Biological and Environmental Research Program grantDE-FG02-05ER63983. This material is based in part on worksupported by the National Science Foundation (NSF) under grantATM-0432377. The Waters LCT Premier XT time-of-flight massspectrometer interfaced to a Waters UPLC system was purchased in2006 with a grant from the National Science Foundation, ChemistryResearch Instrumentation and Facilities Program (CHE-0541745).The LCQ Ion Trap mass spectrometer was purchased in 1997 withfunds from the National Science Foundation through the CRIFprogram (CHE-9709233). J. D. Surratt is supported in part bythe U.S. EPA under the STAR Graduate Fellowship Program.A. J. Kwan acknowledges the support of a NSF graduate researchfellowship. The authors would like to thank M. Shahgohli of theChemistry Department at Caltech for her useful communicationsregarding high-resolution mass spectrometry.
Edited by: A. Nenes
References
Alf arra, M. R., Paulsen, D., Gysel, M., Garforth, A. A., Dommen,J., Prevot, A. S. H., Worsnop, D. R., Baltensperger, U., and Coe,H.: A mass spectrometric study of secondary organic aerosolsformed from the photooxidation of anthropogenic and biogenicprecursors in a reaction chamber, Atmos. Chem. Phys., 6, 5279–5293, 2006,http://www.atmos-chem-phys.net/6/5279/2006/.
Arey, J., Aschmann, S. M., Kwok, E. S. C., and Atkinson, R.: Alkylnitrates, hydroxyalkyl nitrates and hydroxycarbonyl formationfrom the NOx – air photooxidation of C5-C8 n-alkanes, J. Phys.Chem. A, 105, 1020–1027, 2001.
Aschmann,S. M., Arey, J., and Atkinson, R.: Atmospheric chem-istry of three C10 alkanes, J. Phys. Chem. A, 105, 7598–7606,2001.
Aschmann,S. M., Atkinson, R., and Arey, J.: Products of reactionof OH radicals withα-pinene, J. Geophys. Res., 107(D14), 4191,doi:10.1029/2001JD001098, 2002.
Aschmann,S. M., Reissell, A., Atkinson, R., and Arey, J.: Prod-ucts of the gas phase reactions of the OH radical withα- andβ-pinene in the presence of NO, J. Geophys. Res., 103(D19),4191, 25 553–25 561, 1998.
Aschmann,S. M., Reissell, A., Atkinson, R., and Arey, J.: Prod-ucts of the gas phase reactions of the OH radical with a- andb-pinene in the presence of NO, J. Geophys. Res., 103(D19),25 553–25 561, 1998.
Atkinson,R., Kwok, E. S. C., Arey, J., and Aschmann, S. M.: Re-actions of alkoxy radicals in the atmosphere, Faraday Discuss.,100, 23–37, 1995.
Atkinson,R. and Arey, J.: Gas-phase tropospheric chemistry of bio-genic volatile organic compounds: a review, Atmos. Environ.,37, S197-S219, 2003.
Atkinson, R., Aschmann, S. M., and Winer, A. M.: Alkyl nitrateformation from the reaction of a series of branched RO2 radi-cals with NO as a function of temperature and pressure, J. Phys.Chem., 5, 91–102, 1987.
Atkinson,R., Baulch, D. L., Cox, R. A., Hampson, R. F., Kerr, J. A.,Rossi, M. J., and Troe, J.: Evaluated kinetic and photochemical
Atmos. Chem. Phys., 7, 5159–5174, 2007 www.atmos-chem-phys.net/7/5159/2007/
438

N. L. Ng et al.: NOx dependence of SOA formation from terpenes 5173
data for atmospheric chemistry, organic species, supplement VII,J. Phys. Chem. Ref. Data., 28, 2, 1999.
Atkinson, R.: Atmospheric reactions of alkoxy andβ-hydroxyalkoxy radicals, Int. J. Chem. Kinet., 29, 99–111, 1997a.
Atkinson, R.: Gas phase tropospheric chemistry of organic com-pounds, J. Phys. Chem. Ref. Data, Monogr., 2, 11–216, 1994.
Atkinson, R.: Gas phase tropospheric chemistry of volatile organiccompounds: 1. Alkanes and Alkenes, J. Phys. Chem. Ref. Data.,215–290, 1997b.
Baldwin, A. C., Barker, J. R., Golden, D. M., and Hendry, D. G.:Photochemical smog – rate parameter estimates and computersimulations, J. Phys. Chem., 81, 2483–2492, 1977.
Bahreini, R., Keywood, M. D., Ng, N. L., Varutbangkul, V., Gao, S.,Flagan, R. C., and Seinfeld, J. H.: Measurements of secondaryorganic aerosol (SOA) from oxidation of cycloalkenes, terpenes,and m-xylene using an Aerodyne aerosol mass spectrometer, En-viron. Sci. Technol., 39, 5674–5688, 2005.
Carreras-Sospedra, M., Griffin, R. J., and Dabdub, D.: Calculationsof incremental secondary organic aerosol reactivity, Environ. Sci.Technol., 39, 1724–1730, 2005.
Carter, W. P. L. and Atkinson, R.: Alkyl nitrate formation from theatmospheric photooxidation of alkanes; a revised estimation, J.Phys. Chem., 8, 165–173, 1989.
Carter, W. P. L. and Atkinson, R.: Atmospheric chemistry of alka-nes, J. Atmos. Chem. 3, 377–405, 1985.
Chan, A. W. H., Kroll, J. H., Ng, N. L., and Seinfeld, J. H.: Ki-netic modeling of secondary organic aerosol formation: effectof particle- and gas-phase reactions of semivolatile products, At-mos. Chem. Phys. Discuss., 7, 7051–7085, 2007,http://www.atmos-chem-phys-discuss.net/7/7051/2007/.
Cocker III, D. R., Flagan, R. C., and Seinfeld, J. H.: State-of-the-art chamber facility for studying atmospheric aerosol chemistry,Environ. Sci. Technol., 35, 2594–2601. 2001.
Crounse, J. D., McKinney, K. A., Kwan, A. J., and Wennberg, P. O.:Measurements of gas-phase hydroperoxides by chemical ioniza-tion mass spectrometry, Anal. Chem., 78, 6726–6732, 2006.
de Gouw, J. A., Middlebrook, A. M., Warneke, C., Goldan, P.D., Kuster, W. C., Roberts, J. M., Fehsenfeld, F. C., Worsnop,D. R., Canagaratna, M. R., Pszenny, A. A. P., Keene, W. C.,Marchewka, M., Bertman, S. B., and Bates, T. S.: Budget of or-ganic carbon in a polluted atmosphere: Results from the NewEngland Air Quality Study in 2002, J. Geophys. Res., 110,D16305, doi:10.1029/2004JD005623, 2005.
Finlayson-Pitts, B. J. and Pitts, J. N.: Chemistry of the upper andlower atmosphere: theory, experiments and applications, Aca-demic Press, San Diego, 220–221, 2000.
Gao, S., Keywood, M. D., Ng, N. L., Surratt, J. D., Varutbangkul,V., Bahreini, R., Flagan, R. C., and Seinfeld, J. H.: Low-molecular weight and oligomeric components in secondary or-ganic aerosol from the ozonolysis of cycloalkenes andα-pinene,J. Phys. Chem. A, 108, 10 147–10 164, 2004.
Gao, S., Surratt, J. D., Knipping, E. M., Edgerton, E. S., Shahgholi,M., and Seinfeld, J. H.: Characterization of polar organic com-ponents in fine aerosols in the southeastern United States: Iden-tity, origin, and evolution, J. Geophys. Res., 111, D14314,doi:10.1029/2005JD006601, 2006.
Geron, C., Rasmussen, R., Arnts, R. R., and Guenther, A.: A re-view and synthesis of monoterpene speciation from forests in theUnited States, Atmos. Environ., 34, 1761–1781, 2000.
Glasius, M., Duane, M., and Larsen, B. R.: Determinationof polar terpene oxidation products in aerosols by liquidchromatography-ion trap mass spectrometry, J. Chrom. A., 833,121–135, 1999.
Glasius,M., Lahaniati, M., Calogirou, A., Di Bella, D., Jensen, N.R., Hjorth, J., Kotzias, D., and Larsen, B. R.: Carboxylic acidsin secondary aerosols from oxidation of cyclic monoterpenes byozone, Environ. Sci. Technol., 34, 1001–1010, 2000.
Griffin, R. J., Cocker, D. R., Flagan, R. C., Seinfeld, J. H., andDabdub, D.: Estimate of global atmospheric organic aerosol for-mation from the oxidation of biogenic hydrocarbobs, Geophys.Res. Lett., 26, 17, 2721–2724, 1999a.
Griffin, R. J., Cocker, D. R., Flagan, R. C., and Seinfeld, J. H.:Organic aerosol formation from the oxidation of biogenic hydro-carbons, J. Geophys. Res., 104(D3), 3555–3567, 1999b.
Guenther, A., Hewitt, C. N., Erickson, D., Fall, R., Geron, C.,Graedel, T., Harley, P., Klinger, L., Lerdau, M., McKay, W. A.,Pierce, T., Scholes, B., Steinbrecher, R., Tallamraju, R., Tay-lor, T., and Zimmerman, P.: A global model of natural volatileorganic compound emission, J. Geophys. Res., 100,(D5), 8873–8892, 1995.
Hatakeyama, S., Izumi, K., Fukuyama, T., Akimoto, H., andWashida, N.: Reactions of OH withα-pinene andβ-pinene inair: Estimates of global CO production from the atmospheric ox-idation of terpenes, J. Geophys. Res., 96(D1), 947–958, 1991.
Hurley, M. D., Sokolov, O., Wallington, T. J., Takekawa, H., Kara-sawa, M., Klotz, B., Barnes, I., and Becker, K. H.: Organicaerosol formation during the atmospheric degradation of toluene,Environ. Sci. Technol., 35, 1358–1366, 2001.
Jayne,J. T., Leard, D. C., Zhang, X., Davidovits, P., Smith, K. A.,Kolb, C. E., and Worsnop, D. W.: Development of an AerosolMass Spectrometer for size and composition analysis of submi-cron particles, Aerosol Sci. Tech., 33, 49—70, 2000.
Johnson,D., Jenkin, M. E., Wirtz, K., and Martın-Reviejo, M.: Sim-ulating the formation of secondary organic aerosol from the pho-tooxidation of aromatic hydrocarbons, Environ. Chem., 2, 35-48,2005.
Johnson,D., Jenkin, M. E., Wirtz, K., and Martın-Reviejo, M.: Sim-ulating the formation of secondary organic aerosol from the pho-tooxidation of toluene, Environ. Chem., 1, 150–165, 2004.
Kanakidou,M., Seinfeld, J. H., Pandis, S. N., Barnes, I., Dentener,F. J., Facchini, M. C., Van Dingenen, R., Everns, B., Nenes, A.,Swietlicki, E., Pautaud, J. P., Balkanski, Y., Fuzzi, S., Horth,J., Moortgat, G. K., Winterhalter, R., Myhre, C. E. L., Tsigaridis,K., Vignati, E., Stephanou, E. G., and Wilson, J.: Organic aerosoland global climate modeling: a review, Atmos. Chem. Phys., 5,1053–1123, 2005,http://www.atmos-chem-phys.net/5/1053/2005/.
Keywood, M. D., Varutbangkul, V., Bahreini, R., Flagan, R. C.,and Seinfeld, J. H.: Secondary organic aerosol formation fromthe ozonolysis of cycloalkenes and related compounds, Environ.Sci. Technol., 38, 4157–4164, 2004.
Klinedinst,D. B. and Currie, L. A.: Direct quantification of PM2.5fossil and biomass carbon within the northern front range airquality study’s domain, Environ. Sci. Technol., 33. 4146—4154,1999.
Kroll, J. H., Ng, N. L., Murphy, S. M., Flagan, R. C., and Seinfeld,J. H.: Secondary organic aerosol formation from isoprene pho-tooxidation under high-NOx conditions, J. Geophys. Res., 32,
www.atmos-chem-phys.net/7/5159/2007/ Atmos. Chem. Phys., 7, 5159–5174, 2007
439

5174 N. L. Ng et al.: NOx dependence of SOA formation from terpenes
L18808, doi:10.1029/2005GL023637, 2005.Kroll, J. H., Ng, N. L., Murphy, S. M., Flagan, R. C., and Sein-
feld, J. H.: Secondary organic aerosol formation from isoprenephotooxidation, Environ. Sci. Technol., 40, 1869–1877, 2006.
Larsen, B. R., Di Bellla, D., Glasius, M., Winterhalter, R., Jensen,N. R., and Hjorth, J.: Gas-phase OH oxidation of monoterpenes:Gaseous and particulate products, J. Atmos. Chem., 38, 231–276,2001.
Lim, Y. B. and Ziemann, P. J.: Products and mechanism of sec-ondary organic aerosol formation form reactions ofn-alkaneswith OH radicals in the presence of NOx, Environ. Sci. Technol.,39, 9229–9236, 2005.
Ng, N. L., Kroll, J. H., Keywood, M. D., Bahreini, R., Varut-bangkul, V., Flagan, R. C., Seinfeld, J. H., Lee, A., and Gold-stein, A. H.: Contribution of first- versus second-generationproducts to secondary organic aerosols formed in the oxidation ofbiogenic hydrocarbons, Environ. Sci. Technol., 40, 2283–2297,2006.
Ng, N. L., Kroll, J. H., Chan, A. W. H., Chhabra, P. S., Flagan, R. C.,and Seinfeld, J. H.: Secondary organic aerosol formation fromm-xylene, toluene, and benzene, Atmos. Chem. Phys. Discuss.,7, 4085–4126, 2007,http://www.atmos-chem-phys-discuss.net/7/4085/2007/.
O’Brien, J. M., Czuba, E., Hastie, D. R., Francisco, J. S., and Shep-son, P. B.: Determination of the hydroxy nitrate yields from thereaction of C2-C6 alkenes with OH in the presence of NO, J.Phys. Chem., 102, 8903–8908, 1998.
Odum, J. R., Hoffmann, T., Bowman, F., Collins, D., Flagan, R.C., and Seinfeld, J. H.: Gas/particle partitioning and secondaryorganic aerosol yields, Environ. Sci. Technol., 30, 2580–2585,1996.
Odum, J. R., Jungkamp, T. P. W., Griffin, R. J., Forstner, H. J. L.,Flagan, R. C., and Seinfeld, J. H.: Aromatics, reformulated gaso-line and atmospheric organic aerosol formation, Environ. Sci.Technol., 31, 1890–1897, 1997.
Owen, S. M., Boissard, C., and Hewitt, C. N.: Volatile organiccompounds (VOCs) emitted from 40 Mediterranean plan species:VOC speciation and extrapolation to habitat scale, Atmos. Envi-ron., 35, 5393–5409, 2001.
Pandis, S. N., Paulson, S. E., Seinfeld, J. H., and Flagan, R.C.: Aerosol formation in the photooxidation of isoprene andβ-pinene, Atmos. Environ., 25A, 997–1008, 1991.
Presto, A. A., Huff Hartz, K. E., and Donahue, N. M.: Secondaryorganic aerosol production from ozonolysis: 2. Effect of NOxconcentration, Environ. Sci. Technol., 39, 7046–7054, 2005.
Seinfeld, J. and Pankow, J. F.: Organic atmospheric particulate ma-terial, Annu. Rev. Phys. Chem., 54, 121–140, 2003.
Song, C., Na, K., and Cocker III, D. R.: Impact of the hydrocarbonto NOx ratio on secondary organic aerosol formation, Environ.Sci. Technol., 39, 3143–3149, 2005.
Sorooshian,A., Brechtel F. J., Ma, Y. L., Weber R. J., Corless, A.,Flagan, R. C., and Seinfeld, J. H.: Modeling and characterizationof a particle-into-liquid sampler (PILS), Aerosol Sci. Tech., 40,396–409, 2006.
Surratt,J. D., Kroll, J. H., Kleindienst, T. E., Edney, E. O., Claeys,M., Sorooshian, A., Ng, N. L., Offenberg, J. H., Lewandowski,M., Jaoui, M., Flagan, R. C., and Seinfeld, J. H.: Evidence fororganosulfates in secondary organic aerosol, Environ. Sci. Tech-nol., 41, 517–527, 2007.
Surratt,J. D., Murphy, S. M., Kroll, J. H., Ng, N. L., Hildebrandt,L., Sorooshian, A., Szmigielski, R., Vermeylen, R., Maenhaut,W., Claeys, M., Flagan, R. C., and Seinfeld, J. H.: Chemicalcomposition of secondary organic aerosol formed from the pho-tooxidation of isoprene, J. Atmos. Chem., 31, 9665–9690, 2006.
Szmigielski, R., Surratt, J. D., Vermeylen, R., Szmigielska, K.,Kroll, J. H., Ng, N. L., Murphy, S. M., Sorooshian, A., Seinfeld,J. H., and Claeys, M.: Characterization of 2-methylglyceric acidoligomers in secondary organic aerosol formed from the pho-tooxidation of isoprene using trimethylsilylation and gas chro-matography/ion trap mass spectrometry, J. Mass Spectrom., 42,101–116, 2007.
Talukdar, R. K., Herndon, S. C., Burkholder, J. B., Roberts, J. M.,and Ravishankara, A. R.: Atmospheric fate of several alkyl ni-trates, J. Chem. Soc., Faraday Trans., 93, 2787–2796, 1997.
Treves, K. and Rudich, Y.: The atmospheric fate of C3-C6 hydrox-yalkyl nitrates, J. Phys. Chem. A, 107, 7809–7817, 2003.
Weber, R. J., Sullivan, A., Peltier, R. E., Russell, A., Yan, B., Zheng,M., de Gouw, J., Warneke, C., Brock, C., Holloway, J. S., Atlas,E. L., and Edgerton, E.: A study of secondary organic aerosolformation in the anthropogenic-influenced southeastern USA, J.Geophys. Res., 112, D13302, doi:10.1029/2007JD008408, 2007.
Zhang,J., Dransfield, T., and Donahue, N. M.: On the mechanismfor nitrate formation via the peroxy radical + NO reaction, J.Phys. Chem. A, 108, 9082–9095, 2004.
Zhang,J., Hartz, K. E. H., Pandis, S. N., and Dohanue, N. M.:Secondary organic aerosol formation from limonene ozonoly-sis: Homogeneous and heterogeneous influences as a functionof NOx, J. Phys. Chem., A, 110, 11 053–11 063, 2006.
Zhang,S. H., Shaw, M., Seinfeld, J. H., and Flagan, R. C.: Photo-chemical aerosol formation fromα-pinene andβ-pinene, J. Geo-phys. Res., 97(D18), 20 717–20 729, 1992.
Atmos. Chem. Phys., 7, 5159–5174, 2007 www.atmos-chem-phys.net/7/5159/2007/
440

Appendix H
Secondary Organic Aerosol (SOA) Formation from
Reaction of Isoprene with Nitrate Radicals (NO3)∗
∗This chapter is reproduced by permission from “Secondary Organic Aerosol (SOA) Formation from Reaction of Isoprene with Nitrate Radicals (NO3)” by N. L. Ng, A. J. Kwan, J. D. Surratt, A. W. H. Chan, P. S. Chhabra, A. Sorooshian, H. O. T. Pye, J. D. Crounse, P. O. Wennberg, R. C. Flagan, and J. H. Seinfeld, Atmos. Chem. Phys. Disc., 8, 3163-3226, 2008. © 2008 Author(s). This work is distributed under the Creative Commons Attribution 3.0 License.
441

1
Secondary organic aerosol (SOA) formation from reaction of isoprene with nitrate
radicals (NO3)
Nga L. Ng1, Alan J. Kwan
2, Jason D. Surratt
1, Arthur W. H. Chan
1, Puneet S. Chhabra
1,
Armin Sorooshian1, Havala O. T. Pye
1, John D. Crounse
1, Paul O. Wennberg
2,3, Richard
C. Flagan1,2
, and John H. Seinfeld1,2*
1Divison of Chemistry and Chemical Engineering, California Institute of Technology,
Pasadena, CA 91125
2Divison of Engineering and Applied Science, California Institute of Technology,
Pasadena, CA 91125
3Divison of Geological and Planetary Sciences, California Institute of Technology,
Pasadena, CA 91125
*Author to whom correspondence should be addressed. Phone (626) 395-4635, fax (626)
796-2591, e-mail [email protected]
442

2
Abstract
Secondary organic aerosol (SOA) formation from the reaction of isoprene with
nitrate radicals (NO3) is investigated in the Caltech indoor chambers. Experiments are
performed in the dark and under dry conditions (RH < 10%) using N2O5 as a source of
NO3 radicals. For an initial isoprene concentration of 18.4 to 101.6 ppb, the SOA yield
(defined as the ratio of the mass of organic aerosol formed to the mass of parent
hydrocarbon reacted) ranges from 4.3% to 23.8%. By examining the time evolutions of
gas-phase intermediate products and aerosol volume in real time, we are able to constrain
the chemistry that leads to the formation of low-volatility products. Although the
formation of ROOR from the reaction of two peroxy radicals (RO2) has generally been
considered as a minor channel, based on the gas-phase and aerosol-phase data it appears
that RO2 + RO2 reaction (self reaction or cross-reaction) in the gas phase yielding ROOR
products is a dominant SOA formation pathway. A wide array of organic nitrates and
peroxides are identified in the aerosol formed and mechanisms for SOA formation are
proposed. Using a uniform SOA yield of 10% (corresponding to Mo 10 μg m-3
), it is
estimated that ~2 to 3 Tg yr-1
of SOA results from isoprene + NO3. The extent to which
the results from this study can be applied to conditions in the atmosphere depends on the
fate of peroxy radicals (i.e. the relative importance of RO2 + RO2 versus RO2 + NO3
reactions) in the nighttime troposphere.
443

3
1. Introduction
Isoprene is the most abundant non-methane hydrocarbon emitted into the
atmosphere with a global emission of ~500 Tg yr-1
(Guenther et al., 1995; Guenther et al.,
2006). In the troposphere, isoprene reacts with hydroxyl radicals (OH), ozone (O3), and
nitrate radicals (NO3). Owing to its high concentration and reactivity with OH radicals,
isoprene plays an important role in the photochemistry occurring within the atmospheric
boundary layer. Recently, it has been shown that the photooxidation of isoprene leads to
the formation of low volatility species that condense to form SOA (Claeys et al., 2004;
Edney et al., 2005; Kroll et al., 2005; Dommen et al., 2006; Kroll et al., 2006; Surratt et
al., 2006); SOA yields as high as ~ 3% have been observed (Kroll et al., 2005; Kroll et al.
2006). Global SOA production from isoprene photooxidation has been estimated to be
about 13 Tg yr-1
(Henze et al., 2007).
Although emission of isoprene from vegetation is triggered by sunlight and
increases with light intensity and temperature (e. g. Sharkey et al., 1996), the isoprene
mixing ratio has been observed to peak in early evening in several field studies, with a
measured mixing ratio up to a few ppb (Curren et al., 1998; Starn et al., 1998; Stroud et
al., 2002; Steinbacher et al., 2005). After sunset, the isoprene mixing ratio drops rapidly,
and it has been suggested that the reaction with nitrate radicals, NO3, is a major
contributor to isoprene decay at night (Curren et al., 1998; Starn et al., 1998; Stroud et al.,
2002; Steinbacher et al., 2005). Typical NO3 radical mixing ratios in boundary layer
continental air masses range between ~10 to ~100 ppt (Platt and Janssen, 1995; Smith et
al., 1995; Heintz et al., 1996; Carslaw et al., 1997). However, concentrations as high as
several hundred ppt have been observed over northeastern USA and Europe (Platt et al.,
444

4
1981; von Friedeburg et al., 2002; Brown et al., 2006; Penkett et al., 2007). Given the
rapid reaction rate between isoprene and NO3 radicals (kNO3 = 7 x 10-13
cm3 molecule
-1 s
-1
at T = 298 K, IUPAC), it is likely that NO3 radicals play a major role in the nighttime
chemistry of isoprene.
The kinetics and gas-phase products of the isoprene-NO3 reaction have been the
subject of several laboratory and theoretical studies (Jay and Stieglitz, 1989; Barnes et al.,
1990; Skov et al., 1992; Kwok et al., 1996; Berndt and Böge, 1997; Suh et al., 2001;
Zhang et al., 2002; Fan et al., 2004). In many studies, C5-nitroxycarbonyl is identified as
the major first-generation gas-phase reaction product (Jay and Stieglitz, 1989; Skov et al.,
1992; Kwok et al., 1996; Berndt and Böge, 1997). Other compounds such as C5-
hydroxynitrate, C5-nitroxyhydroperoxide, and C5-hydroxycarbonyl have also been
identified (Kwok et al., 1996); C5-hydroxynitrate has also been measured in ambient air
with concentrations in the lower ppt range at a few ng m-3
(Werner et al., 1999).
According to the experimental study by Barnes et al. (1990), the yield for nitrate-
containing compounds from the reaction of isoprene and NO3 radicals can be as high as
80%. A recent modeling study in conjunction with observations from the ICARTT field
campaign suggests that ~50% of the total isoprene nitrates production occurs via reaction
of isoprene and NO3 radicals (Horowitz et al., 2007).
Little is known beyond the formation of the first-generation products of the
reaction of NO3 with isoprene. The isoprene nitrates and other first-generation products
still contain a double bond, and it is likely that the further oxidation of these species will
lead to low volatility products that can contribute to SOA formation at nighttime.
445

5
In this work, SOA formation from the reaction of isoprene with NO3 radicals is
investigated. Laboratory chamber experiments are performed in the dark using N2O5 as a
source of NO3 radicals. Aerosol yields are obtained over a range of initial isoprene
concentrations (mixing ratios). By examining the time evolutions of aerosol volume and
different intermediate gas-phase products, we are able to constrain the chemistry that
leads to the formation of low-volatility products. Mechanisms for SOA formation are
proposed and chemical composition data of the SOA formed are also presented.
2. Experimental Section
Experiments are carried out in the Caltech dual 28 m3 teflon chambers. A detailed
description of the facility is provided elsewhere (Cocker et al., 2001; Keywood et al.,
2004). Before each experiment, the chambers are flushed continuously for over 24 h.
Aerosol number concentration, size distribution, and volume concentration are measured
by a Differential Mobility Analyzer (DMA, TSI model 3081) coupled with a
condensation nucleus counter (TSI model 3760). All aerosol growth data are corrected
for wall loss, in which size-dependent particle loss coefficients are determined from inert
particle wall loss experiments (Keywood et al., 2004). Temperature, relative humidity
(RH), O3, NO, and NOx are continuously monitored. Experiments are performed in the
dark at room temperature (20-21°C) and under dry conditions (RH < 10%).
In most experiments, seed aerosols are introduced into the chamber to act as a
substrate onto which the gas-phase products may condense. Seed aerosols are generated
by atomizing an aqueous solution with a constant-rate atomizer. The seed solution
consists of 0.015 M (NH4)2SO4. In a few experiments, acidic seed is used, consisting of
446

6
0.03 M MgSO4 and 0.05 M H2SO4. The initial particle number concentration is ~20,000
particles cm-3
, with a geometric mean diameter of ~50 nm. The initial seed volume is 10-
12 m3 cm
-3. In some experiments, no seed particles are added and aerosols are formed
via nucleation. After introduction of the seed aerosol (in seeded experiments), a known
volume of isoprene (Aldrich, 99%) is injected into a glass bulb and introduced into the
chambers by an air stream. The mixing ratio of isoprene is monitored with a gas
chromatograph equipped with a flame ionization detector (GC-FID, Agilent model
6890N). The column used is a bonded polystyrene-divinylbenzene based column (HP-
PLOT Q, 15 m 0.53 mm, 40 m thickness, J&W Scientific). The oven temperature is
held at 60°C for 0.5 min, ramped at 35°C min-1
to 200°C, and held constant for 3.5 min.
The thermal decomposition of N2O5 serves as a source of NO3 radicals in these
experiments. N2O5 is prepared and collected offline by mixing a stream of nitric oxide
( 99.5%, Matheson Tri Gas) with a stream of ozone in a glass bulb (Davidson et al.,
1978):
NO + O3 NO2 + O2 (1)
NO2 + O3 NO3 + O2 (2)
NO2 + NO3 N2O5 (3)
Ozone is generated by flowing oxygen through an ozonizer (OREC model V10-0,
Phoenix, AZ) at ~1 L min-1
. The mixing ratio of ozone is measured by a UV/VIS
spectrometer (Hewlett Packard model 8453) to be ~2%. The flow rate of nitric oxide into
the glass bulb is adjusted until the brown color in the bulb disappears. The N2O5 is
trapped for 2 h in an acetone-dry ice bath (approximately at -80°C; cold enough to trap
N2O5 but not O3, as condensed O3 can explode upon warming and is extremely
447

7
dangerous) as a white solid, and stored between experiments under liquid nitrogen
temperature. Once the seed and isoprene concentrations in the chamber stabilize, reaction
is initiated by vaporizing N2O5 into an evacuated 500 mL glass bulb and introduced into
the chamber with an air stream of 5 L min-1
. The amount of N2O5 injected is estimated
based on the vapor pressure in the glass bulb, which is measured using a capacitance
manometer (MKS); this amount corresponds to an initial mixing ratio of ~1 ppm in the
chamber. The thermal decomposition of N2O5 forms NO2 and NO3 radicals. Impurities in
the N2O5 starting material are quantified by FTIR spectroscopy (Nicolet model Magna
550). N2O5 is vaporized into an evacuated pyrex cell (18 cm in length and 300 cm3) with
CaF2 windows. Spectra are collected immediately upon addition over the 1000 cm-1
to
4000 cm-1
window allowing for quantification of NO2 (1616 cm-1
band) and HNO3 (3550
cm-1
band) impurities.
A custom-modified Varian 1200 Chemical Ionization Mass Spectrometer (CIMS)
is used to continuously monitor the concentrations of various gas-phase intermediates and
products over the course of the experiments. The CIMS is operated in negative mode
using CF3O- as a reagent ion, which selectively clusters with protonated compounds to
form ions at m/z MW + 85. Typically, we scan from m/z 50 to 400. More details about the
CIMS technique are given in Crounse et al. (2006) and Ng et al. (2007a). Because
authentic standards are not available for most of the major products, sensitivities have
been estimated from calibration of similar species (Crounse et al., 2006).
Aerosol physical and chemical properties are monitored by many instruments.
Real-time particle mass spectra are obtained with an Aerodyne quadrupole Aerosol Mass
Spectrometer (Q-AMS) (Jayne et al., 2000). A Particle-Into-Liquid Sampler (PILS,
448

8
Brechtel Manufacturing, Inc.) coupled with ion chromatography (IC) is employed for
quantitative measurements of water-soluble ions in the aerosol phase (Sorooshian et al.,
2006). Duplicate Teflon filters (PALL Life Sciences, 47-mm diameter, 1.0- m pore size,
teflo membrane) are collected from a select number of experiments for offline chemical
analysis. Filter sampling is initiated when the aerosol volume reaches its maximum value.
Depending on the total volume concentration of aerosol in the chamber, the filter
sampling time is 2-4 h, which results in ~2-5 m3 of total chamber air sampled. Teflon
filters used for high-resolution electrospray ionization-time-of-flight mass spectrometry
(ESI-TOFMS) analysis are extracted in 5 mL of high-purity methanol (LC-MS
CHROMASOLV-Grade, Sigma-Aldrich) by 45 minutes of sonication. Methanol sample
extracts are then blown dry under a gentle N2 stream (without added heat) once the filters
are removed and archived at 20 °C. Dried residues are then reconstituted with 500 mL
of a 1:1 (v/v) solvent mixture of 0.1% acetic acid in water (LC-MS CHROMASOLV-
Grade, Sigma-Aldrich) and 0.1% acetic acid in methanol (LC-MS CHROMASOLV-
Grade, Sigma Aldrich). All resultant filter extracts are analyzed by a Waters ACQUITY
ultra performance liquid chromatography (UPLC) system, coupled to a Waters LCT
Premier XT time-of-flight mass spectrometer (TOFMS) equipped with an ESI source that
is operated in the negative (–) ionization mode. Detailed operating conditions for the
UPLC/(–)ESI-TOFMS instrument have been described previously (Ng et al., 2007a). A
Waters ACQUITY UPLC HSS column is selected to separate the SOA components
because of its increased retention of water-soluble polar organics; separation is achieved
as a result of trifunctionally-bonded (T3) C18 alkyl residues on this column, which
prevent stationary phase collapse when a 100% aqueous mobile phase is used and result
449

9
in better retention of water-soluble polar organic compounds. In addition to the UPLC/(–
)ESI-TOFMS analysis, all remaining Teflon filters are extracted and analyzed for total
peroxide content (sum of ROOR and ROOH) by using an iodometric-spectroscopic
method previously described by Surratt et al. (2006).
To study the mechanism of SOA formation, in several experiments the
experimental protocols are slightly modified: (1) An excess amount of isoprene (relative
to N2O5 concentration) is injected into the chamber to prevent the further reaction of first-
generation gas-phase products, allowing these products to be detected more readily; (2)
After the addition of isoprene, pulses of N2O5 are introduced into the chamber to study
the evolution of different intermediate gas-phase products; (3) With isoprene well mixed
in the chamber, N2O5 is introduced slowly to maximize the self-reaction of peroxy
radicals (see Sect. 4.2). This is achieved by first injecting N2O5 into a 65 L Teflon bag;
then an air stream of 1 L min-1
is passed through the Teflon bag to introduce N2O5 into
the chamber over a 7-h period. We refer to this as the “slow N2O5 injection experiment”;
and (4) With N2O5 well mixed in the chamber, isoprene is introduced slowly to maximize
the reaction between peroxy radicals and nitrate radicals (see Sect. 4.2). This is achieved
by first injecting isoprene into a 65 L Teflon bag, and then introduced into the chamber
with an air stream of 0.1 L min-1
for 7 h. We refer to this as the “slow isoprene injection
experiment”.
Experimental conditions and results are given in Table 1. In calculating SOA
yield (defined as the ratio of the organic aerosol mass formed to the mass of parent
hydrocarbon reacted), knowledge of the SOA density is required. By comparing volume
450

10
distributions from the DMA and mass distributions from the Q-AMS, the effective
density for the SOA formed can be estimated (Bahreini et al., 2005; Alfarra et al., 2006).
3. Results
3.1 Blank experiments
Blank experiments are performed to ensure that the aerosol growth observed is
from the reaction of isoprene with NO3 radicals. In these experiments, ~1 ppm N2O5 is
introduced into chamber after the addition of ammonium sulfate seed aerosol (with no
isoprene present). As shown in Fig. 1, aerosol volume increases to ~2 μm3 cm
-3 within
an hour after the introduction of N2O5. About 2.5 μg m-3
of inorganic nitrate is measured
by PILS/IC, which agrees well with the amount of nitrates detected by Q-AMS. FTIR
analysis indicates the presence of ~10% HNO3 and 4% NO2 impurity in the N2O5
prepared, thus the nitrates measured by PILS/IC and Q-AMS likely arise from the
partitioning or reactive uptake of gas-phase HNO3 into the aerosol phase, or HNO3
produced from heterogeneous hydrolysis of N2O5. As for the Q-AMS analysis, no organic
species are detected in the filter samples collected from these blank experiments.
3.2 Aerosol yields
A series of experiments with different initial isoprene concentrations are carried
out (these are referred to as “typical yield experiments” hereafter). The initial isoprene
concentration ranged from 18.4 to 203.4 ppb. Figure 2 shows the reaction profile of the
oxidation of an initial mixture containing 203.4 ppb isoprene. Since the chamber is NOx-
free at the beginning of the experiment, once N2O5 is introduced into the chamber the
451

11
equilibrium in Reaction (3) favors the formation of NO3. This generates a relatively high
concentration of NO3 radicals and results in rapid isoprene decay. Aerosol growth is
observed and aerosol volume continues to increase even after all the isoprene is
consumed. Owing to the rapid isoprene decay and the relatively long time between each
GC measurement (12 min), the isoprene decay over time is captured only in experiments
in which the initial isoprene concentration is > 100 ppb. Based on the observed isoprene
decay in these experiments and the isoprene-NO3 rate constant kNO3, the NO3
concentration in the chamber is estimated to be ~140 ppt.
The SOA yield of each experiment (Table 1) is shown in Fig. 3. The density of
the SOA is determined to be 1.42 g cm-3
. The amount of inorganic nitrate detected by
PILS/IC in each experiment ranges from 1.6 to 2.6 μg m-3
, which is approximately equal
to that measured in the blank experiments. In calculating SOA yield, the organic aerosol
mass is corrected for the amount of inorganic nitrate measured in each experiment. For
convenience, SOA yields can be parameterized by a semi-empirical model based on
absorptive gas-particle partitioning of two semivolatile products (Odum et al., 1996,
1997ab):
++
+=
oom
om
oom
om
oMK
K
MK
KMY
2,
2,2
1,
1,1
11 (4)
in which Y is the aerosol yield, Mo is the organic aerosol mass produced, Mo is the
organic aerosol mass present (equal to Mo in chamber experiments with no absorbing
organic mass present initially), i is the mass-based gas-phase stoichiometric fraction for
semivolatile species i, and Kom,i is the gas-particle partitioning coefficient for species i.
With this two-product model, Eq. (4) is fit to the experimental yield data (data with Mo
452

12
< 100 μg m-3
) and the yield parameters obtained are: 1 = 0.089, 2 = 0.203, Kom,1 =
0.182 m3 μg
-1, and Kom,2 = 0.046 m
3 μg
-1. For an organic aerosol mass of ~10 μg m
-3, the
aerosol yield is ~10%.
Also shown in Fig. 3 are aerosol yields from the slow isoprene/N2O5 injection
experiments. Since the PILS/IC is not employed in these experiments, in calculating SOA
yields it is assumed that the amount of inorganic nitrate formed in these slow injection
experiments is roughly the same as that in other experiments. For the slow isoprene
injection experiment, no isoprene is observed by the GC-FID, indicating that once the
isoprene enters the chamber, it is quickly consumed by reaction with NO3. The time
profile of isoprene injection is obtained in a separate experiment, in which the same
amount of isoprene is added into the chamber without N2O5 present. Assuming the
amount of isoprene injected into the chamber is the same as the isoprene reacted, the
amount of isoprene reacted over the course of the slow isoprene experiment can be
deduced. As seen in Fig. 3, the SOA yield from the slow N2O5 injection experiment is
roughly the same as those in the other yield experiments; the yield from the slow isoprene
injection experiment, however, is lower.
The time-dependent “growth curves” (organic aerosol, Mo, as a function of
hydrocarbon reacted, HC) over the course of the slow N2O5 injection experiment and
the slow isoprene injection experiment are shown in Fig. 4. As hydrocarbon
measurements are made with a lower frequency than particle volume, the isoprene
concentrations shown are obtained by interpolating GC-FID measurements. In both
experiments about 50 ppb of isoprene is consumed, the only difference being the order of
isoprene/N2O5 injection. From Fig. 4 it is clear that as the reaction proceeds, more aerosol
453
13
is formed in the slow isoprene injection experiment for the same amount of isoprene
reacted. However, the final SOA yield under the slow N2O5 injection conditions is higher
due to continued aerosol formation even after the complete consumption of isoprene. The
presence of a “hook” at the end of the growth curve for the slow N2O5 injection
experiment indicates that further reactions are contributing to aerosol growth after
isoprene is consumed (Ng et al., 2006). This is further discussed in Sect. 4.3.
3.3 Gas-phase measurements
The CIMS measures the concentrations of different gas-phase products over the
course of the experiments. A series of experiments is carried out to study the mechanisms
of SOA formation by varying the relative amount of isoprene and N2O5 injected and
monitoring the time evolution of the intermediate products. Shown in Fig. 5 are the time
profiles of three major gas-phase products and the corresponding aerosol growth from the
excess isoprene experiment. In this experiment, ~120 ppb of N2O5 is first injected into the
chamber, followed by the introduction of ~800 ppb isoprene. The initial concentration of
isoprene is estimated based on the volume of the isoprene injected and the chamber
volume. Once isoprene is injected, a number of product ions are formed immediately,
with m/z 230, 232, and 248 being the most dominant ones. Several minor product ions at
m/z 185, 377, and 393 are also observed (not shown). With the presence of excess
isoprene, it is expected that the three major products detected are first-generation
products. Their further reaction is suppressed, as indicated by the relatively constant
concentrations of the product ions once they are formed. At the end of the experiment,
725 ppb of isoprene is measured by GC-FID. A small amount of aerosol is formed
454

14
instantaneously, likely from the condensation of relatively nonvolatile first-generation
products, or from further generation products that are formed at a very rapid rate.
To study further the evolution of the gas-phase products, an experiment is
performed in which pulses of N2O5 are introduced into the chamber (with isoprene
present) (Fig. 6). The top panel shows the isoprene decay and aerosol formation; the
middle panel shows the time profiles of the three major first-generation products (m/z
230, 232, and 248); the bottom panel shows the time profiles of three minor products (m/z
185, 377, and 393). In this experiment, 179 ppb of isoprene is first injected into the
chamber, followed by the addition of 3 pulses of N2O5 (~120, 50, 210 ppb). The
observations after the addition of the first pulse of N2O5 are similar to the excess isoprene
experiment described above. With the addition of ~120 ppb N2O5, 97 ppb of isoprene is
reacted away, m/z 230, 232, and 248 are formed with concentrations of ~ 53 ppb, 25 ppb,
and 21 ppb, respectively. Because of the lack of authentic standards, the concentrations
are uncertain. Because the sum of the ion concentrations derived from our estimated
sensitivities is equal to the reacted isoprene, our estimated sensitivity must represent a
lower limit for the actual sensitivity of the CIMS to these compounds. Similar to the data
in Fig. 5, the concentrations of these product ions stay relatively constant owing to the
presence of excess isoprene. The minor products at m/z 185, 377, and 393, are formed
with the concentrations of ~1.5 ppb, 1 ppb, and 1ppb, respectively. It is noted that the
m/z 393 ion is formed with a relatively slower rate than all other product ions. A small
amount of aerosol is observed. At t = 15:40, a second pulse of N2O5 (~50 ppb) is
introduced into the chamber and the remaining 82 ppb isoprene is completely consumed.
As seen from Fig. 6, the concentrations of all intermediate products increase accordingly
455

15
and more aerosol is produced. The relative increase in the concentration of m/z 232 ion is
not as high as would be expected if we assume the ratio of m/z 230 to 232 formed to be
the same as in the first pulse of N2O5 addition (i.e. ~2:1). This indicates that some of m/z
232 ion has reacted with NO3 radicals. The last pulse of N2O5 (~210 ppb) is added at t =
19:00. Since all isoprene has been consumed, the additional NO3 radicals react mainly
with the first-generation products, as indicated by the decay of m/z 230, 232, and 248,
185, 377, and 393 ions. Of all of the observed products, it appears that m/z 232 and 377
ions are the most reactive with NO3 radicals, and their decays in excess NO3 are strongly
correlated with aerosol growth. The rest of the product ions display relatively slower
decay kinetics. The decay of the major product ion at m/z 230 does not appear to correlate
with aerosol growth, as the concentration of the m/z 230 ion continues to decrease
throughout the experiment but there is no further aerosol growth. Although the CIMS
instrument has only 0.5 AMU resolution and it cannot distinguish products of the similar
or identical molecular weight, it is likely that many of observed masses comprise isomers
formed from the NO3 attack at different positions. The fact that many of the observed
product ions show two distinct decay time scales indicates that these isomers have
substantially different reactivity towards NO3 radicals.
3.4 Chemical composition of SOA
3.4.1 Aerosol Mass Spectrometer (Q-AMS) measurements
Figure 7 shows the AMS spectrum of SOA formed in the typical yield
experiments. Each mass fragment is normalized by the total signal. The SOA exhibits
relatively high signals at m/z 30, 43, and 46. The signals at m/z 30 and 46 likely
456

16
correspond to NO+
(30) and NO2+
(46) fragments from the nitrates in the aerosol. The
spectrum shown in Fig. 7 is obtained when aerosol volume reaches its maximum value;
the spectrum obtained several hours after aerosol volume peaks shows minimal changes
in the mass fractions of different fragments, indicating that the aerosol composition is not
changing significantly over time.
Figure 8 shows the mass spectrum of the slow N2O5 injection experiment versus a
typical yield experiment; Figure 9 shows the mass spectrum of the slow isoprene
injection experiment versus a typical yield experiment. As shown in both figures, the
mass fragments fall on the 1:1 line, suggesting a similar SOA composition under the
three different experimental conditions.
3.4.2. Offline chemical analysis
Figure 10 shows the representative UPLC/(–)ESI-TOFMS base peak ion
chromatograms (BPCs) for different types of experiments conducted. The numbers
denoted above the selected chromatographic peaks correspond to the most abundant
negative ions observed in their respective mass spectra. Comparison of the BPCs shown
in Fig. 10 indicates that the compositions of the SOA are quite similar for the typical
yield experiment, slow isoprene injection experiment, and the acid seed experiment,
suggesting a common SOA formation pathway. The SOA composition from the excess
isoprene experiment, however, is different from these experiments. This will be discussed
further in Sect. 4.4.
Accurate mass measurements for all ions observed by the UPLC/(–)ESI-TOFMS
technique for a typical yield experiment are listed in Table 2. The error between the
457

17
measured mass and theoretical mass is reported in two different ways, ppm and mDa.
Overall, the error between the measured and theoretical masses is found to be less than ±
2 mDa and ± 5 ppm, allowing for generally unambiguous identification of molecular
formulae. None of the listed ions is observed in solvent blanks and control filters. By
combining the elemental SOA composition (i.e. TOFMS suggested ion formula) data and
the gas-phase data from CIMS, structures for each of the SOA components are also
proposed. As shown in Table 2, the types of compounds formed included nitroxy-organic
acids, hydroxynitrates, nitroxy-organic peroxides (e.g. nitroxy-hydroxyperoxides), and
nitroxy-organosulfates. It should be noted that the data presented in Table 2 are also
applicable to all other types of experiments conducted in this study; however, none of the
organosulfates are observed in the nucleation experiments, consistent with previous work
(Liggio et al., 2005; Liggio et al., 2006; Surratt et al., 2007ab; Iinuma et al., 2007ab).
Surprisingly, previously characterized organosulfates of the 2-methyltetrols and the 2-
methyltetrol mono-nitrates detected at m/z 215 and m/z 260 (not listed in Table 2),
respectively, which are produced from the photooxidation of isoprene in the presence of
acidified sulfate seed aerosol (Surratt et al., 2007ab; Gómez-González et al., 2007), are
also observed in the acid seed experiment shown in Fig. 10, suggesting that nighttime
oxidation of isoprene in the presence of acidic seed may also be a viable pathway for
these known ambient tracer compounds.
Owing to the implementation of reverse-phase chromatography, the SOA
components that are more hydrophilic elute from the column the earliest, while the more
hydrophobic components elute the latest. It is clear from Table 2 that compounds with the
same carbon number and general functionality (i.e. carboxylic acid, alcohol, or
458

18
organosulfate), but differing number of nitroxy groups, exhibit distinctly different
chromatographic behaviors. The presence of more nitroxy groups appears to increase the
retention time of the SOA compound. For example, it is found that m/z 194 organic acid
compound (C5H8NO7–) containing one nitroxy group elutes earlier than that of the m/z
239 organic acid compounds (C5H7N2O9–) containing two nitroxy groups. Similarly, the
m/z 305 organosulfate (C5H9N2O11S–) elutes earlier than that of the m/z 349 organosulfate
(C5H8N3O13S–).
SOA components that are either nitroxy-organic acids or nitroxy-organosulfates
are detected strongly as the [M – H]– ion, consistent with previous work (Surratt et al.,
2006; Surratt et al., 2007ab; Gao et al., 2004ab; Gao et al., 2006), whereas the
hydroxynitrates and nitroxy-hydroxyperoxides are detected as both the [M – H]– and [M
– H + C2H4O2]– ions, with the latter acetic acid adduct ion, in most cases, being the base
peak ion (i.e. dominant ion). The acetic acid adduct ions for the hydroxynitrates and the
nitroxy-hydroxyperoxides are formed owing to the presence of acetic acid in the UPLC
mobile phase. Previous studies have shown that non-acidic hydroxylated species (such as
the 2-methyltetrols) and organic peroxides formed from the photooxidation of isoprene
(Claeys et al., 2004; Edney et al., 2005; Surratt et al., 2006) are either undetectable or
yield weak negative ions when using (–)ESI-MS techniques. However, it appears that the
co-presence of nitroxy groups in the hydroxylated SOA components allow for these
compounds to become acidic enough to be detected by the UPLC/(–)ESI-TOFMS
technique, or allow for adduction with acetic acid. Further confirmation for the presence
of organic peroxides in the isoprene SOA produced from NO3 oxidation is provided by
the iodometric-spectroscopic measurements shown in Table 3. Based upon the UPLC/(–
459

19
)ESI-TOFMS measurements shown in Table 2, an average molecular weight of 433 for
the organic peroxides is assumed for the calculations shown in Table 3. The contribution
of organic peroxides to the SOA mass concentration is found to be fairly reproducible for
duplicate typical experiments (i.e. 8/22/07 and 10/24/07). The amount of organic
peroxides in the excess isoprene experiment is below detection limits.
4. Gas-phase chemistry and SOA formation
4.1 Formation of various gas-phase products
As seen from Fig. 5 and Fig. 6, the three major first-generation products formed
from isoprene-NO3 reaction are the m/z 230, 232, and 248 ions. Since CIMS uses CF3O-
(MW 85) as the reagent ion, compounds are identified by their molecular weight (MW)
plus 85. The product ions at m/z 230, 232, and 248 likely correspond to C5-
nitroxycarbonyl (MW 145), C5-hydroxynitrate (MW 147), and C5-nitroxyhydroperoxide
(MW 163). These products have been observed in previous studies (Jay and Stieglitz,
1989; Skov et al., 1992; Kwok et al., 1996; Berndt and Böge, 1997) and their formation
from the isoprene-NO3 reaction is relatively straightforward (Fig. 11). The reaction
proceeds by NO3 addition to the C=C double bond, forming four possible nitroxyalkyl
radicals depending the position of the NO3 attack. Previous studies suggest that NO3
radicals predominantly attack isoprene in the 1-position, with a branching ratio (C1-
position/C4-position) varying between 3.5 and 7.4 (Skov et al., 1992; Berndt and Böge,
1997; Suh et al., 2001). In Fig. 11, only the nitroxyalkyl radical formed from the C1
attack is shown. The nitroxyalkyl radicals then react with O2 to form RO2 radicals, which
react further with HO2, RO2, or NO3 radicals under the experimental conditions in this
460

20
study. The reaction of RO2 radicals and HO2 radicals leads to the formation of C5-
nitroxyhydroperoxide (m/z 248). The reaction of two RO2 radicals (self reaction or cross
reaction) has three different possible channels:
RO2 + RO2 2RO + O2 (5a)
ROH + RCHO + O2 (5b)
ROOR + O2 (5c)
The second channel results in the formation of C5-nitroxycarbonyl (m/z 230) and C5-
hydroxynitrate (m/z 232). According to channel (5b), these two products should be
formed with a 1:1 ratio; however, C5-nitroxycarbonyl can also be formed from alkoxy
radicals (either from RO2 + RO2 reaction or RO2 + NO3 reaction). In Fig. 6, about 53 ppb
of C5-nitroxycarbonyl and 25 ppb of C5-hydroxynitrate are formed after the addition of
the first pulse of N2O5, indicating ~28 ppb of C5-nitroxycarbonyl is formed from the
fragmentation of alkoxy radicals. The branching ratios for the reaction of small peroxy
radicals have been investigated in previous studies. It is found that the branching ratio for
channel (5a) for methylperoxy and ethylperoxy radicals is ~0.3-0.4 and ~0.6, respectively
(Lightfoot et al., 1992; Wallington et al., 1992; Tyndall et al., 1998). It is likely that the
isoprene peroxy radicals react via this pathway to form alkoxy radicals and contribute to
the “extra” 28ppb of C5-nitroxycarbonyl. Although the concentrations of the product ions
measured by CIMS are only rough estimates, the above observation is indicative that
most RO2 radicals react with other RO2 radicals instead with NO3 or HO2 radicals.
Other than C5-nitroxycarbonyl, C5-hydroxynitrate, and C5-nitroxyhydroperoxide,
three other minor products (m/z 185, 377 and 393 ions) are also observed as intermediate
products. The proposed mechanisms for the formation of these gas-phase products are
461

21
also shown in Fig. 11. Although channel (5c) in the RO2 + RO2 reaction is found to be
minor for small peroxy radicals such as methylperoxy and ethylperoxy radicals (Kan et
al., 1980; Niki et al., 1981; Niki et al., 1982; Wallington et al., 1989; Tyndall et al., 1998;
Tyndall et al., 2001), the product ion at m/z 377 could be the corresponding ROOR
product formed from the self reaction of isoprene peroxy radicals. The product ion at m/z
185 likely corresponds to the C5-hydroxycarbonyl. It has been observed in previous
studies and it likely arises from the isomerization of nitroxyalkoxy radicals through a 6-
member transition state to form a hydroxynitroxy alkyl radical, which then decomposes
to form NO2 and C5-hydroxycarbonyl (Kwok et al., 1996). Such isomerization has also
been proposed to occur in the photooxidation of isoprene (Paulson and Seinfeld, 1992;
Carter and Atkinson, 1996; Dibble, 2002). It is possible that the hydroxynitroxy alkyl
radical formed proceeds to react with O2 to form a peroxy radical, which then reacts with
the isoprene peroxy radical to form the product ion m/z at 393. The product ion at m/z 393
shows a slower rate of formation (Fig. 6) compared to other product ions suggesting that
it might also be formed from the further oxidation of a first-generation product. 2-methyl-
2-vinyl-oxirane has been observed from isoprene-NO3 reaction in pervious studies at 20
mbar in helium (Berndt and Böge, 1997) and 20 Torr in argon (Skov et al., 1994),
respectively. When operated in positive mode with H+
as the reagent ion (products are
observed at m/z = MW + 1), CIMS detects a product ion at m/z 85. Although the epoxide
yield is found to be <1% of the total reacted isoprene at atmospheric pressure (Skov et al.,
1994), the signal at m/z 85 can arise in part from the epoxide. The further oxidation of the
epoxide results in the formation of an epoxide peroxy radical, which can react with the
isoprene peroxy radical to form the peroxide at m/z 393. It is noted that a product ion at
462

22
m/z 246 is detected in the CIMS, which could arise from the corresponding carbonyl
product formed from the reactions of two epoxide peroxy radicals, or from the
fragmentation of the epoxide alkoxy radicals. Unlike m/z 393 which decays after the
addition of the last pulse of N2O5, m/z 246 stays relatively constant suggesting that it is
not being further oxidized by NO3 radicals. To examine further the possibility of peroxide
formation (m/z 377 and 393) in the gas phase, an experiment is conducted using 1,3-
butadiene as the parent hydrocarbon. The analogous product ions for the 1,3-butadiene
system, i.e. m/z 349 and 365, are observed in the CIMS, providing further indication that
the formation of ROOR products from two RO2 radicals is occurring in the gas phase.
Further details of the gas-phase chemistry of isoprene and 1,3-butadiene will be
forthcoming in a future manuscript.
4.2 Effect of peroxy radical chemistry on SOA yield
The SOA yield ranges from 4.3% to 23.8% for an initial isoprene concentration of
18.4 to 101.6 ppb in the typical yield experiments. While the SOA yield from the slow
N2O5 injection experiment is roughly the same as that in the typical yield experiments,
the SOA yield from the slow isoprene injection experiment is lower (Fig. 3). In both
cases, ~40 ppb of isoprene is consumed, the main difference being the relative
importance of RO2 + RO2 reaction versus RO2 + NO3 reaction in each system. In the slow
N2O5 injection experiment, a relatively small amount of NO3 is available in the chamber.
Once RO2 radicals are formed, it is expected that they would react primarily with other
RO2 radicals instead of NO3 radicals owing to the presence of a relatively higher isoprene
concentration in the chamber. On the other hand, the slow isoprene injection experiment
463

23
favors RO2 + NO3 reaction owing to the presence of excess N2O5 in the chamber. Thus
the higher SOA yield observed in the slow N2O5 injection experiment suggests the
products formed via RO2 + RO2 reaction partition more readily into the aerosol phase, or
the RO2 + RO2 reaction forms products that further react and contribute significantly to
aerosol growth. The fact that the SOA yield from the slow N2O5 injection experiment is
roughly the same as in the typical yield experiments implies that RO2 + RO2 reaction
dominates in typical yield experiments.
The time profile for the three major first-generation gas phase products and SOA
growth from the slow N2O5 injection experiment and slow isoprene injection experiment
are shown in Fig. 12 and Fig. 13, respectively. In both cases, once the first-generation
products are formed they can react further with NO3 radicals, making it difficult to
estimate the formation yields of these products based on the measured concentrations.
The extent to which these products react further is expected to be higher in the slow
isoprene injection experiment owing to the presence of excess NO3 in chamber; this is
consistent with the relatively lower concentrations of first-generation products observed.
As mentioned before, it is possible that the CIMS signal at the observed m/z comprises
isomers formed from the NO3 attack at positions other than the C1 carbon. Such isomers
have slightly different structures but they could exhibit a very different reaction rate
towards NO3 radicals. For instance, studies have shown that the reaction rates of NO3
radicals with unsaturated alcohols and unsaturated carbonyl compounds can vary by
several orders of magnitude depending on the position of the substituted methyl group
(Noda et al., 2002; Canosa-Mas et al., 2005). It is possible that the minor products formed
from NO3 attack at other positions react much slower with NO3 radicals, hence the
464

24
concentrations of the observed product ions do not decay to zero towards the end of the
experiment. At the end of the experiment, about 8 ppb and 3 ppb of C5-hydroxynitrate is
left in the slow N2O5 injection experiment and slow isoprene injection experiment,
respectively. Assuming the amount of reactive isomers and unreactive (or relatively slow
reacting) isomers are formed in the same ratio in the slow N2O5 injection experiment and
the slow isoprene injection experiment, we can deduce that a relatively higher
concentration of reactive C5-hydroxynitrate (as well as the two other first-generation
products) is formed in the slow N2O5 injection experiment. This is consistent with the
larger extent of RO2 + RO2 reaction (which forms C5-hydroxynitrate) and the higher SOA
yield observed in the slow N2O5 injection experiment, as it appears that C5-
hydroxynitrate is an effective SOA precursor (Fig. 6).
4.3 Growth curves: multiple steps in SOA formation
By examining the time-dependent growth curves (organic aerosol, Mo, as a
function of hydrocarbon reacted, HC) we can gain insights into the general mechanisms
of SOA formation (Ng et al., 2006, 2007ab). Fig. 4 shows the time-dependent growth
curves for the slow N2O5 injection experiment and the slow isoprene injection
experiment, respectively. For the slow N2O5 injection experiment, the initial aerosol
growth likely arises from the condensation of first-generation products as the presence of
excess isoprene in the chamber suppresses their further oxidation. If higher generation
products do contribute to SOA formation, they would have to be formed at very rapid
rates. After isoprene is consumed, aerosol mass continues to increases and results in a
“hook” in the growth curve. This indicates that secondary products (or higher generation
465

25
products) also contribute significantly to SOA formation. The same observation can be
made if we examine the reaction profile of a typical yield experiment (Fig. 2): there is
further SOA growth after all isoprene is reacted away, indicating that the further
oxidation of first generation products are contributing to SOA formed. These
observations are consistent with the fact that the decay of first-generation products
observed in the CIMS (especially the m/z 232 and m/z 377 ions) is strongly anticorrelated
with further SOA growth (Fig. 6). On the other hand, the slow isoprene injection
experiment does not allow us to differentiate the contribution of first- and second-
generation products to SOA formation. With the presence of excess NO3 radicals in the
chamber, the first-generation products formed in the slow isoprene injection experiment
would be further oxidized once they are formed. The SOA growth observed throughout
this experiment is from the partitioning of these highly oxidized and nonvolatile products.
Hence, at the beginning of the experiment, for the same amount of HC, the amount of
SOA formed in this experiment is higher than that in the slow N2O5 injection experiment,
in which the aerosol growth is probably from the condensation of relatively more volatile
first-generation products. Both the AMS data and filter sample data (Figs. 8, 9, and 10)
show a very similar composition for the final SOA formed in slow N2O5 injection
experiment and the slow isoprene injection experiment, suggesting a common SOA
forming channel. Based on the previous discussion on the effect of peroxy radical
chemistry on SOA yields, it is likely that the RO2 + RO2 reaction is the SOA-forming
channel in both cases; such a reaction occurs to a large extent in the slow N2O5 injection
experiments and results in the formation of more SOA.
466

26
4.4 Proposed mechanisms of SOA formation
The combination of CIMS gas-phase data and elemental SOA composition data
provides substantial insights into the mechanisms of SOA formation. Shown in Fig. 14-
17 are the proposed SOA formation mechanisms from the further oxidation of the various
gas-phase products measured by CIMS. The compounds in the boxes are the SOA
products detected by UPLC/(-)ESI-TOFMS. Owing to multiple chromatographic peaks
observed in the UPLC/(–)ESI-TOFMS extracted ion chromatograms (EICs) for the
negative ions of the proposed SOA products, structural isomers are likely; however, for
simplicity we show only one possible isomer for each product formed from a particular
reaction pathway. Many of the SOA products detected are formed from the further
oxidation of first- or higher-generation products, which is consistent with the observation
of continual SOA growth after the complete consumption of isoprene (hence a “hook” in
the growth curve). With the large number of nitrate-substituted compounds detected by
UPLC/(-)ESI-TOFMS technique, it is also not surprising that the AMS shows strong
signals at m/z 30 (NO+) and m/z 46 (NO2
+).
Shown in Fig. 14 and 15 are the proposed SOA formation pathways from the
further oxidation of the m/z 232 (i.e. C5-hydroxynitrate) and 377 gas-phase product ions
(as detected by the CIMS). The decay of these two products has been found to be
strongly correlated with aerosol growth (Fig. 6), which is consistent with the large
number of SOA products formed from their further oxidation. The further oxidation of
these two gas-phase products also yields SOA compounds of the same molecular weight
(compounds of MW 371 and 450). Although m/z 393 is a minor gas-phase product, the
further oxidation of this compound leads to formation of several SOA products (Fig. 16).
467

27
As mentioned before, there are two possible formation routes for m/z 393, and the further
oxidation of both products is shown in Fig. 16. The further oxidation of the m/z 393 ion
appears to yield SOA products that are specific only to this gas-phase product: these
include the SOA products of MW 387 and 467.
Figure 17 shows the proposed SOA formation mechanisms from three other gas-
phase products (m/z 185, m/z 230, and m/z 277); the further oxidation of these product
ions leads to relatively minor SOA products. Although C5-nitroxycarbonyl (m/z 230) is
the most abundant gas-phase product detected by CIMS, its further oxidation is not well
correlated with aerosol growth (Fig. 6). The further oxidation of m/z 230 yields an SOA
product at MW 240. This organic acid product is found to be quite minor when
examining the peak area in its corresponding extracted ion chromatogram (EIC). It is
noted that no SOA products are detected from the further oxidation of the C5-
nitroxyhydroperoxide (m/z 248) (also a major gas-phase product); it is possible that these
hydroperoxide products are not acidic enough to be detected by the UPLC/(–)ESI-
TOFMS technique, or degrade during sample workup and/or analysis procedures. It has
been shown that hydroxycarbonyl plays a key role in SOA formation from the reaction of
linear alkenes with NO3 radicals (Gong et al., 2005), however, in the isoprene-NO3
system, the further oxidation of the minor gas-phase product C5-hydroxycarbonyl (m/z
185) leads to the formation of only one minor aerosol product at MW 195. Some
evidence for the formation of a C5-dinitrate first-generation gas-phase product is
indicated from the CIMS and UPLC/(–)ESI-TOFMS data. This first-generation gas-phase
product has been observed previously by Werner et al. (1997). The CIMS detects a weak
signal at m/z 277, which could be associated to the dinitrate product; we do not know,
468

28
however, whether the negative ion efficiently clusters with such compounds. Further
evidence for the dinitrate gas-phase product is provided by the UPLC/(–)ESI-TOFMS
detection of an SOA product at MW 495, which could result from the further oxidation of
a C5-dinitrate precursor. The precursor compound before the last oxidation step shown in
this mechanism in Fig. 17 may exist in the particle phase; however, this compound is not
likely to be detected by the UPLC/(–)ESI-TOFMS technique owing to the lack of acidic
hydrogens from neighboring hydroxyl and/or carboxyl groups.
The SOA products highlighted in Fig. 14-17 are observed in all major
experiments conducted; however, not all of these products are strongly detected in the
excess isoprene experiment (Fig. 10c). With the presence of excess isoprene, further
oxidations of first-generation products should be minimal and no significant SOA
formation is expected. However, SOA growth is observed and it appears from the
UPLC/(–)ESI-TOFMS data that enough RO2 + RO2 chemistry is occurring to yield many
of the products shown in Fig. 14-17. When comparing the UPLC/(–)ESI-TOFMS BPCs
(Fig. 10) of all experiments, it is clear that the m/z 430 and m/z 446 are the dominant ions
in the excess isoprene experiment, while m/z 333 is the dominant chromatographic peak
in other experiments. The chromatographic peak at m/z 430 corresponds to the acetic acid
cluster ion for the compound at MW 371, which can be formed from the further oxidation
of CIMS m/z 232 and 377 ions (Fig. 14 and 15). The chromatographic peak at m/z 446
corresponds to the acetic acid cluster ion for the compound at MW 387, which is formed
from the further oxidation of CIMS m/z 393 (Fig. 16). The detection of these two SOA
products (MW 371 and MW 387) suggests that further oxidation of m/z 232, 377, and
393 is occurring in the excess isoprene experiment and contributing to SOA growth. It is
469

29
also possible that CIMS m/z 393 (a first-generation product according to one of the
formation routes) is nonvolatile enough that it partitions into the aerosol phase and its
further oxidation proceeds heterogeneously. Chromatographic peaks such as m/z 333
(associated with MW 271 compound), 449 (MW 450 compound) and 554 (MW 495
compound) are not as strong in the excess isoprene experiment owing to the fact there is
not enough NO3 in the system to allow for the formation of these highly oxidized
compounds.
As discussed earlier, the formation yields of ROOR from the reaction of two
peroxy radicals is very low for small peroxy radicals (Kan et al., 1980; Niki et al., 1981;
Niki et al., 1982; Wallington et al., 1989; Tyndall et al., 1998; Tyndall et al., 2001).
However, according to both gas-phase and aerosol-phase data in this study, it appears that
RO2 + RO2 reaction (self reaction or cross-reaction) in the gas phase yielding ROOR
products is a dominant SOA formation pathway. In the case of self-reaction of peroxy
radicals, the molecular weight of the product is essentially doubled, providing an efficient
way to form products of low volatility. Owing to the lack of authentic standards, we
cannot accurately quantify how much each of the peroxide products contributes to the
SOA mass. Nevertheless, the total peroxide measurement (Table 3) indicates that they
contribute significantly to the total SOA formed.
From the UPLC/(–)ESI-TOFMS (Table 2) and PILS/IC measurements, it appears
that organic acids are not a major contributor to SOA formation from the oxidation of
isoprene by NO3 radicals. The UPLC/(–)ESI-TOFMS technique detects only two minor
organic acids at MW 195 and 240. Additionally, the PILS/IC technique does not detect
large quantities of any small organic acids. The sum of formate, acetate, glycolate,
470

30
lactate, oxalate, and pyruvate are usually between 0.01 – 0.50 μg m-3
. These observations
are different from the SOA produced in the photooxidation of isoprene (under high- and
low-NOx conditions), in which a large number of organic acids, such as 2-methylglyceric,
formic, and acetic acid, are observed (Surratt et al., 2006; Szmigielski et al., 2007). In the
photooxidation experiments, the level of organic acids detected under low-NOx
conditions is lower than under high-NOx conditions. The low-NOx isoprene SOA was
previously found to also have a significant amount of organic peroxides, as detected in
the current study (Table 3); however, organic peroxides detected previously in low-NOx
isoprene SOA were not structurally elucidated through MS techniques performed in the
present study (Table 2, Fig. 14-17), possibly owing to the lack of nitroxy groups which
seem to induce acidity and/or increase the adductive abilities of organic peroxides with
acetic acid during the ESI-MS analysis. Overall, it appears that the isoprene-NO3 SOA is
much more similar to the previously studied low-NOx isoprene SOA. More specifically, it
appears that both contain a large amount of organic peroxides, organosulfates (if
conducted in the presence of sulfate seed aerosol), and neutral hydroxylated compounds,
such as the hydroxynitrates observed in Fig. 14 (e.g. MW 226 and 271 products).
5. Approximate estimate of global production of SOA from isoprene + NO3
The global chemical transport model GEOS-Chem (v. 7-04-11)
(http://www.as.harvard.edu:16080/chemistry/trop/geos/) is used to estimate, roughly,
global SOA formation from the isoprene + NO3 reaction. The current version of GEOS-
Chem treats mechanistically SOA formation from isoprene + OH, monoterpenes and
sesquiterpenes, and aromatics; here we will estimate SOA formation from isoprene +
471

31
NO3 by using an approximate, uniform SOA yield of 10% (corresponding to Mo 10 μg
m-3
in Fig. 3). It is noted that this yield is quite uncertain and the importance of peroxy
radical self reactions in this study suggest that the SOA yield in the atmosphere will be
highly sensitive to the nature of the nighttime peroxy radical chemistry. Here, we seek to
obtain only a “back-of-the-envelope” estimate.
Two global isoprene emissions are available in GEOS-Chem: GEIA (Global
Emission Inventory Activity) (Guenther et al., 1995) and MEGAN (Model of Emissions
and Gases from Nature) (Guenther et al., 2006). Both models require, as input,
meteorological data such as temperature to calculate the amount isoprene emitted. For the
present estimate, the meteorological fields employed by Wu et al. (2007), generated by
the Goddard Institute for Space Studies (GISS) General Circulation Model III, are used.
Meteorological conditions correspond approximately to those of year 2000.
Table 4 presents the annual emissions of isoprene as predicted by each of the
emission models, together with the amount of isoprene predicted to react via OH, O3, and
NO3, the global burden, and lifetime. We note that there is a significant difference
between the annual isoprene emissions predicted by the earlier and newer emission
models. Isoprene + OH accounts for 300 to 400 Tg yr-1
of isoprene consumption. Henze
et al. (2007) predict that annual SOA production from isoprene + OH is about 13 Tg yr-1
(based on the MEGAN inventory and GEOS-4 meteorological fields, which are
assimilated fields from actual year 2004). Note that SOA production from isoprene + OH,
or any other pathway for that matter, is sensitive to the production of SOA from other
hydrocarbon precursors since gas-aerosol partitioning depends on the total organic
aerosol mass.
472

32
If we take as a rough estimate a 10% SOA yield from the isoprene + NO3 pathway
from the results in Table 4, 2 to 3 Tg yr-1
of SOA results from isoprene + NO3. This rate
of production would make SOA from isoprene + NO3 as significant as that from
sesquiterpenes, biogenic alcohols, and aromatics, each of which produces about 2 to 4 Tg
yr-1
of SOA (Henze et al., 2007). Owing to efficient photodissociation, NO3 achieves its
highest concentrations at night. By contrast, isoprene emissions are assumed to be zero at
night in both emission models. Consequently, the isoprene + NO3 reaction occurs only at
night, involving isoprene that remains unreacted after each daytime period.
We caution that the estimates above are obtained at the crudest level of
approximation, in which a globally uniform SOA yield of 10% from isoprene + NO3 is
applied. As we note from Table 4, there is also as substantial difference between
predictions of the two available isoprene emission models; the more recent MEGAN
model represents an improved level of understanding over the earlier GEIA model.
Predictions of SOA formation from the isoprene + NO3 pathway are, of course, highly
dependent on ambient NO3 radical concentrations. Nitrate radical concentrations
predicted in the current simulations vary from about 0.1 ppt in remote regions of South
America to 20 ppt or more in the southeastern USA (in August). Future work will address
the simulation of SOA formation from isoprene + NO3 following the microphysical
treatment in GEOS-Chem.
6. Implications
We report a series of chamber experiments investigating the formation of
secondary organic aerosols from the reaction of isoprene with nitrate radicals. For an
473

33
initial isoprene concentration of 18.4 to 101.6 ppb, the SOA yield ranges from 4.3% to
23.8% (typical yield experiments). The SOA yield from the slow N2O5 injection
experiment (RO2 + RO2 reaction dominates) is much higher than that from the slow
isoprene injection experiment (RO2 + NO3 dominates), implying that RO2 + RO2 is a
more effective channel of forming SOA. The SOA yield from the slow N2O5 experiment
is roughly the same as that in the typical yield experiments, suggesting that SOA yields
obtained in this study likely represent conditions in which peroxy-peroxy radical
reactions are favored. Using a uniform SOA yield of 10% (corresponding to Mo 10 μg
m-3
), ~2 to 3 Tg yr-1
of SOA results from isoprene + NO3, which is about of the amount
of SOA estimated to be formed from isoprene + OH (~13 Tg yr-1
) (Henze et al., 2007).
The extent to which the results from this study can be applied to conditions in the
atmosphere depends on the relative importance of RO2 + RO2 versus RO2 + NO3
reactions in the nighttime troposphere. However, the fate of peroxy radicals in the
atmosphere is uncertain owing to the large uncertainties in the reaction rate constants and
ambient concentration of both RO2 and NO3 radicals (Skov et al., 1992; Kirchner and
Stockwell, 1996; Bey et al., 2001ab; Vaughan et al., 2006). A modeling study by
Kirchner and Stockwell et al. (1996) suggests that RO2 + NO3 reaction is important at
night; for a moderately polluted site, ~77-90% of the total RO2 at night is predicted to
react with NO3. These results are at odds with the study by Bey et al. (2001ab), which
suggests that NO3 radicals are not involved significantly in the propagation of RO2
radicals. Currently, only the reaction rate constants for small, relatively simple RO2
radicals with NO3 radicals have been reported (e.g. Biggs et al., 1994; Daele et al., 1995;
Canosa-Mas et al., 1996; Vaughan et al., 2006) and they are roughly in the range of (1-3)
474

34
x 10-12
cm3 molecule
-1 s
-1. With the oxidation of various volatile organic compounds by
O3 and NO3 under nighttime conditions, it is expected that multi-functional peroxy
radicals would be prevalent; the reaction rates of these complex peroxy radicals warrants
future study. Furthermore, more field measurements on the concentrations of peroxy
radicals and nitrate radicals would also help to constrain the relative importance of RO2 +
RO2 versus RO2 + NO3 reaction.
In this study, we have shown that the formation of ROOR from the reaction of
two peroxy radicals is an effective SOA-forming channel based on gas-phase data and
elemental SOA composition data. This reaction has generally been considered as a minor
channel and has not been widely studied. If the results from this study can be applied to
other systems (i.e. the reaction of NO3 radicals with other volatile organic compounds),
the organic peroxides could possibly be very important SOA components in all systems;
they may not have been identified previously owing to the lack of suitable analytical
techniques (such as accurate mass measurements from high resolution MS) and clearly
more study is needed.
475

35
Acknowledgements
This research was funded by U.S. Department of Energy Biological and Environmental
Research Program DE-FG02-05ER63983. This material is based in part on work
supported by the National Science Foundation (NSF) under grant ATM-0432377. The
Waters LCT Premier XT time-of-flight mass spectrometer interfaced to a Waters UPLC
system was purchased in 2006 with a grant from the National Science Foundation,
Chemistry Research Instrumentation and Facilities Program (CHE-0541745). The LCQ
Ion Trap mass spectrometer was purchased in 1997 with funds from the National Science
Foundation through the CRIF program (CHE-9709233). Jason D. Surratt is supported in
part by the U.S. EPA under the STAR Graduate Fellowship Program. Alan J. Kwan
acknowledges the support of a NSF graduate research fellowship. The authors would like
to thank Chad D. Vecitis, Jie Cheng, and Michael R. Hoffmann for use of and aid with
their ozonizer and UV-VIS spectrometer; and to Kana Takematsu and Mitchio Okumura
for helpful advice on preparing N2O5. The authors also thank Jesse H. Kroll for helpful
discussions.
476
36
References:
Alfarra, M. R., Paulsen, D., Gysel, M., Garforth, A. A., Dommen, J., Prevot, A. S. H.,
Worsnop, D. R., Baltensperger, U., and Coe, H.: A mass spectrometric study of
secondary organic aerosols formed from the photooxidation of anthropogenic and
biogenic precursors in a reaction chamber, Atmos. Chem. Phys., 6, 5279-5293, 2006.
Bahreini, R., Keywood, M. D., Ng, N. L., Varutbangkul, V., Gao, S., Flagan, R. C., and
Seinfeld, J. H. Measurements of secondary organic aerosol (SOA) from oxidation of
cycloalkenes, terpenes, and m-xylene using an Aerodyne aerosol mass spectrometer.
Environ. Sci. Technol., 39, 5674-5688, 2005.
Barnes, I., Bastian, V., Becker, K. H. and Tong, Z.: Kinetics and products of the reactions
of NO3 with monoalkenes, dialkenes, and monoterpenes, J. Phys. Chem., 94, 2413-
2419, 1990.
Berndt, T. and Böge, O.: Gas-Phase reaction of NO3 radicals with isoprene: A kinetic and
mechanistic study, Inter. J. Chem. Kinet., 29, 755-765, 1997.
Bey, I., Aumont, B. and Toupance, G.: A modeling study of the nighttime radical
chemistry in the lower continental troposphere. 1. Development of a detailed
chemical mechanism including nighttime chemistry, J. Geophys. Res., 106, D9, 9959-
9990, 2001a.
Bey, I., Aumont, B. and Toupance, G.: A modeling study of the nighttime radical
chemistry in the lower continental troposphere. 2. Origin and evolution of HOx, J.
Geophys. Res., 106, D9, 9991-10001, 2001b.
Bey, I., Jacob, D. J., Yantosca, R. M., Logan, J. A., Field, B. D., Fiore, A. M., Li, Q. B.,
Liu, H. G. Y., Mickley, L. J. and Schultz, M. G.: Global modeling of tropospheric
chemistry with assimilated meteorology: Model description and evaluation, J.
Geophys. Res., 106, D19, 23073-23095, 2001c .
Biggs, P., Canosa-Mas, C. E., Fracheboud, J. M., Shallcross, D. E. and Wayne, R. P.:
Investigation into the kinetics and mechanisms of the reaction of NO3 with CH3 and
CH3O at 298K between 0.6 Torr and 8.5 Torr – is there a chain decomposition
mechanism in operation, J. Chem. Soc., Faraday Trans., 90, 1197-1204, 1994.
Brown, S. S., Ryerson, T. B., Wollny, A. G., Brock, C. A., Peltier, R., Sullivan, A. P.,
Weber, R. J., Dube, W. P., Trainer, M., Meagher, J. F., Fehsenfeld, F. C. and
Ravishankara, A. R.: Variability in nocturnal nitrogen oxide processing and its role in
regional air quality, Science, 311, 5757, 67-70, 2006.
Canosa-Mas, C. E., Flugge, M. L., King, M. D. and Wayne, R. P.: An experimental study
of the gas-phase reaction of the NO3 radical with , unsaturated carbonyl
compounds, Phys. Chem. Chem. Phys., 7. 643-650, 2005.
477

37
Canosa-Mas, C. E., King, M. D., Lopez, R., Percival, C. J., Wayne, R. P., Shallcross, D.
E., Pyle, J. A. and Daele, V.: Is the reaction CH3C(O)O2 and NO3 important in the
night-time troposphere? J. Chem. Soc., Faraday Trans., 92, 2211-2222, 1996.
Carslaw, N., Carpenter, L. J., Plane, J. M. C., Allan, B. J., Burgess, R. A., Clemitshaw, K.
C., Coe, H. and Penkett, S. A.: Simultaneous measurements of nitrate and peroxy
radicals in the marine boundary layer, J. Geophys. Res., 102, 18917-18933. 1997.
Carter, W. P. L. and Atkinson, R.: Development and evaluation of a detailed mechanism
for the atmospheric reactions of isoprene and NOx, Int. J. Chem. Kinet., 28, 497-530,
1996.
Claeys, M., Graham, B., Vas, G., Wang, W., Vermeylen, R., Pashynska, V., Cafmeyer, J.,
Guyon, P., Andreae, M.O., Artaxo, P. and Maenhaut, W.: Formation of secondary
organic aerosols through photooxidation of isoprene, Science, 303, 1173-1176, 2004.
Cocker III, D. R., Flagan, R. C., and Seinfeld, J. H.: State-of-the-art chamber facility for
studying atmospheric aerosol chemistry, Environ. Sci. Technol., 35, 2594-2601.
2001.
Crounse, J. D., McKinney, K. A., Kwan, A. J. and Wennberg, P. O.: Measurements of
gas-phase hydroperoxides by chemical ionization mass spectrometry, Anal. Chem.,
78, 6726-6732, 2006.
Curren, K., Gillespie, T., Steyn, D., Dann, T. and Wang, D.: Biogenic isoprene in the
Lower Fraser Valley, British Columbia, J. Geophys. Res., 103, D19, 25467-25477,
1998.
Daele, V., Laverdet, G., Lebras, G. and Poulet, G.: Kinetics of the reactions of
CH3O+NO, CH3O+NO3, and CH3O2+NO3, J. Phys. Chem., 99, 1470-1477, 1995.
Davidson, J. A., Viggiano, A. A., Howard, C. J., Fehsenfeld, F. C., Albritton, D. L. and
Ferguson, E. E.: Rate constants for the reaction of O2+, NO2
+, NO
+, H3O
+, CO3
-, NO2
-,
and halide ions with N2O5 at 300K, J. Chem. Phys., 68, 2085-2087, 1978.
Dibble, T. S.: Isomerization of OH-isoprene adducts and hydroxyalkoxy isoprene
radicals, J. Phys. Chem., 106, 28, 6643-6650, 2002.
Dommen, J., Metzger, A., Duplissy, J., Kalberer, M., Alfarra, M. R., Gascho, A.,
Weingartner, E., Prevot, A. S. H., Verheggen, B. and Baltensperger, U.: Laboratory
observation of oligomers in the aerosol from isoprene/NOx photooxidation, Geophys.
Res. Lett., 33, L13805, 2006.
Edney, E. O., Kleindienst, T. E., Jaoui, M., Lewandowski, M., Offenberg, J. H., Wang,
W. and Claeys, M.: Formation of 2-methyl tetrols and 2-methylglyceric acid in
478

38
secondary organic aerosol from laboratory irradiated isoprene/NOx/SO2/air mixtures
and their detection in ambient PM2.5 samples collected in the eastern United States,
Atmos. Environ., 39, 5281-5289, 2005.
Fan, J. and Zhang, R.: Atmospheric oxidation mechanism of isoprene, Environ. Chem., 1,
140-149, doi:10.1071/EN04045, 2004.
Gao, S., Keywood, M. D., Ng, N. L., Surratt, J. D., Varutbangkul, V., Bahreini, R.,
Flagan, R. C., and Seinfeld, J. H.: Low molecular weight and oligomeric components
in secondary organic aerosol from the ozonolysis of cycloalkenes and -pinene, J.
Phys. Chem. A, 108, 10147-10164, 2004a.
Gao, S., Ng, N. L., Keywood, M. D., Varutbangkul, V., Bahreini, R., Nenes, A., He, J.,
Yoo, K. Y., Beauchamp, J. L., Hodyss, R. P., Flagan, R. C., and Seinfeld, J. H.:
Particle phase acidity and oligomer formation in secondary organic aerosol, Environ.
Sci. Technol., 38, 6582-6589, 2004b.
Gao, S., Surratt, J. D., Knipping, E. M., Edgerton, E. S., Shahgholi, M., and Seinfeld, J.
H.: Characterization of polar organic components in fine aerosols in the southeastern
United States: Identity, origin, and evolution, J. Geophys. Res., 111, D14314,
doi:10.1029/2005JD006601, 2006.
Gong, H., Matsunaga, A. and Ziemann, P.: Products and mechanism of secondary
organic aerosol formation from reactions of linear alkenes with NO3 radicals, J. Phys.
Chem., 109, 4312-4324, 2005.
Gómez-González, Y., Surratt, J. D., Cuyckens, F., Szmigielski, R., Vermeylen, R., Jaoui,
M., Lewandowski, M., Offenberg, J. H., Kleindienst, T. E., Edney, E. O., Blockhuys,
F., Van Alsenoy, C., Maenhaut, W. and Claeys, M.: Characterization of
organosulfates from the photooxidation of isoprene and unsaturated fatty acids in
ambient aerosol using liquid chromatography/(–) electrospray ionization mass
spectrometry, J. Mass Spectrom., 2007, doi:10.1002/jms.1329, 2007.
Guenther, A., Hewitt, C. N., Erickson, D., Fall, R., Geron, C., Graedel, T., Harley, P.,
Klinger, L., Lerdau, M., Mckay, W. A., Pierce, T., Scholes, B., Steinbrecher, R.,
Tallamraju, R., Taylor, J. and Zimmerman, P.: A global-model of natural volatile
organic compound emissions, J. Geophys. Res., 100 (D5), 8873-8892, 1995.
Guenther, A., Karl, T., Harley, P., Wiedinmyer, C., Palmer, P. I. and Geron, C.:
Estimates of global terrestrial isoprene emissions using MEGAN (Model of
Emissions of Gases and Aerosols from Nature), Atmos. Chem. Phys., 6, 3181-3210,
2006.
Heintz, F., Platt, U., Flentje, H. and Dubois, R.: Long-term observation of nitrate radicals
at the tor station, Kap Arkona (Rugen), J. Geophys. Res., 101, D17, 22891-22910,
1996.
479

39
Henze, D. K., Seinfeld, J. H., Ng, N. L., Kroll, J. H., Fu, T. M., Jacob, D. J. and Heald, C.
L.: Global modeling of secondary organic aerosol formation from aromatic
hydrocarbons: High- vs low-yield pathways, Atmos. Chem. Phys. Discuss., 7, 14569-
14601, 2007.
Horowitz, L. W., Fiore, A. M., Milly, G. P., Cohen, R. C., Perring, A., Wooldridge, P. J.,
Hess, P.G., Emmons, L. K. and Lamarque, J.: Observational constraints on the
chemistry of isoprene nitrates over the eastern United States, J. Geophys. Res., 112,
D12S08, doi:10.1029/2006JD007747, 2007.
Iinuma, Y., Müller, C., Berndt, T., Böge, O., Claeys, M. and Herrmann, H.: Evidence for
the existence of organosulfates from -pinene ozonolysis in ambient secondary
organic aerosol, Environ. Sci. Technol., 41, 6678-6683, 2007b.
Iinuma, Y., Müller, C., Böge, O., Gnauk, T. and Herrmann, H.: The formation of organic
sulfate esters in the limonene ozonolysis secondary organic aerosol (SOA) under
acidic conditions, Atmos. Environ., 41, 5571-5583, 2007a.
Jay, K. and Stieglitz, L.: The gas phase addition of NOx to olefins, Chemosphere, 19,
1939-1950, 1989.
Jayne, J. T., Leard, D. C., Zhang, X., Davidovits, P., Smith, K. A., Kolb, C. E., and
Worsnop, D. W.: Development of an Aerosol Mass Spectrometer for size and
composition analysis of submicron particles, Aerosol Sci. Technol., 33, 49-70, 2000.
Kan, C. S., Calvert, J. G. and Shaw, J. H.: Reactive channels of the CH3O2-CH3O2
reaction, J. Phys. Chem., 84, 3411-3417, 1980.
Keywood, M. D., Varutbangkul, V., Bahreini, R., Flagan, R. C., and Seinfeld, J. H.:
Secondary organic aerosol formation from the ozonolysis of cycloalkenes and related
compounds, Environ. Sci. Technol., 38, 4157-4164, 2004.
Kirchner, F. and Stockwell, W. R.: Effect of peroxy radical reactions on the predicted
concentrations of ozone, nitrogenous compounds, and radicals, J. Geophys. Res., 101,
D15, 21007-21022, 1996.
Kroll, J. H., Ng, N. L., Murphy, S. M., Flagan, R. C., and Seinfeld, J. H.: Secondary
organic aerosol formation from isoprene photooxidation under high-NOx conditions,
J. Geophys. Res., 32, L18808, doi: 10.1029/2005GL023637, 2005.
Kroll, J. H., Ng, N. L., Murphy, S. M., Flagan, R. C., and Seinfeld. J. H.: Secondary
organic aerosol formation from isoprene photooxidation, Environ. Sci. Technol., 40.
1869-1877, 2006.
Kwok, E. S. C., Aschmann, S. M., Arey, J. and Atkinson, R.: Product formation from the
480

40
reaction of the NO3 radical with isoprene and rate constants for the reactions of
methacrolein and methyl vinyl ketone with the NO3 radical, Inter. J. Chem. Kinet. 28,
925-934, 1996.
Liggio, J. and Li, S. M.: Organosulfate formation during the uptake of pinonaldehyde on
acidic sulfate aerosols, Geophys. Res. Lett., 33, L13808, 2006.
Liggio, J., Li, S. M. and McLaren, R.: Heterogeneous reactions of glyoxal on particulate
matter: Identification of acetals and sulfate esters, Environ. Sci. Technol., 39, 1532-
1541, 2005.
Lightfoot, P. D., Cox, R..A., Crowley, J. N., Destriau, M. Hayman, G. D., Jenkin, M. E.,
Moortgat G. K. and Zabel, F.: Organic peroxy radicals – kinetics, spectroscopy and
tropospheric chemistry, Atmos. Environ., 26, 1805-1961, 1992.
Ng, N. L., Chhabra, P. S., Chan, A. W. H., Surratt, J. D., Kroll, J. H., Kwan, A. J.,
McCabe, D. C., Wennberg, P. O., Sorooshian, A., Murphy, S. M., Dalleska, N. F.,
Flagan, R. C. and Seinfeld, J. H.: Effect of NOx level on secondary organic aerosol
(SOA) formation from the photooxidation of terpenes, Atmos. Chem. Phys., 7, 5159-
5174, 2007a.
Ng, N. L., Kroll, J. H., Chan, A. W. H., Chhabra, P. S., Flagan, R. C. and Seinfeld, J. H.:
Secondary organic aerosol formation from m-xylene, toluene, and benzene, Atmos.
Chem. Phys., 7, 3909-3922, 2007b.
Ng, N. L., Kroll, J. H., Keywood, M. D., Bahreini, R., Varutbangkul, V., Flagan, R. C.,
Seinfeld, J. H., Lee, A. and Goldstein, A. H.: Contribution of first- versus second-
generation products to secondary organic aerosols formed in the oxidation of biogenic
hydrocarbons, Environ. Sci. Technol., 40, 2283-2297, 2006.
Niki, H, Maker, P. D., Savage, C. M. and Breitenbach L.P.: Fourier Transform Infrared
studies of the self-reaction of CH3O2 radicals, J. Phys. Chem., 85, 877-881, 1981.
Niki, H, Maker, P. D., Savage, C. M. and Breitenbach L.P.: Fourier Transform Infrared
studies of the self-reaction of C2H5O2 radicals, J. Phys. Chem., 86, 3825-3829, 1982.
Noda, J., Nyman, G. and Langer S.: Kinetics of the gas-phase reaction of some
unsaturated alcohols with the nitrate radical, J. Phys. Chem., 106, 945-951, 2002.
Odum, J. R., Hoffmann, T., Bowman, F., Collins, D., R. C. Flagan, R. C., and Seinfeld, J.
H.: Gas/particle partitioning and secondary organic aerosol yields, Environ. Sci.
Technol., 30, 2580-2585, 1996.
Odum, J. R., Jungkamp, T. P. W., Griffin, R. J., Flagan, R. C., and Seinfeld, J. H.: The
atmospheric aerosol-forming potential of whole gasoline vapor, Science, 276, 96-99,
1997a.
481

41
Odum, J. R., Jungkamp, T. P. W., Griffin, R. J., Forstner, H. J. L., Flagan, R. C., and
Seinfeld, J. H.: Aromatics, reformulated gasoline and atmospheric organic aerosol
formation, Environ. Sci. Technol., 31, 1890-1897, 1997b.
Paulson, S. E. and Seinfeld, J. H.: Development and evaluation of a photooxidation
mechanism for isoprene, J. Geophys. Res., 97, D18, 20703-20715, 1992.
Penkett, S.A., Burgess, R.A., Coe, H., Coll, I., Hov, Ø., Lindskog, A., Schmidbauer, N.,
Solberg, S., Roemer, M., Thijsse, T., Beck, J. and Reeves C.E.: Evidence for large
average concentrations of the nitrate radical (NO3) in Western Europe from the
HANSA hydrocarbon database, Atmos. Environ., 41, 3465-3478, 2007.
Platt, U. and Janssen, C.: Observation and role of the free radicals NO3, ClO, BrO and IO
in the troposphere, Faraday Discuss., 100, 175-198, 1995.
Platt, U., Perner, D., Schroder, J., Kessler, C. and Toennissen, A.: The diurnal variation
of NO3, J. Geophys. Res., 86, 11965-11970, 1981.
Sharkey, T. D., Singsaas, E. L., Vanderveer, P. J. and Geron, C.: Field measurements of
isoprene emission from trees in response to temperature and light, Tree Physiol., 16,
649-654, 1996.
Skov, H., Benter, Th., Schindler, R. N., Hjorth, J. and Restelli, G.: Epoxide formation in
the reactions of the nitrate radical with 2,3-dimethyl-2-butene, cis- and trans-2-butene
and isoprene, Atmos. Environ., 28, 1583-1592, 1994.
Skov, H., Hjorth, J., Lohse, C., Jensen, N. R. and Restelli, G.: Products and mechanisms
of the reactions of the nitrate radical (NO3) with isoprene, 1,3-butadiene and 2,3-
dimethyl-1,3-butadiene in air, Atmos. Environ., 26A, 15, 2771-2783, 1992.
Smith, N., Plane, J. M. C., Nien, C. F. and Solomon, P. A.: Nighttime radical chemistry
in the San-Joaquin Valley, Atmos. Environ., 29, 2887-2897, 1995.
Sorooshian, A., Brechtel F. J., Ma, Y. L., Weber R. J., Corless, A., Flagan, R. C., and
Seinfeld, J. H.: Modeling and characterization of a particle-into-liquid sampler
(PILS), Aerosol Sci. Technol., 40, 396-409, 2006.
Starn, T. K., Shepson, P. B., Bertman, S. B., Riemer, D. D., Zika, R. G. and Olszyna, K.:
Nighttime isoprene chemistry at an urban-impacted forest site, J. Geophys. Res., 103,
D17, 22437-22447, 1998.
Steinbacher, M., Dommen, J. Ordonez, C., Reimann, S., Gruebler, F. C., Staehelin, J.,
Andreani-Aksoyoglu, S. and Prevot, A. S. H.: Volatile organic compounds in the Po
Bason. Part B: Biogenic VOCs, J. Atmos. Chem., 51, 293-315, 2005.
482

42
Stroud, C. A., Roberts, J. M., Williams E. J., Hereid, D., Angevine, W. M., Fehsenfeld, F.
C., Wisthaler, A., Hansel, A., Martinez-Harder, M., Harder, H., Brune, W. H.,
Hoenninger, G., Stutz, J. and White, A. B.: Nighttime isoprene trends at an urban
forested site during the 1999 Southern Oxidant Study, J. Geophys. Res., 107, D16,
4291, 10.1029/2001JD000959, 2002.
Suh, I., Lei, W. and Zhang, R.: Experimental and theoretical studies of isoprene reaction
with NO3, J. Phys. Chem., 105, 6471-6478, 2001.
Surratt, J. D., Kroll, J. H., Kleindienst, T. E., Edney, E. O., Claeys, M., Sorooshian, A.,
Ng, N. L., Offenberg, J. H., Lewandowski, M., Jaoui, M., Flagan, R. C. and Seinfeld,
J. H.: Evidence for organosulfates in secondary organic aerosol, Environ. Sci.
Technol., 41, 517-527, 2007a.
Surratt, J. D., Lewandowski, M., Offenberg, J. H., Jaoui, M., Kleindienst, T. E., Edney,
E. O. and Seinfeld, J. H.: Effect of acidity on secondary organic aerosol formation
from isoprene, Environ. Sci. Technol., 41, 5363-5369, 2007b.
Surratt, J. D., Murphy, S. M., Kroll, J. H., Ng, N. L., Hildebrandt, L., Sorooshian, A.,
Szmigielski, R., Vermeylen, R., Maenhaut, W., Claeys, M., Flagan, R. C. and
Seinfeld, J. H.: Chemical composition of secondary organic aerosol formed from the
photooxidation of isoprene, J. Phys. Chem. A, 110, 9665-9690, 2006.
Szmigielski, R., Surratt, J. D., Vermeylen, R., Szmigielska, K., Kroll, J. H., Ng, N. L.,
Murphy, S. M., Sorooshian, A., Seinfeld, J. H. and Claeys, M.: Characterization of 2-
methylglyceric acid oligomers in secondary organic aerosol formed from the
photooxidation of isoprene using trimethylsilylation and gas chromatography/ion trap
mass spectrometry, J. Mass Spectrom., 42, 101-116, 2007.
Tyndall, G. S., Cox, R. A., Granier, C., Lesclaux, R., Moortgat, G. K., Pilling, M. J.,
Ravishankara, A. R. and Wallington, T. J.: Atmospheric chemistry of small peroxy
radicals, J. Geophys. Res., 106, D11, 12157-12182, 2001.
Tyndall, G. S., Wallington, T. J. and Ball, J. C.: FTIR product study of the reactions of
CH3O2+CH3O2 and CH3O2+O3, J. Phys. Chem., 102, 2547-2554, 1998.
Vaughan, S. Canosa-Mas, C. E., Pfrang, C., Shallcross, D. E., Watson, L. and Wayne, R.
P.: Kinetic studies of reactions of the nitrate radical (NO3) with peroxy radicals
(RO2): an indirect source of OH at night? Phys. Chem. Chem. Phys., 8, 3749–3760,
2006.
von Friedeburg, C., Wagner, T., Geyer, A., Kaiser, N., Platt, U., Vogel, B. and Vogel, H.:
Derivation of tropospheric NO3 profiles using off-axis differential optical absorption
spectroscopy measurements during sunrise and comparison with simulations, J.
Geophys. Res., 107, D13, doi:10.1029/2001JD000481, 2002.
483

43
Wallington, T. J., Dagaut, P. and Kurylo, M. J.: Ultraviolet absorption cross-sections and
reaction kinetics and mechanisms for peroxy radicals in the gas phase, Chem. Rev.,
92, 667-710, 1992.
Wallington, T. J., Gierczak, C. A., Ball, J. C. and Japar, S. M.: Fourier Transform
Infrared studies of the self-reaction of C2H5O2 radicals in air at 295K, Int. J. Chem.
Kinet., 21, 1077-1089, 1989.
Werner, G., Kastler, J., Looser, R. and Ballschmiter, K.: Organic nitrates of isoprene as
atmospheric trace compounds, Angew. Chem. Int. Ed., 38, 11, 1634-1637, 1999.
Wu, S. L., Mickley, L. J., Jacob, D. J. Logan, J. A., Yantosca, R. M. and Rind, D.: Why
are there large differences between models in global budgets of tropospheric ozone?
J. Geophys. Res., 112, D5, D05302, 2007.
Zhang, D. and Zhang, R.: Unimolecular decomposition of nitroxyalkyl radicals from
NO3-isoprnene reaction, J. Chem. Phys., 116, 22, 9721-9728, 2002.
484

Table 1. Initial conditions and results for yield experimentsDate T (K) RH (%) HC (ppb) a Mo (μg/m3) b SOA Yield (%)
8/9/07 294 5.1 101.6 ± 0.6 68.1 ± 1.1 23.8 ± 0.58/10/07 293 4.7 30.2 ± 0.1 11.5 ± 0.4 13.5 ± 0.58/11/07 294 5.4 67.1 ± 0.1 39.3 ± 1.2 20.8 ± 0.78/12/07 293 6.0 51.7 ± 0.2 26.7 ± 0.6 18.2 ± 0.58/13/07 294 5.7 18.4 ± 0.1 2.2 ± 0.2 4.3 ± 0.58/14/07 294 5.5 21.8 ± 0.1 4.8 ± 0.4 7.8 ± 0.6
10/4/2007c 293 5.5 39.5 ± 0.1d 7.9 ± 0.3 7.1 ± 0.610/25/2007e 294 6.4 42.0 ± 0.1 16.6 ± 0.6 14.1 ± 0.7
a Stated uncertainties (1 ) are from scatter in isoprene measurements.b Stated uncertainties (1 ) are from scatter in particle volume measurements.c Slow isoprene injection experimentd Concentration estimated based on a separate calibration experiment (see Sect. 3.2); the uncertainty in the measured isoprene concentration is assumed to be the same as in the slow N2O5 experiment.e Slow N2O5 injection experiment
485

Table 2. SOA products identified using UPLC/( )ESI-TOFMS.
3.68b 194.0310 C5H8NO7 0.9, 4.6 c
4.52b 239.0137 C5H7N2O9 -1.5, -6.3
5.09d 304.9946 C5H9N2O11S 1.9, 6.2
5.24b 239.0152 C5H7N2O9 0.0, 0.0
5.43d 304.9944 C5H9N2O11S 1.7, 5.6
6.07 225.0350 C5H9N2O8 -0.9, -4.0
TOFMS Suggested
[M H + C2H4O2]
Ion Formula Proposed Structurea
Measured [M H + C2H4O2] Ion
(m/z)Error
(mDa, ppm)
Retention Time (min)
Measured [M H] Ion
(m/z)
TOFMS Suggested [M H] Ion
FormulaError
(mDa, ppm)
HO
O3N
NO3
OSO3H
HO
O3N
NO3
OSO3H
HO
NO3
OH
O
HO
HO
NO3
OH
O
O3N
HO
NO3
OH
O
O3N
HO
O3N
NO3
OH
486

6.12 225.0342 C5H9N2O8 -1.7, -7.6
6.60 225.0375 C5H9N2O8 1.6, 7.1 285.0676 C7H13N2O10 0.6, 2.1
7.75d 349.9775 C5H8N3O13S -0.3, -0.9
7.85d 349.9764 C5H8N3O13S 0.2, 0.6
8.00d 349.9784 C5H8N3O13S -0.4, -1.1
8.48d 466.0268 C10H16N3O16S 1.7, 3.6
8.54d 466.0264 C10H16N3O16S 1.3, 2.8
NO3
OSO3H
O3N
NO3
NO3
OSO3H
O3N
NO3
NO3
OSO3H
O3N
NO3
O3N
OONO3
O
NO3
HO3SO
O3N
OONO3
O
NO3
HO3SO
HO
O3N
NO3
OH
HO
O3N
NO3
OH
487

8.72d 466.0237 C10H16N3O16S -1.4, -3.0
8.76e 270.0199 C5H8N3O10 -1.1, -4.1 330.0393 C7H12N3O12 -2.8, -8.5
8.81d 466.0237 C10H16N3O16S -1.4, -3.0
8.85e 270.0204 C5H8N3O10 -0.6, -2.2 330.0379 C7H12N3O12 -4.2, -12.7
9.15 370.0734 C10H16N3O12 0.9, 2.4 430.0940 C12H20N3O14 -0.5, -1.2
9.19 386.0678 C10H16N3O13 -0.5, -1.3 446.0888 C12H20N3O15 -0.6, -1.3
NO3
OH
O3N
NO3
NO3
OH
O3N
NO3
O3N
OO
NO3
NO3
OH
O3N
OONO3
O
NO3
HO3SO
O3N
OONO3
O
NO3
HO3SO
O3N
OONO3
O
NO3
HO
488

9.24 370.0732 C10H16N3O12 -0.2, -0.5 430.0937 C12H20N3O14 -0.8, -1.9
9.25 386.0683 C10H16N3O13 -0.2, -0.5 446.0893 C12H20N3O15 -0.1, -0.2
9.37 449.0637 C10H17N4O16 -0.3, -0.7 509.0854 C12H21N4O18 0.3, 0.6
9.41 386.0684 C10H16N3O13 0.1, 0.3 446.0903 C12H20N3O15 0.9, 2.0
9.45 449.0653 C10H17N4O16 1.3, 2.9 509.0853 C12H21N4O18 0.2, 0.4
9.90f 494.0537 C10H16N5O18 4.7, 9.5 554.0669 C12H20N5O20 -3.3, -6.0
O3N
HONO3
NO3
OHO3N
OO
O3N
HONO3
NO3
OHO3N
OO
O3N
OO
NO3
NO3
OH
O3N
OONO3
O
NO3
HO
O3N
OONO3
O
NO3
HO
OO
NO3
O3N
OH
O3N
O3NNO3
489

9.98f 494.0518 C10H16N5O18 2.8, 5.7 554.0676 C12H20N5O20 -2.6, -4.7
a Structural isomers containing nitrate, sulfate, or hyroxyl groups at other positions are likely; for simplicity, only one isomer is shown.b These compounds appear to be very minor SOA products due to very small chromatographic peak areas, confirming that the further oxidation of the nitroxycarbonyl and hydroxycarbonyl first-generation gas-phase products do not yield significant quantities of SOA.c A blank cell indicates that the detected SOA product had no obervable acetic acid adduct ion (i.e. [M H + C2H4O2] ).d These organosulfate SOA products were observed only in experiments employing either (NH4)2SO4 (i.e. neutral) or MgSO4 + H2SO4 (i.e. acidic) seed aerosol. These organosulfate SOA products were also observed in the excess isoprene experiments.e In addition to the acetic acid adduct ion, these compounds also had a significant adduct ion at [M H + HNO3] (m/z 333), indicating that these compounds are likely not very stable due to the fragmentation of one of the NO3 groups during the MS analysis. f These compounds were only weakly detected in the excess isoprene experiments.
OO
NO3
O3N
OH
O3N
O3NNO3
490

Table 3. Peroxide content of SOA formed by NO3 oxidation of isoprene.
Experiment Date
Seededa/ Nucleation
[Isoprene] (ppb)
[N2O5] (ppm)
SOA Volume Growth
Observedb
(μm3/cm3)
Total SOA Mass
Concentrationc
(μg/m3)
Peroxide Aerosol Mass Concentration
(μg/m3)
Contriubtion of Peroxides to
the SOA Mass Concentration
Observed (%)
8/22/07 AS 200 1 102 145 46 328/30/07 AMS 200 1 123 174 40 23
10/22/07d AS 1200 0.7 70 100 b.d.l.e f
10/23/07 nucleation 200 1 125 177 31 1710/24/07 AS 200 1 111 158 47 3010/27/07g AS 300 1 110 156 47 30
a AS = ammonium sulfate seed, AMS = acidified magnesium sulfate seed.b Averaged over the course of filter sampling.c Assuming a SOA density of 1.42 g/cm3. This was based on DMA and Q-AMS measurements.d Excess isoprene experiment.e Below detection limits.f No observable contribution of organic peroxides to the SOA mass concentration.g Slow injection of isoprene in this experiment to enhance the RO2 + NO3 reaction pathway.
491

Table 4. Global estimation of isoprene using GEOS-Chem
GEIAa MEGANb
Isoprene emission (Tg/y) 507 389Global isoprene burden (Tg) 1.7 1.7Isoprene lifetime (days) 1.2 1.6Isoprene reacted (Tg/y) byIsoprene + OH 407 304Isoprene + O3 69 62Isoprene + NO3 29 21a Modification of GEIA for GEOS-Chem are described at Bey et al. (2001c). Orginal GEIA reference is Guenther et al. (1995).b Guenther et al. (2006)
Emission Model
492
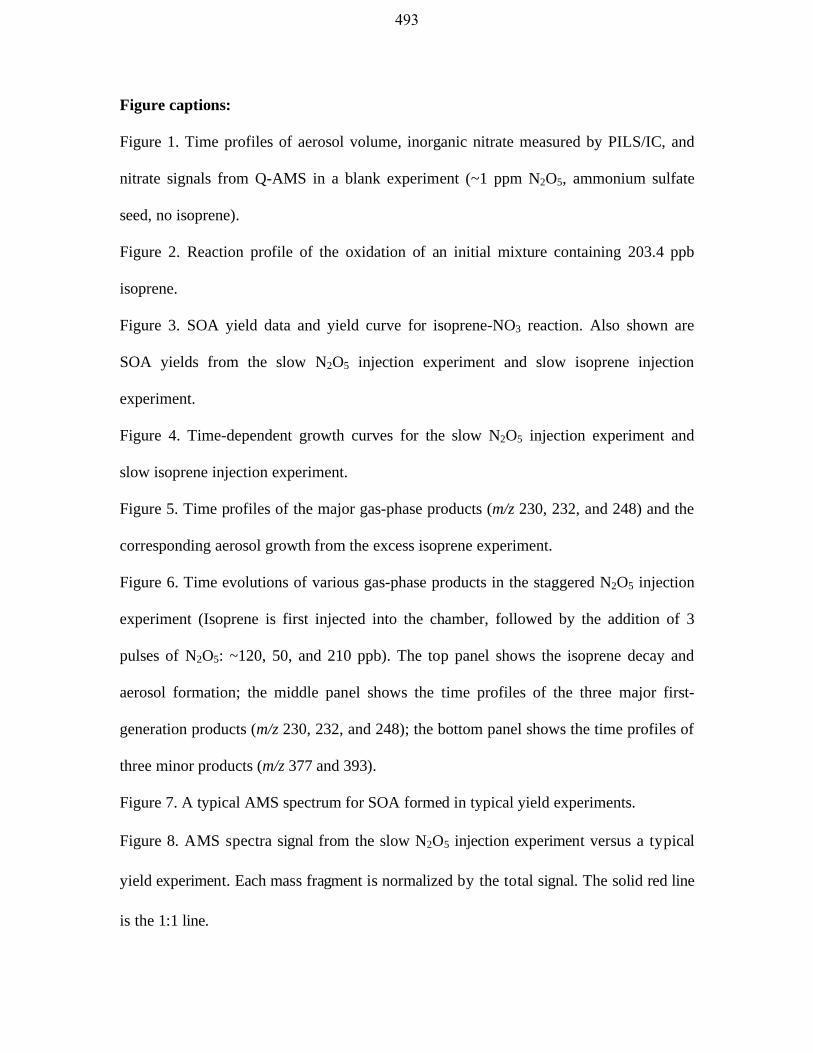
Figure captions:
Figure 1. Time profiles of aerosol volume, inorganic nitrate measured by PILS/IC, and
nitrate signals from Q-AMS in a blank experiment (~1 ppm N2O5, ammonium sulfate
seed, no isoprene).
Figure 2. Reaction profile of the oxidation of an initial mixture containing 203.4 ppb
isoprene.
Figure 3. SOA yield data and yield curve for isoprene-NO3 reaction. Also shown are
SOA yields from the slow N2O5 injection experiment and slow isoprene injection
experiment.
Figure 4. Time-dependent growth curves for the slow N2O5 injection experiment and
slow isoprene injection experiment.
Figure 5. Time profiles of the major gas-phase products (m/z 230, 232, and 248) and the
corresponding aerosol growth from the excess isoprene experiment.
Figure 6. Time evolutions of various gas-phase products in the staggered N2O5 injection
experiment (Isoprene is first injected into the chamber, followed by the addition of 3
pulses of N2O5: ~120, 50, and 210 ppb). The top panel shows the isoprene decay and
aerosol formation; the middle panel shows the time profiles of the three major first-
generation products (m/z 230, 232, and 248); the bottom panel shows the time profiles of
three minor products (m/z 377 and 393).
Figure 7. A typical AMS spectrum for SOA formed in typical yield experiments.
Figure 8. AMS spectra signal from the slow N2O5 injection experiment versus a typical
yield experiment. Each mass fragment is normalized by the total signal. The solid red line
is the 1:1 line.
493

Figure 9. AMS spectra signal from the slow isoprene injection experiment versus a
typical yield experiment. Each mass fragment is normalized by the total signal. The solid
red line is the 1:1 line.
Figure 10. UPLC/(-)ESI-TOFMS base peak ion chromatograms (BPCs) for the following
isoprene-NO3 oxidation experiments: (a) 200 ppb isoprene + 1 ppm N2O5 + seed aerosol
generated from 15 mM (NH4)2SO4 atomizing solution; (b) 300 ppb isoprene + 1 ppm
N2O5 + seed aerosol generated from 15 mM (NH4)2SO4 atomizing solution; (c) 1.2 ppm
isoprene + 700 ppb N2O5 + seed aerosol generated from 15 mM (NH4)2SO4 atomizing
solution; (d) 200 ppb isoprene + 1 ppm N2O5 + seed aerosol generated from 30 mM
MgSO4 + 50 mM H2SO4 atomizing solution. The numbers indicated above the selected
chromatographic peaks correspond to the most abundant negative ion, and is either the
[M - H]- or [M - H + C2H4O2]- ions.
Figure 11. Proposed mechanisms for the formation of various gas-phase intermediate
product ions observed by CIMS. Multiple structural isomers are possible. In this figure,
RO2’ refers to the isoprene peroxy radical (nitroxyperoxy radical), RO2 refer to a generic
peroxy radical.
Figure 12. Time profiles of the major gas-phase products (m/z 230, 232, and 248) and the
corresponding aerosol growth from the slow N2O5 injection experiment.
Figure 13. Time profiles of the major gas-phase products (m/z 230, 232, and 248) and the
corresponding aerosol growth from the slow isoprene injection experiment.
Figure 14. Proposed mechanism for SOA formation from the formation and decay of the
C5-hydroxynitrate gas-phase product formed from the isoprene + NO3 reaction. Boxes
494

indicate UPLC/(-)ESI-TOFMS detected SOA products; molecular formulas were
confirmed by the accurate mass data provided by the UPLC/(-)ESI-TOFMS. Multiple
structural isomers are possible, consistent with the multiple chromatographic peaks
observed in the extracted ion chromatograms; however, only one structural isomer is
shown for simplicity. a This first-generation gas-phase product was previously observed
by Jay and Stieglitz (1989), Skov et al. (1992), Kwok et al. (1996), and Berndt and Böge
(1997); this gas-phase product was detected as the [M + CF3O-]- ion by the CIMS
instrument. b These particle-phase compounds were detected as both their [M - H]- and
[M - H + C2H4O2]- ions; the acetic acid adduct ([M - H + C2H4O2]
-) ion was, in most
cases, the molecular ion (i.e. dominant ion). c These organosulfate compounds were
detected as their [M - H]- ions and were observed only in ammonium sulfate and acidified
magnesium sulfate seeded experiments.
Figure 15. Proposed mechanism for SOA formation from the formation and decay of the
CIMS m/z 377 gas-phase product formed from the isoprene + NO3 reaction. Boxes
indicate UPLC/(-)ESI-TOFMS detected SOA products; molecular formulas were
confirmed by the accurate mass data provided by the UPLC/(-)ESI-TOFMS. Multiple
structural isomers are possible, consistent with the multiple chromatographic peaks
observed in the extracted ion chromatograms; however, only one structural isomer is
shown for simplicity. a This first-generation gas-phase product was detected as the [M +
CF3O-]- ion by the CIMS instrument. b These particle-phase compounds were detected
as both their [M - H]- and [M - H + C2H4O2]- ions; the acetic acid adduct ([M - H +
C2H4O2]-) ion was, in most cases, the molecular ion (i.e. dominant ion).
495

Figure 16. Proposed mechanism for SOA formation from the formation and decay of the
CIMS m/z 393 gas-phase product formed from the isoprene + NO3 reaction. Boxes
indicate UPLC/(-)ESI-TOFMS detected SOA products; molecular formulas were
confirmed by the accurate mass data provided by the UPLC/(-)ESI-TOFMS. Multiple
structural isomers are possible, consistent with the multiple chromatographic peaks
observed in the extracted ion chromatograms; however, only one structural isomer is
shown for simplicity. a This first-generation gas-phase product was detected as the [M +
H]+ ion by the CIMS instrument; this gas-phase product was previously observed by
Berndt and Böge (1997) and could also be 2-(1-methyl-vinyl)oxirane. b This gas-phase
product was detected as the [M + CF3O-]- ion. c These particle-phase compounds were
detected as both their [M - H]- and [M - H + C2H4O2]- ions; the acetic acid adduct ([M -
H + C2H4O2]-) ion was, in most cases, the molecular ion (i.e. dominant ion). d
This
organosulfate compound was detected as its [M - H]- ion and was observed only in the
ammonium sulfate and acidified magnesium sulfate seeded experiments.
Figure 17. Proposed mechanism for SOA formation from the formation and decay of the
C5-nitrooxycarbonyl, C5-hydroxycarbonyl, and C5-dinitrate first-generation products
formed from the isoprene + NO3 reaction. Boxes indicate UPLC/(-)ESI-TOFMS detected
SOA products; molecular formulas were confirmed by the accurate mass data provided by
the UPLC/(-)ESI-TOFMS. Multiple structural isomers are possible, consistent with the
multiple chromatographic peaks observed in the extracted ion chromatograms; however,
only one structural isomer is shown for simplicity. a These first-generation gas-phase
products were previously observed by Skov et al. (1994) and Kwok et al. (1996); these
496

gas-phase products were detected as the [M + CF3O-]- ion by the CIMS instrument. b
These are minor SOA products, confirming that the further oxidation of the C5-
nitrooxycarbonyl and C5-hydroxycarbonyl first-generation products do not yield
significant amounts of SOA. c This first-generation gas-phase product was previously
observed by Werner et al. (1999); this gas-phase product was also detected as the [M +
CF3O-]- ion by the CIMS instrument. d This particle-phase compound was detected as
both its [M - H]- and [M - H + C2H4O2]- ions; the acetic acid adduct ([M - H + C2H4O2]
-
) ion was the molecular ion (i.e. dominant ion).
497

Figure 1.
3.5
3.0
2.5
2.0
1.5
1.0
0.5
0.0
Mass conc. (μg/m
3)
200150100500Time (min)
2.5
2.0
1.5
1.0
0.5Vol
ume
conc
. (μ
m3 /c
m3 )
PILS_nitrate AMS_nitrate DMA_volume
498

Figure 2.
200
150
100
50
0
ΔMo (μg/m
3)
100806040200Time (min)
250
200
150
100
50
0
Isop
rene
mix
ing
ratio
(ppb
)
SOA Isoprene mixing ratio
499

Figure 3.
0.25
0.20
0.15
0.10
0.05
0.00
Yie
ld
806040200Mo (μg/m3)
Typical yield experiment Yield curve
Slow isoprene injection Slow N2O5 injection
500

Figure 4.
20
15
10
5
0
ΔM
o (μ
g/m
3 )
120100806040200ΔHC (μg/m3)
Slow isoprene injection Slow N2O5 injection
501

Figure 5.
60
50
40
30
20
10
0Gas
-pha
se c
once
ntra
tion
(ppb
)
161514131211109Real Time (hrs)
40
30
20
10
0
ΔMo (μg/m
3) ��� 230 (nitroxycarbonyl) ��� 232 (hydroxynitrate) ��� 248 (nitroxy hydroperoxide) SOA
502

Figure 6.
2.5
2.0
1.5
1.0
0.5
0.0Gas
-pha
se c
once
ntra
tion
(ppb
)
2422201816141210
Real time (hrs)
100
80
60
40
20
0
Gas
-pha
se c
once
ntra
tion
(ppb
)
2422201816141210
200
150
100
50
0
Isop
rene
con
cent
ratio
n (p
pb)
2422201816141210
140
120
100
80
60
40
20
0
ΔMo (μg/m
3)
SOAIsoprene
��� 230
��� 232
��� 248
��� 393
��� 377
��� 185
503

Figure 7.
0.0001
0.001
0.01
0.1
Sig
nal F
ract
ion
150140130120110100908070605040302010m/z
m/z 30 m/z 43m/z 46
504

Figure 8.
10-6
10-5
10-4
10-3
10-2
10-1S
igna
l fra
ctio
n (s
low
N2O
5 in
ject
ion
expe
rimen
t)
10-6 10-5 10-4 10-3 10-2 10-1
Signal fraction (typical yield experiment)
121314
15
16
17
18
1920
24
25
2627
2930
3132
3738
4142
43
44
45
46
4748
49
505152
53
54
55
565758
596061
62
63
6465
66
676869 7071
7273
74
75
76
77
78
79
80
81
8283
84858687
8889
90
91
929394
9596
97
9899100101
102103
104105
106
107108109
110111
112
113
114
115
116117118119
120
121122123124
125
126
127128
129130
131
132
133134
135
136
137139
140
141
142143
144145
146
147148150151
152153
154
155
156157
158159160161
162
163
165
167
168
169
170
171172
173 174175176177
179180181187189 190
191192
193194
195
196
197199
200201202
203
204207208
209
211213214215
216220
222
223224225226229
230231
232233234236
237
239
240244247
248
250251252253 254256
257260262
269272274275276
280
283289296297
300
250
200
150
100
50
0
m/z
505

Figure 9.
10-6
10-5
10-4
10-3
10-2
10-1S
igna
l fra
ctio
n (s
low
isop
rene
inje
ctio
n ex
perim
ent)
10-6 10-5 10-4 10-3 10-2 10-1
Signal fraction (typical yield experiment)
121314
15
16
17
18
1920
24
25
2627
2930
3132
373841
42
43
44
45
46
4748
49
505152
53
54
55
565758
596061
62
63
6465
66
676869
7071
727374
75
76
77
78
79
80
81
82
838485
8687
8889
90
91
929394
9596
979899100101
102103104105106107
108109110111
112
113
114
115
116117118119
120
121122123124
125126 127
128
129
130131
132
133134
135
136
137139140
141
142
143144145
146
147148
151
152 153154
155156
157
158
159
160
162
165
167
168
169171
172
174175
177187
195
196
197
200201202
207208
214231243
264269
283294296
300
250
200
150
100
50
0
m/z
506
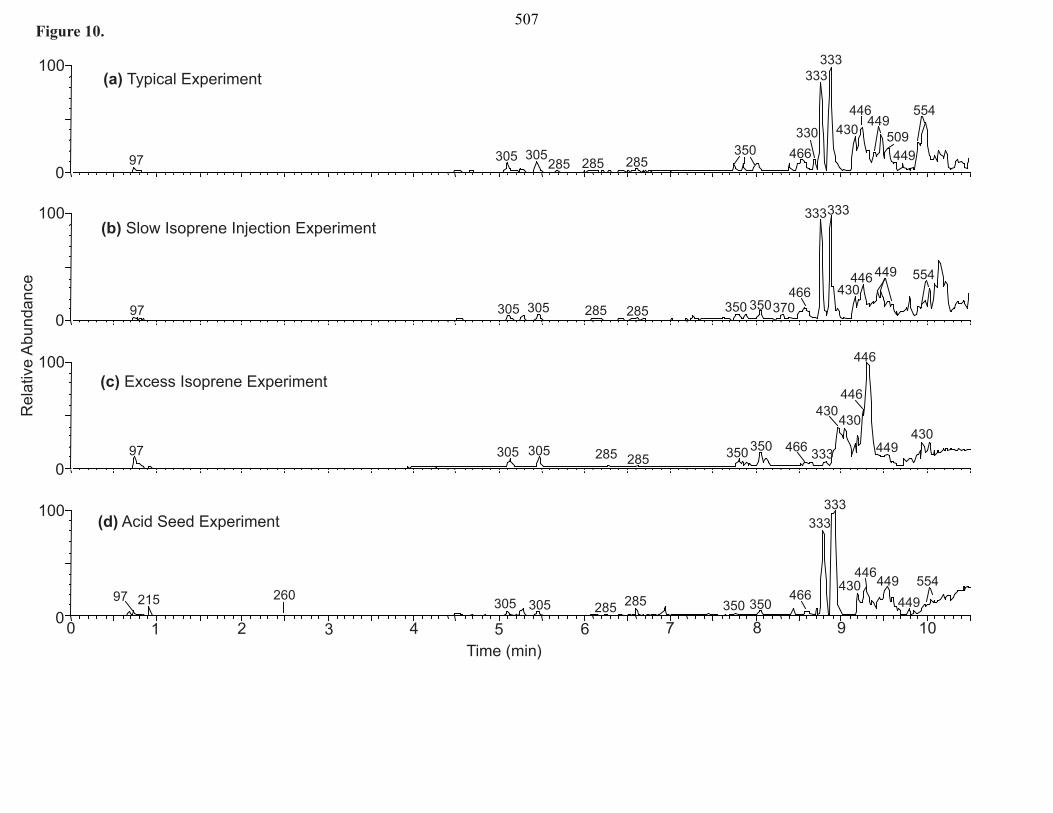
10987650 1 42 3Time (min)
Rel
ativ
e A
bund
ance
0
100
0
100
0
100
0
100
Figure 10.
97
97
97
97 215
305 305
305 305
305 305
305 305 285
285
285
285
350
350 350
350350
350
333333
333333
333333
466
466
466
466
370
446
446
446
430
430
430
554
509449
449
449
449260
(a) Typical Experiment
(b) Slow Isoprene Injection Experiment
(c) Excess Isoprene Experiment
(d) Acid Seed Experiment
285285
330
446
449
285
285
430554
285
446554
449
430
333
430
350
507

O3N
O2
O3N
O
C5-nitroxyhydroperoxide
NO3
O2
O3N
OOH
C5-nitroxycarbonyl
HO2
RO2
O3N
OH
C5-hydroxynitrate
O3N
O2
RO2 NO3Or
O3N
O
RO2
CIMS m/z 230CIMS m/z 232
CIMS m/z 248
O3N
OH
Isomerization - NO2
OH
O
C5-hydroxycarbonyl
CIMS m/z 185O2
O3N
OH
O2 RO2'
[RO2']
O3N
OO
NO3
CIMS m/z 377
- NO2
Decomposition
O
2-methyl-2-vinyl-oxirane
O
O2
NO3
RO2' O3N
OO
CIMS m/z 393
O
NO3
RO2'
Decomposition
O3N
OO
CIMS m/z 393
NO3
OH
NO3
O2
Fragmentation
Figure 11.
508

Figure 12.
100
80
60
40
20
0Gas
-pha
se c
once
ntra
tion
(ppb
)
222018161412 Real Time (hrs)
120
100
80
60
40
20
0
ΔMo (μg/m
3)
��� 230
��� 248
��� 232
SOA
509

Figure 13.
40
30
20
10
0
Gas
-pha
se c
once
ntra
tion
(ppb
)
222018161412 Real Time (hrs)
60
50
40
30
20
10
0
ΔMo (μg/m
3)
��� 230
��� 248
��� 232
SOA
510

NO3
O2
O3N
O2
O3N
OHC5-hydroxynitratea
CIMS = m /z 232
RO2
HO
O3N
NO3
OH
H2SO4
HO
O3N
NO3
OSO3H
MW = 306c
C5H10N2O11S
NO3 / O2
RO2
O3N
OHNO3
O2NO3
NO3 O2
NO3
OH
O3NNO3
MW = 271b
C5H9N3O10
H2SO4 - H2O
NO3
OSO3H
O3NNO3
MW = 351c
C5H9N3O13S
NO3
OHO3N
O3N
OO
MW = 371b
C10H17N3O12
NO3 / O2
RO2
NO3
OHO3N
O3N
OO
MW = 450C10H18N4O16
NO3
HO
b
RO2'
[RO2'']
[RO2']
RO2''
O3N
HONO3
NO3
OHO3N
OO
MW = 450b
C10H18N4O16
MW = 226b
C5H10N2O8
- H2O
Figure 14.
511

NO3
O2
O3N
O2
[RO2']
O3N
OO
NO3
CIMS = m/z 377a
O3N
OO
NO3
NO3
OH
MW = 371b
C10H17N3O12
RO2'
NO3 / O2 RO2
NO3 / O2
RO2
O3N
OO
NO3
NO3
OH
MW = 450b
C10H18N4O16
NO3
HO
Figure 15.
512

O3N
O2
NO3
O2
O3N
O2
RO2 NO3Or
O3N
O
Isomerization
O2
O3N
OH
O2
RO2'
[RO2']
- NO2
Decomposition
O
2-methyl-2-vinyl-oxiranea
O
O2
NO3
RO2' O3N
OO
CIMS = m/z 393b
O
NO3
O3N
OO
NO3
OH
NO3
O2
Figure 16.
O3N
OO
NO3
OH
NO3
HOMW = 387c
C10H17N3O13
O3N
OO
O
NO3NO3
HO
MW = 387c
C10H17N3O13
RO2NO3/O2
H2SO4 -H2O
MW = 467c
C10H17N3O16S
O3N
OO
O
NO3NO3
HO3SO
H2SO4 -H2O
O3N
OO
NO3
OH
NO3
HO3SO
NO3/O2
RO2
MW = 467c
C10H17N3O16S
CIMS = m/z 393b
513

O3N
O2
O3N
O
NO3
O2
RO2 NO3 / O2
RO2
ox.
MW = 240b
C5H8N2O9
or NO3 / O2
HO
O
NO3
O2 HO
HO
ONO3
HO
HO
ONO3
OH
MW = 195b
C5H9NO7
HO
O3N
ONO3
HO
O3N
ONO3
OH
NO3 / O2
RO2
ox.
C5-nitrooxycarbonyla
C5-hydroxycarbonyla
[RO2']
O3N
O2
O3N
NO3
C5-dinitratec
NO3
O2 O2
O3N
NO3
NO3
MW = 495d
C10H17N5O18
NO3 NO3
O2
O3N
O3NNO3
OO
NO3
NO3 / O2 RO2
O3N
O3NNO3
OO
NO3O3NOH
RO2'
Figure 17.
CIMS = m /z 230
CIMS = m /z 185
CIMS = m /z 277
514

Appendix I
Molar Mass, Surface Tension, and Droplet Growth
Kinetics of Marine Organics from Measurements of
CCN Activity∗
∗This chapter is reproduced by permission from “Molar Mass, Surface Tension, and Droplet Growth Kinetics of Marine Organics from Measurements of CCN Activity” by R. H. Moore, E. Ingall, A. Sorooshian, and A. Nenes, Geophys. Res. Lett., 35, L07801, doi:10.1029/2008GL033350, 2008. Copyright 2008. American Geophysical Union.
515

Molar mass, surface tension, and droplet growth kinetics of marine
organics from measurements of CCN activity
R. H. Moore,1 E. D. Ingall,2 A. Sorooshian,3 and A. Nenes1,2
Received 23 January 2008; accepted 25 February 2008; published 1 April 2008.
[1] The CCN-relevant properties and droplet growthkinetics are determined for marine organic matter isolatedfrom seawater collected near the Georgia coast. The organicmatter is substantially less CCN active than (NH4)2SO4, butdroplet growth kinetics are similar. Kohler Theory Analysis(KTA) is used to determine the average organic molarmasses of two samples, which are 4370 ± 24% and 4340 ±18% kg kmol�1. KTA is used to infer surface tensiondepression, which is in excellent agreement with directmeasurements. For the first time it is shown that directmeasurements of surface tension are relevant for CCNactivation, and this study highlights the power of KTA.Citation: Moore, R. H., E. D. Ingall, A. Sorooshian, and A. Nenes
(2008), Molar mass, surface tension, and droplet growth kinetics of
marine organics from measurements of CCN activity, Geophys.
Res. Lett., 35, L07801, doi:10.1029/2008GL033350.
1. Introduction
[2] Oceanic surface waters contain a substantial amountof dissolved organic matter (DOM) that is transferred to theaerosol phase during the process of sea spray generation.The ocean surface layer contains large amounts of surfac-tants [Cavalli et al., 2004], which can influence the abilityof marine aerosol to act as cloud condensation nuclei(CCN). Measurements of primary marine aerosol composi-tion have shown a size-dependent enrichment of organics(particularly water-insoluble species) in submicron aerosol[O’Dowd et al., 2004; Oppo et al., 1999]. Despite theirpotential importance, the CCN-relevant properties of marineorganics are largely unknown. This is because DOM isdifficult to isolate, as its concentration in bulk seawater isorders of magnitude lower than inorganic salts [Ogawa andTanoue, 2003]. Recently, Vetter et al. [2007] developed amethod to remove most of the salt in seawater samples via acombination of electrodialysis and reverse osmosis, thusenabling direct characterization of marine DOM.[3] Kohler Theory Analysis (KTA) [Padro et al., 2007] is
a technique to infer the molar volume, surfactant character-istics, and droplet growth kinetics of organic aerosol con-stituents, all of which are important for linking organicaerosol with cloud formation. KTA has been previouslyevaluated for aerosol composed of C3–C9 organics mixedwith (NH4)2SO4 [Padro et al., 2007], for water-soluble
organics in biomass burning aerosol [Asa-Awuku et al.,2008], and for secondary organic aerosol formed from theozonolysis of biogenic volatile organic carbon [Asa-Awukuet al., 2007]. Asa-Awuku et al. [2007] first extended KTA toinfer surface tension as well, which is useful when samplesize prohibits direct measurement of surface tension; thisaspect of KTA is further developed here.[4] In this study, we measure the CCN-relevant properties
of marine DOM and then use KTA to infer its average molarmass and surface tension depression characteristics. Thepotential impact of marine surfactants on droplet growthkinetics is also explored. Inferred values of surface tensionare compared against direct measurements using the pen-dant drop technique.
2. Experiment
2.1. Sample Collection
[5] Seawater samples were collected near the GeorgiaCoast on board the R/V Savannah during an October 2006research cruise in the Atlantic Ocean. 200-l samples fromthe Gulfstream current (31�32.50N, 79�13.80W, 84 m depth)and the Ogeechee River estuary (31�56.60N, 81�9.10W, 2 mdepth) were collected in Niskin bottles and filtered toremove suspended particulates greater than 0.45 mm witha polypropylene filter. The estuarine sample was collectedunder tidal conditions. Inorganic salt concentrations weresimilar in both samples (3.7 � 104 ppm in the Gulfstreamsample and 3.1 � 104 ppm in the estuarine sample);however, more organics were initially present in the estua-rine sample than the Gulfstream sample (4.36 ppm and0.95 ppm, respectively).[6] The DOM in each sample was subsequently concen-
trated using the electrodialysis/reverse osmosis (ED/RO)technique of Vetter et al. [2007]. In this method, ED is firstused to remove the majority of the inorganic salts and isfollowed by RO to remove excess water. This cycle isrepeated until a desired concentration of DOM is attained,after which the sample is freeze-dried. Typical DOMrecoveries range from 64–93% [Vetter et al., 2007] andwater conductivities were reduced by over 99.98%. Duringthe process, all Cl- is depleted, and the remaining inorganicfraction is primarily Na2SO4 and (NH4)2SO4.
2.2. Chemical Composition of Samples
[7] The water-soluble organic carbon (WSOC) content ofboth samples was measured with a total organic carbon(TOC) analyzer (Sievers Model 800 Turbo). Additionally,inorganic ions (SO4
2-, Cl-, NO3- , Na+, NH4
+, Ca2+, Mg2+, andK+) were measured using a dual ion chromatography (IC)system (Dionex ICS-2000). TOC concentrations of the Gulf-stream and estuarine dry samples are 0.111 kgC kg-1 and0.249 kgC kg-1, respectively. From the IC measurements, the
GEOPHYSICAL RESEARCH LETTERS, VOL. 35, L07801, doi:10.1029/2008GL033350, 2008ClickHere
for
FullArticle
1School of Chemical and Biomolecular Engineering, Georgia Instituteof Technology, Atlanta, Georgia, USA.
2School of Earth and Atmospheric Sciences, Georgia Institute ofTechnology, Atlanta, Georgia, USA.
3Department of Chemical Engineering, California Institute of Technol-ogy, Pasadena, California, USA.
Copyright 2008 by the American Geophysical Union.0094-8276/08/2008GL033350$05.00
L07801 1 of 5
516

major inorganic species present in the DOM extract areNa2SO4 and (NH4)2SO4. The solution pH is neutral, suggest-ing that the organics do not substantially dissociate.
2.3. Surface Tension Measurements
[8] Surface tension measurements were performed usingthe pendant drop method with a KSV CAM 200 goniom-eter. Each droplet was allowed to equilibrate for 20–30 seconds, allowing sufficient time for organics to partitionbetween the bulk and surface layers [Taraniuk et al., 2007].The droplet shape was fit to the Young-Laplace equation toobtain the surface tension, s, at the liquid-air interface. Thetemperature (approximately 297 K) was monitored through-out each set of measurements using a 50 kW thermistor(Digikey ERT-D2FHL503S). Seven pendant drops werephotographed at ten frames per second for each surfacetension measurement.[9] Multiple solutions of each sample (done by preparing
�2000 ppm samples, which are successively diluted downto 100 ppm) were prepared to determine s as a function ofdissolved carbon concentration, C. The data are fit to theSzyskowski-Langmuir (SL) adsorption isotherm [Langmuir,1917]:
s ¼ sw � aT ln 1þ bCð Þ ð1Þ
where sw is the surface tension of water (i.e., an ‘‘infinitedilution’’ sample), T is the absolute temperature, and a and bare empirical constants obtained from least-squares fits tothe data. While the SL isotherm is an adsorption model forone compound, it is able to model the complex DOM/saltsystem reasonably well (Figure 2). a and b were determinedto be 2.952 mN m�1 K�1 and 2� 10�6 l mg�1, respectively.
2.4. CCN Activity and Droplet GrowthKinetics Measurements
[10] The experimental setup used for CCN activity meas-urements is described in detail elsewhere [e.g., Asa-Awukuet al., 2008; Padro et al., 2007]. Aerosol is generated byatomizing an aqueous solution of each of the seawatersamples. The particles are dried and introduced into ascanning mobility CCN analyzer (SMCA) (A. Nenes andJ. Medina, Scanning mobility CCN analysis: A method forfast measurements of size-resolved CCN activity andgrowth kinetics, submitted to Aerosol Science and Technol-ogy, 2007), for characterization of size-resolved CCNactivity and growth kinetics. SMCA uses a differentialmobility analyzer (DMA, TSI 3081), operating in voltage-scanning mode, to classify the aerosol. The monodispersestream is then introduced simultaneously into a DropletMeasurement Technologies Continuous-Flow StreamwiseThermal Gradient CCN Counter (DMT-STGC) [Robertsand Nenes, 2005] and a condensation particle counter(CPC, TSI 3022). The time series of the DMT-STGC andCPC counts are inverted to obtain curves of CCN/CN as afunction of mobility diameter (while maintaining instrumentsupersaturation at a constant value). The dry diameter, dp, forwhich 50% of particles are activated (neglecting multiply-charged particles) represents the aerosol that activates at theinstrument supersaturation, sc. The DMT-STGC uses anoptical particle counter (OPC) to obtain the size distributionof activated droplets exiting the instrument column.
[11] The CCN activity of aerosol containing the estuarinesample and a known amount of added (NH4)2SO4 was alsomeasured in order to see if a ‘‘salting out’’ of the organiccould be observed. The effect occurs at relatively high electro-lyte concentrations (�50 wt%, dry concentration), when thesalts enhance surfactant partitioning to the droplet surface,dramatically reducing the surface tension and increasing theCCN activity [Asa-Awuku et al., 2007]. Two samples wereprepared to total salt concentrations of approximately 60 and90 wt%. The 60 wt% salt sample was also used as an indepen-dent mixture to infer molar mass and surface tension depression.[12] For all CCN measurements, the flow rate of air
through the column was maintained at 0.5 l min�1 (10:1sheath-to-aerosol ratio), which corresponds to a residencetime of 15 seconds. The DMT-STGC instrument supersat-uration was varied from 0.2% to 1.4%.
3. Results and Discussion
3.1. CCN Activity
[13] The CCN activation curves for both samples andpure (NH4)2SO4 are shown in Figure 1. For a CCNcomposed of soluble non-surfactant compounds, Kohlertheory suggests that the ‘‘critical supersaturation’’, sc, scaleswith dp to the �3/2 power [Kohler, 1936]. However, foraerosol containing surfactants, this scaling will change,tending to be lower at smaller d and approaching �3/2 atlarger d. This is because at smaller particle diameters, thehigh concentration of WSOC depresses s, which lowers scmore than would be expected from the solute effect alone; atlarger d, the WSOC concentration is insufficient to inducethis effect [Padro et al., 2007].[14] The activation curve of the Gulfstream sample aero-
sol (blue circles) is almost identical to (NH4)2SO4 (yellowtriangles), despite the presence of �40 wt% surface-activeDOM. It is likely that the surface tension depression fromthe organic fraction compensates for the decreased solublemole fraction. The estuarine sample aerosol contains�85 wt% organic matter and is much less CCN active than(NH4)2SO4 (red circles in Figure 1). Additionally, theactivation curve deviates from the �3/2 exponential powerlaw fit (as indicated by the dotted line) at low dry particlediameters and high sc, where the concentration of organicmatter is high enough to significantly affect the dropletsurface tension (C > 1000 mg l�1, from Figure 2).
3.2. Kohler Theory Analysis
[15] The organic molar mass and surface tension depres-sion were inferred from the CCN activity measurementsusing KTA, method b2 [Padro et al., 2007; Asa-Awuku etal., 2008, 2007]. For each sc/dp measurement, the fittedCCN activity (FCA) parameter, w, is calculated from
w ¼ scd3=2p ð2Þ
KTA entails expressing FCA in terms of its constituents;assuming the aerosol is composed of N components [Padroet al., 2007]:
w ¼ 24Mws3RTrw
� �3=2 XNi¼1
rwMw
� �Mi
ri
� �1
eini
" #1=2
ð3Þ
L07801 MOORE ET AL.: ANALYSIS OF MARINE ORGANICS L07801
2 of 5
517

where Mw, rw are the molar mass and density of water,respectively, R is the universal gas constant, and Mi, ri, ei,vi are the molar mass, density, volume fraction, andeffective van’t Hoff factor of component i, respectively.Denoting the organic fraction as component ‘‘j’’ andrearranging Equation 3 to solve explicitly forMj and s yields
Mj ¼rjejnj
25627
Mw
rw
� �21RT
� 3s3w�2 �PN
i6¼jriMieini
ð4Þ
s ¼rjMj
� �ejnj þ
PNi6¼j
riMieini
25627
Mw
rw
� �21RT
� 3w�2
264
3751=3
ð5Þ
s corresponds to the value at activation for a dissolvedcarbon concentration, of Cact , of [Padro et al., 2007],
Cact ¼27
8xc;j ejrj
d3ps3c
A3ð6Þ
where A = 4MwsRTrw
and xc,j = 0.29 is the mass fraction of carbonin the DOM, estimated from the Redfield ratio (C:N:P =106:16:1) [Schulz and Zabel, 2006; Redfield et al., 1963]. Inapplying equations (4)–(6), we assume an organic density,rj, of 1400 kg m�3 [Schulz and Zabel, 2006], an effectivevan’t Hoff factor of 1 for the organics [Dinar et al., 2007],and 2.5 for (NH4)2SO4 and Na2SO4 [Padro et al., 2007].[16] To compute Mj and s from KTA, the following
procedure is used: First, the average organic molar mass,Mj
*, is estimated for each sc/dp pair (equation (4)), initially
Figure 1. Critical supersaturation versus dry particle diameter for all samples considered.
Figure 2. Fractional surface tension depression with respect to pure water. Shown are direct measurements (opensymbols) and values inferred from KTA (solid symbols).
L07801 MOORE ET AL.: ANALYSIS OF MARINE ORGANICS L07801
3 of 5
518

assuming the surface tension of pure water. Mj is introducedin equations (5) and (6) to estimate s for the sc/dp data ofthe sample plus 60% (NH4)2SO4. The updated s values areused to reevaluate Mj
* and this process is iterated until the sand Mj
* values converge. This procedure allows the con-current inference of Mj and s (as a function of WSOCconcentration) from the CCN activity data alone.[17] Mj is estimated to be 4370 ± 26% kg kmol�1 and
4340 ± 6% kg kmol�1 for the Gulfstream and estuarinesamples, respectively, (the reported uncertainty is onestandard deviation from the mean Mj over all sc/dp pairs).The sensitivities of Mj to each of the independent parame-ters is computed with the method of Padro et al. [2007](Table 1). Using this method, the total estimated uncertain-ties of Mj for the estuarine and Gulfstream samples are 18%and 24%, respectively. As expected, the Gulfstream sampleuncertainty exceeds the estuarine sample uncertainty, sincethe lower organic mass increases the Mj sensitivity to mostof the independent parameters [Padro et al., 2007].[18] Both molar masses are consistent with each other
and fall in the mid-range of the high molar-mass fractionthat comprises 30-35% of the marine surface DOM[Ogawa and Tanoue, 2003]. The inferred Mj is alsoconsistent with that of a theoretical Redfield-based mole-cule, (CH2O)106(NH3)16H3PO4 [Schulz and Zabel, 2006].While most of the DOM is recovered, it is expected that the
small amount of DOM not recovered during the ED/ROprocess would be low-molar-mass species that can perme-ate the ED membranes easiest; therefore, higher molar-mass DOM in the sample may be enriched in the processand the Mj of the sample (and hence, that inferred usingKTA) may be greater than the Mj of in-situ marine DOM.[19] The inferred s is in excellent agreement with the SL
fit to direct measurements (Figure 2)]. The agreement is stillexcellent if other functions for fitting the data are used; thevariability in inferred Mj remains within the reported un-certainty (not shown). Since the inferred values are derivedindependently of the direct measurements, their agreementshows conclusively that diffusion of surface-active mole-cules to the droplet surface is sufficiently rapid to achieveequilibrium surface tension depression. Taraniuk et al.[2007] and Asa-Awuku and Nenes [2007] showed thathumic-like organic species (�500 kg kmol�1) in growingdroplets are in equilibrium; we find this to apply for marineDOM with a tenfold higher molar mass (hence, �
ffiffiffiffiffi10
ptimes
lower diffusivity). The latter finding is consistent with theanalysis of Asa-Awuku and Nenes[2007], as a diffusivity of2 � 10�10 (= 6�1010
101=2, with 6 � 10�10 being the diffusivity of
HULIS) [Taraniuk et al., 2007] implies that the organic con-centration at the droplet surface is more than 90% of itsequilibrium value for the supersaturation range considered here.[20] While the inferred and measured surface tensions
agree, the surfactants require tenfold higher concentrationsto give the same effect as organics isolated from marineaerosol [Cavalli et al., 2004]. This difference reflects theenrichment of marine aerosol in organic surfactants from theprocess of bubble bursting. Hence, the samples investigatedhere are representative of natural marine DOM, but shouldbe interpreted as the lower limit of CCN activity of primarymarine organic aerosol.
3.3. Droplet Growth Kinetics
[21] The mean droplet sizes for each sample measured bythe DMT-STGC OPC at varying values of sc are shown inFigure 3. All samples studied exhibit growth similar to that
Table 1. Molar Mass Uncertainty, D Mj, From Parameter
Uncertainty, D x, for the Estuarine (Gulfstream) Samples
w m3/2 rj, kg m�3 vj xc,j, %
Base x Value 1400 1 0.29Dx 1.47(2.16)
� 10�15a400b 0.2c 0.044b
DMj, % 3.7 (6.9) 10 (17) 0.2 (0.1) 15 (16)Total molar massuncertainty, %
18 (24)
aOne standard deviation from the mean FCA value.bFrom Schulz and Zabel [2006].cFrom Dinar et al. [2007].
Figure 3. Activated droplet sizes for CCN with sc = sinstrument.
L07801 MOORE ET AL.: ANALYSIS OF MARINE ORGANICS L07801
4 of 5
519

of pure (NH4)2SO4 for most supersaturations. For the threeintermediate supersaturations (0.6%, 0.8%, and 1.0%), bothseawater samples appear to grow to larger droplet sizes thanfor pure (NH4)2SO4. Since it is not expected that organicswould enhance droplet growth, the observed discrepancymay be caused by slight shifts in the laser scattering duringthe sizing measurement, resulting from the presence of acompressed film. (NH4)2SO4 growth could also be de-pressed because of water vapor depletion in the columnduring the calibrations; however, this is unlikely since thetotal CCN concentrations were relatively low (�500 cm�3)and constant for all supersaturations. Laser shifts over longtime periods are unlikely, as the results are reproducible. Thedata suggest that the dissolved organics, compared to pure(NH4)2SO4, do not significantly alter the droplet growthkinetics (i.e., the water vapor mass transfer coefficient).
4. Summary and Conclusions
[22] In this study, measurements of CCN activity, dropletgrowth kinetics, and WSOC/ionic composition of marineDOM were used to infer its CCN-relevant properties.Kohler Theory Analysis (KTA) determined the molarmasses of the organic matter in the Gulfstream sampleand estuarine sample to be 4370 ± 24% and 4340 ± 18%,respectively. This is consistent with the high-molar-massmarine DOM typically found in surface ocean waters. KTAwas used to infer the organic surface tension depression,and was found to be in excellent agreement with directmeasurements using the pendant drop technique. Thisshows that very large organic molecules are able to diffuseto the surface of a growing droplet and establish anequilibrium surface tension depression; in fact, direct equi-librium surface tension measurements adequately describedroplet surface tension at activation. Furthermore, KTA isproven to be a powerful technique that can be used to inferorganic surface tension depression using small amounts ofaerosol generated from a dilute solution. Finally, while thedissolved organics form compressed surface films that cansubstantially change surface tension, they exhibited similargrowth to pure (NH4)2SO4. This suggests that the primarychemical effect of marine DOM on CCN activity is throughits impact on surface tension.
[23] Acknowledgments. We acknowledge support from an NSFCAREER Award, NSF grants OCE0425624 and OCE0526178, and aDOE GCEP GRE Fellowship. The authors gratefully acknowledge thecrew of the R/V Savannah, C. Hennigan, R. Weber, S. Balachandran,
A. Russell, C. Jackson, E. M. Perdue, and P. Pfromm for assistance withthis work.
ReferencesAsa-Awuku, A., and A. Nenes (2007), The effect of solute dissolutionkinetics on cloud droplet formation, J. Geophys. Res., 112, D22201,doi:10.1029/2005JD006934.
Asa-Awuku, A., A. Nenes, S. Gao, R. Flagan, and J. Seinfeld (2007),Alkene ozonolysis SOA: Inferences of composition and droplet growthkinetics from Kohler theory analysis, Atmos. Chem. Phys. Discuss., 7,8983–9011.
Asa-Awuku, A., A. Nenes, A. Sullivan, C. Hennigan, and R. Weber (2008),Investigation of molar volume and surfactant characteristics of water-soluble organic compounds in biomass burning aerosol, Atmos. Chem.Phys., 8, 1–14.
Cavalli, F., et al. (2004), Advances in characterization of size-resolvedorganic matter in marine aerosol over the North Atlantic, J. Geophys.Res., 109, D24215, doi:10.1029/2004JD005137.
Dinar, E., I. Taraniuk, E. R. Graber, T. Anttila, T. F. Mentel, and Y. Rudich(2007), Hygroscopic growth of atmospheric and model humic-like sub-stances, J. Geophys. Res., 112, D05211, doi:10.1029/2006JD007442.
Kohler, H. (1936), The nucleus in and growth of hygroscopic droplets,Trans. Faraday Soc., 32, 1152–1161.
Langmuir, I. (1917), The constitution and fundamental properties of solidsand liquids. II. Liquids, Am. Chem. Soc., 39, 1848–1906.
O’Dowd, C.,M. C. Facchini, F. Cavalli, D. Ceburnis,M.Mircea, S. Decesari,S. Fuzzi, Y. J. Yoon, and J. P. Putaud (2004), Biogenically driven organiccontribution to marine aerosol, Nature, 431, 676–680.
Ogawa, H., and E. Tanoue (2003), Dissolved organic matter in oceanicwaters, J. Oceanogr., 59, 129–147.
Oppo, C., S. Bellandi, N. D. Innocenti, A. Stortini, G. Loglio, E. Schiavuta,and R. Cini (1999), Surfactant components of marine organic matter asagents for biogeochemical fractionation and pollutant transport via mar-ine aerosols, Mar. Chem., 63, 235–253.
Padro, L., A. Asa-Awuku, R. Morrison, and A. Nenes (2007), Inferringthermodynamic properties from CCN activation experiments: Single-component and binary aerosols, Atmos. Chem. Phys., 7, 5263–5274.
Redfield, A., B. Ketchum, and F. Richards (1963), The influence of organ-isms on the composition of sea water, in The Sea, vol. 2, edited by M. N.Hill, pp. 26–77, Wiley Intersci., New York.
Roberts, G., and A. Nenes (2005), A continuous-flow streamwise thermal-gradient CCN chamber for atmospheric measurements, Aerosol Sci.Technol., 39, 206–221.
Schulz, H. D., and M. Zabel (Eds.) (2006), Marine Geochemistry, 2nd ed.,Springer, Heidelberg.
Taraniuk, I., E. R. Graber, A. Kostinski, and Y. Rudich (2007), Surfactantproperties of atmospheric and model humic-like substances (HULIS),Geophys. Res. Lett., 34, L16807, doi:10.1029/2007GL029576.
Vetter, T. A., E. M. Perdue, E. Ingall, J. F. Koprivnajak, and P. H. Pfromm(2007), Combining reverse osmosis and electrodialysis for more com-plete recovery of dissolved organic matter from seawater, Sep. Purif.Technol., 56, 383–387.
�����������������������E. D. Ingall, School of Earth and Atmospheric Sciences, Georgia Institute
of Technology, Atlanta, GA 30332–0340, USA.R. H. Moore and A. Nenes, School of Chemical and Biomolecular
Engineering, Georgia Institute of Technology, Atlanta, GA 30332–0340,USA. ([email protected])A. Sorooshian, Department of Chemical Engineering, California Institute
of Technology, Mail Code 210-41, Pasadena, CA 91125, USA.
L07801 MOORE ET AL.: ANALYSIS OF MARINE ORGANICS L07801
5 of 5
520