
1 Lab and field studies of the kinetics and composition of ...
175
1 Lab and field studies of the kinetics and composition of atmospheric reactive nitrogen and volatile organic compounds A thesis submitted to the University of Manchester for the degree of PhD in the Faculty of Engineering and Physical Sciences 2013 Mohamed Ghalaieny School of Earth, Atmospheric and Environmental Sciences
-
Upload
khangminh22 -
Category
Documents
-
view
1 -
download
0
Transcript of 1 Lab and field studies of the kinetics and composition of ...
1
Lab and field studies of the kinetics and composition of atmospheric reactive nitrogen
and volatile organic compounds
A thesis submitted to the University of Manchester for the degree of PhD in the
Faculty of Engineering and Physical Sciences
2013
Mohamed Ghalaieny
School of Earth, Atmospheric and Environmental Sciences
2
Contents
Abstract ........................................................................................................................ 4 Declaration................................................................................................................... 5 Copyright statement.................................................................................................... 6 Dedication .................................................................................................................... 7 Acknowledgements......................................................................................................8 Rationale for submitting this thesis in the alternative format .............................. 10 1. Introduction ....................................................................................................... 12
1.1. Atmospheric NMHC ................................................................................. 12 1.1.1. NMHC emissions............................................................................... 12 1.1.2. Alkene oxidation................................................................................ 16
1.1.2.1. Alkene ozonolysis....................................................................... 18 Ozonolysis mechanism................................................................................ 19 Stabilised Criegee Intermediates (SCIs)..................................................... 20 HOX chemistry............................................................................................. 23 The fate of Criegee intermediates............................................................... 25
1.1.2.2. Debate on formic acid sources in the atmosphere.................. 26 1.2. Reactive nitrogen in the atmosphere....................................................... 31
1.2.1. Reactive nitrogen species.................................................................. 32 1.2.2. NH3......................................................................................................33 1.2.3. HNO3 .................................................................................................. 35 1.2.4. Inorganic aerosol formation............................................................. 35 1.2.5. Nr and tropospheric ozone................................................................ 38
1.3. Importance of measurements................................................................... 39 1.3.1. Atmospheric measurements overview............................................. 39
1.4. Instrument methodology........................................................................... 40 1.4.1. CIMS ......................................................................................................40 1.4.1.1. Georgia Tech Lab and Field CIMS................................................. 42
1.4.1.1.1. CIMS-F ....................................................................................... 44 Calibration, figures of merit and data analysis.......................................... 45 Automated calibrations............................................................................... 45 Cylinder calibration.................................................................................... 48
1.4.1.1.2. CIMS-L ...................................................................................... 48 Calibration.................................................................................................. 49 Data analysis............................................................................................... 50
1.4.2. Gas Chromatography........................................................................... 51 1.4.3. Portable aerosol spectrometer.............................................................. 54 1.4.4. Ozone analyser....................................................................................... 54 1.5. Research aims and objectives................................................................... 56
2. Paper I ................................................................................................................ 56 3. Paper II ............................................................................................................... 75 4. Paper III ............................................................................................................. 78 5. Paper IV ............................................................................................................. 83 6. Paper V............................................................................................................... 87 7. Conclusions......................................................................................................118
Future work .......................................................................................................... 122 8. Appendix: permeation tube calibration........................................................ 123 9. References........................................................................................................ 126

3
List of Tables and figures
Figure 1:............................................................................................................................... 14 Figure 2:............................................................................................................................... 15 Figure 3:............................................................................................................................... 17 Figure 4:............................................................................................................................... 19 Figure 5:............................................................................................................................... 22 Figure 6:............................................................................................................................... 24 Figure 7:............................................................................................................................... 28 Figure 8:............................................................................................................................... 30 Figure 9:............................................................................................................................... 32 Figure 10:............................................................................................................................. 36 Figure 11:............................................................................................................................. 42 Figure 12:............................................................................................................................. 45 Figure 13:............................................................................................................................. 47 Figure 14:............................................................................................................................. 49 Figure 15:............................................................................................................................. 51 Figure 16:............................................................................................................................. 52 Figure 17:............................................................................................................................. 53 Figure 18:........................................................................................................................... 118 Figure 19:........................................................................................................................... 124 Figure 20:........................................................................................................................... 125
Table 1:. ............................................................................................................................. 133 Table 2: ................................................................................................................................ 16 Table 3:. ............................................................................................................................... 21 Table 4:. ............................................................................................................................... 25 Table 5: ................................................................................................................................ 34 Table 6:. ............................................................................................................................... 39 Table 7: ................................................................................................................................ 41 Table 8: ................................................................................................................................ 46 Table 9:. ............................................................................................................................... 51 Table 10:............................................................................................................................ 120
Word count: 45178
4
Abstract
Accurate measurements of ammonia, nitric acid and formic acid are important for achieving a complete understanding of their atmospheric role. Models and measurements of formic acid in the atmosphere continue to show disagreements. Also, the contributions of NMHCs and reactive nitrogen (HNO3 and NH3) to organic and inorganic aerosol formation are important to quantify as gaps in the knowledge of atmospheric aerosols are a source of uncertainty in climate science. In this thesis, concentrations of ammonia were measured in the atmosphere and the production of formic acid from the ozonolysis of isoprene was measured in the EXTRA (EXTreme RAnge) chamber. Both gases were studied using chemical ionisation mass spectrometry (CIMS). The kinetics of the reactions of sesquiterpenes and terminal alkenes with ozone were studied in the EXTRA chamber using the relative rates technique and GC-FID. The ozonolysis rate coefficients of a homologous series of terminal alkenes were measured at elevated temperatures and found to be invariant with the carbon number. This led to the conclusion that previous measurements of these rate coefficients were subject to experimental artefacts. The elevated temperature protocol was employed to study the ozonolysis of sesquiterpenes, leading to revisions in ko3 for β-caryophyllene and α-humulene of 3 orders of magnitude. It was thus concluded that ozonolysis only accounts for 9-15% of sesquiterpene oxidation in the atmosphere. A field intercomparison of CIMS for measuring ammonia was conducted wherein CIMS was found to perform well alongside instruments of comparable time response and limits of detection. This thesis also characterised inlet materials used in atmospheric measurements in the first systematic study on the uptake onto inlet walls in a flow tube system coupled to CIMS. It was found that PFA is the preferable material for atmospheric measurements, both for its kinetic qualities and its ready availability and ease of use. Finally, CIMS was used to measure the yield of formic acid from isoprene ozonolysis as a function of relative humidity. Formic acid yield was found to increase between 0-40% RH to a maximum of 0.18. Using the measured formic acid yields in a global chemistry model leads to an estimate that formic acid production from isoprene ozonolysis is ~9.5 Tg yr-1.

5
Declaration
I hereby declare that no portion of the work referred to in the thesis has been
submitted in support of an application for another degree or qualification of this or
any other university or other institute of learning.
Mohamed Ghalaieny

6
Copyright statement
i. The author of this thesis (including any appendices and/or schedules to this thesis) owns certain copyright or related rights in it (the “copyright”) and he has given the University of Manchester certain rights to use such Copyright, including for administrative purposes.
ii. Copies of this thesis, either in full or in extracts and whether in hard or electronic copy, may be made only in accordance with the Copyright, Designs and Patents Act 1988 (as amended) and regulations issued under it or, where appropriate in accordance with the licensing agreements which the University has from time to time. This page must form part of any such copies made.
iii. The ownership of certain Copyright, patents, designs, trade marks and other intellectual property (the “Intellectual Property”) and any reproductions of copyright works in the thesis, for example graphs and tables (“Reproductions”), which may be described in this thesis, may not be owned by the author and may be owned by third parties. Such Intellectual Property and Reproductions cannot and must not be made available for use without the prior written permission of the owner(s) of the relevant Intellectual Property and/or Reproductions.
iv. Further information on the conditions under which disclosure, publication and commercialisation of this thesis, the Copyright and any Intellectual Property and/or Reproductions described in it may take place is available in the University IP Policy (see http://www.campus.manchester.ac.uk/medialibrary/policies/intellectual-property.pdf), in any relevant Thesis restriction declarations deposited in the University Library, The University Library’s regulations (see http://www.manchester.ac.uk/library/aboutus/regulations) and in The University’s policy on presentation of Theses.

7
Dedication
To my family,
My mother Mona Al-Farra who always believed in me even when I doubted myself, my father Baha Ghalayini who challenged me in my life decisions but was supportive regardless, my sisters Basma and Sondos a source of great companionship and wisdom and advice beyond their years.

8
Acknowledgements First and foremost, thanks go to my supervisor Dr. Carl Percival for giving me the great opportunity to work with him and for helping me secure vital funding. In Carl I was fortunate to have a very hands-on supervisor who was always ready to guide me provided that I lived up to my side of the bargain. Without the consistent support and advice that he provided throughout the highs and lows of the process, both on a personal and professional level, completion would have been exponentially more difficult. Many thanks are due to Carl for imparting to me his great wisdom regarding science and, through his harsh but rigorous comments, forming me into a better writer and researcher. The time required for research is bought with grants and scholarships; for this I am thankful to the University of Manchester Alumni Fund and the generosity of previous students at our alma mater. Along the way I was lucky to work closely with two dedicated researchers: Dr Max McGillen and Dr Asan Bacak. I enjoyed being mentored by Max in the early days. Together we came to grips with the trials and tribulations of getting an instrument ready for field work with only a couple of months to spare. However, I learnt the most from Max in his field of choice, kinetics, or as he liked to call it, ‘the sport of kings’. Our work together testing ideas on alkene ozonolysis was path defining. Asan was a great support when I was first forging my own way studying sesquiterpene ozonolysis and then isoprene ozonolysis, always helping me systematically tackle problems in studying temperamental instruments and reaction systems. I owe much to Asan’s help in the final year of writing this thesis and the papers therein. A debt of gratitude is owed to research technicians both at Manchester University and elsewhere. Messrs, or should that be messers, Alan Lee, Barry Gale, Carl Dixon and Peter Kelly were always at hand to help build and critique whatever unorthodox design was needed for my work, but just as important their collective sense of humour and irreverence were a breath of fresh, if slightly greasy, air during long days in the lab. Thanks also go to Alistair Bewsher. Dave ‘Tech grunt’ Tanner from Georgia Tech for vital tech support crossing time zones during our field work. Alan Knight in Bristol was also extremely helpful in helping me learn the intricacies of GC-FID. Friends, colleagues and office mates at SEAES and in the wider atmospheric science community deserve special thanks for providing encouraging chats, fun diversions, good advice and sharing experience. Particular thanks go to: James Dorsey, Ann Rowan, Jennifer Muller, Rami Al-Farra, Waheed Akram, Hugo Ricketts, Johnny Crosier, Anna Leavey, Murray Booth, Dan Housely, Kim Leather, Ruth Walmsley, Jamie Whitehead, Chris Lee, Niall Robinson, James Allan and Mike Flynn. Special thanks go to Jen Kotila for extremely vital proofreading in the final days before submission. Thanks and appreciation are also due to my work colleagues at ICBUW for their extreme understanding while I juggled my new job with wrapping up my overdue PhD. The PhD process can be a solitary one, particularly in the final months and even more so when coupled with a full time job that lands the student into the twilight zone of evening and weekend writing. As an antidote to this solitude I was fortunate to find a

9
friend in Sarah who was, like me, coming to the end of her studies and kept me company both in person when working together and equally importantly through entertaining emails filled with good music and wit and caring ‘mother hen’ like advice.

10
Rationale for submitting this thesis in the alternative format
The research conducted for this PhD could be effectively subdivided into a series of
publishable articles, each of which could be completed in sequence independently of
the completion of the whole work. Therefore, the alternative format was deemed
preferable for this study due to the inherent efficiency of producing five journal
articles when compared to presenting the work in a traditional thesis format, which
would subsequently require extensive revision prior to further publication in the peer
reviewed literature. It is thus beneficial that the thesis be completed in this way and
considered quite fortuitous that three of the five research papers presented here have
already been accepted for publication.
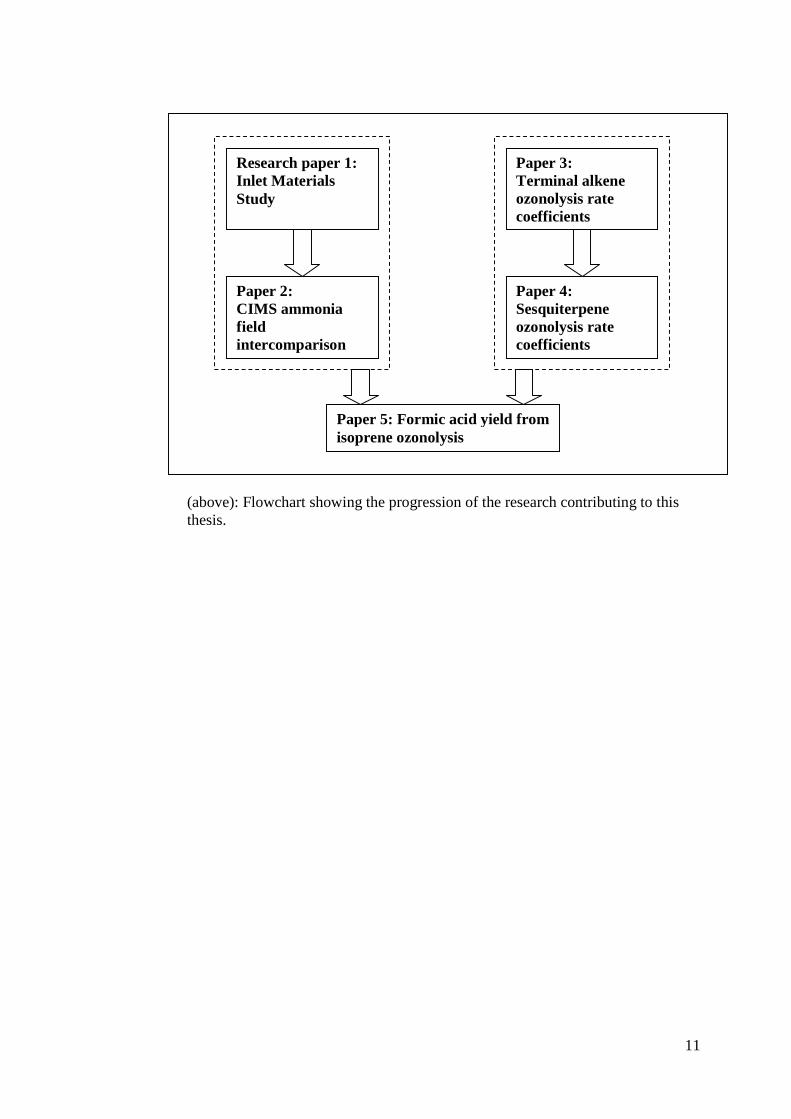
The presentation of the papers follows the progression of the research itself. The flow
chart overleaf shows how the research developed and how the papers are interlinked.
The number assigned to each paper represents both the order of presentation in the
thesis and the order in which the work was completed.
11
(above): Flowchart showing the progression of the research contributing to this thesis.
Research paper 1: Inlet Materials Study
Paper 2: CIMS ammonia field intercomparison
Paper 3: Terminal alkene ozonolysis rate coefficients
Paper 4: Sesquiterpene ozonolysis rate coefficients
Paper 5: Formic acid yield from isoprene ozonolysis
12
1. Introduction 1.1. Atmospheric NMHC
Non methane hydrocarbons (NMHCs) are a diverse and abundant class of trace gases
in the atmosphere that have wide ranging roles in plant physiology, atmospheric
chemistry and subsequent implications for environmental and human health. The
vapour pressure of NMHCs is known to be inversely proportional to their molecular
mass when other factors such as functional groups, temperature, surface area and
other variables are held equal. In a homologous series of alkenes the vapour pressure
is expected to fall with rising carbon number. Therefore higher mass compounds,
usually of 12 or more molecules are more likely to exist in the aerosol phase as a
result of their lower vapour pressure (Holton et al., 2003). As such, NMHCs are liable
to participate in the formation of organic aerosol and to condense readily on surfaces.
The formation of aerosol from NMHCs is particularly accentuated upon oxidation as
this results in compounds with differing functional groups and structures that can
have even lower vapour pressures and therefore leads to enhanced secondary organic
aerosol (SOA) formation (Bonn and Moortgat, 2002).
1.1.1. NMHC emissions
Non methane hydrocarbons (NMHC) are a major emission from plants as hormonal
regulators (e.g. ethene) or when subjected to stresses (e.g. isoprene or sesquiterpenes).
The greater proportion of NMHC in the environment is from natural sources in
comparison to anthropogenic sources (Goldstein and Galbally, 2007; Duhl et al.,
2008). The burgeoning reliance of modern human society on fossil fuels has also
rendered anthropogenic sources of great importance. While natural NMHC emissions
exceed anthropogenic sources by a factor of nine (Guenther et al., 1995), the fact that
anthropogenic emissions are almost always in close proximity to urban areas means
that their environmental and health effects are particularly problematic (Doyle, 2004).
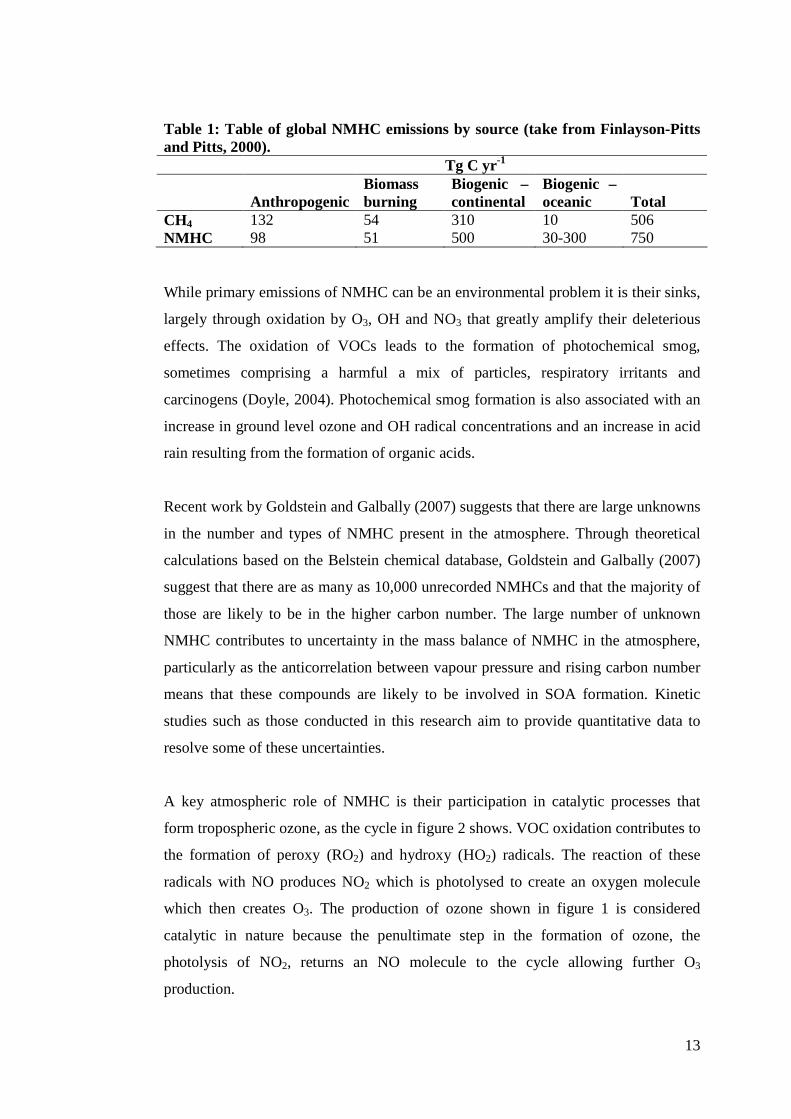
Table 1 (Finlayson-Pitts and Pitts, 2000) is an inventory of natural and anthropogenic
sources of NMHC and demonstrates the predominance of natural sources by a factor
of at least 2.
13
Table 1: Table of global NMHC emissions by source (take from Finlayson-Pitts and Pitts, 2000). Tg C yr-1
Anthropogenic
Biomass burning
Biogenic – continental
Biogenic – oceanic
Total
CH4 132 54 310 10 506 NMHC 98 51 500 30-300 750 While primary emissions of NMHC can be an environmental problem it is their sinks,
largely through oxidation by O3, OH and NO3 that greatly amplify their deleterious
effects. The oxidation of VOCs leads to the formation of photochemical smog,
sometimes comprising a harmful a mix of particles, respiratory irritants and
carcinogens (Doyle, 2004). Photochemical smog formation is also associated with an
increase in ground level ozone and OH radical concentrations and an increase in acid
rain resulting from the formation of organic acids.
Recent work by Goldstein and Galbally (2007) suggests that there are large unknowns
in the number and types of NMHC present in the atmosphere. Through theoretical
calculations based on the Belstein chemical database, Goldstein and Galbally (2007)
suggest that there are as many as 10,000 unrecorded NMHCs and that the majority of
those are likely to be in the higher carbon number. The large number of unknown
NMHC contributes to uncertainty in the mass balance of NMHC in the atmosphere,
particularly as the anticorrelation between vapour pressure and rising carbon number
means that these compounds are likely to be involved in SOA formation. Kinetic
studies such as those conducted in this research aim to provide quantitative data to
resolve some of these uncertainties.
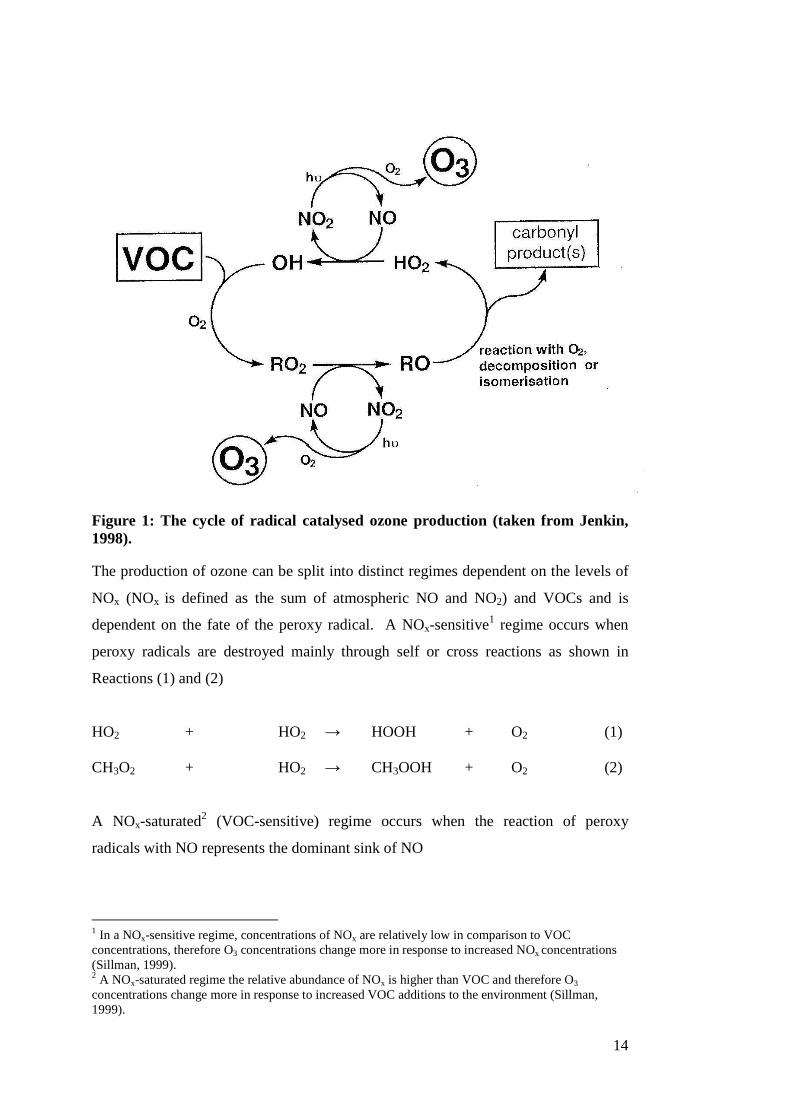
A key atmospheric role of NMHC is their participation in catalytic processes that
form tropospheric ozone, as the cycle in figure 2 shows. VOC oxidation contributes to
the formation of peroxy (RO2) and hydroxy (HO2) radicals. The reaction of these
radicals with NO produces NO2 which is photolysed to create an oxygen molecule
which then creates O3. The production of ozone shown in figure 1 is considered
catalytic in nature because the penultimate step in the formation of ozone, the
photolysis of NO2, returns an NO molecule to the cycle allowing further O3
production.
14
Figure 1: The cycle of radical catalysed ozone production (taken from Jenkin, 1998). The production of ozone can be split into distinct regimes dependent on the levels of
NOx (NOx is defined as the sum of atmospheric NO and NO2) and VOCs and is
dependent on the fate of the peroxy radical. A NOx-sensitive1 regime occurs when
peroxy radicals are destroyed mainly through self or cross reactions as shown in
Reactions (1) and (2)
HO2 + HO2 → HOOH + O2 (1)
CH3O2 + HO2 → CH3OOH + O2 (2)
A NOx-saturated2 (VOC-sensitive) regime occurs when the reaction of peroxy
radicals with NO represents the dominant sink of NO
1 In a NOx-sensitive regime, concentrations of NOx are relatively low in comparison to VOC concentrations, therefore O3 concentrations change more in response to increased NOx concentrations (Sillman, 1999). 2 A NOx-saturated regime the relative abundance of NOx is higher than VOC and therefore O3 concentrations change more in response to increased VOC additions to the environment (Sillman, 1999).
15
RO2 + NO NO2 + RO (3)
HO2 + NO NO2 + OH (4)
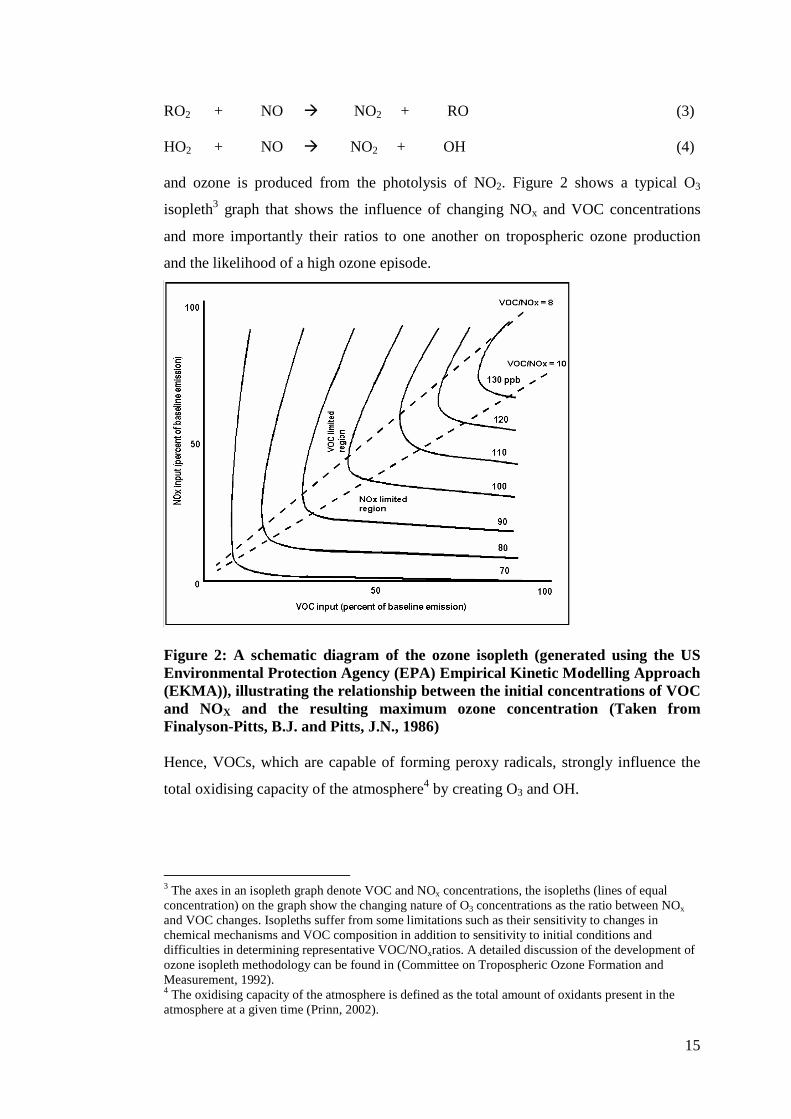
and ozone is produced from the photolysis of NO2. Figure 2 shows a typical O3
isopleth3 graph that shows the influence of changing NOx and VOC concentrations
and more importantly their ratios to one another on tropospheric ozone production
and the likelihood of a high ozone episode.
Figure 2: A schematic diagram of the ozone isopleth (generated using the US Environmental Protection Agency (EPA) Empirical Kinetic Modelling Approach (EKMA)), illustrating the relationship between the initial concentrations of VOC and NOX and the resulting maximum ozone concentration (Taken from Finalyson-Pitts, B.J. and Pitts, J.N., 1986) Hence, VOCs, which are capable of forming peroxy radicals, strongly influence the
total oxidising capacity of the atmosphere4 by creating O3 and OH.
3 The axes in an isopleth graph denote VOC and NOx concentrations, the isopleths (lines of equal concentration) on the graph show the changing nature of O3 concentrations as the ratio between NOx and VOC changes. Isopleths suffer from some limitations such as their sensitivity to changes in chemical mechanisms and VOC composition in addition to sensitivity to initial conditions and difficulties in determining representative VOC/NOxratios. A detailed discussion of the development of ozone isopleth methodology can be found in (Committee on Tropospheric Ozone Formation and Measurement, 1992). 4 The oxidising capacity of the atmosphere is defined as the total amount of oxidants present in the atmosphere at a given time (Prinn, 2002).
16
1.1.2. Alkene oxidation The reactions of alkenes with the OH, O3 and NO3 radicals are their major removal
process from the atmosphere. There is a large variety of alkenes present in the
atmosphere (Goldstein and Galbally, 2007) and these species have widely varying
reaction rate coefficients with respect to the three radicals varying between: 10-14 –
10-19, 10-10 – 10-11 and 10-9 – 10-14cm3molecule-1s-1) for 3Ok , OHk and
3NOk respectively
(McGillen et al., 2006 and references therein detailed in footnote 5). One or other of
the oxidants will dominate as a sink of alkenes depending on variations in
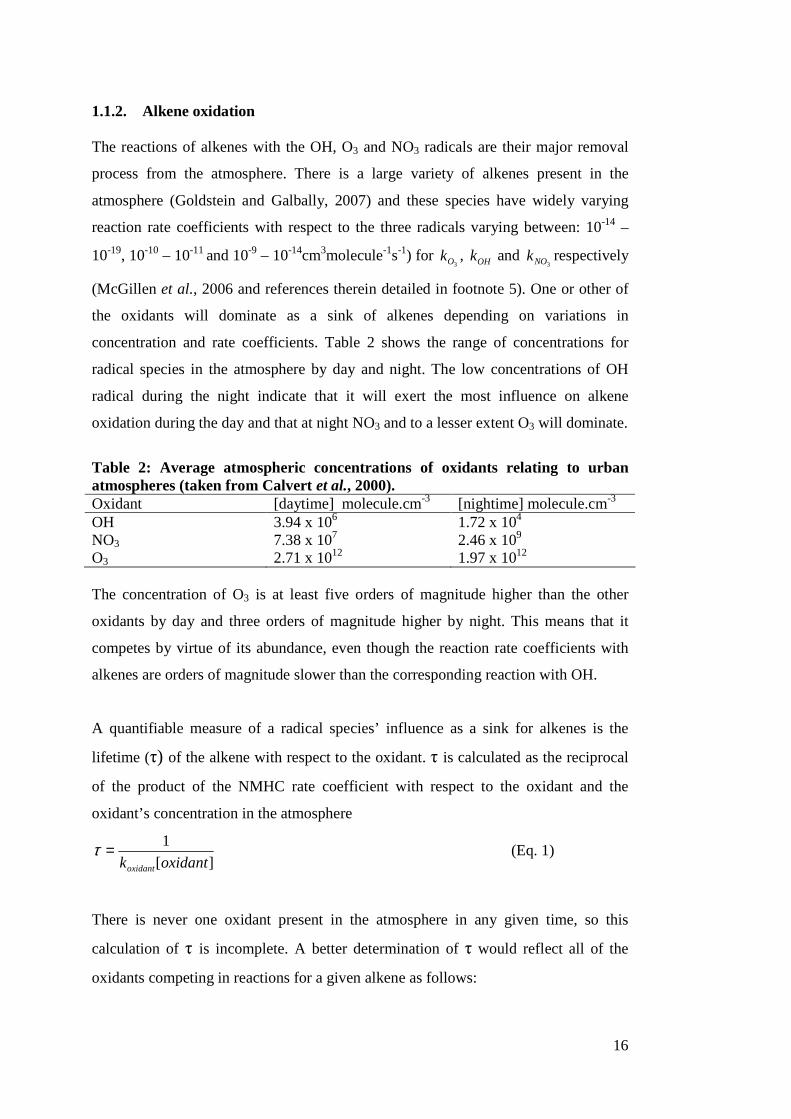
concentration and rate coefficients. Table 2 shows the range of concentrations for
radical species in the atmosphere by day and night. The low concentrations of OH
radical during the night indicate that it will exert the most influence on alkene
oxidation during the day and that at night NO3 and to a lesser extent O3 will dominate.
Table 2: Average atmospheric concentrations of oxidants relating to urban atmospheres (taken from Calvert et al., 2000). Oxidant [daytime] molecule.cm-3 [nightime] molecule.cm-3
OH 3.94 x 10⁶ 1.72 x 10⁴ NO3
7.38 x 10⁷ 2.46 x 10⁹ O3 2.71 x 10¹² 1.97 x 10¹² The concentration of O3 is at least five orders of magnitude higher than the other
oxidants by day and three orders of magnitude higher by night. This means that it
competes by virtue of its abundance, even though the reaction rate coefficients with
alkenes are orders of magnitude slower than the corresponding reaction with OH.
A quantifiable measure of a radical species’ influence as a sink for alkenes is the
lifetime (τ) of the alkene with respect to the oxidant. τ is calculated as the reciprocal
of the product of the NMHC rate coefficient with respect to the oxidant and the
oxidant’s concentration in the atmosphere
][
1
oxidantkoxidant
=τ (Eq. 1)
There is never one oxidant present in the atmosphere in any given time, so this
calculation of τ is incomplete. A better determination of τ would reflect all of the
oxidants competing in reactions for a given alkene as follows:
17
][][][][
1
33 33XkOHkNOkOk xOHNOO +++
=τ (Eq. 2)
A value calculated for τ using the revised equation would be a better determination of
the lifetime of a given hydrocarbon with respect to all oxidants in the atmosphere. As
such, it would allow for a clearer understanding of the impact of each oxidant on the
oxidising capacity of the atmosphere. However, there are still shortcomings in this
calculation. Variations in oxidant concentrations, temperature dependency of reaction
rates and loss processes of alkenes due to phase changes can all influence τ negatively
or positively. Although this analysis is an incomplete approximation of the full
complexity of the atmosphere, it does serve to sufficiently illustrate the influence of
reaction rate coefficients on atmospheric chemistry.
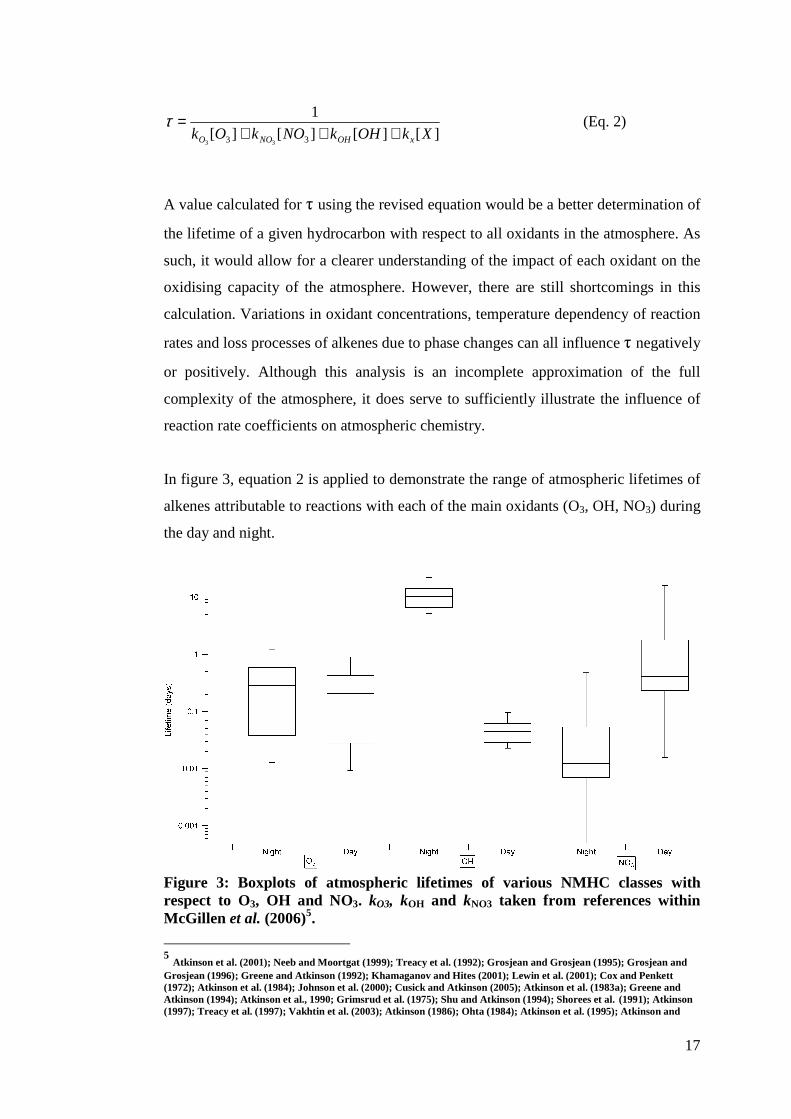
In figure 3, equation 2 is applied to demonstrate the range of atmospheric lifetimes of
alkenes attributable to reactions with each of the main oxidants (O3, OH, NO3) during
the day and night.
Figure 3: Boxplots of atmospheric lifetimes of various NMHC classes with respect to O3, OH and NO3. kO3, kOH and kNO3 taken from references within McGillen et al. (2006)5.
5 Atkinson et al. (2001); Neeb and Moortgat (1999); Treacy et al. (1992); Grosjean and Grosjean (1995); Grosjean and Grosjean (1996); Greene and Atkinson (1992); Khamaganov and Hites (2001); Lewin et al. (2001); Cox and Penkett (1972); Atkinson et al. (1984); Johnson et al. (2000); Cusick and Atkinson (2005); Atkinson et al. (1983a); Greene and Atkinson (1994); Atkinson et al., 1990; Grimsrud et al. (1975); Shu and Atkinson (1994); Shorees et al. (1991); Atkinson (1997); Treacy et al. (1997); Vakhtin et al. (2003); Atkinson (1986); Ohta (1984); Atkinson et al. (1995); Atkinson and
18
The maximum and minimum symbolised by the top and bottom whiskers in figure 3
are an indication of the wide range in lifetimes of alkenes in the atmosphere as
expected from the range in koxidant with respect to alkenes. Using the interquartile
range allows a more focussed comparison of the day and night lifetimes of the
alkenes. During the day lifetime with respect to O3 and OH appears to be of almost
equal importance, but the interquartile range for OH shows that it is in fact of greater
influence during the day. During the night it is clear that OH exerts the least influence
on alkene lifetime. This is to be expected given its significantly lower concentrations
in comparison to NO3 and O3. NO3 exerts the largest influence and O3 retains almost
the same role it does during the day.
1.1.2.1. Alkene ozonolysis The reactivity of ozone with alkenes spans three orders of magnitude. Changes in
functional groups and structure have been demonstrated to have a pronounced effect
on kO3. Steric hindrance (i.e. physical blocking of reactant molecules) has a strong
effect on ozonolysis rates, as was emphasised by McGillen et al. (2008). Structure
activity relationships (SARs) can be used to predict reaction rate coefficients based on
other physical properties of compounds. SARs constructed for alkenes have utilised
knowledge of functional group arrangement, carbon chain length and shape and the
number of bonds or functional groups to calculate reaction rate coefficients of alkene
ozonolysis (e.g. McGillen et al., 2008; Atkinson, 1987; Calvert et al., 2000) However,
it is noted that SARs can only ever be an indication and never a substitute for kinetic
measurements.
Ozonolysis is a common reaction in the atmosphere and while it is several orders of
magnitude slower than alkene oxidation by OH radical (c.f. kO3 ~ 10-18 and kOH ~ 10-10
cm3 molecule-1 s-1), it is still of great atmospheric significance given the higher
concentrations of ozone in the troposphere, as previously discussed. The longevity of
ozone molecules into the night also means that ozonolysis participates in important
night time alkene chemistry alongside the dominant NO3 radical (Finlayson-Pitts and
Pitts, 2000).
Aschmann (1984); Ohta (1983); Jenkin et al. (2003); O’Rji and Stone (1992); Rogers (1989); Nielsen et al., 1990); Darnall et al. (1976); Atkinson et al. (1983b); Atkinson et al. (1986); Corchnoy and Atkinson (1990); Benter et al. (1992); Berndt et al. (1998); Martinez et al. (1997); Kind et al. (1998); Lancar et al., 1991; Berndt and Boge (1997); Berndt et al. (1996); Atkinson (1991); Martinez et al. (1999); Pfrang et al. (2005).
19
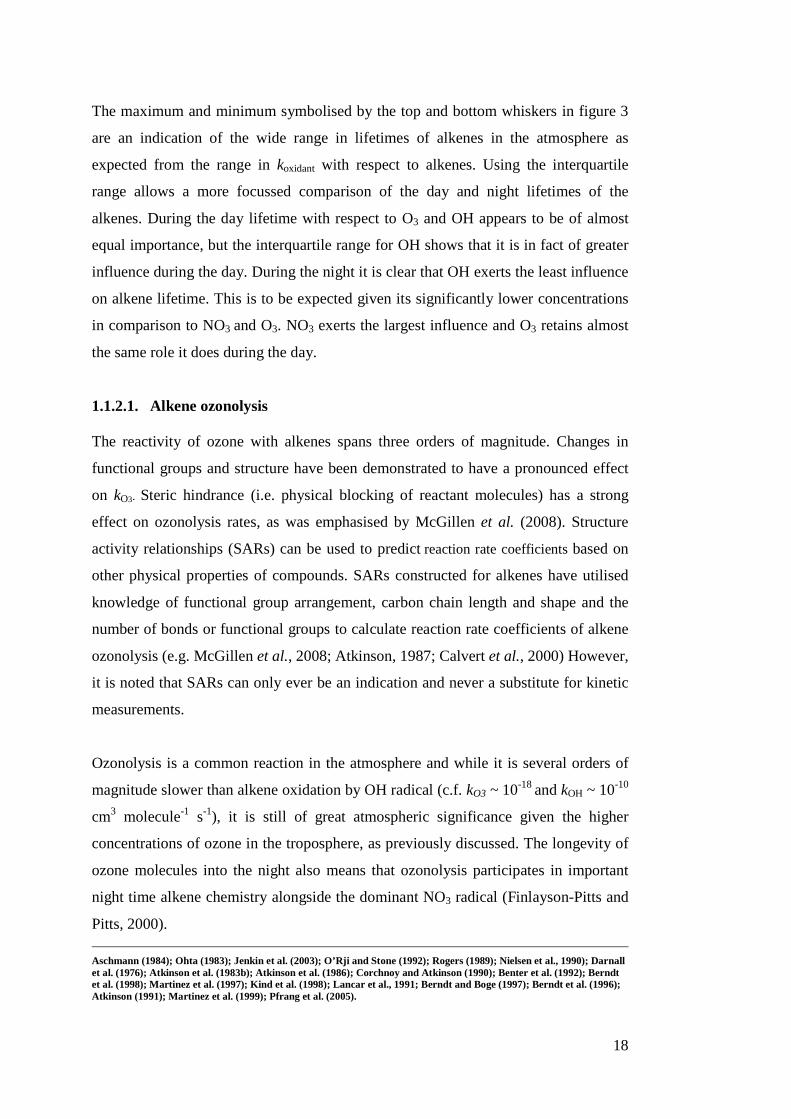
Ozonolysis mechanism The ozonolysis of alkenes occurs through 1,3 cycloaddition of an O3 molecule to the
double bond of an alkene. Figure 4 shows the initial steps of ozonolysis leading to the
formation of Criegee intermediates which were first postulated to exist by Rudolph
Criegee (1949).
Figure 4: Ozone addition to an alkene double bond and subsequent formation of the primary ozoide and Criegee intermediates (adapted from Calvert et al., 2000). In figure 4 we see how the breaking of the alkene double bond by ozone addition
across the 1,3 positions creates a primary ozonide that is now known to be energy
rich. This means that it is capable of undergoing complex unimolecular fragmentation
and rearrangement to form carbonyls and carbonyl oxides, known as Criegee
intermediates (CIs). The initial reaction energy will be distributed amongst the
products in a manner conforming to a Boltzmann distribution. In real terms this
means that the CIs created from a given ozonolysis reaction will vary in the amount
of energy they have. The energy of a CI and the potential for collisional stabilisation
determines its future fate and influences the resulting atmospheric chemistry as
reactions (5-9) illustrate.
[CH2OO]* → CO2 + H2 (5)
→ CO2 + 2H (6)
20
→ CO + H2O (7)
→ HCO + OH (8)
→ HCOOH (9)
The reactions above represent only a small portion of the potential role of CIs in
atmospheric chemistry, which is elucidated further in the sections below.
Stabilised Criegee Intermediates (SCIs)
For CIs to participate in further reactions it is necessary that they are stabilised or they
will decompose. Stabilisation of CIs occurs through collisions with surrounding
molecules that quench the excess energy that would otherwise cause decomposition
as per reactions (5-9). Some CIs are created with a level of energy sufficiently below
the barrier for decomposition and are therefore formed as SCI. In their study of the
ozonolysis of six alkenes, Kroll et al. (2001) found definite pressure dependence in
the yield of OH radicals, with the OH found to form ‘promptly’ upon reaction
commencement and fall with rising pressure. The negative pressure dependency of
OH yields observed by Kroll et al. (2001) clearly shows the SCI stabilisation with
pressure. Raising the pressure of a reaction vessel increases the likelihood of
collisions between CIs and surrounding gas molecules, thus transferring excess
energy and enhancing stabilisation.
To date, determinations of the yield of SCI (YSCI) from alkene ozonolysis have been
based on indirect methods that infer YSCI by measuring the carbonyl and
hydroperoxide products6 from the reaction of SCI with their atmospheric scavengers
(e.g. SO2, NO2, H2O) (Hasson et al., 2001, Rickard et al., 1999). The yield of
sulphuric acid from ozonolysis reactions has also been used to infer YSCI in the work
of Hatekayama et al. (1984). While such measurements of YSCI provide valuable
data, they should not be conflated with direct measurements as none currently exist
(Welz et al., 2012). Variations in YSCI are a testament to the challenges in measuring
this quantity through indirect means. Rickard et al. (1999) cite interferences from OH
reactions as a problem with literature determinations that predate their work, as
6 Measured using GC-FID or HPLC with fluorescence detection.
21
evidenced in the disagreement between Schäfer et al. (1997) and Paulson et al.
(1998), with regard to the source of OH radicals in indirect determinations of YSCI.
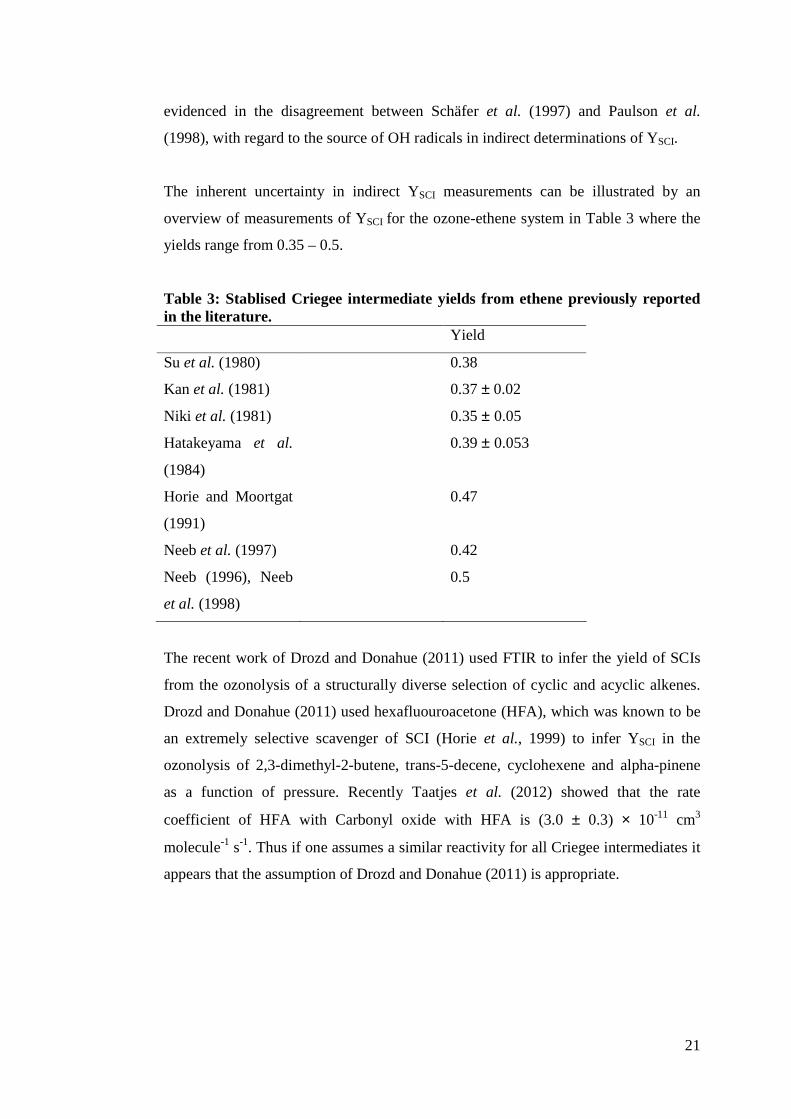
The inherent uncertainty in indirect YSCI measurements can be illustrated by an
overview of measurements of YSCI for the ozone-ethene system in Table 3 where the
yields range from 0.35 – 0.5.
Table 3: Stablised Criegee intermediate yields from ethene previously reported in the literature. Yield
Su et al. (1980) 0.38
Kan et al. (1981) 0.37 ± 0.02
Niki et al. (1981) 0.35 ± 0.05
Hatakeyama et al.
(1984)
0.39 ± 0.053
Horie and Moortgat
(1991)
0.47
Neeb et al. (1997) 0.42
Neeb (1996), Neeb
et al. (1998)
0.5
The recent work of Drozd and Donahue (2011) used FTIR to infer the yield of SCIs
from the ozonolysis of a structurally diverse selection of cyclic and acyclic alkenes.
Drozd and Donahue (2011) used hexafluouroacetone (HFA), which was known to be
an extremely selective scavenger of SCI (Horie et al., 1999) to infer YSCI in the
ozonolysis of 2,3-dimethyl-2-butene, trans-5-decene, cyclohexene and alpha-pinene
as a function of pressure. Recently Taatjes et al. (2012) showed that the rate
coefficient of HFA with Carbonyl oxide with HFA is (3.0 ± 0.3) × 10-11 cm3
molecule-1 s-1. Thus if one assumes a similar reactivity for all Criegee intermediates it
appears that the assumption of Drozd and Donahue (2011) is appropriate.
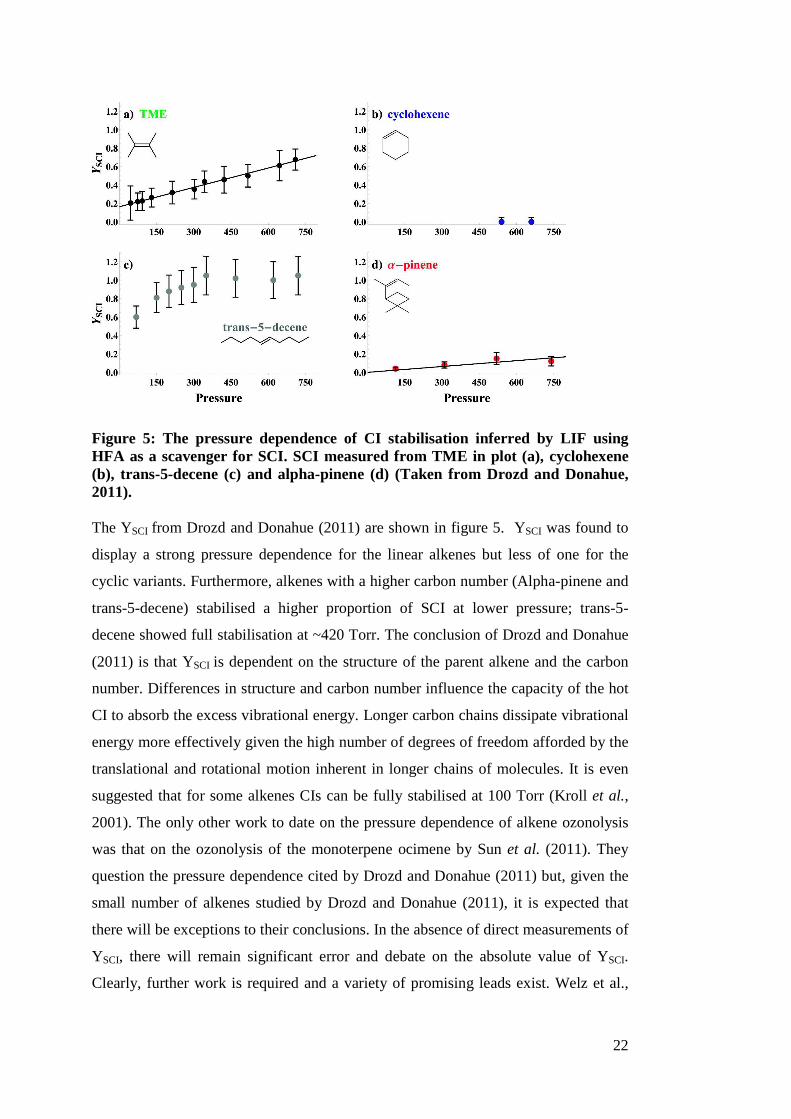
22
Figure 5: The pressure dependence of CI stabilisation inferred by LIF using HFA as a scavenger for SCI. SCI measured from TME in plot (a), cyclohexene (b), trans-5-decene (c) and alpha-pinene (d) (Taken from Drozd and Donahue, 2011). The YSCI from Drozd and Donahue (2011) are shown in figure 5. YSCI was found to
display a strong pressure dependence for the linear alkenes but less of one for the
cyclic variants. Furthermore, alkenes with a higher carbon number (Alpha-pinene and
trans-5-decene) stabilised a higher proportion of SCI at lower pressure; trans-5-
decene showed full stabilisation at ~420 Torr. The conclusion of Drozd and Donahue
(2011) is that YSCI is dependent on the structure of the parent alkene and the carbon
number. Differences in structure and carbon number influence the capacity of the hot
CI to absorb the excess vibrational energy. Longer carbon chains dissipate vibrational
energy more effectively given the high number of degrees of freedom afforded by the
translational and rotational motion inherent in longer chains of molecules. It is even
suggested that for some alkenes CIs can be fully stabilised at 100 Torr (Kroll et al.,
2001). The only other work to date on the pressure dependence of alkene ozonolysis
was that on the ozonolysis of the monoterpene ocimene by Sun et al. (2011). They
question the pressure dependence cited by Drozd and Donahue (2011) but, given the
small number of alkenes studied by Drozd and Donahue (2011), it is expected that
there will be exceptions to their conclusions. In the absence of direct measurements of
YSCI, there will remain significant error and debate on the absolute value of YSCI.
Clearly, further work is required and a variety of promising leads exist. Welz et al.,
23
(2012) suggest that photoionization mass spectrometry (PIMS) offers the chance of
directly measuring YSCI from ozonolysis for the first time based on their direct
observation of CI that were custom created for their experiments on CI reaction rate
coefficients (discussed below). Alternatively, Donahue et al. (2011) believe that
temperature programmed reaction spectroscopy (TPRS) coupled with FTIR could
offer another opportunity for the first direct observation of CI.
HOX chemistry
Even when unstabilised, Criegee intermediates from alkene ozonolysis play a hugely
important role in the oxidative capacity of the atmosphere as they influence the
amount of free radicals available at any given time. This is particularly true in the
case of hydroxyl (OH) and hydroperoxy (HO2) radicals, collectively termed (HOx).
The source of HOx in the atmosphere varies seasonally and diurnally as it is linked to
photolytic processes. For example, in the summer daytime the reactions (10-11)
account for the larger proportion of OH radical formation (Emmerson et al., 2005a):
O3 + hv < 340nm O(1D) + O2 (10)
O(1D) + H2O 2OH (11)
Additionally, this similar photolytic process accounts for the formation of HO2
radicals:
HCHO + hv + O2 CO + 2HO2 (12) OH production can be derived from reactions (10) and (11) as follows:
][))(()]([ 311 ODOJDO ×= (Eq. 3)
][)]([][ 2
111 OHDOkOH ×= (Eq. 4)
where ))(( 1DOJ is the rate of O3 photolysis in reaction (10).
24
In winter, shorter days and larger solar zenith angles7 result in less photolysis. It is
therefore expected that HOx concentrations would be orders of magnitude less in
winter than in summer. In the work of Emmerson et al. (2005b), a photochemical box
model based on the version 3.1 of the Master Chemical Mechanism is used to predict
[OH] from ozone photolysis in reaction (10) and subsequent OH production in
reaction (11). Field observations during the Pollution in Urban Midlands Atmosphere
(PUMA) campaign conducted in the summer of 1999 and winter of 2000 found that
HO2 and OH concentrations were comparable between the summer and winter.
Whereas the box model output found [OH] to be lower than that measured in winter
suggesting that in winter there was a source of HOx not related to photolysis
compensating for the reduced solar activity (Emmerson et al, 2005b).
Various researchers have suggested (e.g. Carslaw et al., 2000; Paulson and Orlando,
1996; Faloona et al., 2001) that CIs could be an important source of HOx in the
absence of photolytic processes. The accurate measurements of PUMA using LIF of
OH are the first proof of this and are important evidence of how crucial CI are
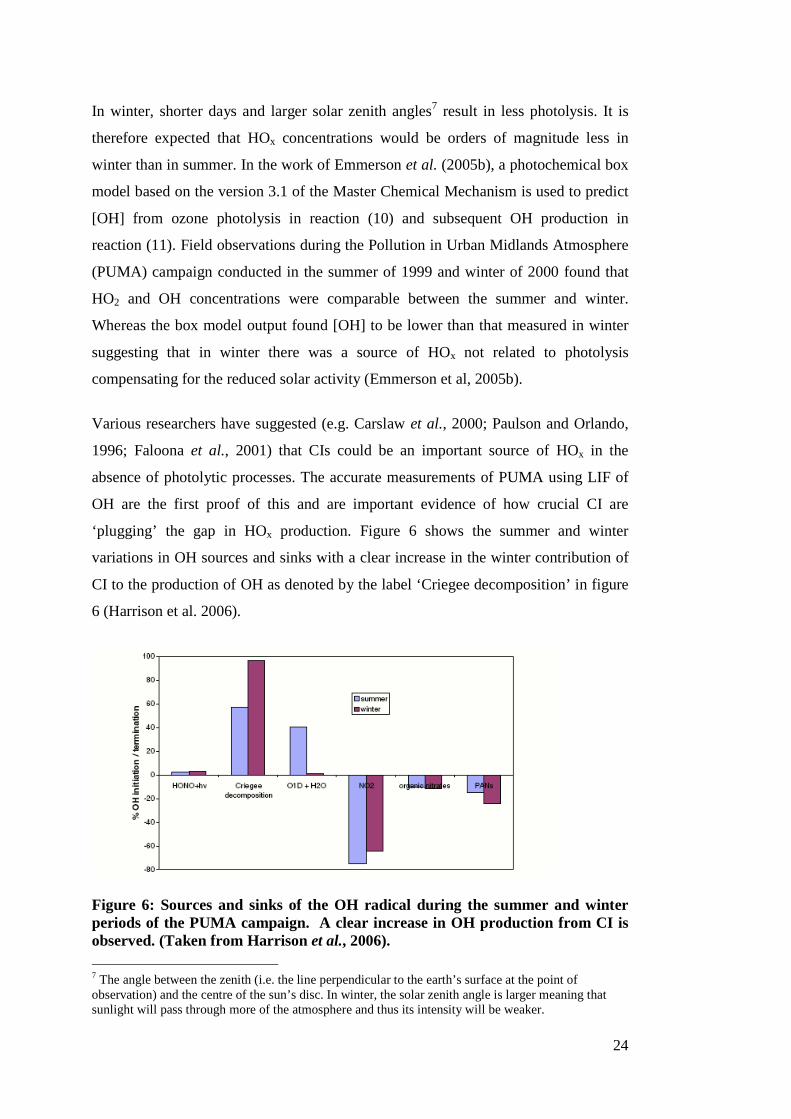
‘plugging’ the gap in HOx production. Figure 6 shows the summer and winter
variations in OH sources and sinks with a clear increase in the winter contribution of
CI to the production of OH as denoted by the label ‘Criegee decomposition’ in figure
6 (Harrison et al. 2006).
Figure 6: Sources and sinks of the OH radical during the summer and winter periods of the PUMA campaign. A clear increase in OH production from CI is observed. (Taken from Harrison et al., 2006).
7 The angle between the zenith (i.e. the line perpendicular to the earth’s surface at the point of observation) and the centre of the sun’s disc. In winter, the solar zenith angle is larger meaning that sunlight will pass through more of the atmosphere and thus its intensity will be weaker.
25
The HOx concentrations from the modelling output of PUMA were generally in
excellent agreement with the measurements, suggesting that the models had
accurately reproduced the mechanisms for HOx production in polluted urban
atmospheres.
The fate of Criegee intermediates As has been demonstrated above, the fate of CIs has important implications for
atmospheric chemistry. Until recently there have only been estimates of reaction rate
coefficients for a number of reaction partners with CH2OO. All measurements so far
have been indirect as there has been no reliable detection method for these species up
until now. Due to this any product studies are extremely speculative as the main
reaction partner cannot be detected and thus major assumptions are necessary with
regard to the value of the rate coefficient. Recently Welz et al. (2012) for the first
time determined the rate coefficient for the reactions of the simplest SCI,
formaldehyde oxide with its key scavengers in the atmosphere:
CH2OO + H2O → Products (13) CH2OO + NO2 → NO3 (14)
CH2OO + SO2 → SO3 + Products (15) Reactions (13-15) were found to proceed at rates between 7 x 10-12 – 3.9 x 10⁻¹¹ cm3
molecule-1 s-1. The new quantification of these rapid rate coefficients demonstrates the
important role of SCIs in the chemistry of the troposphere and is a departure from the
previously estimated rate coefficients for CH2OO that spanned nine orders of
magnitude as can be seen in table 4.
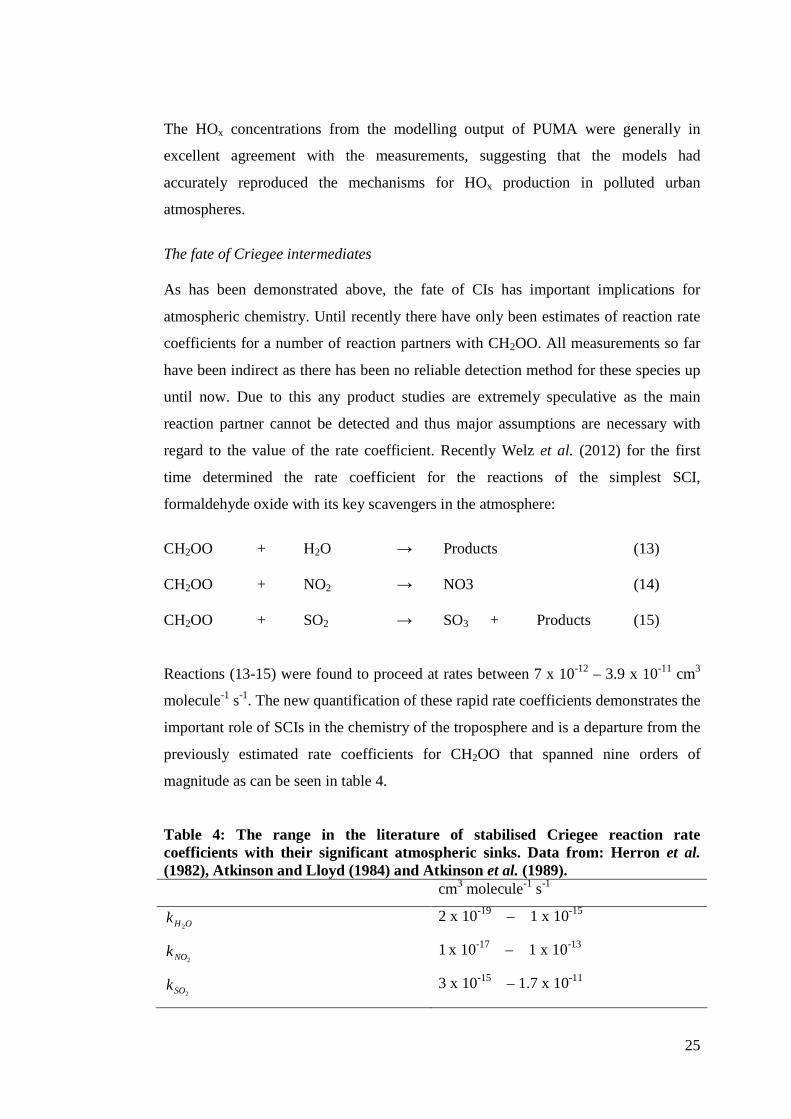
Table 4: The range in the literature of stabilised Criegee reaction rate coefficients with their significant atmospheric sinks. Data from: Herron et al. (1982), Atkinson and Lloyd (1984) and Atkinson et al. (1989). cm3 molecule-1 s-1
OHk2
2 x 10-19 – 1 x 10-15
2NOk 1 x 10-17 – 1 x 10-13
2SOk 3 x 10-15 – 1.7 x 10⁻¹¹
26
According to the new rate determination for reaction (15), Welz et al. (2012) state
that if all SCIs react with SO2 on a similar scale then SCIs are as important oxidizers
of SO2 as the OH radical. Similar implications are true for the production of the NO3
radical via reaction (14) with NO3 concentrations expected to increase by up to 20%
or more depending on alkene concentrations.
An important finding of this research is the role of the reaction of SCIs with H2O or
their water catalyzed transformation into various hydroxy hydroperoxides as in the
example of the formation of hydroxy methyl hydroperoxide (HMHP):
[CH2OO] + H2O → HOCH2OOH (16)
HOCH2OOH + → HCOOH + H2O (17)
HMHP subsequently decomposes into HCOOH other products (Gab et al. 1985).
Again, placing values on the rate of reaction (13) is pivotal to understanding that the
fate of SCIs is critically important with regard to the formation of organic acids in the
atmosphere. This process was first postulated by Calvert et al. (1978). It was then
confirmed as an important source of carboxylic acids by Martinez and Herron (1981).
Now the recent determinations of the SCI reaction rates quantifiably shows this
connection.
High ozonolysis yields of HCOOH measured in this work and other studies (Neeb et
al., 1997; Leather et al., 2012; Atkinson et al., 1997) in the presence of water vapour
are bolstered by the work of Welz et al. (2012), which confirms that the reaction of
SCI with H2O is a major secondary source of carboxylic acids in the atmosphere.
1.1.2.2. Debate on formic acid sources in the atmosphere As previously shown in reactions (16-17), the reaction of SCI with water is a
potentially important source of formic acid in the atmosphere. The carbonyl oxide
(CH2OO) is the simplest SCI. Other more complex carbonyl oxides are naturally
expected to result in the formation of more complex organic acids in the atmosphere.
The focus here is on CH2OO because it is one of the most likely products in the
27
ozonolysis of isoprene (Zhang et al., 2002) and is a key component of this research. In
addition to the SCI mediated formation of organic acids, other sources of organic
acids are myriad. These include both primary emissions from automobiles and other
combustion sources (Kawamura et al., 1985) and secondary formation in the
atmosphere (Grosjean et al., 1990a; Neeb et al., 1997; Atkinson et al., 1997).
According to Grosjean, (1990b), organic acids can be even more important than
inorganic acids with regard to acid deposition (e.g. HNO3, H2SO4). It is also strongly
suspected that organic acids, with their low volatility, play an important role as cloud
condensation nuclei (CCN) (Kavouras et al., 1998; O’Dowd et al., 2002; Bonn and
Moortgat, 2003; Zhang et al., 2004).
Organic acid sources in the atmosphere are complex and there is still uncertainty
regarding the relative contributions of the various sources. More field measurements
of organic acid concentrations (Le Breton et al., 2012) in conjunction with further
laboratory studies of the kinetics of organic acid formation yields would assist in
providing closure between models and measurements of organic acids in the
atmosphere. At present, models continue to under-predict the global atmospheric
concentrations of key acids such as formic acid (Stavroukou et al., 2011; Le Breton et
al., 2012).
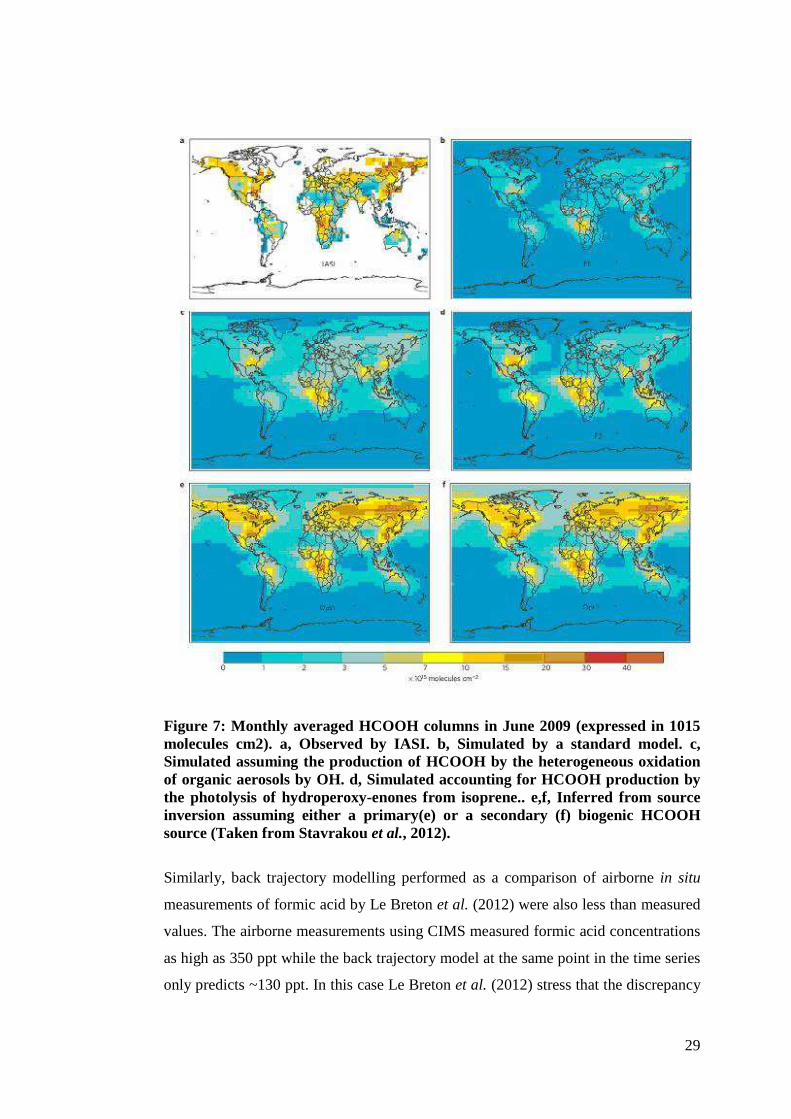
Razavi et al. (2011) measured global concentrations of formic acid (HCOOH) using
the Infrared Atmospheric Sounding Inferometer (IASI) based on the Met-OP satellite.
An analysis of the IASI/Met-OP data by Stavrakou et al. (2011) suggests that the
annual production of HCOOH is 100-120 Tg per year, a factor of two or three higher
than predicted by the IMAGESv2 global chemistry transport model. Figure 8
illustrates the discrepancy between models and measurements in the recent work of
Razavi et al. (2011) (Stavarokou et al., 2011). Portion (a) of figure 8 is the global
distribution of HCOOH columns in molecule cm-2 as retrieved by IASI/Met-OP and
portion (b) is the standard output from the IMAGESv2 model. The difference
between the model and measurement is clear. The main source of the discrepancy
from Razavi et al. (2011) is suggested by Stavrakou et al. (2011) to be either the
oxidation of organic aerosols by OH radicals or the photolysis of hydroperoxy-enones
originating from isoprene (Peeters and Muller, 2010) in addition to ozonolysis of
sesquiterpenes. In portions (c-f) of figure 7 additional model parameters are added to

28
account for the ‘missing sources’ suggested above. The difference from the measured
data becomes progressively less pronounced between (a) and (c-f). However, it is not
a perfect representation which suggests there are still sources of formic acid that are
unaccounted for.
29
Figure 7: Monthly averaged HCOOH columns in June 2009 (expressed in 1015 molecules cm2). a, Observed by IASI. b, Simulated by a standard model. c, Simulated assuming the production of HCOOH by the heterogeneous oxidation of organic aerosols by OH. d, Simulated accounting for HCOOH production by the photolysis of hydroperoxy-enones from isoprene.. e,f, Inferred from source inversion assuming either a primary(e) or a secondary (f) biogenic HCOOH source (Taken from Stavrakou et al., 2012).
Similarly, back trajectory modelling performed as a comparison of airborne in situ
measurements of formic acid by Le Breton et al. (2012) were also less than measured
values. The airborne measurements using CIMS measured formic acid concentrations
as high as 350 ppt while the back trajectory model at the same point in the time series
only predicts ~130 ppt. In this case Le Breton et al. (2012) stress that the discrepancy
30
is indicative of a large missing source of formic acid such as vehicular combustion or
“missing extremely reactive formic acid precursors” such as isoprene or ethene (Le
Breton et al., 2012).
Indeed, the model integration of laboratory studies of the formation yields of formic
acid from ethene ozonolysis in the recent work of Leather et al. (2012) shows the
importance of alkene ozonolysis as a secondary source of formic acid that could
contribute to model/measurement closure in the studies cited above (Razavi et al.,
2011; Le Breton et al., 2012). Leather et al. (2012) measured a high yield (0.3) of
formic acid from ethene ozonolysis at high RH. When integrated into the CRI-
STOCHEM (Jenkin et al., 2008; Utembe et al., 2010) global model they were found
to increase formic acid photochemical source to as much as 19.2 Tg yr-1, almost
double its original value. This important work by Leather et al. (2012) builds upon
and confirms similar findings by Neeb et al. (1997) who found yields of formic acid
from ethene to be 0.42 at 65% relative humidity.
It is clear that there is still uncertainty regarding the sources of formic (and other
organic) acids in the atmosphere. There is also a the vast number of alkenes in the
atmosphere, ~105 according to Goldstein and Galbally (2007), and a high likelihood
that a good proportion of these are terminal alkenes with the potential to form organic
acids through ozonolysis. Therefore, it is important to probe the formation of organic
acids in the ozonolysis of other alkene systems of atmospheric significance (e.g.
isoprene) to attempt further closure between models and measurements.
31
1.2. Reactive nitrogen in the atmosphere
Molecular nitrogen (N2) is the most abundant gaseous species in the atmosphere,
comprising 78% of gases in the atmosphere. Due to the strength of the N≡N triple
bond, not all of this is bio available to life forms or free to participate in chemical
reactions in the atmosphere without conversion to a less inert form, a process
know as fixation or denitrification, that naturally occurs through biotic processes
in plants.
More reactive forms of nitrogen, collectively termed Nr, are ‘fixed’ mainly by
biological process and therefore their environmental abundance is limited by these
processes. In the past century human activity has resulted in a perturbation in the
levels of Nr in the atmosphere through increased manufacturing, the use of
fertilisers, fossil fuel combustion, the cultivation of N2 fixing crops and biomass
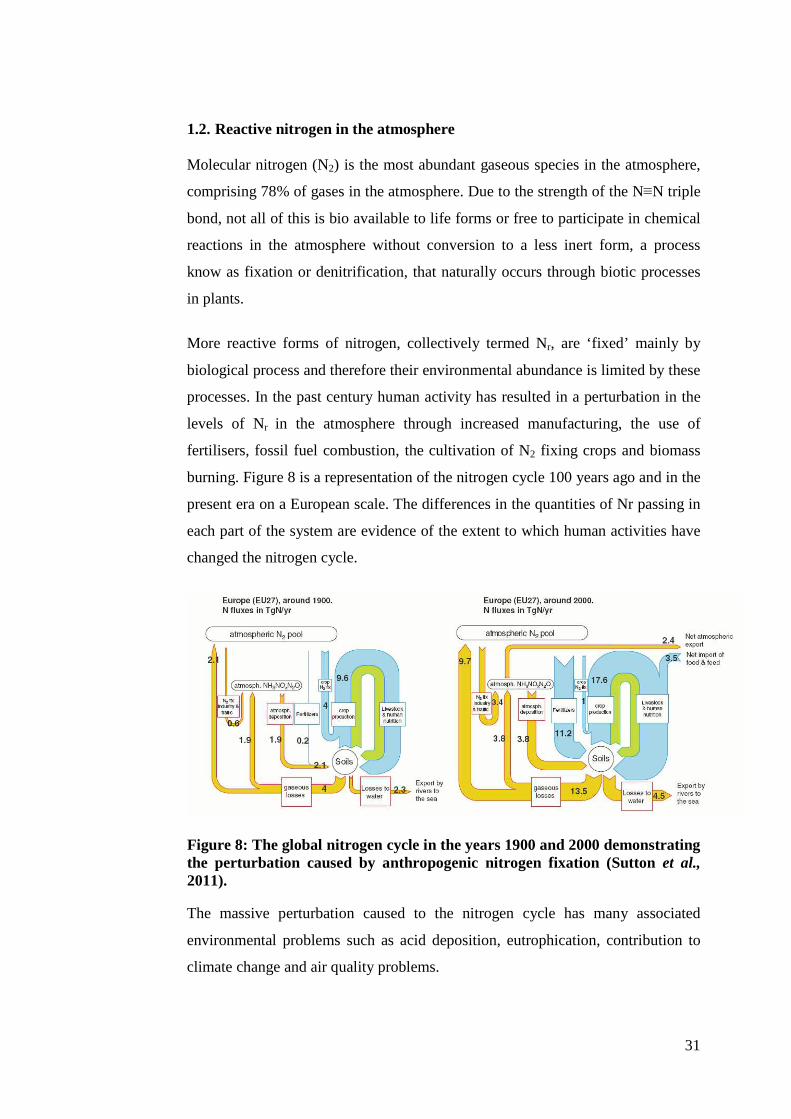
burning. Figure 8 is a representation of the nitrogen cycle 100 years ago and in the
present era on a European scale. The differences in the quantities of Nr passing in
each part of the system are evidence of the extent to which human activities have
changed the nitrogen cycle.
Figure 8: The global nitrogen cycle in the years 1900 and 2000 demonstrating the perturbation caused by anthropogenic nitrogen fixation (Sutton et al., 2011). The massive perturbation caused to the nitrogen cycle has many associated
environmental problems such as acid deposition, eutrophication, contribution to
climate change and air quality problems.
32
1.2.1. Reactive nitrogen species While reactive nitrogen species exist in the atmosphere only in trace amounts,
they attract a great deal of scientific and regulatory attention due to the
impacts noted above.
Nr can either be in oxidised form of NOx (NO + NO2) or NOy (PAN, HNO3,
N2O, N2O5, HONO, NO etc) or in reduced form as NHx (NH3 and NH4).
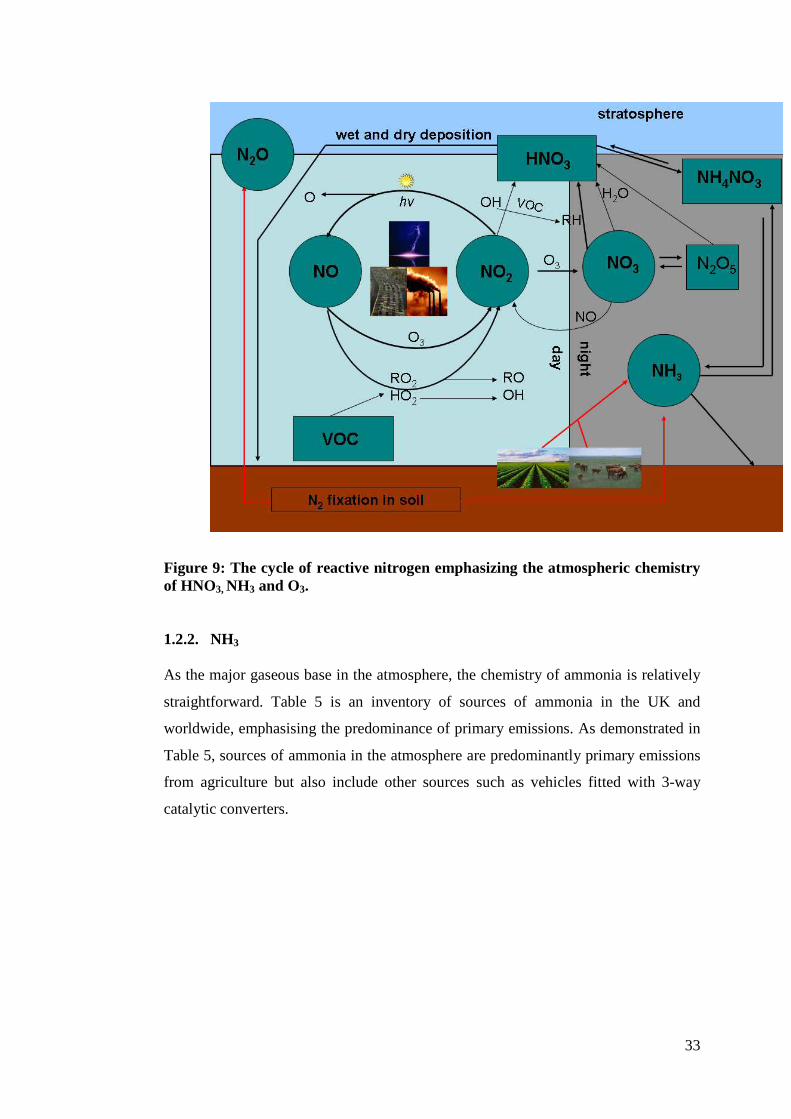
Figure 9 shows some important aspects of the Nr cycle with an emphasis on
the processes leading to the formation of HNO3, emission of NH3 and the
formation of O3. In terms of Nr this study is focused on NH3 and HNO3
chemistry as they both relate to the formation of nitrate aerosols and on the
role HNO3 plays in tropospheric O3 production. The following sections
present the sources and sinks of NH3 and HNO3, their participation in the
formation of nitrate aerosol and the importance of HNO3 as an indicator for
tropospheric O3 formation.
33
Figure 9: The cycle of reactive nitrogen emphasizing the atmospheric chemistry of HNO3, NH3 and O3. 1.2.2. NH3
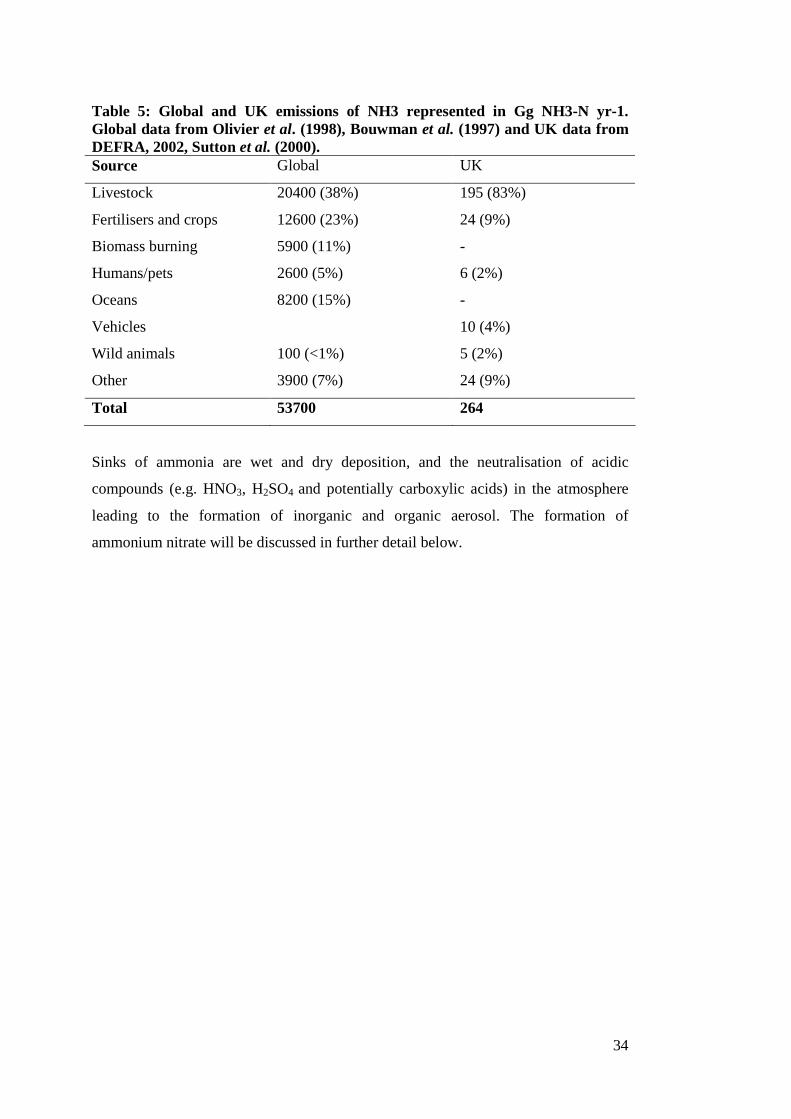
As the major gaseous base in the atmosphere, the chemistry of ammonia is relatively
straightforward. Table 5 is an inventory of sources of ammonia in the UK and
worldwide, emphasising the predominance of primary emissions. As demonstrated in
Table 5, sources of ammonia in the atmosphere are predominantly primary emissions
from agriculture but also include other sources such as vehicles fitted with 3-way
catalytic converters.
34
Table 5: Global and UK emissions of NH3 represented in Gg NH3-N yr-1. Global data from Olivier et al. (1998), Bouwman et al. (1997) and UK data from DEFRA, 2002, Sutton et al. (2000). Source Global UK
Livestock 20400 (38%) 195 (83%)
Fertilisers and crops 12600 (23%) 24 (9%)
Biomass burning 5900 (11%) -
Humans/pets 2600 (5%) 6 (2%)
Oceans 8200 (15%) -
Vehicles 10 (4%)
Wild animals 100 (<1%) 5 (2%)
Other 3900 (7%) 24 (9%)
Total 53700 264
Sinks of ammonia are wet and dry deposition, and the neutralisation of acidic
compounds (e.g. HNO3, H2SO4 and potentially carboxylic acids) in the atmosphere
leading to the formation of inorganic and organic aerosol. The formation of
ammonium nitrate will be discussed in further detail below.
35
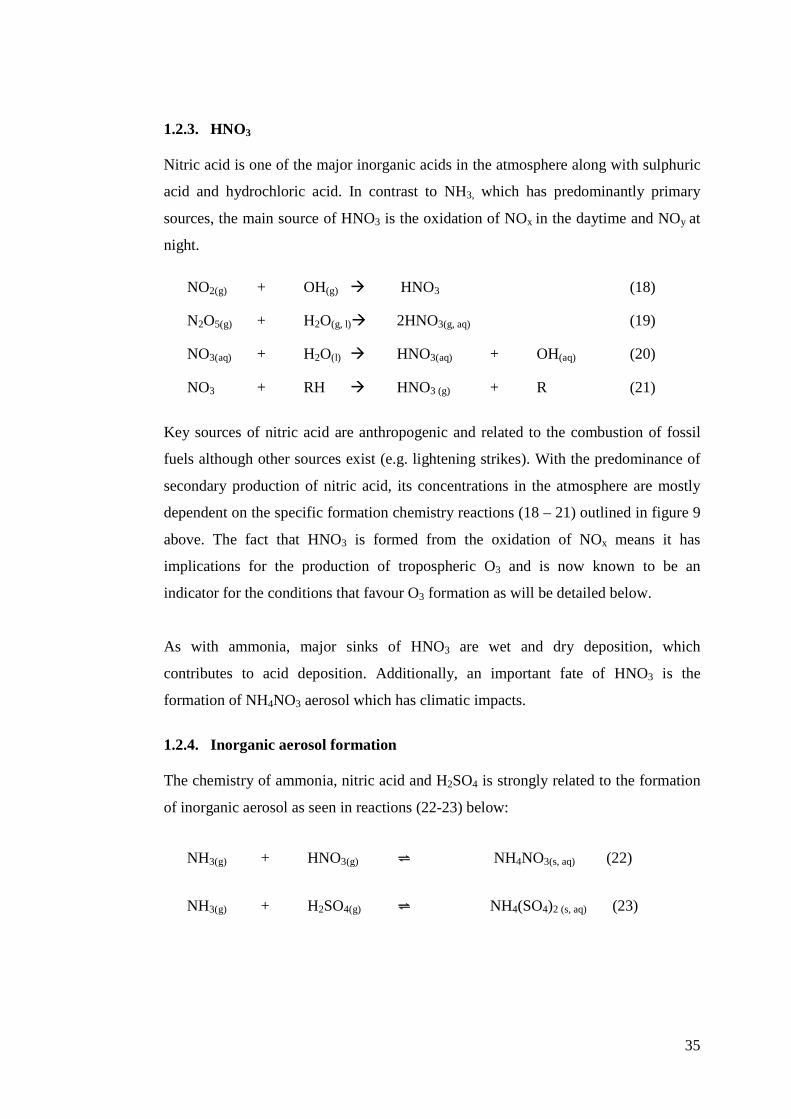
1.2.3. HNO3
Nitric acid is one of the major inorganic acids in the atmosphere along with sulphuric
acid and hydrochloric acid. In contrast to NH3, which has predominantly primary
sources, the main source of HNO3 is the oxidation of NOx in the daytime and NOy at
night.
NO2(g) + OH(g) HNO3 (18)
N2O5(g) + H2O(g, l) 2HNO3(g, aq) (19)
NO3(aq) + H2O(l) HNO3(aq) + OH(aq) (20)
NO3 + RH HNO3 (g) + R (21)
Key sources of nitric acid are anthropogenic and related to the combustion of fossil
fuels although other sources exist (e.g. lightening strikes). With the predominance of
secondary production of nitric acid, its concentrations in the atmosphere are mostly
dependent on the specific formation chemistry reactions (18 – 21) outlined in figure 9
above. The fact that HNO3 is formed from the oxidation of NOx means it has
implications for the production of tropospheric O3 and is now known to be an
indicator for the conditions that favour O3 formation as will be detailed below.
As with ammonia, major sinks of HNO3 are wet and dry deposition, which
contributes to acid deposition. Additionally, an important fate of HNO3 is the
formation of NH4NO3 aerosol which has climatic impacts.
1.2.4. Inorganic aerosol formation The chemistry of ammonia, nitric acid and H2SO4 is strongly related to the formation
of inorganic aerosol as seen in reactions (22-23) below:
NH3(g) + HNO3(g) NH4NO3(s, aq) (22)
NH3(g) + H2SO4(g) NH4(SO4)2 (s, aq) (23)
36
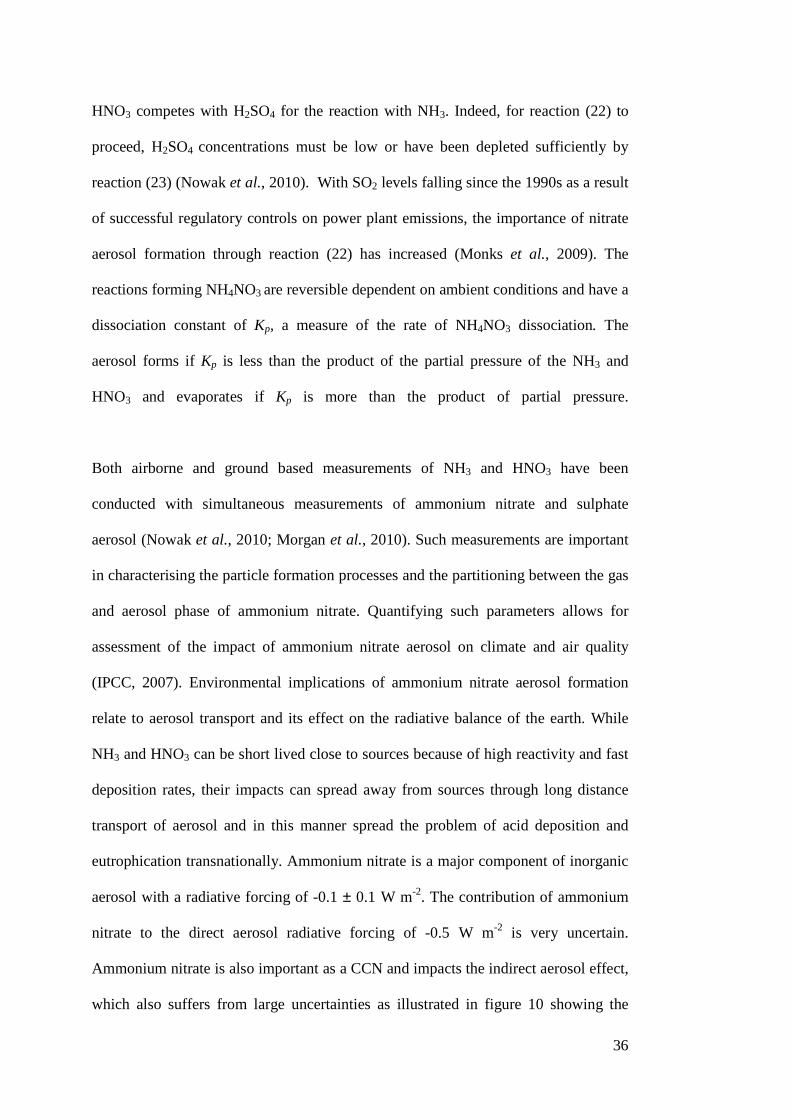
HNO3 competes with H2SO4 for the reaction with NH3. Indeed, for reaction (22) to
proceed, H2SO4 concentrations must be low or have been depleted sufficiently by
reaction (23) (Nowak et al., 2010). With SO2 levels falling since the 1990s as a result
of successful regulatory controls on power plant emissions, the importance of nitrate
aerosol formation through reaction (22) has increased (Monks et al., 2009). The
reactions forming NH4NO3 are reversible dependent on ambient conditions and have a
dissociation constant of Kp, a measure of the rate of NH4NO3 dissociation. The
aerosol forms if Kp is less than the product of the partial pressure of the NH3 and
HNO3 and evaporates if Kp is more than the product of partial pressure.
Both airborne and ground based measurements of NH3 and HNO3 have been
conducted with simultaneous measurements of ammonium nitrate and sulphate
aerosol (Nowak et al., 2010; Morgan et al., 2010). Such measurements are important
in characterising the particle formation processes and the partitioning between the gas
and aerosol phase of ammonium nitrate. Quantifying such parameters allows for
assessment of the impact of ammonium nitrate aerosol on climate and air quality
(IPCC, 2007). Environmental implications of ammonium nitrate aerosol formation
relate to aerosol transport and its effect on the radiative balance of the earth. While
NH3 and HNO3 can be short lived close to sources because of high reactivity and fast
deposition rates, their impacts can spread away from sources through long distance
transport of aerosol and in this manner spread the problem of acid deposition and
eutrophication transnationally. Ammonium nitrate is a major component of inorganic
aerosol with a radiative forcing of -0.1 ± 0.1 W m-2. The contribution of ammonium
nitrate to the direct aerosol radiative forcing of -0.5 W m-2 is very uncertain.
Ammonium nitrate is also important as a CCN and impacts the indirect aerosol effect,
which also suffers from large uncertainties as illustrated in figure 10 showing the
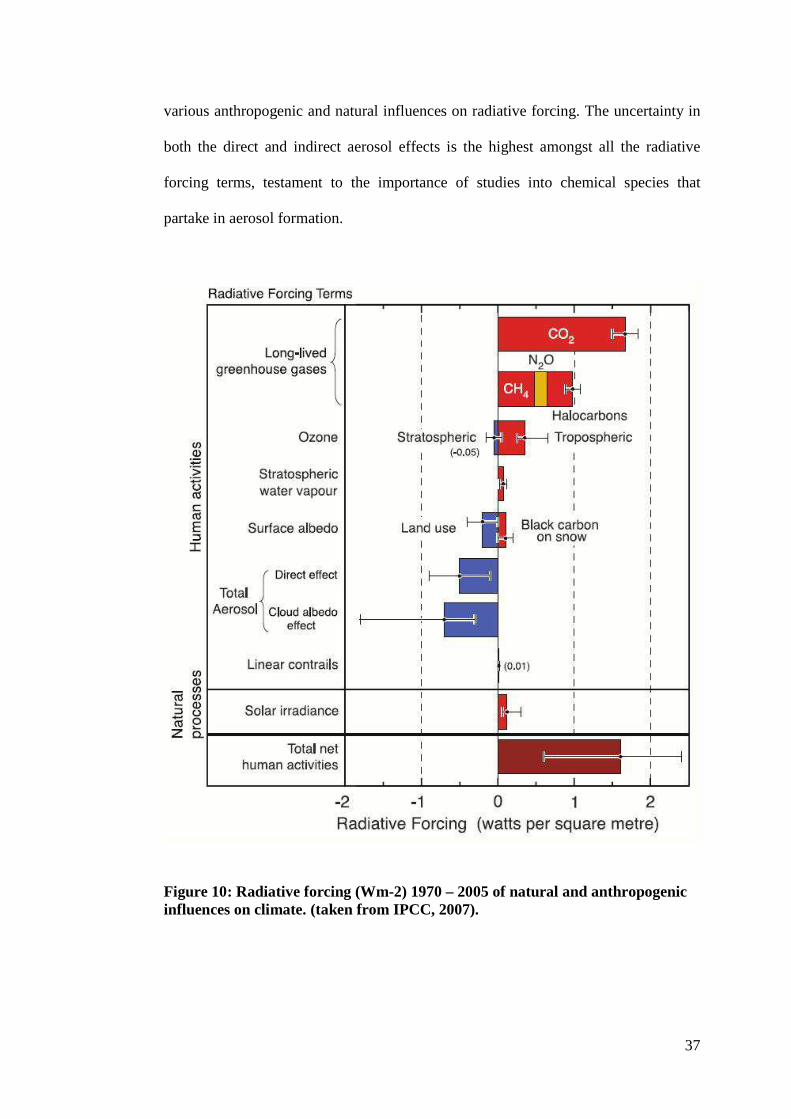
37
various anthropogenic and natural influences on radiative forcing. The uncertainty in
both the direct and indirect aerosol effects is the highest amongst all the radiative
forcing terms, testament to the importance of studies into chemical species that
partake in aerosol formation.
Figure 10: Radiative forcing (Wm-2) 1970 – 2005 of natural and anthropogenic influences on climate. (taken from IPCC, 2007).
38
1.2.5. Nr and tropospheric ozone
As previously discussed, in situ tropospheric ozone formation (and accumulation)
depends on the photolysis of NOx produced in an environment with high VOC
concentrations.
As a sink of NOx, the formation of HNO3 is thought to lead to the reduction of
tropospheric O3 production by acting as a termination step for the O3 production cycle
(figure 1):
OH + NO2 HNO3 (24) It is established that as a sink of NOx, HNO3 can be used as an indicator for whether a
NOx-sensitive or VOC-sensitive regime exists. Because of this, knowledge of HNO3
concentrations is important for regulatory controls on O3 production as it impacts both
urban and rural air quality. A further source of NOx discovered relatively recently is
the photolysis of NO3- deposited in snow covered regions in mid to high latitudes, the
phenomenon first observed by Honrath et al., (1999) was noticed because of a
seemingly anomalous high rate of O3 destruction within the snow pack.
Milford et al. (1994) established a link between total Nr in the atmosphere and the
prevalence of NOx-sensitive conditions. According to Sillman (1995), it is the levels
of OH radical that ultimately dictate whether an environment is NOx-sensitive or
VOC-sensitive. The ratio of HNO3/O3 is thought to be a good indicator of whether
NOx-sensitive or VOC-sensitive conditions prevail and therefore the likelihood of
high ozone episodes (Sillman, 1995). Furthermore, Sillman and He (2002) and
Sillman and West (2009) show that the ratios of HNO3/H2O2 could also be indicative
of VOC-sensitive and NOx-sensitive regimes, thereby providing other valuable
metrics to inform O3 control strategies.
39
1.3. Importance of measurements
As the discussions in the preceding sections show, high quality field and laboratory
measurements of the trace species studied are vital for the improved understanding of
their environmental chemistry and impacts. A brief survey of current techniques for
measuring NMHCs, NH3 and HNO3 follows, along with an overview of the novel
CIMS technique used in the work conducted for this research
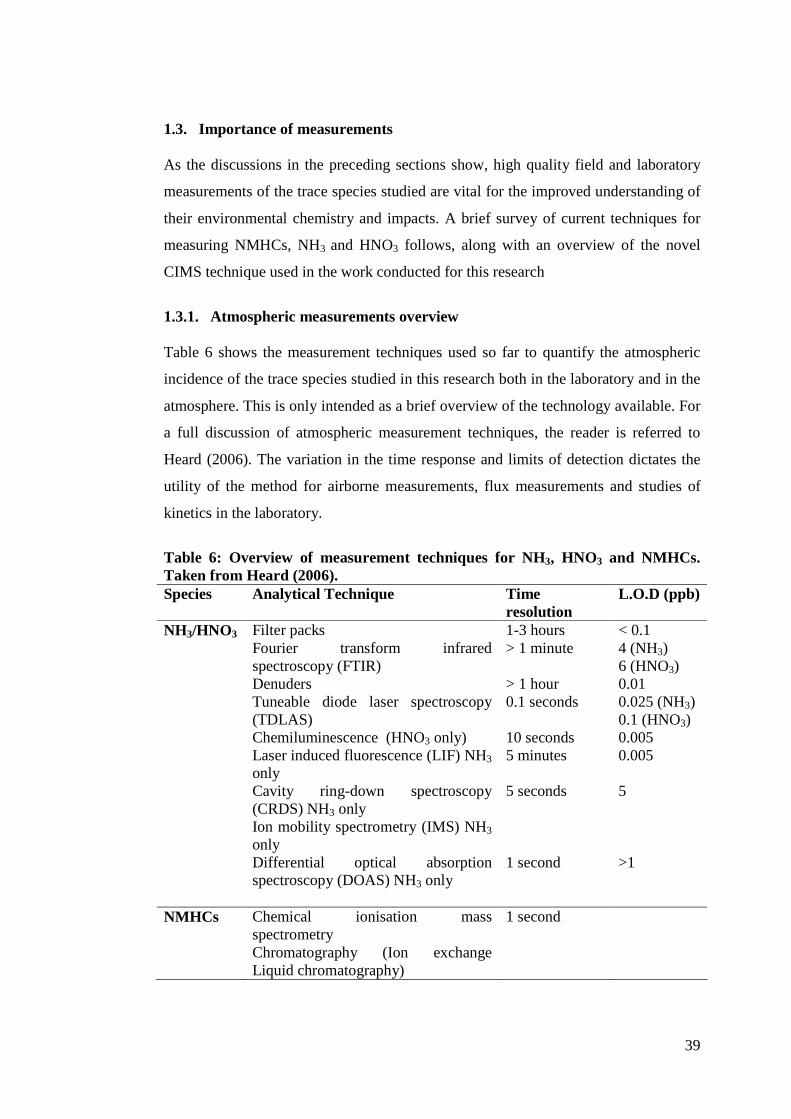
1.3.1. Atmospheric measurements overview Table 6 shows the measurement techniques used so far to quantify the atmospheric
incidence of the trace species studied in this research both in the laboratory and in the
atmosphere. This is only intended as a brief overview of the technology available. For
a full discussion of atmospheric measurement techniques, the reader is referred to
Heard (2006). The variation in the time response and limits of detection dictates the
utility of the method for airborne measurements, flux measurements and studies of
kinetics in the laboratory.
Table 6: Overview of measurement techniques for NH3, HNO3 and NMHCs. Taken from Heard (2006). Species Analytical Technique Time
resolution L.O.D (ppb)
NH3/HNO3 Filter packs 1-3 hours < 0.1 Fourier transform infrared
spectroscopy (FTIR) > 1 minute 4 (NH3)
6 (HNO3) Denuders > 1 hour 0.01 Tuneable diode laser spectroscopy
(TDLAS) 0.1 seconds 0.025 (NH3)
0.1 (HNO3) Chemiluminescence (HNO3 only) 10 seconds 0.005 Laser induced fluorescence (LIF) NH3
only 5 minutes 0.005
Cavity ring-down spectroscopy (CRDS) NH3 only
5 seconds 5
Ion mobility spectrometry (IMS) NH3 only
Differential optical absorption spectroscopy (DOAS) NH3 only
1 second >1
NMHCs Chemical ionisation mass
spectrometry 1 second
Chromatography (Ion exchange Liquid chromatography)
40
As table 6 indicates, not all of the currently available techniques have the required
time response or sensitivity to provide the best measurement of ‘sticky’8 trace
gases such as NH3, HNO3 and organic acids. For example, simultaneously
measuring NH3 and HNO3 with ammonium nitrate (e.g. Nowak et al., 2010;
Morgan et al., 2010) requires instruments with fast time response such as CIMS.
Similarly, the measurement of the ozonolysis yields of carboxylic acids benefits
from a fast response online technique.
1.4. Instrument methodology The following section provides an overview and some detail of each of the analytical
techniques used in the course of this research. Some instruments such as CIMS and
GC, are afforded more detail than others (e.g. portable aerosol spectrometer and
ozone analyser) because they were more important from an analytical perspective and
more complex to use and set up.
1.4.1. CIMS Chemical ionisation mass spectrometry (CIMS) provides the capability to measure
various atmospheric trace gases in the atmosphere with high sensitivity and a fast
time response (t~1s). The limits of detection for the technique have been
demonstrated to be on the order of tens of ppt and even lower. The CIMS method
uses a reagent ion to ionise a neutral species. The product ions resulting from this
process are then filtered by a quadrupole mass analyser to identify species and
determine their abundance by counting the number of ions reaching a detector at the
rear of the mass spectrometer. The distinction between chemical ionization mass
spectrometry and other mass spectrometry techniques is the use of ion molecule
reactions for the selective ionization of compounds of interest in the complicated
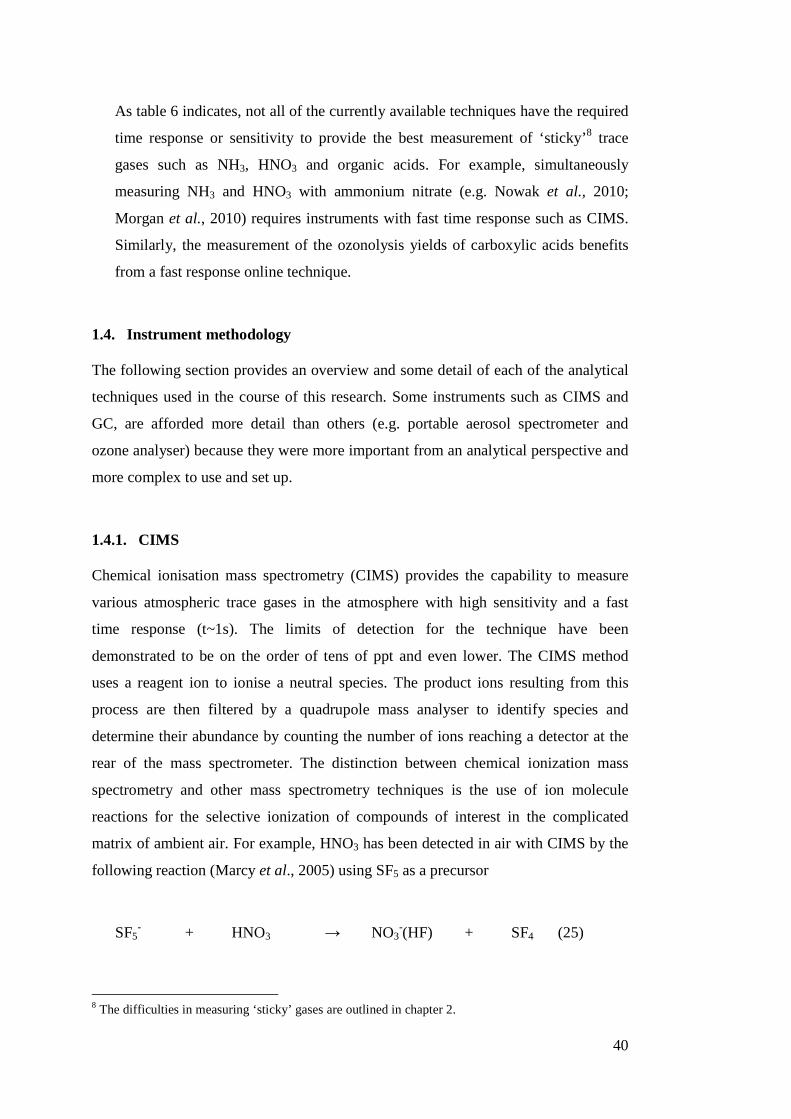
matrix of ambient air. For example, HNO3 has been detected in air with CIMS by the
following reaction (Marcy et al., 2005) using SF5 as a precursor
SF5- + HNO3 → NO3
-(HF) + SF4 (25)
8 The difficulties in measuring ‘sticky’ gases are outlined in chapter 2.
41
It is important when using the CIMS method that the reagent and product ions have
sufficient stability on the time scale of the ionization process (i.e. reaction time) to
avoid interference from other, often more abundant, atmospheric species. An example
of this is when the chosen reagent ion is significantly depleted by reactions with
abundant trace species, such as water vapor, the process results in a series of
interfering mass peaks arising (Slusher et al., 2001). If the product ion is unstable to
reaction with more abundant trace species it might be converted to an ion that doesn’t
provide a distinct signature of the species of interest.
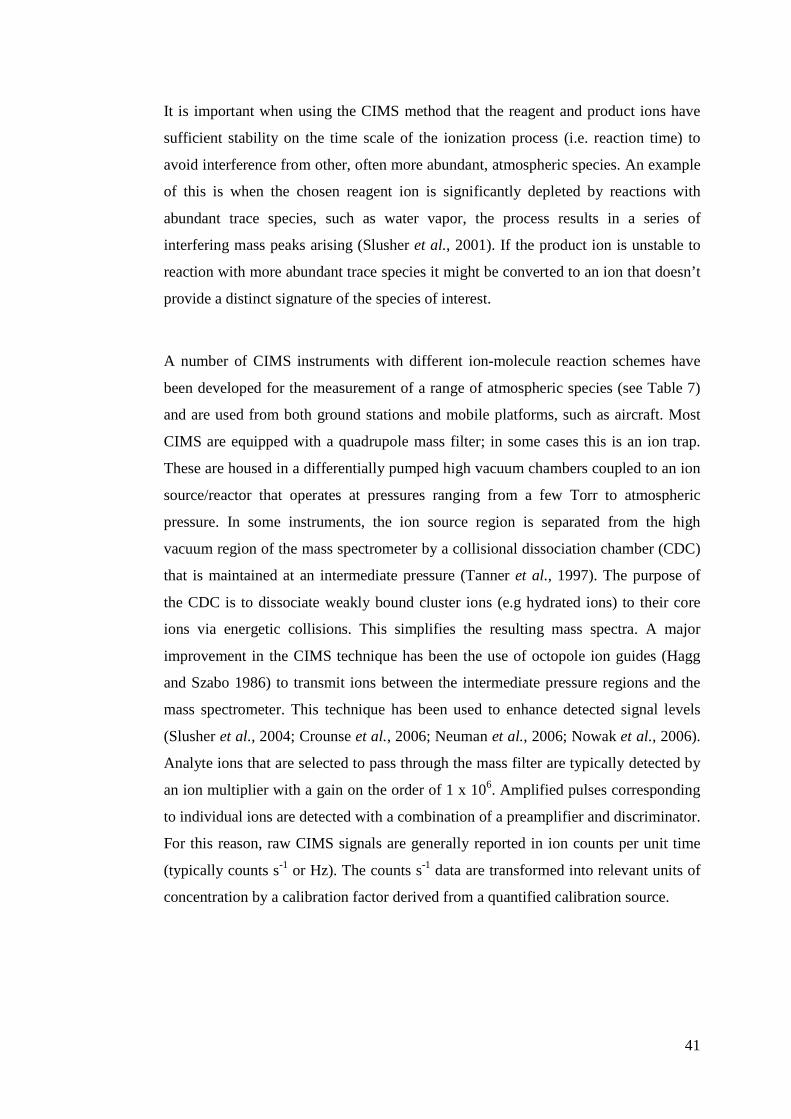
A number of CIMS instruments with different ion-molecule reaction schemes have
been developed for the measurement of a range of atmospheric species (see Table 7)
and are used from both ground stations and mobile platforms, such as aircraft. Most
CIMS are equipped with a quadrupole mass filter; in some cases this is an ion trap.
These are housed in a differentially pumped high vacuum chambers coupled to an ion
source/reactor that operates at pressures ranging from a few Torr to atmospheric
pressure. In some instruments, the ion source region is separated from the high
vacuum region of the mass spectrometer by a collisional dissociation chamber (CDC)
that is maintained at an intermediate pressure (Tanner et al., 1997). The purpose of
the CDC is to dissociate weakly bound cluster ions (e.g hydrated ions) to their core
ions via energetic collisions. This simplifies the resulting mass spectra. A major
improvement in the CIMS technique has been the use of octopole ion guides (Hagg
and Szabo 1986) to transmit ions between the intermediate pressure regions and the
mass spectrometer. This technique has been used to enhance detected signal levels
(Slusher et al., 2004; Crounse et al., 2006; Neuman et al., 2006; Nowak et al., 2006).
Analyte ions that are selected to pass through the mass filter are typically detected by
an ion multiplier with a gain on the order of 1 x 10⁶. Amplified pulses corresponding
to individual ions are detected with a combination of a preamplifier and discriminator.
For this reason, raw CIMS signals are generally reported in ion counts per unit time
(typically counts s-1 or Hz). The counts s-1 data are transformed into relevant units of
concentration by a calibration factor derived from a quantified calibration source.
42
Table 7: A Summary of CIMS reagent ions utilised for ambient measurements of atmospheric trace gases since 1996 (from Huey et al., 1998; Mauldin et al., 1998; Hunton et al., 2000; Leibrock and Huey 2000; Miller et al., 2000; Neuman et al., 2000; Mauldin et al., 2001; Furutani and Akimoto 2002; Hanke et al., 2002; Neuman et al., 2002; Danilin et al., 2003; Sellegri et al., 2005; Leibrock et al., 2003; Fortner et al., 2004; Slusher et al., 2004; Crounse et al., 2006)
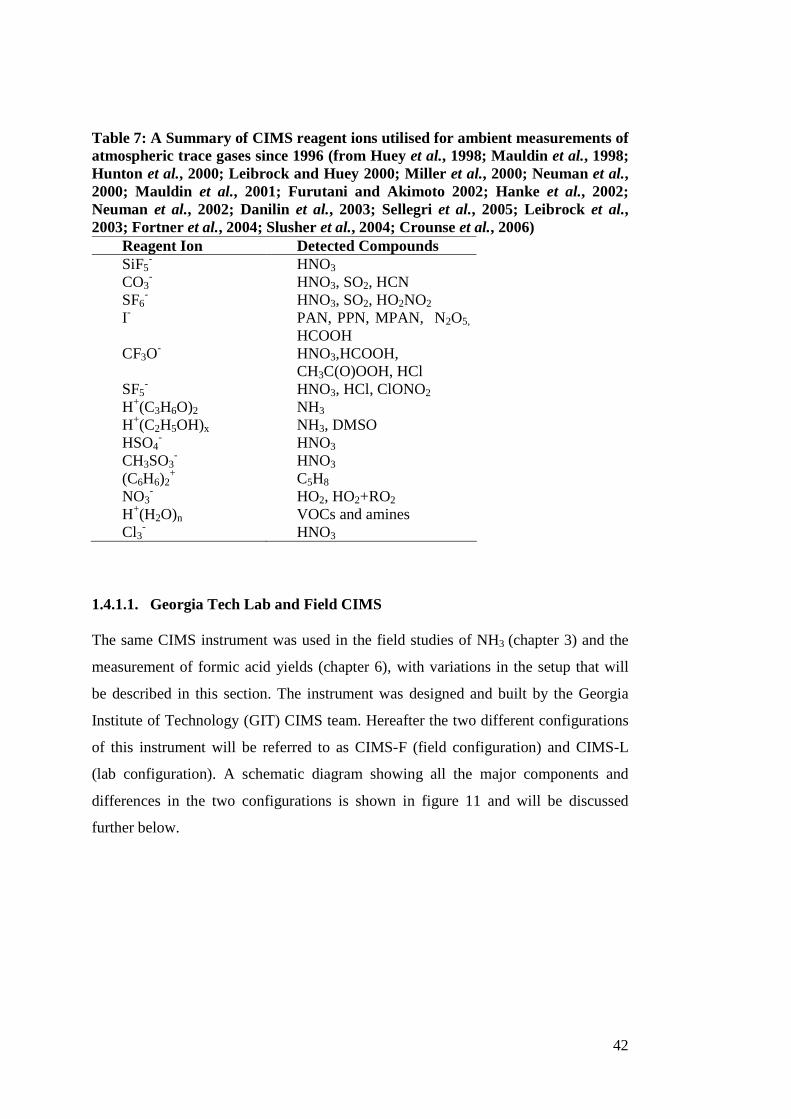
1.4.1.1. Georgia Tech Lab and Field CIMS
The same CIMS instrument was used in the field studies of NH3 (chapter 3) and the
measurement of formic acid yields (chapter 6), with variations in the setup that will
be described in this section. The instrument was designed and built by the Georgia
Institute of Technology (GIT) CIMS team. Hereafter the two different configurations
of this instrument will be referred to as CIMS-F (field configuration) and CIMS-L
(lab configuration). A schematic diagram showing all the major components and
differences in the two configurations is shown in figure 11 and will be discussed
further below.
Reagent Ion Detected Compounds SiF5
- HNO3
CO3- HNO3, SO2, HCN
SF6- HNO3, SO2, HO2NO2
I- PAN, PPN, MPAN, N2O5,
HCOOH CF3O
- HNO3,HCOOH, CH3C(O)OOH, HCl
SF5- HNO3, HCl, ClONO2
H+(C3H6O)2 NH3
H+(C2H5OH)x NH3, DMSO HSO4
- HNO3
CH3SO3- HNO3
(C6H6)2+ C5H8
NO3- HO2, HO2+RO2
H+(H2O)n VOCs and amines Cl3
- HNO3
43
Figure 11: Difference in configuration between field configuration CIMS-F (bottom) and lab configuration CIMS-L (top).
44
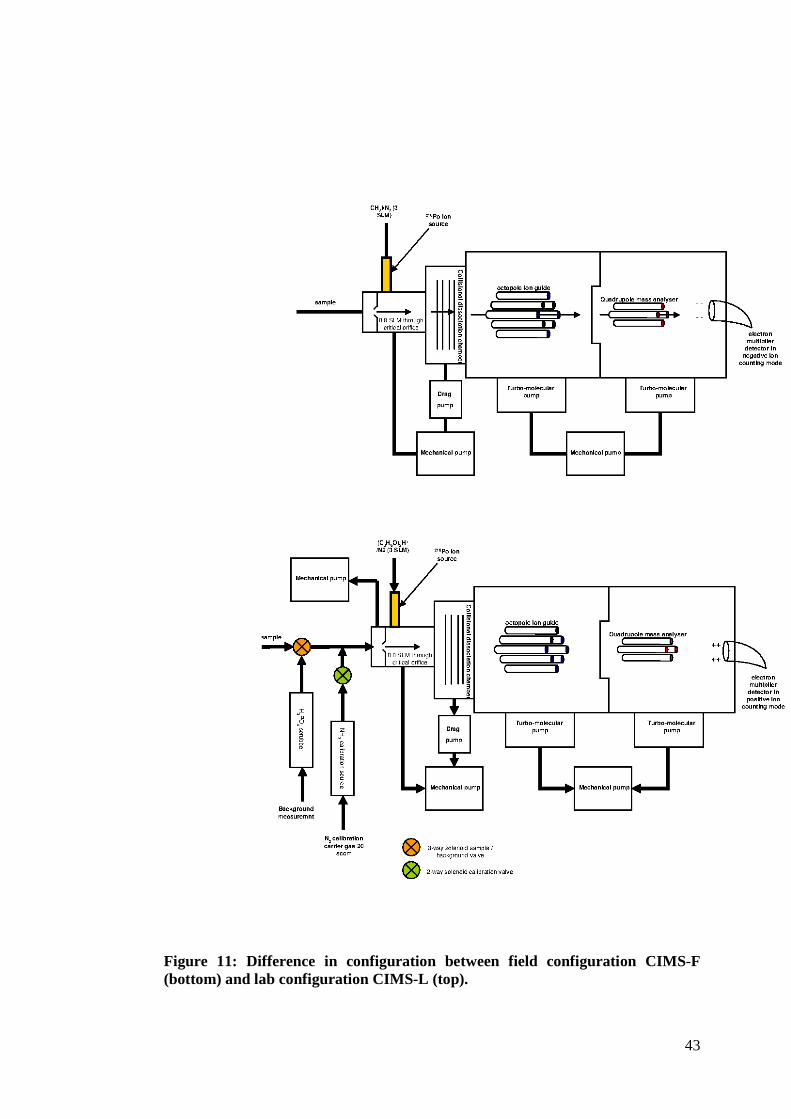
1.4.1.1.1. CIMS-F
The CIMS-F was used for the measurement of NH3 as part of an intercomparison of
11 ammonia measuring instruments at the Easter Bush field study site. The Edinburgh
intercomparison campaign is described in chapter three, but further details of the
instrumental setup, calibration and some data are presented here.
In this configuration ambient air is drawn through the inlet using a pump (Gast) at
19.8 SLM. The inlet is a 5.61 mm internal diameter (i.d.) PFA tube enclosed in a 100
mm long aluminium sleeve. The inlet sleeve is heated by a 50 watt cartridge heater;
the heating temperature is controlled by a PID controller (Love Controls Series 35Z)
with a K-type thermocouple providing temperature feedback. The airflow into the
ion-molecule region is regulated by a 3-way solenoid valve (Teqcom 3/8” M-series
solenoid valve). The valve is controlled by the instrument control software to conduct
regular background measurements by diverting the airflow through a scrubbing
device containing H3PO4 pellets. The pellets produce phosphoric acid when they react
with atmospheric humidity which removes NH3 from the gas stream. The CIMS-F
was run predominantly with the 3-way solenoid valve set to sample ambient air.
However, regular standard addition calibrations were conducted during background
measurement cycles by opening an automated solenoid valve allowing the flow of
NH3 carried in N2; this was the output of a permeation source described in the
calibration section and appendix 1. There is a 0.031” diameter pinhole before the ion-
molecule region. The ion molecule region consists of a QF40 fitting with multiple
ports for the Po210 radioactive source (NRD inc.). The ion molecule region is 165 mm
long and is pumped by a dry scroll pump (Varian Tri Scroll).
NH3 was chemically ionised using the protonated acetone dimer as a reagent ion
(H+(C3H6O)2. This reacts sensitively and selectively with NH3 to form a cluster ion in
reaction 13.
H+(C3H6O)2 + NH3 H+(C3H6O)2.NH3 (R13)
45
H+(C3H6O)2 was generated by combining a 3.2 SLM flow of N2 with a 1 sccm flow of
an SF6/Acetone/N2 mixture (Nowak et al., 2010)
A mass spectrometer with a quadrupole mass analyser was used to detect ions. The
mass spectrometer had a three-stage differentially pumped vacuum chamber leading
to a ceramic channeltron electron multiplier detector (ITT-K & M electronics) with a
gain of ~1 x 10⁶. Product ions from the ion-molecule region pass through several
stages to reach the detector. Firstly, ions enter the collisional dissociation chamber
(CDC), via a 0.076 mm pinhole. The CDC acts to dissociate weakly bound cluster
ions (see section 1.4.1). The CDC was held at a pressure of ~28 Torr by a hybrid
pump (Alcatel ATH31). After the CDC ions were focused by a charged 3 cm outer
diameter (o.d.) and 2.2 mm i.d. stainless steel plate into the second stage, the octopole
chamber; the octopole guides the ion beam into the quadrupole mass filter via a
charged 3 cm o.d. and 2.2 mm i.d. stainless steel plate. Both the second stage and rear
chambers were pumped by individual turbo-molecular pumps (Varian V-81M)
backed by a single scroll pump (Varian Triscroll) to reach a vacuum pressure in the
region of ~9 x 10⁻⁶ Torr..
Calibration, figures of merit and data analysis Two independent calibrations were performed for the instrument as described below.
Automated calibrations
The CIMS is calibrated by the output of a permeation tube (see appendix for
details). During ambient measurement cycles the permeation output is directed
through the Gast mechanical pump. When the green solenoid valve in figure 11 is
closed, the output of the permeation tube is directed through the CIMS inlet to
perform the standard addition calibrations. A background measurement cycle begins
by actuating the 3-way valve, diverting the inflow through a H3PO4 scrubber. The
background signal was allowed to stabilise for one minute. Calibration additions were
performed every hour alternating with background cycles. The use of the solenoid
valves allowed for full automation of switches between ambient measurement,
background and calibration cycles for the duration of the field campaign.
46
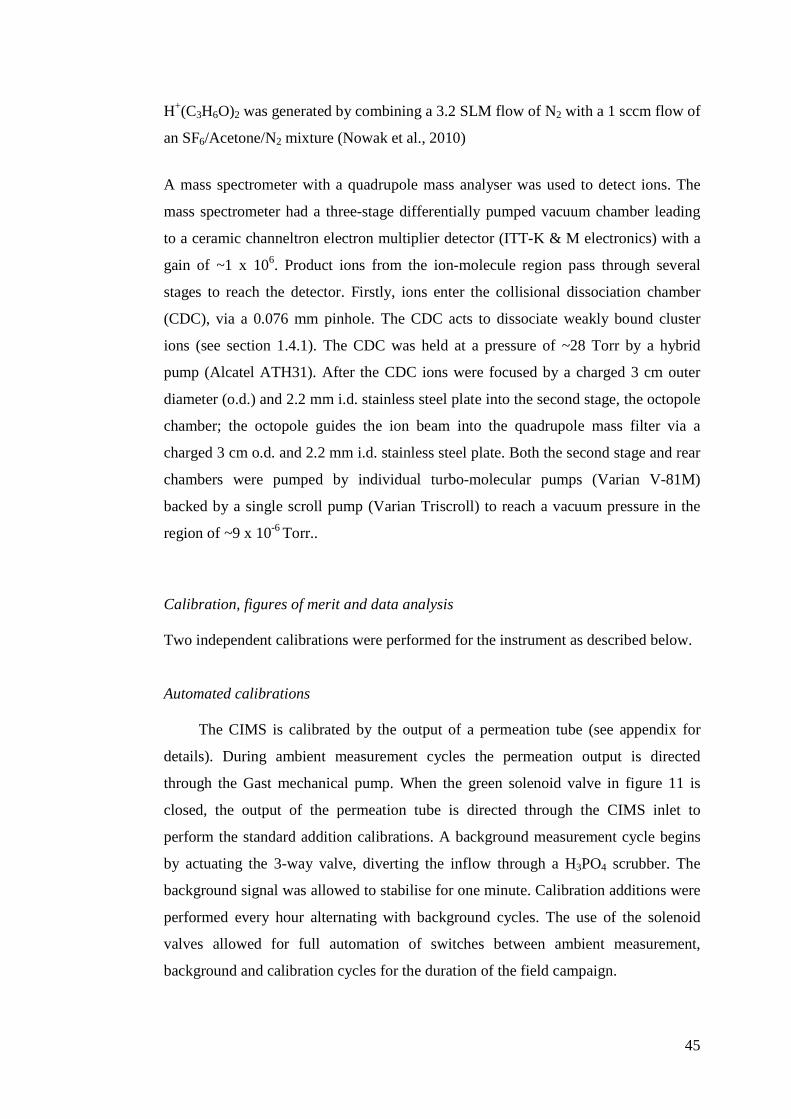
Data from a typical background/calibration cycle are shown in figure 12
Figure 12: Data showing typical background and calibration cycles for the CIMS-F during the 2008 NH3 intercomparision campaign. where calibration factors were calculated first by subtracting an average background
signal from the average of the final ten seconds of a calibration cycle. The calibration
and background cycles used for this calculation are marked in figure 12. A calibration
factor is obtained by dividing the difference in signal by the nominal value of the
standard addition in ppb. An average calibration factor for the duration of the
campaign was found to be 3010 ± 350 Hz ppb-1 (where the error is the 1 σ standard
deviation of calibration factors). The calibration factor, limits of detection (L.O.D)
and other key analytical figures of merit are calculated from the data similar to that in
figure 12 and reported in table 8.
47
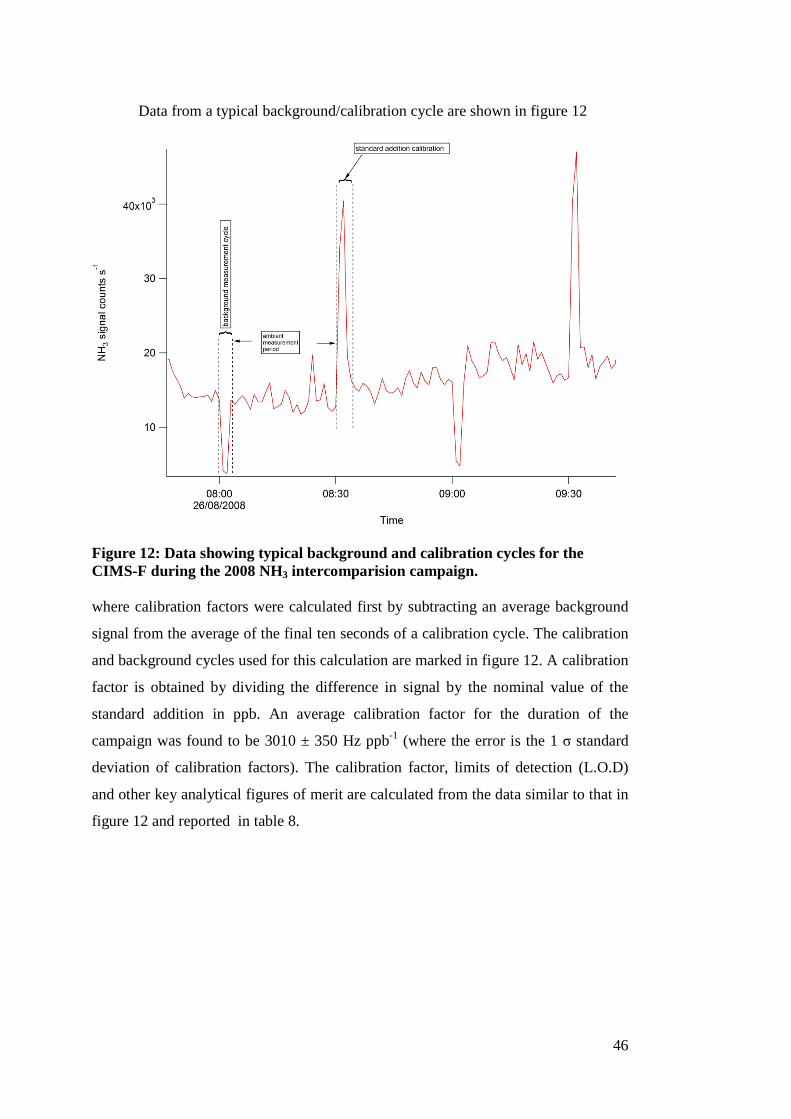
Table 8: Analytical figures of merit for the CIMS-L and CIMS-F.
Instrument Type of
calibration
Instrument
Response
Time (s)
Calibration
Factor
(Hz ppb-1)
Background
(Hz)
Precision
(ppb)
L.O.D
(ppb)
CIMS-F Permeation
tube
<4.95 3010 ± 350 4262 0.69 3.48
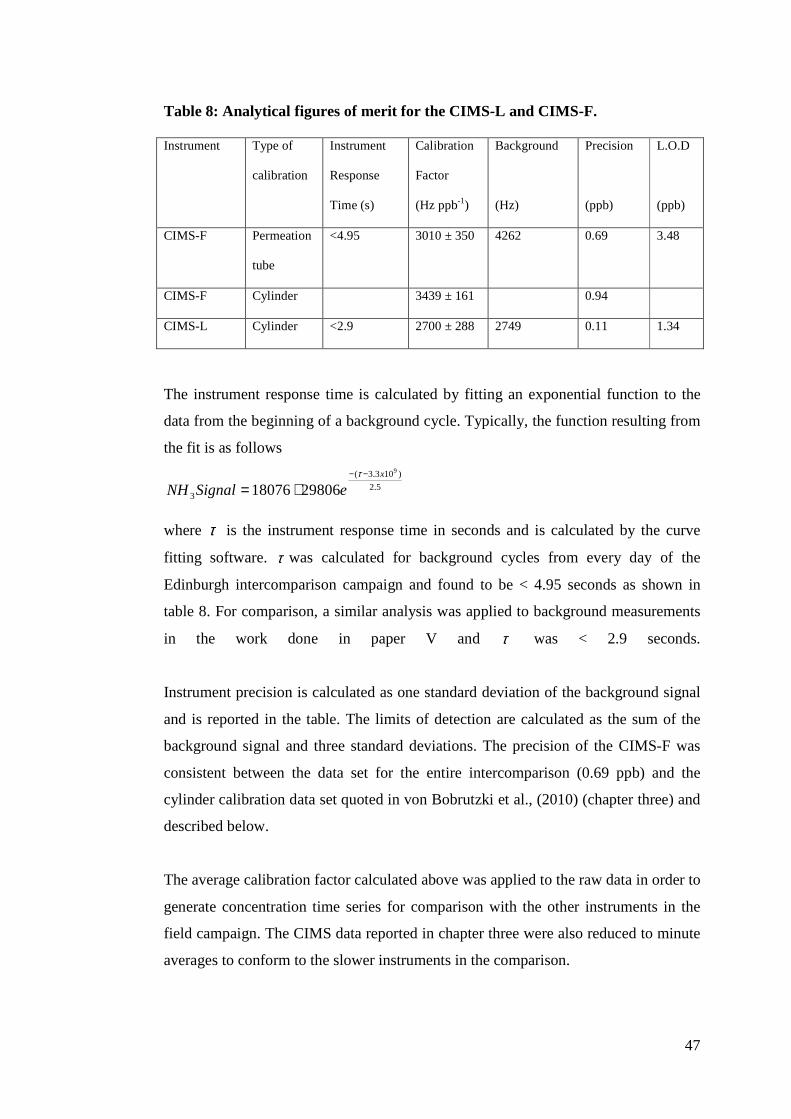
CIMS-F Cylinder 3439 ± 161 0.94
CIMS-L Cylinder <2.9 2700 ± 288 2749 0.11 1.34
The instrument response time is calculated by fitting an exponential function to the
data from the beginning of a background cycle. Typically, the function resulting from
the fit is as follows
5.2
)103.3(
3
9
2980618076x
eSignalNH−−
+=τ
where τ is the instrument response time in seconds and is calculated by the curve
fitting software. τ was calculated for background cycles from every day of the
Edinburgh intercomparison campaign and found to be < 4.95 seconds as shown in
table 8. For comparison, a similar analysis was applied to background measurements
in the work done in paper V and τ was < 2.9 seconds.
Instrument precision is calculated as one standard deviation of the background signal
and is reported in the table. The limits of detection are calculated as the sum of the
background signal and three standard deviations. The precision of the CIMS-F was
consistent between the data set for the entire intercomparison (0.69 ppb) and the
cylinder calibration data set quoted in von Bobrutzki et al., (2010) (chapter three) and
described below.
The average calibration factor calculated above was applied to the raw data in order to
generate concentration time series for comparison with the other instruments in the
field campaign. The CIMS data reported in chapter three were also reduced to minute
averages to conform to the slower instruments in the comparison.
48
Cylinder calibration The cylinder calibration used the more traditional technique of performing multiple
standard additions of varying concentrations to produce a calibration curve shown in
figure 13. The calibration factor to be applied to arrive at a concentration is the slope
of this curve reported in table 8. There is agreement between the calibration factor
derived from the cylinder calibration and the ‘spot’ calibrations performed during the
measurement campaign.
Figure 13: Calibration of CIMS-F for NH 3 using the cylinder method.
1.4.1.1.2. CIMS-L The CIMS-L was used to measure formic acid yields within the EXTRA chamber.
The set-up and construction of EXTRA is described in chapter six. The CIMS-L is the
same instrument used in the NH3 field measurements with a different inlet and
ionisation setup. These are highlighted in figure 11 and described below.
The differences in the setup of the inlet are the removal of the background/calibration
module and the high flow Gast pump on the inlet. A further difference involved the
use of CH3I (methyl iodide) as an ionisation gas resulting in a negative ion-analyte
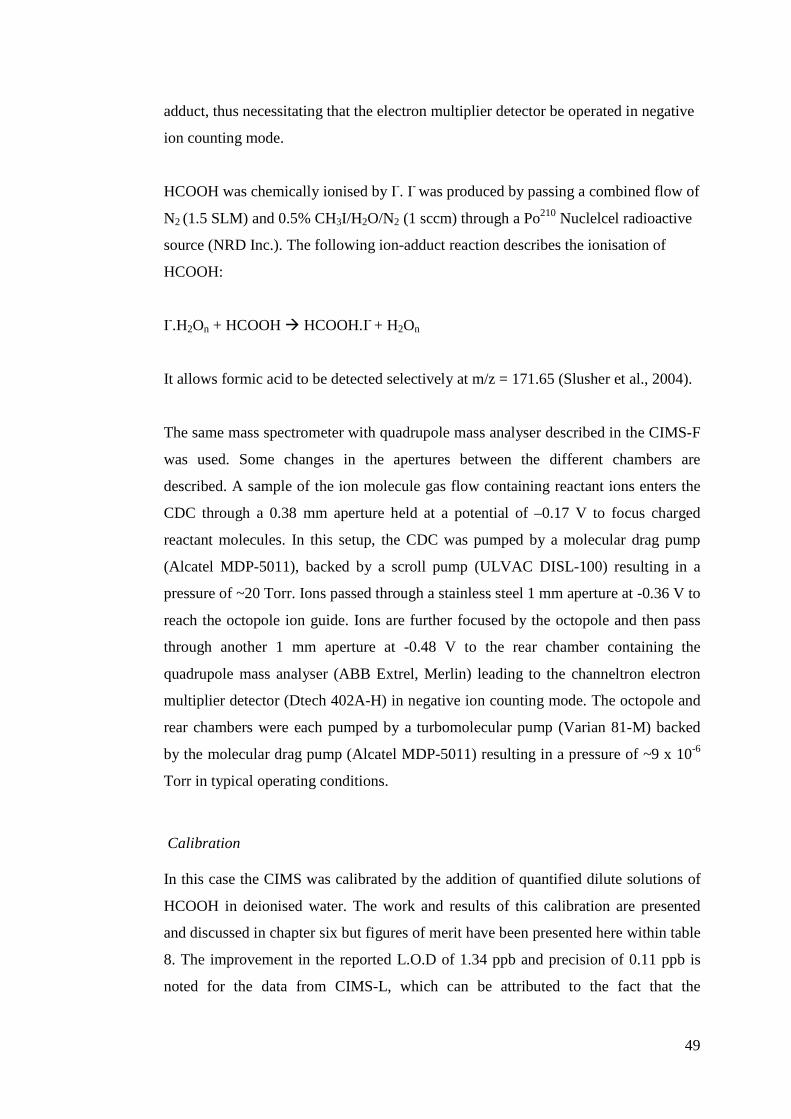
49
adduct, thus necessitating that the electron multiplier detector be operated in negative
ion counting mode.
HCOOH was chemically ionised by I-. I- was produced by passing a combined flow of
N2 (1.5 SLM) and 0.5% CH3I/H2O/N2 (1 sccm) through a Po210 Nuclelcel radioactive
source (NRD Inc.). The following ion-adduct reaction describes the ionisation of
HCOOH:
I-.H2On + HCOOH HCOOH.I- + H2On
It allows formic acid to be detected selectively at m/z = 171.65 (Slusher et al., 2004).
The same mass spectrometer with quadrupole mass analyser described in the CIMS-F
was used. Some changes in the apertures between the different chambers are
described. A sample of the ion molecule gas flow containing reactant ions enters the
CDC through a 0.38 mm aperture held at a potential of –0.17 V to focus charged
reactant molecules. In this setup, the CDC was pumped by a molecular drag pump
(Alcatel MDP-5011), backed by a scroll pump (ULVAC DISL-100) resulting in a
pressure of ~20 Torr. Ions passed through a stainless steel 1 mm aperture at -0.36 V to
reach the octopole ion guide. Ions are further focused by the octopole and then pass
through another 1 mm aperture at -0.48 V to the rear chamber containing the
quadrupole mass analyser (ABB Extrel, Merlin) leading to the channeltron electron
multiplier detector (Dtech 402A-H) in negative ion counting mode. The octopole and
rear chambers were each pumped by a turbomolecular pump (Varian 81-M) backed
by the molecular drag pump (Alcatel MDP-5011) resulting in a pressure of ~9 x 10⁻⁶
Torr in typical operating conditions.
Calibration In this case the CIMS was calibrated by the addition of quantified dilute solutions of
HCOOH in deionised water. The work and results of this calibration are presented
and discussed in chapter six but figures of merit have been presented here within table
8. The improvement in the reported L.O.D of 1.34 ppb and precision of 0.11 ppb is
noted for the data from CIMS-L, which can be attributed to the fact that the
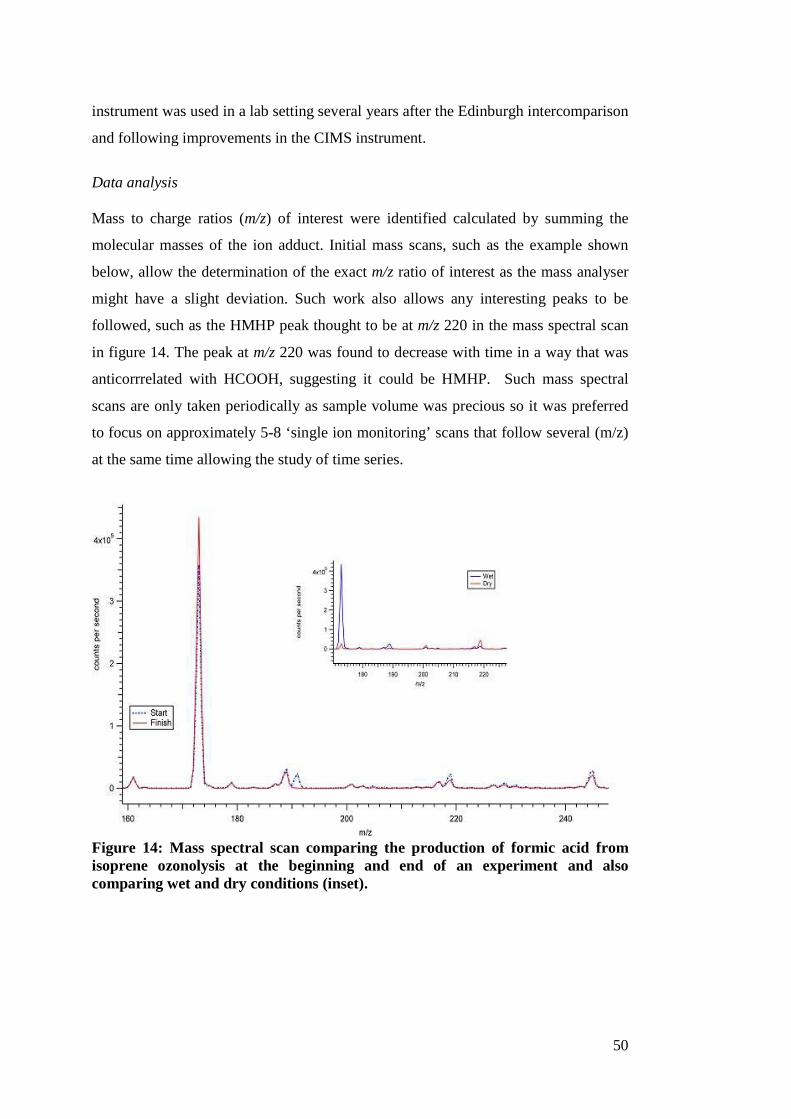
50
instrument was used in a lab setting several years after the Edinburgh intercomparison
and following improvements in the CIMS instrument.
Data analysis Mass to charge ratios (m/z) of interest were identified calculated by summing the
molecular masses of the ion adduct. Initial mass scans, such as the example shown
below, allow the determination of the exact m/z ratio of interest as the mass analyser
might have a slight deviation. Such work also allows any interesting peaks to be
followed, such as the HMHP peak thought to be at m/z 220 in the mass spectral scan
in figure 14. The peak at m/z 220 was found to decrease with time in a way that was
anticorrrelated with HCOOH, suggesting it could be HMHP. Such mass spectral
scans are only taken periodically as sample volume was precious so it was preferred
to focus on approximately 5-8 ‘single ion monitoring’ scans that follow several (m/z)
at the same time allowing the study of time series.
Figure 14: Mass spectral scan comparing the production of formic acid from isoprene ozonolysis at the beginning and end of an experiment and also comparing wet and dry conditions (inset).
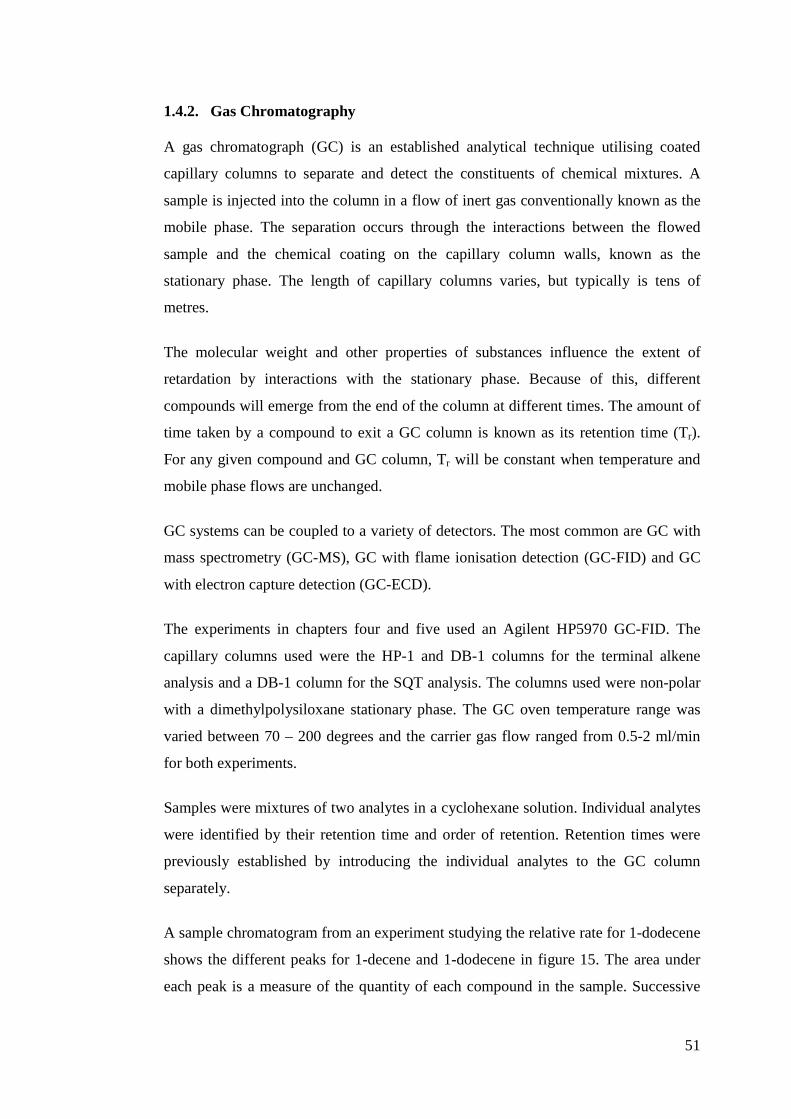
51
1.4.2. Gas Chromatography
A gas chromatograph (GC) is an established analytical technique utilising coated
capillary columns to separate and detect the constituents of chemical mixtures. A
sample is injected into the column in a flow of inert gas conventionally known as the
mobile phase. The separation occurs through the interactions between the flowed
sample and the chemical coating on the capillary column walls, known as the
stationary phase. The length of capillary columns varies, but typically is tens of
metres.
The molecular weight and other properties of substances influence the extent of
retardation by interactions with the stationary phase. Because of this, different
compounds will emerge from the end of the column at different times. The amount of
time taken by a compound to exit a GC column is known as its retention time (Tr).
For any given compound and GC column, Tr will be constant when temperature and
mobile phase flows are unchanged.
GC systems can be coupled to a variety of detectors. The most common are GC with
mass spectrometry (GC-MS), GC with flame ionisation detection (GC-FID) and GC
with electron capture detection (GC-ECD).
The experiments in chapters four and five used an Agilent HP5970 GC-FID. The
capillary columns used were the HP-1 and DB-1 columns for the terminal alkene
analysis and a DB-1 column for the SQT analysis. The columns used were non-polar
with a dimethylpolysiloxane stationary phase. The GC oven temperature range was
varied between 70 – 200 degrees and the carrier gas flow ranged from 0.5-2 ml/min
for both experiments.
Samples were mixtures of two analytes in a cyclohexane solution. Individual analytes
were identified by their retention time and order of retention. Retention times were
previously established by introducing the individual analytes to the GC column
separately.
A sample chromatogram from an experiment studying the relative rate for 1-dodecene
shows the different peaks for 1-decene and 1-dodecene in figure 15. The area under
each peak is a measure of the quantity of each compound in the sample. Successive
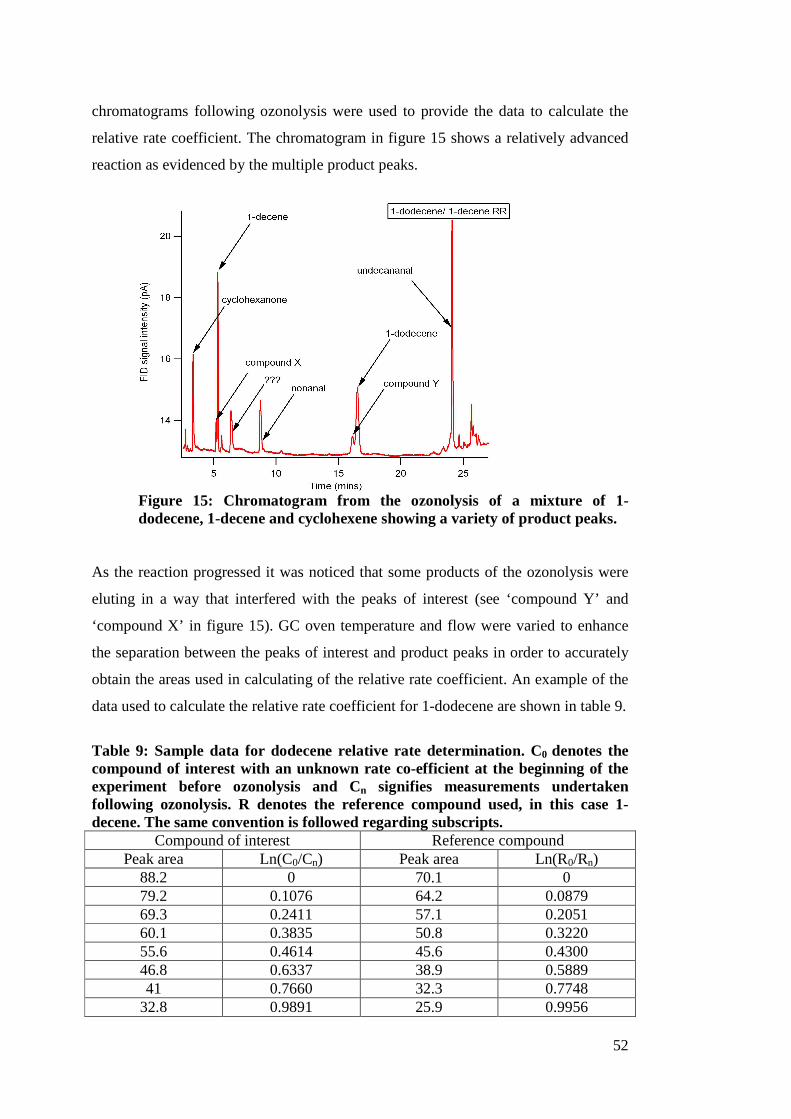
52
chromatograms following ozonolysis were used to provide the data to calculate the
relative rate coefficient. The chromatogram in figure 15 shows a relatively advanced
reaction as evidenced by the multiple product peaks.
Figure 15: Chromatogram from the ozonolysis of a mixture of 1-dodecene, 1-decene and cyclohexene showing a variety of product peaks.
As the reaction progressed it was noticed that some products of the ozonolysis were
eluting in a way that interfered with the peaks of interest (see ‘compound Y’ and
‘compound X’ in figure 15). GC oven temperature and flow were varied to enhance
the separation between the peaks of interest and product peaks in order to accurately
obtain the areas used in calculating of the relative rate coefficient. An example of the
data used to calculate the relative rate coefficient for 1-dodecene are shown in table 9.
Table 9: Sample data for dodecene relative rate determination. C0 denotes the compound of interest with an unknown rate co-efficient at the beginning of the experiment before ozonolysis and Cn signifies measurements undertaken following ozonolysis. R denotes the reference compound used, in this case 1-decene. The same convention is followed regarding subscripts.
Compound of interest Reference compound Peak area Ln(C0/Cn) Peak area Ln(R0/Rn)
88.2 0 70.1 0 79.2 0.1076 64.2 0.0879 69.3 0.2411 57.1 0.2051 60.1 0.3835 50.8 0.3220 55.6 0.4614 45.6 0.4300 46.8 0.6337 38.9 0.5889 41 0.7660 32.3 0.7748
32.8 0.9891 25.9 0.9956
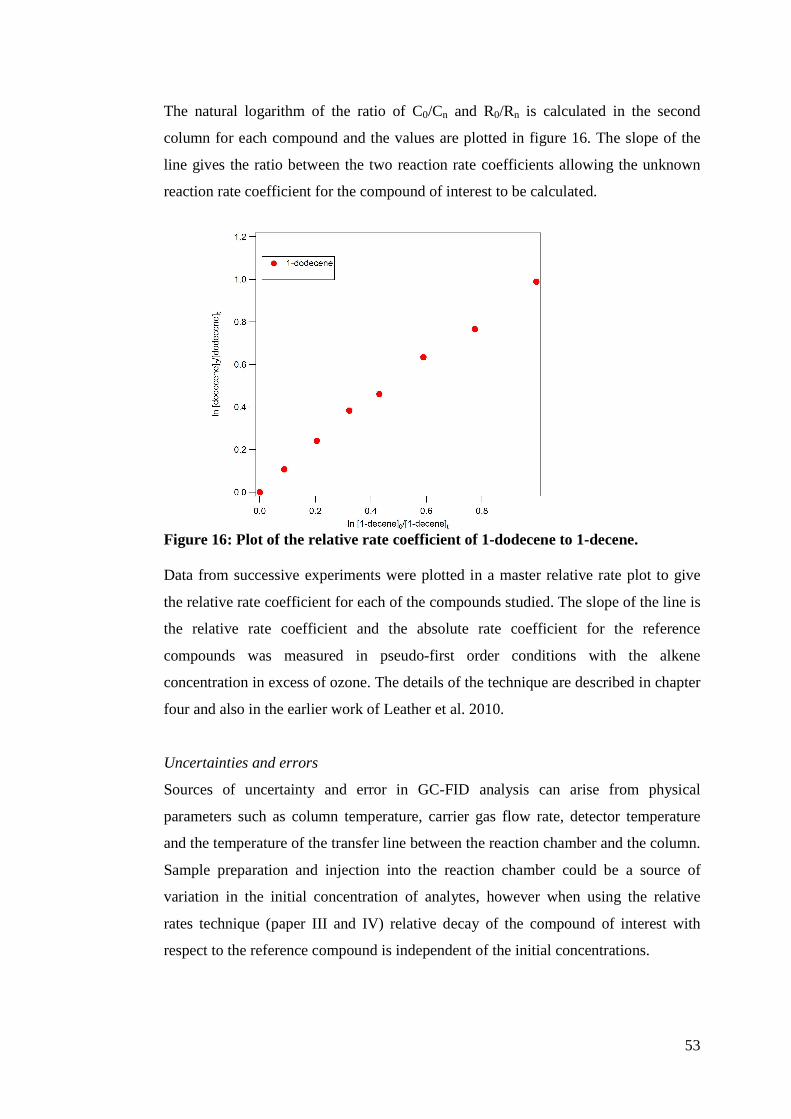
53
The natural logarithm of the ratio of C0/Cn and R0/Rn is calculated in the second
column for each compound and the values are plotted in figure 16. The slope of the
line gives the ratio between the two reaction rate coefficients allowing the unknown
reaction rate coefficient for the compound of interest to be calculated.
Figure 16: Plot of the relative rate coefficient of 1-dodecene to 1-decene.
Data from successive experiments were plotted in a master relative rate plot to give
the relative rate coefficient for each of the compounds studied. The slope of the line is
the relative rate coefficient and the absolute rate coefficient for the reference
compounds was measured in pseudo-first order conditions with the alkene
concentration in excess of ozone. The details of the technique are described in chapter
four and also in the earlier work of Leather et al. 2010.
Uncertainties and errors
Sources of uncertainty and error in GC-FID analysis can arise from physical
parameters such as column temperature, carrier gas flow rate, detector temperature
and the temperature of the transfer line between the reaction chamber and the column.
Sample preparation and injection into the reaction chamber could be a source of
variation in the initial concentration of analytes, however when using the relative
rates technique (paper III and IV) relative decay of the compound of interest with
respect to the reference compound is independent of the initial concentrations.
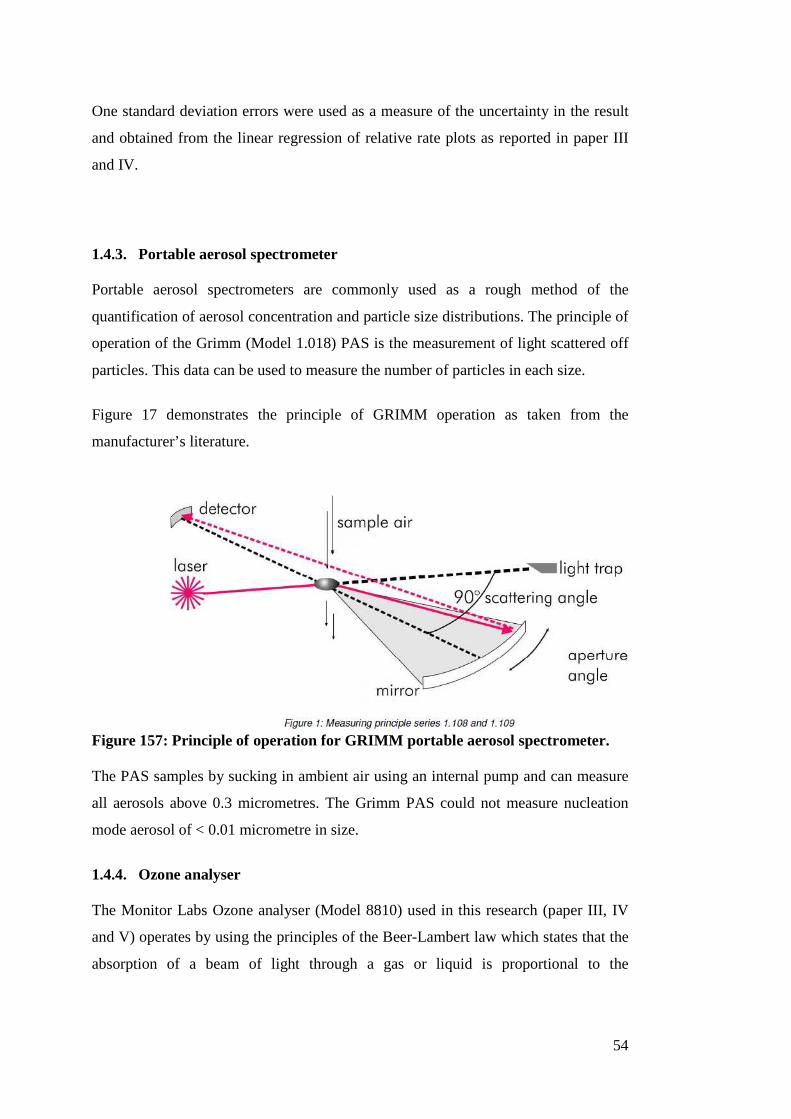
54
One standard deviation errors were used as a measure of the uncertainty in the result
and obtained from the linear regression of relative rate plots as reported in paper III
and IV.
1.4.3. Portable aerosol spectrometer Portable aerosol spectrometers are commonly used as a rough method of the
quantification of aerosol concentration and particle size distributions. The principle of
operation of the Grimm (Model 1.018) PAS is the measurement of light scattered off
particles. This data can be used to measure the number of particles in each size.
Figure 17 demonstrates the principle of GRIMM operation as taken from the
manufacturer’s literature.
Figure 157: Principle of operation for GRIMM portable aerosol spectrometer.
The PAS samples by sucking in ambient air using an internal pump and can measure
all aerosols above 0.3 micrometres. The Grimm PAS could not measure nucleation
mode aerosol of < 0.01 micrometre in size.
1.4.4. Ozone analyser
The Monitor Labs Ozone analyser (Model 8810) used in this research (paper III, IV
and V) operates by using the principles of the Beer-Lambert law which states that the
absorption of a beam of light through a gas or liquid is proportional to the

55
concentration of the constituent of the solution. The monitor labs measured the
absorption by ozone at 284 nm.
56
1.5. Research aims and objectives The study aimed to investigate the reaction kinetics and composition of ‘sticky’
(low vapour pressure and polar) trace gases (e.g. NH3, HNO3, HCOOH,
sesquiterpenes) in the atmosphere. by:
Field and laboratory testing of the CIMS for measuring trace gases A laboratory study to test the performance of inlet materials for measuring
HCOOH and HNO3 (chapter four) was conducted in addition to a field test of
CIMS measurements of ammonia (chapter four).
Providing improved kinetic measurements of semi-volatile NMHCs The rate of the alkene-ozone reaction is not well known for many semivolatile
alkenes, some which have large biogenic emissions. The aim above was achieved
first by employing an adapted protocol at elevated temperatures to measure the
kO3 for terminal alkenes (chapter four) and then by applying the new protocol for
the measurement of kO3 for sesquiterpenes to arrive at an improved determination
(chapter five).
Studying the products of the ozononolysis of alkenes The yield of ozonolysis products is an important quantity to know with regard to
the atmospheric implications of alkenes. The aim above was achieved by using
CIMS and the EXTRA chamber (chapter six) to measure the yield of formic acid
from the ozonolysis of isoprene as a function of temperature.

57

58
2. Paper I “Kinetic study of uptake of trace gases onto inlets to evaluate preferable materials for
atmospheric measurements”
by
Mohamed B. Ghalaieny, Max McGillen, Alistair Murray Booth and Carl J. Percival.
Status: In preparation.
Contributions: Mohamed Ghalaieny conducted the experiments and prepared the
manuscript. Max McGillen assisted with experimental setup and Alistair Murray
Booth made the contact angle measurements. The work was conducted under the
supervision of Carl Percival.
59
Kinetic study of uptake of trace gases onto inlets to evaluate preferable materials for
atmospheric measurements.
Mohamed Ghalaieny, Max McGillen†, Alistair Murray Booth, and Carl J. Percival*
The Centre for Atmospheric Science, The School of Earth, Atmospheric and
Environmental Sciences, The University of Manchester, Simon Building, Brunswick
Street, Manchester, M13 9PL, UK.
† Current address: Chemical Sciences Division, Earth System Research Laboratory,
National Oceanic and Atmospheric Administration (NOAA), 325 Broadway, Boulder,
CO 80305, USA.
*Corresponding author Email: [email protected]
Abstract
The HNO3 and HCOOH uptake onto six flow tube surfaces: PFA, quartz, alumina,
Granger’s ® coated alumina, Granger’s ® coated quartz and silane coated quartz was
measured using Chemical Ionization Mass Spectrometry over a range of
atmospherically relevant pressures from 13-760 Torr; The wall loss rate coefficient
measured k at 760 Torr was 0.9 ± 0.1, 2.2 ± 0.1, 8.4 ± 0.6, 6.7 ± 0.2, 4.9 ± 0.4 and 0.8
± 0.1 s-1 respectively. Within experimental error, PFA and silane coated quartz were
found to have the same value of k. PFA was deemed superior to due to its shorter
signal stabilisation time of 132.2 ± 6.4 seconds vs. 451.6 ± 8.7 seconds for silane
coated quartz. Furthermore, PFA is readily available commercially and a more
practical material for diverse applications. No direct correlation was found between
the superhydrophobicity of surfaces and the wall loss rate coefficient.
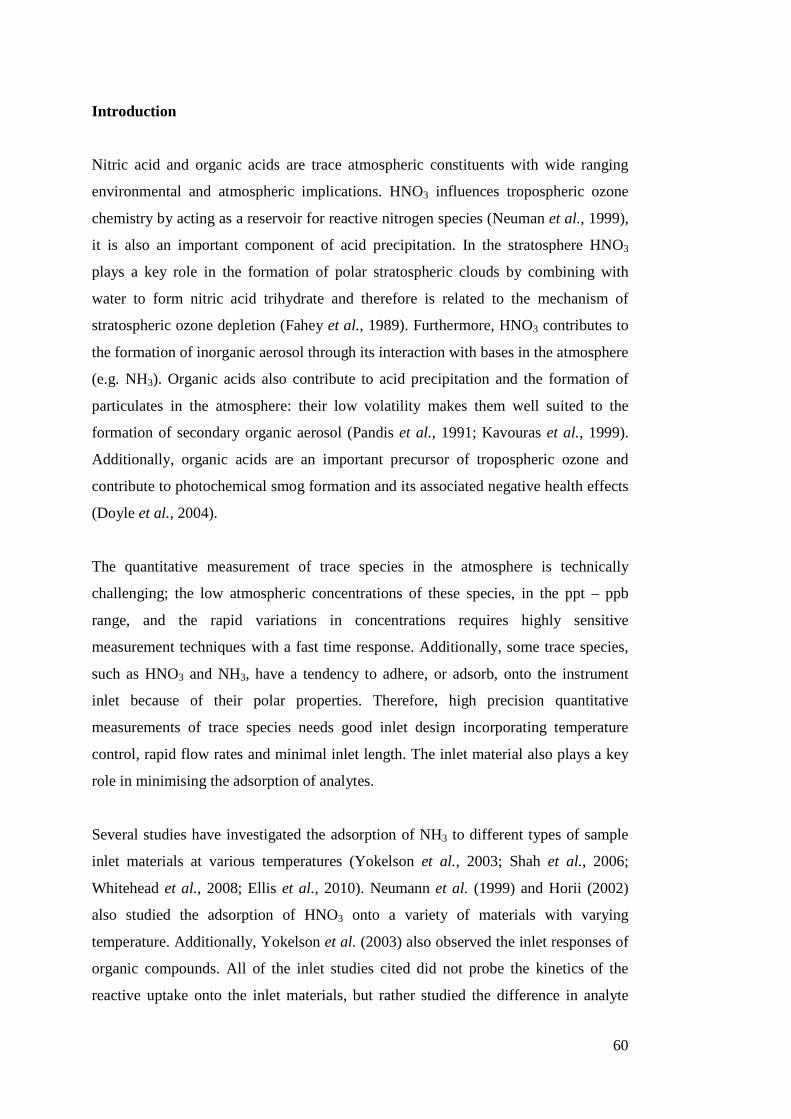
60
Introduction
Nitric acid and organic acids are trace atmospheric constituents with wide ranging
environmental and atmospheric implications. HNO3 influences tropospheric ozone
chemistry by acting as a reservoir for reactive nitrogen species (Neuman et al., 1999),
it is also an important component of acid precipitation. In the stratosphere HNO3
plays a key role in the formation of polar stratospheric clouds by combining with
water to form nitric acid trihydrate and therefore is related to the mechanism of
stratospheric ozone depletion (Fahey et al., 1989). Furthermore, HNO3 contributes to
the formation of inorganic aerosol through its interaction with bases in the atmosphere
(e.g. NH3). Organic acids also contribute to acid precipitation and the formation of
particulates in the atmosphere: their low volatility makes them well suited to the
formation of secondary organic aerosol (Pandis et al., 1991; Kavouras et al., 1999).
Additionally, organic acids are an important precursor of tropospheric ozone and
contribute to photochemical smog formation and its associated negative health effects
(Doyle et al., 2004).
The quantitative measurement of trace species in the atmosphere is technically
challenging; the low atmospheric concentrations of these species, in the ppt – ppb
range, and the rapid variations in concentrations requires highly sensitive
measurement techniques with a fast time response. Additionally, some trace species,
such as HNO3 and NH3, have a tendency to adhere, or adsorb, onto the instrument
inlet because of their polar properties. Therefore, high precision quantitative
measurements of trace species needs good inlet design incorporating temperature
control, rapid flow rates and minimal inlet length. The inlet material also plays a key
role in minimising the adsorption of analytes.
Several studies have investigated the adsorption of NH3 to different types of sample
inlet materials at various temperatures (Yokelson et al., 2003; Shah et al., 2006;
Whitehead et al., 2008; Ellis et al., 2010). Neumann et al. (1999) and Horii (2002)
also studied the adsorption of HNO3 onto a variety of materials with varying
temperature. Additionally, Yokelson et al. (2003) also observed the inlet responses of
organic compounds. All of the inlet studies cited did not probe the kinetics of the
reactive uptake onto the inlet materials, but rather studied the difference in analyte
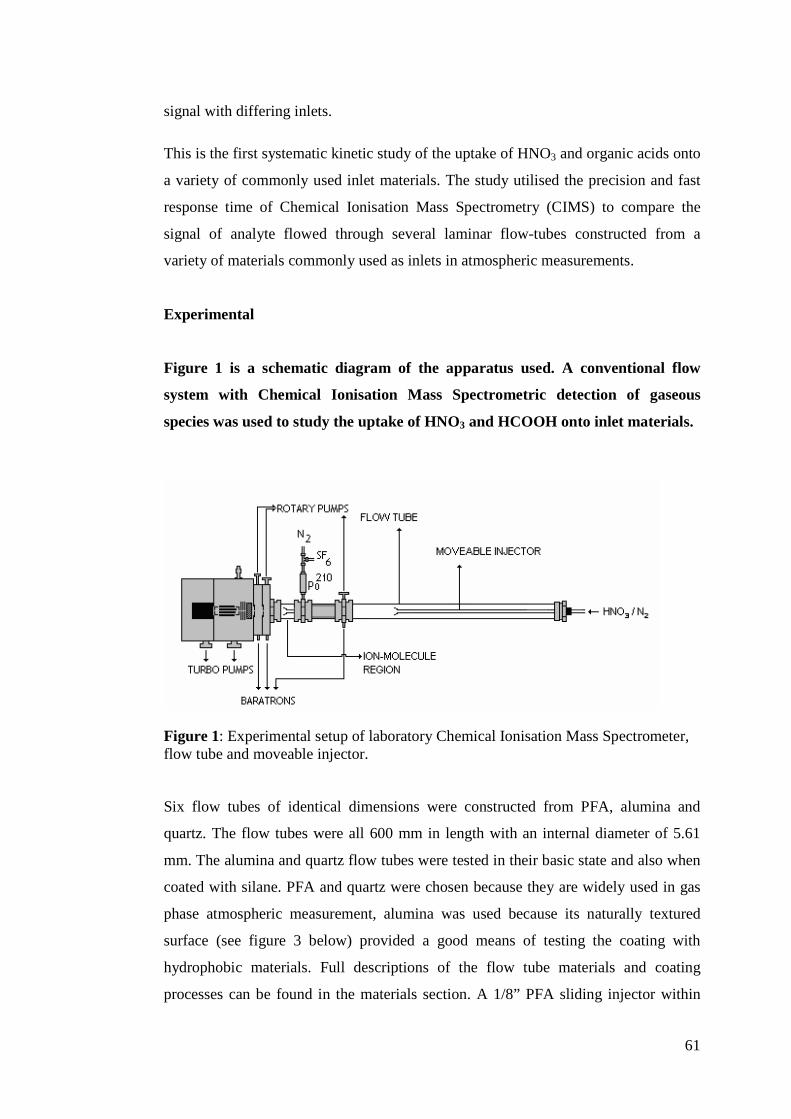
61
signal with differing inlets.
This is the first systematic kinetic study of the uptake of HNO3 and organic acids onto
a variety of commonly used inlet materials. The study utilised the precision and fast
response time of Chemical Ionisation Mass Spectrometry (CIMS) to compare the
signal of analyte flowed through several laminar flow-tubes constructed from a
variety of materials commonly used as inlets in atmospheric measurements.
Experimental
Figure 1 is a schematic diagram of the apparatus used. A conventional flow
system with Chemical Ionisation Mass Spectrometric detection of gaseous
species was used to study the uptake of HNO3 and HCOOH onto inlet materials.
Figure 1: Experimental setup of laboratory Chemical Ionisation Mass Spectrometer, flow tube and moveable injector.
Six flow tubes of identical dimensions were constructed from PFA, alumina and
quartz. The flow tubes were all 600 mm in length with an internal diameter of 5.61
mm. The alumina and quartz flow tubes were tested in their basic state and also when
coated with silane. PFA and quartz were chosen because they are widely used in gas
phase atmospheric measurement, alumina was used because its naturally textured
surface (see figure 3 below) provided a good means of testing the coating with
hydrophobic materials. Full descriptions of the flow tube materials and coating
processes can be found in the materials section. A 1/8” PFA sliding injector within
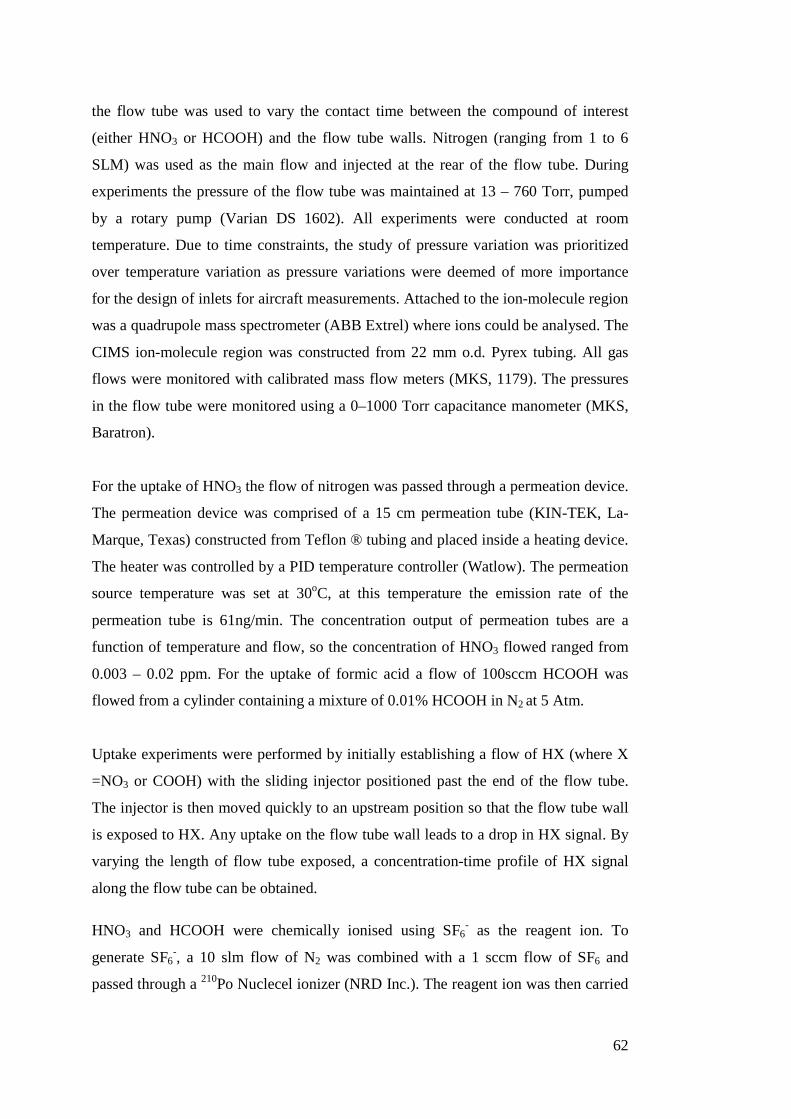
62
the flow tube was used to vary the contact time between the compound of interest
(either HNO3 or HCOOH) and the flow tube walls. Nitrogen (ranging from 1 to 6
SLM) was used as the main flow and injected at the rear of the flow tube. During
experiments the pressure of the flow tube was maintained at 13 – 760 Torr, pumped
by a rotary pump (Varian DS 1602). All experiments were conducted at room
temperature. Due to time constraints, the study of pressure variation was prioritized
over temperature variation as pressure variations were deemed of more importance
for the design of inlets for aircraft measurements. Attached to the ion-molecule region
was a quadrupole mass spectrometer (ABB Extrel) where ions could be analysed. The
CIMS ion-molecule region was constructed from 22 mm o.d. Pyrex tubing. All gas
flows were monitored with calibrated mass flow meters (MKS, 1179). The pressures
in the flow tube were monitored using a 0–1000 Torr capacitance manometer (MKS,
Baratron).
For the uptake of HNO3 the flow of nitrogen was passed through a permeation device.
The permeation device was comprised of a 15 cm permeation tube (KIN-TEK, La-
Marque, Texas) constructed from Teflon ® tubing and placed inside a heating device.
The heater was controlled by a PID temperature controller (Watlow). The permeation
source temperature was set at 30oC, at this temperature the emission rate of the
permeation tube is 61ng/min. The concentration output of permeation tubes are a
function of temperature and flow, so the concentration of HNO3 flowed ranged from
0.003 – 0.02 ppm. For the uptake of formic acid a flow of 100sccm HCOOH was
flowed from a cylinder containing a mixture of 0.01% HCOOH in N2 at 5 Atm.
Uptake experiments were performed by initially establishing a flow of HX (where X
=NO3 or COOH) with the sliding injector positioned past the end of the flow tube.
The injector is then moved quickly to an upstream position so that the flow tube wall
is exposed to HX. Any uptake on the flow tube wall leads to a drop in HX signal. By
varying the length of flow tube exposed, a concentration-time profile of HX signal
along the flow tube can be obtained.
HNO3 and HCOOH were chemically ionised using SF6- as the reagent ion. To
generate SF6-, a 10 slm flow of N2 was combined with a 1 sccm flow of SF6 and
passed through a 210Po Nuclecel ionizer (NRD Inc.). The reagent ion was then carried
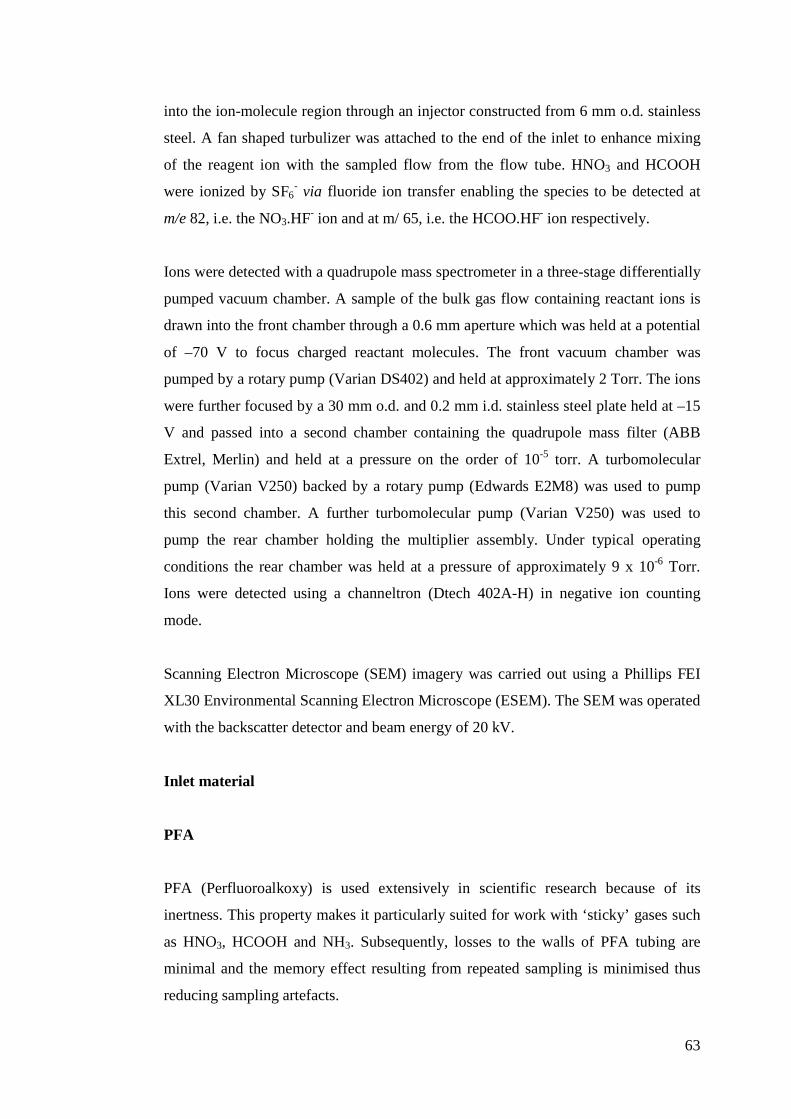
63
into the ion-molecule region through an injector constructed from 6 mm o.d. stainless
steel. A fan shaped turbulizer was attached to the end of the inlet to enhance mixing
of the reagent ion with the sampled flow from the flow tube. HNO3 and HCOOH
were ionized by SF6- via fluoride ion transfer enabling the species to be detected at
m/e 82, i.e. the NO3.HF- ion and at m/ 65, i.e. the HCOO.HF- ion respectively.
Ions were detected with a quadrupole mass spectrometer in a three-stage differentially
pumped vacuum chamber. A sample of the bulk gas flow containing reactant ions is
drawn into the front chamber through a 0.6 mm aperture which was held at a potential
of –70 V to focus charged reactant molecules. The front vacuum chamber was
pumped by a rotary pump (Varian DS402) and held at approximately 2 Torr. The ions
were further focused by a 30 mm o.d. and 0.2 mm i.d. stainless steel plate held at –15
V and passed into a second chamber containing the quadrupole mass filter (ABB
Extrel, Merlin) and held at a pressure on the order of 10-5 torr. A turbomolecular
pump (Varian V250) backed by a rotary pump (Edwards E2M8) was used to pump
this second chamber. A further turbomolecular pump (Varian V250) was used to
pump the rear chamber holding the multiplier assembly. Under typical operating
conditions the rear chamber was held at a pressure of approximately 9 x 10⁻⁶ Torr.
Ions were detected using a channeltron (Dtech 402A-H) in negative ion counting
mode.
Scanning Electron Microscope (SEM) imagery was carried out using a Phillips FEI
XL30 Environmental Scanning Electron Microscope (ESEM). The SEM was operated
with the backscatter detector and beam energy of 20 kV.
Inlet material
PFA
PFA (Perfluoroalkoxy) is used extensively in scientific research because of its
inertness. This property makes it particularly suited for work with ‘sticky’ gases such
as HNO3, HCOOH and NH3. Subsequently, losses to the walls of PFA tubing are
minimal and the memory effect resulting from repeated sampling is minimised thus
reducing sampling artefacts.
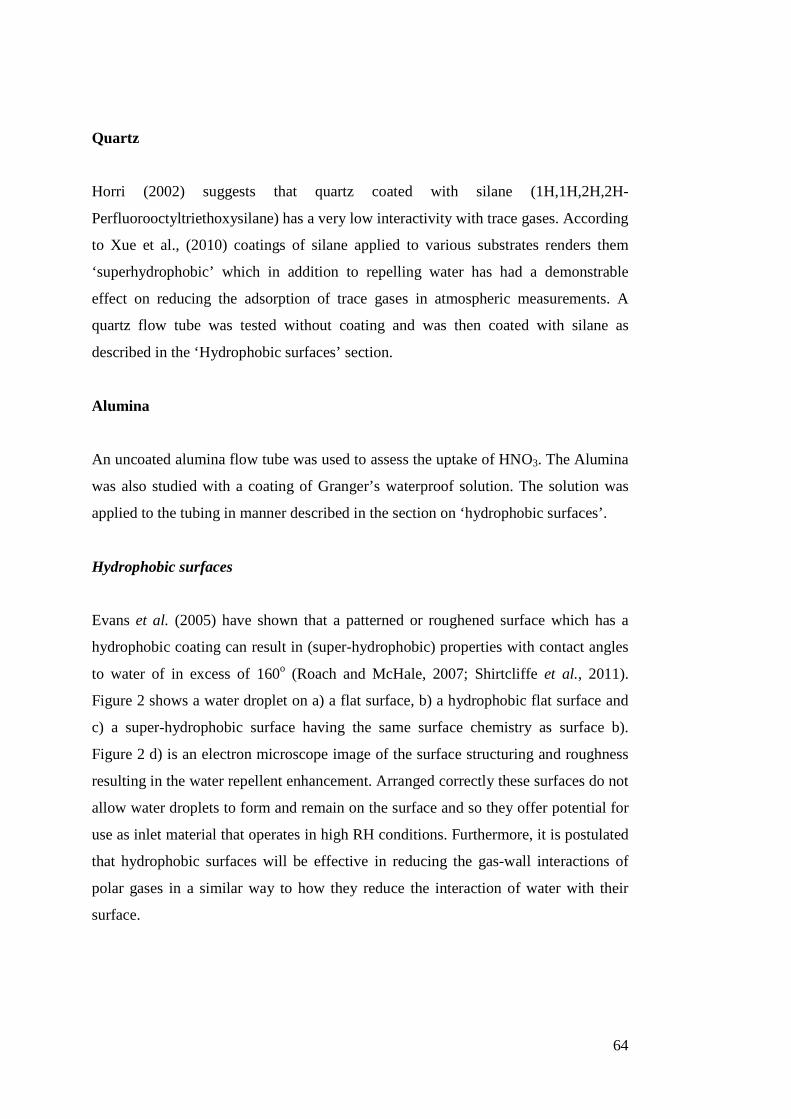
64
Quartz
Horri (2002) suggests that quartz coated with silane (1H,1H,2H,2H-
Perfluorooctyltriethoxysilane) has a very low interactivity with trace gases. According
to Xue et al., (2010) coatings of silane applied to various substrates renders them
‘superhydrophobic’ which in addition to repelling water has had a demonstrable
effect on reducing the adsorption of trace gases in atmospheric measurements. A
quartz flow tube was tested without coating and was then coated with silane as
described in the ‘Hydrophobic surfaces’ section.
Alumina
An uncoated alumina flow tube was used to assess the uptake of HNO3. The Alumina
was also studied with a coating of Granger’s waterproof solution. The solution was
applied to the tubing in manner described in the section on ‘hydrophobic surfaces’.
Hydrophobic surfaces
Evans et al. (2005) have shown that a patterned or roughened surface which has a
hydrophobic coating can result in (super-hydrophobic) properties with contact angles
to water of in excess of 160o (Roach and McHale, 2007; Shirtcliffe et al., 2011).
Figure 2 shows a water droplet on a) a flat surface, b) a hydrophobic flat surface and
c) a super-hydrophobic surface having the same surface chemistry as surface b).
Figure 2 d) is an electron microscope image of the surface structuring and roughness
resulting in the water repellent enhancement. Arranged correctly these surfaces do not
allow water droplets to form and remain on the surface and so they offer potential for
use as inlet material that operates in high RH conditions. Furthermore, it is postulated
that hydrophobic surfaces will be effective in reducing the gas-wall interactions of
polar gases in a similar way to how they reduce the interaction of water with their
surface.
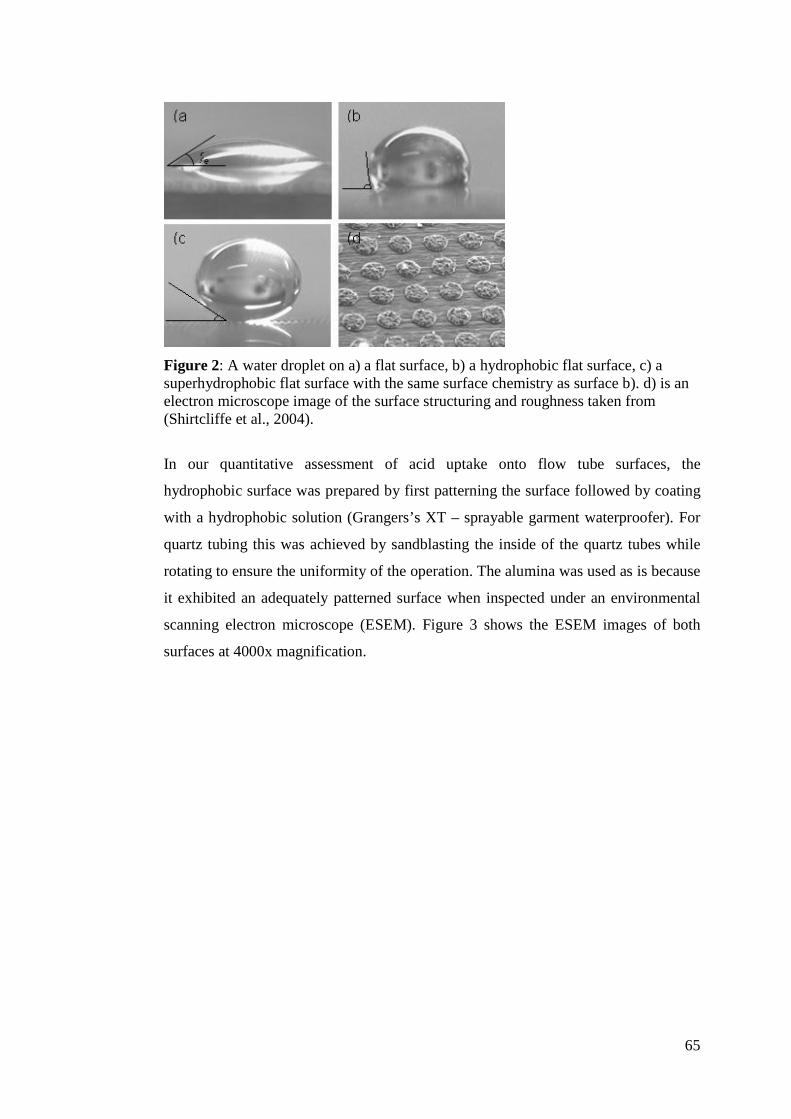
65
Figure 2: A water droplet on a) a flat surface, b) a hydrophobic flat surface, c) a superhydrophobic flat surface with the same surface chemistry as surface b). d) is an electron microscope image of the surface structuring and roughness taken from (Shirtcliffe et al., 2004).
In our quantitative assessment of acid uptake onto flow tube surfaces, the
hydrophobic surface was prepared by first patterning the surface followed by coating
with a hydrophobic solution (Grangers’s XT – sprayable garment waterproofer). For
quartz tubing this was achieved by sandblasting the inside of the quartz tubes while
rotating to ensure the uniformity of the operation. The alumina was used as is because
it exhibited an adequately patterned surface when inspected under an environmental
scanning electron microscope (ESEM). Figure 3 shows the ESEM images of both
surfaces at 4000x magnification.
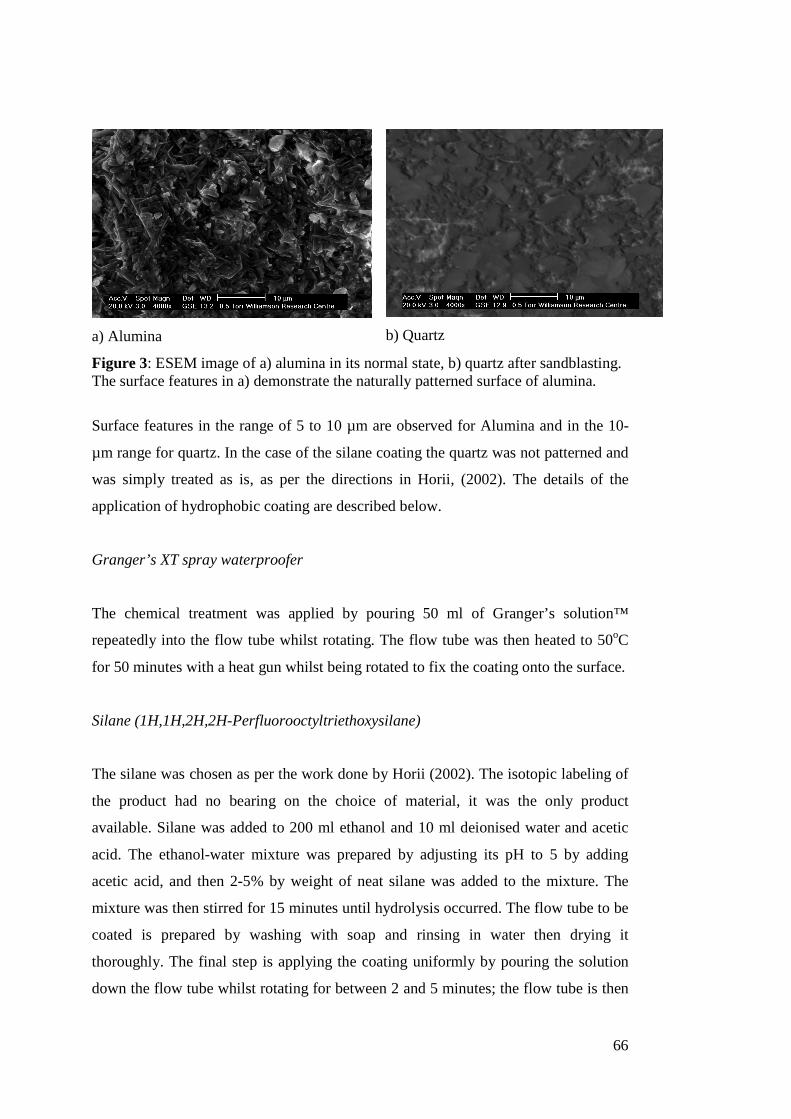
66
a) Alumina
b) Quartz
Figure 3: ESEM image of a) alumina in its normal state, b) quartz after sandblasting. The surface features in a) demonstrate the naturally patterned surface of alumina.
Surface features in the range of 5 to 10 µm are observed for Alumina and in the 10-
µm range for quartz. In the case of the silane coating the quartz was not patterned and
was simply treated as is, as per the directions in Horii, (2002). The details of the
application of hydrophobic coating are described below.
Granger’s XT spray waterproofer
The chemical treatment was applied by pouring 50 ml of Granger’s solution™
repeatedly into the flow tube whilst rotating. The flow tube was then heated to 50oC
for 50 minutes with a heat gun whilst being rotated to fix the coating onto the surface.
Silane (1H,1H,2H,2H-Perfluorooctyltriethoxysilane)
The silane was chosen as per the work done by Horii (2002). The isotopic labeling of
the product had no bearing on the choice of material, it was the only product
available. Silane was added to 200 ml ethanol and 10 ml deionised water and acetic
acid. The ethanol-water mixture was prepared by adjusting its pH to 5 by adding
acetic acid, and then 2-5% by weight of neat silane was added to the mixture. The
mixture was then stirred for 15 minutes until hydrolysis occurred. The flow tube to be
coated is prepared by washing with soap and rinsing in water then drying it
thoroughly. The final step is applying the coating uniformly by pouring the solution
down the flow tube whilst rotating for between 2 and 5 minutes; the flow tube is then
67
rinsed in ethanol and left to cure overnight or heated in an oven at 100 oC for 15
minutes.
Materials
The HNO3 permeation tube was obtained from KIN-TEK (SRT-005.00-2022/30,
Lamarque, Texas, USA). It contains trace amounts of sulphuric acid to sequester any
water, but the concentration of HNO3 is greater than 99%. Formic Acid (99%) was
obtained from Sigma Aldrich. N2 was obtained from BOC. PFA was purchased from
Swagelok. Alumina was obtained from (HP Technical Ceramics, 99.9% purity
alumina tube).Quartz tubing was purchased from the University of Manchester stores.
An overview of the inlet materials used and their treatment prior to experimentation
follows. Silane (1H,1H,2H,2H-Perfluorooctyltriethoxysilane; 97%, ACBR.DE).
Granger’s waterproof treatment (Granger’s, UK)
Results and Discussion
Figure 4 is a typical HCOOH signal response on contact with increasing lengths of
flow tube surface. There is an initial large uptake followed by a stabilisation time to
reach a steady state uptake. Multiple experimental runs repeatedly showed the same
large initial uptake followed by a recovery to a stable steady state, indicating that the
drop in signal immediately following the increased contact time was due to an
interaction between the analyte gas flow and the flow tube surface.
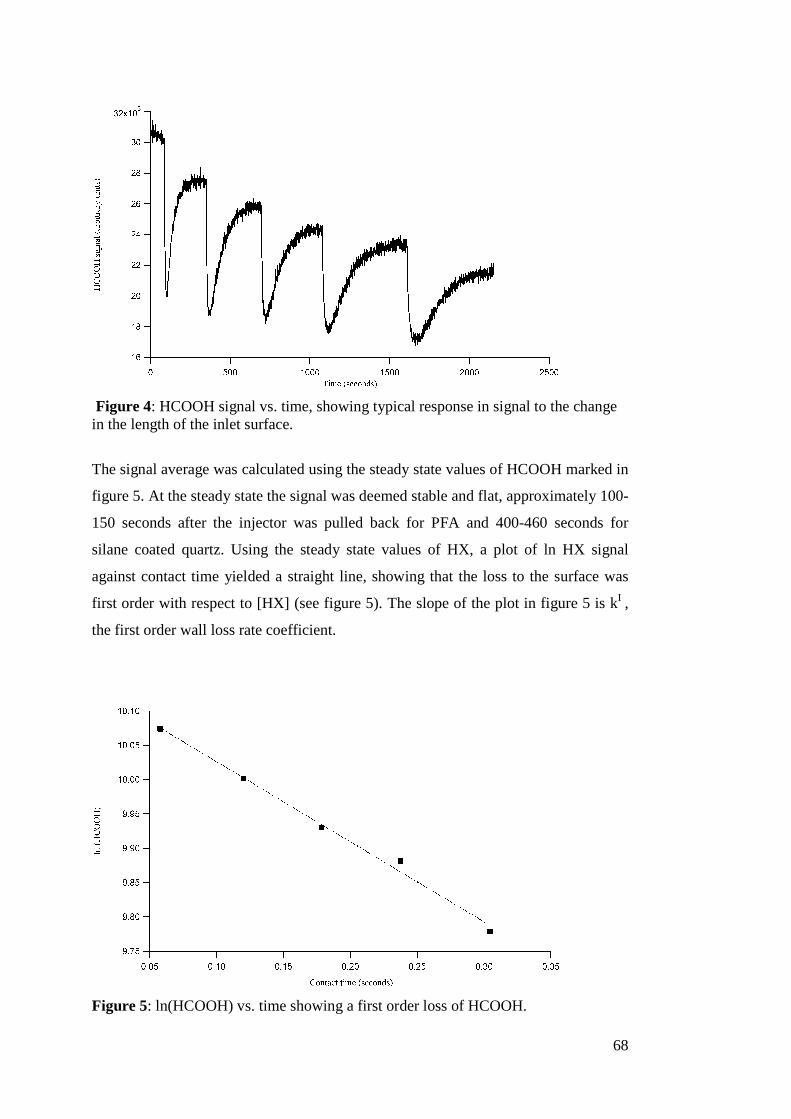
68
Figure 4: HCOOH signal vs. time, showing typical response in signal to the change in the length of the inlet surface.
The signal average was calculated using the steady state values of HCOOH marked in
figure 5. At the steady state the signal was deemed stable and flat, approximately 100-
150 seconds after the injector was pulled back for PFA and 400-460 seconds for
silane coated quartz. Using the steady state values of HX, a plot of ln HX signal
against contact time yielded a straight line, showing that the loss to the surface was
first order with respect to [HX] (see figure 5). The slope of the plot in figure 5 is kI ,
the first order wall loss rate coefficient.
Figure 5: ln(HCOOH) vs. time showing a first order loss of HCOOH.
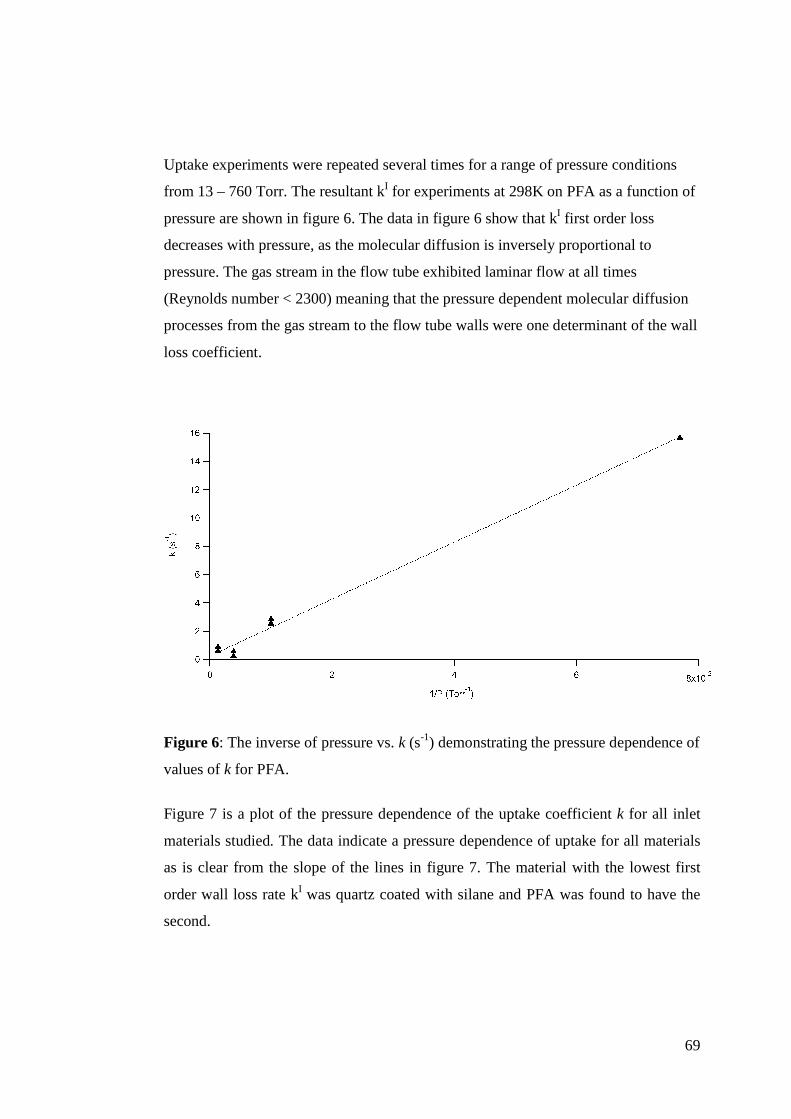
69
Uptake experiments were repeated several times for a range of pressure conditions
from 13 – 760 Torr. The resultant kI for experiments at 298K on PFA as a function of
pressure are shown in figure 6. The data in figure 6 show that kI first order loss
decreases with pressure, as the molecular diffusion is inversely proportional to
pressure. The gas stream in the flow tube exhibited laminar flow at all times
(Reynolds number < 2300) meaning that the pressure dependent molecular diffusion
processes from the gas stream to the flow tube walls were one determinant of the wall
loss coefficient.
Figure 6: The inverse of pressure vs. k (s-1) demonstrating the pressure dependence of
values of k for PFA.
Figure 7 is a plot of the pressure dependence of the uptake coefficient k for all inlet
materials studied. The data indicate a pressure dependence of uptake for all materials
as is clear from the slope of the lines in figure 7. The material with the lowest first
order wall loss rate kI was quartz coated with silane and PFA was found to have the
second.
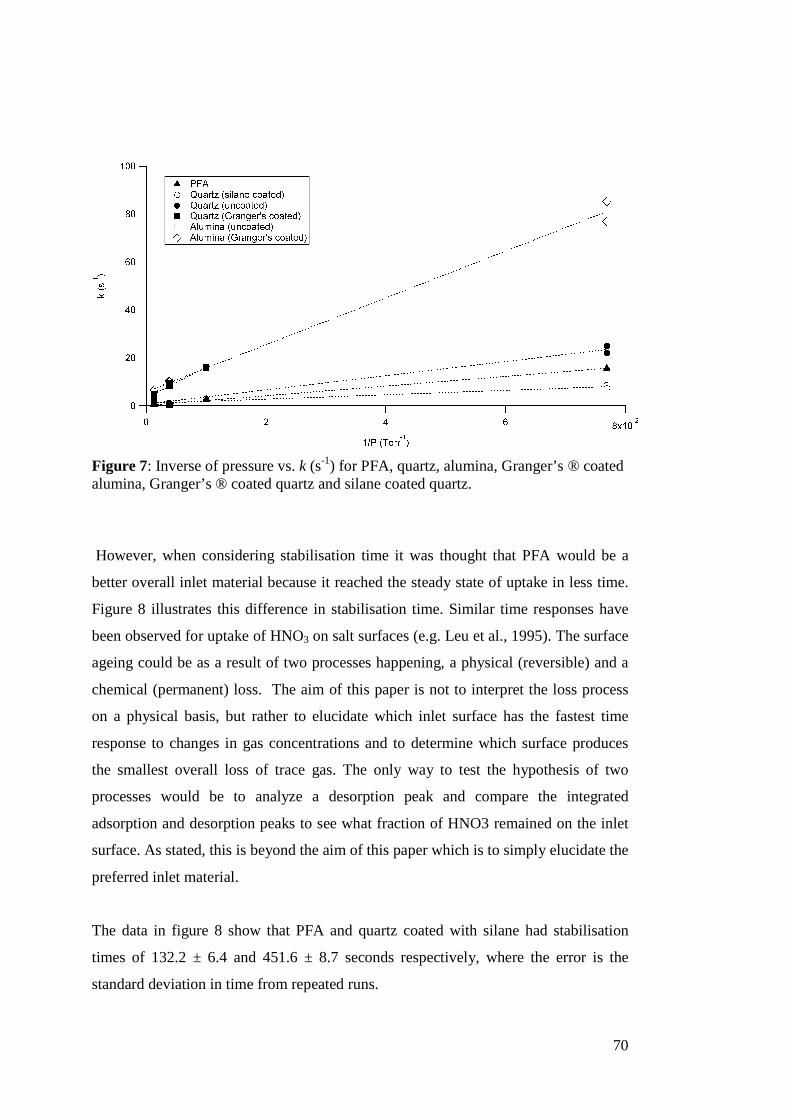
70
Figure 7: Inverse of pressure vs. k (s-1) for PFA, quartz, alumina, Granger’s ® coated alumina, Granger’s ® coated quartz and silane coated quartz.
However, when considering stabilisation time it was thought that PFA would be a
better overall inlet material because it reached the steady state of uptake in less time.
Figure 8 illustrates this difference in stabilisation time. Similar time responses have
been observed for uptake of HNO3 on salt surfaces (e.g. Leu et al., 1995). The surface
ageing could be as a result of two processes happening, a physical (reversible) and a
chemical (permanent) loss. The aim of this paper is not to interpret the loss process
on a physical basis, but rather to elucidate which inlet surface has the fastest time
response to changes in gas concentrations and to determine which surface produces
the smallest overall loss of trace gas. The only way to test the hypothesis of two
processes would be to analyze a desorption peak and compare the integrated
adsorption and desorption peaks to see what fraction of HNO3 remained on the inlet
surface. As stated, this is beyond the aim of this paper which is to simply elucidate the
preferred inlet material.
The data in figure 8 show that PFA and quartz coated with silane had stabilisation
times of 132.2 ± 6.4 and 451.6 ± 8.7 seconds respectively, where the error is the
standard deviation in time from repeated runs.
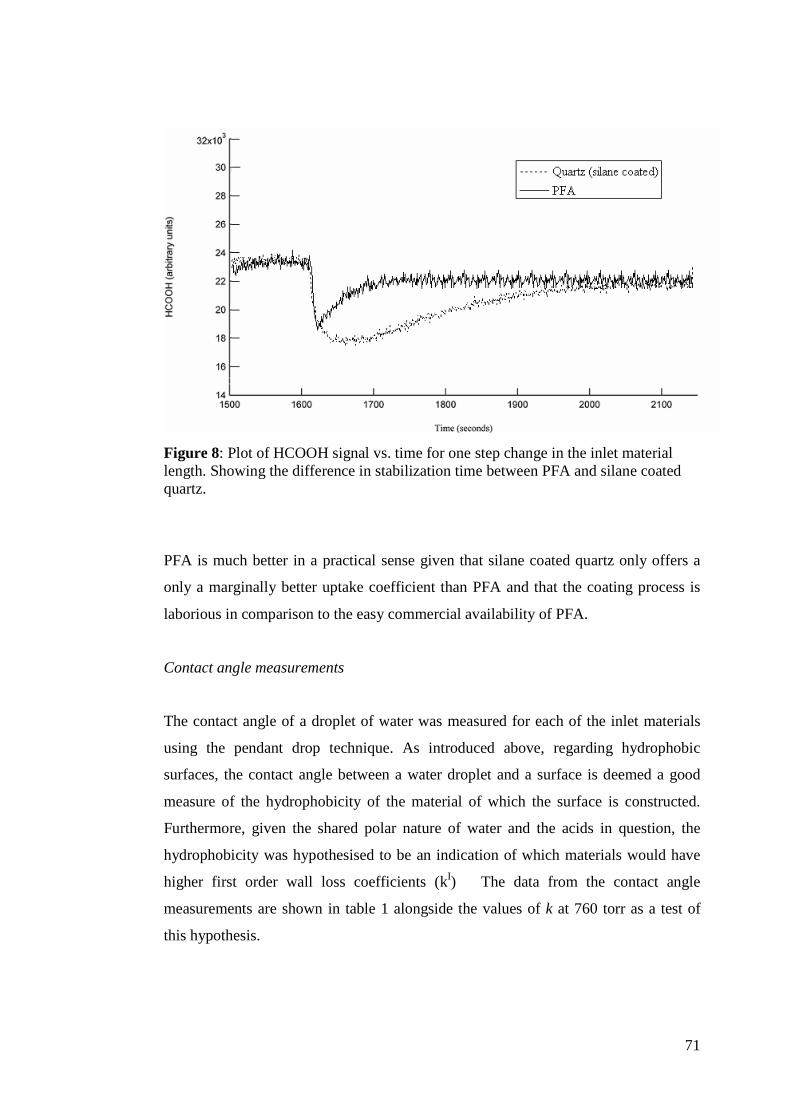
71
Figure 8: Plot of HCOOH signal vs. time for one step change in the inlet material length. Showing the difference in stabilization time between PFA and silane coated quartz.
PFA is much better in a practical sense given that silane coated quartz only offers a
only a marginally better uptake coefficient than PFA and that the coating process is
laborious in comparison to the easy commercial availability of PFA.
Contact angle measurements
The contact angle of a droplet of water was measured for each of the inlet materials
using the pendant drop technique. As introduced above, regarding hydrophobic
surfaces, the contact angle between a water droplet and a surface is deemed a good
measure of the hydrophobicity of the material of which the surface is constructed.
Furthermore, given the shared polar nature of water and the acids in question, the
hydrophobicity was hypothesised to be an indication of which materials would have
higher first order wall loss coefficients (kI) The data from the contact angle
measurements are shown in table 1 alongside the values of k at 760 torr as a test of
this hypothesis.
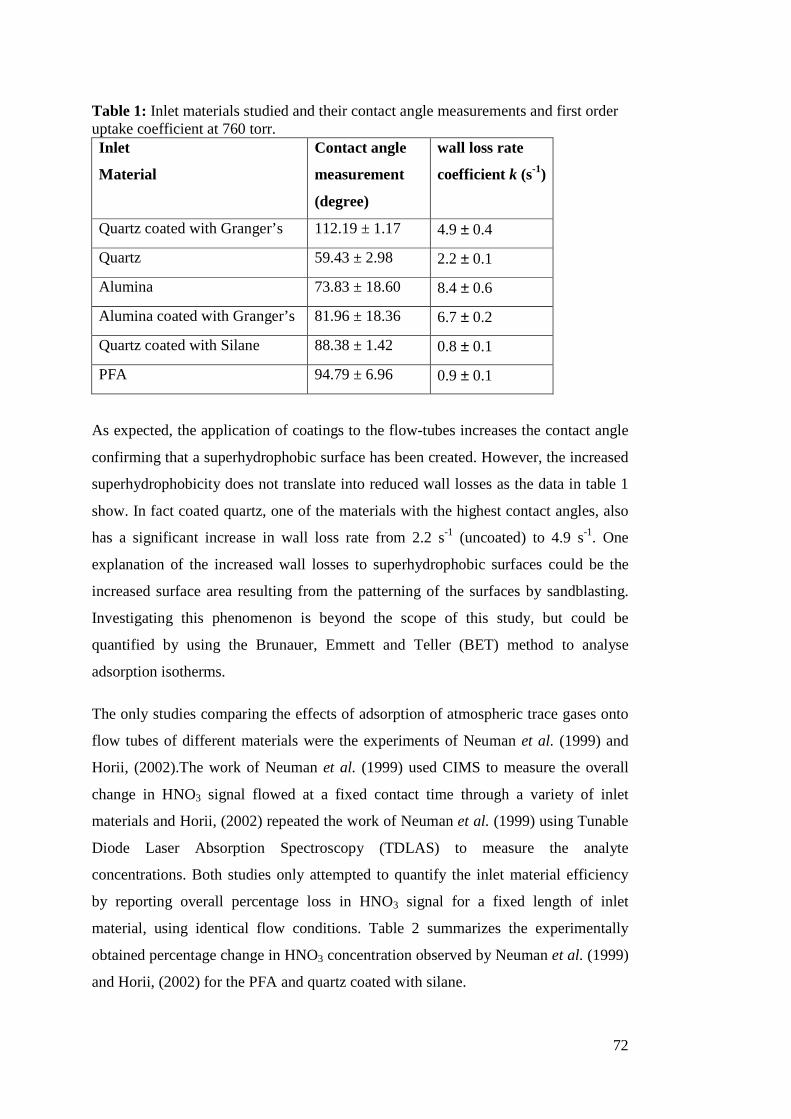
72
Table 1: Inlet materials studied and their contact angle measurements and first order uptake coefficient at 760 torr. Inlet
Material
Contact angle
measurement
(degree)
wall loss rate
coefficient k (s-1)
Quartz coated with Granger’s 112.19 ± 1.17 4.9 ± 0.4
Quartz 59.43 ± 2.98 2.2 ± 0.1
Alumina 73.83 ± 18.60 8.4 ± 0.6
Alumina coated with Granger’s 81.96 ± 18.36 6.7 ± 0.2
Quartz coated with Silane 88.38 ± 1.42 0.8 ± 0.1
PFA 94.79 ± 6.96 0.9 ± 0.1
As expected, the application of coatings to the flow-tubes increases the contact angle
confirming that a superhydrophobic surface has been created. However, the increased
superhydrophobicity does not translate into reduced wall losses as the data in table 1
show. In fact coated quartz, one of the materials with the highest contact angles, also
has a significant increase in wall loss rate from 2.2 s-1 (uncoated) to 4.9 s-1. One
explanation of the increased wall losses to superhydrophobic surfaces could be the
increased surface area resulting from the patterning of the surfaces by sandblasting.
Investigating this phenomenon is beyond the scope of this study, but could be
quantified by using the Brunauer, Emmett and Teller (BET) method to analyse
adsorption isotherms.
The only studies comparing the effects of adsorption of atmospheric trace gases onto
flow tubes of different materials were the experiments of Neuman et al. (1999) and
Horii, (2002).The work of Neuman et al. (1999) used CIMS to measure the overall
change in HNO3 signal flowed at a fixed contact time through a variety of inlet
materials and Horii, (2002) repeated the work of Neuman et al. (1999) using Tunable
Diode Laser Absorption Spectroscopy (TDLAS) to measure the analyte
concentrations. Both studies only attempted to quantify the inlet material efficiency
by reporting overall percentage loss in HNO3 signal for a fixed length of inlet
material, using identical flow conditions. Table 2 summarizes the experimentally
obtained percentage change in HNO3 concentration observed by Neuman et al. (1999)
and Horii, (2002) for the PFA and quartz coated with silane.
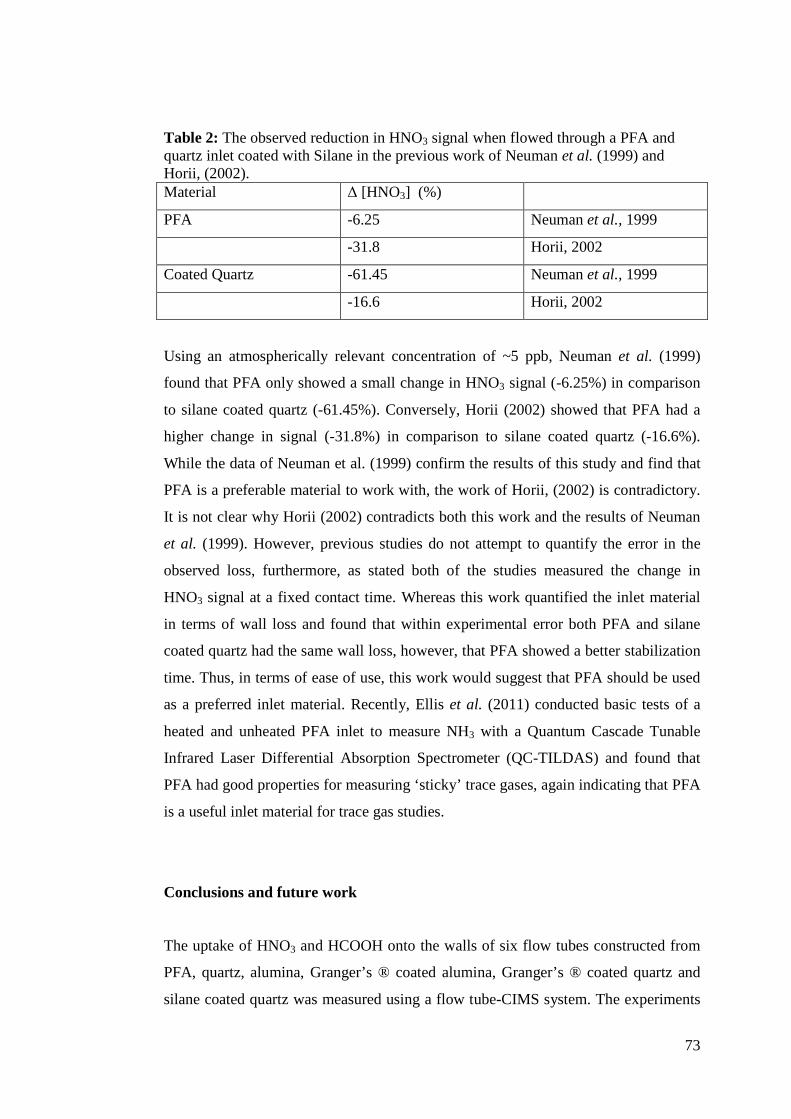
73
Table 2: The observed reduction in HNO3 signal when flowed through a PFA and quartz inlet coated with Silane in the previous work of Neuman et al. (1999) and Horii, (2002). Material ∆ [HNO3] (%)
PFA -6.25 Neuman et al., 1999
-31.8 Horii, 2002
Coated Quartz -61.45 Neuman et al., 1999
-16.6 Horii, 2002
Using an atmospherically relevant concentration of ~5 ppb, Neuman et al. (1999)
found that PFA only showed a small change in HNO3 signal (-6.25%) in comparison
to silane coated quartz (-61.45%). Conversely, Horii (2002) showed that PFA had a
higher change in signal (-31.8%) in comparison to silane coated quartz (-16.6%).
While the data of Neuman et al. (1999) confirm the results of this study and find that
PFA is a preferable material to work with, the work of Horii, (2002) is contradictory.
It is not clear why Horii (2002) contradicts both this work and the results of Neuman
et al. (1999). However, previous studies do not attempt to quantify the error in the
observed loss, furthermore, as stated both of the studies measured the change in
HNO3 signal at a fixed contact time. Whereas this work quantified the inlet material
in terms of wall loss and found that within experimental error both PFA and silane
coated quartz had the same wall loss, however, that PFA showed a better stabilization
time. Thus, in terms of ease of use, this work would suggest that PFA should be used
as a preferred inlet material. Recently, Ellis et al. (2011) conducted basic tests of a
heated and unheated PFA inlet to measure NH3 with a Quantum Cascade Tunable
Infrared Laser Differential Absorption Spectrometer (QC-TILDAS) and found that
PFA had good properties for measuring ‘sticky’ trace gases, again indicating that PFA
is a useful inlet material for trace gas studies.
Conclusions and future work
The uptake of HNO3 and HCOOH onto the walls of six flow tubes constructed from
PFA, quartz, alumina, Granger’s ® coated alumina, Granger’s ® coated quartz and
silane coated quartz was measured using a flow tube-CIMS system. The experiments
74
were conducted under a range of pressure conditions (13 – 760 Torr) at ambient
temperature. Silane coated quartz had the lowest first order uptake co-efficient and
PFA had the second lowest. However, PFA was found to have a much faster
stabilisation time in comparison to silane coated glass, a property that has important
implications for fast time response measurements of ‘sticky’ trace gases. PFA also
benefits from being readily available whereas silane coated quartz requires more
preparation. Fluouro polymers (e.g. Perfluroalkoxy (PFA)) have become established
as good materials to minimise adsorptive sampling losses and this study conforms to
the results of
Neuman et al. (1999) and Ellis et al. (2010) that PFA is a good material for use in
inlet to measure ‘sticky’ nitrogen species in the atmosphere.
Attempts were made to improve inlet efficiency by generating superhydrophobic
surfaces. ESEM and contact analysis confirmed that a superhydrophobic surface was
generated, but no correlation was found between hydrophobicity and a reduction in
uptake coefficient. In fact, an anti-correlation was observed. The process of
generating a superhydrophobic surface produces an increase in surface roughness, as
shown by ESEM analysis. The increase in roughness is likely to create an increase in
surface area and thus has the potential to increase loss. Further work is required to
understand the efficacy of such surfaces to the uptake of nitrogen species.
75
References for paper I
1 J.A. Neuman, L.G. Huey, T.B. Ryerson and D.W. Fahey, Environ. Sci. Technol., 1999, 33, 1133-1136 2 D.W. Fahey, D.M. Murphy, K.K. Kelly, M.K.W. KO, M.H. Proffitt, C.S. Eubank, G.V. Ferry, M. Lowenstein and K.R. Chan, J. Geophys. Res., 1989, 94, 16665 – 16681 3 S.N. Pandis, S.E. Paulson, J.H. Seinfeld and R.C. Flagan, Atmos. Environ. A, 1991, 25, 997- 1008 4 I.G. Kavouras, N. Mihalopoulos and E.G. Stephanou, Envrion. Sci. Technol., 1999, 33, 1028-1097 5 M. Doyle, K.G. Sexton, H. Jeffries, K. Bridge and I. Jaspers, Environ. Health Persp., 2004, 112, 1488-1495 6 R.J. Yokelson, T.J. Christian, I.T. Bertschi, W.M. Hao, J. Geophys. Res., 2003, 108, 4649. 7 S.B. Shah, G.L. Grabow, P.W. Westerman, Applied Eng. in Agric., 2006, 22, 919-923. 8 J.D. Whitehead, M. Twigg, D. Famulari, E. Nemitz, M.A. Sutton, M.W. Gallagher, D. Fowler, Env. Sci. Technol., 2008, 42, 2041-2046. 9 R.A. Ellis, J.G. Murphy, E. Pattey, R. van Haarlem, J.M. O’Brien and S.C. Herndon, Atmos. Meas. Tech., 2010, 3, 397-406 10 C.V Horii, PhD Thesis, Harvard University, Cambridge, USA. 11 C.H. Xue, S.T. Jia, J. Zhang and J.Z. Ma, Sci. Tech. Adv. Mat., 2010, 11, 033002 12 M.-T. Leu, R.S. Timonen, L. F. Keyser and Y.L. Yung, J. Phys. Chem., 1995, 99, 13203-13212. 13 N.J. Shirtcliffe, G. Mchale and M.I. Newton, J. Polym. Sci. Pol. Phys., 2011, 49, 1203-1217 14 N. J. Shirtcliffe, G. McHale, M. I. Newton, G. Chabrol and C. C. Perry, Adv. Maters., 2004, 16 , 1929-1932. 15 C.R. Evans and G. McHale, N.J. Shirtcliffe, S.M. Stanley, M.I. Newton, Sensor Actuat. A-phys., 2005, 123-24, 73-76. 16 P. Roach and G. Mchale, Langmuir, 2007, 23, 9823-9830.

76

77
3. Paper II “Field inter-comparison of eleven atmospheric ammonia measurement techniques” by Kristina von Bobrutzki, Mohamed B. Ghalaieny;Max R. McGillen, Carl J. Percival et al. Published in: Atmospheric Measurement Techniques, (2010), volume 3, pages 91-112.
Contributions: Mohamed Ghalaieny and Max McGillen conducted the field work.
The data analysis and manuscript contribution for CIMS work was led by Mohamed
Ghalaieny and assisted by Max McGillen. All the work was done under the
supervision of Carl Percival. Kristina von Bobrutzki coordinated the project and led
the preparation of the manuscript.

78
Atmos. Meas. Tech., 3, 91–112, 2010www.atmos-meas-tech.net/3/91/2010/© Author(s) 2010. This work is distributed underthe Creative Commons Attribution 3.0 License.
AtmosphericMeasurement
Techniques
Field inter-comparison of eleven atmospheric ammoniameasurement techniques
K. von Bobrutzki 1,2, C. F. Braban1, D. Famulari1, S. K. Jones1, T. Blackall3, T. E. L. Smith3, M. Blom4, H. Coe5,M. Gallagher5, M. Ghalaieny5, M. R. McGillen 5, C. J. Percival5, J. D. Whitehead5, R. Ellis6, J. Murphy 6, A. Mohacsi7,A. Pogany8, H. Junninen9, S. Rantanen9, M. A. Sutton1, and E. Nemitz1
1Centre for Ecology and Hydrology (CEH) Edinburgh, Bush Estate, Penicuik, EH26 0QB, UK2Leibniz-Institute for Agricultural Engineering, Potsdam, Germany3Department of Geography, King’s College London, London, UK4Energy Research Foundation of the Netherlands, Petten, The Netherland5School of Earth, Atmospheric and Environmental Science, University of Manchester, Manchester, UK6Department of Chemistry, University of Toronto, Toronto, Canada7Research Group on Laser Physics of the Hungarian Academy of Sciences, Budapest, Hungary8Department of Optics and Quantum Electronics, University of Szeged, Szeged, Hungary9Department of Physics, University of Helsinki, Helsinki, Finland
Received: 2 July 2009 – Published in Atmos. Meas. Tech. Discuss.: 4 August 2009Revised: 14 January 2010 – Accepted: 15 January 2010 – Published: 27 January 2010
Abstract. Eleven instruments for the measurement of am-bient concentrations of atmospheric ammonia gas (NH3),based on eight different measurement methods were inter-compared above an intensively managed agricultural fieldin late summer 2008 in Southern Scotland. To test the in-struments over a wide range of concentrations, the field wasfertilised with urea midway through the experiment, lead-ing to an increase in the average concentration from 10 to100 ppbv. The instruments deployed included three wet-chemistry systems, one with offline analysis (annular rotat-ing batch denuder, RBD) and two with online-analysis (An-nular Denuder sampling with online Analysis, AMANDA;AiRRmonia), two Quantum Cascade Laser Absorption Spec-trometers (a large-cell dual system; DUAL-QCLAS, and acompact system; c-QCLAS), two photo-acoustic spectrome-ters (WaSul-Flux; Nitrolux-100), a Cavity Ring Down Spec-trosmeter (CRDS), a Chemical Ionisation Mass Spectrometer(CIMS), an ion mobility spectrometer (IMS) and an Open-Path Fourier Transform Infra-Red (OP-FTIR) Spectrometer.The instruments were compared with each other and with theaverage concentration of all instruments. An overall goodagreement of hourly average concentrations between the in-struments (R2>0.84), was observed for NH3 concentrationsat the field of up to 120 ppbv with the slopes against the
Correspondence to:E. Nemitz([email protected])
average ranging from 0.67 (DUAL-QCLAS) to 1.13 (AiR-Rmonia) with intercepts of−0.74 ppbv (RBD) to +2.69 ppbv(CIMS). More variability was found for performance forlower concentrations (<10 ppbv). Here the main factors af-fecting measurement precision are (a) the inlet design, (b) thestate of inlet filters (where applicable), and (c) the qual-ity of gas-phase standards (where applicable). By referenceto the fast (1 Hz) instruments deployed during the study, itwas possible to characterize the response times of the slowerinstruments.
1 Introduction
Ammonia (NH3) plays an important role in atmosphericchemistry. It represents the major alkaline gas and is there-fore important for the neutralization of acidic gases and theformation of particulate matter (Duyzer et al., 1994; Asmanet al., 1998). Deposition of atmospheric NH3 to ecosys-tem can lead to effects such as eutrophication and acidifi-cation of soils, contributing to forest decline and a decreasein biological diversity (Fangmeier et al., 1994; Sutton et al.,1995; Ferm, 1998). As a consequence, many measurementmethods for NH3 have been developed. Ambient measure-ment of NH3 concentrations is difficult due to several fac-tors: ambient levels vary widely, from 5 pptv in remote re-gions (Janson et al., 2001; Sutton et al., 2001) to 500 ppbv
Published by Copernicus Publications on behalf of the European Geosciences Union.
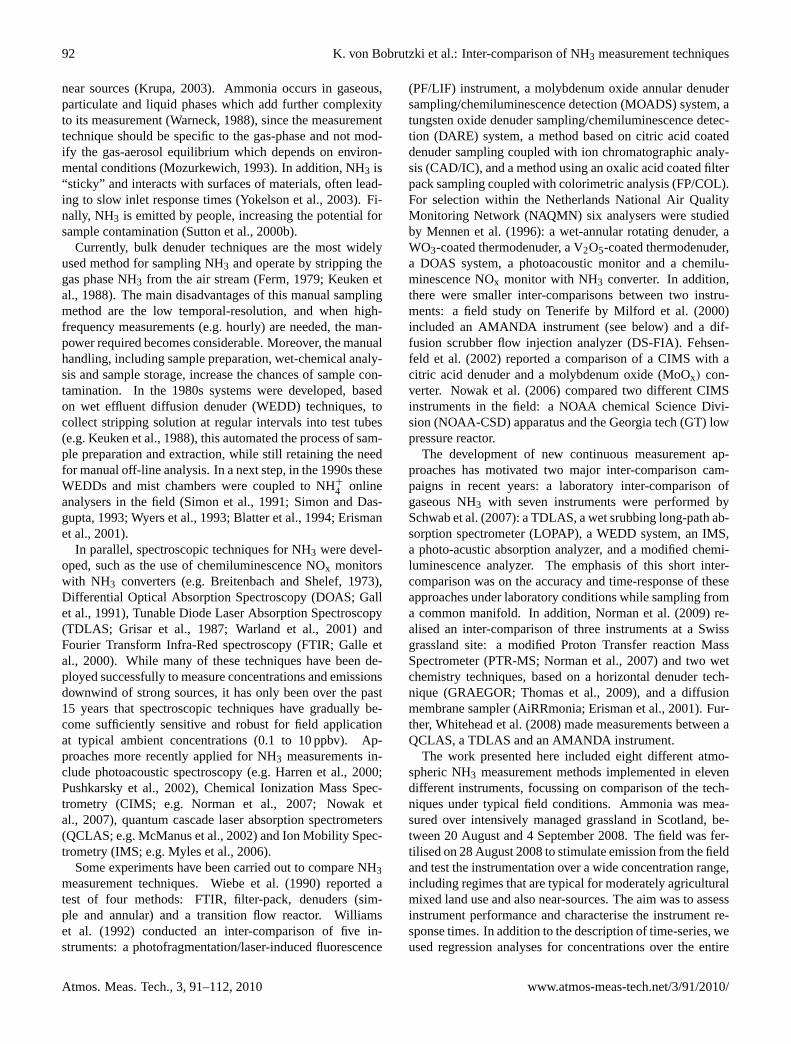
92 K. von Bobrutzki et al.: Inter-comparison of NH3 measurement techniques
near sources (Krupa, 2003). Ammonia occurs in gaseous,particulate and liquid phases which add further complexityto its measurement (Warneck, 1988), since the measurementtechnique should be specific to the gas-phase and not mod-ify the gas-aerosol equilibrium which depends on environ-mental conditions (Mozurkewich, 1993). In addition, NH3 is“sticky” and interacts with surfaces of materials, often lead-ing to slow inlet response times (Yokelson et al., 2003). Fi-nally, NH3 is emitted by people, increasing the potential forsample contamination (Sutton et al., 2000b).
Currently, bulk denuder techniques are the most widelyused method for sampling NH3 and operate by stripping thegas phase NH3 from the air stream (Ferm, 1979; Keuken etal., 1988). The main disadvantages of this manual samplingmethod are the low temporal-resolution, and when high-frequency measurements (e.g. hourly) are needed, the man-power required becomes considerable. Moreover, the manualhandling, including sample preparation, wet-chemical analy-sis and sample storage, increase the chances of sample con-tamination. In the 1980s systems were developed, basedon wet effluent diffusion denuder (WEDD) techniques, tocollect stripping solution at regular intervals into test tubes(e.g. Keuken et al., 1988), this automated the process of sam-ple preparation and extraction, while still retaining the needfor manual off-line analysis. In a next step, in the 1990s theseWEDDs and mist chambers were coupled to NH+
4 onlineanalysers in the field (Simon et al., 1991; Simon and Das-gupta, 1993; Wyers et al., 1993; Blatter et al., 1994; Erismanet al., 2001).
In parallel, spectroscopic techniques for NH3 were devel-oped, such as the use of chemiluminescence NOx monitorswith NH3 converters (e.g. Breitenbach and Shelef, 1973),Differential Optical Absorption Spectroscopy (DOAS; Gallet al., 1991), Tunable Diode Laser Absorption Spectroscopy(TDLAS; Grisar et al., 1987; Warland et al., 2001) andFourier Transform Infra-Red spectroscopy (FTIR; Galle etal., 2000). While many of these techniques have been de-ployed successfully to measure concentrations and emissionsdownwind of strong sources, it has only been over the past15 years that spectroscopic techniques have gradually be-come sufficiently sensitive and robust for field applicationat typical ambient concentrations (0.1 to 10 ppbv). Ap-proaches more recently applied for NH3 measurements in-clude photoacoustic spectroscopy (e.g. Harren et al., 2000;Pushkarsky et al., 2002), Chemical Ionization Mass Spec-trometry (CIMS; e.g. Norman et al., 2007; Nowak etal., 2007), quantum cascade laser absorption spectrometers(QCLAS; e.g. McManus et al., 2002) and Ion Mobility Spec-trometry (IMS; e.g. Myles et al., 2006).
Some experiments have been carried out to compare NH3measurement techniques. Wiebe et al. (1990) reported atest of four methods: FTIR, filter-pack, denuders (sim-ple and annular) and a transition flow reactor. Williamset al. (1992) conducted an inter-comparison of five in-struments: a photofragmentation/laser-induced fluorescence
(PF/LIF) instrument, a molybdenum oxide annular denudersampling/chemiluminescence detection (MOADS) system, atungsten oxide denuder sampling/chemiluminescence detec-tion (DARE) system, a method based on citric acid coateddenuder sampling coupled with ion chromatographic analy-sis (CAD/IC), and a method using an oxalic acid coated filterpack sampling coupled with colorimetric analysis (FP/COL).For selection within the Netherlands National Air QualityMonitoring Network (NAQMN) six analysers were studiedby Mennen et al. (1996): a wet-annular rotating denuder, aWO3-coated thermodenuder, a V2O5-coated thermodenuder,a DOAS system, a photoacoustic monitor and a chemilu-minescence NOx monitor with NH3 converter. In addition,there were smaller inter-comparisons between two instru-ments: a field study on Tenerife by Milford et al. (2000)included an AMANDA instrument (see below) and a dif-fusion scrubber flow injection analyzer (DS-FIA). Fehsen-feld et al. (2002) reported a comparison of a CIMS with acitric acid denuder and a molybdenum oxide (MoOx) con-verter. Nowak et al. (2006) compared two different CIMSinstruments in the field: a NOAA chemical Science Divi-sion (NOAA-CSD) apparatus and the Georgia tech (GT) lowpressure reactor.
The development of new continuous measurement ap-proaches has motivated two major inter-comparison cam-paigns in recent years: a laboratory inter-comparison ofgaseous NH3 with seven instruments were performed bySchwab et al. (2007): a TDLAS, a wet srubbing long-path ab-sorption spectrometer (LOPAP), a WEDD system, an IMS,a photo-acustic absorption analyzer, and a modified chemi-luminescence analyzer. The emphasis of this short inter-comparison was on the accuracy and time-response of theseapproaches under laboratory conditions while sampling froma common manifold. In addition, Norman et al. (2009) re-alised an inter-comparison of three instruments at a Swissgrassland site: a modified Proton Transfer reaction MassSpectrometer (PTR-MS; Norman et al., 2007) and two wetchemistry techniques, based on a horizontal denuder tech-nique (GRAEGOR; Thomas et al., 2009), and a diffusionmembrane sampler (AiRRmonia; Erisman et al., 2001). Fur-ther, Whitehead et al. (2008) made measurements between aQCLAS, a TDLAS and an AMANDA instrument.
The work presented here included eight different atmo-spheric NH3 measurement methods implemented in elevendifferent instruments, focussing on comparison of the tech-niques under typical field conditions. Ammonia was mea-sured over intensively managed grassland in Scotland, be-tween 20 August and 4 September 2008. The field was fer-tilised on 28 August 2008 to stimulate emission from the fieldand test the instrumentation over a wide concentration range,including regimes that are typical for moderately agriculturalmixed land use and also near-sources. The aim was to assessinstrument performance and characterise the instrument re-sponse times. In addition to the description of time-series, weused regression analyses for concentrations over the entire
Atmos. Meas. Tech., 3, 91–112, 2010 www.atmos-meas-tech.net/3/91/2010/
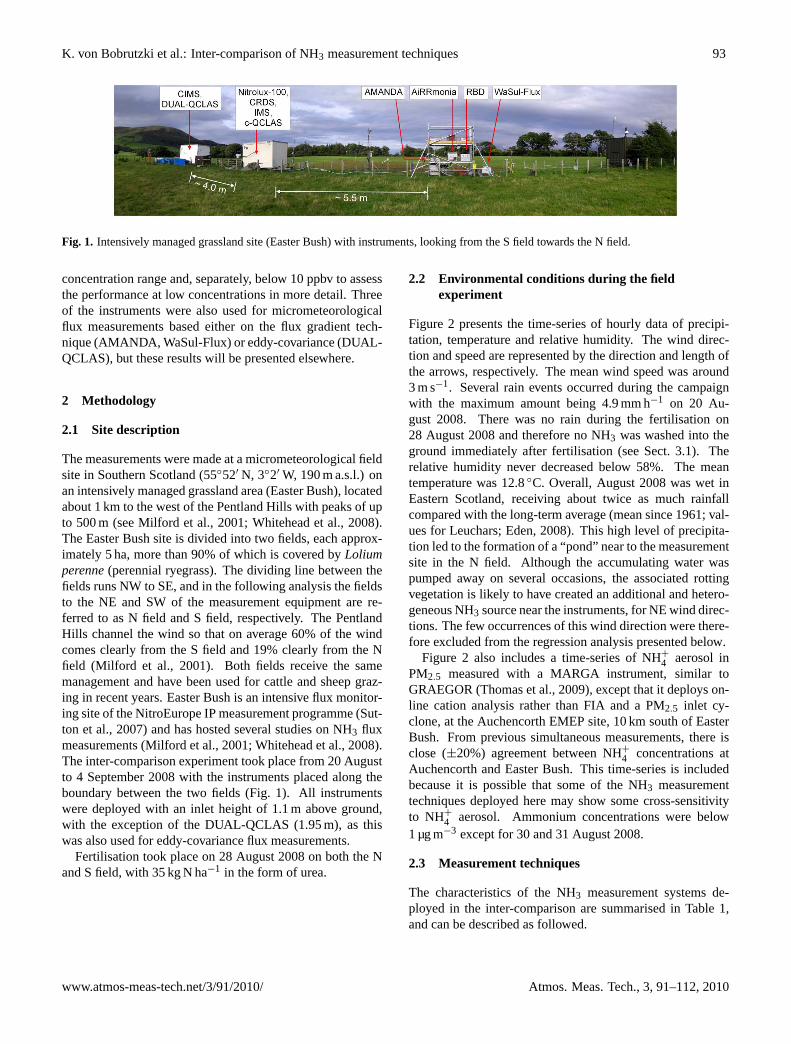
K. von Bobrutzki et al.: Inter-comparison of NH3 measurement techniques 93
Fig. 1. Intensively managed grassland site (Easter Bush) with instruments, looking from the S field towards the N field.
concentration range and, separately, below 10 ppbv to assessthe performance at low concentrations in more detail. Threeof the instruments were also used for micrometeorologicalflux measurements based either on the flux gradient tech-nique (AMANDA, WaSul-Flux) or eddy-covariance (DUAL-QCLAS), but these results will be presented elsewhere.
2 Methodology
2.1 Site description
The measurements were made at a micrometeorological fieldsite in Southern Scotland (5552′ N, 32′ W, 190 m a.s.l.) onan intensively managed grassland area (Easter Bush), locatedabout 1 km to the west of the Pentland Hills with peaks of upto 500 m (see Milford et al., 2001; Whitehead et al., 2008).The Easter Bush site is divided into two fields, each approx-imately 5 ha, more than 90% of which is covered byLoliumperenne(perennial ryegrass). The dividing line between thefields runs NW to SE, and in the following analysis the fieldsto the NE and SW of the measurement equipment are re-ferred to as N field and S field, respectively. The PentlandHills channel the wind so that on average 60% of the windcomes clearly from the S field and 19% clearly from the Nfield (Milford et al., 2001). Both fields receive the samemanagement and have been used for cattle and sheep graz-ing in recent years. Easter Bush is an intensive flux monitor-ing site of the NitroEurope IP measurement programme (Sut-ton et al., 2007) and has hosted several studies on NH3 fluxmeasurements (Milford et al., 2001; Whitehead et al., 2008).The inter-comparison experiment took place from 20 Augustto 4 September 2008 with the instruments placed along theboundary between the two fields (Fig. 1). All instrumentswere deployed with an inlet height of 1.1 m above ground,with the exception of the DUAL-QCLAS (1.95 m), as thiswas also used for eddy-covariance flux measurements.
Fertilisation took place on 28 August 2008 on both the Nand S field, with 35 kg N ha−1 in the form of urea.
2.2 Environmental conditions during the fieldexperiment
Figure 2 presents the time-series of hourly data of precipi-tation, temperature and relative humidity. The wind direc-tion and speed are represented by the direction and length ofthe arrows, respectively. The mean wind speed was around3 m s−1. Several rain events occurred during the campaignwith the maximum amount being 4.9 mm h−1 on 20 Au-gust 2008. There was no rain during the fertilisation on28 August 2008 and therefore no NH3 was washed into theground immediately after fertilisation (see Sect. 3.1). Therelative humidity never decreased below 58%. The meantemperature was 12.8C. Overall, August 2008 was wet inEastern Scotland, receiving about twice as much rainfallcompared with the long-term average (mean since 1961; val-ues for Leuchars; Eden, 2008). This high level of precipita-tion led to the formation of a “pond” near to the measurementsite in the N field. Although the accumulating water waspumped away on several occasions, the associated rottingvegetation is likely to have created an additional and hetero-geneous NH3 source near the instruments, for NE wind direc-tions. The few occurrences of this wind direction were there-fore excluded from the regression analysis presented below.
Figure 2 also includes a time-series of NH+
4 aerosol inPM2.5 measured with a MARGA instrument, similar toGRAEGOR (Thomas et al., 2009), except that it deploys on-line cation analysis rather than FIA and a PM2.5 inlet cy-clone, at the Auchencorth EMEP site, 10 km south of EasterBush. From previous simultaneous measurements, there isclose (±20%) agreement between NH+
4 concentrations atAuchencorth and Easter Bush. This time-series is includedbecause it is possible that some of the NH3 measurementtechniques deployed here may show some cross-sensitivityto NH+
4 aerosol. Ammonium concentrations were below1 µg m−3 except for 30 and 31 August 2008.
2.3 Measurement techniques
The characteristics of the NH3 measurement systems de-ployed in the inter-comparison are summarised in Table 1,and can be described as followed.
www.atmos-meas-tech.net/3/91/2010/ Atmos. Meas. Tech., 3, 91–112, 2010
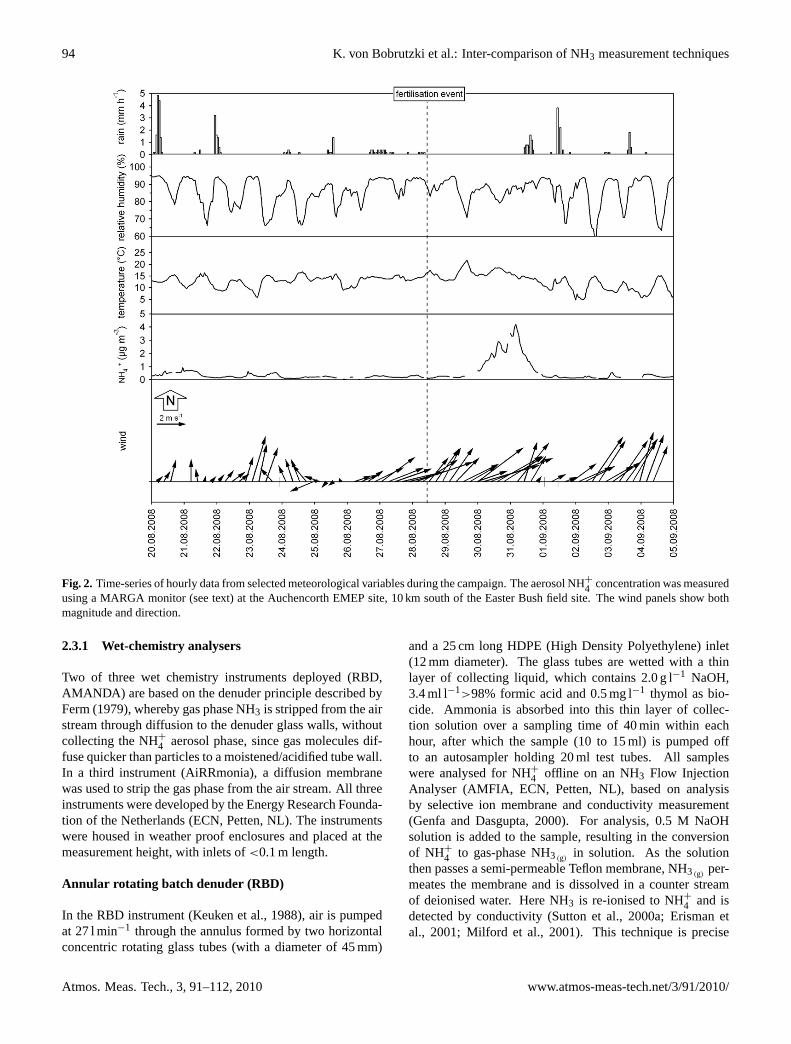
94 K. von Bobrutzki et al.: Inter-comparison of NH3 measurement techniques
Fig. 2. Time-series of hourly data from selected meteorological variables during the campaign. The aerosol NH+
4 concentration was measuredusing a MARGA monitor (see text) at the Auchencorth EMEP site, 10 km south of the Easter Bush field site. The wind panels show bothmagnitude and direction.
2.3.1 Wet-chemistry analysers
Two of three wet chemistry instruments deployed (RBD,AMANDA) are based on the denuder principle described byFerm (1979), whereby gas phase NH3 is stripped from the airstream through diffusion to the denuder glass walls, withoutcollecting the NH+4 aerosol phase, since gas molecules dif-fuse quicker than particles to a moistened/acidified tube wall.In a third instrument (AiRRmonia), a diffusion membranewas used to strip the gas phase from the air stream. All threeinstruments were developed by the Energy Research Founda-tion of the Netherlands (ECN, Petten, NL). The instrumentswere housed in weather proof enclosures and placed at themeasurement height, with inlets of<0.1 m length.
Annular rotating batch denuder (RBD)
In the RBD instrument (Keuken et al., 1988), air is pumpedat 27 l min−1 through the annulus formed by two horizontalconcentric rotating glass tubes (with a diameter of 45 mm)
and a 25 cm long HDPE (High Density Polyethylene) inlet(12 mm diameter). The glass tubes are wetted with a thinlayer of collecting liquid, which contains 2.0 g l−1 NaOH,3.4 ml l−1>98% formic acid and 0.5 mg l−1 thymol as bio-cide. Ammonia is absorbed into this thin layer of collec-tion solution over a sampling time of 40 min within eachhour, after which the sample (10 to 15 ml) is pumped offto an autosampler holding 20 ml test tubes. All sampleswere analysed for NH+4 offline on an NH3 Flow InjectionAnalyser (AMFIA, ECN, Petten, NL), based on analysisby selective ion membrane and conductivity measurement(Genfa and Dasgupta, 2000). For analysis, 0.5 M NaOHsolution is added to the sample, resulting in the conversionof NH+
4 to gas-phase NH3(g)in solution. As the solution
then passes a semi-permeable Teflon membrane, NH3(g)per-
meates the membrane and is dissolved in a counter streamof deionised water. Here NH3 is re-ionised to NH+4 and isdetected by conductivity (Sutton et al., 2000a; Erisman etal., 2001; Milford et al., 2001). This technique is precise
Atmos. Meas. Tech., 3, 91–112, 2010 www.atmos-meas-tech.net/3/91/2010/
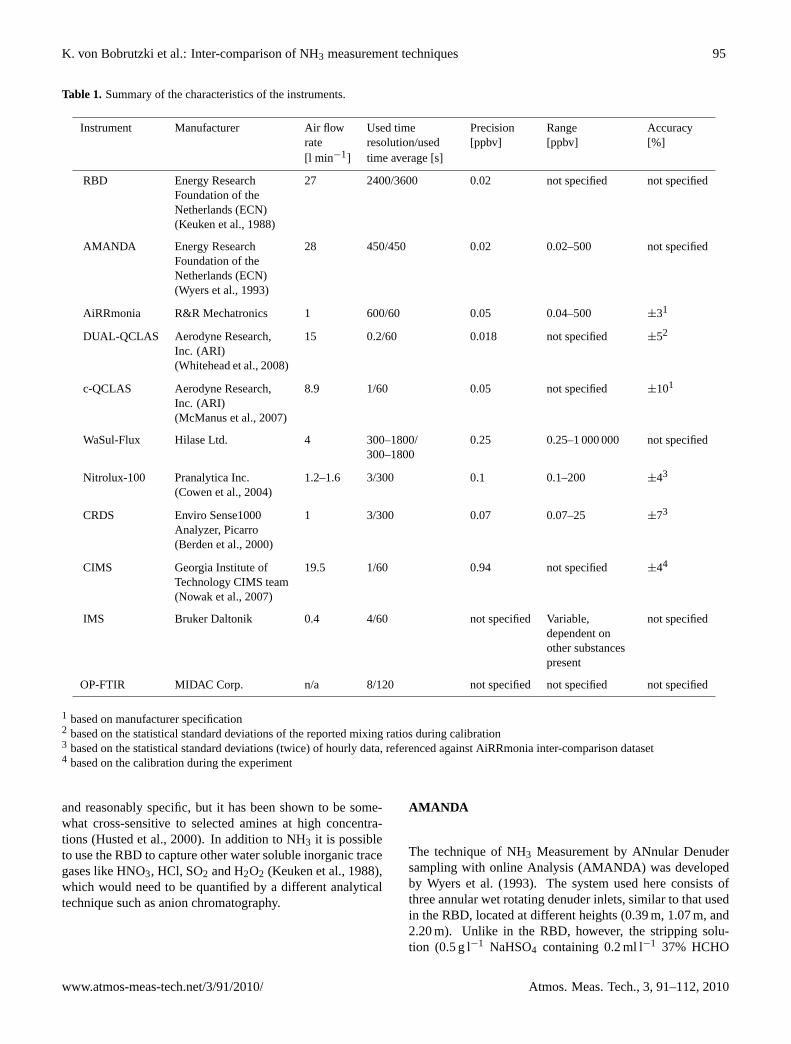
K. von Bobrutzki et al.: Inter-comparison of NH3 measurement techniques 95
Table 1. Summary of the characteristics of the instruments.
Instrument Manufacturer Air flow Used time Precision Range Accuracyrate resolution/used [ppbv] [ppbv] [%][l min−1] time average [s]
RBD Energy ResearchFoundation of theNetherlands (ECN)(Keuken et al., 1988)
27 2400/3600 0.02 not specified not specified
AMANDA Energy ResearchFoundation of theNetherlands (ECN)(Wyers et al., 1993)
28 450/450 0.02 0.02–500 not specified
AiRRmonia R&R Mechatronics 1 600/60 0.05 0.04–500 ±31
DUAL-QCLAS Aerodyne Research,Inc. (ARI)(Whitehead et al., 2008)
15 0.2/60 0.018 not specified ±52
c-QCLAS Aerodyne Research,Inc. (ARI)(McManus et al., 2007)
8.9 1/60 0.05 not specified ±101
WaSul-Flux Hilase Ltd. 4 300–1800/300–1800
0.25 0.25–1 000 000 not specified
Nitrolux-100 Pranalytica Inc.(Cowen et al., 2004)
1.2–1.6 3/300 0.1 0.1–200 ±43
CRDS Enviro Sense1000Analyzer, Picarro(Berden et al., 2000)
1 3/300 0.07 0.07–25 ±73
CIMS Georgia Institute ofTechnology CIMS team(Nowak et al., 2007)
19.5 1/60 0.94 not specified ±44
IMS Bruker Daltonik 0.4 4/60 not specified Variable,dependent onother substancespresent
not specified
OP-FTIR MIDAC Corp. n/a 8/120 not specified not specified not specified
1 based on manufacturer specification2 based on the statistical standard deviations of the reported mixing ratios during calibration3 based on the statistical standard deviations (twice) of hourly data, referenced against AiRRmonia inter-comparison dataset4 based on the calibration during the experiment
and reasonably specific, but it has been shown to be some-what cross-sensitive to selected amines at high concentra-tions (Husted et al., 2000). In addition to NH3 it is possibleto use the RBD to capture other water soluble inorganic tracegases like HNO3, HCl, SO2 and H2O2 (Keuken et al., 1988),which would need to be quantified by a different analyticaltechnique such as anion chromatography.
AMANDA
The technique of NH3 Measurement by ANnular Denudersampling with online Analysis (AMANDA) was developedby Wyers et al. (1993). The system used here consists ofthree annular wet rotating denuder inlets, similar to that usedin the RBD, located at different heights (0.39 m, 1.07 m, and2.20 m). Unlike in the RBD, however, the stripping solu-tion (0.5 g l−1 NaHSO4 containing 0.2 ml l−1 37% HCHO
www.atmos-meas-tech.net/3/91/2010/ Atmos. Meas. Tech., 3, 91–112, 2010
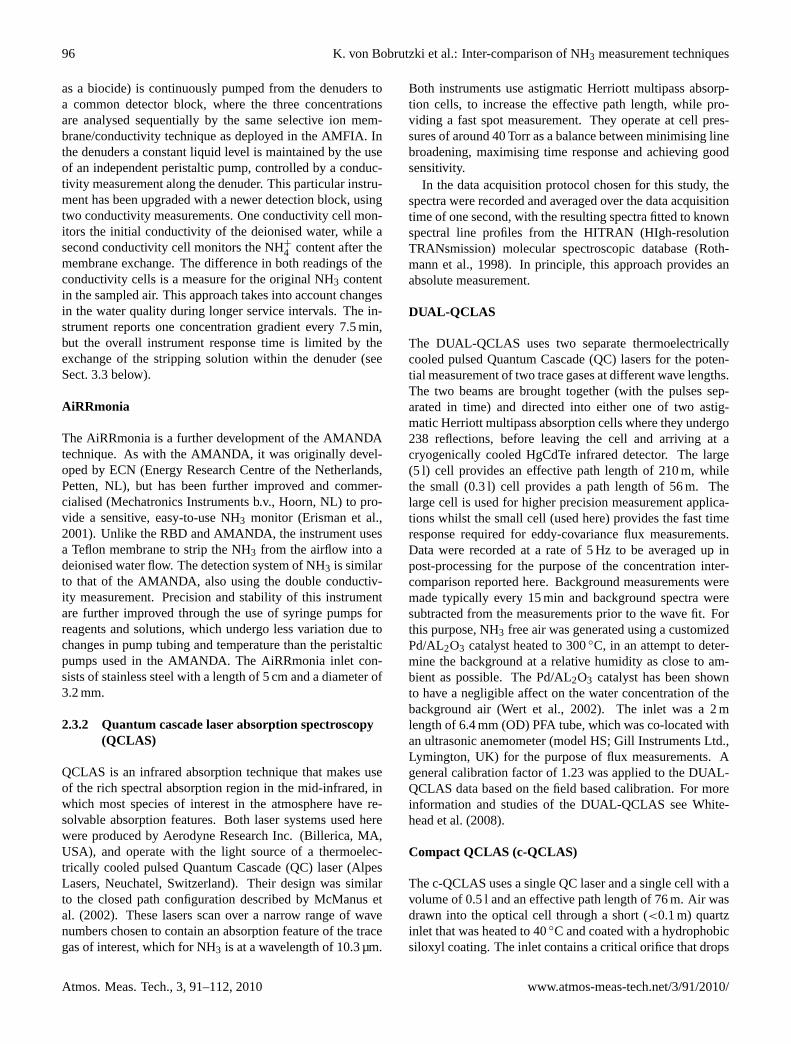
96 K. von Bobrutzki et al.: Inter-comparison of NH3 measurement techniques
as a biocide) is continuously pumped from the denuders toa common detector block, where the three concentrationsare analysed sequentially by the same selective ion mem-brane/conductivity technique as deployed in the AMFIA. Inthe denuders a constant liquid level is maintained by the useof an independent peristaltic pump, controlled by a conduc-tivity measurement along the denuder. This particular instru-ment has been upgraded with a newer detection block, usingtwo conductivity measurements. One conductivity cell mon-itors the initial conductivity of the deionised water, while asecond conductivity cell monitors the NH+
4 content after themembrane exchange. The difference in both readings of theconductivity cells is a measure for the original NH3 contentin the sampled air. This approach takes into account changesin the water quality during longer service intervals. The in-strument reports one concentration gradient every 7.5 min,but the overall instrument response time is limited by theexchange of the stripping solution within the denuder (seeSect. 3.3 below).
AiRRmonia
The AiRRmonia is a further development of the AMANDAtechnique. As with the AMANDA, it was originally devel-oped by ECN (Energy Research Centre of the Netherlands,Petten, NL), but has been further improved and commer-cialised (Mechatronics Instruments b.v., Hoorn, NL) to pro-vide a sensitive, easy-to-use NH3 monitor (Erisman et al.,2001). Unlike the RBD and AMANDA, the instrument usesa Teflon membrane to strip the NH3 from the airflow into adeionised water flow. The detection system of NH3 is similarto that of the AMANDA, also using the double conductiv-ity measurement. Precision and stability of this instrumentare further improved through the use of syringe pumps forreagents and solutions, which undergo less variation due tochanges in pump tubing and temperature than the peristalticpumps used in the AMANDA. The AiRRmonia inlet con-sists of stainless steel with a length of 5 cm and a diameter of3.2 mm.
2.3.2 Quantum cascade laser absorption spectroscopy(QCLAS)
QCLAS is an infrared absorption technique that makes useof the rich spectral absorption region in the mid-infrared, inwhich most species of interest in the atmosphere have re-solvable absorption features. Both laser systems used herewere produced by Aerodyne Research Inc. (Billerica, MA,USA), and operate with the light source of a thermoelec-trically cooled pulsed Quantum Cascade (QC) laser (AlpesLasers, Neuchatel, Switzerland). Their design was similarto the closed path configuration described by McManus etal. (2002). These lasers scan over a narrow range of wavenumbers chosen to contain an absorption feature of the tracegas of interest, which for NH3 is at a wavelength of 10.3 µm.
Both instruments use astigmatic Herriott multipass absorp-tion cells, to increase the effective path length, while pro-viding a fast spot measurement. They operate at cell pres-sures of around 40 Torr as a balance between minimising linebroadening, maximising time response and achieving goodsensitivity.
In the data acquisition protocol chosen for this study, thespectra were recorded and averaged over the data acquisitiontime of one second, with the resulting spectra fitted to knownspectral line profiles from the HITRAN (HIgh-resolutionTRANsmission) molecular spectroscopic database (Roth-mann et al., 1998). In principle, this approach provides anabsolute measurement.
DUAL-QCLAS
The DUAL-QCLAS uses two separate thermoelectricallycooled pulsed Quantum Cascade (QC) lasers for the poten-tial measurement of two trace gases at different wave lengths.The two beams are brought together (with the pulses sep-arated in time) and directed into either one of two astig-matic Herriott multipass absorption cells where they undergo238 reflections, before leaving the cell and arriving at acryogenically cooled HgCdTe infrared detector. The large(5 l) cell provides an effective path length of 210 m, whilethe small (0.3 l) cell provides a path length of 56 m. Thelarge cell is used for higher precision measurement applica-tions whilst the small cell (used here) provides the fast timeresponse required for eddy-covariance flux measurements.Data were recorded at a rate of 5 Hz to be averaged up inpost-processing for the purpose of the concentration inter-comparison reported here. Background measurements weremade typically every 15 min and background spectra weresubtracted from the measurements prior to the wave fit. Forthis purpose, NH3 free air was generated using a customizedPd/AL2O3 catalyst heated to 300C, in an attempt to deter-mine the background at a relative humidity as close to am-bient as possible. The Pd/AL2O3 catalyst has been shownto have a negligible affect on the water concentration of thebackground air (Wert et al., 2002). The inlet was a 2 mlength of 6.4 mm (OD) PFA tube, which was co-located withan ultrasonic anemometer (model HS; Gill Instruments Ltd.,Lymington, UK) for the purpose of flux measurements. Ageneral calibration factor of 1.23 was applied to the DUAL-QCLAS data based on the field based calibration. For moreinformation and studies of the DUAL-QCLAS see White-head et al. (2008).
Compact QCLAS (c-QCLAS)
The c-QCLAS uses a single QC laser and a single cell with avolume of 0.5 l and an effective path length of 76 m. Air wasdrawn into the optical cell through a short (<0.1 m) quartzinlet that was heated to 40C and coated with a hydrophobicsiloxyl coating. The inlet contains a critical orifice that drops
Atmos. Meas. Tech., 3, 91–112, 2010 www.atmos-meas-tech.net/3/91/2010/
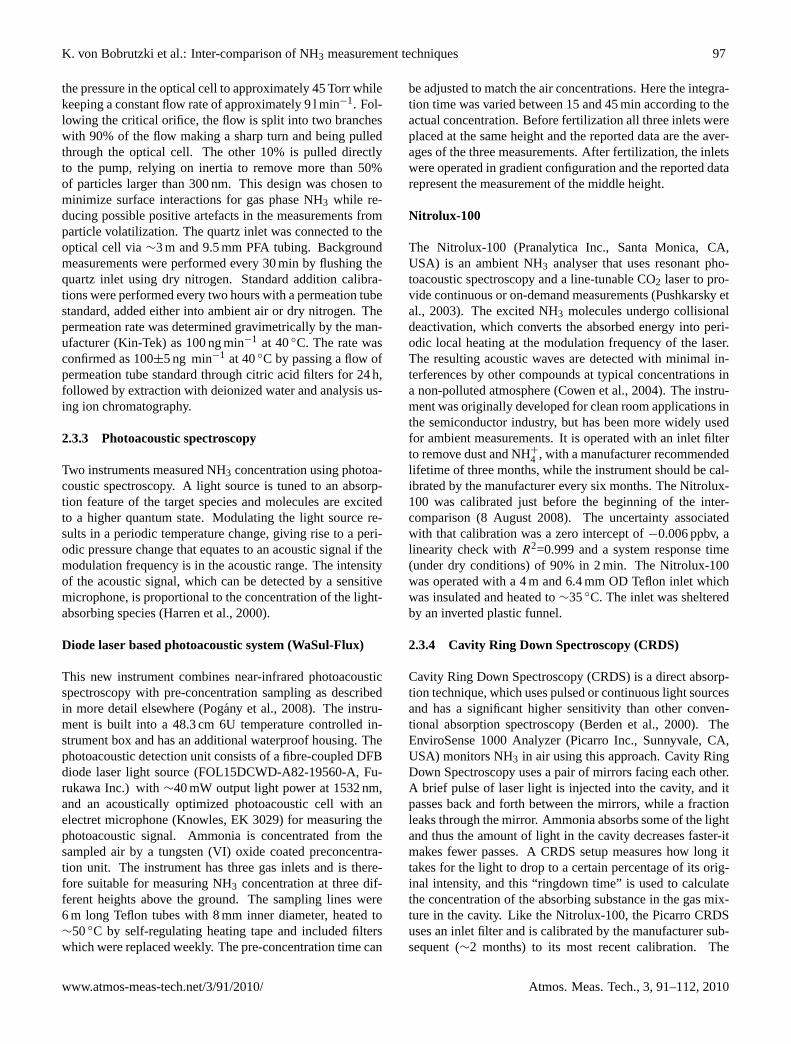
K. von Bobrutzki et al.: Inter-comparison of NH3 measurement techniques 97
the pressure in the optical cell to approximately 45 Torr whilekeeping a constant flow rate of approximately 9 l min−1. Fol-lowing the critical orifice, the flow is split into two brancheswith 90% of the flow making a sharp turn and being pulledthrough the optical cell. The other 10% is pulled directlyto the pump, relying on inertia to remove more than 50%of particles larger than 300 nm. This design was chosen tominimize surface interactions for gas phase NH3 while re-ducing possible positive artefacts in the measurements fromparticle volatilization. The quartz inlet was connected to theoptical cell via∼3 m and 9.5 mm PFA tubing. Backgroundmeasurements were performed every 30 min by flushing thequartz inlet using dry nitrogen. Standard addition calibra-tions were performed every two hours with a permeation tubestandard, added either into ambient air or dry nitrogen. Thepermeation rate was determined gravimetrically by the man-ufacturer (Kin-Tek) as 100 ng min−1 at 40C. The rate wasconfirmed as 100±5 ng min−1 at 40C by passing a flow ofpermeation tube standard through citric acid filters for 24 h,followed by extraction with deionized water and analysis us-ing ion chromatography.
2.3.3 Photoacoustic spectroscopy
Two instruments measured NH3 concentration using photoa-coustic spectroscopy. A light source is tuned to an absorp-tion feature of the target species and molecules are excitedto a higher quantum state. Modulating the light source re-sults in a periodic temperature change, giving rise to a peri-odic pressure change that equates to an acoustic signal if themodulation frequency is in the acoustic range. The intensityof the acoustic signal, which can be detected by a sensitivemicrophone, is proportional to the concentration of the light-absorbing species (Harren et al., 2000).
Diode laser based photoacoustic system (WaSul-Flux)
This new instrument combines near-infrared photoacousticspectroscopy with pre-concentration sampling as describedin more detail elsewhere (Pogany et al., 2008). The instru-ment is built into a 48.3 cm 6U temperature controlled in-strument box and has an additional waterproof housing. Thephotoacoustic detection unit consists of a fibre-coupled DFBdiode laser light source (FOL15DCWD-A82-19560-A, Fu-rukawa Inc.) with∼40 mW output light power at 1532 nm,and an acoustically optimized photoacoustic cell with anelectret microphone (Knowles, EK 3029) for measuring thephotoacoustic signal. Ammonia is concentrated from thesampled air by a tungsten (VI) oxide coated preconcentra-tion unit. The instrument has three gas inlets and is there-fore suitable for measuring NH3 concentration at three dif-ferent heights above the ground. The sampling lines were6 m long Teflon tubes with 8 mm inner diameter, heated to∼50C by self-regulating heating tape and included filterswhich were replaced weekly. The pre-concentration time can
be adjusted to match the air concentrations. Here the integra-tion time was varied between 15 and 45 min according to theactual concentration. Before fertilization all three inlets wereplaced at the same height and the reported data are the aver-ages of the three measurements. After fertilization, the inletswere operated in gradient configuration and the reported datarepresent the measurement of the middle height.
Nitrolux-100
The Nitrolux-100 (Pranalytica Inc., Santa Monica, CA,USA) is an ambient NH3 analyser that uses resonant pho-toacoustic spectroscopy and a line-tunable CO2 laser to pro-vide continuous or on-demand measurements (Pushkarsky etal., 2003). The excited NH3 molecules undergo collisionaldeactivation, which converts the absorbed energy into peri-odic local heating at the modulation frequency of the laser.The resulting acoustic waves are detected with minimal in-terferences by other compounds at typical concentrations ina non-polluted atmosphere (Cowen et al., 2004). The instru-ment was originally developed for clean room applications inthe semiconductor industry, but has been more widely usedfor ambient measurements. It is operated with an inlet filterto remove dust and NH+4 , with a manufacturer recommendedlifetime of three months, while the instrument should be cal-ibrated by the manufacturer every six months. The Nitrolux-100 was calibrated just before the beginning of the inter-comparison (8 August 2008). The uncertainty associatedwith that calibration was a zero intercept of−0.006 ppbv, alinearity check withR2=0.999 and a system response time(under dry conditions) of 90% in 2 min. The Nitrolux-100was operated with a 4 m and 6.4 mm OD Teflon inlet whichwas insulated and heated to∼35C. The inlet was shelteredby an inverted plastic funnel.
2.3.4 Cavity Ring Down Spectroscopy (CRDS)
Cavity Ring Down Spectroscopy (CRDS) is a direct absorp-tion technique, which uses pulsed or continuous light sourcesand has a significant higher sensitivity than other conven-tional absorption spectroscopy (Berden et al., 2000). TheEnviroSense 1000 Analyzer (Picarro Inc., Sunnyvale, CA,USA) monitors NH3 in air using this approach. Cavity RingDown Spectroscopy uses a pair of mirrors facing each other.A brief pulse of laser light is injected into the cavity, and itpasses back and forth between the mirrors, while a fractionleaks through the mirror. Ammonia absorbs some of the lightand thus the amount of light in the cavity decreases faster-itmakes fewer passes. A CRDS setup measures how long ittakes for the light to drop to a certain percentage of its orig-inal intensity, and this “ringdown time” is used to calculatethe concentration of the absorbing substance in the gas mix-ture in the cavity. Like the Nitrolux-100, the Picarro CRDSuses an inlet filter and is calibrated by the manufacturer sub-sequent (∼2 months) to its most recent calibration. The
www.atmos-meas-tech.net/3/91/2010/ Atmos. Meas. Tech., 3, 91–112, 2010
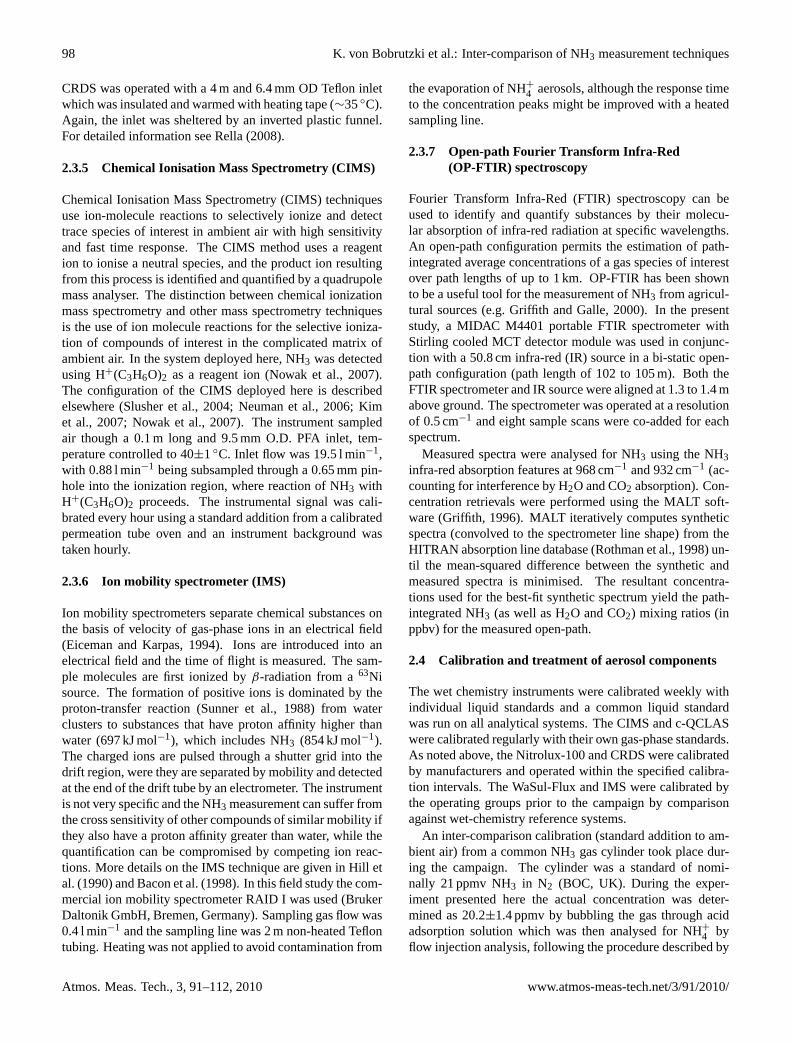
98 K. von Bobrutzki et al.: Inter-comparison of NH3 measurement techniques
CRDS was operated with a 4 m and 6.4 mm OD Teflon inletwhich was insulated and warmed with heating tape (∼35C).Again, the inlet was sheltered by an inverted plastic funnel.For detailed information see Rella (2008).
2.3.5 Chemical Ionisation Mass Spectrometry (CIMS)
Chemical Ionisation Mass Spectrometry (CIMS) techniquesuse ion-molecule reactions to selectively ionize and detecttrace species of interest in ambient air with high sensitivityand fast time response. The CIMS method uses a reagention to ionise a neutral species, and the product ion resultingfrom this process is identified and quantified by a quadrupolemass analyser. The distinction between chemical ionizationmass spectrometry and other mass spectrometry techniquesis the use of ion molecule reactions for the selective ioniza-tion of compounds of interest in the complicated matrix ofambient air. In the system deployed here, NH3 was detectedusing H+(C3H6O)2 as a reagent ion (Nowak et al., 2007).The configuration of the CIMS deployed here is describedelsewhere (Slusher et al., 2004; Neuman et al., 2006; Kimet al., 2007; Nowak et al., 2007). The instrument sampledair though a 0.1 m long and 9.5 mm O.D. PFA inlet, tem-perature controlled to 40±1C. Inlet flow was 19.5 l min−1,with 0.88 l min−1 being subsampled through a 0.65 mm pin-hole into the ionization region, where reaction of NH3 withH+(C3H6O)2 proceeds. The instrumental signal was cali-brated every hour using a standard addition from a calibratedpermeation tube oven and an instrument background wastaken hourly.
2.3.6 Ion mobility spectrometer (IMS)
Ion mobility spectrometers separate chemical substances onthe basis of velocity of gas-phase ions in an electrical field(Eiceman and Karpas, 1994). Ions are introduced into anelectrical field and the time of flight is measured. The sam-ple molecules are first ionized byβ-radiation from a63Nisource. The formation of positive ions is dominated by theproton-transfer reaction (Sunner et al., 1988) from waterclusters to substances that have proton affinity higher thanwater (697 kJ mol−1), which includes NH3 (854 kJ mol−1).The charged ions are pulsed through a shutter grid into thedrift region, were they are separated by mobility and detectedat the end of the drift tube by an electrometer. The instrumentis not very specific and the NH3 measurement can suffer fromthe cross sensitivity of other compounds of similar mobility ifthey also have a proton affinity greater than water, while thequantification can be compromised by competing ion reac-tions. More details on the IMS technique are given in Hill etal. (1990) and Bacon et al. (1998). In this field study the com-mercial ion mobility spectrometer RAID I was used (BrukerDaltonik GmbH, Bremen, Germany). Sampling gas flow was0.4 l min−1 and the sampling line was 2 m non-heated Teflontubing. Heating was not applied to avoid contamination from
the evaporation of NH+4 aerosols, although the response timeto the concentration peaks might be improved with a heatedsampling line.
2.3.7 Open-path Fourier Transform Infra-Red(OP-FTIR) spectroscopy
Fourier Transform Infra-Red (FTIR) spectroscopy can beused to identify and quantify substances by their molecu-lar absorption of infra-red radiation at specific wavelengths.An open-path configuration permits the estimation of path-integrated average concentrations of a gas species of interestover path lengths of up to 1 km. OP-FTIR has been shownto be a useful tool for the measurement of NH3 from agricul-tural sources (e.g. Griffith and Galle, 2000). In the presentstudy, a MIDAC M4401 portable FTIR spectrometer withStirling cooled MCT detector module was used in conjunc-tion with a 50.8 cm infra-red (IR) source in a bi-static open-path configuration (path length of 102 to 105 m). Both theFTIR spectrometer and IR source were aligned at 1.3 to 1.4 mabove ground. The spectrometer was operated at a resolutionof 0.5 cm−1 and eight sample scans were co-added for eachspectrum.
Measured spectra were analysed for NH3 using the NH3infra-red absorption features at 968 cm−1 and 932 cm−1 (ac-counting for interference by H2O and CO2 absorption). Con-centration retrievals were performed using the MALT soft-ware (Griffith, 1996). MALT iteratively computes syntheticspectra (convolved to the spectrometer line shape) from theHITRAN absorption line database (Rothman et al., 1998) un-til the mean-squared difference between the synthetic andmeasured spectra is minimised. The resultant concentra-tions used for the best-fit synthetic spectrum yield the path-integrated NH3 (as well as H2O and CO2) mixing ratios (inppbv) for the measured open-path.
2.4 Calibration and treatment of aerosol components
The wet chemistry instruments were calibrated weekly withindividual liquid standards and a common liquid standardwas run on all analytical systems. The CIMS and c-QCLASwere calibrated regularly with their own gas-phase standards.As noted above, the Nitrolux-100 and CRDS were calibratedby manufacturers and operated within the specified calibra-tion intervals. The WaSul-Flux and IMS were calibrated bythe operating groups prior to the campaign by comparisonagainst wet-chemistry reference systems.
An inter-comparison calibration (standard addition to am-bient air) from a common NH3 gas cylinder took place dur-ing the campaign. The cylinder was a standard of nomi-nally 21 ppmv NH3 in N2 (BOC, UK). During the exper-iment presented here the actual concentration was deter-mined as 20.2±1.4 ppmv by bubbling the gas through acidadsorption solution which was then analysed for NH+
4 byflow injection analysis, following the procedure described by
Atmos. Meas. Tech., 3, 91–112, 2010 www.atmos-meas-tech.net/3/91/2010/
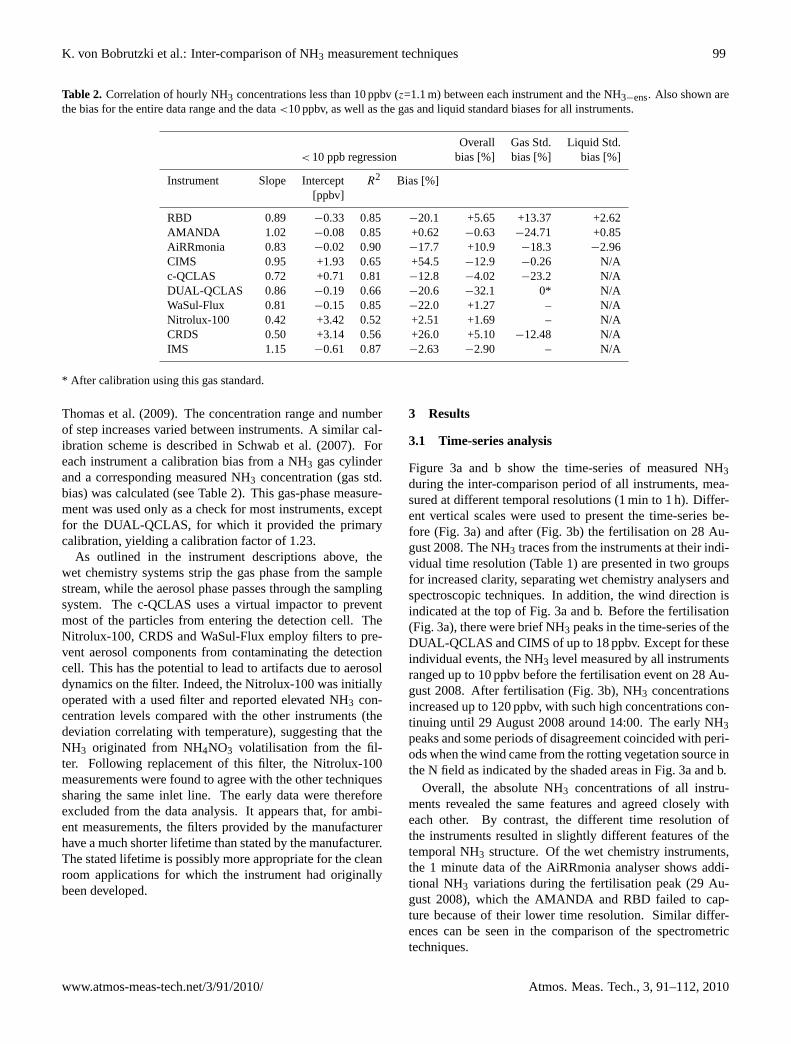
K. von Bobrutzki et al.: Inter-comparison of NH3 measurement techniques 99
Table 2. Correlation of hourly NH3 concentrations less than 10 ppbv (z=1.1 m) between each instrument and the NH3−ens. Also shown arethe bias for the entire data range and the data<10 ppbv, as well as the gas and liquid standard biases for all instruments.
Overall Gas Std. Liquid Std.< 10 ppb regression bias [%] bias [%] bias [%]
Instrument Slope Intercept R2 Bias [%][ppbv]
RBD 0.89 −0.33 0.85 −20.1 +5.65 +13.37 +2.62AMANDA 1.02 −0.08 0.85 +0.62 −0.63 −24.71 +0.85AiRRmonia 0.83 −0.02 0.90 −17.7 +10.9 −18.3 −2.96CIMS 0.95 +1.93 0.65 +54.5 −12.9 −0.26 N/Ac-QCLAS 0.72 +0.71 0.81 −12.8 −4.02 −23.2 N/ADUAL-QCLAS 0.86 −0.19 0.66 −20.6 −32.1 0* N/AWaSul-Flux 0.81 −0.15 0.85 −22.0 +1.27 – N/ANitrolux-100 0.42 +3.42 0.52 +2.51 +1.69 – N/ACRDS 0.50 +3.14 0.56 +26.0 +5.10 −12.48 N/AIMS 1.15 −0.61 0.87 −2.63 −2.90 – N/A
* After calibration using this gas standard.
Thomas et al. (2009). The concentration range and numberof step increases varied between instruments. A similar cal-ibration scheme is described in Schwab et al. (2007). Foreach instrument a calibration bias from a NH3 gas cylinderand a corresponding measured NH3 concentration (gas std.bias) was calculated (see Table 2). This gas-phase measure-ment was used only as a check for most instruments, exceptfor the DUAL-QCLAS, for which it provided the primarycalibration, yielding a calibration factor of 1.23.
As outlined in the instrument descriptions above, thewet chemistry systems strip the gas phase from the samplestream, while the aerosol phase passes through the samplingsystem. The c-QCLAS uses a virtual impactor to preventmost of the particles from entering the detection cell. TheNitrolux-100, CRDS and WaSul-Flux employ filters to pre-vent aerosol components from contaminating the detectioncell. This has the potential to lead to artifacts due to aerosoldynamics on the filter. Indeed, the Nitrolux-100 was initiallyoperated with a used filter and reported elevated NH3 con-centration levels compared with the other instruments (thedeviation correlating with temperature), suggesting that theNH3 originated from NH4NO3 volatilisation from the fil-ter. Following replacement of this filter, the Nitrolux-100measurements were found to agree with the other techniquessharing the same inlet line. The early data were thereforeexcluded from the data analysis. It appears that, for ambi-ent measurements, the filters provided by the manufacturerhave a much shorter lifetime than stated by the manufacturer.The stated lifetime is possibly more appropriate for the cleanroom applications for which the instrument had originallybeen developed.
3 Results
3.1 Time-series analysis
Figure 3a and b show the time-series of measured NH3during the inter-comparison period of all instruments, mea-sured at different temporal resolutions (1 min to 1 h). Differ-ent vertical scales were used to present the time-series be-fore (Fig. 3a) and after (Fig. 3b) the fertilisation on 28 Au-gust 2008. The NH3 traces from the instruments at their indi-vidual time resolution (Table 1) are presented in two groupsfor increased clarity, separating wet chemistry analysers andspectroscopic techniques. In addition, the wind direction isindicated at the top of Fig. 3a and b. Before the fertilisation(Fig. 3a), there were brief NH3 peaks in the time-series of theDUAL-QCLAS and CIMS of up to 18 ppbv. Except for theseindividual events, the NH3 level measured by all instrumentsranged up to 10 ppbv before the fertilisation event on 28 Au-gust 2008. After fertilisation (Fig. 3b), NH3 concentrationsincreased up to 120 ppbv, with such high concentrations con-tinuing until 29 August 2008 around 14:00. The early NH3peaks and some periods of disagreement coincided with peri-ods when the wind came from the rotting vegetation source inthe N field as indicated by the shaded areas in Fig. 3a and b.
Overall, the absolute NH3 concentrations of all instru-ments revealed the same features and agreed closely witheach other. By contrast, the different time resolution ofthe instruments resulted in slightly different features of thetemporal NH3 structure. Of the wet chemistry instruments,the 1 minute data of the AiRRmonia analyser shows addi-tional NH3 variations during the fertilisation peak (29 Au-gust 2008), which the AMANDA and RBD failed to cap-ture because of their lower time resolution. Similar differ-ences can be seen in the comparison of the spectrometrictechniques.
www.atmos-meas-tech.net/3/91/2010/ Atmos. Meas. Tech., 3, 91–112, 2010
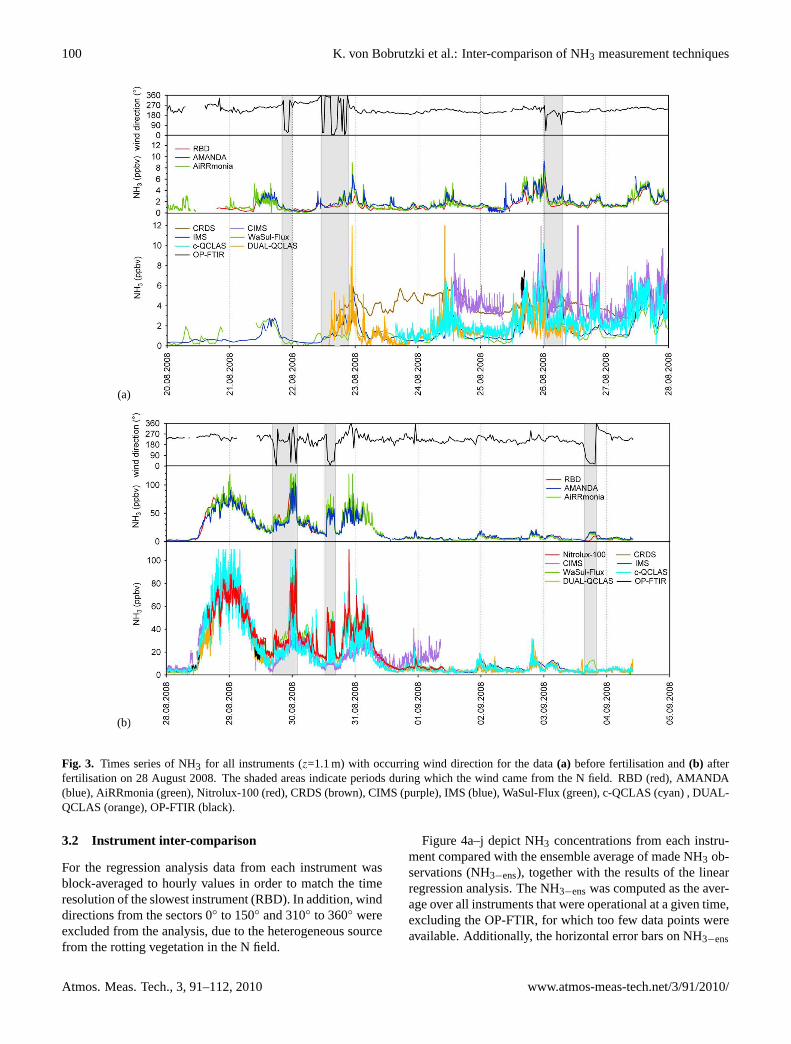
100 K. von Bobrutzki et al.: Inter-comparison of NH3 measurement techniques
(a)
(b)
Fig. 3. Times series of NH3 for all instruments (z=1.1 m) with occurring wind direction for the data(a) before fertilisation and(b) afterfertilisation on 28 August 2008. The shaded areas indicate periods during which the wind came from the N field. RBD (red), AMANDA(blue), AiRRmonia (green), Nitrolux-100 (red), CRDS (brown), CIMS (purple), IMS (blue), WaSul-Flux (green), c-QCLAS (cyan) , DUAL-QCLAS (orange), OP-FTIR (black).
3.2 Instrument inter-comparison
For the regression analysis data from each instrument wasblock-averaged to hourly values in order to match the timeresolution of the slowest instrument (RBD). In addition, winddirections from the sectors 0 to 150 and 310 to 360 wereexcluded from the analysis, due to the heterogeneous sourcefrom the rotting vegetation in the N field.
Figure 4a–j depict NH3 concentrations from each instru-ment compared with the ensemble average of made NH3 ob-servations (NH3−ens), together with the results of the linearregression analysis. The NH3−enswas computed as the aver-age over all instruments that were operational at a given time,excluding the OP-FTIR, for which too few data points wereavailable. Additionally, the horizontal error bars on NH3−ens
Atmos. Meas. Tech., 3, 91–112, 2010 www.atmos-meas-tech.net/3/91/2010/
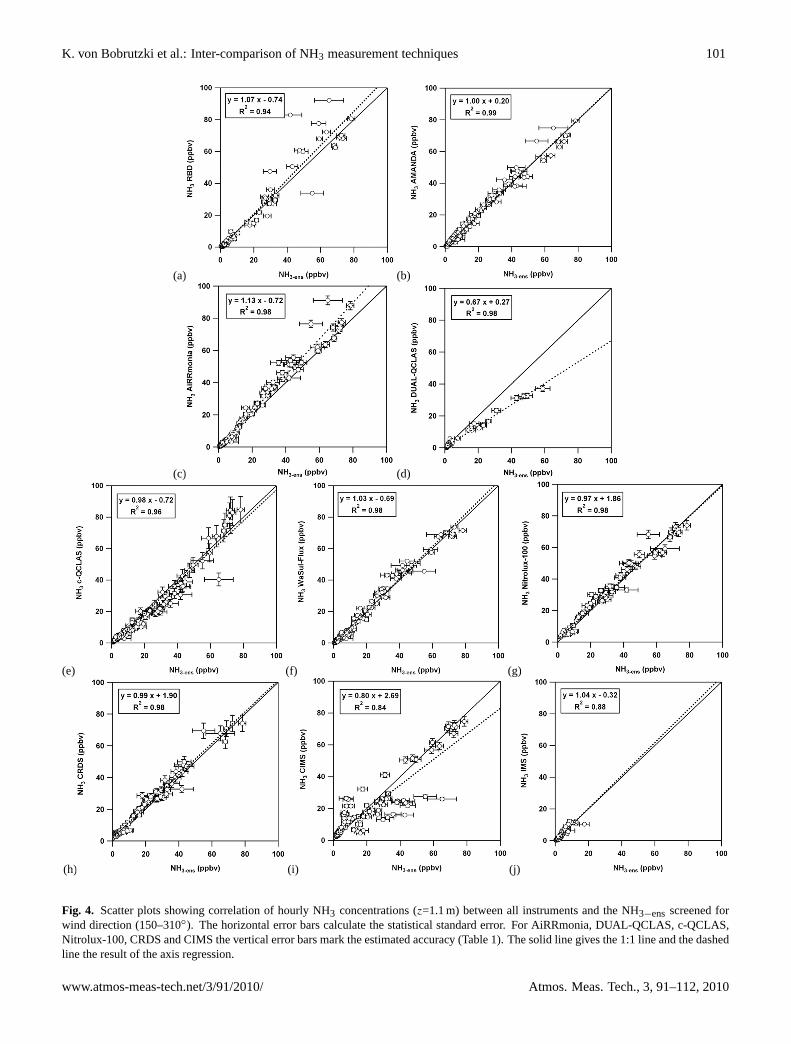
K. von Bobrutzki et al.: Inter-comparison of NH3 measurement techniques 101
(a) (b)
(c) (d)
(e) (f) (g)
(h) (i) (j)
Fig. 4. Scatter plots showing correlation of hourly NH3 concentrations (z=1.1 m) between all instruments and the NH3−ens screened forwind direction (150–310). The horizontal error bars calculate the statistical standard error. For AiRRmonia, DUAL-QCLAS, c-QCLAS,Nitrolux-100, CRDS and CIMS the vertical error bars mark the estimated accuracy (Table 1). The solid line gives the 1:1 line and the dashedline the result of the axis regression.
www.atmos-meas-tech.net/3/91/2010/ Atmos. Meas. Tech., 3, 91–112, 2010
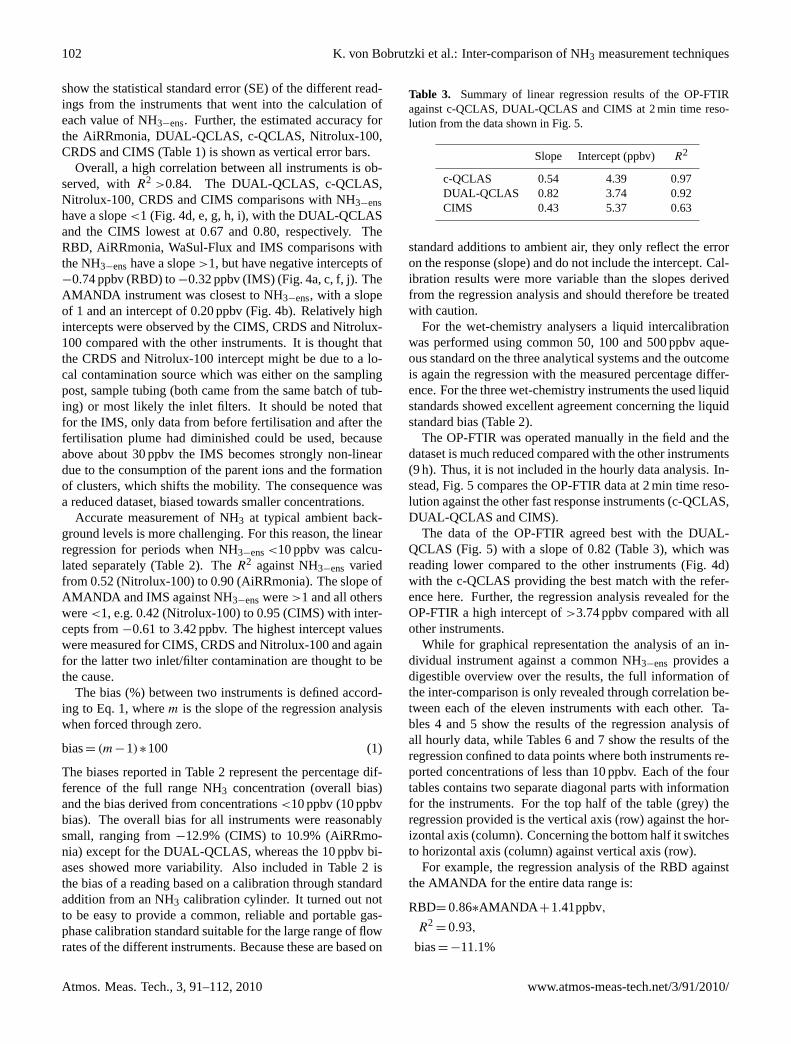
102 K. von Bobrutzki et al.: Inter-comparison of NH3 measurement techniques
show the statistical standard error (SE) of the different read-ings from the instruments that went into the calculation ofeach value of NH3−ens. Further, the estimated accuracy forthe AiRRmonia, DUAL-QCLAS, c-QCLAS, Nitrolux-100,CRDS and CIMS (Table 1) is shown as vertical error bars.
Overall, a high correlation between all instruments is ob-served, withR2 >0.84. The DUAL-QCLAS, c-QCLAS,Nitrolux-100, CRDS and CIMS comparisons with NH3−enshave a slope<1 (Fig. 4d, e, g, h, i), with the DUAL-QCLASand the CIMS lowest at 0.67 and 0.80, respectively. TheRBD, AiRRmonia, WaSul-Flux and IMS comparisons withthe NH3−enshave a slope>1, but have negative intercepts of−0.74 ppbv (RBD) to−0.32 ppbv (IMS) (Fig. 4a, c, f, j). TheAMANDA instrument was closest to NH3−ens, with a slopeof 1 and an intercept of 0.20 ppbv (Fig. 4b). Relatively highintercepts were observed by the CIMS, CRDS and Nitrolux-100 compared with the other instruments. It is thought thatthe CRDS and Nitrolux-100 intercept might be due to a lo-cal contamination source which was either on the samplingpost, sample tubing (both came from the same batch of tub-ing) or most likely the inlet filters. It should be noted thatfor the IMS, only data from before fertilisation and after thefertilisation plume had diminished could be used, becauseabove about 30 ppbv the IMS becomes strongly non-lineardue to the consumption of the parent ions and the formationof clusters, which shifts the mobility. The consequence wasa reduced dataset, biased towards smaller concentrations.
Accurate measurement of NH3 at typical ambient back-ground levels is more challenging. For this reason, the linearregression for periods when NH3−ens<10 ppbv was calcu-lated separately (Table 2). TheR2 against NH3−ens variedfrom 0.52 (Nitrolux-100) to 0.90 (AiRRmonia). The slope ofAMANDA and IMS against NH3−enswere>1 and all otherswere<1, e.g. 0.42 (Nitrolux-100) to 0.95 (CIMS) with inter-cepts from−0.61 to 3.42 ppbv. The highest intercept valueswere measured for CIMS, CRDS and Nitrolux-100 and againfor the latter two inlet/filter contamination are thought to bethe cause.
The bias (%) between two instruments is defined accord-ing to Eq. 1, wherem is the slope of the regression analysiswhen forced through zero.
bias= (m−1)∗100 (1)
The biases reported in Table 2 represent the percentage dif-ference of the full range NH3 concentration (overall bias)and the bias derived from concentrations<10 ppbv (10 ppbvbias). The overall bias for all instruments were reasonablysmall, ranging from−12.9% (CIMS) to 10.9% (AiRRmo-nia) except for the DUAL-QCLAS, whereas the 10 ppbv bi-ases showed more variability. Also included in Table 2 isthe bias of a reading based on a calibration through standardaddition from an NH3 calibration cylinder. It turned out notto be easy to provide a common, reliable and portable gas-phase calibration standard suitable for the large range of flowrates of the different instruments. Because these are based on
Table 3. Summary of linear regression results of the OP-FTIRagainst c-QCLAS, DUAL-QCLAS and CIMS at 2 min time reso-lution from the data shown in Fig. 5.
Slope Intercept (ppbv) R2
c-QCLAS 0.54 4.39 0.97DUAL-QCLAS 0.82 3.74 0.92CIMS 0.43 5.37 0.63
standard additions to ambient air, they only reflect the erroron the response (slope) and do not include the intercept. Cal-ibration results were more variable than the slopes derivedfrom the regression analysis and should therefore be treatedwith caution.
For the wet-chemistry analysers a liquid intercalibrationwas performed using common 50, 100 and 500 ppbv aque-ous standard on the three analytical systems and the outcomeis again the regression with the measured percentage differ-ence. For the three wet-chemistry instruments the used liquidstandards showed excellent agreement concerning the liquidstandard bias (Table 2).
The OP-FTIR was operated manually in the field and thedataset is much reduced compared with the other instruments(9 h). Thus, it is not included in the hourly data analysis. In-stead, Fig. 5 compares the OP-FTIR data at 2 min time reso-lution against the other fast response instruments (c-QCLAS,DUAL-QCLAS and CIMS).
The data of the OP-FTIR agreed best with the DUAL-QCLAS (Fig. 5) with a slope of 0.82 (Table 3), which wasreading lower compared to the other instruments (Fig. 4d)with the c-QCLAS providing the best match with the refer-ence here. Further, the regression analysis revealed for theOP-FTIR a high intercept of>3.74 ppbv compared with allother instruments.
While for graphical representation the analysis of an in-dividual instrument against a common NH3−ens provides adigestible overview over the results, the full information ofthe inter-comparison is only revealed through correlation be-tween each of the eleven instruments with each other. Ta-bles 4 and 5 show the results of the regression analysis ofall hourly data, while Tables 6 and 7 show the results of theregression confined to data points where both instruments re-ported concentrations of less than 10 ppbv. Each of the fourtables contains two separate diagonal parts with informationfor the instruments. For the top half of the table (grey) theregression provided is the vertical axis (row) against the hor-izontal axis (column). Concerning the bottom half it switchesto horizontal axis (column) against vertical axis (row).
For example, the regression analysis of the RBD againstthe AMANDA for the entire data range is:
RBD= 0.86∗AMANDA +1.41ppbv,
R2= 0.93,
bias= −11.1%
Atmos. Meas. Tech., 3, 91–112, 2010 www.atmos-meas-tech.net/3/91/2010/
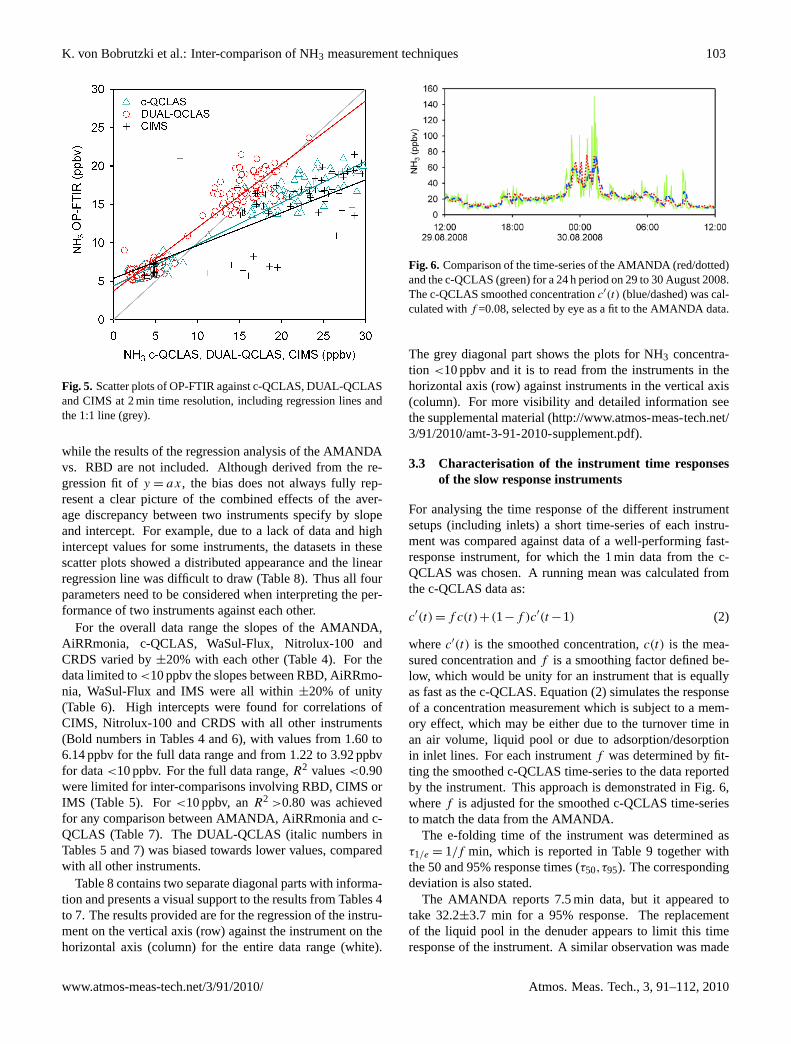
K. von Bobrutzki et al.: Inter-comparison of NH3 measurement techniques 103
Fig. 5. Scatter plots of OP-FTIR against c-QCLAS, DUAL-QCLASand CIMS at 2 min time resolution, including regression lines andthe 1:1 line (grey).
while the results of the regression analysis of the AMANDAvs. RBD are not included. Although derived from the re-gression fit ofy = ax, the bias does not always fully rep-resent a clear picture of the combined effects of the aver-age discrepancy between two instruments specify by slopeand intercept. For example, due to a lack of data and highintercept values for some instruments, the datasets in thesescatter plots showed a distributed appearance and the linearregression line was difficult to draw (Table 8). Thus all fourparameters need to be considered when interpreting the per-formance of two instruments against each other.
For the overall data range the slopes of the AMANDA,AiRRmonia, c-QCLAS, WaSul-Flux, Nitrolux-100 andCRDS varied by±20% with each other (Table 4). For thedata limited to<10 ppbv the slopes between RBD, AiRRmo-nia, WaSul-Flux and IMS were all within±20% of unity(Table 6). High intercepts were found for correlations ofCIMS, Nitrolux-100 and CRDS with all other instruments(Bold numbers in Tables 4 and 6), with values from 1.60 to6.14 ppbv for the full data range and from 1.22 to 3.92 ppbvfor data<10 ppbv. For the full data range,R2 values<0.90were limited for inter-comparisons involving RBD, CIMS orIMS (Table 5). For<10 ppbv, anR2 >0.80 was achievedfor any comparison between AMANDA, AiRRmonia and c-QCLAS (Table 7). The DUAL-QCLAS (italic numbers inTables 5 and 7) was biased towards lower values, comparedwith all other instruments.
Table 8 contains two separate diagonal parts with informa-tion and presents a visual support to the results from Tables 4to 7. The results provided are for the regression of the instru-ment on the vertical axis (row) against the instrument on thehorizontal axis (column) for the entire data range (white).
Fig. 6. Comparison of the time-series of the AMANDA (red/dotted)and the c-QCLAS (green) for a 24 h period on 29 to 30 August 2008.The c-QCLAS smoothed concentrationc′(t) (blue/dashed) was cal-culated withf =0.08, selected by eye as a fit to the AMANDA data.
The grey diagonal part shows the plots for NH3 concentra-tion <10 ppbv and it is to read from the instruments in thehorizontal axis (row) against instruments in the vertical axis(column). For more visibility and detailed information seethe supplemental material (http://www.atmos-meas-tech.net/3/91/2010/amt-3-91-2010-supplement.pdf).
3.3 Characterisation of the instrument time responsesof the slow response instruments
For analysing the time response of the different instrumentsetups (including inlets) a short time-series of each instru-ment was compared against data of a well-performing fast-response instrument, for which the 1 min data from the c-QCLAS was chosen. A running mean was calculated fromthe c-QCLAS data as:
c′(t) = f c(t)+(1−f )c′(t −1) (2)
wherec′(t) is the smoothed concentration,c(t) is the mea-sured concentration andf is a smoothing factor defined be-low, which would be unity for an instrument that is equallyas fast as the c-QCLAS. Equation (2) simulates the responseof a concentration measurement which is subject to a mem-ory effect, which may be either due to the turnover time inan air volume, liquid pool or due to adsorption/desorptionin inlet lines. For each instrumentf was determined by fit-ting the smoothed c-QCLAS time-series to the data reportedby the instrument. This approach is demonstrated in Fig. 6,wheref is adjusted for the smoothed c-QCLAS time-seriesto match the data from the AMANDA.
The e-folding time of the instrument was determined asτ1/e = 1/f min, which is reported in Table 9 together withthe 50 and 95% response times (τ50,τ95). The correspondingdeviation is also stated.
The AMANDA reports 7.5 min data, but it appeared totake 32.2±3.7 min for a 95% response. The replacementof the liquid pool in the denuder appears to limit this timeresponse of the instrument. A similar observation was made
www.atmos-meas-tech.net/3/91/2010/ Atmos. Meas. Tech., 3, 91–112, 2010
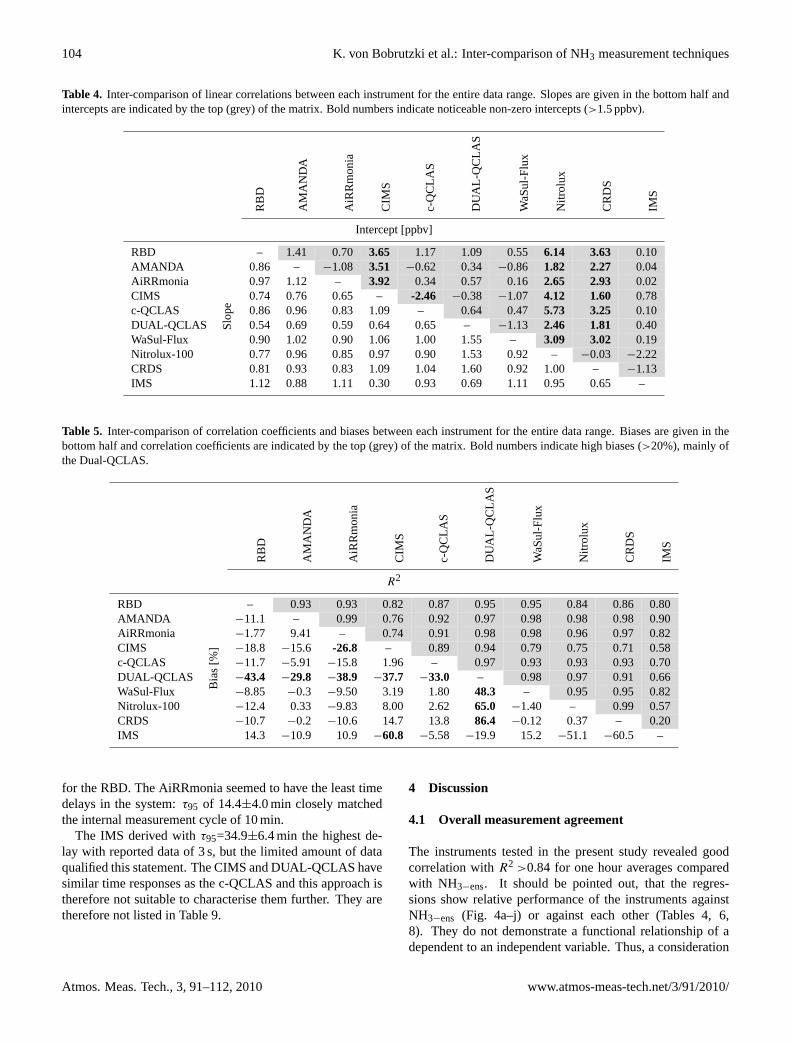
104 K. von Bobrutzki et al.: Inter-comparison of NH3 measurement techniques
Table 4. Inter-comparison of linear correlations between each instrument for the entire data range. Slopes are given in the bottom half andintercepts are indicated by the top (grey) of the matrix. Bold numbers indicate noticeable non-zero intercepts (>1.5 ppbv).
RB
D
AM
AN
DA
AiR
Rm
onia
CIM
S
c-Q
CLA
S
DU
AL-
QC
LAS
WaS
ul-F
lux
Nitr
olux
CR
DS
IMS
Intercept [ppbv]
RBD
Slo
pe
– 1.41 0.70 3.65 1.17 1.09 0.55 6.14 3.63 0.10AMANDA 0.86 – −1.08 3.51 −0.62 0.34 −0.86 1.82 2.27 0.04AiRRmonia 0.97 1.12 – 3.92 0.34 0.57 0.16 2.65 2.93 0.02CIMS 0.74 0.76 0.65 – -2.46 −0.38 −1.07 4.12 1.60 0.78c-QCLAS 0.86 0.96 0.83 1.09 – 0.64 0.47 5.73 3.25 0.10DUAL-QCLAS 0.54 0.69 0.59 0.64 0.65 – −1.13 2.46 1.81 0.40WaSul-Flux 0.90 1.02 0.90 1.06 1.00 1.55 – 3.09 3.02 0.19Nitrolux-100 0.77 0.96 0.85 0.97 0.90 1.53 0.92 – −0.03 −2.22CRDS 0.81 0.93 0.83 1.09 1.04 1.60 0.92 1.00 – −1.13IMS 1.12 0.88 1.11 0.30 0.93 0.69 1.11 0.95 0.65 –
Table 5. Inter-comparison of correlation coefficients and biases between each instrument for the entire data range. Biases are given in thebottom half and correlation coefficients are indicated by the top (grey) of the matrix. Bold numbers indicate high biases (>20%), mainly ofthe Dual-QCLAS.
RB
D
AM
AN
DA
AiR
Rm
onia
CIM
S
c-Q
CLA
S
DU
AL-
QC
LAS
WaS
ul-F
lux
Nitr
olux
CR
DS
IMS
R2
RBD
Bia
s[%
]
– 0.93 0.93 0.82 0.87 0.95 0.95 0.84 0.86 0.80AMANDA −11.1 – 0.99 0.76 0.92 0.97 0.98 0.98 0.98 0.90AiRRmonia −1.77 9.41 – 0.74 0.91 0.98 0.98 0.96 0.97 0.82CIMS −18.8 −15.6 -26.8 – 0.89 0.94 0.79 0.75 0.71 0.58c-QCLAS −11.7 −5.91 −15.8 1.96 – 0.97 0.93 0.93 0.93 0.70DUAL-QCLAS −43.4 −29.8 −38.9 −37.7 −33.0 – 0.98 0.97 0.91 0.66WaSul-Flux −8.85 −0.3 −9.50 3.19 1.80 48.3 – 0.95 0.95 0.82Nitrolux-100 −12.4 0.33 −9.83 8.00 2.62 65.0 −1.40 – 0.99 0.57CRDS −10.7 −0.2 −10.6 14.7 13.8 86.4 −0.12 0.37 – 0.20IMS 14.3 −10.9 10.9 −60.8 −5.58 −19.9 15.2 −51.1 −60.5 –
for the RBD. The AiRRmonia seemed to have the least timedelays in the system:τ95 of 14.4±4.0 min closely matchedthe internal measurement cycle of 10 min.
The IMS derived withτ95=34.9±6.4 min the highest de-lay with reported data of 3 s, but the limited amount of dataqualified this statement. The CIMS and DUAL-QCLAS havesimilar time responses as the c-QCLAS and this approach istherefore not suitable to characterise them further. They aretherefore not listed in Table 9.
4 Discussion
4.1 Overall measurement agreement
The instruments tested in the present study revealed goodcorrelation withR2 >0.84 for one hour averages comparedwith NH3−ens. It should be pointed out, that the regres-sions show relative performance of the instruments againstNH3−ens (Fig. 4a–j) or against each other (Tables 4, 6,8). They do not demonstrate a functional relationship of adependent to an independent variable. Thus, a consideration
Atmos. Meas. Tech., 3, 91–112, 2010 www.atmos-meas-tech.net/3/91/2010/
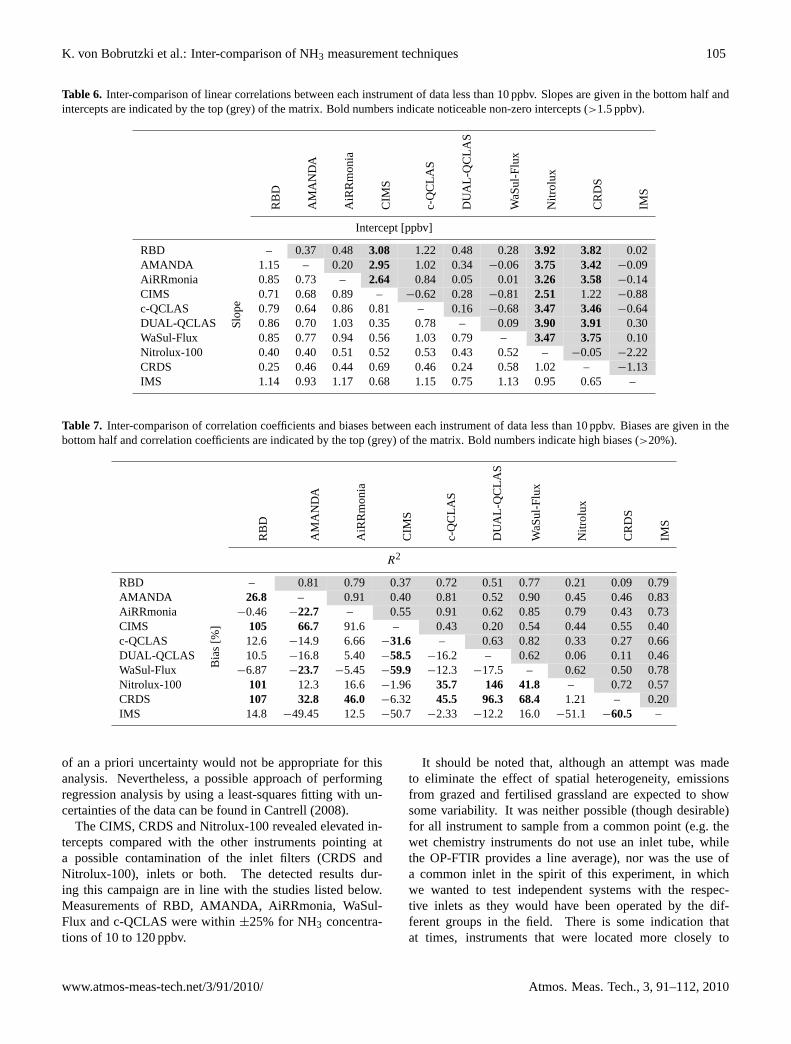
K. von Bobrutzki et al.: Inter-comparison of NH3 measurement techniques 105
Table 6. Inter-comparison of linear correlations between each instrument of data less than 10 ppbv. Slopes are given in the bottom half andintercepts are indicated by the top (grey) of the matrix. Bold numbers indicate noticeable non-zero intercepts (>1.5 ppbv).
RB
D
AM
AN
DA
AiR
Rm
onia
CIM
S
c-Q
CLA
S
DU
AL-
QC
LAS
WaS
ul-F
lux
Nitr
olux
CR
DS
IMS
Intercept [ppbv]
RBDS
lope
– 0.37 0.48 3.08 1.22 0.48 0.28 3.92 3.82 0.02AMANDA 1.15 – 0.20 2.95 1.02 0.34 −0.06 3.75 3.42 −0.09AiRRmonia 0.85 0.73 – 2.64 0.84 0.05 0.01 3.26 3.58 −0.14CIMS 0.71 0.68 0.89 – −0.62 0.28 −0.81 2.51 1.22 −0.88c-QCLAS 0.79 0.64 0.86 0.81 – 0.16 −0.68 3.47 3.46 −0.64DUAL-QCLAS 0.86 0.70 1.03 0.35 0.78 – 0.09 3.90 3.91 0.30WaSul-Flux 0.85 0.77 0.94 0.56 1.03 0.79 – 3.47 3.75 0.10Nitrolux-100 0.40 0.40 0.51 0.52 0.53 0.43 0.52 – −0.05 −2.22CRDS 0.25 0.46 0.44 0.69 0.46 0.24 0.58 1.02 – −1.13IMS 1.14 0.93 1.17 0.68 1.15 0.75 1.13 0.95 0.65 –
Table 7. Inter-comparison of correlation coefficients and biases between each instrument of data less than 10 ppbv. Biases are given in thebottom half and correlation coefficients are indicated by the top (grey) of the matrix. Bold numbers indicate high biases (>20%).
RB
D
AM
AN
DA
AiR
Rm
onia
CIM
S
c-Q
CLA
S
DU
AL-
QC
LAS
WaS
ul-F
lux
Nitr
olux
CR
DS
IMS
R2
RBD
Bia
s[%
]
– 0.81 0.79 0.37 0.72 0.51 0.77 0.21 0.09 0.79AMANDA 26.8 – 0.91 0.40 0.81 0.52 0.90 0.45 0.46 0.83AiRRmonia −0.46 −22.7 – 0.55 0.91 0.62 0.85 0.79 0.43 0.73CIMS 105 66.7 91.6 – 0.43 0.20 0.54 0.44 0.55 0.40c-QCLAS 12.6 −14.9 6.66 −31.6 – 0.63 0.82 0.33 0.27 0.66DUAL-QCLAS 10.5 −16.8 5.40 −58.5 −16.2 – 0.62 0.06 0.11 0.46WaSul-Flux −6.87 −23.7 −5.45 −59.9 −12.3 −17.5 – 0.62 0.50 0.78Nitrolux-100 101 12.3 16.6 −1.96 35.7 146 41.8 – 0.72 0.57CRDS 107 32.8 46.0 −6.32 45.5 96.3 68.4 1.21 – 0.20IMS 14.8 −49.45 12.5 −50.7 −2.33 −12.2 16.0 −51.1 −60.5 –
of an a priori uncertainty would not be appropriate for thisanalysis. Nevertheless, a possible approach of performingregression analysis by using a least-squares fitting with un-certainties of the data can be found in Cantrell (2008).
The CIMS, CRDS and Nitrolux-100 revealed elevated in-tercepts compared with the other instruments pointing ata possible contamination of the inlet filters (CRDS andNitrolux-100), inlets or both. The detected results dur-ing this campaign are in line with the studies listed below.Measurements of RBD, AMANDA, AiRRmonia, WaSul-Flux and c-QCLAS were within±25% for NH3 concentra-tions of 10 to 120 ppbv.
It should be noted that, although an attempt was madeto eliminate the effect of spatial heterogeneity, emissionsfrom grazed and fertilised grassland are expected to showsome variability. It was neither possible (though desirable)for all instrument to sample from a common point (e.g. thewet chemistry instruments do not use an inlet tube, whilethe OP-FTIR provides a line average), nor was the use ofa common inlet in the spirit of this experiment, in whichwe wanted to test independent systems with the respec-tive inlets as they would have been operated by the dif-ferent groups in the field. There is some indication thatat times, instruments that were located more closely to
www.atmos-meas-tech.net/3/91/2010/ Atmos. Meas. Tech., 3, 91–112, 2010
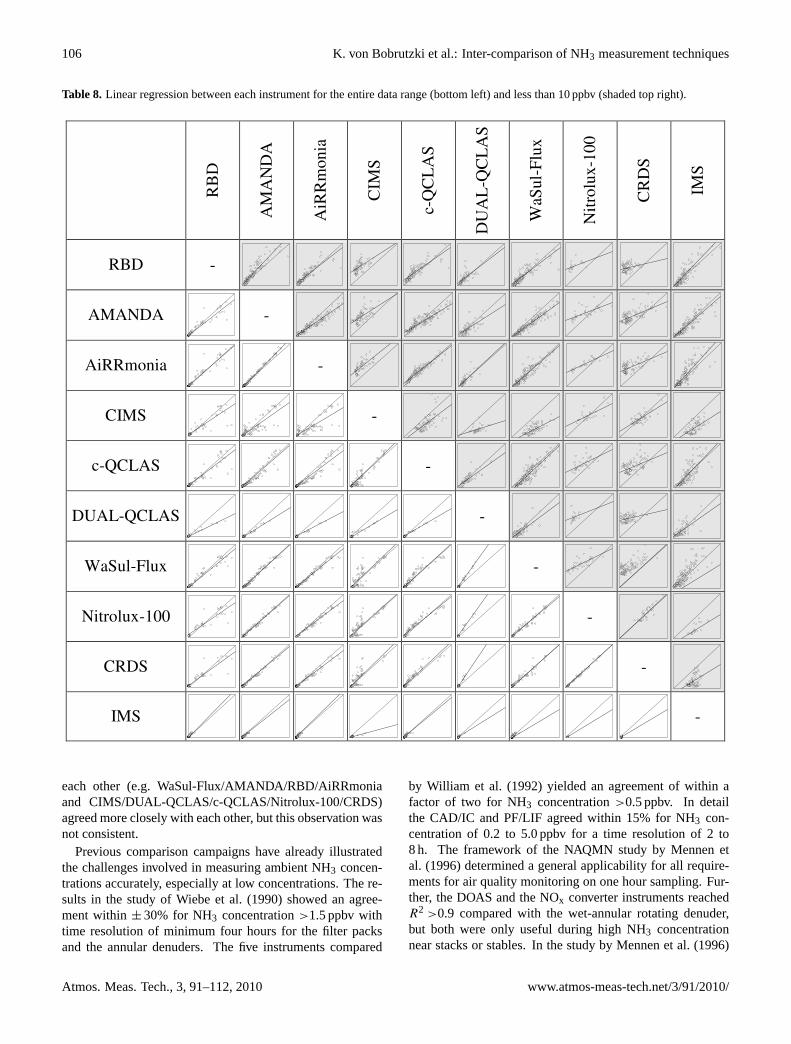
106 K. von Bobrutzki et al.: Inter-comparison of NH3 measurement techniques
Table 8. Linear regression between each instrument for the entire data range (bottom left) and less than 10 ppbv (shaded top right).
48
Table 8. Linear regression between each instrument for the entire data range (bottom left) and
less than 10 ppbv (shaded top right).
RB
D
AM
AN
DA
AiR
Rm
onia
CIM
S
c-Q
CL
AS
DU
AL
-QC
LA
S
WaS
ul-F
lux
Nit
rolu
x-10
0
CR
DS
IMS
RBD -
AMANDA
-
AiRRmonia
-
CIMS
-
c-QCLAS
-
DUAL-QCLAS
-
WaSul-Flux
-
Nitrolux-100
-
CRDS
-
IMS
-
each other (e.g. WaSul-Flux/AMANDA/RBD/AiRRmoniaand CIMS/DUAL-QCLAS/c-QCLAS/Nitrolux-100/CRDS)agreed more closely with each other, but this observation wasnot consistent.
Previous comparison campaigns have already illustratedthe challenges involved in measuring ambient NH3 concen-trations accurately, especially at low concentrations. The re-sults in the study of Wiebe et al. (1990) showed an agree-ment within± 30% for NH3 concentration>1.5 ppbv withtime resolution of minimum four hours for the filter packsand the annular denuders. The five instruments compared
by William et al. (1992) yielded an agreement of within afactor of two for NH3 concentration>0.5 ppbv. In detailthe CAD/IC and PF/LIF agreed within 15% for NH3 con-centration of 0.2 to 5.0 ppbv for a time resolution of 2 to8 h. The framework of the NAQMN study by Mennen etal. (1996) determined a general applicability for all require-ments for air quality monitoring on one hour sampling. Fur-ther, the DOAS and the NOx converter instruments reachedR2 >0.9 compared with the wet-annular rotating denuder,but both were only useful during high NH3 concentrationnear stacks or stables. In the study by Mennen et al. (1996)
Atmos. Meas. Tech., 3, 91–112, 2010 www.atmos-meas-tech.net/3/91/2010/
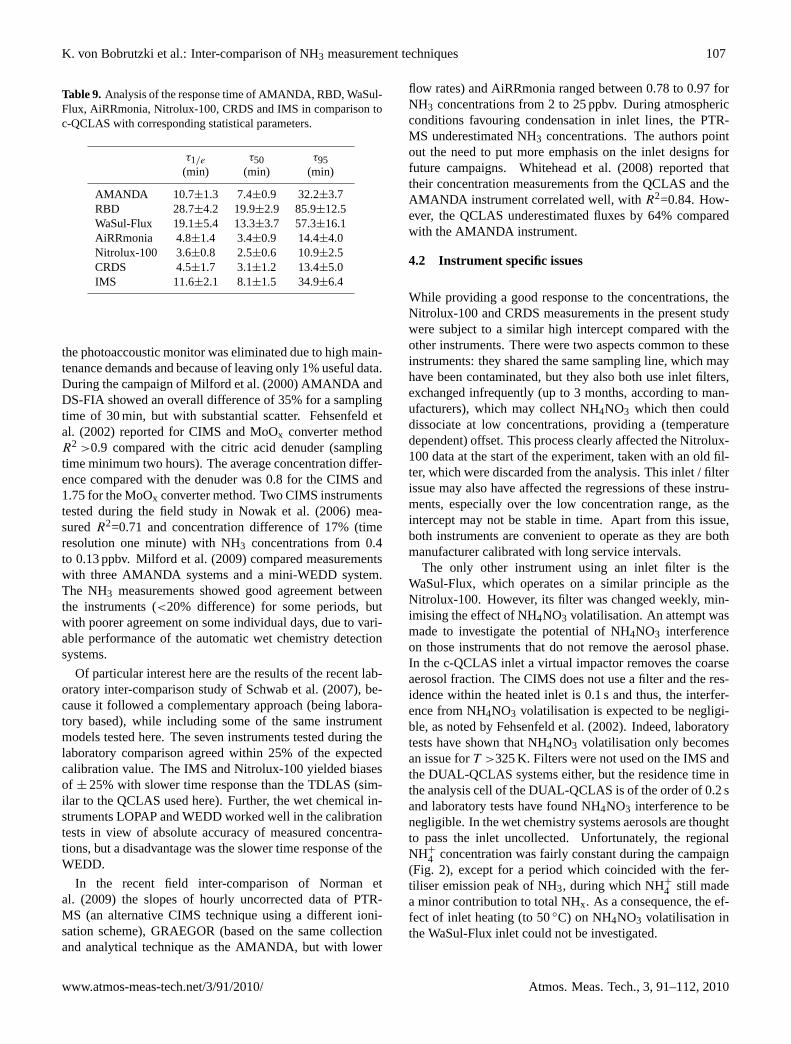
K. von Bobrutzki et al.: Inter-comparison of NH3 measurement techniques 107
Table 9. Analysis of the response time of AMANDA, RBD, WaSul-Flux, AiRRmonia, Nitrolux-100, CRDS and IMS in comparison toc-QCLAS with corresponding statistical parameters.
τ1/e τ50 τ95(min) (min) (min)
AMANDA 10.7±1.3 7.4±0.9 32.2±3.7RBD 28.7±4.2 19.9±2.9 85.9±12.5WaSul-Flux 19.1±5.4 13.3±3.7 57.3±16.1AiRRmonia 4.8±1.4 3.4±0.9 14.4±4.0Nitrolux-100 3.6±0.8 2.5±0.6 10.9±2.5CRDS 4.5±1.7 3.1±1.2 13.4±5.0IMS 11.6±2.1 8.1±1.5 34.9±6.4
the photoaccoustic monitor was eliminated due to high main-tenance demands and because of leaving only 1% useful data.During the campaign of Milford et al. (2000) AMANDA andDS-FIA showed an overall difference of 35% for a samplingtime of 30 min, but with substantial scatter. Fehsenfeld etal. (2002) reported for CIMS and MoOx converter methodR2 >0.9 compared with the citric acid denuder (samplingtime minimum two hours). The average concentration differ-ence compared with the denuder was 0.8 for the CIMS and1.75 for the MoOx converter method. Two CIMS instrumentstested during the field study in Nowak et al. (2006) mea-suredR2=0.71 and concentration difference of 17% (timeresolution one minute) with NH3 concentrations from 0.4to 0.13 ppbv. Milford et al. (2009) compared measurementswith three AMANDA systems and a mini-WEDD system.The NH3 measurements showed good agreement betweenthe instruments (<20% difference) for some periods, butwith poorer agreement on some individual days, due to vari-able performance of the automatic wet chemistry detectionsystems.
Of particular interest here are the results of the recent lab-oratory inter-comparison study of Schwab et al. (2007), be-cause it followed a complementary approach (being labora-tory based), while including some of the same instrumentmodels tested here. The seven instruments tested during thelaboratory comparison agreed within 25% of the expectedcalibration value. The IMS and Nitrolux-100 yielded biasesof ± 25% with slower time response than the TDLAS (sim-ilar to the QCLAS used here). Further, the wet chemical in-struments LOPAP and WEDD worked well in the calibrationtests in view of absolute accuracy of measured concentra-tions, but a disadvantage was the slower time response of theWEDD.
In the recent field inter-comparison of Norman etal. (2009) the slopes of hourly uncorrected data of PTR-MS (an alternative CIMS technique using a different ioni-sation scheme), GRAEGOR (based on the same collectionand analytical technique as the AMANDA, but with lower
flow rates) and AiRRmonia ranged between 0.78 to 0.97 forNH3 concentrations from 2 to 25 ppbv. During atmosphericconditions favouring condensation in inlet lines, the PTR-MS underestimated NH3 concentrations. The authors pointout the need to put more emphasis on the inlet designs forfuture campaigns. Whitehead et al. (2008) reported thattheir concentration measurements from the QCLAS and theAMANDA instrument correlated well, withR2=0.84. How-ever, the QCLAS underestimated fluxes by 64% comparedwith the AMANDA instrument.
4.2 Instrument specific issues
While providing a good response to the concentrations, theNitrolux-100 and CRDS measurements in the present studywere subject to a similar high intercept compared with theother instruments. There were two aspects common to theseinstruments: they shared the same sampling line, which mayhave been contaminated, but they also both use inlet filters,exchanged infrequently (up to 3 months, according to man-ufacturers), which may collect NH4NO3 which then coulddissociate at low concentrations, providing a (temperaturedependent) offset. This process clearly affected the Nitrolux-100 data at the start of the experiment, taken with an old fil-ter, which were discarded from the analysis. This inlet / filterissue may also have affected the regressions of these instru-ments, especially over the low concentration range, as theintercept may not be stable in time. Apart from this issue,both instruments are convenient to operate as they are bothmanufacturer calibrated with long service intervals.
The only other instrument using an inlet filter is theWaSul-Flux, which operates on a similar principle as theNitrolux-100. However, its filter was changed weekly, min-imising the effect of NH4NO3 volatilisation. An attempt wasmade to investigate the potential of NH4NO3 interferenceon those instruments that do not remove the aerosol phase.In the c-QCLAS inlet a virtual impactor removes the coarseaerosol fraction. The CIMS does not use a filter and the res-idence within the heated inlet is 0.1 s and thus, the interfer-ence from NH4NO3 volatilisation is expected to be negligi-ble, as noted by Fehsenfeld et al. (2002). Indeed, laboratorytests have shown that NH4NO3 volatilisation only becomesan issue forT >325 K. Filters were not used on the IMS andthe DUAL-QCLAS systems either, but the residence time inthe analysis cell of the DUAL-QCLAS is of the order of 0.2 sand laboratory tests have found NH4NO3 interference to benegligible. In the wet chemistry systems aerosols are thoughtto pass the inlet uncollected. Unfortunately, the regionalNH+
4 concentration was fairly constant during the campaign(Fig. 2), except for a period which coincided with the fer-tiliser emission peak of NH3, during which NH+
4 still madea minor contribution to total NHx. As a consequence, the ef-fect of inlet heating (to 50C) on NH4NO3 volatilisation inthe WaSul-Flux inlet could not be investigated.
www.atmos-meas-tech.net/3/91/2010/ Atmos. Meas. Tech., 3, 91–112, 2010
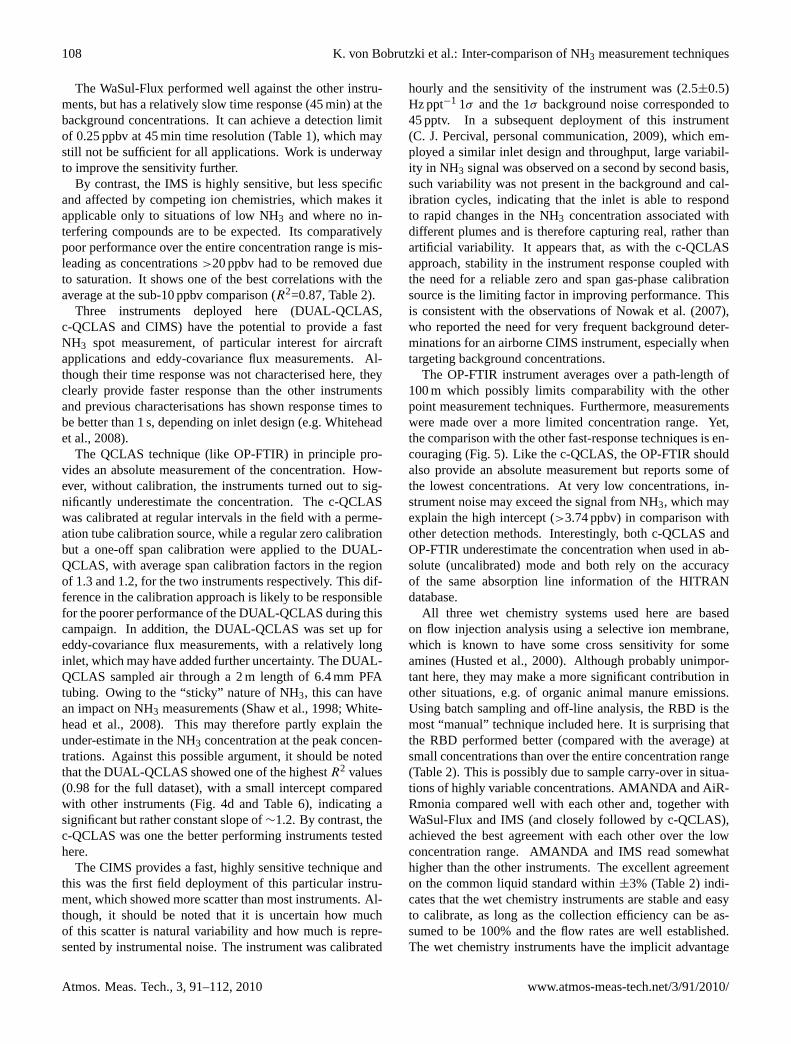
108 K. von Bobrutzki et al.: Inter-comparison of NH3 measurement techniques
The WaSul-Flux performed well against the other instru-ments, but has a relatively slow time response (45 min) at thebackground concentrations. It can achieve a detection limitof 0.25 ppbv at 45 min time resolution (Table 1), which maystill not be sufficient for all applications. Work is underwayto improve the sensitivity further.
By contrast, the IMS is highly sensitive, but less specificand affected by competing ion chemistries, which makes itapplicable only to situations of low NH3 and where no in-terfering compounds are to be expected. Its comparativelypoor performance over the entire concentration range is mis-leading as concentrations>20 ppbv had to be removed dueto saturation. It shows one of the best correlations with theaverage at the sub-10 ppbv comparison (R2=0.87, Table 2).
Three instruments deployed here (DUAL-QCLAS,c-QCLAS and CIMS) have the potential to provide a fastNH3 spot measurement, of particular interest for aircraftapplications and eddy-covariance flux measurements. Al-though their time response was not characterised here, theyclearly provide faster response than the other instrumentsand previous characterisations has shown response times tobe better than 1 s, depending on inlet design (e.g. Whiteheadet al., 2008).
The QCLAS technique (like OP-FTIR) in principle pro-vides an absolute measurement of the concentration. How-ever, without calibration, the instruments turned out to sig-nificantly underestimate the concentration. The c-QCLASwas calibrated at regular intervals in the field with a perme-ation tube calibration source, while a regular zero calibrationbut a one-off span calibration were applied to the DUAL-QCLAS, with average span calibration factors in the regionof 1.3 and 1.2, for the two instruments respectively. This dif-ference in the calibration approach is likely to be responsiblefor the poorer performance of the DUAL-QCLAS during thiscampaign. In addition, the DUAL-QCLAS was set up foreddy-covariance flux measurements, with a relatively longinlet, which may have added further uncertainty. The DUAL-QCLAS sampled air through a 2 m length of 6.4 mm PFAtubing. Owing to the “sticky” nature of NH3, this can havean impact on NH3 measurements (Shaw et al., 1998; White-head et al., 2008). This may therefore partly explain theunder-estimate in the NH3 concentration at the peak concen-trations. Against this possible argument, it should be notedthat the DUAL-QCLAS showed one of the highestR2 values(0.98 for the full dataset), with a small intercept comparedwith other instruments (Fig. 4d and Table 6), indicating asignificant but rather constant slope of∼1.2. By contrast, thec-QCLAS was one the better performing instruments testedhere.
The CIMS provides a fast, highly sensitive technique andthis was the first field deployment of this particular instru-ment, which showed more scatter than most instruments. Al-though, it should be noted that it is uncertain how muchof this scatter is natural variability and how much is repre-sented by instrumental noise. The instrument was calibrated
hourly and the sensitivity of the instrument was (2.5±0.5)Hz ppt−1 1σ and the 1σ background noise corresponded to45 pptv. In a subsequent deployment of this instrument(C. J. Percival, personal communication, 2009), which em-ployed a similar inlet design and throughput, large variabil-ity in NH3 signal was observed on a second by second basis,such variability was not present in the background and cal-ibration cycles, indicating that the inlet is able to respondto rapid changes in the NH3 concentration associated withdifferent plumes and is therefore capturing real, rather thanartificial variability. It appears that, as with the c-QCLASapproach, stability in the instrument response coupled withthe need for a reliable zero and span gas-phase calibrationsource is the limiting factor in improving performance. Thisis consistent with the observations of Nowak et al. (2007),who reported the need for very frequent background deter-minations for an airborne CIMS instrument, especially whentargeting background concentrations.
The OP-FTIR instrument averages over a path-length of100 m which possibly limits comparability with the otherpoint measurement techniques. Furthermore, measurementswere made over a more limited concentration range. Yet,the comparison with the other fast-response techniques is en-couraging (Fig. 5). Like the c-QCLAS, the OP-FTIR shouldalso provide an absolute measurement but reports some ofthe lowest concentrations. At very low concentrations, in-strument noise may exceed the signal from NH3, which mayexplain the high intercept (>3.74 ppbv) in comparison withother detection methods. Interestingly, both c-QCLAS andOP-FTIR underestimate the concentration when used in ab-solute (uncalibrated) mode and both rely on the accuracyof the same absorption line information of the HITRANdatabase.
All three wet chemistry systems used here are basedon flow injection analysis using a selective ion membrane,which is known to have some cross sensitivity for someamines (Husted et al., 2000). Although probably unimpor-tant here, they may make a more significant contribution inother situations, e.g. of organic animal manure emissions.Using batch sampling and off-line analysis, the RBD is themost “manual” technique included here. It is surprising thatthe RBD performed better (compared with the average) atsmall concentrations than over the entire concentration range(Table 2). This is possibly due to sample carry-over in situa-tions of highly variable concentrations. AMANDA and AiR-Rmonia compared well with each other and, together withWaSul-Flux and IMS (and closely followed by c-QCLAS),achieved the best agreement with each other over the lowconcentration range. AMANDA and IMS read somewhathigher than the other instruments. The excellent agreementon the common liquid standard within±3% (Table 2) indi-cates that the wet chemistry instruments are stable and easyto calibrate, as long as the collection efficiency can be as-sumed to be 100% and the flow rates are well established.The wet chemistry instruments have the implicit advantage
Atmos. Meas. Tech., 3, 91–112, 2010 www.atmos-meas-tech.net/3/91/2010/
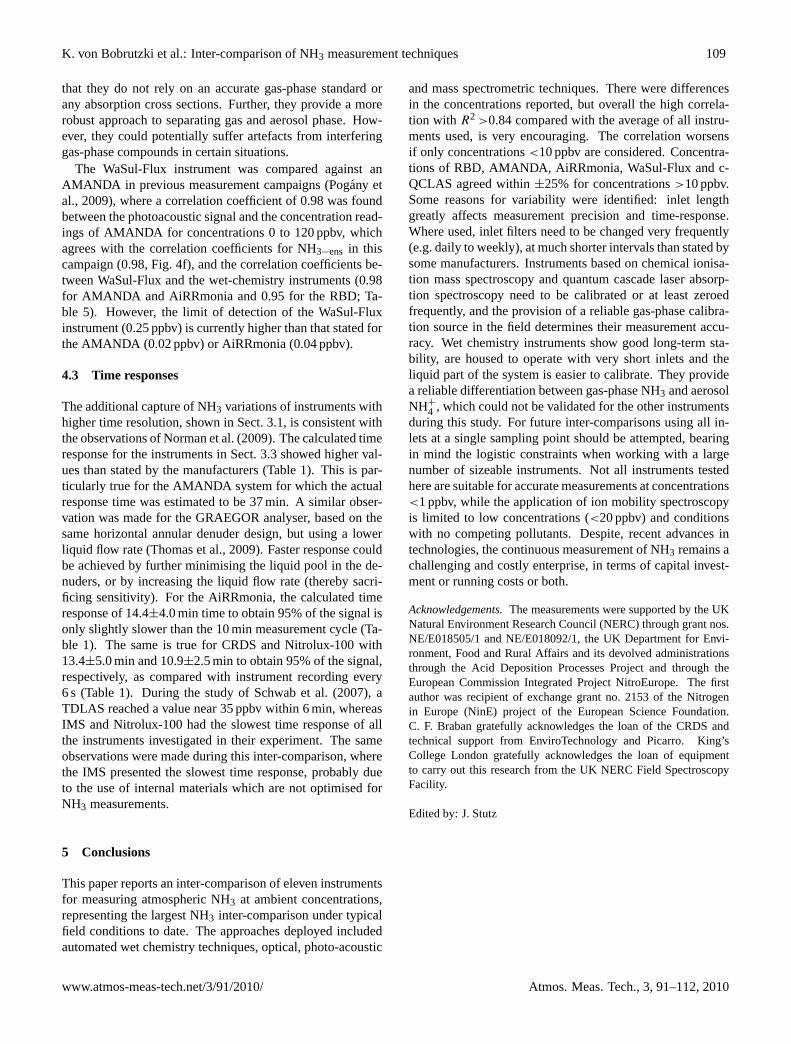
K. von Bobrutzki et al.: Inter-comparison of NH3 measurement techniques 109
that they do not rely on an accurate gas-phase standard orany absorption cross sections. Further, they provide a morerobust approach to separating gas and aerosol phase. How-ever, they could potentially suffer artefacts from interferinggas-phase compounds in certain situations.
The WaSul-Flux instrument was compared against anAMANDA in previous measurement campaigns (Pogany etal., 2009), where a correlation coefficient of 0.98 was foundbetween the photoacoustic signal and the concentration read-ings of AMANDA for concentrations 0 to 120 ppbv, whichagrees with the correlation coefficients for NH3−ens in thiscampaign (0.98, Fig. 4f), and the correlation coefficients be-tween WaSul-Flux and the wet-chemistry instruments (0.98for AMANDA and AiRRmonia and 0.95 for the RBD; Ta-ble 5). However, the limit of detection of the WaSul-Fluxinstrument (0.25 ppbv) is currently higher than that stated forthe AMANDA (0.02 ppbv) or AiRRmonia (0.04 ppbv).
4.3 Time responses
The additional capture of NH3 variations of instruments withhigher time resolution, shown in Sect. 3.1, is consistent withthe observations of Norman et al. (2009). The calculated timeresponse for the instruments in Sect. 3.3 showed higher val-ues than stated by the manufacturers (Table 1). This is par-ticularly true for the AMANDA system for which the actualresponse time was estimated to be 37 min. A similar obser-vation was made for the GRAEGOR analyser, based on thesame horizontal annular denuder design, but using a lowerliquid flow rate (Thomas et al., 2009). Faster response couldbe achieved by further minimising the liquid pool in the de-nuders, or by increasing the liquid flow rate (thereby sacri-ficing sensitivity). For the AiRRmonia, the calculated timeresponse of 14.4±4.0 min time to obtain 95% of the signal isonly slightly slower than the 10 min measurement cycle (Ta-ble 1). The same is true for CRDS and Nitrolux-100 with13.4±5.0 min and 10.9±2.5 min to obtain 95% of the signal,respectively, as compared with instrument recording every6 s (Table 1). During the study of Schwab et al. (2007), aTDLAS reached a value near 35 ppbv within 6 min, whereasIMS and Nitrolux-100 had the slowest time response of allthe instruments investigated in their experiment. The sameobservations were made during this inter-comparison, wherethe IMS presented the slowest time response, probably dueto the use of internal materials which are not optimised forNH3 measurements.
5 Conclusions
This paper reports an inter-comparison of eleven instrumentsfor measuring atmospheric NH3 at ambient concentrations,representing the largest NH3 inter-comparison under typicalfield conditions to date. The approaches deployed includedautomated wet chemistry techniques, optical, photo-acoustic
and mass spectrometric techniques. There were differencesin the concentrations reported, but overall the high correla-tion with R2 >0.84 compared with the average of all instru-ments used, is very encouraging. The correlation worsensif only concentrations<10 ppbv are considered. Concentra-tions of RBD, AMANDA, AiRRmonia, WaSul-Flux and c-QCLAS agreed within±25% for concentrations>10 ppbv.Some reasons for variability were identified: inlet lengthgreatly affects measurement precision and time-response.Where used, inlet filters need to be changed very frequently(e.g. daily to weekly), at much shorter intervals than stated bysome manufacturers. Instruments based on chemical ionisa-tion mass spectroscopy and quantum cascade laser absorp-tion spectroscopy need to be calibrated or at least zeroedfrequently, and the provision of a reliable gas-phase calibra-tion source in the field determines their measurement accu-racy. Wet chemistry instruments show good long-term sta-bility, are housed to operate with very short inlets and theliquid part of the system is easier to calibrate. They providea reliable differentiation between gas-phase NH3 and aerosolNH+
4 , which could not be validated for the other instrumentsduring this study. For future inter-comparisons using all in-lets at a single sampling point should be attempted, bearingin mind the logistic constraints when working with a largenumber of sizeable instruments. Not all instruments testedhere are suitable for accurate measurements at concentrations<1 ppbv, while the application of ion mobility spectroscopyis limited to low concentrations (<20 ppbv) and conditionswith no competing pollutants. Despite, recent advances intechnologies, the continuous measurement of NH3 remains achallenging and costly enterprise, in terms of capital invest-ment or running costs or both.
Acknowledgements.The measurements were supported by the UKNatural Environment Research Council (NERC) through grant nos.NE/E018505/1 and NE/E018092/1, the UK Department for Envi-ronment, Food and Rural Affairs and its devolved administrationsthrough the Acid Deposition Processes Project and through theEuropean Commission Integrated Project NitroEurope. The firstauthor was recipient of exchange grant no. 2153 of the Nitrogenin Europe (NinE) project of the European Science Foundation.C. F. Braban gratefully acknowledges the loan of the CRDS andtechnical support from EnviroTechnology and Picarro. King’sCollege London gratefully acknowledges the loan of equipmentto carry out this research from the UK NERC Field SpectroscopyFacility.
Edited by: J. Stutz
www.atmos-meas-tech.net/3/91/2010/ Atmos. Meas. Tech., 3, 91–112, 2010
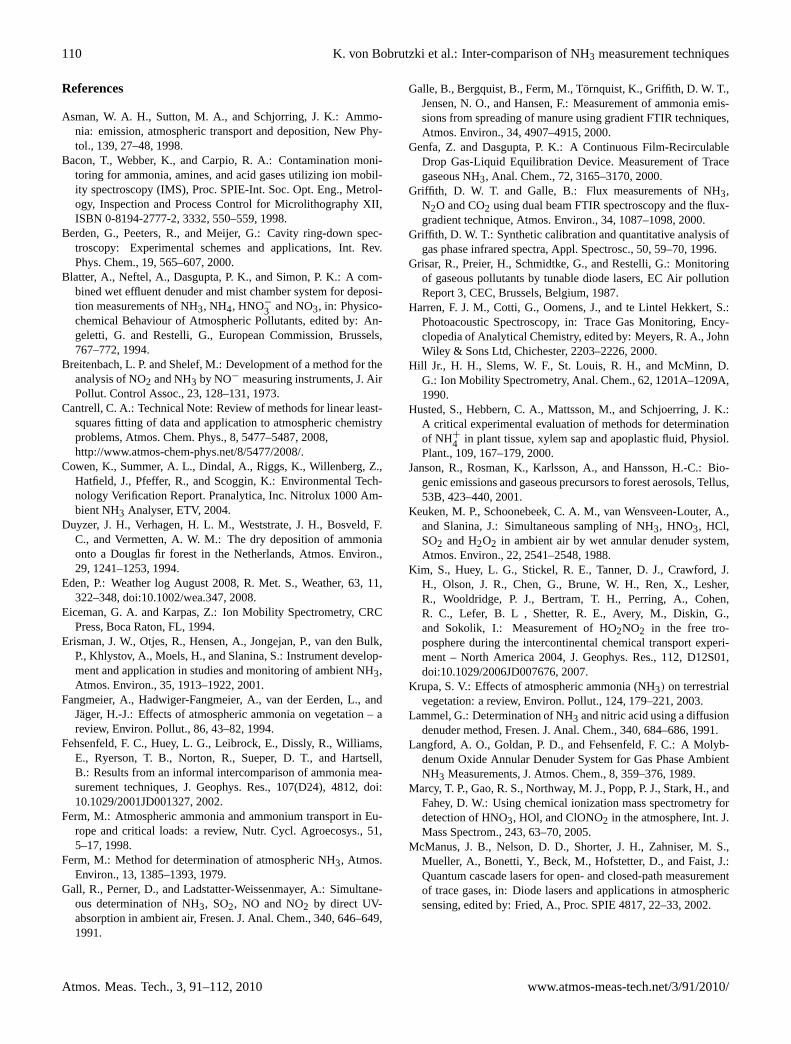
110 K. von Bobrutzki et al.: Inter-comparison of NH3 measurement techniques
References
Asman, W. A. H., Sutton, M. A., and Schjorring, J. K.: Ammo-nia: emission, atmospheric transport and deposition, New Phy-tol., 139, 27–48, 1998.
Bacon, T., Webber, K., and Carpio, R. A.: Contamination moni-toring for ammonia, amines, and acid gases utilizing ion mobil-ity spectroscopy (IMS), Proc. SPIE-Int. Soc. Opt. Eng., Metrol-ogy, Inspection and Process Control for Microlithography XII,ISBN 0-8194-2777-2, 3332, 550–559, 1998.
Berden, G., Peeters, R., and Meijer, G.: Cavity ring-down spec-troscopy: Experimental schemes and applications, Int. Rev.Phys. Chem., 19, 565–607, 2000.
Blatter, A., Neftel, A., Dasgupta, P. K., and Simon, P. K.: A com-bined wet effluent denuder and mist chamber system for deposi-tion measurements of NH3, NH4, HNO−
3 and NO3, in: Physico-chemical Behaviour of Atmospheric Pollutants, edited by: An-geletti, G. and Restelli, G., European Commission, Brussels,767–772, 1994.
Breitenbach, L. P. and Shelef, M.: Development of a method for theanalysis of NO2 and NH3 by NO− measuring instruments, J. AirPollut. Control Assoc., 23, 128–131, 1973.
Cantrell, C. A.: Technical Note: Review of methods for linear least-squares fitting of data and application to atmospheric chemistryproblems, Atmos. Chem. Phys., 8, 5477–5487, 2008,http://www.atmos-chem-phys.net/8/5477/2008/.
Cowen, K., Summer, A. L., Dindal, A., Riggs, K., Willenberg, Z.,Hatfield, J., Pfeffer, R., and Scoggin, K.: Environmental Tech-nology Verification Report. Pranalytica, Inc. Nitrolux 1000 Am-bient NH3 Analyser, ETV, 2004.
Duyzer, J. H., Verhagen, H. L. M., Weststrate, J. H., Bosveld, F.C., and Vermetten, A. W. M.: The dry deposition of ammoniaonto a Douglas fir forest in the Netherlands, Atmos. Environ.,29, 1241–1253, 1994.
Eden, P.: Weather log August 2008, R. Met. S., Weather, 63, 11,322–348, doi:10.1002/wea.347, 2008.
Eiceman, G. A. and Karpas, Z.: Ion Mobility Spectrometry, CRCPress, Boca Raton, FL, 1994.
Erisman, J. W., Otjes, R., Hensen, A., Jongejan, P., van den Bulk,P., Khlystov, A., Moels, H., and Slanina, S.: Instrument develop-ment and application in studies and monitoring of ambient NH3,Atmos. Environ., 35, 1913–1922, 2001.
Fangmeier, A., Hadwiger-Fangmeier, A., van der Eerden, L., andJager, H.-J.: Effects of atmospheric ammonia on vegetation – areview, Environ. Pollut., 86, 43–82, 1994.
Fehsenfeld, F. C., Huey, L. G., Leibrock, E., Dissly, R., Williams,E., Ryerson, T. B., Norton, R., Sueper, D. T., and Hartsell,B.: Results from an informal intercomparison of ammonia mea-surement techniques, J. Geophys. Res., 107(D24), 4812, doi:10.1029/2001JD001327, 2002.
Ferm, M.: Atmospheric ammonia and ammonium transport in Eu-rope and critical loads: a review, Nutr. Cycl. Agroecosys., 51,5–17, 1998.
Ferm, M.: Method for determination of atmospheric NH3, Atmos.Environ., 13, 1385–1393, 1979.
Gall, R., Perner, D., and Ladstatter-Weissenmayer, A.: Simultane-ous determination of NH3, SO2, NO and NO2 by direct UV-absorption in ambient air, Fresen. J. Anal. Chem., 340, 646–649,1991.
Galle, B., Bergquist, B., Ferm, M., Tornquist, K., Griffith, D. W. T.,Jensen, N. O., and Hansen, F.: Measurement of ammonia emis-sions from spreading of manure using gradient FTIR techniques,Atmos. Environ., 34, 4907–4915, 2000.
Genfa, Z. and Dasgupta, P. K.: A Continuous Film-RecirculableDrop Gas-Liquid Equilibration Device. Measurement of Tracegaseous NH3, Anal. Chem., 72, 3165–3170, 2000.
Griffith, D. W. T. and Galle, B.: Flux measurements of NH3,N2O and CO2 using dual beam FTIR spectroscopy and the flux-gradient technique, Atmos. Environ., 34, 1087–1098, 2000.
Griffith, D. W. T.: Synthetic calibration and quantitative analysis ofgas phase infrared spectra, Appl. Spectrosc., 50, 59–70, 1996.
Grisar, R., Preier, H., Schmidtke, G., and Restelli, G.: Monitoringof gaseous pollutants by tunable diode lasers, EC Air pollutionReport 3, CEC, Brussels, Belgium, 1987.
Harren, F. J. M., Cotti, G., Oomens, J., and te Lintel Hekkert, S.:Photoacoustic Spectroscopy, in: Trace Gas Monitoring, Ency-clopedia of Analytical Chemistry, edited by: Meyers, R. A., JohnWiley & Sons Ltd, Chichester, 2203–2226, 2000.
Hill Jr., H. H., Slems, W. F., St. Louis, R. H., and McMinn, D.G.: Ion Mobility Spectrometry, Anal. Chem., 62, 1201A–1209A,1990.
Husted, S., Hebbern, C. A., Mattsson, M., and Schjoerring, J. K.:A critical experimental evaluation of methods for determinationof NH+
4 in plant tissue, xylem sap and apoplastic fluid, Physiol.Plant., 109, 167–179, 2000.
Janson, R., Rosman, K., Karlsson, A., and Hansson, H.-C.: Bio-genic emissions and gaseous precursors to forest aerosols, Tellus,53B, 423–440, 2001.
Keuken, M. P., Schoonebeek, C. A. M., van Wensveen-Louter, A.,and Slanina, J.: Simultaneous sampling of NH3, HNO3, HCl,SO2 and H2O2 in ambient air by wet annular denuder system,Atmos. Environ., 22, 2541–2548, 1988.
Kim, S., Huey, L. G., Stickel, R. E., Tanner, D. J., Crawford, J.H., Olson, J. R., Chen, G., Brune, W. H., Ren, X., Lesher,R., Wooldridge, P. J., Bertram, T. H., Perring, A., Cohen,R. C., Lefer, B. L , Shetter, R. E., Avery, M., Diskin, G.,and Sokolik, I.: Measurement of HO2NO2 in the free tro-posphere during the intercontinental chemical transport experi-ment – North America 2004, J. Geophys. Res., 112, D12S01,doi:10.1029/2006JD007676, 2007.
Krupa, S. V.: Effects of atmospheric ammonia (NH3) on terrestrialvegetation: a review, Environ. Pollut., 124, 179–221, 2003.
Lammel, G.: Determination of NH3 and nitric acid using a diffusiondenuder method, Fresen. J. Anal. Chem., 340, 684–686, 1991.
Langford, A. O., Goldan, P. D., and Fehsenfeld, F. C.: A Molyb-denum Oxide Annular Denuder System for Gas Phase AmbientNH3 Measurements, J. Atmos. Chem., 8, 359–376, 1989.
Marcy, T. P., Gao, R. S., Northway, M. J., Popp, P. J., Stark, H., andFahey, D. W.: Using chemical ionization mass spectrometry fordetection of HNO3, HOl, and ClONO2 in the atmosphere, Int. J.Mass Spectrom., 243, 63–70, 2005.
McManus, J. B., Nelson, D. D., Shorter, J. H., Zahniser, M. S.,Mueller, A., Bonetti, Y., Beck, M., Hofstetter, D., and Faist, J.:Quantum cascade lasers for open- and closed-path measurementof trace gases, in: Diode lasers and applications in atmosphericsensing, edited by: Fried, A., Proc. SPIE 4817, 22–33, 2002.
Atmos. Meas. Tech., 3, 91–112, 2010 www.atmos-meas-tech.net/3/91/2010/
K. von Bobrutzki et al.: Inter-comparison of NH3 measurement techniques 111
McManus, J. B., Shorter, J. H., Nelson, D. D., and Zahniser, M. S.:Sensors Compact Quantum Cascade Laser Instrument for Rapid,High Sensitivity Measurements of Trace Gases in Air, Sensors,2007 IEEE, 1341–1344, 2007.
Mennen, M. G., van Elzakker, B. G., van Putten, E. M., Uiterwijk,J. W., Regts, T. A., van Hellenmond, J., Wyer, G. P., Otjes, R. P.,Verhage, A. J. L., Wouters, L. W., Heffels, C. J. G. Roemer, F. G.,van den Beld, L., and Tetteroo, J. E. H.: Evaluation of automaticammonia monitors for application in an air quality monitoringnetwork, Atmos. Environ., 30, 3239–3256, 1996.
Milford, C., Sutton, M. A., Allen, A. G., Karlsson, A., Davison, B.M., James, J. D., Rosman, K., Harrison, R. M., and Sape, J. N.:Marine and land-based influence on atmospheric ammonia andammonium over Tenerife, Tellus B, 52, 273–289, 2000.
Milford, C., Theobald, M. R., Nemitz, E., and Sutton, M.: Dy-namics of NH3 exchange in response to cutting and fertilising anintensively-managed grassland, Water, Air, Soil Pollut., 1, 167–176, 2001.
Milford, C., Theobald, M. R., Nemitz, E., Hargreaves, K. J., Hor-vath, L., Raso, J., Dammgen, U., Neftel, A., Jones, S. K.,Hensen, A., Loubet, B., Cellier, P., and Sutton, M. A.: Ammo-nia fluxes in relation to cutting and fertilization of an intensivelymanaged grassland derived from an inter-comparison of gradientmeasurements, Biogeosciences, 6, 819–834, 2009,http://www.biogeosciences.net/6/819/2009/.
Mozurkewich, M.: The Dissociation-Constant of Ammonium-Nitrate and Its Dependence on Temperature, Relative-Humidityand Particle-Size, Atmos. Environ., 27, 261–270, 1993.
Myles, L., Meyers, T. P., and Robinson, L.: Atmospheric NH3 mea-surement with an ion mobility spectrometer, Atmos. Environ.,40, 5745–5752, 2006.
Neuman, J. A., Parrish, D. D., Trainer, M., Ryerson, T. B., Hol-loway, J. S., Nowak, J. B., Swanson, A., Flocke, F., Roberts, J.M., Brown, S. S., Stark, H., Sommariva, R., Stohl, A., Peltier, R.,Weber, R., Wollny, A. G., Sueper, D. T., Hubler, G., and Fehsen-feld, F. C.: Reactive nitrogen transport and photochemistry inurban plumes over the North Atlantic Ocean, J. Geophys. Res.,111, D23S54, doi:10.1029/2005JD007010, 2006.
Norman, M., Hansel, A., and Wisthaler, A.: O2+ as reagent ion inthe PTR-MS instrument: detection of gas-phase ammonia, In-tern. J. Mass Spectrom., 265, 382–287, 2007.
Norman, M., Spirig, C., Wolff, V., Trebs, I., Flechard, C., Wisthaler,A., Schnitzhofer, R., Hansel, A., and Neftel, A.: Intercomparisonof ammonia measurement techniques at an intensively managedgrassland site (Oensingen, Switzerland), Atmos. Chem. Phys., 9,2635–2645, 2009,http://www.atmos-chem-phys.net/9/2635/2009/.
Nowak, J. B., Huey, L. G., Russell, A. G., Tian, D., Neu-man, J. A., Orsini, D., Sjostedt, S. J., Sullivan, A. P., Tan-ner, D. J., Nenes, A., Edgerton, E., and Fehsenfeld, F. C.:Analysis of urban gas phase ammonia measurements from the2002 Atlanta Aerosol Nucleation and Real-Time Characteriza-tion Experiment (ANARChE), J. Geophys. Res., 111, D17308,doi:10.1029/2006JD007113, 2006.
Nowak, J. B., Neumann, J. A., Kozai, K., Huey, L. G., Tanner, D.J., Holloway, J. S., Ryerson, T. B., Frost, G. J., McKeen, S. A.,and Fehsenfeld, F. C.: A chemical ionization mass spectrometrytechnique for airborne measurements of NH3, J. Geophys. Res.,112, D10S02, doi:10.1029/2006JD007589, 2007.
Pogany, A., Mohacsi, A., Varga, A., Bozoki, Z., Galbacs, Z.,Horvath, L., and Szabo, G.: A compact NH3 detector with sub-ppb accuracy using near-infrared photoacoustic spectroscopy andpreconcentration sampling, Environ. Sci. Technol., 43, 826–830,2009.
Pushkarsky, M. B., Webber, M. E., and Patel, C. K. N.: Ultra-sensitive ambient ammonia detection using CO2 laser-based pho-toacoustic spectroscopy, Appl. Phys. B-Lasers O., 77, 381–385,2003.
Pushkarsky, M. B., Webber, M. E., Baghdassarian, O., Narasimhan,L. R., and Patel, C. K. N.: Laserbased photoacoustic ammoniasensor for industrial applications, Appl. Phys. B-Lasers O. spe-cial issue: Trends in Laser Sources, Spectroscopic Techniquesand Their Applications to Trace Gas Detection, 75, 391–396,2002.
Rella, C.: Picarro’s NH3 analyzer for Ambient Air Monitoring, 6.Nationales NH3-Treffen. Hannover, Deutschland, 19/20 Novem-ber, 2008.
Rothmann, L. S., Rinsland, C. P., Goldman, A., Massie, S. T., Ed-wards, D. P., Flaud, J. M., Perrin, A., Camy-Peyret, C., Danna,V., Mandin, J. Y., Schroeder, J., McCann, A., Gamache, R. R.,Wattson, R. B., Yoshino, K., Chance, K. V., Jucks, K. W., Brown,L. R., Nemtchinov, V., and Varanasi, P.: The HITRAN molecu-lar spectroscopic database and HAWKS (HITRAN atmosphericworkstation), 1996 Ed., J. Quant. Spectrosc. Ra., 60, 665–710,1998.
Schwab, J. J., Li, Y., Bae, M.-S., Demerjian, K. L., Hou, J., Zhou,X., Jensen, B., and Pryor, S. C.: A laboratory intercomparison ofreal-time gaseous ammonia measurement methods, Environ. Sci.Technol., 41, 8412–8429, 2007.
Shaw, W. J., Spicer, C. W., and Kenny, D. V.: Eddy correlationfluxes of trace gases using a tandem mass spectrometer, Atmos.Environ., 32, 2887–2898, 1998.
Simon, P. K. and Dasgupta, P. K.: Wet effluent denuder coupledliquid/ion chromatography systems: annular and parallel platedenuders, Anal. Chem., 65, 1134–1139, 1993.
Simon, P. K., Dasgupta, P. K., and Vecera, Z.: Wet effluent denudercoupled liquid/ion chromatography systems, Anal. Chem., 63,1237–1242, 1991.
Slusher, D. L., Pitteri, S. J., Haman, B. J., Tanner, D. J., and Huey,L. G.: A chemical ionization technique for measurement of per-nitric acid in the upper troposphere and the polar boundary layer,Geophys. Res. Lett., 28, 3875–3878, 2001.
Sunner, J., Nicol, G., and Kebarle, P.: Factors Determining RelativeSensitivity of Analytes in Positive Mode Atmospheric-PressureIonization Mass-Spectrometry, Anal. Chem., 60, 1300–1307,1988.
Sutton, M., Fowler, D., Burkhardt, J. K., and Milford, C.: Veg-etation atmosphere exchange of ammonia: canopy cycling andthe impacts of elevated nitrogen inputs, Water,Air Soil Poll., 85,2057–2063, 1995.
Sutton, M. A., Nemitz, E., Milford, C., Fowler, D., Moreno, J.,San Jose, R., Wyers, G. P., Otjes, R. P., Harrison, R., Husted,S., and Schjoerring, J. K.: Micrometeorological measurement ofnet NH3 fluxes over oilseed rape during two vegetation periods,Agric. For. Meteorol., 105, 351–369, 2000a.
www.atmos-meas-tech.net/3/91/2010/ Atmos. Meas. Tech., 3, 91–112, 2010
112 K. von Bobrutzki et al.: Inter-comparison of NH3 measurement techniques
Sutton, M. A., Dragosits, U., Tang, Y. S., and Fowler D.: Ammo-nia emissions from non agricultural sources in the UK, Atmos.Environ., 34, 855–869, 2000b.
Sutton, M. A., Tang, Y. S., Dragosits, U., Fournier, N., Dore, T.,Smith, R. I., Weston K. J., and Fowler D.: A spatial analysis ofatmospheric ammonia and ammonium in the UK, The ScientificWorld 1 (S2), 275–286, 2001.
Sutton, M. A., Nemitz, E. , Erisman, J. W., Beier, C., ButterbachBahl, K., Cellier, W. de Vries, P., Cotrufo, F., Skiba, U., DiMarco, C., Jones, S., Laville, P., Soussana, J. F., Loubet, B.,Twigg, M., Famulari, D., Whitehead, J., Gallagher, M. W., Nef-tel, A., Flechard, C. R., Herrmann, B., Calanca, P. L., Schjo-erring, J. K., Daemmgen, U., Horvath, L., Tang, Y. S., Em-mett, B. A., Tietema, A., Penuelas, J., Kesik, M., Brueggemann,N., Pilegaard, K., Vesala, T., Campbell, C. L., Olesen, J. E.,Dragosits, U., Theobald, M. R., Levy, P., Mobbs, D. C., Milne,R., Viovy, N., Vuichard N., Smith, J. U., Smith, P., Bergamaschi,P., Fowler, D., and Reis, S.: Challenges in quantifying biosphere-atmosphere exchange of nitrogen species, Environ. Pollut., 150,125–139, 2007.
Thomas, R. M., Trebs, I., Otjes, R., Jongejan, P. A. C., ten Brink,H., Phillips, G., Kortner, M., Meixner, F. X., and Nemitz, E.:An automated analyzer to measure surface-atmosphere exchangefluxes of water soluble inorganic aerosol compounds and reactivetrace gases, Environ. Sci. Technol., 43(5), 1412–1418, 2009.
Tittel, F. K., Richter, D., and Fried, A.: Mid-infrared laser appli-cations in spectroscopy, in: Topics in Applied Physics vol. 89,edited by: Sorokina, I. T. and Vodopyanov, K. L., Springer-Verlag, 445–516, 2003.
Warland, J. S., Dias, G. M., and Thurtell, G. W.: A tunable diodelaser system for ammonia flux measurement over multiple plots,Environ. Pollut., 114, 215–221, 2001.
Warneck, P.: Chemistry of the Natural Atmosphere, AcademicPress, New York, 1988.
Wert, B. P., Fried, A., Henry, B., and Cartier, S.: Evaluation of inletsused for the airborne measurement of formaldehyde, J. Geophys.Res., 107(D13), 4163, doi:10.1029/2001JD001072, 2002.
Whitehead, J. D., Longley, I. D., and Gallagher, M. W.: Seasonaland diurnal variation in atmospheric NH3 in an urban environ-ment measured using a quantum cascade laser absorption spec-trometer, Water Air Soil Pollut., 183, 317–329, 2007.
Whitehead, J. D., Twigg, M., Famulari, D., Nemitz, E., Sutton,M. A., Gallagher, M. W., and Fowler, D.: Evaluation of LaserAbsorption Spectroscopic Techniques for Eddy Covariance FluxMeasurements of NH3, Environ. Sci. Technol., 42, 2041–2046,2008.
Wiebe, H. A., Anlauf, K. G., Tuazon, E. C., Winer, A. M., Bier-mann, H. W., Appel, B. R., Solomon, P. A., Cass, G. R., Ellestad,T. G., Knapp, K. T., Peake, E., Spicer, C. W., and Lawson, P. A.:A comparison of measurements of atmospheric ammonia by fil-ter packs, transition-flow reactors, simple and annular denudersand Fourier-Transform Infrared-Spectroscopy, Atmos. Environ.A-Gen., 1019–1028, 1990.
Williams, E. J., Sandholm, S. T., Bradshaw, J. D., Schendel, J. S.,Langford, A. O., Quinn, P. K., LeBel, P. J., Vay, S. A., Roberts,P. D., Norton, R. B., Watkins, B. A., Buhr, M. P., Parrish, D. D.,Calvert, J. G., and Fehsenfeld, F. C.: An intercomparison of fiveammonia measurement techniques, J. Geophys. Res., 97, 591–611, 1992.
Wyers, G. P., Otjes, R. P., and Slanina, J.: A continious flow de-nuder for the measurement of ambient concentrations and surfacefluxes of NH3, Atmos. Environ., 27A, 2085–2090, 1993.
Yokelson, R. J., Christian, T. J., Bertschi, I. T., and Hao, W. M.:Evaluation of adsorption effects on measurements of ammonia,acetic acid and methanol, J. Geophys. Res., 108, 46–49, 2003.
Atmos. Meas. Tech., 3, 91–112, 2010 www.atmos-meas-tech.net/3/91/2010/

79

80

81
4. Paper III “ Determination of gas-phase ozonolysis rate coefficients of C8–14 terminal alkenes at
elevated temperatures using the relative rate method”
by Max R. McGillen, Mohamed B. Ghalaieny and Carl J. Percival Published in: Physical Chemistry Chemical Physics, (2011), volume 13, pages 10965-10969. Contributions: Max McGillen conceived and designed the experimental setup.
Mohamed Ghalaieny conducted the experiments. All authors contributed to the
manuscript and the work was conducted under the supervision of Carl Percival.

82
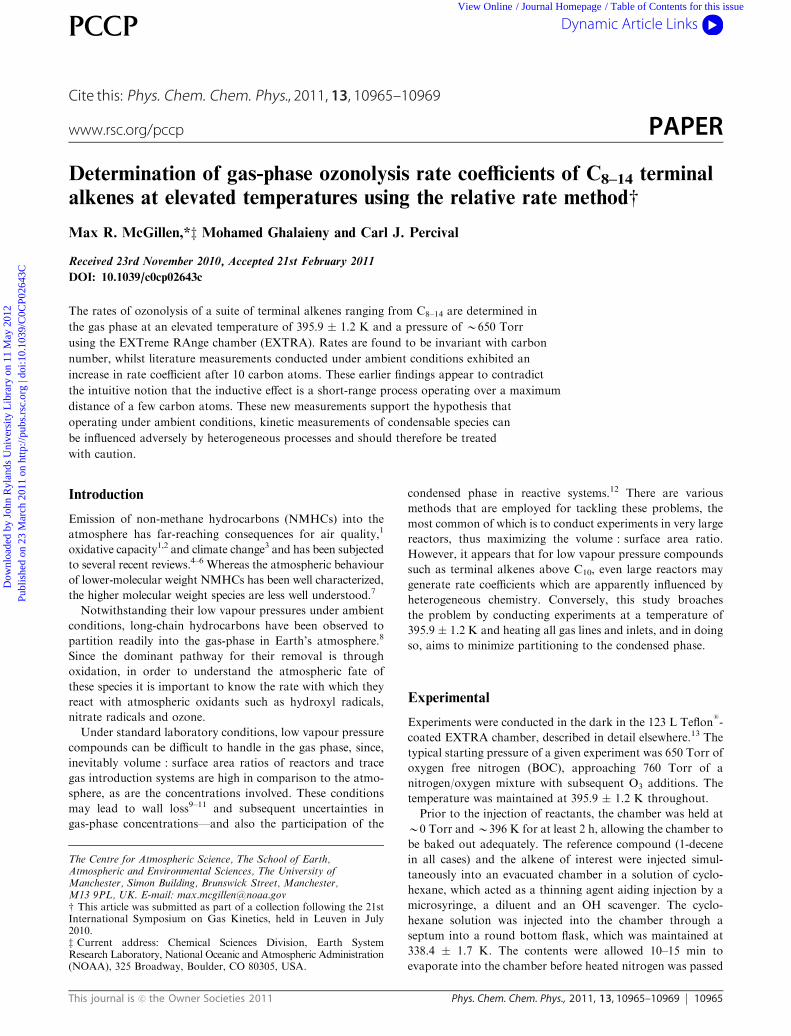
This journal is c the Owner Societies 2011 Phys. Chem. Chem. Phys., 2011, 13, 10965–10969 10965
Cite this: Phys. Chem. Chem. Phys., 2011, 13, 10965–10969
Determination of gas-phase ozonolysis rate coefficients of C8–14 terminal
alkenes at elevated temperatures using the relative rate methodw
Max R. McGillen,*z Mohamed Ghalaieny and Carl J. Percival
Received 23rd November 2010, Accepted 21st February 2011
DOI: 10.1039/c0cp02643c
The rates of ozonolysis of a suite of terminal alkenes ranging from C8–14 are determined in
the gas phase at an elevated temperature of 395.9 1.2 K and a pressure of B650 Torr
using the EXTreme RAnge chamber (EXTRA). Rates are found to be invariant with carbon
number, whilst literature measurements conducted under ambient conditions exhibited an
increase in rate coefficient after 10 carbon atoms. These earlier findings appear to contradict
the intuitive notion that the inductive effect is a short-range process operating over a maximum
distance of a few carbon atoms. These new measurements support the hypothesis that
operating under ambient conditions, kinetic measurements of condensable species can
be influenced adversely by heterogeneous processes and should therefore be treated
with caution.
Introduction
Emission of non-methane hydrocarbons (NMHCs) into the
atmosphere has far-reaching consequences for air quality,1
oxidative capacity1,2 and climate change3 and has been subjected
to several recent reviews.4–6 Whereas the atmospheric behaviour
of lower-molecular weight NMHCs has been well characterized,
the higher molecular weight species are less well understood.7
Notwithstanding their low vapour pressures under ambient
conditions, long-chain hydrocarbons have been observed to
partition readily into the gas-phase in Earth’s atmosphere.8
Since the dominant pathway for their removal is through
oxidation, in order to understand the atmospheric fate of
these species it is important to know the rate with which they
react with atmospheric oxidants such as hydroxyl radicals,
nitrate radicals and ozone.
Under standard laboratory conditions, low vapour pressure
compounds can be difficult to handle in the gas phase, since,
inevitably volume : surface area ratios of reactors and trace
gas introduction systems are high in comparison to the atmo-
sphere, as are the concentrations involved. These conditions
may lead to wall loss9–11 and subsequent uncertainties in
gas-phase concentrations—and also the participation of the
condensed phase in reactive systems.12 There are various
methods that are employed for tackling these problems, the
most common of which is to conduct experiments in very large
reactors, thus maximizing the volume : surface area ratio.
However, it appears that for low vapour pressure compounds
such as terminal alkenes above C10, even large reactors may
generate rate coefficients which are apparently influenced by
heterogeneous chemistry. Conversely, this study broaches
the problem by conducting experiments at a temperature of
395.9 1.2 K and heating all gas lines and inlets, and in doing
so, aims to minimize partitioning to the condensed phase.
Experimental
Experiments were conducted in the dark in the 123 L Teflons
-
coated EXTRA chamber, described in detail elsewhere.13 The
typical starting pressure of a given experiment was 650 Torr of
oxygen free nitrogen (BOC), approaching 760 Torr of a
nitrogen/oxygen mixture with subsequent O3 additions. The
temperature was maintained at 395.9 1.2 K throughout.
Prior to the injection of reactants, the chamber was held at
B0 Torr andB396 K for at least 2 h, allowing the chamber to
be baked out adequately. The reference compound (1-decene
in all cases) and the alkene of interest were injected simul-
taneously into an evacuated chamber in a solution of cyclo-
hexane, which acted as a thinning agent aiding injection by a
microsyringe, a diluent and an OH scavenger. The cyclo-
hexane solution was injected into the chamber through a
septum into a round bottom flask, which was maintained at
338.4 1.7 K. The contents were allowed 10–15 min to
evaporate into the chamber before heated nitrogen was passed
The Centre for Atmospheric Science, The School of Earth,Atmospheric and Environmental Sciences, The University ofManchester, Simon Building, Brunswick Street, Manchester,M13 9PL, UK. E-mail: [email protected] This article was submitted as part of a collection following the 21stInternational Symposium on Gas Kinetics, held in Leuven in July2010.z Current address: Chemical Sciences Division, Earth SystemResearch Laboratory, National Oceanic and Atmospheric Administration(NOAA), 325 Broadway, Boulder, CO 80305, USA.
PCCP Dynamic Article Links
www.rsc.org/pccp PAPER
Dow
nloa
ded
by J
ohn
Ryl
ands
Uni
vers
ity L
ibra
ry o
n 11
May
201
2Pu
blis
hed
on 2
3 M
arch
201
1 on
http
://pu
bs.r
sc.o
rg |
doi:1
0.10
39/C
0CP0
2643
CView Online / Journal Homepage / Table of Contents for this issue
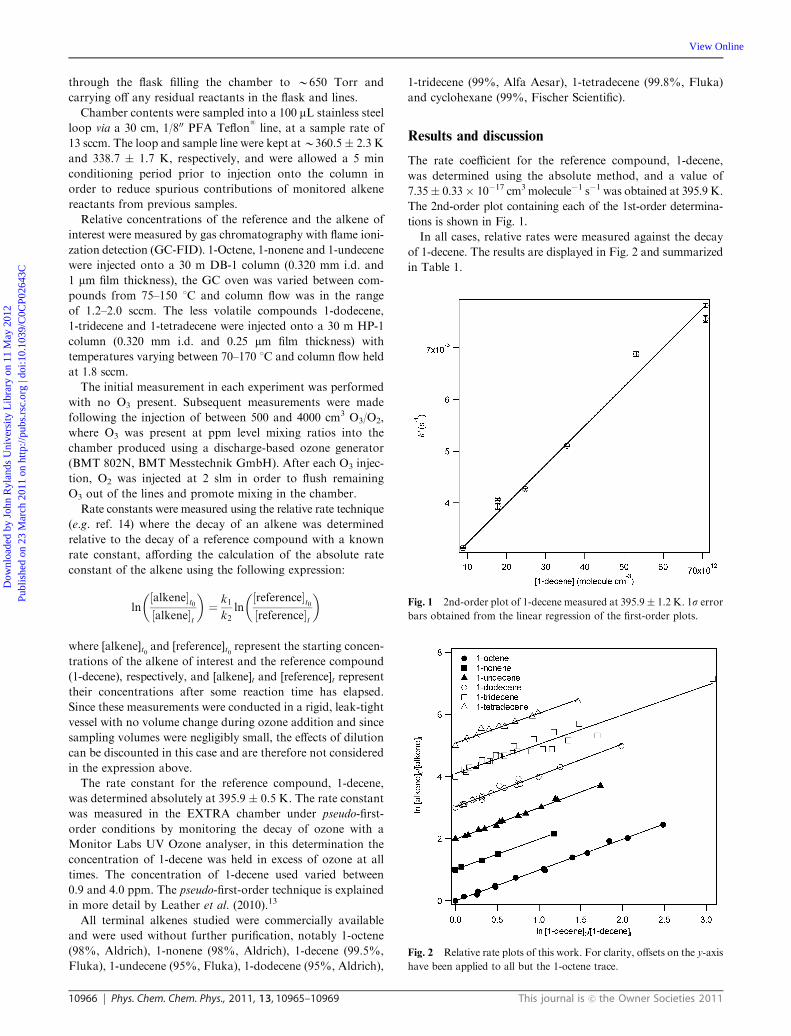
10966 Phys. Chem. Chem. Phys., 2011, 13, 10965–10969 This journal is c the Owner Societies 2011
through the flask filling the chamber to B650 Torr and
carrying off any residual reactants in the flask and lines.
Chamber contents were sampled into a 100 mL stainless steel
loop via a 30 cm, 1/800 PFA Teflons
line, at a sample rate of
13 sccm. The loop and sample line were kept atB360.5 2.3 K
and 338.7 1.7 K, respectively, and were allowed a 5 min
conditioning period prior to injection onto the column in
order to reduce spurious contributions of monitored alkene
reactants from previous samples.
Relative concentrations of the reference and the alkene of
interest were measured by gas chromatography with flame ioni-
zation detection (GC-FID). 1-Octene, 1-nonene and 1-undecene
were injected onto a 30 m DB-1 column (0.320 mm i.d. and
1 mm film thickness), the GC oven was varied between com-
pounds from 75–150 1C and column flow was in the range
of 1.2–2.0 sccm. The less volatile compounds 1-dodecene,
1-tridecene and 1-tetradecene were injected onto a 30 m HP-1
column (0.320 mm i.d. and 0.25 mm film thickness) with
temperatures varying between 70–170 1C and column flow held
at 1.8 sccm.
The initial measurement in each experiment was performed
with no O3 present. Subsequent measurements were made
following the injection of between 500 and 4000 cm3 O3/O2,
where O3 was present at ppm level mixing ratios into the
chamber produced using a discharge-based ozone generator
(BMT 802N, BMT Messtechnik GmbH). After each O3 injec-
tion, O2 was injected at 2 slm in order to flush remaining
O3 out of the lines and promote mixing in the chamber.
Rate constants were measured using the relative rate technique
(e.g. ref. 14) where the decay of an alkene was determined
relative to the decay of a reference compound with a known
rate constant, affording the calculation of the absolute rate
constant of the alkene using the following expression:
ln½alkenet0½alkenet
¼ k1
k2ln½referencet0½referencet
where [alkene]t0 and [reference]t0 represent the starting concen-
trations of the alkene of interest and the reference compound
(1-decene), respectively, and [alkene]t and [reference]t represent
their concentrations after some reaction time has elapsed.
Since these measurements were conducted in a rigid, leak-tight
vessel with no volume change during ozone addition and since
sampling volumes were negligibly small, the effects of dilution
can be discounted in this case and are therefore not considered
in the expression above.
The rate constant for the reference compound, 1-decene,
was determined absolutely at 395.9 0.5 K. The rate constant
was measured in the EXTRA chamber under pseudo-first-
order conditions by monitoring the decay of ozone with a
Monitor Labs UV Ozone analyser, in this determination the
concentration of 1-decene was held in excess of ozone at all
times. The concentration of 1-decene used varied between
0.9 and 4.0 ppm. The pseudo-first-order technique is explained
in more detail by Leather et al. (2010).13
All terminal alkenes studied were commercially available
and were used without further purification, notably 1-octene
(98%, Aldrich), 1-nonene (98%, Aldrich), 1-decene (99.5%,
Fluka), 1-undecene (95%, Fluka), 1-dodecene (95%, Aldrich),
1-tridecene (99%, Alfa Aesar), 1-tetradecene (99.8%, Fluka)
and cyclohexane (99%, Fischer Scientific).
Results and discussion
The rate coefficient for the reference compound, 1-decene,
was determined using the absolute method, and a value of
7.35 0.33 1017 cm3 molecule1 s1 was obtained at 395.9 K.
The 2nd-order plot containing each of the 1st-order determina-
tions is shown in Fig. 1.
In all cases, relative rates were measured against the decay
of 1-decene. The results are displayed in Fig. 2 and summarized
in Table 1.
Fig. 1 2nd-order plot of 1-decene measured at 395.9 1.2 K. 1s error
bars obtained from the linear regression of the first-order plots.
Fig. 2 Relative rate plots of this work. For clarity, offsets on the y-axis
have been applied to all but the 1-octene trace.
Dow
nloa
ded
by J
ohn
Ryl
ands
Uni
vers
ity L
ibra
ry o
n 11
May
201
2Pu
blis
hed
on 2
3 M
arch
201
1 on
http
://pu
bs.r
sc.o
rg |
doi:1
0.10
39/C
0CP0
2643
C
View Online
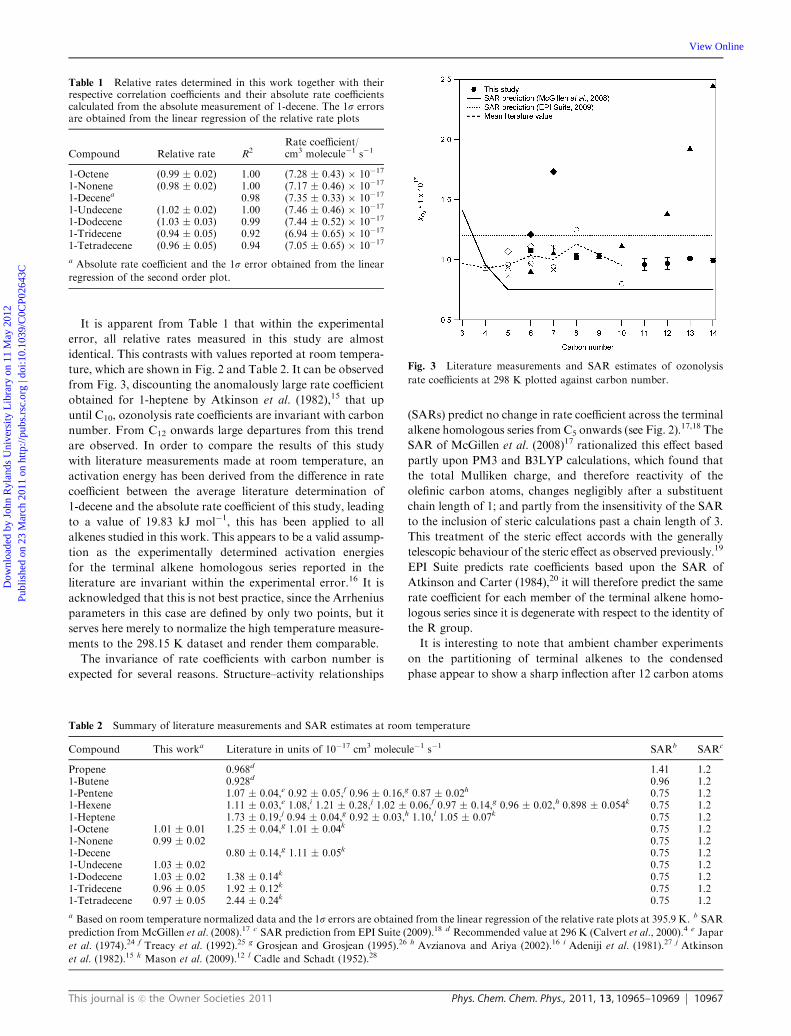
This journal is c the Owner Societies 2011 Phys. Chem. Chem. Phys., 2011, 13, 10965–10969 10967
It is apparent from Table 1 that within the experimental
error, all relative rates measured in this study are almost
identical. This contrasts with values reported at room tempera-
ture, which are shown in Fig. 2 and Table 2. It can be observed
from Fig. 3, discounting the anomalously large rate coefficient
obtained for 1-heptene by Atkinson et al. (1982),15 that up
until C10, ozonolysis rate coefficients are invariant with carbon
number. From C12 onwards large departures from this trend
are observed. In order to compare the results of this study
with literature measurements made at room temperature, an
activation energy has been derived from the difference in rate
coefficient between the average literature determination of
1-decene and the absolute rate coefficient of this study, leading
to a value of 19.83 kJ mol1, this has been applied to all
alkenes studied in this work. This appears to be a valid assump-
tion as the experimentally determined activation energies
for the terminal alkene homologous series reported in the
literature are invariant within the experimental error.16 It is
acknowledged that this is not best practice, since the Arrhenius
parameters in this case are defined by only two points, but it
serves here merely to normalize the high temperature measure-
ments to the 298.15 K dataset and render them comparable.
The invariance of rate coefficients with carbon number is
expected for several reasons. Structure–activity relationships
(SARs) predict no change in rate coefficient across the terminal
alkene homologous series from C5 onwards (see Fig. 2).17,18 The
SAR of McGillen et al. (2008)17 rationalized this effect based
partly upon PM3 and B3LYP calculations, which found that
the total Mulliken charge, and therefore reactivity of the
olefinic carbon atoms, changes negligibly after a substituent
chain length of 1; and partly from the insensitivity of the SAR
to the inclusion of steric calculations past a chain length of 3.
This treatment of the steric effect accords with the generally
telescopic behaviour of the steric effect as observed previously.19
EPI Suite predicts rate coefficients based upon the SAR of
Atkinson and Carter (1984),20 it will therefore predict the same
rate coefficient for each member of the terminal alkene homo-
logous series since it is degenerate with respect to the identity of
the R group.
It is interesting to note that ambient chamber experiments
on the partitioning of terminal alkenes to the condensed
phase appear to show a sharp inflection after 12 carbon atoms
Table 1 Relative rates determined in this work together with theirrespective correlation coefficients and their absolute rate coefficientscalculated from the absolute measurement of 1-decene. The 1s errorsare obtained from the linear regression of the relative rate plots
Compound Relative rate R2Rate coefficient/cm3 molecule1 s1
1-Octene (0.99 0.02) 1.00 (7.28 0.43) 1017
1-Nonene (0.98 0.02) 1.00 (7.17 0.46) 1017
1-Decenea 0.98 (7.35 0.33) 1017
1-Undecene (1.02 0.02) 1.00 (7.46 0.46) 1017
1-Dodecene (1.03 0.03) 0.99 (7.44 0.52) 1017
1-Tridecene (0.94 0.05) 0.92 (6.94 0.65) 1017
1-Tetradecene (0.96 0.05) 0.94 (7.05 0.65) 1017
a Absolute rate coefficient and the 1s error obtained from the linear
regression of the second order plot.
Table 2 Summary of literature measurements and SAR estimates at room temperature
Compound This worka Literature in units of 1017 cm3 molecule1 s1 SARb SARc
Propene 0.968d 1.41 1.21-Butene 0.928d 0.96 1.21-Pentene 1.07 0.04,e 0.92 0.05,f 0.96 0.16,g 0.87 0.02h 0.75 1.21-Hexene 1.11 0.03,e 1.08,i 1.21 0.28,j 1.02 0.06,f 0.97 0.14,g 0.96 0.02,h 0.898 0.054k 0.75 1.21-Heptene 1.73 0.19,j 0.94 0.04,g 0.92 0.03,h 1.10,l 1.05 0.07k 0.75 1.21-Octene 1.01 0.01 1.25 0.04,g 1.01 0.04k 0.75 1.21-Nonene 0.99 0.02 0.75 1.21-Decene 0.80 0.14,g 1.11 0.05k 0.75 1.21-Undecene 1.03 0.02 0.75 1.21-Dodecene 1.03 0.02 1.38 0.14k 0.75 1.21-Tridecene 0.96 0.05 1.92 0.12k 0.75 1.21-Tetradecene 0.97 0.05 2.44 0.24k 0.75 1.2
a Based on room temperature normalized data and the 1s errors are obtained from the linear regression of the relative rate plots at 395.9 K. b SAR
prediction fromMcGillen et al. (2008).17 c SAR prediction from EPI Suite (2009).18 d Recommended value at 296 K (Calvert et al., 2000).4 e Japar
et al. (1974).24 f Treacy et al. (1992).25 g Grosjean and Grosjean (1995).26 h Avzianova and Ariya (2002).16 i Adeniji et al. (1981).27 j Atkinson
et al. (1982).15 k Mason et al. (2009).12 l Cadle and Schadt (1952).28
Fig. 3 Literature measurements and SAR estimates of ozonolysis
rate coefficients at 298 K plotted against carbon number.
Dow
nloa
ded
by J
ohn
Ryl
ands
Uni
vers
ity L
ibra
ry o
n 11
May
201
2Pu
blis
hed
on 2
3 M
arch
201
1 on
http
://pu
bs.r
sc.o
rg |
doi:1
0.10
39/C
0CP0
2643
C
View Online
10968 Phys. Chem. Chem. Phys., 2011, 13, 10965–10969 This journal is c the Owner Societies 2011
and the fraction of a given alkene remaining in the gas phase
decreases rapidly thereafter.11 It is also apparent that the
response time and wall losses of compounds that readily
absorb to Teflons
surfaces (e.g. nitric acid) are improved
greatly at higher temperatures.21 Similarly in this study it was
found during the development of the experimental protocol
that unless all components of the reactor and sampling system
were heated, unacceptable memory effects were observed when
sampling the larger terminal alkenes. Therefore, even though
this study does not speculate upon the mechanism by which
gas-phase species may adhere to Teflons
surfaces, be it a
simple phase change or a more complex mechanism such as
through interaction with Eyring ‘‘holes’’ (e.g. ref. 22), it can be
observed that increasing the temperature of the reactor and
inlet diminishes the ability of the walls to act as reservoirs for
less volatile species.
Experiments involving the oxidation of heavier (CZ 10)
terminal alkenes have produced unusual results previously,
in the example of McGillen et al. (2007),23 a sharp increase in
observed 2nd-order loss rates at and above a carbon number
of 10 could be attributed to heterogeneous chemistry. However
given that these experiments were conducted in turbulent
conditions, reaction with the walls in this case is unlikely.
There is still the possibility that a loss process associated with
particle formation may have been responsible for the observed
loss rates. The experiments undertaken in this present study
were undertaken at elevated temperatures, to ensure that
partitioning to the aerosol phase does not occur. The profiles
of total rate coefficient against carbon number look appreciably
different depending on whether OH, NO3 or O3 is the oxidant.
It must be acknowledged that there are major differences in the
mechanism by which each of these reactions proceed. For
example, the study of McGillen et al.23 on the reactions of the
hydroxyl radical with terminal alkenes attributed the increase
in reactivity of the larger alkenes to an increasingly important
hydrogen abstraction channel. Clearly for ozonolysis reactions
there is only one possible reaction channel and thus the change
in reactivity throughout the terminal alkene homologous series
could only result from a change in inductive or steric effects or
else a long-range interaction engendered by a change in carbon
chain length. It therefore remains that if the inflexion in rate
coefficient observed for the reaction of, for example, O3 with
terminal alkenes under ambient conditions is an experimental
artifact, then the difference in behaviour observed between
each of these oxidants may result from secondary processes
associated with the very different product distributions of
these reactions.
Conclusions
Ozonolysis rate coefficients were determined for the terminal
alkene homologous series from C8–14. The measurements
conducted at 395.9 1.2 K were found to be invariant and
therefore confirm that the rate with which these species react
with ozone does not change significantly as a function of
sidechain length. When normalized to the room temperature
data, these results are in good agreement with litera-
ture determinations for 1-octene, but in disagreement with
the work of Mason et al. (2009)12 for C12–14 compounds,
where the enhancement in rate coefficient observed in that
study is likely to relate to heterogeneous chemistry as was
suggested previously. It is therefore apparent that alkenes
possessing vapour pressures less than or equal to that of
1-dodecene are likely to be problematic for the conventional
chamber apparatus operated under ambient conditions.
Relative ozonolysis rates are provided for 1-nonene and
1-undecene for the first time, as is the absolute rate coefficient
of 1-decene at 395.9 1.2 K. In each case good quality relative
rate plots were generated from the EXTRA chamber, and it is
intended that this experimental methodology will be applied to
probing the reactivity of atmospherically important low
vapour pressure compounds of biogenic origin such as the
sesquiterpenes and heteroatomic unsaturated volatile organic
compounds.
References
1 M. E. Jenkin and K. C. Clemitshaw, Atmos. Environ., 2000, 34,2499–2527.
2 N. C. Hewitt, Reactive Hydrocarbons in the Atmosphere, AcademicPress, London, UK, 1999.
3 S. Sitch, P. M. Cox, W. J. Collins and C. Huntingford, Nature,2007, 448, 791–794.
4 J. G. Calvert, R. Atkinson, K. H. Becker, R. M. Kamens,J. H. Seinfeld, T. J. Wallington and G. Yarwood, The Mechanismsof Atmospheric Oxidation of the Alkenes, Oxford University Press,New York, 2000, p. 552.
5 J. G. Calvert, R. Atkinson, J. A. Kerr, S. Madronich,G. K. Moortgat, T. J. Wallington and G. Yarwood, The Mechan-isms of Atmospheric Oxidation of Aromatic Hydrocarbons, OxfordUniversity Press, New York, 2002, p. 556.
6 J. G. Calvert, R. G. Derwent, J. J. Orlando, G. S. Tyndall andT. J. Wallington, Mechanisms of Atmospheric Oxidation of theAlkanes, Oxford University Press, New York, 2008, p. 992.
7 R. Atkinson, D. L. Baulch, R. A. Cox, J. N. Crowley,R. F. Hampson, R. G. Hynes, M. E. Jenkin, M. J. Rossi andJ. Troe, Atmos. Chem. Phys., 2006, 6, 3625–4055.
8 A. H. Goldstein and I. E. Galbally, Environ. Sci. Technol., 2007,41, 1514–1521.
9 I. Kourtchev, I. Bejan, J. R. Sodeau and J. C. Wenger, Atmos.Environ., 2009, 43, 3182–3190.
10 C. L. Loza, A. W. H. Chan, M. M. Galloway, F. N. Keutsch,R. C. Flagan and J. H. Seinfeld, Environ. Sci. Technol., 2010, 44,5074–5078.
11 A. Matsunaga and P. J. Ziemann, Aerosol Sci. Technol., 2010, 44,881–892.
12 S. A. Mason, J. Arey and R. Atkinson, J. Phys. Chem. A, 2009,113, 5649–5656.
13 K. E. Leather, M. R. McGillen and C. J. Percival, Phys. Chem.Chem. Phys., 2010, 12, 2935–2943.
14 S. M. Aschmann, J. Arey and R. Atkinson, J. Phys. Chem. A, 2010,114, 5810–5816.
15 R. Atkinson, S. M. Aschmann, D. R. Fitz, A. M. Winer andJ. N. Pitts Jr, Int. J. Chem. Kinet., 1982, 14, 13–18.
16 E. V. Avzianova and P. A. Ariya, Int. J. Chem. Kinet., 2002, 34,678–684.
17 M. R. McGillen, T. J. Carey, A. T. Archibald, J. C. Wenger,D. E. Shallcross and C. J. Percival, Phys. Chem. Chem. Phys., 2008,10, 1757–1768.
18 US EPA, Estimation Programs Interface Suitet for Microsofts
Windows, v 4.00, United States Environmental Protection Agency,Washington, DC, USA, 2009.
19 R. Taft, in Steric Effects in Organic Chemistry, ed. M. S. Newman,John Wiley & Sons, Inc., New York, 1956, ch. 13, pp. 556–675.
20 R. Atkinson and W. P. L. Carter, Chem. Rev., 1984, 84, 437–470.21 A. Neuman, L. G. Huey, T. B. Ryerson and D. W. Fahey, Environ.
Sci. Technol., 1999, 33, 1133–1136.22 S. Prager and F. A. Long, J. Am. Chem. Soc., 1951, 78, 4072–4075.
Dow
nloa
ded
by J
ohn
Ryl
ands
Uni
vers
ity L
ibra
ry o
n 11
May
201
2Pu
blis
hed
on 2
3 M
arch
201
1 on
http
://pu
bs.r
sc.o
rg |
doi:1
0.10
39/C
0CP0
2643
C
View Online

This journal is c the Owner Societies 2011 Phys. Chem. Chem. Phys., 2011, 13, 10965–10969 10969
23 M. R. McGillen, C. J. Percival, D. E. Shallcross and J. N. Harvey,Phys. Chem. Chem. Phys., 2007, 9, 4349–4356.
24 S. M. Japar, C. H. Wu and H. Niki, J. Phys. Chem., 1974, 78,2318–2320.
25 J. Treacy, M. El Hag, D. O’Farrell and H. Sidebottom, Ber.Bunsenges. Phys. Chem., 1992, 96, 422–427.
26 E. Grosjean and D. Grosjean, Int. J. Chem. Kinet., 1995, 27,1045–1054.
27 S. A. Adeniji, J. A. Kerr and M. R. Williams, Int. J. Chem. Kinet.,1981, 13, 209–217.
28 R. D. Cadle and C. Schadt, J. Am. Chem. Soc., 1952, 74,6002–6004.
Dow
nloa
ded
by J
ohn
Ryl
ands
Uni
vers
ity L
ibra
ry o
n 11
May
201
2Pu
blis
hed
on 2
3 M
arch
201
1 on
http
://pu
bs.r
sc.o
rg |
doi:1
0.10
39/C
0CP0
2643
C
View Online

83

84

85
5. Paper IV “ Determination of gas-phase ozonolysis rate coefficients of a number of
sesquiterpenes at elevated temperatures using the relative rate method”
by Mohamed B. Ghalaieny, Asan Bacak, Max R. McGillen, Damien Martin, Alan V. Knights, Simon O’Doherty, Dudley E. Shallcross and Carl J. Percival. Published in: Physical Chemistry Chemical Physics, (2012), volume 14, pages 6596-6602. Contributions: The experiments were conceived and conducted by Mohamed
Ghalaieny. Asan Bacak assisted with the experimental setup. Max Mcgillen assisted
in data analysis and interpretation. All the authors above contributed to the
manuscript. Damien Martin, Simon O’Doherty and Alan Knights assisted with setup
of instrumentation. Dudley Shalcross provided modelling for atmospheric
implications of the work. The work was conducted under the supervision of Carl
Percival.

86
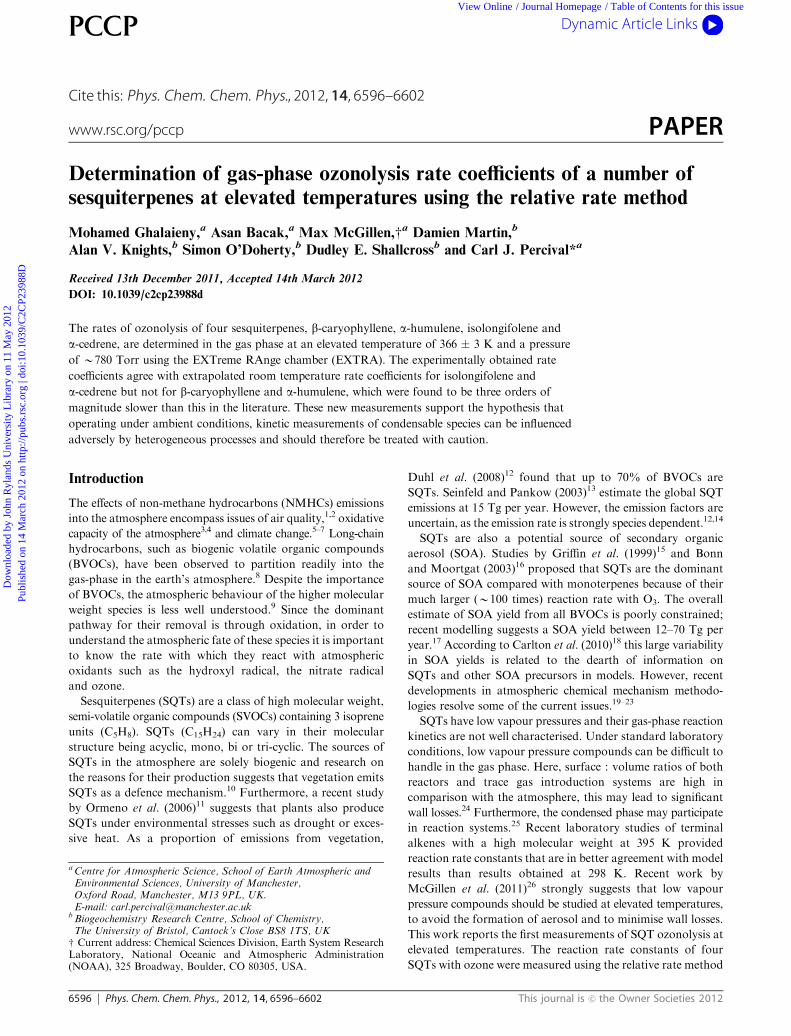
6596 Phys. Chem. Chem. Phys., 2012, 14, 6596–6602 This journal is c the Owner Societies 2012
Cite this: Phys. Chem. Chem. Phys., 2012, 14, 6596–6602
Determination of gas-phase ozonolysis rate coefficients of a number of
sesquiterpenes at elevated temperatures using the relative rate method
Mohamed Ghalaieny,aAsan Bacak,
aMax McGillen,wa Damien Martin,
b
Alan V. Knights,bSimon O’Doherty,
bDudley E. Shallcross
band Carl J. Percival*
a
Received 13th December 2011, Accepted 14th March 2012
DOI: 10.1039/c2cp23988d
The rates of ozonolysis of four sesquiterpenes, b-caryophyllene, a-humulene, isolongifolene and
a-cedrene, are determined in the gas phase at an elevated temperature of 366 3 K and a pressure
of B780 Torr using the EXTreme RAnge chamber (EXTRA). The experimentally obtained rate
coefficients agree with extrapolated room temperature rate coefficients for isolongifolene and
a-cedrene but not for b-caryophyllene and a-humulene, which were found to be three orders of
magnitude slower than this in the literature. These new measurements support the hypothesis that
operating under ambient conditions, kinetic measurements of condensable species can be influenced
adversely by heterogeneous processes and should therefore be treated with caution.
Introduction
The effects of non-methane hydrocarbons (NMHCs) emissions
into the atmosphere encompass issues of air quality,1,2 oxidative
capacity of the atmosphere3,4 and climate change.5–7 Long-chain
hydrocarbons, such as biogenic volatile organic compounds
(BVOCs), have been observed to partition readily into the
gas-phase in the earth’s atmosphere.8 Despite the importance
of BVOCs, the atmospheric behaviour of the higher molecular
weight species is less well understood.9 Since the dominant
pathway for their removal is through oxidation, in order to
understand the atmospheric fate of these species it is important
to know the rate with which they react with atmospheric
oxidants such as the hydroxyl radical, the nitrate radical
and ozone.
Sesquiterpenes (SQTs) are a class of high molecular weight,
semi-volatile organic compounds (SVOCs) containing 3 isoprene
units (C5H8). SQTs (C15H24) can vary in their molecular
structure being acyclic, mono, bi or tri-cyclic. The sources of
SQTs in the atmosphere are solely biogenic and research on
the reasons for their production suggests that vegetation emits
SQTs as a defence mechanism.10 Furthermore, a recent study
by Ormeno et al. (2006)11 suggests that plants also produce
SQTs under environmental stresses such as drought or exces-
sive heat. As a proportion of emissions from vegetation,
Duhl et al. (2008)12 found that up to 70% of BVOCs are
SQTs. Seinfeld and Pankow (2003)13 estimate the global SQT
emissions at 15 Tg per year. However, the emission factors are
uncertain, as the emission rate is strongly species dependent.12,14
SQTs are also a potential source of secondary organic
aerosol (SOA). Studies by Griffin et al. (1999)15 and Bonn
and Moortgat (2003)16 proposed that SQTs are the dominant
source of SOA compared with monoterpenes because of their
much larger (B100 times) reaction rate with O3. The overall
estimate of SOA yield from all BVOCs is poorly constrained;
recent modelling suggests a SOA yield between 12–70 Tg per
year.17 According to Carlton et al. (2010)18 this large variability
in SOA yields is related to the dearth of information on
SQTs and other SOA precursors in models. However, recent
developments in atmospheric chemical mechanism methodo-
logies resolve some of the current issues.19–23
SQTs have low vapour pressures and their gas-phase reaction
kinetics are not well characterised. Under standard laboratory
conditions, low vapour pressure compounds can be difficult to
handle in the gas phase. Here, surface : volume ratios of both
reactors and trace gas introduction systems are high in
comparison with the atmosphere, this may lead to significant
wall losses.24 Furthermore, the condensed phase may participate
in reaction systems.25 Recent laboratory studies of terminal
alkenes with a high molecular weight at 395 K provided
reaction rate constants that are in better agreement with model
results than results obtained at 298 K. Recent work by
McGillen et al. (2011)26 strongly suggests that low vapour
pressure compounds should be studied at elevated temperatures,
to avoid the formation of aerosol and to minimise wall losses.
This work reports the first measurements of SQT ozonolysis at
elevated temperatures. The reaction rate constants of four
SQTs with ozone were measured using the relative rate method
a Centre for Atmospheric Science, School of Earth Atmospheric andEnvironmental Sciences, University of Manchester,Oxford Road, Manchester, M13 9PL, UK.E-mail: [email protected]
b Biogeochemistry Research Centre, School of Chemistry,The University of Bristol, Cantock’s Close BS8 1TS, UK
w Current address: Chemical Sciences Division, Earth System ResearchLaboratory, National Oceanic and Atmospheric Administration(NOAA), 325 Broadway, Boulder, CO 80305, USA.
PCCP Dynamic Article Links
www.rsc.org/pccp PAPER
Dow
nloa
ded
by J
ohn
Ryl
ands
Uni
vers
ity L
ibra
ry o
n 11
May
201
2Pu
blis
hed
on 1
4 M
arch
201
2 on
http
://pu
bs.r
sc.o
rg |
doi:1
0.10
39/C
2CP2
3988
DView Online / Journal Homepage / Table of Contents for this issue
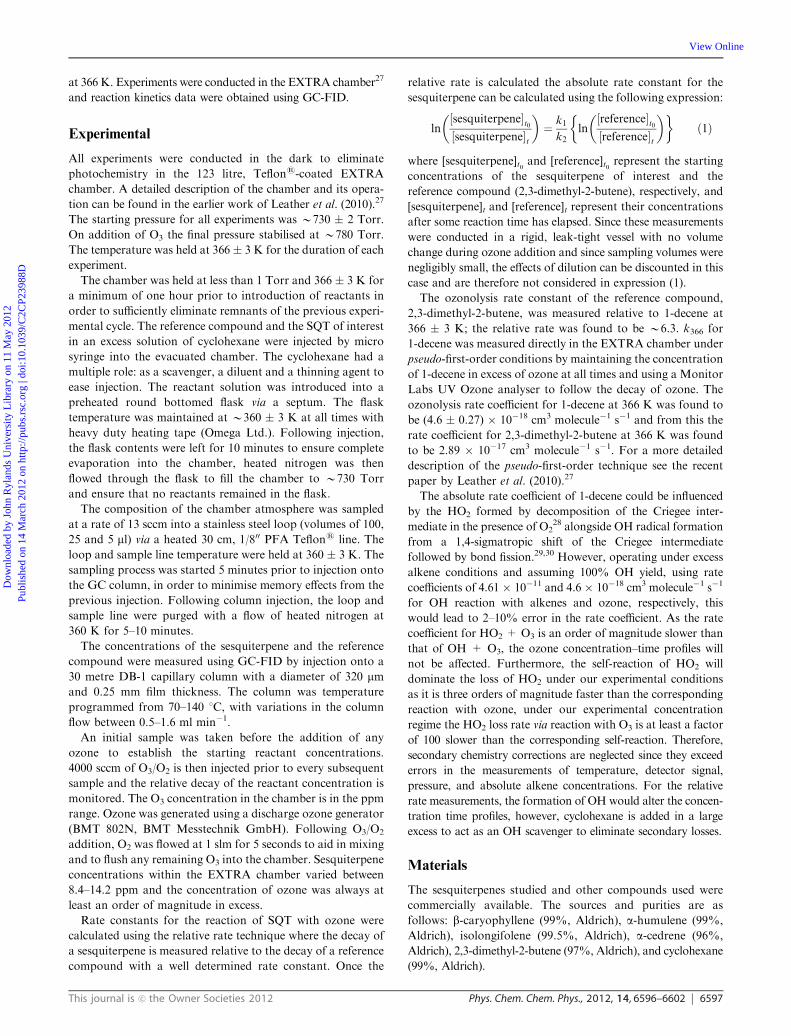
This journal is c the Owner Societies 2012 Phys. Chem. Chem. Phys., 2012, 14, 6596–6602 6597
at 366 K. Experiments were conducted in the EXTRA chamber27
and reaction kinetics data were obtained using GC-FID.
Experimental
All experiments were conducted in the dark to eliminate
photochemistry in the 123 litre, Teflons-coated EXTRA
chamber. A detailed description of the chamber and its opera-
tion can be found in the earlier work of Leather et al. (2010).27
The starting pressure for all experiments was B730 2 Torr.
On addition of O3 the final pressure stabilised at B780 Torr.
The temperature was held at 366 3 K for the duration of each
experiment.
The chamber was held at less than 1 Torr and 366 3 K for
a minimum of one hour prior to introduction of reactants in
order to sufficiently eliminate remnants of the previous experi-
mental cycle. The reference compound and the SQT of interest
in an excess solution of cyclohexane were injected by micro
syringe into the evacuated chamber. The cyclohexane had a
multiple role: as a scavenger, a diluent and a thinning agent to
ease injection. The reactant solution was introduced into a
preheated round bottomed flask via a septum. The flask
temperature was maintained at B360 3 K at all times with
heavy duty heating tape (Omega Ltd.). Following injection,
the flask contents were left for 10 minutes to ensure complete
evaporation into the chamber, heated nitrogen was then
flowed through the flask to fill the chamber to B730 Torr
and ensure that no reactants remained in the flask.
The composition of the chamber atmosphere was sampled
at a rate of 13 sccm into a stainless steel loop (volumes of 100,
25 and 5 ml) via a heated 30 cm, 1/800 PFA Teflons line. The
loop and sample line temperature were held at 360 3 K. The
sampling process was started 5 minutes prior to injection onto
the GC column, in order to minimise memory effects from the
previous injection. Following column injection, the loop and
sample line were purged with a flow of heated nitrogen at
360 K for 5–10 minutes.
The concentrations of the sesquiterpene and the reference
compound were measured using GC-FID by injection onto a
30 metre DB-1 capillary column with a diameter of 320 mmand 0.25 mm film thickness. The column was temperature
programmed from 70–140 1C, with variations in the column
flow between 0.5–1.6 ml min1.
An initial sample was taken before the addition of any
ozone to establish the starting reactant concentrations.
4000 sccm of O3/O2 is then injected prior to every subsequent
sample and the relative decay of the reactant concentration is
monitored. The O3 concentration in the chamber is in the ppm
range. Ozone was generated using a discharge ozone generator
(BMT 802N, BMT Messtechnik GmbH). Following O3/O2
addition, O2 was flowed at 1 slm for 5 seconds to aid in mixing
and to flush any remaining O3 into the chamber. Sesquiterpene
concentrations within the EXTRA chamber varied between
8.4–14.2 ppm and the concentration of ozone was always at
least an order of magnitude in excess.
Rate constants for the reaction of SQT with ozone were
calculated using the relative rate technique where the decay of
a sesquiterpene is measured relative to the decay of a reference
compound with a well determined rate constant. Once the
relative rate is calculated the absolute rate constant for the
sesquiterpene can be calculated using the following expression:
ln½sesquiterpenet0½sesquiterpenet
¼ k1
k2ln½referencet0½referencet
ð1Þ
where [sesquiterpene]t0 and [reference]t0 represent the starting
concentrations of the sesquiterpene of interest and the
reference compound (2,3-dimethyl-2-butene), respectively, and
[sesquiterpene]t and [reference]t represent their concentrations
after some reaction time has elapsed. Since these measurements
were conducted in a rigid, leak-tight vessel with no volume
change during ozone addition and since sampling volumes were
negligibly small, the effects of dilution can be discounted in this
case and are therefore not considered in expression (1).
The ozonolysis rate constant of the reference compound,
2,3-dimethyl-2-butene, was measured relative to 1-decene at
366 3 K; the relative rate was found to be B6.3. k366 for
1-decene was measured directly in the EXTRA chamber under
pseudo-first-order conditions by maintaining the concentration
of 1-decene in excess of ozone at all times and using a Monitor
Labs UV Ozone analyser to follow the decay of ozone. The
ozonolysis rate coefficient for 1-decene at 366 K was found to
be (4.6 0.27) 1018 cm3 molecule1 s1 and from this the
rate coefficient for 2,3-dimethyl-2-butene at 366 K was found
to be 2.89 1017 cm3 molecule1 s1. For a more detailed
description of the pseudo-first-order technique see the recent
paper by Leather et al. (2010).27
The absolute rate coefficient of 1-decene could be influenced
by the HO2 formed by decomposition of the Criegee inter-
mediate in the presence of O228 alongside OH radical formation
from a 1,4-sigmatropic shift of the Criegee intermediate
followed by bond fission.29,30 However, operating under excess
alkene conditions and assuming 100% OH yield, using rate
coefficients of 4.61 1011 and 4.6 1018 cm3 molecule1 s1
for OH reaction with alkenes and ozone, respectively, this
would lead to 2–10% error in the rate coefficient. As the rate
coefficient for HO2 + O3 is an order of magnitude slower than
that of OH + O3, the ozone concentration–time profiles will
not be affected. Furthermore, the self-reaction of HO2 will
dominate the loss of HO2 under our experimental conditions
as it is three orders of magnitude faster than the corresponding
reaction with ozone, under our experimental concentration
regime the HO2 loss rate via reaction with O3 is at least a factor
of 100 slower than the corresponding self-reaction. Therefore,
secondary chemistry corrections are neglected since they exceed
errors in the measurements of temperature, detector signal,
pressure, and absolute alkene concentrations. For the relative
rate measurements, the formation of OH would alter the concen-
tration time profiles, however, cyclohexane is added in a large
excess to act as an OH scavenger to eliminate secondary losses.
Materials
The sesquiterpenes studied and other compounds used were
commercially available. The sources and purities are as
follows: b-caryophyllene (99%, Aldrich), a-humulene (99%,
Aldrich), isolongifolene (99.5%, Aldrich), a-cedrene (96%,
Aldrich), 2,3-dimethyl-2-butene (97%, Aldrich), and cyclohexane
(99%, Aldrich).
Dow
nloa
ded
by J
ohn
Ryl
ands
Uni
vers
ity L
ibra
ry o
n 11
May
201
2Pu
blis
hed
on 1
4 M
arch
201
2 on
http
://pu
bs.r
sc.o
rg |
doi:1
0.10
39/C
2CP2
3988
D
View Online
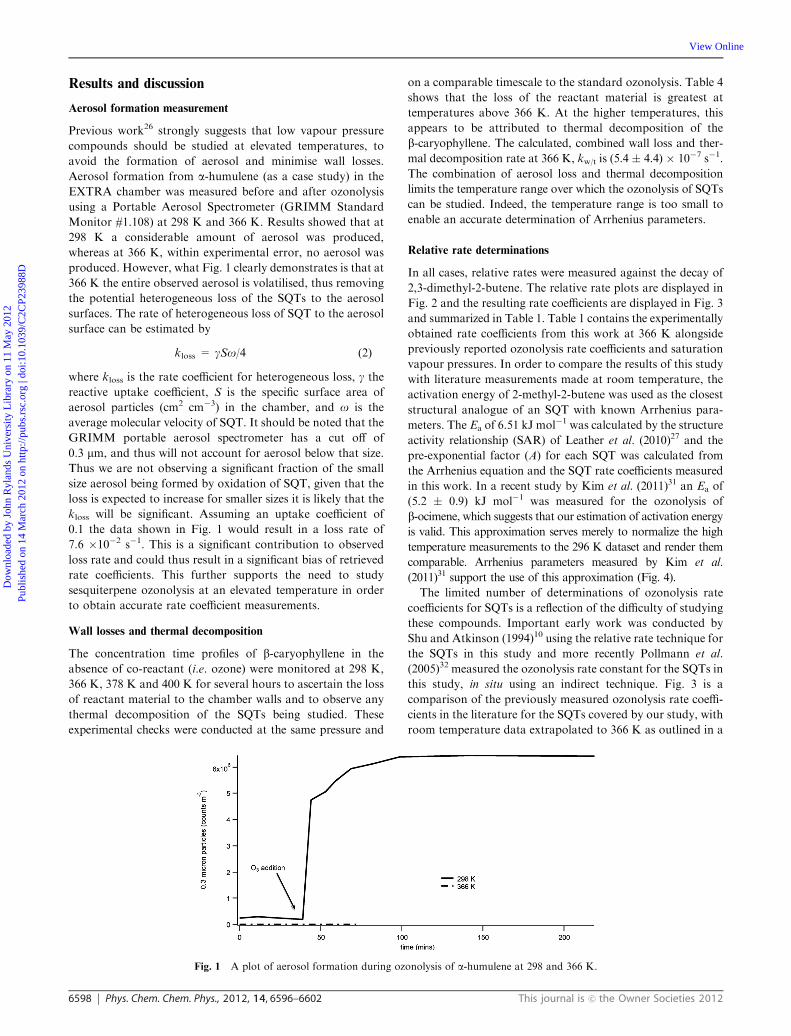
6598 Phys. Chem. Chem. Phys., 2012, 14, 6596–6602 This journal is c the Owner Societies 2012
Results and discussion
Aerosol formation measurement
Previous work26 strongly suggests that low vapour pressure
compounds should be studied at elevated temperatures, to
avoid the formation of aerosol and minimise wall losses.
Aerosol formation from a-humulene (as a case study) in the
EXTRA chamber was measured before and after ozonolysis
using a Portable Aerosol Spectrometer (GRIMM Standard
Monitor #1.108) at 298 K and 366 K. Results showed that at
298 K a considerable amount of aerosol was produced,
whereas at 366 K, within experimental error, no aerosol was
produced. However, what Fig. 1 clearly demonstrates is that at
366 K the entire observed aerosol is volatilised, thus removing
the potential heterogeneous loss of the SQTs to the aerosol
surfaces. The rate of heterogeneous loss of SQT to the aerosol
surface can be estimated by
kloss = gSo/4 (2)
where kloss is the rate coefficient for heterogeneous loss, g the
reactive uptake coefficient, S is the specific surface area of
aerosol particles (cm2 cm3) in the chamber, and o is the
average molecular velocity of SQT. It should be noted that the
GRIMM portable aerosol spectrometer has a cut off of
0.3 mm, and thus will not account for aerosol below that size.
Thus we are not observing a significant fraction of the small
size aerosol being formed by oxidation of SQT, given that the
loss is expected to increase for smaller sizes it is likely that the
kloss will be significant. Assuming an uptake coefficient of
0.1 the data shown in Fig. 1 would result in a loss rate of
7.6 102 s1. This is a significant contribution to observed
loss rate and could thus result in a significant bias of retrieved
rate coefficients. This further supports the need to study
sesquiterpene ozonolysis at an elevated temperature in order
to obtain accurate rate coefficient measurements.
Wall losses and thermal decomposition
The concentration time profiles of b-caryophyllene in the
absence of co-reactant (i.e. ozone) were monitored at 298 K,
366 K, 378 K and 400 K for several hours to ascertain the loss
of reactant material to the chamber walls and to observe any
thermal decomposition of the SQTs being studied. These
experimental checks were conducted at the same pressure and
on a comparable timescale to the standard ozonolysis. Table 4
shows that the loss of the reactant material is greatest at
temperatures above 366 K. At the higher temperatures, this
appears to be attributed to thermal decomposition of the
b-caryophyllene. The calculated, combined wall loss and ther-
mal decomposition rate at 366 K, kw/t is (5.4 4.4) 107 s1.
The combination of aerosol loss and thermal decomposition
limits the temperature range over which the ozonolysis of SQTs
can be studied. Indeed, the temperature range is too small to
enable an accurate determination of Arrhenius parameters.
Relative rate determinations
In all cases, relative rates were measured against the decay of
2,3-dimethyl-2-butene. The relative rate plots are displayed in
Fig. 2 and the resulting rate coefficients are displayed in Fig. 3
and summarized in Table 1. Table 1 contains the experimentally
obtained rate coefficients from this work at 366 K alongside
previously reported ozonolysis rate coefficients and saturation
vapour pressures. In order to compare the results of this study
with literature measurements made at room temperature, the
activation energy of 2-methyl-2-butene was used as the closest
structural analogue of an SQT with known Arrhenius para-
meters. The Ea of 6.51 kJ mol1 was calculated by the structure
activity relationship (SAR) of Leather et al. (2010)27 and the
pre-exponential factor (A) for each SQT was calculated from
the Arrhenius equation and the SQT rate coefficients measured
in this work. In a recent study by Kim et al. (2011)31 an Ea of
(5.2 0.9) kJ mol1 was measured for the ozonolysis of
b-ocimene, which suggests that our estimation of activation energy
is valid. This approximation serves merely to normalize the high
temperature measurements to the 296 K dataset and render them
comparable. Arrhenius parameters measured by Kim et al.
(2011)31 support the use of this approximation (Fig. 4).
The limited number of determinations of ozonolysis rate
coefficients for SQTs is a reflection of the difficulty of studying
these compounds. Important early work was conducted by
Shu and Atkinson (1994)10 using the relative rate technique for
the SQTs in this study and more recently Pollmann et al.
(2005)32 measured the ozonolysis rate constant for the SQTs in
this study, in situ using an indirect technique. Fig. 3 is a
comparison of the previously measured ozonolysis rate coeffi-
cients in the literature for the SQTs covered by our study, with
room temperature data extrapolated to 366 K as outlined in a
Fig. 1 A plot of aerosol formation during ozonolysis of a-humulene at 298 and 366 K.
Dow
nloa
ded
by J
ohn
Ryl
ands
Uni
vers
ity L
ibra
ry o
n 11
May
201
2Pu
blis
hed
on 1
4 M
arch
201
2 on
http
://pu
bs.r
sc.o
rg |
doi:1
0.10
39/C
2CP2
3988
D
View Online
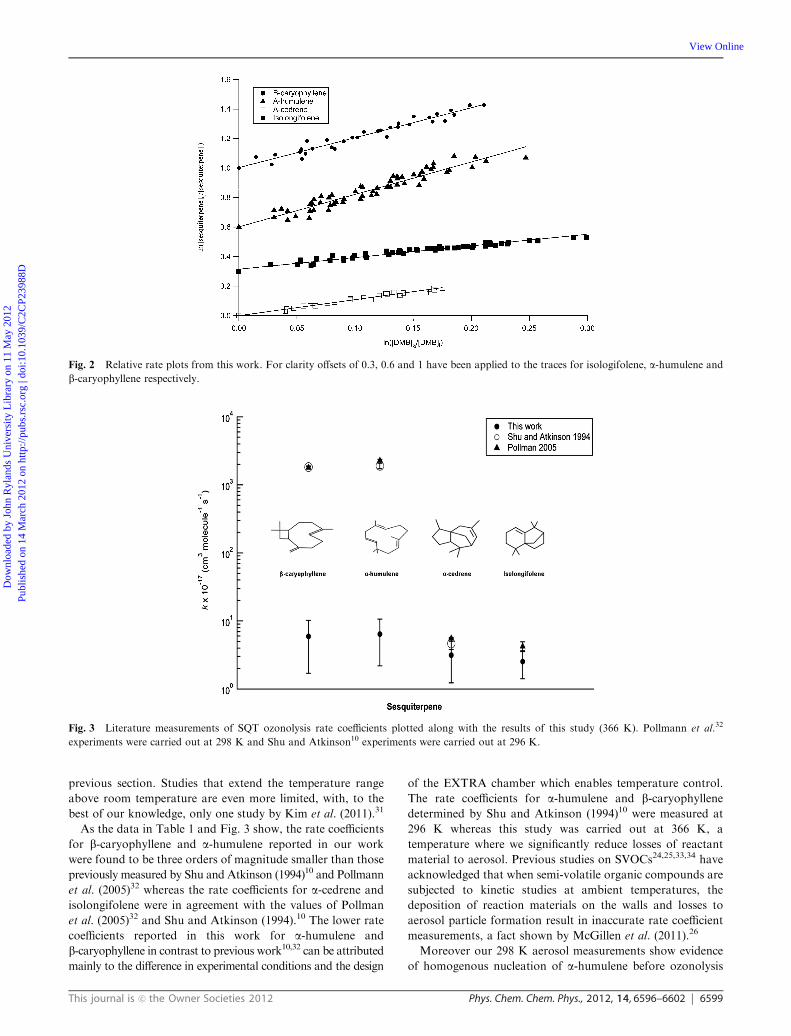
This journal is c the Owner Societies 2012 Phys. Chem. Chem. Phys., 2012, 14, 6596–6602 6599
previous section. Studies that extend the temperature range
above room temperature are even more limited, with, to the
best of our knowledge, only one study by Kim et al. (2011).31
As the data in Table 1 and Fig. 3 show, the rate coefficients
for b-caryophyllene and a-humulene reported in our work
were found to be three orders of magnitude smaller than those
previously measured by Shu and Atkinson (1994)10 and Pollmann
et al. (2005)32 whereas the rate coefficients for a-cedrene and
isolongifolene were in agreement with the values of Pollman
et al. (2005)32 and Shu and Atkinson (1994).10 The lower rate
coefficients reported in this work for a-humulene and
b-caryophyllene in contrast to previous work10,32 can be attributed
mainly to the difference in experimental conditions and the design
of the EXTRA chamber which enables temperature control.
The rate coefficients for a-humulene and b-caryophyllenedetermined by Shu and Atkinson (1994)10 were measured at
296 K whereas this study was carried out at 366 K, a
temperature where we significantly reduce losses of reactant
material to aerosol. Previous studies on SVOCs24,25,33,34 have
acknowledged that when semi-volatile organic compounds are
subjected to kinetic studies at ambient temperatures, the
deposition of reaction materials on the walls and losses to
aerosol particle formation result in inaccurate rate coefficient
measurements, a fact shown by McGillen et al. (2011).26
Moreover our 298 K aerosol measurements show evidence
of homogenous nucleation of a-humulene before ozonolysis
Fig. 2 Relative rate plots from this work. For clarity offsets of 0.3, 0.6 and 1 have been applied to the traces for isologifolene, a-humulene and
b-caryophyllene respectively.
Fig. 3 Literature measurements of SQT ozonolysis rate coefficients plotted along with the results of this study (366 K). Pollmann et al.32
experiments were carried out at 298 K and Shu and Atkinson10 experiments were carried out at 296 K.
Dow
nloa
ded
by J
ohn
Ryl
ands
Uni
vers
ity L
ibra
ry o
n 11
May
201
2Pu
blis
hed
on 1
4 M
arch
201
2 on
http
://pu
bs.r
sc.o
rg |
doi:1
0.10
39/C
2CP2
3988
D
View Online
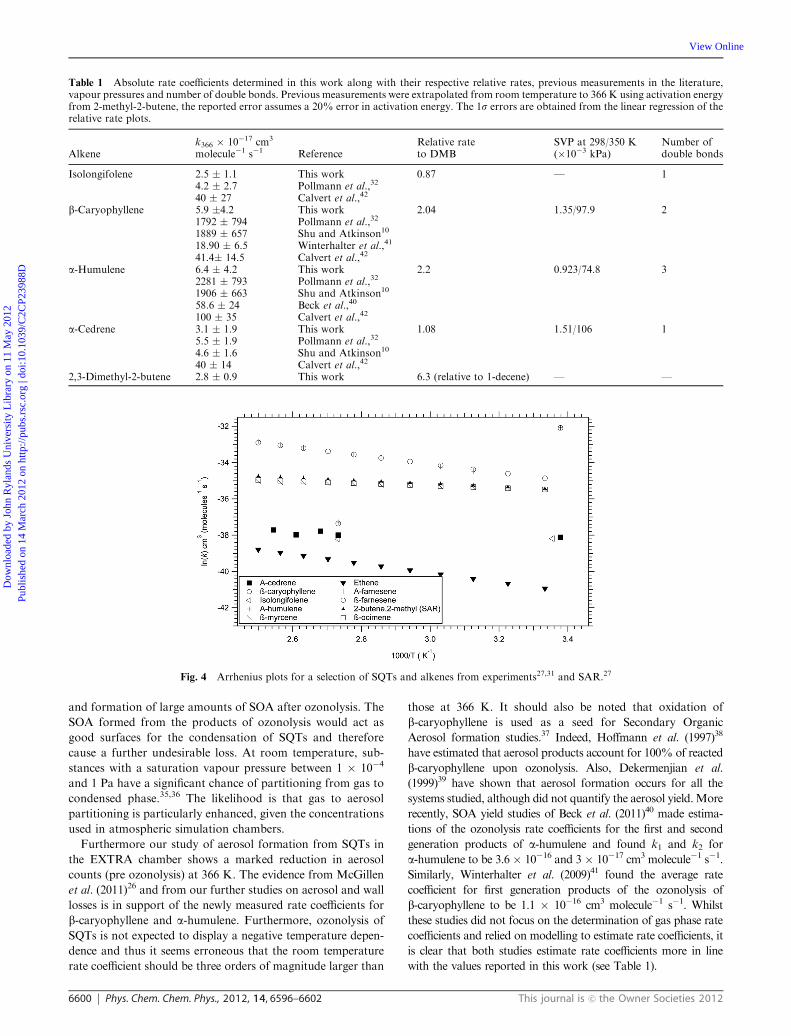
6600 Phys. Chem. Chem. Phys., 2012, 14, 6596–6602 This journal is c the Owner Societies 2012
and formation of large amounts of SOA after ozonolysis. The
SOA formed from the products of ozonolysis would act as
good surfaces for the condensation of SQTs and therefore
cause a further undesirable loss. At room temperature, sub-
stances with a saturation vapour pressure between 1 104
and 1 Pa have a significant chance of partitioning from gas to
condensed phase.35,36 The likelihood is that gas to aerosol
partitioning is particularly enhanced, given the concentrations
used in atmospheric simulation chambers.
Furthermore our study of aerosol formation from SQTs in
the EXTRA chamber shows a marked reduction in aerosol
counts (pre ozonolysis) at 366 K. The evidence from McGillen
et al. (2011)26 and from our further studies on aerosol and wall
losses is in support of the newly measured rate coefficients for
b-caryophyllene and a-humulene. Furthermore, ozonolysis of
SQTs is not expected to display a negative temperature depen-
dence and thus it seems erroneous that the room temperature
rate coefficient should be three orders of magnitude larger than
those at 366 K. It should also be noted that oxidation of
b-caryophyllene is used as a seed for Secondary Organic
Aerosol formation studies.37 Indeed, Hoffmann et al. (1997)38
have estimated that aerosol products account for 100% of reacted
b-caryophyllene upon ozonolysis. Also, Dekermenjian et al.
(1999)39 have shown that aerosol formation occurs for all the
systems studied, although did not quantify the aerosol yield.More
recently, SOA yield studies of Beck et al. (2011)40 made estima-
tions of the ozonolysis rate coefficients for the first and second
generation products of a-humulene and found k1 and k2 for
a-humulene to be 3.6 1016 and 3 1017 cm3 molecule1 s1.
Similarly, Winterhalter et al. (2009)41 found the average rate
coefficient for first generation products of the ozonolysis of
b-caryophyllene to be 1.1 1016 cm3 molecule1 s1. Whilst
these studies did not focus on the determination of gas phase rate
coefficients and relied on modelling to estimate rate coefficients, it
is clear that both studies estimate rate coefficients more in line
with the values reported in this work (see Table 1).
Table 1 Absolute rate coefficients determined in this work along with their respective relative rates, previous measurements in the literature,vapour pressures and number of double bonds. Previous measurements were extrapolated from room temperature to 366 K using activation energyfrom 2-methyl-2-butene, the reported error assumes a 20% error in activation energy. The 1s errors are obtained from the linear regression of therelative rate plots.
Alkenek366 1017 cm3
molecule1 s1 ReferenceRelative rateto DMB
SVP at 298/350 K(103 kPa)
Number ofdouble bonds
Isolongifolene 2.5 1.1 This work 0.87 — 14.2 2.7 Pollmann et al.,32
40 27 Calvert et al.,42
b-Caryophyllene 5.9 4.2 This work 2.04 1.35/97.9 21792 794 Pollmann et al.,32
1889 657 Shu and Atkinson10
18.90 6.5 Winterhalter et al.,41
41.4 14.5 Calvert et al.,42
a-Humulene 6.4 4.2 This work 2.2 0.923/74.8 32281 793 Pollmann et al.,32
1906 663 Shu and Atkinson10
58.6 24 Beck et al.,40
100 35 Calvert et al.,42
a-Cedrene 3.1 1.9 This work 1.08 1.51/106 15.5 1.9 Pollmann et al.,32
4.6 1.6 Shu and Atkinson10
40 14 Calvert et al.,42
2,3-Dimethyl-2-butene 2.8 0.9 This work 6.3 (relative to 1-decene) — —
Fig. 4 Arrhenius plots for a selection of SQTs and alkenes from experiments27,31 and SAR.27
Dow
nloa
ded
by J
ohn
Ryl
ands
Uni
vers
ity L
ibra
ry o
n 11
May
201
2Pu
blis
hed
on 1
4 M
arch
201
2 on
http
://pu
bs.r
sc.o
rg |
doi:1
0.10
39/C
2CP2
3988
D
View Online
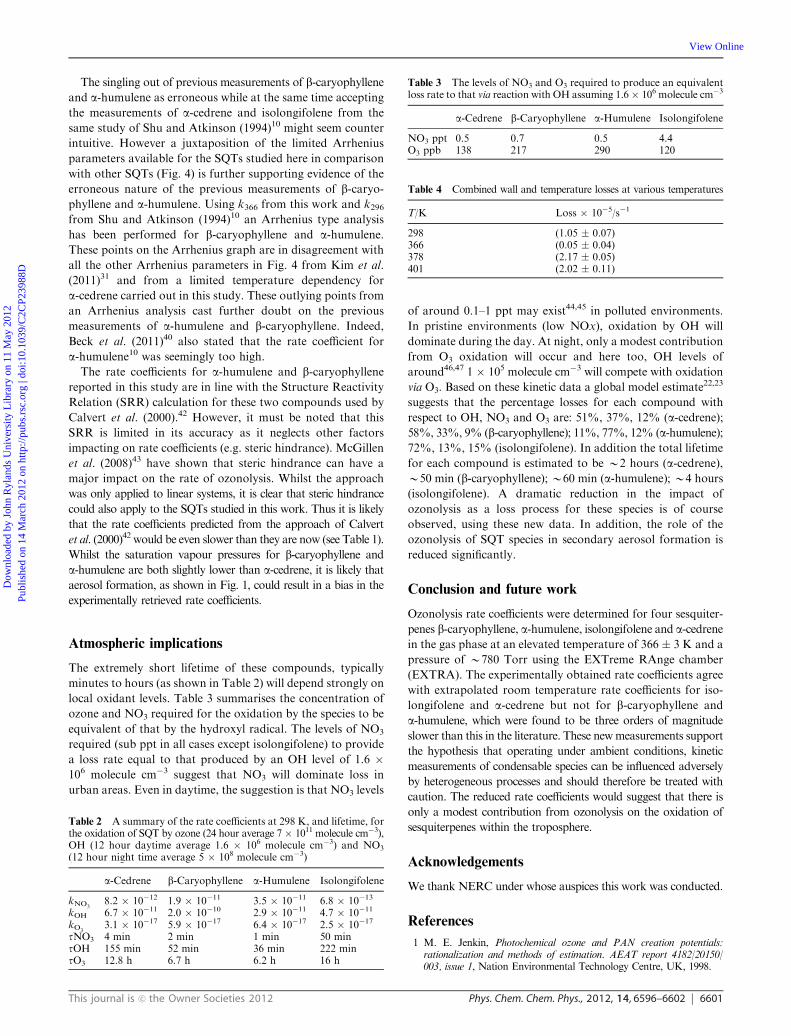
This journal is c the Owner Societies 2012 Phys. Chem. Chem. Phys., 2012, 14, 6596–6602 6601
The singling out of previous measurements of b-caryophylleneand a-humulene as erroneous while at the same time accepting
the measurements of a-cedrene and isolongifolene from the
same study of Shu and Atkinson (1994)10 might seem counter
intuitive. However a juxtaposition of the limited Arrhenius
parameters available for the SQTs studied here in comparison
with other SQTs (Fig. 4) is further supporting evidence of the
erroneous nature of the previous measurements of b-caryo-phyllene and a-humulene. Using k366 from this work and k296from Shu and Atkinson (1994)10 an Arrhenius type analysis
has been performed for b-caryophyllene and a-humulene.
These points on the Arrhenius graph are in disagreement with
all the other Arrhenius parameters in Fig. 4 from Kim et al.
(2011)31 and from a limited temperature dependency for
a-cedrene carried out in this study. These outlying points from
an Arrhenius analysis cast further doubt on the previous
measurements of a-humulene and b-caryophyllene. Indeed,
Beck et al. (2011)40 also stated that the rate coefficient for
a-humulene10 was seemingly too high.
The rate coefficients for a-humulene and b-caryophyllenereported in this study are in line with the Structure Reactivity
Relation (SRR) calculation for these two compounds used by
Calvert et al. (2000).42 However, it must be noted that this
SRR is limited in its accuracy as it neglects other factors
impacting on rate coefficients (e.g. steric hindrance). McGillen
et al. (2008)43 have shown that steric hindrance can have a
major impact on the rate of ozonolysis. Whilst the approach
was only applied to linear systems, it is clear that steric hindrance
could also apply to the SQTs studied in this work. Thus it is likely
that the rate coefficients predicted from the approach of Calvert
et al. (2000)42 would be even slower than they are now (see Table 1).
Whilst the saturation vapour pressures for b-caryophyllene and
a-humulene are both slightly lower than a-cedrene, it is likely that
aerosol formation, as shown in Fig. 1, could result in a bias in the
experimentally retrieved rate coefficients.
Atmospheric implications
The extremely short lifetime of these compounds, typically
minutes to hours (as shown in Table 2) will depend strongly on
local oxidant levels. Table 3 summarises the concentration of
ozone and NO3 required for the oxidation by the species to be
equivalent of that by the hydroxyl radical. The levels of NO3
required (sub ppt in all cases except isolongifolene) to provide
a loss rate equal to that produced by an OH level of 1.6 106 molecule cm3 suggest that NO3 will dominate loss in
urban areas. Even in daytime, the suggestion is that NO3 levels
of around 0.1–1 ppt may exist44,45 in polluted environments.
In pristine environments (low NOx), oxidation by OH will
dominate during the day. At night, only a modest contribution
from O3 oxidation will occur and here too, OH levels of
around46,47 1 105 molecule cm3 will compete with oxidation
via O3. Based on these kinetic data a global model estimate22,23
suggests that the percentage losses for each compound with
respect to OH, NO3 and O3 are: 51%, 37%, 12% (a-cedrene);58%, 33%, 9% (b-caryophyllene); 11%, 77%, 12% (a-humulene);
72%, 13%, 15% (isolongifolene). In addition the total lifetime
for each compound is estimated to be B2 hours (a-cedrene),B50 min (b-caryophyllene); B60 min (a-humulene); B4 hours
(isolongifolene). A dramatic reduction in the impact of
ozonolysis as a loss process for these species is of course
observed, using these new data. In addition, the role of the
ozonolysis of SQT species in secondary aerosol formation is
reduced significantly.
Conclusion and future work
Ozonolysis rate coefficients were determined for four sesquiter-
penes b-caryophyllene, a-humulene, isolongifolene and a-cedrenein the gas phase at an elevated temperature of 366 3 K and a
pressure of B780 Torr using the EXTreme RAnge chamber
(EXTRA). The experimentally obtained rate coefficients agree
with extrapolated room temperature rate coefficients for iso-
longifolene and a-cedrene but not for b-caryophyllene and
a-humulene, which were found to be three orders of magnitude
slower than this in the literature. These newmeasurements support
the hypothesis that operating under ambient conditions, kinetic
measurements of condensable species can be influenced adversely
by heterogeneous processes and should therefore be treated with
caution. The reduced rate coefficients would suggest that there is
only a modest contribution from ozonolysis on the oxidation of
sesquiterpenes within the troposphere.
Acknowledgements
We thank NERC under whose auspices this work was conducted.
References
1 M. E. Jenkin, Photochemical ozone and PAN creation potentials:rationalization and methods of estimation. AEAT report 4182/20150/003, issue 1, Nation Environmental Technology Centre, UK, 1998.
Table 2 A summary of the rate coefficients at 298 K, and lifetime, forthe oxidation of SQT by ozone (24 hour average 7 1011 molecule cm3),OH (12 hour daytime average 1.6 106 molecule cm3) and NO3
(12 hour night time average 5 108 molecule cm3)
a-Cedrene b-Caryophyllene a-Humulene Isolongifolene
kNO38.2 1012 1.9 1011 3.5 1011 6.8 1013
kOH 6.7 1011 2.0 1010 2.9 1011 4.7 1011
kO33.1 1017 5.9 1017 6.4 1017 2.5 1017
tNO3 4 min 2 min 1 min 50 mintOH 155 min 52 min 36 min 222 mintO3 12.8 h 6.7 h 6.2 h 16 h
Table 3 The levels of NO3 and O3 required to produce an equivalentloss rate to that via reaction with OH assuming 1.6 106 molecule cm3
a-Cedrene b-Caryophyllene a-Humulene Isolongifolene
NO3 ppt 0.5 0.7 0.5 4.4O3 ppb 138 217 290 120
Table 4 Combined wall and temperature losses at various temperatures
T/K Loss 105/s1
298 (1.05 0.07)366 (0.05 0.04)378 (2.17 0.05)401 (2.02 0.11)
Dow
nloa
ded
by J
ohn
Ryl
ands
Uni
vers
ity L
ibra
ry o
n 11
May
201
2Pu
blis
hed
on 1
4 M
arch
201
2 on
http
://pu
bs.r
sc.o
rg |
doi:1
0.10
39/C
2CP2
3988
D
View Online
Mohammed
Textbox
* The data in table 2 for reactions rate coefficients of SQT with the nitrate and hydroxyl radicals are from the work of Shu and Atkinson, (1995): 'Y. Shu and R. Atkinson, J. Geophys. Res-Atmos, 1995, 100, 7275-7281'. The rate coefficients for SQT with ozone are from this work.
Mohammed
Textbox
*
Mohammed
Textbox
6602 Phys. Chem. Chem. Phys., 2012, 14, 6596–6602 This journal is c the Owner Societies 2012
2 K.-Y. Wang, D. E. Shallcross, P. Hadjinicolaou andC. Giannakopoulos, Water Air Soil Poll., 2004, 156, 29–55.
3 N. C. Hewitt, Reactive Hydrocarbons in the Atmosphere, AcademicPress, London, UK, 1999.
4 K.-Y. Wang, J. A. Pyle, D. E. Shallcross and S. M. Hall, J. Atmos.Chem., 2001, 40, 123–170.
5 D. E. Shallcross and P. S. Monks, Atmos. Environ., 2000, 34,1659–1660.
6 K.-Y. Wang and D. E. Shallcross, Atmos. Environ., 2000, 34,2909–2925.
7 S. Sitch, P. M. Cox, W. J. Colling and C. Huntingford, Nature,2007, 448, 791–U794.
8 A. H. Goldstein and I. E. Galbally, Environ. Sci. Technol., 2007,41, 1514–1521.
9 R. Atkinson, D. L. Baulch, R. A. Cox, J. N. Crowley,R. F. Hampson, R. G. Hynes, M. E. Jenkin, M. J. Rossi andJ. Troe, Atmos. Chem. Phys., 2006, 6, 3625–4055.
10 Y. Shu and R. Atkinson, Int. J. Chem. Kinet., 1994, 12, 1193–1205.11 E. Ormeno, V. Baldy, C. Ballini, M. Larcheveque, C. Perissol and
C. Fernandez, Pedobiologia, 2006, 50, 1–10.12 T. R. Duhl, D. Helmig and A. Guenther, Biogeosciences, 2008, 5,
761–777.13 J. H. Seinfeld and J. F. Pankow, Annu. Rev. Phys. Chem., 2003, 54,
121–140.14 N. C. Bouvier-Brown, A. H. Goldstein, J. B. Gilman, W. C. Kuster
and J. A. de Gouw, Atmos. Chem. Phys., 2009, 9, 5508–5518.15 R. J. Griffin, D. R. Cocker, J. H. Seinfeld and D. Dabdub,
Geophys. Res. Lett., 1999, 26, 2721–2724.16 B. Bonn and G. K. Moortgat, Geophys. Res. Lett., 2003, 30, 1585.17 M. Kanakidou, J. H. Seinfeld, S. N. Pandis, I. Barnes,
F. J. Dentener, M. C. Facchini, R. Van Dingenen, B. Ervens,A. Nenes, C. J. Nielsen, E. Swietlicki, J. P. Putaud, Y. Balkanski,S. Fuzzi, J. Horth, G. K. Moortgat, R. Winterhalter, C. E. L.Myhre, K. Tsigaridis, E. Vignati, E. G. Stephanou and J. Wilson,Atmos. Chem. Phys., 2005, 5, 1053–1123.
18 A. G. Carlton, P. V. Bhave, S. L. Napelenok, E. D. Edney,G. Sarwar, R. W. Pinder, G. A. Pouliot and M. Houyoux, Environ.Sci. Technol., 2010, 44, 8553–8560.
19 M. E. Jenkin, L. A. Watson, S. R. Utembe and D. E. Shalcross,Atmos. Environ., 2008, 42, 7185–7195.
20 L. A. Watson, D. E. Shallcross, S. R. Utembe and M. E. Jenkin,Atmos. Environ., 2008, 42, 7196–7204.
21 S. R. Utembe, L. A. Watson, D. E. Shallcross and M. E. Jenkin,Atmos. Environ., 2009, 43, 1982–1990.
22 S. R. Utembe, M. C. Cooke, A. T. Archibald, M. E. Jenkin,R. G. Derwent and D. E. Shallcross, Atmos. Environ., 2010, 44,1609–1622.
23 S. R. Utembe, M. C. Cooke, A. T. Archibald, D. E. Shallcross,R. G. Derwent and M. E. Jenkin, Atmos. Environ., 2011, 45,1604–1614.
24 C. L. Loza, A. W. H. Chan, M. M. Galloway, F. N. Keutsch,R. C. Flagan and J. H. Seinfeld, Environ. Sci. Technol., 2010, 44,5074–5078.
25 S. A. Mason, J. Arey and R. Atkinson, J. Phys. Chem., 2009, 113,5649–5656.
26 M. R. McGillen, M. Ghalaieny and C. J. Percival, Phys. Chem.Chem. Phys., 2011, 13, 10965–10969.
27 K. E. Leather, M. R. McGillen and C. J. Percival, Phys. Chem.Chem. Phys., 2010, 12, 2935–2943.
28 T. L. Malkin, A. Goddard and P. W. Seakins, Atmos. Chem. Phys.Discuss., 2009, 9, 17579–17631.
29 R. I. Martinez and J. T. Herron, J. Phys. Chem., 1988, 92,4644–4648.
30 J. Treacy, M. Curley, J. Wenger and H. Sidebottom, J. Chem. Soc.,Faraday Trans., 1997, 93, 2877–2881.
31 D. Kim, P. S. Stevens and R. A. Hites, J. Phys. Chem. A, 2011, 115,500–506.
32 J. Pollman, J. Ortega and D. Helmig, Environ. Sci. Technol., 2005,39, 9620–9629.
33 I. Kourtchev, I. Bejan, J. R. Sodeau and J. C. Wenger, Atmos.Environ., 2009, 43, 3182–3190.
34 A. Matsunaga and P. J. Ziemann, Aerosol Sci. Technol., 2010, 44,881–892.
35 M. Camredon and B. Aumont, Atmos. Environ., 2006, 40,2105–2116.
36 J. H. Seinfeld and J. F. Pankow, Annu. Rev. Phys. Chem., 2003, 54,121–140.
37 J. F. Hamilton, M. Rami Alfarra, K. P. Wyche, M. W. Ward,A. C. Lewis, G. B. McFiggans, N. Good, P. S. Monks, T. Carr,I. R. White and R. M. Purvis, Atmos. Chem. Phys., 2011, 11,5917–5929.
38 T. Hoffmann, J. R. Odum, F. Bowman, D. Collins, D. Klockow,R. C. Flagan and J. H. Seinfeld, J. Atmos. Chem., 1997, 26,189–222.
39 M. Dekermenjian, D. T. Allen, R. Atkinson and J. Arey, AerosolSci. Technol., 1999, 30, 349–363.
40 M. Beck, R. Winterhalter, F. Herrmann and G. K. Moortgat,Phys. Chem. Chem. Phys., 2011, 13, 10970–11001.
41 R. Winterhalter, F. Herrmann, B. Kanawati, T. L. Nguyen,J. Peeters, L. Vereecken and G. K. Moortgat, Phys. Chem. Chem.Phys, 2009, 11, 4152–4172.
42 J. G. Calvert, R. Atkinson, J. A. Kerr, S. Madronich, G. K.Moortgat, T. J. Wallington and G. Yarwood, The Mechanisms ofAtmospheric Oxidation of the Alkenes, Oxford University Press,Oxford, UK, 2000.
43 M. R. McGillen, T. J. Carey, A. T. Archibald, J. C. Wenger,D. E. Shallcross and C. J. Percival, Phys. Chem. Chem. Phys., 2008,10, 1757–1768.
44 S. S. Brown, H. D. Osthoff, H. Stark, W. P. Dube, T. B. Ryerson,C. Warneke, J. A. de Gouw, A. G. Wollny, D. D. Parrish, F. C.Fehsenfeld and A. R. Ravishankara, J. Photochem. Photobiol., A,2005, 176, 270–278.
45 A. Geyer, B. Alicke, R. Ackermann, M. Martinez, H. Harder,W. Brune, P. di Carlo, E. William, T. Jobson, S. Hall, R. Shetterand J. Stutz, J. Geophys. Res., [Atmos.], 2003, 108, 4368.
46 M. A. H. Khan, M. J. Ashfold, G. Nickless, L. A. Watson,P. D. Hamer, R. P. Wayne, C. E. Canosa-Mas andD. E. Shallcross, Atmos. Sci. Lett., 2008, 9, 140–146.
47 M. A. H Khan, M. M. N. Hoque, S. S. Alam, M. J. Ashfold,G. Nickless and D. E. Shallcross, J. Environ. Sci., 2011, 23, 60–64.
Dow
nloa
ded
by J
ohn
Ryl
ands
Uni
vers
ity L
ibra
ry o
n 11
May
201
2Pu
blis
hed
on 1
4 M
arch
201
2 on
http
://pu
bs.r
sc.o
rg |
doi:1
0.10
39/C
2CP2
3988
D
View Online

87

88
89
6. Paper V “ Acid-yield measurements and product studies of gas-phase ozonolysis of isoprene as
a function of humidity using chemical ionisation mass spectrometry (CIMS)”
by Mohamed Ghalaieny, Asan Bacak, Kimberley Leather, Jennifer Muller, Thomas Bannan, Ping Xiao, Damien Martin, Dudley E. Shallcross and Carl J. Percival. Submitted to: Atmospheric Environment. Contributions: Mohamed Ghalaieny, Jennifer Muller and Thomas Bannan conducted
the experiments. Asan Bacak and Kimberley Leather assisted with the experimental
setup and the data analysis. Dudley Shalcross and Ping Xiao performed model
integration of the data. Damien Martin provided gas calibration standards for organic
acids. The work was conducted under the supervision of Carl Percival.

90
91
Acid-yield measurements and product studies of gas-phase ozonolysis of isoprene
as a function of humidity using chemical ionisation mass spectrometry (CIMS)
Mohamed Ghalaieny1, Asan Bacak1, Kimberley Leather1, Jennifer Muller1, Thomas
Bannan1, Ping Xiao,2 Damien Martin,2 Dudley E. Shallcross2 and Carl J. Percival1*
1The Centre for Atmospheric Science, The School of Earth, Atmospheric and
Environmental Sciences, The University of Manchester, Simon Building, Brunswick
Street, Manchester, M13 9PL, UK.
2Biogeochemistry Research Centre, School of Chemistry, The University of Bristol,
Cantock’s Close BS8 1TS, UK
*Corresponding author Email: [email protected]
Abstract
Gas-phase isoprene ozonolysis experiments were conducted at room temperature to
determine formic acid yields as a function of relative humidity (RH) using the
integrated EXTreme RAnge chamber-Chemical Ionisation Mass Spectrometry
technique, employing a CH3I ionisation scheme. RHs studied were < 1, 10, 20, 25, 30,
40% % and formic acid yields of (0.05 ± 0.004) and (0.18 ± 0.006) were determined
at < 1 % RH and 40 % RH respectively, showing a strong water dependence. It has
been possible to estimate the ratio of the rate coefficient for the reaction of the
Criegee intermediate, CH2OO with water compared with decomposition. This
analysis suggests that the rate of reaction with water ranges between 1×10-12 – 1 × 10-
15 cm3 molecule-1 s-1and will therefore dominate its loss with respect to bimolecular
processes in the atmosphere. Global model integrations suggest that ozonolysis of
isoprene represents a source of 9.5 Tg yr-1 of HCOOH.
92
Introduction
Organic acids, specifically formic and acetic acid are known to be some of the most
abundant and widespread trace gases in the atmosphere (Paulot et al., 2011). Past
field studies show that the concentration of organic acids can, in some cases, exceed
that of inorganic acids (Grosejean et al., 1990, D. Taraborrelli et al., 2009). There are
many negative environmental effects caused by organic acids two issues of note are
the contribution of organic acids to SOA formation (Zhang et al., 2004) and
contribution to acid deposition (Finlayson-Pitts and Pitts, 2000). There is still a
limited understanding of SOA formation which necessitates the continued study of
contributing factors, such as the oxidation reactions of alkenes, e.g. isoprene, by O3,
OH and NO3. Recent ground based observations by Rinsland et al. (2004) and
airborne measurements by Le Breton et al. (2012) show that models underestimate
formic acid formation. Whether this is an underestimate of emissions or an
underestimate of in-situ production is not clear and warrants further determination of
secondary sources of formic acid. Furthermore, comparisons between HCOOH
measurements from the infrared atmospheric sounding interferometer (IASI) and
modelled global formic acid concentrations show a discrepancy. The disagreement
between models and measurements is discussed in further detail by Leather et al.
(2012).
The oxidation of alkenes by Ozone is a key secondary source of formic acid proposed
by Neeb et al. (1997). As BVOCs are known to be the largest pool of alkenes in the
atmosphere and isoprene is the major single, non-methane VOC emitted by plants
(Finlayson-Pitts and Pitts, 2000), quantifying the yield of formic acid from terpenoid
(e.g. isoprene) ozonolysis provides a major insight into the discrepancy between
modelled and measured formic acid emissions.
Isoprene has two double bonds and is subject to oxidation by radicals such as NO3,
OH, and O3 that this study focused on. The generalised mechanism of ozonlysis
through the addition of O3 to an alkene’s double bond is well documented and is
reviewed extensively in Calvert (2000) and more recently Johnston and Marston
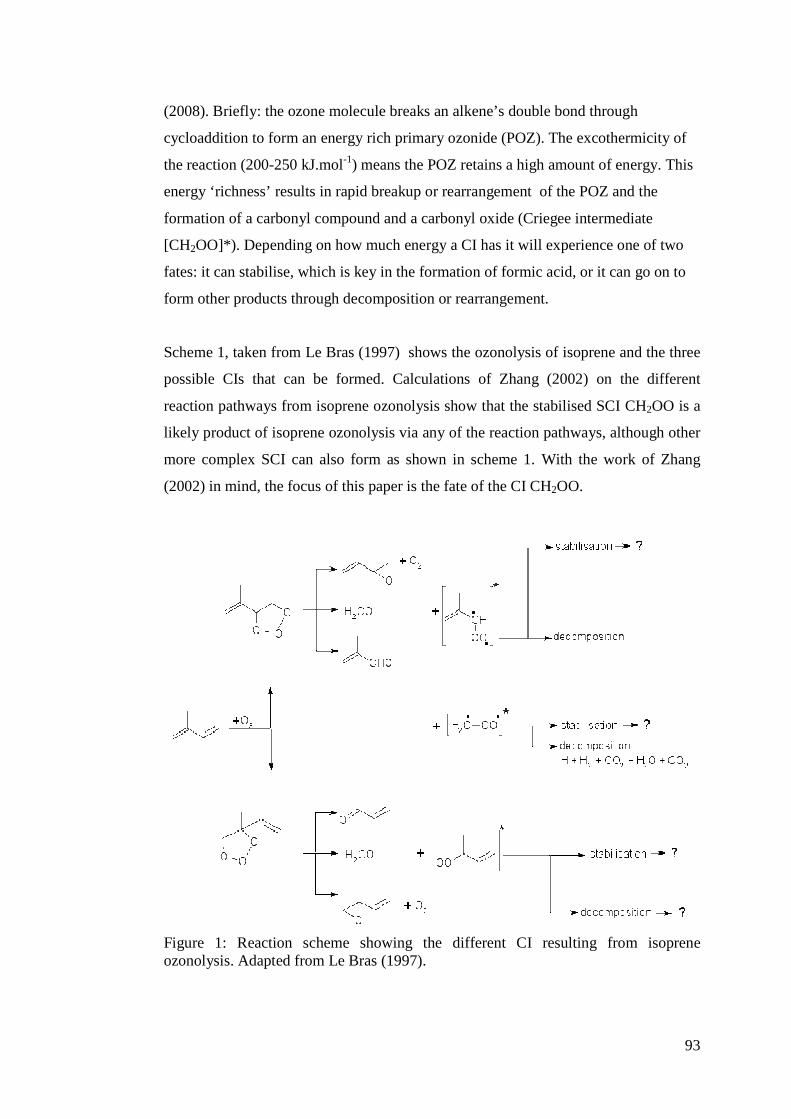
93
(2008). Briefly: the ozone molecule breaks an alkene’s double bond through
cycloaddition to form an energy rich primary ozonide (POZ). The excothermicity of
the reaction (200-250 kJ.mol-1) means the POZ retains a high amount of energy. This
energy ‘richness’ results in rapid breakup or rearrangement of the POZ and the
formation of a carbonyl compound and a carbonyl oxide (Criegee intermediate
[CH2OO]*). Depending on how much energy a CI has it will experience one of two
fates: it can stabilise, which is key in the formation of formic acid, or it can go on to
form other products through decomposition or rearrangement.
Scheme 1, taken from Le Bras (1997) shows the ozonolysis of isoprene and the three
possible CIs that can be formed. Calculations of Zhang (2002) on the different
reaction pathways from isoprene ozonolysis show that the stabilised SCI CH2OO is a
likely product of isoprene ozonolysis via any of the reaction pathways, although other
more complex SCI can also form as shown in scheme 1. With the work of Zhang
(2002) in mind, the focus of this paper is the fate of the CI CH2OO.
Figure 1: Reaction scheme showing the different CI resulting from isoprene ozonolysis. Adapted from Le Bras (1997).
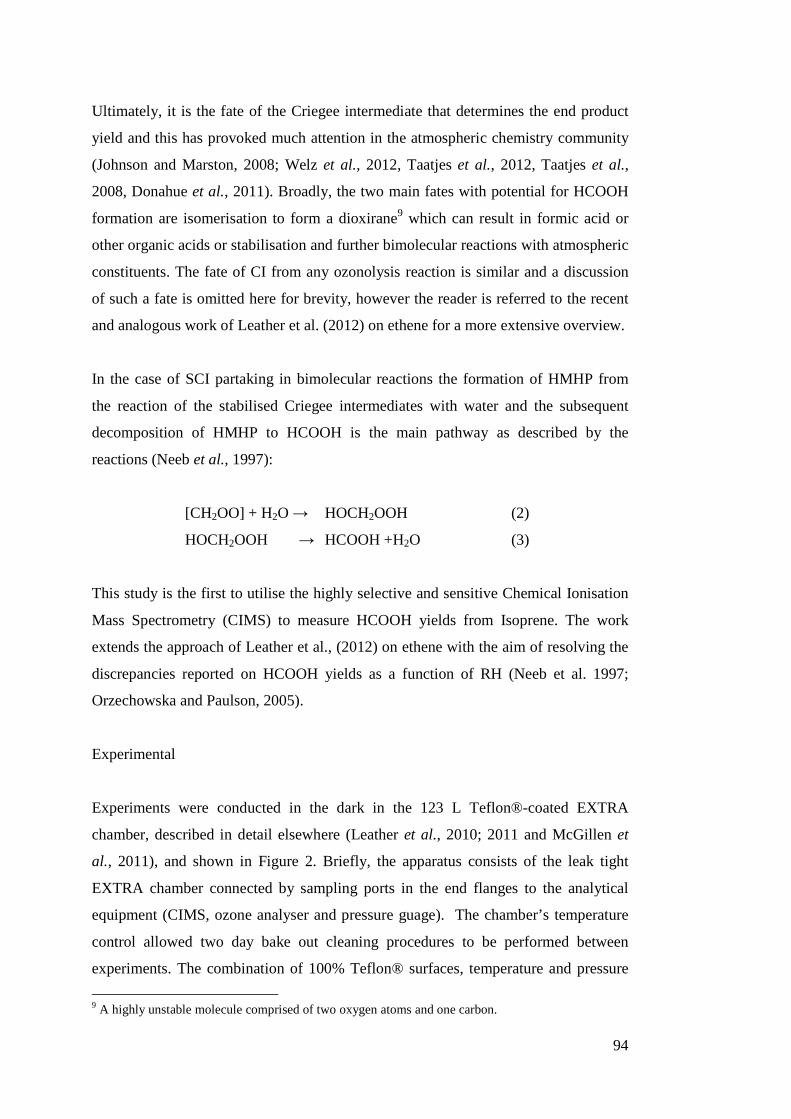
94
Ultimately, it is the fate of the Criegee intermediate that determines the end product
yield and this has provoked much attention in the atmospheric chemistry community
(Johnson and Marston, 2008; Welz et al., 2012, Taatjes et al., 2012, Taatjes et al.,
2008, Donahue et al., 2011). Broadly, the two main fates with potential for HCOOH
formation are isomerisation to form a dioxirane9 which can result in formic acid or
other organic acids or stabilisation and further bimolecular reactions with atmospheric
constituents. The fate of CI from any ozonolysis reaction is similar and a discussion
of such a fate is omitted here for brevity, however the reader is referred to the recent
and analogous work of Leather et al. (2012) on ethene for a more extensive overview.
In the case of SCI partaking in bimolecular reactions the formation of HMHP from
the reaction of the stabilised Criegee intermediates with water and the subsequent
decomposition of HMHP to HCOOH is the main pathway as described by the
reactions (Neeb et al., 1997):
[CH2OO] + H2O → HOCH2OOH (2)
HOCH2OOH → HCOOH +H2O (3)
This study is the first to utilise the highly selective and sensitive Chemical Ionisation
Mass Spectrometry (CIMS) to measure HCOOH yields from Isoprene. The work
extends the approach of Leather et al., (2012) on ethene with the aim of resolving the
discrepancies reported on HCOOH yields as a function of RH (Neeb et al. 1997;
Orzechowska and Paulson, 2005).
Experimental
Experiments were conducted in the dark in the 123 L Teflon®-coated EXTRA
chamber, described in detail elsewhere (Leather et al., 2010; 2011 and McGillen et
al., 2011), and shown in Figure 2. Briefly, the apparatus consists of the leak tight
EXTRA chamber connected by sampling ports in the end flanges to the analytical
equipment (CIMS, ozone analyser and pressure guage). The chamber’s temperature
control allowed two day bake out cleaning procedures to be performed between
experiments. The combination of 100% Teflon® surfaces, temperature and pressure
9 A highly unstable molecule comprised of two oxygen atoms and one carbon.
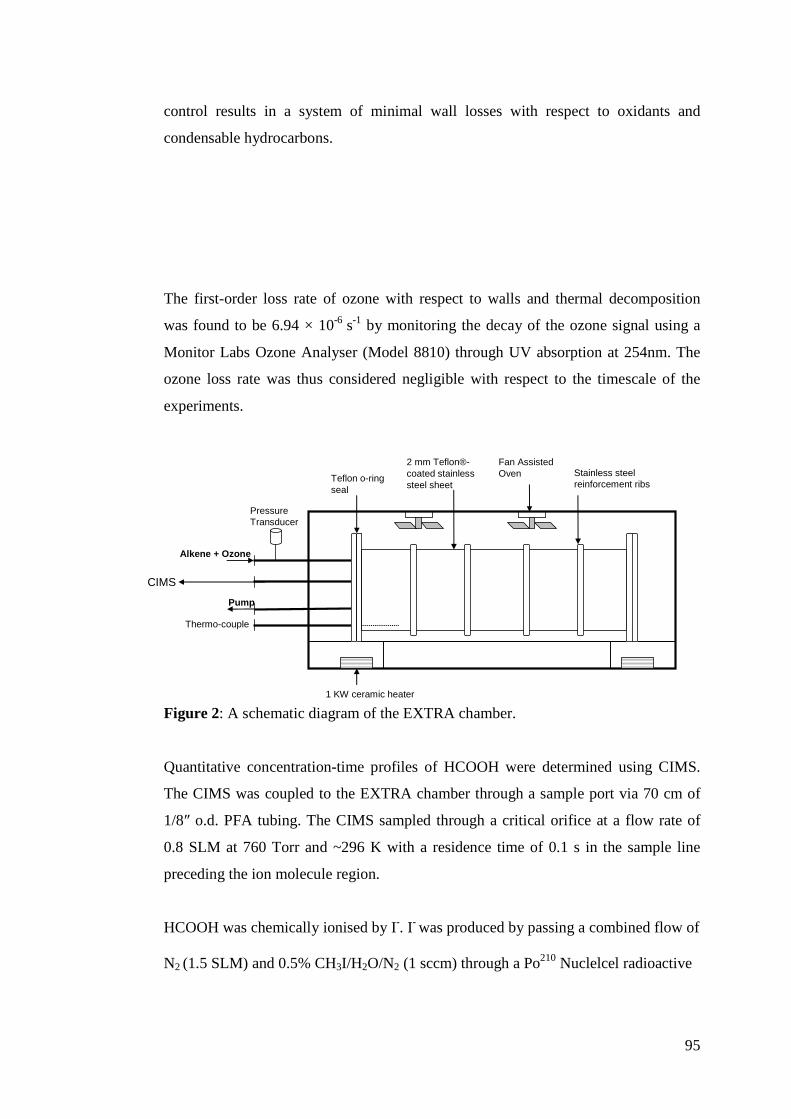
95
control results in a system of minimal wall losses with respect to oxidants and
condensable hydrocarbons.
The first-order loss rate of ozone with respect to walls and thermal decomposition
was found to be 6.94 × 10⁻⁶ s
-1 by monitoring the decay of the ozone signal using a
Monitor Labs Ozone Analyser (Model 8810) through UV absorption at 254nm. The
ozone loss rate was thus considered negligible with respect to the timescale of the
experiments.
Figure 2: A schematic diagram of the EXTRA chamber.
Quantitative concentration-time profiles of HCOOH were determined using CIMS.
The CIMS was coupled to the EXTRA chamber through a sample port via 70 cm of
1/8″ o.d. PFA tubing. The CIMS sampled through a critical orifice at a flow rate of
0.8 SLM at 760 Torr and ~296 K with a residence time of 0.1 s in the sample line
preceding the ion molecule region.
HCOOH was chemically ionised by I-. I- was produced by passing a combined flow of
N2 (1.5 SLM) and 0.5% CH3I/H2O/N2 (1 sccm) through a Po210 Nuclelcel radioactive
Pressure Transducer
Alkene + Ozone
Thermo-couple
Pump
Teflon o-ring seal
Fan Assisted Oven
2 mm Teflon®-coated stainless steel sheet
Stainless steel reinforcement ribs
1 KW ceramic heater
CIMS
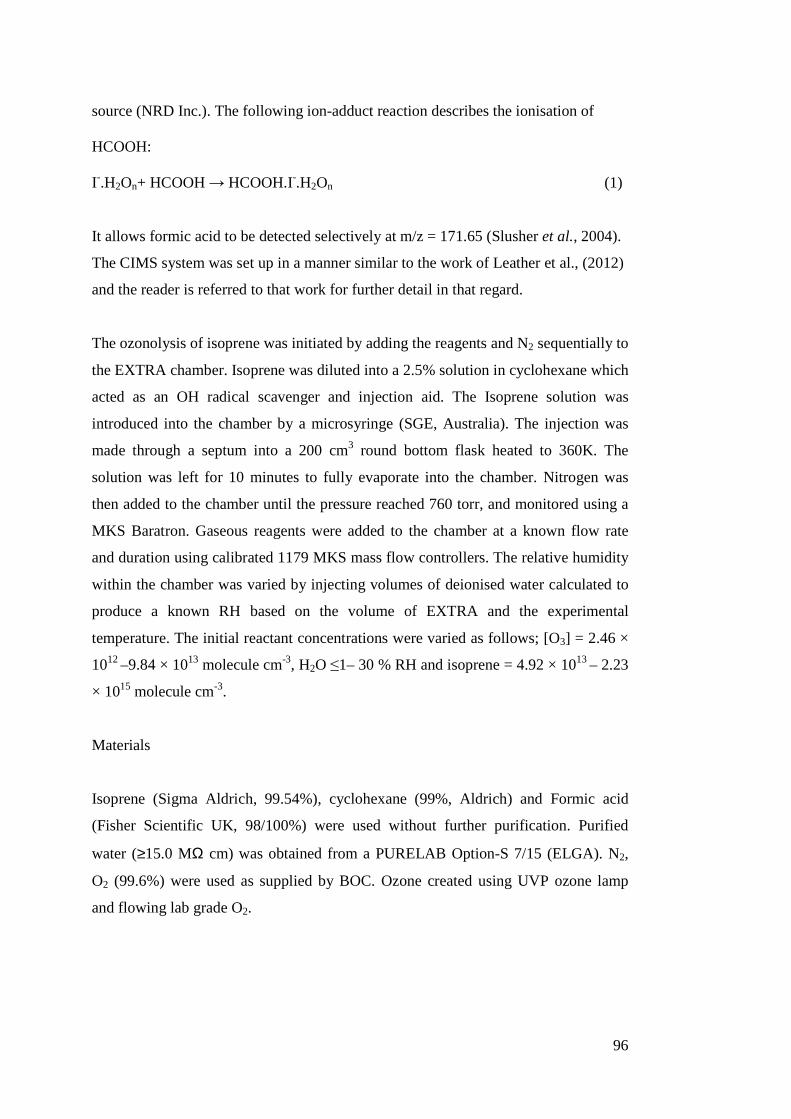
96
source (NRD Inc.). The following ion-adduct reaction describes the ionisation of
HCOOH:
I-.H2On+ HCOOH → HCOOH.I-.H2On (1)
It allows formic acid to be detected selectively at m/z = 171.65 (Slusher et al., 2004).
The CIMS system was set up in a manner similar to the work of Leather et al., (2012)
and the reader is referred to that work for further detail in that regard.
The ozonolysis of isoprene was initiated by adding the reagents and N2 sequentially to
the EXTRA chamber. Isoprene was diluted into a 2.5% solution in cyclohexane which
acted as an OH radical scavenger and injection aid. The Isoprene solution was
introduced into the chamber by a microsyringe (SGE, Australia). The injection was
made through a septum into a 200 cm3 round bottom flask heated to 360K. The
solution was left for 10 minutes to fully evaporate into the chamber. Nitrogen was
then added to the chamber until the pressure reached 760 torr, and monitored using a
MKS Baratron. Gaseous reagents were added to the chamber at a known flow rate
and duration using calibrated 1179 MKS mass flow controllers. The relative humidity
within the chamber was varied by injecting volumes of deionised water calculated to
produce a known RH based on the volume of EXTRA and the experimental
temperature. The initial reactant concentrations were varied as follows; [O3] = 2.46 ×
1012 –9.84 × 10¹³ molecule cm-3, H2O ≤1– 30 % RH and isoprene = 4.92 × 10¹³ – 2.23
× 1015 molecule cm-3.
Materials
Isoprene (Sigma Aldrich, 99.54%), cyclohexane (99%, Aldrich) and Formic acid
(Fisher Scientific UK, 98/100%) were used without further purification. Purified
water (≥15.0 MΩ cm) was obtained from a PURELAB Option-S 7/15 (ELGA). N2,
O2 (99.6%) were used as supplied by BOC. Ozone created using UVP ozone lamp
and flowing lab grade O2.
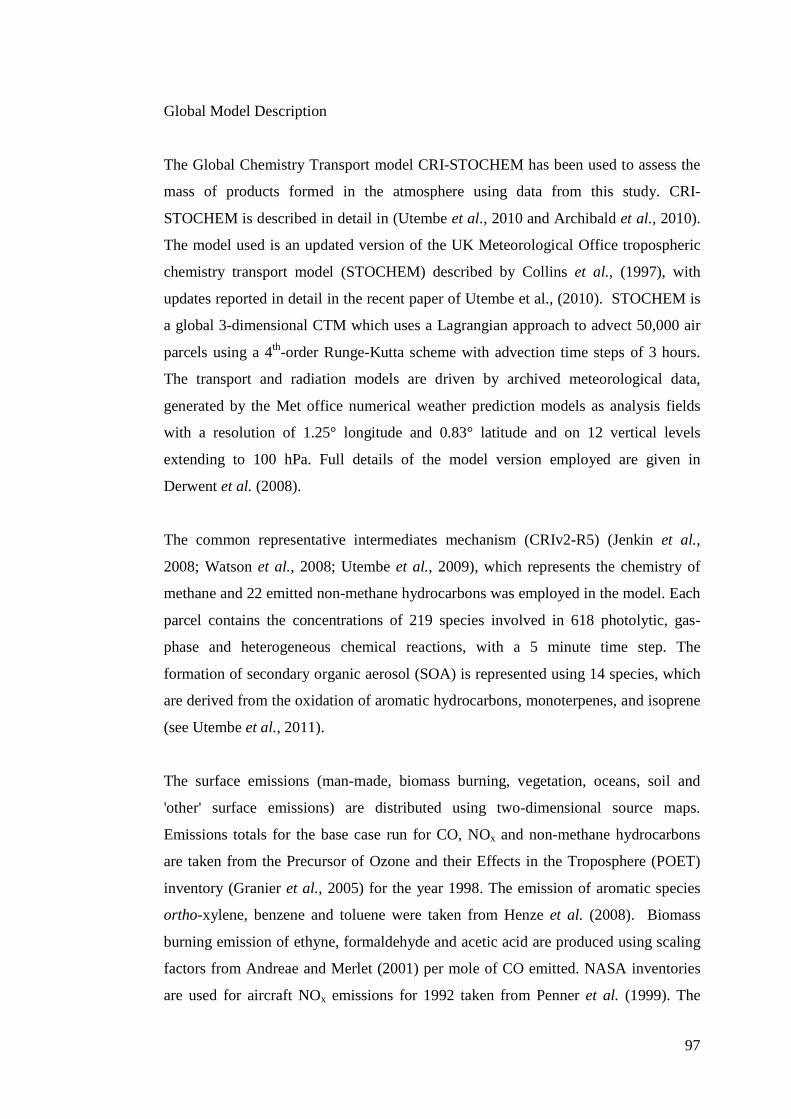
97
Global Model Description
The Global Chemistry Transport model CRI-STOCHEM has been used to assess the
mass of products formed in the atmosphere using data from this study. CRI-
STOCHEM is described in detail in (Utembe et al., 2010 and Archibald et al., 2010).
The model used is an updated version of the UK Meteorological Office tropospheric
chemistry transport model (STOCHEM) described by Collins et al., (1997), with
updates reported in detail in the recent paper of Utembe et al., (2010). STOCHEM is
a global 3-dimensional CTM which uses a Lagrangian approach to advect 50,000 air
parcels using a 4th-order Runge-Kutta scheme with advection time steps of 3 hours.
The transport and radiation models are driven by archived meteorological data,
generated by the Met office numerical weather prediction models as analysis fields
with a resolution of 1.25° longitude and 0.83° latitude and on 12 vertical levels
extending to 100 hPa. Full details of the model version employed are given in
Derwent et al. (2008).
The common representative intermediates mechanism (CRIv2-R5) (Jenkin et al.,
2008; Watson et al., 2008; Utembe et al., 2009), which represents the chemistry of
methane and 22 emitted non-methane hydrocarbons was employed in the model. Each
parcel contains the concentrations of 219 species involved in 618 photolytic, gas-
phase and heterogeneous chemical reactions, with a 5 minute time step. The
formation of secondary organic aerosol (SOA) is represented using 14 species, which
are derived from the oxidation of aromatic hydrocarbons, monoterpenes, and isoprene
(see Utembe et al., 2011).
The surface emissions (man-made, biomass burning, vegetation, oceans, soil and
'other' surface emissions) are distributed using two-dimensional source maps.
Emissions totals for the base case run for CO, NOx and non-methane hydrocarbons
are taken from the Precursor of Ozone and their Effects in the Troposphere (POET)
inventory (Granier et al., 2005) for the year 1998. The emission of aromatic species
ortho-xylene, benzene and toluene were taken from Henze et al. (2008). Biomass
burning emission of ethyne, formaldehyde and acetic acid are produced using scaling
factors from Andreae and Merlet (2001) per mole of CO emitted. NASA inventories
are used for aircraft NOx emissions for 1992 taken from Penner et al. (1999). The
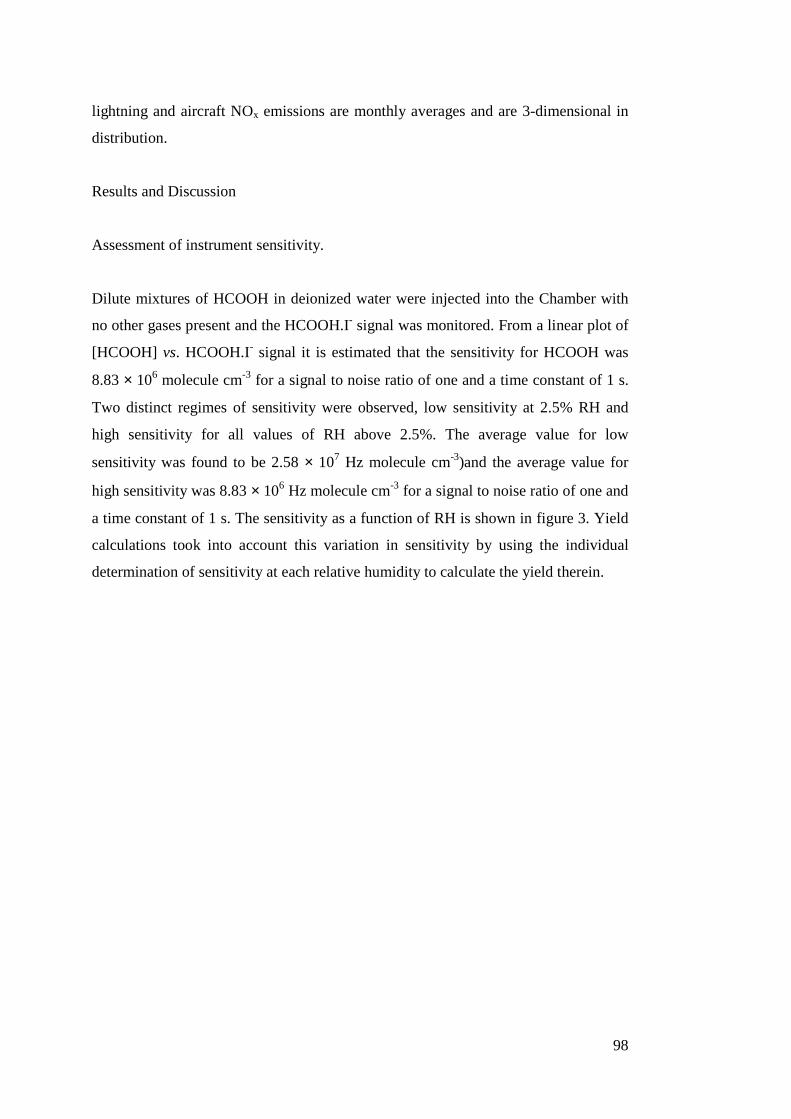
98
lightning and aircraft NOx emissions are monthly averages and are 3-dimensional in
distribution.
Results and Discussion
Assessment of instrument sensitivity.
Dilute mixtures of HCOOH in deionized water were injected into the Chamber with
no other gases present and the HCOOH.I- signal was monitored. From a linear plot of
[HCOOH] vs. HCOOH.I- signal it is estimated that the sensitivity for HCOOH was
8.83 × 10⁶ molecule cm-3 for a signal to noise ratio of one and a time constant of 1 s.
Two distinct regimes of sensitivity were observed, low sensitivity at 2.5% RH and
high sensitivity for all values of RH above 2.5%. The average value for low
sensitivity was found to be 2.58 × 10⁷ Hz molecule cm-3)and the average value for
high sensitivity was 8.83 × 10⁶ Hz molecule cm-3 for a signal to noise ratio of one and
a time constant of 1 s. The sensitivity as a function of RH is shown in figure 3. Yield
calculations took into account this variation in sensitivity by using the individual
determination of sensitivity at each relative humidity to calculate the yield therein.
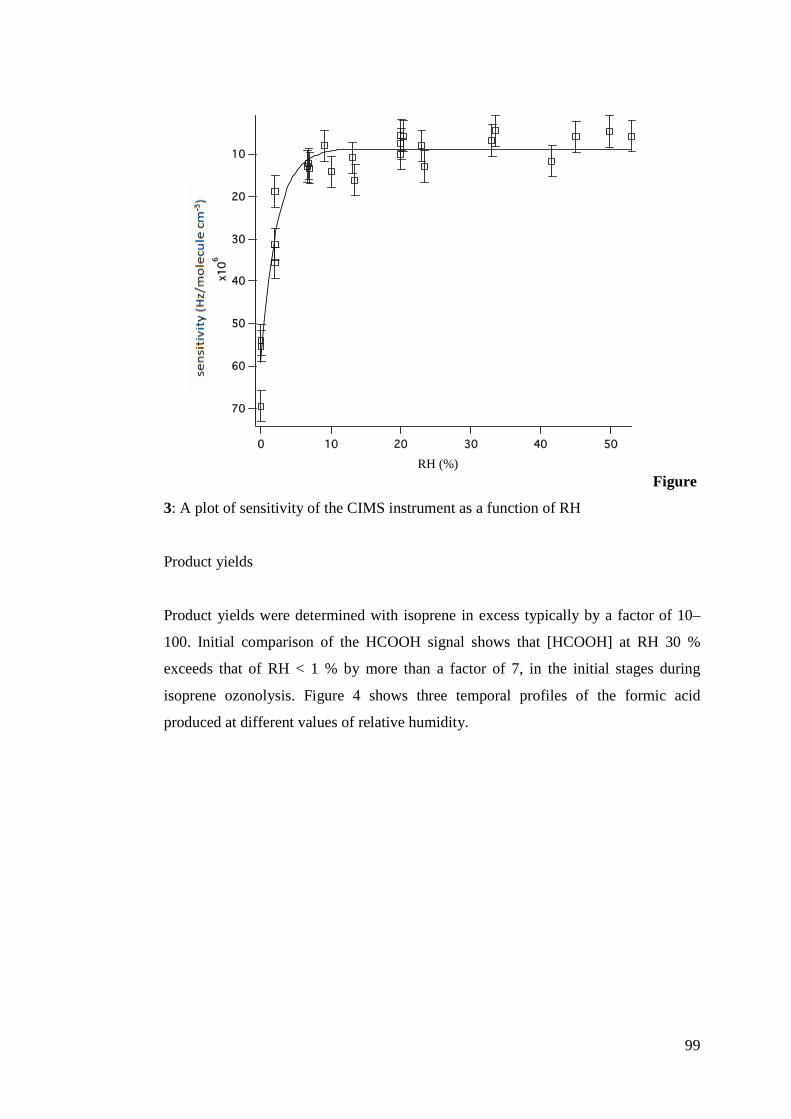
99
Figure
3: A plot of sensitivity of the CIMS instrument as a function of RH
Product yields
Product yields were determined with isoprene in excess typically by a factor of 10–
100. Initial comparison of the HCOOH signal shows that [HCOOH] at RH 30 %
exceeds that of RH < 1 % by more than a factor of 7, in the initial stages during
isoprene ozonolysis. Figure 4 shows three temporal profiles of the formic acid
produced at different values of relative humidity.
RH (%)
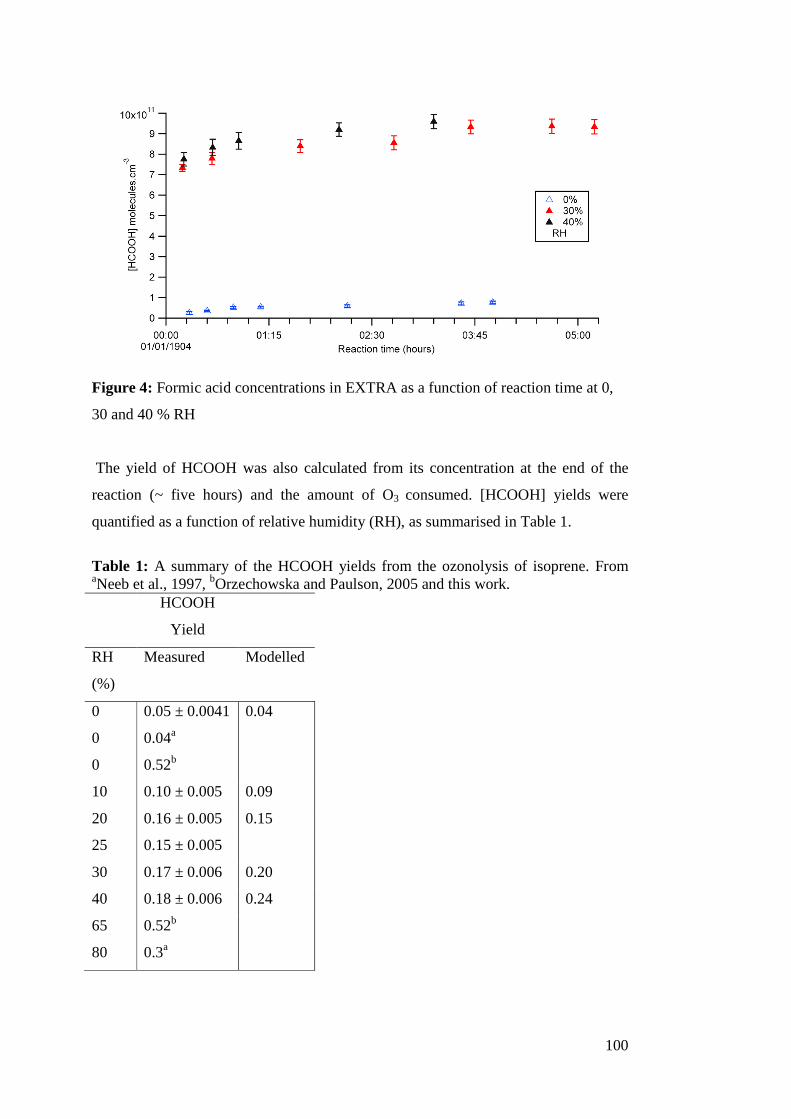
100
Figure 4: Formic acid concentrations in EXTRA as a function of reaction time at 0,
30 and 40 % RH
The yield of HCOOH was also calculated from its concentration at the end of the
reaction (~ five hours) and the amount of O3 consumed. [HCOOH] yields were
quantified as a function of relative humidity (RH), as summarised in Table 1.
Table 1: A summary of the HCOOH yields from the ozonolysis of isoprene. From aNeeb et al., 1997, bOrzechowska and Paulson, 2005 and this work.
HCOOH
Yield
RH
(%)
Measured Modelled
0
0
0
0.05 ± 0.0041
0.04a
0.52b
0.04
10 0.10 ± 0.005 0.09
20 0.16 ± 0.005 0.15
25 0.15 ± 0.005
30 0.17 ± 0.006 0.20
40 0.18 ± 0.006 0.24
65 0.52b
80 0.3a
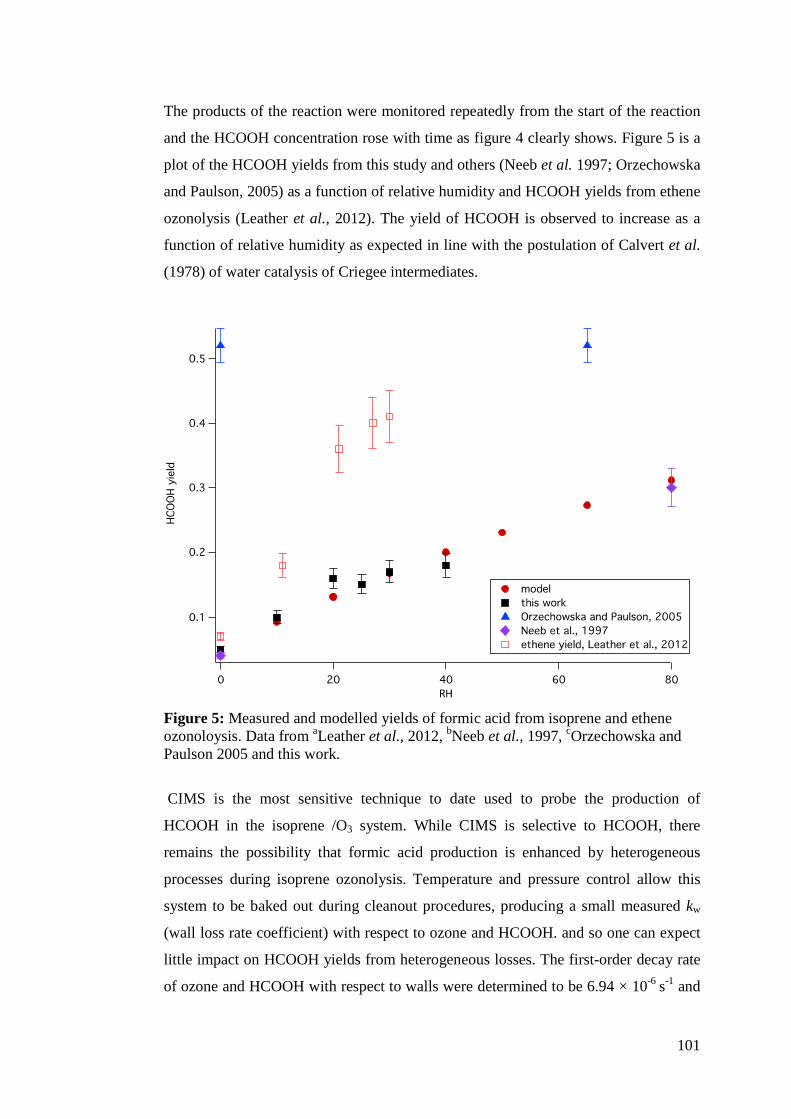
101
The products of the reaction were monitored repeatedly from the start of the reaction
and the HCOOH concentration rose with time as figure 4 clearly shows. Figure 5 is a
plot of the HCOOH yields from this study and others (Neeb et al. 1997; Orzechowska
and Paulson, 2005) as a function of relative humidity and HCOOH yields from ethene
ozonolysis (Leather et al., 2012). The yield of HCOOH is observed to increase as a
function of relative humidity as expected in line with the postulation of Calvert et al.
(1978) of water catalysis of Criegee intermediates.
Figure 5: Measured and modelled yields of formic acid from isoprene and ethene ozonoloysis. Data from aLeather et al., 2012, bNeeb et al., 1997, cOrzechowska and Paulson 2005 and this work.
CIMS is the most sensitive technique to date used to probe the production of
HCOOH in the isoprene /O3 system. While CIMS is selective to HCOOH, there
remains the possibility that formic acid production is enhanced by heterogeneous
processes during isoprene ozonolysis. Temperature and pressure control allow this
system to be baked out during cleanout procedures, producing a small measured kw
(wall loss rate coefficient) with respect to ozone and HCOOH. and so one can expect
little impact on HCOOH yields from heterogeneous losses. The first-order decay rate
of ozone and HCOOH with respect to walls were determined to be 6.94 × 10⁻⁶ s
-1 and
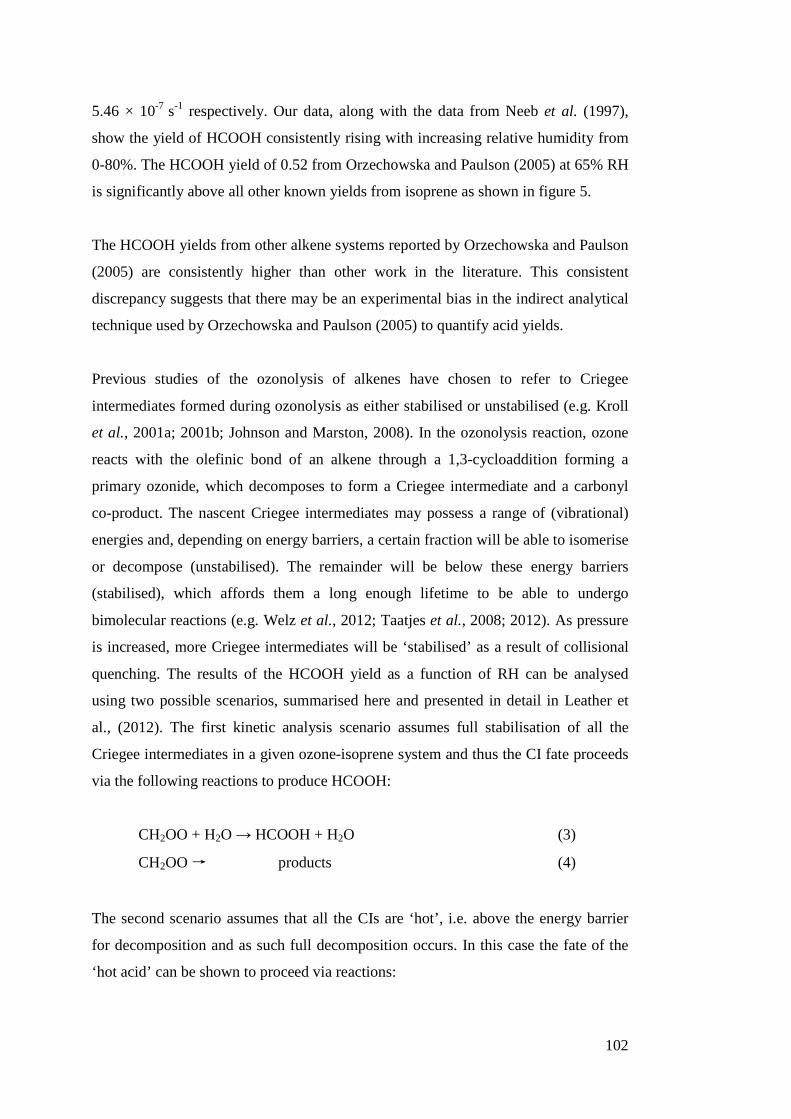
102
5.46 × 10⁻⁷ s-1 respectively. Our data, along with the data from Neeb et al. (1997),
show the yield of HCOOH consistently rising with increasing relative humidity from
0-80%. The HCOOH yield of 0.52 from Orzechowska and Paulson (2005) at 65% RH
is significantly above all other known yields from isoprene as shown in figure 5.
The HCOOH yields from other alkene systems reported by Orzechowska and Paulson
(2005) are consistently higher than other work in the literature. This consistent
discrepancy suggests that there may be an experimental bias in the indirect analytical
technique used by Orzechowska and Paulson (2005) to quantify acid yields.
Previous studies of the ozonolysis of alkenes have chosen to refer to Criegee
intermediates formed during ozonolysis as either stabilised or unstabilised (e.g. Kroll
et al., 2001a; 2001b; Johnson and Marston, 2008). In the ozonolysis reaction, ozone
reacts with the olefinic bond of an alkene through a 1,3-cycloaddition forming a
primary ozonide, which decomposes to form a Criegee intermediate and a carbonyl
co-product. The nascent Criegee intermediates may possess a range of (vibrational)
energies and, depending on energy barriers, a certain fraction will be able to isomerise
or decompose (unstabilised). The remainder will be below these energy barriers
(stabilised), which affords them a long enough lifetime to be able to undergo
bimolecular reactions (e.g. Welz et al., 2012; Taatjes et al., 2008; 2012). As pressure
is increased, more Criegee intermediates will be ‘stabilised’ as a result of collisional
quenching. The results of the HCOOH yield as a function of RH can be analysed
using two possible scenarios, summarised here and presented in detail in Leather et
al., (2012). The first kinetic analysis scenario assumes full stabilisation of all the
Criegee intermediates in a given ozone-isoprene system and thus the CI fate proceeds
via the following reactions to produce HCOOH:
CH2OO + H2O → HCOOH + H2O (3)
CH2OO → products (4)
The second scenario assumes that all the CIs are ‘hot’, i.e. above the energy barrier
for decomposition and as such full decomposition occurs. In this case the fate of the
‘hot acid’ can be shown to proceed via reactions:
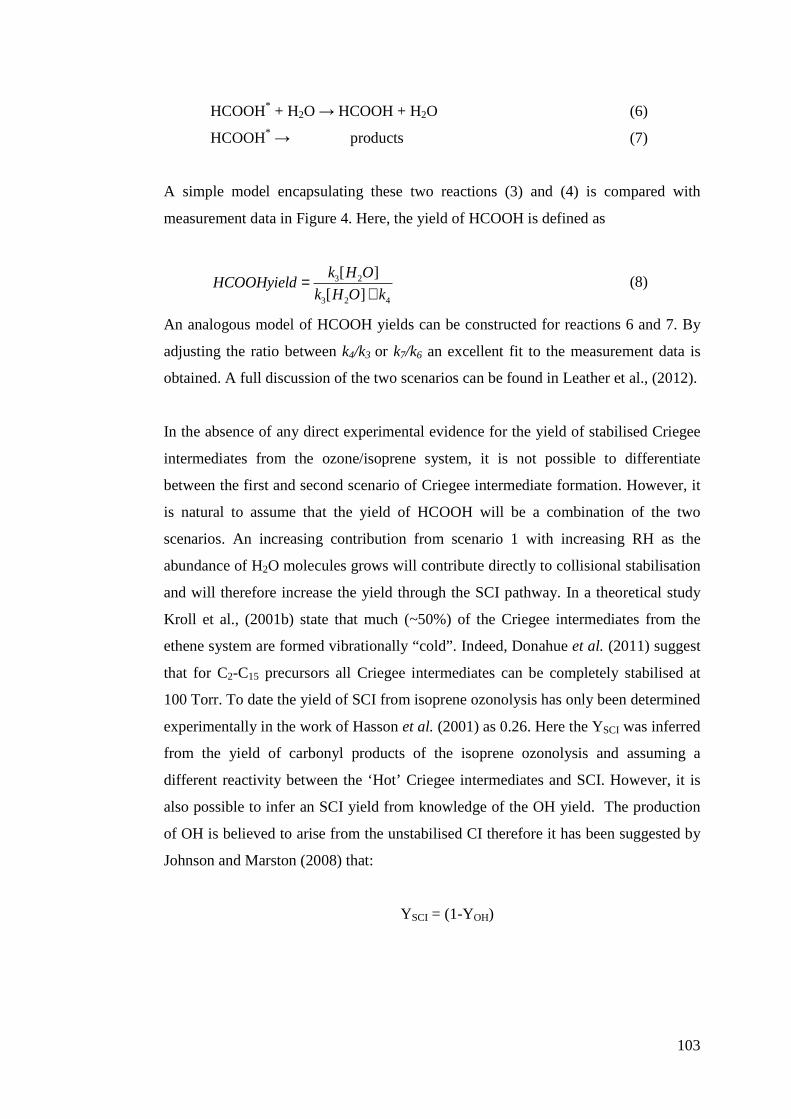
103
HCOOH* + H2O → HCOOH + H2O (6)
HCOOH* → products (7)
A simple model encapsulating these two reactions (3) and (4) is compared with
measurement data in Figure 4. Here, the yield of HCOOH is defined as
HCOOHyield= k3[H2O]
k3[H2O] + k4
(8)
An analogous model of HCOOH yields can be constructed for reactions 6 and 7. By
adjusting the ratio between k4/k3 or k7/k6 an excellent fit to the measurement data is
obtained. A full discussion of the two scenarios can be found in Leather et al., (2012).
In the absence of any direct experimental evidence for the yield of stabilised Criegee
intermediates from the ozone/isoprene system, it is not possible to differentiate
between the first and second scenario of Criegee intermediate formation. However, it
is natural to assume that the yield of HCOOH will be a combination of the two
scenarios. An increasing contribution from scenario 1 with increasing RH as the
abundance of H2O molecules grows will contribute directly to collisional stabilisation
and will therefore increase the yield through the SCI pathway. In a theoretical study
Kroll et al., (2001b) state that much (~50%) of the Criegee intermediates from the
ethene system are formed vibrationally “cold”. Indeed, Donahue et al. (2011) suggest
that for C2-C15 precursors all Criegee intermediates can be completely stabilised at
100 Torr. To date the yield of SCI from isoprene ozonolysis has only been determined
experimentally in the work of Hasson et al. (2001) as 0.26. Here the YSCI was inferred
from the yield of carbonyl products of the isoprene ozonolysis and assuming a
different reactivity between the ‘Hot’ Criegee intermediates and SCI. However, it is
also possible to infer an SCI yield from knowledge of the OH yield. The production
of OH is believed to arise from the unstabilised CI therefore it has been suggested by
Johnson and Marston (2008) that:
YSCI = (1-YOH)
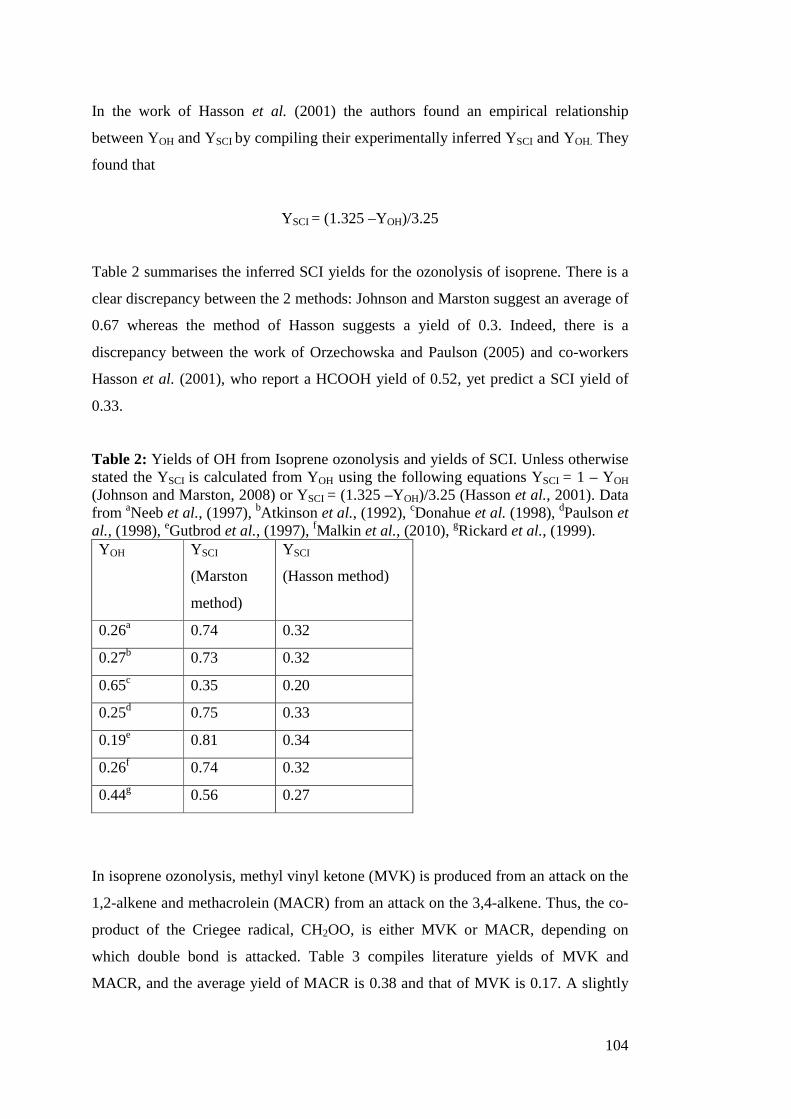
104
In the work of Hasson et al. (2001) the authors found an empirical relationship
between YOH and YSCI by compiling their experimentally inferred YSCI and YOH. They
found that
YSCI = (1.325 –YOH)/3.25
Table 2 summarises the inferred SCI yields for the ozonolysis of isoprene. There is a
clear discrepancy between the 2 methods: Johnson and Marston suggest an average of
0.67 whereas the method of Hasson suggests a yield of 0.3. Indeed, there is a
discrepancy between the work of Orzechowska and Paulson (2005) and co-workers
Hasson et al. (2001), who report a HCOOH yield of 0.52, yet predict a SCI yield of
0.33.
Table 2: Yields of OH from Isoprene ozonolysis and yields of SCI. Unless otherwise stated the YSCI is calculated from YOH using the following equations YSCI = 1 – YOH (Johnson and Marston, 2008) or YSCI = (1.325 –YOH)/3.25 (Hasson et al., 2001). Data from aNeeb et al., (1997), bAtkinson et al., (1992), cDonahue et al. (1998), dPaulson et al., (1998), eGutbrod et al., (1997), fMalkin et al., (2010), gRickard et al., (1999). YOH YSCI
(Marston
method)
YSCI
(Hasson method)
0.26a 0.74 0.32
0.27b 0.73 0.32
0.65c 0.35 0.20
0.25d 0.75 0.33
0.19e 0.81 0.34
0.26f 0.74 0.32
0.44g 0.56 0.27
In isoprene ozonolysis, methyl vinyl ketone (MVK) is produced from an attack on the
1,2-alkene and methacrolein (MACR) from an attack on the 3,4-alkene. Thus, the co-
product of the Criegee radical, CH2OO, is either MVK or MACR, depending on
which double bond is attacked. Table 3 compiles literature yields of MVK and
MACR, and the average yield of MACR is 0.38 and that of MVK is 0.17. A slightly
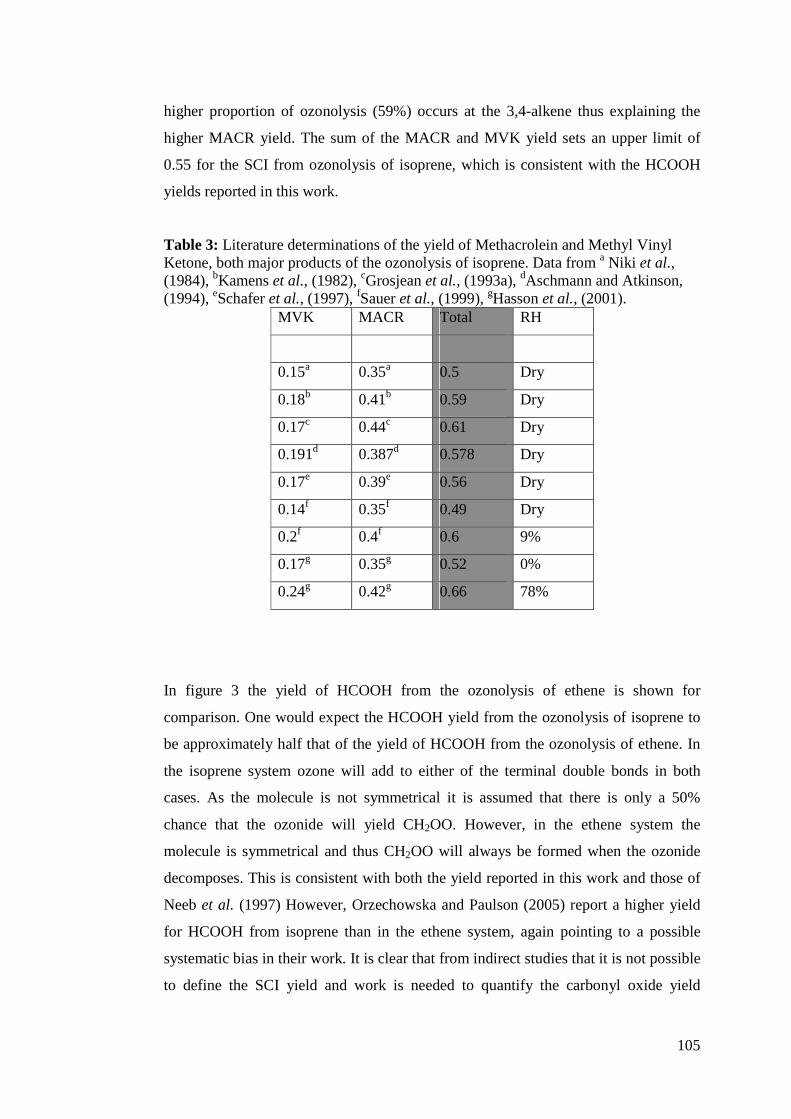
105
higher proportion of ozonolysis (59%) occurs at the 3,4-alkene thus explaining the
higher MACR yield. The sum of the MACR and MVK yield sets an upper limit of
0.55 for the SCI from ozonolysis of isoprene, which is consistent with the HCOOH
yields reported in this work.
Table 3: Literature determinations of the yield of Methacrolein and Methyl Vinyl Ketone, both major products of the ozonolysis of isoprene. Data from a Niki et al., (1984), bKamens et al., (1982), cGrosjean et al., (1993a), dAschmann and Atkinson, (1994), eSchafer et al., (1997), fSauer et al., (1999), gHasson et al., (2001).
MVK MACR Total RH
0.15a 0.35a 0.5 Dry
0.18b 0.41b 0.59 Dry
0.17c 0.44c 0.61 Dry
0.191d 0.387d 0.578 Dry
0.17e 0.39e 0.56 Dry
0.14f 0.35f 0.49 Dry
0.2f 0.4f 0.6 9%
0.17g 0.35g 0.52 0%
0.24g 0.42g 0.66 78%
In figure 3 the yield of HCOOH from the ozonolysis of ethene is shown for
comparison. One would expect the HCOOH yield from the ozonolysis of isoprene to
be approximately half that of the yield of HCOOH from the ozonolysis of ethene. In
the isoprene system ozone will add to either of the terminal double bonds in both
cases. As the molecule is not symmetrical it is assumed that there is only a 50%
chance that the ozonide will yield CH2OO. However, in the ethene system the
molecule is symmetrical and thus CH2OO will always be formed when the ozonide
decomposes. This is consistent with both the yield reported in this work and those of
Neeb et al. (1997) However, Orzechowska and Paulson (2005) report a higher yield
for HCOOH from isoprene than in the ethene system, again pointing to a possible
systematic bias in their work. It is clear that from indirect studies that it is not possible
to define the SCI yield and work is needed to quantify the carbonyl oxide yield
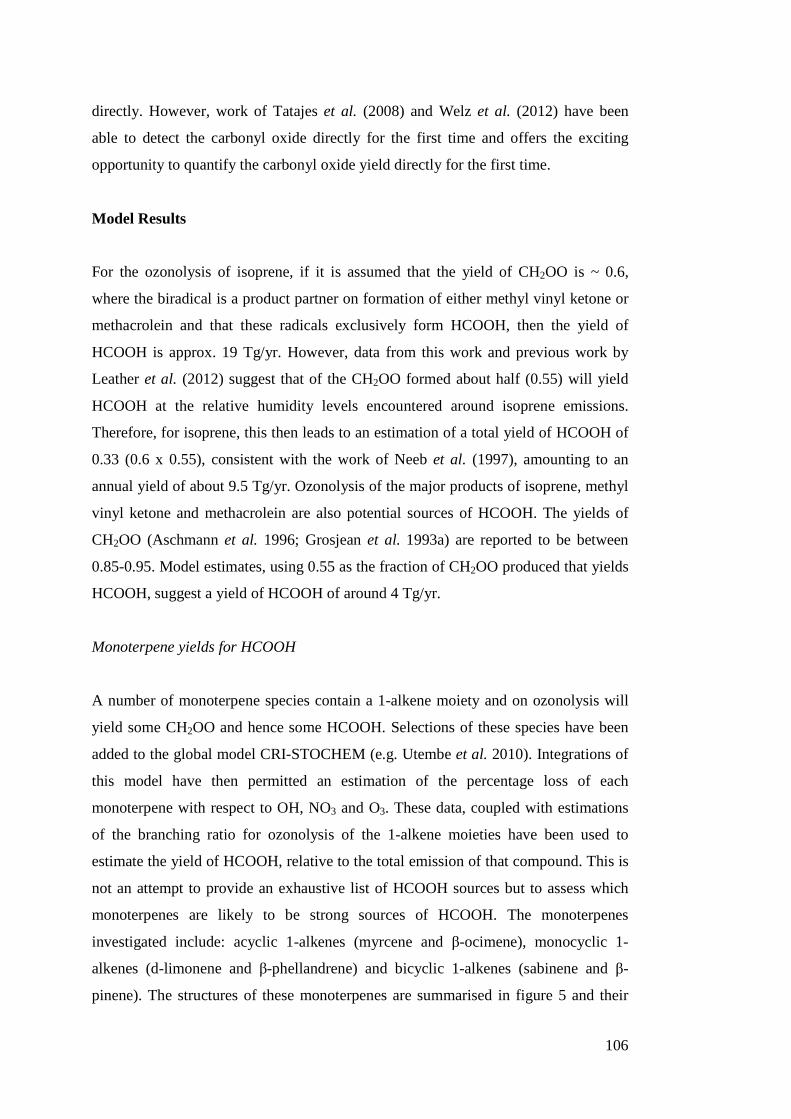
106
directly. However, work of Tatajes et al. (2008) and Welz et al. (2012) have been
able to detect the carbonyl oxide directly for the first time and offers the exciting
opportunity to quantify the carbonyl oxide yield directly for the first time.
Model Results
For the ozonolysis of isoprene, if it is assumed that the yield of CH2OO is ~ 0.6,
where the biradical is a product partner on formation of either methyl vinyl ketone or
methacrolein and that these radicals exclusively form HCOOH, then the yield of
HCOOH is approx. 19 Tg/yr. However, data from this work and previous work by
Leather et al. (2012) suggest that of the CH2OO formed about half (0.55) will yield
HCOOH at the relative humidity levels encountered around isoprene emissions.
Therefore, for isoprene, this then leads to an estimation of a total yield of HCOOH of
0.33 (0.6 x 0.55), consistent with the work of Neeb et al. (1997), amounting to an
annual yield of about 9.5 Tg/yr. Ozonolysis of the major products of isoprene, methyl
vinyl ketone and methacrolein are also potential sources of HCOOH. The yields of
CH2OO (Aschmann et al. 1996; Grosjean et al. 1993a) are reported to be between
0.85-0.95. Model estimates, using 0.55 as the fraction of CH2OO produced that yields
HCOOH, suggest a yield of HCOOH of around 4 Tg/yr.
Monoterpene yields for HCOOH
A number of monoterpene species contain a 1-alkene moiety and on ozonolysis will
yield some CH2OO and hence some HCOOH. Selections of these species have been
added to the global model CRI-STOCHEM (e.g. Utembe et al. 2010). Integrations of
this model have then permitted an estimation of the percentage loss of each
monoterpene with respect to OH, NO3 and O3. These data, coupled with estimations
of the branching ratio for ozonolysis of the 1-alkene moieties have been used to
estimate the yield of HCOOH, relative to the total emission of that compound. This is
not an attempt to provide an exhaustive list of HCOOH sources but to assess which
monoterpenes are likely to be strong sources of HCOOH. The monoterpenes
investigated include: acyclic 1-alkenes (myrcene and β-ocimene), monocyclic 1-
alkenes (d-limonene and β-phellandrene) and bicyclic 1-alkenes (sabinene and β-
pinene). The structures of these monoterpenes are summarised in figure 5 and their
107
rate coefficients for reaction with OH, NO3 and O3 and the fractional loss via reaction
with these species derived from model integrations are shown in table 4.
Table 4: Rate coefficients (298 K) for the reaction of selected monoterpenes with OH, NO3 and O3 (all units are cm3 molecule-1 s-1) and percentage loss via reaction with each of these three reaction partners, derived from global model fields. Rate constant from aAtkinson et al., (1986); bAtkinson (1991); cAtkinson et al., (1990a); dShu and Atkinson (1994); eShorees et al., (1991), fAtkinson (1986); gJohnson et al., (2000) and hAtkinson et al., (1990b) Monoterpene k(OH) k(NO3) k(O3) %OH %NO3 %O3 Lifetime Acyclic Myrcene 2.1 x 10⁻¹⁰a 1.1 x 10⁻¹¹b 4.9 x 10⁻¹⁶c 39.6 24.3 36.1 31 min β-Ocimene 2.5 x 10⁻¹⁰a 2.2 x 10⁻¹¹b 5.6 x 10⁻¹⁶c 33.6 36.4 30.1 22 min Monocyclic d-Limonene 1.7 x 10⁻¹⁰a 1.2 x 10⁻¹¹b 2.0 x 10⁻¹⁶d 42.3 37.6 20.1 42 min β –Phellandrene 1.7 x 10⁻¹⁰e 8.0 x 10⁻¹²e 4.8 x 10⁻¹⁷e 58.9 34.4 6.7 59 min Bicyclic β-Pinene 7.8 x 10⁻¹¹f 2.5 x 10⁻¹²b 2.4 x 10⁻¹⁷g 66.0 26.0 8.0 2.4 hr Sabinene 1.2 x 10⁻¹⁰h 1.0 x 10⁻¹¹b 8.8 x 10⁻¹⁷c 42.3 45.0 12.7 60 min Camphene 5.3 x 10⁻¹¹h 6.6 x 10⁻¹³b 9.0 x 10⁻¹⁹g 86.3 13.1 0.6 4.5 hr
Acyclic 1-alkenes
Myrcene
Based on work by Lee et al. (2006) the ozonolysis of the non 1-alkene site is around
50% and assuming that both the remaining 1-alkene sites yield 50% CH2OO this
produces a yield for HCOOH (Y(HCOOH)
Y(HCOOH) = Emission total * 0.361* 0.50 * 0.50 * 0.55 = Emission total * 0.050.
108
β-Ocimene
Sun et al. (2011) theoretical studies suggest that addition to the 1-alkene is a minor
channel and assuming it is 10% provides the estimate
Y(HCOOH) = Emission total * 0.301* 0.10 * 0.50 * 0.55 = Emission total * 0.008.
Cyclic 1-alkenes
d-Limonene
Grosjean et al. (1993b) show that at least 10% of addition occurs at the 1-alkene (via
HCHO yields). Jiang et al. (2010) have carried out theoretical studies that suggest that
the 1-alkene addition has a branching ratio of about 0.24, but do not determine the
decomposition products of the primary ozonide. So if we estimate that 50% of the
addition leads to CH2OO we then have
Y(HCOOH) = Emission total * 0.201 * 0.24 * 0.5 * 0.55 = Emission total * 0.013.
β –Phellandrene
Hakola et al. (1993) estimate that addition to the 1-alkene is 0.35 at most, leading to
Y(HCOOH) = Emission total * 0.067* 0.35 *0.5* 0.55 = Emission total * 0.007.
Bicyclic 1-alkenes
Sabinene
The yield of Sabina ketone, from the reactions of O3 with Sabinene yielding CH2OO
and the ketone, is about 50%, (Hakola et al., 1994; Yu et al., 1999). Therefore for
Sabinene, we estimate the yield
109
Y(HCOOH) = Emission total * 0.127 * 0.5 * 0.5 * 0.55 = Emission total * 0.023.
Camphene
Based on the product study of Jay and Stieglitz, (1989) it is assumed that formation of
CH2OO following ozonolysis accounts for about 50% of the products. Therefore
Y(HCOOH) = Emission total * 0.006* 0.50 * 0.55 = Emission total * 0.002.
β-Pinene
The theoretical study of Nguyen et al. (2009) suggests that just 5.1% of ozone
addition leads to CH2OO formation. However, the yield of nopinone (the co-product
to CH2OO formation) from β-pinene ozonolysis is around 20% (Lee et al., 2006) and
taking this value yields
Y(HCOOH) = Emission total * 0.08* 0.2 * 0.55 = Emission total * 0.009.
Based on such an analysis it emerges that myrcene and sabinene are potentially the
biggest sources of HCOOH arising from ozonolysis of those studied. When
estimating the yield of HCOOH it is clear that the fraction of loss that is via
ozonolysis, the number of 1-alkene sites and the fraction of reaction occurring at these
sites are all important factors. An estimation of the global emission for monoterpenes
is often reported to be around 130 Tg/yr. Based on this figure and assuming all of this
is one of the monoterpenes inspected here, the yield of HCOOH varies between 0.3 –
6.4 Tg/yr. Given recent work that shows that the ozonolysis of the sesquiterpene, β-
caryophyllene (Ghalaieny et al., 2012) is much slower than previously reported and
that only about 12% of oxidation is via reaction with ozone, it appears that ozonolysis
of monoterpenes and possibly sesquiterpenes containing a 1-alkene moiety are not a
huge source of HCOOH.
Recent work by Stavrakou et al. (2012) has suggested that terpenoids or a reactive
and as yet unidentified biogenic VOC are a substantial source of HCOOH in order to
reconcile satellite measurements and models, particularly in Boreal Forest areas. It
110
would seem that ozonolysis is not a mechanism capable of generating high levels of
HCOOH from these terpenoids. Indeed, Stavrakou et al. (2012) concur with this
assumption in their preliminary analysis. Whether oxidation of these terpenoids via
OH, which has been suggested to yield HCOOH, or some other mechanism is
responsible is unclear. However, the work of Stavrakou et al. (2012) suggests that
current inventories underestimate HCOOH by a factor of 3-4.
Conclusions
This study has confirmed that the yield of HCOOH from the ozonolysis of isoprene
has strong water dependence and rises rapidly with increasing relative humidity.
Assuming a simple two channel model for the fate of the CH2OO radical it has been
possible to estimate the ratio of the rate coefficient for the reaction with water
compared (k3) with decomposition (k4). Such an analysis suggests that k3 probably
ranges between 1×10-12 – 1×10-15 cm3 molecule-1 s-1and as such will indeed be the
dominant loss process, other than decomposition, for this radical in the atmosphere.
Global model integrations suggest that isoprene ozonolysis could contribute up to 9
Tg yr-1 to the HCOOH budget. Further analysis would suggest that ozonolysis of
monoterpenes could contribute between 0.3-6.4 Tg yr-1. The fact remains that
HCOOH is still underestimated, and it appears that ozonolysis of monoterpenes and
possibly sesquiterpenes containing a 1-alkene moiety are not a significant source of
HCOOH.
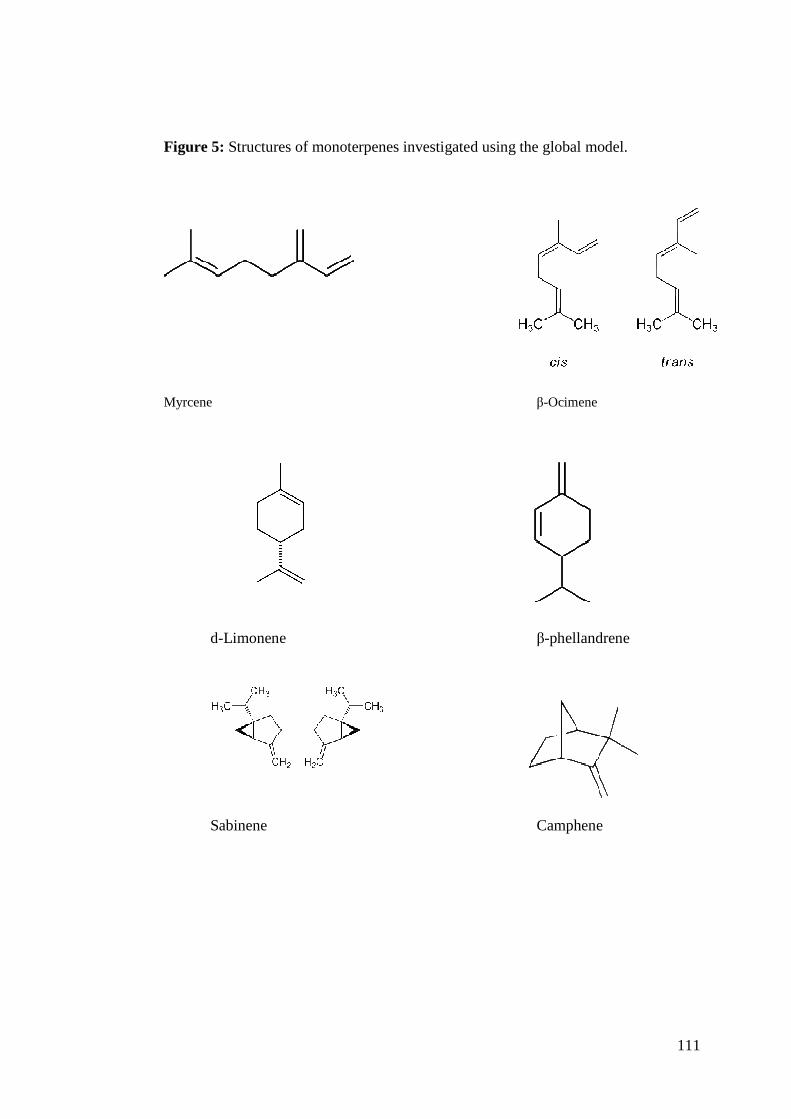
111
Figure 5: Structures of monoterpenes investigated using the global model.
Myrcene β-Ocimene
d-Limonene β-phellandrene
Sabinene Camphene
112
References for paper V Andreae M.O., Merlet P., 2001. Emission of trace gases and aerosols from biomass burning. Global Biogeochemical Cycles 15, 955-966. Anglada J.M., Aplincourt P., Bofill J.M., Cremer D., 2002. Atmospheric formation of OH radicals and H2O2 from alkene ozonolysis under humid conditions. ChemPhysChem 3, 215-221. Archibald A.T., Cooke M.C., Utembe S.R., Shallcross D.E., Derwent R.G., Jenkin M.E., 2010. Impacts of mechanistic changes on HO(x) formation and recycling in the oxidation of isoprene. Atmospheric Chemistry and Physics 10, 8097-8118. Arlander D.W., Cronn D.R., Farmer J.C., 1990. Gaseous oxygenated hydrocarbons in the remote marine troposphere. Journal of Geophysical Reasearch – Atmospheres 95, 16391-16403. Aschmann S.M., Atkinson R., 1994. Formation yields of methyl vinyl ketone and methacrolein from the gas-phase reaction of O3 with isoprene. Environmental Science and Technology 28, 1539-1542. Aschmann S.M., Arey J., Atkinson R., 1996. OH radical formation from the gas-phase reactions of O-3 with methacrolein and methyl vinyl ketone. Atmospheric Environment 30, 2939-2943. Atkinson R., Aschmann S.M., Pitts J.N., 1986. Rate constants for the gas-phase reactions of the OH radical with a series of monoterpenes at 294 ± 1 K. International Journal of Chemical Kinetics 18, 287-299. Atkinson R., Aschmann S.M., Arey J., 1990a. Rate constants for the gas-phase reactions of OH and NO3 radicals and O3 with sabinene and camphene at 296±2K. Atmospheric Environment 24, 2647-2654. Atkinson R., Hasegawa D., Aschmann S.M., 1990b. Rate constants for the gas-phase reactions of O3 with a series of monoterpenes and related compounds at 296 ± 2 K. International Journal of Chemical Kinetics 22, 871-887. Atkinson R., 1991. Kinetics and mechanisms of the gas-phase reactions of the NO3 radical with organic compounds. Journal of Physical Chemistry Reference Data 20, 459-507. Atkinson R., Aschmann S.M., Arey J., Shorees B., 1992. Formation of OH radicals in the gas-phase reactions of O3 with a series of terpenes. Journal of Geophysical Research – Atmospheres 97, 6065-6073. Calvert J.G., Su F., Bottenheim J.W., Strasz O.P., 1978. Mechanism of the homogeneous oxidation of sulfur dioxide in the troposphere. Atmospheric Environment 12, 197-226.
113
Calvert J.G, Atkinson R., Kerr J.A., Madronich S., Moortgat G.K., Wallington T.J., Yarwood G., 2000. The mechanisms of atmospheric oxidation of the alkenes. Oxford University Press, London. Collins W.J., Stevenson D.S., Johnson C.E., Derwent R.G., 1997. Tropospheric ozone in a global-scale three-dimensional Lagrangian model and its response to NOX emission controls. Journal of Atmospheric Chemistry 26, 223-274. Copeland G., Ghost M.V., Shallcross D.E., Percival C.J., Dyke J.M., 2011. A Study of the alkene-ozone reactions, 2,3-dimethyl 2-butene + O3 and 2-methyl propene + O3, with photoelectron spectroscopy: measurement of product branching ratios and atmospheric implications. Physical Chemistry Chemical Physics, 13,17461-17473. Crehuet R., Anglada J.M., Bofill J.M., 2001. Tropospheric formation of hydroxymethyl hydroperoxide, formic acid, H2O2, and OH from carbonyl oxide in the presence of water vapor: A theoretical study of the reaction mechanism. Chemistry-A European Journal 7, 2227-2235. Cremer D., Kraka E., Szaly P.G., 1998. Decomposition modes of dioxirane, methyldioxirane and dimethyldioxirane - a CCSD(T), MR-AQCC and DFT investigation. Chemical Physics Letters 292, 97-109. Derwent R.G., Stevenson D.S., Doherty R.M., Collins W.J., Sanderson M.G., 2008. How is surface ozone in Europe linked to Asian and North American NOx emissions? Atmospheric Environment 42, 7412-7422. Donahue N.M., Kroll J.H., Anderson J.G., Demerjian K.L., 1998. Direct observation of OH production from the ozonolysis of olefins. Geophysical Research Letters 25, 59-62. Donahue N.M., Drozd G.T., Epstein S.A., Presto A.A., Kroll J.H., 2011.Adventures in ozoneland: down the rabbit-hole. Physical Chemistry Chemical Physics 13, 10848-10857. Fenske J.D., Hasson A.S., Ho A.W., Paulson S.E., 2000. Measurement of absolute unimolecular and bimolecular rate constants for CH3CHOO generated by the trans-2-butene reaction with ozone in the gas phase. Journal of Physical Chemistry A 104, 9921-9932. Finlayson-Pitts B.J., Pitts J.N., 2000. Chemistry of the upper and lower atmosphere – theory, experiments and applications. Academic Press, London. Ghalaieny M., Bacak A., McGillen M, Martin D., Knights A.V., O’Doherty S., Shallcross D.E., Percival C.J., 2012. Determination of gas-phase ozonolysis rate coefficients of a number of sesquiterpenes at elevated temperatures using the relative rate method. Physical Chemistry Chemical Physics accepted March 2012. Granier C., Guenther A., Lamarque J.F., Mieville A., Muller J. F., Olivier J., Orlando J., Peters J., Petron G., Tyndall G., Wallens S., 2005. POET, a database of surface emission of ozone precursors. Available at http://www.aero.jussieu.fr/project/ACCENT/POET.php, 2005.
114
Gutbrod R., Meyer S., Rahman M.M., Schindler R.N., 1997. On the use of CO as scavenger for OH radicals in the ozonolysis of simple alkenes and isoprene. International Journal of Chemical Kinetics 29, 717-723. Grosjean D., 1990. Liquid-chromatography analysis of chloride and nitrate with negative ultraviolet detection - ambient levels and relative abundance of gas-phase inorganic and organic-acids in Southern-California. Environmental Science and Technology 24, 77-81. Grosjean D., Williams E.L., Grosjean E., 1993a. Atmospheric chemistry of isoprene and of its carbonyl products. Environmental Science and Technology 27, 830–840. Grosjean D., Williams E.L., Grosjean E., Andino J.M., Seinfeld J.H., 1993b. Atmospheric oxidation of biogenic hydrocarbons – reaction of ozone with beta-pinene, d-limonene and trans-caryophyllene. Environmental Science and Technology 27, 2754-2758. Grosjean E., Grosjean D., 1996. Rate constants for the gas-phase reaction of ozone with 1,1-disubstituted alkenes. International Journal of Chemical Kinetics 28, 911-918. Hakola H., Shorees B., Arey J., Atkinson R., 1993. Product formation from the gas-phase reactions of OH radicals and O3 with β-phellandrene. Environmental Science and Technology 27, 278-283. Hakola H., Arey J., Aschmann S.M., Atkinson R., 1994. Product formation from the gas-phase reactions of OH radicals and O3 with a series of monoterpenes. Journal of Atmospheric Chemistry 18, 75-102. Hasson A.S., Ho A.W., Kuwata K.T., Paulson S.E., 2001. Production of stabilized Criegee intermediates and peroxides in the gas phase ozonolysis of alkenes 2. Asymmetric and biogenic alkenes. Journal of Geophysical Research – Atmospheres 106, 34143-34153. Hatakeyama S., Bandow H., Okuda M., Akimoto H., 1981. Reactions of CH2OO and CH2(
1A1) with H2O in the gas-phase. Journal of Physical Chemistry 85, 2249-2254. Henze D.K, Seinfeld J.H., Ng N.L., 2008. Global modeling of secondary organic aerosol formation from aromatic hydrocarbons: high- vs. low-yield pathways. Atmospheric Chemistry and Physics 8, 2405-2420. Jay K., Stieglitz L., 1989. Gas-phase ozonolysis of camphene in the presence of SO2. Atmospheric Environment 23, 1219-1221. Jenkin M.E., Watson L.A., Utembe S.R., 2008. A Common Representative Intermediates (CRI) mechanism for VOC degradation. Part 1: Gas phase mechanism development. Atmospheric Environment 42, 7185-7195. Jiang L., Wang W., Xu Y., 2010. Ab initio investigation of O(3) addition to double bonds of limonene. Chemical Physics 368, 108-112.
115
Johnson D., Rickard A.R., McGill C.D., Marston G., 2000.The influence of orbital asymmetry on the kinetics of the gas-phase reactions of ozone with unsaturated compounds. Physical Chemistry Chemical Physics 2, 323-328. Johnson D., Marston G., 2008.The gas-phase ozonolysis of unsaturated volatile organic compounds in the troposphere. Chemical Society Reviews 37, 699-716. Kamens R.M, Gery M.W., Jeffries H.E., Jackson M., Cole E.I., 1982. Ozone-isoprene reactions: product formation and aerosol potential. International Journal of Chemical Kinetics 14, 955-975. Kroll J.H., Clarke J.S., Donahue N.M., Anderson J.G., Demerjian K.L., 2001a. Mechanism of HOx formation in the gas-phase ozone-alkene reaction. 1. Direct, pressure-dependent measurements of prompt OH yields. Journal of Physical Chemistry A 105, 1554-1560. Kroll J.H., Hanisco T.F., Donahue N.M., Demerjian K.L., Anderson J.G., 2001b. Accurate, direct measurements of OH yields from gas-phase ozone-alkene reactions using an in situ LIF instrument. Geophysical Research Letters 28, 3863-3866. Leather K.E., McGillen M.R., Percival C.J., 2010. Temperature-dependent ozonolysis kinetics of selected alkenes in the gas phase: an experimental and structure-activity relationship (SAR) study. Physical Chemistry Chemical Physics 12, 2935-2943. Leather K.E., McGillen M.R., Ghalaieny M., Shallcross D.E., Percival C.J., 2011. Temperature-dependent kinetics for the ozonolysis of selected chlorinated alkenes in the gas phase. International Journal of Chemical Kinetics 43, 120-129. Leather K.E., McGillen M.R., Cooke M.C., Utembe S.R., Archibald A.T., Jenkin M.E., Derwent R.G., Shallcross D.E., Percival C.J., 2012. Acid-yield measurements of the gas-phase ozonolysis of ethene as a function of humidity using chemical ionisation mass spectrometry (CIMS). Atmospheric Chemistry and Physics 12, 469-479. Le Breton M., McGillen M.R., Muller J.B.A., Bacak A., Shallcross D.E., Xiao P., Huey L.G., Tanner D., Coe H., Percival C.J., 2012. Airborne observations of formic acid using a chemical ionisation mass spectrometer. Atmospheric Measurement Techniques Discussion 4, 5807-5835 Lee A., Goldstein A.H., Keywood M.D., Gao S., Varutbangkul V., Bahreini R., Ng N.L., Flagan R.C., Seinfeld J.H., 2006. Gas-phase products and secondary aerosol yields from the ozonolysis of ten different terpenes. Journal of Geophysical Research – Atmospheres 111, D07302. Malkin T.L., Goddard A., Heard D.E., Seakins P.W., 2010. Measurements of OH and HO(2) yields from the gas phase ozonolysis of isoprene. Atmospheric Chemistry and Physics 10, 1441-1459. Martinez R.I., Herron J.T., 1981. Gas-phase reaction of SO2 with a Criegee intermediate in the presence of water-vapor. Journal of Environmental Science and
116
Health Part A – Environmental Science and Engineering and Toxic and Hazardous Substance Control 16, 623-636. McGillen M.R., Ghalaieny M., Percival C.J., 2011. Determination of gas-phase ozonolysis rate coefficients of C(8-14) terminal alkenes at elevated temperatures using the relative rate method. Physical Chemistry Chemical Physics 13, 10965-10969. Neeb P., Sauer F., Horie O., Moortgat G.K., 1997. Formation of hydroxymethyl hydroperoxide and formic acid in alkene ozonolysis in the presence of water vapour. Atmospheric Environment 31, 1417-1423. Nguyen T.L., Peeters J., Vereecken L., 2009. Theoretical study of the gas-phase ozonolysis of β-pinene (C10H16). Physical Chemistry Chemical Physics 11, 5643-5656. Niki H., Maker P.D., Savage C.M., Breitenbach L.P., 1984. Fourier transform infrared study of the kinetics and mechanism for the reaction of hydroxyl radical with formaldehyde. Journal of Physical Chemistry 88, 5342-5344. O'Neal H.E., Blumstein C., 1973. A new mechanism for gas phase ozone–olefin reactions. International Journal of Chemical Kinetics 5, 397-413. Orzechowska G.E., Paulson S.E., 2005. Photochemical sources of organic acids. 1. Reaction of ozone with isoprene, propene, and 2-butenes under dry and humid conditions using SPME. Journal of Physical Chemistry 109, 5358-5365. Paulot F., Wunch D., Crounse J.D., Toon G.C., Millet D.B., DeCarlo P.F., Vigouroux C., Deutscher N.M., Abad G.G., Notholt J., Warneke T., Hannigan J.W., Warneke C., de Gouw J.A., Dunlea E.J., De Maziere M., Griffith D.W.T., Bernath P., Jimenez J.L., Wennberg P.O., 2011. Importance of secondary sources in the atmospheric budgets of formic and acetic acids. Atmospheric Chemistry and Physics 11, 1989-2013. Paulson S.E., Chung M., Sen A.D., Orzechowska G., 1998. Measurement of OH radical formation from the reaction of ozone with several biogenic alkenes. Journal of Geophysical Research – Atmospheres 103, 25533-25539. Penner J.E., Lister D.H., Griggs D.J., Dokken D.J., Mcfarland M., (Eds), 1999: Aviation and the global atmosphere. – A special report of IPCC working groups I and III. Intergovernmental Panel on Climate Change. – Cambridge University Press, Cambridge, UK and New York, NY, USA, 365 pp. Rickard A.R., Johnson D., McGill C.D., Marston G., 1999. OH yields in the gas-phase reactions of ozone with alkenes. Journal of Physical Chemistry A 103, 7656-7664. Rinsland C.P., Mahieu E., Zander R., Goldman A., Wood S., Chiou L., 2004. Free tropospheric measurements of formic acid (HCOOH) from infrared ground-based solar absorption spectra: Retrieval approach, evidence for a seasonal cycle, and comparison with model calculations. Journal of Geophysical Research – Atmospheres 109, D18308-18316.
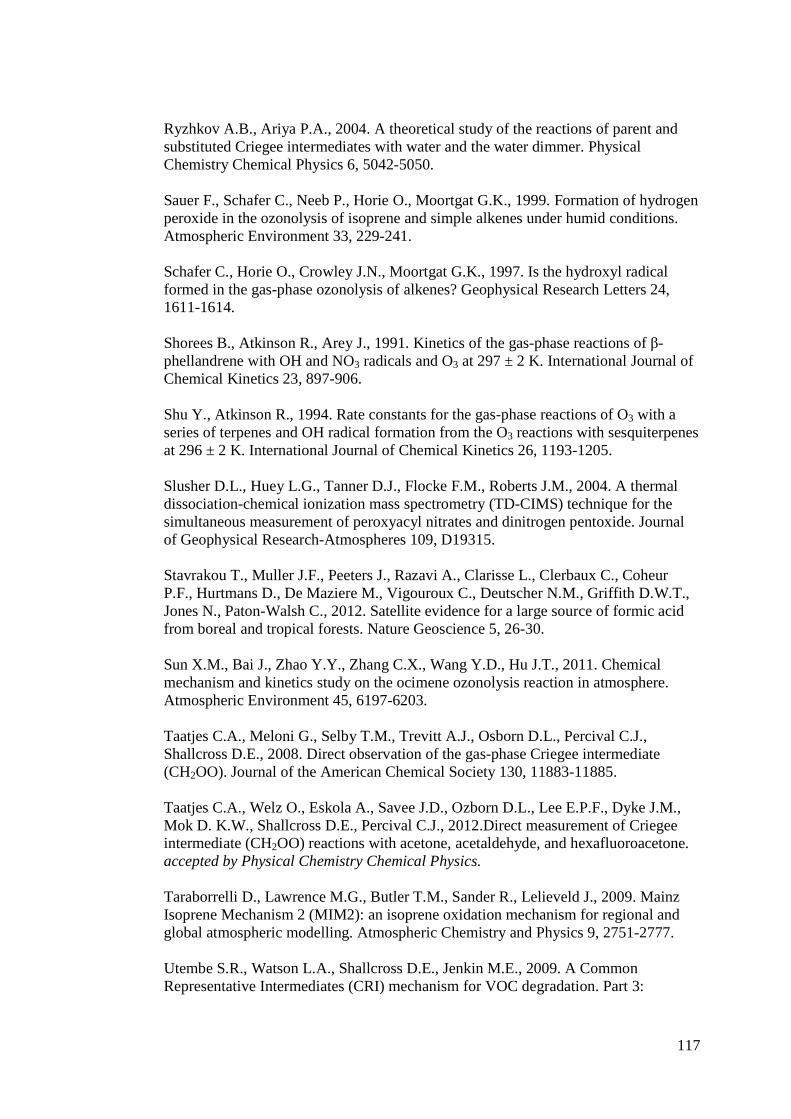
117
Ryzhkov A.B., Ariya P.A., 2004. A theoretical study of the reactions of parent and substituted Criegee intermediates with water and the water dimmer. Physical Chemistry Chemical Physics 6, 5042-5050. Sauer F., Schafer C., Neeb P., Horie O., Moortgat G.K., 1999. Formation of hydrogen peroxide in the ozonolysis of isoprene and simple alkenes under humid conditions. Atmospheric Environment 33, 229-241. Schafer C., Horie O., Crowley J.N., Moortgat G.K., 1997. Is the hydroxyl radical formed in the gas-phase ozonolysis of alkenes? Geophysical Research Letters 24, 1611-1614. Shorees B., Atkinson R., Arey J., 1991. Kinetics of the gas-phase reactions of β-phellandrene with OH and NO3 radicals and O3 at 297 ± 2 K. International Journal of Chemical Kinetics 23, 897-906. Shu Y., Atkinson R., 1994. Rate constants for the gas-phase reactions of O3 with a series of terpenes and OH radical formation from the O3 reactions with sesquiterpenes at 296 ± 2 K. International Journal of Chemical Kinetics 26, 1193-1205. Slusher D.L., Huey L.G., Tanner D.J., Flocke F.M., Roberts J.M., 2004. A thermal dissociation-chemical ionization mass spectrometry (TD-CIMS) technique for the simultaneous measurement of peroxyacyl nitrates and dinitrogen pentoxide. Journal of Geophysical Research-Atmospheres 109, D19315. Stavrakou T., Muller J.F., Peeters J., Razavi A., Clarisse L., Clerbaux C., Coheur P.F., Hurtmans D., De Maziere M., Vigouroux C., Deutscher N.M., Griffith D.W.T., Jones N., Paton-Walsh C., 2012. Satellite evidence for a large source of formic acid from boreal and tropical forests. Nature Geoscience 5, 26-30. Sun X.M., Bai J., Zhao Y.Y., Zhang C.X., Wang Y.D., Hu J.T., 2011. Chemical mechanism and kinetics study on the ocimene ozonolysis reaction in atmosphere. Atmospheric Environment 45, 6197-6203. Taatjes C.A., Meloni G., Selby T.M., Trevitt A.J., Osborn D.L., Percival C.J., Shallcross D.E., 2008. Direct observation of the gas-phase Criegee intermediate (CH2OO). Journal of the American Chemical Society 130, 11883-11885. Taatjes C.A., Welz O., Eskola A., Savee J.D., Ozborn D.L., Lee E.P.F., Dyke J.M., Mok D. K.W., Shallcross D.E., Percival C.J., 2012.Direct measurement of Criegee intermediate (CH2OO) reactions with acetone, acetaldehyde, and hexafluoroacetone. accepted by Physical Chemistry Chemical Physics. Taraborrelli D., Lawrence M.G., Butler T.M., Sander R., Lelieveld J., 2009. Mainz Isoprene Mechanism 2 (MIM2): an isoprene oxidation mechanism for regional and global atmospheric modelling. Atmospheric Chemistry and Physics 9, 2751-2777. Utembe S.R., Watson L.A., Shallcross D.E., Jenkin M.E., 2009. A Common Representative Intermediates (CRI) mechanism for VOC degradation. Part 3:
118
Development of a secondary organic aerosol module. Atmospheric Environment 43, 1982-1990. Utembe S.R., Cooke M.C., Archibald A.T. Jenkin M.E., Derwent R.G., Shallcross D.E., 2010. Using a reduced Common Representative Intermediates (CRIv2-R5) mechanism to simulate tropospheric ozone in a 3-D Lagrangian chemistry transport model. Atmospheric Environment 44, 1609-1622. Utembe S.R., Cooke M.C., Archibald A.T., Shallcross D.E., Derwent R.G., Jenkin M.E., 2011. Simulating secondary organic aerosol in a 3-D Lagrangian chemistry transport model using the reduced Common Representative Intermediates mechanism (CRI v2-R5). Atmospheric Environment 45, 1604-1614. von Kuhlmann R., Lawrence M.G., Crutzen P.J., Rasch P.J., 2003. A model for studies of tropospheric ozone and nonmethane hydrocarbons: Model evaluation of ozone-related species. Journal of Geophysical Reasearch – Atmospheres 108, D003348. Watson L.A., Shallcross D.E., Utembe S.R., Jenkin M.E., 2008. A Common Representative Intermediates (CRI) mechanism for VOC degradation. Part 2: Gas phase mechanism reduction. Atmospheric Environment 42, 7196-7204. Welz O., Savee J.D., Osborn D.L., Vasu S., Percival C.J., Shallcross D.E., Taatjes C.A., 2012. Reaction of CH2I with O2 forms Criegee intermediate: direct measurements of CH2OO kinetics. Science 335, 204-207. Yu J., Crocker D.R., Griffin R.J., Flagan R.C., Seinfeld J.H., 1999. Gas-Phase ozone oxidation of monoterpenes: Gaseous and Particulate Products. Journal of Atmospheric Chemistry 34, 207-258. Zhang, D., Wenfang, L., Zhang, R. 2002. Mechanism of OH formation from ozonolysis of isoprene: kinetics and product yields. Chemical Physics Letters, 358, 171-179. Zhang R.Y., Suh I., Zhao J., Zhang D., Fortner E.C., Tie X.X., Molina L.T., Molina M.J., 2004. Atmospheric new particle formation enhanced by organic acids. Science 304, 1487-1490.

119
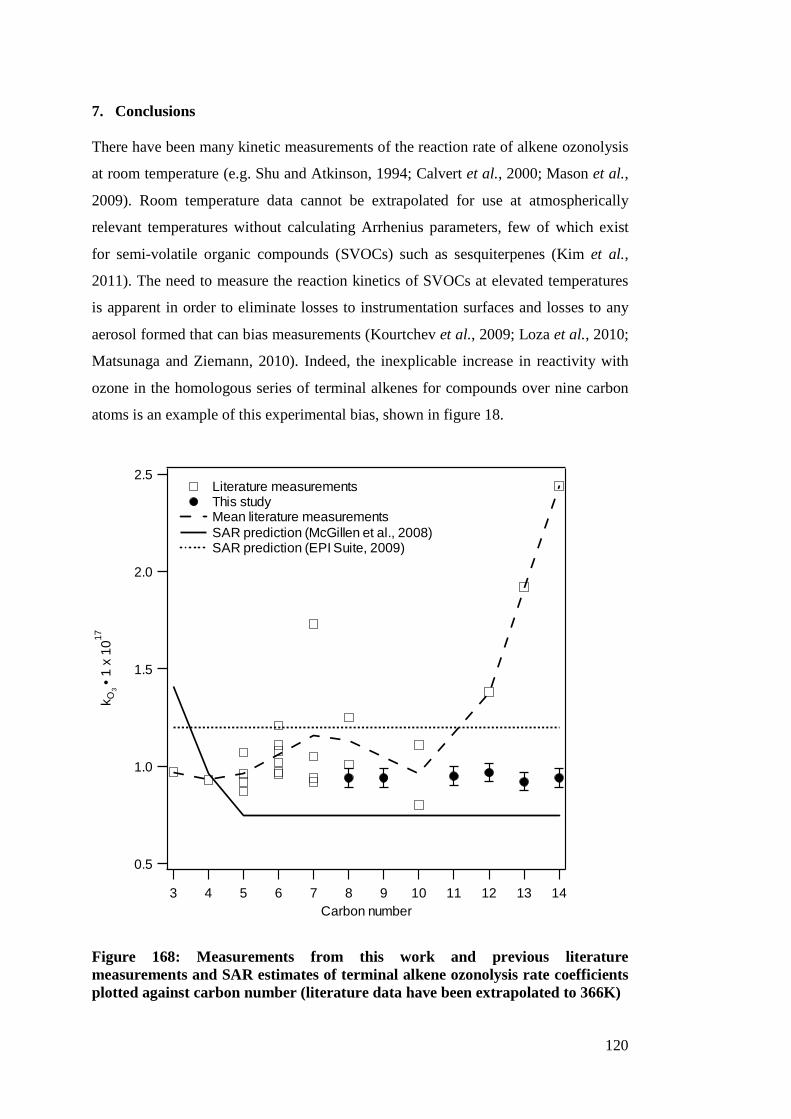
120
7. Conclusions There have been many kinetic measurements of the reaction rate of alkene ozonolysis
at room temperature (e.g. Shu and Atkinson, 1994; Calvert et al., 2000; Mason et al.,
2009). Room temperature data cannot be extrapolated for use at atmospherically
relevant temperatures without calculating Arrhenius parameters, few of which exist
for semi-volatile organic compounds (SVOCs) such as sesquiterpenes (Kim et al.,
2011). The need to measure the reaction kinetics of SVOCs at elevated temperatures
is apparent in order to eliminate losses to instrumentation surfaces and losses to any
aerosol formed that can bias measurements (Kourtchev et al., 2009; Loza et al., 2010;
Matsunaga and Ziemann, 2010). Indeed, the inexplicable increase in reactivity with
ozone in the homologous series of terminal alkenes for compounds over nine carbon
atoms is an example of this experimental bias, shown in figure 18.
2.5
2.0
1.5
1.0
0.5
k O3 •
1 x
1017
14131211109876543Carbon number
Literature measurements This study Mean literature measurements SAR prediction (McGillen et al., 2008) SAR prediction (EPI Suite, 2009)
Figure 168: Measurements from this work and previous literature measurements and SAR estimates of terminal alkene ozonolysis rate coefficients plotted against carbon number (literature data have been extrapolated to 366K)
121
The increase in terminal alkene reactivity could not be explained by several structure
activity relationships or the existence of alternative reaction channels. In this work
(Chapter five: McGillen et al., 2011), the reaction kinetics of C8-C14 terminal
alkenes was studied at an elevated temperature and no increase in reactivity was
observed throughout the series. The results of chapter four lead to the conclusion that
the increased reactivity of higher carbon alkenes was most likely to be an
experimental artefact caused by heterogeneous and surface losses of reactant material.
A major atmospheric implication of this experimental bias in alkene reactivity is the
overestimation of the importance of ozonolysis as a sink for semi-volatile NMHCs
and subsequently as a source of secondary organic aerosol (SOA).
Similar to higher terminal alkenes, sesquiterpenes are semi-volatile NMHCs with low
vapour pressures and have been considered a very important source of SOA. For
example, the extremely fast room temperature ozonolysis reaction rate of β-
caryophyllene, first measured by Shu and Atkinson (1994) as 1.5 x 10⁻¹⁵ cm3
molecules-1 s-1, is repeatedly cited as proof of this compound’s importance for SOA
formation (e.g. Alfarra et al., 2012) even though the high reactivity of β-
caryophyllene (and other SQTs) was in contradiction to basic SARs (Calvert et al.,
2000). The elevated temperature relative rate protocol developed for terminal alkenes
was applied to the ozonolysis of β-caryophyllene and three other sesquiterpenes
(Chapter five: Ghalaieny et al., 2012) and found that β-caryophyllene and α-
humulene were not as reactive with O3 as previously thought and as table 10 shows.
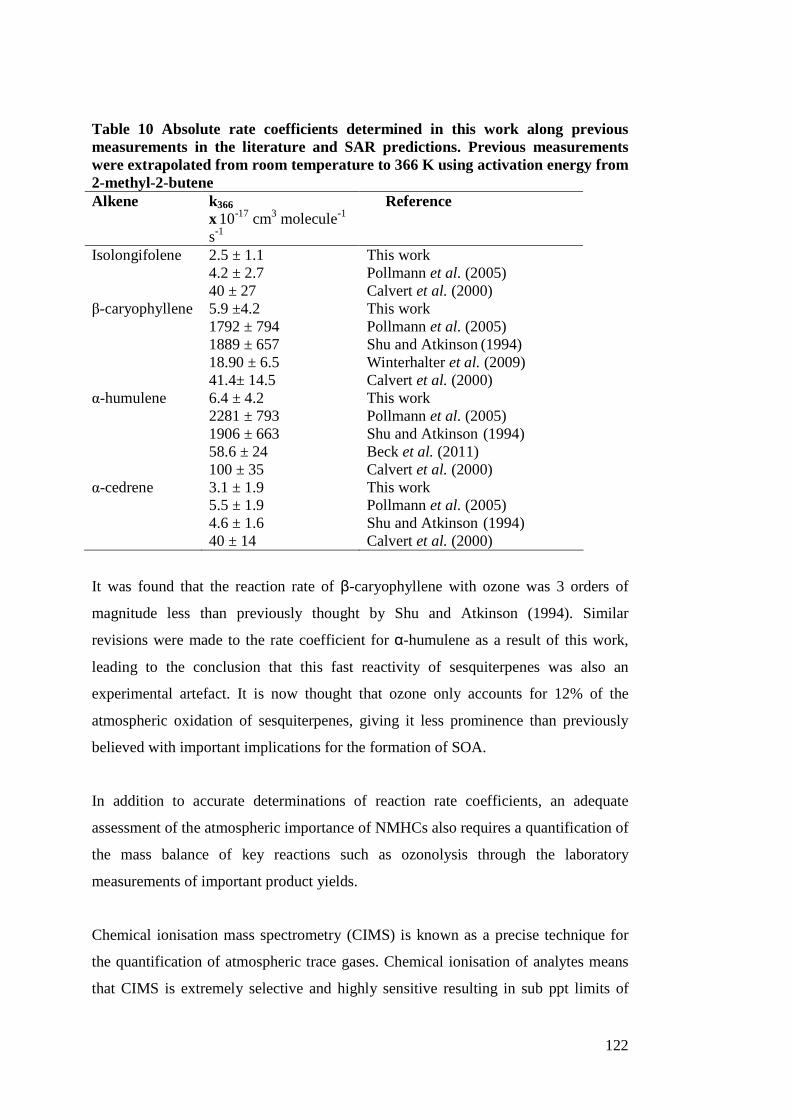
122
Table 10 Absolute rate coefficients determined in this work along previous measurements in the literature and SAR predictions. Previous measurements were extrapolated from room temperature to 366 K using activation energy from 2-methyl-2-butene Alkene k366
x 10-17 cm3 molecule-1 s-1
Reference
Isolongifolene 2.5 ± 1.1 This work 4.2 ± 2.7 Pollmann et al. (2005) 40 ± 27 Calvert et al. (2000) β-caryophyllene 5.9 ±4.2 This work 1792 ± 794 Pollmann et al. (2005) 1889 ± 657 Shu and Atkinson (1994) 18.90 ± 6.5 Winterhalter et al. (2009) 41.4± 14.5 Calvert et al. (2000) α-humulene 6.4 ± 4.2 This work 2281 ± 793 Pollmann et al. (2005) 1906 ± 663 Shu and Atkinson (1994) 58.6 ± 24 Beck et al. (2011) 100 ± 35 Calvert et al. (2000) α-cedrene 3.1 ± 1.9 This work 5.5 ± 1.9 Pollmann et al. (2005) 4.6 ± 1.6 Shu and Atkinson (1994) 40 ± 14 Calvert et al. (2000)
It was found that the reaction rate of β-caryophyllene with ozone was 3 orders of
magnitude less than previously thought by Shu and Atkinson (1994). Similar
revisions were made to the rate coefficient for α-humulene as a result of this work,
leading to the conclusion that this fast reactivity of sesquiterpenes was also an
experimental artefact. It is now thought that ozone only accounts for 12% of the
atmospheric oxidation of sesquiterpenes, giving it less prominence than previously
believed with important implications for the formation of SOA.
In addition to accurate determinations of reaction rate coefficients, an adequate
assessment of the atmospheric importance of NMHCs also requires a quantification of
the mass balance of key reactions such as ozonolysis through the laboratory
measurements of important product yields.
Chemical ionisation mass spectrometry (CIMS) is known as a precise technique for
the quantification of atmospheric trace gases. Chemical ionisation of analytes means
that CIMS is extremely selective and highly sensitive resulting in sub ppt limits of
123
detection with a time response on the order of milliseconds (Huey et al., 1998;
Slusher et al., 2004). Accurate quantification of certain trace gases requires attention
to the choice of inlet material used. By conducting the first systematic study of the
loss of trace gases to inlet walls (Chapter two: Ghalaieny et al., in prep), it was
determined that PFA is indeed the preferable material for use in measuring ‘sticky’
trace gases in the atmosphere. Due to these findings, all inlets used in this study were
constructed from lengths of PFA.
A field test of the Manchester CIMS with a custom made, heated PFA inlet, (Chapter
three: von Bobrutzki et al., 2010) confirmed the instrument’s capability in measuring
atmospheric trace gases. The Manchester CIMS was compared well with ten other
instruments for NH3 measurements in the most comprehensive intercomparison study
in the UK. Indeed, the CIMS was one of the only instruments capable of tracking
rapid variations in NH3 concentrations which highly correlated with concentrations
measured by other instruments of comparable time response, R2 values of 0.89, 0.94
and 0.79 respectively are reported for the cQCLAS, Dual QCLAS and WaSul-Flux
instruments. Amongst all the instruments in the intercomparison, CIMS was the
instrument with the most accurate determination of the unified standard addition
calibration of NH3 used in the field experiment.
Taking into account the suitability and superiority of CIMS for accurate trace gas
measurements and choosing the right inlet material and design (heating, length etc.),
CIMS coupled with the EXTreme Range chamber (EXTRA) was used (Chapter six:
Ghalaieny et al., in prep) to measure the yield of HCOOH from the ozonolysis of
isoprene as a function of relative humidity. The measurement of HCOOH yield from
isoprene was the first study of its kind using CIMS and only the second study utilising
an online realtime measurement technique, FTIR (Neeb et al., 1997). The measured
yield of HCOOH, a maximum of 0.18 at 40% RH was consistent with the previous
FTIR measurements of Neeb et al. (1997). Additionally, the results were also
consistent with the studies conducted using CIMS on HCOOH yields from ethene by
Leather et al. (2012) and related measurements of radical yields from ethene by Alam
et al. (2011). When integrated into a global model, The HCOOH yields measured in
this work lead to the conclusion that the ozonolysis of isoprene accounts for
9.5 Tg yr-1 of HCOOH production and that more work is needed to quantify
124
secondary sources and primary emissions of HCOOH to find agreement between
models and measurements.
Future work
A key area of future research is the further quantification of HCOOH production from
alkene ozonolysis. The research presented herein quantified the contribution of
isoprene to the production of HCOOH in the atmosphere, but other sources have yet
to be quantified. The ozonolysis of any terminal alkene is a source of carbonyl oxides
(Criegee intermediates) that can react with water to yield HCOOH. Therefore further
study of other atmospherically abundant ozone-alkene systems (e.g. propene, 1-
butene, 2-methyl-2-butene, and 1,3-butadiene) is necessary in order to resolve
discrepancies with models that continue to under-predict concentrations of HCOOH
in the atmosphere (Paulot et al., 2011; Stavarakou et al., 2012). In a similar vein,
studies of the formation of other organic acids (e.g. acetic, butyric and pyruvic acids)
from the ozonolysis of asymmetric alkenes are important because field measurements
indicate that these other organic acids also have photochemical sources rather than
direct emissions (Veres et al., 2011).
As has been demonstrated, the fate of Criegee intermediates (CI) is directly linked to
the formation of HCOOH in the atmosphere. Therefore, simultaneous measurements
of CI yields with HCOOH yields using techniques such as tunable synchrotron
photoionization with multiplexed mass spectrometry (Taatjes et al., 2008) or CI
titration by HFA (Drozd and Donahue, 2011) would be fruitful future research. Also,
direct measurements of CI yields from ozonolysis would yield important information
(Welz et al., 2012).
Finally, analogous field measurements of the NMHCs and organic acids mentioned
above (Le Breton et al., 2012) could be useful to complement laboratory
measurements, and to test and validate the output of models.
125
8. Appendix: permeation tube calibration
The CIMS-F was calibrated continuously in the field using permeation tubes
made by KIN-TEK (Lamarque, Texas). These devices were chosen because of the
stability of their output during a certain stage in their lifecycle known as the
saturation stage (Mitchell 2000) Permeation tube based calibration devices also
benefit from being extremely compact in comparison with other gas standard
delivery methods, such as gas cylinders.
Calibration source description A permeation device is a hermetically sealed PTFE tube containing a concentrated
solution of the analyte of interest (e.g. NH3 or HNO3). The permeability of the
PTFE to the analyte inside is mainly driven by the difference in partial pressure
between the inner and outer walls of the tube. It is also dependent on temperature
and therefore the permeation rate varies depending on temperature (Mitchell
2000). Once the tube is heated the calibrant is emitted at a known rate measured
in nanograms per minute (ng min-1). The emission of calibrant is carried in a
known flow of clean N2 to the instrument to be calibrated. The concentration of
the introduced calibrant is calculated from equation 2 below:
Where E is the emission rate in ng min-1at a given temperature, k is a constant
related to the molar mass of the emitted species supplied by the permeation tube
manufacturer, and F is the flow of the carrier gas (N2) measured in standard cubic
centimetres per minute (sccm) and C is the concentration in ppm.
In order to accurately control the emission rate and hence the concentration a
permeation oven with accurate temperature control is required. A field portable
oven was designed and built that consisted of: a 14 cm long PTFE tube sleeved in
aluminum sleeve to hold the permeation tube; a flexible Kapton Polyamide TM
(Minco) heating element providing 6 W of power; a K type thermocouple to
F
EkC
×=
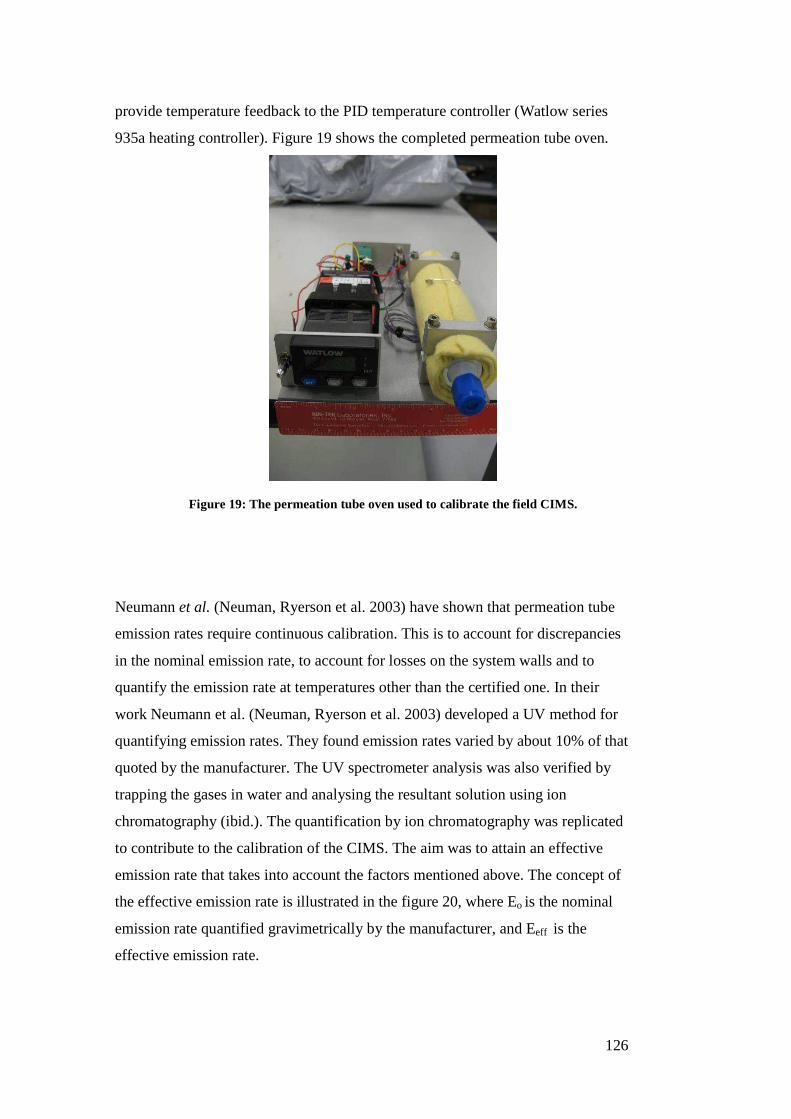
126
provide temperature feedback to the PID temperature controller (Watlow series
935a heating controller). Figure 19 shows the completed permeation tube oven.
Figure 19: The permeation tube oven used to calibrate the field CIMS.
Neumann et al. (Neuman, Ryerson et al. 2003) have shown that permeation tube
emission rates require continuous calibration. This is to account for discrepancies
in the nominal emission rate, to account for losses on the system walls and to
quantify the emission rate at temperatures other than the certified one. In their
work Neumann et al. (Neuman, Ryerson et al. 2003) developed a UV method for
quantifying emission rates. They found emission rates varied by about 10% of that
quoted by the manufacturer. The UV spectrometer analysis was also verified by
trapping the gases in water and analysing the resultant solution using ion
chromatography (ibid.). The quantification by ion chromatography was replicated
to contribute to the calibration of the CIMS. The aim was to attain an effective
emission rate that takes into account the factors mentioned above. The concept of
the effective emission rate is illustrated in the figure 20, where Eo is the nominal
emission rate quantified gravimetrically by the manufacturer, and Eeff is the
effective emission rate.
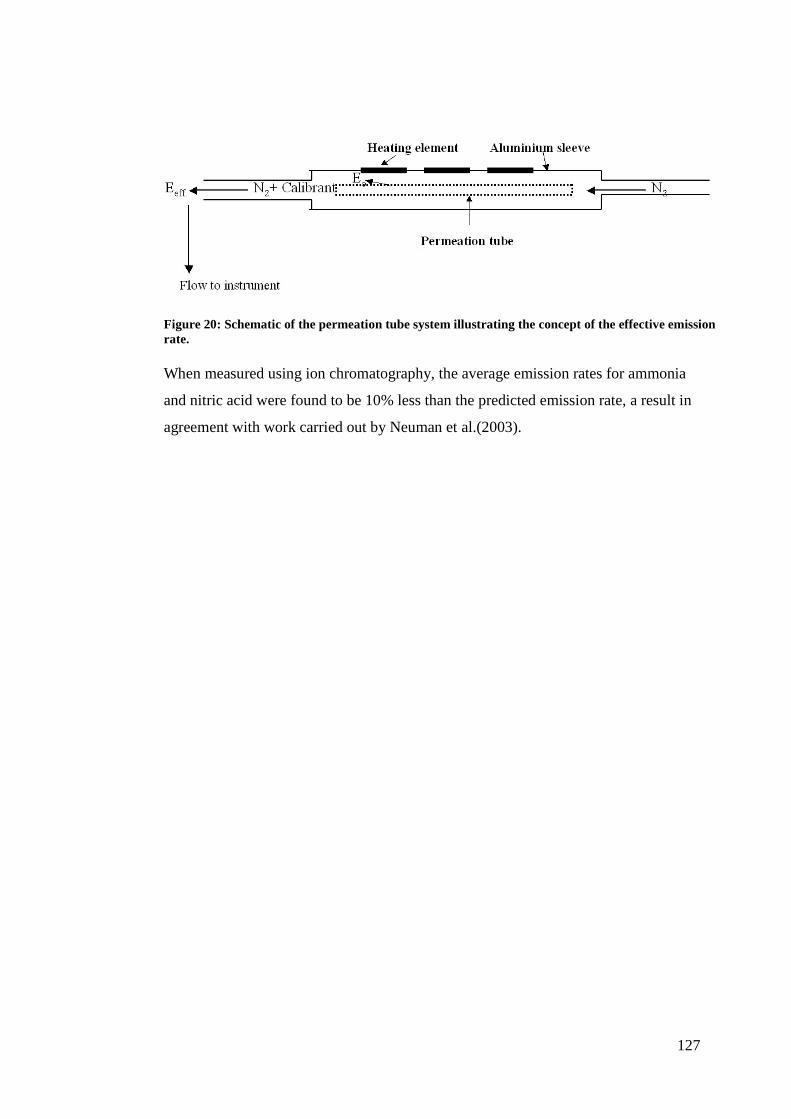
127
Figure 20: Schematic of the permeation tube system illustrating the concept of the effective emission rate. When measured using ion chromatography, the average emission rates for ammonia
and nitric acid were found to be 10% less than the predicted emission rate, a result in
agreement with work carried out by Neuman et al.(2003).
128
9. References Alam, M.S., Camredon, M., Rickard, A.R., Carr, T., Wyche, K.P., Horsnby, K.E., Monks, P.S., Bloss, W.J. 2011. Total radical yields from tropospheric ethene ozonolysis. Physical Chemistry Chemical Physics, 13, 11002-11015. Alfarra, M.R., Hamilton, J.F., Wyche, K.P., Good, N., Ward, M.W., Carr, T., Barley, M.H., Monks, P.S., Jenkin, M.E., McFiggans, G.B. 2012. The effect of photochemical ageing and initial precursor concentration on the composition and hygroscopic properties of β-caryophyllene secondary organic aerosol. Atmospheric Chemistry and Physics Discussion, 12, 2435-2482. Atkinson, R., Aschmann, S.M., Carter, W.P.L., Pitts Jr., J.N., 1983. Effects of ring strain on gas-phase rate constants. I. Ozone reactions with cycloalkenes. International Journal of Chemical Kinetics, 15, 721–731. Atkinson, R., Aschmann, S.M., Carter, W.P., 1983. Effects of ring strain on gas-phase rate constants. 2. OH radical reactions with cycloalkenes. International Journal of Chemical Kinetics, 15, 1161–1177. Atkinson, R., Aschmann, S.M., 1984. Rate constants for the reaction of OH radicals with a series of alkenes and dialkenes at 295 ± 1 K. International Journal of Chemical Kinetics, 16, 1175–1186. Atkinson, R., Lloyd, A.C. 1984. Evaluation of kinetic and mechanistic data for modeling of photochemical smog. Journal of Physical and Chemical Reference Data, 13, 315-444. Atkinson, R., Aschmann, S.M., Pitts Jr., J.N., 1986. Rate constants for the gas-phase reactions of the OH radical with a series of monoterpenes at 294 ± 1 K. International Journal of Chemical Kinetics, 18, 287–299. Atkinson, R. 1987. A structure activity relationship for the estimation of the rate coefficients for the gas-phase reactions of OH radicals with organic comounds. International Journal of Chemical Kinetics, 19, 799-828. Atkinson, R., Baulch, D.L., Cox, R.A., Hampson, R.F., Jr., Kerr, J.A., Troe, J. 1989. Evaluated kinetic and photochemical data for atmospheric chemistry. Supplement III. IUPAC subcommittee on Gas Kinetic Data Evaluation for Atmospheric Chemistry. Journal of Physical Chemistry Reference Data, 18, 881-1097. Atkinson, R., Hasegawa, D., Aschmann, S.M., 1990. Rate constants for the gas-phase reactions of O3 with a series of monoterpenes and related compounds at 296 ± 2 K. International Journal of Chemical Kinetics, 22, 871–887. Atkinson, R., 1991. Kinetics and mechanisms of the gas-phase reactions of the NO3 radical with organic compounds. Journal of Physical Chemistry Reference Data, 20, 459–507.
129
Atkinson, R., Arey, J., Aschmann, S.M., Corchnoy, S.B., Shu, Y., 1995. Rate constants for the gas-phase reactions of cis-3-hexen-1-ol, cis-3-hexenylacetate, trans-2-hexenal, and linalool with OH and NO3, radicals and O3 at 296 ± 2 K, and OH radical formation yields from the O3 reactions. International Journal of Chemical Kinetics, 27, 941–955. Atkinson, R. 1997. Gas-phase tropospheric chemistry of volatile organic compounds .1. Alkanes and alkenes. Journal of Physical and Chemical Reference Data, 26, 215-290. Atkinson, R., Baulch, D.L., Cox, R.A., Crowley, J.N., Hampson, R.F., Jr., Kerr, J.A., Rossi, M.J., Troe, J. 2001. IUPAC Subcommittee on Gas Kinetic Data Evaluation for Atmospheric Chemistry Web Version December 2001. Beck, M., Winterhalter, R., Herrmann, F., Moorgat, G.K. 2011. The gas-phase ozonolysis of alpha-humulene. Physical Chemistry Chemical Physics, 13, 10970-11001. Benter, Th., Becker, E., Wille, U., Rahman, M.M., Schindler, R.N., 1992. The determination of rate constants for the reactions of some alkenes with the NO3 radical. Ber. Bunsenges. Phys. Chem. 96, 769–775. Berndt, T., Boge, O., Kind, I., Rolle, W., 1996. Reaction of NO3 radicals with 1,3-cyclohexadiene, α-terpinene, and α -phellandrene: kinetics and products. Ber. Bunsenges. Phys. Chem., 100, 462–469. Berndt, T., Boge, O., 1997. Gas-phase reaction of NO3 radicals with isoprene: a kinetic and mechanistic study. International Journal of Chemical Kinetics, 29, 755–765. Berndt, T., Kind, I., Karbach, H.-J., 1998. Kinetics of the gas-phase reaction of NO3 radicals with 1-butene, trans-butene, 2-methyl-2-butene and 2,3-dimethyl-2-butene using LIF detection. Ber. Buns-enges. Phys. Chem. 102, 1486–1491. Bonn, B., Moortgat, G.K. 2003. New particle formation during α- and β-pinene oxidation by O3, OH and NO3, and the influence of water vapour: particle size distribution studies. Atmospheric Chemistry and Physics, 2, 183-196. Bonn, B., Moortgat, G.K. 2003. Sesquiterpene ozonolysis: Origin of atmospheric new particle formation from biogenic hydrocarbons. Geophysical Research Letters, 30, 1585. Bouwman, A.F., Lee, D.S., Asman, W.A.H., Dentener, F.J., Van der Hoek, K.W., Olivier, J.G.J. 1997. A global high-resolution emission inventory for ammonia. Global Biogeochemical Cycles, 11, 561-587. Calvert, J.G., Bottenheim, J.W., Strausz, O.P. 1978. Mechanism of the homogenous oxidation of sulphur dioxide in the troposphere. Atmospheric Environment, 12, 197-226.
130
Calvert, J.G., Atkinson, R., Kerr, J.A., Madronich, S., Moortgat, G.K., Wallington, T.J and Yarwood, G. 2000. The Mechanisms of Atmospheric Oxidation of the Alkenes. Oxford University Press, Oxford, UK. Carslaw, N., Jacobs, P.J., Pilling, M.J. 2000. Understanding radical chemistry in the marine boundary layer. Physics and Chemistry of the Earth Part C – Solar-Terrestrial and Planetary Science, 25, 235-243. Committee on Tropospheric Ozone Formation and Measurement, 1992. Rethinking the ozone problem in urban and regional air pollution. National Academies Press, Washington, USA. Corchnoy, S.B., Atkinson, R., 1990. Kinetics of the gas-phase reactions of OH and NO3 radicals with 2-carene, 1,8-cineole, p-cymene, and terpinolene. Environmental Science and Technology, 24, 1497–1502. Cox, R.A., Penkett, S.A., 1972. Aerosol formation from sulphur dioxide in the presence of ozone and olefinic hydrocarbons. Journal of the Chemical Society. Faraday Transactions 1, 68, 1735–1753. Crounse, J.D., McKinney, K.A., Kwan, A.J., Wennberg, P.O. 2006. Measurement of gas-phase hydroperoxides by chemical ionization mass spectrometry. Analytical Chemistry, 78, 6726-6732. Cusick, R.D., Atkinson, R., 2005. Rate constants for the gas-phase reactions of O3 with a series of cycloalkenes at 296 ± 2 K. International Journal of Chemical Kinetics, 37, 183–190. Danilin, M.Y., Popp, P.J., Herman, R.L., Ko, M.K.W., Ross, M.N., Kolb, C.E., Fahey, D.W., Avallone, L.M., Toohey, D.W., Ridley, B.A., Schmid, O., Wilson, J.C., Baumgardner, D.G., Friedl, R.R., Thompson, T.L., Reeves, J.M. 2003. Quantifying uptake of HNO3 and H2O by alumina particles in Athena-2 rocket plume. Journal of Geophysical Research – Atmospheres, 108, 4141. Darnall, K.R., Winer, A.M., Lloyd, A.C., Pitts Jr., J.N., 1976. Relative rate constants for the reaction of OH radicals with selected C6 and C7 alkanes and alkenes at 305 ± 2 K. Chemical Physics Letters, 44, 415–418. DEFRA. 2002. Ammonia in the UK, Department for the Environment, Food and Rural Affairs, London, UK. Doyle, M., Sexton, K.G., Jeffries, H., Bridge, K., Jaspers, I. 2004. Effects of 1,3-butadiene, isoprene, and their photochemical degradation products on human lung cells. Environmental Health Perspectives, 112, 1488-1495. Drozd, G.T., Donahue, N.M. 2011. Pressure Dependence of Stabilized Criegee Intermediate Formation from a Sequence of Alkenes. Journal of Physical Chemistry A, 115, 4381-4387. Duhl, T.R., Helmig, D., Guenther, A. 2008. Sesquiterpene emissions from vegetation: a review. Biogeosciences, 5, 761-777.
131
Emmerson, K.M., Carslaw, N., Pilling, M.J. 2005a. Urban atmospheric chemistry during the PUMA campaign 2: Radical budgets for OH, HO2 and RO2. Journal of Atmospheric Chemistry, 52, 165-183. Emmerson, K.M., Carslaw, N., Carpenter, L.J., Heard, D.E., Lee, J.D., Pilling, M.J. 2005b. Urban atmospheric chemistry during the PUMA campaign 1: Comparison of modelled OH and HO2 concentrations with measurements. Journal of Atmospheric Chemistry, 52, 143-164. Faloona, I., Tan, D., Brune, W., Hurst, J., Barket, D., Couch, T.L., Shepson, P., Apel, E., Riemer, D., Thornberry, T., Carroll, M.A., Sillman, S., Keeler, G.J., Sagady, J., Hooper, D., Paterson, K. 2001. Nighttime observations of anomalously high levels of hydroxyl radicals above a deciduous forest canopy. Journal of Geophysical Research-Atmospheres, 106, 24315-24333. Finlayson-Pitts, B.J. and Pitts, J.N. 1986. Atmospheric chemistry: fundamentals and experimental techniques, Wiley, New York. Finlayson-Pitts, B.J. and Pitts, J.N. Jr. 2000. Chemistry of the Upper and Lower Atmosphere, Academic Press, San Diego, California, Fortner, E.C., Zhao, J., Zhang, R.Y. 2004. Development of ion drift-chemical ionization mass spectrometry. Analytical Chemistry, 76, 5436-5440. Furutani, H., Akimoto, H. 2002. Development and characterization of a fast measurement system for gas-phase nitric acid with a chemical ionization mass spectrometer in the marine boundary layer. Journal of Geophysical Research – Atmospheres, 107, 4016. Gab, S., Hellpointer, E., Turner, W.V., Korte, F. 1985. Hydroxymethyl hydroperoxide and bis(hydroxymethyl) peroxide from gas-phase ozonolysis of naturally-occurring alkenes. Nature, 316, 535-536. Ghalaieny, M., Bacak, A., McGillen, M., Martin, D., Knights, A.V., O’Doherty, S., Shalcross, D.E., Percival, C.J. 2012. Determination of gas-phase ozonolysis rate coefficients of a number of sesquiterpenes at elevated temperatures using the relative rate method. Physical Chemistry Chemical Physics, 14, 6596-6602. Goldstein, A.H., Galbally, I.E. 2007. Known and unexplored organic constituents in the earth's atmosphere. Environmental Science and Technology, 41, 1514-1521. Greene, C.R., Atkinson, R., 1992. Rate constants for the gas-phase reactions of O3 with a series of alkenes at 296 ± 2 K. International Journal of Chemical Kinetics, 24, 803–811. Greene, C.R., Atkinson, R., 1994. Rate constants for the gas-phase reactions of O3 with a series of cycloalkenes and α-, β-unsaturated ketones at 296 ± 2 K. International Journal of Chemical Kinetics, 26, 37–44.
132
Grimsrud, E.P., Westberg, H.H., Rasmussen, R.A., 1975. Atmospheric reactivity of monoterpene hydrocarbons, NOx photooxidation and ozonolysis. Proceedings of the Symposium on Chemical Kinetics Data Upper Lower Atmosphere, 1, 183–196. Grosjean, D. 1990a. Formic-acid and acetic-acid measurements during the southern-california-air-quality-study. Atmospheric Environment Part A-General Topics, 24, 2699-2702. Grosjean, D. 1990b. Liquid-chromatography analysis of chloride and nitrate with negative ultraviolet detection - ambient levels and relative abundance of gas-phase inorganic and organic-acids in Southern-California. Environmental Science and Technology 24, 77-81. Grosjean, E., Grosjean, D., 1995. Rate constants for the gas-phase reaction of C5–C10 alkenes with ozone. International Journal of Chemical Kinetics, 27, 1045–1054. Grosjean, E., Grosjean, D., 1996. Rate constants for the gas-phase reaction of ozone with 1, 1-disubstituted alkenes. International Journal of Chemical Kinetics, 28, 911–918. Hagg, C., Szabo, I. 1986. New ion-optical devices utilizing oscillatory electric-fields .3. stability of ion motion in a two-dimensional octopole field. International Journal of Mass Spectrometry and Ion Processes, 73, 277-294. Hanke, M., Uecker, J., Reiner, T., Arnold, F. 2002. Atmospheric peroxy radicals: ROXMAS, a new mass-spectrometric methodology for speciated measurements of HO2 and Sigma RO2 and first results. International Journal of Mass Spectrometry, 213, 91-99. Harrison, R.M., Yin, J., Tilling, R.M., Cai, X., Seakins, P.W., Hopkins, J.R., Lansley, D.L., Lewis, A.C., Hunter, M.C., Heard, D.E., Carpenter, L.J., Creasy, D.J., Lee, J.D., Pilling, M.J., Carslaw, N., Emmerson, K.M., Redington, A., Derwent, R.G., Ryall, D., Mills, G., Penkett, S.A. 2006. Measurement and modelling of air pollution and atmospheric chemistry in the UK West Midlands conurbation: Overview of the PUMA Consortium project. Science of the Total Environment, 360, 5-25. Hasson A.S., Ho A.W., Kuwata K.T., Paulson S.E. 2001. Production of stabilized Criegee intermediates and peroxides in the gas phase ozonolysis of alkenes 2. Asymmetric and biogenic alkenes. Journal of Geophysical Research – Atmospheres, 106, 34143-34153. Hatakeyama, S., Kobayashi, H., Akimoto, H. 1984. Gas-phase oxidation of so2 in the ozone olefin reactions. Journal of Physical Chemistry, 88, 4736-4739. Heard, D.E. 2006. Analytical Techniques for Atmospheric Measurment, Blackwell, Oxford, UK, 528pp. Herron, J.T., Martinez, R.I., Huie, R.E. 1982. Kinetics and energetics of the Criegee intermediate in the gas phase. I. The Criegee intermediate in ozone-alkene reactions. International Journal of Chemical Kinetics, 10, 1019-1041.
133
Horie, O., Moortgat, G.K. 1991. Decomposition pathways of the excited Criegee intermediates in the ozonolysis of simple alkenes. Atmospheric Environment, 25A, 1881-1896. Holton, James R.; Curry, Judith A.; Pyle, John A. (2003). Encyclopedia of Atmospheric Sciences, Volumes 1-6. (pp: 2438-2446). Elsevier. Online version available at: http://www.knovel.com/web/portal/browse/display?_EXT_KNOVEL_DISPLAY_bookid=1667&VerticalID=0 Huey, L.G., Dunlea, E.J., Lovejoy, E.R., Hanson, D.R., Norton, R.B., Fehsenfeld, F.C., Howard, C.J. 1998. Fast time response measurements of HNO3 in air with a chemical ionization mass spectrometer. Journal of Geophysical Research – Atmospheres, 103, 3355-3360. Hunton, D.E., Ballenthin, J.O., Borghetti, J.F., Federico, G.S., Miller, T.M., Thorn, W.F., Viggiano, A.A., Anderson, B.E., Cofer, W.R., McDougal, D.S., Wey, C.C. 2000. Chemical ionization mass spectrometric measurements of SO2 emissions from jet engines in flight and test chamber operations. Journal of Geophysical Research – Atmospheres, 105, 26841-26855. Horie, O., Schafer, C., Moortgat, G.K. 1999. High reactivity of hexafluoro acetone toward Criegee intermediates in the gas-phase ozonolysis of simple alkenes. International Journal of Chemical Kinetics, 31, 261-269. Honrath, R. E., Peterson, M. С., Guo, S., Dibb, J. E., Shepson, P. B., & Campbell, B. 1999. Evidence of NOs production within or upon ice particles in the Greenland snowpack. Geophysical Research Letters, 26, 695-698. IPCC. 2007. Climate change 2007: Synthesis report. Contribution of working groups I, II and III to the fourth assessment report of the Intergovernmental Panel on Climate Change. IPCC Fourth Assessment Report (AR4). R. K. a. R. Pachauri, A. Geneva, Switzerland, Intergovernmental Panel on Climate Change. Jenkin, M.E. 1998. Photochemical ozone and PAN creation potentials: rationalisation and methods of estimation. AEAT report 4182/20150/003, issue 1, National Environmental Technology Centre, UK. Jenkin, M.E., Sorensen, M., Hurley, M.D., Wallington, T.J., 2003. Kinetics and product study of the OH- and NO2 initiated oxidation of 2,4-hexadiene in the gas-phase. Journal of Physical Chemistry A, 107, 5743–5754. Jenkin M.E., Watson L.A., Utembe S.R., 2008. A Common Representative Intermediates (CRI) mechanism for VOC degradation. Part 1: Gas phase mechanism development. Atmospheric Environment 42, 7185-7195. Johnson, D., Rickard, A.R., McGill, C.D., Marston, G., 2000. The influence of orbital asymmetry on the kinetics of the gas-phase reaction of ozone with unsaturated compounds. Physical Chemistry Chemical Physics, 2, 323–328.
134
Kan, C.S., Su, F., Calvert, J.G., Shaw, J.H. 1981. Mechanism of the ozone-ethene reaction in dilute N2/O2 mixtures near 1-atm pressure. Journal of Physical Chemistry, 85, 2359-2363. Kavouras, I.G., Mihalopoulos, N., Stephanou, E.G. 1998. Formation of atmospheric particles from organic acids produced by forests. Nature, 395, 683-686. Kawamura, K., Ng, L.L., Kaplan, I.R. 1985. Determination of organic-acids (C1-C10) in the atmosphere, motor exhausts, and engine oils. Environmental Science and Technology, 19, 1082-1086. Khamaganov, V.G., Hites, R.A., 2001. Rate constants for the gas-phase reactions of ozone with isoprene,a- and b-pinene, and limonene as a function of temperature. Journal of Physical Chemistry A, 105, 815–822. Kim, D., Stevens, P.S., Hites, R.A. 2011. Rate Constants for the Gas-Phase Reactions of OH and O-3 with beta-Ocimene, beta-Myrcene, and alpha- and beta-Farnesene as a Function of Temperature. Journal of Physical Chemistry A, 115, 500-506. Kind, I., Berndt, T., Boge, O., 1998. Gas-phase rate constants for the reaction of NO3 radicals with a series of cyclic alkenes, 2-ethyl-1-butene and 2,3-dimethyl-1,3-butadiene. Chemical Physics Letters, 288, 111–118. Kourtchev, I., Bejan, I., Sodeau, J. R., Wenger, J. C. 2009. Gas-phase reaction of (E)-beta-farnesene with ozone: Rate coefficient and carbonyl products. Atmospheric Environment, 43, 3182-3190. Kroll J.H., Clarke J.S., Donahue N.M., Anderson J.G., Demerjian K.L., 2001. Mechanism of HOx formation in the gas-phase ozone-alkene reaction. 1. Direct, pressure-dependent measurements of prompt OH yields. Journal of Physical Chemistry A 105, 1554-1560. Lancar, I.T., Daele, V., LeBras, G., Poulet, G., 1991. Etude de la reactivite´ des radicaux, NO3 avec le dimethyl-2,3 butene-2, le butadiene-1,3 et le dimethyl-2,3 butadiene-1,3. J. Chim. Phys., 88, 1777–1792. Le Breton M., McGillen M.R., Muller J.B.A., Bacak A., Shallcross D.E., Xiao P., Huey L.G., Tanner D., Coe H., Percival C.J., 2012. Airborne observations of formic acid using a chemical ionisation mass spectrometer. Atmospheric Measurement Techniques Discussion 4, 5807-5835. Leather K.E., McGillen M.R., Cooke M.C., Utembe S.R., Archibald A.T., Jenkin M.E., Derwent R.G., Shallcross D.E., Percival C.J., 2012. Acid-yield measurements of the gas-phase ozonolysis of ethene as a function of humidity using chemical ionisation mass spectrometry (CIMS). Atmospheric Chemistry and Physics 12, 469-479. Leibrock, E., Huey, L.G. 2000. Ion chemistry for the detection of isoprene and other volatile organic compounds in ambient air. Geophysical Research Letters, 27, 1719-1722.
135
Leibrock, E., Huey, L.G., Goldan, P.D., Kuster, W.C., Williams, E., Fehsenfeld, F.C. 2003. Ground-based intercomparison of two isoprene measurement techniques. Atmospheric Chemistry and Physics, 3, 67-72. Lewin, A.G., Johnson, D., Price, D.W., Marston, G., 2001. Aspects of the kinetics and mechanism of the gas-phase reactions of ozone with conjugated dienes. Physical Chemistry Chemical Physics, 3, 1253–1261. Loza, C.L., Chan, A.W.H., Galloway, M.M., Keutsch, F.N., Flagan, R.C., Seinfeld, J.H. 2010. Characterization of Vapor Wall Loss in Laboratory Chambers. Environmental Science and Technology, 44, 5074-5078. Marcy, T.P., Gao, R.S., Northway, M.J., Popp, P.J., Stark, H., Fahey, D.W. 2005. Using chemical ionization mass spectrometry for detection of HNO3, HOl, and CIONO2 in the atmosphere. International Journal of Mass Spectrometry, 243, 63-70. Martinez R.I., Herron J.T., 1981. Gas-phase reaction of SO2 with a Criegee intermediate in the presence of water-vapor. Journal of Environmental Science and Health Part A – Environmental Science and Engineering and Toxic and Hazardous Substance Control 16, 623-636. Martinez, E., Cabanas, B., Aranda, A., Albaladejo, J., Wayne, R.P., 1997. Absolute rate coefficients for the reaction of NO3 with pent-1-ene and hex-1-ene at T= 298 to 433 K determined using LIF detection. Journal of the Chemical Society Faraday Transactions, 93, 2043–2047. Martinez, E., Cabanas, B., Aranda, A., Martin, P., Salgado, S., 1999. Absolute rate coefficients for the gas-phase reactions of NO3 radical with a series of monoterpenes at T= 298 to 433 K. Journal of Atmospheric Chemistry, 33, 265–282. Mason, S.A., Arey, J., Atkinson, R. 2009. Rate constants for the gas-phase reactions of NO3 Radicals and O3 with C6-C14 1-Alkenes and 2-Methyl-1-alkenes at 296 +/- 2 K. Journal of Physical Chemistry A, 113, 5649-5656. Matsunaga, A., Ziemann, P.J. 2010. Gas-Wall Partitioning of Organic Compounds in a Teflon Film Chamber and Potential Effects on Reaction Product and Aerosol Yield Measurements. Aerosol Science and Technology, 44, 881-892. Mauldin, R.L., Tanner, D.J., Eisele, F.L. 1998. A new chemical ionization mass spectrometer technique for the fast measurement of gas phase nitric acid in the atmosphere. Journal of Geophysical Research – Atmospheres, 103, 3361-3367. Mauldin, R.L., Eisele, F.L., Tanner, D.J., Kosciuch, E., Shetter, R., Lefer, B., Hall, S.R., Nowak, J.B., Buhr, M., Chen, G., Wang, P., Davis, D. 2001. Measurements of OH, H2SO4, and MSA at the South Pole during ISCAT. Geophysical Research Letters, 28, 3629-3632. McGillen, M.R., Crosier, J., Percival, C.J., Sanchez-Reyna, G., Shallcross, D.E. 2006. Can topological indices be used to predict gas-phase rate coefficients of importance to
136
tropospheric chemistry ? Reactions of alkenes with OH, NO3 and O3. Chemosphere, 65, 2035-2044. McGillen, M.R., Carey, T.J., Archibald, A.T., Wenger, J.C., Shallcross, D.E., Percival, C.J. 2008. Structure-activity relationship (SAR) for the gas-phase ozonolysis of aliphatic alkenes and dialkenes. Physical Chemistry Chemical Physics, 10, 1757-1768. McGillen M.R., Ghalaieny M., Percival C.J. 2011. Determination of gas-phase ozonolysis rate coefficients of C(8-14) terminal alkenes at elevated temperatures using the relative rate method. Physical Chemistry Chemical Physics, 13, 10965-10969. Milford J.B., Gao D., Sillman S., Blossey P., and Russell A.G. 1994. Total reactive nitrogen (NOy) as an indicator of the sensitivity of ozone to reductions in hydrocarbon and NOx emissions. Journal of Geophysical Research, 99, 3533-3542. Miller, T.M., Ballenthin, J.O., Meads, R.F., Hunton, D.E., Thorn, W.F., Viggiano, A.A., Kondo, Y., Koike, M. Zhao, Y.J. 2000. Chemical ionization mass spectrometer technique for the measurement of HNO3 in air traffic corridors in the upper troposphere during the SONEX campaign. Journal of Geophysical Research – Atmospheres, 105, 3701-3707. Monks, P.S., Granier, C., Fuzzi, S., Stohl, A., Williams, M.L., Akimoto, H., Amann, M., Baklanov, A., Baltensperger, U. Bey, I. et al. 2009. Atmospheric composition change - global and regional air quality. Atmospheric Environment, 43, 5268-5350. Morgan, W.T., Allan, J.D., Bower, K.N., Highwood, E.J., Liu, D., McMeeking, G.R., Northway, M.J., Williams, P.I., Krejci, R., Coe, H. 2010. Airborne measurements of the spatial distribution of aerosol chemical composition across Europe and evolution of the organic fraction. Atmospheric Chemistry and Physics, 10, 4065-4083. Neeb, P., Horie, O., Moortgat, G.K. 1996. Gas-phase ozonolysis of ethene in the presence of hydroxylic compounds. International Journal of Chemical Kinetics, 28, 721-730. Neeb P., Sauer F., Horie O., Moortgat G.K., 1997. Formation of hydroxymethyl hydroperoxide and formic acid in alkene ozonolysis in the presence of water vapour. Atmospheric Environment 31, 1417-1423. Neeb, P., Horie, O., Moortgat, G.K. 1998. The ethen-ozone reaction in the gas-phase. Journal of Physical Chemistry A, 102, 6778-6785. Neeb, P., Moortgat, G.K. 1999. Formation of OH radicals in the gas-phase reaction of propene, isobutene, and isoprene with O3: yields and mechanistic implications. Journal of Physical Chemistry A, 103, 9003-9012. Neuman, J.A., Gao, R.S., Schein, M.E., Ciciora, S.J., Holecek, J.C., Thompson, T.L., Winkler, R.H., McLaughlin, R.J., Northway, M.J., Richard, E.C., Fahey, D.W. 2000. A fast-response chemical ionization mass spectrometer for in situ measurements of
137
HNO3 in the upper troposphere and lower stratosphere. Review of Scientific Instruments, 71, 3886-3894. Neuman, J.A., Huey, L.G., Dissly, R.W., Fehsenfeld, F.C., Flocke, F., Holecek, J.C., Holloway, J.S., Hubler, G., Jakoubek, R., Nicks, D.K., Parrish, D.D., Ryerson, T.B., Sueper, D.T., Weinheimer, A.J. 2002. Fast-response airborne in situ measurements of HNO3 during the Texas 2000 Air Quality Study. Journal of Geophysical Research – Atmospheres, 107, 4436. Neuman, J.A., Parrish, D.D., Trainer, M., Ryerson, T.B., Holloway, J.S., Nowak, J.B., Swanson, A., Flocke, F., Roberts, J.M., Brown, S.S., Stark, H., Sommariva, R., Stohl, A., Peltier, R., Weber, R., Wollny, A.G., Sueper, D.T., Hubler, G., Fehsenfeld, F.C. 2006. Reactive nitrogen transport and photochemistry in urban plumes over the North Atlantic Ocean. Journal of Geophysical Research – Atmospheres, 111, D23S54. Nielsen, O.J., Jorgensen, O., Donlon, M., Sidebottom, H.W., O’Farrell, D.J., Treacy, J., 1990. Rate constants for the gas-phase reactions of OH radicals with nitroethene, 3-nitropropene and 1-nitrocyclohexene at 298 K and 1 atm. Chemical Physics Letters, 168, 319–323. Niki, H., Maker, P.D., Savage, C.M., Breitenbach, L.P. 1981. A FTIR study of a transitory product in the gas-phase of zoone-ethylene reaction. Journal of Physical Chemistry, 85, 1024-1027. Nowak, J.B., Huey, L.G., Russell, A.G., Tian, D., Neuman, J.A., Orsini, D., Sjostedt, S.J., Sullivan, A.P., Tanner, D.J., Weber, R.J., Nenes, A., Edgerton, E., Fehsenfeld, F.C. 2006. Analysis of urban gas phase ammonia measurements from the 2002 Atlanta Aerosol Nucleation and Real-Time Characterization Experiment (ANARChE). Journal of Geophysical Research – Atmospheres, 111, D17308. Nowak, J.B., Neuman, J.A., Bahreini, R., Brock, C.A., Middlebrook, A.M., Wollny, A.G., Holloway, J.S., Peischl, J., Ryerson, T.B., Fehsenfeld, F.C. 2010. Airborne observations of ammonia and ammonium nitrate formation over Houston, Texas. Journal of Geophysical Research – Atmospheres, 115, D22304. O'Dowd, C.D., Aalto, P., Hameri, K., Kulmala, M., Hoffmann, T. 2002. Aerosol formation - Atmospheric particles from organic vapours. Nature, 416, 497-498. O’Rji, L.N., Stone, D.A., 1992. Relative rate constant measurements for the gas-phase reactions of hydroxyl radicals with 4-methyl-2-penta-none,trans-4-octene, and trans-4-octene, and trans-2-heptene. International Journal of Chemical Kinetics, 24, 703–710. Ohta, T., 1983. Rate constants for the reactions of diolefins with OH radicals in the gas-phase. Estimate of the rate constants from those for monoolefins. Journal of Physical Chemistry, 87, 1209–1213. Ohta, T., 1984. Rate constants for the reactions of OH radicals with alkyl substituted olefins. International Journal of Chemical Kinetics, 16, 879–886.
138
Olivier, J.G.J, Bouwman, A.F., Van der Hoek, K.W., Berdowski, J.J.M. 1998. Global air emission inventories for anthropogenic sources of NOx, NH3 and N2O in 1990. Environmental Pollution, 102, 135-148. Paulot F., Wunch D., Crounse J.D., Toon G.C., Millet D.B., DeCarlo P.F., Vigouroux C., Deutscher N.M., Abad G.G., Notholt J., Warneke T., Hannigan J.W., Warneke C., de Gouw J.A., Dunlea E.J., De Maziere M., Griffith D.W.T., Bernath P., Jimenez J.L., Wennberg P.O., 2011. Importance of secondary sources in the atmospheric budgets of formic and acetic acids. Atmospheric Chemistry and Physics 11, 1989-2013. Paulson, S.E., Orlando, J.J. 1996. The reactions of ozone with alkenes: An important source of HOx in the boundary layer. Geophysical Research Letters, 23, 3727-3730. Paulson S.E., Chung M., Sen A.D., Orzechowska G., 1998. Measurement of OH radical formation from the reaction of ozone with several biogenic alkenes. Journal of Geophysical Research – Atmospheres 103, 25533-25539 Peeters, J., Muller, J.F. 2010. HOx radical regeneration in isoprene oxidation via peroxy radical isomerisations. II: experimental evidence and global impact. Physical Chemistry Chemical Physics, 12, 14227-14235. Pfrang, C., Martin, R.S., Nalty, A., Waring, R., Canosa-Mas, C.E., Wayne, R.P., 2005. Gas-phase rate coefficients for the reactions of nitrate radicals with (Z)-pent-2-ene, (E)-pent-2-ene, (Z)-hex-2-ene, (E)-hex-2-ene, (Z)-hex-3-ene, (E)-hex-3-ene and (E)-3-methylpent-2-ene at room temperature. Physical Chemistry Chemical Physics, 7, 2506–2512. Pollmann, J., Ortega, J., Helming, D. 2005. Analysis of atmospheric sesquiterpenes: Sampling losses and mitigation of ozone interferences. Environmental Science and Technology, 39, 9620-9629. Prinn, R. 2002. The cleansing capacity of the atmosphere. Annual Review of Environment and Resources, 28, 29-57. Razavi, A., Karagulian, F., Clarisse, L., Hurtmans, D., Coheur, P.F., Clerbaux, C., Muller, J.F., Stavrakou, T. 2011. Global distributions of methanol and formic acid retrieved for the first time from the IASI/MetOp thermal infrared sounder. Atmospheric Chemistry and Physics, 11, 857-872. Rickard A.R., Johnson D., McGill C.D., Marston G., 1999. OH yields in the gas-phase reactions of ozone with alkenes. Journal of Physical Chemistry A 103, 7656-7664. Rogers, J.D., 1989. Rate constant measurements for the reaction of the hydroxyl radical with cyclohexene, cyclopentene, and glutaraldehyde. Environmental Science and Technology, 23, 177–181. Schafer C., Horie O., Crowley J.N., Moortgat G.K., 1997. Is the hydroxyl radical formed in the gas-phase ozonolysis of alkenes? Geophysical Research Letters 24, 1611-1614.
139
Sellegri, K., Umann, B., Hanke, M., Arnold, F. 2005. Deployment of a ground-based CIMS apparatus for the detection of organic gases in the boreal forest during the QUEST campaign. Atmospheric Chemistry and Physics, 5, 357-372. Shorees, B., Atkinson, R., Arey, J., 1991. Kinetics of the gas-phase reactions of β-phellandrene with OH and NO3 radicals and O3 at 297 ± 2 K. International Journal of Chemical Kinetics, 23, 897–906. Shu, Y.G., Atkinson, R. 1994. Rate constants for the gas-phase reactions of O3 with a series of terpenes and OH radical formation from the O3 reactions with sesquiterpenes at 296 +/- 2 K. International Journal of Chemical Kinetics, 26, 1193-1205. Sillman, S. 1995. The use of NOy, H2O2, and HNO3 as indicators for ozone-NOx-hydrocarbon sensitivity in urban locations. Journal of Geophysical Research, 100, 14175-14188. Sillman, S. 1999. The relation between ozone, NOx and hydrocarbons in urban and polluted rural environments. Millenial Review series, Atmos. Environ., 33, 12, 1821-1845. Sillman, S., He, D.Y. 2002. Some theoretical results concerning O3-NOx-VOC chemistry and NOx-VOC indicators. Journal of Geophysical Research-Atmospheres, 107, 4659. Sillman, S., West, J.J. 2009. Reactive nitrogen in Mexico City and its relation to ozone-precursor sensitivity: results from photochemical models. Atmospheric Chemistry and Physics, 9, 3477-3489. Slusher, D.L., Pitteri, S.J., Haman, B.J., Tanner, D.J., Huey, L.G. 2001. A chemical ionization technique for measurement of pernitric acid in the upper troposphere and the polar boundary layer. Geophysical Research Letters, 28, 3875-3878. Slusher D.L., Huey L.G., Tanner D.J., Flocke F.M., Roberts J.M. 2004. A thermal dissociation-chemical ionization mass spectrometry (TD-CIMS) technique for the simultaneous measurement of peroxyacyl nitrates and dinitrogen pentoxide. Journal of Geophysical Research-Atmospheres, 109, D19315. Stavrakou T., Muller J.F., Peeters J., Razavi A., Clarisse L., Clerbaux C., Coheur P.F., Hurtmans D., De Maziere M., Vigouroux C., Deutscher N.M., Griffith D.W.T., Jones N., Paton-Walsh C., 2012. Satellite evidence for a large source of formic acid from boreal and tropical forests. Nature Geoscience 5, 26-30. Su, F., Calvert, J.G., Shaw, J.H. 1980. A FTIR spectroscopic study of the ozone-ethene reaction mechanism in O2-rich mixtures. Journal of Physical Chemistry, 84, 239-246. Sun, X.M., Bai, J., Zhao, Y.Y., Zhang, C.X., Wang, Y.D., Hu, J.T. 2011. Chemical mechanism and kinetics study on the ocimene ozonolysis reaction in atmosphere. Atmospheric Environment, 45, 6197-6203.
140
Sutton, M.A., Dragosits, U., Tang, Y.S., Fowler, D. 2000. Ammonia emissions from non-agricultural sources in the UK. Atmospheric Environment, 34, 855-869. Sutton, M.A., Howard, C.M., Erisman, J.W., Billen, G., Bleeker, A., Grennfelt, P., van Grinsven, H., Grizzetti, B. 2011. The European Nitrogen Assessment: Sources, Effects and Policy Perspectives, Cambridge University Press, Cambridge, UK, 612pp. (Also available online http://www.nine-esf.org/ENA) Taatjes C.A., Meloni G., Selby T.M., Trevitt A.J., Osborn D.L., Percival C.J., Shallcross D.E. 2008. Direct observation of the gas-phase Criegee intermediate (CH2OO). Journal of the American Chemical Society, 130, 11883-11885. Taatjes, C.A., Welz, O., Eskola, A., Savee, J.D. Ozborn, D.L., Lee, E.P.F., Dyke, J.M., Mok, D. K.W., Shallcross, D.E. and Percival, C.J. 2012. Direct Measurement of Criegee Intermediate (CH2OO) Reactions with Acetone, Acetaldehyde, and Hexafluoroacetone, Physical Chemistry Chemical Physics, Advance Article. Tanner, D.J., Jefferson, A., Eisele, F.L. 1997. Selected ion chemical ionization mass spectrometric measurement of OH. Journal of Geophysical Research – Atmospheres, 102, 6415-6425. Treacy, J., El Hag, M., O’Farrel, D., Sidebottom, H. 1992. Reactions of ozone with unsaturated organic compounds. Ber Bunsenges. Phys. Chem., 96, 422-427. Treacy, J., Curley, M., Wenger, J., Sidebottom, H., 1997. Determination of Arrhenius parameters for the reactions of ozone with cycloalkenes. Journal of the Chemical Society Faraday Transactions, 93, 2877–2881. Utembe S.R., Cooke M.C., Archibald A.T. Jenkin M.E., Derwent R.G., Shallcross D.E., 2010. Using a reduced Common Representative Intermediates (CRIv2-R5) mechanism to simulate tropospheric ozone in a 3-D Lagrangian chemistry transport model. Atmospheric Environment 44, 1609-1622. Vakhtin, A.B., Murphy, J.E., Leone, S.R., 2003. Low-temperature kinetics of reactions of OH radical with ethene, propene, and 1-butene. Journal of Physical Chemistrt A, 107, 10055–10062. von Bobrutzki, K., Braban, C.F., Famulari, D., Jones, S.K., Blackall, T., Smith, T.E.L., Blom, M., Coe, H., Gallagher, M., Ghalaieny, M., McGillen, M.R., Percival, C.J., Whitehead, J.D., Ellis, R., Murphy, J., Mohacsi, A., Pogany, A., Junninen, H., Rantanen, S., Sutton, M.A., Nemitz, E. 2010. Field inter-comparison of eleven atmospheric ammonia measurement techniques. Atmospheric Measurement Techniques, 3, 91-112. Veres, P.R., Roberts, J.M., Cochran, A.K., Gilman, J.B., Kuster, W.C., Holloway, J.S., Graus, M., Flynn, J., Lefer, B., Warneke, C., de Gouw, J. 2011. Evidence of rapid production of organic acids in an urban air mass. Geophysical Research Letters, 38, L17807.
141
Welz O., Savee J.D., Osborn D.L., Vasu S., Percival C.J., Shallcross D.E., Taatjes C.A., 2012. Reaction of CH2I with O2 forms Criegee intermediate: direct measurements of CH2OO kinetics. Science 335, 204-207. Winterhalter, R., Herrmann, F., Kanawati, B., Nguyen, T.L., Peeters, J., Vereecken, L., Moortgat, G.K. 2009. The gas-phase ozonolysis of beta-caryophyllene (C15H24). Part I: an experimental study. Physical Chemistry Chemical Physics, 11, 4152-4172. Zhang, D., Wenfang, L., Zhang, R. 2002. Mechanism of OH formation from ozonolysis of isoprene: kinetics and product yields. Chemical Physics Letters, 358, 171-179. Zhang R.Y., Suh I., Zhao J., Zhang D., Fortner E.C., Tie X.X., Molina L.T., Molina M.J. 2004. Atmospheric new particle formation enhanced by organic acids. Science, 304, 1487-1490.