Extracellular Enzyme Stoichiometry Reveals Soil Microbial ...
ABSTRACT
Parameters such as temperature, pH and substrate concentration,
were put to test on the activity of Amylase enzyme to hydrolyze
starch to produce glucose and the reaction time was also taken.
2% starch solution was added with amylase enzyme along with
citrate-phosphate buffer (pH7). The solution was used as the
basis for all experiments regarding different parameters to be
tested. The Amylase activity is quantified by taking the
absorbance value for each sample is taken at 540 nm and graph of
amylase activity versus pH, temperature and substrate
concentration were plotted. In order to obtain the glucose
concentration in reference to a previously prepared glucose
concentration calibration curve the reactions at different
parameters were measured according to the optical density (OD) of
the solution. It was found out that the functions optimally at
temperature and pH of 40℃ and 9 respectively. Starch was used as
the substrate medium and the enzyme was found to be increasingly
active as the substrate concentration increased accordingly.
INTRODUCTION
Enzyme kinetics represents the study of the rate at which an
enzyme works usually as a function of the enzyme parameter
available to the enzyme. Enzymes are protein catalysts that, like
all catalysts, speed up the rate of a chemical reaction without
being used up in the process. They achieve their effect by
temporarily binding to the substrate and, in doing so, lowering
1
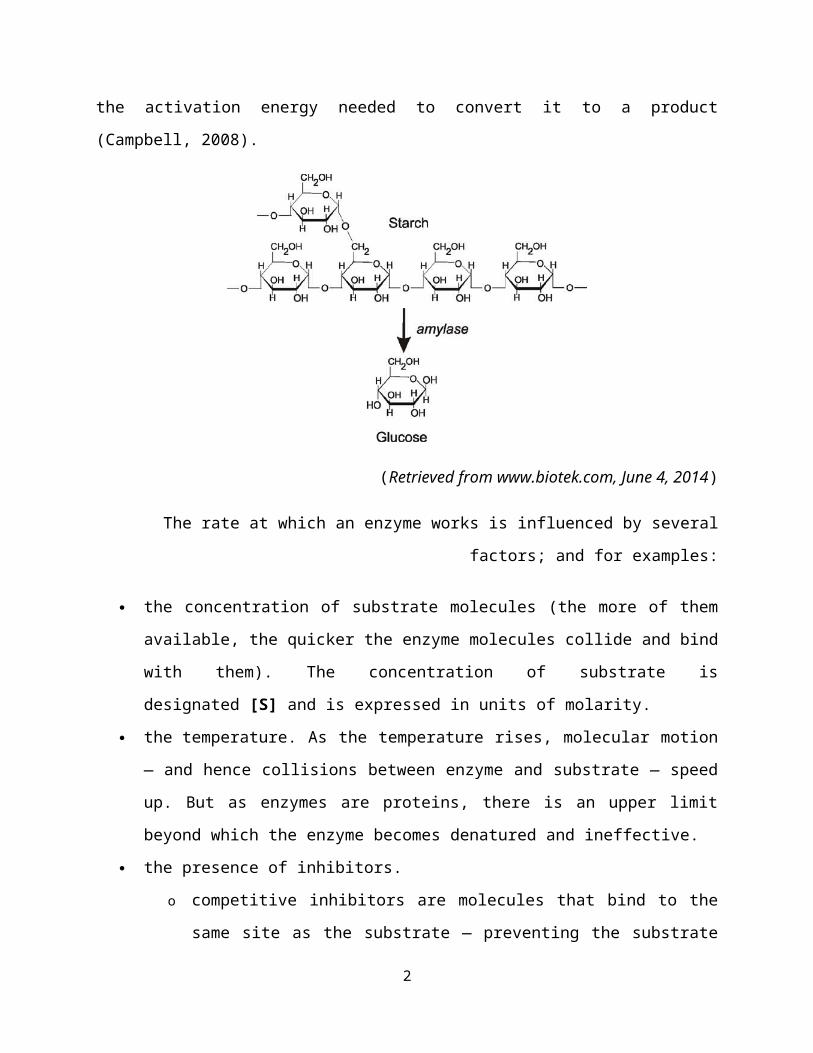
the activation energy needed to convert it to a product
(Campbell, 2008).
(Retrieved from www.biotek.com, June 4, 2014)
The rate at which an enzyme works is influenced by several
factors; and for examples:
the concentration of substrate molecules (the more of them
available, the quicker the enzyme molecules collide and bind
with them). The concentration of substrate is
designated [S] and is expressed in units of molarity.
the temperature. As the temperature rises, molecular motion
— and hence collisions between enzyme and substrate — speed
up. But as enzymes are proteins, there is an upper limit
beyond which the enzyme becomes denatured and ineffective.
the presence of inhibitors.
o competitive inhibitors are molecules that bind to the
same site as the substrate — preventing the substrate
2
from binding as they do so — but are not changed by the
enzyme.
o noncompetitive inhibitors are molecules that bind to
some other site on the enzyme reducing its catalytic
power.
pH. The conformation of a protein is influenced by pH and as
enzyme activity is crucially dependent on its conformation,
its activity is likewise affected.
Enzyme amylase according to Singh & Kayastha (2014), is a
metalloenzyme belonging to the glycosyl hydrolase family and
functions primarily in catalysing the endohydrolysis of starch
molecules into a range of shorter chains of polymers or monomoers
such as glucose, maltose and maltodextrins. Amylase occurs in
mammalian saliva and small intestines and is found in the
intestinal tract of most animals. It can also be found in plants
where its presence acts as a defense mechanism which not only
degrade stored starch and in some bacteria and fungi that attack
plants (Adams and Kelly, 1995).
Amylase is very sensitive towards the changes in their
environment giving rise to vulnerability and instability. They
require a specific environment in order for them to function
optimally. Slightly changes in pH or temperature can halt the
enzyme functionality due to shape changing occurring within the
enzyme molecule itself (Robert K. Scopes, 2002). Thus scientists
3

are constantly trying to improve the functionality of the amylase
through studies and research to optimize processes.
OBJECTIVES
To determine the effect of temperature on enzymatic activity
and changes in enzyme concentration of an enzyme-catalyzed
reaction.
To describe the relationship between substrate concentration
and the maximum velocity of an enzyme.
To estimate the Michaelis-Menten parameters, effect of pH
and temperature on enzyme activity and kinetics of
inhibition.
THEORY
As we all know enzymes are protein molecules composed of
small chains of amino acids and are manufactured by the living
cell. These molecules provide energy for the organism by
catalyzing various biochemical reactions. If enzymes were not
present in cells, most of the chemical reactions would not be
able to take place at measurable rates and at the temperatures of
living systems. Each enzyme has at least a single active site
which is the location where the enzyme binds to the substrate. In
this way the substrate is held rigidly in the most favorable
orientation. Within the active site there are various chemical
groups that are involved in the reaction. It is important to
4

remember that enzymatic reactions usually result in the addition
or removal of some molecule or radical such as H2O, -OH, -H, -NH2
, etc.
Each enzyme possesses a pH and a temperature optimum for its
activity. This optimum pH and temperature can be easily
determined in the laboratory by carrying out the reaction in
buffers over a wide range of pH or conducting tests at different
temperatures. Enzymes demonstrate a rather high degree of
specificity with respect to their substrates. The degree of
specificity varies from enzyme to enzyme: some enzymes carry out
a reaction in only one direction (e.g., dehydrogenation) but some
will catalyze a reaction in both forward and reverse directions
although usually at greatly different rates (e.g., hydrogenation
in addition to dehydrogenation). Some enzymes will accept only
one or two specific substrate molecules; others accept whole
classes or subclasses of molecules as substrates. This
specificity is the basis for enzyme nomenclature: according to
the kind of reaction performed (e.g., hydrogenase) or, even more
specifically, according to the substrate acted upon (e.g.,
succinic dehydrogenase).
The simplest possible case of an enzyme (E)-catalyzed
reaction involves a single substrate (S) molecule giving rise to
one product (P):
5
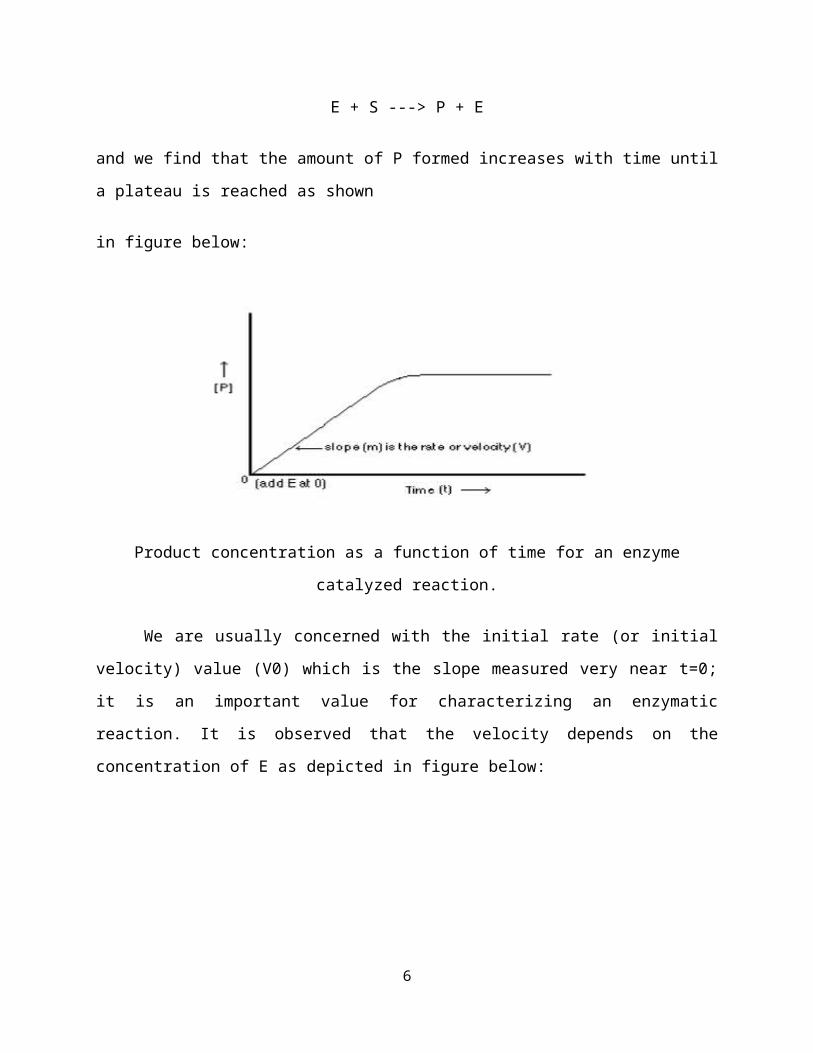
E + S ---> P + E
and we find that the amount of P formed increases with time until
a plateau is reached as shown
in figure below:
Product concentration as a function of time for an enzyme
catalyzed reaction.
We are usually concerned with the initial rate (or initial
velocity) value (V0) which is the slope measured very near t=0;
it is an important value for characterizing an enzymatic
reaction. It is observed that the velocity depends on the
concentration of E as depicted in figure below:
6
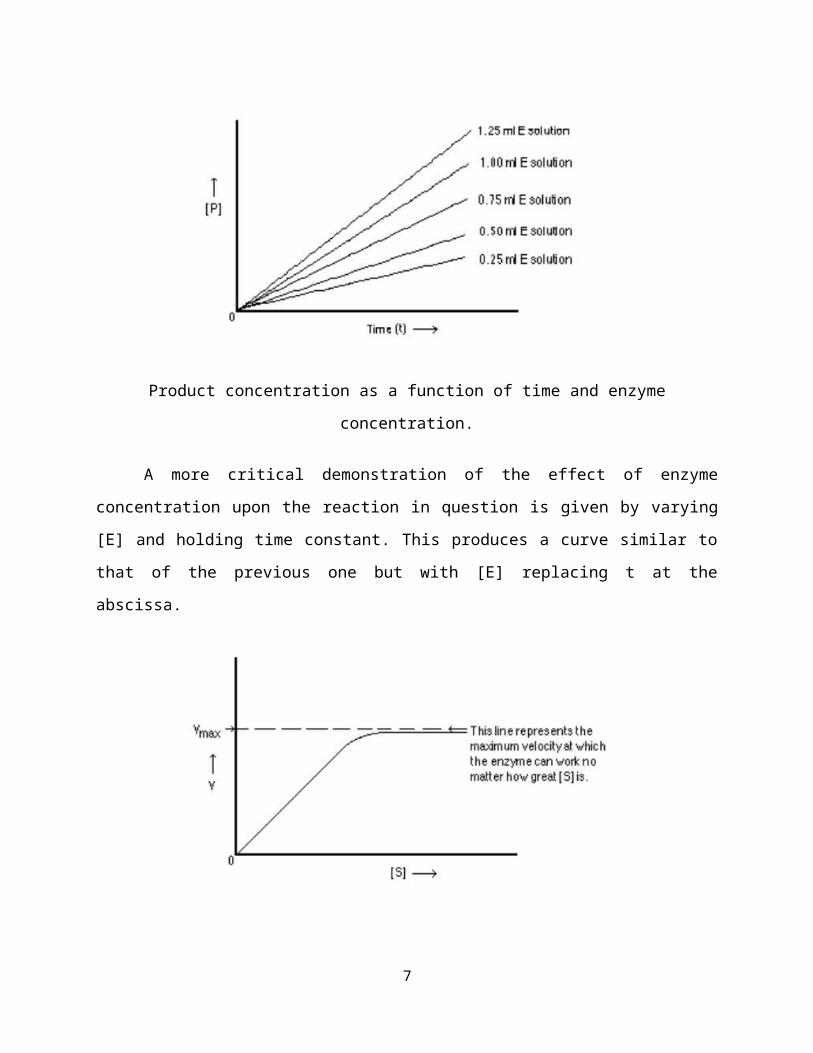
Product concentration as a function of time and enzyme
concentration.
A more critical demonstration of the effect of enzyme
concentration upon the reaction in question is given by varying
[E] and holding time constant. This produces a curve similar to
that of the previous one but with [E] replacing t at the
abscissa.
7

The latest graph shows what happens when [E] is held
constant and [S] is varied. Here we will obtain a curve. In this
graph, the rate of product formation is called the velocity of
the reaction. Notice how the velocity ( O.D. measured by a
spectrophotometer) reaches a maximum as substrate concentration
reaches a saturation level. Doubling [E], under certain
conditions, doubles Vmax, but the reaction rate always reaches a
plateau at high [S].
MATERIALS AND APPARATUS
MaterialsDNS ReagentSoluble starchAmylase enzyme powderGlucose powderDistilled waterBuffers
ApparatusTest tubes Water bath Beaker Measuring cylinder Micro pipette Cuvette
8

Vortex mixerSpectrophotometerHotplate
PROCEDURE
I. Glucose Standard Curve Preparation.
1. Different concentrations of glucose solution (ranging from 1
to 10 g/L)
were prepared.
2. 1 ml of glucose solution of each concentration were added
into individual
test tubes, and they were labeled according to their
concentrations.
3. 1 ml of DNS reagent was added into each test tube and mixed
for a few
seconds with a vortex mixer.
4. All the tubes were placed in a water bath ( at T= 100°C) for
10 min and
left to cool at room temperature.
9
5. The absorbance of the sample was taken at a wavelength of
540 nm.
6. The standard curve of absorbance vs glucose concentration
was plotted.
II. Demonstration of Enzyme Activity
1. After 10 minutes of reaction time, 4ml of DNS reagent was
added to each
of the test tubes to stop the enzyme reaction.
2. The test tubes were boiled for 10 minutes and then left to
cool to room
temperature.
3. The absorbance value for each sample was measured at 540 nm
and recorded.
III. Preparation of Starch Solution
1. 4g of soluble starch was mixed with 200 ml of distilled
water.
2. The solution was stirred until well-mixed, then 100 ml of
boiling water
was added to the mixture.
3. The solution was filled with distilled water up to the 200
ml mark, and
mixed well.
IV. Effect of pH on the activity and stability of amylase enzyme
10
1. 5 test tubes were labeled with pH 4, 5, 6, 8 and 9. 1 ml of
2% starch solution
was added to each test tube.
2. 1 ml of each of the corresponding buffers were added into
the test tubes.
3. Another 5 test tubes were filled with 2 ml of amylase
solution.
4. All 10 test tubes were placed in a 37°C water bath for 5
minutes to allow
the temperature to equilibrate.
5. The contents in the test tube containing the amylase
solution were poured
into the test tubes containing the pH solution. It was then
mixed with a
vortex mixer.
6. The tubes were placed in the water bath for another 10
minutes (for hydrolysis
reaction to occur).
7. Absorbance was measured using method stated in section II.
8. A graph of optical density vs pH was plotted.
V. Effect of temperature on the activity and stability of amylase
enzyme
1. 1 test tube was labeled with 30°C and 1 ml of a mixture of
2% starch solution
and pH 7 buffer was added to the test tube.
11

2. 2 ml of amylase solution was added to another test tube.
3. Both test tubes were placed into 30°C water bath for 5
minutes to allowing
the temperature to equilibrate.
4. The contents in the test tube containing amylase solution
was poured into
the test tube containing the buffer and starch solution.
It was mixed with
the vortex mixer.
5. The tubes were placed in the same temperature water bath
for another 10
minutes (for hydrolysis reaction to occur).
6. The OD was determined using the method stated in section
II.
7. Steps 1 to 6 were repeated for temperatures ranging from 40
– 70°C.
8. A graph of OD vs temperature was plotted.
VI. Effect of substrate concentration on the activity of amylase
enzyme
1. Starch solutions of concentrations 0.5, 1.5, 2.0 and 2.5 %
(w/v) were prepared
for use as the substrate.
2. Each test tube was labeled accordingly and 1 ml of starch
solution of the
12
corresponding concentrations were added to the tubes
respectively.
3. 1 ml of pH 7 buffer was added to each of the tubes.
4. 2 ml of amylase solution was added into another 4
individual test tubes.
5. All test tubes were placed into a 37°C water bath for 5
minutes to allow
the temperature to equilibrate.
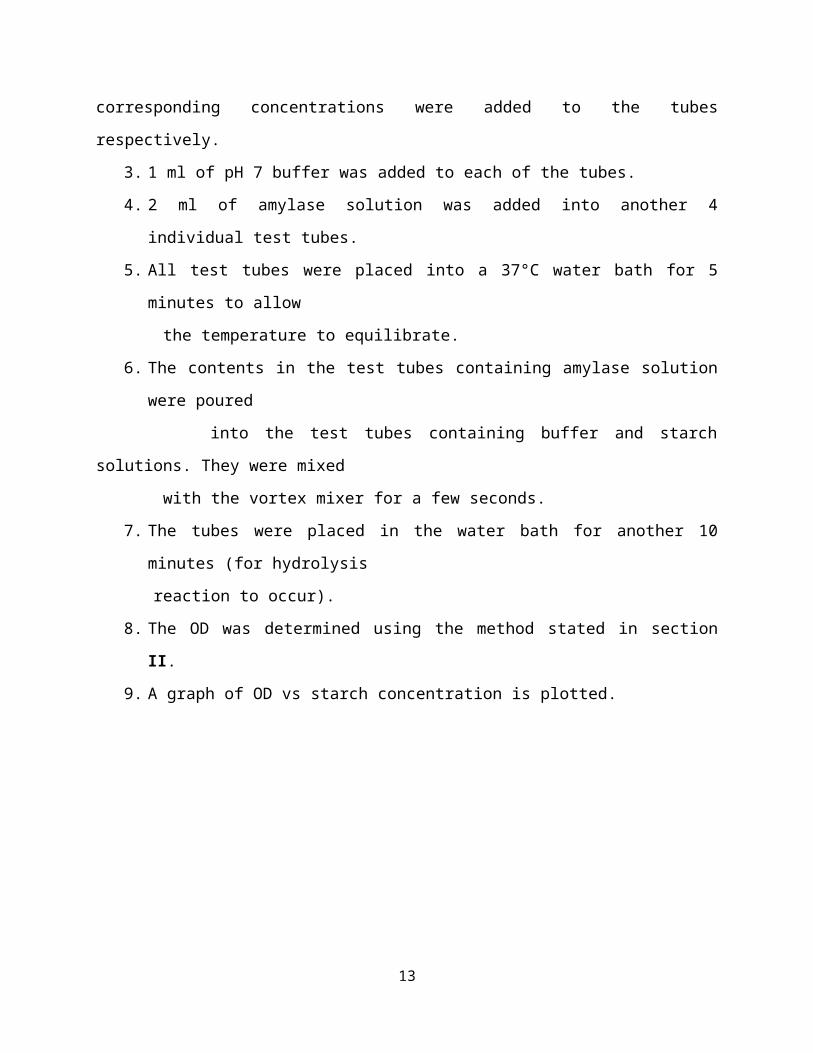
6. The contents in the test tubes containing amylase solution
were poured
into the test tubes containing buffer and starch
solutions. They were mixed
with the vortex mixer for a few seconds.
7. The tubes were placed in the water bath for another 10
minutes (for hydrolysis
reaction to occur).
8. The OD was determined using the method stated in section
II.
9. A graph of OD vs starch concentration is plotted.
13
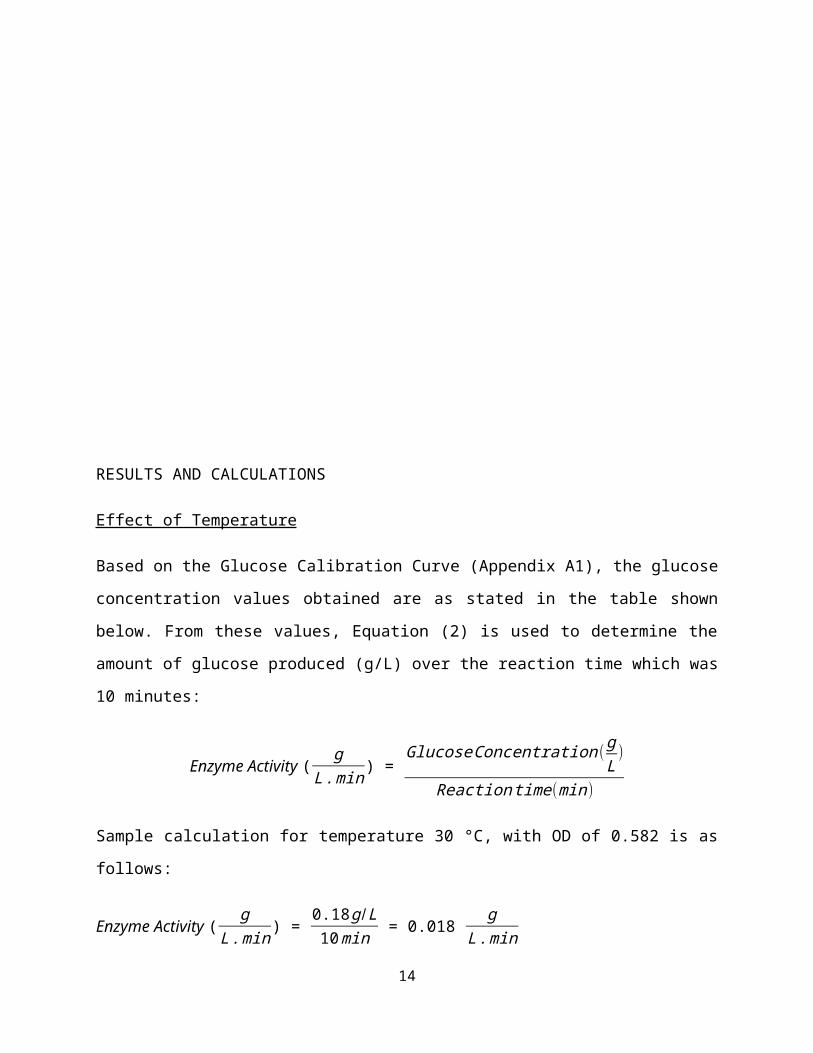
RESULTS AND CALCULATIONS
Effect of Temperature
Based on the Glucose Calibration Curve (Appendix A1), the glucose
concentration values obtained are as stated in the table shown
below. From these values, Equation (2) is used to determine the
amount of glucose produced (g/L) over the reaction time which was
10 minutes:
Enzyme Activity ( gL.min) =
GlucoseConcentration (gL
)
Reactiontime(min)
Sample calculation for temperature 30 °C, with OD of 0.582 is as
follows:
Enzyme Activity ( gL.min) =
0.18g /L10min = 0.018 g
L.min
14

Temperature
(°C)
Absorbance
Value (540 nm)
Glucose
Concentration
(g/L)
Enzyme Activity
(g/L. min)
30 0.582 0.18 0.01840 0.731 0.245 0.024550 0.279 0.165 0.016560 0.240 0.090 0.009070 0.180 0.055 0.0055Table of Manipulated Temperatures for Enzyme Reaction
2.95 3 3.05 3.1 3.15 3.2 3.25 3.3 3.35 3.4 3.450246810
Enzyme Activity Based on Temperature
Series2
Temperature (°C)
OD
Effect of pH
Based on the Glucose Calibration Curve (Appendix A1), the glucose
concentration values obtained are as stated in Table 5.1. From
these values, Equation (1) is used to determine the amount of
glucose produced (g/L) over the reaction time which was 10
minutes.
15
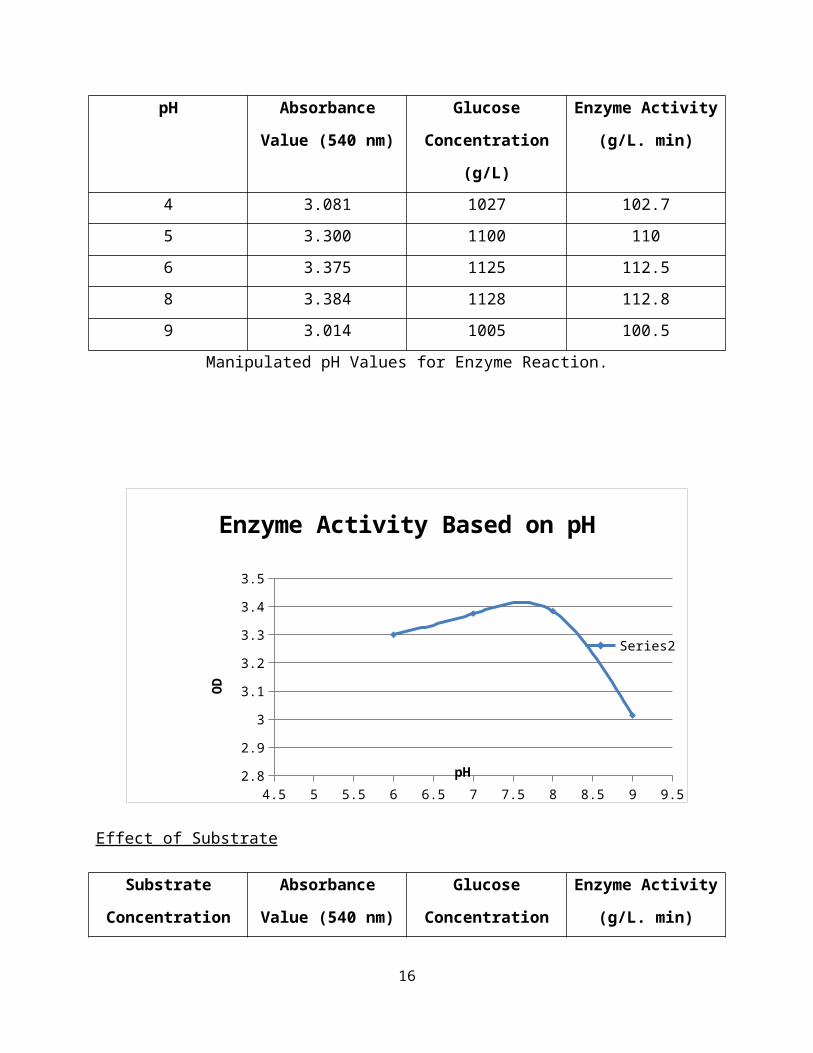
pH Absorbance
Value (540 nm)
Glucose
Concentration
(g/L)
Enzyme Activity
(g/L. min)
4 3.081 1027 102.75 3.300 1100 1106 3.375 1125 112.58 3.384 1128 112.89 3.014 1005 100.5
Manipulated pH Values for Enzyme Reaction.
4.5 5 5.5 6 6.5 7 7.5 8 8.5 9 9.52.8
2.9
3
3.1
3.2
3.3
3.4
3.5
Enzyme Activity Based on pH
Series2
pH
OD
Effect of Substrate
Substrate
Concentration
Absorbance
Value (540 nm)
Glucose
Concentration
Enzyme Activity
(g/L. min)
16
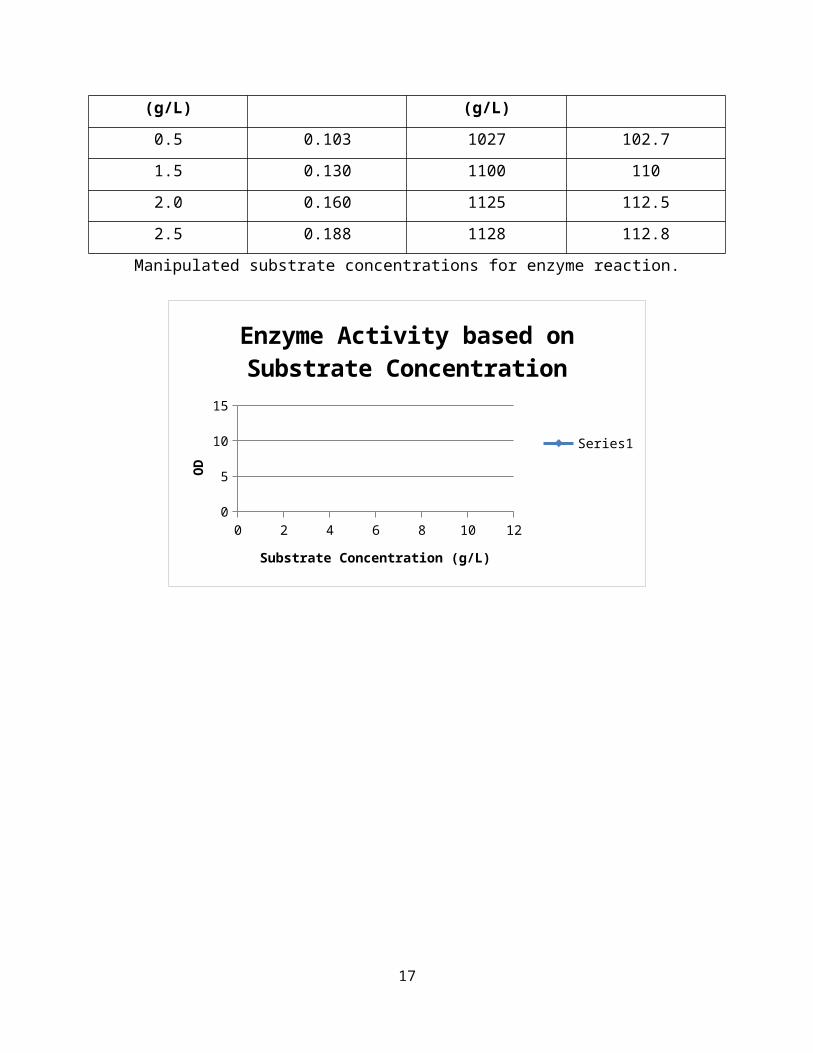
(g/L) (g/L)0.5 0.103 1027 102.71.5 0.130 1100 1102.0 0.160 1125 112.52.5 0.188 1128 112.8
Manipulated substrate concentrations for enzyme reaction.
0 2 4 6 8 10 120
5
10
15
Enzyme Activity based on Substrate Concentration
Series1
Substrate Concentration (g/L)
OD
17
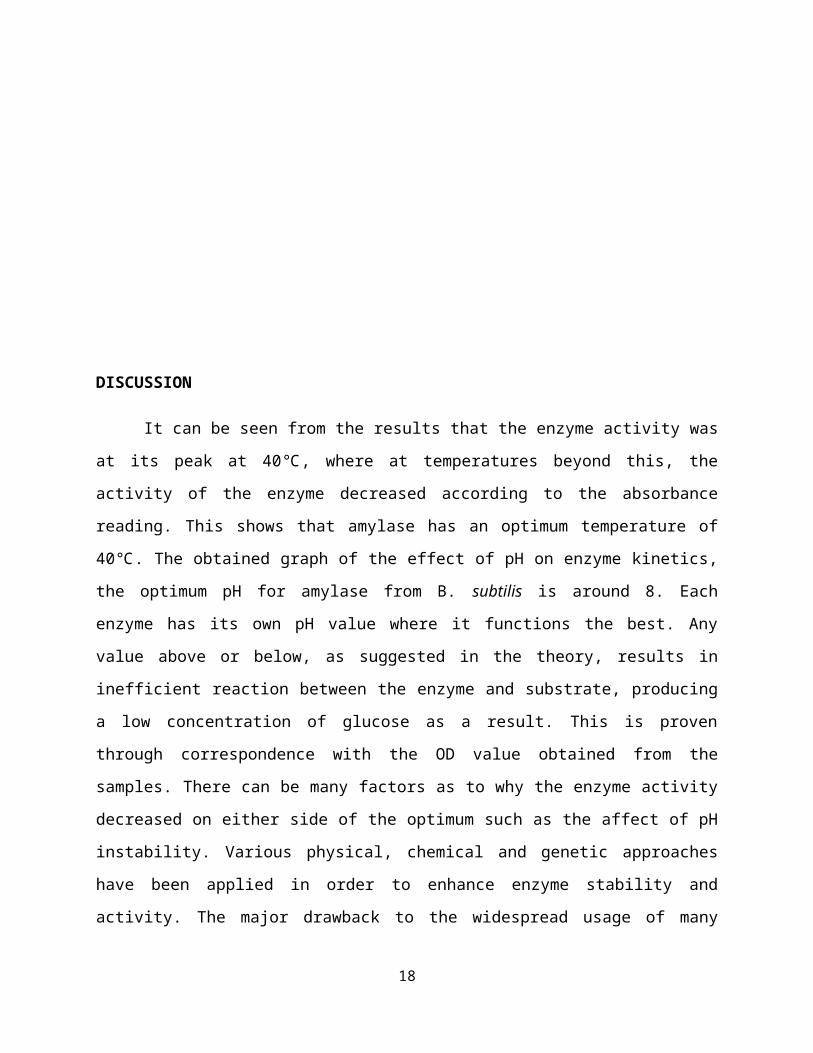
DISCUSSION
It can be seen from the results that the enzyme activity was
at its peak at 40℃, where at temperatures beyond this, the
activity of the enzyme decreased according to the absorbance
reading. This shows that amylase has an optimum temperature of
40℃. The obtained graph of the effect of pH on enzyme kinetics,
the optimum pH for amylase from B. subtilis is around 8. Each
enzyme has its own pH value where it functions the best. Any
value above or below, as suggested in the theory, results in
inefficient reaction between the enzyme and substrate, producing
a low concentration of glucose as a result. This is proven
through correspondence with the OD value obtained from the
samples. There can be many factors as to why the enzyme activity
decreased on either side of the optimum such as the affect of pH
instability. Various physical, chemical and genetic approaches
have been applied in order to enhance enzyme stability and
activity. The major drawback to the widespread usage of many
18

enzymes compared to chemical catalysts is their relatively low
stability in their native state (Senyay-Oncel & Yesil-Celiktas,
2011). This gives it the tendency to be irreversibly inactivated.
Other than that the kinetics of the reaction could also be
affected by the pH as the stability of the enzyme-substrate
complex. The optimum value is when the best reaction occurs and
it indicates that the arrangement of an active sites of an enzyme
is perfectly fixed by the hydrogen and ionic bond between the
substrate and the enzyme. Theoretically, the more substrate is
present or available for the enzyme to hydrolyze, the higher the
concentration of the product should be however only up to a
certain point which is known as Vmax. Beyond this point, the
velocity doesn't change as all of the available enzymes have been
converted into enzyme-substrate complexes. Although, in the graph
plotted obtained from the experiment, no Vmax value is observed.
This is probably due to the fact that the substrate concentration
was still not saturated so as to cause all enzyme active sites to
be occupied. This resulted in a graph that was still struggling
and climbing to reach the Vmax. Without the value of Vmax, the
optimum substrate concentration is not known, and calculations of
Km using the Michaelis-Menten equations are not possible.
CONCLUSION
19
The experiment was conducted successfully and all the objectives
were achieved; however not conclusive in relevance to the optimum
substrate concentration. The optimum temperature and pH for
efficient functionality of Amylase enzyme obtained from the
experiment is about 8 and 40℃ respectively. The substrate
concentration in correspondence to Vmax could not be obtained as
no plateau of the graph was observed.
RECOMMENDATION
Every effects of the parameters involved should be handled
carefully according to the laboratory manual and guidelines.
The Michaelis-Menten parameters can be estimated more
appropriately when the experiment for effect of substrate
concentration is extended for higher starch concentration
maybe until 5.0 and 6.0 g/L of starch.
With higher concentration of starch, the reaction can
proceed until it reaches constant level and the Vmax and Km
of the reaction can be determined.
Starch analysis method can be used to enhance the reaction
process. It can be accomplished by mixing the starch
solution with the buffer.
To measure the starch consumed in the reaction carried out,
the starch-iodine assay can also be used.
20
REFERENCES
Neil A. Campbell, Jane B. Reece, 2008 Biology, 8th Edition,
Pearson Publication.
Kritika Singh, Arvind M. Kayastha, α-Amylase from wheat
(Triticum aestivum) seeds: Its purification, biochemical
attributes and active site studies, Food Chemistry, Volume
162, 1 November 2014, Pages 1-9.
A.Rogers & Y.Gibon.2009.Chapter 4.Enzyme Kinetics: Thoery &
Practice.
Adams M. W. W, and Kelly, R. M. (1995). Enzymes from
microorganisms in extreme environments. Chemical and
Engineering News 73. Pp: 32-42.
Robert K. Scopes (2002). Enzyme Activity and Assays.
Encyclopedia of Life Sciences. Retrieved 14 May 2014.
21

Appendix 1
22

23
Copyright © 2022 FDOKUMEN