Reaction kinetics and structure of enzyme macromolecules ...
309
University of Massachusetts Amherst University of Massachusetts Amherst ScholarWorks@UMass Amherst ScholarWorks@UMass Amherst Doctoral Dissertations 1896 - February 2014 1-1-1977 Reaction kinetics and structure of enzyme macromolecules Reaction kinetics and structure of enzyme macromolecules subjected to hydrodynamic shearing forces: enzyme subjected to hydrodynamic shearing forces: enzyme mechanochemistry. mechanochemistry. Matthew V. Tirrell University of Massachusetts Amherst Follow this and additional works at: https://scholarworks.umass.edu/dissertations_1 Recommended Citation Recommended Citation Tirrell, Matthew V., "Reaction kinetics and structure of enzyme macromolecules subjected to hydrodynamic shearing forces: enzyme mechanochemistry." (1977). Doctoral Dissertations 1896 - February 2014. 619. https://doi.org/10.7275/9zsk-cp43 https://scholarworks.umass.edu/dissertations_1/619 This Open Access Dissertation is brought to you for free and open access by ScholarWorks@UMass Amherst. It has been accepted for inclusion in Doctoral Dissertations 1896 - February 2014 by an authorized administrator of ScholarWorks@UMass Amherst. For more information, please contact [email protected].
-
Upload
khangminh22 -
Category
Documents
-
view
0 -
download
0
Transcript of Reaction kinetics and structure of enzyme macromolecules ...

University of Massachusetts Amherst University of Massachusetts Amherst
ScholarWorks@UMass Amherst ScholarWorks@UMass Amherst
Doctoral Dissertations 1896 - February 2014
1-1-1977
Reaction kinetics and structure of enzyme macromolecules Reaction kinetics and structure of enzyme macromolecules
subjected to hydrodynamic shearing forces: enzyme subjected to hydrodynamic shearing forces: enzyme
mechanochemistry. mechanochemistry.
Matthew V. Tirrell University of Massachusetts Amherst
Follow this and additional works at: https://scholarworks.umass.edu/dissertations_1
Recommended Citation Recommended Citation Tirrell, Matthew V., "Reaction kinetics and structure of enzyme macromolecules subjected to hydrodynamic shearing forces: enzyme mechanochemistry." (1977). Doctoral Dissertations 1896 - February 2014. 619. https://doi.org/10.7275/9zsk-cp43 https://scholarworks.umass.edu/dissertations_1/619
This Open Access Dissertation is brought to you for free and open access by ScholarWorks@UMass Amherst. It has been accepted for inclusion in Doctoral Dissertations 1896 - February 2014 by an authorized administrator of ScholarWorks@UMass Amherst. For more information, please contact [email protected].


DATE DUE
UNIVERSITY OF MASSACHUSETTSLIBRARY
PHYS SCI
3234f*i267
1977T5978

REACTION KINETICS AND STRUCTURE OF ENZYME
MACROMOLECULES SUBJECTED TO HYDRODYNAMIC
SHEARING FORCES: ENZYME MECHANOCHEMISTRY
A Dissertation Presented
By
MATTHEW TIRRELL
Submitted to the Graduate School of the
University of Massachusetts in partial fulfillment
of the requirements for the degree of
DOCTOR OF PHILOSOPHY
August 1977
Polymer Science and Engineering

REACTION KINETICS AND STRUCTURE OF ENZYME
MACROMOLECULES SUBJECTED TO HYDRODYNAxMIC
SHEARING FORCES: ENZYME MECHANOCHEMISTRY
A Dissertation Presented
By
MATTHEW TIRRELL
Approved as to style and content by:
Stanley MiddlemanChairperson of Committee
Lobert L. Iraurence, Member
E . W . Westhead , Member
Chien , Membe
r
W.J. MacKnight, Department HeadPolymer Science and Engineering
ii

Fur Claudia,
Du hast mein Leben
wunderschon gemacht!
and
for my mother,
who worked much
harder than I did
to make this possible.

ACKNOWLEDGMENTS
My sincere thanks go to Professor Stanley Middleman
who suggested this area of research and set a scholarly exam-
ple from which I have learned much; to Professor R.L. Laurence
who is a good friend and stimulating teacher; to Professor
E.W. Westhead who has given me much good advice and who
taught me most of the biochemistry I know and to Professor
J.C.W. Chien from whose penetrating scientific insight and
critical suggestions I have benefited.
I would also like to thank Professor 0. Vogl and Pro-
fessor R.S. Porter for numerous bits of advice and assistance
during the last four years. I am not exaggerating when I say
that the entire populations of the Polymer Science and Engi-
neering Department and Chemical Engineering Department de-
serve my appreciation for creating an atmosphere both stimu-
lating and conducive to research
.
iv
ABSTRACT
Reaction Kinetics and Structure of EnzymeMacromolecules Subjected to HydrodynamicShearing Forces: Enzyme Mechanochemistry
September 1977
Matthew TirrellB.S.Ch.E. , Northwestern UniversityPh.D., University of Massachusetts
Directed by: Professor Stanley Middleman
This dissertation reports on efforts to determine
whether hydrodynamic shearing forces, of a magnitude encoun-
tered in many practical situations, will affect the struc-
ture, and therefore the catalytic activity, of enzyme macro-
molecules. Some of the situations where this type of effect
may be expected to be important are: flow of blood through
some extracorporeal treatment device; biochemical reactor
systems; mechanochemical systems in vivo such as membranes
and muscles; and analytical or rheological measurement condi-
tions involving strong flow fields. With these ideas in
mind, the present work deals primarily with the study of the
kinetics of the urease catalyzed hydrolysis of ur'ea occurring
in deforming reaction media. When effects on the kinetics •
due to shearing were observed, ancillary analytical tech-
niques were employed in an attempt to learn about the struc-
tural changes responsible.

Initially, strong, shear rate dependent, partially
irreversible inactivation of urease was found with applied
stresses up to 2.5 Pascals. Qualitatively similar results
were obtained with urease preparations of three different-
levels of purity. Protection against this inactivation is
provided by millimolar quantities of ethylenediaininetetra-
acetate (EDTA) and g-mercaptoethanol (B-met) . Shearing pro-
motes urease inactivation by parachloromercuribenzoate (PCMB)
These three facts form the basis for the proposed mechanism
of the irreversible inactivation due to shearing. This me-
chanism is a shear-promoted, metal ion catalyzed oxidation of
an essential sulfhydryl group (s) on urease. Evidence that
the metal ion responsible is adventitious ferric ion has been
obtained as well. Size exclusion chromatography of urease
before and after shearing revealed molecular weight hetero-
geneity and preferential inactivation of the larger size
urease species. Some shear-induced aggregation was noted as
well when urease was sheared in relatively concentrated solu-
tions. Circular dichroism studies showed changes in the sec-
ondary structure consistent with this after long shear expo-
sure, although no change in the secondary structure was de-
tected after relatively short exposures, even when an activ-
ity change was seen.
Reaction media of higher viscosity, including 5 mM
EDTA, were investigated by conducting the reactions in glyc-
vi

erin/water mixtures. In this system inactivation was found
to be shear stress dependent and reversible up to at least
21.0 Pascals. This effect must be the result of a hydrody-
namically induced conformational change in urease. Indica-
tions are , in this set of experiments as well as the previous
set, that only the aggregated urease species are significantly
affected by these stress levels.
Viscometric measurements have been combined with a
recently proposed theory to show that the urease oligomers
are linearly arranged. This may be related to their shear
susceptibility.
Preliminary experiments with another enzyme, lactic
dehydrogenase, have shown that it is unaffected by stresses
up to 2.1 Pascals. It is however irreversibly inactivated
about 50% by exposure to 9.4 Pascals. Structural changes,
observed in UV and CD spectra, are seen to accompany inac-
tivation. It is thus seen that the comparatively large size
of urease is not an essential feature to see shear modifica-
tion of enzyme kinetics.
A quantitatively good, phenomenological model of
shear modification urease catalyzed urea hydrolysis has been
developed; unfortunately, the physical significance of some
of the parameters remains obscure. Although some conjectures
are advanced, a detailed molecular understanding of the shear
modification phenomena is a task for the future.
vii

TABLE OF CONTENTS
Page
ACKNOWLEDGMENT
ABSTRACT ^
LIST OF FIGURES X
LIST OF TABLES XV
PREFACE xvii
CHAPTER
I. INTRODUCTION TO ENZYMEMECHANOCHEMISTRY 1
II. BACKGROUND ON UREASE CATALYSIS ANDSTRUCTURE 40
III. EXPERIMENTAL MATERIALS AND METHODS .... 54
IV. RESULTS ON UREASE 81
V. MODELLING OF ENZYME REACTIONSAFFECTED BY DEFORMATION .
" 179
VI. DISCUSSION OF RESULTS ON UREASECATALYZED REACTIONS IN DEFORMINGMEDIA 210
VII. INTRINSIC VISCOSITY STUDIES OFUREASE 215
VIII. PRELIMINARY EXPERIMENTAL RESULTS ONLACTIC DEHYDROGENASE .... 239
IX. CONCLUSION ^ 259
APPENDICES
A. SOLUTION OF EQUATIONS FOR PARALLELDEACTIVATION MODEL OF CHAPTER V 268
viii

Page
APPENDICES
B. PROCEDURE FOR OBTAINING KINETICCONSTANTS FOR SIMPLIFIED DEACTIVATIONMODEL 270
C. BASIC SHEAR INACTIVATION DATA INNORMAL 0.16M PHOSPHATE BUFFER 272
D. SHEAR INACTIVATION DATA IN GLYCERINBUFFER MIXTURE 281
4
ix

LIST OF FIGURES
Page
Chapter I
I-l : Molecular extension as a function of adimensionless shear rate for threetheoretical models and some experi-mental data (after Cottrell, et al.,1969) 6
1-2: Contributions to protein structuralstability 12
1-3 : Apparent molecular length as a functionof velocity gradient for a 2.5% HSAsolution (after Joly, 1958) 18
1-4 : Kinetics of mechanical denaturation of(a) HbA and (b) HbS (after Asakura,et al. , 1974a) 26
Chapter II
II-l: Schematic models of the ureaseisozymes
II-2: Chemistry of urease catalyzed reactionsand the kinetic parameters
Chapter III
III-l: Sketch of Epprecht rheometer system .
III-2: Schematic diagram of MS-0 unit . . .
III-3: Calibration curve for size exclusion
chromatography column
III-4: Calibration curve for urea analysis
Chapter IV
IV-1: Urea concentration as a function of
time under varying rates of shear ..
46
49
56
59
71
76
83
X
9

Page
Chapter IV
IV-2 : Urea concentration as a function of timeat zero shear after variable periods ofsteady shear 86
IV-3: Percent urease activity after shearing asa function of shear strain in thepresence (a) and absence (b) of urea.Urease A 88
IV-4 : Urea concentration as a function of timein the presence of 1.0 mM EDTA. UreaseA 90
IV-5 : Urea concentration as a function of timeduring and after variable periods ofsteady shear . Urease B 93
IV-6: Urea concentration as a function of timeduring and after variable periods ofsteady shear. Urease C 95
IV-7: Zero shear urea hydrolysis by ureasewith and without EDTA 98
IV-8 : Urea concentration as a function of timein the presence of 1.0 mM EDTA. UreaseC
IV-12: Urea concentration as a function of time
with various levels of3-mercaptoethanol
IV-13: Urea concentration as a function of time,
effect of PCMB . .
IV-14: Urease activity remaining vs. PCMB/
urease molar ratio (after Gorin, et al.,
1962)
xi
100
IV-9: Zero shear urea hydrolysis by ureasebefore and after Chelex treatment .... 103
IV-10: Urea concentration as a function of time
after Chelex treatment. Urease C .... 106
IV-11: Urea concentration as a function of time
after chelex treatment. Urease B .... 108
111
114
117

Chapter IV
Page
IV- 15
IV-16
:
IV- 17
IV-18
IV-19
IV-20:
IV-21:
IV- 2 2
IV- 2 3
IV- 2 4
IV-25
IV- 2 6
Urea concentration as a function of timein nitrogen atmosphere
Urea concentration as a function of timeafter addition of 5 M FE(NO-.)-..Urease C ^.
Urea concentration as a function of timeat varying shear rates with severaldifferent chelating agents
Size exclusion chromatography of urease(C) before (a) and after (b)
dialysis
Urease activity and protein concentrationvs. elution volume for urease B . . . .
Protein concentration vs. elutionposition as a function of shearexposure time at 1717s"-'-. UreaseB
Urease activity vs. elution position asa function of shear exposure time at1717s~l. Urease C
Protein concentration vs. elution posi-tion as a function of shear exposuretime at 1717s~l. Urease C .
Idealized absorption band. Cotton effectand ellipticity band of a hypotheticalelectronic transition
Circular dichroism spectra of poly-L-lysine in (a) 100% ot-helix form (b)
100% B-form and (c) 100% random form
(after Greenfield and Fasman, 1969) . .
Circular dichroism spectrum of native
urease *
Optical rotatory dispersion curve of
native urease (after Contaxis and
Reithel, 1971)
xii
120
124
128
133
135
137
140
142
146
149
151
155

Page
Chapter IV
IV-27: Circular dichroism spectrum of urease asa function of shear exposure time at1717S-1
V-4 : Comparison of predicted kinetic behaviorfrom simplified deactivation model with
data of Figure IV-6a
Chapter VII
VII-1: Illustrations of various hypotheticalgeometrical urease oligomerizationpatterns
VII-2: SEC of oligomerized urease sample
illustrating determination of fraction
of each isozyme
xiii
160
IV-28: Urea concentration as a function oftime in glycerin-buffer mixture .... 164
IV-29: Urea concentration as a function of timein glycerin-buffer mixture 166
IV-30: Urea concentration as a function of timein glycerin-buffer mixture 168
IV-31: Urea concentration as a function of timein glycerin-buffer mixture 170
IV-32: Urea concentration as a function of timein glycerin-buffer mixture 172
Chapter V
V-1 : Comparison of predictions from productinhibition model with zero shear datafrom Figure IV-6 . . . 183
V-2: Simulated urea concentration vs. timebehavior for several values of theparameter tv (values of other para-meters given in test) 191
V-3: Comparison of predicted kineticbehavior for tv=11.4RT with dataof Figure IV-2c 193
198
224
228

Page
Chapter VII'
VII-3: Apparent specific viscosities of ureasesamples plotted against ureaseconcentration 232
Chapter VIII
VIII-1 : Three different stereo views of thetetrameric lactic dehydrogenase(after Holbrook, et al., 1975) ..... 242
VIII-2 : Calibration curve for pyruvateanalysis 245
VIII-3: Pyruvate concentration as a functionof time 248
VIII-4 : Pyruvate concentration as a functionof time at zero shear with LDH sampleswith various shear histories 251
VIII-5: Ultraviolet absorption spectra oflactic dehydrogenase samples withvarious shear histories 254
VIII-6: Circular dichroism spectra of lacticdehydrogenase samples with variousshear histories 256
xiv

LIST OF TABLES
Chapter IV Page
IV-1: Results of Atomic Absorption Analyses . . 121
IV-2: Effect of Adding Metal Ions AfterChelex Treatment 125
IV-3: Tabulation of Mean Residue EllipticitiesDerived from CD Spectrum (Figure IV-25
)
of Native Urease 152
IV-4 : Numerical values for Moffitt-Yang PlotCalculated from Figure IV-26 156
IV-5: Summary of Estimates of Urease HelicalContent from This and Previous Work . . . 157
IV-6: Summary of Glycerin/Buffer Data 175
Chapter V
V-1 : Rate Constants Derived from SimplifiedDeactivation Models 199
Chapter VII
VII-1: Values of A and B for AK-B Theory .... 221
VII-2: Intrinsic Viscosities of HypotheticalUrease Isozymes and Mixtures ThereofPredicted by AK-B Theory 225
VII-3: Scheraga-Mandelkern 3 Factors 234
Appendix C
C-1: Data of Figure IV-2a •273
C-2: Data of Figure IV-2b 2"^^
C-3: Data of Figure IV-2c
276C-4 : Data of Figure IV-5a '
277C-5: Data of Figure IV-5b
XV

Appendix C Page
C-6: Data of Figure IV-5c 278
C-7: Data of Figure IV-6a 279
C-8: Data of Figure IV-6b 280
Appendix D
D-1: Data of Figure IV-28 282
D-2: Data of Figure IV-29 284
D-3: Data of Figure IV-30 286
D-4: Data of Figure IV-31 287
D-5: Data of Figure IV-32 288
xvi

PREFACE
This dissertation is divided into nine chapters.
Chapter I begins by discussing some motivation for the work
presented. This is followed by a general discussion of the
effects of flow fields on the conformations of macromolecules
in fluids, including some pertinent remarks on shear degrada-
tion (covalent bond cleavage) of macromolecules. Then^ a
comprehensive review is made of all work relevant to the ef-
fect of mechanical forces on biologically active proteins.
Every known example of an imposed mechanical force causing an
activity change is included, as well as some work on inactive
species structurally similar to enzymes, to obtain some per-
spective on the effects one might possibly expect.
Since the principal object of study in this work was
the enzyme urease, Chapter II is a review of the basics of
urease catalysis and structure. Chapter III contains the de-
tails of all the experiments done with urease. It is intend-
ed to be primarily useful to any future experimentalist pur-
suing similar lines of research. Conceptually, it is inde-
pendent of the remainder of the dissertation and may be
skipped by anyone more interested in the results themselves
than how they were obtained. Sufficient remarks are given
with the results on urease, presented in Chapter IV, to make
xvii

their origin clear.
Chapter V describes two different kinds of efforts
to describe the modifications in kinetics of enzyme catalyzed
reactions occurring in deforming media. The first is empiri-
cal and the second barely scratches the surface of a still
covert molecular understanding.
Chapter VI is a pause to make some general remarks
on the interpretation and significance of the results of this
dissertation. Chapter VII then digresses a bit to discuss
some intrinsic viscosity measurements on urease . These are
used, along with a recently proposed theory, to provide new
evidence that urease aggregates in a linear fashion. Some
preliminary results on shear-kinetic experiments with lactic
dehydrogenase are reported in Chapter VIII. Conclusions are
enumerated and suggestions for future work made in the final
chapter , Chapter IX
.
It is hoped that this preface, and the organization
of this dissertation which the preface describes, will facili-
tate an appreciation on the part of the reader for the motiva-
tion, structure and principal accomplishments of this work.
xviii

CHAPTER I
INTRODUCTION TO ENZYME MECHANOCHEMISTRY
There are two lines of investigation pursued in this
dissertation which unify and motivate the various parts. The
first is, what are the nature and magnitude of the effects of
hydrodynamic stresses on biologically active proteins, spe-
cifically enzymes? The second is, what can be learned about
the structure and function of these macromolecules by their
physical and chemical responses to these stresses? While
more or less classical viscometric structure determination
forms a small part of the work reported herein, the stresses
applied to the enzyme macromolecules have, for the most part,
purposely exceeded the noninfluential (in terms of structural
changes) stress levels of viscometry. The objective is to
understand the behavior of a biologically active protein
molecule when it is subjected to sufficient physical force to
alter its activity. A complete realization of this objec-
tive would consist of: (1) ascertaining the lower limit of
physical force necessary to cause a perceptible activity-
modifying effect, and (2) elucidating the mechanism of activ-
ity modification, meaning the exact nature of the conforma-
tional or chemical changes induced by stress. Included in
the latter are any effects of , the environment which work in

concert with the applied stress to bring about the activity
modification. Among these are effects of surfaces, pH, ions
and temperature. As will be shown in subsequent chapters,
these have been nearly fulfilled in this work for one enzyme
system and some steps have been taken toward study of another
enzyme
.
Extracorporeal treatment of blood for the purposes of
oxygenation or detoxification (Middleman, 1972; Lightfoot,
1974) or for therapy for the multitude of enzyme deficiency
diseases (Wacker and Coombs, 1969) constitutes an area of
very practical application for this sort of research • Appli-
cations to food engineering are possible as well (Charm,
1963; Pradipasena and Rha, 1977). With this in mind, the
literature pertinent to this dissertation is now examined,
first with a general, and quite lacunary, review of the ef-
fect of mechanical forces on the conformations of macromole-
cules, and second with a thorough review of the previous work
relevant to the effects of mechanical forces on the structure
and function of biologically active protein macromolecules
•
For synthetic macromolecules it is fairly well estab-
lished that conform.ational changes occur when they are sub-
jected to hydrodynamic forces; however, most of the evidence
for this is rather indirect, coming from measurements of flow
birefringence and viscometry (Janeschitz-Kriegel , 1969; Bird
et al., 1977) or inferred from molecular theories (Yamakawa,
1971; Bird et al., 1977). There is some direct evidence from

light scattering that molecular extension does occur (Cot-
trell et al., 1969; Cottrell et al., 1970; Champion and
Davis, 1970). This implies that there is mechanically in-
duced rotation about backbone bonds. Qualitatively, what
happens is that the originally spherical statistical shape
of the random coil takes on an ellipsoidal shape when sub-
jected to a homogeneous flow field. This shape change is
fully reversible on stopping flow. For simple shear flow,
deformation occurs in the plane defined by the velocity vec-
tor and the direction of the velocity gradient; for simple
elongational flow these two directions coincide and molecular
deformation occurs in this direction as well. No direct
measurements of macromolecular coil deformation in elongation
flow have been reported as yet although experimental appara-
tus for such work is presently under construction (Leal and
Pings, 1977). For this reason, the bulk of the remainder of
this dissertation will deal with simple shearing flows, ex-
cept for periodic comments where an elongational flow may be
important practically or potentially interesting experimental-
ly. Molecular theories based on models such as the elastic
dumbbell (Bird et al., 1977) or the Rouse model (Rouse, 1953)
treat the inherent resistance of the molecule to deformation
as governed by a Brownian motion-entropic potential. The
2
predictions for = <r^>/<^^>eq' "^^""^'
"'^^'^
square end-to-end length and the subscript eq refers to equi-
librium conditions, as a function of a dimensionless shear

rate 3 = ^ eq^w'^o^/^'^' shown in Figure I-l. All the
results of these molecular theories can be expressed in the2 2form a = 1 + K3 where K = 2/3 for elastic dumbbells (Bird
et al./ 1977), 4/15 for the "free draining" Rouse theory
(Peterlin, 1963) and 0.136 for a version of the Rouse theory
which treats the domain of the polymer coil as impermeable to
solvent flow (Peterlin, 1963). Also shov;n in Figure I-l are
experimental results of Cottrell et al. (1969) which fit the
2 2line a = 1 + 0.013B + 0.000169B . Obviously, real polymer
coils deform significantly, but much less than predicted by
these models. This realization, which had become clear in-
dependently of these results, has led to the notions of "in-
ternal viscosity" and "inherent rigidity" (Cerf, 1960) in
macromolecules . The idea is that there is a force, F^^, op-
posing conformational change, indicated by the time rate of
change of the end-to-end distance, f; this "sluggishness"
leads to the defining relation for inherent rigidity, Q:
Including this effect (Cerf, 1968) brings the predictions of
the molecular theories closer to reality (Cottrell et al.,
1969). Values of Q have been estimated for both polystyrene
and polyisobutylene at 1.6 x 10 ^g/sec (Cottrell et al.,
1969; Peterlin, 1967; Cerf, 1958).
Under extreme conditions of applied hydrodynamic
shearing forces, macromolecules may degrade mechanically, re-

5
Figure I-l. Molecular extension as a function of a dimension-less shear rate for three theoretical models andsome experimental data (after Cottrell et al.,1969) .

0 50 loo 150

suiting in chain scission and decreasing molecular weight.
For macromolecules of sufficient molecular weight and concen-
tration to experience entanglements with other macromolecules
in fluid media, degradation is promoted by the mechanical
energy stored in the chain links between entanglements. F.
Bueche (1960) has presented a theory which treat's this phe-
nomenon; the pertinent essential features of his theoretical
results are: (1) activation energy for bond cleavage is re-
duced by the mechanical tension in the bond; (2) degradation
is highly molecular weight-sensitive; (3) there is a lower
molecular weight below which no mechanical degradation oc-
curs; (4) a reduced parameter, including bulk shear stress,
molecular weight and temperature, controls the extent of deg-
radation; and (5) breakage occurs near the middle of the
chain molecule.
In a dilute, noninteractive solution, mechanical deg-
radation has also been reported (see for example: Casale et
al., 1971; Casale and Porter, 1977). In some cases, degrada-
tion in dilute solution can definitely be attributed to
capillary entrance effects (Culter et al., 1972) or to tur-
bulence (Virk, 1975) both of which have some elorigational
flow character from the point of view of the macromolecule.
It is not now certain whether a laminar shearing flow is
capable of degrading synthetic polymer molecules in the ab-
sence of entanglements. It does seem possible to degrade
high molecular weight polynucleotides such as DNA under di-

8
lute laminar conditions (Davison, I960; Levinthal and
Davison, 1961; Harrington and Zimm, 1965; Yew and Davidson,
1968; Bowman and Davidson, 1972; Adam and Zimm, 1976) as
well as turbulent ones (Cavalieri, 1957; Cavalieri and Rosen-
burg, 1958; Doty et al., 1958; Thomas, 1959; Davison, 1959,
1960; Rosenkranz and Bendich, 1960; Mandell and Hershey,
1960; Hershey and Burgi , 1960; Burgi and Hershey, 1961, 1962;
Davison et al. , 1961; Rubenstein et al., 1961; Kaiser, 1962;
Hershey et al., 1963; Hogness and Simmons, 1964; Harrington
and Zimm, 1965; Harrington, 1966; Rees et al., 1974; Noll et
al., 1975; Lewis et al., 1976). Harrington and Zimm (1965)
also found degradation of polystyrene in dilute solution un-
der laminar and turbulent conditions. The shear stresses
where degradation begins to occur in laminar flow have been
observed to range from about 10.0 to 100.0 Pascals, these
observations having been made in solvents of viscosities from
-3 -210 Pa-s to about 10 Pa-s. If one makes any of a number
of reasonable assumptions, the applied mechanical tension
necessary to cleave a covalent bond (carbon-carbon for exam-
ple) in a purely mechanical fashion may be estimated from
known bond strengths (Levinthal and Davison, 1961, 1967;
-9Harrington and Zimm, 1965; Norrby, 1975). A value of 10
Newtons is typically obtained. If the molecular cross-sec-
tion through which this force acts is taken to be in the
range 10^ to lO^nm, this leads to an estimate of the neces-
3 5sary shear stress to produce rupture of 10 to 10 Pascals.

We see that there is a discrepancy of 1 to 4 orders of mag-
nitude between the estimated and observed critical stresses.
This raises a question, still without a general answer and
very germane to this dissertation: in the cleavage reaction,
do the hydrodynamic forces provide most of the energy for
the chemical reaction or do they function to decrease some-
what the activation energy of a thermal reaction or of a
chemical reaction, such as hydrolysis or solvolysis, so that .
shear breakage is properly viewed as a mechanically assisted
thermal or chemical reaction? Put another way, more appro-
priate to our subsequent discussion of the effect of shear
on biologically active macromolecules , are the hydrodynamic
forces directly causative of some modification reaction or
rather do they simply precondition the macromolecule to sub-
sequent modifying events? This dissertation presents evi-
dence indicating that the latter may be true for some protein
molecules at moderate stress levels
.
However, to put this work in proper perspective, the
existent literature on the effect of shear on proteins will
be reviewed. We begin with some essential features of pro-
tein structure.
In contrast to synthetic macromolecules, whose con-
formations are governed by entropic-Brownian motion consider-
ations, the conformations of protein macromolecules are dic-
tated by specific energetic interactions. This makes a'
general theory of mechanical deformation of proteins very

10
difficult because of the differences among proteins of these
energetic interactions. Some attempt toward this has been
made by some Russian workers for globular protein enzyme
molecules (Khurgin et al., 1967) although they actually only
present a conceptual rather than quantitative discussion.
Hydrogen bonding, van der Waals forces, electrostatic forces,
hydrophobic forces and intramolecular covalent crosslinks
each play important roles in the construction of a protein
molecule. The net result of these forces is the natural or
"native" conformation of the protein. Some of these inter-
actions are illustrated and their relative energetic contri-
bution to the stability of the protein structure compared in
Figure 1-2. In the native state, each polypeptide chain of
a genetically distinct protein does not form a family of
random coils; rather, it exhibits a unique and stable three-
dimensional structure (Haschemeyer and Haschemeyer, 1973).
This structure is present, in almost identical form, in every
molecule of that protein. For convenience in our discussion
of protein structure, it is helpful to differentiate certain
levels of structure. Primary structure refers to the se-
quence of amino acids (residues) in the polypeptide chains
which make up the protein. Both secondary and tertiary
structure refer to elements composing the three-dimensional
conformation. There are decided shortcomings in the arbi-
trariness of the distinction to be made, but operationally,
the distinction is made as follows. Secondary structure re-

11
Figure 1-2. Contributions to protein structural stability.

NH ^R^
NH3* '^R''
C
[a] [bj 0
UNFOLDED CHAINS ^ NATIVE STRUCTURE
AG (kcal)
CONFORMATIONAL ENTROPY + 340
CONFORMATIONAL ENTHALPY - 100
HYDROPHOBIC BONDS [c] - 130
HYDROGEN BONDS [a] - 10
IONIC BONDS [b] - 10
TOTAL + 90

fers to structural elements that involve interactions between
amino acid residues fairly close to one another in the se-
quence. Because of the great diversity in types of near
neighbor interactions in proteins, this definition has proved
to be less useful for native proteins than it is for synthe-
tic polypeptides. In a number of special cases (the triple
helical structure of collagen) , the exact meaning of secon-
dary structure depends on the context in which it is used.
More generally, secondary structure in proteins represents
arrangements of the polypeptide chain that form more or less
regular hydrogen bonded structures, in particular, a-helices
and the parallel (or antiparallel) arrangement of chain seg-
ments known as pleated sheet or B-structures . Often, an ar-
bitrary division of the secondary structure into these cate-
gories is made by quoting a "percent a-helix" and a "percent
e-structure" for some protein, meaning the percent of the
residues in the polypeptide chain participating in each of
these types of structures. Whatever fraction is left over
is usually termed "random chain," implying some degree of
conformational freedom, although it is certainly not "as ran-
dom" as chain segments in a synthetic polymer molecule. As
noted above, there are also a small number of other less im-
portant secondary structures. Tertiary structure refers to
the three-dimensional structure of the polypeptide chain that
results from interactions between amino acid residues rela-
tively far apart in the sequence. It may, more generally, be

14
regarded as that arrangement of the chain in three dimensions
that is not regular (i.e., not composed of repeating struc-
tural elements)• Intramolecular disulfide bonding is often a
crucial element of a protein's tertiary structure. In pro-
teins containing more than one polypeptide chain, the term is
used in reference to the structure within each chain, inde-
pendently. For proteins containing multiple identical or
nonidentical subunits, or which tend to oligomerize, the
total three-dimensional structure is described by the term
quaternary structure, which refers specifically to that
structure resulting from the interactions between distinct
polypeptide chains. The electrostatic and, especially, hy-
drophobic forces are important here. Some individual pro-
teins do exhibit a small number of multiple molecular forms,
for example, different quaternary structures, as in the case
of a distribution of oligomers or different combinations of
nonidentical subunits. These multiple molecular foriris are
termed isozymes. These definitions will be used throughout
this dissertation, although, to avoid confusion, the terms
conformation, shape, or three-dimensional structure will of-
ten be used to include all types of structure above the level
of primary structure.
The conformations of protein molecules which function4.
as enzymes, or other proteins whose biological function in-
volves small molecule binding, have as part of their struc-
ture a "binding site," or in the specific case of enzymes.

15
an "active site." This site has elements of the protein
structure arranged so that groups responsible for binding and
catalysis are appropriately positioned. This is not to imply
however that the protein molecule is totally rigid; on the
contrary, conformational adaptability on small molecule bind-
ing (Citri, 1973) and other aspects of the dynamics of pro-
tein conformations are now recognized (Steitz, 1968; Hasche-
meyer and Haschemeyer, 1973)
.
The first significant research program attacking the
question of shear-induced conformational changes in proteins
was that of Joly and Barbu (Joly, 1948 , 1949; Joly and Barbu,
1949; Barbu and Joly, 1950). Their initial work examined
aqueous solutions of horse serum albumin (HSA) and tobacco
mosaic virus (TMV) , at concentrations from as low as 0.025%
for TMV to as high as 2,5% for HSA, under velocity gradients
(g) from 27 s"-*- to 9900 s"-"-, in a circular Couette device
fitted to measure flow birefringence. Measurement of the
extinction angle, x, for a fixed g, can be used to determine
the rotational diffusion constant, D (Scheraga et al., 1951),
which can in turn be used to calculate the effective length
of the species, £. Their initial findings were that increas-
ing g in the range 0 to 2000 s"-*" produced an increase in £.
This is due to a flow-induced aggregation process. It can,
in fact, be described by the collision coagulation theory of
Smoluchowski (1918) modified (Joly, 1958, 1964) to account
for various interaction strengths between the particles. For

ellipsoidal molecules of small aspect ratio such as HSA, ag-
gregation takes place in an end-to-end fashion where as Joly
(1948, 1949) claims that the rodlike TMV molecules aggregate
laterally.
For shear rates in excess of about 2000 s"^, the
shearing force breaks up the aggregates. Figure 1-3 illus-
trates this behavior for HSA. Subsequently, Joly and Barbu
demonstrated qualitatively similar behavior for a variety of .
other proteins (Joly, 1952a, b, c; Barbu and Joly, 1953;
Joly, 1956, 1958). The picture they present of what is hap-
pening at a molecular level is that shearing increases the
collision frequency of the molecules in solution . If they
have "sticky" surfaces, either naturally or through a shear
induced conformational change (this point has not been clari-
fied) , low velocity gradients will promote aggregation. Ag-
gregation decreases x hence increases the apparent
length, since the f lov7-produced multiplet will align more
readily with the flow direction. At some critical shear
rate, the hydrodynamic forces are sufficiently strong to
cause rupture of the aggregates. This technique has been
suggested as a means of studying the magnitude of physical
forces involved in protein quaternary structures, aggregates
or isozymes (Reithel, 1963). The quantitative behavior
varies, depending on the particular protein, concentration,
temperature, pH and ion content of the medium. More elon-
gated molecules will aggregate more extensively, at lower

17
Figure 1-3. Apparent molecular length as a function ofvelocity gradient for a 2.5% HSA solution(after Joly, 1958)
.

18

19
shear rates and concentrations, than molecules of smaller as-
pect ratio. For fully native protein preparations, these
processes are usually irreversible but do not lead to precip-
itation. This is one of the indications that this process is
flow induced aggregation rather than unfolding of the protein
globule. However, for HSA which has been heated for 10 min
at 70°C prior to shearing, undoubtedly producing some degree
of denaturation, there are small but significant, reversible
shear induced changes in the apparent length (Joly, 1956).
This is an indication that shearing can unfold an at least
partially "loosened" protein coil.
Some interesting insight into the kind of conforma-
tional change that can occur when proteins are sheared in
solutions concentrated enough so that intermolecular inter-
actions are important is provided by the research of Go and
coworkers (Go et al., 1968a, b, c; Nakamura et al., 1968;
Kondo et al . , 1969a, b) . They prepared aqueous buffered
solutions of polypeptides: poly-L-glutamic acid, poly-L-
tyrosine and several copoly (L-glutamic acid-L-alanine) s of
0.1 to 0.2%. Each of these polypeptides undergoes a rather
sharp helix-coil transition upon increasing pH; pH 5.5 to
6.0 for poly-L-glu, pH 10.0 to 11.0 for poly-L-tyr and
pH 3.8 to 4.5 for the copolypeptides . Each was subjected to
mechanical forces in solution both by shaking and in circular
Couette flow in a viscometer. What was found for the homo-
polypeptides was that for pH below the helix-coil transition.

20
shear rates from 500 to 8000 s"^ (or unquantified mechanical
shaking) produced denaturation, meaning molecular coagulation
and precipitation. Close to the transition (within about
1 pH unit) this denaturation was reversible upon removing
the shearing force. No attempt was made to determine a lower
critical shear rate for the onset of this phenom'enon. Above
the transition pH, no permanent effect of shear rate on
structure or solubility was seen, the macromolecules behaving
as random coils. Under conditions where mechanical denatura-
tion occurred it was found, by optical rotatory dispersion
(ORD) , infrared spectroscopy and x-ray diffraction, that the
process of mechanical denaturation is one in which the a-
helical conformation changes to an intermolecular 3-struc-
ture. This means that there is a shear-induced rearrangement
of the hydrogen bonds. These same observations were also
made with the copolypeptides , with some additional interest-
ing features. Copoly (L-glu-L-ala) (19:1) followed the above
pattern; however, copolymers of lower glu:ala ratios dena-
tured (coagulated) but did not make a complete a > B trans-
formation. A (9:1) copolymer maintained some a-helical con-
tent in the shear-denatured product while a (4:1) copolymer
was still largely a-helical in the coagulated state. One
might reasonably speculate that the increased hydrophobic
character, due to increased alanine content, may alter the
nature of the shear-induced coagulation mechanism. Interac-
tions and structural changes of this sort may be responsible

21
for the unusual viscometric and denaturation properties ob-
served when concentrated (up to 40%) protein solutions are
subjected to flow experiences relevant to food processing
(Pradipasena and Rha, 1977). These observations may also he
relevant to the work of Riihimaki and Middleman (1974) who
have shown that increasing shear rate increases the rate of
gelation of gelatin (collagen fold formation) as well as
modifying the structure of the gel, formed in solutions of
concentration around 0.65% by weight gelatin.
There is evidence in the medical literature for
plasma protein denaturation in flow through extracorporeal
devices. If a blood-gas interface exists in the device, the
strong interm.olecular forces acting at the interface may
produce denaturation in the absence of flow; however, it
seems clear that there is also measurable denaturation, even
in the absence of a gas interface, which must be due to hy-
drodynamic effects (Lee et al., 1961a, b; Wright et al.,
1962; Dobell et al. , 1965). Sheared plasma seems to be toxic
in itself; furthermore, it interacts with platelets to delay
ADP-, epinephrine- or collagen-stimulated platelet aggrega-
tion (Wallace et al. , 1975). This indicates the potential
for a shear induced clotting deficiency- Since surfaces of
some sort are present in most flow situations, the investi-
gator must be aware of the separate, and perhaps synergistic,
hydrodynamic and surface effects. The importance of these
two types of effects seems to be well sorted out in studies

22
of flow induced erythrocyte damage. in the presence of solid
boundaries, shear stresses of 1.0 Pascal or less can cause
erythrocyte lysis (Bernstein et al., 1967), however, in the
absence of walls, the critical shear stress for lysis has
been estimated to be 6000 Pascals in liquid-into-liquid jet
experiments (Blackshear et al., 1966; Bernstein et al., 1967)
and 400 to 560 Pascals for lysis due to an ultrasonically
pulsating bubble (Rooney, 1970, 1972) or an ultrasonically
vibrating wire (Williams et al., 1970; Nyborg, 1973). One
method of distinguishing the two types of effects is by as-
certaining whether shear stress or shear rate determines the
magnitude of the flow induced effect (Nevaril et al., 1969).
The former is characteristic of a purely hydrodynamic effect,
while the latter may indicate that wall collision frequency
is most important . Clearly , the complex interaction between
flowing cells and artificial walls dominates the low stress
lysis. This should be kept in mind in studies of shear on
protein solutions, as well. Similar remarks apply with re-
gard to gas-fluid surfaces. Interactions here are also poor-
ly understood. Proteins are known to adsorb at gas-fluid in-
terfaces. In fact, measurements of the surface viscosity
(Scriven, 1960), of protein layers adsorbed at gas-fluid in-
terfaces, have been used to study protein-protein interac-
tions at these interfaces (Watterson et al., 1974) and to
learn something about the conformational flexibility of pro-
tein molecules (Joly, 1968).

23
Some parenthetical remarks about the use of ultra-
sonics in this sort of research are relevant here. Ultra-
sonic irradiation has been used to degrade all types of
macromolecules and cells. The vast literature on this has
been reviewed by El' Finer (1964) and Casale and Porter (1977)
and there are some interesting applications to biological
macromolecules . More to the point , noncavitational ultra-
sound has recently been applied to study mechanochemical ef-
fects in solutions of the enzyme malate dehydrogenase
(Rooney, 1977). The sonically generated viscous shear
stresses can be calculated for known geometries, although
they often have large spatial variations (Rooney, 1972).
This technique would seem to be potentially very useful to
study small amplitude, forced mechanical deformations.
Cavitational ultrasonic irradiation in aqueous solutions of
enzymes produces hydrogen and hydroxyl radicals which in turn
produce drastic chemical effects not directly of interest
here (Berezin et al., 1974a, 1975; Klibanov et al., 1974,
1976).
Returning to the discussion of flow induced structure
and activity changes in blood components, Charm and Wong
(1970a) have observed decreasing clottability of fibrinogen
with prolonged shear exposure. They applied very low values
of shear stress (as low as 0 . 1 Pascal) and found that the
decline in clottability correlates with the total shear
strain (shear rate x exposure time) experienced by the mole-

24
cule. They suggest that shear disruption of molecular sturc-
ture may be a mechanism for fibrinogen turnover in the cir-
culation. Unfortunately, the group at Rice University has
been unable to confirm these experimental results (Mclntire,
1977). There is however some other evidence that distortions
of protein structures, such as those produced by small mole-
cule binding, to higher energy states, has physiological sig-
nificance in protein turnover (Grisolia and Hood, 1972; Sil-
verstein and Grisolia, 1972)
.
Studies of the effects of plasma proteins on blood
rheology have shown that molecules such as fibrinogen, 6-
globulin and albumin interact with cells in flowing blood in
ways that suggest shear-induced conformational change (V7ells,
1964; Merrill et al., 1964). For example, fibrinogen is re-
sponsible for the yield stress shown by normal blood (Mer-
rill et al., 1964). Shear stresses at levels of about 40.0
Pascals have also been shown to irreversibly damage the endo-
thelial layer of blood vessels (Fry, 1968 , 1969; Caro et al.,
1969 ; Texon, 1968) .
Asakura and coworkers (Asakura et al., 1973, 1974a,
b; Adachi and Asakura, 1974; Ohnishi et al., 1974) have re-
ported on a very interesting effect of mechanical forces on
hemoglobins. They found that the oxy form of sickle hem.o-
globin (HbS) is readily denatured and precipitated by applica-
tion of mechanical forces. (Unfortunately, they did not
quantify this aspect.) They applied the mechanical forces

25
Figure 1-4. Kinetics of mechanical denaturation of (a) HbA,and (b) HbS (after Asakura et al., 1974a).

26

27
both by turbulent shaking and laminar mixing. The former was
more rapid, but laminar mixing without a large gas-fluid in-
terface still produced very significant denaturation . In-
creasing oxygen concentration in solution increased the de-
naturation, indicating an oxidative process, and suggesting
that turbulent shaking produced the fastest denaturation by
enhancing the oxygen supply as well as by creating gas-fluid
interface. Normal hemoglobin (HbA) denatures under the same
conditions but more slowly (see Figure 1-4). Deoxy HbS on
the other hand is extremely stable compared to other forms
of Hb. They found, by separating the subunits, that it is
the conformational instability of the 3^ subunit which is re-
sponsible for the mechanical instability of HbS. Binding of
molecules containing phosphate groups completely protected
HbS against mechanical disruption. They speculate that this
mechanical instability may be related to the increased inci-
dence of Heinz bodies (intraerythrocytic aggregations of de-
natured Hb) observed in erythrocytes obtained from patients
with sickle cell disease. Since intraerythrocytic denatura-
tion increases erythrocyte rigidity, the abnormal instability
of HbS may be of importance in the pathogenesis of vaso-oc-
clusive crisis. Rigid erythrocytes may be impeded in their
passage through smaller blood vessels; furthermore, erythro-
cyte deformation at some point in the circulation may ini-
tiate the formation of Heinz bodies in erythrocytes contain-
ing HbS.

An area of biophysical research where the role of
mechanochemistry has long been realized is the study of mus-
cle contraction. Muscle is a mechanochemical system which
normally functions to convert chemical energy into mechanical
energy- In muscle, the mechanical v/ork of contraction is
closely coupled with a chemical reaction (myosin' ATP-ase
catalyzed dephosphorylation of adenosine triphosphate (ATP) )
.
It is also possible to show that mechanical forces applied to
muscle fibers will alter the ATP-ase activity. It has been
demonstrated that the rate of cleavage of ATP by glycerinated
muscle fiber (Szent-Gyorgyi , 1949) is increased when the
fibers are stretched (Vorob'ev and Ganelina, 1963) or oscil-
lated or subjected to sonic vibrations (Ohnishi and Ohnishi,
1963). This effect was hypothesized previously by Vol'ken-
shtein (1962) in his theory of muscle contraction. It was
subsequently shown that larger strains will decrease the
ATP-ase activity (Vorob'ev, 1965). If myosin in solution is
subjected to increasing concentrations of urea or guanidine-
HCl (Brahms et al., 1962) or changing ionic strength (Tono-
mura et al., 1961), expansion of its molecular conformation
can be detected by physical chemical methods, such as visco-
metry. Each of these studies correlated ATP-ase activity
with molecular expansion and found, like the direct mechani-
cal studies, that activity first rose and then fell with ex-
tension. Myosin in solutions, subjected to shearing in a
Couette device (Vorob'ev and Kukhareva, 1965), in the pres-

29
ence of ATP, showed increasing rates of ATP cleavage (up to
120% increase over zero shear rates) with increasing shear
rate up to 4500 s""''; above which activity began to fall. In-
terestingly, if myosin is sheared in the absence of ATP it
loses activity; for example, a 25% loss in activity was ob-
served after 10 min at 3100 s"""" (Vorob'ev and Kukhareva,
1965). This suggests that small molecule binding can prevent
molecular deformation. Similar results were reported for
actomyosin.
Enzymes may be immobilized on deformable supports
(Berezin, 1974b, c; Klibanov, 1974b, 1976b). It has been
shown that trypsin and chymotrypsin show a completely rever-
sible activity loss of up to about 7 5% with about 1% macro-
scopic tensile strain of the support . If the deformation is
affine down to the molecular level, this corresponds to a
o
molecular deformation of only 0.5A. These results suggest
the possible importance of mechanical-chemical coupling
in vivo , not only in muscle, but in dynamic membranes as
well, for example in the movement of sperm flagella and
cilia, where a dynein ATP-ase activity is important (Gibbons
and Gibbons, 1976)
•
Biotechnological processing conditions may also lead
to changes in the structure and activity of proteins. Ex-
trusion of a protein solution through a finely porous mem-
brane causes a globular ^> fibrous transition with some
proteins (Kargin et al., I960). Less drastic treatment seems

30
to have significant effects as well. Increasing the wall
shear rate at the interior of a hollow fiber where a sacchar-
ide polymerizing enzyme is immobilized seems to alter both
the activity and specificity of the enzyme (Drew, 1976).
Shear inactivation of enzymes has been observed in stirred
tank reactors (Foster et al., 1976; Krishnaswamy and Tirrell,
1975) and in ultrafiltration apparatus (Charm and Lai, 1971;
Bowski and Rya, 1974). Charm and Wong (1970b) recognized
early the biotechnological significance of this phenomenon
and published a study which is probably most directly related
to the work of this dissertation. They subjected three en-
zyme preparations , catalase , carboxypeptidase and rennet to
shearing stresses from 0,02 to 2 . 6 Pascals in a concentric
cylinder viscometer. They reported irreversible inactivation
of all three enzymes under these conditions, the extent of
which correlated with the shear strain parameter discussed
previously in connection with their work on fibrinogen
(Charm and Wong, 1970a)
•
This completes our survey of results relevant to the
v;ork presented in this dissertation. The broad spectrum of
examples of, interest in, and applicability of research on
the effects of imposed mechanical forces on enzyme molecules
is quite apparent. However, the individual pieces of work
that have been done are rather isolated from one another.
There is no coinmon or generally accepted methodology. Little
in the way of general results on mechanism or critical stress

31
levels has emerged
.
The bulk of the work of this dissertation has been an
attempt to obtain this information for at least one enzyme
system, with the idea in mind that a thorough understanding
for one system may serve as a starting point from which to
build a more general understanding. The methodology and un-
derlying philosophy of this work has been to study the kine -
tics of enzyme catalyzed reactions occurring in media sub -
jected to uni form shear rate > When a rate-modifying effect
of shearing has been observed, ancillary methods have been
brought to bear to determine the molecular changes responsi-
ble for the effect. The enzyme which was the object of most
of the work reported herein was, urease ; selected primarily
because of the previous experience in our laboratory (Lewis
and Middleman, 1974; Bollmeier and Middleman, 1974; Boll-
meier, 1977) with it and the appropriate analytical tech-
niques. The next chapter discusses the relevant information
on urease catalysis and structure.

REFERENCES
K. Adachi and T. Asakura, Biochemistry, 13^, 4976 (1974).
R.E. Adam and B.H. Zimm, Polymer Preprints , 17 , (2), 870(1976).
T. Asakura, P.L. Agarwal, D.A. Relman, J. A. McCray, B.Chance, E. Schwartz, S. Friedman and B, Lubin,Nature, 244, 437 (1973).
T. Asakura, T. Ohnishi , S. Friedman and E. Schwartz,Proc. Nat. Acad. Sci. U.S., 71^, 1594 (1974)a.
T. Asakura, K. Adachi, M. Sono , S. Friedman and E. Schwartz,Biochem. Biophys . Res. Comm., 51_, 780 (1974)b.
E. Barbu and M. Joly, Bull. Soc . Chim. Biol., 32^, 116 (1950)
E. Barbu and M. Joly, Disc. Far. Soc, 13, 77 (1953).
I.V. Berezin, S.D. Varfolomeyer , A.M. Klibanov and K.
Martinek, FEBS Letters, 39^, 329 (1974)a.
I.V. Berezin, A.M. Klibanov, V.S, Gol'dmakher and
K. Martinek, Doklady Akad. Nauk S.S.S.R., 218 , 367
(1974)b.
I.V. Berezin, A.M. Klibanov and K. Martinek, Biochim.
Biophys. Acta, 364_, 193 (1974)c.
I.V. Berezin, A.M. Klibanov, A. A. Klyosov, K. Martinek
and V.K. Svedas, FEBS Letters, 49^, 325 (1975).
E.F. Bernstein, P.L. Blackshear and K.H. Keller, Am. J.
Surg., 114, 126 (1967).
R.B. Bird, O. Hassager, R.C. Armstrong and C.F. Curtiss,
Dynamics of Polymeric Liquids : Volume 2, Kinetic
Theory, Wiley, N.Y., 1977.
P.L. Blackshear, F.D. Dorman, J.H. Steinbach E.J. Mayback,
A. Singh and R.E. Collingham, Trans. Am. Soc. Art. Int
Org. , 12, 113 (1966)
.
32

33
J. P. Bollmeier and S. Middleman, Biotechnol. Bioena 16859 (1974) .
^" —
'
J. P. Bollmeier, Doctoral Dissertation, Univ. Mass.. in oreo1977. ^ ^"
R.D. Bowman and N. Davidson, Biopolymers, 11, 2601 (1972).
L. Bowski and D.Y. Ryu, Biotechnol. Bioeng., 16, 697 (1974).
R. Brahms, P. Jerzy and C. Kay, J. Biol. Chem. , 237, 3449(1962).
F. Bueche, J. Appl. Polymer Sci., 4_, 101 (1960).
E. Burgi and A.D. Hershey, J. Mol. Biol., 3, 458 (1961).
E. Burgi and A.D. Hershey, J. Mol. Biol., 4^, 313 (1962).
C.G. Caro, J.M. Fitz-Gerald and R.C. Schroter, Thromb.Diath. Haemorr. , Supp. 40 , Chapter 8, 1969.
A. Casale , R.S. Porter and J.F. Johnson, Rubber Chem.Technol., 44_, 534 (1971).
A. Casale and R.S. Porter, Polymer Reactions Induced byStress , to be published, 1977.
L.F. Cavalieri, J. Amer. Chem. Soc . , 79^, 5319 (1957).
L.F. Cavalieri and B.H. Rosenberg, J. Amer. Chem. Soc, 81,
5136 (1959).
R. Cerf, J. Phys. Radium, 19^, 122 (1958).
R. Cerf, Adv. Polymer Sci., 1, (1960).
R. Cerf, C.R. Acad. Sci. (Paris), C267 , 1112 (1968).
J.V. Champion and I.D. Davis, J. Chem. Phys., 52, 381 (1970).
S.E. Charm and B.L. Wong, Science, 170^, 466 (1970).
S.E. Charm and B.L. VJong, Biotechnol. Bioeng., 12, 1103
(1970).
S.E. Charm and C.J. Lai, Biotechnol. Bioeng., 13, 185 (1971).
S.E. Charm, The Fundamentals of Food Engineering ,Avi
,West-
port, Conn., 1963.

34
N. Citri, Adv. Enzymol., 37./ 397 (1973).
F.R. Cottrell, E.W. Merrill and K.A. Smith, J. Polymer SciA-2, 7, 1415 (1969).^-tyraer bci.
F.R. Cottrell, E.W.' Merrill and K.A. Smith, J. Polymer SciA-2, 8, 289 (1970) .
^ '
J.D. Culter, K.G. Mayhan , G.K. Patterson, A. A. Sarmasti andJ.L. Zakin, J. Appl. Polymer Sci., 16^, 3381 (1972).
P.F. Davison, Proc. Nat. Acad. Sci. U.S., 45^, 1510 (1959).
P.F. Davison, Nature, 185 , 918 (1960).
P.F, Davison, D. Freifelder, R. Hede and C. Levinthal,Proc. Nat. Acad. Sci. U.S., 47^, 1123 (1961).
A. R.C. Dobell, M. Mitri, R. Galva, E. Sarkozy and D.R.Murphy, Ann. Surg., 161 , 617 (1965).
P. Doty, B.B. McGill and S.A. Rice, Proc. Nat. Acad. Sci.U.S. , 4£, 423 (1958)
.
S. Drew, Virginia Polytechnic Institute, personal communica-tion, Blacksburg, Va., October, 1976.
I.E. El'piner, Ultrasound: Physical, Chemical and BiologicalEffects , Consultants Bureau, N.Y., 1964.
P.R. Foster, P. Dunhill and M.D. Lilly, Biotechnol, Bioeng.
,
18^, 545 (1976) .
D. Fry, Circulation Res., 22^, 165 (1968).
D. Fry, Circulation Res., 24^, 93 (1969).
B. H. Gibbons and J.R. Gibbons, Biochem. Biophys. Res. Comm.,
73_, 1 (1976).
Y. Go, Y. Kondo and K. Aoyama, Kobunshi Kagaku, 25^, 344
(1968)a.
Y. Go, Y. Kondo, E. Yam.abe and T. Okamura, Kobunshi Kagaku,
25_, 477 (1968)b.
Y. Go, Y. Kondo, E. Yamabe and T. Okamura, Kobunshi Kagaku,
25, 548 (1968)c.
9

35
S. Grisolia and W. Hood in Biochemical Regulatory Mechanismsin Eukaryotic Cells , E. Kun, ed . , p. 137, 1972.
'
R.E. Harrington and B.H. Zimra, J. Phys . Chem. , 69, 161(1965) .
R.E. Harrington, J. Polymer Sci . A-1, 4_, 489 (1966).
R.H. Haschemeyer and A.E.V. Haschemeyer, Proteins : A Guideto Study by Physical and Chemical Methods , Wiley,N.Y., 1973.
A.D. Hershey and E. Burgi, J. Mol. Biol., 2, 143 (1960).
A.D. Hershey, E. Goldberg, E. Burgi and L. Ingraham,J. Mol. Biol., 6, 230 (1963).
D.S. Hogness and J.R. Simmons, J. Mol. Biol., 9^, 411 (1964).
H. Janeschitz-Kriegl, Adv. Polymer Sci., 6, 170 (1969).
M. Joly, Bull. Soc. Chim. Biol., 30^, 404 (1948).
M. Joly, Bull. Soc. Chim. Biol., 31, 108 (1949).
M. Joly and E. Barbu, Bull. Soc. Chim. Biol., 31, 1642
(1949) .
M. Joly, Biochim. Biophys. Acta, 8, 134 (1952) a.
M. Joly, Biochim. Biophys. Acta, 8, 245 (1952)b.
M. Joly, Kolloid-Z., 126, 77 (1952)c.
M. Joly, Kolloid-Z., 1£5, 65 (1956).
M. Joly, Disc. Far. Soc, 25, 150 (1958).
M. Joly, Proc. 4th Infl. Cong. Rheol., vol. 4, p. 45 (1964)
M. Joly, Proc. 5th Int'l. Cong. Rheol., vol. 2, p. 191
(1968).
A.D. Kaiser, J. Mol. Biol., 4, 275 (1962).
V.A. Kargin, P.V. Kozlov, S. Ya. Mirlina and Z.A Kapralova,
Doklady Akad. Nauk S.S.S.R., 135, 1421 (1960).
Yu.I. Khurgin, D.S. Chernarski and S^Ef^J^^^^^^J^Sl^Xm.
Inst. org. Chem.,Frank" ed?, p. 42,
Symp., Pushchino-on-Oka, USSR, G. Frank, ea.,p
1967.

36
A.M. Klibanov, K. Martinek and I.V. Berezin, Biokhimiva 39878 (1974)a. . '
A.M. Klibanov, G. Samokhin , K. Martinek and I.V. Eerezin,Doklady Akad. Nauk S.S.S.R., 218^, 715 (1974)b.
A.M. Klibanov, N.F. Kazanskaya, N.I. Larionova, K. Martinekand I.V. Berezin, Bioorganika Khimiya, 2, 828 (1976)
S. Krishnaswamy and M. Tirrell, Univ. Mass., unpublishedobservations , 19 75
.
Y. Kondo, T. Ilayakawa and Y. Go, Kobunshi Kagaku, 26, 17(1969)a.
—Y. Kondo, T. Hayakawa and Y. Go, Kobunshi Kagaku, 26, 841
(1969)b.
L.G. Leal and C. Pings, California Institute of Technology,personal communication , Pasadena, January, 1977
.
W. H . Lee , D . Krumhaar , E.W. Fonkalsrud , 0 . A . Schjeide andJ.V. Maloney, Surgery, 5_0, 29 (1961)a.
W.H. Lee , D. Krumhaar, G. Derry , D. Sachs , S ,H. Lawrence,G.H.A. Clowes and J.V. Maloney, Surg. Forum, 12,200 (1961)b.
C. Levinthal and P.F. Davison, J. Mol. Biol., 3^, 674 (1961).
C. Levinthal and P.F. Davison, J. Phys. Chem. , 71, 464
(1967)
.
W. Lewis and S. Middleman, A. I. Ch. E. J., 20, 1012 (1974).
E.A. Lewis, M.S. DeBuysere and A.W. Rees, Biochemistry,
14 , 186 (1976) .
E.N. Lightfoot, Transport Phenomena and Living Systems ,
Wiley, N.Y. , 1974.
J.D. Mandell and A.D. Hershey, Anal. Biochem. , 1, 66 (1960).
L.V. Mclntire, Rice University, personal communication,
New York, February, 1977.
E.W. Merrill, W.G. Margetts , G.R. Cokelet, A. Britten,
E.W. Salzman, R.B. Pennell and M. ^^^l^^' ^^^^^
Int'l. Cong. Rheol-, vol. 4, p. 601 (1964).

37
K. Nakamura, S. Matsuzawa and Y. Go, Kobunshi Kagaku, 25,552 (1968). —
C.G. Nevaril, J.D. Heliums, CP. Alfrey and E.G. Lynch,A. I. Ch. E. J., 15, 707 (1969).
M. Noll, J.O. Thomas and R.D. Romberg, Science, 187 , 1203(1975).
S. Norrby, "Association and Shear-Dissociation of CarboxyTerminated Polystyrenes," Doctoral Dissertation,University of Uppsala, 1975.
W.L. Nyborg in Finite Amplitude Wave Effects in Fluids ,
L. Bj0rn0, ed. , IPC Science and Technology Press,Ltd., Surrey, England, p. 245, 1973.
T. Ohnishi and T. Ohnishi , Nature, 197, 184 (1963).
T. Ohnishi, T. Asakura, R.L. Pisani, K.J. Rosenbaum andH.L. Price, Red. Proc. , 33_, 509 (1974).
A. Peterlin, J. Chem. Phys., 39^, 229 (1963).
A. Peterlin, J. Polymer Sci. A-2, 5, 179 (1967).
P. Pradipasena and C. Rha, Massachusetts Institute of Tech-
nology, paper #B10 ,presented at meeting of Society
of Rheology, March 1, 1977.
A.W. Rees, M.S. DeBuysere and E.A. Lewis, Biochim. Biophys.
Acta, 36^, 97 (1974)
.
F.J. Reithel, Adv. Protein Chem., 18_, 123 (1963).
T.A. Riihimaki and S. Middleman, Macromol., 7, 675 (1974).
J. A. Rooney, Science, 169, 869 (1970).
J. A. Rooney, J. Acoust. Soc. Am., 52^, 1718 (1972).
J. A. Rooney, University of Maine, personal communication,
June, 1977.
H. S. Rosenkranz and A. Bendich, J. Am. Chem. Soc, 82, 3198
(1960).
P.E. Rouse, J. Chem. Phys., 21, 1272 (1953).
I. Rubenstein, C.A. Thomas and A.D. Hershey, Proc. Nat. Acad
Sci. U.S., 47, 1113 (1961).

38
L.E. Scriven, Chem. Eng. Sci., 12^, 98 (1960).
H.A. Scheraga, J.T. Edsall and J.O. Gadd, J. Chem. Phvs 191101 (1951) .
y , £2.'
R. Silverstein and S. Grisolia, Physiol. Chem. Phvs.. 437 (1972) .
^ '
M. Smoluchowski , Z. Physik. Chem,, 92^, 129 (1918).
T. Steitz, New. Sci., 38^, 568 (1968).
A. Szent-Gyorgyi , Bull. Biol., 96^, 140 (1949).
M. Texon, Proc. Ann. Conf. Med. Biol., 10, 49B.2 (1968).
C.A. Thomas, J. Gen. Physiol., 42^, 503 (1959).
Y. Tonamura, S. Tokura , K. Sekiya and K. Imamura, Arch.Biochem. Biophys., 95^, 229 (1961).
P.S. Virk, A. I. Ch. E. J., Tl, 625 (1975).
M.V. Volkenshtein, Doklady Akad. Nauk. S.S.S.R., 14i6, 184(1963) .
V.I. Vorob'ev and L. Sh. Ganelina, Tsitologiya, 5^, 672
(1963) .
V.I. Vorob'ev, Symposium on Biophysics of Muscle Contraction,Moscow, 1965.
V.I. Vorob'ev and L.V. Kukhareva, Doklady Akad. Nauk.
S.S.S.R. , 165, 435 (1965)
.
W.E.C. Wacker and T.L. Coombs, Ann. Rev. Biochem., 38^, 539
(1969).
H.W. Wallace, E.M. Liquori , T.P. Stein and H. Brooks,
Trans. Am. Soc . Art. Int. Org., 21_, 450 (1975).
J.G. Watterson, M.C. Schau and P.G. Waser, Biochim. Biophys,
Acta, 356, 133 (1974)
.
R.E. Wells, Proc. 4th Int'l. Cong. Rheol., vol. 4, p. 431
(1964) .
A.R. Williams, D.E. Hughes and W.L. Nyborg, Science, 169,
873 (1970).

39
E.S. Wright, E.Sarkozy, E.R. Harpur, A.R.C. Dobell andD. R. Murphy, J. Thor . Cardiovasc . Surg, , 44_, 550(1962).
H . Yamakawa , Modern Theory of Polymer Solutions , Harper-Row
,
N.Y., 1971.

CHAPTER II
BACKGROUND ON UREASE CATALYSIS AND STRUCTURE
The present state of understanding of the structure
and function of urease has evolved by a series of spasmodic
advances , dramatic breakthroughs followed by periods of rela
tively little advancement. In 1926, Sumner isolated from
jack beans ( Canavalia ensiformis ) , the first crystalline en-
zyme, urease, thereby establishing the now commonplace fact
that enzymes are chemically distinct protein molecules (Sum-
ner, 1926) . It was twelve years later that the molecular
weight of urease was reported to be 483,000 from ultracen-
trifugation measurements (Sumner et al., 1938). Most of the
work from 1935 to 1955 involved more or less routine studies
obtaining kinetic parameters and activation energies.
Sizer and coworkers studied the temperature depen-
dence of urease activity and demonstrated a variation of the
activation energy with temperature (Sizer, 1939, 1940; Sizer
and Tytell, 1941a, b) . As pointed out by Kistiakowsky and
Lumry (1949), their data could not support their claims for
a sharp transition between two activation energies at 23 ^C
but a gradually decreasing activation energy with increasing
temperature was confirmed by Hoare and Laidler (1950b). The
extensive kinetic studies done by Laidler and coworkers

41
(Laidler and Hoare, 1949 ; Hoare and Laidler, 1950a, b; V7all
and Laidler, 1953a, b) during that period contributed much
of the present information on the general features of urease
kinetics. They showed that urease is inhibited by substrate
urea at concentrations greater than about 250 mM (Laidler and
Hoare, 1949; Wall and Laidler, 1953a) and that urease is in-
hibited by product ammonia, with a noncompetitive inhibition
constant of 475 liters/mole (Hoare and Laidler, 1950a)
.
Their temperature studies (Hoare and Laidler, 1950b) showed
that the entropy of activation for formation of a urease-
urea-water complex is positive , suggesting that there is cin
increase in entropy in forming the activated state from the
initial reactants. This is consistent with a reversible
structural change in the enzyme molecule, in their words, an
"opening out" of the molecule and perhaps is related to the
substrate inactivation phenomenon. They reported Michaelis-
Menten parameters of V^^^^^ = 9 pmole/min/SU and K^^ = 4.0 mM,
which are in reasonable agreement with other more recently
reported values, for example: V^^^^ = 35 ymole/min/SU and
= 7 to 10 mM (Fishbein et al., 1965). (SU stands for
Sumner unit; 1 SU will produce 1.0 mg of ammonia from urea
in 5 minutes at pH 7.0 and 30<^C.) Variations among buffers
must be recognized. The only result of Laidler's group which
is not in agreement with more recent results is their report
of a rather sharp optimum in the pH-activity curve at pH 8.0
(Wall and Laidler, 1953a); a broad pH-activity optimum cen-

tered at pH 6.5 to 7.0 with only about 30% activity loss at
pH 8.5 seems to be more correct (Fishbein et al., 1965;
Tirrell and Bollmeier, unpublished)
.
Inactivation of urease by metal containing compounds
was reported early (Hellerman et al., 1943 ; Ambrose et al.,
1951; Evert, 1953; Shaw, 1954) and studied for more than
25 years (Gorin et al., 1962; Gorin and Chin, 1965; Hill and
Elliot, 1966; Hughes et al., 1969). These studies have shown
that inhibition by heavy metals (i.e., Cd, Co, Hg, Zn, Ag)
is noncompetitive and correlates well with metal sulfide in-
solubility. From this type of work, it has become clear that
urease has essential sulfhydryl groups . The species of mole-
cular weight 483,000 contains approximately 47 sulfhydryl
groups (Gorin and Chin, 1965) and various workers have esti-
mated that 4 to 8 of these are essential to activity, from
measurements of the stoichiometry of silver ion (Ambrose et
al., 1951) or mercurial inactivation (Gorin et al., 1962).
If the highest of these reported values is taken, this sug-
gests 8 subunits of molecular weight approximately 60,000.
While physical evidence exists for urease fragments of mole-
cular weight 17,000 (Hand, 1939), 75,000 (Bailey and Boulter,
1969), 83,000 (Reithel et al. , 1964) and 120,000 (Stewart
and Craig, 1966), there is no conclusive evidence for urease
activity in a species of molecular weight this low.
Improvements in Sumner's (1926) method for isolating
crystalline urease have been reported over the years (Dounce,

43
1941; Mamiya and Gorin, 1965), the former introducing a re-
crystallization procedure and the latter demonstrating the
improvements in yield and specific activity possibly by in-
cluding 0.25 M 3-mercaptoethanol (HOCH2CH2SH) in the crystal-
lization liquor. The specific activities (SA) of prepara-
tions used by workers have varied from about 10 SU/mg to
a maximum reported value of 500 SU/mg (Lynn, 1967), with a
generally accepted average maximum SA of 130-150 SU/mg
(Fishbein, 1969). The beneficial effect of 6-mercaptoethanol
is related to the importance of sulfhydryl groups for urease
activity. This thiol-reducing agent also affects the quater-
nary structure of urease in a manner which will be discussed
presently.
Creeth and Nichol (1960) first demonstrated that the
483,000 molecular weight species of urease aggregates. They
attributed this aggregation or oligomerization to intermole-
cular (or intermonomer as we shall henceforth refer to it)
disulfide bonding, due to the fact that the aggregates could
be dissociated by addition of thiol reducing sulfite ion.
In a very insightful and thorough exposition on the multiple
molecular forms of urease, Fishbein (1969) reviewed the work
of his own and other laboratories on the aggregates (he ap-
plied the term "isozymes") found in various urease prepara-
tions. His group (Fishbein, 1969) has identified more than
a dozen urease isozymes, up to a pentamer of 2,500,000 mole-
cular weight. Subsequent publications (Fishbein et al..

44
1969, 1970, 1971, 1973, 1976a), using combined analyses of
electrophoretic mobility and sedimentation coefficient, have
shown that high molecular v/eight species are spatially ex-
tended (as opposed to compact) oligomers of the 483,000 mol.
wt. species. The monomer was found to have a radius of
6.2 nm (Fishbein et al., 1970). In the presence' of 1 mM or
greater 3-mercaptoethanol (g-met), only the monomer exists;
if 3-met is removed by gel filtration or dialysis, a full
series of oligomers forms over the course of several hours.
In view of the dynamics of urease conformations, it is no
wonder that several groups have been led to invoke interact-
ing and interconvertible active sites to explain their own
kinetic data as well as variations between groups (see for
example: Kistiakowsky and Rosenburg, 1952; Lynn and Yankwich,
1962, 1964) .
A significant discovery came in 1967 (Blattler et
al., 1967) when it was found that solutions of urease in mix-
tures of glycerin or glycols and water (9/1) gave molecular
weights of a fully active (Contaxis and Reithel, 1971) urease
subunit of 240,000 molecular weight. This was confirmed by
Fishbein and coworkers (Fishbein et al., 1973, 1976) who also
demonstrated the existence of urease hemipolymers (odd inte-
gral multiples of 240,000 molecular weight) in glycerin
treated preparations. Figure II-l illustrates the formation
of these isozymes as well as some other conformational pos-
sibilities. It is clear that glycerol halves the molecular

45
Figure II-l. Schematic models of the urease isozymes.


47
weight of the 480,000 mol. wt. species by dissociating a non-
covalently bound interface. The nature of this interface is
not yet understood.
Urease was thought to be absolutely specific for urea
until 1965 when Fishbein and coworkers (Fishbein et al.,
1965; Fishbein and Carbone, 1965; Fishbein, 1969) showed that
hydroxy- and dihydroxyurea were also substrates. The chemis-
try and kinetic parameters of all these urease catalyzed re-
actions are given in Figure II-2. Fishbein and Carbone
(1965) also discovered the strong inhibiting action of the
related compounds , hydroxylamine and acetohydroxamic acid
.
During a study of urease denaturation , Fishbein et
al. {1976b) noted that inactivation at pH 7-10 by urea,
guanidine and heat was markedly delayed by EDTA (ethylene-
diaminetetraacetate) and other metal chelating agents. This
suggested that a metal ion, at the time thought to be adven-
titious, could catalyze thiol oxidation in the unfolding
urease protein, if not chelated. This evidence (Fishbein et
al., 1976b), as well as a closer examination of inhibition by
acetohydroxamic acid (Dixon et al. , 1975a, b) , known to be a
strong nickel chelater, led to the independent discovery by
these two groups that urease is a nickel metalloenzyme,the
first natural example. Six to eight nickel atoms (note con-
sistency with subunit estimations mentioned previously) per
483,000 molecular weight seem to be necessary for activity
and maintaining the native structure. Indications are (Fish-

48
Figure II-2. Chemistry of urease catalyzed reactions and thekinetic parameters
.

H,NCNHj + H,0 2NH + CO3
UREA *^rn~ ^mM
30 0>^n^ole/mln-su
Other substrates:
HOHNCNH^
hyd roxyurea
HOHN^NHOH
dihydroxyurea
- 0.03 H^ole/min-SU
K^- 12.5 mM— 0.24^mole/ mln-SU
inhibitor:
HOHNCCH^ acetohydroxamic acid

50
bein et al., 1976b; Nagarajan and Fishbein, 1977) that sulf-
hydryl and ionized carboxyl groups are involved in nickel co-
ordination.
To sum up, urease has been shown to be an enzyme of
catalytic and structural complexity. None of the crystal
structure or primary structure sequencing has been accom-
plished as yet (although several amino acid analyses have
been performed [Reithel and Robbins, 1967; Milton and Taylor,
1969]). This is a disadvantage in the present work, in that
it makes interpretation of any shear-induced conformational
changes more difficult. The large size, labile quaternary
structure, conformation-related effects such as substrate in-
hibition and ease of assay are other features which make
urease a very interesting and amenable protein for the
studies of enzyme mechanochemistry to be reported.

REFERENCES
[NOTE: The references for this chapter only are arrangedchronologically to facilitate following the histori-cal development of the present understanding ofurease catalysis and structure.]
J.B. Sumner, J, Biol. Chem. , 69_, 435 (1926).
J,B. Sumner, N. Gralen and I.B. Eriksson-Quensel , J. Biol.Chem. , 125, 37 (1938)
.
D.B. Hand, J. Am. Chem. Soc, 61^, 3180 (1939).
I.W. Sizer, J. Gen. Physiol., 22^, 719 (1939).
I.W. Sizer, J. Biol. Chem., 132 , 209 (1940).
I.W. Sizer and A. A. Tytell, J. Biol. Chem., 138_, 631 (1941)a
I.W. Sizer and A. A. Tytell, J. Bacterid., 41, 511 (1941)b.
A.L. Dounce, J. Biol. Chem., 140 , .307 (1941).
L. Hellerman, F.P. Chinard and V.R. Dietz, J. Biol. Chem.,
147 , 443 (1943) .
G.B. Kistiakowsky and R. Lumry, J. Am. Chem. Soc, 71, 2006
(1949) .
K.J. Laidler and J. P. Hoare, J. Am. Chem. Soc, 7]^, 2699
(1949) .
J. P. Hoare and K.J. Laidler, J. Am. Chem. Soc, 72_, 2487
(1950) a.
J. P. Hoare and K.J. Laidler, J. Am. Chem. Soc, 72^, 2489
(1950)b.
J.F. Ambrose, G.B. Kistiakowsky and A.G. Kridl, J. Am. Chem.
Soc. , 73^, 1232 (1951) .
G.B. Kistiakowsky and A.J. Rosenburg, J. Am. Chem. Soc, 74,
5020 (1952).

53
R.B. Hughes, S.A. Katz and S.E. Stubbins, Enzymoloqia 36332 (1969) .' -I' uyxd, JO,
R.L. Blakeley, E.G. Webb and B. Zerner, Biochemistrv 81984 (1969)a. ^' -'
R.L. Blakeley, J. A. Hinds, H.E. Kunze, E.G. Webb andB. Zerner, Biochemistry, 8, 1991 (1969)b.
C.J. Bailey and D. Boulter, Biochem. J., 113 , 669 (1969).
J.M. Milton and I.E. P. Taylor, Biochem. J., 113^, 678 (1969).
W.N. Fishbein, C.L. Spears and W. Scurzi, Nature, 223, 191(1969).
W.N. Fishbein, K. Nagarajan and W. Scurzi, J. Biol. Chem.
,
245, 5985 (1970).
G.C. Gontaxis and F.J. Reithel, J. Biol. Ghem. , 246, 677(1971).
W.N. Fishbein and K. Nagarajan, Arch. Biochem. Biophys.
,
144 , 700 (1971).
W.N. Fishbein, K. Nagarajan and W. Scurzi, J. Biol. Ghem.,248 , 7870 (1973)
.
»
N.E. Dixon, C. Gazzola, J.J. Walters, R.L, Blakeley andB. Zerner, J. Am. Chem. Sqc, 97, 4130 (1975)a.
N.E. Dixon, C. Gazzola, R.L. Blakeley and B. Zerner, J. Am.Chem. Soc, 97, 4131 (1975)b.
W.N. Fishbein, K. Nagarajan and W. Scurzi, Arch. Biochem.Biophys., 172, 726 (1976)a.
W.N. Fishbein, M.J. Smith, K. Nagarajan and W. Scurzi,Fed. Proc, 35, 1680 (1976)b.
K. Nagarajan and W.N. Fishbein, Fed. Proc, 36.' 2257 (1977).
See also two more comprehensive reviews on urease catalysisand structure not cited here:
J.E. Varner in The Enzymes , 2nd ed., vol. 4, p. 247, ed. by
P.D. Boyer, H. Lardy and K. Myrback, Academic Press,
N.Y., 1960.
F.J. Reithel in The Enzymes , 3rd ed., vol. 4, p. 1, ed. by
P.D. Boyer, Academic Press, N.Y., 1975.
CHAPTER IIIEXPERIMENTAL METHODS AND MATERIALS
A . Kinetic Experiments
The principal experiment on which this dissertation
is based is the measurement of the rate of the urease cata-
lyzed hydrolysis of urea in a (nearly) homogeneous steady
simple shear flow. The flow system used to generate the
shearing will be discussed first, followed by the manipula-
tive procedures for the basic kinetic experiments and finally
the variations used for the several additives and pretreat-
ments will be described.
1. Flow System
The instrumentation for the flow system was that of
the Epprecht Rheometer-Rheomat 15 manufactured by Contraves
A.G., Ltd., Zurich. It has been designed prim.arily for vis-
cosity measurement of Newtonian and nonNewtonian liquids. A
representation of this system is shown in Figure III-l. It
consists of two main components: (1) a measuring head mounted
on a stand, and (2) a control unit. A precision spring as-
sembly housed in the measuring head measured 3.88 x 10
newton-m of torque per scale division or 3.88 x lO'^ newton-m
54

55
Figure III-l. Sketch of Epprecht rheometer system.

56
WIBOI-IETER
Main PowerCable

. . 57
for full scale deflection. For Newtonian liquids, this
torque reading is directly proportional to the viscosity of
the liquid being sheared. The control unit contains the
electronics for speed control, including a 15 position fre-
quency selector which inputs 15 possible angular velocity
settings to the measuring head from 5.6 to 352 rpm.
The measuring head may be attached to any of a number
of rotational devices, which hold the sample, the most common
being cone and plate and concentric cylinder geometries. In
this work, a specially made, double concentric cylinder geo-
metry was used exclusively. This system, designated by the
letters MS-0, consists of a hollow rotor with holes in the
top to allow air to escape when the rotor is inserted into an
annular cup channel. A schematic diagram of this device is
shown in Figure III-2. With the MS-0 unit and the Epprecht
drive, shear rates from 27 to 1717 s ^ can be obtained with
shear stresses varying from 0.223 to 22.3 Pascals, the lat-
ter producing the largest measurable torque. It is simple
to show (Moore and Davies, 1956) that the shear stress dis-
tributions are identical in the inner and outer gaps, pro-
vided that R]_/R2 = "^^^ shear rates for Newtonian
fluids in the inner (yj,) and outer (yq) gaps are given by:

58
Figure III-2. Schematic diagram of MS-0 unit.

MEASURING COP
MEASURING BOB
- Rubber Joint
Ring Nut
LA
= 0.88^5 cm= 0,90 cm.- 1.00 cm1= 1.02 cm= 15.0 cm= 0.1 cm
(active height)(gap)

• • 60
where ^ is the angular velocity of the rotor, = r^/r^ and
= V^2- readily be calculated from Equations (1)
and (2), this provides a quite homogeneous simple shearing
flow throughout the entire reaction medium. The highest Q
attainable is well below the transition Reynolds number to a
secondary or turbulent flow, for the Newtonian fluids compos-
ing the reaction media in these experiments, aqueous buffers
(0,0013 Pascal-s.) and mixtures, of these with glycerin (up
to 0.012 Pascal-s.)
.
The stand supporting the measuring head is construct-
ed in such a way as to allow the MS-0 system to be fully tem-
perature controlled by immersion in a circulating water bath
(Haake) controlled to ±0.05°C. The MS-0 system has consider-
able thermal inertia. So, to ensure operation at the proper
temperature throughout the entire course of the reactions,
the viscometer (as we shall henceforth refer to the MS-0 sys-
tem) was allowed to sit in the water bath at the proper tem-
perature for 1 hour prior to initiating any kinetic run on a
given day. Throughout the day, when many consecutive experi-
ments were being done, the viscometer was removed from the
bath only briefly for sampling and cleaning.
2. Basic Procedure for ObtainingKinetic Data During Shearing
Urease was dissolved in buffer at a concentration to
give the desired zero shear activity. The exact procedure by

61
which this was accomplished varied somewhat according to the
urease preparation used. Three different commercial urease
preparations were used: (A) Fisher (no further designation,
found to have 0.4 SU/mg) ; (B) Sigma, Type III (a lyophil-
ized preparation, average about 5.0 SU/mg); and (C) Sigma,
Type C-3 (crystalline, 70.0 SU/mg). For ureases A and B the
proper amount of urease was simply weighed out from the bot-
tle (1.0 mg/ml for A; 0.05 mg/ml for B) and dissolved in buf-
fer. Urease A contained m.uch water insoluble material and
therefore was allowed to dissolve for 2 hours prior to start-
ing any kinetic runs. With urease C, the odor of mercaptan
was readily detectable in the bottle as supplied. Therefore,
it was dissolved and dialyzed against buffer prior to use.
To accomplish this, the urease was dissolved at up to
10 mg/ml, placed inside 1/4'* (pencil) dialysis tubing and
dialyzed 12 hours against 400 volumes of well stirred pure
buffer at room temperature. After 12 hours the exterior buf-
fer was changed to fresh buffer and the dialysis continued
for 12 more hours at 4®C. The stock urease solution was pre-
pared then from this dialyzed Urease C. Average concentra-
tion of the stock urease C solution was 0.01 mg/ml. Fifty
to one hundred milliliters of these stock urease solutions
would be prepared, depending on the number of experiments
planned in the next 24 to 48 hour period. All data was taken
with urease solutions not more than 4 8 hours old and main-
tained at 4°C while in solution. A separate 50 to 100 ml of

solution of urea in the same buffer was prepared. These
solutions were prepared twice as concentrated as the desired
initial reaction concentration. The nominal initial concen-
tration of urea at the start of each reaction after combin-
ing with urease solution was 10 mg/ml (160 mM) in experiments
with the Fisher urease and 5 mg/ml in all subsequent experi-
ments. All urea concentrations were determined using the
colorimetric method of Levine et al. (1969) summarized at the
end of this chapter.
To initiate a kinetic run, equal volumes (typically
5 ml of each) of the urease solution and the urea solution
were mixed and 5 ml of the mixture placed in the viscometer
cup. The viscometer was assembled in the water bath and con-
nected to the Epprecht drive unit which could then be
switched on at any of the 15 available shear rates. These
manipulations require approximately 20 seconds . This did not
produce a measurement lag, however, since the initial concen-
tration was determined after this assembly process was com-
plete. So, time = 0 was at the point of initial sampling and
the entire reaction was performed at constant shear rate.
The reaction was allowed to run for the required amount of
time. For experiments where a period of shearing was fol-
lowed by a period of zero shear, the shearing was stopped at
the required point but the viscometer left otherwise undis-
turbed until sampling. Sampling was performed by disassem-
bling the viscometer and withdrawing 1 to 2 ml from the an-

63
nular cup with a 25 cm #20 hypodermic needle and syringe.
One milliliter of this was then taken for the urea assay.
One sample only was taken from a given kinetic run; thus, one
experimental run gave one point in the concentration-time
space. This was done because multiple sampling in an indivi-
dual run gave poorer reproducibility and the sampling itself
seemed to produce deactivation, possibly because of the in-
troduction of oxygen by withdrawal and reinsertion of the
rotor.
Whenever fresh urease and urea solutions were pre-
pared, a zero shear kinetic curve was first obtained, in
exactly the same manner as described above except that the
viscometer drive was never switched on. Once an appropriate
urease activity level was established in the initial experi-
ments with a given grade of urease, subsequent solutions of
that grade urease were prepared to match the zero shear ac-
tivity. So, when a fresh urease solution was prepared, it
was first checked to see if it gave activity which matched
the established zero shear activity level for that series of
experiments. If not, the urease concentration was adjusted
appropriately. As noted above, all zero shear data was ob-
tained from reactions in the viscometer; but, several pre-
liminary experiments indicated that there was only a small
difference in apparent activity observed in the stainless
steel viscometer or in nitric acid washed glass.
After- each individual run, that is, after obtaining

64
each individual concentration-time data point, the viscometer
was rinsed three or four times with distilled water, brushed
with a wet nylon-bristled brush and rinsed several more
times. The viscometer was then dried and reimmersed in the
water bath. The effect of preexposing the clean viscometer
surface to a concentrated urease solution and then allowing
it to air dry prior to starting a run was investigated and no
effect on the resultant kinetic data was found.
3 . Variations
a. EDTA, In the series of experiments which in-
cluded EDTA in the reaction medium, both the urease and urea
solutions were made up to the appropriate concentration in
EDTA. It usually took about 1/2 hour for this amount of EDTA
to dissolve into the buffer and an additional 2 hours incuba-
tion time was allowed before starting any kinetic experi-
ments .
b. Chelex 100 . The urease and urea solutions were
prepared in the basic way. Each was then exposed to one-
fifth their volume of wet Chelex and slurried with a small
magnetic stirrer for 2 hours. After this period, the Chelex
was separated from the solution by filtration. This treat-
ment caused a pH rise from 7.0 to about 7.75; therefore, be-
fore kinetic experiments, pH was readjusted to 7 . 0 by addi-
tion of the required amount of citric acid monohydrate.
c. e-Mercaptoethanol. In the series of experiments

which included e-mercaptoeth..nol (6-met) in the reaction mix-
ture both the urease and urea solutions were made up to the
appropriate concentrations in 3-met. It was found they could
be used immediately without changing the results.
d. Parachloromercuribenzoate (PCMB) , For the ex-
periments including PCMB in the reaction mixture, the urease
solution was made somewhat more concentrated than usual (see
Chapter IV for exact concentration) . The amount of PCMB re-
quired to give the desired final concentration, after combin-
ing the urease and urea solution, was all dissolved in the
otherwise normally prepared urea solution. Thus, when the
two were mixed, the reaction of PCMB with urease proceeded
simultaneously with the urease-catalyzed urea hydrolysis.
e. Glycerin-buffer experiments . In this set of ex-
periments, the urease and urea solutions were prepared as
usual in aqueous buffer, except that: (1) 5 mM EDTA was in-
cluded in both, and (2) it was found necessary to use twice
the normal urease concentration to give the desired zero
shear rate constant. Only urease C was used. To each of
these solutions was added the same required proportion of
pure glycerin to give the desired final viscosity of the re-
action medium. These proportions were in the range 50 to
60% by volume. This gave viscosities of 0.0078 Pascal-s to
0.0120 Pascal-s as measured in the Epprecht MS-0 viscometer.
Since it was tedious to duplicate the viscosities of the
stock solutions of urease and urea, they were prepared in

66
sufficient quantities so that enough data could be taken
without replenishing the stock solutions. Still, no stock
solution more than 4 8 hours old was used for any kinetic ex-
periments. Otherwise, the procedure for obtaining kinetic
data in these media was exactly as described in Section 2.
A change in the calibration curve for the urea assay was
necessary.
li Mi scellaneous , A few kinetic experiments includ-
ing other additives were performed as well. These additives
were 8-hydroxyquinoline, glycine, N ,N- [bis (2-hydroxyethyl) ]
-
glycine (also known as bicine) , ferric nitrate and nickel
nitrate. These were all added to the reaction mixture in the
same manner as for EDTA, except that for the last two, the
solutions received Chelex treatment prior to the addition of
the metal salts. The desired amounts of these substances
were added to the stock solutions of urease and urea and al-
lowed to incubate for 2 hours prior to initiating the kinetic
experiments. Several attempts were made to run kinetic ex-
periments in the absence of oxygen. The entire viscometer,
necessary glassware and chemicals were placed in a glove bag
purged with high purity nitrogen bubbled through an alkaline
pyrogallol solution. This purge lasted 24 hours. The stock
urease and urea solutions v/ere bubbled with nitrogen for 1
hour each before starting the purge. Otherwise, the manipu-
lations were as usual.

67
B. Size Exclusion Chromatography Experiments
1 , General Considerations
In 1965, Siegel and Monty reported the separation of
the oligomeric urease isozymes by size exclusion chromato-
graphy on a Sephadex G-200 column. This finding has been
disputed by Fishbein (1969, 1976) who claims that urease ac-
tivity peaks occur only at smaller elution volumes than the
exclusion limit of the column . Blakeley et al . (1969 ) found
that urease was included in the pore volume of G-200 but did
not report molecular weight separation. It is not clear what
the resolution of this contradiction is. It is obvious, how-
ever, even from the paper of Siegel and Monty (1965) , that
resolution of the higher molecular weight isozymes is impos-
sible on a G-200 column. Fishbein and Nagarajan (1971) also
reported unsuccessful attempts to separate the isozymes on
Sepharose-6B. It was found in preliminary experiments of the
present work, that urease oligomers were not totally excluded
from a Sepharose-6B column, as indicated by the peak elution
volume of Blue Dextran 2000 marker, but that good molecular
weight resolution was not possible.
A system whose urease isozyme separating capabilities
had not previously been investigated and which seemed to have
potential were the CPG-10 porous glasses. This became the
size exclusion chromatography column packing for the separa-
tions to be described in this vork.

68
2. Column Set-up
Since the distribution of urease isozymes has a rela-
tively broad (discrete) distribution of molecular sizes it
seemed probable that several separations on consecutively
arranged columns would provide the best separation. Accord-
ingly, the following design was implemented. A column of
5.6 mm radius by 450 mm length was packed from the bottom
with the following CPG-10 porous glasses: (1) 100 mm, 2000 A;
(2) 100 mm, 1000 A; (3) 100 mm, 500 A; (4) 100 mm, 350 A;
Oand (5) 50 mm, 240 A. The manufacturer's specification is
that 80% of the pore volume be in pores with diameters with-
in ±10% of the nominal value. The minimum specific pore
volume is 0.8 cc/g and efficient packing produces a bulk den-
sity of the empty bed of 0.5 g/cc leading to a figure of 40%
of the coliimn bed volume available for separation. Surface
activity of these materials can cause adsorption. In this
work, the relatively high ionic strength of the buffer worked
against adsorption. To further reduce the possibility of ad-
sorption, the porous glasses were exposed overnight to a 1%
solution of Carbowax 20-M, before packing the column. Con-
tamination of the eluent with Carbowax was not detected after
the column was equilibrated with buffer. After every 30 or
so column runs the packed column was again exposed to the
Carbowax solution. The colximn was operated at ambient tem-
peratures between 23°C and 27°C. Gravity elution was em-

ployed; flow rates of 0.20 1.00 ml/min were used. The en-
tire bed volume (45 cm^) could be eluted in 2 hours. The
column was connected to a Beckman model 132 fraction collec-
tor. The dead volume of the tubing connecting the column and
fraction collector was 4.5 cm^
.
The packed column was calibrated by measuring the
peak elution positions of B-lactoglobulin (36,000), catalase
(240,000), urease monomer. Type C-3 (482,000; eluted with
5 mM B-met) and Blue Dextran 2000 (nominally 2,000,000).
Protein concentration in the eluent was determined by the
Lowry procedure (Lowry et al., 1951). The plot of K^^ =
(^elution " "^bed^ / (^exclusion " ^bed) ^s. molecular weight,
shown in Figure III-3 , is seen to be fairly linear.
Urease solutions for chromatography were prepared in
the same manner as for kinetic experiments, including pre-
dialysis for urease C. Concentrations were somewhat higher,
however, typically 10 mg/ml with urease B and 0.5 mg/ml with
urease C. One half milliliter of sample was applied to the
column in all cases. Fractions of either 0.5 or 1.0 ml were
collected and analyzed for protein concentration by the
method of Lowry et al. (1951) or by measuring optical density
at 278 nm. Analyses for urease activity were done according
to the method of Gorin and Chin (1966).

70
Figure III-3. Calibration curve for size exclusion chroma-tography colximn.


72
C . Spectroscopy
1. Circular Dichroism (CD)
CD spectra were recorded on a Cary 60 spectropolari-
meter with the model 61 CD attachment. The spectra are plot
ted as molar ellipticities [e] = e x MRW/10 x d x c vs. wave
length, where 6 is the measured ellipticity in degrees, MRW
is the mean residue molecular weight taken as 115 for urease
d is the pathlength of the cell in cm and c is the concentra
tion of the sample in g/ml. The buffer for the recording of
the CD spectra was not the usual but rather a 0.01 M Na2HP0^
KH2P0^ pH 7.0 buffer. In the case of sheared samples, the
buffer was exchanged by dialysis from the usual buffer used
for shearing to the 0.01 M phosphate buffer used for record-
ing of CD spectra.
2
.
Ultraviolet-visible
The measurements of optical density required for de-
termining the protein concentrations were done on a Beckman
Acta M-VI double-beam spectrophotometer.
3. Atomic Absorption
The analyses for metal contents reported were ob-
tained from the Microanalytical Laboratory. The results re-
ported are averages of duplicates analyzed by atomic absorp-
tion spectroscopy
.

73
4. Electron Paramagnetic Resonance (EP R)
A Varian E-9 x-band EPR spectrometer was used in an
attempt to record an EPR signal from urease or a nitrosyl de-
rivative. The urease sample was prepared as 25 mg/ml in
0. 050 M Tris-H2S04, pH 7 . 0 . No EPR signal was detected. Ex-
posure to gaseous NO, for 24 hours, of this sample, in an at-
tempt to form a paramagnetic nitrosyl derivative, also failed
to produce any detectable EPR signal.
D. Recipes , Materials and Suppliers
1. Buffer
The buffer used throughout all these experiments
except where otherwise noted was prepared in 2 liter batches
according to the following recipe: 85.7824 g of Na2HP04 ' 7H20;
8,404 g of citric acid monohydrate; make up to 2000 ml with
distilled water; adjust pH to 7.00±0.05 if necessary with
small amount of citric acid monohydrate. This buffer is
variously referred to throughout this dissertation as the
"usual" buffer, the "basic" buffer or the "0.16 M phosphate"
buffer.
2. Analysis for Urea
A modification of the method of Levine et al. (1961)
was used: (1) take 1 ml sample of reaction mixture; (2) add
4 ml trichloroacetic acid solution (10% w/v) ; (3) add 1 ml

74
modified Ehrlich reagent (see below for recipe); (4) filter
through Whatman #1 filter paper (only necessary for sample
containing greater than 0.1 mg/ml protein); (5) adjust Leitz
Model M Photometer to read 100% transmittance at 415 nm
through a blank containing 1 ml distilled water treated as
in steps (l)-(4); (6) measure % transmittance of sample and
obtain urea concentration from calibration curve. Calibra-
tion curve is shown in Figure III-4. Modified Ehrlich re-
agent: 5 g of paradimethylaminobenzaldehyde, 20 ml of con-
centrated HCl, 80 ml distilled water.
3 . Lowry Procedure(Lowry et al., 1951)
Reagents; 1. 3.0% Na2C03 in 0.1 M NaOH; 2_. Alkaline
Cooper Reagent. Add 1.0 ml 2.0% CuS04'5H20 and 1.0 ml 4,0%
NaK Tartrate to 50 ml volumetric flask. Make up to 50 ml
with Reagent 3_. Folin-Phenol Reagent. Dilute 1 part
with 2 parts distilled water immediately before use. Proce-
dure: To 0.5 ml sample, add 5 ml of Reagent 2^. Mix, let
stand 10 minutes. Add 0.5 ml Reagent 3_ and rapidly mix. Af-
ter 30 minutes, measure absorbance at 660 nm relative to
0.5 ml pure buffer treated as above. Obtain protein concen-
tration from calibration curve. Calibration curve was
linear for urease from 0.0 to 0.5 mg/ml; equation of calibra-
tion line: [urease] in mg/ml ='1.15 AggQ.

75
Figure III-4, Calibration curve for urea analysis.

76

77
4, Gorin and Chin Assay for UreaseActivity (Gorin and Chin, 1966)
The following modification of the Gorin and Chin
procedure was used to analyze for urease activity in frac-
tions from exclusion chromatography and other samples. To
1.0 ml of sample, add 0 . 5 ml 1 mTl EDTA (in pH 9.0, 0.1 M
Tris-HCl buffer). Let stand at least 2 hours* Add 0.5 ml
urea solution (6% by weight in above Tris buffer) . After
exactly 5.0 minutes, the reaction is stopped by addition of
1.0 ml of 0.2 M HCl. The excess HCl is then back titrated
with 0.05 M NaOH to the methyl orange endpoint. Vg is the
volume of NaOH (in ml) required. One ml of pure buffer is
treated in the same way. Vj_^ is the volume (in ml) of NaOH
required for the blank.
Activity (in SU) = 14 (Vj^-V^) [NaOH] (in moles/1) (3)
Accurate measurement of Vg and Vj^ is required; a 5.00 ml
burette was employed. Accurate knowledge of [NaOH] is also
required to get accurate absolute numbers for the urease ac-
tivity. Most often the present work required only relative
activities, as in the assay of chromatographic fractions.
When this was the case, Vb-Vg was taken as a measure of the
relative activity, and absolute activities were not deter-
mined .

78
5. Sources of Materials
Material Source
Water
Urease A
Urease B
Urease C
Urea
Na2HP04 •7H2O
Citric Acid,monohydrate
Ethylenediaminetetraacetate , disodium (EDTA)
Chelex 100, •
sodium form
3-Mercaptoethanol
p-Chloromercuribenzoicacid (PCMB)
Glycerin
8-Hydroxyquinoline
Glycine
Ferric Nitrate
Distilled, Deionized with Barnstead Standard BlueDemineralizing Column, resis-tance 1 megaohm at issue.
Fisher Scientific Co.(no other designation)
Sigma Chemical Co., Type III(lot #105C-7350)
Sigma Chemical Co., Type C-3(lot #95C-7110)
Fisher Scientific Co.Certified ACS (lot #754710)
Fisher Scientific Co.Certified ACS (several lots)
Fisher Scientific Co.Certified ACS (lot #731388)
Fisher Scientific Co
.
Certified ACS (lot #722800)
Bio-Rad Laboratories , Inc
.
Analytical grade (lot #13857)
Sigma Chemical Co., Type I
(lot #35C-0104-1)
Sigma Chemical Co,
(lot #17B-5460)
Fisher Scientific Co.Laboratory grade (lot #763894)
Sigma Chemical Co.(lot #95C-0045)
Sigma Chemical Co.
Fisher Scientific Co.Certified ACS Clot #744569)

79
Material
Nickel Nitrate
Porous Glasses
,
80/120 mesh
Blue Dextran 2000
KH2PO4
Trichloroacetic acid,10% w/v solution
p-Dimethylaminobenz aldehyde
HCl, H2SO4 (concentrated)
Na2C03
NaOH
CUS04-5H20
NaK Tartrate
Folin-Phenol Reagent
Tris (hydroxymethyl) amino-methane (Tris)
Methyl Orange, 0.1%
2 , 3-Dimercaptopropanol(British Anti-Lewisite; BAL)
1 , 2-Ethanedithiol
Dialysis tubing
Carbowax 20-M(polyethylene oxide)
Source
Matheson, Coleman and Bell
Electrg-Nucleonics, Inc.( 240 A - lot #P1040)( 350 A - lot #L1039)( 500 A - lot #156)(1000 I - lot unknown)(2000 A - lot #147)
Pharmacia (lot #6567)
Fisher Scientific Co.
Fisher Scientific Co.(several lots)
Fisher Scientific Co.Certified ACS (several lots)
Fisher Scientific Co.Reagent Grade (several lots)
Baker Chemical Co.(lot #38231)
Fisher Scientific Co.Certified ACS (lot #752823)
Fisher Scientific Co.
Fisher Scientific Co.
Will Corporation
Sigma Chemical Co.(several lots)
Fisher Scientific Co.(lot #722347)
Sigma Chemical Co.
Sigma Chemical Co.
Arthur H. Thomas Co.
Union Carbide Corp.

REFERENCES
R.L. Blakeley, J. A. Hinds, H.E, Kunze, E.G. Webb andB. Zerner, Biochemistry, 1991 (1969).
W.N. Fishbein, Ann, N.Y. Acad. Sci., 147 , 857 (1969).
W.N. Fishbein and K. Nagarajan, Arch, Biochem. Biophys., 144,700 (1971).
W.N , Fishbein , personal communication , July 1976 .
G. Gorin and C.-C. Chin, Anal. Biochem., 17_, 49 (1969).
J.M. Levine , R. Leon and F. Steigmann, Clin, Chem. , 7_, 488(1961)
.
O.H. Lowry, N.J. Rosebrough, A.L. Farr and R. Randall,J. Biol. Chem., 193 , 265 (1951).
F. Moore and L.J. Davies , Trans. Brit. Ceram, Soc, 55_, 313
(1956).
L.M. Siegel and K,J, Monty, Biochem. Biophys. Res. Comm.,
19, 499 (1965).
80

CHAPTER IV
RESULTS ON UREASE
A. Kinetic Results in Aqueous Buffers
The preliminary experimental work of this disserta-
tion, done in an effort to see what effects may be possible,
was a study of the kinetics of urea hydrolysis, in the visco-
meter, catalyzed by the crude urease preparation , urease A.
In Figure IV-1, a comparison of data obtained at zero shear
and at various shear rates is seen. The rate of urea hydro-
lysis at zero shear is apparently first order in urea concen-
tration. This may seem surprising since the initial concen-
tration, 160 mM, is well above the concentration for half-
maximal reaction rate, K^, the Michaelis constant. Reported
values of K " range from 4 to 10 mM (see Chapter II). Them ^
reason for this apparent first order behavior is product in-
hibition as will be conclusively demonstrated in Chapter V.
The apparent first order rate constant is still directly pro-
portional to urease activity. The data of Figure IV-1 show
that urease is inactivated during exposure to shearing forces
and that this inactivation occurs more rapidly with increas-
ing shear rate. The first question these data brought to
mind was, "Is this effect reversible?" So, a series of ex-
81

gure IV-1. Urea concentration as a function of time undervarying rates of shear.

83

84
periments was performed in which the shearing was stopped at
various points in time and the remaining zero shear activity
observed. These data are shown in Figure IV-2 where it is
seen that apparent first order kinetics are resumed in all
cases upon stopping the shearing, with a slope greater than
the instantaneous slope of the data at the point in time
where the shearing was stopped but less than the slope of the
data from urease with no shear history. This means that
there is both reversible and irreversible inactivation due
to shearing. If the ratio of the slope of the data obtained
after stopping the shearing to the slope of the data from
urease with no shear history is taken, it is found that all
the data at different shear rates correlate with the product
of shear rate x exposure time, a total shear strain. This
correlation of the shear inactivation data is shown in Figure
IV-3, curve a. Note that this is the same correlation used
by Charm and Wong (1970a, b) for several other biologically
active proteins, but their data were obtained from a differ-
ent type of experiment. In their experiments, the enzyme
preparations were subjected to shearing in the absence of
substrate and subsequently assayed for activity . Here, the
activity is observed during shearing . If that type of Charm-
style experiment is performed with this urease A, it is seen
in Figure IV-3, curve b, that the same correlation works but
that activity is lost much less rapidly.
The next piece of information uncovered is shown in

85
Figure IV-2. Urea concentration as a function of time atzero shear after variable periods of steadyshear.

86

' I-
87
Figure IV-3. Percent urease activity after shearing as afunction of shear strain in the (a) presenceand (b) absence of urea. Urease A.

88

89
Figure IV-4 . Urea concentration as a function of time in thepresence of 1.0 mM EDTA. - zero shear;©- 1717 s~^; 288 s~l. Urease A.

90

91
Figure IV-4. The shear inactivation of urease is drastically
reduced by the inclusion in the reaction medium of 1.0 mM
EDTA.
These experiments establish some general features of
the effect of shearing on the kinetics of the urease cata-
lyzed hydrolysis of urea and were the subject of a prelimi-
nary communication (Tirrell and Middleman, 1975). Study of
the behavior of some more pure .urease preparations was then
undertaken in order to elucidate the molecular basis of this
phenomenon of shear inactivation, and to try to understand
the protective effect of EDTA, Figure IV-5 shows the data
on kinetics during and after shear obtained with urease B
and Figure IV-6 shows the data obtained with the best com-
mercially available grade of urease , urease C • Again , a
shear rate dependent inactivation is seen . The inactivation
seems to be less drastic and less rapid with urease B than
with the other two preparations. The inactivation of ureases
B and C seems to be less reversible than that of urease A.
In fact, no reversibility at all seems to be the most accu-
rate assessment of the data of Figure IV-6b, taken at 288 s
Some slight reversibility after shearing at 1717 s"^ is seen
for urease C in Figure IV-6a. Since urease C, a crystalline
urease as supplied, is the best commercially available grade
of urease, roughly 50 to 75% pure, most of the remainder of
the results to be reported in this dissertation, aimed at a
molecular understanding of the shear inactivation phenomenon.

92
Figure IV-5. Urea concentration as a function of time duringand after variable periods of steady shear
.
Urease B.

93
Time (min)

94
Figure IV-6, Urea concentration as a function of time duringand after variable periods of steady shear
.
Urease C,

Time (min)

unless otherwise specified, have utilized urease
The first step in this mechanistic investigation was
to examine the influence of EDTA on urease C and its shear
inactivation behavior. Some zero shear rate kinetic data in
the presence and absence of EDTA is shown in Figure IV-7.
EDTA is seen to have an activating effect, roughly 30% rate
enhancement, in the buffer system used in this work. When
shearing forces are applied, the data of Figure IV-8 are ob-
tained. Slight inactivation due to shearing is seen at
1717 s , which seems to be completely reversible, within ex-
perimental error, upon removal of the shearing. No inactiva -
tion at all is seen at 288 s Note the correspondence be-
tween these results and the relative amounts of reversible
inactivation seen in the data of Figure IV-6. It seems that
in the presence of EDTA, the irreversible inactivation is fil-
tered out of the total inactivation seen in Figure IV-6,
leaving only the reversible component.
If EDTA reduces the shear inactivation, it means one
of two things: (1) EDTA binds directly to urease to protect
its structure from the hydrodynamic forces in some way, or
(2) metal ions play some role in the apparent shear inactiva-
tion and EDTA, a well known metal chelating agent, sequesters
them. Number (1), EDTA-protein binding, is not without pre-
cedent; for example, EDTA is known to bind to fibrinogen
(Bithell, 1964; Blomback et al., 1966). Number (2) has two
conceivable variations: (a) A metal atom could be responsible

97
Figure IV-7 . Zero shear urea hydrolysis by urease with andwithout EDTA.


99
Figure IV-8. Urea concentration as a function of time in thepresence of 1.0 mM EDTA. - no shear;®- 1717 s"l; - stop shear. Urease C.
4


101
for physically holding together some parts of the urease
quaternary structure. EDTA may bind the metal more strongly
than urease, remove the metal and break the urease structure
down to smaller less shear susceptible species, although
without greatly altering the urease activity. (b) Metal ions
in solution act upon the urease molecules, whose structure is
deformed by shearing, in such a way to greatly enhance the
apparent shear inactivation. Alternative (a) may be rejected
on the basis of previously known evidence. Many chemical and
physical-chemical studies have examined urease in the pres-
ence and absence of EDTA. No changes in structure correlat-
ing with the presence of EDTA in the urease solution can be
detected. Further evidence for this will be mentioned in
section B of this chapter. To distinguish between possibili-
ties (1) and (2b) , experiments were performed where the
urease preparations were exposed to a chelating resin, Chelex
100, prior to shearing. Chelex 100 is essentially one half
of the EDTA molecule immobilized on polystyrene beads. These
beads could then easily be separated from the urease, except
for that portion of the urease which may be bound to the
resin. Figure IV-9 shows zero shear kinetic data obtained
before and after treatment with Chelex. Comparable enhance-
ment in rate to that seen with EDTA is noted, 22% in this
case, strongly indicating that no significant fraction of the
urease has been removed from the solution with the Chelex.
Furthermore, when the Chelex-pretreated urease was subjected

102
Figure IV-9. Zero shear urea hydrolysis by urease before andafter Chelex treatment.


104
to shearing, kinetic data is obtained which is qualitatively
identical to that obtained in the presence of EDTA (Figure
IV-10; compare with Figure IV-8). Slight inactivation due to
shearing is seen at 1717 s'^; no inactivation at all is seen
at 28 8 s ^. Kinetic data with and without applied shearing
forces, after Chelex treatment, have also been obtained with
urease B as shown in Figure IV-11. Similar results are seen,
with reversibility indicated as- well. Taken together, the
data of Figures IV-9 and IV-10 clearly indicate that metal
ions play a role in the shear inactivation of urease. A fur-
ther implication is that the metal species responsible is an
adventitious one, coming from the water or buffer salts or
loosely bound (easily removed by chelating agent) to the pro-
tein, rather than being an essential metal atom or one re-
leased during the shearing process, since it is not necessary
to have the chelating moiety present during shearing to pro-
vide protection.
The speculation on the possible role of metal ions
focused on their potential for catalyzing the oxidation of
sulfhydryl groups in proteins (Patai, 1974; Meens and Feeney,
1971). Elsewhere, independently, remarkably similar specula-
tions were being made. Recall from Chapter II that while
this work was in progress, Fishbein et al. (1976) reported
that inactivation of urease at pH 7 to 10 by concentrated
urea, guanidine and heat was markedly delayed by EDTA and
other chelating agents. He tentatively attributes this to a

105
Figure IV-10. Urea concentration as a function of time afterChelex treatment. 5?J^o shear;
1717 s-1; - 288 s"""". Urease C.


107
Figure IV-11. Urea concentration as a function of time afterChelex treatment. -k- no shear; © - 1717 s"-'-;
288 s"l; - stop shear. Urease B.

108
1 I 1 I,
I L-
0 60 120 180 240
Time [mini

109
metal ion catalyzed oxidation of an essential thiol group (s)
rendered more labile when the protein unfolds due to the ac-
tion of the denaturing agent (Fishbein, 1976), To test
whether shear promoted, metal ion catalyzed thiol oxidation
could be related to the shear inactivation phenomenon, the
kinetic reactions in the viscometer were performed in the
presence of a thiol reducing agent, 6-mercaptoethanol
(HOCH2CH2SH) , The results of these experiments are shown in
Figure IV-12. B-Mercaptoethanol is seen to have an enhancing
effect on the zero shear activity of urease under the condi-
tions of these experiments. When the maximum hydrodynamic
shearing force possible in the purely aqueous buffer is ap-
plied at 1717 s in the presence of 1.0 or 0.1 mM g-mercap-
toethanol, the kinetics are unaltered from the zero shear
kinetics. If the 3-met concentration is further reduced to
0.001 mM, inactivation similar in character to that of
Figures IV-2, IV-5, and IV-6 is seen.
There is a qualitative difference in the protection
of urease from shearing inactivation afforded by EDTA and
B-met. This is that at 1717 s"^, with EDTA there is small,
totally reversible inactivation whereas with 3-met there is
no inactivation at all. This could be due to the fact that,
as a thiol reducing agent, 6-met not only protects against
metal ion catalyzed thiol oxidation but also disaggregates
oligomeric urease isozymes to the 482,000 molecular weight
monomer. This species, being smaller, is probably less shear

110
Figure IV-12. Urea concentration as a function of time withvarious levels of B-mercaptoethanol
.
zero shear, no additive; O- zero shear,1 mM B-mercaptoethanol; ®- 1717 s"l, 1 mMB-mercaptoethanol; *- 1717 s"l, 0.1 mM B-mer-captoethanol; 1717 s~l, stop shear, 0.001mM B-mercaptoethanol; ^- 1717 s-1, stop shear,no additive (data of Figure IV- 6 reproduced forcomparison)
.
4.

oOlO

112
susceptible and therefore the protective effect observed in
these experiments may be partially or totally due to the ef-
fect of 6-met on urease molecular size. It seems likely that
this could at least explain the qualitative difference in the
effects of EDTA and g-met.
So, the 3-met protection observed is consistent with
and some positive evidence for the shear inactivation being
related to a shear promoted metal ion catalyzed thiol oxida-
tion. Hov/ever, because of its effect on molecular size, the
evidence is not clear-cut. Some direct evidence of a shear
promoted reaction with urease thiol group (s) was sought. To
accomplish this, the kinetics, during shear, of Chelex pre-
treated urease were studied in the presence of p-chloro-
mercuribenzoate (PCMB) . PCMB reacts very specifically with
sulfhydryl groups, although with widely varying rates depend-
ing on the reaction conditions and the location of the sulf-
hydryl group (s) within the protein structure (Means and
Feeney, 1971). Figure IV-13 shows the results of the reac-
tions in the presence of PCMB. Note that the metal ion ef-
fect has been eliminated by Chelex pretreatment ;also the
amount of urease has been increased somewhat over the usual
level for kinetic runs to provide a convenient activity level
for these deactivation experiments. It is seen that in the
absence of PCMB, shearing at 1717 s"^ produces about 13% in-
activation whereas in the presence of 1 yM PCMB, shearing at
1717 s-1 produces about 3 8% inactivation. Shearing forces of

113
Figure IV-13. Urea concentration as a function of time,effect of PCMB. O - zero shear, no additive;®- 1717 s"^, no additive; zero shear,1 yM PCMB; @- 1717 s"l, 1 yM PCMB; 288 s"-'-,
1 yM PCMB.

114

115
this magnitude therefore are seen to be roughly three times
as effective in promoting inactivation of urease in the pres -
ence of 1 pM PCMB as in its absence. Even at 288 s"-"-, PCMB
seems to produce markedly enhanced shear inactivation.
It is worth digressing slightly here to discuss the
inactivation of urease by PCMB in the absence of shearing.
Figure IV-14 shows some data previously published by Gorin
et al. (1962) on the stoichiometry of the reaction of PCMB
with urease. Their data was obtained via the method of
Boyer (1954). They report no results on the kinetics of the
mercurial-urease reaction but recorded the final activity
vs. [PCMB] / [urease] values after 3 hours reaction. In con-
trast, the data of Figure IV-13 were obtained in the pres-
ence of saturating concentrations of substrate. The value
of 60% remaining activity at [PCMB] / [urease] = 30 agrees
very well with the data of Gorin et al. (1962) but here, the
mercurial-urease reaction seems to be quite fast in the pres
ence of urea. Similarly, under the conditions of these ex-
periments, [PCMB] /[urease] = 60 produced complete inactiva-
tion of urease within 5 minutes. This enhancement of the
rate of the PCMB-urease reaction by urea may be related to
the substrate inhibition phenomenon discussed earlier in
Chapter II.
In any case, the data of Figure IV-13 provide deci-
sive evidence that a shear-promoted reaction of a low mole-
cular weight moiety and urease thiol group (s) takes place.

116
Figure IV-14. Urease activity remaining vs. PCMB/urease molarratio (after Gorin et al., 1962).

117

118
It is thus quite clear, from all the data presented so far,
that a shear-promoted metal ion catalyzed oxidation is re-
sponsible for the irreversible inactivation of urease under
shearing conditions. A further bit of evidence to support
this conclusion was sought by attempting to perform the kine-
tic reactions in shear in the absence of oxygen in the normal
buffer medium, without additives, the idea being that oxygen
exclusion may prevent thiol oxidation. Figure IV-15 shows
the results of a typical experiment of this sort. It is
seen that reducing the oxygen level has not been successful
in preventing inactivation during shearing. It is not cer-
tain what the oxygen level was in this experiment since no
convenient oxygen measuring technique was available. It is
known that very low levels of oxygen will support metal ion
catalyzed thiol oxidation (Patai, 1974). In the work of
Fishbein et al. (1976) similar attempts at excluding oxygen
were unsuccessful; the metal ion catalyzed thiol oxidation
persisted and residual oxygen could be detected (Fishbein,
1976). So, it is felt that this result, while disappointing,
does not argue convincingly against the mechanism of irrever-
sible shear inactivation being a shear promoted metal ion
catalyzed thiol oxidation.
Attention was next directed toward ascertaining what
metal ion was responsible, under the conditions of these ex-
periments. The field can be rapidly narrowed down by examin-
ing the potential of various metal ions for thiol oxidation

119
Figure IV-15 . Urea concentration as a function of time innitrogen atmosphere . - zero shear;©- 1717 s"l. Urease B.


121
TABLE IV-
1
RESULTS OF ATOMIC ABSORPTION ANALYSES
SAMPLE • Fe • Ni
Urease/buffer 15.6 22.6 pM(0.129 mg/ml)
Urease/buffer (treated)*^ 9.8 pM 19.6 vjM
(0.126 mg/ml)
Buffer alone (treated)** 8.4 pM 16.5 pM
*Treated means exposed to Chelex 100.
"^Note that ANi2_3 >12 atoms Ni/482 ,000 daltons.

122
(Patai, 1974). The most potent metal ion catalysts for thiol
oxidation are Cu^"^ and Fe^"^; Ni^"^ is less than one-half as2+ 2 +potent and Co a bit less than Ni ; many other ions, while
showing dafinite activity, are all an order of magnitude or
more weaker than these. Atomic absorption spectroscopic
analyses for Cu, Fe and Ni found no detectable Cu but sub-
stantial amounts of Fe and Ni as shown in Table 1. Most of
this metal content comes from the buffer salts and water, not
from the urease; the nickel bound by the urease is a little
more than twice the iron apparently bound by urease. To de-
termine which of these two metal ions is responsible for the
shear promoted metal ion catalyzed thiol oxidation, experi-
ments were performed in which all reaction ingredients and
buffers were pretreated with Chelex, previously shown to
eliminate the irreversible inactivation. Various levels of
the nitrate salts of Fe^"*" and Ni^"^ were then added to the re-
action media. The kinetics of urea hydrolysis in and out of
shear were then observed. Figure IV-16 shows the results of
addition of 5 pM Fe^"*", Compare Figures IV-6a, IV-10, and
IV-16. The irreversible inactivation seen in IV-6a, is
eliminated by Chelex treatment in IV-10 and is nearly repro-
duced by adding in 5 pM Fe^^ in IV-16. The effects of vari-
ous levels of Fe^"" and Ni^^ are illustrated in Table 2. In
those experiments fractional conversion after 1 hour was
measured. It is seen that 5 pM Ni^"^ gives no shear effect;
in fact, very little effect with Ni^"*" is seen until concen-

123
Figure IV- 16 . Urea concentration as a function of timeduring and after variable periods of steadyshear in presence of 5 pM Fe (NO^
)3
.
- zero shear; @- 1717 s~l. Urease C,
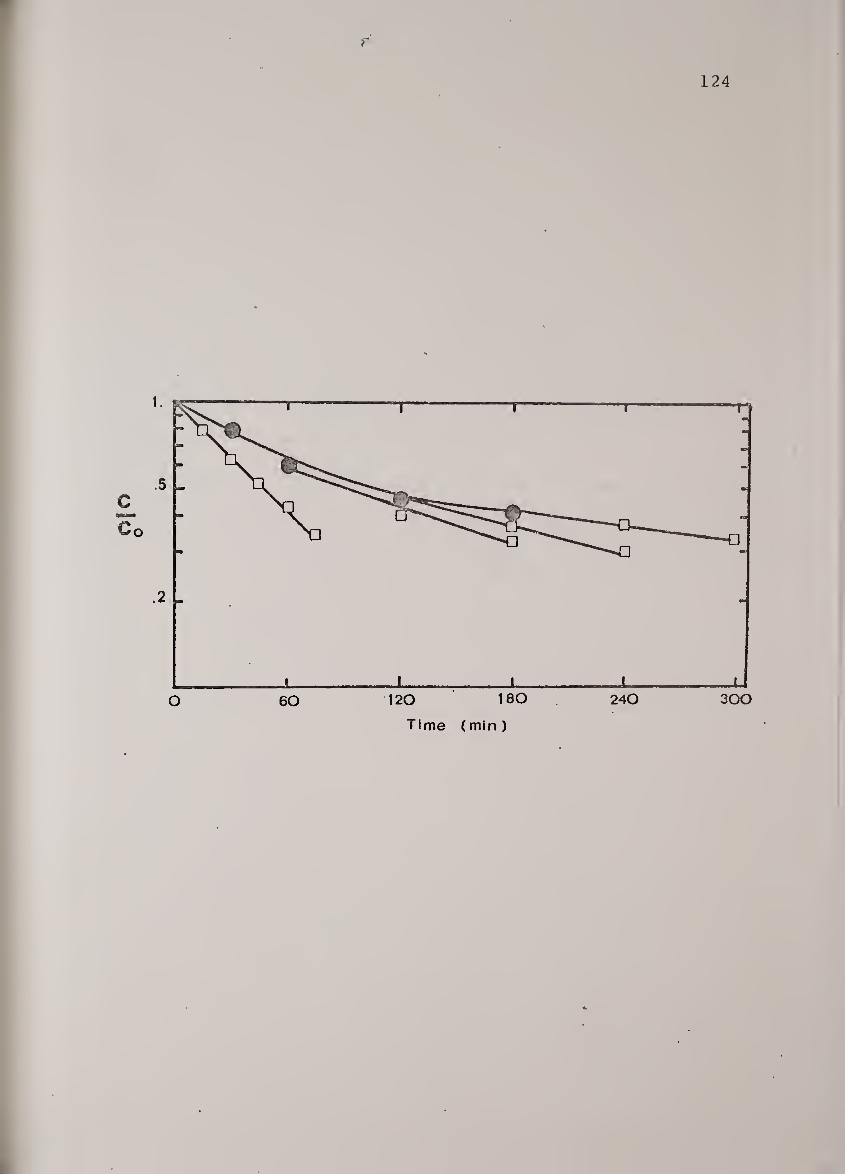

125
TABLE IV-
2
EFFECT OF ADDING METAL IONS AFTERCHELEX TREATMENT
METAL CONCENTRATION (^shear/^no shear^ *iT^etal
^^shear^^no shear^no metal
5 yM 0.81
10 yM Fe3+ 0.79
5 yM Ni2+ 1.00
45 yM Ni2+ 0.86
90 yM Ni2 + 0.91
*X is fractional conversion after 1 hour.
Shear rate = 1717 s"^.

126
trations 2 to 5 times higher than those measured by AA are
reached and even then the effects are much less pronounced. ^ 3+ 3 +than with Fe . In contrast, Fe produces comparable
degrees of inactivation during shearing to that seen in
Figure IV-6 at precisely the concentrations of Fe measured
by AA. Further proof that Fe^"*" is responsible is shown in
3+Figure IV-17. Two Fe specific chelating agents, N,N-
[bis (2-hydroxyethyl) glycine] and 8-hydroxyquinoline are seen
to afford protection against the shearing forces. In the
case of the former, the protection is quite strong, whereas
the kinetic behavior in the presence of the latter more
closely resembles that in the presence of EDTA. Very limited
data with glycine indicates that it, too, affords some pro-
tection, which gives cause for wonder whether previous re-
ports of its activating effect on urease (Wall and Laidler,
1953; Choi and Perlmutter, 1976) may have to do with its
metal chelating ability.
The evidence is thus decisive that the irreversible
inactivation by shearing of urease seen previously in these
reaction media is due to a shear promoted metal ion catalyzed
oxidation of a urease sulfhydryl group{s), rendered more
labile by the hydrodynamic shear. Further, it has been shown
that the monomeric urease isozyme, in the presence of 3-met,
is absolutely unaffected by this magnitude of shearing force,
that is, up to about 2.3 Pascals.
The connection of this work with the results of Fish-

127
Figure IV- 17 . Urea concentration as a function of time atvarying shear rates with several differentchelating agents. S-hydroxyquinoline (1 itiM) :
O- zero shear; -jif- 48 s~l; 288 s"l;@- 1717 s"l; bicine (0.1 mM) : zero shear,a- 1717 s~l; glycine (1 mM) : 1717 s""l.

O 15 30 45 60
Time cmin)

129
bein et al. (1976) on the chemical and thermal deactivation
of urease is worth discussing briefly. Their hypothesis on
the mechanism of EDTA protection was that it, likewise, pre-
vented metal ion catalyzed thiol oxidation on the thermally
or chemically deformed urease molecule. The work of this
dissertation certainly supports the plausibility of that
hypothesis. However, they have also speculated that the
metal ion responsible in their .case is Ni (Fishbein, 1976),
the idea being that a Ni atom, released as a urease molecule
unfolds, catalyzes this oxidation on a different urease mole-
cule. This may be the case in their work. However, the fact
that Chelex pretreatment affords protection against deactiva-
tion in the present work, argues against the essential Ni
atoms of urease being responsible for the effects seen here.
In this connection, it is also relevant to point out that
some evidence was obtained in the course of this work which,
although peripheral to the main thrust of this dissertation,
corroborate the recent reports that urease _is a nickel metal-
loenzyme (Dixon et al., 1975; Fishbein et al., 1976a). The
first is the atomic absorption data shown in Table 1. The
difference in Ni content between Chelex treated Urease +
buffer and Chelex treated buffer alone represents the nickel
bound to urease. From this, it can be calculated that urease
has 12 atoms of Ni per 482 ,000 molecular weight; this is
slightly higher than, but in reasonable agreement with, the
previous reports: 8 to 11 (Dixon et al., 1975) and 6 to 8

130
(Fishbein et al. , 1976a). The other more novel evidence for
the crucial role played by nickel in urease catalysis and
structure is the effect on urease in solution of 10 mM quan-
tities of 1,2-ethanedithiol (HSCH2CH2SH) and 2 , 3-dimercapto-
propanol (H0Cj:HCH2SH; BAL; British antilewisite) . These com-SH
These compounds, in addition to the obvious structural analo-
gies to 3-mercaptoethanol (HOCH2CH2SH) , are very powerful
. 2 +Ni chelating agents with log (stability constant) of 47
(Leussing, 1959, 1960). Evert (1953) had previously used
BAL in concentrations of about 0.1 mM, two orders of magni-
tude lower than the present level, as a thiol reducer, to
reverse mercurial inhibition of urease. They were exposed
to urease more or less as a curiosity, to see if their thiol
reducing capabilities or their nickel binding capabilities
would produce any unusual effects.. What was found with both
reagents was a rapid development of turbidity in the solu-
tion, becoming opaque within 10 minutes. Protein precipita-
tion was obvious visually. This is most likely due to re-
moval of Ni from urease. A similar removal can be accom-
plished at pH 3.5 to 4.0 with EDTA (Fishbein et al., 1976a),
also accompanied by precipitation.
B. Size Exclusion Chromatography Results
mile the chemical evidence of the previous section
is convincing support of the proposed mechanism for the irre-

131
versible inactivation of urease, some attempts were made to
ascertain the nature of the structural changes, if any, ac-
companying the inactivation. The size exclusion chromato-
graphic technique described in Section III-B was used toward
this end. Figure IV-18 shows urease activity vs. elution
volume profiles of urease C before and after dialysis to re-
move any thiol reagent in the crystalline urease as supplied.
The smaller proportion of oligomers in evidence before dialy-
sis is evidence that the thiols which were present initially
were separated from the urease by the column and aggregation
of urease has begun. If thiol is removed prior to chroma-
tography , aggregation is more advanced . Chromatograms vir-
tually the same as Figure IV-18 b were obtained if 1 to 5 mM
EDTA was included in the otherwise identical buffer. This
precludes the EDTA-induced depolymerization mechanism dis-
cussed earlier. The peaks correspond, based on the calibra-
tion curve of Figure III-3, to integral multiples of 482,000
molecular weight. Figure IV-19 shows the urease activity
vs. elution volume and protein concentration vs. elution
voliime profiles of urease B. It can be readily seen that
this urease preparation consists largely (about 9'5%) of in-
active protein. Figure IV-2 0 shows how the protein concen-
tration vs. elution volume profile changes as a function of
shear exposure time at 1717 s"-^. No trends are discernible.
Obviously, this urease preparation B is too impure to be use-
ful in deriving any molecular information. For this reason.

132
Figure IV-18. Size exclusion chromatography of urease C(a) before and (b) after dialysis.

133
25 30 35 40 45 50
elution volume (ml)

134
Figure IV-19. Urease activity and protein concentration vselution volume for Urease B
.

135

136
Figure IV- 2 0 , Protein concentration vs . elution position asa function of shear exposure time at 1717 s"-^
Urease B.
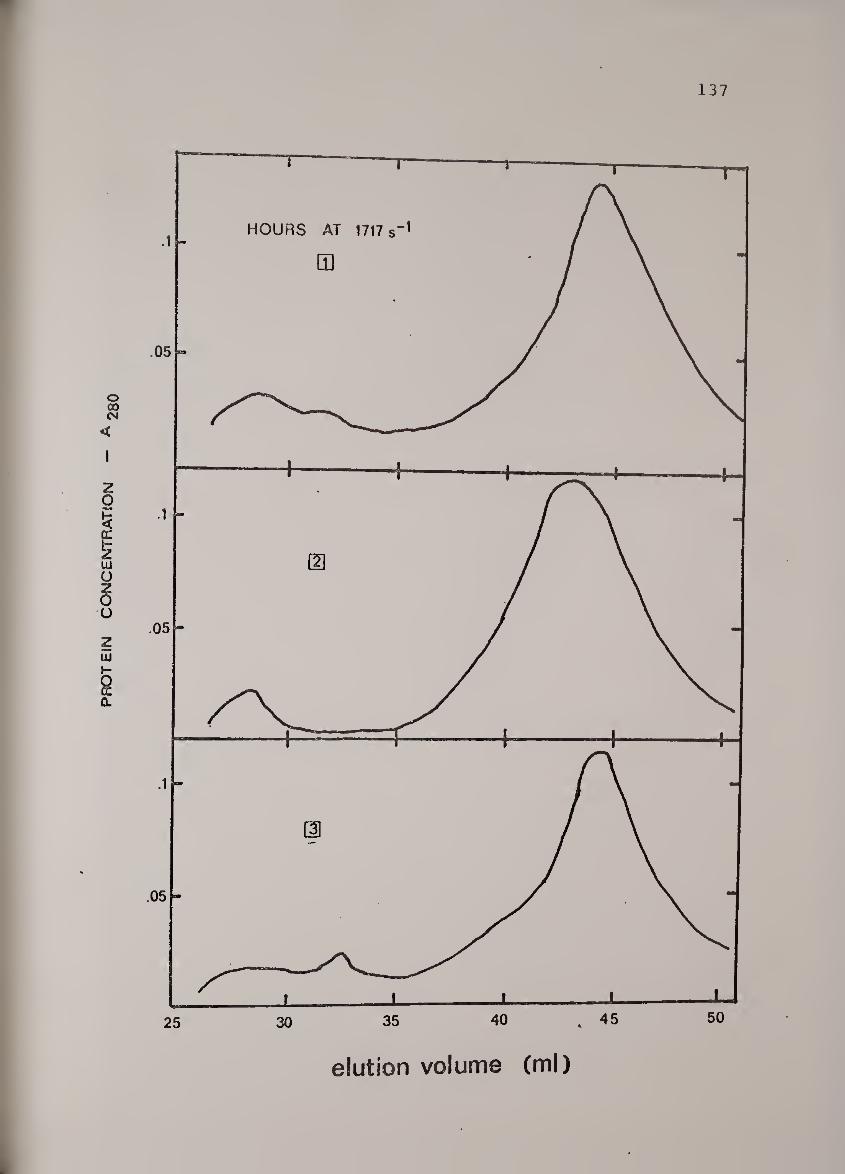
137
elutlon volume (ml)
138
it was not studied further in any kinetic, chromatographic
or spectroscopic experiments.
Urease activity vs. elution volume for urease C as a
function of shear exposure time at 1717 s is shown in
Figure IV-21, Protein concentration vs. elution volume for
this same urease preparation subjected to the same deforma-
tion histories is shown in Figure IV--22. In Figure IV-21,
activity disappearing from the higher molecular weight iso-
zymes is seen. These species are not degraded or broken down
in molecular weight by the shearing forces however, as Figure
IV-22 shows. There is actually an increase in the relative
concentration of the high molecular weight species, implying
a shear induced aggregation is occurring simultaneously with
the loss in activity of the aggregated isozymes. The effect
of e-mercaptoethanol in preventing the shear inactivation may
now be fully understood as a dual function: (1) preventing
metal ion catalyzed thiol oxidation in the shear distorted
urease molecules, and (2) keeping all the urease in the more
shear stable monomeric form. The increase in concentration
of the higher molecular weight species during shearing ac-
counts for the narrowing of the 482,000 molecular weight ac-
tivity peak during shearing seen in Figure IV-21. The util-
ity of these chromatographic results in interpreting the re-
sults of the kinetic reactions in shear is compromised some-
what by the fact that the shearing for the chromatography
samples took place in urease solutions fifty times as concen-

139
Figure IV-21, Urease activity vs. elution position as afunction of shear exposure time at 1717 s
Urease C.

140
elution volume (ml)

141
Figure IV-22. Protein concentration vs. elution position as a
function of shear exposure time at 1717 s~l.Urease C.
4

142

143
trated as in the kinetic experiments. This is necessary to
have sufficient urease in the fractions to perform a sensi-
tive activity assay. Shear induced aggregation could defi^
nitely be altered with such a concentration variation.
Still, the notion that the high molecular weight, disulfide-
bonded urease isozymes are most susceptible, to v;hatever
shear-induced conformational distortion prom.otes the metal
ion catalyzed thiol oxidation, is reinforced by these chroma
tographic results.
C. Circular Dichroism Results
With size exclusion chromatography giving some in-
sight into the quaternary structure of urease, circular di-
chroism spectroscopy was employed in an effort to learn some
thing about any changes in secondary structure that may oc-
cur upon shearing. A very brief summary of the use of op-
tical rotation in general and circular dichroism in particu-
lar for the study of protein conformation is called for (see
Kauzmann, 1957, and Haschemeyer and Haschemeyer, 1973). Op-
tical activity refers to the ability of assymmetric carbon
atoms to rotate plane polarized light. In all amino acid
residues (except glycine) in proteins, the a-carbon atom is
assymmetric. The variation of rotation with wavelength of
incident light is known as optical rotatory dispersion (ORD)
The rotation observed at any wavelength is due to contribu-
tions from various electronic transitions occurring in the

molecule. These transitions have inherent rotational
strengths and the observed rotation at wavelength X is a
function of these rotational strengths as well as the dif-2 2
ference ) -/ where Xj^ is the wavelength corresponding
to the absorption maximum for the associated electronic tran-
sition. The inherent rotational strength of electron transi-
tions in proteins in the wavelength range 270-180 nm is a
strong function of environment,, i.e., of protein conforma-
tion, often even when the ultraviolet absorption spectrum is
not. At the transition, or absorptive maximum, wavelength
the optical rotation changes sign, producing what is known
as a Cotton effect . Circular dichroism (CD) is the absorp-
tive counterpart of ORD. CD refers to the unequal absorptiv-
ity, near an electronic transition with finite rotational
strength, for right and left circularly polarized light.
This difference is referred to as ellipticity . Figure IV-23
illustrates the absorption. Cotton effect and the ellipticity
associated with a hypothetical electronic transition. In
optical rotatory studies of protein conformations, CD is
somewhat preferable to ORD because of the relative ease in
isolating a contribution for a specific chromophore transi-
tion, i.e., the ellipticity band is less spread out than the
Cotton effect.
Means of quantifying CD results are still in the
research stage. A measured CD spectrum of a native protein
is usually though of as a weighted average of contributions

145
Figure IV-23. Idealized absorption band. Cotton effect andellipticity band of a hypothetical, electronictransition.

146
absorption
optical rotation
+
eliipticity;
\

147
from a purely helical spectrum, a purely g-structure spectrum
and purely random spectrum. The weighting factors are the
fractions of residues in the native structure which adopt the
particular conformation. Characteristic spectra for these
three conformations are illustrated in Figure IV-24. Based
on these, several empirical methods of estimating, for exam-
ple, fractional helix content, have been proposed (Greenfield
and Fasman, 1969; Chen et al., 1972; Chen et al., 1974;
Haschemeyer and Haschemeyer, 1973; Baker and Isenberg, 1976).
Several of these will be discussed somewhat further in the
course of presenting the results of the present work.
Figure IV-25 shows the CD spectrum of native urease.
Tabular values of the molar ellipticities are given in Table
3. Two methods were used to estimate the helical content of
urease from this spectrum. Chen et al. (1972) proposed the
following relation
:
fQ^ooo ^ 2340f„ = ^ (1)H -30,300
From this, the fractional helical content may be estimated
at 9.5%. Greenfield and Fasman (1969) proposed (correcting
an obvious misprint in their paper):
[0] + 4000f = ££8 (2)H -29,000
This leads to f = 5.8%. No previously published CD spec-
trum of urease exists. Contaxis and Reithel (1971) published

148
Figure IV-24. Circular dichroism spectra of poly-L-lysine in(1) 100% a-helix form; (2) 100% e-form; and(3) 100% random form (after Greenfield andFasman , 1969)
.

zoo 220 240
X In myu.

150
Figure IV-25. Circular dichroism spectrum of native urease.

151
T 1 1 r- r
I

TABLE IV-
3
TABULATION OF MEAN RESIDUE ELLIPTICITIESDERIVED FROM CD SPECTRUM (FIGURE IV-25)
OF NATIVE UREASE
X (nm) [e](d^g-cm
Jdmole
260.0 0.000251 .5 0 .000255.0 - 27.52252.5 - 55.04250.0 - 110.1247.5 - 316.5245.0 - 509.1242.5 - 839.3240 0 -1225.237.5 -1706.235.0 -2504.232.5 -3316.230.0 -3963.227.5 -4541.225.0 -4981.222.5 -5215.220.0 -5022.217.5 -5215.215.0 -5311.212.5 -5394.210.0 -5269.207.5 -5669.205.0 -4031.202.5 -2972.200.0 + 178.0197.5 +4197.195.0 +9439.

an ORD curve of urease showing the characteristic a-helical
negative Cotton effect. This curve is illustrated in Figure
IV-26. They made no estimate of helical content. Two
methods of estimating the helical content of urease from
their data were therefore employed in an effort to obtain a
quantitative comparison with the present work. A Moffitt-
Yang (1956) plot was constructed by interpolation from Figure
IV-26, utilizing [ni' ] ;^= 0.9 [a] and Xq = 216 nm, good ap-
proximations for many proteins in this wavelength range
(Haschemeyer and Haschemeyer, 1973) . The derived parameters
are aQ = -41® and bQ = -130*^. Helical content is estimated
from:
f„ = —^ (3)" -630
at 20.7%. Chen et al. (1972) proposed the following rela-
tionship to estimate helical content from ORD data:
[m'] + 2520f„ = (4)H -12,700
This gives an estimate of 1% helical content in urease. The
data for the Moffitt-Yang plot are shown in Table 4 and the
estimates of helical contents based on Equations (l)-(4) sum-
marized in Table 5.
For the reasons mentioned previously, the CD results
probably give the more accurate conformation information. In
spite of the discrepancies among the various estimates, it is
154
Figure IV-26. Optical rotatory dispersion curve of nativeurease (after Contaxis and Reithel, 1971).

155
230 270 310 350
wavel ength (nm)

TABLE IV-
4
NUMERICAL VALUES FOR MOFFITT-YANG PLOTCALCULATED FROM FIGURE IV-2 6
X (nm) (X2 (a2 -X2-10 '
290 8 .99 X 10^ 2.67 X 10⁻⁵
280 11.28 X 10^ 3.15 X 10⁻⁵
270 12.75 X 10^ 3.81 X 10⁻⁵
260 15.08 X 10^ 4.77 X 10⁻⁵
250 20.25 X 10^ 6.31 X 10⁻⁵
240 27.58 X 10^ 9.14 X 10⁻⁵
Xq = 216 nm; [m']x = 0.9[a]^;
Bq = -40.6°; bo = -130°.

157
TABLE IV-
5
SUMMARY OF ESTIMATES OF UREASE HELICAL CONTENTFROM THIS AND PREVIOUS VJORK
ESTIMATEDPERCENT HELIX
SPECTRUM USEDFOR ESTIMATE
PROCEDURE* USEDFOR ESTIMATE
9.5% CD spectrumfrom this work
^ ^222
5.8% CD spectrumfrom this work
20.7% ORD spectrumfrom Contaxis
and Reithel (1971)
Moffitt-Yang
1.0% ORD spectrumfrom Contaxis
and Reithel (1971)
tm'lj33
[Average = 9.3%]
*Equations used for these estimates given in text.

158
seen that native urease is quite low in helical content , cer-
tainly less than 20%. By comparison with the computed curves
of Greenfield and Fasman (1969) , a crude estimate that the
remainder of the urease structure is roughly equally shared
between random and 3-structure is offered.
The changes in the CD spectrum that occur when urease
is exposed to shearing forces are illustrated in Figure IV-27.
First of all, no significant change in the CD spectrum is
seen after 1 hour at 1717 s . Note that measurable inactiva-
tion has occurred, however. Whatever changes in structure
have occurred, they have not affected the secondary structure
sufficiently to be seen in the CD spectrum. This could be
the case with a localized thiol oxidation. After longer
periods of time changes are noticeable, but difficult to in-
terpret. There seems to be a change toward a more 3-like
structure, perhaps related to the aggregation phenomenon ob-
served chromatographically . The concentrations here are the
same as those in the chromatography experiments.
In summary, these spectroscopic experiments are seen
to provide some interesting information, but suffer from two
inadequacies for the present purposes. First, they are dif-
ficult to interpret in terms of the structural changes which
are occurring, partly due to the fact that the urease struc-
ture is so poorly understood. Secondly, and this applies to
the chromatographic experiments as well, they can only be
applied to study irreversible shear-induced conformational

159
Figure IV-27. Circular dichroism spectrum of urease asfunction of shear exposure time at 1717

160

161
changes, that is^ after removing the shearing force. Thus,
the only insight we have into the conformational changes
actually happening during shear comes from the kinetic ex-
periments, which fortunately are very sensitive (Teipel and
Koshland, 1971a, b) , albeit rather nondescriptive indicators.
This situation may change, however. Recently, Paladini and
Weber (1977) have constructed a device capable of measuring
protein fluorescence emission while the protein is subjected
to shear in a Couette device. This may open the door to a
direct observation of protein conformational change due to
hydrodynamic forces
.
D. Kinetic Results in Glycerin-BufferMixtures
The results presented in Section A are limited to
shear stresses below 2.5 Pascals. In those results, it was
shown that very little inactivation of urease results direct-
ly from the shearing force. The significant effects there
were caused by a chemical, although shear promoted, phenom-
enon. In order to explore the effects of higher shear
stresses, within the same range of accessible shear rates
^
it was necessary to increase the viscosity of the buffer
medium. This is readily accomplished by the addition of
glycerin. Since in this series of experiments, the emphasis
is strictly on hydrodynamic effects, any possibility of a
inetal ion effect was eliminated by inclusion of 5 mM EDTA in

the reaction medium. The urease catalyzed hydrolysis of urea
proceeds similarly in glycerin/buffer mixtures, up to at
least 60% glycerin.
The effects of shear stresses up to 21.0 Pascals on
the kinetics of urease catalyzed urea hydrolysis are shown
in Figures IV-28 to IV-32. The rheological conditions and
parameters of the buffer medium are given in each case. The
inactivation seen in each case is of the same character as
that seen in EDTA-containing, low viscosity buffers. Shear-
ing produces a modified, lower first order rate constant;
removal of shearing reverses the effect, completely, within
the precision of the data. The first order rate constants
derived from these data are tabulated in Table 6 . k _ ^no shear
refers to data obtained from a urease sample v;ith no shear
history; kx refers to data obtained during shearing at shear
stress equal to x (Pascals) ; k2ero shear refers to the mean
first order rate constant from data obtained after stopping
the shearing at various point. Errors given represent 95%
confidence limits derived from linear regression analyses
performed on an SR-52 pocket calculator. As can be seen in
Figure IV-33, the ratio k^/k^^^ shear decreases in a non-
linear fashion with increasing shear stress . Much of this
data, showing different k /k„^ ^ur.^^f obtained at theT no snear
same shear rate , implying that purely hydrodynamic stress
snd not shear dependent collision frequency is the dominant
mode of inactivation in this range of stress. As noted

163
Figure IV-28. Urea concentration as a function of timeglycerin-buffer mixture. - no shear-- zero shear; ©- 1717 s"!, n = 0,0120Pascal-s, T = 21.0 Pascals.

164
T—I—I—I I1 1
r
o\(f

165
Figure IV-29. Urea concentration as a function of time inglycerin-buffer mixture. *- no shear;n- zero shear; ©- 1717 s"!, n = 0.0078Pascal- s / T = 13.4 Pascals.

166
T r r 1 1 —
r
ce
oE
Old

167
Figure IV-30. Urea concentration as a function of time inglycerin-buffer mixture. *- no shear;
zero shear; ®- 1301 , n = 0.0078Pascal-s, T = 10.4 Pascals.


169
Figure IV-31. Urea concentration as a function of timeglycerin-buffer mixture. * - no shear;©- 741 s"l, n = 0.0120 Pascal-s, x = 8.Pascals.

170

171
Figure IV-32. Urea concentration as a function of time inglycerin-buffer mixture. * - no shear;
- zero shear; ®- 522 , r\ = 0.0095Pascal-s, T = 5.0 Pascals,

172

173
Figure IV-33, Urease activity during shearing as a functionof shear stress.

173
Figure IV-33. Urease activity during shearing as a functionof shear stress
.

TABLE IV-
6
SUmiARY OF GLYCERIN/V7ATER DATA
(Pascals
)
k (min~
5.00.018±0.0.012+0.0.014±0.
001003005
(no shear)(t)
(zero shear)
8.9 0.024±0.0.017±0.
001003
(no shear)(T)
10.40.021±0.0.012±0.0.01610.
001002005
(no shear)(t)
(zero shear)
13.40.024±0.0.013±0.0.019±0.
004001002
(no shear)(t)
(zero shear)
21.00.02410.0.014+0.0.02110.
001002009
(no shear)(x)
(zero shear)

above, all this inactivation is reversible within experimen-
tal error, however, the mean k^^j.^ shear always lower than
the mean kj^^ shear ^^ich may mean- some amount of irreversible
inactivation below the precision of the experiments. In any
case, it is clear that a stress regime has been reached where
a direct effect of applied hydrodynamic force on' the molecule
alters the activity rather than enhancing a chemical modify-
ing effect.
An interesting final observation on these results is
that if the urease was not dialyzed prior to preparing the
stock solutions in glycerin/buffer, no inactivation at all was
observed, similar to the results in Figure IV-12 in the pres-
ence of 3-mercaptoethanol . This leads one to believe that not
only are larger stresses, 10 to 20 Pascals, necessary to sig-
nificantly influence urease conformation, it is also necessary
for the intermonomer disulfide bonds to be intact. Glycerin
is known to modify the urease quaternary structure, in the
manner described previously (Contaxis and Reithel, 1971), by
cleaving a noncovalent interface in the urease monomer. It
will not affect previously formed disulfide bonds (Fishbein
et al. , 1976b) such as those present in these experiments.
So, while the molecular weight of urease is uncertain under
these glycerin-buffer shearing conditions, the necessity of
having intermonomer disulfide bonds to observe shear inac-
tivation of urease is still suggested by this and several
other previously described experiments in this dissertation.

REFERENCES
C.C. Baker and I. Isenberg, Biochemistry, 15_, 629 (1976).
T.C. Bithell, Biochem. J., 93, 431 (1964).
B. Blomback, M. Blomback, T.C. Laurent and H. Pertoft,Biochim. Biophys. Acta, 127 , 560 (1966).
P.D. Boyer, J. Am. Chem. Soc, 76_, 4331 (1954).
S.E. Charm and B.L. VJong, Biotechnol. Bioeng. , 12_, 1103(1970) a.
S.E. Charm and B.L. Wong, Science, 170 , 466 (1970)b.
Y--H. Chen, J.T. Yang and H.M. Martinez, Biochemistry, 11 ,
4120 (1972).
Y.-H. Chen, J.T. Yang and K.H. Chau, Biochemistry, 13_, 3350(1974)
.
C. Y. Choi and D.D. Perlmutter, A. I. Ch. E. J., 22^, 1106(1976).
C.C. Contaxis and F.J. Reithel, J. Biol. Chem., 246 , 677
(1971) .
N.E. Dixon, C. Gazzola, R.L. Blakeley and B. Zerner, J. Am.
Chem. Soc, 97, 4131 (1975).
H.E. Evert, Arch. Biochem. Biophys. , 41L, 29 (1953) .
W.N. Fishbein, M.J. Smith, K. Nagarajan and W. Scurzi, Fed.
Proc. , 35, 1680 (1976)a.
W.N. Fishbein, K. Nagarajan and W. Scurzi, Arch. Biochem.Biophys., 172, 726 (1976)b.
W.N. Fishbein, personal communication, July , 1976
.
G. Gorin, E. Fuchs, L.G. Butler, S.L. Chopra and R.T. Hersh,
Biochemistry, 1, 911 (1962).
N. Greenfield and G.D. Fasman, Biochemistry, 8, 4108 (1969).
177

178
R.R. Haschemeyer and A.E.V. Haschemeyer , Proteins: A Guideto Study by Physical and Chemical Methods , Wiley,N.Y., 1973.
W. Kauzmann , Quantum Chemistry , Academic Press , N . Y . , 1957
.
D.L. Leussing, J. Ain, Chem. Soc. 81^, 4208 (1959) .
D.L. Leussing, J. Am. Chem. Soc. , 82_, 4458 (1960) .
G.E . Means and R.E. Feeney , Chemical Modification of Pro-teins , Holden-Day, Inc., San Francisco, 1971.
W. Moffitt and J.T. Yang, Proc. Nat. Acad. Sci. U.S., 42_,
596 (1956).
A. Paladini and G . Weber , personal communication , Urbana,Illinois , January , 1977
.
S. Patai, ed- , The Chemistry of the Thiol Group , vol, 2,Wiley, N.Y. , 1974.
J.W. Tiepel and D.E. Koshland, Biochemistry, 10^, 792 (1971)a.
J.W. Tiepel and D.E. Koshland, Biochemistry, 10_, 798 (1971)b.
M. Tirrell and S. Middleman, Biotechnol. Bioeng. , ]/7, 299(1975)
.
M.C. Wall and K.J. Laidler, Arch. Biochem. Biophys., 4_3, 312
(1953)
.

CHAPTER V
MODELLING OF ENZYME REACTIONS AFFECTED
BY DEFORMATION
A. Introduction
In attempting to describe physical or chemical phenom-
ena, one oftv3n chooses between a rather superficial phenomeno-
logical description, which may return great predictive capa-
bility for the effort invested in formulation, or a more
"microscopic" mechanistic description, which contains more
rigorous, detailed infomation for a comparatively high level
of invested effort. Both approaches are valid, depending on
the goals and expected uses of the formulated" model • The
overall rate equations derived from analysis of reaction net-
works (Boudart, 196 8) are examples of the former, whereas the
absolute reaction rate calculations of Eyring and coworkers
(see: Glasstone, Laidler and Eyring, 1941) are examples of
the latter. As will presently be shown, a phenomenological
description of the effect of hydrodynamic stresses on the
kinetics of urease catalyzed reactions can be evolved rela-
tively simply. Incorporating more detailed information to
arrive at a theory relating: enzyme activity <—> enzyme
structure —> hydrodynamic stress is a much more formidable
task.
179

180
B. Phenomenological Kinetic Description ofUrease Caralyzed Reactions Subject to
Deformation
1, Zero Deformation Rate Kinetics
The first point to be addressed before proceeding
with the modelling discussion, is whether the kinetic behav-
ior at zero shear, reported in previous chapters, is consis-
tent with the results of other work on the kinetics of urease
catalyzed urea hydrolysis. Unlike most previous studies of
urease, or other enzymes for that matter, the reactions
studied here were carried to high conversion. The more usual
technique in enzyme kinetic studies is to obtain and analyze
initial rate data, that is, data obtained at very low frac-
tional conversion. This is done so that a one-to-one corre-
spondence between a reaction rate and a substrate concentra-
tion (i.e. , the initial substrate concentration) exists, to
avoid having to differentiate rate vs. [S] data, and also to
avoid complications such as inhibition of the enzyme by prod-
ucts of the reaction. In the present work, primary interest
is in modification of the kinetics of urease catalyzed urea
hydrolysis during a deformation experience. As shown in pre-
vious chapters, under some conditions, the deactivation pro-
cess occurs over a period of up to 3 hours. Therefore, it
was necessary to study the reaction kinetics over this time .
period as well. This, in turn, necessitates carrying the re-
action to high conversion in order to see significant varia-

181
tions in reaction rate with shear exposure.
A discussion of the kinetics of urea hydrolysis by
urease at high conversion must include the phenomenon of in-
hibition by product ammonia. The starting point will be the
fundamental Michaelis-Menten expression, appropriate for
urease in the absence of product and substrate inhibition:
dc -k E K c(1)
uninhibited 1 + K c
where c is urea concentration, kQ is the turnover number, E
is the urease concentration, K is the reciprocal of the
Michaelis constant . Since , all experimental conditions of
the present work are well below the onset of substrate inhibi
tion ( [S] > 250 mM) , only product inhibition will be consi-
dered. Hoare and Laidler (1950) have shown inhibition of
urease by ammonium ion to be noncompetitive. This means,
conceptually at least, that NH^"^ alters the rate of the
catalytic function of urease without specifically competing
with urea for binding to urease. Mathematically, this modi-
fication is made in the following way:
-k E K cdc _ 0 0
dt (1+K c)(l+K'I)
where I is the concentration of noncompetitive inhibitor
(see for example Bernhard, 1968), in this case ammonium, and
K' is the inhibition constant. The stoichiometry of urea
hydrolysis dictates that two moles of ammonium are produced

182
Figure V-1. Comparison of predictions from product inhibitimodel with zero shear data from Figure IV-6.

183

184
for each mole of urea cleaved. This allows the rewriting of
Equation (2) entirely in terms of c:
dt (1+K c)[l+2K' (CQ-c) ]
where Cq is the initial urea concentration. Rewriting this
in terms of the dimensionless concentration, r = c/cq, gives
-k^E^Krdr 0 0
l+XoKr+2K'xQ+2K'Kxo^ r-2K ' Xor-2K ' Kkq-^ r^
Solving, subject to r.= 1 at t = 0 gives:
l+2K'x^\ /Kx^+2K'Kx^^ '-2K'x^t = -( ^ inr - —5 5 ^1 (r-1)
(4)
^0^0^ / \ ^0^0^
(5)
So, the time' to reach a given r may be calculated from Equa-
tion (5) if values for the three parameters Icq , K and K' are
specified. Predicted curves for three different groups of
the above parameters are compared to the data in Figure V-1.
All the values of each parameter are quite consistent with
those previously reported. Turnover numbers of order of mag-
nitude 10^ s""*" are reported for urease (Bernhard, 1968) or
can be estimated from published data (Hoare and Laidler,
1950). Typical reported values range from 4 to 10 mM
(Hoare and Laidler, 1950; Fishbein et al., 1965). A single

185
reported ammonium inhibition constant of 2.1 mM (Hoare and
Laidler, 1950) is close to the values used in Figure V-1.
Several features of the theoretical curves in Figure
V-1 are very interesting. Curve A illustrates the highly
linear, apparent first order behavior possible with some
choices of parameters; it is even more linear than the data.
Curve B is an example of the, perhaps intuitively unexpected,
downward curvature on a semilog plot at higher conversions,
possible with product inhibition. Curve C is the closest to
the data obtained in this rather hit-or-miss fitting proce-
dure. It fits the data at higher conversions better than at
low concentration, perhaps partly because the analytical
technique used for urea analysis (see Levine et al., 1961,
and Figure III-4) is more sensitive in this concentration
range. This is not to say that a better fit could not be
obtained with a more rigorous fitting procedure; but five
data points do not warrant exact fitting of a three-parameter
model.
The main points of this section are these: (1) it is
clear that the behavior represented by any of the curves
could be mistaken for strictly first order behavior with
sparse experimental data; (2) Equation (5) shows that the
time to achieve a given conversion is inversely proportional
to the urease activity in solution,^^q^O'
that it is jus-
tifiable to take changes in the slopes of the data under
these conditions as directly proportional to changes in ac-

186
tivity.
Finally, in this connection, it is noted that studies
of the full time course of enzyme catalyzed reactions are be-
ginning to be (Bates and Friedan, 1973a, b) , and could be
more frequently, used to obtain mechanistic infoirmation not
available from initial rate studies. Analyses of the present
type are expected to be relevant in these cases.
2 . Models for Kinetics During Shear
The next question is, "How does one formulate a model
for kinetic reactions modified by shearing?" The first step
in this direction is to postulate a reaction scheme for the,
in this case, inactivation process. Ignoring the details of
the product inhibition mechanism, it is assiimed that the
zero shear reaction is described by a first order model:
= -k°E{t)c (6)
where is the apparent zero shear first order rate constant
and the native enzyme concentration, E, is a function of
time. Since both irreversible and reversible inactivation
occur during shearing, a plausible inactivation model is:

187
where I is irreversibly deactivated enzyme and R is reversi-
bly deactivated enzyme. This leads to the following pair of
equations:
II= -(ki -f k2)E + k3R
(8)
II= - k3R
The secular equation of this pair leads in a straightforward
manner to eigenvalues which are algebraically surprisingly
complex. The solution, obtained illustratively by Laplace
transforms in Appendix A, is:
Tn/^\ i+c -Xit, 1-c -Apt
E(t) = "y- ^ ^ ~2~ ^
where
A-^ = A - B;
= A + B;
A = 1/2 (k-L+k2+k3) ;
2 2 2 1/2B = [1/2 (kj^k2-k^k3+k2k3) + 1/4 (k^j^ +]^2 "^^2
C = -1/2 (ki4-k2-k3)/B.
In order to account for the shear rate dependence of the in-
activation, it is necessary to take the inactivation rate
constants k^, k2 and k3 to be functions of the state of de-
formation of the reaction medium. In this endeavor there is
no formally correct way to proceed. What was done here was
to take the rate constants to be given by the Arrhenius ex-
pression, with activation energies modified by an empirical

188
deformation related function
:
ki = exp[AGr''- Tv]/RT (10)
where i = 1, 2, 3; Aj, is the appropriate frequency factor,
AGjJ the free energy of activation and xv. the deformation
function. It is written in this form to show that if the
shear stress, t, is included explicitly, it must' be multi-
plied by a parameter, v, with the units of volume, which may
be called the activation volume, after Eyring (see Glasstone
et al. , 1941). For guidance as to appropriate values of ac-
tivation energies to use, a survey of literature values for
activation energies of protein unfolding and refolding was
made (see Tanford, 1961, and references on protein denatura-
tion contained therein) . Suitable representative values
chosen were: AG-]_ 2 = 25 kcal/mole and AG3 = 22.5 kcal/mole;
there seemed to be little basis on which to make a distinc-
tion between the AG"*" values appropriate to the reversible and
irreversible reactions- The frequency factors were arbitrar-
ily set at lO"'-*^ sec""^. Given these values, native enzyme
concnetration as a function of time may be predicted from
Equation (9) with xv as a parameter. xv was taken to be
equal in magnitude for all three reactions, but positive for
1 and 2 and negative for 3. Conceptually, this means that
the stress is considered to lower the activation barrier for
inactivation, while raising the activation barrier for reac-
tivation. If the results of Equation (9) are substituted in-
to Equation (6), urea concentration vs. time behavior may be

189
simulated. Results of these predictions for several values
of the deformation function are shown in Figure V-2. Very
close resemblance to the data is seen. In Figure V-3, the
predictions of this model for tv = 11.4 RT are compared di-
rectly to the data of Figure IV-lc. The zero shear lines
after various shear exposures are obtained by setting tv = 0
at the appropriate points in time. The predicted behavior
seems to be qualitatively and quantitatively in good agree-
ment with the data. The stress levels in these experiments
lead to values of the . activation volume of 10 nm which is
an order of magnitude larger than any of the urease species
in solution. This same type of model has been applied by
Adam and Zimm (1976) to DNA shear breakage kinetics. They do
not report any values of parameters but one can estimate that
the activation dimensions derived from their experimental
conditions and results must also be much larger than any
molecular entity in the system.
This model is fairly useful in illustrating the rela-
tive magnitudes of the various effects influencing the kine-
tics of urea hydrolysis and urease deactivation during shear-
ing. A sort of matrix of experiments could be designed,
varying temperature on the one hand and shear stress on the
other. Temperature variation of the kj_ at constant stress
would give AG* plus the contribution from the stress related
term; shear stress variation of the k^ would give tv and
could then be used to separate temperature and stress ef-

190
Figure V-2. Simulated urea' concentration vs. time behaviorfor several values of the parameter xv.
(Values of other parameters given in text.)

c
0)
LO CM

192
Figure V-3. Comparison of predicted kinetic behavior forTV = 11.4 RT with data of Figure IV-2c.

193

194
fects . This procedure assumes constant activation energy-
over the temperature range studied and requires obtaining
three kinetic constants from a nonlinear fit to rather sparse
experimen cal data
.
Skepticism over whether this could be done with rea-
sonable precision provided the incentive for formulating a
somewhat simpler model. Suppose it is assumed that the re-
versible deactivation reaction is always at equilibrium, so
that, k2E = k3R, or, defining an equilibrium constant,
K = k2/k-^ = E/R. The experimental observation that recovery
of activity on stopping shear is instantaneous is consistent
with this assumption; beyond that, the validity of the as-
sumption is difficult to assess. From a mass balance on
total enzyme concentration, Eq , it is seen that:
Eq = E + I + R, (11)
or
Eq = E + I + KE. (12)
Since E^ is constant:
But from Equation (7)
:
Equating these two expressions gives a first order deactiva-
tion model:
-k.^ = .r-^E (parallel deactivation) (15)dt 1+K

195
with a solution considerably simpler than Equation (9)
.
Another inactivation model, which may be more consis-
tent with the mechanism of irreversible inactivation proposed
in Chapter IV, is the following sequential mechanism:
^2 , kiE . , ^ ^ R >^ I. (16)
This model can easily be shown, with the same equilibrium as-
sumption, to lead to a form equivalent to Equation (15)
:
dE ~k-|K3T- =
^ .
E (sequential deactivation) (17)dt 1+K
So, both models may be expected to fit the data equally well
(or poorly) . The difference is in the physical interpreta-
tion of the mechanism and of the derived constants.
These models have two constants , an irreversible in-
activation constant and an equilibrium constant. Both lead
to a deactivation model of the form dE/dt = -k^E. There is
an obvious conceptual scheme for extracting k^ and kj_ from
the data. The overall or total inactivation exhibited by the
data obtained during shear are governed by a first order rate
law with first order catalyst activity decay (Levenspiel,
1962); fitting this exponential decay will yield k^. The
decline in slope of the zero shear data, obtained after stop-
ping the shear at various points, reflects only the irrever-
sible inactivation, that is, k^. Both of these constants can
be obtained from appropriate linear plots. This procedure
for obtaining the constants is given in Appendix B. Values

of the constants obtained in this way are tabulated for all
experimental data taken under conditions of partial irrever-
sible inactivation in Table 1. The one conclusion that can
be drawn from this modelling effort is that, interpreted in
the light of the physically more reasonable sequential model,
the E R equilibrium lies far to the right for all shear
rates, that is, most of the enzyme molecules are in a shear
modified conformation. The problem with the predictions
based on these constants is that they are inaccurate quanti-
tatively. Even with some empirical improving adjustments,
the disagreement is as large as 27% in some parts of the con-
centration vs. time space, as illustrated in Figure V-4. The
reason for this is partly the difficulty, discussed in more
detail in Appendix B, in the fitting procedure and, even more
importantly, in the constraints placed by the model on physi-
cally reasonable values of the constants. From Equations
(15) and (17) it is seen that:
^ 1^ (18)
Kparallel = ~ ^sequential
^d'
^
so that > k, is not reasonable for these models, even
though, were this constraint ignored, very near perfect fits
could be obtained in many cases.
This problem probably arises: (1) because of the dif-
ficult to assess equilibrium assumption, and (2) because of
the need to include more steps in the deactivation reaction
197
c
Figure V-4. Comparison of predicted kinetic behavior fromsimplified deactivation model with data ofFigure IV- 2a
.

198

199
TABLE V-1
RATE CONSTANTS DERIVED FROM SIMPLIFIEDDEACTIVATION MODELS
SHEAR_UREASE RATE (s ^ k^^ (m"!) k^dn"!) Kp^^allel ^^sequential
A 1717 0.0329 0.0234 0.406 2.46
A 741 0.0229 0.0199 0.151 6.63
A 288 0i0213 0.0183 0.164 6.10
B 1717 0.00766 0.00735 0.042 23.7
B 975 0.00802 0.00773 0.037 26.6
B 288 0.00742 0.00793
C 1717 0.0228 0.0211 0.081 12.4
C 288 0.00433 0.00122 2.55 0.392

200
scheme, such as a multiple step sequential process. Physical
understanding of what is happening to urease subjected to
shearing does not justify such a femulation at this point.
This section does serve to outline the possibilities (and im-
possibilities) of a group of very simple kinetic models.
More on the molecular basis of this phenomenon follows di-
rectly.
C . Toward a Molecular Theory of ShearModification of Enzyme Kinetics
The purpose of this section is to discuss the changes
in protein conformation possible under the hydrodynamic con-
ditions of these experiments and speculate on how they might
be related to the changes in activity observed. This must
begin with an examination of the urease enzyme protein macro-
molecule as a mechanical system.
First, the motion of the molecule as a whole in the
shear field will be considered, ignoring the subtle conforma-
tional changes, as the motion of a rigid body. Evidence has
been described in the literature (Fishbein et al., 1970,
1973, 1976) and further conclusive evidence will be provided
in Chapter VII of this dissertation that the urease monomer
is roughly a sphere of radius 6.2 nm and that the higher
molecular weight isozymes are linearly arranged oligomers, a
sort of peas-in-a-pod model. Assuming that no major con-
formational changes occur during shearing, the spherical

201
monomer will translate with the local velocity and rotate
with the vorticity, experiencing the shear stress which ob-
tains in the bulk fluid. The assymmetric isozymes on the
other hand will also rotate, but not at constant angular
velocity. The higher the aspect ratio and shear rate, the
larger proportion of time will be spent aligned with the flow
direction. The distribution of orientations has been ob-
tained analytically by Peterlin- (1938) and computed numeri-
cally by Scheraga (1955) . Orientation is governed by the as-
pect ratio of the molecule and by the rotary Peclet number^
0/Y/ where 0 is the rotary diffusion coefficient and y is the
shear rate. At low enough rotary Peclet number this orien-
tation effect will cause nonNewtonian viscosity. It is
readily verified , for any of the urease isozymes , that the
aspect ratios are too small and the rotary Peclet number too
large to produce any shear rate dependence of viscosity (see
Scheraga, 1961, for a further discussion of this point).
For any species in any orientation, the maximum ten-
sion experienced is of the order of magnitude of the shear
stress multiplied by the macromolecular cross-section. The
question which must be addressed is, "How does this force
modify the catalytic activity?" Assuming that it is by
changing the shape of the protein molecule it must then be
asked, "How does this force modify the shape of the protein
macromolecule?" As mentioned in an earlier chapter, this
question, which can be answered satisfactorily in a very

202
general way with randomly coiling macromolecules , is exceed-
ingly difficult to answer with any generality for a protein
molecule
.
Several quantitative estimates of the possible de-
formation of the urease structure will be made below based on
its known quaternary structure and hopefully plausible as-
sumptions about the "mechanical" properties of proteins. The
2cross-sectional area of the urease monomer is 121 nm which
means that for every 1 Pascal of applied shear stress, the
— 1
6
molecule experiences a maximum tension of 1.21 x 10 new-
tons* In these experiments, significant effects have been
observed at stresses from 0.5 to 21 Pascals, forces from
"16 -1410 to 10 newtons.
a. Estimate based on elastic moduli of proteins .
The elastic or Young's moduli of several protein materials
have been measured: lO''-^ Pascals is typical of wool
9 7(Mizushima, 1954), 10 to 10 Pascals for F-actm and some
other unspecified proteins (Oosawa and Asakura, 1975; Khur-
gin et al., 1967) and lO'^ Pascals has been reported for mus-
cle (see Riseman and Kirkwood, 1948). Comparison of these
values of modulus with the applied stresses gives estimates
of the strain from a minimum of 0.00000001% to a maximum of
0.1%. This latter strain would produce a deformation of ap-
proximately 0.01 nm in the urease monomer. It is not cer-
tain how the effective "elastic modulus" of an isolated
globular protein molecule in solution compares to the above

203
values for solid proteins.
b. Estimate based on bond force constants . The
force constants of various important bonds in protein struc-
tures have been estimated (Mizushima, 1954) : for covalent
bond stretching, 10^ to 10^ newtons/m; for covalent bond
2angle distortion, 10 to 10 newtons/m; for hydrogen bond
stretching, 1 to 10 newtons/m. Comparison of these values
with the applied forces leads to estimates of the deforma-
tion of any individual bond from a minimum of 10 nm to a
maximum of 10 ^ nm. For a molecule containing a linear array
-14of, say, 100 hydrogen bonds all experiencing a force of 10
newtons , the deformation of the entire macromolecule could
conceivably reach 0 . 01 nm. No estimates of force constants
of hydrophobic or apolar bonds are known to this author.
This information is quite important to the present study
since it has been estimated that the contribution of apolar
bonds to the conformational stability is 10 to 15 greater
than that of hydrogen bonds (Haschemeyer and Haschemeyer,
1973). The strength of an individual apolar bond (0.5 to
2.0 kcal per mole of bonds) is known to be somewhat less than
that of a hydrogen bond (2.0 to 5.0 kcal per mole of bonds)
(Nemethy and Scheraga, 1962).
c. Estimate based on the intrinsic rigidity of ran-
domly coiling macromolecules . The so-called intrinsic rigid-
ity, Q, of a randomly coiling macromolecule is the coeffi-
cient of resistance to the rate of conformational change by

204
an applied force:
applied^ = —^^^^-Q (19)
where r is some molecular dimension (Cerf, 1968). Q has been
estimated as 10 newton-s/m. Comparison of this number with
the applied forces shows that very large conformational
changes could occur rapidly in synthetic macromolecules at
these stress levels. For example, Cottrell et al. (1969)
measured, by light scattering, 43% elongation of a high mole-
cular weight polyisobutylene , at an applied stress of about
-1510 newtons , one-tenth the maximum used in the present work.
The relevance of this to conformational distortion of pro-
teins is not clear- Perhaps it indicates that if the protein
contains any relatively large, "loose" or "floppy," "random"
structure, this portion may readily be distorted by stress.
Additional types of stress felt by the enzyme under
these conditions are torques and/or bending moments. It is
difficult to even begin to quantify their possible effects.
In any case, these calculations show that a molecular under-
standing of the shear modification of enzyme kinetics is
still rather remote but that it is intimately related to the .
conformational stability and dynamics of proteins. It is
known, for example, from deuterium-hydrogen exchange experi-
ments (Hvidt and Nielsen, 1966) and low frequency laser Raman
spectroscopy (Brown et al., 1972) on proteins, that conforma-
tions are dynamic rather than static, and that simultaneous

205
coherent displacement of the atomic nuclei occurs continually
throughout all or many of the residues of the molecule. In
addition, it is known that large amplitude conformational
changes in proteins occur on substrate binding; for example,
Lipscomb and coworkers (Reeke et al., 1967) have shown that
a tyrosine oxygen atom moves 1 , 4 nm on binding of a substrate
analog! It seems quite certain that effects demonstrated in
this dissertation must be the result of a complex interaction
between the confonaational dynamics and the flow field; per-
haps a bias is introduced by shearing forces among the vari-
ous conformations assumed naturally by the protein.
D . Conclusion
This lack of understanding should serve as an incen-
tive for further well designed experiments on the interac-
tions of flow fields with kinetic processes. These results,
coupled with adequate phenomenological or molecular models,
would be of interest in a broad range of problems in macro-
molecular science and engineering. Among these are polymer
crystallization kinetics, polymerization kinetics and stress
induced diffusion, all of which may be modified by deforma-
tion. It is interesting to note that this area of kinetic-
kinematic interaction is now beginning to be studied in a
purely formal, and rather elegant, way by mathematicians and
continuum mechanicians (Kelly, 1964; Eringen and Ingram,
1965; Ingram and Eringen, 1967; Bowen, 1968, 1969a, b; Doria

206
and Bowen, 1970; Gurtin and Vargas, 1971; Gurtin, 1971).
Those results may be expected to complement investigations
the present sort.

REFERENCES
R.E. Adam and B.H. Zimm, Polymer Preprints, 17, (2), 870(1976).
D.J. Bates and C. Friedan, J. Biol. Chem. , 248, 7878 (1973)a
D.J. Bates and C. Friedan, J. Biol. Chem., 2_48_, 7885 (1973)b
S. Bernhard, The Structure and Function of Enzymes , W.A. Benjamin, Menlo Park, Ca. , 1968.
M. Boudart , Kinetics of Chemical Processes , Prentice-Hall
,
Englewood Cliffs, N.J., 1968.
R.M. Bowen, J. Chem. Phys., 49_, 1625 (1968).
R.M. Bowen, Arch. Rational Mech. Anal,, 33_, 169 (1969).
R.M. Bowen, Arch. Rational Mech. Anal., 3j4 , 97 (1969).
K.G. Brown, S.C. Erfurth, E.W. Small and W.L. Peticolas,Proc. Nat. Acad. Sci. U.S., 69_/ 1467 (1972).
R. Cerf, C. R. Acad. Sci. (Paris), C267 , 1112 (1968),
F.R. Cottrell, E.W. Merrill and K.A. Smith, J. Polymer Sci.A-2, 7, 1415 (1969)
.
M.L. Doria and R.M. Bowen, Phys. Fluids, 13, 867 (1970).
A.C. Eringen and J.D. Ingram, Int. J. Engng. Sci., 3_'^^'^
(1965)
.
W.N. Fishbein, T.S. Winter and J.D. Davidson, J. Biol. Chem.
240, 2402 (1965)
.
W.N. Fishbein, K. Nagarajan and W. Scurzi, J. Biol. Chem.,
245, 5985 (1970)
.
W.N. Fishbein, K. Nagarajan and W. Scurzi, J. Biol. Chem.,
248, 7870 (1973)
.
W.N. Fishbein, K. Nagarajan and W. Scurzi, Arch. Biochem.
Biophys., 172, 726 (1976).

208
S. Glasstone, K.J. Laidler and H. Eyring, The Theory of RateProcesses , McGraw-Hill, N.Y. , 1941"!
'
M.E. Gurtin and A.S. Vargas, Arch. Rational Mech. Anal., 43.179 (1971).
—M.E. Gurtin, Arch. Rational Mech. Anal., 43_, 198 (1971).
R.H. Haschemeyer and A.E.V. Haschemeyer , Proteins : A Guideto Study by Physical and Chemical Methods , Wiley,N.Y., 1973.
J. P. Hoare and K.J. Laidler, J. Am. Chem. Soc, 72, 2487(1950).
—A. Hvidt and S.O. Nielsen, Adv. Protein Chem., 21, 287
(1966) .
J.D. Ingram and A.C. Eringen, Int. J. Engng. Sci., 5, 289(1967) .
P.D. Kelly, Int. J. Engng. Sci., 2_, 129 (1964).
V.I. Khurgin, D.S. Chernavski and S.E. Schnol, Proceedingsof the Biological Chemistry Symposium, Pushchino-on-Oka, USSR, G. Frank, ed. , 1967. (Rather obscure,available from M. Tirrell on request.)
0. Levenspiel, Chemical Reaction Engineering , Wiley, N.Y.,1962.
J.M. Levine , R. Leon and F. Steigmann, J. Clin. Chem.,488 (1961)
.
S. Mizushima, Structure of Molecules and Internal Rotation ,
Academic Press, N.Y. , 1954.
G. Nemethy and H.A. Scheraga, J. Phys. Chem., 66^, 1773(1962) .
F. Oosawa and S. Asakura, Thermodynamics of the Polymeriza-
tion of Protein , Academic Press, N.Y., 1975.
A. Peterlin, Z. Physik, 111, 232 (1938).
G.N. Reeke, J. A. Hartsuck, N.L. Ludwig, F.A. Quiocho, T.A.Steitz and W.N. Lipscomb, Proc. Nat. Acad. Sci. U.S.,
58^, 2220 (1967) .
J- Riseman and J.G. Kirkwood, J. Am. Chem. Soc, 70_, 2820
(1948)
.

209
H.A. Scheraga, J. Chem. Phys. , 23, 1526 (1955).
H.A. Scheraga, Protein Structure , Academic Press, N.Y., 1961.
C. Tanford, Physical Chemistry of Macromolecules . WilevN.Y., 1961.
' ^

CHAPTER VI
DISCUSSION OF RESULTS ON UREASE CATALYZED
REACTIONS IN DEFORMING MEDIA
The purpose of this chapter is to make some further
general remarks on the interpretation and significance of the
experimental results of Chapter IV and the calculations of
Chapter V. A detailed summary of the specific results of this
dissertation is postponed until Chapter IX.
It has been demonstrated that, for shearing forces up
to about 2.5 Pascals, urease is inactivated only if sulf-
hydryl destroying moieties, such as metal ions (most likely
ferric) or PCMB are present. The basic mechanism proposed is
that urease is rendered more susceptible to these damaging
reactions by the applied hydrodynamic stresses. The stresses
necessary to promote this metal ion effect, i.e., the irre-
versible part of the inactivation, are of the order of 1.0
Pascals. Somewhat higher stresses, 2.0 to 2.5 Pascals are
necessary to produce a direct effect on the activity, i.e.,
any reversible inactivation. More potent inactivation, ap-
parently totally reversible in the absence of metal ions, is
seen in reactions in more viscous media with stresses up to
21.0 Pascals. This represents the first attempt to quantify
the critical stress for measurable inactivation of any enzyme
210

211
system. In this regard, it is reiterated that no statistical-
ly significant permanent inactivation of urease has been ob-
served up to 21.0 Pascals . The dependence of the reversible
inactivation on shear stress rather than shear rate, indi-
cates that wall effects, i.e., collisions, are not the domi-
nant force in this mode of inactivation. The possible role
of wall effects in irreversible inactivation has not been
thoroughly investigated. Indications are that urease is not
strongly absorbed on the surface of the viscometer so, if
there is a surface effect it is a shear induced one.
It is not clear at this point why the stresses neces-
sary for significant inactivation in this work should be so
much higher, 2 to 3 orders of magnitude, than those used by
Charm and Wong (1970a, b) who reported permanent inactivation
at as low as 0.1 Pascals. In light of the present work, an
undetected role of metal ions in their results seems plausi-
ble.
A correlation scheme for the irreversible inactiva-
tion has been shown to apply to urease. For biomedical or
biotechnological reactors or flow devices where the chemical
environment is similar to the present experimental condi-
tions, this type of correlation may be useful in defining
nondeactivating operating conditions. A rule-of-thumb is
5that shear exposures (shear rate x exposure time) below 10
can be tolerated by urease with no loss of activity, sheared
in the presence of micromolar quantities of unchelated metal

212
metal ions
.
The reversible inactivation has been correlated with
shear stress and seems to be leveling off at 55 to 60% of
zero shear activity between 10.0 and 21.0 Pascals. It is
tempting to think that perhaps at this stress level the mole-
cule has been pushed to some physical limit and that at some
higher critical shear stress irreversible inactivation due
directly to a hydrodynamic effect may begin.
These results may imply that shear stress effects may
be present in some of the experiments designed to study very
rapid reactions (see Eigen and de Maeyer, 1963, for a discus-
sion of those techniques) . Tanford (1961) claims that linear
velocities, V, of up to 10 m/sec obtain in some of the con-
tinuous flow and stop-flow devices. If a conservatively
large estimate of the tube diameter, D, at 0.01 m is made, a
nominal shear rate can be calculated from Ynominal ~ ^ V/D.
This means a nominal shear rate of 8000 s""'" may exist in
these apparatus, corresponding to shear stresses in aqueous
media of 8.0 Pascals. Based on the present work, stress re-
lated effects certainly seem possible. It could be that the
rate of shear induced conformational changes prevent them
from happening on the microsecond time scale of some rapid
reaction techniques. In any event, a continuous flow device
seems to have potential for studying these stress effects
themselves. A proposed design for such a device is discussed
in Chapter IX.

213
It is made clear in Chapter V that description of the
shear modification effects is hampered by the lack of de-
tailed structural knowledge of proteins in general and urease
in particular • That is why some preliminary shear-kinetic
experiments have been done with an enzyme that is thoroughly
understood structurally, lactic dehydrogenase. These results
are reported in Chapter VIII after a digression in Chapter
VII to discuss some intrinsic viscosity experiments designed
to further elucidate the urease structure, in particular, the
quaternary structure; it will be seen that the information
from the intrinsic viscosity studies may aid in understanding
the shear-kinetic results
.

REFERENCES
S.E. Charm and B.L. Wong, Science, ITO,, 466 (1970)a.
S E. Charm and B.L. Wong, Biotechnol. Bioeng. ,12, 1103
(1970)b.
M. Eigen and L. de Maeyer, in ^HI^^^^^^^^^^^^^^M^rh anisms of Reactions , ed . by S.L. Friess, E.S.
Li^^IF-lTnd A. Weis^bi^i^r, Vol. VIII, Part II, pg.
896, Wiley, N.Y. , 1963.
C Tanford, Physical Che^^-^^r-v of Macromolecules ,Wiley,
N.Y. , 1961.
214

CHAPTER VIIINTRINSIC VISCOSITY STUDIES OF UREASE
A> Introduction
Calculation of the hydrodynamic properties of rigid,
multisubunit protein assemblies, or plausible models there-
of, utilizing variations of the Oseen tensor (Oseen, 1927) to
account for the hydrodynamic interaction between the sub-
units, has properly drawn the attention of many authors (a
representative sample of the scope of this work is: Kirkwood
and Auer, 1951; Kirkwood, 1954; Bloomfield et al. , 1967a, b;
Paul and Mazo, 196 9; Yamakawa and Tanaka, 1972; Yamakawa and
Yamaki, 1972, 1973; McCammon and Deutch, 1976). Some hydro-
dynamic properties of interest in protein structural studies
are sedimentation coefficient , translational and rotational
diffusion coefficients and intrinsic viscosity. The above
theories lead to relatively simple expressions for the dif-
fusion tensors, from which the sedimentation coefficients and
diffusion coefficient may readily be obtained (Yamakawa,
1971) . These may be interrelated by the molecular friction
coefficient, f, which is related to the translational diffu-
sion coefficient by the Einstein equation (Einstein, 1905):
= kT/f^ (1)
215

216
(an identical relation exists between Dj^ and fj^) and to the
sedimentation coefficient, S, by the Svedberg equation (Yama-
kawa, 1971) : .
where k is Boltzmann's constant, T is absolute temperature,
M is molecular weight, v is the partial specific volume of
the protein molecule, p the solvent density and N is Avogad-
ro's n\imber. On the other hand, explicit expressions for the
intrinsic viscosity of an arbitrarily arranged array of sub-
units have often not been obtained or are computationally
quite complex.
Recently, Abdel-Khalik and Bird (1975) have presented
a theory which is especially well suited to calculating in-
trinsic viscosities of large, irregular assemblies of non-
identical subunits. This theory utilizes shielding coeffi-
cients to account for the hydrodynamic interaction between
subunits, these being determined from exact hydrodynamic cal-
culations on well defined geometries. The purpose of this
chapter is to show how intrinsic viscosity measurements of
urease under various conditions can be combined with the AK-B
theory to elucidate the geometrical arrangement of the urease
quaternary structure. The relationship of the AK-B theory to
the approaches utilizing the Oseen tensor is then discussed.
This is done to show the connections between the present vis-
cosity measurements and previous ultracentrifugal studies of

217
urease by Fishbein and coworkers (1970, 1973) . We begin with
brief sketches of the Kirkwood and AK-B formalisms.
B > Theoretical Treatments
In the Kirkwood theory (1954), the macromolecule is
treated as a collection of point centers of frictional resis-
tance, held together by links which constrain the relative
positions of the N centers to be invariant . These point cen-,
ters of resistance are immersed in a hydrodynamic continuum,
thand the i center exerts a force on the fluid given by:
0^
where T may be the Oseen tensor:
2T. . = ^ [I + (%i^^ii/%i)l •
^Trno^ij —or some modification thereof (see below). Here, 5 is the
friction coefficient of the point center or subunit, Vj^^ is
the velocity of the fluid at the position of center i, which
would have obtained if the macromolecule were not present,
is the velocity of the center i, Hq is the solvent vis-
cosity, Rj^j is the vector between centers i and j, R^j is the
magnitude of this vector and X ^^^^ tensor. (Note
that the subscripts do not refer to components in some coor-
dinate system.) Other, more correct tensorial expressions
for calculating the hydrodynamic interaction have been pro-
posed by Rotne and Prager (1969) and Yamakawa (1970).

218
From simple energy dissipation arguments, it can be
shown (Yamakawa, 1971, pg. 259) that:
[n] = - I v.> (5)
where F. is the x-component of the frictional force of the•1-
i center and y^^ is the y-component of position' of the i
center in a velocity field defined by v^^ = i9Y^r 0/ 0) •
Therefore, what is needed is a solution for the force from
Equation (3). The 3N Equations (3), for the components of
the force F , can be rewritten as a single matrix equation,
following McCammon and Deutch (1976)
:
^ • ^ = JJ^ (6)
whereJJ^
is a 3N x 3N, hydrodynamic interaction hypermatrix
containing the 3x3 blocks:
h. . = I + 5T. . (7)
and X and JJ^ are 3N x 1 column vectors : ^ = (F^^, F2 / . . . / F^)
and ^ = (U]_-V]_^, U2- V2^/ . • . f ^n"^N^ • "^^^ formal solution is,
of course:
Computation of E~-^ is the major hurdle to overcome in apply-
ing this method. If the Oseen tensor is used in constructing
Zwanzig et al . (1968) have pointed out that zero eigen-
values (singularities) of can exist for some strengths
of the hydrodynamic interaction. This, in part, prompted
the modifications suggested by Rotne and Prager (1969) and

219
Yamakawa (1970). Nevertheless, exact analytical expressions
for the transport coefficients can be derived for many of
the variations of geometry and hydrodynamic interaction ten-
sor (Kirkwood, 1954; Bloomfield et al. , 1967a; Paul and Ma^o,
1969). On the other hand, only approximate or numerical
solutions exist for the intrinsic viscosity (Riseman and
Kirkwood, 1950; McCammon and Deutch, 1976). For large assem-
blies, these latter must be done by computer.
Abdel-Khalik and Bird (1975) have taken an entirely
different approach. They have considered each subunit in a
multisubunit assembly to itself be constructed from a tightly
packed array of v identical, spherical beads, of diameter d,
small compared to the subunit dimensions. They have built
their work upon the results of Curtiss et al. (1976). Cur-
tiss et al . have combined a molecular theory expression for
the stress tensor, given in terms of a bead friction coeffi-
cient, 5, , with an expression for the stress tensor suggestedb
by continuum mechanics, the so-called retarded motion expan-
sion (see Bird et al., 1977), to relate the viscosity contri -
bution of the i subunit to the bead friction coefficient:
(^"^n^ = ^ ^ I^sp(i)" ^ 6 s=l p=x,y,z
where n. is the number of i subunits per unit volume and1
Kr.c\ is the p^^ component of the distance from bead s tosp ^ 1
;
the center of resistance of subunit i. Abdel-Khalik and Bird
then take the bead friction coefficient to be given by

220
Stokes' law, modified by a shielding coefficient, C^, to ac-
count for the hydrodynamic interaction between the tightly
packed beads:
^b ^ ^"^^O^S- ^10)
The intrinsic viscosity of the entire multisubunit assembly
is then given by
:
f'^] = ^ I I Z C d- R (11)1=1 s=l p
The subunit shielding coefficients C^"*"^ are determined by
substituting Equation (10) for into Equation (9) and re-
quiring the latter to give the correct analytical results for
isolated units of well-defined geometries, such as spheres,
rods and disks, and where ^gp^ is now the p^^ component of
distance from bead s to the center of resistance of the en-
tire assembly. C^"^^ is actually the appropriate for the
packing arrangement of spheres required to form the subunits
of the above shapes. Equation (11) can be split into two
parts
:
[,] = 5| I (A + BR.^^^^, (12)2M 1=1°
A being dictated by the internal geometry of the subunit and
BR given by the arrangement of subunits in the total as-c
sembly. R^"*"^ is the distance from the center of resistance
of the assembly to the center of resistance of the subunit.
A and B for different subunit geometries have been derived by

221
TABLE VII-1
VALUES OF A AND B FOR AK-B THEORY
GEOMETRY A ' B
Sphere ^ ^ D I(diameter D) ^ ^
16 L^ A(length L, 15 [In (L/D) ] (SD^+L^)
ln{L/D)
diameter D)
1 2Disk 2Hv
2 ^ ^ "
(thicknessdiameter D) [Where v is a function of D/H
given by Scheraga , J. Chem.Phys. , 23_, 1526- (1955) .]
This table is abstracted from Abdel-Khalik and Bird,
1975. It may also be found in Bird et al., 1977, along with
a more complete tabulation of their results.

222
Abdel-Khalik and Bird (1975); some of their results are tabu-
lated in Table 1.
So, Equation (12) is the principal working formula
of the AK-B theory. To use it, one needs only to find the
center of resistance of the assembly under study (Bird et
al. , 1977), specify the distances from it to the centers of
resistance of the subunits (this can often be done by inspec-
tion, as will soon be demonstrated) , look up A and B for the
desired subunit geometries (this theory handles nonidentical
subunits as easily as identical ones) and use Equation (12) .
The ease of using Equation (12) relative to Equations (5) and
(8) is apparent on considering, for example, a four subunit
assembly; some simple arithmetic is required with the former
as opposed to inverting a 12 x 12 matrix with the latter.
C. Calculations on Urease Monomer andOligomers with AK-B Theory
The intrinsic viscosities of urease isozymes, up to
the pentamer, have been calculated using Equation (12).
Based on the best available evidence (Fishbein et al. , 1970,
1973), the radius and molecular weight of the spherical
urease monomer, the oligomerizing unit, have been taken to be
6.2 nm and 482,000 daltons respectively. Four different geo-
metrical oligomerization patterns were assumed. These are
illustrated in Figure VII -1, along with all the values of
R^^^ for each model. The fraction of each oligomer present

223
Figure VII-1. Illustrations of various hypothetical geo-metrical urease oligomerization patterns.

224
2; c8 S c8 c8o
8 8 8

cn
stSJ >^
O OhCO OH wm
w t^CO< CQ
1
D>H
moH QW
CN Eh
1 n: UH t^ HH o Q>H 1^t-q
CQ Ci4 Cm<< O OC-t W
COw caHH
&H
CO COOuCOH Eh
> XuHHS
CO Q13H <Eh;3H
RE
O D1-1 tH
t-^ X n COO H in 00 •
* •
c
!§ \ro
(U(AO ro •rl
iH o4J • • • •
0)CN 00 rH
CD CN rH rH (/}
ca
H-p
u
o LO 0CN • ro ro
• • • •
4J 00GJ rH4-> 0
a)
rC+>
1
•
I / CM CN rM CD• -1 • • • •
H o oiH •H
-Pfd
» (U
-P -p1 oH
rH H ^H ro ro ro fO rH > O0) cs CN CM CN H Ue • • • • • 0) OaO V£) u U
o :3 >im -P•H •H
H Em tn
1 o-K H e o
U * H 0 to
> n •Hg rH iH rH rH 4H >O rH rH rH rH 0)
C • • • • • Jh OO CO 00 ro ro ^3 0) HB »^ tJ^ +J W
-H cP4 g •H
H !h
OJ +J -PCD W
o iH CO HH rH K
IS fCJ
*CD ly u 0 0)
ClI Eh CnEh <D >i >i
ci3 <: rH rHo O O -P
<; P4 CO

during the intrinsic viscosity measurement was determined
chromatographically (see Experimental Section below) . The
fractions were then used as weighting factors to calculate
the intrinsic viscosities for the mixtures of oligomers based
on the four geometrical patterns. The results of these cal-
culations are tabulated in Table 2. It is seen that the
linear aggregation pattern gives a prediction of [n] = 7.13
3cm /g, whereas the more compact- patterns all lead to predic-
3tions in the range 4.79±0,25 cm /g.
D . Experimental
The size exclusion chromatography was performed as
described in Chapter III. Specifically, for this determina-
tion, 55 mg of Sigma, type C-3 , crystalline urease, was dis-
solved in 8 ml of 0.16 M phosphate buffer, pH 7.00±0.05.
This mixture was allowed to stir gently for 2 hours, then
was dialyzed against 400 volumes of buffer for 24 hours at
room temperature, with one change to 400 volumes of fresh di-
alyzate after 12 hours. The solution was then centrifuged
for 1 hour at speed 70, on a Precision Scientific Co., Cen-
tricone, centrifuge to remove any insoluble material. The
supernatant was found by the Lowry procedure to have a urease
concentration of 3.40 mg/ml. A small aliquot was diluted to
0.5 mg/ml and applied to the size separation column described
in Chapter III, section B.2. The elution profile is shown
in Figure VII-2. The remainder of the solution was used for

227
Figure VII-2. SEC of oligomerized urease sample illustratingdetermination of fraction of each isozyme.

228
T1
1
30 40 SQ
elution volume (ml)

229
the intrinsic viscosity measurements. The preparation of a
solution containing urease strictly in the monomeric form,
proceeded in exactly the same way except that the solution
was made 5 mM in B-mercaptoethanol following dialysis. The
urease in solution was found to be 4.1 mg/ml after centrifug-
ing. No chromatography was done with this particular sample
since there is abundant proof that only the 482,000 molecular
weight species exists under these conditions (see Chapter IV,
section B; also Creeth and Nichol, 1960; Fishbein et al.,
1973, 1976).
The percentages of the total urease content contri-
buted by each of the isozymes was determined by graphical
integration of Figure VII-2. These percentages are included
in Table 2.
The intrinsic viscosities of these two sam.ples were
determined using a Cannon-Ubbelohde E796-50 viscometer. The
flow time for buffer alone exceeded 200 sec. The viscometer
was immersed in a constant temperature bath controlled to
25 . 00±0 .05 °C . Centrifugation, then Lowry concentration de-
termination preceded measurement of the flow time at each
concentration. Solvent density was determined using a pync-
nometer.
E. Results and Discussion
The apparent reduced viscosity, ^sp/^' deter-
mined from the flow times t by v /c = (t-to)/toc, where tg

230
is the pure solvent flow time. The results are plotted in
Figure VII-3. Linear regression analysis of the data gives
for the mixture of oligomers [v] - 7.11±0.27 cm^/g and for
3the monomer [v] = 3.57±0.41 cm /g. Errors reported here are
1 standard deviation. The true intrinsic viscosity is ob-
tained after making a buoyancy correction (Tanfoird, 1955) :
[n] = [v] + (1 - vp)/p. (13)
The measured buffer density is 1.0126 g/cm^ . The partial
3specific volume of urease was taken as 0.73 cm /g from
Reithel and Robbins (1966). So, the results for intrinsic
viscosity are:
3[n] = 7.37±0.27 cm /g for the mixture of oligomers,
and
[n] = 3.83±0.41 cm /g for the monomer.
Comparison of the measured value for the mixture of oligomers
and the results of calculations shown in Table 2 show the
clear indication that urease aggregates in a linear fashion.
The measured value for the monomer gives an estimate for the
equivalent hydrodynamic radius from the Einstein viscosity
equation:
(14)
of R = 6.6±0-3 nm. This is 6% higher than what seems toe ^
be the best value of 6.2 nm (Fishbein et al., 1973); the
reason for this slight discrepancy is not clear. Naturally,
the measured value for [n] also exceeds the value calculated

231
Figure VII-3. Apparent reduced viscosities of urease samplesplotted against urease concentration.


from the AK-B theory since the AK-B equation is identical to
the Einstein viscosity equation for spherical molecules.
The sedimentation coefficients of the urease isozymes
have been determined by Fishbein and coworkers (1970, 1973).
They have utilized a Kirkwood type calculation for the sedi-
mentation coefficients and proposed a linear aggregation pat-
tern based on those calculations. So, in a sense, this study
is complementary and corroborative to theirs. In some situ- .
ations, a simple calculation based on the AK-B theory and an
intrinsic viscosity determination may be preferable to a
Kirkwood type analysis and an ultracentrifuge experiment.
The present work demonstrates the ability to obtain similar
information from the two methods.
The results of Fishbein 's group for the sedimenta-
tion coefficients may be combined with the computed values
of [n] for the individual species to calculate the Scheraga-
Mandelkern (1953) 3 factor:
6 = " "°. . (15)
(l-vp) (100) ^/V/-^
Table 3 shows the sedimentation coefficients, the intrinsic
viscosities and the 3's for monomer through pentamer. For
comparison, 3's calculated from an expanding prolate ellip-
soid model (Scheraga and Mandelkern, 1953), of axial ratio
equal to the degree of oligomerization, is shown. It is seen
that 3 for the urease species grows much more rapidly than

234
TABLE VII-3
SCHERAGA-MANDELKERN 3 FACTORS
/for ellipsoid of/ aspect ratio =
2^/3 1 degree of poly-s* [n] ** e*** e****\^erization
monomer 18.3 1.46 2.17 2 .12
diner 27.2 1.84 2.56 2 .13
trimer 32.7 2.18 2.78 2 .16
tetramer 39.8 2.65 3.40 2 .20
pentamer 44.4 3.02 3.72 2 .23
*From Fishbein et al. (1970) •
* *From present calculations.
***From Equation (15),
****From Scheraga and Mandelkern (1953)

the ellipsoid model, consistent with the conclusion reached
by Fishbein et al. (1970) by another route. The 3's for
the tetra- and pentamer are so high that they may reflect
the need for some revision of the [n] and/or s values. The
s values for these are the least precise (Fishbein et al.
,
1970); and the individual [n] values, except for' the mono-
mer, have only been inferred from measurements on the mix-
ture.
The results here do present a totally consistent pic-
ture of the geometrical aggregation pattern in the urease
oligomers. A new avenue in protein structure determination
has been opened by Abdel-Khalik and Bird and exploited in the
present work. One final remark is to note that the AK-B
theory may be connected with the Kirkwood theory by using
the latter to compute Cj^ in Equation (10) . The crucial step
of relating [n] directly to the friction coefficient is
achieved by Curtiss et al. (1976) and used by Abdel-Khalik
and Bird. It may now be possible to improve the AK-B theory
by using a properly constructed hydrodynamic interaction ten-
sor. These calculations may be done once for the various
subunit geometries, then tabulated in the AK-B style. This
will be pursued in future work.
It is highly probable that this extended, linear ag-
gregation pattern of urease causes it to experience larger
hydrodynamic stresses in this type of Couette shear flow than
some more compact protein conformations. This may in part

236
be responsible for the dramatic effects of shearing forces
on urease catalysis demonstrated in previous chapters.

REFERENCES
S.I. Abdel-Khalik and R.B. Bird, Biopolymers, 1£, 1915(1975) .
R.B. Bird, O. Hassager, R.C. Armstrong and C,F. Curtiss,Dynamics of Polymeric Liquids: Volume II, KineticTheory , Wiley, N.Y., 1977.
V. Bloomfield, K.E. VanHolde and W.O. Dalton, Biopolymers, 5_,
135 (1967)a.
V. Bloomfield, K.E. VanHolde and W.O. Dalton, Biopolymers, 5_,
149 (1967)b.
J.M. Creeth and L.W. Nichol, Biochem. J., 77, 230 (1960).
C.F. Curtiss, R.B. Bird and O. Hassager, Adv. Chem. Phys .
,
35^, 31 (1976) .
A. Einstein, Ann. Physik, 17, 549 (1905).
W.N. Fishbein, K. Nagarajan and W. Scurzi, J. Biol. Chem.,
245^, 5985 (1970) .
W.N-. Fishbein, K. Nagarajan and W. Scurzi, J. Biol. Chem.,
248 , 7870 (1973).
W.N. Fishbein, K. Nagarajan and W. Scurzi, Arch. Biochem.
Biophys., 172./ 726 (1976).
J.G. Kirkwood and P.L. Auer, J. Chem. Phys . , 19, 281 (1951).
J.G. Kirkwood, J. Polymer Sci., 12^, 1 (1954).
J. A. McCammon and J.M. Deutch, Biopolymers, 15^, 1397 (1976).
C.W. Oseen, Hydrodynamik , Academisches Verlag, Leipzig, 1927.
E. Paul and R.M. Mazo , J. Chem. Phys., 51, 1102 (1969).
P.J. Reithel and J.E. Robbins, Arch. Biochem. Biophys., 120_,
158 (1966).
J. Riseman and J.G. Kirkwood, J. Chem. Phys., 18, 512 (1950).
237

238
J. Rotne and S. Prager, J. Chem. Phys. , 5£, 4831 (1969).
H.A. Scheraga and L. Mandelkern, J. Am. Chem. Soc. , 75 , 179(1953).
C. Tanford, J. Phys. Chem., 59_, 798 (1955).
H. Yamakawa, J. Chem. Phys., 53_, 436 (1970).
H. Yamakawa, Modern Theory of Polymer Solutions , Harper andRow, N.Y. , 1971.
H. Yamakawa and G. Tanaka, J. Chem. Phys., 57_, 1537 (1972).
H. Yamakawa and J. Yamaki, J. Chem. Phys., 57_, 1542 (1972).
H. Yamakawa and J. Yamaki, J. Chem. Phys., 58_, 2049 (1973).
R. Zwanzig, J. Kiefer and G.H. Wiess, Proc. Nat. Acad. Sci.U.S. , 60, 381 (1968)
.
CHAPTER VIIIPRELIMINARY EXPERIMENTAL RESULTS ON
LACTIC DEHYDROGENASE
A. Introduction
In order to begin to formulate some general ideas on
the causes and characteristics of modifications of enzyme
catalyzed reactions by hydrodynamic forces, it is necessary
to work with more than one enzyme. Since generalizations
about protein structural details are difficult, understanding
the effects of hydrodynamic forces on these structures will
not be easy. Some kinetic reactions in sheared media cata-
lyzed by lactic dehydrogenase (LDH) have been studied in or-
der to see what, if any, of the conclusions obtained with
urease can be extended to at least one other enzyme and what
generalizations may be possible with some knowledge of two
enzymes
.
The reasons for the selection of LDH are primarily
that: (1) its complete three-dimensional structure is known
(Adams et al., 1970; see also the review by Holbrook et al.,
1975); and (2) it has a number of superficial structural
similarities to urease. Among these are a very labile quater-
nary structure consisting of four identical subunits and six
239

240
cysteine residues per subunit, one of them essential. LDH is
a nearly ubiquitous metabolic enzyme which catalyzes the re-
action :
CH3 CH3
C==0 HC-OH + NADI
+ NADH .-
I (1)c=o c=o
OH OH
pyruvate lactate
The particular enzyme used in this work was the rabbit muscle
isozyme. Typical kinetic constants for this enzyme are:
= 0.2 mM; V = 500 ymoles/mg-min (Battellino and Blanco,m max ^ / ^ v ,
1970). The three-dimensional structure is illustrated in
stereo in Figure VIII-1. Based on measurement of the diffu-
sion coefficient of beef muscle isozyme (D2Q ^ = 4.47 x
-7 210 cm /sec; Pesce et al., 1964), this structure corresponds
to an equivalent hydrodynamic sphere of radius approximately
o
48 A. The subunit molecular weight is 35,000; it seems most
likely that hydrophobic forces hold these subunits together
(Holbrook et al. , 1975) to form the active species of 140,000
daltons. There is a conformational change upon pyruvate bind-
ing, as well as on the binding of NADH.
All these factors seem to make LDH an intriguing ob-
ject of study in these shear-kinetic experiments; some inter-
esting conformational dynamics involved in its catalysis are
combined with one of the more thoroughly understood enzyme
structures.

241
Figure VIII-1. Three different stereo views of the tetramericlactic dehydrogenase (after Holbrook et al.^1975).

242

243
B . Experimental
The reaction medium for all these experiments was a
standard solution of sodium pyruvate available from Sigiaa
Chemical Co, (stock no. 500 L-1) . This consists of a 0.75 mM
solution of sodium pyruvate in pH 7.5 Tris buffer. Prior to
a series of reactions, 100 to 200 ml of this substrate solu-
tion was made 1 mg/ml in B-nicotinamide adenine dinucleotide
,
reduced form, disodium (NADH) . All reactions with this solu-
tion were performed within 12 hours subsequent to its prepara-
tion. To initiate each reaction, 50 ul of a 0.080 mg/ml
stock solution of LDH (Sigma, Type V, isozyme) was added
to 8 ml of the substrate-NADH solution. Exact LDH concentra-
tions were determined spectrophotometrically where necessary
from: [LDH] (mg/ml) = 1.13 A280 (Decker, 1977).
Pyruvate concentration was, determined after the de-
sired time interval by analyzing a 1 ml sample according to
a modification of the method of Berger and Broida (1975). To
the 1 ml sample was added 1 ml, 2 , 4-dinitrophenylhydrazine
,
20 mg/100 ml (Sigma Color Reagent, Stock no. 505-2). This
terminated reaction in the sample. After mixing and waiting
20 minutes, 10 ml of 0.4 M NaOH was added and mixed well.
After 5 minutes, the percent transmittance at 415 nm was de-
termined relative to that of a blank of 1 ml distilled water
treated in the same manner. Pyruvate concentration was then
determined from the calibration curve shown in Figure VIII-2.

245
pyruvate (mM)

244
Figure VIII-2. Calibration curve for pyruvate analysis.

246
Experiments with LDH were conducted in two ways: (1)
kinetic reactions were performed in the viscometer, and (2)
kinetic reactions were performed in glassware after subject-
ing the stock LDH solutions to shearing forces. According to
the former procedure the reaction mixture was added to the
viscometer and shearing begun immediately after adding the
enzyme to the substrate-NADH solution. In the latter type of
experiment, stock LDH solutions were prepared in both pure
distilled water and glycerin-water mixture (viscosity 0.0096
Pascal-s) . These were subjected to shearing in the visco-
meter for the appropriate time interval, then removed. A
reaction was then done in glassware, adding the sheared LDH
to the substrate-NADH solution.
Ultraviolet absorption spectra of these sheared stock
LDH solutions were recorded on a Beckman Acta M-VI double-
beam spectrophotometer; the circular dichroism spectra of the
same samples were determined on a Gary 60 spectropolarimeter
with the Model 61 CD attachment.
C. Results and Discussion
The results of performing the LDH catalyzed reduc-
tion of pyruvate in the viscometer are shown in Figure VIII-3.
It is seen there that, within the precision of these experi-
ments, the rate of LDH catalyzed reduction of pyruvate to
lactate is unaltered by shear rates up to 1717 s This
corresponds to shear stresses up to 2.1 Pascals.

247
Figure VIII-3. Pyruvate_concentration as a function of time.O- 48 s l, run LDH-510; 0-48 s"!, runLDK-517; 1717 s"!, run LDH-510;B- 1717 s 1, run LDH-517. (Error bars wheregiven indicate standard deviation of repeti-tive trials.)

248

249
The results of shearing the LDH prior to the reaction
are shown in Figure VIII-4. Two shearing conditions are il-
lustrated: (1) shearing done for 1 hr in purely aqueous
medium, viscosity 0.001 Pascal-s, shear rate 1717 s"""", shear
stress 1.72 Pascal; (2) shearing done for 1 hr in glycerin/
water mixture, viscosity 0,0096 Pascal-s, shear irate 975 s"-'-,
shear stress 9.36 Pascal. For each set of kinetic results
from the sheared LDH there is a control experiment run with
LDH which was exposed to the viscometer for 1 hour under the
same chemical condition but no applied shearing. This was
necessary since mere exposure to the viscometer under quies-
cent conditions seems to alter the activity and structure
(see Figures VIII-5 and VIII-6) of LDH somewhat. The results
in Figure VIII-4 show that under these conditions, in aqueous
(low viscosity) reaction media, the kinetics of pyruvate re-
duction are still unaltered by preexposure to shear rates up
to 1717 s""'". This indicates that the presence of pyruvate
and NADH, and the concommittal conformational changes caused
by them, are not necessarily providing any protection against
shearing at this stress level. Stresses of this magnitude,
that is, up to 2.1 Pascals, simply do not affect LDH activ-
ity. On the other hand, increasing the shear stress by
roughly a factor of five, even while simultaneously reducing
the shear rate, produces very significant irreversible inac-
tivation, to roughly 50% of zero shear activity. This is
clear evidence that hydrodynamic shear stress , as opposed to

250
Figure VIIl-4. Pyruvate concentration as a function of timeat zero shear with LDH samples with variousshear histories. - zero shear, aqueousbuffer; B- r = 1.7 Pascals, y = 1717 s"!aqueous buffer; o - zero shear, q-w mixture;
AJ^ In".P^f^als, y = 975 s-1, g-w mixture.
7 ^T^^^"" deformation condi-tions for 1 hour.


shear rate, is the controlling factor in the shear inactiva-
tion of LDH. The significance of this is that a direct mole-
cular deformation due to stress is indicated as the mechanism
rather than flow induced wall collisions, which depend on
shear rate (Levich, 1962).
Some spectroscopic results on the LDH solutions be-
fore and after shearing are shown in Figures VIII-5 and
VIII-6. Looking first at the UV spectra, it is seen that
there is virtually no difference in the two purely aqueous
samples which were exposed to the viscometer one at 1717 s^
and one at zero shear. There is a pronounced difference,
however, between these two and the spectrum prior to exposure
to the viscometer. This indicates that there is some altera-
tion induced in LDH by mere exposure to the viscometer.
This difference exists also in the samples sheared in glycer-
in and water, but there is also a pronounced spectral differ-
ence between the unsheared and sheared samples , with the same
viscometer exposure. The blue shifting of the peak original-
ly at 280 nm and the hyperchromicity at 250 nm, which appears
on exposure to the viscometer, is significantly enhanced by
the applied shear stress. This same pattern of effects is
repeated in the CD spectra of Figure VIII-6. No difference
between the aqueous samples is seen up to 1717 s although
major disruption of the structure on exposure to the visco-
meter is evident. On the other hand, there are significant
stress-induced alterations evident in the LDH exposed to

253
Figure VIII-5. Ultraviolet absorption spectra of lactic de-hydrogenase samples with various shear his-tories . ^ - no viscometer exposure , aqueousbuffer; tAt - no viscometer exposure, g-w mix-ture. Other symbols have same meaning as inFigure VIII-4.


255
Figure VIII-6. Circular dichroism spectra of lactic de-^hydrogenase samples with various shear histories. Symbols have same meaning as inFigure VIII-5.

256

9.35 Pascals. Glycerin also seems to somehow protect the
native LDH structure under quiescent conditions. These CD
results may be interpretable in terms of the known helical
structure of LDH but that will not be attempted here.
To briefly summarize, it has been found that LDH,
either alone or with bound substrate and cofactor, is unaf-
fected by shearing forces up to 2.1 Pascals. At higher
stress levels, there is inactivation which is shear stress
dependent, as in the case of urease, however in the case of
LDH the inactivation is at least partially irreversible. A
high viscosity reaction medium (as opposed to a preshearing
medium) has not yet been devised. Therefore, no results are
presently available on modifications of LDH kinetics during
shear nor are there any results on the reversibility of any
modifications. Efforts in that direction may be expected to
be fruitful; likewise, further results on the effects of
shear on LDH kinetics and structure may produce a structural
interpretation of the shear modification phenomena. It is
clear now that it is not necessary to have the huge (for a
protein) linearly aggregated structure found in urease in
order for shearing forces to modify the catalytic behavior of
an enzyme.

REFERENCES
M.J. Adarr.3 , G . C . Ford , R. Koekoek , P.J. Lent z , A . McPherson
,
M.G. Rossmann, I.E. Siniley, R.W. Schevitz and A.J.Wonacott, Nature, 227 , 1098 (1970).
L.J. Battelino and A. Blanco, J. Exp. Zool., 174 ', 173 (1970).
L. Berger and D. Broida, Technical Bulletin No. 500, SigmaChemical Co., St. Louis, 1975.
L.A. Decker, ed., Worthington Enzyme Manual , WorthingtonBiochemical Corp., Freehold, N.J., 1977.
J.J. Holbrook, A. Liljas, S.J. Steindal and M.G. Rossmann in^The Enzymes , 3rd edition, vol . 11 , pg. 191, ed. byP.D. Boyer, Academic Press ,N.Y.,1975.
V.G. Levich, Physicochemical Hydrodynamics , Prentice-Hall/Englewood Cliffs, N.J., 1962.
258

CHAPTER IX
CONCLUSION
Since this work began with the rather vague objective
of simply trying to find out what effects, if any, are pos-
sible when enzyme catalyzed reactions occur in deforming
media, it is not surprising that the information gathered
during the course of it covers a rather broad range. The
purpose of this concluding chapter is to concisely enumerate
the most important discoveries of this work so that it may
serve as well as possible as a groundwork for future re-
search. This enumeration is done in section A followed by
some thoughts on significant future work in section B.
A. Summary of Results
1. An experimental methodology of conducting enzyme
catalyzed reactions in deforming media has been developed.
2. In this type of experiment, urease is inacti-
vated, partially irreversibly, if subjected to shearing
stresses in the range 0.5 to 2.5 Pascals, in the presence of
micromolar quantities of metal ions and in the absence of :
chelating or thiol reducing agents.
3. The extent of irreversible inactivation occurring
under these conditions can be correlated with the total shear

260
strain (shear rate x exposure time) experienced by the en-
zyme. A rule -of-thumb is that shear strains below 10^ can be
tolerated by urease with no loss of activity.
4. A shear-promoted metal ion catalyzed thiol oxida-
tion on a urease cysteine is responsible for the irreversible
inactivation.0
5. Evidence that ferric ion is responsible has been
obtained.
6. This irreversible inactivation due to shearing
is decreased when shearing takes place in the absence of
urea. Substrate urea binding to urease is thus seen to cause
a conformational change, detected by these experiments as
enhanced susceptibility to shearing forces.
7. EDTA completely eliminates any irreversible in-
activation. Some reversible inactivation is still seen at
stresses of 2.0 Pascals or greater. Other chelating agents
^
especially ferric specific , produce similar effects
.
8. 6-Mercaptoethanol , at levels greater than 0.01
mM, completely eliminates all inactivation. Parachloro-
mercuribenzoate reaction with urease is enhanced both by
shearing and by presence of urea.
9. Size exclusion chromatography (SEC) indicates
that the high molecular weight urease isozymes are more
readily inactivated by shearing. This means that g-met not
only protects against the metal ion thiol oxidation but also
reduces urease to a more shear stable form. SEC also shows

261
some shear induced aggregation in urease solutions sheared at
[urease] of 0.5 mg/ml or greater. CD spectra of these same
solutions show conformational changes consistent with some
aggregation.
10. Urease catalyzed reactions have been conducted
in high viscosity media in the absence of metal ions. In this
regime, stresses from 5.0 to 21.0 Pascals, inactivation seems
to be totally reversible, within experimental error. The ex-
tent of reversible inactivation, clearly depends on shear
stress , not on shear rate . The extent of inactivation reaches
about 55% at 21.0 Pascals. g-Mercaptoethanol eliminates this
inactivation, also, indicating the necessity of having an in-
tact intermonomer disulfide bond in urease to see any inac-
tivation.
11. Some new structural information on urease has
been obtained in the course of this work: (a) CD spectra of
native urease have been used to estimate the percentage of
a-helical residues in urease at about 8%; (b) intrinsic vis-
cosity measurements have been combined with calculations
based on the Abdel-Khalik-Bird theory to demonstrate that
urease aggregates are linearly arranged; (c) atomic absorp-
tion indicates 12 nickel atoms per urease monomer; (d) some
vicinal dithiol compounds, extremely strongly bound nickel
ligands, have been shown to irreversibly denature urease, in-
dicating that nickel is essential to urease structural in-
tegrity, as well as activity; and (e) urease shows no EPR

262
signal nor can the urease nickels be made paramagnetic by a
24 hour nitrous oxide exposure.
12. Lactic dehydrogenase catalyzed reactions unaf-
fected by shearing forces up to 2.1 Pascals.
13. LDH is irreversibly inactivated 50% by preex-
posure to 9.4 Pascals. Inactivation clearly depends on shear
stress not on shear rate.
14. Structural changes- in LDH are seen by UV and CD
spectra to accompany shear inactivation.
15. A good quantitative model of urease shear inac-
tivation has been developed empirically. The physical sig-
nificance of some of the parameters is obscure, however. A
molecular theory of structural deformation in globular pro-
teins is still a task for the future.
B, Possibilities for Future Work
The most direct and potentially fruitful extension of
this work seems to be a more detailed study of lactic dehy-
drogenase. Experiments outlining the critical stress neces-
sary for inactivation could be done with the present appara-
tus and procedure. A thorough study of activity 'and struc-
tural changes due to stress should be done in order to corre-
late the two. The problem here will be to interpret in de-
tail the structural changes seen through UV and CD spectra.
One path to this objective may be a simultaneous study of the
changes in UV and CD spectra caused by some other denaturing

263
agents. The type of data potentially obtainable from the
fluorescence-in-shear device designed by Paladini and Weber
(1977) would be especially useful in this endeavor.
It would be advisable to build any future apparatus
for this sort of work from some nonmetallic material, given
the major metal ion effects demonstrated in this' work. A de-
vice capable of generating high stresses, say, up to 200 Pas-
cals, in 0.001 Pascal-s fluids is necessary, as well. A
capillary flow device, similar to those employed to study
rapid enzyme reactions, seems to meet this requirement. The
sort of device envisioned would have a substrate solution
reservoir and an enzyme solution reservoir. These two solu-
tions would be brought together by a dual syringe pump (or
possibly gas pressure on the solution reservoirs may be
necessary to achieve high enough flow rate) in a mixing
cham±>er- The design should be such that the stresses experi-
enced by the solutions up to and in the mixing chamber are
minimized. The controlled shearing would be done in a set of
interchangeable capillaries inserted after the mixing cham-
ber. This set would be composed of capillaries of varying
length and diameter, to vary the deformation experience.
Analytical procedures to follow the reaction would be applied
to the effluent, by appropriate quenching of the reaction, or
applied directly, i.e., spectrophotometrically , to the flow-
ing reacting solution. Reversibility of any hydrodynamic ef-
fects may be studied by obtaining concentration vs. residence

264
time data at constant flowrate and cross-section in capil-
laries of varying length and comparing this to concentration
vs. real time data obtained when shearing in any of the capil-
laries is instantaneously stopped.
So, it is seen that this type of device would be as
convenient for every purpose as a Couette device". In addi-
tion, higher stresses may be obtained, sampling is easier and
large volumes of enzyme samples subjected to identical stress
experiences may be prepared for subsequent study, for example,
determ.ination of structural changes. Also, very short time
behavior may be examined which is impossible with the Couette
device. One drawback to the capillary device may be the in-
homogeneous velocity field generated, but some averaging of
the stress history can probably be applied.
Another type of experiment which may be useful in
understanding the molecular basis of these phenomena is one
in which an oscillatory strain is applied to an enzyme cata-
lyzed reacting medium. Oscillations may be applied sonically
or directly mechanically. Study of the frequency dependence
of any modification in the enzyme kinetics may provide a dif-
ferent sort of insight into the conformational dynamics re-
sponsible than the stress dependence studies in the present
work
.
The list of potential future projects could be ex-
tended to more speculative areas. It is hoped that this dis-
sertation has been as worthwhile for its thought provoking

265
character and stimulation for future work as it has for any
of the definite results obtained.

REFERENCE
A. Paladini and G. Weber, personal communication, Urbana,Illinois , January, 1977
.
266

APPENDICES
267

APPENDIX A
SOLUTION OF EQUATIONS FOR PARALLEL
DEACTIVATION MODEL OF CHAPTER V
For the proposed reaction scheme:
I
(A-1)
the following differential equations result, assuming all
first order reactions:
g = -(ki + k2)E + k3R
(A-2)
dt " ^^2^ ^3^-
Algebraic equations are obtained on taking the Laplace tranS'
forms, using the initial conditions E = 1 and R = 0 @ t = 0:
se - 1 = (kj + ^2^^ ^3*^
(A-3)
sp = k2e - k^P/
where s is the transform variable and e = L(E) and p = L(R).
Solving for z gives
:
s+k-^e =
(s+k3) (s+k3_+k2)-k2k3
268
(A-4)

269
The algebraic complexity arises on manipulating this to an
invertible form. Several steps lead to:
s + k3e = 7 ^- (A-5)
k^+k2+k3\22
+ kik3 - -4-(k^+k +k )s +
which may be inverted to give the result in Chapter V on con
suiting any table of Laplace transform pairs.
>

APPENDIX B
PROCEDURE FOR OBTAINING KINETIC CONSTANTS
FOR SIMPLIFIED DEACTIVATION MODEL
For a first-order reaction with first-order catalyst
decay, it is easily shown that reactant concentration, C, as
a function of time is given by:
In C/Cr. = ^ (1 - e d) (B^D
(other symbols have same meanings as in Chapter V) . For an
equation of the form:
y = y<„ - Ae~^^, (B-2)
it can easily be shown that
(B-3)
1 ' ^4 ^2 ^3
where y-|^, y2 / Y^r 74 are the function y evaluated at four
equally spaced time intervals t^^ , t2 , tj , t^. This is simply
verified by substituting the appropriate expressions for y^
from (B-2) into {B-3) and realizing that since the time in-
tervals are equally spaced, exp(ti+t4) = exp(t2+t3).
In Equation (B-1) , k°/k^ may be designated [In C/Cq]„
This quantity was estimated by application of the above
procedure. The composite deactivation constant was then es-
270

271
timated from the slope of a plot of ln[ln(C/Co) ~ I^^^/Cq)^]
vs. t. The irreversible inactivation constant was estimated
by taking the slope at the first stop shear point, calculat-
ing a first order zero shear rate constant at this point in
time, dividing by , taking the natural log of this and
dividing by the time elapsed to the first stop shear point.
This is given as k-j_. The equilibrium constants are then
given by the relations in Chapter V.
This technique proved to be very difficult to use to
obtain good values of constants from data as sparse as these.
Specifically, the entire procedure is very sensitive to the
value of C/CqI
^ which is not estimated accurately when using
as few data points as were obtained here.

APPENDIX C
BASIC SHEAR INACTIVATION DATA IN
NORMAL 0*16 M PHOSPHATE BUFFER
Introduction
This appendix presents in tabular form all the data
obtained on urea hydrolysis by urease during and after shear-
ing in the normal phosphate buffer used throughout this re-
search. By "normal," is it meant that the data here are with-
out any additives (EDTA, etc.) present. The format is as
follows: (a) each set of data is identified with a Figure
number from the main text for cross referencing purposes;
(b) within each set the data is tabulated in groups; (c) each
group is headed by a data point obtained at the indicated
shear rate; and (d) this is followed by any zero shear data
obtained on stopping the shear at the point in time indicated
with the data point heading the group.
272

TABLE C-1
DATA OF FIGURE IV-2aUrease A (1 mg/ml)
SHEARRATE (S~l) TIME (min) C/Cq
0 0 1.0000 20 0.6320 30 0.5020 45 0.3640 60 0.2520 90 0 . 123
1717 30 0.800n 60 0 . 590
0 90 0.505nu 120 0 . 375
0 150 0.277
1717 60 ^ 0.685
0 90 0.555
0 120 0.480
0 150 0.415
0 180 0.330
1717 75 0.653
1717 90 0.628
0 120 0.555
0 150 0.486
0 180 0.430
0 210 0.373
1717 120 0.604
1717 180 0.580
0 210 0.530
0 240 0.487
0 270 0.430
0 300 0.385

TABLE C-2
DATA OF FIGURE IV-2bUrease A (1 rag/ml)
SHEARRATE (s" TIME (min) C/Cq
741 30 0.7120 60 0.4650 90 0.3850 1 20X ^ V 0.2420
•
X -J u 0.197
60 0.5650 90 0.470nu 120 0 3700 150 0.2600 180 0.200
741 90 0.5210 120 0.415nu 150 0 .330
0 180 0.2850 210 0.210
741 120 0.491
741 180 0.445
0 210 0.320
0 240 0.233
0 270 0.210
0 300 0.175

TABLE C-3
DATA OF FIGURE IV-2cUrease A (1 mg/ml)
SHEARRATE (s TIME (min) C/Cq
0 O Q 0 645
U R nJ u 0 450
0 / u \> • J -J J
0 90 0„265
0 120 0.140
288 45 0.553
288 bU U • J W •!
0 y u U . J J J
0ion
!_/ • J U V
u 150 0 .210
0 18 0 * 0.125
288 75 0.472
288 90 0.459
0 120 0.360
0 150 0.210
0 180 0.150
0 210 0.110
288 120 0.429
288 180 0.410
0 210 0.355
0 240 0.315
0 270 0.250
0 300 0.175

276
TABLE C-4
DATA OF FIGURE IV-5aUrease B (0.025 mg/ml)
SHEARRATE (s~l) TIME (min)
' 0
0 0 1.0000 60 0.6610 120 0.3680 180 0.1860 240 0.117
1717 120 0 .5470 150 0.4700 180 0.4130 210 0.3810 240 0.355
1717 180 0.4590 210 0.4040 240 0.3720 270 " 0.3600 300 0.331
1717 240 0.4190 270 0.373
0 300 0.348
0 330 0.314
1717 300 0.398
0 330 0.355
0 360 0.322
0 390 0.300

TABLE C-5
DATA OF FIGURE IV-5bUrease B (0.025 mg/ml)
'DAT'T?K/\i Xj \ S }tryC/Cq
975 45 0 .819u 1 D (\ TinAu J-UD n ^ 0 oU • o z ^
0 1 'J ci Jd U . d4 /
U IbD (\ An 1
975 90 0.7020 105 0.5950 135 0.5290 165 0 . 471
975 120 0.5380 150 0.4150 180 0.3830 210 ^
0.3500 240 0.328
975 180 0.5050 210 0.4620 240 0.4130 270 0.3930 300 0.370
975 240 0.452
975 300 0.488
0 330 0.475
0 360 0.463

TABLE C-6
DATA OF FIGURE IV-5cUrease B (0.025 mg/ml)
SHEARRATE (s~l) TIME (min) C/Cq
288 45 0.761
288 90 0.6000 105 0.5470 120 0.5020 150 0.4030 180 0.359
288 120 0.605
288 180 0.3720 210 0.3200 240 > 0.2620 270 0.2340 300 0.199
283 240 0.3400 270 0.2550 300 0.2190 360 0.177
288 300 0.2990 330 0.2580 360 0.2320 390 0.2200 420 0.181

TABLE C-7
DATA OF FIGURE IV-6aUrease C (0.005 mg/ml)
SHEARKAiili \S )
Ti T XT' / TV* T »-k \illVlij \InXn; C/Cq
0 0 1.0000 15 0.858u
0 45 0.4590 60 0.2920
"7 C75 0 . ly 2
1717 30 0.920
1717 60 0.7500 120 0.5100 210 0.309
1717 90- 0.668
1717 120 0.5900 150 0.4870 210 0.379
1717 180 0.5700 270 0.469

TABLE C-8
DATA OF FIGURE IV-6bUrease C (0.005 mg/ml)
SHEARRATE (s"-*-) TIME (min) C/Cq
ZOO J U U » O -5 O
u D u u . o / o
0 90 0.5700 120
288 60 0.718
288 90 0.6400 120 0.5420 150 0.4850 180 0.402
288 120 0.585
288 180 0.4780 210 0.4420 240 0.3960 300 0.340
APPENDIX D
SHEAR INACTIVATION DATA IN GLYCERIN-BUFFER
MIXTURES
Introduction
This appendix presents in tabular form all the data
of Figures IV-28 through IV-32 which were used to obtain the
constants in Table IV-6, Format is the same as in Appendix
C.
281

TABLE D-1
DATA OF FIGURE IV-28Flow Conditions: y = 1717 s ,
T\ = 0.0120 Pascal-s, t = 21.0 Pascals
C TTT7> TV TJ
RATE (s"-*-) TIME (min) C/Cq
u u 1 n n nJ. . u u u
U lU u , o o X
0 20 0.6800 30 0.5430 A f\4 U n y1 9 "5
U . 4 Z J
U nDU u • ^ z u
0 50 U . J
0 70 0.2000 80 A T >1 A0.1490 90 0.114
1717 15 0.7811717 15 0.803
0 22.5 0 . 694
0 30 .> 0.591
0 45 0 .457
1717 30 0.6800 45 0.5220 60 0.345
1717 45 0.4851717 45 0.485
0 52.5 0.3770 60 0.3680 67.5 0.296
0 75 0.326
1717 60 0.446
1717 60 0.5050 67.5 0.365
0 75 0.3510 82.5 0.295
0 90 0.274

TABLE D-1—Continued
SHEARRATE (s"l) TIME (min) C/Cq
_
1717 75 0.3181717 75 0.342
0 82.5 0 .2900 90 0.2610 97.5 0.2490 105 0.211
1717 90 0.2311717 90 0.243
0 105 0.1940 120 0.1620 135 0.128

TABLE D-2—Continued
SHEARTTMF ( mi n \
1717 60 0.4581717 60 0.440
0 75 0.3460 90 0.2480 97 .
5
0 . 204
1717 75 0.3701717 75 0.334
0 82.5 0.3000 90 0.2590 97.5 0.2560 105 0.187
1717 90 0.3061717 90 0.316
0 105 0.2060 120 0.1760 150 0.130

TABLE D-3
DATA OF FIGURE IV-30Flow Conditions: y = 1301 s"''",
n = 0.0078 Pascal-s, t = 10.4 Pascals
SHEARRATE (s"^) TIME (min) C/C
0 0 1.0000 15 0.7720 30 0 .5630 45 0.4210 60 0 . 3130 75 0.2000 90 0.147
1301 15 0 7600 30 0.6400 45 0.535
1 301 0 7-351301 30 0.666
0 37.5 0.5900 45 0.5440 52.5 0.490
1 3mLO\J L 0 497
0 60 0.4130 75 0.298
1301 60 0.5750 75 0.4460 90 0.335
1301 75 0.3780 90 0.2900 105 0.241
1301 90 0.3651301 90 0.331
0 97.5 0.2950 105 0.2450 112.5 0.230

TABLE D-4
DATA OF FIGURE IV-31Flow Conditions: y = 741 s" ,
n = 0.0120 Pascal-s, t = 8.9 Pascals(no shear data same as in Table D-1)
SHEARRATE (s~^) TIME (min) C/Cq
741 0 1.000741 30 0.532741 60 0.339741 90 0.221

288
TABLE D-5
DATA OF FIGURE IV-32Flow Conditions: y = 522 s
n = 0.0095 Pascal-s, T = 5.0 Pascals
SHEARRATE (s~^) TIME (min) C/Cq
0 0 1.0000 15 0.7600 90 0.196
\J Cd ^ ou U • 0 ^ D
0 60 0.425
522 75 0.4250 90 0.3350 105 0.251
522 90 0.275522 90 0.286
0 105 " 0.2500 112.5 0.2200 120 0.2000 120 0.181

>
fEB78