
Ab initio Direct Phasing in Macromolecular Crystallography: an Application of the Z-test
Upload
khangminh22Category
view
0download
0
The SHELX approach to the experimental phasing of macromolecules
George M. Sheldrick, Göttingen University
http://shelx.uni-ac.gwdg.de/SHELX/
IUCr 2011 Madrid
Experimental phasing of macromoleculesExcept in relatively rare cases where atomic resolu tion data permit the phase problem to be solved by ab initio direct methods, experimental phasing usually implies the presence of’ ‘ heavy’ atoms . In order to locate the heavy atoms, we need their structure fac tors FA.
The phases φφφφA calculated for the heavy atom substructure enable u s to estimate starting phases φφφφT for the full macromolecular structure by:
φφφφT = φφφφA + αααα
After refining these phases we can use them and the native structure factors FT to calculate an electron density map of the macromo lecule.
As we will see, αααα, FA and FT can all be estimated from the experimental data.
Data files used for shelxc/d/eshelxc reads the experimental data and writes three files in addition to some useful statistics that are output to the conso le (and can be displayed graphically by Thomas Schneider’s hkl2map ). These files are:
name.hkl – reflection indices, merged native intensity for density modification with shelxe and possibly later refinement with shelxl .
name_fa.ins – instruction file for running shelxd.
name_fa.hkl – reflection indices, FAand αααα.
The analysis of MAD dataKarle (1980) and Hendrickson, Smith & Sheriff (1985 ) showed by algebra that the measured intensities in a MAD expe riment, assuming only one type of heavy atom, should be given by:
|F±|2 = |FT|2 + a|FA|2 + b|FT||FA|cos αααα ± c|FT||FA|sin ααααwhere a = (f” 2+f’ 2)/f0
2, b = 2f’ /f0, c = 2f” /f0 and αααα = φφφφT – φφφφA. We need to know f ’ and f ” for each wavelength.
In a 2-wavelength MAD experiment, we have 4 equatio ns for the 3 unknowns FA, FT and α, so with error-free data we should get a perfect map!
For SIRAS, we have 2 equations for the derivative p lus a native dataset. Given perfect isomorphism, the phase probl em is solved.
Unfortunately for SAD we only have 2 equations for the 3 unknowns.
SAD phasingFor a single wavelength SAD experiment, we only hav e equations for |F+|2 and |F–|2 . Subtracting the second from the first, we obtain:
|F+|2 – |F–|2 = 2c |FA| |FT| sin αααα
For a small anomalous difference, we can assume:
|FT| ~ ½ ( |F+| + |F–| )
So using |F+|2 – |F–|2 = (|F+| + |F−|) (|F+| − |F−|)
we obtain:|F+| – |F–| = c |FA| sin αααα
where c is 2f ”/ f0. c could be calculated but we would still require |FA|, not |FA|sin αααα, to find the heavy atoms. Lacking a better estimate, we have to input | |F+| – |F–|| (generated by SHELXC) into SHELXD.
For MAD and SIRAS we can use | FA|, so there is no problem.
refine occupancies, save best solution so
far
Starting atoms consistent with
Patterson
reciprocal space:refine phases
real space:select atoms
SF calculation
FFT
Many cycles E > Emin
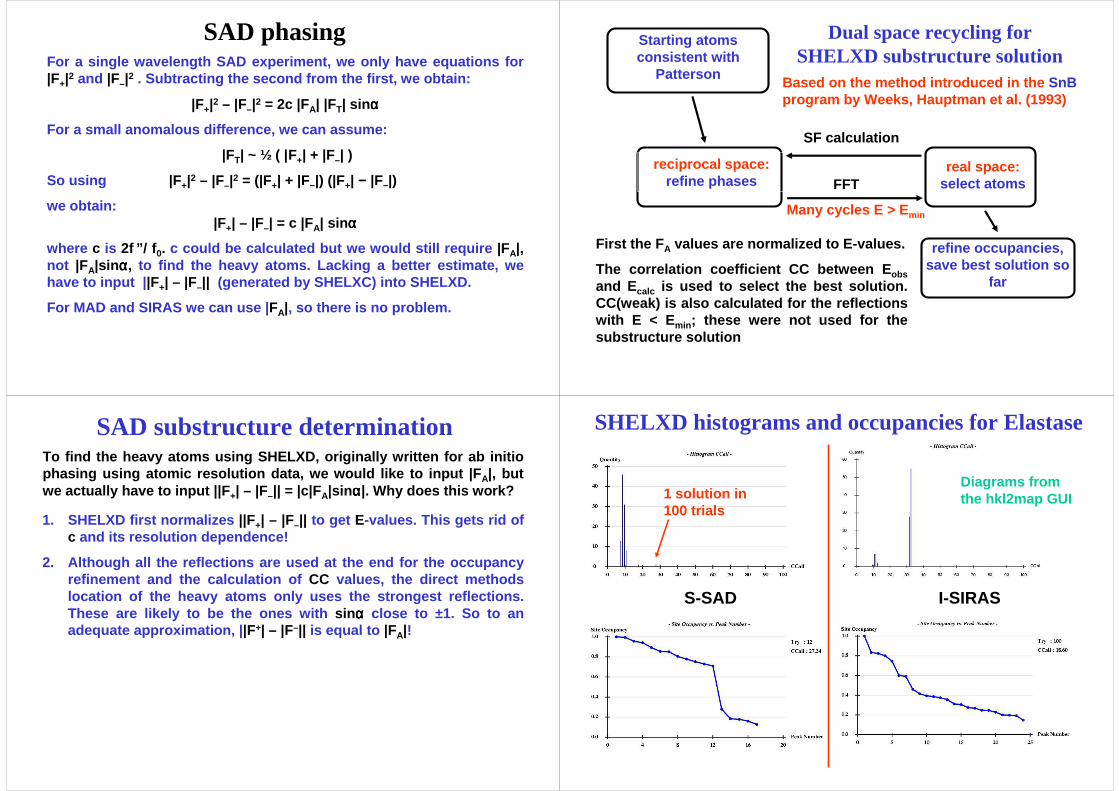
First the FA values are normalized to E-values.
The correlation coefficient CC between Eobsand Ecalc is used to select the best solution. CC(weak) is also calculated for the reflections with E < Emin ; these were not used for the substructure solution
Based on the method introduced in the SnBprogram by Weeks, Hauptman et al. (1993)
Dual space recycling for SHELXD substructure solution
SAD substructure determinationTo find the heavy atoms using SHELXD, originally wr itten for ab initiophasing using atomic resolution data, we would like to input | FA|, but we actually have to input || F+| – |F–|| = |c|FA|sin αααα|. Why does this work?
1. SHELXD first normalizes ||F+| – |F–|| to get E-values. This gets rid of c and its resolution dependence!
2. Although all the reflections are used at the end for the occupancy refinement and the calculation of CC values, the direct methods location of the heavy atoms only uses the strongest reflections.These are likely to be the ones with sin αααα close to ±1. So to an adequate approximation, | |F+| – |F–|| is equal to |FA|!
SHELXD histograms and occupancies for Elastase
S-SAD I-SIRAS
1 solution in 100 trials
Diagrams fromthe hkl2map GUI
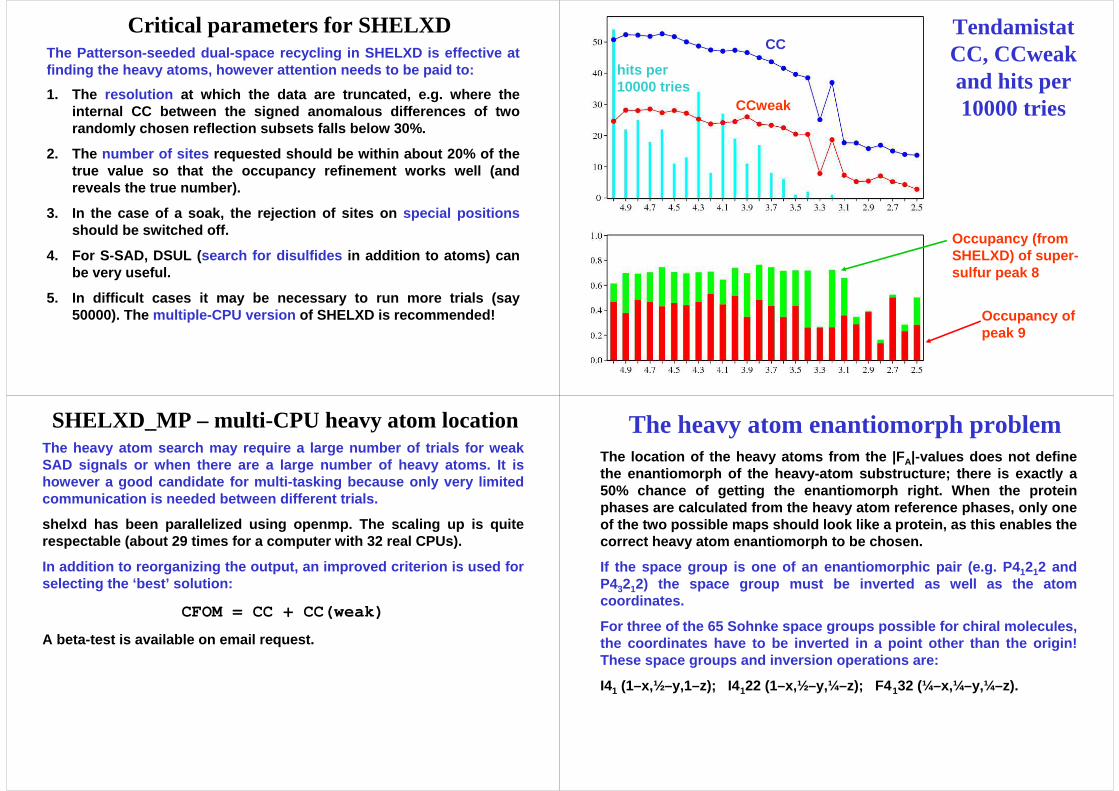
Critical parameters for SHELXD
1. The resolution at which the data are truncated, e.g. where the internal CC between the signed anomalous difference s of two randomly chosen reflection subsets falls below 30%.
2. The number of sites requested should be within about 20% of the true value so that the occupancy refinement works w ell (and reveals the true number).
3. In the case of a soak, the rejection of sites on special positionsshould be switched off.
4. For S-SAD, DSUL ( search for disulfides in addition to atoms) can be very useful.
5. In difficult cases it may be necessary to run mor e trials (say 50000). The multiple-CPU version of SHELXD is recommended!
The Patterson-seeded dual-space recycling in SHELXD is effective at finding the heavy atoms, however attention needs to be paid to:
TendamistatCC, CCweakand hits per 10000 tries
Occupancy (from SHELXD) of super-sulfur peak 8
CC
CCweak
hits per 10000 tries
Occupancy of peak 9
SHELXD_MP – multi-CPU heavy atom locationThe heavy atom search may require a large number of trials for weak SAD signals or when there are a large number of hea vy atoms. It is however a good candidate for multi-tasking because only very limited communication is needed between different trials.
shelxd has been parallelized using openmp. The scali ng up is quite respectable (about 29 times for a computer with 32 real CPUs).
In addition to reorganizing the output, an improved criterion is used for selecting the ‘best’ solution:
CFOM = CC + CC(weak)
A beta-test is available on email request.
The heavy atom enantiomorph problemThe location of the heavy atoms from the | FA|-values does not define the enantiomorph of the heavy-atom substructure; the re is exactly a 50% chance of getting the enantiomorph right. When t he protein phases are calculated from the heavy atom reference phases, only one of the two possible maps should look like a protein , as this enables the correct heavy atom enantiomorph to be chosen.
If the space group is one of an enantiomorphic pair (e.g. P41212 and P43212) the space group must be inverted as well as the atom coordinates.
For three of the 65 Sohnke space groups possible for chiral molecules, the coordinates have to be inverted in a point othe r than the origin! These space groups and inversion operations are:
I41 (1–x,½–y,1–z); I4 122 (1–x,½–y,¼–z); F4 132 (¼–x,¼–y,¼–z).

Simulations with one heavy atom in P1
A perfect MAD or SIRAS experiment should give perfect phases! A centrosymmetric array of heavy atoms is fatal for SIR, but one heavy atom is enough for SAD even in space group P1, because it is easy to remove the negative image by setting negative density to zero!
MAD or SIRAS
SIR
SAD
Density modificationThe heavy atoms can be used to calculate reference phases; initial estimates of the protein phases can then be obtaine d by adding the phase shifts αααα to the heavy atom phases.
These phases are then improved by density modificat ion. Clearly, if we simply do an inverse Fourier transform of the unmod ified density we get back the phases we put in. So we try to make a chemically sensiblemodification to the density before doing the invers e FFT in the hope that this will lead to improved estimates for the p hases.
Many such density modifications have been tried, so me of them very sophisticated. Major contributions have been made by Peter Main, Kevin Cowtan and Tom Terwilliger. One of the simples t ideas, truncating negative density to zero, is actually no t too bad (it is the basic idea behind the program ACORN).
The sphere of influence algorithmThe variance V of the density on a spherical surface of radius 2.4 2 Å is calculated for each pixel in the map. The use of a spherical surface rather than a spherical volume was intended to save time and add a little chemical information (2.42 Å is a typical 1,3 -distance in proteins and DNA). V gives an indication of the probability that a pixel corresponds to a true atomic position.
Pixels with low V are flipped (ρρρρS’ = –γργργργρ where γγγγ is usually set to 1.0).
For pixels with high V, ρρρρ is replaced by [ρρρρ4/(νννν2σσσσ2(ρρρρ)+ρρρρ2)]½ (with νννν usually 0.5) if positive and by zero if negative. This has a similar effect to the procedure used in the CCP4 program ACORN.
For intermediate values of V , a suitably weighted mixture of the two treatments is used.
An empirical weighting scheme for phase recombinati on is used tocombat model bias.
Bernhard Rupp & Peter Zwart
Although SHELXE makes no use of histogram matching, the sphere of influence algorithm is able to bring the histogram much closer to the one for the correct structure!
Density histograms

The free lunch algorithmThe free lunch algorithm (FLA) is an attempt to extend the resolution of the data by including, in the density modificati on, reflections at higher resolution than have been measured. Although discovered independently and first published by the Bari group (Acta Cryst . D61 (2005) 556-565 and 1080-1087), the first successful implementation of the FLA was probably in 2001 in the program ACORN, but was not published until 2005 ( Acta Cryst . D61 (2005) 1465-1475).
The unexpected conclusion was that if these phases are now used to recalculate the density, using very rough guesses f or the (unmeasured) amplitudes, the density actually impro ves! The FLA is incorporated in SHELXE and tests confirm that the p hases of the observed reflections improve, at least when the nat ive data have been measured to a resolution of 2 Å or better.
Maps before and after a free lunch
Best experimental phases after density modification (MapCC 0.57)
After expansion to 1.0 Å with virtual data (MapCC 0.94)
Isabel Usón et al , Acta Cryst. D63 (2007) 1069-1074.
Why do we get a free lunch?It is not immediately obvious why inventing extra d ata improves the maps. Possible explanations are:
1. The algorithm corrects Fourier truncation errors that may have had a more serious effect on the maps than we had r ealised.
2. Phases are more important than amplitudes (see Ke vin Cowtan’sducks and cats!), so as long as the extrapolated ph ases are OK any amplitudes will do.
3. Zero is a very poor estimate of the amplitude of a reflection that we did not measure.
The SHELXE autotracing algorithm
1. Find potential αααα-helices in the density and try to extend them at both ends. Then find other potential tripeptides and try to extend them at both ends in the same way.
2. Tidy up and splice the traces as required, applyi ng any necessary symmetry operations.
3. Use the traced residues to estimate phases and co mbine these with the initial phase information using sigma-A weights , then restart density modification. The refinement of one B-value per residue provides a further opportunity to suppress wrongly traced residues.
A fast but very crude autotracing algorithm has been incorporated into the density modification in SHELXE. It is primarily designed for iterative phase improvement starting from very poor phases. The tracing proceeds as follows:

Extending chains at both endsThe chain extension algorithm looks two residues ah ead of the residue currently being added, and employs a simplex algorithm to find a best fit to the density at the atom centers as well at ‘holes’ in the chain. The quality of each completed trace is t hen assessed independently before accepting it.
Important features of the algorithm are the generat ion of a no-go mapthat defines regions that should not be traced into , e.g. because of symmetry elements or existing atoms, and the effici ent use of crystallographic symmetry. The trace is not restric ted to a predefined volume, and the splicing algorithm takes symmetry e quivalents into account.
Criteria for accepting chains
1. The overall fit to the density should be good.
2. The chains must be long enough (in general at lea st 7 amino-acids); longer chains are given a higher weight.
3. There should not be too many Ramachandran outliers .
4. There should be a well defined secondary structur e (φφφφ /ϕϕϕϕ pairs should tend to be similar for consecutive residues) .
The following criteria are combined into a single f igure of merit for accepting traced chains:
C
N―H - - - - O
Cαααα
5. On average, there should be significant positive density 2.9 Å from N in the N →H direction (to a hydrogen bond acceptor):
Is the structure solved? If the CC for the structure factors calculated for the trace against the native data is better than 25%, it is extremely lik ely that the structure is solved. Another good indication is whether one can see side-chains.
Fibronectin autotracing
In the first cycle, 41% was traced with C αααα within 1.0Å, 33% within 0.5Åand 4% false. After 3 cycles the figures were 94%, 87% and 0%.
< 0.3Å < < 0.6Å < < 1.0Å < < 2.0 Å <
Incorrectlytraced C αααα
Cycle 1:
Cycle 2:
Cycle 3:
Cαααα deviation:
This structure illustrates the ability of the autot racing to start from a noisy S-SAD map. Recycling the partial (but rather accurate) traces leads to better phases and an almost complete struc ture.
N-terminus C-terminus

Fibronectin map quality
MPE[°°°°] mapCC
Standard S-SAD [−h −s0.35]: 53.4 0.63
S-SAD with FLA [−m200 −h −s0.5 −e1]: 42.9 0.70
S-SAD with autotracing [−h −s0.35 −a3]: 32.3 0.84
S-SAD, autotracing and FLA [−h −s0.35 −a3 −e1]: 31.6 0.86
However, combining the FLA (free lunch algorithm) w ith autotracingdid not produce much further improvement. Although the FLA had proved very useful in solving several borderline ca ses, with thephase improvement that arises from autotracing the F LA has almost been relegated to the role of cosmetic map improvem ents!
ACA2011 SHELXE Poly-Ala trace for 1y13-test
In this case, assuming
threefold NCS (−n3) found 50 residues more than without
NCS. However the treatment of NCS in shelxe is ‘quick and dirty’
and needs rewriting.
Extension of small MR fragments using SHELXEIt often happens that a search model for structure solution by molecular replacement (MR) corresponds to only a sm all fraction of the total scattering power, and in such case expans ion to the full structure can be tedious. For input to the beta-tes t shelxe , the PDB file of the MR solution is renamed to name.pda where the merged intensity data (e.g. from shelxc ) are in the file name.hkl . Then e.g.
shelxe name.pda -a30 -s0.5 -y2.0 -q -e1
can be used to run shelxe . A large number of tracing cycles may be needed ( -a30 )! A critical parameter is -y , the resolution at which to truncate the phases calculated from the MR solution . Experience suggests that -y2.0 is often best, with the implication that this approach works best with native data to a resolutio n of 2.0 Å or better.
Progress of fragment extensionFor this test, the variation of the CC value with t he iteration number was unexpected. Instead of gradually improving, it mean ders randomly at a about 10% and then suddenly, in the course of four or five it erations, jumps to a value well above 25%, indicating a solved structure . This strongly resembles the behavior of small-molecule d irect methods, with the important differences that they involve data to about 1 Å or better, and start from random phases.

ARCIMBOLDO – ab initio protein structure solution?Isabel Usón’s arcimboldo uses a supercomputer to produce a large number of phaser MR solutions using very small but precise search fragments such as a 14-residue αααα-helix. Many potential solutions with (say) 1, 2 or 3 placed fragments are fed into shelxe , using the phaserTFZ as a broad-pass filter. If one or more shelxe attempts exceed the magic CC value of 25%, the structure has been solve d!
The only requirements are native data to about 2.1 Å or better, massive computing power and the presence of at least one αααα-helix (the more the better) in the structure. In principle any common f ragment would do, but αααα-helices tend to have the most tightly conserved ge ometry.
Since the median resolution of protein structures i n the PDB is about 2.1 Å, the method should be able to solve at least 2 5% of the structures in the current PDB without using any experimental p hase or otherinformation! Isabel <[email protected]> is currently setting up an arcimboldo supercomputer server.
The new program ANODE reads a PDB format file to calculate φφφφT and a file from shelxc containing FA and αααα. The heavy atom substructure phases are then calculated using φφφφA = φφφφT − αααα. A Fourier map calculated with phases φφφφA and amplitudes FA then reveals the heavy atom substructure from a SAD, MAD or SIRAS etc. experiment.
‘anode lyso’ would read the PDB format file lyso.ent and thelyso_fa.hkl file from shelxc. Lysozyme SAD-phased by four I3C 'sticky triangles' gave the following averaged anom alous densities:
Averaged anomalous densities (sigma)23.207 I2_I3C23.103 I1_I3C21.607 I3_I3C
2.705 SD_MET2.302 S_EPE2.300 SG_CYS0.539 C9_EPE0.289 C4_I3C
ANODE
(EPE is HEPES buffer)
ANODE (continued)This table is followed by a list of the highest uni que anomalous peaks and the nearest atoms to each. In addition, a .pha file is written for displaying the anomalous density in coot . This approach always produces density with the same unit-cell origin as the original PDB file. Where alternative reflection indexing is possible i t may be necessary to take it into account (with the switch -i ).
This figure clearly shows disulfides and other sulfurs, even though the anomalous data were too weak to find them using shelxd.
AcknowledgementsI am particularly grateful to Isabel Usón, Thomas S chneider, Tim Gruene, Tobias Beck, Christian Grosse, Andrea Thorn and NavdeepSidhu for discussions and testing various half-baked ideas. Andrea also prepared many of the pictures.
Posters (Saturday 27th / Sunday 28th) MS58.P01/C591 Isabel Usón, ArcimboldoMS58.P05/C592 Christian Hübschle, shelXleMS58.P11/C595 Andrea Thorn, MR + shelxeMS58.P14/C596 Dayte Rodriguez Arcimboldo.
References:SHELXC/D/E: Sheldrick (2010), Acta Cryst. D66, 479-485.ARCIMBOLDO: Rodríguez, Grosse, Himmel, González, de Ilarduya, Becker, Sheldrick & Usón (2009), Nature Methods 6, 651-653.
The beta-tests of anode, shelxc, shelxd_mp and the a utotracing shelxeare available on email request to [email protected] -ac.gwdg.de
Copyright © 2022 FDOKUMEN