Eurokin. Chemical Reaction Kinetics in Practice
31
feature 30 Volume 5, no. 1, 2001 Chemical reaction kinetics in practice The chemical reactions taking place in the chemical reactor form the heart of any chemical process. Reaction kinetics are the translation of our understanding of the chemical processes into a mathematical rate expression that can be used in reactor design and rating. Because of the importance of correct and safe design of chemical reactors, chemical reaction kinetics is a key aspect of research and development in chemical industries, in research institutes, and academic centers, as well as in industrial laboratories. There is, and there will always be, a strong need for knowledge and a skill base concerning the determination of reaction kinetics and their application in the form of a kinetic model. This paper is a result of cooperation within Eurokin, a consortium of over 10 European companies and 4 universities. An industrial questionnaire in 1995 highlighted that industry is not only a little conservative in the methods it uses to determine kinetics, but also that there was a wide awareness of the scope for improvement. Eurokin was thus founded in 1998 to try and establish the best practices and to facilitate development work in kinetics and associated areas. The paper briefly explains some underlying theory of heterogeneously catalyzed chemical reactions and their kinetics. It deals specifically with the acquisition of kinetic data, and gives recommendations for the selection of the experimental reactor and conditions. A primary aim of this paper is discuss kinetic experimen- tation and modeling through a series of case studies, attempting to illustrate good practice, methods in kinetic modeling, pitfalls, and recommendations. The paper closes with some recommendations and a perspective on the future needs of industrial reaction kinetics. Rob. J. Berger, E. Hugh Stitt*, Guy B. Marin, Freek Kapteijn, Jacob A. Moulijn * corresponding author Synetix PO Box 1, Billingham Cleveland, TS23 1LB, USA Tel +44 1642 522704 Fax +44 1642 522606 e-mail [email protected]
Transcript of Eurokin. Chemical Reaction Kinetics in Practice

feature
30
Volume 5, no. 1, 2001
Chemical reaction kineticsin practice
The chemical reactions taking place in the chemical reactor form the heart of any
chemical process. Reaction kinetics are the translation of our understanding of
the chemical processes into a mathematical rate expression that can be used in
reactor design and rating. Because of the importance of correct and safe design
of chemical reactors, chemical reaction kinetics is a key aspect of research and
development in chemical industries, in research institutes, and academic centers,
as well as in industrial laboratories. There is, and there will always be, a strong
need for knowledge and a skill base concerning the determination of reaction
kinetics and their application in the form of a kinetic model.
This paper is a result of cooperation within Eurokin, a consortium of over 10
European companies and 4 universities. An industrial questionnaire in 1995
highlighted that industry is not only a little conservative in the methods it uses
to determine kinetics, but also that there was a wide awareness of the scope for
improvement. Eurokin was thus founded in 1998 to try and establish the best
practices and to facilitate development work in kinetics and associated areas.
The paper briefly explains some underlying theory of heterogeneously catalyzed
chemical reactions and their kinetics. It deals specifically with the acquisition of
kinetic data, and gives recommendations for the selection of the experimental
reactor and conditions. A primary aim of this paper is discuss kinetic experimen-
tation and modeling through a series of case studies, attempting to illustrate
good practice, methods in kinetic modeling, pitfalls, and recommendations. The
paper closes with some recommendations and a perspective on the future needs of
industrial reaction kinetics.
Rob. J. Berger, E. Hugh Stitt*, Guy B. Marin, Freek Kapteijn, Jacob A. Moulijn
* corresponding author
Synetix
PO Box 1, Billingham
Cleveland, TS23 1LB, USA
Tel +44 1642 522704
Fax +44 1642 522606
e-mail [email protected]

31
Eu
rok
in: c
he
mic
al re
ac
tion
kin
etic
s in
pra
ctic
eWhat are kinetics?“Kinetics” is, simply, a technical term used to describe the rate of a chemical process, such as a catalytic reaction, as a function of the conditions. The models and their mathematical manifestations vary enormously in the level of complexity and the degree to which they reflect the actual chemical and physical processes occurring.At their simplest, they can be of the form:rate ∝ f(T)(concentration)n (where n is termed the order of reaction)
With heterogeneous catalytic reactions, there is more than one rate process occurring in series. The reaction process can be broken down into a number of identifiable steps, all with their own relevant rate equation, some of which may be combined into an overall reaction rate equation. The steps typically cited are:1. Mass transfer of reactant(s) to the catalyst surface2. Adsorption of reactant(s) onto catalyst active sites3. Catalytic reaction4. Desorption of reaction product(s)5. Mass transfer of product(s) away from surfaceSteps 1 and 5 are identifiable fluid phase phenomena, as distinct from the surface processes that characterize adsorption and reaction, and specifically a catalytic reaction. They can, and indeed should, have their own rate equations (but do not always do so in practice).
The surface process itself also typically comprises a number of discrete steps. At its simplest, this may be envisaged as the sorption–reaction–desorption sequence cited above. The next level of model complexity therefore includes these steps either as simple steps, or as competitive adsorption of two reactants (or a reactant and another component such as a solvent or diluent). This can be done
implicitly within a mathematical expression for the reaction rate. At their most complex, the reaction rate expression can be based on the mechanistic or elemental steps of the reaction. This can have increased mathematical complexity, but is generally a better physical representation of the process.
Given the above, a number of questions arise. Why are kinetic models required? Why is there such diversity in the form and exactitude of kinetic and rate models? How are the experimental data measured? And how are the models derived and fitted? This paper will attempt to answer these questions in the context of an industrial viewpoint.
A key issue is that as kinetic models increase in complex-ity, the (experimental) effort, the range and scope of exper-imentation required to build, fit and validate the model also increase. The perception in industry appears to be that the effort required increases beyond the proportional gain in benefit. Therefore, from the point of view of industry, the need for complex models, based on the physicochemical events, must either be justified, or the effort required to derive them significantly reduced.
This paper will therefore explain and illustrate the need for, and the methods used to obtain, reliable kinetic data, focusing on heterogeneous catalysis. It will deal with the acquisition of kinetic data, give some theoretical background on kinetics and kinetic modeling, and will provide recommendations for the selection of the experimental reactor and conditions. A major part of the paper will consider kinetic modeling through the use of a series of case studies attempting to illustrate good practice, methods in kinetic modeling, and pitfalls and recommendations. In view of the limited space, mass transfer and hydrodynamic aspects will not be covered in the case
Eurokin, industry-academia collaboration towards better kineticsintermezzo 1
Eurokin is a consortium of European-based companies, together
with a number of academic centers, focused on developing practice
in kinetic modeling (Web site: www.eurokin.org). It was established
in 1998, after the need was realized via a questionnaire (extensively
cited in this paper) and two workshops in 1996-1997 to better
define needs and collective drivers. It currently consists of 11
companies (Akzo Nobel, Dow Benelux, DSM Research, IFP,
Technip Benelux, Shell Research and Technology Centre, Statoil,
Linde, EniTecnologie, Synetix, and EC Chem Technologies) and
four academic centers (Delft University of Technology, Ghent
University, NTU Trondheim, and UC Louvain). The membership
base is evidently very broad, from seven different countries
and company activities in oil and gas, petrochemicals bulk
and fine chemicals manufacture, engineering contracting to the
oil, petrochemicals and fine chemicals markets, and a catalyst
company.
Eurokin’s stated aim is to produce a precompetitive toolkit for
measuring kinetic data and model development for heterogeneous
catalytic systems. The activities are currently focused on:
i. Experimental methods to determine reaction kinetics; e.g.,
investigation of the capabilities of different types of laboratory
reactors to measure the kinetics of specific reaction classes.
ii. Development of models for a set of selected laboratory reactor
systems, to be used for processing experimental data, and/or
the determination of suitable experimental conditions; e.g.,
to assess if the proposed experimental conditions are in the
kinetically or the mass-transfer controlled regime.
iii. Methods for the determination of kinetic models from
experimental data, including model discrimination, parameter
estimation, and design of experiments.

32
Eu
rok
in: C
he
mic
al re
ac
tion
kin
etic
s in
pra
ctic
e
studies. The paper will close with a forward-looking section considering the future needs of industrial reaction kinetics.
Why do we need kinetic models?This paper is a result of cooperation within Eurokin (Inter-mezzo 1), a consortium of over 10 European companies and 4 universities, established in 1998 specifically to facilitate active collaboration in the field of (catalytic) reaction kinetics. This initiative by so many leading companies gives an indication of the importance that the chemical industry attaches to kinetics. But why are kinetics important?
Knowledge of the rate of a catalytic reaction and its selectivity as a function of the process conditions and reactant concentrations is essential for the application of the catalyst in a commercial reactor. More specifically, the kinetics of the reaction are required in the form of a mathematical rate expression that can be used to reliably translate laboratory and pilot scale data into the design of a commercial scale unit. That rate, or kinetic expression tells how the reaction rate varies with process conditions such as temperature, pressure, and composition, and preferably also with a measure of the volumetric concentration of catalytic sites. The importance of a reaction’s kinetics is that the rate and selectivity of a reaction determine the size of the catalytic reactor for a given overall production rate. Without a reliable means to predict the reaction rate, the reactor design could be highly speculative. There are several effects that can arise from this uncertainty. Firstly, without reliable estimates of the (capital) costs needed to build a production plant and the probable operating costs, it is not possible to carry out a meaningful evaluation of the economic merits of building the plant, and without a persuasive economic imperative, the plant is unlikely to be sanctioned. Secondly, and perhaps more importantly, without reliable kinetics it is not fully possible to evaluate the side reactions and the dynamic effects that may occur in the reactor, which is a critical step in assessing the operational safety and environmental impact of a chemicals production unit.
What does industry use kinetics for?
The importance of knowledge and of having a skill base concerning the determination of reaction kinetics and their application in the form of a kinetic model is clear. This begs the question of how good industry is at measuring and applying chemical rate models, and what precisely it does with them. This was put to the test in 1995 when the “Chemical Engineering in the Applications of Catalysis” Working Party of the European Federation of Chemical Engineering approved a survey of industrial practice in the measurement and evaluation of kinetics. The results of this survey were published in 1996 in summary form[1]. Twenty-four chemical and oil companies, engineering contractors, and catalyst manufacturers responded to the questionnaire, and that level of return indicates how seriously industry takes this issue. The results make interesting reading, not only from the viewpoint of how industry treats its kinetics but also the diversity, according to the industry sector, of how they use them. Additionally, a survey of the gaps and needs for catalysis in European industry[2], stressed the importance of further developments in kinetics research.
Consider firstly how companies use their kinetics; the perceived reason for the determination of kinetic and rate models. The overall results from the survey are shown in Figure 1, and indicate a fairly even three-way split between catalyst development, process development, and process optimization. Significantly, there is only small minority use of kinetic data for mechanistic research (by contrast a major force in academia).
When the same data are presented by the industry sector in Figure 2, some clear trends emerge. The chemical and oil companies mainly use kinetics for process development and process optimization, and to a smaller extent for catalyst development. As might be expected, catalyst producers focus on catalyst development, while engineering companies concentrate on process development. Some mechanistic research is done by the catalyst producers and the chemical companies, but this does not exceed 10% of the utilization of kinetic data.
process development34%
process optimization 30%
other 1%
catalyst development29%
mechanistic research6%
Figure 1 Utilization of kinetic data in industry.

33
Eu
rok
in: C
he
mic
al re
ac
tion
kin
etic
s in
pra
ctic
e
The later parts of the survey focused on how industry measures its data and the types of models it uses to represent the kinetics. Before considering these aspects, it is timely to consider the background to kinetic theory, the measurement of kinetic data, and reaction kinetic modeling.
process optimization 31%
process optimization 37%
other 1%
other 4%
catalyst development26%
catalystdevelopment
27%
mechanistic research8%
mechanistic research2%
a. chemical companies
b. oil companies
c. catalyst companies
process development 34%
process development 30%
process optimization 17%
other 0%
catalyst development56%
mechanisticresearch12%
process development15%
d. engineering companies
process optimization 28% other 0%
catalystdevelopment15%
mechanisticresearch
1%
process development56%
Figure 2 Utilization of kinetic data for different chemical industry sectors.
Types of kinetic modelsResearchers in catalysis, kinetics, and reactor engineering are generally well informed about the general theory concerning reaction kinetics. At the simpler level we can distinguish two common basic approaches to reaction modeling, summarized in Table 1.
Power law kinetics
For the irreversible gas phase reaction A + B → C the rate of reaction may be represented by an expression of the form:r = k pA
n pBm
where pA and pB are the partial pressures of reactants A and B respectively and k is the rate constant. The exponents, n and m, are termed the “orders of reaction”.It may seem natural to assume a rate expression r = k [A] [B] where the orders of reaction match the stoichiometric coefficients, and thus a second order reaction for this example; first order in each reactant. This is not necessarily the case! A reaction mechanism can incorporate a number of subreactions and the power law approach disguises this. The real rate expression will reflect the kinetics of the potentially slowest, or rate-determining step. The reaction order should therefore always be determined experimentally.
The power law expression is commonly used because of its simplicity and its property that it frequently fits the data rather easily. (The ancient wonder of reconciling data by plotting them on log-log graph paper has not faded even in this high technology age.) In catalysis this expression is not, however, based on a sound physicochemical theory, and therefore the reliability of the results and predictions is limited to the range of conditions under which the kinetic experiments were performed.
Effect of equilibrium
A given reaction, such as A + B → C can often occur in both directions, viz. A + B ⇔ C. Which direction prevails at a given condition depends on the thermodynamics. Equilibrium corresponds to the minimization of (Gibbs) free energy. If no barrier (e.g., activation energy) exists then a system will always move towards equilibrium.
Two reactions can be defined, each with its own rate equation. Assuming, for the sake of simplicity, a first order dependency for each component:
Power law expression
r = k0 exp ( ) pA pB
Langmuir-Hinshelwood-Hougen-Watson type expression
r =
Types of commonly used rate expressions for the reaction: A(g) + B(g) → C(g)
Table 1
n m-EA
RT
krKA,adspAKB,adspB
1 + KA,adspA + KB,adspB + KC,adspC

34
Eu
rok
in: C
he
mic
al re
ac
tion
kin
etic
s in
pra
ctic
e
A kinetic model was derived for an effluent treatment process,
the catalytic decomposition of the pollutant. This was based
on experimental data, where the reaction was observed to be
irreversible and first-order in the reactant. The data were only
measured over a narrow temperature range; that believed to be
the probable operating domain for the industrial scale reactor. The
expression for the first-order rate constant that was used to fit the
extensive data set was:
(1)
Here, it can be seen that the Arrhenius term [ A - Ea / T ] has been
supplemented by a second temperature term, intended to improve
the statistical fit, for a total of four fitting parameters for (essentially)
one variable. This worked well until a plant operating one of these
Through overparameterization, the ability of the model to extrapolate beyond the intermezzo 2
reactors wanted to increase throughput, and proposed increasing
the operating temperature to achieve this. The result obtained with
the above model is shown in Figure 1. It was surprising that at
higher temperatures the conversion was essentially independent of
temperature, and eventually experimental data showed that this was
not true. The problem lay in the additional temperature term in the
kinetic expression.
In the first instance, this additional temperature term was simply
removed and a simple Arrhenius-type relationship was fitted
through the data. This modified expression was far more able to
predict performance outside the experimental temperature range.
A comparison of the predicted design catalyst volumes to achieve
a given conversion is shown in Figure 2. The revised model more
accurately predicts the expected trend, which was also observed
experimentally.
ln(k) = A - Ea - C1 T
(1/T - C2)2
C3
0.5
forward reaction A + B → C rate rf = kf [A] [B]
back reaction C → A + B rate rb = kb [C]
These are not independent, except at “very low” conversions, where equilibrium is not approached. At other conditions, the net forward reaction rate for A + B ⇔ C is given by:r = rf - rb = kf [A] [B] - kb [C]
Thus, equilibrium occurs when the forward and reverse reaction rates are equal: rf = rb, and hence no net reaction occurs. For the reaction A + B ⇔ C the equilibrium constant is given by Keq ={ [C] / [A] [B] } eq. It may thus be shown that Keq = kb / kf . The net forward reaction rate is therefore given by: r = kf { [A] [B] – [C]/Keq }.
Effect of temperature
The value of the equilibrium constant is a strong function of temperature. For endothermic reactions, Keq and equilibrium conversion increase with temperature, while for exothermic reactions the converse is true. This strong dependence on temperature is also prevalent in reaction rate constants, and so the next level of detail to be introduced may be the temperature dependence of the rate of reaction. This is most commonly done using an Arrhenius-type expression:k = A0 exp (-Ea / RT)
Here Ea is known as the “Activation Energy”. Reaction rate constants and equilibrium constants commonly show agreement with this relationship. This relationship is shown in Figure 3 with curves plotted for different activation ener-gies (all based around a similar rate constant at 573 K). It can be seen that the value of Ea has a very strong influence on the rate dependency on temperature. This is important in the design of chemical reactors.
The activation energy is a commonly cited parameter, and its value of course tells the reaction engineer how depen-dent the reaction rate is on temperature. Values of 50–100 kJ/mol are typical for many catalyzed reactions. Combus-tion and many other nonequilibrium limited reactions may have much higher values; 150 kJ/mol for example. A rule of thumb often quoted is that the rate of a reaction will double for every 10 K rise in the reaction temperature. This corre-sponds to an activation energy in the range 60 –90 kJ/mol at typical reaction temperatures. Thus, the reaction engineer
experimantal domain is severely compromised: catalytic decomposition reaction
1
10
100
300 320 340 360 380 400
Temperature (C)
rela
tive
reac
tion
rate
con
stan
t activation energy (kJ/mol): 150
125
100
75
50
increasing EA
Figure 3 Reaction rate strongly depends on temperature.
35
Eu
rok
in: C
he
mic
al re
ac
tion
kin
etic
s in
pra
ctic
eLangmuir–Hinshelwood–Hougen–Watson kinetics
In order to obtain a more meaningful kinetic expression, it is necessary to start introducing physical and chemical processes occurring at the catalyst surface into the mathematical representation. One of the simplest methods and most popular approaches to this is via the Langmuir–Hinshelwood model, and the associated Langmuir–Hinshelwood–Hougen–Watson (LHHW) type kinetic expression. A Langmuir–Hinshelwood–Hougen–Watson type ex-pression is derived using the assumptions that the adsorption of all components can be described by the Langmuir–Hinshelwood model and that one surface reaction is rate-determining. The shape of the rate expression depends on the choice of the rate-determining step. A study of the theoretical background can help the researcher to find the most probable rate-determining step and to obtain proper estimates of the kinetic parameters which can be used as initial estimates for the parameter fitting. These initial estimates should also be used to check afterwards if the parameters found by the fitting routine are in physicochemically acceptable ranges.
This model thus makes assumptions about adsorption and desorption on the catalyst surface. At its simplest, the Langmuir–Hinshelwood model assumes that all reactants adsorb onto catalyst surfaces and that reaction occurs as a surface process. This yields a kinetic expression of the form
rate ∝
Through overparameterization, the ability of the model to extrapolate beyond the
can immediately start judging the susceptibility of a reac-tion to runaway, selectivity loss, or effective extinction if the temperature goes outside the ideal operating window. A side reaction with, for example an activation energy of 150 kJ/mol tells the design chemical engineer that if the temper-ature is allowed to rise, the selectivity will fall rapidly. Fur-thermore, unless that side reaction is constrained, then this represents a runaway potential, and that must be considered in the reactor and control system design.
Given the physical interpretations that can be attached to the activation energy, it can easily be seen why this approach is popular. It is still, however, constrained by the flaws of the empirical power law approach. Because of the lack of physicochemical relevance, the accuracy of the kinetic expression and the application of the model is restricted to the experimental conditions under which it was determined.
For example, it may be tempting to improve a temperature fit by increasing the number of temperature terms in the expression. This is not advisable, (see Intermezzo 2). By statistically improving the fit with a term that has no physical meaning, the application of the model is tightly restricted to the experimental range, which in this case prevented use of the original model to evaluate a reactor operating at an increased temperature. This emphasizes the importance of not including too many parameters in a model, particularly with those parameters that do not have any physical significance. It is always worth remembering that with enough fitting parameters, a model can be forced to fit any data set; but just because there is a good statistical fit does necessarily not mean that it is a good model.
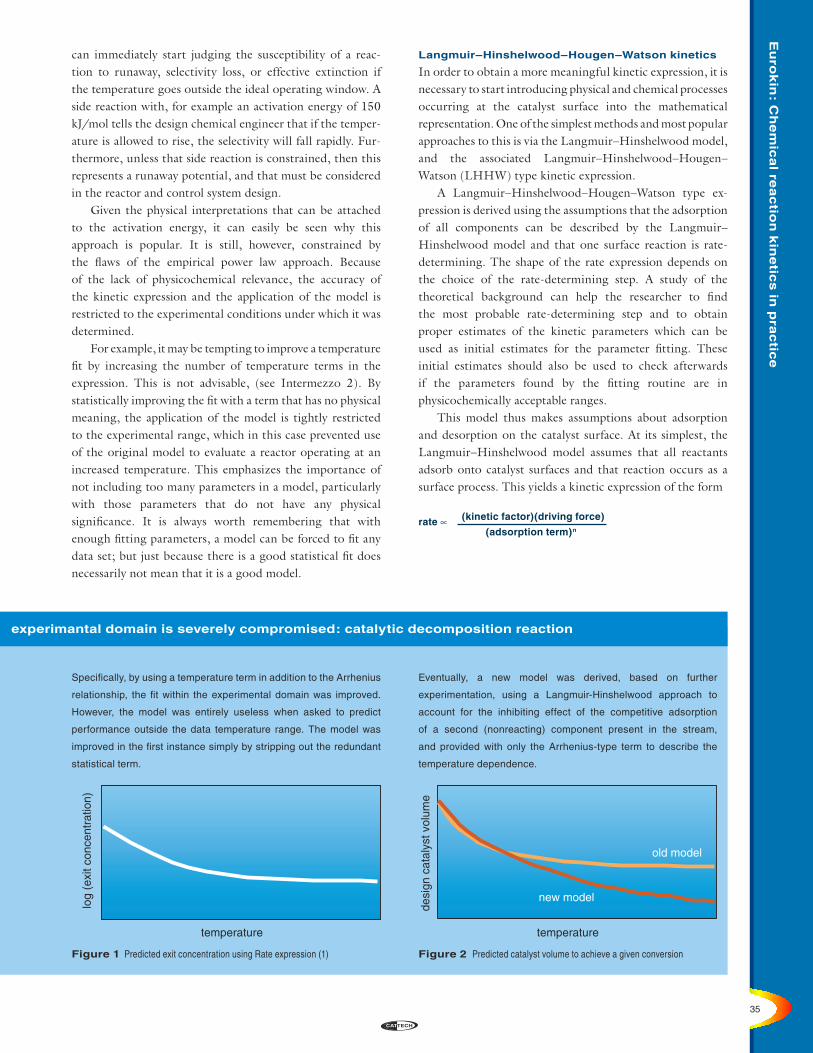
Figure 1 Predicted exit concentration using Rate expression (1) Figure 2 Predicted catalyst volume to achieve a given conversion
temperature
log
(exi
t con
cent
ratio
n)
temperature
desi
gn c
atal
yst v
olum
e
new model
old model
experimantal domain is severely compromised: catalytic decomposition reaction
Specifically, by using a temperature term in addition to the Arrhenius
relationship, the fit within the experimental domain was improved.
However, the model was entirely useless when asked to predict
performance outside the data temperature range. The model was
improved in the first instance simply by stripping out the redundant
statistical term.
Eventually, a new model was derived, based on further
experimentation, using a Langmuir-Hinshelwood approach to
account for the inhibiting effect of the competitive adsorption
of a second (nonreacting) component present in the stream,
and provided with only the Arrhenius-type term to describe the
temperature dependence.
(kinetic factor)(driving force)
(adsorption term)n
36
Eu
rok
in: C
he
mic
al re
ac
tion
kin
etic
s in
pra
ctic
e
The numerator is a basic reaction rate equation, while the denominator accounts for the effects of the sorptive steps. For example, for a reaction A + B → C (not equilibrium limited), the rate of formation of C is given by the LHHW-type expression:r =
where kr is the rate constant for the surface reaction and KA,ads, KB,ads and KC,ads are the adsorption coefficients for the respective species.
Strictly, the Langmuir–Hinshelwood model assumes a homogeneous catalyst surface. Nonhomogeneity and poten-tial adsorption onto different active sites are effectively accounted for by differences in the values of KA,ads and KB,ads or in the form of the adsorption term. This is in fact one of the strengths of the LHHW mathematical expression. In the data fitting, at its simplest, the plot is effectively of :y versus
where the simple power law plot is improved by the denominator that allows a degree of independent curvature. The LHHW-type expressions have been found to fit a wide range of reactions. While the Langmuir–Hinshelwood kinetic model is a good one, its real strength lies in its ability
to describe mixtures based on single component parameters and the robustness of the derived mathematical expression.
These comments may appear to suggest that the model works primarily because of its mathematical form. This is not true. The underlying concept of competitive adsorption equilibria on a finite number of active sites impinging on the reaction kinetics is very important. Many systems exist where the kinetics are in fact strongly affected by adsorption phenomena. The most obvious effect is where a reactant is strongly adsorbed, to the extent that it is always available in excess on the catalyst surface. The reaction rate thus becomes independent of its gas phase concentration, or zero order. An example of this is shown in (Intermezzo 3), where strongly adsorbing systems showing zero (high concentration, low conversion) or first order (low concentration, high conversion) dependencies are discussed. An important point is how this kinetic behavior influences the selection of the reactor type that would be ideal for carrying out the reaction at a commercial scale.
KrKA,AdspAKB,AdspB
1 + KA,adspA + KB,AdspB + KC,AdspC
( 1 + bx)q
a xp
Zero-order kinetics for a strongly adsorbing reactant transform to first-order intermezzo 3
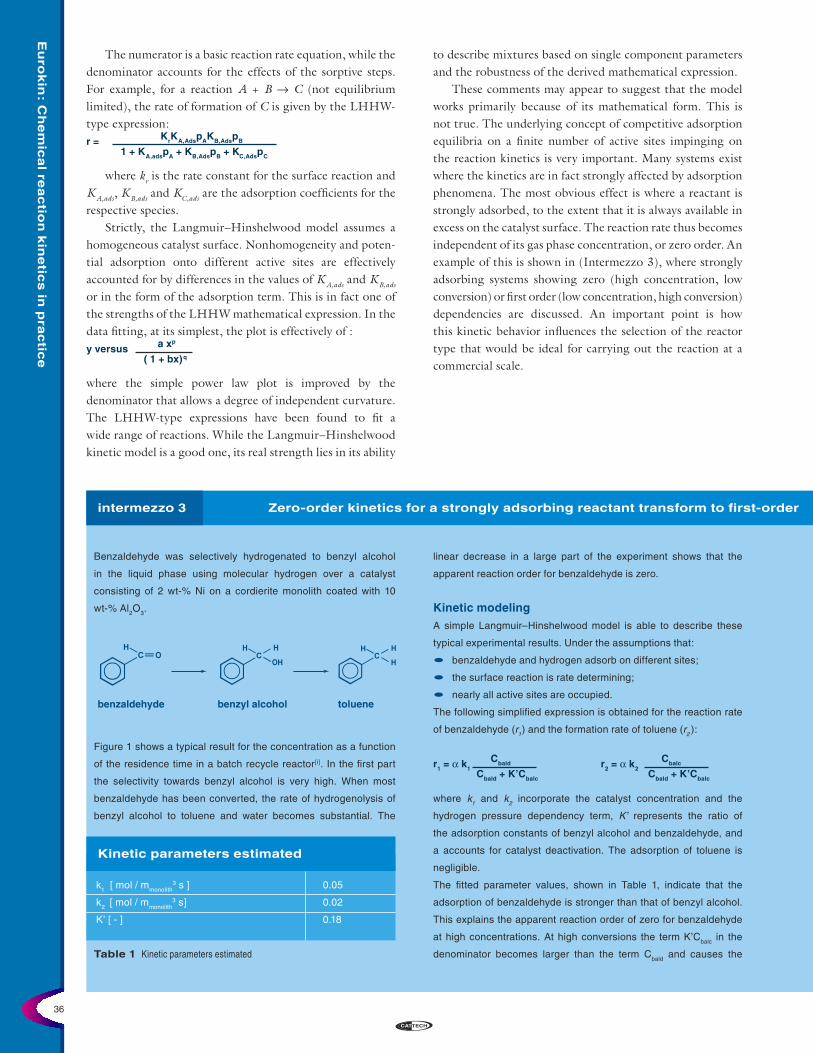
Benzaldehyde was selectively hydrogenated to benzyl alcohol
in the liquid phase using molecular hydrogen over a catalyst
consisting of 2 wt-% Ni on a cordierite monolith coated with 10
wt-% Al2O3.
Figure 1 shows a typical result for the concentration as a function
of the residence time in a batch recycle reactor[i]. In the first part
the selectivity towards benzyl alcohol is very high. When most
benzaldehyde has been converted, the rate of hydrogenolysis of
benzyl alcohol to toluene and water becomes substantial. The
linear decrease in a large part of the experiment shows that the
apparent reaction order for benzaldehyde is zero.
Kinetic modelingA simple Langmuir–Hinshelwood model is able to describe these
typical experimental results. Under the assumptions that:
• benzaldehyde and hydrogen adsorb on different sites;
• the surface reaction is rate determining;
• nearly all active sites are occupied.
The following simplified expression is obtained for the reaction rate
of benzaldehyde (r1) and the formation rate of toluene (r2 ):
r1 = α k1 r2 = α k2
where k1 and k2 incorporate the catalyst concentration and the
hydrogen pressure dependency term, K’ represents the ratio of
the adsorption constants of benzyl alcohol and benzaldehyde, and
a accounts for catalyst deactivation. The adsorption of toluene is
negligible.
The fitted parameter values, shown in Table 1, indicate that the
adsorption of benzaldehyde is stronger than that of benzyl alcohol.
This explains the apparent reaction order of zero for benzaldehyde
at high concentrations. At high conversions the term K’Cbalc in the
denominator becomes larger than the term Cbald and causes the
benzaldehyde benzyl alcohol toluene
kinetics at high conversion due to adsorption of the product: Benzaldehyde hydrogenation
Table 1 Kinetic parameters estimated
Kinetic parameters estimated
k1 [ mol / mmonolith3 s ] 0.05
k2 [ mol / mmonolith3 s] 0.02
K’ [ - ] 0.18
Cbald
Cbald + K’Cbalc
Cbalc
Cbald + K’Cbalc

37
Eu
rok
in: C
he
mic
al re
ac
tion
kin
etic
s in
pra
ctic
eThe role of mass transfer
Intrinsic, apparent, and extrinsic kinetics
As noted in the introductory section, an important part of the catalytic reaction process is the mass transfer of the reactant to the catalyst sites. This involves not only the transfer within the bulk fluid phase, but also the transport within the porous structure of the catalyst pellet or particle. The actual transport in the fluid phase can be slow, and thus the observed reaction rate is in fact affected by — and may indeed be dominated by — the mass transfer process. Typical examples here are catalytic reactions occurring in the liquid phase and catalyzed oxidation processes.
It may not be simple, experimentally, to decouple the transport and kinetic processes. After all, diffusion and kinetic rate (for a first order reaction) have the exact same dependency on concentration — first order. Diffusion and mass transfer, however, have a markedly lower dependency on temperature, and therefore mass transfer-inhibited rates are characterized by an artificially depressed value of the activation energy (and that the Arrhenius plot may yield a curve rather than a straight line).The mass transfer in a reactor occurs on several different length scales:
1. Turbulent mass transfer from the bulk fluid to near the catalyst surface (1–100 mm)
2. Laminar mass transfer in the fluid boundary layer (or mass transfer film) about the catalyst particle (0.01–1 mm)
3. Diffusion within the porous structure of the catalyst (0.2–3 mm)
Aspects 1 and 2 above are conveniently lumped using the well known Whitman film theory, as seen in Figure 4, which assumes total mixing (zero concentration gradients) in the bulk fluid and a laminar film, whose resistance to mass transfer is characterized by a mass transfer coefficient (which is actually a conductance). This rate of mass transfer is largely dependent on the fluid properties (density, viscosity), the fluid velocity relative to the solid, and the size of the channel in which the fluid is flowing. There are many empirical correlations in the literature for mass transfer coefficients[3,5], and many are derived in geometries relevant to catalytic reactors.
A further complication can arise in liquid phase reactions involving a gaseous reactant, such as hydrogenation and oxidation using molecular hydrogen and oxygen, respectively. Commercially, these reactions are typically carried out in sparged stirred tanks or trickle beds. In this case, there is the added step of the gaseous reactant transferring into the
Zero-order kinetics for a strongly adsorbing reactant transform to first-order
Figure 1 Concentrations as a function of time during benzaldehyde hydrogenation at 10 wt-% benzaldehyde at 410 K and 1.5 MPa[i]
0
100
200
300
400
500
600
700
0 5000 10000 15000 20000 25000time / s
conc
entr
atio
n / m
ol/m
3
benzaldehydebenzyl alcohol
toluene
apparent reaction order for benzaldehyde to increase to one. This
was confirmed by experiments with lower intial concentration. It is
clear that for estimation of the parameters, the main part of the
measurement should be carried out at low concentration.
What are the consequences of the transformation of 0th into 1st order
kinetics? For zero-order kinetics the reactor type is not critical and a
continuously stirred tank reactor (CSTR) is suitable for a large part
kinetics at high conversion due to adsorption of the product: Benzaldehyde hydrogenation
of the conversion. In view of the transformation into 1st order and
the undesired consecutive reaction of benzyl alcohol to toluene,
however, a CSTR is not a suitable reactor and a plug-flow reactor
is to be preferred in the final conversion stage as a “finishing reac-
tor.”

38
Eu
rok
in: C
he
mic
al re
ac
tion
kin
etic
s in
pra
ctic
e
When simplifying a model by
liquid phase, en route to the catalyst surface. This opens up an additional area of mass transport in chemical reactors that depends critically on the inter-dispersion of the phases and the reactor hydrodynamics. This is beyond the scope of the present paper, but has been reviewed extensively elsewhere. See [4] for some recommended references.
The mass transport within the catalyst pellet may be harder to characterize. The effect is easily observed experimentally, by varying the size of the catalyst particle. Traditionally, this has been treated mathematically using a “pellet effectiveness,” based on the Thiele modulus[5]. A typical plot of pellet effectiveness as a function of pellet size for a first order reaction is shown in Figure 5. Because techniques and models for characterizing porous networks and mass transfer still do not lead to reliable predictions, there is a tendency to measure kinetics using the same
fluid flowvelocity profile
concentration profiles
- Whitman - actual
Whitmanfilm thickness
concentrationin solid phase
solid surfaceor interface
In gas / liquid systems a film exists on both sides of the interface
Figure 4 Whitman film theory for interfacial mass transfer.
Diffusivity = 1E-5 m2/sec
Reaction rate constant = 5 sec-1
0.1 1 10
100
80
60
40
20
0
pellet diameter (mm)
eff
ect
ive
ne
ss (
%)
Figure 5 Pellet effectiveness is a function of pellet diameter.
lumping, be careful not to go too far: 2nd order effects in HDSintermezzo 4
In hydrodesulphurization (HDS) of vacuum gas oil it is well
documented that real feedstocks (e.g., gasoil) follow an apparent
second-order behavior in the amount of sulphur containing
components (see Figures 1 and 2). How can this be rationalized?
It is quite strange to find a second-order behavior while there is
not any suggestion of a bimolecular reaction step between two
sulphur-containing molecules. Moreover, the sulphur product is
H2S only.
The explanation lies in the complex composition of the real
feedstock, covering thioethers, thiophene, benzothiophene, di-
benzothiophene, and substituted dibenzothiophenes (see Figures
3 and 4). They all have different reactivities over a catalyst in HDS,
resulting in the composite contribution of all these molecules in the
overall kinetic behaviour.
0.0 0.2 0.4 0.6 0.8 1.00.0
0.5
1.0
1.5
2.0
bed length
c
concentration
conversion
0.0 0.1 0.2 0.3 0.4 0.5 0.6
1 / LHSV (h)
0.0
0.2
0.4
0.6
0.8
1.0
1.2
1.4
1.6
1.8
2.0
2.2
1 / S
- 1
/ S
0 (1
/wt.%
)
gasoil CoMo - alumina trickle flowL = 0.2 - 0.4 m
Figure 1 Experimental results for hydrodesulfurization in a fixed bed
reactor[ii,iii]
Figure 2 Fitting results for reaction order = 2

39
Eu
rok
in: C
he
mic
al re
ac
tion
kin
etic
s in
pra
ctic
e
When simplifying a model by lumping, be careful not to go too far: 2nd order effects in HDS
0 5 10 15 20 25 30
Simulated distillation b.p.
0.0
0.5
1.0
1.5
2.0
0 0.5 1 1.5 2space time / kg s / mol
conc
entr
atio
n / m
ol/m
3 C1 + C2 + C3
C1
C2C3
= 2nd order reaction data
Table 1
Kinetics of the second-order reaction used and the fitting results for the three first-order reactions
second-order reaction
k = 10 m3/mol s c0 = 2 mol/m3
three first-order reactions
k1 = 20.9 s-1 c1,0 = 1.438 mol/m3
k2 = 3.06 s-1 c2,0 = 0.447 mol/m3
k3 = 0.448 s-1 c3,0 = 0.115 mol/m3
S
S
SR R
S
RS S
RR
SR thioethers
thiophene
benzothiophene
dibenzothiophene
substituted dibenzothiophene
Figure 3 Composition of oil fractions in vacuum gas oil.
It was demonstrated by the summation of three first-order reactions
in a plug-flow reactor that the composite conversion profile as a
function of space time can be described by second-order kinetics
over a broad range of space times[iv]. This is illustrated in Figure 5
and Table 1.
Problems will arise if this is not recognized and a reactor for deep
HDS is dimensioned on the basis of the second-order kinetics.
This will eventually lead to required reactor volumes that are too
large, while a proper first-order description for the most refractory
components would yield the proper answer.
In this case, three lumps are sufficient to descibe the kinetics of
the mixture of reactants accurately. An important question to be
answered in comparable types of problems is which and how many
lumped components should be used.
Figure 4 Sulphur compounds present in vacuum gas oil.
Figure 5 Successful fit of a simulated second-order profile by means of
the sum of three first-order reactions differing by about a factor of seven in
reactivity.

40
Eu
rok
in: C
he
mic
al re
ac
tion
kin
etic
s in
pra
ctic
e
catalyst pellet size as will be used in the operating plant. In many cases, this leads to a kinetic model that inherently includes intraparticle mass transport rate effects.
Clearly, it is essential to distinguish between models that include only chemical effects, and those that include varying degrees of mass transfer. Regarding mass transfer, we can define three levels of a model:a. Intrinsic — where all the effects of mass transport have
been stripped out and the model represents only the sur-face processes.
b. Apparent — where any transport limitations internal to the catalyst structure are included in the model. Measur-ing kinetics on a full-sized pellet is an example of this. While maybe not strictly correct from a scientific point of view, it is, nonetheless, pragmatic.
c. Extrinsic — where no attempt has been made to decou-ple the gross mass transfer from the real, or intrinsic kinetics. The model may therefore include effects related to gross mixing times and diffusion through the laminar film adjacent to the catalyst surface.One final point here is that in developing an intrinsic
model, it behoves the experimenter to verify the absence of transport effect. There is much guidance in the literature on how to do this[5]. It is clear, however, that this is not always done.
Modeling more complex systems
Many real systems are complex, involving multiple components of feasible reactions. While it is possible to treat such systems exhaustively, it is rarely practical to do so. Techniques have therefore been developed to simplify systems on a rational basis so that the reaction kinetics can be characterized without excessive experimentation and by using a mathematical model of appropriate complexity. Two techniques commonly used are lumped models and reaction networks.
Lumped models
As the name suggests, the essence of this is simplification by collecting related variables. This has been referred to also as ”lumped parameter model.” This, however, is a misnomer as it is the chemical species rather than the parameters that are grouped. This is typically applied to groups of chemicals of similar properties. This is a powerful method, but should be done, however, with extreme care and with due attention to whether the simplifications are in fact valid. As an example, Intermezzo 4 shows the explanation of the often-observed apparent second order behavior, but which was found unable to describe deep HDS accurately. The cause is oversimpli-fication. Reducing the model to one “lump” is excessive, whereas a three “lump” model can describe the deep HDS
When using reaction networks, don’t ignore the possibility that intermediates react intermezzo 5
As part of the hydrodenitrogenation (HDN) network of quinoline,
the conversion of of orthopropylaniline (OPA) into propyl benzene
(PB), propylcyclohexene (PCHE), and propylcyclohexane (PCH),
has been studied. Figure 1 shows the kinetic scheme.
The reactions starting from OPA show first-order dependencies.
The reaction also proceeds via the propylcyclohexylamine (PCHA)
intermediate which is observed only in traces.
Included in this scheme is the direct conversion of OPA to PCH
to obtain a good description of the product concentrations as a
further without desorption and subsequent re-adsorption: Hydrodenitrogenation of quinoline
function of the space time in the reactor (Figure 2). This is explained
by the fact that during the reaction there will be a competition
between desorption and consecutive reaction of the surface species.
That part of the adsorbed OPA will react in consecutive steps towards
the final product accounts for this ‘direct’ reaction step. Intermediate
species don’t necessarily have to desorb first before reacting further
in a consecutive step. This is an important aspect often overlooked
in consecutive reaction schemes, as in selective hydrogenations
and oxidations, and depends on the relative magnitude of the
Figure 1 Reaction scheme of the HDN of orthopropylaniline (OPA) Figure 2 Kinetics of the HDN of orthopropyl-aniline (OPA) over NiMo at 370
°C (one-site model)[v]
OPA
PB
PCHPCHE
k3
k5
k6
k1
NH2
0
1
2
3
4
5
0 0.1 0.2 0.3 0.4
space time / s
part
ial p
ress
ure
/ kP
a
PCH
OPA
PCHE PB
41
Eu
rok
in: C
he
mic
al re
ac
tion
kin
etic
s in
pra
ctic
e
When using reaction networks, don’t ignore the possibility that intermediates react further without desorption and subsequent re-adsorption: Hydrodenitrogenation of quinoline
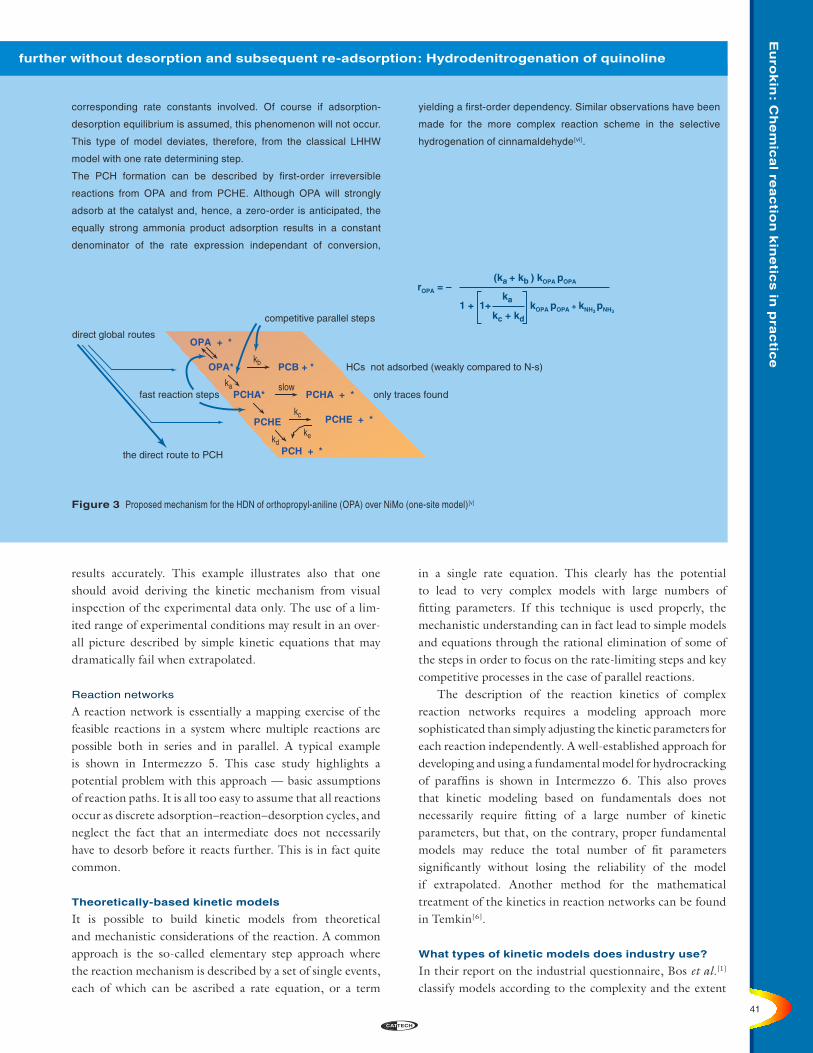
Figure 3 Proposed mechanism for the HDN of orthopropyl-aniline (OPA) over NiMo (one-site model)[v]
corresponding rate constants involved. Of course if adsorption-
desorption equilibrium is assumed, this phenomenon will not occur.
This type of model deviates, therefore, from the classical LHHW
model with one rate determining step.
The PCH formation can be described by first-order irreversible
reactions from OPA and from PCHE. Although OPA will strongly
adsorb at the catalyst and, hence, a zero-order is anticipated, the
equally strong ammonia product adsorption results in a constant
denominator of the rate expression independant of conversion,
yielding a first-order dependency. Similar observations have been
made for the more complex reaction scheme in the selective
hydrogenation of cinnamaldehyde[vi].
results accurately. This example illustrates also that one should avoid deriving the kinetic mechanism from visual inspection of the experimental data only. The use of a lim-ited range of experimental conditions may result in an over-all picture described by simple kinetic equations that may dramatically fail when extrapolated.
Reaction networks
A reaction network is essentially a mapping exercise of the feasible reactions in a system where multiple reactions are possible both in series and in parallel. A typical example is shown in Intermezzo 5. This case study highlights a potential problem with this approach — basic assumptions of reaction paths. It is all too easy to assume that all reactions occur as discrete adsorption–reaction–desorption cycles, and neglect the fact that an intermediate does not necessarily have to desorb before it reacts further. This is in fact quite common.
Theoretically-based kinetic models
It is possible to build kinetic models from theoretical and mechanistic considerations of the reaction. A common approach is the so-called elementary step approach where the reaction mechanism is described by a set of single events, each of which can be ascribed a rate equation, or a term
in a single rate equation. This clearly has the potential to lead to very complex models with large numbers of fitting parameters. If this technique is used properly, the mechanistic understanding can in fact lead to simple models and equations through the rational elimination of some of the steps in order to focus on the rate-limiting steps and key competitive processes in the case of parallel reactions.
The description of the reaction kinetics of complex reaction networks requires a modeling approach more sophisticated than simply adjusting the kinetic parameters for each reaction independently. A well-established approach for developing and using a fundamental model for hydrocracking of paraffins is shown in Intermezzo 6. This also proves that kinetic modeling based on fundamentals does not necessarily require fitting of a large number of kinetic parameters, but that, on the contrary, proper fundamental models may reduce the total number of fit parameters significantly without losing the reliability of the model if extrapolated. Another method for the mathematical treatment of the kinetics in reaction networks can be found in Temkin[6].
What types of kinetic models does industry use?
In their report on the industrial questionnaire, Bos et al.[1] classify models according to the complexity and the extent
OPA + *
OPA* PCB + *
PCHA* PCHA + *
PCHE PCHE + *
PCH + *
HCs not adsorbed (weakly compared to N-s)
only traces foundslow
the direct route to PCH
competitive parallel steps
direct global routes
ka
kb
kdke
kc
fast reaction steps
kc + kd
rOPA = – (ka + kb ) kOPA pOPA
1 + 1+
ka kOPA pOPA + kNH3
pNH3

42
Eu
rok
in: C
he
mic
al re
ac
tion
kin
etic
s in
pra
ctic
e
Model types
1. Simple first order or power law
2. LHHW (Langmuir–Hinshelwood –Hougen–Watson)
3) n-lumped models (for complex systems)
4) Detailed mechanistic model
5) Ab initio, molecular dynamics
Model level
A Intrinsic kinetic models excluding all transport effects
B Apparent kinetic models that include internal transport effects
C Extrinsic models including all transport effects plus kinetics
Classification of kinetic models (Bos et al. [1])
Table 2
of decoupling of mass transfer. It will be reproduced here as it highlights the different approaches.
Concerning the type of kinetic expressions used within the companies, most of the respondents stated that in principle one should strive for intrinsic kinetics, but nevertheless the majority, for various reasons, frequently do not separate all transport phenomena from the chemical reaction kinetics. That is, while the advantages of intrinsic kinetics are acknowledged, these advantages do not always outweigh the difficulties in obtaining them. Specifically, if any of hydrodynamics, mass transfer, and kinetics can be lumped and scaled by similarity, then this is ostensibly the simplest and most favored route — albeit one that may be fraught with difficulties.
Kinetic models are mostly simple first or n th order or Langmuir–Hinshelwood type expressions; more complex kinetic models are scarcely used. Simplicity (and minimization
Kinetic modeling based on fundamentals does not necessarily require a large intermezzo 6
To the contrary, proper fundamental models may significantly
reduce the total number of fit parameters without losing the
reliability of the model, if extrapolated. This is shown here with
reference to a fundamental model for hydrocracking.
ScopeHydrocracking of heavy hydrocarbons represents a case typical
for refining oil. The production capacity of refinery units can be
as high as one million ton per year, i.e. among the largest in
the industry. Hence, even very marginal improvements in product
yields have significant effects on the process economics. This
provides a strong incentive to use detailed kinetic models.
A key feature of refining processes is the complex composition of
the feed and product streams. Thousands, rather than hundreds,
of molecules are involved. At first sight the lumping of individual
molecules with similar physical and chemical properties seems
very attractive. Such an approach is faced with several drawbacks,
however — the lack of a clear physical meaning of the kinetic
parameters in the lumped model being the main one. This requires
a regression of experimental data to obtain estimates of the
values of the latter. Actually, these values can even depend on
the feedstock composition. Moreover, the number of parameters
increases drastically when more lumps have to be considered in
order to enable the model to calculate relevant properties of the
product streams, such as the octane number. Finally, it is hard to
account for the effect of catalyst properties on the kinetics.
None of the above disadvantages are shown by the so-called
fundamental models based on the kinetics of the elementary
reactions occurring between the individual molecules, provided
some reasonable assumptions based on the underlying chemistry
are made.
number of kinetic parameters: Fundamental model for hydrocracking
Reaction chemistryHydrocracking catalysts are bifunctional, i.e., they contain a
hydrogenation function on an acidic carrier. The metal-catalyzed
reactions and the elementary acid-catalyzed reactions considered in
the hydrocracking of alkanes are depicted in Figure 1. Physisorption
of alkanes and alkenes into the zeolite pores precedes these reaction
steps. Alkanes or cycloalkanes dehydrogenate on the metal sites
with formation of unsaturated (cyclo)alkenes, which in turn migrate
to the Brønsted acid sites of the carrier where they are protonated,
yielding carbenium ions. The latter undergo reactions such as
hydride and alkyl shifts, scrambling the position of the charge or
of the alkyl substituents, protonated-cyclopropane (PCP) branching
altering the number of substituents, and cracking cleaving the C-C
bond in β position of the positive charge.
Rate equationsAccounting for all the possible reaction intermediates leads to huge
reaction networks. Starting from, for example, n-nonadecane 1981
alkanes, 25065 alkenes, and 20437 carbenium ions involved in 25065
(de)hydrogenations, 42600 (de)protonations, 33352 hydride shifts,
12470 alkyl shifts, 15970 PCP branchings, and 6429 β-scissions
have to be considered in the first instance. It is very reasonable,
however, to assume that the thermodynamic and kinetic properties
of the individual hydrocarbon species are completely determined by
the nature of the carbon atoms directly involved with the elementary
reactions. In the so-called single- event approach developed by
Froment and co-workers[vii], the possible effects of the skeletal
structure of the reacting species on the rate coefficients are
neglected except for the global symmetry. Hence, the latter only
depends on the type of the involved carbenium ions and the number
of single events, which equals the ratio of the global symmetry
number of reactant and activated complex.

43
Eu
rok
in: C
he
mic
al re
ac
tion
kin
etic
s in
pra
ctic
e
Kinetic modeling based on fundamentals does not necessarily require a large
Figure 1 Reaction scheme of the HDN of orthopropylaniline (OPA)
number of kinetic parameters: Fundamental model for hydrocracking
of number of experiments) is paramount. Interestingly, engineering companies are most likely to use intrinsic kinetics while catalyst companies favor them least. Significantly, there is no evidence for significant use of mechanistic or ab initio models.
Acquisition of kinetic dataThe amount of effort that should be put into the theoretical aspect of a kinetic investigation depends on the complexity of the reaction scheme, the (non-)linearity of the dependencies of the variables, and the reliability of the required kinetic model. This is of course the technical driver. Also to consider is the ultimate estimated product value and the probable cost of non-conformance of the kinetics (financial, safety, health, and environment). As noted above, only occasionally does industry develop complex kinetic models.
Selection of experimental reactorAny kinetic investigation should start with a search of the existing knowledge concerning the reaction system. Armed with the information available from the literature and the start of a conceptual model of the kinetics, it is possible to start considering the experimental approach: the equipment to use and the experimental conditions and program.
The initial step is usually to consider the type of reactor to be used. In many studies it may be expedient to use more than one type. Tables 3 & 4 give overviews of some possible laboratory reactors for kinetic date measurement for gas–solid and gas–liquid–solid systems, respectively. Also given are some of the important characteristics of those reactors.
Gas–solid reactions
No single reactor is right for all systems and therefore a plurality of types exists, as demonstrated by Table 3 (which
When only secondary and tertiary carbenium ions are considered,
the above assumptions reduce the number of different types of
elementary reactions to 24. This includes 3 alkyl shifts, 3 intra-
ring alkyl shifts, 3 PCP branchings, 3 ring contractions, 4 acyclic
β scissions, 4 endocyclic β scissions, and 4 exocyclic β scissions.
Assuming quasi-equilibrium of the (de)hydrogenations and that
the concentration of carbenium ions can be neglected compared to
the total concentration of acid sites leads to the corresponding rate
equations in Figure 2.
Model parametersBoth thermodynamic and kinetic parameters are present in the rate
equations.
The dehydrogenation equilibrium coefficient, Kdeh, can be
calculated from tabulated thermodynamic data.
The physisorption equilibrium coefficient, KL, as well as the
sorption capacity, Csat, depend on the catalyst and have to
be determined experimentally, preferably independently from
the experiments aimed at the determination of the kinetic
parameters[viii].
The rate coefficients, k, only appear combined with the
equilibrium coefficients for protonation, Kprot. Hence, it is not
their individual value but only that of the product kKprot, the
composite rate coefficient, which affects the reaction rates. Of
course the latter should show an Arrhenius dependency on
temperature.
The composite pre-exponential Arrhenius factor, Acomp, can be
calculated without the regression of kinetic data, based on
transition state theory and on the pre-exponential factor of the
physisorption equilibrium coefficient[ix,x].
see next
gas phase
physisorption
(de-)hydrogenation
(de-)protonationalkyl-shift
PCP-branching
ß-scission
zeolite
metal sites
acid sites
+
+
+
+
+
+
Figure 1 Hydrocracking reaction mechanism.
Figure 2 Hydrocracking Rate Equations (HC = hydrocarbon).
calculated via thermodynamic data
determined by NH3 -TPD
parameters to be estimated
Ccat Ct k Kprot Kdeh KL pHC pH2 r = 1 + KL pHC
determined by physisorption experiments
act
RT kcomp = k Kprot = Acomp exp
-Ecomp
act-Ecomp = Eact + ∆Hprot0

44
Eu
rok
in: C
he
mic
al re
ac
tion
kin
etic
s in
pra
ctic
e
G–S reactor Investigation Kinetics Isothermicity Deactivating Typical Fast Costs
of fast at high catalysts particle experimentation ( + = low, - = high)
reactions conversions size [mm]
differential fixed bed +/- + + + 0.05–1 - - +
integral fixed bed +/- - - +/- 0.1–1 - + +
entrained-flow reactor - + +/- + + < 0.2 - -
recycle/gradientless fixed bed + + + + + + + 0.1–10 - +/-
thermal gravimetric analysis - - - - - < 5 - -
differential fluidized bed + + + + + +/- 0.05–0.15 - - +/-
pulse fixed bed +/- + +/- + 0.1–1 + +/-
temporal analysis of products +/- + + + 0.1–1 +/- - -
temp. programmed reactor - - + - - 0.1–1 + + -
Table 3
Overview of characteristics of several types of gas–solid reactors which can be used to select the reactor to carry out the kinetic experiments
Hence, 24 composite activation energies, Ecomp, have to be
estimated, i.e., obtained by regression of kinetic data. Martens et
al.[ix,x] obtained such a set of parameters by regression of data
obtained on Pt/US-Y zeolites and feeding pure components such
as n-alkanes in the range C8 to C12, and cycloalkanes such as
methylcyclohexane, ethylcyclohexane, and n-butylcyclohexane to
a continuous stirred tank reactor (CSTR) at pressures from 0.5
to 5 MPa, molar hydrogen to hydrocarbon ratios from 30 to 300
and temperatures from 493 to 533 K. At these conditions the
hydrocarbons are in a gaseous state. In total more than 500 data
were regressed. ‘Figure 3a shows a typical conversion versus
space time relation and Figure 3b shows the effect of conversion on
the product distribution for n-dodecane at one set of conditions. In
view of the amount of experimental data, the number of adjustable
parameters is rather limited. This, among other things, is due to
the assumed independence of the latter on the hydrocarbon chain
length. The latter is totally accounted for via the physisorption
parameters, Csat and KL.
The adequate mathematical description of conversions and
selectivities on a given catalyst as discussed till now is certainly
an important goal of kinetic modeling. The capability of taking into
account the kinetically relevant properties of the catalyst is an
even more important feature of the hydrocracking model presented
here.
Indeed, the rate equations contain two parameters related to the
catalyst: the total concentration of acid sites, Ct, and the standard
protonation enthalpy, ∆Hoprot. The latter is a measure of the average
strength of the acid[xi,xii]. Adjusting only these two parameters and
the hydrocracking on (US)Y zeolites with a different average, acid
strengths can be modeled adequately.
Figure 3a Conversion vs. space time (493 K, 20 bar, inlet H2 to n-dodecane
molar ratio = 300).
Figure 3b Isomerization and cracking conversion vs. total conversion (for all
experimental conditions (symbols = experimental, curves = model predictions).
Figure 4 Mass fluxes of major product fractions as a function of axial reactor
coordinate at typical industrial conditions (feedstock: hydrogenated vacuum gasoil)[xiii].
0
5
10
15
20
25
30
35
0 200 400 600 800 1000 W/F0 / kg s mol-1
Tot
al c
onve
rsio
n (%
)
8005
1015202530354045
0 20 40 60total conversion (%)
isom
eriz
atio
n,cr
acki
ng c
onve
rsio
n (%
)
isomerization
cracking
00.20.40.60.8
11.21.41.61.8
0 2 4 6 8axial position (m)
mass
flu
x / kg
s-1
m2
0
0.01
0.02
0.03
0.04
LPG
naphtha
middle distillateresidue

45
Eu
rok
in: C
he
mic
al re
ac
tion
kin
etic
s in
pra
ctic
e
Industrially, hydrocracking is performed in an adiabatic fixed bed
reactor consisting of three phases: the fixed catalytic bed, and a
flow of gas and of liquid. In the trickle flow regime, the liquid flows
down dispersed in the form of droplets and rivulets concurrently with
the continuous gas phase. Clearly, this is quite a difference with
the hydrodynamics in the CSTR set-up used for the determination
of the reaction kinetics. Provided that the latter corresponds to
intrinsic kinetics, i.e., reflect only chemical and, hence, scale
independent phenomena, their application to industrial hydrocracking
is straightforward. It suffices to substitute the rate equations in
the reactor model equations accounting for the trickle flow in an
appropriate way. The latter consists of the conservation laws for
mass, energy, and momentum.
Figure 4 shows the evolution of the different product fractions as the
vacuum gasoil streams through the catalyst bed at typical industrial
G–L–S reactor Investigation of Investigation of Deactivating Typical residence Typical cata- Fast Costs
fast reactions sequential reactions catalysts time liquid lyst size [mm] experimentation ( + = low, - = high)
trickle bed +/- - - - 10 s 0.5–2 - +
upflow packed bed +/- - - 1 min 0.5–2 - +
spinning basket +/- +/- - 1–10 min > 2 - -
internal recirculation reactor + + +/- 1–10 min > 0.005 - -
slurry reactor, (semi-)batch + + - 1–10 hr 0.01–0.2 - -
slurry reactor, continuous + + +/- 1–10 min 0.01–0.2 - -
bubble column - - - > 1 min < 0.1 - -
gas lift reactor - - +/- > 1 min < 0.1 - +
wetted wall + - - 1 s not applic. + -
pulse trickle bed +/- - - + 10 s 1–5 +/- +/-
pulse slurry reactor + + +/- 1 min 0.01–0.2 + -
Table 4
Overview of characteristics of several types of gas–liquid–solid reactors which can be used to select the reactor to carry out the kinetic experiments
conditions. The carbon number of the feed ranges from 14 to
33. The residue consists of the hydrocarbon fraction with 18 or
more carbon atoms. Note that the lumping into LPG, naphtha,
middle distillates, and residue is only performed for representation
purposes. The knowledge of the kinetics of the 24 types of
elementary reactions allows us to describe the vacuum gasoil
conversion and the resulting product distribution up to the level of
the individual molecules. Of course, such a degree of precision is
neither really required nor attainable. The major bottleneck consists
of the lack of molecular information provided by today’s state-of-
the-art analytical techniques. But again, as the fundamental kinetic
model contains information up to the molecular level, relumping
can occur to an extent deemed appropriate. Figure 5 illustrates this
by showing the evolution of the liquid concentration of components
constituting a fraction of the residue: the monocyclic naphthenic
lumps with carbon number between 18 and 32.
Figure 5 Breakdown of the monocyclic naphthene fraction of the residue as a function of the axial reactor coordinate[xiii].
0
5
10
15
20
25
30
35
40
0 1 2 3 4 5 6 7 8axial position (m)
liqui
d co
ncen
trat
ion
(mol
/m3 )
0
5
10
15
20
25
30
35
40
45
50
moN24 moN22
moN26moN28moN30 moN29 moN27
moN32moN20
moN18
Application to the hydrocracking of a hydrogenated vacuum gasoil

46
Eu
rok
in: C
he
mic
al re
ac
tion
kin
etic
s in
pra
ctic
e
Figure 6 Six-tube micro-reactor installation (reproduced courtesy of Synetix).
Thermo-gravimetric analysis (TGA) is now a well-established technique, but consider also that the tapered element oscillating microbalance (TEOM) which has much better gas–solid mass transfer characteristics than the TGA due to the forced flow through a small packed bed[7]. The TEOM has been successfully used to measure coke deposition kinetics[8,9], and changing oxidation states of oxide catalysts[10]. If an important part of the kinetic information can be derived from calorimetry, differential scanning calorimetry (DSC) could be of interest. In fine chemicals, calorimeter reactors are becoming increasingly popular partly because they provide the key information for safety in addition to the rate data.
Figure 7 Diagram of a Berty-type internal recycle reactor (Reproduced
courtesy of Autoclave Engineers).
is a summarized version). Easily the most common form of reactor for measuring kinetics over a stationary catalyst is the fixed bed microreactor. These can be operated in differential form, viz. low (<5 %) conversion or in integral mode at higher conversions. The fixed bed microreactors are essentially small tubular reactors, say 3–6 mm (1/8-1/4 inch) in diameter, operated with different catalyst volumes and space velocities to obtain either the very low or relatively high conversions required. Microreactors are now well established, and the best are fully automated with more than one reactor tube operating in parallel, see Figure 6.
The third classic configuration is the well-mixed, or gradientless reactor, typified by the Berty and Carberry type reactors. Because the reactor is well-mixed, the reactor is effectively at the exit concentration. In the case of a Berty reactor (see Figure 7) a turbine-type impeller drives the gas through the catalyst. An alternate design, the Carberry reactor, has the catalyst in a cross rotating basket that itself acts as the impeller.
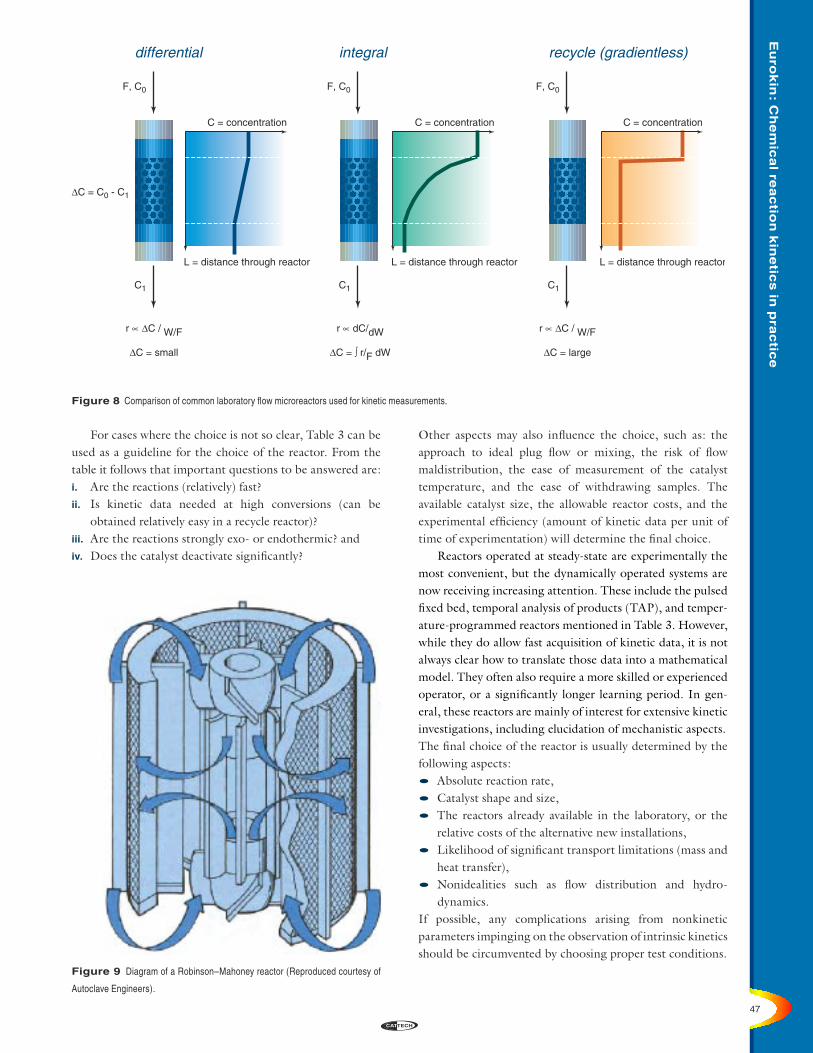
These three configurations, or operating approaches, are compared in Figure 8 in terms of the relationship between the rate and the conversion. The fundamental difference between the differential reactor and the gradientless reactor lies in the fact that in the differential reactor, with low conversions, the reactor is predominantly at the feed composition, whereas for the recycle reactor, assuming perfect mixing, the concentration in the reactor approximates to the exit concentration. Therefore, the reactors fundamentally measure the kinetics under different process conditions regarding composition and conversion.
The fixed bed microreactors and the gradientless version are the workhorses of gas phase heterogeneous catalytic kinetics. There is, however, an increasing number of alternatives, some of which are particularly suited to specific problems. If a catalyst mass change due to the reaction yields important kinetic information, one could select a reactor capable of on-line mass measurement.
47
Eu
rok
in: C
he
mic
al re
ac
tion
kin
etic
s in
pra
ctic
e
∆C = C0 - C1
C = concentration
L = distance through reactor
F, C0
C1
differential recycle (gradientless)
F, C0
C1
C = concentration
L = distance through reactor
integral
F, C0
C1
C = concentration
L = distance through reactor
r ∝ ∆C / W/F
∆C = small
r ∝ dC/dW
∆C = ∫ r/F dW
r ∝ ∆C / W/F
∆C = large
For cases where the choice is not so clear, Table 3 can be used as a guideline for the choice of the reactor. From the table it follows that important questions to be answered are:i. Are the reactions (relatively) fast?ii. Is kinetic data needed at high conversions (can be obtained relatively easy in a recycle reactor)?iii. Are the reactions strongly exo- or endothermic? andiv. Does the catalyst deactivate significantly?
Figure 8 Comparison of common laboratory flow microreactors used for kinetic measurements.
Figure 9 Diagram of a Robinson–Mahoney reactor (Reproduced courtesy of
Autoclave Engineers).
Other aspects may also influence the choice, such as: the approach to ideal plug flow or mixing, the risk of flow maldistribution, the ease of measurement of the catalyst temperature, and the ease of withdrawing samples. The available catalyst size, the allowable reactor costs, and the experimental efficiency (amount of kinetic data per unit of time of experimentation) will determine the final choice.
Reactors operated at steady-state are experimentally the most convenient, but the dynamically operated systems are now receiving increasing attention. These include the pulsed fixed bed, temporal analysis of products (TAP), and temper-ature-programmed reactors mentioned in Table 3. However, while they do allow fast acquisition of kinetic data, it is not always clear how to translate those data into a mathematical model. They often also require a more skilled or experienced operator, or a significantly longer learning period. In gen-eral, these reactors are mainly of interest for extensive kinetic investigations, including elucidation of mechanistic aspects.The final choice of the reactor is usually determined by the following aspects:• Absolute reaction rate,• Catalyst shape and size,• The reactors already available in the laboratory, or the relative costs of the alternative new installations,• Likelihood of significant transport limitations (mass and heat transfer),• Nonidealities such as flow distribution and hydro-
dynamics.If possible, any complications arising from nonkinetic parameters impinging on the observation of intrinsic kinetics should be circumvented by choosing proper test conditions.

48
Eu
rok
in: C
he
mic
al re
ac
tion
kin
etic
s in
pra
ctic
e
Gas–liquid–solid reactions
The choice of the reactor for investigation of the kinetics of gas–liquid–solid systems is usually determined by the characteristics shown in Table 4. For thorough kinetic investigations in which the influence of the reaction products and sequential reactions should also be investigated, only the slurry reactor and the internal recirculation reactor are truly recommended. The slurry reactor most commonly — almost inevitably — takes the format of a stirred autoclave. If not properly assessed, these systems can easily be prone to mass transport limitations, particularly at the gas–liquid interface. A commonly used type of gas–liquid–solid gradientless internal recirculation reactor is the Robinson–Mahoney reactor (see Figure 9) where the gas–liquid dispersion is forced though a catalyst basket. Two alternative types of internal recirculation reactors have been proven successful for kinetic investigations: the turbine reactor, in which the gas–liquid mixture is transported back to the top by turbine blades located in the outer annular of the reactor[11], and the screw impeller stirred reactor (SISR) having the screw in the central shaft[12]. Both reactors are shown in Figure 10.
Selection of experimental conditionsIt is evident that the reactor and analytical equipment generally limit the range of the experimental conditions that can be covered. However, several additional aspects may further limit the ranges of conditions at which useful kinetic data can be obtained. If intrinsic kinetics are to be assured, it is essential to check on rate limitation due to mass and heat transport limitations. One should also check for other phenomena causing nonideality such as axial dispersion in a tubular reactor, catalyst bypass, and inadequate macromixing. There are several “tricks” used to generate conditions where transport is not limiting. The most common of these is the use of inert particles mixed in with the catalyst to artificially increase the active reactor bulk volume. This dilutes any heat effects and, by dilution with fine particles, axial dispersion and bypassing can be limited even for a combination of a relatively short bed and industrial catalyst particle size. If the problem is intra-pellet, then the only option is to operate with a smaller particle size.
Tables 3 and 4 give an indication of suitable catalyst size and shape such as powder, small crushed particles, and complete catalyst bodies. If intrinsic kinetics are to be
Figure 10 Alternate reactors for multiphase kinetics measurements (a) turbine reactor; (b) screw impeller stirred reactor.

49
Eu
rok
in: C
he
mic
al re
ac
tion
kin
etic
s in
pra
ctic
emeasured, the precise catalyst size to be used should be estimated via calculations concerning transport limitations and other phenomena, possibly causing nonidealities. As noted above, if large catalyst pellets are to be used in prac-tice, it may be expedient to use full-sized pellets, often diluted with inert particles, and measure the apparent kinet-ics with the knowledge that the data will include intra-pellet transport effects.
The experimental requirement for intrinsic kinetics is a major area of study in its own right, and anything more than a statement of awareness is beyond the scope of this paper. There is a considerable wealth of literature available in this field (see, for example, Kapteijn & Moulijn[5] or Froment & Bischoff[13]).
Once the range of suitable conditions is set, a choice has to be made for the number of experiments and the sets of conditions at which these should be carried out. From a mechanistic point of view, it often is assumed that most reliable results will be obtained when varying the independent variables just one by one. However, a statistical approach will frequently increase experimental efficiency by varying more than one independent variable simultaneously. Of course, this has the disadvantage that evaluation of the data by visual inspection, rather than by statistical analysis, becomes harder. Experimental design is also a large field, and beyond the scope of the current paper. At its simplest, this is epitomized by factorial design, although more sophisticated techniques are available which are nonlinear in their approach[14, 15, 16].
Measurement of kinetics in industryIt is time now to return to the industrial survey. The results are fairly emphatic. All companies do employ in-house test units for measuring kinetic data, although many also do kinetic work in collaboration with academic institutions and research organizations, with 40% of replies citing the use of external data. All respondents cite the use of fixed bed microreactors, which comes as no surprise. The use of pilot plant for model fitting is common place, but only 20% use full-scale plant operating data for this purpose.
As regards laboratory reactor types, however, utilization is less widespread. Only 25% cite the use of recycled or gradientless reactors, while as few as 12% have used temperature programmed techniques, and only one responding company possessed a TAP reactor.
These data are a few years old now, but in truth little has really changed. Industry still relies heavily on fixed bed microreactors for gas phase reactions, almost to the point of exclusivity. Given the improvement in the techniques now ongoing in academia there is clearly headroom, which shall be addressed later.
It is also apparent from the survey that industry does not believe it is as careful as it should be in selecting experimental conditions. The absence of mass transfer limitation is normally checked, at least experimentally. Plug
flow and isothermicity are frequently assumed without any such verification; the use of rigorous models to describe the microreactor is rare. The goal should be simple reactors that require only simple models. In more complex mixing situations, such as multiphase and fluidized systems, the use of cold flow models for the hydrodynamics and mass transfer is rare.
Collectively, therefore, industry believes it is maybe not as diligent as it should be in ensuring the intrinsic nature of its kinetics. This is almost certainly mitigated by an enormous accumulated experience in translating laboratory data into kinetic models and using these to accurately and safely predict the performance of a commercial reactor.
Kinetic modelingWhen a series of experiments has been carried out, it is then necessary to develop one or more kinetic models, and to try to adjust the kinetic parameters by fitting the mathemat-ical expressions to the experimental data. The amount of work required for this is often significantly underestimated because of unexpected complications. Common “complica-tions” on the chemical side are low-level impurities in the feed, unexpected side reactions, and uncertainties concern-ing the physical properties of the mixture or of some of the compounds present. Examples on the experimental side are residues of chemicals in the reactor from previous work, reactor walls taking part in the reaction, difficulties with chemical analysis, and inaccuracies of the analytical equip-ment. Problems also occur with the modeling itself, such as the use of a kinetic model that is either too simple or too complex, the use of only one or insufficient different models, and a lack of physicochemical background of those models.
Of course, kinetic research has been carried out for many years and accordingly there is much experience available in the literature and in many laboratories regarding suitable approaches for different problems, recommendations to improve the accuracy of models, ways to enhance the entire investigation and, last but not least, a few pitfalls to avoid. A number of case studies have already been introduced. These, and a few more, will now be used to tell a few salutary tales and to try and demonstrate good practice, and lead to some simple recommendations on key points to consider when doing kinetic modeling.
Work on the reaction kinetics can usefully begin even in the earliest stages of a catalyst or reactor development program (see Intermezzo 7). Rather simple models that describe the important reactions reasonably well can be a relatively cheap, but very useful, input in primary economic evaluations concerning the full-scale production and the amount of investigation and development work required.
Although kinetic modeling usually needs the reaction mechanism purely as an input to help build a mathematical description of the events occurring, it can also lead to new insights in the reaction mechanism and reaction sequences. An example concerning the discovery of a new insight

50
Eu
rok
in: C
he
mic
al re
ac
tion
kin
etic
s in
pra
ctic
e
O
O
O
O
OH
O
O
O
OH
O
O
O
O
O
O
O
O
O
O
O
2
R1
R3
R4
R5
R6
R2
R7
Start your kinetics studies early in the development program for maximum advantage: intermezzo 7
Since market prices for butadiene are low, use of butadiene
as feedstock for the production of high-grade chemicals is very
interesting. The telomerization reaction of butadiene with o-phthalic
acid yields a mixture of linear and branched ester isomers, as
shown in Figure 1. After hydrogenation of double bonds in the
alkene groups, the product has potential use as plasticizer.
The reactions are homogeneously catalyzed by a palladium–ligand
complex in a polar organic solvent. The formation of the product
proceeds through monoester species. This has been confirmed
by a combination of experimentation and kinetic modeling. A
simplified reaction scheme is shown in Figure 2.
The telomerization of butadiene with o-phthalic acid
One of the objectives of this research project was to speed
up the course of development of the new product as much as
possible. Therefore, kinetic modeling was started concurrently with
the experimental optimization of the reaction system. The results of
three experiments, in which the butadiene:o-phthalic acid ratio was
varied and other parameters kept constant, were utilized to evaluate
10 proposed kinetic models. Criteria for the selection of the most
appropriate model were: best fit for the conversion of o-phthalic
acid, and selectivities of the products using a minimum number of
parameters (minimize the product of the weighted sum of squares of
residuals and the number of parameters).
Figure 1 Upgrading of butadiene.
Figure 2 Simplified reaction scheme.
H2COOH
COOH
+ 4
COOC8H13
COOC8H13
COOC8H17
COOC8H17
Acknowledgment The authors are grateful to Johan Hoorn (DSM Research, P.O. Box 18, 6160 MD Geleen, The Netherlands) for supplying this case study.
concerning the adsorption mode in a selective hydrogenation process is shown in Intermezzo 8.
The importance of using proper statistical tools in the kinetic investigation should never be underestimated, either for reasons of time effectiveness or confidence in the resulting model. While at the basic level this can simply be the experimental design followed by use of a suitable optimization package for parameter estimation, it may also include mathematical transformation of the model equation
in order to give more reliable fitting. Intermezzo 9 shows how LHHW kinetic expressions may be reparameterized by mathematically removing all kinetic parameters from the numerator. This reparametrization suppresses the interdependency between the parameters, and thus enhances the fitting process.
Kinetic modeling — good practiceIn order to improve the efficiency and accuracy of kinetic modeling, a series of recommendations can be given, of which some were illustrated or mentioned previously:

51
Eu
rok
in: C
he
mic
al re
ac
tion
kin
etic
s in
pra
ctic
e
Start your kinetics studies early in the development program for maximum advantage: The telomerization of butadiene with o-phthalic acid
Figure 3 Experiment (symbols) and model (lines) for three selected components.
The procedure resulted in a model that consists of very simple rate
expressions. When the reactants are denoted by B (butadiene), PA
(o-phthalic acid), Mlinear (linear monoester intermediate) and Mbranched
(branched monoester intermediate), the rate equations are given
by:
r1 = k1[B]2[PA]
r2 = k2[B]2[PA]
r3 = k3[B]2[Mlinear]
r4 = k4[B]2[Mlinear]
r5 = k5[B]2[Mbranched]
r6 = k6[B]2[Mbranched]
r7 = k7[B]2
An example of the comparison between experiment and model
calculations after optimization of the kinetic parameters is given in
Figure 3. In this figure, o-phthalic acid, one of the intermediates,
and the linear product are shown in dimensionless concentrations
as a function of time (all concentrations have been normalized to the
initial o-phthalic acid concentration).
The effect of catalyst concentration is included in the rate constants
for a certain range of concentrations. The role of the catalyst in
determining selectivities and inhibition effects by byproducts such
as octatriene was not considered in the model. Statistical analysis
of the model showed that the accuracy of the parameters would
have to be improved in order to increase the reliability of a plant
scale reactor design.
The simple model obtained from experiments that were conducted
for purposes other than kinetic modeling is suitable for two
reasons:
• Integration in a reactor model for flow sheet calculations in
order to make primary economic evaluations.
• Starting point for the development of a more sophisticated
kinetic model needed for a final reactor design.
The continuation of the development of the kinetic model included
experiments at varying temperatures and specifically identification
of product inhibition (adding octatriene or one of the ester products
to the starting mixture).
Acknowledgment The authors are grateful to Johan Hoorn (DSM Research, P.O. Box 18, 6160 MD Geleen, The Netherlands) for supplying this case study.
• Strive for intrinsic kinetics rather than apparent kinetics where the transport effects and intrinsic kinetics are lumped. This strongly improves the understanding of the physicochemical background of the system, and may give insight into unusual or unexpected effects, and also improves the reliability and accuracy of the model when extrapolated.
• The experimental reactor need not necessarily be a small-scale copy of the industrial reactor. The use of trickle beds and fluid beds should preferably be avoided.
• Determine in advance what kinetic information is really needed, taking into account the resources available.
• Always search for information on comparable chemical systems. Besides literature, one should not forget to check if there is information available in the laboratory from earlier research.
• Use more theoretically-based models if reliability of the kinetics is required for extrapolation.
• Avoid estimating a large number of different kinetic parameters from a small experimental data set. An
0.0
0.2
0.4
0.6
0.8
1.0
1.2
0 25 50 75 100 125time in minutes
conc
en
tra
tion
(dim
en
sio
nle
ss)
OHO
O
O
O
O
OOCOOH
COOH

52
Eu
rok
in: C
he
mic
al re
ac
tion
kin
etic
s in
pra
ctic
e
Kinetic modeling may contribute to new insights in reaction mechanisms and reactionintermezzo 8
The reaction network shown in Figure 1 can describe the selective
hydrogenation of cinnamaldehyde to cinnamyl alcohol.
The development of the concentrations of the various components
in a batch reactor may be well described by a model with first-
order reaction steps, like in Intermezzo 5 for HDN, including ‘direct’
reactions from reactant to intermediate and end products. This is
examplified by Figure 2 where the lines drawn are the kinetic model
predictions for low concentrations of cinnamaldehyde in toluene[xiv].
However, at higher concentrations (~3.5 mol/l), the selectivity for the
desired product, cinnamyl alcohol, increases considerably, while at
the same time the absolute conversion rate of cinnamaldehyde is
about the same. This selectivity change can in no way be predicted
by the low concentration derived kinetic model[xv].
sequences: Selective hydrogenation of cinnamaldehyde to cinnamyl alcohol
appropriate use of statistical tools facilitates the rejection of kinetic models containing too many parameters.
• Define several different kinetic models that may describe the system and model selection criteria to allow making a choice between these models.
• Design additional experiments with two goals: (i) to facilitate the selection of the ‘best’ model, and (ii) to improve the accuracy of the kinetic parameters.
• Apply proportional weighting in order to achieve an equally good description of small experimental response values as for large experimental response values.
• Arrhenius and LHHW expressions can beneficially be reparameterized[17]. This strongly reduces the interdependency between activation energy and the pre-exponential factor which enhances the fitting procedure. See Intermezzo 9 for more details.
Finally, the researcher in kinetics has to choose a suitable software package to perform the parameter estimation. Because several different packages are commercially available, with strongly varying capacities, user interfaces, and versatility, it is difficult to choose the most suitable package. A future paper[18] will focus on aspects to be considered before making a choice of fitting software.
ConclusionsKinetics studies in industry are pragmatic. Experiments are expensive, and there must be a financial justification for kinetic studies. There also needs to be a technical justification for the model, and the overriding requirement is to maintain simplicity. The majority usage of kinetic models is in process, not catalysis research. While industry would like to obtain intrinsic kinetics models based on mechanistic considerations,
In view of the same conversion rate, it is speculated that
the adsorption mode at high concentrations differs from lower
concentrations, comparable to the adsorption of surfactants in
the form of micelles. In this sense the cinnamaldehyde adsorbs
perpendicular to the Pt surface with the aromatic rings in a parallel
arrangement — “self assembling" which is schematically depicted
in Figure 3. Now the carbonylic functionality will be most prone
to hydrogenation. Literature on this type of ordered adsorption is
scarce, but some examples with aromatic molecules have been
reported[xvi].
This stresses the importance that in some cases even the adsorption
mode should be incorporated in a kinetic model, otherwise reaction
selectivities will not be predicted.
cinnamaldehyde (CAL) cinnamyl alcohol (COL) β-methylstyrene
1 5
3
hydrocinnamaldehyde (HCAL) phenylpropane (PP)3-phenyl-1-propanol (HCOL)
cyclohexylpropanol (CHP)
2 4
7
6
Figure 1 Cinnamaldehyde hydrogenation reaction network

53
Eu
rok
in: C
he
mic
al re
ac
tion
kin
etic
s in
pra
ctic
e
Kinetic modeling may contribute to new insights in reaction mechanisms and reaction
Figure 3 Speculated adsorption mode of cinnamaldehyde molecules on the catalyst
sequences: Selective hydrogenation of cinnamaldehyde to cinnamyl alcohol
it is rarely expedient so to do, due to reasons of cost and man-hours as well as elapsed time, and economic and technical justification.
Before setting out on a modeling exercise, it is essential to think carefully about the requirements. What will the model be used for? And by whom? Is a full kinetic model what is actually needed? Will there be a need for extrap-olation regarding operating domain as well as scale? In assembling the mathematical expression, every effort should be made to obtain physicochemical basis. Beware of over-parameterization, and make maximum use of appropriate statistical tools. In doing all this, it is worth bearing in mind that process models do not need detailed kinetics, but rather a reliable rate model. Even with this, the influence of
external factors changes with scale, particularly the effects of macro mixing and transport.
Future activitiesIn considering what the future holds for kinetics — or more precisely what are the main agenda items for kinetics research — it is worth returning again to the industrial survey. This also inquired as to opinions on the aspects of kinetics that most urgently require improvements. Three areas were commonly cited:i. Improvements in the acquisition of kinetic data, since
this is considered too costly and time-consuming.ii. There is considerable difficulty in the determination and
subsequent application of kinetics for the case of unstable or variable catalyst performance (e.g., deactivation).
Pt
C
O
C
C
C
O
C
C
C
O
C
C
C
O
C
C
C
O
C
C
C
O
C
C
Residence time / min.
C /
mol
l-1
0.0
0.2
0.4
0.6
0.8
0 200 400 600 800
0.0
0.05
0.1
0.15
0.2
CAL
COL
HCAL
HCOL
CHP
PP
Figure 2 Experimental results cinnamaldehyde hydrogenation

54
Eu
rok
in: C
he
mic
al re
ac
tion
kin
etic
s in
pra
ctic
e
Statistical techniques help to perform experimental design and to find optimal kineticintermezzo 9 models: A case study of the selective reduction of NO by NH3
Figure 1 Differential reactor model
NO
NO(out)NH 3
NH3 (out)
Z = 0 Z = L
Design of experiments is a collection of statistical techniques
employed for systematic experimentation and optimal model
analysis. This application illustrates the use of experimental design
for model building and analysis for the selective catalytic reduction
of NO by NH3.
Experimental set-upThe experiments for the determination of the intrinsic kinetics have
been performed in a tubular packed bed reactor, which can be
modeled using the plug flow reactor model, as shown in Figure
1. The separate adsorption and surface reaction steps have been
lumped into one overall reaction describing the NO conversion.
4 NO + 4 NH3 + O2 → 4 N2 + 6 H2O
Each experiment covers a specific combination of molar fractions
NO, NH3, H2O, and O2 at the reactor inlet, the reactor temperature,
and the space velocity. A small catalyst particle size has been
selected to avoid mass transfer limitations due to pore diffusion
effects. At the reactor outlet the molar fractions NO and NH3 have
been measured.
Rate expressionsAccording to the different assumptions, several rate expressions
for the surface reaction have been proposed. In Figure 2, some
reaction rate expressions are displayed. The constants a, b, c and
d apply to the power law model. The rate constant is given by k.
The parameters KNO, KNH3 and KH2O are the adsorption constants.
The rate expressions depend on the local partial pressures PNO,
PNH3, PO2 and PH2O. At given inlet concentrations, the NO and NH3
outlet values are computed using the reactor continuity equations
for NH3 and NO. The parameters are adjusted such that the sum of
Power law
Eley Rideal:
r = k KNH3 pNH3 KNO pNO (pO2)
1+KNH3 pNH3 + KH2O pH2O
Figure 2 Sample of selected models
Langmuir–Hinshelwood:
r = k KNH3 pNH3 KNO pNO (pO2)
(1+KNOpNO)(1+KNH3 +KNH3pNH3 +KH2OpH2O)
ar = k pNO pNH3 pH2O pO2b c d
d
d
BA
Parallel experimentation rig with 10 reactorsfor gas phase reactions over a fixed bed.
Endeavor™ unit with 8 reactors for gas-liquid-slurry reactions (e.g. hydrogenation).
eight individual injectors withindependant control of temperature, pressure, reagent addition and gas delivery.
all functions controlled via simple keypad
Figure 11 High–throughput experimentation equipment reproduced courtesy of (a) argonaut technologies (b) zeton altamira

55
Eu
rok
in: C
he
mic
al re
ac
tion
kin
etic
s in
pra
ctic
e
Statistical techniques help to perform experimental design and to find optimal kinetic models: A case study of the selective reduction of NO by NH3
squared residuals (SSR) — the differences between the measured
and the computed NO and NH3 outlet values — is minimized.
Experimental dataFigure 3 displays the levels of the inlet concentrations. The values
have been arranged using a central composite design, consisting
of 8 corners of the cube (low/high values), 6 star points (orange)
outside the cube and one or more replicates in the center. A
composite design has been chosen as it is suitable for determination
of the nonlinear effects arising from the rate expressions and the
solution of the differential mass balances.
Figure 3 Central composte design
Parameter estimationFor all selected models, the least-squares estimates of the rate
constant and the adsorption coefficients have been fitted. However,
in many cases, extremely large standard errors and mutual
correlations of the estimated parameters were experienced. (In
the Langmuir–Hinshelwood model, the correlations between k and
KNO and between KNH3 and KH2O were 0.99 and 0.99, respectively.)
This indicates ill-conditioned behavior of the estimation problem,
including very sensitive and less reliable parameter results.
Using the “parameter-in- denominator” principles, these inaccurate
results have been considerably improved. After division of the
numerator and the denominator of the Langmuir–Hinshelwood
rate by the common parameter product k KNH3 KNO and rearranging
the parameters in the denominator, nearly all high correlations
and high standard errors disappeared. This reparameterization
produces a ‘close-to-linear’ model by clearing off constants in the
numerator of the rate expression.
Model selectionIn order to select the best model, a further model discrimination was
carried out. Figure 4 displays the reaction rates of four rival models,
several forms of Langmuir–Hinshelwood including a model with
surface dissociation, calculated with a high H2O fraction of 20%
at the reactor inlet. Hardly any statistically significant difference
is experienced. Figure 5 displays the rates computed with the
same parameters at a much lower H2O content of 1%. The
differences between the rate values are evident, particularly at
high NO concentrations. Adding experiments carried out at low
H2O concentration increased the discriminative power between the
relevant models; in the same way, other experimental conditions
iii. There is considerable opportunity to improve the user friendliness of software for modeling of reactors, for the regression of kinetic data to rate expressions, and for its application to experimental design.
The majority of the respondents stated that the problems indicated should be solved by co-operation, and this of course was the impetus that led to the formation of Eurokin (Intermezzo 1). The above list essentially relates to simply improving the way we use the current tools, and their incremental development. The alternate question is what are the potential major step changes that are going to impinge on kinetics research in the future. Taking the medium and long-term perspectives as one, here are some thoughts as to what the future might bring — or what we involved in kinetics research ought to be considering.• Software tools (simulation, regression, experimental
design) will be improved. This will relate not only to improved user-friendliness and calculation routines (leading to reduced computational times) but also to
developments in statistical, search, and optimization techniques.
• Molecular modeling can be expected to contribute more to useful mechanistic information and to estimation of initial parameter values. This relates to the rapid developments in the theoretical chemistry and compu-tational tools, as well as to the development in associated computer hardware. The leading companies are now targeting increased computational power on the desktop to facilitate this.
• High throughput experimentation has largely been associated with combinatorial chemistry, discovery, and screening. The potential impact of the gross parallelization of experimental equipment on kinetic measurements should not, however, be underestimated[19]. Parallel microreactor units are in use in industry and are now becoming commercially available. Figure 11 shows two examples of “off-the-shelf” parallel screening units. Kinetic data may be more rapidly measured, but this
NO/NH3
H2O
O2

56
Eu
rok
in: C
he
mic
al re
ac
tion
kin
etic
s in
pra
ctic
e
then puts the emphasis on the statistical tools to set the experimental design and process the acquired data. The theory is that combinatorial (or similar) discovery will increase the number of new products, and so this increase in the efficiency of kinetics research will be required simply to keep pace.
• Nonstationary methods such as temperature programmed reaction and temporal analysis of products are currently quite widely used to obtain mechanistic information, but as yet the output is used in a primarily qualitative fashion, and relatively little quantitative information is obtained. Unsteady state techniques have the benefit that data is acquired much more rapidly. The challenge is to
understand how data measured in a transient condition can be applied quantitatively.
Those in the Eurokin consortium, and their academic partners, will be actively addressing these issues over the next few years. The challenges should not be underestimated. It will require major effort and innovation to achieve these goals.
Further readingThere exist many textbooks concerning the theoretical background of reaction kinetics.
The following books are suitable for a general and basic introduction of chemical kinetics, homogeneous and heterogeneous catalysis, and the thermodynamics related with these: Boudart[20], Boudart and Djega Mariadassou[21],
Figure 4 Rate values at a H2O content of 20%
50
400
300
200
100
0
0 100 150 200
model 1model 2model 3model 4
pNO
Rea
ctio
n ra
te
displaying large divergence between the models have been
added to allow for optimal discrimination — a form of sequential
experimental design. As a last step in the analysis, optimal
parameters of the best model have been refitted using all the
data.
500
50
model 1
model 2
model 3
model 4400
300
200
100
00 100 150 200
pNO
Rea
ctio
n ra
te
Figure 5 Rate values at a H2O content of 1%
ConclusionUsing statistical techniques, optimal model analysis and design for
the selective catalytic reduction of NO by NH3 has been performed.
Special attention has been paid to the statistical design of the
experiments, efficient reparameterization of the models, and the
design for optimal model discrimination.

57
Eu
rok
in: C
he
mic
al re
ac
tion
kin
etic
s in
pra
ctic
e
Where: k = reaction rate coefficientk o = pre - exponential factor
T * = the reparameterized reaction temperature (in K),
calculated from the reaction temperature T (in K) according to
T ref = an arbitrarily chosen reference temperature
within the experimental temperature window.
k ref = k o exp -Ea R · Tref
1 = 1 - 1 T * T T
ref
k = k o exp -Ea R · T
Original Arrhenius expression
k = k ref exp -Ea R · T
Reparameterized Arrhenius expression
This reparameterization strongly reduces the interdependency
between activation energy and the pre-exponential factor, which
enhances the fitting procedure. Estimating the log of kref instead
of kref itself may further facilitate the parameter-estimation proce-
dure, because this strongly reduces the difference in uncertainty
ranges of both parameters.
Acknowledgement: The authors are grateful to Sjoerd van der Wal (formerly Shell Research and Technology Centre, Amsterdam, The Netherlands) for supplying this case study.
r = kK ApAK BpB
1 + K A pA + K BpB
Original LHHW expression
2
2
r = pApB
k K A K B k K B kK A
Reparameterized LHHW expression
2
1 +
pA + pB2
Froment and Bischoff[13], and Kapteijn and Moulijn[22]. These books cover the range from the fundamentals of chemical kinetics up to modeling of reactors. An extensive and useful paper concerning the modeling of catalytic kinetics is given by Froment and Hosten[23].
Sources of more thorough fundamental background of kinetics of heterogeneously catalyzed reactions, also defined as microkinetics, are Dumesic et al. [24], Zhdanov[25], Van Santen[26], and Golden and Manion[27]. A frequently used method for microkinetic modeling is the Bond-order con-servation–Morse-potential approach (BOC–MP approach), see Shustorovich[28, 29] and Bell[30]. Benziger[31] describes several methods for estimating reaction energetics on metal surfaces. Kang and Weinberg[32] give an overview of methods for modeling of surface rate processes. Estimations of heats of chemisorption of gases on metal surfaces can be done using the general rules defined by Tanaka and Tamaru[33].
Guidelines for Reparameterization• Reparameterize Arrhenius expressions according to: • Reparameterize LHHW-type expressions by removing the
kinetic parameters from the numerator according to, for exam-
ple:
Instead of k, Ka and KB the combinations 1/kKAKB, 1/kKB
and 1/kKA are estimated which also enhances the fitting
procedure.

58
Eu
rok
in: C
he
mic
al re
ac
tion
kin
etic
s in
pra
ctic
e
Prof. dr. ir. Guy B. Marin (1954) is full professor of Chemical Engineering at the University of Gent (Belgium). He received his degree from the University of Gent in 1976, where he also obtained his Ph.D. in 1980. After a post-doctoral stay in 1981 at Catalytica Associates and Stanford University he obtained tenure at the University
of Gent in 1986. He took a position of full professor in 1988 at the Eindhoven University of Technology (The Netherlands) where he taught about chemical reactors. In 1997, he returned to Gent as director of the Laboratorium voor Petrochemische Techniek. Chemical reaction engineering catalysis in general, and reaction kinetics in particular are the main foci of his research program. He has co-authored more than 70 papers in international journals.
Laboratorium voor Petrochemische Techniek, Universiteit Gent,
Krijgslaan 281 S5, B-9000 Ghent, Belgium.
curriculum vitae
curriculum vitae
curriculum vitae
E. Hugh Stitt was born in 1958
in Stafford, England. He obtained
his degree in chemical engineering
in 1981, and his Ph.D., for research
into the use of electric fields in liquid
extraction in 1985, both at the Uni-
versity of Bradford, UK. He spent
the next six years as a lecturer in
chemical engineering at the same university, teaching and
researching in separation processes.
Since joining ICI in 1990, the emphasis of Hugh’s work has
moved to catalytic reaction engineering. Initially the focus
was ICI’s petrochemical businesses, involving innovation in
reactors and flow sheets for new processes and for modifica-
tions to existing plants as well as process and reactor model-
ing.
In 1994 Hugh joined ICI’s catalyst and technology licensing
business, ICI Katalco, which merged with 4 other ICI busi-
nesses to form Synetix in 1998. He has continued to work
in the evaluation, development, and commercialization
of novel reactors and catalytic processes, initially for envi-
ronmental applications, focusing on two- and three- phase
catalytic reactors. His present role is to lead the strategic
development of reactor applications and services technol-
ogies for Synetix. This involves significant internal and
external collaboration; exemplified by Eurokin, of which he
is currently chairman.
Synetix, P.O. Box 1, Billingham, Cleveland TS23 1LB, U.K. (hugh_stitt @ ici.com)
Rob Berger was born in 1963 in Enschede, The Netherlands. He graduated in 1987 at the University of Twente in Process Engineering. He received his Ph.D. degree in 1992 at the same university, on research concerning nickel catalysts for internal reforming of methane in molten carbonate fuel cells (with
Prof. Julian Ross). During a five-year postdoctoral position, he investigated the catalytic and homogeneous partial oxidation of methane to synthesis gas at Eindhoven University of Technology with Prof. Guy Marin. In 1998 he accepted his current post-doctoral position at Delft University of Technology on the Eurokin project.
Eurokin, c/o Delft University of Technology, Julianalaan 136
2628 BL Delft, The Netherlands (e-mail: [email protected])

59
Eu
rok
in: C
he
mic
al re
ac
tion
kin
etic
s in
pra
ctic
e
curriculum vitaecurriculum vitae
acknowledgement
One of the authors (RJB) acknowledges the financial support from the eleven companies in the Eurokin consortium: Akzo Nobel, Dow Benelux, DSM Research, IFP, TECHNIP, Shell Research and Technology Centre, STATOIL, Linde, Eni Tecnologie, Synetix, and EC Chem Technologies. All of the authors are grateful to the members of Eurokin for permission to publish this paper.
Jacob A. Moulijn was born in 1942 in Harlingen, The Netherlands. He graduated in 1967 and received his Ph.D. at the University of Amsterdam in 1974 on the Stimulus-Response technique applied to packed beds. Held a tenure position since 1974 and became professor in Chemical Engineering in 1984 at the University of Amsterdam. Moved
to Delft University of Technology in 1990 for the Industrial Catalysis chair. Spent a sabbatical in 1978 in Delaware, USA with Bruce Gates and was visiting professor at the University of Gent 1992-1997. He has been CTA for the United Nations in China from 1995. His research interests cover a wide field, from Coal Science to Heterogeneous Catalysis and Engineering, with the emphasis on the application of catalysis in practice. The use of structured catalysts for multiphase operation is a major current research topic. Specific subjects cover petrochemicals, chemicals and environment. The interest in carbon is still living in the research on the catalytic combustion of diesel soot and the application of carbon as a catalyst support. He is co-author of more than 450 publications, co-edited 7 books and was promotor of over 30 Ph.D. students.
Delft University of Technology, Julianalaan 136, 2628 BL Delft, The Netherlands
Freek Kapteijn was born in 1952 in Amsterdam, The Netherlands. He graduated from the University of Amsterdam in 1974 with degrees in chemistry and mathematics. His Ph.D. on the metathesis of alkenes was received at the same university. As a postdoc he focused on coal science and heterogeneous catalysis. In 1987, he received a tenure position
at the University of Amsterdam and moved to Delft University of Technology in 1993. Since 1999, he was nominated ‘personal’ professor in Delft. He spent several periods abroad among them in the group of Villermaux, Nancy, France (ENSIC) and of Prins, Zürich, Switzerland (ETH). He is co-author of more than 150 publications and a co-promoter of 14 Ph.D. students. Current interests cover the application of monolithic structures in catalytic conversions and related processes, adsorption and diffusion in zeolites and zeolitic membranes, and transient kinetics. The related specific applications of heterogeneous catalysis cover selective hydrogenation and oxidation, N2O decomposition, Fischer–Tropsch, and fine chemicals production.
Delft University of Technology, Julianalaan 136, 2628 BL Delft, The Netherlands

60
Eu
rok
in: C
he
mic
al re
ac
tion
kin
etic
s in
pra
ctic
e
references
[1] A.N.R. Bos, L. Lefferts, G.B. Marin and M.H.G.M. Steijns, Kinetic research on
heterogeneously catalysed processes: A questionnaire on the state-of-the-art in
industry, Appl. Catal. A: General 160 (1997) 185-190.
[2] Survey of gaps, needs and opportunities in industrial catalysis, Network on
Catalysis in Europe (NICE), c/o DECHEMA, Frankfurt am Main, Germany
(web site: http://www.dechema.de/deutsch/dechema/pages/framenav.htm, Sep.
2000).
[3] (a) N. Wakao and S. Kaguei, Heat and mass transfer in packed beds, Gordon
and Breach Science Publishers Inc., New York, 1982 (for mass transfer coef-
ficients in fixed beds),
(b) A.P. de Wasch and G.F. Froment, Heat transfer in packed beds, Chem. Eng.
Sci. 27 (1972) 567-576 (for heat transfer coefficients in fixed beds),
(c) V.R. Choudhary and L.K. Doraiswamy, Development of continuous-stirred
gas-solid reactors for studies in kinetics and catalyst evaluation, Ind. Eng. Chem.
Process Des. Develop. 11 (1972) 420-427 (for mass transfer coefficients in
Berty type reactors)
[4] (a) P.H. Calderbank, Mixing (Eds.: V.W. Uhl and J.B. Gray), Vol. 11, Academic
Press, New York, 1967, pp. 1-114 (for gas-liquid mass transfer coefficients in
slurry reactors),
(b) Y.T. Shah, Gas-liquid-solid reactor design, McGraw-Hill, New York, 1979,
Chapter 9, pp. 304-370 (for liquid-solid mass transfer coefficients in slurry
reactors),
(c) P. Trambouze, H. van Landeghem, J.P. Wauquier, Chemical reactors, Design/
engineering/operation, Edition Technip, Paris, 1988 (for a general overview).
[5] F. Kapteijn and J.A. Moulijn, Laboratory Reactors, Chapter 9 in Volume 3 of Hand-
book of heterogeneous catalysis, (Eds.: G. Ertl, H. Knözinger and J. Weitkamp),
VCH Verlagsgesellschaft mbH, Weinheim, Germany, 1997, pp. 1359-1376 (for a
general overview).
[6] M.I. Temkin, The kinetics of steady state complex reactions, Int. Chem. Eng. 11
(1971) 709-717.
[7] D. Chen, A. Gronvold, H. P. Rebo, K. Moljord, and A. Holmen, Catalyst deactivation
studied by conventional and oscillating microbalance reactors, Appl. Catal. A 137
(1996) L1-L8.
[8] H.P. Rebo, E.A. Blekkan, L. Bednarova and A. Holmen, Deactivation of Pt-Sn cata-
lyst in propane dehydrogenation, Catalyst Deactivation 1999, (Eds.: B. Delmon
and G.F. Froment), Elsevier Science B.V., 1999 (Stud. Surf. Sci. Catal., 126 (1999)
333-340.
[9] D. Chen, H.P. Rebo, A. Grønvold, K. Moljord and A. Holmen, Methanol conversion
to light olefins over SAPO-34: kinetic modeling of coke formation, Microporous
and Mesoporous Materials, 35-36 (2000) 121.
[10] Wang, DX; Kung, HH; Barteau, MA, Identification of vanadium species involved
in sequential redox operation of VPO catalysts, Applied Catalysis A-General,
201(2), 203-213, 10 Jul 2000
[11] T.A. Nijhuis, (Delft University of Technology), unpublished results.
[12] A.C.J.M. van de Riet, F. Kapteijn and J.A. Moulijn, Internal recycle monolith reactor
for three-phase operation; hydrogenation of benzaldehyde: kinetics, Preprints of
the 2nd Int. symp. on catalysis in multiphase reactors (EFCE), Toulouse (France),
March 16-18, 1998, pp. 153-159.
[13] G.F. Froment and K.B. Bischoff, Chemical reactor analysis and design, 2nd ed.,
John Wiley & Sons, New York, 1990.
[14] K.K. Hockman and D. Berengut, Design of experiments, Chem. Engineering (Nov.
1995) 142-147.
[15] R.E. Miller, Experimental design, Chem. Engineering (June 1986) 113-117.
[16] C.D. Hendrix, What every technologist should know about experimental design,
Chemtech (March 1979) 167-174.
[17] J.R. Kittrell, In: Advances in Chemical Engineering (Eds.: T.B. Drew, G.R. Cokelet,
J.W. Hoopes and T. Vermeulen), Academic Press, New York, 1970, Vol. 8, p. 97.
[18] R.J. Berger, J.W. Verwijs, J. Verstraete and J. Hoorn, Software functionality assess-
ment for kinetic reaction model development, model discrimination, parameter
estimation and design of experiments, Accepted for the 3rd Int. Symp. on reaction
kinetics and the development and operation of catalytic processes, April 22-25,
2001, Oostende.
[19] J. Pérez-Ramírez, R.J. Berger, G. Mul, F. Kapteijn and J.A. Moulijn, The six-flow
reactor technology. A review on fast catalyst screening and kinetic studies, Catal.
Today, 60 (2000) 93-109.
[20] M. Boudart, Kinetics of chemical processes, Prentice-Hall Inc., Englewood Cliffs,
New Jersey, 1968.
[21] M. Boudart, and G. Mariadassou, Kinetics of heterogeneous catalytic reactions,
Princeton Univ. Press, Princeton, 1984.
[22] F. Kapteijn and J.A. Moulijn, Rate procurement and kinetic modeling, Section 6.1
in Volume 3 of Handbook of heterogeneous catalysis, (Eds.: G. Ertl, H. Knözinger
and J. Weitkamp), VCH Verlagsgesellschaft GmbH, Weinheim, Germany, 1997,
pp. 1189-1209.
[23] G.F. Froment and L.H. Hosten, Catalytic kinetics: modelling, In: Catalysis: science
and technology, Vol. 2 (Eds.: J.R. Anderson and M. Boudart), Springer-Verlag,
Berlin, 1981, pp. 98-168.
[24] J.A. Dumesic, D.F. Rudd, L.M. Aparicio, J.E. Rekoske and A.A. Treviro, The micro-
kinetics of heterogeneous catalysis, ACS, Washington D.C., 1993, pp. 23-53.
[25] V.P. Zhdanov, Elementary physicochemical processes on solid surfaces, Plenum
Press, New York, 1991.
[26] R.A. van Santen and J.W. Niemantsverdriet, Chemical kinetics and catalysis,
Plenum Press, New York, 1995.
[27] D.M. Golden and J.A. Manion, Applications of chemical kinetics, Advances in
chemical kinetics and dynamics (Ed.: J.R. Barker), Vol. 1, 1992, pp. 187-276.
[28] E. Shustorovich, The bond-order conservation approach to chemisorption and
heterogeneous catalysis: applications and implications, Adv. Catal. 37 (1990)
101-163.
[29] E. Shustorovich, Mechanisms and intermediates of metal surface reactions: bond-
order conservation viewpoint, In: J.B. Moffat, Theoretical aspects of heteroge-
neous catalysis, Van Nostrand Reinhold, New York, 1990.
[30] A.T. Bell, Relationship of reaction energetics to mechanism and kinetics of het-
erogeneously catalyzed reactions, In: Metal-surface reaction energetics (Ed.: E.
Shustorovich), VCH Publishers Inc., New York, Chapter 5, 1991, pp. 191-227.
[31] J.B. Benziger, Thermochemical methods for reaction energetics on metal sur-
faces, In: Metal-surface reaction energetics (Ed.: E. Shustorovich), VCH publish-
ers Inc., New York, Chapter 2, 1991, pp. 53-107.
[32] H.C. Kang and W.H. Weinberg, Kinetic modelling of surface rate processes, Surf.
Sci., 299 (1994) 755-768.
[33] K-I. Tanaka and K. Tamaru, A general rule in chemisorption of gases on metals, J.
Catal. 2 (1963) 366-370.
References from the intermezzos
[i] Nijhuis, X. (Delft University of Technology), unpublished results.
[ii] S.T. Sie, Reaction order and role of hydrogen sulfide in deep hydrodesulfurization
of gas oils: consequences for industrial reactor configuration, Fuel Processing
Technol. 1999, 61, 149-171.
[iii] S.T. Sie, Miniaturization of hydroprocessing catalyst testing systems: Theory and
practice, AIChE J. 1996, 42, 3498-3507.
[iv] H.R. Reinhoudt, The development of novel catalysts for deep hydrodesulfurisation
of diesel fuel, Ph.D. Thesis, Delft University of Technology, 1999, 225 pp.
[v] M. Jian, F. Kapteijn and R. Prins, Kinetics of the hydrodenitrogenation of ortho-
propylaniline over NiMo(P)/Al2O3 catalysts, J.Catal. 1997, 168, 491-500.
[vi] Th. Vergunst , Carbon coated monolithic catalysts. Preparation aspects and testing
in the three-phase hydrogenation of cinnamaldehyde , Ph.D. Thesis Thesis, Delft
University of Technology, 1999, 230 pp
[vii ] P.J. Clymans and G.F. Froment, Computer-generation of reaction paths and rate
equations in the thermal cracking of normal and branched paraffins, Comp. Chem.
Eng. 8, (1984) 137-142.
[viii] J.F.M. Denayer, G.V. Baron, W. Souverijns, J.A. Martens and P.A. Jacobs,
Hydrocracking of n-alkane mixtures on Pt/H-Y zeolite: chain length dependence
of the adsorption and the kinetic constants, Ind. Eng. Chem. Res. 36 (1997)
3242-3247.
[ix ] G.G. Martens, G.B. Marin, J.A. Martens, P.A. Jacobs and G.V. Baron, A
fundamental kinetic model for hydrocracking of C8 to C12 alkanes on Pt/US-Y
zeolites, J. Catal. 195 (2000) 253-267.
[x ] G.G. Martens, J.W. Thybaut, G.B. Marin, Single-Event rate parameters for the
hydrocracking of cycloalkanes on Pt/US-Y zeolites, Ind. Eng. Chem. Res.,
submitted.
[xi] Yaluris, G, Rekoske, JE, Aparicio, LM, Madon, RJ, Dumesic, JA, J. Catal. 153,
(1995). 54.
[xii] Watson, B.A., Klein M.T., Harding, R.H., Ind. Eng. Chem. Res. 35, (1996) 1506.
[xiii] Martens, G.G., and Marin, G.B., AIChE J. submitted.
[xiv] Th.Vergunst, Carbon coated monolithic catalysts. Preparation aspects and testing
in the three-phase hydrogenation of cinnamaldehyde. Ph.D. Thesis, Delft University
of Technology, 1999
[xv] Vergunst Th, Kapteijn F & Moulijn J : Kinetics of Cinnemaldehyde Hydrogenation
– Concentration Dependent Selectivity : pp 197 – 204, proc 3rd Int Symp Catalysis
in Multiphase Reactors, Naples, 29-31 May 2000.
[xvi] M. Komiyama, Adsorption characteristics of pyridine bases on zeolite (010) examined
by atomic force microscopy (AFM), Stud. Surf. Sci. Catal. Vol 109 (1998) 185-191.
[xvii] Kittrell JR in Advances in Chemical Engineering (eds. Drew TB, Cokelet GR,
Hoopes JW, VermeulenT) Academic Press, New York, 1970, Vol. 8, p.97.