Internal Energy Excitation and Chemical Reaction Models for ...
Upload
khangminh22Category
view
1download
0
Exploring Chemical Reaction Space with
Reaction Difference Fingerprints and Parametric
t-SNE
Mikhail G. Andronov,† Maxim V. Fedorov,‡,¶ and Sergey Sosnin∗,‡,¶
†Faculty of Fundamental Physical and Chemical Engineering, Lomonosov Moscow State
University, Moscow, 119991, Russia
‡Center for Computational and Data-Intensive Science and Engineering, Skolkovo Institute
of Science and Technology, Skolkovo Innovation Center, Moscow, 143026, Russia.
¶Syntelly LLC, Skolkovo Innovation Center, Moscow 143026, Russia
E-mail: [email protected]
Phone: +7 (926)6556761
Abstract
Humans prefer visual representations for the analysis of large databases. In this
work, we suggest a method for the visualization of the chemical reaction space. Our
technique uses the t-SNE approach that is parameterized by a deep neural network
(parametric t-SNE). We demonstrated that the parametric t-SNE combined with reac-
tion difference fingerprints could provide a tool for the projection of chemical reactions
onto a low-dimensional manifold for easy exploration of reaction space. We showed
that the global reaction landscape, been projected onto a 2D plane, corresponds well
with already known reaction types. The application of a pretrained parametric t-SNE
model to new reactions allows chemists to study these reactions in a global reaction
space. We validated the feasibility of this approach for two marketed drugs: darunavir
1

and oseltamivir. We believe that our method can help to explore reaction space and
will inspire chemists to find new reactions and synthetic ways.
Introduction
Chemical space is the fundamental concept of organic chemistry. One can regard it as a
set of all possible molecules that can exist and satisfy the predefined conditions. If someone
regards only small molecules (below 500 Da.) there are more than 1060 compounds, and that
is enormous size.1 Chemical reactions are tools that make it possible the traverse through the
chemical space to reach new chemical compounds. There are more than 300 name reactions
in organic chemistry that have a precise definition,2 for example, Suzuki coupling,3 Grignard
reaction, etc. At the same time, there are about 108 of described chemical reactions according
to the largest chemical reaction database CASREACT®.4 This known reaction set is too
large to analyze it using humans’ expertise. Researchers need new computational approaches
that aim to support the exploration of chemical reaction space.
However, the space of chemical reactions is not discrete and concrete. It is hard to at-
tribute many reactions to a certain type as they may be carried out with surprising agents or
result in unexpected products.5–7 The current landscape of drugs is biased towards scaffolds
and overpopulated with certain shapes that are reachable with reactions chemists are used
to (e.g. amide bond formation and SNAr reactions).8 The detailed exploration can mitigate
these shortcomings and boost drug discovery. New methods for the visualization of reaction
space can provide useful insights for chemists and lead to a better understanding of nature.
We believe that, in the ”Big-data” era, these methods should have the ability to extract
information directly from data.
Among various machine learning techniques, the dimensionality reduction of multidimen-
sional space for visualization purposes is particularly popular in cheminformatics. Medical
chemists use this technique to achieve better understanding of chemical data.9 The dimen-
2

sionality reduction methods can be either linear or non-linear. Linear methods assume that
the multidimensional data points are located near a linear manifold of lower dimension-
ality, whereas non-linear methods allow for non-linear manifolds. Linear methods include:
Principal Component Analisys (PCA),10 Canonical Correlations Analysis (CCA),11 Multidi-
mensional Scaling (MDS)12 and many others.13 Principal Component Analisys (PCA) is the
most common linear approach, it aims to find the directions with the highest variation in the
original multidimensional space. This method is fast and deterministic, but its performance
is limited because of its linear nature. Non-linear methods include: t-distributed Stochastic
Neighbor Embedding (t-SNE),14 Self-Organizing Maps (SOM),15 Generative Topographic
Mapping (GTM)16 and others.17 Chen and Gasteiger18 successfully used SOM to obtain a
map of chemical reactions space with distinct regions corresponding to reactions of aliphatic
substitution, double C-C bond acylation and arene acylation. The GTM method has been
successfully applied in drug design.19 It was also recently used to visualize chemical reac-
tions embedded into the latent space of a generative variational autoencoder.20 The t-SNE
method was used to explore the structure of bioactive organic molecules datasets.21 Probst
and Reymond proposed a fresh view on chemical space mapping to non-euclidean domains:
Tree MAP (TMAP).22 This method is based on the visualization of minimum spanning trees.
In the following research,23 Schwaller et al. proposed neural-based vector representations of
chemical reactions and used these vectors for TMAP visualization of the reaction space in a
fully data-driven way.
In this paper, we describe the application of the parametric t-SNE method to explore
chemical reaction space. First, we describe several parametric t-SNE models trained on
chemical reactions extracted from US patents. Then we evaluate the performance of visual-
izations using a reference dataset with predefined chemical reaction classes. Also, we explore
some regions of the reaction space to reveal the chemical essence behind them. Finally, we
use our approach to overview a set of reactions leading to the synthesis of some marketed
drugs. We believe that our technique reflects the space’s inner structure through similar
3

types gathering in distinct clusters. This visualization technique can provide some chemical
insights or aid in synthesis planning to speed up chemists’ work.
Materials and methods
Datasets
In our work we used freely available chemical reactions dataset created by D. Lowe.24 It
contains about 2 million organic reactions in the recent update.25 To train the machine
learning models, we utilized the slightly adjusted dataset, which was used by Schwaller et al.
to predict products of a reaction by a seq2seq model.26 This dataset, further referred to as
dataset A, contains SMILES-strings for single product reactions with atom mapping. Also,
there are no duplicates in this dataset.
To assess the visualization performance, we used a dataset from the paper by Schneider
et al. 27 It comprises 50000 reactions represented as standardized SMILES-strings. These
reactions were labeled by one of the 10 classes (oxidations, reductions, C-C bond formations,
heteroatom acylations, deprotections, etc.) The authors have attributed these reactions
automatically using NameRxn software (version 2.1.84). The NameRxn algorithm is based
on expert-defined SMIRKS patterns.28 We denote this dataset as dataset B.
Parametric t-SNE
The method of t-distributed Stochastic Neighbor Embedding,14 originally described in 2008,
is a common approach in multidimensional data visualization. However, it has two major
shortcomings. First, one can not apply a prepared t-SNE model to new data. Second, the
application of this method is limited only to relatively small datasets. In practice, it is
only viable for datasets comprising 105 or less multi-dimensional points, even with Barnes-
Hut approximation29 on modern computers. In our work, we used parametric t-SNE.30
This approach allows to apply a prepared model to new reactions and requires modest
4
computational resources. In the original t-SNE, the coordinates of the embedding points in
the lower-dimensional space are optimized directly. In parametric t-SNE, a neural network
with adjustable weights is used to project higher-dimensional space to the lower-dimensional
one. A loss function of the neural network corresponds to the divergence between high- and
low-dimensional data relations. At each training iteration, a batch of data points is picked to
calculate a distance matrix d for all points in the batch with a predefined metric. The matrix
d has size n × n, where n is the batch size. Then the distance matrix is used to calculate
the matrix of conditional probability distribution p in a high-dimensional space (Eq. 1):
pij =exp(− d2ij
2σ2i)∑
k 6=i exp(− d2ik2σ2i)
(1)
One can interpret a row of the pij matrix as a Gaussian probability distribution over the
batch that the point j will be picked as a neighbor for the point i. Decreasing of σi leads
to the reduction of the number of nearest neighbors that have non-zero probabilities. All σi
parameters are adjusted to achieve the desirable perplexity of distributions in all rows. One
can regard the perplexity as an approximate number of neighbors taken into consideration
in the original space. It is a hyperparameter of the algorithm. There is a connection between
perplexity P and Shannon’s entropy H of a distribution (Eq. 2):
H = −N∑j=1
pij log pij
P = 2H
(2)
Similarly to Eq. 1, a probability distribution matrix q is built for low-dimensional embedding
points (Eq. 3):
qij =(1− d(yi−yj)2
α)−
α+12∑
i 6=k(1−d(yi−yk)2
α)−
α+12
(3)
5

where d(yi − yj) is the distance between the embedding points yi and yj, α is the number
of degrees of freedom of t-distribution. This distribution is heavy-tailed and it helps to
overcome the ”crowding” problem.14 In our work we defined α equal to one. The weights
of the neural network are optimized by backpropagation, minimizing the Kullback-Leibler
divergence L between distributions in a high-dimensional space and in a low-dimensional
space (Eq. 4):
L =∑i 6=j
pij logpijqij
(4)
Model training
We used a fully connected neural network as a projection function in parametric t-SNE.
The information about the network architecture and the optimization procedure is given
in the Supplementary Material to this article. We trained our network on the dataset A
for 40 epochs with batch size of 7000 and different perplexity values: 10, 30, 100 and 500.
We used several fingerprints available in RDKit package: Morgan Fingerprints (also known
as Extended-Connectivity Fingerprints, ECFP),31 Atom Pair Fingerprints (AtomPairFP),32
and Topological Torsion descriptors.33 One can regard a chemical reaction as a map between a
set of reactants (reagents) and a set of products. Catalysts, solvents, and other molecules that
are not involved in rearrangements of atoms directly on the way from reactants to products
are regarded as agents. By calculating and combining compounds’ fingerprints one can obtain
fingerprint-based representations of chemical reactions. We experimented with two common
types of reaction fingerprints: structural fingerprints and difference fingerprints. Structural
fingerprints are obtained by concatenating fingerprint vectors for reactants, products, and,
optionally, agents. Difference fingerprints are based on the linear combination of fingerprints
for products, reactants and agents. (Eq.5):
FPreaction = wna(∑
i∈products
FPi −∑
j∈reactants
FPj) + wa∑
k∈agents
FPk (5)
6

Here wna stands for a non-agent weight and wa for an agent weight. One should note that
structural fingerprints are binary in contrast to difference fingerprints that are continuous.
We used Jaccard dissimilarity as the distance function for binary vectors. In our experiments,
agents were not included in the reaction fingerprints, so wa = 0.
We trained our models on GPU because it significantly boosts the training speed com-
pared to the non-parametric t-SNE working on CPU.
Validation
We used B for the visual evaluation of the quality of reactions mapping. Because this dataset
contains predefined classes for reactions, one can use it as a reference point to evaluate the
projection’s performance. From a bird’s view, our idea was to classify reactions only by their
places at the resulting maps and compare them with known classification. This approach
follows the fundamental chemical tenet: similar compounds (in our case, reactions) should
provide similar properties. We performed this experiments for several parametric t-SNE
models to reveal these abilities to discriminate between reaction classes. These models vary
in both hyper-parameters and types of fingerprints. We assessed the discrimination ability
quantitatively by a gradient boosting models built on top of the 2D projections. We utilized
LightGBM34 Python package. We trained a gradient boosting classifier with a set of fixed
hyperparameters on every parametric t-SNE projection. The accuracy score for classification
was used as the measure of classes separability. We believe that this score follows with the
human’s perception of the projection quality. The accuracy scores are given in Table 1.
Results and discussion
Our goal was to create a method and for chemists to navigate in reaction space. A good
visualization algorithm should group similar reactions in well-shaped clusters, and these
clusters should reflect prior chemical knowledge.
7

Figure 1: The map of the dataset B based on difference fingerprints. One can see well-formeddistinguishable clusters. Colors reflect reaction classes.
One can see that well-shaped separate clusters are visible on a parametric t-SNE projec-
tion in Fig. 1. This projection uses difference fingerprints. Colors reflect classes of reactions.
Our experiments revealed that the influence of the type of fingerprints on the qualities of pro-
jections is minor. However, Topological Torsion descriptors demonstrated marginally better
performance of the reaction classes discrimination(Table 1). Subjectively, the projections
that are based on Morgan fingerprints look better by the overall picture quality. We demon-
strate the pictures obtained with Topological Torsion descriptors and Atom Pair fingerprints
in Supplementary Material to this paper. We established that the perplexity value signifi-
cantly influences the projections. At higher perplexity, the clusters do not separate well and
look mixed-up. Decreasing the perplexity leads to emerging of many spurious clusters. Our
experiments revealed that the optimal perplexity value for Morgan fingerprints is about 30.
Each point in the projection represents a reaction. One can see that there are some
compounds or fragments which are present in every reaction within a cluster. These ”core”
structures in a reaction are agents or reactants’ substructures, and they have a heavy influ-
ence on the resulting coordinates. This can be explained regarding the formula for differ-
8
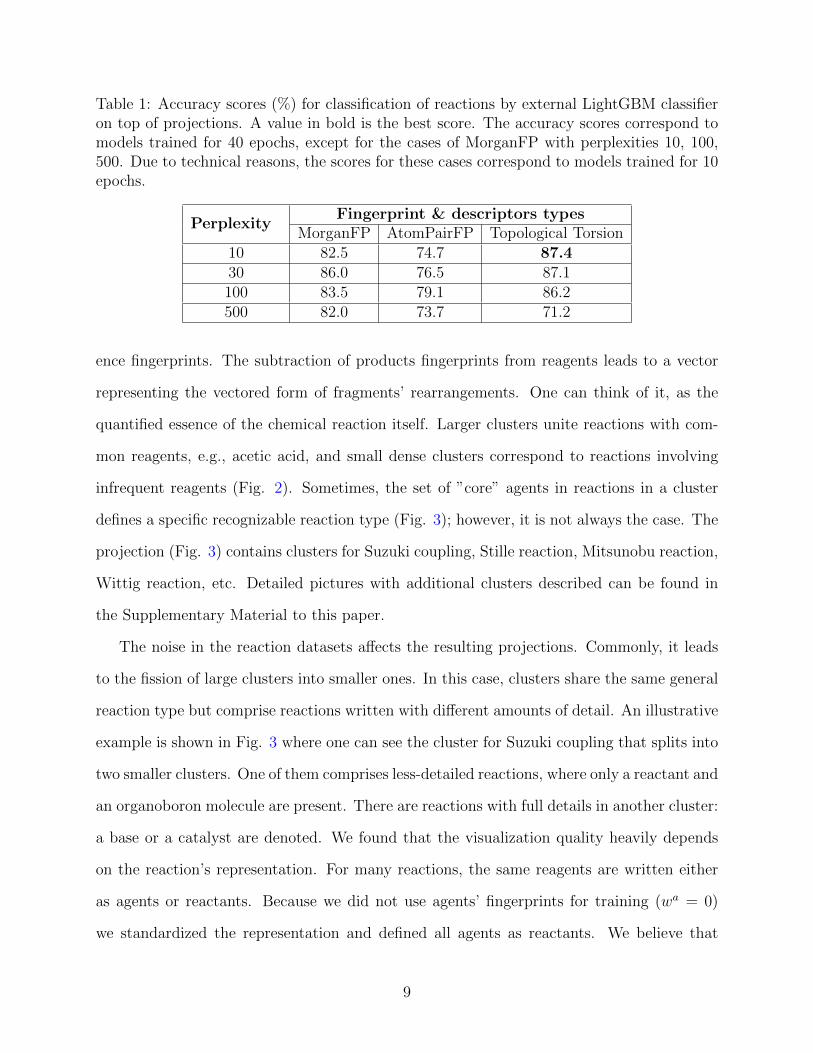
Table 1: Accuracy scores (%) for classification of reactions by external LightGBM classifieron top of projections. A value in bold is the best score. The accuracy scores correspond tomodels trained for 40 epochs, except for the cases of MorganFP with perplexities 10, 100,500. Due to technical reasons, the scores for these cases correspond to models trained for 10epochs.
PerplexityFingerprint & descriptors types
MorganFP AtomPairFP Topological Torsion10 82.5 74.7 87.430 86.0 76.5 87.1100 83.5 79.1 86.2500 82.0 73.7 71.2
ence fingerprints. The subtraction of products fingerprints from reagents leads to a vector
representing the vectored form of fragments’ rearrangements. One can think of it, as the
quantified essence of the chemical reaction itself. Larger clusters unite reactions with com-
mon reagents, e.g., acetic acid, and small dense clusters correspond to reactions involving
infrequent reagents (Fig. 2). Sometimes, the set of ”core” agents in reactions in a cluster
defines a specific recognizable reaction type (Fig. 3); however, it is not always the case. The
projection (Fig. 3) contains clusters for Suzuki coupling, Stille reaction, Mitsunobu reaction,
Wittig reaction, etc. Detailed pictures with additional clusters described can be found in
the Supplementary Material to this paper.
The noise in the reaction datasets affects the resulting projections. Commonly, it leads
to the fission of large clusters into smaller ones. In this case, clusters share the same general
reaction type but comprise reactions written with different amounts of detail. An illustrative
example is shown in Fig. 3 where one can see the cluster for Suzuki coupling that splits into
two smaller clusters. One of them comprises less-detailed reactions, where only a reactant and
an organoboron molecule are present. There are reactions with full details in another cluster:
a base or a catalyst are denoted. We found that the visualization quality heavily depends
on the reaction’s representation. For many reactions, the same reagents are written either
as agents or reactants. Because we did not use agents’ fingerprints for training (wa = 0)
we standardized the representation and defined all agents as reactants. We believe that
9

Figure 2: The projection of the dataset B based on difference fingerprints. Typical repre-sentative compounds are emphasized for some of the clusters. The clusters unite reactionsthat share typical molecules or fragments representative for that cluster.
Figure 3: The projection of the dataset B based on difference fingerprints. Some clusterscorresponding to reactions of particular recognizable type are highlighted.
10
standardization improves the visual quality: large unstructured clusters become clearer, and
some small clusters merge on a reasonable basis.
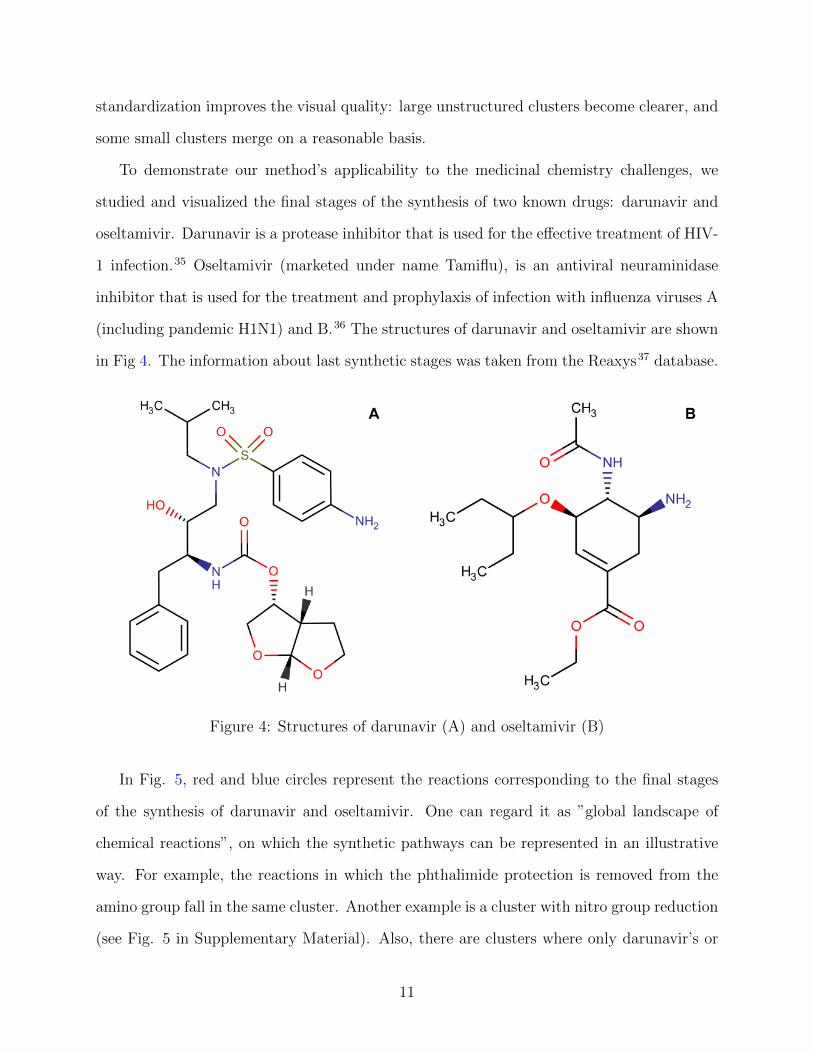
To demonstrate our method’s applicability to the medicinal chemistry challenges, we
studied and visualized the final stages of the synthesis of two known drugs: darunavir and
oseltamivir. Darunavir is a protease inhibitor that is used for the effective treatment of HIV-
1 infection.35 Oseltamivir (marketed under name Tamiflu), is an antiviral neuraminidase
inhibitor that is used for the treatment and prophylaxis of infection with influenza viruses A
(including pandemic H1N1) and B.36 The structures of darunavir and oseltamivir are shown
in Fig 4. The information about last synthetic stages was taken from the Reaxys37 database.
Figure 4: Structures of darunavir (A) and oseltamivir (B)
In Fig. 5, red and blue circles represent the reactions corresponding to the final stages
of the synthesis of darunavir and oseltamivir. One can regard it as ”global landscape of
chemical reactions”, on which the synthetic pathways can be represented in an illustrative
way. For example, the reactions in which the phthalimide protection is removed from the
amino group fall in the same cluster. Another example is a cluster with nitro group reduction
(see Fig. 5 in Supplementary Material). Also, there are clusters where only darunavir’s or
11
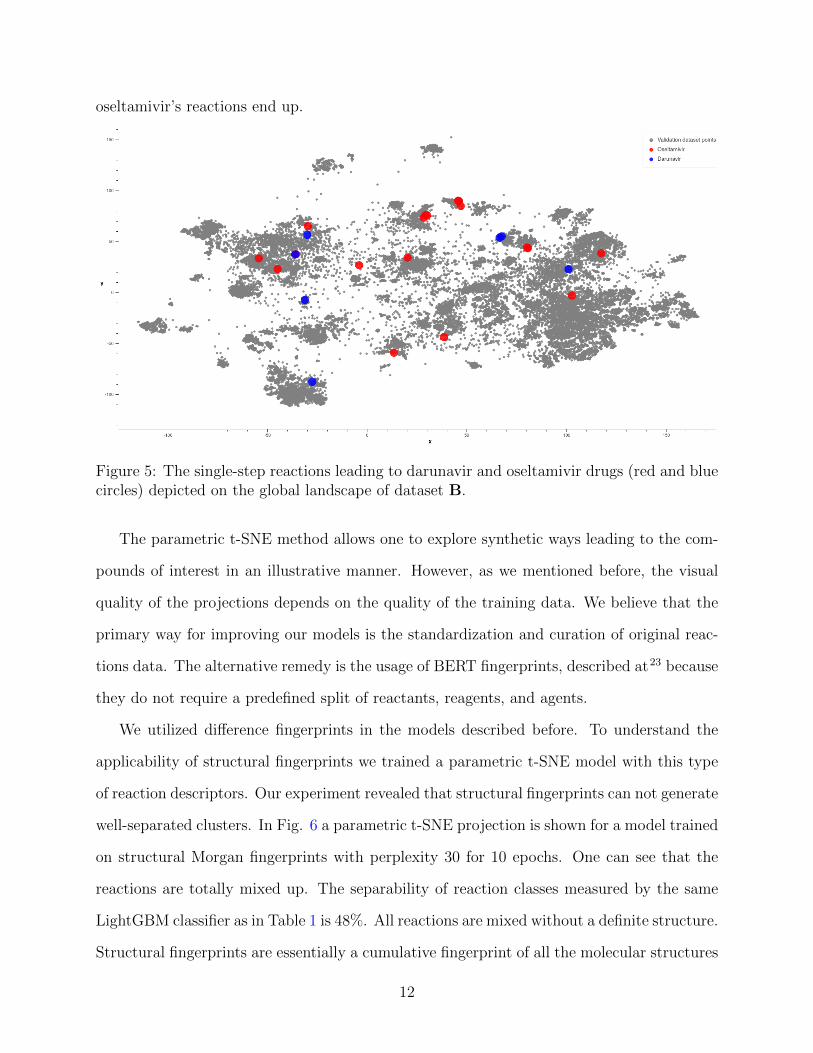
oseltamivir’s reactions end up.
Figure 5: The single-step reactions leading to darunavir and oseltamivir drugs (red and bluecircles) depicted on the global landscape of dataset B.
The parametric t-SNE method allows one to explore synthetic ways leading to the com-
pounds of interest in an illustrative manner. However, as we mentioned before, the visual
quality of the projections depends on the quality of the training data. We believe that the
primary way for improving our models is the standardization and curation of original reac-
tions data. The alternative remedy is the usage of BERT fingerprints, described at23 because
they do not require a predefined split of reactants, reagents, and agents.
We utilized difference fingerprints in the models described before. To understand the
applicability of structural fingerprints we trained a parametric t-SNE model with this type
of reaction descriptors. Our experiment revealed that structural fingerprints can not generate
well-separated clusters. In Fig. 6 a parametric t-SNE projection is shown for a model trained
on structural Morgan fingerprints with perplexity 30 for 10 epochs. One can see that the
reactions are totally mixed up. The separability of reaction classes measured by the same
LightGBM classifier as in Table 1 is 48%. All reactions are mixed without a definite structure.
Structural fingerprints are essentially a cumulative fingerprint of all the molecular structures
12

Figure 6: The reaction space of the dataset B based on structural fingerprints. One can seea low discrimination ability of structural fingerprints.
involved in a reaction. This does not reflect in any way the difference between reagents and
products.
Conclusions
In this work, we demonstrated a method for the exploration of the reaction space. Our find-
ings revealed that a parametric t-SNE method combined with difference fingerprints provides
a basis for such a method. We studied two approaches of representing chemical reactions:
structural and difference fingerprints. Our experiments showed that the structural finger-
prints do not afford the discrimination ability, and the projections on the base of structural
fingerprints are mixed. In contrast, the models build on top of the difference fingerprints can
project to form well-shaped clusters with clear chemical meaning. These clusters correspond
to known classes of chemical reactions. We believe that Morgan fingerprints is the optimal
choice for reaction difference fingerprints, albeit quantitative evaluation of projection perfor-
mance revealed that the models based on Topological Torsion descriptors provide marginally
13
better projections than other types of difference fingerprints. The parametric t-SNE model
can be easily applied to new reactions and this fact opens the doors for chemists to investi-
gate their own datasets of reactions on the global reaction landscape. We also demonstrated
the applicability of this method for the investigation of the synthetic routes for two mar-
keted drugs. We believe that our findings will inspire new findings in studying of chemical
reactions and synthetic ways.
Acknowledgements
This work was carried out using resources of “Zhores” supercomputer installed at Skolkovo
Institute of Science and Technology.38
Code and Models Availability
The web demonstration is available in https://reactionspace.syntelly.com. The code
is available at GitHub: https://github.com/Academich/reaction_space_ptsne. Pre-
trained models are located on zenodo: https://dx.doi.org/10.5281/zenodo.4536502
Supplementary Material
Supplementary Material for this article is located on zenodo: https://dx.doi.org/10.
5281/zenodo.4536502
Competing interests
Maxim V. Fedorov and Sergey Sosnin are co-founders of Syntelly LLC. Mikhail G. Andronov
declares no competing interests.
14

References
(1) Dobson, C. M. Chemical space and biology. Nature 2004, 432, 824–828.
(2) Li, J. J. Name Reactions. A Collection of Detailed Reaction Mechanisms, 3rd ed.;
Springer-Verlag Berlin Heidelberg, 2006.
(3) Miyaura, N.; Suzuki, A. Palladium-Catalyzed Cross-Coupling Reactions of
Organoboron Compounds. Chemical Reviews 1995, 95, 2457–2483.
(4) CASREACT website. https://www.cas.org/support/documentation/reactions,
(accessed January 11, 2020).
(5) Klepp, J.; Dillon, W.; Lin, Y.; P., F.; B., G. Preparation of (-)-Levoglucosenone from
Cellulose Using Sulfuric Acid in Polyethylene Glycol. Organic Syntheses 2020, 97,
38–53.
(6) Braun, M.; Meletis, P.; Fidan, M. (S)-(-)-2-allylcyclohexanone. Organic Syntheses
2009, 86, 47–58.
(7) Fier, P. S.; Maloney, K. M. Deaminative Functionalization of Primary Sulfonamides.
Organic Syntheses 2020, 97, 12–20.
(8) Brown, D. G.; Bostrom, J. Analysis of Past and Present Synthetic Methodologies on
Medicinal Chemistry: Where Have All the New Reactions Gone? Journal of Medicinal
Chemistry 2016, 59, 4443–4458.
(9) Osolodkin, D. I.; Radchenko, E. V.; Orlov, A. A.; Voronkov, A. E.; Palyulin, V. A.;
Zefirov, N. S. Progress in visual representations of chemical space. Expert Opinion on
Drug Discovery 2015, 10, 959–973.
(10) Pearson, K. On Lines and Planes of Closest Fit to Systems of Points in Space. Philo-
sophical Magazine 1901, 2, 559–572.
15

(11) Hotelling, H. Relations between two sets of variates. Biometrika 1936, 28, 321–337.
(12) Borg, I.; Groenen, P. J. F. Modern Multidimensional Scaling. Theory and Applications,
2nd ed.; Springer-Verlag New York, 2005.
(13) Cunningham, J. P.; Ghahramani, Z. Linear Dimensionality Reduction: Survey, Insights,
and Generalizations. Journal of Machine Learning Research 2015, 16, 2859–2900.
(14) van der Maaten, L.; Hinton, G. Visualizing Data using t-SNE. Journal of Machine
Learning Research 2008, 9, 2579–2605.
(15) Kohonen, T. Self-organized formation of topologically correct feature maps. Biological
Cybernetics 1982, 43, 59–69.
(16) Bishop, C. M.; Svensen, M.; Williams, C. K. I. GTM: The Generative Topographic
Mapping. Neural Computation 1998, 10, 215–234.
(17) Gaspar, H. A.; Baskin, I. I.; Varnek, A. Frontiers in Molecular Design and Chemi-
cal Information Science - Herman Skolnik Award Symposium 2015: Jurgen Bajorath;
Chapter 12, pp 243–267.
(18) Chen, L.; Gasteiger, J. Knowledge Discovery in Reaction Databases: Landscaping Or-
ganic Reactions by a Self-Organizing Neural Network. Journal of the American Chem-
ical Society 1997, 119, 4033–4042.
(19) Horvath, D.; Marcou, G.; Varnek, A. Generative topographic mapping in drug design.
Drug Discovery Today: Technologies 2020,
(20) Bort, W.; Baskin, I. I.; Sidorov, P.; Marcou, G.; Horvath, D.; Madzhidov, T.;
Varnek, A.; Gimadiev, T.; Nugmanov, R.; Mukanov, A. Discovery of Novel Chemi-
cal Reactions by Deep Generative Recurrent Neural Network. 2020,
(21) Karlov, D. S.; Sosnin, S.; Tetko, I. V.; Fedorov, M. V. Chemical space exploration
guided by deep neural networks. RSC Adv. 2019, 9, 5151–5157.
16

(22) Probst, D.; Reymond, J.-L. Visualization of very large high-dimensional data sets as
minimum spanning trees. Journal of Cheminformatics 2020, 12 .
(23) Schwaller, P.; Probst, D.; Vaucher, A. C.; Nair, V. H.; Kreutter, D.; Laino, T.; Rey-
mond, J.-L. Mapping the space of chemical reactions using attention-based neural net-
works. Nature Machine Intelligence 2021, 3, 144–152.
(24) Lowe, D. M. Extraction of chemical structures and reactions from the literature (Doc-
toral thesis). 2012.
(25) Chemical reactions from US patents (1976-Sep2016). https://figshare.com/
articles/dataset/Chemical_reactions_from_US_patents_1976-Sep2016_
/5104873, (accessed October 29, 2020).
(26) Schwaller, P.; Gaudin, T.; Lanyi, D.; Bekas, C.; Laino, T. “Found in Translation”:
predicting outcomes of complex organic chemistry reactions using neural sequence-to-
sequence models. Chem. Sci. 2018, 9, 6091–6098.
(27) Schneider, N.; Stiefl, N.; Landrum, G. A. What’s What: The (Nearly) Definitive Guide
to Reaction Role Assignment. Journal of Chemical Information and Modeling 2016,
56, 2336–2346.
(28) NameRxn. Expert System for Named Reaction Identification and Classification. https:
//www.nextmovesoftware.com/namerxn.html, (accessed January 11, 2020).
(29) Barnes, J.; Hut, P. A hierarchical O(N log N) force-calculation algorithm. Nature 1986,
324, 446–449.
(30) van der Maaten, L. Learning a Parametric Embedding by Preserving Local Structure.
2009; pp 384–391.
(31) Rogers, D.; Hahn, M. Extended-Connectivity Fingerprints. Journal of Chemical Infor-
mation and Modeling 2010, 50, 742–754.
17
(32) Carhart, R. E.; Smith, D. H.; Venkataraghavan, R. Atom pairs as molecular features in
structure-activity studies: definition and applications. Journal of Chemical Information
and Computer Sciences 1985, 25, 64–73.
(33) Nilakantan, R.; Bauman, N.; Dixon, J. S.; Venkataraghavan, R. Topological torsion:
a new molecular descriptor for SAR applications. Comparison with other descriptors.
Journal of Chemical Information and Computer Sciences 1987, 27, 82–85.
(34) Ke, G.; Meng, Q.; Finley, T.; Wang, T.; Chen, W.; Ma, W.; Ye, Q.; Liu, T.-Y. Light-
gbm: A highly efficient gradient boosting decision tree. Advances in neural information
processing systems. 2017; pp 3146–3154.
(35) Darunavir page at drugbank.com. https://go.drugbank.com/drugs/DB01264, (ac-
cessed December 30, 2020).
(36) Oseltamivir page at drugbank.com. https://go.drugbank.com/drugs/DB00198, (ac-
cessed December 30, 2020).
(37) Reaxys database. https://www.reaxys.com, (accessed January 11, 2020).
(38) Zacharov, I.; Arslanov, R.; Gunin, M.; Stefonishin, D.; Pavlov, S.; Panarin, O.; Mal-
iutin, A.; Rykovanov, S.; Fedorov, M. ’Zhores’ – Petaflops supercomputer for data-
driven modeling, machine learning and artificial intelligence installed in Skolkovo Insti-
tute of Science and Technology. 2019.
18
Copyright © 2022 FDOKUMEN