A diffusion-reaction model of carbon isotope fractionation in foraminifera
Upload
khangminh22Category
view
2download
0
ACTAUNIVERSITATIS
UPSALIENSISUPPSALA
2015
Digital Comprehensive Summaries of Uppsala Dissertationsfrom the Faculty of Science and Technology 1299
Reaction-Diffusion kinetics ofProtein DNA Interactions
ANEL MAHMUTOVIC
ISSN 1651-6214ISBN 978-91-554-9360-8urn:nbn:se:uu:diva-263527
Acta Universitatis UpsaliensisDigital Comprehensive Summaries of Uppsala Dissertationsfrom the Faculty of Science and Technology 1299
Editor: The Dean of the Faculty of Science and Technology
A doctoral dissertation from the Faculty of Science andTechnology, Uppsala University, is usually a summary of anumber of papers. A few copies of the complete dissertationare kept at major Swedish research libraries, while thesummary alone is distributed internationally throughthe series Digital Comprehensive Summaries of UppsalaDissertations from the Faculty of Science and Technology.(Prior to January, 2005, the series was published under thetitle “Comprehensive Summaries of Uppsala Dissertationsfrom the Faculty of Science and Technology”.)
Distribution: publications.uu.seurn:nbn:se:uu:diva-263527
ACTAUNIVERSITATIS
UPSALIENSISUPPSALA
2015

1
How wonderful that we have met with a paradox. Now we have some hope of making progress. ’Niels Bohr’
2
List of Papers
This thesis is based on the following papers, which are referred to in the text
by their Roman numerals.
I Mahmutovic, A., Berg, O.G., Elf, J. (2015) What matters for lac
repressor search in vivo – sliding, hopping, intersegment transfer,
crowding on DNA or recognition. Nucleic Acids Research,
43(7):3454-3464
II Mahmutovic, A.*, Fange, D.*, Berg, O.G., Elf, J. (2012) Lost in
presumption: stochastic reactions in spatial models. Nature
Methods, 9(12):1163-1166
III Marklund, E.G., Mahmutovic, A., Berg, O.G., Hammar, P.,
Spoel D., Fange, D., Elf, J. (2013) Transcription-factor binding
and sliding on DNA studied using micro- and macroscopic mod-
els. PNAS, 110(49):19796-19801
IV Fange, D., Mahmutovic, A., Elf, J. (2012) MesoRD 1.0: Sto-
chastic reaction-diffusion simulations in the microscopic limit.
Bioinformatics, 28(23):3155-3157
V Hammar, P., Leroy, P., Mahmutovic, A., Marklund, E.G., Berg,
O.G., Elf, J. (2012) The lac Repressor Displays Facilitated Dif-
fusion in Living Cells. Science, 336: 1595-1598
VI Mahmutovic, A., Berg, O.G., Elf, J. (2015) The helical structure
of DNA facilitates binding. Manuscript
Reprints were made with permission from the respective publishers.
*Authors contributed equally to this work.
Other work not directly related to the thesis.
I. Ullman, G., Wallden, M., Marklund, E.G., Mahmutovic, A.,
Razinkov, I., Elf, J. (2013) High-throughput gene expression anal-
ysis at the level of single proteins using a microfluidic turbidostat
and automated cell tracking. Philosophical Transactions B, 368,
20120025-1 – 20120025-8
3
Contents
List of Papers .................................................................................................. 2
Contents .......................................................................................................... 3
Abbreviations .................................................................................................. 5
Introduction ..................................................................................................... 6
Theoretical Considerations ............................................................................. 8 Reaction Kinetics ....................................................................................... 8
The time rate of change of the average number of molecules -
ODE, PDE ............................................................................................. 8 Search Kinetics ......................................................................................... 13
Background .......................................................................................... 13 Thermal fluctuations driving motion ................................................... 14 Microscopic dissociation/binding – Hopping ...................................... 14 Macroscopic dissociation/binding – The experimental observable ..... 15 Sliding – Bridging the gap ................................................................... 15 Intersegment transfer – Making a sandwich ........................................ 16
Dynamics at the atomistic level of detail ................................................. 17 The concept of Molecular Dynamics ................................................... 17 Umbrella Sampling .............................................................................. 19
Results ........................................................................................................... 21 Nonspecific Dissociation .......................................................................... 21
Example: The LacI Dimer ................................................................... 22 Macroscopic dissociation ......................................................................... 23
Example: The LacI Dimer ................................................................... 24 The 1D diffusion along DNA ................................................................... 24
Example: The LacI Dimer ................................................................... 25 Finding The Specific Operator Site .......................................................... 27
Example: The LacI Dimer ................................................................... 29 Diffusion controlled or not? ..................................................................... 31 Steric Effects ............................................................................................ 32 Reactions in 2D ........................................................................................ 39

4
Svensk Sammanfattning................................................................................ 42
Acknowledgments......................................................................................... 46
Bibliography ................................................................................................. 49
5
Abbreviations
ODE Ordinary Differential Equation
PDE Partial Differential Equation
CME Chemical Master Equation
RDME Reaction Diffusion Master Equation
MD Molecular Dynamics
SBML Systems Biology Markup Language
DNA Deoxy Ribonucleic Acid
RNA RiboNucleic Acid
ATP Adenosine Tri Phosphate
E.Coli Escherichia Coli
xD x Dimensions
LacI Lactose Inhibitor
COM Center Of Mass
6
Introduction
This is an exciting time to be involved in the development of the life sciences!
With the intention of inducing the same excitement in yourself I would like to
present a few examples (i) the ongoing progress made on tracking single mol-
ecules in living cells(1-3), the prospect of resolving reaction kinetics at atom-
istic detail in real time by irradiating a sample with high intensity x-rays(4) or
with cryo electron tomography(5-7) and the ever-increasing availability of
computing power allowing even average Joe to approach biological millisec-
ond timescales in molecular dynamics simulations(8-10). While simulations,
experiments and theory are potent disciplines in their own right, the real power
comes from being able to combine them. This thesis aims to do just that in
order to answer the overarching question of how DNA-binding proteins
search, find and bind one specific target site among millions of non-specific
sites(11-16). The quest for the answer brought to light the question of the def-
inition or the nature of reaction rates; thus elucidating this nature is another
major goal of the thesis. These findings came about partly by developing an
in-house tool, MesoRD(17, 18), and by using other tools such as Gromacs(19)
and homebrewn Monte-Carlo simulation schemes. Therefore I will first high-
light the major theoretical themes/subjects underlying these tools in section 2
which is made up of three major sections, reaction kinetics(20-31), search ki-
netics(14, 32-34) and dynamics at the atomistic level of detail(10). In the re-
action kinetics section I will describe the theory behind modeling chemical
reactions at different levels of detail (ODE, PDE, CME, RDME). In these
models, the molecules are viewed as structure-less point particles, and hard
spheres in the RDME case, where the individuality of these particles and
spheres are taken into account by endowing chemical reactions with the theory
of stochastic processes. The atomistic level section will describe how to study
the dynamics of molecules at a level of detail where the motion of each con-
stituting atom is handled. At the end of the theory section there is a general
description of search kinetics governed by diffusion and a more in-depth dis-
cussion about transcription factors searching for a specific binding site on
DNA. I will justify why the properties of diffusion and the geometry of the
molecules naturally lead to the need to distinguish between microscopic and
macroscopic reaction rates. I highly recommend reading the theory section
first before sinking your teeth into the results section. In the results section I
7
will show how to couple the different levels of detail to simulations and ex-
perimental data to gain quantitative insight into the interaction between the
LacI dimer and DNA.
8
Theoretical Considerations
Reaction Kinetics
The time rate of change of the average number of molecules -
ODE, PDE
Consider a vial into which two types of molecules are poured, some alcohol
and a carboxylic acid which can react to form ester (fragrances, oils, phero-
mones) and water. The concentrations of the species in the vial will change
until equilibrium is reached at which point the forward and backward rates
are balanced. Wouldn’t it be nice to be able to figure out the time develop-
ment of the concentrations of the species and to be able to predict the
amount of each species at equilibrium given the amount of chemicals that we
started with? I think so, and so did Guldberg and Wage who in 1864-1867
conjectured the law of mass action based on experiments on alcohol-acid re-
actions. This law was shown to be derivable from first thermodynamic prin-
ciples as shown by van’t Hoff later in the beginning of the 20th century. In
words, this law states that the time-rate of change of the average concentra-
tion of a product is proportional to a phenomenological reaction rate constant
and the average reactant concentrations raised to the power of their stoichio-
metric coefficients. This results in a system of ODEs (Ordinary Differential
Equations) which relates the average concentrations of the reactants in the
vial and which more often than not need to be solved numerically rather than
analytically. In biology one employs this law to translate a graphical repre-
sentation of a biochemical network to the corresponding ODEs in the hope
of validating or discovering something new about the inner workings of the
system of interest. The need to somehow standardize the translation of the
graphical representation to the system of equations arose as more and more
people acquired a taste for quantitative biology, and thus the System Biology
Markup Language (SBML) was devised(35). SBML is a xml schema where
species definitions, compartments, reaction rates etc. are represented by xml
tags. The first step in gaining quantitative information of the biomolecular
9
system of interest is thus to transform it to the corresponding SBML repre-
sentation and then use one of the many software solutions available to parse
the SBML file and usually output the time development of the average con-
centration of all species(18, 36-39). One of these implementations lying
close to heart is MesoRD(18), developed to be able to generate stochastic
trajectories corresponding to the RDME or the CME descriptions discussed
below and which can also numerically solve systems of ODEs.
The species making up biological systems are often very few in number and
the chemical reactions between them are random due to the encounter be-
tween reactants being probabilistic with statistically independent positions
and velocities (Boltzmanns Stosszahlansatz) (40). A consequence of this ran-
domness is that the magnitude of the copy number fluctuations relative to the
average is inversely proportional to the square root of the copy number(41).
Thus, these fluctuations become substantial for low copy numbers which is a
common situation in the interior of the living cell. A model which takes into
account the discreetness of molecules seems therefore necessary to capture
the dynamics in living cells. The ODE model on the other hand is appropri-
ate to use when there are a large number of well stirred molecules close to
equilibrium and since we have not included any spatial dependence they
should be homogenously distributed. This means that an ODE model may
not accurately describe a situation where molecules react immediately upon
contact with each other (the diffusion limit) because this introduce depletion
zones around the molecules which usually calls for an inclusion of
space(42). However the ODE model works well in the other limit where the
molecules have to overcome an energy barrier at contact to be able to react
which is called the reaction limit. The space independent ODE description
demands inclusion of space if the underlying homogeneity assumption
breaks down due to fast reactions relative to the diffusion rate of the mole-
cules. Operationally, what one does is add the diffusion operator (D acting
on the concentration of all the species which changes the time rate of change
of the local concentration of molecules due to fluxes in space in addition to
the time rate of change due to chemical reactions. A more rigorous deriva-
tion can be found by starting at the mesoscopic CME level of description
where the addition of the diffusion operator is justified by noting that the
moments are changing in time due to both reactions and diffusion(41).
The time rate of change of state probabilities – CME, RDME
The discreeteness of molecules are taken into account by applying the theory
of stochastic processes to the change in the number of molecules of each
species, here exemplified with one species only and extended to multiple
species in Eq. 6 by vectorizing an index, as time goes on due to chemical re-
actions. We also consider the case where the future change in the number of
10
molecules X(t) only depends on the current state and not on how many mole-
cules there was for s<t. This is appropriately called the memoryless property
of the process which makes it a time-continuous Markov process with dis-
crete states taking on integer values (the discreeteness of molecules)(43).
One can deduce the dwell time distribution based on the fact that jumps be-
tween states are memoryless which means that the probabilistic process of
drawing dwell times from a distribution needs to restart itself. The only con-
tinuous distribution with this memoryless property is the exponential distri-
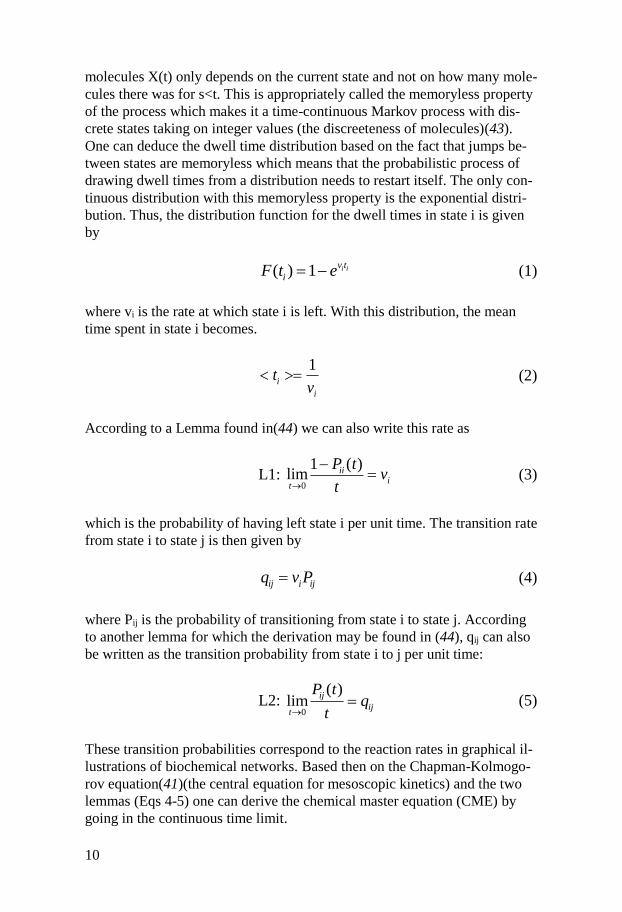
bution. Thus, the distribution function for the dwell times in state i is given
by
(1)
where vi is the rate at which state i is left. With this distribution, the mean
time spent in state i becomes.
(2)
According to a Lemma found in(44) we can also write this rate as
L1: (3)
which is the probability of having left state i per unit time. The transition rate
from state i to state j is then given by
(4)
where Pij is the probability of transitioning from state i to state j. According
to another lemma for which the derivation may be found in (44), qij can also
be written as the transition probability from state i to j per unit time:
L2: (5)
These transition probabilities correspond to the reaction rates in graphical il-
lustrations of biochemical networks. Based then on the Chapman-Kolmogo-
rov equation(41)(the central equation for mesoscopic kinetics) and the two
lemmas (Eqs 4-5) one can derive the chemical master equation (CME) by
going in the continuous time limit.
( ) 1 i iv t
iF t e
1i
i
tv
0
1 ( )lim ii
it
P tv
t
ij i ijq v P
0
( )lim
ij
ijt
P tq
t
11
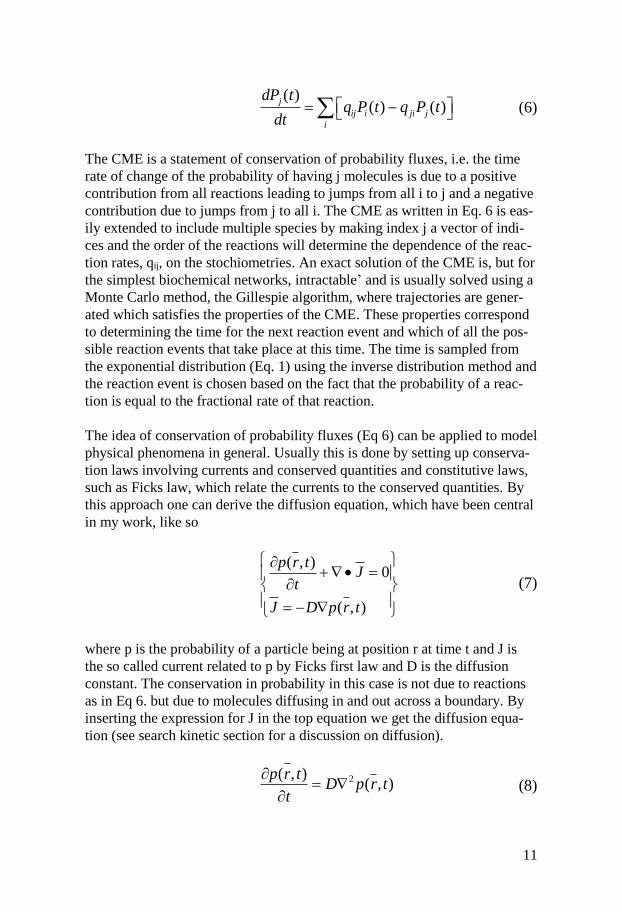
(6)
The CME is a statement of conservation of probability fluxes, i.e. the time
rate of change of the probability of having j molecules is due to a positive
contribution from all reactions leading to jumps from all i to j and a negative
contribution due to jumps from j to all i. The CME as written in Eq. 6 is eas-
ily extended to include multiple species by making index j a vector of indi-
ces and the order of the reactions will determine the dependence of the reac-
tion rates, qij, on the stochiometries. An exact solution of the CME is, but for
the simplest biochemical networks, intractable’ and is usually solved using a
Monte Carlo method, the Gillespie algorithm, where trajectories are gener-
ated which satisfies the properties of the CME. These properties correspond
to determining the time for the next reaction event and which of all the pos-
sible reaction events that take place at this time. The time is sampled from
the exponential distribution (Eq. 1) using the inverse distribution method and
the reaction event is chosen based on the fact that the probability of a reac-
tion is equal to the fractional rate of that reaction.
The idea of conservation of probability fluxes (Eq 6) can be applied to model
physical phenomena in general. Usually this is done by setting up conserva-
tion laws involving currents and conserved quantities and constitutive laws,
such as Ficks law, which relate the currents to the conserved quantities. By
this approach one can derive the diffusion equation, which have been central
in my work, like so
(7)
where p is the probability of a particle being at position r at time t and J is
the so called current related to p by Ficks first law and D is the diffusion
constant. The conservation in probability in this case is not due to reactions
as in Eq 6. but due to molecules diffusing in and out across a boundary. By
inserting the expression for J in the top equation we get the diffusion equa-
tion (see search kinetic section for a discussion on diffusion).
(8)
( )( ) ( )
j
ij i ji j
i
dP tq P t q P t
dt
( , )0
( , )
p r tJ
t
J D p r t
2( , )( , )
p r tD p r t
t
12
This is where the diffusion operator which was added to the ODE descrip-
tion above comes from. What about adding spatial fluxes at the CME level
of description which assume that molecules diffuse very fast compared to the
fastest reaction times so that they are homogenized throughout the reaction
volume? The extension is made by discretizing the reaction volume at the
CME level into yet smaller subvolumes, and assuming that the conditions for
the CME description are satisfied in each subvolume, we get the Reaction
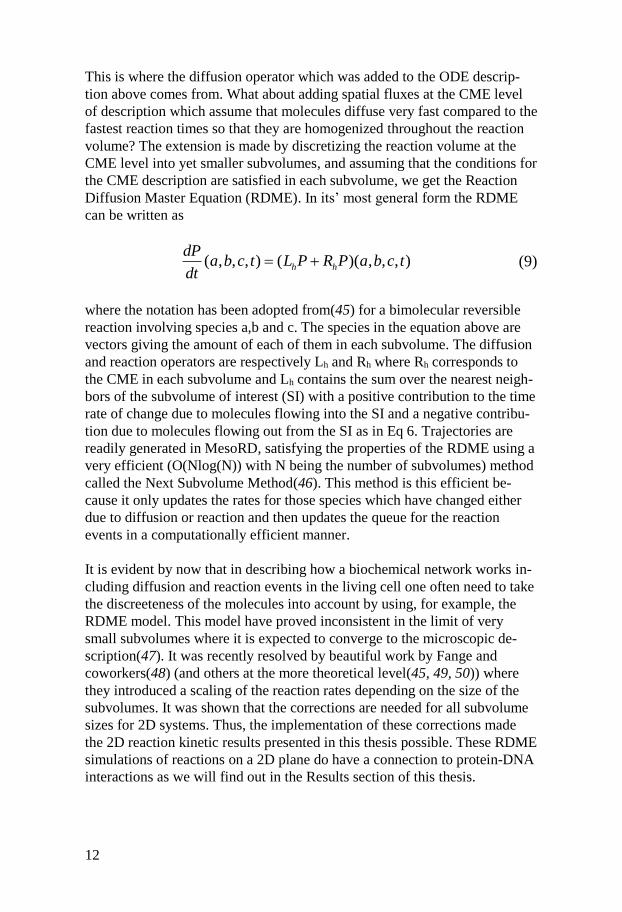
Diffusion Master Equation (RDME). In its’ most general form the RDME
can be written as
(9)
where the notation has been adopted from(45) for a bimolecular reversible
reaction involving species a,b and c. The species in the equation above are
vectors giving the amount of each of them in each subvolume. The diffusion
and reaction operators are respectively Lh and Rh where Rh corresponds to
the CME in each subvolume and Lh contains the sum over the nearest neigh-
bors of the subvolume of interest (SI) with a positive contribution to the time
rate of change due to molecules flowing into the SI and a negative contribu-
tion due to molecules flowing out from the SI as in Eq 6. Trajectories are
readily generated in MesoRD, satisfying the properties of the RDME using a
very efficient (O(Nlog(N)) with N being the number of subvolumes) method
called the Next Subvolume Method(46). This method is this efficient be-
cause it only updates the rates for those species which have changed either
due to diffusion or reaction and then updates the queue for the reaction
events in a computationally efficient manner.
It is evident by now that in describing how a biochemical network works in-
cluding diffusion and reaction events in the living cell one often need to take
the discreeteness of the molecules into account by using, for example, the
RDME model. This model have proved inconsistent in the limit of very
small subvolumes where it is expected to converge to the microscopic de-
scription(47). It was recently resolved by beautiful work by Fange and
coworkers(48) (and others at the more theoretical level(45, 49, 50)) where
they introduced a scaling of the reaction rates depending on the size of the
subvolumes. It was shown that the corrections are needed for all subvolume
sizes for 2D systems. Thus, the implementation of these corrections made
the 2D reaction kinetic results presented in this thesis possible. These RDME
simulations of reactions on a 2D plane do have a connection to protein-DNA
interactions as we will find out in the Results section of this thesis.
( , , , ) ( )( , , , )h h
dPa b c t L P R P a b c t
dt
13
Search Kinetics
Background
The prototypical example of gene expression control is the repression of the
lac-operon in E. coli by the protein LacI(51). The LacI protein binds to an
operator region upstream of the lac operon in the absence of lactose and ste-
rically obstructs RNA polymerase from binding the promoter region. The
rate with which LacI finds and binds the operator region need to be fast to
keep the cost of unnecessary expression down in the absence of lactose
while rapid dissociation in the presence of lactose (allolactose) determines
the fitness of the bacteria. The binding kinetics of LacI is therefore of some
interest for understanding the biology of the specific system, but more im-
portantly the lac system has become the well established bacterial model sys-
tem for gene regulation and for this reason it is appropriate for studies of
binding kinetics. An experimental measurement of LacI binding to its oper-
ator site on DNA in vitro was made in the early 70s using filter-binding tech-
niques(52) which when compared to theoretical estimates of the specific as-
sociation rate constant resulted in surprising results. According to the experi-
ment, the association rate of one LacI tetramer to one operator site per ge-
nome equivalent was estimated to be ~1010 M-1s-1. A theoretical upper limit
of the association rate can be determined using the Smoluchowski for-
mula(47). The formula gives the rate with which two molecules react when
diffusing and colliding with each other and where the reaction takes place
immediately upon contact (the diffusion limit). According to the Smolu-
chowski formula one gets ka ~108 M-1s-1, i.e. two orders of magnitude smaller
than suggested by the filter binding assay! Although Riggs remarked on the
theoretical possibility of LacI being able to slide along the DNA he quickly
dismissed it as a possibility(52). Two years after that, Richter and Eigen re-
visited the remark and concluded based on quantitative modeling that the
necessary two order of magnitude speedup could not be accounted for solely
due to electrostatic attraction and sliding is necessary(135). However, they
neglected the proper coupling between 3D and 1D diffusion and the time
spent on nonspecific DNA before binding the specific site. Berg and
coworkers recognized this and developed an extensive model on search ki-
netics in a series of papers for straight DNA chains(53) for coiled DNA(54)
and with the inclusion of ions(55). This model has served as the foundation
upon which much of my work is built. It has been expanded by simulations
to investigate more realistic and complex situations where the equations be-
comes intractable(56). The need for complicating things may seem exces-
sive; after all the search kinetic model have adequately explained in vitro re-
sults by predicting both the association rate dependence on the nonspecific
14
binding strength and the salt concentration(57). However, the development
of new experimental techniques lets us follow single molecules such as LacI
in living complex cells. To be able to extract quantitative information from
this experimental data one needs to apply a model which demands inclusion
of e.g. the existence of a congested interior of the cell(58-73) and reactive
patches on the reacting molecules(74-83).
Thermal fluctuations driving motion
My view of search kinetics, which has emerged as a result of research, is de-
scribed below. The way the picture is painted is most easily conveyed by con-
sidering the physics that drives the search, i.e. diffusion. Thermal diffusion is
the movement of molecules due to the numerous (~1020 s-1) collisions with
other molecules. There is a probability distribution associated with being col-
lided with from any directions per unit time and although the distribution is
uniform, the probability is nonzero of transiently being hit by say ~108 mole-
cules more in one direction than another. The displacement of the molecule
will appear erratic when this occurs, as first witnessed by Robert Brown in
1827. A particle whose motion is driven by diffusion will after having moved
a distance R from where it started at time zero have explored a volume 4πR3/3
on average and it will have returned to its starting point many times. These
properties makes diffusion take on a volume-filling character(42) on average
which is evident in that the sphere-sphere association rate is proportional to
the linear extension of the axially symmetric reactive patch on one of the
sphere and not to the area of the patch(75). Based then on these properties of
diffusion and the geometry of DNA being a linear chain of base pairs we can
identify different dissociation and association regimes.
Microscopic dissociation/binding – Hopping
From the point of view that LacI is nonspecifically bound to DNA, one can
imagine that LacI breaks its bonds to DNA and diffuses away a distance where
it might be free to move along the length of the DNA chain and if it rebinds
does so to the same or a nearby base pair. This mode of transfer is referred to
as hopping(12, 84-92). The event of LacI diffusing to the distance were hop-
ping ensues will be referred to as a microscopic dissociation and the rebinding
as a microscopic association. These events take place with rates λ (s-1) and k
(μm3s-1), respectively. The existence of hopping is due to the properties of
diffusion discussed above and the geometry of DNA, so we need to take it into
account and by doing so we are forced to properly define how far out LacI
15
have to diffuse before hopping occur. This definition is made by recognizing
that the nonspecific association is entropic in nature(57) i.e. the magnitude of
the equilibrium constant is proportional to the entropy gained by ions and wa-
ter molecules when released from DNA when LacI binds. This will be ex-
ploited in the molecular dynamics simulations to figure out the microscopic
dissociation distance by the LacI dimer.
Macroscopic dissociation/binding – The experimental observable
After a microscopic dissociation there is a possibility for LacI to leave the
DNA segment altogether without rebinding. The demarcation point for when
this occurs is a distance Rc where the binding of LacI to any other DNA strand
is equally probable. This is denoted as a macroscopic dissociation and the rate
with which it occurs, kd, is given by λ (microscopic dissociation rate) times the
probability of reaching Rc. This probability can be derived by solving the dif-
fusion equation in cylindrical coordinates(14). Mathematically, the diffusion
of LacI out to a certain distance will take on a 2D character, which makes the
probability of reaching Rc dependent on Rc for all Rc. This distance dependence
is manifested in the simulations of the Michaelis-Menten kinetics on a 2D
plane (see Results section), which calls for a correction of the rates at all sub-
volume length-scales in the simulations with MesoRD(93). The macroscopic
association rate, ka, is likewise given by the microscopic association rate k
times the probability of reaching Rc. This makes sense when compared to the
macroscopic dissociation rate because the dynamical equations governing the
search kinetics are time symmetric, a symmetry which implies microscopic
reversibility(94). Applied to our system this means that k/ λ = ka / kd = KRD
which is satisfied throughout the simulations.
Sliding – Bridging the gap
Equipped with an understanding of the distinction between microscopic and
macroscopic dissociations/rebindings and the transfer modes of hopping and
macroscopic binding, we move on to describe two modes of transfer for which
LacI is associated with DNA. First up is sliding whereby LacI diffuses along
the length of the DNA and while doing so, tracks the phosphate backbone(14,
95-105). This means that LacI experience additional rotational friction with
water molecules in relation to free diffusion, which makes the 1D diffusion
coefficient D1 about two orders of magnitude smaller than D3, the 3D diffusion
coefficient. There are also spatially localized charges on the DNA due to the
negatively charged phosphate groups which serve as electrostatic “bumps in
the road” and further hinders the 1D diffusion of LacI(106). There could also
be an important contribution to the dynamics of LacI sliding due to the DNA
16
segment diffusion at these length and time scales(14, 107). This diffusion of
DNA segments is partly neglected in our MD simulations due to the periodic
boundary conditions employed. Water molecules and the accompanying hy-
drodynamic couplings are further ignored in the non-MD models which could
have an impact on the result(58). The sliding of different proteins have been
observed in vitro (1) but the question remained whether sliding is actually a
mode of transfer in vivo where we have to consider crowding(108), DNA con-
densation(73) and physiological salt concentrations. Hammar et al. recently
showed that the LacI dimer attached to the fluorescent protein Venus do slide
in living E. coli cells(2). The rationale behind the experiments is that if sliding
exists then it should bridge two operator sites when the sites are at a distance
from each other less than the sliding length. Without sliding, the operator sites
would be perceived as independent and the ratio between the rates of finding
two sites relative to finding one site is 2 while the bridging due to sliding
makes this ratio < 2. It was found that the ratio as a function of distance be-
tween operator sites showed a (1+tanh(L/2s)) dependence, with L being the
distance between operator sites and s the sliding length. A fit of a function of
this form with explicit dependence on the sliding length made it possible to
extract a sliding length from the data of ~32bp. Another interesting finding is
that the association rate of LacI to the operator site Osym is different from the
association rate of LacI to another operator site O1, which adds a twist to the
model in (14). This difference in association rate can be explained by intro-
ducing different specific binding probabilities(2).
Intersegment transfer – Making a sandwich
This is another mode of transfer where the LacI tetramer remains nonspecifi-
cally bound to DNA. The idea is that LacI can transiently bind to two different
DNA segments at the same time and move from one segment to the other(14,
56, 109-113). A requirement for this to be a workable search mode is that the
doubly bound complex should be unstable, otherwise intersegment transfer
will not contribute, especially considering that the rate limiting step for this
transfer mode is for two DNA segments to find each other. The physical ef-
fects of intersegment transfer are essentially equivalent to a macroscopic dis-
sociation in that the relocation to a new position on DNA is uncorrelated with
the old one not counting the negative transfer correlation to nearby sites. To
my knowledge, there have never been an experimental observation of this
transfer mode for the LacI tetramer in vivo nor for the LacI dimer in vitro
although recent theoretical work suggests that it may play a role in facilitating
the transfer of LacI to the operator site O1 from auxiliary operator sites O3
and O2(114).
17
Dynamics at the atomistic level of detail
The concept of Molecular Dynamics
The ODE, PDE, CME and RDME descriptions allow deducing the outcome
from the numerous collision and reaction events between molecules repre-
sented as structureless point-particles ODE, PDE and CME descriptions and
hard spheres in the RDME description. Wouldn’t it be cool to be able to
magnify (~200000x) for example the RNAP interacting with the bound LacI
; what would you see?
As philosophized by the ancient Greeks and Indians, suggested by Daltons
law of multiple proportions, implicitly witnessed by Brown, calculated by
Einstein(115) and experimentally proven by Perrin(116), matter is made of
discrete units called atoms. The atom is composed of a positively charged
core the nucleus which is surrounded by a diffuse cloud of negative charges,
the electrons (the subdivision goes on but this will do for our purposes), with
the nucleus being at least 1800 times more massive than the electrons. The
electrons interact constructively with each other to form bonds between at-
oms thus making a molecule. Considering the dynamics of these subatomic
particles we invoke the Born-Oppenheimer approximation stating that the
dynamics of the electrons are instantaneously adjusted to the motion of the
nucleus (due to separation in mass) (117). Therefore, ignoring any relativ-
istic or quantum effects, we consider the molecule as a mechanical system of
soft balls with springs holding them together where the trajectories of the at-
oms can be determined by the principle of least action from which the equa-
tions of motion can be derived. Dividing the N-body problem into pairwise
interactions the force, Fi experienced by atom i due to the presence of other
atoms j is
(10)
where Upot is the potential energy surface set up by the other atoms j and is
given as a sum of bonding contributions (bonds, angles, dihedrals, improper
dihedrals) and nonbonding contributions (vdw interactions and Coloumb
electrostatic interactions):
i i i i potm a F U
18
(11)
Here kx are force constants, n is a periodicity, δ is a phase shift, qi is the partial
charge on atom i, ε is the permittivity, rij is the distance between atoms i and
j, εD is the well depth and σij is the distance for which the inter-particle poten-
tial is zero. The collection of constants in the potential for different atom types
and the form of the potential is what is referred to as a force field and this
force field in combination with a method for integrating the equations of mo-
tion for each atom in the system is the concept of Molecular Dynamics(118).
Usually there is a trade-off between the form of the potential, how amenable
the potential is for evaluation on a computer and how transferable the force-
field is to other molecules. Most of the terms in the potential are straightfor-
ward except maybe the vdw expression which warrants a bit of discussion.
The attractive 6-term is indicative of a transient dipole-dipole interaction and
models the electronic redistribution in atoms as the molecules approach one
another and is therefore, for example, proportional to the size of the atoms.
This makes chlorine a gas at room-temperature whereas bromine is a liquid.
The 12-term models repulsion between atoms which is a consequence of the
Pauli exclusion principle(119). This 12-term is an example of a tradeoff as it
is particularly amenable to computation while a more accurate expression
would include an exponential as suggested by the radial part of the solution to
the Schrödinger equation for the hydrogenic atom. A major consequence of
the 12-term and the associated steep rise in potential when atoms come close
together is to make the trajectories (the coordinates of the atoms as a function
of time) chaotic. This means that Bob and Alice do not get the same trajectory
if they execute a MD simulation run on the same computer, for the same sys-
tem, at the same time. Infinitesimal perturbations in the initial conditions due
to truncation errors in the Leap Frog integrator method we use in our
work(120) and roundoff errors makes deviations grow at an exponential rate
which makes the accuracy of an otherwise deterministic trajectory, after a cou-
ple of timesteps, not so accurate. There is no need to panic however as the
macroscopic observables do not depend on the accuracy of one trajectory but
correspond to ensemble averages which is to say averages over the different
ways that an observation can be realized at the microscopic level. But MD
takes the coordinates and updates them every femtosecond, does then each
such updated configuration necessarily correspond to the same observable?
The answer is no. However, assuming ergodicity, if any point in phase space
2 2 2
0 0 0
12 6
1 1 1( ) ( ) ( )
2 2 2
1(1 cos(n )) 4 (( ) ( ) )
2 4
pot b
bonds angles improperdihedrals
i j ij ij
D
dihedrals nonbonded nonbondedij ij ij
U k b b k k
q qk
r r r
19
(the space that contains all that the system can be in terms of its state which
for a mechanical system is fully specified by listing all the coordinates and
momenta for all atoms) can be reached by any other point, then the ensemble
average equals the time average. This means that if you simulate long enough,
the average of the property of interest over time will correspond to the macro-
scopic observable. This poses a problem for those points in phase space which
have a higher energy than a few kT and correspond to so called rare transi-
tions(121, 122). To find a way of sampling this rare transition was particularly
important for me because the few 100ns that molecular dynamics can achieve
is not enough to sample the microscopic dissociation and sliding of LacI while
bound to a nonspecific stretch of DNA. One method to do this is umbrella
sampling(123) which is briefly described in the next section.
Umbrella Sampling
Given states A,B and an order parameter (the reaction coordinate ξ) which
when varied advances the system from A towards the end state B, one can
pick out representative configurations along the reaction coordinate (these
are called windows) and restrain these configurations by the application of a
harmonic potential w on each atom. This corresponds to locally flattening
the free energy profile, which ensures an adequate sampling of configura-
tions high in free energy. Operationally, one equates the probability of ob-
serving the system at the reaction coordinate, Pib(ξ), with the fraction of time
the system has been in the configuration corresponding to the coordinate for
each window i (the ergodicity assumption at work). In each window there is
an associated free energy, Ai(ξ), which can be calculated from the following
equation which takes into account that the sampling have been collected in a
biased potential wi:
(12)
The Fi connects the free energy curves in different windows and is an inevi-
table consequence of introducing the harmonic potential wi(ξ). One can esti-
mate the Fi by stating that the global unbiased probability distribution for ξ,
Pu(ξ) is a weighted average of the unbiased probability distribution for ξ in
each window i, Piu(ξ). The relation between the sampled Pi
b(ξ) and Piu(ξ) is
given by
(13)
where the average <…> is over configuration space. Lastly, the weights pi(ξ)
are chosen to minimize the statistical error of Pu(ξ),
( ) (1/ )ln( ( )) ( )b
i i i iA P w F
( ) ( )( ) ( )e ei iw wu b
i iP P
20
(14)
This is the rationale behind the method of WHAM(124) used to get the unbi-
ased global free energy as a function of a reaction coordinate, which I have
employed in my work. A nice review on methods for sampling rare events,
the difference between the methods having to do mostly with whether con-
figurations along the reaction coordinate are restrained (umbrella sampling),
constrained (thermodynamic integration), slowly moved (slow growth) or
rapidly moved (fast growth) etc. can be found here(123) . A slowly moving
restraint, commonly called steered molecular dynamics, have also been em-
ployed in our work to figure out how a protein slides along a DNA molecule
(96).
2( )0
u
i
P
p
21
Results
Is there something that connects the concepts of microscopic rate constants,
macroscopic rate constants, Brownian motion, molecular dynamics, um-
brella sampling, reactions in 3D vs 2D? This is the question we seek to an-
swer in this section by means of our results. This section is a tad more tech-
nical and right to the point than the introduction so if there are any difficul-
ties understanding it I suggest reading the introductory sections thoroughly.
Let us begin.
Nonspecific Dissociation
A characteristic trait of dissociating species is that they need to separate by
pure diffusion in a potential field, set up by the reacting and other species, to
a distance, ρ, where all correlations are lost between them before being
counted as dissociated. We use the idea of extracting the mean residence
time a molecule spends within correlation distance of another molecule
based on diffusion in a potential,
(15)
with p(r,t) being the probability of finding the molecule at distance r at time t
from the other molecule, D3 is the 3D diffusion coefficient and Gb is the free
energy where the subscript b signifies that the molecules are in a bound state
i.e. a state where the molecules are correlated with each other through non-
bonding interactions. Integrating the time-integrated form (p with tilde in eq
16) of this expression with respect to space we get the mean residence time
τd, the inverse of which is the microscopic dissociation rate constant kdmicro,
as a function of the free energy
2 2
3 3 32 2
( , ) ( , ) ( , ) ( ) ( )( , )b bp r t p r t p r t dG r d G r
D D D p r tt r r dr dr
22
(16)
where r0 is the minimum in the free energy profile as a function of radial dis-
tance and the integrand is the time integrated form of the diffusion equation
above.
Example: The LacI Dimer
By using molecular dynamics and the method of umbrella sampling we get
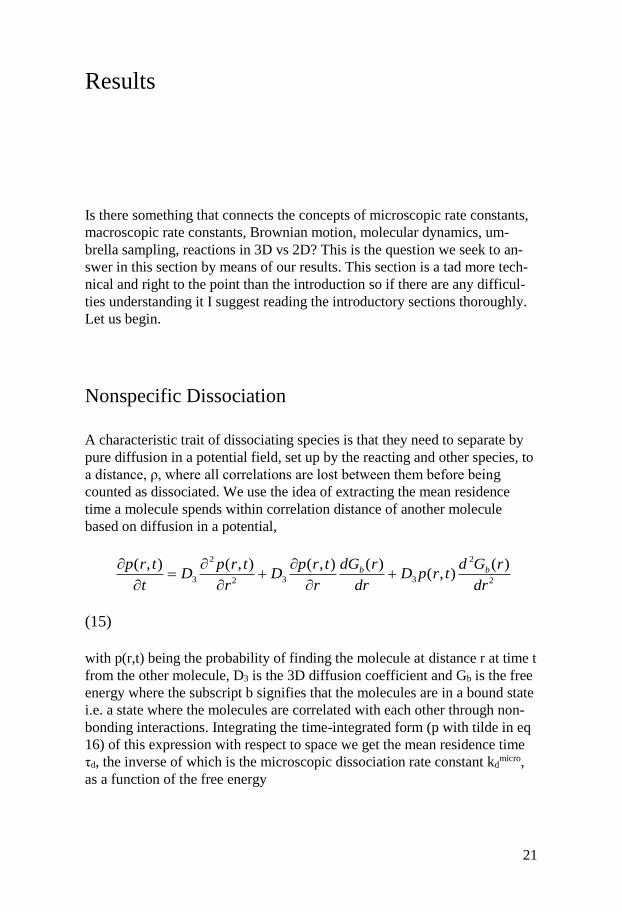
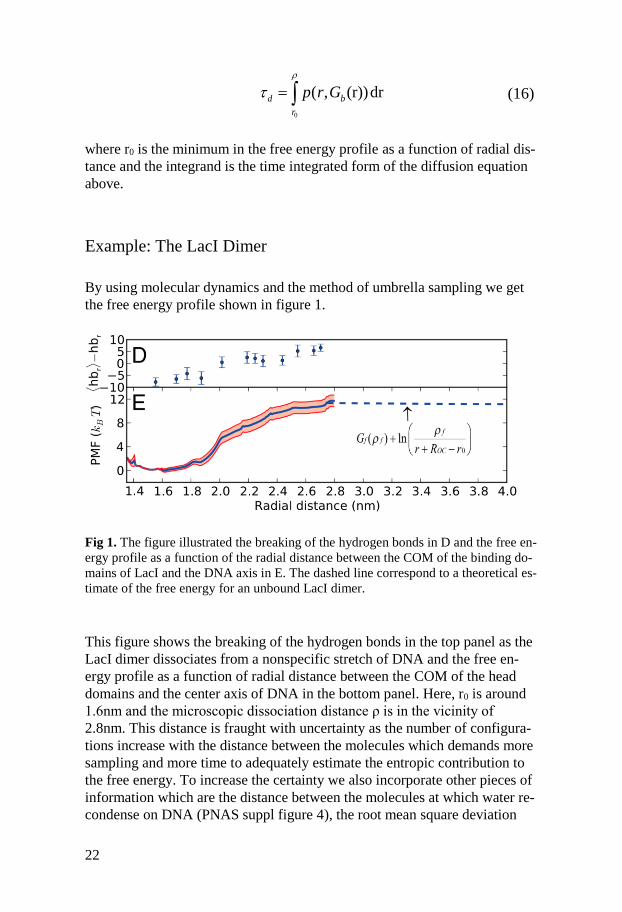
the free energy profile shown in figure 1.
Fig 1. The figure illustrated the breaking of the hydrogen bonds in D and the free en-
ergy profile as a function of the radial distance between the COM of the binding do-
mains of LacI and the DNA axis in E. The dashed line correspond to a theoretical es-
timate of the free energy for an unbound LacI dimer.
This figure shows the breaking of the hydrogen bonds in the top panel as the
LacI dimer dissociates from a nonspecific stretch of DNA and the free en-
ergy profile as a function of radial distance between the COM of the head
domains and the center axis of DNA in the bottom panel. Here, r0 is around
1.6nm and the microscopic dissociation distance ρ is in the vicinity of
2.8nm. This distance is fraught with uncertainty as the number of configura-
tions increase with the distance between the molecules which demands more
sampling and more time to adequately estimate the entropic contribution to
the free energy. To increase the certainty we also incorporate other pieces of
information which are the distance between the molecules at which water re-
condense on DNA (PNAS suppl figure 4), the root mean square deviation
0
( , (r))drd b
r
p r G
23
(RMSD) of the binding interfaces of LacI (suppl figure 4) and an estimate of
what the free energy should be at equilibrium by equating the chemical po-
tentials of the bound and the free states (the formula in bottom panel). These
pieces of information in combination with reports of binding free energies in
the range 10-15kbT(125) for nonspecific transcription factor – DNA interac-
tions suggest that we are in the right ballpark. Also, the fact that there are no
bumps in the free energy in going from r0 to ρ imply that there are no confor-
mational changes that need to occur before dissociation which lend support
to the ‘diffusion in a potential’ approach. With the integrand in equation 16
being a smooth function we numerically integrate it using a simple trapezoi-
dal method and get a residence time τD=69μs which correspond to a micro-
scopic dissociation rate constant kdmicro=1.45×10⁴s-1.
Macroscopic dissociation
The microscopic rate for breaking the hydrogen bonds is so far not directly
observable and the experimentalist see an average number of molecules in
time and space where the microscopic rates are averaged out. There is how-
ever a connection between the observable fluxes and the microscopic rates.
That connection can be made through a boundary condition to the diffusion
equation (126).
(17)
where Pb(t) is the probability of the molecules being bound and kamicro is the
microscopic association rate constant. This equation is an instantiation of the
conservation law discussed in the introductory sections. The rate of change
of the conserved quantity Pb(t) have a positive contribution due to binding
reactions with free molecules at the reaction radius ρ with a rate kamicro and
negative contribution due to dissociation reactions with rate kdmicro. The
boundary condition in eq. 17 together with the diffusion equation describes
the diffusion and reaction of a fully reactive disk/sphere to another in contin-
uous space and time. By discretizing the boundary condition in space one
gets a master equation representation of the reaction-diffusion process which
becomes amenable to Monte Carlo simulations(48). Thus we let the DNA
correspond to a disk fixed at origin and the protein to be another disk which
is allowed to jump between concentric circles and react within the innermost
circle containing the DNA. Furthermore, we introduce Brownian rotational
realizations(127) of the protein relative to the DNA and relative to its own
( )( , ) ( )micro microb
a d b
dP tk p t k P t
dt
24
center. This scheme allows for determining the average number of micro-
scopic dissociations per macroscopic dissociation by introducing an absorb-
ing boundary at a distance Rc determined by the density of DNA segments
used in the experiments to which the simulations will be anchored. The mac-
roscopic observable rate is simply the average microscopic residence time,
τD, times the average number of microscopic dissociations per macroscopic
dissociation which is equivalent to
(18)
where Pdiss is the probability of a macroscopic dissociation. Microscopic re-
versibility ensures us that this equation is also satisfied by the association rate
constant.
Example: The LacI Dimer
Letting the size of the active patch on the protein range between π/10 and
π/20 radians and the size of the patch on the DNA range between π/3 and π/2
radians one gets 700± 180 rebindings, resulting in an average macroscopic
residence time of 48±12 ms. Thus, we have a numerical value for the macro-
scopic dissociation rate, but is it reasonable? The best we can do in answer-
ing this question is to find consistency in independent pieces of information.
One of these pieces can be experiments that as closely as possible represent
the molecular dynamics setup such as an in vitro experiment reporting on the
value of the sliding length(128). However the sliding length is defined as
(19)
which depends on the 1D diffusion coefficient as well as the macroscopic
dissociation rate so we need information on the diffusion coefficient as well.
The 1D diffusion along DNA
The relation between the diffusion coefficient and the friction coefficient (f)
is given by the Einstein-Smoluchowski formula
macro micro
d d dissk k P
1
macro
d
Ds
k
25
(20)
where kb is the Boltzmann constant and T is the temperature. This equation
is a statement about the common origin of the friction experienced by parti-
cles in solution and the jittering (a negligible velocity autocorrelation time)
of that same particle. This origin is the numerous collisions per unit time
with water molecules experienced by the particle. Increase the temperature
and thus the jittering frequency will make the particle search a larger volume
per unit time and the diffusion constant is higher. But raising the collision
frequency with water molecules also increase the rate with which the mo-
mentum of the particle is dampened out which means an increase in the fric-
tion f which lowers the diffusion coefficient. The winner of these competing
effects depends on the geometry of the particle and the specific properties of
the solvent they are in. Using this relation means knowing how the protein
moves on DNA as it slides to accurately determine the viscous drag and con-
sequently the friction f.
Example: The LacI Dimer
While it has been implicitly shown that LacI tracks the phosphate backbone
in a recent in vitro experiment we wanted to see and prove it at the atomistic
level. So the idea is to pull LacI very slowly along the DNA in both direc-
tions (the different colors in Figure 2) and see whether it is prone to track the
phosphate backbone (figure 2).
1bk T
Df
26
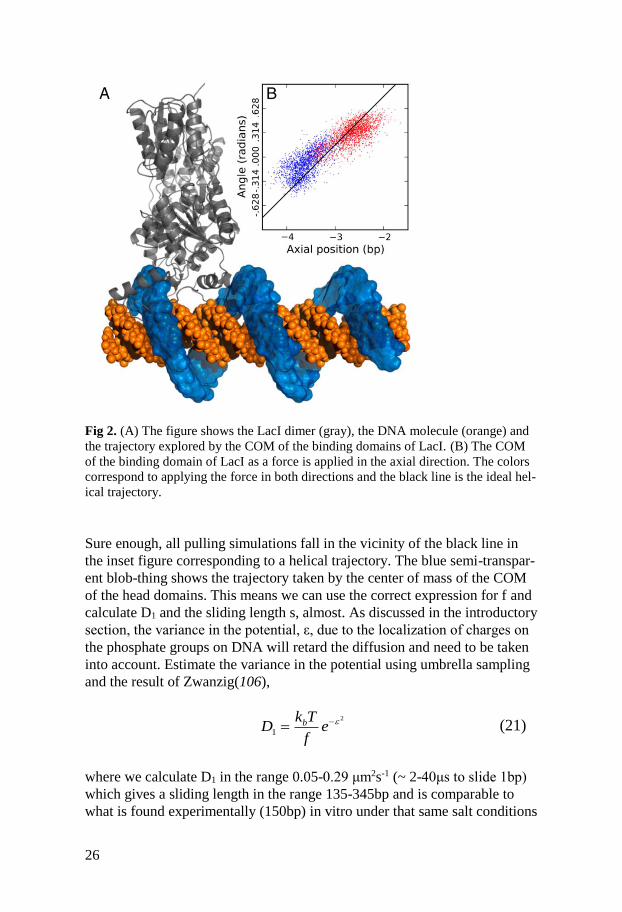
Fig 2. (A) The figure shows the LacI dimer (gray), the DNA molecule (orange) and
the trajectory explored by the COM of the binding domains of LacI. (B) The COM
of the binding domain of LacI as a force is applied in the axial direction. The colors
correspond to applying the force in both directions and the black line is the ideal hel-
ical trajectory.
Sure enough, all pulling simulations fall in the vicinity of the black line in
the inset figure corresponding to a helical trajectory. The blue semi-transpar-
ent blob-thing shows the trajectory taken by the center of mass of the COM
of the head domains. This means we can use the correct expression for f and
calculate D1 and the sliding length s, almost. As discussed in the introductory
section, the variance in the potential, ε, due to the localization of charges on
the phosphate groups on DNA will retard the diffusion and need to be taken
into account. Estimate the variance in the potential using umbrella sampling
and the result of Zwanzig(106),
(21)
where we calculate D1 in the range 0.05-0.29 μm2s-1 (~ 2-40μs to slide 1bp)
which gives a sliding length in the range 135-345bp and is comparable to
what is found experimentally (150bp) in vitro under that same salt conditions
2
1bk T
D ef
27
as the MD simulation(128). By comparison, the microscopic residence time
is 69μs which makes the existence of sliding as a transfer mode for the LacI
dimer highly probable.
Finding The Specific Operator Site
How does this knowledge of the characteristics of LacI-DNA nonspecific in-
teractions at the atomistic level of detail factor into the time it takes for LacI
to search, find and bind the specific operator site? In particular, is sliding
also present in the interior of the congested living cell? By shifting focus to
the question of specific site searching we greatly expand the timescales that
need to be taken into account which means that molecular dynamics is no
longer a feasible method of investigation. Again, we are going to use the ra-
tionale of anchoring a simulation to a recent single molecule in vivo experi-
ment. The simulation approach will be a realization of a continuous-time dis-
crete state markov jump process by the searching protein on a 1D lattice oc-
cupied by other proteins on DNA that prevents sliding protein to bypass
them (so called roadblocks). Although the method appear simplistic it is
fully adequate in relation to the questions posed. This jump process will con-
currently take into account the different modes of transfer by LacI discussed
in the introductory sections, i.e. sliding, hopping, intersegment transfer and
macroscopic dissociations. The in vivo experiment also suggest the possibil-
ity of LacI traversing the specific binding site which is contained in a param-
eter pbind in the simulations. The experiment suggest that the total search time
for one LacI dimer coupled to Venus is between 236s and 416s and the ex-
tent to which two operator sites are correlated at distances
[25,45,65,113,203] bp. This information together with the parameter set de-
fining the transfer modes and binding probability allows measuring the de-
generacy of the parameter set which is a measure of how many parameter
combinations satisfy the absolute search time and the sliding length con-
straints. The simulation of the markov jump process requires knowledge
only about the probabilities of the different events which are equal to the
fractional rate of the different modes of transfer. That means having an idea
of how the microscopic dissociation rate constant and the probability of a
macroscopic dissociation given a microscopic dissociation behaves as a
function of fundamental input parameters listed in table 1.
28
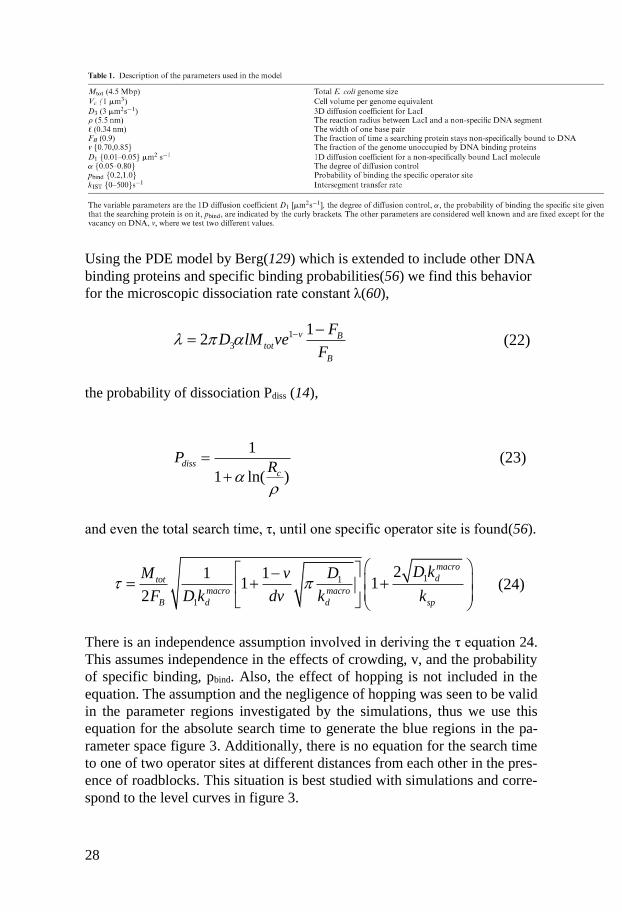
Using the PDE model by Berg(129) which is extended to include other DNA
binding proteins and specific binding probabilities(56) we find this behavior
for the microscopic dissociation rate constant λ(60),
(22)
the probability of dissociation Pdiss (14),
(23)
and even the total search time, τ, until one specific operator site is found(56).
(24)
There is an independence assumption involved in deriving the τ equation 24.
This assumes independence in the effects of crowding, v, and the probability
of specific binding, pbind. Also, the effect of hopping is not included in the
equation. The assumption and the negligence of hopping was seen to be valid
in the parameter regions investigated by the simulations, thus we use this
equation for the absolute search time to generate the blue regions in the pa-
rameter space figure 3. Additionally, there is no equation for the search time
to one of two operator sites at different distances from each other in the pres-
ence of roadblocks. This situation is best studied with simulations and corre-
spond to the level curves in figure 3.
1
3
12 v B
tot
B
FD lM ve
F
1
1 ln( )diss
c
PR
11
1
21 11 1
2
macro
dtot
macro macro
B d d sp
D kM v D
F D k dv k k
29
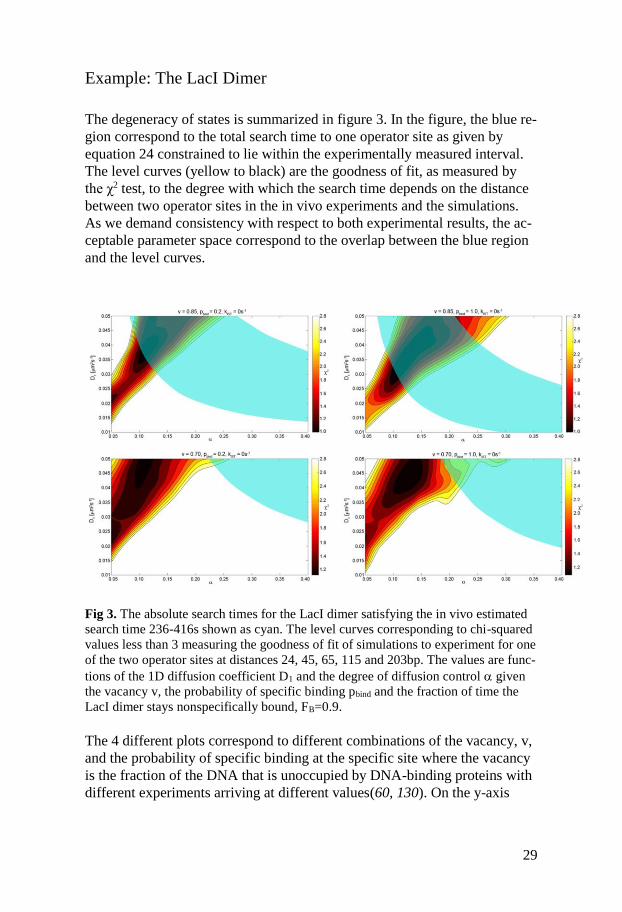
Example: The LacI Dimer
The degeneracy of states is summarized in figure 3. In the figure, the blue re-
gion correspond to the total search time to one operator site as given by
equation 24 constrained to lie within the experimentally measured interval.
The level curves (yellow to black) are the goodness of fit, as measured by
the χ2 test, to the degree with which the search time depends on the distance
between two operator sites in the in vivo experiments and the simulations.
As we demand consistency with respect to both experimental results, the ac-
ceptable parameter space correspond to the overlap between the blue region
and the level curves.
Fig 3. The absolute search times for the LacI dimer satisfying the in vivo estimated
search time 236-416s shown as cyan. The level curves corresponding to chi-squared
values less than 3 measuring the goodness of fit of simulations to experiment for one
of the two operator sites at distances 24, 45, 65, 115 and 203bp. The values are func-
tions of the 1D diffusion coefficient D1 and the degree of diffusion control given
the vacancy v, the probability of specific binding pbind and the fraction of time the
LacI dimer stays nonspecifically bound, FB=0.9.
The 4 different plots correspond to different combinations of the vacancy, v,
and the probability of specific binding at the specific site where the vacancy
is the fraction of the DNA that is unoccupied by DNA-binding proteins with
different experiments arriving at different values(60, 130). On the y-axis
30
there is the 1D coefficient in units μm2s-1 and on the x-axis there is the de-
gree of diffusion control α which is proportional to the ratio of the associa-
tion rate to the 3 dimensional diffusion coefficient at contact between the
LacI dimer and the DNA molecule. A very high means that the protein
will be absorbed immediately upon contact while a very low correspond to
a low probability of association upon contact. Based on the plots we can dis-
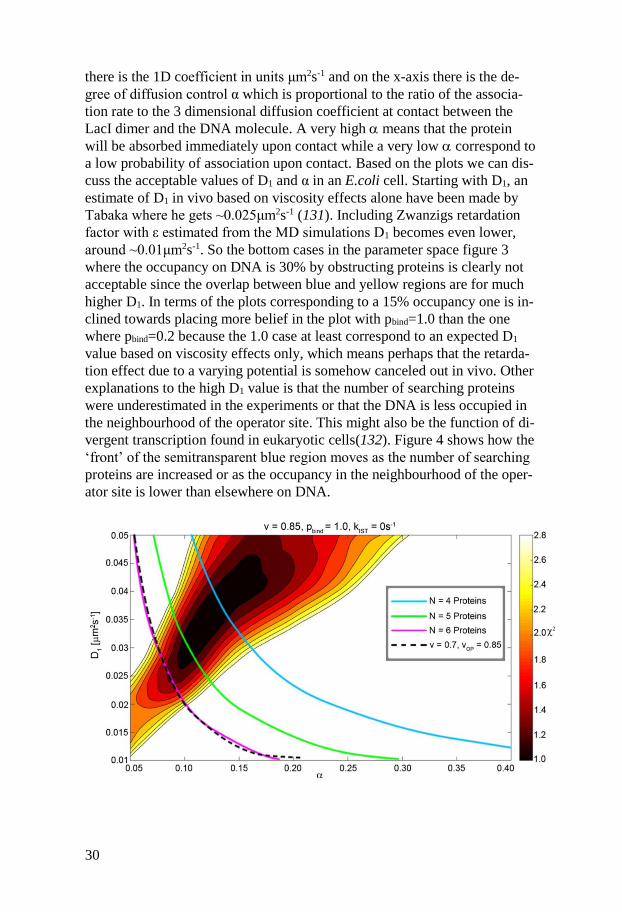
cuss the acceptable values of D1 and α in an E.coli cell. Starting with D1, an
estimate of D1 in vivo based on viscosity effects alone have been made by
Tabaka where he gets ~0.025μm2s-1 (131). Including Zwanzigs retardation
factor with ε estimated from the MD simulations D1 becomes even lower,
around ~0.01μm2s-1. So the bottom cases in the parameter space figure 3
where the occupancy on DNA is 30% by obstructing proteins is clearly not
acceptable since the overlap between blue and yellow regions are for much
higher D1. In terms of the plots corresponding to a 15% occupancy one is in-
clined towards placing more belief in the plot with pbind=1.0 than the one
where pbind=0.2 because the 1.0 case at least correspond to an expected D1
value based on viscosity effects only, which means perhaps that the retarda-
tion effect due to a varying potential is somehow canceled out in vivo. Other
explanations to the high D1 value is that the number of searching proteins
were underestimated in the experiments or that the DNA is less occupied in
the neighbourhood of the operator site. This might also be the function of di-
vergent transcription found in eukaryotic cells(132). Figure 4 shows how the
‘front’ of the semitransparent blue region moves as the number of searching
proteins are increased or as the occupancy in the neighbourhood of the oper-
ator site is lower than elsewhere on DNA.
31
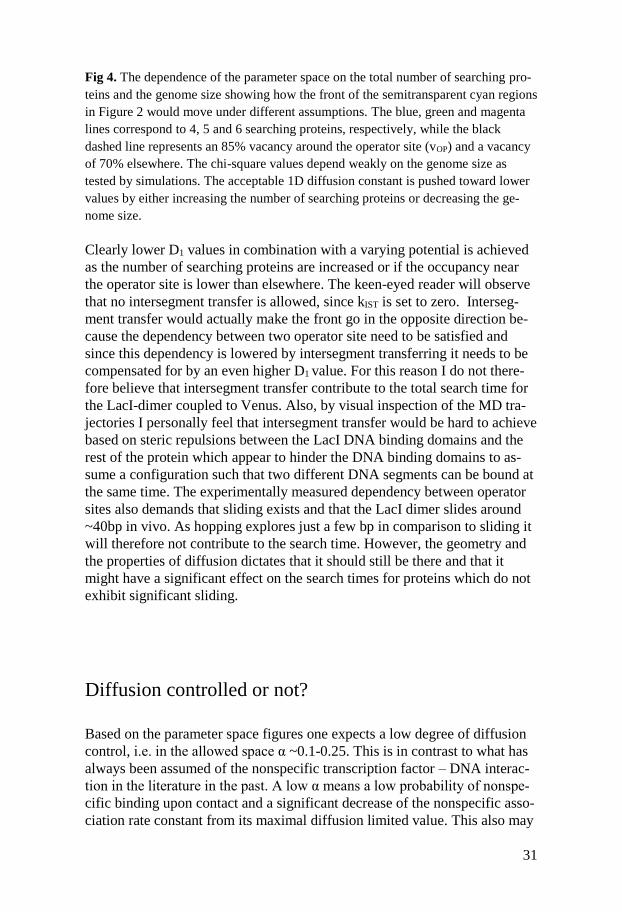
Fig 4. The dependence of the parameter space on the total number of searching pro-
teins and the genome size showing how the front of the semitransparent cyan regions
in Figure 2 would move under different assumptions. The blue, green and magenta
lines correspond to 4, 5 and 6 searching proteins, respectively, while the black
dashed line represents an 85% vacancy around the operator site (vOP) and a vacancy
of 70% elsewhere. The chi-square values depend weakly on the genome size as
tested by simulations. The acceptable 1D diffusion constant is pushed toward lower
values by either increasing the number of searching proteins or decreasing the ge-
nome size.
Clearly lower D1 values in combination with a varying potential is achieved
as the number of searching proteins are increased or if the occupancy near
the operator site is lower than elsewhere. The keen-eyed reader will observe
that no intersegment transfer is allowed, since kIST is set to zero. Interseg-
ment transfer would actually make the front go in the opposite direction be-
cause the dependency between two operator site need to be satisfied and
since this dependency is lowered by intersegment transferring it needs to be
compensated for by an even higher D1 value. For this reason I do not there-
fore believe that intersegment transfer contribute to the total search time for
the LacI-dimer coupled to Venus. Also, by visual inspection of the MD tra-
jectories I personally feel that intersegment transfer would be hard to achieve
based on steric repulsions between the LacI DNA binding domains and the
rest of the protein which appear to hinder the DNA binding domains to as-
sume a configuration such that two different DNA segments can be bound at
the same time. The experimentally measured dependency between operator
sites also demands that sliding exists and that the LacI dimer slides around
~40bp in vivo. As hopping explores just a few bp in comparison to sliding it
will therefore not contribute to the search time. However, the geometry and
the properties of diffusion dictates that it should still be there and that it
might have a significant effect on the search times for proteins which do not
exhibit significant sliding.
Diffusion controlled or not?
Based on the parameter space figures one expects a low degree of diffusion
control, i.e. in the allowed space α ~0.1-0.25. This is in contrast to what has
always been assumed of the nonspecific transcription factor – DNA interac-
tion in the literature in the past. A low α means a low probability of nonspe-
cific binding upon contact and a significant decrease of the nonspecific asso-
ciation rate constant from its maximal diffusion limited value. This also may
32
seem to be in conflict with the molecular dynamics results, where the radial
monotonic free energy profile suggest a diffusion limited binding, since
there is no barriers in the PMF profile. The discrepancy between the allowed
alpha to get a consistent model and the expectancy can be reconciled by rec-
ognizing that only a part of LacI is reactive while the model in the parameter
space results considers LacI to be a fully reactive sphere.
Steric Effects
In the last section it was suggested that a target search model without steric
effects demand reaction control when compared with in vivo data for con-
sistency. The reaction control without steric effects is interpreted as a low re-
activity upon contact between the fully reactive sphere and cylinder. However,
steric effects might account for the low reactivity due to inert non-reactive
parts on the protein and the DNA while still allowing for a high reactivity
given contact between the reactive parts so the effects of geometry needs a
thorough investigation. The path of least resistance towards understanding the
effect of reactive patches on the spherical protein and the cylindrical DNA
molecule is to consider the magnitude of these effects in simple limits and to
gradually add complexity and thus gradually close the distance between real-
ism and the model world. We start by considering a fully reactive protein,
whether it is a disk or sphere does not matter in this case. Let the geometry of
the reactive patch on the cylinder DNA be either a stripe running along the
length of the cylinder (Fig 5A) or rings placed periodically along the cylinder
(Fig 5B). If F is the fraction of the cylinder surface covered by the reactive
patch then one would expect a linear dependence of the macroscopic associa-
tion rate on F in the reaction controlled limit as this limit correspond to a ho-
mogenous sampling of configuration space. Actually, in the reaction con-
trolled limit where the association rate is independent of diffusion the macro-
scopic association rate becomes equal to the microscopic rate, k. Thus, we
expect that k=2DlF and the measure of the extent of diffusion control be-
comes times F meaning that F = constant correspond to an unchanging
equilibrium constant for nonspecific binding to DNA. The small value of what
was thought when compared with in vivo experiments is with inclusion of
geometry a small value for F which means there can be a high value for the
reactivity if F is small.
33
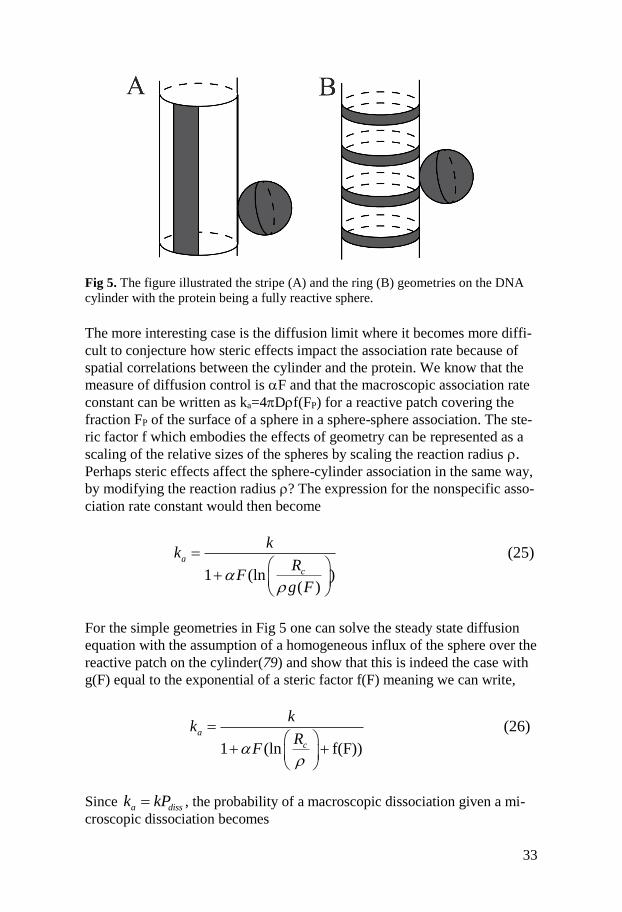
Fig 5. The figure illustrated the stripe (A) and the ring (B) geometries on the DNA
cylinder with the protein being a fully reactive sphere.
The more interesting case is the diffusion limit where it becomes more diffi-
cult to conjecture how steric effects impact the association rate because of
spatial correlations between the cylinder and the protein. We know that the
measure of diffusion control is F and that the macroscopic association rate
constant can be written as ka=4Df(FP) for a reactive patch covering the
fraction FP of the surface of a sphere in a sphere-sphere association. The ste-
ric factor f which embodies the effects of geometry can be represented as a
scaling of the relative sizes of the spheres by scaling the reaction radius . Perhaps steric effects affect the sphere-cylinder association in the same way,
by modifying the reaction radius ? The expression for the nonspecific asso-
ciation rate constant would then become
1 (ln )( )
a
c
kk
RF
g F
(25)
For the simple geometries in Fig 5 one can solve the steady state diffusion
equation with the assumption of a homogeneous influx of the sphere over the
reactive patch on the cylinder(79) and show that this is indeed the case with
g(F) equal to the exponential of a steric factor f(F) meaning we can write,
1 (ln f(F))
a
c
kk
RF
(26)
Since a dissk kP , the probability of a macroscopic dissociation given a mi-
croscopic dissociation becomes
34
1
1 (ln f(F))
diss
c
PR
F
(27)
When geometry is introduced on the cylinder, i.e. F<1 then as expected Pdiss
becomes higher and ka becomes lower. The term in the denominator equals
the ratio between the microscopic association rate constant k and the diffu-
sion-controlled macroscopic association rate constant ka,
ln ( )c
diff
a
R kF f F
k
(28)
can be viewed as a measure of the spatial correlations between the sphere
and the cylinder. This is also accurately the degree of diffusion control rather
than being a measure of it as stated above for F. Let’s consider the ex-
pected differences in the spatial correlation measure (eq 28) for the stripe
and the ring cases. If the protein start just outside the reaction radius at time
zero then it would need to diffuse a distance 2 to go around the DNA
which corresponds to ~100bp. It is therefore much more likely that the pro-
tein have sampled many sites along the length of the cylinder before having
sampled sites around the DNA. For this reason the spatial correlations,
which are due to the smearing of reactive sites on the cylinder that compete
for binding to the protein, are expected to be larger in the stripe case than in
the ring case. This is what we have observed as a smaller probability of dis-
sociation for the stripe case than the ring case.
Let’s add another layer of complexity to the geometry due to the helical
twisting of the phosphate backbone of the DNA molecule and the fact that
only a subset of the amino acids constituting a protein are actually involved
in the nonspecific interaction to the phosphate backbone and the grooves
(Fig 6).
35
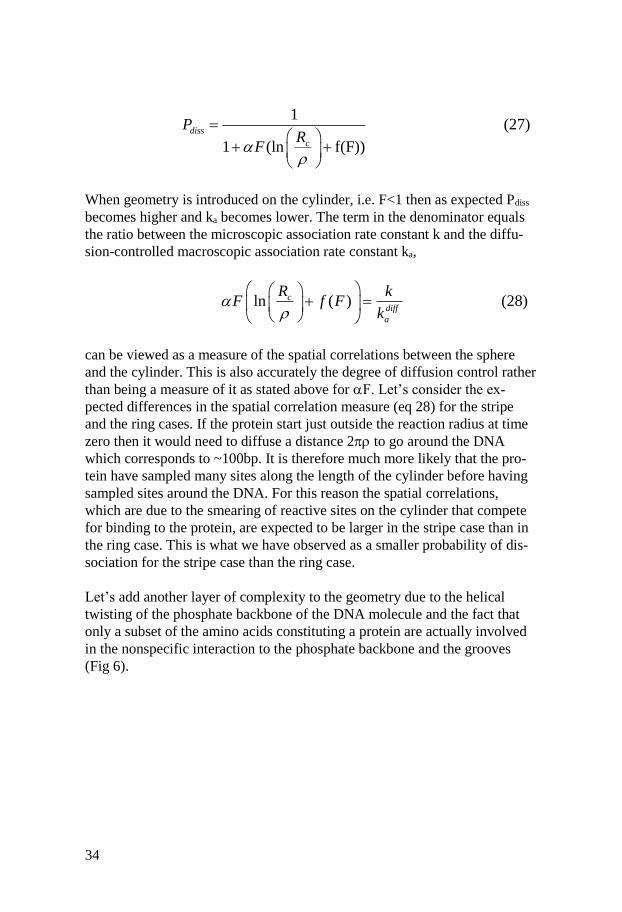
Fig 6. The figure shows the helix geometry on the DNA cylinder and the axially
symmetric patch on the spherical protein for which the dynamics is investigated by
an event driven simulation scheme.
This geometric situation is beyond the scope of my analytical capabilities
and was studied using a simulation instead. The idea behind the simulation
scheme is to start the protein just outside the reactive patch homogenously
over the reactive patches on both the protein and the DNA as demanded by
microscopic reversibility. Then the protein can dissociate with a probability
given in eq 27 with f=0 and F=1. If the protein do not dissociate, then return
times are sampled from a distribution. Given the return times one can sample
how much the protein have rotated around the DNA, around its own center
and how much it has diffused along the DNA. The simulation keep execut-
ing these events until the protein binds nonspecifically or leaves the DNA
segment at which point the simulation is restarted and the coordinates reset.
The probability of dissociation, Pdiss, is estimated as the fraction of nonspe-
cific binding events out of a total of 4*105 events. The details of how the
simulation was performed and the coordinate systems can be found in the
supplementary material in the manuscript in this thesis. The first question
one might ask is if the steric effects can be incorporated by a scaling of rela-
tive sizes when also a reactive patch on the protein, FP, is introduced. If so,
then 1/Pdiss-1 should be a linear function of .
36
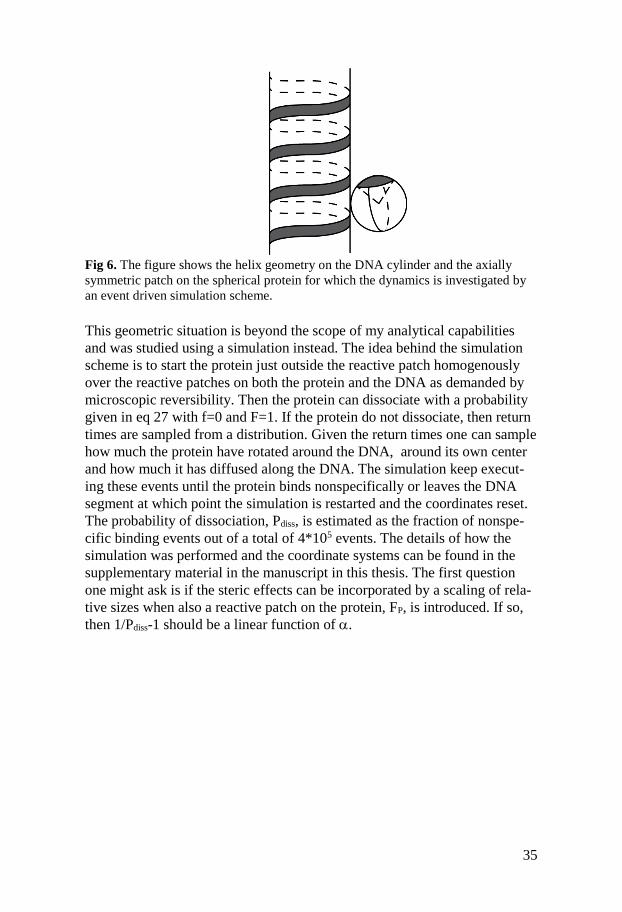
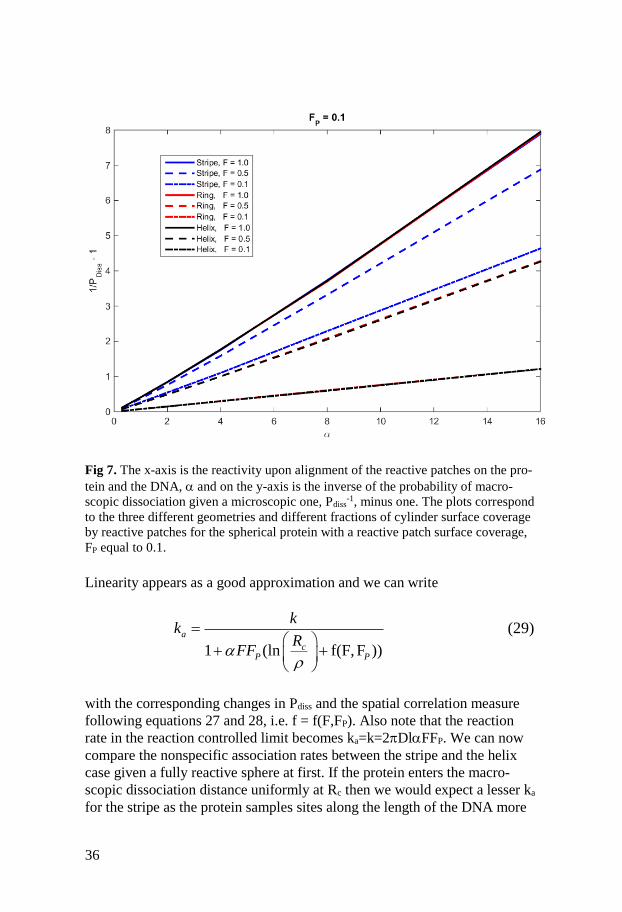
Fig 7. The x-axis is the reactivity upon alignment of the reactive patches on the pro-
tein and the DNA, and on the y-axis is the inverse of the probability of macro-
scopic dissociation given a microscopic one, Pdiss-1, minus one. The plots correspond
to the three different geometries and different fractions of cylinder surface coverage
by reactive patches for the spherical protein with a reactive patch surface coverage,
FP equal to 0.1.
Linearity appears as a good approximation and we can write
1 (ln f(F, F ))
a
cP P
kk
RFF
(29)
with the corresponding changes in Pdiss and the spatial correlation measure
following equations 27 and 28, i.e. f = f(F,FP). Also note that the reaction
rate in the reaction controlled limit becomes ka=k=2DlFFP. We can now
compare the nonspecific association rates between the stripe and the helix
case given a fully reactive sphere at first. If the protein enters the macro-
scopic dissociation distance uniformly at Rc then we would expect a lesser ka
for the stripe as the protein samples sites along the length of the DNA more
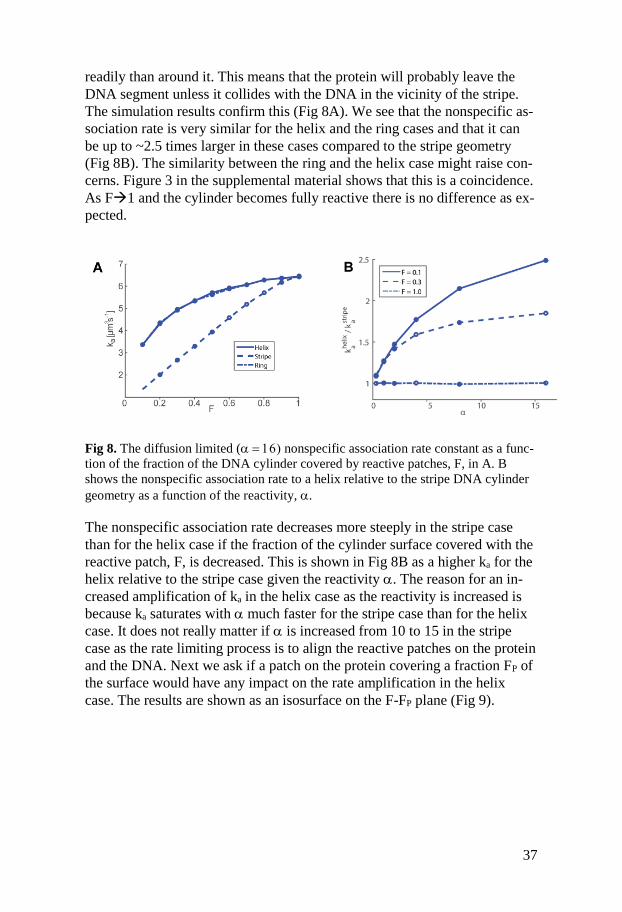
37
readily than around it. This means that the protein will probably leave the
DNA segment unless it collides with the DNA in the vicinity of the stripe.
The simulation results confirm this (Fig 8A). We see that the nonspecific as-
sociation rate is very similar for the helix and the ring cases and that it can
be up to ~2.5 times larger in these cases compared to the stripe geometry
(Fig 8B). The similarity between the ring and the helix case might raise con-
cerns. Figure 3 in the supplemental material shows that this is a coincidence.
As F1 and the cylinder becomes fully reactive there is no difference as ex-
pected.
Fig 8. The diffusion limited (nonspecific association rate constant as a func-
tion of the fraction of the DNA cylinder covered by reactive patches, F, in A. B
shows the nonspecific association rate to a helix relative to the stripe DNA cylinder
geometry as a function of the reactivity, .
The nonspecific association rate decreases more steeply in the stripe case
than for the helix case if the fraction of the cylinder surface covered with the
reactive patch, F, is decreased. This is shown in Fig 8B as a higher ka for the
helix relative to the stripe case given the reactivity . The reason for an in-
creased amplification of ka in the helix case as the reactivity is increased is
because ka saturates with much faster for the stripe case than for the helix
case. It does not really matter if is increased from 10 to 15 in the stripe
case as the rate limiting process is to align the reactive patches on the protein
and the DNA. Next we ask if a patch on the protein covering a fraction FP of
the surface would have any impact on the rate amplification in the helix
case. The results are shown as an isosurface on the F-FP plane (Fig 9).
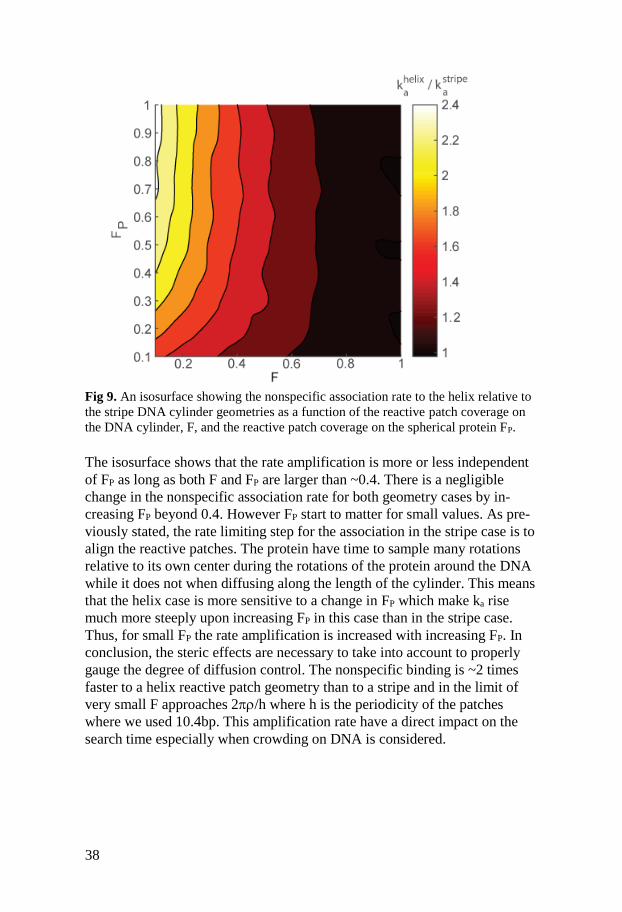
38
Fig 9. An isosurface showing the nonspecific association rate to the helix relative to
the stripe DNA cylinder geometries as a function of the reactive patch coverage on
the DNA cylinder, F, and the reactive patch coverage on the spherical protein FP.
The isosurface shows that the rate amplification is more or less independent
of FP as long as both F and FP are larger than ~0.4. There is a negligible
change in the nonspecific association rate for both geometry cases by in-
creasing FP beyond 0.4. However FP start to matter for small values. As pre-
viously stated, the rate limiting step for the association in the stripe case is to
align the reactive patches. The protein have time to sample many rotations
relative to its own center during the rotations of the protein around the DNA
while it does not when diffusing along the length of the cylinder. This means
that the helix case is more sensitive to a change in FP which make ka rise
much more steeply upon increasing FP in this case than in the stripe case.
Thus, for small FP the rate amplification is increased with increasing FP. In
conclusion, the steric effects are necessary to take into account to properly
gauge the degree of diffusion control. The nonspecific binding is ~2 times
faster to a helix reactive patch geometry than to a stripe and in the limit of
very small F approaches 2/h where h is the periodicity of the patches
where we used 10.4bp. This amplification rate have a direct impact on the
search time especially when crowding on DNA is considered.
39
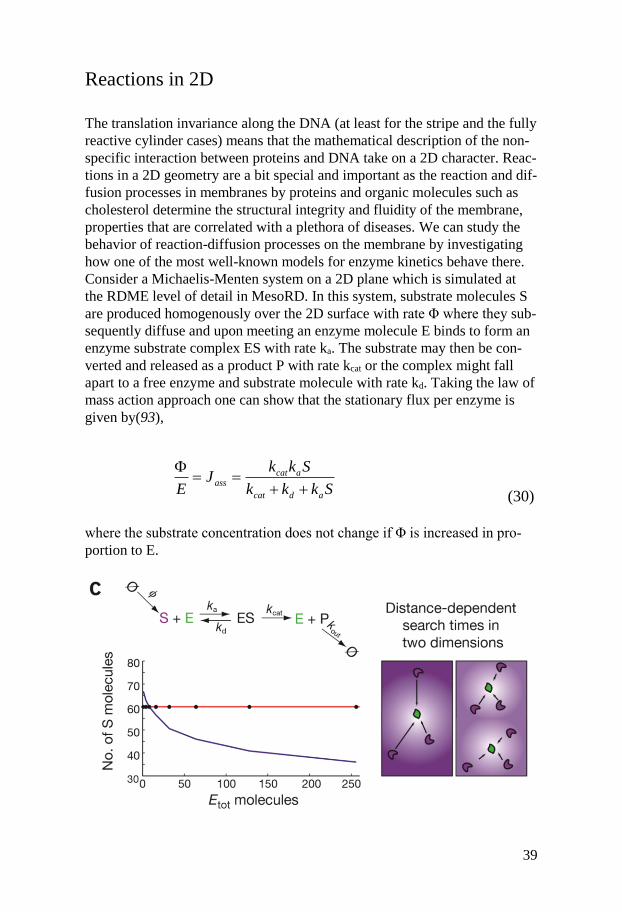
Reactions in 2D
The translation invariance along the DNA (at least for the stripe and the fully
reactive cylinder cases) means that the mathematical description of the non-
specific interaction between proteins and DNA take on a 2D character. Reac-
tions in a 2D geometry are a bit special and important as the reaction and dif-
fusion processes in membranes by proteins and organic molecules such as
cholesterol determine the structural integrity and fluidity of the membrane,
properties that are correlated with a plethora of diseases. We can study the
behavior of reaction-diffusion processes on the membrane by investigating
how one of the most well-known models for enzyme kinetics behave there.
Consider a Michaelis-Menten system on a 2D plane which is simulated at
the RDME level of detail in MesoRD. In this system, substrate molecules S
are produced homogenously over the 2D surface with rate Φ where they sub-
sequently diffuse and upon meeting an enzyme molecule E binds to form an
enzyme substrate complex ES with rate ka. The substrate may then be con-
verted and released as a product P with rate kcat or the complex might fall
apart to a free enzyme and substrate molecule with rate kd. Taking the law of
mass action approach one can show that the stationary flux per enzyme is
given by(93),
(30)
where the substrate concentration does not change if Φ is increased in pro-
portion to E.
cat aass
cat d a
k k SJ
E k k k S
40
Fig 10. Long-range correlations on membranes. Right, illustration of the decrease in
search time when the enzyme concentration doubles. Left, reaction scheme modeled
with the indicated frameworks. The influx rate increases in proportion to the total
number of degradation enzymes, Etot.
In line with the law of mass action, figure 10 show that the number of sub-
strate molecules is constant for the 3D CME (black dots) or PDE (red line)
description of the biochemical network of reactions while it is not in 2D!
The substrate to product conversion capacity for each enzyme molecule in-
creases as the total number of enzymes increase on the membrane and the
number of stationary state substrate molecules decreases monotonically.
From the microscopic point of view, whenever a substrate molecule is added
the distribution of molecules will be perturbed and it will take some redis-
tributing of the molecules before a possible stationary flux is reached. This
means that the association rate constant between the molecules will depend
on time. In 3 dimensions the redistributions are short lived and the associa-
tion rate will reach a constant value in the ~1μs timescale. In 2 dimensions
however the association rate constant is inversely proportional to ln(t) and
will never reach a nonzero constant value. In the case of a centered enzyme
molecule on an infinite plane, this means that a constant association flux can
never be attained and consequently a reaction rate constant cannot be defined
there. Intuitively, the depletion zone around the enzyme will continuously
expand with the constant concentration at infinity not being sufficient to bal-
ance this expansion. In our Michaelis-Menten example above we have a ho-
mogenous influx of substrates over the membrane which allows for a non-
trivial stationary state to be found but the spatial correlations between mole-
cules at all distances remain. This becomes evident as the association rate
constant ka is dependent through Rc on the concentration of sinks/enzymes E,
(31)
where Rc is the radius of the depletion zone around each enzyme. Thus, πRc
2
= 1/E and ka = ka(E) making the reaction rate not strictly proportional to the
product of the number of the reacting species thus breaking the law of mass
action. In other words, a substrate molecule on a membrane never forgets
where it has been before and adding another enzyme molecule on a membrane
will, due to this memory effect, have a disproportionate effect on the associa-
tion rate to substrate molecules making the substrate conversion capacity for
each enzyme higher. Another effect of 2 dimensions is to increase the sensi-
tivity of the number of stationary state substrate molecules to the regularity of
3
3
2
2 3ln( )
4
ac
Dk
D R
41
the enzyme molecules on the membrane. This is related to protein DNA inter-
actions due to their 2D character where there can be up to a 20% difference in
the nonspecific association rate ka between a protein and a DNA molecule
depending on whether the DNA segments are modeled as a regular array or if
the DNA molecule is modeled as ‘spaghetti’(56). It also means that there
could be a potential for the DNA breathing(133) dynamics to regulate the non-
specific association rate constant for DNA binding proteins at a global level.
42
Svensk Sammanfattning
I början av 1800-talets andra hälft började kemister, matematiker och fysiker
intressera sig för vad som bestämmer hur fort molekyler reagerar med
varandra och hur man kan modellera denna hastighet i förhoppningen att
förutspå mängden av varje typ av molekyl vid ett givet tillfälle(20). Intresset
gav till en början upphov till massverkans lag som konstaterar att
reaktionshastigheten är direkt proportionell mot produkten av reaktanternas
koncentration i provröret(20). Denna lag visade sig senare vara härledningsbar
från termodynamikens första huvudsats som implicerar att
reaktionshastigheten är relaterad till energi och temperatur. Arrhenius insåg
att detta exponentiella samband antydde förekomsten av ett kortlivat instabilt
aktiveringskomplex och en aktiveringsenergi som reaktanterna transient
behöver låna från sin omgivning för att ta sig till aktiveringstillståndet och
vidare till produkttillståndet(29). Decennier av arbete visade senare att
aktiveringsenergin motsvarar den fria energin för reaktioner i lösning(134).
Detta gör det möjligt att bestämma reaktionshastighetskonstanterna om man
har tillgång till en fri energiprofil som tar reaktanttillståndet till
produkttillståndet. En sådan profil kan man få genom att studera molekylernas
dynamik på atomnivån och simulera varje atoms position över tid i enlighet
med Newtons andra lag.
Vidare arbete uppdagade att de determinstiska ekvationerna som följer av
massverkans lag inte räcker till för att modellera kemiska reaktioner i de fall
där man har relativt stora fluktuationer i antalet molekyler. Ett exempel på
detta är när man har få molekyler, vilket är en vanligt förekommande situation
i levande celler. Modellering av kemiska processer i levande celler utnyttjar
därför den matematiska teorin om stokastiska processer vilket leder till en
evolutionsekvation i tiden för sannolikheten att ha ett visst antal molekyler av
en viss typ. Denna ekvation balanserar alla utgående och inkommande
reaktionsflöden och kallas för den kemiska master ekvationen. Ekvationens
komplexitet kräver oftast att den löses numeriskt t.ex. genom att man
realiserar trajektorier motsvarande evolutionsekvationen. Det är också möjligt
att lägga till ett rumsberoende i massverkans lag och för den kemiska
masterekvationen. Det senare fallet kan exempelvis realiseras genom att dela
upp den totala volymen i kubiska subvolymer där varje subvolym uppfyller
masterekvationen med tillägget att man tillåter hopp ut från subvolymen och
hopp in från de närmaste grannarna. Förutom att hålla koll på antalet
43
molekyler måste man därför även hålla reda på i vilken subvolym de befinner
sig.
MesoRD är en mjukvara som simulerar kemiska reaktionssystem med hjälp
av subvolymer, men i likhet med andra program av den här typen stöter
MesoRD på problem när subvolymerna blir mycket små. I detta gränsområde
håller inte de grundläggande antagandena för den kemiska masterekvationen
och resultaten divergerar. I mitt arbete har jag vidareutvecklat MesoRD för att
råda bot på detta och skapa konsistens i detta gränsområde.
Ett tillämpningsområde för teorin ovan är studiet av hur genreglerande DNA-
bindande proteiner hittar fram till ett specifikt bindningsställe bland ~4.5
miljoner (E.Coli) ospecifika bindningsställen. Om ett protein letar
slumpmässigt i 3 dimensioner så behöver proteinet i medeltal besöka varje
ställe på DNAt innan det hittar fram. För transkriptionsfaktorn LacI skulle
detta innebära i medeltal ~2.5 dagars letande vilket naturligtvis är biologiskt
ohållbart. Experiment visar också att det tar 4-5 minuter för LacI att hitta sitt
bindningsställe i levande E.Coli celler(2). Om man antar att de ospecifika
bindningställena fungerar som fällor så kan man skatta en nedre gräns för
söktiden genom att räkna på hur lång tid det skulle ta för ett protein att hitta
fram utan det ospecika DNAt närvarande. Experiment med ospecifikt DNA
visar dock att LacI hittar fram fortare än den beräknade nedre gränsen för
söktiden(52), hujedamej! Detta betyder att LacI måste utnyttja sin ospecifika
bindning till DNA för att förkorta söktiden. Den rådande hypotesen, som stöds
av experiment både in vitro och nyligen in vivo, är att LacI glider längs med
DNA helixen och på så vis kombinerar tredimensionell diffusion med
diffusion i en dimension(135). En annan potentiell sökstrategi, så kallad
hopping, går ut på att proteinet dissocierar ut i lösning till ett avstånd där det
inte känner av DNA segmentet i termer av elektrostatiska eller transienta
dipol-dipol växelverkningar men där proteinet ändå är spatiellt korrelerad till
DNA segmentet(14). Ytterligare en modell är att ett protein binder två DNA
segment samtidigt och att detta instabila komplex vid sönderfall lämnar
proteinet bundet till det andra DNA segmentet, en sökstrategi som kallas för
intersegment överföring.
Från den finaste detaljnivån vi har arbetat med, atomnivån, får vi den fria
energiprofilen för LacI dimeren när den mikroskopiskt dissocierar från ett
ospecifikt DNAsegment och även den fria energiprofilen för dimeren när den
glider längs med DNAt. Genom att långsamt ”dra” LacI längs DNAt, kunde
vi bekräfta den tidigare observationen att proteinet rör sig i en spiralrörelse.
Från den fria energiprofilerna får vi dels den mikroskopiska
associationshastighetskonstantens värde som är kdmicro = 1.45×10⁴s-1 och den 1
dimensionella diffusionshastigheten som är D1 = 0.05-0.29 μm2s-1 (det tar 2-
40μs att glida ett baspar). Vi kan också skatta hur många gånger LacI
återvänder innan en makroskopisk dissociation sker. Genom att multiplicera
medelantalet gånger proteinet återvänder med kdmicro får vi en uppskattning av
44
den makroskopiska dissociationshastigheten vars invers ger en makroskopisk
medelresidenstid på 48±12ms. Från D1 och medelresidenstiden kan vi
uppskatta att proteinet glider 135-345 baspar, vilket är jämförbart med in
vitro-experiment (~150 baspar). En naturlig följdfråga är om vi kan använda
den här informationen för att få reda på hur proteinet letar sig fram till sitt
specifika bindingsställe in vivo?
Jajamänsan! Vi kan härleda uttryck för sannolikheterna att glida ett baspar
längsmed DNAt, att dissociera mikroskopiskt, att dissociera makroskopiskt,
sannolikheten för intersegmentell överföring samt för specifik bindning i
närvaron av andra DNA-bindande proteiner. Den matematiska beskrivningen
av sökproblemet baseras på den stokastiska processteorin där proteinet anses
hoppa mellan de olika tillstånden glidning, hopping, intersegmentell
överföring, makroskopiska dissociationer och specifik binding. Numerisk
simulering av processen kan identifiera begränsningar i de ingående
parametrernas värde vid jämförelse med experimentella resultat för söktiden.
Dessa parameterar är den specifika bindingssannolikheten pbind, graden av
diffusions kontroll α, den relative mängden DNA som är fri för inbindning v,
fraktionen av tiden ett protein sitter ospecifikt bundet till DNA FB, den 1
dimensionella diffusions hastigheten D1 och intersegment
överföringshastigheten kIST.
Tidigare estimat av D1 in vivo med hänsyn taget till endast viskositetseffekter
ger ett värde omkring ~0.025μm2s-1. Om vi även tar hänsyn till
potentialfluktuationerna längs med DNAt från våra MD simuleringar, så
förväntas D1 ligga omkring ~0.01μm2s-1. Vår stokastiska processsimulering
kräver efter jämförelse med experiment ett D1 värde ~0.025μm2s-1, att
mängden uppbundet DNA ~15%, en specific bindningssannolikhet som är
nära 1, att FB är 0.9 samt att α ligger omkring 0.15. Uppseendeväckande är det
höga värdet på D1 och det låga värdet på α (en så kallad reaktionskontrollerad
association; högt α innebär en diffusionskontrollerad association). Vårt värde
på D1 antyder att effekten av potentialfluktuationer längs med DNAt på något
sätt negeras i levande celler. Alternativa förklaringar är att vi har underskattat
antalet proteiner som söker efter det specifika bindningsstället i experiment
eller att det finns en mekanism i levande celler som håller området omkring
det specifika bindningsstället relativt fritt från andra DNA-bindande proteiner.
En sådan mechanism i eukaryota celler kan möjligtvis vara divergent
transcription. Vi finner även att hopping inte bidrar nämnvärt till den totala
söktiden p.g.a. den relativt obetydliga uppsnabbningen i söktiden jämfört med
glidning. Notera att det här inte betyder att hopping inte finns bara att det inte
bidrar till söktiden i närvaro av glidningar större än ca 10 baspar. Vi finner
också att införandet av intersegmentell transfer gör simuleringsresultaten
inkonsistenta med experiment. Följaktligen tror vi inte att LacI utnyttjar
intersegment överföring som en sökstrategi under våra experimentella
45
förhållanden. Vad gäller α så är det ett proportionerligt mått på hur sannolikt
det är att ett protein binder ospecifikt till ett DNA segment givet att de stöter
ihop. Decennier av in vitro experiment och våra molekyldynamiksimuleringar
antyder att denna sannolikhet ska vara stor och därmed att α ska vara stort (>1)
vilket gör vårt resultat förvånande.
Förklaringen kan ligga i steriska effekter samt att den matematiska
beskrivningen för protein-DNA-interaktioner vi har utnyttjat modellerar
proteinet som en helt reaktiv sfär och DNAt som en helt reaktiv cylinder. För
att komma närmare sanningen kan vi utföra simuleringarna med olika reaktiva
ytor på proteinet och DNAt. De huvudsakliga resultaten från dessa
simuleringar är att utan hänsyn till geometri och begränsade reaktiva ytor på
både proteinet och på DNAt kan en ospecifik association misstolkas som
reaktionskontrollerad. Vidare så finner vi att proteinet associerar fortare till
DNAt om den reaktiva ytan på DNA cylindern har en helix form än om den
reaktiva ytan är en strip som löper längs längden på DNA cylindern. Detta har
en direkt betydelse för hur fort proteinet hittar fram till sitt specifika
bindningsställe, speciellt i levande celler där andra proteiner ockuperar DNA
molekylen. Simuleringsresultaten antyder också att man kan sammanfatta de
steriska effekterna i en parameter, den så kallade steriska faktorn, f, som
naturligt är en funktion av hur stor del av DNAts (F) och proteinets (FP) ytor
som är reaktiva. Vi föreslår en generalisering av tidigare uttryck för den
makroskopiska dissociations sannolikheten på följande form.
Den steriska faktorn, f, beror på ett icke trivialt sätt på F och FP och kan inte
ges ett explicit uttryck som function av dessa utan att inför tvivelaktiga
konstanter. Framtida arbete får utröna mer om detta ogenomskinliga
funktionella samband kanske genom studier på molekyl dynamiknivå. Det
skulle även vara väldigt intressant att se en glidningstrajektorie, och
motsvarande fri energiprofil på molekyldynamiknivå, in till det specifika
bindningsstället. En sån trajektorie bör kunna kopplas till en
bindningssannolikhet. Framtiden får utvisa resultat från en sådan
undersökning.
1
1 (ln( ) ( , ))
dissc
P P
PR
FF f F F
46
Acknowledgments
Johan:
@Sälen, steak and chocolate cake 2 nights in a row => dream come true.
Thank you for your guidance and patience.
Otto:
Thank you for being so knowledgeable and for putting up with my silly questions
during all this time. Would have absolutely never made it this far without your help.
You are and will forever remain a mentor and a friend.
Spoel:
Thank you for always being available to answer whatever questions I might have had.
Michael:
Thank you for your support and friendship. Your heart and mind are big. You will do
great things! Oh, and thank you for always listening. Dissapointed in your ka-ka skills
however.
David (The Taker): Your consistent support, selfishless character
and intelligence make you a great human being and scientist. Absolute convergence
is established, you are doing and will do great things!
Mats:
An inquisitive mind that never ceases to amaze me! Wait a minute ...
did you ever bring cake?!
Irmeli:
Your cake bringing skills are, as your mind is, top notch!
It's very nice talking to u. I like you! Thank you for all the help with the papers and
writing this thesis.
Harriet:
You are such a nice person, very nice talking to u!
This thesis would have been much delayed without your assistance. Thanks!
Cecilia:
Chocolate cake brought => friends 4 ever!
47
Vladimir:
You are such a nice and smart guy, really enjoy talking to you. You are my friend.
Good luck with everything.
Fredrik:
veet => boom-chikki ~ within 1...2? orders of magnitude.
Daniel C:
Finally, I’m about to enter the realm of doctoral jokes! See you there buddy!
Daniel J:
Thanks for being unconditionally nice and good luck with everything!
Martin:
Your theoretical prowess is huge.
Ebba:
Yo! Talkin to u is awsm. Right on! The cakes brought after maternity leave were
awsm.
Emil:
Your potential is humongous, looking forward to reading your papers! However, need
to work on the ka-ka-ing dude! Visit grandma now and again, she'll be happy and
perhaps will make cake for you to bring. "Oh no he didn't!"
Ozzy:
Lokum from turkey => friends 4 ever! Erkek cucuk yemek yior.
Prune:
Many cakes brought => ...you get it... If your sons ever need some ninja tutoring...
Petter:
Spooning in San Francisco... Oh hush you know what I'm talkin bout!
Alexi:
Lemon pie => ... Thanks for being supportive and a friend!
Magnus:
Talkin to you is super duper. Looking forward to the ribosome results. Right on.
Ivan:
Cake brought 15:30 08-19-2015! You're great! Good luck with everything.
48
Kalle:
What happens in London stays in London. Right Kalle? Thank you for being a friend
and good luck with everything!
Jimmy:
That's right, this is what happens, the no-cake zone!
Bwaha, just kidding you're great! Looking forward to that ping-pong match!
Zahedeh:
Ouch, the no-cake zone! You are awesome anyhow! Looking forward
to see all the great papers from you!
Arvid:
My man! Thank you for always being nice to me! You’re awsm!
Erik:
Thank you for giving me much needed guidance in the arts of molecular dynamics
simulations.
Gustaf:
Thank you for teaching me about image analysis, that was fun!
Arash:
Thank you for always being nice to me.
Claudia:
Thank you for being there for me when I needed a friend.
Murat:
You are my best friend and have showed me unconditional support all these years.
Thank you!
Family: A special thank you to my family which have been as supportive as you can
possible get. Thank you Plavo Mahmutovic, Nevzeta Mahmutovic, Erol Mahmutovic,
Aida Mahmutovic, Hilmo Mahmutovic, Nafija Beganovic, Sehida Mahmutovic, Diba
Mahmutovic, Arben Mahmutovic, Adisa Mahmutovic, Arialda Mahmutovic, Enida
Mahmutovic, Eden Mahmutovic, Elvira Pirelic, Dzemajl Pirelic, Hasib Mahmutovic,
Zehra Mahmutovic, Kenan Mahmutovic, Lejla Mahmutovic, Indira Softic, Vehbia
Softic, Safet Beganovic with family, Sead and Trivuna Beganovic with children,
Esnaf Beganovic with family, Fadil Mahmutovic with family.
49
Bibliography
1. J. Elf, G. W. Li, X. S. Xie, Probing transcription factor dynamics at the
single-molecule level in a living cell. Science 316, 1191-1194 (2007).
2. P. Hammar et al., The lac Repressor Displays Facilitated Diffusion in
Living Cells. Science 336, 1595-1598 (2012).
3. F. Persson, M. Linden, C. Unoson, J. Elf, Extracting intracellular diffusive
states and transition rates from single-molecule tracking data. Nat Methods
10, 265-269 (2013).
4. R. Neutze, R. Wouts, D. van der Spoel, E. Weckert, J. Hajdu, Potential for
biomolecular imaging with femtosecond X-ray pulses. Nature 406, 752-757
(2000).
5. K. Grunewald et al., Three-dimensional structure of herpes simplex virus
from cryo-electron tomography. Science 302, 1396-1398 (2003).
6. F. Forster, O. Medalia, N. Zauberman, W. Baumeister, D. Fass, Retrovirus
envelope protein complex structure in situ studied by cryo-electron
tomography. P Natl Acad Sci USA 102, 4729-4734 (2005).
7. J. L. S. Milne, S. Subramaniam, Cryo-electron tomography of bacteria:
progress, challenges and future prospects. Nat Rev Microbiol 7, 666-675
(2009).
8. H. J. C. Berendsen, J. P. M. Postma, W. F. Vangunsteren, A. Dinola, J. R.
Haak, Molecular-Dynamics with Coupling to an External Bath. J Chem
Phys 81, 3684-3690 (1984).
9. S. Nose, A Molecular-Dynamics Method for Simulations in the Canonical
Ensemble. Mol Phys 52, 255-268 (1984).
10. M. Karplus, J. A. McCammon, Molecular dynamics simulations of
biomolecules. Nat Struct Biol 9, 646-652 (2002).
11. H. Kabata et al., Visualization of Single Molecules of Rna-Polymerase
Sliding Along DNA. Science 262, 1561-1563 (1993).
12. T. Terakawa, H. Kenzaki, S. Takada, p53 Searches on DNA by Rotation-
Uncoupled Sliding at C-Terminal Tails and Restricted Hopping of Core
Domains. J Am Chem Soc 134, 14555-14562 (2012).
13. T. G. Fazzio, T. Tsukiyama, Chromatin remodeling in vivo: Evidence for a
nucleosome sliding mechanism. Mol Cell 12, 1333-1340 (2003).
14. O. G. Berg, R. B. Winter, P. H. von Hippel, Diffusion-Driven Mechanisms
of Protein Translocation on Nucleic-Acids .1. Models and Theory.
Biochemistry-Us 20, 6929-6948 (1981).
15. J. Widom, Target site localization by site-specific, DNA-binding proteins.
P Natl Acad Sci USA 102, 16909-16910 (2005).
16. M. E. van Royen, A. Zotter, S. M. Ibrahim, B. Geverts, A. B. Houtsmuller,
Nuclear proteins: finding and binding target sites in chromatin.
Chromosome Res 19, 83-98 (2011).
50
17. J. Hattne, D. Fange, J. Elf, Stochastic reaction-diffusion simulation with
MesoRD. Bioinformatics 21, 2923-2924 (2005).
18. D. Fange, A. Mahmutovic, J. Elf, MesoRD 1.0: Stochastic reaction-
diffusion simulations in the microscopic limit. Bioinformatics 28, 3155-
3157 (2012).
19. D. Van der Spoel et al., GROMACS: Fast, flexible, and free. J Comput
Chem 26, 1701-1718 (2005).
20. E. O. Voit, H. A. Martens, S. W. Omholt, 150 Years of the Mass Action
Law. Plos Comput Biol 11, (2015).
21. F. C. McLean, Application of the law of chemical equilibrium (law of mass
action) to biological problems. Physiol Rev 18, 495-523 (1938).
22. A. B. Doktorov, A. A. Kipriyanov, Deviation from the kinetic law of mass
action for reactions induced by binary encounters in liquid solutions. J
Phys-Condens Mat 19, (2007).
23. D. T. Gillespie, A Rigorous Derivation of the Chemical Master Equation.
Physica A 188, 404-425 (1992).
24. S. Macnamara, K. Burrage, R. B. Sidje, Multiscale Modeling of Chemical
Kinetics Via the Master Equation. Multiscale Model Sim 6, 1146-1168
(2008).
25. A. M. Turing, The Chemical Basis of Morphogenesis. Philos T Roy Soc B
237, 37-72 (1952).
26. E. W. Montroll, The Application of the Theory of Stochastic Processes to
Chemical Kinetics. Adv Chem Phys 1, 361-399 (1958).
27. J. Ross, P. Mazur, Some Deductions from a Formal Statistical Mechanical
Theory of Chemical Kinetics. J Chem Phys 35, 19-& (1961).
28. S. A. Isaacson, D. Isaacson, Reaction-diffusion master equation, diffusion-
limited reactions, and singular potentials. Phys Rev E 80, (2009).
29. E. Pollak, P. Talkner, Reaction rate theory: What it was, where is it today,
and where is it going? Chaos 15, (2005).
30. P. Hanggi, P. Talkner, M. Borkovec, Reaction-Rate Theory - 50 Years after
Kramers. Rev Mod Phys 62, 251-341 (1990).
31. M. A. Savageau, Biochemical Systems Analysis .3. Dynamic Solutions
Using a Power-Law Approximation. J Theor Biol 26, 215-& (1970).
32. P. H. Vonhippel, O. G. Berg, Facilitated Target Location in Biological-
Systems. J Biol Chem 264, 675-678 (1989).
33. A. Marcovitz, Y. Levy, Frustration in protein-DNA binding influences
conformational switching and target search kinetics. P Natl Acad Sci USA
108, 17957-17962 (2011).
34. L. Mirny et al., How a protein searches for its site on DNA: the mechanism
of facilitated diffusion. J Phys a-Math Theor 42, (2009).
35. A. Finney, M. Hucka, Systems biology markup language: Level 2 and
beyond. Biochem Soc T 31, 1472-1473 (2003).
36. L. Serrano, SmartCell; a cell network simulation program. Mol Cell
Proteomics 4, S13-S13 (2005).
37. B. Drawert, S. Engblom, A. Hellander, URDME: a modular framework for
stochastic simulation of reaction-transport processes in complex
geometries. Bmc Syst Biol 6, (2012).
51
38. J. S. van Zon, P. R. ten Wolde, Simulating biochemical networks at the
particle level and in time and space: Green's function reaction dynamics.
Phys Rev Lett 94, (2005).
39. S. S. Andrews, D. Bray, Stochastic simulation of chemical reactions with
spatial resolution and single molecule detail. Phys Biol 1, 137-151 (2004).
40. R. Silva, The H-theorem in kappa-statistics: influence on the molecular
chaos hypothesis. Phys Lett A 352, 17-20 (2006).
41. N. G. v. Kampen, Stochastic Processes in Physics and Chemistry.
(Elsevier, 2007).
42. O. G. Berg, P. H. Vonhippel, Diffusion-Controlled Macromolecular
Interactions. Annu Rev Biophys Bio 14, 131-160 (1985).
43. D. T. Gillespie, Stochastic simulation of chemical kinetics. Annual Review
of Physical Chemistry 58, 35-55 (2007).
44. S. M. Ross, Stochastic Processes. (JOHN WILEY & SONS, INC., ed. 2nd,
1996).
45. S. A. Isaacson, Relationship between the reaction-diffusion master equation
and particle tracking models. J Phys a-Math Theor 41, (2008).
46. Spontaneous separation of bi-stable biochemical systems into spatial
domains of opposite phases. Systems Biol 1, 230-236 (2004).
47. M. Smoluchowski, Versuch einer mathematischen Theorie der
Koagulationskinetik kolloider Lösungen. Z. Phys. Chem. 92, 129-168
(1917).
48. D. Fange, O. G. Berg, P. Sjoberg, J. Elf, Stochastic reaction-diffusion
kinetics in the microscopic limit. P Natl Acad Sci USA 107, 19820-19825
(2010).
49. S. Hellander, A. Hellander, L. Petzold, Reaction rates for mesoscopic
reaction-diffusion kinetics. Phys Rev E 91, (2015).
50. R. Erban, S. J. Chapman, Stochastic modelling of reaction-diffusion
processes: algorithms for bimolecular reactions. Phys Biol 6, (2009).
51. F. Jacob, J. Monod, On Regulation of Gene Activity. Cold Spring Harb
Sym 26, 193-& (1961).
52. A. D. Riggs, Bourgeoi.S, M. Cohn, Lac Repressor-Operator Interaction .3.
Kinetic Studies. J Mol Biol 53, 401-& (1970).
53. O. G. Berg, C. Blomberg, Association Kinetics with Coupled Diffusional
Flows - Special Application to Lac Repressor-Operator System. Biophys
Chem 4, 367-381 (1976).
54. O. G. Berg, C. Blomberg, Association Kinetics with Coupled Diffusion -
Extension to Coiled-Chain Macromolecules Applied to Lac Repressor-
Operator System. Biophys Chem 7, 33-39 (1977).
55. O. G. Berg, C. Blomberg, Association Kinetics with Coupled Diffusion .3.
Ionic-Strength Dependence of Lac Repressor-Operator Association.
Biophys Chem 8, 271-280 (1978).
56. A. Mahmutovic, O. G. Berg, J. Elf, What matters for lac repressor search in
vivo-sliding, hopping, intersegment transfer, crowding on DNA or
recognition? Nucleic Acids Res 43, 3454-3464 (2015).
57. M. D. Barkley, Salt Dependence of the Kinetics of the Lac Repressor-
Operator Interaction - Role of Non-Operator Deoxyribonucleic-Acid in the
Association Reaction. Biochemistry-Us 20, 3833-3842 (1981).
52
58. T. Ando, J. Skolnick, Crowding and hydrodynamic interactions likely
dominate in vivo macromolecular motion. P Natl Acad Sci USA 107,
18457-18462 (2010).
59. A. H. Elcock, Models of macromolecular crowding effects and the need for
quantitative comparisons with experiment. Curr Opin Struc Biol 20, 196-
206 (2010).
60. G. W. Li, O. G. Berg, J. Elf, Effects of macromolecular crowding and DNA
looping on gene regulation kinetics. Nat Phys 5, 294-297 (2009).
61. A. Bancaud et al., Molecular crowding affects diffusion and binding of
nuclear proteins in heterochromatin and reveals the fractal organization of
chromatin. Embo J 28, 3785-3798 (2009).
62. R. J. Ellis, Macromolecular crowding: obvious but underappreciated.
Trends Biochem Sci 26, 597-604 (2001).
63. D. Hall, A. P. Minton, Macromolecular crowding: qualitative and
semiquantitative successes, quantitative challenges. Bba-Proteins Proteom
1649, 127-139 (2003).
64. S. R. McGuffee, A. H. Elcock, Diffusion, Crowding & Protein Stability in a
Dynamic Molecular Model of the Bacterial Cytoplasm. Plos Comput Biol
6, (2010).
65. A. P. Minton, G. C. Colclasure, J. C. Parker, Model for the Role of
Macromolecular Crowding in Regulation of Cellular-Volume (Proc Natl
Acad Sci, Vol 89, Pg 1054, 1992). P Natl Acad Sci USA 90, 1137-1137
(1993).
66. A. P. Minton, The influence of macromolecular crowding and
macromolecular confinement on biochemical reactions in physiological
media. J Biol Chem 276, 10577-10580 (2001).
67. D. Ridgway et al., Coarse-grained molecular simulation of diffusion and
reaction kinetics in a crowded virtual cytoplasm (vol 94, pg 3748, 2008).
Biophys J 96, 2548-2548 (2009).
68. G. Rivas, J. A. Fernandez, A. P. Minton, Direct observation of the
enhancement of noncooperative protein self-assembly by macromolecular
crowding: Indefinite linear self-association of bacterial cell division protein
FtsZ. P Natl Acad Sci USA 98, 3150-3155 (2001).
69. S. Schnell, T. E. Turner, Reaction kinetics in intracellular environments
with macromolecular crowding: simulations and rate laws. Prog Biophys
Mol Bio 85, 235-260 (2004).
70. K. Takahashi, S. N. V. Arjunan, M. Tomita, Space in systems biology of
signaling pathways - towards intracellular molecular crowding in silico.
Febs Lett 579, 1783-1788 (2005).
71. H. X. Zhou, G. N. Rivas, A. P. Minton, Macromolecular crowding and
confinement: Biochemical, biophysical, and potential physiological
consequences. Annu Rev Biophys 37, 375-397 (2008).
72. S. B. Zimmerman, A. P. Minton, Macromolecular Crowding - Biochemical,
Biophysical, and Physiological Consequences. Annu Rev Bioph Biom 22,
27-65 (1993).
73. S. B. Zimmerman, L. D. Murphy, Macromolecular crowding and the
mandatory condensation of DNA in bacteria. Febs Lett 390, 245-248
(1996).
53
74. K. Solc, Stockmay.Wh, Kinetics of Diffusion-Controlled Reaction between
Chemically Asymmetric Molecules .1. General Theory. J Chem Phys 54,
2981-& (1971).
75. O. G. Berg, Orientation Constraints in Diffusion-Limited Macromolecular
Association - the Role of Surface-Diffusion as a Rate-Enhancing
Mechanism. Biophys J 47, 1-14 (1985).
76. K. S. Schmitz, J. M. Schurr, Role of Orientation Constraints and Rotational
Diffusion in Bimolecular Solution Kinetics. J Phys Chem-Us 76, 534-&
(1972).
77. T. L. Hill, Effect of Rotation on Diffusion-Controlled Rate of Ligand-
Protein Association. P Natl Acad Sci USA 72, 4918-4922 (1975).
78. R. Samson, J. M. Deutch, Diffusion-Controlled Reaction-Rate to a Buried
Active-Site. J Chem Phys 68, 285-290 (1978).
79. D. Shoup, G. Lipari, A. Szabo, Diffusion-Controlled Bimolecular Reaction-
Rates - the Effect of Rotational Diffusion and Orientation Constraints.
Biophys J 36, 697-714 (1981).
80. S. Hess, L. Monchick, A Simple Analytic Model of the Diffusion
Controlled Reaction-Rates of Asymmetric Molecules. J Chem Phys 84,
1385-1390 (1986).
81. S. Lee, M. Karplus, Kinetics of Diffusion-Influenced Bimolecular
Reactions in Solution .2. Effects of the Gating Mode and Orientation-
Dependent Reactivity. J Chem Phys 86, 1904-1921 (1987).
82. S. D. Traytak, The Steric Factor in the Time-Dependent Diffusion-
Controlled Reactions. J Phys Chem-Us 98, 7419-7421 (1994).
83. A. I. Shushin, Manifestation of anisotropic reactivity and molecular
interactions in chemical reaction kinetics. J Chem Phys 110, 12044-12058
(1999).
84. F. W. Dahlquist, Slip sliding away: new insights into DNA-protein
recognition. Nat Chem Biol 2, 353-354 (2006).
85. M. Hedglin, P. J. O'Brien, Hopping Enables a DNA Repair Glycosylase To
Search Both Strands and Bypass a Bound Protein. Acs Chem Biol 5, 427-
436 (2010).
86. G. Komazin-Meredith, R. Mirchev, D. E. Golan, A. M. van Oijen, D. M.
Coen, Hopping of a processivity factor on DNA revealed by single-
molecule assays of diffusion. P Natl Acad Sci USA 105, 10721-10726
(2008).
87. S. E. Halford, J. F. Marko, How do site-specific DNA-binding proteins find
their targets? Nucleic Acids Res 32, 3040-3052 (2004).
88. R. H. Porecha, J. T. Stivers, Uracil DNA glycosylase uses DNA hopping
and short-range sliding to trap extrahelical uracils. P Natl Acad Sci USA
105, 10791-10796 (2008).
89. M. C. DeSantis, J. L. Li, Y. M. Wang, Protein sliding and hopping kinetics
on DNA. Phys Rev E 83, (2011).
90. F. Wang et al., The promoter-search mechanism of Escherichia coli RNA
polymerase is dominated by three-dimensional diffusion. Nat Struct Mol
Biol 20, 174-181 (2013).
91. N. Y. Sidorova, T. Scott, D. C. Rau, DNA Concentration-Dependent
Dissociation of EcoRI: Direct Transfer or Reaction during Hopping.
Biophys J 104, 1296-1303 (2013).
54
92. A. Bhattacherjee, Y. Levy, Search by proteins for their DNA target site: 1.
The effect of DNA conformation on protein sliding. Nucleic Acids Res 42,
12404-12414 (2014).
93. A. Mahmutovic, D. Fange, O. G. Berg, J. Elf, Lost in presumption:
stochastic reactions in spatial models. Nat Methods 9, 1163-1166 (2012).
94. R. C. Tolman, The principle of microscopic reversibility. P Natl Acad Sci
USA 11, 436-439 (1925).
95. P. C. Blainey, A. M. van Oijent, A. Banerjee, G. L. Verdine, X. S. Xie, A
base-excision DNA-repair protein finds intrahelical lesion bases by fast
sliding in contact with DNA. P Natl Acad Sci USA 103, 5752-5757 (2006).
96. E. G. Marklund et al., Transcription-factor binding and sliding on DNA
studied using micro- and macroscopic models. P Natl Acad Sci USA 110,
19796-19801 (2013).
97. O. Givaty, Y. Levy, Protein Sliding along DNA: Dynamics and Structural
Characterization. J Mol Biol 385, 1087-1097 (2009).
98. J. Gorman, E. C. Greene, Visualizing one-dimensional diffusion of proteins
along DNA. Nat Struct Mol Biol 15, 768-774 (2008).
99. A. Tafvizi, L. A. Mirny, A. M. van Oijen, Dancing on DNA: Kinetic
Aspects of Search Processes on DNA. Chemphyschem 12, 1481-1489
(2011).
100. J. M. Schurr, The one-dimensional diffusion coefficient of proteins
absorbed on DNA hydrodynamic considerations. Biophys Chem 9, 413-414
(1975).
101. B. Bagchi, P. C. Blainey, X. S. Xie, Diffusion constant of a nonspecifically
bound protein undergoing curvilinear motion along DNA. J Phys Chem B
112, 6282-6284 (2008).
102. P. C. Blainey et al., Nonspecifically bound proteins spin while diffusing
along DNA. Nat Struct Mol Biol 16, 1224-U1234 (2009).
103. K. Ragunathan, C. Liu, T. Ha, RecA filament sliding on DNA facilitates
homology search (vol 1, e00067, 2012). Elife 2, (2013).
104. J. Dikic et al., The rotation-coupled sliding of EcoRV. Nucleic Acids Res
40, 4064-4070 (2012).
105. I. Echeverria, G. A. Papoian, DNA Exit Ramps Are Revealed in the
Binding Landscapes Obtained from Simulations in Helical Coordinates.
Plos Comput Biol 11, (2015).
106. R. Zwanzig, Diffusion in a Rough Potential. P Natl Acad Sci USA 85,
2029-2030 (1988).
107. T. Ando, J. Skolnick, Sliding of Proteins Non-specifically Bound to DNA:
Brownian Dynamics Studies with Coarse-Grained Protein and DNA
Models. Plos Comput Biol 10, (2014).
108. L. Liu, K. F. Luo, Molecular crowding effect on dynamics of DNA-binding
proteins search for their targets. J Chem Phys 141, (2014).
109. A. J. Pollak, A. T. Chin, F. L. H. Brown, N. O. Reich, DNA Looping
Provides for "Intersegmental Hopping" by Proteins: A Mechanism for
Long-Range Site Localization. J Mol Biol 426, 3539-3552 (2014).
110. T. Hu, B. I. Shklovskii, How a protein searches for its specific site on
DNA: The role of intersegment transfer. Phys Rev E 76, (2007).
55
111. O. G. Berg, Effective Diffusion Rate through a Polymer Network -
Influence of Nonspecific-Binding and Intersegment Transfer. Biopolymers
25, 811-821 (1986).
112. C. Bustamante, M. Guthold, X. S. Zhu, G. L. Yang, Facilitated target
location on DNA by individual Escherichia coli RNA polymerase
molecules observed with the scanning force microscope operating in liquid.
J Biol Chem 274, 16665-16668 (1999).
113. D. Vuzman, A. Azia, Y. Levy, Searching DNA via a "Monkey Bar"
Mechanism: The Significance of Disordered Tails. J Mol Biol 396, 674-684
(2010).
114. M. Bauer, E. S. Rasmussen, M. A. Lomholt, R. Metzler, Real sequence
effects on the search dynamics of transcription factors on DNA. Sci Rep-Uk
5, (2015).
115. A. Einstein, The theory of the Brownian Motion. Ann Phys-Leipzig 19,
371-381 (1906).
116. J. Perrin, The origin of the Brownian movement. Cr Hebd Acad Sci 147,
530-532 (1908).
117. M. Born, R. Oppenheimer, Quantum theory of molecules. Ann Phys-
Leipzig 84, 0457-0484 (1927).
118. D. C. Rapaport, The Art of Molecular Dynamics Simulation. (Cambridge
University Press, ed. 2nd, 2004).
119. W. Heisenberg, Quantum-theoretical reinterpretation of kinematic and
mechanical connections. Z Phys 33, 879-893 (1925).
120. R. W. Hockney, Potential calculation and some applications. Methods
Comput. Phys 9, 135-211 (1970).
121. R. J. Allen, C. Valeriani, P. R. ten Wolde, Forward flux sampling for rare
event simulations. J Phys-Condens Mat 21, (2009).
122. R. J. Allen, P. B. Warren, P. R. ten Wolde, Sampling rare switching events
in biochemical networks. Phys Rev Lett 94, (2005).
123. J. Kastner, Umbrella sampling. Wires Comput Mol Sci 1, 932-942 (2011).
124. S. Kumar, D. Bouzida, R. H. Swendsen, P. A. Kollman, J. M. Rosenberg,
The Weighted Histogram Analysis Method for Free-Energy Calculations
on Biomolecules .1. The Method. J Comput Chem 13, 1011-1021 (1992).
125. R. A, The Biology of Nonspecific DNA-Protein interactions. (CRC Press,
Boca Raton, Fl, 1990).
126. F. C. Collins, G. E. Kimball, Diffusion-Controlled Reaction Rates. J Coll
Sci Imp U Tok 4, 425-437 (1949).
127. D. S. Kim, S. Y. Lee, A Brownian Dynamics Method for Systems of
Nonspherical Brownian Particles. B Korean Chem Soc 11, 127-131 (1990).
128. R. B. Winter, O. G. Berg, P. H. Vonhippel, Diffusion-Driven Mechanisms
of Protein Translocation on Nucleic-Acids .3. The Escherichia-Coli-Lac
Repressor-Operator Interaction - Kinetic Measurements and Conclusions.
Biochemistry-Us 20, 6961-6977 (1981).
129. O. G. Berg, R. B. Winter, P. H. Vonhippel, Diffusion-Driven Mechanisms
of Protein Translocation on Nucleic-Acids .1. Models and Theory.
Biochemistry 20, 6929-6948 (1981).
130. S. C. Dillon, C. J. Dorman, Bacterial nucleoid-associated proteins, nucleoid
structure and gene expression. Nat Rev Microbiol 8, 185-195 (2010).
56
131. M. Tabaka, T. Kalwarczyk, R. Holyst, Quantitative influence of
macromolecular crowding on gene regulation kinetics. Nucleic Acids Res
42, 727-738 (2014).
132. A. C. Seila et al., Divergent Transcription from Active Promoters. Science
322, 1849-1851 (2008).
133. S. K. Banik, T. Ambjornsson, R. Metzler, Stochastic approach to DNA
breathing dynamics. Europhys Lett 71, 852-858 (2005).
134. D. Chandler, Statistical-Mechanics of Isomerization Dynamics in Liquids
and Transition-State Approximation. J Chem Phys 68, 2959-2970 (1978).
135. P. H. Richter, M. Eigen, Diffusion Controlled Reaction-Rates in Spheroidal
Geometry - Application to Repressor-Operator Association and Membrane-
Bound Enzymes. Biophys Chem 2, 255-263 (1974).
Copyright © 2022 FDOKUMEN