Biospecific fractionation matrices for sequence specific endonucleases
Upload
independentCategory
view
2download
0
Ž .Marine Chemistry 64 1999 199–227
A diffusion-reaction model of carbon isotope fractionation inforaminifera
Richard E. Zeebe ), Jelle Bijma 1, Dieter A. Wolf-Gladrow 2
Alfred-Wegener-Institut fur Polar- und Meeresforschung, Postfach 12 01 61, D-27515, BremerhaÕen, Germany¨
Received 17 September 1997; accepted 29 June 1998
Abstract
Fossil foraminiferal shells are utilized in paleoceanography to extract information about environmental conditions of thepast ocean. Based on several assumptions, the ratio of 13C and 12C preserved in their shells is used to reconstruct, forexample, the paleoproductivity or the oceanic pCO . Metabolism of the living organism and the sea water chemistry,2
however, can influence the incorporation of carbon isotopes during calcification such that the signal of the shells differ fromŽthe signal of the sea water. These effects occur because the chemical microenvironment of the foraminifer boundary layer
. 13thickness ;500 mm differs from the bulk sea water. Here, we present a numerical model that calculates the d C of theforaminiferal shell as a function of the sea water chemistry and the magnitude of vital effects. Concentration profiles of thechemical species of the carbonate system within the microenvironment of foraminifera are obtained by solving diffusion-re-action equations. The compounds of dissolved forms of carbon dioxide containing either the stable carbon isotope 13C or 12Care considered separately. Spherical symmetry of the foraminifer is assumed. The model outcome is compared to resultsfrom culture experiments with the planktonic foraminifer Orbulina uniÕersa. Model results indicate that the interactionbetween vital effects of the foraminifer and the sea water chemistry can account for changes in the d
13C of foraminiferalcalcite of 0.3–0.4‰ when glacial and interglacial sea water conditions are compared. These effects occur even though thed
13C of the total dissolved inorganic carbon is kept constant. Thus, changes in sea water chemistry should be distinguishedfrom events which changed the d
13C of the inorganic carbon of the sea water. q 1999 Elsevier Science B.V. All rightsreserved.
Keywords: foraminifera; paleoceanography; sea water; carbon isotopes
1. Introduction
The d13C of foraminiferal shells is routinely used as a proxy for d
13C of the total dissolved inorganic carbonŽ .SCO of the sea water. This value can, for example, be employed to yield information about carbon fluxes2
Ž .between ocean and land biosphere on geological time scales e.g., Shackleton et al., 1983 . During the last
) Corresponding author. Tel.: q49-471-4831-812; Fax: q49-471-4831-425; E-mail: [email protected] Present address: Geosciences, University of Bremen, P.O. Box 330 440, D-28334 Bremen, Germany. E-mail: [email protected] E-mail: [email protected].
0304-4203r99r$ - see front matter q 1999 Elsevier Science B.V. All rights reserved.Ž .PII: S0304-4203 98 00075-9

( )R.E. Zeebe et al.rMarine Chemistry 64 1999 199–227200
decades it has become evident that foraminiferal calcite does not record the characteristics of the sea water by asimple 1:1 relationship. It was clearly demonstrated that the metabolism of the organism and the chemical stateof the sea water affect the d
13C of the calcite shells in the species Orbulina uniÕersa, Globigerina bulloidesŽ .Spero and Williams, 1988; Spero and Lea, 1996; Spero et al., 1997 , Globigerinoides sacculifer, and
Ž .Globigerinoides ruber Bijma et al., unpublished data . These results demand an understanding of themechanisms which influence the stable carbon isotope discrimination within the shells before experimentally
Ž 13 w 2yx.determined relationships e.g., d C vs. CO can be extrapolated back into the past for the reconstruction of3
ocean history.Foraminifera are unicellular marine organisms which build calcareous shells of diameters ranging approxi-
Žmately from 0.1 to 1 mm for review of these and other calcareous species, see for example, Hemleben et al.,.1989 and Wefer and Berger, 1991 . Foraminifera are distributed throughout the entire world ocean, living in a
benthonic or a planktonic habitat. A total of forty-four recent planktonic foraminiferal species are known, fromwhich twenty-one species are common in the world’s ocean. Planktonic foraminifera secrete a calcite testŽ .CaCO that includes a series of chambers coiled about an axis according to a planispiral or trochospiral mode.3
The geographic distribution of the different species is restricted to global climate belts and five major faunalŽ . Ž .provinces polar, subpolar, transitional, subtropic, and tropic were recognized e.g., Be, 1977 . The distribution´
of species appears to be clearly related to water mass temperature but the factors governing abundance andrange are certainly more complex. Foraminifera can be divided into non-spinose and spinose species. In general,the non-spinose species are herbivorous and most of the spinose species are carnivorous and harbor large
Ž .numbers of actively photosynthesizing symbiotic algae between their spines Hemleben et al., 1989 .The assumption inherent to all proxies is that they are mostly unequivocal and truly reflect the characteristics
of the reconstructed parameter. For example, it is often presupposed that the isotopic signal of oxygen andcarbon of the sea water is preserved in foraminiferal shells and is not affected by the living organism. However,life processes of the host-symbiont system such as respiration, photosynthesis of the symbiotic algae, and
Žcalcification can strongly influence the signal. These life processes are called vital effects Spero and DeNiro,.1987; Spero and Williams, 1988 . In addition, it was recently demonstrated for the planktonic foraminifera O.
uniÕersa and G. bulloides that the isotopic composition of the calcite strongly depends on the carbonatechemistry of the sea water even if the isotopic composition of SCO is not changed. A change of the seawater2
Ž Ž ..chemistry for the last glacial maximum 0.2–0.3 units increase in pH as proposed by Sanyal et al. 1995 would13 Ž .produce a 0.3 to 0.4‰ decrease in the d C of foraminiferal shells Spero et al., 1997 .
The differences between the signal of the bulk medium and the signal stored in the shells may be explainedby an alteration of the isotopic composition of carbon at the site of calcification; i.e., the carbonate system andthe d
13C change markedly within the microenvironment of the foraminifer. To elucidate the nature of theseprocesses, we have developed a numerical model of the carbonate system within the foraminiferal microenviron-ment that includes calculations of the concentrations of the stable carbon isotopes 13C and 12 C. The goal of thispaper is to provide a model that explains changes of the d
13C of foraminiferal calcite attributed to changes ofthe sea water chemistry and vital effects which otherwise could be misinterpreted as changes of the d
13C of thesea water.
2. Modelled species
As model species for carbon isotope fractionation in foraminiferal calcite the planktonic foraminifer O.ŽuniÕersa was chosen the applicability of our results to other species will be discussed in the concluding
.section . O. uniÕersa secretes a terminal spherical chamber which contains 90 to 100% of the total shell mass.This species is therefore ideal for culture experiments and for numerical modeling because the calcite of theterminal chamber is precipitated under controlled laboratory conditions. In addition, spherical geometry of theshell is an assumption for model purposes and is fulfilled by this species. Since numerous studies have been

( )R.E. Zeebe et al.rMarine Chemistry 64 1999 199–227 201
carried out to examine the effect of light, temperature, and the sea water chemistry on the isotopic compositionŽ .of the shell of O. uniÕersa e.g., Spero and DeNiro, 1987; Spero and Williams, 1988; Spero et al., 1997 the
model outcome can be directly compared to laboratory investigations.O. uniÕersa has a tropical to temperate distribution and the salinity and temperature limits are 23–46 and
128–318C, respectively. Like most spinose species, O. uniÕersa is carnivorous and mainly feed on calanoidŽcopepods at a rate of one to two per day. A large number of photosynthetic active symbiotic algae cells up to
.ca. 7000 are harbored between the spines of O. uniÕersa. For a more detailed description of O. uniÕersa andŽ .associated life processes, see Wolf-Gladrow et al. 1999, this issue .
3. Model description
ŽThe model is based on the diffusion-reaction model in spherical geometry by Wolf-Gladrow et al. 1999, this.issue which describes the influence of vital effects on the inorganic carbonate system in the vicinity of
foraminiferal shells. A brief recapitulation of this model will be given in Section 3.1, whereas Section 3.2 willfocus on the inclusion of the different stable carbon isotopes to calculate the inorganic isotopic fractionation ofthe species of the carbonate system. Section 3.3 will describe the parameterization of the biological processesassociated with the host-symbiont system such as respiration, photosynthesis, and calcification.
3.1. The existing diffusion-reaction model
Ž .The diffusion-reaction model by Wolf-Gladrow et al. 1999 calculates concentration profiles of chemicalspecies of the carbonate system as a function of the distance to the center of the foraminiferal shell. The bulk
y 2y Ž . Ž .ysea water concentrations of CO , HCO , CO , B OH , and B OH depend on temperature, salinity, SCO ,2 3 3 3 4 2Ž .and the pH. Given the equilibrium values of the chemical reaction constants DOE, 1994 , the bulk
concentrations can be calculated. The volume of the water surrounding the foraminifer is large compared to theŽ .size of the foraminifer, i.e., far away from the shell ;3000 mm the concentration of all chemical substances
Ž .will equal their bulk values outer boundary condition . In the close vicinity of the foraminiferal shell, however,where CO is released by respiration, carbon is taken up through photosynthesis, and calcite is precipitated, the2
concentrations of the chemical species differ from the bulk medium. A schematic representation of the model isgiven in Fig. 1.
Ž .The temporal change in the concentration c r,t of a species of the carbonate system at distance r to thecenter of the shell is determined by diffusion, chemical reaction and uptake or release of this species. At steadystate, the fluxes are in equilibrium and EcrEt is zero. Thus, the model equations are of the form:
E c r ,tŽ .0s sDiffusionqReactionqUptake
E t
3.1.1. DiffusionThe diffusion term in spherical coordinates reads:
D d dcc 2Diffusions r2 ž /d r d rr
where D is the diffusion coefficient of the chemical species c. Diffusion coefficients at a specific temperaturecŽ . Ž . y 2y q ywere taken from Jahne et al. 1987 for CO , from Li and Gregory 1974 for HCO , CO , H , and OH ,¨ 2 3 3
Ž . Ž . Ž . Ž .yfrom Mackin 1986 for B OH , and from Boudreau and Canfield 1993 for B OH . The temperature and3 4Žsalinity dependence of the diffusion coefficients were taken into account by the Stokes–Einstein relation e.g.,
.Cussler, 1984 .

( )R.E. Zeebe et al.rMarine Chemistry 64 1999 199–227202
Ž .Fig. 1. Schematic illustration of the spherical model of the foraminifer. The foraminiferal shell is approximated by a sphere R . Respired1
CO diffuses through apertures of the shell. Calcification is modelled by the uptake of CO2y and Ca2q at the surface of the shell. The2 3Ž .photosynthesizing symbiotic algae are attached to the spines of the foraminifer and are located within a halo around the shell R . Model2
equations describe diffusion and chemical conversion of dissolved carbon compounds including the stable carbon isotopes 13C and 12 C.
3.1.2. Chemical reactionsŽThe chemical reactions between carbon species, water, and borate considered in the model are in this paper
Ž . .the notation CO [CO aq. is used :2 2
kq1 q yCO qH O | H qHCO 1Ž .2 2 3ky1
kq4y yCO qOH | HCO 2Ž .2 3ky4
kq52y q yCO qH | HCO 3Ž .3 3ky5
kq6 q yH O | H qOH 4Ž .2ky6
kq7 y qB OH qH O | B OH qH 5Ž . Ž . Ž .3 42ky7
where k and k are reaction rates of the forward and backward reaction, respectively. In the literature, k andq y 2Ž .k are often used for reactions including carbonic acid H CO and are therefore omitted here. Carbonic acid3 2 3
Ž .which always occurs in negligible concentrations is taken into account by the effective reaction 1 . For detailsŽ .and values of the reaction rates, see Wolf-Gladrow and Riebesell 1997 . Equilibrium constants K are related to
Žthe reaction rates by Ksk rk . Numerical values for equilibrium constants depending on sea waterq y

( )R.E. Zeebe et al.rMarine Chemistry 64 1999 199–227 203
. Ž .temperature and salinity were taken from DOE 1994 . Fig. 2 displays the concentrations of the dissolvedcarbon species CO , HCOy, and CO2y in equilibrium as a function of pH. The concentrations of CO and2 3 3 2
CO2y exhibit large changes in the pH range from 7 to 9. While the concentration of CO decreases from about3 2y1 2y y1 Ž200 to 1 mmol kg , the concentration of CO increases from about 10 to over 800 mmol kg note the3
. y y1logarithmic scale of the vertical axis . Even though, HCO changes by ca. 800 mmol kg within the3
considered pH range the relative change in the concentration of HCOy is small compared to the relative3
variations in the concentrations of CO and CO2y.2 3
3.1.3. UptakeUptake of species of the carbonate system is either specified as sourcersink-term in the model equations or
as a boundary condition. The volume described by the model is a shell of a sphere extending from the surface ofŽ . Ž .the foraminiferal shell inner boundary, rsR to the bulk sea water outer boundary, R s10=R .1 3 1
Calcification was implemented in the model by the uptake of CO2y and Ca2q ions at the inner boundary, i.e.,3
the inner boundary condition for CO2y is given by the calcification flux at the surface of the shell.3
Photosynthesis and respiration of the symbiotic algae occur within a halo surrounding the shell, resulting in ay Žsink and source term in the equations for CO and HCO the neutrality of ion fluxes into the cell during2 3
HCOy uptake is modelled by a simultaneous Hq uptake or the release of OHy ions, for further discussion, see3Ž ..Wolf-Gladrow et al. 1999 . Respiration of the foraminifer represents the inner boundary condition for CO .2
3.1.4. Diffusion-reaction equationsAs an example, the diffusion-reaction equation for CO is considered:2
w xD d d COCO 22 2 q y y CO CO2 2w x w x w x0s r q k H qk HCO y k qk OH CO q f y fŽ . Ž .y1 y4 3 q1 q4 2 res phs2 ž /d r d rr6Ž .
where D is the diffusion coefficient of CO , r is the distance to the center of the foraminiferal shell, and k’sCO 22
Ž .are reaction constants Wolf-Gladrow and Riebesell, 1997 . The source and sink of CO through respiration and2
photosynthesis of the symbiotic algae, is denoted by f CO 2 and f CO 2, respectively. The complete set of equationsres phsŽ 13 12 .for total carbon compounds Cs Cq C for the various components of the carbonate system is given in
Ž .Wolf-Gladrow et al. 1999 .
Fig. 2. Concentrations of the dissolved carbon species as a function of pH. While the concentration of CO decreases dramatically within2
the considered pH range, the concentration of CO2y increases.3

( )R.E. Zeebe et al.rMarine Chemistry 64 1999 199–227204
3.2. Equations for 13C isotopes
Ž .Model Eqs. such as 6 describe the reaction, diffusion and uptake of the components of the carbonatew x w yx w 2yxsystem. The concentration of each carbon species, i.e., CO , HCO , or CO , represents the concentration2 3 3
of the sum of the stable carbon isotopes 13C and 12 C within this species. We found that solving equations for13C and for the sum of 13C and 12 C was equivalent to the concept of solving equations for 13C and for 12 C whenthe mathematics were done thoroughly. In this paper, the former approach was chosen.
12 13CO s CO q CO2 22
y 12 y 13 yHCO s H CO q H CO3 3 3
13122y 2y 2yCO s CO q CO3 3 3
To determine the isotopic ratio of the carbon species within the microenvironment of the foraminifer three moreequations for 13CO , H13COy, and 13CO2y are included. Once, the concentration profiles of the 13C species2 3 3
Ž13 12 . 13have been found, the isotopic ratio Cr C and thus the d C values of the carbon species can be calculated.The chemical reactions including 13C are:
kXq113 13q yCO qH O | H qH CO 7Ž .2 2 3Xky1
kXq413 13y yCO qOH | H CO 8Ž .2 3Xky4
kXq513 132y q yCO qH | H CO 9Ž .3 3Xky5
where the kX are the reaction rates for the chemical reactions associated with 13C compounds. Therefore, thediffusion-reaction equations for the 13C components read13CO :2
1313 d COD d 2CO 13X X2 2 q yw x0s r q k H qk H COŽ .y1 y4 32 ž /d r d rr
13 13 13X X y CO CO2 2w xy k qk OH CO q f y f 10Ž .Ž .q1 q4 2 res phs
H13COy:3
13 y13 d H COD d 3H CO 13 13X X3 2 q yw x0s r qk CO yk H H COq1 2 y1 32 ž /d r d rr
y13 13 13 13 13X X X Xy y y q 2y HCO 3w x w xyk H CO qk CO OH yk H CO qk H CO y f 11Ž .y4 3 q4 2 y5 3 q5 3 phs
13CO2y:3
13 2y13 d COD d 3CO 13 13X X3 2 y q 2yw x0s r qk H CO yk H CO 12Ž .y5 3 q5 32 ž /d r d rr

( )R.E. Zeebe et al.rMarine Chemistry 64 1999 199–227 205
The diffusion-reaction equations for Hq and OHy do not need to be modified because the 13C compoundsŽ q y.which react with H and OH are already included in the total concentration of the carbon species. The
13 Ž . Ž . y12 13diffusion coefficient for CO was taken from O’Leary 1984 D rD s1.0007 , while for HCO and2 CO CO 32 2
CO2y the diffusion coefficients of the 13C and 12 C species were assumed to be equal. The HCOy and CO2y3 3 3
ions are surrounded by a significant number of water molecules of hydration which contribute to the effectivesize of the molecule. Thus, the effect of the 13C atom on the effective size of the molecule and thus on the
Ž .diffusion coefficient is probably very small O’Leary, pers. comm. 1996 .The chemical equilibrium constants of the corresponding reactions of the 13C species are:
13q yw xH H CO3XK s 13Ž .1 13CO2
13X yH COK 31s 14Ž .13 yK w xCO OHw 2
13 2y qw xCO H3XK s 15Ž .2 13 yH CO3
where K X and K X correspond to the first and second dissociation constant of carbonic acid; K is the ion1 2 w
product of water. The reaction rates kX and equilibrium constants K X for the 13C species are not the same as for12 C. Their values must be inferred from measurements of the isotopic composition of the carbon species.
3.2.1. Equilibrium constantsThe differences between the equilibrium constants of the chemical reactions of the 13C and 12 C species lead
to fractionation effects between the different carbon species. In equilibrium CO is about 9‰ ‘lighter’ than2y Ž 13 . 2y yHCO i.e., the d C of CO is more negative , while CO is about 0.5‰ ‘lighter’ than HCO at 258C. To3 2 3 3
comprehend the mathematics involved in the following calculations it is useful to recapitulate the definitions ofR, a , ´ , and d values. For example, the isotopic ratio R of CO is defined as:2
13CO2R sCO 122 CO2
whereas the fractionation factor between CO and HCOy is defined by a y :2 3 ŽCO yHCO .2 3
RCO 2ya sŽCO yHCO .2 3
yRHCO 3
Since a values are generally very close to 1.0, ´ values are used to express the isotopic ratio in per mill:
´ y s a y y1 =1000.Ž .ŽCO yHCO . ŽCO yHCO .2 3 2 3
The d13C is used to compare isotopic compositions with a standard ratio. For example, the d
13C of CO is2
defined as
RCO13 2d C s y1 =1000CO 2 ž /RPDB

( )R.E. Zeebe et al.rMarine Chemistry 64 1999 199–227206
Ž13 12 .where R s0.01124 is the standard ratio Cr C of the fossil belemnite from the Pee Dee Formation inPDBŽ .South Carolina O’Leary, 1981 . The fractionation factors ´ for carbonate species and calcite were taken from
Ž .Mook 1986 :
´ [´ y sy9483rTq23.89 16Ž .Ž .1 CO g yHCOŽ .2 3
´ [´ sy373rTq0.19 17Ž .Ž .2 CO yCO gŽ .2 2
´ [´ y sy9866rTq24.12 18Ž .3 ŽCO yHCO .2 3
´ [´ 2y y sy867rTq2.52 19Ž .4 ŽCO yHCO .3 3
´ [´ y sy4232rTq15.10 20Ž .Ž .5 CaCO calc yHCOŽ .3 3
´ [´ 2y sy3341rTq12.54 21Ž .Ž .6 CaCO calc yCOŽ .3 3
Ž . Ž . Ž .where T is the absolute temperature in Kelvin. Eq. 21 was calculated from Eqs. 19 and 20 .Ž . Ž .Using Eqs. 18 and 19 , and the definition of ´ values, isotopic ratios a for the dissolved forms of carbon
dioxide can be calculated.
13 12CO r CO2 2 y3a [ s´ =10 q1 22Ž .3 313 y 12 yH CO r H CO3 3
13 122y 2yCO r CO3 3 y3a [ s´ =10 q1 23Ž .4 413 y 12 yH CO r H CO3 3
Ž . Ž . 13Isotopic ratios for the chemical reactions of the total carbon compounds 1 - 5 and the C compoundsŽ . Ž .7 - 9 are given by the ratio of the equilibrium constants:
13 w xCO r CO2 2XK rK s 24Ž .1 1 13 y yž /H CO r HCO3 3 1
13 2y 2yCO r CO3 3XK rK s 25Ž .2 2 13 y yž /H CO r HCO3 3 2
y Ž . Ž .The conversion between CO and HCO occurs mainly via reaction 7 at low pH and via reaction 8 at2 3
high pH. However, the isotopic ratio of CO and HCOy in equilibrium does not depend on the reaction way2 3Ž . ybetween the both species thermodynamic constraint . Thus, the isotopic ratio of CO and HCO in equilibrium2 3
Ž . X X 13is given by Eq. 24 . The chemical equilibrium constants K and K for the reactions of the C compounds1 2Ž .can therefore be calculated from the fractionation factors given by Mook and the isotopic ratios Eqs. 24 and
Ž .25 .
K X sK raX 26Ž .1 1 3
K X sK =aX 27Ž .2 2 4
X w13 x w12 xwhere factors a slightly differ from a because the fractionation factors a are given for the ratio C r CX w13 x Žw13 x w12 x. Xwhile KrK reflects the ratio of C r C q C . For example, a is given by:4
13 2y 2y1y CO r CO3 3Xa sa4 4 13 y y1y H CO r HCO3 3

( )R.E. Zeebe et al.rMarine Chemistry 64 1999 199–227 207
X 13 X ŽThe error using a instead of a expressed in terms of d C would be in the order of 0.1‰. Thus, a exact.value was used in the model calculations since even small changes are important when discussing for e.g., the
d13C of the total dissolved carbon of the ocean.
3.2.2. Reaction ratesEquilibrium fractionation is a result of the kinetic fractionation of the forward and backward chemical
y Ž Ž . . yreaction. For example, the hydration step of CO to HCO reaction 1 forward results in a lighter HCO of2 3 3Ž Ž . .about 13‰. On the other hand, the dehydration step reaction 1 backward results in a lighter CO of about2
Ž .22‰ O’Leary et al., 1992 . The difference between the forward and backward reaction equals the equilibriumy Ž Ž .fractionation between CO and HCO of about 9‰ the equilibrium value given by Mook 1986 is 8.97‰ at2 3
. Ž X. Ž X .258C . Generally, the relationship between equilibrium fractionation KrK and kinetic fractionation k rk" "
can be written as
K k =kXq y
sas 28Ž .X XK k =ky q
where a is the equilibrium fractionation factor of the corresponding chemical reaction. Values for the ratios ofŽ Ž . Ž . .reaction rates for the hydration and hydroxylation of CO Eqs. 1 and 2 forward implemented in the model2
are
kX rk s0.987 at 248C, OX Leary et al., 1992 29Ž .q1 q1
kX rk s0.989 OX Leary pers. comm. 30Ž . Ž .q4 q4
The temperature dependence of the kinetic fractionation was taken into account by the temperature dependenceŽ Ž . Ž ..of the equilibrium fractionation a is a function of the temperature, compare e.g., Eqs. 18 and 22 . Values
Ž Ž . Ž . .for the dehydration and dehydroxylation Eqs. 1 and 2 backward were calculated from equilibriumfractionation:
kX rk s0.987=a 31Ž .y1 y1 3
kX rk s0.989=a 32Ž .y4 y4 3
The fact that there are no data available for kX , and kX is of minor importance because the equilibriumq5 y5y 2y Ž .fractionation between HCO and CO is very small ;0.5‰ . It is much smaller than the fractionation3 3
between CO and HCOy because the proton transfer reaction is several orders of magnitude faster than the2 3X X Ž .carbon–oxygen bond change reaction. The values of k and k were set consistently with Eq. 28 . Theq5 y5
effect on the model outcome was negligible when kX rk and kX rk were varied between 1 and 0.999,q5 q5 y5 y5
which is twice the equilibrium fractionation.
3.2.3. Initializing d13C Õalues
w13 12 xIn addition to the initialization of the bulk concentrations of the carbon species Cq C , which is done by13 Ž 13using chemical equilibrium constants, the bulk concentrations of the C carbon species and thus the bulk d C
. 13values have to be initialized. This is done by using the d C value of the total dissolved CO which is an input2
parameter to the model.The d
13C value of the total dissolved CO is defined as:2
13 13 13 13y 2yw x w xy 2yd C [ d C CO qd C HCO qd C CO r SCOž /SCO CO 2 HCO 3 CO 3 22 2 3 3

( )R.E. Zeebe et al.rMarine Chemistry 64 1999 199–227208
Fig. 3. Fractionation between the species of the carbonate system at pH 8.15 and a temperature of 208C. Values for equilibrium fractionationŽ . 13are taken from Mook 1986 . The d C of SCO is 2‰. Variations in pH from 7.5 to 9 have little effect on the isotopic compositions of the2
Ž . ycarbon species -0.2‰ . The large fractionation effect between HCO and CO results from the break of the carbon–oxygen bond during3 2
chemical conversion.
with
RCO13 2d C s y1 =1000CO 2 ž /RPDB
R yHCO13 3yd C s y1 =1000HCO 3 ž /RPDB
R 2yCO13 32yd C s y1 =1000CO 3 ž /RPDB
Ž . Ž . y3 13Using fractionation factors Eqs. 18 and 19 , and neglecting terms ´=10 , the bulk d C values of thecarbon species can be determined: 3
2yw x´ CO q´ CO3 2 4 313 13yd C sd C y 33Ž .HCO S CO3 2 w xSCO2
d13C sd
13C y q´ 34Ž .CO HCO 32 3
d13C 2y sd
13C y q´ 35Ž .CO HCO 43 3
Fig. 3 displays the d13C of the different carbon species and of CaCO at a temperature of 208C and a d
13C3 S CO 2
of 2‰ at pHs8.15. The d13C of the carbon species change less than 0.2‰ within the pH range from 7.5 to 9.
This range covers the pH changes in the ambient environment of a foraminifer as well as changes of sea waterconditions during culture experiments. The d
13C of HCOy and CO2y are similar because the addition or3 3
release of Hq has little effect on the isotopic fractionation. The d13C of CO is, however, about 9‰ more2
negative than the d13C of CO2y. This effect can be explained by the break-up of the carbon–oxygen bond3
which leads to a higher fractionation than the proton transfer in the case of HCOy and CO2y.3 3
3 Ž y3 .In the numerical model the exact formula was used including terms ´=10 which are omitted here for simplicity .

( )R.E. Zeebe et al.rMarine Chemistry 64 1999 199–227 209
3.3. Mathematical description of biological processes
Ž .In the previous sections, the abiotic part chemical reactions, inorganic isotope fractionation, etc. of themodel was described. Vital effects of the living organism such as respiration, photosynthesis of the symbioticdinoflagellates, and calcification are also included in the model calculations. The mathematical description ofthese biological processes are presented in this section. Total fluxes of the life processes are denoted by an
Ž .uppercase F e.g., F whereas a lowercase f refers to the uptake or release of a chemical species at distance rresŽ CO 2Ž ..to the center of the foraminiferal shell e.g., f r .phs
3.3.1. RespirationRespiration of the foraminifer and of the symbiotic algae produce CO which is depleted in 13C. Isotopic2
analyses of Artemia used as food source in culture experiments with O. uniÕersa gave a d13C value of
Ž .y21.9‰ Spero, 1992 . It was assumed that the respired CO exhibits the same isotopic composition as the2
food source and the d13C of the respiration flux F was therefore set at y21.9‰. The 13C flux was determinedres
from the definition of the d13C values:
13F r12Fres res13d C s y1 =1000 36Ž .F ,res ž /RPDB
and the total flux F :res
F s12F q13F 37Ž .res res res
Ž . Ž .Combination of Eqs. 36 and 37 yields:
113F sF 38Ž .res res y113 y31q R d C =10 q1Ž .PDB F ,res
3.3.2. PhotosynthesisPhotosynthesis of the microalgae preferentially consumes 12 CO and possibly H12 COy, resulting in an2 3
13 Ž12 13 .enrichment of C within the microenvironment of the foraminifer. The uptake of CO CO q CO by2 2 2
photosynthesis is described by Michaelis–Menten kinetics, while the HCOy uptake is calculated as the3Ž Ž ..difference between the total carbon uptake and the CO uptake for detail see Wolf-Gladrow et al. 1999 . The2
d13C of the photosynthetic product therefore depends on the ratio of the CO and HCOy flux because the2 3
carbon sources exhibit different d13C values. In this section an expression will be derived for the 13C fluxes of
CO and HCOy during photosynthesis. Once, these fluxes have been determined, the enrichment of 13C in the2 3
microenvironment of the foraminifer can be calculated. This enrichment is eventually reflected in the calcite.13 Ž .From the definition of the d C example CO :2
13 f CO 2 r r12 f CO 2 rŽ . Ž .phs phs13 CO 2d C r s y1 =1000Ž .phs ž /RPDB
and the fluxes at r:
f CO 2 r s12 f CO 2 r q13 f CO 2 rŽ . Ž . Ž .phs phs phs

( )R.E. Zeebe et al.rMarine Chemistry 64 1999 199–227210
one obtains:
113 CO CO2 2f r s f r 39Ž . Ž . Ž .phs phs y113 CO y321q R d C r =10 q1Ž .ž /PDB phs
1y y13 HCO HCO3 3f r s f r 40Ž . Ž . Ž .phs phs y1y13 HCO y331q R d C r =10 q1Ž .ž /PDB phs
CO 2Ž . HCOy3 Ž . 12 13 12 y 13 ywhere f r and f r are the fluxes of CO q CO and H CO qH CO through photosynthesisphs phs 2 2 3 3
13 13 CO 2Ž . 13 HCOy3 Ž .associated with the respective d C of these fluxes, namely d C r and d C r . Since these fluxesphs phs
have already been calculated by the model via Michaelis–Menten kinetics, the remaining unknown variable isthe d
13C of the CO and HCOy flux, respectively. The d13C of the CO and HCOy uptake of the symbionts is2 3 2 3
calculated as:
d13CCO 2 r sd
13C r y´ CO 2 41Ž . Ž . Ž .phs CO p2
d13C HCOy
3 r sd13C y r y´ HCOy
3 42Ž . Ž . Ž .phs HCO p3
where ´ CO and ´ HCOy3 is the fractionation factor for CO and HCOy uptake, respectively. The literature2p p 2 3
Žreports values for the fractionation in marine dinoflagellates between 18‰ to 29.7‰ Descolas-Gros and13 13.Fontugne, 1985; Wong and Sackett, 1978; Falkowski, 1991 , referring to an overall ´ [d C yd C .p S CO POM2
In order to cover the range of the reported fractionation values, the fractionation factors ´ CO 2 and ´ HCOy3 werep p
set to a value of 18‰ and are therefore assumed to be identical for CO and HCOy uptake: If HCOy was the2 3 313 Ž 13 13 yexclusive source for photosynthesis the d C of organic matter would be about y18‰ d C sd HCOPOM 3
HCOy3 . 13y´ f0–18sy18 . If CO was the exclusive source for photosynthesis the d C of organic matterp 2
Ž 13 13 CO 2 .would be about y27‰ d C sd C y´ fy9–18sy27 .POM CO p2
The fractionation of carbon isotopes during carbon assimilation by phytoplankton is a complex process andŽsubject of intensive investigations e.g., Rau et al., 1992; Francois et al., 1993; Goericke and Fry, 1994; Rau et
. 13al., 1996 . These studies demonstrate that the C fractionation may vary with temperature, the carbon dioxideconcentration of the bulk medium, nutrients, and light. For example, a common observed feature is that ´ isp
Ž . Ž .decreasing with decreasing CO concentration. This effect is included in Eqs. 41 and 42 because the total2Ž .carbon uptake of the symbionts is divided into CO uptake described by Michaelis–Menten kinetics and2
y Ž .HCO uptake calculated as the difference between total carbon demand and CO uptake . The overall3 2Ž .fractionation ´ is therefore decreasing with decreasing CO concentration because more carbon in the formp 2
of HCOy is taken up which is isotopically heavier than the carbon dioxide.3
Unfortunately, no data are available on the response of the 13C fractionation in the symbiotic dinoflagellatesto variations of other parameters such as temperature, nutrients, and light. Hence, constant ´ CO 2 and ´ HCOy
3p p
were chosen in the model to avoid further complications at this stage and because the fractionation of carbonisotopes during symbiont photosynthesis is one of the many aspects of the entire concept.
3.3.3. CalcificationThe goal of the model is to calculate the d
13C of the shell to understand the interaction of vital effects and thesea water chemistry which affect the isotopic composition of the calcite. The model results will be used toinvestigate to which extent the life processes mask the d
13C of SCO that the shell d13C is thought to have. In2
the previous sections, it was described how respiration and photosynthesis are implemented in the model andthereby affect the isotopic composition of CO and HCOy in the vicinity of the foraminifer. Part of the2 3
isotopically altered carbon diffuses away from the shell, part of it is chemically converted and eventuallyincorporated into the shell.
Chamber calcification in foraminifera commences at a so called primary organic membrane on which calciteŽ . 2yis precipitated e.g., Hemleben et al., 1989 . Laboratory observations indicate that CO is probably the3

( )R.E. Zeebe et al.rMarine Chemistry 64 1999 199–227 211
primary source for calcification because shell weight increases with increasing carbonate ion concentrationŽ . 2yBijma et al., in press . If not stated otherwise, calcification in the model is described by the uptake of CO3
2q Ž yand Ca at the inner boundary rsR , where R is the radius of the shell the effect of HCO utilization is1 1 3. 2y 13 12discussed in Section 4.3.1 . The process thus consumes CO from a reservoir with a certain Cr C ratio3
w13 2yx w12 2yxgiven by CO r CO . In addition, the calcification reaction discriminates against the light isotope;3 R 3 R1 12y ŽŽ . .CaCO is 1‰ ‘heavier’ than CO Romanek et al., 1992 , see Fig. 3 . Thus, the ratio of the calcification3 3
fluxes can be written as13 2y13 COF 3 Rclc 1sa . 43Ž .612 12 2yF COclc 3 R1
2y Ž .2ywhere a sa is the discrimination factor between CO and CaCO . Eq. 43 indicates that6 ŽCaCO Žcalc .yCO . 3 33 313F is itself a function of the solution of the model equations because the right hand side is calculated byclcw13 2yx w12 2yx 13numerical iteration. Thus, the calculated concentration profiles of CO and CO , and F must3 3 clc
Ž . 13 13satisfy the inner boundary condition 43 . Once F has been calculated, the d C of the shell is eventuallyclc
given by:13F r12Fclc clc13
d C s y1 =1000 44Ž .sh ž /RPDB
4. Model results
In this section, we will investigate the influence of vital effects as well as the interaction between vital effectsŽ 13 .and the sea water chemistry on the model output i.e., the d C of the foraminiferal calcite . First, a qualitative
introduction will be given in which the influence of respiration, calcification, and symbiont-photosynthesis isŽ .described. Subsequently, the model results for a combination of vital effects dark and light experiments and
the model output including sea water chemistry changes will be discussed in detail. Eventually, model resultsare compared to laboratory data for O. uniÕersa. Based on this comparison it can be tested if the modeladequately describes fractionation effects in O. uniÕersa and therefore furthers our understanding of theunderlying mechanisms.
4.1. Vital effects
The influence of vital effects such as respiration, calcification, and photosynthesis on the carbonate system inŽ .the vicinity of the foraminifer was described by Wolf-Gladrow et al. 1999 . To investigate the associated
fractionation effects, we will now discuss the qualitative response of the shell d13C to the isotopically altered
carbonate environment which is produced by vital effects.
4.1.1. QualitatiÕe considerationRespiration of the symbiotic algae and the foraminifer produce CO which is depleted in 13C. When2
Ž .inorganic carbon is fixed by the enzyme Rubisco ribulose biphosphate carboxylase oxygenase duringŽ .photosynthesis it is associated with a large isotope fractionation of about y29‰ O’Leary et al., 1992 . The
produced organic matter consequently exhibits a negative d13C value, i.e., it is isotopically ‘light’. The isotopic
composition of the respired CO of the symbiotic algae reflects the d13C of the carbon during uptake and is2
13 Žtherefore depleted in C. Similarly, respired CO of the foraminifer stems from organic matter preferential2.food source are copepods and is also ‘light’. In summary, the microenvironment is enriched in ‘light’ carbon
by respiration. Photosynthesis of the symbiotic algae, on the other hand, preferentially utilizes 12 C over 13C

( )R.E. Zeebe et al.rMarine Chemistry 64 1999 199–227212
which results in an enrichment of 13C in the microenvironment of the foraminifer. The environment is becomingisotopically ‘heavy’.
Ž y1 . Ž y1 .Respiration ca. 1–3 nmol h and photosynthesis ca. 3–10 nmol h fluxes of carbon are associated withŽ 13 .strong isotopic signals d C ;y22‰ . The extent to which the microenvironment is isotopically altered
therefore depends on the magnitude of the respirationrphotosynthesis flux and on the d13C of the released and
fixed carbon, respectively.Ž .Calcite precipitation in equilibrium is accompanied by a small fractionation of 1‰ Romanek et al., 1992
Ž y1 . 13and is independent of the flux ca. 1–3 nmol h . Calcification therefore results in a direct enrichment of CŽ Ž 2y.within the shell there is no additional chemical conversion between the source of calcification CO and the3
Ž . 2y .precipitated calcite CaCO as in the case of respired CO and the CO pool .3 2 3
A schematic presentation of the influence of respiration, symbiont photosynthesis, and calcification on thed
13C of the foraminiferal shell is provided by Fig. 4a. Starting with a d13C of the total dissolved carbon of 2‰,
Fig. 4. Qualitative description of the influence of vital effects on the d13C of foraminiferal calcite. Adding up the vectors yields the d
13C ofŽ . Ž . Ž . 13 Ž .the shell. a Respiration R and photosynthesis P decrease and increase the d C, respectively. Calcification C fractionates with a
Ž . Ž .constant value, independent of the calcification rate. b Dark conditions: calcification effect may cancel respiration effect. c Lightconditions: photosynthesis enriches the shell in 13C. It should be noticed that the length and direction of the vectors may vary significantlyfor different foraminiferal species.

( )R.E. Zeebe et al.rMarine Chemistry 64 1999 199–227 213
13 Ž 13 . 13vectors are added to determine the final d C of the shell d C . The obtained d C should be regarded as ash sh
qualitative result which cannot be generalized. The horizontal axis represents the flux, while the vertical axis13 13 Ž .refers to the d C of the shell. The enrichment and depletion of C in the shell through photosynthesis P and
Ž .respiration R is a function of the magnitude of the associated flux. Photosynthesis is therefore presented by avector with positive slope whereas respiration is presented by a vector with negative slope. For simplicity, alinear relationship between respirationrphotosynthesis flux and d
13C is assumed. Calcification is described bysh
a vertical vector of length 1‰ since the fractionation associated with calcification is independent of the flux.Even though, this description is highly simplified it illustrates the basic influence of the vital effects on theisotopic composition of the calcite and may help to understand the results of the detailed model.
Ž .For example, calcite precipitation during the night, when no photosynthesis occurs Fig. 4b can be described13 Ž .as follows. Starting with d C s2‰, respiration R which produces isotopically ‘light’ carbon maySCO 213 Ž .decrease the d C to about 1‰. The fractionation during CaCO precipitation C , however, results in ansh 3
increase in d13C of ca. 1‰ and may bring the isotopic composition of the shell close to the d value of SCO .sh 2
We should emphasize here, that the length and direction of the vectors might vary significantly for differentŽ .foraminiferal species. In the light, photosynthesis P of the symbiotic algae enriches the microenvironment in
13 Ž .C which is incorporated in the shell Fig. 4c . The contribution of photosynthesis is added to respiration andcalcification, ending up, for example at a d
13C which is 1 to 1.5‰ higher than the d13C of SCO . Thissh 2
qualitative description will be quantified in the next section where the model calculated contributions of the vitaleffects to the isotopic composition of the shell are discussed.
4.1.2. Results of the base modelŽ .Model results for light and dark experiments are studied for a set of input parameters Table 1 corresponding
to a model run for the planktonic foraminifer O. uniÕersa. Sea water salinity and temperature of the modelŽcalculations are similar to those reported for laboratory experiments specimens for culture experiments were
Ž X X . Žcollected near Santa Catalina Island, California 33833 N, 118830 W e.g., Spero and DeNiro, 1987; Spero,..1992 .
Fig. 5 shows model results of a dark simulation for the d13C of the three dissolved carbon species and SCO2
as a function of the distance to the center of the foraminiferal shell at rs0. Towards the surface of the shell at13 Ž .rs300 mm the d C of CO is strongly decreasing Fig. 5a due to the isotopically ‘light’ CO which is2 2
Table 1Input variables for the base model run for O. uniÕersa
Variable Symbol Value
Sea water temperature T 20.08CSea water salinity S 33.5Sea water pH pH 8.15
y1Sea water alkalinity A 2400 meq kgT
Radius of shell R 300 mm113 13
d C of SCO d C 2.0‰2 S CO 213 13 ad C of respiration d C y21.9‰F ,res
13 13d C of photosynthesis d C see textF ,phs
Dark Lighty1 bRespiration flux F 2.1 2.1 nmol hresy1bPhotosynthesis flux F 0.0 7.2 nmol hphsy1cCalcification flux F 1.0 3.0 nmol hclc
a Ž .Spero 1992 .b Ž .Spero et al. 1991 .c Ž .Lea et al. 1995 .

( )R.E. Zeebe et al.rMarine Chemistry 64 1999 199–227214
13 Ž . Ž . y Ž . 2y Ž .Fig. 5. Results of the base model in the dark for the d C of a CO , b HCO , c CO , and d SCO as a function of the distance to2 3 3 2
the center of the shell r. Respired isotopically ‘light’ CO decreases the d13C of CO and consequently of CO2y at the shell, while calcite2 2 3
13 13 Ž .precipitation increases d C by ;1‰. The final d C of the shell is indicated by the diamond in c .sh
released by respiration at this site. Part of the CO is diffusing away from the shell, part of it is chemically2y 13 y Ž .converted to HCO , resulting in a decrease of the d C of HCO at the shell Fig. 5b . The signature of the3 3
Žrespired CO is strongly reflected in the CO adjacent to the shell because this pool is small ca. 13.4 mmol2 2y1 .kg in the bulk medium at pH 8.15, see Fig. 2 . In other words, the proportion of respired CO is large in2
comparison to the CO close to the shell. The response in the d13C of HCOy is much smaller because the2 3
y Ž y1 .chemical conversion is relatively slow and the HCO pool is much larger ca. 2000 mmol kg .3
Since the reaction between HCOy and CO2y is fast, the isotopic exchange is fast, and the d13C signal in3 3
y 13 2y Ž . 2yHCO is almost directly reflected in the d C of CO Fig. 5c . In the model, calcification utilizes CO for3 3 313 2y Ž . 13calcite precipitation. The calcite is enriched in C relative to CO see Fig. 3 . Consequently, the d C of the3
Ž . 2yshell indicated by the diamond in Fig. 5c is about 1.1‰ ‘heavier’ than the CO and about 1.2‰ ‘heavier’3
than the SCO at the site of calcification, respectively. The enrichment of CaCO of about 1‰ relative to2 32y Ž . 13CO Romanek et al., 1992 increases the d C of the shell to about 1.9‰. Thus, the effect of respiration3
nearly cancels the effect of calcification for the base model run, resulting in a d13C of the shell which is close to
d13C of the bulk medium.SCO 2
ŽResults of the base model for light conditions are shown in Fig. 6. Photosynthesis of the symbiotic algae 7.2y1 . 12nmol C h which are located between 300 and 800 mm preferentially utilizes C. The simultaneous
enrichment of the environment in 13C produces a maximum in d13C within the symbiont halo at about 600CO 2
Ž . 13mm Fig. 6a . At the surface of the shell respiration of the foraminifer dominates; the d C of CO decreases to2
y Ž .about y15‰. The isotopic composition of HCO Fig. 6b , however, demonstrates that photosynthesis is the3
major process influencing the d13C of HCOy and consequently that of CO2y; the d
13C is increasing towards the3 3
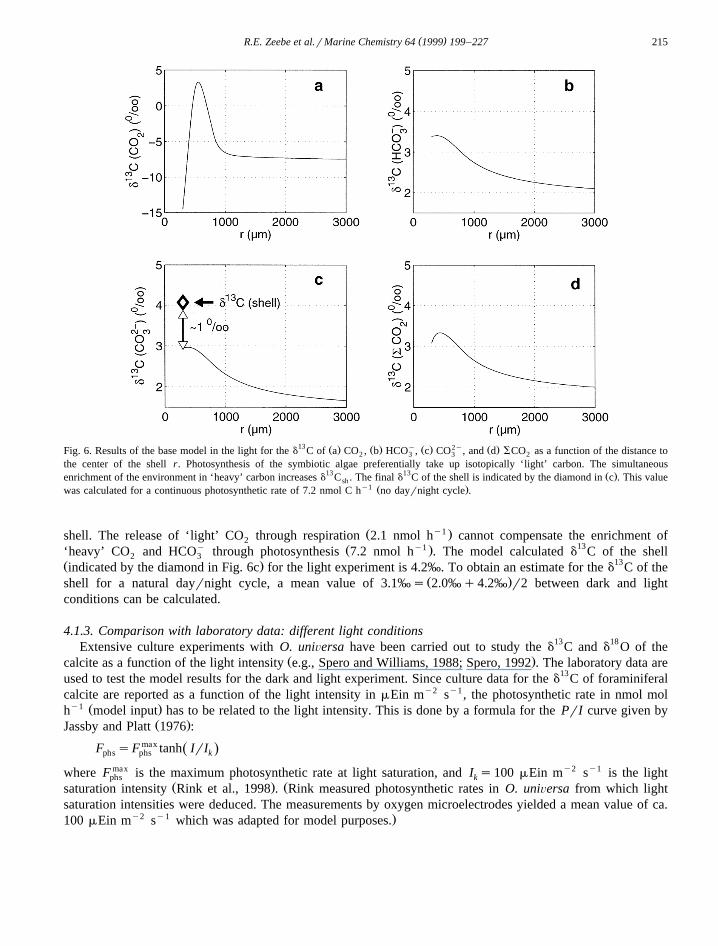
( )R.E. Zeebe et al.rMarine Chemistry 64 1999 199–227 215
13 Ž . Ž . y Ž . 2y Ž .Fig. 6. Results of the base model in the light for the d C of a CO , b HCO , c CO , and d SCO as a function of the distance to2 3 3 2
the center of the shell r. Photosynthesis of the symbiotic algae preferentially take up isotopically ‘light’ carbon. The simultaneous13 13 Ž .enrichment of the environment in ‘heavy’ carbon increases d C . The final d C of the shell is indicated by the diamond in c . This valuesh
y1 Ž .was calculated for a continuous photosynthetic rate of 7.2 nmol C h no dayrnight cycle .
Ž y1 .shell. The release of ‘light’ CO through respiration 2.1 nmol h cannot compensate the enrichment of2y Ž y1 . 13‘heavy’ CO and HCO through photosynthesis 7.2 nmol h . The model calculated d C of the shell2 3
Ž . 13indicated by the diamond in Fig. 6c for the light experiment is 4.2‰. To obtain an estimate for the d C of theŽ .shell for a natural dayrnight cycle, a mean value of 3.1‰s 2.0‰q4.2‰ r2 between dark and light
conditions can be calculated.
4.1.3. Comparison with laboratory data: different light conditionsExtensive culture experiments with O. uniÕersa have been carried out to study the d
13C and d18 O of the
Ž .calcite as a function of the light intensity e.g., Spero and Williams, 1988; Spero, 1992 . The laboratory data areused to test the model results for the dark and light experiment. Since culture data for the d
13C of foraminiferalcalcite are reported as a function of the light intensity in mEin my2 sy1, the photosynthetic rate in nmol mol
y1 Ž .h model input has to be related to the light intensity. This is done by a formula for the PrI curve given byŽ .Jassby and Platt 1976 :
F sF max tanh IrIŽ .phs phs k
where F max is the maximum photosynthetic rate at light saturation, and I s100 mEin my2 sy1 is the lightphs kŽ . Žsaturation intensity Rink et al., 1998 . Rink measured photosynthetic rates in O. uniÕersa from which light
saturation intensities were deduced. The measurements by oxygen microelectrodes yielded a mean value of ca.y2 y1 .100 mEin m s which was adapted for model purposes.

( )R.E. Zeebe et al.rMarine Chemistry 64 1999 199–227216
13 Ž . Ž .Model results for the d C of the shell as a function of the light intensity lines and laboratory data circlesŽ . 13are shown in Fig. 7. Laboratory data are taken from Spero and Williams 1988 ; the d C of the culture water
Ž . 13was approximately 1.5‰. In the dark light intensity zero measured d C of Orbulina uniÕersa are slightlyhigher than the d
13C of the culture water which is in agreement with model results. At light saturationSCO 2
Ž y2 y1. ŽIrradiance)100 mEin m s the measured values approach a value of ca. 3‰. The model results solid. 13and dashed lines confirm the increase of d C with increasing light intensity. The calculated curve for a
y1 Ž . 13medium photosynthetic rate of 7.2 nmol C h solid line results in a predicted d C of the calcite which isabout 0.5‰ ‘lighter’ than observed values at light saturation. The calculated curve for the higher photosynthetic
y1 Ž .rate of 10.3 nmol C h dashed line is in good agreement with the observed isotopic composition of the shells.Ž .The photosynthetic rates were taken from Spero et al. 1991 where the net assimilation rate of 7.2 and 10.3
nmol C hy1 corresponds to a density of 4200 and 6000 symbionts per foraminifera, respectively.The increase of the d
13C values in the 0–100 mEin my2 sy1 range is a direct consequence of the shape ofthe PrI curve in the same range and therefore depends on the I value. To investigate the model outcome fork
different PrI curves the shell d13C values were calculated as a function of the light intensity for I s75 andk
y2 y1 Ž . y2100 mEin m s smallest and mean value of O. uniÕersa given by Rink et al., 1998 , and 170 mEin my1 Ž Ž ..s determined for G. sacculifer by Jørgensen et al. 1985 . The results are shown in Fig. 8. Obviously, Ik
y2 y1 Ž .values of 75–100 mEin m s given by Rink et al. 1998 are consistent with the laboratory data, whereasthe larger value of 170 mEin my2 sy1 does not produce a sufficient increase of the shell d
13C at low light.The saturation value of d
13C at high light is, on the other hand, independent of the shape of the PrI curve.The saturation value is a function of the maximum photosynthetic rate which depends on symbiont density.Within the uncertainties of the biological input parameters the model adequately describes the increase of shelld
13C vs. irradiance at low light and the saturation value of d13C at high light.
4.2. Carbonate sea water chemistry
The concentrations of the dissolved forms of CO , alkalinity, SCO , and pH of the bulk sea water are the2 2
variables of the carbonate sea water chemistry. The quantities are not independent of each other; given two ofŽ .the quantities and the borate concentration , all other components can be determined. In the previous sections,
the influence of vital effects on the d13C of foraminiferal calcite was studied for a constant carbonate sea water
Ž y1 .chemistry representative for todays ocean pHf8.15, alkalinityf2400 mEq kg . On geological time scales,however, ocean chemistry may have changed markedly. For example, there is evidence that the pH of the
Ž . Ž . 13Fig. 7. Model results lines and laboratory data closed circles for the d C of the calcite as a function of the light intensity. The maximumŽ . y1 Ž . Ž .photosynthetic rate at light saturation of 7.2 solid line and 10.3 nmol C h dashed line were taken from Spero et al., 1991 ,
corresponding to a maximum density of 4200 and 6000 symbionts per foraminifera, respectively.

( )R.E. Zeebe et al.rMarine Chemistry 64 1999 199–227 217
Fig. 8. Same as Fig. 7 with a maximum photosynthetic rate at light saturation of 10.3 nmol C hy1 and different I values. The curve ofk13 Ž .shell d C vs. light intensity is a direct result of the Pr I curve. Thus, a smaller I value steeper increase of photosynthesis at low lightk
produces a steeper increase of d13C. The saturation value of the shell d
13C at the maximum photosynthetic rate is independent of the Ik
value.
Žsurface and the deep ocean during the last glaciation has been 0.2 and 0.3 units higher than today Sanyal et al.,.1995; Sanyal et al., 1996 .
Ž . 13Spero et al. 1997 have shown, that the d C of O. uniÕersa and G. bulloides strongly depend on thecarbonate chemistry, even though the d
13C of the total dissolved carbon in sea water is not affected by changesin the sea water chemistry. We suggest that these effects can be explained by an interaction between vital effectsand the carbonate sea water chemistry of the bulk medium. To elucidate the nature of the underlyingmechanisms the model was run for different conditions of the bulk carbonate system. Possible scenarios for pHchanges were examined by setting the alkalinity to a constant value, while pH was varied over a considerablerange. This approach provides a comparison with culture data of O. uniÕersa.
4.2.1. Constant alkalinityTo investigate the influence of varying bulk concentrations of CO , HCOy, and CO2y on the isotopic2 3 3
Ž .environment of the foraminiferal shell the dark experiment see Section 4.1.2 is examined for different pH. Thealkalinity is held constant at 2723 meq kgy1 while pH is set at 7.7, 8.15, and 8.8; all other parameters are the
Ž .same as for the base model run see Table 1 .To understand the fractionation of carbon isotopes, the total concentrations of the dissolved carbon species
are studied first. Model results for the concentrations of CO , HCOy, CO2y, and pH for the dark experiment2 3 3Ž . Ž .are displayed in Fig. 9. The bulk concentration of CO rs3000 mm dramatically varies with pH Fig. 9a . At2
pH 7.7 and pH 8.8, the concentration of CO of the bulk medium is 2 and 50 mmol kgy1, respectively. The2
steep increase of CO towards the shell results from the respiration of the foraminifer. It should be emphasized2Ž .that the concentration of CO at the shell is about twice the bulk value at low pH 7.7 while it is about 10 times2
Ž .the bulk value at high pH 8.8 .y Ž .No drastic change in the concentration profile of HCO was calculated Fig. 9b because bicarbonate is the3
largest pool and changes slowly over the considered pH range. The bulk concentration of CO2y, however,3y1 y1 Ž .strongly increases from 100 mmol kg at pH 7.7 to over 600 mmol kg at pH 8.8 Fig. 9c . The decrease of
2y 2y Ž y1 . 2yCO at the shell is due to the uptake of CO for calcite precipitation 1 nmol h . If CO is the major3 3 3Ž . 2ysource to form calcite, calcification is limited at low pH 7.7 by the small concentration of CO at the shell.3
Culture experiments support this hypothesis because the foraminiferal shell weight of O. uniÕersa decreases2y Ž .with decreasing CO concentration Bijma et al., in press . In addition, calcification was incomplete or shells3
Ž .even dissolved over night when pH was below 7.3 Bijma et al., unpublished data .

( )R.E. Zeebe et al.rMarine Chemistry 64 1999 199–227218
Ž . Ž . y Ž . 2y Ž . ŽFig. 9. Model results for the concentration profiles of a CO , b HCO , c CO , and d pH in the dark for constant alkalinity 2723.02 3 3y1 . Ž . Ž .meq kg . Results for different pH values of the bulk medium are indicated by dashed lines pH 7.7 , solid lines pH 8.15 , and
Ž . 2ydot–dashed lines pH 8.8 . Bulk concentrations of CO and CO vary dramatically with pH.2 3
13 Ž . 13Fig. 10 shows model results of the corresponding profiles of d C. At the shell rs300 mm the d C ofCO is decreasing for the indicated bulk pH values. Isotopically ‘light’ carbon is released by the foraminifer and2
Ž .diffuses away from the shell Fig. 10a . The decrease is most pronounced at high pH because the amount ofŽrespired CO relative to the bulk concentration is extremely high the concentration of CO at the shell is 102 2
. ytimes higher than in the bulk medium . The ‘light’ CO is partially converted to HCO resulting in a decrease2 313 Ž . 13 yof d C of the bicarbonate and carbonate at the shell Fig. 10b and c . Again, the lowest d C of HCO and3
CO2y at the shell was calculated for the highest pH. This trend is eventually reflected in the d13C of the shell3
Ž . 13diamonds in Fig. 10c . In summary, the calculated d C of the foraminiferal calcite in the dark is decreasingwith increasing pH at constant alkalinity.
( )4.2.2. Comparison with laboratory data dark conditionsFor the planktonic foraminifera O. uniÕersa culture experiments have demonstrated that the d
13C values of2y Ž .the shell calcite decrease with increasing CO ion concentration or pH Spero et al., 1997 . The model was run3
for the reported sea water conditions of the culture experiments of O. uniÕersa and a calcificationrrespirationy1 Ž . 13rate of 1.0 and 2.1 nmol h , respectively see Table 1 . Model results for the d C of the shell under dark
Ž . Ž .conditions open diamonds and laboratory data obtained in the dark filled circles are presented in Fig. 11. Theexpected d
13C of inorganic calcite formed in equilibrium with the isotopic composition of the total dissolvedŽ Ž ..carbon of the bulk sea water calculated after Mook 1986 is indicated by the dashed line. It is obvious that the
d13C of the calcite precipitated within the microenvironment of O. uniÕersa differs significantly from the
expected d13C of the calcite precipitated in equilibrium with d
13C .SCO 2

( )R.E. Zeebe et al.rMarine Chemistry 64 1999 199–227 219
13 Ž . Ž . y Ž . 2y Ž .Fig. 10. Model results for the d C of a CO , b HCO , c CO , and d SCO of the dark experiment corresponding to sea water2 3 3 2Ž . 13 13conditions presented in Fig. 9. The diamonds in c indicate the d C of the foraminiferal shell. Shell d C decreases with increasing pH
Ž 2y .CO concentration .3
w 2yxLaboratory data show a large scatter even for small changes in CO , while the model results exhibit a3
continuous decrease with increasing pH. The model calculated d13C values centered around 200 mmol kgy1
Ž y1 .must be regarded as an exception. The alkalinity of the culture water was exceptionally low ;2160 meq kg
Ž . Ž . 13 2yFig. 11. Model results open diamonds and laboratory data closed circles in the dark for the d C of the shell as a function of CO ion3Ž .concentration and pH upper horizontal axis . The reported error bars of the laboratory data are in some cases smaller than the diameter of
the circles. The model results are in fair agreement within the pH range from 7.7 to 8.4. The larger slope observed in the laboratory data forhigh CO2y concentrations is discussed in Section 4.3.2.3

( )R.E. Zeebe et al.rMarine Chemistry 64 1999 199–227220
Ž y1 .for these two data points in comparison to the mean value ;2720 meq kg . The low SCO resulting from213 Žthe low alkalinity explains the calculated low d C of the shell the amount of isotopically ‘light’ respired CO2
.is larger relative to the concentration of CO in the bulk medium .2
The model d13C is in fair agreement with culture data in the pH range from 7.76 to about 8.4 which includes
Žthe pH range of the deep and surface ocean between the last glacial maximum and the Holocene period Sanyal. 13 2yet al., 1995 . The slope of the decrease of d C of the calcite with increasing CO concentration, however, is3
more pronounced in the laboratory data than in the model calculated values. The very low values of d13C above
pH 8.4 cannot be satisfactory explained by the model with the standard model setup. The key parameters which13 w 2yxinfluence the model outcome for the slope of d C vs. CO will be discussed in Section 4.3.2.3
( )4.2.3. Comparison with laboratory data light conditionsThe model was run for the reported pH and sea water alkalinity of the culture experiments of O. uniÕersa in
y1 Ž .the light. The calcification and respiration rate was 3.0 and 2.1 nmol h , respectively see Table 1 . Whilethere are no data available on the variability of respiration and calcification as a function of the sea water pH,
Ž .there is evidence that photosynthesis is decreasing with increasing pH. Spero et al. 1991 reported ay1 Ž .photosynthetic uptake of 7.2 nmol h of O. uniÕersa at pH 8.15. However, Rink unpublished data measured
a mean photosynthetic rate of only 2.8 nmol hy1 at pH 8.9. Even though, the symbiotic algae utilize CO and2y Ž .presumably additional HCO and therefore should not be limited by the availability of CO photosynthesis3 2
seems to be reduced at low CO concentrations. This effect might be due to the low carbon dioxide2
concentration, to physiological stress at high pH values, or both.Diminished symbiont photosynthesis at high pH was included in the model calculations by a linear
Ž . Ž .relationship between the photosynthetic uptake F and the bulk CO concentration see Fig. 12 . Fromphs 2Ž y1 . Ž . Ž y1 .the measured values by Rink at pH 8.9 2.8 nmol h and by Spero et al. 1991 at pH 8.15 7.2 nmol h the
linear relationship was determined. At high CO concentration photosynthesis will reach its maximum value2Ž . Ž .saturation . The highest value found in the literature Jørgensen et al., 1985 was therefore chosen for F atphs
y1 w x y1saturation. The total carbon uptake of 12.44 nmol C h for CO )28 mmol kg corresponds to the2 bulky1 Žreported maximum photosynthetic rate of 15 nmol O production h for details about the conversion between2
Ž ..oxygen production and carbon uptake, see Wolf-Gladrow et al. 1999 .
Ž .Fig. 12. Photosynthetic uptake F of the symbiont community as a function of the CO concentration of the bulk medium. A linearphs 2Ž . Ž .relationship between the measured uptake rates for O. uniÕersa of Rink unpublished data at pH 8.9 and of Spero et al. 1991 at pH 8.15
was assumed. The saturation value of 12.44 nmol C hy1 at high CO concentration corresponds to the reported maximum photosynthesis of2y1 Ž . Ž15 nmol O production h measured by Jørgensen et al. 1985 for details about the conversion between oxygen production and carbon2
Ž ..uptake, see Wolf-Gladrow et al. 1999 .

( )R.E. Zeebe et al.rMarine Chemistry 64 1999 199–227 221
Ž . Ž . 13Fig. 13. Model results open diamonds and laboratory data closed circles in the light for the shell d C of O. uniÕersa as a function of thew 2y xcarbonate ion concentration. The slightly smaller decrease of the calculated values with increasing CO is again a result of the dark3
Ž .simulation compare Fig. 11 . As in laboratory experiments light conditions in the model refer to a 12:12-h dayrnight cycle. Thus, thecalculated values are influenced by the results of the dark simulation by 50%.
13 Ž .Model results for the d C of the shell under light conditions open diamonds and laboratory data obtainedŽ .for a 12:12-h dayrnight cycle filled circles are presented in Fig. 13. The agreement between model results and
measured values is quite satisfactory. The smaller negative slope of modelled shell d13C at high carbonate ion
concentration is again a result of the dark simulation: Since each diamond represents the arithmetic mean of adark and light experiment at this carbonate ion concentration, the dark simulation accounts for 50% of the
2y Ž .obtained value. At high CO ion concentration photosynthesis is reduced see above and respiration in the313 w 2yxdark becomes the dominant process. Thus, at high pH the slope of shell d C vs. CO is determined to a3
large degree by the results of the dark simulation.
4.3. The response to parameter Õariations
A number of parameters have been implemented to run the diffusion-reaction model. In this section, it isinvestigated to what degree the parameterizations and parameter values affect the model outcome.
4.3.1. CO 2 y and HCOy uptake3 3
The model results presented in the preceding sections were obtained under the assumption that CO2y is used3
for calcification. The carbon species which is also likely to be used for calcification is HCOy. The assumption3
of CO2y utilization in O. uniÕersa is based on results of culture experiments which showed that the shell3
weight of O. uniÕersa increases with increasing carbonate ion concentration. If HCOy is the primary source for3w yxcalcification this effect is difficult to understand. For example, over the pH range 7.5 to 8.5, HCO decreases3
y1 w 2yx y1from ca. 2200 to ca. 1400 mmol kg , while CO increases from ca. 65 to ca. 365 mmol kg . Thus, if the3
increase in shell weight in O. uniÕersa is attributed to the availability of the source, the primary source shouldbe CO2y. However, the uptake of HCOy for calcification cannot generally be ruled out. It is possible that O.3 3
uniÕersa partially utilizes HCOy, whereas other species might even use HCOy as the primary source. The3 3
influence of HCOy uptake on the model outcome is therefore investigated.3
The uptake of CO2y is determined by the chemical reaction3
Ca2qqCO2y ™CaCO 45Ž .3 3

( )R.E. Zeebe et al.rMarine Chemistry 64 1999 199–227222
whereas the uptake of HCOy is commonly described by3
Ca2qq2 HCOy ™CaCO qCO qH O. 46Ž .3 3 2 2
Ž .It can be seen from Eq. 46 that the stoichiometry requires that one molecule CO is released for each molecule2
CaCO precipitated, whereas two molecules HCOy are consumed. In the model, the produced CO is released3 3 2
at the surface of the foraminiferal shell and added to the respired CO of the host.22y Ž .Fig. 14 shows model results of the dark simulation for O. uniÕersa for CO uptake solid lines and the3
y Ž . y1 ycalculated profiles for HCO uptake dashed lines . The input calcification rate is 1 nmol h . Thus, for HCO3 3y y1 y1 Župtake 2 nmol HCO h are taken up, whereas 1 nmol CO h is added to the respiration of the host 2.13 2
y1 . y1 Ž . ynmol h resulting in a total release of 3.1 nmol CO h at the shell Fig. 14a, dashed line . The HCO2 3Ž .concentration Fig. 14b increases towards the shell for both scenarios because respired CO is converted to2
HCOy. In the case of HCOy uptake, a gradient is established at the shell, reflecting the flux of HCOy towards3 3 3
the shell. It is emphasized that both, respiration and calcification have minor influence on the HCOy profile.3y Ž y1 .Because of the size of the HCO reservoir ;2170 mmol kg the change is less than 4% with respect to the3
bulk medium.2y Ž . 2yThe decrease in the CO concentration towards the shell Fig. 14c is slightly more pronounced for CO3 3
Ž . y Ž .uptake solid line than for HCO uptake dashed line . It is obvious from the CO and pH profile that the CO3 2 2Ž .released at the surface of the shell is the dominant process the medium close to the shell gets more acid .
Ž . Ž . y Ž . 2y Ž .Fig. 14. Model results for the concentration profiles of a CO , b HCO , c CO , and d pH in the dark for different sources of the2 3 32y 2q Ž 2y .calcification. Calcite precipitation via CO qCa ™CaCO CO uptake is indicated by the solid lines, whereas calcite precipitation3 3 3
y 2q Ž y . yvia 2HCO qCa ™CaCO qCO qH O HCO uptake is indicated by the dashed lines. In the case of HCO uptake one molecule3 3 2 2 3 3
CO is released for each CaCO precipitated explaining the increase of CO at the surface of the shell.2 3 2

( )R.E. Zeebe et al.rMarine Chemistry 64 1999 199–227 223
Particularly, in the case of HCOy uptake, the release of additional CO due to the precipitation of CaCO has a3 2 3
similar effect on the CO2y profile as the direct uptake of CO2y. The pH profile closely follows the buffer3 3Ž 2y. 2y yCO and drops to about 7.85 and 7.95 at the shell for CO and HCO uptake, respectively. The calculated3 3 3
pH values for both scenarios are compatible with measurements by pH microelectrodes in the vicinity of O.Ž . Ž Ž ..uniÕersa Rink, 1996 this also holds for G. sacculifer see Jørgensen et al., 1985; Wolf-Gladrow et al., 1999 .
Two conclusions can be drawn from these results. Firstly, from a comparison between modelled profiles andmicroelectrode measurements neither CO2y or HCOy can be favored as the primary source for calcification.3 3
Secondly, the utilization of CO2y or HCOy has a minor influence on the model outcome for the carbon3 3
chemistry in the vicinity of O. uniÕersa. The effect on the stable carbon isotope fractionation is discussed in thenext section.
13 [ 2 y]4.3.2. Slope of d C Õs. CO for parameter Õariations313 w 2yxAs shown in Fig. 11, the modelled slope of d C vs. CO for the dark simulation in O. uniÕersa was3
insufficient to explain the observed trend seen in the experimental results for high CO2y concentrations. The3Ž . Ž 2y y1.y1slope given by Spero et al. 1997 is y0.0061‰= mmol CO kg , whereas the calculated mean slope3Ž . Ž y1 .y1for the standard model run input parameters, see Table 1 is y0.0024‰= mmol kg . Thus, the standard
parameterization accounts for ca. 40% of the observed trend. Here we investigate which parameters have thepotential to affect the slope and how much they have to be changed to reproduce the observed trend. Model runs
13 w 2yxwere carried out to calculate the influence of parameter variations on the slope of d C vs. CO for the dark3
simulation in O. uniÕersa. The results are summarized in Table 2. It turns out that the uptake of HCOy instead3
of CO2y has a minor influence on the isotope discrimination. This also holds for the increase of the respiration3y1 Ž 2y . 13rate from 2.1 to 4 nmol h independent of CO concentration , the decrease of the d C of the respired CO3 2
from y21.9‰ to y30‰, and the increase of the chemical rate constant k by one order of magnitude.q1
When the respiration is increased from 1 to 4 nmol hy1 over the pH range 7.7 to 8.6 the model reproducesŽ y1 .y1the desired slope of y0.0061‰= mmol kg . Thus, if an increase in the respiration rate of O. uniÕersa of
this magnitude would be observed with increasing pH, the model results suggest that increased respiration might13 w 2yxbe the reason for the observed decrease in shell d C vs. CO . Unfortunately, changes of the respiration rate3
Ž .in foraminifera with changing pH have not been quantified yet see discussion .What is referred to as ‘kinetic effect’ in Table 2 has a similar impact on the model results. In equilibrium the
2y Ž .calcite is enriched in the heavier isotope by about 1‰ with respect to CO see, e.g., Fig. 5 . Thermodynamic3
equilibrium implies that a permanent carbonate ion exchange between the calcite lattice and the dissolvedŽ .species simultaneous precipitation and dissolution occurs such that the statistics of this process dictate the
isotope discrimination: the heavier isotope is slightly enriched in the calcite. Therefore, equilibrium fractionationdemands that the carbonate ions absorbed on the surface of the calcite are exposed for a certain time interval to
Table 213 w 2y xThe influence of parameter variation on d C vs. CO3
y1 y1Ž Ž . .Parameter Value Standard Slope ‰= mmol kg
Ž .All Standard see Table 1 see Table 1 y0.0024y 2yUptake HCO CO y0.00213 3
y1 y1Respiration 4 nmol h 2.1 nmol h y0.0033a y1Respiration 1–4 nmol h constant y0.0061
13d C of respiration y30‰ y21.9‰ y0.0028
bKinetic effect yes no y0.0061y1 y1Rate constant k 0.36 s 0.036 s y0.0030q1
a The respiration rate was increased from 1 to 4 nmol hy1 over the pH range 7.7 to 8.6.bSee text.

( )R.E. Zeebe et al.rMarine Chemistry 64 1999 199–227224
Ž .the calcifying fluid to guarantee the described exchange before the ions are buried below subsequently formedlayers of the crystal. If calcification proceeds faster at higher carbonate ion concentrations, this process is
Žhindered and the isotopic composition of the calcite will carry the isotopic fingerprint of the source or isisotopically lighter because the lighter isotope has a smaller activation energy and is kinetically preferred in both
.directions of the reaction . This process is called kinetic fractionation.To estimate the possible influence of this mechanism on the model results it was assumed as a first guess that
2y 13 13 Ž 2y.at high CO concentration the d C of the calcite equals the d C of the source CO at the site of3 32y w 2yxcalcification, i.e., the constant offset of ca. 1‰ between CO and CaCO was removed for high CO . As a3 3 3
13 w 2yx Ž y1 .y1 Žresult, the obtained slope for d C vs. CO increased from y0.0024‰= mmol kg standard model3. Ž y1 .y1 Ž .run to y0.0061‰= mmol kg including the kinetic effect . Possible reasons for the nonequilibrium
fractionation at the site of calcification are discussed in Section 5.
5. Discussion and conclusions
The results of the numerical model indicate that the enrichment and depletion of 13C in the shell calcite of O.uniÕersa can be explained in terms of calcite precipitation within an isotopically altered microenvironment. Themedium within the vicinity of the foraminifer is strongly perturbed by life processes of the host–symbiontsystem and therefore differs significantly from the bulk medium with regard to the concentrations and theisotopic compositions of the carbonate species. The calculated d
13C of the shell is lowered by ‘light’ respiredCO , while it is enriched in 13C through photosynthesis. The calculated difference between dark and light2
Ž . Ž .conditions ;1.5‰ are consistent with laboratory measurements see Fig. 7 . Within the uncertainties of thebiological input parameters, the model adequately describes the increase of shell d
13C vs. light intensity at lowlight as well as the saturation values at high light. In addition, model calculations predicted limited calcification
Ž .rates at low pH in the dark Section 4.2.1, Fig. 9c which are confirmed by observed incomplete calcification ordissolution of the calcite at pH values of 7.3.
It should be pointed out that despite the somewhat lengthy mathematical formalism, the concept of the modelŽ .is straightforward and is based on the inorganic carbonate chemistry no elaborate enzyme kinetics is required .
Since the basic features of carbon isotope fractionation in foraminifera can be reproduced, we believe that themodel includes the essential mechanisms which determine the isotope discrimination during calcite precipita-tion. However, some questions remain unaddressed.
There is evidence that certain foraminifera accumulate carbon and calcium within an internal pool and utilizeŽ .it when new chambers are added this calcite precipitation often occurs within a very short time interval . The
possible carbon isotope fractionation associated with the accumulation into or the release from this internal pool13 Ž .is unknown but might influence the d C of the shell calcite to a large degree. Spero et al. 1977 demonstrated
13 2y Ž .that the decrease in d C of the shell with increasing CO ion concentration carbonate ion effect is much3
more pronounced in the symbiont barren species G. bulloides which adds chambers intermittently and isŽ .therefore likely to have an internal pool see Wolf-Gladrow et al., 1999 . Orbulina uniÕersa, however, calcifies
the terminal spherical chamber continuously within 5–7 days and does not rely on an internal pool because thecalcium and carbon demand during calcification can be met by diffusion from the surrounding seawater alone.Thus, the different slopes of d
13C vs. carbonate ion concentration for these two species might be attributed todifferent calcite precipitation mechanisms.
Even though, the model assumptions seem to work satisfactory for O. uniÕersa, discrepancies between themodel outcome and observed data are present and should be further investigated. The trend of decreasing d
13Cof the shell with increasing CO2y ion concentration was reproduced by the model and is attributed to an3
Ž .increasing incorporation of ‘light’ respired CO at higher pH into the shell see Fig. 11 . The larger negative2
slope of the culture data in comparison to the model outcome, however, was not reproduced. From Table 2 it is
( )R.E. Zeebe et al.rMarine Chemistry 64 1999 199–227 225
obvious that the observed slope could be explained by the model if the respiration rate of the foraminiferincreases systematically with higher carbonate ion concentration. The CO concentration of the bulk medium is2
Ž y1 .very small at high pH ca. 2 mmol kg at pH 8.8 . If the CO release of the foraminifer is a function of the2Žw xCO gradient between the external and internal carbon dioxide concentration CO of bulk medium and inside2 2
.the cell , one could argue that the stronger gradient at high pH increases the CO efflux at higher carbonate ion2
concentration. However, this argument is speculative since there are no data available on the CO efflux from2
foraminiferal cells at different pH values.Another mechanism to explain the missing coherence in the modelled and observed slope might be an
Ž 13 .increasing kinetic fractionation depletion of C in the calcite with increasing precipitation rate at higherŽ . 13carbonate ion concentration. Romanek et al. 1992 found no dependence of the d C of inorganically formed
Ž . 13calcite on the precipitation rate. However, Turner 1982 reported a depletion of C in calcite with increasingŽ .precipitation rate. In general, the product of a chemical reaction kinetic process in one direction is depleted in
the heavier isotope. From the fact that CaCO at normal sea water pH is enriched in the heavier isotope relative3Ž 2y y. Žto the source CO or HCO , it follows that the ratio of precipitation to dissolution ratio of reactions in3 3
.forward and backward direction must be closer to equilibrium at normal pH. Consequently, one would expect a‘heavy’ calcite for small precipitation rates and ‘light’ calcite for high precipitation rates. If the precipitationrate goes to infinity, the d
13C of the calcite should be equal to or smaller than that of the carbon source. Hence,13 w 2yxthe larger negative slope of the observed shell d C vs. CO could be due to a kinetic fractionation effect3Ž .through increased precipitation rates at high pH Table 2 . These questions should be clarified by experimental
investigations which are currently in preparation by members of our group.Despite the discrepancies between model results and observations it should be emphasized that the fact that
the shell d13C of foraminifera decreases with increasing carbonate ion concentration is observed in laboratory
w 2yx y1 Žmeasurements and is predicted by the model. An increase of CO from 248 to 355 mmol kg equivalent to3.an 0.2 units increase in pH from 8.15 to 8.35, see Fig. 13 produced a decrease of 0.35‰ in the modelled shell
d13C. This fact may have important consequences for the interpretation of paleoceanographical data. For
Ž . 13 Žinstance, it was proposed by Shackleton 1977 that the decrease in the d C of foraminiferal calcite direct13 .proxy for d C during the last glacial maximum was brought about by the transfer of isotopically lightSCO 2
carbon from the terrestrial biosphere to the atmosphere–ocean system. However, part of the effect of decreasing13 Žd C during the last glaciation might be attributed to changes in ocean chemistry Sanyal et al., 1995; Lea et al.,
.in press .The relevance of our results to paleoceanographic studies seems limited by the fact that O. uniÕersa is not
widely used for reconstructions. Orbulina uniÕersa is a spinose, symbiont bearing species, whereas othercommonly used species for proxy studies are symbiont barren or non-spinose. However, the basic mechanismswhich control stable carbon isotope fractionation in O. uniÕersa should be applicable to other foraminifera aswell. This statement is based on the observation that the general effect of the carbonate ion concentration on the
13 Žd C of foraminiferal calcite appears to be independent of the species chosen whether symbiont bearing or.symbiont barren , even though the magnitude of the effect is species-dependent. The carbonate ion effect was
hitherto demonstrated in the symbiont bearing species O. uniÕersa, G. sacculifer, and G. ruber, and in theŽ .symbiont barren species G. bulloides Spero et al., 1997; Bijma et al., unpublished data . The magnitude of the
Žtrend, however, varies for different species and might be attributed to different calcification mechanisms e.g.,.calcification via an internal pool .
The results of the dark simulation for O. uniÕersa should be comparable to a symbiont barren species,provided that the geometry of the shell, the dark respiration of the symbionts, and physiological differences havea minor influence. For non-spinose species such as Neogloboquadrina dutertrei culture experiments are desiredto investigate the response of isotope discrimination to sea water changes.
We conclude that more detailed work is needed on the carbonate ion effect in other species and on theunderlying mechanisms such as the interaction between sea water chemistry and vital effects which determine
Žthe isotopic composition of the shells. This will hopefully lead to a sound understanding of carbon but also of

( )R.E. Zeebe et al.rMarine Chemistry 64 1999 199–227226
. Ž .oxygen and boron isotope fractionation in foraminifera Zeebe, in press and a better interpretation ofpaleoceanographical data in the future.
Acknowledgements
We would like to thank Marion O’Leary for discussions about fractionation in chemical reactions.Suggestions by Howard J. Spero and Abhijit Sanyal are gratefully acknowledged. The comments of twoanonymous referees were of great value and have improved the manuscript. Alfred-Wegener-Institut fur Polar-¨und Meeresforschung publication 1504.
References
Ž .Be, A.W.H., 1977. An ecological, zoogeographic and taxonomic review of recent planktonic foraminifera. In: Ramsay, A.T.S. Ed. ,´Oceanic Micropaleontology, Vol. 1, London, pp. 1–100.
Bijma, J., Spero, H.J., Lea D.W., Archer, D., in press. Reassessing foraminiferal stable isotopes: Effects of seawater carbonate chemistry.Ž .In: Fischer, G., Wefer, G. Eds. , Proxies in Paleoceanography, Springer.
Boudreau, B.P., Canfield, D.E., 1993. A comparison of closed- and open-system models for porewater pH and calcite-saturation state.Geochim. Cosmochim. Acta 57, 317–334.
Cussler, E.L., 1984. Diffusion. Mass transfer in fluid systems, Cambridge Univ. Press, New York, pp. 105–124.Descolas-Gros, C., Fontugne, M.R., 1985. Carbon fixation in marine phytoplankton: carboxylase activities and stable carbon-isotope ratios;
physiological and paleoclimatological aspects. Mar. Biol. 87, 1–6.Ž .DOE, 1994. Dickson, A.G., Goyet, C. Eds. , Handbook of Methods for the Analysis of the Various Parameters of the Carbon Dioxide
System in Sea Water, Version 2, ORNLrCDIAC-74.Falkowski, P.G., 1991. Species variability in the fractionation of 13C and 12 C by marine phytoplankton. J. Plankton Res. 13, 21–28, Suppl.Francois, R., Altabet, M.A., Goericke, R., McCorkle, D.C., Brunet, C., Poisson, A., 1993. Changes in the d
13C of surface water particulateorganic matter across the subtropical convergence in the S. W. Indian Ocean. Glob. Biogeochem. Cycles 7, 627–644.
Goericke, R., Fry, B., 1994. Variations of marine plankton d13C with latitude, temperature and dissolved CO in the world ocean. Glob.2
Biogeochem. Cycles 8, 85–90.Hemleben, Ch., Spindler, M., Anderson, O.R., 1989. Modern Planktonic Foraminifera, Springer Verlag, New York.Jahne, B., Heinz, G., Dietrich, W., 1987. Measurement of the diffusion coefficients of sparingly soluble gases in water. J. Geophys. Res. 92,¨
10767–10776.Jassby, A.D., Platt, T., 1976. Mathematical formulation of the relationship between photosynthesis and light for phytoplankton. Limnol.
Ž .Oceanogr. 21 4 , 540–547.Jørgensen, B.B., Erez, J., Revsbech, N.P., Cohen, Y., 1985. Symbiotic photosynthesis in a planktonic foraminiferan, Globigerinoides
Ž . Ž .sacculifer Brady , studied with microelectrodes. Limnol. Oceanogr. 30 6 , 1253–1267.Lea, D.W., Martin, P.A., Chan, D.A., Spero, H.J., 1995. Calcium uptake and calcification rate in the planktonic foraminifer Orbulina
uniÕersa. J. Foram. Res. 25, 14–23.Lea, D.W., Bijma, J., Spero, H.J., Archer, D., in press. Implications of a carbonate ion effect on shell carbon and oxygen isotopes for glacial
Ž .ocean conditions. In: Fischer, G., Wefer, G. Eds. , Proxies in Paleoceanography, Springer.Li, Y.H., Gregory, S., 1974. Diffusion of ions in sea water and in deep-sea sediments. Geochim. Cosmochim. Acta 38, 703–714.Mackin, J.E., 1986. The free-solution diffusion coefficient of Boron: influence of dissolved organic matter. Mar. Chem. 20, 131–140.
13 Ž .Mook, W.G., 1986. C in atmospheric CO . Netherlands Journal of Sea Research 20 2r3 , 211–223.2
O’Leary, M.H., 1981. Carbon isotope fractionation in plants. Phytochemistry 20, 553–557.O’Leary, M.H., 1984. Measurement of the isotope fractionation associated with diffusion of carbon dioxide in aqueous solution. J. Phys.
Chem. 88, 823–825.O’Leary, M.H., Madhavan, S., Paneth, P., 1992. Physical and chemical basis of carbon isotope fractionation in plants. Plant, Cell and
Environment 15, 1099–1104.Rau, G.H., Takahashi, T., Des Marais, D.J., Repeta, D.J., Martin, J.H., 1992. The relationship between d
13C of organic matter andw Ž .xCO aq in ocean surface water: Data from a JGOFS site in the northeast Atlantic Ocean and a model. Geochim. Cosmochim. Acta 56,2
1413–1419.Rau, G.H., Riebesell, U., Wolf-Gladrow, D., 1996. A model of photosynthetic 13C fractionation by marine phytoplankton based on diffusive
molecular CO uptake. Mar. Ecol. Prog. Ser. 133, 275–285.2

( )R.E. Zeebe et al.rMarine Chemistry 64 1999 199–227 227
Rink, S., 1996. Untersuchung der Photosynthese und Respiration der symbiontentragenden planktischen Foraminifere Orbulina uniÕersa,Universitat Bremen.¨
Rink, S., Kuhl, M., Bijma, J., Spero, H.J., 1998. Microsensor studies of photosynthesis and respiration in the symbiotic foraminifer¨Orbulina uniÕersa. Mar. Biol. 131, 583–595.
Romanek, Ch.S., Grossman, E.L., Morse, J.W., 1992. Carbon isotopic fractionation in synthetic aragonite and calcite: effects of temperatureand precipitation rate. Geochim. Cosmochim. Acta 56, 419–430.
Sanyal, A., Hemming, N.G., Hanson, G.N., Broecker, W.S., 1995. Evidence for a higher pH in the glacial ocean from boron isotopes inforaminifera. Nature 373, 234–236.
Sanyal, A., Hemming, N.G., Broecker, W.S., Lea, D.W., Spero, H.J., Hanson, G.N., 1996. Oceanic pH control on the boron isotopiccomposition of foraminifera: evidence from culture experiments. Paleoceanography 11, 513–517.
Ž .Shackleton, N.J., 1977. in The fate of fossil fuel CO . In: Anderson, N.R., Malahoff, A. Eds. , The Oceans, Plenum, New York, pp.2
401–427.Shackleton, N.J., Hall, M.A., Line, J., Shuxi, C., 1983. Carbon isotope data in core V19-30 confirm reduced carbon dioxide concentration in
the ice age atmosphere. Nature 306, 319–322.Spero, H.J., 1992. Do planktic foraminifera accurately record shifts in the carbon isotopic composition of sea water SCO ?. Mar.2
Micropaleontol. 19, 275–285.Spero, H.J., DeNiro, M.J., 1987. The influence of symbiont photosynthesis on the d
18 O and d13C values of planktonic foraminiferal shell
calcite. Symbiosis 4, 213–228.Spero, H.J., Williams, D.F., 1988. Extracting environmental information from planktonic foraminiferal d
13C data. Nature 335, 717–719.Spero, H.J., Lea, D.W., 1996. Experimental determination of stable isotope variability in Globigerina bulloides: implications for
paleoceanographic reconstructions. Mar. Micropaleontol. 28, 231–246.Spero, H.J., Lerche, I., Williams, D.F., 1991. Opening the carbon isotope ‘vital effect’ black box: 2. Quantitative model for interpreting
foraminiferal carbon isotope data. Paleoceanography 6, 639–655.Spero, H.J., Bijma, J., Lea, D.W., Bemis, B.E., 1997. Effect of seawater carbonate concentration on foraminiferal carbon and oxygen
isotopes. Nature 390, 497–500.Turner, J.V., 1982. Kinetic fractionation of carbon-13 during calcium carbonate precipitation. Geochim. Cosmochim. Acta 46, 1183–1191.Wefer, G., Berger, W.H., 1991. Isotope paleontology: growth and composition of extant calcareous species. Mar. Geol. 100, 207–248.Wolf-Gladrow, D.A., Riebesell, U., 1997. Diffusion and reactions in the vicinity of plankton: a refined model for inorganic carbon transport.
Mar. Chem. 59, 17–34.Wolf-Gladrow, D.A., Bijma, J., Zeebe, R.E., 1999. Model simulation of the carbonate system in the microenvironment of symbiont bearing
foraminifera. Mar. Chem. 64, 181–198.Wong, W.W., Sackett, W.M., 1978. Fractionation of stable carbon isotopes by marine phytoplankton. Geochim. Cosmochim. Acta 42,
1809–1815.Zeebe, R.E., in press. An explanation of the effect of sea water carbonate concentration on foraminiferal oxygen isotopes. Geochim.
Cosmochim. Acta.
Copyright © 2022 FDOKUMEN