Diesbar-Seußlitz und die Goldkuppe. Bei gutem Wein Geschichte entdecken. Archaeo 4, 2007, 74-79.
Upload
khangminh22Category
view
1download
0
Physik-Department der Technischen Universitat Munchen
Ausbeuten und Spektroskopie radioaktiver Isotopebei LOHENGRIN und ISOLDE
Ulli Koster
Vollstandiger Abdruck der von der Fakultat fur Physik der Technischen Universitat Munchenzur Erlangung des akademischen Grades eines
Doktors der Naturwissenschaften (Dr. rer. nat.)
genehmigten Dissertation.
Vorsitzender: Univ.-Prof. Dr. M. Kleber
Prufer der Dissertation:1. Univ.-Prof. Dr. T. von Egidy, im Ruhestand2. Univ.-Prof. Dr. H.J. Korner3. Univ.-Prof. Dr. F. Gonnenwein,
Eberhard Karls Universitat Tubingen (schriftliche Beurteilung)
Die Dissertation wurde am 30. Dezember 1999 bei der Technischen Universitat Muncheneingereicht und durch die Fakultat fur Physik am 31. Juli 2000 angenommen.


Summary
Yields of radioactive nuclei were measured at two facilities: the recoil separator LOHENGRIN atthe Institut Laue Langevin in Grenoble and the on-line isotope separator ISOLDE at CERN inGeneva.
At LOHENGRIN the yields of light charged particles were measured from thermal neutron inducedternary fission of several actinide targets: 233U, 235U, 239Pu, 241Pu and 245Cm. Thin targets arebrought into a high neutron flux. The produced nuclei leave these with the recoil obtained in thefission reaction. They are measured at different energies and ionic charge states. After correctionsfor the experimental acceptance, the time behaviour of the fission rate and the ionic chargefraction, the yields are integrated over the kinetic energy distribution. Comparing these yieldswith the predictions of various ternary fission models shows that the most abundant nuclides arewell reproduced. On the other hand the models overestimate significantly the production of more“exotic” nuclides with an extreme N/Z ratio. Therefore a refinement of the models is required.The collected yields provide a good database to test improved versions.
In the second part yields of various radioactive nuclei were determined at the ISOL (isotope separa-tion on-line) facility ISOLDE. Here, high energy protons (1.0 or 1.4 GeV) hit targets from differentmaterials and cause various nuclear reactions. The produced radioactive nuclei are stopped in thethick target, diffuse and effuse out at high temperatures, are ionized, electrostatically acceleratedto 60 keV and mass separated. Subsequently they are delivered to different beam ports for variousapplications. The measurement of these beam intensities is less used to study the mechanism ofthe production reaction (fission, spallation or fragmentation), but to understand and reduce thelosses occuring on the way from production to detection. In contrast to a recoil separator theselosses vary strongly from isotope to isotope. To increase the final yields a careful optimization ofmany parameters is required: the chemical composition and the microscopic structure of the targetmaterial, the temperature of the target and ion source system, the type and operation conditionsof the ion source, etc. The obtained yields and possible improvements are discussed at the exampleof some elements: Be, Al, Mn, Ni, Cu, Ga, Cd, In, Sn, Cs and Fr. An important contribution tothe efficient and selective separation of many metallic elements gives the RILIS (resonance ioniza-tion laser ion source) technique. Its applications can be further extended to provide even isomericselectivity or to perform atomic spectroscopy with radioactive isotopes.
With these intense and pure radioactive ion beams several new nuclear physics results were ob-tained. The span reaches nearly over the full periodic system, including a new determination ofthe lifetime and the beta-delayed neutron emission probability of 12Be (T1/2 = 21.34(23) ms,
Pn = 0.48+0.12−0.10 %), a rough measurement of the magnetic moments of 70gCu (µ = (+)1.8(3)µN)and 70mCu (|µ| = 1.2(3)µN), the study of beta-delayed neutron emission of the neutron-richcopper isotopes 73−78Cu with the first detection of beta-delayed neutrons from 73Cu, the firstmeasurement of the lifetimes of 149Cs (T1/2 = 112(3) ms) and 150Cs (T1/2 = 82(7) ms) and theobservation of new gamma lines in the decay of 232Fr.

Zusammenfassung
Ausbeuten radioaktiver Nuklide wurden an zwei verschiedenen Anlagen gemessen: dem Ruck-stoßseparator LOHENGRIN am Institut Laue Langevin in Grenoble und am “on-line” Isotopensep-arator ISOLDE am CERN in Genf.
Am LOHENGRIN wurden die Ausbeuten leichter geladener Teilchen in der neutroneninduziertenternaren Spaltung verschiedener Aktinidentargets bestimmt: 233U, 235U, 239Pu, 241Pu und 245Cm.Dazu werden dunne Targets in einen hohen Neutronenfluß eingebracht. Die produzierten Kerneverlassen die Targets mit dem Ruckstoß den sie in der Kernspaltung erhalten. Die Intensitatwird bei verschiedenen Energien und Ionenladungszustanden vermessen. Nach Korrekturen furdie experimentelle Akzeptanz, den zeitlichen Verlauf der Spaltrate und der Bevolkerung der Io-nenladungszustande werden die Ausbeuten uber die Verteilung der kinetischen Energie integriert.Ein Vergleich der so gewonnenen Ausbeuten mit den Vorhersagen verschiedener ternarer Spalt-modelle zeigt daß die Ausbeuten der haufigsten Nuklide gut vorhergesagt werden. Andererseitsunterschatzen die Modelle deutlich die Produktion von “exotischen” Kernen mit einem extremenN/Z Verhaltnis. Daher ist eine Uberarbeitung dieser Modelle notwendig. Die gesammelten Datenbieten eine gute Grundlage um verbesserte Modelle zu testen.
Im zweiten Teil der Arbeit wurden Ausbeuten von radioaktiven Nukliden an der “ISOL” (isotopeseparation on-line) Anlage ISOLDE bestimmt. Hier treffen hochenergetische Protonen (1.0 oder1.4 GeV) auf Targets aus verschiedenen Materialien und verursachen diverse Kernreaktionen. Diedabei produzierten radioaktiven Kerne werden in den dicken Targets gestoppt und konnen bei hohenTemperaturen herausdiffundieren und freigesetzt werden. Anschließend werden sie ionisiert, elek-trostatisch auf 60 keV beschleunigt und nach der Masse separiert. Nun konnen sie an verschiedeneExperimentierplatze verteilt werden und dienen einer Vielzahl von Anwendungen. Die Messungdieser Strahlintensitaten wird weniger genutzt um den Mechanismus der Produktion (Spaltung,Spallation oder Fragmentation) zu untersuchen, sondern um die Verluste die auf dem Weg vonder Produktion zur Freisetzung auftreten besser zu verstehen und zu reduzieren. Im Gegensatz zueinem Ruckstoßseparator schwanken diese Verluste stark zwischen verschiedenen Isotopen. Um dienutzbare Strahlintensitat zu erhohen ist eine sorgfaltige Optimierung vieler Faktoren notwendig:der chemischen Zusammensetzung und mikroskopischen Beschaffenheit des Targetmaterials, derTemperatur der Target- und Ionenquelleneinheit, des Typs und der Betriebsparameter der Ionen-quelle, etc. Die erzielten Ausbeuten und mogliche Verbesserungen werden diskutiert anhand einigerElemente: Be, Al, Mn, Ni, Cu, Ga, Cd, In, Sn, Cs and Fr. Ein wichtiger Beitrag zur effizientenund selektiven Separation vieler metallischer Elemente ist die RILIS Technik (Resonanzionisation-slaserionenquelle). Ihre Anwendungen konnen sogar erweitert werden um selbst Isomere zu trennenoder um Atomspektroskopie mit radioaktiven Isotopen zu betreiben.
Mit diesen intensiven und “reinen” radioaktiven Ionenstrahlen wurden verschiedene neue Resultatein der Kernphysik erzielt. Diese umspannen fast die gesamte Nuklidkarte und beinhalten eine neueBestimmung der Lebensdauer und der Emissionswahrscheinlichkeit fur beta-verzogerte Neutronenvon 12Be (T1/2 = 21.34(23) ms, Pn = 0.48+0.12−0.10 %), eine grobe Bestimmung der magnetischenMomente von 70gCu (µ = (+)1.8(3)µN) und 70mCu (|µ| = 1.2(3)µN), die Untersuchung derbeta-verzogerten Neutronenemission der neutronenreichen Kupfer-Isotope 73−78Cu mit dem erstenNachweis der beta-verzogerten Neutronenemission von 73Cu, der ersten Messung der Lebensdauernvon 149Cs (T1/2 = 112(3) ms) und 150Cs (T1/2 = 82(7) ms) und dem Nachweis neuer Gammalinienim Zerfall von 232Fr.

Contents
1. Ternary fission yields 5
1.1. Fission . . . . . . . . . . . . . . . . . . . . . . . . . . . . . . . . . . . . . . . . . 5
1.2. Ternary fission . . . . . . . . . . . . . . . . . . . . . . . . . . . . . . . . . . . . . 7
1.3. Ternary fission models . . . . . . . . . . . . . . . . . . . . . . . . . . . . . . . . . 7
1.3.1. Valskii fit formula . . . . . . . . . . . . . . . . . . . . . . . . . . . . . . . 8
1.3.2. Double-neck-rupture model . . . . . . . . . . . . . . . . . . . . . . . . . . 9
1.3.3. Modified double-neck-rupture model . . . . . . . . . . . . . . . . . . . . . 10
1.3.4. “Transition energy” model . . . . . . . . . . . . . . . . . . . . . . . . . . 10
1.3.5. Boltzmann model . . . . . . . . . . . . . . . . . . . . . . . . . . . . . . . 11
1.3.6. Extended Halpern model . . . . . . . . . . . . . . . . . . . . . . . . . . . 12
1.3.7. Summary . . . . . . . . . . . . . . . . . . . . . . . . . . . . . . . . . . . 13
1.4. LOHENGRIN separator . . . . . . . . . . . . . . . . . . . . . . . . . . . . . . . . 16
1.4.1. Targets . . . . . . . . . . . . . . . . . . . . . . . . . . . . . . . . . . . . . 16
1.4.2. Separator . . . . . . . . . . . . . . . . . . . . . . . . . . . . . . . . . . . 18
1.4.3. Particle identification . . . . . . . . . . . . . . . . . . . . . . . . . . . . . 18
1.4.4. Calibrations . . . . . . . . . . . . . . . . . . . . . . . . . . . . . . . . . . 19
1.4.5. Data evaluation . . . . . . . . . . . . . . . . . . . . . . . . . . . . . . . . 20
1.5. Results . . . . . . . . . . . . . . . . . . . . . . . . . . . . . . . . . . . . . . . . . 26
1.5.1. Yields from 241Pu(nth,f) . . . . . . . . . . . . . . . . . . . . . . . . . . . 26
1.5.2. Yields from 245Cm(nth,f) . . . . . . . . . . . . . . . . . . . . . . . . . . . 26
1.5.3. Yields from 233U(nth,f) . . . . . . . . . . . . . . . . . . . . . . . . . . . . 30
1.5.4. Yields from 235U(nth,f) . . . . . . . . . . . . . . . . . . . . . . . . . . . . 32
1.6. Discussion . . . . . . . . . . . . . . . . . . . . . . . . . . . . . . . . . . . . . . . 34
1.6.1. Binary contributions to ternary fission yields? . . . . . . . . . . . . . . . . 34
1.6.2. General comparison with model predictions . . . . . . . . . . . . . . . . . 34
1.6.3. Yields of neutron-deficient nuclei . . . . . . . . . . . . . . . . . . . . . . . 37
1.6.4. Yield of very neutron-rich nuclei . . . . . . . . . . . . . . . . . . . . . . . 41
1.6.5. Improvement of ternary fission models . . . . . . . . . . . . . . . . . . . . 44
1.7. Outlook . . . . . . . . . . . . . . . . . . . . . . . . . . . . . . . . . . . . . . . . 48
2. Isotope separation 51
2.1. Radioactive Ion Beam facilities . . . . . . . . . . . . . . . . . . . . . . . . . . . . 51
2.1.1. Efficiency of individual steps . . . . . . . . . . . . . . . . . . . . . . . . . 52
2.1.2. Comparison of different RIB facility concepts . . . . . . . . . . . . . . . . 53

2.2. Production mechanisms . . . . . . . . . . . . . . . . . . . . . . . . . . . . . . . . 55
2.2.1. Production of neutron-deficient nuclei . . . . . . . . . . . . . . . . . . . . 55
2.2.2. Production of neutron-rich nuclei . . . . . . . . . . . . . . . . . . . . . . . 55
2.2.3. Collection of decay products . . . . . . . . . . . . . . . . . . . . . . . . . 59
2.2.4. Summary . . . . . . . . . . . . . . . . . . . . . . . . . . . . . . . . . . . 59
2.3. Separation methods . . . . . . . . . . . . . . . . . . . . . . . . . . . . . . . . . . 60
2.4. ISOL targets . . . . . . . . . . . . . . . . . . . . . . . . . . . . . . . . . . . . . . 64
2.4.1. Release optimization . . . . . . . . . . . . . . . . . . . . . . . . . . . . . 64
2.4.2. Efficiency and release time measurement . . . . . . . . . . . . . . . . . . . 65
2.4.3. Pulsed or dc driver beam? . . . . . . . . . . . . . . . . . . . . . . . . . . 69
2.5. Ion sources . . . . . . . . . . . . . . . . . . . . . . . . . . . . . . . . . . . . . . . 70
2.5.1. Surface ionization . . . . . . . . . . . . . . . . . . . . . . . . . . . . . . . 70
2.5.2. Plasma ion sources . . . . . . . . . . . . . . . . . . . . . . . . . . . . . . 72
3. Resonance ionization laser ion source 77
3.1. Laser ionization . . . . . . . . . . . . . . . . . . . . . . . . . . . . . . . . . . . . 77
3.2. Ionization schemes . . . . . . . . . . . . . . . . . . . . . . . . . . . . . . . . . . . 78
3.2.1. Applied schemes . . . . . . . . . . . . . . . . . . . . . . . . . . . . . . . . 80
3.2.2. Power requirements . . . . . . . . . . . . . . . . . . . . . . . . . . . . . . 82
3.3. Laser system . . . . . . . . . . . . . . . . . . . . . . . . . . . . . . . . . . . . . . 84
3.4. The RILIS cavity . . . . . . . . . . . . . . . . . . . . . . . . . . . . . . . . . . . . 88
3.4.1. Geometry of the cavity . . . . . . . . . . . . . . . . . . . . . . . . . . . . 88
3.4.2. Role of the thermal plasma potential . . . . . . . . . . . . . . . . . . . . . 89
3.4.3. Influence of the cavity material . . . . . . . . . . . . . . . . . . . . . . . . 94
3.4.4. Line with inverted polarity . . . . . . . . . . . . . . . . . . . . . . . . . . 100
3.5. Atomic physics effects . . . . . . . . . . . . . . . . . . . . . . . . . . . . . . . . . 102
3.5.1. Isotope shift . . . . . . . . . . . . . . . . . . . . . . . . . . . . . . . . . . 102
3.5.2. Hyperfine splitting . . . . . . . . . . . . . . . . . . . . . . . . . . . . . . . 104
3.5.3. Nuclear polarized beams . . . . . . . . . . . . . . . . . . . . . . . . . . . 107
3.6. Implementation of the RILIS . . . . . . . . . . . . . . . . . . . . . . . . . . . . . 108
3.6.1. Beam observation and tuning . . . . . . . . . . . . . . . . . . . . . . . . . 108
3.6.2. Compatibility of RILIS and HRS . . . . . . . . . . . . . . . . . . . . . . . 109
3.6.3. RILIS implementation at other RIB facilities . . . . . . . . . . . . . . . . . 110
3.6.4. Combination with off-line use . . . . . . . . . . . . . . . . . . . . . . . . . 112
4. Yields and release of various elements 113
4.1. Separation of molecular sidebands . . . . . . . . . . . . . . . . . . . . . . . . . . 115
4.2. Beryllium yields . . . . . . . . . . . . . . . . . . . . . . . . . . . . . . . . . . . . 119
4.3. Manganese yields . . . . . . . . . . . . . . . . . . . . . . . . . . . . . . . . . . . 122
4.4. Nickel yields . . . . . . . . . . . . . . . . . . . . . . . . . . . . . . . . . . . . . . 126
4.5. Copper yields . . . . . . . . . . . . . . . . . . . . . . . . . . . . . . . . . . . . . 129
4.6. Gallium yields . . . . . . . . . . . . . . . . . . . . . . . . . . . . . . . . . . . . . 134

4.7. Silver yields . . . . . . . . . . . . . . . . . . . . . . . . . . . . . . . . . . . . . . 137
4.8. Cadmium yields . . . . . . . . . . . . . . . . . . . . . . . . . . . . . . . . . . . . 138
4.9. Indium yields . . . . . . . . . . . . . . . . . . . . . . . . . . . . . . . . . . . . . . 144
4.10. Tin yields . . . . . . . . . . . . . . . . . . . . . . . . . . . . . . . . . . . . . . . 147
4.11. Cesium yields . . . . . . . . . . . . . . . . . . . . . . . . . . . . . . . . . . . . . 149
4.12. Francium yields . . . . . . . . . . . . . . . . . . . . . . . . . . . . . . . . . . . . 153
4.13. A universal RIB facility? . . . . . . . . . . . . . . . . . . . . . . . . . . . . . . . . 158
5. Nuclear physics results 161
5.1. 12Be decay . . . . . . . . . . . . . . . . . . . . . . . . . . . . . . . . . . . . . . . 161
5.2. Nuclear spectroscopy of heavy copper isotopes . . . . . . . . . . . . . . . . . . . . 163
5.2.1. Magnetic moments of 70gCu and 70mCu . . . . . . . . . . . . . . . . . . . 163
5.2.2. Lifetimes and Pn values of 73Cu to 78Cu . . . . . . . . . . . . . . . . . . . 166
5.3. Decay of heavy cesium isotopes . . . . . . . . . . . . . . . . . . . . . . . . . . . . 168
5.3.1. Decay of 149Cs . . . . . . . . . . . . . . . . . . . . . . . . . . . . . . . . 169
5.3.2. Decay of 150Cs . . . . . . . . . . . . . . . . . . . . . . . . . . . . . . . . 170
5.3.3. Comparison . . . . . . . . . . . . . . . . . . . . . . . . . . . . . . . . . . 171
5.4. Beta-decay of heavy francium isotopes . . . . . . . . . . . . . . . . . . . . . . . . 172
5.4.1. Decay of 232Fr . . . . . . . . . . . . . . . . . . . . . . . . . . . . . . . . . 172
5.4.2. Search for 233Fr . . . . . . . . . . . . . . . . . . . . . . . . . . . . . . . . 177
5.4.3. Outlook to 234+xFr . . . . . . . . . . . . . . . . . . . . . . . . . . . . . . 179
A. Appendix to LOHENGRIN measurements 183
A.1. Preparation of thin, self-supporting nickel films . . . . . . . . . . . . . . . . . . . 183
A.2. Field settings of the LOHENGRIN separator . . . . . . . . . . . . . . . . . . . . . 184
A.3. Entrance window of the ionization chamber . . . . . . . . . . . . . . . . . . . . . 185
A.4. Kinetic energy distributions of ternary particles . . . . . . . . . . . . . . . . . . . 187
A.4.1. 233U(nth,f) . . . . . . . . . . . . . . . . . . . . . . . . . . . . . . . . . . . 187
A.4.2. 235U(nth,f) . . . . . . . . . . . . . . . . . . . . . . . . . . . . . . . . . . . 188
A.4.3. 241Pu(nth,f) . . . . . . . . . . . . . . . . . . . . . . . . . . . . . . . . . . 189
A.4.4. 245Cm(nth,f) . . . . . . . . . . . . . . . . . . . . . . . . . . . . . . . . . . 190
A.5. Ternary particle yields . . . . . . . . . . . . . . . . . . . . . . . . . . . . . . . . . 191
A.5.1. 229Th(nth,f) . . . . . . . . . . . . . . . . . . . . . . . . . . . . . . . . . . 191
A.5.2. 233U(nth,f) . . . . . . . . . . . . . . . . . . . . . . . . . . . . . . . . . . . 192
A.5.3. 235U(nth,f) . . . . . . . . . . . . . . . . . . . . . . . . . . . . . . . . . . . 193
A.5.4. 239Pu(nth,f) . . . . . . . . . . . . . . . . . . . . . . . . . . . . . . . . . . 195
A.5.5. 241Pu(nth,f) . . . . . . . . . . . . . . . . . . . . . . . . . . . . . . . . . . 196
A.5.6. 241Am(2nth,f) . . . . . . . . . . . . . . . . . . . . . . . . . . . . . . . . . 197
A.5.7. 245Cm(nth,f) . . . . . . . . . . . . . . . . . . . . . . . . . . . . . . . . . . 199
A.5.8. 249Cf(nth,f) . . . . . . . . . . . . . . . . . . . . . . . . . . . . . . . . . . 200
A.5.9. 252Cf(sf) . . . . . . . . . . . . . . . . . . . . . . . . . . . . . . . . . . . . 201
A.5.10. Other fissioning systems . . . . . . . . . . . . . . . . . . . . . . . . . . . . 202

B. Appendix to ISOL technique 203
B.1. Useful conversion factors and formulae . . . . . . . . . . . . . . . . . . . . . . . . 203
B.2. Release from ISOL targets . . . . . . . . . . . . . . . . . . . . . . . . . . . . . . 204
B.2.1. Diffusion . . . . . . . . . . . . . . . . . . . . . . . . . . . . . . . . . . . . 204
B.2.2. Effusion . . . . . . . . . . . . . . . . . . . . . . . . . . . . . . . . . . . . 205
B.2.3. Desorption . . . . . . . . . . . . . . . . . . . . . . . . . . . . . . . . . . . 206
B.2.4. Real situation . . . . . . . . . . . . . . . . . . . . . . . . . . . . . . . . . 206
B.2.5. Wall sticking times from the Eichler systematics . . . . . . . . . . . . . . . 207
B.3. Target materials . . . . . . . . . . . . . . . . . . . . . . . . . . . . . . . . . . . . 210
B.3.1. Molten metal targets . . . . . . . . . . . . . . . . . . . . . . . . . . . . . 210
B.3.2. Solid metal targets . . . . . . . . . . . . . . . . . . . . . . . . . . . . . . 211
B.3.3. Carbides . . . . . . . . . . . . . . . . . . . . . . . . . . . . . . . . . . . . 212
B.3.4. Oxides . . . . . . . . . . . . . . . . . . . . . . . . . . . . . . . . . . . . . 213
B.3.5. Other materials . . . . . . . . . . . . . . . . . . . . . . . . . . . . . . . . 214
B.4. Uranium carbide targets . . . . . . . . . . . . . . . . . . . . . . . . . . . . . . . . 215
B.4.1. Production . . . . . . . . . . . . . . . . . . . . . . . . . . . . . . . . . . . 215
B.4.2. Target aging effects . . . . . . . . . . . . . . . . . . . . . . . . . . . . . . 218
B.4.3. Operation temperature of UCx/graphite targets . . . . . . . . . . . . . . . 220
B.5. Surface ionization efficiency . . . . . . . . . . . . . . . . . . . . . . . . . . . . . . 223
B.5.1. Positive surface ionization . . . . . . . . . . . . . . . . . . . . . . . . . . . 223
B.5.2. Negative surface ionization . . . . . . . . . . . . . . . . . . . . . . . . . . 223
B.5.3. Ionization in a hot cavity . . . . . . . . . . . . . . . . . . . . . . . . . . . 224
B.6. Ionization potentials and electron affinities . . . . . . . . . . . . . . . . . . . . . . 227
B.7. Work function and Richardson parameter . . . . . . . . . . . . . . . . . . . . . . 229
B.8. Resonance ionization schemes . . . . . . . . . . . . . . . . . . . . . . . . . . . . . 230
B.9. Background and selectivity . . . . . . . . . . . . . . . . . . . . . . . . . . . . . . 235
B.10.Experimental resonance width . . . . . . . . . . . . . . . . . . . . . . . . . . . . . 237
B.10.1. Natural linewidth . . . . . . . . . . . . . . . . . . . . . . . . . . . . . . . 237
B.10.2. Doppler width . . . . . . . . . . . . . . . . . . . . . . . . . . . . . . . . . 237
B.10.3. Collisional broadening . . . . . . . . . . . . . . . . . . . . . . . . . . . . . 237
B.10.4. Power broadening . . . . . . . . . . . . . . . . . . . . . . . . . . . . . . . 238
B.10.5. Shape of the resonance curve . . . . . . . . . . . . . . . . . . . . . . . . . 238
B.10.6. Laser bandwidth . . . . . . . . . . . . . . . . . . . . . . . . . . . . . . . . 238
B.11.Beta-delayed neutron emission . . . . . . . . . . . . . . . . . . . . . . . . . . . . 239
B.11.1. Detection of delayed neutrons . . . . . . . . . . . . . . . . . . . . . . . . 240
B.11.2. Neutron long counter . . . . . . . . . . . . . . . . . . . . . . . . . . . . . 241
B.12.“Radioactive-Ion-Beam” facility or “Radioactive” Ion-Beam-facility? . . . . . . . . 242
B.13.A poor man’s radioactive beam collider . . . . . . . . . . . . . . . . . . . . . . . . 243
B.13.1. Radioactive on-line target . . . . . . . . . . . . . . . . . . . . . . . . . . . 243
B.13.2. Ion optics . . . . . . . . . . . . . . . . . . . . . . . . . . . . . . . . . . . 244
B.13.3. Collection foil . . . . . . . . . . . . . . . . . . . . . . . . . . . . . . . . . 245
B.13.4. Conclusion . . . . . . . . . . . . . . . . . . . . . . . . . . . . . . . . . . . 246

Introduction
Radioactive decay of nuclei has been discovered about one hundred years ago [Bec96]. In thefollowing years specific nuclides were isolated from the natural radioactive decay chains to studytheir individual decay characteristics [Skl98, Cur98]. Later nuclear reactions were used to produceartificial radio-nuclides (see e.g. ref. [Fer34b]). Most of the newly created isotopes and elementswere identified and separated by chemical means. These and other traditional off-line methods,where the production happens at one place and the target or catcher is then transported elsewherefor subsequent separation of the desired isotopes, is limited to lifetimes in the minute to hourrange1. A lot of time can be gained by coupling production and separation to a single system, aso-called on-line separator. With the use of recoil and isotope on-line separators more short-livednuclides could be studied. This lead to a rapid growth of the number of “known” isotopes. Thechart of nuclides has been extended to heavier elements and to isotopes with extreme neutronto proton ratios. Today nuclear properties like half-lives, masses, decay characteristics or evenmore or less complete schemes of excited levels are known for about 3000 isotopes. However, justas many exotic isotopes between the expected proton- and neutron-drip-lines are still completelyunexplored. The further extension of our knowledge on these exotic isotopes is directly related tothe development of efficient and selective separation methods.
The wish to study not only ground state properties of radioactive nuclei, but also reactions withthem, requires facilities which provide fast beams (1 MeV <∼ E/A <∼ 1 GeV). These so-called RIB(radioactive ion beam) facilities will provide a better insight into nuclear physics and neighboringfields like nuclear astrophysics, nuclear solid state physics, atomic physics, nuclear chemistry, thestudy of fundamental interactions, nuclear medicine and others, see e.g. [Cas97, Ben96, PIAFE]for an overview. There is a consensus that an important part of this physics is best addressedby post-accelerated beams from an ISOL (isotope separator on-line) facility. It is important todevelop appropriate post-accelerators and efficient detector arrays, but one should not forget thatthe required beam has first to be produced and separated before being accelerated. Often a highpotential for improving yields and selectivity by orders of magnitude is hidden in the first part ofthe separation process (target and ion source), exceeding any amelioration which could be achievedat high effort and cost in the later stages (accelerator and detector).
Looking at the chart of nuclides it is apparent that for some elements the chains of experimentallystudied isotopes reach out much further than for neighboring ones. This is not always due to longerlifetimes or a special interest of nuclear physics in these isotopes, but also given by the technicalfeasibility of beams from these isotopes. Important progress of the ISOL technique in the last yearsallowed to provide intense beams of elements which were difficult to be produced at all before.The technological status of the separation of some typical elements will be discussed in this work.
The success of an experiment at a RIB facility is mainly determined by the efficiency, rapidity andselectivity of all individual steps from production to detection. Unfortunately it is not possible tooptimize each point individually and then to simply join the “best” target with the “best” ionsource, etc. Often these independently optimized systems are not at all compatible. It is thereforeimportant to keep an eye on the complete system and an optimum interplay of all components.
1Seaborg describes the important contribution of a fast car to the discovery of the first mendelevium isotope[Sea90].
1

2
This makes the approach quite extensive and interdisciplinary, joining different fields like nuclearphysics, chemistry, materials science, atomic physics, laser technology, etc.
The NuPECC2 working group on Radioactive Beam Facilities is currently preparing a detailedcomparative study of different concepts for a few key elements of high physics interest: Be, Ar,Ni, Ga, Kr, Sn and Fr. For each case over a hundred involved individual parameters have to beaddressed. Even with the restriction to a single element, the answer to all open questions fromproduction to detection would go far beyond the scope of a single thesis. Instead, only some of theproperties of the stages “target” and “ion source” will be discussed here. The noble gases Ar andKr will not be discussed in detail, but additionally a few other elements are included which havebeen separated recently at ISOLDE. The obtained yields are compared with the beams availableat other facilities.
In the tradition of the Technische Universitat Munchen this work emphasizes the importance of thetechnical developments and achievements. These new and improved techniques are an importantprerequisite to obtain new physics results. Thus, even a short measurement can provide newinformation on nuclear properties of known and new isotopes. It allowed to adorn this work withseveral nuclear physics “tidbits”.
2Nuclear Physics European Collaboration Committee.

3
Outline of the thesis
The first production method used for on-line isotope separation was thermal neutron inducedfission [KH51]. It is less known that in fission not only neutron-rich medium-mass nuclides areproduced, but also light elements from hydrogen to about silicon. In chapter 1 new measurementsof yields and energy distributions of these light charged particles from the so-called ternary fissionof 241Pu(nth,f) and 245Cm(nth,f) are presented. The most rare ternary nuclei were also studiedin the thermal-neutron-induced fission of 233U and 235U. These experiments were performed withthe LOHENGRIN separator at the Institut Laue Langevin (Grenoble). The experimental yields arecompared with the predictions of several ternary fission models.
In chapter 2 different methods and techniques are discussed to separate beams of short-livedisotopes efficiently and selectively. Isotope separation on-line (ISOL) facilities can produce intensebeams for a large variety of elements. The key part of an ISOL facility is the target-ion source unit.The design of the target determines the production rate and the release speed of the radioactiveisotopes. The ion source directly affects the efficiency and the selectivity of the separation process.A review is given on some of the presently used ISOL target- and ion source types.
An ion source type which was very successful in the last years is the resonance ionization laser ionsource (RILIS). It provides an element selective ionization of many elements. Using the detailedproperties of the atomic spectrum, even additional applications like the separation of individualisomers become possible. The technology and applications of a RILIS are presented in chapter 3.This discussion is mainly guided by experiences with the ISOLDE RILIS.
In chapter 4 the state-of-the-art technology for ISOL production of specific elements is discussed.Yields obtained in recent experiments at ISOLDE PSB (CERN) are summarized and comparedwith yields from other facilities. The possibilities and limitations of the techniques are shown andan outlook is given to further improvements.
Finally the new nuclear physics results are presented in chapter 5. These include various nuclearproperties like new lifetimes, magnetic moments, branching ratios for neutron emission and theassignment of new gamma lines. These results have in common that they could be achieved onlyby using the recently developed techniques presented in chapters 2 and 3.
This work treats problems from different disciplines. Therefore not every point can be discussedin the last detail. Instead an overview is given together with an ample number of more specificreferences. I experienced that the search and access of certain (less common) references can takea significant amount of time. To simplify the access to some useful values from literature (e.g.ternary fission yields and material constants) they have been summarized in the appendix.


1. Ternary fission yields
1.1. Fission
Some years after the discovery of radioactivity most natural elements were identified and arrangedin the periodical system of Mendeleev. In the 1930s attempts were made to create new trans-uranic elements by bombarding uranium with neutrons. Indeed, new radioactive isotopes werefound [Fer34a], but Hahn and Strassmann [Hah39b, Hah39a] showed that the discovered isotopeshad the chemical properties of strontium, yttrium, xenon, cesium, barium, etc. That meant thatnew elements were not found, but a new type of nuclear reaction: the break-up of uranium intotwo lighter nuclei, called fission [Mei39]. Ida Noddack had already proposed this possibility in 1934[Nod34]. Soon the large amount of energy liberated in fission (about 170 MeV kinetic energy ofthe fragments) was measured by Frisch [Fri39], and a theoretical explanation based on the liquiddrop model (LDM) was given by Bohr and Wheeler [Boh39]. Following their arguments, a briefsummary will be given here, using more recent evaluations of the parameters involved.
After reaching a maximum of about 8.8 MeV around 56Fe, the average binding energy per nucleondecreases to about 7.8 MeV for the actinides. Breaking these heavy nuclides into two lighter frag-ments releases a difference of about 0.8 MeV per nucleon1. Although being strongly exoenergetic,an immediate fission is normally prevented by a potential barrier.
Regarding the deformation of a nucleus in the liquid drop model, one finds that the surface energyEs of an ellipsoid increases with the elongation ε like:
Es = as · A23 · (1 +
2
5· ε2 + . . . ), (1.1.1)
while the Coulomb energy EC decreases like:
EC = aC · Z2 · A− 13 · (1− 1
5· ε2 + . . . ). (1.1.2)
The total energy change is thus positive if:
2
5asA
23 ε2 <
1
5aC
Z2
A13
ε2. (1.1.3)
Solving for Z and A and introducing the numerical values for the constants as and aC, obtainedfrom fits to nuclear masses [Wei91], gives:
Z2
A>
(Z2
A
)crit
=2asaC
=2 · 17.8 MeV
0.71 MeV≈ 50. (1.1.4)
This shows that nuclei with high Z2/A become unstable against fission. The decisive parameter(Z2/A)/(Z2/A)crit is called fissility.
1This energy release is calculated for typical asymmetrical or symmetrical mass splits respecting the conservationof the N/Z ratio of the compound nucleus.
5

6 1.1 Fission
Before fissioning, the nucleus has to be strongly elongated. During the elongation the system has toovercome a potential barrier, the height and width of which decrease with increasing fissility. Whilevery fissile nuclei can tunnel through the barrier and fission spontaneously, for most nuclides thesmall tunneling transmission coefficients result in extremely long half-lives for spontaneous fission.These nuclei are still fissile when the excitation energy is provided from “outside”. Practically themost important case is thermal neutron induced fission where the neutron binding energy gainedin neutron capture is used to excite the compound nucleus. Using more energetic projectiles, i.e.by capture of – or collisions with – fast neutrons, protons or heavy ions, fission can also be inducedin isotopes which are not fissile by thermal neutrons. Another possibility is the excitation by realor virtual photons (the latter from electron scattering or Coulomb excitation) leading to gammainduced fission. The necessary energy can also be expended by capture of – or reactions with– myons, antiprotons, pions or hyperons; see e.g. ref. [Dav87, Egi93, Hic85, Pol89]. For exoticradio-isotopes far from β-stability even the Q-value of electron capture (EC), β+ or β− decaycan be sufficient to overcome the fission barrier. On the proton-rich side few cases of EC- andβ+-delayed fission were reported [Sko72, Hab78, Laz87, Hal92], but of the nuclides predicted todecay via β−f up to now only 256mEs could be synthesized [Hal89].
While the liquid drop model favors a symmetrical separation2, many experimental mass- and energydistributions show an asymmetrical fission into a light and a heavy fragment. Strutinsky introducedshape dependent shell correction energies which allow the calculation of the potential energy independence of elongation [Str67]. For actinides the ground state has a small prolate deformation.With increasing elongation a double humped barrier occurs in most cases, where the higher peakis called fission barrier. Between both peaks a local second minimum exists as a so-called superde-formed state with a ratio of 2:1 for the long to short axis. Due to the smaller remaining barrierthis isomeric state can decay rapidly by fission. The first experimental confirmation that the fissionisomer is indeed located in the second minimum was obtained at the Munich Tandem acceleratorby spectroscopy of conversion electrons preceding the fission of the 4 ns fission isomer 240mPu[Spe72]. For uranium and thorium the existence of a third minimum with hyperdeformed states(axis ratio 3:1) was also found. The first spectroscopy of hyperdeformed states in 236U and 234Uwas again made at the Munich Tandem accelerator [Kra98a, Kra99].
When passing the barrier the fissioning system can probe different channels. Especially with lowexcitation energy it will preferentially decay via energetically favorable channels, i.e. follow valleysin a multi-dimensional landscape where the energy is plotted against various multipole orders ofdeformations. These so-called fission modes show up in the mass and kinetic energy distributionof the fission fragments. The fission yields are therefore tightly linked to the nuclear structure ofthe compound system. For most light actinides an asymmetrical mass distribution with a light anda heavy fragment is found, with the maximum of the heavy fragment distribution always beingcentered around AH ≈ 134, while the light fragment mass is given by: AL = AComp−AH−ν, withAComp the mass of the fissioning compound nucleus and ν the number of emitted neutrons. Onlyin very heavy actinides (A ≥ 258) symmetric fission with two fragments of equal size dominates.With increasing excitation energy the shell effects are washed out and symmetrical fission is alsofavored in lighter systems.
Fission is a collective process including all nucleons, so most of the information on the entrancechannel is lost and for a given excitation energy most gross features (mass distribution, kineticenergy distribution, etc.) are similarly regardless3 of the excitation mechanism which led to thecompound nucleus. This was confirmed in many experiments, see e.g. ref. [Dav87, Sch92, Hof94,
2Some calculations show an instability towards asymmetrical mass splits, but only at high deformation far beyondthe saddle point.
3An important exception are the correlations of the asymmetry of fragment angular distribution and polarizationof the fission inducing neutron. Thus, it becomes possible to measure parity nonconservation in fission (see e.g.[Gon94, Kot98]) and possibly even time reversal invariance [Jes98].

1.2 Ternary fission 7
Eng98]. While other excitation mechanisms may create a mixture of high- and low-energy fission,thermal neutron-induced and spontaneous fission are free of high-energy contributions. Thereforethey always played a leading role in the investigation of low-energy fission. The high cross-sectionsand the possibility to “switch” the fission on and off with the neutron beam allows the productionand handling of much higher source strengths with neutron-induced fission than with spontaneousfission. Thus, very rare events which will be discussed in the following are mainly studied in thermalneutron induced fission.
1.2. Ternary fission
The possibility for fission not into two, but into three fragments was already proposed in 1941[Pre41]. Experimental evidence for emission of a third charged particle was found from fission tracksin nuclear emulsions [ST46, ST47, Far47]. Detailed investigations showed that about 90% of theternary particles (TP) are 4He nuclei with a kinetic energy distribution centered around 16 MeV.They are also called long-range alphas (LRA) in order to differentiate from less energetic alphasfrom radioactive alpha decay. Next most abundant are all hydrogen and the heavier helium isotopes.Only about 1% of the ternary particles have a Z > 2, and the yields drop rapidly with increasingZ. For “real” ternary events with three fragments of comparable size only upper limits exist inlow-energy fission4, see [Sto66, SO87] and references therein. Also in heavy ion reactions (e.g.12.5 MeV/nucleon Xe projectiles on Sn) fission-like three-body events were observed. However,they are interpreted as sequential fission, i.e. a subsequent fission of one of the still highly excitedfission fragments occurs, thus creating three particles in a two-step process [Gla82, Har82]. Forbrevity I will use the expressions “ternary fission” and “tripartition” synonymously to the morecorrect name “light charged particle (LCP) accompanied fission”.
Measured angular correlations of the TP with the fission fragments (FF) show a maximum emissionof TP about perpendicular to the momenta of the FF. This fact, as well as the width of the kineticenergy distributions are consistent with an emission from the region of the stretched neck whichforms between the fragments just before scission. In rare cases this neck can break more or lesssimultaneously5 at two positions, thus leaving nucleons between the fragments which form a lightcharged particle. In the Coulomb field of both fragments it is accelerated and preferentially emittedperpendicular to the emission direction of the fragments. In fact the angle of maximum emissionto the fission axis (defined by the momentum of the light fragment) is slightly smaller than 90degrees (about 83.9 degree for helium isotopes from 252Cf(sf) [Sin96]), accounting for the strongerrepulsion and “shadowing” from the heavy fragment. So-called polar emission of LCP parallel tothe fragment’s direction is much less abundant (only about 1% of the ternary yield comes frompolar emission), and probably stems from a different mechanism. Only protons show a significantcontribution of polar emission angles which can be explained by statistical evaporation models[SO91]. A detailed discussion of this polar emission of light charged particles can be found inliterature, e.g. [Pia80].
1.3. Ternary fission models
The models which are successful in describing binary fission are difficult to apply for ternaryfission. The scission point model of Wilkens et al. [Wil76] starts with the presence of two fissionfragments and has only the tip distance as free parameter. The introduction of a third particle is
4Positive results for true ternary fission can often be explained by experimental artifacts as discussed in the givenreferences.
5The actual configuration in the moment of TP creation is the main difference between various models to bediscussed below.

8 1.3 Ternary fission models
not foreseen. Also the random neck rupture model of Brosa et al. [Bro90] which uses the Lawrenceparameterization [Law65] with five parameters does not have enough degrees of freedom to directlydescribe the development of a third particle in the neck region. Therefore, at a certain elongationa projection onto a dedicated ternary scission configuration would become necessary which is notfeasible without ambiguities.
There is still no theory which can reproduce the individual yields and energy distributions of ternaryfission fragments from first principles. Only in the special case of alpha accompanied fission of236U∗ a numerical solution of the one-body Schrodinger equation describing “alpha decay duringfission” was possible, and gave approximately correct values for the absolute emission probabilityand energy distributions of the alpha particles [Tan87, Sch95]. A similar classical approach hadbeen used by Carjan et al. to reproduce average energy and emission probability of LRA in thesame fissioning system [Car75, Car76, Obe92]. For cold spontaneous 10Be accompanied fission of252Cf the relative probabilities of the associated fragment mass splits have recently been calculatedvia barrier penetrabilities in a cluster model6 [San98b]. The calculations were performed by WKBapproximation of a barrier obtained from a liquid drop model including deformations β2, β3 and β4,according to Moller et al. [Mol95]. The one-body densities were obtained from a spherical Hartree-Fock calculation. The inverse problem, i.e. the calculation of individual ternary particle yields witha fixed or averaged mass split for the light and heavy fragments, has not been approached yet.
A nice graphical illustration of ternary fission has been given by Mutterer and Theobald [Mut96a],who show the analogy to multifragmentation according to the Rayleigh criterion in hydrodynamicalsystems. However, this is a classical picture which cannot take into account quantum mechanicalproperties of the system (e.g. fluctuations). There are also fundamental problems if the liquiddrop model (LDM) approach should be used quantitatively. If the ratio of surface to volumebecomes large, which is the case in the long-stretched and thin neck, the prerequisites for a LDMapproximation are no longer valid.
The statistical model of Fong [Fon71] and the first model of Pik-Pichak [PP84] only deal withthe ratio of LRA to binary fission. Bouzid et al. gave a relationship between the ternary to binaryratio and the proton-odd-even-effect in binary fission [Bou98]. Other approaches gave only aqualitative discussion of ternary particle emission without treating yields or energy distributions[Hal71, Rot89, Roy92].
In the following some models will be presented which describe the relative emission probabilitiesof various ternary particles in different fissioning systems.
1.3.1. Valskii fit formula
Valskii [Val76] gave a pure interpolation formula without assuming any specific scission configu-ration:
ln y(ATP, ZTP) = ln
(g(ATP, ZTP)ATP
2
)+
B(ATP, ZTP)T + ZTP lnXp +
+(ATP − ZTP) lnXn − (ATP − 1)[ln(ηT 2) + K], (1.3.1)
with y(ATP, ZTP) the yield of the TP relative to 10000 4He, B(ATP, ZTP) the binding energyof the TP, and K a normalization factor which contains the absolute emission probability ofLRA and some constants. The four free parameters lnXp, lnXn, ln(ηT 2) and T were fittedto reproduce the then known ternary yields of 233U(nth,f),
235U(nth,f) and 239Pu(nth,f). Thetemperature parameter T also determines the average initial kinetic energy of the ternary particleEkin 0TP = 2T . It has the values 1.32 MeV, 1.17 MeV and 1.38 MeV for the systems 233U(nth,f),
6As in the case of cluster decay calculations, the influence of the preformation factor is neglected.

1.3.2 Double-neck-rupture model 9
235U(nth,f) and 239Pu(nth,f). For the statistical weight g(ATP, ZTP), a sum over all particle stablelevels of the isotope is used:
g(ATP, ZTP) =∑i
(2Ii + 1) exp(−Ei/T ), (1.3.2)
with Ei the excitation energies and Ii the spins of the individual levels. A more detailed discussionof the contribution from excited states is given in section 1.6.5.
The formula tends to strongly overestimate the emission of heavy particles7. Also the parameterslnXp and lnXn, which describe the energy necessary for separation of protons and neutrons as akind of chemical potential, do not agree with similar separation energies from nuclear mass models.
In the next paragraphs the graphical insets show typical scission configurations of the discussedmodels. They are roughly drawn to scale with a fixed radius parameter of r0 = 1.2 fm.
1.3.2. Double-neck-rupture model
Rubchenya and Yavshits proposed a statistical modelof a double neck rupture [Rub88]. A ternary proto-particle (A0TP, Z
0TP) with mass A0TP≈10 is created be-
tween both fragments (AH, ZH) and (AL−A0TP, ZL−Z0TP) in a compact collinear configuration. AH = 140is fixed and ZH = (Z/A) ·AH chosen to have the sameN/Z ratio as the compound nucleus. Due to the compact configuration, the ternary proto-particlewill stay in close contact with the light fission fragment for a while and exchange nucleons. Theproton and neutron numbers are changed to that of the finally ejected particle (ATP, ZTP).
The yields are calculated according to:
y(ATP, ZTP) = C exp
(Q − VCoul
T
), (1.3.3)
where C is a normalization constant, T the “effective temperature”, and Q the energy necessaryto create the final ternary particle from the primary one:
Q = M(AL − A0TP, ZL − Z0TP) + M(A0TP, A0TP)−
−M(AL − ATP, ZL − ZTP) + M(ATP, ZTP), (1.3.4)
with M the nuclear masses of the respective isotopes. VCoul is the Coulomb energy between ternaryand light fragment:
VCoul =e2ZTP(ZL − ZTP)
r, (1.3.5)
r = r0(3√
AL − ATP + 3√
ATP), (1.3.6)
where r0 = 1.7 fm is chosen larger than the standard nuclear radius parameter to account forthe reduced interaction energy of deformed fragments. The heavy fragment is placed at 1-2 fmdistance to the ternary particle and acts only as a spectator. With T = 2.1, 2.3 and 2.8 MeV forthe compound nuclei 236U, 240Pu and 252Cf, the experimental yields of the most abundant ternaryparticles can be reproduced quite well, but the odd-even effect is underestimated. For heavy ternaryfragments it is difficult to understand how so many nucleons can be exchanged between the ternaryproto-particle and the light fragment in the rather short time (O(10−21 s)) before separation.7Especially for 233U(nth,f) the predictions are completely off. This can be understood from the small number ofmeasured values used for the fit.

10 1.3 Ternary fission models
Imposing an even-even heavy fragment for even-even compound nuclei (i.e. 140Xe instead of140Cs for 235U(n,f)) helps to improve the reproduction of the odd-even-effect [Bau92a]. Includingexplicitly momentum conservation of the three fragments leads to a better reproduction of someexperimental yields [Bou94]. Trajectory calculations which can reproduce the experimental angularand energy distribution of light charged particle and fragments give additional information on thescission configuration [Ros94]. The average interfragment distance D was found to scale with[Rub94]:
D = 1.2( 3√
AH + 3√
AL + 6.3 3√
ZTP) (1.3.7)
New version In a more recent version of the double-neck-rupture model [Rubch], the ternaryyields were averaged over the contributions of all mass splits, weighted with the pre-neutron-emission fragment yields from binary fission. Now a radius parameter of r0 = 1.6 fm is used andthe temperatures taken from an empirical formula are: 2.24, 2.19, 2.39, 2.31, 2.61 and 3.05 MeVfor 233U(nth,f),
235U(nth,f),239Pu(nth,f),
241Pu(nth,f),245Cm(nth,f) and 249Cf(nth,f).
1.3.3. Modified double-neck-rupture model
Baum et al. proposed a fundamental modification ofthe double neck rupture model [Bau92a, Bau92b]. Theyomitted the idea of a proto-particle and calculated di-rectly the Q-value of the reaction. The mass split ischosen to obtain the highest Q-value. A triangular scis-sion configuration is assumed where the TP is emittedoff-axis about midway between both fragments. The tipdistance between TP and light fragment is just half of
the tip distance between both fragments. The Coulomb energy of all three fragments is calculatedwith the three distances8:
DL−H = rL + rH + b0 · rTP,DL−TP = rL + rTP + 0.5 · b0 · rTP,DH−TP = rH + rTP + 0.5 · b0 · rTP, (1.3.8)
and the radii given by:
ri = 1.2 3√
Ai fm. (1.3.9)
The scission configuration provides also the start conditions for trajectory calculations. The freeparameter b0 is adapted to reproduce the mean kinetic energies of the heavier ternary particles(Z ≥ 3). b0 = 4.26 is found for 235U(nth,f) which corresponds to a rather stretched configuration.The second free parameter T is fitted to reproduce the measured yields: T = 1.7-2.5 MeV is foundfor 235U(nth,f) depending on the mass split9. For 235U(n,f) the model can approximately reproducethe experimentally observed yields, including the neutron- and proton-odd-even effect. Also theyields of rare nuclei are better reproduced than in other models. However, for the higher actinides239Pu(n,f), 242Am(n,f) and 252Cf(sf) it also starts to overestimate the yields of rare nuclei.
1.3.4. “Transition energy” model
In a model proposed by Pik-Pichak [PP94] the relative emission probability of a ternary particle isrelated to a relative “transition energy” ∆εTP−α by:
y(ATP, ZTP) = b exp(−∆εTP−α/Γ). (1.3.10)
8In the original work [Bau92b] there is some inconsistency of the distances DL−TP and DH−TP used in figure 2.7and equation (3.3.)
9For the results published in [Bau92a] a temperature T = 1.91 MeV was chosen [Neu92].
1.3.5 Boltzmann model 11
The transition energy is given by the difference of reaction Q-value and Coulomb energy.
∆εTP−α = −∆QTP−αR + ∆ETP−αCoul . (1.3.11)
In principle the total excitation energy TXE, consisting of deformation energy and internal exci-tation energy of the fragments has also to be taken into account. However, for the chosen masssplit it is assumed that TXE is roughly constant for all ternary particles and thus drops out whennormalizing to the yield of LRA.
A collinear scission configuration of nearly touchingfragments is used. The heavy fragment (132Sn or anucleus in its close vicinity) and the ternary particleare chosen to be spherical with a radius parameterr0 = 1.4 fm. Only the light fragment is deformed,which is reflected in a modified radius parameterr0 = 2.146 fm. The parameter Γ is 2.1 MeV, 2.2 MeV, 2.3 MeV and 2.7 MeV respectivelyfor the compound nuclei 234U, 236U, 240Pu and 252Cf. This parameter can be related to an effec-tive temperature T = 0.75 Γ. The temperature in turn determines the average initial kinetic energyof the ternary particles (E0 = 2T ) which is roughly consistent with values obtained by trajectorycalculations [PP84].
With coincident detection of ternary particles, fragments, neutrons and gammas, Singer and oth-ers could indeed measure the excitation energy of the fragments accompanied by different ternaryparticles [Sin96, Sin97]. He thus proposed to include the measured dependence on the total exci-tation energy as an additional factor in equation (1.3.10): exp(−∆TXE/Γ). This method gives anindependent access to the temperature parameter Γ. He finds Γ = 2.35(9) MeV for 252Cf(sf).
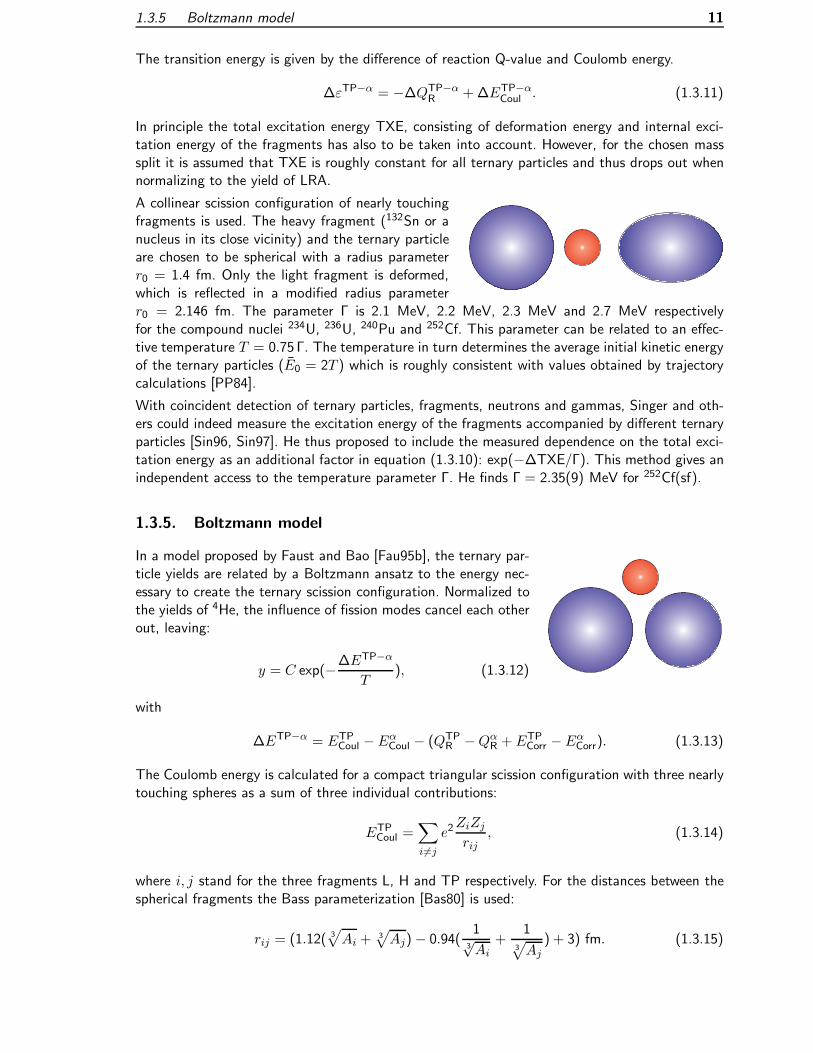
1.3.5. Boltzmann model
In a model proposed by Faust and Bao [Fau95b], the ternary par-ticle yields are related by a Boltzmann ansatz to the energy nec-essary to create the ternary scission configuration. Normalized tothe yields of 4He, the influence of fission modes cancel each otherout, leaving:
y = C exp(−∆ETP−α
T), (1.3.12)
with
∆ETP−α = ETPCoul − EαCoul − (QTPR − QαR + ETPCorr − EαCorr). (1.3.13)
The Coulomb energy is calculated for a compact triangular scission configuration with three nearlytouching spheres as a sum of three individual contributions:
ETPCoul =∑i=j
e2ZiZjrij
, (1.3.14)
where i, j stand for the three fragments L, H and TP respectively. For the distances between thespherical fragments the Bass parameterization [Bas80] is used:
rij = (1.12( 3√
Ai +3√
Aj)− 0.94(13√
Ai+
13√
Aj) + 3) fm. (1.3.15)
12 1.3 Ternary fission models
The reaction Q-value QR is calculated from the difference of the mass excesses of the compoundnucleus and all involved fragments. In case of neutron-induced fission the neutron binding energyof 6 MeV is added.
The corrections ETPcorr account for the loss of pairing energy of the ternary particles at a finitenuclear temperature T [Mor72]. The values are parameterized with:
ETPcorr =
b1 · ATP + a1 for ATP < 10,b2/ATP + a2 for ATP ≥ 10.
(1.3.16)
The a and b are individually fitted for even-even, even-odd, odd-even and odd-odd ternary particlesto reproduce the measured yields from 241Am(2n,f).
The temperature T is assumed to be identical to the one used in a similar model for binary fission[Fau95a]. It varies between T = 1.3 MeV for 235U(nth,f) and T = 2.3 MeV for 249Cf(nth,f).Temperatures of other compound nuclei are interpolated. Contributions of the Boltzmann ansatzare summated over all possible fission mass splits weighted with the known binary mass yields.
Compared with all other models the scission configuration is very compact with a minimum tipdistance even smaller than in compact binary fission [Gon91]. Therefore the chosen scission con-figuration is prohibited by energy conservation and has rather to be regarded as a “virtual” state.While initially a dozen of free parameters (a and b for the correction energies in all different cases)have to be fitted to reproduce the yields of one fissioning system, only the temperature parameteris changed when applying the formula to other compound nuclei.
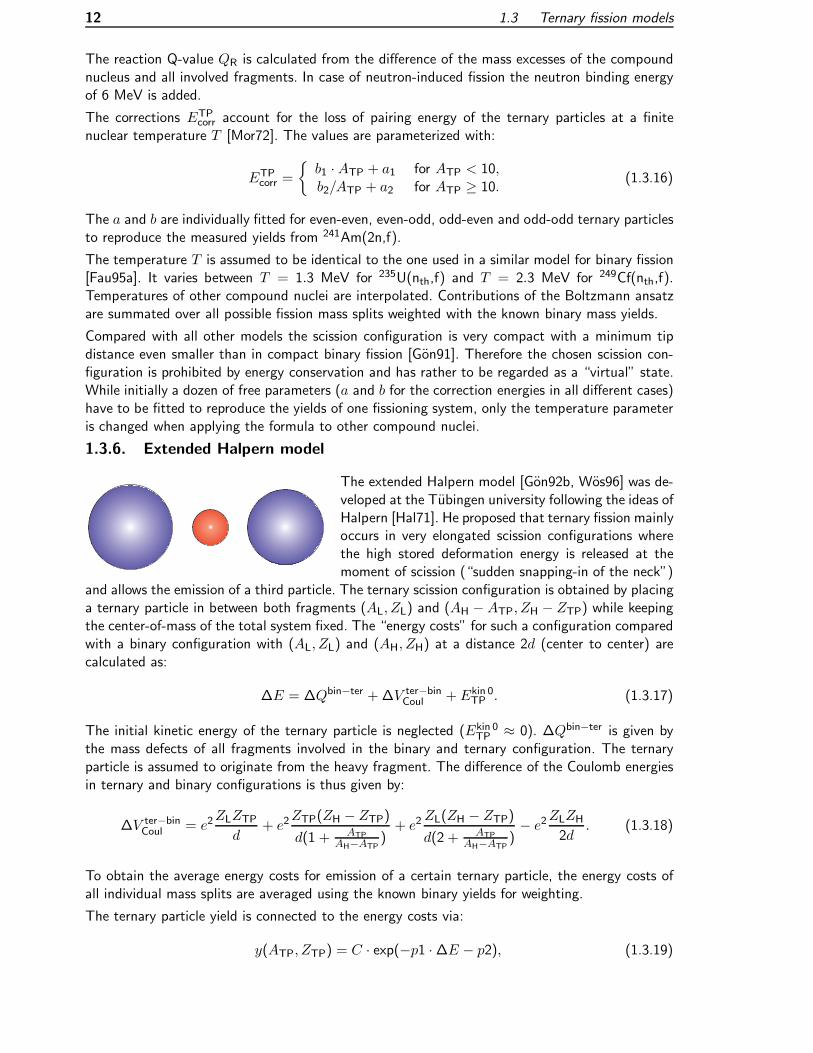
1.3.6. Extended Halpern model
The extended Halpern model [Gon92b, Wos96] was de-veloped at the Tubingen university following the ideas ofHalpern [Hal71]. He proposed that ternary fission mainlyoccurs in very elongated scission configurations wherethe high stored deformation energy is released at themoment of scission (“sudden snapping-in of the neck”)
and allows the emission of a third particle. The ternary scission configuration is obtained by placinga ternary particle in between both fragments (AL, ZL) and (AH − ATP, ZH − ZTP) while keepingthe center-of-mass of the total system fixed. The “energy costs” for such a configuration comparedwith a binary configuration with (AL, ZL) and (AH, ZH) at a distance 2d (center to center) arecalculated as:
∆E = ∆Qbin−ter + ∆V ter−binCoul + Ekin 0TP . (1.3.17)
The initial kinetic energy of the ternary particle is neglected (Ekin 0TP ≈ 0). ∆Qbin−ter is given bythe mass defects of all fragments involved in the binary and ternary configuration. The ternaryparticle is assumed to originate from the heavy fragment. The difference of the Coulomb energiesin ternary and binary configurations is thus given by:
∆V ter−binCoul = e2ZLZTP
d+ e2
ZTP(ZH − ZTP)
d(1 + ATPAH−ATP )
+ e2ZL(ZH − ZTP)
d(2 + ATPAH−ATP )
− e2ZLZH2d
. (1.3.18)
To obtain the average energy costs for emission of a certain ternary particle, the energy costs ofall individual mass splits are averaged using the known binary yields for weighting.
The ternary particle yield is connected to the energy costs via:
y(ATP, ZTP) = C · exp(−p1 ·∆E − p2), (1.3.19)

1.3.7 Summary 13
where p1 and p2 are fit parameters and C is a constant for normalization of the yield to 104 4He.The tip distance in the binary configuration (and thus d) is calculated from the minimum kineticenergies of the fragments observed in binary fission: Eminkin = Ekin − 3 · σ(Ekin). For 235U(nth,f)a tip distance of 9 fm is used. Thus, the ternary events are assigned to extremely stretchedscission configurations10. The size of the fragments is parameterized with a radius constant ofr0 = 1.29 fm. The model can reproduce measured yields over a wide range but underestimatesthe proton odd-even-effect. The yields of lithium isotopes are generally overestimated by aboutone order of magnitude.
1.3.7. Summary
Different models have been proposed to describe the emission probabilities of ternary particles. Itis remarkable that all models (except for the Valskii fit formula) formally have the same simpledependence:
y = C exp(−∆E/T ). (1.3.20)
The energy parameter ∆E describes the effort of the fissioning system to emit a ternary particle.It is mainly composed of the Q-value and the Coulomb energy of the scission configuration. Themain difference of the models lies in the geometry of the scission configuration which in turnstrongly influences the Coulomb energy term in ∆E. The second difference between the modelsis the interpretation of the parameter T describing the ability to access energetically unfavorablescission configurations. While some models explicitly introduce it as nuclear temperature of thefissioning system, others explicitly claim it is not a temperature.
h
D
rTP
rH rL
dLdH
Figure 1.3.1.: Universal parameterization for the scission configuration of most ternary fission mod-els.
Figure 1.3.1 shows a universal parameterization of the scission configuration. The parameters ofthe individual models are summarized in table 1.3.1. The interfragment distance of most modelsis in reasonable agreement with a value of 21 to 22 fm as determined by trajectory calculationsfor LRA accompanied fission [Gav75]. Only the Faust formula has a more compact configurationwhich has to be regarded as a virtual state (see above).
All models use some free parameters which are fitted to reproduce experimentally determinedyield values. This procedure will always result in a more or less good reproduction of the mostabundant yields, see figure 1.3.2. However, larger deviations between the models occur for rareternary particles, i.e. very heavy ones (ATP 20) and “exotic” isotopes with an extreme N/Z
10This argument is also supported by the statistical model of Fong. Generally it has more compact scission shapes[Fon56], but the ternary emission preferentially proceeds via elongated shapes [Fon71]. Some trajectory calcula-tions give even more stretched configurations [Nar69].
11This is the light fragment after emission of the ternary particle, i.e. (AL−ATP,ZL−ZTP) in the original notation.12This is the parameter used in formula (1.3.20). T = 0.75Γ is correspondingly 1.6 MeV.13This is the heavy fragment after emission of the ternary particle, i.e. (AH−ATP,ZH−ZTP) in the original notation.14The given value is just the inverse of parameter p1 in formula (1.3.19). Note that it is explicitly declared to benot a temperature.

14 1.3 Ternary fission models
Table 1.3.1.: Parameters as defined in figure 1.3.1 for the case of 10Be accompanied fission of235U(nth,f). The models are listed as above. For models using an average over manymass splits only a typical example close to the peak of the fragment mass distributionis given.
Model (ref.) (AH, ZH) (AL, ZL) D dL dH h Tfm fm fm fm MeV
[Rub88] 140Cs 86As(11 ≈ 25 11.2 ≈ 13.8 0 2.1[Rub94, Rubch] 132Sn 94Sr 23.6 11.3 12.3 0 2.19[Bau92b] 132Sn 94Sr 22.6 13.6 14.2 7.5 1.91
[PP94] 132Sn 94Sr 22.9 12.8 10.1 0 2.1(12
[Fau95b] 132Sn 94Sr 13.4 9.9 10.5 7.7 1.3
[Wos96] 132Sn(13 94Sr 22.4 10.8 11.6 0 (3.1)(14
2H 4He
6He
8He
6Li
8Li
10Li
8Be
10B
e12
Be
14B
e
10B
12B
14B
16B
12C
14C
16C
18C
20C
14N
16N
18N
20N
16O
18O
20O
22O
24O
Valski Rubchenya Baum
Pik-Pichak Faust Ext. Halpern
Isotope (ordered by element and mass)
Yie
ld (
per
1000
0 LR
A)
10-5
10-4
10-3
10-2
10-1
1
10
10 2
10 3
10 4
Figure 1.3.2.: Ternary fission yields for 235U(nth,f), calculated with different models. Here, and inthe following yield comparisons the isotopes of each element are grouped togetherin a series. From left to right: 1−3H, 3−8He, 6−11Li, 7−14Be, 10−17B, 12−20C, 14−21Nand 15−24O.
ratio (3He, 11Li, etc.). The measurement of such ternary particle yields is a good way to probe thepredictions of the different models.
The yield of the heavier ternary particles is affected by both the Q-value and the Coulomb en-ergy term, while the yields of lighter exotic nuclei depend mainly on the Q-value. Exemplary thisdependence is shown in figures 1.3.3 and 1.3.4. The most abundant particle-stable isotopes ofthe elements hydrogen to oxygen are plotted. The calculation was performed with the Boltz-mann model, but all other models show qualitatively the same dependence: with slightly varyingtemperature the yields of less abundant nuclei change by more than one order of magnitude.

1.3.7 Summary 15
2H 4He
6He
8He
6Li
8Li
10Li
8Be
10B
e
12B
e
14B
e
10B
12B
14B
16B
12C
14C
16C
18C
20C
14N
16N
18N
20N
16O
18O
20O
22O
24O
T = 2.0 MeV T = 1.6 MeV T = 1.3 MeV
Isotope (ordered by element and mass)
Yie
ld (
per
1000
0 LR
A)
10-5
10-4
10-3
10-2
10-1
1
10
10 2
10 3
10 4
Figure 1.3.3.: Ternary fission yields for 241Pu(nth,f), calculated with different temperatures in the“Faust formula”. The scale is identical to figure 1.3.2.
2H 4He
6He
8He
6Li
8Li
10Li
8Be
10B
e
12B
e
14B
e
10B
12B
14B
16B
12C
14C
16C
18C
20C
14N
16N
18N
20N
16O
18O
20O
22O
24O
rx = 1.12 fm rx = 1.30 fm rx = 1.60 fm
Isotope (ordered by element and mass)
Yie
ld (
per
1000
0 LR
A)
10-5
10-4
10-3
10-2
10-1
1
10
10 2
10 3
10 4
Figure 1.3.4.: Ternary fission yields for 241Pu(nth,f), calculated with different interfragment dis-tances in the “Faust formula”. rx is the main radius parameter in the Bass formula:rx = 1.12 in equation (1.3.15). The scale is identical to figure 1.3.2.
When changing the shape of the scission configuration from a compact to an elongated one15,the yields of the light rare isotopes stay practically constant, while the yields of heavier elementsincrease considerably. With increasing distance of the fragments, the Coulomb energy term isreduced, affecting less the “energy costs” of the heavy ternary particle production.
15Here, simply the first radius parameter in the Bass formula has been varied. Other changes of the parameterizationtowards a more stretched shape lead to qualitatively similar results.

16 1.4 LOHENGRIN separator
Thus, yield data of both, the light exotic and the heavy ternary particles, is required to determinethe two main model parameters: “temperature” and “elongation”. Dedicated measurements of theheavy ternary particle yields are mainly performed by the Tubingen group [Bor93, Hes97, Wos99a],while results on light “exotic” nuclei are reported in the following.
1.4. LOHENGRIN separator
Coming directly from the scission point, the LCP is expected to carry valuable information on thescission configuration. Therefore yields and energy distributions of various ternary particles hadbeen measured for several thermal neutron induced fissioning systems: 233U(n,f) [Vor69], 235U(n,f)[Vor72, Bau92b, Bau92a], 239Pu(n,f) [Vor75] and 241Am(2n,f)16 [Vor75, Bau92a, Bau92b, Gon92b,Bor93]. However, for other fissioning systems only scarce data existed, which made a systematicstudy of the dependence of yields and energy distributions of ternary particles on the fissility andneutron excess of the compound system difficult.
Very low yields of fission products can be measured with a recoil separator. To date the mostsensitive recoil separator for neutron-induced fission products is LOHENGRIN at the high-fluxreactor of the Institut Laue Langevin (ILL) in Grenoble. Recently a series of measurements wasperformed at LOHENGRIN to study the ternary fission of: 229Th(n,f) [Wos99a], 233U(n,f) [Wos98],239Pu(n,f) [Kos95, Wos99a], 241Am(2n,f) [Hes97], 245Cm(n,f) [Hes97] and 249Cf(n,f) [Dav97].
In the following I will report on new results for ternary particle yields of the systems 241Pu(n,f)and 245Cm(n,f), where practically no information was previously available. Moreover I measurednew yields of exotic isotopes with an extreme N/Z ratio from 233U(n,f) and 235U(n,f).
1.4.1. Targets
Since at LOHENGRIN only individual fission fragments are measured without coincidence, thefissioning system has to be clearly defined. Therefore targets with a high isotopic purity are used.In many cases a radiochemical separation is not sufficient, but additionally every target atom has topass a mass separator before use. This makes the complete chain of the target production processmore elaborate and expensive. The access to more “exotic” fissioning systems depends mainlyon the availability of appropriate target material. All targets are produced by deposition of theactinide material as oxide within an area of 70 · 5 mm2 on a platinum-coated17 titanium backing.Targets from rare material have a smaller area (see below). All except for the “thick” 235U target(461 µg/cm2) were covered with a 2500 A thick nickel foil to reduce loss of target material bysputtering and thus guarantee a smoother “burnup”. Delivery problems of Goodfellow, the formersupplier of the very thin nickel foils, forced us to produce these foils ourselves. A description isfound in appendix A.1. Table 1.4.1 shows a summary of all used targets.
241Pu
In total four different targets of 241Pu were used. They were prepared by the IRMM (Institute forReference Materials and Measurements) of the Joint Research Centre of the European Commissionin Geel. A “thin” target with 208 µg Pu per cm2 thickness was used to determine during ameasurement of binary fission [Fri98a] the yield of 10Be as a reference point for further ternaryfission measurements [Kos95]. Another “thin” target (100 µg/cm2 Pu) was used to exactly measurethe energy distribution of the helium isotopes down to 3 MeV. Two “thick” targets with 379 and
16The expression 241Am(2n,f) stands for the fissioning compound nucleus 243Am∗. In the high neutron flux bothisomers of 242Am are breeded in-situ from the fertile 241Am target and fission after capture of a second neutron.
17The 400 µg per cm2 thick Pt layer reduces the diffusion of target material into the Ti backing.

1.4.1 Targets 17
362 µg Pu per cm2 thickness served for the measurement of ternary fission yields relative to 10Be.The first three targets in November 1990 had an isotopic composition of 87 % 241Pu, 1.6 % 239Puand 11 % other plutonium isotopes with low fission cross-sections. At the time of the measurementsabout 20 %, 31 % and 28 % respectively of the 241Pu had decayed to 241Am, but as discussedin [Fri98a] during two weeks of measurement18 the contribution of other fissioning isotopes (e.g.from bred 242Am(n,f)) will stay below 6 %. The last target was used 9 months after plutoniumseparation, thus limiting contributions from other fissioning systems to below 2 %.
245Cm
Three curium targets were used. The first two with 13.3 and 10.4 µg of 245Cm came from theAll-Russian Scientific Research Institute of Experimental Physics in Sarov (formerly Arzamas-16)[Ves92]. The curium oxide was deposited on an area of 10 · 4 mm2 corresponding to a targetthickness of 33 and 26 µg/cm2. Beside 245Cm (98.8 % of the curium fraction) mainly the non-fissile isotopes 244Cm and 246Cm and small traces of the radioactive decay daughters 241Pu and241Am were present. The third target with an amount of 4 µg of 245Cm on a 3 mm diameter spotwas produced in the nuclear chemistry department of Mainz University from 245Cm separated atthe trans-plutonium element production facilities at Oak Ridge National Laboratory and providedby the U.S. Department of Energy (contract No. W-31-109-ENG-38).
In all three targets the contribution of impurities to the total fission rate can be neglected. Notethat while the amount of 245Cm target material used for these experiments seems to be very small,it constitutes some per mil of the world resources of isotope separated curium!
233U and 235U
The uranium targets were also provided by the IRMM in Geel. The 233U target had a thickness of380 µg/cm2. Two 235U targets with 461 µg/cm2 and 323 µg/cm2 thickness were used. The areawas always 70 · 5 mm2. Contaminations with other fissile isotopes are negligible (≤ 0.1 %).
Table 1.4.1.: Overview over all targets used for the measurement of ternary particles.
Fissile Total mass Area Cover Measured elementsnucleus (µg) (cm2)233U 1329 7 · 0.5 2500 A Ni He to F235U 1614 7 · 0.5 100 A Ta He to O235U 1130 7 · 0.5 2500 A Ni He to O241Pu 636 7 · 0.5 2500 A Ni Be241Pu 1157 7 · 0.5 2500 A Ni He to Si241Pu 1268 7 · 0.5 2500 A Ni H to Si241Pu 350 7 · 0.5 2500 A Ni He245Cm 13.3 1 · 0.4 2500 A Ni He, C245Cm 10.4 1 · 0.4 2500 A Ni He to O245Cm 4 0.07 (round) 2500 A Ni H to F
18The second target was not even kept for 48 h in the neutron flux.

18 1.4 LOHENGRIN separator
1.4.2. Separator
The targets are inserted in an evacuated beam tube of the ILL high-flux reactor (58 MW thermalpower and 1.5 · 1015 cm2 s−1 maximum unperturbed thermal flux). At the target position, about50 cm from the reactor core, the thermal neutron flux is about 5.3 · 1014 cm2 s−1. The epithermalneutron flux is more than two orders of magnitude smaller and the fast neutron flux is more thanthree orders of magnitude smaller. Both contributions can be neglected for our purposes. Recoilingfission products leave the target with a small energy loss and fly as highly charged ions throughthe beam tube. While binary fragments typically have ionic charges of 20 to 25, light ternaryparticles are mostly fully stripped. After 8 m the ions enter a horizontally deflecting homogeneousmagnetic sector field, separating ions according to the ratio of momentum to ionic charge p/q.Subsequently they pass a vertically deflecting cylindrical condenser which provides a separationaccording to the ratio of kinetic energy to ionic charge E/q. Both fields are arranged to thedouble focusing parabola spectrometer LOHENGRIN [Mol70, Arm76, Mol77], separating ions ofthe same A/q ratio onto a parabola on which the position is given by the kinetic energy of the ion[Neu62]. For cases where no ultimate energy resolution is needed, but rather a high beam intensityor transmission should be achieved, a second magnet was designed which focuses about 40 cmof the mass parabola to a small area (some cm2), see figure 1.4.1. This so-called RED (ReverseEnergy Dispersion) magnet [Fio93] was used for most measurements. Only the measurements withthe “thin” plutonium targets and the measurement of the ternary to binary ratio with the curiumtarget were made without RED magnet.
Figure 1.4.1.: Arrangement of the recoil separator LOHENGRIN.
The formulae to calculate the field settings are found in appendix A.2. While the usable rangeof magnetic fields (up to 0.24 T for the first magnet and 1.6 T maximum for the RED magnet)is sufficient to cover most of the required separator settings, the maximum high voltage of thecondenser limits the E/q ratio to about 6.5 MeV, thus excluding the measurement of high kineticenergies at low charge states.
The flight time of the fragments from the target to the detector is below 2 µs. Therefore decaylosses of the studied particles with half-lives larger than milliseconds can be neglected.
1.4.3. Particle identification
LOHENGRIN only separates particles according to their A/q and E/q ratios. For an unambiguousdetermination of the fragment mass it is still necessary to directly measure the kinetic energy ofthe fragments. With the known settings for E/q and A/q the ionic charge q and finally the massA can be determined. The kinetic energy is measured with an ionization chamber (IC) placed in

1.4.4 Calibrations 19
the focus of the separator. Using a split anode for the readout of the energy signal, the nuclearcharge Z can additionally be deduced from the specific energy loss in the first section of theionization chamber, the so-called ∆E part. The ionization chambers used are described in detailin ref. [Boc88, Hes93]. The counting gas (isobutane) pressure was adapted in the range of 15 to160 mbar for best Z identification. The gas volume of the IC is separated from the beam tubevacuum by a thin polypropylene window. Due to energy loss and scattering of the fragments in thewindow, its thickness and homogeneity directly affect the Z resolution of the chamber. Details onpreparation and use of these windows are given in appendix A.3.
The signals from the IC are amplified by charge-sensitive preamplifiers (Ortec 142) and mainamplifiers (Ortec 571). After summation of both signals to obtain the total energy they are savedboth in list-mode and in a histogram of 1024 times 1024 channels.
In all cases the Z-resolution of the ionization chamber is by far sufficient for a clear identificationof the ternary particles. The significant divergence of the ion beam behind the RED magnet (halfopening angle Φ up to about 17 [Fio93]) causes an additional uncertainty in the ∆E signal of:
δ(∆E)
∆E≈(
1
cosφ− 1
)≈ 5 % (1.4.1)
This does not affect the clear identification of ternary particles, but has to be taken into accountfor accurate Z identification in binary fission. A correction can be applied by reconstructing theangle of the ion path from the delay between ∆E and Eres signals resulting from the drift timedifference of the electron cloud [Hes97].
1.4.4. Calibrations
Magnet calibration
During the measurement the magnetic fields are controlled with NMR probes and stabilized to some10−5. However, the NMR probe measures the field only locally, whereas the particles are deflectedaccording to the integrated field along their flight path. Hysteresis and remanence effects maychange the calibration of the magnet. The optimum magnetic field settings are found by scanningthe beam horizontally over the detector placed in the focus, while keeping the electrical field fixed.The so determined magnet constants, called χ (for the first magnet) and κ (the ratio of fields ofRED to first magnet), stayed constant within a range ≤ 2 · 10−4 during the measurement periodsof about 2 weeks.
Energy calibration
The absolute energy calibration of the separator can be checked with direct (n,X)-reactions pro-ducing monoenergetic particles. The electric and magnetic fields are scanned simultaneously tofind the high energy edge of the energy distribution, which typically has a low energy tail due toenergy loss in the target and scattered particles (see figure 1.4.2).
Three reactions were used:
1. 6Li(n,α)t giving tritons with 2.73 MeV kinetic energy and alphas with 2.05 MeV. Thesecalibrations are done “off-line” by introducing a thin 6Li target at the target position [Fau82].
2. 59Ni(n,α) giving alphas with 4.78 MeV kinetic energy. The unstable 59Ni is produced “on-line” by neutron capture on 58Ni present in the nickel foil which is used to cover the target.
3. Decay alphas of 242Cm with up to 6.11 MeV energy. The 242Cm is produced in 241Putargets by beta-decay to 241Am which is subsequently transmuted to 242Am by neutron
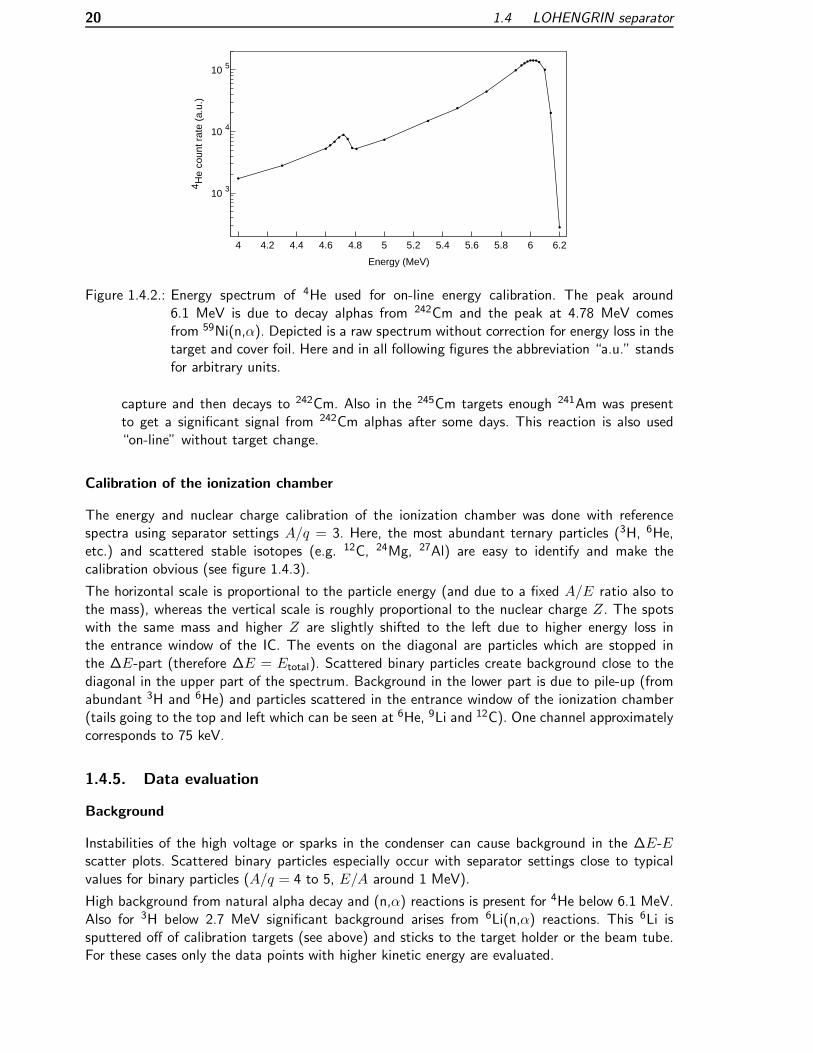
20 1.4 LOHENGRIN separator
10 3
10 4
10 5
4 4.2 4.4 4.6 4.8 5 5.2 5.4 5.6 5.8 6 6.2
Energy (MeV)
4 He
coun
t rat
e (a
.u.)
Figure 1.4.2.: Energy spectrum of 4He used for on-line energy calibration. The peak around6.1 MeV is due to decay alphas from 242Cm and the peak at 4.78 MeV comesfrom 59Ni(n,α). Depicted is a raw spectrum without correction for energy loss in thetarget and cover foil. Here and in all following figures the abbreviation “a.u.” standsfor arbitrary units.
capture and then decays to 242Cm. Also in the 245Cm targets enough 241Am was presentto get a significant signal from 242Cm alphas after some days. This reaction is also used“on-line” without target change.
Calibration of the ionization chamber
The energy and nuclear charge calibration of the ionization chamber was done with referencespectra using separator settings A/q = 3. Here, the most abundant ternary particles (3H, 6He,etc.) and scattered stable isotopes (e.g. 12C, 24Mg, 27Al) are easy to identify and make thecalibration obvious (see figure 1.4.3).
The horizontal scale is proportional to the particle energy (and due to a fixed A/E ratio also tothe mass), whereas the vertical scale is roughly proportional to the nuclear charge Z. The spotswith the same mass and higher Z are slightly shifted to the left due to higher energy loss inthe entrance window of the IC. The events on the diagonal are particles which are stopped inthe ∆E-part (therefore ∆E = Etotal). Scattered binary particles create background close to thediagonal in the upper part of the spectrum. Background in the lower part is due to pile-up (fromabundant 3H and 6He) and particles scattered in the entrance window of the ionization chamber(tails going to the top and left which can be seen at 6He, 9Li and 12C). One channel approximatelycorresponds to 75 keV.
1.4.5. Data evaluation
Background
Instabilities of the high voltage or sparks in the condenser can cause background in the ∆E-Escatter plots. Scattered binary particles especially occur with separator settings close to typicalvalues for binary particles (A/q = 4 to 5, E/A around 1 MeV).
High background from natural alpha decay and (n,α) reactions is present for 4He below 6.1 MeV.Also for 3H below 2.7 MeV significant background arises from 6Li(n,α) reactions. This 6Li issputtered off of calibration targets (see above) and sticks to the target holder or the beam tube.For these cases only the data points with higher kinetic energy are evaluated.

1.4.5 Data evaluation 21
E (channels)total
∆E (
chan
nel
s)
A/q = 3
E/q = 3.75 MeV
9A= 12 15 18 21 24 27
NOFNeNaMgAlSi
CBBeLi
30
Figure 1.4.3.: ∆E-E-scatter plot with separator setting A/q = 3 and E/q = 3.75 MeV. Themeasurement time for this spectrum was 6.1 h.
Some stable particles (12C, 14N, 16O, etc.) occur very abundantly. They are knocked out of thetarget and its cover by fission fragments, from the residual gas in the vacuum chamber or fromdiaphragms in the separator. Their abundance rapidly drops towards higher kinetic energies. How-ever, if the contribution of such background gets too high, the events stemming from fission cannotbe identified and no fission yield can be determined for these stable isotopes.
Typically the background conditions are more favorable for isotopes with high neutron excess thanfor proton-rich isotopes. This partly explains the great differences in measured upper limits for rareternary isotopes on the neutron-rich and the neutron-deficient side.
Separator acceptance
The energy dispersion coefficient19 of the separator is 7.2 m, i.e. a 1 % large slice of the energydistribution is spread out over 7.2 cm of the mass parabola. The accepted energy range is thereforeproportional to the chosen energy. To correct this effect, all count rates are divided by the set energyfor normalization.
In mass direction (i.e. perpendicular to the mass parabola) the dispersion coefficient20 is 3.24 m.Due to the different mass defects, the difference between ionic mass and atomic mass depending
19Particles with a kinetic energy E0+∆E are separated in the plane of dispersion by a distance ∆x from the referenceparticles with energy E0. For small deviations (∆E E0) the linear relation with the energy dispersion coefficientDE applies: ∆x = DE
∆EE0.
20In analogy to the energy dispersion, the mass dispersion coefficient Dm is defined as: ∆x = Dm∆mm.

22 1.4 LOHENGRIN separator
on the charge state, and due to relativistic corrections, not all isotopes with the same A/q ratio lieexactly on the mass parabola. The actual transmission is a complicated function, which could becalculated by folding the size of the target with the transmission through intermediate diaphragmsand vacuum chambers, the edge focusing by the RED magnet and the acceptance of the circularentrance window of the ionization chamber. It can also be experimentally deduced from the scancurve of the main magnetic field (see figure 1.4.4). The FWHM is typically 0.2 to 0.3 % of themagnetic field. For small deviations from the ideal field the yield of a given isotope is corrected forthe transmission. In case of larger deviations (e.g. for the light particles 3H, 6He, etc. in a spectrumwith A/q = 3) two spectra with different magnetic field settings have to be taken. The scan curveof the RED magnet is much broader (FWHM some %), therefore no correction is necessary.
0
0.2
0.4
0.6
0.8
1
0.998 0.999 1 1.001 1.002
Detuning of main magnet (B/B0)
Rel
ativ
e co
unt r
ate
Figure 1.4.4.: Measured transmission in dependence of a detuning of the main magnetic field.
Target burnup
The fission rate of the target decreases with time. This is mainly due to the nuclear burnup in thehigh neutron flux. Additional losses of target material occur from sputtering by fission fragments,evaporation from the heated target, and diffusion and sputtering into the target backing. The slightreduction of the neutron flux (about 3 % during one reactor cycle of 52 days) can be neglected.The decrease of the fission rate is monitored with a reference spectrum taken once to twice a dayand can be described with an exponential decay curve.
It should be noted that plutonium targets can show a less regular burnup characteristic than otheractinide targets. This might be due to a rapid migration into the target backing or sideways out ofthe target area (see also [Fri98a]). The former explanation is supported by differing burnup timesfor heavier and lighter isotopes and a broadening of the “natural” width of the energy distribution.These effects are difficult to quantify, but contribute to the systematic errors. For very precisemeasurements plutonium targets cannot be “completely” used, but should be changed after somedays.
The uranium targets showed a regular burnup and the curium targets were thin enough that suchproblems did not occur.
Energy loss
To deduce the original kinetic energy distribution of the fission fragments from the measured one,the energy loss in the target and in the cover foil has to be taken into account. The energy loss for

1.4.5 Data evaluation 23
all measured isotopes and kinetic energies was calculated with the Monte-Carlo program TRIM21
[Bie80]. Note that the energy loss in the entrance window of the ionization chamber occurs afterthe mass separation and therefore does not have to be considered here.
Ionic charge distribution
Due to the limitations of the separator fields and the available beam time it is not possible tomeasure the yields of a given isotope at all possible ionic charge states. Therefore a model has tobe applied to inter- and extrapolate the ionic charge state fractions to other energies and isotopes.Several empiric formulae are available to predict the mean ionic charge states and the width of thecharge state distribution, thus allowing the calculation of the equilibrium charge state distributions(ECSDs) [Nor63, Hec63, Bet66, Nik68, To79, BR81, BR82, Shi82, Shi92]. However, the ECSDsused for these formulae were measured under well defined experimental conditions, mostly bytransmitting low charged ions from tandem accelerators through free-standing foils made frompure materials. On the other hand at LOHENGRIN the charge state before passing the foil is notwell known. Moreover the target cover foils are quite fragile (0.25 µm of nickel) and coated witha protective film of acrylic or polystyrene for better handling. The nuclear heating in the reactorbrings the target to above 600 C and the coating evaporates. Some atomic layers of e.g. carbonmay be still left and then influence the ECSDs. Therefore the constants of such formulae have tobe determined for each target by measuring in-situ the ECSDs of appropriate isotopes (10Be, 14C,20O).
None of the investigated formulae was able to reproduce the ECSDs of all elements with a givenset of constants or with one single fit parameter. For better comparison with other LOHENGRINmeasurements we finally used a modified reduced chi-square distribution with a parameterizationin analogy to the data evaluation of [Bau92b, Bor93, Hes97, Wos98].
The mean charge is calculated as:
q =
(Z +
1
Z2
)·(1− exp
(−2.7284 · vion ·
(Z +
1
Z2
) 0.5λ−0.48))
, (1.4.2)
and the width of the charge state distribution is:
σq =
(0.426 − µ · vion ·
(Z +
1
Z
)−0.475)·(
Z +1
Z
)0.447− 1λ2
, (1.4.3)
with two fit parameters λ and µ depending on the element and target. vion is given in units ofcm/ns. This expression for q is, with exception of the small modifications by λ and 1/Z, identicalto that of [To79]. σq is similar to formula (6) in [BR81].
The fraction of an individual charge state can be calculated with a “reduced chi-square distribution”[BR81], modified by a factor exp(−a):
F (q) =c · t(q)n
2−1
2n2 · Γ(n2 ) · exp( t(q)2 )
· exp(−a). (1.4.4)
21Since TRIM does not contain trans-uranium elements as target, the calculation was performed for uranium oxidein all cases and scaled. The resulting uncertainty is negligible.

24 1.4 LOHENGRIN separator
with Γ being the gamma function and the constants:
c =2 · (Z − q + 2)
σ2q,
t(q) = c · (Z − q + 2),
n = c · (Z − q + 2),
a =
(vZ−q+1
vion
)√1+Zλ
,
where exp(−a) gives the stripping probability for the (Z-q+1)th electron. Its orbital velocity inthe Bohr model vZ−q+1 is calculated from the qth ionization energy given in ref. [HB].
The parameters λ and µ have to be adapted for each element. It appears, that λ differs stronglybetween some targets. This could be explained by different evaporation residues on the targetcover foil. In the earlier measurements the nickel foil was covered by an acetate film (Ni foils fromGoodfellow), in later ones by a polystyrene film (homemade Ni foils). On the other hand µ showedonly a weak variation (ranging from 0.02 to 0.025 at maximum). It is possible to fit the constantsby using the measured charge state fractions of different isotopes of one element up to aboutoxygen. Figure 1.4.5 shows one of the fitted ECSDs for 14C. For these light elements the ECSDsformula is mainly used for interpolation of the measured charge state fractions and simplifies atransfer of these ratios to other isotopes of the same element. The systematic errors are thereforeacceptable. However, for lack of experimental data22 the trends of the charge state distributionhave to be extrapolated towards heavier elements. Here, it has to be assumed, as in [Hes97], that,compared with the big differences for light elements, the variation of the fit constants from elementto element continue to decrease and the “constants” can be kept constant. The uncertainty ofthis extrapolation causes the main part of the systematic errors. The only target covered with aTa layer was used to measure exotic isotopes of light elements (Li, Be). Here, the charge ratioscan directly be measured with more abundant isotopes of the same element, and the ionic chargecorrection does not introduce a systematic error.
0%
10%
20%
30%
40%
50%
60%
70%
80%
0 5 10 15 20 25 30 35
q=6
q=5
q=4
q=3
q=2
E (MeV)
Cha
rge
stat
e fr
actio
n
Figure 1.4.5.: Measured charge state fractions and fitted charge state distribution for 14C.
22It is in principle possible to also measure the ECSDs of elements like Mg, Si, etc. in a dedicated experiment atLOHENGRIN. Instead of ternary particles, stable isotopes of these elements would be used which are knockedout from an additional layer containing the elements in question between the actinide and the cover foil bycollisions with binary fragments. In this way the constants could be determined more precisely even for heavierelements, reducing the systematic errors significantly.

1.4.5 Data evaluation 25
Note that a model with a differing energy dependence of the charge state corrections will slightlyinfluence the average and the width of the deduced kinetic energy distributions. In the dataevaluation by Vorobyov et al. [Vor69, Vor72, Vor75] and Bouzid [Bou94] the values tabulated byNorthcliffe [Nor63] were used, while Davi [Dav97] used a Gaussian distribution for the correction.In the measurement of Baum [Bau92b] a tantalum layer was sputtered onto the target and nonickel foil was used. He found a better description of the charge state distribution by suppressingthe factor exp(−a) in formula (1.4.4) (“capture model” instead of “stripping model”).
Kinetic energy distribution
The total yield of an isotope is determined by integration over its yield at different kinetic energies.In cases where, due to limitations in electric field or beam time, not enough different energies couldbe measured to determine the energy distribution, the mean energy and/or the width of the energydistribution have to be fixed for the fitting.
For 4He the mean energy and width reported in literature was used: from [Wag86] for 241Pu(n,f)and from [Wag91b] for the uranium isotopes. Note that a different energy distribution for LRAfrom 241Pu(n,f) had been reported in [Sol69]: Emean=15.0(6) MeV. Only one measurement ofthe 4He energy distribution in 245Cm(n,f) is reported in literature [Koz88]. The 16.8 MeV averageenergy differs significantly from the reported energies of all other fissioning systems [Wag91b]. Theexperimental spectrum in [Koz88] showed at lower energies a significant enhancement over a Gaus-sian distribution, but the influence of systematic effects was not discussed. Since at LOHENGRINonly the low energy flank (<∼ 13 MeV) can be measured, an uncertainty of about 1 MeV in theaverage kinetic energy translates to a systematic error of about 20 % for the yield of 4He.
For 3H from 241Pu(n,f) the mean energy came from ref. [Wag86], while the width was kept as afree fit parameter. Also for 2H from 241Pu(n,f) the mean energy of 3H was used, which is justifiableregarding the systematics of other fissioning systems [Wag91b]. For 245Cm(n,f) no measurementswere available for the kinetic energy parameters of 3H. Thus, the identical parameters to 241Pu(n,f)were used. For 3H from 235U(n,f) the mean energy was taken from [Vor72].
For the rare isotopes an extrapolation is used which is consistent with the systematics in otherfissioning systems and the results of trajectory calculations for the fissioning systems 235U(n,f) and242Am(n,f) [Bau92a, Bou94]. In all cases where the energy parameters were fixed for the fit, anadditional systematic error was added to account for the uncertainties of these values.
Nearly all energy distributions are well reproduced by a Gaussian. An exception is 4He. It is wellknown that the low energy part of the 4He spectrum shows an enhancement over a symmetricalGaussian distribution [Caı80]. This is due to contributions from the breakup residues of the particleunstable isotope 5He [Mut99] and possibly also 8Be [Mut96a]. Therefore only the data points withenergies above 10 MeV were used for the integration of the yield.
A double humped structure observed in the energy distribution of 8He from 241Pu(n,f) [Kos98c] wasprobably a transmission artifact of the RED magnet. It was neither reproduced in a measurementwithout RED magnet nor with the RED magnet after removing a support brace in the middle ofits vacuum chamber.
The measured kinetic energy distributions of prominent ternary particles are shown in appendixA.4.

26 1.5 Results
1.5. Results
1.5.1. Yields from 241Pu(nth,f)
Figure 1.5.1 shows an overview of the isotopes measured in 241Pu(nth,f). The detailed data is givenin tables 1.5.1 and 1.5.2. Emean and EFWHM are obtained by fitting a Gaussian distribution to thedata points. Cases where these values were taken from systematics are marked by the label “fix”in the row of the corresponding uncertainty. For better comparison with other fissioning systemsthe yields are normalized to a standard of 10000 for 4He. Note that the reference point itself hasa rather large error since the yield of 4He can only be determined from a small energy range (10to 13 MeV). An additional systematic error (difficult to estimate and not included in table 1.5.1)could occur if the energy distribution showed a non-Gaussian behavior in the fit range. The givenerrors are the individual errors for each isotope and do not include the error of the reference point.
energy distribution and yield
yield from empiric energy distribution
upper limit for yield
stable isotope
Figure 1.5.1.: Overview of the ternary particles measured with the 241Pu targets. They are arrangedin form of a chart of nuclides. The numbers mark the mass of the lightest andheaviest measured isotope of each element. Black squares show stable nuclides wherethe background from scattered nuclei exceeds a possible contribution from ternaryfission.
Figures 1.5.2 and 1.5.3 show that isotopes with large neutron excess can, despite their extremelylow yield, be clearly and unambiguously identified in the ∆E-E-scatter plot. Thus, from 241Pu(nth,f)also the neutron-rich nuclides 11Li, 14Be and 19C could be identified with absolute yields of 8.4(28)·10−10, 5.0(19) · 10−10 and 4.7(26) · 10−10 per fission respectively.
1.5.2. Yields from 245Cm(nth,f)
The measurement of 245Cm(nth,f) was performed in collaboration with the group from TubingenUniversity. We concentrated on a systematic study of the ternary particle yields up to oxygen andthey studied especially the yields of heavier isotopes.
Figure 1.5.4 shows an overview of the isotopes measured by us. The detailed data is given in tables1.5.3 and 1.5.4. Again Emean and EFWHM are obtained by fitting a Gaussian distribution to thedata points. For the fluorine isotopes the energy parameters were taken identical to the ones usedin [Hes97]. For the other elements our measured values were extrapolated to those nuclides forwhich no complete energy distribution could be taken. These energies are slightly lower than theones used in [Hes97]. Within the error bars the yields of most isotopes measured by both groupsare consistent and the remaining differences can be explained by the varying energy parameters

1.5.2 Yields from 245Cm(nth,f) 27
Table 1.5.1.: Measured yields and energy parameters for hydrogen to carbon isotopes from241Pu(nth,f). The label “u.l.” marks an upper limit for isotopes where no or toofew events were found to determine a reliable yield. See section 1.6.1 for a discussionof the last column (Ebin).
Isotope Emean σ(Emean) EFWHM σ(EFWHM) Yield σ(Yield) Ebin(MeV) (MeV) (MeV) (MeV) (MeV)
2H 8.4 fix 7.4 0.4 42 4 -3H 8.4 fix 7.2 0.4 786 42 -
4He 15.9 fix 10.7 0.5 10000 700 11.16He 11.3 0.2 10.3 0.5 260 30 18He 8.7 0.2 9.6 0.5 15 1 -
7Li 14.7 0.5 11.6 1.2 6.7 0.6 3.78Li 15.7 1.1 13.9 2.2 4.2 0.6 -9Li 12.6 0.6 14.6 1.0 8.3 0.8 -11Li 11 fix 12.9 fix 0.0045 0.0015 -
7Be 20 fix 15.3 fix 0.2 u.l. 19Be 17.9 0.6 15.2 1.6 4.4 0.5 10.510Be 18 0.7 18.8 2.9 46 6 12.411Be 17.5 0.7 14.1 2.4 5.9 1.7 6.712Be 14.3 0.8 15.7 2.2 2.8 0.3 4.814Be 13 fix 15.3 fix 0.0027 0.0010 -
10B 22 fix 21.2 fix 0.03 u.l. 9.411B 21 fix 20 fix 1.6 1.0 15.712B 20 fix 18.8 fix 1.0 0.4 13.414B 19 fix 17.6 fix 0.13 0.04 815B 17.7 0.6 15.2 1.2 0.046 0.010 5.817B 16 fix 15.3 fix 0.001 u.l. -
14C 20.8 0.6 25.4 2.2 12.6 0.8 27.415C 18.6 1.3 27.1 3.1 4.3 0.4 22.516C 16.6 2.7 30 7 5.0 0.9 22.117C 18 fix 23.5 fix 0.64 0.15 16.718C 17.7 1.7 17.9 2.2 0.28 0.05 1619C 17 fix 20 fix 0.0025 0.0014 10.120C 16 fix 18.8 fix 0.0036 0.0028 8.4
used in the evaluation. All isotopes where the energy parameters were taken from systematics aremarked by the label “fix” in the row of the corresponding uncertainty.
Note that even for some stable isotopes a yield could be evaluated. In contrary to [Bau92b] wherea correction for contributions of scattered stable particles had been applied, here only the highenergy part (> 25 MeV) was evaluated. From the upper limit of the most abundant stable isotopes(12C, 14N and 16O) the maximum contribution of scattered events to the evaluated isotopes (13C,15N and 18O) can be calculated with the ratio of natural isotopic abundances. In all cases thiscontribution is much smaller than the measured values and one can conclude that the observedevents are indeed from ternary fission. 19F showed a large background which was clearly due toscattered stable fluorine, probably from CF4 which had diffused into the beam tube (see appendixA.3).
To calculate the elemental yield of hydrogen and the total ternary yield, the sum of proton anddeuteron yield was estimated to 2.0(5) % of the LRA yield. This is in agreement with the system-

28 1.5 Results
Table 1.5.2.: Measured yields and energy parameters for nitrogen to silicon isotopes in 241Pu(nth,f).The label “u.l.” marks an upper limit for isotopes where no or too few events werefound to determine a reliable yield.
Isotope Emean σ(Emean) EFWHM σ(EFWHM) Yield σ(Yield) Ebin(MeV) (MeV) (MeV) (MeV) (MeV)
15N 22 fix 21.2 3.5 0.044 u.l. 29.316N 21 fix 23.5 fix 0.079 0.032 26.217N 20 fix 23.5 fix 0.34 0.10 27.318N 19 fix 21.9 2.3 0.16 0.04 24.319N 18 fix 21.2 fix 0.26 0.08 24.720N 17.5 fix 20.6 fix 0.0029 0.0016 2121N 17 fix 20 fix 0.0025 0.0014 20.6
15O 24 fix 23.5 fix 0.12 u.l. 23.619O 23 fix 23.5 fix 0.26 0.12 34.520O 22.1 0.9 21.7 2.4 1.10 0.12 37.521O 21 fix 19.9 4.1 0.23 0.06 35.122O 20 fix 18.8 fix 0.12 0.04 37.424O 18 fix 21.2 fix 0.08 u.l. 33.2
19F 26 fix 25.9 fix 0.020 0.016 35.920F 25 fix 27 fix 0.002 u.l. 36.921F 23 fix 22.6 8.8 0.021 0.006 40.322F 23 fix 27 fix 0.30 0.21 4024F 21 fix 26.2 3.8 0.030 0.016 40.9
24Ne 25 fix 23.5 3.2 0.040 0.012 52.827Ne 24 fix 25.9 fix 0.008 u.l. 48.4
24Na 28 fix 28.2 fix 0.001 u.l.27Na 26 fix 28.2 fix 0.005 u.l. 57.728Na 26 fix 28.2 fix 0.006 0.004 55.930Na 24 fix 28.2 fix 0.0008 u.l. 53.1
27Mg 30 fix 30.6 fix 0.0012 u.l.28Mg 30 fix 30.6 fix 0.018 u.l. 67.430Mg 28 fix 30.6 fix 0.009 0.006 67.9
30Al 32 fix 33 fix 0.002 u.l.
34Si 36 fix 35.3 fix 0.001 u.l. 58.335Si 35 fix 35.3 fix 0.003 u.l. 78.436Si 33 fix 35.3 fix 0.004 u.l. 80.4
atics from other fissioning systems, see appendix A.5. For the calculation of the summated massand elemental yields the missing values (16N, 21F and 22F) were taken from [Hes97]. The completeset of values evaluated in [Hes97] can be found in appendix A.5.
Again the yields are normalized to a standard of 10000 for 4He. Due to the uncertainty in themean energy of 4He (see 1.4.5), the yield was evaluated under two different assumptions for themean energy: once with the average value of all fissioning systems reported in [Wag91b] and oncewith the value reported in [Koz88]. Both results are given in table 1.5.3.
For the ternary to binary ratio in 245Cm(nth,f) only one measurement had been published: 2.00(45)·10−3 [Koz88]. Thus, after having finished the measurement of ternary particle yields with thesecond curium target, we removed the RED magnet and continued to measure a binary referencemass at the straight beam position. For mass 90 an integrated mass yield of 4.5(5) · 104 in the

1.5.2 Yields from 245Cm(nth,f) 29
0
50
100
150
200
250
300
350
400
450
0 50 100 150 200 250 300 350 400 450 500
A/q = 11/3E/q = 5 MeV
11B
11Li
11Be
22O
22F
Etotal (channels)
∆E (
chan
nel
s)
Figure 1.5.2.: ∆E-E-scatter plot with separator settings A/q = 11/3 and E/q = 5 MeV. Themeasurement time was 18.5 h.
0
50
100
150
200
250
300
350
400
450
0 50 100 150 200 250 300 350 400 450 500
A/q = 7/2E/q = 4 MeV
14Be
28Mg
Etotal (channels)
∆E (
chan
nel
s)
7Li
14N14C14B
21N
21O
21F
28Na
Figure 1.5.3.: ∆E-E-scatter plot with separator settings A/q = 7/2 and E/q = 4 MeV. Themeasurement time was 19.5 h.
normalization used in tables 1.5.3 and 1.5.4 (i.e. per 104 4He) was obtained. The mean ionic chargeat E = 104.6 MeV was q = 20.8(1) and the width of the charge distribution qFWHM = 5.0(2).These values are in good agreement with the ones obtained in [Fri98b]. Also the mean kineticenergy at ionic charge 21 is in good agreement (Emean ≈ 103.5 MeV in [Fri98b]). Only thewidth of the energy distribution (EFWHM ≈ 15 MeV in [Fri98b]) was broadened, probably due tomigration of curium into the backing23.
For the binary yield of mass 90 different values had been reported [Gun67, Dic81, Koz88, Fri98b].They are shown in table 1.5.5. The derived binary to ternary ratio fluctuates depending on thechosen reference value. Note that an additional systematic error due to the unknown kinetic energy
23Between both measurements the target was removed for a while from the high-flux position. It cooled down andwas heated again. This could provoke changes of the target layer.

30 1.5 Results
45
H 36
11
10
1420
20
21
36
1415
12
17 22
HeLi
BeB
CN
OF
9
8
energy distribution and yield
yield from empiric energy distribution
upper limit for yield
stable isotope
Figure 1.5.4.: Overview of the ternary particles which were measured with the 245Cm targets.The numbers mark the mass of the lightest and heaviest measured isotope of eachelement.
distribution of 4He should be added. The two reference values with the smallest errors are mutuallyinconsistent. Due to unknown contributions of systematic errors an unweighted average has beenused. It is obvious that LOHENGRIN measurements are not ideal to derive the kinetic energydistribution of 4He and the ternary to binary ratio. These measurements are better performed withsolid state detectors at an external neutron beam (compare e.g. the set-up of ref. [Wag86]).
1.5.3. Yields from 233U(nth,f)
The measurements with the 233U target were mainly performed to find the yields of the exoticnuclei 11Li and 14Be. Also 21F was measured to complete an overview of heavy ternary particlesfrom 233U(nth,f) made by Wostheinrich et al. [Wos99a].
Unfortunately 4He could only be measured up to a maximum energy of 11.6 MeV. An extrapolationof the low-energy values would cause a large overestimation due to the well-known deviation of theenergy distribution from a Gaussian [Vor69]. Moreover the mean energy of the 4He distribution isnot well known. Values of 15.8 MeV [Wag86] and 16.3 MeV [Vor69] have been reported. Thereforeall yields were normalized to a 10Be yield of 43 per 10000 LRA which had been found in [Vor69].The same normalization has been used in [Wos98]. The measured values are shown in table 1.5.6.
Compared with an earlier measurement of the helium, lithium and beryllium isotopes in Gatchina[Vor69], the energy distributions of this measurement are shifted towards lower energies by about0.5 to 1 MeV. A similar tendency had been found in the comparison of light ternary particles from235U measured in Gatchina [Vor72] and at LOHENGRIN [Bau92b]. For the helium isotopes thedeviation can be explained by the difference in the measured energy range. The spectrometer inGatchina allows to access the high energy wing of the Gaussian distribution. Any deviation fromthe assumed ideal Gaussian energy distribution will cause a systematic error which affects theexperiments differently, depending on the measured energy range.
The yields measured in both, ref. [Wos98] and this work, are completely consistent, see table A.5.2in appendix A.5. However, the measurement of [Wos98] gave a mean kinetic energy of 17.2 MeVfor 10Be, thus confirming the result of Vorobiev (17.0 MeV [Vor69]). Also the widths of the 15C andthe 20O energy distributions are larger in [Wos98]. It cannot be excluded that this difference wascaused by instabilities of the high voltage of the LOHENGRIN condenser during our measurementof 10Be at the two highest energies (E > 20 MeV). This would lead to the observed reductionof the mean energy and the integrated yield. For the isotopes measured with the same settings(15C and 20O), the two corresponding points are well above the mean kinetic energy. The deducedaverage kinetic energy is not significantly affected, while the width of the energy distribution isslightly reduced.

1.5.3 Yields from 233U(nth,f) 31
Table 1.5.3.: Measured yields and energy parameters for hydrogen to carbon isotopes from245Cm(nth,f). The label “u.l.” marks an upper limit for isotopes where no or toofew events were found to determine a reliable yield.
Isotope Emean σ(Emean) EFWHM σ(EFWHM) Yield σ(Yield)(MeV) (MeV) (MeV) (MeV)
3H 8.4 fix 7.4 0.3 679 44
3He 20 fix 10 fix 0.6 u.l.4He 15.9 fix 11.6 0.5 10000 6004He 16.8 fix 12.7 0.5 11900 6006He 11.3 0.4 11.2 0.7 286 168He 10.4 0.9 12.8 2.5 19 4
6Li 20 fix 10 fix 0.3 u.l.7Li 15.1 0.7 14.3 1.3 13.6 1.38Li 15.8 1.1 14.1 2.7 5.6 0.89Li 13.4 0.7 15.2 2.4 13.6 1.711Li 12 fix 12 fix 0.010 0.006
9Be 18.3 1.1 19.6 2.7 9.1 1.110Be 19.2 0.6 17.5 1.6 66 511Be 15.6 0.8 17.5 2.3 8.1 1.012Be 14.2 0.9 18.0 2.0 5.5 0.714Be 14 fix 14 fix 0.018 0.012
10B 25 fix 20 fix 0.3 u.l.11B 22 fix 18 fix 2.4 1.312B 20.6 1.5 18.1 2.2 2.3 0.413B 20.3 1.3 16.7 5.8 2.2 0.614B 19 fix 17 fix 0.21 0.0615B 18 fix 16 fix 0.09 0.05
12C 25 fix 27 fix 4.8 u.l.13C 24 fix 26 fix 1.1 0.514C 23.3 0.7 27.7 2.2 23.3 1.615C 22.4 1.0 24.6 3.0 7.7 1.116C 22.8 2.7 26 9.5 9.5 3.317C 22 fix 24 fix 0.65 0.2118C 21.5 fix 22.9 fix 0.32 0.1119C 20 fix 21 fix 0.030 u.l.20C 19 fix 20 fix 0.053 u.l.
Note that our yield value for 6He (179) is significantly larger than the value 137(7) per 10000LRA found in [Vor69]. This could be partly due to a non-Gaussian shape in the low-energy part ofthe spectrum. Such a deviation is already seen in figure 2 of ref. [Vor69]. On the other hand thisinconsistency could also be caused by a too high value for 10Be in [Vor69]. In this case our yieldsand the yields from [Wos98] should be renormalized to a value of about 33 10Be per 10000 LRA.Then also the lithium yields of [Vor69] and [Wos98] would agree completely.
From the given data it cannot be finally decided which yield values of 6He and 10Be are correct.Therefore both values are given in brackets in table 1.5.6. However, for the points which will bediscussed in the following, i.e. the relative yields of exotic nuclei, a possible systematic error in thenormalization plays no role.

32 1.5 Results
Table 1.5.4.: Measured yields and energy parameters for nitrogen to fluorine isotopes from245Cm(nth,f). The label “u.l.” marks an upper limit for isotopes where no or toofew events were found to determine a reliable yield.
Isotope Emean σ(Emean) EFWHM σ(EFWHM) Yield σ(Yield)(MeV) (MeV) (MeV) (MeV)
14N 26 fix 27 fix 4.1 u.l.15N 25 fix 26 fix 0.17 0.0717N 22 fix 24 fix 0.77 0.3118N 22 fix 24.6 6.5 0.47 0.2119N 21 fix 22 fix 0.53 0.1920N 20 fix 21 fix 0.061 u.l.21N 19 fix 20 fix 0.024 u.l.
16O 28 fix 28 fix 47 u.l.17O 27 fix 27 fix 0.2 u.l.18O 26 fix 26 fix 1.0 0.419O 21.3 4.9 24 14.3 0.77 0.4720O 23.5 1.3 22.1 3.8 2.7 0.421O 20.6 4.3 24.8 5.6 0.71 0.2422O 22 fix 23 fix 0.39 0.18
20F 32 fix 28 fix 0.08 u.l.
A = 90 103.6 0.6 20.4 1.8 45000 5000
Table 1.5.5.: For A = 90 and 4He the absolute yields per fission of 245Cm(nth,f) are given. Binaryto ternary ratios are calculated for different yields of the reference mass A = 90.For 4He the average energy was assumed to be 15.9 MeV in accordance with thenormalization of tables 1.5.3 and 1.5.4.
Reference A = 90 fiss. yield 4He fiss. yield ternary/binary binary/ternary(%) (%) ratio ratio
[Gun67] 1.08(15) 0.24(5) 2.7(6) · 10−3 370(80)[Dic81] 1.15(28) 0.25(7) 2.9(9) · 10−3 350(100)[Koz88] 0.99(2) 0.22(3) 2.5(4) · 10−3 410(60)[Fri98b] 1.28(5) 0.28(4) 3.2(5) · 10−3 310(50)Average ≈1.13 ≈0.25 ≈ 2.8 · 10−3 ≈360
1.5.4. Yields from 235U(nth,f)
Also the experiments with the 235U targets were dedicated to determine the yields of light isotopeswith extreme N/Z ratio: 11Li, 14Be, 3He, etc. Unfortunately these measurements were stronglyhampered by instabilities of the condenser high voltage. Only few reliable points could be takenat higher voltages. This affects mainly the helium isotopes, causing large uncertainties in thedetermination of yields and energy distributions. Therefore the helium isotopes were not evaluatedand 10Be was chosen as normalization point as in the case of 233U(nth,f). The yield of 10Bevaries in literature between 27.6 [Bau92b] and 32 per 10000 LRA [Vor72]. To allow for a bettercomparison with the yields of [Bau92b], arbitrarily the first value is taken for normalization. Notethat the yields of light isotopes (3H, 6He, 8He, 10Be, . . . ) from [Bau92b] are lower by 10 % to15 % compared with ref. [Vor72], see table A.5.5 in appendix A.5. Again this could be caused by

1.5.4 Yields from 235U(nth,f) 33
Table 1.5.6.: Measured yields and energy parameters for helium to fluorine isotopes from233U(nth,f). The label “u.l.” marks an upper limit for isotopes where no or toofew events were found to determine a reliable yield. Questionable values are shownin parentheses, see text.
Isotope Emean σ(Emean) EFWHM σ(EFWHM) Yield σ(Yield)(MeV) (MeV) (MeV) (MeV)
3He 20 fix 10 fix 0.018 u.l.4He 10000 –6He 10.3 0.3 10.3 0.6 (179) 159Li 11.2 0.7 13.2 2.0 4.3 0.611Li 11 fix 11 fix 0.00037 0.0002710Be (16.5) 0.5 (14.9) 0.8 (43) 311Be 15 fix 15 fix 1.9 1.014Be 12 fix 12 fix 0.0011 u.l.14B 18.2 fix 18.7 fix 0.021 0.00715C 21.6 0.8 (16.7) 1.3 2.2 0.315O 30 fix 18 fix 0.013 u.l.20O 22.8 1.5 (21.6) 2.1 0.73 0.0921O 22 fix 21 fix 0.031 0.00822O 21 fix 20 fix 0.0052 0.002421F 26.1 2.2 12.5 4.4 0.0077 0.0034
Table 1.5.7.: Measured yields and energy parameters for hydrogen to oxygen isotopes from235U(nth,f). The label “u.l.” marks an upper limit for isotopes where no or toofew events were found to determine a reliable yield.
Isotope Emean σ(Emean) EFWHM σ(EFWHM) Yield σ(Yield)(MeV) (MeV) (MeV) (MeV)
3He 20 fix 10 fix 0.008 u.l.4He 10000 –6Li 20 fix 10 fix 0.015 u.l.9Li 11.8 0.5 13.2 1.5 2.9 0.311Li 9.6 1.1 7.9 2.1 0.00090 0.000227Be 28 fix 14 fix 0.009 u.l.10Be 16.8 0.5 16.5 0.8 27.6 2.014Be 13 fix 13 fix 0.00034 0.0002010B 25 fix 20 fix 0.008 u.l.17B 15 fix 15 fix 0.0004 u.l.15C 22.3 2.5 22.0 7.7 1.5 0.515O 30 fix 18 fix 0.016 u.l.20O 22.5 2.4 22.2 2.9 0.45 0.0821O 21 fix 21 fix 0.053 0.01522O 20 fix 20 fix 0.017 0.006
uncertainties in the energy distribution of the normalization point 4He in the measurement of ref.[Bau92b].
With the second target even a rough energy distribution of 11Li could be measured, see figureA.4.4 in appendix A.4. The free fit indicates that the energy distribution of 11Li seems to be

34 1.6 Discussion
narrower than expected from trajectory calculations and systematics. This might also apply toother exotic isotopes from other fissioning systems. In this case the derived upper limits would befurther reduced.
Also yields of the heavier oxygen isotopes could be evaluated. The value for 22O lies clearlyabove the upper limit given by Baum [Bau92b]. Probably the latter was obtained from a parasiticmeasurement with separator settings for 11Be. The used ∆E-E telescope had an acceptance ofabout 1 cm in mass direction while in our case the edge focusing of the RED magnet and the largerentrance window increased the acceptance considerably. Thus, uncertainties of the transmissionare reduced.
1.6. Discussion
1.6.1. Binary contributions to ternary fission yields?
In principle the detected light charged particles could be created in an extremely asymmetricalbinary fission or a cluster decay from an excited state. In LOHENGRIN measurements the lightcharged particle is detected without coincidence to the heavy fragments. Its origin from ternaryfission24 therefore has to be deduced from its kinetic energy distribution. Tables 1.5.1 and 1.5.2also show the maximum kinetic energy Ebin which the light charged particle could attain if it wasproduced in a binary reaction, e.g. 241Pu(n,α)238U. A dash indicates that the Q-value of such adirect reaction is negative, i.e. the reaction is impossible with thermal neutrons. No entry is madein cases where the mass of the potential heavy binary partner is unknown [Aud97]. Especially forthe lighter isotopes it is evident from the high measured energies (> Ebin) that they are indeedproduced in ternary fission. The same conclusion can be drawn for the other fissioning systemswhich are not explicitly shown.
Possible additional contributions of light charged particles from extremely asymmetric binary fissionare hidden in a large background of ternary events. For example reactions like 233U(n,14C)220Rn,233U(n,20C)214Po, etc. are energetically possible. To unambiguously identify such events the heavypartner which does not have any ternary background has to be detected. The heavy recoil nuclei(some MeV kinetic energy and low charge states 3 <∼ q <∼ 5) can also be separated with theLOHENGRIN spectrometer. For a unique identification they are implanted into a silicon detectorwhich subsequently detects the characteristic alpha decay with a delayed coincidence. Due to thelow event rate, a time window of many minutes can be used even with an unsegmented silicondetector. A first experiment (ILL proposal 3-01-355) indicated evidence for such events, but moresystematic studies need to be performed for proof.
1.6.2. General comparison with model predictions
Figure 1.6.1 shows a plot of the individual isotopic yields of 241Pu(nth,f). The strong protonodd-even effect which favors emission of ternary particles with even Z is obvious, see also figure1.6.3. Also the less pronounced neutron odd-even effect is clearly visible as a staggering withinone element.
Only from two of the models discussed in section 1.3, predictions are available for 241Pu(nth,f).In general the “Faust formula” (Boltzmann model) gives a slightly better agreement with theexperimental values than the “Rubchenya model” (double-neck rupture model). Both overestimate
24It could also come from quaternary fission. However, such an event was never observed and should be much rarerthan ternary fission. Breakup fragments from decay of excited ternary 7Li∗ and 8Be∗ which can experimentallygive the impression of quaternary fission are discussed in ref. [Kat73, Fea74].
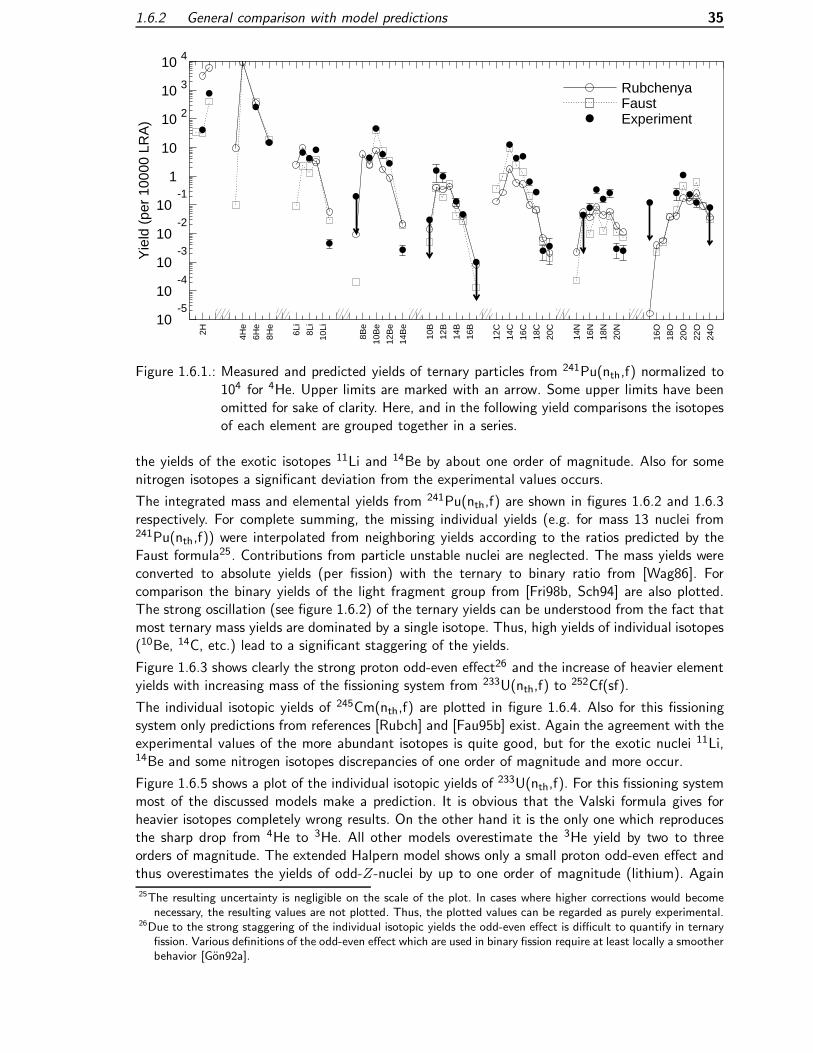
1.6.2 General comparison with model predictions 35
2H 4He
6He
8He
6Li
8Li
10Li
8Be
10B
e
12B
e
14B
e
10B
12B
14B
16B
12C
14C
16C
18C
20C
14N
16N
18N
20N
16O
18O
20O
22O
24O
Rubchenya Faust Experiment
Yie
ld (
per
1000
0 LR
A)
10-5
10-4
10-3
10-2
10-1
1
10
10 2
10 3
10 4
Figure 1.6.1.: Measured and predicted yields of ternary particles from 241Pu(nth,f) normalized to104 for 4He. Upper limits are marked with an arrow. Some upper limits have beenomitted for sake of clarity. Here, and in the following yield comparisons the isotopesof each element are grouped together in a series.
the yields of the exotic isotopes 11Li and 14Be by about one order of magnitude. Also for somenitrogen isotopes a significant deviation from the experimental values occurs.
The integrated mass and elemental yields from 241Pu(nth,f) are shown in figures 1.6.2 and 1.6.3respectively. For complete summing, the missing individual yields (e.g. for mass 13 nuclei from241Pu(nth,f)) were interpolated from neighboring yields according to the ratios predicted by theFaust formula25. Contributions from particle unstable nuclei are neglected. The mass yields wereconverted to absolute yields (per fission) with the ternary to binary ratio from [Wag86]. Forcomparison the binary yields of the light fragment group from [Fri98b, Sch94] are also plotted.The strong oscillation (see figure 1.6.2) of the ternary yields can be understood from the fact thatmost ternary mass yields are dominated by a single isotope. Thus, high yields of individual isotopes(10Be, 14C, etc.) lead to a significant staggering of the yields.
Figure 1.6.3 shows clearly the strong proton odd-even effect26 and the increase of heavier elementyields with increasing mass of the fissioning system from 233U(nth,f) to 252Cf(sf).
The individual isotopic yields of 245Cm(nth,f) are plotted in figure 1.6.4. Also for this fissioningsystem only predictions from references [Rubch] and [Fau95b] exist. Again the agreement with theexperimental values of the more abundant isotopes is quite good, but for the exotic nuclei 11Li,14Be and some nitrogen isotopes discrepancies of one order of magnitude and more occur.
Figure 1.6.5 shows a plot of the individual isotopic yields of 233U(nth,f). For this fissioning systemmost of the discussed models make a prediction. It is obvious that the Valski formula gives forheavier isotopes completely wrong results. On the other hand it is the only one which reproducesthe sharp drop from 4He to 3He. All other models overestimate the 3He yield by two to threeorders of magnitude. The extended Halpern model shows only a small proton odd-even effect andthus overestimates the yields of odd-Z-nuclei by up to one order of magnitude (lithium). Again
25The resulting uncertainty is negligible on the scale of the plot. In cases where higher corrections would becomenecessary, the resulting values are not plotted. Thus, the plotted values can be regarded as purely experimental.
26Due to the strong staggering of the individual isotopic yields the odd-even effect is difficult to quantify in ternaryfission. Various definitions of the odd-even effect which are used in binary fission require at least locally a smootherbehavior [Gon92a].
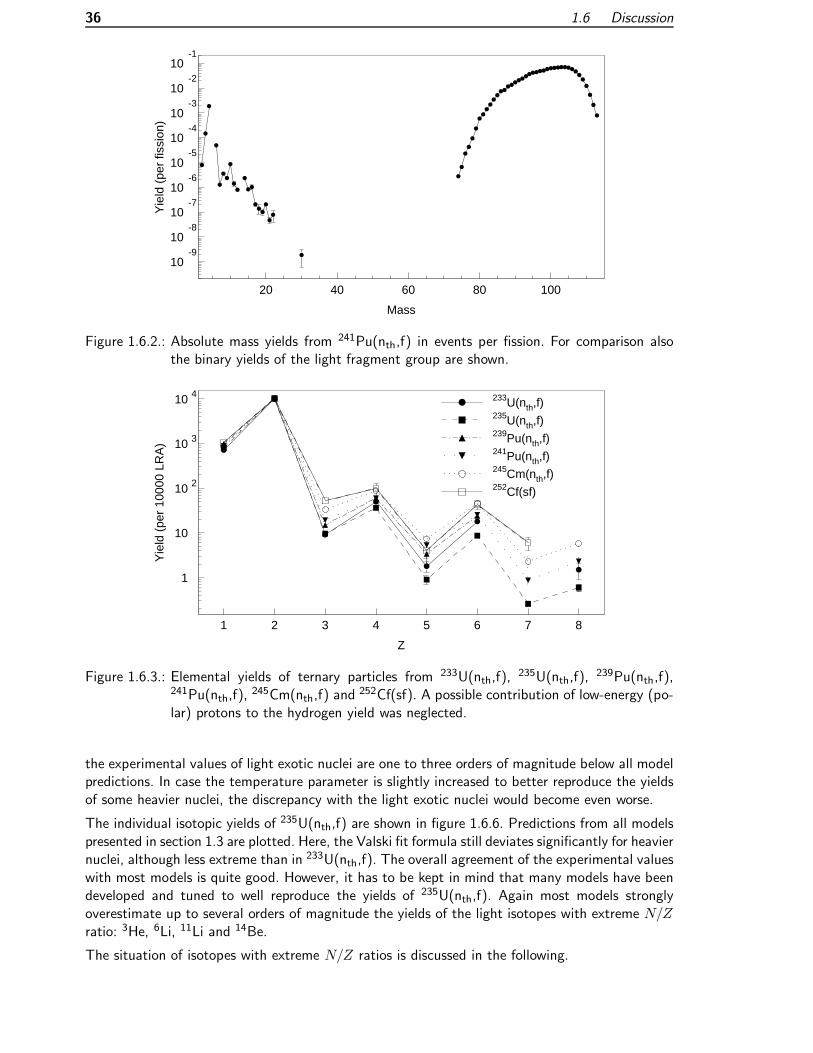
36 1.6 Discussion
Mass
Yie
ld (
per
fissi
on)
10-9
10-8
10-7
10-6
10-5
10-4
10-3
10-2
10-1
20 40 60 80 100
Figure 1.6.2.: Absolute mass yields from 241Pu(nth,f) in events per fission. For comparison alsothe binary yields of the light fragment group are shown.
233U(nth,f)
235U(nth,f)
239Pu(nth,f)
241Pu(nth,f)
245Cm(nth,f)
252Cf(sf)
Z
Yie
ld (
per
1000
0 LR
A)
1
10
10 2
10 3
10 4
1 2 3 4 5 6 7 8
Figure 1.6.3.: Elemental yields of ternary particles from 233U(nth,f),235U(nth,f),
239Pu(nth,f),241Pu(nth,f),
245Cm(nth,f) and 252Cf(sf). A possible contribution of low-energy (po-lar) protons to the hydrogen yield was neglected.
the experimental values of light exotic nuclei are one to three orders of magnitude below all modelpredictions. In case the temperature parameter is slightly increased to better reproduce the yieldsof some heavier nuclei, the discrepancy with the light exotic nuclei would become even worse.
The individual isotopic yields of 235U(nth,f) are shown in figure 1.6.6. Predictions from all modelspresented in section 1.3 are plotted. Here, the Valski fit formula still deviates significantly for heaviernuclei, although less extreme than in 233U(nth,f). The overall agreement of the experimental valueswith most models is quite good. However, it has to be kept in mind that many models have beendeveloped and tuned to well reproduce the yields of 235U(nth,f). Again most models stronglyoverestimate up to several orders of magnitude the yields of the light isotopes with extreme N/Zratio: 3He, 6Li, 11Li and 14Be.
The situation of isotopes with extreme N/Z ratios is discussed in the following.

1.6.3 Yields of neutron-deficient nuclei 37
2H 4He
6He
8He
6Li
8Li
10Li
8Be
10B
e
12B
e
14B
e
10B
12B
14B
16B
12C
14C
16C
18C
20C
14N
16N
18N
20N
16O
18O
20O
22O
24O
Rubchenya Faust Experiment
Yie
ld (
per
1000
0 LR
A)
10-5
10-4
10-3
10-2
10-1
1
10
10 2
10 3
10 4
Figure 1.6.4.: Measured and predicted yields of ternary particles from 245Cm(nth,f). All experi-mental values except that of 16N [Hes97] are from the present measurement. Seecaption of figure 1.6.1 for details.
2H 4He
6He
8He
6Li
8Li
10Li
8Be
10B
e12
Be
14B
e
10B
12B
14B
16B
12C
14C
16C
18C
20C
14N
16N
18N
20N
16O
18O
20O
22O
24O
Valski Rubchenya
Pik-Pichak Faust Ext. Halpern
Exp. [Vor69]Exp. [Woe98]Exp. this work
Isotope (ordered by element and mass)
Yie
ld (
per
1000
0 LR
A)
10-5
10-4
10-3
10-2
10-1
1
10
10 2
10 3
10 4
Figure 1.6.5.: Measured and predicted yields of ternary particles from 233U(nth,f). See caption offigure 1.6.1 for details.
1.6.3. Yields of neutron-deficient nuclei
Compared with neutron-rich nuclei, the measurement of rare neutron-deficient27 nuclei is generallymore difficult with the LOHENGRIN spectrometer. In spectra of fully stripped neutron-rich nucleialways isobars with the same ionic charge state but higher Z are present on the ∆E-E plots and
27The use of the term “neutron-deficient” is here slightly extended to include also N = Z nuclei. These are still“neutron-deficient” compared with the N/Z ratio of the compound nucleus.

38 1.6 Discussion
2H 4He
6He
8He
6Li
8Li
10Li
8Be
10B
e12
Be
14B
e
10B
12B
14B
16B
12C
14C
16C
18C
20C
14N
16N
18N
20N
16O
18O
20O
22O
24O
Valski Rubchenya Baum
Pik-Pichak Faust Ext. Halpern
Exp. [Vor72]Exp. [Bau92a]Exp. this work
Isotope (ordered by element and mass)
Yie
ld (
per
1000
0 LR
A)
10-5
10-4
10-3
10-2
10-1
1
10
10 2
10 3
10 4
Figure 1.6.6.: Measured and predicted yields of ternary particles from 235U(nth,f). See caption offigure 1.6.1 for details.
allow a direct monitoring of the experimental conditions. Any electronic artifacts or instabilitiesof the separator can be easily detected. On the other hand, if the separator is set to A/q < 2,only fully stripped neutron-deficient isotopes can pass and no other isobars are available whichwould allow a monitoring of the intensity. Set to A/q = 2 for detection of N = Z nuclei, a highbackground of scattered stable nuclides 12C, 14N and 16O is present, especially at lower energies.Moreover, from trajectory calculations it is expected that neutron-deficient nuclei have very highaverage kinetic energies which would require voltages well beyond the maximum settings of theLOHENGRIN condenser. Thus, only the low-energy tail of the energy distribution can be probedand one has to rely on the predicted energy distribution to deduce a yield. To deduce the upperlimits, an unfavorably high average kinetic energy was assumed in accordance with the trajectorycalculations of ref. [Bau92b, Bou94].
A dedicated set-up with a thick energy degrader foil mounted in front of the target to match thekinetic energy to the high-energy limit of the LOHENGRIN spectrometer would allow an increaseof the sensitivity by at least one order of magnitude.
3He
Several older measurements gave upper limits for the fission yield of 3He [Weg61, Cos67, Whe67,Kug72, Vor72, Vor75], see table 1.6.1. Only in ref. [Cam69] a high yield for 3He from 233U(n,f)was reported: about 1.8 % of the LRA yield. However, this measurement was done with a simple∆E-Eres telescope without additional particle separation. The alleged “3He events” are clearlydue to scattered alphas which show up on the ∆E-Eres plot in the “3He banana” (see figure 4 in[Cam69]).
With the present work the upper limits for the yield of 3He from 235U(nth,f) and 233U(nth,f) couldbe confirmed and improved by a factor six in the latter case. Also for 245Cm(nth,f) an upper limitcould be given.
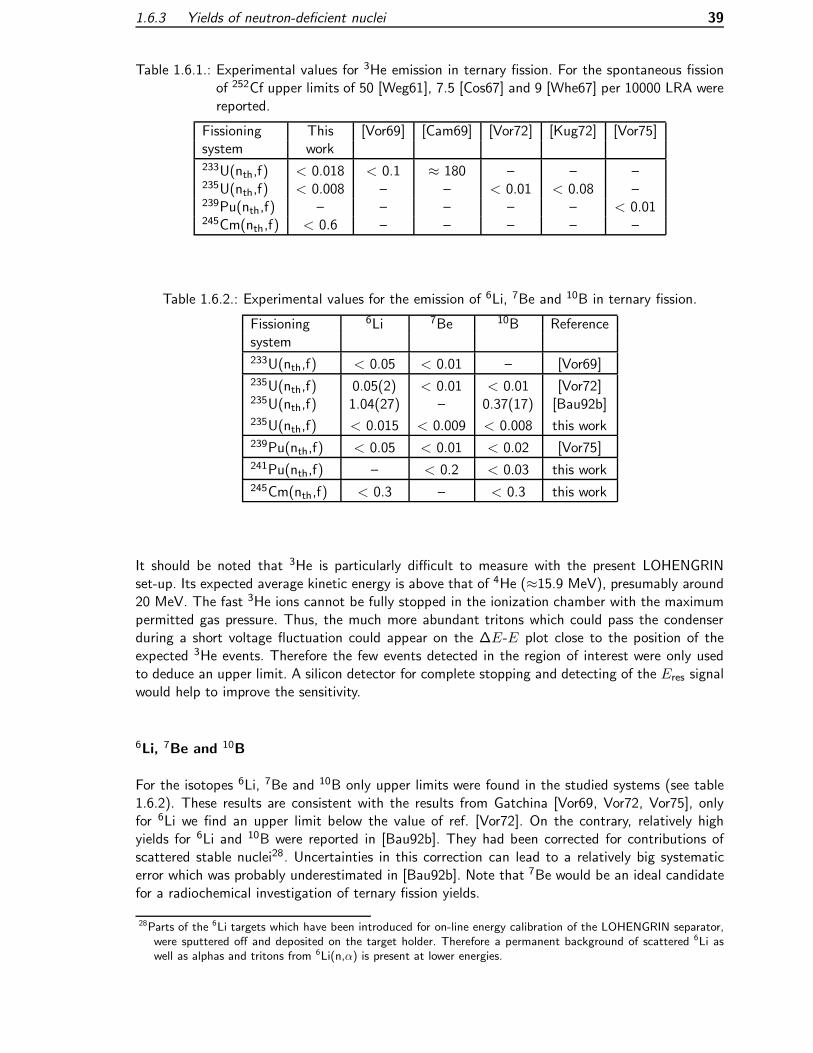
1.6.3 Yields of neutron-deficient nuclei 39
Table 1.6.1.: Experimental values for 3He emission in ternary fission. For the spontaneous fissionof 252Cf upper limits of 50 [Weg61], 7.5 [Cos67] and 9 [Whe67] per 10000 LRA werereported.
Fissioning This [Vor69] [Cam69] [Vor72] [Kug72] [Vor75]system work233U(nth,f) < 0.018 < 0.1 ≈ 180 – – –235U(nth,f) < 0.008 – – < 0.01 < 0.08 –239Pu(nth,f) – – – – – < 0.01245Cm(nth,f) < 0.6 – – – – –
Table 1.6.2.: Experimental values for the emission of 6Li, 7Be and 10B in ternary fission.
Fissioning 6Li 7Be 10B Referencesystem233U(nth,f) < 0.05 < 0.01 – [Vor69]235U(nth,f) 0.05(2) < 0.01 < 0.01 [Vor72]235U(nth,f) 1.04(27) – 0.37(17) [Bau92b]235U(nth,f) < 0.015 < 0.009 < 0.008 this work239Pu(nth,f) < 0.05 < 0.01 < 0.02 [Vor75]241Pu(nth,f) – < 0.2 < 0.03 this work245Cm(nth,f) < 0.3 – < 0.3 this work
It should be noted that 3He is particularly difficult to measure with the present LOHENGRINset-up. Its expected average kinetic energy is above that of 4He (≈15.9 MeV), presumably around20 MeV. The fast 3He ions cannot be fully stopped in the ionization chamber with the maximumpermitted gas pressure. Thus, the much more abundant tritons which could pass the condenserduring a short voltage fluctuation could appear on the ∆E-E plot close to the position of theexpected 3He events. Therefore the few events detected in the region of interest were only usedto deduce an upper limit. A silicon detector for complete stopping and detecting of the Eres signalwould help to improve the sensitivity.
6Li, 7Be and 10B
For the isotopes 6Li, 7Be and 10B only upper limits were found in the studied systems (see table1.6.2). These results are consistent with the results from Gatchina [Vor69, Vor72, Vor75], onlyfor 6Li we find an upper limit below the value of ref. [Vor72]. On the contrary, relatively highyields for 6Li and 10B were reported in [Bau92b]. They had been corrected for contributions ofscattered stable nuclei28. Uncertainties in this correction can lead to a relatively big systematicerror which was probably underestimated in [Bau92b]. Note that 7Be would be an ideal candidatefor a radiochemical investigation of ternary fission yields.
28Parts of the 6Li targets which have been introduced for on-line energy calibration of the LOHENGRIN separator,were sputtered off and deposited on the target holder. Therefore a permanent background of scattered 6Li aswell as alphas and tritons from 6Li(n,α) is present at lower energies.

40 1.6 Discussion
15O
A significant yield for 15O from 235U(nth,f) was reported in [Bau92a]: 0.34(21) per 10000 LRA.Also in some of our measurements events showed up in the ∆E-E spectra which might be assignedto 15O. However, a more careful analysis showed that they are slightly shifted from the expectedposition on the ∆E-E plot. Such background could be created by 16O from the residual gas beingscattered in the beam tube and passing the spectrometer with a tilted trajectory at separatorsettings for mass 15. This explanation is supported by several facts:
1. The energy distribution does show a non-Gaussian behavior and rises significantly towardslower energies which is typical for scattered particles (see figure 1.6.7).
2. The yield of “15O” changes considerably between different measurements with the samefissioning system. It showed a correlation with the vacuum conditions in the beam tube(increase of the “yield” with bad vacuum).
3. Moreover, the ionic charge state distribution of “15O” events deviates from that for ternaryoxygen isotopes. The same effect occurs for other scattered stable particles. Obviously theequilibrium charge state is not reached in a single scattering process.
Using only the points above 20 MeV together with an average energy consistent with the trajectorycalculations of [Bau92b, Bou94], upper limits were deduced from the present measurements: 0.013in 233U(nth,f), 0.016 in 235U(nth,f) and 0.12 in 241Pu(nth,f) per 10000 LRA respectively.
0 5 10 15 20 25 30 35 400,0
0,5
1,0
15O
E (MeV)
Cou
nts
per
MeV
and
100
0 s
Figure 1.6.7.: Energy distribution of alleged “15O” events in thermal neutron-induced fission of233U. The rise towards lower energies indicates a large contribution of scattered16O.
It can be summarized that presently in low-energy fission only upper limits exist for the experimentalyields of all neutron-deficient ternary particles. Most models of ternary fission yields fail to predictthe very sharp drop of the yields towards small N/Z ratio.
Mutterer et al. have shown that 5He and 7He are also emitted in ternary fission and follow asmooth exponential drop towards higher masses without markable neutron odd-even effect [Mut99].Therefore it is even more astonishing why for 3He such an abrupt drop occurs.

1.6.4 Yield of very neutron-rich nuclei 41
1.6.4. Yield of very neutron-rich nuclei
From the experimental results it is evident that the yields of very neutron-rich light nuclei areconsiderably smaller than most model predictions. Before interpreting this fact as a model failureit has to be checked whether other effects could cause such a deviation. It is clear that the N/Zratios of exotic isotopes differ strongly from that of the fissioning compound nucleus. Such nucleiare intuitively expected to be created with a lower yield. However, this effect is already assumedto be included in the presented models which are generally applicable to all ternary particles.
Suppression of halo nuclei?
Another effect could occur for very neutron-rich nuclei. If the binding energy for the last neutron(s)Sxn is very low, some nuclides show a so-called neutron halo. That means the wave functionof the weakly bound valence neutrons has a tail which extends far away. Therefore the meansquare matter radius and the nuclear cross-section for breakup are significantly increased. Firstexperimental evidence for this fact was found by Tanihata et al. [Tan85].
The possibility of a halo depends on the neutron separation energy Sxn and the angular momentumof the “halo” neutron(s). As a rule of thumb a halo can appear if Sxn is smaller than approximately5− 10 MeV fm2/R2, where R is the radius of an equivalent square well potential [Rii92]. Amongthe studied ternary particles, 11Be and 19C are known to have a one-neutron halo, 6He, 11Li, 14Beand 17B have a two-neutron halo and 8He can be described by an alpha core with a four-neutronhalo [Zhu94]. Table 1.6.3 gives a summary of the binding energies of the last neutron(s). Rmsmatter radii are not given in table 1.6.3. They are somehow model dependent, a recent compilationis found in [She96]. The mean square distance of the halo neutron(s) can be estimated when usinga two-body approximation: core plus neutron or core plus “dineutron” [Han87]:
〈r2〉 = 2/(4µSxn) (1.6.1)
with µ the reduced mass of the system.
Table 1.6.3.: Binding energies of the halo neutrons in neutron-halo nuclei. Where no reference isgiven they were calculated from the atomic mass evaluation of Audi and Wapstra[Aud95].
Isotope S1n S2n S4n ReferenceMeV MeV MeV
6He 0.973(1)8He 2.139(7) 3.112(7)11Li 0.30(3)11Be 0.504(6)14Be 1.34(12)17B 1.39(15)19C 0.25(9)(29 [Jon98]
For kinetic energies far below the Coulomb barrier as in our case, Coulomb breakup of the ternaryparticles while passing the target can be neglected. Also, the dissociation of the halo nucleus in ascattering reaction is negligible in the thin target. The only process which could cause a significanteffect is the breakup of the halo while the ternary particle is exposed to the strong nuclear and
29Recent results indicate a higher value of Sn = 0.53(13) [Nak98].

42 1.6 Discussion
Table 1.6.4.: Yield ratios of halo nuclei and well-bound isotopes. Only in two systems the ratio of15B to 17B has been measured: > 140 for 235U(nth,f) and > 36 for 241Pu(nth,f).
Fissioning
system[4He]
[6He]
[6He]
[8He]
[7Li]
[9Li]
[9Li]
[11Li]
[9Be]
[11Be]
[10Be]
[12Be]
[12Be]
[14Be]233U(nth,f) 73(4) 38(5) 1.0(2) 11500(9000) 1.9(11) 39(8) > 840235U(nth,f) 52(3) 23(3) 1.1(1) 3300(900) 1.2(3) 23(2) 3600(2200)239Pu(nth,f) 52(2) 22(2) 1.2(1) 3100(1200) 1.5(3) 22(6) 5600(3700)241Pu(nth,f) 38(4) 17(3) 0.81(11) 1800(700) 0.75(23) 16(3) 1000(400)245Cm(nth,f) 35(3) 15(3) 1.0(2) 1400(900) 1.1(2) 12(2) 310(210)
Table 1.6.5.: Yield ratios of halo nuclei and well-bound isotopes.
Fissioning
system[14C]
[16C]
[15C]
[17C]
[16C]
[18C]
[17C]
[19C]
[18C]
[20C]
[20O]
[22O]233U(nth,f) 6.0(10) – 40(11) – – 140(70)235U(nth,f) 6.1(9) 8.3(12) 25(7) – 9(4) 26(11)241Pu(nth,f) 2.5(5) 6.7(17) 18(5) 260(160) 78(63) 9.2(32)245Cm(nth,f) 2.5(9) 12(5) 30(15) >15 >4 7.0(35)
Coulomb forces when the neck is snapping and all three fragments are accelerated. The magnitudeof this effect, however, is extremely dependent on all details of the scission configuration. Themissing knowledge on the scission configuration already causes most of the uncertainties in thepredictions of the ternary fission models discussed above. Thus, a quantitative treatment of thisadditional effect does not make sense. Nevertheless, it can be qualitatively checked whether amajor influence on the yields could occur. For different ternary particles which are created insimilar scission configurations, the breakup probability should show a strong dependence on Sxn.The effect would be more pronounced for isotopes with a weak binding of the last neutrons. Theproblem is to find a suitable normalization for such a comparison. To avoid biasing by proton-or neutron-odd-even effects, the ratio of the yield of the isotope A−2
ZX to the yield of AZX canbe regarded. Thus, the influence of the proton- and neutron pairing energy should mainly cancel.Tables 1.6.4 and 1.6.5 show experimental values of the yield ratios for several pairs of nuclei.
In the case of carbon, the yields of directly neighboring nuclei can be compared. Also for theodd-N isotope 11Be a different ratio is chosen for comparison. These ratios are shown in table1.6.6. They are influenced by the neutron-pairing energy. However, the relative influence shouldbe small since identical ratios are regarded: i.e. (o,e)- versus (e,e)- and (e,e)- versus (e,o)-nuclei.
The ratios presented in tables 1.6.4 and 1.6.5 have been calculated from the values measuredin this work. Other values were taken from [Wos98, Vor69] for 233U(nth,f), from [Bau92b] for235U(nth,f) and from [Vor75, Kos95] for 239Pu(nth,f).
Table 1.6.4 shows clearly a more pronounced drop towards heavier isotopes for lithium and berylliumcompared with helium, carbon and oxygen nuclei. However, from table 1.6.6 it can be seen thatthe other halo nuclei 11Be and 19C do not show such a significant reduction. If a suppression ofhalo nuclei occurs for 11Li and 14Be, it should also be present in comparable magnitude for thelatter nuclei. Thus, it cannot be excluded that halo nuclei are possibly “suppressed” by a factortwo or three, but this effect is not able to explain deviations of one order of magnitude and more.
To decide why the models fail to explain the yield drop for exotic lithium and beryllium nuclei, thedifference in “energy costs” has to be analyzed in more detail. As explained before, the influence

1.6.4 Yield of very neutron-rich nuclei 43
Table 1.6.6.: Yield ratios of halo nuclei and well-bound isotopes.
Fissioning
system[15C][16C]
[17C][18C]
[19C][20C]
[10Be][11Be]
[14C][15C]
[20O][21O]
233U(nth,f) 1.1(3) – – 22(12) 5.2(8) 23(7)235U(nth,f) 1.2(2) 3.6(10) – 12(2) 5.3(2) 8.5(28)239Pu(nth,f) 1.0(6) – – 14(2) 4.0(15) –241Pu(nth,f) 0.9(2) 2.3(7) 0.7(7) 7.8(25) 2.9(4) 4.8(14)245Cm(nth,f) 0.8(3) 2.0(9) – 8.1(12) 3.0(5) 3.8(14)
of the pairing energy is mainly removed30 by the choice of these yield ratios. In the double-neck-rupture model and the Boltzmann model the Coulomb energy is practically constant for differentisotopes of one element31. However, in the parameterization of the other models the fragmentdistance depends strongly on the ternary particle mass. Therefore, for the considered nuclei thedifference in Coulomb energy ETPCoul(
A−2ZX)− ETPCoul(
AZX) attains about 1.5 MeV in the extended
Halpern model [Wos96] and even higher values for the two other models [Bau92b, PP94]. Still thedominant contribution to the energy costs comes from the reaction Q-value. Figure 1.6.8 showsa plot of the yield ratios [A−2ZX]/[AZX] from tables 1.6.4 and 1.6.5 versus the Q-value difference∆Q = Q(A−2ZX)−Q(AZX). The Q-value difference was calculated with the heavy fragment fixedto 132Sn.
233U(n,f)235U(n,f)239Pu(n,f)241Pu(n,f)245Cm(n,f)
∆Q (MeV)
Yie
ld r
atio
1
10
10 2
10 3
10 4
0 2 4 6 8 10 12 14
Figure 1.6.8.: Yield ratios [A−2ZX]/[AZX] versus the Q-value difference. Arrows indicate lower limitsof the yield ratio. The values of [9Li]/[11Li] and [12Be]/[14Be] are marked with aring around. For comparison an exponential function y = 0.01 · exp(∆Q/1 MeV) isshown as dashed line.
Despite a significant scattering of the values, the dependence of the yields on the Q-value isapparent. The dashed line shows an exponential dependence with a parameter T = 1 MeV informula (1.3.20)32 . This is significantly lower than the T parameter used in all discussed ternaryfission models (compare table 1.3.1). For a detailed analysis each fissioning system has to be
30Only in the Boltzmann model the pairing energy is explicitly included. For the discussed yield ratios the differenceETPcorr(
A−2ZX)−ETP
corr(AZX) will attain up to 5 MeV, but this can be due to the somehow artificial parameterization
of the pairing energy.31ETP
Coul(A−2
ZX)− ETPCoul(
AZX) ≤ 0.3 MeV.
32This is not a real fit, but just an illustration of the qualitative dependence of several fissioning systems.

44 1.6 Discussion
studied specifically, including the features of the individual models (influence of the Coulomb andcorrection energies) and the yields of very heavy ternary particles.
It can be concluded that the present models of ternary fission fail to predict the strong decreaseof yields for light exotic nuclei. This disagreement cannot be easily removed by “tuning” a singlemodel parameter. Possibly the basic assumption of a direct exponential dependence of the yieldson the energy costs holds no longer good for very unfavorable mass splits. A similar overestimationof the experimental yields is found for the heaviest ternary particles [Gon98, Wos99a]. From theinvestigation of heavy ternary particles a clear dependence between the maximum recorded massand the mass of the compound nucleus is observed [Wos99a]. The emission of the heaviest ternaryparticles is interpreted as the limiting case where the system is running out of excitation energy andcan no longer afford to emit still heavier ternary particles. The last detectable events are created incold ternary fission with a remaining excitation energy of few MeV at maximum [Gon97, Gon98].
1.6.5. Improvement of ternary fission models
Including these and other recent measurements, the amount of available yield data from ternaryfission was more than doubled in the last years. This gives a solid basis for improving and refiningthe currently available ternary fission models. While developing such an improved model is beyondthe scope of this work, some useful “ingredients” will be discussed in the following:
Reproduction of hydrogen yields
As discussed in the introduction, the yield of ternary protons contains a significant contribution ofpolar events which are assumed to be created in a different mechanism [Sch91]. While coincidencemeasurements show an equal shift of both mass peaks for most ternary particles, for tritons only theheavy fragment peak is shifted [Sin97]. This could indicate contributions from a slightly differentemission mechanism. Thus, it is not unreasonable to exclude the yields of the hydrogen isotopesfrom a comparison with the model predictions, or to accept an underestimation of the hydrogenyields from the models.
Scission configuration
All experimental results point to a dominant creation of ternary particles in the neck region. Morerestrictions on the configuration can be obtained by trajectory calculations which have to reproducethe experimental energy- and angular distributions, see [Fon70, Obe92, Bau92b, Bou94, Ros94]and further references in [Sin89]. It has been shown that trajectory calculations often cannotdetermine the scission configuration unambiguously [Dak79, Gue80, Sin83]. A general problem isthe definition of time zero. That means an elongated configuration may lead to similar trajectoriesto a compact one, if the initial kinetic energy of the LCP is changed accordingly to the initialinterfragment separation. Therefore a compatible energy spectrum or angular distribution cannotprove a certain scission configuration, but on the other hand some scission configurations (e.g.too compact or too far stretched) can be falsified when they do not allow consistent trajectorycalculations. In all statistical models the used temperature should also determine the average initialkinetic energy of the ternary particle, E0 = 2T . If a very different start energy is required for thetrajectory calculations, the statistical approach becomes questionable.
The correlation of light charged particle emission with other observables like neutron- and gammamultiplicities, kinetic energy of the fission fragments, total excitation energy etc. is discussed e.g.in [Meh73, Mut96b].

1.6.5 Improvement of ternary fission models 45
Besides results from ternary fission, there are also several other methods to determine the elon-gation at scission. To achieve a compact scission configuration, a high nuclear friction is requiredto slow down the fission process. This in turn would lead to an enhanced emission of pre-scissionneutrons which could be detected in coincidence measurements.
The approximation of the Coulomb energy as interaction of point-like charges or homogeneouslycharged spheres is only correct for elongated scission configurations. In compact configurationsthe deformation and short-range interactions have to be taken into account. This is often done ina simplified way by modifying the nuclear radius used in the Coulomb energy formula. Care has tobe taken to make the trajectory calculations with a consistent shape description [Car80].
Contribution of individual mass splits
Some of the ternary models weight the yields calculated for individual mass splits with theirabundance in binary fission. This is not fully correct, since, especially for heavier ternary particles,the mass peaks of the fission fragments are considerably shifted due to the nucleons lost to theternary particle. For most fissioning systems no experimental information is available on the masssplits of the fission fragments in coincidence with the TP. In a good approximation an empiricallycorrected mass split distribution could be used for the weighting where both peaks are shiftedby half of the TP mass [Sin97], if possible with an additional correction for the reduced neutronmultiplicity in ternary fission.
Only little experimental information exists on the real contribution of individual mass splits. Forcold (neutronless) spontaneous fission of 252Cf accompanied by 4He, 6He, 10Be and 14C, individualyields have recently been derived with gamma coincidence measurements [Ram96, Ram97, San97,Ram98a]. For 10Be a yield of 4 · 10−6 per fission has been reported in coincidence with the fissionfragments 96Sr and 146Ba [Ram98b].
Table 1.6.7.: Experimentally determined yields for ternary beryllium isotopes from 252Cf(sf) relativeto LRA. The experimental lower cut-off energies Emin for both nuclei are given. Notethat the errors are purely statistical and do not account for the uncertainty arisingfrom a Gaussian extrapolation to zero energy.
Emin(4He) Emin(Be) [all Be]/10000[4He] [10Be]/10000[4He] Reference
8.3 23 20.1(20) [Cos67]6 15 32 [And69]
<6 13 65(7) [Gaz70]8 22.5 164(9) [Gra88]7.8 23.5 185(20) [Dlo92]8 26 126(30) [Sin97]
It is known that 252Cf(sf) emits 3.2(1) · 10−3 LRA per fission [Rai68, Wil85]. Different values arereported for the ratio of ternary beryllium to LRA. They are summarized in table 1.6.7. While notexplicitly measured for 252Cf(sf), it can safely be assumed that 10Be contributes about four fifthsto the total beryllium yield, as in all other investigated fissioning systems. Roughly one ternary10Be is emitted per 100 LRA33. Thus, the total 10Be yield is ≈ 3 · 10−5 per fission. The singlemass split measured in [Ram98b] contributes more than 10 % to the total 10Be yield. However,this mass split (96:146) is considerably more asymmetrical than the mean mass split measured incoincidence with ternary 10Be (about 103.5:138.5 before neutron emission [Sin97]). According to
33Due to the probably large contribution of systematic errors it does not make sense to take a weighted average ofthe values shown in table 1.6.7.

46 1.6 Discussion
the fragment mass distributions of [Sin97] only about 3 % of the 10Be events should be found incoincidence with a light fragment of A = 96 or a heavy fragment of A = 146. This already includesa summation of all isobaric contributions and neutron evaporation channels. With typical widthsfor the isobaric distribution in binary fission [Wah88] and the measured neutron multiplicity in 10Beaccompanied fission [Sin97], the contribution of the specific mass split 10Be-96Sr-146Ba to the total10Be yield should rather be below 1 %, which is in contrast to the experimental result (> 10 %).It should be noted that this is not an absolute contradiction, since the results of [Sin97] are onlybased on ternary 10Be with high kinetic energies above the experimental energy cut-off at 26 MeV.Moreover, the biasing towards cold ternary events in the analysis of the gamma-coincidence datacould enhance the contribution of energetically more favorable mass splits involving even-even-nuclides.
“Temperature” and population of excited levels
In the statistical models a parameter of “effective temperature” is introduced which determinesthe probability of accessing energetically unfavorable scission configurations. It is clear that thedefinition of a temperature for the light ternary particles with few nucleons and a low level densityis not really correct. However, if such a temperature is used to describe the production probabilitiesof different ternary particles, it should also allow the derivation of the occupation probabilities ofexcited levels in one ternary particle [Mor94]. Valskii [Val76] proposed to sum over all excitedlevels using statistical factors (see equation (1.3.2)). The same “temperature” parameter shouldbe used which governs the reduction of yields for mass splits with unfavorable Q-value. Using aBoltzmann distribution and taking into account the statistical weights as proposed in [Val76], thefractional yield of individual levels yi should follow:
yi =(2Ii + 1) exp(−Ei/T )
∞∑j=0
(2Ij + 1) exp(−Ej/T ), (1.6.2)
with Ii the spin of the level and Ei its excitation energy. Figure 1.6.9 shows the relative yieldincrease (1/y0) obtained by including the population of excited levels. Contributions of the loweststates were included where known from literature [Fir96, AS88, AS90, AS91, Til93, AS87, End90].Only levels decaying by gamma emission are considered. Particle-unstable states decay into lighternuclei (protons, alphas or neutrons plus the residual nuclei). Since the yields drop significantlytowards higher masses, these contributions to the total yield of the break-up fragments can normallybe neglected. Only in few cases such events were studied experimentally (see below).
For most isotopes the contribution of the excited levels stays below 50 % of the isotopic yield. Forthe more exotic isotopes no excited states are known. Anyhow, the contribution of excited statesdecaying by gamma emission should decrease due to competition of particle emission. Isotopes forwhich the population of excited levels becomes dominant are: 12Be, 12B, 14B, 15C, 16C and someheavier ones. While the inclusion of the statistical weights in the yield calculation would improvethe agreement for some even-even-nuclides, also the yields of odd-odd-nuclides (e.g. 12B, 14B,etc.) would be increased. Their yields already tend to be overestimated by the discussed modelswhich underestimate the odd-even-effect. An inclusion of the excited states would further enhancethe calculated yield and even worsen the agreement.
Solely from the experimental isotopic yields it is not possible to decide on the importance ofthe population of excited states. An independent, direct determination is necessary. While a lotof experimental data exists on isomeric ratios and the population of short-lived excited states inbinary fission, only little experimental information is available on the population of excited levelsof ternary particles.
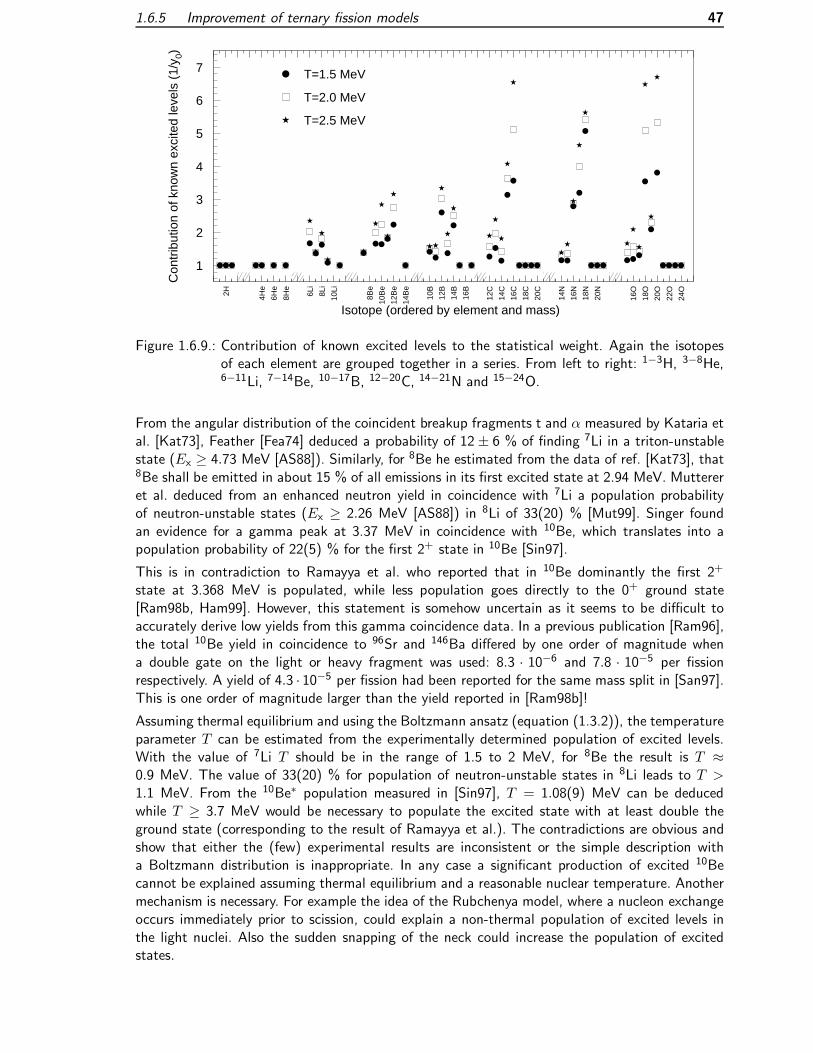
1.6.5 Improvement of ternary fission models 47
2H 4He
6He
8He
6Li
8Li
10Li
8Be
10B
e
12B
e
14B
e
10B
12B
14B
16B
12C
14C
16C
18C
20C
14N
16N
18N
20N
16O
18O
20O
22O
24O
T=1.5 MeV
T=2.0 MeV
T=2.5 MeV
Isotope (ordered by element and mass)
Con
trib
utio
n of
kno
wn
exci
ted
leve
ls (
1/y 0)
1
2
3
4
5
6
7
Figure 1.6.9.: Contribution of known excited levels to the statistical weight. Again the isotopesof each element are grouped together in a series. From left to right: 1−3H, 3−8He,6−11Li, 7−14Be, 10−17B, 12−20C, 14−21N and 15−24O.
From the angular distribution of the coincident breakup fragments t and α measured by Kataria etal. [Kat73], Feather [Fea74] deduced a probability of 12± 6 % of finding 7Li in a triton-unstablestate (Ex ≥ 4.73 MeV [AS88]). Similarly, for 8Be he estimated from the data of ref. [Kat73], that8Be shall be emitted in about 15 % of all emissions in its first excited state at 2.94 MeV. Muttereret al. deduced from an enhanced neutron yield in coincidence with 7Li a population probabilityof neutron-unstable states (Ex ≥ 2.26 MeV [AS88]) in 8Li of 33(20) % [Mut99]. Singer foundan evidence for a gamma peak at 3.37 MeV in coincidence with 10Be, which translates into apopulation probability of 22(5) % for the first 2+ state in 10Be [Sin97].
This is in contradiction to Ramayya et al. who reported that in 10Be dominantly the first 2+
state at 3.368 MeV is populated, while less population goes directly to the 0+ ground state[Ram98b, Ham99]. However, this statement is somehow uncertain as it seems to be difficult toaccurately derive low yields from this gamma coincidence data. In a previous publication [Ram96],the total 10Be yield in coincidence to 96Sr and 146Ba differed by one order of magnitude whena double gate on the light or heavy fragment was used: 8.3 · 10−6 and 7.8 · 10−5 per fissionrespectively. A yield of 4.3 · 10−5 per fission had been reported for the same mass split in [San97].This is one order of magnitude larger than the yield reported in [Ram98b]!
Assuming thermal equilibrium and using the Boltzmann ansatz (equation (1.3.2)), the temperatureparameter T can be estimated from the experimentally determined population of excited levels.With the value of 7Li T should be in the range of 1.5 to 2 MeV, for 8Be the result is T ≈0.9 MeV. The value of 33(20) % for population of neutron-unstable states in 8Li leads to T >1.1 MeV. From the 10Be∗ population measured in [Sin97], T = 1.08(9) MeV can be deducedwhile T ≥ 3.7 MeV would be necessary to populate the excited state with at least double theground state (corresponding to the result of Ramayya et al.). The contradictions are obvious andshow that either the (few) experimental results are inconsistent or the simple description witha Boltzmann distribution is inappropriate. In any case a significant production of excited 10Becannot be explained assuming thermal equilibrium and a reasonable nuclear temperature. Anothermechanism is necessary. For example the idea of the Rubchenya model, where a nucleon exchangeoccurs immediately prior to scission, could explain a non-thermal population of excited levels inthe light nuclei. Also the sudden snapping of the neck could increase the population of excitedstates.

48 1.7 Outlook
It should be noted that the gamma line observed in [Sin96, Ram98b] is amazingly not Dopplerbroadened as expected from a half-life of 125 fs for the 2+ level [Fir96] and a flight time forthe beryllium recoils larger than 1 ns. The proposed explanation [Sin97, Ram98b, Ham99] thatthe gamma is emitted while the beryllium sits in a potential well between the fragments is instrong contrast to typical fission time scales and would undermine the general assumption of acommon emission mechanism of ternary particles. Not only the nuclides mentioned before: 8Bewith T1/2 = 6.7 · 10−17 s, 8Be∗ with T1/2 = 3 · 10−22 s and 7Li∗ with T1/2 = 5 · 10−21 s areaccelerated before decaying. It has also been established from α-n-correlation measurements thateven ternary 5He with T1/2 = 7.6 · 10−22 s [Che72, Mut99], 7He with T1/2 = 2.9 · 10−21 s [Mut99]and 8Li∗ with T1/2 = 2.9 · 10−21 s [Mut99] are emitted and decay after acceleration. It is difficultto understand why just 10Be∗ should not be accelerated during an up to eight orders of magnitudelonger time.
In any case it would be very useful to also analyze the fission data taken with the EUROGAM andEUROBALL set-ups34 for ternary yields.
1.7. Outlook
A comparison of different ternary fission measurements from literature (see appendix A.5) showsthat often the differences of the individual yields and energy parameters exceed largely the errorbars. In many publications only the statistical or fit errors are given, while in such measurementsnormally the systematic errors dominate. For the light isotopes the main systematic error is dueto the extrapolation of an only partially measured energy distribution. Often the measurementshave to stay incomplete due to hardware limitations. For example the maximum high voltage ofthe LOHENGRIN condenser sets an upper energy limit of about 6 to 6.5 MeV per charge state.On the other hand, in cases where no spectrometer is used and the binary fission fragments areblocked by an absorber foil, only ternary particles with energies above a certain threshold canpass. For heavier isotopes additionally the uncertainty of the ionic charge distribution becomesimportant. Still the yields are typically reproduced with average deviations of less than 25 % andthe average energies are reproduced better than 10 %. Most cases of larger deviations can beexplained by clear systematic errors, e.g. an insufficient consideration of background (especiallyfor stable isotopes) or acceptance artifacts. Where necessary, the uncertainties can be significantlyreduced with the use of a dedicated set-up or method. Individual isotopes can be measured withhigh accuracy by measuring a maximum number of different energies and charge states of theseisotopes (e.g. in [Wos99a]), but such an attempt requires considerably more beamtime per mea-sured isotope. Presently the uncertainties of the theoretical or semi-empirical models are largerthan the experimental uncertainties.
In the last years important information was obtained from multiparameter studies of spontaneouslyfissioning actinides, see e.g. [Sin97, Ram98a, Ram98b]. It would be very interesting to extendthese studies, possibly using the same set-ups, to neutron-induced fission where more detailedinformation is available from complementary methods on individual yields, etc. A general problemof ternary particle detection with spontaneous fission sources is the high background of decayalphas. It can be removed by shielding the source with appropriate absorber foils, but simultaneouslythe detection thresholds for ternary particles are increased considerably, for lithium and heavierelements even beyond the most probable energy. With neutron-induced fission of 235U, the naturalalpha background is much less and the detection thresholds could be lowered significantly.
34Presently data sets with 2.5 · 109 triple- and higherfold coincidence events exist for 248Cm(sf) from EUROGAMII and 9.7 · 109 for 252Cf(sf) from EUROBALL III. Inclusion of this data would already reduce the statisticaluncertainty of the present evaluation which is based on 9.8 · 109 coincidences from GAMMASPHERE.

1.7 Outlook 49
On the other hand, LOHENGRIN measurements of yields of 247Cm(nth,f) and 251Cf(nth,f) wouldenable a comparison with the yields measured in spontaneous fission of 248Cm and 252Cf. Thiswould allow to study the relation between the excitation energy of the compound nucleus and thetemperature parameter used in ternary fission models.232U(n,f) is another fissioning system where no information on ternary fission yields is presentlyavailable. With the study of this system, which differs from 233U(n,f) by only one neutron, a betterinsight into the influence of the neutron pairing on the neutron odd-even-effect of ternary particleyields could be gained.
All three proposed LOHENGRIN experiments depend mainly on the availability of suitable targets.While for the heavy actinides it is difficult to find a sufficient amount (some 10−100 µg) of isotope-separated material, the problem of 232U is rather the high dose rate of its decay daughters35.Therefore the target material needs to be chemically separated shortly before production and useof the target. Else transport and handling of the target are subject to very strict regulations.
Also other detection method could give new information on ternary fission yields. The neutron-deficient nuclides 7Be and 22Na can be searched for with good sensitivity by gamma spectroscopy ofchemically separated fission products. The influence of the excitation energy on the yields of heavyternary particles could be checked by analyzing the integrated mass yields of e.g. A = 24. This canbe done rather easily by irradiating actinide samples with neutrons or gamma rays of different en-ergy and detecting the high-energy gammas from the decay of 24Na off-line. If the target impuritiesare too high, the result could be veiled by other reactions (23Na(n,γ)24Na, 25Mg(γ,n)24Na, . . .). In this case it is better to use a tracer nuclide further away from stability, which is less subjectto such background. 32Si would be a good candidate, but its sensitive detection requires moreinvolved techniques like accelerator mass spectroscopy. Such an experiment is analogous to thedetection of 60Fe from far-asymmetric fission [Elh98].
35The high energy gamma rays of 212Po are difficult to shield.


2. Isotope separation
2.1. Radioactive Ion Beam facilities
Before going into technical details, a rather general description shall give an overview of thefundamental aspects which have to be considered in the design of a powerful radioactive ionbeam (RIB) facility1. The production and separation process involves several important steps. Thenumbers (X.) refer to the schematic overview shown in figure 2.1.1:
1. Primary beam: A powerful accelerator (1.) is required to provide an intense beam of primaryparticles. The various types of accelerators2 differ largely in beam energy, particle flux andbeam size.
2. Target: The production rate in the target depends on the flux of the primary beam, theproduction cross-section of the individual target atoms and the number of target atomsexposed to the primary beam (2.). The target size should be matched to the area coveredby the primary beam.
3. Extraction: For the subsequent use the produced nuclei have to be extracted from the targetwith a high efficiency. Obviously this task gets more and more difficult with increasing targetsize. Note that an intense primary beam can cause a hostile environment in the target area(e.g radiation from scattered particles). An access of this area is difficult (3.) or impossibleduring operation.
4. Transport: In the next step the nuclei have to be transported to the end user (6.) who istypically situated at a remote position. In order to avoid losses in this stage the transportcapacity (4.) has to be high enough to accept the complete intensity extracted from thetarget.
5. Rapidity: Since the valuable product nuclei have often a short lifetime, all steps betweenthe target and the detection system have to be fast enough. Any delay can cause additionallosses (5.).
6. Selectivity: Taking into account all points mentioned above will provide an intense beam.Nonetheless this may be completely useless for the end user (6.). Normally the latter requiresa pure beam, containing only a particular nuclide. Therefore the discussed stages from pro-duction to “delivery” also have to provide sufficient selectivity to exclude excessive impuritiesof the beam. Typically the user is less interested in the most abundant species, but requestsan intense and pure beam of a rather exotic species (7.). This puts even more stringentrequirements on the efficiency and selectivity of all stages, including the production method.
1Often the designation “RIB facility” is used for facilities providing “fast” ion beams. However, also a 60 keVISOLDE beam is a “radioactive ion beam” and therefore in principle such a low-energy facility also deserves thename “RIB facility”.
2The primary accelerator can also be replaced by a nuclear reactor (see below).
51
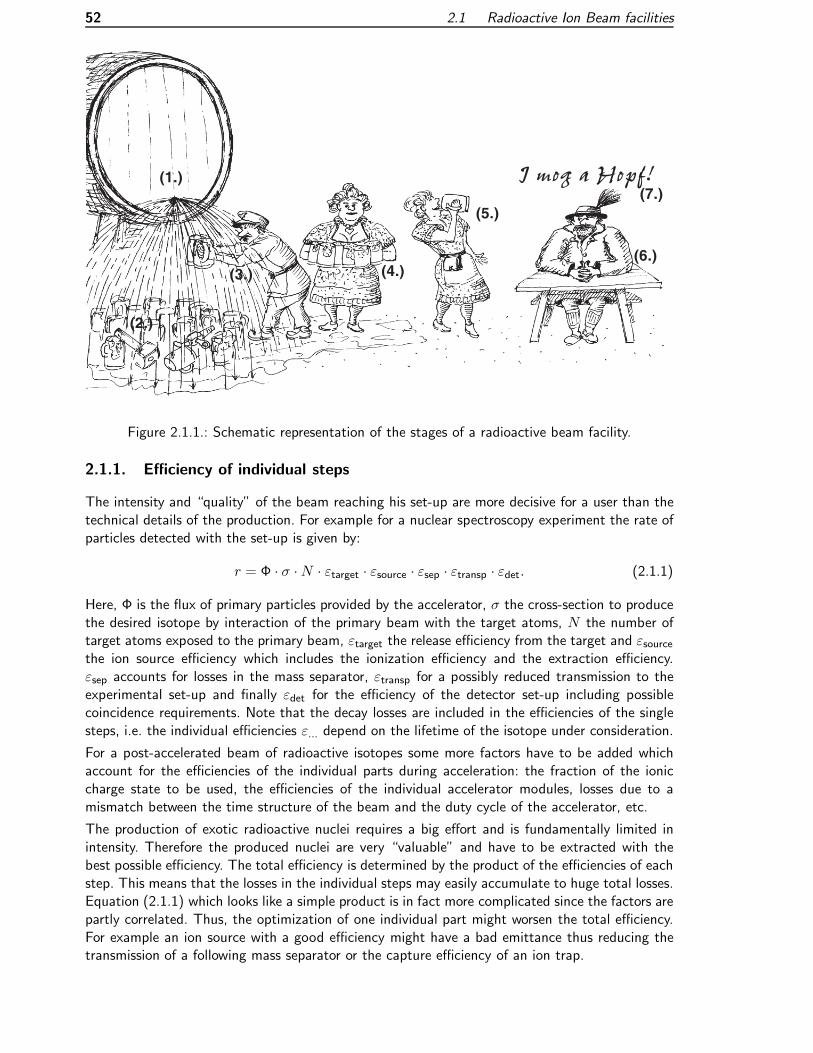
52 2.1 Radioactive Ion Beam facilities
(1.)
(2.)
(3.) (4.)
(5.)
(6.)
(7.)I mog a Hopf!
Figure 2.1.1.: Schematic representation of the stages of a radioactive beam facility.
2.1.1. Efficiency of individual steps
The intensity and “quality” of the beam reaching his set-up are more decisive for a user than thetechnical details of the production. For example for a nuclear spectroscopy experiment the rate ofparticles detected with the set-up is given by:
r = Φ · σ · N · εtarget · εsource · εsep · εtransp · εdet. (2.1.1)
Here, Φ is the flux of primary particles provided by the accelerator, σ the cross-section to producethe desired isotope by interaction of the primary beam with the target atoms, N the number oftarget atoms exposed to the primary beam, εtarget the release efficiency from the target and εsourcethe ion source efficiency which includes the ionization efficiency and the extraction efficiency.εsep accounts for losses in the mass separator, εtransp for a possibly reduced transmission to theexperimental set-up and finally εdet for the efficiency of the detector set-up including possiblecoincidence requirements. Note that the decay losses are included in the efficiencies of the singlesteps, i.e. the individual efficiencies ε... depend on the lifetime of the isotope under consideration.
For a post-accelerated beam of radioactive isotopes some more factors have to be added whichaccount for the efficiencies of the individual parts during acceleration: the fraction of the ioniccharge state to be used, the efficiencies of the individual accelerator modules, losses due to amismatch between the time structure of the beam and the duty cycle of the accelerator, etc.
The production of exotic radioactive nuclei requires a big effort and is fundamentally limited inintensity. Therefore the produced nuclei are very “valuable” and have to be extracted with thebest possible efficiency. The total efficiency is determined by the product of the efficiencies of eachstep. This means that the losses in the individual steps may easily accumulate to huge total losses.Equation (2.1.1) which looks like a simple product is in fact more complicated since the factors arepartly correlated. Thus, the optimization of one individual part might worsen the total efficiency.For example an ion source with a good efficiency might have a bad emittance thus reducing thetransmission of a following mass separator or the capture efficiency of an ion trap.

2.1.2 Comparison of different RIB facility concepts 53
Moreover some of the factors depend not only on the element or mass of the isotope considered,but also strongly on its lifetime or other nuclear and atomic properties. Therefore, in principle thecomplete ISOL system has to be optimized individually for each individual isotope. In practice acompromise has to be found between this individual optimization and the universality of the usedsystem.
In most RIB applications a high intensity of an exotic beam is of no use if it is accompanied byan overwhelming amount of other radioactive isotopes. Thus, the separation process has to havenot only a good efficiency for one isotope (the desired one), but also a very small “efficiency” forothers to suppress contaminating isobars.
For short-lived isotopes the decay losses in the separation process become an important factor. Tolimit these losses the separation has to be fast compared with the half-life of the nuclides.
The three key requirements for all individual parts of a RIB facility are thus efficiency, selectivityand rapidity.
2.1.2. Comparison of different RIB facility concepts
It is not easy to find a suitable figure of merit for the comparison of different RIB facilities. Manyindividual parameters have been proposed and used, but all of them have a fundamental weaknessand can be misleading if used solely. This is seen at the example of the subsystem “driver beam& target”.
Driver beam intensity
The performance of existing first generation RIB facilities often depends strongly on the capabilitiesof the driver accelerator. However, for the projected next generation RIB facilities using thermalneutrons or high-energy protons and light3 ions as primary beam, the production rate in the targetwill no longer be limited by the intensity of the provided beam. The limitation is rather due tothe associated power which has to be removed from the target and which exposes the targetconstruction to high thermal and mechanical stress. The energy and intensity of the primarybeam is “only” limited by economical considerations, but the power deposited in the target isfundamentally limited by technological and physical reasons!
Production cross-section
Figure 2.2.2 (see page 56) shows the cross-sections for the production of rubidium isotopes withdifferent methods. Obviously the cross-sections differ by several orders of magnitude when usingdifferent projectiles. However, not only the cross-section, but also other features of the reactionmechanism have to be considered. For example thermal neutron induced fission provides very highcross-sections, but can only be applied for neutron-rich nuclides of medium mass (75 <∼ A <∼ 160).Moreover the produced nuclei are emitted into a solid angle of 4π which badly matches the lowangular acceptance of a recoil separator. Another example are fusion-evaporation reactions (notshown in figure 2.2.2). They have high cross-sections, but a small excitation width. This severelylimits the effective target thickness.
It should be noted that on the one hand a sharp peaking of the production cross-sections in acertain area of the chart of nuclides makes such a production method less universal, but provideson the other a high intrinsic selectivity in the first stage of the production and separation chain.
3Accelerators for very intense beams of heavy ions are still under development.

54 2.1 Radioactive Ion Beam facilities
Luminosity
The product of primary beam flux and number of target atoms within the effective target thick-ness4, called luminosity (L = ΦNeff), is a useful parameter when treating reactions of comparablecross-sections or when comparing accelerators with the same or similar primary beam (e.g. in high-energy physics). However, for RIB applications it veils completely the fact that the cross-sectionsof different production mechanisms are not at all comparable and differ by orders of magnitude.The use of the luminosity as a classification parameter is therefore only justified in very specialcases.
Production rate
The product of the driver beam intensity, the cross-section and the effective target thicknessgives the production rate in the target. The fact that an optimization of the latter does notnecessarily mean an optimum ion beam intensity is shown in the following, admittedly extreme,example: In a reactor-based facility not the neutron “current” is given, but the neutron flux. Thisstays relatively constant over a rather large region (tenth of cm)5. Thus, the production rate canbe easily increased by increasing the target size and the uranium concentration in the target.The straightforward optimization of the production rate in the target would result in nothingelse than a standard power reactor. There the total production rate of radioactive isotopes ris roughly given by twice the ratio of the thermal power and the energy released per fission:r ≈ 2 · (3200 MW)/(200 MeV) = 2 · 1020 s−1. On the other hand the construction of a powerreactor prevents the release of short-lived6 fission products from the core, making it completelyuseless as a direct ISOL target.
At high target temperatures most of the power is emitted by radiation. Therefore the maximumtolerated primary beam current scales roughly with the target surface. With a given beam andtarget diameter, a surface increase is equivalent to an increase in length and volume of the target.However, with increasing target volume the path length an atom spends in random walk before“finding” the extraction hole will increase considerably. Correspondingly the decay losses for short-lived species are increased and the release efficiency decreased. A more suitable figure of meritwhich accounts for this fact could be e.g. the production rate per target volume. In fact the releaseefficiency is a more complicated function of the target geometry, therefore also this ratio is notvery suitable.
One could follow this argumentation through all other steps of the separation process and willfind that the only figure of merit which allows a direct comparison for practical applications isthe radioactive ion beam intensity and purity delivered to the user’s set-up. Even this has to becompared under the boundary condition of a certain required beam energy. Thus, when judgingRIB facilities there is no other way than directly comparing the provided beam parameters. Forprojected facilities where these are not known, they have to be calculated from all individual stepsusing a reasonable scaling from existing facilities.
4When passing the target the primary beam will be decelerated. The range where its energy lies within the excitationfunction determines the effective target thickness.
5In the picture of figure 2.1.1, this “primary accelerator” would correspond to the legendary, inexhaustible beerlake into which the target is completely immersed.
6Some commercially available radio-isotopes can indeed be extracted from burned reactor fuel elements in repro-cessing plants, but this method is clearly restricted to rather long-lived (T1/2 ≥ months) fission products.

2.2 Production mechanisms 55
2.2. Production mechanisms
2.2.1. Production of neutron-deficient nuclei
On the proton-rich side fusion-evaporation, transfer and direct7 reactions are selective processeswhich produce only a small number of different nuclei. However, the excitation functions of thesereactions are quite narrow and only allow the use of thin targets (<∼ 0.1 g/cm2). For thick targets( 1 g/cm2) beam energies above some 10 A·MeV are required which are only compatible with theunselective reactions spallation and fragmentation. In spallation reactions one (heavy) fragmentis created by evaporation of protons, neutrons and light ions. In (multi-)fragmentation the targetnucleus is broken into several smaller fragments. The relative performance of the different methodsdiffers from isotope to isotope. It is therefore discussed at the example of specific elements inchapter 4.
2.2.2. Production of neutron-rich nuclei
The principal production method for light (Z <∼ 24) and very heavy neutron-rich nuclei (Z >∼ 68)is fragmentation. With sufficient beam energy either a heavier projectile or a heavier target canbe fragmented. Generally the production cross-sections for light neutron-rich fragments tend toincrease with the bombarding energy. For example the heavy sodium isotopes could be studiedeven up to 35Na at the PS on-line separator (26 GeV protons) [Lan83]. Recently the use of 1.4 GeVprotons from the PS Booster gave for different fragmentation products a yield increase by up toa factor four in comparison with 1 GeV protons [Geo99] (see also section 4.12).
Multi-nucleon transfer is another reaction mechanism, providing a good alternative for the pro-duction of neutron-rich nuclei in regions not accessible by fission (see e.g. [Ryk89]). It will bediscussed in section 4.12.
Fission
For neutron-rich nuclei of medium mass the favorite production mechanism is fission of actinides.Due to the high N/Z ratio of the latter, the products also carry a neutron excess. Fission canbe induced by various projectiles. Figure 2.2.2 shows a comparison of production cross-sectionsfor rubidium isotopes from a uranium target. The values for fission of 238U by protons weretaken from [Tra72] (40 MeV), [Ama67] (150 MeV), [Bel80] (1 GeV) and [Kla68] (10.5 GeV). Forthermal neutron induced fission of 235U the evaluation by Wahl [Wah88] was used up to 97Rb. Theexperimental values for 98,99Rb were taken from [Rud91]. For fast fission of 238U the independentyields of [Rud94] were normalized with an average cross-section of 0.3 barn for a typical reactorneutron spectrum. The cross-sections for 12C bombardment of 238U targets were taken from [SS82]and those for reactions of a 750 A·MeV 238U beam in inverse kinematics with a beryllium or leadtarget were taken from [Eng98] and [Sch98b], respectively.
Neutron-induced fission
Thermal neutron induced fission has been used for forty years for on-line separation of radioactiveisotopes [KH51]. Several actinide isotopes with high fission cross-sections could be provided insufficient quantities for an ISOL target (233U, 235U, 239Pu, 241Pu, 241Am, etc.). However, due topractical problems with trans-uranium targets (higher vapor pressure than uranium and very strictsafety regulations) presently only the uranium isotopes (mainly 235U) are used in reactor-basedRIB facilities.
7For example (p,xn) or (α,xn) with few emitted neutrons.
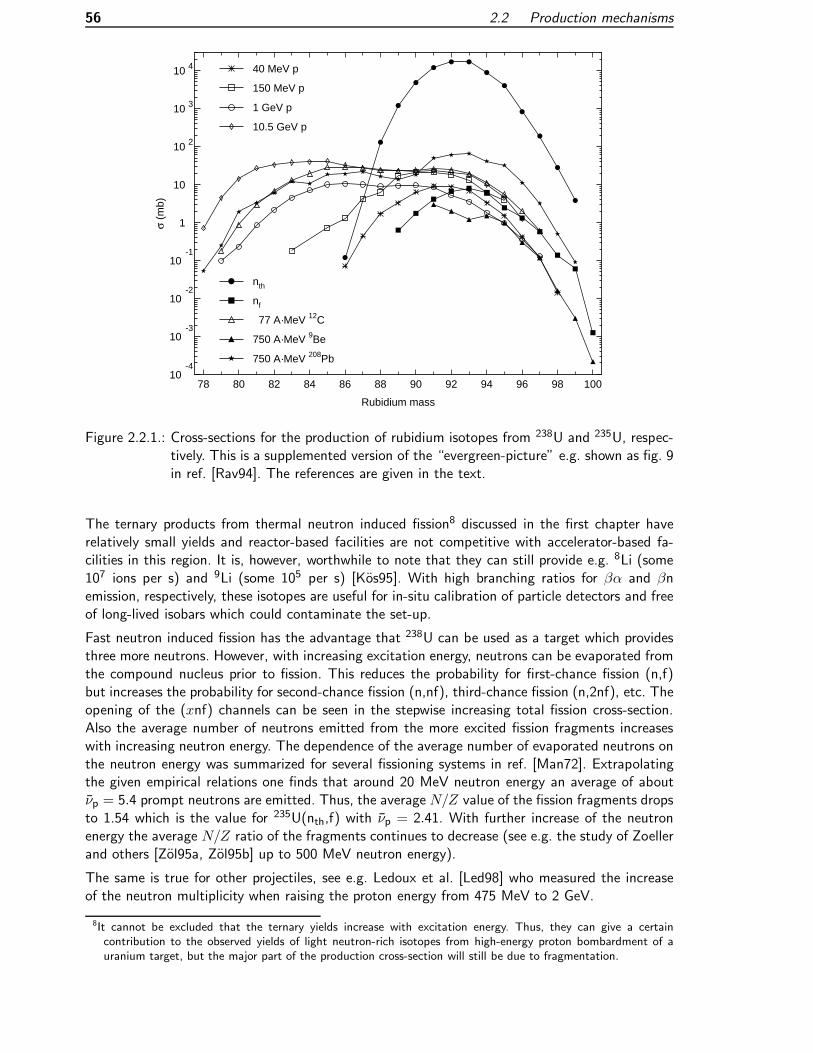
56 2.2 Production mechanisms
10-4
10-3
10-2
10-1
1
10
10 2
10 3
10 4
78 80 82 84 86 88 90 92 94 96 98 100
nth
nf
40 MeV p
150 MeV p
1 GeV p
10.5 GeV p
77 A·MeV 12C
750 A·MeV 9Be
750 A·MeV 208Pb
Rubidium mass
σ (m
b)
Figure 2.2.1.: Cross-sections for the production of rubidium isotopes from 238U and 235U, respec-tively. This is a supplemented version of the “evergreen-picture” e.g. shown as fig. 9in ref. [Rav94]. The references are given in the text.
The ternary products from thermal neutron induced fission8 discussed in the first chapter haverelatively small yields and reactor-based facilities are not competitive with accelerator-based fa-cilities in this region. It is, however, worthwhile to note that they can still provide e.g. 8Li (some107 ions per s) and 9Li (some 105 per s) [Kos95]. With high branching ratios for βα and βnemission, respectively, these isotopes are useful for in-situ calibration of particle detectors and freeof long-lived isobars which could contaminate the set-up.
Fast neutron induced fission has the advantage that 238U can be used as a target which providesthree more neutrons. However, with increasing excitation energy, neutrons can be evaporated fromthe compound nucleus prior to fission. This reduces the probability for first-chance fission (n,f)but increases the probability for second-chance fission (n,nf), third-chance fission (n,2nf), etc. Theopening of the (xnf) channels can be seen in the stepwise increasing total fission cross-section.Also the average number of neutrons emitted from the more excited fission fragments increaseswith increasing neutron energy. The dependence of the average number of evaporated neutrons onthe neutron energy was summarized for several fissioning systems in ref. [Man72]. Extrapolatingthe given empirical relations one finds that around 20 MeV neutron energy an average of aboutνp = 5.4 prompt neutrons are emitted. Thus, the average N/Z value of the fission fragments dropsto 1.54 which is the value for 235U(nth,f) with νp = 2.41. With further increase of the neutronenergy the average N/Z ratio of the fragments continues to decrease (see e.g. the study of Zoellerand others [Zol95a, Zol95b] up to 500 MeV neutron energy).
The same is true for other projectiles, see e.g. Ledoux et al. [Led98] who measured the increaseof the neutron multiplicity when raising the proton energy from 475 MeV to 2 GeV.
8It cannot be excluded that the ternary yields increase with excitation energy. Thus, they can give a certaincontribution to the observed yields of light neutron-rich isotopes from high-energy proton bombardment of auranium target, but the major part of the production cross-section will still be due to fragmentation.

2.2.2 Production of neutron-rich nuclei 57
However, for RIB applications individual yields of relevant neutron-rich isotopes (e.g. 132Sn) aremore important than the discussed average values. It is well known that the mass distributionsget broader in high-energy fission, i.e. the valley of symmetry is filled up and the wings reachfurther out to far asymmetric fission. Unfortunately most of the elements produced in symmetricfission are refractory (40 ≤ Z ≤ 46) and are thus practically not released from an ISOL target.An advantage remains only for few cases like lighter silver and cadmium isotopes. Also for manyshort-lived isotopes populated in far asymmetric fission (of the elements iron, cobalt, nickel andthe lanthanides) there is no significant advantage for fast neutron induced fission until an ISOLactinide target with rapid release of these elements is found (see e.g. section 4.4).
While mass yields have been determined for many fissioning systems over wide ranges of excitationenergies, much less data exist on isotopic yields of exotic isotopes. Radiochemical methods givegood information on cumulative mass yields, but the determination of independent yields9 ofshort-lived nuclei is more difficult. For an overview of available methods see ref. [Den86].
Data on thermal neutron induced fission have been collected over many years, e.g. at the recoilseparator LOHENGRIN (for 235U(n,f) see [Lan79, Sid89]) and at the ISOL separator OSIRIS (for235U(n,f) see [Rud90]). Wahl gave a summary of measured yields from 235U(nth,f),
233U(nth,f),239Pu(nth,f) and 252Cf(sf) together with an empirical model which allows to inter- and extrapolatethe yields to other nuclei [Wah88]. Another model has been proposed for the extrapolation ofyields in far asymmetric fission [Fau94]. These models give predictions with sufficient reliability forRIB applications.
On the other hand for fast neutron induced fission the used model calculations have more de-grees of freedom and react sometimes sensibly on small changes of parameters [Ric99]. Also lessexperimental information exists. A dedicated ISOL separator had been built to measure indepen-dent yields of Rb (up to 97Rb) and Cs (up to 146Cs) isotopes10 from fission of 238U in a reactorneutron spectrum [Bal74]. Only recently programs have been started to extend the measurementstowards more exotic isotopes and other elements (e.g. Sn). At OSIRIS the yields of 238U(nf ,f)were measured [Rud94]. Similar measurements were also performed for 233U(nf ,f) [Gal99].
Also plans exist to measure the independent yields of most fast fission products simultaneouslyby detecting their characteristic gamma lines with a powerful Ge detector array [Joh99]. However,the analysis to extract a complete yield map is extremely tedious and the lowest detectable yieldsare limited by statistics and background to some 10−6 to 10−4 per fission which is still far awayfrom the detection limit of a recoil separator or ISOL system.
A dedicated ISOL facility is very useful for the reliable determination of low yields in fast neutroninduced fission. Such test facilities are presently used or in preparation to study yields of 238U(nf ,f)at Orsay (PARRNE), Argonne and Legnaro. The “simulation” at an existing ISOL facility, e.g. byplacing a thick spallation target in front or beside of a standard UCx/graphite target at ISOLDE,ISAC or IRIS is also possible. Such an experiment was recently performed at the IRIS facility byplacing a tantalum rod beside a standard UCx/graphite target [Nolen].
Charged particle induced fission
Fission can also be induced with charged particles of sufficient energy. Primary beams of protons,alphas and heavy ions have been used for a long time at ISOL facilities. Compared with neutronsthey have two intrinsic drawbacks:
9The independent fission yield is the number of atoms of a specific isotope produced directly per fission. Thecumulative fission yield includes additional contributions from decay of precursors.
10Rb and Cs are good candidates for such measurements. They diffuse rapidly in graphite matrices and are easilysurface ionized, giving a relatively constant and high separation efficiency. Moreover they are complementaryfission fragments (Z(Rb)+Z(Cs)=92), permitting a cross check of the neutron multiplicity.

58 2.2 Production mechanisms
1. While in neutron-induced fission the target is only heated by the “useful” fission reactionwhich provides the radioactive isotopes, in charged-particle induced reactions the electronicstopping power exceeds the nuclear stopping power by three to four orders of magnitude. Thismeans that a lot of kinetic energy of the projectiles is dissipated in the target without inducinga nuclear reaction. With a technologically given limit for the maximum target heating, themaximum fission rate per target volume will be lower in charged-particle induced fission thanin neutron-induced fission.
2. The intrinsic selectivity of fission, i.e. the unique production of neutron-rich isotopes, is lostwhen using high-energy projectiles. There spallation and fragmentation reactions will producesimultaneously neutron-deficient nuclides which can act as beam contaminants. High efforthas to be spent to remove these isobars later on.
Other fission sources
Even the use of an intense electron beam has been proposed for an ISOL facility [Dia99]. However,of all primary beams discussed here, electrons have by far the worst ratio of target heating toproduction rate (only about 5 · 1011 fissions per kW for 30 MeV electrons). Therefore the electronbeam will not be sent directly onto the production target, but is stopped in a converter target andthe produced Bremsstrahlung induces photofission in a subsequent ISOL target [Dia99].
Occasionally proposed spontaneous fission sources are absolutely no alternative as a productiontarget for a high-intensity RIB facility. Sufficient quantities of such sources (e.g. 252Cf) are notavailable11 and, even more important, could not be handled! While the activity of a productiontarget in an ISOL facility decreases rapidly from its maximum value (up to some 10 kCi) afterswitching off the projectile beam, a spontaneous fission source cannot be switched off.
Energy dependence of (p,X) cross-sections
At low proton energies (Ep <∼ 100 MeV) the yields of medium-mass nuclei are mainly due to fission.As in neutron-induced fission the elemental yields of medium-heavy isotopes are well described bya single Gaussian, peaking at isotopes with a slight neutron excess (e.g. 91Rb or 137Cs). Due toan enhanced neutron emission the maximum of the peak shifts towards lower N/Z ratios withincreasing proton energy. Above about 500 MeV proton energy a second peak on the neutron-deficient side (e.g. around 129Cs) appears [Fri63]. This causes a widening of the total peak widthtowards lower N/Z ratios.
For the detailed behavior on the very neutron-rich side less data exist. With off-line measurements[Fri63, Ale63] the short-lived isotopes cannot be accessed. ISOL facilities allow to reach out muchfurther (see e.g. [Bel80]), but for very short-lived nuclei (T1/2 τrelease) the errors due to decay-loss-corrections become important. The cross-sections of these nuclei could be measured betterwith recoil separators12, but the unfavorable kinematics will largely reduce the acceptance for lightprojectiles and heavy targets. Recently experiments were performed at the GSI fragment separatorFRS where these cross-sections are measured in inverse kinematics, i.e. with a heavy ion beamon a light13 target (hydrogen and deuterium). Cross-sections from H(197Au,X) [Far98, Ben99a],H(208Pb,X) [Wla00], H(238U,X) and D(238U,X) [Cas01, Ric01] were determined. Fortunately theseexperiments were performed at beam energies of 750-1000 A·MeV which is just identical to the
11The annual production of 252Cf at the high-flux isotope reactor in Oak Ridge is about 500 mg [Erd98c]. 300 timesthis amount would be required to reach 1014 fissions per s!
12The cross-sections for production of light isotopes in 800 MeV induced reactions could e.g. be measured with theTOFI spectrometer (see ref. [Ree91]).
13Also many experiments with heavy targets were performed, but these are less suitable for a direct comparisonwith ISOLDE yields.

2.2.3 Collection of decay products 59
typical proton beam energy at ISOLDE PSB14. The derived cross-sections are thus of great valuefor a cross check of the measurements from ISOLDE and for an improvement of the models whichare used for cross-section predictions.
Engelmann has thoroughly studied the fission yields from the interaction of a 750 A·MeV 238Ubeam with a Be target [Eng98]: he has shown that even at this high kinetic energy a significantpart of the nuclei undergoes low-energy fission. In the far asymmetric region the typical featuresof fission like the odd-even-effect and an increase of yields at the N = 50 shell are found. Withthe increasing width of the mass distribution the yields in the far asymmetric region increasedrastically compared with thermal-neutron induced fission. On the other hand the isobaric width(σZ(A)) found in [Eng98] and [Don98] is comparable to that of thermal-neutron induced fission.It was shown in ref. [Ben98] that e.g. the most neutron-rich nickel isotopes are mainly producedin nuclear fission. Therefore the production cross-sections are nearly identical for light (Be) andheavy (Pb) targets. For a given energy loss in the target, a beryllium target allows to reach thehighest yields for very neutron-rich fission products from a relativistic 238U beam. However, theproduction of less neutron-rich isotopes in electromagnetic fission and of neutron-deficient nuclidesby fragmentation increases with the mass of the target atoms.
It is interesting to note that not only the beam energies of ISOLDE and the GSI-FRS are compara-ble, but also the typical target thickness in mol/cm2. A standard UCx/graphite target at ISOLDE(50 g/cm2) has a thickness of 0.2 mol/cm2 which is identical to that of a typical fragmentationtarget at the FRS with 2 g/cm2 Be. However, the average beam intensity is quite different: about2 µA of protons at ISOLDE and some particle nA of 238U at the GSI (projected intensity for theend of 1999). That means the production rates in the target are higher by orders of magnitudeat ISOLDE. How these production rates translate to final beam intensities for the user will bediscussed in chapter 4.
2.2.3. Collection of decay products
Of a certain importance is the method to “milk” radioactive decay products from a stock oflong-lived mother nuclides. Compared with a complete on-line facility these experiments can beperformed with a reduced effort (once a suitable source is obtained) and still allow to gain newspectroscopic information (see e.g. [Lia99]). An interesting combination is the production of along-lived source at an isotope separator and the subsequent separation of decay daughters witha second isotope separation. In certain cases this method can give an excellent beam purity, e.g.by collection of 223Ra and 225Ra at ISOLDE and separation of daughters in the Pb and Bi regionwith the LISOL facility [Ver99].
2.2.4. Summary
Neutrons are clearly the optimum projectiles for an efficient and selective production of medium-mass neutron-rich nuclides. The yields of most isotopes which can be separated from the presentISOL target materials behave similarly for thermal and fast neutron induced fission. Therefore thischoice is rather a technical question than a matter of principle. High energy protons allow to usedifferent targets for the production of isotopes all over the chart of nuclides, but the reactionsare rather unselective. The low-energy fusion-evaporation, transfer and direct reactions are notable to produce very high beam intensities, but have a high intrinsic selectivity which makes themcompetitive for nuclear spectroscopy experiments on the neutron-deficient side. High-energy heavyion beams have a significantly higher specific energy loss causing a high thermal load of the target
14This is one of the few cases where the cross-sections are comparable and it makes sense to use the concept ofluminosity.

60 2.3 Separation methods
and are presently still limited in the primary beam intensity. However, in certain regions the gainin cross-section overcompensates the loss in effective target thickness compared with high-energyprotons. Heavy ions are the only projectiles, which allow to access certain isotopes and give alarger flexibility in the choice of the target material in other cases.
To conclude: there is no single primary beam which offers optimum conditions for all regions of thenuclide chart. On the contrary, the particle and energy of the primary beam is the first parameterwhich has to be individually adapted for the production of the desired radio-isotope. Clearly acompromise has to be found between the individual optimization in this stage and the universalityof the facility, but it should be kept in mind that a change in the production mechanism can easilyaffect the production rate and selectivity by orders of magnitude.
2.3. Separation methods
The search for new isotopes goes towards more and more exotic nuclides with extreme ratios ofprotons to neutrons. The production cross-sections for exotic nuclei decrease considerably andmore efficient and selective methods are required to separate the few exotic nuclei from the bulkof other (radioactive) nuclei. Going from the valley of beta stability to the driplines, the lifetimesdecrease by many orders of magnitude and the separation method has to be fast enough to avoidexcessive decay losses. To decide on the suitability of a separation method it is important toremember the main requirements: efficiency, selectivity and rapidity.
The presently used isotope separators can be classified into four types:
In-flight separation
In-flight separation includes recoil and fragment separators. In a recoil separator the particles passwith the kinetic energy released in the reaction, e.g. fission. In a fragment separator the momentumof the fragments is mainly given by the center-of-mass movement of the projectile/target system(in fusion reactions) or by the projectile beam (in fragmentation). The nuclei leave the targethighly ionized and are separated by means of magnetic and/or electric fields. When separatingaccording to A/q, the ionic charge state distribution results in a loss of efficiency (only the ionswith one charge state are separated at a time) and selectivity (due to interference with isotopesof identical or close-by A/q ratios). These problems are eliminated with relativistic beam energieswhere practically all ions are fully stripped. The Z identification can be done via the specific energyloss with ∆E/E telescopes. The Z identification gets easier at higher energies (larger differencein ∆E) and a real Z separation in space becomes possible by placing an energy degrader at anintermediate position of the spectrometer. At lower energies gas-filled magnets provide a valuablealternative. Here, the initial ionic charge is replaced by a mean ionic charge which in turn dependson Z. The separation follows about A/Z1/3 [Ghi88]. Recently the competitiveness of the latterseparation method was impressively confirmed with the possible discovery of element 118 at theBerkeley Gas-filled Separator (BGS) [Nin99].
All elements can be separated in-flight and the separation time is given by the flight time throughthe separator, typically some 0.1 − 2 µs.
The targets have to be thin enough to prevent excessive energy loss in the target. The optimumthickness is determined by the accepted energy range of the recoil separator which varies betweenabout 0.4 mg/cm2 at LOHENGRIN (fission products with 0.5 − 1.5 A·MeV) and several g/cm2
at the FRS (GSI) (for 1000 A·MeV beams). At high beam energies the main limitation of theproduction rates is presently the available primary beam intensity.
The fast secondary beams can be used directly for subsequent experiments (mass spectroscopy,scattering, Coulomb excitation, breakup reactions, etc.), but if a deceleration is required, the

2.3 Separation methods 61
transversal emittance increases and large transmission losses can occur. Also the efficient focusingand stopping of the beam in a small area (e.g. for gamma spectroscopy) is difficult.
IGISOL
In an IGISOL (Ion Guide Isotope Separator On-Line) the reaction products recoiling from the targetare stopped in a gas cell filled with helium or argon. In charge-changing collisions the ionic chargedecreases rapidly to 1+ and remains constant for a while, since neutralization does not occur incollisions with the buffer gas, but requires an interaction with impurity molecules (O2, N2, etc.)
15.In contrast to in-flight separators, practically all initial ionic charge states are collapsed into one(1+) and the initial energy distribution, often with a large spread, is replaced by a well definedbeam energy, given by the extraction voltage. The total target thickness can be increased to themaximum range of the reaction products (≈ 10 mg/cm2 for fission products) or even beyond ifa stack of individual targets is used. The method has practically no chemical selectivity and canbe applied to nearly16 all elements. This makes it the presently leading method for the separationof short-lived fission products of refractory elements in the symmetric (40 ≤ Z ≤ 46, see e.g.[Wan99]) and far asymmetric fission (26 ≤ Z ≤ 28, see e.g. [Fra98a]).
The separation time is given by the time to reach charge state 1+ and the evacuation time fromthe target chamber, which is of the order of some ms.
The beam emittance and energy spread is generally worse than at ISOL facilities (see below),but can be improved with sextupole (or more generally multipole) ion guides, so-called SPIGs.Thus, mass resolving powers of about 1000 can be reached which are comparable to that of astandard ISOL mass separator. Even collinear laser spectroscopy experiments requiring very goodbeam quality were already performed at the IGISOL facility in Jyvaskyla [Bil97, Lev99].
An IGISOL variant with higher Z selectivity is obtained by combination with an element specificresonance ionization laser ion source. The residence time in the gas is increased to reach fullneutralization. Then the atoms of a certain isotope are selectively reionized with a laser ion source(see below) and extracted. Such an ion guide laser ion source (IGLIS) is under operation at theLeuven ISOL separator [Kud96]. To increase the element selectivity, remaining ions are removedfrom the extraction region by an electric field prior to the laser pulse. Here, the separation timeis increased to about 100 ms. IGRIS, a similar set-up with faster extraction (∼1 ms) is used forlaser spectroscopy of short-lived isotopes and isomers of transuranium elements [Bac97].
Upgrading the beam intensity of an IGISOL facility by orders of magnitude to reach that of ISOLfacilities (see below) would cause major technical problems. The operation of large amounts ofbuffer gas in an extended pumping system would disperse the produced activity over a large area,creating huge problems for radiation protection. Further problems could arise from plasma creationin the buffer gas due to the high current of the primary beam and of the produced ions [Den97].
ISOL
A further drastic increase of the target thickness can be obtained by stopping the reaction productsnot in an external gas cell, but in the target itself. Thus, no longer the range of the recoils, but therange of the primary beam determines the maximum target thickness. For most elements the targethas to be heated to high temperatures to allow a rapid diffusion and effusion of the radio-isotopes.An attached ion source is used to reionize the completely neutralized atoms. This technique is
15The binding energy for the valence electron of the produced ions is much smaller than the first ionization potentialof the buffer gas, but comparable to the ionization potential of the impurity molecules. In fact, already for thestep from 2+ to 1+ the impurities play an important role, i.e. a well defined level of impurities is required foroptimum operation [Den97].
16Obviously less efficiently for the noble gases with high ionization potential.

62 2.3 Separation methods
known as isotope separation on-line (ISOL)17. Presently targets with thicknesses of up to about200 g/cm2 are employed. The release time varies strongly depending on the chemical propertiesof target and product elements. Refractory elements are practically not released. In certain casesa high chemical selectivity can be achieved by an appropriate choice of the target material orionization mechanism. At several occasions the status of the ISOL technique has been thoroughlyreviewed by Ravn et al. (see e.g. [Rav79, Rav89, Rav98]).
A variant of the ISOL technique (e.g. at the GSI on-line separator) uses only thin targets whichthe product nuclei can leave with the recoil momentum. They are implanted into a catcher whichis optimized for rapid release of the desired chemical species. Thus, the difficulty to find a targetmaterial which has not only optimum chemical properties for fast release, but moreover highproduction cross-sections, is circumvented by separating the functions of target and catcher. Thesame advantage is obtained by a combination of projectile fragmentation with an ISOL target.With primary heavy ion beams (e.g. at the SPIRAL facility, GANIL), the target material can bechosen nearly freely. This allows to optimize the target material for fast release even of elementswhich are chemically similar to the “mother element”18, e.g. lanthanides produced in the fissionof uranium.
Chemical separator
In chemical on-line separators the product isotopes pass a chemical separation process as atoms,ions or bound in molecules. The transport medium can be liquid or gaseous. A very good chemicalselectivity is obtained, but the mass information has to come from the production mechanism19.As in the case of ISOL separation, thick targets can be employed and high separation efficienciesare reached. Applications where the separated isotopes are not only detected, but used for asubsequent application (implantation, post-acceleration, etc.) require them to be transformed intoan easier handable form. Often this is done by reionization. Obviously chemistry plays also animportant role in ISOL targets and there is no clear dividing line between a chemical separatorwith a subsequent ionization and an ISOL system. A review on chemical separation methods isgiven e.g. in ref. [Her82].
Other methods
The gas- or aerosol-jets do not provide a real separation, but are useful for rapid transport ofreaction products and are mainly employed in combination with other separation methods. Ex-amples are the gas-jet ISOL at JAERI for neutron-rich lanthanides [Ich98], the aerosol-jet at theChalk River ISOL facility [Kos97a], the He-jets of the SIRIUS facility in Strasbourg [Zir74] andthe HELIOS separator in Mainz [Maz81] or a mobile aerosol-jet using carnaubawax [Key94]. Ther-moseparators have been used successfully to increase the chemical selectivity by combination withthe OSIRIS ISOL separator [Rud81] and the JASNAPP facility in Dubna [Bey81].
Combining several of the separation methods presented above often allows to further improve theefficiency and/or the selectivity of the separation. Several projects aim at the use of an in-flightseparator for pre-separation and a subsequent IGISOL set-up for the preparation of a low-energy1+ beam with good beam quality. In the SHIPTRAP project [Sch01] the beam of product nuclei
17In fact all presented separation methods do separate isotopes on-line, but traditionally the expression ISOL tech-nique is only used for cases where the produced isotopes are stopped in the target or a catcher.
18This is the element which undergoes the nuclear reaction. Normally it is the target element, but here it is theprojectile.
19Uncertainties in this point can lead to severe problems in the interpretation as the examples of the alleged trans-uranium elements discovered by Fermi [Fer34b] or the lengthy disputes on the discovery of element 104 (see ref.[Gag88] for a review) show.

2.3 Separation methods 63
will be separated with the recoil separator SHIP at GSI [Mun79] and then stopped in a gas-filledRadio-Frequency-Quadrupole (RFQ) and transported to a Penning trap, allowing among othersdirect mass measurements of exotic nuclei.
A similar design is planned for the separator MORRIS [Thi97] at the Munich Accelerator for FissionFragments. It is designed for efficient and selective separation of heavy neutron-rich fusion productswhich are provided as 1+ ion beam for subsequent experiments (chemistry, mass measurements,etc.).
A new proposal from Argonne National Lab even aims at building a complete next-generation RIBfacility based on this concept [Sav01]. The pre-separation with a fragment separator can avoid thetwo main problems of the IGISOL system (missing selectivity and plasma creation) while keepingall its advantages (high efficiency and good beam quality for all elements).
Table 2.3.1.: Different methods of on-line isotope separation.
in-flight IGISOL ISOL chemical
separation time O(µs) O(ms) O(s) O(min)
elements all all no refractory dedicated
targets thin to thick thin thick thick
increases no difficult very goodZ selectivity
with E/A good with RILIS good with RILIS
beam intensitylimited by
primary beam activity handling target heating target heating
beam quality large size and no realat exp. set-up energy spread
good very good“beam”
Table 2.3.1 summarizes the main features of the different on-line separation methods. The typicalseparation times in table 2.3.1 are given only as an order of magnitude. Accepting a reductionin intensity, experiments can still be performed with isotopes of shorter half-life which has beenshown in many examples: At LOHENGRIN (see section 1.4) the time of flight is about 1.4 µs, butspectroscopy experiments have already been performed with isomers of 400 ns half-life [Gen99]. Atthe fragment separator LISE3 (GANIL) a 0+ isomer in 74Kr with a half-life of 42 ns was detected[Cha97] while the flight time is about 0.4 µs20. Also at the IGISOL facility in Jyvaskyla short-livedisomers were separated, e.g. 207mBi (T1/2 = 182 µs) [Arj86] and 204mTl (T1/2 = 64 µs) [Dendo].At ISOL facilities several isotopes with half-lives in the millisecond range could be separated. A 5 msisomer in 125In (probably 23/2−) was separated at OSIRIS [Fog98] and 14Be with T1/2 = 4.35 mswas separated at ISOLDE (see section 4.2.1). Francium isotopes with half-lives down to 0.7 mswere seen at ISOLDE [Klu86] and 35Na (T1/2 = 1.5 ms) was discovered at the CERN PS on-linemass spectrometer [Lan83]. The relatively short-lived isotope 265Sg (T1/2 = 7.4 s) was recentlystudied at a chemical on-line separator [Tur98] and the most short-lived isotope which was studiedafter chemical separation is 92Br (T1/2 = 0.34 s) [Kra74, Kra75].
Chemical off-line separation is still used for identification and spectroscopy of new isotopes inregions where the on-line methods are presently less efficient. Examples are 185Hf [Shu93a] and237Th [Shu93b].
For the production of accelerated beams in principle two methods can be used. One is the post-acceleration of a low-energy ISOL beam and the other is the direct use of an in-flight separated
20The decay proceeds normally by E0 conversion electrons and is thus suppressed during flight as a fully strippedion.

64 2.4 ISOL targets
beam. Obviously it becomes more and more expensive to build post-accelerators which bring theISOL beam to higher and higher energies. On the other hand a necessary deceleration of high-energy fragment beams becomes less efficient and the beam quality suffers significantly for lowerbeam energies. Both methods have only a small overlap and are rather complementary. The dividingline depends strongly on the isotope considered and the technical advances expected in the nextyears. It can be roughly drawn at a beam energy of the order of 20-30 A·MeV. In any case it is wellabove the Coulomb barrier. A discussion of the different approaches is found e.g. in ref. [Gei95].
2.4. ISOL targets
2.4.1. Release optimization
The key part of an ISOL facility is the target and ion source unit. When using thick targets, thechoice of the target material is guided by the simultaneous optimization of the production rate inthe target and the release efficiency from the target. Often the same or similar target elements canbe used in different chemical forms. Various materials have been tested and used as ISOL targets.An overview is given in appendix B.3.
The release efficiency from a target and ion source unit is not a fixed parameter, but depends onthe rapidity of the release and the half-life of the released nuclide. The mechanisms and parametersdetermining the release efficiency in an ISOL system were nicely reviewed by Kirchner [Kir92a]. Inappendix B.2 the main points are summarized using his terminology.
The main features of the release behavior can be summarized as follows:
• For sufficiently long times more or less everything will get released, but for ISOL applicationsthe opposite limit, i.e. the behavior for very short times- and lifetimes, respectively, is ofinterest.
• The efficiency of diffusional release depends on the square root of the half-life (equation(B.2.7)). Thus, even for very short-lived nuclides a certain amount can get released.
• The effusional release shows already a linear dependence on the half-life (equation (B.2.12)),thus causing a stronger suppression of short-lived nuclei.
• The combination of both processes causes a t3/2 dependence (equation (B.2.15)) whichis even more unfavorable for the release of short-lived nuclei. Depending on µ0 and ν therelease efficiency will approach the unfavorable t3/2 dependence sooner or later.
• An additional problem occurs if the desorption time gets very long. Then the boundarycondition of negligible surface concentration (equation (B.2.5)) is no longer fulfilled and theadsorbed particles can diffuse backwards into the bulk material. This will cause the releaseefficiency to drop with an even higher power ( 3/2) and the separation of short-livednuclides gets practically impossible. This is often the case for refractory elements.
Obviously a change in target geometry to optimize the mean diffusion time can affect the effusiontime negatively. For smallest diffusion times it is of advantage to use very thin foils, fibers orspheres. This in turn will largely increase the inner surface, thus increasing the effusion time. Sucha geometry can be of advantage for elements where the release time is dominated by diffusion, e.g.noble gases, alkalis and other atoms and molecules with high volatility. This was confirmed by arelease test with a special Ta target made of 2 µm thick foils. It showed to double the yield of 11Lialthough the target thickness was reduced by a factor of ten compared to a standard Ta targetwith 20 µm thick foils [Ben99c]. On the other hand for elements with a significant desorptiontime it can make sense to use a more coarse-grained target structure where the diffusion time isincreased, but the average number of surface collisions is largely reduced.

2.4.2 Efficiency and release time measurement 65
For example in a tantalum foil the diffusion coefficients decrease in the following order: Y > As> Lanthanides > Sr > Ba > Hf > Rb > Cs > Kr [Bey77, Kir92a, HB]. This can be understoodintuitively: the diffusion is related to the size of the atom. With increasing valence the volume ofthe atom or ion, respectively, is reduced, thus allowing a faster diffusion. However, simultaneouslythe element gets chemically more similar to the host (Ta) and is desorbed less easily. Noble gasesand alkalis show a rather “diffusion-controlled” release while others, e.g. rare earths, are rather“desorption-controlled”. Clearly this is only a very qualitative statement for intermediate times.For short times always the unfavorable t3/2 dependence will be reached.
Literature data
A lot of literature data exists on the release behavior of fission products from various matrices.These were studied as possible containment materials for the fuel elements of a high-temperaturereactor (see e.g. [Hil88, Kwa90, TFP83]). However, in these applications the opposite aim, i.e. themaximum retention of radio-nuclides is pursued. Therefore typically materials with a very unfa-vorable release characteristic were chosen. Moreover the data normally concerns the slow releasebehavior (hours or longer) at much lower temperatures and has large errors when extrapolated tohigher temperatures.
That compound creation with other elements can significantly affect the release behavior wasshown e.g. in [Bau87]. This underlines the importance of target impurities!
It has been shown that the structural changes due to a strong irradiation of the material can leadto a considerable acceleration of the release, especially at lower temperatures [Mat86]. This effectis called “radiation enhanced diffusion”.
A useful compilation of diffusion data, especially in oxide matrices including ThO2 is given in[Ree77]. Also included are empirical relations which allow an estimation of the diffusion behaviorfor elements without measured data.
2.4.2. Efficiency and release time measurement
Several methods are used to measure the efficiency of a target and ion source system. Some ofthem can also be used to measure the release profile or an average release time. Therefore bothpoints are discussed together in the following.
Off-line measurement with a stable tracer:
To determine the source efficiency of the ISOLDE ion sources, a small, well-known amount ofthe respective element is brought into the target container or an attached oven. While slowlyevaporating this sample into the source, the current is measured with a Faraday cup (FC) andcontinuously logged. After complete evaporation, the source efficiency is given by the ratio of theintegrated current to the inserted amount by:
εsource =
∫Ixdt
nx · 96485 As, (2.4.1)
where nx is the molar quantity of the inserted isotope.
As an example figure 2.4.1 shows the determination of the ion source efficiency for resonant laserionization of copper (see below). The target heating was stepwise increased, seen in the peaking ioncurrent. Between 21:00 and 23:00 several tests where performed with the laser set-up. Thereforethe current had to be interpolated.

66 2.4 ISOL targets
0
10
20
30
40
50
60
70
80
90
100
4.4.97 19:00 4.4.97 21:00 4.4.97 23:00 5.4.97 1:00 5.4.97 3:00 5.4.97 5:00
Time
Cur
rent
of
63C
u (n
A)
Integrated current: 155 nAh Inserted amount: 0.15 µmol Transmission to FC: 83 %
Efficiency: 6.6(2) %
Figure 2.4.1.: Off-line determination of the laser ion source efficiency for copper.
The used samples contain typically some µg of material. They are normally prepared by dilutionof aqueous solutions21 (typically nitrates or chlorides). Some drops are deposited with a calibratedpipette onto a tantalum foil or graphite disk and dried.
Special care has to be taken to avoid systematic errors. Any contamination of the target containeror source with the same element would pretend a higher source efficiency. Typical impurities areNa, Fe, Ba, etc. Contaminations with isobars can normally be identified by verifying the naturalisotopic ratios of an element. On the other hand, if the sample is deposited in a “cold” part ofthe target-ion source system, an incomplete evaporation would lead to an underestimation of theefficiency. In any case for each efficiency determination the full sample has to be evaporated. It isnot possible to determine the absolute momentary source efficiency with this method.
The response of the system to a fast temperature change can give a first indication on the rapidityof the release, but often disturbing phenomena (memory effects by condensation, etc.) render aquantitative analysis impossible.
The ionization efficiency of gases can be measured by feeding into the source a support gas witha well-known composition through a calibrated leak. The ionization efficiency of Ar and Xe inthe ISOLDE plasma sources is routinely monitored in this way. Controlling the gas supply with afast valve allows additionally to measure the delay time (mainly the effusion part) of the system[Kir81b, Wel98].
Occasionally a Knudsen cell (temperature controlled oven) is used for providing a “constant” flowof evaporated material for efficiency measurements. However, the detailed thermodynamics of thetracer and possible chemical compounds has to be studied carefully to avoid large systematic errorsin the resulting efficiency values.
Off-line measurement with radioactive tracers:
Most of the systematic errors mentioned above can be excluded by using a radioactive tracer for theexperiment. This method was e.g. used for various rare earth elements [Lat74]. No contaminationswith stable isobars can occur and in case the source efficiency shows to be low, the source caneven be taken apart and analyzed at which places the not released tracer was deposited. Using7Be as tracer, the areas where beryllium is lost in a plasma source could be identified [Barke].
21Tin tends to precipitate in aqueous solutions easily as oxide. Therefore dry mixtures of Sn and Ta powder as wellas Sn films evaporated onto a Ta foil were used as samples.

2.4.2 Efficiency and release time measurement 67
This method relies on the existence of a suitable radio-nuclide as tracer. The half-life has to belong enough (T1/2 min) and the decay should be specific and easy to detect, i.e. preferablyshow characteristic gamma lines.
The radioactive tracers can be produced either by reactions in the target matrix (see e.g. [Bey77,Hof84] or are implanted at ISOLDE as radioactive beams into different matrices (see e.g. [Men97]).The former method requires a dedicated system for irradiation and handling of the samples, thelatter requires an available ion beam of the tracer nuclide. However, often no suitable beam exists22.Either the required tracer nuclide can be produced indirectly by decay of an isotope existing ason-line beam or another method has to be used.
For some elements the method can be inverted: first several identical samples are marked with astable tracer. After individual heat treatment of each sample the remaining amount of tracer isthen analysed by a sensitive trace analysis method, e.g. by (prompt) neutron activation analysis.Occasionally even a depth profile of the tracer distribution can be measured in this way [Kos94].
This off-line method allows also to study the release behavior quantitatively. From several mea-surements at different temperatures both Arrhenius factors, D0 and Q (see equation (B.2.8)),are obtained. However, very fast release components or effects of “radiation enhanced diffusion”remain unobserved.
On-line measurement with stable tracers:
The efficiency can also be determined by implanting a known amount of tracer atoms directly intoan ISOL target and ion source system and monitor simultaneously the current which is releasedfrom the ISOL source. Heavy-ion beams with sufficient energy (some A·MeV) are required topass a thin window in the source envelope. The GSI offers the combination of sufficiently intenseand energetic ion beams from the UNILAC and a well working on-line mass separator which isroutinely used for release measurements from thin targets [Kir92a, Kir96]. The release behaviorcan be tested over a wide range in time (fractions of a second to many minutes), temperatures(even over 2500 C with a thermal ion source) and fractional release (down to below 10−4). Thequantitative analysis of the release profiles is described in [Kir92a]. The relation F (µt) ≈ Y (ν/λ)(compare appendix B.2) gives a direct conversion of the measured release profile into the releaseefficiency.
Of all presented methods to measure release profiles it is the most universal, allowing to testdifferent target matrices in a short time. Due to the time correlation with the implanted beam, aconstant background can be corrected in the analysis. In some target materials the beam impactcan trigger the release of an additional background beam which can no longer be corrected. Inthese cases an isotope with a different mass has to be chosen as tracer.
This method can be used for most elements and materials, the only condition is that the beamshave to be available from the UNILAC accelerator. This sets a principal limitation to elements withstable isotopes (e.g. no francium). Since these measurements take only some minutes, normally nodedicated beam is provided for them but they are performed parasitically, i.e. an available beamis used for a short time while other users do not need it.
On-line measurement with radioactive tracers:
If the production cross-sections for certain isotopes are well known from other measurements(recoil separator or gamma spectroscopy of irradiated samples), the on-line measurement of theisotope yield at an ISOL separator gives directly the efficiency of the complete target and ionsource system. This method is used at OSIRIS [Rud90], ISOLDE and many other ISOL facilities.
22Normally the off-line tests are just made in the preparation of a new on-line beam.

68 2.4 ISOL targets
It is less susceptible to systematic errors than the off-line methods, but requires a higher effort,i.e. for the test of each material a complete target and ion source unit has to be irradiated.
Just as with a stable tracer, the release profile can be measured also with the available radioactivebeams. At ISOLDE the yield and release profile is normally determined with a sampling technique[Let97a]. The beam gate is opened for a short time with a well-defined delay after the protonpulse impact. The radioactive nuclides are collected on a metallised tape and transported into a4π beta-detector. From the β-activity measured with this so-called “monitoring tape station” theion beam intensity during the collection period is calculated. Scanning the delay time allows tomeasure the release time profile in a range from some milliseconds to many seconds and longer.The lower limit is given by the minimum collection period to obtain enough statistics and theupper is related to the lifetime of the sampling isotope. For example for lithium the most long-lived tracer nuclide 8Li limits the range to <∼ 10 s. Alternatively the current of a (stable) radiogenicisotope can be followed by direct particle detection, e.g. with a Faraday cup. To deduce the totalrelease efficiency it is important to monitor the release profile over a large range. Especially atlower temperatures the existence of a fast release component does not exclude that the bulk ofthe tracer is released very slowly [Bau87].
An ISOLDE target and ion source unit consists of the target, a transfer line and the ion source.The geometry of all components influences the effusion. The release profiles are typically describedby a sum of two exponential decay terms multiplied by an exponential grow-in [Let97a]:
p(t) = C (1− exp(−t/τr)) [α exp(−t/τf) + (1− α) exp(−t/τs)] (2.4.2)
with τr the characteristic rise time, τf the decay time of the fast component and τs the decay timeof the slow component. α describes the relative contribution of the fast and slow components andC gives the normalization to the observed intensity. Figure 2.4.2 shows a typical release profile ofcesium.
0
2000
4000
6000
8000
10000
12000
14000
0 2000 4000 6000 8000 10000 12000 14000
Delay (ms)
Cou
nts
(a.u
.)
Experimental points
Fitted release profile
Figure 2.4.2.: Measured and fitted release profile of cesium from a UCx/graphite target. The fitparameters are: τr = 0.1 s, τf = 0.8 s, τs = 10 s and α = 0.85.
Note that the form of this release function is chosen somehow arbitrarily. If no indication for atwo-component release is observed, this function is reduced to a single exponential decay by settingα = 1. The release profiles from molten metal targets are well reproduced with a single exponentialdecay23 [Rav79]. On other occasions even two decay components do not allow to fully describe23Note that also a possible oxide layer swimming on the surface of the molten metal can contribute to the diffusiontime [And91].

2.4.3 Pulsed or dc driver beam? 69
the release characteristics, but still the two-component form is used as an approximation. This isjustified since the fluctuations of the experimental points within one measurement do not allow areasonable “fit” of a function with too many free parameters.
Note that the release function is “fitted” manually to give a good agreement with the experimentalpoints. Therefore the resulting values for τr, τf , τs and α give not necessarily the minimum χ2.To perform a mathematically correct fit, it would be necessary to accumulate much more data.On the other hand the manual “fit” allows to apply an empiric weighting of the individual points.Thus, corrections for known deviations (background, beam fluctuations, etc.) can be easier takeninto account. A more objective parameter which is barely affected by the detailed fit parametersis the time t50 in which 50 % of the stable nuclides are released: F (t50) = 0.5. However, it is notvery useful if clearly two or more release components are present.
With a well-known release profile the decay losses can be calculated for most half-lives. A knownor estimated half-life allows to convert an upper yield limit into a cross-section limit. On the otherhand together with a cross-section systematics a limit can be set on the lifetime or binding energyof the isotope in question [Jok96].
The ISOLDE target and ion source systems have a more complicated geometry compared with theGSI ion sources with integrated catcher. Therefore the measured release profile cannot be identifiedeasily with the diffusion and effusion contributions. Densham et al. started such an approach usingMonte Carlo simulations [Den97]. Some release curves measured at ISOLDE were used to deriveabsolute values for the diffusion coefficient D and the mean sticking time τsorp. However, some ofthe results are in clear contradiction to other values from literature [Bey77, Kir86, Kir87a].
A combination of the GSI- and ISOLDE-method is used at GANIL. There a beam of radioactivenuclei is prepared with the fragment separator SISSI and then implanted into the ISOL targetand ion source unit SIRa. The isotopes released from the ISOL separator are monitored at a tapestation [Lec97]. This method allows a direct measurement of the total efficiency for a certainradio-nuclide from a given target and ion source unit. It can be applied with the given set-up atGANIL, but has no specific advantage over the far less elaborate GSI method.
2.4.3. Pulsed or dc driver beam?
Techniques were developed to improve the signal- to background ratio by bunching the radioactiveion beam. Variants of the FEBIAD ion source (see section 2.5.2) [Kir86, Kir87a, Kir92b] can berun in a bunched mode where the produced nuclei are continuously adsorbed on a cold spot in thesource. Heating the latter rapidly releases the collected atoms as a bunch. By optimization of theadsorbent and temperature a chemical selectivity can be added to the timing effect.
With a sufficiently fast release and a pulsed driver accelerator with low repetition rate (frep <∼ 1/t50)an automatic beam bunching occurs. This is of great advantage for many nuclear spectroscopystudies. In all cases where the nuclides are identified by their half-life or the lifetime should bemeasured, a certain measurement cycle of “collection” and “decay” periods has to be used. Thebunching can help in two ways:
1. It can increase the efficiency. With a dc beam the continuously produced and released radio-isotopes which are provided during the “decay” period are just lost24. However, if a buncheddriver beam with identical average current is used, the nuclei can be collected when theirion beam intensity is at the maximum. Less nuclei are lost during the “decay” period. Infact some of the recent experiments which lead to the discovery of the most exotic isotopes
24In certain cases a more complicated set-up with a tape or wheel moving the collected nuclei alternately betweenseveral detection positions allows to make full use of a dc beam [Kir77], but with a standard set-up the nucleiare lost.

70 2.5 Ion sources
of manganese or silver would have been more difficult at a facility with a 2 µA dc protonbeam!
2. The bunching can also increase the selectivity. If the beam contaminations show a signifi-cantly different release profile, they can be suppressed by an appropriate choice of the beamgate timing. Extremely high selectivities can be obtained for the suppression of a contaminantwith much shorter lifetime. The beam gate is only opened after most of this contaminanthas decayed. This method was applied to study the decay of the new isotope 217Bi free ofbackground from the abundant, but short-lived isobars [Dup98].
On the other hand there are also applications where the pulsing beam structure is rather disturbing,e.g. for precision lifetime determinations if a simultaneous bunching of beam contaminants occurs(causing non-linear dead-time effects), for β-NMR experiments where the measurement cycle hasto be synchronized to a multiple of the pulse repetition period, etc. Also the target is exposed toa higher thermal stress with a pulsed beam.
During impact of the proton pulses, the high voltage of the target and ion source unit at ISOLDEPSB is taken down to zero to avoid sparking by the large amount of secondary ions and electronscreated in the target area [Kug92]. The beam gate remains closed for some ms till the high voltageis stabilized again at its operating value (60 kV). For extremely short-lived nuclei (11Li, 14Be) thiscauses a loss in beam intensity compared with a dc facility where the nuclei are permanentlyextracted.
When doing nuclear spectroscopy at a pulsed RIB facility one has to keep in mind that also thebackground is pulsed, possibly with some delay. Besides well known background due to scatteredhigh energy spallation neutrons or delta electrons, another source of background was identified: byimpact of the pulsed proton beam onto a (heavy) target, a bunch of radioactive gas is expelled.This diffuses through the beam lines and can cause an increase in background activity some secondsafter the proton pulse. This effect is more pronounced at beam ports closer to the target.
2.5. Ion sources
After release from the target the radioactive atoms have to be ionized and accelerated at least tosome tens keV to allow for subsequent magnetic mass separation and electrostatic beam guiding.In the following, different types of ion sources are discussed which are used at ISOL facilities. Theirperformance has to be assessed according to the same criteria which are decisive for all steps ofthe ISOL process: efficiency – selectivity – rapidity.
2.5.1. Surface ionization
If an atom X with low ionization potential (IP) Wi hits the hot surface of a material with highwork function Φ (e.g. a noble metal), it has a high probability to give its valence electron to themetal and get ionized, see figure 2.5.1. This process is called (positive) surface ionization. Ananalogous process of negative surface ionization exists for elements with high electron affinity AEwhich hit a hot surface of a material with low work function Φ (e.g. LaB6) and get negativelyionized.
The efficiency of positive surface ionization can be significantly enhanced when using a hot cavityin which a thermal plasma consisting of surface ionized ions and thermionic electrons is created.The ionization efficiency of “normal” surface ion sources and of the latter, so-called “thermal ionsources”, is discussed in appendix B.5.
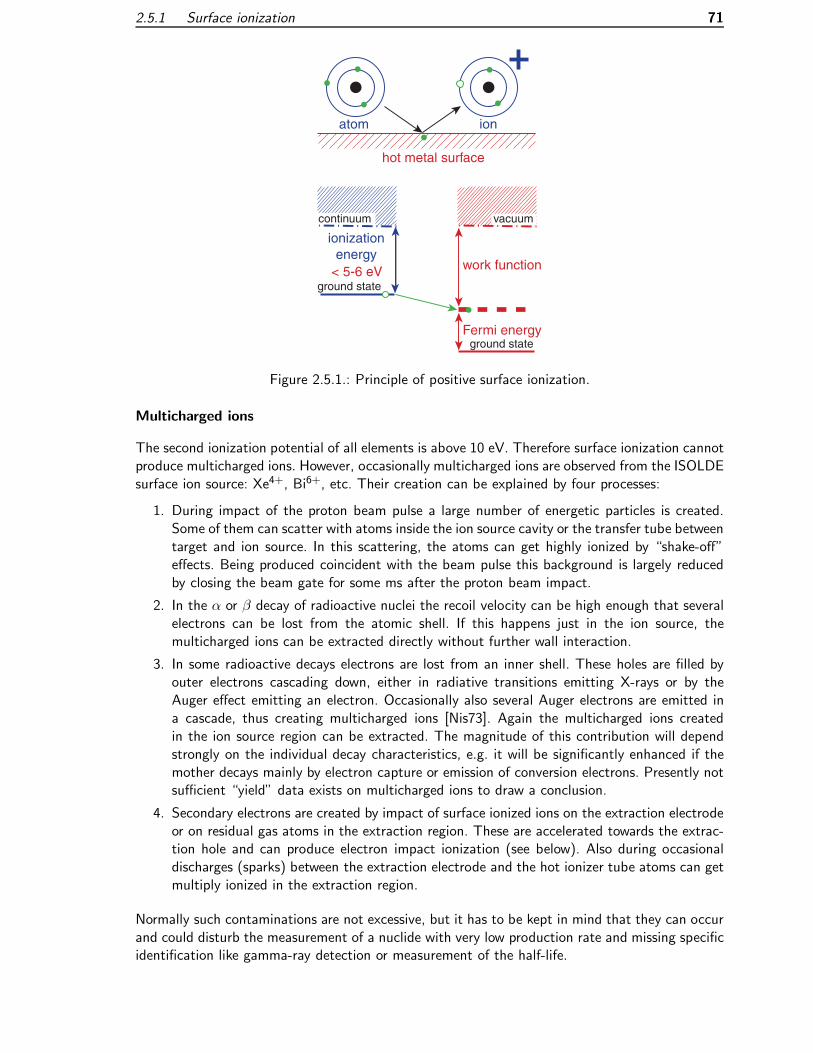
2.5.1 Surface ionization 71
work function
Fermi energy
hot metal surface
< 5-6 eV
atom
ionizationenergy
ion
continuum
ground state
ground state
vacuum
Figure 2.5.1.: Principle of positive surface ionization.
Multicharged ions
The second ionization potential of all elements is above 10 eV. Therefore surface ionization cannotproduce multicharged ions. However, occasionally multicharged ions are observed from the ISOLDEsurface ion source: Xe4+, Bi6+, etc. Their creation can be explained by four processes:
1. During impact of the proton beam pulse a large number of energetic particles is created.Some of them can scatter with atoms inside the ion source cavity or the transfer tube betweentarget and ion source. In this scattering, the atoms can get highly ionized by “shake-off”effects. Being produced coincident with the beam pulse this background is largely reducedby closing the beam gate for some ms after the proton beam impact.
2. In the α or β decay of radioactive nuclei the recoil velocity can be high enough that severalelectrons can be lost from the atomic shell. If this happens just in the ion source, themulticharged ions can be extracted directly without further wall interaction.
3. In some radioactive decays electrons are lost from an inner shell. These holes are filled byouter electrons cascading down, either in radiative transitions emitting X-rays or by theAuger effect emitting an electron. Occasionally also several Auger electrons are emitted ina cascade, thus creating multicharged ions [Nis73]. Again the multicharged ions createdin the ion source region can be extracted. The magnitude of this contribution will dependstrongly on the individual decay characteristics, e.g. it will be significantly enhanced if themother decays mainly by electron capture or emission of conversion electrons. Presently notsufficient “yield” data exists on multicharged ions to draw a conclusion.
4. Secondary electrons are created by impact of surface ionized ions on the extraction electrodeor on residual gas atoms in the extraction region. These are accelerated towards the extrac-tion hole and can produce electron impact ionization (see below). Also during occasionaldischarges (sparks) between the extraction electrode and the hot ionizer tube atoms can getmultiply ionized in the extraction region.
Normally such contaminations are not excessive, but it has to be kept in mind that they can occurand could disturb the measurement of a nuclide with very low production rate and missing specificidentification like gamma-ray detection or measurement of the half-life.

72 2.5 Ion sources
It should be noted that the last mechanism is more pronounced with the single-gap extraction of theISOLDE sources where nothing prevents the secondary electrons from flowing back to the positivelycharged source. For the ISAC ion sources a multi-gap extraction system was developed [Dom98]where an accel-decel structure25 can hinder this effect. Another advantage of this system is thebetter adaption to a change of the extracted current. By tuning the field of the first extraction gapthe curvature of the plasma sheat26 is influenced. The overfocusing of the beam in the extractionregion can be reduced to avoid an inflation of the phase space due to space charge effects. Thevoltage of the second electrode allows to focus the beam and match its divergence to the ionoptical elements downstream. The last electrode is kept at ground potential to provide a welldefined reference. With this system the source emittance was maintained below 10 π mm mrad(at 30 keV beam energy) even when raising the total extracted current above 10 µA [Dom98].This is an important feature when running an ISOL facility with an intense driver beam, e.g. upto 100 µA of protons, which will create a large rate of effusing particles (radiogenic and stable).
On the other hand the electrodes of such an extraction system are spaced more closely than atISOLDE and the higher electric field strengths could cause a sparking under bad vacuum conditions.These can occur with a bunched release of gas from the target after impact of a proton pulse. AtISAC this problem does not occur (dc beam from the cyclotron) and at ISOLDE it is cured bytaking down the source potential to zero during impact of the proton beam [Kug92]. Note thatthe latter method is practicable at a repetition rate of ≤1 Hz, but not necessarily ideal for a driveraccelerator with 50 Hz repetition rate.
2.5.2. Plasma ion sources
fast electrons
<electron impact energy
ionizationenergy
atom ion
continuum
ground state
Figure 2.5.2.: Principle of ionization by electron impact.
It has been shown that elements with low IP can be ionized efficiently and selectively with asurface ion source. However, there are many interesting elements with higher IP which requireanother type of ion source. Plasma ion sources are such a universal tool for ionization of manydifferent elements. If the plasma temperature Tp is high enough (kTp >∼ Wi), practically all atomsentering the plasma can get ionized by electron impact (see figure 2.5.2) and charge changingcollisions. Traditionally the plasma was created in an arc discharge. However, the electrodes are
25In an accel-decel structure the intermediate electrode is put on a positive potential compared to the first (“puller”)electrode. This decelerates the ion beam.
26In the case of thermal ionization this is the boundary of the (thin) thermal plasma.

2.5.2 Plasma ion sources 73
used up quite rapidly (some hours) and have to be exchanged frequently. This causes problems inthe environment of a radioactive ion beam facility with difficult access to the target area. Severalother types of plasma ion sources require less maintenance and have been applied successfully atISOL facilities:
FEBIAD: The Forced Electron Beam Induced Arc Discharge (FEBIAD) source was developedby Kirchner and Roeckl for the GSI on-line separator [Kir76]. It can reach high efficiencies(around 50 % [Kir96]) for elements above argon and runs stably even at low gas pressures(10−5 mbar). Meanwhile several types exist at GSI, optimized for high temperatures27 or evenallowing beam bunching (an adsorber area placed in the ion source is cycled in temperatureto accumulate continuously produced isotopes and desorb them in bunches) [Kir87a].
Copies and variants have been applied at many ISOL facilities (see e.g. [Ver81, Gil85, Wal85,Bjø87, Sun92, Hag92a, Alt96, Ton96]). At ISOLDE the heating filament [Kir87a] was re-placed by a more rugged cathode with direct ohmic heating [Sun92]. Four different typesare in use at ISOLDE [Bjø86, Sun92]: MK5 is the so-called “hot plasma source” where thetransfer line is maintained around 1900 C. It permits to ionize also less volatile elements.In a medium temperature version (MK3 and MK6) the temperature of the transfer line iskept between 200 and 400 C, mainly for the selective separation of Cd and Hg. Finally theMK7 has a water-cooled transfer line at room temperature to condense all elements exceptthe noble gases. The MK3 has two anodes with independently controlled voltages while allothers have only a single anode.
For an efficient operation of the FEBIAD it is important to keep the beam of molecularimpurities at mass 28 (CO+ and N+2 ) in a range of some µA. For elements with Wi <Wi(CO)=14.0 eV [Rad85] or Wi < Wi(N2)=15.6 eV [Rad85], respectively, charge transferin collisions with these molecular ions contributes considerably to the ionization efficiency.Additionally the atoms to be ionized have to stay in the ionization region long enough.Therefore the FEBIAD is very efficient for elements heavier than argon, but for lighterelements with higher ionization potential (especially He, Ne and Ar) and shorter residencetime in the plasma chamber the efficiency drops considerably. For the same reason the yieldsof doubly charged ions are significantly reduced and for q ≥ 3 normally negligible. Doubly-charged ions are occasionally required for special applications, e.g. to attain higher beamenergies for experiments with tilted foil polarization [Lin97]. In general multicharged ions arerather considered as disturbing beam contaminants and particularly in nuclear spectroscopyexperiments they can lead to misassignments (see e.g. [SO92]).
An ion source based on the same principle, but with a radial arrangement of the electrodeswas developed by Nitschke [Nit85] at the OASIS facility at LBNL. It reaches an ionizationefficiency of 35 % for krypton at currents up to 10 µA. It does not use a magnetic field anddoes not contain insulators in the high temperature region. Instead the plasma chamber is“closed” by molecular flow restriction. Thus, the internal Ta catcher can be brought to atemperature of up to 2700 C and the cold spot temperature exceeds 2200 C. However,this source is more sensible than the FEBIAD types.
ECRIS: The Electron Cyclotron Resonance Ion Source (ECRIS) [Gel96a] was developed by Gellerin 1965. In an ECRIS the plasma is confined by a minimum-B-configuration, where the fieldlines are almost everywhere concave towards the plasma. The electrons are accelerated byresonant excitation in a microwave field (typically used frequencies range from 2.45 GHz to
27The FEBIAD-H [Kir92a] can be operated at temperatures exceeding 2000 C and has a very small ionizationchamber (1.3 cm3) to minimize the intrinsic delay time.

74 2.5 Ion sources
30 GHz). High plasma temperatures28 in the keV range can be reached which allow to ionizeeven elements with high IP (e.g. He) very efficiently [Gel96a].
Also higher charge states are easily obtained. Presently up to q/A ≈ 0.2 is obtained withoptimum efficiency, but even highly stripped ions were already produced (e.g. U64+ [Xie98]),although with lower efficiency. This opens the possibility of highly charged RIBs suitablefor efficient post-acceleration with a compact accelerator. For compact linear accelerators(LINACs) a charge to mass ratio of 1/9 to 1/4 is required. For cyclotrons high charge statesare also crucial (the end energy scales with E ∼ (q/A)2). It has been shown that an ECRIScan be coupled directly to an on-line target for the production of n+ beams of mainly noblegases [Vil97]. However, for other elements (particularly metals) the efficiency is considerablyreduced due to decay losses when the radioactive atoms stick to the relatively cold walls.On the other hand an n+ ECRIS which ionizes practically all species of atoms leaving thetarget can cause problems. Not only many isobars of one mass will occur, but due to theA/q ambiguity also different masses get mixed. Moreover the relatively large emittance ofan ECRIS (50π mm mrad and more at typical ISOL beam energies) makes it even moredifficult to perform isobar separation with a high resolution separator. Post-accelerationwith a cyclotron circumvents this problem since the cyclotron can act as an efficient isobarseparator [Vil97, Boy97], but the problem remains when low-energy beams are used. Anadditional problem arises from the radiation damage to which the permanent magnets ofthe source are exposed in the target area [Ler98].
For the PIAFE project a new method was developed and studied in detail to use an ECRIS asan efficient “charge state breeder” [Gel96b, Tam96, Tam97, Lam98]. Thus, standard ISOLtarget and ion source units can be used to provide a 1+ ion beam which is, after massseparation, injected directly into the ECRIS plasma and subsequently brought to high chargestates. The advantages and disadvantages of this method compared with an alternativeElectron Beam Ion Source (EBIS) charge state breeder29 are discussed e.g. in [Kos98a].Meanwhile it has been shown that an ECRIS can also be used for trapping [Cha98] andbunching of the RIBs [Oya98, Cha98].
Presently ECRIS sources are employed at the ISOL facilities TISOL in Vancouver [Dom90],LISOL in Louvain [Dup92], SPIRAL in Caen [Vil97] and INS in Tokyo [Oya98]. A 1+ ECRISwith quartz body was used at the SARA on-line separator in Grenoble [Gim92]. A small 1+ECRIS (type “Picogan”) fitting into an ISOLDE target unit has been proposed [Sorta] andcould give an immediate gain in ISOLDE yield by one to two orders of magnitude for beamsof the light elements He, C, N, O, Ne and Ar.
Besides the two performant types FEBIAD and ECRIS, other source types have some ad-vantages for specific ISOL applications.
Nielsen- and Nier-Bernas sources: When running molten targets or target materials with muchintrinsic impurities at very high temperatures or when using a molecular separation technique(CF4 addition) which “consumes” macroscopic amounts of the target material30, a high gasload from the target occurs. FEBIAD sources are not able to cope with such a high gas loadand the ionization efficiency is quenched. For these applications a more robust (“mediumcurrent”) plasma ion source has to be used. Sources of the Nielsen [Nie57, Alm57] andNier-Bernas type have been successfully used at the separator ISOCELE with currents of
28Actually the electron energy spectrum of an ECRIS is non-Maxwellian with part of the electrons accelerated tomany keV while the rest remains thermal.
29In an EBIS the positive ions are confined in the negative potential of a dense electron beam. An EBIS requires avery good vacuum and can thus not be coupled directly to an ISOL target.
30This consumption could amount up to 1 g/h [Par76]!

2.5.2 Plasma ion sources 75
several mA [Put87]. The emittance remained acceptable: about 20π mm mrad at 40 kVacceleration voltage.
Multicusp source: Multicusp ion sources for radioactive ion beam applications are presently de-veloped at TRIUMF [Kuo98] and LBNL [Lee96, Wut98]. A multicusp field created by al-ternately poled permanent magnets provides a radial confinement of the plasma which isheated by a filament or an RF (radio frequency) antenna. Multicusp sources have perfor-mances which can reach that of a 1+ ECRIS, but allow a cheaper construction. They couldbe used in target and ion source units which are frequently changed and thrown away afteruse. Typically multicusp sources reach a high efficiency for currents of some mA (1.5 mAin [Wut98], 0.2 − 1.5 mA in [Kuo98]) which cause space-charge problems for most existingon-line separators31.
Electron impact source: Electron impact ion sources are not really plasma sources, but com-parable from the viewpoint of universality and nonselectivity. The ionization is done bybombardment with an electron beam, but the ions are not confined as in an EBIS and theefficiency is given by the small interception volume of atom and electron beam. Their ad-vantage is normally restricted to few cases where the reduced decay losses due to a veryhigh operation temperature compensate the low ionization efficiency (about 0.1 %) [Jac87].
Other types: Ion sources which produce multicharged ions in a plasma created by a strong laserpulse are still under development to improve efficiency and reliability of operation with stableisotopes (see e.g. ref. [Has98a]), but presently do not seem to have practical applicationsfor RIB purposes.
The main advantage of the plasma ion sources, i.e. their universality, is simultaneously theirmain drawback, i.e. the missing selectivity. The selectivity has to be provided in another step ofthe separation process, preferably before reaching the ion source. Making use of their chemicalproperties, many non-metals can be brought from the target to the ion source in a rather selectiveway, either profiting from their low evaporation temperature or their tendency to form specificmolecules. However, for metals these methods are more restricted.
Another problem occurs for elements with high adsorption enthalpy on surfaces. Nearly all32 plasmaion sources include electrically insulating materials in the high temperature region. The FEBIADuses insulators for mechanical separation of cathode and anode, while in an ECRIS insulators areused as windows to introduce the RF power or to hold an RF antenna. These insulating materials(mainly Al2O3, BeO, BN) limit the maximum operation temperature of the source normally towell below 2000 C. This is considerably lower than the operation temperature of a thermal ionsource. The sticking of short-lived isotopes to the insulator material can result in large decay lossesfor metals which form stable oxides like e.g. Be.
Thus, the problem remains to find a source type which is able to ionize efficiently and selectivelyhigh-melting elements with an IP between about 6 and 10 eV, i.e. most metals.
An alternative ionization method which provides high selectivity and a vast choice of constructionmaterials for the ion source chamber is the resonant photo ionization. Here, the valence electronis brought to the continuum by resonant absorption of photons via several excited levels. If thephotons are provided by a powerful laser, efficiencies of the order of 10 % and more becomepossible. The state of the art and applications of such a resonance ionization laser ion source(RILIS) are discussed in the next chapter.
31Experimentally it was observed that the extraction efficiency at ISOLDE is markedly reduced when the totalcurrent exceeds some µA.
32An exception is the Nitschke ion source [Nit85] using molecular flow restriction to “close” the plasma chamberand keep the insulators at a lower temperature (see above).


3. Resonance ionization laser ion source
3.1. Laser ionization
The theory and techniques used in a resonance ionization laser ion source (RILIS) are very similar tothose of standard resonance ionization spectroscopy (RIS). In fact an ISOL facility combined witha RILIS is nothing else than a comfortable resonance ionization mass spectroscopy (RIMS) facility,optimized in efficiency and rapidity for the extraction of short-lived radioactive ions. Reviews on RIScan be found in [Let77, Hur79, Bek83, Let87, Hur88]. The proceedings of the biannual symposiaon RIS (see e.g. [RIS94, RIS98]) are a good source of detailed information and further references.In the following some features of RIS are discussed which are important for the use of a RILIS.
An atom exposed to a photon flux Φ of wavelength λ = hc/E12 will be excited with the rate:
W12 = Φσ12(λ) (3.1.1)
from the ground state (1) to a level (2) with excitation energy E12. σ12(λ) is the absorption cross-section for atoms in the ground state. If the absorption rate W12 is larger than the spontaneousemission rate from the excited level, the occupation of ground state and excited state and therates of absorption and stimulated emission will come into equilibrium1. The transition is thencalled saturated. The transition of the excited level to another excited level at higher energy canbe treated analogously. If enough photons for each transition are provided simultaneously, theoccupation is equilibrated among all participating levels. If the highest level is above the ionizationthreshold, the excited atom will emit an electron and get ionized. In a (small) electrical field theion and the electron are separated rapidly. Thus, for the last step the upper level is always emptyand stimulated emission does not occur. If the produced ions are extracted permanently, more andmore atoms are shoveled upwards level by level and get ionized. Using non-resonant transitionsinto the continuum with a typical cross-section of 10−17 cm2 and a spontaneous emission rate tometastable states2 of 106 s−1, a photon flux of the order of 1023 cm−2s−1 is required. With a beamspot of some mm2 area and visible light this corresponds to a power of some kW. Such a powercan presently only be provided by pulsed lasers. These, however, have small duty cycles (∼ 10−4).The interaction of a pulsed laser beam crossing a fast atomic beam has therefore intrinsically asmall efficiency3.
If the atoms can be confined for a while in the region irradiated by the laser beam, the overlap intime can be improved considerably and higher efficiencies can be reached even with low duty-cyclelasers. Three ways have been used to store the atoms:
1. collection on and desorption from a cold surface,
2. stopping in a buffer gas cell,1Detailed features of the dynamics like Rabi oscillations, etc. are not regarded in this gross description. They arediscussed thoroughly e.g. in [Hur88].
2“Trapping” in metastable states should be avoided since such atoms do no longer participate in the excitationand ionization process.
3Direct laser ionization at the outlet hole of a gas jet was proposed and estimated to reach 10 % efficiency, butoff-line tests gave only about 0.1 % efficiency [Ren97].
77

78 3.2 Ionization schemes
3. diffusion through a hot cavity.
In the first method the atoms are continuously adsorbed onto a cold4 surface. Shortly beforefiring the ionizing lasers, the surface is heated rapidly (e.g. by the pulsed laser desorption (PLD)method with an intense laser beam) and the atoms get desorbed. The efficiency depends stronglyon the spatial and temporal overlap between ionizing laser beams and desorbed atom cloud. Fornot too short-lived isotopes repetition rates of 1 − 50 Hz, which can be provided by cheap Nd-YAG lasers, are sufficient. This method has been applied for resonance ionization spectroscopy(RIS) experiments (see e.g. [Kro91, Bla97]) and was proposed as ion source at an ISOL facility[Fai87, Seb97].
In the second method the atoms are stopped in a buffer gas cell where they remain for some tensms before being evacuated. Excimer lasers with a repetition rate of some 100 Hz are well adaptedfor this application [Dup97]. The set-up is comparable to that of a standard IGISOL facility. At theLISOL facility in Leuven, presently laser-ionized beams of the refractory elements Ti, Co, Ni andRh are available [Kud96, Reu99]. In a buffer gas cell the radio-nuclides have only a small chanceto interact with the walls. Therefore this method is very suitable for refractory elements whichtend to stick to the walls.
In the third method the atoms are stored in a hot cavity with a small outlet hole. The cavity hasto be heated to avoid excessive adsorption of the atoms to the walls. At ISOLDE normally cavitiesin form of a tube are used, but also other geometries are possible. With 3 mm inner diameter and30 mm length an atom makes about 40 wall collisions while passing the tube (Awall/Aorifice =2πrl/(πr2) ≈ 40 )5. The mean free path is 3 mm and e.g. an atom of mass 33 with thermalvelocity in a 2000 C hot cavity (v =
√8kT/(mπ) ≈ 1200 m/s) will remain in the free volume
of the tube for about 0.1 ms. To have at least one chance to interact with the laser beam, thelatter should have a repetition rate of the order of 10 kHz. For lighter atoms the requirements arein principle even stricter while for heavier atoms they are slightly reduced. Still a higher repetitionrate helps to improve the total efficiency by multiple chances of interaction.
In the following some fundamental characteristics of the “hot cavity type” ISOLDE RILIS arediscussed. Comparisons to the other methods are given where appropriate.
The main “ingredients” for the efficient operation of a “hot cavity type” RILIS are:
• the ionization scheme,
• the laser system,
• the ionizer cavity,
• equipment for beam tuning and monitoring,
• additional equipment (beam chopper, etc.).
Figure 3.1.1 gives an overview of the main components of the ISOLDE RILIS.
3.2. Ionization schemes
Ionization schemes including two, three or more transitions have been employed. They can beclassified according to the nature of the last populated level before ionization (see also figure3.2.1):
4The surface temperature is kept below the desorption temperature of the respective element.5The face of the tube pointing towards the target is not taken into account. Atoms diffusing back into the targetcontainer will come back to the ionizer cavity sooner or later if they do not decay before.

3.2 Ionization schemes 79
BBOBBO
+
+
+
+
High mass (GHM)
Low mass (GLM)
Central mass
Distance to target: 17 m
GPS
Proton beam
Frontend
Laser system
Target Ion Source Unit
Target
Ionizercavity(Nb...)
Laserbeams
+60 kV
some V- +
Extractionelectrode
+
Figure 3.1.1.: Set-up of the ISOLDE RILIS at the general purpose separator (GPS).
• With a last non-resonant step to the continuum, the ionization efficiency depends stronglyon the laser power for the last transition. Normally a strong non-tunable laser is used for thisnon-resonant step. Often it is still not sufficient to reach saturation since the non-resonantcross-sections into the continuum are relatively small (σ = 10−19 − 10−17 cm2).
• Excitation cross-sections to autoionizing states often exceed the non-resonant ones by ordersof magnitude (e.g. σ = 1.6 · 10−14 cm2 in Lu [Xu93]). An autoionizing state (AIS) is a two-electron excitation above the atomic ionization potential Wi which decays in a radiationlesstransition into an ion and an electron. It is evident that the excitation energy for innerelectrons is larger than that of the valence electron. Thus, a subsequent excitation of twoelectrons to individual levels below the ionization limit can lead to a total excitation energylarger than the first ionization potential. By Coulomb interaction the AIS will decay rapidly,where one electron drops to the ground state or an excited state (with energy Ex) of theion and the other is emitted and gets the exceeding energy ∆E = EAIS−Wi−Ex as kineticenergy6. Typical lifetimes of AIS are from 10−15 to 10−10 s, i.e. the natural width is quitelarge (many GHz or even THz) and exceeds the radiative decay width (typically some tenMHz) by orders of magnitude. While all many-electron atoms have autoionizing states, onlysome are favorable for efficient resonance ionization.
6The atomic recoil is negligible.

80 3.2 Ionization schemes
• High cross-sections (of the order of 10−14 cm2) can also be obtained in transitions to Rydbergstates.
The lifetime of a state with high principal quantum number increases like [Fri90]: τ = τ0(n∗)3
where τ0 is of the order of 1 ns for alkali atoms [Rad85] and n∗ is the effective quantumnumber corrected for the quantum defect7. τ can reach easily values of µs and longer.Simultaneously the binding energy of a Rydberg state decreases: E = R M
M+meZ2
(n∗)2 where
R is the Rydberg constant.
This highly excited atom can be ionized with a high cross-section by absorption of aninfrared photon from an additional laser or just from the thermal radiation in the hot cavity.Moreover, the atomic radius increases like < r >= a0(n
∗)2. Thus, the geometric cross-section for collisions with other atoms increases like (n∗)4 and reaches large values. Alreadya peripheral collision with an atom or an electron will remove the loosely bound electronand lead to an ionization. This ionization mode is used in buffer gas cells.
Also a pulsed or strong static electrical field (about 10 kV/cm) can Stark shift the closelyspaced Rydberg levels into the continuum and lead to ionization (see e.g. ref. [Amb75,Wor78, And86]).
• Non-resonant multiphoton ionization with high power lasers is in principle possible, but hasa lower efficiency and practically no chemical selectivity. It is thus not very useful for ISOLapplications.
AIS |E|
metastablestate
virtualstate
realstate
continuum
ground state
Rydberglevels
collisions
IRStarkshift
collisionse- impact
Figure 3.2.1.: Excitation schemes used for resonant laser ionization.
3.2.1. Applied schemes
An overview of the experimentally used resonance ionization schemes of most elements can befound in appendix B.8. In principle every element can be laser ionized. However, only if transitions7The quantum defect accounts for the core polarization and the exchange interaction between the excited electronand the inner-shell electrons.

3.2.1 Applied schemes 81
to low-lying states (<∼ 6 eV) with a sufficient transition strength exist, appreciable yields can beobtained with the present RILIS technique. Table 3.2.1 shows the excitation schemes of elementspresently ionized at the ISOLDE RILIS and figure 3.2.2 gives an overview of elements which couldbe ionized using dye lasers which are pumped by copper vapor lasers. Generally it can be said thatthe optical set-up of the ISOLDE RILIS can be applied for most metallic elements. Still it has tobe kept in mind that first the radio-isotopes have to be released from the target. Thus, refractoryelements could well be laser ionized when supplied as an atomic beam, but they are hardly releasedfrom a thick ISOL target. Such elements are better released at the buffer gas RILIS LISOL (seetable 3.2.2).
Table 3.2.1.: Excitation schemes used at the ISOLDE RILIS. λ1, λ2 and λ3 are the wavelengthsof the first, second and possibly third excitation step. More details to the individualschemes and set-ups are given in the quoted references. A star marks the schemeswhere the efficiency was determined or redetermined during this work.
Element IP λ1 λ2 λ3 Efficiency Reference(eV) (nm) (nm) (nm) (%)
Li 5.39 670.8 610.4 610.4, 670.8 [Mis93]Be 9.32 234.9 297.3 – >∼ 7 *,[Fed98]Mg 7.65 285.2 552.8 578.2 9.8 *,[Fed98]Mn 7.43 279.8 628.3 510.6 19.2 *,[Fed97]Ni 7.64 305.1 611.1 748.2 >∼ 6 *,[Jok97]Cu 7.73 327.4 287.9 – >∼ 7 *,[Kos99]Zn 9.39 213.9 636.2 510.6 4.9 *,[Let98]Ag 7.58 328.1 546.6 510.6 14 [Mis93, Jad97]Cd 8.99 228.8 643.8 510.6 10.4 *,[Let98, Fed98]
Sn 7.34 300.9 811.4 823.5 8.5(8 *,[Mis93, Fed95b]Tm 6.18 589.6 571.2 575.5 [Mis87a, Mis93]Yb 6.25 555.6 581.1 581.1 15 [Mis93]
Table 3.2.2.: Laser ionized elements at LISOL. The efficiency depends mainly on the efficiency ofstopping the recoils in the gas cell. This explains the lower value for rhodium measuredwith fission products, in comparison with cobalt and nickel where fusion-evaporationproducts were used.
Element IP λ1 λ2 Efficiency Reference(eV) (nm) (nm) (%)
Ti 6.82 395.8, 337.8 339.4, 384.1 [Weiss]Co 7.86 230.9 481.9 6.6 [Kud96]Ni 7.64 232.0 537.8 4.6 [Kud96]Rh 7.46 232.3 572.6 0.22 [Kud96]
The first excited state in the atomic spectra of non-metals is often at a relatively high energy. Theionization of such elements requires different techniques, e.g. a shorter wavelength for the firstexcitation step or a combination with other excitation methods (see figure 3.2.1).
There are schemes for RIS of non-metals which use selective ionization by photolysis of certainmolecules with resonant laser light. This method will not be treated in the following. One has
8This efficiency was measured with a slightly different set-up at the GSI ISOL.

82 3.2 Ionization schemes
1 2H He
3 4 5 6 7 8 9 10Li Be B C N O F Ne
11 12 13 14 15 16 17 18Na Mg Al Si P S Cl Ar
19 20 21 22 23 24 25 26 27 28 29 30 31 32 33 34 35 36K Ca Sc Ti V Cr Mn Fe Co Ni Cu Zn Ga Ge As Se Br Kr
37 38 39 40 41 42 43 44 45 46 47 48 49 50 51 52 53 54Rb Sr Y Zr Nb Mo Tc Ru Rh Pd Ag Cd In Sn Sb Te I Xe
55 56 57 72 73 74 75 76 77 78 79 80 81 82 83 84 85 86Cs Ba La Hf Ta W Re Os Ir Pt Au Hg Tl Pb Bi Po At Rn
87 88 89 104 105 106 107 108 109 110 111 112Fr Ra Ac Rf Db Sg Bh Hs Mt
58 59 60 61 62 63 64 65 66 67 68 69 70 71Ce Pr Nd Pm Sm Eu Gd Tb Dy Ho Er Tm Yb Lu
90 91 92 93 94 95 96 97 98 99 100 101 102 103Th Pa U Np Pu Am Cm Bk Cf Es Fm Md No Lr
elements available at ISOLDE RILIS
ionization scheme tested
ionization scheme untested
Figure 3.2.2.: Elements ionizable with dye lasers pumped by copper vapor lasers.
to keep in mind that a dominant occupation of certain molecular states depends strongly on thechemical environment of the target and ion source system. This is not easy to control (see alsosection 4.1).
3.2.2. Power requirements
The laser ionization efficiency depends on the saturation of all participating excitations. Thepower requirements to saturate these transitions can be estimated by regarding the rate equations.In the following the brief discussion from ref. [Amb76] is presented for the case of a two-stepphotoionization scheme. The generalization to more intermediate levels is straightforward. Thedensity of the atoms in the ground state is N1, that in the excited state is N2 and the ion densityis Ni. With τ2 the relaxation time of the excited state, σxy the absorption cross-sections and Φxythe provided photon flux for the respective transitions, the rate equations read:
dN1dt
= −σ12Φ12(N1 − N2) +N2τ2
, N1(t = 0) = N0,
dN2dt
= σ12Φ12(N1 − N2)− σ2iΦ2i − N2τ2 , N2(t = 0) = 0,
dNidt
= σ2iΦ2i.
(3.2.1)
For strong enough excitation:
σ12Φ12 1/τ2,σ2iΦ2i 1/τ2,
(3.2.2)
the radiative decay of the excited state τ2 can be neglected and the ionization degree dependingon the time after start of the laser pulse is given by:
α =NiN0
= 1− a1 + a22a2
exp (−(a1 − a2)t) +a1 − a22a2
exp (−(a1 + a2)t) , (3.2.3)
with:

3.2.2 Power requirements 83
a1 = σ12Φ12 +12σ2iΦ2i,
a2 =√
(σ12Φ12)2 + (12σ2iΦ2i)2.
(3.2.4)
α reaches its maximum for:
σ2iΦ2i = 2σ12Φ12. (3.2.5)
Thus, the characteristic time for ionization of all atoms is given by:
τi =1
a1 − a2=
1
σ12Φ12
[1 +
σ2iΦ2i2σ12Φ12
−√
1 +
(σ2iΦ2i
2σ12Φ12
)]−1
=
=1
(2−√2)σ12Φ12
. (3.2.6)
Not only the photon flux Φ has to be high enough, but also the photon fluence integrated overthe full laser pulse
∫Φdt. Only then all atoms in the volume can interact with the laser beam and
get ionized: ∫Φ12dt (2σ12)
−1,∫Φ2idt σ−1
2i .(3.2.7)
To achieve an optimum photo-ionization efficiency both, the flux condition (3.2.2) and the fluencecondition (3.2.7) have to be fulfilled.
The discussion above assumes that the laser bandwidth δνlaser just matches the width of thepossibly broadened resonance δνres. If the laser bandwidth is too small, only the atoms in theoverlapping part of the frequency range will get excited. In case of a too broad laser bandwidththe power in the wings is lost and the effective photon flux is reduced to: Φeff ≈ Φδνres/δνlaser.
Fulfilling the flux condition for intermediate steps is normally not very demanding. From the relationof the Einstein coefficients the stimulated emission cross-section σ21 can be derived as [Hur88]:
σ21(ν0)δνres ≈∫
σ21(ν)dν =λ2
4τ21. (3.2.8)
Here, the integration of the cross-section over the resonance was replaced by the value at theline center ω0 times the resonance width δνres. τ21 is the partial lifetime of the excited statefor spontaneous emission back to the ground state. The cross-sections for absorption σ12 andstimulated emission σ21 are connected by:
σ12g1 = σ21g2 (3.2.9)
with the statistical factors gx = 2Jx + 1 (see appendix B.6 for the ground state values). Thus:
σ12 =g2g1
λ2
4δνresτ21. (3.2.10)
That means for levels with a low τ21 the corresponding absorption cross-section is higher andthe determining product for the saturation condition σ12τ21 remains constant. However, this isonly valid if the intermediate level decays mainly back to the ground state. If it has a significanttransition rate to a metastable state (i.e. a short partial decay time τ2m), these atoms will belost for further laser excitation. This problem occurs e.g. for lead where the intermediate level6p7s 3P o1 has a lifetime of 5.8 ns and only 15 % of the spontaneous decays go back to the groundstate. Therefore a larger laser power is required to enhance the rate of photoionization over thespontaneous decay rate. Equation (3.2.10) shows also that a certain gain can be achieved whenchoosing a transition from a state with low angular momentum to one with a higher angularmomentum. However, also the selection rules of the transition and the polarization of the laserlight will play a role. This will be discussed at the end of this chapter.

84 3.3 Laser system
3.3. Laser system
For an efficient operation of a “hot-cavity-RILIS” the pumping lasers should meet the followingrequirements:
• The wavelength should be as short as possible (yellow to green or shorter).
• The repetition rate should be of the order of 10 kHz.
• For the non-resonant ionization step the number of photons should be at least some 1015 pershot. For visible light this corresponds to some mJ pulse energy. With the given repetitionrate the average beam power will be some ten W.
• The pulse length should be of the order of some 10 − 30 ns, giving a pulse power of about100 kW at 10 kHz repetition rate.
• The laser system should allow a continuous operation for several days with minimum main-tenance.
Presently mainly copper vapor lasers are used for efficient operation at such a repetition rate.The set-up of the ISOLDE RILIS consists of dye lasers pumped by copper vapor lasers. It hasbeen described in [Sch93]. A similar system is used at Mainz university for resonance ionizationspectroscopy of actinides [Rus89].
Copper vapor laser
Copper atoms are excited in a plasma discharge from the ground state 3d10(1S)4s 2S to the levels3d10(1S)4p 2P o. The latter decay by emission of light with 510.6 and 578.2 nm to the metastablestates 3d94s2 2D. These have to be quenched to repopulate the ground state. Their effectivelifetime is some 10 to 100 µs and depends on the gas pressure in the tube. Therefore a coppervapor laser (CVL) can only run in a pulsed operation with a maximum repetition rate of someten kHz. The yellow light is delayed by about 3 − 5 ns with respect to the green one. CVLs canalready be built with simple means [Wal90], but to obtain an efficient and reliable operation moreeffort is needed. Sealed tubes allow an easier set-up. A certain amount of copper is kept in thesealed glass tube which is filled with a noble gas; for the ISOLDE RILIS CVL it is Ne at 200 mbarpressure. Slowly heating the tube by plasma discharges in the noble gas will evaporate the copper.After some time (1-2 h) a thermal equilibrium (around 1500 C9) with constant copper vaporpressure (about 1 mbar) is obtained and the laser is running stably and efficiently. After switchingoff the plasma discharge heating, the copper will condense again. These tubes have lifetimes of1000 to 2000 h of operation. Their performance goes down gradually and eventually they have tobe exchanged if too much copper was lost due to leakage or deposition in the plasma channel oron the exit windows. Compared to other lasers, CVL can reach a relatively high “plug efficiency”(total efficiency from electrical input power to emitted light) of about 1 %. A system of threetubes is used which gives a better beam quality than a single big tube. A smaller tube (about 6 Wlight output) runs as an oscillator with an unstable resonator and two bigger tubes (30 and 45 Wlight output) are used to amplify the low-divergence part of the oscillator beam. The componentswith higher divergence are removed with a diaphragm.
For optimum overlap in time of the three laser beams, they have to be fired within some ns.A trigger unit is used for synchronization. Thyratrons (fast triodes) are used to provide the highvoltage (about 30 kV after doubling in a resonantly charged circuit) and high current (some kA peakcurrent) with a small time jitter (some ns). For fast recovery they are filled with hydrogen. Theirlifetime is also in the range of 1000 to 2000 h. An improvement could be achieved by replacingthe thyratrons by fast solid state switches. These systems have lifetimes exceeding 20000 h ofoperation and do not show significant changes of the timing characteristics during their lifetime.9This operation temperature can be significantly reduced by adding halides to the gas.

3.3 Laser system 85
Dye laser
Dye lasers are used to provide laser light with tunable wavelength. Two or three dye lasers inHansch geometry [Han72] are pumped transversely by the CVL beams. The wavelength is tunedby rotation of a diffraction grating. If necessary the light is amplified in one or two subsequent dyelaser cells identical to the first one. The choice of the laser dyes and the set-up has to be optimizedindividually for the ionization of different elements. Beams in a spectral range of 540−850 nm havebeen produced. As an example the set-up for ionization of copper is described in the following.
For the first step transition a narrow-band dye laser was used. Its resonator includes a holographicgrating with 2400 grooves/mm and a glass etalon of 6 mm thickness. The frequency of the dyelaser could be tuned by synchronous rotation of the diffraction grating and the Fabry-Perot etalon.Such rotation was provided by electronical control of both elements with a microprocessor unit.The bandwidth of this dye laser is 1.2 GHz. The light is amplified in a subsequent dye laser cellidentical to the first one and then frequency doubled (see below) in an external type-I BBO crystal(6 mm long). Part of the first harmonic is guided with an optical fiber to a lambdameter (modelLM-007 from ATOS [ATOS]) where the frequency is measured with a resolution of < 300 MHzand an accuracy of < 90 MHz by analysing the fringe patterns of four Fizeau interferometers. Thefrequency can be logged continuously.
Amplifier 1.5 W
CV-Laser 3 (Oscillator) 6 W
CV-Laser 2 (Amplifier) 30 W
CV-Laser 1 (Amplifier) 45 W
Copper-Vapor-Laser System Dye-Laser System
To Ionizer Cavity
Dye-Laser 2
511 nm
654.8 nm327.4 nm
578 nm
575.8 nm
578 nm
511 nm
TheodoliteEye
Amplifier 6 W
BBODye-Laser 1
At ion source: 0.1 W 0.3 W
0.3 W
287.9 nm
1.5 W
Lambdameter
Frequency doubling
yellow
green
BBO
Figure 3.3.1.: Setup of the RILIS laser system for ionization of copper.
Using the laser dye Phenoxazon 9 (Lambda Physics) pumped with the yellow CVL light, a fun-damental beam (654.8 nm) of 1.5 W was obtained, which then was frequency doubled producing0.3 W at 327.4 nm. About 0.1 W of the UV beam could be focused over 17 m into the 3 mmdiameter ionizer cavity. This was sufficient to saturate the first transition which has an oscillatorstrength of 0.22 [Rad85].
For the second step a broad-band (25 GHz bandwidth) dye laser was used. With the laser dyeRhodamine 6G pumped with the green CVL light it produced about 6 W in the fundamentalbeam (575.8 nm) with two dye amplifiers. With 25 % conversion efficiency for second harmonicgeneration about 1.5 W were available at 287.9 nm on the table and about 0.3 W were focusedinto the cavity. Figure 3.3.1 gives an overview of the used laser system.

86 3.3 Laser system
Generation of ultraviolet light
For many elements the first excited level has an excitation energy above 3 eV. Therefore a sourceof intense ultraviolet light with tunable wavelength is required. Dye lasers can only produce lightwith wavelengths longer than that of the pumping beam and are generally restricted to wavelengthslonger than about 320 nm. For shorter wavelengths a dye laser beam in the visible range can beproduced and frequency doubled by Second Harmonic Generation (SHG) in a nonlinear opticalcrystal. While the summing of two photons of a given wavelength to one photon with half thewavelength can occur in many media, only a nonlinear medium allows to produce an intensefrequency-doubled beam by a coherent superposition. For an efficient energy transfer from theelectromagnetic wave with frequency ω to the wave with frequency 2ω, both have to remain inphase over a certain distance, i.e. their phase velocity and thus their indices of refraction haveto be equal: n(ω) = n(2ω). In non-linear crystals the birefringence (i.e. the difference betweenthe refraction indices of extraordinary and ordinary beam ne − no) can be used to offset thedispersion. This condition is called phase matching. It is achieved by tuning entrance angle and/ortemperature of the non-linear crystal.
Beta-Barium-Borate10 (BBO) crystals are used for frequency doubling of dye laser light withefficiencies of 20 % and above for λ >∼ 210 nm. The shortest possible wavelength for SHG is204.8 nm [Kat86, Miy86], however with low efficiency. To reach short wavelengths also ThirdHarmonic Generation (THG), Forth Harmonic Generation (FHG), etc. can be used. The efficiencyof these nonlinear processes increases with the power density of the fundamental beam, e.g. thepower of the third harmonic goes with the third power of the fundamental beam power density.With less intense dye laser beams, the third harmonic (3ω) can be produced more efficiently byfrequency doubling in a first crystal and then summing fundamental (ω) and frequency doubledbeam (2ω) in a second crystal. Wavelengths down to 189 nm can be produced in this way withBBO crystals [CAS].
Production of 210 nm light with 10 mW average power has been demonstrated with dye laserspumped by CVL [Kop94]. Using this technique beams with 2 mW average power at 229 nmwere applied for resonant photo ionization of Cd [Erd98b]. Further optimizing the method for theefficient ionization of beryllium at the ISOLDE RILIS, an intense tunable UV laser beam of up to200 mW average power at 235 nm was developed as a spin-off.
The damage threshold of BBO crystals for visible light is larger than 1 GW/cm2 (for 10 ns pulselength). Although the dye laser power of the RILIS stays well below this limit, problems occurredin cases where a very intense dye laser beam (some W average power) was frequency doubled,e.g. for the second transition in Be and Cu. Heating of the nonlinear crystal changes its refractionindex and thus the phase matching angle. Any power fluctuation of the copper vapor laser affectsthe power of the dye laser. This in turn changes the temperature of the BBO crystal, reducing theSHG efficiency. This coupling makes a stable operation of the RILIS more difficult. Moreover dustparticles deposited on the surface of the crystal will absorb the dye laser light and heat the crystal.This leads locally to an enhanced absorption. Both effects are mutually amplifying and can leadeventually to a destruction of the crystal (“drilling” of a channel or cracking).
Going to wavelengths in the far UV region (below 200 nm) would require significantly higher efforts:frequency conversion with low efficiencies in gaseous media, change of quartz lenses and windowsagainst CaF2 and an evacuated or helium filled tube to guide the UV laser beam without absorptionin oxygen. This and the partial loss in selectivity due to increasing direct one-step ionization ofisobars make an extension of the RILIS to non-metallic elements less promising. Nevertheless, bycombination with other excitation mechanisms photo-ionization could still be applied. In caseswhere metastable states with sufficient lifetime exist, these can be populated by electron impact, a
10β-BaB2O4.

3.3 Laser system 87
plasma discharge or atomic collisions in a gas cell and then be used as initial levels for subsequentphoto-ionization. The lifetime should be long enough (∼ms) to remove by an electrical field isobarswhich were ionized in the first non-selective excitation.
CVL and alternatives
The electromagnetic RF pulses emitted by the CVL ignition can disturb electronic devices inthe environment. Especially preamplifiers of charge-collecting detectors (e.g. germanium or silicondetectors) are very sensitive to this background11. Despite additional shielding of the cables, ananti-gating has to be applied to close the data acquisition of nuclear spectroscopy experiments inthe ISOLDE hall for some µs at each laser ignition. With about 11 kHz repetition rate this createsa constant deadtime of some percent.
Another disadvantage of the CVL is the long start-up time. A stable operation mode with thermalequilibrium of the laser tube and a constant copper vapor pressure is reached only after about twohours of heating.
Alternative pumping lasers
Excimer lasers have the advantage that wavelengths down to the vacuum ultraviolet region (e.g.157 nm with F2 gas) can be produced. However, the repetition rates do not exceed some 100 Hz.Putting a series of multiplexed excimer lasers in parallel to reach higher repetition rates wouldbecome very expensive and the maintenance is also very cumbersome.
High-power, high repetition rate Nd-YAG lasers are under development and should become com-mercially available at reasonable prices in the next years. Presently available Nd-YAG lasers alreadymatch the required repetition rate and average power, but the pulse width is still quite long (200-600 ns), reducing considerably the peak power of the pumped dye laser and the frequency-doublingefficiency. Others already have the required pulse length (30 ns) and repetition rate (10 kHz), butthe power is still low [Leb98].
From a Nd-YAG laser with intracavity frequency doubling a second harmonic beam of 532 nm isextracted for pumping the dye lasers. Being not too far from the 511 nm and 578 nm wavelengthsof a CVL, the tested excitation schemes and optical set-ups can often be adopted with smallmodifications. With increasing power of the Nd-YAG laser also the efficiency for THG and FHGbecomes appreciable and in individual cases these shorter wavelengths (355 and 266 nm) can beemployed for direct pumping of a dye laser.
A Nd-YAG laser is ideally suitable to pump a titanium doped sapphire laser [Gru98]. The latter hasan absorption band of 400 to 600 nm and the use of Q-switching allows to reduce the pulse lengthto the required values (about 10 to 30 ns). Moreover such a full solid-state system requires lessmaintenance (e.g. no change of dyes). However, only wavelengths in the red and infrared region(700 to 1000 nm) can be produced and thus additional SHG or THG steps are required. Also thecommercially available Ti-sapphire lasers (e.g. INTRA-Ti from Laser Analytical Systems [LAS])are still rather limited in power.
There is great economic interest to make uranium enrichment by resonant laser ionization compet-itive to the classical methods of diffusion and centrifugation. Such projects are pursued in the U.S.(AVLIS project [Har00], LLNL) and in France (SILVA project [Caz96], Cogema and CEA). Firstindustrial application of this method is expected in 2005 and should replace the presently operatingdiffusion facilities within 20 years [Mot97]. The RILIS application at ISOL facilities should profit
11These pulses are even directly visible as interferences to the program on a TV screen in a building next to theISOLDE hall (some 40 m from the laser barrack). A change of this interference pattern indicates a misfunctionof the CVL. Thus, this TV is the first step towards a remote supervision system for the RILIS.

88 3.4 The RILIS cavity
from the effort which is spent on this development of efficient and reliable laser systems whichmeet exactly the requirements of a hot cavity type RILIS.
3.4. The RILIS cavity
3.4.1. Geometry of the cavity
The role of the cavity is to keep the effusing atoms for a certain time in a volume where they canbe irradiated by the laser light. The ISOLDE RILIS cavities are tubes with a diameter d =3 mm(adapted to the size of the focused laser beams) and a length of 30 to 60 mm.
The flux of atoms effusing through the cavity is given by Fick’s first law:
Jat = −D∂ρ
∂x. (3.4.1)
For thin gases D can be expressed as:
D =1
3λv, (3.4.2)
with v the mean thermal velocity and λ the mean free path. For thin tubes (d l) the latter isidentical to d.
With an efficient ion extraction, the flux of photo-ions leaving the cavity is given by:
Jion =
∫ l
0ρ(x)εphotofrepdx, (3.4.3)
where frep is the repetition rate of the laser system and εphoto the probability of photo-ionizationper laser pulse. The latter is determined by the degree of saturation of all transitions and thepopulation of the state excited in the first step. It is typically of the order of some ten percent.
Supposing a linear decrease of the atom density along the cavity (ρ(x) = ρ0(1 − x/l)), the totalefficiency for photo-ionization in the cavity can be estimated to:
εion =Jion
Jion + Jat=
1
2lρ0εphotofrep
1
2lρ0εphotofrep +
1
3dv
ρ0l
=εphotofrep
εphotofrep +2
3
d
l2v
. (3.4.4)
For example with εphoto ≈ 10 %, frep = 10 kHz, l = 3 cm, v ≈ 600 m/s (for A = 130 andθ = 2000 C) a total photo-ionization efficiency of εphoto ≈ 60 % can be reached for stableisotopes (T1/2 → ∞). For lighter isotopes, e.g. 7Be in a 2400 C hot cavity (v ≈ 2800 m/s), andidentical εphoto the efficiency drops to εion ≈ 24 %.
For short-lived radio-nuclides additionally the radioactive decay has to be taken into account.The intrinsic delay time of the RILIS cavity (∼ 0.1 ms) is much shorter than that of the targetand can be neglected. On the other hand the delay due to adsorption on the cavity surface canbecome important, especially at lower temperatures. Therefore a compromise has to be found forthe geometry (d and l), material and temperature of the cavity.
According to equation (3.4.4) the neutral effusion losses can be reduced by increasing the lengthof the cavity. However, the calculated photo-ionization efficiency εion is not equal to the sourceefficiency εsource observed in practice. The latter includes also the significant losses due to imperfection extraction from the cavity. Obviously these losses tend to increase for long and thin cavities.

3.4.2 Role of the thermal plasma potential 89
3.4.2. Role of the thermal plasma potential
Without any radial potential well in the ionizer cavity, a large part of the created ions wouldhit the wall and recombine to neutral atoms. Due to the repelling positive space charge, thepercentage of ions extracted without wall collisions would be even smaller than estimated fromsimple geometrical considerations. However, heating of the cavity will release electrons from thewalls by thermal emission. If enough electrons are emitted into the cavity, they will not onlycompensate the positive space charge of the ions, but even create a negative potential which willkeep most ions from touching the walls.
Compared with the current from thermionic emission, the number of electrons released by ionizationof atoms in the cavity can be neglected. On the other hand the positive ions created in laser orsurface ionization cannot be neglected. Due to their lower speed, they stay in the cavity muchlonger than the electrons. Not taking into account the electrical fields these ions would remain inthe cavity for about 100 µs, giving a density of positive ions of about ni ≈ 3 · 107 cm−3. In realitya plasma potential will build up, which traps the ions in a trough and repels the electrons towardsthe wall. Thus, both densities become equal and in the interior of the cavity quasi-neutrality isgiven: ni = ne = np
12. With typical ISOL targets, a significant part of the ions in the RILIS cavitystill consists of easily surface ionizable species (alkalis or earth alkalis). Therefore the formalism ofthermal ion sources can be applied (see appendix B.5).
Two principal differences should be noted:
1. In a thermoionization source the source efficiency increases with the work function of thecavity material. In contrast the source efficiency of a hot cavity RILIS increases when a cavitymaterial with lower work function and thus stronger electron emission is used. The latterlowers the negative plasma potential further and thus increases the extraction efficiency ofthe ions (ω in equation (B.5.5)). On the other hand the single-shot laser ionization efficiency(β in equation (B.5.5)) is only given by the ionization scheme and the laser power and is notaffected by the cavity material. In this analogy the number of wall collisions (κ in equation(B.5.5)) could be identified with the number of laser pulses which interact with the atomwhile the latter is stored in the cavity volume.
2. Unlike in a thermoionization source the photoionized ions are created not at the surfacebut mainly in the volume of the cavity, i.e. already at negative potential Up. If the depthof the potential trough is larger than the radial kinetic energy of the ions (−Up Eradkin )they cannot touch the wall which is at positive potential. Thus, an increase of the neutralgas pressure will not increase ω, but rather cause a loss in efficiency and selectivity due tocharge-exchange collisions.
Typical plasma parameters
To quantify the ion trapping effect of the cavity the plasma parameters have to be derived fromexperimentally accessible values. The plasma potential Up depends on the cavity temperature T ,the ion density ni and the work function Φ of the cavity wall material [Lat75]:
Up = kT lnA∗T 2
eni
√M
2πme
− Φ, (3.4.5)
with A∗ the Richardson constant (see table B.7.1). The only parameter in this equation which isnot directly accessible by experiments is the density of ions in the plasma, which is in fact equalto the density of electrons and therefore just called plasma density ni = ne = np.12np is called the plasma density.
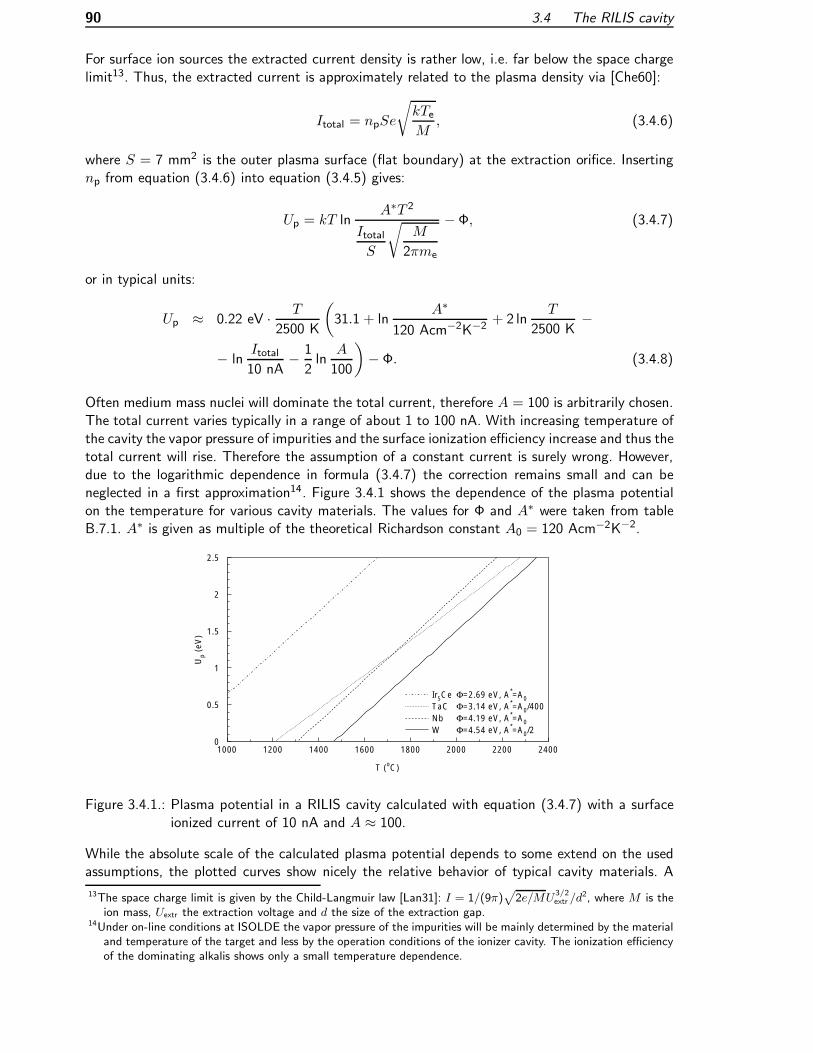
90 3.4 The RILIS cavity
For surface ion sources the extracted current density is rather low, i.e. far below the space chargelimit13. Thus, the extracted current is approximately related to the plasma density via [Che60]:
Itotal = npSe
√kTeM
, (3.4.6)
where S = 7 mm2 is the outer plasma surface (flat boundary) at the extraction orifice. Insertingnp from equation (3.4.6) into equation (3.4.5) gives:
Up = kT lnA∗T 2
ItotalS
√M
2πme
−Φ, (3.4.7)
or in typical units:
Up ≈ 0.22 eV · T
2500 K
(31.1 + ln
A∗
120 Acm−2K−2 + 2 lnT
2500 K−
− lnItotal10 nA
− 1
2ln
A
100
)− Φ. (3.4.8)
Often medium mass nuclei will dominate the total current, therefore A = 100 is arbitrarily chosen.The total current varies typically in a range of about 1 to 100 nA. With increasing temperature ofthe cavity the vapor pressure of impurities and the surface ionization efficiency increase and thus thetotal current will rise. Therefore the assumption of a constant current is surely wrong. However,due to the logarithmic dependence in formula (3.4.7) the correction remains small and can beneglected in a first approximation14. Figure 3.4.1 shows the dependence of the plasma potentialon the temperature for various cavity materials. The values for Φ and A∗ were taken from tableB.7.1. A∗ is given as multiple of the theoretical Richardson constant A0 = 120 Acm−2K−2.
W Φ=4.54 eV, A*=A0/2Nb Φ=4.19 eV, A*=A0
TaC Φ=3.14 eV, A*=A0/400Ir5Ce Φ=2.69 eV, A*=A0
T (oC)
Up
(eV
)
0
0.5
1
1.5
2
2.5
1000 1200 1400 1600 1800 2000 2200 2400
Figure 3.4.1.: Plasma potential in a RILIS cavity calculated with equation (3.4.7) with a surfaceionized current of 10 nA and A ≈ 100.
While the absolute scale of the calculated plasma potential depends to some extend on the usedassumptions, the plotted curves show nicely the relative behavior of typical cavity materials. A
13The space charge limit is given by the Child-Langmuir law [Lan31]: I = 1/(9π)√2e/MU
3/2extr /d
2, where M is theion mass, Uextr the extraction voltage and d the size of the extraction gap.
14Under on-line conditions at ISOLDE the vapor pressure of the impurities will be mainly determined by the materialand temperature of the target and less by the operation conditions of the ionizer cavity. The ionization efficiencyof the dominating alkalis shows only a small temperature dependence.
3.4.2 Role of the thermal plasma potential 91
tungsten cavity requires the highest temperatures to provide sufficient electron emission for atrapping of the laser ionized ions. A niobium cavity will give a similar potential already at about200 C lower temperature. For very low temperatures a tantalum carbide cavity shows a slowerdrop of the plasma potential. Thus, such a cavity should better conserve a high RILIS efficiencywhen the cavity temperature is lowered. Indeed this was experimentally observed, see figure 9 inref. [Mis93]. However, due to the small Richardson constant of TaC the gain is less than expectedfrom the low work function. Finally Ir5Ce is shown as an example for a possible alternative materialwith very good electron emission at lower temperatures. However, it was not yet tested as RILIScavity (see discussion below). Taking into account also the dependence of the total surface ionizedcurrent on the work function of the material would even enhance the differences between thematerials presented in figure 3.4.1.
Using equation (3.4.6) the Debye length15 can be estimated to:
λD =
√ε0kT
npe2= 0.8 mm
(I
10 nA
)− 12(
T
2500 K
) 34(
A
100
)− 14
. (3.4.9)
Thus, it is smaller than the cavity dimensions16 (diameter d = 3 mm) and allows in a firstapproximation to neglect the influence of wall collisions on the velocity distribution of the ions.Still this plasma is quite thin and not all ions can be trapped.
The potential drop along the cavity influences the plasma potential. The ions are accelerated to alongitudinal velocity which exceeds their thermal speed considerably. Electrons are pulled towardsthe positive end of the line (the RILIS or surface ionizer cavity is also called “line” in the ISOLDEsynoptic), therefore increasing the trapping potential there and thus the extraction probability ofions created towards this end. The front part will get depleted of electrons, thus decreasing theextraction probability. The magnitude of these effects depends on the maximum electron emissionfrom the cavity walls (see equation (B.7.1)) and thus on the cavity material. This effect is morepronounced if the electron emission per surface area is limited, e.g. in insulator cavities.
Note that due to the pulsed laser ionization in addition ni and ne will show variations in time ona level of several 10 % (partial pressure of laser ionizable element multiplied by laser ionizationefficiency per shot εion). Locally ni(z) and ne(z) may vary even stronger. The time to react onthis perturbation is governed by the plasma frequency ωp:
ωp =
√npe2
meε0. (3.4.10)
With the parameters derived above, the plasma frequency is of the order of 0.1−1 GHz. Thus, onthe time scale of a laser ion pulse (see below) the plasma immediately follows the perturbationscaused during the impact of the laser beam. For a surface ionized species, a clear drop of thecurrent is observed simultaneously to the maximum of the laser ionized peak.
Pulse shape
The laser ionization happens during some ten ns, but the observed ion pulse will be much longerdue to the different ion extraction times depending on the position in the cavity. The ohmic heatingcauses a voltage drop U along the length l of the line and thus a constant longitudinal field GE with
15The Debye length characterizes the distance over which a plasma compensates an external electrical field.16The relation λD d is a necessary condition to obtain a “true” plasma. If the plasma is thinner, the trappingeffect for the ions is significantly reduced.

92 3.4 The RILIS cavity
| GE| = U/l. Created at rest in a distance x from the extraction hole, the ions with mass m = A uare extracted with a delay tex of about17:
tex =
√2mx
e| GE| = 1.44 µs
√Ax/cm
| GE|/(V/cm)= 1.44 µs
√A
U/V
√xl/cm2. (3.4.11)
The spread can reach 43 µs for ions of mass A = 100 created in a 3 cm long cavity with alongitudinal voltage drop of 1 V.
In fact the ions are not created at rest, but during ionization they will mainly keep their initialmomentum18. Ions with kinetic energy Ekin moving away from the orifice will get an additionaldelay δtex compared with ions moving with Ekin towards the orifice:
δtex =
√8mEkin
e| GE| . (3.4.12)
Thus, the thermal velocity distribution translates to a Gaussian broadening of the time structurewith a width:
δtFWHMex =
√8 ln(2)mkT
e| GE| = 1.06 µs
√AT/(2273 K)l/(cm)
U/(V). (3.4.13)
A comparison of relations (3.4.11) and (3.4.13) shows that the first contribution to the total pulsewidth τpulse is dominant if the potential drop U along the line is not too small:
U >∼ 0.54 V T/(2273 K). (3.4.14)
From equations (3.4.11) and (3.4.13) it is obvious that a short cavity is of advantage to providea narrow pulse width. On the other hand a short cavity will reduce the laser ionization efficiencyaccording to equation (3.4.4). Thus a compromise has to be found for the cavity length. Thedetailed shape of the laser ion pulse depends on the density distribution of the neutral atoms alongthe line (determining the position dependent laser ionization rate), the extraction time and theposition dependent extraction efficiency19. The latter depends in turn on the radial and longitudinalvelocity components of the ion. A Monte Carlo simulation reproduces nicely most features of theexperimentally observed pulse shape [Lettr]. In the following only experimentally observed pulseshapes are shown to illustrate the dependence on the cavity properties discussed above.
Measurement of the pulse shape
Different methods are employed to measure the shape of the laser ion pulses:
Beam chopper: A fast beam gate (rise and fall time about 1 µs) is opened for a given timeinterval after each laser pulse. Shifting the delay of this time interval relative to the laserpulse allows to scan the pulse form with a standard Faraday cup (FC) behind the beamchopper. Since the pulse form is very well reproduced from shot to shot, the FC current canbe averaged over several seconds.
17Here, only the relative delay between ions created at different positions along the cavity is regarded. The additionalacceleration due to the extraction field entering the front part of the cavity is neglected.
18The momentum of the absorbed photon and the recoil of the emitted electron are negligible.19These contributions result in a reduction of the pulse width compared with the “worst-case” estimation of equation(3.4.11).

3.4.2 Role of the thermal plasma potential 93
Fast Faraday cup: Mounting the catcher plate (5 mm diameter) of a Faraday cup as part of anintegrated amplifier circuit provides a fast response. The maximum sampling frequency is150 kHz and the amplification is 100 mV per 1 nA. Also another circuit is used which hascharacteristics similar to the dynode amplifier.
Dynode amplifier: The highest sampling rate of 1.8 MHz can be reached with a dynode amplifierat an amplification of 1 mV per 1 nA. It is just the amplification stage of a photomultiplierwhere the photocathode has been removed. Its dynamic range goes from 20 pA to 200 nA.
The following pulse shapes were measured with the latter two devices.
The mass dependence in formulae (3.4.11) and (3.4.13) is directly seen by comparing the pulseshapes of two different isotopes. This is shown in figure 3.4.2. The flight time of the copper ionsfrom the source to the detector position is about 50 µs. Thus, the fluctuation of the 63Cu signalafter about 38 µs is due to electronic noise from the ignition of the next laser pulse20 after 88 µs.
0
1
2
3
0 10 20 30 40 50 60 70 80
63Cu63Cu scaled to A=114114Cd
Time (µs)
Ion
curr
ent (
a.u.
)
Figure 3.4.2.: The solid black line shows the measured signal of 63Cu from a thin niobium cavity(see below). The pulse shape of 114Cd (dotted black line) was measured in the samecavity under comparable conditions. Rescaling the abscissa of the copper signal witht′ =
√114/63·t (grey line) gives a shape practically identical to the cadmium signal.
In figure 3.4.3 the pulse shapes from a 30 mm long and a 60 mm long tungsten cavity are compared.As expected in the long cavity (black line) the maximum of the pulse is significantly delayed andthe pulse is broader compared with the short cavity (grey line). The long cavity shows moreovera steeper drop towards shorter extraction times and a reduced prompt peak. Both effects couldbe explained by a reduced temperature in the front part of the cavity, reducing the extractionefficiency of ions created there. The small “prompt” peak consists of ions which were laser ionizedin the region where the electrical field enters the ionizer cavity. They are thus extracted morerapidly, but reach a lower energy. This small peak increases the longitudinal emittance comparedwith a surface ion source21. Nevertheless it can be removed easily with the fast beam chopper.
The temperature dependence of the trapping efficiency is shown in figure 3.4.4. The extractedlaser ion current rises with increasing line temperature. At about 2100 C the plasma potentialin the hot cavity is sufficiently high to trap most of the created ions and the current saturates.
20The CVL were running with a repetition rate of about 11.4 kHz.21In the thermal ion source such a peak cannot occur since the atoms are ionized on the hot metal surface whichis an equipotential area (except the small potential gradient along the line).

94 3.4 The RILIS cavity
0
0.2
0.4
0.6
0.8
1
0 10 20 30 40Time (µs)
Ion
curr
ent
(a.u
.)
30 mm line 60 mm line
Figure 3.4.3.: Pulse shapes of 9Be from a 30 mm and a 60 mm long tungsten cavity (called “line”)with 1 mm wall thickness.
Unfortunately such a hot tungsten line will also act as an efficient surface ionizer and cause strongisobaric background.
30 mm W line
0.001
0.01
0.1
1
10
260 280 300 320 340 360 380 400
Line current (A)
Ion
curr
ent (
nA)
1000
1200
1400
1600
1800
2000
2200
2400
Line
tem
pera
ture
(o C
)Ion current Sn
Line temperature
Figure 3.4.4.: Dependence of the tin beam current on the heating current of the ionizer cavity(“line”). For comparison a reference temperature calibration of the latter is shown.
A short pulse width τpulse is important to further increase the selectivity of the RILIS. The surfaceionized isobars are released as a dc current (at least compared with the time between two laserpulses τrep). If a fast beam gate (“beam chopper”) is opened only synchronously with the mainpart of the laser pulse, the dc surface ionized background can be suppressed by a factor τrep/τpulse(see also figure 3.4.8).
3.4.3. Influence of the cavity material
In order to reach a high laser ion source efficiency a material with low work function is preferablewhich provides strong thermionic emission of electrons at a given temperature. Keeping the cavityat lower temperatures, a wall material with low work function will moreover decrease the disturbingcontaminations of surface ionized elements. However, too low temperatures increase the delay timeand worsen the ratio between exotic short-lived nuclei and the long-lived isobaric contaminants.

3.4.3 Influence of the cavity material 95
Inner cavity diameters of one, two and three mm had been tested [Mis93, Jad97, Lettr]. In principlesmaller diameters should enhance the efficiency since the residence time in the cavity gets longerand the power density of the focused laser beam is increased (thus increasing εphoto). However, inpractice it is difficult to focus the laser beam over 20 m to very small diameters. Moreover withsmall cavity diameters the system gets more sensible to misalignments between tube and laserbeam. Thus, for subsequent experiments mainly cavities with 3 mm inner diameter were used. Inthe following the properties of different RILIS cavities are discussed which were tested up to now.
Standard tungsten cavity
For many RILIS runs a 30 mm long standard tungsten cavity (3 mm inner diameter, 5 mm outerdiameter) was used which serves also in standard ISOLDE surface ion sources. This geometry isa good compromise to confine the atoms long enough to interact with the laser light, while thediameter still allows to focus a significant part of the laser light over about 20 m into the opening.The tungsten cavity is brought to temperatures around 2400 C by ohmic heating with currentsup to about 400 A. Tungsten has a high work function: ΦW ≈ 4.54 eV (or even above 5 eV witha surface layer of tungsten oxide). It has the advantage that the same target and ion source unitcan also be used to produce surface ionized elements. Thus, the break in which the set-up of theRILIS is changed from one to another element (one to three days) can be used to continue thephysics program with surface ionized elements from the same target. Since this source is optimizedfor high surface ionization, it shows a maximum of surface ionized isobars. It is normally used forelements where surface ionized background is less a problem (e.g. for Be or Mn) or where thehigher temperature decreases the adsorption time and thus allows a faster release (e.g. for Ni).
Long tungsten cavity
To increase the efficiency of the RILIS, tests were made with a 60 mm long version of the tungstencavity. The first design showed an unequilibrated temperature distribution along the tube. It becamemuch hotter in the center and thus prevented it from reaching the normal operation temperatureat the ends. With an improved design this problem could be solved, but due to other parameterswhich were changed between the runs up to now no clear proof of a significant increase in ionizationefficiency could be obtained. With a longer tube it becomes even more important to keep its axisaligned. Otherwise the laser beam cannot penetrate the full length and the possible advantage islost. Note that the alignment has to be kept also during possible heating/cooling cycles of thetarget and/or ion source.
Standard niobium cavity
To decrease the background of surface ionized isobars the cavity material was changed to niobium(ΦNb ≈ 4.19 eV). The standard niobium cavity is comparable to the standard tungsten cavity witha length of 30 mm, an inner diameter of 3 mm and a wall thickness of 1 mm. It is operated witha lower current (up to 300 A) and at lower temperatures (up to about 2100C).
Thin niobium cavity
To increase the potential drop along the tube and thus to improve the bunching of the laser ionizedpulse, the wall thickness has to be reduced. Else the ohmic power gets too high. On the otherhand a reduction of the wall thickness decreases the mechanical stability of the tube. Therefore,thin disks are attached radially to the tube which act as heat radiators (see figure 3.4.5). This
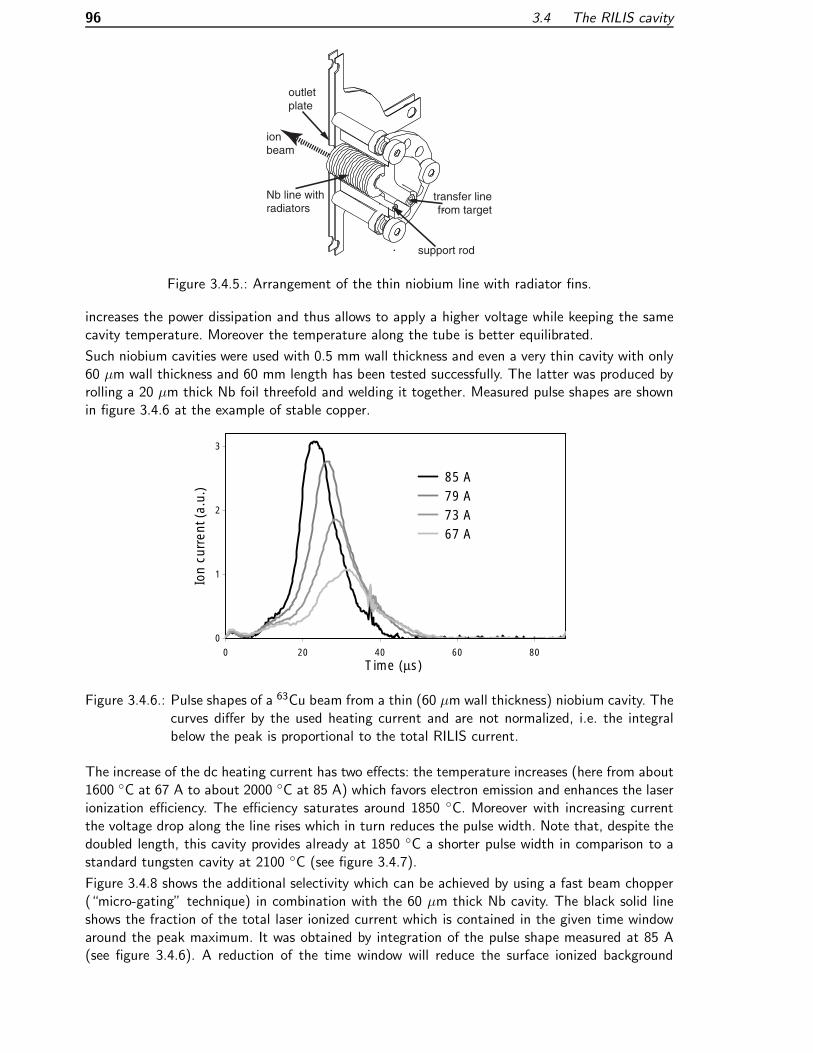
96 3.4 The RILIS cavity
Nb line withradiators
outletplate
transfer linefrom target
support rod
ionbeam
Figure 3.4.5.: Arrangement of the thin niobium line with radiator fins.
increases the power dissipation and thus allows to apply a higher voltage while keeping the samecavity temperature. Moreover the temperature along the tube is better equilibrated.
Such niobium cavities were used with 0.5 mm wall thickness and even a very thin cavity with only60 µm wall thickness and 60 mm length has been tested successfully. The latter was produced byrolling a 20 µm thick Nb foil threefold and welding it together. Measured pulse shapes are shownin figure 3.4.6 at the example of stable copper.
0
1
2
3
0 20 40 60 80
Time (µs)
Ion
curr
ent (
a.u.
)
85 A 79 A 73 A 67 A
Figure 3.4.6.: Pulse shapes of a 63Cu beam from a thin (60 µm wall thickness) niobium cavity. Thecurves differ by the used heating current and are not normalized, i.e. the integralbelow the peak is proportional to the total RILIS current.
The increase of the dc heating current has two effects: the temperature increases (here from about1600 C at 67 A to about 2000 C at 85 A) which favors electron emission and enhances the laserionization efficiency. The efficiency saturates around 1850 C. Moreover with increasing currentthe voltage drop along the line rises which in turn reduces the pulse width. Note that, despite thedoubled length, this cavity provides already at 1850 C a shorter pulse width in comparison to astandard tungsten cavity at 2100 C (see figure 3.4.7).
Figure 3.4.8 shows the additional selectivity which can be achieved by using a fast beam chopper(“micro-gating” technique) in combination with the 60 µm thick Nb cavity. The black solid lineshows the fraction of the total laser ionized current which is contained in the given time windowaround the peak maximum. It was obtained by integration of the pulse shape measured at 85 A(see figure 3.4.6). A reduction of the time window will reduce the surface ionized background

3.4.3 Influence of the cavity material 97
0
1
2
0 20 40 60 80
Time (µs)
Ion
curr
ent (
a.u.
)
W 2100 oC30 mm - 1 mmNb 1850 oC
60 mm - 60 µm
Figure 3.4.7.: Comparison of pulse widths (63Cu) from a thin (60 µm wall thickness) niobium anda standard tungsten cavity (1 mm wall thickness). The normalization of the curvesis arbitrary.
linearly (dotted line). The ratio of both gives the additional selectivity by micro-gating. Thus, theselectivity can be increased by a factor of about four to five in the case of 63Cu. Note that a verysmall width of the gate gives a good selectivity, but only at the expense of a rapidly droppingbeam intensity! With a reduction of the cavity length a further improvement might be possible22,but the micro-gating selectivity is principally limited to <∼ 10 with self-supporting metal cavities.For heavier nuclides (e.g. silver isotopes) this factor is reduced by
√63/A.
0
1
2
3
4
5
6
7
0 20 40 60 80
Bunch length (µs)
Sel
ectiv
ity C
u
0%
20%
40%
60%
80%
100%
Fra
ctio
n of
tota
l pul
se
Selectivity Cu
laser ionized copper
surface ionizedbackground
Figure 3.4.8.: Additional selectivity which can be obtained by micro-gating for 63Cu. See the textfor an explanation of the curves.
Insulator cavity
A much higher electrical field could be applied along an insulator cavity. Indeed, earlier tests witha sapphire cavity showed a very narrow pulse shape (>∼ 10 µs for stable silver ions) [Jad97], butthe ionization efficiency is reduced by a factor of three23 compared with a niobium cavity. Sapphire
22It still needs to be tested which length gives the best compromise between efficiency and selectivity.23In fact the only sapphire cavity which could be tested so far at operational temperature had only 2 mm innerdiameter. Therefore it is not directly comparable to the other cavities.

98 3.4 The RILIS cavity
(crystalline Al2O3) has a high work function (ΦAl2O3 ≈ 4.7 eV) and very low thermionic electronemission. Therefore the thermal plasma in the cavity cannot be sustained and the ionizationefficiency drops. Moreover sapphire tubes are sensitive to thermal shocks and break easily athigher temperatures. Tubes from boron nitride were tested, but all reacted with the touchingheating elements before reaching the operational temperature. A construction where the insulatortube is heated indirectly by radiation from a concentric meandering graphite heater [Jad97] couldreduce these problems.
Insulator with metal layer
If one manages to combine the mechanically stable insulator cavity with a metal surface as thinas possible, the advantages of both systems, i.e. the short laser ion pulses and a good ionizationefficiency could be combined. As in the case of pure insulator cavities, these metal layers are toothin to provide a homogeneous ohmic heating of the cavity. Therefore an extra cylindrical graphiteheater is mounted around the insulator tube.
Attempts were made to coat an insulator (Al2O3 and ZrO2) with layers of rhenium and nio-bium. The coating with Re via Chemical Vapor Deposition (CVD) (by Ultramet, California) failedcompletely, since the CVD process attacked heavily the insulator materials. Niobium layers weredeposited onto ZrO2 and Al2O3 by evaporation (LMU24 target laboratory) and sputtering (CERN).Great difficulties arose to provide a permanent electrical contact at the front faces. Mostly the Nblayer was just too thin and lost contact at higher temperatures. Tubes with Nb layers of 0.01 to1.6 µm were tested. However, they all “burned” before reaching a temperature of 1650 C. Toavoid a direct oxidation of niobium at higher temperatures, a rhenium layer was sputtered ontothe insulator surface before deposition of the niobium. The Re did not stick well to the surfaceof ZrO2, but a better adhesion was obtained onto Al2O3. Unfortunately also the system with theintermediate rhenium layer burned before reaching the operation temperature.
Graphite cavity
Graphite has a work function around 4.5 eV and a lower thermionic emission coefficient thanmetals. As expected from these parameters, only a low ionization efficiency was found using acavity with a graphite surface [Lettr].
Tantalum carbide cavity
TaC has a low work function (ΦTaC ≈ 3.14 eV). Indeed earlier off-line tests with a tantalum carbidecavity showed a very good suppression of surface ionization while the laser ionization efficiencystayed high even at lower temperatures [Mis93]. This tube had been prepared in Russia by sinteringof hot pressed TaC powder. It showed to be extremely brittle.
Alternative production methods have been tested: TaC can also be produced by carbidisation of Tasurfaces. A tantalum tube of the desired form is heated under CH4 atmosphere to a temperaturebetween 1800 C and 3000 C [Swa70]. The methane is cracked on the hot surface and reactsto a golden layer of TaC. The thickness of the TaC layer increases linearly with time. We usedthis method, keeping a tantalum tube for some days in a graphite oven heated with a current of≈750 A25 while passing through CH4. However, due to a temperature gradient the carbidisationtook mainly place at the “entry” of the tube and gave no homogeneous result.
24Ludwig-Maximilians-Universitat, Munchen.25The actual temperature was not determined directly, but from the calibration of other targets it should be wellbeyond 1800 C.

3.4.3 Influence of the cavity material 99
Another way of production has been used in Russia by applying chemical vapor deposition oftantalum to a graphite tube. With these tubes we measured a laser ionization efficiency of 5.5 %for silver and a surface ionization efficiency of 0.17 % for indium. Both ionization efficiencies, forsilver and indium, were a factor of two to three smaller than from a niobium cavity [Jad97]. Thus,no improvement in selectivity was obtained. In fact the ionization efficiency of these TaC cavitiesdropped after some hours of operation at high temperature. The color of the tubes turned fromgolden to grey and a surface analysis showed that a carbon layer was built up which can explainthe deterioration of the performance.
Note that at the RILIS of the Institute of Modern Physics (IMP Lanzhou, China) a Nb-Zr alloy(ratio 19:1) tube coated with a TaC layer has been successfully tested off-line as cavity of a laserion source [Zhi96].
The literature values for the work function of TaC vary significantly. This might indicate a generalproblem with the surface properties of heated tantalum carbide. Any deviation from the stochio-metric ratio can lead to an increase of the work function: pure tantalum ΦTa ≈ 4.25 eV, graphiteΦC ≈ 4.5 eV and tantalum oxide ΦTa2O5 ≈ 4.65 eV.
Cavity with “active surface cover”
The work function of a surface can be reduced by covering it with an electropositive element. Theconcentration of the latter has to be kept constant. This can be achieved by an attached ovenwhich provides a continuous flow of the electropositive element [Pio97]. An alternative was testedat the IRIS RILIS [Bez97]: a tantalum tube is coated with a SrO layer which in turn is covered bya carbon film. The SrO molecules traversing the carbon layer are reduced to strontium and thencover the surface. The carbon layer prevents a fast evaporation of the strontium oxide, but it isnot clear if the properties of such a tube can be maintained over the full length of an on-line run(several days).
Summary and outlook
A series of different laser cavities has been tested, mainly off-line. Up to now unfortunately nobreakthrough was obtained in the search for a single cavity type which provides simultaneously goodlaser ionization efficiency, very low surface ionization efficiency and a reliable operation over longertime (days). Several parameters (cavity material and geometry, target and line temperature, ionizedelement, etc.) have to be optimized and the tests proceed iteratively with small improvements.The “on-line-diagnostic” of the pulse shape is very useful for an understanding of the conditions inthe cavity. Some cavity materials are particularly promising and their development will be pursuedin future:
The very thin Nb foil cavity (60 µm wall thickness) gave the best off-line results for the efficiencyand pulse width. It still needs to be tested on-line. However, it cannot provide ultimate suppressionof surface ionizable elements due to the relatively high work function.
The principal problem of TaC tubes is the conservation of the surface properties over longer timeat high temperature. The production of a TaC tube starting with tantalum should be tried again.The excess of tantalum in the bulk material could possibly hinder the creation of a surface layerfrom carbon. An alternative to tantalum carbide could be zirconium carbide. Literature gives astill lower work function (ΦZrC = 2.18 eV), but the behavior as RILIS cavity was not yet tested.
Instead of sapphire, also an uncoated ZrO2 cavity (stabilized with Y2O3) could give short bunches.The ionic conduction of ZrO2 at high temperatures can help to provide a smoother potentialdistribution. Other possibilities are ThO2 or CeO2 with work functions of 2.6 eV and 2.3 eV,respectively. However, just like Al2O3 or ZrO2, these materials have to be avoided for elementswhich are known to stick to oxide surfaces (e.g. beryllium).
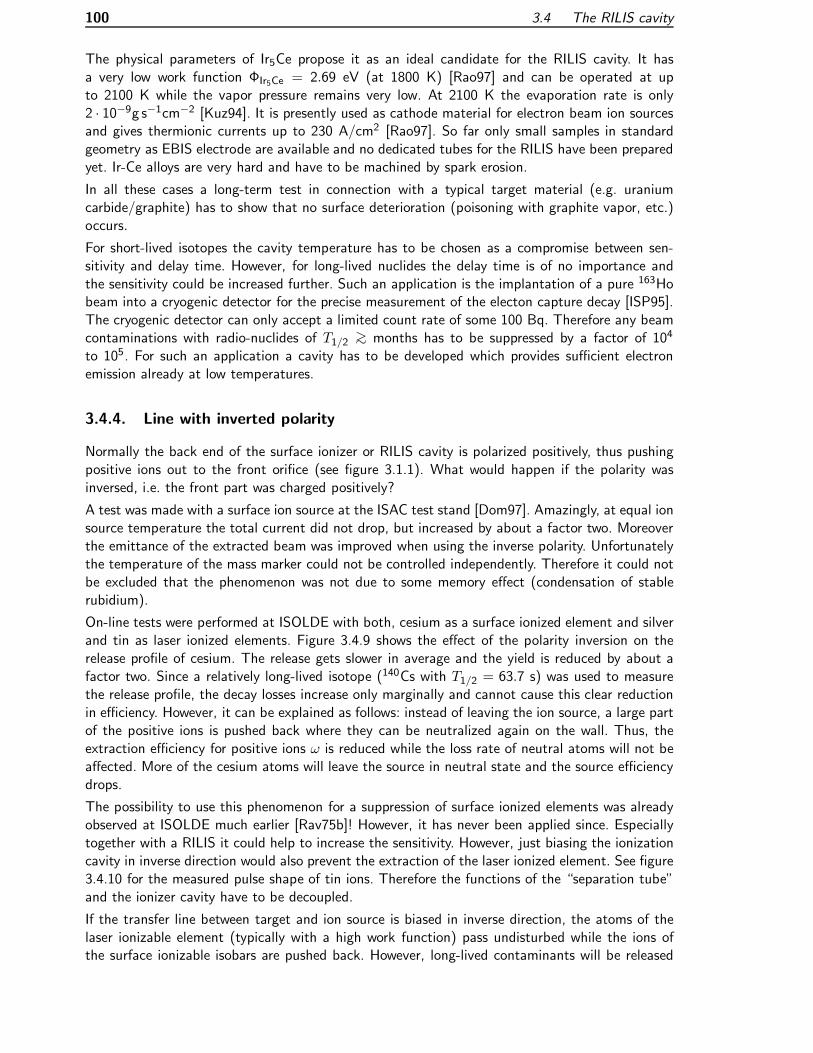
100 3.4 The RILIS cavity
The physical parameters of Ir5Ce propose it as an ideal candidate for the RILIS cavity. It hasa very low work function ΦIr5Ce = 2.69 eV (at 1800 K) [Rao97] and can be operated at upto 2100 K while the vapor pressure remains very low. At 2100 K the evaporation rate is only2 · 10−9g s−1cm−2 [Kuz94]. It is presently used as cathode material for electron beam ion sourcesand gives thermionic currents up to 230 A/cm2 [Rao97]. So far only small samples in standardgeometry as EBIS electrode are available and no dedicated tubes for the RILIS have been preparedyet. Ir-Ce alloys are very hard and have to be machined by spark erosion.
In all these cases a long-term test in connection with a typical target material (e.g. uraniumcarbide/graphite) has to show that no surface deterioration (poisoning with graphite vapor, etc.)occurs.
For short-lived isotopes the cavity temperature has to be chosen as a compromise between sen-sitivity and delay time. However, for long-lived nuclides the delay time is of no importance andthe sensitivity could be increased further. Such an application is the implantation of a pure 163Hobeam into a cryogenic detector for the precise measurement of the electon capture decay [ISP95].The cryogenic detector can only accept a limited count rate of some 100 Bq. Therefore any beamcontaminations with radio-nuclides of T1/2 >∼ months has to be suppressed by a factor of 104
to 105. For such an application a cavity has to be developed which provides sufficient electronemission already at low temperatures.
3.4.4. Line with inverted polarity
Normally the back end of the surface ionizer or RILIS cavity is polarized positively, thus pushingpositive ions out to the front orifice (see figure 3.1.1). What would happen if the polarity wasinversed, i.e. the front part was charged positively?
A test was made with a surface ion source at the ISAC test stand [Dom97]. Amazingly, at equal ionsource temperature the total current did not drop, but increased by about a factor two. Moreoverthe emittance of the extracted beam was improved when using the inverse polarity. Unfortunatelythe temperature of the mass marker could not be controlled independently. Therefore it could notbe excluded that the phenomenon was not due to some memory effect (condensation of stablerubidium).
On-line tests were performed at ISOLDE with both, cesium as a surface ionized element and silverand tin as laser ionized elements. Figure 3.4.9 shows the effect of the polarity inversion on therelease profile of cesium. The release gets slower in average and the yield is reduced by about afactor two. Since a relatively long-lived isotope (140Cs with T1/2 = 63.7 s) was used to measurethe release profile, the decay losses increase only marginally and cannot cause this clear reductionin efficiency. However, it can be explained as follows: instead of leaving the ion source, a large partof the positive ions is pushed back where they can be neutralized again on the wall. Thus, theextraction efficiency for positive ions ω is reduced while the loss rate of neutral atoms will not beaffected. More of the cesium atoms will leave the source in neutral state and the source efficiencydrops.
The possibility to use this phenomenon for a suppression of surface ionized elements was alreadyobserved at ISOLDE much earlier [Rav75b]! However, it has never been applied since. Especiallytogether with a RILIS it could help to increase the sensitivity. However, just biasing the ionizationcavity in inverse direction would also prevent the extraction of the laser ionized element. See figure3.4.10 for the measured pulse shape of tin ions. Therefore the functions of the “separation tube”and the ionizer cavity have to be decoupled.
If the transfer line between target and ion source is biased in inverse direction, the atoms of thelaser ionizable element (typically with a high work function) pass undisturbed while the ions ofthe surface ionizable isobars are pushed back. However, long-lived contaminants will be released
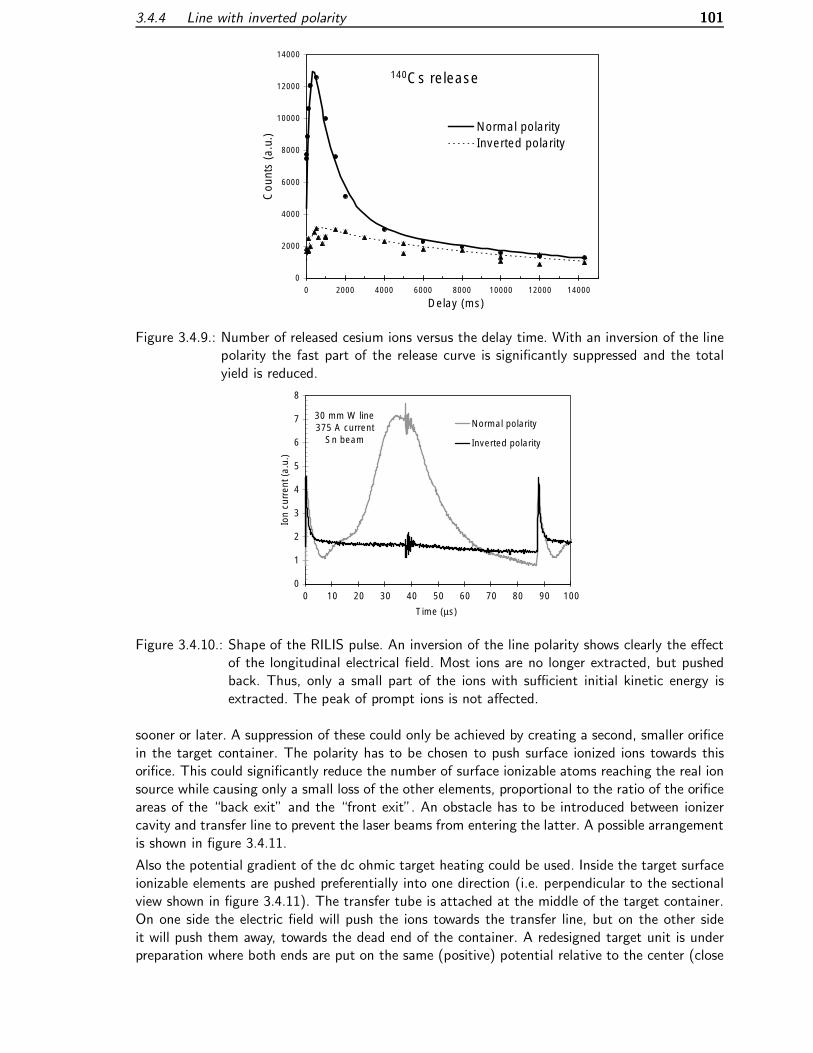
3.4.4 Line with inverted polarity 101
140Cs release
0
2000
4000
6000
8000
10000
12000
14000
0 2000 4000 6000 8000 10000 12000 14000
Delay (ms)
Cou
nts
(a.u
.)
Normal polarityInverted polarity
Figure 3.4.9.: Number of released cesium ions versus the delay time. With an inversion of the linepolarity the fast part of the release curve is significantly suppressed and the totalyield is reduced.
30 mm W line375 A current
Sn beam
0
1
2
3
4
5
6
7
8
0 10 20 30 40 50 60 70 80 90 100
Time (µs)
Ion
curr
ent (
a.u.
)
Normal polarity
Inverted polarity
Figure 3.4.10.: Shape of the RILIS pulse. An inversion of the line polarity shows clearly the effectof the longitudinal electrical field. Most ions are no longer extracted, but pushedback. Thus, only a small part of the ions with sufficient initial kinetic energy isextracted. The peak of prompt ions is not affected.
sooner or later. A suppression of these could only be achieved by creating a second, smaller orificein the target container. The polarity has to be chosen to push surface ionized ions towards thisorifice. This could significantly reduce the number of surface ionizable atoms reaching the real ionsource while causing only a small loss of the other elements, proportional to the ratio of the orificeareas of the “back exit” and the “front exit”. An obstacle has to be introduced between ionizercavity and transfer line to prevent the laser beams from entering the latter. A possible arrangementis shown in figure 3.4.11.
Also the potential gradient of the dc ohmic target heating could be used. Inside the target surfaceionizable elements are pushed preferentially into one direction (i.e. perpendicular to the sectionalview shown in figure 3.4.11). The transfer tube is attached at the middle of the target container.On one side the electric field will push the ions towards the transfer line, but on the other sideit will push them away, towards the dead end of the container. A redesigned target unit is underpreparation where both ends are put on the same (positive) potential relative to the center (close

102 3.5 Atomic physics effects
++
some V some V
+ 60 kV
+- -
Target
Transfer linewith obstacle "leak" for
surfaceionizableelements
+Laser beam
Extractionelectrode
RILIScavity
Figure 3.4.11.: Set-up with an “inversely polarized” transfer line. Atoms will mainly effuse towardsthe ionizer cavity while ions created in the transfer line are pushed out through the“back exit” on the right hand side.
to the transfer line). This should accelerate the release of surface ionizable elements and coulde.g. help to increase the release efficiency for the short-lived 11Li. Inverting the polarity could helpto deliberately suppress short-lived surface ionizable beam contaminants. Note that at the IRISfacility the target and transfer line are heated by an ac current. This causes a fast bunching of theextracted beam [Bar00].
3.5. Atomic physics effects
The RILIS efficiency is reduced for elements with a large fine structure splitting of the ground state(e.g. Sn) or low-lying levels in multielectron atoms (e.g. U). The thermal distribution in the hotionizer cavity leads to a dispersion of the population over several states of which only one can beexcited with a small bandwidth laser. Here, the residence time of the atoms in the laser field has tobe increased (to profit from the thermal reequilibration of the population) or several wavelengthshave to be provided simultaneously for excitation of more levels. The latter way further complicatesthe laser system.
3.5.1. Isotope shift
The atomic levels of different isotopes of the same element have not exactly equal energy, but showa characteristic difference, the so-called isotope shift (IS). The isotope shift of a given transition isthe difference of the IS in the higher level and the IS of the lower level. A positive IS correspondsto a shift towards higher frequencies for heavier isotopes.
The IS can be separated into three individual parts:
δνAA′= δνAA
′NMS + δνAA
′SMS + δνAA
′FS (3.5.1)
The normal mass shift δνAA′
NMS is due to the motion of the nucleus around the atom’s center ofmass and is given by the reduced electron mass in the Bohr model.
δνAA′
NMS = ν0me
1u· M ′ − M
M ′M(3.5.2)

3.5.1 Isotope shift 103
where ν0 is the transition frequency for infinite mass, me is the electron mass and M , M ′ are thenuclear masses of the two isotopes to be compared.
The specific mass shift δνAA′
SMS arises due to the electron exchange interaction between the valenceelectron and the rest of the atomic shell which makes a collective movement in reaction to thenuclear motion. The SMS has the same mass dependence as the NMS, but has a different size andcan have the same or opposite sign. In the calculation of the SMS of complex atoms contributionsof all electrons have to be taken into account. This is usually done with the Hartree-Fock method.Empirically it is found that for most s-p transitions the SMS does not exceed the NMS, while inmore complicated spectra involving shielded d or f electrons it may be one order of magnitudelarger than the NMS [Ott89].
The total mass shift δνAA′
MS = δνAA′
NMS+ δνAA′
SMS is significant for light nuclei. For beryllium the massshift was measured at the ISOLDE RILIS for all particle-stable isotopes [Seb98]. For an optimizationof individual yields (e.g. 7Be or 14Be) the laser frequency has to be tuned accordingly. For heaviernuclei the mass shift becomes much smaller than the Doppler width and is negligible for ourapplications.
The field shift νAA′
FS or volume shift reflects the change in the binding energy of the electrons whenthe radial distribution of the nuclear charge is changed. It is the product of the electronic fieldshift factor F and a power series of nuclear radial moments [Buc87].
δνAA′
FS = F (δ〈r2〉+ C2δ〈r4〉+ C3δ〈r6〉+ · · · ) ≈ Fδ〈r2〉 (3.5.3)
Accurately measured it allows to derive the mean square radius of the proton density distribution inthe nucleus. This can be separated into contributions from a spherical distribution and correctionsdue to the deformation (see e.g. [Buc87]). By investigation of long isotopic chains significantchanges in the nuclear deformation could thus be found (see e.g. [Ott89]).
For RILIS applications the field shift becomes important for elements with high Z where theoverlap of the electron orbitals with the nucleus increases (smaller Bohr radius and larger nuclearradius). In uranium the IS is big enough to be exploited for commercial separation of 235U and238U in a large-scale RILIS [Gil74, Jan76, Boh78, Bec82]. However, for individual transitions largedifferences exist in the IS and in the disturbing hyperfine splitting of 235U (see below) [Rad75] (seethe two examples in table 3.5.1). A careful choice of the excitation scheme is therefore essential foran efficient separation. A compilation with 1600 assigned levels and many data on isotope shiftsand g-factors is found in [Bla76].
Table 3.5.1.: Isotope shifts for the first transition in RILIS excitation schemes. Note the additionalnotation for the upper levels in uranium (given by the wavenumber in cm−1) whichhas a very dense spectrum with about 300000 lines [Bec82].
Element Transition λ Isotopes IS Reference(nm) A − A′ GHz
4Be 2s2 1S0 − 2s2p 1P o1 235.0 9− 10 8.78 [Chu93]
12Mg 3s2 1S0 − 3s3p 1P o1 285.2 24− 26 1.8 [Rad85]
29Cu 4s 2S1/2 − 4p 2P o1/2 327.4 63− 65 0.6 [Rad85]
48Cd 5s2 1S0 − 5s5p 3P o1 326.1 102− 114 3.5 [Buc87]
82Pb 6p2 3P0 − 6p7s 3P o1 283.3 208− 214 11.5 [Ans86]
92U 6d7s2 5Lo6 − 6d7s7p 7L6(169007) 591.5 235-238 -8.5 [Ana92]
92U 6d7s2 5Lo6 − 6d27p 7N7(278867) 358.5 235-238 -17.1 [Ana92]

104 3.5 Atomic physics effects
In contrary to the mass shift, which is a common atomic property of all isotopes of an element,the field shift is a nuclear property of an individual isotope. Table 3.5.1 shows isotope shifts ofsome transitions relevant for RILIS. More details are found in references [Kin84, Rad85, Ott89].
On the one hand, a large isotope shift rather disturbs the RILIS operation. It requires to retunethe laser frequency when switching between different isotopes and can even reduce the ionizationefficiency for rare isotopes with unknown isotope shift. At an ISOL facility this mass selectivity ofionization is of no use since the following separator magnet anyhow provides a sufficient separationin mass. On the other hand the direct relation between frequency tuning and obtained ion yieldallows to use the RILIS as a sensitive tool for resonance ionization spectroscopy (RIS) [Mis87a,Bar98b, Seb98].
3.5.2. Hyperfine splitting
The interaction of the electrons with the spin of the nucleus leads to a splitting of the atomic energylevels into a number of hyperfine components. Nuclear spin GI and atomic angular momentum Jcouple to the total angular momentum GF = GI + GJ . In a good approximation I and J are goodquantum numbers and the dominant contributions from the lowest order multipole moments canbe written as [Ott89]:
E = E0 +h
2AK +
3h
8B
K(K + 1)− 43I(I + 1)J(J + 1)
I(2I − 1)J(2J − 1), for I, J ≥ 1, (3.5.4)
with K = F (F + 1)− I(I + 1)− J(J + 1). A is the magnetic dipole interaction constant:
A =µHe(0)
IJ(3.5.5)
with µ the nuclear magnetic dipole moment and He(0) the magnetic field of the electron shell atthe position of the nucleus. B is the electric quadrupole interaction constant:
B =eQsdΦdr
∣∣0
(3.5.6)
with Qs the spectroscopic26 quadrupole moment of the nucleus and dΦdr
∣∣0the electric field gradient
of the atomic electrons at the nucleus.
Table 3.5.2.: Hyperfine splitting of some levels or transitions used in RILIS excitation schemes.
Isotope Nuclear Transition or A B ReferenceSpin atomic state or ∆νHFSI (MHz) (MHz)
6529Cu 3/2 4s 2S1/2 12568 [Rad85]6529Cu 3/2 4p 2P o1/2 540 [Ber89]10348 Cd 5/2 5s2 1S0 − 5s5p 3P o1 −1129 188 [Buc87]20782 Pb 1/2 6p2 3P0 − 6p7s 3P o1 8807 – [Ans86]23592 U 7/2 6d7s2 5Lo6 − 6d7s7p 7L6(16900)7 250 [Rad75]23592 U 7/2 6d7s2 5Lo6 − 6d27p 7N7(27886)7 100 [Rad75]
26The spectroscopic quadrupole moment is related to the intrinsic quadrupole moment Q0 via a transformation
from the body-fixed frame to the laboratory frame: Qs =3K2−J(J+1)(J+1)(2J+3)
Q0 [Cas90].

3.5.2 Hyperfine splitting 105
Just as the isotope shift, a large hyperfine splitting complicates the normal RILIS operation butalso enables additional applications like isomer separation and even the measurement of nuclearmoments. Table 3.5.2 shows the hyperfine splitting of low levels relevant for RIS.
Isomer separation
Some silver isotopes show a strong hyperfine splitting. After the suspicion that earlier attemptsto find the r-process waiting-point nuclide 129Ag with the ISOLDE RILIS failed due to this reason[Jad97], this effect was studied in more detail. With the two abundant isomers of 107Ag the effectof the hyperfine splitting is clearly seen [Seb98]. The small hyperfine splitting of the stable ground-state 107gAg with spin 1/2− is not resolved with the RILIS resolution. However, the signal of themetastable state 107mAg with spin 7/2+ shows a clear separation into two distinct peaks. In theeven isotope 122Ag the tuning of the frequency allowed to assign individual gamma-rays to thedecay of the low- and the high-spin isomer [Kau98].
Isomerically selective photo-ionization of 197Hg is discussed in [Dye85] and the separation ofsamarium and thulium isomers was reported in [Mis87b].
Separation of 70gCu and 70mCu
The isomeric selectivity of the RILIS was also applied for the separation of the 70Cu isomers. Incontrast to silver where the stable low spin isomers of mass 107 and 109 can be easily distinguishedfrom the respective radioactive high spin isomers, in 70Cu both isomers are radioactive. A distinctionhas to be done via the different lifetimes and feeding of excited states after β-decay to 70Zn. TheLeuven βγγ-coincidence set-up was used for detection and identification of the radio-isotopes (see[Wei99] for technical details). The background from the surface ionized isobar 70Ga was small anddid not disturb the measurement. Despite the reduction of the laser power for the scan the ionyield was high enough to determine the analysed gamma-ray intensities with statistical errors inthe range of some percent.
Some gamma lines had been assigned in literature [Taf71, Rei75], but a detailed decay schemeof 70Cu based on our measurements is still under evaluation [Roosb]. The main characteristicsrequired for the analysis of the frequency scan are known from literature and can be summarizedas follows: the short-lived isomer (T1/2 ≈ 5 s) is the 1+ ground state, while the longer-lived isomer(T1/2 ≈ 42 s) is a metastable state with spin assignment 3−, 4−, 5− or 6− [Bha93].
For the following frequency scan the “intensity” of 70gCu was defined by the sum of the gammacounts at 874, 1072 and 1653 keV while the lines at 902, 1108, 1252, 1782 and 2155 keV wereadded up for the 70mCu intensity.
The measured ratio of gamma intensities does not reflect directly the ratio of production rates.Only gamma lines with a unique assignment were summed, but they do not represent the completefeeding. Moreover, the raw count rates are not corrected for detection efficiency or timing of themeasurement cycles27.
For the frequency scan the power of the first step laser beam was attenuated to about 20 %to reduce the saturation broadening of the resonance line. The frequency of the first step wasscanned over a range of 40 GHz. Due to the huge width of the autoionizing state (FWHM morethan 5 cm−1) it was not necessary to retune the second transition when scanning the first.
Twenty measurements of two to four minutes each were done for different settings of the laserfrequency (see figures 3.5.1 and 3.5.2). Unfortunately the first scan was stopped abruptly dueto a technical problem of the wavelength control unit and could not be extended or repeated
27The short-lived ground state experiences more decay losses in the target than the isomeric state, on the otherhand contributions from 70Ni decaying in the target will mainly feed 70gCu [Fra99].

106 3.5 Atomic physics effects
during this beam time. The large error on the ordinate is mainly due to power fluctuations fromsynchronization shifts between the three CVL.
The hyperfine splitting of the 3d104p 2Po1/2 level (excited state: es) is much smaller than the
one of the 3d104s 2S1/2 ground state (gs). Hence only the splitting of the ground state into twopeaks is resolved. We use a fit with four Voigtian peaks of identical width, consisting of a fixedGaussian part (3.8 GHz Doppler width) and a Lorentzian part with free width. The ratio of theupper level HFS to the lower level HFS was fixed to 0.086, given by the ratio of the A factorsin 65Cu: A(2P o1/2) = 540.1 MHz [Ber89] and A(2S1/2) = 6284.39 MHz [Rad85]. The relativeamplitudes of the four peaks were constrained to the theoretical ones taking into account theexcitation with linearly polarized light28 [Fedos]. They are equal for the (Fgs,Fes)= (1/2,1/2),(1/2,3/2) and (3/2,1/2) transitions and twice bigger for the (3/2,3/2) transition. To account fora modification of this ratio due to and a partial saturation of the transition, the intensity ratiowas varied by 20 % in the fit. Finally for 70gCu a hyperfine splitting of 10.5(14) GHz is found (seefigure 3.5.1).
For 70mCu the hyperfine splitting is not resolved (figure 3.5.2), but from the broadening of theresonance line a rough value of 5.3(10) GHz can be deduced. Here equal amplitudes were takenfor the transitions since at high total angular momenta F a multitude of magnetic substatescontributes, leveling polarization effects nearly out (i.e. the calculated intensity ratio is close tounity).
0
1
2
3
4
5
6
30535 30535.2 30535.4 30535.6
Frequency of first transition (cm-1)
Cou
nt r
ate
(a.u
.)
Figure 3.5.1.: Yield of 70gCu versus laser frequency of the first transition.
Measurement of magnetic moments
The magnitude of the hyperfine splitting is directly determined by the nuclear spin I and themagnetic moment µ via relation (3.5.5).
The hyperfine splitting of two hyperfine components with total angular momenta F and F − 1 isgiven by the Casimir formula [Ott89]:
∆νHFS = AF + B3F (F 2 + 1
2)
I(2I − 1)J(2J − 1)(3.5.7)
Due to the spherical symmetry of the charge distribution, for J ≤ 1/2 the quadrupole interactionconstant B is zero. Thus, the measured hyperfine splitting follows Lande’s interval rule:
∆νHFS = A · F = A · (I + J) (3.5.8)
28The ratios were calculated by summing over all allowed transitions between the magnetical sublevels of theparticipating states according to formula (1) in ref. [Bek81].

3.5.3 Nuclear polarized beams 107
0
20
40
60
80
100
120
140
30535 30535.2 30535.4 30535.6
Frequency of first transition (cm-1)
Cou
nt r
ate
(a.u
.)
Figure 3.5.2.: Yield of 70mCu versus laser frequency of the first transition. For the fit the line widthwas taken identical to the 70gCu fit.
and the spectroscopic constant A can be extracted from the measured frequency scan.
For the accuracy which can be obtained with the ISOLDE RILIS set-up, the HFS anomaly due tothe finite size of the nucleus (the so-called Bohr-Weisskopf effect [Boh50]) can be neglected:
AXAY
· gYgX
− 1!= 0. (3.5.9)
.
Therefore, the unknown magnetic moment of an isotope Y follows directly from that of a calibra-tion isotope X:
µY = µX · AY · IYAX · IX . (3.5.10)
Thus, the magnetic moment of radioactive nuclei can be derived from the hyperfine splittingmeasured with a RILIS if the nuclear spin is determined independently (e.g. from beta-decay ortransfer reactions). The results for 70gCu and 70mCu are discussed in section 5.2.1.
3.5.3. Nuclear polarized beams
A possible further application of the RILIS is the production of nuclear polarized beams. Withoutexternal field the magnetic substates mF are degenerate and the selection rule for the angularmomentum: ∆mF = +1 (−1) for right (left) circularly polarized light manifests only in a generalreduction of the ionization efficiency. In some cases the different magnitude of this effect allowsa moderate separation of even and odd isotopes, e.g. for ytterbium [Bek81], molybdenum and tin[Fai89].
By absorption of circularly polarized light the polarization is transferred to the excited state of theatom. The coupling of electronic and nuclear spin will transfer this polarization to the nucleus.Thus, the ionized beam gets a certain degree of nuclear polarization (e.g. some 10 to 20 % foralkalis [Ney97]).
Optical pumping
The polarization can be increased considerably by passing several cycles of excitation with circularlypolarized light and subsequent spontaneous emission. This method is called optical pumping. Figure3.5.3 shows the principle of optical pumping at the example of alkalis (lithium). This pumping

108 3.6 Implementation of the RILIS
scheme was successfully applied to an atomic 8Li beam at the MPI fur Kernphysik in Heidelberg[Wid95]. It is also routinely used for β-NMR experiments with the collinear laser spectroscopyset-up COLLAPS at ISOLDE (see e.g. [Arn87, Arn92]).
2S1/2
F
5/2
3/2
3/2
5/2
2P1/2
mF 5/2-5/2 3/2-3/2 -1/2 1/2
∆mF=+1
Figure 3.5.3.: In excitations of lithium atoms from the ground state 2S1/2 to the 2P1/2 state withright circularly polarized laser light only transitions with ∆mF = +1 are allowedaccording to the selection rule (solid arrows). Spontaneous emission proceeds with∆mF = −1, 0 and +1 (dashed arrows). High polarization is obtained after multiplecycles of excitation and spontaneous emission, i.e. the angular momentum of thephotons is transferred to the lithium atom by “pumping” the population of the latterpreferentially in a well-defined Zeeman level.
Normally the optical pumping has to be done at the atom since the respective transitions of theion are too far in the ultraviolet region. However, if one combines this optical pumping with anionization method which preserves completely the nuclear polarization (i.e. without wall- or gascollisions as in the case of a surface ion source or a plasma source respectively), it is possibleto form a highly polarized ion beam which can be guided subsequently to a remote experimentalsetup. The RILIS provides such an ionization. The excitation scheme for resonant photo ionizationof lithium was already tested at the ISOLDE laser ion source [Mis93].
Production of the radioactive atoms, optical pumping, ionization and detection are approvedtechniques. However, the conservation of the polarization during beam transport from the ionsource through the separator to the experimental set-up has to be checked. Loss of polarizationcan happen due to non-adiabatic changes of the magnetic field, e.g. when entering the strongperpendicular magnetic field of the separator magnet or in the passage close to Penning vacuumgauges or turbo pumps. To prevent such depolarization, a longitudinal guide field has to be appliedduring the beam transport. Such a guide field can be easily realized with permanent magnetsmounted around the beamline. This technique is commonly used, e.g. when guiding polarizedneutrons close to superconducting magnets with high stray fields (ILL), for the injection of polarizedprotons into cyclotrons (TRIUMF), etc.
3.6. Implementation of the RILIS
3.6.1. Beam observation and tuning
During operation of the RILIS the stability of the laser beams has to be monitored. Normallythe wavelength does not fluctuate and it can be easily controlled with a lambdameter. Due totemperature changes of the laser set-up and the nonlinear crystals the spatial alignment of thelaser beams can drift and they have to be retuned to the ionizer cavity. Therefore a quartz plate isinstalled halfway between the laser lab and the ion source. It will reflect about 6 % of the light backonto a reference screen in the laser lab. This feedback helps enormously to focus and align all laser

3.6.2 Compatibility of RILIS and HRS 109
beams. A diaphragm with the source diameter is installed at the reference point. The laser powerdetected behind this diaphragm is proportional to that available at the source position. Moreoverthe synchronization of the three CVL can drift. Depending on the condition of the thyratrons andlaser tubes it has to be retuned more or less frequently (minutes to hours). The synchronizationof the oscillator and amplifier tubes is tuned to maximize the output power of the latter. Stillthe delay between both amplifier tubes has to be set to optimize the laser ionization efficiency.This can be controlled by optimizing the current of a stable or intense radiogenic isotope of thelaser-ionized element measured with a Faraday cup (FC). The ISOLDE general purpose separator(GPS) has the nice feature that the monitor mass can be sent to the FC of another beam port(low- or high mass side, see figure 3.1.1). This allows to retune the laser with an on-line signaland facilitates the supervision considerably. For elements with low yields or very fast release atemperature controlled oven (Knudsen cell) has to be attached to the target container to providea stable monitoring beam.
3.6.2. Compatibility of RILIS and HRS
In principle a high resolution mass separator (HRS) could be applied to remove remaining contami-nations from surface ionizable isobars. However, at the present ISOLDE set-up such a combinationof RILIS and HRS is not ideal.
With the HRS the permanent supervision of a stable mass is not possible since only one masspasses the separator29. That means for each check of the laser settings the running experimenthas to be stopped, a Faraday cup introduced into the beam line and the mass changed to themonitoring isotope. Without a major improvement of the RILIS stability a run at the HRS canthus become extremely tedious!
The ISOLDE HRS (see figure 3.6.1) is designed to analyze a real object defined by a slit (SL240in ISOLDE synoptic) with a 90 degree bending magnet. After a preselection in the first focal plane(HRS.SL470) and a following 60 degree bending magnet the main separation is done with a slit inthe second focal plane (SL675). The magnification from SL240 to the second focus is M = −1.57.while the dispersion of both magnets adds to Dm = 4 m. Thus, to reach a resolving power of atleast Rm ≥ 10000, the object size w has to be restricted to about 0.25 mm in horizontal direction(w ≤ Dm/(M · Rm)). To prevent a deterioration of the selectivity, the slit is introduced to cutthe beam halo at the object position (SL240). This slit would also limit the open diameter for thelaser beams which enter through a window in the HRS vacuum chamber. Since the laser beam isabout 7 mm wide when passing the SL240 slit position (8 m away from the ion source) this slitcannot be used in combination with the RILIS and one has to rely on the slit in the first focalplane only.
If a RILIS cavity with a high potential drop is used, the reachable mass resolving power is limitedby the energy dispersion of the beam: Rm = M/∆M ≤ E/∆E. To reach a mass resolving powerof Rm > 104 with 60 keV beam energy, the energy dispersion should not exceed some eV. CeramicRILIS cavities which could provide a higher potential drop would thus require an additional energycompensation.
The problem with the energy spread can be solved in several ways:
• Including an electrostatic deflector in the high resolution separator allows to compensate theenergy dispersion of any ion source, but makes the separator more elaborate.
• The given energy spread from a RILIS is not randomly distributed in the longitudinal phasespace, but correlated to the phase. That means ions which are created deeper inside the
29In principle, the set-up could be modified to monitor also the current of some neighboring mass in the first focalplane. However, due to the high dispersion the mass range covers ±5 % at maximum. This is not sufficient fora monitoring of exotic isotopes (see section 3.6.3).

110 3.6 Implementation of the RILIS
Distance to Target: 23 m
Laser System
SL240
SL470
SL675
Frontend
Proton beam
Figure 3.6.1.: Combination of the ISOLDE RILIS with the high resolution separator HRS.
cavity get a higher energy, but arrive later30. A debuncher which makes a transformation inthe E-δt-phase space could be used to provide a less bunched beam with reduced energyspread. Clearly this debuncher has to be placed behind the fast beam chopper, else thepossibility to gate on the well-defined laser pulses is lost.
• Another alternative is a gas-filled RFQ which can effectively reduce the phase space due todissipation in the buffer gas [Lun99]. All these devices have to be placed behind a primarymass separator.
A beam with small energy spread is also required for other applications, e.g. collinear laser spec-troscopy. Therefore the latter two methods are favorable.
3.6.3. RILIS implementation at other RIB facilities
It has been shown that a RILIS can fulfill for many metallic elements the main demands tothe ion source of a RIB facility: efficiency – selectivity – rapidity. In some cases it can evenprovide additional features like isomer separation or nuclear polarization. Moreover, in the standardversion the front-end part of a RILIS is relatively robust compared with a plasma ion source. The
30The use of this correlation to increase the selectivity of the micro-gating technique with a “time focus” wasproposed [Sch93]. However, it requires a system of adapted extraction electrodes and was not yet realized.

3.6.3 RILIS implementation at other RIB facilities 111
parts which require maintenance are far away from the target and remain easily accessible duringirradiation of the target. With the rapid technical development of the laser technology it is expectedthat the RILIS performances will be further improved in the next years. It is important to planalready now the implementation of a RILIS at new RIB facilities. The following list gives a summaryof the most important points which were already discussed above:
• The simplest RILIS ionizer cavity is identical to a typical surface ionization source, i.e. ametal tube with some mm diameter and some cm length, heated to temperatures of 2000to 2500 C.
• To obtain higher selectivity, a more elaborate ionizer cavity is needed. While the developmentof an optimum cavity is still under work, it is safe to foresee a space of about 80 mm diameterby 80 mm length to accommodate cavity and holding structures. An additional voltage supplywith some ten Volts tension and low current has to be foreseen for use of insulator cavitieswith better beam bunching.
• A Knudsen cell should be attached to the target to provide stable beams for optimizing andretuning of the RILIS settings.
• For introduction of the laser beam, there has to be a free sight onto the ionizer cavity, notobstructed by slits, etc.
• If the options isomer separation and resonance ionization spectroscopy should be used ex-tensively, a set-up for Doppler free two-photon absorption can be foreseen. This requires toaccess the ionizer cavity with two laser beams from opposite directions.
• The quartz window in the vacuum chamber through which the laser beams enter, has tobe large enough (free diameter >∼ 25 mm). It has to be easily accessible for exchange whenthe transmission is reduced due to excessive deposition of neutral particles on the surface.Depending on the vacuum quality and the distance from the source, this happens after someweeks to years of operation.
• A shutter installed inside the vacuum chamber in front of the window protects it frompollution while the RILIS is not used.
• To reduce the diffraction limited beam size, the last focusing element has to be as closeas possible to the source position (<∼ 20 m). Note that it should be accessible or remotecontrollable for beam tuning.
• A semitransparent or removable reflector plate halfway between laser lab and ion sourceproved to be extremely useful for easier beam tuning.
• While not necessary for the operation, safety regulations require often to guide the laserbeams in a closed envelope from the laser lab to the entrance of the vacuum chamber.
• For monitoring of the ionization efficiency it is highly desirable to control the current of astable isotope in a Faraday cup. To not disturb separation and use of the radioactive isotope,this FC is best placed in a lateral position of the focal plane or in a parallel beam line whichaccepts a second mass from the separator.
• In both cases the selection of the monitor mass has to be movable along the focal plane. Forseparation of very neutron-rich beams, the monitor mass is up to 23 % smaller31 (for lightelements: Be, Mg) and for separation of very neutron-deficient beams the monitor mass canbe up to 20 % larger than the central mass. Therefore the dispersion of the first separatormagnet should not be too large to accommodate this rather large mass range in the focal
31In a reactor-based facility specialized on fission products this requirement is reduced to about 19 %.

112 3.6 Implementation of the RILIS
plane. On the other hand care has to be taken that the heaviest masses are not implantedstraight into the optical window. Eventually this has to be placed into a more remote positionand protected by an additional magnetic or electrostatic beam deflector.
• The limitation of the dispersion clearly excludes a single stage separator with high resolution.Instead a high resolution separator should be placed behind a preseparator with resolvingpower Rm ≤ 1000. This configuration is anyhow better to handle safely the activity whichis deposited in the focal plane (see ref. [PIAFE]).
• The size of the laser lab depends on the used laser system. A minimum area of about4 m by 7 m is a good estimate. More equipment for additional frequency stabilization orbandwidth reduction (cw-seeded dye lasers) requires additional space. For better temperaturestabilization a sufficient height and a climatisation should be foreseen. This gives an externalheight of ≥ 3 m.
• For the pumping lasers a plug power of up to 20 kW is required. If CVL are used, this shouldbe provided from a separate net to reduce the perturbations caused by the high frequencynoise. In the latter case it would also help to equip the laser lab as a Faraday cage for betterhigh frequency shielding.
3.6.4. Combination with off-line use
Up to now only applications of the RILIS for on-line produced radio-nuclides were described.However, by upgrading the laser system, the RILIS at ISOLDE and generally also at other RIBfacilities is mutating from a small supplement of the target-ion source system to an importantset-up for its own. It would be possible to use it for off-line applications during shutdown of theRIB facility or even while running the RIB facility simultaneously with another ion source type, bysending the laser beams to a dedicated off-line separator. Besides an improvement of the RILIScapabilities by a more frequent development work, additional applications become possible. Thus,the investment into a performant laser system could be used more extensively.
• Long-lived laser-ionized isotopes could be implanted off-line for production of radioactivetargets. For example “strong” implanted 7Be samples for a detailed measurement of the7Be(p,γ) cross-section or for applications in nuclear solid state physics can be produced.
• After post-acceleration light radio-isotopes (e.g. 7Be) can be implanted deeper into thesurface of workpieces as tracer for wear analysis in materials research [Feh97].
• With a small-bandwidth laser the hyperfine splitting could be used to separate the 11/2−
isomer 119mSn (produced by 118Sn(n,γ)) from the 1/2+ ground state 119gSn and implant itinto semiconductors for Moßbauer spectroscopy [Weyer].
• There are many other radio-isotopes which can be efficiently produced off-line by neutroncapture in a reactor or by direct reactions at a cyclotron. After separation with a RILISand implantation in a carrier-free form they can serve for various applications in materialsresearch or nuclear medicine (see e.g. [Bey98]).
• Also applications for trace analysis of metallic elements by RIS become possible. This methodis often complementary to other ultrasensitive methods like neutron activation analysis oraccelerator mass spectroscopy. An implementation at the MAFF set-up in Garching wouldprovide an ideal supplement to the nearby existing facilities.

4. Yields and release of various elements
In the following the yields of isotopes from individual elements are discussed which were obtainedrecently at ISOLDE. ISOLDE yields are given as the beam intensity in the focal plane of the massseparator, normalized to 1 µA of primary proton beam. They do not include transmission lossesin the subsequent beam transport. Traditionally always the optimum yield ever obtained is quoted[Klu86]. However, there are noticeable fluctuations of the performance from one target and ionsource unit to another or even during a longer time of operation with the same target. Dependingon the type of ion source the yields are generally reproducible within a factor two or three, but fromcertain targets they can even differ by one order of magnitude. Also the yields of very short-livednuclei depend strongly on the individual conditions (target structure and temperature) and tend tofluctuate more. Due to the limited reproducibility it makes no sense to perform an error calculationfor the presented yield values. They are therefore given without error bars. In the planning of newISOLDE experiments an appropriate safety margin has to be considered in the count rate estimate.
Different methods are used to determine the yields:
• The ion current can be simply measured with a Faraday cup. The ISOLDE Faraday cups arereliable down to about 20 pA. With an average proton beam of 2.5 µA this is equivalentto a yield of about 5 · 107 per µC of primary protons. This method can be applied underthe condition that no major isobaric contaminations occur and that the current does notfluctuate too much. Yields obtained in this way are marked with the label “FC”.
• Lower intensities of radioactive nuclei can be determined by measuring the decay activity.A monitoring tape station attached to the main beam line is normally used to measurebeta-active nuclei. A short bunch of the ion beam is implanted into a tape which is thenmoved into a 4π β-detector (scintillator). The integration of the release profile measuredwith this sampling technique [Let97a] gives the yield. This method is usable for nuclei with0.4 s <∼ T1/2 <∼ hours. More long-lived activities are not implanted to avoid a contaminationof the tape, more short-lived ones decay during the tape transport (0.9 s). In some casesmore short-lived nuclei can be analysed by observing the activity of the decay daughters. Fornuclei decaying mainly by an isomeric transition or alpha emission the detector is less suitableand the deduced yields include the uncertainty of the detector response. A multiscaling unitallows to follow the time behaviour of the beta activity and to disentangle contributionsof different isomers or isobars. However, this separation is no longer reliable if a mixtureof several nuclei with similar lifetimes occurs. In these cases the sum yield was estimatedby using an averaged half-life. Yields obtained with the monitoring tape station are markedwith the label “β”.
• Nuclei with longer lifetime (>∼ 1 h) and a suitable gamma branching are collected by ionimplantation into a metal foil and determined off-line by gamma spectroscopy. These nucleiare marked with the label “Coll”.
• For the yield determination of the most short-lived nuclei a complete nuclear spectroscopyset-up has to be used. Depending on the decay pattern an efficiency calibrated alpha, beta,gamma or neutron-detector gives the count rate of the nuclei. This has to be corrected
113

114 3.6 Implementation of the RILIS
for the transmission to and the efficiency of the detector as well as for the time structureof the collection and measurement period. For a yield estimation of unknown nuclei thebranching ratio for neutron emission or certain gamma lines has to be taken from theoreticalpredictions. Yields obtained with these detection methods are marked with the labels “γ”or “βn”, respectively.
It is a very honorable work of many ISOLDE users to perform themselves the complete yielddetermination of all isotopes observed with their set-up and report these. However, others do notevaluate the yields at all. They should keep in mind that this evaluation is not lost time, but theyields are useful for everyone:
• For other groups who can better plan their own experiments when having detailed informationon the expected intensities of the desired beams and occuring contaminations.
• For the ISOLDE technical group to improve the target performance. Absolute yields are themost important mean to decide if a certain target is performing better or worse than anotherone. With the simple monitoring equipment only rough properties can be determined likeyields of abundant isotopes and a release profile. Extrapolations to more exotic isotopes arepossible, but a direct measurement is always better.
• For the experimental groups themselves: a rough on-line determination of the obtainedyields can uncover e.g. a bad transmission of the beamline or a major misfunction of theexperimental set-up (trigger settings, etc.). A detailed off-line analysis gives an additionalpossibility to control the evaluation. Obtained yields which differ significantly from the ex-pected (smooth) drop towards more exotic isotopes, can give an indication of unexpectedeffects. Beam contaminations are easier discovered and even hints to nuclear properties canbe deduced. Possibly even a limit can be given on the half-life of unobserved isotopes or onthe branching ratios towards unobserved decay modes (e.g a strong beta transition to theground state).
To allow for a better judgement of the ISOLDE yields, where available also the yields from otherRIB facilities are given for comparison. Unfortunately only some facilities (e.g. the GSI ISOL)have the useful tradition to quote always the obtained yields directly in the nuclear spectroscopypublications. Otherwise the yields have to be estimated from “hints” given in the text. In the worstcase this may be from the given statistical accuracy or a from figure with a gamma spectrumand an estimated measurement period1. Clearly these indirectly derived yields (marked with thelabel “est.” in the corresponding tables) have a quite large uncertainty. Often also those importanttechnical details (average beam current, transmission, etc.) are missing which would allow a scalingto meanwhile improved machine parameters (e.g. for the GSI SIS/FRS).
The used ion source types are abbreviated as follows: “XSI” for surface ion source with X thematerial of the ionizer cavity and “F.” for FEBIAD (complemented by the type if quoted), “MK5”for the ISOLDE “hot plasma source” and “MK3” for the ISOLDE source with medium temperaturetransfer line (200 to 400 C).
Most ISOLDE SC yields were taken from ref. [Klu86, SCyie], exceptions are quoted. For thecomparison with other facilities not the normalized yields (ions per µC), but the absolute yields(ions per s) are used. If not marked otherwise the ISOLDE yields are then given for a typicalaverage proton beam current of 2.5 µA. The yields of other facilities were taken as published andnot scaled to a meanwhile improved machine performance.
1If no other indications are given in the text a measurement time of one day was assumed.

4.1 Separation of molecular sidebands 115
4.1. Separation of molecular sidebands
Data from literature
For elements where the release time is mainly determined by the desorption of the atoms, aseparation as molecules can accelerate considerably the release. Especially many oxides and halidesare stable enough at high temperatures to serve as carrier for various elements.
Ichikawa et al. made detailed off-line and on-line studies of the current ratio of monoxide to atomicions for different lanthanides [Ich89]. Lanthanide monoxides were separated on-line at the KUR-ISOL facility [Kaw89] and are also seen as stable mass beams at ISOLDE. A barium oxide beamwas found at OSIRIS [Hel92].
Also polyatomic molecular ions can be used as molecular sidebands. For example a COSe+ beamfrom a ZrO2 target was used for chemically pure separation of selenium [Hag92b].
Fluorides are preferred among the halides due to their strong binding and the existence of a singlestable isotope (19F). Chlorides cause an ambiguity in the mass assignment due to the existence oftwo stable isotopes (35Cl and 37Cl).
Occasionally impurities of the target material or the target container provide enough fluorineto cause significant molecular sidebands. BaF+ was observed ten times more intense than Ba+
from a molten lanthanum target without additional fluorination [Rav75b, Rav75a]. This can beexplained by a 0.05 (mass)% fluorine contamination of the lanthanum [Put81]. However, in a laterexperiment with a controlled CF4 addition, providing a CF4 pressure of 5 · 10−4 torr, the ratio[BaF+]/[Ba+] dropped to 8 % [Hag92b]. Still, the use of the molecular sideband allows to suppressisobaric contaminations from alkalis2 and gives a much higher beam purity.
Reeder et al. observed ratios of [BaF+]/[Ba+] ≈ 10 and [SrF+]/[Sr+] ≈ 1 from fluorine contami-nations of the SOLAR UO2/graphite target [Ree76].
By addition of fluoride vapors to a molten La-Th alloy at ISOLDE a ratio [RaF+]/[Ra+] > 10 wasobserved for radioactive radium isotopes [Rav76].
With fluorination (5 % CF4 addition to the carrier gas) of the OSIRIS UCx/graphite target,fluoride sidebands were observed for a series of elements [Hof80]. The following intensity ratios werereported: [GaF+]/[Ga+] ≈ 0.4, [SrF+]/[Sr+] ≈ 15, [YF+2 ]/[YF+]/[Y+] ≈ 75/25/1, [InF+]/[In+] ≈0.1, [BaF+]/[Ba+] ≈ 20 and for various lanthanides (Ln): [LnF+2 ]/[LnF
+]/[Ln+] ≈ 140/40/1.
In [Hel92] a flow rate of 0.5−1.0 nmol/s of CF4 (equivalent to (1−2)·10−5 mbar l/s) was used withthe OSIRIS target, but the intensity of the fluoride sidebands was reduced to: [SrF+]/[Sr+] ≈ 0.2and [BaF+]/[Ba+] ≈ 2,
Putaux et al. [Put81] report a ratio of [LaF+2 ]/[LaF+]/[La+] ≈ 10 : 4 : 1 for the stable ion currents
from a ISOCELE molten lanthanum target with CF4 addition. For a molten cerium target withoutCF4 addition they find [BaF+]/[Ba+] ≈ 1. At ISOCELE fluorination of different targets was alsoused to separate new Ta, Zr and Sr isotopes as TaF+4 , ZrF
+3 and SrF+ respectively [Lia82].
Hoff et al. reported the improved release characteristics when adding CF4 to different ISOLDEtarget materials [Hof84]. From a UCx/graphite cloth target at 1900 C the release of lanthanumand cerium was significantly accelerated (reduction of t50 from > 15 min to < 2 min) when addingCF4 at a pressure of 1.5 · 10−4 torr. For ISOLDE targets this corresponds to a leak rate of about2 · 10−5 mbar l/s CF4.
With CF4 addition to an ISOLDE niobium foil target practically elemental pure beams of neutron-deficient SrF+ and YF+2 were separated [Ede92]. Yttrium fluorides were also separated from atantalum foil target with an intensity ratio of [YF+2 ]/[YF+]/[Y+] ≈ 4/1.7/1. A significant depen-dence on the operation conditions of the plasma ion source was noticed. Among the rare earths2The alkalis do not form positive fluoride ions, probably due to immediate dissociation when a binding electrongets lost in the ionization process [Kir97].

116 4.1 Separation of molecular sidebands
only lutetium showed considerable fluoride sidebands (as LuF+ and LuF+2 ). Also hafnium trifluorideions could be separated with a remarkable yield from the tantalum target [Ede92, Hag92b]. Thisseparation method for hafnium isotopes had already been used before at ISOCELE [Sau84]. CaF+
and ScF+ beams were obtained from a titanium foil target, however with yields about forty andten times smaller than the corresponding atomic ion yields [Ede92].
Beams of BeF+ and UF+ were observed in a test with a UCx/graphite target at ISOLDE, but incontrary to the results at OSIRIS no increase was seen for yttrium or the rare earths [Ede92]. Allthese experiments were done with a leak rate of about 10−5 mbar l/s.
Kirchner measured the release profiles and intensity ratios for atomic and monofluoride beams ofgroup IIa and IIIa elements [Kir97]. In all cases the monofluoride ion beam showed a significantfaster desorption and (with a FEBIAD source) a higher current. These experiments were performedwith a CF4-flow of only 3 · 10−6 mbar l/s, but it should be kept in mind that the used target andion source system has a total volume of only 1.3 cm3 [Kir92b], about fifty times smaller than anISOLDE target. With increasing CF4 flow (from 4 ·10−7 to 10−4 mbar l/s) the [BaF+]/[Ba+] ratioincreased from about 6 to 400.
A much higher CF4 flow3 of up to 0.15 ml/s was used by Kawase et al. to separate BaF+ andSrF+ beams [Kaw92]. The intensity of the latter was ten times higher than that of Sr+.
Fluorination of a UCx/graphite target
A release test was made with a fluorinated standard ISOLDE UCx/graphite target and tungstensurface ionizer. With a calibrated leak a constant CF4 flow of 6.8 · 10−6 mbar l/s is provided. Forcomparison yields and release curves were measured without and with fluorination.
Aluminum
Kirchner had shown that the release of aluminum can be significantly accelerated by fluorination[Kir97]. The addition of aluminum vapor was also used for separation of radioactive fluorine isotopesfrom a silicon carbide target as AlF+ [Hag92b]. At Oak Ridge AlF+ beams were separated froman Al2O3/SiO2 target [Car97]. AlBr+ and AlI+ beams were used at OSIRIS to obtain chemicallypure beams of halogens as an alternative to negative surface ionization [Ale80, Hof81].
However, in our measurement no difference in the release profile of Al+ was observed with andwithout fluorination. Note that AlF+ cannot be surface ionized due to its high ionization potential(9.8 eV). Also Mg is not surface ionized. With a delay of 0.9 s between ion collection and mea-surement there remain no other contributions on mass 28 (sodium decays rapidly to the long-livedmagnesium) and the measured beta-activity is entirely due to aluminum. The release curve canbe fitted with the following parameters, see equation (2.4.2): τr = 1 ms, τf = 0.5 s, τs = 20 s,α = 0.5. At mass 30, the first part of the release curve (up to 300 ms delay) was not taken intoaccount. It shows a contribution of 30Na which decays via magnesium and aluminum. Note thatthe 30Al yield was higher than reported from the ISOLDE SC [Klu86, SCyie].
The release of aluminum was fast enough to get sufficient yields of the short-lived isotopes 34Al(T1/2 = 55 ms) and 35Al (T1/2 = 38 ms) to perform new nuclear spectroscopy experiments[Han99a].
It should be noted that the heavy aluminum isotopes start to emit beta-delayed neutrons at mass32. The contribution of these neutrons is possibly the reason for the “bump” in the measuredyield curve of heavy sodium isotopes from ISOLDE SC reported in [Klu86]. These yields had beenderived from the measured neutron activity with the assumption that only sodium is extracted fromthe surface ion source. In a measurement at the ISOLDE PSB the “bump” was not confirmed.3With a fixed helium flow rate of 13 ml/s.

4.1 Separation of molecular sidebands 117
Strontium
The measured release curve of 95Sr+ was very similar without and with fluorination. It was fittedwith the parameters: τr = 20 ms, τf = 0.6 s, τs = 30 s, α = 0.9.
At mass 114 some contaminations (indium, etc.) occured. Therefore only an upper limit couldbe derived for the yield of 95SrF+. The ratio [SrF+]/[Sr+] <∼ 0.05 is much smaller than in allmeasurements reported in literature.
Barium
Yields of radioactive barium isotopes were measured as atomic ions as well as monofluoride ions.For BaF+ the release curve was fitted with a rise time of 1 s and a single fall time of about100 s. This is in agreement with the Ba+ release measured from a UCx/graphite target withoutfluorination [Eve97]. For Ba+ the first part of the release curve is veiled by a large backgroundfrom Cs+. Within the experimental errors the later part is identical to that of BaF+. Applying therelease profile of BaF+ also for Ba+ one finds for the latter a yield thirty times that of BaF+. Thisis in contradiction to the ratios reported in literature where [BaF+] [Ba+].
It should be noted that these and all other fluoride yields and release curves were measured afteroperating the target already for three days with CF4 addition. A measurement of 145Ba+ and145BaF+ some hours after the first CF4 addition gave a much faster rise (τr <∼ 50 ms) and asignificantly higher yield for 145BaF+ (about 7 · 106 µC−1). This fact indicates a breakdown of theCF4 supply during the experiment.
Europium
160Eu+ was identified by its lifetime and thus separated from 141BaF+ which is present at the samemass. The release profile can be reproduced with a fast rise (∼ 0.1 s) and a slow drop (∼ 100 s).For the monofluoride 160EuF+ only an upper limit was obtained: [EuF+]/[Eu+] ≤ 1 %. Notethat from another unfluorinated UCx/graphite target 160Eu+ was observed with similar releasecharacteristics and a yield of 2 · 105 per µC. Thus, there is no indication for an improvement byfluorination.
Radium and others
The yields of 231Ra and 232Ra were estimated by disentangling from the measured beta activitythe contributions of francium and radium by their half-lives. A rise time of 1 s and a single fall timeof 100 s was taken for the evaluation. This arbitrary choice does not affect the yields significantly.
There was no indication of significant amounts of 39CaF+, 46mScF+, 84gYF+, rare earth fluoridesor RaF+ 4. At masses 71, 102 and 176 some activity was observed, but from the beta-decay curvesit could not be attributed unambiguously to individual isotopes.
Fluorine partial pressure?
The low intensity of the observed fluoride sidebands, the small effect on the release times and thechanging values for barium fluoride give rise to the suspect that either not enough fluorine reachedthe target (blocked leak) or it reacted mainly with some impurity to a non-surface-ionizable (andthus not detected molecule.
4In fact, at another occasion RaF+ beams were observed from a not specially fluorinated target (see section 4.12).

118 4.1 Separation of molecular sidebands
Table 4.1.1.: Yields and release parameters from a standard ISOLDE uranium carbide/graphitetarget with CF4 addition. The target was kept at about 2200 C and the W surfaceionizer at 2400 C. All yields without reference were measured in this experiment bybeta counting at the monitoring tape station.
Isotope Yield Reference(µC−1)
28Al+ 1.2 · 10630Al+ 2.7 · 10534Al+ 13 [Num01]35Al+ 4 [Num01]95Sr+ 3.5 · 10895SrF+ ≤ 1.9 · 107145Ba+ 3.4 · 106141BaF+ 6 · 106144BaF+ 6 · 105145BaF+ 1.4 · 105146BaF+ ≈ 1.4 · 104147BaF+ ≈ 2000148BaF+ ≈ 600160Eu+ ≈ 1.5 · 105231Ra+ ≈ 4 · 105232Ra+ ≈ 2 · 105
The ratio of uranium fluoride ions to uranium ions could be used for a monitoring of the fluorinepartial pressure in the target. The UF+ current reached only 0.2 % of the U+ current, althoughits ionization potential is slightly lower (6.0 eV instead of 6.2 eV [Lau82]). A value of ≈ 8.2was measured for the equilibrium constant of the reaction: U(g) + BaF(g) UF(g) + Ba(g) at2200 C [Lau82]. With the typical ratio of [BaF+]/[Ba+] >∼ 10 measured in [Rav75b, Hof80, Kir97]and comparable ratios of the ionization potentials of fluoride and atom for uranium and bariumone should expect a much higher current of UF+ under equilibrium conditions. UF+2 (ionizationpotential 6.2 eV [Lau82]) and higher fluorides5 were not observed at all. The only markable currentabove A =238 was at mass 262 with about 5 % of the 238U+ intensity. 238UC+2 has an ionizationpotential of 6.4 eV while that of the other uranium carbides is above 7 eV [Gup79].
It can be concluded that the partial pressure of the fluorine was probably too low in these experi-ments. The obtained results give only a lower limit of the yield increase and the release accelerationwhich can be obtained by fluorination of a UCx/graphite target.
The literature data show that the use of molecular sidebands can provide a good possibility forefficient and selective separation of certain elements. However, the considerable fluctuations inthe reported ratios of molecular to atomic ion current indicate that the detailed high-temperaturethermodynamics plays an important role. Thus, changes of the chemical composition or impuritiescan affect the intensity of molecular sidebands much stronger than that of the atomic ions. Toguarantee a good reproducibility of molecular ion beam intensities special care has to be takento avoid impurities in the target and ion source system and to provide a sufficient flow of CF4,especially when using thick targets.
5These are practically not surface ionized with ionization potentials of 7.05 eV, 10.2 eV [Lau82], 11.3 eV and 14 eV[Hil77] for UF3, UF4, UF5 and UF6 respectively.

4.2 Beryllium yields 119
4.2. Beryllium yields
Beryllium is a “difficult” element for ISOL facilities, which is often released very slowly or not atall. With a vapor pressure of ≈ 10 mbar at 2000 K [Hon69], about equal to tin, it is less a problemof evaporation than of adsorption to surfaces.
To allow for a fast desorption the whole target-ion source assembly has to be kept at high temper-atures. Off-line tests with 7Be in a hot plasma source gave an efficiency of 10−4 at best. About95 % of the 7Be got stuck to cold spots and did not reach the ionizer [Barke]. It accumulatedespecially on the surface of the oxide insulators in the plasma source, forming very stable BeO.
Also by addition of CF4 and separation of the monofluoride sideband no major increase wasobtained. On-line tests with 11BeF+ and a hot plasma source (all parts above 1800 C) gave onlyan efficiency of 4 · 10−4.A recently presented ECRIS for the production of 7Be beams at TRIUMF [Jay98] reaching anefficiency of 2 to 3 % might be an alternative for off-line produced 7Be. However, the source bodyis too cold to allow a rapid release of short-lived beryllium isotopes. Moreover, the beam is mainlyseparated as BeF+ and BeF+2 . With a heavy target, huge contaminations of isobars like Ne+, Na+,Ar+, K+, AlF+, etc. are unavoidable and will disturb nuclear spectroscopy experiments stronglydue to their similar lifetimes and decay modes (e.g. βn).
The use of a hot cavity RILIS allows a major increase of the ion source temperature and thesuppression of any oxide surface.
Graphite target
Initially a “long” (40 cm length) and dense (73 g/cm2) target from pure graphite was used for theproduction of the long-lived isotopes 7Be and 10Be. However, the target temperature was limitedby the maximum current of the power supply and it took very long (hours) that the beam came intosaturation. With this target an ion implanted 7Be target was produced and used for a measurementof the astrophysical S17 factor (i.e. the cross-section for 7Be(p,γ)8B, see ref. [Has98b]).
UCx/graphite target
A standard UCx/graphite target (52 g/cm2) was used to produce a 11Be beam for a collinear laserspectroscopy experiment, where the magnetic moment of 11Be was measured with β-NMR [Gei99].In a target test also the short-lived isotopes 12Be (T1/2 = 21.3 ms) and 14Be (T1/2 = 4.4 ms)could be separated for the first time at an ISOL facility. The latter is among the most short-livedisotopes separated so far at ISOLDE.
Table 4.2.1.: Measured yields of beryllium isotopes from a standard UCx/graphite target.
Isotope 7Be 9Be 10Be 11Be 12Be 14Be
T1/2 53 d stable 1.6 · 106 a 13.8 s 21.3 ms 4.4 msY (µC−1) 1.4 · 1010 1.7 · 1010 6 · 109 1.6 · 107 1500 4Method FC FC FC β β βn
With another UCx/graphite target (53 g/cm2 of uranium) the yield of 14Be was confirmed and ameasurement of the β count rate allowed to redetermine the Pn value [Ber99]. With this targetalso a higher yield of 11Be was observed, indicating some transmission loss to the monitoring tapestation in the last measurement. Another measurement gave a still higher yield for 11Be but couldnot be confirmed. It had possibly been fooled by a misfunction of the beam gate.

120 4.2 Beryllium yields
11Be release from UC/graphite target
0
5000
10000
15000
20000
25000
30000
35000
40000
0 2 4 6 8 10 12 14Delay time (s)
Inte
nsi
ty (
a.u
.)
Measured values
Fitted release function
tf ≈ 25 s
12Be release from UC/graphite target
0
10
20
30
40
50
60
70
80
90
100
0 10 20 30 40 50 60 70 80 90 100
Delay time (ms)
Inte
nsi
ty (
a.u
.)
Measured values
Fitted release function
Figure 4.2.1.: Release function of beryllium measured with 11Be and 12Be.
For the simplified one-component release function (not taking into account the contribution ofa possible slow component) a fall time τf of about 25 s can be deduced after correction for theradioactive decay of 11Be, see figure 4.2.1. The very first part of the release function (up to about100 ms) was monitored with 12Be. Despite some fluctuations a rise time τr of the order of 1 mscan be deduced. This extremely fast rise might indicate a small component which is released asa bunch due to the impact of the intense proton pulse. Such a “radiation enhanced release” hasalready been experienced before, e.g. for noble gases from oxide targets [Rav97b]. A slower tail inthe minute range can be observed in a Faraday cup from the release of the long-lived radio-nuclides7Be and 10Be after switching off the proton beam. A quantitative evaluation is however difficult,since the proton beam contributes to the target heating and to the just mentioned bunched release.During the whole run the target was kept at temperatures above 2000 C and the tungsten ionizercavity above 2300C.
0 10 20 30 40 50 601
10
100
1000
yield: ≈ 4 ions per µC proton beambeam gate open: 0-10 ms
Neu
tron
cou
nts
Time (ms)
Figure 4.2.2.: Grow-in and decay curve of 14Be. The beam gate was closed after 10 ms.
14Be was detected via its beta-delayed neutrons with a 4π neutron long counter. Figure 4.2.2shows the release and decay curve of 14Be.

4.2 Beryllium yields 121
Comparison
ISOLDE is presently the only ISOL facility where short-lived beryllium isotopes are available. Beforethis has been a unique domain of fragment separators. Yields from other facilities are shown in table4.2.2. In fact the beams are not directly comparable since the beam energy differs significantly.Depending on the application a higher or lower energy is of advantage. The low-energy ISOL beamsare particularly favorable for nuclear spectroscopy experiments. This explains why new informationcould be gained [Ber99] despite a lower beam intensity,
Table 4.2.2.: Beam intensities of short-lived beryllium isotopes at different RIB facilities. E/A givesthe energy of the projectile. Note that LOHENGRIN is not a dedicated “production”facility for light elements. The given yields are for a 0.4 mg/cm2 241Pu target. The14Be beam from the FRS was used in Cave B and had a very poor transmission[Simon].
Intensity Facility Proj. E/A Reference(s−1) ISOLDE (MeV)
11Be
4 · 107 ISOLDE, PSB p 1000 RILIS Be1 · 106 A1200, MSU 13C 100 [Var98]3 · 104 SISSI, GANIL 15N 35.3 [For98]0.4 LOHENGRIN n thermal chapter 1
12Be
4 · 103 ISOLDE, PSB p 1000 RILIS Be1 · 105 RIPS, RIKEN 18O 100 [Kor95]2 · 104 LISE3, GANIL 18O 63 [Fre98]0.2 LOHENGRIN n thermal chapter 1
14Be
10 ISOLDE, PSB p 1000 RILIS Be350 A1200, MSU 18O 80 [Zah93]300 RIPS, RIKEN 18O 100 [Aoi97]100 LISE3, GANIL 18O 63 [Fre98]44 U400, FLNR 18O [Pen95]16 FRS, GSI 18O 325 [Simon]
2 · 10−4 LOHENGRIN n thermal chapter 1
Prospects
Already now new experiments with beryllium beams are scheduled at ISOLDE (detailed nuclearspectroscopy of 11Be, 12Be and 14Be [ISP99]) or planned for the future (measurement of S17 ininverse kinematics at REX-ISOLDE [ISI20]). To perform these experiments a further increase inyield would be very useful. This could be achieved by optimizing the target geometry for fastestrelease (more compact design). Beryllium was also found to be released from other carbides [Hof84].Release times below 30 s were measured for TiC-C3, ZrC-C3 and VC at 1900 C each. However,for the most neutron-rich isotopes the production cross-sections are expected to be highest fromfragmentation of heavier nuclei. It is not possible to predict if one of the other carbides will showa fast enough release to overcompensate this handicap.

122 4.3 Manganese yields
By adding CF4 the release time might be further reduced, but the beryllium-fluoride moleculeshave to be dissociated in the ionizer tube before laser ionization can be applied. Molecules likeBeF or BeF2 are not laser ionized with the wavelengths of the present scheme. They are neithersurface ionized due to their high ionization potentials (> 9 eV). Unfortunately a first test of CF4addition to a UCx/graphite target was not conclusive (see section 4.1). For beryllium no majorinfluence of the fluorination on the release profile was observed. The yield could not be compareddirectly due to changed operation conditions: a four days “older” target, a retuning of the laserset-up and different target and ionizer temperatures.
A tantalum or tungsten foil target which can be heated to very high temperatures (2400 C andabove) could be a good alternative to UCx/graphite. At 2400
C the sticking time calculated fromthe Eichler systematics (see B.2.5) is about 2 µs for either Ta or W surfaces.
4.3. Manganese yields
UCx/graphite target
A pure 57Mn beam was required for Moßbauer spectroscopy in semiconductors. Normally theMoßbauer level in 57Fe is populated by electron capture decay of the long-lived 57Co. However, athigher temperatures the cross-section for recoil free resonance absorption is reduced and a highersource strength is required to overcome the experimental noise. With the low specific activityof 57Co (1 GBq per 3 µg) this would result in an overdose of cobalt doping. Thus, no longerthe intrinsic properties of the pure semiconductor material are observed, but those of a heavilycobalt doped material which is technologically irrelevant. The β− decay of 57Mn is an alternativeto populate the 14.4 keV level in iron. Due to the shorter half-life (85.4 s) the specific activityis significantly higher: 1 GBq per 1011 atoms. Because of its short half-life the 57Mn beam hasto be implanted on-line. However, the beam of a “hot plasma source” has typically a strongcontamination with stable iron. This would again result in an overdoping of the sample. Thereforea more selective ionization method was required: resonant laser ionization.
For manganese a new ionization scheme was found which attains a very high efficiency (≈ 19.2 %)since the green CVL line just matches a resonant transition to an AIS. It was shown that aUCx/graphite target can provide intense beams of heavy manganese isotopes [Fed97].
Also a tantalum target was tested, but even at a temperature of 2100 C the release was muchslower (t50 > 50 s) and the yield lower, only 2 · 106 µC−1 for 57Mn.
In summer 1997 another manganese beam time with a UCx/graphite target was scheduled and theMainz neutron detector was set up to extend the target test towards more neutron-rich isotopes.The tuning of the RILIS took most of the night, but in the early morning the test could finally bestarted. The release was fast and the yields were significantly better compared with the tantalumtarget: till breakfast beta-delayed neutrons up to 68Mn were found. Later also 69Mn could bemeasured. This was surely one of the most successful “target tests” at ISOLDE with nine new orsignificantly improved half-lives from 61Mn to 69Mn [Han99b].
Obviously not only the fast release and the high ionization efficiency were a prerequisite for thissuccess, but also the very good beam purity. Fortunately in this mass range there are very fewisobaric contaminations. Only gallium is significantly surface ionized, but the gallium isotopes upto 68Ga are neutron-deficient and therefore less produced from an actinide target. Moreover theyare long-lived and give only a flat background. Using additionally the selective detection of beta-delayed neutrons, there is absolute no isobaric contamination from surface ionized beta-delayedneutron emitters up to mass 78!
Table 4.3.1 shows the yields obtained with the 50 g/cm2 UCx/graphite target. The target temper-ature was 2100 C, the line temperature 2400 C. The release profile was fitted with (see equation

4.3 Manganese yields 123
(2.4.2)): τr = 0.1 s, τf = 0.6 s, τs = 12 s and α = 0.6. Note that the yield of the short-livednuclei is higher compared with the values given in [Fed97]. The latter experiment was made withthe target and line at only 2000 C giving a slightly slower release. The half-lives shown in table4.3.2 are from [Aud97] for 53−60Mn and [Han99b] for 61−69Mn. The predicted branching ratios forneutron emission Pn were taken from [Mol97].
Table 4.3.1.: Yields of manganese isotopes from a 51 g/cm2 UCx/graphite target and resonantlaser ionization. The yield Y is given in atoms per µC of primary proton beam.
Isotope 53Mn 54Mn 56Mn 57Mn 59Mn 60g+mMn 61Mn
T1/2 3.7 · 106 a 312 d 2.6 h 85 s 4.6 s 1.8 s, 51 s 625 msY (µC−1) > 3 · 107 9 · 107 4 · 108 1.5 · 108 1.5 · 108 > 4 · 107 1.7 · 106Method FC Coll Coll β Coll FC β
Isotope 62Mn 63Mn 64Mn 65Mn 66Mn 67Mn 68Mn 69Mn
T1/2 671 ms 275 ms 89 ms 88 ms 66 ms 42 ms 26 ms 14 msY (µC−1) 7 · 105 2 · 105 7000 1000 ≈ 170 ≈ 100 ≈ 4 ≈ 1Method β β β β β βn βn βnPn (%) ≈ 11 ≈ 16 ≈ 24
The yield values of 63−66Mn determined from the decay daughters Fe and Co and those of 67−69Mnobtained with the estimated neutron branching ratios have clearly a larger uncertainty. The “bump”at mass 67 could indicate an underestimated Pn value6. A better yield determination will becomepossible with completely evaluated βn- and βγ branching ratios.
Also some samples of 53Mn and 60Mn (decaying to 60Fe) were collected and used as calibrationstandards at the AMS facilities in Munich and Zurich. The number of 53Mn atoms found inMunich was about twice as much as estimated from the Faraday cup measurement [Knie]. Thisindicates that the calibration of the used FC (in the collection chamber) might be too low and thetransmission to the GLM beam line higher than estimated.
Nb foil target
The ISOLDE proposal P94 intends to study the decay of the very neutron-deficient isotope 47Mn.This is best produced in spallation of a nearby target. On the other hand it has a short half-life(≈ 100 ms) and requires a rapid release to limit the decay losses. A target with high production ratesand a fast release of manganese is moreover useful for the production of other neutron-deficientmanganese isotopes, e.g. 50gMn which decays by a superallowed 0+ → 0+ Fermi transition and istherefore suitable for the determination of the vector coupling constant GV (see e.g. [Hag94]).
As first choice a niobium foil target was tested. However, even at nearly 2100 C the release wastoo slow. The release profile was fitted with a rise time of 0.2 s and a fall time of 30 s. 47Mn wasnot observed, but new nuclear spectroscopy information could be obtained for other manganeseisotopes, e.g. 59Mn [Oin01]. Table 4.3.2 shows the yields obtained with the 50 g/cm2 Nb foiltarget. The shown half-lives are from [Aud97] for 48−60Mn and [Han99b] for 61,62Mn.
Interestingly at mass 60 the isomer 60mMn was observed, while for 60gMn only an upper limit canbe given based on a possible T1/2 = 51 s component. Taking into account the correction for decaylosses, the ratio of ground state to metastable state intensity is about 1 : 10 in 58Mn, but < 1 : 100
6Note that other estimations propose a Pn value of the order of 26 % [Pfe99].

124 4.3 Manganese yields
Table 4.3.2.: Yields of manganese isotopes from a 50 g/cm2 niobium foil target and resonantlaser ionization. The yield Y is given in atoms per µC of primary proton beam.Yields marked by βγ were measured with the set-up of the IS-P94 collaboration andevaluated by Markku Oinonen [Oinon].
Isotope 48Mn 49Mn 50gMn 50mMn 51Mn 52Mn 53Mn 54Mn 56Mn
T1/2 0.16 s 0.38 s 0.28 s 105 s 46 min 5.6 d 3.7 · 106 a 312 d 2.6 hY (µC−1) 5 2800 400 6 · 105 6 · 107 3.8 · 108 9 · 108 1.1 · 109 2.7 · 108Method βγ βγ βγ βγ FC FC FC FC FC
Isotope 57Mn 58gMn 58mMn 59Mn 60gMn 60mMn 61Mn 62Mn
T1/2 85 s 3 s 65 s 4.6 s 51 s 1.8 s 625 ms 671 msY (µC−1) 6 · 107 1.3 · 105 1.2 · 107 4.6 · 105 < 2000 2 · 104 2000 400Method βγ β β βγ β βγ β β
in 60Mn. Unfortunately with the UCx/graphite target the decay curves of mass 58 and 60 werenot measured and no conclusion can be drawn on the contribution of the individual isomers.
It should be noted that the 60gMn 0+ ground state with 51 s half-life was only observed onceat the GSI ISOL [Bos88]. It was not found in a later search and the suspicion came up that theearlier measurement had been fooled by a beam contamination with doubly-charged 120In [SO92].The intense and pure Mn beam from the UCx/graphite target ionized by the RILIS should allowto check the half-life of 60gMn.
The value for the ionization efficiency (19.2 %) quoted in ref. [Fed97] had been obtained by scalingan earlier off-line result (4.8 %) with the increased dye laser power. With the yields derived aboveit is possible to redetermine the efficiency independently. Measured spallation cross-sections areavailable for long-lived manganese isotopes produced by 1 GeV protons on a zirconium target[Mic97]: about 1 mbarn for 52Mn and 3 mbarn for 54Mn. The cross-sections for niobium shouldbe very similar. The total efficiency of the target and ion source unit7 is given by the ratio of themeasured yield to the calculated production rate. For 52Mn one obtains 20 % and for 54Mn 19 %.This impressive agreement shows that the RILIS efficiency obtained off-line is fully reproducibleunder on-line conditions.
Comparison
Figure 4.3.1 shows a comparison of experimentally obtained yields of manganese isotopes at dif-ferent facilities. For all isotopes from 50mMn to 69Mn the ISOLDE yields exceed those of otherfacilities by orders of magnitude!
Prospects
On the neutron-rich side there is presently no urgent need to find an even more performant target.Already the obtained yields will allow to perform detailed nuclear spectroscopy of the iron nucleipopulated in beta decay (compare [IS364]).
However, for the short-lived neutron-deficient manganese isotopes the yields are not very compet-itive. With a typical proton beam current of 2.5 µA the present yield of 50gMn (1000 s−1) is justhalf of that obtained at IGISOL with 1 µA protons on a 50Cr target [Arj86] and a factor of twenty
7For long-lived isotopes it is practically equivalent to the ion source efficiency.

4.3 Manganese yields 125
Table 4.3.3.: Production of manganese isotopes at different RIB facilities.
Ref. Facility Proj. E/A I Target ζ Comm.(MeV) (pnA) (g/cm2)
RILIS Nb ISOLDE p 1000 2500 Nb 50 RILISRILIS UC ISOLDE p 1000 2500 UCx 51 RILIS[Hag92b] ISOLDE p 600 2500 Nb 9.6 MK5[Run85] GSI-ISOL 82Se 11.5 20 W 0.046 F.-E[Bos88] GSI-ISOL 76Ge 11.5 20 W 0.036 F.-F[Kirch] GSI-ISOL 76Ge 11.5 10 W 0.023 F.-F[SO91] GSI-ISOL 50Ti 13.5 20 W[Web92] GSI-FRS 86Kr 500 0.0017 Be 2[Eng98] GSI-FRS 238U 750 0.0033 Be 1
1E-06
1E-05
1E-04
1E-03
1E-02
1E-01
1E+00
1E+01
1E+02
1E+03
1E+04
1E+05
1E+06
1E+07
1E+08
1E+09
1E+10
46 48 50 52 54 56 58 60 62 64 66 68 70Mass
Yie
ld (
per
s)
RILIS NbRILIS UC[Hag92][Run85][Bos88][Kirch][Sch91][Web92][Eng98]
Figure 4.3.1.: Comparison of manganese yields, see table 4.3.3 for experimental details of eachcurve.
lower compared with the typical yields obtained at the Chalk River ISOL facility (10 µA protons ona 50Cr target) [Kos97a]. Most of the produced short-lived nuclei decayed in the ISOLDE niobiumtarget. A target with comparable production rate and faster release has the potential to increasethe yields of short-lived manganese isotopes by at least one order of magnitude.
Some release data exists on alternative materials: Hoff et al. measured in an off-line test t50 ≈ 1 minfor the Mn release from a Cr2O3 target at 1700
C [Hof84]. While chromium oxide cannot be heatedmuch more due to excessive vapor pressure, a zirconium oxide fiber target could be an alternative.Due to its fiber structure it should show intrinsically a faster release. Moreover it can be heatedto significantly higher temperatures (about 2000 C). Presently no direct data is available on therelease characteristics of Mn from a ZrO2 fiber target, but neutron-deficient manganese beams werealready observed at the ISOLDE SC from a ZrO2 target and a hot plasma source. The manganese

126 4.4 Nickel yields
oxides MnO and MnO2 are nearly completely dissociated at higher temperatures [Hil94] and willnot hinder the resonant laser ionization of the atom.
Another possibility would be a zirconium germanide (Zr5Ge3) target which showed a rapid releaseof manganese at 1800 C: t50 1 min [Hof84]. Hafnium germanide (Hf5Ge3) is less suitable.At equal temperature the release of Mn is slower [Hof84] and the hafnium spallation would causemore isobaric background on the neutron-rich side, e.g. 47K.
4.4. Nickel yields
UCx/graphite target
Neutron-rich nickel isotopes were produced from two standard UCx/graphite targets (52 and53 g/cm2 of uranium respectively) and ionized with the RILIS in a tungsten cavity. The targetswere kept at a temperature of about 2100 C and the lines at about 2300 C and 2400 Crespectively.
The current of the isotopes 59−66Ni was directly measured with a Faraday cup and correctedfor the contributions of stable nickel calculated from the natural abundance ratio and the 58Nicurrent. The yields of 56,65,67Ni were determined by collection of a sample and subsequent off-linemeasurement of the gamma ray intensity.
The beta-decay of the isotopes 67−70Ni was identified by their half-life. The release curve wasfitted with a rise time of 1 s and a single exponential decay of 120 s. The second target (withthe line at 2400 C) showed a faster rise time: about 0.2 s. At mass 69 only the 9/2+ groundstate with T1/2 = 11.2 s was observed (see figure 4.4.1). A possible contribution of the 1/2−
metastable state with T1/2 = 3.5 s [Fra98b] is at least one order of magnitude smaller8. At mass71 no significant beta-activity was visible which gives an upper limit for the 71Ni yield.
0 10 20 30 40 500
1000
2000
3000
69Ni decay
3 collections of 10 s each
Be
ta c
ou
nts
pe
r s
Time (s)
Figure 4.4.1.: Beta decay curve of 69Ni. The free fit gives a half-life of about 11.1 s. The small“bumps” at 4 s, 18 s, 33 s and 48 s are due to background from the impact of thenext proton pulse.
A priori the slow average release time of nickel does not exclude that a small part of more short-livedisotopes is still released in a fast release component9. Therefore at the masses 74 and 76 a searchwas made for beta-delayed neutrons. However, no short-lived neutron activity was observed atthese masses. With a calculated Pn value of 4.5 % and 22 % respectively [Mol97] this corresponds
8Note that also in figure 3 of [Jok97] there is no indication for the 1298 keV line of the 69mNi decay [Fra99].9Remember that this was experienced in the case of beryllium.
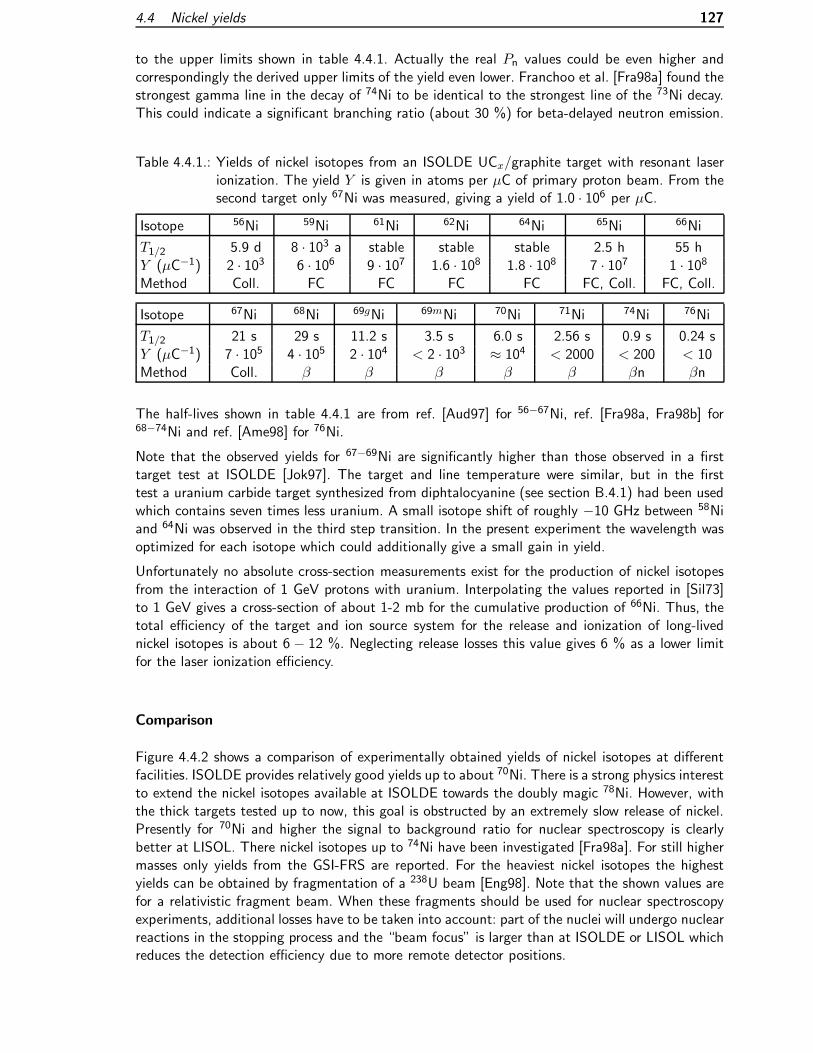
4.4 Nickel yields 127
to the upper limits shown in table 4.4.1. Actually the real Pn values could be even higher andcorrespondingly the derived upper limits of the yield even lower. Franchoo et al. [Fra98a] found thestrongest gamma line in the decay of 74Ni to be identical to the strongest line of the 73Ni decay.This could indicate a significant branching ratio (about 30 %) for beta-delayed neutron emission.
Table 4.4.1.: Yields of nickel isotopes from an ISOLDE UCx/graphite target with resonant laserionization. The yield Y is given in atoms per µC of primary proton beam. From thesecond target only 67Ni was measured, giving a yield of 1.0 · 106 per µC.
Isotope 56Ni 59Ni 61Ni 62Ni 64Ni 65Ni 66Ni
T1/2 5.9 d 8 · 103 a stable stable stable 2.5 h 55 hY (µC−1) 2 · 103 6 · 106 9 · 107 1.6 · 108 1.8 · 108 7 · 107 1 · 108Method Coll. FC FC FC FC FC, Coll. FC, Coll.
Isotope 67Ni 68Ni 69gNi 69mNi 70Ni 71Ni 74Ni 76Ni
T1/2 21 s 29 s 11.2 s 3.5 s 6.0 s 2.56 s 0.9 s 0.24 sY (µC−1) 7 · 105 4 · 105 2 · 104 < 2 · 103 ≈ 104 < 2000 < 200 < 10Method Coll. β β β β β βn βn
The half-lives shown in table 4.4.1 are from ref. [Aud97] for 56−67Ni, ref. [Fra98a, Fra98b] for68−74Ni and ref. [Ame98] for 76Ni.
Note that the observed yields for 67−69Ni are significantly higher than those observed in a firsttarget test at ISOLDE [Jok97]. The target and line temperature were similar, but in the firsttest a uranium carbide target synthesized from diphtalocyanine (see section B.4.1) had been usedwhich contains seven times less uranium. A small isotope shift of roughly −10 GHz between 58Niand 64Ni was observed in the third step transition. In the present experiment the wavelength wasoptimized for each isotope which could additionally give a small gain in yield.
Unfortunately no absolute cross-section measurements exist for the production of nickel isotopesfrom the interaction of 1 GeV protons with uranium. Interpolating the values reported in [Sil73]to 1 GeV gives a cross-section of about 1-2 mb for the cumulative production of 66Ni. Thus, thetotal efficiency of the target and ion source system for the release and ionization of long-livednickel isotopes is about 6 − 12 %. Neglecting release losses this value gives 6 % as a lower limitfor the laser ionization efficiency.
Comparison
Figure 4.4.2 shows a comparison of experimentally obtained yields of nickel isotopes at differentfacilities. ISOLDE provides relatively good yields up to about 70Ni. There is a strong physics interestto extend the nickel isotopes available at ISOLDE towards the doubly magic 78Ni. However, withthe thick targets tested up to now, this goal is obstructed by an extremely slow release of nickel.Presently for 70Ni and higher the signal to background ratio for nuclear spectroscopy is clearlybetter at LISOL. There nickel isotopes up to 74Ni have been investigated [Fra98a]. For still highermasses only yields from the GSI-FRS are reported. For the heaviest nickel isotopes the highestyields can be obtained by fragmentation of a 238U beam [Eng98]. Note that the shown values arefor a relativistic fragment beam. When these fragments should be used for nuclear spectroscopyexperiments, additional losses have to be taken into account: part of the nuclei will undergo nuclearreactions in the stopping process and the “beam focus” is larger than at ISOLDE or LISOL whichreduces the detection efficiency due to more remote detector positions.

128 4.4 Nickel yields
Table 4.4.2.: Production of nickel isotopes at different RIB facilities. At the recoil separatorLOHENGRIN the 3.5 cm2 large targets (235U and 239Pu) were exposed to a neutronflux of about 5 · 1014 cm−2s−1. With the RED magnet (see chapter 1.4) the yieldscould be increased by a factor of about 5. The yields of ref. [Ame98] were estimatedfrom the number of detected particles.
Ref. Facility Proj. E/A I Target ζ Comm.(MeV) (pnA) (g/cm2)
RILIS UC ISOLDE p 1000 2500 U 52 RILIS[Run85] GSI-ISOL 82Se 11.5 20 W 0.046 F.-E[Huh97] IGISOL p 25 3000 U 0.015[Fra98a] LISOL p 30 6000 U 0.03 RILIS[Ber91] LOHENGRIN nth – – 235U, 239Pu 0.00015[Web92] GSI-FRS 86Kr 500 0.0017 Be 2[Ame98] GSI-FRS 86Kr 500 ≤0.05 Be 2 est.[Eng98] GSI-FRS 238U 750 0.0033 Be 1
1E-061E-051E-041E-031E-021E-011E+001E+011E+021E+031E+041E+051E+061E+071E+081E+09
64 66 68 70 72 74 76 78Mass
Yie
ld (
per
s)
RILIS UC[Run85][Huh97][Fra98][Ber91][Web92][Ame98][Eng98]
Figure 4.4.2.: Comparison of nickel yields, see table 4.4.2 for experimental details of each curve.Upper limits were omitted.
Prospects
It is not easy to find target materials which promise a much faster release of nickel. Kirchnermeasured for nickel a three orders of magnitude faster diffusion in tantalum compared with graphite[Kir92a, Kir97]. However, in a first test at ISOLDE [Jok97] also a tantalum foil target showed avery slow release and the yields were not better than from a UCx/graphite target.
From the published diffusion data at lower temperatures it is not expected that nickel diffusesparticularly fast in a bulk oxide matrix, but it would still be interesting to test the release from e.g.a zirconium oxide fiber target10. NiO dissociates around 1950 C, thus any nickel oxide releasedfrom the target would be mostly dissociated in the hot ionizer cavity and also be available forresonant laser ionization.
10Heavy nickel isotopes are poorly produced in spallation of zirconium, but the ZrO2 target can serve for a releasetest before building a ThO2 fiber target (see section B.3).

4.5 Copper yields 129
The desorption enthalpies estimated from the Eichler systematics give for nickel a particularly longdesorption time from tantalum surfaces (about 60 ms at 2200 C). Niobium is no alternative sinceit cannot be heated high enough. However, for tungsten and rhenium at the same temperature thedesorption time is calculated to be 50 and 100 times shorter respectively. Thus, a coating of thetarget container with a W or Re layer could possibly reduce the effusion time. Also the use of asmall tungsten foil target in a tungsten target container should be tested for the release of nickel.This combination would moreover allow to reach the highest possible target temperatures.
4.5. Copper yields
Beams of short-lived copper isotopes are of particular interest for the study of the nuclear structureclose to the Z = 28 shell closure.
The neutron-deficient isotope 56Cu decays into the doubly-magic 56Ni. Due to the high QEC-value(15.3 MeV) there is a large energy window for population of excited levels.
With the difficulties to separate short-lived nickel (and presumably also iron and cobalt) isotopes(see preceding section), the heavy copper isotopes allow presently the closest approach to thedoubly-magic 78Ni at a thick target ISOL facility. Information on the decay properties of veryneutron-rich nuclei with magic neutron number is also important to put constraints on the astro-physical r-process conditions (see e.g. ref. [Kra87, Kra99]). The heaviest copper isotopes (up to79Cu) had been studied at ISOLDE SC with a UCx/graphite cloth target [Kra91]. However, whenionized with a hot plasma source the copper beams suffer from a strong background of isobars(mainly zinc and gallium for neutron-rich copper isotopes and manganese for neutron-deficientones). The ionization with the RILIS promises a significant amelioration of the element selectivity.
Nb foil target
A first test for production of neutron-deficient copper isotopes was made with a standard niobiumfoil target. This target had given a sufficient yield for spectroscopy of the nearby nuclide 58Zn[Jok98]. However, the release of copper showed to be very slow. With the target at 2000 C andthe tungsten surface ionizer at about 2300 C the release half-time t50 was above 100 s. Thiscaused a significant suppression of short-lived radio-isotopes. The obtained yields are shown infigures 4.5.1 and 4.5.2.
Ta foil target
The next test was performed with a tantalum foil RIST target. Ta foil targets can be operatedat the highest temperatures among all standard ISOLDE targets and the RIST target [Ben97] isspecially designed for a fast effusion11. Unfortunately even at a temperature above 2200 C therelease remained slow (t50 ∼ 90 s) and the yields were even lower compared with the Nb foiltarget (see figures 4.5.1 and 4.5.2). Note that a slow diffusion of copper in tantalum had alsobeen measured at Oak Ridge [Alt96]: D = 1.5 ·10−10 cm2/s, however at much lower temperatures(1650 − 1700 C).
ZrO2 fiber target
Since the metal foil targets did not give satisfactory results, a target material with completelydifferent structure was tested: zirconium oxide. To assure a fast effusion and to reduce sintering11This model consisted of 100 µm thick tantalum foils, thus minimizing the effusion time at the expense of a longerdiffusion time.

130 4.5 Copper yields
problems a fiber material was used (see appendix B.3). Indeed the release was much faster andthe yields of short-lived isotopes were significantly improved. The release can be fitted with asingle decay component: τr = 30 ms and τf = 0.7 s, i.e. there is no indication for a slow releasecomponent. The first test had been performed at the HRS with a vacuum chamber window fromstandard glass. The transmission of the UV laser beams was significantly reduced, thus reducingthe RILIS efficiency. Unfortunately also the second test had to be performed at the HRS. Animperfect ion beam trajectory (with a significant tilt between both magnets) caused a stronglymass-dependent transmission to the nuclear spectroscopy set-up which changed by one order ofmagnitude and more when switching the mass! Thus, only lower limits could be derived from thelatter measurement. Table 4.5.1 shows the yields which were measured in the first test and scaledby a factor 14 to account for the increased laser ionization efficiency in normal operation (usinga quartz window). This scaling factor was confirmed by the measurement of the isotopes 62Cuand 66Cu at the monitoring tape station. In the gamma spectra taken at mass 56 only few countswere observed at 1225 keV and 2701 keV (see ref. [Ram98a] for the most intense gamma lines inthe 56Cu decay). However, the peaks were not unambiguously identified and it is safer to use thisintensity only as an upper limit of the 56Cu yield.
Table 4.5.1.: Yields of copper isotopes from a 6 g/cm2 zirconia fiber target with resonant laserionization in a standard tungsten cavity. The yield Y is given in atoms per µC ofprimary proton beam.
Isotope 56Cu 57Cu 58Cu 59Cu 60Cu 61Cu 62Cu
T1/2 78 ms 199 ms 3.2 s 82 s 23 min 3.4 h 9.7 minY (µC−1) ≤ 35 ≈ 3000 ≈ 3 · 105 7 · 106 5 · 107 1.2 · 108 9 · 108Method γ γ β β β β β
Isotope 66Cu 68gCu 68mCu 69Cu 70gCu 70mCu 71Cu
T1/2 5.1 min 30 s 3.8 min 3 min 5 s 42 s 19.5 sY (µC−1) 5 · 107 6 · 105 1.7 · 106 8 · 105 7 · 103 105 3 · 104Method β β β β β β β
UCx/graphite target
A standard UCx/graphite target with Nb ionizer was used for the production of neutron-rich copperbeams. The release is faster than from the metal foil targets, but considerably slower comparedwith the ZrO2 target. With the target at a temperature of 2100 C and the niobium cavity at1900 C the release can be described with a single decay component: τr = 1.5 s (12 and τf = 15 s.
The neutron-rich copper isotopes were studied by βγ, γγ and βn spectroscopy. Even withoutany additional gating the gamma spectra up to mass 73 were absolutely dominated by gamma-lines from the copper decay. The impressive intensity of these neutron-rich copper beams can bedemonstrated with two examples:
67Cu: A sample of 67Cu was collected for an off-line measurement of the magnetic moment inOxford (ISOLDE experiment IS358 [IS358]). The collection took less than half an hour,but the following procedure of shipping the sample and passing the customs bureaucracytook longer than expected. Additional delays occured when the experimental set-up (dilution
12Note that with another UCx/graphite target at equal temperature a much faster rise was observed (τr < 50 ms)while the fall time was identical.

4.5 Copper yields 131
Table 4.5.2.: Yields of copper isotopes from a ≈ 50 g/cm2 UCx/graphite target with resonantlaser ionization in a standard niobium cavity. The yield Y is given in atoms per µCof primary proton beam.
Isotope 62Cu 64Cu 66Cu 67Cu 68gCu 68mCu 69Cu 70gCu 70mCu
T1/2 9.7 min 12.7 h 5.1 min 61.9 h 30 s 3.8 min 3 min 5 s 42 sY (µC−1) ≈ 3 · 107 ≈ 2 · 108 4 · 108 3.5 · 108 8 · 107 3 · 108 1.8 · 108 7 · 106 9 · 107Method β FC β FC β β β β β
Isotope 71Cu 72Cu 73Cu 74Cu 75Cu 76Cu 77Cu 78Cu 79Cu
T1/2 19.5 s 6.6 s 4.2 s (1.6 s) 1.22 s 0.64 s 0.47 s 0.34 s 0.19 sY (µC−1) 5 · 107 1.3 · 107 4 · 106 6 · 105 1.5 · 105 2 · 104 ≈ 2000 ≈ 200 < 1Method β β β β β βn βn βn βn
refridgerator) had to be warmed up again for repair work. The real experiment could notbe started for three weeks, but finally a resonance signal was found. Even ten half-lives(T1/2 = 61.9 h) after the collection the copper activity was still high enough to determinethe magnetic moment of 67Cu with good statistical accuracy [Rikov]!
73Cu: Nuclear spectroscopy was recently performed with a 73Cu beam at MSU [Huh98]. Afterone day of data taking [Manti] about a dozen coincidences had been observed between the450 keV and the 674 keV line (see figure 4 in [Huh98]). Even less coincidences were seenbetween the 450 keV and the 1559 keV line. With a similar detection set-up at ISOLDE thesame coincidence windows showed about 30 times better statistics after only 20 min of datataking!
A large amount of gamma decay data was taken for the heavy copper isotopes (A ≥ 70). It ispresently under analysis [Roosb, Krugl]. Starting at A = 74 the isobaric gallium background getsremarkable and for A ≥ 77 it is overwhelming. Also neutron-deficient rubidium isotopes showup as background. For instance the yield of 80Rb was about 108 per µC from this target. Withdetection of beta-delayed neutrons a “clean” copper signal is observed till mass 78, but for highermasses the βn background from 79+xGa overlays the copper signal (see section 4.6).
Unfortunately no target with a thin niobium cavity (compare section 3.4) was available for on-lineuse. Therefore a “thick” niobium cavity had to be used which gave a rather broad width of thelaser ion pulses and did not allow to use the beam chopper for a major suppression of the surfaceionized background. Only a slight improvement of the copper to gallium ratio was obtained byreduction of the ionizer temperature.
The yields up to 76Cu shown in table 4.5.2 were determined from beta counting with the monitoringtape station and the βn set-up. Those of the heavier copper isotopes were deduced from thedetected neutron activity. For 77Cu and 78Cu an arbitrary Pn value of 20 % was assumed which isin line with theoretical predictions [Pfe99]. For 79Cu no short-lived activity was observed besidesthe gallium background. An upper limit for the 79Cu yield was derived by using the measuredvalues from [Kra91]: T1/2 = 188 ms and Pn = 55 %.
All yields given in table 4.5.2 were measured using a broad bandwidth laser for both excitationsteps. For the hyperfine scan (see section 3.5.2) a small bandwidth laser (1.2 GHz) was used forthe first excitation step. This reduced the yield by about a factor of three.

132 4.5 Copper yields
Comparison
Figure 4.5.1 shows a comparison of experimentally obtained yields of light copper isotopes atdifferent facilities. The experimental details are given in table 4.5.3.
1E-03
1E-02
1E-01
1E+00
1E+01
1E+02
1E+03
1E+04
1E+05
1E+06
1E+07
1E+08
1E+09
1E+10
54 55 56 57 58 59 60 61 62 63
Mass
Yie
ld (
per
s) RILIS ZrO2
RILIS Nb
RILIS Ta
[Arj86]
[Yos87]
[Sem96]
[Ram98]
[Pou87]
Figure 4.5.1.: Comparison of yields of neutron-deficient copper isotopes, see table 4.5.3 for exper-imental details of each curve. Upper limits were omitted.
Table 4.5.3.: Production of neutron-deficient copper isotopes at different RIB facilities.
Ref. Facility Proj. E/A I Target ζ Comm.(MeV) (pnA) (g/cm2)
RILIS ZrO2 ISOLDE PSB p 1000 2500 ZrO2 6 RILISRILIS Nb ISOLDE PSB p 1000 2500 Nb 48 RILISRILIS Ta ISOLDE PSB p 1000 2500 Ta 114 RILISZrO2 SC ISOLDE SC p 600 2500 ZrO2 6.3 MK5Nb SC ISOLDE SC p 600 2500 Nb 47 MK5Ta SC ISOLDE SC p 600 2500 Ta 112 MK5
[Arj86] Jyvaskyla p 16 1000 58Ni IGISOL[Yos87] Tohoku p, 3He 16-33 7000 58Ni 0.0027 IGISOL[Sem96] Texas A&M 58Ni 30 0.3 H2 0.028[Ram98a] GSI-ISOL 32S 4.6 50 Si 0.002 F.-B2-C[Pou87] LISE, GANIL 58Ni 55 2 Ni 0.05
It is obvious that for light copper isotopes the ISOLDE yields (with a ZrO2 target) exceed thoseof all other facilities down to 57Cu. It is expected that this remains valid also for 56Cu, but upto now nuclear spectroscopy with a 56Cu beam was only performed at GSI ISOL [Ram98a]. Themost neutron-deficient copper isotope 55Cu was only detected at a fragment separator [Pou87]. Itis probably too short-lived to be separated at an ISOL facility.
For all neutron-rich copper isotopes the ISOLDE yields exceed those of other facilities by manyorders of magnitude. An extension of the nuclear spectroscopy towards the most neutron-richcopper isotopes is presently less limited by the yields than by the missing beam purity, i.e. theimmense isobaric background from gallium and rubidium.
The ISOLDE SC yields were measured with a 9.6 g/cm2 UCx/graphite cloth target and a hotplasma source [SCyie]. The quoted 79Cu yield was roughly estimated from figure 1 in ref. [Kra91]

4.5 Copper yields 133
1E-5
1E-4
1E-3
1E-2
1E-1
1E+0
1E+1
1E+2
1E+3
1E+4
1E+5
1E+6
1E+7
1E+8
1E+9
64 66 68 70 72 74 76 78 80
Mass
Yie
ld (
per
s) RILIS UCRILIS ZrO2RILIS NbRILIS TaUC SCZrO2 SCNb SCTa SC[Run85][Sch89][Huh97][Huh98][Ber91][Ree85][Eng98]
Figure 4.5.2.: Comparison of yields of neutron-rich copper isotopes, see table 4.5.4 for experimentaldetails of each curve. Upper limits were omitted.
Table 4.5.4.: Production of neutron-rich copper isotopes at different RIB facilities. At the recoilseparator LOHENGRIN the 3.5 cm2 large targets were exposed to a neutron flux ofabout 5 · 1014 cm−2s−1. With the RED magnet (see chapter 1.4) the yields could beincreased by a factor of about 5.
Ref. Facility Proj. E/A I Target ζ Comm.(MeV) (pnA) (g/cm2)
RILIS UC ISOLDE PSB p 1000 2500 UCx/graphite 50 RILISRILIS ZrO2 ISOLDE PSB p 1000 2500 ZrO2 6 RILISRILIS Nb ISOLDE PSB p 1000 2500 Nb 48 RILISRILIS Ta ISOLDE PSB p 1000 2500 Ta 114 RILISUC SC ISOLDE SC p 600 2500 UCx/graphite ≈10 MK5ZrO2 SC ISOLDE SC p 600 2500 ZrO2 6.3 MK5Nb SC ISOLDE SC p 600 2500 Nb 47 MK5Ta SC ISOLDE SC p 600 2500 Ta 112 MK5[Run85] GSI-ISOL 82Se 11.5 20 W 0.046 F.-E[SO89] GSI-ISOL 20Ne 4.7-10.9 160 UC/UC2 0.02 F.-H[Huh97] Jyvaskyla p 25 3000 UCx/graphite 0.015 IGISOL[Huh98] A1200, MSU 76Ge 70 15 9Be 0.2[Ber91] LOHENGRIN nth – – 235U 0.00015[Ree85] TRISTAN nth – – 235U 4 g F.[Eng98] GSI-FRS 238U 750 0.0033 Be 1
and given for a 13 g/cm2 UCx/graphite cloth target with a 2.2 µA beam. Note that in thepresent experiment many parameters had been changed: the target matrix and target thickness,

134 4.6 Gallium yields
the proton beam energy, the time structure of the proton beam and finally the ion source. Thereforeit is difficult to determine which parameter caused the failure to observe 79Cu in this experiment.
Neutron-rich copper isotopes were also produced at the GSI ISOL facility by multi-nucleon transferreactions between a 76Ge beam and a tungsten target [Run83, Bos88], but the yields are similarto those obtained with a 82Se beam [Run85] which are shown in figure 4.5.2.
The yields of neutron-rich copper isotopes from thermal neutron induced fission drop only bya factor four from 75Cu to 77Cu [Sid89], but the yield of isobaric background increases consid-erably. Therefore no half-lives could be measured for 76Cu and 77Cu at LOHENGRIN. Nuclearspectroscopy of neutron-rich copper isotopes 74−78Cu had been performed at the reactor-basedRIB facilities OSIRIS [Lun88] and TRISTAN [Win89, Win90], but no evaluated yields were givenin these publications.
Prospects
The ZrO2 target provides a fast release and offers good yields of neutron-deficient copper isotopes.This opens the way for many new experiments (nuclear spectroscopy, measurement of magneticmoments, etc.). No experimental yield can be quoted for 56Cu, but from an extrapolation of themeasured yields of the heavier isotopes it could reach some ten ions per second.
The UCx/graphite target gives sufficient yields on the neutron-rich side up to about 76Cu. Afurther extension towards more neutron-rich nuclei is presently hampered by an unfavorable ratioof copper to isobaric gallium background. This is comparable to the situation of heavy silver andcadmium isotopes which suffer from an indium background (see sections 4.7 and 4.8). The effectof this background can be seen with the following comparison: The yield of 77Cu is one order ofmagnitude higher than that of 66Mn (see section 4.3). While the latter was easily observed bysimple beta counting with the monitoring tape station, even with a dedicated set-up no beta decaysignal could be clearly attributed to the former.
The further development of a selective RILIS cavity (see section 3.4) is needed for an improvementof the signal to background ratio. Another gain can be achieved by reducing the decay losses ofthe short-lived copper isotopes in the target. At Oak Ridge a quite rapid diffusion of copper wasobserved in graphite D = 7 · 10−7 cm2/s, already at 1650 − 1700 C. Therefore it is not obviouswhy the release from a 2050 C hot UCx/graphite target is not faster. Possibly the delay is causedby a slow desorption from the niobium cavity. However, the Eichler systematics (see B.2.5) givesa desorption time of about 0.1 ms for both, a Nb surface at 1800 C and a W surface at 2150 C.Due to the good experiences with the ZrO2 fiber target a ThO2 target with comparable structureis proposed for very neutron-rich copper isotopes (see section B.3). If the release characteristic iscomparable to that of the ZrO2 matrix this could immediately improve the yield of 79Cu and thusthe signal to background ratio by up to two orders of magnitude! Figure 4.5.3 shows the releaseefficiency Y (T1/2) (see appendix B.2) which was derived from the measured release profiles ofboth targets.
4.6. Gallium yields
Gallium is included in the NuPECC list of “key elements” for the next generation RIB facilities.On the neutron-deficient side 62Ga is one of the nuclides decaying by a superallowed 0+ → 0+
Fermi transition. A high yield of this isotope would help to extend the precision measurements ofGV beyond the presently heaviest isotope of this type: 54gCo.
On the neutron-rich side gallium is one of the lightest elements which is produced with high yieldsat a reactor-based RIB facility. It is therefore of interest for experiments with post-acceleratedbeams, e.g. at the MAFF facility [MAFF].
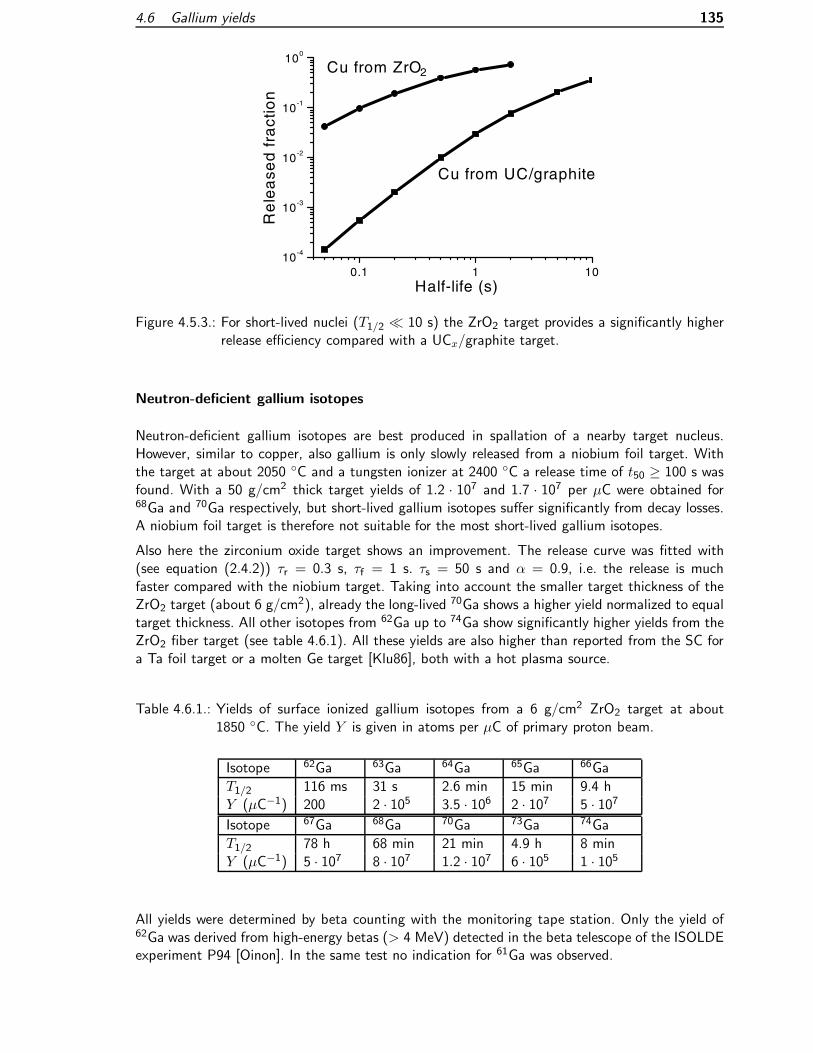
4.6 Gallium yields 135
0.1 1 1010-4
10-3
10-2
10-1
100
Cu from ZrO2
Cu from UC/graphite
Re
lea
sed
fra
ctio
nHalf-life (s)
Figure 4.5.3.: For short-lived nuclei (T1/2 10 s) the ZrO2 target provides a significantly higherrelease efficiency compared with a UCx/graphite target.
Neutron-deficient gallium isotopes
Neutron-deficient gallium isotopes are best produced in spallation of a nearby target nucleus.However, similar to copper, also gallium is only slowly released from a niobium foil target. Withthe target at about 2050 C and a tungsten ionizer at 2400 C a release time of t50 ≥ 100 s wasfound. With a 50 g/cm2 thick target yields of 1.2 · 107 and 1.7 · 107 per µC were obtained for68Ga and 70Ga respectively, but short-lived gallium isotopes suffer significantly from decay losses.A niobium foil target is therefore not suitable for the most short-lived gallium isotopes.
Also here the zirconium oxide target shows an improvement. The release curve was fitted with(see equation (2.4.2)) τr = 0.3 s, τf = 1 s. τs = 50 s and α = 0.9, i.e. the release is muchfaster compared with the niobium target. Taking into account the smaller target thickness of theZrO2 target (about 6 g/cm2), already the long-lived 70Ga shows a higher yield normalized to equaltarget thickness. All other isotopes from 62Ga up to 74Ga show significantly higher yields from theZrO2 fiber target (see table 4.6.1). All these yields are also higher than reported from the SC fora Ta foil target or a molten Ge target [Klu86], both with a hot plasma source.
Table 4.6.1.: Yields of surface ionized gallium isotopes from a 6 g/cm2 ZrO2 target at about1850 C. The yield Y is given in atoms per µC of primary proton beam.
Isotope 62Ga 63Ga 64Ga 65Ga 66Ga
T1/2 116 ms 31 s 2.6 min 15 min 9.4 hY (µC−1) 200 2 · 105 3.5 · 106 2 · 107 5 · 107Isotope 67Ga 68Ga 70Ga 73Ga 74Ga
T1/2 78 h 68 min 21 min 4.9 h 8 minY (µC−1) 5 · 107 8 · 107 1.2 · 107 6 · 105 1 · 105
All yields were determined by beta counting with the monitoring tape station. Only the yield of62Ga was derived from high-energy betas (> 4 MeV) detected in the beta telescope of the ISOLDEexperiment P94 [Oinon]. In the same test no indication for 61Ga was observed.

136 4.6 Gallium yields
Neutron-rich gallium isotopes
Neutron-rich gallium isotopes are known to be well produced and released from UCx/graphitetargets. The presently heaviest gallium isotope with measured half-life, 84Ga, was discovered atthe ISOLDE SC [Kra91]. On the other hand the nuclides from 72Ga to 81Ga play also the negativerole of an omnipresent background in experiments aiming for the heaviest nickel, copper and zincisotopes. Even when ionizing the latter with the element selective RILIS additional measures haveto be taken to suppress this background.
Gallium yields were measured from a standard UCx/graphite target with niobium surface ionizer,both at around 2000 C. They are plotted in figure 4.6.1. The release can be fitted with (seeformula 2.4.2): τr = 0.1 s, τf = 1.5 s. τs = 4.5 s and α = 0.8. Note that the quoted yields wereneither reduced by additional measures (beam chopper, etc.) nor optimized for a maximum yield ofgallium (tungsten surface ionizer). Therefore they are mainly of interest for a comparison with theyields of heavy nickel and copper isotopes presented before. A comparison with yields from otherfacilities was omitted. Up to mass 79 gallium is the dominating beta activity and can be measuredwith the monitoring tape station. The 80Ga yield was determined from its beta-delayed neutronactivity. Still heavier gallium isotopes (A ≥ 81) were not measured to avoid a contamination ofthe tape station with the strong isobaric rubidium background.
Comparison
1E-04
1E-03
1E-02
1E-01
1E+00
1E+01
1E+02
1E+03
1E+04
1E+05
1E+06
1E+07
1E+08
59 61 63 65 67 69 71 73 75 77 79 81Mass
Yie
ld (
per
s)
ZrO2 WSIUC NbSI[Oin99][Yos87][Win93][Bla95]
Figure 4.6.1.: Comparison of gallium yields, see table 4.6.2 for experimental details of each curve.
Figure 4.6.1 shows that the ISOLDE yields from a ZrO2 target are even competitive for the short-lived 62Ga (T1/2 = 116 ms), especially if an additional increase could be obtained by further raisingthe target temperature. Also the GSI ISOL can give comparable or slightly higher yields for 62Ga,but the fragmentation facilities are still more than one order of magnitude below.
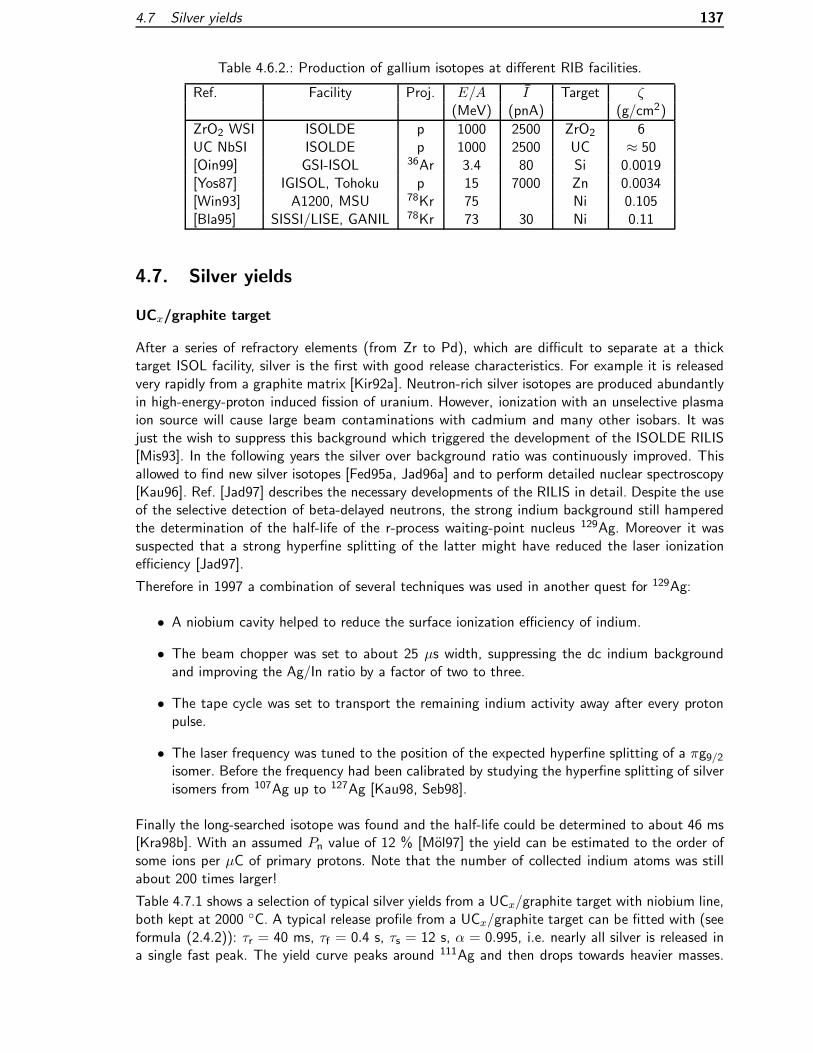
4.7 Silver yields 137
Table 4.6.2.: Production of gallium isotopes at different RIB facilities.
Ref. Facility Proj. E/A I Target ζ(MeV) (pnA) (g/cm2)
ZrO2 WSI ISOLDE p 1000 2500 ZrO2 6UC NbSI ISOLDE p 1000 2500 UC ≈ 50[Oin99] GSI-ISOL 36Ar 3.4 80 Si 0.0019[Yos87] IGISOL, Tohoku p 15 7000 Zn 0.0034[Win93] A1200, MSU 78Kr 75 Ni 0.105[Bla95] SISSI/LISE, GANIL 78Kr 73 30 Ni 0.11
4.7. Silver yields
UCx/graphite target
After a series of refractory elements (from Zr to Pd), which are difficult to separate at a thicktarget ISOL facility, silver is the first with good release characteristics. For example it is releasedvery rapidly from a graphite matrix [Kir92a]. Neutron-rich silver isotopes are produced abundantlyin high-energy-proton induced fission of uranium. However, ionization with an unselective plasmaion source will cause large beam contaminations with cadmium and many other isobars. It wasjust the wish to suppress this background which triggered the development of the ISOLDE RILIS[Mis93]. In the following years the silver over background ratio was continuously improved. Thisallowed to find new silver isotopes [Fed95a, Jad96a] and to perform detailed nuclear spectroscopy[Kau96]. Ref. [Jad97] describes the necessary developments of the RILIS in detail. Despite the useof the selective detection of beta-delayed neutrons, the strong indium background still hamperedthe determination of the half-life of the r-process waiting-point nucleus 129Ag. Moreover it wassuspected that a strong hyperfine splitting of the latter might have reduced the laser ionizationefficiency [Jad97].
Therefore in 1997 a combination of several techniques was used in another quest for 129Ag:
• A niobium cavity helped to reduce the surface ionization efficiency of indium.
• The beam chopper was set to about 25 µs width, suppressing the dc indium backgroundand improving the Ag/In ratio by a factor of two to three.
• The tape cycle was set to transport the remaining indium activity away after every protonpulse.
• The laser frequency was tuned to the position of the expected hyperfine splitting of a πg9/2isomer. Before the frequency had been calibrated by studying the hyperfine splitting of silverisomers from 107Ag up to 127Ag [Kau98, Seb98].
Finally the long-searched isotope was found and the half-life could be determined to about 46 ms[Kra98b]. With an assumed Pn value of 12 % [Mol97] the yield can be estimated to the order ofsome ions per µC of primary protons. Note that the number of collected indium atoms was stillabout 200 times larger!
Table 4.7.1 shows a selection of typical silver yields from a UCx/graphite target with niobium line,both kept at 2000 C. A typical release profile from a UCx/graphite target can be fitted with (seeformula (2.4.2)): τr = 40 ms, τf = 0.4 s, τs = 12 s, α = 0.995, i.e. nearly all silver is released ina single fast peak. The yield curve peaks around 111Ag and then drops towards heavier masses.

138 4.8 Cadmium yields
Table 4.7.1.: Yields of laser ionized silver isotopes from ≈50 g/cm2 UCx/graphite targets withniobium line. The yield Y is given in atoms per µC of primary proton beam. Theyields of different isotopes were measured from different targets which introducessome additional fluctuations.
Isotope 101g+mAg 103g+mAg 105g+mAg 106mAg 109mAg 111g+mAg 112Ag
T1/2 11 min 1.1 h 41 d 8.3 d 40 s 7.5 d 3.1 hY (µC−1) 2 · 105 1.6 · 106 7 · 107 7 · 107 6 · 108 4 · 109 2.3 · 109Method Coll. Coll. Coll., FC Coll. β(13 Coll. Coll.
Isotope 113gAg 114Ag 115gAg 117g+mAg 121Ag 129Ag
T1/2 5.4 h 4.5 s 20 min 73 s, 5.3 s 0.78 s 46 msY (µC−1) 2 · 109 1 · 109 1.8 · 108 7 · 108 3 · 107 ≈1Method Coll. β, FC Coll. Coll., FC β βn
Indium and cesium are the principal beam contaminants, but occasionally also other impurities arefound. For example on mass 111 92Sr19F+ occured with a yield of about 106 per µC [Burch].
“Neutron yields” were already reported in ref. [Fed95a, Jad96b], but the complete evaluation ofthe βn and βγ decay of the heavy silver isotopes is still in work [Kauts]. These results should alsogive a better overview of the yields of neutron-rich silver nuclei up to 129Ag.
Comment on neutron-deficient silver isotopes
Yields of neutron-deficient silver isotopes down to 99Ag were reported from ISOLDE SC [SCyie]. Itwould also be possible to produce and separate silver beams from a LaCx/graphite target (see nextsections). The release characteristics should be similar to that of a UCx/graphite target. Just asthe heavy silver isotopes, also the neutron-deficient ones could be ionized with the RILIS. However,compared with the lightest cadmium beams (see next section) the contamination problem withrubidium will get even more serious. Going towards the most neutron-deficient silver isotopes(around 94Ag), the production rate of the isobaric rubidium will increase by about two orders ofmagnitude in comparison with 97Rb. Moreover, the lifetimes of the rubidium isotopes get longerand a suppression with the beam gate will be even less efficient. Therefore the very light silvernuclei will remain rather a domain of ISOL facilities using fusion-evaporation reactions and offragment separators. However, for heavier masses (around 96−102Ag) an ISOLDE LaCx/graphitetarget combined with the RILIS remains very interesting, in particular also for atomic spectroscopyand isomer separation.
4.8. Cadmium yields
Neutron-deficient cadmium nuclides were one of the first beams separated at ISOLDE [Han69].Concerning beam intensity and purity, these beams from a molten tin target remained always amongthe showpieces of ISOLDE. With a target thickness up to 130 g/cm2 and practically completecondensation of non-cadmium activities in a temperature controlled transfer line the beam qualityof cadmium isotopes with T1/2 >∼ minutes can hardly be improved further. A drawback of themolten targets is their rather slow release behavior: t50 >∼ 100 s [Let97b]. Thus, considerable decaylosses occur for the isotopes below 102Cd.13Obviously 109mAg does not emit betas. Instead the conversion electrons of the highly converted (E3) IT decay aredetected.
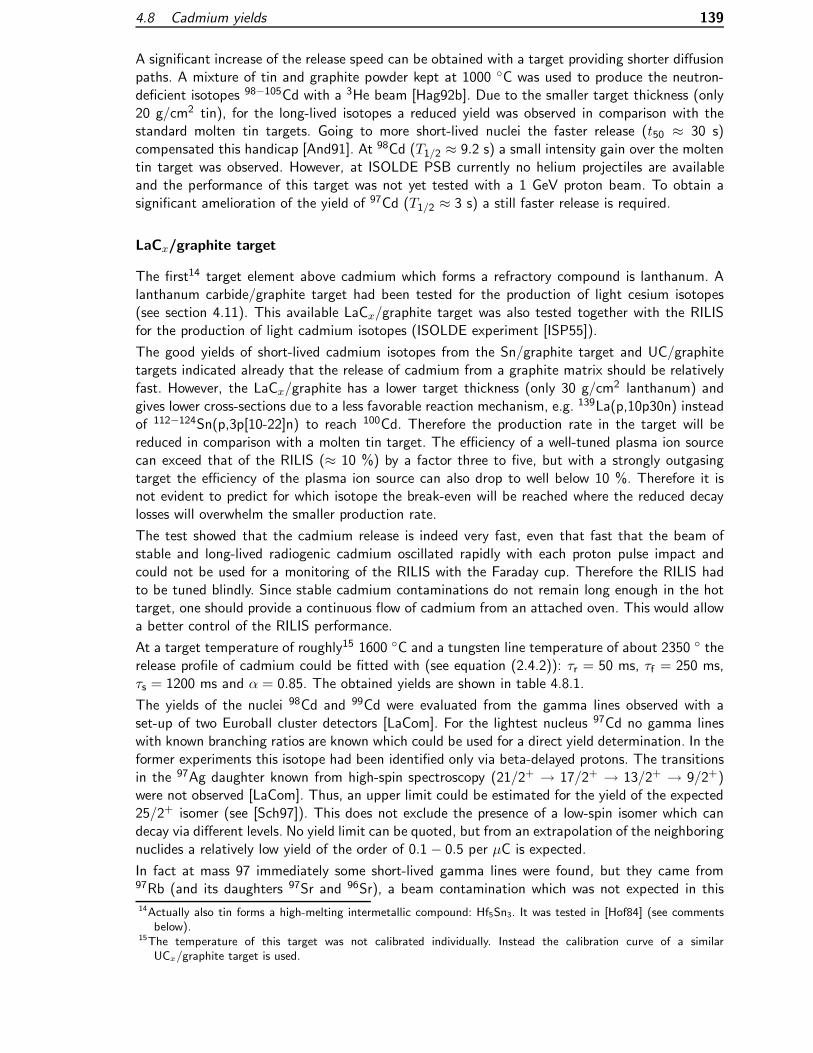
4.8 Cadmium yields 139
A significant increase of the release speed can be obtained with a target providing shorter diffusionpaths. A mixture of tin and graphite powder kept at 1000 C was used to produce the neutron-deficient isotopes 98−105Cd with a 3He beam [Hag92b]. Due to the smaller target thickness (only20 g/cm2 tin), for the long-lived isotopes a reduced yield was observed in comparison with thestandard molten tin targets. Going to more short-lived nuclei the faster release (t50 ≈ 30 s)compensated this handicap [And91]. At 98Cd (T1/2 ≈ 9.2 s) a small intensity gain over the moltentin target was observed. However, at ISOLDE PSB currently no helium projectiles are availableand the performance of this target was not yet tested with a 1 GeV proton beam. To obtain asignificant amelioration of the yield of 97Cd (T1/2 ≈ 3 s) a still faster release is required.
LaCx/graphite target
The first14 target element above cadmium which forms a refractory compound is lanthanum. Alanthanum carbide/graphite target had been tested for the production of light cesium isotopes(see section 4.11). This available LaCx/graphite target was also tested together with the RILISfor the production of light cadmium isotopes (ISOLDE experiment [ISP55]).
The good yields of short-lived cadmium isotopes from the Sn/graphite target and UC/graphitetargets indicated already that the release of cadmium from a graphite matrix should be relativelyfast. However, the LaCx/graphite has a lower target thickness (only 30 g/cm2 lanthanum) andgives lower cross-sections due to a less favorable reaction mechanism, e.g. 139La(p,10p30n) insteadof 112−124Sn(p,3p[10-22]n) to reach 100Cd. Therefore the production rate in the target will bereduced in comparison with a molten tin target. The efficiency of a well-tuned plasma ion sourcecan exceed that of the RILIS (≈ 10 %) by a factor three to five, but with a strongly outgasingtarget the efficiency of the plasma ion source can also drop to well below 10 %. Therefore it isnot evident to predict for which isotope the break-even will be reached where the reduced decaylosses will overwhelm the smaller production rate.
The test showed that the cadmium release is indeed very fast, even that fast that the beam ofstable and long-lived radiogenic cadmium oscillated rapidly with each proton pulse impact andcould not be used for a monitoring of the RILIS with the Faraday cup. Therefore the RILIS hadto be tuned blindly. Since stable cadmium contaminations do not remain long enough in the hottarget, one should provide a continuous flow of cadmium from an attached oven. This would allowa better control of the RILIS performance.
At a target temperature of roughly15 1600 C and a tungsten line temperature of about 2350 therelease profile of cadmium could be fitted with (see equation (2.4.2)): τr = 50 ms, τf = 250 ms,τs = 1200 ms and α = 0.85. The obtained yields are shown in table 4.8.1.
The yields of the nuclei 98Cd and 99Cd were evaluated from the gamma lines observed with aset-up of two Euroball cluster detectors [LaCom]. For the lightest nucleus 97Cd no gamma lineswith known branching ratios are known which could be used for a direct yield determination. In theformer experiments this isotope had been identified only via beta-delayed protons. The transitionsin the 97Ag daughter known from high-spin spectroscopy (21/2+ → 17/2+ → 13/2+ → 9/2+)were not observed [LaCom]. Thus, an upper limit could be estimated for the yield of the expected25/2+ isomer (see [Sch97]). This does not exclude the presence of a low-spin isomer which candecay via different levels. No yield limit can be quoted, but from an extrapolation of the neighboringnuclides a relatively low yield of the order of 0.1 − 0.5 per µC is expected.
In fact at mass 97 immediately some short-lived gamma lines were found, but they came from97Rb (and its daughters 97Sr and 96Sr), a beam contamination which was not expected in this14Actually also tin forms a high-melting intermetallic compound: Hf5Sn3. It was tested in [Hof84] (see commentsbelow).
15The temperature of this target was not calibrated individually. Instead the calibration curve of a similarUCx/graphite target is used.
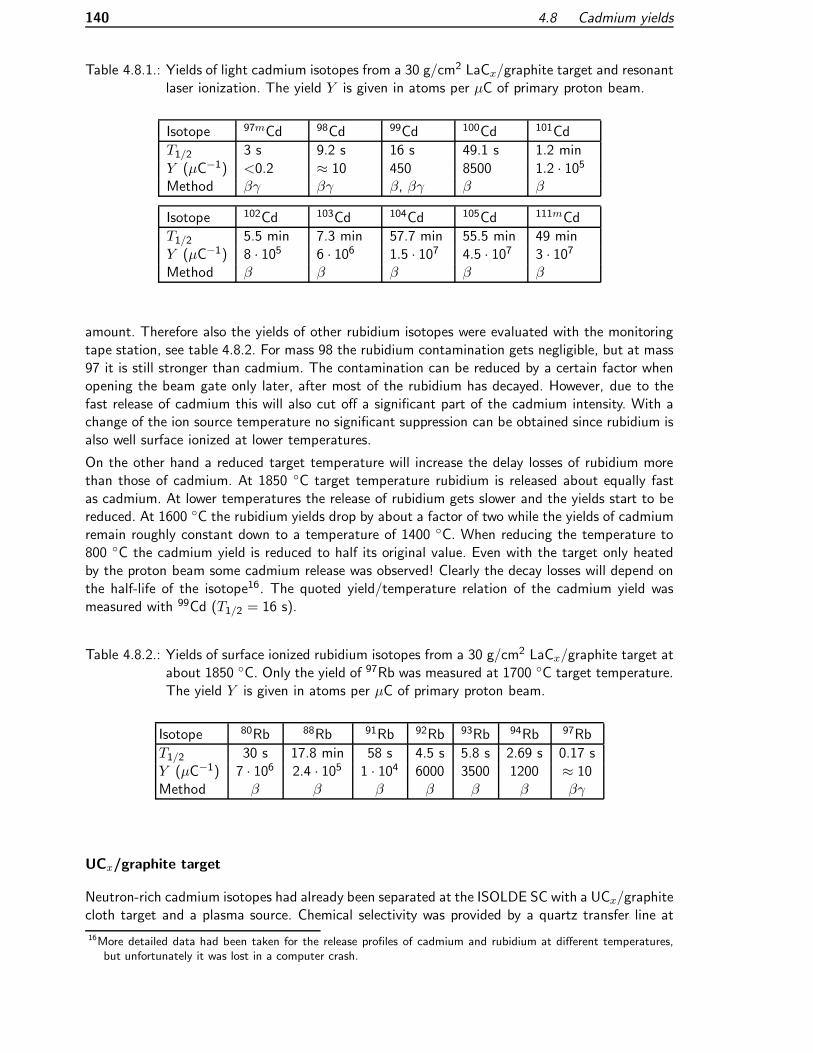
140 4.8 Cadmium yields
Table 4.8.1.: Yields of light cadmium isotopes from a 30 g/cm2 LaCx/graphite target and resonantlaser ionization. The yield Y is given in atoms per µC of primary proton beam.
Isotope 97mCd 98Cd 99Cd 100Cd 101Cd
T1/2 3 s 9.2 s 16 s 49.1 s 1.2 min
Y (µC−1) <0.2 ≈ 10 450 8500 1.2 · 105Method βγ βγ β, βγ β β
Isotope 102Cd 103Cd 104Cd 105Cd 111mCd
T1/2 5.5 min 7.3 min 57.7 min 55.5 min 49 minY (µC−1) 8 · 105 6 · 106 1.5 · 107 4.5 · 107 3 · 107Method β β β β β
amount. Therefore also the yields of other rubidium isotopes were evaluated with the monitoringtape station, see table 4.8.2. For mass 98 the rubidium contamination gets negligible, but at mass97 it is still stronger than cadmium. The contamination can be reduced by a certain factor whenopening the beam gate only later, after most of the rubidium has decayed. However, due to thefast release of cadmium this will also cut off a significant part of the cadmium intensity. With achange of the ion source temperature no significant suppression can be obtained since rubidium isalso well surface ionized at lower temperatures.
On the other hand a reduced target temperature will increase the delay losses of rubidium morethan those of cadmium. At 1850 C target temperature rubidium is released about equally fastas cadmium. At lower temperatures the release of rubidium gets slower and the yields start to bereduced. At 1600 C the rubidium yields drop by about a factor of two while the yields of cadmiumremain roughly constant down to a temperature of 1400 C. When reducing the temperature to800 C the cadmium yield is reduced to half its original value. Even with the target only heatedby the proton beam some cadmium release was observed! Clearly the decay losses will depend onthe half-life of the isotope16. The quoted yield/temperature relation of the cadmium yield wasmeasured with 99Cd (T1/2 = 16 s).
Table 4.8.2.: Yields of surface ionized rubidium isotopes from a 30 g/cm2 LaCx/graphite target atabout 1850 C. Only the yield of 97Rb was measured at 1700 C target temperature.The yield Y is given in atoms per µC of primary proton beam.
Isotope 80Rb 88Rb 91Rb 92Rb 93Rb 94Rb 97Rb
T1/2 30 s 17.8 min 58 s 4.5 s 5.8 s 2.69 s 0.17 sY (µC−1) 7 · 106 2.4 · 105 1 · 104 6000 3500 1200 ≈ 10Method β β β β β β βγ
UCx/graphite target
Neutron-rich cadmium isotopes had already been separated at the ISOLDE SC with a UCx/graphitecloth target and a plasma source. Chemical selectivity was provided by a quartz transfer line at
16More detailed data had been taken for the release profiles of cadmium and rubidium at different temperatures,but unfortunately it was lost in a computer crash.

4.8 Cadmium yields 141
600 C, suppressing a large part of the indium and cesium isobars [Kra86, SCyie]. To find ther-process waiting point nucleus 130Cd the selective detection of beta-delayed neutrons was used.Still a molecular beam of 40Ca90Br+ remained as background. The well-known lifetime of 90Brallowed to substract this background and to derive the half-life of 130Cd [Kra86]. The latter hada yield of about 50 atoms per µC [SCyie].
The heavier isotopes 131+xCd are already beyond the N = 82 shell closure and are expected tohave still shorter lifetimes. To minimize the decay losses, the full target and ion source unit hasto be kept at a sufficiently high temperature. To assure this and to obtain a better suppressionof molecular beam contaminations it was proposed to use a hotter transfer line together withionization by the chemically selective RILIS [ISI22].
In a first experiment a standard UCx/graphite target with niobium ionizer was used17. However,the broad width of the laser ion pulses did not allow to improve the cadmium over indium ratioby micro gating with the beam chopper.
Similarly to the LaCx/graphite target a very fast release was measured. At about 2050 C targettemperature the release curve could be fitted with: τr = 50 ms, τf = 400 ms, τs = 1000 ms andα = 0.7. With the monitoring tape station the yield of 122Cd was determined (see table 4.8.3) ata reduced proton beam intensity of 1012 protons per pulse. Already here a indium background upto 30 % had to be substracted. For all other isotopes a yield determination with the monitoringtape station was not possible due to a complicated mixture of often several isomers of cadmium,indium, cesium and their decay daughters.
The yields of 121Cd to 128Cd were determined from the analysis of γ intensities measured with theset-up described in ref. [Wei99]. It should be noted that the derived yields have a large uncertainty(>∼ factor 3) due to a varying transmission to the end of the hall, an unknown portion of thebeam which was implanted next to the tape and a high, but not constant dead time (pulsedimplantation). During the measurement of mass 123 the lasers were not running properly and theyield was reduced. Still the isomeric ratio could be deduced: about 70 % of 123gCd and 30 %of 123mCd. The masses A = 125, 127 and ≥ 129 were not studied with this set-up to avoid acontamination with long-lived isobars.
Gamma data at masses 130 and 131 were taken with the cluster detector set-up and beta-delayedneutrons were recorded at masses 130 to 132. As in the case of the heaviest silver isotopes thereis a strong background from indium isobars. Still the short-lived neutron activities of the isotopes130Cd, 131Cd and 132Cd could be identified. From the decay curves the half-lives and the Pn valueswere extracted [Kra00, Han00], see table 4.8.3.
For comparison also yields from ISOLDE SC are given [SCyie]. There a 13.6 g/cm2 UCx/graphitecloth target with MK3 plasma ion source had been used. It is evident that the present yieldsare nearly two orders of magnitude higher. However, this cannot be attributed solely to the goodefficiency of the RILIS. The target thickness at ISOLDE PSB was four times that at ISOLDE SC.Moreover the quoted SC yields close to stability are nearly a factor twenty below those of anotherSC target (UCx/graphite cloth target with MK5 source), indicating that the source efficiency ofthe used ion source was particularly low.
Comparison
Due to the intense cadmium beams already available since long time at ISOLDE [Hag70, Rav75b]not much concurrence developed at other facilities. However, for the most neutron-deficient iso-topes the facilities using fusion-evaporation reactions become competitive.
The odd cadmium isotopes 97Cd and 99Cd had been produced at the GSI ISOL facility in (40Ca,xn)fusion-evaporation reactions on 3 mg/cm2 nickel targets (with a beam of up to 66 pnA of 4 A·MeV17In fact it was the same target unit which was also used for the copper run.

142 4.8 Cadmium yields
Table 4.8.3.: Yields of heavy cadmium isotopes from a 53 g/cm2 UCx/graphite target and resonantlaser ionization at the PSB. The yield Y is given in atoms per µC of primary protonbeam and compared to a yield from ISOLDE SC (see text). Note that the yield ofthe isotopes determined by βγ spectroscopy is quite uncertain! The half-lives and Pnvalues of 130−132Cd were taken from [Kra00, Han00].
Isotope 121gCd 121mCd 122Cd 124Cd 126Cd 128Cd 130Cd 131Cd 132Cd
T1/2 12.8 s 8.3 s 5.5 s 1.3 s 0.51 s 0.3 s 165 ms 68 ms 97 msY (µC−1) PSB 1.3 · 108 5 · 108 6 · 108 4 · 107 3 · 106 2 · 105 ≈ 104 ≈ 103 some 10Y (µC−1) SC 1 · 107 9 · 106 3 · 103 50Method βγ βγ β βγ βγ βγ βn βn βnPn (%) 3.6 3.4 60
40Ca). They were ionized with a FEBIAD-F ion source [Kur82]. Due to an unknown branching ratiofor the detected protons no yield was reported for 97Cd. However, from the number of detectedevents reported in ref. [Kur82, Sch97] a yield can be estimated by using the same calculatedbranching ratio which was used in [Elm78]: 4 %. The yield is comparable to the quoted ISOLDESC yield, but due to the selective production mechanism contaminations like Rb and molecularions play no role at the GSI ISOL facility.
Figure 4.8.1 shows a comparison of experimentally obtained yields of light cadmium isotopes atdifferent facilities. The technical details are given in table 4.8.4. The yields of ref. [Ryk95] wereestimated from figure 3 therein.
Table 4.8.4.: Production of light cadmium isotopes at different RIB facilities.
Ref. Facility Proj. E/A I Target ζ Source(MeV) (pnA) (g/cm2)
RILIS LaC ISOLDE PSB p 1000 2500 LaCx 30 RILISSC Sn ISOLDE SC p 600 1500 Sn 120 MK3[Hag92b] ISOLDE p 600 2500 Sn/C 20 MK5[Hel96] GSI-ISOL 58Ni 5.9-6.7 40 50Cr F.-B2-C[Ryk95] LISE3, GANIL 112Sn 63 2.4 Ni 0.144[Sch97] GSI-ISOL 40Ca 4.2 50 60Ni 0.003 F.-B2[Stolz] GSI-FRS 112Sn 1000 0.004 Be 4
Prospects
It has been shown that neutron-deficient cadmium beams can be produced with a LaCx/graphitetarget and ionized by the RILIS. However, only for 99Cd a small gain in yield could be obtainedcompared with a tin target, but not for 98Cd and 100+xCd. Probably this remains also true for themost short-lived isotope 97Cd. Despite the element selective ionization with a RILIS, at mass 97the beam purity was not sufficiently improved in comparison with a molten tin target18. This caseis a textbook example for the principle to “suppress contaminations as early as possible”! Thatmeans it is better to not produce them at all (e.g. by fusion-evaporation reactions) or to keep
18It should be noted that occasionally strong beam impurities were also observed with a molten tin target, e.g.23Na75Br+ beams in [Plo92].
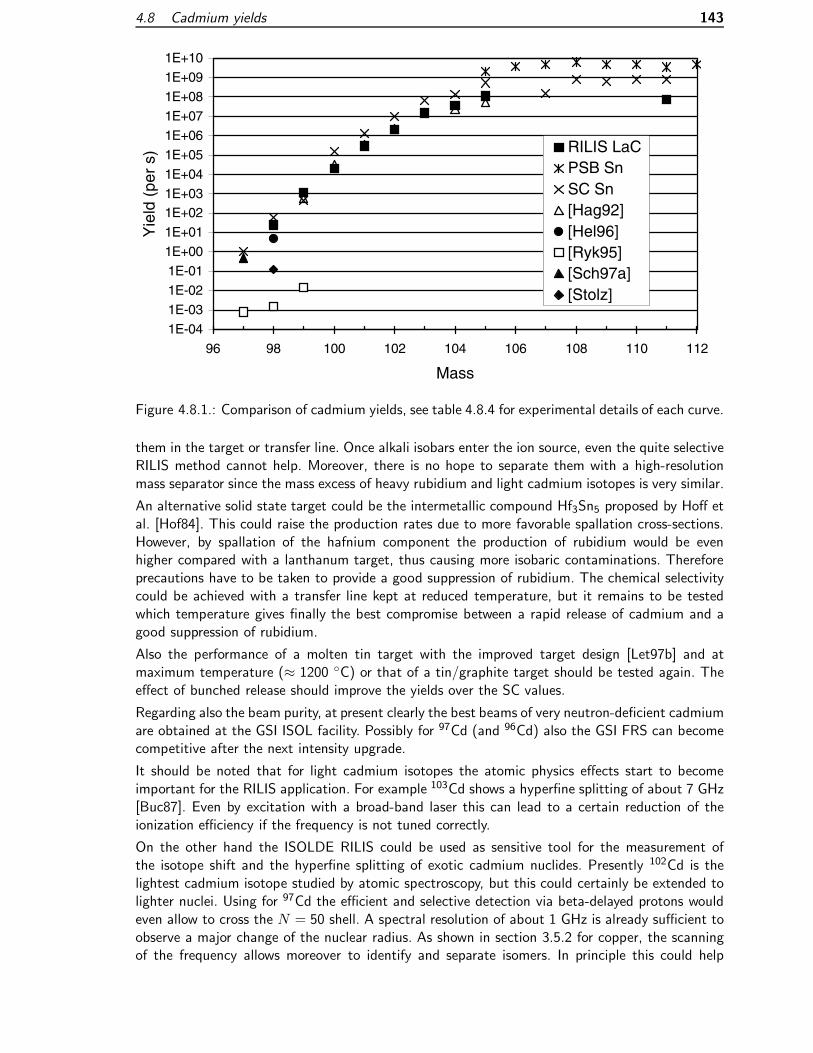
4.8 Cadmium yields 143
1E-04
1E-03
1E-02
1E-01
1E+00
1E+01
1E+021E+03
1E+04
1E+05
1E+06
1E+07
1E+08
1E+09
1E+10
96 98 100 102 104 106 108 110 112
Mass
Yie
ld (
per
s)RILIS LaCPSB SnSC Sn[Hag92][Hel96][Ryk95][Sch97a][Stolz]
Figure 4.8.1.: Comparison of cadmium yields, see table 4.8.4 for experimental details of each curve.
them in the target or transfer line. Once alkali isobars enter the ion source, even the quite selectiveRILIS method cannot help. Moreover, there is no hope to separate them with a high-resolutionmass separator since the mass excess of heavy rubidium and light cadmium isotopes is very similar.
An alternative solid state target could be the intermetallic compound Hf3Sn5 proposed by Hoff etal. [Hof84]. This could raise the production rates due to more favorable spallation cross-sections.However, by spallation of the hafnium component the production of rubidium would be evenhigher compared with a lanthanum target, thus causing more isobaric contaminations. Thereforeprecautions have to be taken to provide a good suppression of rubidium. The chemical selectivitycould be achieved with a transfer line kept at reduced temperature, but it remains to be testedwhich temperature gives finally the best compromise between a rapid release of cadmium and agood suppression of rubidium.
Also the performance of a molten tin target with the improved target design [Let97b] and atmaximum temperature (≈ 1200 C) or that of a tin/graphite target should be tested again. Theeffect of bunched release should improve the yields over the SC values.
Regarding also the beam purity, at present clearly the best beams of very neutron-deficient cadmiumare obtained at the GSI ISOL facility. Possibly for 97Cd (and 96Cd) also the GSI FRS can becomecompetitive after the next intensity upgrade.
It should be noted that for light cadmium isotopes the atomic physics effects start to becomeimportant for the RILIS application. For example 103Cd shows a hyperfine splitting of about 7 GHz[Buc87]. Even by excitation with a broad-band laser this can lead to a certain reduction of theionization efficiency if the frequency is not tuned correctly.
On the other hand the ISOLDE RILIS could be used as sensitive tool for the measurement ofthe isotope shift and the hyperfine splitting of exotic cadmium nuclides. Presently 102Cd is thelightest cadmium isotope studied by atomic spectroscopy, but this could certainly be extended tolighter nuclei. Using for 97Cd the efficient and selective detection via beta-delayed protons wouldeven allow to cross the N = 50 shell. A spectral resolution of about 1 GHz is already sufficient toobserve a major change of the nuclear radius. As shown in section 3.5.2 for copper, the scanningof the frequency allows moreover to identify and separate isomers. In principle this could help

144 4.9 Indium yields
to identify the predicted 1/2− and 25/2+ isomeric states in 97Cd [Sch97]. However, the latterexperiment could only be performed at ISOLDE if both isomers also show a significant branchingratio for βp decay, allowing a “background-free” detection. Else a RILIS has to be set up again atthe GSI ISOL facility.
On the neutron-deficient side the production cross-section is limiting an extension to more exoticisotopes. On the neutron-rich side the limiting factor is rather the beam purity. The productionrates of heavy cadmium isotopes are high enough to perform interesting nuclear spectroscopyexperiments, but presently the isobaric background is just overwhelming. With the help of a thincavity and the beam chopper or with a high resolution separator this background may possibly besuppressed by about one order of magnitude, but for a larger gain the problem has to be tackledat an earlier stage, i.e. before entering the ion source.
The beam purity could be significantly improved by combining a temperature controlled transferline with the RILIS. The former can suppress background from less volatile elements (indium andcesium) and the latter will remove molecular beams with higher ionization potential. Systematicinvestigations are required to find an optimum combination of material, geometry and temperatureof this transfer line. The Eichler systematics indicates that e.g. a chromium surface is very promisingfor the Cd/In separation, but also palladium and platinum should show a significant separationeffect [Ros86]. The latter could be used simultaneously for a further suppression of the surfaceionizable elements by using a transfer line with “inverted polarity” (see section 3.4.4). Also non-metallic or compound surfaces could be considered for such a thermo-separator.
4.9. Indium yields
LaCx/graphite target
No yields for very neutron-deficient indium isotopes had been reported from ISOLDE SC. However,the LaCx/graphite target with tungsten surface ionizer provides ideal conditions to produce them.Therefore the release and yields of indium beams were studied together with the test of the lightCd and Cs beams. With the target at about 1850 C a fast release was found which could be fittedwith (see equation (2.4.2)): τr = 60 ms, τf = 600 ms, τs = 6 s and α = 0.98.
Table 4.9.1.: Yields of light indium isotopes from a 30 g/cm2 LaCx/graphite target and tungstensurface ionizer. The yield Y is given in atoms per µC of primary proton beam.
Isotope 101In 102In 103gIn 104gIn 105gIn 106g+mIn 112gIn 114gIn
T1/2 14.9 s 22.1 s 60 s 1.8 min 4.8 min ≈ 6 min 14.4 min 72 sY (µC−1) 30 900 1.4 · 104 4.4 · 104 1.9 · 105 3.7 · 106 1 · 107 1.2 · 105Method βγ β β β β β β β
Comparison
Figure 4.9.1 shows a comparison of experimentally obtained yields of light indium isotopes atdifferent facilities. The technical details are given in table 4.9.2. The yields of ref. [Ryk95] wereestimated from figure 3 therein. The yield of 100In from ref. [Sch96] was corrected for the lowtransmission.

4.9 Indium yields 145
Table 4.9.2.: Production of light indium isotopes at different RIB facilities.
Ref. Facility Proj. E/A I Target ζ Source(MeV) (pnA) (g/cm2)
LaC ISOLDE PSB p 1000 2500 LaCx 30 WSI[Bar97] IRIS p 1000 100 GdCx 7 WSI[Sze95, Sze97] GSI-ISOL 58Ni 5.6-5.9 40 50Cr F.-B2-C,-E[Ebe86, Ebe87] GSI-ISOL 16O 6-9 Mo 0.03 F.-B2[Ver81, Ver84] LISOL 14N 5.1 1200 Mo 0.005 Nielsen[Ryk95] LISE3, GANIL 112Sn 63 2.4 Ni 0.144[Sch96] GSI-FRS 124Xe 1095 0.0037 Be 6[Wefer] GSI-FRS 112Sn 1000 0.004 Be 4
1E-05
1E-04
1E-03
1E-02
1E-01
1E+00
1E+01
1E+02
1E+03
1E+04
1E+05
1E+06
1E+07
1E+08
97 99 101 103 105 107 109 111 113
Mass
Yie
ld (
per
s) LaC[Bar97][Sze95,Sze97][Ebe86,Ebe87][Ver81,Ver84][Ryk95][Sch96][Wefer]
Figure 4.9.1.: Comparison of indium yields, see table 4.9.2 for experimental details of each curve.
UCx/graphite target
Heavy indium beams are of high interest for nuclear spectroscopy, since they populate by β− decayexcited levels of tin nuclei around the doubly magic 132Sn. The first studies of the 132In decay wereperformed with beams of neutron-induced fission products at the reactor-based facilities OSIRIS[Ker73] and JOSEF [Bjø80]. Later also ISOLDE beams were used for these studies [Bjø86]. Thesewere more intense than at OSIRIS, but the production of the cesium isobar was more than sevenorders of magnitude larger! At the ISOLDE PSB also the decay of the isotopes 133In and 134Incould be studied [Jok95, Hof96a].
The yield of 132−134In from a UCx/graphite target was measured by detecting beta-delayed neu-trons. For 132In and 133In the known branching ratios were used and for 134In the predicted valuefrom [Mol97]. To integrate the total indium yield per proton pulse the beam gate was kept open for2 s. Therefore the half-life could not be fitted. However, folding the release profile with the knownhalf-lives gives a satisfying agreement. That means a possible contamination with molecular ionscould only contribute a minor part of the detected neutrons. The obtained yields are higher by afactor three to six compared with those obtained by Jokinen et al. [Jok95]. At another occasionanother order of magnitude higher yields were observed for 132In and 133In [PSyie]. It is not clear

146 4.9 Indium yields
if this is due to a better transmission or detection efficiency19, or just the “normal” fluctuationfrom target to target. The yields of 133In and 134In were not measured with other targets to avoidan excessive cesium and barium contamination of the respective tape station.
Table 4.9.3.: Yields of heavy indium isotopes from a 52 g/cm2 UCx/graphite target with tungstensurface ionizer. The yield Y is given in atoms per µC of primary proton beam.
Isotope 132In 133In 134In
T1/2 206 ms 180 ms 138 msPn 5.2 % 87 % (100 %)Y (µC−1) 1.3 · 105 6000 450
In a recent attempt to do a more detailed gamma spectroscopy of the 134In decay the cesiumbackground was just overwhelming. The problem of the cesium contamination is obvious whenregarding the production cross-sections in high energy proton induced reactions. The width of theisobaric distribution is larger than in neutron-induced fission, causing the strong background fromcesium isotopes close to stability.
To show the behavior of all isobars unaffected by experimental variations of release and ionizationefficiency exceptionally no experimental yields are plotted in figure 4.9.2, but the independent cross-sections. For the proton-induced reactions the cross-sections were calculated once from the semi-empiric systematics of Silberberg and Tsao [Sil90] and once with a Monte Carlo code (abrasion-ablation model) [Farge, Benll, Ben98]. Taking into account the completely different nature ofthe models, the predictions agree reasonably well. For the yields from neutron-induced fission thesystematics from Wahl [Wah88] was used.
1E-6
1E-5
1E-4
1E-3
1E-2
1E-1
1E+0
1E+1
1E+2
1E+3
1E+4
1E+5
49 50 51 52 53 54 55 56 57 58 59 60
Z
Cro
ss s
ectio
n (m
barn
)
therm. neutrons [Wah88]
1 GeV protons [Sil90]
1 GeV protons [Benll]
Figure 4.9.2.: Production cross-sections for the A = 134 isobars. The values for thermal-neutroninduced fission are connected with a black line, those for 1 GeV proton inducedreactions by a grey line.
Note that the ratio of the experimental yields is even more unfavorable than that of the productioncross-sections: the decay losses in the target are higher for indium while the surface ionizationefficiency is higher for cesium. Therefore the yield of 134Cs is about seven orders of magnitudehigher than that of 134In! A major background suppression is achieved by using a tape station
19These are normally already included in the quoted yields, but occasionally the transmission varies considerablywhen changing the mass.

4.10 Tin yields 147
to transport the long-lived cesium contaminants periodically away. Beta gating helps to suppressthe background from the 134mCs decay. But still these experiments are done at the limit and asmall fluctuation of the yields can render them impossible. Similar contamination problems canalso occur for neighboring masses. The light lanthanides and metastable barium isomers can causeadditional background.
To improve the indium to cesium ratio a transfer line with “inverted polarity” (see section 3.4.4)could help as well as the use of a high resolution mass separator. However, these measures mightgive an improvement of one order of magnitude while the production via neutron-induced fissionsolves the problem completely! Therefore an intense reactor-based RIB facility would be veryprofitable for nuclear spectroscopy in this region [Mac95].
An interesting fact which was not yet studied thoroughly is the different population of variousisomers in charged particle induced fission compared with thermal- [Den86, Rud90] and fast neu-tron induced fission [Rud94]. Most indium isotopes have several isomers and can offer a goodopportunity for a systematic study.
4.10. Tin yields
Tin has the magic proton number Z = 50. Therefore it is highly appreciated by theorists whopredict its nuclear properties from the proton- up to neutron drip line and beyond, see e.g. [Dob96]and references in [Lun97]. The experimental physics is far from keeping pace with these far-reachingpredictions. However, as shown in [Lun97] e.g. the mass predictions start to differ significantlyalready when going only few nuclei beyond the last experimentally measured nuclei. An extensionof the provided tin yields towards more exotic isotopes is particularly interesting for all RIB facilities.Therefore tin was chosen as one of the key elements to evaluate the projects of next-generationRIB facilities in Europe and North America.
Production
On the neutron-deficient side (around 100Sn) facilities using fragmentation and fusion-evaporationare presently competing to reach the highest yields. The spallation cross-sections and the intrinsicbeam purity (broad width of the isobaric production curve) of a spallation facility are not expectedto be particularly favorable in this region (compare section 4.8).
However, on the neutron-rich side the heavy fission fragment distribution peaks just around thedoubly-magic 132Sn. Therefore all facilities using fission reactions profit from large productioncross-sections. The performance of an ISOL facility is here less limited by the production rate thanby the release time and possibly by isobaric contaminations.
The heaviest tin isotopes were always produced by fission reactions, see e.g. ref. [Gre63] where 132Snwas chemically separated from irradiated 235U for the determination of its half-life, or ref. [Kaw82]where the 2 µs 8+ isomer of 132Sn was separated with the gas-filled recoil separator JOSEF.Presently 134Sn is the heaviest tin isotope with measured half-life and mass. It was studied already25 years ago at OSIRIS [Sha74] and LOHENGRIN [Asg75]. The study of the neutron-rich isotopesaround 132Sn remains one of the most important domains for the reactor-based RIB facilities evento this day [Fog99].
Release
Tin isotopes (107−113Sn) were already separated at ISOLDE 1 from a TeCl4 target [Als70]. Later108−111Sn was separated with a Ta foil target and a hot plasma source. However, for the productionof neutron-rich tin isotopes by fission, an actinide target is required. The isotopes 125−132Sn were

148 4.10 Tin yields
separated from an ISOLDE UCx/graphite cloth target at 1950 C together with a hot plasmasource [Hag92b].
Carraz et al. found for tin a release half-life of 2 to 3 min from both, a UCx/graphite cloth materialat 1600 C and a pure UC/UC2 powder at 2000 C [Car78]. A much faster release ( 1 min) wasobserved from ThO2 at 2100 C [Hof84].
Kirchner measured the release of tin from different materials: Nb, Mo, W and various types ofgraphite [Kir92a, Kir97]. The obtained diffusion constants are all of the same order of magnitude(some 10−10 cm2/s at 2200 K), but it is noticeable that the mean effusion times are quite im-portant: already several seconds for the small GSI target and ion source systems. Interestingly thisoccurs for two different types of ion sources: a FEBIAD-B2 with Ta-electrodes and BN insulators[Kir87a] and a FEBIAD-E with graphite electrodes and BeO insulators [Kir81b]. Thus, tin doesnot seem to stick to a particular surface of the source construction materials, but rather showsgenerally a larger desorption enthalpy.
On the other hand Rudstam et al. found a reasonably fast release of tin from the OSIRISUCx/graphite target with a tungsten enclosure [Rud90]. It should be noted that in another yieldand release evaluation from the OSIRIS target the average release time of tin was significantlylarger [Rud96]. It is not clear if this effect is an artifact from mother-daughter corrections20 or dueto a change in the target properties, e.g. a changed graphite “coating” of the tungsten surface.
Bolshakov et al. found at temperatures above 1600 C a rapid release from UCx/graphite materialproduced from diphtalocyanine [Bol92].
Note that the Eichler systematics predicts a 100 times longer adsorption time on tungsten at2300 C compared with niobium at 2000 C. This could lead to the unexpected effect that tinis released much faster from a niobium cavity than from a tungsten cavity. According to thissystematics another order of magnitude in desorption time could be gained with a molybdenumtube at 2000 C.
Ionization
With an ionization potential of 7.34 eV, tin is practically not surface ionized. A hot plasma ionsource can give a good ionization efficiency but does not show any selectivity. The heavier isobarsantimony, tellurium, iodine, etc. will cause large background in nuclear spectroscopy experiments.
The RILIS can provide a more selective ionization of tin. Several laser ionization schemes for tinhave been tested successfully off-line at ISOLDE and GSI (see section B.8). However, no on-linerelease test with the RILIS was made yet.
With a RILIS isobaric contaminations from Sb to Xe should be significantly reduced since all theseelements have ionization potentials above 8 eV. The neighboring surface ionizable isobar indiumhas for heavy masses a production cross-section which is about one order of magnitude lower.Moreover, due to the shell stabilization of Z = 50 the indium half-life is typically one order ofmagnitude shorter compared with the tin isobar. A suitable collection- and measurement cycleallows to exclude most indium background.
Cesium can cause a problem. With its very low ionization potential (3.89 eV) it will get surfaceionized on practically all surfaces if the temperature is raised high enough to release tin. As shownin section 4.9 in high-energy proton-induced reactions the production cross-sections for heaviercesium isotopes (A >∼ 128) are many orders of magnitude larger than the corresponding cross-sections for indium and tin. Thus, even the “tricks” with the RILIS cavity discussed in section 3.4,which allow to suppress the surface ionized background by up to one order of magnitude, will nothelp sufficiently.
20The release of cadmium and indium was not determined in the latter evaluation.
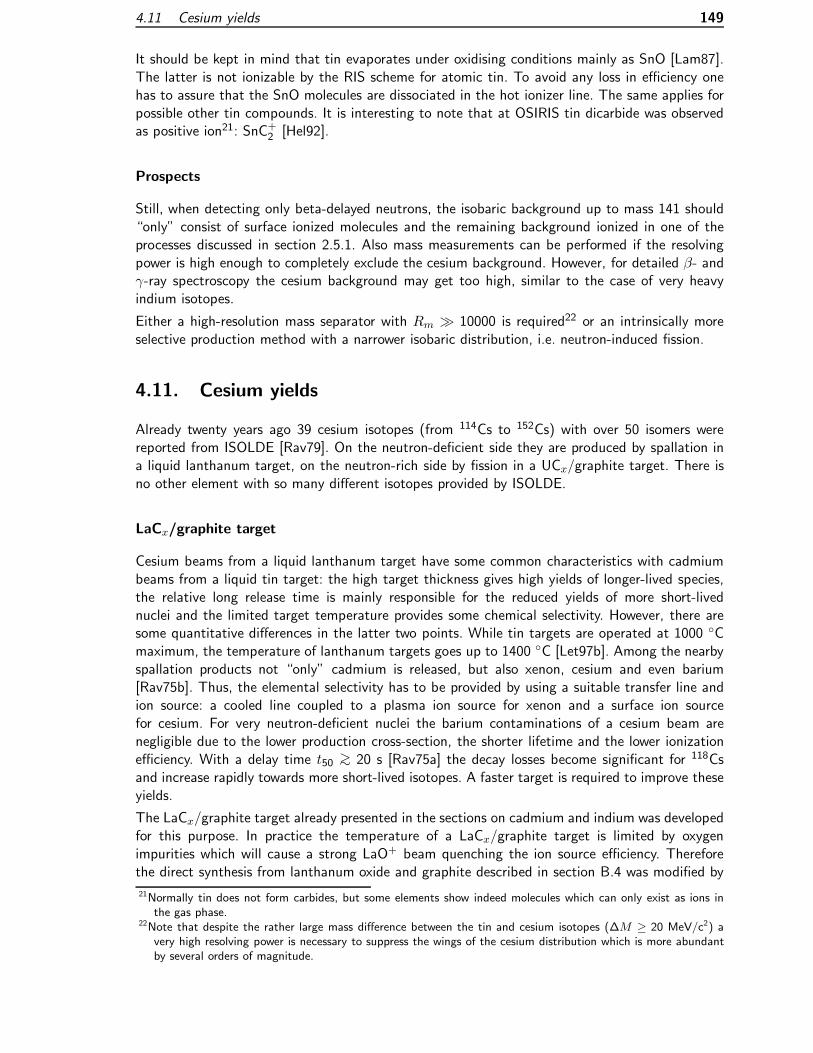
4.11 Cesium yields 149
It should be kept in mind that tin evaporates under oxidising conditions mainly as SnO [Lam87].The latter is not ionizable by the RIS scheme for atomic tin. To avoid any loss in efficiency onehas to assure that the SnO molecules are dissociated in the hot ionizer line. The same applies forpossible other tin compounds. It is interesting to note that at OSIRIS tin dicarbide was observedas positive ion21: SnC+2 [Hel92].
Prospects
Still, when detecting only beta-delayed neutrons, the isobaric background up to mass 141 should“only” consist of surface ionized molecules and the remaining background ionized in one of theprocesses discussed in section 2.5.1. Also mass measurements can be performed if the resolvingpower is high enough to completely exclude the cesium background. However, for detailed β- andγ-ray spectroscopy the cesium background may get too high, similar to the case of very heavyindium isotopes.
Either a high-resolution mass separator with Rm 10000 is required22 or an intrinsically moreselective production method with a narrower isobaric distribution, i.e. neutron-induced fission.
4.11. Cesium yields
Already twenty years ago 39 cesium isotopes (from 114Cs to 152Cs) with over 50 isomers werereported from ISOLDE [Rav79]. On the neutron-deficient side they are produced by spallation ina liquid lanthanum target, on the neutron-rich side by fission in a UCx/graphite target. There isno other element with so many different isotopes provided by ISOLDE.
LaCx/graphite target
Cesium beams from a liquid lanthanum target have some common characteristics with cadmiumbeams from a liquid tin target: the high target thickness gives high yields of longer-lived species,the relative long release time is mainly responsible for the reduced yields of more short-livednuclei and the limited target temperature provides some chemical selectivity. However, there aresome quantitative differences in the latter two points. While tin targets are operated at 1000 Cmaximum, the temperature of lanthanum targets goes up to 1400 C [Let97b]. Among the nearbyspallation products not “only” cadmium is released, but also xenon, cesium and even barium[Rav75b]. Thus, the elemental selectivity has to be provided by using a suitable transfer line andion source: a cooled line coupled to a plasma ion source for xenon and a surface ion sourcefor cesium. For very neutron-deficient nuclei the barium contaminations of a cesium beam arenegligible due to the lower production cross-section, the shorter lifetime and the lower ionizationefficiency. With a delay time t50 >∼ 20 s [Rav75a] the decay losses become significant for 118Csand increase rapidly towards more short-lived isotopes. A faster target is required to improve theseyields.
The LaCx/graphite target already presented in the sections on cadmium and indium was developedfor this purpose. In practice the temperature of a LaCx/graphite target is limited by oxygenimpurities which will cause a strong LaO+ beam quenching the ion source efficiency. Thereforethe direct synthesis from lanthanum oxide and graphite described in section B.4 was modified by
21Normally tin does not form carbides, but some elements show indeed molecules which can only exist as ions inthe gas phase.
22Note that despite the rather large mass difference between the tin and cesium isotopes (∆M ≥ 20 MeV/c2) avery high resolving power is necessary to suppress the wings of the cesium distribution which is more abundantby several orders of magnitude.

150 4.11 Cesium yields
reducing the remaining oxides under CH4 flow [Men97]. A LaCx/graphite target with approximately30 g/cm2 thickness lanthanum23 was produced.
At a target temperature of about 1850 C the release was reasonably fast and could be fittedwith (see equation (2.4.2)): τr = 20 ms, τf = 1 s, τs = 15 s and α = 0.8. Table 4.11.1 showsthe obtained yields. The isotopes 115−138mCs were detected by beta counting with the monitoringtape station. The yield for masses 117 to 121 was evaluated without separation of the isomers byusing an average lifetime. At mass 116 it was not possible to separate the mixture of two cesiumand three indium isomers. The yield of 114Cs was derived from the most abundant gamma lines(450, 698 and 758 keV) observed in a short measurement with the Euroball cluster detectors.
Table 4.11.1.: Yields of cesium isotopes from a 30 g/cm2 LaCx/graphite target and tungstensurface ionizer. The yield Y is given in atoms per µC of primary proton beam. Allyields but that of 114Cs were determined by beta counting.
Isotope 114Cs 115Cs 117g+mCs 118g+mCs 119g+mCs 120Cs 121Cs
T1/2 0.57 s 1.4 s ≈ 7.5 s ≈ 15.5 s ≈ 37 s ≈ 60 s ≈ 2.3 min
Y (µC−1) ≈ 6 ≈ 200 1.3 · 105 2 · 106 7 · 106 4.5 · 107 1.8 · 108
Isotope 122gCs 123gCs 123mCs 124gCs 124mCs 125Cs 126Cs
T1/2 21 s 5.9 min 1.6 s 30.8 s 6.3 s 45 min 1.6 min
Y (µC−1) 8 · 108 1.4 · 109 2 · 107 1 · 109 1.5 · 107 8 · 108 1.4 · 109
Isotope 128Cs 130mCs 134mCs 135mCs 136mCs 138mCs
T1/2 3.8 min 3.5 min 2.9 h 53 min 19 s 2.9 minY (µC−1) 1.1 · 109 5 · 108 1.3 · 108 1.5 · 107 3.5 · 106 9 · 104
Comparison
Figure 4.11.1 shows experimentally obtained yields of light cesium isotopes at different facilities.Details are given in table 4.11.2. For better comparison the yields quoted in [Bar97] were scaledto a typical proton beam current at ISOLDE: 2.5 µA.
Table 4.11.2.: Production of light cesium isotopes at different RIB facilities. All presented ISOLfacilities use a tungsten surface ion source.
Ref. Facility Proj. E/A I Target ζ(MeV) (pnA) (g/cm2)
PSB LaC ISOLDE p 1000 2500 LaC 30PSB La ISOLDE p 1000 1000 La 123SC La ISOLDE p 1000 1000 La 140SC Ta ISOLDE p 1000 2500 Ta 122[Bar97] IRIS p 1000 (2500) GdCx 7[Roe80] GSI-ISOL 58Ni 5 250 58Ni 0.004[Bog75] BEMS-2, JINR 32S 5.94 92Mo 0.002[Hof89] SHIP, GSI 58Ni 3.95 10 58Ni 0.0004
Note that the molten lanthanum targets are not run with the maximum available beam intensity toprotect the target container from excessive thermal stress. The large difference between the yields23Some of the material could have been lost in the production process. Therefore the thickness can only be givenapproximately.
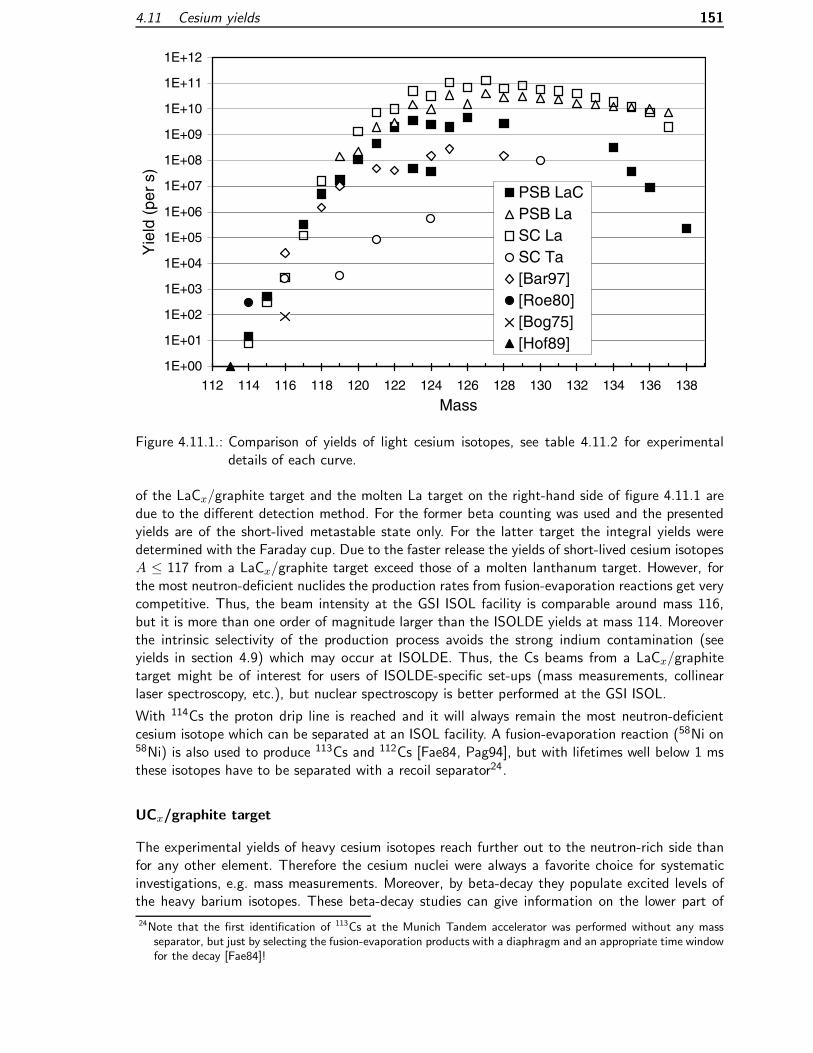
4.11 Cesium yields 151
1E+00
1E+01
1E+02
1E+03
1E+04
1E+05
1E+06
1E+07
1E+08
1E+09
1E+10
1E+11
1E+12
112 114 116 118 120 122 124 126 128 130 132 134 136 138
Mass
Yie
ld (
per
s)
PSB LaCPSB LaSC LaSC Ta[Bar97][Roe80][Bog75][Hof89]
Figure 4.11.1.: Comparison of yields of light cesium isotopes, see table 4.11.2 for experimentaldetails of each curve.
of the LaCx/graphite target and the molten La target on the right-hand side of figure 4.11.1 aredue to the different detection method. For the former beta counting was used and the presentedyields are of the short-lived metastable state only. For the latter target the integral yields weredetermined with the Faraday cup. Due to the faster release the yields of short-lived cesium isotopesA ≤ 117 from a LaCx/graphite target exceed those of a molten lanthanum target. However, forthe most neutron-deficient nuclides the production rates from fusion-evaporation reactions get verycompetitive. Thus, the beam intensity at the GSI ISOL facility is comparable around mass 116,but it is more than one order of magnitude larger than the ISOLDE yields at mass 114. Moreoverthe intrinsic selectivity of the production process avoids the strong indium contamination (seeyields in section 4.9) which may occur at ISOLDE. Thus, the Cs beams from a LaCx/graphitetarget might be of interest for users of ISOLDE-specific set-ups (mass measurements, collinearlaser spectroscopy, etc.), but nuclear spectroscopy is better performed at the GSI ISOL.
With 114Cs the proton drip line is reached and it will always remain the most neutron-deficientcesium isotope which can be separated at an ISOL facility. A fusion-evaporation reaction (58Ni on58Ni) is also used to produce 113Cs and 112Cs [Fae84, Pag94], but with lifetimes well below 1 msthese isotopes have to be separated with a recoil separator24.
UCx/graphite target
The experimental yields of heavy cesium isotopes reach further out to the neutron-rich side thanfor any other element. Therefore the cesium nuclei were always a favorite choice for systematicinvestigations, e.g. mass measurements. Moreover, by beta-decay they populate excited levels ofthe heavy barium isotopes. These beta-decay studies can give information on the lower part of
24Note that the first identification of 113Cs at the Munich Tandem accelerator was performed without any massseparator, but just by selecting the fusion-evaporation products with a diaphragm and an appropriate time windowfor the decay [Fae84]!
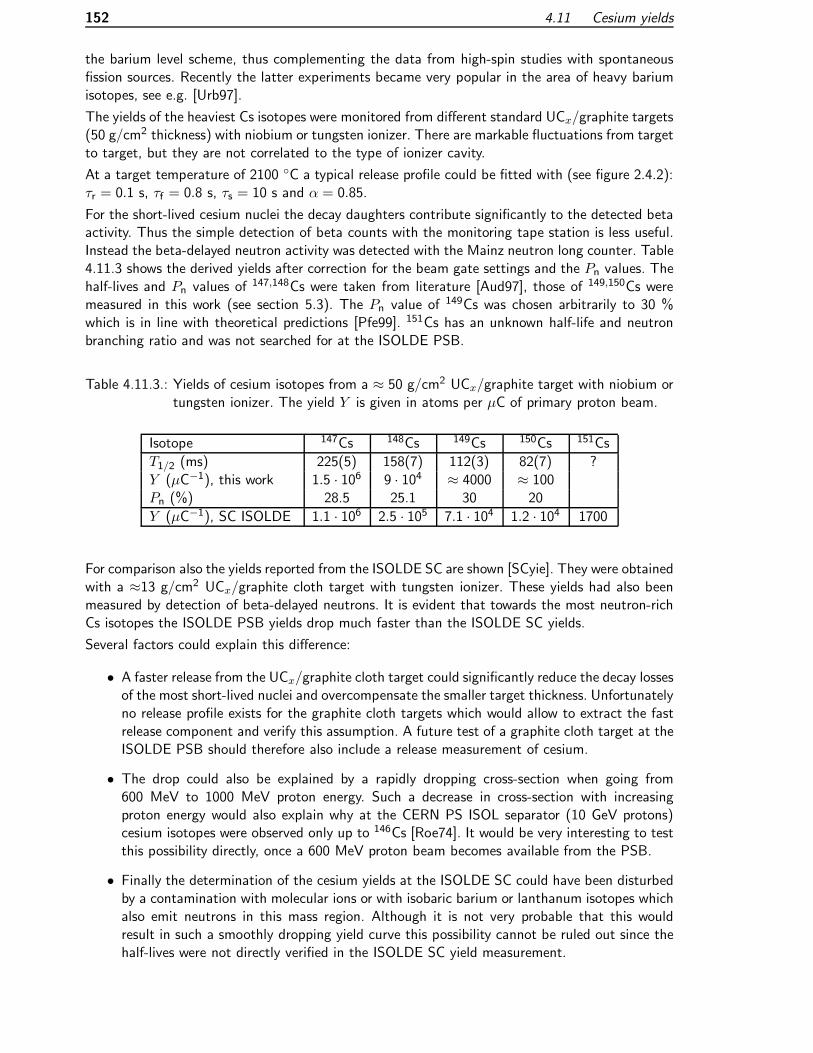
152 4.11 Cesium yields
the barium level scheme, thus complementing the data from high-spin studies with spontaneousfission sources. Recently the latter experiments became very popular in the area of heavy bariumisotopes, see e.g. [Urb97].
The yields of the heaviest Cs isotopes were monitored from different standard UCx/graphite targets(50 g/cm2 thickness) with niobium or tungsten ionizer. There are markable fluctuations from targetto target, but they are not correlated to the type of ionizer cavity.
At a target temperature of 2100 C a typical release profile could be fitted with (see figure 2.4.2):τr = 0.1 s, τf = 0.8 s, τs = 10 s and α = 0.85.
For the short-lived cesium nuclei the decay daughters contribute significantly to the detected betaactivity. Thus the simple detection of beta counts with the monitoring tape station is less useful.Instead the beta-delayed neutron activity was detected with the Mainz neutron long counter. Table4.11.3 shows the derived yields after correction for the beam gate settings and the Pn values. Thehalf-lives and Pn values of 147,148Cs were taken from literature [Aud97], those of 149,150Cs weremeasured in this work (see section 5.3). The Pn value of 149Cs was chosen arbitrarily to 30 %which is in line with theoretical predictions [Pfe99]. 151Cs has an unknown half-life and neutronbranching ratio and was not searched for at the ISOLDE PSB.
Table 4.11.3.: Yields of cesium isotopes from a ≈ 50 g/cm2 UCx/graphite target with niobium ortungsten ionizer. The yield Y is given in atoms per µC of primary proton beam.
Isotope 147Cs 148Cs 149Cs 150Cs 151Cs
T1/2 (ms) 225(5) 158(7) 112(3) 82(7) ?Y (µC−1), this work 1.5 · 106 9 · 104 ≈ 4000 ≈ 100Pn (%) 28.5 25.1 30 20
Y (µC−1), SC ISOLDE 1.1 · 106 2.5 · 105 7.1 · 104 1.2 · 104 1700
For comparison also the yields reported from the ISOLDE SC are shown [SCyie]. They were obtainedwith a ≈13 g/cm2 UCx/graphite cloth target with tungsten ionizer. These yields had also beenmeasured by detection of beta-delayed neutrons. It is evident that towards the most neutron-richCs isotopes the ISOLDE PSB yields drop much faster than the ISOLDE SC yields.
Several factors could explain this difference:
• A faster release from the UCx/graphite cloth target could significantly reduce the decay lossesof the most short-lived nuclei and overcompensate the smaller target thickness. Unfortunatelyno release profile exists for the graphite cloth targets which would allow to extract the fastrelease component and verify this assumption. A future test of a graphite cloth target at theISOLDE PSB should therefore also include a release measurement of cesium.
• The drop could also be explained by a rapidly dropping cross-section when going from600 MeV to 1000 MeV proton energy. Such a decrease in cross-section with increasingproton energy would also explain why at the CERN PS ISOL separator (10 GeV protons)cesium isotopes were observed only up to 146Cs [Roe74]. It would be very interesting to testthis possibility directly, once a 600 MeV proton beam becomes available from the PSB.
• Finally the determination of the cesium yields at the ISOLDE SC could have been disturbedby a contamination with molecular ions or with isobaric barium or lanthanum isotopes whichalso emit neutrons in this mass region. Although it is not very probable that this wouldresult in such a smoothly dropping yield curve this possibility cannot be ruled out since thehalf-lives were not directly verified in the ISOLDE SC yield measurement.

4.12 Francium yields 153
4.12. Francium yields
Already in the earliest ISOLDE experiments the half-life of 224−226Fr had been measured for thefirst time [Han69]. Later the β− decay of heavy francium isotopes from ISOLDE was used to studythe nuclear structure of the populated radium isotopes: 227Fr [Egi81], 228Fr [Ruc82], 229Fr [Bor92],230Fr [Kur87] and 231Fr [Hil85]. The presently heaviest francium isotope 232Fr was discovered atthe IRIS facility in Gatchina [Mez90] which is technically very similar to ISOLDE.
On the neutron-deficient side the isotopes 201Fr and 202Fr were discovered at ISOLDE [Ewa80].The beams of francium nuclides close to beta stability can reach an intensity of one 1 pnA andmore [Klu86].
The simple atomic structure of an alkali and the fact that francium is the heaviest element which isvery efficiently separated from a thick target ISOL facility, make it the favorite choice for systematicstudies of atomic physical properties of high-Z elements.
Precision experiments for parity non-conservation studies in atoms are under preparation. For thispurpose a sufficient amount of francium atoms has to be kept long enough in an atom trap. Withthe expected trapping efficiencies and storage times beam intensities of the order of 1010 − 1011
francium atoms per second are required [Cas97].
Therefore francium was included as the heaviest element in the list of “key beams” for the evalu-ation of ISOL facilities by the NuPECC study group.
Yields
Obviously an actinide target is required for the production of francium in spallation reactions. Forthe lighter francium isotopes the optimum yields are obtained from a ThC/graphite target andfor the heavier ones a UCx/graphite target gives the best yields. Like all other alkalis franciumreaches a high vapor pressure already at relatively low temperatures and the desorption from hotsurfaces is uncritical. Compared with the lighter alkalis the diffusion is somewhat slower due tothe larger atomic mass and volume, but the release is fast enough for an efficient separation of thebeta-decaying francium isotopes with half-lives in the second to minute range. With a standardUCx/graphite target at about 2100 C and a tungsten surface ionizer25 at 2100 C the releasecan be fitted with (see equation (2.4.2)): τr = 0.1 s, τf = 0.6 s, τs = 6 s and α = 0.9.
For the more short-lived isotopes (T1/2 <∼ 1 s) the decay losses become considerable, but evenisotopes with lifetimes in the millisecond range (214,218,219Fr) were already separated at ISOLDE[Klu86].
Table 4.12.1 shows the yields of heavy francium isotopes measured in this work at the ISOLDEPSB. All yields were measured by beta counting in the monitoring tape station. The relative yieldsof 230−232Fr were moreover checked by detection of gammas and high-energy betas (see section5.4)26. No significant difference was found for the francium yields from a niobium or tungstenionizer. It is evident that the yields increase when increasing the proton beam energy from 1.0 to1.4 GeV. Since all other parameters (target, ion source, temperature, etc.) were kept constant,this difference can be attributed to an increased cross-section.
25Note that the release from a target with niobium ionizer was slower by a factor three. It is not clear if this is dueto the lower line temperature (around 1850 C) or a target aging effect (see section B.4.2). The yield of themeasured isotopes was not affected significantly.
26No absolute yields were determined in this experiment since the transmission to the end of the hall was particularlylow.

154 4.12 Francium yields
Table 4.12.1.: Yields of heavy francium isotopes from a ≈50 g/cm2 UCx/graphite target withtungsten or niobium surface ionizer. The yield Y is given in atoms per µC of primaryproton beam of 1.0 and 1.4 GeV.
Isotope 223Fr 224Fr 225Fr 226Fr 228Fr 229Fr 230Fr 231Fr 232Fr
T1/2 22 min 3.3 min 4 min 49 s 39 s 50 s 19 s 18 s 5.5 s
Y (µC−1) 1.0 GeV 4 · 107 1.7 · 107 8 · 106 4 · 106 1 · 106 4 · 105 1.1 · 105 2.8 · 104 3 · 103Y (µC−1) 1.4 GeV 2.5 · 107 6 · 106 1.4 · 106 1.8 · 105 4.3 · 104 5 · 103
Beam purity
Francium is normally ionized with a surface ion source. The ionization efficiency is good due tothe low ionization potential (Wi = 4.07 eV).
The beam purity of the most neutron-deficient francium isotopes is limited by the resolving powerof the mass separator. Due to the steep drop of the production cross-sections even a 10−4 contam-ination with neighboring nuclides can cause a significant background [Ewa80]. The high resolutionseparator (HRS) could help to solve this problem27.
For the heaviest francium isotopes some beam contaminations with isobaric radium occur. How-ever, due to their longer lifetimes the latter are easy to differentiate. Therefore this contaminationis normally not critical. Using a niobium surface ionizer the radium background is further reduced.Thus, at mass 232 the yield of directly produced radium and actinium was lower than the franciumyield. Moreover no indication was observed for directly released 232Np or 232Pa.
However, an isobaric contamination with a molecular 213RaF+ beam was found. Its yield was ofthe order of 105 − 106 per µC28. Note that the fluorine is not specially introduced (see section4.1), but is present as an impurity in the target material or the target container. At mass 230 thecontamination with 211RaF+ is about one order of magnitude less (estimated from the observed207Rn activity). A RaF+ contamination had already been observed before at masses 230 and231 [Kur87, Hil85]. For still heavier masses the RaF+ contamination is less problematic for βγspectroscopy. The 214RaF+ background at mass 233 decays mainly by alphas to the ground stateof 210Rn. The latter again decays mainly by alphas to the ground state of 206Po. Moreover 210Rnis longlived (T1/2 = 2.4 h) and can be efficiently removed with the tape transport. From mass 234on the RaF+ beams can be easily suppressed with an appropriate beam gate setting due to theshort half-lives of the corresponding radium isotopes (215Ra and higher).
Also other molecular contaminations like e.g. BaBr+ beams have been observed [Kur81]. Franciumbeams suffer more from isobaric contaminations with molecular beams than other neutron-richalkalis. On one hand there are more possible combinations of atom masses to create a molecule withmass 232 than e.g. one with mass 32 isobaric to heavy sodium. On the other hand the ionizationpotentials of the halide molecules tend to decrease for the heavier metals, thus increasing theirsurface ionization efficiency. With decreasing ionizer temperature these contaminations will bereduced, but a too low temperature can cause more decay losses of short-lived francium isotopes.An individual optimization of the ionizer temperature and work function for sufficiently fast releaseand low contamination has to be made. To avoid excessive amounts of fluoride beams, care hasto be taken to choose a tantalum container with very low fluorine contamination.
27Note that for this application there is no extreme mass resolution needed, but one can profit from the fact thattwo consecutive separation stages can provide a much better suppression of scattered ions and beam halos.
28The error is relatively large due to an unknown fraction of the beam which might have missed the tape and wasnot transported away after each measurement cycle.

4.12 Francium yields 155
Comparison
Figure 4.12.1 shows a comparison of the francium yields at different facilities. The experimentaldetails are given in table 4.12.2.
1E-04
1E-03
1E-02
1E-01
1E+00
1E+01
1E+02
1E+03
1E+04
1E+05
1E+06
1E+07
1E+08
1E+09
1E+10
1E+11
198 200 202 204 206 208 210 212 214 216 218 220 222 224 226 228 230 232Mass
Yie
ld (
per
s)
PSB UC 1.4 GeVPSB UC 1.0 GeVSC UCSC 3HeSC 12CSC ThC[Enq96][Mor95,Tag99][Bar97][Spr97,Gro99][Bog98]
Figure 4.12.1.: Comparison of francium yields, see table 4.12.2 for experimental details of eachcurve.
The CERN synchro-cyclotron provided also ions heavier than protons: 3He, 12C, etc. [Klu86]. Thicktarget yield ratios for the production of different isotopes with p, 3He and 12C beams are reportedin [Bjø81]. 3He beams could provide more intense beams of neutron-deficient francium isotopes,but for very neutron-rich ones no data were reported. In the studied mass range (A ≤ 229) the useof 12C beams gave in fact lower yields for most nuclides (normalized to the same beam current),but it has to be kept in mind that the 1 GeV 12C beams were completely stopped in the front partof the target, thus reducing the effective target thickness considerably. Unfortunately no data isavailable for the region where an advantage for the heavy-ion projectiles is expected (A > 230).
The “hole” in the yield curve for masses 214 to 219 is due to the large decay losses of the short-lived nuclei (21 ms down to 90 ns). Their yields could be improved with a “faster” target, butpresently there is no particular request for such beams. These isotopes are normally produced andstudied as members of an alpha decay chain (see e.g. [Lia96]).
For better comparison the yields quoted in ref. [Bar97] were scaled from the typical proton currentat IRIS (80 nA) to that of ISOLDE (2500 nA). Taking into account the differing target thicknessand the “normal” fluctuation between different targets, the yields of IRIS and ISOLDE PSB areconsistent.
For very neutron-rich francium isotopes from a UCx/graphite target the ISOLDE PSB yields (filledsquares in figure 4.12.1) are obviously higher than those reported from the ISOLDE SC (600 MeVprotons, empty squares) [SCyie, Aud86]. Even when considering the larger target thickness, thereremains an additional gain by about a factor of two which can be due to a cross-section increase

156 4.12 Francium yields
Table 4.12.2.: Production of francium isotopes at different RIB facilities.
Ref. Facility Proj. E/A I Target ρ Comm.(MeV) (pnA) (g/cm2)
PSB UC ISOLDE p 1400 2500 U 50 NbSIPSB UC ISOLDE p 1000 2500 U 50 NbSISC UC ISOLDE p 600 2500 U 13 WSISC 3He ISOLDE 3He 910 500 U 13 WSISC 12C ISOLDE 12C 1000 100 U 4 WSISC ThC ISOLDE p 600 2500 Th 54 WSI[Bar97] IRIS p 1000 (2500) U 10 scaled![Spr97, Gro99] Stony Brook 18O 5.7 150 Au[Gro99] Stony Brook 19F 198Pt[Bog98] VASSILISSA, JINR 35Cl 5.0-6.2 50 175Lu 0.0005 est.[Bog98] VASSILISSA, JINR 31P 4.8-5.1 50 181Ta 0.0002 est.[Enq96] RITU, JYFL 35Cl 4.9-5.3 50 170Yb 0.00035 est.[Mor95] GARIS, RIKEN 36Ar 5.2 50 169Tm 0.002 est.[Tag99] GARIS, RIKEN 36Ar 6 160 169Tm 0.00044 est.[Huy92] LISOL 20Ne <12 Ir 0.005 F., SI[Huy92] LISOL 32S <8.8 Ta 0.008 F., SI
when going from 600 MeV to 1 GeV. This is in agreement with the trend observed for the increasefrom 1.0 to 1.4 GeV proton beam energy.
Note that the most neutron-deficient francium isotopes (199,200Fr) were discovered and studied atgas-filled recoil separators. The latter provide a high transmission (10− 100 %) [Lei97]. Especiallyin combination with the recoil decay tagging technique they are extremely powerful for in-beamspectroscopy. The yields of ref. [Bog98] were estimated from the cross-sections given therein andfrom the separation efficiency and primary beam current of ref. [Yer94]. The yields of the otherfacilities were estimated from the number of detected events. Light francium isotopes (202,204,206Fr)were also studied in fusion-evaporation reactions at LISOL [Huy92], but no yields are quoted.
Prospects
It would be very interesting to extend the study of the francium isotopes to higher masses A ≥ 234(see section 5.4 for a discussion of the physics motivation). However, the production cross-sectionsfor proton-induced spallation drop rapidly for the heaviest francium isotopes. With 92 protons and146 neutrons in the target nucleus it is already obvious from simple stochastic considerations29
that it is very improbable that five protons are lost while all or most neutrons remain in the residualnucleus. Taking into account that neutrons are more easily evaporated due to the missing Coulombbarrier, the realistic ratio gets even more unfavorable.
It is not principally excluded that even nuclei with more neutrons than the target are produced atISOLDE. In fact 207Hg has been observed at ISOLDE, produced by proton interaction with a longlead target [Jon81]. Obviously it is a thick-target effect, i.e. a spallation neutron produced in thefront part of the target induces a (n,2p) reaction in the same target. However, the probability forsuch reactions is significantly reduced in comparison with the direct (p,xnyp) reactions30. Note
29Note that some models tend to overestimate the production cross-sections for very neutron-rich nuclei close touranium (see e.g. [Sch98a]).
30An alternative process where a pion is emitted, i.e. a reaction like 208Pb(p,2pπ+)207Hg occurs, would have stillsmaller cross-sections.

4.12 Francium yields 157
that the 138mCs seen from the LaCx/graphite target (see section 4.11) could also be created byspallation of some target impurity (higher lanthanides) or of tantalum from the target container.
To further increase the yields of heavy francium isotopes obviously the N/Z ratio of the system“target+projectile” has to be increased. In principle neutron-rich isotopes of a higher actinideelement (plutonium or curium) could be used as target. However, these elements are more volatilethan uranium or thorium. Thus, the target could only be run at a reduced temperature whichincreases the delay and the decay losses. Moreover sufficient amounts of these isotopes are difficultto handle and even more difficult to obtain31. Only at the IRIS facility in Gatchina a test with a0.2 mg curium (mainly 244Cm) target was made for the production of 220Fr [Bol92] and at theBrookhaven National Laboratory targets with 0.1− 0.2 g of 244Pu were used to produce the newneutron-rich isotope 242U by a (n,2pn) reaction [Hau79].
Since it is difficult to increase the neutron number of the target, a projectile has to be chosen whichcarries along some neutrons. An interesting approach would be the use of direct (n,xp) reactionswith fast neutrons. This showed already to be successful for the production of several new isotopes(see e.g. [Hau76, Hau77, Shu93a, Shu93b]). Mirzadeh et al. [Mir83] have shown that the cross-section for 238U(n,2pn)236Th (En = 30− 160 MeV) is fifty times larger than for 238U(p,3p)236Th(Ep = 100 MeV). At least part of this advantage is expected to persist also for more evaporatedprotons, e.g. for the production of 234Fr via 238U(n,5p)234Fr. Note that the reaction Q-value is−33 MeV, i.e. high energy neutrons (for maximum cross-sections at least some MeV above thereaction Q-value) are required. As proposed by Nolen [Nolen] these could be obtained from thebreakup of a fast deuteron beam in a light (Be) converter target. The production cross-sectionsof 228−234Fr from a 238U target were calculated to be up to one order of magnitude higher with75 MeV neutrons in comparison with 1 GeV protons [Ben99b].
However, the use of neutron-induced reactions will allow to reach in the best case32 234Fr. To gofurther out a qualitatively different reaction mechanism is needed. Fusion-evaporation reactionswith stable projectiles and targets produce rather neutron-deficient nuclides and are therefore notsuitable. Even the use of a radioactive neutron-rich beam together with a stable target33 does notallow to go out far enough in this region.
With heavy-ion beams as projectiles also an alternative production mechanism can be used: multi-nucleon transfer. This was successfully applied e.g. for nuclear spectroscopy experiments of heavyradium and actinium nuclei at GSI ISOL [Gip86]. Here, moreover the problem with contaminationsby molecular sidebands (XO+, XF+, XBr+, etc.) is significantly reduced by the more selectiveproduction mechanism.
Cross-sections of multi-neutron transfer reactions between different nuclei (16O up to 238U) and238U were mainly studied relatively close to the Coulomb barrier (>∼ 8.5A ·MeV) [Gua84, Tok85,Kor86, Sou88]. Gaeggeler et al. [Gag86, Gag88] measured production cross-sections of multi-nucleon transfer reactions with higher actinide targets. Recently Cocks et al. performed high-spinspectroscopy of radon to thorium isotopes (e.g. 222−230Ra), using multi-nucleon transfer reactionsbetween a 136Xe beam and a 232Th target [Coc99, Coc00]. This reaction mechanism also allowsan extension to more neutron-rich isotopes, but presently the identification method is the limitingfactor34.
However, for an efficient use in a thick target ISOL facility the beam energy has to be increasedconsiderably. In contrast to fusion-evaporation reactions multi-nucleon transfer can also be per-formed well above the Coulomb barrier. For example 600 MeV 18O projectiles on 208Pb were
31The practical problems (high alpha activity, etc.) could be solved, but the legal restrictions virtually exclude theuse of gram amounts of transuranium elements in West European RIB facilities.
32For additional π+ emission even considerably higher neutron energies would be required.33The “wild idea” of fusing radioactive projectiles with radioactive target nuclides is discussed in appendix B.13.34The experiments are performed in-beam and at least two gamma transitions have to be known to identify theindividual isotopes.

158 4.13 A universal RIB facility?
used to produce the new isotope 209Hg [Zha98b, Zha98a]. The cross-section (≈ 4 µbarn) is twoorders of magnitude higher compared with 1000 A·MeV 238U fragmentation on a beryllium tar-get (≈ 30 nbarn) [Pfu98]. Unfortunately at high beam energies >∼ 30A · MeV no data exist onmulti-nucleon transfer reactions on actinide targets.
Experimental possibilities
Since the move of ISOLDE from the synchrocyclotron (SC) to the proton synchrotron booster(PSB) only protons of 1 GeV were provided. In principle also a deuteron beam with 980 MeVenergy and some 1012 particles per pulse could be delivered by the PSB [Schin]. This beam wouldbe only one order of magnitude less intense than the proton beam and an increased productioncross-section for very neutron-rich isotopes could compensate this drawback. On the other handthe efficiency of high-energy neutron-induced reactions could be tested at ISOLDE also by placinge.g. a tungsten block as converter in front of the target and using the “beam” from W spallationneutrons. Probably this “simulation” requires less effort than the tuning of the PSB acceleratorcomplex to deuterons.
The PSB is also able to accelerate heavy ions. Presently only 208Pb is used to feed the PS andSPS for heavy-ion experiments, but other ions could be accelerated by the LINAC 3 for injectioninto the PSB if they are delivered from the ion source. As the ECR ion source runs with oxygenas support gas [Hil96], a beam of oygen ions is always present. This beam could be optimized[Scriv] and accelerated with the PSB [Schin]. Thus, a 16O beam with 490 A·MeV energy could besent to ISOLDE, however with an intensity (∼ 3 pnA) which is three orders of magnitude smallercompared with the proton beam [Hil89]. With this handicap the possible advantage of a 16O beamover protons remains restricted to very few cases. Thus, it is presently not very promising to makethe effort of tuning LINAC 3 and PSB to an oxygen beam.
Much stronger light ion beams will be provided at the SPIRAL ISOL facility [Put97]. A beamintensity of up to 3 µA for 12C, 16O and 20Ne at 95 A·MeV is the goal of the THI project (highintensity operation of the GANIL cyclotrons) [Bar99]. Even when considering the reduced effectivetarget thickness at SPIRAL35 the luminosity will still be two orders of magnitude larger at GANIL.
Since moreover the cross-sections for multi-nucleon transfer reactions are expected to drop towardshigh beam energies at present the most promising ISOL facility to produce very neutron-richfrancium (A >∼ 234) isotopes is probably SPIRAL.
4.13. A universal RIB facility?
From the yields shown in this chapter it is obvious that a large choice of nuclides can be providedby an ISOLDE-like facility. The availability of a universal RIB facility which can provide intensebeams of all short-lived radioactive isotopes from 6He to the actinides has clear advantages formany experiments. Systematic studies can be done over a wide range of the chart of nuclideswithout moving expensive and complicated experimental equipment like mass spectrometers, largedetector arrays, laser spectroscopy set-ups etc. from one facility to another. ISOLDE is the bestexample for such a multi-use and multi-user facility which allows to switch between different beamswithin seconds to days.
However, from the yield comparisons it is also seen that in certain mass regions the ISOLDE beamsare outrun in intensity and/or purity by other, more specialized, facilities. In fact for most existingand planned RIB facilities a certain region can be identified where the given method provides
35With a standard UCx/graphite target material a range of about 3.6 g/cm2 is obtained with a 95 A·MeV 16O
beam at GANIL instead of 45 g/cm2 with a 490 A·MeV 16O beam at ISOLDE.

4.13 A universal RIB facility? 159
better beams than all others. It should be kept in mind that the choice of the presented nuclideswas already biased to elements which are more or less suitable for separation at ISOLDE. Takingalso into account the refractory elements underlines even more the importance of complementarytechniques: fragment separators and IGISOL facilities. A simple look at important publicationsof the last years shows that it is just this diversity of smaller facilities which makes the field ofradioactive ion beams so lively.
Especially when dealing with high beam intensities and thus high activities one should separate thedesired nuclides from all contaminants as early as possible. The best way is the choice of a selectiveproduction mechanism which avoids the production of disturbing isobars. The large width of theisobaric distribution in high energy proton induced reactions can give surprising effects: e.g. whenan isotope close to the proton drip-line is searched (97Cd), but a beta-delayed neutron emitteris found (97Rb) (see section 4.8), or when studying the very neutron-rich francium isotopes (seesection 5.4) and the most intense gamma lines are from a nuclide decaying by EC.
A selective production mechanism on the neutron-deficient side is fusion-evaporation. Unfortu-nately it is not compatible to thick targets due to a small width of the excitation function. With theavailable technology of driver beams and targets it is not possible to reach with fusion-evaporationthe high secondary beam intensities necessary for many experiments of post-accelerated beams.
Neutron-induced fission is a selective mechanism only populating neutron-rich nuclides in themedium mass region. However, thermal neutrons are best provided by a reactor. This type of “pri-mary accelerator” cannot produce other beams. A reactor-based RIB facility is therefore clearlyspecialized for the production of neutron-rich medium-mass nuclides. Even with the most intenseradioactive beams, many typical experiments on the neutron-rich side (fusion to superheavy ele-ments, etc.) will require beam times which are rather in the range of weeks or months than days.This time scale is ideally adapted to the “macroscopic duty cycle” of a high-flux reactor (≈50days).
Again it has to be emphasized that an important part of the selectivity can and should be guaran-teed already in the production step. Clearly this requires to choose a selective mechanism which isjust the extreme opposite to a universal one. Thus one unique ISOL facility which relies on a singleprimary beam (high energy protons) can provide a large variety of beams, but will remain for someelements intrinsically limited in beam purity36. A facility which allows to adapt the reaction mech-anism to the individual isotopes is as versatile but provides moreover the important selectivity inthe first step of the ISOL process. For the same reason a division into several, specialized facilitiesmakes sense. Moreover is can never be excluded completely that an unforeseeable problem occurs(complete failure of the target changing mechanism, vacuum leak, insulator breakdown, etc.). Inthe worst case a long delay (months) has to be accepted before the radiation level is sufficientlydecreased and a repair becomes possible. This would severely hit the user community if it has torely on a single RIB facility.
36The idea to have one unique (“ISOSPIN”) facility which should be able to provide intense and pure beams allover the chart of nuclides sounds “typically American”. It should be kept in mind that large-scale projects wherethe size starts to be a property for its own sake carry the risk to add another superlative to the impressive seriesof the world-largest particle collider (SSC), the world-strongest neutron source (ANS), the most intense protonaccelerator (APT), etc.

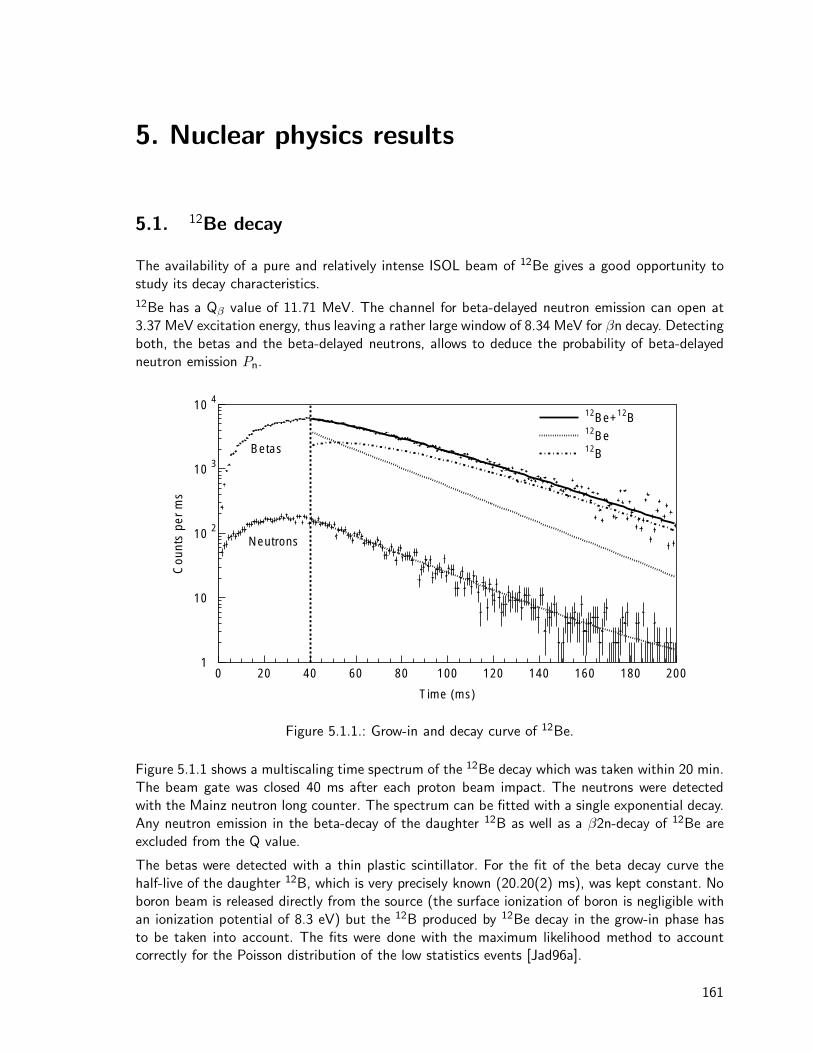
5. Nuclear physics results
5.1. 12Be decay
The availability of a pure and relatively intense ISOL beam of 12Be gives a good opportunity tostudy its decay characteristics.
12Be has a Qβ value of 11.71 MeV. The channel for beta-delayed neutron emission can open at3.37 MeV excitation energy, thus leaving a rather large window of 8.34 MeV for βn decay. Detectingboth, the betas and the beta-delayed neutrons, allows to deduce the probability of beta-delayedneutron emission Pn.
Time (ms)
Cou
nts
per
ms
Neutrons
Betas
12Be+12B12Be12B
1
10
10 2
10 3
10 4
0 20 40 60 80 100 120 140 160 180 200
Figure 5.1.1.: Grow-in and decay curve of 12Be.
Figure 5.1.1 shows a multiscaling time spectrum of the 12Be decay which was taken within 20 min.The beam gate was closed 40 ms after each proton beam impact. The neutrons were detectedwith the Mainz neutron long counter. The spectrum can be fitted with a single exponential decay.Any neutron emission in the beta-decay of the daughter 12B as well as a β2n-decay of 12Be areexcluded from the Q value.
The betas were detected with a thin plastic scintillator. For the fit of the beta decay curve thehalf-live of the daughter 12B, which is very precisely known (20.20(2) ms), was kept constant. Noboron beam is released directly from the source (the surface ionization of boron is negligible withan ionization potential of 8.3 eV) but the 12B produced by 12Be decay in the grow-in phase hasto be taken into account. The fits were done with the maximum likelihood method to accountcorrectly for the Poisson distribution of the low statistics events [Jad96a].
161

162 5.1 12Be decay
The deduced half-lifes of the neutron and the beta-decay curves are in agreement and give inaverage: 21.34(23) ms. This is shorter than some older values in literature: 24.4(30) ms [Alb78],24(1) ms [Duf84], 45(29) ms [Ree91] and 26.1(24) ms [Kel94], but in good agreement with twoother literature values: 21.3(22) [Cur86] and 21.3(1) [Aud97].
The efficiency ratios of the neutron and beta counters were calibrated on-line with several neutronemitters of known Pn values. Since the alignment of these weak ion beams cannot be checkeddirectly with a scanner or Faraday cup, a systematic error arises due to differences in the effectivesolid angle of the detectors to a possibly shifted implantation position. While this effect is small forthe neutron detector it can affect the efficiency for beta detection considerably. An error of about25 % (relative) for the Pn value was derived from the different calibration measurements includingthe response to various beta and neutron energies of the calibration isotopes. This is certainly apessimistic estimate for the mainly systematic uncertainty and could still be considerably reducedwith an enlarged set of calibration data and a careful study of the effective detector efficiencies byMonte Carlo simulations.
The obtained value (Pn = 0.48+0.12−0.10 %) is remarkably low compared with the large energy windowavailable for neutron emission. It is in agreement with the upper limits 1 % from [Alb78, Duf84] andthe value reported in [Aud97]: 0.52(9) %. The former value of Reeder et al. [Ree91] was higher, butis consistent within the error: 0.9(4) %. An older measurement gave a much higher value: 7.0+7.0−3.5 %[Pos65], but probably the beam was contaminated with other neutron emitters1. Meanwhile themeasurement at ISOLDE was repeated and gave a more precise2 value of Pn = 0.50(3) % [Ber99].
12Be0 : T=2+ 0.0
12B
11B+n
1 : T=1+ 0.0
0+ 2.7233.389
4.301
5.00
8.1
10.00
11.59
6.6
1+
1+
3.769
2- 1.674
2+ 0.953
20.20(2) ms
21.34(23) ms
1- 2.621<0.040(26)%<0.008(6)%
0.50(3)%
3.370
Q =11.708 MeVβ
99.45 %+8-5
1 : T=1+1 : T=1+
Figure 5.1.2.: Decay scheme of 12Be from this work and ref. [AS90, Kel94, Ber99].
Combining our value for the half-life with the Pn value from [Ber99] and the upper limits fortransitions to gamma emitting levels [Kel94] gives for the decay to the ground state of 12B an
1Also the quoted half-life is quite off from all other values: 11.4(5) ms.2It should be noted that in the latter measurement no systematic error was included to account for possiblevariations of the beta detection efficiency.

5.2 Nuclear spectroscopy of heavy copper isotopes 163
improved value: log ft = 3.79(1)3. Suzuki and Otsuka explain this relatively high value by a strongbreaking (about 65 %) of the neutron p-shell closure [Suz97].
Figure 5.1.2 summarizes the present knowledge on the decay scheme of 12Be. The assumptionthat the complete branch for beta-delayed neutron emission goes to a single level moreover allowsto estimate lower limits for the log ft values to other levels. For the allowed transitions to the1+ levels at 5.00 MeV and at 6.6 MeV follows log ft > 4.9 and log ft > 4.3 respectively4. Thecorresponding upper limits for the Gamow-Teller strength (B(GT ) = 6146.6/ft) are 0.076 for the5.00 MeV state and 0.27 for that at 6.6 MeV. They are in agreement with the predictions fromref. [Suz97] (see figure 9 therein).
Also the observed ring ratio (see appendix B.11.1) indicates a high kinetic energy of the neu-trons: En >∼1 MeV. This would be consistent with a neutron emission from the discussed levels(En =1.5 MeV and 3.0 MeV respectively).
Prospects
In our set-up the neutron energy could not be measured accurately. With a different set-up (3Heionization chambers or a time-of-flight arrangement) it will be possible to determine the populatedneutron-emitting levels in 12B. Together with a detailed βγ spectroscopy this should allow tomonitor the beta strength distribution over a rather large energy range and to compare it withtheoretical predictions, e.g. [Suz97, Suz98].
5.2. Nuclear spectroscopy of heavy copper isotopes
5.2.1. Magnetic moments of 70gCu and 70mCu
In section 3.5.2 it was shown that 70gCu and 70mCu can be separated by scanning the laserfrequency over the hyperfine structure. In fact the magnetic moments of both isomers were notknown before. The hyperfine splitting which was experimentally observed in our experiment canbe used to derive a rough estimation of the magnetic moments.
As discussed before the linear relationship (3.5.10) can be used with J = 1/2:
µ(70Cu) = µ(65Cu) · A(70Cu) · I(70Cu)A(65Cu) · I(65Cu) = µ(65Cu) · ∆νHFS(
70Cu)
A(65Cu) · I(65Cu) ·I(70Cu)
I(70Cu) + 12
. (5.2.1)
With the magnetic dipole coupling constant A(65Cu) = 6284.39 MHz [Rad85], the magneticmoment µ(65Cu) = 2.38167(25)µN [Fir96] and the spin I(65Cu) = 3/2 one finds:
µ(70gCu) = (+)1.8(3)µN, (5.2.2)
|µ(70mCu)| = 1.2(3)µN. (5.2.3)
Note that for 70mCu the result depends slightly on the nuclear spin varying between 3 and 6(see figure 5.2.1). The sign of the magnetic moment of 70gCu was deduced tentatively from theintensity ratio5 of the subpeaks in figure 3.5.1, while for 70mCu the quality of the experimentaldata does not allow to deduce the sign of its magnetic moment.
3Calculated by scaling the log ft value from ref. [AS90].4Calculated from a slight extrapolation of the log f values tabulated in [Gov71].5In case of a negative magnetic moment the right subpeak should be more intense.

164 5.2 Nuclear spectroscopy of heavy copper isotopes
“Theoretical” estimation
It is known that 68Ni can be well described as a semi-double-magic nucleus with a closed protonshell (Z = 28) and a closed neutron subshell (Z = 40). Therefore one could try to describe thelow-lying states of the odd-odd nucleus 70Cu as an inert core plus a single valence proton coupledto a single valence neutron.
Obviously the 29th proton will be in a p3/2 orbital [Fir96]. The first empty neutron orbital abovethe Z = 40 subshell closure is a g9/2. The coupling of such a neutron with the proton gives anuclear spin of: 3 = |jp − jn| ≤ I ≤ |jp + jn| = 6. This configuration is expected for the isomericstate 70mCu. However, to create the 1+ ground state 70gCu one needs to couple a p1/2 neutron tothe p3/2 proton. This will give I = |jp − jn| = 1 according to the strong Nordheim rule [Nor51].To have a half-empty p1/2 orbital one pair of neutrons has to be in the g9/2 orbitals6.
In a first approximation one can neglect the proton-neutron interaction and use the additiontheorem to estimate the g-factor7 of the two-particle state (jp, jn)I from the single particle g-factors of the valence proton and valence neutron [Cas90]:
g =1
2(g(p) + g(n)) +
1
2
jp(jp + 1)− jn(jn + 1)
I(I + 1)(g(p) − g(n)). (5.2.4)
The g-factors of the single particle states g(p) and g(n) are given by:
g(p, n) = geffL ± geffS − geffL2lp,n + 1
, for jp,n = lp,n ± 1
2. (5.2.5)
geffL and geffS are the effective g-factors of the valence nucleons in the nucleus. The orbital magne-tization comes entirely from the proton, i.e.:
geffL (p) = 1, and geffL (n) = 0. (5.2.6)
The effective spin g-factors can be written as multiple of the free nucleon g-factors:
geffS (p) = g(p) · gfreeS (p) = g(p) 5.587µN,geffS (n) = g(n) · gfreeS (n) = −g(n) 3.826µN.
(5.2.7)
In a first approximation one can set the empirical quenching factors g to unity, i.e. use directly thefree nucleon g-factors. This would give µ(70gCu) = +2.84µN and µ(70mCu) = −4.60 to + 1.88for I = 3 to 6 (see figure 5.2.1). Thus, the calculated value for 70gCu is considerably larger thanthe measured one while for 70mCu no statement can be made without knowing the spin.
Clearly the magnetic moment of nucleons changes when they are bound in a heavy nucleus.Empirically it was found that a quenching of the g-factors to about g ∼ 60 % often gives a betterdescription for medium-mass and heavy nuclei [Cas90]. In fact, the quenching of the g-factordepends on a series of different contributions (meson exchange currents, etc.) which have to beadded up. These contributions were calculated in detail mainly for light (e.g. around 16O and40Ca) and heavy (around 208Pb) nuclei, see e.g. [Tow87]. In between some calculated data existe.g. around 90Zr [Hau77, Hin97b, Joh98] and 132Sn [Sto97]. However, in the area of 68Ni suchcalculations are still in work [Rikov].
A better approximation than above can be achieved by fitting g to reproduce the known magneticmoments of neighboring nuclei. All odd copper isotopes from 57−71Cu have a 3/2− ground state.Their magnetic moment will be dominated by the contribution of the p3/2 proton since the contri-butions of the paired neutrons mainly cancel. Table 5.2.1 shows the measured magnetic momentsof 61−67Cu8. They are well reproduced by a shell model plus RPA (random phase approximation)6Note that in the Nilsson diagram the p1/2 energy exceeds that of the lowest g9/2 orbital already at low deformation(|β2| ≈ 0.1).
7The gyromagnetic ratio or g-factor gives the ratio of the magnetic dipole moment µ and the nuclear spin I inunits of the nuclear magneton: µ = gIµN with µN = e/(2mpc) = 5.0508 · 10−17 J/T.
8The value for 67Cu was recently measured with a sample collected with the ISOLDE RILIS (see section 4.5).

5.2.1 Magnetic moments of 70gCu and 70mCu 165
calculation [Rikov]. Therefore, the same model was used for an extrapolation to 69,71Cu. The g-factor of the p3/2 proton in 70Cu is taken from an interpolation of the neighboring copper isotopes:g(π(p3/2)) ≈ +1.87µN.
Table 5.2.1.: Measured and calculated (slanted) values for the magnetic moments of odd copperisotopes with Iπ = 3/2− and derived g-factor quenching.
Isotope 61Cu 63Cu 65Cu 67Cu 69Cu 71Cu
µ (µN) +2.14 +2.223 +2.382 +2.536 +2.77 +2.84g 0.41 0.44 0.49 0.55 0.63 0.66Reference [Fir96] [Fir96] [Fir96] [Rikov] [Rikov] [Rikov]
The g-factor of the p1/2 neutron can be estimated similarly. The magnetic moment of 67Ni (Iπ =1/2−) was recently measured at the on-line nuclear orientation facility NICOLE at ISOLDE9 to be+0.605µN. Thus, g(ν(p1/2)) ≈ +1.21µN.
Magnetic moments are also known for the 9/2+ states of the odd zinc isotopes 65−71Zn. For71mZn a value of µ = −1.035µN was reported [Her89]. Stone proposes a slight correction toµ = −1.052µN [Stone]. Assuming a pure (g9/2)
3 configuration allows to deduce the g-factor:g(ν(g9/2)) ≈ −0.234µN.
Combining these empirical single particle g-factors with the addition theorem gives µ(70gCu) =+2.04µN and µ(70mCu) = −3.07 to + 1.75 for I = 3 to 6 (see figure 5.2.1).
experimental result
calc. with free nucleon g-factors
calc. with fitted g-factors
Nuclear spin
Mag
netic
mom
ent (
µ N)
-5
-4
-3
-2
-1
0
1
2
3 4 5 6
Figure 5.2.1.: Magnetic moment of 70mCu as function of the nuclear spin. The shaded areas indi-cate the range consistent with our measurements. The filled circles show the valuescalculated with the free nucleon g-factors and the empty squares the values with thesingle particle g-factors fitted to the neighboring isotopes.
It is difficult to assess an empirical error for such an estimation of the magnetic moments. Aroundthe double magic 16O and the semi-double-magic 90Zr the calculation with free nucleon g-factorscan reproduce many experimental values within about 20 %. However, large deviations (up to100 % and beyond) occur around 208Pb. The use of empirical single particle g-factors improvesthe results and allows to well reproduce also magnetic moments around 40Ca. However, some othercases remain which are off by more than 100 %.9Also here the ion beam was provided from the ISOLDE RILIS.

166 5.2 Nuclear spectroscopy of heavy copper isotopes
As seen in figure 5.2.1 the magnetic moment of 70mCu depends strongly on the nuclear spin. Thusno final conclusion can be drawn with the given accuracy of the experimental and theoretical value.Still our result supports the result from the β-decay spectroscopy [Roosb] that a nuclear spin of3− (which would be obtained with an antiparallel coupling of the proton and neutron spin) is notprobable for 70mCu. The best agreement is obtained with I = 4.
Although this simple model could reproduce the magnetic moment of 70gCu within the relativelylarge experimental error, it should be kept in mind that several factors were not taken into account:
1. A change of the magnetic moment can occur when the core polarization gets large. Forexample contributions from a partial breaking of the g9/2 neutron pair will affect the result.Results of nuclear spectroscopy experiments indicate that the Z = 40 subshell closure van-ishes rapidly when going away from 68Ni to surrounding nuclei (see [Mue99] and referencestherein). Thus, also contributions of other core nucleons should be taken into account.
2. The p-n interaction is completely neglected in this independent particle model. It can alsoaffect the magnetic moment considerably.
Outlook
It has been shown that a rough determination of the magnetic moment is possible by scanning thelaser wavelength over the hyperfine structure of the transition. In this experiment the absolute ionyield had considerable fluctuations in time due to power fluctuations of the lasers, spatial driftsof the second harmonic beams changing the overlap area, etc. A correction for these fluctuationscan be applied by simultaneously monitoring the intensity of a reference isotope (e.g. 65Cu) ina second beam-line (see figure 3.1.1). Multiple scans and a direct comparison with other knowncopper nuclides will allow to further increase the accuracy by about one order of magnitude.Although still far less accurate than a measurement via nuclear magnetic resonance (NMR) thismethod can give a valuable evidence which allows a considerable reduction of the scanning rangein subsequent precise NMR experiments.
5.2.2. Lifetimes and Pn values of 73Cu to 78Cu
The beams of heavy copper isotopes (see section 4.5) were sent to the Mainz neutron long counterto study the emission of beta-delayed neutrons. The built-in tape transport was used to removelong-lived background after each measurement cycle. A thin plastic scintillator served for thedetection of betas. Unfortunately the beta detector suffered from the electronic noise of the CVLs.Therefore the detection threshold had to be increased which lowered the detection efficiency.
Figures 5.2.2, 5.2.3 and 5.2.4 show the beta- and neutron acitivities which were registered in mul-tiscaling mode. The neutron decay curves were fitted with a single exponential decay to determinethe half-lives. The daughter nuclides (zinc) and the surface ionized isobaric background (galliumand rubidium) does not emit beta-delayed neutrons up to mass 78 [Aud97] and did not disturbthese measurements. Table 5.2.2 shows the determined half-lives.
All measured lifetimes, but one, are consistent with those known from literature. The reason forthe deviation in the case of 74Cu is not obvious. It could be due to a beam contamination, e.g. withmolecular ions in one of the measurements. The analysis of the gamma ray decay data [Roosb]should give a final answer to this question. For 73Cu the emission of beta-delayed neutrons wasobserved for the first time. The deduced half-life is just between those known from literature[Aud97, Huh98]. For the heavier nuclei 76−78Cu the present data are slightly more precise thanknown before. As in ref. [Kra91] we did not observe any indication for beta-delayed neutronemission from 76mCu with a reported half-life of 1.27(3) s.

5.2.2 Lifetimes and Pn values of 73Cu to 78Cu 167
Figure 5.2.2.: Grow-in and decay curves of the beta- and neutron-activity of 73Cu (left) and 74Cu(right). The measurement time was 37 min and 25 min respectively, the beam gatewas closed after 4 s (73Cu) and 1.6 s (74Cu).
Figure 5.2.3.: Grow-in and decay curves of the beta- and neutron-activity of 75Cu (left) and 76Cu(right). The measurement time was 15 min and 20 min respectively, the beam gatewas closed after 1.1 s (75Cu) and 0.9 s (76Cu).
Figure 5.2.4.: Grow-in and decay curves of the beta- and neutron-activity of 77Cu (left) and 78Cu(right). The measurement time was 45 min and 67 min respectively, the beam gatewas closed after 610 ms (77Cu) and 410 ms (78Cu).
Table 5.2.2.: Half-lives of heavy copper isotopes determined from the decay curve of the beta-delayed neutron activity.
Isotope 73Cu 74Cu 75Cu 76Cu 77Cu 78Cu
T1/2, this work 4.22(15) s 1.68(3) s 1.225(7) s 647(5) ms 466(5) ms 335(6) ms
T1/2, literature 3.9(3) s, 4.4(3) s 1.594(10) s 1.224(3) s 641(6) ms 469(8) ms 342(11) msReference [Aud97], [Huh98] [Kra91] [Kra91] [Kra91] [Kra91] [Kra91]
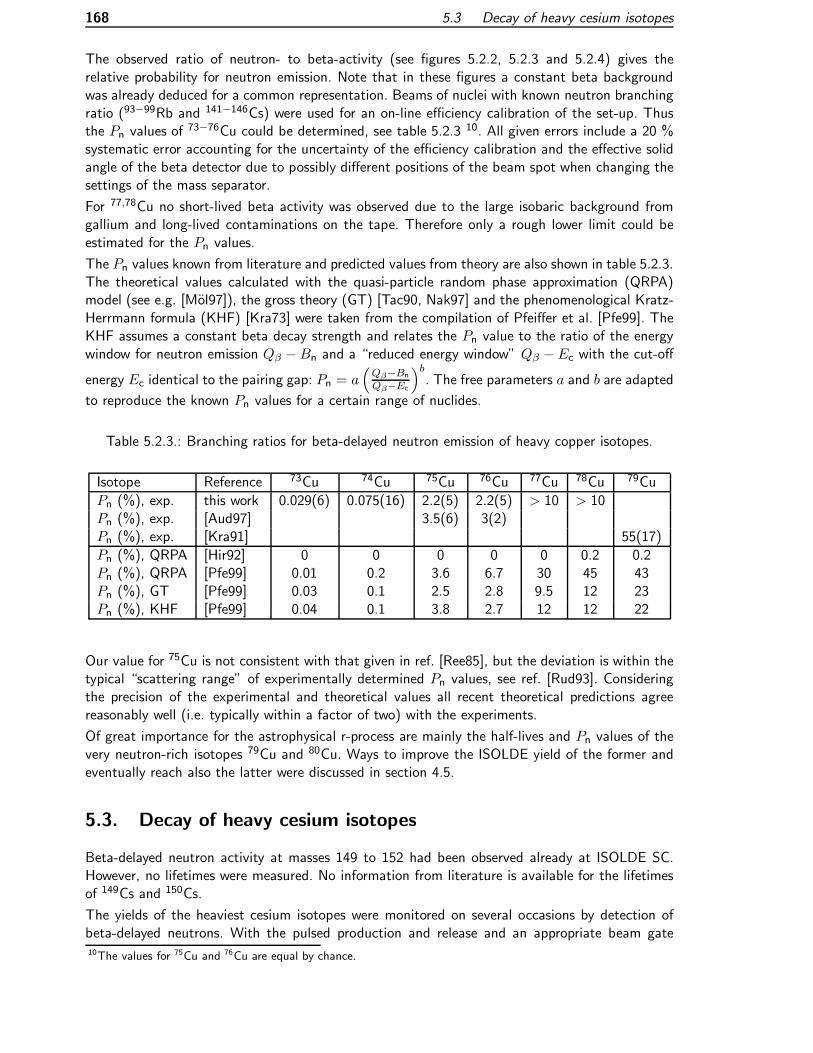
168 5.3 Decay of heavy cesium isotopes
The observed ratio of neutron- to beta-activity (see figures 5.2.2, 5.2.3 and 5.2.4) gives therelative probability for neutron emission. Note that in these figures a constant beta backgroundwas already deduced for a common representation. Beams of nuclei with known neutron branchingratio (93−99Rb and 141−146Cs) were used for an on-line efficiency calibration of the set-up. Thusthe Pn values of 73−76Cu could be determined, see table 5.2.3 10. All given errors include a 20 %systematic error accounting for the uncertainty of the efficiency calibration and the effective solidangle of the beta detector due to possibly different positions of the beam spot when changing thesettings of the mass separator.
For 77,78Cu no short-lived beta activity was observed due to the large isobaric background fromgallium and long-lived contaminations on the tape. Therefore only a rough lower limit could beestimated for the Pn values.
The Pn values known from literature and predicted values from theory are also shown in table 5.2.3.The theoretical values calculated with the quasi-particle random phase approximation (QRPA)model (see e.g. [Mol97]), the gross theory (GT) [Tac90, Nak97] and the phenomenological Kratz-Herrmann formula (KHF) [Kra73] were taken from the compilation of Pfeiffer et al. [Pfe99]. TheKHF assumes a constant beta decay strength and relates the Pn value to the ratio of the energywindow for neutron emission Qβ − Bn and a “reduced energy window” Qβ − Ec with the cut-off
energy Ec identical to the pairing gap: Pn = a(Qβ−BnQβ−Ec
)b. The free parameters a and b are adapted
to reproduce the known Pn values for a certain range of nuclides.
Table 5.2.3.: Branching ratios for beta-delayed neutron emission of heavy copper isotopes.
Isotope Reference 73Cu 74Cu 75Cu 76Cu 77Cu 78Cu 79Cu
Pn (%), exp. this work 0.029(6) 0.075(16) 2.2(5) 2.2(5) > 10 > 10Pn (%), exp. [Aud97] 3.5(6) 3(2)Pn (%), exp. [Kra91] 55(17)
Pn (%), QRPA [Hir92] 0 0 0 0 0 0.2 0.2Pn (%), QRPA [Pfe99] 0.01 0.2 3.6 6.7 30 45 43Pn (%), GT [Pfe99] 0.03 0.1 2.5 2.8 9.5 12 23Pn (%), KHF [Pfe99] 0.04 0.1 3.8 2.7 12 12 22
Our value for 75Cu is not consistent with that given in ref. [Ree85], but the deviation is within thetypical “scattering range” of experimentally determined Pn values, see ref. [Rud93]. Consideringthe precision of the experimental and theoretical values all recent theoretical predictions agreereasonably well (i.e. typically within a factor of two) with the experiments.
Of great importance for the astrophysical r-process are mainly the half-lives and Pn values of thevery neutron-rich isotopes 79Cu and 80Cu. Ways to improve the ISOLDE yield of the former andeventually reach also the latter were discussed in section 4.5.
5.3. Decay of heavy cesium isotopes
Beta-delayed neutron activity at masses 149 to 152 had been observed already at ISOLDE SC.However, no lifetimes were measured. No information from literature is available for the lifetimesof 149Cs and 150Cs.
The yields of the heaviest cesium isotopes were monitored on several occasions by detection ofbeta-delayed neutrons. With the pulsed production and release and an appropriate beam gate10The values for 75Cu and 76Cu are equal by chance.
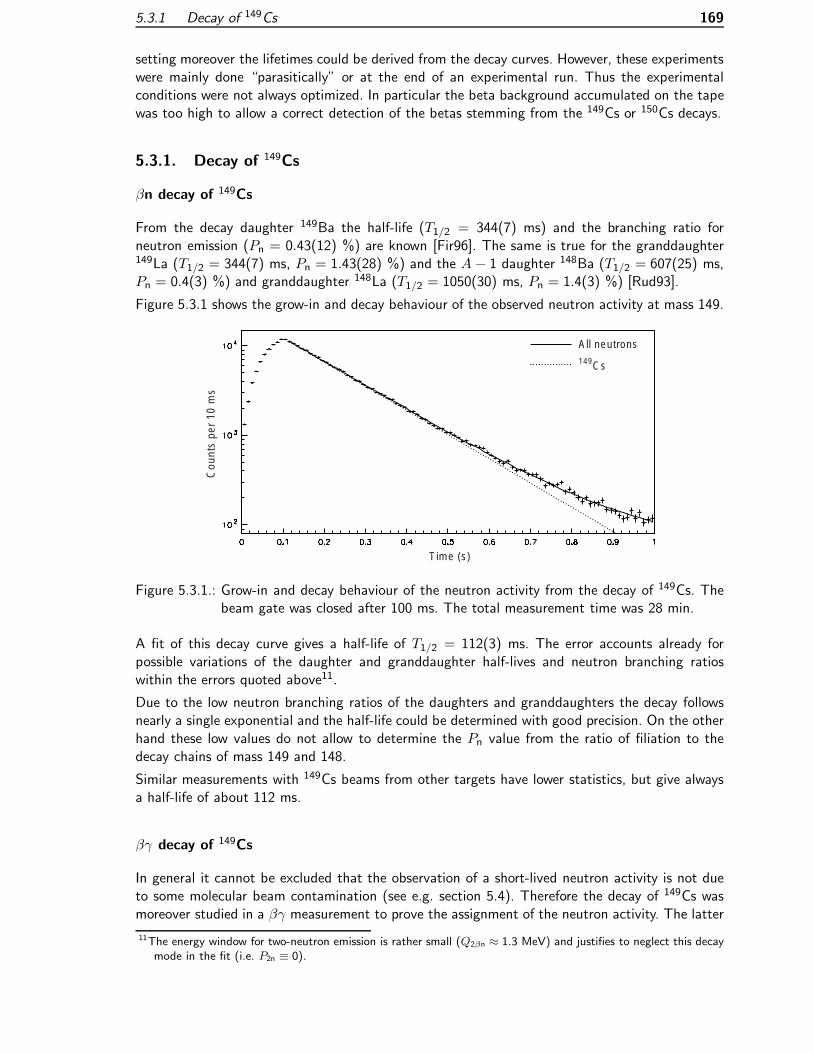
5.3.1 Decay of 149Cs 169
setting moreover the lifetimes could be derived from the decay curves. However, these experimentswere mainly done “parasitically” or at the end of an experimental run. Thus the experimentalconditions were not always optimized. In particular the beta background accumulated on the tapewas too high to allow a correct detection of the betas stemming from the 149Cs or 150Cs decays.
5.3.1. Decay of 149Cs
βn decay of 149Cs
From the decay daughter 149Ba the half-life (T1/2 = 344(7) ms) and the branching ratio forneutron emission (Pn = 0.43(12) %) are known [Fir96]. The same is true for the granddaughter149La (T1/2 = 344(7) ms, Pn = 1.43(28) %) and the A − 1 daughter 148Ba (T1/2 = 607(25) ms,Pn = 0.4(3) %) and granddaughter 148La (T1/2 = 1050(30) ms, Pn = 1.4(3) %) [Rud93].
Figure 5.3.1 shows the grow-in and decay behaviour of the observed neutron activity at mass 149.
All neutrons149Cs
Time (s)
Cou
nts
per
10 m
s
Figure 5.3.1.: Grow-in and decay behaviour of the neutron activity from the decay of 149Cs. Thebeam gate was closed after 100 ms. The total measurement time was 28 min.
A fit of this decay curve gives a half-life of T1/2 = 112(3) ms. The error accounts already forpossible variations of the daughter and granddaughter half-lives and neutron branching ratioswithin the errors quoted above11.
Due to the low neutron branching ratios of the daughters and granddaughters the decay followsnearly a single exponential and the half-life could be determined with good precision. On the otherhand these low values do not allow to determine the Pn value from the ratio of filiation to thedecay chains of mass 149 and 148.
Similar measurements with 149Cs beams from other targets have lower statistics, but give alwaysa half-life of about 112 ms.
βγ decay of 149Cs
In general it cannot be excluded that the observation of a short-lived neutron activity is not dueto some molecular beam contamination (see e.g. section 5.4). Therefore the decay of 149Cs wasmoreover studied in a βγ measurement to prove the assignment of the neutron activity. The latter
11The energy window for two-neutron emission is rather small (Q2βn ≈ 1.3 MeV) and justifies to neglect this decaymode in the fit (i.e. P2n ≡ 0).

170 5.3 Decay of heavy cesium isotopes
was done with a 50 g/cm2 UC/graphite target and niobium surface ionizer. The used detectionset-up is described in [Wei99].
No gamma decay information is available for 149Cs, 149Ba and 149La. A nuclear spectroscopyexperiment at the masses 149 to 152 had been performed at TRISTAN and some results werementioned in an abstract [Mac87], but no publication is available. The βn decay can also populateexcited levels in the A−1Z−1X daughter nucleus. Therefore the gamma spectrum was first analysedfor known transitions in 148Ba [Hil86, Urb97]. Indeed the 141.7 keV 2+→0+ and the 281.4 keV4+→2+ transitions are found among the strong lines of the gamma spectrum. Figure 5.3.2 showsthe time behaviour of the former. A half-life of 114(16) ms can be deduced which is fully consistentwith the observed half-life of the neutron activity. The 281 keV line was too weak for a reasonablefit, but shows a similar decay behaviour.
Time (s)
Gam
ma
coun
ts p
er 2
0 m
s
0
10
20
30
40
50
60
0 0.2 0.4 0.6 0.8 1 1.2
Figure 5.3.2.: Grow-in and decay behaviour of the 142 keV line from the βγ decay of 149Cs. Thebeam gate was closed after 155 ms. The measurement time was 2 h.
Several other lines were found which could be assigned to transitions in 149Ba or the decay ofthe daughter nuclei 149Ba and 149La. The detailed evaluation is still under way, but the observedintensities of the transitions in 148Ba indicates a markable branching ratio for beta-delayed neutronemission. The complete evaluation of the intensities of the daughter activities should allow todeduce a value for Pn.
It can be concluded that the decay of 149Cs was clearly identified from the time behaviour of theneutrons and gamma rays. At least the major part of the neutron activity consists indeed of 149Cs.Therefore the half-life of 112(3) ms is adopted for the latter.
5.3.2. Decay of 150Cs
The decay of 150Cs was also studied with the Mainz neutron long counter set-up. Obviously thestatistics is worse than in the case of 149Cs. Moreover the daughter 150Ba has an unknown branchingratio for beta-delayed neutron emission and an only roughly known half-life (T1/2 ≈ 0.3 s).
Figure 5.3.3 shows the grow-in and decay behaviour of the observed neutron activity at mass 150.
The statistics of this decay data is not sufficient for a completely free fit (i.e. free lifetimes andneutron branching ratios for 150Cs and 150Ba). Therefore the data of the latter had to be fixed.However, the results of the fit depend strongly on the used parameters12. Varying T1/2(
150Ba)
12Again the branching ratio for β2n was arbitrarily set to zero. This assumption is justified by the relatively lowQ2βn of about 2.8 MeV and the fact that a small β2n branch (some %) would not affect the fitted half-life.

5.3.3 Comparison 171
All neutrons150Cs
Time (s)
Cou
nts
per
10 m
s
Figure 5.3.3.: Grow-in and decay behaviour of the neutron activity from the decay of 150Cs. Thebeam gate was closed after 100 ms. The measurement time was 65 min.
from 250 ms to 350 ms and Pn(150Ba) from 0.1 % to 10 % gives T1/2(
150Cs)=82(7) ms, but theresulting Pn value is quite uncertain. Most theoretical predictions for Pn(
150Ba) are around 1 %[Pfe99]. Fixing Pn(
150Ba) to this ratio one can deduce a rough value of Pn(150Cs) ≈ 20(10) %.
Note that the obtained yield for 150Cs would be sufficient to perform also βγ spectroscopy. Withinfew shifts of beam time it should be possible to identify at least the most intense lines (e.g. the2+→0+ and 4+→2+ transitions). Thus, with a gating on two or three known gamma lines, theavailable high-spin spectroscopy data (e.g. from spontaneous fission of 248Cm [Urb97]) could alsobe analysed for 150Ba. Moreover, such a gamma ray measurement would allow to separate the150Cs activity from 150Ba and other daughters. Thus the lifetimes and neutron branching ratioscould be determined with better precision.
5.3.3. Comparison
Table 5.3.1 shows for the heavy cesium isotopes a comparison of measured half-lives and theoreticalpredictions. For a better overview also the known values for 145−148Cs were included. The differentmodels were already explained in section 5.2.2.
Table 5.3.1.: Comparison of measured half-lives of heavy cesium isotopes with theoretical predic-tions.
Isotope Model Reference 145Cs 146Cs 147Cs 148Cs 149Cs 150Cs
T1/2 (ms) exp. this work 112(3) 82(7)T1/2 (ms) exp. [Aud97] 582(6) 323(6) 225(5) 158(7)
T1/2 (ms) micr. [Kla84] 127 85T1/2 (ms) QRPA [Pfe99] 382 656 193 157 200 169T1/2 (ms) GT [Pfe99] 1079 1075 457 545 363 295T1/2 (ms) KHF [Pfe99] 436 381 206 207 172 123
It is evident from the table that the older microscopic theory of Klapdor et al. is able to reproducethe experimental half-lives of the heaviest cesium isotopes astonishingly well while the modern

172 5.4 Beta-decay of heavy francium isotopes
theories overestimate them systematically. To explain the reason for this failure more experimentaldata has to be collected: a directly measured mass will reduce the uncertainties in the Qβ value anda measured Pn value plus possibly observed gamma rays can give an indication on the Gamow Tellerstrength distribution. With this additional information the mentioned models could be refined.
The cesium isotopes are not as predestined for a direct test of individual model parameters as thenuclei close to filled proton shells (cobalt, nickel, indium, tin, etc.). However, the experimentalconditions allow to reach very far out and provide a good testing ground for the general modelbehaviour far from stability.
5.4. Beta-decay of heavy francium isotopes
5.4.1. Decay of 232Fr
232Fr was first identified at the IRIS facility in Gatchina [Mez90]. Only one gamma ray with 125 keVwas reported. The half-life was measured to be 5(1) s. The Qβ-value of 232Fr is estimated to be5.55(74) MeV [Aud97], thus opening a rather large window for population of higher levels in 232Ra.The ground state spin of 232Fr is unknown.
During the change of the RILIS from copper to cadmium (see above) we used the available nuclearspectroscopy set-ups to look for the heaviest francium isotopes. This test was performed with astandard UCx/graphite target and niobium surface ionizer. For 232Fr a 1 h measurement was madeat the Leuven βγγ set-up described in ref. [Wei99]. Five consecutive pulses with 3.1 · 1013 protonseach were used per 19.2 s supercycle. 15 ms after each pulse the beam gate was opened for1.15 s to collect the activity. It followed an undisturbed decay period of 11 s, then the tape wastransported to remove the remaining activity and the next cycle started. In a second experimentthe set-up was complemented by a small beta telescope made from plastic scintillators. A 20 minmeasurement was done with four consecutive proton pulses per supercycle.
The obtained gamma spectrum shows a contamination with 209Rn, 209At and 205Po. This are decaydaughters of 213Ra being separated as RaF+ ion. The significant amount of the long-lived daughtersindicates that part of the 213Ra α decay recoils left the tape and were implanted in the front partof the tape station. Also gamma lines of 232Ra and 232Ac decay were observed, but their intensitywas small as expected from the timing of the tape cycle. However, the spectrum was dominated bya series of gamma lines with unknown assignment. Many of them are mutually coincident. In thebeta gated spectrum this background is significantly reduced. Gating with the beta telescope onhigh energy betas it is further suppressed with increasing electron energy threshold. This indicatesthat the nucleus showing the background lines is populated by electron capture with a small β+
branch. Therefore the contamination is from the neutron-deficient side.
Figure 5.4.1 shows the gamma spectrum gated with the beta telescope. The threshold was chosenhigh enough to eliminate most contaminations13. One can identify the radium Kα X-rays andseveral gamma lines.
The three strongest gamma lines are also clearly visible in the gamma single spectra and theenergy can be fitted with good statistics: 124.6(1) keV, 188.4(1) keV and 720.5(2) keV. They aremoreover coincident with the radium X-rays and can be assigned unambiguously to the 232Fr decay.A fit of their half-lives gives a value of 5.8(8) s, 5.3(10) s and 5.4(12) s respectively (see figure5.4.2). The weighted mean of the three values is 5.5(6) s. Note that in the gamma single spectrathese lines were “sitting” on a mixed background of small other peaks and a Compton continuum.Most of the error in the half-life determination is due to the subtraction of this background. Thedecay behavior gives an additional indication that the three gamma lines are to be attributed to
13The telescope was not calibrated, but the threshold energy is estimated to 2−2.5 MeV.

5.4.1 Decay of 232Fr 173
Ra
Kα
125
keV
188
keV
249
keV
294
keV
511
keV
630
keV
721
keV
834
keV
846
keV
Energy (keV)
Cou
nts
per
2 ke
V
0
2
4
6
8
10
12
14
100 200 300 400 500 600 700 800 900
Figure 5.4.1.: Gamma spectrum of mass 232 gated with high energy betas.
the same isotope, but for a more precise determination of the half-life the tape cycle should beextended to follow the decay over several lifetimes.
10 2
0 2 4 6 8 10 12 14 16
Time (s)
Pea
k in
tens
ity
125 keV188 keV720 keV
Figure 5.4.2.: Time behavior of the three strongest gamma lines of the 232Fr decay.
The 511 keV line in figure 5.4.1 is obviously due to high-energy positrons which annihilate afterstopping in the nearby beta telescope. The 630 and 834 keV lines are background from 72Ga decay.Before this experiment 72Cu had been studied at the same set-up. The isobaric beam contamination72Ga was implanted into the tape and remained there.
Other very weak lines are only visible with a gate on high-energy betas, (see figure 5.4.1):249(1) keV, 294(1) keV, and 846(1) keV. In the gamma single spectra they are burried underbackground and no lifetime could be measured. Thus no assignment can be made.
From the γγ coincidence spectra it is found that the 125 keV line is coincident to both, the188 and the 721 keV line. However, there is no coincidence between the latter two. There arealso traces of a coincidence between the 125 keV and other lines but due to the presence of beamcontaminations with high gamma multiplicity it cannot be excluded that the observed coincidencesare not just randomly.

174 5.4 Beta-decay of heavy francium isotopes
Level assignment
Figure 5.4.3 shows the development of the lowest levels in the even radium isotopes. The energieswere taken from ref. [Fir96, Coc99]. When moving away from the N = 126 shell closure the positiveparity states of the ground state band show the typical transition from a shell model structurevia a vibrator to a rotator structure. Their energy is continuously decreasing towards midshell(N = 139 at 225Ra). Due to increasing deformation β2, this tendency continues beyond midshelland for the heaviest radium isotopes the typical values of rotational bands in the actinide region areapproached. Extrapolating this systematics to 232Ra, the first 2+ level should be around 55 keV.Due to the high Z this 2+→0+ E2 transition will be highly converted14. Conversion electronscannot be detected with our experimental set-up and the efficiency for gamma ray detectionwith the standard HP-Ge detectors is already significantly reduced at this energy. Therefore thistransition was not observable with the given statistics.
2+ GSB 4+ GSB 6+ GSB 1- OB 3- OB 5- OB 0+ βB 2+ βB
Radium mass
Ene
rgy
(keV
)
0100200300400500600700800900
10001100120013001400150016001700180019002000
212 214 216 218 220 222 224 226 228 230 232
Figure 5.4.3.: Systematics of the lowest levels in even radium isotopes. Shown are levels of theground state band (GSB), the octupole vibration band (OB) and the β-vibrationband (βB). For a presentation of the present results for 232Ra the 2+ GSB level wasplaced arbitrarily at 54.5 keV. The ≈900 keV level is tentatively assigned to a 3−
OB state.
For an even-even nucleus it is not expected that usually high-lying states are found below 1 MeVexcitation energy. Therefore the two strongest gamma lines detected in the 232Fr beta decay to232Ra (125 and 188 keV) can safely be assigned to the E2 transitions 4+→2+ and 6+→4+. The721 keV line is coincident to 125 keV, but not to 188 keV. Therefore it should feed the 4+ leveldirectly, possibly from the 3− or 5− level of the octupole vibration band. In case the 721 keVtransition comes from the 5− level, the 532.2 keV 5−→6+ should show up in the single spectraas well as in coincidence to the 125 and 188 keV lines. This was not observed. If, however, itcomes from the 3− level one should also see the 845.1 keV 3−→2+ transition in the gamma singlespectra. In fact, a slight indication for such a line is seen in figure 5.4.1. Therefore the 721 keVline is tentatively15 assigned to the 3−→2+ transition. As seen in figure 5.4.3 the deduced 3−
14The total conversion coefficient is α ≈ 160 [Fir96].15It should be noted that the transition strength expected from a Weisskopf estimation is 20 % higher for 3−→2+compared with 3−→4+. This is not observed in figure 5.4.1, but the trigger efficiency of the data acquisition is

5.4.1 Decay of 232Fr 175
position fits well in the systematics. The energy of the collective octupole excitation increases aftermidshell due to the reduced number of valence neutrons.
The feeding of the 4+ level by the 188 keV line is slightly stronger than by the 721 keV line16.Both lines together give about half of the 4+→2+ intensity. Thus the 4+ level is also populatedby other sources: either gamma transitions which are not detected or directly from the beta decay.From a comparison with the detected intensity of high-energy betas it is found that roughly halfof all 232Fr decays go via the 4+→2+ transitions to the ground state. Conversion coefficients of3.5 for the 125 keV line and 0.7 for the 188 keV line were used for these comparisons.
Due to an unknown direct population of the 0+ ground state and the 2+ state no useful log ftvalues could be derived and no statement can be made on the ground state spin of 232Fr. Figure5.4.4 summarizes the observed gamma lines in a tentative level scheme of 232Ra.
232Fr?? 0.0
232Ra0+
(3 )-
(2 )+
(4 )+
(6 )+
0.0
(179.1)
(899.6)
(367.5)
(≈54.5)
188.2
720.5(845)
250(50) s
5.5(6) s
124.6
Predicted value: Qβ = 5.55(74) MeV
Figure 5.4.4.: Placement of the observed gamma lines in a tentative level scheme of 232Ra. Forthe 845 keV line only a weak hint was observed. The energy of the 2+ state wasderived from systematics. The Qβ value was taken from [Aud97] and the half-life of232Ra from [Gip86].
The ratio of the energies E(6+→4+)/E(4+→2+) = 1.51 comes close to that of an ideal rotator.Its energy eigenvalues for a total angular momentum I are:
E = I(I + 1)2/(2θ). (5.4.1)
Thus: E(6+→4+)/E(4+→2+) = (6 ·7−4 ·5)/(4 ·5−2 ·3) = 11/7 ≈ 1.57. The kinetic momentumof inertia is obtained as:
θ =2(2I − 1)
EI − EI−2. (5.4.2)
not necessarily equal for both lines (see below). Else the intensity ratio would rather indicate an assignment toe.g. a 2+, K = 2 state.
16A more precise intensity evaluation is still to be done by taking into account the total trigger efficiency (beta andgamma-gamma events). Due to the very close geometry it depends noticeably on the gamma multiplicity of thedecay and on random gamma-gamma coincidences. This effect is reproduced with GEANT simulations [Wei99].

176 5.4 Beta-decay of heavy francium isotopes
Thus: θ(4+→2+) = 56.2 2/MeV and θ(6+→4+) = 58.4
2/MeV.
A more precise reproduction of the rotator energies is obtained with an additional quadratic termin equation (5.4.1) [Cas90]:
E = AI(I + 1) + BI2(I + 1)2 (5.4.3)
with A = 2/(2θ) and B A a small correction term. With the two given transition energies
θ = 54.7 2/MeV and B = −0.0093 keV are found. Thus the 2+ level is expected to be at about
54.5 keV. The extrapolated energy of the 8+ and 10+ levels is 610 and 893 keV, respectively.
The rigid rotator momentum of inertia of a solid sphere is θ = 2/5Mr2, that of an ellipsoid withquadrupole deformation β2:
θrigid ≈ 2
5AmNr20(1 + 0.31β2). (5.4.4)
The radius and the deformation of even-even nuclei were recently calculated by the relativisticmean-field theory [Lal99]. For 232Ra the mean proton radius rp = 5.75 fm and the mean neutron
radius rn = 6.07 fm can be combined to the mean matter radius: rmat =√
r2p Z/A + r2nN/A =
5.95 fm. Using also β2 = 0.202 from ref. [Lal99] gives θrigid = 83.5 keV. The experimental valueis just two third of the calculated one, showing that the description with a rigid rotator is lesssuitable than e.g. for neutron-rich lanthanides.
Actually the nuclear charge distribution up to 232Ra was already measured by collinear laser spec-troscopy at ISOLDE 17 [Ahm83, Wen87]. A comparison of the calculated and experimental valuesshows for the heaviest radium nuclei (A ≥ 228) a slight overestimation of δ〈r2〉A,214 by theory(14 % in 232Ra). However, this affects θrigid only marginally.
Outlook
To increase the efficiency for detection of the low-energy transitions (2+→0+, 4+→2+, 3−→1−,etc.) it would be very profitable to use a conversion electron detector. An X-ray detector is necessaryto see the L-X-rays18. A set-up dedicated for the detailed decay study of 232Fr should moreovercontain a calibrated beta telescope19. This could give additional information on a direct betafeeding of the low levels. It would also allow a rough determination of the nuclear mass. Presentlythe uncertainty of the experimental masses is still quite high in this region [Aud97].
Setting a double gate on the gamma lines 124.6 keV and 188.4 keV or 124.6 keV and 720.5 keV,respectively, can help to extract higher levels of 232Ra from the coincidence data taken withGAMMASPHERE in multi-nucleon transfer reactions of 136Xe on 232Th [Coc99].
“The contamination”
Finally also the strong contamination could be identified. The gamma lines are coincident withfrancium X-rays. They can be assigned to the EC/β+ decay of the 1/2− ground state of 213Ra(20 % branching ratio for EC and β+). This decay will mainly populate low spin states in 213Fr.Indeed the strongest observed line is the 7/2−→9/2− transition: 498.3(2) keV. The intensity ofthis line was used (with an assumed branching ratio of 80 %) to determine the yield of 213RaF+
(see section 4.12). Up to now 213Fr was mainly studied by high spin spectroscopy, and except the17In fact, 232Ra was first discovered in this experiment. Even the half-life was not known at this time. This is a goodexample for the sensitivity of on-line laser spectroscopy.
18The conversion of the E2 transitions mainly creates vacancies in the L shell.19The one used was very small, just to fit between both Ge detectors in close geometry. It was not optimized forlinearity etc.
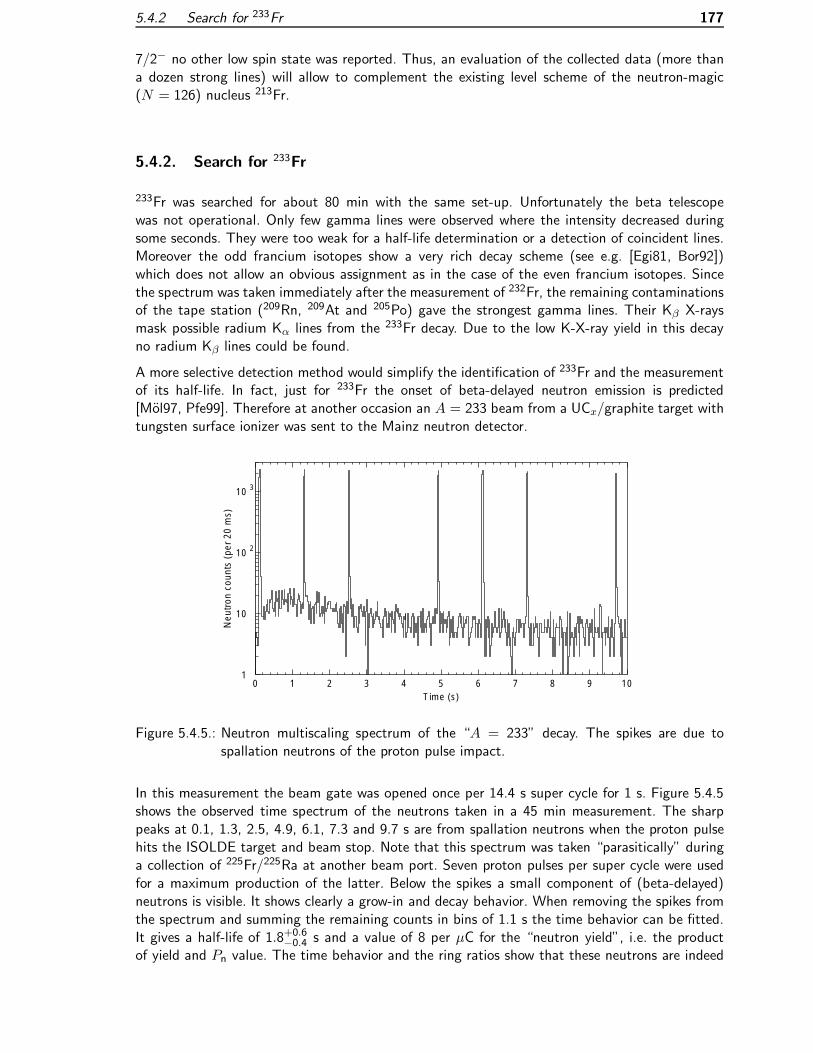
5.4.2 Search for 233Fr 177
7/2− no other low spin state was reported. Thus, an evaluation of the collected data (more thana dozen strong lines) will allow to complement the existing level scheme of the neutron-magic(N = 126) nucleus 213Fr.
5.4.2. Search for 233Fr
233Fr was searched for about 80 min with the same set-up. Unfortunately the beta telescopewas not operational. Only few gamma lines were observed where the intensity decreased duringsome seconds. They were too weak for a half-life determination or a detection of coincident lines.Moreover the odd francium isotopes show a very rich decay scheme (see e.g. [Egi81, Bor92])which does not allow an obvious assignment as in the case of the even francium isotopes. Sincethe spectrum was taken immediately after the measurement of 232Fr, the remaining contaminationsof the tape station (209Rn, 209At and 205Po) gave the strongest gamma lines. Their Kβ X-raysmask possible radium Kα lines from the 233Fr decay. Due to the low K-X-ray yield in this decayno radium Kβ lines could be found.
A more selective detection method would simplify the identification of 233Fr and the measurementof its half-life. In fact, just for 233Fr the onset of beta-delayed neutron emission is predicted[Mol97, Pfe99]. Therefore at another occasion an A = 233 beam from a UCx/graphite target withtungsten surface ionizer was sent to the Mainz neutron detector.
Time (s)
Neu
tron
cou
nts
(per
20
ms)
1
10
10 2
10 3
0 1 2 3 4 5 6 7 8 9 10
Figure 5.4.5.: Neutron multiscaling spectrum of the “A = 233” decay. The spikes are due tospallation neutrons of the proton pulse impact.
In this measurement the beam gate was opened once per 14.4 s super cycle for 1 s. Figure 5.4.5shows the observed time spectrum of the neutrons taken in a 45 min measurement. The sharppeaks at 0.1, 1.3, 2.5, 4.9, 6.1, 7.3 and 9.7 s are from spallation neutrons when the proton pulsehits the ISOLDE target and beam stop. Note that this spectrum was taken “parasitically” duringa collection of 225Fr/225Ra at another beam port. Seven proton pulses per super cycle were usedfor a maximum production of the latter. Below the spikes a small component of (beta-delayed)neutrons is visible. It shows clearly a grow-in and decay behavior. When removing the spikes fromthe spectrum and summing the remaining counts in bins of 1.1 s the time behavior can be fitted.It gives a half-life of 1.8+0.6−0.4 s and a value of 8 per µC for the “neutron yield”, i.e. the productof yield and Pn value. The time behavior and the ring ratios show that these neutrons are indeed
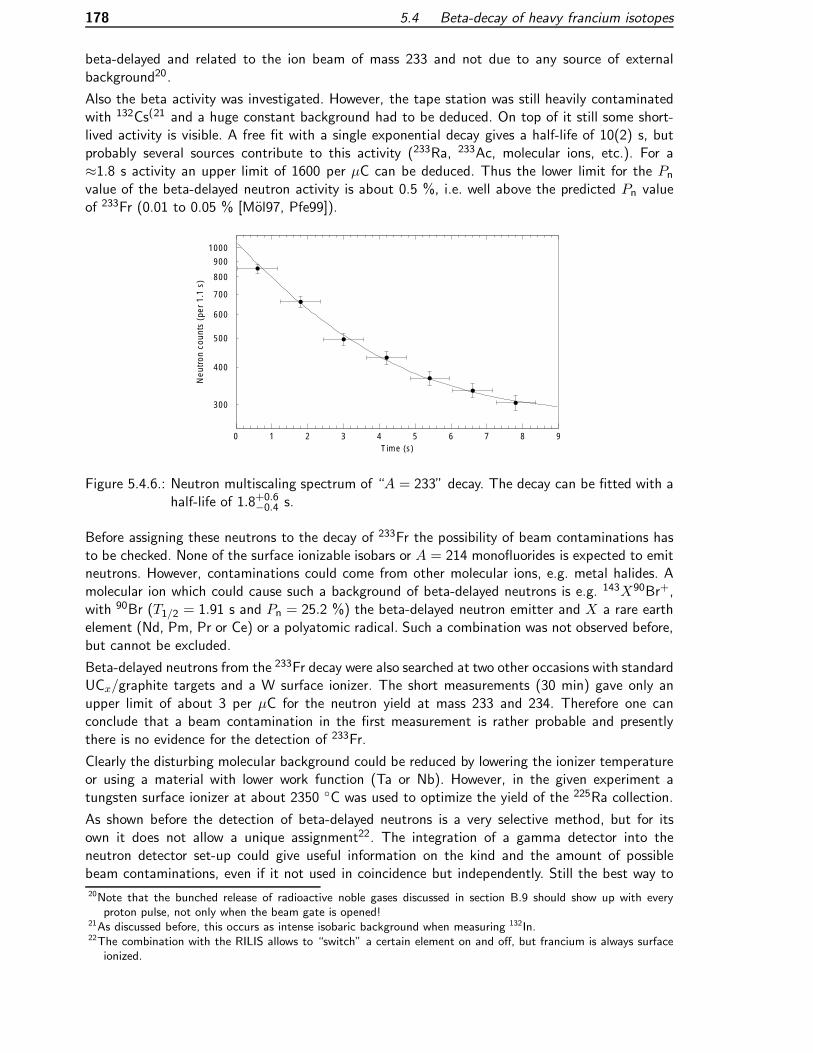
178 5.4 Beta-decay of heavy francium isotopes
beta-delayed and related to the ion beam of mass 233 and not due to any source of externalbackground20.
Also the beta activity was investigated. However, the tape station was still heavily contaminatedwith 132Cs(21 and a huge constant background had to be deduced. On top of it still some short-lived activity is visible. A free fit with a single exponential decay gives a half-life of 10(2) s, butprobably several sources contribute to this activity (233Ra, 233Ac, molecular ions, etc.). For a≈1.8 s activity an upper limit of 1600 per µC can be deduced. Thus the lower limit for the Pnvalue of the beta-delayed neutron activity is about 0.5 %, i.e. well above the predicted Pn valueof 233Fr (0.01 to 0.05 % [Mol97, Pfe99]).
Time (s)
Neu
tron
cou
nts
(per
1.1
s)
300
400
500
600
700
800
900
1000
0 1 2 3 4 5 6 7 8 9
Figure 5.4.6.: Neutron multiscaling spectrum of “A = 233” decay. The decay can be fitted with ahalf-life of 1.8+0.6−0.4 s.
Before assigning these neutrons to the decay of 233Fr the possibility of beam contaminations hasto be checked. None of the surface ionizable isobars or A = 214 monofluorides is expected to emitneutrons. However, contaminations could come from other molecular ions, e.g. metal halides. Amolecular ion which could cause such a background of beta-delayed neutrons is e.g. 143X90Br+,with 90Br (T1/2 = 1.91 s and Pn = 25.2 %) the beta-delayed neutron emitter and X a rare earthelement (Nd, Pm, Pr or Ce) or a polyatomic radical. Such a combination was not observed before,but cannot be excluded.
Beta-delayed neutrons from the 233Fr decay were also searched at two other occasions with standardUCx/graphite targets and a W surface ionizer. The short measurements (30 min) gave only anupper limit of about 3 per µC for the neutron yield at mass 233 and 234. Therefore one canconclude that a beam contamination in the first measurement is rather probable and presentlythere is no evidence for the detection of 233Fr.
Clearly the disturbing molecular background could be reduced by lowering the ionizer temperatureor using a material with lower work function (Ta or Nb). However, in the given experiment atungsten surface ionizer at about 2350 C was used to optimize the yield of the 225Ra collection.
As shown before the detection of beta-delayed neutrons is a very selective method, but for itsown it does not allow a unique assignment22. The integration of a gamma detector into theneutron detector set-up could give useful information on the kind and the amount of possiblebeam contaminations, even if it not used in coincidence but independently. Still the best way to20Note that the bunched release of radioactive noble gases discussed in section B.9 should show up with everyproton pulse, not only when the beam gate is opened!
21As discussed before, this occurs as intense isobaric background when measuring 132In.22The combination with the RILIS allows to “switch” a certain element on and off, but francium is always surfaceionized.

5.4.3 Outlook to 234+xFr 179
identify 233Fr unambiguously remains the detection of X-rays and high-energy betas. Thereforea spectroscopy set-up as proposed above for a further study of the 232Fr decay will also be verysuitable for the detection of heavier francium isotopes.
5.4.3. Outlook to 234+xFr
For very heavy francium isotopes (A >∼ 234) a new decay mode could occur: beta-delayed fission(see section 1.1). Its study is not only of principal interest to improve the knowledge of thedevelopment of the fission barriers towards very neutron-rich isotopes, but has also implicationson the astrophysical r-process.
All naturally occuring actinide isotopes were created in the r-process. See Burbidge et al. (BBFH)[Bur57] for a general description and e.g. ref. [Cow99] for a recent review. Neutron-induced andspontaneous fission of very heavy neutron-rich r-process nuclei can occur already during the r-process. It sets an upper limit to the produced masses and causes some recycling of the r-processnuclei: the fission products act again as seed material for further neutron capture.
As in the case of lighter r-process nuclei the observed abundances of actinides are related to themass yields at the end of the neutron burst. For lighter masses the final abundances are slightlymodified by beta-delayed neutron emission occuring on the way from the primary r-process nucleito the beta stable daughters. For the heaviest nuclei additionally spontaneous and beta-delayedfission can occur. This can cause some enhancement in the fission product region and, even moreimportant, a depletion of the actinide yields. The long-lived actinides 232Th, 235U and 238U arenormally used as cosmochronometers to determine the age of the solar system. A significantsuppression of one of these nuclei by beta-delayed fission of a progenitor would change the primaryabundance ratio and thus affect the derived age of the Galaxy. Clearly the yields of these nucleido not reflect directly the mass yields of the respective isobaric progenitors. Instead they representan integration over all mass yields of the (alpha) decay chains ending there. For example the yieldof 238U is a collection of the mass yields A =238, 242, 246 and 250(23. Still, due to the odd-evenstaggering of the Qβ values and fission barriers the three cosmochronometers will be affecteddifferently by beta-delayed fission. Therefore a good understanding of the latter process is veryimportant.
The theoretical predictions for beta-delayed fission probabilities differ significantly. Thielemann etal. predicted a beta-delayed fission probability of 3 to 20 % for 234Fr, depending on the used massformula [Thi83]. This is in contrast to other calculations [Ber69, Lyu86, Mey89, Sta92] whichpredict the on-set of beta-delayed fission much further out (around 244Fr or even beyond). Ageneral difficulty in the calculation of delayed fission probabilities is the need to find a consistentdescription of the nuclear masses and the fission barrier heights. This was recently achieved withthe microscopic ETFSI method [Mam98] and fission barriers of many neutron-rich heavy isotopeshave been calculated [Ray99]. Consistent fission barriers and Q values could also be deduced fromrelativistic mean field calculations [Lal99, Lalaz].
As in the case of most medium-mass r-process nuclei, there is no hope to study experimentallyall heavy isotopes between beta stability and the end of the r-process path in the near future. Onthe other hand already nuclear spectroscopy information on few prominent isotopes in this areahelps to improve the theoretical predictions for the full region. The branching ratio for beta-delayedfission is determined by the beta-strength function, the Qβ value and the fission barrier. However,any experimentally accessible property (e.g. the lifetime, the mass, the beta-strength distributionor the ground state deformation) is a valuable input parameter to test and improve the modelcalculations.
23Contributions from higher masses will mainly undergo spontaneous fission.

180 5.4 Beta-decay of heavy francium isotopes
Experimental information on β−-delayed fission
Gangrskii et al. reported beta-delayed fission of heavy protactinium isotopes (236,238Pa) [Gan78],but a later study could not confirm the results [BM85]. Thus, 256mEs remains the only case ofexperimentally observed β−f activity [Hal92].
An experimental search for β−-delayed fission in the sub-actinide region was performed at the IRISfacility [Mez90]. No fission event was detected in the decay of 232Fr. Estimating the number ofobserved 232Fr decays with the assumption of one Lβ Ra X-ray per decay gave an upper limit of2 · 10−6 for the delayed fission probability PDF [Mez90]. Using this value Izosimov estimated theheight of the fission barrier in 232Ra [Izo92].
Very neutron-rich actinide nuclei were produced by multiple neutron capture on 238U and 242Putargets [Dor65, Ing69]. Information on the fission barrier heights was deduced from the productionyields of higher actinides. However, such experiments give only an integral information and donot allow to study individual short-lived nuclei. Moreover the experimental set-up to produce therequired neutron flux is rather involved (nuclear explosions). Note that in the given referencesbeta-delayed fission was not yet included in the evaluation. See ref. [Hof86] for a discussion of thecorrections.
Several methods can be used to find an experimental indication of beta-delayed fission:
• The fission fragments could be detected directly. Their high kinetic energy (>∼ 130 MeV intotal24) gives an unambiguous signal. Implanting the beam into a silicon detector allows toreach a detection efficiency of nearly 100 %. However, if very abundant beam contaminationswith alpha activity are present, pile-up could cause a problem.
• Another feature of fission is the high gamma multiplicity. Also here a good detection efficiencycan be obtained with a segmented array of gamma detectors covering a large solid angle(e.g. over 90 % in [Sin97]), but the experimental effort is much higher.
• Finally the fission neutrons could be detected. For example with the Mainz neutron detectorand an expected neutron multiplicity νp >∼ 3 a detection efficiency above 65 % can bereached. However, an ambiguity occurs if the isotope in question has also a decay branch forbeta-delayed neutron emission. This is the case for all nuclei in this region with a sufficientlyhigh Q value for β−f. Then a time-correlation technique [Ber99] has to be used to findevents with higher neutron multiplicity.
Thus, the search for beta-delayed fission does not necessarily require particular set-ups, but canbe performed in parallel to the standard nuclear spectroscopy. The heavy francium isotopes wouldprovide a good opportunity for such a study.
24Compared to fission of e.g. 236U∗ the Q value is somehow reduced due to a higher neutron excess of the fissionfragments.

5.4.3 Outlook to 234+xFr 181
Epilog
Many yields of radioactive isotopes have been measured in this work25.
They were obtained with two completely different set-ups: the recoil separator LOHENGRIN atthe Institut Laue Langevin in Grenoble and the on-line isotope separator ISOLDE at CERN inGeneva. Not only the separation method is very different, but also the production process (thekinetic energy of the “primary beam” varies by more than ten orders of magnitude) and the aimof the measurement. However, there are several important parallels between the first and secondpart of this thesis and in particular one “red line”: fission. First it was shown that even light exoticisotopes are created in a variation of the well-known process of thermal neutron induced fissionof actinides. Later fission occured again as a powerful production method for many neutron-richisotopes at ISOLDE. There fission is induced by high-energy protons26. In some regions of thenuclide chart thermal neutron induced fission would be an even better, i.e. more efficient and moreselective, production method for ISOL facilities. And finally it was discussed that the availabilityof ISOL beams could possibly be extended towards the region where beta-delayed fission sets in.
Another parallel is the quest for very exotic isotopes. Why should one take the high effort to produceand study “exotic” nuclides far from beta-stability if there are still many unsolved problems in theexperimental and theoretical study of “standard” nuclides?
The systematic study of nuclear parameters (masses, lifetimes, excitation energies, decay modes,beta-strength functions, spins, magnetic moments, nuclear density distributions, etc.) along longisotopic chains allows to find qualitative changes in the proton-neutron-interaction and othermodel parameters. Often many models based on completely different assumptions give predictionsfor observables which differ only marginally for nuclei around the valley of beta stability, but goingtowards the drip-lines they start to deviate significantly, see e.g. [Lun97]. Thus, an even roughstudy of exotic nuclides can often provide more information to prove or falsify certain models orto fix free model parameters than a detailed study of nuclides close to stability. The situation isjust identical in the case of ternary fission: as discussed in chapter 1 the yields of very rare ternaryparticles provide a good test of the various ternary fission models.
The experimental methods and difficulties to provide appropriate beams of these exotic nuclei werediscussed in detail in chapters 2, 3 and 4. One should always recall the basic principles which haveto be followed: efficiency, selectivity and rapidity.
Finally the most “exotic” isotope separated in this work coincides at LOHENGRIN and ISOLDE:14Be. It is the rarest nuclide detected from ternary fission of 235U (only one per twenty billionfissions and the most short-lived isotope (T1/2 = 4.35 ms) which was separated up to now at theISOLDE PSB. A last example shall put the frequently used designation “exotic nuclide” into adifferent perspective: While you, dear reader, might have spent two hours under a 60 W desk lampfor reading parts of this thesis, about one million 14Be nuclei were produced in the nuclear reactorsproviding the electrical power for it. However, already before this page is completely turned, allof them have decayed inside the fuel elements. This illustrates the central problem of an ISOLfacility: an abundant production is often easier realized than an efficient extraction. Improvementsof the latter point offer still a huge potential to increase the yields.
25Still the number falls short of justifying the more poetic thesis title “Mille et un rendements en mille et une nuitsde manip” [Lettr].
26It should be noted that even ISOLDE could hardly operate without neutron-induced fission: French nuclear reactorsprovide affordable electricity to run the CERN accelerators.


A. Appendix to LOHENGRIN measurements
A.1. Preparation of thin, self-supporting nickel films
The foils are produced by evaporation or sputtering of nickel onto a flat surface. The substratehas to be impregnated with a parting agent to allow the removal of the foil. To stabilize the foilduring removal and subsequent handling, one side is covered by a thin protective film. It follows arecipe with the fundamental production steps:
• Prepare a saturated solution from betain (C5H11NO2 ·H2O) and saccharose (C12H22O11)with a mass ratio of about 7 to 1 [MK72].
• Keep it at least over night, that the oversaturated part can settle.
• Clean glass plates (in our case 100 · 100 mm2) with detergent and rinse well with water. Letthem dry.
• Distribute a little of the sugar solution with a damp cloth on the glass.
• When the film starts to dry, grind it with a dry cloth that it gets milky. The plates shouldlook homogeneously like frosted glass. Store these glass plates in dry atmosphere, they arehygroscopic.
• Evaporate or sputter the metal in the requested thickness (here 2500 A) onto the substrates.
• Dissolve polystyrene in chloroform, about 10 to 20 g per liter for a thin film; 50 g per litergives a thicker film [Richa].
• Coat the plate by dipping it briefly into the polystyrene solution. Let it dry.
• Cut the coated foil with a scalpel into pieces of the desired size.
• Place the plate slightly inclined in a bowl.
• Fill the bowl slowly with water. This will dissolve the sugar film and make the metal foilswim on the water. If the water rises faster than the sugar layer dissolves, the buoyancy willbreak the foil.
• Carefully fish the swimming foil out with a suitable frame. When the foil is wet, it will berelatively stable and stay on the frame, but after drying (less than half an hour) it getsextremely brittle. To prevent that it comes off the frame, the rim of the foil should beclamped as soon as possible with another frame.
• If it did not come off already in the water, the protective layer of polystyrene can be removedwithout detectable residues by heating the foil under vacuum for a while to about 500 C.
183

184 A.2 Field settings of the LOHENGRIN separator
The evaporated foils are more brittle than the sputtered ones, resulting in more loss due to crackswhen removing them from the substrate.
The betain parting agent also could be replaced by a salt layer deposited onto the substratewith an appropriate evaporation facility. With both methods a small agglomeration of betainor salt can form a needle which in turn causes a pinhole in the foil when the parting agentis removed. While for the use as target cover foil such pinholes are absolutely uncritical, otherapplications have more severe requirements. Simultaneously to our foils we prepared a batch offoils for “subbarrier penetration” experiments with ultracold neutrons [Var97]. To stay below therequested limit of pinhole area (less than 10−7 surface of open holes on a freestanding area of upto 70 cm2 [Nesvi]) we tried also other parting agents, however with inferior results. A thin layerpainted with a waterproof marker (“Edding”) onto the glass substrate was dissolved in acetone, butthe foil cracked completely. The evaporation of nickel onto a thin aluminum foil and a subsequentdissolving of the aluminum in a diluted sodium hydroxide solution did only allow to produce foilsof small size (about 1 cm2). Foils with larger area were broken from the pressure of gas bubblesproduced in: 2 Al + 6 H2O → 2 Al3+ + 6 OH− + 3 H2 ↑.
A.2. Field settings of the LOHENGRIN separator
In the LOHENGRIN spectrometer the ions are separated according to their mass, ionic charge andkinetic energy. The trajectory is given by the identity of the centrifugal force Fz and the Lorentzforce FL. First they traverse a homogeneous magnetic sector field B and are deflected horizontallyaccording to their momentum over ionic charge ratio p/q:
Fz =mv2
ρmagn= qvB = FL,
p
q=
mv
q= Bρmagn. (A.2.1)
Next they are deflected by a cylindrical condenser in vertical direction and separated according tothe ratio of kinetic energy to ionic charge E/q:
mv2
ρel= qE ,
E
q=
mv2
2q=
1
2Eρel, (A.2.2)
where E is the electrical field strength in the condenser. The field of a cylindrical condenser isgiven by:
E(r) =U
r · ln(ρel+d/2ρel−d/2
) ≈ U
r. (A.2.3)
With r = ρel = 5.6 m and d = 0.3 m the full denominator only deviates by 70 µm from d = 0.3 m.This is much less than the positioning accuracy of the electrodes and can be neglected.
Solving equations A.2.1 and A.2.2 for the experimental parameters U and B gives:
U =mv2
q· dρel = E
q· 1
Φ, (A.2.4)
B =
√m
q· U · ρel
dρ2magn=
√m
q· U · χ. (A.2.5)

A.3 Entrance window of the ionization chamber 185
Here, the separator constants Φ =ρel2d
and χ =ρel
dρ2magnwere introduced. For the RED magnet a
higher field has to be applied, which is given by the ratio of the mean radii of the main magnetρmagn and the RED magnet ρRED:
κ =BRED
B=
ρmagnρRED
≈ 4 m
0.6 m= 6.67. (A.2.6)
For binary fission fragments these equations are normally accurate enough. However, for fastternary particles the small relativistic correction (some per mil) has to be taken into account.Using a power series in β = v/c, they can be expressed as [Hes97]:
U =E
q· 1
Φ· 1
1 +β2
4− β4
2− 3β6
32
, (A.2.7)
B =
√m
q· U · χ ·
(1 +
β2
2+
3β4
8
). (A.2.8)
It should be kept in mind that m is the ionic mass of AZXq+. The nuclear mass defect and the qmissing electron masses have to be taken into account.
A.3. Entrance window of the ionization chamber
The window of the ionization chamber has to separate the counting gas (normally isobutane) fromthe vacuum in the separator beam tube. The counting gas pressure is typically around 50 mbar forbinary fission product measurements, but has to be increased up to 150 mbar and more for lightcharged particles. The window has to be thin and homogeneous to avoid excessive energy lossand scattering of the fragments. Plastic foils show a good compromise between tensile strengthand energy loss of the fragments. The thin foils are supported with a metal mesh of about 90 %transmission.
Originally the foils were produced at ILL with a special foil stretching apparatus, following therecipe of ref. [Bar77, Het86]. A commercial polypropylene foil (about 35 µm thickness) is clampedonto a ring frame. A mushroom structure heated to 100-120 C is moved at a constant speedof some mm/s through the frame and stretches the foil. The approximate thickness of the foilis observed by regarding the interference colors under neon light. When the desired thickness isreached, the mushroom is stopped and a smaller ring is glued around a homogeneous lookingarea. The foil is then removed and glued onto the window holder. To allow a smooth stretching,the mushroom is covered with a teflon layer which has to be cleaned and polished before use.Foils with thicknesses down to some 40 µg/cm2 can be produced, but the thinner the foil gets,the higher is the probability that it breaks before being taken off. Thus, the yield of successfulattempts drops significantly. Any dust particle on the mushroom can provoke a local rupture ofthe foil. After an unprofessional building operation, the ILL room with the stretching machine waseven further from reaching clean room conditions. Thin IC windows were then prepared with asimilar machine at Tubingen University.
Alternatively the polypropylene foil can also be stretched cold by slowly inflating it to a bubblewith compressed air [Kat72]. Other production methods are discussed in ref. [Hui81].
Originally the maximum pressure for isobutane (potentially inflammable gas) in the ionizationchamber was limited to 100 mbar for safety reasons. This is not sufficient to stop energeticternary particles. Therefore the counting gas was changed to carbon tetrafluoride where no pressure

186 A.3 Entrance window of the ionization chamber
limitation applies. Also in binary fission measurements where the entrance angle of the ions isreconstructed from the time difference of the ∆E and Eres signal, CF4 is preferable due to thefaster drift and better time resolution. However, the molecular diameter of CF4 is smaller than thatof C4H10 and it tends to diffuse faster through the IC window. Leak rates up to some 10 Pa l/sthrough the 20 cm2 big window were measured. This had dramatic consequences!
The CF4 diffused into the LOHENGRIN condenser and deposited on the electrodes. In dischargesof the condenser, the CF4 was cracked and the radicals attacked the surface of the electrodesand the insulators of the holding structure. This in turn caused even more frequent sparking.Consequently the maximum voltage of the condenser dropped drastically. Therefore the carbontetrafluoride was replaced again by isobutane, most insulators had to exchanged and the surface ofthe electrodes was cleaned in a long conditioning period. That CF4 had indeed diffused far into thebeam tube could also be seen from the increase of the “yield” of 19F atoms, scattered by fissionfragments between target and magnet and detected in the ionization chamber after separation.

A.4 Kinetic energy distributions of ternary particles 187
A.4. Kinetic energy distributions of ternary particles
In the following some experimental energy distributions are shown. The measured points includealready all corrections discussed in section 1.4.5.
A.4.1. 233U(nth,f)
0 5 10 15 200
200
400
600
800
1000
1200
1400
1600
1800
6He
E (MeV)
Cou
nts
per
MeV
and
100
0 s
0 5 10 15 20 25 300
20
40
60
80
100
120
140
160
180
200
220
240
260
280
E (MeV)
Cou
nts
per
MeV
and
100
0 s
10Be
Figure A.4.1.: Kinetic energy distributions of 6He and 10Be from 233U(nth,f).
0 5 10 15 20 25 30 35 400
10
20 15C
Co
un
ts p
er
Me
V a
nd
10
00
s
E (MeV)
0 5 10 15 20 25 30 35 40 45 500,0
0,5
1,0
1,5
2,0
2,5
3,0
3,5
20OC
ou
nts
pe
r M
eV
an
d 1
00
0 s
E (MeV)
Figure A.4.2.: Kinetic energy distributions of 15C and 20O from 233U(nth,f).
0 5 10 15 20 25 30 35 40 45 500,00
0,01
0,02
0,03
0,04
0,05
0,06
0,07
0,08
0,09
0,10
21F
Co
un
ts p
er
Me
V a
nd
10
00
s
E (MeV)
Figure A.4.3.: Kinetic energy distribution of 21F from 233U(nth,f).

188 A.4 Kinetic energy distributions of ternary particles
A.4.2. 235U(nth,f)
0 2 4 6 8 10 12 14 16 18 20 220
10
20
30
40
50
60C
ou
nts
pe
r M
eV
an
d 1
00
0 s
E (MeV)
9Li
0 2 4 6 8 10 12 14 16 18 200,000
0,005
0,010
0,015
0,020
0,025
0,030
0,035
0,040
11Li
Co
un
ts p
er
Me
V a
nd
10
00
s
E (MeV)
Figure A.4.4.: Kinetic energy distributions of 9Li and 11Li from 235U(nth,f).
0 2 4 6 8 10 12 14 16 18 20 220
50
100
150
200
250
300
350
400
Co
un
ts p
er
Me
V a
nd
10
00
s
E (MeV)
10Be
0 10 20 30 40 500
10
20
15C
Co
un
ts p
er
Me
V a
nd
10
00
s
E (MeV)
Figure A.4.5.: Kinetic energy distributions of 10Be and 15C from 235U(nth,f).
0 5 10 15 20 25 30 350
2
4
Co
un
ts p
er
Me
V a
nd
10
00
s
E (MeV)
20O
Figure A.4.6.: Kinetic energy distributions of 20O from 235U(nth,f).

A.4.3 241Pu(nth,f) 189
A.4.3. 241Pu(nth,f)
0 2 4 6 8 10 12 14 16 18 200
2000
4000
6000
8000
10000
4He
E (MeV)
Cou
nts
per
MeV
and
100
0 s
0 2 4 6 8 10 12 14 160
50
100
150
200
250 6He
Cou
nts
per
MeV
and
100
0 s
E (MeV)
Figure A.4.7.: Kinetic energy distributions of 4He and 6He from 241Pu(nth,f).
0 2 4 6 8 10 12 14 160
2
4
6
8
10
12
14
16
18
Cou
nts
per
MeV
and
100
0 s
8He
E (MeV)
0 5 10 15 200
100
200
300
400
500
600
700
10Be
Co
un
ts p
er
Me
V a
nd
10
00
s
E (MeV)
Figure A.4.8.: Kinetic energy distributions of 8He and 10Be from 241Pu(nth,f).
0 5 10 15 20 25 30 35 40 45 500
20
40
60
80
100
120
140
14C
Co
un
ts p
er
Me
V a
nd
10
00
s
E (MeV)0 5 10 15 20 25 30 35
0
2
4
6
8
10
12
14
Co
un
ts p
er
Me
V a
nd
10
00
s
E (MeV)
20O
Figure A.4.9.: Kinetic energy distributions of 14C and 20O from 241Pu(nth,f).

190 A.4 Kinetic energy distributions of ternary particles
A.4.4. 245Cm(nth,f)
0 2 4 6 8 100
100
200
300
400
500
E (MeV)
Cou
nts
per
MeV
and
100
0 s
3H
0 2 4 6 8 10 12 140
500
1000
1500
2000
2500
3000
3500
4000
4500
E (MeV)
Cou
nts
per
MeV
and
100
0 s
4He
Figure A.4.10.: Kinetic energy distributions of 3H and 4He from 245Cm(nth,f).
0 2 4 6 8 10 12 140
50
100
150
E (MeV)
Cou
nts
per
MeV
and
100
0 s
6He
0 5 10 15 20 25 300
5
10
15
20
Co
un
ts p
er
Me
V a
nd
10
00
s
E (MeV)
10Be
Figure A.4.11.: Kinetic energy distributions of 6He and 10Be from 245Cm(nth,f).
0 10 20 30 400
2
4
Co
un
ts p
er
Me
V a
nd
10
00
s
E (MeV)
14C
0 5 10 15 20 25 30 35 40 45 500,0
0,1
0,2
0,3
0,4
0,5
0,6
0,7
Co
un
ts p
er
Me
V a
nd
10
00
s
E (MeV)
20O
Figure A.4.12.: Kinetic energy distributions of 14C and 20O from 245Cm(nth,f).
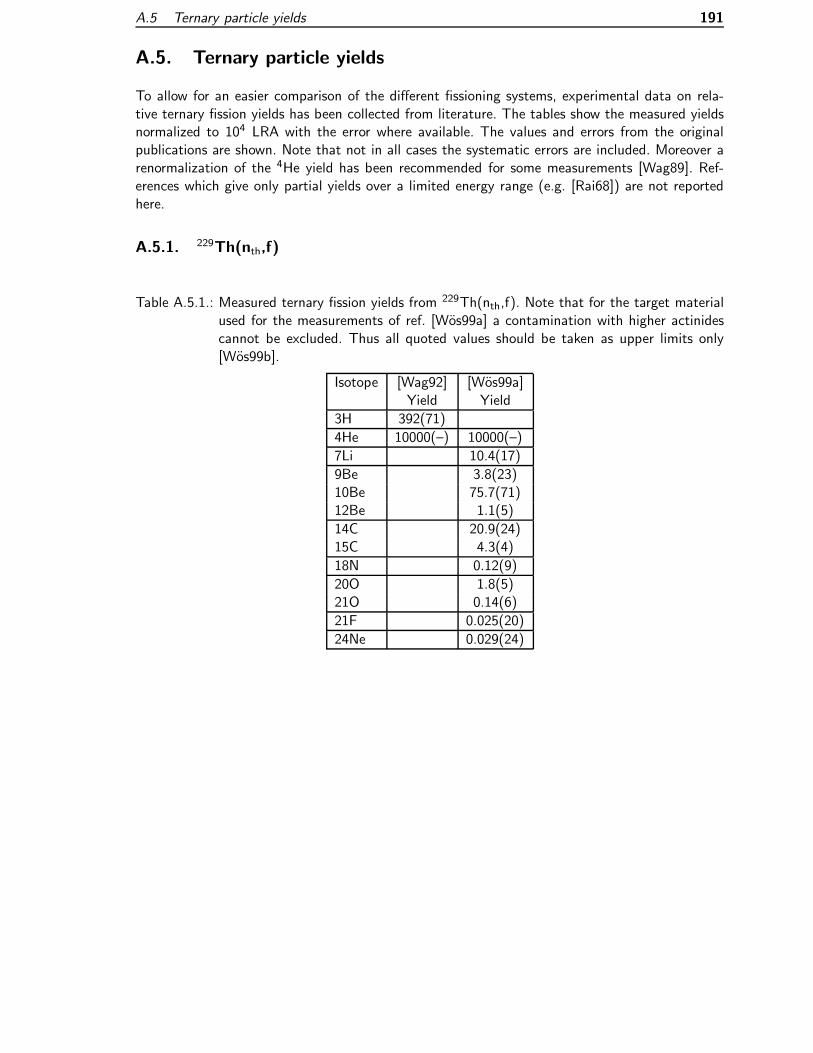
A.5 Ternary particle yields 191
A.5. Ternary particle yields
To allow for an easier comparison of the different fissioning systems, experimental data on rela-tive ternary fission yields has been collected from literature. The tables show the measured yieldsnormalized to 104 LRA with the error where available. The values and errors from the originalpublications are shown. Note that not in all cases the systematic errors are included. Moreover arenormalization of the 4He yield has been recommended for some measurements [Wag89]. Ref-erences which give only partial yields over a limited energy range (e.g. [Rai68]) are not reportedhere.
A.5.1. 229Th(nth,f)
Table A.5.1.: Measured ternary fission yields from 229Th(nth,f). Note that for the target materialused for the measurements of ref. [Wos99a] a contamination with higher actinidescannot be excluded. Thus all quoted values should be taken as upper limits only[Wos99b].
Isotope [Wag92] [Wos99a]Yield Yield
3H 392(71)
4He 10000(–) 10000(–)
7Li 10.4(17)
9Be 3.8(23)10Be 75.7(71)12Be 1.1(5)
14C 20.9(24)15C 4.3(4)
18N 0.12(9)
20O 1.8(5)21O 0.14(6)
21F 0.025(20)
24Ne 0.029(24)

192 A.5 Ternary particle yields
A.5.2. 233U(nth,f)
Table A.5.2.: Measured ternary fission yields from 233U(nth,f).
Isotope [Vor69] [Cam69] [Wag86] [Wos98] This workYield Yield Yield Yield Yield
d 41(2)t 460(20) 280 527(14)
3He ≤0.1 180 ≤0.0184He 10000(–) 10000(–) 10000(–)6He 137(7) 73(5) (179(15))8He 3.6(4)
6Li ≤0.057Li 3.7(2) 5.1(13)8Li 1.8(2) 2.0(3)9Li 3.6(5) 4.3(6)11Li 0.00037(27)
7Be ≤0.019Be 3.7(8)10Be 43(3) 43(3) (43(3))11Be ≤0.3 1.9(10)12Be 1.1(2)14Be ≤ 0.0011
12B 0.37(6)13B 0.62(13)14B 0.014(8) 0.021(7)15B 0.0024(11)
14C 11.4(4)15C 2.4(3) 2.2(3)16C 2.1(3)18C 0.052(12)
16N 0.026(11)18N 0.047(9)
20O 0.71(8) 0.73(9)21O 0.034(10) 0.031(8)22O 0.0052(24)
21F 0.0077(34)
24Ne 0.0040(21)
27Na ≤0.00064

A.5.3 235U(nth,f) 193
A.5.3. 235U(nth,f)
Table A.5.3.: Measured ternary fission yields from 235U(nth,f).
Isotope [Chw67] [Dak67] [And69] [Blo69] [Kug72] [D’H80]Yield Yield Yield Yield Yield Yield
p 200 115(15) 96(1)d 60 50(10) 56(2)t 550 620(50) 310(80) 627(3)
3He ≤0.084He 10000(–) 10000(–) 10000(–) 10000(–) 10000(–) 10000(–)6He 80 110(20) 170(2)8He 8all Li 90 12(2) 10all Be 32 37(4) 39all B 1all C 50all N 2all O 50all F 24
Table A.5.4.: Measured ternary fission yields from 235U(nth,f).
Isotope [Vor72] [Doa86] [Bau92b] [Bou94] This workYield Yield Yield Yield Yield
d 50(2) 28.15(16)t 720(30) 610(2)
3He ≤0.01 ≤0.0084He 10000(–) 10000(–) 10000(–)6He 191(8) 169(2) 169(2)8He 8.2(6) 7.4(8)
6Li 0.05(2) 1.04(27) ≤0.0127Li 4.1(3) 3.99(15) 4.2(3)8Li 1.8(3) 1.68(6) 2.0(2)9Li 3.0(4) 2.19(11) 3.54(12) 2.3(3) 2.9(3)11Li ≤0.0019 0.00090(22)
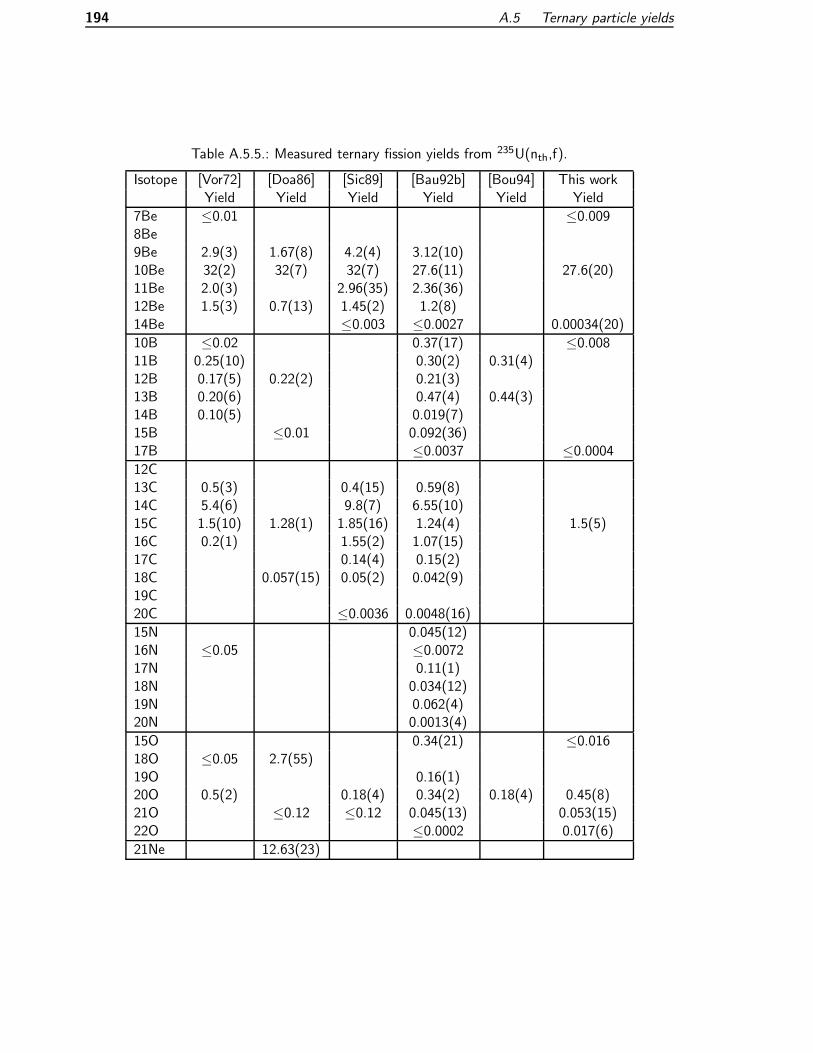
194 A.5 Ternary particle yields
Table A.5.5.: Measured ternary fission yields from 235U(nth,f).
Isotope [Vor72] [Doa86] [Sic89] [Bau92b] [Bou94] This workYield Yield Yield Yield Yield Yield
7Be ≤0.01 ≤0.0098Be9Be 2.9(3) 1.67(8) 4.2(4) 3.12(10)10Be 32(2) 32(7) 32(7) 27.6(11) 27.6(20)11Be 2.0(3) 2.96(35) 2.36(36)12Be 1.5(3) 0.7(13) 1.45(2) 1.2(8)14Be ≤0.003 ≤0.0027 0.00034(20)
10B ≤0.02 0.37(17) ≤0.00811B 0.25(10) 0.30(2) 0.31(4)12B 0.17(5) 0.22(2) 0.21(3)13B 0.20(6) 0.47(4) 0.44(3)14B 0.10(5) 0.019(7)15B ≤0.01 0.092(36)17B ≤0.0037 ≤0.0004
12C13C 0.5(3) 0.4(15) 0.59(8)14C 5.4(6) 9.8(7) 6.55(10)15C 1.5(10) 1.28(1) 1.85(16) 1.24(4) 1.5(5)16C 0.2(1) 1.55(2) 1.07(15)17C 0.14(4) 0.15(2)18C 0.057(15) 0.05(2) 0.042(9)19C20C ≤0.0036 0.0048(16)
15N 0.045(12)16N ≤0.05 ≤0.007217N 0.11(1)18N 0.034(12)19N 0.062(4)20N 0.0013(4)
15O 0.34(21) ≤0.01618O ≤0.05 2.7(55)19O 0.16(1)20O 0.5(2) 0.18(4) 0.34(2) 0.18(4) 0.45(8)21O ≤0.12 ≤0.12 0.045(13) 0.053(15)22O ≤0.0002 0.017(6)
21Ne 12.63(23)

A.5.4 239Pu(nth,f) 195
A.5.4. 239Pu(nth,f)
Table A.5.6.: Measured ternary fission yields from 239Pu(nth,f).Isotope [Kro69] [Cam72] [Vor75] [Wag86] [Kos95] [Wos98]
Yield Yield Yield Yield Yield Yield
p 190(10)d 50(10) 69(2)t 680(30) 570 720(30) 641(19)
3He ≤0.014He 10000(–) 10000(–) 10000(–) 10000(–) 10000(–) 10000(–)6He 190(20) 196 192(5) 186(10)8He 8(2) 8.8(4)
6Li ≤0.057Li 6.5(2)8Li 3.2(3)9Li 5.3(3)11Li 0.0016(6)
7Be ≤0.019Be 5.1(6)10Be 49(1) 49(–) 49(1)11Be 3.5(3)12Be 2.2(5)14Be 0.00037(23)
10B ≤0.0211B 0.9(3)12B 1.0(4)13B 1.3(4)14B 0.2(1)
13C ≤114C 14.0(6)15C 3.5(13)16C 3.5(16)
16N ≤0.0217N 0.19(1)
20O 0.8(4) 0.68(3)
21F 0.025(4)
24Ne 0.025(3)
27Na 0.0020(5)
30Mg 0.0028(15)
32Al ≤0.00032
34Si ≤0.00035
F to Mg ≤0.00002Si to Ar ≤0.000004K to Fe ≤0.00002

196 A.5 Ternary particle yields
A.5.5. 241Pu(nth,f)
Table A.5.7.: Measured ternary fission yields from 241Pu(nth,f).
Isotope [Wag86] This workYield Yield
d 42(4)t 761(19) 786(42)
4He 10000(–) 10000(700)6He 263(18)8He 15(1)
7Li 6.7(6)8Li 4.2(6)9Li 8.3(8)11Li 0.0045(15)
7Be ≤0.29Be 4.4(5)10Be 46(6)11Be 5.9(17)12Be 2.8(3)14Be 0.0027(10)
10B ≤0.0311B 1.6(10)12B 1.0(4)14B 0.13(4)15B 0.046(10)17B ≤0.001
14C 12.6(8)15C 4.3(4)16C 5.0(9)17C 0.64(15)18C 0.28(5)19C 0.0025(14)20C 0.0036(28)
Isotope [Wag86] This workYield Yield
15N ≤0.04416N 0.079(32)17N 0.34(10)18N 0.16(4)19N 0.26(8)20N 0.0029(16)21N 0.0025(14)
15O ≤0.1219O 0.26(12)20O 1.10(12)21O 0.23(6)22O 0.12(4)24O ≤0.08
19F 0.020(16)20F 0.00221F 0.021(6)22F 0.30(21)24F 0.030(16)
24Ne 0.040(12)27Ne ≤0.008
24Na ≤0.00127Na ≤0.00528Na 0.006(4)30Na ≤0.0008
27Mg ≤0.001228Mg ≤0.01830Mg 0.009(6)
30Al ≤0.002
34Si ≤0.00135Si ≤0.00336Si ≤0.004
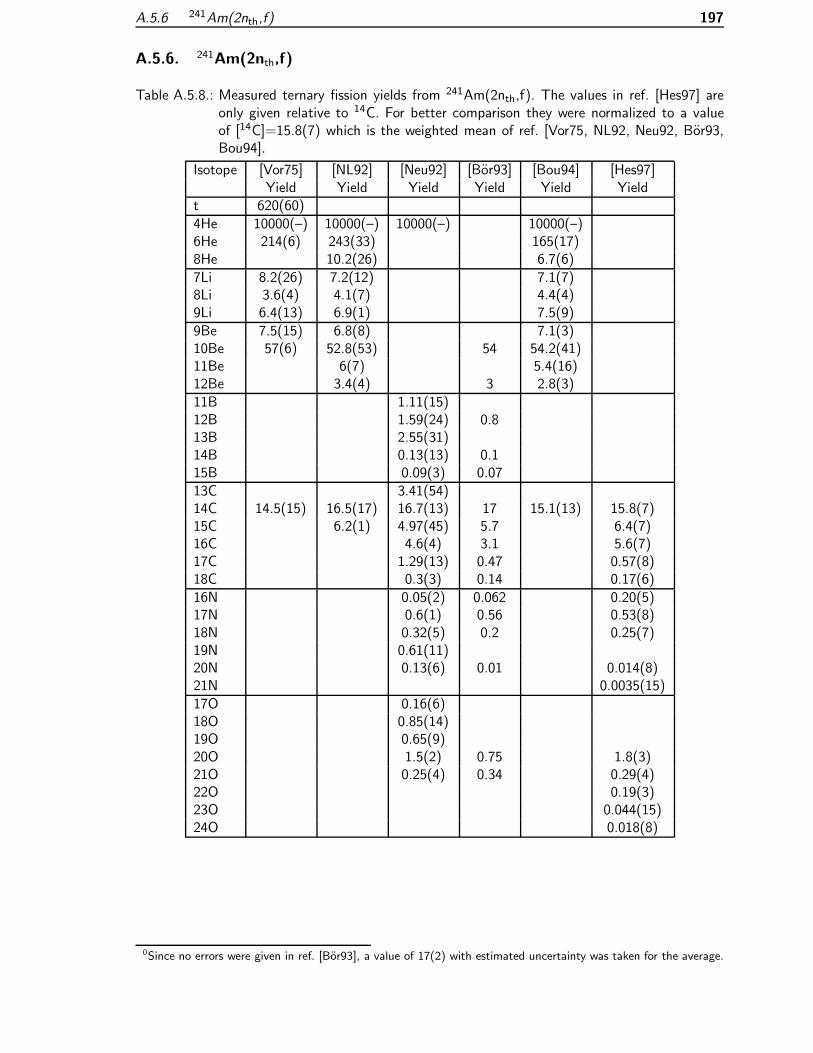
A.5.6 241Am(2nth,f) 197
A.5.6. 241Am(2nth,f)
Table A.5.8.: Measured ternary fission yields from 241Am(2nth,f). The values in ref. [Hes97] areonly given relative to 14C. For better comparison they were normalized to a valueof [14C]=15.8(7) which is the weighted mean of ref. [Vor75, NL92, Neu92, Bor93,Bou94].
Isotope [Vor75] [NL92] [Neu92] [Bor93] [Bou94] [Hes97]Yield Yield Yield Yield Yield Yield
t 620(60)4He 10000(–) 10000(–) 10000(–) 10000(–)6He 214(6) 243(33) 165(17)8He 10.2(26) 6.7(6)7Li 8.2(26) 7.2(12) 7.1(7)8Li 3.6(4) 4.1(7) 4.4(4)9Li 6.4(13) 6.9(1) 7.5(9)9Be 7.5(15) 6.8(8) 7.1(3)10Be 57(6) 52.8(53) 54 54.2(41)11Be 6(7) 5.4(16)12Be 3.4(4) 3 2.8(3)11B 1.11(15)12B 1.59(24) 0.813B 2.55(31)14B 0.13(13) 0.115B 0.09(3) 0.0713C 3.41(54)14C 14.5(15) 16.5(17) 16.7(13) 17 15.1(13) 15.8(7)15C 6.2(1) 4.97(45) 5.7 6.4(7)16C 4.6(4) 3.1 5.6(7)17C 1.29(13) 0.47 0.57(8)18C 0.3(3) 0.14 0.17(6)16N 0.05(2) 0.062 0.20(5)17N 0.6(1) 0.56 0.53(8)18N 0.32(5) 0.2 0.25(7)19N 0.61(11)20N 0.13(6) 0.01 0.014(8)21N 0.0035(15)17O 0.16(6)18O 0.85(14)19O 0.65(9)20O 1.5(2) 0.75 1.8(3)21O 0.25(4) 0.34 0.29(4)22O 0.19(3)23O 0.044(15)24O 0.018(8)
0Since no errors were given in ref. [Bor93], a value of 17(2) with estimated uncertainty was taken for the average.

198 A.5 Ternary particle yields
Table A.5.9.: Measured ternary fission yields from 241Am(2nth,f). Continuation of table A.5.8.
Isotope [Bor93] [Hes97]Yield Yield
20F ≤ 0.01 0.015(9)21F 0.055 0.11(3)22F 0.056(20)23F 0.086(21)24F 0.0266 0.084(34)25F ≤ 0.0121Ne ≤ 0.00523Ne 0.024(11)24Ne 0.091 0.13(40)25Ne 0.0527Ne ≤ 0.00528Ne 0.0060(20)24Na ≤ 0.0125Na ≤ 0.0127Na 0.0328Na ≤ 0.01 0.024(6)30Na ≤ 0.01 0.0036(27)27Mg ≤ 0.00528Mg 0.01 0.014(5)30Mg 0.01 0.030(7)31Mg 0.051(36)32Mg 0.01 0.050(45)28Al ≤ 0.005 0.11(3)30Al ≤ 0.00532Al ≤ 0.005 0.034(25)33Al 0.0048(43)32Si 0.01 0.084(41)33Si 0.0078(53)34Si 0.01 0.018(16)35Si 0.0089(64)33P ≤0.003540S ≤0.001942S ≤0.001242Cl ≤0.001044Ar ≤0.001150Ca ≤0.000950Sc ≤0.0009

A.5.7 245Cm(nth,f) 199
A.5.7. 245Cm(nth,f)
Table A.5.10.: Measured ternary fission yields from 245Cm(nth,f). The values in [Hes97] are onlygiven relative to 14C. For better comparison they were renormalized to a value of[14C]=23.3(16) which was obtained from our measurement, see section 1.5.
Isotope This work [Hes97]Yield Yield
t 679(44)
3He ≤0.64He 10000(600)6He 286(16)8He 19(4)
6Li ≤0.37Li 13.6(13)8Li 5.6(8)9Li 13.6(17)11Li 0.010(6)
9Be 9.1(11)10Be 66(5)11Be 8.1(10)12Be 5.5(7)14Be 0.018(12)
10B ≤0.311B 2.4(13)12B 2.3(4)13B 2.2(6)14B 0.21(6)15B 0.09(5)
12C ≤4.813C 1.1(5)14C 23.3(16) 23.3(16)15C 7.7(11) 9.6(12)16C 9.5(33) 9.2(11)17C 0.65(21)18C 0.32(11) 0.51(10)19C ≤0.03020C ≤0.053
Isotope This work [Hes97]Yield Yield
14N ≤4.115N 0.17(7)16N 0.27(8)17N 0.77(31)18N 0.47(21) 0.77(21)19N 0.53(19)20N ≤0.06121N ≤0.024
16O ≤4717O ≤0.218O 1.0(4)19O 0.77(47)20O 2.7(4)21O 0.71(24) 0.75(19)22O 0.39(18) 0.53(11)
20F ≤0.0821F 0.17(5)22F 0.21(5)24F 0.082(28)
24Ne 0.23(6)27Na 0.12(6)
27Mg 0.062(32)28Mg 0.026(18)30Mg 0.060(27)32Mg 0.021(17)
28Al 0.47(11)
33Si ≤0.03
44Ar ≤0.016
44K ≤0.01148K ≤0.05

200 A.5 Ternary particle yields
A.5.8. 249Cf(nth,f)
Table A.5.11.: Measured ternary fission yields from 249Cf(nth,f). Exceptionally absolute yields (perfission) are given since no data for the 4He yield is known. Lower limits are for caseswhere some events were observed, but not enough data could be taken to deducean energy distribution or a yield.
Isotope [Dav97]Yield
6He ≥ 5.9 · 10−58Li ≥ 2.3 · 10−69Li ≥ 3.4 · 10−610Be 4.1(9) · 10−611Be 3.6(12) · 10−612Be ≥ 1.6 · 10−612B 1.3(3) · 10−713B 2.4(7) · 10−714B 1.8(12) · 10−715B 4.2(13) · 10−814C 1.3(3) · 10−615C 5.3(10) · 10−616C 4.7(13) · 10−617C 6.0(32) · 10−718C 1.5(4) · 10−816N 1.3(11) · 10−718N 4.4(24) · 10−720O 1.5(3) · 10−721O 9.8(59) · 10−722O ≥ 9.4 · 10−821F 1.3(5) · 10−824F ≥ 1.7 · 10−824Ne ≥ 1.0 · 10−727Na ≥ 1.1 · 10−828Na ≥ 3.2 · 10−930Mg 8.4(31) · 10−833Al ≥ 4.1 · 10−10

A.5.9 252Cf(sf) 201
A.5.9. 252Cf(sf)
Table A.5.12.: Measured ternary fission yields from 252Cf(sf).
Isotope [Weg61] [Bay81] [Wil85] [Gra88] [Bud90] [Iva96]Yield Yield Yield Yield Yield Yield
p 220(50) 156(39) 180(60)d ≤50 68(3)t 600(50) 779(192) 836(12) 700(40)
3He ≤504He 10000(–) 10000(–) 10000(–) 10000(–) 10000(–) 10000(–)6He 306(15) 386(12)
7Li 12.7(21)8Li 8.5(14)all Li 55(4)
all Be 164(9)
Additionally a yield of 200(70) per 10000 LRA is quoted for 6He in ref. [Cum81].
Table A.5.13.: Measured ternary fission yields from 252Cf(sf).
Isotope [Whe67] [Cos67] [And69] [Gaz70] [Dlo92] [Sin97]Yield Yield Yield Yield Yield Yield
p 160(20) 175(30)d 63(3) 68(3)t 590(20) 846(28)
3He ≤9 ≤7.54He 10000(–) 10000(–) 10000(–) 10000(–) 10000(–) 10000(–)6He 240(50) 263(18) 403(26) 315(60)8He 18(5) 9.0(12) 25(4) 25(5)
7Li 17(4)8Li 10(5)9Li 25(11)all Li 12(6) 13.2(16) 9 29(5) 52(5)
8Be 0.4810Be 185(20)all Be ≥1 20.1(20) 32 65(7) 126(30)
all B 0.95 3.5(10) 6.3(4)
all C 48 43(9)
all N 2.4 6.6(15)
all O 48 0.5(1)
all F 24

202 A.5 Ternary particle yields
A.5.10. Other fissioning systems
Table A.5.14.: Measured ternary fission yields from 248Cm(sf), 250Cf(sf) and 256Fm(sf).
248Cm(sf) 248Cm(sf) 250Cf(sf) 256Fm(sf)Isotope [Iva96] [Iva97] [Wil85] [Wil85]
Yield Yield Yield Yield
p 150(70) 160(20) 226(53) 152(47)d 50(5)t 860(40) 922(18) 678(134) 844(153)
4He 10000(–) 10000(–) 10000(–) 10000(–)6He 354(31)8He 24(4)
all Li 26(9)
all Be 49(24)

B. Appendix to ISOL technique
B.1. Useful conversion factors and formulae
Thermodynamics
In chemistry the energies and enthalpies are often given in kJ/mol or kcal/mol. The followingconversion (given by the Faraday constant) applies for the reaction energy of a single atom ormolecule:
(eV) (kJ/mol) (kcal/mol)
1 96.48 404.00.01036 1 4.187
2.475 · 10−3 0.2388 1
Evaporation
The maximum unhindered1 evaporation rate per unit surface of a material with molar mass Mand vapor pressure pvap is given by the Hertz-Knudsen equation:
J0 = αpvapM√2πRT
J0/(kg m−2s−1) = 0.438αpvapmbar
√M
g mol−1TK
(B.1.1)
R is the gas constant, T the temperature and α the accommodation or Langmuir coefficient.This empirical coefficient was taken to be unity by Langmuir [Lan13]. Meanwhile several studiesindicated that it may differ by many orders of magnitude [Nes63]. Therefore the values derivedwith α = 1 should be taken as an upper limit.
Laser spectroscopy
In laser spectroscopy different units are employed, the following compilation gives some handyconversion factors:
Energy Frequency Vac. wavelength Wave numberE ν λ k
(eV) (GHz) (nm) (cm−1)1 2.418 · 105 1239.85 8065.54
1.2399 · 10−4 29.979 107 1
The unit cm−1 is also called kayser in older publications.
1Unhindered means that all evaporated particles are pumped away immediately and are not redeposited onto thesurface.
203

204 B.2 Release from ISOL targets
B.2. Release from ISOL targets
The efficiency for release from an ISOL target and ion source system Y (T1/2) is obtained by foldingp(t), the probability for release in the interval [t; t + dt], with the probability for survival of theradioactive decay exp(−λt), where λ = ln 2/T1/2:
Y (T1/2) =
∫ ∞
0p(t) exp(−λt)dt. (B.2.1)
The fractional release F (t) quantifies the fraction of stable nuclei which is released up to the timet:
F (t) =
t∫0
p(t′)dt′. (B.2.2)
The total release time is composed of the diffusion time in the bulk material and the effusion timethrough target container, transfer line and ion source.
B.2.1. Diffusion
Diffusion in solid state matrices is driven by a concentration gradient as described by Fick’s secondlaw:
∂
∂tρ(Gx, t) = D∆ρ(Gx, t) (B.2.3)
with ρ(Gx, t) the local density of the diffusing species, D the diffusion coefficient and ∆ the Laplaceoperator.
In many ISOL applications2 the spread of the stopped reaction products will be uniform comparedwith the size of the microscopic structure of the target matrix. Thus, the starting condition is:
ρ(Gx, 0) = ρ0. (B.2.4)
Under the assumption that the nuclei desorb and effuse rapidly away from the surface, the con-centration above the surface remains negligible and the boundary condition becomes:
D
(∂ρ(Gx, t)
∂n
)'x='xsurface
= Cρ(Gx, t)'x='xsurface , (B.2.5)
where ∂/∂n denotes the differentiation normal to the surface and C is a constant.
This set of equations can be solved for the three practical cases of one-dimensional diffusion(n = 1: a flat foil), two-dimensional diffusion (n = 2: a long fiber) and three-dimensional diffusion(n = 3: a sphere) giving the diffusional delay pµ(t) (see e.g. references [Cra70, Fuj81, Kir92a] forthe exact solutions). For one-dimensional diffusion (n = 1) in a foil with thickness d the fractionalrelease is given by:
Fµ(t)for µ0t<∼0.5≈ 0.72
õ0t. (B.2.6)
with µ0 = π2D/d2 the delay parameter. For short times it increases with the square root of thedelay parameter and for longer times it goes into saturation: limt→∞ Fµ(t) = 1. For the detailedbehavior in intermediate times see e.g. ref. [Fuj81, Kir92a].2This is surely valid for high-energy proton induced reactions. However, it is not necessarily true for a catcher offusion-evaporation products [Kir92a].

B.2.2 Effusion 205
The behavior of the release efficiency Yµ(T1/2) is similar for all discussed geometries:
Yµ(T1/2)for µ0T1/2<∼0.3≈ 0.76n
õ0T1/2, (B.2.7)
where n gives the dimension of the Laplace operator as defined above.
It is intuitively clear that the diffusion out of a sphere with diameter d is faster compared witha fiber with diameter d, which in turn is faster than from a foil with thickness d. However, in apractical target material it is difficult to realize these ideal geometries. Metal foil targets come closeto the ideal description if the touching area between neighboring foils is not too big. In practicethis is achieved by denting the foils. On the other hand the close packing of small spheres (e.g.in a powder target) can result in a denser structure with more touching surfaces. Therefore thedifference between the actual material density and the theoretical bulk density does not necessarilyshow up as open porosity, but caverns are created in which the diffusing particles can get trapped.This was experienced in the diffusion of xenon in graphite [Kir97]. The closing of the pores whichincreases the release time gets even worse if the spheres start to “bake” together, i.e. if the targetsinters. This was e.g. observed with powder targets from metal oxides [Han73]. Fibers on the otherhand support themselves and can provide a stable structure with large open porosity. Therefore afiber target can show in practice a faster release compared to a powder target.
The temperature dependence of the diffusion coefficient D is normally represented by an Arrheniusequation of the form:
D(T ) = D0 exp
(− Q
RT
), (B.2.8)
where D(T ) is the diffusion coefficient at the temperature T , D0 is the extrapolated diffusioncoefficient at infinite temperature, Q is the activation energy (in kJ/mol) and R the gas constant.There are cases where one has to use more than one exponential term in the Arrhenius equation totake into account components with different diffusion mechanisms or different activation energies[Flu39, Cow58].
In principle the diffusion constant D is also influenced by the atomic mass A of the diffusingisotope. The isotope effect parameter describing this fact is defined as:
EA1,A2 =DA1/DA2 − 1√
A2/A1 − 1. (B.2.9)
It takes values between 1 (maximum mass effect) and 0. Generally EA1,A2 tends to decrease forhigher temperatures. Only few values have been measured for typical ISOL elements and targets:e.g. 0.025 for Fe in Nb at 1900 C [Bak90] or 0.11 for Cr in W at 2400 C. The isotope effect isgenerally neglected when discussing ISOL applications.
B.2.2. Effusion
The total effusion time τν is given by the number of wall collisions χ times the average timebetween two wall collisions. The latter is the sum of the average flight time τfree between twocollisions and the average surface sticking time τsorp. Neglecting surface sticking (e.g. for noblegas atoms) the effusion time is just given by the total flight time inside the target. This is calledintrinsic delay time.
The delay function is given by:
pν(t) = ν exp(−νt) (B.2.10)

206 B.2 Release from ISOL targets
with the delay parameter ν = 1/τν = (χ(τfree + τsorp))−1. The fractional release becomes:
Fν(t) = 1− exp(−νt)for νt<∼0.2≈ νt (B.2.11)
and the release efficiency is:
Yν(T1/2) =ν
ν + λ
for νT1/2<∼0.2≈ 1.44νT1/2. (B.2.12)
The number of wall collisions is very approximately given by the ratio of the inner surface tothe size of the extraction opening3. In a typical ISOLDE metal foil target the inner surface canreach 1 m2 or more. In other materials similar or even bigger surfaces occur, e.g. about 10 m2
in a graphite cloth target. Thus, the atoms will make in average some hundred thousand4 wallcollisions before being released through the 7 mm2 orifice. Consequently even a surface stickingtime of some µs can lead to delays in the range of seconds.
B.2.3. Desorption
The average desorption time of an adsorbate atom from an adsorbent surface τsorp is governed bya Frenkel equation [Kir86]:
τsorp = τ0 exp
(− Ed
RT
)(B.2.13)
with 1/τ0 a frequency factor, Ed the interaction energy of the adsorbed atom with the surface,R the gas constant and T the surface temperature. With the assumption of negligible activationenergy and low surface coverage, Ed is approximately equal to the partial molar absorption en-thalpy ∆Ha. For many adsorbate/adsorbent pairs no literature values exist for ∆Ha. However, theempirical “Eichler systematics” [Roß84, Eic85a, Eic85b] can allow a rough estimation of the des-orption enthalpy from metal surfaces. Tables B.2.1 and B.2.2 in appendix B.2.5 give an overviewof derived desorption times. Note that these calculated times should only be taken as an estimateof the order of magnitude in the cases where no measured values are available!
It is obvious that some elements are practically not desorbed in elemental form. Here, the separationas molecules can decrease the desorption enthalpy and thus drastically accelerate the release (seesection 4.1).
B.2.4. Real situation
For a real target and ion source unit the total release time is given by a combination of the diffusiontime and the effusion time. The fractional release and the release efficiency become:
F (t)for ν>0.1µ0 and νt<∼0.2≈ 0.48nν
õ0t
3/2 =2
3Fµ(t)Fν(t). (B.2.14)
Y (T1/2) = Yµ(T1/2) · Yν(T1/2). (B.2.15)
3This assumes 100 % diffuse scattering and a geometry with high conductance. A small part of reflecting collisionscould accelerate the effusion while a complicated geometry with low conductance can hinder it strongly.
4For the RIST target still higher values of (0.7− 5.2) · 106 [Den97] or even 2 · 107 [Ben97] were calculated.

B.2.5 Wall sticking times from the Eichler systematics 207
B.2.5. Wall sticking times from the Eichler systematics
Eichler et al. developed an empirical model for the calculation of the desorption enthalpy of differentadsorbates A on metallic surfaces M [Roß84, Eic85a, Eic85b].
First the partial molar solution enthalpy ∆Hs is calculated:
∆Hs =2 · V 2/3A · P
n−1/3WSA + n
−1/3WSM
·(9.4 · (n1/3WSA − n
1/3WSM)2 − (eΦ∗
A − eΦ∗M)2 − Rm
P
), (B.2.16)
with nWS the electron density at the border of the Wigner-Seitz-cell, P and Rm/P constantsspecific for the chemical group, Φ∗ the electro-negativity parameter and VA the effective atomvolume of the adsorbate:
VA = VA · (1 + a · (Φ∗A − Φ∗
M))3/2 (B.2.17)
which accounts for the change of the original atom volume VA due to charge transfer.
With ∆Hs ≥ 50 kJ/mol the adsorbate is practically insoluble in the metal and only adsorbed tothe surface. Then ∆Ha is given by:
∆Ha = ∆H0DA + 0.6 ·
(∆Hs − V ∗
A
VM·∆HVM
), (B.2.18)
with ∆H0DA the de-sublimation enthalpy of the adsorbate, VM the atom volume of the metal and
∆HVM the enthalpy for creation of volume vacancies in the metal.
With ∆Hs < 50 kJ/mol the adsorbate is partially or totally soluble in the metal and can evencreate compounds. In these cases the adsorbate can substitute a surface atom of the metal andthe absorption enthalpy becomes:
∆Ha = ∆H0DA + 0.9 · (∆Hs − V ∗
A
VM·∆HVM) +
V ∗A
VM·∆HSM, (B.2.19)
with ∆HSM the enthalpy for creation of surface vacancies in the metal.
All required values are listed in references [Roß84, Eic85a, Eic85b]. A large uncertainty arises fromthe unknown frequency factor C in equation (B.2.13) which varies between 108 and 1013 s−1
[Ros86]. In the following C = 1013 s−1 will be used which allows to give an estimate on thelower limit of the desorption time. Thus, a rough comparison between different materials becomespossible.
Tables B.2.1 and B.2.2 give an overview of calculated desorption times of different elements fromtypical metal surfaces. These calculated values can give a first hint in cases where no measureddata are available.

208 B.2 Release from ISOL targets
Table B.2.1.: Mean wall sticking times calculated with the Eichler systematics. The calculatedtimes should only be taken as a relative estimate for the order of magnitude!
Metal Ti Zr Nb Mo Ta W Re Ir Ptθ (C) 1600 1800 2000 2000 2400 2400 2400 2200 1700
Z El. log(t) log(t) log(t) log(t) log(t) log(t) log(t) log(t) log(t)(s) (s) (s) (s) (s) (s) (s) (s) (s)
3 Li -7.9 -8.3 -9.3 -8.8 -9.0 -8.9 -9.9 -9.3 -6.64 Be -2.7 -3.7 -4.8 -4.6 -5.6 -5.7 -5.0 -4.3 -1.65 B 7.0 5.5 2.7 1.9 0.7 -0.4 -0.4 0.7 4.66 C 14.1 11.9 9.0 7.6 5.8 4.4 3.3 4.5 8.57 N 16.3 14.7 9.5 6.1 6.2 2.6 0.3 1.4 4.611 Na -10.7 -10.6 -11.9 -11.2 -10.5 -10.5 -9.4 -9.4 -10.512 Mg -8.9 -8.6 -7.9 -7.5 -7.6 -7.6 -9.4 -8.7 -5.713 Al 1.3 0.6 -2.5 -3.2 -3.4 -4.6 -3.8 -2.9 0.814 Si 7.2 5.9 2.4 1.2 0.7 -0.9 -0.9 0.2 4.219 K -11.0 -11.1 -12.2 -10.6 -9.7 -9.4 -8.1 -8.3 -6.920 Ca -6.0 -6.8 -7.7 -6.2 -6.7 -6.0 -8.4 -7.4 -2.921 Sc -2.1 -2.9 -1.8 -3.9 -2.2 -4.7 -1.6 -0.3 5.322 Ti 0.9 -0.5 -1.9 -0.8 -2.7 -2.1 0.3 1.5 6.823 V 2.1 0.7 -0.7 -0.3 -1.9 -1.9 -0.6 0.4 4.624 Cr -0.6 -1.7 -3.0 -3.2 -4.0 -4.4 -3.8 -3.1 -0.225 Mn -3.7 -4.3 -5.9 -6.2 -6.4 -7.0 -6.3 -5.7 -3.126 Fe 1.0 -0.1 -1.8 -2.5 -3.0 -3.9 -3.8 -3.2 -0.527 Co 2.2 1.2 -1.0 -2.1 -2.4 -3.7 -4.0 -3.3 -0.828 Ni 2.8 1.9 -0.6 -2.0 -2.1 -3.7 -4.1 -3.4 -1.029 Cu -1.3 -1.7 -4.7 -3.7 -5.5 -4.8 -4.7 -5.9 -3.330 Zn -5.9 -5.9 -8.7 -9.4 -8.7 -9.9 -9.2 -8.6 -6.431 Ga -0.4 -0.8 -4.3 -5.2 -4.8 -6.2 -5.3 -4.3 -0.732 Ge 4.3 3.6 -0.5 -2.1 -1.7 -3.7 -3.6 -2.6 1.033 As 4.9 4.2 -0.3 -2.3 -1.4 -4.0 -4.2 -3.4 -0.137 Rb -11.0 -11.2 -12.2 -10.3 -9.3 -8.9 -7.5 -7.9 -6.638 Sr -6.4 -7.1 -8.1 -6.2 -6.6 -5.7 -3.8 -8.0 -3.239 Y 2.3 -2.1 -0.5 1.0 -0.8 0.1 -1.1 0.4 6.940 Zr 4.9 3.1 1.2 2.9 0.2 1.2 4.3 6.0 13.141 Nb 7.7 5.5 4.0 5.2 2.4 3.0 5.1 6.6 12.742 Mo 6.5 4.6 3.0 3.1 1.3 1.1 1.8 2.9 7.343 Tc 11.3 9.5 6.4 4.8 4.0 2.2 1.5 2.5 6.344 Ru 9.1 7.6 4.6 2.9 2.5 0.5 -0.3 0.5 3.745 Rh 8.9 7.5 4.0 1.9 2.0 -0.4 -1.4 -0.5 2.546 Pd 5.7 5.0 0.8 -2.0 -0.8 -3.9 -5.2 -4.5 -2.447 Ag -2.7 -2.6 -6.6 -4.8 -6.8 -5.5 -5.3 -5.1 -5.148 Cd -6.4 -5.9 -9.8 -7.5 -9.4 -7.7 -10.2 -9.7 -7.3

B.2.5 Wall sticking times from the Eichler systematics 209
Table B.2.2.: Continuation of table B.2.1.
Metal Ti Zr Nb Mo Ta W Re Ir Ptθ (C) 1600 1800 2000 2000 2400 2400 2400 2200 1700
Z El. log(t) log(t) log(t) log(t) log(t) log(t) log(t) log(t) log(t)(s) (s) (s) (s) (s) (s) (s) (s) (s)
49 In -2.2 -2.1 -6.7 -3.5 -6.5 -4.1 -7.2 -6.3 -2.550 Sn 1.6 1.4 -3.6 -5.1 -3.9 -2.0 -5.3 -4.3 -0.351 Sb 2.6 2.6 -3.2 -5.4 -3.5 -6.6 -6.2 -5.3 -1.755 Cs -10.7 -11.0 -11.8 -9.5 -8.4 -7.9 -6.7 -7.1 -5.956 Ba -5.2 -6.1 -7.1 -5.0 -5.4 -4.4 -2.3 -7.3 -2.057 La 1.8 0.4 -1.3 0.1 -1.3 -0.5 -2.7 -1.2 5.358 Ce 1.3 -2.6 -1.5 -0.2 -1.8 -1.1 -2.1 -0.7 5.259 Pr -0.4 -1.6 -3.0 -1.7 -2.9 -2.1 -4.0 -2.7 3.360 Nd -0.6 -1.9 -3.1 -1.6 -2.9 -2.0 -3.5 -2.1 3.861 Pm -0.6 -2.0 -3.0 -1.5 -2.9 -1.9 -3.1 -1.7 4.462 Sm -4.2 -5.2 -6.1 -4.7 -5.5 -4.7 -6.2 -5.1 0.163 Eu -5.4 -6.2 -7.4 -5.4 -6.0 -4.9 -7.7 -6.4 -0.464 Gd 1.8 -2.6 -0.9 0.7 -1.1 -0.1 -1.2 0.3 6.765 Tb 1.3 -3.0 -1.4 0.1 -1.6 -0.6 -1.7 -0.3 5.966 Dy -1.5 -5.4 -3.6 -2.2 -3.5 -2.6 -3.6 -2.3 3.367 Ho -4.5 -5.0 -3.3 -1.8 -3.2 -2.2 -3.1 -1.8 3.968 Er -3.7 -4.4 -2.6 -1.1 -2.7 -1.6 -2.4 -1.0 4.869 Tm -6.4 -6.8 -5.0 -3.5 -4.7 -3.8 -4.6 -3.5 1.870 Yb -6.1 -6.7 -7.8 -6.3 -6.7 -5.8 -8.4 -7.3 -2.071 Lu -0.6 -1.6 -0.2 1.3 -0.6 0.4 -0.3 1.2 7.572 Hf 5.2 3.4 1.5 2.9 0.4 1.1 4.0 5.6 12.373 Ta 9.5 7.1 5.5 6.6 3.6 4.2 6.2 7.7 14.174 W 12.2 9.8 7.7 7.7 5.4 4.9 5.4 6.7 11.975 Re 13.7 11.7 8.5 7.0 5.9 4.0 3.2 4.3 8.276 Os 14.2 12.1 8.8 7.3 6.1 4.3 3.4 4.5 8.677 Ir 12.5 10.8 7.2 5.0 4.7 2.3 1.0 2.0 5.378 Pt 11.9 10.6 6.2 3.4 3.9 0.7 -0.9 0.0 2.879 Au 3.9 3.7 -1.2 -4.0 -2.3 -5.6 -3.3 -3.0 -3.480 Hg -7.1 -6.4 -10.8 -8.5 -10.1 -8.5 -8.4 -11.3 -9.381 Tl -4.6 -4.0 -9.1 -5.6 -5.1 -5.9 -5.4 -5.3 -5.782 Pb -2.5 -1.9 -7.7 -4.4 -7.2 -4.7 -4.4 -4.3 -5.183 Bi -1.2 -0.7 -6.8 -3.6 -6.4 -4.0 -3.7 -7.8 -4.484 Po -3.7 -1.7 -5.2 -7.1 -4.6 -7.1 -7.6 -7.9 -7.189 Ac 1.9 0.5 -1.2 0.2 -1.2 -0.5 -2.8 -1.3 5.290 Th 4.3 2.7 4.3 1.8 3.4 0.4 4.5 6.4 14.591 Pa 4.2 2.6 3.5 1.6 2.3 0.1 3.4 5.1 12.392 U 2.8 1.3 -0.5 0.5 -1.4 -1.0 1.5 2.9 8.793 Np 0.7 -0.6 -2.2 -1.3 -2.9 -2.6 -0.4 0.8 5.994 Pu -2.5 -3.5 -5.0 -3.9 -5.3 -4.8 -2.2 -1.0 4.0

210 B.3 Target materials
B.3. Target materials
In ISOL facilities using thick targets, the choice of the target material is guided by the simultaneousoptimization of the production rate in the target and the release efficiency from the target. Oftenthe same or similar target elements can be used in different chemical forms.
B.3.1. Molten metal targets
The highest target density can be obtained with bulk material. The target thickness is just givenby the product of target length and natural density of the material. To allow the release of theproduced nuclei despite of the close packing, the target has to be kept in a molten state.
Normally elements melting at relatively low temperatures are used: tin, lanthanum and lead. Alsoliquid germanium, bismuth, gold and several other elements and alloys have been employed.
Table B.3.1.: Overview of molten metal targets used at ISOLDE. The molten uranium target wasnot yet used on-line at ISOLDE, but is given as an outlook. ϑm is the melting pointof the target material and ϑmax the maximum operation temperature. pvap is thevapor pressure (from [Hon69, Bal94, Mey88]) and ρ the bulk density at ϑmax. ζ isthe calculated target thickness at 20 cm length and ϑmax.
Elem. ϑm ϑmax pvap ρ ζ Typical Ref.C C mbar g/cm3 g/cm2 isotopes
Ge 937 1100 6 · 10−5 5.5 110 60−74Zn, 64−75Ga [Rav75b, Bjø86]Sn 232 1200 7 · 10−3 6.4 128 97−122Cd [Elm78]
115-133Xe, 114-137CsLa 920 1400 10−4 6.2 124 122-138Ba
[Rav75b, D’A78]
Pb 328 800 10−1 10.1 200 177−207Hg [Let97b]Bi 271 600 2 · 10−3 9.6 190 177−207Hg [Let97b]U 1132 1400 8 · 10−7 17.9 (350) Kr, Xe, Br, I, Te, etc. [KR00]
Table B.3.1 gives an overview of typical ISOLDE molten metal targets. It should be noted thatthe quoted vapor pressures are inside the target. Condensation in the chimney and transfer linewill reduce it sufficiently to avoid a quenching of the ion source efficiency.
Experiences with other liquid targets (various La-X alloys, a U-Cr alloy and a ThF4-LiF mixture)are discussed in [Rav75b]. Yields from a molten La-Th target are given in [Rav76]. A molten goldtarget was tested at ISOLDE for the production of mercury beams via Au(3He,pxn) reactions asan alternative to the Pb(p,3pxn) reactions [Klu86]. At the ISOCELE facility also molten targets ofother elements or compounds were used: Ag, Ce, Pr, Nd, Tb, Gd-Cu, Er-Cu, Pt-B and ThF4-NaF[Par76, Put81]. Molten Ce3S4 was proposed for the production of tellurium isotopes [Car78]. Aliquid germanium target at temperatures up to 1570 C is presently used at the HRIBF facility(Oak Ridge) for the production of arsenic beams [Car97]. An eutectic mixture of TeO2, KCl andLiCl was used for production of elementally pure beams of antimony [Hof84].
There is high interest to use also liquid uranium targets. However, liquid uranium is very aggressive,attacking practically all possible container materials [Rav75b]. Recent experiments at Orsay showedthat Y2O3 can be used as wall material up to 1400 C [KR00]. The relation between higher targettemperatures and target lifetime is still under study.
Normally only elements with a low boiling point (<∼ target temperature) are released. The averagerelease times are typically of the order of minutes [Let97b]. They decrease at higher target tem-

B.3.2 Solid metal targets 211
peratures. In general the vapor pressure of the target material sets an upper limit for the usabletarget temperatures. For higher-melting materials the target is not run to this limit to avoid areduction of the target lifetime by cavitation damage of the container [Let97b].
Due to the high target density molten metal targets can provide the highest intensities for not tooshort-lived isotopes of certain elements: Cd from a Sn target, Hg from a Pb target, Xe and Csfrom a La target.
The pulsed structure of the PSB (proton synchrotron booster) beam gave some changes comparedwith the continuous beam from the SC (synchrocyclotron). Due to the impact of the beam pulsea shock wave “shakes” the liquid metal. Drops splashing into the transfer line or ion source canprovoke an immediate failure (blocking of the transfer line or destruction of the ion source). Aspecial chimney construction with baffle plates was developed to prevent this [Let97b]. Moreoverthe spacing of the sub-pulses from the four individual PSB rings was increased up to 500 µs(“staggered beam”), reducing the shock waves and the damage to the target container. Theends of the target container were reinforced. The slightly reduced intensity of the staggered beam(about 3.5 µC per pulse instead of 5 µC) is not really a drawback since normally the proton beamintensity is even further reduced to assure a longer target lifetime. On the other hand the shockwaves accelerate the release, rising the yields of short-lived isotopes [Let97b].
B.3.2. Solid metal targets
Elements with high boiling point and high desorption enthalpy require higher target temperaturesfor an efficient release. Liquid metal targets can no longer be used due to their excessive vaporpressure and the rapid attack of the container materials. Instead high-melting metals in solid formare used. To keep the diffusion path short5, powders or thin foils (typically 20 µm thick) areused. The foil targets are made from a single strip of foil which is rolled and kept together with atantalum wire. The foil is embossed to keep some distance between the layers and hinder thermalcontact. The round package is inserted along the length of a tantalum target container. Typicalpacking fractions are 30-40 %, i.e. the average target density is about one third of the bulk density.Table B.3.2 shows an overview of typical ISOLDE metal foil targets.
Table B.3.2.: Overview of metal foil targets presently used at ISOLDE. Note that the Ti foil targetsare run close to the melting point and can even start to melt locally. For the symbolsused see the caption of table B.3.1. Here, ρ is the bulk density at room temperature.
Elem. ϑm ϑmax pvap ρ ζ TypicalC C mbar g/cm3 g/cm2 isotopes
Ti 1675 1600 2 · 10−3 4.5 25 37−46CaNb 2470 2050 3 · 10−6 8.6 50 manyTa 2996 2200 5 · 10−7 16.7 110 many
W 3410 2200 5 · 10−8 19.3 7(6 test: 11Li
A tantalum target optimized for minimum effusion time was proposed for the RIST (RadioactiveIon Source Test) project in the UK. It consists of 6000 disks with 25 µm thickness arrangedalternately with washers and radiator fins [Ben97]. Tests at ISOLDE showed improvements for therelease of certain species [Dru97], but the production is significantly more labor-intensive thanthat of a standard ISOLDE metal foil target.5The diffusion coefficient in solid metals is typically some orders of magnitude smaller than in liquid metals.However, the smaller dimensions (∼ µm instead of cm) normally overcompensate this drawback.
6This target has a very compact geometry: 7 mm in diameter and 50 mm long.

212 B.3 Target materials
While the production cross-sections with high-energy protons are similar from Zr, Nb and Mo,normally only niobium foil targets are used at ISOLDE since niobium has a lower vapor pressurethan zirconium or molybdenum at a given temperature. Moreover the diffusion of rubidium wasfound to be twenty times faster in Nb compared with Mo [Car78]. Also Beyer et al. [Bey78] foundat equal temperature the release of Rb, Sr and Y to be fastest in Zr, followed by Nb and thenMo7. Note that at TISOL a zirconium foil target gave higher yields than a niobium foil target formost isotopes [Dom90].
Metal powder targets (Nb, Mo, Ir, V, Hf, Ta, W) [Car78] were studied off-line and partly usedon-line at ISOLDE [Bjø86, Bjø87] and deposited metal layers from Si, V, Mo, Ta, Ir, Th and Uwere used at the PS on-line separator [Kla68, TP71]. Bjørnstad et al. report on the use of a mixedTh/Nb powder target [Bjø86]. The release from other metals (Ru, Re, Os), such as pure powderor mixed with graphite powder, was studied off-line [Hof84].
Sn- and Pt/graphite powder mixtures were heated above the melting point of the metal, thusgiving a target structure which is something in between a solid and a liquid target. The targetelement is kept in a liquid phase, but the admixture of graphite powder assures a reduced diffu-sion length in the bulk material. With this method beams of short-lived cadmium isotopes wereseparated from the Sn/graphite target at 1000 C and gold beams from the Pt/graphite target atup to 1900 C [Hag92b].
There are target elements which are difficult to keep in metallic state at high temperatures. Theytend to react with the container material or the metal foils fuse together, increasing the diffusionpath. Also some elements show a very slow diffusion in solid metals. In these cases refractorycompounds like carbides, oxides, etc. have to be used as target material.
B.3.3. Carbides
Some metals form very stable carbides: actinides, lanthanides, titanium, chromium, etc. Here, itis not the melting point of the target material which limits the operation temperature, but thevapor pressure of impurities and of the metal component.
Table B.3.3.: Overview of carbide targets used at ISOLDE. For the symbols used see the caption oftable B.3.1. pvap(LaC2) is the sum of all evaporated compounds, taken from [Ste71].ρ is the bulk density of the pure carbide, but in fact most materials are mixed withadditional graphite. ζ gives the effective thickness of the metal content. A “meltingpoint” in parentheses indicates the decomposition temperature of the compound.
Elem. ϑm ϑmax pvap ρ ζ Typical Ref.C C mbar g/cm3 g/cm2 isotopes
C 3600 1800 (8 2 · 10−7 2.5 37 (9 7,10,11Be [Seb99]Al4C3 (1400) 1200 4 · 10−4 2.4 21 20−24Na
SiC ≈2700 1200 (< 10−6) (10 3.2 21 20−24NaLaC2 ? ≈ 1750 2 · 10−3 5.0 ≈ 30 Cd, In, Cs
ThC2 ≈ 2450 ≈ 2200 (11 2 · 10−5 9.0 ≈ 50 many
UC2 ≈ 2450 ≈ 2200 (11 2 · 10−4 11.3 ≈ 50 many
7However, at ISOCELE a molybdenum foil target was used to separate by fluorine addition YF+2 and ZrF+3 [Sau84].
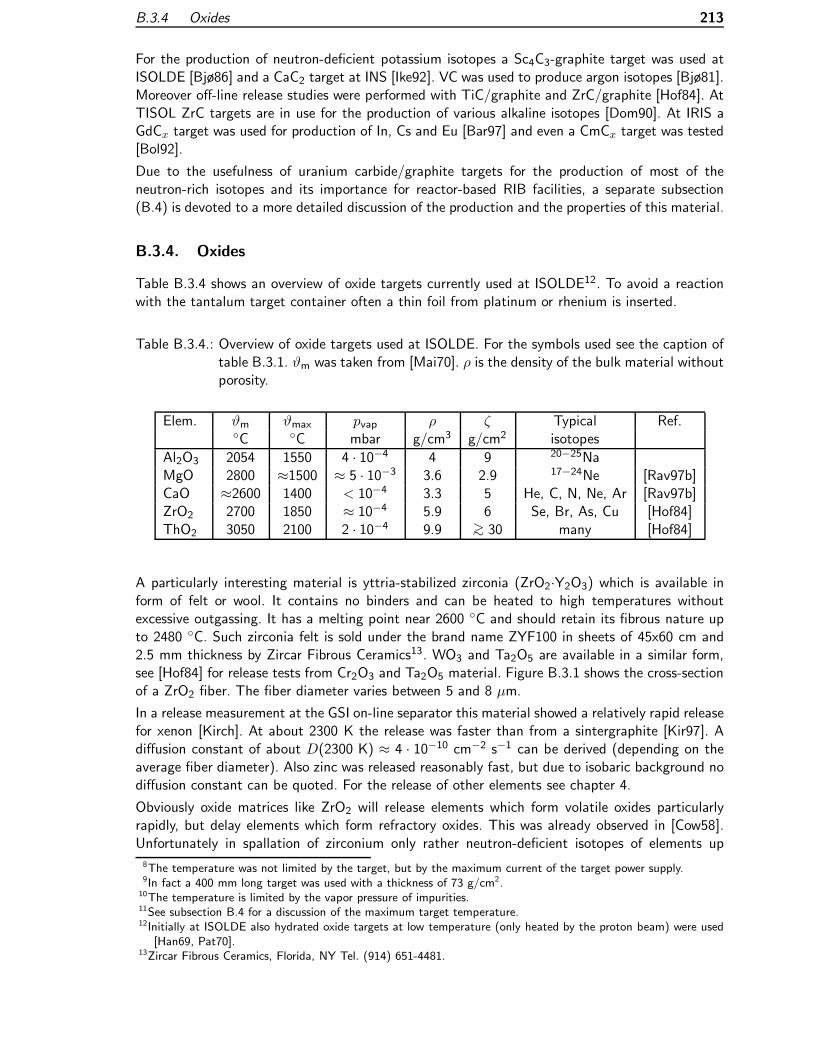
B.3.4 Oxides 213
For the production of neutron-deficient potassium isotopes a Sc4C3-graphite target was used atISOLDE [Bjø86] and a CaC2 target at INS [Ike92]. VC was used to produce argon isotopes [Bjø81].Moreover off-line release studies were performed with TiC/graphite and ZrC/graphite [Hof84]. AtTISOL ZrC targets are in use for the production of various alkaline isotopes [Dom90]. At IRIS aGdCx target was used for production of In, Cs and Eu [Bar97] and even a CmCx target was tested[Bol92].
Due to the usefulness of uranium carbide/graphite targets for the production of most of theneutron-rich isotopes and its importance for reactor-based RIB facilities, a separate subsection(B.4) is devoted to a more detailed discussion of the production and the properties of this material.
B.3.4. Oxides
Table B.3.4 shows an overview of oxide targets currently used at ISOLDE12. To avoid a reactionwith the tantalum target container often a thin foil from platinum or rhenium is inserted.
Table B.3.4.: Overview of oxide targets used at ISOLDE. For the symbols used see the caption oftable B.3.1. ϑm was taken from [Mai70]. ρ is the density of the bulk material withoutporosity.
Elem. ϑm ϑmax pvap ρ ζ Typical Ref.C C mbar g/cm3 g/cm2 isotopes
Al2O3 2054 1550 4 · 10−4 4 9 20−25NaMgO 2800 ≈1500 ≈ 5 · 10−3 3.6 2.9 17−24Ne [Rav97b]CaO ≈2600 1400 < 10−4 3.3 5 He, C, N, Ne, Ar [Rav97b]ZrO2 2700 1850 ≈ 10−4 5.9 6 Se, Br, As, Cu [Hof84]ThO2 3050 2100 2 · 10−4 9.9 >∼ 30 many [Hof84]
A particularly interesting material is yttria-stabilized zirconia (ZrO2·Y2O3) which is available inform of felt or wool. It contains no binders and can be heated to high temperatures withoutexcessive outgassing. It has a melting point near 2600 C and should retain its fibrous nature upto 2480 C. Such zirconia felt is sold under the brand name ZYF100 in sheets of 45x60 cm and2.5 mm thickness by Zircar Fibrous Ceramics13. WO3 and Ta2O5 are available in a similar form,see [Hof84] for release tests from Cr2O3 and Ta2O5 material. Figure B.3.1 shows the cross-sectionof a ZrO2 fiber. The fiber diameter varies between 5 and 8 µm.
In a release measurement at the GSI on-line separator this material showed a relatively rapid releasefor xenon [Kirch]. At about 2300 K the release was faster than from a sintergraphite [Kir97]. Adiffusion constant of about D(2300 K) ≈ 4 · 10−10 cm−2 s−1 can be derived (depending on theaverage fiber diameter). Also zinc was released reasonably fast, but due to isobaric background nodiffusion constant can be quoted. For the release of other elements see chapter 4.
Obviously oxide matrices like ZrO2 will release elements which form volatile oxides particularlyrapidly, but delay elements which form refractory oxides. This was already observed in [Cow58].Unfortunately in spallation of zirconium only rather neutron-deficient isotopes of elements up
8The temperature was not limited by the target, but by the maximum current of the target power supply.9In fact a 400 mm long target was used with a thickness of 73 g/cm2.10The temperature is limited by the vapor pressure of impurities.11See subsection B.4 for a discussion of the maximum target temperature.12Initially at ISOLDE also hydrated oxide targets at low temperature (only heated by the proton beam) were used[Han69, Pat70].
13Zircar Fibrous Ceramics, Florida, NY Tel. (914) 651-4481.

214 B.3 Target materials
Figure B.3.1.: Cross-section through a single fiber from the ZrO2 felt material. The picture wastaken with a Scanning Electron Microscope (SEM) at a magnification of about3000.
to Z = 40 can be produced. It would be very useful to find a material with similar releasecharacteristics but significantly higher Z, if possible in the actinide range. Due to the chemicalsimilarity the actinide oxides could allow to produce and separate more neutron-rich isotopes ofthose elements which proved to be well released from ZrO2.
Among the actinides especially uranium and thorium form stable oxides. Thoria (ThO2) is morestable at higher temperatures14 and therefore preferable. Thorium oxide powder targets havealready been used at ISOLDE and showed a rapid release of noble gases [Rav87], but had thetendency to sinter within some hours at operational temperature15.
The process of sintering could be slowed down by admixture of an oxide which is more stable athigh temperatures, e.g. zirconium oxide. A good target could consist of a mixture of ZrO2 andThO2 fibers.
In the production process of thoria natural radon (220Rn) will emanate. Due to this fact very severesafety regulations apply for the treatment of thoria. Therefore the commercial producers of theZrO2 felt or of rock wool are not able to provide thoria in a similar form. However, thoria fibercloth is commonly used as so-called Welsbach mantle for gas lights. It remains to be checked ifcommercially available material fulfills the requirements towards purity for vacuum application athigh temperatures. Else these fibers can also be synthesized with limited effort. Either cotton orrayon are soaked with a solution of a thorium salt (e.g. chloride). When burning the supportingtissue pure thoria fibers will remain [Div77]. Alternatively zirconia cloth material could be impreg-nated with a thorium salt solution and sintered. Similarly also felt materials of other refractoryoxides can be produced.
B.3.5. Other materials
Off-line release tests of many other refractory compounds (Hf3Si2, Ta5Si3, Zr5Ge3, Hf5Ge3,Hf5Sn3) are reported in [Hof84]. Other tested samples include CeB6, CeS, BaB6 and BaZrO3[Car78]. CaB6 was tested on-line for the release of argon [Bjø81]. At Oak Ridge the release ofvarious elements from BN, CeS, Zr5Si3 and Zr5Ge3 was measured [Alt96].
14Urania has at 2100 C already a vapor pressure of 6 · 10−2 mbar.15It is also possible that the observed slower delay arises due to radiation induced structural changes which causemore “trapping” (compare [Kir97]) of the noble gas. This has been observed for a fission fluence > 1016 cm−3
[Mat80].

B.4 Uranium carbide targets 215
At TISOL targets from AlN and from Na-, Ca- and Tl-zeolites were successfully used for the releaseof C, N, O and noble gases [Dom96, Dombs].
LuF3 and SrF2 powder targets were successfully used at ISOCELE for the separation of new Ta, Zrand Sr isotopes as TaF+4 , ZrF
+3 and SrF+ respectively [Lia82]. However, these materials are quite
volatile and can only be handled with the robust ISOCELE ion sources. The large gas amountwould immediately quench the efficiency of the low-current ion sources used at ISOLDE.
B.4. Uranium carbide targets
Especially for uranium and thorium different chemical compounds have been tested as targetmaterial. In the very first ISOL facility a mixture of uranium oxide and ammonium carbonate(baking powder) kept at room temperature had been used [KH51]. Later uranium stearates wereused at room temperature for the release of noble gases [Wah62, Bor65, Hag67, Boc70, Ehr72,Bur74]. Other materials were used off- and on-line: uranyl ions on hydrated ZrO2, UO2, U3O8(pure or mixed with B2O3) and UF4 at temperatures up to 650 C [Bor71, Bur74, McC75, Tal76].
Mixtures of uranium oxide and graphite at higher temperatures have shown a particulary favorablerelease characteristic for many elements. However, a large amount of carbon monoxide is releasedfrom the reaction of uranium oxide and graphite. An excessive amount of gas decreases theefficiency of most ion sources. Thus, it is favorable if this reaction proceeds previously off-linewhere the carbon monoxide can be pumped off more easily. The produced uranium carbide/graphitemixtures have been used as targets at many ISOL facilities.
B.4.1. Production
Many different methods can be used for the production of uranium16 carbide/graphite targets[Kat86]. In most cases the uranium carbide is diluted in graphite to obtain a faster release. It hasbeen observed qualitatively that an increasing uranium concentration causes a slower release17
[Ort61, Fog92].
Natural graphite contains too much impurities and would outgas strongly at high target tem-peratures. Therefore “artificial” graphite has to be used. This is produced at high temperatures( 2000 C) by pyrolysis of hydrocarbon compounds or thermal decomposition of carbides (e.g.SiC) or other compounds [Man68]. Depending on the production process a multitude18 of struc-tures is obtained, varying in density, open porosity, size of the microscopic units (particles andpores), etc. All these details can influence the release characteristics of the target material consid-erably.
Standard ISOLDE UCx/graphite
The standard ISOLDE ThC/graphite19 and UCx/graphite targets [Bjø81, Rav87] are prepared bymixing uranium oxide and graphite (from Johnson Matthey, Nr. 00641, graphite powder < 325mesh size, purity 99.5 %) in a molar ratio 1:6. After careful mixing of the powder in a ballmill, it is statically (cold) pressed into 1 mm thick pills of 14 mm diameter. These pills are
16Thorium behaves very similar and is not discussed separately. Also lanthanide carbides can be produced in a similarway.
17It should be noted that in ref. [Ort61] the samples of varying concentrations had been prepared by differentmethods.
18Hundreds of different types are commercially available.19More precisely these materials will consist mainly of dicarbides, e.g. UC2, which are solved in the graphite matrix.However, in the following the short notation “XC/graphite” will be used to indicate a composition with a largecarbon excess over the stochiometric ratio.

216 B.4 Uranium carbide targets
heated under vacuum in a graphite container for several hours to about 1900 C [Hof84]. Thegraphite will react with the uranium oxide to uranium carbide, thereby releasing carbon monoxide:UO2 + 6 C −→ UC2 + 2 CO↑ + 2 C. Finally one obtains uranium carbide dispersed in excessgraphite with a molar ratio U:C ≈ 1:4. The release of the gaseous carbon monoxide automaticallycreates some open porosity. The pills are finally crushed and then filled in the target container. Aninserted graphite cylinder with 2 mm wall thickness is used to prevent a reaction between uraniumcarbide and the tantalum target container.
Lacking a uranium carbide sample, figure B.4.1 shows instead the surface of an ISOLDE lanthanumcarbide pill which was prepared in a similar way from lanthanum oxide and graphite20. Note thatthe lanthanum carbide started to hydrolyze rapidly (within minutes) while being removed fromthe protective argon atmosphere and inserted into the microscope. This rapid reaction had beenobserved also in ref. [Car79]. The picture looks a bit fuzzy due to loose crumbs which are sweptaway and due to surface charges which built up during the exposure.
Figure B.4.1.: Scanning Electron Microscope (SEM) picture of the microscopic LaC2-Cx structurewith about 600fold magnification. The smallest units of the cauliflower structurehave a size of about 10 µm.
Impregnated graphite cloth
A less dense graphite cloth material was mainly used at the ISOLDE SC. Graphite cloth materialfrom Union Carbide (grade WCA, X2014, fiber density 1.5 g/cm2) is impregnated with a uranylnitrate (UO2(NO3)2) solution. Heating to 2000 C for several hours again causes a reaction to ura-nium carbide [Car79]. The filling of an ISOLDE target container gives an effective target thicknessof 9-17 g/cm2 uranium. For historical reasons at the ISOLDE SC mainly graphite cloth targetswere used, while at the ISOLDE PSB only UCx/graphite targets from pressed pills were used up tonow. This makes a systematic comparison of yields and release times from UCx/graphite targetsat the SC and PSB more difficult.
Impregnated porous graphite
The UCx/graphite targets at OSIRIS [Rud76, Jac87] and many other facilities (see e.g. [Ami76,Wun78, Rei80]) are produced similarly to the ISOLDE graphite cloth targets. Instead of graphitecloth a porous graphite cylinder (e.g. at OSIRIS from Le Carbone Lorraine, grade 60, apparent
20La2O3 + 11 C −→ 2 LaC2 + 3 CO↑ + 4 C.

B.4.1 Production 217
Figure B.4.2.: SEM picture of the untreated graphite cloth material. The single fibers are looselybundled to a plait without fixed connections. The magnification is about 120fold,the diameter of single fibers is 8-10 µm.
density 1.05 g/cm3, porosity 50 %, ashcontent 1.2 %) is used as base material. Following therecipe from Studsvik [Fogel], some test samples have been prepared in the target laboratory of theLudwig-Maximilians-Universitat. After saturating the graphite samples with uranyl nitrate solutionit was heated under vacuum to 600 C. The uranyl nitrate will decompose to uranium oxide. Amolar ratio (U/C) of about 1:100 is obtained21. The samples were further outgassed for one hourat 2000C. An additional mass loss of 2-4 % was observed, probably due to ongoing emission ofcarbon monoxide.
Figure B.4.3.: SEM picture of the “Studsvik graphite” with deposited uranium oxide. The mag-nification is about 600fold for the general view (left) and about 3000fold for thedetail (right).
The scanning electron microscope picture showed that the uranium oxide did not react completelyto uranium carbide immersed in graphite but was rather deposited on the surface in well definedspots of about 1 µm diameter. See the left part of figure B.4.3 for the general structure and the
21The uranium content could be enhanced by repeating the impregnation/heating cycle several times.

218 B.4 Uranium carbide targets
right part for the magnified uranium oxide spots. An elemental analysis of these spots by EDXRF(Energy Dispersive X-Ray Fluorescence) analysis22 showed still a significant content of oxide.
A TRISTAN graphite cloth target produced in a similar way showed a gradual increase of thelanthanide yields during operation for several days [Shm83]. This could be explained by a reductionof the oxygen content in the target and consequently an improvement of the release for elementswhich tend to form very stable oxides.
Pyrolysis of uranium diphtalocyanine
Tikhonov et al. developed a technique to synthesize carbides of different metals (M) by pyrolysisof diphtalocyanine compounds (C64H32N16M) [Bar97]. These targets are typically used at the IRISfacility at Gatchina. In case of uranium carbide the molar ratio U:C is about 1:13. The filling of anISOLDE standard target container with powder produced from uranium diphtalocyanine gives atarget thickness of 7.5 g/cm2. For some elements a faster release was measured from this materialcompared with a standard ISOLDE UCx/graphite target [Eve97, Bar97], but there is practicallyno case where the faster release could compensate for the target thickness reduced by a factorof seven. A practical drawback of the method is the high effort to produce the material and thelarge amount of iodine contamination which comes in from an intermediate production step andproduces a strong outgassing23.
Oak Ridge porous graphite
For the use at the HFRIB facility at Oak Ridge various types of highly “porous” graphite havebeen proposed as target material [Alt96]. A carbon-bonded-carbon-fiber material is comparable tothe ISOLDE graphite cloth material, but has a smaller fiber diameter of 6 µm. Also a reticulatedcarbon material is investigated. The uranium should be deposited by chemical vapor depositioneither directly onto the graphite or onto a thin intermediate layer of rhenium.
Another target material from Oak Ridge looks macroscopically like a porous foam. Under themicroscope it is seen that the material consists of “twisted bars” of about 100 to 200 µm diameterwhich in turn have some fissures probably caused by shrinking when the hot sample was cooled inthe production process. The effective diffusion paths vary largely between about 2 and 50 µm.
B.4.2. Target aging effects
A significant yield decrease is observed after longer operation (several days) of ISOLDE UCx/graphitetargets [Rav97a]. Several mechanisms could be responsible for this effect:
Poisoning of the surface ionizer: At ISOLDE the UCx/graphite targets are mainly used to-gether with a tungsten surface ionizer ion source. It is known that a surface layer of oxideincreases the work function of tungsten and thus improves the efficiency of surface ioniza-tion. If a significant amount of carbon is evaporated from the target, it could react withadsorbed oxygen by creation of carbon monoxide or even react to tungsten carbide whichhas an even lower work function. In this case the intensity drop should show a dependenceon the ionization potential of the element under consideration. The effect should be largerfor the lighter alkalis and the earth alkalis than for the heavier alkalis.
22The energetic electron beam of the SEM creates vacancies in the inner electron shells of sample atoms. Char-acteristic X-rays are emitted when the vacancies are filled in radiative transitions by outer electrons. An energydispersive X-ray detector allows to identify the elemental distribution.
23This in turn can cause a large “consumption” of turbo pumps.

B.4.2 Target aging effects 219
Figure B.4.4.: SEM picture of the porous “graphite foam” material from Oak Ridge. The left sideshows an about 50fold magnification, the right side a detail from the center withabout 500fold magnification.
Loss of uranium: Loss of target material could be one explanation for a continuous drop of theintensity which is equal for all produced isotopes. Clearly the nuclear burnup of the uraniumcontent by fission and spallation reactions is negligible in the ISOLDE target24. Still uraniumcould get lost by diffusing out of the target. A self-diffusion coefficient of 10−10 cm2/s wasmeasured for U in pure UC2.00 at 2000 C, rising to about 10−8 cm2/s at 2400 [Mat73]. InUC1.00 the diffusion coefficients are two to three orders of magnitude lower [Mat73, Mat86],while in pure pyrolytic graphite the diffusion coefficients are at 2200 C: 1.5 · 10−9 cm2/sfor diffusion orthogonal to the crystal planes and 4.5 · 10−7 cm2/s [Ask70, Bor88] parallelto the planes. At 2400 C these values are one order of magnitude larger. Obviously theuranium is not lost in significant amounts by evaporation through the ion source orifice.The U+ current which is always observed from a surface ion source lies in the range ofsome tens to hundred nA. Even assuming a particularly low ionization efficiency for U (theionization potential is 6.2 eV) of ∼ 0.1 % and taking into account the evaporation of otherUCx compounds, the loss will never exceed 1 % of the uranium content in several weeksof permanent operation. The hypothesis that uranium diffuses slowly into the surroundinggraphite cylinder and subsequently into the tantalum container [Rav97a] was checked byscanning the proton beam across the cross-section of target and container. No change ofthe profile was observed after two weeks of operation. Still this is rather an indication thana proof since fission products produced in the bulk graphite or tantalum cylinder would bereleased much slower and are not necessarily detected by a rapid scan over the target. A clearanswer to this question could be given by a quantitative analysis of the uranium content inthe irradiated target.
Losses through the target container: During operation the tantalum target container will re-crystallize to large domains (some cm2) with visible grain boundaries traversing the completewall. Uranium on the one hand and the produced radio-nuclides on the other could escape bygrain boundary diffusion [Rav97a], thus reducing the portion which reaches the ion source.A test of this hypothesis could be made by an analysis of the heat screens around the targetcontainer. If uranium and radio-nuclides escaped in significant amounts (i.e. about 90 %of the target inventory to explain the observed yield decrease), a certain part should havecondensed on the colder heat screens.
24On the contrary in a high-flux reactor there is a significant nuclear burnup of fission targets, see e.g. section 1.4.5and references [Kos97b, Gro97] for a more detailed discussion.

220 B.4 Uranium carbide targets
Sintering of the target: It is also possible that the radio-nuclides are still created with the samerate in the target, but the diffusion losses are increased due to a change in the microscopicstructure of the target material. If such a structural change is confirmed, the question remainsif it arises from purely thermal equilibrium effects, i.e. by vaporization and redeposition ofgraphite, or if it is mainly caused by the impact of the intense proton pulses25. In the firstcase it would set a limit to the target lifetime just depending on the target temperature.In the latter case it would seriously affect the operation of UCx/graphite targets at a high-current proton beam facility. If the target degradation is roughly proportional to the protonbeam dose, the scaling from the 2 µA average current at ISOLDE to a 100 µA facility wouldresult in a lifetime of only some hours!
Due to changes in the operation conditions (target and source temperature) the first dedicatedmeasurements at ISOLDE do not yet allow to decide which of the discussed effects causes the lossin yield. A measurement with a plasma ion source would allow to exclude the first point and amore detailed examination of a larger part of the release curve (“slow contribution”) would allowto probe the last effect.
B.4.3. Operation temperature of UCx/graphite targets
There have been contradictory reports on the maximum temperature at which UCx/graphitetargets can be operated over longer time, see e.g. [Fog97, Rav97a, Put97, Kirch]. A part of thesecontradictions can be explained by differing definitions of the “target temperature”. At ISOLDE therelation between heating current and target temperature is individually calibrated off-line for eachtarget container. The temperature at the outside of the target cylinder is measured by pyrometry.The reproducibility is difficult to estimate (changing effect of the heat screens, only estimatedcontribution of the proton beam heating, etc.) but should be in the range of ± 50 − 100 K. Thesame applies for the temperature measurements of the OSIRIS target which are also performedoff-line. However, at OSIRIS the temperature is measured in the central part of the target [Fog92].This is the hottest point of the target. At GSI the temperature of the source with integratedcatcher is normally given for the coldest point which is determining for the delay losses. Under on-line conditions the average temperature of the ISOLDE UCx/graphite target is kept at maximum2150 or even 2200 C, but locally it can be heated to much higher temperatures during the impactof the intense proton beam pulses! Taking all these factors into account, the data from Studsvik,GSI and ISOLDE do not differ as extremely as sometimes quoted.
Considering only thermal effects, the effective target lifetime is mainly determined by two factors:the loss of graphite and uranium carbide through the extraction orifice and the lifetime of thetarget container.
Evaporation of graphite
Figure B.4.5 shows the total vapor pressure over graphite taken from literature26 [Hul73]. In thisrange the vapor pressure can be fitted with:
log(pvap/mbar) = 12.70 − 39840/(T/ K). (B.4.1)
Also the maximum unhindered evaporation rate per unit surface J0 (in kg m−2s−1), calculated withequation (B.1.1) and α = 1 is shown in figure B.4.5. This maximum value is only valid in the case25It should be noted that no change in yields was observed when operating standard UCx/graphite targets at thereactor-based ISOL facilities TRISTAN [Shm83] and OSIRIS [Fogel] for several weeks. On the other hand agraphite cloth target at TRISTAN showed a significant yield decrease for most elements [Shm83].
26The literature values for the vapor pressure of graphite differ up to a factor three. The cited reference is at theupper end of the range of values.

B.4.3 Operation temperature of UCx/graphite targets 221
of free evaporation, i.e. if the evaporated particles are pumped away and are not redeposited on thesurface and with a Langmuir coefficient of α = 1. Experimentally lower values have been observed[Put97] rather suggesting α ∼ 0.1. Clearly the evaporation rate in a nearly closed system is muchlower, being determined by the equilibrium between evaporation and redeposition. Note that thecalculated maximum unhindered regress rate dx/dt = J0/ρ would attain 0.1 µm/s at 2400 C,i.e. under vacuum a single fiber of the graphite cloth material should completely evaporate withinseconds to minutes. However, practically it was observed that graphite cloth material can be usedat 2500 C over an extended period [Man68].
Evaporation rate J (kg m-2 s-1)
p (mbar)
1/T (K-1)
p (
mba
r)
- J
(kg
m-2
s-1
)
10-10
10-9
10-8
10-7
10-6
10-5
10-4
10-3
10-2
10-1
1
10
10 210 3
0.25 0.3 0.35 0.4 0.45 0.5 0.55
x 10-3
Figure B.4.5.: Vapor pressure and maximum evaporation rate for graphite at temperatures between1800 and 4000 K. Note that the slope of the two curves is slightly different due toa different contribution of the carbon clusters C, C2, C3, etc.
The amount of graphite leaving the target container is determined by the vapor pressure in thetarget container and by the orifice area. With a small outlet hole most of the evaporated graphitewill redeposit inside the target. Only a small part (given by the ratio of orifice area to inner surface)will leave the target. For a container with an orifice of 2 mm diameter the graphite loss can beestimated to about 4 mg per day at a temperature of 2200 C and 70 mg per day at 2400Crespectively. Thus, even when operating the MAFF target for 50 days at 2400 C, not more than10 % of the original target content may get lost. This amount will not harm the integrity of thetarget.
Excessive amounts of graphite leaving the target can cause a coating of ion source insulators andresult in a short circuit. This problem had occured at TRISTAN, but was cured with a modifieddesign of the ion source [Gil85].
Even if the loss through the target orifice is kept under control, the evaporation and redepositionin the target container can change the microscopic structure of the target material. It is difficultto predict the structural change quantitatively27, since it will depend on many factors like thermalgradients, the content of impurities, etc. A clear answer can only be given by an experimentalinvestigation for each individual target design.
As discussed before, the antagonism of diffusion and effusion can affect the release behaviour ofdifferent elements in quite different way, i.e. due to the structural change the target may becomeslower for some elements but even faster for others!
27The structure created in the equilibrium of evaporation and redeposition has not necessarily maximum density.Note that occasionally even dendritic structures are created in vapor deposition [Gue87].

222 B.4 Uranium carbide targets
Self-diffusion of target material
Changes can also occur in the bulk target material due to self-diffusion. Normally this diffusion, ifsignificant at all, has the rather positive effect to equilibrate concentration differences.
The thermodiffusion or Soret effect could play a role in a target which is heated inhomogeneously.This can happen in an ISOL facility driven by a high-current-accelerator where the target heatingis dominated by the energy loss of the beam. It could also occur in the target of a high-flux-reactorbased ISOL facility where the main heating is due to the fission power of the uranium content. Anymajor irregularities in the uranium concentration can cause thermal gradients, which in turn couldincrease the concentration inhomogeneity by thermodiffusion. No thermodiffusion of uranium hasbeen observed in UC2 [Mat86]. However, the carbon content has the tendency to diffuse towardsthe colder parts, i.e. it has a positive heat of transport [Mat86]. The flux of carbon atoms JC isdescribed by:
JC = −DC
(∂cC∂x
+Q∗CcC
RT 2∂T
∂x
), (B.4.2)
where Dc is the diffusion constant and cC is the concentration of carbon. The first term de-scribes the normal diffusion which will level out inhomogeneities and the second term describesthe thermodiffusion. The heat of transport for carbon in UC2 was measured at 1600 C toQ∗C = 385(113) kJ/mol [Gul72]. The concentration of the carbon content will remain close to
unity, even if a major migration occurs. Therefore the first term can be neglected and the migrationrate dx/dt (in cm/s) can be expressed by:
dx
dt≈ C∗
T 2dT
dxexp
(−∆H
RT
)(B.4.3)
with an activation energy of ∆H = 320(38) kJ/mol and an experimental migration rate coefficientC∗ ≈ 1.1 · 105 K cm2/s deduced from figure 5 of ref. [Gul72]. Extrapolation gives a migrationrate of 0.27 mm per day at 2200 C and 0.74 mm per day at 2400 C. Clearly there are largeuncertainties due to the extrapolation from the measured temperature range (up to 1700 C), butthe magnitude of the effect shows that it is worthwile to study it in more detail.
However, even if a major transport of carbon occurs, it will only slightly affect the distribution ofuranium. With an initial molar ratio of C:U≈ 1000:1 these changes play no role, since the criticalstochiometric ratio UC1.00, where uranium would start to migrate considerably, is three orders ofmagnitude smaller.
Lifetime of the target container
The ISOLDE target containers made from tantalum show a significant recrystallization after aboutone week of operation at 2200 C [Rav97a]. A tungsten container is used for the OSIRIS target. Itshows similar recrystallization grains after 50 days of operation at 2400 C [Fog97]. The containerfor the MAFF target will be made from rhenium. Rhenium forms much smaller grains duringrecrystallization (37 µm grain diameter at 2400 C [Sav62]), not causing cracks of the container28.Moreover it does not form carbides [Sim62] as tantalum and tungsten do and is therefore chemicallymore stable in contact with graphite. At OSIRIS a graphite liner has to be used to protect theinner part of the target against reaction with tungsten to WC. It is consumed at a rate of 1 mmper 1000 h at 2300 C and 1 mm per 300 h at 2500 C [Jac87]. Therefore the thickness of thisgraphite liner (2 mm) sets an upper limit for the useful lifetime of the target.
28Re and W/Re alloys are even considered for the containment of high-temperature reactors driving spacecrafts.

B.5 Surface ionization efficiency 223
To study all the points discussed above experimentally, an oven was installed at the target lab-oratory of the LMU where rhenium containers loaded with various graphite and uranium carbidesamples can be heated over several weeks to a temperature of 2400 C [Maier].
B.5. Surface ionization efficiency
B.5.1. Positive surface ionization
The degree of ionization α = [X+]/[X0] is described by:
αs =[X+]
[X0]=
g+g0
exp
(Φ− Wi
kT
), (B.5.1)
with Φ the work function and T the temperature of the source material, Wi the ionization potentialof the element to be ionized, g+ = 2J+ + 1 and g0 = 2J0 + 1 the statistical weights of the ionicand atomic ground state of X. For example g0 = 2 and g+ = 1 for alkalis (2S1/2 atomic groundstate and 1S0 ionic ground state). Equation (B.5.1) is called Langmuir equation or Saha-Langmuirequation. It can be derived from the chemical equilibrium constant of the reaction X++ e− Xwith the law of mass action, see ref. [Lan25, Zan71]. Several other ways to derive the same equationare shown in [Zan71]. The surface ionization efficiency is:
βs =[X+]
[X+] + [X0]=
αs1 + αs
(B.5.2)
Tables B.6.1 and B.6.2 in appendix B.6 give an overview of the ionization potentials of theelements. Table B.7.1 summarizes the work function and maximum operation temperature ofmaterials typically used in ion sources. Note that the work function depends significantly on thesurface properties, i.e. on the orientation of a single crystal structure or the use of a polycrystallinesurface, and on the adsorption of impurities29 (see e.g. [Alt86]). The temperature dependent vaporpressure and adsorption time of these impurities can lead to a stronger temperature dependenceof the effective work function. A strong electric field will also cause a modification of equation(B.5.1) [Zan71].
Even with very noble metal ionizers, the numerator in the exponent of equation (B.5.1) (Φ−Wi)is negative for most elements. To reach higher ionization efficiencies “the hotter - the better”applies. The upper temperature limit is normally given by the vapor pressure of the ionizer materialor impurities. On the other hand for alkalis with Wi < Φ the efficiency will decrease with highertemperatures. Here, it can be favorable to use lower temperatures or a material with lower Φ.Both will also reduce the isobaric background of elements with larger ionization potential.
B.5.2. Negative surface ionization
In the case of negative surface ionization the ionization degree is given by:
α =[X−]
[X0]=
g−g0
exp
(AE − Φ
kT
), (B.5.3)
with AE the electron affinity of the element to be ionized. The ionization efficiency is again givenby equation (B.5.2). The electron affinities are also shown in tables B.6.1 and B.6.2 of appendixB.6.29Adsorbed electronegative layers like oxygen enhance the work function while adsorbed electropositive layers (par-ticularly alkali and earth alkali elements) lower it.

224 B.5 Surface ionization efficiency
Negative surface ionization is used for the efficient (up to about 50 % efficiency) and selectiveionization of halogens30 and some other non-metallic elements. For more details see references[Ven70, Vos81, Shm81, Rab87, Pio97]. Negative ions are also required for the RIB facilities usinga Tandem post-accelerator: HFRIB in Oak Ridge [Alt96] and the EXCYT project in Catania [Cia97].There the adaption of the physics program to negative surface ionizable elements and moleculeswill avoid an additional efficiency loss in a charge exchange cell.
In most cases LaB6 is used as ionizer with a low work function of about 2.6 eV. However, it cannotbe combined with all target materials. For example the carbon emanation from carbide/graphitetargets leads to a rapid poisoning of the surface [Vos81]. Negative surface ionization is not prac-ticable either for in-pile sources in a high neutron flux. The rapid transmutation of LaB6 by the10B(n,α)7Li reaction and the excessive electron emission from a negatively biased hot ion sourceare prohibitive. An alternative selective ionization method for halogens is discussed in section 4.1.
B.5.3. Ionization in a hot cavity
Experimentally it was found that the efficiency of positive surface ionization can reach high values inhot cavities where the area of the extraction orifice is small compared with the inner cavity surface[Bey71, Joh73]. The observed ionization efficiency can exceed the predictions of the Saha-Langmuirequation (B.5.1) by many orders of magnitude. This effect was studied in detail experimentallyand theoretically [Lat75, Kal76, Afa77, Kir78, Kir81a, Huy83, Kir90].
It was shown that the ionization efficiency is strongly influenced by the space charge potential inthe ionizer cavity. The latter is determined by an equilibrium between the flow of surface ionizedparticles and thermionic electrons from the wall into the cavity volume. A thermal plasma iscreated with a plasma potential which assures quasi-neutrality in the cavity volume. Assumingthermal equilibrium the ionization efficiency in the volume βv becomes:
βv =γ
1 + γ ,
γ =2g+g0
(2πmh2
) 32 1
p(kT )52 exp
(−Wi
kT
).
(B.5.4)
p is the total pressure in the cavity, involving neutrals, ions and electrons: p = (n0+n++ne)kT .Equation (B.5.4) is called the Saha equation. It was derived by Saha to describe the ionizationdegree in the solar chromosphere [Sah20]. It is interesting that equation (B.5.4) does no longercontain Φ, i.e. in thermal equilibrium the ionization efficiency of a hot cavity becomes independentof the work function of the wall material. A material with lower work function has a lower surfaceionization efficiency, but will emit more electrons into the cavity volume31. Thus, the negativeplasma potential is further decreased and the positive ions are better trapped in the plasmaprotecting them against neutralization at the wall. The neutrals have still a finite chance to getsurface ionized at each wall collision. In thermal equilibrium the better trapping just compensatesthe lower ionization efficiency.
To assure the necessary condition, i.e. complete thermalization, the atoms and ions have to remain“infinitely long” in the cavity. However, a cavity without extraction hole is not very useful for ISOLapplications. Therefore a compromise has to be found, combining a slightly reduced ionizationefficiency with a finite extraction efficiency. This situation was described by Kirchner [Kir90] withthe following equation:
η =βsωκ
1− βsωκ. (B.5.5)
30However, fluorine shows a low efficiency in negative surface ion sources. This is caused by strong adsorption ofthe very reactive fluorine atoms to surfaces in the source [Ewa84].
31Therefore at the SOLIS thermal ion source a ZrC disk was inserted into the cavity to act as an additional efficientelectron emitter [Pil87].

B.5.3 Ionization in a hot cavity 225
η is the ionization efficiency for particles which are extracted from the cavity, ω the probabilitythat a surface ionized particle leaves the cavity as ion, κ the mean number of wall collisions andβs the surface ionization efficiency according to equations (B.5.1) and (B.5.2).
To increase ω towards unity, one has to assure that the created ions lose their excess energy inthe cavity volume before hitting the opposite wall. This can be achieved by increasing the neutralgas pressure to reduce the mean free path below cavity dimensions. Kirchner could increase theionization efficiency by up to a factor of five when introducing xenon with a flow rate of about10−3 mbar l/s [Kir90].
κ is given by the ratio of the orifice area to the total inner cavity surface. With decreasing orificediameter the mean number of wall collisions increases, but simultaneously the penetration of theextraction field and thus the extraction efficiency decrease. Moreover, the mean residence time inthe cavity is increased, which can cause additional decay losses for very short-lived isotopes. Withan orifice diameter of 0.8 mm for the GSI thermal ion source κ is around 700, but for a standardISOLDE surface ionizer with a tube diameter of 3 mm it is only 40.
ω can be determined by measuring a set of ionization efficiencies with the same ion source andfitting the product N = ωκ to reproduce the measured efficiencies. For the GSI thermal ionsource N was found to be around 150, but at ISOLDE the ionization efficiency of surface ionizableelements is measured only occasionally and under varying conditions. Therefore no exact value canbe given, but N is estimated to be between 5 and 20.
Figures B.5.1 and B.5.2 show typical ionization efficiencies derived with equation (B.5.5). Theratio g+/g0 was taken as unity. The efficiency with a Nb cavity should be similar to that of a Tacavity.
N = 150
N = 40
N = 10
N = 1
Ionization potential (eV)
Ioni
zatio
n ef
ficie
ncy
10-6
10-5
10-4
10-3
10-2
10-1
4 5 6 7 8
Figure B.5.1.: Influence of the parameter N = ωκ on the calculated surface ionization efficiencyfor a tungsten ionizer cavity (ΦW = 4.54 eV) at 2400 C. The case N = 1 is equalto pure surface ionization without cavity effect.
To emphasize the difference to standard surface ionization which is only governed by the Langmuirequation, the hot cavity surface ion sources are also called thermal ion sources or thermoionizationsources. Note that in the following, according to the ISOLDE synoptics, also the expression “line”will be used for the hot cavity.
Also negative ions can be exctracted from a hot tungsten cavity, see [Pio97] for experimentalresults.

226 B.5 Surface ionization efficiency
Re 2400 °C
W 2400 °C
Ta 2400 °C
Ta 2000 °C
Ionization potential (eV)
Ioni
zatio
n ef
ficie
ncy
10-6
10-5
10-4
10-3
10-2
10-1
4 5 6 7 8
Figure B.5.2.: Influence of the ion source parameters on the calculated ionization efficiency. Thefour curves show Ta (ΦTa = 4.25 eV) at 2000 C and 2400 C respectively, W(ΦW = 4.54 eV) at 2400 C and Re (ΦRe = 4.96 eV) at 2400 C.

B.6 Ionization potentials and electron affinities 227
B.6. Ionization potentials and electron affinitiesTable B.6.1.: Ionization potentials Wi (from [NISTA, Erd98a]), electron affinities AE (from [Moi76,
Hot85, Rad85, HB, Ber95, And99] and references therein) and statistical weights ofthe elements: g0 for the atomic ground state (from [NISTA]), g+ for the positive ion(from [Rad85]) and g− for the negative ion (from [Moi76, Hot85] where known).The label “–” in the column of AE indicates that the negative ion is unstable or wasnot observed. Estimated values are given in parentheses.
Z El. Wi AE g0 g+ g−(eV) (eV)
1 H 13.6 0.75 2 1 12 He 24.59 – 1 23 Li 5.39 0.62 2 1 14 Be 9.32 – 1 25 B 8.3 0.28 2 1 16 C 11.26 1.26 1 2 47 N 14.53 – 4 18 O 13.62 1.46 5 4 49 F 17.42 3.40 4 5 1
10 Ne 21.56 – 1 411 Na 5.14 0.55 2 1 112 Mg 7.65 – 1 213 Al 5.99 0.43 2 1 114 Si 8.15 1.39 1 2 415 P 10.49 0.75 4 1 516 S 10.36 2.08 5 4 417 Cl 12.97 3.61 4 5 118 Ar 15.76 – 1 419 K 4.34 0.50 2 1 120 Ca 6.11 0.02 1 221 Sc 6.56 0.19 4 3 522 Ti 6.83 0.08 5 4 423 V 6.75 0.53 4 1 124 Cr 6.77 0.678 7 6 625 Mn 7.43 – 6 726 Fe 7.9 0.15 9 10 1027 Co 7.88 0.66 10 9 928 Ni 7.64 1.16 9 11 629 Cu 7.73 1.24 2 1 130 Zn 9.39 – 1 231 Ga 6.00 0.41 2 1 132 Ge 7.9 1.23 1 2 433 As 9.82 0.81 4 1 534 Se 9.75 2.02 5 4 435 Br 11.81 3.36 4 5 136 Kr 14 – 1 4
Z El. Wi AE g0 g+ g−(eV) (eV)
37 Rb 4.18 0.49 2 1 138 Sr 5.69 0.05 1 239 Y 6.22 0.31 4 1 540 Zr 6.63 0.43 5 4 441 Nb 6.76 0.89 2 1 142 Mo 7.09 0.75 7 6 643 Tc 7.28 0.55 6 7 944 Ru 7.36 1.05 11 10 1045 Rh 7.46 1.14 10 9 1046 Pd 8.34 0.56 1 6 647 Ag 7.58 1.30 2 1 148 Cd 8.99 – 1 249 In 5.79 0.40 2 1 150 Sn 7.34 1.11 1 2 451 Sb 8.61 1.05 4 1 552 Te 9.01 1.97 5 4 453 I 10.45 3.06 4 5 154 Xe 12.13 – 1 455 Cs 3.89 0.47 2 1 156 Ba 5.21 0.14 1 257 La 5.58 0.47 4 5 558 Ce 5.54 0.26 9 859 Pr 5.47 0.11 10 960 Nd 5.53 0.1 9 861 Pm 5.58 – 6 562 Sm 5.64 0.3 1 263 Eu 5.67 – 8 964 Gd 6.15 0.34 5 665 Tb 5.86 0.5 16 1766 Dy 5.94 0.16 17 1867 Ho 6.02 – 16 1768 Er 6.11 – 13 1469 Tm 6.18 0.03 8 970 Yb 6.25 0.01 1 2 271 Lu 5.43 0.26 4 172 Hf 6.83 – 5 4

228 B.6 Ionization potentials and electron affinities
Table B.6.2.: Continuation of table B.6.1.
Z El. Wi AE g0 g+ g−(eV) (eV)
73 Ta 7.55 0.32 4 3 174 W 7.86 0.82 1 2 675 Re 7.83 0.15 6 7 976 Os 8.44 1.08 9 1077 Ir 8.97 1.56 10 11 978 Pt 8.96 2.13 7 6 679 Au 9.23 2.31 2 1 180 Hg 10.44 – 1 281 Tl 6.11 0.38 2 1 182 Pb 7.42 0.36 1 2 483 Bi 7.29 0.94 4 1 584 Po 8.42 1.9 5 485 At 2.8 4 186 Rn 10.75 – 187 Fr 4.07 0.50 2 188 Ra 5.28 0.15 1 289 Ac 5.17 0.35 4 190 Th 6.31 0.37 5 491 Pa 5.89 (0.3) 12 992 U 6.19 0.3 13 1093 Np 6.27 (0.3) 12 1394 Pu 6.03 – 1 295 Am 5.97 – 8 996 Cm 5.99 (0.3) 5 897 Bk 6.2 – 16 1798 Cf 6.28 – 17 1899 Es 6.37 – 16 17
100 Fm 6.5 – 13101 Md 6.58 (1.0) 8102 No 6.65 – 1 2

B.7 Work function and Richardson parameter 229
B.7. Work function and Richardson parameter
The cavity material plays an important role for the efficiency of surface ionization sources andresonance ionization laser ion sources. The saturated emission current per unit area J is describedby the Richardson-Dushman equation:
J = A∗T 2 exp(− Φ
kT
). (B.7.1)
The theoretical value32 for the Richardson constant of most metals is A0 = 120 Acm−2K−2.Including a possible temperature dependence of Φ gives an effective constant A∗ which may bedifferent. The work function is considerably affected by the surface properties. Here, the valuesfor clean polycrystalline surfaces are given. As example for surface modifications the value for anoxygen covered tungsten surface (W-O) is also given. The values were taken from [HB, Fom70,Sam71, Mic77, Smi92, Rao97]. The second column of table B.7.1 shows the range of reportedvalues measured with the thermionic emission method; extreme values were omitted. The last twocolumns give the “recommended” values, mainly from [Smi92].
Table B.7.1.: Work function Φ and effective Richardson constant A∗.Mat. Φexp Φrec A∗
(eV) (eV) (Acm−2K−2)C 3.9-5.0 4.5 15Ti 3.7-4.2 3.9Zr 3.5-4.5 4.12 330Nb 4.0-4.3 4.19 120Mo 4.1-4.5 4.15 55Hf 3.5-3.9 3.6 22Ta 4.0-4.4 4.25 120W 4.4-5.0 4.54 60Re 4.7-5.1 4.96 120Ir 5.0-5.4 5.27 120Pt 4.1-6.3 5.32 32Th 3.3-3.5 3.38 70
TiB2 3.8-4.0LaB6 2.6-3.2 2.7 29
Mat. Φexp Φrec A∗
(eV) (eV) (Acm−2K−2)TiC 2.4-4.2 3.35 25ZrC 2.1-4.1 2.18 0.3HfC 3.0-4.0TaC 3.1-4.4 3.14 0.3WC 3.6ThC2 3.2-3.5 3.5 550
Al2O3 4.7 4.7ZrO2 4.0-4.6 3.96CeO2 2.3-3.2 2.3 1Ta2O5 4.65WO2 4.96W-O 5.3-9.2ThO2 2.5-3.1 2.6 5
Ir5Ce 2.69 120
32A0 = G · 2πemek2
h3with G the number of electrons in the conduction band, i.e. typically 2 for metals.

230 B.8 Resonance ionization schemes
B.8. Resonance ionization schemes
In principle resonance ionization can be applied for all elements. However, there are large differencesin the required set-up and the ionization efficiency which can be obtained.
The following tables B.8.1, B.8.2, B.8.3 and B.8.4 give an overview of experimentally used res-onance ionization schemes for various elements. In cases where no application of RIS has beenreported in literature, a promising “theoretical” scheme is included. The proposed schemes aremarked with a label ‘prop.’ in the column ‘Pumping laser’. The wavelengths marked with an ‘A’ ora ‘R’ indicate a transition to an autoionizing state or a Rydberg state respectively. In some casesa static or pulsed electrical field is used for the final ionization step - marked with ‘ GE’ in the table.
The shown wavelengths may give an idea of the difficulty of a technical realization. Often amultitude of alternative schemes exist and only some representative ones are shown. Extensivecompilations can be found in [Let87] and [Hur79].
Useful data for resonance ionization spectroscopy has been collected at NIST, Gaithersburg andwas published as a series of data sheets: [Sal90] contains As, B, Cd, C, Ge, Au, Fe, Pb, Si andZn, [Sal91] contains Al, Ca, Cs, Cr, Co, Cu, Kr, Mg, Hg and Ni, [Sal92] contains Sb, Bi, P, Naand Sn, [Sal93] contains Be, In, Li, K, Rb, Ag, Ti, V and an update for Ni and [Sal95] containsGa, Mn, Sc and Tl. They also include information on transition strengths, lifetimes, isotope shiftsand hyperfine splitting constants. Many other references can be found in the proceedings of thebiannual conference series “Resonance Ionization Spectroscopy”.
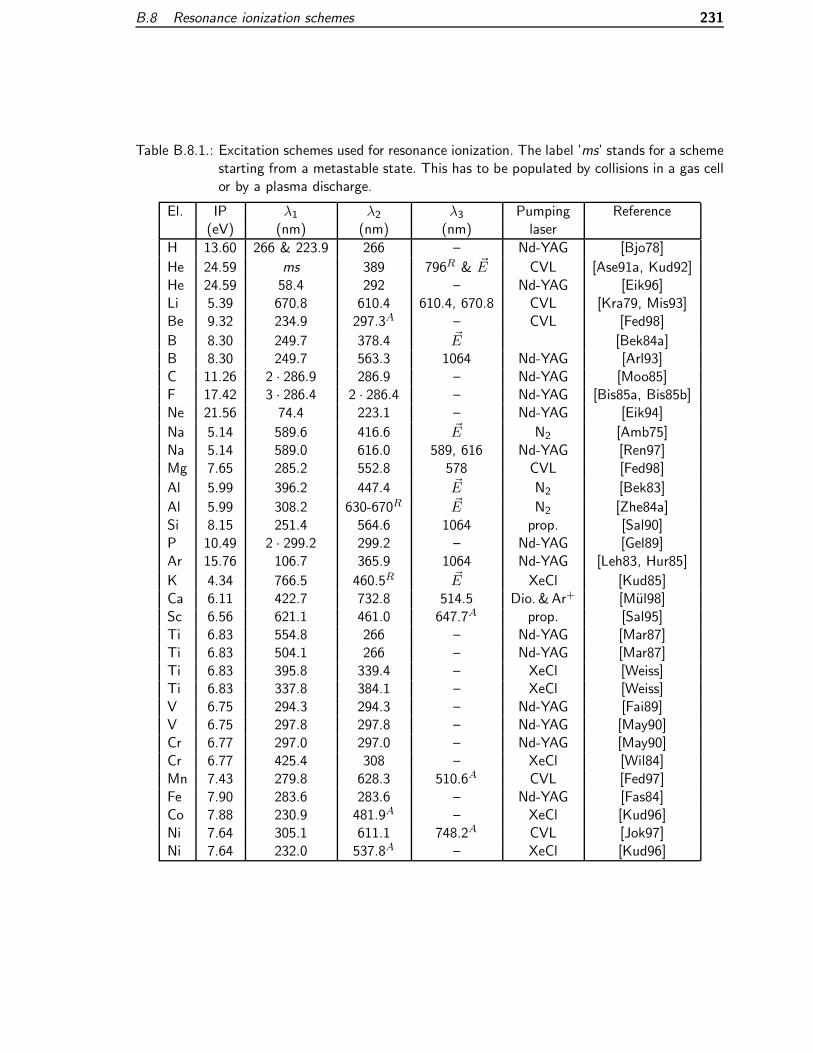
B.8 Resonance ionization schemes 231
Table B.8.1.: Excitation schemes used for resonance ionization. The label ’ms’ stands for a schemestarting from a metastable state. This has to be populated by collisions in a gas cellor by a plasma discharge.
El. IP λ1 λ2 λ3 Pumping Reference(eV) (nm) (nm) (nm) laser
H 13.60 266 & 223.9 266 – Nd-YAG [Bjo78]
He 24.59 ms 389 796R & GE CVL [Ase91a, Kud92]He 24.59 58.4 292 – Nd-YAG [Eik96]Li 5.39 670.8 610.4 610.4, 670.8 CVL [Kra79, Mis93]Be 9.32 234.9 297.3A – CVL [Fed98]
B 8.30 249.7 378.4 GE [Bek84a]B 8.30 249.7 563.3 1064 Nd-YAG [Arl93]C 11.26 2 · 286.9 286.9 – Nd-YAG [Moo85]F 17.42 3 · 286.4 2 · 286.4 – Nd-YAG [Bis85a, Bis85b]Ne 21.56 74.4 223.1 – Nd-YAG [Eik94]
Na 5.14 589.6 416.6 GE N2 [Amb75]Na 5.14 589.0 616.0 589, 616 Nd-YAG [Ren97]Mg 7.65 285.2 552.8 578 CVL [Fed98]
Al 5.99 396.2 447.4 GE N2 [Bek83]
Al 5.99 308.2 630-670R GE N2 [Zhe84a]Si 8.15 251.4 564.6 1064 prop. [Sal90]P 10.49 2 · 299.2 299.2 – Nd-YAG [Gel89]Ar 15.76 106.7 365.9 1064 Nd-YAG [Leh83, Hur85]
K 4.34 766.5 460.5R GE XeCl [Kud85]Ca 6.11 422.7 732.8 514.5 Dio.&Ar+ [Mul98]Sc 6.56 621.1 461.0 647.7A prop. [Sal95]Ti 6.83 554.8 266 – Nd-YAG [Mar87]Ti 6.83 504.1 266 – Nd-YAG [Mar87]Ti 6.83 395.8 339.4 – XeCl [Weiss]Ti 6.83 337.8 384.1 – XeCl [Weiss]V 6.75 294.3 294.3 – Nd-YAG [Fai89]V 6.75 297.8 297.8 – Nd-YAG [May90]Cr 6.77 297.0 297.0 – Nd-YAG [May90]Cr 6.77 425.4 308 – XeCl [Wil84]Mn 7.43 279.8 628.3 510.6A CVL [Fed97]Fe 7.90 283.6 283.6 – Nd-YAG [Fas84]Co 7.88 230.9 481.9A – XeCl [Kud96]Ni 7.64 305.1 611.1 748.2A CVL [Jok97]Ni 7.64 232.0 537.8A – XeCl [Kud96]

232 B.8 Resonance ionization schemes
Table B.8.2.: Continuation of table B.8.1. Further schemes for the lanthanides from cerium toerbium can be found in [Wor78].
El. IP λ1 λ2 λ3 Pumping Reference(eV) (nm) (nm) (nm) laser
Cu 7.73 327.4 287.9A – CVL [Kos00]Zn 9.39 213.9 636.2 510.6 CVL [Let98]Ga 6.00 294.4 578.2 – CVL [Zhe83]Ge 7.90 265.2 569.2 1064 prop. [Sal90]As 9.82 2 · 318.0 540.9A – prop. [Sal90]Kr 14.00 116.5 558.1 1064 Nd-YAG [Leh83, Kra86]
Kr 14.00 ms 557.0 676.0R & GE CVL [Ase91b]
Kr 14.00 ms 760.2 510.6R & GE CVL [Kud92]Rb 4.18 794.8 347.1 – Ruby [Amb71]Rb 4.18 420.2 694.3 – Ruby [Amb76]Sr 5.69 689.3 687.8 602.7 CVL [And86]Y 6.22 2 · 548 548 – Exc. [Est91]
Zr 6.63 451.6 319R GE Exc.&Nd-Y. [Hac86]Nb 6.76 566.5 524.0 523.0 Excimer [Lau90]Mo 7.09 313.3 313.3 – Nd-YAG [Fas83, Fai89]Mo 7.09 386.5 2 · 386.5 – XeCl [Min92]Tc 7.28 318.2 787.9 670.7A CVL [Rus89]Tc 7.28 313.2 821.1 670.7 CVL [Ame90]
Ru 7.36 392.6 633.1 567.3R & GE [Bek84b, Bek85]
Ru 7.36 330.2 344-346R GE XeCl [Xu90]Ru 7.36 273.6 435.1A – [Xu95]Rh 7.46 232.3 572.6A – XeCl [Kud96]Pd 8.34 244.9 344.6A – [Cal88b]Ag 7.58 328.1 546.6 510.6 CVL [Mis93, Jad97]Cd 8.99 228.8 643.8 510.6 CVL [Erd98b, Let98]In 5.79 2 · 423.7A – – N2 [Mir78]In 5.79 303.9 578.2 – CVL [Muc83]Sn 7.34 286 617 617 Nd-YAG [Fai89]Sn 7.34 303.6 606.9 606.9 CVL [Mis93]Sn 7.34 317.5 811.4 823.5A CVL [Mis93]Sb 8.61 231.1 563.2 < 1186 prop. [Sal92]Xe 12.13 125.0 532 – Nd-YAG [Leh83, Hur85]Xe 12.13 94.2A – – Nd-YAG [Bon85]

B.8 Resonance ionization schemes 233
Table B.8.3.: Continuation of table B.8.1.
El. IP λ1 λ2 λ3 Pumping Reference(eV) (nm) (nm) (nm) laser
Cs 3.89 455.5 455.5 – Flashlamp [Hur77]Cs 3.89 852.1 603.5 503 Nd-YAG [Tem98]Ba 5.21 350.1 532 – Nd-YAG [Koi97]La 5.58 593.0 820.5 532 Nd-YAG [Koi97]
Ce 5.54 458.3 437.1R GE N2 [Wor78]Pr 5.46 394.5 576.2A – N2 [Wor78]Nd 5.53 463.4 435.2A – N2 [Wor78]Nd 5.53 588.8 596.9 596.9A CVL [Alk87, Zyu88]Sm 5.64 600.4 675.2 676.2A CVL [Mis87b]Eu 5.67 576.5 557.3 555.7A CVL [Alk83, Zhe84b]Gd 6.15 561.8 635.2 613.4A N2 [Bek78a]Gd 6.15 569.6 597.6 613.5A N2 [Mis87a]Gd 6.15 276.1 740.8A – XeCl [?]Tb 5.86 601.9 613.9 618.7 CVL [Let87]Dy 5.94 625.9 677.0 583.1A N2 [Wor78]Ho 6.02 592.1 572.5 626.8 CVL [Alk87]Er 6.11 622.1 645.2 564.9 [Let87]Tm 6.18 589.6 571.2 575.5A CVL [Mis87b, Mis93]Tm 6.18 597.1 600.3 552.4 CVL [Bar98a]Yb 6.25 555.6 581.1 581.1 CVL [Mis93, Bar98a]Yb 6.25 555.6 680.0 581.3R CVL [Bek78b, Bek81]Lu 5.43 452.0 452.0 – Flashl. [Mil82]
Lu 5.43 451.9 463-471R GE N2 [VA92]
Hf 6.83 ? ?R GE Excimer [Cal88a]
Ta 7.55 575.2 ≈ 230R GE [Sim94]
W 7.86 384.9 ≈ 267R GE Nd-YAG [CM96]Re 7.83 299.2 299.2 – Nd-YAG [Fas83]Re 7.83 283.5 297.2 – Nd-YAG [Wal86]
Re 7.83 346.1 ≈ 292R GE Nd-YAG [CM96]Os 8.44 280.7 297.7 – Nd-YAG [Wal86]Os 8.44 353.0 ≈ 252R – Nd-YAG [Col97]Ir 8.97 307.6 ≈ 251.5R – Nd-YAG [Col97]Ir 8.97 266.5 562.0 642R Excimer [Mat95]Ir 8.97 380.0 402.0 516R Excimer [Mat95]
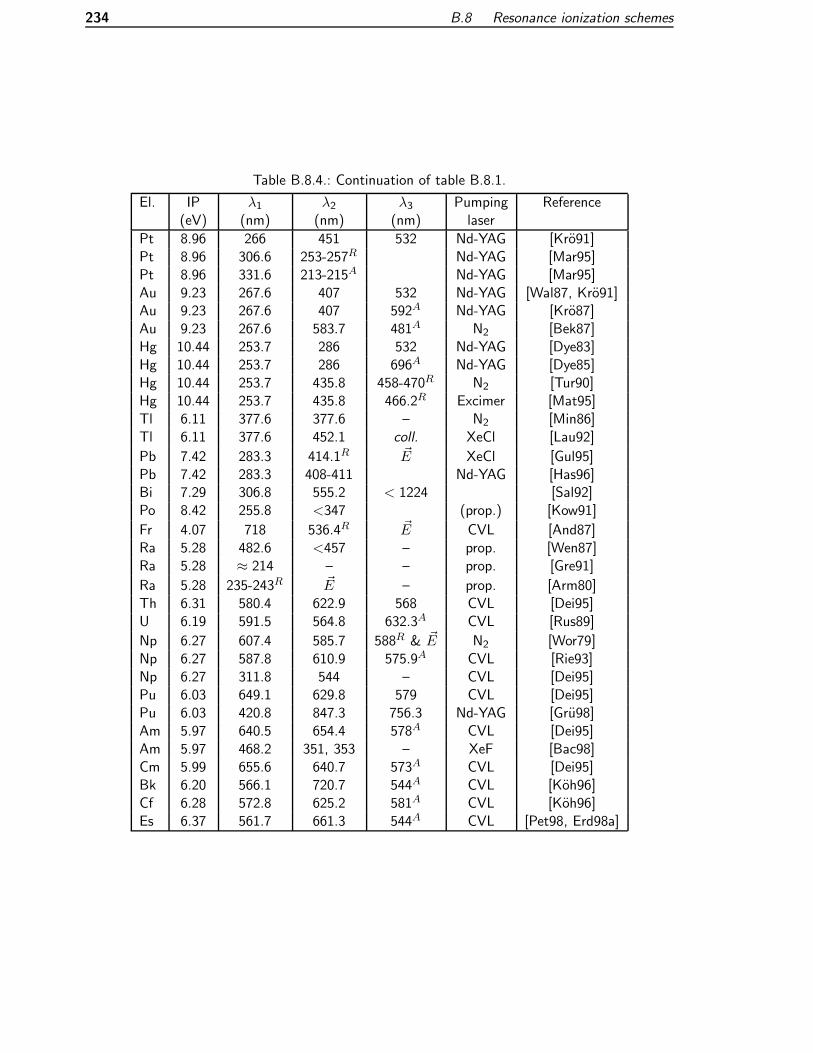
234 B.8 Resonance ionization schemes
Table B.8.4.: Continuation of table B.8.1.
El. IP λ1 λ2 λ3 Pumping Reference(eV) (nm) (nm) (nm) laser
Pt 8.96 266 451 532 Nd-YAG [Kro91]Pt 8.96 306.6 253-257R Nd-YAG [Mar95]Pt 8.96 331.6 213-215A Nd-YAG [Mar95]Au 9.23 267.6 407 532 Nd-YAG [Wal87, Kro91]Au 9.23 267.6 407 592A Nd-YAG [Kro87]Au 9.23 267.6 583.7 481A N2 [Bek87]Hg 10.44 253.7 286 532 Nd-YAG [Dye83]Hg 10.44 253.7 286 696A Nd-YAG [Dye85]Hg 10.44 253.7 435.8 458-470R N2 [Tur90]Hg 10.44 253.7 435.8 466.2R Excimer [Mat95]Tl 6.11 377.6 377.6 – N2 [Min86]Tl 6.11 377.6 452.1 coll. XeCl [Lau92]
Pb 7.42 283.3 414.1R GE XeCl [Gul95]Pb 7.42 283.3 408-411 Nd-YAG [Has96]Bi 7.29 306.8 555.2 < 1224 [Sal92]Po 8.42 255.8 <347 (prop.) [Kow91]
Fr 4.07 718 536.4R GE CVL [And87]Ra 5.28 482.6 <457 – prop. [Wen87]Ra 5.28 ≈ 214 – – prop. [Gre91]
Ra 5.28 235-243R GE – prop. [Arm80]Th 6.31 580.4 622.9 568 CVL [Dei95]U 6.19 591.5 564.8 632.3A CVL [Rus89]
Np 6.27 607.4 585.7 588R & GE N2 [Wor79]Np 6.27 587.8 610.9 575.9A CVL [Rie93]Np 6.27 311.8 544 – CVL [Dei95]Pu 6.03 649.1 629.8 579 CVL [Dei95]Pu 6.03 420.8 847.3 756.3 Nd-YAG [Gru98]Am 5.97 640.5 654.4 578A CVL [Dei95]Am 5.97 468.2 351, 353 – XeF [Bac98]Cm 5.99 655.6 640.7 573A CVL [Dei95]Bk 6.20 566.1 720.7 544A CVL [Koh96]Cf 6.28 572.8 625.2 581A CVL [Koh96]Es 6.37 561.7 661.3 544A CVL [Pet98, Erd98a]

B.9 Background and selectivity 235
B.9. Background and selectivity
The detected event rate in a certain region of interest is typically composed from events of the iso-tope to study rx, from events of internal background rint (isobars and other beam contaminations)and from external background rBG. These detected event rates are connected to the activity of therespective sources by multiplication with the individual branching ratios and the detector responsefor the respective decay. It is obvious that detection methods being only sensitive to “exotic” decaymodes like beta-delayed particles are intrinsically able to suppress background from activity closeto stability by many orders of magnitude. For simplicity in the following the hypothetical case isdiscussed where all contributing sources have a proportionality factor (equal branching ratio timesdetector response) of unity. This case is approximately realized when using a beta detector with aflat energy response function. A generalization of the formulae, including the individual branchingratios and detector response, is straightforward.
The number of events detected during the measurement time tM in the region of interest becomes:
n1 = (rx + rint + rBG)tM. (B.9.1)
The external background can be determined in a separate measurement by blocking the ion beamwhile keeping all other parameters similar. At a spallation facility it has to be taken into accountthat this background is partly related to the primary beam. A small part of the energetic spallationneutrons can pass all shieldings and enter the experimental hall. Background is then created directlyin neutron sensitive detectors or by secondary reactions ((n,γ), etc.) in the surroundings.
An additional contribution was observed with actinide targets: through the impact of the pulsedproton beam noble gases are released as a bunch and drift through the beam tubes. With detectorpositions close to the separator the corresponding activity can cause background rates of upto 1 kHz within some seconds after proton impact. With appropriate shielding or coincidencerequirements the external background can be normally reduced to an acceptable level.
The internal background is in many cases much worse. Implanted at the same position as thedesired isotope, the solid angle for detection is equal and normally no improvement is achievablewith unspecific coincidence requirements (beta trigger, gamma multiplicity trigger, etc.). Theapplication of gamma gating has a major limitation: for very exotic nuclides often no transitionsare known which could be used to install a hardware gate. Thus, all data has to be saved inlist-mode for later reconstruction. Depending on the data acquisition system the event rate cannotexceed some 0.1 to 10 kHz. For precise lifetime measurements requiring a low dead time therestrictions are even much stricter.
The decay daughters of the isotope to study reach in the worst case a comparable intensity.Accumulation of longer-lived daughters can be prevented by implanting the beam onto a tape andmoving this periodically away.
In the case of laser ionization the surface ionized background can be determined in a separatemeasurement, where all target and ion source parameters are kept the same, but at least oneof the resonant laser beams is detuned in frequency or blocked. Such a measurement of totalbackground (i.e. external plus internal background) should be done shortly before or after thecorresponding “real” measurement, since the target ion source system is subject to changes duringa beam time of hours or days.
The number of events detected in the region of interest during the laser-off measurement with thetime tBG is:
n0 = (rint + rBG)tBG. (B.9.2)
For simplification tBG is chosen identical to tM. In reality it should be optimized for individual cases.For gamma background from isotopes with accurately known decay schemes the contribution of
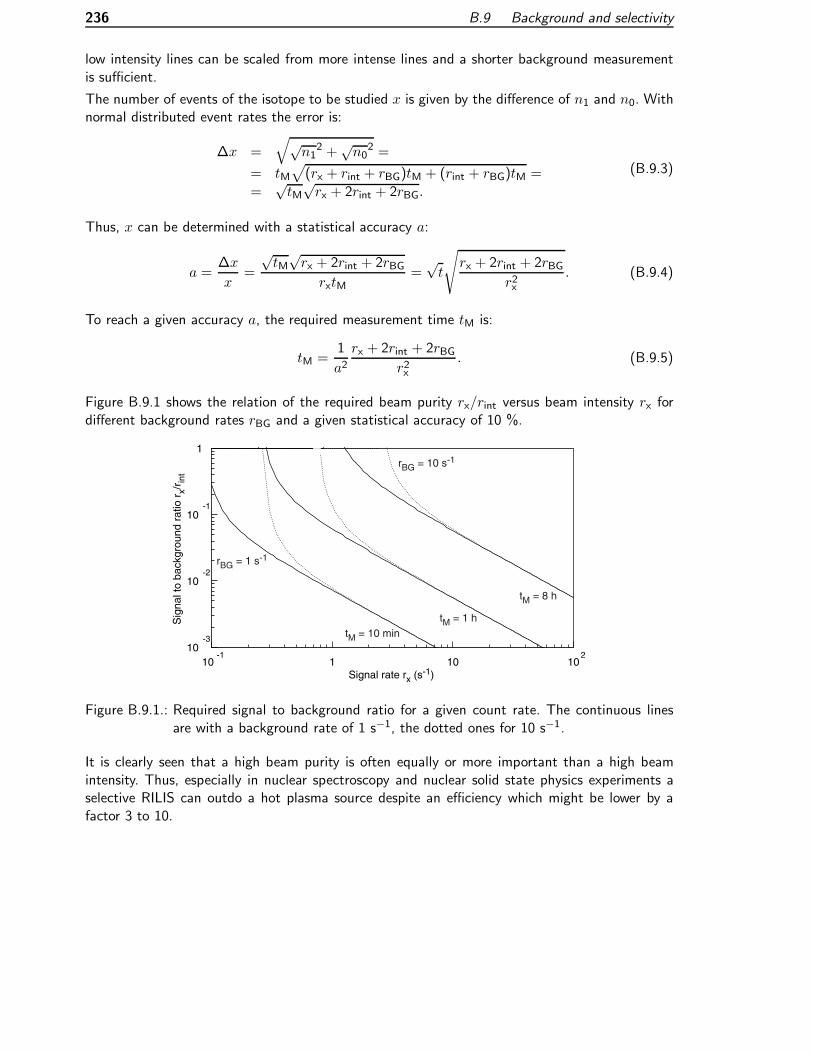
236 B.9 Background and selectivity
low intensity lines can be scaled from more intense lines and a shorter background measurementis sufficient.
The number of events of the isotope to be studied x is given by the difference of n1 and n0. Withnormal distributed event rates the error is:
∆x =√√
n12 +
√n02 =
= tM√
(rx + rint + rBG)tM + (rint + rBG)tM =
=√
tM√
rx + 2rint + 2rBG.
(B.9.3)
Thus, x can be determined with a statistical accuracy a:
a =∆x
x=
√tM
√rx + 2rint + 2rBG
rxtM=
√t
√rx + 2rint + 2rBG
r2x. (B.9.4)
To reach a given accuracy a, the required measurement time tM is:
tM =1
a2rx + 2rint + 2rBG
r2x. (B.9.5)
Figure B.9.1 shows the relation of the required beam purity rx/rint versus beam intensity rx fordifferent background rates rBG and a given statistical accuracy of 10 %.
10-3
10-2
10-1
1
10-1
1 10 102
Signal rate rx (s-1)
Sig
nal t
o ba
ckgr
ound
rat
io r
x/r in
t
rBG = 1 s-1
tM = 10 min
tM = 8 h
tM = 1 h
rBG = 10 s-1
Figure B.9.1.: Required signal to background ratio for a given count rate. The continuous linesare with a background rate of 1 s−1, the dotted ones for 10 s−1.
It is clearly seen that a high beam purity is often equally or more important than a high beamintensity. Thus, especially in nuclear spectroscopy and nuclear solid state physics experiments aselective RILIS can outdo a hot plasma source despite an efficiency which might be lower by afactor 3 to 10.

B.10 Experimental resonance width 237
B.10. Experimental resonance width
The experimental width δνres of a resonant laser transition (i,f) is determined by several contri-butions.
B.10.1. Natural linewidth
The finite lifetimes of the levels involved in the transition will cause a finite line width describedby a Lorentzian profile:
I(ν) =1
2π
δνnat(ν − ν0)2 + (δνnat/2)2
(B.10.1)
with ν0 the central frequency of the transition and the natural linewidth δνnat (FWHM):
δνnat = δνinat + δνfnat =1
2πτi+
1
2πτf. (B.10.2)
Typical lifetimes are in the range of some ns. Thus, the natural width is of the order of some tento hundreds of MHz which is much smaller than the contributions discussed below.
Only in the case of autoionizing states the lifetime is much shorter (10−15 − 10−10 s) and conse-quently the width significantly broader (GHz to THz). Therefore transitions to autoionizing statesare not used for scanning the frequency in spectroscopic applications.
B.10.2. Doppler width
Depending on the motion of the atom relative to the photon beam, the atom will “observe” aDoppler shifted frequency. In thermal equilibrium with the hot ionizer cavity the atoms will followa Maxwellian velocity distribution with the most probable velocity v =
√2kT/m. m is the mass
of the atom and T the temperature of the cavity.
The Doppler broadened spectral line is described by a Gaussian:
I(ν) = I0 exp
(−(ν − ν0)
2
ν0v
)= I0 exp
(−4 ln 2(ν − ν0)
2
δνD
). (B.10.3)
The full halfwidth δνD, called Doppler width, is:
δνD = ν0
√8kT ln 2
mc2= 7.16 · 10−7ν0
√T/K
M/(g/mol). (B.10.4)
For a 2000 C hot cavity and a transition in the visible range (λ0 = 500 nm) the Doppler widthvaries between 1.3 GHz (A = 238) and 8.4 GHZ (A = 6).
B.10.3. Collisional broadening
At a high gas pressure the mean time between two atomic collisions can get shorter than thenatural lifetime. The collisions will provoke non-radiative transitions between different levels. Thelevel population is disturbed and the lifetime is reduced. The resonance profile remains a Lorentzian,but the effective linewidth becomes:
δνeff = δνnat + δνcoll (B.10.5)
where the collisional broadening is proportional to the gas pressure p:
δνcoll = acoll p. (B.10.6)
The magnitude of acoll is some ten to hundred MHz per mbar gas pressure [Dem98]. It is negligiblein a hot cavity RILIS but can become important in a gas cell RILIS.

238 B.10 Experimental resonance width
B.10.4. Power broadening
Also a strong pumping of the atomic transition (i,f) with a laser beam will disturb the levelpopulation. Due to this saturation effect the width of the natural Lorentzian profile is broadenedto:
δνsat = δνnat√1 + S (B.10.7)
with the saturation parameter S given by:
S =2σ12I(ν)τ21
hν. (B.10.8)
Using equation (3.2.10) as expression for σ12 and assuming that the resonance width δνres isdominated by the Doppler broadening δνD gives:
S =g2λ
3
g1hc2δνDI(ν). (B.10.9)
In the case of much stronger pumping even a splitting of the resonance line into two peaks canoccur.
However, in the practical application of a RILIS it is more a problem that occasionally the laserpower is not sufficient rather than that far too much power is available. In the latter case the dyelaser power can be easily reduced. For spectroscopic applications the beam power of the scannedtransition is deliberately reduced by introduction of an absorber. Some ionization efficiency is lost,but the spectral resolution is increased.
B.10.5. Shape of the resonance curve
The widths of all Lorentzian contributions, i.e. natural linewidth, collisional broadening and powerbroadening, will add directly to the resonance width δνres. In a hot cavity RILIS normally theDoppler width will dominate the resonance width and the resonance is rather described by aGaussian. However, if the Lorentzian width becomes larger (e.g. by significant power broadening)for a correct description of the shape Gaussian and Lorentzian have to be folded, resulting in aVoigtian curve.
B.10.6. Laser bandwidth
The bandwidth of the dye lasers depends on the geometry of the used resonator cavity. In normaloperation the ISOLDE RILIS dye lasers have a large bandwidth of some 20 to 30 GHz. Thus,typically the experimentally observed resonance width is dominated by the laser bandwidth. Thisis useful since atomic physics effects (isotope shift, hyperfine splitting) should not reduce theionization efficiency of exotic isotopes.
However, for atomic spectroscopy applications a smaller bandwidth is required. By introductionof a Fabry-Perot etalon the dye laser bandwidth can be reduced to some GHz (depending on theetalon). The actual bandwidth of a single laser pulse is much smaller, but since the dye laser ispulsed, it has to pass the laser threshold 10000 times per second. Each time one of the possibleresonance modes will be randomly amplified and the frequency will “jump” from shot to shotwithin the quoted range. To reduce these wavelength fluctuations, one has to stabilize a singlelasing mode of the multi-mode laser. This can be achieved by “seeding”: i.e. the dye laser isalways pumped by a cw pumping laser and amplified with the pulsed CVL or Nd-YAG beam, seee.g. [Pin77]. An Ar+ laser provides 514.5 nm light which is close enough to the green line of theCVL (511 nm) or Nd-YAG (532 nm) laser to excite the same dye. Thus, it is ideal for seeding thedye laser.

B.11 Beta-delayed neutron emission 239
B.11. Beta-delayed neutron emission
For very neutron-rich nuclei the Qβ value often exceeds the neutron binding energy Sn of thedaughter nuclide. Thus, particle-unstable levels above the neutron separation threshold can bepopulated in beta-decay, leading to so-called beta-delayed neutron emission (βn). This decaymode was observed in neutron-rich fission products already in 1939 [Rob39] and was theoreticallyexplained soon after that [Boh39]. The average number of emitted neutrons per decay is called Pnvalue (probability of neutron emission). For extremely neutron-rich isotopes even multiple neutronemission can occur (for Qβ− > S2n, S3n, etc.). The respective individual branching ratios aredesignated P1n, P2n, . . . and the total Pn value is given by:
Pn = P1n + 2 · P2n + 3 · P3n + · · · . (B.11.1)
The neutron emission does not necessarily proceed to the ground state, but can also populateexcited states in A−1(Z − 1). The difference between the energy of the neutron unstable levelEx(
A(Z − 1)) and the populated level Ey(A−1(Z − 1)) is distributed as kinetic energy among the
emitted neutron and the recoiling rest nucleus respecting momentum conservation:
En =A − 1
A· (Ex(A(Z − 1))− Ey(
A−1(Z − 1))). (B.11.2)
The width of the energy distribution is given by the lifetime τy of the neutron-emitting level:
∆E =h
τ(B.11.3)
and slightly broadened by the recoil of the decay beta.
For most of the heavier nuclides the high level density leads to an overlap of the discrete neutron-emitting levels giving a more or less continuous neutron energy spectrum N(E) which can becharacterized by the mean energy En and the width σ. σ is the square root of the second momentof the energy distribution:
σ =
√∫(En − En)2N(E)dE∫
N(E)dE. (B.11.4)
Typically the energies of beta-delayed neutrons range from some ten keV to MeV. Due to thetechnological importance for the control of reactors, Pn values and neutron energy spectra havebeen studied for most beta-delayed neutron emitters in the fission product region, see e.g. [Rud91].
For very proton-rich nuclei the corresponding process is beta-delayed proton emission (βp)33. Thedetection of beta-delayed protons with ∆E/E telescopes is a good way for efficient and selectiveidentification of nuclei close to the proton dripline.
33In rare cases also other particles can be emitted after beta-decay, giving rise to decay modes like: βd, βt and βα.For an overview see e.g. [Han89].

240 B.11 Beta-delayed neutron emission
B.11.1. Detection of delayed neutrons
Several methods are used to detect neutrons and to determine their kinetic energy (see e.g. ref.[Kno89]):
1. Direct recoils from n-p-scattering in a hydrogen containing counter (gas or scintillator) areused in so-called “proton recoil detectors” for the detection of neutrons down to energies ofsome keV. In organic scintillators the neutron events are separated from gamma events bypulse shape discrimination.
2. For a time-of-flight (TOF) measurement the start signal is given by detection of a beta- orgamma-ray emitted in the decay and the stop signal by the detected neutron. With typicalTOF distances l ≈ 1 m and a timing resolution δt ≈ 1 ns, the achievable energy resolutionδEn is about 50 keV for 1 MeV neutrons.
δEn = 2Enδt
t=
(2E)32
l√
m. ≈ 50 · (En/MeV)
32 keV (B.11.5)
An alternative way, the TOF spectroscopy of the recoil atoms, is still under development,see ref. [Der95].
3. Also direct detection with an ionization chamber filled with 3He can provide an energyinformation. For slow neutrons the energy given to the subsequently detected fragments isjust the Q-value of the reaction:
3He + n → p + t, Q = 764 keV (B.11.6)
For higher energies the fragments carry additionally the kinetic energy of the incomingparticle and an energy Q + En is detected. Other contributions have to be taken intoaccount like elastic scattering on helium or competing channels opening at higher energies,e.g. (n,d). With a typical energy resolution δE ≤ 20 keV [Fra77], the energy of individualneutron peaks can be resolved with an accuracy better than about 4 keV.
In all these cases the cross-section and thus the detection efficiency decrease considerably athigher neutron energies. Only few detector arrays exist which are big enough to give a good TOFresolution and still cover a large solid angle. An example is the TONNERRE array, which wasspecially designed for delayed-neutron spectroscopy [Orr98, But00].
High detection efficiencies ( 10%) which are essential for the detection of very rare beta-delayedneutron emitters are obtained by moderating the neutrons before detection. 3He proportionalcounters are embedded into a moderating matrix of low-Z material, e.g. polyethylene (CH2)n.Loosing half of the kinetic energy in each collision with a hydrogen atom, the neutrons will bethermalized after about 25 collisions34. The time between emission and detection is thus somehundred µs, requiring a large time window for coincidences with the prompt signal from beta- orgamma detectors. With sufficient moderating material a flat response curve can be achieved whichis useful to determine Pn values for isotopes with an unknown neutron energy spectrum.
The direct energy information is lost through moderation, but from the mean range of the neutronsa rough energy information can be gained. An arrangement of 3He counters in concentric ringsof different radius embedded in a cylindrical moderator allows to combine the advantage of a flatenergy response while retaining some energy sensitivity. The total efficiency (obtained by summingthe count rates of all rings) is approximately constant over a large energy range (up to some MeV),but the ratio of detected neutrons in outer and inner rings gives an approximate information onEn. This technique was extensively used for measurement of delayed neutron energies of fissionproducts at TRISTAN [Ree81] and OSIRIS [Rud91].
34x ≈ log(
En25 meV
)/ log(2) with En given in eV.

B.11.2 Neutron long counter 241
B.11.2. Neutron long counter
We used the Mainz neutron long counter [Boh96] for all presented measurements of β-delayedneutrons. It consists of up35 to 64 3He proportional counters embedded in a polyethylene matrix.The counters are arranged in three concentric rings of 22, 20 and 22 counters. The tubes are ofthe type Reuter-Stokes RS-P4-0810-109, they are filled with 4000 torr of 3He (at 273 K) andsome percent of CO2 as quenching gas. The active length is 254 mm and the active volume is113.7 cm3. The complete detector is shielded against neutrons coming from outside by severallayers of boron carbide, cadmium and moderating material.
Due to the long moderation time β-n, γ-n or n-n coincidences are problematic to measure athigh count rates. However, with clean conditions (one or few distinguishable isotopes involved),the time spectra of the neutrons and the betas can be taken independently and after fittingthe spectra individually, the Pn value is calculated from the ratio of the derived amplitudes. Theindividual probabilities for multi-neutron emission (P2n, etc.) cannot be obtained in this way. Eithern-n-coincidences with fast neutron detectors (scintillators) or a special time-correlation technique[Ber99] has to be used.
The data were accumulated with a 8-channel multiscaling module (model 7884 from FAST ComTec[FAS]), which accepts event rates up to 1.5 MHz and has very low deadtime effects for lower eventrates. This is extremely important for a reliable lifetime determination. Taking decay data of short-lived nuclei, the dead-time can change significantly during each measurement cycle and it wouldbe very difficult to extract reliable lifetime information if a large dead-time correction has to beapplied.
35In experiments where less tubes were available, the missing ones in the outer ring were replaced by polyethyleneplugs and the resulting loss of detection efficiency was taken into account.

242 B.12 “Radioactive-Ion-Beam” facility or “Radioactive” Ion-Beam-facility?
B.12. “Radioactive-Ion-Beam” facility or “Radioactive”Ion-Beam-facility?
Due to the high intensities of radioactive beams which can be achieved at ISOLDE, measures haveto be taken for an efficient radiation protection. The target area and the separator room are wellshielded and closed during proton beam operation. Depending on the target and the irradiationhistory they can be accessed after a certain decay period (hours to days). The targets are removedby a robot.
With the most intense ion beams (maximum some 1011 ions per s) an equilibrium activity of up to10 Ci (including the daughter decays) can be reached at the collection point. However, such strongbeams of isotopes rather close to stability are only used for off-line applications. The samples arecollected in dedicated collection chambers with appropriate shielding and remote handling.
Applications in nuclear spectroscopy involve much smaller activities (a too strong beam would justsaturate all detectors), and the resulting dose rate for the experimentalists is negligible. As a typicalexample figure B.12.1 shows the radiation level measured with a monitor close to the experimentalset-up of a nuclear spectroscopy experiment where beams of heavy copper and cadmium isotopeswere used [IS365].
0,0
0,1
0,2
0,3
0,4
0,5
0,6
0,7
0,8
0,9
1,0
14.Okt
15.Okt
16.Okt
17.Okt
18.Okt
19.Okt
20.Okt
21.Okt
22.Okt
23.Okt
24.Okt
Dos
e eq
uiva
lent
(µS
v/h)
Figure B.12.1.: Monitored dose rate close to the beam position LA1 in the ISOLDE hall. Note thatthe detector (a hydrogen ionization chamber) is calibrated to measure directlythe dose equivalent of fast neutrons. The response to gammas will result in anoverestimation of the gamma dose equivalent by a factor of about three.
An experimentalist who spends during one week 15 h daily close to this set-up would get anadditional (above natural background) dose equivalent of less than 40 µSv. This can be comparedwith the average annual dose equivalent of 2000 µSv or to other sources of activity. Assume thathe decides after the successful experiment to climb some high mountains of the Western Alps (e.g.the nearby Mont Blanc). Staying for one week at 4000 m altitude he will get from cosmic radiationalso an additional dose equivalent of about 40 µSv. Going to present his results on a conference inthe U.S. he will be exposed to cosmic radiation and receive during a return flight Geneva-Chicagoalso about 40 µSv.
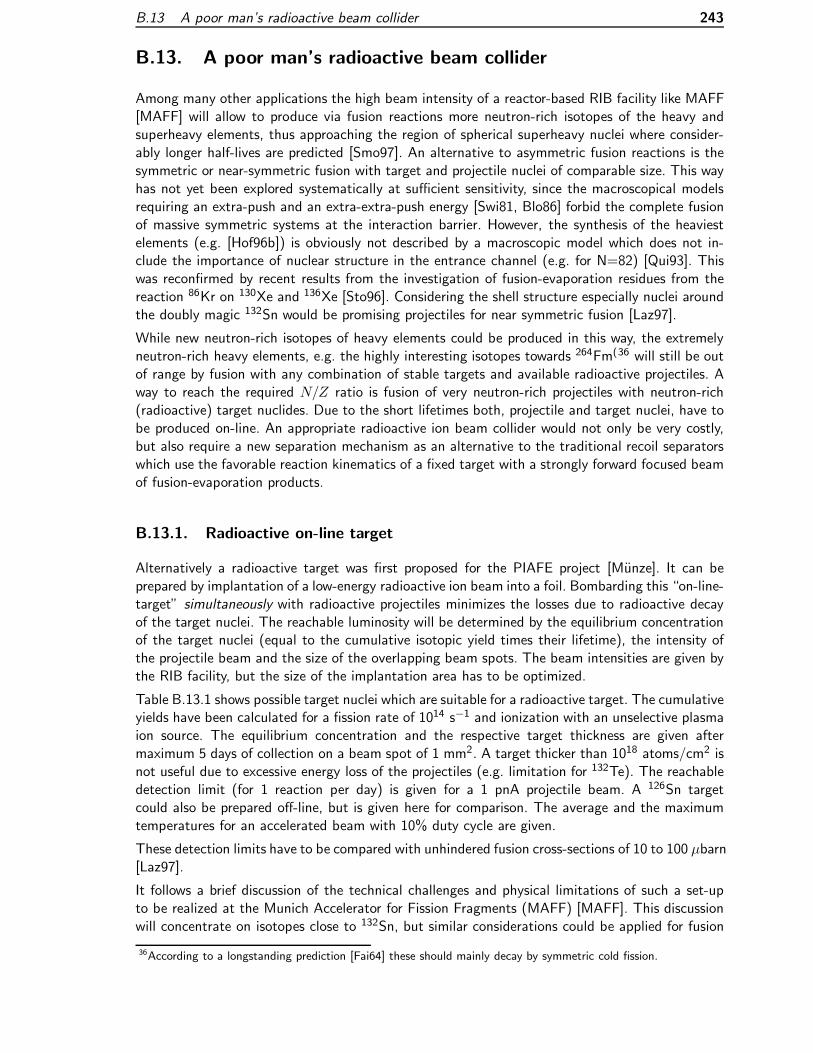
B.13 A poor man’s radioactive beam collider 243
B.13. A poor man’s radioactive beam collider
Among many other applications the high beam intensity of a reactor-based RIB facility like MAFF[MAFF] will allow to produce via fusion reactions more neutron-rich isotopes of the heavy andsuperheavy elements, thus approaching the region of spherical superheavy nuclei where consider-ably longer half-lives are predicted [Smo97]. An alternative to asymmetric fusion reactions is thesymmetric or near-symmetric fusion with target and projectile nuclei of comparable size. This wayhas not yet been explored systematically at sufficient sensitivity, since the macroscopical modelsrequiring an extra-push and an extra-extra-push energy [Swi81, Blo86] forbid the complete fusionof massive symmetric systems at the interaction barrier. However, the synthesis of the heaviestelements (e.g. [Hof96b]) is obviously not described by a macroscopic model which does not in-clude the importance of nuclear structure in the entrance channel (e.g. for N=82) [Qui93]. Thiswas reconfirmed by recent results from the investigation of fusion-evaporation residues from thereaction 86Kr on 130Xe and 136Xe [Sto96]. Considering the shell structure especially nuclei aroundthe doubly magic 132Sn would be promising projectiles for near symmetric fusion [Laz97].
While new neutron-rich isotopes of heavy elements could be produced in this way, the extremelyneutron-rich heavy elements, e.g. the highly interesting isotopes towards 264Fm(36 will still be outof range by fusion with any combination of stable targets and available radioactive projectiles. Away to reach the required N/Z ratio is fusion of very neutron-rich projectiles with neutron-rich(radioactive) target nuclides. Due to the short lifetimes both, projectile and target nuclei, have tobe produced on-line. An appropriate radioactive ion beam collider would not only be very costly,but also require a new separation mechanism as an alternative to the traditional recoil separatorswhich use the favorable reaction kinematics of a fixed target with a strongly forward focused beamof fusion-evaporation products.
B.13.1. Radioactive on-line target
Alternatively a radioactive target was first proposed for the PIAFE project [Munze]. It can beprepared by implantation of a low-energy radioactive ion beam into a foil. Bombarding this “on-line-target” simultaneously with radioactive projectiles minimizes the losses due to radioactive decayof the target nuclei. The reachable luminosity will be determined by the equilibrium concentrationof the target nuclei (equal to the cumulative isotopic yield times their lifetime), the intensity ofthe projectile beam and the size of the overlapping beam spots. The beam intensities are given bythe RIB facility, but the size of the implantation area has to be optimized.
Table B.13.1 shows possible target nuclei which are suitable for a radioactive target. The cumulativeyields have been calculated for a fission rate of 1014 s−1 and ionization with an unselective plasmaion source. The equilibrium concentration and the respective target thickness are given aftermaximum 5 days of collection on a beam spot of 1 mm2. A target thicker than 1018 atoms/cm2 isnot useful due to excessive energy loss of the projectiles (e.g. limitation for 132Te). The reachabledetection limit (for 1 reaction per day) is given for a 1 pnA projectile beam. A 126Sn targetcould also be prepared off-line, but is given here for comparison. The average and the maximumtemperatures for an accelerated beam with 10% duty cycle are given.
These detection limits have to be compared with unhindered fusion cross-sections of 10 to 100 µbarn[Laz97].
It follows a brief discussion of the technical challenges and physical limitations of such a set-upto be realized at the Munich Accelerator for Fission Fragments (MAFF) [MAFF]. This discussionwill concentrate on isotopes close to 132Sn, but similar considerations could be applied for fusion
36According to a longstanding prediction [Fai64] these should mainly decay by symmetric cold fission.
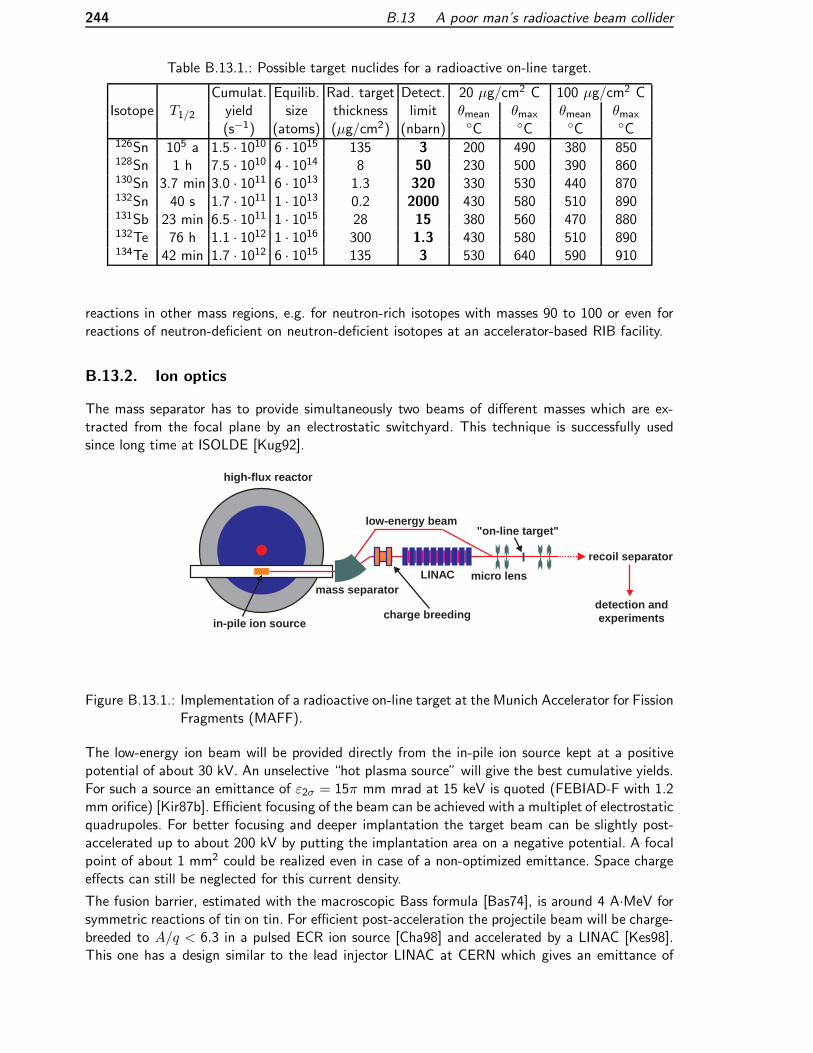
244 B.13 A poor man’s radioactive beam collider
Table B.13.1.: Possible target nuclides for a radioactive on-line target.
Cumulat. Equilib. Rad. target Detect. 20 µg/cm2 C 100 µg/cm2 CIsotope T1/2 yield size thickness limit θmean θmax θmean θmax
(s−1) (atoms) (µg/cm2) (nbarn) C C C C126Sn 105 a 1.5 · 1010 6 · 1015 135 3 200 490 380 850128Sn 1 h 7.5 · 1010 4 · 1014 8 50 230 500 390 860130Sn 3.7 min 3.0 · 1011 6 · 1013 1.3 320 330 530 440 870132Sn 40 s 1.7 · 1011 1 · 1013 0.2 2000 430 580 510 890131Sb 23 min 6.5 · 1011 1 · 1015 28 15 380 560 470 880132Te 76 h 1.1 · 1012 1 · 1016 300 1.3 430 580 510 890134Te 42 min 1.7 · 1012 6 · 1015 135 3 530 640 590 910
reactions in other mass regions, e.g. for neutron-rich isotopes with masses 90 to 100 or even forreactions of neutron-deficient on neutron-deficient isotopes at an accelerator-based RIB facility.
B.13.2. Ion optics
The mass separator has to provide simultaneously two beams of different masses which are ex-tracted from the focal plane by an electrostatic switchyard. This technique is successfully usedsince long time at ISOLDE [Kug92].
high-flux reactor
in-pile ion source
low-energy beam
mass separator
"on-line target"
LINAC micro lens
recoil separator
detection andexperimentscharge breeding
Figure B.13.1.: Implementation of a radioactive on-line target at the Munich Accelerator for FissionFragments (MAFF).
The low-energy ion beam will be provided directly from the in-pile ion source kept at a positivepotential of about 30 kV. An unselective “hot plasma source” will give the best cumulative yields.For such a source an emittance of ε2σ = 15π mm mrad at 15 keV is quoted (FEBIAD-F with 1.2mm orifice) [Kir87b]. Efficient focusing of the beam can be achieved with a multiplet of electrostaticquadrupoles. For better focusing and deeper implantation the target beam can be slightly post-accelerated up to about 200 kV by putting the implantation area on a negative potential. A focalpoint of about 1 mm2 could be realized even in case of a non-optimized emittance. Space chargeeffects can still be neglected for this current density.
The fusion barrier, estimated with the macroscopic Bass formula [Bas74], is around 4 A·MeV forsymmetric reactions of tin on tin. For efficient post-acceleration the projectile beam will be charge-breeded to A/q < 6.3 in a pulsed ECR ion source [Cha98] and accelerated by a LINAC [Kes98].This one has a design similar to the lead injector LINAC at CERN which gives an emittance of

B.13.3 Collection foil 245
about ε4rms = 10π mm mrad at 4.2 A·MeV output energy [Las96]. The focusing of the projectilebeam will be done by a multiplet of strong magnetic quadrupoles. Such a microlens, capable tofocus ion beams with up to 200 MeV·q2/A to sub-µm dimensions, has just been constructed atthe Technische Universitat in Munchen [Hin97a]. For our case the requirements concerning thebeam size are much less stringent than in real microbeam applications (the current density will belimited by other considerations, see below), but the design of this microlens allows to guide andfocus both, target and projectile beam, from the same side onto the target.
While the magnetic rigidity varies between both beams only by a factor of two to six (for 200keV and 30 keV target beams respectively), the electrical rigidity differs by two to three orders ofmagnitude. This allows to set the magnetic elements for the high-energy beam and focus the low-energy beam nearly independently by applying additional electrical multipole fields and optionallyeven a longitudinal acceleration voltage. The electrical multipoles inside the Munich microlens canhold a voltage of up to 4 kV [Dolli] which is largely sufficient to control the low-energy ion beamwith up to 200 keV energy. Both beams will be combined with an electrostatic deflector in frontof the microlens.
The fusion products will be separated from the primary beam by the MORRIS separator [Thi97].Its first part consists of a Wien-filter type recoil separator similar to SHIP at the GSI [Mun79].With an angular acceptance of about 50 mrad most fusion products will be transmitted even fora highly focused beam spot.
B.13.3. Collection foil
The key part of an on-line collected target is the collection foil. Its thickness has to be sufficientto be mechanically stable and stop the target beam, but thin enough to avoid too high energyloss of the projectile beam37 and the fusion products. Foils of low-Z materials (Be, C, . . . ) with20 to 100 µg/cm2 thickness have not only a good ratio of mechanical stability to energy loss, butmoreover avoid the losses of target nuclei due to backscattering.
The electrical conductivity of the foil has to be sufficient to avoid a charging-up due to the depositedcharge of the low-energy beam and emitted secondary electrons. Materials with a specific electricalresistivity < 100 Ωm will keep the potential difference small enough to prevent any deteriotationof the low-energy beam focus. Most metal and graphite foils fulfill this requirement while insulatorslike diamond-like graphite or pure Al2O3 can cause problems.
Foil temperature
Several sources contribute to the heating of the foil:
• The low energy beam will deposit its full kinetic energy in the immediate vicinity of theimpact (some nm straggling). With a non-selective ion source the mass yield may reach600 nA (at mass 134) and thus contribute up to 18 mW heating for 30 keV implantationenergy and up to 120 mW for 200 keV implantation energy respectively.
• The stopping power of 4 A·MeV Sn in carbon is about 72 MeV per mg/cm2 [Bie80], i.e. fora 100 µg/cm2 foil and 1 pnA of 132Sn the accelerated beam deposits about 7 mW.
• Only a small part of the energy released in the radioactive decay of the target atoms willcontribute to a local heating. Most will be deposited further away by the long range betaparticles.
37The fusion excitation function has a narrow width, typically about 10 MeV for asymmetric fusion [Hof95].

246 B.13 A poor man’s radioactive beam collider
• Also the energy loss of the fusion products can be neglected due to their low productionrate.
The deposited energy will mainly be emitted by radiation. Neglecting the thermal conduction inthe thin foil an upper limit for the foil temperature can be estimated. Depending on the duty cycleof the accelerated beam, the target temperature will fluctuate more or less around the averagetemperature. Due to the small heat capacity the characteristic time for heating and cooling is inthe millisecond range (see [Mar79] for an analytical description).
The heating of the foil has several side effects: by annealing structural damages created by theparticle impact the lifetime of the foil can be considerably prolonged. On the other hand an over-heating will reduce the lifetime due to evaporation of foil material. Already before, the implantedradioactive isotopes start to migrate from the implantation region to other parts of the foil oreven leave it completely. While for tin no large release is expected at the quoted temperatures,the more volatile elements antimony and tellurium start to escape much earlier. Higher targettemperatures could be tolerated if the implanted nuclides form an appropriate chemical compoundwhich hinders migration and release (e.g. very slow diffusion of Te in Si [Zhd77]). In a suitabletarget matrix the volatilization enthalpy can exceed the sublimation enthalpy considerably, thuskeeping the implanted atoms bound even at temperatures above the boiling point.
Foil lifetime
To run most of the time “in saturation” after buildup to the maximum concentration of targetatoms, the foil lifetime should be at least of the order of days. The irradiation damage mechanismsin carbon foils were studied thoroughly [Dol89] and empirical formulae were proposed to estimatethe lifetime of a carbon foil bombarded by energetic heavy ions [Fri77, Nic82, Kop87]. With aprojectile beam of 1 pnA lifetimes of weeks and longer are predicted. However, for the low energybeam these formulae cannot be applied since the ions are stopped close to the surface (20 to 110nm range depending on the implantation energy) while most of the bulk material stays unaffectedof the recoil cascades. Also the structural changes due to a high concentration of implanted ions aredifficult to evaluate. Therefore the foil lifetime should be tested experimentally with an appropriatestable ion beam.
B.13.4. Conclusion
It has been shown that a “poor man’s radioactive beam collider” realized by on-line collection ofradioactive ions on a target foil could attain a detection limit which is orders of magnitude belowthe predicted unhindered fusion cross-sections. Since the reaction rate depends on the productof the intensities of projectile and target beams, the natural place for such a radioactive on-linetarget is a reactor-based RIB facility providing by far the highest yields in the region around 132Sn.While carbon foils are suitable for the collection of tin beams, for very volatile elements specialfoil materials have to be chosen to prevent a rapid release of the radioactive nuclides.
The specific requirements of a radioactive on-line target (e.g. the parallel separation of at leasttwo masses) can be foreseen at MAFF without big additional effort as interesting supplement tothe huge physics program with stable targets.
The largest uncertainty lies however in the expected fusion cross-sections for neutron-rich systems.It is difficult to quantify how the shell stabilization affects the fusion probability and the theoriesdiffer significantly in their predictions. Also complementary reaction mechanisms like multinu-cleon transfer from neutron-rich projectiles to trans-uranium targets should be considered [Fri99].Another possible way to produce neutron-rich superheavy isotopes is the indirect population viaalpha decay chains from even heavier isotopes. Each alpha decay removes an equal number of

B.13.4 Conclusion 247
protons and neutrons from the nuclide and thus further increases the N/Z ratio. With the veryhigh production cross-section recently observed for the possible production of element 118 [Nin99]and an efficient trapping mechanism for the recoil nuclei (buffer gas cell) this way could becomecompetitive for the production of very neutron-rich superheavy elements.


Bibliography
[Afa77] V.P. Afanas’ev, V.A. Obukhov and V.I. Raiko, ‘Thermoionization efficiency in the ionsource cavity’, Nucl. Instr. Meth. 145 (1977) 533–536.
[Ahm83] S.A. Ahmad et al., ‘Determination of nuclear spins and moments in a series of radiumisotopes’, Phys. Lett. B 133 (1983) 47–52.
[Alb78] D.E. Alburger et al., ‘Core excited T = 2 levels in A = 12 from studies of 12Be’,Phys. Rev. C 17 (1978) 1525–1530.
[Ale63] J.M. Alexander, C. Baltzinger and M. Frances Gazdik, ‘Cross sections and recoil studiesof reactions of U238 with protons of 0.5 to 6.2 GeV’, Phys. Rev. C 129 (1963) 1826–1834.
[Ale80] K. Aleklett, P. Hoff, E. Lund and G. Rudstam, ‘Delayed neutron emission probabilitiesof the precursors 89,90,91Br and 139,140,141I’, Z. Phys. A 295 (1980) 331–332.
[Alk83] G.D. Alkhazov et al., ‘Measurement of isotropic variations in the charge radii ofeuropium nuclei by the method of three-stepped laser photoionization of atoms’,JETP Lett. 37 (1983) 274–278.
[Alk87] G.D. Alkhazov et al., ‘Studies of the nuclear charge radii and electromagnetic momentsof radioactive Nd, Sm, Eu, Ho, Tm isotopes by laser resonance atomic photoionization’,Preprint 1309, Leningrad Nucl. Phys. Inst., Leningrad (1987).
[Alm57] O. Almen and K.O. Nielsen, ‘Systematic investigation of a magnetic ion source for anelectromagnetic isotope separator’, Nucl. Instr. Meth. 1 (1957) 302–322.
[Als70] J. Alstad, B. Bergersen, T. Jahnsen, A.C. Pappas and T. Tunaal, ‘Tellurium tetra-chloride as a target for production of tin and antimony’, CERN Report 70-3, Geneva(1970).
[Alt86] G.D. Alton, ‘Semi-empirical mathematical relationships for electropositive adsorbateinduced work function changes’, Surf. Sci. 175 (1986) 226–240.
[Alt96] G.D. Alton, ‘Selection of targets and ion sources for radioactive ion beam generationat the Holifield radioactive ion beam facility’, Rev. Sci. Instr. 67 (1996) 3831–3842.
[Ama67] I. Amarel et al., ‘On-line mass-spectrometric method for the study of short-lived Rb,Cs and Na isotopes’, Ark. Fys. 36 (1967) 77–89.
[Amb71] R.V. Ambartsumyan, V.N. Kalinin and V.S. Letokhov, ‘Two-step photoionization ofrubidium atoms by laser radiation’, JETP Lett. 13 (1971) 217–219.
[Amb75] R.V. Ambartsumyan, G.I. Bekov, V.S. Letokhov and V.I. Mishin, ‘Excitation of high-lying state of the sodium atom by dye-laser radiation and their autoionization in anelectric field’, JETP Lett. 21 (1975) 279–281.
[Amb76] R.V. Ambartsumyan et al., ‘Selective two-step ionization of rubidium by laser radiation’,Sov. Phys. JETP 43 (1976) 866–872.
[Ame90] F. Ames et al., ‘A high-temperature laser ion source for trace analysis and other appli-cations’, Appl. Phys. B 51 (1990) 200–206.
249

250 Bibliography
[Ame98] F. Ameil et al., ‘β-decay half-lives of very neutron-rich isotopes of elements from Ti toNi’, Eur. Phys. J. A 1 (1998) 275–283.
[Ami76] S. Amiel, G. Engler, Y. Nir-El and M. Shmid, ‘Experiments with the surface ionizationintegrated target-ion source of the SOLIS’, Nucl. Instr. Meth. 139 (1976) 305–309.
[Ana92] A. Anastassov et al., ‘Nuclear charge radii changes of uranium and hafnium isotopesdetermined by laser spectroscopy’, Hyp. Int. 74 (1992) 31–40.
[And69] V.N. Andreev, V.G. Nedopekin and V.I. Rogov, ‘Long-range particles with Z > 2 internary fission of U235 by thermal neutrons’, Sov. J. Nucl. Phys. 8 (1969) 22–28.
[And86] S.V. Andreev, V.I. Mishin and V.S. Letokhov, ‘High-efficiency laser resonance photoion-ization of Sr atoms in a hot cavity’, Opt. Comm. 57 (1986) 317–320.
[And87] S.V. Andreev, V.S. Letokhov and V.I. Mishin, ‘Laser resonance photoionization spec-troscopy of Rydberg levels in Fr’, Phys. Rev. Lett. 59 (1987) 1274–1276.
[And91] H. Andreasen et al., ‘Mixtures of molten metals and graphite as targets for on-line massseparators’, Nucl. Instr. Meth. B 58 (1991) 247–251.
[And99] T. Andersen, H.K. Haugen and H. Hotop, ‘Binding energies in atomic negative ions:III’, J. Phys. Chem. Ref. Data 28 (1999) 1511–1533.
[Ans86] M. Anselment et al., ‘The odd-even staggering of the nuclear charge radii of Pb iso-topes’, Nucl. Phys. A 451 (1986) 471–480.
[Aoi97] N. Aoi et al., ‘β-spectroscopy of 11Li and 14Be – with a β-n-γ triple coincidence method’,Nucl. Phys. A 616 (1997) 181c–188c.
[Arj86] J. Arje et al., ‘The ion guide isotope separator on-line, IGISOL’, Nucl. Instr. Meth. A247 (1986) 431–437.
[Arl93] H.F. Arlinghaus et al., ‘Quantitative and sensitive profiling of dopants and impurities insemiconductors using sputter-initiated resonance ionization spectroscopy’, J. Vac. Sci.Technol. A 11 (1993) 2317–2323.
[Arm76] P. Armbruster et al., ‘The recoil separator LOHENGRIN: performance and special fea-tures for experiments’, Nucl. Instr. Meth. 139 (1976) 213–222.
[Arm80] J.A. Armstrong, J.J. Wynne and F.S. Tomkins, ‘Bound, 7snp1P o1 series in Ra I: mea-surements and predictions’, J. Phys. B 13 (1980) L133–L137.
[Arn87] E. Arnold et al., ‘Nuclear spin and magnetic moment of 11Li’, Phys. Lett. B 197 (1987)311–314.
[Arn92] E. Arnold et al., ‘Quadrupole moment of 11Li’, Phys. Lett. B 281 (1992) 16–19.
[AS87] F. Ajzenberg-Selove, ‘Energy levels of light nuclei A = 18 − 20’, Nucl. Phys. A 475(1987) 1–198.
[AS88] F. Ajzenberg-Selove, ‘Energy levels of light nuclei A = 5 − 10’, Nucl. Phys. A 490(1988) 1–225.
[AS90] F. Ajzenberg-Selove, ‘Energy levels of light nuclei A = 11 − 12’, Nucl. Phys. A 506(1990) 1–158.
[AS91] F. Ajzenberg-Selove, ‘Energy levels of light nuclei A = 13 − 15’, Nucl. Phys. A 523(1991) 1–196.
[Ase91a] S.A. Aseyev, Yu.A. Kudryavtsev, V.S. Letokhov and V.V. Petrunin, ‘Laser detection ofthe rare isotope 3He at concentrations as low as 10−9’, Opt. Lett. 16 (1991) 514–516.
[Ase91b] S.A. Aseyev, Yu.A. Kudryavtsev, V.S. Letokhov and V.V. Petrunin, ‘A method of de-tecting the rare isotopes 85Kr and 81Kr by means of collinear laser photoionization ofatoms in an accelerated beam’, J. Phys. B 24 (1991) 2755–2763.

Bibliography 251
[Asg75] M. Asghar et al., ‘The Pn values of the 235U(nth,f) produced precursors in the masschains 90, 91, 93-95, 99, 134 and 137-139’, Nucl. Phys. A 247 (1975) 359–376.
[Ask70] J. Askill, Tracer Diffusion Data for Metals, Alloys and Simple Oxides, IFI/Plenum, NewYork (1970).
[ATOS] http://www.atos-online.de.
[Aud86] G. Audi et al., ‘Mass-spectrometric measurements of exotic Rb, Cs and Fr isotopes’,Nucl. Phys. A 449 (1986) 491–518.
[Aud95] G. Audi and A.H. Wapstra, ‘The 1995 update to the atomic mass evaluation’,Nucl. Phys. A 595 (1995) 409–480.
[Aud97] G. Audi, O. Bersillon, J. Blachot and A.H. Wapstra, ‘The Nubase evaluation of nuclearand decay properties’, Nucl. Phys. A 624 (1997) 1–124.
[Bac97] H. Backe et al., ‘A compact apparatus for mass selective resonance ionization spec-troscopy in a buffer gas cell’, Nucl. Instr. Meth. B 126 (1997) 406–410.
[Bac98] H. Backe et al., ‘Isotope shift measurements for superdeformed fission isomeric states’,Phys. Rev. Lett. 80 (1998) 920–923.
[Bak90] H. Bakker et al., Diffusion in Solid Metals and Alloys, vol. III/26 of Landolt-Bornstein,Springer, Berlin (1990).
[Bal74] S.J. Balestrini and L. Forman, ‘Independent fission yields of Rb and Cs from 238Uinduced by fission-spectrum neutrons’, Phys. Rev. C 10 (1974) 1872–1879.
[Bal94] ‘Coating materials and targets, Catalogue’, Balzers, Liechtenstein (1994).
[Barke] James Barker, priv. comm.
[Bar77] D.M. Barrus and R.L. Blake, ‘Technique for producing ultrathin polypropylene films’,Rev. Sci. Instr. 48 (1977) 116–117.
[Bar97] A.E. Barzakh, V.P. Denisov, D.V. Fedorov, S.Yu. Orlov and M.D. Seliverstov, ‘A mass-separator laser ion source’, Nucl. Instr. Meth. B 126 (1997) 85–87.
[Bar98a] A.E. Barzakh et al., ‘Application of the laser ion source for isotope shift and hyperfinestructure investigations’, in [ENA98], pp. 94–97.
[Bar98b] A.E. Barzakh et al., ‘Isotope shift and hyperfine structure measurements for 155Yb bylaser ion source technique’, Eur. Phys. J. A 1 (1998) 3–5.
[Bar99] E. Baron, ‘High intensities for SISSI and SPIRAL in 1999’, Nouvelles du GANIL 64(1999) 10–11.
[Bar00] A.E. Barzakh et al., ‘Mean square charge radii of the neutron-deficient rare-earth iso-topes in the region of the nuclear shell N = 82 measured by the laser ion sourcespectroscopy technique’, Phys. Rev. C 61 (2000) 034304.
[Bas74] R. Bass, ‘Fusion of heavy nuclei in a classical model’, Nucl. Phys. A 231 (1974) 45–63.
[Bas80] R. Bass, Lecture notes in physics: Deep-inelastic and fusion reactions with heavy ions,vol. 117, Springer, Berlin, 1980, pp. 281–293.
[Bau87] F. Baumgartner, K. Krebs and B. Merte, ‘Zur Emission von Spaltprodukten undTransuranen aus hochradioaktivem Abfall zwischen 200 und 1100 C’, Kerntechnik51 (1987) 151–156.
[Bau92a] W. Baum et al., ‘Light charged particles (Z ≤ 8) in 235U(nth,f) and 241Am(nth,f)’, in[BKS92], pp. 477–479.
[Bau92b] Wolf Baum, Teilchenbegleitete Spaltung von 235U und 242Am, Ph.D. thesis, TH Darm-stadt (1992).

252 Bibliography
[Bay81] R. Bayer, Z. Dlouhy, J. Svanda and I. Wilhelm, ‘A multiparameter system for heavynuclei fission study’, Czech. J. Phys. B 31 (1981) 1273–1285.
[Bec96] H. Becquerel, ‘Sur les radiations invisibles emises par les corps phosphorescents’, C. R.Acad. Sci. Paris 122 (1896) 501.
[Bec82] F.S. Becker and K.L. Kompa, ‘The practical and physical aspect of uranium isotopeseparation with lasers’, Nucl. Techn. 58 (1982) 329–353.
[Bek78a] G.I. Bekov, V.S. Letokhov, O.I. Matveev and V.I. Mishin, ‘Observation of a long-livedautoionization state in the spectrum of the gadolinium atom’, JETP Lett. 28 (1978)283–285.
[Bek78b] G.I. Bekov, V.S. Letokhov, O.I. Matveev and V.I. Mishin, ‘Single-atom detection ofytterbium by selective laser excitation and field ionization from Rydberg states’, Opt.Lett. 3 (1978) 159–161.
[Bek81] G.I. Bekov, A.N. Zherikhin, V.S. Letokhov, V.I. Mishin and V.N. Fedoseev, ‘Differencein the yields of even and odd Yb isotopes in multistep photoionization by polarized laserbeams’, JETP Lett. 33 (1981) 450–453.
[Bek83] G.I. Bekov and V.S. Letokhov, ‘Laser atomic photoionization spectral analysis of ele-ment traces’, Appl. Phys. B 30 (1983) 161–176.
[Bek84a] G.I. Bekov, G.A. Maksimov, D.N. Nikogosyan and V.N. Radaev, ‘Enhancement of theselectivity of laser photoionization analysis in the case of two-pulse interaction of anelectric field with Rydberg atoms’, Sov. J. Quant. Electron. 14 (1984) 852–853.
[Bek84b] G.I. Bekov et al., ‘Ruthenium in the ocean’, Nature 312 (1984) 748–750.
[Bek85] G.I. Bekov, V.S. Letokhov and V.N. Radaev, ‘Laser photoionization spectroscopy ofruthenium traces at the level of 1 part in 1012’, J. Opt. Soc. Amer. B 2 (1985) 1554–1560.
[Bek87] G.I. Bekov, A.T. Tursunov, G. Khasanov and N.B. Eshkobilov, ‘Laser photoionizationspectroscopy of highly excited states of gold atoms’, Opt. Spectr. (USSR) 62 (1987)163–166.
[Bel80] B.N. Belyaev, V.D. Domkin, Yu.G. Korobulin, L.N. Andronenko and G.E. Solyakin, ‘Rband Cs isotopic distributions from 1 GeV proton fission of 238U’, Nucl. Phys. A 348(1980) 479–492.
[Benll] Jose Benlliure, priv. comm.
[Ben96] T. von Egidy et al., eds., ‘Int. Workshop on Research with Fission Fragments, Benedik-tbeuern, October 1996’, World Scientific, Singapore, 1997.
[Ben97] J.R.J. Bennett, ‘Targets for production of high intensity radioactive ion beams’, Nucl. In-str. Meth. B 126 (1997) 105–112.
[Ben98] J. Benlliure, A. Grewe, M. de Jong, K.H. Schmidt and S. Zhdanov, ‘Calculated nuclideproduction yields in relativistic collisions of fissile nuclei’, Nucl. Phys. A 628 (1998)458–478.
[Ben99a] J. Benlliure et al., ‘Fission investigation in Au+p collisions at 800A MeV’, Nucl. Phys. AA654 (1999) 833c–836c.
[Ben99b] J. Benlliure et al., ‘Possibilities for the production of non-stable isotopes’, in ‘Proc. ofthe XXXVII Int. Winter Meeting on Nuclear Physics, Bormio’, 1999.
[Ben99c] J.R.J. Bennett et al., ‘Measurement of intense beams of 11Li from a tantalum foiltarget’, Nucl. Instr. Meth. B 155 (1999) 515–517.
[Ber69] E.Ye. Berlovich and Yu.N. Novikov, ‘Delayed nuclear fission’, Phys. Lett. 29B (1969)155–156.

Bibliography 253
[Ber89] H. Bergstrom, W.X. Peng and A. Persson, ‘Two different types of hollow-cathodedischarges used for high resolution laser spectroscopy on copper’, Z. Phys. D 13 (1989)203–206.
[Ber91] M. Bernas et al., ‘Discovery of neutron-rich Co and Fe isotopes in 239Pu(nth,f): yieldsand half-lives’, Phys. Rev. Lett. 67 (1991) 3661–3664.
[Ber95] Dan Berkovits, Laser and accelerator mass spectrometry, Ph.D. thesis, Hebrew Univer-sity of Jerusalem (1995).
[Ber99] U.C. Bergmann et al., ‘New information on β-delayed neutron emission from 12,14Be’,Nucl. Phys. A 658 (1999) 129–145.
[Bet66] H.D. Betz et al., ‘The average charge of stripped heavy ions’, Phys. Lett. 22 (1966)643–644.
[Bey71] G.J. Beyer, E. Herrmann, A. Piotrowski, V.J. Raiko and H. Tyrroff, ‘A new method forrare-earth isotope separation’, Nucl. Instr. Meth. 96 (1971) 437–439.
[Bey77] G.J. Beyer, W.D. Fromm and A.F. Novgorodov, ‘Trace diffusion of different nuclearreaction products in polycrystalline tantalum’, Nucl. Instr. Meth. 146 (1977) 419–430.
[Bey78] G.J. Beyer, O. Knotek, M. Jachim, J. Jushkevic and A.F. Novgorodov, ‘Selektive Gewin-nung kurzlebiger neutronendefizierter Nuklide des Yttriums, Strontiums und Rubidiumsbei Verwendung von Molybdan bzw. Zirkonium als on-line Festkorpertargetmaterial’,Nucl. Instr. Meth. 148 (1978) 543–551.
[Bey81] G.J. Beyer et al., ‘Fast isobaric separation at the collector of ISOL-facilities’, Nucl. In-str. Meth. 186 (1981) 401–407.
[Bey98] G.J. Beyer, ‘Medical applications of radioactive ion beams’, in [PIAFE], 1998, p. 29.
[Bez97] V.I. Beznosjuck, D.V. Fedorov, S.Yu. Orlov, M.D. Seliverstov and V.I. Tikhonov, ‘Re-duction of the thermoionic current in the laser ion source’, Nucl. Instr. Meth. B 126(1997) 92–94.
[Bha93] M.R. Bhat, ‘Nuclear data sheets update for A = 70’, Nucl. Data Sheets 68 (1993)117–63.
[Bie80] J.P. Biersack and L.G. Haggmark, ‘A Monte Carlo computer program for the transportof energetic ions in amorphous targets’, Nucl. Instr. Meth. 174 (1980) 257–269.
[Bil97] J. Billowes et al., ‘First collinear laser spectroscopy measurements of radioisotopes froman IGISOL ion source’, Nucl. Instr. Meth. B 126 (1997) 416–418.
[Bis85a] W.K. Bischel and L.J. Jusinski, ‘Multiphoton ionization spectroscopy of atomic fluorine’,in T.W. Hansch and Y.R. Shen, eds., ‘Laser Spectroscopy VII, Proc. of Seventh Int.Conf., Hawaii’, Springer, Berlin, 1985, pp. 94–95.
[Bis85b] W.K. Bischel and L.J. Jusinski, ‘Multiphoton ionization spectroscopy of atomic fluorine’,J. Opt. Soc. Amer. A 2 (1985) P5.
[Bjo78] G.C. Bjorklund, C.P. Ausschnitt, R.R. Freeman and R.H. Storz, ‘Detection of atomichydrogen and deuterium by resonant three-photon ionization’, Appl. Phys. Lett. 33(1978) 54–56.
[Bjø80] T. Bjørnstad et al., ‘Structure of the levels in the doubly magic nucleus 13250 Sn82’,
Phys. Lett. 91B (1980) 35–37.
[Bjø81] T. Bjørnstad et al., ‘New targets for on-line mass separation of nuclei formed in 600MeV proton and 910 MeV 3He reactions’, Nucl. Instr. Meth. 186 (1981) 391–400.
[Bjø86] T. Bjørnstad et al., ‘Methods for production of intense beams of unstable nuclei: newdevelopments at ISOLDE’, Phys. Scr. 34 (1986) 578–590.

254 Bibliography
[Bjø87] T. Bjørnstad et al., ‘Recent developments of high-temperature metal targets forISOLDE’, Nucl. Instr. Meth. B 26 (1987) 174–182.
[BKS92] R. Neugart and A. Wohr, eds., ‘6th Int. Conf. on Nuclei far from Stability & 9th Int.Conf. on Atomic Masses and Fund. Const., Bernkastel-Kues’, Inst. Phys. Conf. Ser. No.132, IOP, Bristol, 1992.
[Bla76] J. Blaise and L.J. Radziemski, ‘Energy levels of neutral atomic uranium (U I)’,J. Opt. Soc. Amer. 66 (1976) 644–659.
[Bla95] B. Blank et al., ‘New isotopes from 78Kr fragmentation and the ending point of theastrophysical rapid-proton-capture process’, Phys. Rev. Lett. 74 (1995) 4611–4614.
[Bla97] F. Le Blanc et al., ‘Nuclear moments and deformation change in 184Aug,m from laserspectroscopy’, Phys. Rev. Lett. 79 (1997) 2213–2216.
[Blo69] J. Blocki et al., ‘Li and Be nuclei emitted during the thermal neutron fission of 235U’,Nucl. Phys. A 127 (1969) 495–502.
[Blo86] J.P. Blocki, H. Feldmeier and W.J. Swiatecki, ‘Dynamical hindrance to compound-nucleus formation in heavy-ion reactions’, Nucl. Phys. A 459 (1986) 145–172.
[BM85] A. Baas-May, J.V. Kratz and N. Trautmann, ‘Absence of delayed fission in the β− decayof 2.3 min 238Pa’, Z. Phys. A 322 (1985) 457–462.
[Boc70] J.P. Bocquet, R. Brissot, J. Crancon, C. Ristori and A. Moussa, ‘An isotope separa-tor connected with a 14 MeV neutron generator for on-line fission studies’, Nucl. In-str. Meth. 88 (1970) 51–59.
[Boc88] J.P. Bocquet, R. Brissot and H.R. Faust, ‘A large ionization chamber for fission fragmentnuclear charge identification at the LOHENGRIN spectrometer’, Nucl. Instr. Meth. A267 (1988) 466–472.
[Bog75] D.D. Bogdanov, A.V. Demyanov, V.A. Karnaukhov and L.A. Petrov, ‘New delayed-proton emitters 119Ba, 121Ba and 116Cs’, Sov. J. Nucl. Phys. 21 (1975) 123–125.
[Bog98] D.D. Bogdanov et al., ‘Cross-sections for the production of evaporation particles fromcompound nuclei 210,212Ra obtained in 35Cl+175Lu and 31P+181Ta interactions’, Phys.At. Nucl. 61 (1998) 727–733.
[Boh39] N. Bohr and J.A. Wheeler, ‘The mechanism of nuclear fission’, Phys. Rev. 56 (1939)426–450.
[Boh50] A. Bohr and V.F. Weisskopf, ‘The influence of nuclear structure on the hyperfine struc-ture of heavy elements’, Phys. Rev. 77 (1950) 94–98.
[Boh78] H.D. V. Bohm, W. Michaelis and C. Weitkamp, ‘Hyperfine structure and isotope shiftmeasurements on 235U and laser separation of uranium isotopes by two-step photoion-ization’, Opt. Comm. 26 (1978) 177–182.
[Boh96] Wigbert Bohmer, Kernphysikalische Aspekte zur Erklarung der korrelierten Ca-Ti-Cr Isottopenanomalien im Einschluß EK 1-4-1 des Allende-Meteoriten, Ph.D. thesis,Johannes-Gutenberg-Universitat Mainz (1996).
[Bol92] V.A. Bolshakov, ‘The production of neutron-rich heavy nuclei of astrophysical interestat the IRIS facility’, Nucl. Instr. Meth. B 70 (1992) 69–74.
[Bon85] K.D. Bonin, T.J. McIlrath and K. Yoshino, ‘High-resolution laser and classical spec-troscopy of xenon autoionization’, J. Opt. Soc. Amer. B 2 (1985) 1275–1283.
[Bor65] S. Borg, U. Fagerquist, G. Holm and F. Kropff, ‘Experiences of on-line isotope separationof short-lived isotopes’, Nucl. Instr. Meth. 38 (1965) 296–298.
[Bor71] S. Borg et al., ‘On-line separation of isotopes at a reactor in Studsvik (OSIRIS)’,Nucl. Instr. Meth. 91 (1971) 109–116.
Bibliography 255
[Bor88] R.J. Borg and G.J. Dienes, An Introduction to Solid State Diffusion, Academic Press,Boston (1988).
[Bor92] M.J.G. Borge et al., ‘On the nuclear structure of 229Ra’, Nucl. Phys. A 539 (1992)249–262.
[Bor93] Berthold Borsig, Neutroneninduzierte Clusteremission von 241Am(2nth,f), Ph.D. thesis,Universitat Tubingen (1993).
[Bos88] U. Bosch et al., ‘Beta- and gamma-decay studies of neutron-rich chromium, manganese,cobalt and nickel isotopes including the new isotopes 60Cr and 60gMn’, Nucl. Phys. A477 (1988) 89–104.
[Bou94] Boualem Bouzid, Etude de l’emission de particules legeres chargees dans la fissiond’uranium 235 et d’americium 241 induite par des neutrons thermiques, Ph.D. thesis,Universite des sciences et de technologie Houari Boumedienne, Alger (1994).
[Bou98] B. Bouzid, M. Asghar, M. Djebara and M. Medkour, ‘The nature of dynamics of thelast stages of the fission process’, J. Phys. G 24 (1998) 1029–1037.
[Boy97] L. Boy, A. Chabert, C. Ricaud and B. Laune, ‘Tuning methods for the SPIRAL facility’,Nucl. Instr. Meth. A 400 (1997) 1–8.
[BR81] Y. Baudinet-Robinet, ‘Equilibrium charge-state distributions of highly stripped ions incarbon foils’, Nucl. Instr. Meth. 190 (1981) 197–202.
[BR82] Y. Baudinet-Robinet, ‘Equilibrium charge-state distributions for heavy ions exiting car-bon foils’, Phys. Rev. A 26 (1982) 62–71.
[Bro90] U. Brosa, S. Grossmann and A. Muller, ‘Nuclear Scission’, Phys. Rep. 197 (1990) 167–262.
[Buc87] F. Buchinger et al., ‘The N-dependence of Cd mean square charge radii (54 ≤ N ≤ 72)and the nuclear moments of 103Cd’, Nucl. Phys. A 462 (1987) 305–332.
[Bud90] A. Budzanovski et al., Report IFI N1509/Pl, IFI, Krakow (1990).
[Burch] Angela Burchard, priv. comm.
[Bur57] E.M. Burbidge, G.R. Burbidge, W.A. Fowler and F. Hoyle, ‘Synthesis of the elementsin stars’, Rev. Mod. Phys. 29 (1957) 547–650.
[Bur74] K.H. Burkhard, W. Dumanski, R. Kirhner and E. Roeckl, ‘Statusbericht der On-line-Massenseparator-Gruppe’, Rep. GSI-PB-2-74, GSI, Darmstadt (1974).
[But00] A. Buta et al., ‘TONNERRE: an array for delayed-neutron decay spectroscopy’, Nucl. In-str. Meth. A 455 (2000) 412–423.
[Caa98] J.L. Duggan and I.L. Morgan, eds., ‘Applications of Accelerators in Research and In-dustry, Proc. of the Fifteenth Int. Conf., Denton’, AIP Conf. Proc. 475, Woodbury, NY,1998.
[Caı80] F. Caıtucoli et al., ‘The thermal-neutron-induced alpha-accompanied fission of 235U,investigation of the low energy part of the alpha spectrum’, Z. Phys. A 298 (1980)219–223.
[Cal88a] C.L. Callender, P.A. Hackett and D.M. Rayner, ‘First ionization potential of hafnium bydouble-resonance field-ionization spectroscopy’, J. Opt. Soc. Amer. B 5 (1988) 1341–1342.
[Cal88b] C.L. Callender, P.A. Hackett and D.M. Rayner, ‘First-ionization potential ofruthenium, rhodium and palladium by double-resonance ionization spectroscopy’,J. Opt. Soc. Amer. B 5 (1988) 614–618.
[Cam69] M. Cambiaghi, F. Fossati and T. Pinelli, ‘Long-range alpha-particles and light chargednuclei in the neutron-induced fission of 233U’, Il Nuovo Cimento LIX B (1969) 236–243.

256 Bibliography
[Cam72] M. Cambiaghi et al., ‘Experimental results concerning long-range light particles andfragments in the ternary fission of 233U, 235U, 239Pu and 252Cf’, Nuovo Cimento 11A(1972) 716–723.
[Car75] N. Carjan, A. Sandulescu and V.V. Pashkevich, ‘Shell and pairing effects in alpha-accompanied fission’, Phys. Rev. C 11 (1975) 782–788.
[Car76] N. Carjan, ‘Sur l’origine des alphas de scission’, J. Phys. (Paris) 37 (1976) 1279–1285.
[Car78] L.C. Carraz, I.R. Haldorsen, H.L. Ravn, M. Skarestad and L. Westgaard, ‘Fast releaseof nuclear reaction products from refractory matrices’, Nucl. Instr. Meth. 148 (1978)217–230.
[Car79] L.C. Carraz, S. Sundell, H. Ravn, M. Skarestad and L. Westgaard, ‘High-temperaturecarbide targets for fast on-line mass separation of alkali and noble gas elements’,Nucl. Instr. Meth. 158 (1979) 69–80.
[Car80] N. Carjan and B. Leroux, ‘Finite-size effects in trajectory calculations for α particlesemitted during nuclear fission’, Phys. Rev. C 22 (1980) 2008–2017.
[Car97] H.K. Carter et al., ‘First on-line results for As and F beams from HRIBF target/ionsources’, Nucl. Instr. Meth. B 126 (1997) 166–169.
[CAS] http://www.casix.com.
[Cas90] B. Castel and I.S. Towner, Modern theories of nuclear moments, Clarendon Press,Oxford (1990).
[Cas97] R.F. Casten et al., ‘Scientific opportunities with an advanced ISOL facility’,http://www.er.doe.gov/production/henp/np/manpwr98.html (1997).
[Cas01] E. Casarejos et al., ‘Isotopic cross-sections of heavy residues from reactions of 1 GeVprotons and 2 GeV deuterons with 238U measured in inverse kinematics’, Nucl. Phys. A(2001) in press.
[Caz96] J. Cazalet, ‘Le procede atomique SILVA’, Revue Generale Nucleaire 2 (Mars-Avril)(1996) 20–23.
[Cha97] C. Chandler et al., ‘Evidence for a highly deformed oblate 0+ state in 7436Kr’, Phys. Rev. C56 (1997) R2924–R2928.
[Cha98] N. Chauvin et al., ‘Electron cyclotron resonance ion trap, a multicharged ionbreeder/buncher’, Nucl. Instr. Meth. A 419 (1998) 185–188.
[Che60] Francis F. Chen, Electric Probes, Chapman & Hall, London, 1960, pp. 113–200.
[Che72] E. Cheifetz, B. Eylon, E. Fraenkel and A. Gavron, ‘Emission of 5He in the spontaneousfission of 252Cf’, Phys. Rev. Lett. 29 (1972) 805–808.
[Chu93] K.T. Chung and X.W. Zhu, ‘Energies, fine structures and isotope shifts of the 1s22snlexcited states of the beryllium atom’, Phys. Rev. A 48 (1993) 1944–1954.
[Chw67] J. Chwaszczewska et al., ‘Emission of long-range charged particles in the fission of 235Uinduced by thermal neutrons’, Phys. Lett. 24B (1967) 87–89.
[Cia97] G. Ciavola et al., ‘The ISOL exotic beam facility at LNS: the EXCYT project’, Nucl. In-str. Meth. B 126 (1997) 258–261.
[CM96] M.D. Campbell-Miller and B. Simard, ‘First ionization potentials of tungsten and rhe-nium by mass-selected double-resonance ionization spectroscopy’, J. Opt. Soc. Amer. B13 (1996) 2115–2120.
[Coc99] J.F.C. Cocks et al., ‘Spectroscopy of Rn, Ra and Th isotopes using multi-nucleontransfer reactions’, Nucl. Phys. A 645 (1999) 61–91.
[Coc00] J.F.C. Cocks et al., ‘Multi-nucleon transfer reactions as a tool for spectroscopy of heavynuclei’, J. Phys. G 26 (2000) 23–34.

Bibliography 257
[Col97] P. Colarusso, M.A. Lebeault-Dorget and B. Simard, ‘First ionization potentials of os-mium and iridium determined by mass-analyzed double-resonance field-ionization spec-troscopy’, Phys. Rev. A 55 (1997) 1526–1529.
[Cos67] S.W. Cosper, J. Cerny and R.C. Gatti, ‘Long-range particles of Z = 1 to 4 emittedduring the spontaneous fission of 252Cf’, Phys. Rev. 154 (1967) 1193–1206.
[Cow58] G.A. Cowan and C.J. Orth, ‘Diffusion of fission products at high temperatures fromrefractory matrices’, in ‘Proc. 2nd Int. Conf. Peaceful Uses Atomic Energy, Geneva’,vol. 7, United Nations, 1958, pp. 328–334.
[Cow99] J.J. Cowan et al., ‘R-process abundances and chronometers in metal-poor stars’, As-trophys. J. 521 (1999) 194–205.
[Cra70] J. Crank, The mathematics of diffusion, Clarendon Press, Oxford (1970).
[Cum81] D.E. Cumpstey and D.G. Vass, ‘The 6He emission accompanying the spontaneous fissionof 252Cf’, Nucl. Phys. A 359 (1981) 377–385.
[Cur98] P. Curie and M. Slodowska-Curie, ‘Sur une nouvelle substance radio-active contenudans la pechblende’, C. R. Acad. Sci. Paris 127 (1898) 175.
[Cur86] M.S. Curtin et al., ‘Lifetime measurements of neutron-rich light isotopes 14Be and 17C’,Phys. Rev. Lett. 56 (1986) 34–37.
[D’A78] J.M. D’Auria et al., ‘Properties of the lightest known caesium isotopes 114−118Cs’,Nucl. Phys. A 301 (1978) 397–410.
[Dak67] M. Dakowski, J. Chwaszczewska, T. Krogulski, E. Piasecki and M. Sowinski, ‘Energyspectra of long range particles from the thermal neutron fission of 235U’, Phys. Lett.25B (1967) 213–214.
[Dak79] M. Dakowski, E. Piasecki and L. Nowicki, ‘On the incorrect use of ternary fission datain the determination of scission configuration’, Nucl. Phys. A 315 (1979) 370–380.
[Dan96] J. Kliman and B.I. Pustylnik, eds., ‘Dynamical Aspects of Nuclear Fission, Proc. of 3rdInt. Conf. held at Casta-Papiernicka’, JINR, Dubna, 1996.
[Dav87] P. David et al., ‘The study of prompt and delayed muon induced fission’, Z. Phys. A328 (1987) 37–47.
[Dav97] Marco Davi, Messung von Ausbeuten in der Spaltung von 250Cf∗ und 239Np∗ amMassenseparator LOHENGRIN, Ph.D. thesis, Universitat Mainz (1997).
[Dei95] R. Deissenberger et al., ‘First determination of the ionization potential of americiumand curium’, Angew. Chem. Int. 34 (1995) 814–815.
[Dem98] Wolfgang Demtroder, Laser Spektroscopy, Basic Concepts and Instrumentation,Springer, Berlin, second edn. (1998).
[Dendo] Peter Dendooven, priv. comm.
[Den86] H.O. Denschlag, ‘Independent fission yield measurements’, Nucl. Sci. Eng. 94 (1986)337–352.
[Den97] C.J. Densham, C. Thwaites and J.R.J. Bennett, ‘Critical parameters for the delay timeof a RIB target’, Nucl. Instr. Meth. B 126 (1997) 154–159.
[Der95] A.G. Dernjatin et al., ‘Recoil-atom time-of-flight spectrometer for delayed neutronstudy’, in [ENA95], pp. 585–586.
[D’H80] P. D’Hondt, C. Wagemans, A. Declercq, G. Barreau and A. Deruytter, ‘Energy distri-butions and absolute yields of the charged light particles emitted during the thermalneutron induced ternary fission of 235U’, Nucl. Phys. A 346 (1980) 461–472.
[Dia99] W.T. Diamond, ‘A radioactive ion beam facility using photofission’, Nucl. Instr. Meth. A432 (1999) 471–482.

258 Bibliography
[Dic81] J.K. Dickens and J.W. McConnell, ‘Yields of fission products produced by thermal-neutron fission of 245Cm’, Phys. Rev. C 23 (1981) 331–350.
[Div77] R.B. Diver and E.A. Fletchner, ‘Thoria effusion membranes’, Am. Ceram. Soc. Bull. 56(1977) 1019–1020.
[Dlo92] Z. Dlouhy, J. Svanda, R. Bayer and I. Wilhelm, ‘Emission of light charged particles withZ ≥ 2 in spontaneous fission of 252Cf’, in [BKS92] 481–483.
[Doa86] T.P. Doan et al., ‘Light nuclei from the thermal neutron induced fission of 235U’, Rad.Eff. 93 (1986) 61–64.
[Dob96] J. Dobaczewski et al., ‘Mean-field description of ground-state properties of drip-linenuclei: pairing and continuum effects’, Phys. Rev. C 53 (1996) 2809–2840.
[Dolli] Gunther Dollinger, priv. comm.
[Dol89] G. Dollinger and P. Maier-Komor, ‘Heavy-ion irradiation damage in carbon stripperfoils’, Nucl. Instr. Meth. A 282 (1989) 223–235.
[Dombs] Marik Dombsky, priv. comm.
[Dom90] M. Dombsky et al., ‘Target and ion source development at the TISOL facility at TRI-UMF’, Nucl. Instr. Meth. A 295 (1990) 291–298.
[Dom96] M. Dombsky and J.M. D’Auria, ‘Zeolite target development at TISOL’, in J.L. Dugganand I.L. Morgan, eds., ‘Applications of Accelerators in Research and Industry, Proc. ofthe Fourteenth Int. Conf., Denton’, AIP Conf. Proc. 492, Woodbury, NY, 1996, pp.365–368.
[Dom97] M. Dombsky et al., ‘An ion source test stand for the ISAC facility at TRIUMF’, Nucl. In-str. Meth. B 126 (1997) 50–54.
[Dom98] M. Dombsky et al., ‘Evaluation of a prototype isotope separator accelerator surfaceionization source’, Rev. Sci. Instr. 69 (1998) 1170–1172.
[Don98] C. Donzaud et al., ‘Low-energy fission investigated in reactions of 750A· MeV 238U-ionson 208Pb. II: Isotopic distributions’, Eur. Phys. J. A 1 (1998) 407–426.
[Dor65] D.W. Dorn and R.W. Hoff, ‘Spontaneous fission in very neutron-rich isotopes’,Phys. Rev. Lett. 14 (1965) 440–441.
[Dru97] P.V. Drumm et al., ‘A comparison of RIST and ISOLDE tantalum targets and geometriesused on-line at ISOLDE’, Nucl. Instr. Meth. B 126 (1997) 121–124.
[Duf84] J.P. Dufour et al., ‘Beta-delayed neutron radioactivity of 15B’, Z. Phys. A 319 (1984)237–238.
[Dup92] P. Van Duppen et al., ‘A laser ion source for on-line mass separation’, Hyp. Int. 74(1992) 193–204.
[Dup97] P. Van Duppen, ‘Laser ion sources for on-line isotope separators’, Nucl. Instr. Meth. B126 (1997) 66–72.
[Dup98] P. Van Duppen et al., ‘A new pulsed release method for element selective productionof neutron rich isotopes near 208Pb’, Nucl. Instr. Meth. B 134 (1998) 267–270.
[Dye83] P. Dyer, G.C. Baldwin, C. Kittrell, D.G. Imre and E. Abramson, ‘Isotopically selectivephotoionization of mercury atoms’, Appl. Phys. Lett. 42 (1983) 311–313.
[Dye85] P. Dyer et al., ‘Isomerically selective photoionization of mercury-197’, J. Appl. Phys.58 (1985) 2431–2436.
[Ebe86] J. Eberz et al., ‘Collinear laser spectroscopy on 108g,108mIn using an ion source withbunched beam relase’, Z. Phys. A 323 (1986) 119–123.
[Ebe87] J. Eberz et al., ‘Nuclear spins, moments and charge radii of 108−111Sn’, Z. Phys. A 326(1987) 121–129.

Bibliography 259
[Ede92] R. Eder et al., ‘The production yields of radioactive ion-beams from fluorinated targetsat the ISOLDE on-line mass separator’, Nucl. Instr. Meth. B 62 (1992) 535–540.
[Egi81] T. von Egidy et al., ‘The rotational structure of 227Ra’, Nucl. Phys. A 365 (1981)26–60.
[Egi93] T. von Egidy et al., ‘Antiproton induced fission’, Nucl. Phys. A 558 (1993) 383c–392c.
[Ehr72] B. Ehrenberg and S. Amiel, ‘Independent yields of Krypton and Xenon isotopes inthermal-neutron induced fission of 235U. Observation of an odd-even effect in the ele-ment yield distribution’, Phys. Rev. C 6 (1972) 618–628.
[Eic85a] B. Eichler, S. Hubener and H. Roßbach, ‘Adsorption fluchtiger Metalle auf metallischenOberflachen und Moglichkeiten ihrer Anwendung in der Kernchemie - Berechnung derAdsorptionsenthalpien der Actinoide’, Rep. ZfK-560, Zentralinstitut fur Kernforschung,Rossendorf (1985).
[Eic85b] B. Eichler, S. Hubener and H. Roßbach, ‘Adsorption fluchtiger Metalle auf metallischenOberflachen und Moglichkeiten ihrer Anwendung in der Kernchemie - Berechnung derAdsorptionsenthalpien der Seltenerdmetalle’, Rep. ZfK-561, Zentralinstitut fur Kern-forschung, Rossendorf (1985).
[Eik94] K.S.E. Eikema, W. Ubachs and W. Hogervorst, ‘Isotope shift in the neon ground stateby extreme-ultraviolet laser spectroscopy at 74 nm’, Phys. Rev. A 49 (1994) 803–808.
[Eik96] K.S.E. Eikema, W. Ubachs, W. Vassen and W. Hogervorst, ‘Precision measurements inhelium at 58 nm: ground state Lamb shift and the 1 1S − 2 1P transition isotope shift’,Phys. Rev. Lett. 76 (1996) 1216–1219.
[Elh98] Angelika Elhardt, Bestimmung der Spaltausbeute von 60Fe aus der Spaltung von 235U,Master’s thesis, TU Munchen (1998).
[Elm78] T. Elmroth et al., ‘Beta-delayed proton emission from 97Cd and 99Cd’, Nucl. Phys. A304 (1978) 493–502.
[ENA95] M. de Saint Simon and O. Sorlin, eds., ‘Exotic Nuclei and Atomic Masses, ENAM’95,Arles, June 1995’, Editions Frontieres, Gif-sur-Yvette, 1995.
[ENA98] B.M. Sherill, D.J. Morrissey and C.N. Davids, eds., ‘Exotic Nuclei and Atomic Masses,ENAM’98, Bellaire, Michigan June 1998’, AIP Conf. Proc. 455, Woodbury, NY, 1998.
[End90] P.M. Endt, ‘Energy levels of A = 21−44 nuclei (VII)’, Nucl. Phys. A 521 (1990) 1–830.
[Eng98] Christian Otto Engelmann, Kernspaltung relativistischer Uranprojektile und Erzeugungextrem neutronenreicher Isotope, Ph.D. thesis, Universitat Tubingen (1998).
[Enq96] T. Enqvist et al., ‘Alpha decay properties of 200−202Fr’, Z. Phys. A 354 (1996) 1–2.
[Erd98a] N. Erdmann et al., ‘Determination of the first ionization potential of nine actinideelements by resonance ionization mass spectroscopy (RIMS)’, J. Alloys and Compounds271-273 (1998) 837–840.
[Erd98b] N. Erdmann et al., ‘Frequency tripling for resonance ionization spectroscopy (RIS) ofCd’, Appl. Phys. B 66 (1998) 431–433.
[Erd98c] Nicole Erdmann, Resonanzionisationsmassenspektroskopie zur Bestimmung der Ionisa-tionsenergien von Berkelium und Californium und zur Spurenanalytik von Plutonium,Ph.D. thesis, Universitat Mainz (1998).
[Est91] R.C. Estler and N.S. Nogar, ‘Ablation of high temperature superconductor studied byresonance ionization mass spectrometry (RIMS)’, J. Appl. Phys. 69 (1991) 1654–1659.
[Eve97] A.H.M. Evensen et al., ‘Release and yields from thorium and uranium targets irradiatedwith a pulsed proton beam’, Nucl. Instr. Meth. B 126 (1997) 160–165.

260 Bibliography
[Ewa80] G.T. Ewan, E. Hagberg, B. Jonson, S. Mattsson and P. Tidemand-Petersson, ‘Alpha de-cay studies of new neutron-deficient francium isotopes and their daughters’, Z. Phys. A296 (1980) 223–228.
[Ewa84] G.T. Ewan et al., ‘Intense mass-separated beams of halogens and beta-delayed neutronemission from heavy bromine isotopes’, Z. Phys. A 318 (1984) 309–314.
[Fae84] T. Faestermann, A. Gillitzer, K. Hartel, P. Kienle and E. Nolte, ‘Evidence for protonradioactivity of 113Cs and 109I’, Phys. Lett. 137B (1984) 23–26.
[Fai64] H. Faissner and K. Wildermuth, ‘Cluster model of nuclear fission. (I.) Aymmetric massdistributions’, Nucl. Phys. A 58 (1964) 177–200.
[Fai87] W.M. Fairbank and H.K. Carter, ‘A completely cold laser ion source for separators’,Nucl. Instr. Meth. B 26 (1987) 357–361.
[Fai89] W.M. Fairbank, M.T. Spaar, J.E. Parks and J.M.R. Hutchinson, ‘Anomalous odd- toeven-mass isotope ratios in resonance ionization with broad-band lasers’, Phys. Rev. A40 (1989) 2195–2198.
[Farge] Fanny Farget, priv. comm.
[Far47] G. Farwell, E. Segre and C. Wiegand, ‘Long range alpha-particles emitted in connectionwith fission. Preliminary report’, Phys. Rev. 71 (1947) 327–330.
[Far98] F. Farget et al., ‘Spallation-reaction cross sections relevant for accelerator-driven sys-tems’, in [Sey98], pp. 11–18.
[FAS] http://www.fastcomtec.com.
[Fas83] J.D. Fassett, J.C. Travis, L.J. Moore and F.E. Lytle, ‘Atomic ion formation and measure-ment with resonance ionization mass spectrometry’, Anal. Chem. 55 (1983) 765–770.
[Fas84] J.D. Fassett, L.J. Powell and L.J. Moore, ‘Determination of iron in serum and waterby resonance ionization isotope dilution mass spectrometry’, Anal. Chem. 56 (1984)2228–2233.
[Fau82] H. Faust, P. Geltenbort, F. Gonnenwein and A. Oed, ‘Determination of isobaric elemen-tal yields in velocity selected fission products’, Nucl. Instr. Meth. 193 (1982) 577–580.
[Fau94] H. Faust and G. Fioni, ‘Estimates for far asymmetric fission yields from Lohengrin data’,in [Sey94], pp. 91–96.
[Fau95a] H. Faust, ‘Calculation of mass and charge distribution in nuclear fission using a Boltz-mann formulation’, in C. Wagemans, ed., ‘Proc. Seminar on Fission, Pont d’Oye III’,1995, pp. 211–219.
[Fau95b] H. Faust and Z. Bao, ‘Calculation of relative LCP yields in ternary fission by a Boltzmanndistribution’, in C. Wagemans, ed., ‘Proc. Seminar on Fission, Pont d’Oye III’, 1995,pp. 220–231.
[Fea74] N. Feather, ‘Simultaneous emission of two light charged particles in fission’, Proc. RoyalSoc. Edinburgh 71 (1974) 323–331.
[Fedos] Valentin N. Fedoseyev, priv. comm.
[Fed95a] V.N. Fedoseyev et al., ‘Study of short-lived silver isotopes with a laser ion source’,Z. Phys. A 353 (1995) 9–10.
[Fed95b] V.N. Fedoseyev et al., ‘Study of short-lived tin isotopes with a laser ion source’, in[RIS94], 465–467.
[Fed97] V.N. Fedoseyev et al., ‘Chemically selective laser ion source of manganese’, Nucl. Instr.Meth. B 126 (1997) 88–91.
[Fed98] V.N. Fedoseyev, ‘The use of lasers for the selective ionization of radionuclei for RIBgeneration’, in [Caa98], pp. 296–300.

Bibliography 261
[Feh97] P. Fehsenfeld, A. Kleinrahm and R. Kubat, ‘Thin layer activation for wear measure-ments’, in M.N.H. Comsan and Z.A. Saleh, eds., ‘2nd School and Workshop on Cy-clotrons and Applications, 15.-19. March 1997, Cairo’, Nuclear Research Center, AtomicEnergy Authority, 1997.
[Fer34a] E. Fermi, ‘Possible production of elements of atomic number higher than 92’, Nature133 (1934) 898–899.
[Fer34b] E. Fermi, ‘Radioactivity induced by neutron bombardment’, Nature 133 (1934) 757.
[Fio93] G. Fioni et al., ‘Reduction of energy dispersion on a parabola mass spectrometer’,Nucl. Instr. Meth. A 332 (1993) 175–180.
[Fir96] R.B. Firestone and V.S. Shirley, eds., Table of Isotopes, John Wiley & Sons, New York,8th edn. (1996).
[Flu39] S. Flugge and K.E. Zimens, ‘Die Bestimmung von Korngroßen und von Diffusionskon-stanten aus dem Emaniervermogen’, Z. Phys. Chem. B42 (1939) 179–220.
[Fogel] Birger Fogelberg, priv. comm.
[Fog92] B. Fogelberg et al., ‘Efficiency and delay of the integrated target-ion source of OSIRIS’,Nucl. Instr. Meth. B 70 (1992) 137–141.
[Fog97] B. Fogelberg, H. Mach and L. Jacobsson, ‘The OSIRIS facility and ion source atStudsvik’, in [Ben96], pp. 69–73.
[Fog98] B. Fogelberg, H. Mach, H. Gausemel, J.P. Omtvedt and K.A. Mezilev, ‘New high spinisomers obtained in thermal fission’, in [Sey98], pp. 191–195.
[Fog99] B. Fogelberg, K.A. Mezilev, H. Mach, V.I. Isakov and J. Slivova, ‘Precise atomic massvalues near 132Sn: the resolution of a puzzle’, Phys. Rev. Lett. 82 (1999) 1823–1826.
[Fom70] V.S. Fomenko, Emissionnij svoijstva materialov, Naukova Dumka, Kiev (1970).
[Fon56] P. Fong, ‘Statistical theory of nuclear fission: asymmetric fission’, Phys. Rev. 102 (1956)434–448.
[Fon70] P. Fong, ‘α-particle trajectories in ternary fission’, Phys. Rev. C 2 (1970) 735–742.
[Fon71] P. Fong, ‘Mechanism and rate of long-range α-particle emission in fission’, Phys. Rev. C3 (1971) 2025–2027.
[For98] S. Fortier et al., ‘Study of the 11Be structure via the p(11Be,10Be)d reaction’, in[ENA98], pp. 239–244.
[Fra77] H. Franz et al., ‘Delayed-neutron spectroscopy with 3He spectrometers’, Nucl. In-str. Meth. 144 (1977) 253–261.
[Fra98a] S. Franchoo et al., ‘Beta-decay of 68−74Ni and level structure of neutron-rich Cu iso-topes’, Phys. Rev. Lett. 81 (1998) 3100–3103.
[Fra98b] S. Franchoo et al., ‘Beta decay of neutron-rich cobalt and nickel isotopes’, in [ENA98],pp. 757–760.
[Fra99] Serge Franchoo, Evolution of nuclear structure towards 78Ni investigated by the β decayof laser-ionized 68−74Ni, Ph.D. thesis, K.U. Leuven (1999).
[Fre98] M. Freer et al., ‘Exotic molecular and halo states in 12,14Be’, in [ENA98], pp. 314–318.
[Fri39] O.R. Frisch, ‘Physical evidence for the division of heavy nuclei under neutron bombard-ment’, Nature 143 (1939) 276.
[Fri63] G. Friedlander, L. Friedman, B. Gordon and L. Yaffe, ‘Excitation functions and nuclearcharge dispersion in the fission of uranium by 0.1 to 6.2 GeV protons’, Phys. Rev. C129 (1963) 1809–1825.

262 Bibliography
[Fri77] G. Frick et al., ‘Stripping experiments in carbon foils with heavy ions in the energyrange of 0.4-0.9 MeV/A’, Rev. Phys. Appl. 12 (1977) 1525.
[Fri90] Harald Friedrich, Theoretical Atomic Physics, Springer, Berlin (1990).
[Fri98a] T. Friedrichs et al., ‘Investigation of mass, charge and energy of thermal neutron inducedfission of 245Cm and 241Pu’, in [Sey98], pp. 231–238.
[Fri98b] Thomas Friedrichs, Untersuchung der neutroneninduzierten Spaltung von 245Cm und241Pu sowie Bestimmung von Kernmassen mittels βγ-Koinzidenzspektroskopie, Ph.D.thesis, TU Braunschweig (1998).
[Fri99] J. Friese, Nucleon transfer on transuranium targets, in [MAFF], 1999.
[Fuj81] M. Fujioka and Y. Arai, ‘Diffusion of radioisotopes from solids in the form of foils, fibersand particles’, Nucl. Instr. Meth. 186 (1981) 409–412.
[Gag86] H. Gaggeler et al., ‘Production of cold target-like fragments in the reaction of48Ca+248Cm’, Phys. Rev. C 33 (1986) 1983–1987.
[Gag88] H.W. Gaggeler, ‘Reaktionsmechanismen zur Synthese schwerster Elemente aus Schwe-rionenreaktionen’, Rep. 14, Paul Scherrer Institut, Villingen, Switzerland (1988).
[Gal99] Jean Galy, Mesure de la distribution en masse et en charge des produits de la fissionrapide de l’233U, Ph.D. thesis, Universite d’Aix-Marseille I (1999).
[Gan78] Yu.P. Gangrskii, G.M. Marinescu, M.B. Miller, V.N. Samosyuk and I.F. Kharisov, ‘De-layed fission of neutron-rich protactinium isotopes’, Sov. J. Nucl. Phys. 27 (1978) 475–478.
[Gav75] A. Gavron, ‘Scission-point parameters determined by light particle emission in fissionof 252Cf’, Phys. Rev. C 11 (1975) 580–586.
[Gaz70] Y. Gazit, E. Nardi and S. Katcoff, ‘Emission of particles of 3 ≤ Z ≤ 8 in the fission of252Cf’, Phys. Rev. C 1 (1970) 2101–2108.
[Gei95] H. Geissel, G. Munzenberg and K. Riisager, ‘Secondary exotic nuclear beams’, Annu.Rev. Nucl. Part. Sci. 45 (1995) 163–203.
[Gei99] W. Geithner et al., ‘Measurement of the magnetic moment of the one-neutron-halonucleus 11Be’, Phys. Rev. Lett. 83 (1999) 3792–3795.
[Gel89] P. Gelin, J.L. Debrun, O. Gobert, R.L. Inglebert and B. Dubreuil, ‘Resonant ionization ofsputtered neutral atoms for trace analysis in high purity materials’, Nucl. Instr. Meth. B40/41 (1989) 290–292.
[Gel96a] R. Geller, Electron Cyclotron Resonance Ion Sources and ECR Plasmas, IOP, Bristol(1996).
[Gel96b] R. Geller, C. Tamburella and J.L. Belmont, ‘The ISOL-MAFIOS source’, Rev. Sci. Instr.67 (1996) 1281–1285.
[Gen99] J. Genevey et al., ‘Identification of µs isomers in the fission products of 241Pu(nth,f)’,Phys. Rev. C 59 (1999) 82–89.
[Geo99] U. Georg et al., ‘Radioactive ion beams at ISOLDE/CERN, recent developments andperspectives’, in B. Rubio, M. Lozano and W. Gelletly, eds., ‘Experimental NuclearPhysics in Europe, ENPE’99, Sevilla, June 1999’, AIP Conf. Proc. 495, Woodbury, NY,1999, pp. 349–352.
[Ghi88] A. Ghiorso et al., ‘SASSY, a gas-filled magnetic separator for the study of fusion reactionproducts’, Nucl. Instr. Meth. A 269 (1988) 192–201.
[Gil74] R. Gillette, ‘Uranium enrichment: rumors of Israeli progress with lasers’, Science 183(1974) 1173–1174.

Bibliography 263
[Gil85] R.L. Gill and A. Piotrowski, ‘A new FEBIAD-type ion source for use at the reactor-basedISOL facility TRISTAN’, Nucl. Instr. Meth. A 234 (1985) 213–217.
[Gim92] G. Gimond et al., ‘Present status of singly charged ion ECR sources at the SARA on-lineseparator’, Nucl. Instr. Meth. B 70 (1992) 118–124.
[Gip86] K.L. Gippert et al., ‘Decay studies of neutron-rich radium and actinium isotopes, in-cluding the new nuclides 232Ra and 233,234Ac’, Nucl. Phys. A 453 (1986) 1–14.
[Gla82] P. Glassel, D. v. Harrach, L. Grodzins and H.J. Specht, ‘Direct observation of nonequi-librium effects in sequential fission’, Phys. Rev. Lett. 48 (1982) 1089–1093.
[Gon91] F. Gonnenwein and B. Borsig, ‘The model of cold fission’, Nucl. Phys. A 530 (1991)27–57.
[Gon92a] F. Gonnenwein, ‘On the notion of odd-even effects in the yields of fission fragments’,Nucl. Instr. Meth. A 316 (1992) 405–415.
[Gon92b] F. Gonnenwein et al., ‘Emission of clusters in nuclear fission’, in [BKS92], pp. 453–458.
[Gon94] F. Gonnenwein et al., ‘Parity violation in ternary fission’, Nucl. Phys. A 567 (1994)303–316.
[Gon97] F. Gonnenwein et al., ‘Cold binary and ternary fission’, Il Nuovo Cimento 110 A (1997)1089–1095.
[Gon98] F. Gonnenwein et al., ‘Cold ternary fission’, in ‘Proc. Conf. Perspectives in NuclearPhysics, Paradise Island, 1998’, 1998.
[Gov71] N.B. Gove and M.J. Martin, ‘Log-f tables for beta decay’, Nucl. Data Tables 10 (1971)205–317.
[Gra88] V.T. Grachev, Yu.I. Gusev and D.M. Seliverstov, ‘Angular, energy and mass distri-butions for spontaneous fission of 252Cf with emission of 3H, 4He and 6He nuclei’,Sov. J. Nucl. Phys. 47 (1988) 395–402.
[Gre63] A.E. Greendale and D.L. Love, ‘A rapid radiochemical procedure for tin’, Anal. Chem.35 (1963) 1712–1715.
[Gre91] C.H. Greene and M. Aymar, ‘Spin-orbit effects in the heavy alkaline-earth atoms’,Phys. Rev. A 44 (1991) 1773–1790.
[Gro97] M. Groß and D. Habs, ‘An adjustable neutron absorber for the fission fragment ac-celerator’, Jahresbericht, Beschleunigerlaboratorium der Universitat und TechnischenUniversitat Munchen (1997).
[Gro99] J.S. Grossman et al., ‘Hyperfine anomaly measurements in francium isotopes and theradial distribution of neutrons’, Phys. Rev. Lett. 83 (1999) 935–938.
[Gru98] C. Gruning et al., ‘A high repetition rate solid state laser system for resonance ionisationspectrometry of actinides’, in [RIS98], 1998.
[Gua84] G. Guarino et al., ‘Mass drift in reactions between a heavy and a light nucleus’,Nucl. Phys. A 424 (1984) 157–183.
[Gue80] C.R. Guet, H.A. Nifenecker, C. Signarbieux and M. Asghar, ‘On the compatibility ofLRA fission distributions with compact scission’, in ‘Conf. on Chemistry and Physics ofFission’, IAEA-SM-241/F13, 1980, pp. 247–265.
[Gue87] K.H. Guenther, ‘Growth structures in a thick vapor deposited MgF2 multiple layercoating’, Appl. Opt. 26 (1987) 188–190.
[Gul72] T.D. Gulden, ‘Carbon thermal diffusion in the UC2-C system’, J. Am. Chem. Soc. 55(1972) 14–18.
[Gul95] V.M. Gulevich, D.Yu. Pakhomov and A.D. Zuzikov, ‘Optical schemes of resonant pho-toionization of lead atoms’, Opt. Comm. 118 (1995) 275–280.

264 Bibliography
[Gun67] H.R. von Gunten, K.F. Flynn and L.E. Glendenin, ‘Distribution of mass and charge inthe fission of 245Cm’, Phys. Rev. 161 (1967) 1192–1195.
[Gup79] S.K. Gupta and K.A. Gingerich, ‘Observation and atomization energies of the gaseousuranium carbides, UC, UC2, UC3, UC4, UC5 and UC6 by high temperature mass spec-trometry’, J. Chem. Phys. 71 (1979) 3072–3080.
[Hab78] D. Habs, H. Klewe-Nebenius, V. Metag, B. Neumann and H.J. Specht, ‘Determinationof the fission barrier of 232Pu from β-delayed fission and the problem of the first barrier’,Z. Phys. A 285 (1978) 53–57.
[Hac86] P.A. Hackett, M.R. Humphries, S.A. Mitchell and D.M. Rayner, ‘The first ionizationpotential of zirconium atoms determined by two laser, field-ionization spectroscopy ofhigh lying Rydberg series’, J. Chem. Phys. 85 (1986) 3194–3197.
[Hag67] E. Hagebø, A. Kjelberg and S. Sundell, ‘ISOLDE target development at CERN’,Ark. Fys. 36 (1967) 127–132.
[Hag70] E. Hagebø, A. Kjelberg, P. Patzelt, G. Rudstam and S. Sundell, ‘Performance of theISOLDE target system’, CERN Report 70-3, Geneva (1970).
[Hag92a] E. Hagberg et al., ‘Indirect measurements of beam-energy differences for various speciesof ions extracted from a FEBIAD source’, Nucl. Instr. Meth. B 70 (1992) 546–550.
[Hag92b] E. Hagebø et al., ‘New production systems at ISOLDE’, Nucl. Instr. Meth. B 70 (1992)165–174.
[Hag94] E. Hagberg et al., ‘Tests of isospin mixing corrections in superallowed 0+ → 0+ βdecays’, Phys. Rev. Lett. 73 (1994) 396–399.
[Hah39a] O. Hahn and F. Strassmann, ‘Nachweis der Entstehung aktiver Bariumisotope aus Uranund Thorium durch Neutronenbestrahlung; Nachweis weiterer aktiver Bruchstucke beider Uranspaltung’, Naturwiss. 28 (1939) 89–95.
[Hah39b] O. Hahn and F. Strassmann, ‘uber den Nachweis und das Verhalten der bei der Be-strahlung des Urans mittels Neutronen entstehenden Erdalkalimetalle’, Naturwiss. 28(1939) 11–15.
[Hal71] I. Halpern, ‘Three fragment fission’, Annu. Rev. Nucl. Sci. 21 (1971) 245–294.
[Hal89] H.L. Hall et al., ‘β-delayed fission from 256Esm and the level scheme of 256Fm’,Phys. Rev. C 39 (1989) 1866–1875.
[Hal92] H.L. Hall and D.C. Hoffman, ‘Delayed fission’, Annu. Rev. Nucl. Part. Sci. 42 (1992)147–175.
[Ham99] J.H. Hamilton et al., ‘Cold spontaneous fission processes of 252Cf and the structure ofneutron rich Ba and La nuclei’, Acta Phys. Slovaca 49 (1999) 31–42.
[Han69] P.G. Hansen et al., ‘Decay characteristics of short-lived radio-nuclides studied by on-lineisotope separation techniques’, Phys. Lett. 29B (1969) 415–419.
[Han72] T.W. Hansch, ‘Repetitively pulsed tunable dye laser for high resolution spectroscopy’,Appl. Opt. 11 (1972) 895–898.
[Han73] F. Hansen, A. Lindahl, O.B. Nielsen and G. Sidenius, ‘The application of ceramic oxidesat high temperatures as ISOL-targets’, in G. Andersson and G. Holmen, eds., ‘Proc.of the 8th Int. EMIS Conf. on Low Energy Ion Accelerators and Mass Separators’,Chalmers University of Technology, 1973, pp. 426–431.
[Han87] P.G. Hansen and B. Jonson, ‘The neutron halo of extremely neutron-rich nuclei’, Eu-rophys. Lett. 4 (1987) 409–414.
[Han89] P.G. Hansen and B. Jonson, Beta-delayed particle emission from neutron-rich nuclei,vol. III of Poenaru and Ivascu [Poe89], 1989, pp. 157–202.

Bibliography 265
[Han99a] S. Hankonen et al., ‘Exotic neutron rich 34Al and 35Al isotopes studied at CERNISOLDE’, in [Str99], pp. 191–195.
[Han99b] M. Hannawald et al., ‘Decay of neutron-rich Mn nuclides and deformation of heavy Feisotopes’, Phys. Rev. Lett. 82 (1999) 1391–1394.
[Han00] M. Hannawald et al., ‘Selective laser ionisation of very neutron-rich cadmium isotopes:decay properties of 131Cd83 and 132Cd84’, Phys. Rev. C 62 (2000) 054301.
[Har82] D. v. Harrach, P. Glassel, L. Grodzins, S.S. Kapoor and H.J. Specht, ‘Direct observationof proximity effects in ternary heavy-ion reactions’, Phys. Rev. Lett. 48 (1982) 1093–1097.
[Har00] S. Hargrove, ‘Laser technology follows in Lawrence’s footsteps’, Science and TechnologyReview (LLNL) May (2000) 13–21.
[Has96] Sh. Hasegawa and A. Suzuki, ‘Resonance ionization spectroscopy and analysis on even-parity states of Pb I’, Phys. Rev. A 53 (1996) 3014–3022.
[Has98a] H. Haseroth et al., ‘Developments of the CERN laser ion source’, Rev. Sci. Instr. 69(1998) 1051–1053.
[Has98b] M. Hass et al., ‘Measurement of the 7Be(p,γ)8B cross-section with an implanted 7Betarget’, in [ENA98], pp. 864–867.
[Hau76] P.E. Haustein et al., ‘New neutron-rich isotope: 190W’, Phys. Rev. C 14 (1976) 645–649.
[Hau77] P.E. Haustein, E.M. Franz, R.F. Petry and J.C Hill, ‘New neutron-rich isotope: 196Os’,Phys. Rev. C 16 (1977) 1559–1565.
[Hau79] P.E. Haustein et al., ‘Identification and decay of 242U and 242Np’, Phys. Rev. C 19(1979) 2332–2343.
[Hec63] H.H. Heckman, E.L. Hubbard and W.G. Simon, ‘Electronic charge distributions forheavy ions at high velocities’, Phys. Rev. 129 (1963) 1240–1249.
[Hel92] M. Hellstrom, B. Fogelberg, L. Jacobsson, L. Spanier and G. Rudstam, ‘Some studiesof molecular ions obtained from a U + C target at > 2100C’, Nucl. Instr. Meth. B 70(1992) 142–145.
[Hel96] M. Hellstrom et al., ‘Beta-delayed proton emission around N = 50 and the rp-process’,Z. Phys. A 356 (1996) 229–231.
[Her82] G. Herrmann and N. Trautmann, ‘Rapid chemical methods for identification and studyof short-lived nuclides’, Annu. Rev. Nucl. Part. Sci. 32 (1982) 117–147.
[Her89] P. Herzog, U. Dammrich, K. Freitag, C.D. Herrmann and K. Schlosser, ‘The magneticmoments of (νg9/2)-levels in odd Zn isotopes’, Z. Phys. A 332 (1989) 247–250.
[Hes93] M. Hesse, H. Faust, G. Fioni, M. Groß and F. Gonnenwein, in H. Maerten et al., eds.,‘Proc. Workshop on High Resolution Spectroscopy of Fission Fragments. Neutrons andγ rays’, report FZR-93-08, Rossendorf, 1993, pp. 31–.
[Hes97] Michael Hesse, Emission von schweren ternaren Teilchen in der Kernspaltung, Ph.D.thesis, Eberhard-Karls-Universitat Tubingen (1997).
[Het86] D.W. Hetherington, M.A. Lone and R.L. Graham, ‘Leak rates for air and isobutanethrough thin polypropylene films’, Nucl. Instr. Meth. A 242 (1986) 270–276.
[Hic85] K.H. Hicks et al., ‘Fission of heavy nuclei induced by energetic pions’, Phys. Rev. C 31(1985) 1323–1333.
[Hil77] D.L. Hildenbrand, ‘Thermochemistry of gaseous UF5 and UF4’, J. Chem. Phys. 66(1977) 4788–4794.
[Hil85] P. Hill, N. Kaffrell, W. Kurcewicz and G. Nyman, ‘The new neutron-rich nuclei 231Frand 231Ra’, Z. Phys. A 320 (1985) 531–532.

266 Bibliography
[Hil86] J.C. Hill et al., ‘Level structure of 148Ba: a test of the NpNn scheme far off stability’,Phys. Rev. C 34 (1986) 2312–2315.
[Hil88] K. Hilpert, H. Gerads, D. Kath and D. Kobertz, ‘Sorption of cesium and its vaporizationfrom graphitic materials at high temperatures’, High Temperatures-High Pressures 20(1988) 157–164.
[Hil89] C. Hill, K. Schindl and H. Schonauer, ‘Move of ISOLDE – Implications for the PSBooster’, Internal Note PS/HI 89-7, CERN, Geneva (1989).
[Hil94] D.L. Hildenbrand and K.H. Lau, ‘Thermochemistry of gaseous manganese oxides andhydroxides’, J. Chem. Phys. 100 (1994) 8377–8380.
[Hil96] C.E. Hill and K. Langbein, ‘Experiments on a 14.5 GHz ECR source’, in [LIN96], pp.366–368.
[Hin97a] G. Hinderer, G. Dollinger, G. Datzmann and H.J. Korner, ‘Design of the superconductingmicroprobe system in Munich’, Nucl. Instr. Meth. B 130 (1997) 51–56.
[Hin97b] B. Hinfurtner, G. Seewald, E. Hagn, E. Zech and I.S. Towner, ‘Nuclear magnetic mo-ments of 2.0 h 89Nb and 78 h 89Zr’, Nucl. Phys. A 620 (1997) 317–326.
[Hir92] M. Hirsch, A. Staudt and H.V. Klapdor-Kleingrothaus, ‘Prediction of average β and γenergies and probabilities of β-delayed neutron emission in the region of fission prod-ucts’, At. Data Nucl. Data Tables 51 (1992) 243–271.
[Hof80] P. Hoff et al., ‘Production of molecular ions in the integrated target/ion-source of anisotope-separation-on-line system’, Nucl. Instr. Meth. 172 (1980) 413–418.
[Hof81] P. Hoff et al., ‘Molecular ion techniques at the OSIRIS mass separator’, Nucl. In-str. Meth. 186 (1981) 381–383.
[Hof84] P. Hoff, O.C. Jonsson, E. Kugler and H. Ravn, ‘Release of nuclear reaction productsfrom refractory compounds’, Nucl. Instr. Meth. 221 (1984) 313–329.
[Hof86] R.W. Hoff, ‘Beta decay of neutron-rich transuranic nuclei’, in H.V. Klapdor, ed., ‘Weakand Electromagnetic Interactions in Nuclei’, Springer, Berlin, 1986, pp. 207–212.
[Hof89] D.C. Hoffman and L.P. Somerville, Spontaneous fission, vol. III of Poenaru and Ivascu[Poe89], 1989, pp. 1–40.
[Hof94] P. Hofmann et al., ‘Fission of heavy nuclei induced by stopped antiprotons. I. Inclusivecharacteristics of fission fragments’, Phys. Rev. C 49 (1994) 2555–2268.
[Hof95] S. Hofmann et al., ‘Production and decay of 269110’, Z. Phys. A 350 (1995) 277–280.
[Hof96a] P. Hoff et al., ‘Single-neutron states in 133Sn’, Phys. Rev. Lett. 77 (1996) 1020–1023.
[Hof96b] S. Hofmann et al., ‘The new element 112’, Z. Phys. A 354 (1996) 229–230.
[Hon69] R.E. Honig and D.A. Kramer, ‘Vapour pressure data for the solid and liquid elements’,RCA Review 30 (1969) 285–305.
[Hot85] H. Hotop and W.C. Lineberger, ‘Binding energies in atomic negative ions: II’, J. Phys.Chem. Ref. Data 14 (1985) 731–750.
[Huh97] M. Huhta et al., ‘Independent yields of neutron-rich nuclei in charged-particle inducedfission’, Nucl. Instr. Meth. B 126 (1997) 201–204.
[Huh98] M. Huhta et al., ‘New evidence for deformation in 73Zn’, Phys. Rev. C 58 (1998)3187–3194.
[Hui81] H. Huizenga, J.A.M. Bleeker, W.H. Diemer and A.P. Huben, ‘Submicron entrance win-dows for an ultrasoft x-ray camera’, Rev. Sci. Instr. 52 (1981) 673–677.
[Hul73] R. Hultgen et al., Selected values of the thermodynamic properties of the elements,American Society for Metals, Metals Park, Ohio (1973).

Bibliography 267
[Hur77] G.S. Hurst, M.H. Nayfeh and J.P. Young, ‘A demonstration of one-atom detection’,Appl. Phys. Lett. 30 (1977) 229–231.
[Hur79] G.S. Hurst, M.G. Payne, S.D. Kramer and J.P. Young, ‘Resonance ionization spec-troscopy and one-atom detection’, Rev. Mod. Phys. 51 (1979) 767–819.
[Hur85] G.S. Hurst et al., ‘Method for counting noble gas atoms with isotopic selectivity’, Rep.Prog. Phys. 48 (1985) 1333–1370.
[Hur88] G.S. Hurst and M.G. Payne, Principles and Applications of Resonance Ionisation Spec-troscopy, Adam Hilger, Bristol (1988).
[Huy83] M. Huyse, ‘Ionization in a hot cavity’, Nucl. Instr. Meth. 215 (1983) 1–5.
[Huy92] M. Huyse et al., ‘Isomers in three doubly odd Fr-At-Bi α-decay chains’, Phys. Rev. C46 (1992) 1209–1216.
[Ich89] S. Ichikawa, T. Sekine, H. Iimura, M. Oshima and N. Takahashi, ‘Selective mass separa-tion of light lanthanoids by means of ionization of their monoxides’, Nucl. Instr. Meth. A274 (1989) 259–264.
[Ich98] S. Ichikawa et al., ‘β-decay half-lives of new neutron-rich lanthanide isotopes’, in[ENA98], pp. 540–543.
[Ike92] N. Ikeda et al., ‘Study of a thick target surface ionizer at INS’, Nucl. Instr. Meth. B 70(1992) 150–155.
[Ing69] J.S. Ingley, ‘Nuclear explosion experiments to determine nuclear properties of heavyisotopes’, Nucl. Phys. A 124 (1969) 130–144.
[IS358] ‘Magnetic moment of 67Ni and 67Ni→67Cu beta decay’, ISOLDE experiment IS358,spokesperson: J. Rikovska.
[IS364] ‘Beta decay study of nømega excitations in neutron-rich (fp) nuclei. Test of the em-pirical nuclear interaction’, ISOLDE experiment IS364, spokesperson: G. Walter.
[IS365] ‘Nuclear spectroscopy with copper isotopes of extreme N/Z ratios’, ISOLDE experimentIS365, spokesperson: D. Habs.
[ISI20] ‘Measurement of the 7Be(p,γ)8B absolute cross section in inverse kinematics’, ISOLDELetter of Intent I20, spokespersons: C. Rolfs and U. Greife.
[ISI22] ‘Test measurements of neutron-rich Cd isotopes with a chemically selective laser ionsource’, ISOLDE Letter of Intent I22, spokesperson: K.L. Kratz.
[ISP55] ‘Towards the proton drip-line along the cadmium isotopic chain’, ISOLDE ProposalP55, spokesperson: K. Rykaczewski.
[ISP95] ‘Study of the 163Ho decay for a neutrino mass experiment’, ISOLDE Proposal P95,spokesperson: M. Altmann.
[ISP99] ‘Beta-decay study of dripline isotopes of Be’, ISOLDE Proposal P99, spokesperson: G.Nyman.
[Iva96] M.P. Ivanov et al., ‘Dependence of light charged particles parameters on Z2/A in ternaryfission’, Z. Phys. A 355 (1996) 341–342.
[Iva97] M.P. Ivanov, I.V. Kuznetsov, V.F. Kushniruk and Yu.G. Sobolev, ‘Inclusive energy spec-tra and yields of light nuclei from the spontaneous fission of 248Cm’, Phys. At. Nucl.60 (1997) 329–333.
[Izo92] I.N. Izosimov, ‘Structure of the β-decay strength function and delayed fission of 232Fr’,Bull. Russ. Acad. Sci. Phys. 56 (1992) 88–90.
[Jac87] L. Jacobsson, B. Fogelberg, B. Ekstrom and G. Rudstam, ‘An unconventional bi-modeion source (ANUBIS) for the OSIRIS facility’, Nucl. Instr. Meth. B 26 (1987) 223–226.

268 Bibliography
[Jad96a] Y. Jading and K. Riisager, ‘Systematic errors in χ2-fitting of Poisson distributions’,Nucl. Instr. Meth. A 372 (1996) 289–292.
[Jad96b] Ylva Jading, Towards the ”Waiting-Point” Nucleus 129Ag, Ph.D. thesis, Johannes-Gutenberg-Universitat Mainz (1996).
[Jad97] Y. Jading et al., ‘Production of radioactive Ag ion beams with a chemically selectivelaser ion source’, Nucl. Instr. Meth. B 126 (1997) 76–80.
[Jan76] G.S. Janes, I. Itzkan, C.T. Pike, R.H. Levy and L. Levin, ‘Two-photon laser isotopeseparation of atomic uranium: spectroscopic studies, excited-state lifetimes and pho-toionization cross sections’, IEEE J. Quant. Elec. QE-12 (1976) 111–120.
[Jay98] K. Jayamanna et al., ‘An electron cyclotron resonance source for radioactive berylliumion beam production’, Rev. Sci. Instr. 69 (1998) 756–757.
[Jes98] P. Jesinger et al., ‘Can time reversal invariance be tested in ternary fission’, in [Sey98],pp. 395–404.
[Joh73] P.G. Johnson, A. Bolson and C.M. Henderson, ‘A high temperature ion source forisotope separators’, Nucl. Instr. Meth. 106 (1973) 83–87.
[Joh98] I.P. Johnstone and I.S. Towner, ‘Effective magnetic dipole operators for 88Sr and 90Zrclosed-shell cores’, Eur. Phys. J. A 3 (1998) 237–242.
[Joh99] G.D. Johns et al., ‘High energy neutron induced fission: charge yield distributions andnew isomer search and spectroscopy’, in ‘Second Int. Conf. on Fission and Neutron-richNuclei, St. Andrews, Scotland’, World Scientific, Singapore, 1999.
[Jok95] A. Jokinen et al., ‘First observation of neutron single particle states in 133Sn’, in[ENA95], 1995, pp. 499–504.
[Jok96] A. Jokinen et al., ‘Proton instability of 73Rb’, Z. Phys. A 355 (1996) 227–230.
[Jok97] A. Jokinen et al., ‘Selective laser ionization of radioactive Ni-isotopes’, Nucl. Instr.Meth. B 126 (1997) 95–99.
[Jok98] A. Jokinen et al., ‘Beta decay of the MT = −1 nucleus 58Zn studied by selective laserionization’, Eur. Phys. J. A 3 (1998) 271–276.
[Jon81] B. Jonson, O.B. Nielsen, L. Westgaard and J. Zylicz, ‘The decay of 20780 Hg→20781 Tl’,
in ‘4th International Conference on Nuclei far from Stability, Helsingør’, CERN report81-09, Geneva, 1981, pp. 640–643.
[Jon98] B. Jonson, ‘Status of neutron drip-line nuclei’, in [ENA98], pp. 166–173.
[Kal76] V.V. Kalygin and V.M. Prokop’ev, ‘Efficiency of a tubular surface ionizer’, Sov. Phys.Tech. Phys. 20 (1976) 801–803.
[Kat72] T. Kato et al., ‘Thin polypropylene window proportional counters for the observationof cosmic soft X-rays’, Jap. J. Appl. Phys. 11 (1972) 1351–1356.
[Kat73] S.K. Kataria, E. Nardi and S.G. Thompson, ‘Simultaneous emission of two light-chargedparticles in spontaneous fission of 252Cf’, in ‘Physics and Chemistry of Fission 1973,Proc. of an Int. Symp.’, Preprint IAEA-SM-174/63, 1973, pp. 389–403.
[Kat86] K. Kato, ‘Second-harmonic generation to 2048 A in β-BaB2O4’, IEEE J. Quant. Elec.22 (1986) 1013–1014.
[Kauts] Thomas Kautzsch, priv. comm.
[Kau96] T. Kautzsch et al., ‘Laser ionization of 124Ag and its decay to levels of 124Cd’,Phys. Rev. C 54 (1996) R2811–R2814.
[Kau98] T. Kautzsch, W.B. Walters and K.L. Kratz for the ISOLDE-IS333 Collaboration, ‘Laserisotope and isomer separation of neutron-rich Ag isotopes’, in [Sey98] 1998, pp. 183–190.

Bibliography 269
[Kaw82] K. Kawade et al., ‘Evidence for doubly magic structure of 132Sn’, Z. Phys. A 308 (1982)33–38.
[Kaw89] Y. Kawase and K. Okano, ‘The oxidation technique for efficient ionization of lanthanidesby a helium-jet loaded on-line isotope separator’, Nucl. Instr. Meth. B 37/38 (1989)116–119.
[Kaw92] Y. Kawase, K. Okano, M. Shibata and A. Taniguchi, ‘Fluorination method for thesurface ionization of Sr and Ba with a helium-jet type ISOL’, Nucl. Instr. Meth. B 70(1992) 146–149.
[Kel94] H. Keller et al., ‘Search for forbidden β-decays of the drip line nucleus 12Be’, Z. Phys. A348 (1994) 61–62.
[Ker73] A. Kerek, G.B. Holm, L.E. De Geer and S. Borg, ‘The first excited state in the doubly-closed-shell nucleus 132Sn populated in the 0.12 s β−-decay of 132In’, Phys. Lett. 44B(1973) 252–254.
[Kes98] O. Kester et al., ‘The LINAC of the Munich accelerator for fission fragments (MAFF)’,in ‘XIV Int. Linear Accelerator Conf., LINAC’98, Chicago, August 1998’, 1998.
[Key94] U. Keyser and A. Paul, ‘Aerosolgenerator for the collection and transport of radioactiveisotopes’, in [Sey94], 1994, pp. 161–168.
[KH51] O. Kofoed-Hansen and K.O. Nielsen, Mat. Fys. Medd. Dan. Vid. Selsk. 26 (1951) 3–16.
[Kin84] W.H. King, Isotope shifts in atomic spectra, Physics of atoms and molecules, PlenumPress, New York (1984).
[Kirch] Reinhard Kirchner, priv. comm.
[Kir76] R. Kirchner and E. Roeckl, ‘Investigation of gaseous discharge ion sources for isotopeseparation on-line’, Nucl. Instr. Meth. 133 (1976) 187–204.
[Kir77] R. Kirchner et al., ‘New neutron-deficient tellurium, iodine and xenon isotopes producedby reactions of 290 MeV 58Ni ions on 58Ni and 63Cu targets’, Phys. Lett. 70B (1977)150–154.
[Kir78] R. Kirchner and A. Piotrowski, ‘Thermal ionization in a hot cavity’, Nucl. Instr. Meth.153 (1978) 291–292.
[Kir81a] R. Kirchner, ‘Progress in ion source development for on-line separators’, Nucl. In-str. Meth. 186 (1981) 275–293.
[Kir81b] R. Kirchner, K.H. Burkard, W. Huller and O. Klepper, ‘The ion sources for the GSIon-line separator’, Nucl. Instr. Meth. 186 (1981) 295–305.
[Kir86] R. Kirchner, ‘An ion source with storage capability for bunched beam release and con-trolled chemical separation’, Nucl. Instr. Meth. A 247 (1986) 265–280.
[Kir87a] R. Kirchner, ‘An ion source with bunched beam release’, Nucl. Instr. Meth. B 26 (1987)204–212.
[Kir87b] R. Kirchner, O. Klepper, D. Schardt and T. Sekine, ‘Ion source development for theGSI on-line isotope separator’, Nucl. Instr. Meth. B 26 (1987) 235–239.
[Kir90] R. Kirchner, ‘On the thermoionization in hot cavities’, Nucl. Instr. Meth. A 292 (1990)203–208.
[Kir92a] R. Kirchner, ‘On the release and ionization efficiency of catcher-ion-source systems inisotope separation on-line’, Nucl. Instr. Meth. B 70 (1992) 186–199.
[Kir92b] R. Kirchner, K. Burkard, W. Huller and O. Klepper, ‘Ion source development for theon-line isotope separator at GSI’, Nucl. Instr. Meth. B 70 (1992) 56–61.
[Kir96] R. Kirchner, ‘Ion sources for radioactive beams and related problems (Review)’,Rev. Sci. Instr. 67 (1996) 928–933.

270 Bibliography
[Kir97] R. Kirchner, ‘Release studies of elementary and metal-fluoride ions at the GSI on-linemass separator’, Nucl. Instr. Meth. B 126 (1997) 135–140.
[Kla68] R. Klapisch et al., ‘Isotopic distributions of Rb and Cs produced by 10.5 MeV protonson U, Th, Ta and identification of new isotopes: 77Rb, 78Rb, 120Cs, 121Cs, 122Cs and124Cs’, Phys. Rev. Lett. 20 (1968) 743–745.
[Kla84] H.V. Klapdor, J. Metzinger and T. Oda, ‘Beta-decay half-lives of neutron-rich nuclei’,At. Data Nucl. Data Tables 31 (1984) 81–111.
[Klu86] H.J. Kluge, ‘ISOLDE user’s guide’, Rep. 86-05, CERN, Geneva (1986).
[Knie] Klaus Knie, priv. comm.
[Kno89] G.F. Knoll, Radiation detection and measurement, John Wiley & Sons, New York(1989).
[Koh96] S. Kohler et al., ‘Die experimentelle Bestimmung der Ionisationsenergien von Berkeliumund Californium’, Angew. Chem. 108 (1996) 3036–3038.
[Koi97] M. Koizumi, A. Osa, T. Sekine and M. Kubota, ‘Development of a laser ion sourcewith pulsed ion extraction’, Nucl. Instr. Meth. B 126 (1997) 100–104.
[Kop87] E.A. Koptelov, S.G. Lebedev and V.N. Panchenko, ‘A model of carbon stripper targetfailure under ion beam bombardment’, Nucl. Instr. Meth. A 256 (1987) 247–250.
[Kop94] I.G. Koprinkov, G.A. Naylor and J.P. Pique, ‘Generation of 10 mW tunable narrowbandradiation around 210 nm using a 6.5 kHz repetition rate copper vapour laser pumpeddye laser’, Opt. Comm. 104 (1994) 363–368.
[Kor86] H.J. Korner, ‘Uranium-induced multinucleon transfer reactions’, in N. Angert andP. Kienle, eds., ‘Proc. of the Symp. 10 Years of Uranium Beam at the Unilac’, GSI,GSI report 86-19, Darmstadt, 1986, pp. 158–178.
[Kor95] A.A. Korsheninnikov et al., ‘Spectroscopy of 12Be and 13Be using a 12Be radioactivebeam’, Phys. Lett. B 343 (1995) 53–58.
[Kos94] U. Koster, ‘Neutronenaktivierungsanalyse: Nachweis von metallischen Verunreinigungenauf Silizium-Wafern’, Institut fur Radiochemie, TU Munchen (1994).
[Kos95] U. Koster, Ternare Spaltprodukte am LOHENGRIN & PIAFE: Ausbeuten leichter Iso-tope und ein hochauflosender Massenseparator, Master’s thesis, TU Munchen (1995).
[Kos97a] V.T. Koslowsky et al., ‘The half-lives of 42Sc, 46V, 50Mn and 54Co’, Nucl. Instr. Meth. A401 (1997) 289–298.
[Kos97b] U. Koster et al., ‘In-pile arrangements of reactor-based RIB facilities’, Nucl. Instr.Meth. B 126 (1997) 253–257.
[Kos98a] U. Koster, O. Kester and D. Habs, ‘Ion sources for fission fragment accelerators’,Rev. Sci. Instr. 69 (1998) 1316–1321.
[Kos98c] U. Koster et al., ‘Ternary fission yields of 241Pu(nth,f)’, in [Sey98], 1998, pp. 315–329.
[Kos99] U. Koster et al., ‘Ternary fission yields of 241Pu(nth,f)’, Nucl. Phys. A 652 (1999)371–387.
[Kos00] U. Koster et al., ‘Isomer separation of 70gCu and 70mCu with a resonance ionizationlaser ion source’, Nucl. Instr. Meth. B 160 (2000) 528–535.
[Kot98] A. Kotzle et al., ‘Parity nonconservation in nuclear fission’, in [Sey98], 1998, pp. 384–394.
[Kow91] D. Kowalewska et al., ‘Isotope shifts and hyperfine structure in polonium isotopes byatomic-beam laser spectroscopy’, Phys. Rev. A 44 (1991) R1442–R1445.
[Koz88] Piotr Kozcon, Mass and energy distributions of the products from the 245Cm(nth,f)reaction, Ph.D. thesis, TH Darmstadt (1988).

Bibliography 271
[KR00] S. Kandri-Rody et al., ‘Exotic nuclei produced by fast neutrons in a liquid uraniumtarget’, Nucl. Instr. Meth. B 160 (2000) 1–6.
[Kra73] K.L. Kratz and G. Herrmann, ‘Systematics of neutron emission probabilities from de-layed neutron precursors’, Z. Phys. 263 (1973) 435–442.
[Kra74] K.L. Kratz and G. Herrmann, ‘Delayed-neutron emission from short-lived Br and Iisotopes’, Nucl. Phys. A 229 (1974) 179–188.
[Kra75] K.L. Kratz, W. Lauppe and G. Herrmann, ‘Gamma-ray emission from short-livedbromine and iodine isotopes’, Inorg. Nucl. Chem. Lett. 11 (1975) 331–339.
[Kra79] S.D. Kramer, J.P. Young, G.S. Hurst and M.G. Payne, ‘Resonance ionization spec-troscopy of lithium’, Opt. Comm. 30 (1979) 47–50.
[Kra86] S.D. Kramer et al., ‘Analysis of 81Kr in groundwater using laser resonance ionizationspectroscopy’, Nucl. Instr. Meth. B 17 (1986) 395–401.
[Kra87] K.L. Kratz et al., ‘Constraints on r-process conditions from beta-decay properties faroff stability and r-abundances’, Rep. MPA 320, Max-Planck-Institut fur Physik undAstrophysik, Garching (Oct 1987).
[Kra91] K.L. Kratz et al., ‘Neutron-rich isotopes around the r-process “waiting-point” nuclei7929Cu50 and 8030Zn50’, Z. Phys. A 340 (1991) 419–420.
[Kra98a] A. Krasznahorkay et al., ‘Experimental evidence for hyperdeformed states in U isotopes’,Phys. Rev. Lett. 80 (1998) 2073–2076.
[Kra98b] K.L. Kratz et al., ‘Laser isotope and isomer separation of heavy Ag nuclides: half-lifeof the r-process waiting-point isotope 129Ag and structure of neutron-rich Cd nuclides’,in J.H. Hamilton and A.V. Ramayya, eds., ‘Proc. Int. Conf. on Fission and Propertiesof Neutron-Rich Nuclei, Sanibel Island, Nov. 1997’, World Scientific, Singapore, 1998,pp. 586–595.
[Kra99] A. Krasznahorkay et al., ‘On the excitation energy of the ground state in the thirdminimum of 234U’, Phys. Lett. B 461 (1999) 15–21.
[Kra00] K.L. Kratz, B. Pfeiffer, F.K. Thielemann and W.B. Walters, ‘Nuclear structure studiesat ISOLDE and their impact on the astrophysical r-process’, Hyp. Int. 129 (2000) 185–221.
[Kro69] T. Krogulski et al., ‘Emission of light nuclei in thermal neutron fission of 239Pu’,Nucl. Phys. A 128 (1969) 219–223.
[Kro87] U. Kronert, St. Becker, Th. Hilberath, H.J. Kluge and C. Schulz, ‘Resonance ionizationmass spectroscopy with a pulsed thermal atomic beam’, Appl. Phys. A 44 (1987) 339–345.
[Kro91] U. Kronert et al., ‘On-line laser spectroscopy by resonance ionization of laser-desorbedrefractory elements’, Nucl. Instr. Meth. A 300 (1991) 522–537.
[Krugl] Kirill Kruglov, priv. comm.
[Kud85] Yu.A. Kudryavtsev, V.S. Letokhov and V.V. Petrunin, ‘Laser detection of 40K by iso-topically selective ionization in a beam of accelerated atoms’, JETP Lett. 42 (1985)26–30.
[Kud92] Yu.A. Kudryavtsev, ‘Detection of very rare isotopes by laser collinear resonant ionizationof fast atoms’, Hyp. Int. 74 (1992) 171–180.
[Kud96] Y. Kudryavtsev et al., ‘Beams of short-lived nuclei produced by selective laser ionizationin a gas cell’, Nucl. Instr. Meth. B 114 (1996) 350–365.
[Kug72] G. Kugler and W.B. Clarke, ‘Mass-spectrometric measurements of 3H, 3He and 4Heproduced in thermal-neutron ternary fission of 235U: evidence for short-range 4He’,Phys. Rev. C 5 (1972) 551–560.

272 Bibliography
[Kug92] E. Kugler et al., ‘The new CERN-ISOLDE on-line mass-separator facility at the PS-booster’, Nucl. Instr. Meth. B 70 (1992) 41–49.
[Kuo98] T. Kuo et al., ‘Beam characteristics using stable isotopes from a multicusp source forthe TRIUMF ISAC facility’, Rev. Sci. Instr. 69 (1998) 767–769.
[Kur81] W. Kurcewicz, E. Ruchowska, N. Kaffrell, T. Bjørnstad and G. Nyman, ‘Collectiveexcitations in the transitional nuclei 224,226Ra’, Nucl. Phys. A 356 (1981) 15–25.
[Kur82] W. Kurcewicz et al., ‘Investigations of very neutron-deficient isotopes below 100Sn in40Ca-induced reactions’, Z. Phys. A 308 (1982) 21–31.
[Kur87] W. Kurcewicz et al., ‘Collective states in 230Ra fed by β− decay of 230Fr’, Nucl. Phys. A464 (1987) 1–8.
[Kuz94] G. Kuznetsov, ‘High temperature cathodes for high current density’, Nucl. Instr. Meth. A340 (1994) 204–208.
[Kwa90] J. Kwasny, K. Hilpert and H. Nickel, ‘Casium-Sorptionsuntersuchungen an graphitischenReaktorwerkstoffen’, Rep. Jul-2353, Forschungszentrum Julich (1990).
[LaCom] Marco La Commara, priv. comm.
[Lalaz] Georgios Lalazissis, priv. comm.
[Lal99] G.A. Lalazissis, S. Raman and P. Ring, ‘Ground-state properties of even-even nuclei inthe relativistic mean-field theory’, At. Data Nucl. Data Tables 71 (1999) 1–40.
[Lam87] R.H. Lamoreaux, D.L. Hildenbrand and L. Brewer, ‘High-temperature vaporization be-haviour of oxides - II. oxides of Be, Mg, Ca, Sr, Ba, B, Al, Ga, In, Tl, Si, Ge, Sn, Pb,Zn, Cd and Hg’, J. Phys. Chem. Ref. Data 16 (1987) 419–443.
[Lam98] T. Lamy et al., ‘Production of multicharged radioactive ion beams: New results forthe 1+ → n+ method with the MINIMAFIOS and SARA-CAPRICE electron cyclotronresonance ion sources’, Rev. Sci. Instr. 67 (1998) 1322–1326.
[Lan13] I. Langmuir, Phys. Rev. 2 (1913) 329–.
[Lan25] I. Langmuir and K.H. Kingdon, ‘Thermionic effects caused by vapours of alkali metals’,Proc. Roy. Soc. London 107 (1925) 61–79.
[Lan31] I. Langmuir and K.T. Compton, ‘Electrical discharges in gases. Part II. Fundamentalphenomena in electrical discharges’, Rev. Mod. Phys. 3 (1931) 191–257.
[Lan79] Willi Lang, Nuklidausbeuten bei der Reaktion 235U(nth,f) als Funktion der kinetis-chen Energie der Spaltprodukte – ein experimenteller Zugang zur Dynamik des Spalt-prozesses, Ph.D. thesis, TH Darmstadt (1979).
[Lan83] M. Langevin et al., ‘35Na: a new neutron-rich sodium isotope’, Phys. Lett. B 125 (1983)116–118.
[LAS] http://www.las.de.
[Las96] N. Catalan Lasheras, M. Crescenti and M. Vretenar, ‘Commissioning and experience instripping, filtering and measuring the 4.2 MeV/u lead ion beam at CERN LINAC 3’, in[LIN96], 1996, pp. 363–365.
[Lat74] A. Latuszynski, K. Zuber, J. Zuber, A. Potempa and W. Zuk, ‘Method of electromag-netic separation of radioactive isotopes of rare-earth elements directly from targets’,Nucl. Instr. Meth. 120 (1974) 321–328.
[Lat75] A. Latuszynski and V.I. Raiko, ‘Studies of the ion source with surface-volume ionization’,Nucl. Instr. Meth. 125 (1975) 61–66.
[Lau82] K.H. Lau and D.L. Hildenbrand, ‘Thermodynamical properties of the gaseous lowervalent fluorides of uranium’, J. Chem. Phys. 76 (1982) 2646–2652.

Bibliography 273
[Lau90] H.M. Lauranto, I.H. Auterinen, T.T. Kajava, K.M. Nyholm and R.R.E. Salomaa, ‘De-termination of hyperfine structures and Rydberg convergence limits of selected opticaltransitions in 93Nb using resonance ionization spectroscopy’, Appl. Phys. B 50 (1990)323–329.
[Lau92] W. Lauth et al., ‘Resonance ionization spectroscopy in a buffer gas cell with radioactivedecay detection, demonstrated using 208Tl’, Phys. Rev. Lett. 68 (1992) 1675–1678.
[Law65] J.N.P. Lawrence, ‘Static fission barrier calculations of a two-parameter liquid drop’,Phys. Rev. 139 (1965) B1227–B1231.
[Laz87] Yu.A. Lazarev et al., ‘Observation of delayed nuclear fission in the region of 180Hg’,Europhys. Lett. 4 (1987) 893–898.
[Laz97] Yu.A. Lazarev and Yu.Ts. Oganessian, ‘Nuclear fusion studies with PIAFE beams’, in[Ben96], 1997, pp. 314–339.
[Leb98] E. Lebiush et al., ‘High power high repetition rate diode side-pumped Q-switchedNd:YAG rod laser’, Opt. Comm. 145 (1998) 119–122.
[Lec97] N. Lecesne et al., ‘A new method for measuring the absolute efficiency of isotopeseparation on-line’, Nucl. Instr. Meth. B 126 (1997) 141–145.
[Led98] X. Ledoux et al., ‘Formation and decay of hot nuclei in 475 MeV, 2 GeV proton- and 2GeV 3He-induced reactions on Ag, Bi, Au and U’, Phys. Rev. C 57 (1998) 2375–2392.
[Lee96] Y. Lee et al., ‘Production of low energy spread ion beams with multicusp sources’,Nucl. Instr. Meth. A 374 (1996) 1–6.
[Leh83] B.E. Lehmann et al., ‘A pulsed laser ionization source for an ultrasensitive noble gasmass spectrometer’, in H.P. Weber and W. Luthy, eds., ‘Laser Spectroscopy VI, Proc.of Sixth Int. Conf., Interlaken, Switzerland’, Springer, Berlin, 1983 p. 100.
[Lei97] M. Leino, ‘In-flight separation with gas-filled systems’, Nucl. Instr. Meth. B 126 (1997)320–328.
[Ler98] R. Leroy et al., ‘Constraints due to the production of radioactive ion beams in theSPIRAL project’, Rev. Sci. Instr. 69 (1998) 758–760.
[Lettr] Jacques Lettry, priv. comm.
[Let77] V.S. Letokhov, V.I. Mishin and A.A. Puretzky, ‘Selective photoionization of atoms bylaser radiation and its applications’, Prog. Quant. Electr. 5 (1977) 139–203.
[Let87] V.S. Letokhov, Laser photoionization spectroscopy, Academic Press, Orlando (1987).
[Let97a] J. Lettry et al., ‘Pulse shape of the ISOLDE radioactive ion beams’, Nucl. Instr. Meth. B126 (1997) 130–134.
[Let97b] J. Lettry et al., ‘Release from ISOLDE molten metal targets under pulsed proton beamconditions’, Nucl. Instr. Meth. B 126 (1997) 170–175.
[Let98] J. Lettry et al., ‘Recent developments of the ISOLDE laser ion source’, Rev. Sci. Instr.69 (1998) 761–763.
[Lev99] J.M.G. Levins et al., ‘First on-line laser spectroscopy of radioisotopes of a refractoryelement’, Phys. Rev. Lett. 82 (1999) 2476–2479.
[Lia82] C.F. Liang et al., ‘Selective on-line separation of new Ta, Zr and Sr isotopes’, Z. Phys. A309 (1982) 185–186.
[Lia96] C.F. Liang, P. Paris, R.K. Sheline, P. Alexa and A. Gizon, ‘α-decay of 216Fr and 212At’,Phys. Rev. C C54 (1996) 2304–2309.
[Lia99] C.F. Liang, P. Paris and R.K Sheline, ‘Configurations and level structure of 215Po’,Phys. Rev. C 59 (1999) 648–654.

274 Bibliography
[HB] David R. Lide, ed., Handbook of Chemistry and Physics, CRC Press, Cleveland, 79thedn. (1998).
[LIN96] C. Hill and M. Vretenar, eds., ‘Proc. of the XVIII int. linear accelerator conference’,CERN, Geneva, 1996.
[Lin97] M. Lindroos et al., ‘Measurement of the magnetic moment of 23Mg using the tilted foilpolarization technique’, Nucl. Instr. Meth. B 126 (1997) 423–426.
[Lun88] E. Lund, B. Ekstrom, B. Fogelberg and G. Rudstam, ‘Identification and half-life deter-mination of very neutron-rich copper isotopes’, in I.S. Towner, ed., ‘Fifth Int. Conf. onNuclei far from Stability, Rosseau Lake, Ontario, 1987’, AIP Conf. Proc. 164, 1988, pp.578–580.
[Lun97] D. Lunney et al., ‘Accurate mass measurements of very short-lived nuclei at ISOLDEwith MISTRAL’, in [Ben96], 1997, pp. 225–230.
[Lun99] M.D. Lunney and R.B. Moore, ‘Cooling of mass-separated beams using an RFQ ionguide’, Int. J. Mass Spectrometry 190/191 (1999) 153–160.
[Lyu86] Yu.S. Lyutostanskii, ‘The processes which accompany β-decay of nuclei with a greatexcess of neutrons’, Bull. Acad. Sci. USSR, Phys. Ser. 50 (1986) 1–13.
[Mac87] H. Mach et al., ‘Search for new isotopes in the mass 149-152 region’, Bull. Am. Phys.Soc. 32 (1987) 1018, only abstract!
[Mac95] H. Mach et al., ‘Detailed spectroscopy of doubly-magic 132Sn and its neighbours; per-spective for further studies at PIAFE’, Nucl. Phys. A 588 (1995) 179c–184c.
[MAFF] D. Habs et al., eds., MAFF, Munich Accelerator for Fission Fragments, Physics Caseand Technical Description, Ludwig-Maximilians-Universitat, Munchen (Oct 1998).
[Maier] Hans-Jorg Maier, priv. comm.
[Mai70] L.I. Maissel and R. Glang, Handbook of Thin Film Technology, McGraw-Hill, New York(1970).
[Mam98] A. Mamdouh, J.M. Pearson, M. Rayet and F. Tondeur, ‘Large-scale fission-barrier cal-culations with the ETFSI method’, Nucl. Phys. A 644 (1998) 389–414.
[Manti] Paul Mantica, priv. comm.
[Man68] C.L. Mantell, Carbon and Graphite Handbook, Interscience Publishers, New York(1968).
[Man72] F. Manero and V.A. Konshin, ‘Status of the energy-dependent ν-values for the heavyisotopes (Z > 90) from thermal to 15 MeV and of ν-values for spontaneous fission’,At. Energy Rev. 10 (1972) 637–756.
[Mar79] D. Marx, F. Nickel and W. Thalheimer, ‘Rotating sandwich targets of isotopically en-riched lead for high intensity heavy ion beams’, Nucl. Instr. Meth. 167 (1979) 151–152.
[Mar87] Y. Maruyama, Y. Suzuki, T. Arisawa and K. Shiba, ‘Laser isotope separation of titaniumby two-step photoionization’, Appl. Phys. B 44 (1987) 163–166.
[Mar95] A. Marijnissen, J.J. ter Meulen, P.A. Hackett and B. Simard, ‘First ionization po-tential of platinum by mass-selected double-resonance field-ionization spectroscopy’,Phys. Rev. A 52 (1995) 2606–2610.
[Mat73] Hj. Matzke and C. Politis, ‘Self-diffusion of uranium in uranium dicarbide UC2’, SolidState Comm. 12 (1973) 401–404.
[Mat80] Hj. Matzke, ‘Gas release mechanisms in UO2 – a critical review’, Rad. Eff. 53 (1980)219–242.
[Mat86] Hj. Matzke, ‘Diffusion processes in nuclear fuels’, J. Less-Common Metals 121 (1986)537–564.

Bibliography 275
[Mat95] O.I. Matveev, P. Cavalli and N. Omenetto, ‘Three-step laser induced ionization of Irand Hg atoms in an air-acetylene flame and a gas cell’, in [RIS94], 1995, pp. 269–272.
[May90] S. Mayo, J.D. Fassett, H.M. Kingston and R.J. Walker, ‘Measurement of vanadiumimpurity in oxygen-implanted silicon by isotope dilution and resonance ionization massspectrometry’, Anal. Chem. 62 (1990) 240–244.
[Maz81] K. Mazumdar et al., ‘Performance of the on-line isotope separation facility HELIOS atthe Mainz reactor’, Nucl. Instr. Meth. 186 (1981) 131–134.
[McC75] J.R. McConnell and W.L. Talbert, ‘The TRISTAN on-line isotope separator facility’,Nucl. Instr. Meth. 128 (1975) 227–243.
[Meh73] G.K. Mehta, J. Poitou, M. Ribrag and C. Signarbieux, ‘Detailed study of alpha emissionin 252Cf fission’, Phys. Rev. C 7 (1973) 373–387.
[Mei39] L. Meitner and O.R. Frisch, ‘Disintegration of uranium by neutrons: a new type ofnuclear reaction’, Nature 143 (1939) 239–240.
[Men97] Mariano Menna, Nuclear and radiochemistry at CERN-ISOLDE: target synthesis anddiffusion studies, Master’s thesis, Universita di Napoli ”Federico II” (1997).
[Mey88] R.J. Meyer, E.H.E. Pietsch and A. Kotowski, eds., Thorium Supplement, vol. A3 ofGmelin Handbuch der Anorganischen Chemie, Springer, Berlin, 8th edn. (1988).
[Mey89] B.S. Meyer et al., ‘Beta-delayed fission and neutron emission calculations for the actinidecosmochronometers’, Phys. Rev. C 39 (1989) 1876–1882.
[Mez90] K.A. Mezilev, Yu.N. Novikov, A.V. Popov, Yu.Ya. Sergeev and V.IU. Tikhonov, ‘Searchfor delayed fission in neutron-rich nuclei’, Z. Phys. A 337 (1990) 109.
[Mic77] H.B. Michaelson, ‘The work function of the elements and its periodicity’, J. Appl. Phys.48 (1977) 4729–4733.
[Mic97] R. Michel and P. Nagel, ‘International codes and model intercomparison for intermediateenergy activation yields’, Rep. NSC/DOC(97)-1, Nuclear Energy Agency, OECD, Paris(1997).
[Mil82] C.M. Miller, N.S. Nogar, A.J. Gancarz and W.R. Shields, ‘Selective laser photoionizationfor mass spectrometry’, Anal. Chem. 54 (1982) 2377–2378.
[Min86] T. Minowa, H. Katsuragawa, A. Kawamura and M. Shimazu, ‘Highly sensitive detectionof thallium atoms using resonance ionization’, Opt. Comm. 60 (1986) 37–40.
[Min92] T. Minowa, H. Katsuragawa and H. Komatsu, ‘Resonance ionization spectroscopy ofmolybdenum and its applications to a pure ion source’, Nucl. Instr. Meth. B 72 (1992)255–260.
[Mir78] M.Y. Mirza and W.W. Duley, ‘Two photon laser spectroscopy of indium’, Proc. Roy.S. Lond. A 364 (1978) 255–263.
[Mir83] S. Mirzadeh, P.P. Parekh, S. Katcoff and Y.Y. Chu, ‘Cross-section systematics fornuclide production at a medium energy spallation neutron facility’, Nucl. Instr. Meth.216 (1983) 149–154.
[Mis87a] V.I. Mishin and V.N. Fedoseev, ‘Laser resonance photoionization spectroscopy ofexcited and autoionizing atomic states of rare-earth elements. 2: Gadolinium’,Opt. Spectr. (USSR) 63 (1987) 420–422.
[Mis87b] V.I. Mishin et al., ‘Resonance photoionization spectroscopy and laser separation of141Sm and 164Tm nuclear isomers’, Opt. Comm. 61 (1987) 383–386.
[Mis93] V.I. Mishin et al., ‘Chemically selective laser ion-source for the CERN-ISOLDE on-linemass separator facility’, Nucl. Instr. Meth. B 73 (1993) 550–560.

276 Bibliography
[Miy86] K. Miyazaki, H. Sakai and T. Sato, ‘Efficient deep-ultraviolet generation by frequencydoubling in β-BaB2O4 crystals’, Opt. Lett. 11 (1986) 797–799.
[MK72] P. Maier-Komor, ‘A simple technique of producing thin carbon films’, Nucl. Instr. Meth.102 (1972) 485–486.
[Moi76] B.L. Moiseiwitsch, Negative ions, North-Holland, Amsterdam (1976).
[Mol70] E. Moll et al., ‘A mass spectrometer for the investigation of fission products’, in H. Wag-ner and W. Walcher, eds., ‘Proc. of the Int. Conf. on Electromagnetic Isotope Sepa-rators and the Techniques of their Applications’, Universitat Marburg, Report BMBW-FB K 70-28, 1970, pp. 241–254.
[Mol77] E. Moll et al., ‘Design and working principles of the Lohengrin mass separator for fissionproducts at the high flux reactor in Grenoble’, Kerntechnik 19 (1977) 374–381.
[Mol95] P. Moller, J.R. Nix, W.D. Myers and W.J. Swiatecki, ‘Nuclear ground-state masses anddeformations’, At. Data Nucl. Data Tables 59 (1995) 185–381.
[Mol97] P. Moller, J.R. Nix and K.L. Kratz, ‘Nuclear properties for astrophysical and radioactive-ion-beam applications’, At. Data Nucl. Data Tables 66 (1997) 131–343.
[Moo85] L.J. Moore, J.D. Fassett, J.C. Travis, T.B. Lucatorto and C.W. Clark, ‘Resonance-ionization mass spectrometry of carbon’, J. Opt. Soc. Amer. B 2 (1985) 1561–1565.
[Mor72] L.G. Moretto, ‘Pairing fluctuations in excited nuclei and the absence of a second orderphase transition’, Phys. Lett. 40B (1972) 1–4.
[Mor94] D.J. Morrissey, W. Benenson and W.A. Friedman, ‘Measurement of temperature innuclear reactions’, Annu. Rev. Nucl. Part. Sci. 44 (1994) 27–63.
[Mor95] K. Morita et al., ‘New α-decaying neutron deficient isotopes 197Rn and 200Fr’, Z. Phys. A352 (1995) 7–8.
[Mot97] B. Le Motais and V. Panchout, ‘Urananreicherung in Frankreich’, atw 42 (1997) 626–628.
[Muc83] M.L. Muchnik et al., ‘Production of the indium ion beam with the method of selectivelaser photoionization’, Sov. J. Quant. Electr. 10.
[Mue99] W.F. Mueller et al., ‘On the magicity of the 68Ni semi-double-magic nucleus probed byGamow-Teller decay of the odd-A neighbors’, Phys. Rev. Lett. 83 (1999) 3613–3616.
[Mul98] P. Muller et al., ‘Ultratrace determination of the long-lived isotope 41Ca’, in [RIS98],1998.
[Munze] Gottfried Munzenberg, priv. comm.
[Mun79] G. Munzenberg et al., ‘The velocity filter SHIP, a separator of unslowed heavy ion fusionproducts’, Nucl. Instr. Meth. 161 (1979) 65–82.
[Mut96a] M. Mutterer and J.P. Theobald, Particle-accompanied fission, IOP, Bristol, 1996, pp.487–530.
[Mut96b] M. Mutterer et al., ‘Recent results on the energetics of the ternary fission process’, in[Dan96], 1996, pp. 250–261.
[Mut99] M. Mutterer et al., ‘Angular correlations with γ-rays and neutrons in ternary fissionof 252Cf’, in C. Wagemans, O. Serot and P. D’Hondt, eds., ‘Seminar on Fission, Pontd’Oye IV’, World Scientific, Singapore, 1999, pp. 95–109.
[Nak97] H. Nakata, T. Tachibana and M. Yamada, ‘Semi-gross theory of nuclear β-decay’,Nucl. Phys. A 625 (1997) 521–553.
[Nak98] T. Nakamura et al., ‘Coulomb dissociation of 19C’, in [ENA98], pp. 215–220.
[Nar69] E. Nardi, Y. Boneh and Z. Fraenkel, ‘Trajectory calculations in light-particle fission’, in‘Conf. on Physics and Chemistry of Fission’, IAEA, Vienna, 1969, pp. 143–152.
Bibliography 277
[Nesvi] Valery Nesvishevsky, priv. comm.
[Nes63] A.N. Nesmeyanov, Vapor pressure of the chemical elements, Elsevier, Amsterdam(1963).
[Neu62] S. Neumann and H. Ewald, ‘Fokussierende Parabelspektrographen’, Z. Phys. 169 (1962)224–238.
[Neu92] Sigurd Neumaier, Energieverteilungen und Haufigkeiten der leichten Teilchen 5 ≤ Z ≤ 8bei der teilchenbegleiteten Spaltung von 242Am(nth,f), Master’s thesis, TH Darmstadt(1992).
[Ney97] G. Neyens, G. S’heeren and R. Coussement, ‘Nuclear orientation in a two-step laserionization process’, Nucl. Instr. Meth. B 122 (1997) 121–126.
[Nic82] F. Nickel, ‘The influence of temperature on stripper foil lifetimes’, Nucl. Instr. Meth.195 (1982) 457–460.
[Nie57] K.O. Nielsen, ‘The development of magnetic ion sources for an electromagnetic isotopeseparator’, Nucl. Instr. Meth. 1 (1957) 289–301.
[Nik68] V.S. Nikolaev and I.S. Dmitriev, ‘On the equilibrium charge distribution in heavy elemention beams’, Phys. Lett. 28A (1968) 277–278.
[Nin99] V. Ninov et al., ‘Observation of superheavy nuclei produced in the reaction of 86Kr with208Pb’, Phys. Rev. Lett. 83 (1999) 1104–1107.
[NISTA] ‘NIST Atomic Spectra Database’, http://physics.nist.gov/cgi-bin/AtData/display.ksh.
[Nis73] K. Nishizawa, K. Narisada, H. Teranatsu, M. Soya and M. Shinagawa, ‘Charge distri-bution for 133Xe-133Cs decay process’, Mass Spectrometry (Japan) 21 (1973) 45–51.
[Nit85] J.M. Nitschke, ‘An electron-beam-generated-plasma ion source for on-line isotope sep-aration’, Nucl. Instr. Meth. A 236 (1985) 1–16.
[NL92] Ute Nast-Linke, Die relativen Haufigkeiten der leichten geladenen Teilchen der teilchen-begleiteten Spaltung, Master’s thesis, TH Darmstadt (1992).
[Nod34] I. Noddack, ‘uber das Element 93’, Angew. Chem. 47 (1934) 653–655.
[Nolen] Jerry Nolen, priv. comm.
[Nor51] L.W. Nordheim, ‘Nuclear shell structure and beta-decay. II. Even A nuclei’,Rev. Mod. Phys. 23 (1951) 322–327.
[Nor63] L.C. Northcliffe, ‘Passage of heavy ions through matter’, Annu. Rev. Nucl. Sci. 13(1963) 67–102.
[Num01] S. Nummela et al., ‘Spectroscopy of 34,35Si by β decay: sd-fp shell gap and single-particlestates’, Phys. Rev. C (2001) in press.
[Obe92] S. Oberstedt and N. Carjan, ‘Information on nuclear shapes near the scission point frominternal trajectory calculations’, Z. Phys. A 344 (1992) 59–66.
[Oinon] Markku Oinonen, priv. comm.
[Oin99] M. Oinonen et al., ‘Beta decay of 61Ga’, Eur. Phys. J. A 5 (1999) 151–156.
[Oin01] M. Oinonen et al., ‘Ground-state spin of 59Mn’, Eur. Phys. J. A (2001) in press.
[Orr98] N. Orr et al., ‘TONNERRE: an array for delayed-neutron spectroscopy’, Nouvelles duGANIL 63 (1998) 4–7.
[Ort61] C.J. Orth, ‘Diffusion of lanthanides and actinides from graphite at high temperatures’,Nucl. Sci. Eng. 9 (1961) 417–420.
[Ott89] E.W. Otten, Nuclear Radii and Moments of Unstable Isotopes, vol. 8 of Treatise onHeavy-Ion Science, Plenum Press, New York (1989).

278 Bibliography
[Oya98] M. Oyaizu et al., ‘Beam bunching of the radioactive nuclear beam in a 6.4 GHz electroncyclotron resonance ion source’, Rev. Sci. Instr. 69 (1998) 770–772.
[Pag94] R.D. Page et al., ‘Decays of odd-odd N − Z = 2 nuclei above 100Sn: the observationof proton radioactivity from 112Cs’, Phys. Rev. Lett. 72 (1994) 1798–1801.
[Par76] P. Paris et al., ‘Development of the Orsay high current on-line separator ISOCELE’,Nucl. Instr. Meth. 139 (1976) 251–256.
[Pat70] P. Patzelt, ‘The hydroxides of titanium, zirconium, cerium (IV) and thorium for on-lineproduction of noble gases’, Rep. 70-3, CERN, Geneva (1970).
[Pen95] Yu.E. Penionzhkevich, ‘Investigation of very neutron-rich isotopes of the lightest ele-ments’, in [ENA95], 1995, pp. 269–274.
[Pet98] J.R. Peterson et al., ‘Determination of the first ionization potential of einsteinium byresonance ionization mass spectroscopy (RIMS)’, J. Alloys and Compounds 271-273(1998) 876–878.
[Pfe99] B. Pfeiffer, K.L. Kratz and P. Moller, ‘Predictions of T1/2- and Pn-values’, rep., Institutfur Kernchemie, Johannes-Gutenberg Universitat Mainz (1999).
[Pfu98] M. Pfutzner et al., ‘New isotopes and isomers produced by the fragmentation of 238Uat 1000 MeV/nucleon’, Phys. Lett. B 444 (1998) 32–37.
[PIAFE] U. Koster and J.A. Pinston, eds., PIAFE (Production, Ionisation et Acceleration desFaisceaux Exotiques), Project Report, Institut des Sciences Nucleaires, Grenoble (Mar1998).
[Pia80] E. Piasecki and L. Nowicki, ‘Polar emission in fission’, in ‘Physics and Chemistry ofFission 1979, Proc. of an Int. Symp., Julich’, IAEA, Vienna, 1980, pp. 193–221.
[Pil87] E.H. Pilzer and G. Engler, ‘A new ion source for fission-yield measurements of rare-earthisotopes’, Nucl. Instr. Meth. B 26 (1987) 218–222.
[Pin77] J. Pinard and S. Liberman, ‘A frequency locked, single mode pulsed dye laser. Applica-tion to single frequency tunable UV generation’, Opt. Comm. 20 (1977) 344–346.
[Pio97] A. Piotrowski, T. Kozlowski and M. Laskus, ‘Study of negative ion emission from thetubular ionizer’, Nucl. Instr. Meth. 129 (1997) 410–413.
[Plo92] A. Plochoki et al., ‘Gamow-Teller beta decay of the very neutron-deficient N = 50nuclide 98Cd’, Z. Phys. A 342 (1992) 43–51.
[Poe89] D.N. Poenaru and M.S. Ivascu, eds., Particle emission from nuclei, CRC Press, BocaRaton (1989).
[Pol89] S. Polikanov, ‘Meson, hyperon and antiproton induced fission’, Nucl. Phys. A 502 (1989)195c–212c.
[Pos65] A.M. Poskanzer, P.L. Reeder and I. Dostrovsky, ‘New delayed-neutron-emitting isotope:12Be’, Phys. Rev. 138 (1965) B18–B20.
[Pou87] F. Pougheon et al., ‘Direct observation of new proton rich nuclei in the region 23 ≤Z ≤ 29 using a 55A MeV 58Ni beam’, Z. Phys. A 327 (1987) 17–24.
[PP84] G.A. Pik-Pichak, ‘Ternary fission with emission of α particles’, Sov. J. Nucl. Phys. 40(1984) 215–222.
[PP94] G.A. Pik-Pichak, ‘On the mechanism of ternary fission with emission of light chargedparticles’, Phys. At. Nucl. 57 (1994) 906–913.
[Pre41] R.D. Present, ‘Possibility of ternary fission’, Phys. Rev. 59 (1941) 466.
[PSyie] ISOLDE PSB yield databank, unpublished.
[Put81] J.C. Putaux et al., ‘Target ion source systems at the Orsay ISOCELE 2 separator’,Nucl. Instr. Meth. 186 (1981) 321–328.

Bibliography 279
[Put87] J.C. Putaux, J. Obert, G. Boissier and P. Paris, ‘Comparison between Nier-Bernas andNielsen type ion sources for extracted ion-beam intensities in the mA range’, Nucl. Instr.Meth. B 26 (1987) 213–217.
[Put97] J.C. Putaux et al., ‘Graphite target for the SPIRAL project’, Nucl. Instr. Meth. B 126(1997) 113–116.
[Qui93] B. Quint et al., ‘Investigation of the fusion of heavy nearly symmetric systems’,Z. Phys. A 346 (1993) 119–131.
[Rab87] V. Rabbel et al., ‘A negative surface-ionization ion source for the on-line mass separatorOSTIS’, Nucl. Instr. Meth. B 26 (1987) 246–248.
[Rad75] L.J. Radziemski, S. Gerstenkorn and P. Luc, ‘Uranium transitions and energy levelswhich may be useful in atomic-photoionization schemes for separating 238U and 235U’,Opt. Comm. 15 (1975) 273–276.
[Rad85] A.A. Radzig and B.M. Smirnov, Reference Data on Atoms, Molecules and Ions, Springer,Berlin (1985).
[Rai68] G.M. Raisbeck and T.D. Thomas, ‘Light nuclei emitted in the fission of 252Cf’,Phys. Rev. 172 (1968) 1272–1282.
[Ram96] A.V. Ramayya et al., ‘Cold fragmentation in the spontaneous fission of 252Cf’, in[Dan96], 1996, pp. 307–321.
[Ram97] A.V. Ramayya et al., ‘Cold binary and ternary fragmentations in spontaneous fission of252Cf’, Il Nuovo Cimento 110 A (1997) 1073–1078.
[Ram98a] A.V. Ramayya et al., ‘Cold (neutronless) α ternary fission of 252Cf’, Phys. Rev. C 57(1998) 2370–2374.
[Ram98b] A.V. Ramayya et al., ‘Observation of 10Be emission in the cold ternary spontaneousfission of 252Cf’, Phys. Rev. Lett. 81 (1998) 947–950.
[Rao97] R. Rao and O. Kultashev, ‘Ir-Ce cathodes as high-density emitters in electron beam ionsources’, Meas. Sci. Technol. 8 (1997) 184–188.
[Rav75a] H.L. Ravn, S. Sundell, L. Westgaard and E. Roeckl, ‘Short-lived isotopes of alkali andalkaline-earth elements studied by on-line isotope separator techniques’, J. Inorg. Nucl.Chem. 37 (1975) 383–393.
[Rav75b] H.L. Ravn, S. Sundell, L. Westgaard and the ISOLDE Collaboration, ‘Target techniquesfor the ISOLDE on-line isotope separator’, Nucl. Instr. Meth. 123 (1975) 131–144.
[Rav76] H.L. Ravn, ‘Progress in targets and ion sources for on-line separators’, Nucl. Instr. Meth.139 (1976) 281–290.
[Rav79] H.L. Ravn, ‘Experiments with intense secondary beams of radioactive ions’, Phys. Rep.54 (1979) 201–259.
[Rav87] H.L. Ravn et al., ‘Use of refractory oxides, carbides and borides as targets for on-linemass separation’, Nucl. Instr. Meth. B 26 (1987) 183–189.
[Rav89] H.L. Ravn and B.W. Allardyce, On-line mass separators, vol. 8 of Treatise on Heavy-IonScience, Plenum Press, New York (1989).
[Rav94] H.L. Ravn et al., ‘Comparison of radioactive ion-beam intensities produced by means ofthick targets bombarded with neutrons, protons and heavy ions’, Nucl. Instr. Meth. B88 (1994) 441–461.
[Rav97a] H.L. Ravn, ‘ISOLDE ion sources and targets with relevance to PIAFE’, in [Ben96],1997, pp. 62–68.
[Rav97b] H.L. Ravn et al., ‘Bunched release of gases from oxide targets’, Nucl. Instr. Meth. B126 (1997) 176–181.

280 Bibliography
[Rav98] H.L. Ravn, ‘Radioactive ion-beam projects based on the two-accelerator or ISOL prin-ciple’, Phil. Trans. R. Soc. Lond. A 356 (1998) 1955–1984.
[Ray99] A. Ray et al., ‘Observation of large change of 7Be decay rate in Au and Al2O3 and itsimplications’, Phys. Lett. B 455 (1999) 69–76.
[Ree76] P.L. Reeder, L.J. Alquist and J.F. Wright, ‘Separation of alkaline earth from alkalimetal fission products in the SOLAR on-line mass spectrometer’, Nucl. Instr. Meth.133 (1976) 501–502.
[Ree77] T. Reetz, B. Eichler, H. Gaggeler and I. Zvara, ‘Verfluchtigung der Schwerionenreak-tionsprodukte Hg, Tl, Pb und Bi aus den Catchermaterialien Cu, Au, Ni und Graphit’,Radiochim. Acta 24 (1977) 69–72.
[Ree81] P.L. Reeder and R.A. Warner, ‘Measurement of average neutron energies by a countingrate ratio technique’, Nucl. Instr. Meth. 180 (1981) 173–183.
[Ree85] P.L. Reeder, R.A. Warner, G.P. Ford and H. Willmes, ‘Independent isomer yield ratioof 90Rb from thermal neutron fission of 235U’, Phys. Rev. C 32 (1985) 1327–1334.
[Ree91] P.L. Reeder, R.A. Warner, W.K. Hensley, D.J. Vieira and J.M. Wouters, ‘Half-lives anddelayed neutron emission probabilities of neutron-rich Li-Al nuclides’, Phys. Rev. C 44(1991) 1435–1453.
[Rei75] W.L. Reiter, W.H. Breunlich and P. Hille, ‘Short-lived activities produced in 70Zn with14 MeV neutrons’, Nucl. Phys. A 249 (1975) 166–172.
[Rei80] L. von Reisky et al., ‘An on-line mass separator for fission-produced alkali isotopes’,Nucl. Instr. Meth. 172 (1980) 423–430.
[Ren97] Sh. Rencheng et al., ‘Laser ion source via direct ionization at the outlet of a heliumjet’, Rev. Sci. Instr. 68 (1997) 3027–3030.
[Reu99] I. Reusen et al., ‘β-decay study of 54,55Ni produced by an element-selective laser ionsource’, Phys. Rev. C 59 (1999) 2416–2421.
[Richa] Jean-Paul Richaud, priv. comm.
[Ric99] M.V. Ricciardi et al., ‘Dependence of exotic nuclides production on target and beamfeatures’, Ann. Nucl. En. 26 (1999) 1643–1656.
[Ric01] M.V. Ricciardi et al., ‘Experimental study on the production of light nuclei in spallation-fission reactions and projectile fragmentation of 238U’, Nucl. Phys. A (2001) in press.
[Rie93] J. Riegel et al., ‘Resonance ionization mass spectroscopy for trace analysis of neptu-nium’, Appl. Phys. B 56 (1993) 275–280.
[Rii92] K. Riisager, A.S. Jensen and P. Moller, ‘Two-body halos’, Nucl. Phys. A 548 (1992)393–413.
[Rikov] Jirina Rikovska, priv. comm.
[RIS94] H.J. Kluge, J.E. Parks and K. Wendt, eds., ‘7th Int. Symp. on Resonance IonizationSpectroscopy, RIS’94, Bernkastel-Kues’, AIP Conf. Proc. 329, Woodbury, 1995.
[RIS98] J.C. Vickerman, I. Lyon, N.P. Lockyer and J.E. Parks, eds., ‘Proc. of the 9th Int. Symp.on Resonance Ionisation Spectroscopy, Manchester’, AIP Conf. Proc. 454, Woodbury,NY, 1998.
[Rob39] R.B. Roberts, R.C. Meyer and P. Wang, ‘Further observations on the splitting of ura-nium and thorium’, Phys. Rev. 55 (1939) 510–511.
[Roe74] E. Roeckl et al., ‘Decay properties of the neutron-rich isotopes 11Li and 27−31Na’,Phys. Rev. C 10 (1974) 1181–1188.
[Roe80] E. Roeckl et al., ‘The decay of 0.57 s 114Cs’, Z. Phys. A 294 (1980) 221–232.

Bibliography 281
[Roosb] Jan Van Roosbroeck, priv. comm.
[Ros86] F. Rosch and B. Eichler, ‘Adsorption von Metallen auf metallische Oberflachen undMoglichkeiten ihrer Nutzung in der Kernchemie - Modellberechnungen zur Trennungvon Radionukliden durch thermische Desorption von festen Metalloberflachen’, Rep.ZfK-575, Zentralinstitut fur Kernforschung, Rossendorf (1986).
[Ros94] A.S. Roshchin, V.A. Rubchenya and S.G. Yavshits, ‘Trajectory calculations of ternaryfission of nuclei’, Phys. At. Nucl. 57 (1994) 974–983.
[Roß84] H. Roßbach and B. Eichler, ‘Adsorption von Metallen auf metallische Oberflachen undMoglichkeiten ihrer Nutzung in der Kernchemie - Ermittlung von Adsorptionsenthalpienmit dem Rechenprogramm APO’, Rep. ZfK-527, Zentralinstitut fur Kernforschung,Rossendorf (1984).
[Rot89] I. Rotter, ‘Particle decay and fission’, J. Phys. G 15 (1989) 251–263.
[Roy92] G. Royer, F. Haddad and J. Mignen, ‘On nuclear ternary fission’, J. Phys. G 18 (1992)2015–2026.
[Rubch] Valery Rubchenya, priv. comm.
[Rub88] V.A. Rubchenya and S.G. Yavshits, ‘Dynamic treatment of ternary fission’, Z. Phys. A329 (1988) 217–228.
[Rub94] V.A. Rubchenya, A.S. Roschin and S.G. Yavshits, ‘Fission dynamics and ternary fission’,in [Sey94], 1994, pp. 26–36.
[Ruc82] E. Ruchowska, W. Kurcewicz, N. Kaffrell, T. Bjørnstad and G. Nyman, ‘The decayscheme of 228Fr and K = 0 bands in 228Ra’, Nucl. Phys. A 383 (1982) 1–10.
[Rud76] G. Rudstam, ‘The on-line mass separator OSIRIS and the study of short-lived fissionproducts’, Nucl. Instr. Meth. 139 (1976) 239–249.
[Rud81] G. Rudstam, P. Aagaard, P. Hoff, B. Johansson and H.U. Zwicky, ‘Chemical separationcombined with an ISOL-system’, Nucl. Instr. Meth. 186 (1981) 365–379.
[Rud90] G. Rudstam et al., ‘Yields of products from thermal neutron-induced fission of 235U’,Radiochim. Acta 49 (1990) 155–191.
[Rud91] G. Rudstam, K. Aleklett and L. Sihver, ‘Delayed-neutron branching ratios and averagekinetic energies’, Research report NFL-69, Univ. of Uppsala, The Studsvik NeutronResearch Laboratory, S-61182 Nykoping (1991).
[Rud93] G. Rudstam, K. Aleklett and L. Sihver, ‘Delayed-neutron branching ratios of precursorsin the fission product region’, At. Data Nucl. Data Tables 53 (1993) 1–22.
[Rud94] G. Rudstam, P.I. Johansson, K. Aleklett and J. Eriksen, ‘Fast fission of 238U’, in J.K.Dickens, ed., ‘Proc. of the Int. Conf. on Nuclear Data for Science and Technology’,American Nuclear Society, La Grange Park, Il, 1994, pp. 977–980.
[Rud96] G. Rudstam, P.I. Johansson and J. Eriksen, ‘Summary of yield values from thermalfission of 233U’, Research report nfl-78, University of Uppsala (1996).
[Run83] E. Runte et al., ‘Decay studies of neutron-rich products from 76Ge induced multinucleontransfer reactions including the new isotopes 62Mn, 63Fe and 71,72,73Cu’, Nucl. Phys. A399 (1983) 163–180.
[Run85] E. Runte et al., ‘Decay studies of neutron-rich isotopes of manganese, iron, cobalt,nickel, copper and zinc’, Nucl. Phys. A 441 (1985) 237–260.
[Rus89] W. Ruster et al., ‘A resonance ionization mass spectrometer as an analytical instrumentfor trace analysis’, Nucl. Instr. Meth. A 281 (1989) 547–558.
[Ryk89] K. Rykaczewski et al., ‘Investigation of neutron-rich rare-earth nuclei including the newisotopes 177Tm and 184Lu’, Nucl. Phys. A 499 (1989) 529–545.

282 Bibliography
[Ryk95] K. Rykaczewski et al., ‘Identification of new nuclei at and beyond the proton drip linenear the doubly magic nucleus 100Sn’, Phys. Rev. C 52 (1995) R2310–R2313.
[Sah20] M.N. Saha, ‘Ionization in the solar chromosphere’, Phil. Mag. 40 (1920) 472.
[Sal90] E.B. Saloman, ‘A resonance ionization spectroscopy/resonance ionization mass spec-trometry data service. I. Data sheets for As, B, Cd, C, Ge, Au, Fe, Pb, Si and Zn’,Spectrochim. Acta 45B (1990) 37–83.
[Sal91] E.B. Saloman, ‘A resonance ionization spectroscopy/resonance ionization mass spec-trometry data service. II. Data sheets for Al, Ca, Cs, Cr, Co, Cu, Kr, Mg, Hg and Ni’,Spectrochim. Acta 46B (1991) 319–378.
[Sal92] E.B. Saloman, ‘A resonance ionization spectroscopy/resonance ionization mass spec-trometry data service. III. Data sheets for Sb, Bi, P, Na and Sn’, Spectrochim. Acta47B (1992) 517–543.
[Sal93] E.B. Saloman, ‘A resonance ionization spectroscopy/resonance ionization mass spec-trometry data service. IV. Data sheets for Be, In, Li, K, Rb, Ag, Ti and V and an updateof the data sheet for Ni’, Spectrochim. Acta B 48B (1993) 1139–1203.
[Sal95] E.B. Saloman, ‘A resonance ionization spectroscopy/resonance ionization mass spec-trometry data service. V. Data sheets for Ga, Mn, Sc and Ti’, Spectrochim. Acta B49B (1995) 251–281.
[Sam71] G.V. Samsonov, V.Ya. Naumenko and L.N. Okhremchuk, ‘Herstellung und Eigen-schaften von Karbiden der Ubergangsmetalle in ihren Homogenitatsbereichen’, Phys.Stat. Sol. (a) 6 (1971) 201–211.
[San97] A. Sandulescu et al., ‘Binary and ternary cold fission of 252Cf’, Il Nuovo Cimento 110A (1997) 1079–1087.
[San98b] A. Sandulescu et al., ‘Cold (neutronless) alpha ternary fission of 252Cf: theory andcomparison with experiment’, Int. J. Mod. Phys. E 7 (1998) 625–638.
[Sau84] J. Sauvage et al., ‘The ISOCELE II separator: a general description, recent resultsand future developments’, in J. Crawford and J.M. D’Auria, eds., ‘Proceedings of theTRIUMF-ISOL Workshop, Mont Gabriel, Quebec’, TRIUMF, report TRI-84-1, 1984,pp. 161–178.
[Sav62] E.M. Savitzkii and M.A. Tylkina, Physical Properties of Re and its Alloys, Elsevier,Amsterdam, 1962, pp. 36–66.
[Sav01] G. Savard, ‘ISOL beams from fragmentation: the best of both worlds’, Nucl. Phys. A(2001) in press.
[Schin] Karlheinz Schindl, priv. comm.
[Sch91] Arndt Schubert, Emissionsmechanismen leichter geladener Teilchen bei der Spon-tanspaltung von 252Cf, Ph.D. thesis, TU Dresden (1991).
[Sch92] P. Schillebeeckx, C. Wagemans, A.J. Deruytter and R. Barthelemy, ‘Comparative studyof the fragments’ mass and energy characteristics in the spontaneous fission of 238Pu,240Pu and 242Pu and in the thermal-neutron-induced fission of 239Pu’, Nucl. Phys. A545 (1992) 623–645.
[Sch93] Franz Scheerer, Eine chemisch selektive Laserionenquelle zur on-line Isotopenseparation,Ph.D. thesis, Johannes-Gutenberg Universitat, Mainz (1993).
[Sch94] P. Schillebeeckx, C. Wagemans, P. Geltenbort, F. Gonnenwein and A. Oed, ‘Investi-gation of mass, charge and energy of 241Pu(nth,f) fragments with the Cosi-Fan-Tuttespectrometer’, Nucl. Phys. A 580 (1994) 15–32.
[Sch95] R. Schafer and T. Fliessbach, ‘Quantum mechanical treatment of alpha-particle emissionduring fission’, J. Phys. G 21 (1995) 861–878.
Bibliography 283
[Sch96] A. Schuttauf et al., ‘Universality of spectator fragmentation at relativistic bombardingenergies’, Nucl. Phys. A 607 (1996) 457–486.
[Sch97] K. Schmidt et al., ‘Decay properties of very neutron-deficient isotopes of silver andcadmium’, Nucl. Phys. A 624 (1997) 185–209.
[Sch98a] K.H. Schmidt et al., ‘Influence of shell effects on fission probabilities and on fission-fragment properties of 238U projectile fragments’, Nucl. Phys. A 630 (1998) 208c–214c.
[Sch98b] W. Schwab et al., ‘Fission of highly excited fragments from collisions of 750A· MeV238U-ions on 208Pb’, Eur. Phys. J. A 2 (1998) 179–191.
[Sch01] J. Schonfelder et al., ‘SHIPTRAP - a capture and storage facility for heavy radionuclidesat GSI’, Nucl. Phys. A (2001) in press.
[Scriv] Richard Scrivens, priv. comm.
[SCyie] http://www.cern.ch/ISOLDE/normal/isoprodsc.html.
[Sea90] Glenn T. Seaborg and Walter D. Loveland, The Elements beyond Uranium, John Wiley& Sons, New York (1990).
[Seb97] V. Sebastian, T. Budiman and G. Huber, ‘Laser preparation of bunched ion beams’,Nucl. Instr. Meth. B 126 (1997) 73–75.
[Seb98] V. Sebastian et al., ‘Spectroscopic applications of the ISOLDE laser ion source’, in[ENA98] pp. 126–129.
[Seb99] Volker Sebastian, Laserionisation und Laserionenquelle an ISOLDE/CERN, Ph.D. thesis,Johannes-Gutenberg-Universitat, Mainz (1999).
[Sem96] D.R. Semon et al., ‘l-forbidden Gamow-Teller β-decay of 57Cu’, Phys. Rev. C 53 (1996)96–105.
[Sey94] H. Faust and G. Fioni, eds., ‘Proc. of the Workshop on Nuclear Fission and Fission-Product Spectroscopy, Seyssins’, Institut Laue Langevin, ILL report 94FA05T, 1994.
[Sey98] G. Fioni, H. Faust, S. Oberstedt and F.J. Hambsch, eds., ‘Nuclear Fission and Fission-Product Spectroscopy, Second Int. Workshop, Seyssins, France’, AIP Conf. Proc. 447,Woodbury, NY, 1998.
[Sha74] S. Shalev and G. Rudstam, ‘Energy spectra of delayed neutrons from separated fissionproducts. (I). The precursors 85As, 87Br, 134Sn, 135Sb, 136Te and 137I’, Nucl. Phys. A230 (1974) 153–172.
[She96] R. Sherr, ‘Simple model of neutron ”halo nuclei”’, Phys. Rev. C 54 (1996) 1177–1181.
[Shi82] K. Shima, T. Ishihara and T. Mikumo, ‘Empirical formula for the average equilibriumcharge-state of heavy ions behind various foils’, Nucl. Instr. Meth. 200 (1982) 605–608.
[Shi92] K. Shima, N. Kuno, M. Yamanouchi and H. Tawara, ‘Equilibrium charge fractions ofions of Z = 4−92 emerging from a carbon foil’, At. Data Nucl. Data Tables 51 (1992)173–241.
[Shm81] M. Shmid, G. Engler, I. Yoresh and E. Skurnik, ‘A negative surface ionization integratedtarget-ion source for an on-line isotope separator’, Nucl. Instr. Meth. 186 (1981) 349–351.
[Shm83] M. Shmid, R.L. Gill and C. Chung, ‘Comparison between solid graphite and graphitecloth as a target backing material for an ISOL system’, Nucl. Instr. Meth. 211 (1983)287–291.
[Shu93a] Y. Shuanggui et al., ‘New neutron-rich nuclide 185Hf’, Z. Phys. A 344.
[Shu93b] Y. Shuanggui et al., ‘The synthesis and identification of new heavy neutron-rich nuclide237Th’, Z. Phys. A 346.
284 Bibliography
[Sic89] A. Sicre et al., ‘Emission of Be, C and O isotopes in 235U(nth,f)’, preprint CENBG8926, CENBG, Bordeaux-Gradignan (1989).
[Sid89] J.L. Sida et al., ‘Mass, charge and energy distributions in very asymmetric thermalfission of 235U’, Nucl. Phys. A 502 (1989) 233c–242c.
[Sil73] R. Silberberg and C.H. Tsao, ‘Cross Sections of Proton-Nucleus Interactions at HighEnergies’, NRL Report 7593, Naval Research Laboratory, Washington, D.C. (1973).
[Sil90] R. Silberberg and C.H. Tsao, ‘Spallation processes and nuclear interaction products ofcosmic rays’, Phys. Rep. 191 (1990) 351–408.
[Simon] Haik Simon, priv. comm.
[Sim62] C.T. Sims, Properties of Rhenium, Elsevier, Amsterdam, 1962, pp. 23–35.
[Sim94] B. Simard, P. Kowalczyk and A.M. James, ‘First ionization potential of tantalum bymass-selected double-resonance field-ionization spectroscopy’, Phys. Rev. A 50 (1994)846–849.
[Sin83] A.K. Sinha and G.K. Mehta, ‘Model for deriving scission configuration’, Phys. Rev. C28 (1983) 271–275.
[Sin89] A.K. Sinha, D.M. Nadkarni and G.K. Mehta, ‘Light-charge particle emission in fission’,Pramana J. Phys. 33 (1989) 85–107.
[Sin96] P. Singer et al., ‘New results on γ emission in binary and ternary fission of 252Cf’, in[Dan96], 1996, pp. 262–269.
[Sin97] Peter Singer, Kinematik und Abregungsprozeß der Fragmente und des ternarenTeilchens bei der teilchenbegleiteten Spontanspaltung von 252Cf, Ph.D. thesis, THDarmstadt (1997).
[Skl98] M. Sklodowska Curie, ‘Rayons emis par les composes de l’uranium et du thorium’, C.R. Acad. Sci. Paris 126 (1898) 1101–1103.
[Sko72] N.K. Skobelev, ‘Delayed fission of some neutron-deficient nuclei’, Sov. J. Nucl. Phys.15 (1972) 249–250.
[Smi92] C.J. Smithells, Smithells metals reference book, Butterworth-Heinemann, Oxford, 7thedn. (1992).
[Smo97] R. Smolanczuk, ‘Properties of the hypothetical spherical superheavy nuclei’,Phys. Rev. C 56 (1997) 812–824.
[SO87] W.D. Schmidt-Ott et al., ‘Search for light fragments in the 50Ti+238U reaction’, GSIscientific report 1987, p. 18, Darmstadt (1987).
[SO89] W.D. Schmidt-Ott et al., ‘Isotope production in fast fission of 20Ne and 238U’, GSIscientific report 1989, p. 29, Darmstadt (1989).
[SO91] W.D. Schmidt-Ott, ‘Neutron-rich isotope production in reactions of 50Ti with natWand 238U in fission of 238U with 13 MeV/u 20Ne’, Nucl. Phys. A 522 (1991) 610–620.
[SO92] W.D. Schmidt-Ott et al., ‘Conversion measurements in the odd-odd isotopes 58Mn and60Mn’, in [BKS92], 1992, pp. 627–629.
[Sol69] Z.I. Solov’eva, ‘Energy distribution of α particles formed in thermal-neutron fission ofPu241 and Am241’, Sov. J. Nucl. Phys. 8 (1969) 264–266.
[Sorta] Pascal Sortais, priv. comm.
[Sou88] R.T. de Souza et al., ‘Evolution of mass and charge asymmetry in damped heavy-ionreactions’, Phys. Rev. C 37 (1988) 1783–1786.
[Spe72] H.J. Specht, J. Weber, E. Konecny and D. Heunemann, ‘Identification of a rotationalband in the 240Pu fission isomer’, Phys. Lett. 41B (1972) 43–46.
Bibliography 285
[Spr97] G.D. Sprouse, L.A. Orozco, J.E. Simsarian, W. Shi and W.Z. Zhao, ‘Laser trapping ofradioactive francium atoms’, Nucl. Instr. Meth. B 126 (1997) 370–373.
[SS82] M. de Saint-Simon et al., ‘Independent cross sections of Na, K, Rb, Cs and Fr iso-topes produced in Ta and U targets bombarded by 12C ions up to 77 MeV/nucleon’,Phys. Rev. C 26 (1982) 2447–2457.
[ST46] T. San-Tsiang, R. Chastel, H. Zah-Wei and L. Vigneron, ‘Sur la tripartition de l’uraniumprovoquee par la capture d’un neutron’, C. R. Acad. Sci. Paris 223 (1946) 986–987.
[ST47] T. San-Tsiang, H. Zah-Wei, R. Chastel and L. Vigneron, ‘On the new fission processesof uranium nuclei’, Phys. Rev. 71 (1947) 382–383.
[Sta92] A. Staudt and H.V. Klapdor-Kleingrothaus, ‘Calculation of β-delayed fission rates ofneutron-rich nuclei far off stability’, Nucl. Phys. A 549 (1992) 254–264.
[Ste71] C.A. Stearns and F.J. Kohl, ‘Vaporization thermodynamics of the lanthanum carbonsystem. Mass spectrometric determination of the dissociation energy of LaC2, LaC3 andLaC4’, J. Chem. Phys. 54 (1971) 5180–5187.
[Stolz] Andreas Stolz, priv. comm.
[Stone] N.J. Stone, ‘Table of new nuclear moments (preprint)’,http://www.nndc.bnl.gov/nndc/stone moments/moments.html.
[Sto66] R.W. Stoenner and M. Hillman, ‘Search for radiochemical evidence for ternary fissionof 235U by thermal neutrons’, Phys. Rev. 142 (1966) 716–719.
[Sto96] C. Stodel et al., ‘Evaporation residue cross sections for the reaction 86Kr + 130,136Xe’,GSI annual report, Darmstadt (1996).
[Sto97] N.J. Stone et al., ‘Magnetic moments of odd-A Sb isotopes to 133Sb: significant ev-idence for mesonic exchange current contributions and on core collective g factors’,Phys. Rev. Lett. 78 (1997) 820–823.
[Str67] V.M. Strutinsky, ‘Shell effects in nuclear masses and deformation energies’,Nucl. Phys. A 95 (1967) 420–442.
[Str99] Ph. Dessagne, A. Michalon and Ch. Miehe, eds., ‘The beta decay, from weak interac-tion to nuclear structure, Proc. of the workshop, March 1999, Strasbourg’, Institut deRecherches Subatomiques, IRES, Strasbourg, 1999.
[Sun92] S. Sundell, H. Ravn and the ISOLDE Collaboration, ‘Ion source with combined cathodeand transfer line heating’, Nucl. Instr. Meth. B 70 (1992) 160–164.
[Suz97] T. Suzuki and T. Otsuka, ‘Gamov-Teller transitions from 11Li and 12Be’, Phys. Rev. C56 (1997) 847–856.
[Suz98] T. Suzuki, ‘Gamow-Teller and magnetic dipole transitions for 11Li, 12Be and 11Be’,J. Phys. G 24 (1998) 1455–1460.
[Swa70] K. Swars, ed., Tantal, vol. B1 of Gmelin Handbuch der Anorganischen Chemie, VerlagChemie, Weinheim, 8th edn. (1970).
[Swi81] W.J. Swiatecki, ‘The dynamics of nuclear coalescence or reseparation’, Phys. Scr. 24(1981) 113–122.
[Sze95] J. Szerypo et al., ‘Beta decay of neutron-deficient even-mass indium isotopes: evidencefor population of highly-excited states in the cadmium-daughter nuclei’, Nucl. Phys. A584 (1995) 221–240.
[Sze97] J. Szerypo et al., ‘Decay properties of the ground-state and isomer of 103In’, Z. Phys. A359 (1997) 117–126.
[Tac90] T. Tachibana, M. Yamada and Y. Yoshida, ‘Improvement of the gross theory of β-decay.II’, Prof. Theo. Phys. 84 (1990) 641–657.

286 Bibliography
[Taf71] L.M. Taff, B.K.S. Koene and J. Van Klinken, ‘The decays of 70aCu, 70bCu and 67Ni’,Nucl. Phys. A 164 (1971) 565–575.
[Tag99] Y. Tagaya et al., ‘The α-decay energies and halflives of 195g,mAt and 199Fr’,Eur. Phys. J. A 5 (1999) 123–125.
[Tal76] W.L. Talbert et al., ‘Target developments at TRISTAN’, Nucl. Instr. Meth. 139 (1976)257–266.
[Tam96] Claire Tamburella, Projet PIAFE: production d’etats de charges elevees pour des ionsradioactifs, Ph.D. thesis, Universite Denis Diderot Paris VII (1996).
[Tam97] C. Tamburella et al., ‘Production of multicharged radioactive ion beams: the 1+ to n+
charge state transformation for the Production, Ionisation, Acceleration de FasiceauxExotiques project’, Rev. Sci. Instr. 68 (1997) 2319–2321.
[Tan85] I. Tanihata et al., ‘Measurements of interaction cross sections and radii of He isotopes’,Phys. Lett. 160B (1985) 380–384.
[Tan87] O. Tanimura and T. Fliessbach, ‘Dynamic model for alpha particle emission duringfission’, Z. Phys. A 328 (1987) 475–486.
[Tem98] J.P. Temirov, O. Tuhlibaev and A.T.Tursunov, ‘Measurement of the ultra-low partialpressure of cesium by the method of laser spectroscop’, Opt. Spectr. (USSR) 85 (1998)709–710.
[TFP83] Ernst Hoinkis, ed., ‘Transport of Fission Products in Matrix and Graphite, Proc. of Coll.held at the HMI, Nov. 1981’, HMI-B372, Berlin, 1983.
[Thi83] F.K. Thielemann, J. Metzinger and H.V. Klapdor, ‘Beta-delayed fission and neutronemission: consequences for the astrophysical r-process and the age of the galaxy’,Z. Phys. A 309 (1983) 301–317.
[Thi97] P. Thirolf et al., ‘Concept of a high-resolution online mass separator for the Munichfission fragment accelerator’, Nucl. Instr. Meth. B 126 (1997) 242–245.
[Til93] D.R. Tilley, H.R. Weller and C.M. Cheves, ‘Energy levels of light nuclei A = 16− 17’,Nucl. Phys. A 564 (1993) 1–184.
[To79] K.X. To and R. Drouin, ‘Determination semi-empirique des etats de charges d’un fais-ceau d’ions rapides (Z ≤ 18)’, Nucl. Instr. Meth. 160 (1979) 461–463.
[Tok85] J. Toke et al., ‘Quasi-fission – the mass-drift mode in heavy-ion reactions’, Nucl. Phys. A440 (1985) 327–365.
[Ton96] W. Tongqing, F. Hongmei, G. Bing, Zh. Jinghua and G. Yingxiang, ‘FEBIAD target-ion-source for on-line isotope separator in Lanzhou’, Annual report IMP & NLHIAL,Institute of Modern Physics, Lanzhou, China (1996), p. 151.
[Tow87] I.S. Towner, ‘Quenching of spin matrix elements in nuclei’, Phys. Rep. 155 (1987)263–377.
[TP71] Catherine Thibault-Philippe, Etude par spectrometre de masse en ligne de noyaux legersexotiques produits dans les reactions a haute energie, Ph.D. thesis, Universite de Paris(1971).
[Tra72] B.L. Tracy et al., ‘Rb and Cs isotopic cross sections from 40-60 MeV-proton-inducedfission of 238U, 232Th and 235U’, Phys. Rev. C 5 (1972) 222–234.
[Tur90] A.T. Tursunov, N.B. Eshkobilov and A.T. Khalmanov, ‘Laser spectroscopy of atomicmercury Rydberg states’, Opt. Spectr. (USSR) 68 (1990) 294–297.
[Tur98] A. Turler et al., ‘Decay properties of 265Sg (Z = 106) and 266Sg (Z = 106)’,Phys. Rev. C 57 (1998) 1648–1655.
Bibliography 287
[Urb97] W. Urban et al., ‘Octupole correlations in neutron-rich, even-even barium isotopes’,Nucl. Phys. A 613 (1997) 107–131.
[VA92] E.P. Vidolova-Angelova, D.A. Angelov, T.B. Krustev and S.T. Mincheva, ‘Investiga-tion of lutetium Rydberg states by laser multistep resonance ionization spectroscopy’,Z. Phys. D 23 (1992) 215–218.
[Val76] G.V. Val’skiı, ‘Yields of light nuclei in ternary fission’, Sov. J. Nucl. Phys. 24 (1976)140–144.
[Var97] V.E. Varlamov et al., ‘Observation of the penetration of subbarrier ultracold neutronsthrough beryllium foils and coatings’, JETP Lett. 66 (1997) 336–343.
[Var98] R.L. Varner et al., ‘Measurement of the E1 strength function of 11Be’, in [ENA98] pp.245–251.
[Ven70] A. Venezia and S. Amiel, ‘Separation of fission produced iodine by surface ionization’,Nucl. Instr. Meth. 87 (1970) 307–309.
[Ver81] J. Verplancke et al., ‘Present status and expected evolution of LISOL, the Leuvenisotope separator on-line’, Nucl. Instr. Meth. 186 (1981) 99–103.
[Ver84] J. Verplancke et al., ‘Decay study of 103In and 105In’, Z. Phys. A 315 (1984) 307–317.
[Ver99] S. Versyck, ‘Meson exchange currents in first forbidden beta decays in the lead region’,in [Str99], 1999, pp. 22–29.
[Ves92] S.P. Vesnovskii, V.N. Polynov and L.D. Danilin, ‘Highly enriched isotope samples ofuranium and transuranium elements for scientific investigation’, Nucl. Instr. Meth. A312 (1992) 1–4.
[Vil97] A.C.C. Villari, ‘ECR development for accelerated radioactive ion beams’, Nucl. Instr.Meth. B 126 (1997) 35–44.
[Vor69] A.A. Vorobiev et al., ‘Light nuclei from 233U neutron fission’, Phys. Lett. 30B (1969)332–334.
[Vor72] A.A. Vorobyov et al., ‘Light nuclei from 235U neutron fission’, Phys. Lett. 40B (1972)102–104.
[Vor75] A.A. Vorob’ev et al., ‘Ternary fission of 239Pu and 242mAm by neutrons’,Sov. J. Nucl. Phys. 20 (1975) 248–250.
[Vos81] B. Vosicki, T. Bjørnstad, L.C. Carraz, J. Heinemeier and H.L. Ravn, ‘Intense beams ofradioactive halogens produced by means of surface ionization’, Nucl. Instr. Meth. 186(1981) 307–313.
[Wag86] C. Wagemans, P. D’hondt, P. Schillebeeckx and R. Brissot, ‘Triton and alpha emis-sion in the thermal-neutron-induced ternary fission of 233U, 235U, 239Pu and 241Pu’,Phys. Rev. C 33 (1986) 943–953.
[Wag89] C. Wagemans, Light particle-accompanied fission, vol. III of Poenaru and Ivascu [Poe89],1989, pp. 63–98.
[Wag91a] C. Wagemans, ed., CRC Press, Boca Raton (1991).
[Wag91b] C. Wagemans, Charged-particle-induced fission, in [Wag91a], 1991, pp. 199–226.
[Wag92] C. Wagemans, in J. Kristiak and B.I. Pustylnik, eds., ‘Proc. Int. Workshop on DynamicalAspects of Nuclear Fission, Smolenice, Slovakia, 1991’, Dubna, pp. 139–.
[Wah62] A.C. Wahl et al., ‘Nuclear-charge distribution in low-energy fission’, Phys. Rev. 126(1962) 1112–1127.
[Wah88] A.C. Wahl, ‘Nuclear-charge distribution and delayed-neutron yields for thermal-neutron-induced fission of 235U, 233U and 239Pu and for spontaneous fission of 252Cf’,At. Data Nucl. Data Tables 39 (1988) 1–156.

288 Bibliography
[Wal85] P.M. Walker, ‘First experiments and future prospects at the Daresbury on-line isotopeseparator’, Hyp. Int. 22 (1985) 475–482.
[Wal86] R.J. Walker and J.D. Fassett, ‘Isotopic measurement of subnanogram quantities ofrhenium and osmium by resonance ionization mass spectrometry’, Anal. Chem. 58(1986) 2923–2927.
[Wal87] K. Wallmeroth et al., ‘Sudden change in the nuclear charge distribution of very lightgold isotopes’, Phys. Rev. Lett. 58 (1987) 1516–1519.
[Wal90] Jearl Walker, ‘A homemade copper chloride laser emits powerful bursts of green andyellow light’, Scientific American 262 (1990) 88–91.
[Wan99] J.C. Wang et al., ‘β-delayed neutron decay of 104Y, 112Tc, 113Tc and 114Tc: test ofhalf-life predictions for neutron-rich isotopes of refractory elements’, Phys. Lett. B 454(1999) 1–7.
[Web92] M. Weber et al., ‘New neutron-rich isotopes in the scandium-to-nickel region, producedby fragmentation of a 500 MeV/u 86Kr beam’, Z. Phys. A 343 (1992) 67–71.
[Wefer] Elmar Wefers, priv. comm.
[Weg61] H.E. Wegner, ‘Additional long-range particles from the spontaneous fission of Cf252’,Bull. Am. Phys. Soc. 6 (1961) 307.
[Weiss] Leo Weissman, priv. comm.
[Wei91] H. Weigmann, Fission barriers, in [Wag91a], 1991, pp. 7–33.
[Wei99] L. Weissman et al., ‘A detector setup to study the decay properties of exotic nuclei’,Nucl. Instr. Meth. A 423 (1999) 328–336.
[Wel98] R. Welton, G.D. Alton, B. Cui and S.N. Murray, ‘Experimental methods in radioac-tive ion-beam target/ion source development and characterization’, Rev. Sci. Instr. 69(1998) 2892–2896.
[Wen87] K. Wendt et al., ‘On the hyperfine structure and isotope shift of radium’, Z. Phys. D4 (1987) 227–241.
[Weyer] Gerd Weyer, priv. comm.
[Whe67] S.L. Whetstone and T.D. Thomas, ‘Light charged particles from spontaneous fission ofCf252’, Phys. Rev. 154 (1967) 1174–1181.
[Wid95] W. Widdra et al., ‘β-NMR on single-crystal surfaces: method’, Rev. Sci. Instr. 66 (1995)2465–2475.
[Wil76] B.D. Wilkens, E.P. Steinberg and R.R. Chasman, ‘Scission-point model of nuclear fissionbased on deformed-shell effects’, Phys. Rev. C 14 (1976) 1832–1863.
[Wil84] M.W. Williams, D.W. Beekman, J.B. Swan and E.T. Arakawa, ‘Detection of traceelements with resonance ionization and time-of-flight mass spectrometry’, Anal. Chem.56 (1984) 1348–1350.
[Wil85] J.F. Wild et al., ‘Light-charged-particle emission in the spontaneous fission of 250Cf,256Fm and 257Fm’, Phys. Rev. C 32 (1985) 488–495.
[Win89] J.A. Winger et al., ‘Structure of neutron-rich 74Zn from 74Cu decay and shell-modelcalculations for even-A Zn nuclei’, Phys. Rev. C 39 (1989) 1976–1984.
[Win90] J.A. Winger et al., ‘Structure of 76Zn from 76Cu decay and systematics of neutron-richZn nuclei’, Phys. Rev. C 42 (1990) 954–960.
[Win93] J.A. Winger et al., ‘Half-life measurements for 61Ga, 63Ge and 65As and their importancein the rp process’, Phys. Rev. C 48 (1993) 3097–3105.
[Wla00] W. Wlazlo et al., ‘Cross-sections of spallation residues produced in 1A GeV 208Pb onproton reactions’, Phys. Rev. Lett. 84 (2000) 5736–5739.

Bibliography 289
[Wor78] E.F. Worden, R.W. Solarz, J.A. Paisner and J.G. Conway, ‘First ionization potentialsof lanthanides by laser spectroscopy’, J. Opt. Soc. Amer. 68 (1978) 52–61.
[Wor79] E.F. Worden and J.G. Conway, ‘Laser spectroscopy of neptunium: first ionization po-tential, lifetimes and new high-lying energy levels of Np I’, J. Opt. Soc. Amer. 69 (1979)733–738.
[Wos96] M. Wostheinrich, M. Hesse and F. Gonnenwein, ‘Yields of ternary particles from fissionin an extended Halpern model’, in [Dan96], 1996, pp. 231–237.
[Wos98] M. Wostheinrich et al., ‘Ternary particles from the reactions 229Th(nth,f),233U(nth,f)
and 239Pu(nth,f)’, in [Sey98], 1998, pp. 330–337.
[Wos99a] M. Wostheinrich et al., ‘Yields of ternary particles from the reactions 229Th(nth,f),233U(nth,f) and 239Pu(nth,f)’, Acta Phys. Slovaca 49 (1999) 117–124.
[Wos99b] Marcus Wostheinrich, Emission von ternaren Teilchen aus den Reaktionen 229Th(nth,f),233U(nth,f) und
239Pu(nth,f), Ph.D. thesis, Uni Tubingen (1999).
[Wun78] K.D. Wunsch, ‘An on-line mass-separator for thermically ionisable fission products:OSTIS’, Nucl. Instr. Meth. 155 (1978) 347–351.
[Wut98] D. Wutte et al., ‘Development of an rf driven multicusp ion source for nuclear scienceexperiments’, Nucl. Instr. Meth. B 142 (1998) 409–416.
[Xie98] Z.Q. Xie, ‘Techniques for enhancing the performances of high charge state ECR ionsources’, in [Caa98], 1998, pp. 48–51.
[Xu90] X.Y. Xu, J.Z. Tang, W. Huang, W.Z. Zhao and D.Y. Chen, ‘Rydberg energy levels andtheir structure in the ruthenium atom’, JPB 23 (1990) 3315–3323.
[Xu93] C.B. Xu et al., ‘The study of autoionizing states of lutetium atoms by resonance ion-ization spectroscopy’, JPB 26 (1993) 2827–2835.
[Xu95] X.Y. Xu, D.Y. Chen, K.L. Wen, S.L. Wang and Q. Hui, ‘RIMS efforts in China’, in[RIS94], 1995, pp. 227–232.
[Yer94] A.V. Yeremin et al., ‘The kinematic separator VASSILISSA. Performance and experi-mental results’, Nucl. Instr. Meth. A 350 (1994) 608–617.
[Yos87] M. Yoshii et al., ‘The ion-guide isotope separator on-line at the Tohoku universitycyclotron’, Nucl. Instr. Meth. B 26 (1987) 410–418.
[Zah93] M. Zahar et al., ‘Momentum distributions for 12,14Be fragmentation’, Phys. Rev. C 48(1993) R1484–R1487.
[Zan71] E.Ya. Zandberg and N.I. Ionov, Surface ionization, Israel Program for Scientific Trans-lations, Jerusalem (1971).
[Zha98a] L. Zhang et al., ‘Identification of 209Hg’, Eur. Phys. J. A 2 (1998) 5–7.
[Zha98b] L. Zhang et al., ‘Neutron-rich heavy residues and exotic multinucleon transfer’,Phys. Rev. C 58 (1998) 156–163.
[Zhd77] N.S. Zhdanovich and Yu.I. Kozlov, Nauka, Moscow, 1977, pp. 115–.
[Zhe83] A.N. Zherikhin, V.S. Letokhov, V.I. Mishin, M.E. Muchnik and V.N. Fedoseyev, ‘Pro-duction of photoionic gallium beams through stepwise ionization of atoms by laserradiation’, Appl. Phys. B 30 (1983) 47–52.
[Zhe84a] A.N. Zherikhin, V.I. Mishin and V.N. Fedoseev, ‘Determining the absolute nf2F 0 en-ergy levels of the Al I Rydberg series via laser step excitation and photoionization’,Opt. Spectr. (USSR) 57 (1984) 476–479.
[Zhe84b] A.N. Zherikhin et al., ‘High-resolution laser photoionization spectroscopy of radioactiveeuropium isotopes’, Sov. Phys. JETP 59 (1984) 729–736.
290 Bibliography
[Zhi96] Zh. Zhizheng et al., ‘Chemical selectivity of a laser ion source for on-line mass separatorof IMP’, Annual report IMP & NLHIAL, Institute of Modern Physics, Lanzhou, China(1996), p. 150.
[Zhu94] M.V. Zhukov, A.A. Korsheninnikov and M.H. Smedberg, ‘Simplified α + 4n model forthe 8He nucleus’, Phys. Rev. C 50 (1994) R1–R4.
[Zir74] J.P. Zirnheld, ‘On-line fission fragment separator using a helium jet ion source’, Nucl. In-str. Meth. 114 (1974) 517–520.
[Zol95a] Christoph M. Zoller, Untersuchung der neutroneninduzierten Spaltung von 238U imEnergiebereich von 1 MeV bis 500 MeV, Ph.D. thesis, TH Darmstadt (1995).
[Zol95b] C.M. Zoller et al., ‘Fission fragment properties in the 238U(n,f) reaction at incidentneutron energies from 1 MeV to 500 MeV’, Rep. IKDA 95/25, Institute for NuclearPhysics, TH Darmstadt (1995).
[Zyu88] A.D. Zyuzikov, V.I. Mishin and V.N. Fedoseev, ‘Laser resonance photoionizationspectroscopy of excited and autoionizing atomic states of rare-earth elements. 3:Neodymium’, Opt. Spectr. (USSR) 64 (1988) 287–288.

Acknowledgements
My first thanks go to Prof. Till von Egidy who gave me the freedom to participate directly atseveral RIB facilities (LOHENGRIN, ISOLDE, LISOL, ISAC, PIAFE and MAFF) and thus gainvaluable insight into state-of-the-art techniques at very different stages of a RIB facility: from thefirst sketch of a new project to the continuously ongoing beam development and daily operationat a user facility.
Not only I learnt a lot about techniques and physics of radioactive ions, but at these and otherphysics labs I got to know many helpful people. Without their support I could not have done thiswork. To really acknowledge individually all help and support I experienced, even another heftyappendix would not be sufficient. In the following condensed version I risk to omit involuntarilyimportant references, which is obviously worse than in any other chapter of this thesis. In advancea big excuse to all those who are looking in vain to find their names here. They shall be assuredthat I forgot to mention them just because of the routine I took in relying on their continuoushelp.
Great thanks to Herbert Faust, Gabriele Fioni, Thomas Friedrichs, Martin Groß and Stephan Ober-stedt for their help in the LOHENGRIN measurements. I am grateful to Prof. Friedrich Gonnenwein,Michael Hesse, Marcus Wostheinrich, Achim Kotzle, Peter Jesinger and Marco Davi for many valu-able discussions about ternary fission and related experimental problems. Thanks to Irshad Ahmadfor the provision and Prof. Hans-Otto Denschlag for the preparation of the 245Cm target. Thanksto Werner Graf, Peter Høghøj and Iain Anderson for the help in the preparation of the nickel foils.Thanks also to all other College 3 and ILL members who contributed to an excellent workingatmosphere.
I am glad that I could abuse the neighboring ISN as an always available “inquiry office”; partic-ular thanks to: Jean-Loup Belmont, Jean-Marie De Conto, Michel Fruneau, Michel Guisset, GuyLaborie, Jean-Alain Pinston and Jean-Paul Richaud.
Thanks to the ISAC team for their warm reception at TRIUMF during the cold (in fact more rainythan cold) time of the year: John D’Auria, Rick Baartman, Nick Bateman, Lynn DeCaire, MarekDombsky, Jaap Doornbos, Gerardo Dutto, Don Hunter, Uli Giessen, Dave Hutcheon, KeerthieJayamanna, Tom Kuo, Paul Schmor, Helmut Weick and Dick Yuan.
Thanks to Prof. Ernst Roeckl and Reinhard Kirchner for organizing and performing the releasemeasurements at the GSI ISOL facility and for sharing the great experience in target and ion sourcequestions.
Despite a stay of several years at ISOLDE I did not yet manage to learn a skandinavian language.However, at least the structure of this thesis shows first signs of assimilation to the nordic style(collection of individual publications).
I am very grateful to Helge Ravn who showed me many interesting things, some remarkable ones(e.g. on the chemistry and thermodynamics of ISOL targets and camping stoves) and one unique.
Thanks to Jacques Lettry for his continuous efforts to convince me of his virtuos combinations ofprecision measurements and “zero order” models.
A big excuse to the “engineers in charge” Ove Jonsson, Richard Catherall, Uwe Georg and Tim Gilesas well as to Erich Kugler, Gerrit-Jan Focker, Jean-Claude Bertrand, Rene Gapihan, Andre Mullerand Sophie Meunier for annoying phone calls (about crashed FECs, missing pieces, etc.) at dayand night. Thanks to Ermanno Barbero, Daniel Carminati and Rudi Stockli for the rapid executionof difficult and impossible machining tasks and to Thea Diaz-Nootenboom for the prompt mailforwarding and all daily office work.
I am grateful to the ISOLDE coordinators Doris Forkel-Wirth and Thomas Nilsson, to the nuclearsolid state physics coordinators Angela Burchard and Marc Dietrich, to the ISOLDE fellows Claire

Tamburella, Ylva Jading, Matthias Keim, Markku Oinonen, to Haik Simon and to all ISOLDEvisitors and users for their support and great flexibility which enabled many of the presented targettests to be done on short notice or in “parasitic” mode.
Thanks to Gerd Beyer for fruitful discussions on his diffusion and release studies in Dubna.
I am very glad about the excellent working atmosphere and the good cooperation with all membersof the RILIS team (even after weeks of continuous shifts): Valentin Fedoseyev, Slava Mishin, MitsuoKoizumi and Volker Sebastian.
A great thanks goes to all participants of the legendary “500 hour shift” in october 1998 (IS365experiment) which provided, despite an impressive series of unexpected breakdowns and losses, alot of the data presented in chapters 4 and 5: Piet Van Duppen, Mark Huyse, Leo Weissman, KirillKruglov, Jan Van Roosbroeck, Will Mueller, Peter Thirolf, Karsten Schmidt, Marco La Commara,Ruxandra Borcea, Hendrick Schatz, Heinz-Georg Thomas, Dirk Weisshaar, Werner Schulze andStefan Rottger.
A great thanks to all colleagues from the TUM physics department E18 for providing always agood atmosphere. Particular thanks are to Karin Frank for keeping the contact during my foreigntour, and to the “co-thesards” Bernhard Ketzer, Hans-Friedrich Wirth, Rolf Schmidt and MichaelWiesmann for providing help to solve the daily problems (PAW, LATEX, . . . ) and for sharing theunchangeable ones (WINDOWS and the Mensa food).
Besides the TUM one should not forget the second university of Munich which is presently leadingthe development of the MAFF facility. It was always very interesting to develop new ideas in theplanning of the set-up during intense discussions with Prof. Dieter Habs, Oliver Kester, MartinGroß, Alfred Kolbe, Jorg Schmidt and H.J. Maier.
Thanks to Prof. Karl-Ludwig Kratz for the loan of the Mainz neutron detector and tape stationsfor various tests and measurements and thanks for the good cooperation with the collaboratorsfrom Mainz: Andreas Wohr, Bernd Pfeiffer, Michael Hannawald and Thomas Kautzsch.
Financial support from the ”Beschleunigerlabor der TU und LMU Munchen”, the Institut LaueLangevin and the European Union (contract ERBFMGEECT980120) is greatfully acknowledged.This work was also supported by the U.S. Department of Energy, Nuclear Physics Division, contractNo. W-31-109-ENG-38. I am indebted for the use of 245Cm to the Office of Basic Energy Sciences,U.S. Department of Energy, through the trans-plutonium element production facilities at Oak RidgeNational Laboratory.
A big thanks to Bernhard Ketzer and Paul Hix for their indefatigable proof-reading.
Thanks to the Department of Physics of the Florida International University, Miami and to theFacultad de Sistemas, Universidad Politecnica Nacional, Quito which allowed me to use theircomputers for the final latex iterations of this thesis and to Hans-Friedrich Wirth for the printingand submission still in 1999.
Last but not least I thank my family for their continuous support as well as Helle, Claude, Fabrice,Nicola, Stefan, Vincent, Volker, Wim and all other friends for their patience and flexibility infinding time for joined excursions even if my unforeseeable schedule resulted often in multiplepostponements and unorthodox dates (dinner after midnight, backcountry skiing in August, rockclimbing in January, . . . ).
Copyright © 2022 FDOKUMEN