Chemical Fractionation at Environmental Interfaces
209
Chemical Fractionation at Environmental Interfaces Thesis by Jie Cheng In Partial Fulfillment of the Requirements for the Degree of Doctor of Philosophy CALIFORNIA INSTITUTE OF TECHNOLOGY Pasadena, California 2010 (Defended October 14, 2009)
-
Upload
khangminh22 -
Category
Documents
-
view
6 -
download
0
Transcript of Chemical Fractionation at Environmental Interfaces

Chemical Fractionation at Environmental
Interfaces
Thesis by
Jie Cheng
In Partial Fulfillment of the Requirements
for the Degree of
Doctor of Philosophy
CALIFORNIA INSTITUTE OF TECHNOLOGY
Pasadena, California
2010
(Defended October 14, 2009)

ii
2010
Jie Cheng
All Rights Reserved

iii
Acknowledgements
Looking back at my years at Caltech, I have every reason to be grateful. Caltech has not
only offered abundant resources and a creative environment for scientific research, but has
also provided enriching opportunities for self–discovery. Above all, I would like to extend
my gratitude to all those who have made my years at Caltech rewarding and enjoyable.
First, I would like to thank Professor Michael Hoffmann for being a great advisor. In my
junior year of college, I read a few of his articles on TiO2 photocatalysis and got very
interested in the work. So I sent him an email, expressing interest in doing graduate work
with him, and he replied with six words: “I strongly recommend you to apply.” Thus, here I
am. Although I did not end up working on TiO2 photocatalysis, Professor Hoffmann has
allowed me the freedom to explore my interest and to work on a variety of topics in
environmental chemistry. Professor Hoffmann was always ready to listen to me and to
provide guidance on many issues that matter to me.
I wish to thank my other committee members, Professors John Seinfeld, Richard Flagan,
and Paul Wennberg, for their valuable time and comments. Working with Professor
Richard Flagan on the pollen project was a great learning experience and a lot of fun. The
wonderful courses taught by Professor John Seinfeld and Professor Paul Wennberg further
developed my interest in atmospheric chemistry.
I owe many thanks to Dr. A. J. Colussi, with whom I have worked closely on several
projects. Dr. Colussi impressed me with his unfailing passion for science, and his ability to
connect the dots and come up with new ideas.

iv
I benefited a great deal from collaboration with Dr. Chad Vecitis and Dr. Hyunwoong
Park on the ion fractionation project and the perfluorochemical remediation project. Dr.
Chad Vecitis was able to use analytical instrument in very creative ways and was always
willing to help other group members. Dr. Hyunwoong Park had excellent multitasking
skills and worked very efficiently in the lab. I enjoyed working with Cherrie Soetjipto, a
SURF student, on the ice–pH project. Waiting endlessly for our samples to freeze on the
microscope stage could have been boring without those interesting stories she told me
about Indonesia. Dr. Shinichi Enami and I collaborated on the ozone–electrospray project.
He did not talk much but consistently produced quality work. I would also like to thank
collaborators Professor Deming Zhao and Professor Elefteria Psillakis.
My thesis could not have been completed without the help of a number of people. Dr.
Nathan Dalleska at the Environmental Analysis Center graciously shared his expertise in
analytical chemistry with me. Dr. Sonjong Hwang and Dr. Chris Waters provided training
and support for the solid–state NMR and the confocal microscope, respectively. Mike
Vondrus at the machine shop, Tom Dunn at the electronics shop, and Richard Gerhart at
the glass shop made it possible for me to conduct experiments with tailor–made equipment.
I want to thank Cecilia Gamboa, Fran Matzen, Linda Scott, and Dian Buchness for keeping
the department running smoothly.
I cannot forget other members of the Hoffmann group who have helped me along the
way, including Dr. Christopher Boxe, Dr. Marcello Guzman, Dr. Suyoung Ryu, Dr. Angela
Rincon, Jina Choi, Tammy Campbell, Will Ford, and Rifkha Kameel. I enjoyed the time
we spent together in group meetings, and group activities such as barbecue on the beach,
celebrations at the Hoffmann house, and Friday nights at the Athenaeum.

v
There are many people at Caltech who have been great friends over the years. Dinners
out with Yue Zou, Dr. Xin Guo, Dr. Dongping Zhuang, Dr. Bo Li, Yingying Wang, Le
Kuai, Xiaobai Li, Ying Wang, Dr. Hua Wang, Hongjing Tan, Tong Chen, and Jinghao
Huang were always relaxing and full of fun. I had a great time working with Yizhou Liu,
Yao Sha, Lijun Liu, Dr. Ruihua Fang, Molei Tao, and Brian Yu at the Caltech Chinese
Association. Dr. Mingshr Lin, Dr. Wanwan Yang, Dr. Hilary Glidden, Dr. Shankar
Kalyanaraman, Dr. Shripad Thite, Dr. Jonas Oxgaard, Dr. Guangxi Wang, Kai Shen, Ming
Gu, and Jay Chen shared interest in management consulting. Will Yardley helped me better
understand the American culture and the Chinese culture! Susanna Tran taught me Italian
of which I can still speak a few words. Jim Endrizzi and Athena Trentin at ISP worked hard
to ensure that international students like me quickly adjust to life in the United States.
Yvonne Banzali at the Career Development Center offered useful job–hunting tips. I am
also thankful to Dr. Ling Zheng, Dr. Yi Liu, Dr. Mo Li, Dr. Yajuan Wang, Dr. Chengzhong
Zhang, Dr. Xiao Lu, Dr. Changlin Pang, and many other friends for their help.
My friends from Tsinghua University have been a good source of encouragement as well
as entertainment. Dr. Xin Dong kept me updated with all the exciting news of old friends
from college. Yeqing Zheng kindly provided professional literature search services at no
charge. Shuo Wang and I agreed on both the danger of procrastination and the
awesomeness of certain video games.
My final thanks go to my family for their unconditional support and love. My parents,
Yongfang Cheng and Jing Zhang, always gave me the freedom to chart my own course and
respected my decisions. My fiancée Li Liu has been my best friend. We have learned and
will continue to grow together and to nurture, support, and encourage each other.

vi
Abstract
Chemical processes at the interfaces often differ kinetically and mechanistically from the
bulk counterparts, partly due to the concentration inhomogeneity of different chemicals at
the interfaces. The fractionation of chemicals at the interfaces not only determines their
interfacial concentrations, but also affects the physicochemical properties of the interfaces.
In this thesis, three sets of chemicals/interfaces with important environmental implications
are studied: (1) anion fractionation at the gas–liquid microdroplet interfaces, (2)
fractionation of perfluoroalkyl surfactants and matrix components at the bubble–water
interface in ultrasonically irradiated solutions, and (3) ion fractionation across the ice–water
interface during the freeze–thaw cycle of electrolyte solutions.
The relative anion affinity for the air–water interface, as measured by Electrospray Mass
Spectrometry (ES–MS), is exponentially correlated with ionic radius. The affinities
respond differently to different additives, suggesting that specific anion effects are due to
different energy levels of physical interactions. Relative anion affinities at the air–methanol
interfaces are almost identical to those at the air–water interface, suggesting that surface
structure is not the primary driving force for interfacial anion fractionation.
Perfluoroalkyl carboxylates and sulfonates can be transferred from the ocean to marine
aerosols due to their high affinity for the air–water interface, but transfer to gas phase is
unlikely as they remain deprotonated in aqueous phase because of their low pKa. Organic
matrix components may reduce the sonochemical kinetics of Perfluorooctanesulfonate
(PFOS) and Perfluorooctanoate (PFOA) by competitive adsorption onto the bubble–water
interface or by lowering the interfacial temperatures. Inorganic anions, but not cations, may
significantly enhance or reduce the sonochemical kinetics of PFOS and PFOA. The

vii
specific anion effects following the Hofmeister series are likely related to anions’
partitioning to and interaction with the bubble–water interface.
Time–resolved confocal fluorescence microscopy of freezing electrolyte solutions reveals
that the thickness of interstitial liquid films depends non–monotonically on electrolyte
concentration. It also confirms that selective incorporation of cations (anions) into the ice
lattice decreases (increases) the pH of the interstitial liquid films. Since the magnitude of
pH change during freezing is smaller than during the subsequent thawing process, it is
likely to be limited by the seepage of H+ (OH−) slowly produced via water dissociation.

viii
Table of Contents
List of Figures ........................................................................................................................ xiii
List of Tables .......................................................................................................................... xii
List of Schemes ...................................................................................................................... xiv
Chapter 1: Introduction ....................................................................................................... 1
1.1 Overview of Chemical Fractionation at Environmental Interfaces ........................... 2
1.2 Ions at Air–Water Interface ....................................................................................... 3
1.3 Sonochemical Degradation of Perfluochemicals at Water–Bubble Interface ........... 7
1.4 Chemical Fractionation during Freezing of Electrolyte Solutions .......................... 10
1.5 Outline of the Thesis ............................................................................................... 13
1.6 References ............................................................................................................... 18
Chapter 2: Experimental Anion Affinities for the Air–Water Interface ............................ 26
2.1 Abstract .................................................................................................................... 27
2.2 Introduction .............................................................................................................. 28
2.3 Experimental Section ............................................................................................... 29
2.4 Results and Discussion ............................................................................................ 30
2.5 Acknowledgments .................................................................................................... 35
2.6 References ................................................................................................................ 36
Chapter 3: Anion Fractionation and Reactivity at Air–Water and Air–Methanol Interfaces:
Implications for the Origin of Hofmeister Effects ................................................................. 50
3.1 Abstract .................................................................................................................... 51
3.2 Introduction .............................................................................................................. 52
3.3 Experimental Section ............................................................................................... 53
3.4 Results and Discussion ............................................................................................ 55
3.5 Acknowledgement .................................................................................................... 59
3.6 References ................................................................................................................ 59
Chapter 4: Enrichment Factors of Perfluoroalkyl Oxoanions at the Air–Water Interface ... 72
4.1 Abstract .......................................................................................................................... 73
4.2 Introduction .................................................................................................................... 74

ix
4.3 Experimental Section .................................................................................................... 75
4.4 Results and Discussion .................................................................................................. 77
4.5 Acknowledgments ......................................................................................................... 81
4.6 References ...................................................................................................................... 81
Chapter 5: Acid Dissociation versus Molecular Association of Perfluoroalkyl Oxoacids:
Environmental Implications ................................................................................................... 93
5.1 Abstract .......................................................................................................................... 94
5.2 Introduction .................................................................................................................... 95
5.3 Experimental Section .................................................................................................... 96
5.4 Results and Discussion .................................................................................................. 97
5.5 Acknowledgments ....................................................................................................... 100
5.6 References .................................................................................................................... 100
Chapter 6: Sonochemical Degradation of Perfluorooctane Sulfonate (PFOS) and
Perfluorooctanoate (PFOA) in Landfill Groundwater: Environmental Matrix Effect ....... 113
6.1 Abstract ........................................................................................................................ 114
6.2 Introduction .................................................................................................................. 115
6.3 Experimental Methods ................................................................................................ 117
6.4 Experimental Results ................................................................................................... 119
6.5 Discussion .................................................................................................................... 122
6.6 Acknowledgements ..................................................................................................... 127
6.7 References .................................................................................................................... 127
Chapter 7: Sonochemical Degradation of Perfluorooctane Sulfonate (PFOS) and
Perfluorooctanoate (PFOA) in Groundwater: Kinetic Effects of Matrix Inorganics ......... 144
7.1 Abstract ........................................................................................................................ 145
7.2 Introduction .................................................................................................................. 146
7.3 Experimental Methods ................................................................................................ 147
7.4 Results .......................................................................................................................... 149
7.5 Discussion .................................................................................................................... 153
7.6 Acknowledgements ..................................................................................................... 159

x
7.7 References .................................................................................................................... 159
Chapter 8: Confocal Fluorescence Microscopy of Interstitial Fluids in Freezing Electrolyte
Solutions ................................................................................................................................ 172
8.1 Abstract ..................................................................................................................... 173
8.2 Introduction .............................................................................................................. 174
8.3 Experimental Section ............................................................................................... 175
8.4 Results and Discussion ............................................................................................. 177
8.5 Acknowledgements .................................................................................................. 180
8.6 References ................................................................................................................ 180

xi
List of Figures
Figure Page
Figure 2.1 ES–MS spectrum of equimolar aqueous SCN–, NO3–, Br–, BF4
–, ClO4–, and I– 42
Figure 2.2 Anion affinities versus anionic radius ................................................................. 43
Figure 2.3 Normalized anion affinity versus free energy of anion dehydration .................. 44
Figure 2.4. Normalized anion affinity versus anion polarizability ........................................ 45
Figure 2.5 Ratios of normalized anion affinity versus urea concentration ........................... 46
Figure 2.6 Ratios of normalized anion affinity versus (CTAC) concentration ..................... 47
Figure 2.7 Ratios of normalized anion affinity versus Triton X–114 concentration ............ 48
Figure 2.8 Normalized anion affinity versus SDS concentration.. ........................................ 49
Figure 3.1 ES–MS spectrum of equimolar aqueous NO3–, BF4
–, ClO4–, PF6
–, and IO3– ..... 65
Figure 3.2 Normalized anion affinity versus ionic radius ..................................................... 66
Figure 3.3 (a) Relative anion affinities of NO3–, BF4
–, ClO4–, PF6
–, and IO3– (b) The surface
coverage of –CH3 groups (c) The dielectric permitivity versus methanol molar fraction .... 67
Figure 3.3 (c) The dielectric permitivity versus methanol molar fraction ............................ 67
Figure 3.4 Interfacial iodide concentration versus [O3(g)] in H2O and MeOH ................... 68
Figure 3.5 The product branching ratio [IO3–]/[I3
–] versus [O3(g)]/[I–] ............................... 69
Figure 4.1 ES–MS calibration curves of perluoalkyl sulfonate ............................................ 88
Figure 4.2 ES–MS spectrum of a 1 μM equimolar multianion aqueous solution ................ 89
Figure 4.3 Enrichment factor versus n–alkyl chain length. ................................................... 90
Figure 4.4 The effect of NaCl and 1–octanol on the enrichment factor ............................... 91
Figure 5.1 ES–MS titration curves of n–hexanoic and n–octanoic acids ........................... 107
Figure 5.2 ES–MS spectra of PFOS under different pH and electrolyte conditions ......... 108
Figure 5.3 ES–MS spectra of PFO under different pH and electrolyte conditions ............ 109
Figure 5.4 ES–MS titration curves for PFOSA and PFOA. ................................................ 110
Figure 5.5 Signal intesity ratio of (PFOA)2H– to the sum of PFOA species versus pH ..... 111
Figure 6.1 PFOX sonolysis in MilliQ water and landfill groundwater at 354 kHz ............ 134
Figure 6.2 The effect of five VOCs on PFOX sonolysis kinetics ....................................... 135
Figure 6.3 The effect of alkyl benzenes and MIBK on PFOX sonolysis kinetics .............. 136

xii
Figure 6.4 The effect of humic and fulvic acids .................................................................. 137
Figure 6.5 Sonolysis and sonozone of PFOX in MilliQ and landfill groundwater ............ 138
Figure 6.6 Surface tension curves for the VOCs in figure 6.2 ............................................ 139
Figure 6.7 PFOX sonolysis in MilliQ water and landfill groundwater at 612 kHz ............ 140
Figure 6.8 PFOX sonolysis under Ar, O2, and O3 ............................................................... 141
Figure 6.9 Temperature dependence of Cp,g and kiaw for the VOCs in figure 6.2 ............... 142
Figure 6.10 LC/MS calibration curves for PFOX ............................................................... 143
Figure 7.1 PFOX sonolysis in MilliQ water and groundwater at 612 kHz ......................... 165
Figure 7.2 The effect of anions on PFOX sonolysis kinetics .............................................. 166
Figure 7.3 The effect of cations on PFOX sonolysis kinetics ............................................. 167
Figure 7.4 Rate constant for sonolysis of PFOX versus solution pH ................................. 168
Figure 7.5 Effect of pH adjustment on PFOX sonolysis kinetics in groundwater ............. 169
Figure 7.6 PFOX sonolysis in MilliQ water and groundwater at 354 kHz ......................... 170
Figure 7.7 The acid–base titration curve of the groundwater sample ................................. 171
Figure 8.1 Temperature profile during the freeze–thaw cycle of sample ........................... 185
Figure 8.2 Fluorescence emission ratio versus pH by fluorometer and CLSM .................. 186
Figure 8.3 C-SNARF-1 in MilliQ, NaCl and (NH4)2SO4 solution during freezing. ........... 187
Figure 8.4 Fluorescence image of C-SNARF-1 in NaCl during freeze–thaw cycle .......... 189
Figure 8.5 Fluorescence image of C-SNARF-1 in (NH4)2SO4 during freeze–thaw cycle . 191
Figure 8.6 Fluorescence emission ratio versus pH curves at different temperatures ......... 193
Figure 8.7 Fluorescence emission ratio versus laser intensity and probe concentration .... 194

xiii
List of Tables
Table Page
Table 2.1 Interfacial affinities and molecular properties of anions ....................................... 41
Table 3.1 Interfacial affinities and molecular properties of anions ....................................... 64
Table 4.1 Relative anion enrichment factors f at the air–water interface .............................. 87
Table 5.1 Isotope ratios of PFO species observed by ES–MS. ........................................... 106
Table 6.1 Primary components of the landfill groundwater ................................................ 131
Table 6.2 Physical and thermodynamic properties of the five VOCs in figure 6.2 ............ 132
Table 6.3 Representative analytical results of quality-control samples .............................. 133
Table 7.1 Primary components of the groundwater sample ................................................ 164
Table 8.1 Fitting parameters of equation (8.2) ................................................................... 184

xiv
List of Schemes
Scheme Page
Scheme 1.1 Sonochemical PFOS transformation into its organic constituents ................... 25
Scheme 3.1 Iodide oxidation by ozone in water. ................................................................... 70
Scheme 3.2 Schematic diagram of the iodide–ozone reaction chamber ............................... 71
Scheme 4.1 Anti- and gauche-perfluorobutanoate at the air–water interface ....................... 92
Scheme 5.1 Schematic drawing of The MM2 structure of the (PFO)2H– cluster. .............. 112
Scheme 8.1 The chemical structure of C-SNARF-1 ........................................................... 195

1
Chapter 1
Introduction

2
1.1 Overview of Chemical Fractionation at Environmental Interfaces
Fractionation, is of, relating to, or involving a process for separating components of a
mixture through differences in physical or chemical properties. In this thesis, it is
occasionally used more broadly to mean partitioning, which emphasizes the separation of
a species between different phases. An interface is a surface that forms the common
boundary of two different phases. It can alternatively be defined by the concentration
inhomogeneity of the different species, whereas the bulk is defined as the region where
the species are homogeneously mixed. More broadly, gradients in not only the chemical
composition but also in physicochemical properties such as dielectric constant and
density are present across the interface, with the boundary values being those of the two
phases the interface connects. The thickness of the interface as defined by the gradient
can thus vary depending on the specific property in consideration. For example, the
water-vapor interface is considered very broad as the water density gradient effectively
covers a distance of roughly 0.5 nm.1
Interfaces provide a unique chemical environment: the kinetics and mechanisms of
chemical processes occurring at the interfaces are usually neither identical to nor readily
extrapolated from those of the bulk processes. There are many examples in which
interfacial chemical transformation is the rate-determining step of a heterogeneous
chemical reaction series. The fractionation behavior of chemical species at the interface is
important in that it affects not only the interfacial concentration of the chemical species
of interest, but also the physicochemical properties of the interface through a variety of
specific or nonspecific interactions.

3
Interfaces play important roles in many physical, chemical, and biological processes,
many of which have important environmental implications. In this thesis, I present three
independent studies on the fractionation of chemicals at environmental interfaces. The
first part describes anion fractionation and reactivity at the air-liquid interfaces. The
second part focuses on the partitioning of common groundwater matrix components at the
bubble-water interface under ultrasonic irradiation and the effect of partitioning on the
sonochemical degradation efficiency of two perfluorinated chemicals. The third part
provides direct experimental evidence of the compositional change in the interstitial
liquid channels during freezing of electrolyte solutions due to fractionation of ionic
species at the ice-water interface.
1.2 Ions at air-water interface
The behavior of ions at aqueous interfaces is important in numerous chemical and
biological systems.2-3 For example, the distribution and transport of ions at the air-water
interface has important implications for heterogeneous atmospheric chemistry in that they
affect not only the reactive uptake of gaseous species on aqueous aerosols but also the
surface reactivity of ions toward gas phase reactants such as O3 or OH radical.
Understanding the equilibrium and dynamic properties of ions at the air-water interface is
thus essential in modeling and even the chemical reactivity in many environmental systems
that involve an air-water interface.
1.2.1 Historical view
A traditional view in physical chemistry has it that small ions are effectively repelled
from the air-water interface simply due to Coulomb interactions. According to the Born
model, the dehydration energy, i.e., the free energy change upon moving an ion from

4
water to air (vacuum), is 20(1 1/ ) / 4G q R , where 80 is the dielectric constant
of water, 0 is the permittivity of a vacuum, q and R are the size of charge and radius of
the ion, respectively. The large value of G , which is on the order of 102 kT for small
ions such as Na+, forces the ion to stay in bulk liquid. This concept has also been
illustrated with a classical image charge model, in which an ion with charge q at the air-
water interface can be conceived as being repelled by an image charge with the same sign
' ( 1) /( 1)q q .
Given a finite ion size and a smooth gradual interface between the two phases, the
energy required to bring an ion from bulk water to the water side of the air-water
interface is only a few kT,4 and may thus be compensated by other interactions that are
neglected by the classic models, including ion-water interactions, polarization and
dispersion effects, and solvation entropy effects.5 In this more complete picture of ion
solvation, it is possible for ions to be present or even enriched at the air-water interface.
1.2.2 Simulation results
Molecular simulations such as molecular dynamics (MD) and Monte Carlo (MC)
methods can directly probe the molecular details of solutes at the interface. These
approaches have been used to examine the equilibrium properties of neat-water surfaces,
and the distribution and transport of ions at the air-water interface.6-7 For molecular
dynamics simulations, either the classical force-field approach or the ab initio approach is
employed.8 In the former case, the use of polarizable force fields is considered essential
for an accurate description of ions at the aqueous interfaces.6-7
The traditional view of ion depletion at the air-water interface has recently been
challenged by the results of molecular simulation studies, which predict that certain ions

5
are present or even enriched at the air-water interface. In particular, MD simulations have
suggested that ions such as Cl-, Br-, I- ,SCN-, NO3-, N3
- and H3O+ are enriched at the air-
water interface to varying degrees, whereas F-, Na+, SO42- prefer to stay in the bulk
solution.9-15 The propensity for ions to reside at the air-water interface is believed to
positively correlate with their size and polarizability. In addition, surface curvature also
plays an important role in determining the solvation of ions.16
1.2.3 Experimental results
Results from surface tension and surface potential measurements have been used to
infer the microscopic structures at the air-water interface. The surface tension of most
aqueous salt solutions has been found to increase with increasing salt concentration.17-19
According to the Gibbs adsorption isotherm, ln T
RTc
, where is the surface
tension, c is the bulk concentration, and is the surface excess, i.e., the concentration at
the air-water interface in excess of the bulk concentration, a positive correlation between
the surface tension and electrolyte concentration is often seen as evidence for the
depletion of ions at the air-water interface. However, an alternative explanation is that
ions may indeed be enriched at the outermost layers of the interface, but depleted in the
sublayers due to strong electrostatic repulsion, thus leading to an overall depletion of ions
across the interfacial region to which the surface tension measurements are relevant.
Surface potential measurements show little correlation with the surface tension
measurements.20 Anions play a more important role than cations in determining the sign
and magnitude of the surface potential, and anions with smaller hydration energies lead to

6
lower surface potentials. In addition to the electrostatic effect, ions may also affect the
surface potential by changing the orientation of polar water molecules at the surface.
The presence of halides at the air-water interface has been inferred from several
laboratory measurements of the chemical reaction kinetics of halogen species. For
example, the magnitude of the measured uptake of gas phase Cl2 and Br2 by their
respective sodium halide solutions, and its dependence on ion concentration suggest a
significant role of the reaction at the air-water interface.21 The kinetics of chlorine
oxidation in sea salt aerosol by hydroxyl radical also suggests that chlorine occupies a
significant fraction of the sea salt aerosol surface.12
The development of surface specific techniques such as nonlinear optical spectroscopy
(vibrational sum-frequency generation, or VSFG, and second harmonic generation, or
SHG),22-24 X-ray photoelectron spectroscopy (XPS),25 X-ray diffraction and reflection,
and neutron reflection,26 has made it possible to directly probe the molecular details,
including the behavior of ions, at the air-water interface. These experimental results are
in qualitative agreement with the molecular simulation results, revealing the presence or
enhancement of large and polarizable ions at the air-water interface.10,25,27 The interfacial
depth of aqueous solutions is also found to depend on the electrolyte. For example, the
interfacial depth of the NaBr and NaI solutions is observed to be greater than that of neat
water, NaF, and NaCl solution, implying that there are concentration gradients of the
various species that extend the interfacial region several layers into what was the bulk.
1.2.4 Hofmeister effects
The difference in the preference of ions for the air-water interface versus the bulk
liquid phase is an example of specific ion effects, also known as the Hofmeister effects.

7
The Hofmeister series originally ranked common ions according to their ability to affect
protein solubility in aqueous solution, and has since been found relevant to a wide range
of interfacial phenomena such as surface tensions to ion exchange resins, zeta potentials,
critical micelle concentrations, transport across membranes, and gas bubble-bubble
interactions.28-29 At the air-water interface, for example, the following order is observed
regarding ions’ propensity to orient interfacial water molecules: SCN- > NaClO4- > I- >
NO3- ≈ Br- > Cl-> (pure water) ≈ F- ≈ SO4
2-. 30 These effects have been attributed to a
wide range of “forces” such as hydration forces, specific pi electron-cation interactions,
ionic bonding, hydrogen bonding, and hydrophobic forces,29 but a comprehensive
molecular understanding remains elusive.
1.3 Sonochemical degradation of perfluochemicals at water-bubble interface
1.3.1 Reaction sites and mechanisms in an ultrasonically irradiated liquid
Sonochemistry, the chemical reactivity induced by ultrasonic irradiation in a liquid
medium, has emerged as an alternative method for the removal of recalcitrant organic
compounds in the wastewater treatment process. The efficacy of sonochemical degradation
has been demonstrated for a wide variety of organic compounds such as phenol and
phenolic compounds, methyl tert-butyl ether (MTBE), and perfluorinated surfactants.31-35
The sonochemical effects derive principally from acoustic cavitation, i.e., the formation,
growth and implosive collapse of bubbles in a liquid medium under ultrasonic irradiation.
When a liquid medium is exposed to ultrasonic irradiation, acoustic pressure waves
consisting of compression and rarefaction cycles are produced. During the rarefaction cycle,
the acoustic pressure waves lead to the formation and growth of vapor bubbles from
preexisting gas nuclei. If the intensity of the acoustic pressure waves exceeds that of the

8
acoustic cavitational threshold, the bubbles would overgrow and eventually collapse.36 The
transient collapse of bubbles leads to almost adiabatic compression of gas and vapor inside
the bubbles, thus creating extremely high temperatures and pressures. The average vapor
temperatures within the bubble have been shown through chemical methods to reach values
as high as 4200–5000 K,37-38 consistent with the single-bubble collapse model,39 and
bubble-water interface temperatures have been calculated to be in the range of 600 to 1000
K.40-41 These transient high temperatures lead to in situ pyrolytic reactions in the vapor and
interfacial regions of each collapsing bubble resulting in the breakdown of gaseous water
molecules to produce highly reactive radical species such as hydroxyl radicals (·OH). These
radicals react readily with compounds in the bubble gas phase or at the bubble-water
interface. Some of the radical species may be dispersed into the bulk solution by
nonspherical bubble collapse. The hydroxyl radicals also recombine rapidly at the bubble-
water interface or in the solution bulk to produce hydrogen peroxide and water.32
Sonochemical decomposition can occur at three potential sites in an ultrasonically
irradiated liquid: (1) the cavitation bubble where the temperatures are the highest, (2) the
bubble-water interface where temperatures are still high enough to induce thermal effects,
and (3) the solution bulk where temperatures are ambient. The target compound can be
decomposed at the first two sites via both pyrolytic decomposition and hydroxylation, or in
the solution bulk via reaction with hydroxyl radicals and hydrogen peroxide. The
sonochemical degradation kinetics and mechanisms of a given compound thus critically
depend on its partition coefficient between the solution phase and the liquid phase, and on
that between the bulk solution and the bubble-water interface. Sonochemical degradation is
effective for the removal of contaminants with high Henry’s law constants that readily

9
partition into the vapor phase of the bubble,42-43 and those preferentially partition to the
bubble-water interface. Nonvolatile surfactants have been found to undergo pyrolytic
decomposition at the bubble-water interface where they are oriented radially with their
polar head groups pointing to the bulk solution.44
1.3.2 Sonochemical degradation of perfluorinated chemicals
Perfluorinated chemcials (PFCs) such as perfluorooctanoate (PFOA) and
perfluorooctane sulfonate (PFOS) have been categorized as emerging contaminants.
PFOS and PFOA have been consistently detected at pg L-1 to low ng L-1 in surface waters
worldwide,45-48 and at mg L-1 in waters near point sources.49-53 Given their potential
environmental and health effects, efforts are underway to establish regulatory standards
of PFOS and PFOA in drinking water. The United States Environmental Protection
Agency (EPA) recently set short-term provisional health advisories (PHA) for PFOS and
PFOA of 0.2 and 0.4 µg L-1, respectively.54
Not only are PFCs persistent in the environment, but they are also recalcitrant to most
conventional water and wastewater treatment methods.55-57 Various other treatment
techniques have been studied for PFOS and PFOA58, among which sonochemical
degradation has been shown to be effective. A representative scheme of the sonochemical
degradation of PFOS into its inorganic constituents is shown in scheme 1.1. In aqueous
solution, perfluorinated surfactants are found to accumulate at the air-water interface with
its hydrophobic perfluorinated carbon tail pointing to the gas phase, and its ionic
headgroup pointing to the aqueous phase.59-60 Thus the first step of PFOS sonochemical
degradation involves its adsorption onto the bubble-water interface, where it then
undergoes pyrolytic decomposition via cleavage of the C-S bond. The sulfur trioxide

10
hydrolyzes to form sulfate, and the fluoro-intermeidates are transformed into C1 fluoro-
radicals via pyrolysis in the bubble vapor phase. The C1 fluoro-radicals were eventually
transformed to CO, CO2 and F-. The sonochemical degradation kinetics depend on the
PFC concentration, and on the ultrasound parameters that determine the total bubble-
water interface area and the average temperatures of the cavitation bubble and of the
bubble-water interface.35,61
To evaluate the application of sonochemical degradation for environmental
remediation of aqueous PFCs, it is important to understand the effect of various
environmental matrix components, in particular how their fractionation behaviors at the
bubble-water interface would affect the PFC degradation kinetics. For example, surface
active species may compete with PFCs for the bubble-water interface, and volatile
species may affect the composition and thus the temperature of the cavitation bubble.
1.4 Chemical fractionation during freezing of electrolyte solutions
1.4.1 Unfrozen liquid in ice
Ice, in the form of sea ice, ice crystals in clouds, snow, glacier and polar ice, and so on,
is an important medium for many chemical and photochemical reactions. The transport
and transformation of chemical species in ice actually take place in a small liquid fraction
in the form of microscopic films at grain boundaries and ice surfaces.62-64
Liquid water exists in ice at temperatures below its thermodynamic melting point due
to the presence of impurities, the curvature depression of the freezing point known as the
Gibbs-Thomson effect, and the formation of disordered quasi-liquid layers at ice-vapor
interfaces and grain boundaries, i.e., interfacial premelting.65 In polycrystalline ice, liquid
water driven by impurity and curvature effects forms a network of microscopic channels

11
that are approximately 10 to 100 m in thickness at temperatures near the bulk freezing
point.66 Bulk ice is also covered by a quasi-liquid layer of variable thickness down to
about 240 K.67 Many calibrated techniques such as x-ray scattering, atomic force
microscopy (AFM), proton scattering, ellipsometry, optical microscopy, attenuated total
reflection in the IR (ATR-IR), and photoelectron spectroscopy have been employed to
measure the thickness of the quasi-liquid layer, but there is considerable variance
between measurements using different techniques.68 In addition, the thickness of both the
quasi-liquid layer and the grain boundary liquid channels markedly depends on the
presence of ice impurities,69 although the thickness at a given temperature is not
necessarily a monotonically increasing function of the impurity concentration.70
1.4.2 Solute rejection and fractionation during freezing
During freezing of most solutions, solutes are mostly rejected from the growing ice
lattice and concentrated in the remaining liquid phase.71-73 Impurities in glacial ice are
found to be preferentially located at grain boundaries and bubble surfaces.74-75 Even
within the liquid layer, solute distribution within microcrystalline ice aggregates is not
homogenous, but tends to peak at the triple intersection of grain boundaries. For example,
it has been found that the liquid H2SO4 is concentrated at the junctions, but that NaCl and
its ions could not be detected inside ice crystals. A spectroscopic study revealed that upon
fast freezing of an aqueous methylene blue (MB) solution (c 10-7 M) at 77 K, the local
concentration at the grain boundaries increased by approximately 3 orders of magnitude
relative to the initial bulk concentration, and the concentration rose by at least 6 orders of
magnitude upon “slow" freezing at 243 K.76

12
It is also of note that different anions and cations are selectively incorporated into or
rather rejected from the ice due to their different structural relationship with the ice
lattice.72,77-78 For example, NH4+ and F- are preferentially incorporated into ice as
substitutional impurities due to structural similarity to H3O+ and OH-, respectively. As a
result of solute fractionation at the ice-water interface, the liquid fractions between ice
grains are not simply concentrates of the initial solutions.
1.4.3 Electrical and pH changes at the ice-solution interface during freezing
Solute fractionation at the ice-solution interface during freezing may also induce
significant electrical and chemical changes. Specifically, the differential partitioning of
anions and cations across the water-ice interface during freezing creates a potential
difference between the liquid phase and ice phase, whose sign and magnitude depend on
the ionic species in the solution, their concentration, and the freezing rate.71,79-80 For
example, a significant positive potential of liquid with respect to ice was measured during
freezing of a dilute NaCl aqueous solution due to the preferential incorporation of Cl-
over Na+ into the ice lattice.71 Since the diffusion of ions in ice is very slow,81-82 the
electrical imbalance across the water-ice interface can relax on a short timescale only via
migration of H3O+ and OH-, the highly mobile intrinsic charge carriers of ice.83 This,
according to Bronshteyn and Chernov,84 will subsequently change the acidity of the
remaining liquid in grain boundaries, i.e., preferential incorporation of cations into the ice
lattice leads to acidification of the remaining liquid, whereas preferential incorporation of
anions has the opposite effect.
The freezing-induced pH change of electrolyte solution due to freeze-concentration
and/or freezing hydrolysis has been experimentally confirmed. UV-Vis spectroscopic

13
measurements of cresol red (CR) in frozen aqueous solution of various acids (HF, HCl,
HNO3, H2SO4) showed significant enhancement in CR protonation at the grain
boundaries due to increased acid concentration.85 Solid-state 19F NMR chemical shift of
3-fluorobenzoic acid was used to probe the acidity of frozen electrolyte solutions. It was
observed that upon freezing, aqueous solution of NaCl became more basic, that of
(NH4)2SO4 became more acidic, and that of 2-(N-morpholino)ethanesulfonic acid
zwitterion retained its acidity.86
Freezing-induced changes in the composition, in particular the increase in solute
concentration and change in acidity, of the microscopic channels affect not only the
exchange of chemical species between ice and gas phase,64,87 but also the kinetics of
certain chemical reactions.88 Most chemical and physical processes are slowed down
since the phase transition radically modifies the reaction microenvironment, but certain
reactions can be accelerated in partially frozen aqueous solutions. Examples of chemical
reactions whose kinetics have been shown to be significantly enhanced during freezing
include the oxidation of nitrate by dissolved oxygen to form nitrate,89 the oxidative
decomposition of gallic acid,90 the photochemical nucleophilic substitution of p-
nitroanisole with pyridine,91 and the reaction between nitrite and iodide to form gas-phase
nitric oxide and iodine.92 The magnitude of the freezing-induced effect on chemical
reaction kinetics is usually a function of temperature, freezing rate, and initial solution
composition.
1.5 Outline of the thesis
This thesis consists of relatively independent chapters that fit into the unifying theme
of chemical fractionation at environmental interfaces. Chapter 1 provides an overview of

14
this theme and an introduction to the topics covered in later chapters. Chapters 2 to 8,
each focusing on a specific research topic, are reproduced from seven articles published
in or submitted to journals such as Environmental Science and Technology and Journal of
Physical Chemistry.
Chapters 2 to 3 report the studies on the fractionation and reactivity of simple anions at
the air-liquid interface of aerosol droplets. In chapter 2, the relative enrichment factor of a
set of anions at the air-water interface of microdroplets, as measured by the electrospray
mass spectrometry (ES-MS), is found to correlate exponentially with the ionic radius
rather than the polarizability. The dissimilar effects of solution pH, cationic surfactant,
anionic surfactant, neutral surfactant, glycerol, and urea on relative anion enrichment
factor suggest that different levels of physical forces are at play at the air-water interface.
The work in chapter 2 is extended in chapter 3 to include the large PF6- and the highly
polarizable IO3- species. A strict exponential correlation between relative anion
enrichment factor and ionic radius is confirmed. Experiments performed on
microdroplets of water/methanol mixtures show that the relative enrichment factor is
almost independent of the molar fraction of methanol. The rates of the heterogeneous
reaction between the gas-phase ozone and aqueous iodide on water and methanol
microdroplets are found to be virtually identical.
In this project, I also collaborated with Dr. Shinichi Enami and Dr. Chad Vecitis on
the studies of heterogeneous ozone-anion reactions, which resulted in three coauthor
papers that are not included in this thesis: [1] Enami S.; Vecitis C. D.; Cheng J.;
Hoffmann M. R.; Colussi A. J. “Global inorganic sources of atmospheric bromine”, J.
Phys. Chem. A, 2007, 111, 8749, [2] Enami S.; Vecitis C. D.; Cheng J.; Hoffmann M. R.;

15
Colussi A. J. “Electrospray mass spectrometric detection of products and short-lived
Intermediates in Aqueous Aerosol Microdroplets Exposed to a Reactive Gas”, J. Phys.
Chem. A, 2007, 111, 13032, and [3] Enami S.; Vecitis C. D.; Cheng J.; Hoffmann M. R.;
Colussi A. J. “Interfacial chemistry of aqueous S(IV)/iodide aerosol microdroplets in
gaseous ozone”, Chem. Phys. Lett., 2008, 455, 316.
Chapters 4 to 7 describe a variety of interfacial processes pertaining to the transport
and transformation of perfluoroalkyl surfactants such as PFOS and PFOA in the
environment. In chapter 4, relative enrichment factor at the air-water intreface for the
perfluoroalkyl carboxylates and sulfonates of different carbon chain length, as measured
by electrospray mass spectrometry, positively correlates with carbon chain length.
Perfluoroalkyl sulfonates are found to be more highly enriched at the air-water interface
than perfluoroalkyl carboxylates of the same carbon chain length, as the sulfonate head
group is less well hydrated than the carboxylate. A hyperbolic rather than linear
correlation between the logarithm of enrichment factor and chain length is due to
conformational restrictions. The study suggests that marine aerosols produced from
contaminated ocean surface waters may be highly enriched in these perfluoroalkyl
surfactants. My role in this study was to conduct part of the experiments and to edit the
manuscript.
Chapter 5 seeks to determine the acid dissociation constants, i.e., pKa values, of
perfluorooctanoate (PFO) and perfluorooctanesulfate (PFOS). An acid-base titration
method based on electrospray mass spectrometry is developed to determine the pKa
values for chemicals that are sufficiently surface active yet poorly soluble in water, and is
validated with two carboxylic acids (C6 and C8). Although PFO is observed to form a

16
very stable (PFO)2H- cluster at low pH, the pKa values of PFOS and PFOA are both well
below 1.0, suggesting that the species will remain deprotonated and therefore non-
volatile under environmentally relevant conditions.
Chapters 6 and 7 describe the effects of matrix components on the sonochemical
degradation kinetics of two perfluoroalkyl surfactants, PFOS and PFOA. The study has
important implications for the application of sonochemical techniques in the
environmental remediation of these chemicals. Since the sonochemical degradation of
PFOS and PFOA is actually via pyrolysis at the bubble-water interface, the fractionation
of both the target compounds and the various other matrix components at the bubble-
water interface can markedly affect the sonochemical reaction kinetics. In chapter 6, it is
found that organic compounds in environmental matrices may reduce the sonochemical
degradation rates of PFOS and PFOA by competitive adsorption onto the bubble-water
interface or by lowering the average interfacial temperatures during transient bubble
collapse events. The magnitude of the negative effect positively correlates with the
Langmuir adsorption constant, the Henry’s law constant, the specific heat capacity, and
the total endothermic heat of dissociation of an individual compound.
Chapter 7 focuses on the effect of common groundwater anions and cations on the
sonochemical degradation kinetics of PFOS and PFOA. The effect of anions follows the
Hofmeister series; the more-surface-active species enhance the reaction rate, whereas the
better-hydrated species have the opposite effect. In contrast, cations have much less
pronounced effect than anions over the same concentration range. Initial solution pH
enhances the degradation rates of PFOX at 3, but has negligible effects over the range of

17
4 to 11. The observed inorganic effects on sonochemical kinetics are hypothesized to be
due to ions’ partitioning to and interaction with the bubble-water interface.
In addition to the perfluorochemical remediation work presented in this thesis, I have
collaborated with Dr. Chad Vecitis, Dr. Hyunwoong Park, Dr. Yajuan Wang, and Dr.
Deming Zhao on the study of perluorochemical removal in pure water and other matrices
such as the aqueous film-forming foam (AFFF), using sonochemical degradation,
photocatalytic reduction, and granular activated carbon (GAC) adsorption. Below is a list
of related coauthor papers that have been published but are not included in this thesis: [1]
Vecitis C. D.; Park H.; Cheng J.; Mader B. T.; Hoffmann M. R. “Kinetics and mechanism
of the sonochemical transformation of perfluorooctane derivatives, PFOS and PFOA, into
primary inorganic constituents”, J. Phys. Chem. A, 2008, 112, 4261, [2] Vecitis C. D.;
Park H.; Cheng J.; Mader B. T.; Hoffmann M. R. “Enhancement of perfluorooctanoate
and perfluorooctanesulfonate activity at acoustic cavitation bubble interfaces”, J. Phys.
Chem. C, 2008, 112, 16850, [3] Park H.; Vecitis C. D.; Cheng J.; Mader B. T.; Hoffmann
M. R. “Reductive defluorination of aqueous perfluorinated surfactants: effects of ionic
headgroup and chain length”, J. Phys. Chem. A, 2009, 113, 690, and [4] Vecitis C. D.;
Park H.; Cheng J.; Mader B.T.; Hoffmann M. R. “Treatment technologies for aqueous
perfluorooctanesulfonate (PFOS) and perfluorooctanoate (PFOA)”, Front. Environ. Sci.
Engin. China, 2009, 3, 129. Two more related papers are in print.
The final chapter concerns the fractionation of ions at the ice-water interface during
freezing of dilute aqueous electrolyte solutions. Time-resolved confocal fluorescence
microscopy is used to monitor the composition, in particular the pH, of the interstitial
liquid films in freezing electrolyte solutions. The dependence of the liquid film thickness

18
on electrolyte concentration is observed to be non-monotonic. In addition, moderate pH
changes ( 0.4 pH) in the microscopic liquid channels are observed during freezing of
dilute aqueous NaCl and NH4Ac solutions, respectively, whereas more dramatic pH
changes (> 1.0 pH unit) are observed during the thawing process, suggesting that the
pH change is limited by the relatively slow process of water dissociation. The results
corroborate the theory of freezing hydrolysis by Bronshteyn and Chernov.83
1.5 References
(1) Marrink, S. J.; Marcelja, S. Langmuir 2001, 17, 7929.
(2) Tieleman, D. P.; Biggin, P. C.; Smith, G. R.; Sansom, M. S. P. Q. Rev. Biophys.
2001, 34, 473.
(3) Benjamin, I. Chem. Rev. 1996, 96, 1449.
(4) Markin, V. S.; Volkov, A. G. J. Phys. Chem. B 2002, 106, 11810.
(5) Lynden-Bell, R. M.; Rasaiah, J. C. J. Chem. Phys. 1997, 107, 1981.
(6) Jungwirth, P.; Tobias, D. J. Chem. Rev. 2005, 106, 1259.
(7) Chang, T. M.; Dang, L. X. Chem. Rev. 2006, 106, 1305.
(8) Kuo, I. F. W.; Mundy, C. J. Science 2004, 303, 658.
(9) Salvador, P.; Curtis, J. E.; Tobias, D. J.; Jungwirth, P. Phys. Chem. Chem. Phys.
2003, 5, 3752.
(10) Petersen, P. B.; Saykally, R. J.; Mucha, M.; Jungwirth, P. J. Phys. Chem.B 2005,
109, 10915.
(11) Yang, X.; Kiran, B.; Wang, X.-B.; Wang, L.-S.; Mucha, M.; Jungwirth, P. J. Phys.
Chem. A 2004, 108, 7820.

19
(12) Knipping, E. M.; Lakin, M. J.; Foster, K. L.; Jungwirth, P.; Tobias, D. J.; Gerber,
R. B.; Dabdub, D.; Finlayson-Pitts, B. J. Science 2000, 288, 301.
(13) Buch, V.; Milet, A.; Vacha, R.; Jungwirth, P.; Devlin, J. P. Proc. Natl. Acad. Sci.
U. S.A. 2007, 104, 7342.
(14) Gopalakrishnan, S.; Jungwirth, P.; Tobias, D. J.; Allen, H. C. J. Phy. Chem. B
2005, 109, 8861.
(15) Jungwirth, P.; Tobias, D. J. J. Phys. Chem. B 2002, 106, 6361.
(16) Stuart, S. J.; Berne, B. J. J. Phys. Chem. A 1999, 103, 10300.
(17) Jones, G.; Ray, W. A. J. Am. Chem. Soc. 1937, 59, 187.
(18) Jones, G.; Ray, W. A. J. Am. Chem. Soc. 1941, 63, 3262.
(19) Jones, G.; Ray, W. A. J. Am. Chem. Soc. 1942, 64, 2744.
(20) Jarvis, N. L.; Scheiman, M. A. J. Phys. Chem. 1968, 72, 74.
(21) Hu, J. H.; Shi, Q.; Davidovits, P.; Worsnop, D. R.; Zahniser, M. S.; Kolb, C. E. J.
Phys. Chem. 1995, 99, 8768.
(22) Zhuang, X.; Miranda, P. B.; Kim, D.; Shen, Y. R. Phys. Rev. B 1999, 59, 12632.
(23) Miranda, P. B.; Shen, Y. R. J. Phys. Chem. B 1999, 103, 3292.
(24) Richmond, G. L. Chem. Rev. 2002, 102, 2693.
(25) Ghosal, S.; Hemminger, J. C.; Bluhm, H.; Mun, B. S.; Hebenstreit, E. L. D.;
Ketteler, G.; Ogletree, D. F.; Requejo, F. G.; Salmeron, M. Science 2005, 307, 563.
(26) Alsnielsen, J.; Jacquemain, D.; Kjaer, K.; Leveiller, F.; Lahav, M.; Leiserowitz, L.
Phys. Rep.-Rev. Sec. Phys. Lett. 1994, 246, 252.
(27) Gopalakrishnan, S.; Liu, D. F.; Allen, H. C.; Kuo, M.; Shultz, M. J. Chem. Rev.
2006, 106, 1155.

20
(28) Kunz, W.; Henle, J.; Ninham, B. W. Curr. Opin. Colloid Interface Sci. 2004, 9,
19.
(29) Kunz, W.; Lo Nostro, P.; Ninham, B. W. Curr. Opin. Colloid Interface Sci. 2004,
9, 1.
(30) Chen, X.; Yang, T.; Kataoka, S.; Cremer, P. S. J. Am. Chem. Soc. 2007, 129,
12272.
(31) Kotronarou, A.; Mills, G.; Hoffmann, M. R. J. Phys. Chem. 1991, 95, 3630.
(32) Serpone, N.; Terzian, R.; Hidaka, H.; Pelizzetti, E. J. Phys. Chem. 1994, 98, 2634.
(33) Kang, J. W.; Hoffmann, M. R. Environ. Sci. Technol. 1998, 32, 3194.
(34) Moriwaki, H.; Takagi, Y.; Tanaka, M.; Tsuruho, K.; Okitsu, K.; Maeda, Y.
Environ. Sci. Technol. 2005, 39, 3388.
(35) Vecitis, C. D.; Park, H.; Cheng, J.; Mader, B. T.; Hoffmann, M. R. J. Phys. Chem.
A 2008, 112, 4261.
(36) Ince, N. H.; Tezcanli, G.; Belen, R. K.; Apikyan, I. G. Appl. Catal. B-Environ.
2001, 29, 167.
(37) Suslick, K. S. Science 1990, 247, 1439.
(38) Misik, V.; Miyoshi, N.; Riesz, P. J. Phys. Chem. 2002, 99, 3605.
(39) Colussi, A. J.; Weavers, L. K.; Hoffmann, M. R. J. Phys. Chem. A 1998, 102,
6927.
(40) Hua, I.; Hoffmann, M. R. Environ. Sci. Technol. 1996, 30, 864.
(41) Weavers, L. K.; Ling, F. H.; Hoffmann, M. R. Environ. Sci. Technol. 1998, 32,
2727.
(42) Colussi, A. J.; Hung, H.-M.; Hoffmann, M. R. J. Phys. Chem. A 1999, 103, 2696.

21
(43) Krishna, C. M.; Lion, Y.; Kondo, T.; Riesz, P. J. Phys. Chem. 2002, 91, 5847.
(44) Alegria, A. E.; Lion, Y.; Kondo, T.; Riesz, P. J. Phys. Chem. 2002, 93, 4908.
(45) So, M. K.; Taniyasu, S.; Yamashita, N.; Giesy, J. P.; Zheng, J.; Fang, Z.; Im, S.
H.; Lam, P. K. S. Environ. Sci. Technol. 2004, 38, 4056.
(46) Murakami, M.; Imamura, E.; Shinohara, H.; Kiri, K.; Muramatsu, Y.; Harada, A.;
Takada, H. Environ. Sci. Technol. 2008, 42, 6566.
(47) Furdui, V. I.; Helm, P. A.; Crozier, P. W.; Lucaciu, C.; Reiner, E. J.; Marvin, C.
H.; Whittle, D. M.; Mabury, S. A.; Tomy, G. T. Environ. Sci. Technol. 2008, 42, 4739.
(48) Yamashita, N.; Kannan, K.; Taniyasu, S.; Horii, Y.; Petrick, G.; Gamo, T. “A
global survey of perfluorinated acids in oceans”, 2005.
(49) Konwick, B. J.; Tomy, G. T.; Ismail, N.; Peterson, J. T.; Fauver, R. J.;
Higginbotham, D.; Fisk, A. T. Env. Toxicol. Chem. 2008, 27, 2011.
(50) Clara, M.; Scheffknecht, C.; Scharf, S.; Weiss, S.; Gans, O. Wat. Sci. Technol.
2008, 58, 59.
(51) Oliaei, F. O.; Kriens, D.; Kessler, K. “Investigation of perfluorochemical (PFC)
contamination in minnesota phase one,” Minnesota Pollution Control Agency, 2006.
(52) Schultz, M. M.; Barofsky, D. F.; Field, J. A. Environ. Sci. Technol. 2004, 38,
1828.
(53) Moody, C. A.; Hebert, G. N.; Strauss, S. H.; Field, J. A. J Environ. Monit. 2003, 5,
341.
(54) Provisional Health Advisories for Perfluorooctanoic Acid (PFOA) and
Perfluorooctane Sulfonate (PFOS); U.S.E.P.A., Ed., 2009.
(55) Key, B. D.; Howell, R. D.; Criddle, C. S. Environ. Sci. Technol. 1998, 32, 2283.

22
(56) Schultz, M. M.; Higgins, C. P.; Huset, C. A.; Luthy, R. G.; Barofsky, D. F.; Field,
J. A. Environ. Sci. Technol. 2006, 40, 7350.
(57) Sinclair, E.; Kannan, K. Environ. Sci. Technol. 2006, 40, 1408.
(58) Vecitis, C. D.; Park, H.; Cheng, J.; Mader, B. T.; Hoffmann, M. R. Front. Environ.
Sci. Engin. China 2009, 3, 129.
(59) Lu, J. R.; Ottewill, R. H.; Rennie, A. R. Colloid Surf. A-Physicochem. Eng. Asp.
2001, 183, 15.
(60) Lopez-Fontan, J. L.; Sarmiento, F.; Schulz, P. C. Colloid Polym. Sci. 2005, 283,
862.
(61) Vecitis, C. D.; Park, H.; Cheng, J.; Mader, B. T.; Hoffmann, M. R. J. Phys. Chem.
C 2008, 112, 16850.
(62) Grannas, A. M.; Jones, A. E.; Dibb, J.; Ammann, M.; Anastasio, C.; Beine, H. J.;
Bergin, M.; Bottenheim, J.; Boxe, C. S.; Carver, G.; Chen, G.; Crawford, J. H.; Domine,
F.; Frey, M. M.; Guzman, M. I.; Heard, D. E.; Helmig, D.; Hoffmann, M. R.; Honrath, R.
E.; Huey, L. G.; Hutterli, M.; Jacobi, H. W.; Klan, P.; Lefer, B.; McConnell, J.; Plane, J.;
Sander, R.; Savarino, J.; Shepson, P. B.; Simpson, W. R.; Sodeau, J. R.; von Glasow, R.;
Weller, R.; Wolff, E. W.; Zhu, T. Atmos. Chem. Phys. 2007, 7, 4329.
(63) Domine, F.; Albert, M.; Huthwelker, T.; Jacobi, H. W.; Kokhanovsky, A. A.;
Lehning, M.; Picard, G.; Simpson, W. R. Atmos. Chem. Phys. 2008, 8, 171.
(64) Huthwelker, T.; Ammann, M.; Peter, T. Chem. Rev. 2006, 106, 1375.
(65) Wettlaufer, J. S.; Worster, M. G. Annu. Rev. Fluid Mech. 2006, 38, 427.
(66) Rempel, A. W.; Waddington, E. D.; Wettlaufer, J. S.; Worster, M. G. Nature 2001,
411, 568.

23
(67) Doppenschmidt, A.; Butt, H. J. Langmuir 2000, 16, 6709.
(68) Henson, B. F.; Voss, L. F.; Wilson, K. R.; Robinson, J. M. J. Chem. Phys. 2005,
123.
(69) McNeill, V. F.; Loerting, T.; Geiger, F. M.; Trout, B. L.; Molina, M. J. Proc. Natl.
Acad. Sci. U. S. A. 2006, 103, 9422.
(70) Benatov, L.; Wettlaufer, J. S. Phys. Rev. E 2004, 70.
(71) Workman, E. J.; Reynolds, S. E. Phys. Rev. 1950, 78, 254.
(72) Lodge, J. P.; Baker, M. L.; Pierrard, J. M. J. Chem. Phys. 1956, 24, 716.
(73) Carignano, M. A.; Shepson, P. B.; Szleifer, I. Chem. Phys. Lett. 2007, 436, 99.
(74) Barnes, P. R. F.; Wolff, E. W. J. Glaciol. 2004, 50, 311.
(75) Mulvaney, R.; Wolff, E. W.; Oates, K. Nature 1988, 331, 247.
(76) Heger, D.; Jirkovsky, J.; Klan, P. J. Phys. Chem. A 2005, 109, 6702.
(77) Gross, G. W.; Wong, P. M.; Humes, K. J. Chem. Phys. 1977, 67, 5264.
(78) Vrbka, L.; Jungwirth, P. Phys. Rev. Lett. 2005, 95.
(79) Wilson, P. W.; Haymet, A. D. J. J. Phys. Chem. B 2008, 112, 11750.
(80) Cobb, A. W.; Gross, G. W. J. Electrochem. Soc. 1969, 116, 796.
(81) Thibert, E.; Domine, F. The J. Phys. Chem. B 1998, 102, 4432.
(82) Thibert, E.; Domine, F. The J. Phys. Chem. B 1997, 101, 3554.
(83) Petrenko, V. F.; Whitworth, R. W. Physics of Ice; New York: Oxford University
Press, 2002.
(84) Bronshteyn, V. L.; Chernov, A. A. J. Cryst. Growth 1991, 112, 129.
(85) Heger, D.; Klanova, J.; Klan, P. J. Phys. Chem. B 2006, 110, 1277.

24
(86) Robinson, C.; Boxe, C. S.; Guzman, M. I.; Colussi, A. J.; Hoffmann, M. R. J.
Phys. Chem. B 2006, 110, 7613.
(87) Sato, K.; Takenaka, N.; Bandow, H.; Maeda, Y. J. Phys. Chem. A 2008, 112,
7600.
(88) Takenaka, N.; Bandow, H. J. Phys. Chem. A 2007, 111, 8780.
(89) Takenaka, N.; Ueda, A.; Maeda, Y. Nature 1992, 358, 736.
(90) Takenaka, N.; Tanaka, M.; Okitsu, K.; Bandow, H. J. Phys. Chem. A 2006, 110,
10628.
(91) Grannas, A. M.; Bausch, A. R.; Mahanna, K. M. J. Phys. Chem. A 2007, 111,
11043.
(92) O'Driscoll, P.; Minogue, N.; Takenaka, N.; Sodeau, J. J. Phys. Chem. A 2008, 112,
1677.

25
Scheme 1.1. A representative scheme of the sonochemical PFOS transformation into its organic constituents. The inorganic products are highlighted in purple boxes.

26
Chapter 2
Experimental Anion Affinities for the Air–Water Interface*
*This chapter is reproduced with permission from J. Cheng, C. D. Vecitis, M. R. Hoffmann, and A. J. Colussi, Journal of Physical Chemistry B, 2006, 110, 25598. Copyright © 2006, American Chemical Society

27
2.1 Abstract
Anion affinities, X-, for the aerial interface of aqueous (Br- + NO3- + I- + SCN- + BF4
- +
ClO4-) solutions are determined by electrospray ionization-mass spectrometry. The
composition of the ions ejected from the surface of fissioning nanodroplets shows that X-’s
increase (decrease) exponentially with anionic radii, aX- (dehydration free energies, dGX-), and
selectively respond to the presence of surfactants. BF4-, the least hydrated and polarizable
anion of the set, has one of the largest X-’s. Non-ionic surfactants decrease I-and SCN-, but
increase BF4-. Cetyltrimethyl ammonium markedly enhances the X-’s of smaller anions over
those of larger ones. A similar, but weaker effect is observed upon lowering the pH of the
bulk solutions from 8.2 to 3.0. Dodecyl sulfate has a negligible effect on X-’s. Considering
that: (1) universal many-body electrodynamic interactions will progressively stabilize the
interfacial layer as its dielectric permittivity falls relative to that of the bulk solution, (2) water
permittivity is uniformly depressed by increasing concentrations of these anions, we infer that
the observed Hofmeister correlation: ln X- - dGX-, is consistent with the optimal depression
of the permittivity of the drier interfacial layer by the least hydrated ions. Ion-ion interactions
can significantly influence X-’s in environmental aqueous media.

28
2.2 Introduction
Few phenomena are more ubiquitous, or have been more investigated, than those
induced by the dissimilar propensities of anions for aqueous interfaces.1-4 Fundamental
biochemical, technological and environmental processes are driven by the selective affinities
of the various anions for the interfaces involved. They are labeled “Hofmeister effects” (HEs)
after observations made 118 years ago.5-6 Explanations abound. They range from those based
on continuum,7-13 or heuristic molecular models,14 to non-primitive molecular dynamic
simulations.15-18 However, “HEs remain a mystery after more than 100 years”,10 “perhaps the
only thing certain about HEs is that we do not understand the physical basis for the
process”,19 “simulations that confirm intuitions should be considered tautological”.11
Hofmeister correctly linked anion propensities for the boundaries between water and less
polar media with the ‘water withdrawing power’ of anions, an unquantified property at the
time.20 It has been recently argued, however, that anion polarizability is the most important
factor determining HEs at air/electrolyte solution interfaces.18,21-22 The argument rests on
molecular dynamic (MD) calculations in which anions accumulate in the outermost layer
after their polarizabilities are turned on in the models, and on similarly interpreted surface-
sensitive experiments.23 Thus, it has been alleged that halide anion propensities are
proportional to their polarizabilities.24 Notice that the negative surface potentials measured
over (most) electrolyte solutions ~50 years ago themselves require anions to be closer than
cations to the interface.25-27
The affinities of the heavier halide anions for aerosol interfaces play important roles in
atmospheric chemistry.2,28-36 The same tendencies underlie the fact that the saline aerosol (up
to ~104 Tg/yr) incessantly released by the oceans is highly (10 to 104 times) enriched in

29
bromide and iodide.32,37 Considering that these huge enrichment factors cannot be accounted
for by the modest differential Cl-/Br-/I- concentration gradients predicted for the interfacial
region, we decided to reinvestigate the mechanism of anion fractionation during the
aerosolization of electrolyte solutions.33,38-43 In this chapter we report experiments on the
simultaneous detection of Br-, NO3-, I-, SCN-, BF4
- and ClO4- at the aerial interface of sub-
millimolar aqueous senary solutions via electrospray ionization-mass spectrometry40,44-48 in
the presence or absence of surfactants and urea.31,49-55 The results are analyzed in terms of
fundamental concepts and new information.
2.3 Experimental Section
An electrospray ionization mass spectrometer (HP-1100 MSD) with an atmospheric
pressure ionization interface of orthogonal geometry was used in this study. Electrolyte
solutions (50 L min-1) were pumped into the spraying chamber through a grounded stainless
steel needle injector (100 m bore). Continuous flow conditions minimize contamination by
spurious tensioactive species, which often compromises static experiments. Instrumental
parameters (drying gas flow: 10 L min-1; drying gas temperature: 250 C; nebulizer pressure:
35 psi; collector capillary voltage: 1.5 kV; fragmentor voltage: 80 V) were chosen to optimize
mass signals with minimal ion fragmentation. Mass spectra were acquired at preset m/z-
values: 58 and 60 (32,34SCN-), 62 (NO3-), 79 and 81 (Br-), 86 and 87 (10,11BF4
-), 99 and 101
(35,37ClO4-) and 127 (I-). Reported data are the average of at least duplicate experiments.
Pure (98% purity or higher) NaBr, NaI, NaNO3, NaClO4, NaBF4 and NaSCN (EM
science or Sigma-Aldrich), Triton X-114 and cetyltrimethyl ammonium chloride (CTAC,
Sigma-Aldrich), sodium dodecylsulfate (SDS, Bio-Rad) and urea (Mallinckrodt) were used
as received. Equimolar senary solutions were prepared in MilliQ water or D2O (Cambridge

30
Isotopes) with and without surfactants or urea. The use of senary solutions substantially
reduces experimental dispersion, and the possible effect of potential impurities on present
measurements. The pH of senary solutions, initially at 6.5, was adjusted by addition of 1 mM
NaOH or HCl at constant ionic strength, and measured with a calibrated pH meter.
2.4 Results and Discussion
Figure 2.1 shows a negative ion mass spectrum of electrosprayed salt solutions. From
this information, normalized anion affinities, X-, were calculated from the sum of ion counts,
Im/z, for the isotopic variants of each anionic species (e.g., (I58 + I60) for SCN-, etc.) and the
total ion count:
/
/
m zX
Xm z
I
fI
(2.1)
Relative anion affinities, X-, are defined as multiples of Br-, the value for the least
enriched anion at the interface in the absence of surfactants: X- = X-/Br- (table 2.1). X-s
measured in H2O or D2O are identical within experimental error.
Droplets generated during breakup of the liquid jet issuing from the grounded nozzle are
spontaneously charged via microscopic fluctuations. The subsequent, uneven shedding of
mass and charge by electrosprayed droplets forces the anions present at the air/water interface
to preferentially carry most of the excess charge into offspring droplets.56 Individual anions
are ultimately ejected into the gas-phase via field desorption from negatively charged
nanodroplets.40,45-46,57-63 Therefore, the relative anion abundances registered by the mass
spectra (figure 2.1) reflect the anion distribution in the ensemble of single-ion water clusters
ejected from the surface of disintegrating nanodroplets.57-58 In the orthogonal geometry

31
employed in these experiments the instrument samples the nanodroplets ejected laterally
from the electrosprayed jet. There is conclusive evidence that tensioactive species tend to
accumulate in the periphery of the conical mist created ahead of the inlet orifice.48
Considering that the relative anion signals obtained by spraying solutions doped with 10 M
SDS (anionic) or CTAC (cationic) surfactants are identical within experimental error, we
conclude that the basic mechanism of anion enrichment does not involve ion-ion interactions.
Figures 2.2 to 2.4 show semilogarithmic plots of X- as a function of the aqueous anionic
radius, aX-, free energy of dehydration dGX-, and polarizability X-, respectively.64 It is
apparent that anion affinities for the air/water interface are strongly correlated with anionic
radii: ln X- aX- (R2 = 0.96), and free energies of dehydration: ln X- dGX- (R2 = 0.91), in
full accord with Hofmeister’s analysis,20 and Monte Carlo calculations.15,65 However, there is
no discernible correlation between X-s and anion polarizabilities X-s (Figure 2.4).3,7,18,21,66-67
Tetrahedral BF4-, which has the smallest dehydration free energy of this set of anions, but is
approximately 2.75 times less polarizable than iodide (table 2.1), provides a fair test of the
relative importance of anion polarizability versus anion dehydration energy in the mechanism
of interfacial enrichment. Although the reported anion affinities depend to a certain extent on
instrumental settings, these correlations are robust: X-’s measured at 3 kV capillary voltage
still increase exponentially with aX-. X-’s measured in the 10 M to 10 mM concentration
range are identical within experimental error.
Surfactants significantly affect X-’s. All surfactants uniformly depress the total anion
count at concentrations below their critical micellar concentrations.68-69 Since nonionic
surfactants do not displace anions from the interface at these concentrations (a weak

32
attraction might be even expected) this finding suggests that surfactants compete with anions
in decreasing surface energy. Urea (Figure 2.5), a water structure-breaker,52 and Triton X-114
(Figures 2.7 and 2.8), a non-ionic polyether amphiphile, comparably, slightly, but selectively
influence X-’s. The interfacial layer becomes more populated by the least hydrated BF4- at
the expense of the more polarizable I- and SCN- anions upon addition of urea or Triton X-
114. The devaluation of the comparative advantage of I- and SCN- over BF4- (BF4
-, having the
smallest dGX-, is indeed underrepresented at the interface, cf. Figure 2.3) further suggests that
the more polarizable anions are somewhat more efficient in stabilizing the interfacial layer.70-
71
While the anionic dodecylsulfate indiscriminately repels all anions from the interface, as
expected from electrostatics, X-’s are quite sensitive to the cationic amphiphile
cetyltrimethylammonium (Figure 2.6).72-73 The smallest (and least enriched in the absence of
additives) anions, NO3- and Br-, are specifically enhanced several fold. As a result, the X-’s
measured in the presence of 1 mM CTAC no longer correlate with anion radii or dehydration
free energies. Positive headgroups seem to attract the smaller anions into closer contact, and
induce significant changes in their orientation and solvation at the interface.74 It is well
known that ion charges and radii both affect ion distributions near interfaces.75 We also found
that NO3- increases 2.3 times, respectively, while most X-‘s remain nearly constant as the pH
of the bulk solutions is lowered from 8.2 to 3.0. The onset of NO3- increases occurs at about
pH 4.0, suggesting that the interface becomes positively charged via proton adsorption under
acidic conditions.4 In this context, it is relevant to point out that the marine aerosol, which is
generated during bubble bursting at the ocean surface, consists of positively charged

33
droplets.39,76
Much of the current literature focuses on the width of the interfacial region.77 However,
since even surface-sensitive spectroscopies collect signals from interfacial slabs of ≈ 1.0 nm
thicknesses,23 the fine-grained interfacial concentration profiles obtained by MD calculations,
if they were consequential, represent an authentic challenge.18 Anions are effectively enriched
in the layers probed in our experiments because the combined ClO4- (m/z = 99 and 101)
signals are only 2.5 times smaller than the m/z = 265 signal of the SDS surfactant in
equimolar 10 M solutions. Assuming that SDS is bound to a ≈ 0.3 nm outermost layer, we
tentatively infer that ClO4- ions are sampled from ≈ 1.0 nm interfacial sections that are
smaller than the estimated ≈ 2.5 nm radii of fissioning droplets,57-58 On the other hand,
surface tension measurements involve integral concentration profiles. The possibility that
different interactions dominate at various depths, i.e., that the results obtained by different
techniques could not be comparable, cannot be dismissed at this time.23
A physically meaningful interpretation of interfacial anion affinities should be based on
an energy balance between opposing effects, rather than on simply correlating affinities with
specific ion properties. Since anions are polarizable, the finding that some anions become
enriched at the interface after their polarizabilities are included in MD calculations strictly
shows that a deficiency has been corrected, not that anion enrichments should correlate with
anion polarizabilities. While it is easy to envision that water density decreases smoothly
toward the interface, the factors that determine the concentration profiles of cations and
anions in the boundary layer are not immediately apparent. The sizable dehydration free
energies of most ions, in conjunction with lower water density at the interface, will draw
them into the bulk.9,15,65 Image charge repulsion will enhance this tendency. This drive would

34
be ultimately balanced by the entropy losses associated with ion confinement into a reduced
volume. Hence, large dehydration free energies conspire against significant interfacial ion
excesses. The preferential stabilization of the more polarizable anions in the strong electric
field at the interface would, in principle, contribute to mitigate the adverse energy balance.
Figure 2.4 shows, however, that this contribution is at best minor. Clearly, the major
interactions remain to be identified that draw anions toward the interface and offset their
aversion for this drier medium. Notice that if these were the only interactions involved, the
solution bulk would be separated from air by a more dilute layer.
The thermodynamic stability of a contiguous three-layer macroscopic array cannot be
exclusively analyzed in terms of localized ion-water interactions. Macroscopic phases in
contact are mutually stabilized via collective dispersive interactions arising from density and
orientation fluctuations over the entire system.78-80 By properly accounting for the global,
many-body electrodynamic interactions among three contiguous phases, it is possible to infer
that the central layer is stabilized when its overall (i.e., dispersive and orientational)
polarizability lies between those of the bulk solution and air.78-79 This powerful criterion shifts
the focus from ion polarizabilities to ion effects on the polarizability of water as a
macroscopic medium. The broad temporal scales of many-body interactions in dielectric
water are presumably better captured by Monte Carlo than by Molecular Dynamic
calculations. The large difference between the dielectric permittivities of water and air, due to
the unique properties of water as a hydrogen-bonded solvent, tends to amplify the effects of
perturbations to water dynamics. Since electrolytes, as a rule, decrease the dielectric
permittivity of water,81-84 aqueous layers separating electrolyte solutions from air are
expected to be stabilized by excess ion concentrations. Anions largely achieve this effect in

35
the bulk by shortening the range and slowing down water dipolar correlations. From this
perspective, we propose that the rival factors controlling ion affinities for the air/water
interface appear to be: (1) ion dehydration energies and (2) nonlocal stabilization energies
resulting from the depression of interfacial water permittivity by local ion excesses.9
Since the concentration dependences of the static permittivities and relaxation times of
water in NaBr, NaI, NaNO3, NaClO4 and NaSCN solutions are nearly independent of the
nature of the anion,85-86 anion affinities largely reflect differences in dehydration free
energies. Considering that the dehydration energies of anions are considerably smaller than
those of cations, this analysis naturally accounts for the negative (relative to the bulk) surface
potentials measured long ago.26-27 The Jones-Ray effect,87 i.e., the lower surface tensions of
dilute aqueous electrolyte solutions, also follows from this analysis and the Gibbs isotherm.
This view readily allows for variations of anion affinities when air is replaced by other media,
such as hydrophobic membranes or proteins.1,11,20 If for no other reason, anions, particularly
in the ~1 M model solutions used in MD simulations, must be polarizable to relay (rather
than shield) electrodynamic interactions over the entire molecular ensemble.
Summing up, the Hofmeister series of anion affinities for the air/water interface is
paradoxically realized by the nonspecific effect of anions on the dielectric properties of
interfacial water. Under realistic environmental conditions, surfactants may decisively affect
anion affinities. The huge anion enrichments found in the finest marine aerosol likely result
from the amplification of relative anion affinities in successive droplet fission events. 39,47
Further work is underway.
2.5 Acknowledgments
This work was financed by NSF grant ATM-0534990.

36
2.6 References
(1) Kunz, W. Pure Appl. Chem. 2006, 78, 1611.
(2) Lewis, E. R.; Schwartz, S. E. Sea Salt Aerosol Production: Mechanisms, Methods,
Measurements and Models – A Critical Review; American Geophysical Union:
Washington, DC, 2004; Geophysical Monograph, Vol. 152.
(3) Ghosal, S.; Hemminger, J. C.; Bluhm, H.; Mun, B. S.; Hebenstreit, E. L. D.; Ketteler,
G.; Ogletree, D. F.; Requejo, F. G.; Salmeron, M. Science 2005, 307, 563.
(4) Pegram, L. M.; Record, M. T. Proc. Nat. Acad. Sci. U.S.A. 2006, 103, 14278.
(5) Hofmeister, F. Arch. Exp. Pathol. Pharmakol. (Leipzig) 1888, 24, 247.
(6) Gurau, M. C.; S.M., L.; Castellana, E. T.; Albertorio, F.; Kataoka, S.; Cremer, P. S. J.
Am. Chem Soc. 2004, 126, 10522.
(7) Bondesson, L.; Frediani, L.; Agren, H.; Mennucci, B. J. Phys. Chem. B 2006, 110,
11361.
(8) Edwards, S. A.; Williams, D. R. M. Europhys. Lett. 2006, 74, 854.
(9) Bostrom, M.; Kunz, W.; Ninham, B. W. Langmuir 2005, 21, 2619.
(10) Bostrom, M.; Ninham, B. W. Langmuir 2004, 20, 7569.
(11) Kunz, W.; Lo Nostro, P.; Ninham, B. W. Curr. Opin. Colloid Interface Sci. 2004, 9,
1.
(12) Zhou, H. X. Proteins 2005, 61, 69.
(13) Frediani, L.; Mennucci, B.; Cammi, R. J. Phys. Chem. B 2004, 108, 13796.
(14) Dill, K. A.; Truskett, T. M.; Vlachy, V.; Hribar-Lee, B. Annu. Rev. Biophys. Biomol.
Struct. 2005, 34, 173.
(15) Hagberg, D.; Brdarski, S.; Karlstrom, G. J. Phys. Chem. B 2005, 109, 4111.

37
(16) Wilson, M. A.; Pohorille, A. J. Chem. Phys. 1991, 95, 6005.
(17) Cacace, M. G.; Landau, E. M.; Ramsden, J. J. Quarterly Rev. Biophys. 1997, 30, 241.
(18) Jungwirth, P.; Tobias, D. J. Chem. Rev. 2006, 106, 1259.
(19) Bowron, D. T.; Finney, J. L. J. Chem. Phys. 2003, 118, 8357.
(20) Kunz, W.; Henle, J.; Ninham, B. W. Curr. Opin. Colloid Interface Sci. 2004, 9, 19.
(21) Petersen, P. B.; Saykally, R. J. Annu. Rev. Phys. Chem. 2006, 57, 333.
(22) Jungwirth, P.; Tobias, D. J. J. Phys. Chem. B 2002, 106, 6361.
(23) Petersen, P. B.; Saykally, R. J. J. Phys. Chem. B 2006, 110, 14060.
(24) Knipping, E. M.; Lakin, M. J.; Foster, K. L.; Jungwirth, P.; Tobias, D. J.; Gerber, R.
B.; Dabdub, D.; Finlayson-Pitts, B. J. Science 2000, 288, 301.
(25) Randles, J. E. B. Discuss. Faraday Soc. 1957, 24, 194.
(26) Jarvis, N. L. J. Geophys. Res. 1972, 77, 5177.
(27) Jarvis, N. L.; Scheiman, M. A. J. Phys. Chem. 1968, 72, 74.
(28) McFiggans, G. Nature 2005, 433, E13.
(29) O'Dowd, C. D.; Jimenez, J. L.; Bahreini, R.; Flagan, R. C.; Seinfeld, J. H.; Hameri,
K.; Pirjola, L.; Kulmala, M.; Jennings, S. G.; Hoffmann, T. Nature 2002, 417, 632.
(30) Carpenter, L. J. Chem. Rev. 2003, 103, 4953.
(31) Liss, P. S.; Duce, R. A. The Sea Surface and Global Change; Cambridge University
Press: Cambridge, UK, 1997.
(32) Duce, R. A.; Hoffman, E. J. Ann. Rev. Earth Planet. Sci. 1976, 4, 187.
(33) Macintyre, F. Tellus 1970, 22, 451.
(34) Sander, R.; Keene, W. C.; Pszenny, A. A. P.; Arimoto, R.; Ayers, G. P.; Baboukas, E.;
Cainey, J. M.; Crutzen, P. J.; Duce, R. A.; Honninger, G.; Huebert, B. J.; Maenhaut, W.;

38
Mihalopoulos, N.; Turekian, V. C.; Van Dingenen, R. Atmos. Chem. Phys. 2003, 3, 1301.
(35) Finlayson-Pitts, B. J. Chem. Rev. 2003, 103, 4801.
(36) Garrett, B. C. Science 2004, 303, 1146.
(37) Boyce, S. G. Science 1951, 113, 620.
(38) Macintyre, F. J. Phys. Chem. 1968, 72, 589.
(39) Blanchard, D. C. Prog. Oceanogr. 1963, 1, 71.
(40) Lin, S. P.; Reitz, R. D. Ann. Rev. Fluid Mech. 1998, 30, 85.
(41) Leifer, I.; de Leeuw, G.; Cohen, L. H. Geophys. Res. Lett. 2000, 27, 4077.
(42) Blanchard, D. C.; Syzdek, L. D. Limnol. Oceanogr. 1978, 23, 389.
(43) Duchemin, L.; Popinet, S.; Josserand, C.; Zaleski, S. Phys. Fluids 2002, 14, 3000.
(44) Yamashita, M.; Fenn, J. B. J. Phys. Chem. 1984, 88, 4451.
(45) Fenn, J. B. Angew. Chem. Int. Ed. 2003, 42, 3871.
(46) Fenn, J. B. J. Am. Soc. Mass Spectrom. 1993, 4, 524.
(47) Cech, N. B.; Enke, C. G. Anal. Chem. 2001, 73, 4632.
(48) Tang, K. Q.; Smith, R. D. J. Am. Soc. Mass Spectrom. 2001, 12, 343.
(49) Liu, X.; Duncan, J. H. Nature 2003, 421, 520.
(50) Quinn, J. A.; Steinbrook, R. A.; Anderson, J. L. Chem. Eng. Sci. 1975, 30, 1177.
(51) Stepanets, O. V.; Soloveva, G. Y.; Mikhailova, A. M.; Kulapin, A. I. J. Anal. Chem.
2001, 56, 290.
(52) Franks, F. Water, a Comprehensive Treatise; New York: Plenum Press, 1975; Vol. 4.
(53) Ohmine, I. J. Phys. Chem. 1995, 99, 6767.
(54) Siu, D.; Koga, Y. J. Phys. Chem. B 2005, 109, 16886.
(55) Frinak, E. K.; Abbatt, J. P. D. J. Phys. Chem. A 2006, 110, 10456.

39
(56) Enke, C. G. Anal. Chem. 1997, 69, 4885.
(57) Consta, S. Theor. Chem. Acc. 2006, 116, 373.
(58) Ichiki, K.; Consta, S. J. Phys. Chem. B 2006, 110, 19168.
(59) Rohner, T. C.; Lion, N.; Girault, H. H. Phys. Chem. Chem. Phys. 2004, 6, 3056.
(60) Cech, N. B.; Enke, C. G. Mass Spectrom. Rev. 2001, 20, 362.
(61) Iribarne, J. V.; Dziedzic, P. J.; Thomson, B. A. Int. J. Mass Spectrom. Ion Processes
1983, 50, 331.
(62) Iribarne, J. V.; Thomson, B. A. J. Chem. Phys. 1976, 64, 2287.
(63) Znamenskiy, V.; Marginean, I.; Vertes, A. J. Phys. Chem. A 2003, 107, 7406.
(64) Marcus, Y. Ion Properties; Marcel Dekker: New York, 1997.
(65) Karlstrom, G.; Hagberg, D. J. Phys. Chem. B 2002, 106, 11585.
(66) Weber, R.; Winter, B.; Schmidt, P. M.; Widdra, W.; Hertel, I. V.; Dittmar, M.; Faubel,
M. J. Phys. Chem. B 2004, 108, 4729.
(67) Chang, T. M.; Dang, L. X. Chem. Rev. 2006, 106, 1305.
(68) Hernainz, F.; Calero, M.; Blazquez, G.; Caro, A. J. Chem. Eng. Data 2006, 51, 1216.
(69) Chang, H. C.; Hwang, B. J.; Lin, Y. Y.; Chen, L. J.; S.Y., L. Rev. Sci. Instr. 1998, 69,
2514.
(70) Schrodle, S.; Hefter, G.; Kunz, W.; Buchner, R. Langmuir 2006, 22, 924.
(71) Fernandez, P.; Schrodle, S.; Buchner, R.; Kunz, W. ChemPhysChem. 2003, 4, 1065.
(72) Ryhanen, S. J.; Saily, V. M. J.; Kinnunen, P. K. J. J. Phys. Condens. Matter 2006, 18,
S1139.
(73) Baar, C.; Buchner, R.; Kunz, W. J. Phys. Chem. B 2001, 105, 2906.
(74) Benderskii, A. V.; Henzie, J.; Basu, S.; Shang, X.; Eisenthal, K. B. J. Phys. Chem. B

40
2004, 108, 14017.
(75) Luo, G.; Malkova, S.; Yoon, J.; Schultz, D. J.; Lin, B.; Meron, M.; Benjamin, I.;
Vanysek, P.; Schlossman, M. L. Science 2006, 311, 216
(76) Blanchard, D. C. J. Meteor. 1958, 15, 383.
(77) Deutsch, M. Faraday Discuss. 2005, 129, 89.
(78) Israelachvilii, J. Intermolecular & Surface Forces, 2nd ed.; Academic Press: London,
1992.
(79) Dzyaloshinskii, I.E.; Lifshitz, E. M.; Pitaevskii, L. P. Adv. Phys. 1961, 10, 165.
(80) Wilen, L. A.; Wettlaufer, J. S.; Elbaum, M.; Schick, M. Phys. Rev. B 1995, 52, 12426.
(81) Kaatze, U. J. Solut. Chem. 1997, 26, 1049.
(82) Barthel, J.; Buchner, R. Pure Appl. Chem. 1991, 63, 1473.
(83) Hildebrandt, A.; Blossey, R.; Rjasanow, S.; Kohlbacher, O.; Lenhof, H. P. Phys. Rev.
Lett. 2004, 93, 108104.
(84) Gavryushov, S.; Linse, P. J. Phys. Chem. B 2003, 107, 7135.
(85) Wachter, W.; Kunz, W.; Buchner, R.; Hefter, G. J. Phys. Chem. A 2005, 109, 8675.
(86) Koga, Y.; Westh, P.; Davies, J. V.; Miki, K.; Nishikawa, K.; Katayanagi, H. J. Phys.
Chem. A 2004, 108, 8533.
(87) Petersen, P. B.; Saykally, R. J. J. Am. Chem Soc. 2006, 127, 15446.

41
Table 2.1 Interfacial affinities and molecular properties of anions
Anion X-
Normalized Affinit iesa
X - b
Relative Affinit iesa
X - b
Radii c
aX - 1012 /m
Dehydration Free Energies c
dGX - / kJ mol-1
Polarizabilities
c
X- 1030 / m3
Br- 0.023 1.00 196 321 4.99
NO3- 0.033 1.40 206 d 306 4.20
I- 0.090 3.85 220 283 7.65
SCN- 0.098 4.17 213 287 6.86
BF4- 0.301 12.86 230 200 2.78
ClO4- 0.455 19.45 240 214 4.92
a See text for definition b This work c Reference 60 d Equatorial radius

42
Figure 2.1. ESI-MS of a 100 M aqueous solution of the sodium salts of each of the following anions: SCN-, NO3
-, Br-, BF4-, ClO4 and I-, at pH 6.5. Ion signal intensities
normalized to the total ion intensity: i = 1. ISCN- = 0.097, INO3
- = 0.033, IBr- = 0.023, IBF4- =
0.301, IClO4- = 0.455, II
- = 0.090.
m/z
50 60 70 80 90 100 110 120 130
No
rmal
ized
Sig
nal
In
ten
sity
0.0
0.1
0.2
0.3
0.4
SCN-
NO3-
Br-
BF4-
ClO4-
I-

43
Figure 2.2. Symbols: Normalized anion affinities, X-, versus anionic radii, aX-, from
Reference 60. Solid line: linear regression: ln X- aX- (R2 = 0.956).
aX- / pm200 210 220 230 240
ln f
X-
-4.0
-3.5
-3.0
-2.5
-2.0
-1.5
-1.0
-0.5
Br-
NO3-
SCN-
I-
BF4-
ClO4-

44
Figure 2.3. Symbols: Normalized anion affinities, X-, versus free energies of anion
dehydration, dGX-, from Ref. 60. Solid line: linear regression: ln X- dGX- (R2=0.910).
dGX- / kJ mol-1200 220 240 260 280 300 320
ln f
X-
-4.0
-3.5
-3.0
-2.5
-2.0
-1.5
-1.0
-0.5
Br-
NO3-
SCN-
I-
ClO4-
BF4-

45
Figure 2.4. Normalized anion affinities, X-, versus anion polarizabilities, X-, from Ref. 60.
X- / 10-30m3
2 3 4 5 6 7 8
ln f
X-
-4.0
-3.5
-3.0
-2.5
-2.0
-1.5
-1.0
-0.5
NO3-
Br-
SCN-I-
ClO4-
BF4-

46
Figure 2.5. Symbols: Ratios of normalized anion affinities, X-/X-(0), as function of urea concentration. (BF4
-); (NO3-); (ClO4
-); (Br-); (I-); (SCN-). [Xi-] = 0.1 mM.
[Urea] / M
10-5 10-4 10-3 10-2
f X- /
f X-(0
)
0.6
0.8
1.0
1.2
1.4

47
Figure 2.6. Symbols: Ratios of normalized anion affinities, X-/X-(0), as function of cetyltrimetyl ammonium chloride (CTAC) concentration. (BF4
-); (NO3-); (ClO4
-); (Br-); (I-); (SCN-). [Xi
-] = 0.1 mM.
[CTAC] / M
10-5 10-4 10-3
f x- /
f x-(0)
0.1
1
10

48
Figure 2.7. Symbols: Ratios of normalized anion affinities, X-/X-(0), as function of Triton X-114. (BF4
-); (NO3-); (ClO4
-); (Br-); (I-); (SCN-). [Xi-] = 0.1 mM.
[Triton X114] / M
10-5 10-4 10-3
f x- / f
x-(0)
0.5
0.7
0.9
1.1
1.3

49
Figure 2.8. Symbols: Normalized anion affinities, X-, as function of sodium dodecylsulfate (SDS) concentration. (BF4
-); (NO3-); (ClO4
-); (Br-); (I-); (SCN-). [Xi
-] = 0.1 mM.
[SDS] / M
10-5 10-4 10-3
f X-
10-2
10-1
100

50
Chapter 3
Anion fractionation and reactivity at air–water and air–methanol interfaces: implications for the origin of Hofmeister effects*
*This chapter is reproduced with permission from J. Cheng, M. R. Hoffmann, and A. J.
Colussi, Journal of Physical Chemistry B, 2008, 112, 7157. Copyright © 2008, American Chemical Society

51
3.1 Abstract
Anions are selectively enriched in interfacial layers. This universal phenomenon, first
identified in connection with protein precipitation 120 years ago, underlies fundamental
processes. Its physical causes, however, remain conjectural. It has been speculated that
the more polarizable anions should have larger affinities for air/liquid interfaces, and that
their reactivities toward gaseous species would be affected by whether the liquid is
capped by hydroxyl groups, as in water itself, or by hydrophobic layers of organic
contaminants. These issues are particularly relevant to the composition and fate of
atmospheric aerosols. Recently we found that fractionation factors X- of simple anions at
the air/water interface increase exponentially with ion radius aX-. In this chapter we report
new experimental results on a set of anions that include the large PF6- and the highly
polarizable IO3- species. A strict ln X- aX- correlation is confirmed. Experiments
performed in xw H2O + (1 - xw) MeOH mixtures show that X- is almost independent of
xw. Furthermore, O3(g) oxidizes I- at virtually identical rates on H2O and MeOH.

52
3.2 Introduction
Bromide and particularly iodide are known to be highly enriched in the finest marine
aerosol particles.1-3 This phenomenon has long been ascribed to the binding of halide ions
to surface-active organic material,2 and/or the release of biogenic halocarbon gases from
the ocean.4,5 Since the aerial interfaces of most electrolyte solutions are negatively
charged relative to the bulk,6-8 i.e., anions are selectively enriched at the interface as a
matter of course, anion fractionation will inevitably take place during the aerosolization
of the ocean upper layers upon bubble breakup.9,10 Establishing the physical basis of this
universal,11,12 as opposed to contingent or episodic, mechanism of solute fractionation at
the air/water interface is key to our understanding of aerosol chemistry13-15 and its global
impact on atmospheric processes.16,17
The origin of interfacial ion partitioning is not well understood.18-20 Electrostatic,
hydration, dispersion and hydrophobic forces, hydrogen bonding, and chaotropic/
kosmotropic effects on solvent structure12,18,20-26 have been invoked to explain specific
ion effects. Molecular dynamics and Monte Carlo calculations have revitalized the
subject,15,27,28 using ab initio water-water potential energy functions calibrated to account
for many-body effects in the bulk.29 Since the modest enrichment factors (less than an
order of magnitude) associated with most interfacial phenomena entail free energy
differences G 5 kJ mol-1 ~ 2 kT at 300 K, one may envision multiple explanations for
‘anion enrichment’.19,30,31 A more stringent test for theory and calculations would be to
account for robust, quantitative correlations between reliable interfacial fractionation data
with ion and/or solvent properties.

53
The very concept of ‘interface’, i.e., the depth of what is considered the ‘interface’ as
opposed to the ‘interfacial region’, is itself ambiguous because it depends on both the
phenomenon studied and the probing technique. Surface-specific techniques collect
signals from ~ 1 nm deep layers,32-37 but again, since the free energy gradients associated
with interfacial ion enrichment are commensurate with kT, chemically activated
processes specifically confined to the ‘interface’ proper appear to be a contradiction in
terms. Perhaps only the fastest reactions, which occur upon heterogeneous reactant
encounters could truly probe interfacial structure and dynamics.38
In this article, we extend our previous study on anion fractionation39 to the large PF6-
and the highly polarizable IO3-, and report experimental tests of whether anion
fractionation depends on local interfacial properties in water:methanol mixtures, which
are largely capped with -CH3 groups above xMeOH ~ 0.2.40-42 We also investigate whether
the rates and course of the diffusion-controlled oxidation of interfacial I- by O3(g) change
from water to methanol.43-47
3.3 Experimental Section
NaSCN (98%, Sigma-Aldrich), NaNO3 (99 %, EM Science), NaBr (99.5%, EM
Science), NaBF4 (98%, Fluka), NaClO4 (99%, EM Science), NaI (99%, EM Science),
NaPF6 (98%, Sigma-Aldrich), and NaIO3 (99%, Sigma-Aldrich) were used as received.
Equimolar stock solutions were prepared in purified water (18.2 MΩ cm-1 resistivity)
from a Millipore Milli-Q Gradient water purification system or in methanol (HRGC
grade, EMD Chemicals). Anions at the liquid-air interfaces are directly monitored by
electrospray mass spectrometry (ES-MS).48-50 Equimolar solutions of the sodium salts of
various anions were pumped (at 50 L min-1) into the spraying chamber of the

54
electrospray mass spectrometer (HP-1100) through a grounded stainless steel needle (100
m ID, 150 m OD) surrounded by a coaxial sheath (250 m ID) that issues N2(g) at 0.5
L min-1. The large difference between the exit velocities of the liquid jet (10.6 cm s-1) and
the N2 gas (2.65 104 cm s-1) forces the liquid to fragment into fine droplets. The spray
produced from a grounded nozzle injector consists of a normal distribution of weakly
charged microdroplets (centered at zero charge) arising from statistical charge separation
during the fragmentation of a neutral liquid. In the electrospray chamber, rapid solvent
evaporation leads to the shrinking, and concomitant surface charge crowding of droplets
that become mechanically unstable when electric repulsion overtakes liquid cohesion; as
a result, they shed their interfacial films to produce finer droplets. This process repeats
itself until anions are ultimately field-ejected from the last-generation nanodroplets, and
deflected into the mass spectrometer region by applying an appropriate bias to its inlet
port. This technique therefore reports the multiplicatively amplified differences in
composition of the outermost layers of original droplets. Typical instrumental parameters
were: drying gas temperature, 250 oC; drying gas flow, 10 L min-1; nebulizer pressure, 35
psi; collector capillary voltage, +3.5 kV; fragmentor voltage, 80 V. Mass spectra were
acquired at preset m/z values, 58 and 60 (32,34SCN-), 62 (NO3-), 79 and 81 (Br-), 86 and
87 (10,11BF4-), 99 and 101 (35, 37ClO4
-), 127 (I-), 145 (PF6-), and 175 (IO3
-). The
composition of the interfacial layers of reacting droplets is directly monitored after sub-
millisecond contact times, , by online electrospray mass spectrometry (ES-MS) of field-
ejected anions.49 Ozone was produced by passing O2 (g) (ultrapure, Air Liquid America
Co.) through an ozone generator (Ozone Solutions), diluted 10-fold with ultrapure N2 (g),
and quantified by a UV-Vis spectrophotometer (Agilent 8452). Ozone concentrations

55
were calculated from absorbance measurements using recommended values for its
absorption cross sections: = 1.1 10-17 (250 nm) and = 3.9 10-19 (300 nm) cm2
molecule-1. The mixed gas was then injected into the chamber, where it was further
diluted six-fold by the countercurrent drying gas. Gas flows were regulated by calibrated
mass flow controllers (MKS). A schematic diagram of the ozone reaction chamber is
shown in Scheme 3.2.
3.4 Results and Discussion
Figure 3.1 shows the negative ion mass spectrum of an electrosprayed equimolar
solution of sodium NO3-, BF4
-, ClO4-, PF6
- and IO3- salts. Since the technique detects ions
already present in solution, Figure 3.1 should display similarly intense signals in the
absence of interfacial fractionation. This is clearly not the case. From the mass spectrum
of Figure 3.1, normalized anion fractionation factors, X-, are calculated from the sum of
ion counts, Im/z, for the isotopic variants of each anionic species (e.g., (I99 + I101) for ClO4-
, etc.) and the total ion count:
-m/z,X-X -m/z,X
=I
fI
(3.1)
Thus, by definition, X-’s are relative (rather than absolute, i.e., interfacial versus bulk)
fractionation factors. They are independent of bulk concentration from 10 to 1000 M.
PF6-, which has the largest radius (aX- = 295 pm) of the set, is exceedingly enriched at the
droplet surface. This is consistent with previous surface potential measurements in which
PF6- displayed a several-fold stronger affinity for the air-water interface than either ClO4
-
or SCN-.6 In line with this finding, the smallest anion in the group, IO3-, is the least

56
enriched,15,34,51,52 despite possessing the largest polarizability (see Table 3-1). The strict
linearity of the ln X- vs. aX- plots (correlation coefficients r2 > 0.98) of Figure 3.2
demonstrates that the (negative) free energies associated with the segregation of anions
from the bulk solution to the air-liquid interface (i.e., X- exp[- BIFG/kT]) increase
with the first power of ion radius aX- 39,53 rather than with ion volume or polarizability.
Because many ion properties concomitantly depend on ion radius in one way or another,
and to avoid confounding cause and effect, we adopted the criterion that the nature of the
interactions involved should be sought in the best functional correlation. Thus, since
solvation free energies SGX- (1/aX-) are inversely rather than directly proportional to
aX-54,55, ln X- vs. - SGX- plots are also quasi-linear (with a negative slope) within a
limited range, but they have smaller correlation coefficients than ln X- vs. aX- plots39; we
therefore reject SGX- differences as the origin of anion fractionation.
Perhaps unexpectedly, interfacial anion fractionation factors X- measured in
water/methanol mixtures are weakly dependent on solvent composition over the entire
range (Figure 3.3a). Methanol preferentially partitions to the liquid-air interface,56,57
where water hydroxyls are readily replaced by hydrophobic methyl groups that project
into the vapor phase (Figure 3.3b).41 Thus, we find no experimental grounds to support
the hypothesis that interfacial anion fractionation is driven by surface structure or
dynamics. By excluding local effects, we realize that any explanation of ‘interfacial
affinities’ becomes conceptually related to Archimedes’s principle: lower density bodies
float not because they have ‘affinity’ for the surface, but because the fluid forces them
there.24,25,58-60 We infer that anions are enriched and/or fractionated at air/liquid interfaces

57
not because they have ‘affinity’ for these boundaries, but because they are expelled by
the whole liquid. The collective underlying interaction in this case is many-body
electrodynamic rather than gravitational.
It has been hypothesized that the reactivity of solutes at the air/water interface might
be different from in the bulk. This issue arises, for example, in connection with gas-liquid
reactions occurring in atmospheric aerosol droplets exposed to reactive gaseous species
such as OH-radicals, O3 or NO2. Note that, in principle, only the fastest reactions could
display ‘kinetic surface effects’ before the gaseous species have the chance to be solvated
and diffuse into the bulk medium. Besides solute fractionation, which expresses
preexisting equilibrium interfacial gradients, reactivity is expected to be affected by the
state of the solute at the interface, particularly its solvation state, and by the intrinsic
asymmetry of an interfacial region open to mass transfer with both the gas-phase and the
bulk.
Figure 3.4 shows relative iodide concentrations [I-]/[I-]0 at the air-liquid interface as a
function of [O3(g)]. We have shown that the initial slopes, S0, of [I-]/[I-]0 vs. [O3(g)]
curves are proportional to the ratio of the second-order-reaction rate constant, k, over the
diffusion coefficient DI- in the condensed phase: S0 k/DI-.61 Despite the dissimilar
structures of the aerial interfaces of water and methanol, and an estimated ten-fold larger
solubility in methanol than in water,62 O3(g) oxidizes I- at identical rates in both solvents:
S0 = 0.0152 ± 0.0010 ppmv-1 (H2O), S0
= 0.0145 ± 0.0002 ppmv-1 (MeOH), regardless of
the diverse interactions it may experience upon approaching each surface. Product
branching ratios: = [IO3-]/[I-], are also similar in water and methanol. By assuming that

58
k3 >> k2, k5 >> k4, the mechanism in Scheme 3.1 implies that should be a linear
function of [O3(g)]/[I-]:13
3 32
43
[IO ] [O ]
[I ] [I ]
k
k
(3.2)
This functional dependence is experimentally confirmed in both solvents, with slopes
(k2/k4)MeOH ~ 1.03 (k2/k4)water (Figure 3.5a,b). Thus, secondary reactions, which possibly
take place in subsurficial layers (such as the one denoted by in Figure 3.3b) are also
insensitive to the nature of the solvent surface.
Based on the above results and considerations, we propose that the selective
enrichment of larger radius anions in air/liquid interfacial layers likely results from
rejection by the medium via collective dispersive interactions.24-26,59,63 The current view
is that “the dominant forces on ions in water are short range forces of a chemical
nature”,21 i.e., ions hardly perturb the solvent beyond the first solvation shell.64,65 By
strongly binding solvent molecules, the dielectric permittivities of the solvated ions X-
are necessarily smaller than that of the bulk solvent’s S, except at the air/liquid interface,
where S(z) monotonically falls off to S(z) air = 1 as z0.66 Electrolyte solutions
should be realistically viewed as ‘colloidal’ suspensions of weakly dielectric, inert
solvated ions of radius aX- in a continuous dielectric medium, rather than intermolecularly
perturbed fluids.65,67,68 Far from the interface, ions remain in a state of indifferent
equilibrium, but in the interfacial region, where S(z) air, they experience a net
electrodynamic force toward the interface because S(z+) > X- > S(z-) > 1.26,58-60
Furthermore, ions can be treated as large spheres close to the infinite planes separating

59
solvents from air, and therefore will be repelled toward the interface by many-body
dispersion energies that scale with ~(aX-/z) [(X- - S(z)) (X- + S(z))-1 (1 - S(z)) (1 +
S(z))-1] as z0,25 conforming to the ln X- vs. aX- correlation of Figure 3.2. Notice that if
the likely condition X- S applies, these energies, which involve dielectric permittivity
ratios, are expected to be weakly dependent on absolute S values (cf. Figure 3.3c). How
far ions approach, or even protrude into the gas-phase will be ultimately limited, of
course, by hydration energy losses. Summing up, interfacial anion fractionation is the
electrodynamic equivalent of flotation in a gravitational field, and is determined by ionic
radii and solvent permittivity profiles across interfacial layers.
3.5 Acknowledgement
This project was financially supported by the National Science Foundation (ATM-
0534990).
3.6 References
(1) Moyers, J. L.; Duce, R. A. J. Geophys. Res. 1972, 77, 5229.
(2) Duce, R. A.; Hoffman, E. J. Ann. Rev. Earth Planet. Sci. 1976, 4, 187.
(3) Liss, P. S.; Duce, R. A. The sea surface and global change; Cambridge University
Press: Cambridge, UK, 1997.
(4) Vogt, R.; Sander, R.; von Glasow, R.; Crutzen, P. J. J. Atmos. Chem. 1999, 32, 375.
(5) Cicerone, R. J. Rev. Geophys. Space Phys. 1981, 19, 123.
(6) Randles, J. E. B. Discuss. Faraday Soc. 1957, 194.
(7) Jarvis, N. L. J. Geophys. Res. 1972, 77, 5177.
(8) Jarvis, N. L.; Scheiman, M. A. J. Phys. Chem. 1968, 72, 74.

60
(9) Macintyre, F. J. Phys. Chem. 1968, 72, 589.
(10) Macintyre, F. Tellus 1970, 22, 451.
(11) Kunz, W. Pure Appl. Chem. 2006, 78, 1611.
(12) Kunz, W.; Lo Nostro, P.; Ninham, B. W. Curr. Opin. Colloid Interface Sci. 2004, 9,
1.
(13) Enami, S.; Vecitis, C. D.; Cheng, J.; Hoffmann, M. R.; Colussi, A. J. J. Phys. Chem.
A 2007, 111, 8749.
(14) Finlayson-Pitts, B. J. Chem. Rev. 2003, 103, 4801.
(15) Jungwirth, P.; Tobias, D. J. Chem. Rev. 2006, 106, 1259.
(16) Hunt, S. W.; Roeselova, M.; Wang, W.; Wingen, L. M.; Knipping, E. M.; Tobias, D.
J.; Dabdub, D.; Finlayson-Pitts, B. J. J. Phys. Chem. A 2004, 108, 11559.
(17) Knipping, E. M.; Lakin, M. J.; Foster, K. L.; Jungwirth, P.; Tobias, D. J.; Gerber, R.
B.; Dabdub, D.; Finlayson-Pitts, B. J. Science 2000, 288, 301.
(18) Tobias, D. J.; Hemminger, J. C. Science 2008, 319, 1197.
(19) Ninham, B. W.; Bostrom, M. Cell. Mol. Bio. 2005, 51, 803.
(20) Karlstrom, G.; Hagberg, D. J. Phys. Chem. B 2002, 106, 11585.
(21) Collins, K. D.; Neilson, G. W.; Enderby, J. E. Biophys. Chem. 2007, 128, 95.
(22) Ninham, B. W.; Yaminsky, V. Langmuir 1997, 13, 2097.
(23) Gavryushov, S.; Linse, P. J. Phys. Chem. B 2003, 107, 7135.
(24) van Oss, C. J.; Absolom, D. R.; Neumann, A. W. Coll. Surf. 1980, 1, 45.
(25) Parsegian, V. A. Van der Waals Forces; Cambridge University Press: New York,
2006.
(26) Dzyaloshinskii, I.E.; Lifshitz, E. M.; Pitaevskii, L. P. Adv. Phys. 1961, 10, 165.

61
(27) Frediani, L.; Mennucci, B.; Cammi, R. J. Phys. Chem. B 2004, 108, 13796.
(28) Garrett, B. C. Science 2004, 303, 1146.
(29) Stone, A. J. Science 2007, 315, 1228.
(30) Pegram, L. M.; Record, M. T., Jr. Proc. Natl. Acad. Sci. USA 2006, 103, 14278.
(31) Pegram, L. M.; Record, M. T., Jr. J. Phys. Chem. B 2007, 111, 5411.
(32) Petersen, P. B.; Johnson, J. C.; Knutsen, K. P.; Saykally, R. J. Chem. Phys. Lett.
2004, 397, 46.
(33) Petersen, P. B.; Saykally, R. J. Chem. Phys. Lett. 2004, 397, 51.
(34) Petersen, P. B.; Saykally, R. J. Annu. Rev. Phys. Chem. 2006, 57, 333.
(35) Petersen, P. B.; Saykally, R. J. J. Am. Chem Soc. 2006, 127, 15446.
(36) Smith, J. D.; Saykally, R. J.; Geissler, P. L. J. Am. Chem. Soc. 2007, 129, 13847.
(37) Wilson, K. R.; Rude, B. S.; Smith, J.; Cappa, C.; Co, D. T.; Schaller, R. D.; Larsson,
M.; Catalano, T.; Saykally, R. J. Rev. Sci. Instrum. 2004, 75, 725.
(38) Davidovits, P.; Kolb, C. E.; Williams, L. R.; Jayne, J. T.; Worsnop, D. R. Chem.
Rev. 2006, 106, 1323.
(39) Cheng, J.; Vecitis, C. D.; Hoffmann, M. R.; Colussi, A. J. J. Phys. Chem. B 2006,
110, 25598.
(40) Prtay, L. B.; Jedlovszky, P. I.; Vincze, A.; Horvai, G. J. Phys. Chem. B 2008.
(41) Chen, H.; Gan, W.; Lu, R.; Guo, Y.; Wang, H. F. J. Phys. Chem. B 2005, 109, 8064.
(42) Liu, W. T.; Zhang, L. N.; Shen, Y. R. J. Chem. Phys. 2006, 125, 6.
(43) Liu, Q.; Schurter, L. M.; Muller, C. E.; Aloisio, S.; Francisco, J. S.; Margerum, D.
W. Inorg. Chem. 2001, 40, 4436.
(44) Donaldson, D. J.; Vaida, V. Chem. Rev. 2006, 106, 1445.

62
(45) Krisch, M. J.; D'Auria, R.; Brown, M. A.; Tobias, D. J.; Hemminger, J. C.;
Ammann, M.; Starr, D. E.; Bluhm, H. J. Phys. Chem. C 2007, 111, 13497.
(46) Smoydzin, L.; von Glasow, R. Atmo. Chem. Phys. 2007, 7, 5555.
(47) Cwiklik, L.; Andersson, G.; Dang, L. X.; Jungwirth, P. Chemphyschem 2007, 8,
1457.
(48) Kebarle, P. J. Mass Spectrom. 2000, 35, 804.
(49) Kebarle, P.; Peschke, M. Anal. Chim. Acta 2000, 406, 11.
(50) Kebarle, P.; Tang, L. Anal. Chem. 1993, 65, A972.
(51) Mucha, M.; Frigato, T.; Levering, L. M.; Allen, H. C.; Tobias, D. J.; Dang, L. X.;
Jungwirth, P. J. Phys. Chem. B 2005, 109, 7617.
(52) Tuma, L.; Jenicek, D.; Jungwirth, P. Chem. Phys. Lett. 2005, 411, 70.
(53) Eggimann, B. L.; Siepmann, J. I. J. Phys. Chem. C 2008, 112, 210.
(54) Ashbaugh, H. S. J. Phys. Chem. B 2000, 104, 7235.
(55) Marcus, Y. Ion Properties; Marcel Dekker: New York, 1997.
(56) Chang, T. M.; Dang, L. X. J. Phys. Chem. B 2005, 109, 5759.
(57) Wolfrum, K.; Graener, H.; Laubereau, A. Chem. Phys. Lett. 1993, 213, 41.
(58) Israelachvili, J. N. Quart. Rev. Biophys. 1974, 6, 341.
(59) Israelachvilii, J. Intermolecular & Surface Forces, 2nd ed.; Academic Press:
London, 1992.
(60) Israelachvilii, J.; Wennerstrom, H. Nature 1996, 379, 219.
(61) Enami, S.; Hoffmann, M. R.; Colussi, A. J. Proc. Natl. Acad. Sci. U.S.A., 2008, 105,
7365.
(62) Bin, A. K. Ozone-Science & Engineering 2006, 28, 67.

63
(63) van Oss, C. J.; Chaudhury, M. K. Chem. Rev. 1988, 88, 927.
(64) Omta, A. W.; Kropman, M. F.; Woutersen, S.; Bakker, H. J. Science 2003, 301, 347.
(65) Bakker, H. J. Chem. Rev. 2008, 108, 1456.
(66) Hildebrandt, A.; Blossey, R.; Rjasanow, S.; Kohlbacher, O.; Lenhof, H. P. Phys.
Rev. Lett. 2004, 93, 108104.
(67) Bakker, H. J.; Kropman, M. F.; Omta, A. W. J. Phys. Condens. Matter 2005, 17,
S3215.
(68) Grossfield, A. J. Chem. Phys 2005, 122, 024506.
(69) Akerlof, G. J. Am. Chem. Soc. 1932, 54, 4125.
(70) Baumgartner, E.; Busch, M.; Fernandez, R. J. Phys. Chem. 1970, 74, 1821.

64
Table 3.1. Interfacial affinities and molecular properties of anions 55
Anion X- Affinities fX- a
Radii aX- (10-12 m)
Dehydration Energies (kJ mol-1)
Polarizability (10-30 m3)
Ion Volume (cm3 mol-1)
IO3- 0.0103 181 408 7.41 30.8
NO3- 0.0149 206 b 306 4.20 34.5
BF4- 0.0661 230 200 2.78 50.6
ClO4- 0.0814 240 214 4.99 49.6
PF6- 0.8273 295 70 - 4.36 [c] 58.0
a. See text for definition b. Equatorial radius c. Value for SiF6
2-

65
Figure 3.1. ES-MS of a 10 M equimolar aqueous solution of the sodium salts of the following anions: NO3
-, BF4-, ClO4
-, PF6-, and IO3
- at pH = 6.5. Ion signal intensities are normalized to total ion intensity.
- m/z
60 80 100 120 140 160 180
f X-
0.0
0.1
0.2
0.3
0.4
0.5
0.6
0.7
0.8
0.9
NO3- BF4
- ClO4-
PF6-
IO3-

66
Figure 3.2. Symbols: Normalized anion affinities, X- versus crystalline ion radii,a X-.
Solid line: linear regression of ln X- vs. a X-.
aX- (pm)
180 200 220 240 260 280 300
ln f
X-
-5
-4
-3
-2
-1
0 10-5 M, r2=0.982
10-4 M, r2=0.980
10-3 M, r2=0.976
IO3-
NO3-
BF4-ClO4
-
PF6-

67
Figure 3.3. (a) X- measured in 10 M solutions of the sodium salts of the corresponding
anions; (b) the fractional coverage of -CH3 groups at the surface, , and in the layer beneath, ;41 (c) the dielectric permitivity of the solvent,69 as functions of methanol molar fraction in water:methanol mixtures.
f
X-
10-2
10-1
100
0.0 0.2 0.4 0.6 0.8 1.0
30
40
50
60
70
80
-CH
3 c
ove
rag
e
0.0
0.2
0.4
0.6
0.8
1.0
ClO4-
BF4-
SCN -
NO3-
l -
Br -
X MeOH
a
b
c

68
Figure 3.4. Symbols: normalized interfacial iodide concentration [I-]/[I-]0 versus [O3(g)] in (a) H2O and (b) MeOH; [I-]0= 10 M. The data are fitted with exponential decay curves (r2 > 0.99).
[I- ]/
[I- ] 0
0.0
0.2
0.4
0.6
0.8
1.0
[O3(g)] (ppmv)
0 50 100 150 200 250
[I- ]/
[I- ] 0
0.0
0.2
0.4
0.6
0.8
1.0
a. H2O
b. MeOH

69
Figure 3.5. The product branching ratio [IO3-]/[I3
-] as a function of [O3(g)]/[I-] in (a) H2O and (b) MeOH; [I-]0 = 100 M.
y= 0.245x,r2= 0.998
0 50 100 150 200 250
[IO
3- ]/ [
I 3- ]
0
10
20
30
40
50
60
y= 0.252 x, r2= 0.997
[O3(g)] / [I-] (ppmv M-1)
0 20 40 60 80 100
[IO
3- ]/ [
I 3- ]
0
5
10
15
20
25
a. H2O
b. MeOH

70
Scheme 3.1. Iodide oxidation by ozone in water.
I- HOI
O3 O2
H+
IO2-
I2
O3
O2
O3 O2
IO3-
I-I-
I3-
k1 k4
k2
k3
k5

71
Scheme 3.2. Schematic diagram of the spraying chamber, O3 (g) injection, and mass spectrometer sampling inlet.

72
Chapter 4
Enrichment Factors of Perfluoroalkyl Oxoanions at the Air/Water interface*
* This chapter is reproduced with permission from E. Psillakis, J. Cheng, M. R. Hoffmann, and A. J. Colussi, Journal of Physical Chemistry A, 2009, 113, 8826. Copyright © 2009, American Chemical Society

73
4. 1 Abstract
The refractory, water-bound perfluoro-n-alkyl carboxylate F(CF2)nCO2- and
sulfonate F(CF2)nSO3- surfactant anions reach remote locations by mechanisms that
are not well understood. Here we report experiments in which the relative
concentrations of these anions on the surface of microdroplets produced by nebulizing
their aqueous solutions are measured via electrospray ionization mass spectrometry.
Enrichment factors f (relative to Br-: f(Br-) 1) increase with n, asymptotically
reaching f[F(CF2)nSO3-] ~ 2 f[F(CF2)nCO2
-] ~ 200 f(Br-) values above n ~ 8. The
larger f values for F(CF2)nSO3- over their F(CF2)nCO2
- congeners are consistent with a
closer approach of the bulkier, less-hydrated SO3- headgroup to the air/water
interface. A hyperbolic, rather than the predicted linear log f[F(CF2)nCO2-] vs. n
dependence suggests the onset of conformational restrictions to interfacial enrichment
above n ~ 4. Marine aerosols produced from contaminated ocean surface waters are
therefore expected to be highly enriched in F(CF2)nCO2-/F(CF2)nSO3
- species.

74
4.2 Introduction
The exceptionally persistent perfluoroalkyl (F-alkyl) sulfonates, F(CF2)nSO3-, and
F-alkyl carboxylates, F(CF2)nCO2-, surfactants have spread and bioaccummulated
globally since their inception ~50 years ago.1-4 Because their strong conjugated F-
alkyl acids (pKa < 1)5 are fully dissociated in water (particularly in seawater pH ~ 8.1)
oceans are expected to be the main reservoir, and ocean currents the ultimate conduits
for these water-bound anions.6-10 F-alkyl anions, however, reach water bodies and
continental sites far removed from both sources and oceans.9 The short (within
oceanic transport time frames) bioaccumulation times and decay half-life of
F(CF2)8SO3- in Canadian Arctic seals after its phase-out11-12 suggest an atmospheric
mechanism of dispersal.8,10,13
F-alkyl anions can be indirectly transported by gaseous alcohol (PFOH) and
sulfonamide (PFSN) precursors.14 However, F-alkyl surfactant anions can also be
aerosolized.8,10,15-16 There is conclusive evidence that aerosols produced from the
ocean’s uppermost microlayer are highly enriched in ionic and non-ionic amphiphiles,
carrying them far afield over continental masses.16-29 Fine aerosol particles may be
transported over 102–103 km without settling.30 The recently reported spatial and
depth concentration profiles of several F-alkyl anions in the world’s oceans,
particularly in the Labrador Sea and the Middle Atlantic Ocean,7 together with
regional atmospheric and oceanic circulation patterns,31-39 could provide key data to
test whether the aerosolization of marine F-alkyl anions is a key stage in their global
dispersal.8,13,40-41
Partition coefficients of F-alkyl acids between n-octanol and water have been
estimated empirically and theoretically without experimental validation.42 Until very
recently,43 no information was available on the partitioning of their hydrophobic

75
anions between water and organic solvents, although it had been reported that
perfluorooctyl oxoanions could be extracted from biological matrices into methyl tert-
butyl ether as tetrabutylammonium salts for subsequent mass spectrometric
detection.44-45 Selective partition of the perfluorooctyl species versus chloride from
water into lipophilic polymer membranes or fluorous solvents had been previously
demonstrated by potentiometry.46
We have recently investigated the fractionation of globular anions at the air/water
interface using a novel approach in which relative interfacial anion concentrations in
microdroplets produced by pneumatic nebulization of multicomponent solutions are
simultaneously measured by online thermospray ionization mass spectrometry.17,47-48
Here we report the dynamic enrichment factors of various F-alkyl anions at the
air/water interface, and analyze their physicochemical and environmental implications.
4. 3 Experimental Section
Sodium acetate (EM Science 99%), CF3COOH (Aldrich 99%), CH3SO3Na and
CF3SO3Na (Aldrich 98%), NaCl, NaBr, NaI, NaNO3, NaClO4 and NaSCN (> 98%,
Aldrich), sodium dodecylsulfate (SDS, Baker), 1-octanol (Aldrich), potassium F-
butane-1-sulfonate (4-PFSK 98%, Aldrich), potassium F-hexane-1-sulfonate (6-
PFSO3K 98%, Fluka), potassium F-octane-1-sulfonate (8-PFSO3K 98%, Fluka), F-
butyric acid (3-PFCO2H, 98%, Aldrich), F-pentanoic acid (4-PFCO2H, 97%, Aldrich),
F-hexanoic acid (5-PFCO2H, 97%, Fluka), F-heptanoic acid (6-PFCO2H, 99%,
Aldrich), F-octanoic acid (7-PFCO2H, 97%, Aldrich), and F-nonanoic acid (8-
PFCO2H, 97%, Aldrich), were used as received. Individual stock solutions (1 mM)
were prepared with Milli-Q water (resistivity 18.2 MΩ cm) in borosilicate bottles.
Negative ion mass spectra of multicomponent aqueous solutions (1 M in each
surfactant unless otherwise indicated) were obtained via direct infusion into a

76
commercial thermospray ionization mass spectrometer (ESI-MS, HP-1100 MSD)
operated under the following conditions: drying gas flow, 10 L min-1; drying gas
temperature, 340 °C; nebulizer pressure, 28 psi; collector capillary voltage, 3.5 kV;
fragmentor voltage, 80 V. Solutions were pumped (50 L/min) into the spraying
chamber of the mass spectrometer through a grounded stainless steel needle inserted
in a coaxial sheath issuing nebulizer N2 gas. The high velocity nebulizer gas breaks up
the liquid jet into a conical mist of microdroplets carrying net charges of either sign.49-
53 Pneumatic nebulization generates weakly negatively charged microdroplets.49 Fast
solvent evaporation leads to droplet shrinkage and concomitant surface charge
crowding.54 Droplets become mechanically unstable when electrostatic repulsion
among charges overcomes liquid cohesion, and spontaneously shed their interfacial
films into even smaller droplets. A series of these events ultimately leads to
nanodroplets from which unsolvated ions are electrostatically ejected into the gas
phase.55-59 Gas-phase ions are then deflected into the mass spectrometer by applying a
suitable electric bias to its inlet port orthogonal to the injector. It has been shown that
surfactant species tend to accumulate in the periphery of the conical mist,60 i.e.,
precisely in the finer microdroplets sampled by the orthogonal port.47 This technique
therefore probes the composition of nanodroplets created from the interfacial layers of
the microdroplets produced by pneumatic nebulization of test solutions.
Mass spectra were acquired in single ion mode preset at m/z = [149 + (n - 1) 50]
for F(CF2)nSO3-, at [69 + (n - 1) 50] and [113 + (n - 1) 50] for F(CF2)nCO2
-, 58 and 60
(32,34SCN-), 62 (NO3-), 79 and 81 (79,81Br-), 99 and 101 (35,37ClO4
-), 127 (I-), and 265
(SDS). MS signal intensities for the various F-alkyl anions were found to increase
linearly with the concentration of their solutions in the range 0.1 to 5 μM, relative to
the m/z = 265 signal of 0.2 μM SDS used as a reference (Figure 4.1). Repeatability

77
and reproducibility of the derived enrichment factors f (see below), expressed as %
RSD, were better than 2.5% and 4%, respectively. Reported data are the average of at
least duplicate runs.
4.4 Results and Discussion
Under present instrumental settings, F(CF2)nSO3- are detected as molecular
monoanions (M) at [149 + (n - 1) 50] Da, whereas F(CF2)nCO2- decarboxylate
significantly and appear both at [113 + (n - 1) 50] Da (M) and [69 + (n - 1) 50] Da (M
CO2). The relative enrichment factor of anion i, f (i), is defined herein as the sum of
the mass spectral signal intensities of the j ions originating from this species: Si,j,
divided by those for 79,81Br-, the least-enriched anion of the set, measured (or
extrapolated) at the same bulk molar concentration:
,
79 81( )
i jj
S
f iS S
(4.1)
The f[F(CF2)nSO3-]s and f[F(CF2)nCO2
-]s calculated using equation (4.1) and the
data from Figure 4.2 and Table 4.1 are shown in Figure 4.3. f(i) > fBr- 1 signifies that
the i-anion is enriched relative to Br- at the air/water interfacial layers monitored in
these experiments. It should be emphasized that fs are lower bounds to absolute
enrichment factors because Br- itself is slightly enriched relative to Cl-, which has
been shown to nearly neutral toward interfacial enrichment.61-62 Since f(i) were
determined at, or scaled to 1 M in all cases, they are proportional to the partition
coefficient between bulk water (B) and its aerial interface (S):63
( ) Si
i Bi
xf i K
x (4.2)
( ) log ( )
4.6
oB SG i
f ikT
(4.3)

78
where xiP represents the molar fraction of i in phase P, and GBS the molar free
energy released upon transferring i from the bulk to the air/water interface.
Figure 4.3 shows that fs for carboxylates are most sensitive to alkyl chain length
between n = 1 and 3 and appear to plateau beyond n = 9. It is apparent that both
F(CF2)nSO3- and F(CF2)nCO2
- are highly enriched at the interface, with f[F(CF2)nSO3-]
~ 2.3 f[F(CF2)nCO2-] ~ 190 f(Br-) as n (Figure 4.3). Figure 4.4 shows that the
addition of 100 M electrolyte tends to depress fs for the shorter, least-enriched
homologues and enhance those for higher members of both carboxylate and sulfonate
classes. A similar trend is observed upon saturation with 1-octanol. These phenomena
are consistent with the competition of various solutes for the air/water interface.
Simple anions at 100 M will crowd the interface in competition with surfactant
anions at 1 M. Short F-alkyl chain surfactant anions will be rejected, whereas the
longer homologues will be expelled from the interface by electrostatic forces.
We have previously shown that fs for globular anions at air/liquid interfaces
increase exponentially with ionic radius R.48 Hydrated ions have a smaller dielectric
constant than water and will be expelled to the interface by many-body
electrodynamic dispersive interactions that scale with R.48,64-65 Since the sulfonate
headgroup is larger than the carboxylate, f[F(CF2)nSO3-]s are predictably larger than
f[F(CF2)nCO2-]s (Figure 4.3, Table 4.1). This result is consistent with previous
observations that the alkyl sulfonates with a larger ionic radius is more lipophilic that
the corresponding carboxylate at water/1,2-dichloroethane or nitrobenzene
interfaces.46 Perfluorination enhances anion partitioning to the aerial interface, viz.:
(CF3SO3-)/(CH3SO3
-) = 2.7, (CF3COO-)/(CH3COO-) = 3.0 (see Table 4.1).66
From equations (4.2)-(4.4), enrichment factors of F-alkyl surfactants f should
increase exponentially with n:63

79
2 2 2[F CF CO ] ( )o o oB S P B Sn
G G n G CF (4.4)
if the GoBS(CF2) = Go
BAIR(CF2) + GoAIRS(CF2) = -2.74 - 2.32 = - 5.06 kJ
mol-1 67-68 group contribution to the molar free energy of B S transfer were
independent of n. GPo is the contribution of the headgroup plus the difference
between the CF3- and CF2-group contributions. Note that both GoBS(CF2) and
GoAIRS(CF2) are negative, meaning that the location of lowest free energy for CF2
groups is the interface. Since linear log f vs. n dependences have been verified for
most surfactant classes,63 enrichment factors for F-alkyl surfactant homologues were
expected to increase as f[F(CF2)nCO2-]/f[F(CF2)n-1CO2
-] = exp[-GoBS (CF2)/2kT)] =
2.7 at 300 K. Figures 4.2 and 4.3, and Table 4.1 show that this is not the case. Neither
log f increases linearly with n, nor f[F(CF2)8CO2-]/f(CF3CO2
-) exceeds ~ 28 (vs. 2.77 ~
1244). Instead, we find that log f[F(CF2)nCO2-] increases as predicted up to n ~ 3, and
considerably less so afterward (Figure 4.3). The experimental f[F(CF2)nCO2-
]/f[F(CF2)n-1CO2-] ~ 1.16 (vs. 2.7) in the range 3 n 8 effectively corresponds to
GoBS (CF2) = - 0.74 kJ mol-1 (vs. – 5.06 kJ mol-1). Since f(PF6
-), which has a similar
value to f[F(CF2)8SO3-], adhered to the linear log f vs. R correlation followed by
smaller anions,47-48 we infer that non-linearity is not due to dynamic range limitations
and less-than-linear instrumental response but likely reflects molecular properties of
the F-alkyl chain. It is also possible, given the dynamic nature of our experiments,
that the microdroplets surfaces we probe here might not be fully equilibrated with
these highly surface-active species. However, since a similar limitation is expected to
apply to F-alkyl oxoanion surfactant partitioning during bubble bursting events,34,35
we believe that our results are particularly relevant to surfactant enrichment in
aerosols of marine origin.

80
In this context, the rather sharp inflection in the log f[F(CF2)nCO2-] vs. n plot
(Figure 4.3) amounts to a 4.32 kJ mol-1 increase of the net GoBS (CF2) contribution
beyond n ~ 3. Since GoAIRS(CF2) = - 2.32 kJ mol-1 67 thermodynamics dictates that
F-alkyl chains should tend to lie flat on the water surface.69 Scheme 4.1 shows that
the (most stable in an isotropic and homogeneous medium) anti F(CF2)3CO2- rotamer
at the air/water interface is unable to maximize the attractive dispersive interactions of
F-alkyl chains with the water surface, a restriction that is relaxed by a 90 torsion
about the C2-C3 bond. It is apparent that only the syn rotamer can keep the headgroup
immersed and the F-alkyl chain bent over the water surface.
A recent report suggests that the higher lipophilicity of F-alkyl oxoanions relative
to their alkyl counterparts is actually due to the electron-withdrawing effect of the F-
alkyl chain on the headgroup,43 because the insertion of a (CH2)2 spacer between a
perfluorohexyl chain and the –CO2H group increases the pKa of the latter by 2.32
units, and reduces about 400 times the lipophilicity of the corresponding nonanoate.
We wish to point out that both outcomes could not be physically correlated were
interfacial partitioning actually involved. Distance effects on electron withdrawal
from oxoanion headgroups by CF2 moieties would be probably responsible for
changes in acidity, whereas the large concomitant reduction of lipophilicity could be
due to the loss of the dominant C(2)F2 and C(3)F2 hydrophobic contributions to
interfacial partitioning.
Positive fractionation to the air/water interface underlies surfactant enrichment in
the microdroplets probed in our experiments, as well as in the aerosol droplets
produced via bubble bursting over the oceans.24 Because microdroplets are
electrically charged, in our experiments as well as in the atmospheric aerosol,17,70
solvent evaporation may induce further fragmentation into progeny droplets. A

81
cascade of these events is equivalent to a distillation process in which solute
enrichment is multiplicatively amplified at each stage, i.e., the net fractionation after
m stages will be given by fm = (f1)m. The implication is that the most enriched marine
aerosol droplets will be the finest, i.e., those whose settling velocity is lowest,71 have
the longest atmospheric lifetimes and can, therefore, be transported farther and at
higher altitudes.23,72 The bioaccumulation rates of F-alkyl oxoanions in water- or air-
breathing animals, including humans, depends on their partitioning from lipids to
water or air interfaces, respectively.73 Our results, in conjunction with Jing et. al.,
data,43 show that aqueous perfluorosurfactant oxoanions may have similar affinities
for 1-octanol and air interfaces. Further work is underway.
4.5 Acknowledgments
This project was financially supported by the National Science Foundation (ATM-
0534990). E. P. is grateful to the Fullbright Foundation for financial support.
4.6 References
(1) Houde, M.; Martin, J. W.; Letcher, R. J.; Solomon, K. R.; Muir, D. C. G.
Environ. Sci. Technol. 2006, 40, 3463.
(2) Shoeib, M.; Harner, T.; Vlahos, P. Environ. Sci. Technol. 2006, 40, 7577.
(3) Giesy, J. P.; Kannan, K. Environ. Sci. Technol. 2001, 35, 1339.
(4) Giesy, J. P.; Kannan, K. Environ. Sci. Technol. 2001, 35, 1339.
(5) Goss, K. U. Environ. Sci. Technol. 2008, 42, 456.
(6) Wania, F. Environ. Sci. Technol. 2007, 41, 4529.
(7) Yamashita, N.; Taniyasu, S.; Petrick, G.; Wei, S.; Gamo, T.; Lam, P. K. S.;
Kannan, K. Chemosphere 2008, 70, 1247.

82
(8) Young, C. J.; Furdui, V. I.; Franklin, J.; Koerner, R. M.; Muir, D. C. G.;
Mabury, S. A. Environ. Sci. Technol. 2007, 41, 3455.
(9) Simcik, M. F. J. Environ. Monit. 2005, 7, 759.
(10) Armitage, J.; Cousins, I. T.; Buck, R. C.; Prevedouros, K.; Russell, M. H.;
MacLeod, M.; Korzeniowski, S. H. Environ. Sci. Technol. 2006, 40, 6969.
(11) Olsen, G. W.; Mair, D. C.; Church, T. R.; Ellefson, M. E.; Reagen, W. K.;
Boyd, T. M.; Herron, R. M.; Medhdizadehkashi, Z.; Nobilett, J. B.; Rios, J. A.;
Butenhoff, J. L.; Zobel, L. R. Environ. Sci. Technol. 2008, 42, 4989.
(12) Renner, R. Environ. Sci. Technol 2008, 42, 4618.
(13) Powley, C. R.; George, S. W.; Russell, M. H.; Hoke, R. A.; Buck, R. C.
Chemosphere 2008, 70, 664.
(14) Schenker, U.; Scheringer, M.; Macleod, M.; Martin, J. W.; Cousins, I. T.;
Hungerbuhlert, K. Environ. Sci. Technol. 2008, 42, 3710.
(15) Prevedouros, K.; Cousins, I. T.; Buck, R. C.; Korzeniowski, S. H. Environ. Sci.
Technol. 2006, 40, 32.
(16) McMurdo, C. J.; Ellis, D. A.; Webster, E.; Butler, J.; Christensen, R. D.; Reid,
L. K. Environ. Sci. Technol. 2008, 42, 3969.
(17) Enami, S.; Vecitis, C. D.; Cheng, J.; Hoffmann, M. R.; Colussi, A. J. J. Phys.
Chem. A 2007, 111, 8749.
(18) Liss, P. S.; Duce, R. A. The Sea Surface and Global Change; Cambridge
University Press: Cambridge, UK, 1997.
(19) Duce, R. A.; Hoffman, E. J. Ann. Rev. Earth Planet. Sci. 1976, 4, 187.
(20) Rontu, N.; Vaida, V. J. Phys. Chem. C 2007, 111, 11612.
(21) Calace, N.; Petronio, B. M.; Cini, R.; Stortini, A. M.; Pampaloni, B.; Udisti, R.
Internat. J. Environ. Anal. Chem. 2001, 79, 331.

83
(22) Desideri, P. G.; Lepri, L.; Udisti, R.; Checchini, L.; Del Bubba, M.; Cini, R.;
Stortini, A. M. Int. J. Environ. Anal. Chem. 1998, 71, 331.
(23) Oppo, C.; Bellandi, S.; Degli Innocenti, N.; Stortini, A. M.; Loglio, G.;
Schiavuta, E.; Cini, R. Mar. Chem. 1999, 63, 235.
(24) Blanchard, D. C. Science 1964, 146, 396.
(25) Macintyre, F. J. Phys. Chem. 1968, 72, 589.
(26) Macintyre, F. Tellus 1970, 22, 451.
(27) Donaldson, D. J.; Vaida, V. Chem. Rev. 2006, 106, 1445.
(28) Cavalli, F.; Facchini, M. C.; Decesari, S.; Mircea, M.; Emblico, L.; Fuzzi, S.;
Ceburnis, D.; Yoon, Y. J.; O'Dowd, C. D.; Putaud, J. P.; Dell'Acqua, A. J.
Geophys. Res. ‒Atmospheres 2004, 109, D24215.
(29) Latif, M. T.; Brimblecombe, P. Environ. Sci. Technol. 2004, 38, 6501.
(30) Seinfeld, J. H.; Pandis, S. N. Atmospheric chemistry and physics : from air
pollution to climate change, 2nd ed.; Wiley: Hoboken, N.J. , 2006.
(31) Hutterli, M. A.; Crueger, T.; Fischer, H.; Andersen, K. K.; Raible, C. C.;
Stocker, T. F.; Siggaard-Andersen, M. L.; McConnell, J. R.; Bales, R. C.;
Burkhart, J. F. Clim. Dyn. 2007, 28, 635.
(32) Eckhardt, S.; Stohl, A.; Beirle, S.; Spichtinger, N.; James, P.; Forster, C.;
Junker, C.; Wagner, T.; Platt, U.; Jennings, S. G. Atmos. Chem. Phys. 2003, 3,
1769.
(33) Hameed, S.; Piontkovski, S. Geophys. Res. Lett. 2004, 31, L09303.
(34) Francis, J. A.; Hunter, E.; Zou, C. Z. J. Climate 2005, 18, 2270.
(35) Barreiro, M.; Fedorov, A.; Pacanowski, R.; Philander, S. G. Annu. Rev. Earth
Planet. Sci. 2008, 36, 33.

84
(36) Kieke, D.; Rhein, M.; Stramma, L.; Smethie, W. M.; Bullister, J. L.; LeBel, D.
A. Geophys. Res. Lett. 2007, 34, L06605.
(37) Dickson, B.; Yashayaev, I.; Meincke, J.; Turrell, B.; Dye, S.; Holfort, J.
Nature 2002, 416, 832.
(38) Curry, R.; Mauritzen, C. Science 2005, 308, 1772.
(39) Peterson, B. J.; McClelland, J.; Curry, R.; Holmes, R. M.; Walsh, J. E.;
Aagaard, K. Science 2006, 313, 1061.
(40) Dietz, R.; Bossi, R.; Riget, F. F.; Sonne, C.; Born, E. W. Environ. Sci. Technol.
2008, 42, 2701.
(41) Smithwick, M.; Norstrom, R. J.; Mabury, S. A.; Solomon, K.; Evans, T. J.;
Stirling, I.; Taylor, M. K.; Muir, D. C. G. Environ. Sci. Technol. 2006, 40,
1139.
(42) Arp, H. P. H.; Niederer, C.; Goss, K. U. Environ. Sci. Technol. 2006, 40, 7298.
(43) Jing, P.; Rodgers, P. J.; Amemiya, S. J. Am. Chem. Soc. 2009, 131, 2290.
(44) Hansen, K. J.; Clemen, L. A.; Ellefson, M. E.; Johnson, H. O. Environ. Sci.
Technol. 2001, 35, 766.
(45) Kannan, K.; Koistinen, J.; Beckmen, K.; Evans, T.; Gorzelany, J. F.; Hansen,
K. J.; Jones, P. D.; Helle, E.; Nyman, M.; Giesy, J. P. Environ. Sci. Technol.
2001, 35, 1593.
(46) Kihara, S.; Suzuki, M.; Sugiyama, M.; Matsui, M. J. Electroanal. Chem. 1988,
249, 109.
(47) Cheng, J.; Vecitis, C.; Hoffmann, M. R.; Colussi, A. J. J. Phys. Chem. B 2006,
110, 25598.
(48) Cheng, J.; Hoffmann, M. R.; Colussi, A. J. J. Phys. Chem. B 2008, 112.

85
(49) Zilch, L. W.; Maze, J. T.; Smith, J. W.; Ewing, G. E.; Jarrold, M. F. J. Phys.
Chem. A 2008, 112, 13352.
(50) Dodd, E. E. J. Appl. Phys. 1953, 24, 73.
(51) Manisali, I.; Chen, D. D. Y.; Schneider, B. B. Trends Anal. Chem. 2006, 25,
243.
(52) Hirabayashi, A.; Sakairi, M.; Koizumi, H. Anal. Chem 1994, 66, 4557.
(53) Van Berkel, G. J.; Pasilis, S. P.; Ovchinnikova, O. J. Mass Spectrom. 2008, 43,
1161.
(54) Kebarle, P.; Peschke, M. Anal. Chim. Acta 2000, 406, 11.
(55) Iribarne, J. V.; Dziedzic, P. J.; Thomson, B. A. Int. J. Mass Spectrom. Ion
Process. 1983, 50, 331.
(56) Hirabayashi, A.; Sakairi, M.; Koizumi, H. Anal. Chem 1995, 67, 2878.
(57) Pol, J.; Kauppila, T. J.; Haapala, M.; Saarela, V.; Franssila, S.; Ketola, R. A.;
Kotiaho, T.; Kostiainen, R. Anal. Chem. 2007, 79, 3519.
(58) Nguyen, S.; Fenn, J. B. Proc. Natl. Acad. Sci. U.S.A. 2007, 104, 1111.
(59) Yamashita, M.; Fenn, J. B. J. Phys. Chem. 1984, 88, 4671.
(60) Tang, K.; Smith, R. D. J. Am. Soc. Mass Spectrom. 2001, 12, 343.
(61) Pegram, L. M.; Record, M. T., Jr. Proc. Natl. Acad. Sci. U.S.A. 2006, 103,
14278.
(62) Pegram, L. M.; Record, M. T., Jr. J. Phys. Chem. B 2007, 111, 5411.
(63) Fainerman, V. B.; Miller, R.; Mohwald, H. J. Phys. Chem. B 2002, 106, 809.
(64) Israelachvilii, J. Intermolecular & Surface Forces, 2nd ed.; Academic Press:
London, 1992.
(65) Parsegian, V. A. Van der Waals Forces; Cambridge University Press: New
York, 2006.

86
(66) Shinoda, K.; Hato, M.; Hayashi, T. J. Phys. Chem. 1972, 76, 909.
(67) Goss, K. U.; Bronner, G. J. Phys. Chem. A 2006, 110, 9518.
(68) Goss, K. U.; Bronner, G. J. Phys. Chem. A 2006, 110, 14054.
(69) Tyrode, E.; Johnson, C. M.; Rutland, M. W.; Day, J. P. R.; Bain, C. D. J. Phys.
Chem. C 2007, 111, 316.
(70) Reiter, R. J. Geophys. Res. 1994, 99, 10807.
(71) Finlayson-Pitts, B. J.; Pitts, J. N. Chemistry of the Upper and Lower
Atmosphere; Academic Press: San Diego, CA, 2000.
(72) Cincinelli, A.; Stortini, A. M.; Checchini, L.; Martellini, T.; Del Bubba, M.;
Lepri, L. J. Environ. Monit. 2005, 7, 1305.
(73) Kelly, B. C.; Ikonomou, M. G.; Blair, J. D.; Morin, A. E.; Gobas, F. Science
2007, 317, 236.

87
Table 4.1. Relative anion enrichment factors f at the air/water interface
Anion f CH3COO- 0.95
79,81 Br- 1.00 32,34SCN- 2.08
I- 2.61 NO3
- 2.65 CF3COO- 2.86 CH3SO3
- 6.65 35,37 ClO4
- 13.4 F(CF2)2COO- 22.4 F(CF2)4COO- 36.1
CF3SO3- 37.9
H(CH2)12OSO3- 42.8
F(CF2)5COO- 45.0 F(CF2)3COO- 46.3 F(CF2)6COO- 55.9 F(CF2)7COO- 77.9 F(CF2)8COO- 79.6 F(CF2)4SO3
- 133.8 F(CF2)6SO3
- 175.2 F(CF2)8SO3
- 182.7

88
Figure 4.1. Ratio of F(CF2)nSO3-/DS- signal intensities in mass spectra of aqueous
[F(CF2)nSO3- + 0.2 μM dodecyl sulfate] solutions at pH 6.0 as functions of F-
surfactant concentration. Lines are linear regressions to the experimental data (R2 > 0.99). Linear plots were also obtained for F(CF2)nCO2
-. Error bars contained within symbol size.

89
Figure 4.2 Electrospray ionization mass spectrum of a 1 μM equimolar multianion aqueous solution at pH 7. Signal intensities S normalized to (S79 + S81) ≡ 1 (see text for details). The inset is a semilogarithmic plot. Blue and red drop lines and legends correspond to F(CF2)nCO2
- and F(CF2)nSO3- surfactants, respectively. DS is dodecyl
sulfate.

90
Figure 4.3. Enrichment factors f versus n-alkyl chain length. Gray-red symbols: f[F(CF2)nSO3
-]. Gray-blue symbols (connected by straight lines; diamonds/circles stand for odd/even n-homologues): f[F(CF2)nCO2
-]. All data obtained in 1 M solutions. Sth designates the theoretical log f vs. n slope predicted by equation (4.2) –(4.4) and data from References 67 and 68. Error bars contained within symbol size.

91
Figure 4.4. Enrichment factors ratios f+/f for F(CF2)nSO3- (red) and F(CF2)nCO2
- (blue) surfactants. f : in 1 M aqueous F-surfactant solutions, f+: plus 100 M NaCl and 1-octanol saturation. Error bars contained within symbol size.

92
Scheme 4.1. Anti-perfluorobutanoate (left) and gauche-perfluorobutanoate (right) at the air/water interface. A closer approach of fluorine atoms to the water surface minimizes the free energy of the system.48,64,67

93
Chapter 5
Acid Dissociation versus Molecular Association of Perfluoroalkyl Oxoacids: Environmental Implications*
* This chapter is reproduced with permission from J. Cheng, E. Psillakis, M. R. Hoffmann, and A. J. Colussi, Journal of Physical Chemistry A, 2009, 113, 8152. Copyright © 2009, American Chemical Society

94
5.1 Abstract
Perfluorooctanoate (PFO) and perfluorooctanesulfonate (PFOS) surfactant anions,
once released, may rapidly reach remote regions. This phenomenon is puzzling because
the water-bound anions of strong F-alkyl acids should be largely transported by slow
oceanic currents. Herein we investigate whether these hydrophobic F-alkyl oxoanions
would behave anomalously under environmental conditions, as suggested elsewhere.
Negative electrospray ionization mass spectra of micromolar aqueous PFO or PFOS
solutions from pH 1.0 to 6.0 show: (1) m/z = 499 (PFOS) signals that are independent of
pH, (2) m/z = 413 (PFO) and 369 (PFO CO2) signals plus m/z = 213 (C3F7CO2-) and
169 (C3F7-) signals at higher collision energies and, below pH ~ 4, m/z = 827 signals
from a remarkably stable (PFO)2H- cluster that increase with decreasing pH. Since the
sum of m/z = 369, 413, and 827 signal intensities is independent of pH, i.e., effectively
encompasses all major species, we infer that pKa(PFOSA) < 1.0 and pKa(PFOA) < 1.0.
We also derive K2 4 107 M-2 for the clustering equilibrium: 2 PFO + H+
(PFO)2H. Thus, although (PFO)2H is held together by an exceptionally strong
homonuclear covalent hydrogen bond, neither PFOS nor PFO will associate or protonate
significantly at environmentally relevant sub-nanomolar concentrations above pH ~ 1.

95
5. 2 Introduction
Perfluoroalkyl (F-alkyl) chemicals (PFCs) began to be produced and commercialized
about 50 years ago.1-3 Exceptional chemical inertness confers on these materials valuable
properties but also ensures unwanted environmental persistence.4,5 As a result, they have
spread and bioaccumulated globally with unforeseeable consequences.5-13 The most
conspicuous congeners perfluorooctanoate (PFO) and perfluorooctanesulfonate (PFOS)
have been detected in surface waters and precipitation,14-16 sediments,17 and biota
worldwide.18-22 F-alkyl oxoanions apparently perturb peptide chains and DNA strands
conformations via non-covalent, entropy-driven interactions.9,11,23,24
The rapid decline of PFOS levels in Canadian Arctic seals following its phaseout in
2000 strongly suggests an atmospheric transport mechanism,25 and defies the notions that
oceans are the ultimate sink, and that slow ocean currents the long-range conduits for
these weakly basic F-alkyl oxoanions.26-28 The issue of whether marine aerosols enriched
in these anionic surfactants29,30 or their gas-phase conjugated acids mediate atmospheric
transport31 clearly hinges on the extent of F-alkyl oxoacids dissociation under
environmental conditions.32 Their long-range transport can also be indirectly effected, in
part, by degradable gas-phase precursors. Although the powerful electron-withdrawing F-
alkyl chains demonstrably stabilize these anions, viz., pKa(CF3COOH) = 0.3 vs.
pKa(CH3COOH) = 4.8,33 and more than ~ 8 CH2-links are required to insulate functional
groups from F-alkyl segments,34 the acidity of PFOA remains elusive. Titrations in
water/alcohol solvents yielded pKa(PFOA) = 2.8 and 3.8,35,36 whereas SPARC/COSMO
models37 and semiempirical PM6 computations 38 predict pKa(PFOA) 0.7. The
significantly larger than predicted experimental pKa(PFOA) values have been tentatively

96
ascribed to the aggregation of hydrophobic PFOA (note that PFO aggregation should
have the opposite effect) in aqueous solvents at amenable laboratory mM
concentrations.39-41 Herein we address these basic issues36,42-46 and report experiments on
the speciation of the PFOA (perfluorooctanoic acid) and PFOSA
(perfluorooctanesulfonic acid, not to be confused with perfluorooctane sulfonamide) in
micromolar aqueous solutions as a function of pH via pneumatically assisted electrospray
ionization mass spectrometry (ESI-MS).
5.3 Experimental Section
PFONH4 and PFOSK (3M), NaClO4 (EM Science, >99%), Na-hexanoate and Na-
octanoate (Sigma Aldrich, >99%), 3M NaOH and 6M HCl solutions (VWR, Reagent
grade) were used as received. Aqueous solutions were prepared with purified water from
a Millipore Milli-Q system (18.2 MΩ cm resistivity). Aqueous 1 to 10 M PFO or PFOS
solutions also contained ClO4- [pKa(HClO4) <-7] at fivefold larger concentrations as
internal standard. HCl or NaOH were used to adjust the pH in the range of 1.0 to 6.0 at
constant ionic strength, unless otherwise specified. Solutions were directly infused into a
HP 1100 MSD ESI-MS operated in the negative ion mode.47-49 The initial search for
anion signals in the 50 m/z 2000 range was performed in the scan mode. Signal
intensities of m/z = 499 (PFOS), 413 and 369 (PFO, PFO CO2), 99 and 101 (35ClO4-,
37ClO4-), and 827 [(PFO)2H] peaks were quantified from mass spectra acquired in the
SIM mode under the following conditions: drying gas flow rate = 10 L min-1, drying gas
temperature = 250 °C, capillary voltage = 3500 V, fragmentor (cone) voltage FV varied
from 30 to 150 V.

97
5.4 Results and Discussion
Given the ongoing debate about whether proton activity at the air/water interface, from
which the ions detected by ESI-MS arise, is larger or smaller than in bulk solution,50-54
we deemed it essential to validate our procedures by reproducing the titration curves of n-
hexanoic and n-octanoic acids in this setup (Figure 5.1). Non-linear regressions (R2 =
0.995) through the experimental data based on the universal titration function, equation
(5.1):
a
-
K HT
[A ] 1 (5.1)
[A] 1 10 p p
led to pKa (n-hexanoic acid) = 4.81 ± 0.05, pKa (n-octanoic acid) = 4.81± 0.06 values in
excellent agreement with their pKa values in bulk solution.55 This agreement cannot be
regarded fortuitous or accidental, and has important implications. Since equation (5.1)
can be construed as a function of the difference (pKa – pH) rather than of pH alone, the
same data would have been obtained had pKa and pH shifted equally at the interface
relative to their bulk values.56 Such coincidental shifts, however, are deemed unlikely
because we cannot envision a physical reason that it should be so. More importantly, the
observed agreement further implies that the output signal sets generated by our ESI mass
spectrometer are linear transfer functions of the ionic composition of the interfacial layers
of infused solutions. This is not a trivial observation because the detected ions are field-
ejected from nanodroplets produced after extensive solvent evaporation from nascent
microdroplets.57,58 Thus, nascent microdroplets emanating from the aerial interface
faithfully reflect its composition, which, as Figure 5.1 shows, is evidently preserved
during successive solvent evaporation, microdroplet fragmentation, and ion ejection
events. Since charge imbalances must persist in non-interacting microdroplets carrying

98
anions in excess over cations, anion neutralization is prevented even in concentrated
nanodroplets. Elsewhere, we have provided conclusive evidence that: (1) anion
composition of the air/water interface may be quite different from that of the bulk,47,48
and (2) surfactant anion signals are linearly proportional to bulk anion submillimolar
concentrations.29 We infer that the pH of the interfacial layers sampled by our instrument
is, on average, identical to that in bulk solution.
Figure 5.2a‒c shows ESI-MS (50 m/z 1000) of 10 M PFOS solutions in water at
pH 6.5, in 10 mM HCl at pH 2.0 and in 10 mM NaCl at pH 7.0 obtained at FV = 70 V.
PFOS only produces the molecular anion at m/z = 499 (PFOS) without evidence of a
(PFOS)2H cluster at m/z = 999. The small signal at m/z = 399 is a perfluorohexanoate
impurity. In contrast, ESI-MS of PFO solutions reveal the presence of a major (PFO)2H
cluster anion at m/z = 827, in addition to the anticipated signals at m/z = 413 (PFO), and
369 (PFO – CO2) (Figure 5.3a‒c).59 The relative intensity of the m/z = 828 [13C1-
(PFO)2H] satellite peak confirms that m/z = 827 corresponds to a singly charged C16
species (Table 5.1). The more extensive collisionally induced secondary dissociation of
PFO at FV = 150 V (Figure 5.3d) leads to new signals at m/z = 213 (C3F7CO2-) and 169
(C3F7-). Note that the C3F7
- carbanion is a secondary species produced from C7F15- (PFO –
CO2) via a neutral C4F8 loss,59 whereas C3F7CO2- is a primary species ensuing from PFO
by splitting C4F8, presumably through a higher energy fragmentation channel.
Remarkably, since we can still detect m/z = 827 ion signals under 150 V acceleration
potentials, the (PFO)2H cluster is apparently held together by a very strong [OHO-
O-HO] homonuclear, three-center four-electron covalent hydrogen bond whose
resonant forms are rigorously equivalent (Scheme 5.1).60,61 This bond is a much stronger

99
version of those observed among most carboxylate-carboxylic acid dimers.62,63 The
detection of (PFO)2H signals in HCl, but not in NaCl solutions of identical ionic strength,
and the absence of a (PFOS)2H cluster in PFOS solutions of similar concentrations
suggest that clustering is not an analytical artifact under present experimental
conditions.64-66 There is no evidence for the formation of PFOS or PFOA
trimeric/tetrameric aggregates under present conditions.
Figure 5.4 shows that normalized PFOS (m/z = 499) signal intensities are independent
of pH down to pH 1.0, confirming that PFOSA is a strong acid, i.e., pKa(PFOSA) < 1.
The sum of the signal intensities of the anions derived from PFO (at FV = 70 V), (2 I827
+ I413 + I369) [PFO]T, is also independent of pH, implying negligible concentrations of
other species such as the undissociated PFOA acid at pH 1. Therefore, pKa(PFOA) < 1.
Figure 5.5 shows how the molar fraction (2 [(PFO)2H-]/[PFO]T) varies with pH. This
dependence is consistent with the clustering equilibrium, equation (5.2):
2 PFO + H+ (PFO)2H (5.2)
2 2
1 2 12 2 22
T
[ ] [ ]
2[ ][ ]
8 [ ] 10[(PFO) H] 1 1
[PFO] 2 2 4[ ] 10
T
pHT
pHT
PFO PFOK
H PFO
K K K PFO
PFO
(5.3)
Non-linear regressions to the experimental data of Figure 5.5 based on equation (5.3)
and bulk concentration values yield K2 ~ (3.9 0.3) 107 M-2. Although many studies
have shown that the noncovalent complexes observed by electrospray mass spectrometry
are not artifactual because their abundances respond to subtle molecular effects,64-66
interfacial PFO concentrations are demonstrably larger than in the bulk,31 and the derived
K2 value should be strictly considered an upper limit. Thus, the calculated 2[(PFO)2H-]/

100
[PFO]T values (blue triangles in Figure 5.5) using K2 ~ (3.9 0.3) 107 M-2 for [PFO]T =
2 nM (a hard upper bound to PFOA concentrations in environmental aqueous media)
14,67,68 show that neither PFOS nor PFO will appreciably self-associate or protonate under
realistic environmental conditions. [PFOSA]/[PFOS] and [PFOA]/[PFO] ratios should
remain well below 10-7 in ocean waters at pH ~ 8.1, but may significantly increase in
marine aerosols that become acidified over polluted regions. Further work is underway.
5.5 Acknowledgments
This project was financially supported by the National Science Foundation (ATM-
0714329). E. P. is grateful to the Fullbright Foundation for financial support.
5.6 References
(1) Persistent Organic Pollutants: A Global Issue, A Global Response; U. S.
Environmental Protection Agency, http://epa.gov/oia/toxics/pop.htm, 2009.
(2) Draft Risk Profiles on Perfluoroalkyl Surfactants. In
http://chm.pops.int/Convention/POPsReviewCommittee/Submissions20062007/Co
mmentsondraftsofRMEYear2006/PFOSInformationsubmitted/tabid/473/language/e
n-US/Default.aspx; Stockholm Convention on Persistent Organic Pollutants, 2008.
(3) Kissa, E. Fluorinated Surfactants and Repellents, 2nd ed.; Marcel Dekker: New
York, 2001.
(4) Wang, T.; Wang, Y.; Liao, C. Y.; Cai, Y.; Jiang, G. B. Environ. Sci. Technol.
2009.43, doi: 10.1021/es900464a.
(5) Conder, J. M.; Hoke, R. A.; De Wolf, W.; Russell, M. H.; Buck, R. C. Environ. Sci.
Technol. 2008, 42, 995.

101
(6) Lau, C.; Butenhoff, J. L.; Rogers, J. M. Toxicol. Appl. Pharmacol. 2004, 198, 231.
(7) Hekster, F. M.; Laane, R.; de Voogt, P. Environmental and toxicity effects of
perfluoroalkylated substances. In Reviews of Environmental Contamination and
Toxicology; Springer-Verlag: New York, 2003; vol. 179; pp 99.
(8) Houde, M.; Martin, J. W.; Letcher, R. J.; Solomon, K. R.; Muir, D. C. G. Environ.
Sci. Technol. 2006, 40, 3463.
(9) Cui, L.; Zhou, Q. F.; Liao, C. Y.; Fu, J. J.; Jiang, G. B. Arch. Environ. Contam.
Toxicol. 2009, 56, 338.
(10) Slotkin, T. A.; MacKillop, E. A.; Melnick, R. L.; Thayer, K. A.; Seidler, F. J.
Environ. Health Perspect. 2008, 116, 716.
(11) Zhang, X.; Chen, L.; Fei, X. C.; Ma, Y. S.; Gao, H. W. BMC Mol. Biol. 2009,
10.16
(12) Mollenhauer, M. A. M.; Carter, B. J.; Peden-Adams, M. M.; Bossart, G. D.; Fair, P.
A. Aquat. Toxicol. 2009, 91, 10.
(13) Kelly, B. C.; Ikonomou, M. G.; Blair, J. D.; Surridge, B.; Hoover, D.; Grace, R.;
Gobas, F. Environ. Sci. Technol. 2009, 43, 4037.
(14) Yamashita, N.; Taniyasu, S.; Petrick, G.; Wei, S.; Gamo, T.; Lam, P. K. S.;
Kannan, K. Chemosphere 2008, 70, 1247.
(15) Young, C. J.; Furdui, V. I.; Franklin, J.; Koerner, R. M.; Muir, D. C. G.; Mabury, S.
A. Environ. Sci. Technol. 2007, 41, 3455.
(16) Scott, B. F.; Spencer, C.; Mabury, S. A.; Muir, D. C. G. Environ. Sci. Technol.
2006, 40, 7167.

102
(17) Higgins, C. P.; Field, J. A.; Criddle, C. S.; Luthy, R. G. Environ. Sci. Technol.
2005, 39, 3946.
(18) Sinclair, E.; Mayack, D. T.; Roblee, K.; Yamashita, N.; Kannan, K. Arch. Environ.
Contam. Toxicol. 2006, 50, 398.
(19) Dietz, R.; Bossi, R.; Riget, F. F.; Sonne, C.; Born, E. W. Environ. Sci. Technol.
2008, 42, 2701.
(20) Butt, C. M.; Mabury, S. A.; Muir, D. C. G.; Braune, B. M. Environ. Sci. Technol.
2007, 41, 3521.
(21) Powley, C. R.; George, S. W.; Russell, M. H.; Hoke, R. A.; Buck, R. C.
Chemosphere 2008, 70, 664.
(22) Giesy, J. P.; Kannan, K. Environ. Sci. Technol. 2001, 35, 1339.
(23) Bjork, J. A.; Lau, C.; Chang, S. C.; Butenhoff, J. L.; Wallace, K. B. Toxicology
2008, 251, 8.
(24) Grasty, R. C.; Bjork, J. A.; Wallace, K. B.; Lau, C. S.; Rogers, J. M. Birth Defects
Res. Part B‒Dev. Reprod. Toxicol. 2005, 74, 405.
(25) Butt, C. M.; Muir, D. C. G.; Stirling, I.; Kwan, M.; Mabury, S. A. Environ. Sci.
Technol. 2007, 41, 42.
(26) Prevedouros, K.; Cousins, I. T.; Buck, R. C.; Korzeniowski, S. H. Environ. Sci.
Technol. 2006, 40, 32.
(27) Wania, F. Environ. Sci. Technol. 2007, 41, 4529.
(28) Czub, G.; Wania, F.; McLachlan, M. S. Environ. Sci. Technol. 2008, 42, 3704.
(29) Psillakis, E.; Cheng, J.; Hoffmann, M. R.; Colussi, A. J. J. Phys. Chem. A 2009,
113.

103
(30) Bernett, M. K.; Zisman, W. A. Advances in Chemistry Series 1975, 199.
(31) McMurdo, C. J.; Ellis, D. A.; Webster, E.; Butler, J.; Christensen, R. D.; Reid, L.
K. Environ. Sci. Technol. 2008, 42, 3969.
(32) Armitage, J. M.; MacLeod, M.; Cousins, I. T. Environ. Sci. Technol. 2009, 43,
1134.
(33) Goss, K. U. Environ. Sci. Technol. 2008, 42, 5032.
(34) Jiao, H. J.; Le Stang, S.; Soos, T.; Meier, R.; Kowski, K.; Rademacher, P.;
Jafarpour, L.; Hamard, J. B.; Nolan, S. P.; Gladysz, J. A. J. Am. Chem. Soc. 2002,
124, 1516.
(35) Brace, N. O. J. Org. Chem. 1962, 27, 4491.
(36) Burns, D. C.; Ellis, D. A.; Li, H.; McMurdo, C. J.; Webster, E. Environ. Sci.
Technol. 2008, 42, 9283.
(37) Goss, K. U. Environ. Sci. Technol. 2008, 42, 456.
(38) Rayne, S.; Forest, K.; Friesen, K. J. J. Environ. Sci. Health Part A‒Toxic/Hazard.
Subst. Environ. Eng. 2009, 44, 317.
(39) Lopez-Fontan, J. L.; Gonzalez-Perez, A.; Costa, J.; Ruso, J. M.; Prieto, G.; Schulz,
P. C.; Sarmiento, M. J. Colloid Interface Sci. 2006, 294, 458.
(40) Lopez-Fontan, J. L.; Sarmiento, F.; Schulz, P. C. Colloid Polym. Sci. 2005, 283,
862.
(41) Moroi, Y.; Yano, H.; Shibata, O.; Yonemitsu, T. Bull. Chem. Soc. Jpn. 2001, 74,
667.
(42) Burns, D. C.; Ellis, D. A.; Webster, E.; McMurdo, C. J. Environ. Sci. Technol.
2009, 43.

104
(43) Goss, K. U.; Arp, H. P. H. Environ. Sci. Technol. 2009, 43.
(44) Barton, C. A.; Kaiser, M. A.; Russell, M. H. J. Environ. Monit. 2007, 9, 839.
(45) Ellis, D. A.; Webster, E. Environ. Sci. Technol. 2009, 43, 1234.
(46) Mader, B. T. Environ. Sci. Technol. 2009, 43, 1232.
(47) Cheng, J.; Hoffmann, M. R.; Colussi, A. J. J. Phys. Chem. B 2008, 112.
(48) Cheng, J.; Vecitis, C.; Hoffmann, M. R.; Colussi, A. J. J. Phys. Chem. B 2006, 110,
25598.
(49) Enami, S.; Vecitis, C. D.; Cheng, J.; Hoffmann, M. R.; Colussi, A. J. J. Phys.
Chem. A 2007, 111, 8749.
(50) Beattie, J. K. Phys. Chem. Chem. Phys. 2008, 10, 330.
(51) Buch, V.; Milet, A.; Vacha, R.; Jungwirth, P.; Devlin, J. P. Proc. Natl. Acad. Sci.
U. S. A. 2007, 104, 7342.
(52) Iuchi, S.; Chen, H. N.; Paesani, F.; Voth, G. A. J. Phys. Chem. B 2009, 113, 4017.
(53) Vacha, R.; Buch, V.; Milet, A.; Devlin, J. P.; Jungwirth, P. Phys. Chem. Chem.
Phys. 2008, 10, 332.
(54) Beattie, J. K. Faraday Discuss. 2009, 141, 31.
(55) Perrin, D. D. Pure Appl. Chem. 1969, 20, 132.
(56) Ariga, K.; Nakanishi, T.; Hill, J. P.; Shirai, M.; Okuno, M.; Abe, T.; Kikuchi, J. J.
Am. Chem. Soc. 2005, 127, 12074.
(57) Kebarle, P.; Peschke, M. Analytica Chimica Acta 2000, 406, 11.
(58) Nguyen, S.; Fenn, J. B. Proc. Natl. Acad. Sci. U. S. A. 2007, 104, 1111.
(59) Arsenault, G.; McAlees, A.; McCrindle, R.; Riddell, N. Rapid Commun. Mass
Spectrom. 2007, 21, 3803.

105
(60) Gilli, P.; Bertolasi, V.; Ferretti, V.; Gilli, G. J. Am. Chem. Soc. 1994, 116, 909.
(61) Gilli, P.; Pretto, L.; Bertolasi, V.; Gilli, G. Accounts Chem. Res. 2009, 42, 33.
(62) Steiner, T. Angew. Chem. ‒Int. Ed. 2002, 41, 48.
(63) Hibbert, F.; Emsley, J. Adv. Phys. Org. Chem 1990, 26, 255.
(64) Ganem, B.; Li, Y. T.; Henion, J. D. J. Am. Chem. Soc. 1991, 113, 7818.
(65) Ganem, B.; Li, Y. T.; Henion, J. D. J. Am. Chem. Soc. 1991, 113, 6294.
(66) McCullough, B. J.; Gaskell, S. J. Comb. Chem. High Throughput Screen 2009, 12,
203.
(67) Ju, X. D.; Jin, Y. H.; Sasaki, K.; Saito, N. Environ. Sci. Technol. 2008, 42, 3538.
(68) Yamashita, N.; Kannan, K.; Taniyasu, S.; Horii, Y.; Petrick, G.; Gamo, T. Mar.
Pollut. Bull. 2005, 51, 658.

106
Table 5.1. Isotope ratios of PFO species observed by ES-MS.a
m/z Im/z (a.u.) Im/z+1 (a.u.) I(m+1)/z/Im/z
measured (%) I(m+1)/z/Im/z
calculated(%) PFO- 413 7027 165 8.8 9.0 PFO-CO2
- 369 2212 619 7.5 7.9 (PFO)2H
- 827 1564 283 18.1 18.0 a. ES-MS signal intensities were recorded at m/z= 369, 370, 413, 414, 827, 828 for 5
mM PFOA solution at pH 1.5 under the SIM mode. Values in the last column are calculated as I(m+1)/z/Im/z = n 0.0111/0.9889 for Cn-species.

107
Figure 5.1. Titration curves of n-hexanoic and n-octanoic acids. ESI-MS signal intensities of n-hexanoate (m/z = 115, blue circles) and n-octanoate (m/z = 143, red circles) relative to ClO4
- (m/z = 99, 101) as functions of solution pH. Solutions are 100 M in NaClO4 and n-hexanoic or n-octanoic acids. HCl or NaOH solutions were used to adjust pH while keeping the total chloride concentration at 1.0 mM by NaCl addition.
pKa= 4.81
pH
3 4 5 6 7 8 9
[A- ]/
[A
] To
tal
0.0
0.2
0.4
0.6
0.8
1.0
C7H15COOH
C5H11COOH

108
Figure 5.2. ESI-MS spectra of 10 M PFOS in: (a) MilliQ water at pH 6.5, (b) 10 mM HCl at pH 2.0, (c) 10 mM NaCl at pH 7.0. Spectra were acquired in the scan mode at a fragmentor voltage of 70 V. Maximum signal intensities 100.
0
20
40
60
80
100
0
20
40
60
80
100
m/z
200 400 600 800 1000
No
rmal
ize
d S
ign
al In
ten
sity
0
20
40
60
80
100
a
b
c
499
499
499
(NaCl)nCl-, n=1,2,...

109
Figure 5.3. ESI-MS spectra of 10 M PFO in: (a) MilliQ water at pH 6.0, (b) 10 mM HCl at pH 2.0, (c) 10 mM NaCl at pH 7.0, (d) 10 mM HCl at pH 2.0. Spectra were acquired in the scan mode at a fragmentor voltage set at 70 V for (a)-(c) and at 150 V for (d). Maximum signal intensities 100.
0
20
40
60
80
100
200 400 600 800 1000
No
rmal
ized
Sig
nal
Inte
nsi
ty
0
20
40
60
80
100
a
b
m/z
200 400 600 800 1000
c
d
413 413
413
413
369
369
369
369
827
827169
213
(NaCl)nCl-

110
Figure 5.4. ESI-MS titration curves for PFOSA and PFOA. ESI-MS signal intensities from PFOS (m/z = 499, black circles) and PFOA (I369 + I413 + I827, red circles) relative to ClO4
- (m/z = 99, 101) as functions of solution pH. Solutions are 10 M in NaClO4 and PFOSA or PFOA. 10 mM HCl and varying concentrations of NaOH were added to adjust pH while keeping the total chloride concentration constant at 10 mM, with the exception of the solution at pH 1.
pH
1 2 3 4 5 6
[A- ]
/ [A
] To
tal
0.0
0.2
0.4
0.6
0.8
1.0
1.2
PFOSA (I499)
PFOA (I369+I413+2I827)

111
Figure 5.5. The ratio of the ESI-MS intensities of (PFOA)2H- (m/z = 827) to the sum of
the intensities of all PFOA species: R = 2 I827/[I369 + I413+ 2 I827], as a function of pH for 2 M (red triangles) and 5 M (black triangles) PFOA solutions.
pH
1 2 3 4 5 6
R =
2 I 82
7/(I
369
+ I 4
13 +
2 I 82
7)
0.0
0.1
0.2
0.3
0.4 2 M PFOA
5M
(2 nM)

112
Scheme 5.1. Schematic drawing of The MM2 structure of the (PFO)2H- cluster.
1.772.57(PFO)2H-

113
Chapter 6
Sonochemical Degradation of Perfluorooctane Sulfonate (PFOS) and Perfluorooctanoate (PFOA) in Landfill Groundwater: Environmental Matrix Effect*
*This chapter is reproduced with permission from J. Cheng, C. D. Vecitis, H. Park, B. T. Mader, and M.R. Hoffmann, Environmental Science and Technology, 2008, 42, 8057. Copyright © 2008, American Chemical Society

114
6.1 Abstract
Perfluorinated chemicals such as perfluorooctane sulfonate (PFOS) and
perfluorooctanoic acid (PFOA) are environmentally persistent and recalcitrant to most
conventional chemical and microbial treatment technologies. In this chapter, we show
that sonolysis is able to decompose PFOS and PFOA present in groundwater beneath a
landfill. However, the pseudo-first-order rate constant for the sonochemical degradation
in the landfill groundwater is reduced by 61% and 56% relative to Milli-Q water for
PFOS and PFOA, respectively, primarily due to the presence of other organic
constituents. In this study, we evaluate the effect of various organic compounds on the
sonochemical decomposition rates of PFOS and PFOA. Organic components in
environmental matrices may reduce the sonochemical degradation rates of PFOS and
PFOA by competitive adsorption onto the bubble-water interface or by lowering the
average interfacial temperatures during transient bubble collapse events. The effect of
individual organic compounds depends on the Langmuir adsorption constant, the Henry’s
law constant, the specific heat capacity, and the overall endothermic heat of dissociation.
Volatile organic compounds (VOCs) are identified as the primary cause of the
sonochemical rate reduction for PFOS and PFOA in landfill groundwater, whereas the
effect of dissolved natural organic matter (DOM) is not significant. Finally, a combined
process of ozonation and sonolysis is shown to substantially recover the rate loss for
PFOS and PFOA in landfill groundwater.

115
6.2 Introduction
Perfluorooctane sulfonate (PFOS) and perfluorooctanoate (PFOA) have been found to
be widespread in the environment due to their persistence and the long-range atmospheric
and oceanic transport of their precursors such as perfluoroalkyl sulfonamides (PFASs)
and fluorotelomer alcohols (FTOHs).1-3 PFOS and PFOA have been measured in most
natural waters from non-detectable to ng L-1 levels,4-6 whereas higher concentrations (up
to 2300 and 6570 g L-1 for PFOS and PFOA, respectively) have been measured in
groundwater collected from military bases where aqueous film-forming foams (AFFF)
are used for fire-training activities.7 Recently, PFOS and PFOA, together with other
perfluorinated chemicals, have been detected in groundwater emanating from disposal
sites in the Minneapolis/St. Paul area.8 In addition, PFOS and PFOA have been detected
in wildlife 9-11 as well as in human blood serum,12 seminal plasma,13 and breast milk.14
The presence of PFOS and PFOA has initiated efforts to develop effective water
treatment technologies. Both compounds are recalcitrant to most conventional chemical
and microbial treatment schemes.15,16 It was found in a wastewater treatment process that
in some cases the mass flows of PFOS and PFOA could increase as a result of precursor
degradation.16,17 Advanced oxidation processes (AOPs) are also ineffective for treating
PFOS and PFOA due to their relatively slow reaction rates with OH radicals.18
Wastewater containing perfluorochemicals can potentially be treated by activated carbon
adsorption, reverse osmosis (RO), or nanofiltration (NF).19,20 Nevertheless, the removal
efficiency may be significantly impaired by other components in the wastewater
matrix.19,20 On the other hand, treating PFOS and PFOA at lower concentrations present
in natural waters presents certain challenges. Various treatment techniques have been
116
evaluated, such as UV photolysis,21,22 reduction by elemental iron,23 and acoustic
cavitation,24 but to our knowledge, none have been tested on environmental samples.
Sonochemical degradation is effective in treating PFOS and PFOA present in aqueous
solution over a wide range of concentrations.25 Acoustic cavitation induced by high-
frequency ultrasonic irradiation of aqueous solutions produces transient high
temperatures in the bubble vapor phase and at the bubble-water interface. Because of
their high surface activity, PFOS and PFOA preferentially partition to the bubble-water
interface, where temperatures are on the order of 1000 K during a transient bubble
collapse,26 and are thus decomposed via in situ pyrolysis. Following the initial rate-
limiting pyrolysis step, PFOS and PFOA are rapidly converted to CO, CO2, fluoride (F-),
and sulfate (SO42-). A sonochemical degradation half-life under 30 minutes has been
reported for both PFOS and PFOA.25 In addition, the sonochemical degradation rates are
observed to increase linearly with increasing acoustic power density, and scaling-up the
reactor size has minimal effect on reaction rates,27 thus making sonochemical degradation
a promising treatment method for PFOS and PFOA.
Previous studies on the sonochemical decomposition of PFOS and PFOA have focused
on pure aqueous solutions. It is of practical interest to examine this process in
environmentally relevant matrices, as the various matrix components may significantly
affect the sonochemical kinetics and therefore the overall treatment efficiency. In this
chapter, we determined the sonochemical kinetics of PFOS and PFOA present in the
groundwater beneath a landfill. In addition, landfill groundwater components including
volatile organic compounds (VOCs) and dissolved natural organic matter (DOM) were
evaluated individually with respect to their effect on sonochemical degradation rates.

117
Finally, the sonozone process, i.e., sonolysis combined with ozonation, was applied in an
attempt to enhance the degradation rates of PFOS and PFOA in the landfill groundwater.
Results from this study can be used to estimate the matrix effect on the sonochemical
degradation rates of PFOS and PFOA in various environmental media and to design
remediation strategies accordingly.
6.3 Experimental Methods
Materials. Ammonium perfluorooctanoate (APFO) and potassium perfluorooctane
sulfonate (PFOS-K+) standards were provided by 3M. Methanol, acetone, isopropyl
alcohol, methyl-t-butyl-ether (MTBE), ethyl acetate, toluene, p-xylene, m-xylene, ethyl
benzene, methyl isobutyl ketone (MIBK), and ammonium acetate were obtained from
EMD chemicals. Suwannee River humic and fulvic acid standards were purchased from
International Humic Substances Society. Sep-Pak Vac tC18 (6 cc, 1 g) solid phase
extraction (SPE) cartridges were purchased from Waters. Purified water (18.2 MΩ cm-1
resistivity) was prepared using the Millipore Milli-Q Gradient water purification system.
Sonolysis. Sonications were performed in a 600 mL jacketed glass reactor at a
frequency of 354 or 612 kHz using an Allied Signal‒ELAC Nautik ultrasonic transducer.
The applied power density was 250 W L-1 with an average energy-transfer efficiency of
72% as measured by calorimetry. The solutions were maintained at 10 ºC by water
cooling and sparged with argon 30 minutes prior to and during the course of the reaction.
In sonozone experiments, an ozone/oxygen gaseous mixture (2.5% v/v ozone) produced
by an Orec V10-0 corona ozone generator was sparged into the reaction solution at 0.5 L
min-1. In all experiments the initial concentrations of both PFOS and PFOA were
approximately 100 g L-1.

118
Solid phase extraction. Landfill groundwater samples taken during the sonochemical
reactions were purified by SPE using Sep-Pak Vac tC18 cartridges (6 cc, 1 g) to remove
matrix components that may interfere with the LC/MS analysis. The SPE cartridges were
conditioned by passing 10 mL methanol and 50 mL water through the cartridges at a flow
rate of 2 mL min-1. The analytical samples were subsequently loaded onto the wet
cartridges at 1 mL min-1. The columns were dried with nitrogen gas for 5 minutes, rinsed
with 10 mL 20% methanol in water at 2 mL min-1, and dried with nitrogen gas for
another 30 minutes. The analytes were eluted with methanol at 1 mL min-1, and 4.0 mL
samples were collected into 14 mL polypropylene tubes (Falcon). Sample aliquots (700
μL) were transferred to HPLC vials (Agilent) for the LC/MS analysis. All steps except
sample loading were performed on a Caliper AutoTrace SPE Work Station.
LC/MS analyses. The concentrations of PFOS and PFOA were quantified by LC/MS.
Sample aliquots (700 μL) were withdrawn from the reactor using disposable plastic
syringes, transferred into 750 μL polypropylene autosampler vials, and sealed with PTFE
septum crimp caps (Agilent). 20 μL of samples were injected into an Agilent 1100
HPLC for separation on a Thermo-Electron Betasil C18 column (100 mm × 2.1 mm, 5
μm). An identical guard column was placed in front of the analytical column. The flow
rate was maintained at 0.3 mL min-1 with a mobile phase of 2 mM ammonium acetate in
water (A) and methanol (B). The eluent gradient started with 5% B over the first minute,
was ramped to 90% B over 10 minutes and held for 2.5 minutes, then ramped back to 5%
B over 0.5 minutes and held for 3 minutes, and finished with a 3 minute post time.
Chromatographically separated samples were analyzed by an Agilent Ion Trap in
negative mode monitoring for the perfluorooctanesulfonate molecular ion (m/z = 499)

119
and the decarboxylated perfluorooctanoate (m/z = 369). Instrumental parameters were set
at the following levels: nebulizer pressure 40 PSI, drying gas flow rate 9 L min-1, drying
gas temperature 325 ºC, capillary voltage +3500 V, and skimmer voltage –15 V.
Quantification was based on a 8-point calibration curve spanning the 1 to 200 μg L-1
range fitted to a quadratic with X-1 weighting. Analytical standards, quality control, and
reagent blank samples were included in each analytical batch along with the unknown
samples. Further analytical details were described in Table 6.3 and Figure 6.10, and in a
previous paper (25).
Surface tension measurements. The surface tension of sample solutions was
determined by a du Nouy interfacial tensiometer using the standard ring method (ASTM
D1331-89).
6.4 Experimental Results
Groundwater characterization. The groundwater used in this study was sampled from
beneath a landfill located within the city of Oakdale, MN, and therefore contains organic
chemicals that are also present in the landfill. As summarized in Table 6.1, the landfill
groundwater has a total organic carbon (TOC) concentration of 20 mg L-1, primarily
volatile organic compounds (VOCs) such as acetone, diisopropyl ether, and 2-butanone at
mg L-1 levels. It also contains a moderately high level of bicarbonate and iron. The
concentrations of PFOS and PFOA in the landfill groundwater are 30 and 65 g L-1,
respectively.
Sonolysis of PFOS and PFOA- Matrix Effects. The sonochemical degradation
kinetics of PFOS and PFOA ([PFOS]i = [PFOA]i = 100 g L-1) in landfill groundwater
and Milli-Q water are shown in Figure 6.1. Sonolysis was performed under the following

120
conditions: ultrasonic frequency set at 354 or 612 kHz, applied power density set at a
constant 250 W L-1, and temperature maintained at 10 °C under an argon atmosphere.
PFOS and PFOA were spiked into the groundwater to increase the concentration to 100
g L-1 each. The sonochemical degradation of groundwater PFOS and PFOA follows
pseudo first-order kinetics as is observed in Milli-Q, which agrees with the hypothesis
that the initial decomposition mechanism remains the same. However, at 354 kHz, the
first-order rate constant for the sonolysis of groundwater PFOS, -PFOSGWk = 0.0094 min-1, is
39% of the Milli-Q rate constant, -PFOSMQk = 0.024 min-1. Similar results are observed for
PFOA, where the rate constant for groundwater PFOA, -PFOAGWk = 0.021 min-1, is 44% of
the Milli-Q rate constant, -PFOAMQk = 0.047 min-1. At a sonolytic frequency of 612 kHz, a
similar reduction in rate constant is observed when comparing sonolysis in Milli-Q versus
in groundwater (Figure 6.7).
In order to probe the organic chemical species present in the landfill groundwater that
are the most responsible for the reduction in sonochemical degradation rates,
representative organic compounds were individually added to the aqueous solution of
PFOS and PFOA, and their effect on the sonochemical degradation rates of PFOS and
PFOA evaluated under the same sonolytic conditions as used in the previous experiments.
Figure 6.2 shows the effect of methanol, acetone, isopropyl alcohol, ethyl acetate, and
MTBE on the sonochemical degradation rates of PFOS and PFOA. In all cases, two
regimes are observed with respect to the decrease in the sonochemical degradation rates
as a function of increasing organic concentrations. The sonochemical degradation rate
constant gradually decreases at relatively low organic concentrations, but above an

121
organic-specific threshold concentration, the decrease in rate constant shifts to a much
steeper slope.
The effect of larger organic compounds such as toluene, ethyl benzene, p-xylene, m-
xylene, and MIBK was also evaluated. At 10-4 mol L-1, no significant effect on the
sonochemical degradation rates is observed (Figure 6.3), but at 10-3 mol L-1, MIBK
reduces the sonochemical degradation rates of PFOA and PFOS by 46% and 66%,
respectively. The effect of MIBK is greater than any of the five organic compounds in
Figure 6.2. For the other four larger compounds, no higher concentrations were tested due
to their low water solubilities.
In addition to VOCs, the effect of DOM on the sonochemical kinetics of PFOS and
PFOA was also examined. DOM is composed of heterogeneous organic compounds
including humic and fulvic acids. As is shown in Figure 6.4, no significant difference is
found between the sonochemical degradation kinetics of PFOS and PFOA in Milli-Q
water, a 15 mg L-1 humic acid solution, and a 15 mg L-1 fulvic acid solution. 15 mg L-1
represents the highest concentration of DOM found in most natural waters.
Sonozone treatment of PFOS and PFOA. We evaluated the performance of sonozone,
a process that combines ozonation and sonolysis, on the degradation of PFOS and PFOA
in landfill groundwater. As Figure 6.5 shows, by continuously sparging an oxygen/ozone
mix gas (2.5% v/v O3) during the course of sonolysis, the degradation rates are increased
to 0.019 min-1 for PFOS and 0.033 min-1 for PFOA. This is equal to 79% and 70% of the
Milli-Q rate constant for PFOS and PFOA, respectively. In comparison, replacing argon
with either oxygen or an oxygen/ozone mix gas has no significant effect on the
sonochemical kinetics of PFOS and PFOA in Milli-Q water (Figure 6.8).

122
6.5 Discussion
Based on the observation of two distinct regimes as shown in Figure 6.2, we propose that
two different mechanisms are active in reducing the sonochemical degradation rates of
PFOS and PFOA. The first mechanism is competitive adsorption onto the bubble-water
interface by organic compounds other than PFOS and PFOA, which reduces the number
of active surface sites available for PFOS and PFOA pyrolysis. The second mechanism is
evaporation of the volatile organic compounds into the bubble vapor phase, which
reduces the bubble vapor and interfacial temperatures during transient bubble collapse
events by increasing the specific heat capacity of the bubble vapor and subsequent
endothermic dissociation of these organic vapors.28
The two mechanisms are further elucidated by examining the mathematical expression
for the sonochemical degradation rates of PFOS and PFOA. Assuming that competitive
adsorption is active at the bubble-water interface, and that interfacial pyrolysis is the only
viable degradation pathway for PFOS and PFOA, the sonochemical degradation rate of
PFOX (PFOX denotes PFOS or PFOA) can be expressed as 29
[ ][ ]
PFOX PFOX PFOXapp
d PFOXk PFOX k
dt (6.1)
where PFOXappk is the apparent pseudo first-order rate constant,
PFOXk the maximum
absolute rate attained when all of the transiently cavitating bubble surface sites are
occupied by PFOX molecules, and PFOX the fraction of PFOX molecules at the bubble-
water interface in the presence of other organic compounds.
PFOXk is given by
int[ ] exp /
PFOX PFOX PFOX bubAk S A E R T
(6.2)

123
where [ ]S is the molarity of bubble adsorption sites, PFOXA and PFOXAE are the pre-
exponential constant and activation energy for the initial PFOX pyrolysis, respectively,
and intbubT is the average interfacial temperature during the high-temperature period of a
transient bubble collapse. PFOX , in the presence of other organic compounds competing
for bubble interfacial sites, is given by
,
[ ]
1 [ ] [ , ]
PFOX
PFOX LPFOX org iL L
i
K PFOX
K PFOX K Org i (6.3)
where XLK is the Langmuir adsorption constant for compound X in L mol-1. The LK
values for the five organic compounds in Figure 6.2 can be obtained from the surface
tension curves shown in Figure 6.6. Least square fitting of the surface tension curves
( ) c ’s to the Szyszkowski equation (Eq. (6.4)), the surface equation of state for the
Langmuir isotherm (Eq. (6.5)), yields LK as well as max , the maximum surface
concentration, for these five compounds (Table 6.2).
0 max- ( ) ln(1 ) Lc nRT K c (6.4)
max 1
L
L
K c
K c (6.5)
In Eq. (6.4), is the surface pressure in N m-1, 0 = 0.072 N m-1 is the surface tension
of pure water and ( ) c is the surface tension of the aqueous solution of an organic
compound at a given concentration c . As is shown in Table 6.2, max varies little among
the five organic compounds, ranging from 4.7×10⁻⁶ to 8.2 × 10⁻⁶ mol m-2. In contrast, LK
spans a much wider range from 3.9 × 10⁻⁴ m3 mol-1 for methanol to around 1.9 × 10⁻² m3
mol-1 for ethyl acetate, which is about 50 times higher. Thus LK is the key determining

124
factor for surface activity. According to Eq. (6.3), organic compounds with greater LK
values are more effective in reducing the sonochemical degradation rates of PFOS and
PFOA by competitive adsorption onto the bubble-water interface. This trend is consistent
with the experimental results shown in Figure 6.2.
As Eq. (6.2) suggests, another key driver for the sonochemical degradation rate of
PFOS and PFOA is the average interfacial temperature during the high-temperature
period of a transient bubble collapse. For example, considering that the activation energy
for PFOA pyrolysis is PFOAAE = 172 kJ mol-1,30 lowering int
bubT from 1000 K to 900 K
will reduce the reaction rate by 10 times. Volatile solutes such as alcohols are known to
be able to significantly reduce the vapor and interfacial temperatures during bubble
collapse.28, 31, 32 The magnitude of the effect that an organic compound has on the bubble
and interfacial temperatures is positively correlated with its Henry’s law constant, its
specific heat capacity, and its overall endothermic heat of dissociation. First, the Henry’s
law constant will determine the relative amount of solute that partitions to the bubble
vapor phase during bubble expansion. Second, the presence of VOCs in the bubble vapor
phase which have larger specific heat capacities than argon (Cp,Ar = 20.8 J mol−1 K−1 at
298 K) will reduce the maximum bubble and interfacial temperatures achieved during
bubble collapse. In addition, the organic compounds will be thermally decomposed under
high temperatures inside the bubble, producing H2, CO, and smaller organic
compounds.33-35 The endothermic dissociation of these compounds will further reduce
bubble vapor and interfacial temperatures. Table 6.2 lists the Henry's law constants and
the specific heat capacities at 298 K of the five organic compounds in Figure 6.2, and the
values at a wider range of temperatures can be found in Figure 6.9. Although a complete

125
calculation of the overall heat of dissociation values taking into account all thermal
reaction pathways is beyond the scope of this chapter, a positive correlation can be
assumed between the overall heat of dissociation and the molecular size. The argument
that VOCs affect the sonochemical kinetics by lowering the interfacial temperature is
supported by the trend among the five organic compounds shown in Figure 6.2. The
interfacial temperature reduction is also consistent with the observation that the
groundwater matrix has a greater effect on the sonochemical degradation rate of PFOS
than that of PFOA, since PFOS has a higher thermal activation energy.36
At concentrations up to 15 mg L-1, neither humic nor fulvic acid has a significant
effect on the sonochemical degradation rates of PFOS and PFOA. This suggests that
neither of the aforementioned mechanisms is significant under these conditions. First,
humic and fulvic acids are non-volatile and thus are expected to have little effect on the
interfacial temperatures during bubble collapse. Second, though DOM is considered to be
moderately surface active,37 the effect of competitive adsorption onto the bubble-water
interface is expected to be negligible at 15 mg L-1. Given that the average molecular
weight of DOM is at least 1 kDa 38 and that the average LK value of DOM is arguably
much smaller than 1.97PFOSLK m3 mol-1 and 0.36PFOA
LK m3 mol-1,29 the
term , [ , ] Org iL
i
K Org i in Eq. 6.3 is << 1, and thus negligible, at a DOM concentration of
15 mg L-1.
Given the relatively low concentrations and surface activities of groundwater organic
components evaluated in this study, competitive adsorption onto the bubble-water
interface is expected to be of minor importance. However, this effect may be important in
environmental matrices with higher concentrations of surface active components such as

126
aqueous film-forming foams (AFFF). The landfill groundwater in this study contains
approximately 0.3 ~ 0.5 mmol L-1 VOCs, including larger and more volatile compounds
such as diisopropyl ether and MIBK that are more effective than smaller VOCs (Figure
6.2) in reducing interfacial temperatures during bubble collapse. Therefore, temperature
reduction by VOCs should be considered as the primary cause of the sonochemical rate
reduction for PFOS and PFOA in the landfill groundwater. Inorganic components such as
bicarbonate and sulfate ions may also contribute to the sonochemical rate reduction. In
addition, adsorption of PFOS and PFOA onto organic matter and iron oxides in the
landfill groundwater may reduce their concentrations at the bubble-water interface and
therefore the degradation rates. However, the effect is not expected to be significant due
to the relatively low partitioning coefficients of PFOS and PFOA.39, 40
The sonozone process is shown to significantly enhance the degradation rates of
PFOS and PFOA in landfill groundwater, though it has no significant effect in Milli-Q
water. The sonozone process has been shown to enhance the OH production rate.35, 41, 42
Though reactions of OH radical with PFOS and PFOA are kinetically limited, OH
radicals will react with VOCs present in the bubble vapor phase at a much faster rate than
the thermal dissociation of these molecules and will increase their mineralization rates.
The rapid destruction of VOCs will reduce their negative impact on interfacial
temperatures during bubble collapse. The sonozone process shows potential for
improving the degradation rates of PFOS and PFOA in landfill groundwater and other
environmental media with high levels of VOCs.

127
6.6 Acknowledgements
The authors would like to thank 3M for the financial support and the Caltech
Environmental Analysis Center (Dr. Nathan Dalleska) for technical assistance in sample
analysis.
6.7 References
(1) Prevedouros, K.; Cousins, I. T.; Buck, R. C.; Korzeniowski, S. H., Environ. Sci.
Technol. 2006, 40, 32-44.
(2) Ellis, D. A.; Martin, J. W.; De Silva, A. O.; Mabury, S. A.; Hurley, M. D.;
Andersen, M. P. S.; Wallington, T. J., Environ. Sci. Technol. 2004, 38, 3316-3321.
(3) Shoeib, M.; Harner, T.; Vlahos, P., Environ. Sci. Technol. 2006, 40, 7577-7583.
(4) Yamashita, N.; Kannan, K.; Taniyasu, S.; Horii, Y.; Okazawa, T.; Petrick, G.;
Gamo, T., Environ. Sci. Technol. 2004, 38, 5522-5528.
(5) So, M. K.; Taniyasu, S.; Yamashita, N.; Giesy, J. P.; Zheng, J.; Fang, Z.; Im, S. H.;
Lam, P. K. S., Environ. Sci. Technol. 2004, 38, 4056-4063.
(6) Yamashita, N.; Kannan, K.; Taniyasu, S.; Horii, Y.; Petrick, G.; Gamo, T., Mar.
Pollut. Bull. 2005, 51, 658-668.
(7) Schultz, M. M.; Barofsky, D. F.; Field, J. A., Environ. Sci. Technol. 2004, 38, 1828-
1835.
(8) Minnesota Pollution Control Agency. Investigation of Perfluorochemical (PFC)
Contamination in Minnesota ‒ Phase One; Minnesota Pollution Control Agency,
St. Paul, MN, 2006.
(9) Smithwick, M.; Mabury, S. A.; Solomon, K. R.; Sonne, C.; Martin, J. W.; Born, E.
W.; Dietz, R.; Derocher, A. E.; Letcher, R. J.; Evans, T. J.; Gabrielsen, G. W.;

128
Nagy, J.; Stirling, I.; Taylor, M. K.; Muir, D. C. G., Environ. Sci. Technol. 2005,
39, 5517-5523.
(10) Sinclair, E.; Mayack, D. T.; Roblee, K.; Yamashita, N.; Kannan, K., Arch. Environ.
Contam. Toxicol. 2006, 50, 398-410.
(11) Gulkowska, A.; Jiang, Q. T.; So, M. K.; Taniyasu, S.; Lam, P. K. S.; Yamashita, N.,
Environ. Sci. Technol. 2006, 40, 3736-3741.
(12) Yeung, L. W. Y.; So, M. K.; Jiang, G. B.; Taniyasu, S.; Yamashita, N.; Song, M.
Y.; Wu, Y. N.; Li, J. G.; Giesy, J. P.; Guruge, K. S.; Lam, P. K. S., Environ. Sci.
Technol. 2006, 40, 715-720.
(13) Guruge, K. S.; Taniyasu, S.; Yamashita, N.; Wijeratna, S.; Mohotti, K. M.;
Seneviratne, H. R.; Kannan, K.; Yamanaka, N.; Miyazaki, S., J. Environ. Monit.
2005, 7, 371-377.
(14) So, M. K.; Yamashita, N.; Taniyasu, S.; Jiang, Q. T.; Giesy, J. P.; Chen, K.; Lam, P.
K. S., Environ. Sci. Technol. 2006, 40, 2924-2929.
(15) Key, B. D.; Howell, R. D.; Criddle, C. S., Environ. Sci. Technol. 1998, 32, 2283-
2287.
(16) Schultz, M. M.; Higgins, C. P.; Huset, C. A.; Luthy, R. G.; Barofsky, D. F.; Field, J.
A., Environ. Sci. Technol. 2006, 7350-7357.
(17) Sinclair, E.; Kannan, K., Environ. Sci. Technol. 2006, 40, 1408-1414.
(18) Schroder, H. F.; Meesters, R. J. W., J. Chromatogr. A 2005, 1082, 110-119.
(19) Tang, C. Y. Y.; Fu, Q. S.; Robertson, A. P.; Criddle, C. S.; Leckie, J. O., Environ.
Sci. Technol. 2006, 40, 7343-7349.

129
(20) Tang, C. Y.; Fu, Q. S.; Criddle, C. S.; Leckie, J. O., Environ. Sci. Technol. 2007,
41, (6), 2008-2014.
(21) Hori, H.; Yamamoto, A.; Hayakawa, E.; Taniyasu, S.; Yamashita, N.; Kutsuna, S.,
Environ. Sci. Technol. 2005, 39, 2383-2388.
(22) Yamamoto, T.; Noma, Y.; Sakai, S. I.; Shibata, Y., Environ. Sci. Technol. 2007, 41,
5660-5665.
(23) Hori, H.; Nagaoka, Y.; Yamamoto, A.; Sano, T.; Yamashita, N.; Taniyasu, S.;
Kutsuna, S.; Osaka, I.; Arakawa, R., Environ. Sci. Technol. 2006, 40, 1049-1054.
(24) Moriwaki, H.; Takagi, Y.; Tanaka, M.; Tsuruho, K.; Okitsu, K.; Maeda, Y.,
Environ. Sci. Technol. 2005, 39, 3388-3392.
(25) Vecitis, C. D., Park, H., Cheng, J., Mader, B. T., Hoffmann, M. R., J. Phys. Chem.
A 2008, 112, 4261-4270
(26) Kotronarou, A.; Mills, G.; Hoffmann, M. R., J. Phys. Chem. 1991, 95, 3630-3638.
(27) Destaillats, H.; Lesko, T. M.; Knowlton, M.; Wallace, H.; Hoffmann, M. R., Ind.
Eng. Chem. Res. 2001, 40, (18), 3855-3860.
(28) Yasui, K., J. Chem. Phys. 2002, 116, 2945-2954.
(29) Vecitis, C. D.; Park, H.; Cheng, J.; Mader, B. T.; Hoffmann, M. R., J. Phys. Chem.
A, 2008, 112, 16850-16857
(30) Krusic, P. J.; Roe, D. C., Anal. Chem. 2004, 76, 3800-3803.
(31) Ciawi, E.; Rae, J.; Ashokkumar, M.; Grieser, F., J. Phys. Chem. B 2006, 110,
13656-13660.
(32) Rae, J.; Ashokkumar, M.; Eulaerts, O.; von Sonntag, C.; Reisse, J.; Grieser, F.,
Ultrason. Sonochem. 2005, 12, 325-329.

130
(33) Anbar, M.; Pecht, I., J. Phys. Chem. 1964, 68, 1462-1465.
(34) Buttner, J.; Gutierrez, M.; Henglein, A., J. Phys. Chem. 1991, 95, 1528-1530.
(35) Kang, J. W.; Hoffmann, M. R., Environ. Sci. Technol. 1998, 32, 3194-3199.
(36) Glockner, V.; Lunkwitz, K.; Prescher, D., Z. Tenside Surf. Det. 1989, 26, 376-380.
(37) Ma, J.; Jiang, J.; Pang, S.; Guo, J., Environ. Sci. Technol. 2007, 41, 4959-4964.
(38) Perminova, I. V.; Frimmel, F. H.; Kudryavtsev, A. V.; Kulikova, N. A.; Abbt-
Braun, G.; Hesse, S.; Petrosyan, V. S., Environ. Sci. Technol. 2003, 37, 2477-2485.
(39) Johnson, R. L.; Anschutz, A. J.; Smolen, J. M.; Simcik, M. F.; Penn, R. L., J. Chem.
Eng. Data. 2007, 52, 1165-1170.
(40) Higgins, C. P.; Luty, R. G., Environ. Sci. Technol. 2007, 41, 3254-3261
(41) Weavers, L. K.; Ling, F. H.; Hoffmann, M. R., Environ. Sci. Technol. 1998, 32,
2727-2733.
(42) Lesko, T.; Colussi, A. J.; Hoffmann, M. R., Environ. Sci. Technol. 2006, 40, 6818-
6823.
(43) Staudinger, J.; Roberts, P. V., Chemosphere 2001, 44, 561-576.
(44) Yaws, C. L. Chemical Properties Handbook; McGraw-Hill: New York, 1999.

131
Table 6.1. Primary components of the landfill groundwater a
pH 6.9-7.9 Dissolved Oxygen 2 mg L-1
Temperature 10 – 15 ºC TIC 40 mg L-1 C
TOC 20 mg L-1 C Fe (s) 30 mg L-1
Acetone 7.15 mg L-1 Fe (aq) 5-8 mg L-1
Diisopropyl Ether 3.54 mg L-1 Mn(s)
2 mg L-1
MEK 3.37 mg L-1 Mn(aq)
0.5-1.6 mg L-1
2-Propanol 2.47 mg L-1 NH4
+ 0.2-0.6 mg L-1
2-Butyl Alcohol 0.92 mg L-1 SO4
2- 4-30 mg L-1
MIBK 0.55 mg L-1 HS- 0.2-0.5 mg L-1
a. Measurements completed by Pace Analytical.

132
Table 6.2. Physical and thermodynamic properties of the five organic compounds in Figure 6.2
a. max, maximum surface concentration in Langmuir isotherm b. KL, Langmuir adsorption constant c. K iaw, Henry’s law constant at 298 K , Reference 43 d. Cp,g, specific heat capacity at 298 K, Reference 44 e. max and KL values for PFOS and PFOA listed for comparison, Reference 29
max×106 a
(mol m-2)
KL b
(m3 mol-1)
K iaw c Cp,g d
(J mol-1 K-1)
Methanol 8.2 3.9×10⁻⁴ 1.8×10⁻⁴ 45.2
Acetone 5.1 3.2×10⁻³ 1.4×10⁻³ 75.3
Isopropanol 4.8 7.8×10⁻³ 3.2×10⁻⁴ 90.0
Ethyl Acetate 4.7 1.9×10⁻² 6.9×10⁻³ 117.5
MTBE 6.1 1.8×10⁻² 2.6×10⁻² 131.8
PFOS e 5.1 1.97 - -
PFOA e 4.5 0.36 - -

133
Table 6.3. Representative analytical results of quality-control samples
Standard concentration (ppb)
Average measurement (ppb) (n ≥ 4)
Standard deviation (%) (n ≥ 4)
PFOS 10 9.5 3.3
25 24.1 5.8
50 53.3 2.3
100 104.3 4.6
PFOA
10 9.6 6.9
25 26.5 3.7
50 51.4 3.7
100 106.1 3.4

134
Figure 6.1. ln([PFOS]t / [PFOS]i) (a) and ln([PFOA]t / [PFOA]i) (b) vs. time in minutes during sonochemical degradation in Milli-Q water () and landfill groundwater () under 354 kHz, 250 W L-1, Ar, 10 oC for [PFOS]i = [PFOA]i = 100 g L-1. Each error bar represents one standard deviation from the mean of at least three experiments.
Time (min)
0 20 40 60 80 100 120 140
ln (
[PF
OS
] t/[P
FO
S] i)
-2.5
-2.0
-1.5
-1.0
-0.5
0.0
GW
MilliQ
Time (min)
0 20 40 60 80 100 120 140
ln (
[PF
OA
] t/[P
FO
A] i)
-5
-4
-3
-2
-1
0
GW
MilliQ
a
b

135
Figure 6.2. The observed pseudo first-order rate constant normalized to the Milli-Q rate constant, k-PFOS/k0
-PFOS (a) and k-PFOA/k0
-PFOA (b), vs. molar concentration of methanol
(MeOH, ), acetone (AC, ), isopropyl alcohol (IPA, ), ethyl acetate (EA, ), and MTBE () in aqueous solutions. The reaction conditions are: 354 kHz, 250 W L-1, Ar, 10 oC, and [PFOS]i = [PFOA]i = 100 g L-1. Note that since the rate constant at 0.2 mol L-1 MTBE virtually drops to 0, the corresponding data point is not shown in the figure.
Concentration (mol L-1)
10-4 10-3 10-2 10-1 100 101 102
k-PF
OS/k
0-PF
OS
10-3
10-2
10-1
100
MeOH
AC
IPA
EA
MTBE
Concentration (mol L-1)
10-4 10-3 10-2 10-1 100 101 102
k-PF
OA/k
0-PF
OA
10-3
10-2
10-1
100
MeOH
AC
IPA
EAMTBE
a
b

136
Figure 6.3. The pseudo-first-order rate constant for sonolysis of PFOA (clear bars) and PFOS (filled bars) in Milli-Q, 0.1 mM ethyl benzene (EB), 0.1 mM toluene (TL), 0.1 mM m-xylene (m-XL), 0.1 mM p-xylene (p-XL), 0.1 mM MIBK (MIBK), and 1 mM MIBK (MIBK*). The reaction conditions are 354 kHz, 250 W L-1, Ar, 10 oC, [PFOS]i = [PFOA]i = 100 g L-1.
Milli-Q EB TL m-XL p-XL MIBKMIBK*
k P
FO
X (
min
-1)
0.00
0.01
0.02
0.03
0.04
0.05PFOAPFOS

137
Figure 6.4 ln([PFOS]t / [PFOS]i) (a) and ln([PFOA]t / [PFOA]i) (b) vs. time in minutes during sonochemical degradation in Milli-Q water (),15 mg L-1 humic acid solution (), and 15 mg L-1 fulvic acid solution () under 612 kHz, 250 W L-1, Ar, 10 oC, for [PFOS]i = [PFOA]i = 100 g L-1.
Time (min)
0 20 40 60 80 100 120 140
ln (
[PF
OS
] t/[P
FO
S] i)
-2.5
-2.0
-1.5
-1.0
-.5
0.0
Humic AcidFulvic AcidMilliQ
Time (min)
0 20 40 60 80 100 120 140
ln (
[PF
OA
] t/[P
FO
A] i)
-5
-4
-3
-2
-1
0
Humic AcidFulvic AcidMilliQ
a
b

138
Figure 6.5. (a) ln([PFOS]t / [PFOS]i) and ln([PFOA]t / [PFOA]i) (b) vs. time in minutes during the sonolysis () and sonozone () process of PFOS and PFOA in landfill groundwater. Sonochemical degradation kinetics in Milli-Q () are also included for comparison. Other reaction parameters are: 354 kHz, 250 W L-1, Ar, 10 oC, and [PFOS]i
= [PFOA]i = 100 g L-1.
Time (min)
0 20 40 60 80 100 120
ln (
[PF
OS
] t / [
PF
OS
] i)
-3
-2
-1
0Ar, GW
O3, GW
Ar, MQ
Time (min)
0 20 40 60 80 100 120
ln (
[PF
OA
] t / [
PF
OA
] i)
-5
-4
-3
-2
-1
0
Ar, GW
O3, GW
Ar, MQ
a
b

139
Figure 6.6. Surface tension vs. molar concentration of methanol (), acetone (), isopropyl alcohol (), ethyl acetate (), and MTBE () in aqueous solutions, measured at 298 K.
Concentration (mol L-1)
10-3 10-2 10-1 100 101
(m
N m
-1)
30
40
50
60
70
MeOH
IPA
EAMTBE
AC

140
Figure 6.7. ln([PFOS]t / [PFOS]i) (a) and ln([PFOA]t / [PFOA]i) (b) vs. time in minutes during sonochemical degradation in Milli-Q water () and landfill groundwater () under 612 kHz, 250 W L-1, Ar, 10 oC for [PFOS]i = [PFOA]i = 100 g L-1.
Time (min)
0 20 40 60 80 100 120 140 160
ln (
[PF
OS
] t/[P
FO
S] i)
-2.5
-2.0
-1.5
-1.0
-0.5
0.0
GW
MQ
Time (min)
0 20 40 60 80 100 120 140 160
ln (
[PF
OA
] t/[P
FO
A] i)
-5
-4
-3
-2
-1
0
GW
MQ
a
b

141
Figure 6.8. ln([PFOS]t / [PFOS]i) (a) and ln([PFOA]t / [PFOA]i) (b) vs. time in minutes during sonochemical degradation in Milli-Q water under Ar (), O2 () and 2.5% O3 in O2 (). Other reaction parameters are: 354 kHz, 250 W L-1, 10 oC, and [PFOS]i = [PFOA]i = 100 g L-1.
Time (min)
0 20 40 60 80 100
ln (
[PF
OS
] t / [
PF
OS
] i)
-2.0
-1.5
-1.0
-0.5
0.0
ArO2
O3-O2
Time (min)
0 20 40 60 80 100
ln (
[PF
OA
] t / [
PF
OA
] i)
-4
-3
-2
-1
0
ArO2
O3-O2
a
b

142
Figure 6.9. The gas phase specific heat capacity Cp,g from T = 200 K to T = 1500 K (a), and the Henry’s law constant kiaw from T = 273 K to T = 373 K (b), for methanol (MeOH, ), acetone (AC,), isopropyl alcohol (IPA, ), ethyl acetate (EA, ), and MTBE ().
T (K)
200 400 600 800 1000 1200 1400
Cp
,gas
(J
mo
l-1 K
-1)
0
50
100
150
200
250
300
350
400MeOHACIPAEAMTBE
T (K)
280 300 320 340 360
Kia
w
10-5
10-4
10-3
10-2
10-1
100
101
MeOHACIPAEA MTBE
a
b

143
Figure 6.10. The LC/MS calibration curves for PFOS (a) and PFOA (b) from 1 to 200 ppb.
[PFOS] (ppb)
0 50 100 150 200
Res
po
nse
, a.u
.
0.0
5.0e+6
1.0e+7
1.5e+7
2.0e+7R2=0.998
[PFOA] (ppb)
0 50 100 150 200
Res
po
nse
, a.u
.
0
2e+6
4e+6
6e+6
8e+6
1e+7R2=0.999
a
b

144
Chapter 7
Sonochemical Degradation of Perfluorooctane Sulfonate (PFOS) and Perfluorooctanoate (PFOA) in Groundwater: Kinetic Effects of Matrix Inorganics*
* The chapter is reproduced with permission from J. Cheng, C. D. Vecitis, H. Park, B. T. Mader, and M. R. Hoffmann, Environmental Science and Technology, Article ASAP, December 1, 2009. Copyright © 2009, American Chemical Society

145
7.1 Abstract
Ultrasonic irradiation has been shown to effectively degrade perfluorinated
chemicals (PFCs) such as perfluorooctane sulfonate (PFOS) and perfluorooctanoate
(PFOA) in aqueous solution. Reduced PFC sonochemical degradation rates in organic-
rich groundwater taken from beneath a landfill, however, testify to the negative kinetic
effects of the organic groundwater constituents. In this study, the PFOX (X = S or A)
sonochemical degradation rates in a groundwater sample with organic concentrations 10
times lower than those in the groundwater taken from beneath a landfill are found to be
29.7% and 20.5% lower, respectively, than the rates in MilliQ water, suggesting that
inorganic groundwater constituents also negatively affect PFC sonochemical kinetics. To
determine the source of the groundwater matrix effects, we evaluate the effects of various
inorganic species on PFOX sonochemical kinetics. Anions over the range of 1-10 mM
show Hofmeister effects on the sonochemical degradation rates of PFOX, -PFOX
ClO 4k > -PFOX
NO3k
~ -PFOX
Clk ≥ -PFOX
MQk > -PFOX
HCO 3k ~ -PFOX
SO 24
k . In contrast, common cations at 5 mM have negligible
effects. Initial solution pH enhances the degradation rates of PFOX at 3, but has
negligible effects over the range of 4 to 11. The observed inorganic effects on
sonochemical kinetics are hypothesized to be due to ions’ partitioning to and interaction
with the bubble-water interface. Finally, it is shown that the rate reduction in the
groundwater in this study is primarily due to the presence of bicarbonate and thus can be
fully rectified by pH adjustment prior to sonolysis.

146
7.2 Introduction
Perfluorinated chemicals (PFCs) such as perfluorooctane sulfonate (PFOS) and
perfluorooctanoate (PFOA) have been manufactured for use in a variety of industrial and
consumer applications.1-2 Due to their environmental persistence, PFOX (X= S or A)
have been detected in surface waters at a number of locations at concentrations ranging
from pg L-1 to low ng L-1.3-6 Elevated concentrations (on the order of mg L-1) of PFOX
have been measured in surface and ground waters near specific point sources.7-11
PFOX are chemically inert due to the strength of the C-F bonds, and there is no direct
evidence to date of their biodegradation.12-13 PFOX cannot be removed by conventional
water and wastewater treatment processes that do not utilize activated carbon adsorption
or reverse osmosis.13-15 Various treatment techniques have been proposed to abiotically
decompose aqueous PFOX, including direct UV photolysis,16 thermal- or UV-activated
persulfate oxidation,17-18 reductive defluorination using elemental iron at subcritical water
conditions,19 UV-iodide reduction,20 B12-mediated reduction,21 and ultrasonic
irradiation.22 It is shown that ultrasonic irradiation can effectively degrade
perfluoroalkylsulfonates such as PFOS and perfluoroalkylcarboxylates such as PFOA via
pyrolysis under transient high temperatures at the bubble-water interface.23 Advantages of
the sonochemical degradation of PFOX include fast and complete mineralization of
PFOX and a wide effective concentration range.24
It is important to understand the various environmental matrix effects on PFCs
sonochemical degradation in order to better evaluate the prospect of its environmental
applications. Our previous study on the sonochemical decomposition of PFOX in
organic-rich groundwater taken from beneath a landfill has suggested that volatile

147
organic constituents decrease the sonochemical degradation rates of PFOX by reducing
the average cavitation temperature at the bubble-water interface. Surface-active organic
compounds may also compromise the sonochemical degradation efficiency via
competitive adsorption onto the bubble-water interface. The rate reductions can be
rectified by simultaneous application of ozonation and ultrasonic irradiation.25
Herein, we now report on the sonochemical degradation kinetics of PFOX in a
distinctively different groundwater sample with a 10-fold lower total organic
concentration (TOC) and a much higher electrolyte concentration. We extend the
discussion of environmental matrix effects on PFC sonochemical degradation kinetics to
include the inorganic ions most commonly found in surface and ground waters. A more
comprehensive scheme of matrix effects will enable engineering improvements on the
sonochemical degradation efficiency of PFOX in a variety of environmental waters.
7.3 Experimental Methods
Materials. Ammonium perfluorooctanoate (APFO) and potassium perfluorooctane
sulfonate (PFOS-K+) standards were provided by 3M. The sodium salts of chloride,
nitrate, perchlorate, sulfate, and bicarbonate, ammonium chloride, magnesium chloride,
and calcium chloride (Sigma Aldrich, 99% or higher purity) were used as received. Sep-
Pak Vac tC18 (6 cc, 1 g) solid phase extraction (SPE) cartridges were purchased from
Waters. Purified water (18.2 MΩ cm-1 resistivity) was prepared from a Millipore MilliQ
Gradient water purification system.
Sonolysis. The sonochemical degradation kinetics of PFOX was measured in MilliQ,
aqueous electrolyte solutions, and groundwater. Ultrasonication was performed in a 600

148
mL jacketed glass reactor at a frequency of 612 or 354 kHz using an Allied Signal -
ELAC Nautik ultrasonic transducer. The applied power density was 250 W L-1 with an
average energy transfer efficiency of 72 ± 5% as determined by calorimetry. The PFOX
solutions were maintained at 10 ± 2 ºC by water cooling and sparged with argon 30
minutes prior to and during the course of the reaction. In all experiments the initial
concentrations of PFOS and PFOA were spiked to approximately 100 g L-1, or 200 nM
and 240 nM, respectively.
Solid Phase Extraction for Groundwater Samples. Groundwater samples taken
during the sonochemical reactions were purified by SPE using Sep-Pak Vac tC18
cartridges (6 cc, 1 g) to remove matrix components that may interfere with the LC/MS
analysis. The SPE cartridges were conditioned by passing 10 mL methanol, and then 50
mL water through the cartridges at a flow rate of 2 mL min-1. The analytical samples
were subsequently loaded onto the wet cartridges at 1 mL min-1. The columns were dried
with nitrogen gas for 5 minutes, rinsed with 10 mL 20% methanol in water at 2 mL min-1,
and dried with nitrogen gas for another 30 minutes. The analytes were eluted with
methanol at 1 mL min-1, and 4.0 mL samples were collected into 14 mL polypropylene
tubes (Falcon). The recovery rates of PFOX were above 90%, consistent with literature
values.26 All steps except sample loading were performed on a Caliper AutoTrace SPE
Work Station.
LC/MS Analyses. The PFOX concentrations were quantified by LC/MS. For MilliQ
and electrolyte solutions, sample aliquots (700 μL) were withdrawn from the reactor
using disposable plastic syringes, transferred into 750 μL polypropylene autosampler
vials, and sealed with PTFE septum crimp caps (Agilent). Groundwater samples were

149
purified by SPE before they were transferred to the autosampler vials. 20 μL of samples
were injected into an Agilent 1100 HPLC for separation on a Thermo-Electron Betasil
C18 column (100 mm × 2.1 mm, 5 μm). The flow rate was maintained at 0.3 mL min-1
with a mobile phase of 2 mM ammonium acetate in water (A) and methanol (B). The
eluent gradient started with 5% B over the first minute, was ramped to 90% B over 10
minutes and held for 2.5 minutes, then ramped back to 5% B over 0.5 minute and held for
3 minutes, and finished with a 3 minute post-time. Chromatographically separated
samples were analyzed by an Agilent Ion Trap in negative mode monitoring for the
perfluorooctanesulfonate molecular ion (m/z = 499) and the decarboxylated
perfluorooctanoate (m/z = 369). Instrumental parameters were set at the following levels:
nebulizer pressure 40 PSI, drying gas flow rate 9 L min-1, drying gas temperature 325 ºC,
capillary voltage +3500 V, and skimmer voltage –15 V. Quantification was based on a 8-
point calibration curve spanning the 1 to 200 μg L-1 range fitted to a quadratic with X-1
weighting. Analytical standards, quality control, and reagent blank samples were
included in each analytical batch along with the unknown samples. Further analytical
details were described in a previous paper.23
7.4 Results
Groundwater Characterization. The groundwater used in the study was sampled from
a well in the city of Oakdale, MN. The groundwater sample was stored in darkness at 4°C
in a sealed container with minimal headspace. As summarized in Table 7.1, the TOC
concentration of the groundwater sample is 1.5 mg L-1, about an order of magnitude
lower than that of groundwater taken from beneath a landfill that was used in our
previous study,25 whereas the concentrations of common groundwater ions such as

150
bicarbonate, sulfate, chloride, calcium, and magnesium are much higher than in the
previous study. PFOX were spiked into the groundwater to increase the concentration to
approximately 100 g L-1, or 200 and 240 nM for PFOS and PFOA, respectively.
Sonolysis of Groundwater PFOS and PFOA. The sonochemical degradation kinetics
of PFOX in groundwater and MilliQ water are shown in Figure 7.1a and b, respectively (f
= 612 kHz, PD = 250 W L-1, T = 10 oC, argon). The sonochemical degradation of
groundwater PFOX follows pseudo-first-order kinetics as is observed in MilliQ. However,
the pseudo-first-order rate constant for groundwater PFOS at 612 kHz, -PFOSGWk = 0.0135
min-1, is 70.3% of the MilliQ rate constant, -PFOSMQk = 0.0192 min-1. Similar results are
observed for PFOA, where the rate constant for groundwater PFOA, -PFOAGWk = 0.0291
min-1, is 79.5% of the MilliQ rate constant, -PFOAMQk = 0.0366 min-1. At a frequency of 354
kHz, a similar reduction in rate constant is observed when comparing sonolysis in MilliQ
versus in groundwater (Figure 7.6).
Sonolysis of PFOS and PFOA in Aqueous Electrolyte Solutions. In order to evaluate
the electrolytes most responsible for the rate reduction in the groundwater sample, the
sonochemical degradation kinetics of PFOX in selected aqueous electrolyte solutions
were evaluated under the same sonolysis conditions as in previous experiments. Figure
7.2a and b shows the concentration-dependent effect of 1-10 mM Na2SO4, NaHCO3,
NaCl, NaNO3, or NaClO4 on the sonochemical degradation rates of PFOX. The
sonochemical rate constants for PFOX increase steadily as the concentration of NaClO4
increases from 0 to 10 mM, with the rate enhancement at 10 mM being 47% for PFOS
and 11% for PFOA. In aqueous solutions of NaNO3 and NaCl, the sonochemical

151
degradation rates for PFOS are moderately enhanced, whereas those for PFOA are
identical within experimental error to the MilliQ rate. NaHCO3 and Na2SO4 are found to
reduce the sonochemical rate constants for PFOX. Thus, with Na+ being the common
cation, the overall effect of anions on the differential sonochemical degradation rate
constants relative to those in MilliQ for PFOX, -PFOX -PFOX -PFOXMQi ik k k , follows the
order: -4
-PFOX
ClOk > -
3
-PFOX
NOk ~ -
-PFOX
Clk ≥ 0 > -
3
-PFOX
HCOk > 2-
4
-PFOX
SOk . The negative effects of SO4
2-
and HCO3- on PFOA degradation rates are of similar magnitude. This order is consistent
with the Hofmeister series, which was initially observed for specific ion effects on
protein solubility and now has been extended to a number of other systems including ion
partitioning between bulk water and the air-water interface.27-28 It is also of note that the
specific anion effects on the sonochemical degradation rates, though similar in order, are
greater for PFOS than for PFOA.
In contrast, the effect of cations on the sonochemical degradation rates of PFOX is
much less pronounced than that of anions over the same concentration range. As shown
in Figure 7.3, no significant difference in sonochemical rate constant is observed in
aqueous solutions of NaCl and NH4Cl at 5 mM and of CaCl2 and MgCl2 at 2.5 mM.
The effect of solution pH, as adjusted by addition of NaOH or HCl, on the
sonochemical degradation rates of PFOX in MilliQ water was also examined. As is
shown in Figure 7.4, the sonochemical rate constants remain unchanged within
experimental error as a function of pH over the range of 4 to 11. At pH 3, the rate
constants increase by 23.4% and 13.7% for PFOS and PFOA, respectively, relative to
those in MilliQ water at pH 7. For comparison, the rate enhancement in the 1 mM HCl
solution is significantly greater than that in the 1 mM NaCl solution, indicating the role of

152
increased proton concentration. Also, acidification increases the degradation rate of
PFOS to a greater extent, consistent with the effect of anions reported in this text as well
as that of organics reported in our previous study.25 Together, these suggest that PFOS
sonochemical kinetics is more susceptible to matrix effects.
Sonolysis of PFOS and PFOA in Groundwater after pH Adjustment. Given that
bicarbonate (pK1 = 6.3, pK2 = 10.3), at approximately 2.2 mM, is the primary anionic
component of the groundwater sample, we evaluated the effect of bicarbonate removal by
pH adjustment, both acidification and alkalization, on the sonochemical degradation rates
of PFOX, as shown in Figure 7.5a and b. Sonolysis conditions were the same as in
previous experiments. For the alkalization experiments, the groundwater pH was adjusted
from its initial value of 8.0 to 11.0 by NaOH and the white CaCO3 precipitate thus
formed was removed by filtration. The PFOS and PFOA sonochemical rate constants in
the alkaline groundwater supernatant are rectified to 101.0% and 94.0%, respectively, of
the MilliQ rates. For the acidification experiments, the groundwater was acidified to pH
3.9 by HCl to convert bicarbonate to carbon dioxide (titration curve shown in Figure 7.7),
which was then removed from solution by bubbling with argon. The acidification may
also have removed volatile organic acids from the groundwater through a similar
mechanism. The sonochemical degradation rates are enhanced to 133.9% for PFOS and
104.4% for PFOA relative to the MilliQ rates. Both experiments suggest that bicarbonate
is primarily responsible for the reduction in PFOX sonochemical kinetics in the
groundwater in this study.
7.5 Discussion

153
A sonochemical kinetic model is defined and utilized to better understand the specific
ion effects observed in Figures 7.2 to 7.4. Assuming that interfacial pyrolysis is the only
viable sonochemical degradation pathway for PFOX, and that adsorption to the bubble-
water interface is required for interfacial pyrolysis to occur,23 the sonochemical
degradation rate of PFOX can be expressed as eq. (7.1).
PFOX PFOX PFOX[PFOX][PFOX]app
dk k
dt
(7.1)
PFOXappk is the apparent pseudo first-order rate constant,
PFOXk the maximum absolute
rate, i.e., the pyrolytic unimolecular decomposition rate attained when all of the
transiently cavitating bubble surface sites are occupied by PFOX molecules, and PFOX
the fraction of bubble-water interface sites occupied by PFOX molecules.
PFOXk is
defined by eq. (7.2).
PFOX PFOX PFOX
int[ ] exp / bubAk S A E R T
(7.2)
where [S] is the molarity of transiently cavitating bubble-water interfacial sites, PFOXA
the preexponential constant in s-1, PFOXAE the activation energy for the pyrolytic cleavage
of the ionic head group of PFOX in kJ mol-1,29-30 and intbubT the average interfacial
temperature during the high-temperature period of a transient bubble collapse.31-32 In the
presence of other matrix components that may compete for bubble-water interfacial sites,
PFOX is represented by eq. (7.3).
PFOX
PFOXPFOX
[PFOX]
1 [PFOX] [ ]i
i
K
K K i
(7.3)

154
Ki is the bulk water to air-water interface partitioning coefficient for species i. It has
been observed that sonochemical partitioning coefficients, PFOXsonoK , are enhanced over
equilibrium partitioning coefficients, PFOXeqK , due to high-velocity radial bubble
oscillations.24
Our previous study on the effect of groundwater taken from beneath a landfill on
PFOX sonochemical kinetics suggests that matrix organics may reduce PFOX
degradation kinetics through reduction both in intbubT
due to energy consumption by
volatile organics in the bubble vapor phase, and in PFOX due to competition for bubble-
water interfacial sites by surface-active organics.25 As for aqueous electrolyte solutions,
since ions cannot partition to the bubble vapor phase, temperature effects, if present,
should be caused by other mechanisms. Given that the more surface active ClO4- actually
increases the PFOX degradation rates whereas the less surface active SO42- and HCO3
-
reduce the PFOX degradation rates, the surface competition effect is minimal, i.e.,
[ ]i
i
K i << 1 in eq. (7.3).
Addition of electrolytes such as NaCl has been reported to enhance both the
sonoluminescence intensity33-34 and the sonochemical degradation rates of compounds
such as phenol and 2,4-dinitrophenol.35-36 The enhancement has been explained by the
effect of electrolytes on gas solubility in aqueous solution and by the “salting out” effect
that increases the concentration of organics at the bubble-water interface, respectively.
However, both effects were observed at significantly higher electrolyte concentrations
than those used in this study.

155
Observations that anions have both positive and negative effects on PFOX
sonochemical kinetics indicate specific ion effects. Relative anionic effects on PFOX
sonochemical kinetics (Figure 7.2) follow the Hofmeister series. We hypothesize that
these effects are correlated to the ion partitioning between the bulk water and the bubble-
water interface, which will affect bubble-water interfacial properties such as surface
potential and interfacial water structure. For example, ClO4- is highly enriched at the air-
water interface relative to the bulk solution,28 and therefore yields a more negatively
charged bubble-water interface. The increase in negative surface potential at the bubble-
water interface enhances electrostatic repulsion between cavitating bubbles, thus reducing
their propensity to coalesce.37 This further results in a population of smaller bubbles with
greater surface area to volume ratio and thus a greater number of surface sites available
for PFOX pyrolysis, i.e., greater [S] in eq. (7.2). Well hydrated and thus less surface
active anions such as SO42- will reduce the negative potential at the bubble-water
interface. The results in Figure 7.2 are qualitatively consistent with measured surface
potentials of various aqueous electrolyte solutions.38
A quantitative explanation based on the surface potential measurements is difficult to
establish, not only because the exact relationship between [S] and bubble-water
interfacial potential is unclear, but also because surface potential measurements yield
equilibrium air-water interface partitioning values, whereas ion partitioning to the
ultrasonically cavitating bubble interface is kinetically constrained. Cavitating bubble
lifetimes (100 s) are much shorter than ion partitioning half-lives (>1 ms), and high-
velocity bubble radial oscillations will dominate over chemical diffusion. Thus, relative

156
differences in equilibrium surface potential can only be used as a rough guideline for
adsorption processes at acoustically cavitating bubble interfaces.
In addition, the observed anionic effects on PFOX sonochemical kinetics may also be
due to the effect of anions on the interfacial water structure. The propensity of anions to
orient interfacial water has been observed to follow the Hofmeister series: NaClO4 >
NaNO3 > NaCl > pure water > Na2SO4.39 Altering the interfacial water structure may
affect the amount of water vapor transported into the bubble, and thus intbubT . Alterations
in water structure and composition at the bubble-water interface may also affect heat
transfer from the bubble vapor to the bulk liquid. The resulting changes in average
bubble-water interfacial temperatures during transient cavitation will subsequently affect
the observed sonochemical rates of PFOX degradation.
The negligible effect of cations on PFOX sonochemical kinetics, as shown in Figure
7.3, is likely due to their much greater degree of hydration that limits their interactions
with the sonochemically active bubble-water interface. This is consistent with
observations in other systems that the Hofmeister effects of small cations, if present, are
much smaller in magnitude than those of anion.39-41
The enhanced PFOX sonochemical kinetics at pH below 4 may also result from the
interactions of proton with the bubble-water interface. The interface is believed to
become increasingly positively charged as the pH drops below 4, despite the uncertainty
over the extent of proton and hydroxide enhancement at the bubble-water interface.42-43
The increasingly positive surface charge may not only reduce bubble coalescence, thus
increasing [S] in eq. (7.2), but also attract more of the oppositely charged PFOX to the
surface, thus increasing PFOX in eq. (7.3). It is also of note that at pH 3, PFOA may form

157
a (PFO)2H- cluster, which may affect the overall sonochemical degradation rate of
PFOA.44
Bicarbonate, whose concentration in the groundwater sample is nearly 2 orders of
magnitude greater than TOC, is likely to be the primary matrix component affecting
PFOX sonochemical kinetics as shown in Figure 7.1. Indeed, the rate reduction in a 2
mM HCO3- aqueous solution as shown in Figure 7.2, -
3
-PFOS
HCOk / -PFOS
MQk = 0.82 and -3
-PFOA
HCOk /
-PFOAMQk = 0.86, does account for a major part of the rate reduction observed in the
groundwater, -PFOSGSk / -PFOS
MQk = 0.70 and -PFOAGSk / -PFOA
MQk = 0.80. Since the primary
sonochemical degradation mechanism for PFOX is interfacial pyrolysis, the effect of
bicarbonate on PFOX sonochemical kinetics is likely due to its impact on the interfacial
pyrolysis conditions. The effect of bicarbonate as OH radical scavenger, while having
been shown in general to reduce sonochemical degradation rates,45 is inconsequential in
this case, because the reaction of PFOX with OH radical is slow.23 Other groundwater
matrix components such as sulfate and organic compounds may have minor impacts on
the sonochemical degradation rates of PFOX.
The sonochemical degradation rates post-acidification are even higher than the MilliQ
rates, presumably due to a combination of factors including the effect of pH and Cl-. First,
at pH 3.9 the sonochemical degradation rates may be slightly enhanced. Second, the
addition of 2.5 mM Cl- to adjust pH may also increase the degradation rates, but as shown
in Figure 7.2, the rate enhancement in MilliQ upon addition of 2 mM Cl- is smaller than
5%. Since both factors combined cannot fully account for the observed rate enhancement,
synergistic effects from the groundwater matrix are likely to be present.

158
The observed reduction in PFOX sonochemical degradation rates in groundwater
relative to MilliQ rates in the range of 20%‒30% is moderate considering the relative
concentrations of PFOX (100 g L-1) to the various groundwater components: on a mass
basis, TOC / [PFOX] = 15, [SO42-] / [PFOX] = 180, and [HCO3
-] / [PFOX] = 1400. It is
found in our previous study that even in a groundwater with TOC / [PFOX] > 100, the
sonochemical PFOX degradation rates are decreased by no more than 60%. Some other
oxidative or reductive degradation methods46 may be more significantly affected by
matrix compounds at these concentrations, since reactions rates with these compounds
greatly exceed reaction rates with PFOX. In the example of UV-persulfate oxidation
where PFOX is effectively degraded by reaction with sulfate anion radical, the matrix
effect of HCO3- is expected to be much more significant because sulfate anion radical
reacts with PFOX with a second-order rate constant of 104 M-1 s-1 and with HCO3- with a
second-order rate constant of 9 × 10⁶ M-1 s-1.47-48 Finally, the decrease in PFOX
sonochemical degradation rates due to bicarbonate can be effectively rectified by a
simple pH adjustment. Both alkalization and acidification have been observed to rectify
rates to at least those observed in MilliQ, with acidification even amplifying rates over
those expectations.

159
7.6 Acknowledgements
The authors would like to thank 3M for the financial support and Dr. Nathan Dalleska
and the Caltech Environmental Analysis Center for technical assistance in sample
analysis.
7.7 References
(1) Houde, M.; Martin, J. W.; Letcher, R. J.; Solomon, K. R.; Muir, D. C. G.,
Environ. Sci. Technol. 2006, 40, 3463-3473.
(2) Prevedouros, K.; Cousins, I. T.; Buck, R. C.; Korzeniowski, S. H., Environ. Sci.
Technol. 2006, 40, 32-44.
(3) So, M. K.; Taniyasu, S.; Yamashita, N.; Giesy, J. P.; Zheng, J.; Fang, Z.; Im, S.
H.; Lam, P. K. S., Environ. Sci. Technol. 2004, 38, 4056-4063.
(4) Murakami, M.; Imamura, E.; Shinohara, H.; Kiri, K.; Muramatsu, Y.; Harada, A.;
Takada, H., Environ. Sci. Technol. 2008, 42, 6566-6572.
(5) Furdui, V. I.; Helm, P. A.; Crozier, P. W.; Lucaciu, C.; Reiner, E. J.; Marvin, C.
H.; Whittle, D. M.; Mabury, S. A.; Tomy, G. T., Environ. Sci. Technol. 2008, 42,
4739-4744.
(6) Yamashita, N.; Kannan, K.; Taniyasu, S.; Horii, Y.; Petrick, G.; Gamo, T. In A
Global Survey of Perfluorinated Acids in Oceans, 2005; Pergamon-Elsevier
Science Ltd: 2005; pp 658-668.
(7) Konwick, B. J.; Tomy, G. T.; Ismail, N.; Peterson, J. T.; Fauver, R. J.;
Higginbotham, D.; Fisk, A. T., Environ. Toxicol. Chem. 2008, 27, 2011-2018.

160
(8) Clara, M.; Scheffknecht, C.; Scharf, S.; Weiss, S.; Gans, O., Water Sci. Technol.
2008, 58, 59-66.
(9) Oliaei, F. O.; Kriens, D.; Kessler, K. Investigation of Perfluorochemical (PFC)
Contamination in Minnesota Phase One; Minnesota Pollution Control Agency:
2006.
(10) Schultz, M. M.; Barofsky, D. F.; Field, J. A., Environ. Sci. Technol. 2004, 38,
1828-1835.
(11) Moody, C. A.; Hebert, G. N.; Strauss, S. H.; Field, J. A., J. Environ. Monit. 2003,
5, 341-345.
(12) Key, B. D.; Howell, R. D.; Criddle, C. S., Environ. Sci. Technol. 1998, 32, 2283-
2287.
(13) Schultz, M. M.; Higgins, C. P.; Huset, C. A.; Luthy, R. G.; Barofsky, D. F.; Field,
J. A., Environ. Sci. Technol. 2006, 40, 7350-7357.
(14) Sinclair, E.; Kannan, K., Environ. Sci. Technol. 2006, 40, 1408-1414.
(15) Takagi, S.; Adachi, F.; Miyano, K.; Koizumi, Y.; Tanaka, H.; Mimura, M.;
Watanabe, I.; Tanabe, S.; Kannan, K., Chemosphere 2008, 72, 1409-1412.
(16) Yamamoto, T.; Noma, Y.; Sakai, S. I.; Shibata, Y., Environ. Sci. Technol. 2007,
41, 5660-5665.
(17) Hori, H.; Nagaoka, Y.; Murayama, M.; Kutsuna, S., Environ. Sci. Technol. 2008,
42, 7438-7443.
(18) Hori, H.; Yamamoto, A.; Kutsuna, S., Environ. Sci. Technol. 2005, 39, 7692-
7697.

161
(19) Hori, H.; Nagaoka, Y.; Yamamoto, A.; Sano, T.; Yamashita, N.; Taniyasu, S.;
Kutsuna, S.; Osaka, I.; Arakawa, R., Environ. Sci. Technol. 2006, 40, 1049-1054.
(20) Park, H.; Vecitis, C. D.; Cheng, J.; Choi, W.; Mader, B. T.; Hoffmann, M. R., J.
Phys. Chem. A 2009, 113, 690-696.
(21) Ochoa-Herrera, V.; Sierra-Alvarez, R.; Somogyi, A.; Jacobsen, N. E.; Wysocki,
V. H.; Field, J., Environ. Sci. Technol. 2008, 42, 3260-3264.
(22) Moriwaki, H.; Takagi, Y.; Tanaka, M.; Tsuruho, K.; Okitsu, K.; Maeda, Y.,
Environ. Sci. Technol. 2005, 39, 3388-3392.
(23) Vecitis, C. D.; Park, H.; Cheng, J.; Mader, B. T.; Hoffmann, M. R., J. Phys.
Chem. A 2008, 112, 4261-4270.
(24) Vecitis, C. D.; Park, H.; Cheng, J.; Mader, B. T.; Hoffmann, M. R., J. Phys.
Chem. C 2008, 112, 16850-16857.
(25) Cheng, J.; Vecitis, C. D.; Park, H.; Mader, B. T.; Hoffmann, M. R., Environ. Sci.
Technol. 2008, 42, 8057-8063.
(26) Hansen, K. J.; Johnson, H. O.; Eldridge, J. S.; Butenhoff, J. L.; Dick, L. A.,
Environ. Sci. Technol. 2002, 36, 1681-1685.
(27) Cacace, M. G.; Landau, E. M.; Ramsden, J. J., Q. Rev. Biophys. 1997, 30, 241-
277.
(28) Cheng, J.; Vecitis, C. D.; Hoffmann, M. R.; Colussi, A. J., J. Phys. Chem. B 2006,
110, 25598-25602.
(29) Krusic, P. J.; Marchione, A. A.; Roe, D. C., J. Fluor. Chem. 2005, 126, 1510-
1516.
(30) Krusic, P. J.; Roe, D. C., Anal. Chem. 2004, 76, 3800-3803.

162
(31) Kotronarou, A.; Mills, G.; Hoffmann, M. R., J. Phys. Chem. 1991, 95, 3630-3638.
(32) Suslick, K. S.; Hammerton, D. A.; Cline, R. E., J. Am. Chem. Soc. 1986, 108,
5641-5642.
(33) Wall, M.; Ashokkumar, M.; Tronson, R.; Grieser, F., Ultrason. Sonochem. 1999,
6, 7-14.
(34) Tronson, R.; Ashokkumar, M.; Grieser, F., J. Phys. Chem. B 2002, 106, 11064-
11068.
(35) Mahamuni, N. N.; Pandit, A. B., Ultrason. Sonochem. 2006, 13, 165-174.
(36) Guo, Z. B.; Feng, R.; Li, J. H.; Zheng, Z.; Zheng, Y. F., J. Hazard. Mater. 2008,
158, 164-169.
(37) Sunartio, D.; Ashokkumar, M.; Grieser, F., J. Am. Chem. Soc. 2007, 129, 6031-
6036.
(38) Jarvis, N. L.; Scheiman, M. A., J. Phys. Chem. 1968, 72, 74-&.
(39) Chen, X.; Yang, T.; Kataoka, S.; Cremer, P. S., J. Am. Chem. Soc. 2007, 129,
12272-12279.
(40) Piazza, R.; Pierno, M. In Protein Interactions near Crystallization: A Microscopic
Approach to the Hofmeister Series, 2000; Iop Publishing: 2000; pp A443-A449.
(41) Fesinmeyer, R. M.; Hogan, S.; Saluja, A.; Brych, S. R.; Kras, E.; Narhi, L. O.;
Brems, D. N.; Gokarn, Y. R., Pharm. Res. 2009, 26, 903-913.
(42) Beattie, J. K.; Djerdjev, A. N.; Warr, G. G., 2009, 141, 31-39.
(43) Winter, B.; Faubel, M.; Vacha, R.; Jungwirth, P., Chem. Phys. Lett. 2009, 474,
241-247.

163
(44) Cheng, J.; Psillakis, E.; Hoffmann, M. R.; Colussi, A. J., J. Phys. Chem. A 2009,
113, 8152-8156.
(45) Hung, H. M.; Kang, J. W.; Hoffmann, M. R., Water Environ. Res. 2002, 74, 545-
556.
(46) Vecitis, C. D.; Park, H.; Cheng, J.; Mader, B. T.; Hoffmann, M. R., Front.
Environ. Sci. Eng. China 2009, 3, 129-151.
(47) Kutsuna, S.; Hori, H., Int. J. Chem. Kinet. 2007, 39, 276-288.
(48) Neta, P.; Huie, R. E.; Ross, A. B., J. Phys. Chem. Ref. Data 1988, 17, 1027-1284.

164
Table 7.1, Primary components of the groundwater sample a
pH 7.9 Chloride, mg L-1 as Cl 14
Temperature, ºC 11.7 Nitrate-nitrite, mg L-1 as N
1.9
Dissolved oxygen, mg L-1 6.3 Calcium, mg L-1 as Ca 64
TOC, mg L-1 1.5 Magnesium, mg L-1 as Mg
20
Total suspended solids, mg L-1 3.0 Sodium, mg L-1 as Na 7.3
Total alkalinity, mg L-1 as CaCO3 220 Potassium, mg L-1 as K 1.0
Bicarbonate alkalinity, mg L-1 as CaCO3
220 Iron, mg L-1 as Fe <0.05
Sulfate, mg L-1 as SO4 18 Manganese, mg L-1 as Mn
<0.01
a. Measurements completed by PACE Analytical

165
Figure 7.1. ln([PFOS]t / [PFOS]i) (a) and ln([PFOA]t / [PFOA]i) (b) vs. time in minutes during sonochemical degradation in MilliQ water () and groundwater (). Reaction conditions are 612 kHz, 250 W L-1, Ar, 10 oC, and [PFOS]i = [PFOA]i = 100 g L-1. Each error bar represents one standard deviation from the mean of at least three experiments.
-PFOSMQk = 0.0192 min-1, -PFOS
GWk = 0.0135min-1, -PFOAMQk = 0.0366 min-1, and -PFOA
GWk = 0.0291
min-1.
Time (min)
0 15 30 45 60 75 90 105 120
ln (
[PF
OS
] t/[P
FO
S] i)
-2.5
-2.0
-1.5
-1.0
-0.5
0.0
MQ
GW
a
Time (min)
0 15 30 45 60 75 90 105 120
ln (
[PF
OA
] t/[P
FO
A] i)
-5
-4
-3
-2
-1
0
MQ
GW
b

166
Figure 7.2. The observed pseudo-first-order rate constant normalized to the MilliQ rate constant, -PFOSk / -PFOS
MQk (a) and -PFOAk / -PFOAMQk (b), vs. concentration of NaClO4 ( ),
NaNO3 (), NaCl (), Na2SO4(), and NaHCO3() in mM. Reaction conditions are 612 kHz, 250 W L-1, Ar, 10 oC, and [PFOS]i = [PFOA]i = 100 g L-1.
Electrolyte Concentration (mM)
0 2 4 6 8 10
k-P
FO
S/k
MQ
-PF
OS
0.6
0.8
1.0
1.2
1.4
1.6NaClO4
NaNO3
NaCl
Na2SO4
NaHCO3
a
Electrolyte Concentration (mM)
0 2 4 6 8 10
k-PF
OA/k
MQ
-PF
OA
0.7
0.8
0.9
1.0
1.1
1.2
NaHCO3
Na2SO4
NaNO3
NaClO4
NaCl
b

167
Figure 7.3. The observed pseudo-first-order rate constant for sonolysis of PFOA (clear bars) and PFOS (filled bars) in MilliQ water, aqueous solutions of 5mM NaCl, 5mM NH4Cl, 2.5mM CaCl2, and 2.5 mM MgCl2. Reaction conditions are 612 kHz, 250 W L-1, Ar, 10 oC, and [PFOS]i = [PFOA]i = 100 g L-1.
k-PF
OX (
min
-1)
0.00
0.01
0.02
0.03
0.04
Milli-Q NaCl NH4Cl CaCl2 MgCl2
PFOS
PFOA

168
Figure 7.4. k-PFOX, the pseudo-first-order rate constant for sonolysis of PFOS () and PFOA (), vs. pH of the aqueous solution. Dashed lines represent values of plus and minus one standard deviation from the mean rate constant obtained under pH 7, k-PFOS = 0.0192 ± 0.0016 min-1, and k-PFOA = 0.0366 ± 0.0003 min-1.
pH
3 4 5 6 7 8 9 10 11
K-P
FO
X (
min
-1)
0.015
0.020
0.025
0.030
0.035
0.040
0.045
PFOA
PFOS

169
Figure 7.5. (a) ln([PFOS]t / [PFOS]i) and ln([PFOA]t / [PFOA]i) (b) vs. time in minutes during the sonolysis of PFOS and PFOA in groundwater under its original pH 8.0 () , pH 11.0 (), and pH 3.9 (). Other reaction parameters are: 612 kHz, 250 W L-1, Ar, 10 oC, and [PFOS]i = [PFOA]i = 100 g L-1.
Time (min)
0 15 30 45 60 75 90 105 120
ln (
[PF
OS
] t/[P
FO
S] i)
-3.5
-3.0
-2.5
-2.0
-1.5
-1.0
-0.5
0.0
pH=8.0
pH=11.0
pH=3.9
a
Time (min)
0 15 30 45 60 75 90 105 120
ln (
[PF
OA
] t/[P
FO
A] i)
-5
-4
-3
-2
-1
0
pH=8.0
pH=3.9
pH=11.0
b

170
Figure 7.6. ln([PFOS]t / [PFOS]i) (a) and ln([PFOA]t / [PFOA]i) (b) vs. time in minutes during sonochemical degradation in Milli-Q water () and groundwater () under 354 kHz, 250 W L-1, Ar, 10 oC for [PFOS]i = [PFOA]i = 100 g L-1. Each error bar represents one standard deviation from the mean of at least three experiments. -PFOS
MQk = 0.0239 min-1, -PFOSGWk = 0.0170 min-1, -PFOA
MQk = 0.0469 min-1, and -PFOAGWk = 0.0356 min-1.
Time (min)
0 15 30 45 60 75 90 105 120
ln (
[PF
OS
] t/[P
FO
S] i)
-2.5
-2.0
-1.5
-1.0
-0.5
0.0
GW
MQ
a
Time (min)
0 15 30 45 60 75 90 105 120
ln (
[PF
OA
] t/[P
FO
A] i)
-5
-4
-3
-2
-1
0
MQ
GW
b

171
Figure 7.7. The titration curve of the groundwater sample: pH of the groundwater sample vs. the concentration of HCl added in mM.
HCl added (mM)
0.0 0.5 1.0 1.5 2.0 2.5
pH
4
5
6
7
8

172
Chapter 8
Confocal Fluorescence Microscopy of Interstitial Fluids in Freezing Electrolyte Solutions*
* This chapter is reproduced, with moderate changes, with permission from J. Cheng, C. Soetjipto, M. R. Hoffmann, and A. J. Colussi, Journal of Physical Chemistry Letters, 2010, 1, 374-378. Copyright © 2010, American Chemical Society

173
8.1 Abstract
The information content of ice core records and the strength of ice-atmosphere
interactions depend on the morphology and composition of the fluid films threading
polycrystalline ice. Flat ice surfaces separated by pure water always attract by dispersive
forces. Thus, these films owe their existence to the presence of impurities and to
curvature effects. Electrolyte impurities induce colligative effects, but also adsorb on
charged ice surfaces and screen their resulting electrostatic repulsion. Film thickness is
not therefore a monotonically increasing function of electrolyte concentration as it may
be surmised. This possibility is herein demonstrated via time-resolved confocal
fluorescence microscopy imaging of the freezing and thawing process of electrolyte
solutions doped with a dual-emission pH probe. During freezing of water, the pH probe
accumulates into 12 2 m thick veins embedded in a pristine ice matrix. The ice front
advancing into a 1.0 mM NaCl electrolyte solution, in contrast, engulfs the pH probe into
small pockets (<1 1 m2) distributed over the sample. Together, these observations are
consistent with a non-monotonic dependence of on ion concentration. The local pH
value increases by less than 0.4 units in the interstitial liquid films during freezing of a
0.1 mM NaCl solution, and by over 1.0 units upon subsequent thawing, revealing that the
excess negative charge generated by the preferential incorporation of Cl- over Na+ into
the ice phase is relieved by the seepage of OH- slowly produced via H2O H+ + OH-. In
contrast, preferential incorporation of the NH4+ over the Ac- into ice leads to the
acidification of the interstitial liquid films in ice frozen from dilute NH4Ac solutions.

174
8.2 Introduction
Most solids exist as polycrystalline aggregates. Their properties, ranging from the
rheology and paleography of glacial ice to the reduction of critical current density in
high-temperature superconductors1-3 are determined by the composition and geometry of
grain boundaries. Gaps among grains arise because advancing planar solid fronts are
unstable and bifurcate under the thermal and concentration gradients generated by
freezing itself.4-6 They persist within thermally equilibrated (but dynamically arrested)7-10
frozen materials because the fractionation of melt components at grain boundaries usually
minimizes interfacial free energy. Chemical11-13 and biological activity14-16 in snow, ice
cores and permafrost actually takes place in microfluids wetting polycrystalline ice grains
that contain the solutes and nutrients rejected by the ice matrix.
Ice is notoriously intolerant to impurities, but interstitial fluids are not concentrates of
the starting solutions,17-21 because molecular isomorphism imposes strong selectivity
rules. For example, ammonium (NH4+) and fluoride (F-), being isoelectronic with H2O
and OH-, respectively, are selectively but marginally (~1 out of 104) incorporated into the
ice matrix over their counterions. This phenomenon generates transient charge
imbalances between the solid and the liquid phases during freezing that eventually relax
via migration of the intrinsic H+/HO- ice carriers.22-26 Preferential incorporation of cations
over anions into the ice lattice therefore leads to acidification of the liquid, and vice
versa. The local acidity of interstitial fluids determines, for example, whether weak,
volatile acids or bases can be exchanged between ice and the gas phase, and whether
reactions between dopants are inhibited or catalyzed in frozen media.27-34

175
The equilibrium fluid films that persist at the air/ice interface below the normal
melting point have been characterized theoretically and experimentally.17,35-39 Only the
dihedral angle of water channels along ice grain boundaries is, however, known with any
certainty.18,21,40-44 Optically transparent polycrystalline ice seems ideally suited to test
current views on grain boundary melting18. Herein we address these issues, and report
preliminary results of a time-resolved confocal fluorescence microscopy study of freezing
aqueous electrolyte solutions, and their subsequent thawing.
8.3 Experimental Section
C-SNARF-1 (Invitrogen, C1270, see Scheme 8.1) was used as the dual-emission
fluorescence pH indicator. A 50 M stock C-SNARF-1 solution in MilliQ water was
prepared and stored frozen at -20 ˚C until use. Sodium chloride (> 99.9% purity; EMD),
ammonium acetate (>99.999% purity; Aldrich), and ammonium sulfate (> 99.5% purity;
EMD) were used as received. 1 M sodium hydroxide solution (VWR), 30% ammonium
hydroxide solution (J.T. Baker), 1 M hydrochloric acid (VWR), 1 M sulfuric acid (VWR),
KH2PO4·3H2O(AR; Mallinckrodt), and KH2PO4 (>99.7% purity; Mallinckrodt) were
used to adjust the pH of the sample solutions as indicated. All solutions were prepared
with deionized water (resistivity 18.2 MΩ cm) purified with a Milli-Q ultrapure water
system (Millipore).
Temporally and spectrally resolved fluorescence imaging of test solutions was
performed with a Zeiss LSM 510 META NLO confocal laser scanning microscope
(CLSM) equipped with a programmable PE-120 Peltier cryostage (Linkam). 1.0 M C-
SNARF-1 test solutions were prepared by dilution of the stock solution in water, or in a

176
binary electrolyte of known concentration, as indicated. Their pH was adjusted prior to
freezing by means of acid (basic) solutions containing the same anion (cation) as the
selected electrolyte. Fluorescence was acquired from 30 l samples of the test solutions
contained in a cylindrical well (6.0 mm in diameter, 1.0 mm deep) bored into a clear
quartz plate, which was tightly clamped to the cryostage lying on the (x, y)-movable plate
of the CLSM. A typical freeze-and-thaw cycle involved a temperature program consisting
of three consecutive steps: (1) cooling at -10 K min-1 from 298 K to 268 K, (2) holding at
268 K for 5 minutes after completion of sample freezing, and (3) warming at 10 K min-1
back to 298 K. The actual sample temperature was simultaneously measured with a
calibrated type-K thin wire thermocouple immersed in the test solution (Figure 8.1).
The fluorescence emitted by the sample was continuously scanned during the freeze-
thaw cycle, which allowed tracking the advancing ice front by adjusting the position of
the stage. LD C-Apochromat 40/1.1 W Corr M27 or EC Plan-Neofluar 10/0.3
objective lenses were used to collect images from x-y planes with (512 512) pixels
resolution, which corresponds to (225 m 225 m) and (900 m 900 m) frames,
respectively. The following instrumental parameters were used unless otherwise
specified: exc = 488 or 514 nm at 50% argon laser output power, 15% transmission; scan
speed: 1.0 frame s-1; pinhole set at 750, corresponding to a z-slice of < 9.3 m for the
40/1.1 objective; detector gain: 720. The META detector and the Lambda acquisition
mode were used to obtain fluorescence emission spectra from 565.1 nm to 650.7 nm with
a step size of 10.7 nm. The images were analyzed using Zeiss LSM Image Examiner
software.

177
The pH dependence of C-SNARF-1 fluorescence emissions was independently
calibrated with a Perkin Elmer LS 50B luminescence spectrometer. 3.0 mL of 0.2 M C-
SNARF-1 solutions in 0.05 M KH2PO4/K2HPO4 buffers contained in square prismatic
silica cuvettes were excited at exc = 514 nm, and emission spectra recorded between 550
and 750 nm. The excitation slit and scan speed were set at 10 and 200 nm min-1,
respectively.
8.4 Results and Discussion
The fluorescence emission of C-SNARF-1 as a function of pH was calibrated with the
CLSM using 1.0 M C-SNARF-1 solutions in 0.05 M KH2PO4/K2HPO4 buffer at
different pH values ranging from 5.6 to 9.2, under different conditions of temperature, C-
SNARF-1 concentration, laser intensity, scan speed, and detector gain. The fluorescence
emission spectra of C-SNARF-1 show two distinctive emission maxima at 1 = 581 nm
and 2 = 635 nm. R = I(1)/I(2), is the ratio of their corresponding fluorescence
intensities. Figure 8.2 shows R vs. pH calibration curves obtained by fitting equation
(8.1):
min
max
pH p log log
a
a b
R R IK
R R I (8.1)
to CLSM or fluorometer R measurements. pKa (C-SNARF-1) = 7.5, Rmax and Rmin are the
maximum and minimum R-values, respectively, and I(2)a/I(2)
b is the ratio of I(2) in
acid to that in base. Ratiometric measurements minimize uneven probe distribution,
differences in sample thickness, photobleaching and self-quenching effects.45-46 As long
as fluorescence is not oversaturated, calibration curves are also insensitive to sample

178
concentration and instrumental parameters such as excitation laser intensity, scan speed,
and detector gain (See Figure 8.7). Temperature has a minor effect on R vs. pH
calibration curves (~ 0.01 pH K-1 between 268 and 298 K, see Table 8.1 and Figure 8.6).
Other factors, such as ionic strength variations are negligible under present conditions.47
Figure 8.1 shows that under a preset cooling ramp of -10.0 K min-1, the sample
temperature Ts fell at about -7.9 K min-1 down to Ts ~ 268 K during step (1), when the
electrolyte solution began to freeze, releasing latent heat. Ts remained at ~ 273 K during
freezing, before cooling to 265 K for the rest of step (2). We found that cooling ramp
settings affect the velocity of the ice front rather than Ts during step (2). As the ice front
moves radially inward at ~ 5 m s-1 toward the axis of the cylindrical sample, the
fluorescent probe C-SNARF-1 is rejected by the ice and trapped in the liquid channels,
whose morphology depends markedly on the presence of electrolytes (Figure 8.3). C-
SNARF-1 in MilliQ water or very dilute electrolyte solutions accumulates into liquid
channels arranged in a hexagonal network with well-developed veins, = (12 2) m,
and nodes occluded in very pure ice (Figure 8.3a). In contrast, C-SNARF is randomly
distributed in pockets and dendritic channels, except in the last stages, upon freezing
NaCl and (NH4)2SO4 solutions at concentrations above 1 mM (Figure 8.3b and c).
Topological considerations suggest that the average number of sides of the disordered
polygonal cells arising spontaneously in systems far from equilibrium via symmetry
breaking is six (Figure 8.3a).48 We infer that dynamic instabilities, rather than
thermodynamics, determine the morphologies observed in our experiments.6
Figure 8.4 shows in detail the fluorescence intensity and pH (x, y)-distributions during
the freezing of a solution containing 10 M C-SNARF-1 and 0.1 mM NaCl. Figure 8.4a

179
shows that the probe was evenly distributed in the sample solution at pH 6.4 across the
entire imaging area prior to freezing. As freezing started, C-SNARF-1 was observed to
accumulate at the ice front, forming a band of approximately 20 m in width (Figure 8.4
b), showing that C-SNARF-1 diffusion is slow relative to the forward velocity of the ice
front. As shown in Figures 8.4b and c, the pH of the liquid phase increased moderately to
~7.2 in the interfacial region and to ~7.0 in the bulk liquid away from the interface. pH
rose to ~8.4, however, upon thawing the sample after being frozen for 5 minutes (Figure
8.4(d)). The timescales involved are quite consistent with the seepage of OH- produced at
rates: kf(H2O H+ + OH-) = Kw kb < 10-14 M 1010 M-1 s-1 = 10-4 s-1,49 into the pockets,
as suggested by Bronshteyn and Chernov.29,34,47,50-51 pH returned to the initial value after
the sample has completely melted. We verified that the areas under the fluorescence
intensity curves (black traces) in Figures 8.4 (c) and (d), along the path = (x = y): A =
I() d, are identical within experimental error, proving the reversibility of freeze-and-
thaw cycles, and indirectly, the absence of self-quenching and other possible artifacts.
Figure 8.5 shows the pH changes during freezing a 0.05 mM CH3COONH4 solution.
The pH of the liquid phase was expected to drop during freezing due to preferential
incorporation of NH4+ into the ice lattice. However, as shown in Figure 8.5 (a) and 8.5
(b), during freezing the pH of the liquid phase slightly increased from approximately 7.9
to 8.2, presumably due to freeze-concentration of an initially basic solution and to the
temperature effect. When the sample was thawed after being frozen for 5 minutes, the pH
did decrease to 6.8 in the liquids surrounding the air bubbles (Figure 8.5(c)).

180
8.5 Acknowledgements
This project was financially supported by the National Science Foundation (ATM-
0534990).
8.6 Reference
(1) Duval, P.; Arnaud, L.; Brissaud, O.; Montagnat, M.; de la Chapelle, S. Ann. Glaciol.
2000, 30, 83.
(2) Cuffey, K.; Conway, H.; Gades, A.; Hallet, B.; Raymond, C.; Whitlow, S. J.
Geophys. Res. 2000, 105, 27895.
(3) Cullen, D.; Baker, I. J. Glaciol. 2000, 46, 703.
(4) Coriell, S. R.; McFadden, G. B.; Sekerka, R. F. Annu. Rev. Mater. Sci. 1985, 15,
119.
(5) Nagashima, K.; Furukawa, Y. J. Phys. Chem. B 1997, 101, 6174.
(6) Wettlaufer, J. S. Europhys. Lett. 1992, 19, 337.
(7) Brader, J. M.; Voigtmann, T.; Fuchs, M.; Larson, R. G.; Cates, M. E. Proc. Natl.
Acad. Sci. U. S. A. 2009, 106, 15186.
(8) Cates, M. E.; Wittmer, J. P.; Bouchaud, J. P.; Claudin, P. Phys. Rev. Lett. 1998, 81,
1841.
(9) Lu, K.; Brodsky, E. E.; Kavehpour, H. P. Nat. Phys. 2008, 4, 404.
(10) Smart, A.; Ottino, J. M. Soft Matter 2008, 4, 2125.
(11) Grannas, A. M.; Jones, A. E.; Dibb, J.; Ammann, M.; Anastasio, C.; Beine, H. J.;
Bergin, M.; Bottenheim, J.; Boxe, C. S.; Carver, G.; Chen, G.; Crawford, J. H.;
Domine, F.; Frey, M. M.; Guzman, M. I.; Heard, D. E.; Helmig, D.; Hoffmann, M.

181
R.; Honrath, R. E.; Huey, L. G.; Hutterli, M.; Jacobi, H. W.; Klan, P.; Lefer, B.;
McConnell, J.; Plane, J.; Sander, R.; Savarino, J.; Shepson, P. B.; Simpson, W. R.;
Sodeau, J. R.; von Glasow, R.; Weller, R.; Wolff, E. W.; Zhu, T. Atmos. Chem.
Phys. 2007, 7, 4329.
(12) Domine, F.; Albert, M.; Huthwelker, T.; Jacobi, H. W.; Kokhanovsky, A. A.;
Lehning, M.; Picard, G.; Simpson, W. R. Atmos. Chem. Phys. 2008, 8, 171.
(13) Huthwelker, T.; Ammann, M.; Peter, T. Chem. Rev. 2006, 106, 1375.
(14) Price, P. B. FEMS Microbiol. Ecol. 2007, 59, 217.
(15) Price, P. B.; Rohde, R. A.; Bay, R. C. Biogeosciences 2009, 6, 479.
(16) Rohde, R. A.; Price, P. B.; Bay, R. C.; Bramall, N. E. Proc. Natl. Acad. Sci. U. S. A.
2008, 105, 8667.
(17) Dash, J. G.; Rempel, A. W.; Wettlaufer, J. S. Rev. Mod. Phys. 2006, 78, 695.
(18) Benatov, L.; Wettlaufer, J. S. Phys. Rev. E 2004, 70.
(19) Mader, H. M. J. Glaciol. 1992, 38, 333.
(20) Mader, H. M. J. Glaciol. 1992, 38, 359.
(21) Nye, J. F. J. Glaciol. 1989, 35, 17.
(22) Workman, E. J.; Reynolds, S. E. Phys. Rev. 1950, 78, 254.
(23) Cobb, A. W.; Gross, G. W. J. Electrochem. Soc. 1969, 116, 796.
(24) Gross, G. W. Adv. Chem. Ser. 1968, 27.
(25) Grimm, R. E.; Stillman, D. E.; Dec, S. F.; Bullock, M. A. J. Phys. Chem. B 2008,
112, 15382.
(26) Gross, G. W.; Wong, P. M.; Humes, K. J. Chem. Phys. 1977, 67, 5264.

182
(27) O'Driscoll, P.; Minogue, N.; Takenaka, N.; Sodeau, J. J. Phys. Chem. A 2008, 112,
1677.
(28) Takenaka, N.; Ueda, A.; Maeda, Y. Nature 1992, 358, 736.
(29) Takenaka, N.; Tanaka, M.; Okitsu, K.; Bandow, H. J. Phys. Chem. A 2006, 110,
10628.
(30) Takenaka, N.; Bandow, H. J. Phys. Chem. A 2007, 111, 8780.
(31) Sato, K.; Furuya, S.; Takenaka, N.; Bandow, H.; Maeda, Y.; Furukawa, Y. Bull.
Chem. Soc. Jpn. 2003, 76, 1139.
(32) Sato, K.; Takenaka, N.; Bandow, H.; Maeda, Y. J. Phys. Chem. A 2008, 112, 7600.
(33) Takenaka, N.; Furuya, S.; Sato, K.; Bandow, H.; Maeda, Y.; Furukawa, Y. Int. J.
Chem. Kinet. 2003, 35, 198.
(34) Takenaka, N.; Ueda, A.; Daimon, T.; Bandow, H.; Dohmaru, T.; Maeda, Y. J. Phys.
Chem. 1996, 100, 13874.
(35) Wettlaufer, J. S.; Worster, M. G. Ann. Rev. Fluid Mech. 2006, 38, 427.
(36) Sadtchenko, V.; Ewing, G. E. J. Chem. Phys. 2002, 116, 4686.
(37) Wei, X.; PB, M.; C, Z.; Shen, Y. R. Phys. Rev. B 2002, 66, art. no.
(38) Wei, X.; Miranda, P. B.; Shen, Y. R. Phys. Rev. Lett. 2001, 86, 1554.
(39) Doppenschmidt, A.; Butt, H.-J. Langmuir 2000, 16, 6709.
(40) Barnes, P. R. F.; Wolff, E. W. J. Glaciol. 2004, 50, 311.
(41) Barnes, P. R. F.; Wolff, E. W.; Mallard, D. C.; Mader, H. M. Microsc. Res. Tech.
2003, 62, 62.

183
(42) Baker, I.; Iliescu, D.; Obbard, R.; Chang, H.; Bostick, B.; Daghlian, C. P.
Microstructural characterization of ice cores. In Ann. Glaciol.; Dowdeswell, J.,
Willis, I. C., eds., 2005; vol. 42; pp 441.
(43) Rempel, A. W.; Waddington, E. D.; Wettlaufer, J. S.; Worster, M. G. Nature 2001,
411, 568.
(44) Hobbs, P. V. Ice Physics; Clarendon Press: Oxford, 1974.
(45) Pawley, J. B. Handbook of Biological Confocal Microscopy, 2nd ed.; Plenum
Press: New York, 1995.
(46) Mason, W. T. Fluorescent and Luminescent Probes for Biological Activity, 2nd ed.;
Academic Press: London, U.K., 1999.
(47) Robinson, C.; Boxe, C. S.; Guzman, M. I.; Colussi, A. J.; Hoffmann, M. R. J. Phys.
Chem. B 2006, 110, 7613.
(48) Schliecker, G. Adv. Phys. 2002, 51, 1319.
(49) Geissler, P. L.; Dellago, C.; Chandler, D.; Hutter, J.; Parrinello, M. Science 2001,
291, 2121.
(50) Bronshteyn, V. L.; Chernov, A. A. J. Cryst. Growth 1991, 112, 129.
(51) Sola, M. I.; Corti, H. R. An. Asoc. Quim. Argent. 1993, 81, 483.

184
Table 8.1. Fitting parameters of equation (8.2) obtained under various temperature and instrument conditions.
Instrument T (k) nm
2(nm) c minR maxR loga
b
I
I
FL 298 587 634 -1.089 0.078 2.184 -0.425 CLSM 298 581 635 -1.119 0.095 2.413 -0.321 CLSM 288 581 635 -1.144 0.095 2.409 -0.229 CLSM 278 581 635 -1.145 0.099 2.379 -0.114 CLSM 268 581 635 -1.148 0.100 2.360 0.005

185
Figure 8.1. A typical temperature profile during the freeze-thaw cycle of electrolyte solution sample. Red line: cryostage programmed temperature. Black line: actual sample temperature.
t (s)
0 200 400 600 800 1000
T (
oC
)
-10
0
10
20
30Set TSample T

186
Figure 8.2. Fluorescence emission ratio vs. pH measured by fluorometer (FL, blue line; 1 = 587 nm, 2 = 634 nm) and by CLSM (red line; 1 = 581 nm, 2 = 635 nm). The solutions measured by fluorometer experiments contain 0.2 M C-SNARF-1 and 0.05 M KH2PO4/K2HPO4 buffer, and those measured by CLSM contain 1.0 M C-SNARF-1 and 0.05 M phosphate buffer.
R= I635 nm/I581 nm
0.0 0.5 1.0 1.5 2.0 2.5
pH
6
7
8
9
CLSM
FL

187
Figure 8.3. 10 M C-SNARF-1 in (a) MilliQ, (b) 1mM NaCl solution, (c) 1mM (NH4)2SO4 solution during freezing. Fluorescence intensity is indicated by a color scale (blue: zero-low intensity, red: high intensity-saturation). Frame sizes are 900 m 900 m for (a) and 225 m 225 m for (b) (c).
a

188
b
c

189
Figure 8.4 Fluorescence emission spectra of an aqueous solution containing 10 M C-SNARF-1and 0.1 mM NaCl (a) before freezing, (b) 9.8s after freezing began, (c) 52.4 s after freezing began, and (d) 20 s after thawing began. The pH values shown are based on the emission ratio averaged over the area of interest. The frame size is 225 m 225 m.

190

191
Figure 8.5. Fluorescence emission spectra of an aqueous solution containing 5 M C-SNARF-1and 0.05 mM CH3COONH4 (a) before freezing at 298 K, (b) during freezing, and (c) during thawing. The pH values shown are based on the emission ratio averaged over the area of interest. The frame size is 225 m 225 m.
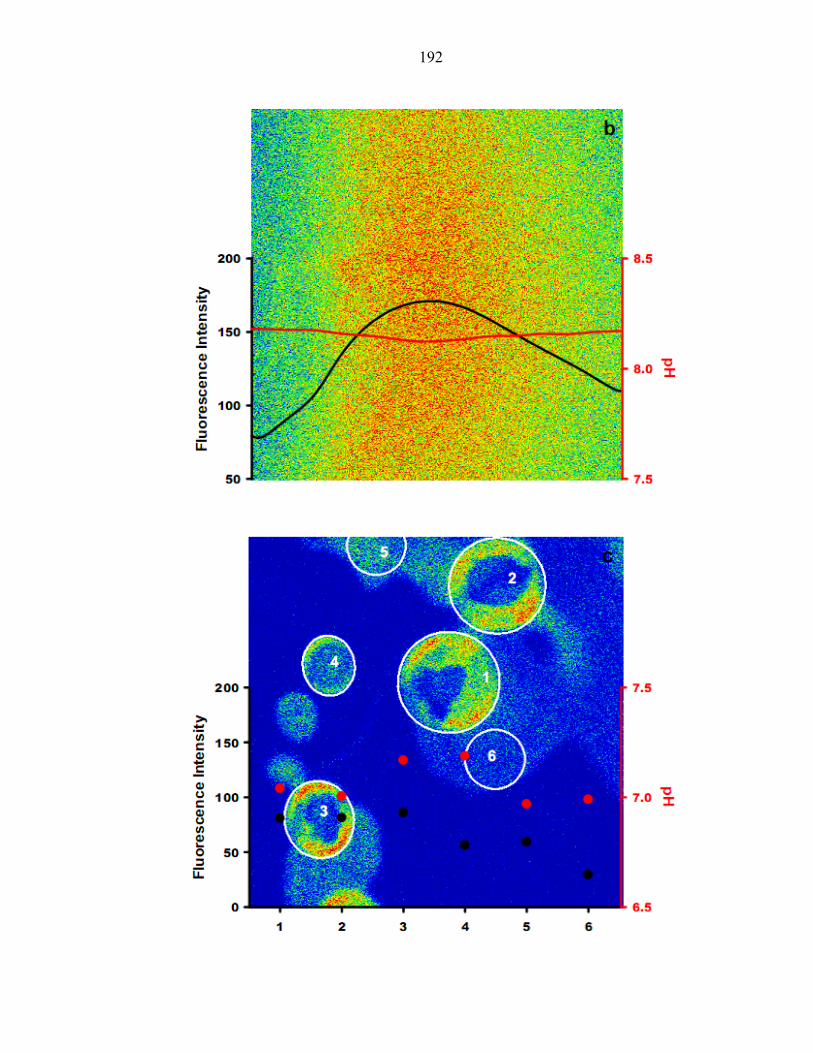
192

193
Figure 8.6. fluorescence emission ratio vs. pH measured by CLSM at different temperatures. The solutions contain 1.0 M C-SNARF-1 and 0.05 M phosphate buffer.
R = I 581nm/ I 635nm
0.0 0.5 1.0 1.5 2.0 2.5
pH
6
7
8
9
298 k288 k278 k268 k

194
Figure 8.7. fluorescence emission ratio measured by CLSM as a function of (a) laser intensity and (b) C-SNARF-1 concentration.
Laser transmission (%)
10 15 20 25 30 35 40
R =
I 581
nm
/I 63
5nm
0.0
0.5
1.0
1.5
2.0
2.5a
[C-SNARF-1] /M
0.1 1 10 100
R =
I 581
nm
/I 635n
m
0.0
0.5
1.0
1.5
2.0
2.5
b

195
Scheme 8.1. The chemical structure of C-SNARF-1.
O
O
COOH
(Me)2N
COOH
C-SNARF-1