Torino: A Tangible Programming Language Inclusive ... - CORE
Upload
khangminh22Category
view
0download
0
Tangible Fidgeting Interfaces forMental Wellbeing Recognitionusing Deep Learning applied to
Physiological Sensor Data
Kieran WoodwardN0501413
A thesis submitted in partial fulfilment of therequirements of Nottingham Trent University for
the degree of Doctor of PhilosophyMarch, 2021
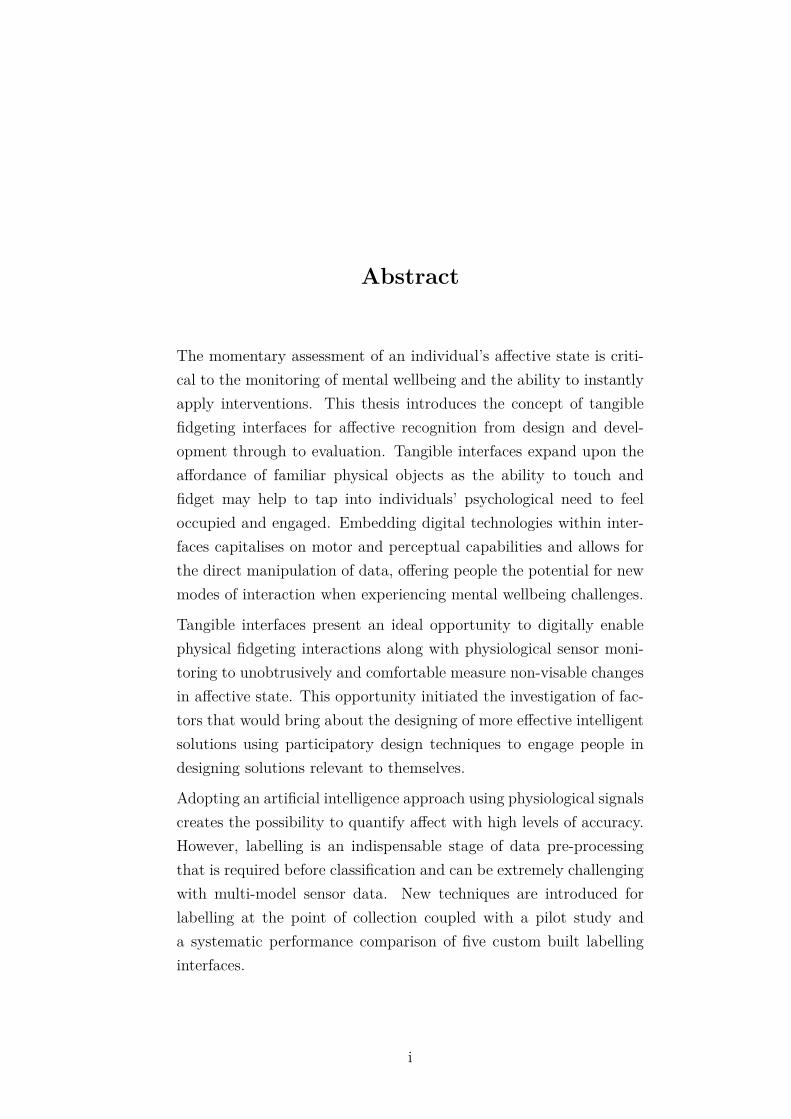
Abstract
The momentary assessment of an individual’s affective state is criti-cal to the monitoring of mental wellbeing and the ability to instantlyapply interventions. This thesis introduces the concept of tangiblefidgeting interfaces for affective recognition from design and devel-opment through to evaluation. Tangible interfaces expand upon theaffordance of familiar physical objects as the ability to touch andfidget may help to tap into individuals’ psychological need to feeloccupied and engaged. Embedding digital technologies within inter-faces capitalises on motor and perceptual capabilities and allows forthe direct manipulation of data, offering people the potential for newmodes of interaction when experiencing mental wellbeing challenges.
Tangible interfaces present an ideal opportunity to digitally enablephysical fidgeting interactions along with physiological sensor moni-toring to unobtrusively and comfortable measure non-visable changesin affective state. This opportunity initiated the investigation of fac-tors that would bring about the designing of more effective intelligentsolutions using participatory design techniques to engage people indesigning solutions relevant to themselves.
Adopting an artificial intelligence approach using physiological signalscreates the possibility to quantify affect with high levels of accuracy.However, labelling is an indispensable stage of data pre-processingthat is required before classification and can be extremely challengingwith multi-model sensor data. New techniques are introduced forlabelling at the point of collection coupled with a pilot study anda systematic performance comparison of five custom built labellinginterfaces.
i
When classifying labelled physiological sensor data, individual differ-ences between people limit the generalisability of models. To addressthis challenge, a transfer learning approach has been developed thatpersonalises affective models using few labelled samples. This ap-proach to personalise models and improve cross-domain performanceis completed on-device, automating the traditionally manual process,saving time and labour. Furthermore, monitoring trajectories overlong periods of time inherits some critical limitations in relation tothe size of the training dataset. This shortcoming may hinder thedevelopment of reliable and accurate machine learning models. Asecond framework has been developed to overcome the limitation ofsmall training datasets using an image-encoding transfer learning ap-proach.
This research offers the first attempt at the development of tangibleinterfaces using artificial intelligence towards building a real-worldcontinuous affect recognition system in addition to offering real-timefeedback to perform as interventions. This exploration of affectiveinterfaces has many potential applications to help improve quality oflife for the wider population.
Acknowledgements
I would like to thank all the people who have helped and supportedme both academically and personally throughout the process of thisPhD. In particular, I would like to mention those people who havecontributed most directly to my efforts to bring this dissertation tothe light of day.
First, I would like to express my sincere gratitude to Prof. EimanKanjo my Director of Studies. Thanks to her I launched myself intothis adventure of doing a doctorate. It is her invaluable guidance,constant encouragement and useful advice that have contributed tothe success of this research. Thank you, for giving me the opportunityto work on such an important research project and for helping meacquire the skills necessary to become a better researcher.
I would also like to thank my second supervisor Prof. David Brownwho gave me advice about how to conduct my experiments and hisinvaluable help of constructive comments and suggestions throughoutmy PhD have contributed to the success of this research. I wouldalso like to thank my third supervisor Prof. T.M. McGinnity whohas provided invaluable insights and comments. They have pushedme to consider all possible research angles and helped me become amore rigorous and thorough researcher.
My sincere thanks must also go to all of the people, past and present,that occupied the Smart Sensing lab. Thank you for all the worth-while discussions, support and encouragement. You have been a greathelp, and it has been a pleasure working besides you all.
I would also like to express thanks to all of the individuals who havehelped in my research via their participation in my studies. In par-

ticular, I would like to thank members of the NICER group and theteachers who have helped participate in numerous workshops and datacollection studies.
Finally, I would like to show my gratitude to my friends and family, fortheir endless encouragement and support; I could not have completedmy PhD without them.

The copyright in this work is held by the author. You may copy up to 5%of this work for private study, or personal, non-commercial research. Any re-useof the information contained within this document should be fully referenced,quoting the author, title, university, degree level and pagination. Queries orrequests for any other use, or if a more substantial copy is required, should bedirected to the author.
v

Contents
Abstract i
Acknowledgments iii
Contents vi
List of Figures xii
List of Tables xvi
1 Introduction 11.1 Background and Motivation . . . . . . . . . . . . . . . . . . . . . 11.2 Research Gap . . . . . . . . . . . . . . . . . . . . . . . . . . . . . 31.3 Aim and Objectives . . . . . . . . . . . . . . . . . . . . . . . . . . 51.4 Contributions . . . . . . . . . . . . . . . . . . . . . . . . . . . . . 61.5 Publications . . . . . . . . . . . . . . . . . . . . . . . . . . . . . . 71.6 Thesis Outline . . . . . . . . . . . . . . . . . . . . . . . . . . . . 9
2 Literature Review 102.1 Models of Affect . . . . . . . . . . . . . . . . . . . . . . . . . . . 102.2 Methods to Monitor Affective State . . . . . . . . . . . . . . . . . 12
2.2.1 Traditional Methods . . . . . . . . . . . . . . . . . . . . . 122.2.2 mHealth Apps . . . . . . . . . . . . . . . . . . . . . . . . 132.2.3 Tangible User Interfaces . . . . . . . . . . . . . . . . . . . 172.2.4 Physiological Sensor Measurement . . . . . . . . . . . . . 19
2.2.4.1 Heart Rate (HR) . . . . . . . . . . . . . . . . . . 19
vi
CONTENTS
2.2.4.2 ElecotroDermal Activity (EDA) . . . . . . . . . 202.2.4.3 Motion . . . . . . . . . . . . . . . . . . . . . . . 202.2.4.4 Labelling Mental Wellbeing . . . . . . . . . . . . 21
2.3 Deep Learning Architectures . . . . . . . . . . . . . . . . . . . . . 222.3.1 1 Dimension Convolutional Neural Network (1D CNN) . . 232.3.2 Long-Short Term Memory (LSTM) . . . . . . . . . . . . . 242.3.3 Gated Recurrent Unit (GRU) . . . . . . . . . . . . . . . . 262.3.4 Capsule Network (CapsNet) . . . . . . . . . . . . . . . . . 262.3.5 Residual network (ResNet) . . . . . . . . . . . . . . . . . 282.3.6 Time Warping Invariant Echo State Network (TWIESN) . 282.3.7 Encoder . . . . . . . . . . . . . . . . . . . . . . . . . . . . 282.3.8 InceptionTime . . . . . . . . . . . . . . . . . . . . . . . . 292.3.9 Multi Channel Deep Convolutional Neural Network (MCD-
CNN) . . . . . . . . . . . . . . . . . . . . . . . . . . . . . 292.4 Mental Wellbeing Classification . . . . . . . . . . . . . . . . . . . 30
2.4.1 Mobile Apps . . . . . . . . . . . . . . . . . . . . . . . . . 302.4.2 Multimodal Physiological Sensors . . . . . . . . . . . . . . 322.4.3 Transfer Learning (TL) . . . . . . . . . . . . . . . . . . . 352.4.4 Real-world Classification . . . . . . . . . . . . . . . . . . . 37
2.5 Technological Based Interventions . . . . . . . . . . . . . . . . . . 382.5.1 Biofeedback Therapy . . . . . . . . . . . . . . . . . . . . . 382.5.2 Real-time Feedback . . . . . . . . . . . . . . . . . . . . . . 39
2.6 Reflection and Challenges of Affective Technologies . . . . . . . . 452.6.1 Discussion of Existing Research . . . . . . . . . . . . . . . 452.6.2 Challenges . . . . . . . . . . . . . . . . . . . . . . . . . . . 46
2.6.2.1 Privacy and Ethics . . . . . . . . . . . . . . . . . 462.6.2.2 Digital Competency . . . . . . . . . . . . . . . . 472.6.2.3 Data Collection and User Adherence . . . . . . . 472.6.2.4 Classification . . . . . . . . . . . . . . . . . . . . 482.6.2.5 Portability . . . . . . . . . . . . . . . . . . . . . 482.6.2.6 Battery Life . . . . . . . . . . . . . . . . . . . . 48
2.6.3 Summary of Current Gaps in the Research . . . . . . . . . 49
vii
CONTENTS
3 In the hands of users: Co-Designing Tangible Interfaces to Mon-itor Affective State 513.1 Introduction . . . . . . . . . . . . . . . . . . . . . . . . . . . . . . 513.2 Background of Co-design . . . . . . . . . . . . . . . . . . . . . . . 533.3 Participatory Iterative Design Methodology . . . . . . . . . . . . 55
3.3.1 Preparation Phase . . . . . . . . . . . . . . . . . . . . . . 563.3.2 Co-design Workshop 1 . . . . . . . . . . . . . . . . . . . . 57
3.3.2.1 Introduction and Demonstration . . . . . . . . . 583.3.2.2 Storyboarding and Drawing . . . . . . . . . . . . 583.3.2.3 Prioritising Requirement Cards . . . . . . . . . . 593.3.2.4 Real-time 3D Printing . . . . . . . . . . . . . . . 603.3.2.5 Interactive Electronics . . . . . . . . . . . . . . . 60
3.3.3 Prototyping . . . . . . . . . . . . . . . . . . . . . . . . . . 613.3.4 Co-analysis . . . . . . . . . . . . . . . . . . . . . . . . . . 613.3.5 Co-design Workshop 2 . . . . . . . . . . . . . . . . . . . . 623.3.6 Product Development . . . . . . . . . . . . . . . . . . . . 633.3.7 Validation . . . . . . . . . . . . . . . . . . . . . . . . . . . 64
3.4 Results . . . . . . . . . . . . . . . . . . . . . . . . . . . . . . . . . 643.4.1 Thematic Analysis . . . . . . . . . . . . . . . . . . . . . . 64
3.4.1.1 Design and Personalisation . . . . . . . . . . . . 653.4.1.2 User Engagement . . . . . . . . . . . . . . . . . 663.4.1.3 Sensor Inputs . . . . . . . . . . . . . . . . . . . . 663.4.1.4 On-device Feedback . . . . . . . . . . . . . . . . 673.4.1.5 Design Requirements . . . . . . . . . . . . . . . 713.4.1.6 Design Limitations . . . . . . . . . . . . . . . . . 723.4.1.7 Cognitive Barriers . . . . . . . . . . . . . . . . . 73
3.4.2 Product Development . . . . . . . . . . . . . . . . . . . . 773.5 Discussion . . . . . . . . . . . . . . . . . . . . . . . . . . . . . . . 82
3.5.1 Research Questions . . . . . . . . . . . . . . . . . . . . . . 833.5.1.1 How can the co-design process be adapted to best
suit the needs of those with intellectual disabilities? 833.5.1.2 What are the optimal design guidelines for pro-
totyping affective tangible interfaces? . . . . . . 84
viii

CONTENTS
3.5.1.3 Which sensors would be most beneficial for userinteraction? . . . . . . . . . . . . . . . . . . . . . 85
3.5.1.4 How do users believe on-device feedback couldhelp improve their mental wellbeing? . . . . . . . 85
3.6 Conclusion . . . . . . . . . . . . . . . . . . . . . . . . . . . . . . . 86
4 Tangible Techniques for Real-World Labelling and Collection ofWellbeing Sensor Data 874.1 Introduction . . . . . . . . . . . . . . . . . . . . . . . . . . . . . . 884.2 LabelSens Feasibility Study . . . . . . . . . . . . . . . . . . . . . 90
4.2.1 LabelSens Method . . . . . . . . . . . . . . . . . . . . . . 914.2.2 Results . . . . . . . . . . . . . . . . . . . . . . . . . . . . 95
4.2.2.1 Labelling Rate . . . . . . . . . . . . . . . . . . . 954.2.2.2 Deep Learning Classification . . . . . . . . . . . 98
4.2.3 Evaluation of LabelSens . . . . . . . . . . . . . . . . . . . 1044.3 Data Collection for Tangible Fidgeting Interfaces . . . . . . . . . 107
4.3.1 Experimental Setup . . . . . . . . . . . . . . . . . . . . . 1084.3.2 Experimental Observations . . . . . . . . . . . . . . . . . 1094.3.3 Evaluation of the Data Collection . . . . . . . . . . . . . . 1104.3.4 Revised Data Collection . . . . . . . . . . . . . . . . . . . 111
4.4 Conclusion . . . . . . . . . . . . . . . . . . . . . . . . . . . . . . . 115
5 Mental Wellbeing Recognition using On-Device Transfer Learn-ing 1175.1 Introduction . . . . . . . . . . . . . . . . . . . . . . . . . . . . . . 1175.2 Transfer Learning Framework . . . . . . . . . . . . . . . . . . . . 119
5.2.1 Controlled Stressor Experiment (Source Model Data Col-lection) . . . . . . . . . . . . . . . . . . . . . . . . . . . . 120
5.2.2 Real-World Mental Wellbeing Trial (Target Model DataCollection) . . . . . . . . . . . . . . . . . . . . . . . . . . 124
5.2.3 On-device Model Personalisation . . . . . . . . . . . . . . 1245.3 Method . . . . . . . . . . . . . . . . . . . . . . . . . . . . . . . . 1275.4 Results . . . . . . . . . . . . . . . . . . . . . . . . . . . . . . . . . 128
ix
CONTENTS
5.4.1 Multivariate Physiological Models . . . . . . . . . . . . . . 1285.4.1.1 Deep Learning Models . . . . . . . . . . . . . . . 1285.4.1.2 Personalised TL Model . . . . . . . . . . . . . . 129
5.4.2 Mutivariate Motion and Physiological models . . . . . . . 1315.4.2.1 Deep Learning Models . . . . . . . . . . . . . . . 1315.4.2.2 Personalised TL Model . . . . . . . . . . . . . . 132
5.4.3 Univariate Models . . . . . . . . . . . . . . . . . . . . . . 1335.4.3.1 Deep Learning Models . . . . . . . . . . . . . . . 1335.4.3.2 Personalised TL Model . . . . . . . . . . . . . . 134
5.5 Discussion . . . . . . . . . . . . . . . . . . . . . . . . . . . . . . . 1355.6 Conclusion . . . . . . . . . . . . . . . . . . . . . . . . . . . . . . . 139
6 Combining Deep Transfer Learning and Signal-image Encodingfor Multimodal Mental Wellbeing Classification 1406.1 Introduction . . . . . . . . . . . . . . . . . . . . . . . . . . . . . . 1406.2 Data Collection . . . . . . . . . . . . . . . . . . . . . . . . . . . . 142
6.2.1 EnvBodySens . . . . . . . . . . . . . . . . . . . . . . . . . 1436.2.2 The Human Activity Recognition Using Smartphones Data
Set (WISDM) . . . . . . . . . . . . . . . . . . . . . . . . . 1466.3 Methods . . . . . . . . . . . . . . . . . . . . . . . . . . . . . . . . 146
6.3.1 Modality Transformation . . . . . . . . . . . . . . . . . . 1476.3.2 Model Architecture . . . . . . . . . . . . . . . . . . . . . . 149
6.3.2.1 1-Dimensional CNN TL Model . . . . . . . . . . 1496.3.2.2 Image Encoding TL Model . . . . . . . . . . . . 150
6.4 Results . . . . . . . . . . . . . . . . . . . . . . . . . . . . . . . . . 1526.4.1 1D CNN TL Stress Model - WISDM & Controlled Stressor
Data . . . . . . . . . . . . . . . . . . . . . . . . . . . . . . 1526.4.2 Image Encoding Transfer Learning Model - EnvBodySens 153
6.4.2.1 Comparison of Data Modalities . . . . . . . . . . 1536.4.2.2 Comparison of Pre-trained Models . . . . . . . . 1556.4.2.3 Comparison of Signal-Image Encoding Techniques 1566.4.2.4 Subject-Independent Models . . . . . . . . . . . 156
6.5 Discussion . . . . . . . . . . . . . . . . . . . . . . . . . . . . . . . 157
x
CONTENTS
6.6 Conclusion . . . . . . . . . . . . . . . . . . . . . . . . . . . . . . . 159
7 Research Applications and Real-Time Interventions 1607.1 Introduction . . . . . . . . . . . . . . . . . . . . . . . . . . . . . . 1617.2 Applications . . . . . . . . . . . . . . . . . . . . . . . . . . . . . . 162
7.2.1 iFidgetCube . . . . . . . . . . . . . . . . . . . . . . . . . . 1627.2.1.1 Evaluation . . . . . . . . . . . . . . . . . . . . . 164
7.2.2 Fidget Watch . . . . . . . . . . . . . . . . . . . . . . . . . 1647.2.3 Tangible Toys . . . . . . . . . . . . . . . . . . . . . . . . . 166
7.2.3.1 Communication Framework . . . . . . . . . . . . 1677.2.3.2 Empirical Evaluation . . . . . . . . . . . . . . . 169
7.3 Conclusion . . . . . . . . . . . . . . . . . . . . . . . . . . . . . . . 169
8 Conclusion and Future Work 1718.1 Conclusion . . . . . . . . . . . . . . . . . . . . . . . . . . . . . . . 1718.2 Challenges and Future Work . . . . . . . . . . . . . . . . . . . . . 175
8.2.1 Datasets . . . . . . . . . . . . . . . . . . . . . . . . . . . . 1758.2.2 Mental Health Recognition . . . . . . . . . . . . . . . . . 1758.2.3 Model Architecture . . . . . . . . . . . . . . . . . . . . . . 1768.2.4 Edge Computing . . . . . . . . . . . . . . . . . . . . . . . 1768.2.5 Sensors . . . . . . . . . . . . . . . . . . . . . . . . . . . . 1768.2.6 COVID-19 . . . . . . . . . . . . . . . . . . . . . . . . . . 176
8.3 Summary of Contributions . . . . . . . . . . . . . . . . . . . . . . 1778.3.1 Co-designing Tangible User Interfaces . . . . . . . . . . . 1778.3.2 Real-world Labelled Data Collection . . . . . . . . . . . . 1778.3.3 Deep Transfer Learning Approaches . . . . . . . . . . . . 1788.3.4 Real-time Interventions . . . . . . . . . . . . . . . . . . . 178
References 179
xi
List of Figures
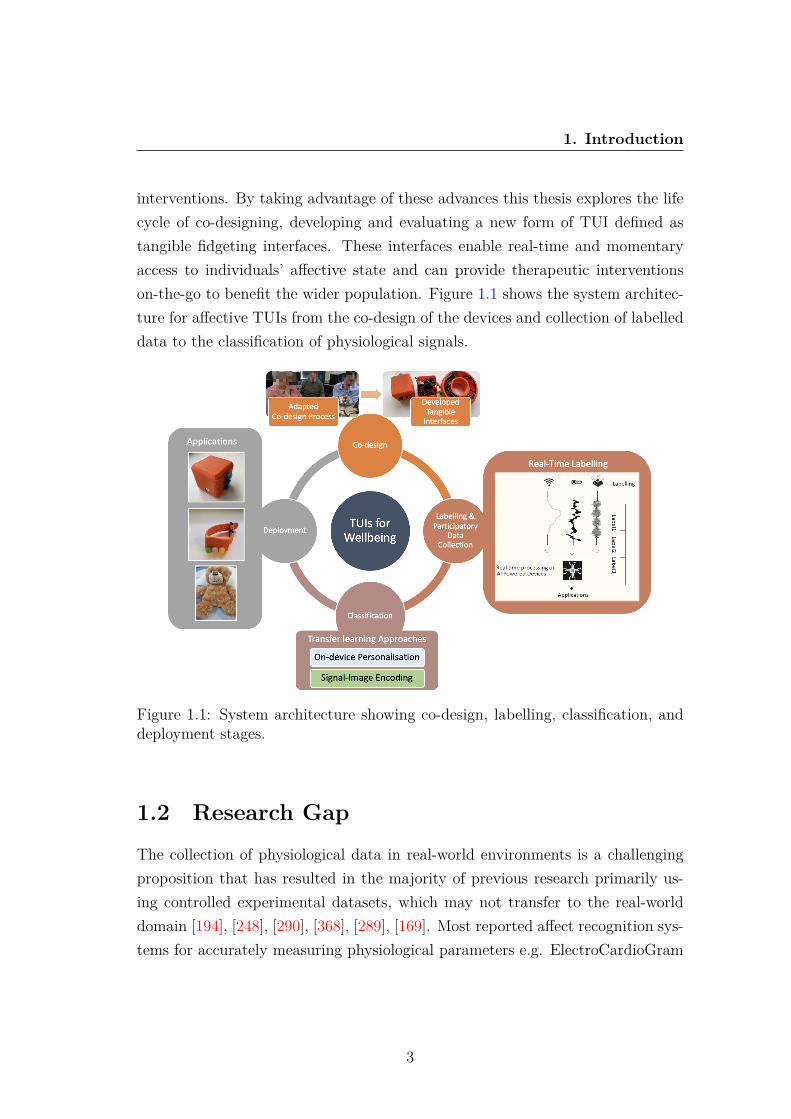
1.1 System architecture showing co-design, labelling, classification,and deployment stages. . . . . . . . . . . . . . . . . . . . . . . . . 3
2.1 Russell’s circumplex model of affect. . . . . . . . . . . . . . . . . 112.2 Comparison of average rating (left) and total global downloads
(right) of the six most downloaded mental health apps from theGoogle Play store. . . . . . . . . . . . . . . . . . . . . . . . . . . 15
2.3 Keppi TUI used to record pain. . . . . . . . . . . . . . . . . . . . 172.4 Subtle Stone TUI for communicating emotions. . . . . . . . . . . 182.5 1D CNN architecture. . . . . . . . . . . . . . . . . . . . . . . . . 242.6 LSTM cell showing input vector (X), cell output (h), cell memory
(c) and input (I), forget (f) and output (o) gates [200]. . . . . . . 252.7 Comparison of LSTM (left) and GRU (right) cells [334]. . . . . . 262.8 CapsNet encoder architecture [261]. . . . . . . . . . . . . . . . . . 272.9 The Inception module of InceptionTime [91]. . . . . . . . . . . . . 292.10 BrightHearts app showing light pattern. . . . . . . . . . . . . . . 432.11 BioFidget TUI used to promote deep breathing. . . . . . . . . . . 442.12 Paro therapy seal. . . . . . . . . . . . . . . . . . . . . . . . . . . . 44
3.1 Stages of iterative co-design process. . . . . . . . . . . . . . . . . 563.2 Original mental wellbeing interface prototype. . . . . . . . . . . . 593.3 Participants exploring different haptic patterns during a co-design
workshop. . . . . . . . . . . . . . . . . . . . . . . . . . . . . . . . 693.4 Percentage of vibration amplitude for the four tested vibration
patterns. . . . . . . . . . . . . . . . . . . . . . . . . . . . . . . . . 70
xii
LIST OF FIGURES
3.5 HR sensor connected to a breadboard used during the co-designworkshops (left) compared with soldered sensors within the 3Dprinted cube (right). . . . . . . . . . . . . . . . . . . . . . . . . . 78
3.6 Early prototyping with soft toys. . . . . . . . . . . . . . . . . . . 793.7 Shapes considered for 3D printed interfaces. . . . . . . . . . . . . 80
4.1 LabelSens framework: real-time sensor data fused with a label. . . 914.2 Example of two electronic circuits and interfaces with three but-
tons and slider labelling mechanisms. . . . . . . . . . . . . . . . . 944.3 Maximum labelling rate for each label per device during the pre-
liminary labelling rate experiment. . . . . . . . . . . . . . . . . . 954.4 Comparison of total maximum label changes vs in-situ label changes
per device. . . . . . . . . . . . . . . . . . . . . . . . . . . . . . . . 964.5 Total number of in-situ label changes per device. . . . . . . . . . 974.6 Comparison of deep learning techniques on the combined data col-
lected from each devices. . . . . . . . . . . . . . . . . . . . . . . . 1004.7 Comparison of training accuracy and loss when using GRU on the
total data collected for each device. . . . . . . . . . . . . . . . . . 1004.8 GRUmodel accuracy when individually trained on the first 5 users’
data. . . . . . . . . . . . . . . . . . . . . . . . . . . . . . . . . . . 1014.9 Comparison of 50 users’ labelling preference. . . . . . . . . . . . . 1054.10 The emotions used in the diary enabling participants to record
additional labels. . . . . . . . . . . . . . . . . . . . . . . . . . . . 1084.11 Updated data labelling diaries using photo realistic images (top)
and five point emoji scale (bottom). . . . . . . . . . . . . . . . . . 1124.12 Comparison of real-world HRV data (left) and EDA data (right)
collected using the tangible interfaces. . . . . . . . . . . . . . . . 115
5.1 Comparison of one user’s stressed (red) and relaxed (green) datacollected from one the controlled stressor experiment for HR (top),HRV (middle) and EDA (bottom). . . . . . . . . . . . . . . . . . 122
5.2 Summarising the controlled experiment EDA and HR data whenparticipants were relaxed (left panel) vs data when participantswere stressed (right panel). . . . . . . . . . . . . . . . . . . . . . . 123
xiii
LIST OF FIGURES
5.3 1D CNN architecture. . . . . . . . . . . . . . . . . . . . . . . . . 1255.4 Transfer learning approach transferring learned knowledge from
the source model trained using controlled stressor data to the tar-get model classifying real-world mental wellbeing. . . . . . . . . . 126
5.5 Comparison of confusion matrix for user 5 physiological and mo-tion TL model (left) and univariate motion TL model (right). . . 135
5.6 Comparison of average accuracy from 1D CNN models comparedwith personalised TL models. . . . . . . . . . . . . . . . . . . . . 136
5.7 Comparison of accuracy for each user’s TL model. . . . . . . . . . 1375.8 Violin chart comparing total acceleration between positive and
negative states of wellbeing. . . . . . . . . . . . . . . . . . . . . . 138
6.1 EnvBodySens EDA data for reported emotional states from 1 (pos-itive) to 5 (negative). . . . . . . . . . . . . . . . . . . . . . . . . . 144
6.2 EnvBodySens HR data for reported emotional states from 1 (pos-itive) to 5 (negative). . . . . . . . . . . . . . . . . . . . . . . . . . 144
6.3 Total number of label changes per participant. . . . . . . . . . . . 1456.4 An example of raw accelerometer data (X, Y, Z and average mo-
tion) transformed using MTF, GASF and GADF. . . . . . . . . . 1496.5 Combinatory model consisting of 1D CNN trained using raw phys-
iological sensor data (top) and a 2D CNN using a transfer learningapproach trained using accelerometer encoded images (bottom). . 151
6.6 Confusion matrix of 1D CNN using TL to infer stressed and re-laxed states of wellbeing from the controlled stressor dataset. . . . 153
6.7 Confusion matrix for DenseNet model trained using HR, EDA andGADF (left), GASF (middle) and MTF (right) encoded motion data.155
6.8 Confusion matrix of CNN model without TL when trained usingall data achieving 93% accuracy (left) and only physiological andmotion data achieving 94% accuracy (right). . . . . . . . . . . . . 155
7.1 iFidgetcube showing labelling buttons, fidgeting buttons, HR sen-sor and EDA sensor. . . . . . . . . . . . . . . . . . . . . . . . . . 163
7.2 TFI electronic schematic. . . . . . . . . . . . . . . . . . . . . . . 163
xiv

LIST OF FIGURES
7.3 Example of a Fidget watch (left) and connected mobile application(right). . . . . . . . . . . . . . . . . . . . . . . . . . . . . . . . . . 165
7.4 Two children playing using TangToys. . . . . . . . . . . . . . . . . 168
xv
List of Tables
3.1 Co-design workshop 1 participant characteristics (age, gender dis-ability) for total Number of participants (N), with Williams Syn-drome (WS), Down Syndrome (DS) and Autism. . . . . . . . . . 58
3.2 Co-design workshop 2 participant characteristics including Num-ber of participants (N), with Williams Syndrome (WS), Down Syn-drome (DS) and Autism. . . . . . . . . . . . . . . . . . . . . . . . 63
3.3 5 Participants’ tangible interfaces priorities as ordered during theco-design workshop from highest to lowest priority. . . . . . . . . 71
3.4 Description of the 9 developed wellbeing TUIs and the embeddedelectronics for real-world sensor data collection. . . . . . . . . . . 81
4.1 Number of in-situ samples collected per labelling interface for eachof the 3 labels. . . . . . . . . . . . . . . . . . . . . . . . . . . . . 99
4.2 F1-Score for each physical activity label when trained using eachof the labelling interfaces. . . . . . . . . . . . . . . . . . . . . . . 102
4.3 Cochran’s test and F test comparing the developed classificationmodels for each labelling interface. . . . . . . . . . . . . . . . . . 103
4.4 McNemar’s test comparing the 2 opposite buttons and slider clas-sification models. . . . . . . . . . . . . . . . . . . . . . . . . . . . 104
4.5 Comparison of positive and negative real-world emotional statesamples for all 10 users. . . . . . . . . . . . . . . . . . . . . . . . 114
5.1 Controlled stressor experiment subject experience from the NASATask Load Index (NASA-TLX), Rating Scale Mental Effort (RSME),Self-Assessment Manikin (SAM) and Visual Analogue Scale (VAS). 121
xvi

LIST OF TABLES
5.2 Comparison of 8 deep learning models’ accuracy tested on indi-vidual users’ physiological data. . . . . . . . . . . . . . . . . . . . 128
5.3 Comparison of 9 target users’ multivariate physiological model ac-curacy and AUC using the transfer learning approach. . . . . . . 130
5.4 Comparison of 8 deep learning models’ accuracy tested on indi-vidual users’ physiological and motion data . . . . . . . . . . . . 131
5.5 Comparison of 6 target users’ multivariate physiological and mo-tion model accuracy and AUC using the transfer learning approach.132
5.6 Comparison of univariate 1D CNNs accuracy tested using LOOCVon 10 individual’s HR (BPM), HRV, EDA or motion data. . . . . 133
5.7 Comparison of 6 target users’ univariate motion models using thetransfer learning approach. . . . . . . . . . . . . . . . . . . . . . . 134
6.1 Description of the two proposed TL methodologies to overcomedata scarcity. . . . . . . . . . . . . . . . . . . . . . . . . . . . . . 142
6.2 Comparison of accuracy for different pre-trained deep learningmodels adapted for mental wellbeing classification through TLtrained using only physiological data (HR EDA) or all data (HR,EDA, UV, body temperature, air pressure and noise). . . . . . . . 154
6.3 Comparison of subject-independent classification accuracy for 20users using the TL approach with GADF encoded images. . . . . 156
7.1 Encoded haptic patterns for different states of wellbeing to beactivated on connected TangToys based on touch and motion in-teractions. . . . . . . . . . . . . . . . . . . . . . . . . . . . . . . . 168
xvii

Chapter 1
Introduction
1.1 Background and MotivationMental health problems constitute a global challenge that affects a large numberof people of all ages and socioeconomic backgrounds [102]. The World HealthOrganisation (WHO) [343] defines the wellbeing of an individual as being en-compassed in the realisation of their abilities, coping with the normal stresses oflife, productive work and contribution to their community. Stress and anxietyare one of the most prevalent mental wellbeing problems in the UK and else-where, yet it is still under-reported, under-diagnosed and under-treated [310].According to the Mental Health Foundation, about a quarter of the populationwill experience some form of mental health problem in the course of a year [310].Hectic modern lifestyles contribute to daily stress and a general decline in mentalwellbeing, as 59% of UK adults currently experience work-related stress [236].This makes stress the leading cause of sickness-related absences from work, withabout 70 million days lost each year at an estimated cost of £2.4 billion [236].Mental disorders are closely associated with fear of stigma, structural barrierssuch as financial burden, and lack of available services and resources which of-ten prohibit the delivery of frequent clinical advice and monitoring. Advances intechnologies exhibit a range of attractive properties, which facilitate the deliveryof state-of-the-art monitoring.
Computers are a ubiquitous part of life although their inability to recognise
1

1. Introduction
mental wellbeing states results in poor human computer interactions. Affectivecomputing [238] is computing’s relationship with human emotions, if comput-ers can recognise their users’ behaviours including emotional experiences [242] itmay be possible for new devices to provide intuitive interventions that improvequality of life. Expanding upon the natural affordance of touch, Tangible UserInterfaces (TUIs) describe physical computer interfaces that are able to trans-late user actions into input events [144]. TUIs enable the interaction of digitalinformation through users’ existing skills and knowledge with physical objects,making them more intuitive to use [317], [143]. Actions on physical rather thanvirtual interfaces enable new forms of multi-sensory access such as fidgeting thatmay help regulate stress and alleviate mental wellbeing challenges [211], [141].Little body of work has thus far looked towards tangibles as an effective inter-action paradigm to automatically recognise real-world affective state and offeron-device interventions.
A vital aspect towards measuring affective state is the development of meth-ods that can comfortably measure the non-specific responses of the body. Poorwellbeing often results in reduced Heart Rate Variability (HRV - variation in timebetween heartbeats) [165] and increased ElectroDermal Activity (EDA) [362] asthey directly correlate with sympathetic nervous system [344] [276] [281]. Thisprovides new opportunities to utilise non-invasive technologies for behaviouralhealth care in order to comfortably conduct assessments in real-time. Multimodalinteractions are currently used for a wide variety of purposes such as improvingcommunication but affective computing is an area where these interactions couldhave a profound impact [5] [84]. By adopting a non-invasive multi physiologicalsensing approach and building accurate and reliable machine learning classifica-tion models it creates the opportunity for the automatic inference of affect inreal-world settings.
Previously there have only been humble attempts at developing affective tan-gible interfaces that have not utilised advances in Artificial Intelligence (AI) suchas deep learning to recognising real-world mental wellbeing. Advances in deeplearning present new opportunities for the inference of wellbeing by alleviatingthe need for manual feature extraction and when combined with physical manip-ulation tools, opens the door for new forms of natural interactions and responsive
2
1. Introduction
interventions. By taking advantage of these advances this thesis explores the lifecycle of co-designing, developing and evaluating a new form of TUI defined astangible fidgeting interfaces. These interfaces enable real-time and momentaryaccess to individuals’ affective state and can provide therapeutic interventionson-the-go to benefit the wider population. Figure 1.1 shows the system architec-ture for affective TUIs from the co-design of the devices and collection of labelleddata to the classification of physiological signals.
Figure 1.1: System architecture showing co-design, labelling, classification, anddeployment stages.
1.2 Research GapThe collection of physiological data in real-world environments is a challengingproposition that has resulted in the majority of previous research primarily us-ing controlled experimental datasets, which may not transfer to the real-worlddomain [194], [248], [290], [368], [289], [169]. Most reported affect recognition sys-tems for accurately measuring physiological parameters e.g. ElectroCardioGram
3
1. Introduction
(ECG) usually require sticky electrodes or bands which can be burdensome. Ad-ditionally, the costs associated with these devices are usually high, limiting thepotential scalability. While commercial wearables offer the potential for real-world physiological monitoring they have not been designed for the purpose ofaffect recognition, limiting their capabilities. Commercial wearables are ham-pered by poor sample rates, low accuracy [168], [30], [206], [234], [128], [218]and often forgo physical sensors such as EDA, that may help provide a betterindication of health [305], [168].
Real-world labelled longitudinal data collection poses even greater challengesas it relies on multiple users continually self-reporting, while simultaneously usingsensors for extended periods. Advances in edge computing are aiding on-deviceclassification but little focus has been paid to the initial collection of labelled mul-timodal datasets. This results in studies that only consider subjects performingwell-defined acted expressions, in a very controlled condition such as watchingmovie clips to elicit emotional responses [194]. Therefore, the models developedare not robust enough for real-world recognition tasks with subject variation.Most previous approaches have not considered real-world physiological data col-lection, making this a novel attempt at building an entire affective recognitionsystem using multi-on-body senors and advances in AI.
Furthermore, while the use of AI to monitor affective state is not new, manyprevious systems have used a one-size-fits-all solution [98], [10], [340], [240]. How-ever, due to large individual differences in physiology when experiencing differentstates of wellbeing personalised models may be required, especially for those withintellectual disabilities who are often overlooked. Finally, little research has con-sidered the possibility of automatically actuating feedback on-device in real-timesuch as fidgeting mechanisms that may meet an unmet demand by helping peoplefeel occupied. By combining advances in edge computing and AI it is possible toautomatically activate therapeutic interventions when they are most needed.
4
1. Introduction
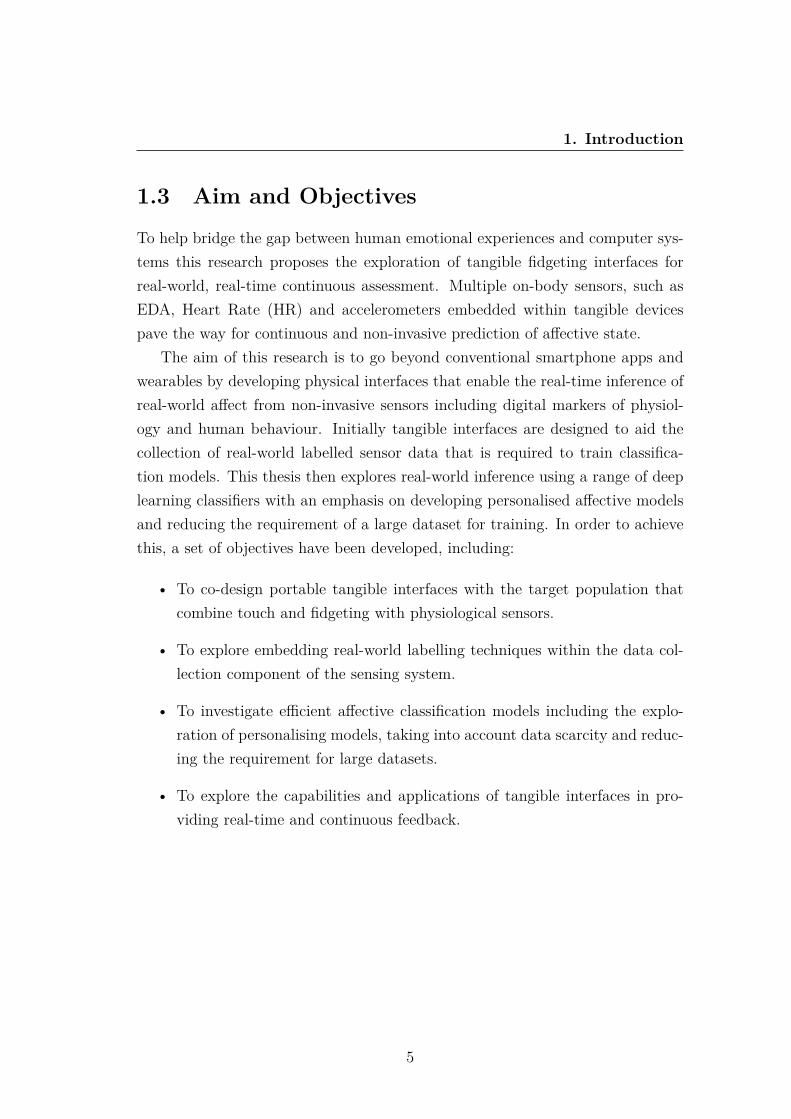
1.3 Aim and ObjectivesTo help bridge the gap between human emotional experiences and computer sys-tems this research proposes the exploration of tangible fidgeting interfaces forreal-world, real-time continuous assessment. Multiple on-body sensors, such asEDA, Heart Rate (HR) and accelerometers embedded within tangible devicespave the way for continuous and non-invasive prediction of affective state.
The aim of this research is to go beyond conventional smartphone apps andwearables by developing physical interfaces that enable the real-time inference ofreal-world affect from non-invasive sensors including digital markers of physiol-ogy and human behaviour. Initially tangible interfaces are designed to aid thecollection of real-world labelled sensor data that is required to train classifica-tion models. This thesis then explores real-world inference using a range of deeplearning classifiers with an emphasis on developing personalised affective modelsand reducing the requirement of a large dataset for training. In order to achievethis, a set of objectives have been developed, including:
• To co-design portable tangible interfaces with the target population thatcombine touch and fidgeting with physiological sensors.
• To explore embedding real-world labelling techniques within the data col-lection component of the sensing system.
• To investigate efficient affective classification models including the explo-ration of personalising models, taking into account data scarcity and reduc-ing the requirement for large datasets.
• To explore the capabilities and applications of tangible interfaces in pro-viding real-time and continuous feedback.
5

1. Introduction
1.4 ContributionsThis work marks an initial attempt at developing tangible interfaces combin-ing physical object manipulation with the monitoring of affective state throughphysiological sensors. The five main contributions of this work are as follows:
• The co-design and development of tangible fidgeting interfaces with endusers through participatory design techniques and principles. In particular,the exploration of designs, sensors and interventions and the developmentof prototypes through a series of co-design workshops and focus groups.The workshops were specifically designed to engage participants who haveintellectual disabilities, as mental wellbeing challenges for this target groupare often misattributed to their disability [102].
• Collecting well labelled data is vital to train classification models, how-ever labelling is an indispensable stage of data pre-processing that can beparticularly challenging when applied to multimodal real-time sensor datacaptured from physical devices in real-world environments. Therefore, a pi-lot study has been conducted exploring new techniques for labelling at thepoint of collection running on five custom built devices, before the collectionof a real-world labelled affective dataset utilising the developed techniques.
• The exploration of deep learning architectures to classify real-world mentalwellbeing, some of which have not previously been used for affective mod-elling. A range of deep learning models including CNN, LSTM CapsNets,ResNet, Encoder and others have been trained using real-world sensor datato explore the impact different neural networks have on modelling perfor-mance.
• The development of deep classification approaches employing on-deviceTransfer Learning (TL) and the combination of multimodal sensor datawith signal-encoded images to personalise affective models and improveperformance using few labelled samples. Using the developed TL approachthe process of personalising real-world affective models and improving cross-domain performance can be completed on-device, automating the tradition-ally manual process saving time and labour.
6
1. Introduction
• The exploration of real-time, technological feedback performing as interven-tions to improve quality of life. Three applications are examined; sensorytools embedded within interfaces to promote fidgeting, automated on-bodyhaptic feedback issued when poor wellbeing is inferred and wireless connec-tivity between interfaces to aid communication between children.
1.5 Publications• Woodward, K., Kanjo, E., Brown, D. J., and McGinnity, T. M. (2021). To-
wards Personalised Mental Wellbeing Recognition On-Device using TransferLearning “in the Wild.” IEEE International Smart Cities Conference 2021.
• Woodward, K. and Kanjo, E., 2020. iFidgetCube: Tangible Fidgeting In-terfaces (TFIs) to Improve Wellbeing. IEEE Sensors Journal.
• Woodward, K., Kanjo, E., Brown, D., McGinnity, T. M., Inkster, B., Mac-intyre, D. J., and Tsanas, A., 2020. Beyond Mobile Apps: A Survey ofTechnologies for Mental Well-being. IEEE Transactions on Affective Com-puting.
• Woodward, K., Kanjo, E. and Oikonomou, A., 2020. LabelSens: EnablingReal-time Sensor Data Labelling at the point of Collection on Edge Com-puting. Personal and Ubiquitous Computing.
• Woodward, K., Kanjo, E., Brown, D. J., and Inkster, B., 2020. TangToys:Smart Toys to Communicate and Improve Children’s Wellbeing. Proceed-ings of the 2020 ACM International Joint Conference on Pervasive andUbiquitous Computing.
• Woodward, K., Kanjo, E., Brown, D., and McGinnity, T. M., 2020. On-Device Transfer Learning for Personalising Psychological Stress ModellingUsing a Convolutional Neural Network. On-device Intelligence Workshop,MLSys, Texas.
7
1. Introduction
• Woodward, K., Kanjo, E. and Brown, D., 2019. AI-powered tangible in-terfaces to transform children’s mental well-being. 5th IEEE InternationalConference on Internet of People (IoP 2019).
• Woodward, K., Kanjo, E., Umair, M. and Sas, C., 2019. Harnessing digitalphenotyping to deliver real-time interventional bio-feedback. Proceedingsof the 2019 ACM International Conference on Pervasive and UbiquitousComputing.
• Woodward, K., Kanjo, E., Brown, D., Kanjo, E., and Brown, D., 2019.Challenges of Designing and Developing Tangible Interfaces for MentalWell-Being. ACM CHI Conference on Human Factors in Computing Sys-tems 2019.
• Woodward, K., Kanjo, E., Burton, S. and Oikonomou, A., 2018. EmoEcho:A Tangible Interface to Convey and Communicate Emotions. Proceedingsof the 2018 ACM International Conference on Pervasive and UbiquitousComputing and Wearable Computers.
• Woodward, K. and Kanjo, E., 2018, October. Things of the Internet (ToI)Physicalization of Notification Data. Proceedings of the 2018 ACM Inter-national Conference on Pervasive and Ubiquitous Computing and WearableComputers.
8
1. Introduction
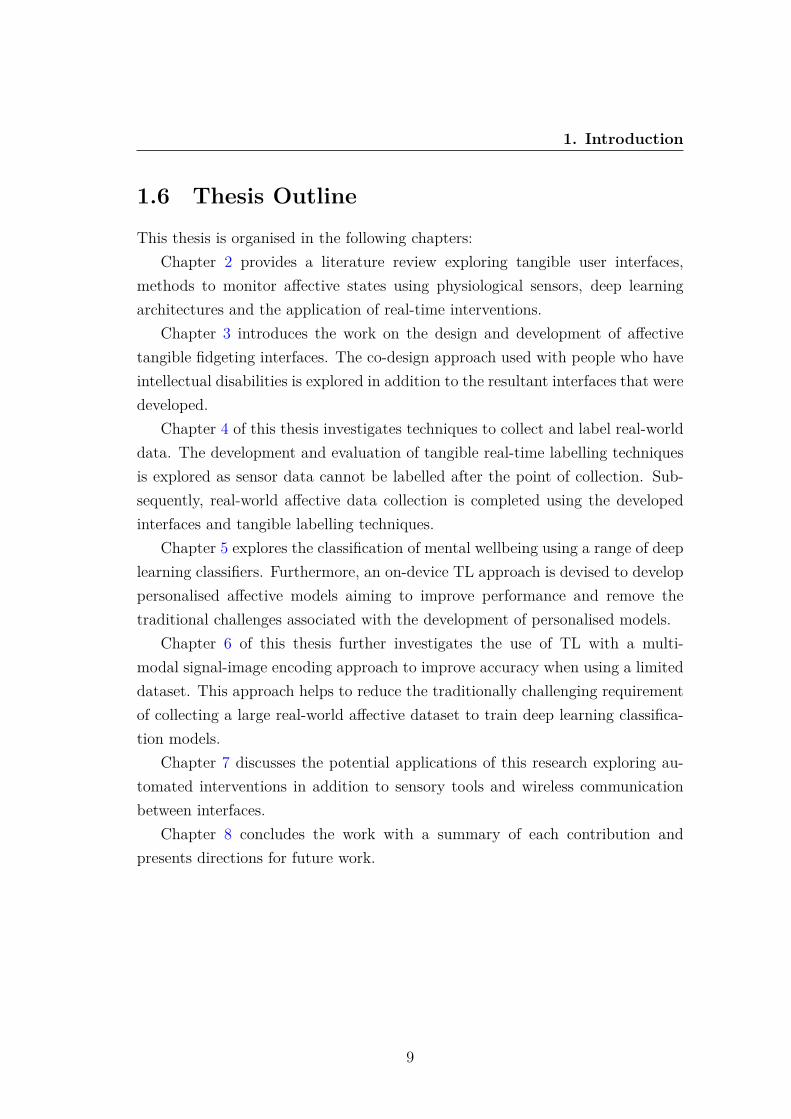
1.6 Thesis OutlineThis thesis is organised in the following chapters:
Chapter 2 provides a literature review exploring tangible user interfaces,methods to monitor affective states using physiological sensors, deep learningarchitectures and the application of real-time interventions.
Chapter 3 introduces the work on the design and development of affectivetangible fidgeting interfaces. The co-design approach used with people who haveintellectual disabilities is explored in addition to the resultant interfaces that weredeveloped.
Chapter 4 of this thesis investigates techniques to collect and label real-worlddata. The development and evaluation of tangible real-time labelling techniquesis explored as sensor data cannot be labelled after the point of collection. Sub-sequently, real-world affective data collection is completed using the developedinterfaces and tangible labelling techniques.
Chapter 5 explores the classification of mental wellbeing using a range of deeplearning classifiers. Furthermore, an on-device TL approach is devised to developpersonalised affective models aiming to improve performance and remove thetraditional challenges associated with the development of personalised models.
Chapter 6 of this thesis further investigates the use of TL with a multi-modal signal-image encoding approach to improve accuracy when using a limiteddataset. This approach helps to reduce the traditionally challenging requirementof collecting a large real-world affective dataset to train deep learning classifica-tion models.
Chapter 7 discusses the potential applications of this research exploring au-tomated interventions in addition to sensory tools and wireless communicationbetween interfaces.
Chapter 8 concludes the work with a summary of each contribution andpresents directions for future work.
9
Chapter 2
Literature Review
Recent advances in sensors, edge computing and machine learning have enabledthe increased exploration of affective monitoring, classification and intervention.The following chapter will review the related work regarding the monitoring ofhuman wellbeing starting with affective models, followed by methods to monitorwellbeing using apps, TUIs and sensors, then reviewing advances in deep learningto perform classification and finally exploring technological interventions. Thissection is adapted from [348], previously published in IEEE Affective Computingand [347], previously published in IEEE Sensors Journal.
2.1 Models of AffectAffect, in psychology, refers to the underlying experience of feeling, emotion ormood and is an integral aspect of human life [132]. There are many aspects tomonitoring affective state including measuring emotions and stress levels beingfelt. Where mental health conditions are clinically diagnosed [237], emotions aredefined as psychological states brought on by neurophysiological changes, vari-ously associated with thoughts, feelings, behavioural responses, and a degree ofpleasure or displeasure [67]. Similarly, moods are defined as affective states typ-ically described as having either a positive or negative valence that in contrastto emotions, are less specific, less intense and less likely to be provoked or in-stantiated by a particular stimulus or event [35]. In contrast, mental wellbeing
10
2. Literature Review
is defined as a state of well-being in which an individual realises his or her ownabilities to cope with the normal stresses of life and can be impacted by emotionsfelt [343].
Numerous psychologists have developed different theories to classify emotionsranging from small groups such as happiness and sadness [338] and pain andpleasure [212] to groups containing a larger number of emotions. There are nouniversal categories for emotions but the Ekman model [83] is commonly used,which comprises of 6 basic emotions: sadness, happiness, surprise, fear, angerand disgust, all of which can be distinguished through facial expressions.
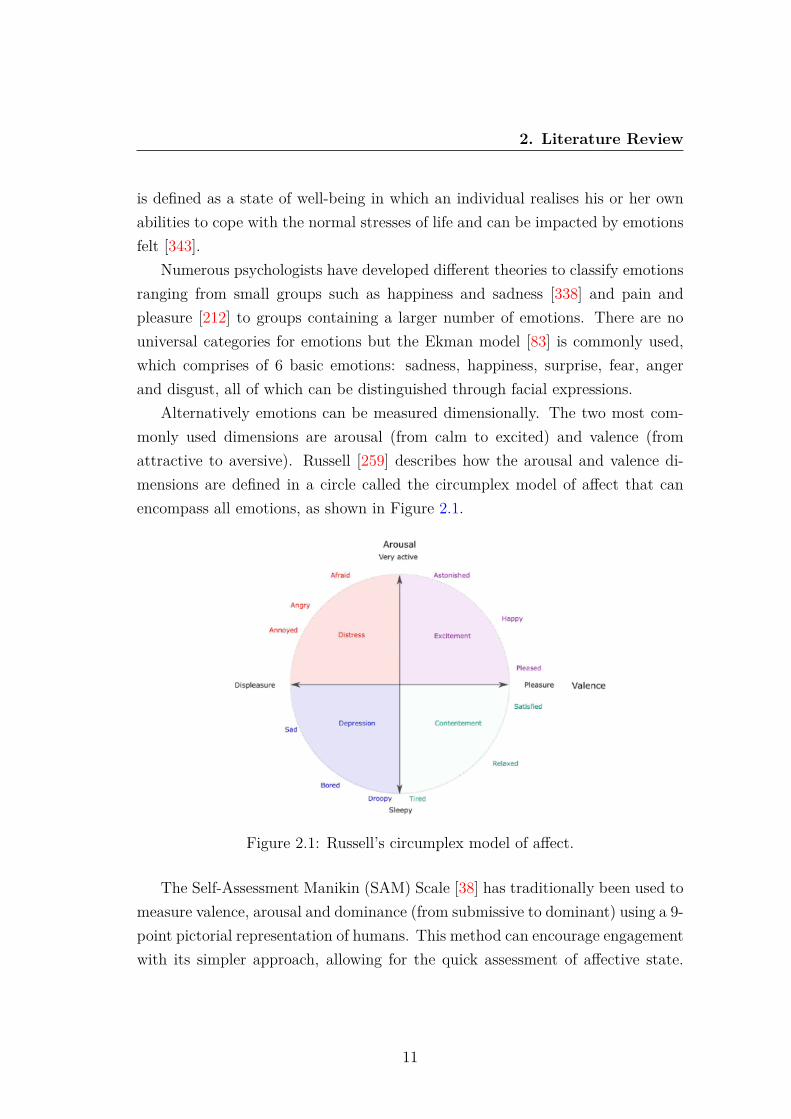
Alternatively emotions can be measured dimensionally. The two most com-monly used dimensions are arousal (from calm to excited) and valence (fromattractive to aversive). Russell [259] describes how the arousal and valence di-mensions are defined in a circle called the circumplex model of affect that canencompass all emotions, as shown in Figure 2.1.
Figure 2.1: Russell’s circumplex model of affect.
The Self-Assessment Manikin (SAM) Scale [38] has traditionally been used tomeasure valence, arousal and dominance (from submissive to dominant) using a 9-point pictorial representation of humans. This method can encourage engagementwith its simpler approach, allowing for the quick assessment of affective state.
11
2. Literature Review
However, this approach can be challenging when collecting real-time, real-worlddata as it requires the immediate completion of the scale, whenever a change inemotions is experienced.
Finally, stress levels can be used to assess affective state by describing thenonspecific response of the body to any demand upon it, elicited by a stressor[277]. The stress response is mainly influenced by two aspects: first the stressoritself and second the organism’s perceived ability to cope with the threat [105].Stress can either be classified as a binary task (stress vs. no stress) [213], [241]or different levels of stress can be classified (e.g. no stress - low stress - highstress) [104].
While each of the models can be useful to capture different aspects of wellbe-ing, this thesis captures binary stress and categorical affective states as it providesthe greatest opportunity for real-world reporting.
2.2 Methods to Monitor Affective State
2.2.1 Traditional Methods
Traditional methods used to assess mental wellbeing often use standardised clin-ical questionnaires, typically in the form of Patient Reported Outcome Measures(PROMs) or experience sampling [216] to understand longitudinal variability.Examples of validated questionnaires used to measure daily life stresses and symp-toms include the Positive and Negative Affect Schedule (PANAS) [339], QuickInventory of Depressive Symptomatology (QIDS) [257] and the Patient HealthQuestionnaire (PHQ-9) [210]. Self-reporting is used to enable people to recordtheir emotions and stresses which can be assessed and monitored to help estab-lish stressful triggers [298], [116]. However, self-reporting can take considerabletime to assess as it must be completed over a long period to gain useful in-sights [297]. Also, symptom self-reporting can often be inaccurate due to poorrecall; for example when a study investigated how accurately individuals self-reported the number of fruit and vegetables eaten, accuracies only ranged from40.4% to 58% [113].
Traditionally clinical visits may also be required but these are infrequent and
12
2. Literature Review
intermittent, representing a very small time window into patients’ lives, whereclinicians are challenged to decipher the possible manifestation of symptoms andtrajectory. Diagnostic interviews would be performed by psychiatrists/care pro-fessionals by asking service users and their friends or family about their symptoms,experiences, thoughts, feelings and the impact they are having. Diagnostic inter-views allow for a diagnosis to be made according to standard classification systemssuch as ICD-10 [353] and DSM-5 [11] and these are used in conjunction with abiopsychosocial formulation to construct a management plan [85], [339]. Discus-sions with trained experts lead to potentially identifying under-lying problemsand can be used as treatment by teaching people new behaviours (e.g., to copewith stressful events). However, all of the traditional assessment methods requirepeople to be aware of their mental health and actively seek help, which manyoften forego due to fear of social stigma and lack of available resources [328], [61].
2.2.2 mHealth Apps
With the high prevalence of smartphone ownership [244] access to treatmentwhich is flexible and fits in with people’s lifestyles is greatly enhanced [14]. Thoseat risk of mental health problems often have difficulty accessing quality mentalhealth care [48] especially when symptoms first manifest [313], demonstrating theneed for more accessible help. An Australian survey found that 76% of peoplewould be interested in using mobile phone apps for mental health monitoring andself-management [245], illustrating the high demand for technological solutionsbecause of their convenience and accessibility.
Many apps have been developed to modernise and advance existing prac-tices of recording mental wellbeing. Numerous mental health diary apps areavailable to download, although these are effectively digital representations ofexisting self-reporting diaries using new techniques such as the touchscreen andmonitoring notifications [360], [154], [312]. However, using a phone in public ismore socially acceptable than completing a paper form, allowing monitoring to becompleted discreetly in real-time, unlike paper forms which are often completedretrospectively, resulting in less accurate data being recorded [297]. A problemmany apps face is the frequency for eliciting PROMs, which may under represent
13
2. Literature Review
the true symptom’s fluctuations. Given that mood is highly variable, clinicallyuseful information is likely to be included in the daily fluctuations of mood formany cohorts suffering from mental disorders. Previous research demonstratesthe possibility of eliciting daily responses to assess mental health with very goodadherence over a 1 year period [314], demonstrating the feasibility of longitudi-nal daily PROMs. This study used engagements by two cohorts diagnosed withbipolar disorders and borderline personality disorders. More recently, chatbotapps have been developed to assess mental wellbeing, in some cases by mimick-ing conversation with users via a chat interface [1] thus removing the requirementto continuously self-report. A survey conducted on 5,141 participants in the agerange 16-24 years showed nearly two thirds would be comfortable with a chatbotgiving them a diagnosis [254]. Chatbots can utilise AI to reduce their relianceon predefined scripts and deliver individualised therapy suggestions based on lin-guistic analysis enhancing user engagement [66].
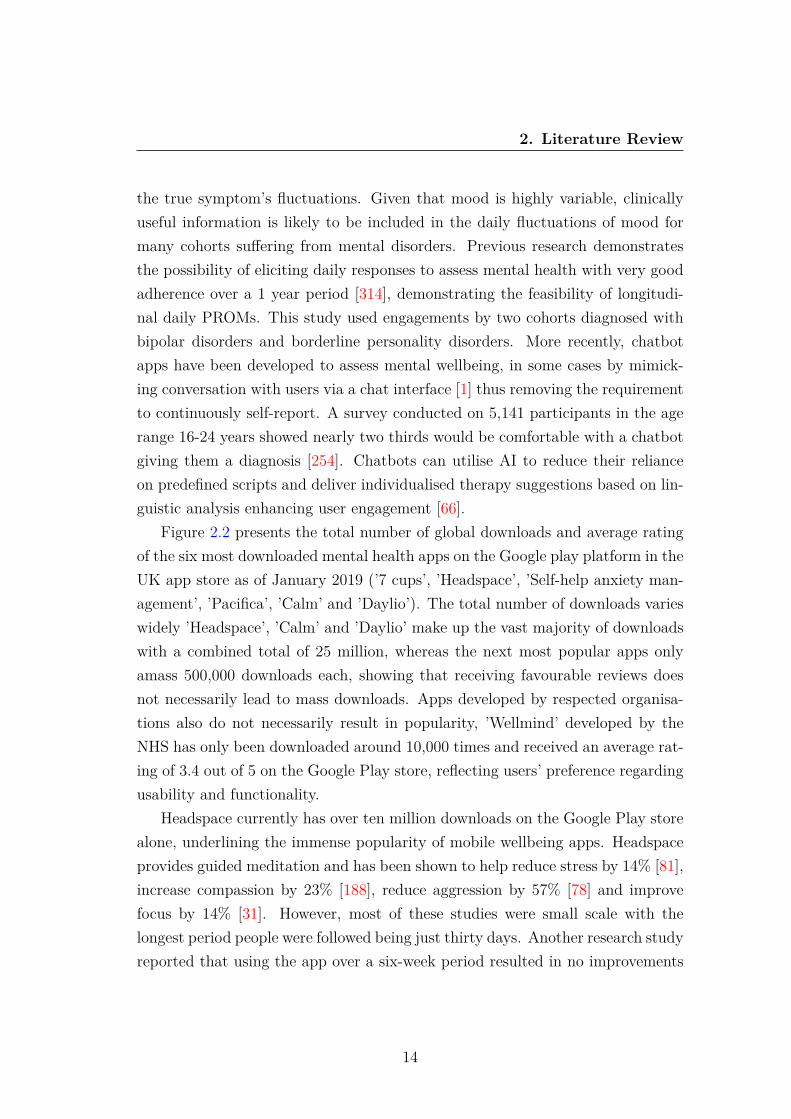
Figure 2.2 presents the total number of global downloads and average ratingof the six most downloaded mental health apps on the Google play platform in theUK app store as of January 2019 (’7 cups’, ’Headspace’, ’Self-help anxiety man-agement’, ’Pacifica’, ’Calm’ and ’Daylio’). The total number of downloads varieswidely ’Headspace’, ’Calm’ and ’Daylio’ make up the vast majority of downloadswith a combined total of 25 million, whereas the next most popular apps onlyamass 500,000 downloads each, showing that receiving favourable reviews doesnot necessarily lead to mass downloads. Apps developed by respected organisa-tions also do not necessarily result in popularity, ’Wellmind’ developed by theNHS has only been downloaded around 10,000 times and received an average rat-ing of 3.4 out of 5 on the Google Play store, reflecting users’ preference regardingusability and functionality.
Headspace currently has over ten million downloads on the Google Play storealone, underlining the immense popularity of mobile wellbeing apps. Headspaceprovides guided meditation and has been shown to help reduce stress by 14% [81],increase compassion by 23% [188], reduce aggression by 57% [78] and improvefocus by 14% [31]. However, most of these studies were small scale with thelongest period people were followed being just thirty days. Another research studyreported that using the app over a six-week period resulted in no improvements
14

2. Literature Review
Figure 2.2: Comparison of average rating (left) and total global downloads (right)of the six most downloaded mental health apps from the Google Play store.
in critical thinking performance [222]. Additionally, there has been no follow-upafter the initial studies and as some studies lasted as little as ten days it raisessome concerns as to whether the positive outcomes from the app may only beapparent during an individual’s initial period of use.
Additional apps have been developed by researchers that actively aim to im-prove mental health and wellbeing, such as mobile stress management apps thatuse stress inoculation training to prepare people to better handle stressful events.Studies show stress inoculation apps were consistently successful in reducing stressin participants and increasing their active coping skills [324], [323]. Grassi etal. [112] demonstrated that mHealth apps are not only capable of augmentingtraditional techniques to help monitor conditions but they can also be used toeducate users on more modern techniques to actively improve their mental well-being.
A smartphone app, FOCUS, has been developed to proactively ask users withschizophrenia about their mood, feelings and wellbeing multiple times each dayto provide relevant coping strategies [29]. This allows the app to go beyondtraditional self-reporting as it educates users on methods to help immediatelyafter an issue has been reported, which is only possible using technology thatpeople have continuous access to, such as smartphones. FOCUS demonstrateda reduction in positive symptoms of schizophrenia and depression, when trialled
15
2. Literature Review
by 33 participants over 4 weeks. A common issue with mental wellbeing apps islow user engagement. However, FOCUS was used by participants on 86.5% ofdays, averaging 5.2 times each day over 30 days and Oiva, a mental wellbeingtraining app [4] was on average used every third day for 12 minutes over a 30day period, demonstrating the possibility for mental wellbeing technologies to behighly engaging.
While apps cannot be considered as an alternative to seeking professional helpsome apps have been designed to work in conjunction with clinicians such as Post-Traumatic Stress Disorder (PTSD) Coach. The app allows users to learn moreabout PTSD, track symptoms, set up a support network and provides strate-gies for coping with overwhelming emotions. 10 US veterans with PTSD wereassigned to use PTSD Coach independently while another 10 used the app withthe support of their primary-care providers [14]. At the end of the trial, seven ofthe ten patients using the app with support showed a reduction in PTSD symp-toms, compared with just three of the patients who used the app independently.Technological solutions used with care providers show more potential for effectivetreatment in the small sample trials to date although they still require users toactively seek help [201].
Pairing apps with psychiatrists’ and psychologists’ support has been shownto be successful resulting in a range of apps using content explicitly created bypsychiatrists. Rizvi et al. [253] developed the app DBT Field Coach to provide in-structions, exercises, reminders, games, videos and messages to help people copewith emotional crises. The results of that study, showed that all 22 participantsused the app frequently over at least 10 days, successfully reducing intense emo-tions, reducing substance use cravings and improving symptoms of depressionwithout the need to visit a clinician [253]. This app again shows the success ofapps utilising psychiatrists and clinicians, although as this app only used contentcreated by psychiatrists, it improves accessibility by removing to some extent theneed to visit clinicians to access the same tools. Mobile health apps provide manyadvantages over traditional techniques including improved accessibility, real-timesymptom monitoring, reduced cost and reduced barriers to access [80]. However,one of the main short-comings of available smartphone apps is the lack of per-sonalised features, as many treatments and strategies have to be individually
16
2. Literature Review
tailored [119].
2.2.3 Tangible User Interfaces
An alternative method to enhance existing monitoring techniques is through theuse of TUIs. As TUIs are physical objects they rely on users’ knowledge ofhow the physical world works for interaction [146], making them more intuitiveespecially for people with less digital knowledge. Matthews and Doherty [204] andNiemantsverdriet and Versteeg [220] have reported that people are more likely tocreate stronger emotional attachments with physical devices such as TUIs ratherthan digital interfaces such as apps.
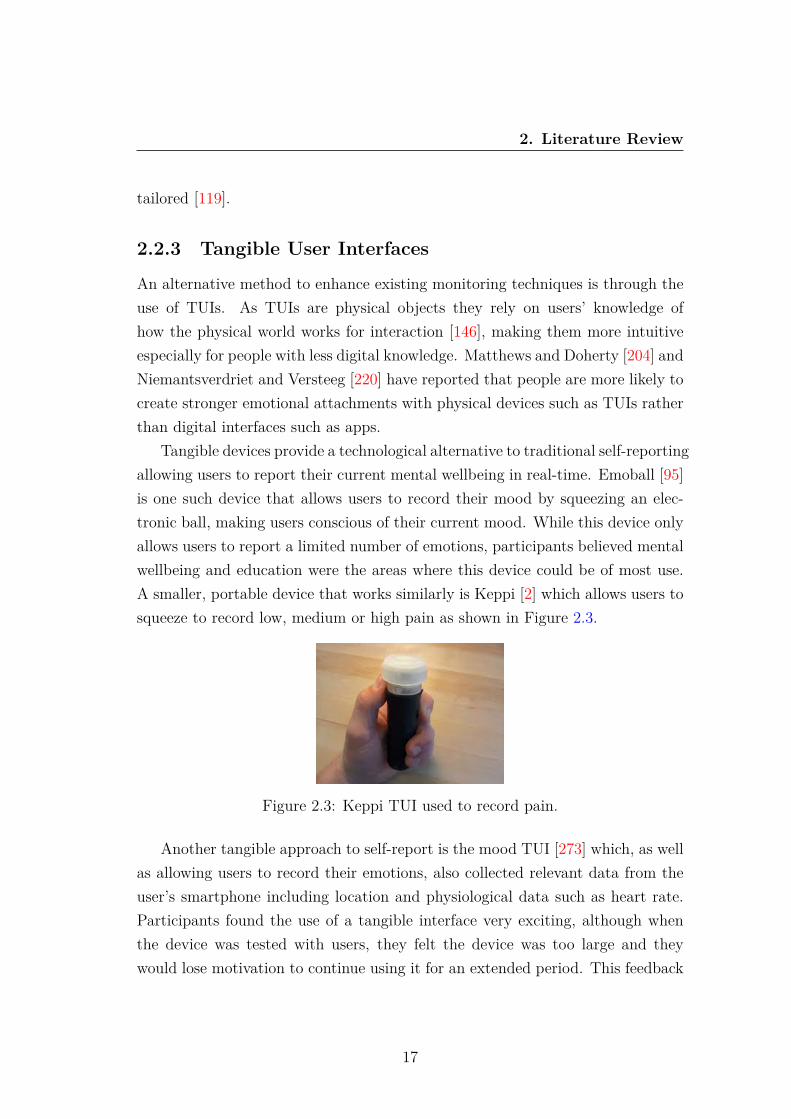
Tangible devices provide a technological alternative to traditional self-reportingallowing users to report their current mental wellbeing in real-time. Emoball [95]is one such device that allows users to record their mood by squeezing an elec-tronic ball, making users conscious of their current mood. While this device onlyallows users to report a limited number of emotions, participants believed mentalwellbeing and education were the areas where this device could be of most use.A smaller, portable device that works similarly is Keppi [2] which allows users tosqueeze to record low, medium or high pain as shown in Figure 2.3.
Figure 2.3: Keppi TUI used to record pain.
Another tangible approach to self-report is the mood TUI [273] which, as wellas allowing users to record their emotions, also collected relevant data from theuser’s smartphone including location and physiological data such as heart rate.Participants found the use of a tangible interface very exciting, although whenthe device was tested with users, they felt the device was too large and theywould lose motivation to continue using it for an extended period. This feedback
17
2. Literature Review
shows the use of TUIs excites users, but the design and functionality of the inter-face must be prioritised. Mood sprite [25] is another handheld device developedto help people suffering from anxiety and stress by using coloured lights and aninfinity mirror to assist with relaxation. The device records the time users cre-ate new sprites allowing them to be revisited much like a diary, again showingways in which tangible interfaces can accompany traditional techniques to maketreatment more accessible and user-centric. Similar to traditional self-reportingdiaries, the device educates users by allowing them to recall their emotions butis more engaging with different coloured lights representing different times andmoods, promoting continued use. However, a common issue with mental wellbe-ing tangible interfaces is that they remain largely unproven and even those thathave been trialled with users such as Mood sprite have been limited to small-scaletrails that lack statistical power.
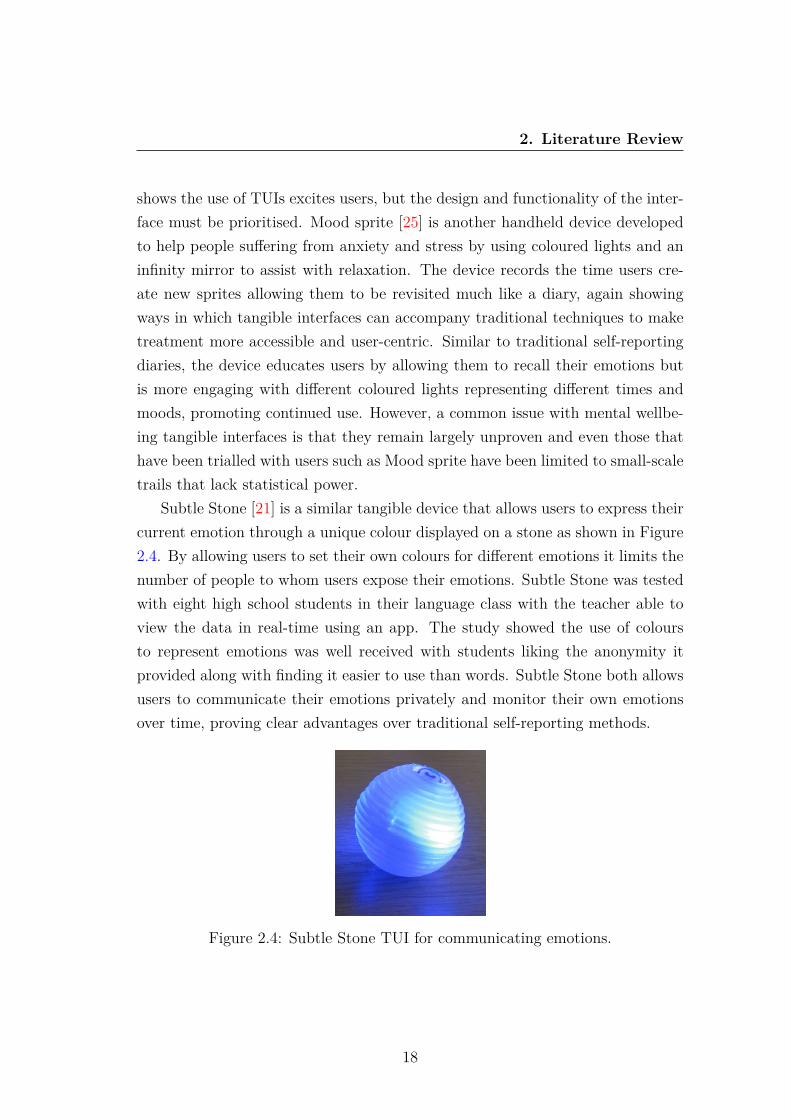
Subtle Stone [21] is a similar tangible device that allows users to express theircurrent emotion through a unique colour displayed on a stone as shown in Figure2.4. By allowing users to set their own colours for different emotions it limits thenumber of people to whom users expose their emotions. Subtle Stone was testedwith eight high school students in their language class with the teacher able toview the data in real-time using an app. The study showed the use of coloursto represent emotions was well received with students liking the anonymity itprovided along with finding it easier to use than words. Subtle Stone both allowsusers to communicate their emotions privately and monitor their own emotionsover time, proving clear advantages over traditional self-reporting methods.
Figure 2.4: Subtle Stone TUI for communicating emotions.
18
2. Literature Review
A tangible interface used to detect stress in real-time without the need toself-report is Grasp, which was tested with anxious participants in a dentist’soffice [115]. Participants were able to squeeze Grasp whenever they felt stressedand the device detected how much pressure was exerted and displayed this data ona mobile app. Force sensors have also been used to create a tactile ball that allowsfor the manipulation of music by squeezing different areas of the ball along withmovement detected by an accelerometer [28]. The research concluded squeezemusic could successfully be used for music therapy with children as it promotedpositive emotions through tactile input and music. Sensors such as force sensorshave been shown to provide an intuitive method of interaction for TUIs and showthe possibility for additional sensors to be utilised when educating, detectingand improving mental wellbeing, that is not possible when using smartphones ortraditional techniques.
2.2.4 Physiological Sensor Measurement
This section reviews non-invasive sensors that present the most significant oppor-tunity to assess affective state as they can easily be embedded within tangibleinterfaces and inconspicuously used in the real-world unlike ElectroCardioGrams(ECG) or ElectroEncephaloGrams (EEG). Features can be extracted from thesensor data to train machine learning classification models or raw data can be usedwithin deep learning models. Alternatively, time series data can be transformedinto images using Gramian Angular Summation Field (GASF), Gramian Angu-lar Difference Field (GADF) and Markov Transition Field (MTF) [336]. Thesesignal-image encoding techniques have previously been used to improve classifi-cation accuracy across a range of time series data including human motions andfigure shapes, improving accuracy [357], reducing Mean Squared Error (MSE) by12.18%-48.02% [336] and outperforming state of the art time series classificationmethods such as dynamic time warping and ResNet by 1.96%-10.13%.
2.2.4.1 Heart Rate (HR)
HR sensors are commonly used within wearable computing systems as they can beembedded within a wide range of devices due to their small footprint and provide
19
2. Literature Review
insights into the autonomous nervous system. Similarly, HRV is commonly usedwithin affective computing as it is the variation in time between heartbeats andfurther represents autonomic nervous system activity. Low HRV has been shownto be correlated with impaired parasympathic activity, higher anxiety, a varietyof depression disorders [320], [110], [217] and higher stress [250]. It is possible tomeasure HR and HRV using electrocardiograms [57] but in 1997 it was found thatfinger pulse amplitude decreased significantly during mental tasks [106] leadingto HRV being accurately measured using PhotoPlethysmoGraphy (PPG). Thisis easier and more cost-effective to use than ECGs as it only requires one contactpoint.
There have been three main forms of PPG developed: transmitted, reflectedand remote. Transmitted signals are most commonly used in medical monitor-ing, remote signals often utilise cameras to measure changes in skin colour andreflected signals measure the amount of backscattered light from an LED usingphotodiodes above the skin voxel where each cardiac cycle appears as a peak inthe PPG signal. Reflection PPG is the the smallest and most convenient methodto measure HR and HRV within tangible interfaces [198].
2.2.4.2 ElecotroDermal Activity (EDA)
EDA is often used to train affective models to classify mental wellbeing as itdirectly correlates to the sympathetic nervous system which controls rapid in-voluntary responses to dangerous or stressful situations [276]. To measure EDAthe resistance between two electrodes is measured, most commonly where thereis a high density of sweat glands such as the palm and finger [58]. Alternatively,near-infrared spectroscopy can be used to measure oxyhemoglobin and deoxy-hemoglobin enabling the inference of stress with similar levels of accuracy asEDA [306]. However, near-infrared spectroscopy cannot be used to collect datain the real-world due to its large size and placement on the forehead.
2.2.4.3 Motion
Motion data measures movement through accelerometers, gyroscopes and mag-netometers and can be used in addition to physiological sensor data to monitor
20
2. Literature Review
mental wellbeing. Previous work has attempted to use motion data to classifyemotions achieving 81.2% accuracy across 3 classes [367]. However, similar workhas reported lower levels of accuracy when inferring emotions from motion dataalone ranging from 50% to 72% [249] [225] [137]. Instead of using motion dataalone as previous studies have researched, there is potential for it to be combinedwith physiological data to assist with the classification of mental wellbeing.
2.2.4.4 Labelling Mental Wellbeing
Deep Neural Networks (DNNs), are attracting more and more attention as abreakthrough in the advance of AI, showing high potential to accurately classifysensory data. However, in order to train DNNs, vast quantities of sensor datamust be first collected and labelled.
The techniques used to label data vary vastly depending on the data type, asimages can be labelled offline using an automated process based on clickthroughdata, greatly reducing the effort required to create a labelled dataset [315]. Ad-ditionally, crowdsourcing tools have been developed that enable users around theworld to label images [258], [109] and audio [179], [228], [316] while text can beautomatically labelled using the hashtags and emojis contained within posts [70]or using natural language processing and machine learning [193]. Crowdsourcinglabels [322] is not possible with time series data which has to be labelled online,in real-time, at the point of collection due to the nature of the data.
In pervasive sensing there are three data collection methods [360], these are:1) Passive data sensing using smartphones or other sensors to record unlabelleddata in the background [360], often used to collect weather [175], health [156] [5]and environmental data [360], 2) Active data sensing enables users to label thedata in real-time through self-reporting, often used to report wellbeing or physicalactivity and 3) Hybrid data sensing combining both passive and active datacollection as it involves users actively labelling the passive sensor data that isrecorded in the background [154].
With sensor data researchers often manually label the activity participantsundertake [308] which typically prevents the collection of in-situ data as it re-quires the researcher to continuously video participants’ activities so that they
21
2. Literature Review
can be labelled offline. Alternatively, sensor data can be labelled using a hybridapproach where the sensor data is continuously recorded and the user occasionallyrecords a label against all or part of the previously recorded data. The labellingof human activities increasingly relies on hybrid data collection techniques tocontinuously record accelerometer data as well as enable users to self-report theircurrent activity [178], [176].
Smartphone applications are becoming increasingly popular to label sensordata as they provide a familiar, always accessible interface for users [360]. How-ever, it is not possible to use smartphones to collect data when additional sensorsthat are not embedded within smartphones are required e.g. EDA or HRV. It ispossible for a combination of a smartphone application (for labelling) and tan-gible interfaces (for sensory data collection) to be used but this increases thecomplexity by forcing users to use two devices, along with requiring a continuousstable wireless connection between the devices.
2.3 Deep Learning ArchitecturesWhen developing a reliable wellbeing classification model it is imperative to findthe best classifier. A variety of classification methods have previously been em-ployed in the affective computing domain for classifying physiological data. Ad-vances in deep learning have resulted in the capability to classify raw sensor dataover-coming the laborious process of manual feature engineering and presentingthe extracted features to a statistical learner. There are two main neural networktypes: Convolutional Neural Networks (CNNs) and Recurrent Neural Networks(RNNs). CNNs and RNNs are structurally different and are used fundamentallyfor different purposes. CNNs have convolutional layers to transform data, whilstRNNs essentially reuse activation functions from other temporal data points. Thissection discusses different deep learning architectures that demonstrate potentialto classify physiological signals.
22
2. Literature Review
2.3.1 1 Dimension Convolutional Neural Network (1D CNN)
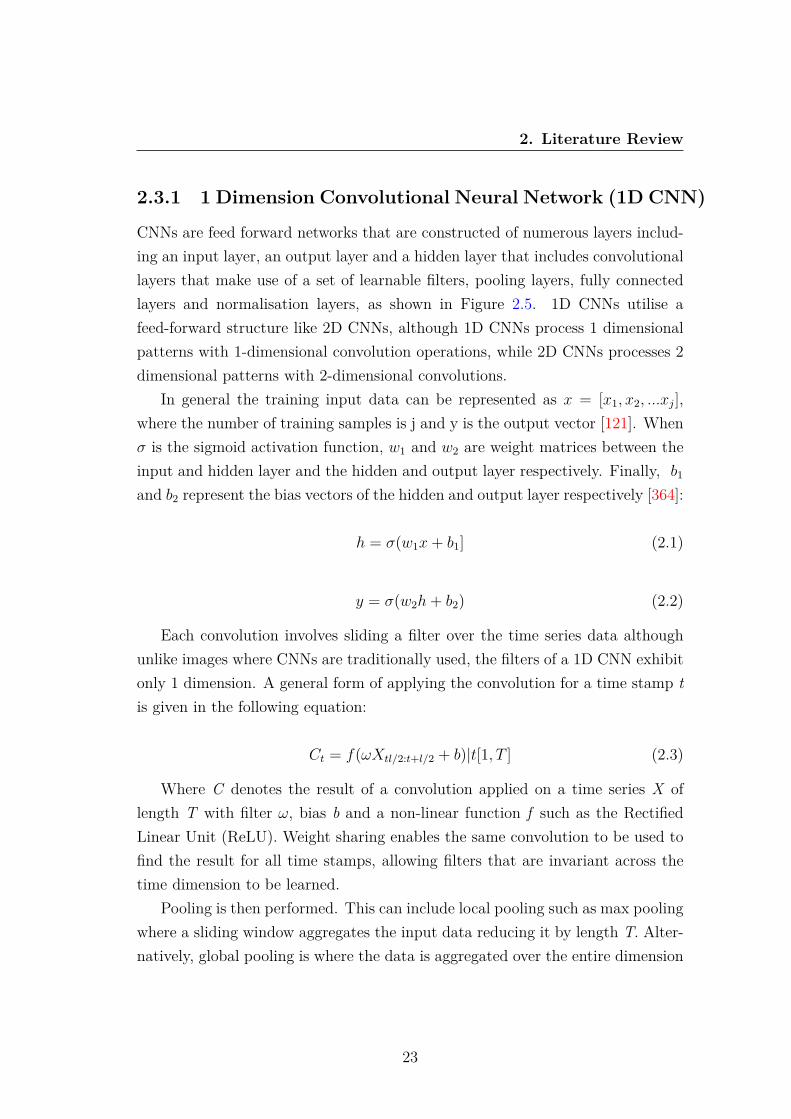
CNNs are feed forward networks that are constructed of numerous layers includ-ing an input layer, an output layer and a hidden layer that includes convolutionallayers that make use of a set of learnable filters, pooling layers, fully connectedlayers and normalisation layers, as shown in Figure 2.5. 1D CNNs utilise afeed-forward structure like 2D CNNs, although 1D CNNs process 1 dimensionalpatterns with 1-dimensional convolution operations, while 2D CNNs processes 2dimensional patterns with 2-dimensional convolutions.
In general the training input data can be represented as x = [x1, x2, ...xj],where the number of training samples is j and y is the output vector [121]. Whenσ is the sigmoid activation function, w1 and w2 are weight matrices between theinput and hidden layer and the hidden and output layer respectively. Finally, b1
and b2 represent the bias vectors of the hidden and output layer respectively [364]:
h = σ(w1x+ b1] (2.1)
y = σ(w2h+ b2) (2.2)
Each convolution involves sliding a filter over the time series data althoughunlike images where CNNs are traditionally used, the filters of a 1D CNN exhibitonly 1 dimension. A general form of applying the convolution for a time stamp tis given in the following equation:
Ct = f(ωXtl/2:t+l/2 + b)|t[1, T ] (2.3)
Where C denotes the result of a convolution applied on a time series X oflength T with filter ω, bias b and a non-linear function f such as the RectifiedLinear Unit (ReLU). Weight sharing enables the same convolution to be used tofind the result for all time stamps, allowing filters that are invariant across thetime dimension to be learned.
Pooling is then performed. This can include local pooling such as max poolingwhere a sliding window aggregates the input data reducing it by length T. Alter-natively, global pooling is where the data is aggregated over the entire dimension
23

2. Literature Review
Figure 2.5: 1D CNN architecture.
resulting in a single value. In addition to pooling layers, normalisation layers canbe used to help a network converge quicker.
Batch normalization can then be performed to normalise the inputs of eachlayer so they have a mean of 0 and standard deviation of 1. This enables themodels to train quicker, allows for higher learning rates, makes the weights easierto initialise [142] and prevents the internal covariate shifting across one mini-batch training set [142]. The final layer takes the result of the convolutions andoutputs a probability distribution using the SoftMax activation function.
2.3.2 Long-Short Term Memory (LSTM)
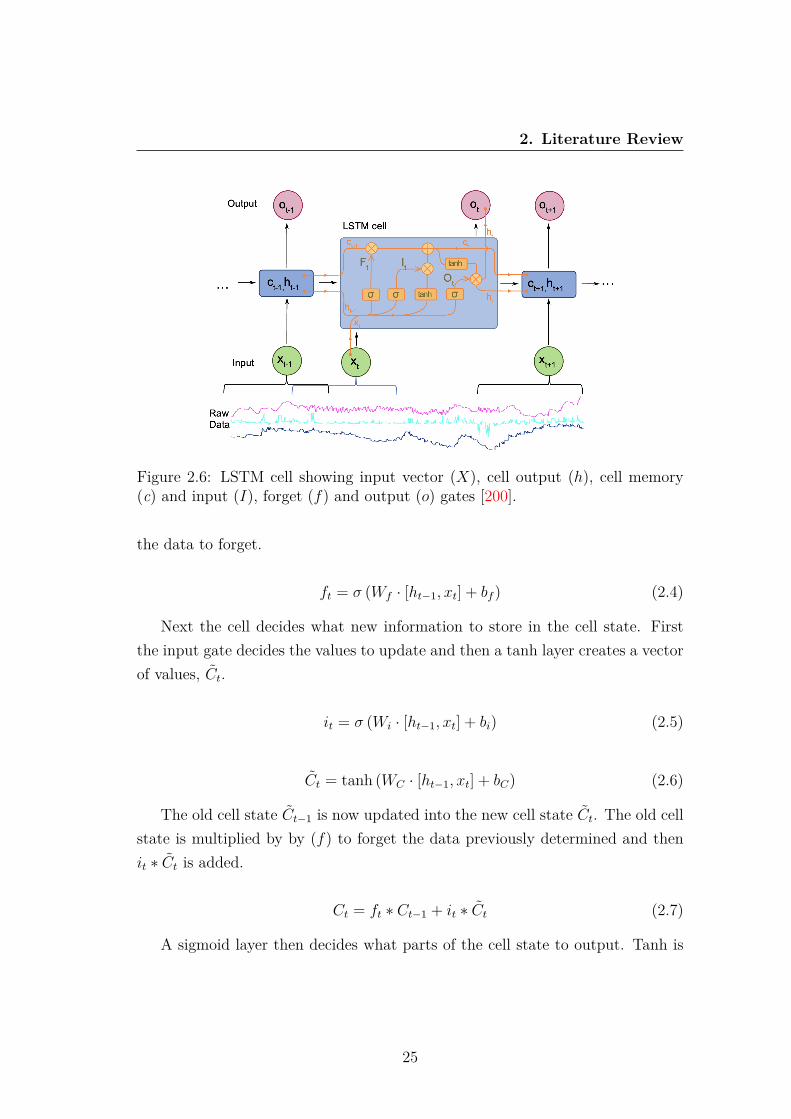
LSTM [130] networks are a specific kind of RNN where the LSTM cells serveas the memory units through gradient descent making them capable of learninglong-term dependencies. LSTM cells use input (I), forget (f) and output (o)gates to regulate the flow of information, as shown in figure 2.6, helping removethe vanishing gradient problem faced by traditional RNNs.
The LSTM network uses the sigmoid forget gate layer to evaluate the inputsht1 and xt and then outputs a value between 0 and 1 in the cell state to determine
24
2. Literature Review
Figure 2.6: LSTM cell showing input vector (X), cell output (h), cell memory(c) and input (I), forget (f) and output (o) gates [200].
the data to forget.
ft = σ (Wf · [ht−1, xt] + bf ) (2.4)
Next the cell decides what new information to store in the cell state. Firstthe input gate decides the values to update and then a tanh layer creates a vectorof values, Ct.
it = σ (Wi · [ht−1, xt] + bi) (2.5)
Ct = tanh (WC · [ht−1, xt] + bC) (2.6)
The old cell state Ct−1 is now updated into the new cell state Ct. The old cellstate is multiplied by by (f) to forget the data previously determined and thenit ∗ Ct is added.
Ct = ft ∗ Ct−1 + it ∗ Ct (2.7)
A sigmoid layer then decides what parts of the cell state to output. Tanh is
25
2. Literature Review
applied to the cell state and it is multiplied by the output of the sigmoid gate.
ot = σ (Wo [ht−1, xt] + bo) (2.8)
ht = ot ∗ tanh (Ct) (2.9)
Finally, a SoftMax layer follows the LSTM cell using a cross entropy lossfunction to produce an output prediction vector from the classes.
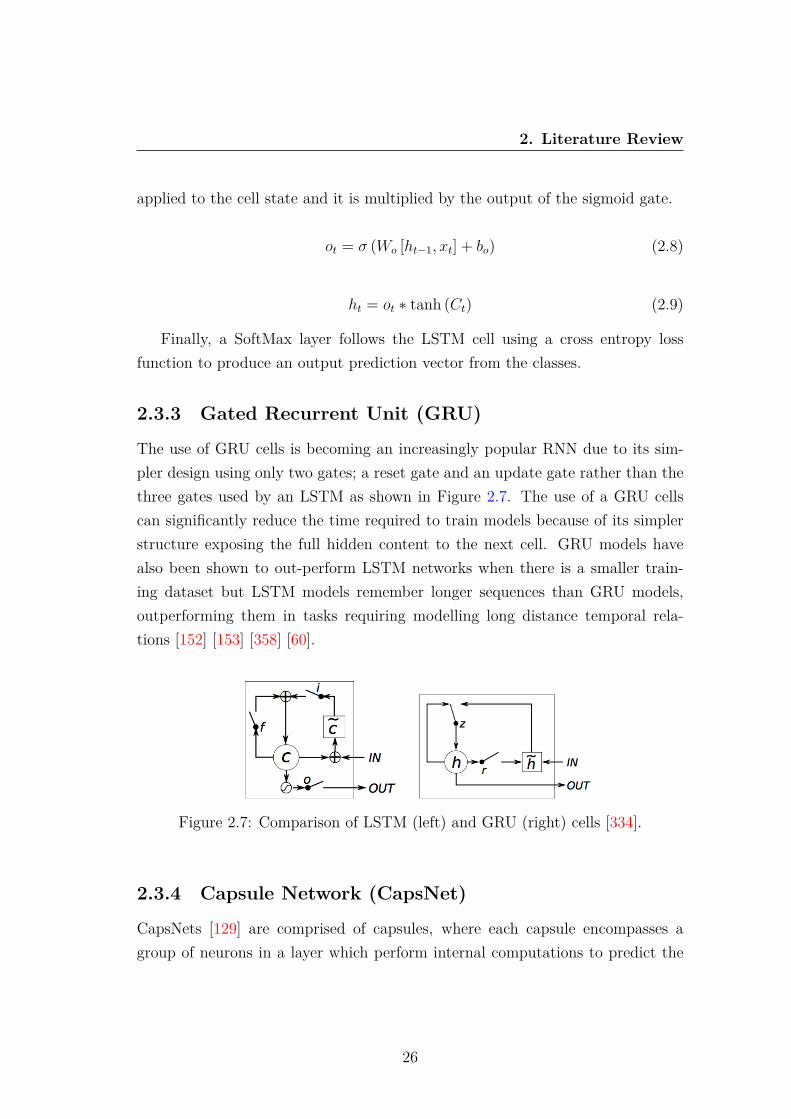
2.3.3 Gated Recurrent Unit (GRU)
The use of GRU cells is becoming an increasingly popular RNN due to its sim-pler design using only two gates; a reset gate and an update gate rather than thethree gates used by an LSTM as shown in Figure 2.7. The use of a GRU cellscan significantly reduce the time required to train models because of its simplerstructure exposing the full hidden content to the next cell. GRU models havealso been shown to out-perform LSTM networks when there is a smaller train-ing dataset but LSTM models remember longer sequences than GRU models,outperforming them in tasks requiring modelling long distance temporal rela-tions [152] [153] [358] [60].
Figure 2.7: Comparison of LSTM (left) and GRU (right) cells [334].
2.3.4 Capsule Network (CapsNet)
CapsNets [129] are comprised of capsules, where each capsule encompasses agroup of neurons in a layer which perform internal computations to predict the
26
2. Literature Review
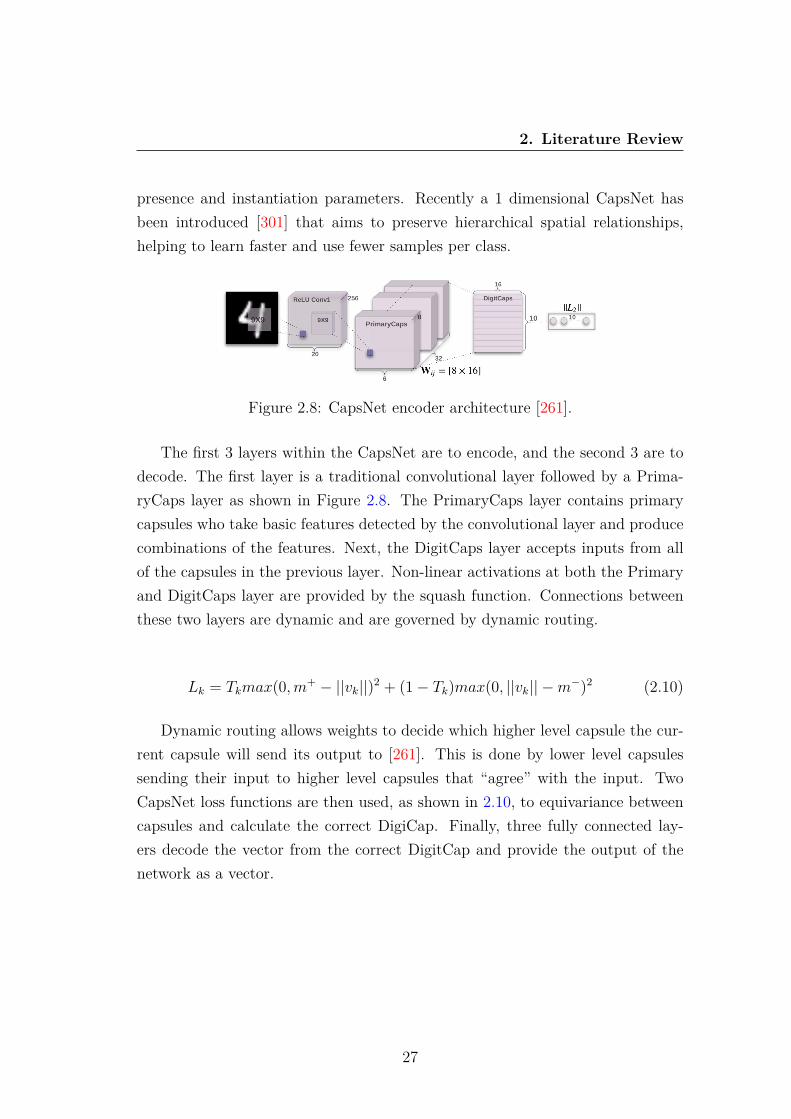
presence and instantiation parameters. Recently a 1 dimensional CapsNet hasbeen introduced [301] that aims to preserve hierarchical spatial relationships,helping to learn faster and use fewer samples per class.
Figure 2.8: CapsNet encoder architecture [261].
The first 3 layers within the CapsNet are to encode, and the second 3 are todecode. The first layer is a traditional convolutional layer followed by a Prima-ryCaps layer as shown in Figure 2.8. The PrimaryCaps layer contains primarycapsules who take basic features detected by the convolutional layer and producecombinations of the features. Next, the DigitCaps layer accepts inputs from allof the capsules in the previous layer. Non-linear activations at both the Primaryand DigitCaps layer are provided by the squash function. Connections betweenthese two layers are dynamic and are governed by dynamic routing.
Lk = Tkmax(0,m+ − ||vk||)2 + (1− Tk)max(0, ||vk|| −m−)2 (2.10)
Dynamic routing allows weights to decide which higher level capsule the cur-rent capsule will send its output to [261]. This is done by lower level capsulessending their input to higher level capsules that “agree” with the input. TwoCapsNet loss functions are then used, as shown in 2.10, to equivariance betweencapsules and calculate the correct DigiCap. Finally, three fully connected lay-ers decode the vector from the correct DigitCap and provide the output of thenetwork as a vector.
27
2. Literature Review
2.3.5 Residual network (ResNet)
A proposed architecture from [337] is a ResNet. The network is composed of threeresidual blocks followed by a global average pooling layer and a final SoftMaxclassifier using a cross entropy loss function, whose number of neurons is equal tothe number of classes in the dataset. Batch normalisation and ReLU activationfunction follow. Each residual block is comprised of three convolutions whoseoutput is added to the residual block’s input and then fed to the next layer.The fundamental feature of a ResNet is a linear shortcut to link the output of aresidual block to its input, enabling the direct flow of the gradient through theconnections and removing the vanishing gradient problem [123].
2.3.6 Time Warping Invariant Echo State Network (TWIESN)
TWIESN [307] is another RNN. For each element in an input time series, thereservoir space is used to project this element into a higher dimensional space.Then for each element, a ridge classifier [131] is trained to predict the class ofeach time series element. During testing, the ridge classifier outputs a probabilitydistribution over the classes in a dataset. Then the posteriori probability for eachclass is averaged assigning a label for each test set where the averaged probabilityis highest.
2.3.7 Encoder
An Encoder network [279] is a hybrid CNN [337] where the global average pool-ing layer is replaced with an attention layer, enabling invariance across all layers.The first three layers are convolutional. Each convolution is followed by batchnormalisation and then a Parametric Rectified Linear Unit (PReLU) [122] acti-vation function. The output of PReLU is followed by a dropout layer and a finalmax pooling layer. The third convolutional layer is fed to an attention layer [19]that enables the network to learn the most important aspects for classification.Finally, a SoftMax classifier with a cross entropy loss function is used to producea predicted label from the available classes.
28
2. Literature Review
2.3.8 InceptionTime
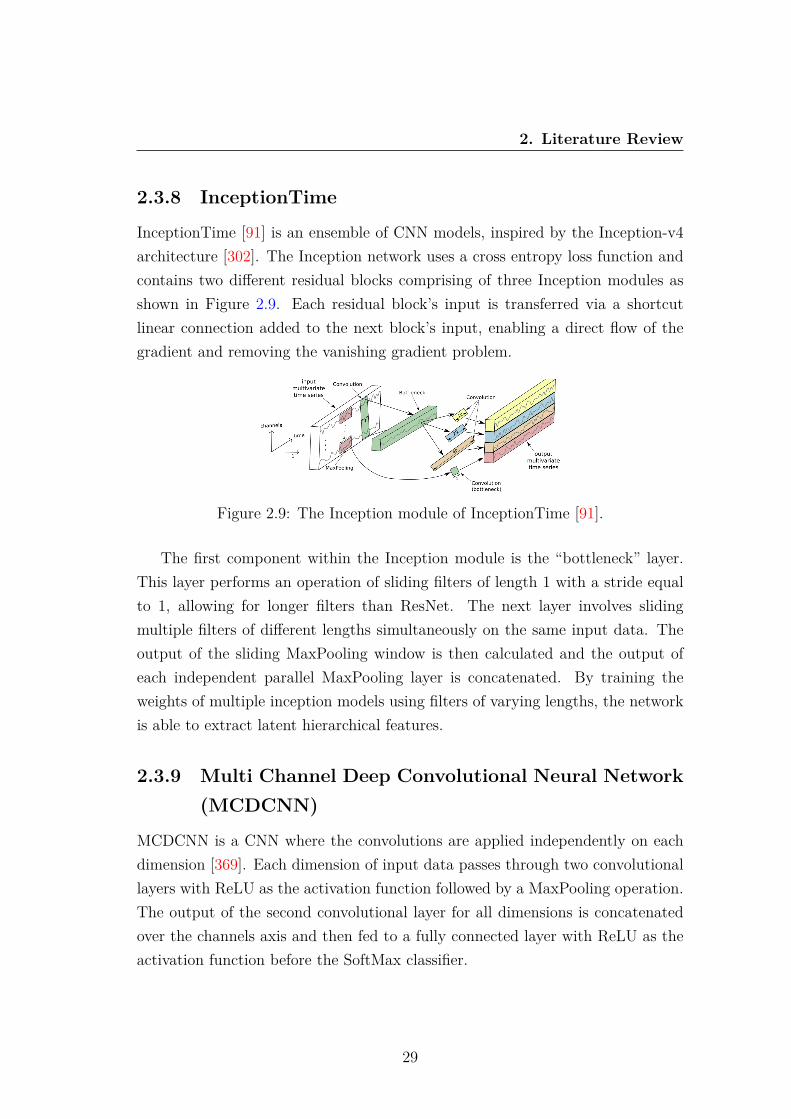
InceptionTime [91] is an ensemble of CNN models, inspired by the Inception-v4architecture [302]. The Inception network uses a cross entropy loss function andcontains two different residual blocks comprising of three Inception modules asshown in Figure 2.9. Each residual block’s input is transferred via a shortcutlinear connection added to the next block’s input, enabling a direct flow of thegradient and removing the vanishing gradient problem.
Figure 2.9: The Inception module of InceptionTime [91].
The first component within the Inception module is the “bottleneck” layer.This layer performs an operation of sliding filters of length 1 with a stride equalto 1, allowing for longer filters than ResNet. The next layer involves slidingmultiple filters of different lengths simultaneously on the same input data. Theoutput of the sliding MaxPooling window is then calculated and the output ofeach independent parallel MaxPooling layer is concatenated. By training theweights of multiple inception models using filters of varying lengths, the networkis able to extract latent hierarchical features.
2.3.9 Multi Channel Deep Convolutional Neural Network(MCDCNN)
MCDCNN is a CNN where the convolutions are applied independently on eachdimension [369]. Each dimension of input data passes through two convolutionallayers with ReLU as the activation function followed by a MaxPooling operation.The output of the second convolutional layer for all dimensions is concatenatedover the channels axis and then fed to a fully connected layer with ReLU as theactivation function before the SoftMax classifier.
29
2. Literature Review
2.4 Mental Wellbeing ClassificationDeep learning algorithms have generated great impact in affective modelling.RNNs relying on LSTM are especially valuable for use with sensor data as theyare fundamental in distinguishing similar data which differ only by the ordering ofthe samples which can often dictate differences in mental health [229]. CNNs havetraditionally been used to classify images and speech, however their applicationhas been expanded to classify raw sensor data [202], [162]. This section exploresthe different methods used to classify mental wellbeing including mobile apps,physiological sensors including the use of TL and the exploration of real-worldclassification.
2.4.1 Mobile Apps
Apps have been shown to enhance traditional PROMS-based assessment tech-niques and by utilising the sensors within phones the capability of apps can befurther enhanced as they may provide a more holistic picture using passivelycollected data. Smartphones are capable of collecting a vast amount of datasuch as location, motion and phone use which can result in many features beingextracted to train machine learning algorithms. It is possible to use the datacollected from smartphones to determine emotions with a 70% accuracy utilis-ing machine learning to process the data [365]. Automatically inferring emotionsbased on smartphone use is extremely valuable in determining mental wellbeingand can provide new clinical insights from passively monitoring users’ behaviour.Furthermore, an app has been used to monitor social media use (Facebook andTwitter) and capture ground truth mood data [182]. The results demonstratethe ability to infer real-world mood from social media data with up to 95.2%accuracy showing the possibility of monitoring wellbeing through online activity.
In addition to using the phones’ sensors to detect mental wellbeing, it may bepossible to use the phone’s touchscreen to sense stress. Using an infrared touch-screen to measure HR it was possible to recognise stress with accuracies of 87%and 96% across two tests, a vast improvement upon previous touchscreen basedstress detection [366]. However, infrared touchscreens are rarely used especiallywithin smartphones whereas the capability of measuring stress through capacitive
30

2. Literature Review
touchscreens could have significant impact.Smartphone apps have also been paired with wrist-worn sensors to infer men-
tal wellbeing by allowing a high magnitude of data to be collected [270]. Thecollected data was expressed using 15 multimodal features ranging from physio-logical data such as skin conductance to phone usage data such as screen timeduration. The 15 sets of features were then trained with a variety of classifiersand the accuracy of the different features were examined for each classifier. Thesystem was capable of detecting binary stress with over 75% accuracy, with someof the features such as increased acceleration during sleep and high evening phoneuse being more beneficial than others in determining stress.
Similarly, a wrist sensor along with a mobile app and a self-reported PHQ-8and PHQ-4 depression scores were used to quantify depression symptoms in 83 un-dergraduate college students across two 9-week periods by measuring phone use,heart rate, sleep and location [335]. The study concluded students who reportedthey were depressed were more likely to use their phone at study locations, haveirregular sleep, spend more time being stationary and visit fewer places. Theydemonstrated that they could automatically detect depression with 69.1% pre-cision when evaluated against the PHQ-4 depression sub-scale [171], this couldpotentially be improved if additional physiological sensors were included. In ad-dition to physiological sensors, location could be used to assess mental wellbeingas movement patterns and uncertainty in visits has been shown to be predictiveof the Quick Inventory of Depressive Symptomatology (QIDS) [232].
Alternatively apps can be developed for smartwatches. BreathWell, [329]which has been developed for Android Wear smartwatches has been designed toassist users in practising deep breathing to reduce stress from PTSD, although theapp has limited functionality to determine stress as it only uses the user’s heartrate. Despite the limited functionality, all seven participants believed the appcould help them, although the extent of the trial was extremely limited. Thesestudies demonstrate the potentially powerful combination machine learning, sen-sors and mobile apps provide to automatically determine stress levels.
31
2. Literature Review
2.4.2 Multimodal Physiological Sensors
There are numerous sensors that when combined with sufficiently trained machinelearning classifiers can go beyond mobile apps to assess mental wellbeing in real-time. Non-invasive physiological sensors such as EDA and HRV present the mostsignificant opportunity to assess mental wellbeing [281] with EDA alone detectingstressed and cognitive load with 82.2% accuracy [276]. A CNN has been trainedto classify four emotions; relaxation, anxiety, excitement and fun using EDAand blood volume pulse signals [202]. The deep learning model outperformedstandard feature extraction across all emotions achieving accuracies between 70-75% when the features were fused. Furthermore, when EDA sensors were pairedwith accelerometers to classify human activity and stress using logistic regression,91% accuracy was achieved [372]. EDA, blood oxygen and HR have also beenused to classify five emotions using random forests achieving 74% accuracy [340].When using 30 statistical features from EDA data to infer six emotions; surprise,fear, disgust, grief, happy and angry 78.72%, 73.37%, 70.48%, 62.65%, 62.52%and 44.93% accuracy was achieved for each of the six emotions respectively [354].Finally, when EDA and ECG signals were combined to infer happy, sad andneutral emotions accuracies ranged from 90.12% for happy-neutral to 93.32% forhappy-sad [68].
Both EDA and HRV were used in a wearable device to measure stress duringdriving [124]. The wearable device took measurements over a 5-minute periodto detect stress levels with an accuracy of 97.4% and found that HRV and skinconductance are highly relatable making them extremely useful in detecting men-tal state. A minimum redundancy maximum relevance selection algorithm hasdemonstrated the capability to select the optimal HRV features to train machinelearning classifier, achieving 84.4%, an increase of 10.8% over the sample baseSVM [101]. The ability to use sensors to measure HRV and skin conductanceallows for small devices to accurately determine stress levels in real-time andshould be further utilised to detect stress, anxiety and mental wellbeing. How-ever, physiological signals do not account for the context in which the devices areused as the context can play a significant role in the users’ perceived stress levelsmeaning additional environmental sensors may also be required [300].
32
2. Literature Review
EDA and HR signals have also been used to infer stressed and relaxed statedusing K Nearest Neighbour (KNN) and Fisher discriminant analysis achieving95% accuracy stating that 5-10 second intervals are suitable for real-time stressdetection [73]. A controlled stressor experiment with 166 participants completingpuzzles to collect EDA and HRV signals when experiencing high, medium and lowstress has been conducted. A finite state machine classifier achieved 0.984, 0.970and 0.943 F-measure scores for high, medium and low levels of stress respectively[203].
Another non-invasive sensor that has previously been used to detect stress isskin temperature as it can indicate acute stressor intensity [127]. One study [164]used a wearable device that contained multiple sensors including skin conduc-tance, skin temperature and motion and provided it to 6 people with dementiaand 30 staff in a nursing home for 2 months. The device aimed to automati-cally detect stress and categorise it into one of five levels, the accuracy for eachof these levels varied from 9.9% to 89.4% showing an extremely wide variation.This was due to the threshold setting: when it was raised, fewer events wereclassified as stress because of the harder criteria, in turn, increasing precision.Furthermore, when inferring six emotions HR, EDA, skin temperature and envi-ronmental temperature were used within a wearable glove and chest belt [192].Using KNN, direction finding and multiple back-propagation classifiers with fourfeatures, emotions could be classified with accuracies between 72.3% and 84.1%.
Stress can also be detected from brain activity using EEG [59] as Khos-rowabadi et al. demonstrates using eight channels to classify students’ stressduring exams with over 90% accuracy [162]. A CNN with channel selection strat-egy, where the channels with the strongest correlations are used to generate thetraining set, has also been used to infer emotions from EEG signals [247]. Themodel achieved 87.27% accuracy, nearly 20% greater than a comparative modelwithout channel selection strategy. Similarly raw EEG signals have been used totrain a LSTM network achieving 85.45% in valence [8] and to classify stress inconstruction workers with 80.32% accuracy using a gaussian support vector ma-chine model [149]. Dynamical Graph CNNs have also been used to infer emotionsfrom EEG signals achieving 90.4% accuracy using subject dependent models andan average of 79.95% accuracy with 15 subject independent models [290]. How-
33
2. Literature Review
ever, the inconvenient placement and cumbersome nature of EEG sensors resultin limited use in real-world environments.
Another device aimed to detect stress using ECG, EDA and ElectroMyoGra-phy (EMG) of the trapezius muscles [344]. Principal component analysis reduced9 features from the sensor data to 7 principal components. 18 participants com-pleted three different stressors; a calculation task, a puzzle and a memory taskwith a perceived stress scale questionnaire completed before and after each task.The principal components and different classifiers were used to detect stressedand non-stressed states with an average of almost 80% accuracy across the threetests compared with the questionnaire results. However, this study only detectedtwo states; stressed and non-stressed and was conducted in a controlled environ-ment so it is not known how accurate it is in real-world setting as physiologicalsignals can be affected by factors other than mental wellbeing.
Furthermore, LSTM networks have been used to classify sensor data includingEDA, skin temperature, accelerometer and phone usage data to infer stress. TheLSTMmodel achieved 81.4% accuracy outperforming support vector machine andlogistic regression models [319]. LSTM networks have also been used to classifyemotions from EEG signals with 81.1% accuracy when using the context correla-tions of the feature sequences [356]. A CNN and LSTM have been combined toallow raw data to be classified more accurately [155], [156]. This deep learningapproach is capable of using raw data to automate the feature extraction and se-lection. This approach to classifying emotions from physiological, environmentaland location data outperformed traditional multilayer perceptrons by over 20%.The ad-hoc feature extraction by the CNN matched or outperformed models withthe features already extracted showing the clear advantages of using deep learningapproaches.
Sensing devices are increasing in popularity with advancements in physiolog-ical and environmental sensors resulting in cheaper and smaller devices promot-ing extensive use. The ability to pair machine learning algorithms with sensorspresents an enormous opportunity allowing for mental wellbeing to be detectedwith accuracies exceeding 90% [162], [124]. While AI has enormous potential inclassifying affective states, it does present its own set of challenges as a largeamount of labelled data is required to train the models accurately.
34
2. Literature Review
2.4.3 Transfer Learning (TL)
TL [233] is a common approach in machine learning to mitigate the problem ofscarcity of data. Caruana [54] introduced multi-task learning that uses domaininformation contained in the training signals of related tasks. It is based onthe ability to learn new tasks quickly even without many samples, by relying onprevious, similar samples. TL involves pre-training a model on a task which issimilar to the target task but has significantly more training data available andtransferring the learned knowledge.
CNNs are commonly used in TL as they are initially trained on a large datasetand then the last fully-connected layer is removed and the model is further trainedon a smaller target dataset. A pre-trained CNN alleviates the need for a largedataset while simultaneously decreasing the time required to train the model. Thepremise of TL is to improve the learning of a target task in three ways [311]: (1)improve initial performance, (2) sharp performance growth, (3) potential highertraining performance.
TL has most commonly been used for object recognition [227], human activityrecognition [271] and speech recognition [333] although it could be used to addressthe challenges of affect recognition. By using a pre-trained model from a differentdomain and transferring the learned knowledge to the new domain it is possibleto improve modelling performance while training using few samples.
Previously, large ImageNets have been used to developed pretrained networkssuch as VGGNet [285], Inceptionv3 [303] and mobileNetv3 [139] that contain pre-trained object classification models. The pre-trained CNN models were employedto compute mid-level image representations for object classification in PASCALVOC images [88], leading to significantly improved results. TL has enabled thepossibility to easily train new models in the visual domain using pretrained net-works, however, sensor data is not always easily visually interpreted [280].
TL using physiological signals has previously been used to detect driver status[177] and seizures [72]. Furthermore, an inter-subject TL approach has beenused with ECG signals to infer mental state achieving 79.26% compared with abaseline of 67.90%, demonstrating the potential for TL to improve affective modelperformance with small physiological datasets [89].
35
2. Literature Review
The possibility for TL to be used to personalise affective models has previouslybeen explored and has helped personalise EEG signals, improving model accuracyby 19% [368] and 12.72% [185] while also reducing the amount of data requiredto train the models. TL can be used to help alleviate scarce data as by usingdecision trees, data from similar subjects can be used to improve accuracy byaround 10% although if data from dissimilar subjects is used it can have a negativeimpact on the model accuracy [205]. To ensure negative TL that degrades theperformance of the model does not occur, a conditional TL framework has beendeveloped that assesses an individual’s transferability against individual’s datawithin the dataset. The conditional TL model identified 16 individuals who couldbenefit from 18 individuals data within the EEG dataset, improving classificationaccuracy by around 15% [189].
The inference of emotions from images and videos has also benefited fromTL approaches. When using models pre-trained on the ImageNet dataset andtesting using images of faces expressing seven emotions an accuracy of 55.6% wasachieved compared with a baseline performance of 39.13% [219]. Additionally,audio and video have been explored to infer six emotions where the TL approachimproved base line accuracy by 16.73% [230].
Another TL approach has helped increase the classification accuracy of PTSDusing speech by 13.5% [22]. Similarly, a sparse autoencoder-based feature TLapproach has been developed to infer emotions from speech using the FAU Ai-boEmotion Corpus dataset [27]. The autoencoder approach to find a commonstructure in a small target base dataset and apply the structure to source dataimproved unrated average recall from 51.6% to 59.9% with only 50 data instancesused [77]. Whispered speech has also been explored to infer emotions applyingthree TL approaches; denoising autoencoders, shared-hidden-layer autoencoders,and extreme learning machines autoencoders. Extreme learning machines autoen-coders provide good generalisation extremely fast [140], enhancing the predictionaccuracy on a range of emotion tasks achieving up to 74.6% arousal [76]. Speechhas also been explored to improve PTSD diagnosis using TL and deep belief net-works. The TL approach improved model accuracy from 61.53 to 74.99% [23].Furthermore, deep belief TL networks have been used to improve the accuracy ofemotion recognition through speech cross-language [180]. TL for emotion recog-
36
2. Literature Review
nition has also been used to infer wellbeing from text [283]. A RNN with fullweight transfer where the base model was trained using a Twitter dataset to clas-sify tweets as positive or negative valence achieved an overall accuracy of 78% forall four classes where the standard RNN achieved 72%.
2.4.4 Real-world Classification
The vast majority of previous literature has classified mental wellbeing in con-trolled experimental conditions. Real-world environments provide many addi-tional challenges as there can be numerous factors that influence physiologyrather than purely wellbeing such as music [166], sleep deprivation [243] and nu-trition [359]. However, it is necessary to test models in real-world environmentsto ensure their effectiveness in every day scenarios. HRV and EDA physiologicalsensors present the largest opportunity for real-world mass adoption monitoringdue to their non-invasive, inconspicuous nature.
Classifying stress has been explored in the real-world [103]. Using 63 featuresfrom blood volume pulse, HR, EDA, skin temperature and respiratory rate sen-sors, binary stress was inferred with 83% accuracy and 3 stress levels with 72%accuracy. When inferring stress in real-world environments binary classificationreduced to 76% but by using accelerometer data to provide context the accuracywas increased to 92% over 1 hour periods. HRV has also been used to infer stressover periods of 3 minutes from 45 students experiencing a stress inducing oralexam. Using a decision tree classifier accuracies of around 80% were achieved [55].
HRV data from chestbelts along with audio, physical activity and commu-nication data from a smartphone has similarly been used to infer real-worldstress [214]. Using the PANAS questionnaire as ground truth labels, 13 fea-tures obtained from the smartphone data and 10 HRV features which were moredistinctive than the smartphone features, 61% accuracy was achieved for high,medium and low stress classification. Similarly when using a chest band respi-ratory sensor and accelerometer to infer stress using an SVM, classifier accuracydeclined from 89% in controlled conditions to 72% in the real-world demonstrat-ing the challenges of inferring real-world mental wellbeing [138].
Multi-task learning has been used on real-world data with students reporting
37
2. Literature Review
their health, stress and happiness each morning and evening [147]. The best per-forming models were trained using 343 features extracted from EDA, skin temper-ature and accelerometer sensors, smartphone logs and weather achieving 82.52%,86.07% and 87.5% accuracy for health, stress and happiness respectively. Fur-thermore, 19 participants collected EDA and HR sensor data over 5 days labellingtheir valence and arousal whenever they experienced a change in emotions [125].The model successfully classified 85% of the high and low energy emotions and70% of the positive and negative emotions.
Similarly, to monitor mood at work a smartphone app and wearable em-bedding an ECG, EDA, accelerometer and skin temperature sensor has beendeveloped [363]. 4 users used the system over a period of 11 days labelling theiremotions every 8 hours to collect the sensor data to train the KNN, decision treeand Bagged Ensembles of Decision Trees (BE-DT) networks. When inferringthe strength of 8 emotions the BE-DT model achieved the highest performanceof 62.1% for generalised models and 70.6% for personalised models demonstrat-ing the capability to infer real-world emotions albeit using a small test sample.However, there remains many challenges when developing a classification modelto infer real-world wellbeing including collecting data from a large sample andcollecting ground truth labels [52].
2.5 Technological Based InterventionsAn area of application still in its infancy is technologies that go beyond sensingto additionally provide feedback helping to improve mental wellbeing. A varietyof feedback mechanisms can be used to improve wellbeing and by combiningthese with real-time classification models it enables the possibility for real-timeinterventions to be automatically applied.
2.5.1 Biofeedback Therapy
One method to improve mental wellbeing is bio-feedback therapy; this involvesmonitoring a normal automatic bodily function and then training people to ac-quire voluntary control of that function. Nolan et al. [221] measured HRV in
38
2. Literature Review
patients with coronary heart disease as cardiac death is more likely in these pa-tients when stressed. The study recruited 46 patients, of whom 23 undertookHRV biofeedback involving training patients in paced breathing in order to im-prove their HRV and stress management. The study resulted in patients showingreduced symptoms of psychological stress and depression, proving the positiveeffect of biofeedback training and controlled breathing. However, further work isrequired to investigate whether these findings could be generalised within real-world environments.
Another study [170] used biofeedback for general stress management; thisbiofeedback used a game to encourage users to improve their HR and cerebralblood flow control. This study used stress focused questionnaires, a stress markerand a voxel-based morphometric analysis to determine stress, allowing the studyto conclude that the biofeedback helped reduce daily stress due to the increasein regional grey matter [100]. HRV biofeedback has also been used during thepostpartum period after the birth of a child. The study [174] showed that biofeed-back helped improve HRV and improve sleep over the 1 month period it was usedby 25 mothers. However, the lack of a control group means the study does notdefinitively show the improvements were due to the biofeedback training.
Biofeedback has been shown to have a significant impact in reducing stressduring trials although its effectiveness in real-world stressful situations has notbeen proven [341]. The possibility of pairing bio-feedback training with virtualreality could allow users to practice the techniques learned through biofeedbackto reduce stress in a setting they find stressful, which would demonstrate theeffectiveness of biofeedback. Furthermore, biofeedback requires people to havean understanding, willingness and time to train their body to acquire voluntarycontrol which many people do not possess. Tangible interfaces may solve many ofthese problems by using sensors to analyse affective state similar to biofeedback,and additionally provide automated feedback to improve wellbeing in real-time.
2.5.2 Real-time Feedback
Devices that sense and provide feedback ranging from tangible interfaces torobotics have the possibility to positively impact the wider population who may
39
2. Literature Review
temporarily experience mental wellbeing challenges but do not seek professionalhelp. Tangible devices offer the capability to improve mental wellbeing in real-time by pairing sensors with automated feedback.
A variety of tangible mental wellbeing devices have been produced by Vau-celle, Bonanni, and Ishii [321]. These include touch me; which contains multiplevibrotactile motors to provide the sensation of touch, squeeze me; a vest to sim-ulate therapeutic holding, hurt me; a wearable device that applies a moderatedpainful stimuli to ground people’s senses and cool me down; a device that heatsup to ground people’s senses. From the devices developed clinicians believedhurt me had the most potential as it could allow for the patient and therapist tobetter relate to one another, by having the therapist working with the class ofpain the patient is experiencing psychologically and externalising viscerally. Allof these interfaces have specific purposes such as hurt me which may be benefi-cial for people considering self-harming but not for people suffering from othermental health challenges. A more general device is required for people who mayexperience temporary mental wellbeing challenges.
It is possible to help improve general mental wellbeing using small deviceswith real-time interventions; one such device is Squeeze, Rock and Roll [47].This device allows users to simulate rolling behaviours as many people do witha pen when stressed but the device gradually guides the user to reduce theirmovements and their stress through dynamic tactile feedback. However, whilepeople acknowledged the device helped them relax no stress reduction was found,possibly because the device offered very little feedback. Guiding users’ behavioursis a novel approach to improve mental wellbeing although possibly less effective assome people may find the action of rolling or twisting objects relaxing and is oftenused as a coping strategy for people suffering from mental health conditions [53].
Haptic feedback is a method of providing feedback that recreates the sense oftouch through the use of motors and vibrations; this allows people to experiencereal sensations which can significantly affect emotions and has been shown tosuccessfully improve mental wellbeing [332], [62]. Good vibes [159] used a hapticsleeve to provide varying feedback dependent on heart rate readings. A stress testwas conducted while the sleeve used dynamic vibrations to help reduce the heartrates of the participants by 4.34% and 8.31% in the two tests compared to the
40
2. Literature Review
control group. Doppel [17] also used haptic feedback in a wearable device thataimed to reduce stress before public speaking, measuring users’ heart rates andskin conductance to determine stress. The speed of the vibration was dependanton the user’s HR, providing personalised real-time feedback. When users weretold they were to present a speech the skin conductance data showed users wearingthe Doppel remained less stressed than the control group. This research showsthat haptic feedback can have a substantial positive impact in improving mentalwellbeing and is more successful than guiding user interactions. The advantageof personalised haptic feedback is clear, but more research needs to be conductedto establish the best rate and type of feedback for individual users.
A headband has also been developed that uses EEG combined with machinelearning to assess stress by analysing alpha and beta waves as alpha waves de-crease when stressed [278] and then uses massage therapy to reduce stress [50].The massage motors were tested on 4 participants with 3 of these responding wellto the feedback and becoming less stressed showing the possibility for massagetherapy to be further utilised in stress reduction devices. However, as the devicewas only used by 4 participants with a 75% success rate, it is far too small to haveany statistical significance with much more research needing to be conducted toprove it can be as effective as haptic feedback.
Communicating with others has a positive mental impact leading to researchthat remotely connects people through biofeedback. When communicating emo-tions, a range of output modalities have been explored including including visual,haptic and audio feedback in addition to more novel feedback modalities such astemperature, shape changing, taste and smell [184]. Haptic feedback has com-monly been used due to its unobtrusive nature and ability to represent the feel-ing of touch [215]. Haptic feedback can further be utilised as a breathing pacer.Miri [208] found that the development of a personalised routine where users findthe breathing frequency comfortable was more important in relaxing users thanthe placement of the feedback itself, demonstrating the benefits of haptic feed-back to both passively calm users and actively aid relaxing breathing practices.Similarly, shared breathing experiences through Breeze using tactile, visual andaudio feedback helped to increase the feeling of belonging between connectedparticipants [94]. Communication with others is vital to ensure positive mental
41

2. Literature Review
wellbeing and while feedback devices that remotely connect individuals appearto improve mental wellbeing they have only been tested in limited trials.
Many existing approaches have not classified wellbeing to issue feedback butinstead mirrored physiological reactions back to users for their reflection [264].Visual feedback in the form of flexible wrist-worn displays have been developedenabling users to view real-time representations of their physiology [318]. How-ever, the use of a thermochromic displays resulted in the visualisations beingambiguous and potential privacy concerns as other people could easily view thewearer’s emotions.
Somaesthetics has also been used as a method of combining bodily experienceswith aesthetic appreciation, presenting many opportunities for expressing mentalwellbeing [346]. The Breathing Light [135] created an enclosed space where lightdynamically changed with the user’s breathing patterns enabling deep reflection.The Breathing Light provided a more calming alternative for visual feedback butmay be challenging to adopt in real-world environments. Alternatively, Bright-Hearts [163] is a biofeedback mobile app that changes patterns, colour and soundwith the user’s HR, helping people become self-aware of their wellbeing and as-sisting them to relax as shown in Figure 2.10. Another app aimed to improveemotional wellbeing without the use of somaesthetics, instead using momentaryphotography [183]. The results demonstrated photographic features such as thenumber of photos taken and the number of photos revisited were positively cor-related with an improvement in the participant’s mood showing photography asa simple real-time method to improve wellbeing.
BioFidget [186] shown in Figure 2.11 is a self-contained device that monitorsHRV and allows users to train their breathing by blowing on the fidget spinner toreduce stress. Twenty participants stated BioFidget helped them feel relaxed andoverall it helped the majority of users improve their HRV showing they were lessstressed. Inner Flower [117] has also been developed as an ambient device thatuses the user’s HR and HRV to create a breathing guide using visual feedback.The results showed that breathing exercises reduced stress levels although theambient visual feedback had no significant impact on stress.
Additionally, somatics has been used to translate EDA data into felt expe-riences through changes in temperature [7]. Wearer’s of the device found the
42

2. Literature Review
Figure 2.10: BrightHearts app showing light pattern.
cooling sensation triggered by changing arousal levels to be pleasant. The use ofvarying temperatures as feedback is a novel method that when paired with addi-tional sensors to better monitor wellbeing could provide subtle calming feedbackthat may help improve wellbeing.
A different approach to provide real-time feedback is to alert the user regard-ing their current mental state, allowing them to take appropriate measures suchas reducing workload or taking time to relax. MoodWings [197] aimed to reducestress through wing actuations informing users of their current stress levels. Par-ticipants wore the device on their arm while ECG and EDA readings were takento determine stress. A simulated driving experience was undertaken by partici-pants and once stress was detected the wing movement was manually activated.The results show that MoodWings improved the participants’ awareness of theirstress, but their awareness further increased their stress as shown by EDA data,resulting in the device having a negative effect on users’ mental wellbeing. Over-all this study demonstrated that sharing wellbeing data with users needs to becarefully considered [197].
A novel approach to provide feedback is through the use of robotics suchas therapy animals which are most commonly used to reduce loneliness. One
43

2. Literature Review
Figure 2.11: BioFidget TUI used to promote deep breathing.
example of a robot used for therapy is Paro; a robotic seal that was designedas an easy to use robotic animal that encourages user interaction with its largeeyes and soft fur [282]. Tactile sensors allow Paro to understand the locationand force of users’ touch allowing for the response’s magnitude to be relevant tothe input. Studies show Paro provided extremely effective therapy as it helpedreduce stress in a day service centre for elderly adults [16], increased user’s socialinteractions and improved their reactions to stress in a care home [282]. Parohas been shown to have a great impact in helping reduce stress in elderly adultseven with its limited sensors and responses and has the potential to have a widerpositive impact on people’s mental wellbeing.
Figure 2.12: Paro therapy seal.
Although most therapeutic robots such as Paro target the elderly, a roboticteddy aimed at reducing stress in young children at the hospital has been de-veloped [150]. Rather than relying upon tactile interaction like Paro, this teddyuses vocal interactions, which children preferred. The children who used therobotic teddy spent more time playing with it than the comparative virtual or
44
2. Literature Review
traditional plush teddy, they also had more meaningful interactions and their be-haviours conveyed they were emotionally attached to the bear and not stressed.Robotic interactions can have a positive impact on emotional experiences andhelp reduce stress in both the young and the elderly. Robotic animals could beeasily adapted to incorporate additional sensors to automatically detect mentalwellbeing allowing for more personalised responses to be produced.
Feedback devices aim to advance upon sensing devices by actively improvingmental wellbeing in real-time using varying feedback mechanisms including hap-tic, visual and auditory [94]. Many of these techniques proved to be beneficial inimproving mental wellbeing, displaying the need for more widespread adoptionof such devices. While some feedback devices incorporated sensors, very littleresearch has been conducted pairing physiological sensors, feedback mechanismsand AI into devices that aim to both sense and improve mental wellbeing in real-time. Overall, the feedback incorporated in a device requires careful considerationand evaluation to ensure it is effective with future devices potentially employingclassification models to accurately determine when feedback should be provided.
2.6 Reflection and Challenges of Affective Tech-nologies
2.6.1 Discussion of Existing Research
A number of systems to support mental wellbeing using apps, sensors, TUIs,biofeedback and robotics have been reviewed. A large number of apps alreadyexist, with many aiming to improve traditional self-reporting tools and experiencesampling. Apps designed to elicit PROMs provide additional convenience overtraditional methods as they can be used anywhere discreetly, but self-reportingis subjective and people may fail to report [284] or be less truthful [113] whenrecording their mental state, showing the benefits of using objective measure-ments from sensors. Mobile apps reaffirm the increasing popularity of peoplewishing to monitor and improve their wellbeing using technological alternativesto traditional techniques.
45
2. Literature Review
Sensing devices are also increasing in popularity with advancements in physi-ological sensors resulting in cheaper and smaller devices promoting extensive use.A range of sensors have been explored measuring HR, HRV, EDA and motion.The ability to pair machine learning algorithms with sensor data presents anenormous opportunity allowing for affective states to be detected with accuraciesexceeding 90% [162], [124]. Integrating sensors with classification models in aportable interface potentially enables continuous monitoring without the need toself-report. However, while AI has enormous benefits, it does present its own setof challenges, as a large amount of labelled data is first required to accuratelytrain models.
Feedback devices aim to actively improve wellbeing in real-time using varyingfeedback mechanisms such as haptics, visuals and audio [94]. Haptic feedback hasbeen used in multiple devices and often resulted in reduced stress, in particularwhen the feedback was personalised. Other feedback interfaces aimed to reducestress using existing techniques such as deep breathing [186], [94], or massagetherapy [56]. All these techniques proved to be beneficial, demonstrating theneed for more widespread adoption of such devices. While some feedback devicesincorporated sensors to monitor the impact the feedback had, very little researchhas been conducted pairing physiological sensors, feedback mechanisms and AIinto devices that aim to both sense and improve real-world wellbeing.
2.6.2 Challenges
2.6.2.1 Privacy and Ethics
Applying therapies and translating them into digital versions is not straightfor-ward as there are many challenges associated with mental wellbeing technologies.Privacy is a significant issue as the majority of users want to keep their mentalhealth information private [39]. Users are more cautious regarding sharing theirhealth data making integrating the data with established e-health systems chal-lenging [345]. Efforts such as the General Data Protection Regulation (GDPR)in the EU and EEA have attempted to give control to citizens over their personaldata by ensuring they are able to access their data and understand how it is beingprocessed [87]. Ideally data processing should be completed locally to preserve
46
2. Literature Review
privacy. Furthermore, care needs to be exercised regarding users’ privacy withthe data collected; ethical guidelines should be abided by, and users should bemade aware of the data being collected and how it is being processed.
2.6.2.2 Digital Competency
An issue with some of the discussed devices is users’ digital competence as elderlyadults generally lack a high level of digital skills which may be required to operatethese devices. However, one study [256] found elderly users preferred wearabledevices over mobile phones to report emotions. Furthermore, Emoball [95] is aself-contained device and there was no evidence of digital competence affectinguser interactions, showing affective TUIs can be widely adopted.
2.6.2.3 Data Collection and User Adherence
An issue with much of the existing research is very few trials collect or test usingreal-world data as people becoming artificially stressed in trials may not exhibitthe same patterns when stressed or suffer from other wellbeing challenges in real-world situations. For real-world data collection recruiting and incentifying usersto test and provide feedback on the use of such devices can be challenging, partic-ularly regarding users’ willingness to trial new affective technologies. Users willbe required to trial devices to ensure their effectiveness but also to collect dataenabling machine learning models to be trained. User adherence and engage-ment is another crucial problem as users may not immediately see the benefits ofsuch solutions, preventing continued use. Furthermore, engaging hard to reachcommunities where mental wellbeing technologies could have a profound impactposes even greater challenges. Making the devices as small and portable as pos-sible should encourage engagement as it allows them to be used anywhere [273].The design of the devices must also be carefully considered for widespread useas they must be aesthetically pleasing to ensure the promotion of continued en-gagement [231].
47

2. Literature Review
2.6.2.4 Classification
On the diagnostic side, one of the biggest issues is affective sensing: this is inher-ently subjective and it may be difficult to infer through sensor data alone [299].Machine learning models could be trained on an individual basis to allow for sub-jectivity to be taken into account, but this would initially require a vast amountof time and data to be collected from each user which may not be possible withoutfirst developing more accessible data collection tools. Sensing mental wellbeingnot only requires accurate classification models but also accurate sensors, sinceif the data recorded from the sensors is not reliable, the classification from themachine learning model will not be accurate. However, when machine learningclassifiers were paired with off the shelf sensors, stress was detected with simi-lar accuracy to clinical grade sensors [209] demonstrating the potential for AI toimprove accessibility to affective tools.
2.6.2.5 Portability
There are many challenges to overcome when using sensors and feedback actua-tors in tangible interfaces to improve mental well-being. One issue is the size ofthe device as it must contain sensors, a battery and feedback mechanisms whichcan make the device large. There are new approaches to provide feedback includ-ing Visio-Tactile feedback, that moves liquid metal drops in real-time betweenelectrodes allowing for the feedback to be dynamic and smaller [262]. However,this is very early in development and it may not yet be possible to incorporate itinto tangible devices.
2.6.2.6 Battery Life
Assuming patients are willing to use instruments used in the domain of assessingmental wellbeing, the underlying issue of battery life still needs to be addressed.Often IoT devices need to remain small and contain the necessary microcontrollerand sensors leaving little room for the battery meaning it will need to be rechargedregularly. A possible solution to this would be to only enable specific sensors afterother actions have been performed; this means high powered sensors will nothave to be continually powered but an additional step is required to collect data.
48
2. Literature Review
Until batteries with considerably longer battery life are developed, it will remainimpractical to continually collect vast amounts of behavioural data. Instead,pragmatic solutions to optimise power consumption are necessary.
2.6.3 Summary of Current Gaps in the Research
1. Only few attempts are present in the literature that have looked at util-ising multimodal real-time sensing approaches. Very often key sensors formental wellbeing assessment are not utilised such as EDA, either becauseit’s not available in the sensing kit or due to the fact devices with EDAsensors are often expensive [86]. Even those with multi model sensing ap-proaches are not integrated within a full comprehensive system that alsodelivers meaningful feedback to the user as instant intervention. Therefore,the development of custom TUIs may improve accessibility to continuousmonitoring and real-time interventions.
2. Digital markers such as physiological and human behaviour sensors andadvances in edge computing present clear opportunities for real-time mo-mentary assessment and instant intervention. However, there is an absenceof large scale real-world trials to confirm the results. Many studies haveused controlled experimental datasets to evaluate the models, not consid-ering real-world performance. If affective states are to be inferred in in-situenvironments then real-world labelled datasets are required to train themodels. Therefore, techniques to aid the collection of real-world labelleddata need to be explored.
3. The current research demonstrates two major constraints when using deeplearning classifiers: a large dataset is required to first train the model andindividual differences make the development of a one-size-fits-all model ex-tremely challenging. The use of new techniques such as TL presents op-portunities to reduce the impact of these limitations and to overcome datascarcity which is often associated with personal data.
4. Although the possibility of including feedback within interfaces to act asinterventions has been considered there has been little focus on a single
49
2. Literature Review
interface that processes real-wold physiological data and provides inter-ventions. This creates the possibility to explore new methods that auto-matically monitor and positively impact mental wellbeing going beyondtraditional feedback mechanisms.
5. Privacy and data sharing are key concerns in the development of wellbeingdevices as health data is extremely personal. Advances in edge computingare enabling instant monitoring whilst retaining privacy by not sharing dataand completing all processing on-device, helping to put users in control oftheir wellbeing whilst also protecting their data.
50
Chapter 3
In the hands of users:Co-Designing Tangible Interfacesto Monitor Affective State
This chapter presents the exploration of inclusive and participatory co-designtechniques and principles to engage potential users who could benefit from in-novations in affective tangible technologies. In particular, individuals with cog-nitive impairments participated in a co-design process via a series of workshopsand focus groups as their wellbeing is often diagnostically overshadowed and theycan traditionally find it challenging to express their emotions [102]. The work-shops helped participants explore new technologies including sensors and feedbackmechanisms that can help monitor and potentially improve their mental wellbe-ing. The adopted co-design approach resulted in a range of effective and suitableinterfaces being developed for varying ages.
3.1 IntroductionTraditional mental wellbeing assessment methods require people to be aware oftheir mental health status and seek help which can be challenging due to socialstigma and lack of available resources [61]. The decreasing cost and increasingcapabilities of sensors and edge computing is enabling new forms of interfaces
51

3. Co-Design of Tangible Interfaces to Monitor Affective State
which are more powerful and dynamic than traditional assessment technologies.A technological alternative that could actively monitor an individual’s affectivestate and provide feedback could be extremely beneficial in improving accessibilityto mental health tools for all [51].
Recent advances in sensors, batteries and processors have resulted in an in-crease of pervasive computing technologies. However, many interfaces only in-clude a limited range of sensors such as those measuring motion and HR andinfrequently record this data, resulting in a dataset that may not capture all ofthe wellbeing states experienced by users and is not sufficient to effectively trainmachine learning classifiers. Furthermore, the vast majority of current interfacesthat monitor wellbeing do not include methods that can serve as intervention topromote the regulation of negative emotions [114].
TUIs enable people to interact with digital data through physical objects andare ideal to embed all of the necessary sensors and processing power [317]. Tangi-ble manipulation presents an opportunity to develop novel devices introduced astangible fidgeting interfaces that go beyond traditional devices to enable uniqueinteraction methods and encourage continued engagement [136]. A successfulTUI is envisioned that will enable affective state to be automatically monitoredusing multimodal sensors embedded within the device. The possibility of a deviceto accurately monitor real-world wellbeing using sensor data, further enables thepossibility of applying digital feedback to act as interventions aiming to automat-ically and gradually regulate emotions and improve wellbeing in real-time.
A person diagnosed with an intellectual disability [274] shows deficits in intel-lectual functioning such as reasoning or problem solving with an IQ score oftenless than 70 and deficits and impairments in adaptive functioning such as com-munication or social skills, all during the developmental period before the age of18 [11]. Intellectual disabilities can be divided into four levels: mild, moderate,severe and profound where for each level the person requires more support [196].Individuals with intellectual disabilities often experience mental wellbeing chal-lenges but these are frequently overlooked and attributed erroneously to theirdisability (diagnostic overshadowing) or classed as challenging behaviour [102].Diagnostic overshadowing often results in a significant impact on an individual’slikelihood of engaging with mental healthcare systems. Furthermore, many in-
52
3. Co-Design of Tangible Interfaces to Monitor Affective State
dividuals with intellectual disabilities find it challenging to express the emotionsthey experience [3]. Individuals with intellectual disabilities face additional chal-lenges in expressing their emotions, correctly interpreting social situations andpredicting the behavioural consequences of specific actions [46], [263]. This re-search seeks to address these challenges using a co-design approach.
To ensure the proposed TUIs are effective and usable by individuals who expe-rience mental wellbeing challenges, including those with intellectual disabilities, itis imperative to design the interfaces with end users. An iterative co-design pro-cess has been proposed that has been adapted to enable the designing of interfacesand exploration of different sensing and feedback mechanisms with participantsfrom the Nottingham Interactive Community for Education Research (NICER)group at Oak Field school, Nottingham, UK. The group is formed of adults witha range of intellectual disabilities who have a wide range of experience in eval-uating enabling technologies, including virtual environments and serious games.This approach hopes to alleviate communication challenges faced by the targetgroup and gather feedback that results in the development of interfaces that caneffectively monitor real-world affective state.
The aim of the iterative co-design process was not to achieve one design withspecific sensors, instead a range of different devices was expected to be proposedto suit the needs of all potential users including those who may experience a widerange of limitations. The co-design process aimed to investigate the followingresearch questions 1) How can the co-design process be adapted to best suit theneeds of those with intellectual disabilities? 2) What are the optimal designguidelines for prototyping affective tangible interfaces? 3) Which sensors wouldbe most beneficial for user interaction? 4) How do users believe on-device feedbackcould help improve their mental wellbeing?
3.2 Background of Co-designCo-design is closely connected with participatory design and is the methodologyfor actively engaging people directly involved in an issue, place or process in itsdesign, allowing them to make a meaningful contribution to the design process[49], [32], [134]. Co-design enables the reduction of the gap in knowledge between
53

3. Co-Design of Tangible Interfaces to Monitor Affective State
end users and researchers, allowing non-designers to become equal members ofthe design team, ensuring designer subjectivity is removed and the technologiesdeveloped are suitable for the target population [325], [269]. During the process,design tools are used to empower all of the participants to facilitate a ‘jointinquiry’ where ‘problem and solution co-evolve’ [295]. Co-design brings manybenefits to the design of the project by helping the researcher better understandthe challenges faced by users and any potential solutions [296], [287].
Co-designing helps solve real-world problems by bringing together people fromdifferent backgrounds into the design process, resulting in more inclusive solu-tions. However, to work most effectively it is important to select appropriatemethods and ways of working which need to match the project being designedand the potential users’ capabilities and limitations. Co-design methods helpmake things that are normally unobservable through traditional interviews andfocus groups available as resources for design [326], [82], [327], this can be achievedby:
• using visual, creative methods [266].
• physically making things helping people to explore, verbalise, rememberand imagine [269].
• creating and telling stories helping to put things into context and providinga central way of sharing and communicating. Story sharing can be visual,verbal or include role play. [266].
Co-design can be used to promote the inclusion of people living with disabili-ties when designing new solutions by including their personal experiences, makingthem more likely to take ownership of the final outcome [272]. People with in-tellectual disabilities may face barriers such as communication challenges whenbeing involved in the co-design of new assistive technologies, resulting in co-designtechniques needing to be modified to fit with participants’ abilities [34]. To helpreduce the challenges faced, a set of guidelines have previously been devised forco-designing with people who have autism spectrum disorders [93].
Co-design has previously been used to engage individuals with cognitive dis-abilities in successfully designing a picture-based remote communication system,
54
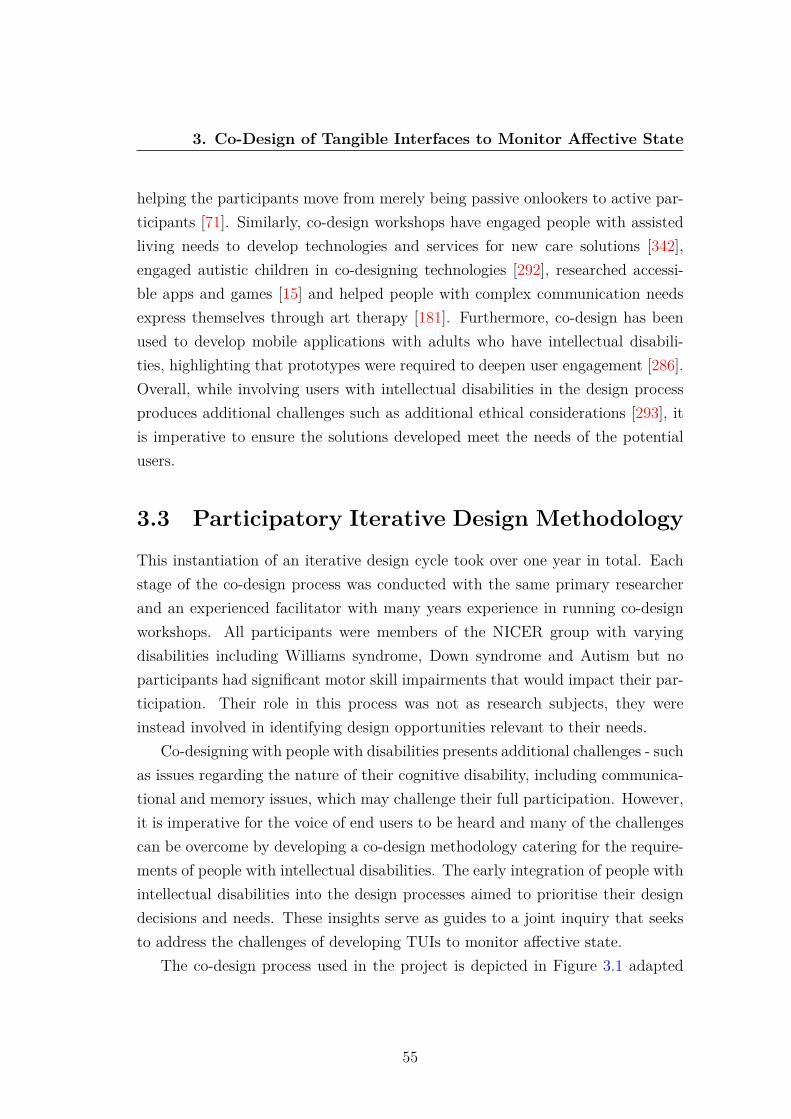
3. Co-Design of Tangible Interfaces to Monitor Affective State
helping the participants move from merely being passive onlookers to active par-ticipants [71]. Similarly, co-design workshops have engaged people with assistedliving needs to develop technologies and services for new care solutions [342],engaged autistic children in co-designing technologies [292], researched accessi-ble apps and games [15] and helped people with complex communication needsexpress themselves through art therapy [181]. Furthermore, co-design has beenused to develop mobile applications with adults who have intellectual disabili-ties, highlighting that prototypes were required to deepen user engagement [286].Overall, while involving users with intellectual disabilities in the design processproduces additional challenges such as additional ethical considerations [293], itis imperative to ensure the solutions developed meet the needs of the potentialusers.
3.3 Participatory Iterative Design MethodologyThis instantiation of an iterative design cycle took over one year in total. Eachstage of the co-design process was conducted with the same primary researcherand an experienced facilitator with many years experience in running co-designworkshops. All participants were members of the NICER group with varyingdisabilities including Williams syndrome, Down syndrome and Autism but noparticipants had significant motor skill impairments that would impact their par-ticipation. Their role in this process was not as research subjects, they wereinstead involved in identifying design opportunities relevant to their needs.
Co-designing with people with disabilities presents additional challenges - suchas issues regarding the nature of their cognitive disability, including communica-tional and memory issues, which may challenge their full participation. However,it is imperative for the voice of end users to be heard and many of the challengescan be overcome by developing a co-design methodology catering for the require-ments of people with intellectual disabilities. The early integration of people withintellectual disabilities into the design processes aimed to prioritise their designdecisions and needs. These insights serve as guides to a joint inquiry that seeksto address the challenges of developing TUIs to monitor affective state.
The co-design process used in the project is depicted in Figure 3.1 adapted
55
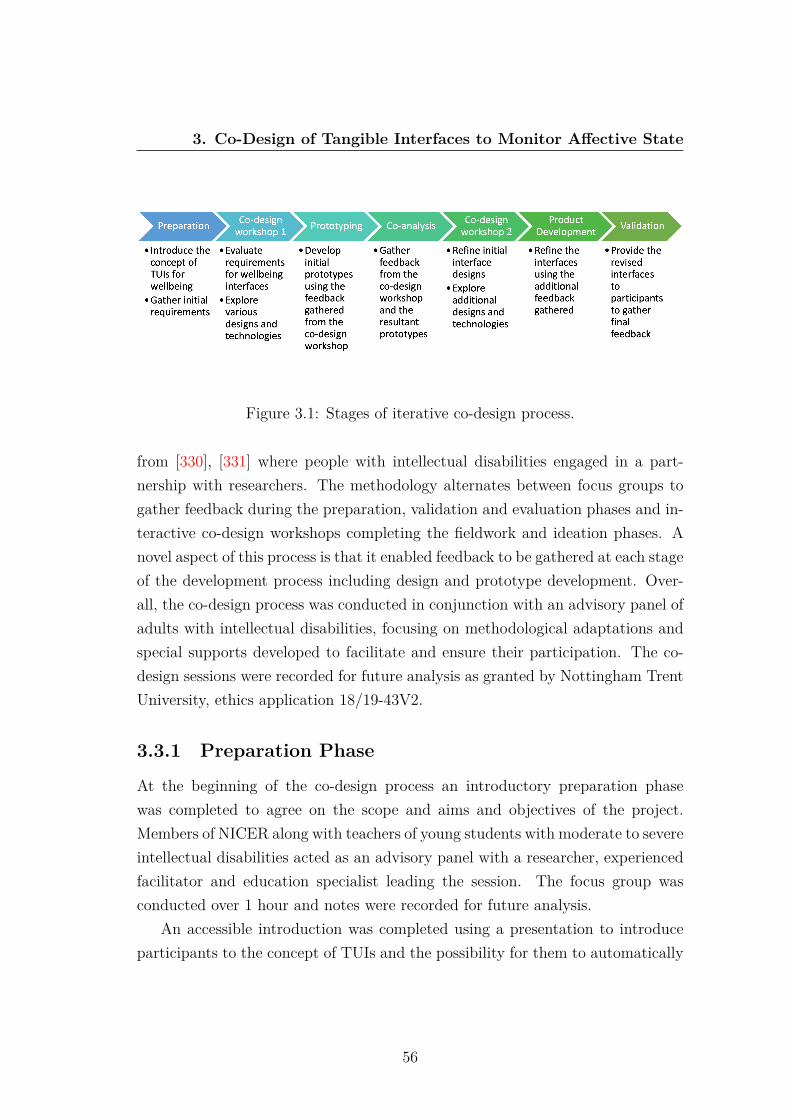
3. Co-Design of Tangible Interfaces to Monitor Affective State
Figure 3.1: Stages of iterative co-design process.
from [330], [331] where people with intellectual disabilities engaged in a part-nership with researchers. The methodology alternates between focus groups togather feedback during the preparation, validation and evaluation phases and in-teractive co-design workshops completing the fieldwork and ideation phases. Anovel aspect of this process is that it enabled feedback to be gathered at each stageof the development process including design and prototype development. Over-all, the co-design process was conducted in conjunction with an advisory panel ofadults with intellectual disabilities, focusing on methodological adaptations andspecial supports developed to facilitate and ensure their participation. The co-design sessions were recorded for future analysis as granted by Nottingham TrentUniversity, ethics application 18/19-43V2.
3.3.1 Preparation Phase
At the beginning of the co-design process an introductory preparation phasewas completed to agree on the scope and aims and objectives of the project.Members of NICER along with teachers of young students with moderate to severeintellectual disabilities acted as an advisory panel with a researcher, experiencedfacilitator and education specialist leading the session. The focus group wasconducted over 1 hour and notes were recorded for future analysis.
An accessible introduction was completed using a presentation to introduceparticipants to the concept of TUIs and the possibility for them to automatically
56
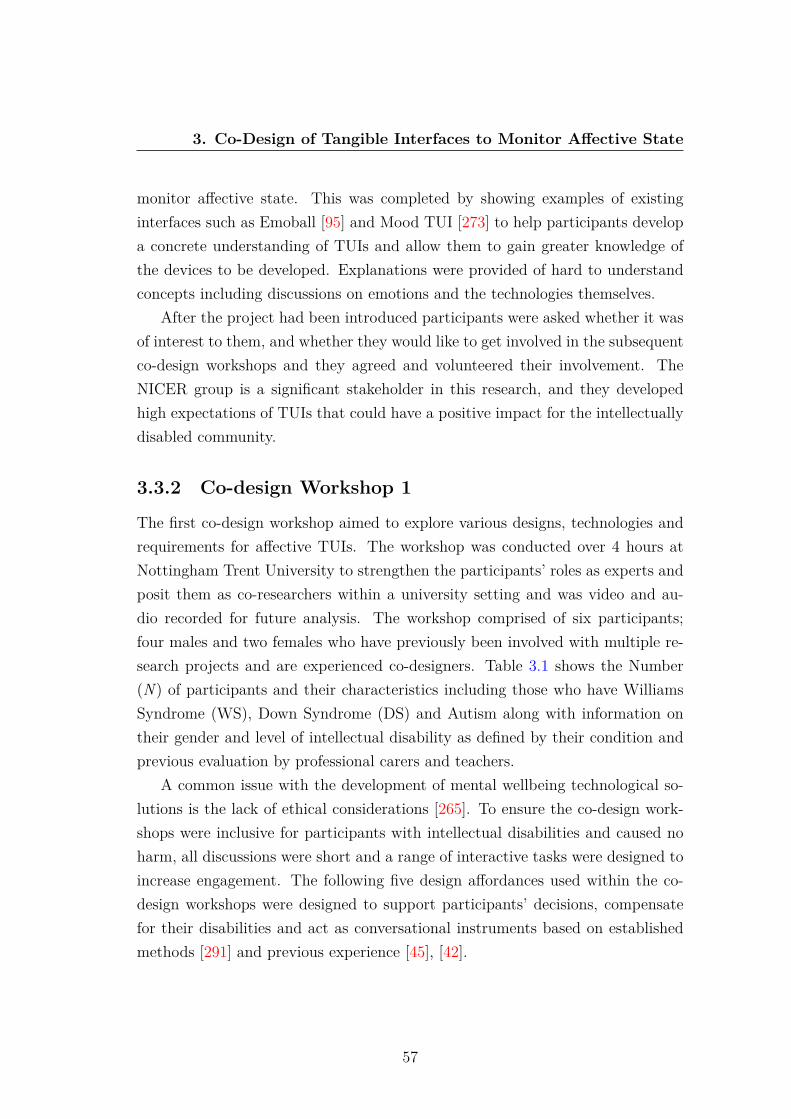
3. Co-Design of Tangible Interfaces to Monitor Affective State
monitor affective state. This was completed by showing examples of existinginterfaces such as Emoball [95] and Mood TUI [273] to help participants developa concrete understanding of TUIs and allow them to gain greater knowledge ofthe devices to be developed. Explanations were provided of hard to understandconcepts including discussions on emotions and the technologies themselves.
After the project had been introduced participants were asked whether it wasof interest to them, and whether they would like to get involved in the subsequentco-design workshops and they agreed and volunteered their involvement. TheNICER group is a significant stakeholder in this research, and they developedhigh expectations of TUIs that could have a positive impact for the intellectuallydisabled community.
3.3.2 Co-design Workshop 1
The first co-design workshop aimed to explore various designs, technologies andrequirements for affective TUIs. The workshop was conducted over 4 hours atNottingham Trent University to strengthen the participants’ roles as experts andposit them as co-researchers within a university setting and was video and au-dio recorded for future analysis. The workshop comprised of six participants;four males and two females who have previously been involved with multiple re-search projects and are experienced co-designers. Table 3.1 shows the Number(N) of participants and their characteristics including those who have WilliamsSyndrome (WS), Down Syndrome (DS) and Autism along with information ontheir gender and level of intellectual disability as defined by their condition andprevious evaluation by professional carers and teachers.
A common issue with the development of mental wellbeing technological so-lutions is the lack of ethical considerations [265]. To ensure the co-design work-shops were inclusive for participants with intellectual disabilities and caused noharm, all discussions were short and a range of interactive tasks were designed toincrease engagement. The following five design affordances used within the co-design workshops were designed to support participants’ decisions, compensatefor their disabilities and act as conversational instruments based on establishedmethods [291] and previous experience [45], [42].
57

3. Co-Design of Tangible Interfaces to Monitor Affective State
Table 3.1: Co-design workshop 1 participant characteristics (age, gender disabil-ity) for total Number of participants (N), with Williams Syndrome (WS), DownSyndrome (DS) and Autism.
Total(N=6)
WS(N=1)
DS(N=4)
Autism(N=1)
Mean age 36 39 39.75 18(range) (18-47) (30-47)Gender N (%) Men 4 (66.7) 1 (100) 2 (50) 1 (100)
Women 2 (33.3) 0 (0) 2 (50) 0 (0)Level of intellec-tual disability N(%)
ModerateSevere
1 (16.67)5 (83.33)
0 (0)1 (100)
1 (25)3 (75)
0 (0)1 (100)
3.3.2.1 Introduction and Demonstration
When conducting co-design workshops with participants who have intellectualdisabilities it is imperative to ensure all participants fully understand the goal ofthe workshop to improve communication. To ensure this, an experienced facilita-tor introduced the session by clearly explaining the concept of affective tangibleinterfaces.
Challenges can arise from communicating with participants and difficultiesinterpreting non-verbal interactions [126], [224]. Therefore, in the co-design pro-cesses the adage “show me don’t tell me” [49] is often used, resulting in previouslydeveloped prototypes such as the cube shown in Figure 7.1 being demonstrated tothe participants. Concrete prototypes, create opportunities for participants withintellectual disabilities to interact directly with the interfaces and understand thefeasibility of developing new interfaces [40]. The prototypes embedded a range ofsensors including 9 Degree of Freedom Inertial Measurement Units (9-DOF IMU)to measure motion, Force Sensitive Resistors (FSR) to measure touch and HRand EDA sensors to measure physiological changes.
3.3.2.2 Storyboarding and Drawing
The design of the interfaces was then explored. Previous work provides manyuseful strategies for engaging individuals with intellectual disabilities in the de-sign process such as storyboards and pictures, and avoiding open-ended ques-
58
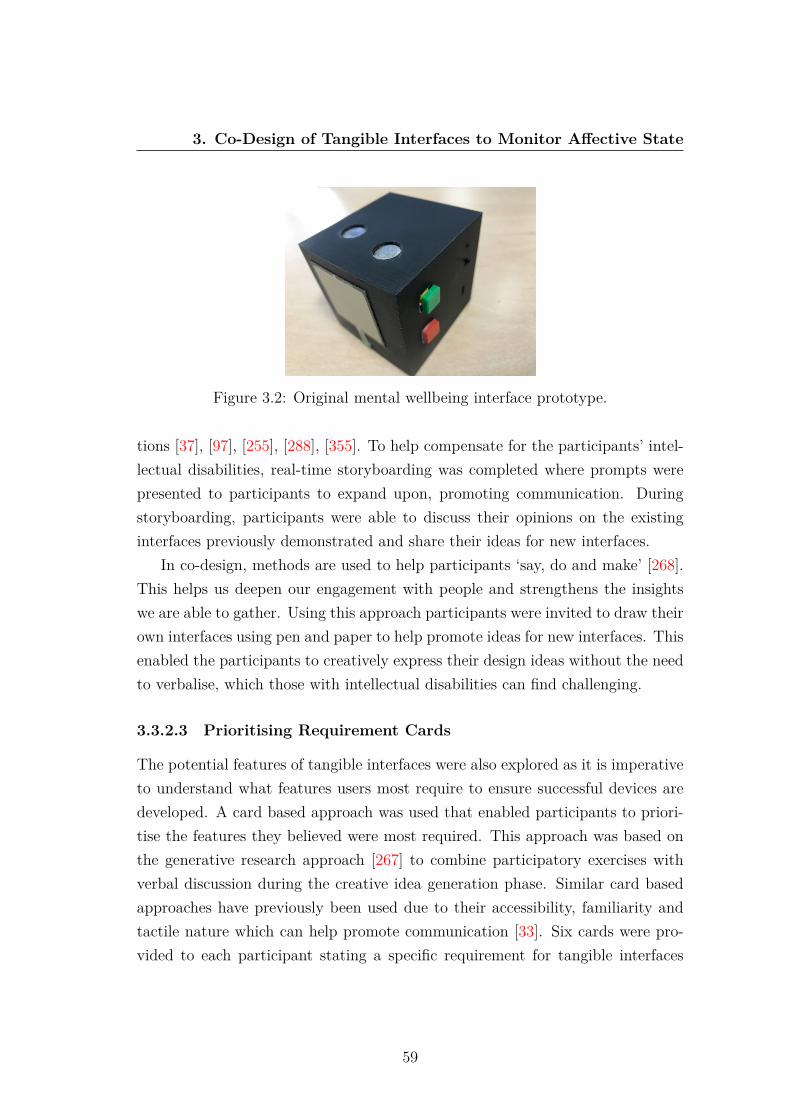
3. Co-Design of Tangible Interfaces to Monitor Affective State
Figure 3.2: Original mental wellbeing interface prototype.
tions [37], [97], [255], [288], [355]. To help compensate for the participants’ intel-lectual disabilities, real-time storyboarding was completed where prompts werepresented to participants to expand upon, promoting communication. Duringstoryboarding, participants were able to discuss their opinions on the existinginterfaces previously demonstrated and share their ideas for new interfaces.
In co-design, methods are used to help participants ‘say, do and make’ [268].This helps us deepen our engagement with people and strengthens the insightswe are able to gather. Using this approach participants were invited to draw theirown interfaces using pen and paper to help promote ideas for new interfaces. Thisenabled the participants to creatively express their design ideas without the needto verbalise, which those with intellectual disabilities can find challenging.
3.3.2.3 Prioritising Requirement Cards
The potential features of tangible interfaces were also explored as it is imperativeto understand what features users most require to ensure successful devices aredeveloped. A card based approach was used that enabled participants to priori-tise the features they believed were most required. This approach was based onthe generative research approach [267] to combine participatory exercises withverbal discussion during the creative idea generation phase. Similar card basedapproaches have previously been used due to their accessibility, familiarity andtactile nature which can help promote communication [33]. Six cards were pro-vided to each participant stating a specific requirement for tangible interfaces
59
3. Co-Design of Tangible Interfaces to Monitor Affective State
including: ease of use, makes me feel better, design, battery life, physical sizeand understands how I am feeling. Each of the six requirements were explainedto the participants by the researcher and experienced facilitator to ensure theyfully understood the meaning of the requirements and their role in prioritisingthe requirement cards.
3.3.2.4 Real-time 3D Printing
The process of showing participants with an intellectual disability how their de-sign decisions have a direct real-world consequence in a rapid and concrete waywas developed in an earlier study and replicated here [44]. 3D modelling softwarewas used to demonstrate how the interfaces can be designed and printed to makeconcrete the relationship between the participants’ decisions and the tangible in-terfaces produced. A majority vote was conducted to decide on the shape to beprinted and as the workshops were conducted over several hours there was suf-ficient time to design and 3D print a small interface, providing opportunity forparticipants to provide reflection on the design. Creating the interfaces duringthe workshops resulted in a deeper and more practical understanding about theparticipants’ experiences [268].
3.3.2.5 Interactive Electronics
When exploring new technological solutions, providing demonstrations is neces-sary to ensure all participants understand the functionality and how the technol-ogy can be used, thereby improving confidence and communication [41]. Duringthe session a range of non-invasive, easy to use sensors that could be used inreal-world environments [6] were explored through interactive demonstrations.This was designed to increase engagement and ensure participants understoodthe functionality of the electronics by allowing them to experience the differentcapabilities offered by each sensor. All electronics were made simple to operatewith the electrical circuits pre-built, as used in previous co-design studies [20], toensure all participants would be able to fully participate [133].
A HR sensor was first explored where participants were able to place theirfinger on the sensor and lights would flash at the same rate as their pulse. An
60
3. Co-Design of Tangible Interfaces to Monitor Affective State
EDA sensor was also explored as it functions in a similar way to the HR sen-sor with participants having to place their fingers on the sensor. An FSR wasdemonstrated next, where as participants pressed harder on the sensor it causeda haptic motor to vibrate. Finally, a 9-DOF IMU was demonstrated inside aball; as participants shook the ball it would vibrate. Overall, this method ofexploring the sensors promoted participants’ understanding and enabled them toexperience how the sensors will be used in future interfaces.
Varying forms of feedback acting as real-time interventions were also exploredgiving participants time to reflect and express their feedback between demonstra-tions. Visual feedback continued to be explored following the use of multicolouredLEDs to demonstrate the HR sensor. Participants were shown multiple examplesincluding one device where different colours represented different emotions. Au-ditory feedback was also demonstrated where a speaker was used to play calmingsounds from nature. Haptic feedback was the last intervention explored; four dif-ferent feedback patterns were demonstrated to each of the participants who heldthe vibration motor to experience the different sensations. The exploration ofinterventions through interactive sessions enabled all participants to experienceeach of the feedback mechanisms, allowing them to provide personal insights andshare their immediate impressions.
3.3.3 Prototyping
Using the feedback from the co-design workshop, initial high-fidelity prototypeswere developed using the designs, sensors and feedback mechanisms suggested.This rapid prototype development was conducted to enable participants to phys-ically experience their design suggestions from the workshop, promoting furtherdiscussion and the continued refinement of the interfaces.
3.3.4 Co-analysis
During the co-analysis phase, focus groups were held where the participants whotook part in the co-design workshop, along with other members of the NICERgroup and teachers of young students with intellectual disabilities, were providedwith the opportunity to give feedback on the workshop and the resultant ideas.
61
3. Co-Design of Tangible Interfaces to Monitor Affective State
Typically, the focus groups were shorter in nature than the co-design sessionallowing for reflection on the outcomes of the workshops. During the co-analysisnotes were recorded for future analysis.
The various activities conducted within the workshop were discussed to anal-yse what activities participants enjoyed and how they though the workshops couldbe improved, allowing for adjustments to be made to the co-design process whererequired. The group facilitator asked the NICER group members who attendedthe co-design workshop to present the main activities and outcomes of the work-shop and their implications. Volunteers presented their memories, experiencesand design preferences and this again was all recorded using an accessible story-board format. Implications for adjustment of co-design techniques and plans forfollow up activities at the next co-design workshop were also discussed.
The initial prototypes based on the feedback gathered from the co-designworkshop were also demonstrated to participants. This allowed participantsto provide feedback and describe each functional prototype to the rest of thegroup, with the experienced facilitator and researcher eliciting further feedbackon favourite designs, future design iterations and considerations.
3.3.5 Co-design Workshop 2
The second co-design workshop advanced upon the findings from the first work-shop and co-analysis aiming to refine the developed interfaces. The workshop wasconducted over 3 hours and was audio recorded for future analysis. The workshopcomprised of 8 participants; 5 males and 3 females who again are experienced co-designers. 5 participants previously participated in the first co-design workshop,these included 1 with Williams syndrome and 4 with Down syndrome. Table 3.2shows the characteristics of the participants including those who have WilliamsSyndrome (WS), Down Syndrome (DS), along with information on their genderand level of intellectual disability.
During the co-design workshop the affordances previously developed wereused. The session was introduced and the previously developed interfaces weredemonstrated to the participants, ensuring all participants were familiar with theinterfaces and understood the purpose of the co-design session. After participants
62

3. Co-Design of Tangible Interfaces to Monitor Affective State
Table 3.2: Co-design workshop 2 participant characteristics including Numberof participants (N), with Williams Syndrome (WS), Down Syndrome (DS) andAutism.
Total(N=8)
WS(N=2)
DS(N=4)
Other(N=2)
Mean age 36.5 38.5 39.75 28(Range) (27-47) (38-39) (30-47) (27-29)Gender N (%) Men 5 (62.5) 2 (100) 2 (50) 1 (50)
Women 3 (37.5) 0 (0) 2 (50) 1 (50)Level of intellec-tual disability N(%)
ModerateSevere
1 (12.5)7 (87.5)
0 (0)2 (100)
1 (25)3 (75)
0 (0)2 (100)
understood the aim of the session was to refine the existing prototypes, story-boarding was again utilised to help participants effectively communicate theirnew ideas for the interfaces. However, following feedback from the co-analysisand the challenges encountered during the first workshop participants did notdraw their own interfaces. Instead, 3D modelling was performed and partici-pants experienced 3D printing a new interface during the workshop to help themunderstand the prototyping process and ensure they understood the impact theirdesign decisions have on the developed interfaces.
The electronics within the interfaces were also explored with participants ex-periencing the same sensors as previously explored to ensure the suitability of thesensors and help gather additional feedback from new participants who hadn’tpreviously experienced the electronics. Finally, potential features were not pri-oritised using cards as conducted in the initial workshop due to this workshopfocusing on refining the ideas already produced. Instead, further discussions wereheld enabling participants to express their opinions on the required functionalityand how the prototypes could be improved.
3.3.6 Product Development
Using the feedback from the second co-design workshop, the initial prototypeswere refined. Multiple refined interfaces were developed over several weeks, eachconsidering the feedback gathered throughout the iterative co-design process.
63

3. Co-Design of Tangible Interfaces to Monitor Affective State
These final products allow participants to experience how their design decisionsimpacted the development of solutions relevant to themselves.
3.3.7 Validation
The final aspect of the iterative co-design process was to evaluate the developedinterfaces. Each of the developed interfaces were demonstrated to members of theNICER group and teachers of young students with intellectual disabilities wherenotes were taken for future analysis. The participants had the opportunity toexperience the different interfaces developed throughout the co-design process andexamine how their feedback helped influence the design and functionality of thedevices. Participants also had the opportunity to provide their final feedback onall concepts generated, including the design and technologies within the interfacesin addition to the co-design process itself and how it was adapted to promotecommunication and idea generation.
Finally, volunteers were sought to take the TUIs home for longer term test-ing and labelling. At the end of these label collection phases, feedback on theusability, durability and performance of the devices in home settings was alsosought.
3.4 Results
3.4.1 Thematic Analysis
Handwritten notes, video recordings and audio recordings of the co-analysis andco-design workshops have been analysed using thematic analysis [36]. Duringthematic analysis, codes are used to describe specific topics from the recordingsand then themes are created from the codes. When conducting thematic analysisof the data, whenever a possible feature to include or exclude was discussed, itwas coded. This approach highlighted all of the recommendations suggested byparticipants during the co-design workshop and the justification of each feature.
After coding the sessions, similar codes were grouped together to create initialthemes. Each theme contains feature suggestions or restrictions, answering the
64
3. Co-Design of Tangible Interfaces to Monitor Affective State
research questions used to create the codes. Each code was then checked withinthe themes to ensure its suitability, resulting in minor changes to the themes. Thethematic analysis process resulted in seven themes being created from the codeswhich were all consistent and represented the feedback gathered. For each ofthe seven themes discussed, relevant excerpts from the recordings are provided tohighlight the opinions of potential users experiencing mental wellbeing challenges.The complete list of recommendations organised by themes is shown in Table3.4.1.7.
3.4.1.1 Design and Personalisation
When considering the design of the interfaces size was a key factor, it was statedthe interfaces should be ”not too big and not too small”. The size of the existingcube prototype was liked by participants with them stating ”like that size” whenreferring to the size of new interfaces. However, when discussing compromiseswith size all participants agreed they would prefer slightly larger devices with ad-ditional sensors, stating ”a big device with everything... would be really handy”.Participants also wanted the ability to use it anywhere so a rechargeable batteryis necessary. Participants discussed numerous usage scenarios for the portableinterfaces including using them as work, college and at home. Participants en-visioned carrying the device with them and possibly placing it on their deskallowing them to use it whenever they felt necessary to help them understandtheir affective state or help them relax.
When exploring the existing prototypes opinions varied as to whether thehard 3D printed shapes or the soft interfaces were preferred. Most participantssuggested the softer devices could represent toys and be developed for youngerchildren while the 3D printed interfaces could be reserved for older children andadults. The separation of devices for different age ranges had not previouslybeen considered but participants believed this would be beneficial to reach themost people who may benefit from the technology. Drawing on their own pastexperiences and examining the developed prototypes helped participants suggestthese new ideas that they believed would be beneficial for children to promoteinclusivity.
65
3. Co-Design of Tangible Interfaces to Monitor Affective State
The colour and personalisation of devices was repeatably mentioned by partic-ipants and in particular it was stated the devices should ”not be black and white”for children and participants would like the ability for the devices to ”changedifferent colours”. When asked whether everyone could use a similar device orwhether personalised devices would be required, participants suggested the ideaof a base interface being developed that can then be customised with cases tomake the device more personal.
3.4.1.2 User Engagement
When considering potential users of the device, children were suggested multipletimes throughout the workshops. It was agreed that younger children aged around5-8 (middle childhood) would be engaged by softer interfaces stating ”these are forthe kids” . It was also stated that the larger soft devices may be more appropriatefor younger children with less parts to break or chew. The 3D printed interfaceswere considered less appropriate for children but would be more engaging forolder children and adults to use during everyday life due to their inconspicuousdesign.
When drawing future interfaces, a novel method to personalise the interfacesby attaching extensions that contain additional sensors or feedback was devisedto increase engagement. The addition of extensions would enable the devices toadapt to the user enabling the most beneficial sensors and feedback to be includedon an individual basis.
3.4.1.3 Sensor Inputs
When the device inputs were explored, participants were successfully able to useall of the tested sensors. Participants found the IMU and FSR sensors the easi-est and most natural to use. However, not all sensors would be appropriate forchildren, such as the HR sensor, as children would not be able to keep their fin-ger in continuous contact with the sensor for the device to accurately measurephysiological changes. It was suggested that physiological sensors should be re-served for the 3D printed interfaces and not the soft interfaces, where children inparticular may continuously move their hands preventing accurate readings from
66
3. Co-Design of Tangible Interfaces to Monitor Affective State
being recorded.The use of accelerometers to measure motion was well received with partic-
ipants finding it useful for the device to recognise how it is being handled suchas being bounced or thrown. Accelerometers could be easily embedded within allinterfaces, with participants believing the manner in which the devices will beinteracted with will be different depending on the user’s state of wellbeing. Sim-ilarly, FSRs to measure touch could be embedded within both 3D printed andsoft interfaces. The ability to measure touch is useful as participants believedstroking the soft interfaces was relaxing as it simulated stroking a pet. Partici-pants enjoyed interacting with touch to activate the feedback, such as pressinghard to enable the visual and haptic feedback as they found this method of in-teraction intuitive. The way in which the device was touched was also suggestedas a mechanism to indicate wellbeing, with users potentially squeezing the deviceharder when angry. Overall, the touch sensors and accelerometers were preferredby participants as they were simple to interact with and can be embedded withinall interfaces for all potential users.
The ability for the interfaces to record messages was a popular request forthe soft interfaces. Participants stated they would like to ”talk to it about howyou feel” and they would ”want it to record what is being said ... and play itback”. Participants believed the soft toy-like interfaces could act as friends forchildren where they could express their emotions. The inclusion of buttons withinthe interfaces was also proposed, with participants liking the buttons to fidgetwith to potentially improve wellbeing and to initiate feedback. A keyboard inputwas also suggested, although inclusion of this feature would result in the keysperforming the same function as buttons. The majority of the inputs suggestedcan be implemented using force sensors to measure touch, stroking and squeezing,IMU to measure shaking, HR and EDA sensors to measure physiological changesand buttons for fidgeting.
3.4.1.4 On-device Feedback
When considering outputs, the ability for the devices to make sounds was fre-quently mentioned. Participants liked the audio feedback playing calming sounds
67
3. Co-Design of Tangible Interfaces to Monitor Affective State
but it was suggested that alternative sounds could also be played to improvemood. Participants believed the ability for interfaces to play calming sounds,music, stories or recorded messages may greatly improve wellbeing. Guided re-laxation was also explained to participants as a potential method to assist re-laxation, which participants preferred along with recorded messages. However, acommon criticism with the auditory feedback was the quality of the reproducedsound. This could be improved by using a larger speaker, although this wouldincrease the physical size of the device to larger than what participants believedwould be comfortable.
Visual feedback was suggested multiple times throughout the workshops, sug-gestions included ”letting people see different shapes and colours”, ”make it flasheither once or twice”, ”different colours like traffic lights”, ”lights up brightcolours” and ”disco lights”. When participants designed their own interfaces,the majority included lights activated through either buttons or touch. Visualfeedback was the most popular choice for inclusion in the children’s interfaceswhere it was suggested that lights should be included throughout the interfacesto make them easy to see with ”different shapes and colours of lights”. Par-ticipants found the inclusion of lights to be vital in making the interfaces moreengaging as well as helping them to feel relaxed. Varying combinations of lightswere trialled, with participants preferring light matrices enabling different pat-terns to be displayed in addition to varying colours. However, when participantswere shown an example where different colours represented different emotions,some were not able to understand the concept. This suggests that visual feed-back can be used as a distraction technique aiming to improve wellbeing but notto convey information to those with an intellectual disability.
The possibility of embedding a screen within the interfaces was suggested toshow pictures and ”sometimes show happy, sometimes show sad faces” dependenton the participant’s inferred state of wellbeing. While participants suggestedadding a screen, they also suggested that directly showing measures of stressthrough the feedback may induce additional stress, as has been previously found[197]. Therefore, to ensure no additional stress is caused, visual feedback shouldonly be used to display varying patterns to aid relaxation.
All participants enjoyed experiencing haptic feedback as shown in Figure 3.3
68
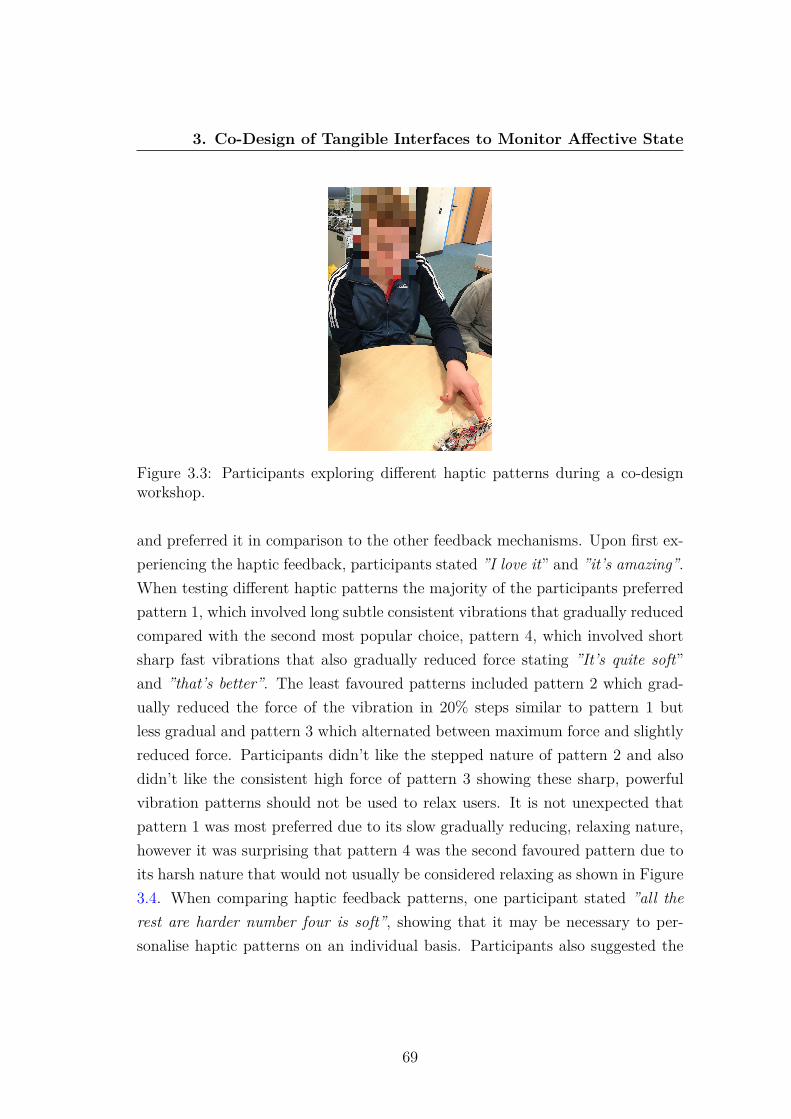
3. Co-Design of Tangible Interfaces to Monitor Affective State
Figure 3.3: Participants exploring different haptic patterns during a co-designworkshop.
and preferred it in comparison to the other feedback mechanisms. Upon first ex-periencing the haptic feedback, participants stated ”I love it” and ”it’s amazing”.When testing different haptic patterns the majority of the participants preferredpattern 1, which involved long subtle consistent vibrations that gradually reducedcompared with the second most popular choice, pattern 4, which involved shortsharp fast vibrations that also gradually reduced force stating ”It’s quite soft”and ”that’s better”. The least favoured patterns included pattern 2 which grad-ually reduced the force of the vibration in 20% steps similar to pattern 1 butless gradual and pattern 3 which alternated between maximum force and slightlyreduced force. Participants didn’t like the stepped nature of pattern 2 and alsodidn’t like the consistent high force of pattern 3 showing these sharp, powerfulvibration patterns should not be used to relax users. It is not unexpected thatpattern 1 was most preferred due to its slow gradually reducing, relaxing nature,however it was surprising that pattern 4 was the second favoured pattern due toits harsh nature that would not usually be considered relaxing as shown in Figure3.4. When comparing haptic feedback patterns, one participant stated ”all therest are harder number four is soft”, showing that it may be necessary to per-sonalise haptic patterns on an individual basis. Participants also suggested the
69
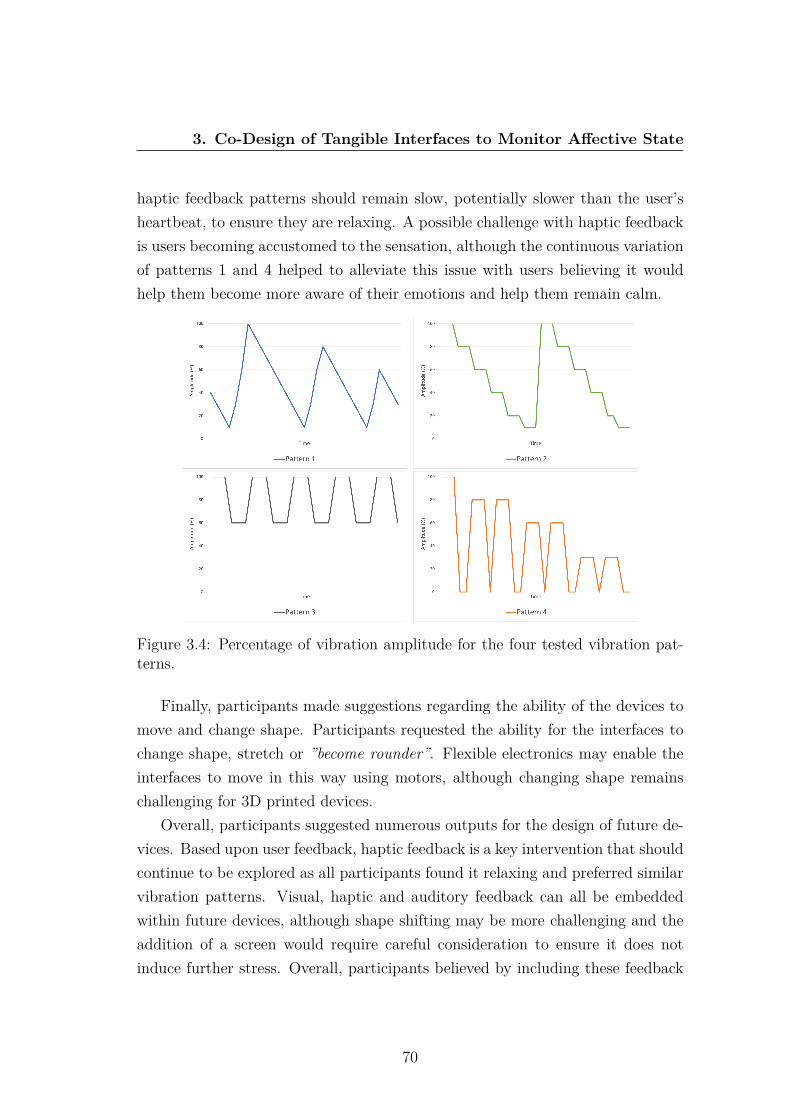
3. Co-Design of Tangible Interfaces to Monitor Affective State
haptic feedback patterns should remain slow, potentially slower than the user’sheartbeat, to ensure they are relaxing. A possible challenge with haptic feedbackis users becoming accustomed to the sensation, although the continuous variationof patterns 1 and 4 helped to alleviate this issue with users believing it wouldhelp them become more aware of their emotions and help them remain calm.
Figure 3.4: Percentage of vibration amplitude for the four tested vibration pat-terns.
Finally, participants made suggestions regarding the ability of the devices tomove and change shape. Participants requested the ability for the interfaces tochange shape, stretch or ”become rounder”. Flexible electronics may enable theinterfaces to move in this way using motors, although changing shape remainschallenging for 3D printed devices.
Overall, participants suggested numerous outputs for the design of future de-vices. Based upon user feedback, haptic feedback is a key intervention that shouldcontinue to be explored as all participants found it relaxing and preferred similarvibration patterns. Visual, haptic and auditory feedback can all be embeddedwithin future devices, although shape shifting may be more challenging and theaddition of a screen would require careful consideration to ensure it does notinduce further stress. Overall, participants believed by including these feedback
70
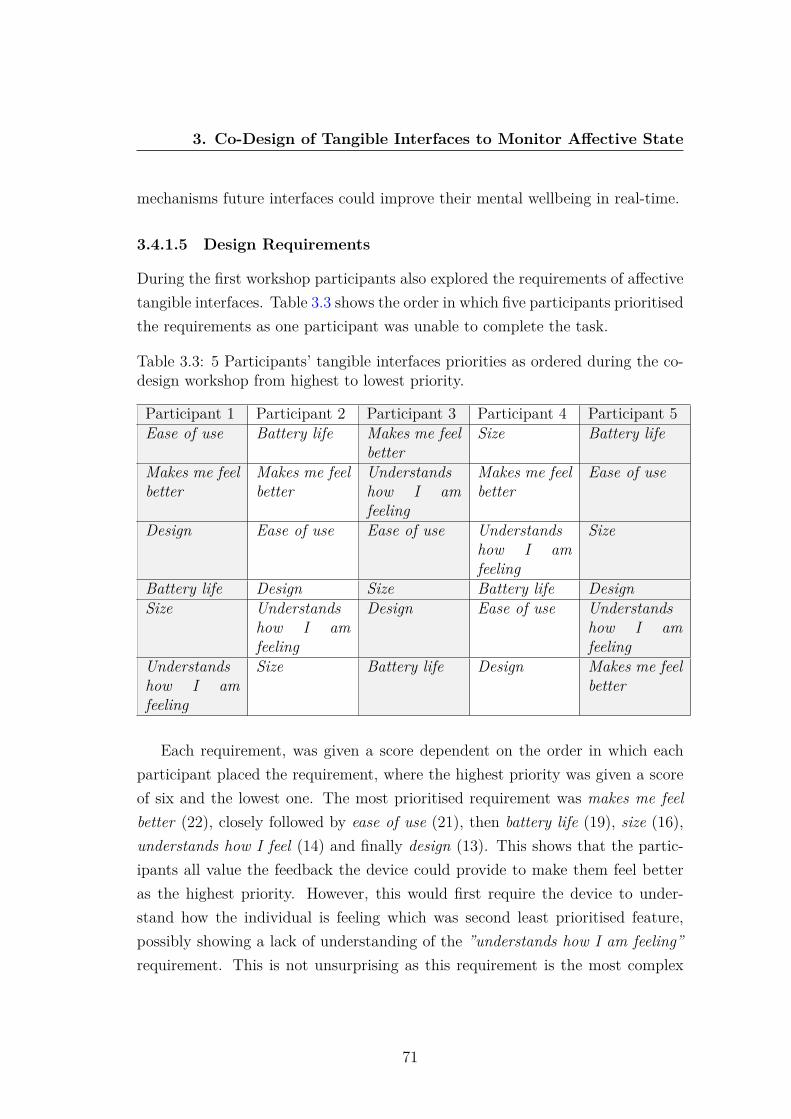
3. Co-Design of Tangible Interfaces to Monitor Affective State
mechanisms future interfaces could improve their mental wellbeing in real-time.
3.4.1.5 Design Requirements
During the first workshop participants also explored the requirements of affectivetangible interfaces. Table 3.3 shows the order in which five participants prioritisedthe requirements as one participant was unable to complete the task.
Table 3.3: 5 Participants’ tangible interfaces priorities as ordered during the co-design workshop from highest to lowest priority.
Participant 1 Participant 2 Participant 3 Participant 4 Participant 5Ease of use Battery life Makes me feel
betterSize Battery life
Makes me feelbetter
Makes me feelbetter
Understandshow I amfeeling
Makes me feelbetter
Ease of use
Design Ease of use Ease of use Understandshow I amfeeling
Size
Battery life Design Size Battery life DesignSize Understands
how I amfeeling
Design Ease of use Understandshow I amfeeling
Understandshow I amfeeling
Size Battery life Design Makes me feelbetter
Each requirement, was given a score dependent on the order in which eachparticipant placed the requirement, where the highest priority was given a scoreof six and the lowest one. The most prioritised requirement was makes me feelbetter (22), closely followed by ease of use (21), then battery life (19), size (16),understands how I feel (14) and finally design (13). This shows that the partic-ipants all value the feedback the device could provide to make them feel betteras the highest priority. However, this would first require the device to under-stand how the individual is feeling which was second least prioritised feature,possibly showing a lack of understanding of the ”understands how I am feeling”requirement. This is not unsurprising as this requirement is the most complex
71

3. Co-Design of Tangible Interfaces to Monitor Affective State
and requires the understanding that a computer model is capable of interpret-ing affective state. Ease of use was the second highest rated priority showingit to be highly valued amongst all participants. Battery life and size followed,although this greatly varies between participants, with some participants ratingthem as the highest priority and others rating them as the lowest priority. Thelowest overall priority was design which was unexpected as participants enjoyedexploring the different prototypes suggesting they see makes me feel better as theoverall design goal.
3.4.1.6 Design Limitations
During the workshops numerous limitations were discussed but all participantsconsidered it highly important that the interfaces did not appear as a medicaldevice in order to reduce stigma. When a participant previously used medicalsensors they stated ”I felt awful, I was panicking...the first time I thought I’mnot doing this”. This makes it vital that any physiological sensors and feedbackmechanisms within the interfaces are non-invasive, easy to use and inconspicuous,as to not induce additional stress. As the sensors explored during the workshopswere all small and unobtrusive, participants believed they were ideal to monitorreal-world affective state. By developing wellbeing interfaces for the general pop-ulation, as well as for those experiencing mental health challenges, it will reducethe associated stigma by ensuring the devices are suitable for all.
When exploring haptic feedback, all participants liked the varying haptic pat-terns but when initially experiencing the full powered haptic motor, it was ”toomuch” for one participant, while another did not like the noise when the motorvibrated against the table. This demonstrates that while haptic feedback wasenjoyed and should be explored, the haptic patterns played within the devicescan have a major impact on enjoyment and wellbeing. On the other hand, whenthe haptic motor was embedded within a large soft toy one participant could notfeel the motor, showing a careful balance is required to ensure the haptic feedbackcan be felt within the interfaces but is not overpowering.
Finally, participants stated they would like to have all of the sensors andfeedback within one device, however this would drastically decrease battery life
72
3. Co-Design of Tangible Interfaces to Monitor Affective State
and increase the size and cost of the interface. The soft interfaces contain amplespace to embed a variety of sensors and feedback. However, the 3D printedinterfaces are very limited in space especially if they are designed to be smallenough to use in the real-world, resulting in only those sensors and feedbackpreferred by the majority of participants being included.
3.4.1.7 Cognitive Barriers
During the workshops cognitive barriers was a theme that appeared throughout,mainly through lack of communication. Frequently, participants would requireprompting when discussing specific topics, for example when explaining whichsensors would be most appropriate for use. There was a large variation in thecommunication skills within the group, with some participants elaborating ontheir feedback in great detail and others who frequently replied with one-wordanswers, simply nod or shake their head or always agree with the other partic-ipants. These are challenging issues to overcome as some participants may notfeel comfortable in expressing their opinions in groups. However, the involvementof an experienced facilitator who understood the commonly occurring communi-cation issues for this group, the use of Makaton symbols where appropriate alongwith the interactive activities during the co-design workshops, helped improvecommunication with all participants.
Providing initial prototypes for participants to explore aided their understand-ing of potential uses for the devices, helping them to communicate new ideas andfeatures and the interactive sessions were all received extremely positively. Thesesessions helped participants gain a clearer understanding of the interfaces and thetechnologies used within them, helping many to better communicate their ideasand hence provide qualitative data to help answer the research questions.
Drawing new interfaces helped some participants creatively express their ideasthat they were not able to verbally communicate such as the sensors and feed-back they believed were most important to include, although other participantsstruggled to draw an example device. Allowing participants to express themselvesnon-verbally through 3D printing during the workshops helped demonstrate howthe interfaces are developed and encouraged all participants to consider how dif-
73
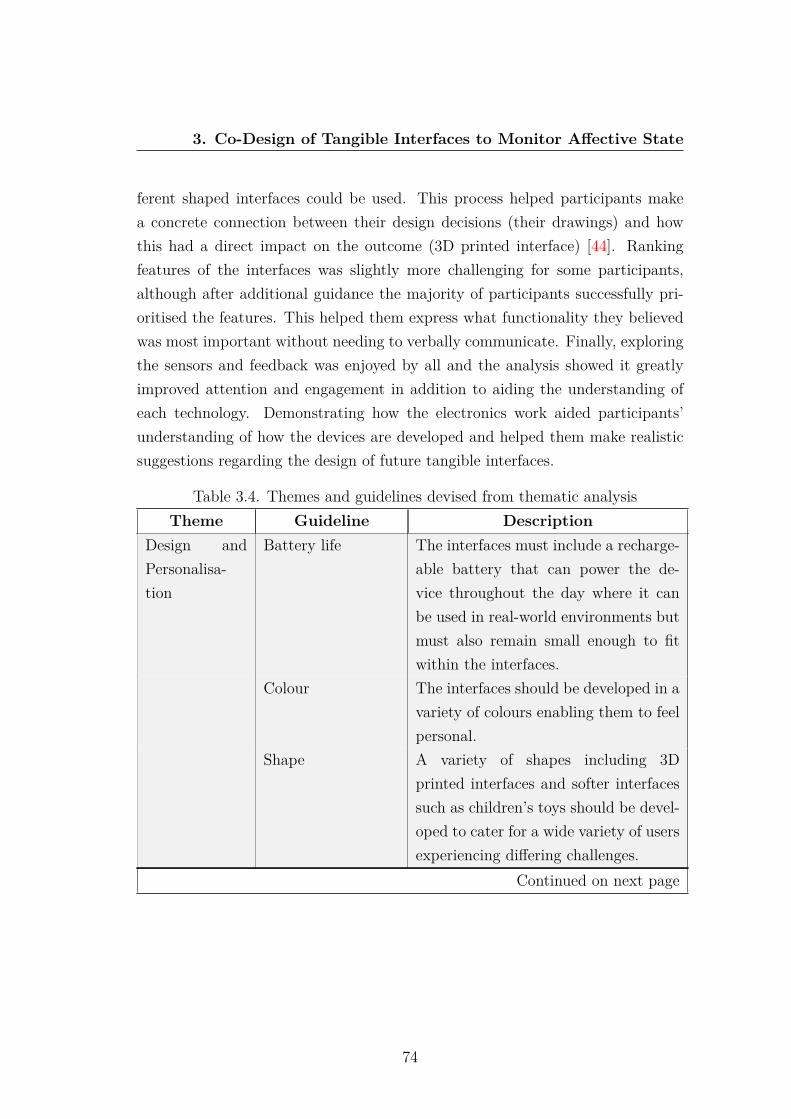
3. Co-Design of Tangible Interfaces to Monitor Affective State
ferent shaped interfaces could be used. This process helped participants makea concrete connection between their design decisions (their drawings) and howthis had a direct impact on the outcome (3D printed interface) [44]. Rankingfeatures of the interfaces was slightly more challenging for some participants,although after additional guidance the majority of participants successfully pri-oritised the features. This helped them express what functionality they believedwas most important without needing to verbally communicate. Finally, exploringthe sensors and feedback was enjoyed by all and the analysis showed it greatlyimproved attention and engagement in addition to aiding the understanding ofeach technology. Demonstrating how the electronics work aided participants’understanding of how the devices are developed and helped them make realisticsuggestions regarding the design of future tangible interfaces.
Table 3.4. Themes and guidelines devised from thematic analysisTheme Guideline Description
Design andPersonalisa-tion
Battery life The interfaces must include a recharge-able battery that can power the de-vice throughout the day where it canbe used in real-world environments butmust also remain small enough to fitwithin the interfaces.
Colour The interfaces should be developed in avariety of colours enabling them to feelpersonal.
Shape A variety of shapes including 3Dprinted interfaces and softer interfacessuch as children’s toys should be devel-oped to cater for a wide variety of usersexperiencing differing challenges.
Continued on next page
74
3. Co-Design of Tangible Interfaces to Monitor Affective State
Table 3.4. Themes and guidelines devised from thematic analysisTheme Guideline Description
User Engage-ment
Children Soft children’s toys should be devel-oped that embed the necessary childfriendly electronics and interventionssuch as visual and haptic feedback toimprove engagement.
Extensions A fundamental interface could be de-veloped that can then be expandedupon to customise the sensors and feed-back on an individual basis.
Sensor Inputs Physiological Sensors to measure physiologicalchanges such as HR and EDA shouldbe utilised to help monitor affectivestate but their use may not be suitablein soft children’s interfaces.
Motion The use of IMUs to measure motion caneasily be embedded within all interfacesand may show how device interactionsdiffer with wellbeing state.
Touch The ability to recognise where and howhard the device is touched may helpinfer wellbeing, with stroking possiblyproviding relaxation.
Buttons Buttons to promote fidgeting or to ac-tivate feedback should be included toimprove individuals’ wellbeing.
Microphone It may be possible to infer affect viavoice although this imposes privacyconcerns.
Continued on next page
75
3. Co-Design of Tangible Interfaces to Monitor Affective State
Table 3.4. Themes and guidelines devised from thematic analysisTheme Guideline Description
Feedback Auditory Calming sounds, guided relaxation,stories or voice recordings could beplayed to aid relaxation.
Haptic Calming haptic feedback patterns canbe played when a user is stressed tohelp improve wellbeing.
Visual Lights can be displayed in variousshapes and colours to convey informa-tion or act as a distraction to calmusers.
Tactile Interactions The possibility for interfaces to physi-cally move or change shape could pro-vide therapeutic tactile feedback.
Limitations Size The interfaces need to remain smallenough to be portable while also em-bedding the required sensors and feed-back. Individuals may have their ownpreferences concerning which sensorsand types of feedback function most ef-fectively, resulting in personalised de-vices.
Stigma It is vital the interfaces do not resem-ble medical devices to make them ubiq-uitous and reduce stigma as the inter-faces should benefit anyone experienc-ing mental wellbeing challenges.
Continued on next page
76
3. Co-Design of Tangible Interfaces to Monitor Affective State
Table 3.4. Themes and guidelines devised from thematic analysisTheme Guideline Description
Haptic sensation Haptic feedback should be felt withinthe interfaces but it must not be over-powering to ensure it has a positive im-pact on wellbeing.
Cognitive bar-riers
Prototypes The development of initial prototypesaided the understanding of the func-tionality required within the interfaces,helping to improve communication.
Interactivity Interactive sessions improved engage-ment and enabled greater communica-tion regarding the design, sensors andfeedback for the wellbeing interfaces.
3.4.2 Product Development
A number of prototypes were developed and categorised into soft toys for youngchildren aged 5-8 (middle childhood) as this is when children develop relevantsocial, emotional and cognitive skills [118] [260] and 3D printed interfaces forolder children (8+) and adults. Age is an important factor to consider whendeveloping tangible interfaces to ensure they are accessible and engaging, helpingto reduce stigma with affective tools. Privacy was a key consideration whendeveloping the interfaces. Therefore, the interfaces do not communicate withany external devices as all data processing and storage is local. Additionally,microphones were not included within the interfaces to capture audio data as thecontinuous recording of voice to infer wellbeing is highly sensitive and may raiseprivacy concerns [172]. Speakers were also dismissed due to the requirement forlarge speakers to play better quality audio.
Initially, the soft children’s prototypes were developed. Learning from thefeedback gathered, physiological sensors were omitted from these interfaces, in-stead only touch and motion interactions would be measured. An FSR sensor
77
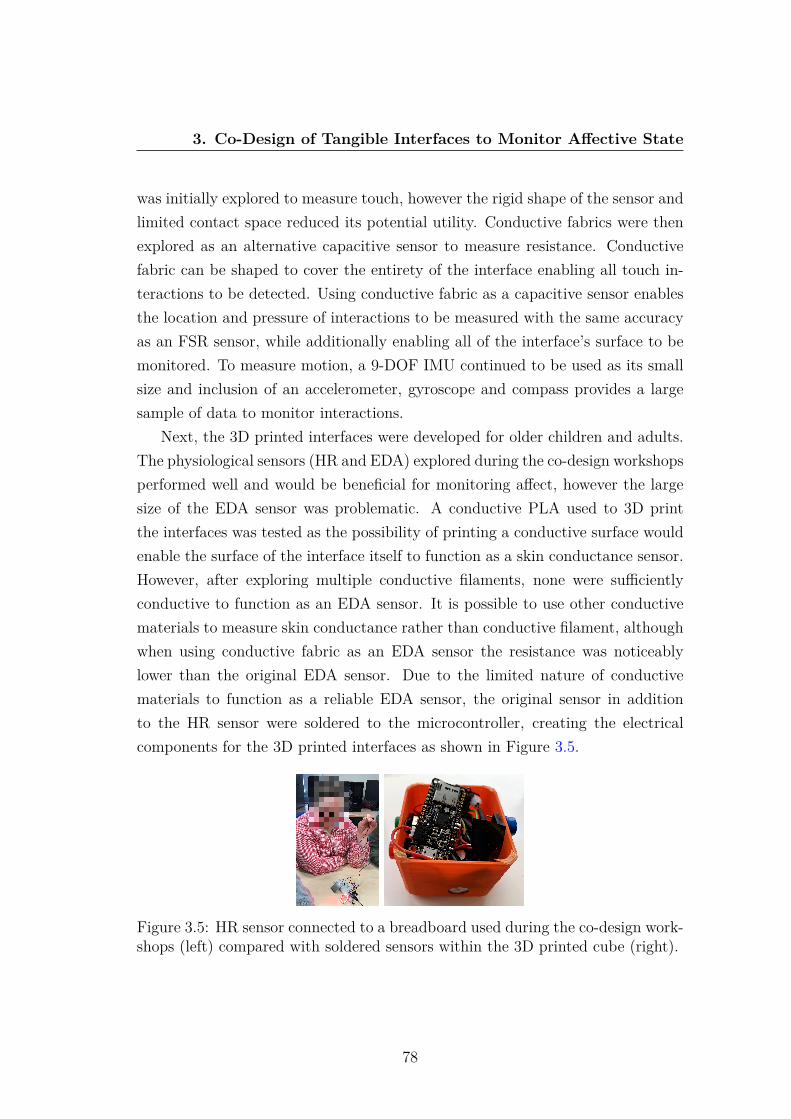
3. Co-Design of Tangible Interfaces to Monitor Affective State
was initially explored to measure touch, however the rigid shape of the sensor andlimited contact space reduced its potential utility. Conductive fabrics were thenexplored as an alternative capacitive sensor to measure resistance. Conductivefabric can be shaped to cover the entirety of the interface enabling all touch in-teractions to be detected. Using conductive fabric as a capacitive sensor enablesthe location and pressure of interactions to be measured with the same accuracyas an FSR sensor, while additionally enabling all of the interface’s surface to bemonitored. To measure motion, a 9-DOF IMU continued to be used as its smallsize and inclusion of an accelerometer, gyroscope and compass provides a largesample of data to monitor interactions.
Next, the 3D printed interfaces were developed for older children and adults.The physiological sensors (HR and EDA) explored during the co-design workshopsperformed well and would be beneficial for monitoring affect, however the largesize of the EDA sensor was problematic. A conductive PLA used to 3D printthe interfaces was tested as the possibility of printing a conductive surface wouldenable the surface of the interface itself to function as a skin conductance sensor.However, after exploring multiple conductive filaments, none were sufficientlyconductive to function as an EDA sensor. It is possible to use other conductivematerials to measure skin conductance rather than conductive filament, althoughwhen using conductive fabric as an EDA sensor the resistance was noticeablylower than the original EDA sensor. Due to the limited nature of conductivematerials to function as a reliable EDA sensor, the original sensor in additionto the HR sensor were soldered to the microcontroller, creating the electricalcomponents for the 3D printed interfaces as shown in Figure 3.5.
Figure 3.5: HR sensor connected to a breadboard used during the co-design work-shops (left) compared with soldered sensors within the 3D printed cube (right).
78

3. Co-Design of Tangible Interfaces to Monitor Affective State
During the prototyping stage a ball was first developed, this provided amplespace to include all of the electronics but also presented its own set of challenges.The foam filling of the ball resulted in any haptic sensations being lost meaningonly visual feedback was included using multi-coloured LEDs. A Soft teddy wasexplored next which presented similar challenges to the ball, different designs wereexplored including adapting the prototype demonstrated to participants althoughthe design of this soft toy made it challenging to measure touch. Instead, a newdesign was selected and the sensors were successfully embedded to measure touchand motion interactions. Finally, a soft cushion was developed that may providecomfort similar to the soft toys but for older children or adults. The conductivefabric based conductance sensor was implemented within the cushion to test itsreal-world usability. However, embedding all of the sensors within a cushion wasmore challenging than the toys requiring careful holes to be cut for the buttons,cables, LED to show when the cushion was on, and power switch. The abilityfor a cushion to measure skin conductance may simplify the process of collectingphysiological sensor data but the sensor was less reliable when tested due to theconductive fabric losing connection with the microcontroller.
Figure 3.6: Early prototyping with soft toys.
A range of different shapes were considered for the 3d-printed interfaces asshown in Figure 3.7. After considering the various shapes, cubes were initiallydeveloped along with the torus selected during the co-design workshop. Initiallythe cube was printed with sharp edges and was too large to comfortably holdin one hand. The design was changed to include rounded edges and was madesmaller while remaining possible to include all of the sensors. The size of the holesfor the sensors and buttons had to be carefully designed to ensure they wouldbe usable when encased in the interfaces. The placement of the physiologicalsensors within the interfaces was also given particular attention to ensure the
79
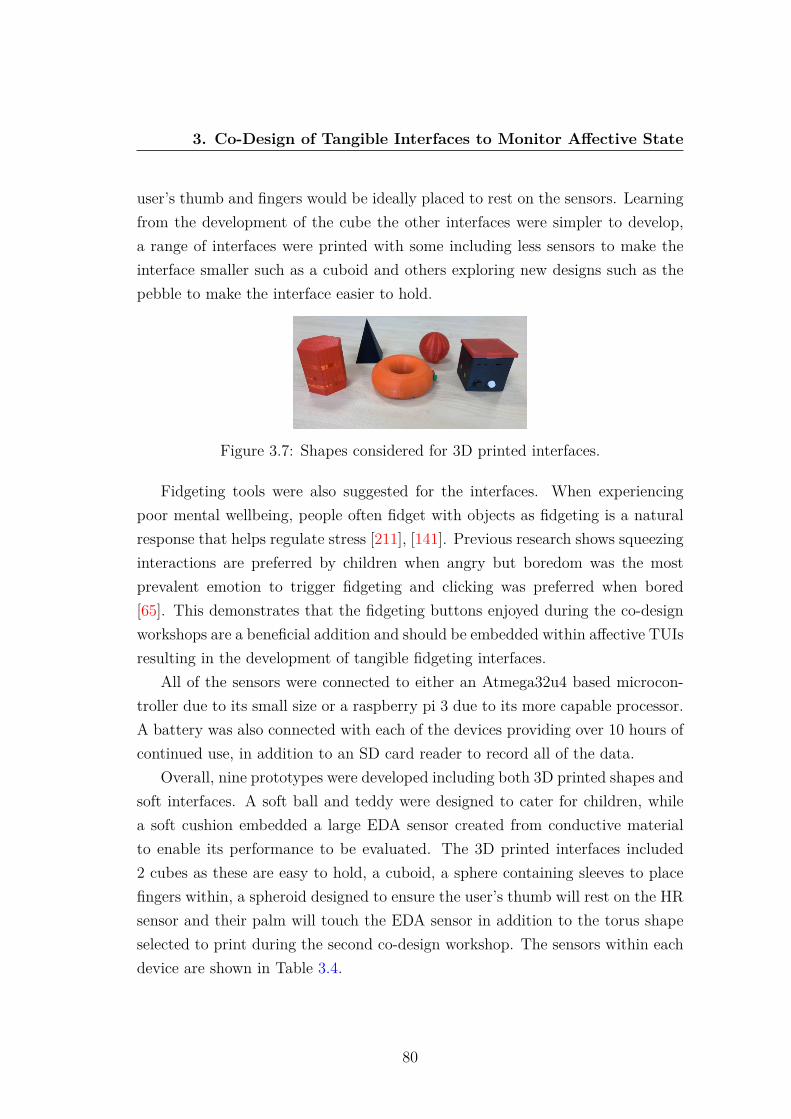
3. Co-Design of Tangible Interfaces to Monitor Affective State
user’s thumb and fingers would be ideally placed to rest on the sensors. Learningfrom the development of the cube the other interfaces were simpler to develop,a range of interfaces were printed with some including less sensors to make theinterface smaller such as a cuboid and others exploring new designs such as thepebble to make the interface easier to hold.
Figure 3.7: Shapes considered for 3D printed interfaces.
Fidgeting tools were also suggested for the interfaces. When experiencingpoor mental wellbeing, people often fidget with objects as fidgeting is a naturalresponse that helps regulate stress [211], [141]. Previous research shows squeezinginteractions are preferred by children when angry but boredom was the mostprevalent emotion to trigger fidgeting and clicking was preferred when bored[65]. This demonstrates that the fidgeting buttons enjoyed during the co-designworkshops are a beneficial addition and should be embedded within affective TUIsresulting in the development of tangible fidgeting interfaces.
All of the sensors were connected to either an Atmega32u4 based microcon-troller due to its small size or a raspberry pi 3 due to its more capable processor.A battery was also connected with each of the devices providing over 10 hours ofcontinued use, in addition to an SD card reader to record all of the data.
Overall, nine prototypes were developed including both 3D printed shapes andsoft interfaces. A soft ball and teddy were designed to cater for children, whilea soft cushion embedded a large EDA sensor created from conductive materialto enable its performance to be evaluated. The 3D printed interfaces included2 cubes as these are easy to hold, a cuboid, a sphere containing sleeves to placefingers within, a spheroid designed to ensure the user’s thumb will rest on the HRsensor and their palm will touch the EDA sensor in addition to the torus shapeselected to print during the second co-design workshop. The sensors within eachdevice are shown in Table 3.4.
80
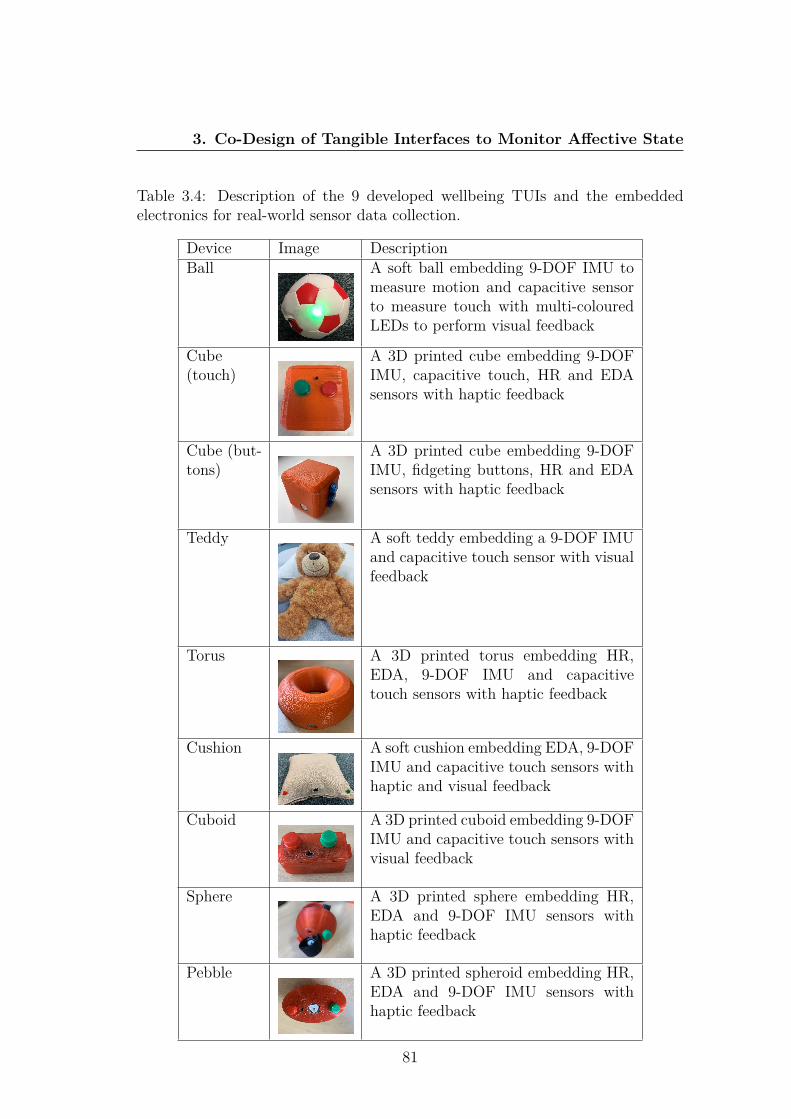
3. Co-Design of Tangible Interfaces to Monitor Affective State
Table 3.4: Description of the 9 developed wellbeing TUIs and the embeddedelectronics for real-world sensor data collection.
Device Image DescriptionBall A soft ball embedding 9-DOF IMU to
measure motion and capacitive sensorto measure touch with multi-colouredLEDs to perform visual feedback
Cube(touch)
A 3D printed cube embedding 9-DOFIMU, capacitive touch, HR and EDAsensors with haptic feedback
Cube (but-tons)
A 3D printed cube embedding 9-DOFIMU, fidgeting buttons, HR and EDAsensors with haptic feedback
Teddy A soft teddy embedding a 9-DOF IMUand capacitive touch sensor with visualfeedback
Torus A 3D printed torus embedding HR,EDA, 9-DOF IMU and capacitivetouch sensors with haptic feedback
Cushion A soft cushion embedding EDA, 9-DOFIMU and capacitive touch sensors withhaptic and visual feedback
Cuboid A 3D printed cuboid embedding 9-DOFIMU and capacitive touch sensors withvisual feedback
Sphere A 3D printed sphere embedding HR,EDA and 9-DOF IMU sensors withhaptic feedback
Pebble A 3D printed spheroid embedding HR,EDA and 9-DOF IMU sensors withhaptic feedback
81
3. Co-Design of Tangible Interfaces to Monitor Affective State
3.5 DiscussionThis co-design study has explored the design and development of TUIs to monitorreal-world affect. A co-design methodology was adopted based on previous re-search with participants whose mental wellbeing can often be diagnostically over-shadowed and who commonly have difficulty in expressing their emotions [102].This co-design process promotes the role that people with intellectual disabilitieshave in acting as collaboration partners.
This research has many implications for both affective recognition technolo-gies and the process of co-designing technologies with people who have intellectualdisabilities. The five developed affordances aimed to increase individuals’ auton-omy [187] and promote communication within the workshops. It is hypothesisedthat participants’ investment in the co-design process resulted from their abil-ity to recognise the practical applications of affective technologies whilst alsoappreciating the impact that they may have on the daily lives of diverse userpopulations.
When co-designing with people who have intellectual disabilities it is vitalto gradually unfold their creative potential to encourage meaningful participa-tion [199]. Therefore, a number of activities were mediated with education pro-fessionals and conducted within each workshop that were designed to elicit designinput and opinions, reach consensus and check understanding, such as the priori-tisation of requirements.
A number of probes (instructional and conversational instruments) were alsoused during the co-design process to aid inclusivity [291]. Design probes wereused such as demonstrations and hands on experiences with existing prototypes,sensors and actuators to serve as conversational instruments. During conversa-tions design probes were iterated in conjunction with co-design participants, forexample it was explained to participants that including all sensors in each designwould lead to a TUI that was physically large. Furthermore, all information suchas notes and video recording was collected in a structured way for subsequentanalysis and major outcomes were recorded on a note board in picture form andsimple sentences as a joint record of achievement, that was easy to understandfor the entire design team.
82

3. Co-Design of Tangible Interfaces to Monitor Affective State
Mixed probes were also used as the co-design session lasted from morningto early afternoon, allowing probes to incorporate physical (drawing, prioritisingcards) and digital (3D modelling, exploration of electronics) elements and providecontinuity between exploration and prototype testing. This meant that ideascaptured from the whole team could be storyboarded and 3D printed all in oneday, to make concrete the connection between design decisions and embodimentto support cognitive accessibility.
During the ideation phase, the production of prototypes was completed ina stimulating and playful environment, free from pressures that intimidate andblock the creativity of the participants, including the use of design kits (drawingmaterials, cards, electronic components and sensors) as facilitating tools. Theparticipants have previously been involved in the design of enabling technologiesand hence they bring experience and expectations to be central to design decisionsat co-design workshops.
These probes along with the five developed affordances and the inclusion ofanalysis and validation phases ensured participants were able to fully participateand provide valuable feedback. The feedback gathered from the co-design pro-cess resulted in the development of multiple affective interfaces for real-worldmonitoring.
3.5.1 Research Questions
The following sections use the analysis from Section 3.4.1 and feedback from theevaluation session where participants experienced the final developed interfacesto answer the four research questions.
3.5.1.1 How can the co-design process be adapted to best suit theneeds of those with intellectual disabilities?
Co-designing for people with severe, profound and complex intellectual disabili-ties has shown additional challenges as not all tasks were successfully completedby all participants - such as drawing a new interface design. Significant com-munication challenges were also present. However, the majority of the taskswere completed successfully, particularly the interactive activities within the co-
83
3. Co-Design of Tangible Interfaces to Monitor Affective State
design workshops, involving exploring sensors and feedback mechanisms and the3D printing of new interfaces to immediately show participants the results oftheir design decisions. These interactive activities helped maintain engagement,improved understanding of new concepts and improved communication withinthe workshops. By combining interactive sessions with storyboarding to gainfeedback, it has been possible to gain valuable insights, aiding the design anddevelopment of future affective interfaces.
Overall, the co-design approach adopted addressed the limitations experi-enced by people with intellectual disabilities (e.g. communication and workingmemory), enabling them to participate more effectively. This approach takes apractical stance in guiding how co-design methods can be made to work in realis-tic settings and adjusted to the needs of participants who experience intellectualdisabilities.
3.5.1.2 What are the optimal design guidelines for prototyping affec-tive tangible interfaces?
The results from this study show there is no one-size-fits-all solution to the designof mental wellbeing interfaces. Instead, different devices should be developed fordifferent age ranges with soft devices for young children and 3D printed interfacesfor older children and adults. However, all devices should remain inconspicuousand not appear as medical devices to help reduce stigma.
During the evaluation participants stated that the interfaces developed thusfar are suitable for potential users. During the time participants experiencedthe devices they stated that their use made them feel happy, in particular thefidgeting buttons helped them feel calmer. Teachers and end users agreed, likingthe shapes of the 3D printed interfaces in addition to the ubiquitous nature ofthe devices with the sensors being embedded within objects such as cushions andteddies. Overall, the devices were found to be suitable for their intended purposeof monitoring affective state and collecting real-world data.
84
3. Co-Design of Tangible Interfaces to Monitor Affective State
3.5.1.3 Which sensors would be most beneficial for user interaction?
A range of non-invasive sensors were explored using co-design sessions to measurephysiological changes and physical interactions. Physiological sensors measuringHR, HRV and EDA present the greatest opportunity to automatically monitorwellbeing due to their correlation with the sympathetic nervous system and non-invasive nature. However, the analysis shows touch and motion sensors should beincluded within all devices due to their simplicity and ease of use, with the morecomplex physiological sensors reserved for 3D printed interfaces for older childrenand adults. Overall, the sensors included within the developed interfaces wereconsidered suitable to collect real-world sensor data and affective state.
3.5.1.4 How do users believe on-device feedback could help improvetheir mental wellbeing?
A range of feedback actuators to serve as interventions and improve wellbeingwere explored including haptic, visual and auditory feedback in addition to fid-geting tools. The co-design workshops helped establish the requirements such asthe preference for fidgeting buttons and haptic feedback to improve wellbeing.Participants believed these feedback mechanisms have great potential to improvewellbeing with some participants finding the fidgeting aspects of the final tangiblefidgeting interfaces especially relaxing. This demonstrates the use of the deviceand the fidgeting buttons themselves can serve as a benefit of using the artifactwithout the need for additional feedback mechanisms.
Visual feedback patterns were also enjoyed by users but it is not possible touse this feedback to convey information to users with intellectual disabilities andwhilst the use auditory feedback was suggested to play stories and calming sounds,the quality of the sound is of high priority. Visual feedback, slow haptic feedbackand fidgeting buttons were found most relaxing and have been embedded withinthe developed prototypes to act as real-time interventions.
85
3. Co-Design of Tangible Interfaces to Monitor Affective State
3.6 ConclusionInclusive co-design workshops and focus groups have been conducted to rethinkthe user design approach of affective TUIs. Adjustments to traditional co-designtechniques included demonstrations, real-time 3D printing, prioritising cards andinteractive electronics to enable successful and practical co-design with peoplewith intellectual disabilities. In particular, the 3D printing of new interfacesimproved engagement, ensured participants understood the discussed technolo-gies and demonstrated how their decisions influenced the final designs. Thematicanalysis of the qualitative data outlined many recommendations and resulted in arange of new interfaces being developed. In the future additional methods of anal-ysis could continue to be explored such as Interpersonal Process Recall [43] wherethe recorded co-design session is played back to participants as a stimulus for re-call and reflection, allowing them to expand upon or clarify their comments. Also,the use of fictional inquiry [291] could be explored to imagine how co-designerswith intellectual disabilities may use their devices to express and communicatetheir emotions and how this process might support their future design decisions.Overall, the participatory process has enabled the successful design and develop-ment of TUIs for real-world data collection and affect recognition.
86
Chapter 4
Tangible Techniques forReal-World Labelling andCollection of Wellbeing SensorData
To build an accurate and reliable affect recognition system a large labelled datasetis first required to train the model. However, collecting a real-world labelleddataset is a challenging proposition as sensor data must be labeled at the pointof collection. Even though real-world physiological sensor data is notoriouslychallenging to collect due to body movements impacting sensor data [52] andthe challenging propositions of labelling at the point of collection, it is vitalto collect data in different settings, and not just controlled ’synthetic’ data fromexperiments to ensure the model and device can successfully operate in the ”wild”(naturalistic settings). This chapter seeks to address the challenges of labellingreal-time sensor data by exploring on-device methods of labelling for inclusionwithin the developed tangible interfaces, resulting in the collection of a real-world labelled affective dataset. This section is adapted from [352], previouslypublished in Personal and Ubiquitous Computing.
87
4. Real-time Labelling of Sensor Data
4.1 IntroductionLabelling data is not a trivial task, especially as the promise of affective TUIsis to make the possibility of ubiquitous wellbeing inference a reality. However,the labelling of sensor data is essential to enable classification models to be de-veloped. Real-time emotions are often reported using the Ecological MomentaryAssessment (EMA) [284], however this requires answering multiple questions of-ten using a mobile app which is not suitable for labelling sensor data while usinga TUI. Currently, real-time sensor data labelling is an unwieldy process withlimited tools available and poor performance characteristics that can lead to theperformance of the machine learning models being compromised. So far, mostof the attention has been focused on the processing power of edge computingdevices [108] [223] and little attention has been paid on how to obtain clean andefficient labelled data to train models [178].
The techniques used to label data vastly vary dependant on the data type asimages can be labelled using an automated process based on clickthrough data,greatly reducing the effort required to create a labelled dataset [315]. Crowd-sourcing labels is often employed for images and audio data tagging as it is mostcommonly processed offline [322]. Web based apps have been developed thatenable people from around the world to highlight and label objects within im-ages [258]. Outsourcing the labelling of image, video and audio data is gainingpopularity although this is not possible for time series data as activities cannotbe deduced from the raw data meaning real-time labelling techniques must bedeveloped [179].
When collecting data in the real-world, outside the confines of the research laba participant could be doing anything from driving a car to eating in a restaurant.A hybrid data collection approach is most suitable when collecting sensor data dueto the subjectivity of the data. Using a hybrid data collection approach allowsself-reporting to be combined with the passive collection of sensor data [273].Smartphone applications are a popular method to label real-time data althoughrecently the use of new smartphone labelling techniques such as NFC and volumebuttons have shown to be intuitive and popular when using an application isinconvenient [360]. It is crucial to label sensor data in real-time, because unlike
88

4. Real-time Labelling of Sensor Data
images and audio it is not usually possible to label the data after the point ofcollection without the real-time context. Longitudinal data collection poses evengreater challenges as it relies on multiple users continually self-reporting, whilesimultaneously wearing sensors for extended periods. These challenges may resultin limited labelled data which significantly impacts model accuracy.
The labelling rate of sensor data can dictate which labelling approach tochoose as data that frequently changes may require a higher labelling rate alongwith a more convenient approach. The sample size is another factor that candictate labelling approach as the labelling of images can be automated or crowd-sourced whereas a large sample size of sensor data requires recruiting many par-ticipants for an extended period. The best approach to label data often funda-mentally depends on the data and source type being recorded. Labelling at thepoint of collection is highly accurate as it is real-time, cost effective, time effectiveand enables in-situ sensor data to be collected. Thus far however labelling at thepoint of collection has had limited use mainly consisting of smartphone appli-cations and its feasibility and performance has not been evaluated. There arenumerous scenarios where labelling sensor data at the point of collection wouldresult in the most effective and accurate data but there is currently no establishedframework.
The use of TUIs embedding different labelling methods present significantopportunities for the real-time labelling of sensor data. These interfaces canembed a variety of sensors enabling the collection of in situ data. TUIs canvary in size and shape but the developed interfaces from the co-design workshopscontain ample space to include the necessary sensors in addition to a real-timelabelling mechanism. On-device labelling simplifies the process of self-reportingby not requiring additional materials, such as questionnaires, and its ease ofaccess promotes frequent labelling. When providing participants with tangibleinterfaces to collect a wide array of sensory data, embedding a labelling methoddirectly into the device simplifies the labelling process. This concept creates asimple, tangible, easy to use method to label sensor data in real-time and in-situaiming to improve the quantity and reliability of labelled data.
This chapter presents two main contributions. The first is the development ofLabelSens, a new framework for labelling sensor data at the point of collection,
89
4. Real-time Labelling of Sensor Data
promoting the adoption of labelling techniques that can achieve higher perfor-mance levels. Five prototypes are presented utilising different tangible labellingmechanisms along with a comparative mobile app. A pilot study aims to explorethe impact different labelling techniques embedded within TUIs has on the accu-racy of labelling, label rate, usability and classification performance. Using thedata from the study a comprehensive performance comparison and analysis ofthe prototypes is then provided. Looking beyond the data collection stage, theclassification accuracy of different labelling techniques is examined. The secondcontribution is the collection of a real-world affective dataset. Using the resultsfrom the experimental LabenSens study, tangible labelling techniques are em-bedded with the co-designed tangible interfaces to enable the real-time labellingof affective state. The methods used and challenges encountered when collectingreal-world labelled physiological data are then explored.
4.2 LabelSens Feasibility StudyLabelling data at the point of collection provides many benefits including lowcost, reduced time and the ability to label in real-world environments. TUIspresent many opportunities to embed unique physical labelling techniques thatmay be easier to use than comparative virtual labelling techniques frequentlyused. Furthermore, TUIs provide ideal interfaces to directly embed a magnitudeof sensors, negating the need for participants to carry the sensors in addition toa separate labelling mechanism.
TUIs can vary in shape and size ranging from small wearables to physical de-vices that are designed to be frequently interacted with. This enables a wide arrayof opportunities to embed sensors within a variety of objects which when com-bined with machine learning classifiers could be used to infer behaviour change,emotions, movement and more. However, before machine learning models canbe trained labelled data is first required. By embedding a labelling techniquealong with the sensors within TUIs it ensures the sensor data and label are bothbeing collected in real-time aiming to improve data collection rates and accuracy.This novel approach to in-situ labelling provides an easy to use interface thatfacilitates the collection of real-time labelled data.
90

4. Real-time Labelling of Sensor Data
Figure 4.1 demonstrates the concept of the LabelSens framework; pairing timeseries sensors with a physical labelling technique inside a TUI to collect in-situlabelled sensor data.
Figure 4.1: LabelSens framework: real-time sensor data fused with a label.
4.2.1 LabelSens Method
An experiment has been conducted that aims to explore the feasibility of self-labelling tangible techniques and the accuracy in which tangible techniques canlabel sensor data. The controlled collection of physiological data where peopleexperience a variety of different emotions using each of the labelling techniqueswould be extremely challenging, inconsistent and time consuming. Instead, aninitial pilot study has been conducted where tangible labelling mechanisms havebeen used to label physical activities from accelerometer sensor data which ismore easily replicable whilst still requiring real-time labelling. This study en-ables each user to test all of the labelling mechanisms by completing differentphysical activities, not requiring users to experience different emotions to testthe labelling approaches. Five new prototypes are presented that each containa unique labelling technique along with a comparative mobile application thatwill be used to label human activities (walking, climbing downstairs and climb-ing upstairs) as these activities are frequently used in human activity recognition
91
4. Real-time Labelling of Sensor Data
studies [252], [18], [9], [251], [160]. The developed labelling techniques are asfollows:
• Two adjacent buttons (press one button for climbing upstairs, press theother button for climbing downstairs and press both buttons simultaneouslyto record walking)
• Two opposite buttons (press one button for climbing upstairs, press theother button for climbing downstairs and press both buttons simultaneouslyto record walking)
• Three buttons (one button each for climbing upstairs, climbing downstairsand walking)
• FSR to measure touch (Light touch for walking, medium touch for climbingdownstairs, hard touch for climbing upstairs) with LED to visualise thelabel selection
• Slide potentiometer (slide to the left for climbing downstairs, slide to themiddle for walking and slide to the right for climbing upstairs)
• An Android mobile application provided on a Google Pixel 3 smartphonewith 3 virtual buttons to label walking, climbing downstairs and climbingupstairs.
Each TUI is a 6cm * 6cm * 6cm 3d printed cube that contains a labellingtechnique combined with the required sensor and microcontroller. The size of theTUI could be reduced dependent on the labelling technique used and the sensorsrequired but here all interfaces were the same size to reduce bias. The embeddedelectronics include:
• Arduino Nano microcontroller. Due to its small size, open source natureand wide compatibility with sensors.
• IMU to record motion data. An IMU with 9 degrees of freedom has beenused as it integrates an accelerometer, a magnetometer and a gyroscope toprovide better accuracy and additional data.
92

4. Real-time Labelling of Sensor Data
• Micro SD card reader to locally record the IMU sensor data along with theuser inputted label.
It is envisioned that TUIs will be used to label a maximum of 5 classes toensure users are not overwhelmed and can sufficiently label at all times. Addi-tional buttons could be added e.g. 1 button each for up to 5 classes but as only 3activities are being classified the impact of having varying number of buttons (2or 3) can be explored. The mobile app provides visual feedback once a label hasbeen selected and presents easier opportunities to include more labels but usersmay still be overwhelmed by numerous virtual buttons. The buttons and slidepotentiometer also enable users to easily visualise the activity they are labellingand feel tangible feedback whereas when using the touch sensor it is difficultto distinguish between the three levels of force. To visualise the selected label amulticoloured LED has also been incorporated into the touch device that changesfrom green to yellow to red when the device is touched with low, medium andhigh force. Figure 4.2 shows the electronic circuit and the developed TUI for thethree buttons and slider interfaces.
The mobile application was developed for the Android operating system andwas tested using a Google Pixel 3. The application consisted of three virtualbuttons in the centre of the screen labelled ”downstairs”, ”walking” and ”upstairs”.When a button is pressed the text at the top of the screen changes to show thecurrently selected label. Finally, at the bottom of the screen are two additionalvirtual buttons to begin and end the recording of data. The sensor data alongwith its label is then saved to a CSV file stored on the phone’s internal storage.A challenge when developing the mobile app for data labelling is the frequencyof the data as the gyroscopic data had a significantly lower frequency than theaccelerometer data resulting in the reduction of data sampling frequency.
This pilot study involved ten participants using all of the developed interfacescontaining the 5 different labelling techniques and mobile app while undertakingwalking, climbing upstairs and climbing downstairs over a set route to ensuresufficient data was collected for all three activities. Participants were instructedthat the label should only be recorded when commencing a new activity and ifan incorrect label is recorded then the correct label should be recorded as soonas possible to simulate real-world labelling. Ideally the labeling system should
93

4. Real-time Labelling of Sensor Data
Figure 4.2: Example of two electronic circuits and interfaces with three buttonsand slider labelling mechanisms.
be unobtrusive; in a way that the process of labeling the data should not alteror affect the data being collected. Therefore participants were not accompaniedduring the data collection period to realistically simulate in-situ data collectionwhich is the fundamental purpose of these interfaces. No issues arose during datacollection with each participant understanding how to use each of the interfacesand successfully collecting data from all devices. The three activities allowed foreach participant to experience the different labelling techniques as well as collectsensor data which can be used to examine the accuracy and performance of eachlabelling technique.
94
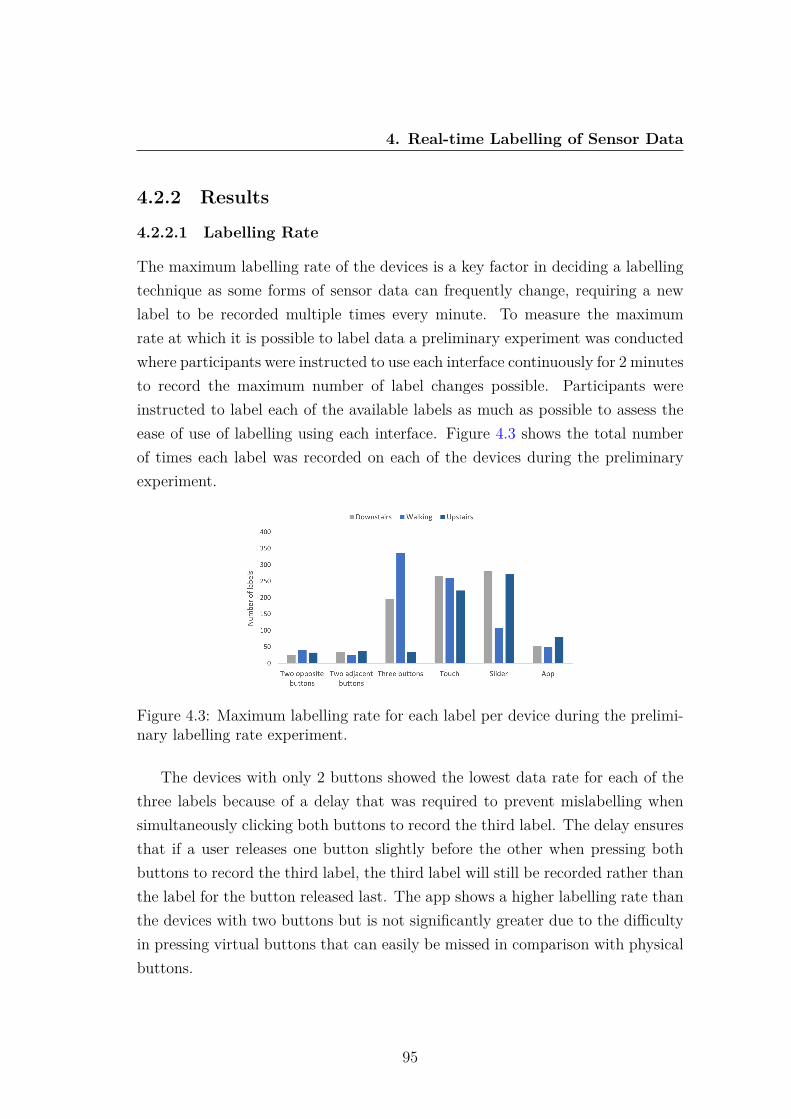
4. Real-time Labelling of Sensor Data
4.2.2 Results
4.2.2.1 Labelling Rate
The maximum labelling rate of the devices is a key factor in deciding a labellingtechnique as some forms of sensor data can frequently change, requiring a newlabel to be recorded multiple times every minute. To measure the maximumrate at which it is possible to label data a preliminary experiment was conductedwhere participants were instructed to use each interface continuously for 2 minutesto record the maximum number of label changes possible. Participants wereinstructed to label each of the available labels as much as possible to assess theease of use of labelling using each interface. Figure 4.3 shows the total numberof times each label was recorded on each of the devices during the preliminaryexperiment.
Figure 4.3: Maximum labelling rate for each label per device during the prelimi-nary labelling rate experiment.
The devices with only 2 buttons showed the lowest data rate for each of thethree labels because of a delay that was required to prevent mislabelling whensimultaneously clicking both buttons to record the third label. The delay ensuresthat if a user releases one button slightly before the other when pressing bothbuttons to record the third label, the third label will still be recorded rather thanthe label for the button released last. The app shows a higher labelling rate thanthe devices with two buttons but is not significantly greater due to the difficultyin pressing virtual buttons that can easily be missed in comparison with physicalbuttons.
95
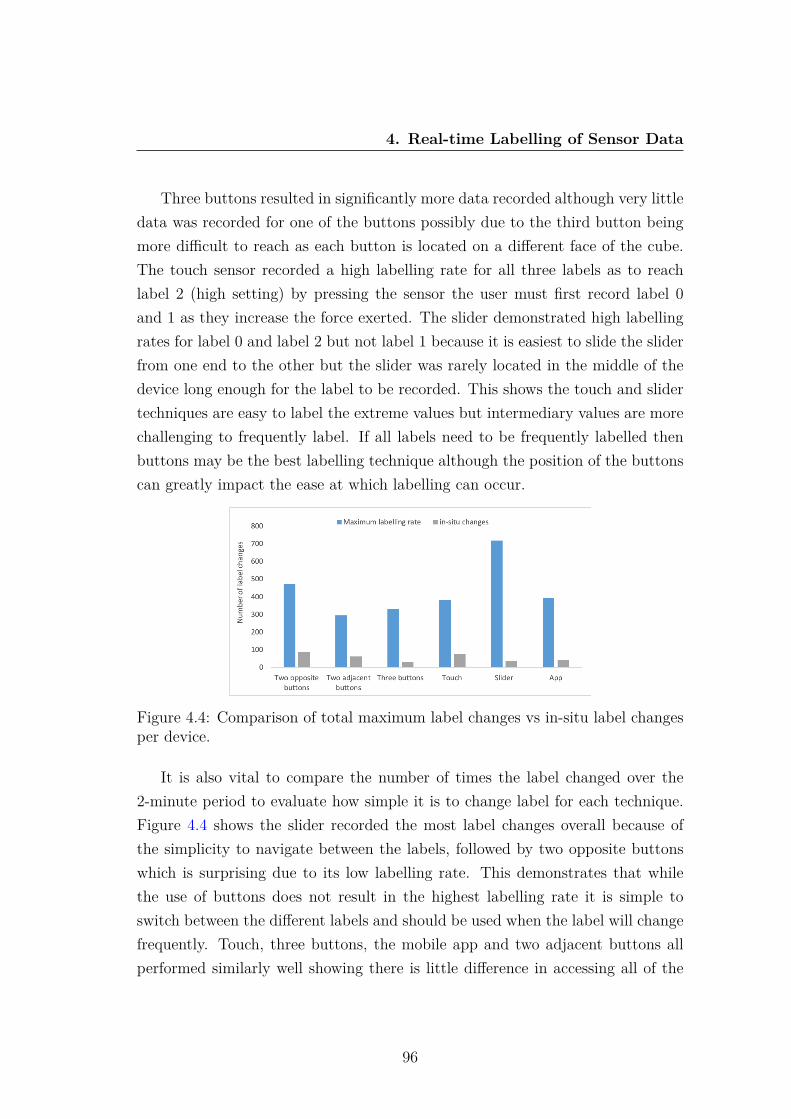
4. Real-time Labelling of Sensor Data
Three buttons resulted in significantly more data recorded although very littledata was recorded for one of the buttons possibly due to the third button beingmore difficult to reach as each button is located on a different face of the cube.The touch sensor recorded a high labelling rate for all three labels as to reachlabel 2 (high setting) by pressing the sensor the user must first record label 0and 1 as they increase the force exerted. The slider demonstrated high labellingrates for label 0 and label 2 but not label 1 because it is easiest to slide the sliderfrom one end to the other but the slider was rarely located in the middle of thedevice long enough for the label to be recorded. This shows the touch and slidertechniques are easy to label the extreme values but intermediary values are morechallenging to frequently label. If all labels need to be frequently labelled thenbuttons may be the best labelling technique although the position of the buttonscan greatly impact the ease at which labelling can occur.
Figure 4.4: Comparison of total maximum label changes vs in-situ label changesper device.
It is also vital to compare the number of times the label changed over the2-minute period to evaluate how simple it is to change label for each technique.Figure 4.4 shows the slider recorded the most label changes overall because ofthe simplicity to navigate between the labels, followed by two opposite buttonswhich is surprising due to its low labelling rate. This demonstrates that whilethe use of buttons does not result in the highest labelling rate it is simple toswitch between the different labels and should be used when the label will changefrequently. Touch, three buttons, the mobile app and two adjacent buttons allperformed similarly well showing there is little difference in accessing all of the
96

4. Real-time Labelling of Sensor Data
labels when using these devices.Once all participants used each device to label walking, climbing downstairs
and climbing upstairs the data was extracted, enabling comparisons to be es-tablished. The route participants were instructed to follow would require 11label changes if followed correctly. Figure 4.5 shows the average number of labelchanges compared with the correct number of label changes. The average rateat which labels were changed from one label to another during the collectionof physical activity data shows three buttons recorded fewest in-situ labellingchanges at 5.6 significantly lower than the correct number of label changes (11)which is surprising but potentially shows the difficulty in accessing all of thebuttons. Two opposite buttons had the highest overall rate of in-situ labellingchanges with an average 17.6 labels recorded. Labelling via touch had a con-sistently high rate of label changes for users but this again could be due to therequirement of looping through all of the labels to reach the desired label. Themobile app achieved a slightly higher rate than three buttons and slider but stilllower than the actual number of labels that should have been recorded showingthe potential benefits of tangible labelling methods. Overall the slider and threebuttons produced the lowest rate of label changes during data collection showingthese labelling techniques should not be utilised with data that requires frequentlabelling changes because of the difficulty in accessing all three labels. Two ad-jacent buttons recorded the most accurate number of labels showing the ease ofaccessing the buttons increased the accuracy of labelling.
Figure 4.5: Total number of in-situ label changes per device.
97
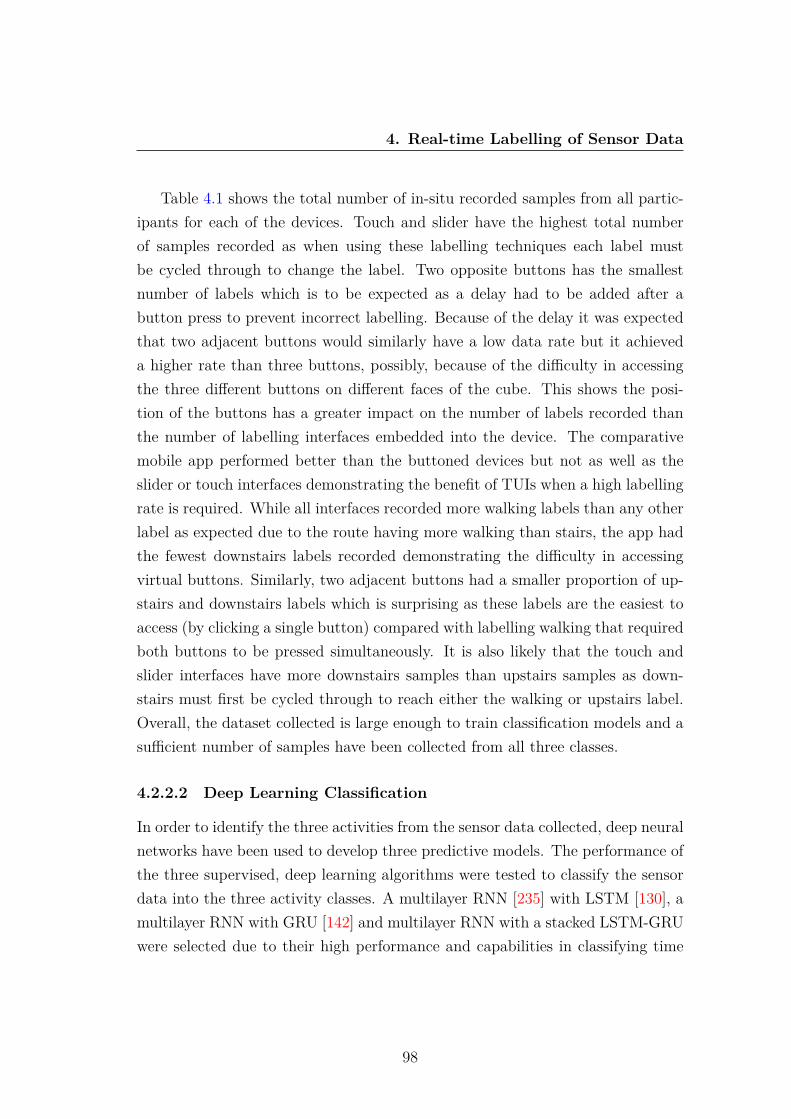
4. Real-time Labelling of Sensor Data
Table 4.1 shows the total number of in-situ recorded samples from all partic-ipants for each of the devices. Touch and slider have the highest total numberof samples recorded as when using these labelling techniques each label mustbe cycled through to change the label. Two opposite buttons has the smallestnumber of labels which is to be expected as a delay had to be added after abutton press to prevent incorrect labelling. Because of the delay it was expectedthat two adjacent buttons would similarly have a low data rate but it achieveda higher rate than three buttons, possibly, because of the difficulty in accessingthe three different buttons on different faces of the cube. This shows the posi-tion of the buttons has a greater impact on the number of labels recorded thanthe number of labelling interfaces embedded into the device. The comparativemobile app performed better than the buttoned devices but not as well as theslider or touch interfaces demonstrating the benefit of TUIs when a high labellingrate is required. While all interfaces recorded more walking labels than any otherlabel as expected due to the route having more walking than stairs, the app hadthe fewest downstairs labels recorded demonstrating the difficulty in accessingvirtual buttons. Similarly, two adjacent buttons had a smaller proportion of up-stairs and downstairs labels which is surprising as these labels are the easiest toaccess (by clicking a single button) compared with labelling walking that requiredboth buttons to be pressed simultaneously. It is also likely that the touch andslider interfaces have more downstairs samples than upstairs samples as down-stairs must first be cycled through to reach either the walking or upstairs label.Overall, the dataset collected is large enough to train classification models and asufficient number of samples have been collected from all three classes.
4.2.2.2 Deep Learning Classification
In order to identify the three activities from the sensor data collected, deep neuralnetworks have been used to develop three predictive models. The performance ofthe three supervised, deep learning algorithms were tested to classify the sensordata into the three activity classes. A multilayer RNN [235] with LSTM [130], amultilayer RNN with GRU [142] and multilayer RNN with a stacked LSTM-GRUwere selected due to their high performance and capabilities in classifying time
98
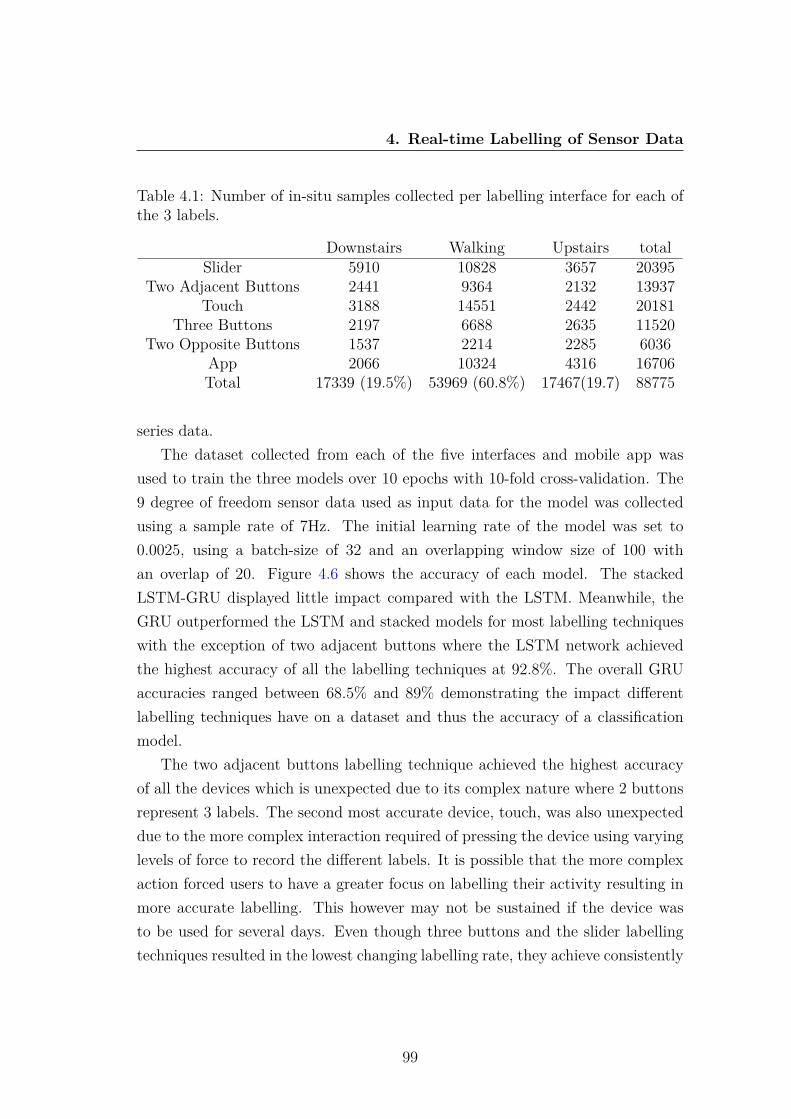
4. Real-time Labelling of Sensor Data
Table 4.1: Number of in-situ samples collected per labelling interface for each ofthe 3 labels.
Downstairs Walking Upstairs totalSlider 5910 10828 3657 20395
Two Adjacent Buttons 2441 9364 2132 13937Touch 3188 14551 2442 20181
Three Buttons 2197 6688 2635 11520Two Opposite Buttons 1537 2214 2285 6036
App 2066 10324 4316 16706Total 17339 (19.5%) 53969 (60.8%) 17467(19.7) 88775
series data.The dataset collected from each of the five interfaces and mobile app was
used to train the three models over 10 epochs with 10-fold cross-validation. The9 degree of freedom sensor data used as input data for the model was collectedusing a sample rate of 7Hz. The initial learning rate of the model was set to0.0025, using a batch-size of 32 and an overlapping window size of 100 withan overlap of 20. Figure 4.6 shows the accuracy of each model. The stackedLSTM-GRU displayed little impact compared with the LSTM. Meanwhile, theGRU outperformed the LSTM and stacked models for most labelling techniqueswith the exception of two adjacent buttons where the LSTM network achievedthe highest accuracy of all the labelling techniques at 92.8%. The overall GRUaccuracies ranged between 68.5% and 89% demonstrating the impact differentlabelling techniques have on a dataset and thus the accuracy of a classificationmodel.
The two adjacent buttons labelling technique achieved the highest accuracyof all the devices which is unexpected due to its complex nature where 2 buttonsrepresent 3 labels. The second most accurate device, touch, was also unexpecteddue to the more complex interaction required of pressing the device using varyinglevels of force to record the different labels. It is possible that the more complexaction forced users to have a greater focus on labelling their activity resulting inmore accurate labelling. This however may not be sustained if the device wasto be used for several days. Even though three buttons and the slider labellingtechniques resulted in the lowest changing labelling rate, they achieve consistently
99
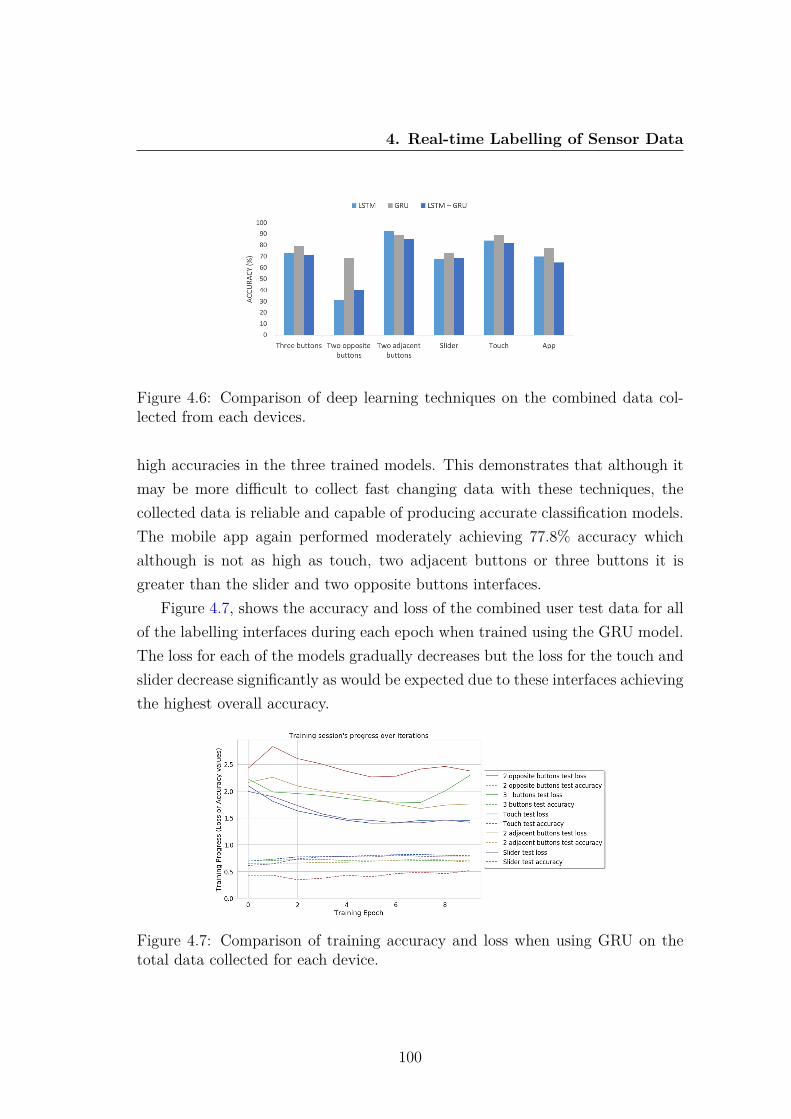
4. Real-time Labelling of Sensor Data
Figure 4.6: Comparison of deep learning techniques on the combined data col-lected from each devices.
high accuracies in the three trained models. This demonstrates that although itmay be more difficult to collect fast changing data with these techniques, thecollected data is reliable and capable of producing accurate classification models.The mobile app again performed moderately achieving 77.8% accuracy whichalthough is not as high as touch, two adjacent buttons or three buttons it isgreater than the slider and two opposite buttons interfaces.
Figure 4.7, shows the accuracy and loss of the combined user test data for allof the labelling interfaces during each epoch when trained using the GRU model.The loss for each of the models gradually decreases but the loss for the touch andslider decrease significantly as would be expected due to these interfaces achievingthe highest overall accuracy.
Figure 4.7: Comparison of training accuracy and loss when using GRU on thetotal data collected for each device.
100
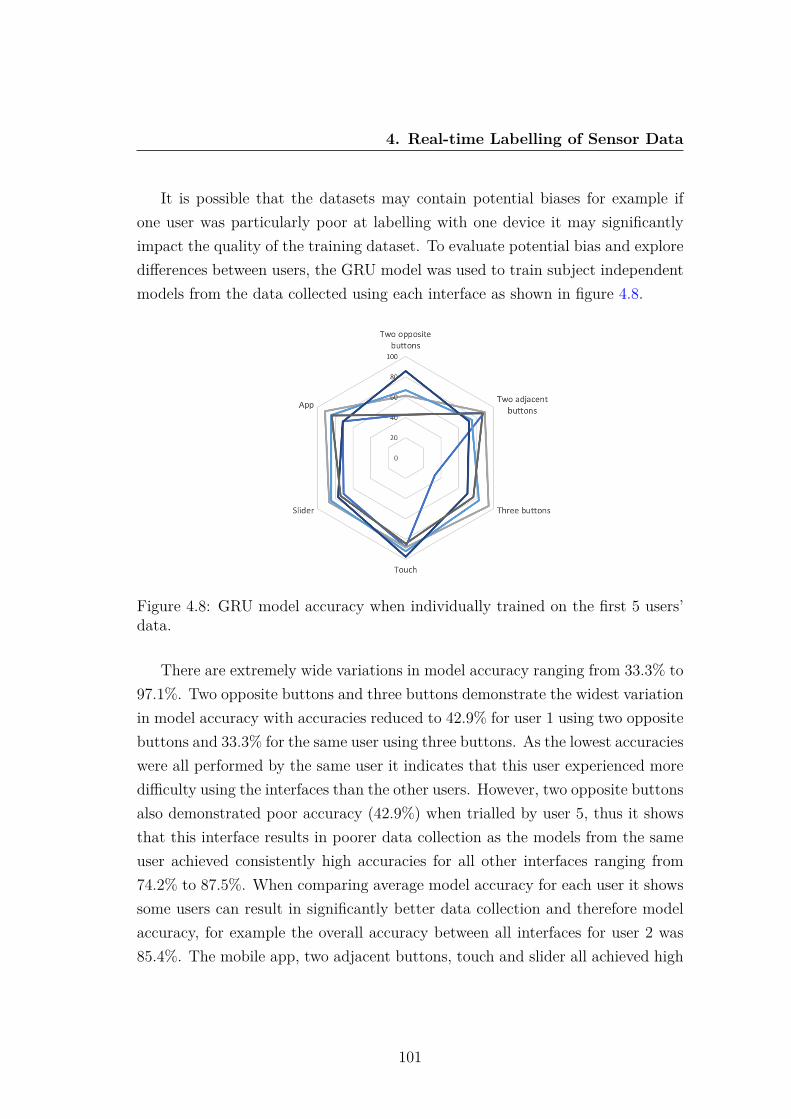
4. Real-time Labelling of Sensor Data
It is possible that the datasets may contain potential biases for example ifone user was particularly poor at labelling with one device it may significantlyimpact the quality of the training dataset. To evaluate potential bias and exploredifferences between users, the GRU model was used to train subject independentmodels from the data collected using each interface as shown in figure 4.8.
Figure 4.8: GRU model accuracy when individually trained on the first 5 users’data.
There are extremely wide variations in model accuracy ranging from 33.3% to97.1%. Two opposite buttons and three buttons demonstrate the widest variationin model accuracy with accuracies reduced to 42.9% for user 1 using two oppositebuttons and 33.3% for the same user using three buttons. As the lowest accuracieswere all performed by the same user it indicates that this user experienced moredifficulty using the interfaces than the other users. However, two opposite buttonsalso demonstrated poor accuracy (42.9%) when trialled by user 5, thus it showsthat this interface results in poorer data collection as the models from the sameuser achieved consistently high accuracies for all other interfaces ranging from74.2% to 87.5%. When comparing average model accuracy for each user it showssome users can result in significantly better data collection and therefore modelaccuracy, for example the overall accuracy between all interfaces for user 2 was85.4%. The mobile app, two adjacent buttons, touch and slider all achieved high
101
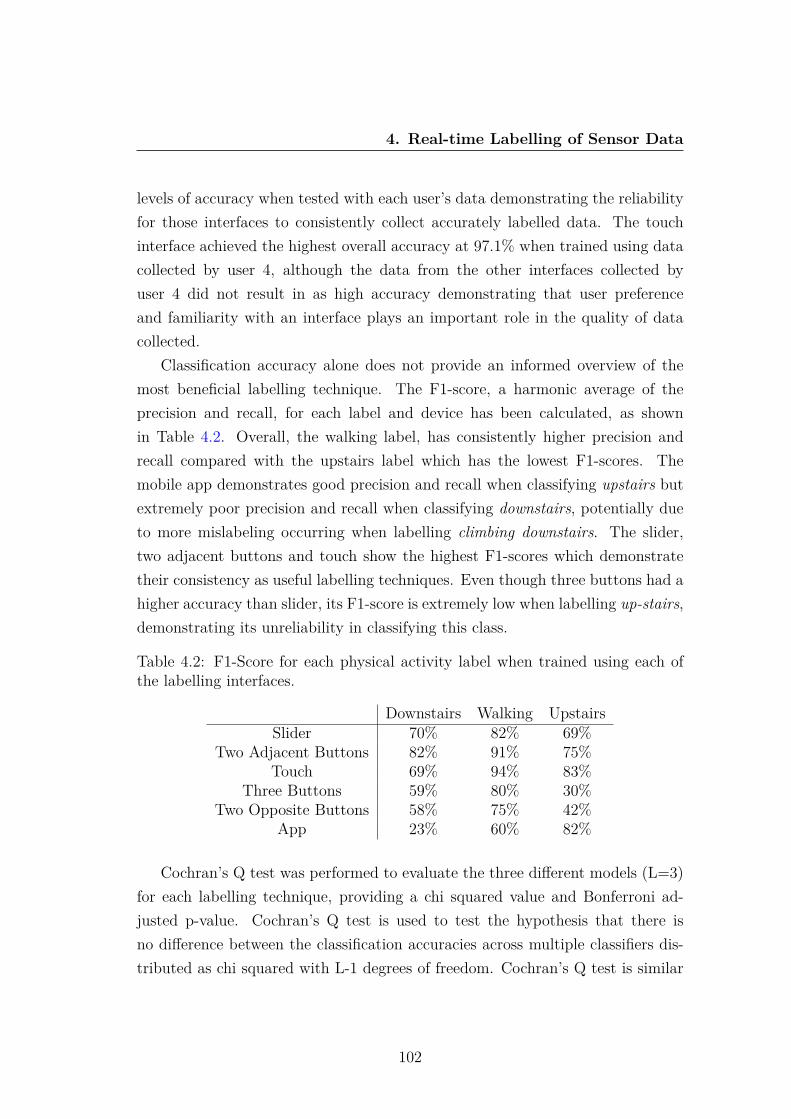
4. Real-time Labelling of Sensor Data
levels of accuracy when tested with each user’s data demonstrating the reliabilityfor those interfaces to consistently collect accurately labelled data. The touchinterface achieved the highest overall accuracy at 97.1% when trained using datacollected by user 4, although the data from the other interfaces collected byuser 4 did not result in as high accuracy demonstrating that user preferenceand familiarity with an interface plays an important role in the quality of datacollected.
Classification accuracy alone does not provide an informed overview of themost beneficial labelling technique. The F1-score, a harmonic average of theprecision and recall, for each label and device has been calculated, as shownin Table 4.2. Overall, the walking label, has consistently higher precision andrecall compared with the upstairs label which has the lowest F1-scores. Themobile app demonstrates good precision and recall when classifying upstairs butextremely poor precision and recall when classifying downstairs, potentially dueto more mislabeling occurring when labelling climbing downstairs. The slider,two adjacent buttons and touch show the highest F1-scores which demonstratetheir consistency as useful labelling techniques. Even though three buttons had ahigher accuracy than slider, its F1-score is extremely low when labelling up-stairs,demonstrating its unreliability in classifying this class.
Table 4.2: F1-Score for each physical activity label when trained using each ofthe labelling interfaces.
Downstairs Walking UpstairsSlider 70% 82% 69%
Two Adjacent Buttons 82% 91% 75%Touch 69% 94% 83%
Three Buttons 59% 80% 30%Two Opposite Buttons 58% 75% 42%
App 23% 60% 82%
Cochran’s Q test was performed to evaluate the three different models (L=3)for each labelling technique, providing a chi squared value and Bonferroni ad-justed p-value. Cochran’s Q test is used to test the hypothesis that there isno difference between the classification accuracies across multiple classifiers dis-tributed as chi squared with L-1 degrees of freedom. Cochran’s Q test is similar
102
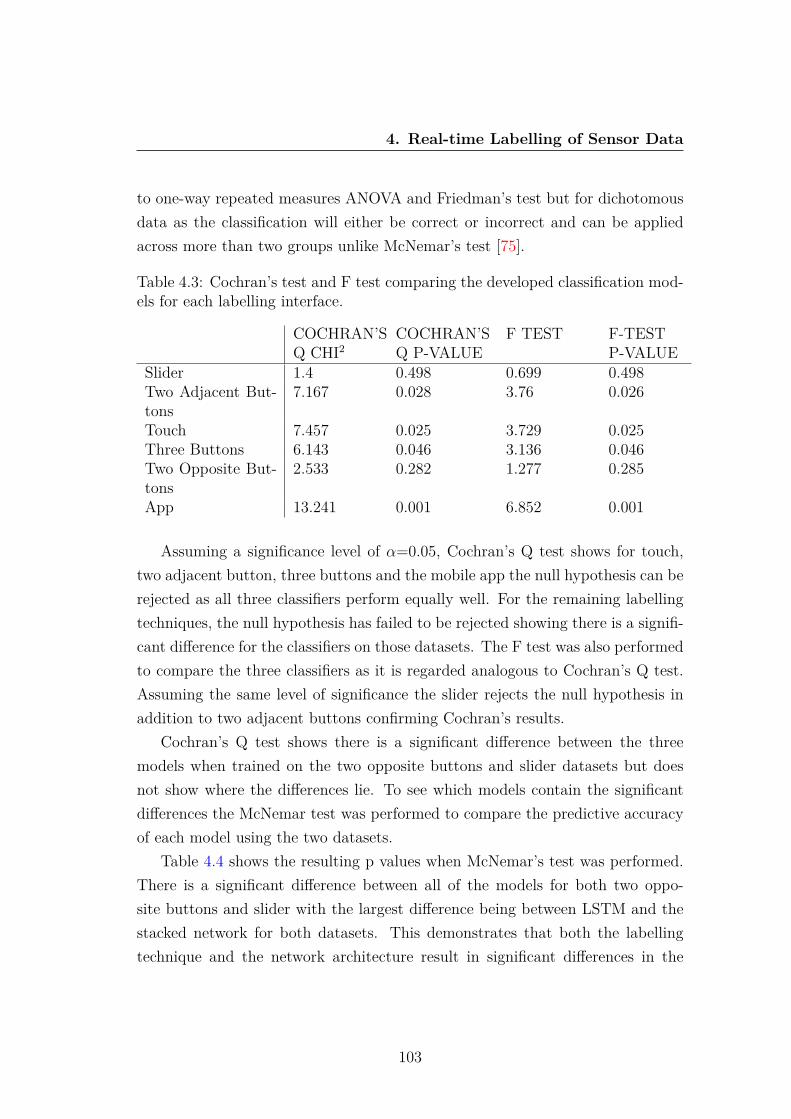
4. Real-time Labelling of Sensor Data
to one-way repeated measures ANOVA and Friedman’s test but for dichotomousdata as the classification will either be correct or incorrect and can be appliedacross more than two groups unlike McNemar’s test [75].
Table 4.3: Cochran’s test and F test comparing the developed classification mod-els for each labelling interface.
COCHRAN’SQ CHI2
COCHRAN’SQ P-VALUE
F TEST F-TESTP-VALUE
Slider 1.4 0.498 0.699 0.498Two Adjacent But-tons
7.167 0.028 3.76 0.026
Touch 7.457 0.025 3.729 0.025Three Buttons 6.143 0.046 3.136 0.046Two Opposite But-tons
2.533 0.282 1.277 0.285
App 13.241 0.001 6.852 0.001
Assuming a significance level of α=0.05, Cochran’s Q test shows for touch,two adjacent button, three buttons and the mobile app the null hypothesis can berejected as all three classifiers perform equally well. For the remaining labellingtechniques, the null hypothesis has failed to be rejected showing there is a signifi-cant difference for the classifiers on those datasets. The F test was also performedto compare the three classifiers as it is regarded analogous to Cochran’s Q test.Assuming the same level of significance the slider rejects the null hypothesis inaddition to two adjacent buttons confirming Cochran’s results.
Cochran’s Q test shows there is a significant difference between the threemodels when trained on the two opposite buttons and slider datasets but doesnot show where the differences lie. To see which models contain the significantdifferences the McNemar test was performed to compare the predictive accuracyof each model using the two datasets.
Table 4.4 shows the resulting p values when McNemar’s test was performed.There is a significant difference between all of the models for both two oppo-site buttons and slider with the largest difference being between LSTM and thestacked network for both datasets. This demonstrates that both the labellingtechnique and the network architecture result in significant differences in the
103
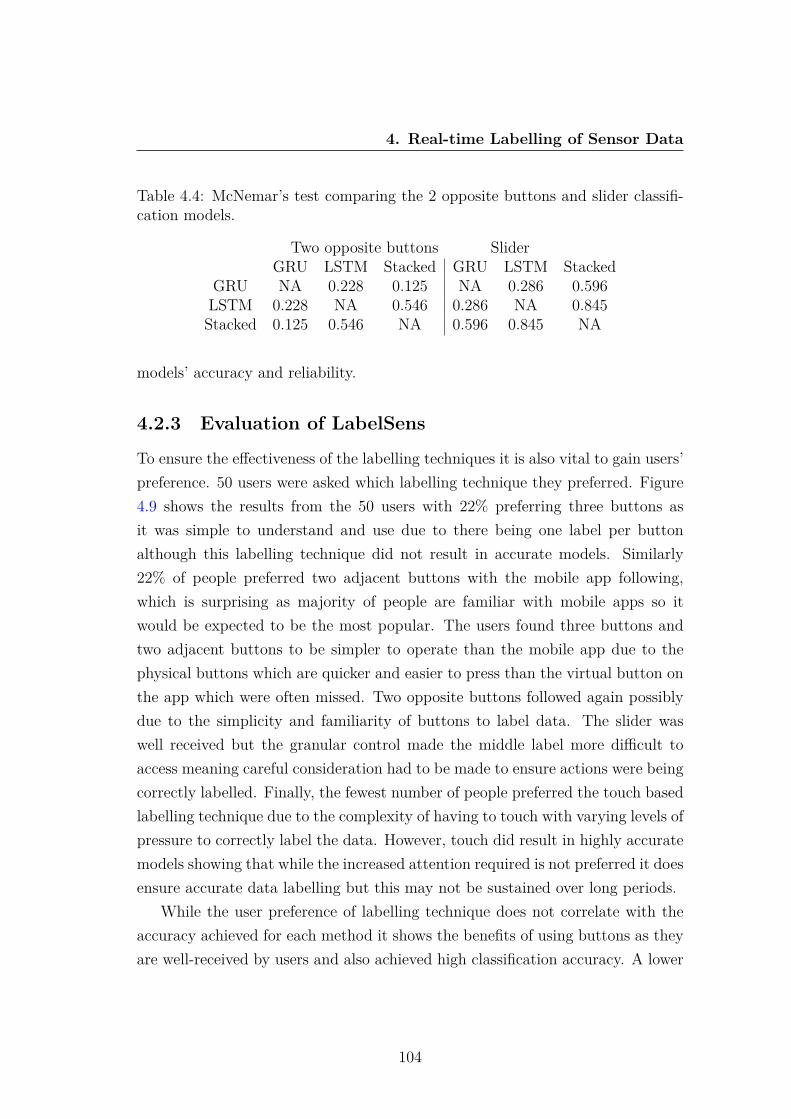
4. Real-time Labelling of Sensor Data
Table 4.4: McNemar’s test comparing the 2 opposite buttons and slider classifi-cation models.
Two opposite buttons SliderGRU LSTM Stacked GRU LSTM Stacked
GRU NA 0.228 0.125 NA 0.286 0.596LSTM 0.228 NA 0.546 0.286 NA 0.845Stacked 0.125 0.546 NA 0.596 0.845 NA
models’ accuracy and reliability.
4.2.3 Evaluation of LabelSens
To ensure the effectiveness of the labelling techniques it is also vital to gain users’preference. 50 users were asked which labelling technique they preferred. Figure4.9 shows the results from the 50 users with 22% preferring three buttons asit was simple to understand and use due to there being one label per buttonalthough this labelling technique did not result in accurate models. Similarly22% of people preferred two adjacent buttons with the mobile app following,which is surprising as majority of people are familiar with mobile apps so itwould be expected to be the most popular. The users found three buttons andtwo adjacent buttons to be simpler to operate than the mobile app due to thephysical buttons which are quicker and easier to press than the virtual button onthe app which were often missed. Two opposite buttons followed again possiblydue to the simplicity and familiarity of buttons to label data. The slider waswell received but the granular control made the middle label more difficult toaccess meaning careful consideration had to be made to ensure actions were beingcorrectly labelled. Finally, the fewest number of people preferred the touch basedlabelling technique due to the complexity of having to touch with varying levels ofpressure to correctly label the data. However, touch did result in highly accuratemodels showing that while the increased attention required is not preferred it doesensure accurate data labelling but this may not be sustained over long periods.
While the user preference of labelling technique does not correlate with theaccuracy achieved for each method it shows the benefits of using buttons as theyare well-received by users and also achieved high classification accuracy. A lower
104
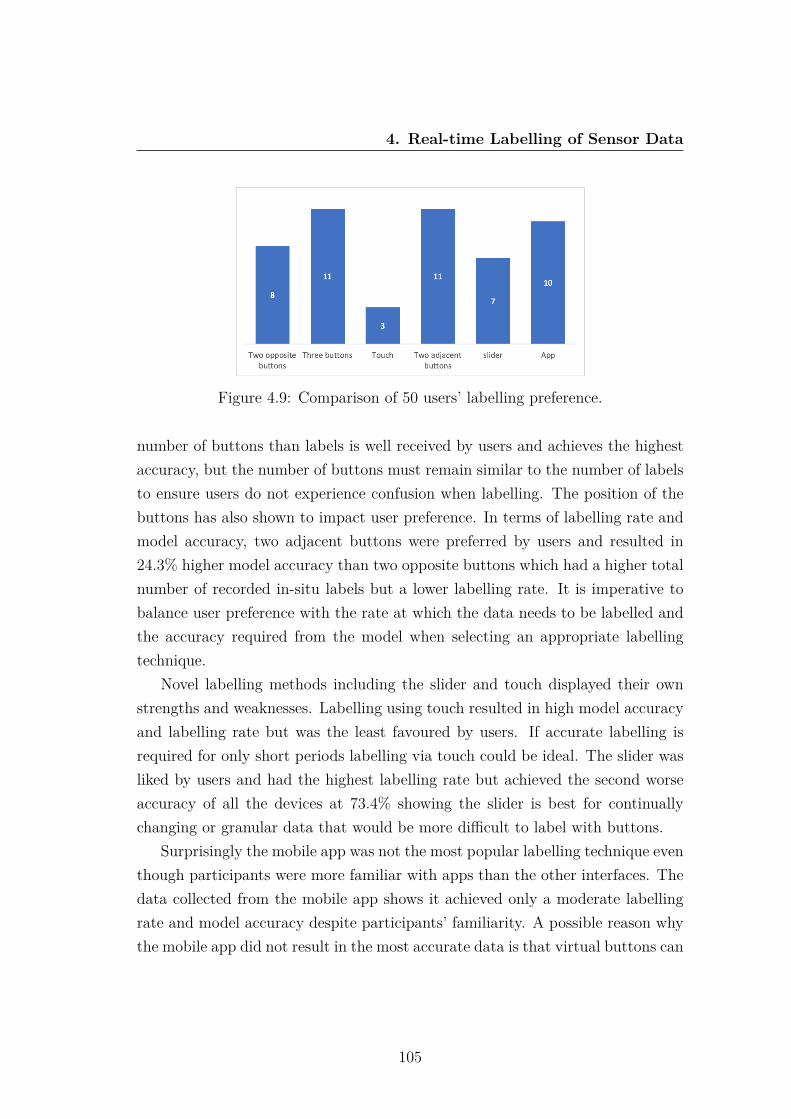
4. Real-time Labelling of Sensor Data
Figure 4.9: Comparison of 50 users’ labelling preference.
number of buttons than labels is well received by users and achieves the highestaccuracy, but the number of buttons must remain similar to the number of labelsto ensure users do not experience confusion when labelling. The position of thebuttons has also shown to impact user preference. In terms of labelling rate andmodel accuracy, two adjacent buttons were preferred by users and resulted in24.3% higher model accuracy than two opposite buttons which had a higher totalnumber of recorded in-situ labels but a lower labelling rate. It is imperative tobalance user preference with the rate at which the data needs to be labelled andthe accuracy required from the model when selecting an appropriate labellingtechnique.
Novel labelling methods including the slider and touch displayed their ownstrengths and weaknesses. Labelling using touch resulted in high model accuracyand labelling rate but was the least favoured by users. If accurate labelling isrequired for only short periods labelling via touch could be ideal. The slider wasliked by users and had the highest labelling rate but achieved the second worseaccuracy of all the devices at 73.4% showing the slider is best for continuallychanging or granular data that would be more difficult to label with buttons.
Surprisingly the mobile app was not the most popular labelling technique eventhough participants were more familiar with apps than the other interfaces. Thedata collected from the mobile app shows it achieved only a moderate labellingrate and model accuracy despite participants’ familiarity. A possible reason whythe mobile app did not result in the most accurate data is that virtual buttons can
105

4. Real-time Labelling of Sensor Data
be easier to miss than physical mechanisms. However, when used in real worldenvironments apps are easier to deploy but solely using an app does not allow forany additional sensors that are not embedded within the smartphone to be used.Apps possess many benefits when used to label motion data including ease ofaccess but when additional sensors are required such as physiological sensors tomonitor affective states using apps for labelling is not recommended over physicallabelling techniques.
One of the most significant challenges encountered was the inconsistent qualityof labelled data as when collecting in-situ data to train machine learning modelsit is not possible to ensure all users are successfully labelling their actions. By notaccompanying users during the labelling process the experiment more replicatedin-situ data labelling resulting in the different labelling rates experienced eventhough all users were instructed to walk the same route. Additionally, as usershad to repeat the experiment five times to enable them to use each device, theirlabelling rate may change as they become more familiar with the experiment. Tocombat this, users were provided with the devices in varying orders preventingthe same device from being used by all users at the same stage of the experiment.
106
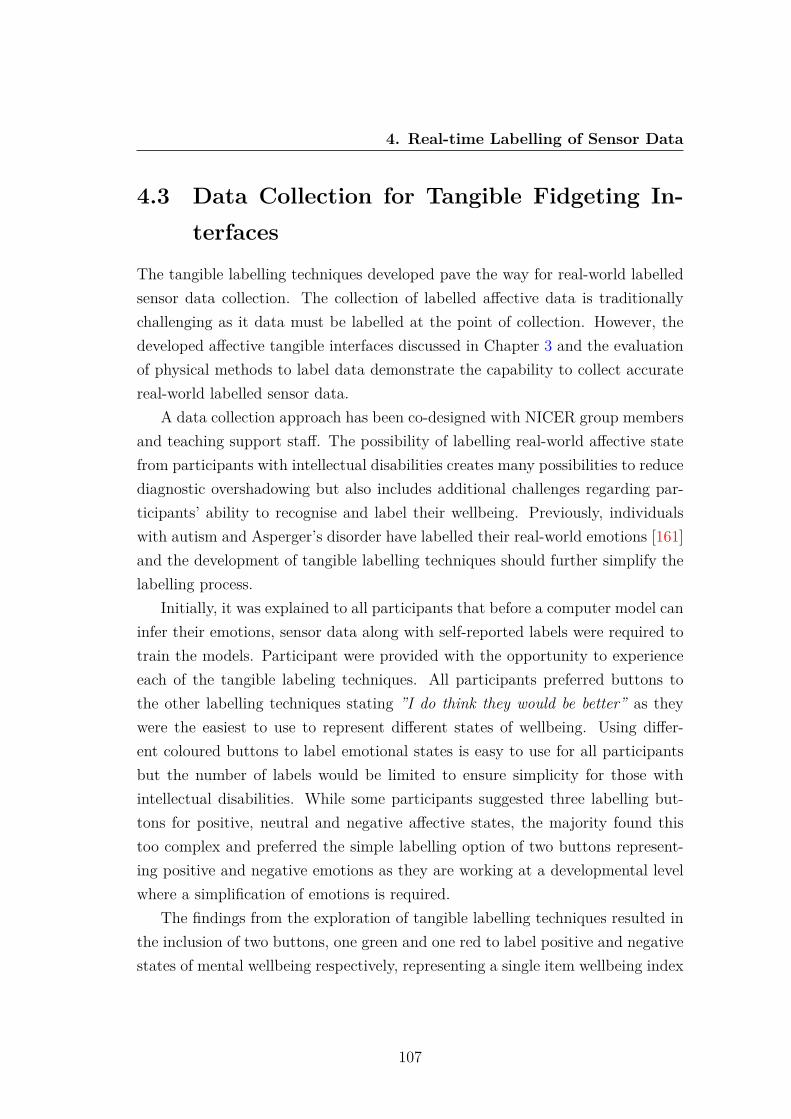
4. Real-time Labelling of Sensor Data
4.3 Data Collection for Tangible Fidgeting In-terfaces
The tangible labelling techniques developed pave the way for real-world labelledsensor data collection. The collection of labelled affective data is traditionallychallenging as it data must be labelled at the point of collection. However, thedeveloped affective tangible interfaces discussed in Chapter 3 and the evaluationof physical methods to label data demonstrate the capability to collect accuratereal-world labelled sensor data.
A data collection approach has been co-designed with NICER group membersand teaching support staff. The possibility of labelling real-world affective statefrom participants with intellectual disabilities creates many possibilities to reducediagnostic overshadowing but also includes additional challenges regarding par-ticipants’ ability to recognise and label their wellbeing. Previously, individualswith autism and Asperger’s disorder have labelled their real-world emotions [161]and the development of tangible labelling techniques should further simplify thelabelling process.
Initially, it was explained to all participants that before a computer model caninfer their emotions, sensor data along with self-reported labels were required totrain the models. Participant were provided with the opportunity to experienceeach of the tangible labeling techniques. All participants preferred buttons tothe other labelling techniques stating ”I do think they would be better” as theywere the easiest to use to represent different states of wellbeing. Using differ-ent coloured buttons to label emotional states is easy to use for all participantsbut the number of labels would be limited to ensure simplicity for those withintellectual disabilities. While some participants suggested three labelling but-tons for positive, neutral and negative affective states, the majority found thistoo complex and preferred the simple labelling option of two buttons represent-ing positive and negative emotions as they are working at a developmental levelwhere a simplification of emotions is required.
The findings from the exploration of tangible labelling techniques resulted inthe inclusion of two buttons, one green and one red to label positive and negativestates of mental wellbeing respectively, representing a single item wellbeing index
107

4. Real-time Labelling of Sensor Data
[309]. However, to resolve the limitations of on-device labelling mechanisms whileensuring the interfaces are still easy to use, the use of a paper diary was also used,allowing for a larger range of emotional states to be captured and to ensure theon-device labelling techniques are used correctly. Potential emotions and theirrepresentations for inclusion within the diaries were discussed and co-created,with emojis being favoured by the majority of participants to represent differentemotions.
4.3.1 Experimental Setup
Six participants with intellectual disabilities each used one of the developed tangi-ble interfaces incorporating the tangible labelling buttons over a two-week periodin real-world environments. This differs from many previous studies that collectedcontrolled experimental data or included specified activities during the data col-lection period to artificially impact wellbeing [194], [248], [290], [368], [289], [169].Participants were instructed to use the red and green buttons to label negativeand positive states of affect each time they used the interface. The label wouldthen be stored along with the sensor data from each session of use. Participantswere also instructed to correct their labelling as soon as possible if they acciden-tally mislabelled their wellbeing. In addition to being given a device to use intheir home and work environments, each participant was provided with a diaryto record their emotions as shown in Figure 4.10.
Figure 4.10: The emotions used in the diary enabling participants to recordadditional labels.
To ensure the diary was easy to use, five emotions (happy, neutral, sad,stressed and frustrated) were represented using emojis, ensuring emotions fromeach of the four quadrants from Russell’s circumplex [259] were included. Eachpage of the diary consisted of three sets of emotions enabling labelling each morn-ing, afternoon and evening of the data collection period.
108

4. Real-time Labelling of Sensor Data
4.3.2 Experimental Observations
After the two-week data collection period the devices along with the diaries werecollected for analysis. One participant had to be immediately excluded due tothe unexpected circumstance of their dog chewing the device. The remaining fiveparticipants completed their diaries and successfully used the device every dayduring the two-week period.
Participants used the interfaces for varying lengths of time with some partic-ipants using the device for a few minutes and others using it for several secondsat a time. Participants were instructed to label each session of use with someparticipants labelling before using the device and others after. Before the datacould be explored it had to be cleaned to match the sensor data with the recordedlabel. When cleaning the data any sessions without a label were removed, if a la-bel was recorded near a session (either before, during or directly after) the entiresession was recorded with that label and if multiple labels were recorded in quicksuccession the last label was aligned with the sensor data as participants were in-structed to correct the label if they accidentally mislabelled a session of use. If alabel was recorded but no physiological sensor data was recorded (potentially dueto fidgeting motions while interactive with the interface) then the accelerometerdata was aligned with the recorded label but the physiological sensor data wasremoved. After cleaning the data all sessions of sensor data had a label alignedwith them enabling further evaluation.
Upon evaluation of the diaries and the on-device labels it was shown thatthree of the five remaining participants were consistently reporting their emotionas happy or neutral throughout the two-week data collection period and neverreported a negative state of wellbeing. One of the participants who recordednegative emotions only recorded two instances of such affect states during thetwo-week period, while the final participants added text to justify their selectionof emotion and subsequently reported the most negative states. A potentialexplanation to the overwhelmingly positive recorded emotions suggested by anexperienced teacher of students with intellectual disabilities is that participantswith an intellectual disability are often keen to please researchers and give positiveresponses to questions. This demonstrates that the collection of overly positive
109
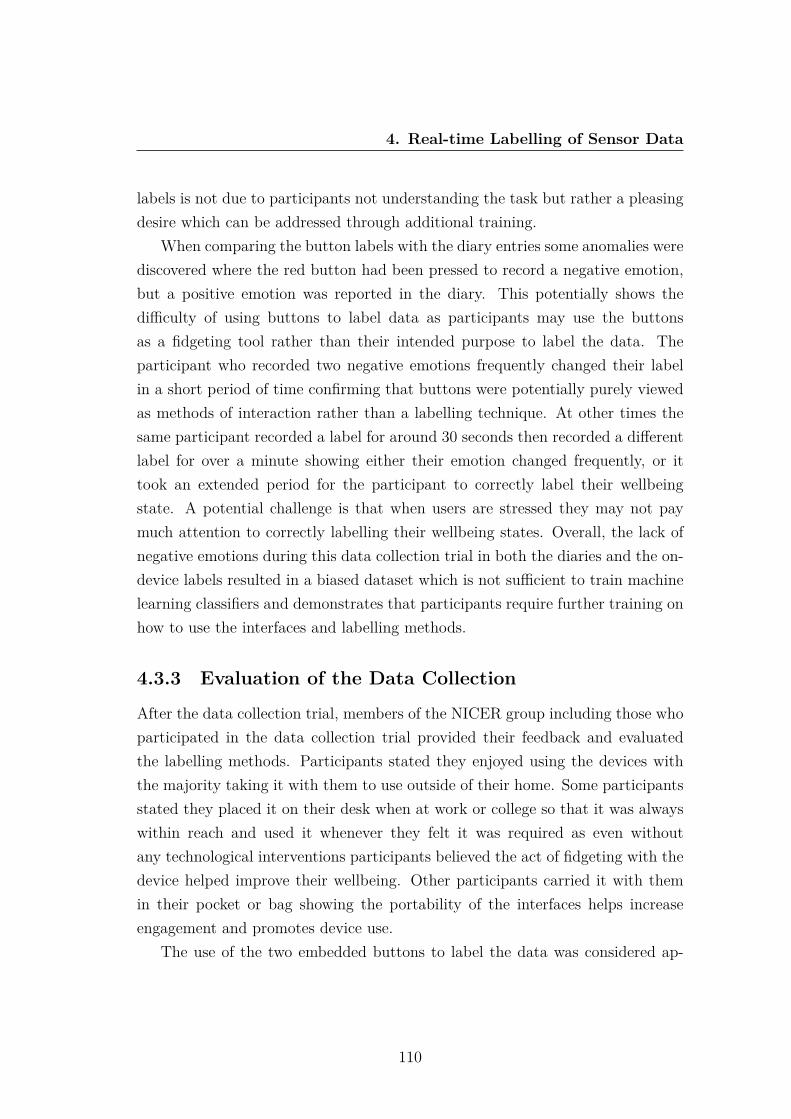
4. Real-time Labelling of Sensor Data
labels is not due to participants not understanding the task but rather a pleasingdesire which can be addressed through additional training.
When comparing the button labels with the diary entries some anomalies werediscovered where the red button had been pressed to record a negative emotion,but a positive emotion was reported in the diary. This potentially shows thedifficulty of using buttons to label data as participants may use the buttonsas a fidgeting tool rather than their intended purpose to label the data. Theparticipant who recorded two negative emotions frequently changed their labelin a short period of time confirming that buttons were potentially purely viewedas methods of interaction rather than a labelling technique. At other times thesame participant recorded a label for around 30 seconds then recorded a differentlabel for over a minute showing either their emotion changed frequently, or ittook an extended period for the participant to correctly label their wellbeingstate. A potential challenge is that when users are stressed they may not paymuch attention to correctly labelling their wellbeing states. Overall, the lack ofnegative emotions during this data collection trial in both the diaries and the on-device labels resulted in a biased dataset which is not sufficient to train machinelearning classifiers and demonstrates that participants require further training onhow to use the interfaces and labelling methods.
4.3.3 Evaluation of the Data Collection
After the data collection trial, members of the NICER group including those whoparticipated in the data collection trial provided their feedback and evaluatedthe labelling methods. Participants stated they enjoyed using the devices withthe majority taking it with them to use outside of their home. Some participantsstated they placed it on their desk when at work or college so that it was alwayswithin reach and used it whenever they felt it was required as even withoutany technological interventions participants believed the act of fidgeting with thedevice helped improve their wellbeing. Other participants carried it with themin their pocket or bag showing the portability of the interfaces helps increaseengagement and promotes device use.
The use of the two embedded buttons to label the data was considered ap-
110

4. Real-time Labelling of Sensor Data
propriate and easy to use. However, nearly all participants found the stressedand angry emojis used in the diaries difficult to understand. The use photo real-istic images of faces [26] was proposed, which may be easier to understand thanemojis. Alternatively, it was suggested to change the colours of the emoji faces,where the happy emoji would be green and the angry emoji red.
The frequency of the self-reporting was also problematic as the diary onlyallowed participants to record their emotions over long periods of time, suchas one label for the morning or afternoon. However, when stress or anger wasexperienced it was only for a short or transient period, but as the individualfelt happy for majority of the time frame it resulted in positive emotions beingrecorded. To resolve this issue it was suggested that the diaries could ask forparticipants’ affective states to be recorded during the past hour as this shouldincrease the frequency of emotional variation. Users could also be instructedto use the device whenever they feel stressed or angry as these emotions don’tusually last very long. This should help increase the frequency of data collectionrelated to poor mental wellbeing states being collected, allowing for the successfultraining of machine learning classifiers.
Additionally, it was suggested that parents or carers could help provide in-sights into the mental wellbeing states of participants by completing their ownquestionnaires to expertly label participants’ affective states, and justifying eachemotion reported. However, the presence of a paid carer may pressure users intoresponding more positively and if parents and carers only complete questionnairesinfrequently they will not capture the transient periods of time where users mayexperience negative emotions. Further training will be required to ensure thatall participants with an intellectual disability understand each emotion as thereis the need to first train them in understanding and recognising their differentemotions before going onto record these as labels.
4.3.4 Revised Data Collection
The data collection approach was revised to obtain more accurate labels. Thedevelopment of new labelling diaries continued to be discussed and designed withthe participants and education specialists through focus groups over two design
111
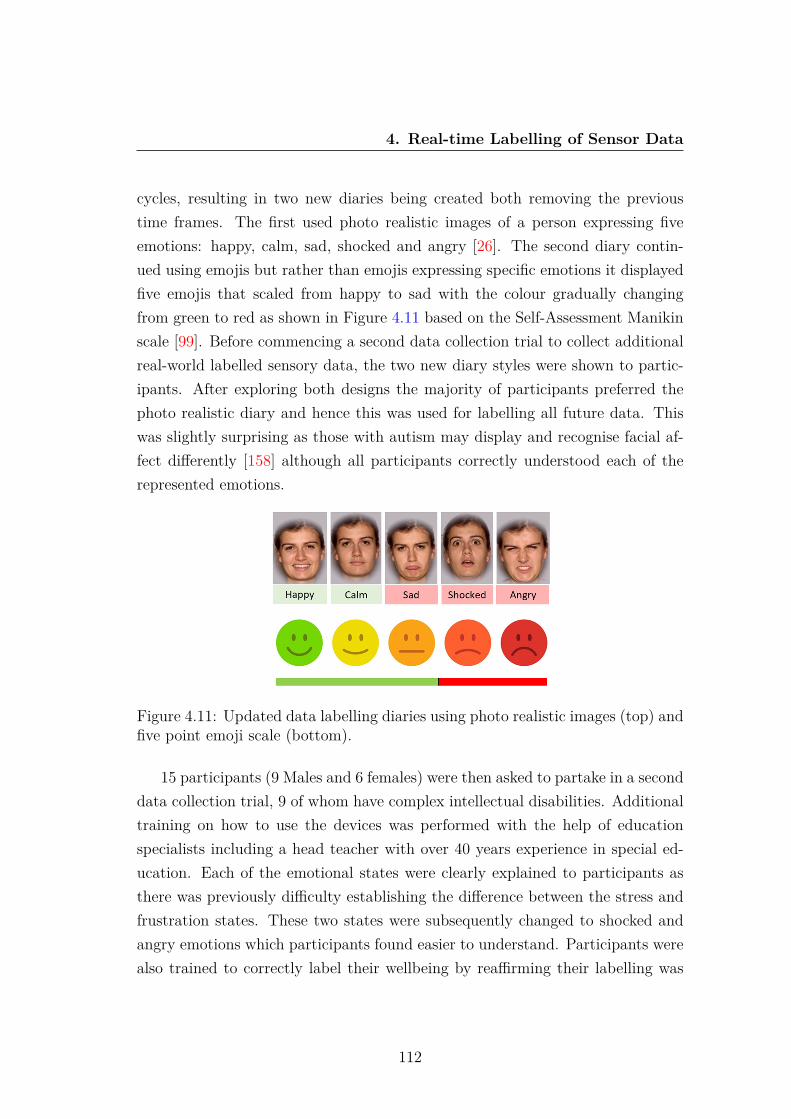
4. Real-time Labelling of Sensor Data
cycles, resulting in two new diaries being created both removing the previoustime frames. The first used photo realistic images of a person expressing fiveemotions: happy, calm, sad, shocked and angry [26]. The second diary contin-ued using emojis but rather than emojis expressing specific emotions it displayedfive emojis that scaled from happy to sad with the colour gradually changingfrom green to red as shown in Figure 4.11 based on the Self-Assessment Manikinscale [99]. Before commencing a second data collection trial to collect additionalreal-world labelled sensory data, the two new diary styles were shown to partic-ipants. After exploring both designs the majority of participants preferred thephoto realistic diary and hence this was used for labelling all future data. Thiswas slightly surprising as those with autism may display and recognise facial af-fect differently [158] although all participants correctly understood each of therepresented emotions.
Figure 4.11: Updated data labelling diaries using photo realistic images (top) andfive point emoji scale (bottom).
15 participants (9 Males and 6 females) were then asked to partake in a seconddata collection trial, 9 of whom have complex intellectual disabilities. Additionaltraining on how to use the devices was performed with the help of educationspecialists including a head teacher with over 40 years experience in special ed-ucation. Each of the emotional states were clearly explained to participants asthere was previously difficulty establishing the difference between the stress andfrustration states. These two states were subsequently changed to shocked andangry emotions which participants found easier to understand. Participants werealso trained to correctly label their wellbeing by reaffirming their labelling was
112

4. Real-time Labelling of Sensor Data
private and that their honesty was valued, showing they didn’t need to providepositive labels to please the researchers.
Participants were informed they were to use the device as frequently as possi-ble throughout their normal daily life, in particular when experiencing a changein emotions, (labelling a minimum of 3 times per day), keeping the device withthem for as much time as possible. Participants were also instructed to frequentlylabel their affective states, especially when their emotion might change to ensurea wide range of labels connected to different affect states are collected as thiswas problematic with the previous data collection trial. Once the participantsunderstood the requirement for increased labelling frequency, the interfaces werethen selected by the participants themselves.
All participants used the interfaces during their daily life to collect real-worldlabelled affective data over a period of at least one week. After participants usedthe devices, the interfaces were collected so that the data could be analysed andused for computational analysis. The on-device labels have been used to explorethe data as participants used the on-device labelling buttons more often thanthe diary due to their convenience. Also, when using the diaries participantsregularly used only two emotions, one to represent negative emotions and oneto represent positive emotions, matching the labelling buttons. Out of the nineparticipants with intellectual disabilities, the data collected from five participantswas insufficient to train classification models as either the devices were not usedsufficiently or all of the recorded labels were positive emotions resulting in biaseddatasets. The remaining participants all successfully used the devices to collectphysiological data in addition to motion data and labels.
The number of positive and negative samples and percentage of positive andnegative labelled events recorded from each of the remaining ten interfaces isshown in Table 4.5. The data shows users 1, 2, 3, 4, 5 and 8 used their devicesthe most collecting a large number of both positive and negative samples. Users6, 9 and 10 collected mostly positive samples during the data collection period butalso collected sufficient negative samples to train machine learning models. User7 collected the least the number of samples, using the device the least althoughas both positive and negative samples were collected it remains possible to utilisethis data.
113
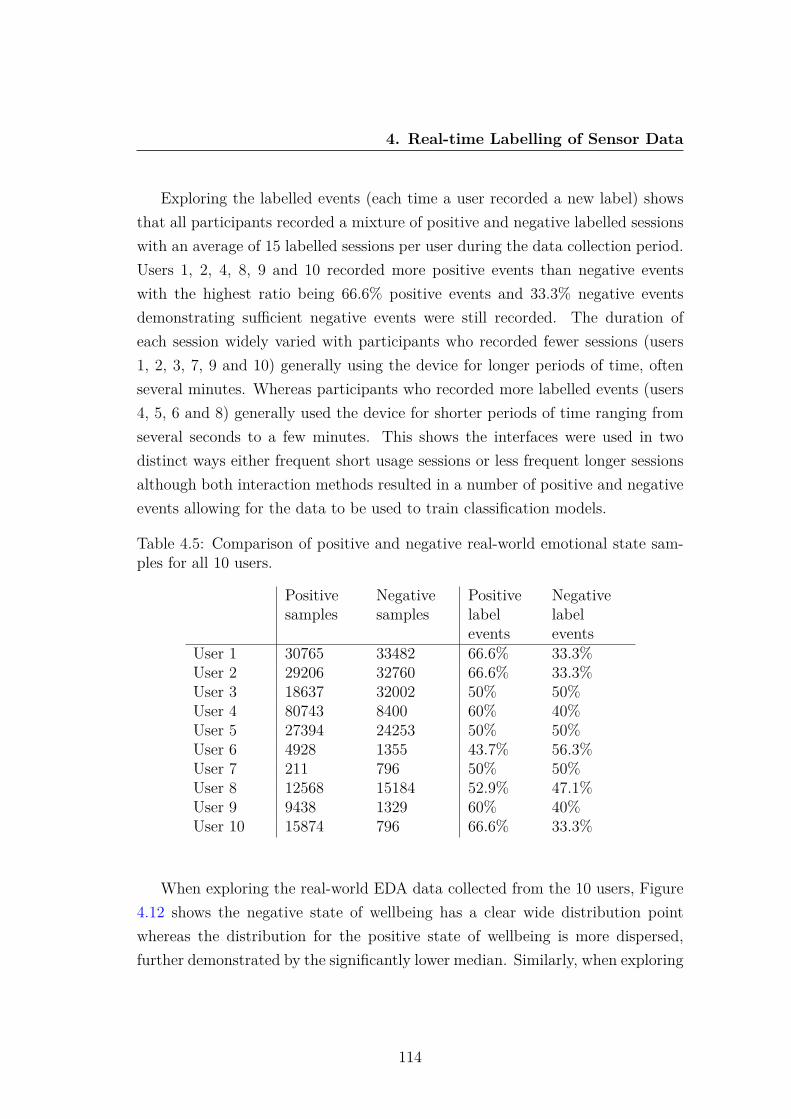
4. Real-time Labelling of Sensor Data
Exploring the labelled events (each time a user recorded a new label) showsthat all participants recorded a mixture of positive and negative labelled sessionswith an average of 15 labelled sessions per user during the data collection period.Users 1, 2, 4, 8, 9 and 10 recorded more positive events than negative eventswith the highest ratio being 66.6% positive events and 33.3% negative eventsdemonstrating sufficient negative events were still recorded. The duration ofeach session widely varied with participants who recorded fewer sessions (users1, 2, 3, 7, 9 and 10) generally using the device for longer periods of time, oftenseveral minutes. Whereas participants who recorded more labelled events (users4, 5, 6 and 8) generally used the device for shorter periods of time ranging fromseveral seconds to a few minutes. This shows the interfaces were used in twodistinct ways either frequent short usage sessions or less frequent longer sessionsalthough both interaction methods resulted in a number of positive and negativeevents allowing for the data to be used to train classification models.
Table 4.5: Comparison of positive and negative real-world emotional state sam-ples for all 10 users.
Positivesamples
Negativesamples
Positivelabelevents
Negativelabelevents
User 1 30765 33482 66.6% 33.3%User 2 29206 32760 66.6% 33.3%User 3 18637 32002 50% 50%User 4 80743 8400 60% 40%User 5 27394 24253 50% 50%User 6 4928 1355 43.7% 56.3%User 7 211 796 50% 50%User 8 12568 15184 52.9% 47.1%User 9 9438 1329 60% 40%User 10 15874 796 66.6% 33.3%
When exploring the real-world EDA data collected from the 10 users, Figure4.12 shows the negative state of wellbeing has a clear wide distribution pointwhereas the distribution for the positive state of wellbeing is more dispersed,further demonstrated by the significantly lower median. Similarly, when exploring
114
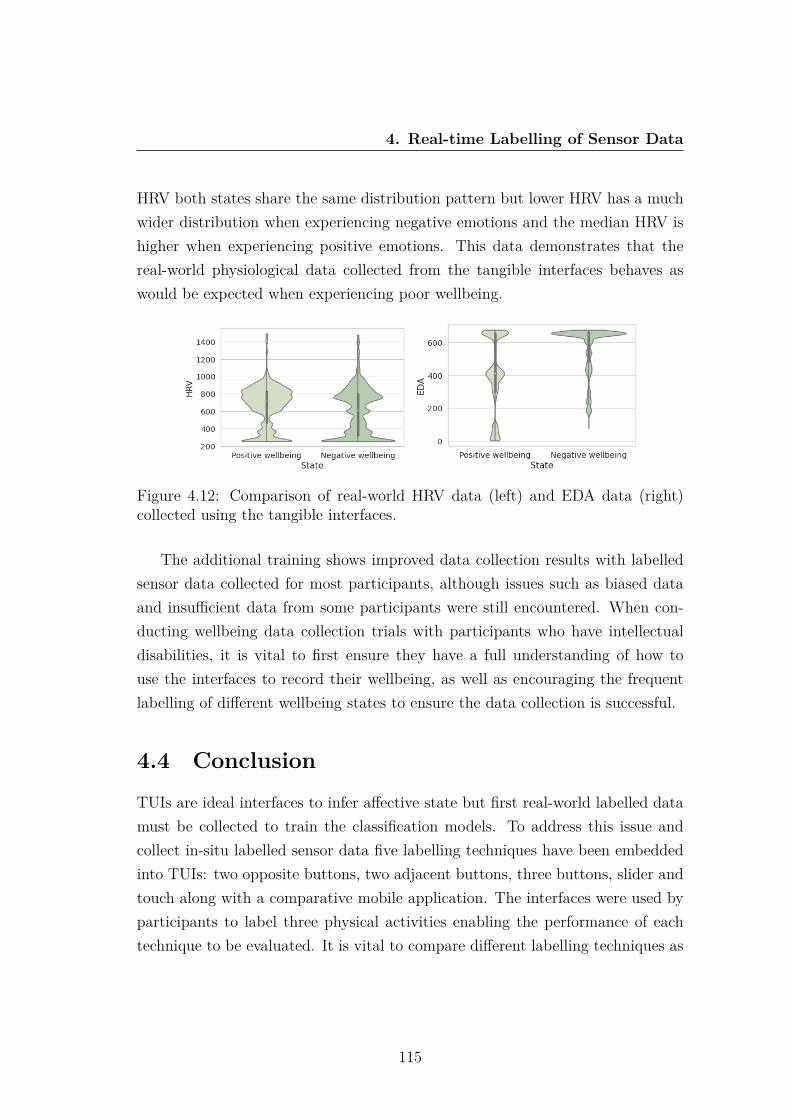
4. Real-time Labelling of Sensor Data
HRV both states share the same distribution pattern but lower HRV has a muchwider distribution when experiencing negative emotions and the median HRV ishigher when experiencing positive emotions. This data demonstrates that thereal-world physiological data collected from the tangible interfaces behaves aswould be expected when experiencing poor wellbeing.
Figure 4.12: Comparison of real-world HRV data (left) and EDA data (right)collected using the tangible interfaces.
The additional training shows improved data collection results with labelledsensor data collected for most participants, although issues such as biased dataand insufficient data from some participants were still encountered. When con-ducting wellbeing data collection trials with participants who have intellectualdisabilities, it is vital to first ensure they have a full understanding of how touse the interfaces to record their wellbeing, as well as encouraging the frequentlabelling of different wellbeing states to ensure the data collection is successful.
4.4 ConclusionTUIs are ideal interfaces to infer affective state but first real-world labelled datamust be collected to train the classification models. To address this issue andcollect in-situ labelled sensor data five labelling techniques have been embeddedinto TUIs: two opposite buttons, two adjacent buttons, three buttons, slider andtouch along with a comparative mobile application. The interfaces were used byparticipants to label three physical activities enabling the performance of eachtechnique to be evaluated. It is vital to compare different labelling techniques as
115

4. Real-time Labelling of Sensor Data
machine learning models can only be as accurate as the labelled data they aretrained on.
During the pilot study participants used the six labelling techniques to collectdata which was then used to train various RNNs. The results demonstrate thatwhile a touch interface resulted in a high labelling rate and high model accuracy,it is the least favoured by users due to the high level of attention required touse the device. The mobile app was popular with users due to its familiaritybut only achieved the fourth highest accuracy. The slider resulted in high userpreference and labelling rate but poor model accuracy while two adjacent buttonsachieved both high user preference and the highest model accuracy showing it isthe most beneficial technique for sensor data collection. Based on these results 2adjacent buttons was selected as the labelling technique to be embedded withinthe affective tangible interfaces as this approach simplifies the labelling of real-world sensor data.
Following the pilot study, the process of collecting real-world labelled affectivedata was explored. Two labelling buttons were embedded within the co-designedtangible interfaces due to their simplicity and effectiveness during the pilot study.The initial affective data collection trial demonstrated the challenges of collectinga real-world labelled dataset. After re-evaluating the data collection method, ad-ditional training was provided to users and by using on-device labelling, frequentaccurate labelling was successfully completed during the second real-world datacollection trial.
Overall, tangible labelling techniques within TUIs address many of the chal-lenges facing the collection of in-situ, time series sensor data collection. Twoadjacent buttons have been used within the tangible interfaces to enable users tolabel their mental wellbeing in real-time. This labelling approach encouraged theaccurate collection of real-world affective labelled data that can then be used totrain classification models.
116

Chapter 5
Mental Wellbeing Recognitionusing On-Device TransferLearning
This chapter presents work applied to the real-world physiological wellbeing datacollected using the developed tangible interfaces. This data is first leveraged totrain 8 subject-independent deep learning models based on a leave-one-out crossvalidation approach. The use of TL is then explored to train individual affec-tive models on-device, increasing model performance by developing personalisedmodels using small labelled datasets. This section is adapted from [347], previ-ously published in IEEE Sensors Journal and [350] previously published in IEEEInternational Smart Cities Conference 2021.
5.1 IntroductionThe ability to infer affective states from sensors is an exciting proposition, asit could enable better real-world management of wellbeing. Non-invasive phys-iological sensors are ideal to infer affect as they can easily be embedded withinTUIs, presenting a significant opportunity for wide role real-world adoption, un-like many previous approaches often using EEGs which are challenging to widelyadopt outside of controlled experiments [8], [185]. The classification of mental
117
5. Real-World Mental Wellbeing Recognition using On-DeviceTransfer Learning
wellbeing is a time series classification task which takes the physiological signalsas input and outputs a label for each sequence. Deep learning presents manyopportunities for advancing the classification of mental wellbeing as models canbe trained using raw sensor data unlike machine learning classifiers that firstrequire features to be extracted, which is often domain-driven and can be a time-consuming process. CNNs have traditionally been used to classify 2D data suchas images but these networks are also employed towards extracting features from1-dimensional sensor data as they can learn from raw time series data withoutfirst requiring feature extraction [107].
Affective states are often personal with individuals experiencing large varia-tions in physiological parameters, despite experiencing the same state of mentalwellbeing. Furthermore, those with intellectual disabilities often have their men-tal wellbeing challenges misattributed to their disability, thus making the real-isation of a generalised model additionally challenging [102]. Advances in deeplearning have helped increase affective modelling performance, however the ma-jority of previous work has not considered the personalisation of models or thepossibility of the models being used in different domains [98], [10], [340], [240]. Forexample a model developed using a controlled experiment dataset may not per-form as accurately when used in real-world environments. Therefore, it is essentialto develop personalised, subject-independent models for real-world monitoring aswhen working with a heterogeneous population there are numerous factors suchas age, gender, disabilities and diet that result in a variation of physiologicaldata [240].
Little research has explored the development of personalised affective modelsusing non-invasive sensors that can be used in real-world environments. TL canhelp the development of personalised models by training a base model usinglabelled data from a different domain and transferring the learned knowledge tothe new target domain [54], [233]. However, developing a custom model for eachuser remains a labour and time intensive task preventing real-world adoption. Toaddress the challenge of real-world affective data collection and the developmentof personalised models an on-device TL approach has been devised. While theuse of TL to improve modelling performance is not new conceptually, this TLapproach for real-world physiological signal modelling helps address many of the
118
5. Real-World Mental Wellbeing Recognition using On-DeviceTransfer Learning
traditional challenges by:
1. Exploring real-world, personalised affective modelling using few labelledsamples from non-invasive physiological sensors. Thus, reducing the chal-lenging proposition of longitudinal, real-world, labelled wellbeing data col-lection usually required to train affective models.
2. Removing the labour and time intensive process of developing personalisedmodels by completing the TL process on-device using the custom-built tan-gible interfaces.
To achieve personalised affective models the development of an initial sourcemodel followed by the on-device TL approach to personalise the model is pro-posed. This approach hopes to alleviate many of the challenges traditionallyassociated with affective modelling such as the requirement of large datasets,enabling accurate real-world wellbeing inference.
5.2 Transfer Learning FrameworkThis work formulates model adaption as a cross-domain, personalisation TL prob-lem. Here, a source model trained on a dataset collected from a controlled stressorexperiment is adapted to classify real-world affective state using an individual’slabelled physiological sensor data. While a TL approach may assist personalisingmodels and improving performance across multiple domains, it has traditionallyrelied on collecting the target domain data in advance to then complete the re-training before the updated model can be exported. A new approach has beendevised where the target user provides only a few labelled samples over a shortperiod of time and TL is then performed to personalise the model on-device.Collecting a small labelled dataset and then personalising models on-device sim-plifies the process of developing personalised, cross-domain models as the devicedoes not need to be returned for the TL model to be developed. It is antici-pated that the personalised cross-domain models will improve the accuracy inwhich real-world wellbeing can be inferred. The following sections discuss thedata collection for the source model and the real-world wellbeing data as well asthe on-device transfer learning methodology.
119
5. Real-World Mental Wellbeing Recognition using On-DeviceTransfer Learning
5.2.1 Controlled Stressor Experiment (Source Model DataCollection)
Before the source stressor model could be developed, the stressed and relaxedphysiological data first had to be collected. A lab-based stressor experiment hasbeen conducted where participants’ various emotions were stimulated using theMontreal stress test [74]. This experiment induced stress in 20 healthy partic-ipants aged 18-50 between June - September 2019 as approved by NottinghamTrent University human ethics board, application number 600. To allow theeffects of stress and mental arithmetic to be investigated separately the experi-ment had three test conditions; rest, control and experimental. Each participantwas initially briefed before completing a 3-minute rest period where participantslooked at a static computer screen where no tasks were displayed. This was fol-lowed by 3 minutes of the control condition where a series of multiplication mentalarithmetic questions were displayed which participants answered, followed by an-other 3-minute rest period. Participants then completed the stressor experimentwhere the difficulty of the questions increased and the time limit of the taskswas adjusted to be 10% less than the average time taken to answer questionsduring the training, taking it just beyond the individual’s mental capacity. Thetime pressure along with a progress bar showing their progress compared withan artificially inflated average were both designed to induce stress during the10-minute experiment. Finally, participants completed a 3-minute rest sessionand answered questions on their subjective experience of task load (NASA TaskLoad Index) [120], mental effort (Rating Scale Mental Effort) [371], emotionalwellbeing (Self-Assessment Manikin) [38] and stress (visual analogue scale) [111].
Sensors: Participants wore hand-held non-invasive sensors on their fingers.The sensors recorded HR Beats Per Minute (BPM), raw HR amplitude, HRV,and EDA, each sampled at 30Hz to collect physiological data while experiencingrelaxed and stressed states of mental wellbeing.
The subjective experience data from the post-experiment questionnaire isshown in Table 5.1. The results show that participants experienced high levelsof mental and temporal demand, effort and mental effort but remained slightlypositive with an average valence of 6.57. The average stress store was 5.36 which
120
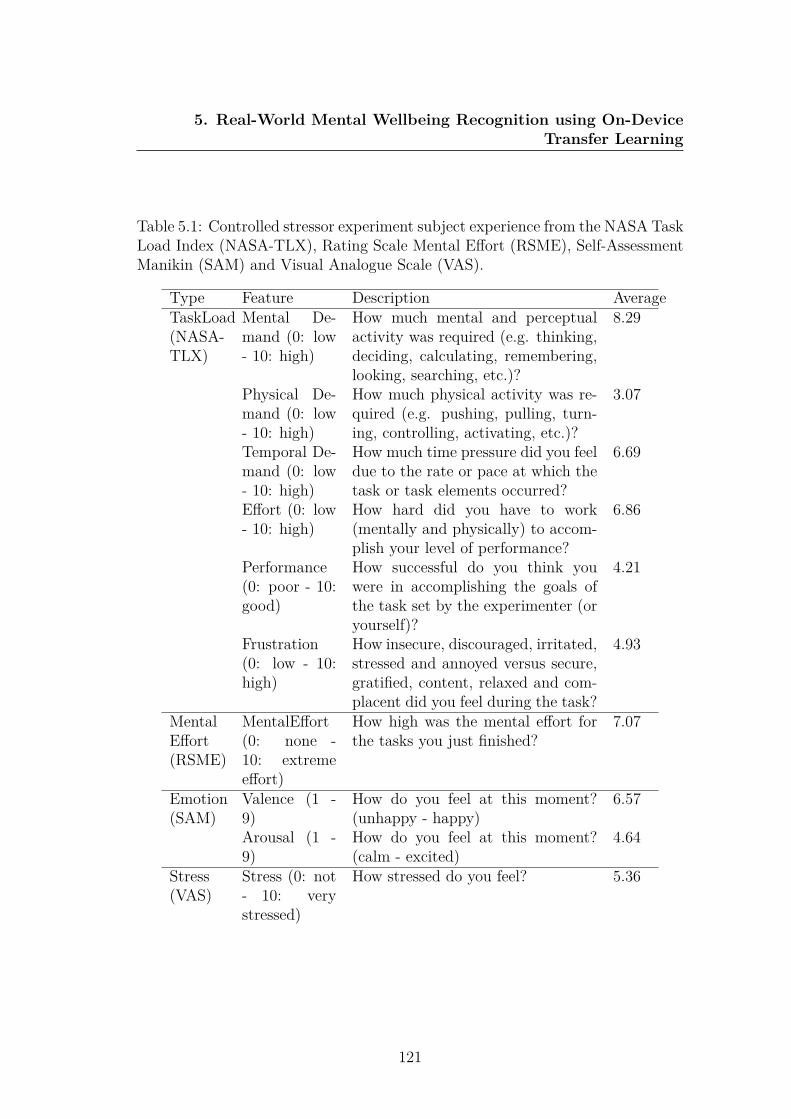
5. Real-World Mental Wellbeing Recognition using On-DeviceTransfer Learning
Table 5.1: Controlled stressor experiment subject experience from the NASA TaskLoad Index (NASA-TLX), Rating Scale Mental Effort (RSME), Self-AssessmentManikin (SAM) and Visual Analogue Scale (VAS).
Type Feature Description AverageTaskLoad(NASA-TLX)
Mental De-mand (0: low- 10: high)
How much mental and perceptualactivity was required (e.g. thinking,deciding, calculating, remembering,looking, searching, etc.)?
8.29
Physical De-mand (0: low- 10: high)
How much physical activity was re-quired (e.g. pushing, pulling, turn-ing, controlling, activating, etc.)?
3.07
Temporal De-mand (0: low- 10: high)
How much time pressure did you feeldue to the rate or pace at which thetask or task elements occurred?
6.69
Effort (0: low- 10: high)
How hard did you have to work(mentally and physically) to accom-plish your level of performance?
6.86
Performance(0: poor - 10:good)
How successful do you think youwere in accomplishing the goals ofthe task set by the experimenter (oryourself)?
4.21
Frustration(0: low - 10:high)
How insecure, discouraged, irritated,stressed and annoyed versus secure,gratified, content, relaxed and com-placent did you feel during the task?
4.93
MentalEffort(RSME)
MentalEffort(0: none -10: extremeeffort)
How high was the mental effort forthe tasks you just finished?
7.07
Emotion(SAM)
Valence (1 -9)
How do you feel at this moment?(unhappy - happy)
6.57
Arousal (1 -9)
How do you feel at this moment?(calm - excited)
4.64
Stress(VAS)
Stress (0: not- 10: verystressed)
How stressed do you feel? 5.36
121
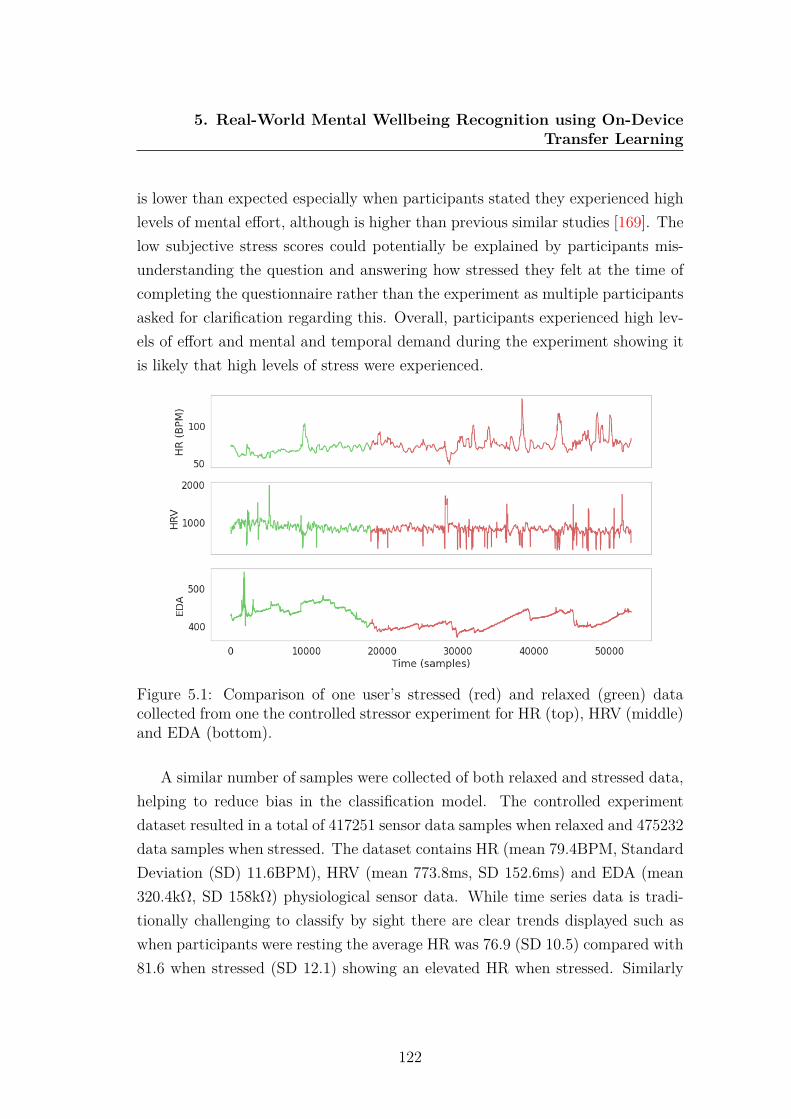
5. Real-World Mental Wellbeing Recognition using On-DeviceTransfer Learning
is lower than expected especially when participants stated they experienced highlevels of mental effort, although is higher than previous similar studies [169]. Thelow subjective stress scores could potentially be explained by participants mis-understanding the question and answering how stressed they felt at the time ofcompleting the questionnaire rather than the experiment as multiple participantsasked for clarification regarding this. Overall, participants experienced high lev-els of effort and mental and temporal demand during the experiment showing itis likely that high levels of stress were experienced.
Figure 5.1: Comparison of one user’s stressed (red) and relaxed (green) datacollected from one the controlled stressor experiment for HR (top), HRV (middle)and EDA (bottom).
A similar number of samples were collected of both relaxed and stressed data,helping to reduce bias in the classification model. The controlled experimentdataset resulted in a total of 417251 sensor data samples when relaxed and 475232data samples when stressed. The dataset contains HR (mean 79.4BPM, StandardDeviation (SD) 11.6BPM), HRV (mean 773.8ms, SD 152.6ms) and EDA (mean320.4kΩ, SD 158kΩ) physiological sensor data. While time series data is tradi-tionally challenging to classify by sight there are clear trends displayed such aswhen participants were resting the average HR was 76.9 (SD 10.5) compared with81.6 when stressed (SD 12.1) showing an elevated HR when stressed. Similarly
122
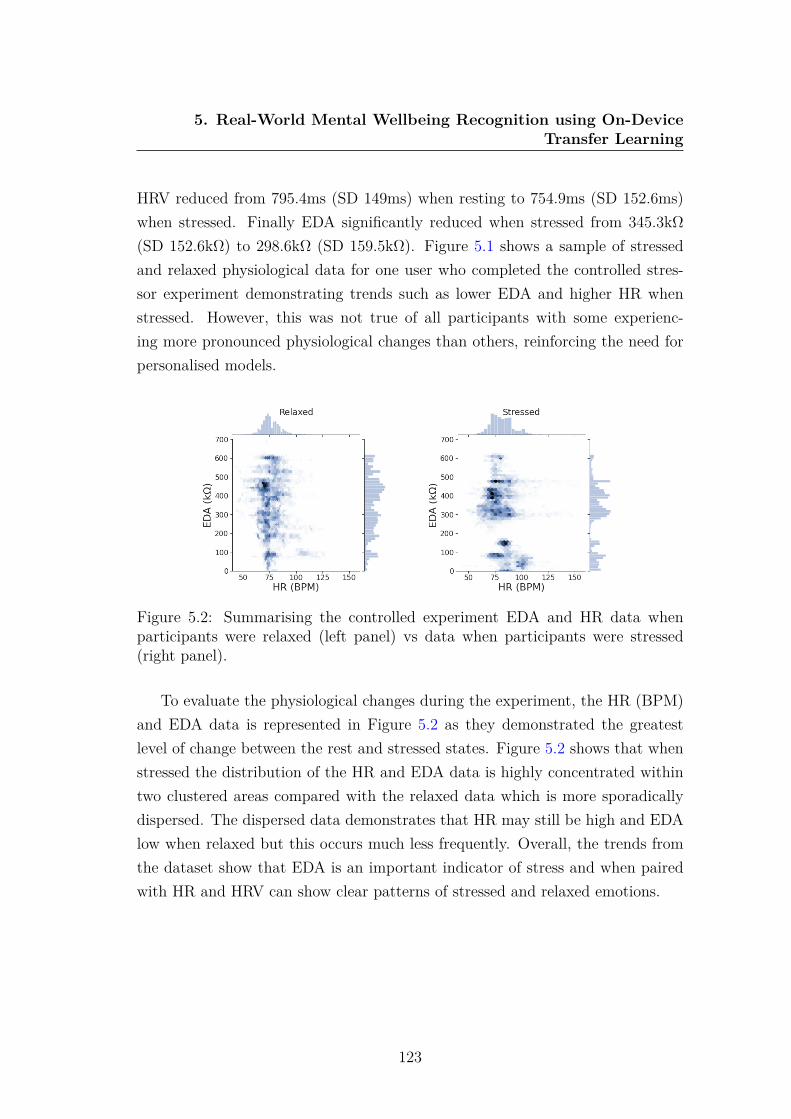
5. Real-World Mental Wellbeing Recognition using On-DeviceTransfer Learning
HRV reduced from 795.4ms (SD 149ms) when resting to 754.9ms (SD 152.6ms)when stressed. Finally EDA significantly reduced when stressed from 345.3kΩ(SD 152.6kΩ) to 298.6kΩ (SD 159.5kΩ). Figure 5.1 shows a sample of stressedand relaxed physiological data for one user who completed the controlled stres-sor experiment demonstrating trends such as lower EDA and higher HR whenstressed. However, this was not true of all participants with some experienc-ing more pronounced physiological changes than others, reinforcing the need forpersonalised models.
Figure 5.2: Summarising the controlled experiment EDA and HR data whenparticipants were relaxed (left panel) vs data when participants were stressed(right panel).
To evaluate the physiological changes during the experiment, the HR (BPM)and EDA data is represented in Figure 5.2 as they demonstrated the greatestlevel of change between the rest and stressed states. Figure 5.2 shows that whenstressed the distribution of the HR and EDA data is highly concentrated withintwo clustered areas compared with the relaxed data which is more sporadicallydispersed. The dispersed data demonstrates that HR may still be high and EDAlow when relaxed but this occurs much less frequently. Overall, the trends fromthe dataset show that EDA is an important indicator of stress and when pairedwith HR and HRV can show clear patterns of stressed and relaxed emotions.
123
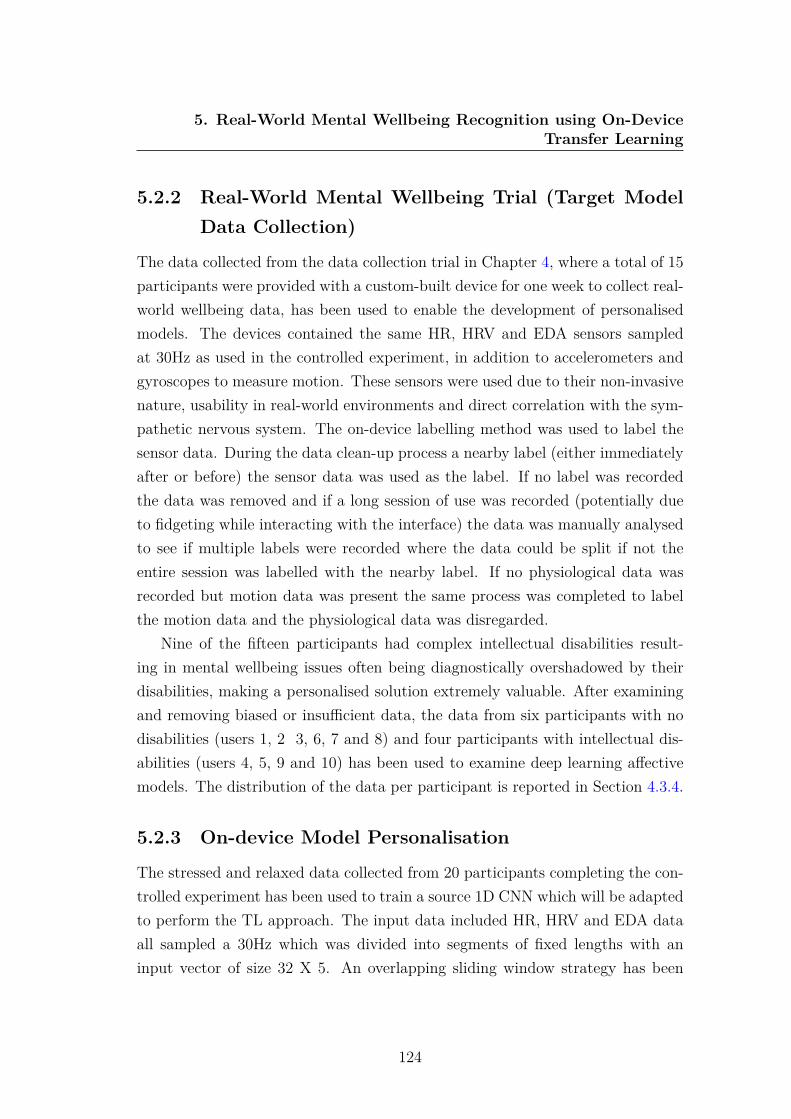
5. Real-World Mental Wellbeing Recognition using On-DeviceTransfer Learning
5.2.2 Real-World Mental Wellbeing Trial (Target ModelData Collection)
The data collected from the data collection trial in Chapter 4, where a total of 15participants were provided with a custom-built device for one week to collect real-world wellbeing data, has been used to enable the development of personalisedmodels. The devices contained the same HR, HRV and EDA sensors sampledat 30Hz as used in the controlled experiment, in addition to accelerometers andgyroscopes to measure motion. These sensors were used due to their non-invasivenature, usability in real-world environments and direct correlation with the sym-pathetic nervous system. The on-device labelling method was used to label thesensor data. During the data clean-up process a nearby label (either immediatelyafter or before) the sensor data was used as the label. If no label was recordedthe data was removed and if a long session of use was recorded (potentially dueto fidgeting while interacting with the interface) the data was manually analysedto see if multiple labels were recorded where the data could be split if not theentire session was labelled with the nearby label. If no physiological data wasrecorded but motion data was present the same process was completed to labelthe motion data and the physiological data was disregarded.
Nine of the fifteen participants had complex intellectual disabilities result-ing in mental wellbeing issues often being diagnostically overshadowed by theirdisabilities, making a personalised solution extremely valuable. After examiningand removing biased or insufficient data, the data from six participants with nodisabilities (users 1, 2 3, 6, 7 and 8) and four participants with intellectual dis-abilities (users 4, 5, 9 and 10) has been used to examine deep learning affectivemodels. The distribution of the data per participant is reported in Section 4.3.4.
5.2.3 On-device Model Personalisation
The stressed and relaxed data collected from 20 participants completing the con-trolled experiment has been used to train a source 1D CNN which will be adaptedto perform the TL approach. The input data included HR, HRV and EDA dataall sampled a 30Hz which was divided into segments of fixed lengths with aninput vector of size 32 X 5. An overlapping sliding window strategy has been
124
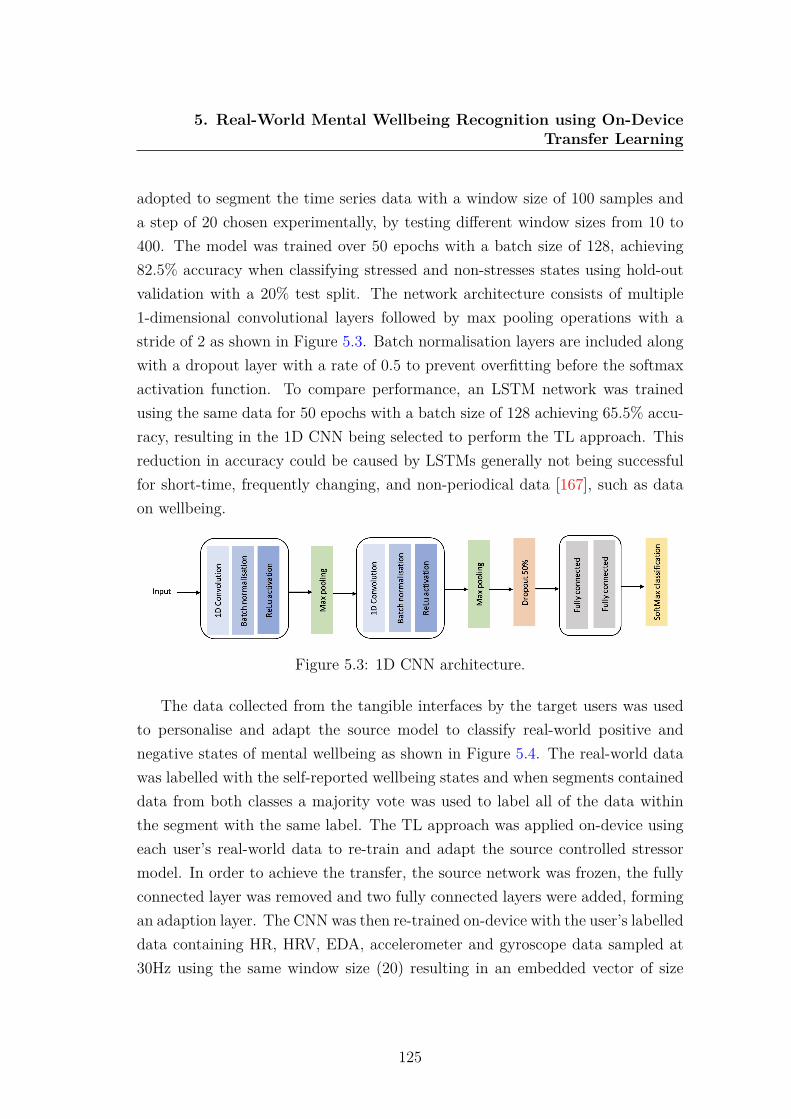
5. Real-World Mental Wellbeing Recognition using On-DeviceTransfer Learning
adopted to segment the time series data with a window size of 100 samples anda step of 20 chosen experimentally, by testing different window sizes from 10 to400. The model was trained over 50 epochs with a batch size of 128, achieving82.5% accuracy when classifying stressed and non-stresses states using hold-outvalidation with a 20% test split. The network architecture consists of multiple1-dimensional convolutional layers followed by max pooling operations with astride of 2 as shown in Figure 5.3. Batch normalisation layers are included alongwith a dropout layer with a rate of 0.5 to prevent overfitting before the softmaxactivation function. To compare performance, an LSTM network was trainedusing the same data for 50 epochs with a batch size of 128 achieving 65.5% accu-racy, resulting in the 1D CNN being selected to perform the TL approach. Thisreduction in accuracy could be caused by LSTMs generally not being successfulfor short-time, frequently changing, and non-periodical data [167], such as dataon wellbeing.
Figure 5.3: 1D CNN architecture.
The data collected from the tangible interfaces by the target users was usedto personalise and adapt the source model to classify real-world positive andnegative states of mental wellbeing as shown in Figure 5.4. The real-world datawas labelled with the self-reported wellbeing states and when segments containeddata from both classes a majority vote was used to label all of the data withinthe segment with the same label. The TL approach was applied on-device usingeach user’s real-world data to re-train and adapt the source controlled stressormodel. In order to achieve the transfer, the source network was frozen, the fullyconnected layer was removed and two fully connected layers were added, formingan adaption layer. The CNN was then re-trained on-device with the user’s labelleddata containing HR, HRV, EDA, accelerometer and gyroscope data sampled at30Hz using the same window size (20) resulting in an embedded vector of size
125

5. Real-World Mental Wellbeing Recognition using On-DeviceTransfer Learning
160X9 before the fully connected layers.The TL approach fine-tuned the models and updated the weights to develop
personalised affective models. However, overfitting is a common problem whentraining CNNs using small datasets such as an individual’s personal data andrefers to a model that models the training data too well. Specifically, overfittingrefers to a model that fits exactly against its training data therefore making itunable to accurately classify unseen data. This prevents the generalization of themodel, limiting its use on new data. To help overcome overfitting, dropout layershave been included within the network that randomly ignore 50% of neuronsduring training [294]. Using dropout layers makes the training process noisy,forcing nodes within a layer to probabilistically take on more or less responsibilityfor the inputs therefore helping to overcome challenges when training CNNs usingsmall personal datasets.
Figure 5.4: Transfer learning approach transferring learned knowledge from thesource model trained using controlled stressor data to the target model classifyingreal-world mental wellbeing.
The TL personalisation approach where the model was re-trained with anindividual’s data to classify positive and negative states of affect was completedon-device using the custom built tangible interfaces. Each device contained aRaspberry Pi 3, with 1GB of RAM and a 1.2GHz quad core CPU for processingdue to its affordability, compact nature and being sufficiently powerful to perform
126

5. Real-World Mental Wellbeing Recognition using On-DeviceTransfer Learning
TL. Using the Raspberry Pi it is possible to apply the TL approach, adaptingthe source model for the target user’s real-world wellbeing data, on-device. Thisapproach enables the model to infer real-world affective state rather than stressfrom the controlled experiment while simultaneously personalising the model forimproved accuracy.
The on-device processing was slower than expected taking an average of 25minutes to train the model using the TL approach due to the Raspberry Pi beingresource-constrained. However, as this training only needs to be completed once,this is not a major limitation and remains quicker and simpler than returning thedevices to train the model offline and then returning the device to users with thepersonalised model embedded.
5.3 MethodThe real-world data consisting of HR (BPM), HRV, HR (amplitude), EDA andmotion (accelerometer and gyroscopic) collected from the tangible interfaces wasfirst cleaned and normalised before being used to train eight deep learning modelsto classify positive and negative states of wellbeing. Four of the tested networks(ResNet, TWIESN, Encoder and MCDCNN) have been previously explored usingtime series data [145] however, their effectiveness for affective modeling has notbeen explored. These four models have been compared with an additional fourmodels (1D CNN, LSTM, CapsNet and Inception) to evaluate their affective mod-elling performance. Each model has been tested using Leave-One-participant-OutCross Validation (LOOCV) to develop subject independent models, enabling com-parisons with the personalised TL models. This method of testing accuratelymeasures model performance on an individual basis and better simulates real-world performance.
In addition to comparing multiple deep learning classifiers the TL approachwas also completed. Once each of the participants had used their device to collecta personal labelled dataset and the on-device TL approach had been performed,each user’s individual model was tested using 10-fold cross validation. It is impor-tant to assess the performance of the model trained using a small dataset usinga resampling technique such as k-fold cross validation as it allows for a better
127

5. Real-World Mental Wellbeing Recognition using On-DeviceTransfer Learning
estimate of the performance of the model on unseen data, helping to establishwhether overfitting has occurred.
5.4 Results
5.4.1 Multivariate Physiological Models
5.4.1.1 Deep Learning Models
The real-world physiological data (HR (BPM), HRV, HR (amplitude) and EDA)was used to train each of the aforementioned deep learning networks. The resultsfor each model tested using LOOCV is shown in Table 5.2 where the highestaccuracy for each user is highlighted.
Table 5.2: Comparison of 8 deep learning models’ accuracy tested on individualusers’ physiological data.
User 1DCNN
LSTM Caps-Net
Res-Net
TWIESN Encoder Inception MCD-CNN
1 74.1% 64.2% 53.1% 67.8% 59.8% 47.9% 68.8% 47.9%2 85.1% 68.4% 58.5% 59.6% 54.4% 47.1% 59.3% 56%3 72.5% 66.7% 63.2% 35.9% 25.4% 36.8% 36% 36.8%4 85.5% 56.4% 67.7% 33.5% 52.5% 9.4% 36.4% 9.5%5 86.2% 74.7% 53.1% 51.1% 52.7% 53% 45.8% 53%6 83% 55% 81% 24.8% 22.7% 21.6% 25.6% 78.4%7 81.1% 50% 17.4% 83.3% 21% 21% 81.6% 21%8 85.3% 68.3% 54.8% 40.2% 43.2% 45.3% 43.2% 54.7%9 83.8% 59.9% 88% 47.4% 87.6% 87.7% 43.5% 87.7%10 87% 71% 53.3% 27.1% 94.9% 57.9% 29.7% 95.2%avg 82.4% 63.4% 59% 47.1% 51.4 42.77% 47% 54%
The results show that for the physiological model the 1D CNN outperformedall other models for the majority of users, achieving between 72.5% and 87%accuracy (SD 5.1) with an average of 82.4%. This shows that wellbeing is highlypersonal as there was a 14.5% variation in accuracy between users when testedusing the same 1D CNN model. The 1D CNN achieved 19% higher averageaccuracy than the next best performing model (LSTM), which is surprising asRNNs are commonly used with time series data.
128
5. Real-World Mental Wellbeing Recognition using On-DeviceTransfer Learning
The results show a wide variation in accuracy between the models when usingthe same data. For the physiological models the average standard deviationbetween models was 20.1. Four users (4, 6, 7 and 10) experienced higher standarddeviance between models than the average deviation, with user 7 experiencingthe greatest deviation of 30.7 with a 65.9% variance in model accuracy.
Similarly, there was a wide variation between users when tested with the samemodel, with an average standard deviation of 17.96. CapsNet outperformed the1D CNN by 4.2% for user 9, achieving an overall accuracy of 88%, while ResNetoutperformed the 1D CNN for user 7 by 2.2% and MCDCNN achieved the highestoverall accuracy of 95.2% for user 10. While there is a 14.5% range of accuracyfor the 1D CNN, the two next best performing physiological models, LSTM andCapsNet show much wider variation of 24.7% for LSTM (SD 7.82) and 70.6%for CapsNet (SD 19.06). The model accuracy for CapsNet ranges between 17.4%to 88% and while the 17.4% accuracy is an outlier, all other models achievedhigher performance with the same user’s data. Similarly, model accuracy forMCDCNN ranged between 9.5% and the highest overall accuracy achieved, 95.2%demonstrating a wide range of 85.7% (SD 27.56). This demonstrates that whileCapsNet and MCDCNN can be used to infer wellbeing, their high volatility resultsin inadequate subject-independent models.
5.4.1.2 Personalised TL Model
When performing the TL approach each personalised model was initially trainedusing only physiological sensor data (HR, HRV, EDA). However, it was not pos-sible to apply the TL approach for user 7 due to this user recording the lowestnumber of samples which whilst sufficient to test using LOOCV was not sufficientto train the personalised model without extreme bias and overfitting.
The accuracies of the personalised models for the remaining nine target usersranged between 84% and the highest overall performing model at 99.6% with anaverage accuracy of 92.3%, as shown in Table 5.3. The Area Under the Curve(AUC) shows the degree to which the model is capable of distinguishing betweenthe two classes (positive and negative states of wellbeing). The AUC scoresrange between 86.2% and 99.6% with an average of 91.9%, remaining similar to
129

5. Real-World Mental Wellbeing Recognition using On-DeviceTransfer Learning
accuracy. The personalised TL model for each user outperformed their respectivebest performing non-TL model, demonstrating the potential for mental wellbeingto be more accurately classified using personalised models.
Table 5.3: Comparison of 9 target users’ multivariate physiological model accu-racy and AUC using the transfer learning approach.
Accuracy AUCUser 1 84% 86.2%User 2 90.4% 90.6%User 3 99.6% 99.6%User 4 95.8% 91.6%User 5 90.6% 90.7%User 6 93.5% 92%User 8 89% 89%User 9 91% 95%User 10 97% 92%Average 92.3% 91.9%
To ensure the TL approach had successfully learned the new real-world do-main, the original source model trained using the controlled stressor data wastested using the target users’ real-world data. The average accuracy achieved was48.77%, representing a significant reduction in accuracy. These results demon-strate the model developed to classify stress is not capable of classifying real-world affective state, as while stress is an example of a negative affective statethere are numerous other negative affective states that elicit different physio-logical responses. These results confirm the TL approach has greatly improvedcross-domain performance, enabling more accurate inference of real-world mentalwellbeing.
The aim of using TL was to additionally personalise the models. To demon-strate model personalisation, each of the target users’ models were used to classifythe data from all of the other users. The results show an average 36.09% reduc-tion in accuracy when a user’s personalised model was tested with alternativeusers’ data. This demonstrates the TL approach has developed cross-domainpersonalised models as there is a significant accuracy improvement when the per-sonalised model is tested using the matching user’s data.
130
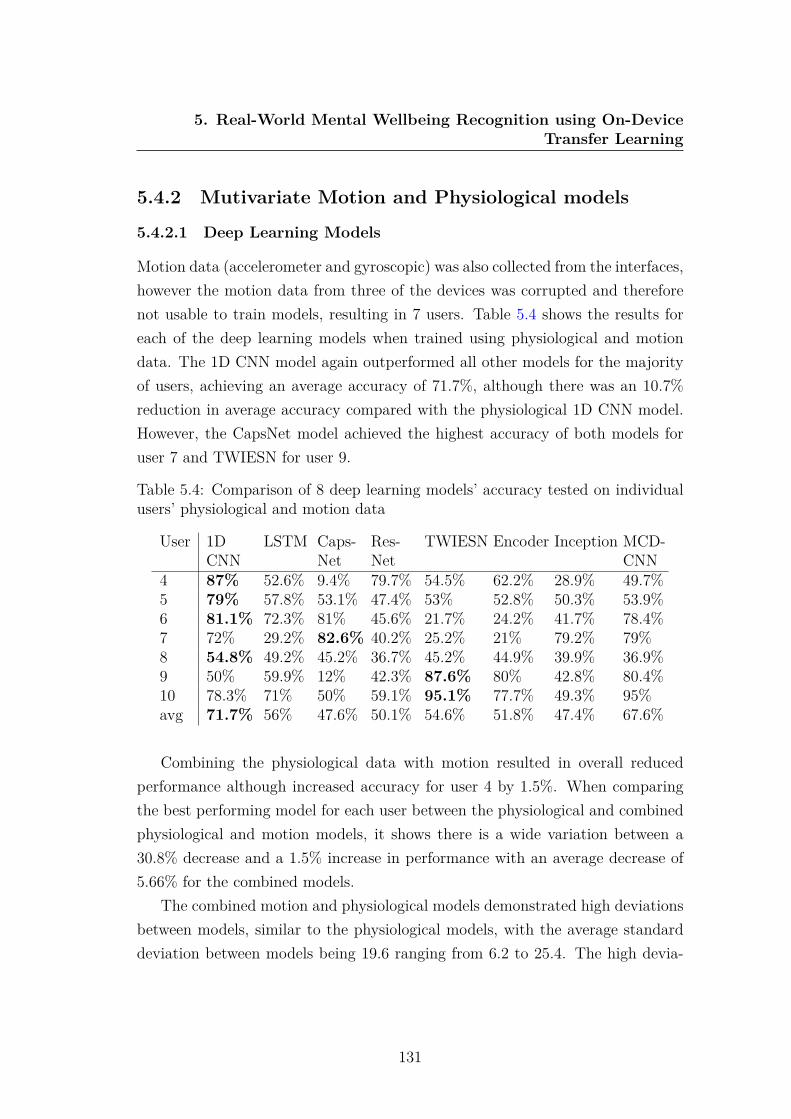
5. Real-World Mental Wellbeing Recognition using On-DeviceTransfer Learning
5.4.2 Mutivariate Motion and Physiological models
5.4.2.1 Deep Learning Models
Motion data (accelerometer and gyroscopic) was also collected from the interfaces,however the motion data from three of the devices was corrupted and thereforenot usable to train models, resulting in 7 users. Table 5.4 shows the results foreach of the deep learning models when trained using physiological and motiondata. The 1D CNN model again outperformed all other models for the majorityof users, achieving an average accuracy of 71.7%, although there was an 10.7%reduction in average accuracy compared with the physiological 1D CNN model.However, the CapsNet model achieved the highest accuracy of both models foruser 7 and TWIESN for user 9.
Table 5.4: Comparison of 8 deep learning models’ accuracy tested on individualusers’ physiological and motion data
User 1DCNN
LSTM Caps-Net
Res-Net
TWIESN Encoder Inception MCD-CNN
4 87% 52.6% 9.4% 79.7% 54.5% 62.2% 28.9% 49.7%5 79% 57.8% 53.1% 47.4% 53% 52.8% 50.3% 53.9%6 81.1% 72.3% 81% 45.6% 21.7% 24.2% 41.7% 78.4%7 72% 29.2% 82.6% 40.2% 25.2% 21% 79.2% 79%8 54.8% 49.2% 45.2% 36.7% 45.2% 44.9% 39.9% 36.9%9 50% 59.9% 12% 42.3% 87.6% 80% 42.8% 80.4%10 78.3% 71% 50% 59.1% 95.1% 77.7% 49.3% 95%avg 71.7% 56% 47.6% 50.1% 54.6% 51.8% 47.4% 67.6%
Combining the physiological data with motion resulted in overall reducedperformance although increased accuracy for user 4 by 1.5%. When comparingthe best performing model for each user between the physiological and combinedphysiological and motion models, it shows there is a wide variation between a30.8% decrease and a 1.5% increase in performance with an average decrease of5.66% for the combined models.
The combined motion and physiological models demonstrated high deviationsbetween models, similar to the physiological models, with the average standarddeviation between models being 19.6 ranging from 6.2 to 25.4. The high devia-
131
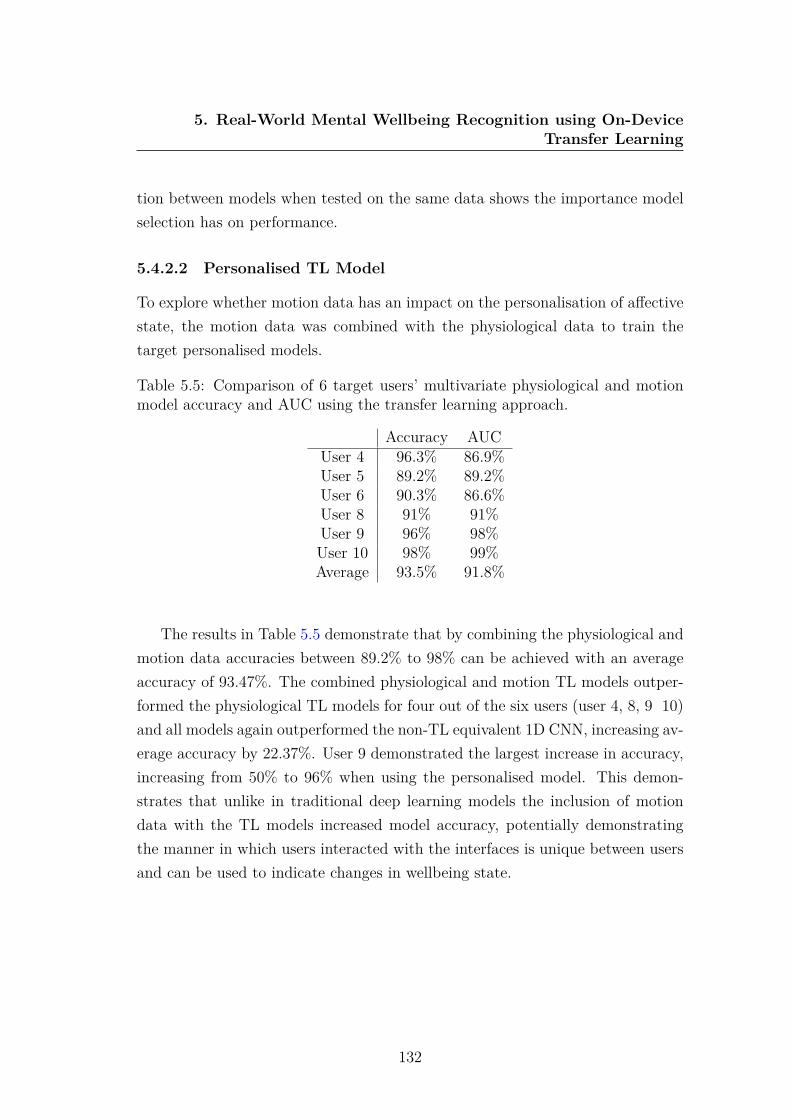
5. Real-World Mental Wellbeing Recognition using On-DeviceTransfer Learning
tion between models when tested on the same data shows the importance modelselection has on performance.
5.4.2.2 Personalised TL Model
To explore whether motion data has an impact on the personalisation of affectivestate, the motion data was combined with the physiological data to train thetarget personalised models.
Table 5.5: Comparison of 6 target users’ multivariate physiological and motionmodel accuracy and AUC using the transfer learning approach.
Accuracy AUCUser 4 96.3% 86.9%User 5 89.2% 89.2%User 6 90.3% 86.6%User 8 91% 91%User 9 96% 98%User 10 98% 99%Average 93.5% 91.8%
The results in Table 5.5 demonstrate that by combining the physiological andmotion data accuracies between 89.2% to 98% can be achieved with an averageaccuracy of 93.47%. The combined physiological and motion TL models outper-formed the physiological TL models for four out of the six users (user 4, 8, 9 10)and all models again outperformed the non-TL equivalent 1D CNN, increasing av-erage accuracy by 22.37%. User 9 demonstrated the largest increase in accuracy,increasing from 50% to 96% when using the personalised model. This demon-strates that unlike in traditional deep learning models the inclusion of motiondata with the TL models increased model accuracy, potentially demonstratingthe manner in which users interacted with the interfaces is unique between usersand can be used to indicate changes in wellbeing state.
132

5. Real-World Mental Wellbeing Recognition using On-DeviceTransfer Learning
5.4.3 Univariate Models
5.4.3.1 Deep Learning Models
As the 1D CNN outperformed all other models for the majority of users, thismodel was further explored to examine the impact training using each individualdata source has on performance. The 1D CNN was again tested on a subject-independent basis using LOOCV for each of the 10 users with either the HR(BPM), HRV, EDA or motion data used to train the models, as shown in Table5.6.
Table 5.6: Comparison of univariate 1D CNNs accuracy tested using LOOCV on10 individual’s HR (BPM), HRV, EDA or motion data.
User HR HRV EDA MotionUser 1 60% 66% 75% N/AUser 2 65% 62% 86% N/AUser 3 63% 56% 86% N/AUser 4 50% 56% 72% 86%User 5 78% 78% 77% 80%User 6 74% 75% 77% 73%User 7 69% 66% 75% 28%User 8 74% 75% 80% 27%User 9 68% 71% 70% 69%User 10 61% 59% 77% 74%Average 66.2% 66.4% 77.5% 62.4%
The results show that high model accuracy up to 86% can be achieved usingonly one data source with EDA being the most accurate univariate model for themajority of users, achieving an average accuracy of 77.5%. This demonstratesthe importance of using EDA sensors when inferring wellbeing. However, HRVwas the highest performing univariate model for user 9 and while the motionmodels achieved the lowest average accuracy of 62.4%, it was the most accurateunivariate model for users 4 and 5, demonstrating the possibility of inferringwellbeing from motion data alone.
Surprisingly the EDA univariate models for users 1, 2 and 3 all outperformedthe comparative multivariate physiological 1D CNNs by 0.9%, 0.9% and 13.5%respectively. However, the average overall accuracy for the univariate models
133
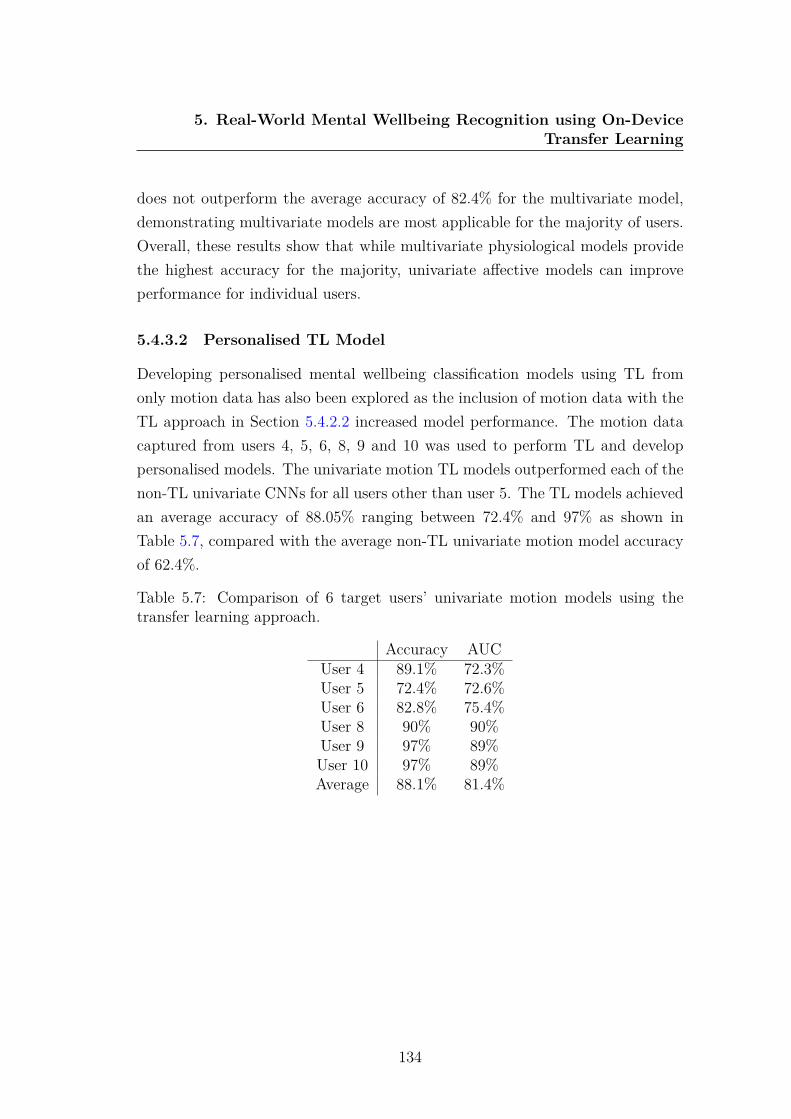
5. Real-World Mental Wellbeing Recognition using On-DeviceTransfer Learning
does not outperform the average accuracy of 82.4% for the multivariate model,demonstrating multivariate models are most applicable for the majority of users.Overall, these results show that while multivariate physiological models providethe highest accuracy for the majority, univariate affective models can improveperformance for individual users.
5.4.3.2 Personalised TL Model
Developing personalised mental wellbeing classification models using TL fromonly motion data has also been explored as the inclusion of motion data with theTL approach in Section 5.4.2.2 increased model performance. The motion datacaptured from users 4, 5, 6, 8, 9 and 10 was used to perform TL and developpersonalised models. The univariate motion TL models outperformed each of thenon-TL univariate CNNs for all users other than user 5. The TL models achievedan average accuracy of 88.05% ranging between 72.4% and 97% as shown inTable 5.7, compared with the average non-TL univariate motion model accuracyof 62.4%.
Table 5.7: Comparison of 6 target users’ univariate motion models using thetransfer learning approach.
Accuracy AUCUser 4 89.1% 72.3%User 5 72.4% 72.6%User 6 82.8% 75.4%User 8 90% 90%User 9 97% 89%User 10 97% 89%Average 88.1% 81.4%
134
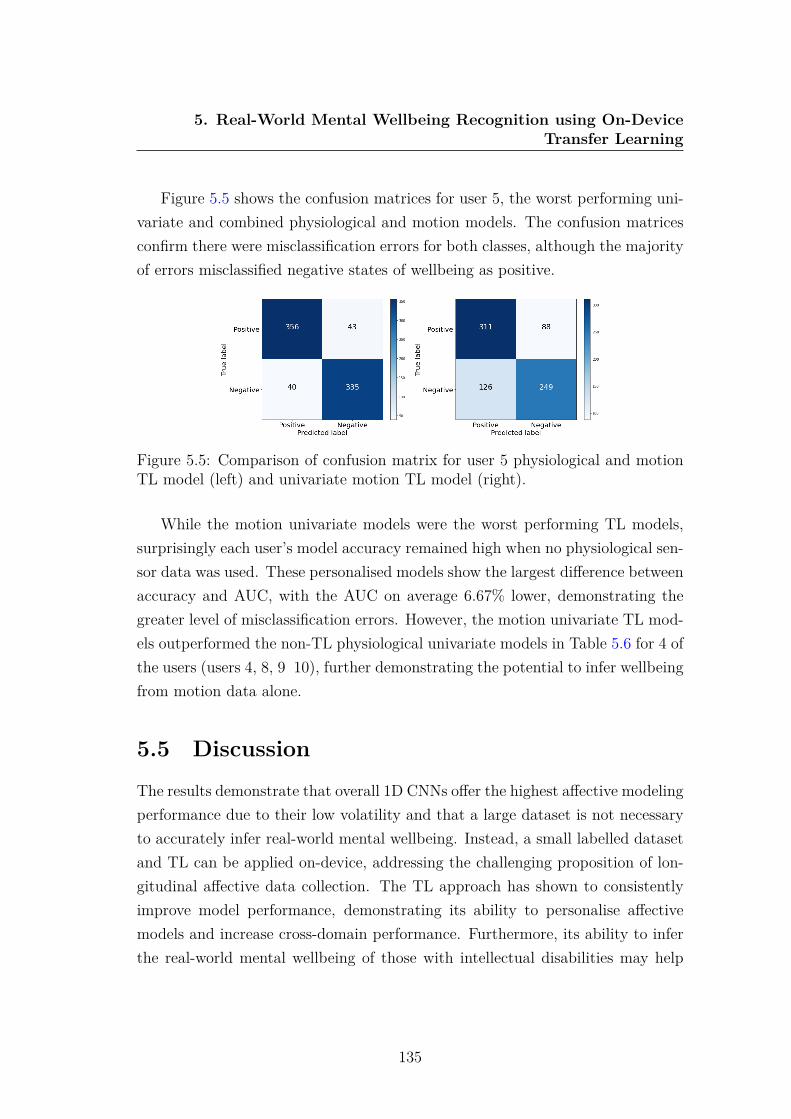
5. Real-World Mental Wellbeing Recognition using On-DeviceTransfer Learning
Figure 5.5 shows the confusion matrices for user 5, the worst performing uni-variate and combined physiological and motion models. The confusion matricesconfirm there were misclassification errors for both classes, although the majorityof errors misclassified negative states of wellbeing as positive.
Figure 5.5: Comparison of confusion matrix for user 5 physiological and motionTL model (left) and univariate motion TL model (right).
While the motion univariate models were the worst performing TL models,surprisingly each user’s model accuracy remained high when no physiological sen-sor data was used. These personalised models show the largest difference betweenaccuracy and AUC, with the AUC on average 6.67% lower, demonstrating thegreater level of misclassification errors. However, the motion univariate TL mod-els outperformed the non-TL physiological univariate models in Table 5.6 for 4 ofthe users (users 4, 8, 9 10), further demonstrating the potential to infer wellbeingfrom motion data alone.
5.5 DiscussionThe results demonstrate that overall 1D CNNs offer the highest affective modelingperformance due to their low volatility and that a large dataset is not necessaryto accurately infer real-world mental wellbeing. Instead, a small labelled datasetand TL can be applied on-device, addressing the challenging proposition of lon-gitudinal affective data collection. The TL approach has shown to consistentlyimprove model performance, demonstrating its ability to personalise affectivemodels and increase cross-domain performance. Furthermore, its ability to inferthe real-world mental wellbeing of those with intellectual disabilities may help
135
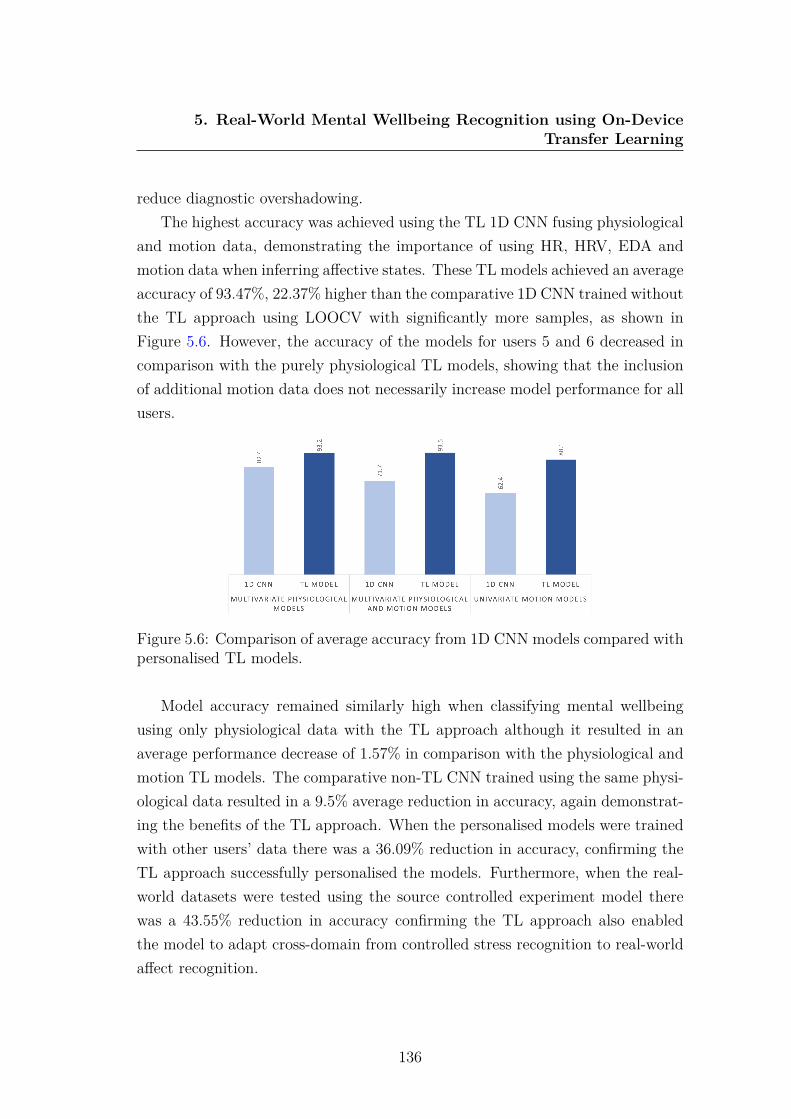
5. Real-World Mental Wellbeing Recognition using On-DeviceTransfer Learning
reduce diagnostic overshadowing.The highest accuracy was achieved using the TL 1D CNN fusing physiological
and motion data, demonstrating the importance of using HR, HRV, EDA andmotion data when inferring affective states. These TL models achieved an averageaccuracy of 93.47%, 22.37% higher than the comparative 1D CNN trained withoutthe TL approach using LOOCV with significantly more samples, as shown inFigure 5.6. However, the accuracy of the models for users 5 and 6 decreased incomparison with the purely physiological TL models, showing that the inclusionof additional motion data does not necessarily increase model performance for allusers.
Figure 5.6: Comparison of average accuracy from 1D CNN models compared withpersonalised TL models.
Model accuracy remained similarly high when classifying mental wellbeingusing only physiological data with the TL approach although it resulted in anaverage performance decrease of 1.57% in comparison with the physiological andmotion TL models. The comparative non-TL CNN trained using the same physi-ological data resulted in a 9.5% average reduction in accuracy, again demonstrat-ing the benefits of the TL approach. When the personalised models were trainedwith other users’ data there was a 36.09% reduction in accuracy, confirming theTL approach successfully personalised the models. Furthermore, when the real-world datasets were tested using the source controlled experiment model therewas a 43.55% reduction in accuracy confirming the TL approach also enabledthe model to adapt cross-domain from controlled stress recognition to real-worldaffect recognition.
136

5. Real-World Mental Wellbeing Recognition using On-DeviceTransfer Learning
When using solely motion data to infer wellbeing, an average accuracy of88.05% was achieved using the TL approach, outperforming all univariate non-TLmodels, although reducing average multivariate physiological and motion modelperformance by 5.42%. While this is lower than models trained using physiologicaldata, it is higher than expected, with user 9 achieving their highest respectiveaccuracy at 97% using the univariate motion TL model. Figure 5.7 shows theaccuracy using the univariate TL model remained similar to the other TL modelsfor users 8, 9 and 10 although there was a larger reduction in accuracy for users4, 5 and 6.
Figure 5.7: Comparison of accuracy for each user’s TL model.
To investigate whether there is a distinct pattern of device motion betweendifferent states of wellbeing the total acceleration from the accelerometer data wascalculated using 5.1, enabling exploration between the two states of wellbeing.
|a| =√
a2x + a2y + a2z (5.1)
Figure 5.8 shows the distribution of the total acceleration across positive andnegative states of wellbeing. The vast majority of total acceleration was between 1and 1.2 where the negative state of wellbeing had a much wider distribution whenthe total acceleration was 1, had a smaller interquartile range and a lower me-dian value. This demonstrates that the interactions with the interfaces changedwith state of mental wellbeing, possibly as people fidget when experiencing poor
137

5. Real-World Mental Wellbeing Recognition using On-DeviceTransfer Learning
wellbeing [211] [141]. This may be beneficial for future wellbeing devices such aswearables as they can infer wellbeing while remaining physically small by embed-ding fewer sensors.
Figure 5.8: Violin chart comparing total acceleration between positive and neg-ative states of wellbeing.
The ability to collect a labelled, real-world, personal dataset using custom-built devices and perform the TL approach on-device significantly simplified theprocess of developing personalised models. While the devices were mostly used asanticipated, the lack of negative wellbeing states reported by some participantsresulted in their elimination from the study. However, as a personalised model wasdeveloped for each user, the requirement of a large dataset, which is traditionallychallenging to collect was reduced.
The TL approach was successfully completed on-device using a Raspberry Piand while the initial training of the personalised models took an average of 25minutes, the models were then able to infer real-world mental wellbeing. Thisapproach means future devices could be provided to the wider population toinfer real-world wellbeing without the need to first collect large labelled datasets,greatly improving accessibility to personalised affective models. In the future, itwould be beneficial to explore edge computing devices other than the RaspberryPi to reduce the time required to train the model and perform the TL approach.
138
5. Real-World Mental Wellbeing Recognition using On-DeviceTransfer Learning
5.6 ConclusionThe personal, labelled, real-world data collected from the developed tangibleinterfaces has been used to train 8 deep learning subject-independent classifiers toinfer affective state including CNN, CapsNet, ResNet, LSTM, TWIESN, Encoder,Inception and MCDCNN. Furthermore, a novel method for personalising affectivemodels using a TL approach has been applied on-device to improve performanceand adapt a source 1D CNN to infer real-world affect.
The results showed that the 1D CNN outperformed all other classificationmodels for the majority of users, achieving an average accuracy of 82.4%. Uni-variate 1D CNN models, trained using a single data source were also explored,demonstrating EDA alone can achieve high performing models with an averageaccuracy of 77.5%. Surprisingly the univariate models for 3 users outperformedtheir comparative multivariate physiological models, demonstrating the potentialto infer mental wellbeing from a single data source.
When applying the TL approach using physiological and motion data to clas-sify positive and negative states of affect, an average accuracy of 93.5% wasachieved. The TL approach not only enabled the model to adapt from a con-trolled stressor experiment to real-world affect recognition but also successfullypersonalised the models. Training a source model using a controlled datasetand then performing TL on-device, enabled high performing models without thechallenging proposition of longitudinal real-world data collection.
Overall the TL approach only required a small sample of labelled data savingtime, labour and money, while also improving model performance and operatingacross different domains. Advances in edge computing have enabled this per-sonalised TL approach to be trained and run on-device, enabling the accurateinference of real-world affective state.
139

Chapter 6
Combining Deep TransferLearning and Signal-imageEncoding for Multimodal MentalWellbeing Classification
It is impractical, time consuming and extremely challenging to collect large real-world datasets of individuals’ wellbeing to train deep learning classifiers as it relieson users labelling their wellbeing for extended periods. To help address this issuea second TL approach has been developed to negate the requirement of havinga large affective dataset to train deep learning classification models. This chap-ter explores signal-encoded images trained using a TL approach combined withan additional CNN trained using physiological sensor data, to improve affectivemodelling performance using limited data.
6.1 IntroductionTime series data from multiple modalities such as physiological and motion sensordata have proven to be integral for measuring mental wellbeing. However, theperformance of machine learning models deteriorates considerably when trainingdata is scarce, even more so with deep learning models. This lack of sufficient sta-
140
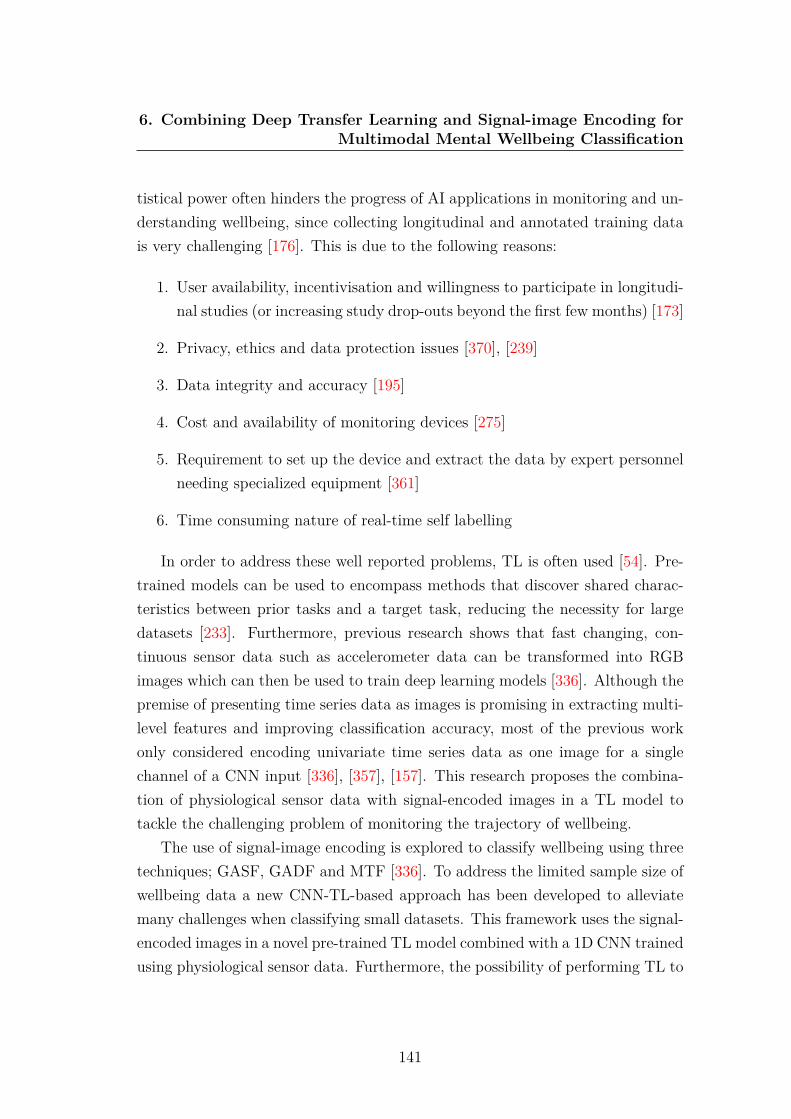
6. Combining Deep Transfer Learning and Signal-image Encoding forMultimodal Mental Wellbeing Classification
tistical power often hinders the progress of AI applications in monitoring and un-derstanding wellbeing, since collecting longitudinal and annotated training datais very challenging [176]. This is due to the following reasons:
1. User availability, incentivisation and willingness to participate in longitudi-nal studies (or increasing study drop-outs beyond the first few months) [173]
2. Privacy, ethics and data protection issues [370], [239]
3. Data integrity and accuracy [195]
4. Cost and availability of monitoring devices [275]
5. Requirement to set up the device and extract the data by expert personnelneeding specialized equipment [361]
6. Time consuming nature of real-time self labelling
In order to address these well reported problems, TL is often used [54]. Pre-trained models can be used to encompass methods that discover shared charac-teristics between prior tasks and a target task, reducing the necessity for largedatasets [233]. Furthermore, previous research shows that fast changing, con-tinuous sensor data such as accelerometer data can be transformed into RGBimages which can then be used to train deep learning models [336]. Although thepremise of presenting time series data as images is promising in extracting multi-level features and improving classification accuracy, most of the previous workonly considered encoding univariate time series data as one image for a singlechannel of a CNN input [336], [357], [157]. This research proposes the combina-tion of physiological sensor data with signal-encoded images in a TL model totackle the challenging problem of monitoring the trajectory of wellbeing.
The use of signal-image encoding is explored to classify wellbeing using threetechniques; GASF, GADF and MTF [336]. To address the limited sample size ofwellbeing data a new CNN-TL-based approach has been developed to alleviatemany challenges when classifying small datasets. This framework uses the signal-encoded images in a novel pre-trained TL model combined with a 1D CNN trainedusing physiological sensor data. Furthermore, the possibility of performing TL to
141
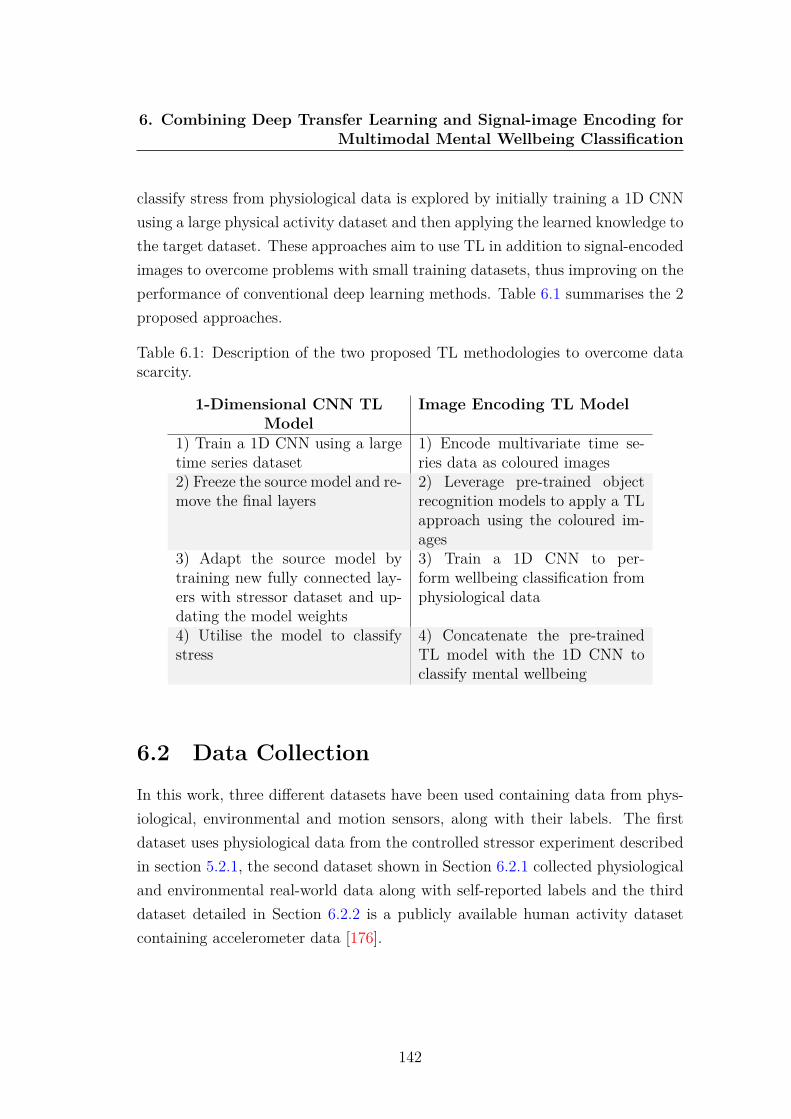
6. Combining Deep Transfer Learning and Signal-image Encoding forMultimodal Mental Wellbeing Classification
classify stress from physiological data is explored by initially training a 1D CNNusing a large physical activity dataset and then applying the learned knowledge tothe target dataset. These approaches aim to use TL in addition to signal-encodedimages to overcome problems with small training datasets, thus improving on theperformance of conventional deep learning methods. Table 6.1 summarises the 2proposed approaches.
Table 6.1: Description of the two proposed TL methodologies to overcome datascarcity.
1-Dimensional CNN TLModel
Image Encoding TL Model
1) Train a 1D CNN using a largetime series dataset
1) Encode multivariate time se-ries data as coloured images
2) Freeze the source model and re-move the final layers
2) Leverage pre-trained objectrecognition models to apply a TLapproach using the coloured im-ages
3) Adapt the source model bytraining new fully connected lay-ers with stressor dataset and up-dating the model weights
3) Train a 1D CNN to per-form wellbeing classification fromphysiological data
4) Utilise the model to classifystress
4) Concatenate the pre-trainedTL model with the 1D CNN toclassify mental wellbeing
6.2 Data CollectionIn this work, three different datasets have been used containing data from phys-iological, environmental and motion sensors, along with their labels. The firstdataset uses physiological data from the controlled stressor experiment describedin section 5.2.1, the second dataset shown in Section 6.2.1 collected physiologicaland environmental real-world data along with self-reported labels and the thirddataset detailed in Section 6.2.2 is a publicly available human activity datasetcontaining accelerometer data [176].
142

6. Combining Deep Transfer Learning and Signal-image Encoding forMultimodal Mental Wellbeing Classification
6.2.1 EnvBodySens
Experiment setup: EnvBodySens is a dataset that has been previously collectedby [202] that consists of 26 data files collected from 26 healthy female participants(average age of 28) walking around the city centre in Nottingham, UK on specificroutes. The participants were asked to spend no more than 45 minutes walkingin the city center. Data was collected in similar weather conditions (average20C), at around 11am. Participants were asked to continuously report how theyfelt based on a 5-point predefined emotion scale as they walked around the citycentre experiencing general daily life stressors such as loud environmental noisesand crowded environments. The 5-step SAM Scale for Valence from Banzhaf etal. [24] was adopted using a smartphone app developed for the study simplifyingthe continuous labelling process. The screen auto sleep mode on the mobiledevices was disabled, so the screen was kept on during the data collection process.Data from six users were excluded due to logging problems. For example, oneuser was unable to collect data due to a battery problem with the mobile phoneand another user switched the application off accidentally.
Sensors: The dataset is composed of non-invasive physiological data (HR,EDA, body temperature, acceleration) sampled at 8Hz, environmental data (noiselevels, Ultra Violet (UV) and air pressure) also sampled at 8Hz, time stamps andself reports. The data was logged by the EnvBodySens mobile application onAndroid phones, connected wirelessly to a Microsoft wrist Band 2 [207] that wasprovided to participants to collect the physiological and environmental data.
The EnvBodySens dataset resulted in 29965 samples for state 1, 35333 samplesfor state 2, 106210 samples for state 3, 77103 samples for state 4 and 106478samples for state 5. Figure 6.1 shows the EDA (mean 1455.2kΩ, SD 2870.5kΩ)and HR (mean 74.5BPM, SD 11.8BPM) for all participants when experiencingeach of the five self-reported states of valence from 1 being most positive to 5being most negative.
143
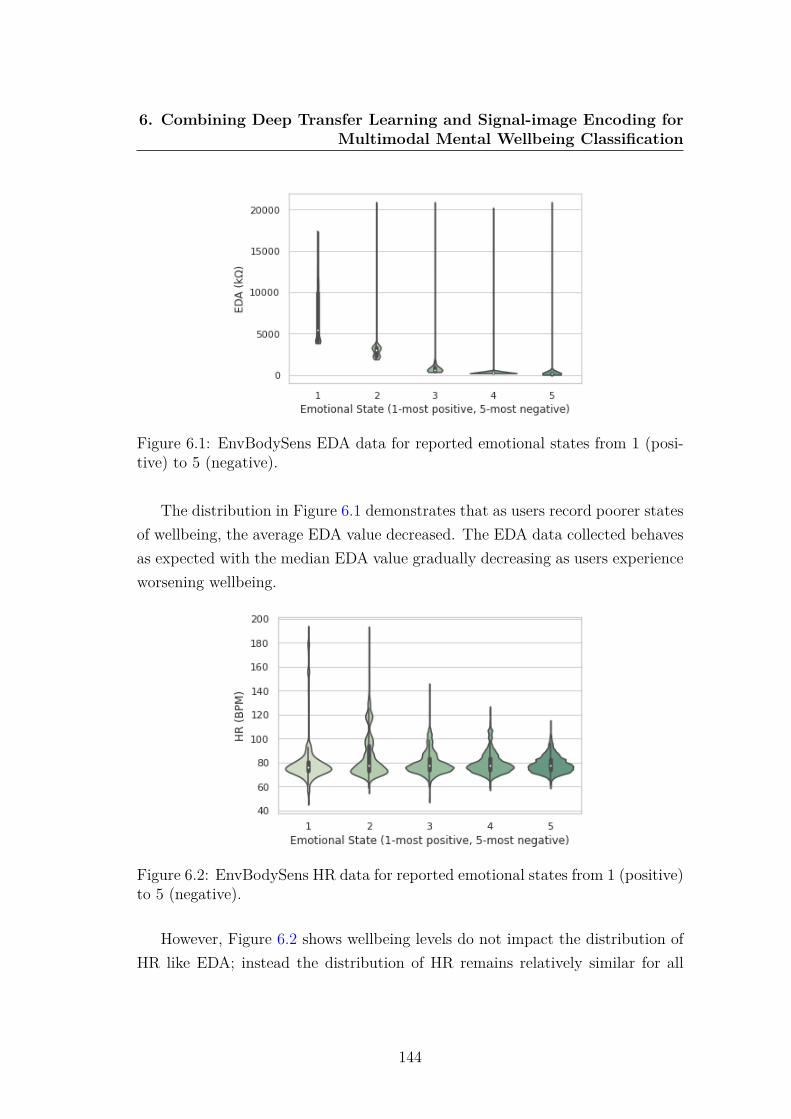
6. Combining Deep Transfer Learning and Signal-image Encoding forMultimodal Mental Wellbeing Classification
Figure 6.1: EnvBodySens EDA data for reported emotional states from 1 (posi-tive) to 5 (negative).
The distribution in Figure 6.1 demonstrates that as users record poorer statesof wellbeing, the average EDA value decreased. The EDA data collected behavesas expected with the median EDA value gradually decreasing as users experienceworsening wellbeing.
Figure 6.2: EnvBodySens HR data for reported emotional states from 1 (positive)to 5 (negative).
However, Figure 6.2 shows wellbeing levels do not impact the distribution ofHR like EDA; instead the distribution of HR remains relatively similar for all
144
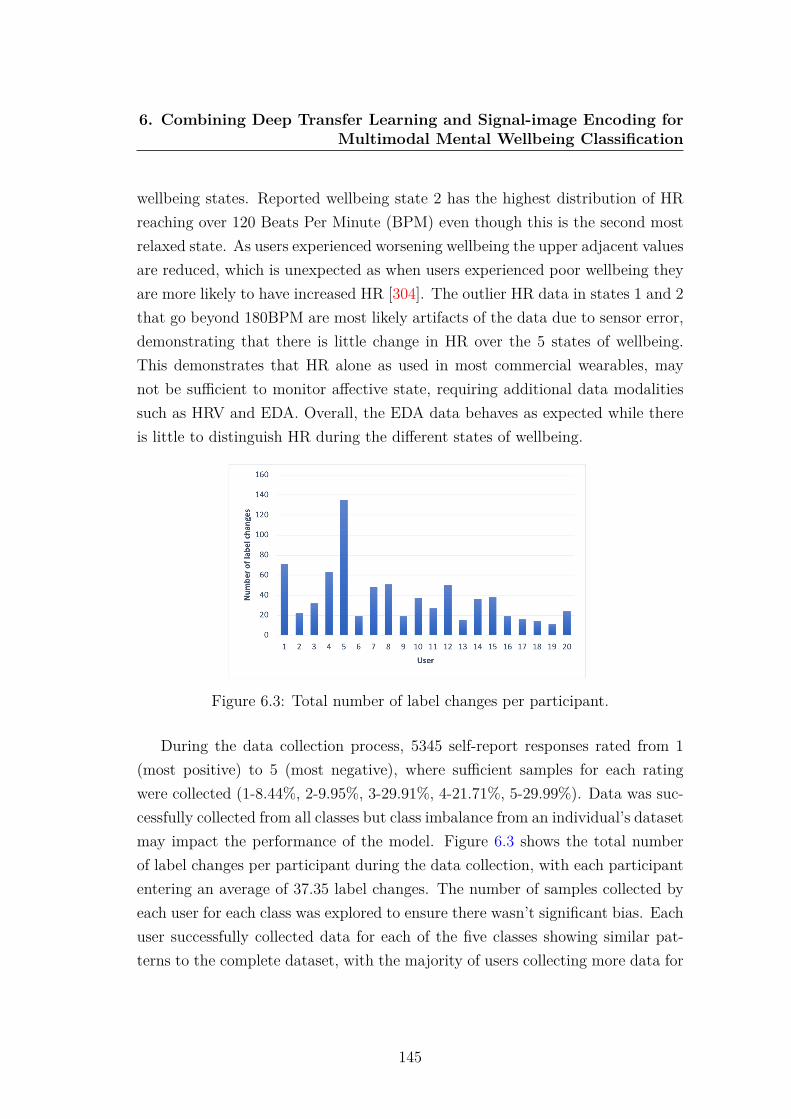
6. Combining Deep Transfer Learning and Signal-image Encoding forMultimodal Mental Wellbeing Classification
wellbeing states. Reported wellbeing state 2 has the highest distribution of HRreaching over 120 Beats Per Minute (BPM) even though this is the second mostrelaxed state. As users experienced worsening wellbeing the upper adjacent valuesare reduced, which is unexpected as when users experienced poor wellbeing theyare more likely to have increased HR [304]. The outlier HR data in states 1 and 2that go beyond 180BPM are most likely artifacts of the data due to sensor error,demonstrating that there is little change in HR over the 5 states of wellbeing.This demonstrates that HR alone as used in most commercial wearables, maynot be sufficient to monitor affective state, requiring additional data modalitiessuch as HRV and EDA. Overall, the EDA data behaves as expected while thereis little to distinguish HR during the different states of wellbeing.
Figure 6.3: Total number of label changes per participant.
During the data collection process, 5345 self-report responses rated from 1(most positive) to 5 (most negative), where sufficient samples for each ratingwere collected (1-8.44%, 2-9.95%, 3-29.91%, 4-21.71%, 5-29.99%). Data was suc-cessfully collected from all classes but class imbalance from an individual’s datasetmay impact the performance of the model. Figure 6.3 shows the total numberof label changes per participant during the data collection, with each participantentering an average of 37.35 label changes. The number of samples collected byeach user for each class was explored to ensure there wasn’t significant bias. Eachuser successfully collected data for each of the five classes showing similar pat-terns to the complete dataset, with the majority of users collecting more data for
145
6. Combining Deep Transfer Learning and Signal-image Encoding forMultimodal Mental Wellbeing Classification
classes 3, 4 and 5. Therefore, the percentage of the data each user collected perclass was calculated with an average standard deviation was 0.15 showing thatwhile there is a small class imbalance, no user has a significant class imbalancethat would impact the classification model. No single user collected significantlymore or less data than the average user with the number of samples collectedbetween users having a standard deviation of 0.01 with the size of each user’sdataset ranging from 3.1% to 6.8% of the total dataset.
6.2.2 The Human Activity Recognition Using SmartphonesData Set (WISDM)
Experiment setup: This dataset has been published by Kwapisz JR, Weiss GM,Moore SA (2011) [176]. The dataset comprises of 36 participants performingsix physical activities (walking, walking upstairs, walking downstairs, sitting,standing and jogging) while carrying the provided Android-based smartphone intheir front trouser leg pocket. The 36 participants resulted in 1,098,207 datasamples being collected consisting of 39% walking, 31% jogging, 11% walkingupstairs, 9% walking downstairs 6% sitting and 4% standing.
Sensors: The dataset comprises of accelerometer data from the embeddedsensor within the Android phone sampled at 20Hz. A graphical user interfacewas included within the custom Android application enabling users to label the 6prespecified physical activities (walking, jogging, walking upstairs, walking down-stairs, sitting and standing) when commencing a new activity and to end the datacollection.
This external dataset is freely available at:http://www.cis.fordham.edu/wisdm/dataset.php
6.3 MethodsUsing the three aforementioned datasets, two TL approaches are proposed to helpimprove accuracy and reduce the requirement of large datasets when classifyingmental wellbeing:
146
6. Combining Deep Transfer Learning and Signal-image Encoding forMultimodal Mental Wellbeing Classification
1. Training a base model on a large human activity dataset and transferringthe learned knowledge to a 1D CNN trained using the controlled experimentdataset to classify stress.
2. Using signal-image encoding to transform accelerometer data into imagesand then applying a novel CNN-TL-based approach combined with a sepa-rate 1D CNN trained using the remaining sensor data to classify real-worldaffective state.
6.3.1 Modality Transformation
An image is comprised of pixels which can be conveniently represented in a matrixwith a colour image containing three channels; red, green and blue for each pixel,compared with grayscale images that contain only one channel. Transformingtime series data into images can help extract multi-level features [336] and improveclassification accuracy [357], [157].
This study aims to explore the use of signal-image encoding and the additionof TL with time series data. Therefore the continuous, fast changing datastreamof accelerometer data must first be transformed into images. It is not plausibleto transform the physiological data into images due to its static nature whereHR and EDA can often remain constant for several seconds resulting in no databeing encoded. Three methods of modality transformation using accelerometerdata are utilised: GADF, GASF and MTF.
Wang and Oates transformed time series data into images using GramianAngular Field (GAF) [336]. First, the data was normalised between -1 and 1 byapplying 6.1. The normalised data is then encoded using the value as the angularcosine and the time stamp as the radius r with 6.2, where ϕ is the angle polarcoordinates, ti is the time stamp, N is a constant factor to regularize the span ofthe polar coordinate system and X represents the re-scaled time series data [357].
xi−1 =
(xi −max(x)) + (xi −min(x))
max(x)−min(x)(6.1)
ϕ = arccos (xi) ,−1 ≤ xi ≤ 1, xi ∈ X
r = tiN, ti ∈ N
(6.2)
147

6. Combining Deep Transfer Learning and Signal-image Encoding forMultimodal Mental Wellbeing Classification
GASF = [cos (∅i + ∅j)] (6.3)
= X ′ · X −√
I − X2′·√
I − X2 (6.4)
GADF = [sin (∅i − ∅j)] (6.5)
=√
I − X2′· X − X ′ ·
√I − X2 (6.6)
The normalized data is then transformed into polar coordinates instead of thetypical Cartesian coordinates. After transformation, the vectors are transformedinto a symmetric matrix called the Gramian Matrix. There are two ways totransform the vectors into a symmetric matrix: GASF and GADF as shown from6.3 to 6.6 where ∅ is the angle polar coordinates. These methods preserve thetemporal dependency, with the position moving from top-left to bottom-rightwith time.
M =
wij|x1∈qi,x1∈qj · · · wij|x1∈qi,xn∈qj
wij|x2∈qi,x1∈qj · · · wij|x2∈qi,xn∈qj... . . . ...
wij|xn∈qi,x1∈qj · · · wij|xn∈qi,xn∈qj
(6.7)
Alternatively, images can be generated using MTF where the Markov matrixis built and the dynamic transition probability is encoded in a quasi-Gramianmatrix as defined in 6.7. Given a time series x and its q quantile bins each xi
is assigned to the corresponding bins, qj (j ∈ [1, q]). A q X q Markov transitionmatrix (w) is created by dividing the data into q quantile bins. The quantilebins that contain the data at time stamp i and j (temporal axis) are qi and qj.The information of the inter-relationship is preserved by extracting the Markovtransition probabilities to encode dynamic transitional fields in a sequence ofactions [336]. A comparison of identical X, Y, Z and total acceleration datatransformed as GASF, GADF and MTF can be seen in figure 6.4.
148
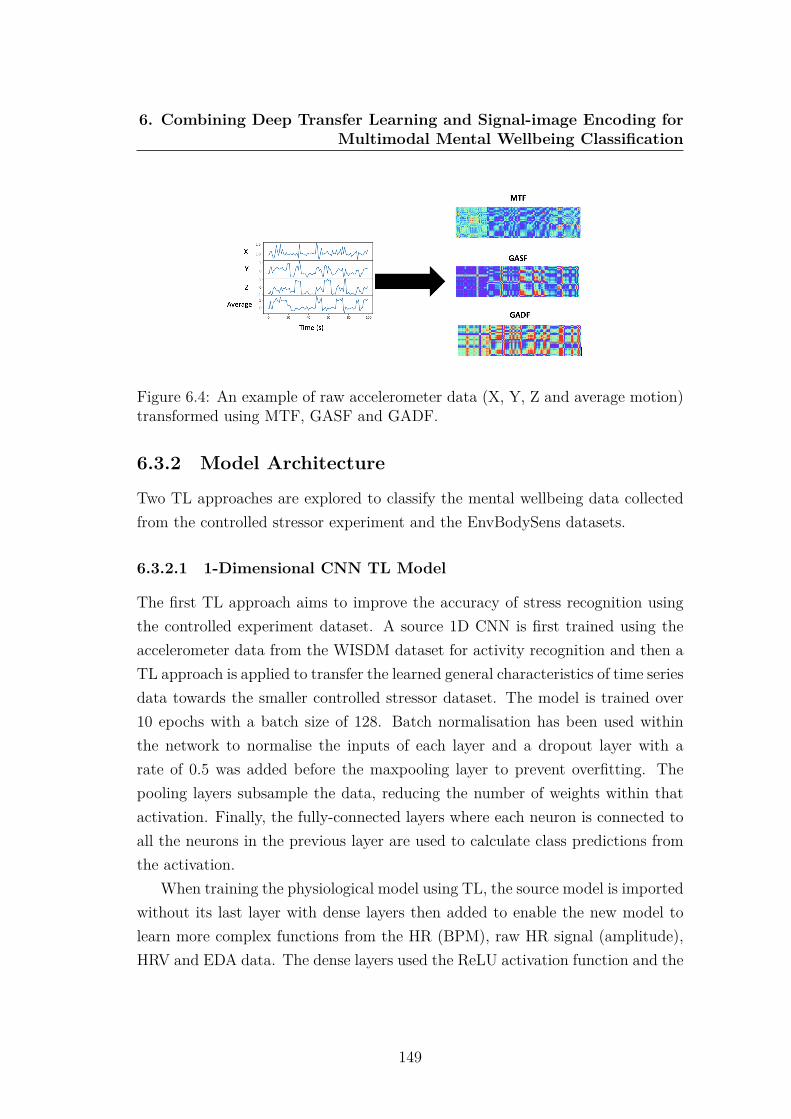
6. Combining Deep Transfer Learning and Signal-image Encoding forMultimodal Mental Wellbeing Classification
Figure 6.4: An example of raw accelerometer data (X, Y, Z and average motion)transformed using MTF, GASF and GADF.
6.3.2 Model Architecture
Two TL approaches are explored to classify the mental wellbeing data collectedfrom the controlled stressor experiment and the EnvBodySens datasets.
6.3.2.1 1-Dimensional CNN TL Model
The first TL approach aims to improve the accuracy of stress recognition usingthe controlled experiment dataset. A source 1D CNN is first trained using theaccelerometer data from the WISDM dataset for activity recognition and then aTL approach is applied to transfer the learned general characteristics of time seriesdata towards the smaller controlled stressor dataset. The model is trained over10 epochs with a batch size of 128. Batch normalisation has been used withinthe network to normalise the inputs of each layer and a dropout layer with arate of 0.5 was added before the maxpooling layer to prevent overfitting. Thepooling layers subsample the data, reducing the number of weights within thatactivation. Finally, the fully-connected layers where each neuron is connected toall the neurons in the previous layer are used to calculate class predictions fromthe activation.
When training the physiological model using TL, the source model is importedwithout its last layer with dense layers then added to enable the new model tolearn more complex functions from the HR (BPM), raw HR signal (amplitude),HRV and EDA data. The dense layers used the ReLU activation function and the
149

6. Combining Deep Transfer Learning and Signal-image Encoding forMultimodal Mental Wellbeing Classification
final layer, which contains two neurons, one for each class (stressed and relaxed)used the Softmax activation function. Hold-out validation is used to test thisapproach by using a randomly selected 20% test split to test the model andcalculate accuracy. This approach aims to reduce overfitting and improve theaccuracy in which stress can be classified from a limited sample by transferringthe weights from the source model.
6.3.2.2 Image Encoding TL Model
This second approach proposes the novel combination of a 2D CNN utilisingTL with signal-encoded images and a 1D CNN model to improve the accuracy ofmental wellbeing classification from the EnvBodySens dataset. TL first requires apre-trained model; for this work multiple pre-trained object recognition networkshave been explored. Given that the majority of pre-trained models for TL havebeen trained on images it is beneficial to train these networks using signal encodedimages from the continually changing motion data and not the physiological datawhich can often remain static resulting in little data being encoded.
This approach transforms the accelerometer data from the EnvBodySensdataset into images using GADF, GASF and MTF, resulting in a total of 17,750images for each encoding technique. These images are then used as input (size 64X 64 X 3) to train a 2D CNN consisting of 2 convolutional layers, polling layer,dropout layer and fully connected layer over 10 epochs to classify 5 states of well-being by exploring 7 pre-trained models (Xception, VGG19, ResNet, NasNet,DenseNet, DenseNet V2 MobileNet) to apply the TL approach. An overlappingsliding window strategy has been adopted to segment the motion data with awindow size of 100 samples and a step of 20 chosen experimentally, resulting inan embedded vector of size 4X4 being fed into the fully connected layers. Anadditional 1D CNN model using the same parameters as the aforementioned 1DCNN is trained using the remaining sensor data from the EnvBodySens dataset(HR, EDA, body temperature, acceleration, noise, UV and air pressure). Batchnormalisation and dropout layers with a rate of 0.5 have also been utilised. Thesetwo models are frozen and then the concatenated feature vector is fed into twofully-connected layers as shown in figure 6.5.
150

6. Combining Deep Transfer Learning and Signal-image Encoding forMultimodal Mental Wellbeing Classification
Figure 6.5: Combinatory model consisting of 1D CNN trained using raw phys-iological sensor data (top) and a 2D CNN using a transfer learning approachtrained using accelerometer encoded images (bottom).
151
6. Combining Deep Transfer Learning and Signal-image Encoding forMultimodal Mental Wellbeing Classification
The use of TL to transfer weights from pre-trained image classification modelsand the use of dropout layers help to prevent overfitting, where a model fitsexactly against its training data and is unable to classify new data. The use ofmethods to prevent overfitting is necessary as while the EnvBodySens includesdata from 20 participants, deep learning models typically require vast datasetsto accurately classify without overfitting.
Hold-validation using a 20% test split has been used to test the model usingaround 284,000 sensor data samples for training and 71,000 for testing. Ad-ditionally, Leave-One-participant-Out Cross-Validation (LOOCV) has also beenutilised to test the TL approach on a subject-independent basis. This is wherethe model is trained with 19 users’ data then tested on the remaining user’s data(19926 average data samples) to better simulate how the model would be used inthe real-world to infer an individual’s wellbeing.
6.4 Results
6.4.1 1D CNN TL Stress Model - WISDM & ControlledStressor Data
As the controlled stressor experiment only collected physiological data (HR BPM,raw HR amplitude, HRV, EDA) it is not possible to use the same modalitytransformation techniques to transform fast changing motion data as used withthe EnvBodySens dataset. However, it is possible to perform TL by initiallytraining a similar model and then using a TL approach to adapt the model withthe target stressor dataset.
Initially a 1D CNN model was trained using the physiological data from thecontrolled experiment dataset, achieving a baseline accuracy of 82.5%. To eval-uate whether TL can improve model performance the same network architecturewas trained using the larger WISDM dataset consisting of accelerometer data forsix human activities, achieving 91% accuracy.
The activity recognition model was then used to apply the TL approach. Oncethe model had been re-trained with the target controlled stressor dataset an accu-racy of 91% was achieved using a 20% test split, an 8.5% accuracy improvement
152

6. Combining Deep Transfer Learning and Signal-image Encoding forMultimodal Mental Wellbeing Classification
Figure 6.6: Confusion matrix of 1D CNN using TL to infer stressed and relaxedstates of wellbeing from the controlled stressor dataset.
over the non-TL 1D CNN approach as shown in figure 6.6. This demonstratesthe potential of TL to have a significant impact in improving the classificationaccuracy of stress recognition without the need to collect extremely large datasets.
6.4.2 Image Encoding Transfer Learning Model - Env-BodySens
The second approach used the EnvBodySens dataset to explore the multi-classproblem of classifying five emotional states using the signal-image encoding TLmodel. Seven pre-trained models (Xception, VGG19, ResNet, NasNet, DenseNet,DenseNet V2 MobileNet) were used to explore the TL approach for the threemethods of signal-image transformation (GADF, GASF MTF). Each of the ap-proaches used transformed the motion data from the EnvBodySens dataset toimages using a TL approach paired with a 1D CNN to train the remaining timeseries data from the EnvBodySens dataset. The final testing accuracy using the20% test data split are reported for each model in Table 6.2.
6.4.2.1 Comparison of Data Modalities
The data modalities were investigated to explore which modalities most con-tributed towards the classification of mental wellbeing. When all sensor data(HR, EDA, UV, body temperature, air pressure and noise) was used to trainthe 1D CNN combined with the TL approach for the signal-image transformed
153
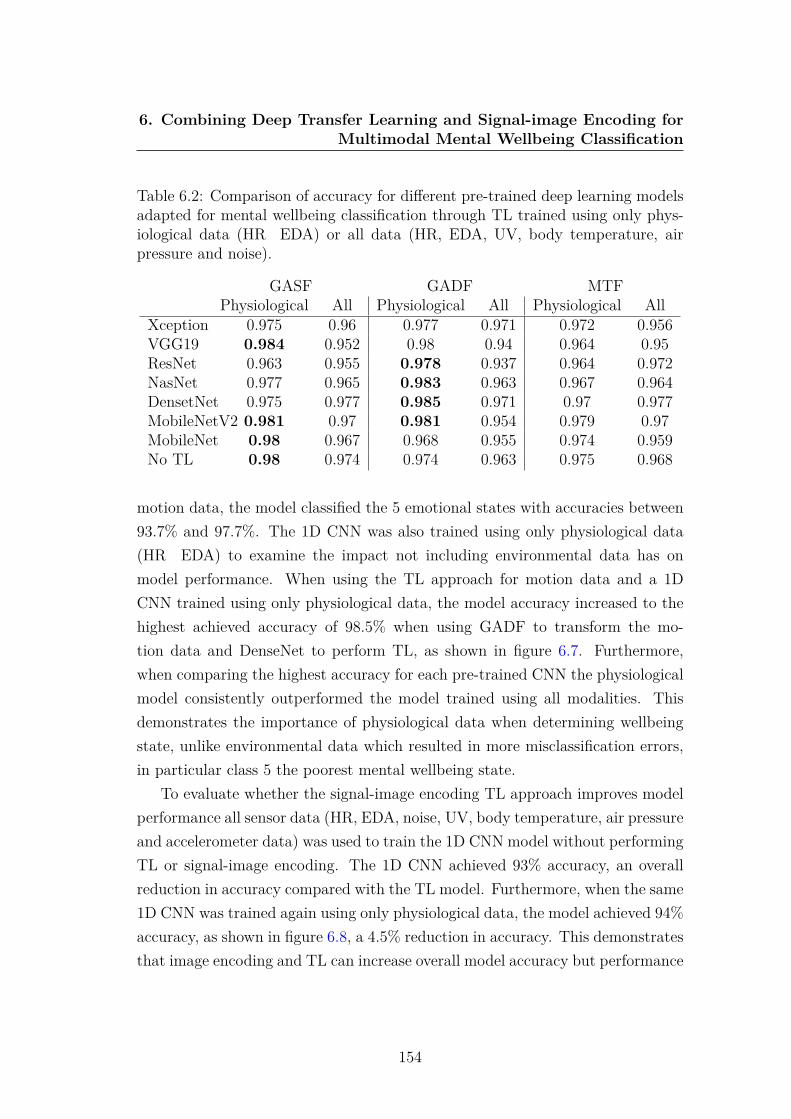
6. Combining Deep Transfer Learning and Signal-image Encoding forMultimodal Mental Wellbeing Classification
Table 6.2: Comparison of accuracy for different pre-trained deep learning modelsadapted for mental wellbeing classification through TL trained using only phys-iological data (HR EDA) or all data (HR, EDA, UV, body temperature, airpressure and noise).
GASF GADF MTFPhysiological All Physiological All Physiological All
Xception 0.975 0.96 0.977 0.971 0.972 0.956VGG19 0.984 0.952 0.98 0.94 0.964 0.95ResNet 0.963 0.955 0.978 0.937 0.964 0.972NasNet 0.977 0.965 0.983 0.963 0.967 0.964DensetNet 0.975 0.977 0.985 0.971 0.97 0.977MobileNetV2 0.981 0.97 0.981 0.954 0.979 0.97MobileNet 0.98 0.967 0.968 0.955 0.974 0.959No TL 0.98 0.974 0.974 0.963 0.975 0.968
motion data, the model classified the 5 emotional states with accuracies between93.7% and 97.7%. The 1D CNN was also trained using only physiological data(HR EDA) to examine the impact not including environmental data has onmodel performance. When using the TL approach for motion data and a 1DCNN trained using only physiological data, the model accuracy increased to thehighest achieved accuracy of 98.5% when using GADF to transform the mo-tion data and DenseNet to perform TL, as shown in figure 6.7. Furthermore,when comparing the highest accuracy for each pre-trained CNN the physiologicalmodel consistently outperformed the model trained using all modalities. Thisdemonstrates the importance of physiological data when determining wellbeingstate, unlike environmental data which resulted in more misclassification errors,in particular class 5 the poorest mental wellbeing state.
To evaluate whether the signal-image encoding TL approach improves modelperformance all sensor data (HR, EDA, noise, UV, body temperature, air pressureand accelerometer data) was used to train the 1D CNN model without performingTL or signal-image encoding. The 1D CNN achieved 93% accuracy, an overallreduction in accuracy compared with the TL model. Furthermore, when the same1D CNN was trained again using only physiological data, the model achieved 94%accuracy, as shown in figure 6.8, a 4.5% reduction in accuracy. This demonstratesthat image encoding and TL can increase overall model accuracy but performance
154

6. Combining Deep Transfer Learning and Signal-image Encoding forMultimodal Mental Wellbeing Classification
Figure 6.7: Confusion matrix for DenseNet model trained using HR, EDA andGADF (left), GASF (middle) and MTF (right) encoded motion data.
is highly dependent on the additional sensor modalities used to train the network.
Figure 6.8: Confusion matrix of CNN model without TL when trained usingall data achieving 93% accuracy (left) and only physiological and motion dataachieving 94% accuracy (right).
6.4.2.2 Comparison of Pre-trained Models
To explore whether the high accuracy achieved was influenced by the pre-trainedmodel used in the TL approach, other pre-trained CNNs were tested using thesame GASF, GADF and MTF transformed images. As shown in table 6.2 Den-sNet achieved the highest accuracy for the GADF transformed data althoughVGG19 achieved the highest accuracy for GASF data and MobileNetV2 for MTFdata. This demonstrates that the pre-trained model selected has little impact onperformance with the average variance between the best and worst performingmodel for all 3 image encoding techniques being only 1.77% for the physiological
155
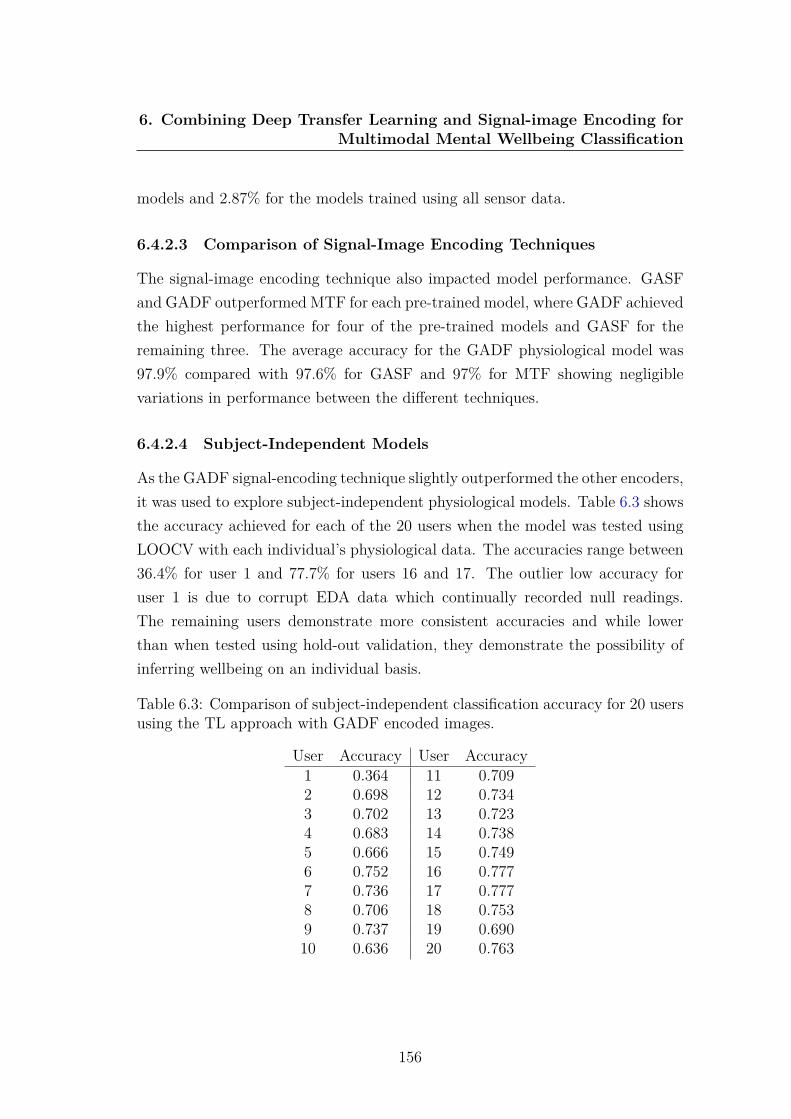
6. Combining Deep Transfer Learning and Signal-image Encoding forMultimodal Mental Wellbeing Classification
models and 2.87% for the models trained using all sensor data.
6.4.2.3 Comparison of Signal-Image Encoding Techniques
The signal-image encoding technique also impacted model performance. GASFand GADF outperformed MTF for each pre-trained model, where GADF achievedthe highest performance for four of the pre-trained models and GASF for theremaining three. The average accuracy for the GADF physiological model was97.9% compared with 97.6% for GASF and 97% for MTF showing negligiblevariations in performance between the different techniques.
6.4.2.4 Subject-Independent Models
As the GADF signal-encoding technique slightly outperformed the other encoders,it was used to explore subject-independent physiological models. Table 6.3 showsthe accuracy achieved for each of the 20 users when the model was tested usingLOOCV with each individual’s physiological data. The accuracies range between36.4% for user 1 and 77.7% for users 16 and 17. The outlier low accuracy foruser 1 is due to corrupt EDA data which continually recorded null readings.The remaining users demonstrate more consistent accuracies and while lowerthan when tested using hold-out validation, they demonstrate the possibility ofinferring wellbeing on an individual basis.
Table 6.3: Comparison of subject-independent classification accuracy for 20 usersusing the TL approach with GADF encoded images.
User Accuracy User Accuracy1 0.364 11 0.7092 0.698 12 0.7343 0.702 13 0.7234 0.683 14 0.7385 0.666 15 0.7496 0.752 16 0.7777 0.736 17 0.7778 0.706 18 0.7539 0.737 19 0.69010 0.636 20 0.763
156
6. Combining Deep Transfer Learning and Signal-image Encoding forMultimodal Mental Wellbeing Classification
The subject-independent models were also trained without the TL approachwhile still transforming signals into images to explore whether performance im-provements were due to TL. A 2D CNN was implemented to train the signalencoded images which was concatenated with the 1D CNN trained using thephysiological data. The results show TL increased average accuracy by 0.55% forall users which falls within the margin of error, demonstrating no overall perfor-mance improvement. However, the TL approach never degraded the performanceof individuals’ models and achieved up to a 4% increase in accuracy showing itcan be beneficial and should continue to be used.
6.5 DiscussionA new CNN-TL-based approach towards affective state classification has beenintroduced that goes beyond previous signal-image encoding frameworks by in-corporating TL in addition to a separate 1D CNN. This research demonstratesthat a signal-image encoding TL approach can improve the performance in whichfive affective states can be classified, achieving up to 98.5% accuracy using hold-out validation and an average of 72.3% using LOOCV. This outperforms manyprevious real-world affect recognition systems [55], [214], [138], [363] including aprevious stacked machine learning approach using the same EnvBodySens datasetwhich achieved an accuracy of 86% [156] and a combined CNN and RNN using thesame dataset that achieved 94.9% accuracy [155]. Furthermore, a TL approach toalleviate limited wellbeing data by transferring knowledge from a model trainedusing a large physical activity dataset improved accuracy to 91% when classifyingstress.
The results have demonstrated that the integration of TL as part of the newlyproposed methodology, extending standard deep learning algorithms can greatlyimprove the classification of affective state. In particular, the combinatory ap-proach of encoding accelerometer data as images using GADF, GASF and MTFthen using a pre-trained model to perform TL and combining this model with a1D CNN trained using physiological data, has improved the accuracy with whichaffect can be classified. The encoding technique used was shown to have a minorimpact in model accuracy demonstrating GADF was most effective for the ma-
157

6. Combining Deep Transfer Learning and Signal-image Encoding forMultimodal Mental Wellbeing Classification
jority of the models. Similarly, the pre-trained model used to perform TL had alimited impact on model performance with an average difference of only 2.32%between the different models. However, TL only slightly improved performanceby an average of 0.55% when testing using subject-independent models, demon-strating the transformed images had a greater impact on model performance thanTL.
Furthermore, solely using physiological and motion data resulted in the high-est accuracy (98.5%), outperforming models additionally trained using environ-mental data. This suggests that environmental factors such as noise and UV aremore challenging to use for affect recognition even when paired with physiologicaldata. The reduced performance may be due to the intricate information in theenvironmental data already being captured inherently in the physiological andmotion data for example poor weather having a negative impact on mood.
When testing using LOOCV the subject-independent accuracies are lowerthan subject-dependent accuracies. The average accuracy of the subject-independentphysiological models excluding user 1 was 72.3% (SD 0.038), compared with98.5% for the subject-dependent model both using GADF to transform the signalsand a DenseNet pre-trained model. This likely reflects that different individu-als have different patterns of physiology when experiencing the same state ofwellbeing and that similar levels of activity are perceived differently in terms ofvalence [314] demonstrating similar results as other studies [148], [190], [13].
An additional TL approach involved training a 1D CNN using a human activ-ity dataset and then performing TL to adapt the model using physiological datafrom a controlled stressor experiment. This TL approach improved model accu-racy by 8.5% over the source model achieving 91% accuracy, again demonstratingthe benefits of TL approaches. However, this model did not perform as well asthe image encoded TL model even though it was only classifying two classes incontrolled conditions compared with five states of real-world affect. This demon-strates the vital role motion data encoded as images plays in improving wellbeingclassification, although it may not always be possible to collect motion data suchas during the controlled stressor experiment where participants were stationary.
Overall, three multivariate datasets were used as benchmark datasets to eval-uate the TL approaches. This work demonstrates that by using the proposed
158
6. Combining Deep Transfer Learning and Signal-image Encoding forMultimodal Mental Wellbeing Classification
approaches it is possible to capitalize on two modalities to accurately classifywellbeing on a 5-point Likert scale. The results have demonstrated that TL ap-proaches are appropriate for modeling affective states especially when trainingdata is scarce. These TL approaches have outperformed previous models us-ing the same EnvBodySens dataset built on ad-hoc extracted features [156] and2 dimensional CNNs [155]. These findings showcase the potential for TL andsignal-encoded images to improve affective multimodal modeling.
6.6 ConclusionRecent developments in tangible interfaces and edge computing are producingsensory datasets as people are going about their daily activities. However, accu-rately classifying these limited datasets can be a challenging proposition. In thischapter, a scenario of wellbeing classification using small multimodal datasets hasbeen presented. Although these types of time series datasets can help us under-stand people’s wellbeing, current recognition techniques are not efficient enoughto tackle data scantiness. TL offers an automated way to utilise the learningoutcomes from larger datasets to help overcome these challenges. This researchhas demonstrated the advantages of employing a combinatory TL approach forraw multimodal sensor data modelling.
Based on experimental results, the proposed frameworks employ two TL mod-els using three multimodal sensor datasets. The first approach trained a 1D CNNmodel using the WISDM dataset and performed a TL approach to adapt themodel for the target stress dataset of physiological signals. This model achieved91% accuracy, a 8.5% improvement over the same 1D CNN trained without TL.The second model used the proposed framework combining a TL approach usingsignal encoded images with a 1D CNN. Accelerometer data was transformed intoRGB images using GADF, MTF and GASF. This data was subsequently used totrain a 2D CNN using pre-trained models to apply a TL approach. This modelwas concatenated with a 1D CNN architecture trained using raw physiologicalsensor data and resulted in increased performance, achieving up to 98.5% accu-racy. Overall, incorporating a TL signal-image encoding approach in addition toa 1D CNN helped further improve model performance with limited data.
159
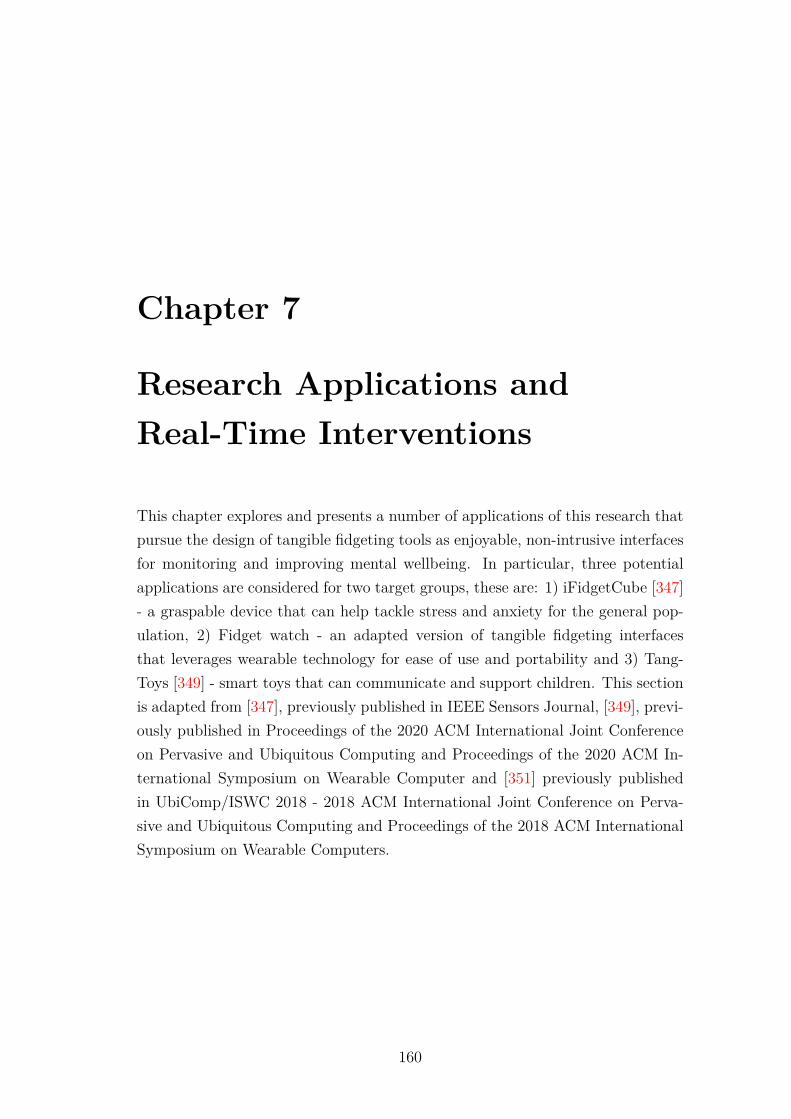
Chapter 7
Research Applications andReal-Time Interventions
This chapter explores and presents a number of applications of this research thatpursue the design of tangible fidgeting tools as enjoyable, non-intrusive interfacesfor monitoring and improving mental wellbeing. In particular, three potentialapplications are considered for two target groups, these are: 1) iFidgetCube [347]- a graspable device that can help tackle stress and anxiety for the general pop-ulation, 2) Fidget watch - an adapted version of tangible fidgeting interfacesthat leverages wearable technology for ease of use and portability and 3) Tang-Toys [349] - smart toys that can communicate and support children. This sectionis adapted from [347], previously published in IEEE Sensors Journal, [349], previ-ously published in Proceedings of the 2020 ACM International Joint Conferenceon Pervasive and Ubiquitous Computing and Proceedings of the 2020 ACM In-ternational Symposium on Wearable Computer and [351] previously publishedin UbiComp/ISWC 2018 - 2018 ACM International Joint Conference on Perva-sive and Ubiquitous Computing and Proceedings of the 2018 ACM InternationalSymposium on Wearable Computers.
160
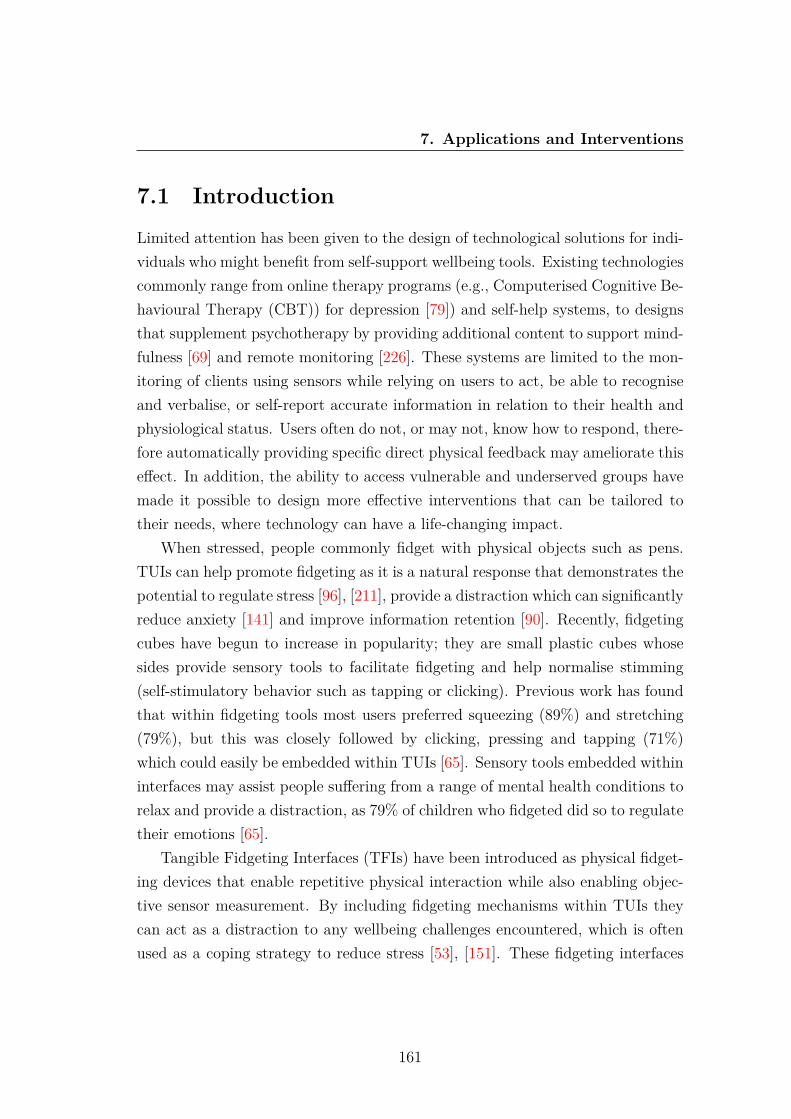
7. Applications and Interventions
7.1 IntroductionLimited attention has been given to the design of technological solutions for indi-viduals who might benefit from self-support wellbeing tools. Existing technologiescommonly range from online therapy programs (e.g., Computerised Cognitive Be-havioural Therapy (CBT)) for depression [79]) and self-help systems, to designsthat supplement psychotherapy by providing additional content to support mind-fulness [69] and remote monitoring [226]. These systems are limited to the mon-itoring of clients using sensors while relying on users to act, be able to recogniseand verbalise, or self-report accurate information in relation to their health andphysiological status. Users often do not, or may not, know how to respond, there-fore automatically providing specific direct physical feedback may ameliorate thiseffect. In addition, the ability to access vulnerable and underserved groups havemade it possible to design more effective interventions that can be tailored totheir needs, where technology can have a life-changing impact.
When stressed, people commonly fidget with physical objects such as pens.TUIs can help promote fidgeting as it is a natural response that demonstrates thepotential to regulate stress [96], [211], provide a distraction which can significantlyreduce anxiety [141] and improve information retention [90]. Recently, fidgetingcubes have begun to increase in popularity; they are small plastic cubes whosesides provide sensory tools to facilitate fidgeting and help normalise stimming(self-stimulatory behavior such as tapping or clicking). Previous work has foundthat within fidgeting tools most users preferred squeezing (89%) and stretching(79%), but this was closely followed by clicking, pressing and tapping (71%)which could easily be embedded within TUIs [65]. Sensory tools embedded withininterfaces may assist people suffering from a range of mental health conditions torelax and provide a distraction, as 79% of children who fidgeted did so to regulatetheir emotions [65].
Tangible Fidgeting Interfaces (TFIs) have been introduced as physical fidget-ing devices that enable repetitive physical interaction while also enabling objec-tive sensor measurement. By including fidgeting mechanisms within TUIs theycan act as a distraction to any wellbeing challenges encountered, which is oftenused as a coping strategy to reduce stress [53], [151]. These fidgeting interfaces
161
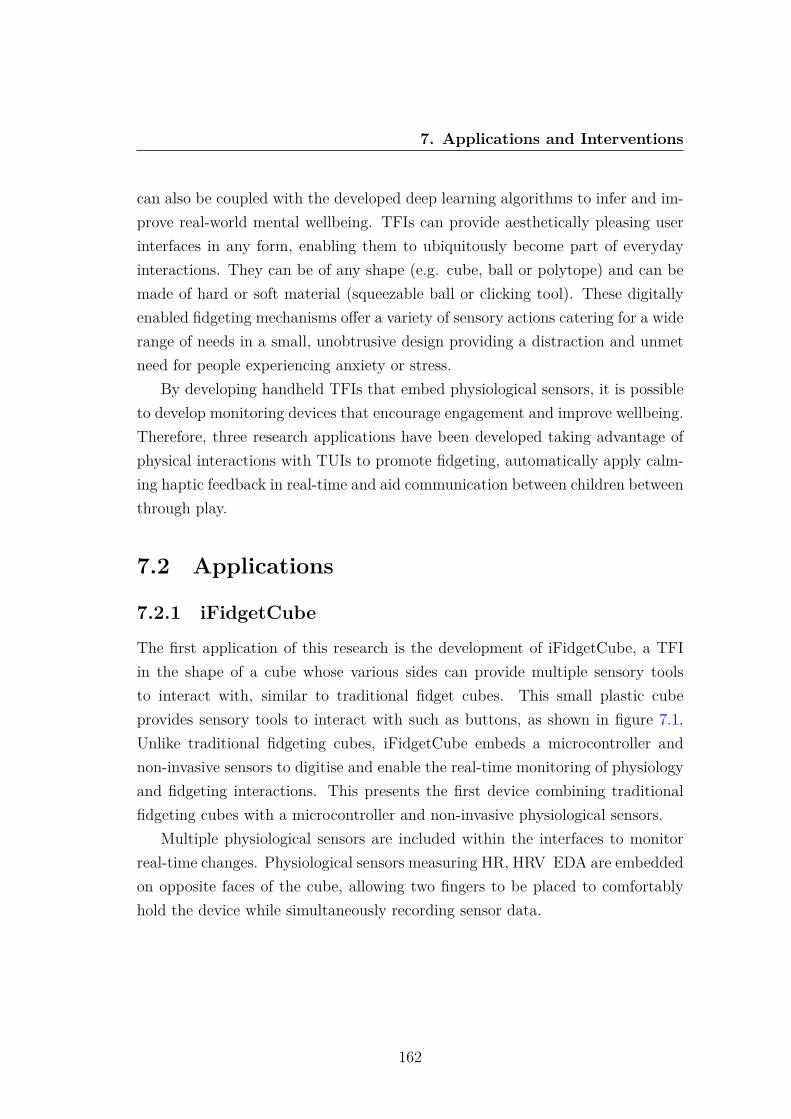
7. Applications and Interventions
can also be coupled with the developed deep learning algorithms to infer and im-prove real-world mental wellbeing. TFIs can provide aesthetically pleasing userinterfaces in any form, enabling them to ubiquitously become part of everydayinteractions. They can be of any shape (e.g. cube, ball or polytope) and can bemade of hard or soft material (squeezable ball or clicking tool). These digitallyenabled fidgeting mechanisms offer a variety of sensory actions catering for a widerange of needs in a small, unobtrusive design providing a distraction and unmetneed for people experiencing anxiety or stress.
By developing handheld TFIs that embed physiological sensors, it is possibleto develop monitoring devices that encourage engagement and improve wellbeing.Therefore, three research applications have been developed taking advantage ofphysical interactions with TUIs to promote fidgeting, automatically apply calm-ing haptic feedback in real-time and aid communication between children betweenthrough play.
7.2 Applications
7.2.1 iFidgetCube
The first application of this research is the development of iFidgetCube, a TFIin the shape of a cube whose various sides can provide multiple sensory toolsto interact with, similar to traditional fidget cubes. This small plastic cubeprovides sensory tools to interact with such as buttons, as shown in figure 7.1.Unlike traditional fidgeting cubes, iFidgetCube embeds a microcontroller andnon-invasive sensors to digitise and enable the real-time monitoring of physiologyand fidgeting interactions. This presents the first device combining traditionalfidgeting cubes with a microcontroller and non-invasive physiological sensors.
Multiple physiological sensors are included within the interfaces to monitorreal-time changes. Physiological sensors measuring HR, HRV EDA are embeddedon opposite faces of the cube, allowing two fingers to be placed to comfortablyhold the device while simultaneously recording sensor data.
162
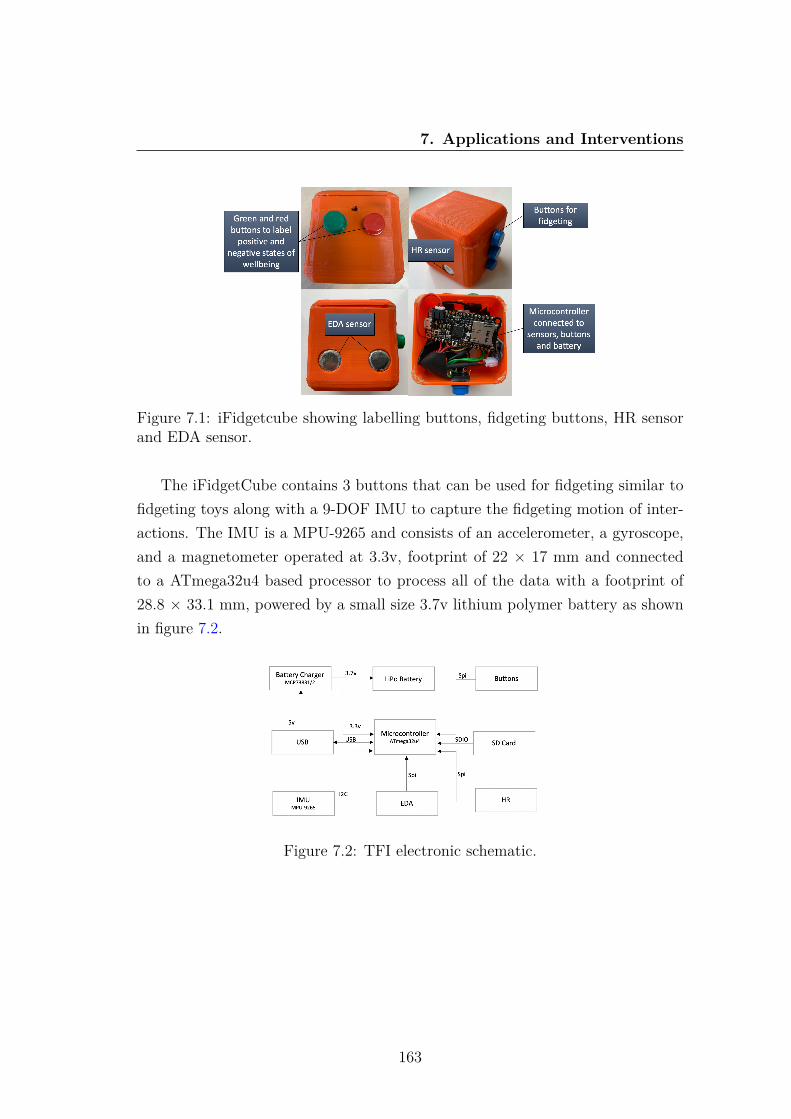
7. Applications and Interventions
Figure 7.1: iFidgetcube showing labelling buttons, fidgeting buttons, HR sensorand EDA sensor.
The iFidgetCube contains 3 buttons that can be used for fidgeting similar tofidgeting toys along with a 9-DOF IMU to capture the fidgeting motion of inter-actions. The IMU is a MPU-9265 and consists of an accelerometer, a gyroscope,and a magnetometer operated at 3.3v, footprint of 22 × 17 mm and connectedto a ATmega32u4 based processor to process all of the data with a footprint of28.8 × 33.1 mm, powered by a small size 3.7v lithium polymer battery as shownin figure 7.2.
Figure 7.2: TFI electronic schematic.
163

7. Applications and Interventions
7.2.1.1 Evaluation
During the real-world data collection discussed in Section 4.3, 4 participants ex-perienced the fidgeting cubes. During a focus group participants stated theyenjoyed using the physical interfaces, finding them easy to handle and engag-ing unlike other physiological sensing devices. The interfaces were described as”calming” and ”relaxing” due to being able to fidget by moving the devices aswell as pressing the buttons.
Real-world trials with the devices enabled the collection of labelled physio-logical sensor data used to train the developed classification models. During thedata collection period, users consistently moved the interfaces and used the fid-geting buttons, demonstrating their simplicity and effectiveness. Users believedusing the fidgeting buttons helped them relax and improved their mental wellbe-ing however due to the nature of the device it was not always possible to use thephysiological sensors while fidgeting.
7.2.2 Fidget Watch
The second research application extends the use of fidgeting tools by additionallyexploring the feasibility of wellbeing classification models activating instant hapticfeedback upon changes in wellbeing, in the form of subtle vibrations experiencedas a tap on the wrist.
A watch has been developed that embeds physiological sensors measuringHR, HRV and EDA in addition to incorporating fidgeting buttons similar tothe iFidgetCube. The Fidget watch is smaller and easier to use during dailyactivities than iFidgetCube and also includes haptic feedback in the form ofvibrating motors that are small in size and require very low power to operate.
The Fidget watch incorporates Bluetooth to connect to a custom built An-droid application. Due to the resource constrained nature of the device it is notcapable of running the developed classification models on-device. Instead, thephysiological data is continuously transmitted wirelessly to the Android app thatis capable of running in the background without requiring any action from theuser to ensure the data is always received. The app inputs the physiologicaldata into the developed personalised classification model and when poor mental
164
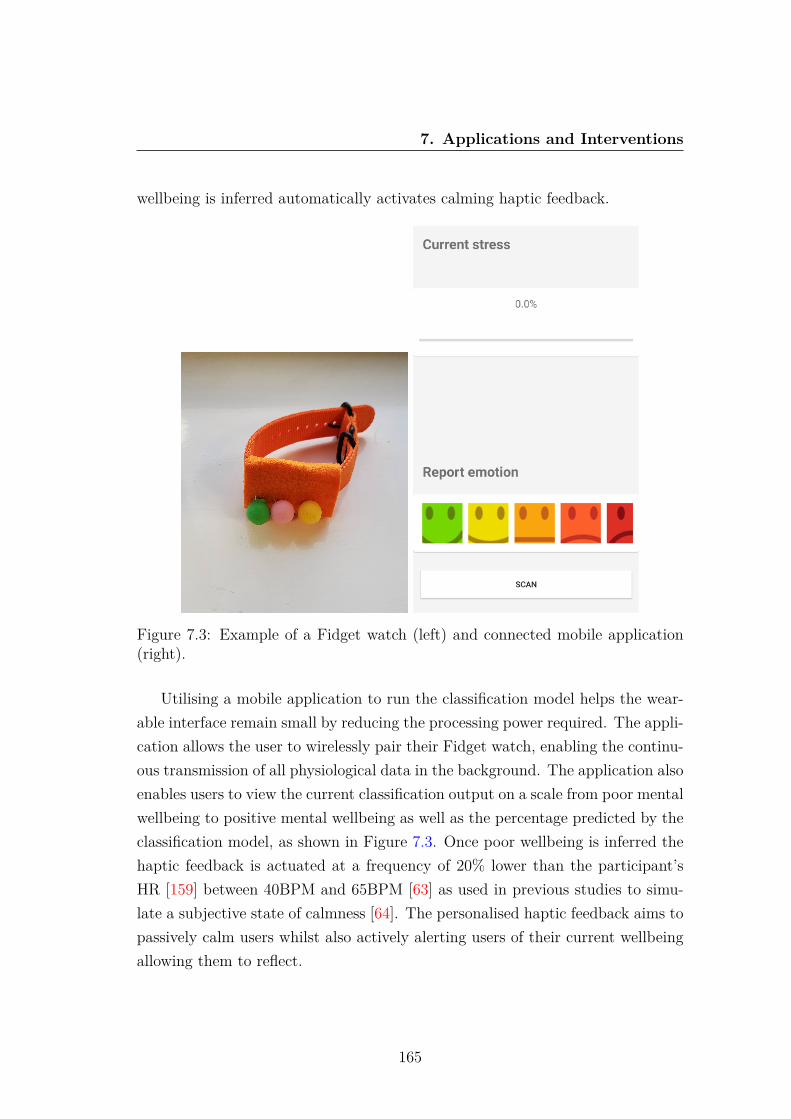
7. Applications and Interventions
wellbeing is inferred automatically activates calming haptic feedback.
Figure 7.3: Example of a Fidget watch (left) and connected mobile application(right).
Utilising a mobile application to run the classification model helps the wear-able interface remain small by reducing the processing power required. The appli-cation allows the user to wirelessly pair their Fidget watch, enabling the continu-ous transmission of all physiological data in the background. The application alsoenables users to view the current classification output on a scale from poor mentalwellbeing to positive mental wellbeing as well as the percentage predicted by theclassification model, as shown in Figure 7.3. Once poor wellbeing is inferred thehaptic feedback is actuated at a frequency of 20% lower than the participant’sHR [159] between 40BPM and 65BPM [63] as used in previous studies to simu-late a subjective state of calmness [64]. The personalised haptic feedback aims topassively calm users whilst also actively alerting users of their current wellbeingallowing them to reflect.
165
7. Applications and Interventions
The Fidget watch has been trialled in laboratory settings to test its function-ality where it was found to continuously monitor wellbeing due to its on-bodyplacement and allowed for easy access to the fidgeting buttons. Overall, thisdevice combines the real-world application of mental affective state classificationwith the automatic delivery of tangible interventions to improve wellbeing.
7.2.3 Tangible Toys
Children’s toys represent another ideal embodiment for TUIs as they providesufficient space for the electronics and encourage tactile interactions. Althougha limited number of TUIs for mental wellbeing have previously been developedby researchers, many of these were not engaging for children and often containedphysiological sensors which prevented physical interactions commonly used bychildren to interact with objects such as toys. An interface that can activelymonitor and enable the communication of a user’s physical interactions and well-being would be beneficial for all.
Few sensor based interfaces have been designed for children even though theytraditionally find it challenging to communicate their mental wellbeing [246].The ability for children to communicate their wellbeing is vital as children withdifficulties communicating are more at risk in terms of social acceptance and bul-lying [191]. Furthermore, better relationships and communication with friendsoffers protection against poor mental health in the future [92]. This research ap-plication introduces Tangible Toys (TangToys) with the aim of enabling childrento communicate wellbeing through embedded sensors and feedback actuators.The devices embed sensors used to measure physical interactions and mentalwellbeing along with Bluetooth Low Energy (BLE) to enable real-time commu-nication. Through the use of BLE TUIs can communicate with one another,enabling real-time communication networks to be developed. The ability for de-vices to communicate with each other enables children to communicate whensocially distant and the ability to discover other nearby users.
TangToys can vary in shape, size and material. The four TangToys developedhave been designed for younger children aged 5-7 as this is when children developself-conscious emotions and develop an emotional front [260], they include 2 soft
166

7. Applications and Interventions
teddies, a soft ball and a cushion. As children physically interact with TangToysin the same way as traditional toys all of the interfaces are suitable for childrenand encourage engagement by resembling familiar toys.
Each TangToy includes a microcontroller and micro SD card to record allinteractions along with BLE 4.2 for communication. A range of sensors can beused to monitor children’s interactions with the toys including capacitive sensorsto measure touch and 9-DOF IMU to measure motion. Physiological sensors werenot embedded within the toys as younger children may not understand how tooperate the sensors and they may hinder physical interactions whilst playing withthe toy.
In addition to the sensors, TangToys can provide real-time feedback activatedby wireless communication with other TangToys. Haptic feedback has been in-cluded within some of the developed prototypes issuing a physical sense, resem-bling touch and providing comfort which can improve mental wellbeing [62], [17].Additionally, visual feedback in the form of multi-coloured LEDs has been in-cluded within the soft ball and teddy prototypes.
7.2.3.1 Communication Framework
Embedding sensors within toys that can communicate with one another throughBLE offers many new opportunities for real-time interactions. BLE 4.2 has arange of around 50m allowing TangToys to communicate with one another inlocations such as playgrounds. Two opportunities are presented for real-timedigital social interaction between TangToys.
By utilising Peer to Peer (P2P) communication it is possible for two connecteddevices to directly communicate with each other. This method of communicationhelps friends who may be nearby but socially distanced to provide physical com-munication that is not possible with other devices. When a child plays with aTangToy the capacitive sensor and accelerometer data measuring touch and mo-tion respectively can be actuated on the paired interface through the embeddedhaptic and visual feedback to simulate physical communication. The connectedfriend can then react to this communication by interacting with their device al-lowing friends to wirelessly support one another through physical interactions.
167
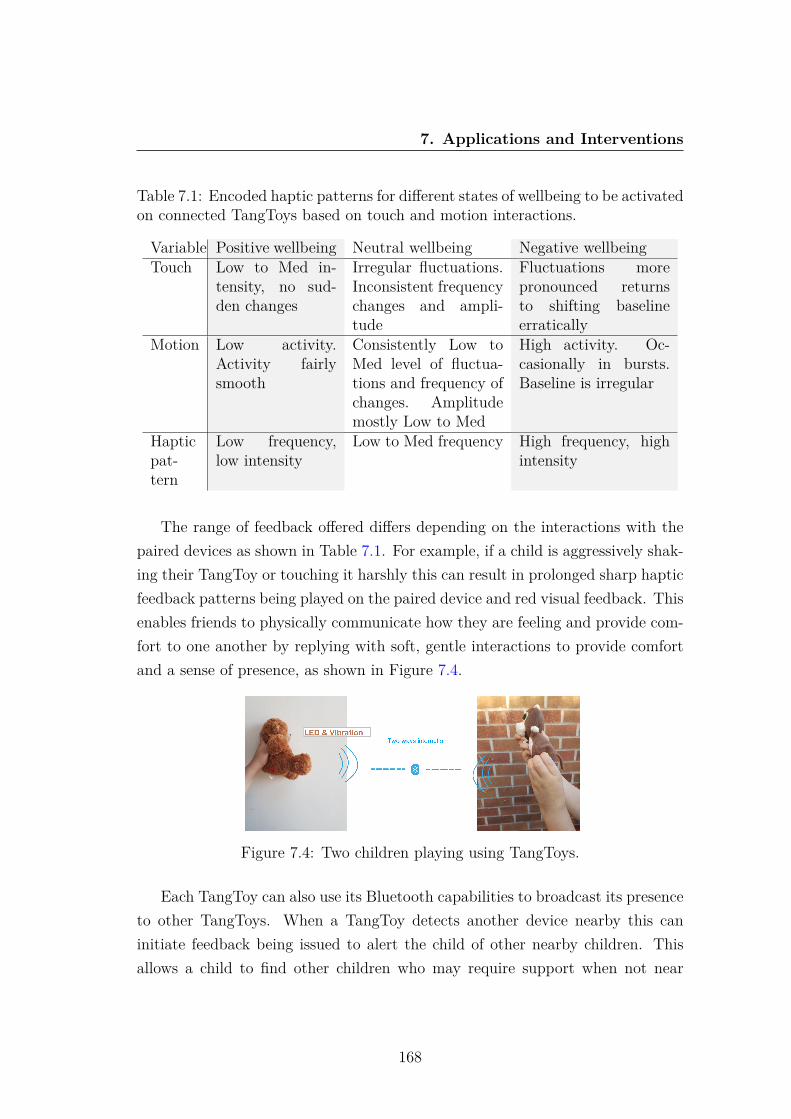
7. Applications and Interventions
Table 7.1: Encoded haptic patterns for different states of wellbeing to be activatedon connected TangToys based on touch and motion interactions.
Variable Positive wellbeing Neutral wellbeing Negative wellbeingTouch Low to Med in-
tensity, no sud-den changes
Irregular fluctuations.Inconsistent frequencychanges and ampli-tude
Fluctuations morepronounced returnsto shifting baselineerratically
Motion Low activity.Activity fairlysmooth
Consistently Low toMed level of fluctua-tions and frequency ofchanges. Amplitudemostly Low to Med
High activity. Oc-casionally in bursts.Baseline is irregular
Hapticpat-tern
Low frequency,low intensity
Low to Med frequency High frequency, highintensity
The range of feedback offered differs depending on the interactions with thepaired devices as shown in Table 7.1. For example, if a child is aggressively shak-ing their TangToy or touching it harshly this can result in prolonged sharp hapticfeedback patterns being played on the paired device and red visual feedback. Thisenables friends to physically communicate how they are feeling and provide com-fort to one another by replying with soft, gentle interactions to provide comfortand a sense of presence, as shown in Figure 7.4.
Figure 7.4: Two children playing using TangToys.
Each TangToy can also use its Bluetooth capabilities to broadcast its presenceto other TangToys. When a TangToy detects another device nearby this caninitiate feedback being issued to alert the child of other nearby children. Thisallows a child to find other children who may require support when not near
168
7. Applications and Interventions
their friends to facilitate P2P communication. These children can then interactwith the devices to form a support group to communicate their wellbeing to eachother. The feedback actuated when detecting other devices can be impactedby the number of nearby interfaces. For example, if a single child is detectednearby, more subtle haptic feedback is issued compared with more pronouncedfeedback when multiple TangToys are nearby. Similarly, the colour displayedon the TangToy can change dependent on the number of users located nearbyto alert the user visually. Using this method of interaction does not enable thesame capabilities as the P2P communication, but enables each device to interactautomatically with other nearby devices, and afford a sense of ’togetherness’.
7.2.3.2 Empirical Evaluation
TangToys have been presented in focus groups to members of the NICER groupand teachers to provide feedback on the design and functionality of the interfaces.Teachers considered the methods used to interact with TangToys suitable forchildren and believed the way in which children interact with the toys will likelyindicate their wellbeing. Additionally, teachers liked the design of the toys as theyappear similar to other toys helping to reduce stigma. Overall, the participantsreported the design, sensors and communication capabilities were all suitable forchildren and believed TangToys would promote the communication of wellbeingbetween friends.
7.3 ConclusionOverall, three real-world applications have been developed to monitor and im-prove mental wellbeing. iFidgetCube provides a simple method to both monitorphysiological changes and simultaneously provide a fidgeting interface as a pre-ventative mechanism to aid relaxation and ease restlessness. The Fidget watchincorporates physiological sensors and fidgeting mechanisms within a wearableinterface utilising personalised models to automatically activate haptic feedbackwhen poor wellbeing is inferred. Finally, TangToys present a new opportunity tomonitor children’s physical interactions which may help provide an indication of
169
7. Applications and Interventions
their mental wellbeing. The ability for TangToys to communicate with one an-other provides a non-intrusive means for children to communicate their wellbeingthrough play.
These research applications demonstrate the potential for tangible interfacesto monitor real-world affective state and actuate interventions in real-time. Inparticular, the Fidget watch demonstrates the potential to classify real-worldphysiological data and automatically activate real-time interventions when re-quired. Overall, these applications including fidgeting mechanisms and hapticfeedback help to automatically improve real-world mental wellbeing and demon-strate the benefits of tangible interfaces, the developed classification models andreal-time feedback.
170

Chapter 8
Conclusion and Future Work
This thesis has presented the design of novel TUIs and the development of classi-fication models to advance the understanding and measurement of affective statein real-world environments. This final chapter provides a general discussion of thework, a summary of the different contributions, potential areas of improvementand future work.
8.1 ConclusionThis thesis has contributed to the development of methods to improve the classifi-cation of real-world affective state using non-invasive physiological sensors embod-ied within co-designed tangible interfaces. In particular, this thesis has studiedhow TUIs can help advance the real-world measurement of affect by exploring:
1. The co-design of TUIs with people who have intellectual disabilities thatgo beyond existing devices to offer continuous monitoring and feedbackmechanisms.
2. The exploration and use of tangible labelling methods to enable the collec-tion of in-situ physiological labelled data which is notoriously challengingto collect.
3. The implementation of two transfer learning approaches to personaliseaffective models on-device and reduce the necessity for large real-world
171
8. Conclusion and Future Work
datasets to accurately train deep learning classifiers.
4. The development of three research applications acting as preventative inter-ventions to improve wellbeing by providing calming sensory tools, issuingreal-time haptic feedback and aiding the communication of children’s well-being.
To investigate the use of TUIs for mental wellbeing, several explorations,experiments, and real-life studies have been conducted. Based on these efforts,this section summarises the main findings.
Participants with intellectual disabilities often have their wellbeing challengesmisattributed to their disability [102]. To help develop solutions relevant to themand the wider population, they were invited to help co-design TUIs for affectivestate recognition as existing devices cannot continuously, accurately and unob-trusively measure physiological changes in-situ. Chapter 3 explores the methodsdeveloped within a series of co-design workshops to engage people with intel-lectual disabilities in the development of TUIs, including the use of interactivesessions to explore the design process in addition to the sensors and feedbackmechanisms used within the interfaces. The participants’ contributions resultedin the development of numerous tangible interfaces including 3D-printed inter-faces for older children and adults embedding physiological sensors and soft toydevices for children measuring touch and motion interactions.
Before the developed interfaces could be leveraged for real-world data collec-tion, methods to gather accurate self-reported data in real-world environmentswere required. This is vital for improving our understanding of affective state dueto the inability to label sensor data after the point of collection. The developedLabelSens framework discussed in Chapter 4, explores multiple tangible labellingmethods that could be incorporated into the co-designed interfaces to simplify thelabelling process. Evaluation of the framework resulted in labelling buttons beingembedded within all of the developed interfaces to enable participants to labelin real-time. The interfaces were then used by participants to collect real-worldlabelled affective data.
Choosing an appropriate model to effectively classify real-world affect us-ing physiological signals is a challenging proposition. Physiological signals often
172
8. Conclusion and Future Work
consist of time series data with a variation over a long period of time and de-pendencies within shorter periods. Furthermore, physiology is inherently uniqueto an individual, especially those with intellectual disabilities, limiting the appli-cation of generic models. Therefore, Chapter 5 proposed the development of aTL approach to personalise affective models. Initially, a source CNN was trainedusing controlled stressed and relaxed data, the model was then adapted using theTL approach to personalise and adapt it for the real-world domain. The resultsshow adopting the TL approach significantly increased model performance withthe multivariate physiological and motion affective model achieving an averageaccuracy of 93.5% compared with the comparative non-TL 1D CNN accuracyof 71.7%. Leveraging motion data helped improve multivariate physiologicalmodel accuracy and enabled the development of univariate motion TL modelsthat achieved an average accuracy of 88.1%, demonstrating the importance ofmotion in real-world affect inference. Furthermore, by utilising advances in edgecomputing the TL approach was applied on-device. This enabled participants toself-label for only a few days before the model could be personalised to greatlyimprove accuracy. Empowering sensors with this TL approach in portable in-terfaces paves the way for continuous real-world monitoring without the need toself-report.
While advances in deep learning are helping advance the accuracy in whichaffective states can be classified, large datasets of multiple users over long peri-ods of time are usually required to accurately train the models [176]. Therefore,many studies in the domain of affective computing have developed models fromcontrolled experimental data as the collection of real-world labelled sensor data ischallenging. Chapter 6 presents a second TL approach that alleviates some of thechallenges imposed by deep learning architectures. The signal-image encoding TLapproach transformed accelerometer data into images which were used to adapta pre-trained image classification model, this was then combined with a separateCNN used to train the remaining physiological sensor data. When tested with20 users self-reporting their emotional wellbeing on a 5-point Likert scale, per-formance was enhanced, resulting in up to 98.5% accuracy. Subject-independentmodels using the same approach resulted in an average of 72.3% (SD 0.038) ac-curacy. This methodology demonstrates improved accuracy and helps alleviate
173

8. Conclusion and Future Work
the requirements for large affective datasets with deep learning classifiers.This research has resulted in the development of many real-world applica-
tions, discussed in Chapter 7 that leverage the co-designed tangible interfacesand developed classification models. Children’s mental wellbeing is more impor-tant than ever before with an increasing number of children experiencing highlevels of stress [12]. Therefore, TangToys have been developed to help promotephysical communication through play, benefiting those who find it difficult toverbalise their emotions. This technological solution helps children communicatedigitally and receive support from one another as advances in networking andsensors have enabled the real-time transmission of physical interactions. Further-more, iFidgetCubes have been constructed combining physiological sensors withtactile engagement through fidgeting, enabling repetitive interaction methods totap into an individual’s psychological need to feel occupied and engaged. Finally,a Fidget watch has been developed that combines repetitive calming interactionswith physiological sensors, enabling automatic inference using a custom mobileapp. By developing a wearable and connecting it to an Android application it ispossible to continuously and unobtrusively monitor affective state by utilising thedeveloped classification models. If the model infers poor wellbeing, personalisedhaptic feedback is automatically issued to promote relaxation. These interfacesdemonstrate the real-world applications of this research to automatically monitoraffective state and provide instant interventions.
Overall, this work has systematically demonstrated that the development ofcustom TUIs and tangible labelling techniques has aided the collection of real-world wellbeing data. Furthermore, the two TL frameworks proposed demon-strate the ability to personalise affective models and reduce the reliance of largedatasets for deep affective modelling. Tangible interfaces and the TL frameworksdemonstrate numerous potential applications to monitor real-world affective stateand provide therapeutic interventions such as fidgeting tools and real-time hap-tic feedback. This work has the potential to greatly improve access to tools thatassess real-world wellbeing including for those with intellectual disabilities.
174
8. Conclusion and Future Work
8.2 Challenges and Future WorkThis thesis presents a step towards real-world affective measurement using thedeveloped tangible interfaces and TL approaches. While the findings of thisresearch are encouraging there are ways in which this work can be extendedand improved upon. This section acknowledges the limitations and providessuggestions for future work.
8.2.1 Datasets
While the personalised TL results using the real-world data are encouraging, theyare by no means sufficient. This is because the dataset is too small to suggeststhat the affect recognition systems can generalise to unconstrained wellbeing inthe wild. To properly test the boundaries of the proposed systems, they needto be trained on datasets that are large scale and continue to accurately mimicreal-life situations.
While the datasets used include physiological sensor data and are representa-tive of a typical affective modelling scenario, the TL approaches could be testedon diverse datasets with more participants and for longer periods of time in var-ious real-world scenarios to ensure their performance is sustained.
8.2.2 Mental Health Recognition
The developed systems monitor affective state but in the future it may be bene-ficial to further explore the classification of specific mental health conditions. Apossible future direction would be to study the detection of anxiety or autism,to help clinicians in medical diagnosis. Currently, the manner in which a patientis diagnosed is based on individual assessment where as the number of patientsincreases so does the need for accurate diagnosis. Standardisation of the diag-nosis task using the developed models could greatly help doctors or counsellorsprovide personalised care to the most at risk patients.
175
8. Conclusion and Future Work
8.2.3 Model Architecture
The developed TL approaches utilise CNNs as they were shown to outperform thevarious other models tested. However, with advances in network architectures,new neural networks could continue to be explored utilising the developed TLapproaches to further increase affective modelling performance.
8.2.4 Edge Computing
On-device processing presents many future opportunities for this research. Presently,resource-constrained edge computing interfaces such as the Raspberry Pi havebeen used to develop personalised models. However, the limited processing powerof the device limits its capabilities and its large size prevents its use in on-body in-terfaces. Advances in edge computing may reduce the size of computing devicesand remove the reliance of mobile apps, potentially enabling a small wearableinterface to perform real-time classification on-device.
8.2.5 Sensors
As part of the analysis, several types of wearable signals have been consideredwith a focus on the use of non-invasive physiological sensors that can be used un-obtrusively in the real-world. In the future, additional contextual and behaviouralsensor data could be collected to help better capture different changes. However,the size and invasive nature of the sensors will have to be carefully considered toensure the devices remain functional in real-world environments.
8.2.6 COVID-19
A limitation of this research is the relatively small sample sizes used during thedata collection trials. However, due to the global pandemic of COVID-19 it hasnot been possible to conduct further experiments involving human participants.In the future, it would be beneficial to trial the developed interfaces and classifi-cation models with a larger number of participants. It would also be beneficial totrial the applications of this research including the iFidgetCube, tangible toys and
176
8. Conclusion and Future Work
Fidget watch with additional participants using real-world longitudinal studiesto explore the impact of these real-time interventions.
8.3 Summary of ContributionsThe research detailed in this thesis makes several original contributions which aresummarised below.
8.3.1 Co-designing Tangible User Interfaces
• A range of TUIs to monitor real-world mental wellbeing have been devel-oped with potential end users. The co-design process was adapted to suitthe needs of the participants with intellectual disabilities and ensure de-signer subjectivity was removed. The use of interactive sessions enabledtarget users to express their decisions and ensured designs were suitable forfuture users.
• The co-designed interfaces and data collection methodology was evaluatedthrough multiple focus groups, ensuring the suitability to monitor real-world affective state using the developed interfaces and non-invasive phys-iological sensors.
8.3.2 Real-world Labelled Data Collection
• Tangible methods to label data in real-time have been explored and eval-uated as sensor data cannot be labelled after the point of collection. Theresults demonstrate the benefits of using 2 adjacent buttons to collect reli-able and accurate labelled data.
• The tangible labelling methodology and co-designed interfaces enabled thesuccessful collection of a real-world labelled physiological affective datasetthat can be used to train classification models.
177
8. Conclusion and Future Work
8.3.3 Deep Transfer Learning Approaches
• Personalising affective models using an on-device TL approach improvedindividual model performance by an average of 21.8%, including those withintellectual disabilities. The ability to perform this approach on-deviceusing few labelled samples significantly simplified the process of developingpersonalised models and paves the way for ubiquitous personalised affectivemodelling.
• Developing an image-encoding TL approach to classify five states of real-world mental wellbeing helped overcome problems with small datasets whentraining deep learning models. This approach resulted in up to 98.5% accu-racy, thus improving the performance of conventional deep learning meth-ods.
8.3.4 Real-time Interventions
• The real-world inference of mental wellbeing provides many opportunities toissue feedback that serves as interventions. Three research applications havebeen developed including: iFidgetCube - providing a fidgeting interface asa preventative mechanism, TangToys - enabling children to communicatethrough physical interactions and afford a sense of togetherness and Fidgetwatch - combining fidgeting tools with real-time classification to activatepersonalised haptic feedback.
• The ability to run classification models on-device using edge computingor using mobile apps enables automated real-world monitoring using thedeveloped models. Real-world inference has enabled interventions such ashaptic feedback to be issued, aiming to improve wellbeing in real-time.
178

References
[1] Sameera Abdul-Kade and John Woods. Survey on Chatbot Design Tech-niques in Speech Conversation Systems. International Journal of AdvancedComputer Science and Applications, 6(7), 2015. 14
[2] Alexander T Adams, Elizabeth L Murnane, Phil Adams, Michael Elfen-bein, Pamara F Chang, Shruti Sannon, Geri Gay, and Tanzeem Choudhury.Keppi: A Tangible User Interface for Self-Reporting Pain. Proceedings ofthe 2018 CHI Conference on Human Factors in Computing Systems - CHI’18, 2018. doi:10.1145/3173574.3174076. 17
[3] Dawn Adams and Chris Oliver. The expression and assessment of emo-tions and internal states in individuals with severe or profound intellectualdisabilities, 2011. doi:10.1016/j.cpr.2011.01.003. 53
[4] Aino Ahtinen, Elina Mattila, Pasi Välkkynen, Kirsikka Kaipainen, ToniVanhala, Miikka Ermes, Essi Sairanen, Tero Myllymäki, and Raimo Lap-palainen. Mobile mental wellness training for stress management: feasibilityand design implications based on a one-month field study. JMIR mHealthand uHealth, 1(2):e11, jul 2013. doi:10.2196/mhealth.2596. 16
[5] Lulwah Al-barrak, Eiman Kanjo, and Eman M. G. Younis. Neuro-Place: Categorizing urban places according to mental states. PLOS ONE,12(9):e0183890, sep 2017. doi:10.1371/journal.pone.0183890. 2, 21
[6] Miquel Alfaras, William Primett, Muhammad Umair, Charles Windlin,Pavel Karpashevich, Niaz Chalabianloo, Dionne Bowie, Corina Sas, Pe-dro Sanches, Kristina Höök, Cem Ersoy, and Hugo Gamboa. Biosensing
179
REFERENCES
and actuation-platforms coupling body input-output modalities for affec-tive technologies. Sensors (Switzerland), 2020. doi:10.3390/s20215968.60
[7] Miquel Alfaras, Vasiliki Tsaknaki, Pedro Sanches, Charles Windlin,Muhammad Umair, Corina Sas, and Kristina Höök. From Biodata to So-madata. In Conference on Human Factors in Computing Systems - Pro-ceedings, 2020. doi:10.1145/3313831.3376684. 42
[8] Salma Alhagry, Aly Aly, and Reda A. Emotion Recognition based on EEGusing LSTM Recurrent Neural Network. International Journal of AdvancedComputer Science and Applications, 8(10), 2017. doi:10.14569/ijacsa.2017.081046. 33, 117
[9] Abdulrahman Alruban, Hind Alobaidi, Nathan Clarke, and Fudong Li.Physical activity recognition by utilising smartphone sensor signals. InICPRAM 2019 - Proceedings of the 8th International Conference onPattern Recognition Applications and Methods, 2019. doi:10.5220/0007271903420351. 92
[10] Sherin F. Aly and A. Lynn Abbott. Facial Emotion Recognition withVarying Poses and/or Partial Occlusion Using Multi-stage ProgressiveTransfer Learning. In Lecture Notes in Computer Science (including sub-series Lecture Notes in Artificial Intelligence and Lecture Notes in Bioin-formatics), volume 11482 LNCS, pages 101–112. Springer Verlag, 2019.doi:10.1007/978-3-030-20205-7_9. 4, 118
[11] American Psychiatric Association. DSM-5 Diagnostic Classification. InDiagnostic and Statistical Manual of Mental Disorders. 2013. doi:10.1176/appi.books.9780890425596.x00diagnosticclassification. 13, 52
[12] American Psychological Association. Stress in America Are Teens AdoptingAdults’ Stress Habits?, 2013. URL: https://www.apa.org/news/press/releases/stress/2013/stress-report.pdf. 174
[13] Viet Hoang Anh, Manh Ngo Van, Bang Ban Ha, and Thang HuynhQuyet. A real-time model based Support Vector Machine for emotion
180
REFERENCES
recognition through EEG. In 2012 International Conference on Con-trol, Automation and Information Sciences, ICCAIS 2012, 2012. doi:10.1109/ICCAIS.2012.6466585. 158
[14] Emily Anthes. Pocket psychiatry: mobile mental-health apps have ex-ploded onto the market, but few have been thoroughly tested. Nature,532(7597):20–24, apr 2016. 13, 16
[15] Lisa Anthony, Sapna Prasad, Amy Hurst, and Ravi Kuber. A participatorydesign workshop on accessible apps and games with students with learningdifferences. In ASSETS’12 - Proceedings of the 14th International ACMSIGACCESS Conference on Computers and Accessibility, 2012. doi:10.1145/2384916.2384979. 55
[16] Brenna D. Argall and Aude G. Billard. A survey of Tactile HumanRobotInteractions, 2010. doi:10.1016/j.robot.2010.07.002. 44
[17] Ruben T Azevedo, Nell Bennett, Andreas Bilicki, Jack Hooper, FotiniMarkopoulou, and Manos Tsakiris. The calming effect of a new wearabledevice during the anticipation of public speech. Sci Rep, 7(1):2285, 2017.41, 167
[18] Muhammad Sufyian Mohd Azmi and Md Nasir Sulaiman. Accelerator-based human activity recognition using voting technique with NBTree andMLP classifiers. International Journal on Advanced Science, Engineeringand Information Technology, 2017. doi:10.18517/ijaseit.7.1.1790. 92
[19] Dzmitry Bahdanau, Kyung Hyun Cho, and Yoshua Bengio. Neural machinetranslation by jointly learning to align and translate. In 3rd InternationalConference on Learning Representations, ICLR 2015 - Conference TrackProceedings, 2015. arXiv:1409.0473. 28
[20] Uddipana Baishya, Elgin Skye McLaren, and Alissa N. Antle. Idea bits: Atangible design tool to aid idea generation for tangible manipulation. InConference on Human Factors in Computing Systems - Proceedings, 2019.doi:10.1145/3290607.3312820. 60
181
REFERENCES
[21] Madeline Balaam, Geraldine Fitzpatrick, Judith Good, and RosemaryLuckin. Exploring Affective Technologies for the Classroom with the SubtleStone. Proceedings of the 28th international conference on Human factorsin computing systems - CHI ’10, page 1623, 2009. 18
[22] Debrup Banerjee, Kazi Islam, Gang Mei, Lemin Xiao, Guangfan Zhang,Roger Xu, Shuiwang Ji, and Jiang Li. A deep transfer learning approachfor improved post-traumatic stress disorder diagnosis. In Proceedings -IEEE International Conference on Data Mining, ICDM, 2017. 36
[23] Debrup Banerjee, Kazi Islam, Keyi Xue, Gang Mei, Lemin Xiao, GuangfanZhang, Roger Xu, Cai Lei, Shuiwang Ji, and Jiang Li. A deep transferlearning approach for improved post-traumatic stress disorder diagnosis.Knowledge and Information Systems, 60(3):1693–1724, sep 2019. 36
[24] Ellen Banzhaf, Francisco De La Barrera, Annegret Kindler, Sonia Reyes-Paecke, Uwe Schlink, Juliane Welz, and Sigrun Kabisch. A conceptualframework for integrated analysis of environmental quality and quality oflife. Ecological Indicators, 2014. doi:10.1016/j.ecolind.2014.06.002.143
[25] Matthew Barker and LindenJanet. A sprite in the dark: supporting con-ventional mental healthcare practices with a tangible device. Proceedings ofthe Tenth International Conference on Tangible, Embedded, and EmbodiedInteraction - TEI ’17, 2016. 18
[26] Paul D. Barrows and Shirley A. Thomas. Assessment of mood in aphasiafollowing stroke: validation of the Dynamic Visual Analogue Mood Scales(D-VAMS). Clinical Rehabilitation, 32(1):94–102, jan 2018. doi:10.1177/0269215517714590. 111, 112
[27] A Batliner, S Steidl, and E Nöth. Releasing a thoroughly annotated andprocessed spontaneous emotional database: the FAU Aibo Emotion Corpus.Proc. of Workshop on Corpora for Research on Emotion and Affect LREC,2008. 36
[28] David Beattie. SqueezeMusic- HCI Audio Interaction Research, 2017. 19
182
REFERENCES
[29] Dror Ben-Zeev, Susan M. Kaiser, Christopher J. Brenner, Mark Begale,Jennifer Duffecy, and David C. Mohr. Development and usability test-ing of FOCUS: a smartphone system for self-management of schizophrenia.Psychiatric rehabilitation journal, 2013. 15
[30] Simone Benedetto, Christian Caldato, Elia Bazzan, Darren C. Greenwood,Virginia Pensabene, and Paolo Actis. Assessment of the fitbit charge 2 formonitoring heart rate. PLoS ONE, 2018. doi:10.1371/journal.pone.0192691. 4
[31] Ida H Bennike, Anders Wieghorst, and Ulrich Kirk. Online-based Mind-fulness Training Reduces Behavioral Markers of Mind Wandering. 2017.14
[32] Thomas Binder, Giorgio De Michelis, Pelle Ehn, Giulio Jacucci, Per Linde,and Ina Wagner. Participation in Design Things. In Design Things. 2019.doi:10.7551/mitpress/8262.003.0011. 53
[33] Martin Bollard and Paul Magee. Myhealth–developing accessible healthmaterials with men with intellectual disability: a co-created Proof of Con-cept. Design for Health, 2020. doi:10.1080/24735132.2020.1836862. 59
[34] Fleur Heleen Boot, J. Owuor, J. Dinsmore, and M. Maclachlan. Access toassistive technology for people with intellectual disabilities: A systematicreview to identify barriers and facilitators, 2018. doi:10.1111/jir.12532.54
[35] Thomas Boraud. How the Brain Makes Decisions. 2020. doi:10.1093/oso/9780198824367.001.0001. 10
[36] Richard E. Boyatzis. Transforming qualitative information. Sage Publica-tions, Inc, 1998. 64
[37] Jordan Boyd-Graber, Sonya Nikolova, Karyn Moffatt, Kenrick Kin, JoshuaLee, Lester Mackey, Marilyn Tremaine, and Maria Klawe. Participatorydesign with proxies: Developing a desktop-PDA system to support peoplewith aphasia. In Conference on Human Factors in Computing Systems -Proceedings, 2006. 59
183
REFERENCES
[38] Margaret M. Bradley and Peter J. Lang. Measuring emotion: The self-assessment manikin and the semantic differential. Journal of BehaviorTherapy and Experimental Psychiatry, 1994. doi:10.1016/0005-7916(94)90063-9. 11, 120
[39] José Bravo, Ramón Hervás, and Vladimir Villarreal. Ambient intelligencefor health first international conference, AmIHEALTH 2015 Puerto Varas,Chile, December 1–4, 2015 proceedings. Lecture Notes in Computer Science,9456:189–200, 2015. 46
[40] Margot Brereton, Laurianne Sitbon, Muhammad Haziq Lim Abdullah,Mark Vanderberg, and Stewart Koplick. Design after design to bridge be-tween people living with cognitive or sensory impairments, their friends andproxies. CoDesign, 2015. doi:10.1080/15710882.2015.1009471. 58
[41] Amanda Briggs-Goode, Martha Glazzard, Sarah Walker, Sarah Kettley,Tincuta Heinzel, and Rachel Lucas. Wellbeing and Smart Textiles: Re-flecting on Collaborative Practices and the Design Process. Journal of Tex-tile Design Research and Practice, 2016. doi:10.1080/20511787.2016.1256599. 60
[42] D Brown, R Kettley, and S Kettley. Interpersonal Process Recall – a methodfor reflecting on co-design experiences. In Method Stories Workshop, ACMCHI 2016, 2016. URL: https://chimethodstories.wordpress.com/. 57
[43] D Brown, R Kettley, and S Kettley. Interpersonal Process Recall – a methodfor reflecting on co-design experiences. 2016. 86
[44] David J. Brown, Steven Battersby, Penny Standen, Nicola Anderton,Matthew Harrison, and David J. Brown. Inclusive design for disabil-ity: A prototype switch for use in virtual learning environments. In-ternational Journal on Disability and Human Development, 2005. doi:10.1515/IJDHD.2005.4.2.103. 60, 74
[45] David J. Brown, David McHugh, Penny Standen, Lindsay Evett, Nick Shop-land, and Steven Battersby. Designing location-based learning experiencesfor people with intellectual disabilities and additional sensory impairments.
184
REFERENCES
Computers and Education, 2011. doi:10.1016/j.compedu.2010.04.014.57
[46] R. M. Bruno. Interpretation of pictorially presented social situations bylearning disabled and normal children. Journal of learning disabilities, 1981.doi:10.1177/002221948101400617. 53
[47] Miguel Bruns, Alonso David, V Keyson, and Caroline C M Hummels.Squeeze, Rock, and Roll; Can Tangible Interaction with Affective ProductsSupport Stress Reduction? Proceedings of the 2nd international conferenceon Tangible and embedded interaction - TEI ’08, 2008. 40
[48] Philip M. Burgess, Jane E. Pirkis, Tim N. Slade, Amy K. Johnston, Gra-ham N. Meadows, and Jane M. Gunn. Service Use for Mental HealthProblems: Findings from the 2007 National Survey of Mental Health andWellbeing. Australian New Zealand Journal of Psychiatry, 43(7):615–623,jul 2009. doi:10.1080/00048670902970858. 13
[49] Ingrid Burkett. An Introduction to Co-design. Technical report, 2016.URL: http://www.csi.edu.au/. 53, 58
[50] Steven H Cady and Gwen E Jones. Massage therapy as a workplace inter-vention for reduction of stress. O Perceptual and Motor Skills, 84:157–158,1997. 41
[51] Rafael A. Calvo and Dorian Peters. Promoting psychological wellbeing:Loftier goals for new technologies [opinion], 2013. doi:10.1109/MTS.2013.2286429. 52
[52] Yekta Said Can, Bert Arnrich, and Cem Ersoy. Stress detection in daily lifescenarios using smart phones and wearable sensors: A survey. Journal ofBiomedical Informatics, 2019. doi:10.1016/j.jbi.2019.103139. 38, 87
[53] Vaughan Carr. Patients’ techniques for coping with schizophrenia: Anexploratory study. British Journal of Medical Psychology, 61(4):339–352,dec 1988. 40, 161
[54] Rich Caruana. Multitask Learning. Machine Learning, 28(1):41–75, 1997.doi:10.1023/A:1007379606734. 35, 118, 141
185
REFERENCES
[55] R. Castaldo, W. Xu, P. Melillo, L. Pecchia, L. Santamaria, and C. James.Detection of mental stress due to oral academic examination via ultra-short-term HRV analysis. In Proceedings of the Annual International Conferenceof the IEEE Engineering in Medicine and Biology Society, EMBS, 2016.doi:10.1109/EMBC.2016.7591557. 37, 157
[56] Nair Chaitanya M., Sharmila Jayakkumar, Edwin Chong, and C.H. Yeow.A wearable, EEG-based massage headband for anxiety alleviation. In 201739th Annual International Conference of the IEEE Engineering in Medicineand Biology Society (EMBC), volume 2017, pages 3557–3560. IEEE, jul2017. doi:10.1109/EMBC.2017.8037625. 46
[57] Hsiu-Sen Chiang. ECG-based Mental Stress Assessment Using Fuzzy Com-puting and Associative Petri Net. Journal of Medical and Biological Engi-neering, 35(6):833–844, dec 2015. doi:10.1007/s40846-015-0095-7. 20
[58] Jongyoon Choi, B. Ahmed, and Ricardo Gutierrez-Osuna. Developmentand evaluation of an ambulatory stress monitor based on wearable sensors.IEEE Transactions on Information Technology in Biomedicine, 2012. doi:10.1109/TITB.2011.2169804. 20
[59] Yoorim Choi and Minjung Kim. Measurement of occupants’ stress based onelectroencephalograms (EEG) in twelve combined environments. Buildingand Environment, 88:65–72, jun 2015. doi:10.1016/J.BUILDENV.2014.10.003. 33
[60] Junyoung Chung, Caglar Gulcehre, KyungHyun Cho, and Yoshua Bengio.Empirical Evaluation of Gated Recurrent Neural Networks on SequenceModeling. dec 2014. URL: http://arxiv.org/abs/1412.3555, arXiv:1412.3555. 26
[61] S. Clement, O. Schauman, T. Graham, F. Maggioni, S. Evans-Lacko,N. Bezborodovs, C. Morgan, N. Rüsch, J. S. L. Brown, and G. Thorni-croft. What is the impact of mental health-related stigma on help-seeking?A systematic review of quantitative and qualitative studies. PsychologicalMedicine, 45(01):11–27, jan 2015. 13, 51
186

REFERENCES
[62] Brendan Corbett, Chang S. Nam, and Takehiko Yamaguchi. The Effectsof Haptic Feedback and Visual Distraction on Pointing Task Performance.International Journal of Human-Computer Interaction, 32(2):89–102, feb2016. 40, 167
[63] Jean Costa, François Guimbretière, Malte Jung, and Tanzeem Choudhury.BoostMeUp: Improving Cognitive Performance in the Moment by Un-obtrusively Regulating Emotions with a Smartwatch. Proceedings of theACM on Interactive, Mobile, Wearable and Ubiquitous Technologies, 2019.doi:10.1145/3328911. 165
[64] Ian Cross, Susan Hallam, and Michael Thaut. The Oxford Handbook ofMusic Psychology. 2008. doi:10.1093/oxfordhb/9780199298457.001.0001. 165
[65] Suzanne B. Da Câmara, Rakshit Agrawal, and Katherine Isbister. Iden-tifying children’s fidget object preferences: Toward exploring the impactsof fidgeting and fidget-friendly tangibles. In DIS 2018 - Proceedings ofthe 2018 Designing Interactive Systems Conference, 2018. doi:10.1145/3196709.3196790. 80, 161
[66] Simon D’Alfonso, Olga Santesteban-Echarri, Simon Rice, Greg Wadley,Reeva Lederman, Christopher Miles, John Gleeson, and Mario Alvarez-Jimenez. Artificial Intelligence-Assisted Online Social Therapy for YouthMental Health. Frontiers in Psychology, 8:796, jun 2017. 14
[67] Antonio R. Damasio. Emotion in the perspective of an integrated ner-vous system. In Brain Research Reviews, volume 26, 1998. doi:10.1016/S0165-0173(97)00064-7. 10
[68] Priyanka Das, Anwesha Khasnobish, and D. N. Tibarewala. Emotionrecognition employing ECG and GSR signals as markers of ANS. InConference on Advances in Signal Processing, CASP 2016, 2016. doi:10.1109/CASP.2016.7746134. 32
[69] Claudia Daudén Roquet and Corina Sas. Evaluating Mindfulness Medita-tion Apps. In Extended Abstracts of the 2018 CHI Conference on Human
187
REFERENCES
Factors in Computing Systems - CHI ’18, pages 1–6, New York, New York,USA, 2018. ACM Press. URL: http://dl.acm.org/citation.cfm?doid=3170427.3188616, doi:10.1145/3170427.3188616. 161
[70] Dmitry Davidov, Oren Tsur, and Ari Rappoport. Enhanced SentimentLearning Using Twitter Hashtags and Smileys. Technical report, 2010.URL: https://www.aclweb.org/anthology/C10-2028. 21
[71] Melissa Dawe. ”let me show you what i want”: Engaging individuals withcognitive disabilities and their families in design. In Conference on HumanFactors in Computing Systems - Proceedings, 2007. doi:10.1145/1240866.1240976. 55
[72] Thomas De Cooman, Kaat Vandecasteele, Carolina Varon, Borbála Hun-yadi, Evy Cleeren, Wim Van Paesschen, and Sabine Van Huffel. Personal-izing Heart Rate-Based Seizure Detection Using Supervised SVM TransferLearning. Frontiers in Neurology, 2020. doi:10.3389/fneur.2020.00145.35
[73] Alberto De Santos Sierra, Carmen Sanchez Avila, Javier Guerra Casanova,Gonzalo Bailador Del Pozo, and Vicente Jara Vera. Two stress detec-tion schemes based on physiological signals for real-time applications.In Proceedings - 2010 6th International Conference on Intelligent Infor-mation Hiding and Multimedia Signal Processing, IIHMSP 2010, 2010.doi:10.1109/IIHMSP.2010.95. 33
[74] Katarina Dedovic, Robert Renwick, Najmeh Khalili Mahani, and VeronikaEngert. The Montreal Imaging Stress Task : using functional imaging toinvestigate the ... Psychiatry Neuroscience, 30(5):319–325, 2005. 120
[75] Janez Demšar. Statistical Comparisons of Classifiers over Multiple DataSets. Journal of Machine Learning Research, 7(Jan):1–30, 2006. URL:http://www.jmlr.org/papers/v7/demsar06a.html. 103
[76] Jun Deng, Sascha Fruhholz, Zixing Zhang, and Bjorn Schuller. Recogniz-ing Emotions from Whispered Speech Based on Acoustic Feature TransferLearning. IEEE Access, pages 1–1, 2017. doi:10.1109/ACCESS.2017.2672722. 36
188
REFERENCES
[77] Jun Deng, Zixing Zhang, Erik Marchi, and Björn Schuller. Sparseautoencoder-based feature transfer learning for speech emotion recogni-tion. In Proceedings - 2013 Humaine Association Conference on AffectiveComputing and Intelligent Interaction, ACII 2013, pages 511–516, 2013.doi:10.1109/ACII.2013.90. 36
[78] David DeSteno, Daniel Lim, Fred Duong, and Paul Condon. MeditationInhibits Aggressive Responses to Provocations. Mindfulness, 9(4):1117–1122, aug 2018. 14
[79] Gavin Doherty, David Coyle, John Sharry, and James Joyce St. Engagementwith Online Mental Health Interventions: An Exploratory Clinical Studyof a Treatment for Depression. 2012. URL: https://www.scss.tcd.ie/Gavin.Doherty/papers/DohertyCS12.pdf. 161
[80] Tara Donker, Katherine Petrie, Judy Proudfoot, Janine Clarke, Mary-RoseBirch, and Helen Christensen. Smartphones for smarter delivery of mentalhealth programs: a systematic review. Journal of medical Internet research,15(11):e247, nov 2013. doi:10.2196/jmir.2791. 16
[81] Marcos Economides, Janis Martman, Megan J. Bell, and Brad Sander-son. Improvements in Stress, Affect, and Irritability Following Brief Useof a Mindfulness-based Smartphone App: A Randomized Controlled Trial.Mindfulness, 9(5):1584–1593, oct 2018. 14
[82] Bo Edvardsson, Thomas Meiren, Adrienne Schäfer, and Lars Witell. Havinga strategy for new service development - does it really matter? Journal ofService Management, 2013. doi:10.1108/09564231311304170. 54
[83] Paul Ekman and Wallace V. Friesen. Constants across cultures in theface and emotion. Journal of Personality and Social Psychology, 1971.doi:10.1037/h0030377. 11
[84] Nour El Mawass and Eiman Kanjo. A supermarket stress map. In Ubi-Comp 2013 Adjunct - Adjunct Publication of the 2013 ACM Conference onUbiquitous Computing, 2013. 2
189

REFERENCES
[85] Irene Elkin, M. Tracie Shea, John T. Watkins, Stanley D. Imber, Stuart M.Sotsky, Joseph F. Collins, David R. Glass, Paul A. Pilkonis, William R.Leber, John P. Docherty, Susan J. Fiester, and Morris B. Parloff. NationalInstitute of Mental Health Treatment of Depression Collaborative ResearchProgram. Archives of General Psychiatry, 46(11):971, nov 1989. doi:10.1001/archpsyc.1989.01810110013002. 13
[86] Empatica. E4 wristband | Real-time physiological signals | Wearable PPG,EDA, Temperature, Motion sensors, 2020. 49
[87] European Comission. Data protection, 2018. URL: https://ec.europa.eu/info/law/law-topic/data-protection_en. 46
[88] M Everingham, L Van Gool, C K I Williams, J Winn, and A Zisser-man. DLPASCALThe PASCAL Visual Object Classes Challenge 2012(VOC2012) Development Kit. Pattern Analysis, Statistical Modelling andComputational Learning, Tech. Rep, 2012. 35
[89] Fatemeh Fahimi, Zhuo Zhang, Wooi Boon Goh, Tih Shi Lee, Kai KengAng, and Cuntai Guan. Inter-subject transfer learning with an end-to-enddeep convolutional neural network for EEG-based BCI. Journal of NeuralEngineering, 2019. doi:10.1088/1741-2552/aaf3f6. 35
[90] James Farley, Evan F. Risko, and Alan Kingstone. Everyday attentionand lecture retention: The effects of time, fidgeting, and mind wandering.Frontiers in Psychology, 2013. doi:10.3389/fpsyg.2013.00619. 161
[91] Hassan Ismail Fawaz, Benjamin Lucas, Germain Forestier, Charlotte Pel-letier, Daniel F. Schmidt, Jonathan Weber, Geoffrey I. Webb, LhassaneIdoumghar, Pierre-Alain Muller, and François Petitjean. InceptionTime:Finding AlexNet for Time Series Classification. sep 2019. arXiv:1909.04939. xii, 29
[92] Claire L Forrest, Jenny L Gibson, Sarah L Halligan, and Michelle C St Clair.A longitudinal analysis of early language difficulty and peer problems onlater emotional difficulties in adolescence: Evidence from the MillenniumCohort Study. Autism Developmental Language Impairments, 2018. 166
190
REFERENCES
[93] Peter Francis, Sandrine Balbo, and Lucy Firth. Towards co-design withusers who have autism spectrum disorders. Universal Access in the Infor-mation Society, 2009. doi:10.1007/s10209-008-0143-y. 54
[94] Jérémy Frey, Jessica Cauchard, and I D C Herzliya. Remote BiofeedbackSharing, Opportunities and Challenges. Proceedings of the ACM Inter-national Joint Conference on Pervasive and Ubiquitous Computing, pages730–733, aug 2018. arXiv:1808.08713, doi:arXiv:1808.08713v1. 41, 45,46
[95] Carolina Fuentes, Iyubanit Rodríguez, and Valeria Herskovic. EmoBall: Astudy on a tangible interface to self-report emotional information consider-ing digital competences. In Lecture Notes in Computer Science (includingsubseries Lecture Notes in Artificial Intelligence and Lecture Notes in Bioin-formatics), 2015. doi:10.1007/978-3-319-26508-7_19. 17, 47, 57
[96] T. L. Galinsky, R. R. Rosa, J. S. Warm, and W. N. Dember. Psychophysicaldeterminants of stress in sustained attention. Human Factors, 1993. doi:10.1177/001872089303500402. 161
[97] Julia Galliers, Stephanie Wilson, Abi Roper, Naomi Cocks, Jane Marshall,Sam Muscroft, and Tim Pring. Words are not enough: Empowering peo-ple with aphasia in the design process. In ACM International ConferenceProceeding Series, 2012. doi:10.1145/2347635.2347643. 59
[98] Enrique Garcia-Ceja, Michael Riegler, Tine Nordgreen, Petter Jakobsen,Ketil J. Oedegaard, and Jim Tørresen. Mental health monitoring withmultimodal sensing and machine learning: A survey. Pervasive and MobileComputing, 51:1–26, dec 2018. 4, 118
[99] B. Geethanjali, K. Adalarasu, A. Hemapraba, S. Pravin Kumar, and R. Ra-jasekeran. Emotion analysis using sam (Self-assessment manikin) scale.Biomedical Research (India), 2017. 112
[100] Peter J. Gianaros, J. Richard Jennings, Lei K. Sheu, Phil J. Greer, Lewis H.Kuller, and Karen A. Matthews. Prospective reports of chronic life stresspredict decreased grey matter volume in the hippocampus. NeuroImage,2007. doi:10.1016/j.neuroimage.2006.10.045. 39
191
REFERENCES
[101] Giorgos Giannakakis, Kostas Marias, and Manolis Tsiknakis. A stressrecognition system using HRV parameters and machine learning tech-niques. In 2019 8th International Conference on Affective Computingand Intelligent Interaction Workshops and Demos, ACIIW 2019, pages269–272. Institute of Electrical and Electronics Engineers Inc., sep 2019.doi:10.1109/ACIIW.2019.8925142. 32
[102] Alison Giraud-Saunders. Mental health in people with learning disabilities,2011. 1, 6, 51, 52, 82, 118, 172
[103] Martin Gjoreski, Hristijan Gjoreski, Mitja Luštrek, and Matjaž Gams.Continuous stress detection using a wrist device - in laboratory and reallife. In UbiComp 2016 Adjunct - Proceedings of the 2016 ACM Inter-national Joint Conference on Pervasive and Ubiquitous Computing, 2016.doi:10.1145/2968219.2968306. 37
[104] Martin Gjoreski, Mitja Luštrek, Matjaž Gams, and Hristijan Gjoreski. Mon-itoring stress with a wrist device using context. Journal of BiomedicalInformatics, 2017. doi:10.1016/j.jbi.2017.08.006. 12
[105] David S. Goldstein and Irwin J. Kopin. Evolution of concepts of stress,2007. doi:10.1080/10253890701288935. 12
[106] HARRIS S. GOLDSTEIN and ROBERT EDELBERG. A plethysmographicmethod for demonstrating the response specificity of the oral vascular bed.Psychophysiology, 34(1):124–128, jan 1997. doi:10.1111/j.1469-8986.1997.tb02423.x. 20
[107] Ian Goodfellow, Yoshua Benigo, and Courville Aaron. Deep Learning(Adaptive Computation and Machine Learning), 2016. 118
[108] Google. Google Play Store, 2019. URL: https://play.google.com/store/apps?hl=en. 88
[109] Google. reCAPTCHA: Easy on Humans, Hard on Bots, 2019. URL: https://www.google.com/recaptcha/intro/v3.html. 21
192
REFERENCES
[110] Jack M. Gorman and Richard P. Sloan. Heart rate variability in depressiveand anxiety disorders. American Heart Journal, 2000. doi:10.1067/mhj.2000.109981. 20
[111] D. Gould. Visual Analogue Scale (VAS) - Information Point. Journal ofClinical Nursing, 2001. doi:10.4193/Rhino10.303. 120
[112] Alessandra Grassi, Andrea Gaggioli, and Giuseppe Riva. New technolo-gies to manage exam anxiety. Annual Review of CyberTherapy andTelemedicine, 2011. 15
[113] Matthew M Graziose. On the Accuracy of Self-Report Instruments forMeasuring Food Consumption in the School Setting. Advances in Nutrition,8(4):635–636, jul 2017. 12, 45
[114] James J Gross and R Thompson. Emotion regulation: Conceptual founda-tions. In J. J. Gross (Eds.) Handbook of Emotion Regulation. 2007. 52
[115] Frode Guribye and Tor Gjøsæter. Tangible Interaction in the Dentist Of-fice. In Proceedings of the Twelfth International Conference on Tangible,Embedded, and Embodied Interaction - TEI ’18, pages 123–130, New York,New York, USA, 2018. ACM Press. doi:10.1145/3173225.3173287. 19
[116] John Garcia Gustavson and Andrew R. The Science of Self-Report. APSObserver, 10(1), jan 1997. 12
[117] Morgane Hamon, Rémy Ramadour, and Jérémy Frey. Exploring biofeed-back with a tangible interface designed for relaxation. In PhyCS 2018 -Proceedings of the 5th International Conference on Physiological Comput-ing Systems, 2018. arXiv:1808.08711, doi:10.5220/0006961200540063.42
[118] Gordon T. Harold and Dale F. Hay. Normal development in middle child-hood. Psychiatry, 4(6):3–5, jun 2005. doi:10.1383/psyt.4.6.3.66355.77
[119] Virginia Harrison, Judith Proudfoot, Pang Ping Wee, Gordon Parker, Du-san Hadzi Pavlovic, and Vijaya Manicavasagar. Mobile mental health: Re-view of the emerging field and proof of concept study. Journal of Mental
193
REFERENCES
Health, 20(6):509–524, dec 2011. doi:10.3109/09638237.2011.608746.17
[120] Sandra G. Hart and Lowell E. Staveland. Development of NASA-TLX (TaskLoad Index): Results of Empirical and Theoretical Research. Advances inPsychology, 1988. doi:10.1016/S0166-4115(08)62386-9. 120
[121] Md Junayed Hasan, Muhammad Sohaib, and Jong Myon Kim. 1D CNN-based transfer learning model for bearing fault diagnosis under variableworking conditions. In Advances in Intelligent Systems and Comput-ing, volume 888, pages 13–23. Springer Verlag, nov 2019. doi:10.1007/978-3-030-03302-6_2. 23
[122] Kaiming He, Xiangyu Zhang, Shaoqing Ren, and Jian Sun. Delving deepinto rectifiers: Surpassing human-level performance on imagenet classifica-tion. In Proceedings of the IEEE International Conference on ComputerVision, 2015. arXiv:1502.01852, doi:10.1109/ICCV.2015.123. 28
[123] Kaiming He, Xiangyu Zhang, Shaoqing Ren, and Jian Sun. Deep residuallearning for image recognition. In Proceedings of the IEEE Computer SocietyConference on Computer Vision and Pattern Recognition, 2016. arXiv:1512.03385, doi:10.1109/CVPR.2016.90. 28
[124] J.A. Healey and R.W. Picard. Detecting Stress During Real-World Driv-ing Tasks Using Physiological Sensors. IEEE Transactions on IntelligentTransportation Systems, 6(2):156–166, jun 2005. 32, 34, 46
[125] Jennifer Healey, Lama Nachman, Sushmita Subramanian, Junaith Shahab-deen, and Margaret Morris. Out of the lab and into the fray: Towards mod-eling emotion in everyday life. In Lecture Notes in Computer Science (in-cluding subseries Lecture Notes in Artificial Intelligence and Lecture Notesin Bioinformatics), 2010. doi:10.1007/978-3-642-12654-3_10. 38
[126] Niels Hendriks, Karin Slegers, and Pieter Duysburgh. Codesign with peopleliving with cognitive or sensory impairments: a case for method stories anduniqueness. International Journal of CoCreation in Design and the Arts,2015. 58
194
REFERENCES
[127] Katherine A. Herborn, James L. Graves, Paul Jerem, Neil P. Evans, RuediNager, Dominic J. McCafferty, and Dorothy E.F. F McKeegan. Skin tem-perature reveals the intensity of acute stress. Physiology Behavior, 152(PtA):225–230, dec 2015. doi:10.1016/J.PHYSBEH.2015.09.032. 33
[128] David Hernando, Surya Roca, Jorge Sancho, Álvaro Alesanco, and RaquelBailón. Validation of the apple watch for heart rate variability measure-ments during relax and mental stress in healthy subjects. Sensors (Switzer-land), 2018. doi:10.3390/s18082619. 4
[129] Geoffrey E. Hinton, Alex Krizhevsky, and Sida D. Wang. Transformingauto-encoders. In Lecture Notes in Computer Science (including subseriesLecture Notes in Artificial Intelligence and Lecture Notes in Bioinformat-ics), 2011. 26
[130] Sepp Hochreiter and Jürgen Schmidhuber. Long Short-Term Memory. Neu-ral Computation, 9(8):1735–1780, nov 1997. doi:10.1162/neco.1997.9.8.1735. 24, 98
[131] Arthur E. Hoerl and Robert W. Kennard. Ridge Regression: Applica-tions to Nonorthogonal Problems. Technometrics, 1970. doi:10.1080/00401706.1970.10488635. 28
[132] M A Hogg, Dominic Abrams, and G N Martin. Social cognition and atti-tudes. Psychology, pages 646–677, 2010. 10
[133] Nic Hollinworth, Gosia Malgosia Kwiatkowska, Faustina Hwang, AndyMinnion, and Kate Allen. Making electronics more accessible to peoplewith learning disabilities. In Conference on Human Factors in ComputingSystems - Proceedings, 2014. doi:10.1145/2559206.2581175. 60
[134] Stefan Holmlid. Participative, co-operative, emancipatory: From partici-patory design to service design. First Nordic Conference on Service Designand Service Innovation, 2009. 53
[135] Kristina Höök, Martin P. Jonsson, Anna Ståhl, and Johanna Mercurio.Somaesthetic Appreciation design. In Conference on Human Factors in
195
REFERENCES
Computing Systems - Proceedings, 2016. doi:10.1145/2858036.2858583.42
[136] Eva Hornecker and Jacob Buur. Getting a Grip on Tangible Interaction:A Framework on Physical Space and Social Interaction. Proceedings of theSIGCHI conference on Human Factors in computing systems - CHI ’06,2006. doi:10.1145/????????? 52
[137] Rasam Bin Hossain, Mefta Sadat, and Hasan Mahmud. Recognition ofhuman affection in smartphone perspective based on accelerometer anduser’s sitting position. In 2014 17th International Conference on Computerand Information Technology, ICCIT 2014, 2014. 21
[138] Karen Hovsepian, Mustafa Al’absi, Emre Ertin, Thomas Kamarck, Moto-hiro Nakajima, and Santosh Kumar. CStress: Towards a gold standard forcontinuous stress assessment in the mobile environment. In UbiComp 2015- Proceedings of the 2015 ACM International Joint Conference on Pervasiveand Ubiquitous Computing, 2015. doi:10.1145/2750858.2807526. 37, 157
[139] Andrew Howard, Mark Sandler, Grace Chu, Liang-Chieh Chen, Bo Chen,Mingxing Tan, WeijunWang, Yukun Zhu, Ruoming Pang, Vijay Vasudevan,Quoc V Le, Hartwig Adam, Google Ai, and Google Brain. Searching forMobileNetV3. Technical report. arXiv:1905.02244v5. 35
[140] Guang Bin Huang, Hongming Zhou, Xiaojian Ding, and Rui Zhang. Ex-treme learning machine for regression and multiclass classification. IEEETransactions on Systems, Man, and Cybernetics, Part B: Cybernetics, 2012.doi:10.1109/TSMCB.2011.2168604. 36
[141] B. F. Hudson, J. Ogden, and M. S. Whiteley. Randomized controlled trialto compare the effect of simple distraction interventions on pain and anxietyexperienced during conscious surgery. European Journal of Pain (UnitedKingdom), 2015. 2, 80, 138, 161
[142] Sergey Ioffe and Christian Szegedy. Batch normalization: Accelerating deepnetwork training by reducing internal covariate shift. In 32nd InternationalConference on Machine Learning, ICML 2015, volume 1, pages 448–456.International Machine Learning Society (IMLS), 2015. 24, 98
196
REFERENCES
[143] Hiroshi Ishii. The tangible user interface and its evolution. Communicationsof the ACM, 2008. doi:10.1145/1349026.1349034. 2
[144] Hiroshi Ishii and Brygg Ullmer. Tangible bits: Towards seamless inter-faces between people, bits and atoms. In Conference on Human Factors inComputing Systems - Proceedings, 1997. 2
[145] Hassan Ismail Fawaz, Germain Forestier, Jonathan Weber, LhassaneIdoumghar, and Pierre Alain Muller. Deep learning for time series clas-sification: a review. Data Mining and Knowledge Discovery, 2019. arXiv:1809.04356, doi:10.1007/s10618-019-00619-1. 127
[146] Robert J.K. Jacob, Orit Shaer, Audrey Girouard, Leanne M. Hirshfield,Michael S. Horn, Erin Treacy Solovey, and Jamie Zigelbaum. Reality-Basedinteraction: A framework for post-WIMP interfaces. In Conference onHuman Factors in Computing Systems - Proceedings, 2008. doi:10.1145/1357054.1357089. 17
[147] Natasha Jaques, Sara Taylor, Ehimwenma Nosakhare, Akane Sano, andRosalind Picard. Multi-task Learning for Predicting Health, Stress, andHappiness, 2016. 38
[148] Noppadon Jatupaiboon, Setha Pan-Ngum, and Pasin Israsena. Real-timeEEG-based happiness detection system. The Scientific World Journal, 2013.doi:10.1155/2013/618649. 158
[149] Houtan Jebelli, Sungjoo Hwang, and Sang Hyun Lee. EEG-based workers’stress recognition at construction sites. Automation in Construction, 2018.doi:10.1016/j.autcon.2018.05.027. 33
[150] Sooyeon Jeong, Miriam Zisook, Luke Plummer, Cynthia Breazeal, PeterWeinstock, Deirdre E. Logan, Matthew S. Goodwin, Suzanne Graca, Bri-anna O’Connell, Honey Goodenough, Laurel Anderson, Nicole Stenquist,and Katie Fitzpatrick. A Social Robot to Mitigate Stress, Anxiety, and Painin Hospital Pediatric Care. In Proceedings of the Tenth Annual ACM/IEEEInternational Conference on Human-Robot Interaction Extended Abstracts- HRI’15 Extended Abstracts, pages 103–104, New York, New York, USA,2015. ACM Press. doi:10.1145/2701973.2702028. 44
197

REFERENCES
[151] Jutta Joormann, Matthias Siemer, and Ian H Gotlib. Mood Regulation inDepression: Differential Effects of Distraction and Recall of Happy Memo-ries on Sad Mood. 2007. 161
[152] Rafal Jozefowicz, Wojciech Zaremba, and Ilya Sutskever. An empiricalexploration of recurrent network architectures, 2015. URL: https://dl.acm.org/citation.cfm?id=3045367. 26
[153] Łukasz Kaiser and Ilya Sutskever. Neural GPUs Learn Algorithms. nov2015. URL: http://arxiv.org/abs/1511.08228, arXiv:1511.08228. 26
[154] Eiman Kanjo, Daria J. Kuss, and Chee Siang Ang. NotiMind: UtilizingResponses to Smart Phone Notifications as Affective Sensors. IEEE Access,5:22023–22035, 2017. doi:10.1109/ACCESS.2017.2755661. 13, 21
[155] Eiman Kanjo, Eman M G Younis, and Chee Siang Ang. Deep learninganalysis of mobile physiological, environmental and location sensor datafor emotion detection. Information Fusion, 49:46–56, 2019. 34, 157, 159
[156] Eiman Kanjo, Eman M.G. Younis, and Nasser Sherkat. Towards unravellingthe relationship between on-body, environmental and emotion data usingsensor information fusion approach. Information Fusion, 2018. 21, 34, 157,159
[157] Saeed Karimi-Bidhendi, Faramarz Munshi, and Ashfaq Munshi. ScalableClassification of Univariate and Multivariate Time Series. In Proceedings- 2018 IEEE International Conference on Big Data, Big Data 2018, 2019.doi:10.1109/BigData.2018.8621889. 141, 147
[158] Connor Tom Keating and Jennifer Louise Cook. Facial Expression Produc-tion and Recognition in Autism Spectrum Disorders: A Shifting Landscape,2020. doi:10.1016/j.chc.2020.02.006. 112
[159] Chelsea Kelling, Daniella Pitaro, and Jussi Rantala. Good vibes. In Pro-ceedings of the 20th International Academic Mindtrek Conference on - Aca-demicMindtrek ’16, pages 130–136, New York, New York, USA, 2016. ACMPress. 40, 165
198

REFERENCES
[160] A. M. Khan, Y. K. Lee, and S. Y. Lee. Accelerometer’s position free humanactivity recognition using a hierarchical recognition model. In 12th IEEEInternational Conference on e-Health Networking, Application and Services,Healthcom 2010, 2010. doi:10.1109/HEALTH.2010.5556553. 92
[161] Angela S. Khor, Kylie M. Gray, Sophie C. Reid, and Glenn A. Melvin. Fea-sibility and validity of ecological momentary assessment in adolescents withhigh-functioning autism and Asperger’s disorder. Journal of Adolescence,2014. doi:10.1016/j.adolescence.2013.10.005. 107
[162] Reza Khosrowabadi, Chai Quek, Kai Keng Ang, Sau Wai Tung, and MichelHeijnen. A Brain-Computer Interface for classifying EEG correlates ofchronic mental stress. In The 2011 International Joint Conference on Neu-ral Networks, pages 757–762. IEEE, jul 2011. doi:10.1109/IJCNN.2011.6033297. 30, 33, 34, 46
[163] George Poonkhin Khut. Designing biofeedback artworks for relaxation. InConference on Human Factors in Computing Systems - Proceedings, 2016.doi:10.1145/2851581.2891089. 42
[164] Basel Kikhia, Thanos G Stavropoulos, Stelios Andreadis, Niklas Karvo-nen, Ioannis Kompatsiaris, Stefan Sävenstedt, Marten Pijl, and CatharinaMelander. Utilizing a Wristband Sensor to Measure the Stress Level forPeople with Dementia. Sensors (Basel, Switzerland), 16(12), nov 2016.doi:10.3390/s16121989. 33
[165] Hye-Geum Kim, Eun-Jin Cheon, Dai-Seg Bai, Young Hwan Lee, and Bon-Hoon Koo. Stress and Heart Rate Variability: A Meta-Analysis and Reviewof the Literature. Psychiatry investigation, 15(3):235–245, mar 2018. 2
[166] Jonghwa Kim and Elisabeth André. Emotion recognition based on physio-logical changes in music listening. IEEE Transactions on Pattern Analysisand Machine Intelligence, 2008. doi:10.1109/TPAMI.2008.26. 37
[167] Nobuaki Kimura, Ikuo Yoshinaga, Kenji Sekijima, Issaku Azechi, andDaichi Baba. Convolutional Neural Network Coupled with a Transfer-Learning Approach for Time-Series Flood Predictions. Water, 12(1):96,dec 2019. 125
199
REFERENCES
[168] Evan Kleiman, Alexander J. Millner, Victoria W. Joyce, Carol C. Nash,Ralph J. Buonopane, and Matthew K. Nock. Using wearable physiologicalmonitors with suicidal adolescent inpatients: Feasibility and acceptabilitystudy. JMIR mHealth and uHealth, 2019. doi:10.2196/13725. 4
[169] Saskia Koldijk, Maya Sappelli, Suzan Verberne, Mark A. Neerincx, andWessel Kraaij. The Swell knowledge work dataset for stress and user mod-eling research. In ICMI 2014 - Proceedings of the 2014 International Confer-ence on Multimodal Interaction, pages 291–298. Association for ComputingMachinery, Inc, nov 2014. doi:10.1145/2663204.2663257. 3, 108, 122
[170] Yuka Kotozaki, Hikaru Takeuchi, Atsushi Sekiguchi, Yuki Yamamoto,Takamitsu Shinada, Tsuyoshi Araki, Kei Takahashi, Yasuyuki Taki,Takeshi Ogino, Masashi Kiguchi, and Ryuta Kawashima. Biofeedback-based training for stress management in daily hassles: an interventionstudy. Brain and behavior, 4(4):566–579, jul 2014. doi:10.1002/brb3.241.39
[171] Kurt Kroenke, Robert L. Spitzer, Janet B.W. Williams, and Bernd Löwe.An Ultra-Brief Screening Scale for Anxiety and Depression: The PHQ–4.Psychosomatics, 50(6):613–621, nov 2009. 31
[172] Jacob Leon Kröger, Otto Hans Martin Lutz, and Philip Raschke. Privacyimplications of voice and speech analysis – information disclosure by infer-ence. In IFIP Advances in Information and Communication Technology,2020. doi:10.1007/978-3-030-42504-3_16. 77
[173] Dustin C. Krutsinger, Kuldeep N. Yadav, Elizabeth Cooney, Steven Brooks,Scott D. Halpern, and Katherine R. Courtright. A pilot randomized trial offive financial incentive strategies to increase study enrollment and retentionrates. Contemporary Clinical Trials Communications, 2019. doi:10.1016/j.conctc.2019.100390. 141
[174] Naoko Kudo, Shinohara Hitomi, and Hideya Kodama. Heart Rate Variabil-ity Biofeedback Intervention for Reduction of Psychological Stress Duringthe Early Postpartum Period. Applied Psychophysiology and Biofeedback,39(3-4):203–211, 2014. 39
200
REFERENCES
[175] Vivian Kwan, Gregory Hagen, Melanie Noel, Keith Dobson, and KeithYeates. Healthcare at Your Fingertips: The Professional Ethics of Smart-phone Health-Monitoring Applications. Ethics Behavior, 27(8):615–631,nov 2017. URL: https://www.tandfonline.com/doi/full/10.1080/10508422.2017.1285237, doi:10.1080/10508422.2017.1285237. 21
[176] Jennifer R. Kwapisz, Gary M. Weiss, and Samuel A. Moore. Activityrecognition using cell phone accelerometers. ACM SIGKDD ExplorationsNewsletter, 2011. doi:10.1145/1964897.1964918. 22, 141, 142, 146, 173
[177] Lan lan Chen, Ao Zhang, and Xiao guang Lou. Cross-subject driver statusdetection from physiological signals based on hybrid feature selection andtransfer learning. Expert Systems with Applications, 2019. doi:10.1016/j.eswa.2019.02.005. 35
[178] Óscar D. Lara and Miguel A. Labrador. A survey on human activity recogni-tion using wearable sensors. IEEE Communications Surveys and Tutorials,15(3):1192–1209, 2013. doi:10.1109/SURV.2012.110112.00192. 22, 88
[179] Walter S. Lasecki, Young Chol Song, Henry Kautz, and Jeffrey P. Bigham.Real-time crowd labeling for deployable activity recognition. In Proceedingsof the 2013 conference on Computer supported cooperative work - CSCW’13, page 1203, New York, New York, USA, 2013. ACM Press. doi:10.1145/2441776.2441912. 21, 88
[180] Siddique Latif, Rajib Rana, Shahzad Younis, Junaid Qadir, and JulienEpps. Transfer learning for improving speech emotion classification accu-racy. In Proceedings of the Annual Conference of the International SpeechCommunication Association, INTERSPEECH, 2018. arXiv:1801.06353,doi:10.21437/Interspeech.2018-1625. 36
[181] Amanda Lazar, Jessica L. Feuston, Caroline Edasis, and Anne Marie Piper.Making as expression: Informing design with people with complex commu-nication needs through art therapy. In Conference on Human Factors inComputing Systems - Proceedings, 2018. doi:10.1145/3173574.3173925.55
201
REFERENCES
[182] James Alexander Lee, Lu Bai, and Christos Efstratiou. OSN mood track-ing: Exploring the use of online social network activity as an indicator ofmood changes. In UbiComp 2016 Adjunct - Proceedings of the 2016 ACMInternational Joint Conference on Pervasive and Ubiquitous Computing,2016. doi:10.1145/2968219.2968304. 30
[183] James Alexander Lee, Christos Efstratiou, Panote Siriaraya, DinkarSharma, and Chee Siang Ang. SnapAppy: A positive psychology inter-vention using smartphone photography to improve emotional well-being.Pervasive and Mobile Computing, page 101369, mar 2021. URL: https://linkinghub.elsevier.com/retrieve/pii/S1574119221000377, doi:10.1016/j.pmcj.2021.101369. 42
[184] Hong Li, Jonna Häkkilä, and Kaisa Väänänen. Review of unconventionaluser interfaces for emotional communication between long-distance part-ners. In MobileHCI 2018 - Beyond Mobile: The Next 20 Years - 20thInternational Conference on Human-Computer Interaction with Mobile De-vices and Services, Conference Proceedings, 2018. doi:10.1145/3229434.3229467. 41
[185] Jinpeng Li, Shuang Qiu, Yuan-Yuan Shen, Cheng-Lin Liu, and HuiguangHe. Multisource Transfer Learning for Cross-Subject EEG Emotion Recog-nition. IEEE Transactions on Cybernetics, 50(7):3281 – 3293, 2019. 36,117
[186] Rong-Hao Liang, Bin Yu, Mengru Xue, Jun Hu, and Loe M G Feijs. BioFid-get: Biofeedback for Respiration Training Using an Augmented Fidget Spin-ner. Extended Abstracts of the 2018 CHI Conference on Human Factors inComputing Systems - CHI ’18, 2018. doi:10.1145/3173574.3174187. 42,46
[187] Berta Liliana and Brusilovsky Filer. Evaluating Cognitive Accessibility. Sci-entific keys to strengthen the role of the evaluator with functional diversity(English edition). La Ciudad Accesible, 2018. 82
202
REFERENCES
[188] Daniel Lim, Paul Condon, and David DeSteno. Mindfulness and Com-passion: An Examination of Mechanism and Scalability. PLOS ONE,10(2):e0118221, feb 2015. 14
[189] Yuan Pin Lin and Tzyy Ping Jung. Improving EEG-based emotion clas-sification using conditional transfer learning. Frontiers in Human Neuro-science, 2017. 36
[190] Yuan Pin Lin, Chi Hong Wang, Tzyy Ping Jung, Tien Lin Wu, Shyh KangJeng, Jeng Ren Duann, and Jyh Horng Chen. EEG-based emotion recog-nition in music listening. IEEE Transactions on Biomedical Engineering,2010. doi:10.1109/TBME.2010.2048568. 158
[191] Geoff Lindsay and Julie Dockrell. The relationship between speech, lan-guage and communication needs (SLCN) and behavioural, emotional andsocial difficulties (BESD). Department for Education, 2012. 166
[192] Christine Lætitia Lisetti and Fatma Nasoz. Using noninvasive wearablecomputers to recognize human emotions from physiological signals, 2004.doi:10.1155/S1110865704406192. 33
[193] Kun-Lin Liu, Wu-Jun Li, and Minyi Guo. Emoticon Smoothed LanguageModels for Twitter Sentiment Analysis. Twenty-Sixth AAAI Conference onArtificial Intelligence, jul 2012. URL: https://www.aaai.org/ocs/index.php/AAAI/AAAI12/paper/viewPaper/5083. 21
[194] Yong Jin Liu, Minjing Yu, Guozhen Zhao, Jinjing Song, Yan Ge, andYuanchun Shi. Real-time movie-induced discrete emotion recognition fromEEG signals. IEEE Transactions on Affective Computing, 2018. doi:10.1109/TAFFC.2017.2660485. 3, 4, 108
[195] Irene Lopatovska. Researching emotion: challenges and solutions. In Pro-ceedings of the 2011 iConference on - iConference ’11, New York, NewYork, USA, 2011. ACM Press. doi:10.1145/1940761. 141
[196] Ruth Luckasson, Sharon Borthwick-Duffy, Wil H. E. Buntinx, David L.Coulter, Ellis M. (Pat) Craig, Alya Reeve, Robert L. Schalock, Martha E.Snell, Deborah M. Spitalnik, Scott Spreat, and Marc J. Tassé. Mental
203

REFERENCES
retardation: Definition, classification, and systems of supports. AmericanAssociation on Mental Retardation, 10 edition, 2002. 52
[197] Diana MacLean, Asta Roseway, and Mary Czerwinski. MoodWings. InProceedings of the 6th International Conference on PErvasive TechnologiesRelated to Assistive Environments - PETRA ’13, pages 1–8, New York,New York, USA, 2013. ACM Press. doi:10.1145/2504335.2504406. 43,68
[198] Yuka Maeda, Masaki Sekine, and Toshiyo Tamura. The Advantages ofWearable Green Reflected Photoplethysmography. Journal of Medical Sys-tems, 35(5):829–834, oct 2011. doi:10.1007/s10916-010-9506-z. 20
[199] Julia Makhaeva, Christopher Frauenberger, and Katharina Spiel. Creat-ing creative spaces for co-designing with autistic children - The conceptof a ”Handlungsspielraum”. In ACM International Conference ProceedingSeries, 2016. doi:10.1145/2940299.2940306. 82
[200] Alexandru Ion Marinescu. Bach 2.0 - Generating classical music usingrecurrent neural networks. In Procedia Computer Science, 2019. doi:10.1016/j.procs.2019.09.166. xii, 25
[201] Justin Marley and Saeed Farooq. Mobile telephone apps in mental healthpractice: uses, opportunities and challenges. BJPsych Bulletin, 39(6):288–290, dec 2015. 16
[202] Hector P. Martinez, Yoshua Bengio, and Georgios Yannakakis. Learningdeep physiological models of affect. IEEE Computational Intelligence Mag-azine, 8(2):20–33, 2013. 30, 32, 143
[203] R. Martinez, E. Irigoyen, A. Arruti, J. I. Martin, and J. Muguerza. Areal-time stress classification system based on arousal analysis of the ner-vous system by an F-state machine. Computer Methods and Programs inBiomedicine, 2017. doi:10.1016/j.cmpb.2017.06.010. 33
[204] Mark Matthews and Gavin Doherty. In the Mood: Engaging Teenagersin Psychotherapy Using Mobile Phones. Proceedings of the 2011 annualconference on Human factors in computing systems - CHI ’11, 2011. 17
204
REFERENCES
[205] Alban Maxhuni, Pablo Hernandez-Leal, L. Enrique Sucar, Venet Osmani,Eduardo F. Morales, and Oscar Mayora. Stress modelling and predictionin presence of scarce data. Journal of Biomedical Informatics, 63:344–356,oct 2016. 36
[206] Lisa J. Meltzer, Laura S. Hiruma, Kristin Avis, Hawley Montgomery-Downs, and Judith Valentin. Comparison of a commercial accelerometerwith polysomnography and actigraphy in children and adolescents. Sleep,2015. doi:10.5665/sleep.4918. 4
[207] Microsoft. Microsoft Band 2 features and functions, 2019. URL: support.microsoft.com/en-gb/help/4000313. 143
[208] Pardis Miri, Robert Flory, Andero Uusberg, Heather Culbertson,Richard H. Harvey, Agata Kelman, Davis Erik Peper, James J. Gross,Katherine Isbister, and Keith Marzullo. PIV: Placement, pattern, and per-sonalization of an inconspicuous vibrotactile breathing pacer. ACM Trans-actions on Computer-Human Interaction, 2020. doi:10.1145/3365107.41
[209] Varun Mishra. The Case for a Commodity Hardware Solution for StressDetection. Proceedings of the ACM International Joint Conference on Per-vasive and Ubiquitous Computing: Adjunct, pages 1717–1728, 2018. 48
[210] Alex J. Mitchell, Motahare Yadegarfar, John Gill, and Brendon Stubbs.Case finding and screening clinical utility of the Patient Health Question-naire (PHQ-9 and PHQ-2) for depression in primary care: a diagnosticmeta-analysis of 40 studies. BJPsych Open, 2(02):127–138, mar 2016. 12
[211] Changiz Mohiyeddini and Stuart Semple. Displacement behaviour regulatesthe experience of stress in men. Stress, 2013. 2, 80, 138, 161
[212] O. Hobart Mowrer. Learning theory and behavior. John Wiley Sons Inc,jan 1960. URL: /record/2005-06665-000, doi:10.1037/10802-000. 11
[213] Oscar Martinez Mozos, Virginia Sandulescu, Sally Andrews, David Ellis,Nicola Bellotto, Radu Dobrescu, and Jose Manuel Ferrandez. Stress de-
205
REFERENCES
tection using wearable physiological and sociometric sensors. InternationalJournal of Neural Systems, 2017. doi:10.1142/S0129065716500416. 12
[214] Amir Muaremi, Bert Arnrich, and Gerhard Tröster. Towards MeasuringStress with Smartphones and Wearable Devices During Workday and Sleep.BioNanoScience, 2013. doi:10.1007/s12668-013-0089-2. 37, 157
[215] Joe Mullenbach, Craig Shultz, J. Edward Colgate, and Anne Marie Piper.Exploring affective communication through variable-friction surface hap-tics. In Conference on Human Factors in Computing Systems - Proceedings,2014. doi:10.1145/2556288.2557343. 41
[216] Inez Myin-Germeys, Zuzana Kasanova, Thomas Vaessen, Hugo Vachon,Olivia Kirtley, Wolfgang Viechtbauer, and Ulrich Reininghaus. Experiencesampling methodology in mental health research: new insights and technicaldevelopments. World Psychiatry, 2018. 12
[217] Eitan Nahshoni, Dan Aravot, Dov Aizenberg, Mayanit Sigler, Gil Zalsman,Boris Strasberg, Shula Imbar, Edgar Adler, and Abraham Weizman. HeartRate Variability in Patients with Major Depression. Psychosomatics, 2004.doi:10.1176/appi.psy.45.2.129. 20
[218] Benjamin W. Nelson and Nicholas B. Allen. Accuracy of consumer wear-able heart rate measurement during an ecologically valid 24-hour pe-riod: Intraindividual validation study. JMIR mHealth and uHealth, 2019.doi:10.2196/10828. 4
[219] Hong Wei Ng, Viet Dung Nguyen, Vassilios Vonikakis, and Stefan Win-kler. Deep learning for emotion recognition on small datasets using trans-fer learning. In ICMI 2015 - Proceedings of the 2015 ACM Interna-tional Conference on Multimodal Interaction, pages 443–449, New York,New York, USA, nov 2015. Association for Computing Machinery, Inc.doi:10.1145/2818346.2830593. 36
[220] Karin Niemantsverdriet and Maarten Versteeg. Interactive Jewellery asMemory Cue. In Proceedings of the TEI ’16: Tenth International Con-ference on Tangible, Embedded, and Embodied Interaction - TEI ’16,
206

REFERENCES
pages 532–538, New York, New York, USA, 2016. ACM Press. doi:10.1145/2839462.2856524. 17
[221] Robert P. Nolan, Markad V. Kamath, John S. Floras, Jill Stanley, ClementPang, Peter Picton, and Quincy R. Young. Heart rate variability biofeed-back as a behavioral neurocardiac intervention to enhance vagal heartrate control. American Heart Journal, 149(6):1137.e1–1137.e7, jun 2005.doi:10.1016/j.ahj.2005.03.015. 38
[222] Chris Noone and Michael J. Hogan. A randomised active-controlled trial toexamine the effects of an online mindfulness intervention on executive con-trol, critical thinking and key thinking dispositions in a university studentsample. BMC Psychology, 6(1):13, dec 2018. 15
[223] Nvidia. NVIDIA Jetson Nano Developer Kit | NVIDIA Devel-oper, 2019. URL: https://developer.nvidia.com/embedded/buy/jetson-nano-devkit. 88
[224] Cian O’Connor, Geraldine Fitzpatrick, Malcolm Buchannan-Dick, andJames McKeown. Exploratory prototypes for video: Interpreting PD fora complexly disabled participant. In ACM International Conference Pro-ceeding Series, 2006. doi:10.1145/1182475.1182500. 58
[225] Andreas Færøvig Olsen and Jim Torresen. Smartphone accelerometer dataused for detecting human emotions. In 3rd International Conference onSystems and Informatics, 2017. 21
[226] Jukka-Pekka Onnela and Scott L Rauch. Harnessing Smartphone-Based Digital Phenotyping to Enhance Behavioral and MentalHealth. Neuropsychopharmacology, 41(7):1691–1696, jun 2016.URL: http://www.ncbi.nlm.nih.gov/pubmed/26818126http://www.pubmedcentral.nih.gov/articlerender.fcgi?artid=PMC4869063http://www.nature.com/articles/npp20167, doi:10.1038/npp.2016.7. 161
[227] Maxime Oquab, Leon Bottou, Ivan Laptev, and Josef Sivic. Learning andtransferring mid-level image representations using convolutional neural net-
207
REFERENCES
works. In Proceedings of the IEEE Computer Society Conference on Com-puter Vision and Pattern Recognition, 2014. 35
[228] Sergio Oramas, Oriol Nieto, Francesco Barbieri, and Xavier Serra. Multi-label Music Genre Classification from Audio, Text, and Images Using DeepFeatures. jul 2017. 21
[229] Francisco Ordóñez and Daniel Roggen. Deep Convolutional and LSTMRecurrent Neural Networks for Multimodal Wearable Activity Recognition.Sensors, 16(1):115, jan 2016. doi:10.3390/s16010115. 30
[230] Xi Ouyang, Shigenori Kawaai, Ester Gue Hua Goh, Shengmei Shen, WanDing, Huaiping Ming, and Dong Yan Huang. Audio-visual emotion recog-nition using deep transfer learning and multiple temporal models. InICMI 2017 - Proceedings of the 19th ACM International Conference onMultimodal Interaction, volume 2017-Janua, pages 577–582, New York,New York, USA, nov 2017. Association for Computing Machinery, Inc.doi:10.1145/3136755.3143012. 36
[231] Minna Pakanen, Ashley Colley, Jonna Häkkilä, Johan Kildal, and VuokkoLantz. Squeezy bracelet. In Proceedings of the 8th Nordic Conferenceon Human-Computer Interaction Fun, Fast, Foundational - NordiCHI ’14,pages 305–314, New York, New York, USA, 2014. ACM Press. doi:10.1145/2639189.2639238. 47
[232] N. Palmius, A. Tsanas, K. E. A. Saunders, A. C. Bilderbeck, J. R. Geddes,G. M. Goodwin, and M. De Vos. Detecting Bipolar Depression From Ge-ographic Location Data. IEEE Transactions on Biomedical Engineering,64(8):1761–1771, aug 2017. 31
[233] Sinno Jialin Pan and Qiang Yang. A survey on transfer learning, 2010.doi:10.1109/TKDE.2009.191. 35, 118, 141
[234] Jonathan M. Peake, Graham Kerr, and John P. Sullivan. A critical reviewof consumer wearables, mobile applications, and equipment for providingbiofeedback, monitoring stress, and sleep in physically active populations,2018. doi:10.3389/fphys.2018.00743. 4
208

REFERENCES
[235] Pearlmutter. Learning state space trajectories in recurrent neural networks.In International Joint Conference on Neural Networks, pages 365–372 vol.2.IEEE, 1989. doi:10.1109/IJCNN.1989.118724. 98
[236] Perkbox. THE 2O18 UK WORKPLACE STRESS SURVEY. Technicalreport, 2018. URL: https://www.perkbox.com/uk/resources/library/interactive-the-2018-uk-workplace-stress-survey. 1
[237] Amorette Perkins, Joseph Ridler, Daniel Browes, Guy Peryer, Caitlin Not-ley, and Corinna Hackmann. Experiencing mental health diagnosis: a sys-tematic review of service user, clinician, and carer perspectives across clin-ical settings, 2018. doi:10.1016/S2215-0366(18)30095-6. 10
[238] R W Picard. Affective Computing. 1997. URL: http://www.media.mit.edu/˜picard/. 2
[239] Rosalind W. Picard. Affective computing: challenges. International Jour-nal of Human-Computer Studies, 59(1-2):55–64, jul 2003. doi:10.1016/S1071-5819(03)00052-1. 141
[240] Rosalind W. Picard, Elias Vyzas, and Jennifer Healey. Toward machineemotional intelligence: Analysis of affective physiological state. IEEETransactions on Pattern Analysis and Machine Intelligence, 23(10):1175–1191, oct 2001. doi:10.1109/34.954607. 4, 118
[241] Kurt Plarre, Andrew Raij, Syed Monowar Hossain, Amin Ahsan Ali, Moto-hiro Nakajima, Mustafa Al’Absi, Emre Ertin, Thomas Kamarck, SantoshKumar, Marcia Scott, Daniel Siewiorek, Asim Smailagic, and Lorentz E.Wittmers. Continuous inference of psychological stress from sensory mea-surements collected in the natural environment. In Proceedings of the 10thACM/IEEE International Conference on Information Processing in SensorNetworks, IPSN’11, 2011. 12
[242] Thomas S Polzin and Alexander Waibel. EMOTION-SENSITIVEHUMAN-COMPUTER INTERFACES. 2000. URL: http://www.iscaaspeech.org/archive. 2
209

REFERENCES
[243] Hugo F. Posada-Quintero, Jeffrey B. Bolkhovsky, Natasa Reljin, and Ki H.Chon. Sleep deprivation in young and healthy subjects is more sensitivelyidentified by higher frequencies of electrodermal activity than by skin con-ductance level evaluated in the time domain. Frontiers in Physiology, 2017.doi:10.3389/fphys.2017.00409. 37
[244] Jacob Poushter. Smartphone Ownership and Internet Usage Continues toClimb in Emerging Economies. Technical report, 2016. 13
[245] Judith Proudfoot, Gordon Parker, Dusan Hadzi Pavlovic, Vijaya Mani-cavasagar, Einat Adler, and Alexis Whitton. Community attitudes to theappropriation of mobile phones for monitoring and managing depression,anxiety, and stress. Journal of medical Internet research, 12(5):e64, dec2010. doi:10.2196/jmir.1475. 13
[246] Public Health England. Mental health of children in England, 2016. URL:https://assets.publishing.service.gov.uk/government/uploads/system/uploads/attachment_data/file/575632/Mental_health_of_children_in_England.pdf. 166
[247] Rui Qiao, Chunmei Qing, Tong Zhang, Xiaofen Xing, and Xiangmin Xu.A novel deep-learning based framework for multi-subject emotion recog-nition. In ICCSS 2017 - 2017 International Conference on Information,Cybernetics, and Computational Social Systems, pages 181–185. IEEE, oct2017. 33
[248] University of London Queen Mary. DEAP: A Dataset for Emotion Analysisusing Physiological and Audiovisual Signals. Ieee Trans. Affective Comput-ing, 2012. 3, 108
[249] Juan C. Quiroz, Min Hooi Yong, and Elena Geangu. Emotion-recognitionusing smart watch accelerometer data: Preliminary findings. In 2017 ACMInternational Joint Conference on Pervasive and Ubiquitous Computingand Proceedings of the 2017 ACM International Symposium on WearableComputers (UbiComp ’17), 2017. 21
210

REFERENCES
[250] U. Rajendra Acharya, K. Paul Joseph, N. Kannathal, Choo Min Lim,and Jasjit S. Suri. Heart rate variability: a review. Medical Biologi-cal Engineering Computing, 44(12):1031–1051, dec 2006. doi:10.1007/s11517-006-0119-0. 20
[251] Sreenivasan Ramasamy Ramamurthy and Nirmalya Roy. Recent trendsin machine learning for human activity recognition—A survey. WileyInterdisciplinary Reviews: Data Mining and Knowledge Discovery, 2018.doi:10.1002/widm.1254. 92
[252] Sarthak Singh Rawat, Abhishek Bisht, and Rahul Nijhawan. A Classi-fier Approach using Deep Learning for Human Activity Recognition. InProceedings of the IEEE International Conference Image Information Pro-cessing, 2019. doi:10.1109/ICIIP47207.2019.8985926. 92
[253] Shireen L. Rizvi, Linda A. Dimeff, Julie Skutch, David Carroll, and Mar-sha M. Linehan. A Pilot Study of the DBT Coach: An Interactive MobilePhone Application for Individuals With Borderline Personality Disorderand Substance Use Disorder. Behavior Therapy, 42(4):589–600, dec 2011.doi:10.1016/j.beth.2011.01.003. 16
[254] Roche. THE NHS AT 100, 2018. URL: http://roche-images.co.uk/design/corporate/rxukcomm01930b(1)a(1)_nhs100_roche_report.pdf. 14
[255] Paul A. Rodgers. Co-designing with people living with dementia. CoDesign,2018. doi:10.1080/15710882.2017.1282527. 59
[256] Iyubanit Rodríguez, Gabriela Cajamarca, Valeria Herskovic, CarolinaFuentes, and Mauricio Campos. Helping Elderly Users Report Pain Levels:A Study of User Experience with Mobile and Wearable Interfaces. MobileInformation Systems, 2017:1–12, nov 2017. doi:10.1155/2017/9302328.47
[257] A John Rush, Madhukar H Trivedi, Hicham M Ibrahim, Thomas J Car-mody, Bruce Arnow, Daniel N Klein, John C Markowitz, Philip T Ninan,Susan Kornstein, Rachel Manber, Michael E Thase, James H Kocsis, and
211

REFERENCES
Martin B Keller. The 16-Item Quick Inventory of Depressive Symptomatol-ogy (QIDS), clinician rating (QIDS-C), and self-report (QIDS-SR): a psy-chometric evaluation in patients with chronic major depression. Biologicalpsychiatry, 54(5):573–83, sep 2003. 12
[258] Bryan C. Russell, Antonio Torralba, Kevin P. Murphy, and William T.Freeman. LabelMe: A database and web-based tool for image annota-tion. International Journal of Computer Vision, 2008. doi:10.1007/s11263-007-0090-8. 21, 88
[259] James A. Russell. A circumplex model of affect. Journal of Personality andSocial Psychology, 39(6):1161–1178, dec 1980. doi:10.1037/h0077714. 11,108
[260] Carolyn Saarni. Emotional development in childhood. Encyclopedia onEarly Childhood Develpment, 2011. 77, 166
[261] Sara Sabour, Nicholas Frosst, and Geoffrey E. Hinton. Dynamic routingbetween capsules. In Advances in Neural Information Processing Systems,2017. xii, 27
[262] Deepak Ranjan Sahoo, Timothy Neate, Yutaka Tokuda, Jennifer Pearson,Simon Robinson, Sriram Subramanian, Matt Jones, Deepak, Ranjan Sahoo,Jennifer Pear-Son, © Deepak, Ranjan Sahoo, and Jennifer Pear-Son. Tangi-ble Drops: A Visio-Tactile Display Using Actuated Liquid-Metal Droplets.Proceedings of the 2018 CHI Conference on Human Factors in ComputingSystems - CHI ’18, 2018. doi:10.1145/3173574.3173751. 48
[263] Michele R. Saloner and Maribeth Gettinger. Social inferenceskills in learning disabled and nondisabled children. Psychologyin the Schools, 1985. doi:10.1002/1520-6807(198504)22:2<201::AID-PITS2310220214>3.0.CO;2-V. 53
[264] Pedro Sanches, Kristina Höök, Elsa Vaara, Claus Weymann, Markus By-lund, Pedro Ferreira, Nathalie Peira, and Marie Sjölinder. Mind the body!Designing a mobile stress management application encouraging personal re-flection. In DIS 2010 - Proceedings of the 8th ACM Conference on DesigningInteractive Systems, 2010. doi:10.1145/1858171.1858182. 42
212
REFERENCES
[265] Pedro Sanches, Axel Janson, Pavel Karpashevich, Camille Nadal,Chengcheng Qu, Claudia Daudén Roquet, Muhammad Umair, CharlesWindlin, Gavin Doherty, Kristina Höök, and Corina Sas. HCI and Af-fective Health Taking stock of a decade of studies and charting future re-search directions. In Conference on Human Factors in Computing Systems- Proceedings, page 17. Association for Computing Machinery, may 2019.doi:10.1145/3290605.3300475. 57
[266] E Sanders. Design Research in 2006. Design Research Society, 2006. 54
[267] E. B.-N. Sanders. Generative Tools for Co-designing. In Collab-orative Design, pages 3–12. Springer London, 2000. doi:10.1007/978-1-4471-0779-8_1. 59
[268] Elizabeth B. N. Sanders and Uday Dandavate. Design for Experiencing:New tools. In First International Conference on Design and Emotion,1999. 59, 60
[269] Elizabeth B.-N. Sanders and Pieter Jan Stappers. Co-creation and the newlandscapes of design. CoDesign, 2008. doi:10.1080/15710880701875068.54
[270] Akane Sano and Rosalind W Picard. Stress Recognition using WearableSensors and Mobile Phones. 2013 Humaine Association Conference onAffective Computing and Intelligent Interaction, 2013. 31
[271] Allah Bux Sargano, Xiaofeng Wang, Plamen Angelov, and Zulfiqar Habib.Human action recognition using transfer learning with deep representations.In Proceedings of the International Joint Conference on Neural Networks,volume 2017, pages 463–469. IEEE, jun 2017. doi:10.1109/IJCNN.2017.7965890. 35
[272] Martha Patricia Sarmiento-Pelayo. Co-design: A central approach to theinclusion of people with disabilities. Revista Facultad de Medicina, 2015.doi:10.15446/revfacmed.v63n3sup.49345. 54
[273] Federico Sarzotti. Self-Monitoring of Emotions and Mood Using a TangibleApproach. Computers, 7(1):7, jan 2018. 17, 47, 57, 88
213

REFERENCES
[274] Robert L. Schalock, Sharon A. Borthwick-Duffy, Valerie J. Bradley, WilH. E. Buntinx, David L. Coulter, Ellis M. Craig, Sharon C. Gomez, YvesLachapelle, Ruth Luckasson, Alya Reeve, Karrie A. Shogren, Martha E.Snell, Scott Spreat, Marc J. Tasse, James R. Thompson, Miguel A. Verdugo-Alonso, Michael L. Wehmeyer, and Mark H. Yeager. Intellectual Disability:Definition, Classification, and Systems of Supports. Eleventh Edition. 2010.52
[275] Björn Schuller, R A Calvo, S Dmello, J Gratch, and A Kappas. Multimodalaffect databases: Collection, challenges, and chances. Handbook of AffectiveComputing, pages 323–333, 2015. 141
[276] Johannes Schumm, Eth Zurich, Ulrike Ehlert, Cornelia Setz, Bert Arnrich,Roberto La Marca, and Gerhard Tröster. Discriminating stress from cogni-tive load using a wearable EDA device. IEEE Transactions on InformationTechnology in Biomedicine, 14(2), 2010. 2, 20, 32
[277] Hans Selye. Stress without Distress. In George Serban, editor, Serban G.(eds). Psychopathology of Human Adaptation, pages 137–146. Springer US,1976. doi:10.1007/978-1-4684-2238-2_9. 12
[278] Ssang-Hee Seo and Jung-Tae Lee. Stress and EEG. In Convergence andHybrid Information Technologies. 2012. arXiv:9809069v1, doi:10.5772/9651. 41
[279] Joan Serrà, Santiago Pascual, and Alexandros Karatzoglou. Towards a Uni-versal Neural Network Encoder for Time Series. In Frontiers in Artificial In-telligence and Applications, 2018. doi:10.3233/978-1-61499-918-8-120.28
[280] Monit Shah Singh, Vinaychandran Pondenkandath, Bo Zhou, Paul Lukow-icz, Marcus Liwicki, and Tu Kaiserslautern. Transforming Sensor Data tothe Image Domain for Deep Learning-an Application to Footstep Detection.arXiv:1701.01077v3, doi:10.1109/IJCNN.2017.7966182. 35
[281] Nandita Sharma and Tom Gedeon. Objective measures, sensors and com-putational techniques for stress recognition and classification: A survey.
214

REFERENCES
Computer Methods and Programs in Biomedicine, 108(3):1287–1301, dec2012. 2, 32
[282] Takanori Shibata and Kazuyoshi Wada. Robot Therapy: A New Ap-proach for Mental Healthcare of the Elderly – A Mini-Review. Gerontology,57(4):378–386, 2011. doi:10.1159/000319015. 44
[283] Benjamin Shickel, Martin Heesacker, Sherry Benton, and Parisa Rashidi.Hashtag Healthcare: From Tweets to Mental Health Journals Using DeepTransfer Learning. aug 2017. 37
[284] Saul Shiffman, Arthur A Stone, and Michael R Hufford. Ecological mo-mentary assessment. Annual review of clinical psychology, 4:1–32, 2008. 45,88
[285] Karen Simonyan and Andrew Zisserman. Very deep convolutional net-works for large-scale image recognition. In 3rd International Conferenceon Learning Representations, ICLR 2015 - Conference Track Proceedings,2015. arXiv:1409.1556. 35
[286] Laurianne Sitbon and Shanjana Farhin. Co-designing interactive appli-cations with adults with intellectual disability: A case study. In ACMInternational Conference Proceeding Series, 2017. doi:10.1145/3152771.3156163. 55
[287] Iouliia Skliarova and Valery Sklyarov. Hardware/software co-design.In Lecture Notes in Electrical Engineering. 2019. doi:10.1007/978-3-030-20721-2_6. 54
[288] Wina Smeenk, Janienke Sturm, and Berry Eggen. Empathic handover:how would you feel? Handing over dementia experiences and feelings in em-pathic co-design. CoDesign, 2018. doi:10.1080/15710882.2017.1301960.59
[289] Mohammad Soleymani, Jeroen Lichtenauer, Thierry Pun, and Maja Pantic.A multimodal database for affect recognition and implicit tagging. IEEETransactions on Affective Computing, 2012. doi:10.1109/T-AFFC.2011.25. 3, 108
215

REFERENCES
[290] Tengfei Song, Wenming Zheng, Peng Song, and Zhen Cui. EEG EmotionRecognition Using Dynamical Graph Convolutional Neural Networks. IEEETransactions on Affective Computing, 2018. doi:10.1109/TAFFC.2018.2817622. 3, 33, 108
[291] Herbert Spencer González, Vanessa Vega Córdova, Katherine Exss Cid,Marcela Jarpa Azagra, and Izaskun Álvarez-Aguado. Including intellectualdisability in participatory design processes: Methodological adaptationsand supports. In ACM International Conference Proceeding Series, 2020.doi:10.1145/3385010.3385023. 57, 82, 86
[292] Katta Spiel. SIGCHI outstanding dissertation award: Evaluating expe-riences of autistic children with technologies in co-design. In Confer-ence on Human Factors in Computing Systems - Proceedings, pages 1–4, New York, NY, USA, apr 2020. Association for Computing Machin-ery. URL: https://dl.acm.org/doi/10.1145/3334480.3386151, doi:10.1145/3334480.3386151. 55
[293] Katta Spiel, Emeline Brulé, Christopher Frauenberger, Gilles Bailly,and Geraldine Fitzpatrick. Micro-ethics for participatory design withmarginalised children. 2018. doi:10.1145/3210586.3210603. 55
[294] Nitish Srivastava, Geoffrey Hinton, Alex Krizhevsky, and Ruslan Salakhut-dinov. Dropout: A Simple Way to Prevent Neural Networks from Overfit-ting. Technical report, 2014. 126
[295] Marc Steen. Co-design as a process of joint inquiry and imagination. DesignIssues, 2013. doi:10.1162/DESI_a_00207. 54
[296] Marc Steen, Menno Manschot, and Nicole de Koning. Benefits of co-designin service design projects. International Journal of Design, 2011. 54
[297] Arthur A Stone, Saul Shiffman, Joseph E Schwartz, Joan E Broderick,and Michael R Hufford. Patient non-compliance with paper diaries. BMJ(Clinical research ed.), 324(7347):1193–1194, may 2002. 12, 13
[298] Arthur A Stone, Jaylan S Turkkan, Christine A Bachrach, Jared B Jobe,Howard S Kurtzman, and Virginia S Cain, editors. The science of self-
216

REFERENCES
report: Implications for research and practice. Lawrence Erlbaum Asso-ciates Publishers, Mahwah, NJ, US, 2000. 12
[299] Feng-Tso Sun, Cynthia Kuo, Heng-Tze Cheng, Senaka Buthpitiya, PatriciaCollins, and Martin Griss. Activity-Aware Mental Stress Detection UsingPhysiological Sensors. pages 211–230. Springer, Berlin, Heidelberg, oct2012. doi:10.1007/978-3-642-29336-8_12. 48
[300] Si Sun, Marion J Ball, and Ching-hua Chen. Investigating the Role ofContext in Perceived Stress Detection in the Wild. Proceedings of the ACMInternational Joint Conference on Pervasive and Ubiquitous Computing,(July 2017):1708–1716, 2018. 32
[301] Karush Suri and R. Gupta. Continuous sign language recognition fromwearable IMUs using deep capsule networks and game theory. Computersand Electrical Engineering, 2019. 27
[302] Christian Szegedy, Sergey Ioffe, Vincent Vanhoucke, and Alexander A.Alemi. Inception-v4, inception-ResNet and the impact of residual con-nections on learning. In 31st AAAI Conference on Artificial Intelligence,AAAI 2017, 2017. arXiv:1602.07261. 29
[303] Christian Szegedy, Vincent Vanhoucke, Sergey Ioffe, Jon Shlens, and Zbig-niew Wojna. Rethinking the Inception Architecture for Computer Vi-sion. In Proceedings of the IEEE Computer Society Conference on Com-puter Vision and Pattern Recognition, 2016. arXiv:1512.00567, doi:10.1109/CVPR.2016.308. 35
[304] Joachim Taelman, S. Vandeput, A. Spaepen, and S. Van Huffel. Influenceof mental stress on heart rate and heart rate variability. In IFMBE Pro-ceedings, volume 22, pages 1366–1369. Springer, Berlin, Heidelberg, 2008.doi:10.1007/978-3-540-89208-3_324. 145
[305] Mohammed Taj-Eldin, Christian Ryan, Brendan O’flynn, and Paul Galvin.A review of wearable solutions for physiological and emotional monitoringfor use by people with autism spectrum disorder and their caregivers, 2018.doi:10.3390/s18124271. 4
217
REFERENCES
[306] Masahiro Tanida, Masako Katsuyama, and Kaoru Sakatani. Relation be-tween mental stress-induced prefrontal cortex activity and skin conditions:A near-infrared spectroscopy study. Brain Research, 1184:210–216, dec2007. 20
[307] Pattreeya Tanisaro and Gunther Heidemann. Time series classification us-ing time warping invariant Echo State Networks. In Proceedings - 201615th IEEE International Conference on Machine Learning and Applica-tions, ICMLA 2016, 2017. doi:10.1109/ICMLA.2016.166. 28
[308] Emmanuel Munguia Tapia, Stephen S. Intille, William Haskell, Kent Lar-son, Julie Wright, Abby King, and Robert Friedman. Real-time recognitionof physical activities and their intensities using wireless accelerometers anda heart rate monitor. In Proceedings - International Symposium on Wear-able Computers, ISWC, 2007. doi:10.1109/ISWC.2007.4373774. 21
[309] The International Well Being Group. Personal Wellbeing Index – Adult (English ). 2006. 108
[310] The Mental Health Foundation. Fundamental facts about mental health.Technical report, 2015. 1
[311] Tatiana Tommasi, Francesco Orabona, and Barbara Caputo. Safety innumbers: Learning categories from few examples with multi model knowl-edge transfer. In Proceedings of the IEEE Computer Society Conferenceon Computer Vision and Pattern Recognition, 2010. doi:10.1109/CVPR.2010.5540064. 35
[312] John Torous, Rohn Friedman, and Matcheri Keshavan. Smartphone own-ership and interest in mobile applications to monitor symptoms of men-tal health conditions. JMIR mHealth and uHealth, 2(1):e2, jan 2014.doi:10.2196/mhealth.2994. 13
[313] Sarah Geiss Trusz, Amy W. Wagner, Joan Russo, Jeff Love, and Dou-glas F. Zatzick. Assessing Barriers to Care and Readiness for Cogni-tive Behavioral Therapy in Early Acute Care PTSD Interventions. Psy-chiatry: Interpersonal and Biological Processes, 74(3):207–223, sep 2011.doi:10.1521/psyc.2011.74.3.207. 13
218
REFERENCES
[314] A. Tsanas, K.E.A. Saunders, A.C. Bilderbeck, N. Palmius, M. Osipov, G.D.Clifford, G.Μ. Goodwin, and M. De Vos. Daily longitudinal self-monitoringof mood variability in bipolar disorder and borderline personality disorder.Journal of Affective Disorders, 205:225–233, nov 2016. 14, 158
[315] Theodora Tsikrika, Christos Diou, Arjen P. de Vries, and AnastasiosDelopoulos. Image annotation using clickthrough data. 2009. doi:10.1145/1646396.1646415. 21, 88
[316] G. Tur, R.E. Schapire, and D. Hakkani-Tur. Active learning for spoken lan-guage understanding. In 2003 IEEE International Conference on Acoustics,Speech, and Signal Processing, 2003. Proceedings. (ICASSP ’03)., volume 1,pages I–276–I–279. IEEE, 2003. 21
[317] B. Ullmer and H. Ishii. Emerging frameworks for tangible user interfaces.IBM Systems Journal, 2000. doi:10.1147/sj.393.0915. 2, 52
[318] Muhammad Umair, Muhammad Hamza Latif, and Corina Sas. Dynamicdisplays at wrist for real time visualization of affective data. In DIS 2018 -Companion Publication of the 2018 Designing Interactive Systems Confer-ence, 2018. doi:10.1145/3197391.3205436. 42
[319] Terumi Umematsu, Akane Sano, Sara Taylor, and Rosalind W. Picard.Improving Students’ Daily Life Stress Forecasting using LSTM Neural Net-works. pages 1–4. Institute of Electrical and Electronics Engineers (IEEE),sep 2019. 34
[320] Evgeny G. Vaschillo, Bronya Vaschillo, and Paul M. Lehrer. Characteristicsof resonance in heart rate variability stimulated by biofeedback. AppliedPsychophysiology Biofeedback, 2006. doi:10.1007/s10484-006-9009-3.20
[321] Cati Vaucelle, Leonardo Bonanni, and Hiroshi Ishii. Design of haptic in-terfaces for therapy. In Proceedings of the 27th international conference onHuman factors in computing systems - CHI 09, page 467, New York, NewYork, USA, 2009. ACM Press. doi:10.1145/1518701.1518776. 40
219

REFERENCES
[322] Jenn Wortman Vaughan. Making Better Use of the Crowd: How Crowd-sourcing Can Advance Machine Learning Research. JMLR, 18, jan 2019.URL: https://www.microsoft.com/en-us/research/publication/making-better-use-of-the-crowd-how-crowdsourcing-can-advance-machine-learning-research/.21, 88
[323] Daniela Villani, Alessandra Grassi, Chiara Cognetta, Pietro Cipresso, Da-vide Toniolo, and Giuseppe Riva. The effects of a mobile stress managementprotocol on nurses working with cancer patients: a preliminary controlledstudy. In MMVR, pages 524–528, 2012. 15
[324] Daniela Villani, Alessandra Grassi, Chiara Cognetta, Davide Toniolo,Pietro Cipresso, and Giuseppe Riva. Self-help stress management trainingthrough mobile phones: An experience with oncology nurses. PsychologicalServices, 10(3):315–322, 2013. 15
[325] John Vines, Rachel Clarke, Peter Wright, John McCarthy, and PatrickOlivier. Configuring participation: On how we involve people in design. InConference on Human Factors in Computing Systems - Proceedings, 2013.doi:10.1145/2470654.2470716. 54
[326] Froukje Sleeswijk Visser. Bringing the everyday life of people into design.2009. doi:Isbn978-90-9024244-6. 54
[327] Eric von Hippel. “Sticky Information” and the Locus of Problem Solving:Implications for Innovation. Management Science, 1994. doi:10.1287/mnsc.40.4.429. 54
[328] O. F. Wahl. Mental Health Consumers’ Experience of Stigma. Schizophre-nia Bulletin, 25(3):467–478, jan 1999. doi:10.1093/oxfordjournals.schbul.a033394. 13
[329] Tracey Wallace, John T Morris, Scott Bradshaw, and Corissa Bayer.BreatheWell: Developing a Stress Management App on Wearables for TBIPTSD. Journal on Technology and Persons with Disabilities Santiago, J,2017. 31
220
REFERENCES
[330] Jan Walmsley. Inclusive learning disability research: The (nondisabled)researcher’s role. British Journal of Learning Disabilities, 2004. doi:10.1111/j.1468-3156.2004.00281.x. 56
[331] Jan Walmsley, Iva Strnadová, and Kelley Johnson. The added value ofinclusive research. Journal of Applied Research in Intellectual Disabilities,2018. doi:10.1111/jar.12431. 56
[332] C. L. Walters. The Psychological and Physiological Effects of VibrotactileStimulation, Via a Somatron, on Patients Awaiting Scheduled Gynecologi-cal Surgery. Journal of Music Therapy, 33(4):261–287, dec 1996. 40
[333] Dong Wang and Thomas Fang Zheng. Transfer learning for speech and lan-guage processing. In 2015 Asia-Pacific Signal and Information ProcessingAssociation Annual Summit and Conference, APSIPA ASC 2015, pages1225–1237. Institute of Electrical and Electronics Engineers Inc., feb 2016.35
[334] Ri Wang, Maysum Panju, and Mahmood Gohari. Classification-based RNNmachine translation using GRUs, 2017. arXiv:1703.07841. xii, 26
[335] Rui Wang, Weichen Wang, Alex DaSilva, Jeremy F. Huckins, William M.Kelley, Todd F. Heatherton, and Andrew T. Campbell. Tracking DepressionDynamics in College Students Using Mobile Phone and Wearable Sensing.Proceedings of the ACM on Interactive, Mobile, Wearable and UbiquitousTechnologies, 2(1):1–26, 2018. arXiv:1803.08955, doi:10.1145/3191775.31
[336] Zhiguang Wang and Tim Oates. Imaging time-series to improve classifica-tion and imputation. In IJCAI International Joint Conference on ArtificialIntelligence, 2015. arXiv:1506.00327. 19, 141, 147, 148
[337] Zhiguang Wang, Weizhong Yan, and Tim Oates. Time series classificationfrom scratch with deep neural networks: A strong baseline. In Proceedingsof the International Joint Conference on Neural Networks, 2017. arXiv:1611.06455, doi:10.1109/IJCNN.2017.7966039. 28
221
REFERENCES
[338] B Weiner and S Graham. An attributional approach to emotional develop-ment. In Emotions, cognition, and behavior. 1985. 11
[339] John R. Weisz, Irwin N. Sandler, Joseph A. Durlak, and Barry S. Anton.Promoting and Protecting Youth Mental Health Through Evidence-BasedPrevention and Treatment. American Psychologist, 60(6):628–648, 2005.doi:10.1037/0003-066X.60.6.628. 12, 13
[340] Wanhui Wen, Guangyuan Liu, Nanpu Cheng, Jie Wei, Pengchao Shang-guan, and Wenjin Huang. Emotion recognition based on multi-variant cor-relation of physiological signals. IEEE Transactions on Affective Comput-ing, 2014. doi:10.1109/TAFFC.2014.2327617. 4, 32, 118
[341] Amanda L. Wheat and Kevin T. Larkin. Biofeedback of Heart RateVariability and Related Physiology: A Critical Review. Applied Psy-chophysiology and Biofeedback, 35(3):229–242, sep 2010. doi:10.1007/s10484-010-9133-y. 39
[342] Joseph Wherton, Paul Sugarhood, Rob Procter, Sue Hinder, and TrishaGreenhalgh. Co-production in practice: How people with assisted livingneeds can help design and evolve technologies and services. ImplementationScience, 2015. doi:10.1186/s13012-015-0271-8. 55
[343] WHO and World Health Organisation. WHO | Mental health: a stateof well-being, 2014. URL: https://www.who.int/features/factfiles/mental_health/en/. 1, 11
[344] J. Wijsman, B. Grundlehner, Hao Liu, H. Hermens, and J. Penders. To-wards mental stress detection using wearable physiological sensors. In 2011Annual International Conference of the IEEE Engineering in Medicine andBiology Society, pages 1798–1801. IEEE, aug 2011. 2, 34
[345] Robin Williams. Why is it difficult to achieve e-health systems at scale?Information, Communication Society, 19(4):540–550, apr 2016. 46
[346] Charles Windlin. Designing with the body: Addressing emotion regula-tion and expression. In DIS 2020 Companion - Companion Publication
222

REFERENCES
of the 2020 ACM Designing Interactive Systems Conference, pages 557–562, New York, NY, USA, jul 2020. Association for Computing Machin-ery, Inc. URL: https://dl.acm.org/doi/10.1145/3393914.3395835,doi:10.1145/3393914.3395835. 42
[347] Kieran Woodward and Eiman Kanjo. iFidgetCube: Tangible FidgetingInterfaces (TFIs) to Monitor and Improve Mental Wellbeing. IEEE Sen-sors Journal, pages 1–1, 2020. URL: https://ieeexplore.ieee.org/document/9223707/, doi:10.1109/JSEN.2020.3031163. 10, 117, 160
[348] Kieran Woodward, Eiman Kanjo, David Brown, T. M. McGinnity, BeckyInkster, Donald J Macintyre, and Athanasios Tsanas. Beyond Mobile Apps:A Survey of Technologies for Mental Well-being. IEEE Transactions onAffective Computing, 2020. 10
[349] Kieran Woodward, Eiman Kanjo, David J Brown, and Becky Inkster. Tang-Toys: Smart Toys to Communicate and Improve Children’s Wellbeing. InProceedings of the 2020 ACM International Joint Conference on Pervasiveand Ubiquitous Computing and Proceedings of the 2020 ACM InternationalSymposium on Wearable Computers, New York, NY, USA, 2020. ACM.URL: https://doi.org/10.1145/3410530.3414375. 160
[350] Kieran Woodward, Eiman Kanjo, David J. Brown, and T.M. McGin-nity. Towards Personalised Mental Wellbeing Recognition On-Device usingTransfer Learning ”in the Wild”. In IEEE International Smart Cities Con-ference 2021, 2021. 117
[351] Kieran Woodward, Eiman Kanjo, Andreas Oikonomou, and Samuel Bur-ton. Emoecho: A tangible interface to convey and communicate emotions.In UbiComp/ISWC 2018 - 2018 ACM International Joint Conference onPervasive and Ubiquitous Computing and Proceedings of the 2018 ACMInternational Symposium on Wearable Computers, 2018. 160
[352] Kieran Woodward, Eiman Kanjo, Andreas Oikonomou, and Alan Cham-berlain. LabelSens: enabling real-time sensor data labelling at the pointof collection using an artificial intelligence-based approach. Personal andUbiquitous Computing, 24(5):709–722, jun 2020. 87
223
REFERENCES
[353] World Health Organization. The ICD-10 classification of mental and be-havioural disorders: Diagnostic criteria for research. 1993. 13
[354] Guanghua Wu, Guangyuan Liu, and Min Hao. The analysis of emotionrecognition from GSR based on PSO. In Proceedings - 2010 InternationalSymposium on Intelligence Information Processing and Trusted Computing,IPTC 2010, 2010. doi:10.1109/IPTC.2010.60. 32
[355] Mike Wu, Brian Richards, and Ron Baecker. Participatory design withindividuals who have amnesia. In PDC 2004 - Proceedings of the EightParticipatory Design Conference 2004 - Artful Integration: InterweavingMedia, Materials and Practices, 2004. doi:10.1145/1011870.1011895. 59
[356] Xiaofen Xing, Zhenqi Li, Tianyuan Xu, Lin Shu, Bin Hu, and Xiangmin Xu.SAE+LSTM: A new framework for emotion recognition from multi-channelEEG. Frontiers in Neurorobotics, 13, 2019. 34
[357] Chen Yi Chao Lung Yang, Chen Yi Chao Lung Yang, Zhi Xuan Chen,and Nai Wei Lo. Multivariate Time Series Data Transformation for Con-volutional Neural Network. In Proceedings of the 2019 IEEE/SICE In-ternational Symposium on System Integration, SII 2019, pages 188–192.Institute of Electrical and Electronics Engineers Inc., apr 2019. doi:10.1109/SII.2019.8700425. 19, 141, 147
[358] Wenpeng Yin, Katharina Kann, Mo Yu, and Hinrich Schütze. ComparativeStudy of CNN and RNN for Natural Language Processing. feb 2017. URL:http://arxiv.org/abs/1702.01923, arXiv:1702.01923. 26
[359] Hayley A. Young and David Benton. Heart-rate variability: A biomarker tostudy the influence of nutrition on physiological and psychological health?,2018. doi:10.1097/FBP.0000000000000383. 37
[360] Eman M. G. Younis, Eiman Kanjo, and Alan Chamberlain. Designingand evaluating mobile self-reporting techniques: crowdsourcing for citizenscience. Personal and Ubiquitous Computing, pages 1–10, mar 2019. 13,21, 22, 88
224
REFERENCES
[361] Xin Yu and Panos D. Prevedouros. Performance and Challenges in UtilizingNon-Intrusive Sensors for Traffic Data Collection. Advances in RemoteSensing, 2013. doi:10.4236/ars.2013.22006. 141
[362] Roberto Zangróniz, Arturo Martínez-Rodrigo, José Manuel Pastor, María TLópez, and Antonio Fernández-Caballero. Electrodermal Activity Sensorfor Classification of Calm/Distress Condition. Sensors (Basel, Switzerland),17(10), oct 2017. 2
[363] Alexandros Zenonos, Aftab Khan, Georgios Kalogridis, Stefanos Vatsikas,Tim Lewis, and Mahesh Sooriyabandara. HealthyOffice: Mood recognitionat work using smartphones and wearable sensors. In 2016 IEEE Interna-tional Conference on Pervasive Computing and Communication Workshops,PerCom Workshops 2016, 2016. doi:10.1109/PERCOMW.2016.7457166. 38,157
[364] Ran Zhang, Hongyang Tao, Lifeng Wu, and Yong Guan. Transfer Learningwith Neural Networks for Bearing Fault Diagnosis in Changing WorkingConditions. IEEE Access, 5:14347–14357, 2017. 23
[365] Xiao Zhang, Wenzhong Li, Xu Chen, and Sanglu Lu. MoodExplorer:Towards Compound Emotion Detection via Smartphone Sensing. Proc.ACM Interact. Mob. Wearable Ubiquitous Technol. Article, 1(176), 2017.doi:10.1145/3161414. 30
[366] Xiao Zhang, Yongqiang Lyu, Xiaomin Luo, Jingyu Zhang, Chun Yu, HaoYin, and Yuanchun Shi. Touch Sense. Proceedings of the ACM on In-teractive, Mobile, Wearable and Ubiquitous Technologies, 2(2):1–18, 2018.doi:10.1145/3214290. 30
[367] Zhan Zhang, Yufei Song, Liqing Cui, Xiaoqian Liu, and Tingshao Zhu.Emotion recognition based on customized smart bracelet with built-in ac-celerometer. PeerJ, 4:e2258, 2016. 21
[368] Wei-Long Zheng and Bao-Liang Lu. Personalizing EEG-Based AffectiveModels with Transfer Learning. In Proceedings of the Twenty-Fifth Inter-national Joint Conference on Artificial Intelligence (IJCAI-16), 2016. 3,36, 108
225
REFERENCES
[369] Yi Zheng, Qi Liu, Enhong Chen, Yong Ge, and J. Leon Zhao. Time seriesclassification using multi-channels deep convolutional neural networks. InLecture Notes in Computer Science (including subseries Lecture Notes inArtificial Intelligence and Lecture Notes in Bioinformatics), 2014. doi:10.1007/978-3-319-08010-9_33. 29
[370] Jan Henrik Ziegeldorf, Oscar Garcia Morchon, and Klaus Wehrle. Privacy inthe internet of things: Threats and challenges. Security and CommunicationNetworks, 2014. doi:10.1002/sec.795. 141
[371] F R H Zijlstra and L Doorn. The construction of a scale to measure sub-jective effort. Delft, The Netherlands: Delft University of Technology, De-partment of Philosophy and Social Sciences, 1985. 120
[372] Muhammad Zubair, Changwoo Yoon, Hyunyoung Kim, Jisu Kim, and Jin-sul Kim. Smart wearable band for stress detection. In 2015 5th InternationalConference on IT Convergence and Security, ICITCS 2015 - Proceedings,2015. doi:10.1109/ICITCS.2015.7293017. 32
226
Copyright © 2022 FDOKUMEN