Particle separation and fractionation by microfiltration - WUR ...
192
Particle separation and fractionation by microfiltration
-
Upload
khangminh22 -
Category
Documents
-
view
2 -
download
0
Transcript of Particle separation and fractionation by microfiltration - WUR ...

Particle separation and fractionationby microfiltration

Promotor: Prof. Dr. Ir. R.M. BoomHoogleraar Levensmiddelenproceskunde, Wageningen Universiteit
Copromotoren: Dr. Ir. C.G.P.H. SchroenUniversitair docent, sectie Proceskunde, Wageningen Universiteit
Dr. Ir. R.G.M. van der SmanUniversitair docent, sectie Proceskunde, Wageningen Universiteit
Promotiecommissie: Prof. Dr. Ir. J.A.M. KuipersUniversiteit Twente
Prof. Dr. Ir. M. WesslingUniversiteit Twente
Dr. Ir. A. van der PadtRoyal Friesland Foods
Prof. Dr. M.A. Cohen StuartWageningen Universiteit

Janneke Kromkamp
Particle separation and fractionationby microfiltration
Scheiding en fractioneringvan deeltjes
middels microfiltratie
Proefschrift
Ter verkrijging van de graad van doctorop gezag van de rector magnificus
van Wageningen Universiteit,Prof.dr. M.J. Kropff,
in het openbaar te verdedigenop dinsdag 6 september 2005
des namiddags te vier uur in de Aula.

Particle separation and fractionation by microfiltrationJanneke KromkampThesis Wageningen University, The Netherlands, 2005 - with Dutch summaryISBN: 90-8504-239-9

Contents
1 Introduction 11.1 Membrane filtration 21.2 Microfiltration 21.3 Mass transport 51.4 Shear-induced diffusion 71.5 Research aim and outline 9
2 Lattice Boltzmann simulation of 2D and 3D non-Brownian suspensions inCouette flow 132.1 Introduction 142.2 Computer simulation method 15
2.2.1 Simulation of the fluid 152.2.2 Fluid-particle interactions 172.2.3 Accuracy of particle representation and particle-particle interactions 18
2.3 Single and pair particles in Couette flow 202.3.1 Wall effects on a single particle 202.3.2 Two colliding particles in shear flow 21
2.4 2D and 3D multiparticle suspensions in Couette flow 232.4.1 Wall effects 232.4.2 Viscosity 252.4.3 Shear-induced diffusion 27
2.5 Conclusions 332.6 Lubrication force in a 2D suspension 342.7 Analytical model for shear-induced diffusion 36
2.7.1 The collision frequency of the particle in 3D 362.7.2 The collision frequency of a particle in 2D 382.7.3 The displacement of the particle in a collision 382.7.4 The self-diffusion tensor 40
3 Shear-induced self-diffusion and microstructure in non-Brownian suspen-sions at non-zero Reynolds numbers 413.1 Introduction 423.2 Computer simulation method 453.3 Effects of hydrodynamics and inertia in particle suspensions 483.4 Shear-induced diffusion at non-zero Reynolds numbers 553.5 Shear-induced changes in microstructure 613.6 Conclusions 63

3.7 Lubrication force in a 2D suspension 65
4 Shear-induced self-diffusion in bidisperse suspensions 694.1 Introduction 704.2 Computer simulation method 734.3 Rheology and microstructure of bidisperse particle suspensions at non-
zero Reynolds numbers 764.4 Shear-induced self-diffusion in bidisperse suspensions 794.5 Conclusions 86
5 Shear-induced diffusion model for microfiltration of polydisperse suspen-sions 895.1 Introduction 905.2 Shear-induced migration model for polydisperse suspensions 915.3 Materials and methods 925.4 Results and discussion 92
5.4.1 Predicted steady-state fluxes 925.4.2 Experimental results 95
5.5 Conclusions 96
6 Effects of particle size segregation on crossflow microfiltration performance:control mechanism for concentration polarisation and particle fractionation 996.1 Introduction 1006.2 Shear-induced diffusion in polydisperse suspensions 101
6.2.1 Particle back-transport as determined by shear-induced migration 1016.2.2 Shear-induced particle segregation in channel flow 102
6.3 Materials and methods 1036.3.1 CSLM experiments 1036.3.2 Fractionation of milk fat globules 105
6.4 Results 1066.4.1 Kinetics of particle deposition 1066.4.2 Shear-induced diffusive particle behaviour 1076.4.3 Fractionation of milk fat globules 112
6.5 Conclusions 114
7 Differential analysis of particle deposition layers from micellar casein andmilk fat globule suspensions 1177.1 Introduction 1187.2 Materials and methods 120
7.2.1 Preparation of colloidal suspensions 1207.2.2 Viscosity of micellar casein suspensions 1217.2.3 Dead-end filtration 1227.2.4 Analysis of cake properties 122
7.3 Results 1247.3.1 Latex suspensions 1247.3.2 Micellar casein suspensions 1267.3.3 Milk fat globule suspensions 129
7.4 Conclusions 131
8 A suspension flow model for hydrodynamics and concentration polarisationin crossflow microfiltration 1378.1 Introduction 1388.2 Computer simulation method 140
8.2.1 Suspension flow model 1408.2.2 Lattice Boltzmann method for hydrodynamics and convection-
diffusion 1418.2.3 Initial and boundary conditions 144
8.3 Results 1478.3.1 Simulation of microfiltration with the suspension flow model 1478.3.2 Effect of transmembrane pressure on flux and cake layer formation 1478.3.3 Position-dependence of flux and cake layer thickness 1508.3.4 Microfiltration in systems with different geometries 152
8.4 Conclusions 155
9 References 161
Summary 169
Samenvatting 173
Nawoord 177
Curriculum vitae 181
List of publications 183


1
Introduction

2 CHAPTER 1
1.1 Membrane filtration
In the field of separation processes, two groups can be distinguished, techniques to sep-arate phases and techniques to separate components [1, 2]. Phase separation techniquestake advantage of differences in particle size (sieving, filtration) or density (sedimentation,centrifugation). Component separation techniques are based on differences in vapourpressure (distillation, stripping), freezing point (crystallization), charge (ion exchange,electrolysis), affinity (absorption, extraction), or chemical nature (leaching, complexa-tion).
Membrane filtration is a separation technique in which the flow through a membraneis used to separate different components from each other. In pressure-driven membranefiltration processes, such as microfiltration, ultrafiltration, nanofiltration and reverse os-mosis, these components are present in a fluid and their separation is driven by a pressuregradient over the membrane. These processes can be classified based on the separationproperty of the process and on the membrane pore size (Table 1). Consequently, somebelong to the group of phase separation techniques and others to the group of componentseparation techniques.
Table 1.1: Pressure-driven membrane filtration processesProcess Separation property Membrane Operating
pore size pressureMicrofiltration size 0.05 - 5 µm ≤ 3 barUltrafiltration size 2 nm - 0.05 µm 1 - 10 barNanofiltration size and/or affinity 0.5 - 2 nm 5 - 40 bar
and/or chargeReverse osmosis affinity and/or charge - ∗ 10 - 100 bar
∗ subject of debate; often considered not to have pores
In general, advantageous aspects of pressure-driven membrane filtration processes aretheir high selectivity and the possibilities for operation without a phase change. Furtherthey are operated at ambient temperatures, without the need for additives and with rel-atively low energy consumption. Besides that, membrane filtration processes offer theadvantages of continuous and automatic operation, modular construction and simple in-tegration in existing production processes, as well as relatively low capital and runningcosts.
1.2 Microfiltration
Microfiltration (MF) is one of the pressure-driven membrane filtration processes. Asstated in table 1.1, MF membranes are size-selective, have relatively large pores and areoperated at pressures below 3 bar. In general, the size of the particles that are retainedduring MF ranges from 0.02 to 20 µm.
Some of the particles in the feed solution may be small compared to the membranepores and are consequently able to pass the membrane. In this case, not only a fluid-particle but also a size-selective particle-particle separation may be accomplished (see
INTRODUCTION 3
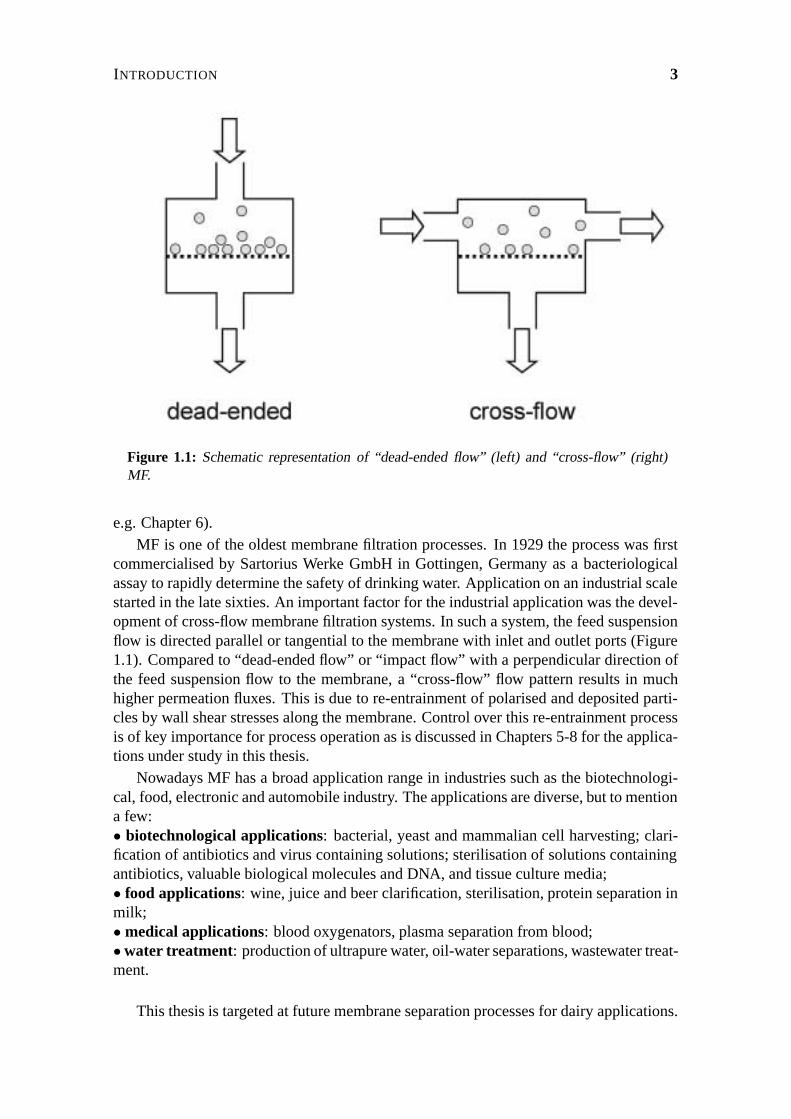
Figure 1.1: Schematic representation of “dead-ended flow” (left) and “cross-flow” (right)MF.
e.g. Chapter 6).MF is one of the oldest membrane filtration processes. In 1929 the process was first
commercialised by Sartorius Werke GmbH in Gottingen, Germany as a bacteriologicalassay to rapidly determine the safety of drinking water. Application on an industrial scalestarted in the late sixties. An important factor for the industrial application was the devel-opment of cross-flow membrane filtration systems. In such a system, the feed suspensionflow is directed parallel or tangential to the membrane with inlet and outlet ports (Figure1.1). Compared to “dead-ended flow” or “impact flow” with a perpendicular direction ofthe feed suspension flow to the membrane, a “cross-flow” flow pattern results in muchhigher permeation fluxes. This is due to re-entrainment of polarised and deposited parti-cles by wall shear stresses along the membrane. Control over this re-entrainment processis of key importance for process operation as is discussed in Chapters 5-8 for the applica-tions under study in this thesis.
Nowadays MF has a broad application range in industries such as the biotechnologi-cal, food, electronic and automobile industry. The applications are diverse, but to mentiona few:• biotechnological applications: bacterial, yeast and mammalian cell harvesting; clari-fication of antibiotics and virus containing solutions; sterilisation of solutions containingantibiotics, valuable biological molecules and DNA, and tissue culture media;• food applications: wine, juice and beer clarification, sterilisation, protein separation inmilk;• medical applications: blood oxygenators, plasma separation from blood;• water treatment: production of ultrapure water, oil-water separations, wastewater treat-ment.
This thesis is targeted at future membrane separation processes for dairy applications.

4 CHAPTER 1
Figure 1.2: Components in milk: size indication and membrane processes [3].MF=microfiltration UF=ultrafiltration NF=nanofiltration RO=reverse osmosis.
Milk consists of a wide variety of constituents with different functionalities. The function-ality of these constituents could be used more effectively if they were available separately.Because these constituents often have different sizes (Figure 1.2), membrane separationtechnology is in general very suited to accomplish this separation. However, milk is alsoa very complex feed for membrane separation, because of the broad particle size distribu-tion (1 nm-20 µm), high volume fractions of dispersed components (± 15% in total) anddifferent properties of the feed constituents (deformability, charge, hydrophilicity, etc.).As a consequence, current membrane processes for milk have either a rather low capacity,due to strong particle accumulation at the membrane surface, or are energy demanding,because of the high cross-flow velocity that has to be applied to control particle accumu-lation. Also the selectivity of the membrane separation processes is affected negativelyby the complexity of milk, an effect that is often related to particle accumulation. Prac-tical application of many promising separation steps of milk, such as the separation andfractionation of fat globules, the reduction of bacteria and spores, and the separation ofcasein micelles and serum proteins, is currently limited because of the low capacity andselectivity. The main issue that has to be resolved for membrane separation to be appliedon industrial scale milk separation is control of particle accumulation at the membrane.In order to do so, more detailed information on particle behaviour is required. This thesisstudies various aspects of this particle behaviour, in order to obtain better understandingof the phenomena playing a role during MF of milk.
INTRODUCTION 5
wall membrane wall
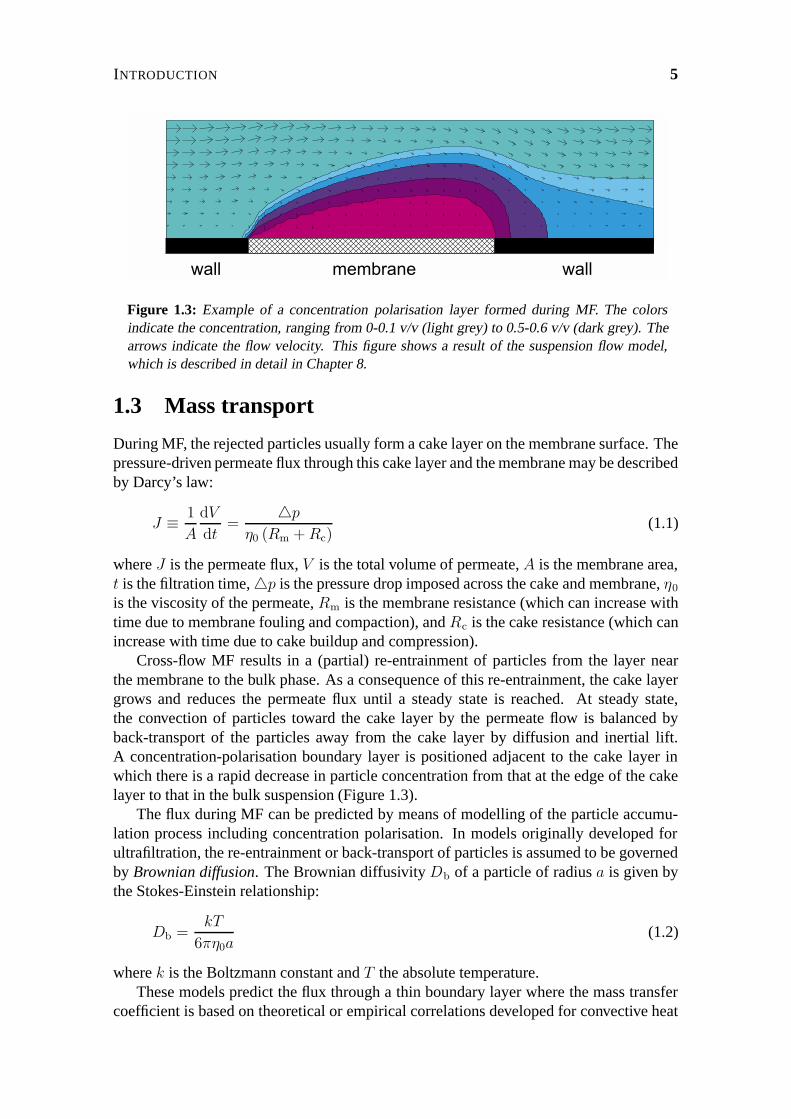
Figure 1.3: Example of a concentration polarisation layer formed during MF. The colorsindicate the concentration, ranging from 0-0.1 v/v (light grey) to 0.5-0.6 v/v (dark grey). Thearrows indicate the flow velocity. This figure shows a result of the suspension flow model,which is described in detail in Chapter 8.
1.3 Mass transport
During MF, the rejected particles usually form a cake layer on the membrane surface. Thepressure-driven permeate flux through this cake layer and the membrane may be describedby Darcy’s law:
J ≡ 1
A
dV
dt=
p
η0 (Rm +Rc)(1.1)
where J is the permeate flux, V is the total volume of permeate, A is the membrane area,t is the filtration time, p is the pressure drop imposed across the cake and membrane, η0
is the viscosity of the permeate, Rm is the membrane resistance (which can increase withtime due to membrane fouling and compaction), and Rc is the cake resistance (which canincrease with time due to cake buildup and compression).
Cross-flow MF results in a (partial) re-entrainment of particles from the layer nearthe membrane to the bulk phase. As a consequence of this re-entrainment, the cake layergrows and reduces the permeate flux until a steady state is reached. At steady state,the convection of particles toward the cake layer by the permeate flow is balanced byback-transport of the particles away from the cake layer by diffusion and inertial lift.A concentration-polarisation boundary layer is positioned adjacent to the cake layer inwhich there is a rapid decrease in particle concentration from that at the edge of the cakelayer to that in the bulk suspension (Figure 1.3).
The flux during MF can be predicted by means of modelling of the particle accumu-lation process including concentration polarisation. In models originally developed forultrafiltration, the re-entrainment or back-transport of particles is assumed to be governedby Brownian diffusion. The Brownian diffusivity Db of a particle of radius a is given bythe Stokes-Einstein relationship:
Db =kT
6πη0a(1.2)
where k is the Boltzmann constant and T the absolute temperature.These models predict the flux through a thin boundary layer where the mass transfer
coefficient is based on theoretical or empirical correlations developed for convective heat

6 CHAPTER 1
or mass transfer in tubes or channels having nonporous walls [4]. When this model ishowever used for MF, the predicted fluxes are much lower than those observed in practice.This discrepancy is often referred to as the “flux paradox for colloidal suspensions” [5].The explanation for this flux paradox has been found in other back-transport mechanismsthat supplement or even exceed the Brownian back-diffusion away from the membrane.
One of the other proposed back-transport mechanisms is inertial lift, which leads tothe so-called “tubular-pinch effect”. Inertial lift is experienced by an isolated, neutrallybuoyant particle in a duct under laminar flow conditions as a result of complex interactionswith the flow field and the duct walls. When the channel Reynolds number is much largerthan unity, the maximum lift velocity vL,0 for a spherical particle near the wall of a two-dimensional channel is [6]:
vL,0 = 0.577ρ0a
3γ20
16η0(1.3)
where ρ0 is the density of the suspending fluid and γ0 is the wall shear rate. With thebasic premise that particles are carried to the membrane walls only if the permeate fluxexceeds the maximum inertial lift velocity, the flux model can be (numerically) solved.The numerical solutions showed that the inertial lift velocity is often much lower than thepermeation velocity in typical cross-flow MF systems, and therewith this mechanism isclearly not the solution for the flux paradox.
An alternative back-transport mechanism is shear-induced diffusion, also called hy-drodynamic diffusion. This diffusion is the result of particle displacements from thestreamlines in a shear flow as they interact with and tumble over other particles. Theshear-induced diffusivity is proportional to the square of the particle size multiplied bythe shear rate. Davis and Leighton [7] and Romero and Davis [8, 9] have developed anintegral MF theory, including both cake resistance and membrane resistance, that usesconcentration-dependent shear-induced diffusivities and shear viscosities appropriate forparticulate suspensions. The shear-induced diffusivity Ds is given by:
Ds (φ) = 0.33φ2(1 + 0.5e8.8φ
)(1.4)
The diffusivity Ds is a dimensionless parameter that is obtained by normalising for γa2
(see also Equation 1.6). Obviously, the volume fraction of particles φ is of influence onDs. The shear-induced diffusive behaviour of particulate suspensions is evaluated in greatdetail in Chapters 2-4.
In Figure 1.4, the three back-transport mechanisms (Brownian diffusion, inertial lift,shear-induced diffusion) are compared by calculation of the steady state flux as a functionof the particle size. MF is normally used for the separation of particles in the size rangeof 0.02 - 20 µm. From Figure 1.4, it can be concluded that shear-induced diffusion isthe predominant back-transport mechanism for particles of this size. Therefore, our mainfocus is on shear-induced diffusion in this thesis. The basics are explained in the nextsection.
Other back-transport mechanisms that have been proposed for MF are for instancescouring [11], turbulent burst [12] and friction forces [13]. Because these back-transportmechanisms are more intuitive rather than theoretically founded, they are only mentionedhere but are not part of this thesis.

INTRODUCTION 7
Figure 1.4: Permeate flux as a function of particle size as predicted by models based onthree different back-transport mechanisms: Brownian diffusion, inertial lift, shear-induceddiffusion (modified version of the figure published by Belfort and co-workers [10]). Thepermeate flux is indicated for shear rates ranging between 1000 (lower grey line) and 10000(upper black line) s−1.
1.4 Shear-induced diffusion
Shear-induced diffusion is the result of particle displacements from the streamlines in ashear flow as these particles interact with and tumble over other particles (Figure 1.5). Ina suspension where the particles are homogeneously distributed, these displacements giverise to a diffusive behaviour called shear-induced self-diffusion. The shear-induced self-diffusion coefficient can be deduced from the individual particle displacements following:
Ds ≡ limt→∞
1
2
d
dt〈 x(t)x(t)〉 (1.5)
where dx(t) is the particle displacement vector, dt the time step and Ds the associateddiffusion tensor. A tensor is needed since the motion of particles is anisotropic due to theanisotropy of shear flow. The motion of a non-Brownian particle is in principle purely de-terministic and the displacement of a given particle only depends on the external velocityfield and its interactions with all other particles in the system. To obtain the random dis-placements that are a characteristic of diffusive motion, the initial particle configurationalso needs to be changed. As a consequence, shear-induced diffusion is to be characterisedas a long-time diffusion process.
The relevant time and length scales in the system are the shear rate γ and the particleradius a, respectively. Because Ds has the dimension [length2/time], it scales as γa2 and

8 CHAPTER 1
Figure 1.5: Schematic representation of shear-induced self-diffusion.
a dimensionless diffusivity Ds can be defined:
Ds =Ds
γa2(1.6)
The dimensionless diffusivity still depends on dimensionless parameters like the particlevolume fraction φ.
In 1977, Eckstein, Bailey and Shapiro [14] were the first authors that reported aboutdiffusive-like behaviour of particles in shear flow. Since then, the phenomenon of shear-induced diffusion has been studied experimentally [15–19], theoretically [20–24] andcomputationally [25–27]. In general, it is technically complex to monitor individual par-ticle displacements or other particle behaviour on a microscopic scale in an experimen-tal set-up, therefore computer simulations play an important role in research on shear-induced diffusion. In recent years, Acrivos and co-workers [25, 26] and Brady and co-workers [27] have carried out extensive research on shear-induced self-diffusion, makinguse of the Stokesian Dynamics computer simulation technique. As a result, shear-inducedself-diffusion in monodisperse suspensions and at Stokes flow conditions can be consid-ered well-understood.
In MF systems, rather than shear-induced self-diffusion solely, the collective processof gradient diffusion plays a role, leading to net migration of particles on the macroscopiclevel. In one of their very recent papers, Brady and co-workers [28] present a techniqueto determine migratory diffusion coefficients in homogeneous suspensions. The resultswere in excellent agreement with available experimental results. It was postulated by theauthors that the gradient diffusivity D may be approximated by:
D ≈ Ds
Seq (0)(1.7)

INTRODUCTION 9
where Seq (0) is the static structure factor corresponding to the hard-sphere suspension atthermodynamic equilibrium.
1.5 Research aim and outline
In this thesis, factors affecting the efficiency of MF processes for milk separation arestudied on various levels of detail. The main focus is on concentration polarisation andits effects, because this can be considered the key factor for the process efficiency.
For monodisperse suspensions of ideal hard spheres, concentration polarisation is arelatively well-known process, but for suspensions with a complex composition like milk,concentration polarisation can be considered an unexplored area because the diffusivebehaviour of suspensions is not yet sufficiently understood.
It is chosen to start at the basic level of shear-induced self-diffusion, because this diffu-sive behaviour can be considered the basis for microfiltration (Figure 1.6: particle dynam-ics). Up to now, computer simulations have been the most succesful research method forshear-induced self-diffusion, since it is hard to experimentally monitor individual particletrajectories in concentrated suspensions in shear flow. Presently, these computer simula-tion studies were exclusively carried out with the Stokesian dynamics technique, whichresulted in a good knowledge of shear-induced self-diffusion of monodisperse suspen-sions at Stokes flow conditions. In this study, the Lattice Boltzmann (LB) method is usedto study shear-induced diffusion by computer simulation. The LB method for suspensionflow is a well-established technique, which was originally developed by Ladd [29, 30].Compared to Stokesian dynamics, the LB method has the advantage that it is not lim-ited to the Stokes flow regime, which for instance facilitates computations on suspensionflow at non-zero Reynolds numbers, in the vicinity of walls and with multi-sized parti-cles. These are all conditions that are relevant to membrane separation systems. The LBmethod was preferred because it is considered better suited for these complex conditionsthan the Stokesian dynamics technique. Although the LB method is a well-establishedtechnique for suspension flow, the application to shear-induced self-diffusion is new.
The LB computer simulation results are validated by means of experiments on micro-filtration processes, where different aspects of suspension composition have been investi-gated (Figure 1.6: particle accumulation and deposition, particle separation and fractiona-tion). Part of the experimental research is carried out on so-called microsieve membranes[31]. In comparison with conventional MF membranes, they have exemplary properties,such as a smooth and flat surface, a narrow pore size distribution, and a membrane thick-ness in the order of µm, resulting in an extremely high permeability. Although thesemembranes are not yet used for large-scale applications, they seem to be promising forMF of complex suspensions. The success of these microsieves is however expected todepend heavily on a proper control of concentration polarisation. This is an importantreason to take them into account in this thesis.
Chapters 2, 3 and 4 of this thesis focus on shear-induced diffusion, which is the pre-dominant transport mechanism for particles in the size range under study (0.02-20 µm).This phenomenon is studied by means of computer simulations following the LB method(Figure 1.6). First (Chapter 2), the flow behaviour of 2D and 3D suspensions in a Cou-ette system is studied, which resulted in a modelling approach for computer simulationof shear-induced self-diffusion. Following this modelling approach, shear-induced dif-

10 CHAPTER 1
fusion at non-Stokesian conditions has been studied in Chapter 3. In Chapter 4, a studyof the mutual influence of different-sized particles on their shear-induced diffusivity ispresented.
The research described in Chapter 2, 3 and 4 lays the foundation for the research in thenext chapters, which focus on concentration polarisation in MF systems (Figure 1.6). InChapter 5, the effect of the presence of different-sized particles in the feed suspension onthe steady-state flux is investigated. Chapter 6 focuses on different-sized particles as well,but here, the effect of these particles on the deposition of particles onto the membrane andon the fractionation of particles is investigated. In Chapter 7, a step is made towardsactual milk ingredients. The properties of deposited casein micelles and fat globules frombovine milk are studied. Finally (Chapter 8), a computer simulation model is developedfor suspension flow in MF systems, which allows the complete solution of the flow field insystems with complex geometries and for polydisperse suspensions (Figure 1.6: particleseparation and fractionation). The computer simulation model is meant as a design toolfor microfiltration membranes, systems and processses.

INTRODUCTION 11
Fig
ure
1.6:
Out
line
per
chap
ter,
indi
catin
gth
eva
riou
sle
vels
ofde
tail
inth
isth
esis
.


2
Lattice Boltzmann simulation of 2Dand 3D non-Brownian suspensions in
Couette flow
J. Kromkamp, D.T.M. van den Ende, D. Kandhai, R.G.M. v.d. Sman, R.M. Boom, submitted.

14 CHAPTER 2
In this study, the Lattice Boltzmann (LB) method is applied for computer simulationof suspension flow in Couette systems. Typical aspects of Couette flow such as walleffects and non-zero Reynolds numbers can be studied well with the LB method becauseof its time-dependent character. Couette flow of single, two and multi-particle systemswas studied, where two-dimensional (2D) systems were compared with three-dimensional(3D) systems.
Computations on multi-particle 3D suspensions, for instance to assess the viscosityor shear-induced diffusivity, were found to be very intensive. This was only partly aconsequence of the 3D system size. The critical particle grid size, necessary for accurateresults, was found to be relatively large, increasing the system to impractical sizes.
It is however demonstrated that it is possible to carry out computer simulations on 2Dsuspensions and use relatively simple, linear scaling relations to translate these results to3D suspensions, in this way avoiding intensive computations. By doing so, the LB methodis shown to be well-suited for study of suspension flow in Couette systems, particularlyfor aspects as particle layering near solid walls, hydrodynamic particle interactions andviscous stresses at non-zero Reynolds numbers, which cannot be easily solved with al-ternative methods. It also opens the way to employ the LB method for other unexploredaspects, such as particle polydispersity and high Reynolds number flow, with large rele-vance to practical processing of suspensions.
2.1 Introduction
Since many manufacturing processes involve the transport of suspensions such as slurries,colloids, polymers and ceramics, knowledge of the flow behaviour of suspensions is ofgeneral interest. Not only the behaviour in shear flow but also in the presence of rigidboundaries, such as a pipe wall, is important, because these rigid boundaries can induceeffects such as structuring, demixing and wall slip [32]. In experimental research as wellas theoretical research, Couette flow is often used as a means to investigate the suspensionflow behaviour in simple shear flow and in the presence of walls.
In the recent years, computer simulation models for colloidal suspension flow havedeveloped into powerful research tools [33]. These numerical models take explicit ac-count of the hydrodynamic forces between the suspended particles, although the variousmodels do this in different ways. In Brownian and Stokesian dynamics, the hydrodynamicinteractions are assumed to be fully developed. This virtually means that the time scalesbetween the fluid dynamics and the motion of the solid particles are completely sepa-rated. These methods are however not suited for suspensions bounded by walls, and aretherewith also not suited for Couette flow. Time-dependent models do not assume fullydeveloped hydrodynamic interactions, but take into account the development of hydrody-namic interactions in time and space from purely local stresses generated at the solid-fluidsurface. These models, including Lattice Boltzmann (LB) and finite-element methods, aswell as particle-based schemes such as dissipative particle dynamics, are suited for de-scribing Couette flow. In comparison to the LB method, finite-element methods requiremuch more computing power, while dissipative particle dynamics is less often used forhydrodynamics. Therefore, the Lattice-Boltzmann method can be considered the best-
2D AND 3D SUSPENSIONS IN COUETTE FLOW 15
developed of the time-dependent models for multi-particle suspensions.In the time-dependent methods, the solid-fluid surface is explicitly present in the sys-
tem. This mostly means that the solid particles are represented on a numerical grid, whichintroduces inaccuracy not only in the shape of the particle but also in the fluid flow aroundthe particle. The degree of inaccuracy is dependent on the particle grid size and this bringsup limitations in the range of conditions where accurate results can be obtained. One obvi-ous limitation is the volume fraction of particles in the system. Dependent on the particlesize, there will be a limiting volume fraction above which the accuracy will be insufficient.
An advantage of computer modelling is that very detailed knowledge on the particledynamics and structure can be gained, such as the translational and rotational velocities ofthe individual particles in the suspension. In spite of the large progress in computationalpower, these computer modelling techniques still require a large computing effort, whichlimits the system size in the computations. This is particularly the case when the particlegrid size needs to be relatively large in order to have sufficient accuracy. One way toreduce the computing power can be to carry out simulations on two-dimensional (2D)instead of three-dimensional (3D) suspensions. Adequate 2D-3D scaling relations arethen required to be able to translate the 2D results to predictions for 3D suspensions.
In this paper, we present a study on the use of the LB method for computer simulationof 2D and 3D suspensions in Couette flow, with the aim to investigate whether computersimulations on 2D suspensions can (partly) replace computer simulations on 3D suspen-sions, especially when the latter are computationally intensive. Hereto, we compare dif-ferent aspects of the flow behaviour of 2D and 3D suspensions in Couette systems in orderto find 2D-3D scaling relations. Furthermore we investigate the accuracy of the resultsin relation to the particle size and the volume fraction, as related to the explicit presenceof the solid-fluid surface in the system. Therewith, this paper demonstrates the use andthe limitations of LB computations on 2D suspensions in Couette flow as compared to 3Dreal suspensions.
2.2 Computer simulation method
For general information about the LB method, we refer to literature (see e.g. [34]). In thissection, the emphasis is on the suspended particles, their incorporation in the fluid andtheir interactions.
2.2.1 Simulation of the fluid
The LB method is based on the well-established connection between the dynamics of adilute gas and the Navier-Stokes equations [35]. In the LB method, the discretised Boltz-mann equation is solved for fictitious fluid particles, that are constrained to move on alattice. The state of the fluid is characterised by the single-particle distribution functionfi(x, t), describing the average number of particles at a particular node of the lattice x,at a time t, with the discrete velocity ci, which brings the fluid particles in one time stepto an adjacent lattice node. It is known that only a small set of discrete velocities isnecessary to simulate the Navier-Stokes equations [36]. In the simulations described inthis paper, the fluid dynamics were solved with a D2Q9 or a D3Q19 LB scheme, whichis respectively defined on a 2D square lattice with rest particles and 8 non-zero particle

16 CHAPTER 2
Figure 2.1: Schematic representation of the 2D Couette system. The solid box lines representrigid walls and the dashed lines periodic boundaries. The 3D Couette system is similar, buthas an extra dimension Z , which is bounded by periodic boundaries.
velocities or on a 3D square lattice with rest particles and 18 non-zero particle veloci-ties. The velocity directions link lattice sites to its nearest and next-nearest neighbours.The hydrodynamic field’s mass density ρ, momentum density j, and the momentum fluxdensity Π are moments of this velocity distribution:
ρ =∑i
fi, j =∑i
fici, Π =∑i
ficici (2.1)
The fictitious fluid particles and their interactions evolve by collisions and subsequentpropagation to neighbouring lattice sites. In a collision step, the distribution function isrelaxed towards the local equilibrium distribution according to:
fi(x+∆xi, t+∆t) = fi(x, t)− fi(x, t)− f eqi (x, t)
τ(2.2)
The relaxation time τ controls the relaxation of the viscous stress in the fluid and is linkedto the kinematic viscosity ν via:
ν = c2s
(τ − 1
2
)∆t (2.3)
where the speed of sound cs is defined by c2s = c2/3. In our simulations we appliedτ = 1.0 (in lattice units), which corresponds to a kinematic viscosity ν of the fluid of 1/6(in lattice units). The equilibrium distribution f eq
i (x, t) is chosen such that the Navier-Stokes equations for a weakly compressible system are obtained [37].
The 2D Couette system consists of a rectangular box with a width X and a heightY (Figure 2.1). Periodic boundaries were applied at the left and right side of the box,while the upper and lower boundaries consist of a rigid wall. The rigid walls move witha constant velocity v in a horizontal but opposite direction in order to create a shear flow.The 3D Couette system is similar to the 2D system, but has an extra dimension Z, whichis bounded by periodic boundaries.
2D AND 3D SUSPENSIONS IN COUETTE FLOW 17
2.2.2 Fluid-particle interactions
In the LB scheme for particulate suspensions as developed by Ladd [29, 30], the solid par-ticles are defined by a boundary surface, which can be of any size or shape. The spherical(3D) or circular (2D) particles are projected on the lattice, where the boundary surfacecuts off some of the links between lattice nodes. Fluid particles moving along the bound-ary surface interact with the surface at boundary nodes that are located at the lattice nodesnearest to the boundary surface of the solid particles, following an alternative method toLadd’s, that was developed by Behrend [38]. In this method, called relaxed bounce backconditions at the nodes, the LB collisions are carried out at every node, including theboundary nodes. The method of Behrend avoids some complications of Ladd’s method,where additional information is to be passed between lattice nodes because the boundarynodes are placed in between instead of on lattice nodes. The resolution of the particleson the grid is better for Ladd’s method, although Behrend showed that the translationalfriction of the particles agreed well with results of Ladd and with independent numericalresults. The rotational friction however, agreed less well, due to the worse resolution.Comparable results were obtained for the hydrodynamic interactions between pairs ofspheres, where the parallel friction coefficients were in excellent agreement with indepen-dent numerical solutions, whereas the agreement of the perpendicular friction coefficientswas less. Results for three different transport coefficients were all again very accurate. Inthis study, we have chosen for Behrend’s method because of its relative simplicity.
The collision rules at the boundary surface enforce a stick boundary condition onthe fluid, which means that the fluid velocity is matched to the local solid-body velocityub. This local solid-body velocity ub (at position xb) is determined by the solid-particlevelocity U, its angular velocity Ω and the position of its center of mass R:
ub = U + Ω× (xb − R) (2.4)
After the collision phase, the boundary nodes are updated in the following way:
fi(x +∆xi, t+∆t) = f ′−i(x, t) +
2ρwi
c2sub · ci (2.5)
fi(x −∆xi, t+∆t) = f ′i(x, t)−
2ρwi
c2sub · ci (2.6)
Here f ′i(x, t) is the post-colllisional distribution function. For moving suspension par-
ticles, in this update, momentum is exchanged between the incoming particles from thefluid and the solid side (the combined momentum of the fluid and the solid phase is how-ever conserved). From this momentum exchange the force and torque exerted on a suspen-sion particle is calculated. Hereafter the kinematic properties of the suspension particlesthemselves are updated with a simple Euler forward integration of Newton’s second law.
The calculations on spherical (3D) and circular (2D) particles follow essentially thesame method. Only the mass M and the moment of inertia I in Newton’s second lawdiffer. For 3D particles, they are given by:
M = ρs4
3πa3 (2.7)
I = 0.4Ma2 (2.8)

18 CHAPTER 2
where ρ and ρs are the density of the fluid and the solid particle respectively, and a is theparticle radius. For 2D particles, M and I are given by:
M = ρsπa2 (2.9)
I = 0.5Ma2 (2.10)
Since a suspended particle is essentially simulated by the introduction of a boundarysurface, separating the interior of the particle from the exterior, the interior of the particlealso consists of fluid. The particles thus comprise a solid shell of given mass and inertia,filled with fluid of the same mass density as the bulk fluid. Ladd [30] examined the effectsof the interior fluid on the behaviour of the particle. Dynamically, the particle behaves asif its mass is the sum of the shell mass and the mass of the interior fluid. With a sufficientlyhigh effective mass of the shell, the contribution of the interior fluid to the inertial forceis negligibly small. Our computations were carried out in this regime, with an effectivemass ρs/ρ of 10. Since our computations are carried out in the Stokes flow regime, inertialeffects do not play a role (see also Kromkamp and others [39]).
2.2.3 Accuracy of particle representation and particle-particle inter-actions
By the projection of the suspended particles on the lattice, a discrete representation of thesurface is obtained, which becomes more and more precise as the surface curvature getssmaller and which is exact for surfaces parallel to lattice planes. Together with the choiceof the location of the boundary nodes and the boundary update rules, the discretisationof the particle surface onto the lattice induces a hydrodynamic particle diameter that isslightly larger than the diameter based on the number of occupied lattice nodes [30]. It istherefore often proposed that the particle diameter should be corrected for this hydrody-namic effect. The magnitude of the correction is mostly based on the particle behaviour inthe Stokes flow regime and at low particle concentrations. As also presented in an earlierpaper [39], we have seen that in suspensions in shear flow, particles can approach eachother very closely, such that particles would largely overlap when the hydrodynamic par-ticle size would be taken into account. The closest approach distance is moreover foundto be dependent on conditions such as the particle concentration and the shear rate. Sinceassessment of the hydrodynamic particle diameter in these systems is virtually impossi-ble, while the corrections would probably be very small, we did not apply this correctionbut used the input particle diameter in our calculations.
Since the suspension flow behaviour in Couette systems is mainly governed by hy-drodynamic particle-particle or particle-wall interactions, these interactions need to beaccurately resolved in the computations. When two suspension particles come into closecontact with each other, the lubrication force becomes important. This force is caused bythe attenuation of the fluid film in the gap between the two particles and is repulsive uponapproach and attractive upon separation of the particles. When the gap width between twoparticles is in the order of one lattice spacing, the lubrication force is however not exactlyresolved with the LB method. This is due to the discretisation of the particles and fluidon a grid and is a problem that is encountered by all numerical methods. This lubricationbreakdown leads to a so-called “depletion force” that pushes particles into each other. Toovercome this problem we applied a lubrication correction method based on an explicit

2D AND 3D SUSPENSIONS IN COUETTE FLOW 19
calculation of the lubrication force F [40]. For a 3D system F is given by [40]:
F = −6πηU12.R12a1a2
(a1 + a2)2
(1
h− 1
hc
), h < hc (2.11)
F = 0, h > hc
where η is the viscosity, U12 = U1 − U2 and h = |R12| − (a1 + a2) is the gap (distancebetween the particle surfaces). The unit vector R12 = R12/ |R12|. For a 2D system thelubrication force per unit cylinder length F is given by (see appendix 2.6):
F = −1
2ηU12.R12
((a1 + a2
h
) 32
(F0 +h
a1 + a2F1)−
(a1 + a2
hc
) 32
(F0 +hc
a1 + a2
F1), h < hc
(2.12)
F = 0, h > hc
where F0 is the numerical constant 34π√2 = 3.3322 and F1 is the first order correction
for the lubrication limit h/2a << 1 with a value of 23180
· π · √2 = 12.829. In accordancewith Ladd and Verberg [33], we applied a correction on the lubrication force to accountfor the lubrication force that is already resolved in the computations of the fluid dynamics.This was done by subtracting the lubrication force at a cut-off distance hc from the totallubrication force, as indicated in Equations 2.11 and 2.12. The cut-off distance hc rep-resents the cut-off distance between the particle surfaces for the added lubrication forceand was chosen equal to 1.1 lattice units for a 3D system and to 2.0 lattice units for a2D system (as was found optimal in our simulations). For 3D systems, Nguyen and Ladd[40] showed that this correction leads to more accurate results for particle interactionsat short interparticle distances, even with neutrally buoyant particles very near to contactand without causing instabilities in the particle dynamics.
Since tangential lubrication has a weaker logarithmic divergence and its breakdowndoes not lead to serious problems, we have not included this correction in our simulations.
We have noticed before, that in suspensions with relatively high particle fractions orat high particle Reynolds number, particle clustering and overlap can occur, which greatlyaffects the diffusive behaviour of the particles [39]. This behaviour seems to be correlatedwith the lubrication breakdown of concentrated colloids, that was reported by Ball andMelrose [41]. As suggested by these authors, we applied a Hookean spring force betweenthe particles to avoid this clustering and overlap. This Hookean spring force was appliedfor gaps h smaller than a thickness δ and was applied in the direction of the line of particlecentres, according to:
Fh = F0 −(F0
δ
)h (2.13)
with a maximal Hookean spring force F0 of 2.5*10−6 (in lattice units) for a 3D systemand 10.0 (in lattice units) for a 2D system. The Hookean spring force is active in a layeraround the particle with a thickness δ/2 of 0.025 lattice units for a 3D system and 0.05lattice units for a 2D system.

20 CHAPTER 2
Figure 2.2: The angular velocity ω as a function of the relative channel height Y/a for asingle cylinder with radius a in shear flow (Reshear,p = 0.058, a=8 lattice units). The distancebetween the solid walls of the Couette system was varied between 2.5a and 40a. The resultsare compared to results of Nirschl and co-workers [42] for a 3D system. The line representsTaylor’s solution for Y/a = ∞ [43] and the inset shows a scheme of the simulated situation.
2.3 Single and pair particles in Couette flow
2.3.1 Wall effects on a single particle
In order to compare wall effects between a single suspended 2D particle and a 3D particlein shear flow, the rotation was studied in Couette systems with varying ratio of channelheight to particle radius Y/a. For 3D particles, we take the data from Nirschl and others[42], who used a finite volume numerical scheme. We studied the rotation of 2D particleswith our LB model.
The LB calculations were carried out for a 2D particle with a radius a of 8 latticeunits. The distance X/a between the periodic boundaries was 80, which was verified togive results corresponding to a system with an infinitely large distance X/a. The channelheight Y/a varied between 2.5 and 40. The shear rate γ was 3.75 ∗ 10−5 per time step,which was verified to give results corresponding to Stokes flow. The shear-based particleReynolds number Reshear,p = 4γa2/ν, where ν is the kinematic viscosity, was equal to0.058. The 2D particle was placed at the horizontal centerline of the Couette system. Weassessed the equilibrium angular velocity ω of the 2D particle, which is normalised forthe shear rate.
For a channel height Y/a larger than 10, the angular velocity ω was close to theanalytical solution of Taylor [43] for a rotating particle in simple shear (Figure 2.2). For

2D AND 3D SUSPENSIONS IN COUETTE FLOW 21
smaller channel heights, the angular velocity ω starts to decrease due to interaction withthe walls. The decrease starts earlier and is most pronounced for the 2D particle, wherethe angular velocity ω decreased from the maximum value of 0.50 to a value of 0.33at a channel height Y/a of 2.5. This effect can be understood because the intensity ofthe flow field around a 2D particle is larger than around a 3D particle. As a result, for2D particles, wall effects start at a channel height Y/a, which is about 3 units higherthan for 3D particles, while the wall effects for 2D particles are more intense as well.The results suggest that a scaling relation can be obtained between 2D and 3D resultsby normalisation of the channel height. For the 2D results, the channel height should bemultiplied with a factor of about 0.33.
2.3.2 Two colliding particles in shear flow
The hydrodynamic interactions between particles in a 2D and a 3D system can be com-pared from the flow trajectory of two interacting particles. Batchelor and Green [44] havederived an analytical solution for 3D particles, but a solution for 2D particles is not yetavailable. Therefore, we calculated the flow trajectories with the LB model for 2D as wellas 3D particles, at equivalent conditions.
For 2D particles, two equal-sized particles (a=8 lattice units) were placed at equidis-tant heights above and under the horizontal centerline. The initial horizontal distance(x − xmidpoint)/a from the midpoint between the particles was 5, while the initial ver-tical distance was varied. Both the channel height (Y/a=40) and the distance betweenthe periodic boundaries (X/a=80) were chosen such that they did not affect the particletrajectories. Reshear,p was equal to 0.058, which was verified to give results in accordancewith Stokes flow. For 3D particles, virtually the same conditions are applied, except forthe particle radius, which was chosen as 11 lattice units.
The resulting flow trajectories are presented in figure 2.3. When the two particlespass each other, they move away from the horizontal centerline upon approach and moveback to their original height upon separation, as is described by Batchelor and Green[44]. When comparing 2D and 3D particles, it is clear that the 3D particles move closeraround each other: the minimal gap between the 2D particles is equal to 0.27a and 0.11afor initial vertical distances from the midpoint of respectively 0.44a and 0.25a, while theminimal gap between 3D particles is respectively 0.01a and 0.00a.
These differences between the inter-particle distances are caused by differences be-tween the ratio of drag to lubrication force for 2D and 3D particles, which causes the fluidto move less easily out of or into the gap for 2D particles. A consequence of the observedbehaviour is that the range of hydrodynamic interactions is longer for 2D particles. In2D multi-particle systems, this may lead to more intense hydrodynamic interactions at asimilar particle fraction.
A full scaling of the particle trajectories would at least require a numerical solution ofthe lubrication force, but here we apply an analytical scaling by simply rescaling of theX-axis and Y -axis in figure 2.3. The X-axis is rescaled by normalising X for X∗, theX-value where the particle has reached a distance Y ∗ = 0.5(Ymax − Yinitial). The Y -axisis rescaled by normalising Y for the factor Ymax(Y −Yinitial)/(Ymax−Yinitial)+1.0(Ymax−Y )/(Ymax−Yinitial). Obviously, this rescaling can only be applied when X∗ and Ymax arealready known. The result is presented in figure 2.4.
The rescaling lead to 2D and 3D trajectories with a good resemblance. This indicates

22 CHAPTER 2
Figure 2.3: Cylinder or sphere trajectory during interaction of two cylinders (a=8.0 latticeunits (2D)) or two spheres (a=11.0 lattice units (3D)) in a linear shear field (Reshear,p =0.058) between two walls, for varying initial positions of the cylinders and spheres.

2D AND 3D SUSPENSIONS IN COUETTE FLOW 23
Figure 2.4: Cylinder or sphere trajectory during interaction of two cylinders (a=8.0 latticeunits (2D)) or two spheres (a=11.0 lattice units (3D)) in a linear shear field (Reshear,p =0.058) between two walls, for varying initial positions of the cylinders and spheres. Thevalues for X and Y are scaled as explained in the text (section 2.3.2).
that the trajectories of 2D and 3D systems can be scaled with the parameters X∗ and Ymax,which can thus be considered characteristic for this system. Only when the particles arerelatively far apart discrepancies occur but these long-range effects are often less relevantin concentrated suspensions.
2.4 2D and 3D multiparticle suspensions in Couette flow
2.4.1 Wall effects
The 2D multiparticle system consists of a rectangular box with X : Y = 1 : 2. The totalnumber of particles (particle radius 8 lattice units) was equal to 200. Reshear,p was equalto 0.023. In the 3D multiparticle system, the particle radius and Reshear,p were similar tothe 2D system. The box size was X : Y : Z = 1 : 1.5 : 1 and the total number of particles400.
Walls can induce effects as particle structuring, demixing and wall slip. In order toanalyse these effects, we compare the time-averaged concentration distribution and theparticle velocity profile as a function of the distance to the wall for 2D and 3D systems(Figure 2.5). In the 2D system, a layer near the walls with a height close to a was depleted
24 CHAPTER 2
relative Y position
0 1
are
afr
actio
n
0
1(a) (b) (c)
(c)
relative Y position
0 1
Ux
/uw
all
-1
0
1
(a) (b)
relative Y position
0 1
are
afr
actio
n
0
1(a) (b) (c)
relative Y position
0 1
Ux
/uw
all
-1
0
1
(c)(a) (b)
< >=0.10 < >=0.30 < >=0.45
< >=0.30 < >=0.36< >=0.10
2D
3D
relative Y position
0 1
are
afr
actio
n
0
1(a) (b) (c)
(c)
relative Y position
0 1
Ux
/uw
all
-1
0
1
(a) (b)
relative Y position
0 1
are
afr
actio
n
0
1(a) (b) (c)
relative Y position
0 1
Ux
/uw
all
-1
0
1
(c)(a) (b)
< >=0.10 < >=0.30 < >=0.45
< >=0.30 < >=0.36< >=0.10
relative Y position
0 1
are
afr
actio
n
0
1(a) (b) (c)
(c)
relative Y position
0 1
Ux
/uw
all
-1
0
1
(a) (b)
relative Y position
0 1
are
afr
actio
n
0
1(a) (b) (c)
relative Y position
0 1
Ux
/uw
all
-1
0
1
(c)(a) (b)
< >=0.10 < >=0.30 < >=0.45
< >=0.30 < >=0.36< >=0.10
2D
3D
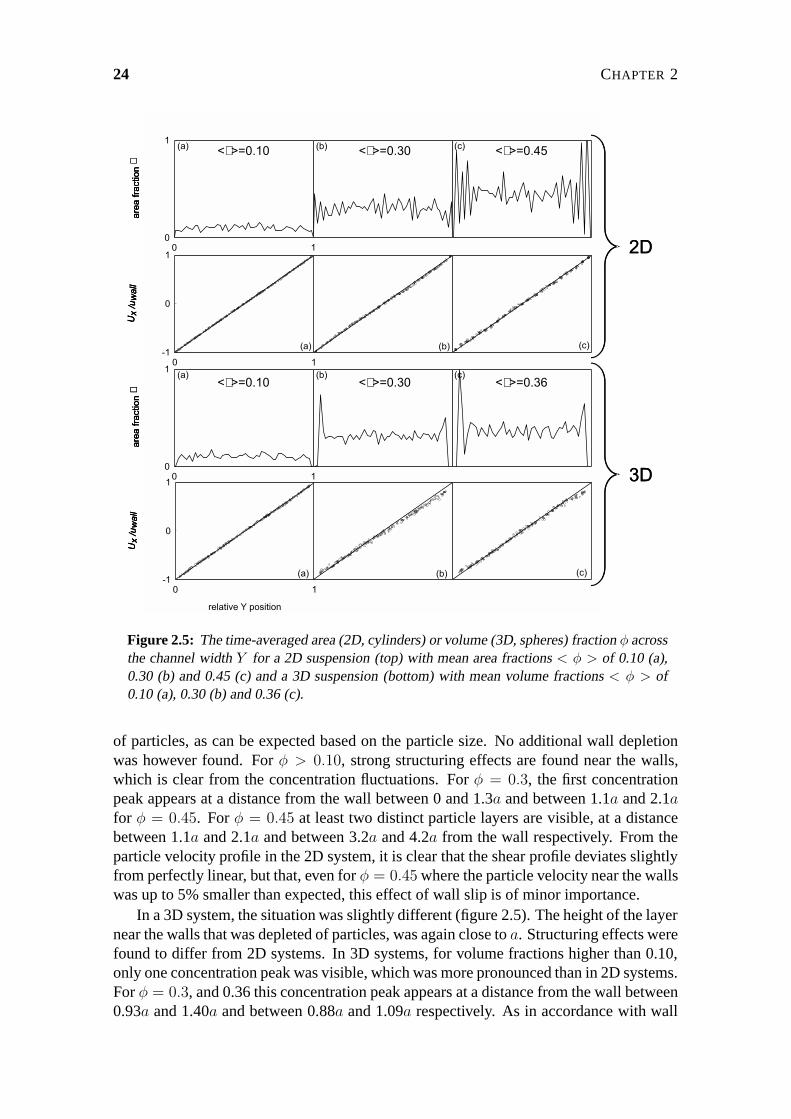
Figure 2.5: The time-averaged area (2D, cylinders) or volume (3D, spheres) fraction φ acrossthe channel width Y for a 2D suspension (top) with mean area fractions < φ > of 0.10 (a),0.30 (b) and 0.45 (c) and a 3D suspension (bottom) with mean volume fractions < φ > of0.10 (a), 0.30 (b) and 0.36 (c).
of particles, as can be expected based on the particle size. No additional wall depletionwas however found. For φ > 0.10, strong structuring effects are found near the walls,which is clear from the concentration fluctuations. For φ = 0.3, the first concentrationpeak appears at a distance from the wall between 0 and 1.3a and between 1.1a and 2.1afor φ = 0.45. For φ = 0.45 at least two distinct particle layers are visible, at a distancebetween 1.1a and 2.1a and between 3.2a and 4.2a from the wall respectively. From theparticle velocity profile in the 2D system, it is clear that the shear profile deviates slightlyfrom perfectly linear, but that, even for φ = 0.45 where the particle velocity near the wallswas up to 5% smaller than expected, this effect of wall slip is of minor importance.
In a 3D system, the situation was slightly different (figure 2.5). The height of the layernear the walls that was depleted of particles, was again close to a. Structuring effects werefound to differ from 2D systems. In 3D systems, for volume fractions higher than 0.10,only one concentration peak was visible, which was more pronounced than in 2D systems.For φ = 0.3, and 0.36 this concentration peak appears at a distance from the wall between0.93a and 1.40a and between 0.88a and 1.09a respectively. As in accordance with wall

2D AND 3D SUSPENSIONS IN COUETTE FLOW 25
effects in a 2D and 3D single particle system, where these effects were only evident atsmall channel heights for 3D spheres, the concentration peak was closer to the wall ina 3D system (at the highest concentration). As a consequence of this more pronouncedstructuring in 3D systems, the particle velocity profile was also found to deviate morefrom perfectly linear. The profile exhibited a tendency towards a sigmoid shape. Thevelocity of particles near the walls deviated around 10% from the velocity expected for alinear velocity profile.
2.4.2 Viscosity
The viscosity of a concentrated suspension is a characteristic that strongly depends onhydrodynamic interactions. By calculation of the squeezing flow contribution, the viscos-ity can be calculated as a function of the particle fraction, as is done for 3D particles byFrankel and Acrivos [45]. The result is practically identical to the semi-empirical modelof Krieger and Dougherty [46], which is valid for both 2D and 3D suspensions:
ηr =
(1− 〈φs〉
φmax
)−[η]φmax
(2.14)
where ηr is the relative viscosity, 〈φs〉 is the averaged particle fraction and φmax, themaximum packing fraction. The dimensionless factor [η] is the intrinsic relative viscosityof the suspension. It is often suggested that the factor [η]φmax is similar for 2D and 3Dsuspensions [47]. Here we will use [η]φmax=1.82, as derived from the values for φmax
and [η] of 0.68 and 2.68 respectively, that are reported by Phillips and co-workers [16] for3D suspensions. The value for φmax in the denominator of Equation 2.14 followed froma subsequent fit of the simulation results.
Because the viscosity simply evolves from the lubrication force as a function of themean distance between the particles, the scaling relation between 2D and 3D systemsdirectly follows from this derivation. Therefore, we only determined the viscosity as afunction of the particle fraction to compare the accuracy between 2D and 3D systems. Inour simulations, the viscosity is determined from the stress at the walls in a multiparticleCouette system. For a 2D system, the height Y/a and width X/a of the Couette systemare equal to respectively 64.75 and 32.38. The particle fraction was varied by varyingthe number of particles up to a maximum of 365. Reshear,p was equal to 0.012, whichwas verified to give results in accordance with Stokes flow. For a 3D system, the systemproperties were as described in section 2.4.1.
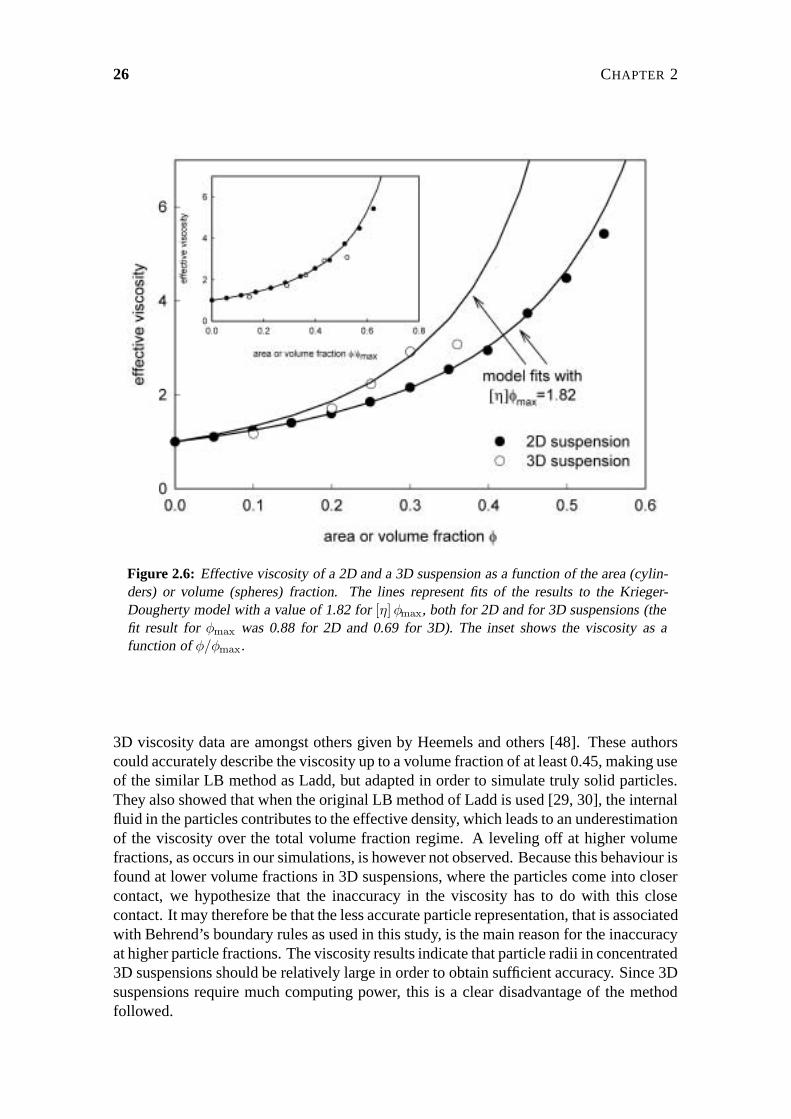
Figure 2.6 presents the results. There is a good agreement between the 2D computersimulation results and the Krieger-Dougherty model for φmax=0.88. At a particle fractionφ exceeding 0.49 however, the viscosity is slightly lower than according to the Krieger-Dougherty model. Also the 3D computer simulation results show a good agreement withthe Krieger-Dougherty model (φmax=0.69). Similar to the 2D system, at higher concen-trations, the viscosity starts to get lower than the Krieger-Dougherty model. This occurshowever at a particle fraction φ exceeding 0.3 instead of 0.49 for a 2D system. More-over, from Figure 2.6, it is clear that an appropriate scaling is obtained when the particlefractions of both 2D and 3D suspensions are related to φmax.
From comparison of our 2D viscosity data with LB results from literature (see e.g.[47] for an overview), it is clear that our data do not significantly differ from these data.
26 CHAPTER 2
Figure 2.6: Effective viscosity of a 2D and a 3D suspension as a function of the area (cylin-ders) or volume (spheres) fraction. The lines represent fits of the results to the Krieger-Dougherty model with a value of 1.82 for [η]φmax, both for 2D and for 3D suspensions (thefit result for φmax was 0.88 for 2D and 0.69 for 3D). The inset shows the viscosity as afunction of φ/φmax.
3D viscosity data are amongst others given by Heemels and others [48]. These authorscould accurately describe the viscosity up to a volume fraction of at least 0.45, making useof the similar LB method as Ladd, but adapted in order to simulate truly solid particles.They also showed that when the original LB method of Ladd is used [29, 30], the internalfluid in the particles contributes to the effective density, which leads to an underestimationof the viscosity over the total volume fraction regime. A leveling off at higher volumefractions, as occurs in our simulations, is however not observed. Because this behaviour isfound at lower volume fractions in 3D suspensions, where the particles come into closercontact, we hypothesize that the inaccuracy in the viscosity has to do with this closecontact. It may therefore be that the less accurate particle representation, that is associatedwith Behrend’s boundary rules as used in this study, is the main reason for the inaccuracyat higher particle fractions. The viscosity results indicate that particle radii in concentrated3D suspensions should be relatively large in order to obtain sufficient accuracy. Since 3Dsuspensions require much computing power, this is a clear disadvantage of the methodfollowed.

2D AND 3D SUSPENSIONS IN COUETTE FLOW 27
2.4.3 Shear-induced diffusion
Computer simulation
Another interesting phenomenon in multiparticle suspensions in shear flow is shear-induceddiffusion, a phenomenon that arises from the hydrodynamic interactions between the par-ticles. As can be seen in Figure 2.3, apart from the displacement caused by the affine flow,two-particle interactions do not lead to permanent displacements of these particles. In aconcentrated multi-particle suspension however, simultaneous interactions between morethan two particles can lead to permanent displacements, which can have a diffusive char-acter on a sufficiently large timescale. The shear-induced self-diffusivity is thus definedas the time rate of change of one half times the mean-square displacement:
Dxx ≡ limt→∞
1
2
d
dt〈 x(t)x(t)〉 (2.15)
Sierou and Brady [27] have done extensive computer simulation work on shear-inducedself-diffusion, using the Stokesian dynamics technique. As far as we know, they have notpublished any results from 2D simulations. In contrast to Stokesian dynamics, our LBmethod enables research on shear-induced diffusion at non-Stokesian conditions, such asin the presence of walls and at non-zero Reynolds number. Here, we investigate 2D-3Dscaling relations for shear-induced diffusion because this knowledge may enable the useof computationally less intensive 2D simulations.
The 2D and 3D systems were as described in section 2.4.1. For a 2D system, theshear-induced diffusivity is determined over a strain range between 18 and 60. In orderto evaluate the effect of the initial particle configuration on the diffusion coefficient, wesplitted the displacement curve of one simulation run into several curves which start at dif-ferent times of the simulation run (and consequently at different particle configurations).In each separate curve, the mean square displacement was monitored over a strain of 30.The final diffusion coefficient is the mean value of the diffusion coefficients that were de-termined from the individual mean square displacement curves. Dependent on the particlevolume fraction, the 2D calculations required between 70 and 650 h CPU time. With asimilar particle radius, the 3D system requires much more computational power per sim-ulated particle than a 2D system. For 3D systems, a particle number of 400 is found tobe sufficiently high to obtain results that are representative for an infinitely large system.This particle number was twice as high as in a 2D system, which results in an improvedstatistical reliability of the 3D simulations. In order to limit the computational effort, theshear-induced diffusivity is determined over a strain range between 4.5 and 15, which wasverified to give results representative for the long-range diffusive regime. In this way, the3D simulations required about 40 times more CPU time than the 2D simulations (withequal particle radius).
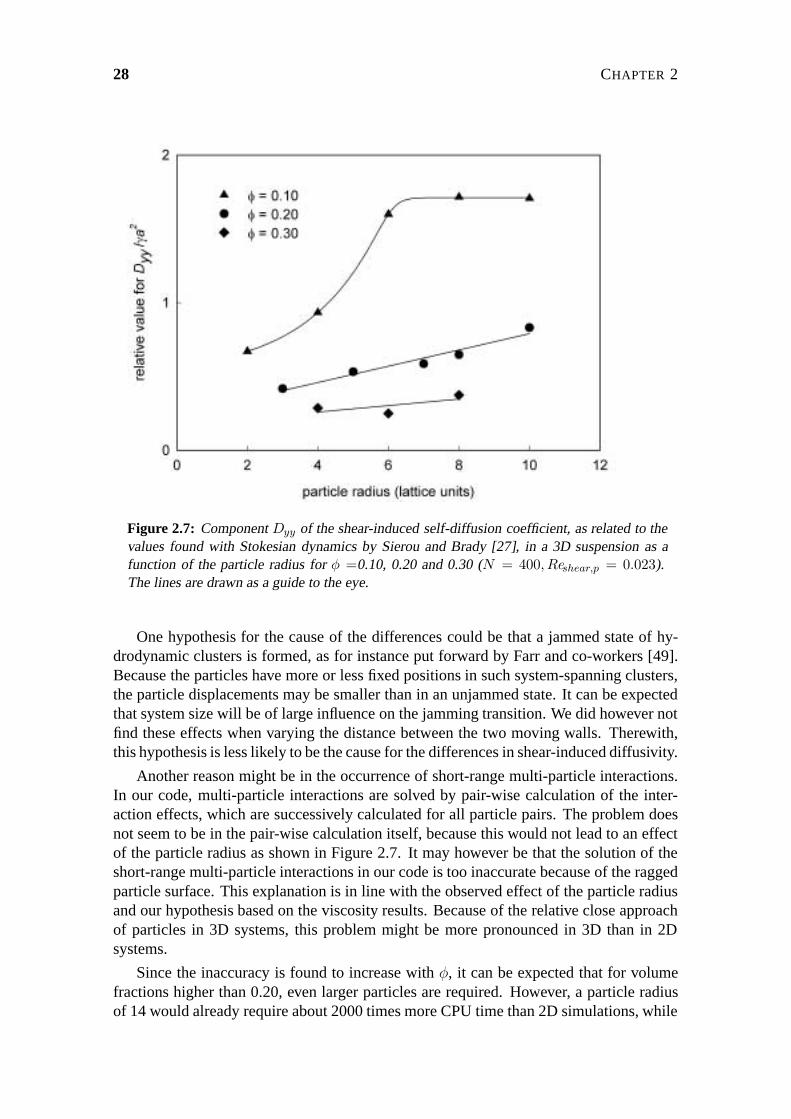
For a 3D system and φ ≥ 0.20, our simulations generated shear-induced diffusivitiesthat are smaller than the results found by Sierou and Brady [27]. In order to try to elucidatethese differences, we assessed the influence of the particle radius on the shear-induceddiffusivity at φ =0.10, 0.20 and 0.30 (figure 2.7). The shear-induced diffusivity increasedwith the particle radius, but seems to have reached a plateau value for φ = 0.10 at aparticle radius of 8 lattice units. For φ =0.20 and 0.30, even at a particle radius of 10lattice units, a plateau value was not reached. The values for φ =0.30 were furthest awayfrom the values presented by Sierou and Brady [27].
28 CHAPTER 2
Figure 2.7: Component Dyy of the shear-induced self-diffusion coefficient, as related to thevalues found with Stokesian dynamics by Sierou and Brady [27], in a 3D suspension as afunction of the particle radius for φ =0.10, 0.20 and 0.30 (N = 400, Reshear,p = 0.023).The lines are drawn as a guide to the eye.
One hypothesis for the cause of the differences could be that a jammed state of hy-drodynamic clusters is formed, as for instance put forward by Farr and co-workers [49].Because the particles have more or less fixed positions in such system-spanning clusters,the particle displacements may be smaller than in an unjammed state. It can be expectedthat system size will be of large influence on the jamming transition. We did however notfind these effects when varying the distance between the two moving walls. Therewith,this hypothesis is less likely to be the cause for the differences in shear-induced diffusivity.
Another reason might be in the occurrence of short-range multi-particle interactions.In our code, multi-particle interactions are solved by pair-wise calculation of the inter-action effects, which are successively calculated for all particle pairs. The problem doesnot seem to be in the pair-wise calculation itself, because this would not lead to an effectof the particle radius as shown in Figure 2.7. It may however be that the solution of theshort-range multi-particle interactions in our code is too inaccurate because of the raggedparticle surface. This explanation is in line with the observed effect of the particle radiusand our hypothesis based on the viscosity results. Because of the relative close approachof particles in 3D systems, this problem might be more pronounced in 3D than in 2Dsystems.
Since the inaccuracy is found to increase with φ, it can be expected that for volumefractions higher than 0.20, even larger particles are required. However, a particle radiusof 14 would already require about 2000 times more CPU time than 2D simulations, while

2D AND 3D SUSPENSIONS IN COUETTE FLOW 29
Figure 2.8: Component Dyy of the shear-induced self-diffusion coefficient as a function ofthe cylinder area fraction for a 2D suspension (N = 200) in shear flow at Reshear,p = 0.023.The open symbols represent the relation found by Sierou and Brady [27] for a 3D systemwith spheres instead of cylinders.
the CPU time would increase with a factor of about 25000 for a particle radius of 20. Evenon advanced supercomputers, one would run into problems with these requirements.
The 2D results on shear-induced diffusivity are presented in figure 2.8. These resultswere not found to be dependent on the particle size within a range of plus or minus25%. We can thus conclude that, similar to the viscosity results, the 2D results for shear-induced diffusion are less sensitive to inaccuracy in the particle representation on thegrid. At area fractions higher than 0.45 however, very large standard deviations werefound, which may be caused by comparable reasons as mentioned above for 3D systems,namely formation of a jammed state or inaccuracies in the calculation of the short-rangemulti-particle interactions. Therefore, we limited the results up to an area fraction of 0.45.
The relation between shear-induced diffusivity and φ is clearly different from the 3Drelation. For volume fractions lower than 0.25, the 2D shear-induced diffusivity wasaround three times higher, and at higher fractions around two times. In order to betterunderstand these differences and to be able to translate 2D results into 3D results, we havedeveloped an analytical model for shear-induced diffusivity. This model is discussed inthe next section.

30 CHAPTER 2
Analytical model for 2D-3D scaling
We used an analytical model for shear-induced diffusion (an adapted version of the modelthat was originally published by Breedveld [50]), which is based on a simple collisionmechanism.
Our simple collision model, described in appendix 2.7, approaches self-diffusion ina similar way as Leighton and Acrivos [15] did. It describes the movement of individ-ual particles in a homogeneous suspension and shear field under the action of excludedvolume effects that are caused by interactions with neighbouring particles on differentstreamlines in the shear flow. The particle motion during each encounter is described as adeterministic process, but it is assumed that this can lead to diffusive behaviour in systemswith many particles and random initial positions. An encounter of particles is modelledas an effective two-particle collision process, which proceeds unhindered until it is ter-minated by the presence of a third neighbouring particle. Without the presence of a thirdneighbouring particle, the collision is ended when the angle θ = π is reached (see figurein appendix 2.7), which does not result in a net displacement of the colliding particle.This is consistent with the shear flow trajectories that are obtained in the symmetric prob-lem of two colliding ideal hard spheres [21]. When particle concentrations are high, theaverage time between subsequent collisions is shorter than the time needed to completethe interaction and then the collisions end when interaction with a third incoming particleoccurs. Under these model assumptions, in a following step, particle trajectories are cal-culated as a function of initial particle positions and finally, averaging the displacementsover all configurations provides a measure for shear-induced self-diffusion. It is clear thatthe model will be valid for a restricted range of particle fractions. This range is deter-mined by factors such as the presence of two-particle interactions and the homogeneity ofthe suspension. In previous work [39], we have seen that particles in an inhomogeneoussuspension can have an increased shear-induced diffusivity. But, although the model issimplistic in that it does not at all consider complex hydrodynamics, it provides inter-esting insights into the nature of the microscopic processes that could be responsible forshear-induced self-diffusion, even more because the model does not contain adjustableparameters.
With our collision model, the components Dxx, Dyy, Dzz and Dxy of the diffusiontensor have been calculated for a 3D system (figure 2.9). The calculated values for thecomponents Dyy and Dzz are almost a factor 4 lower than most experimental data (seee.g. [17, 18]). The latest numerical results, calculated with ASD, are however a factor 2lower than experimental data; it was postulated by the authors that discrepancies are dueto analysing over too short strains in the experiments [27].
A feature that seems to be captured well by the collision model is the volume fractiondependence. Dyy and Dzz level off for volume fractions above 25%. In the model, this isdue to the fact that above this critical concentration, the average duration of an interactionis shorter than needed for the completion of the trajectory to θ = π. The diffusion com-ponents Dyy and Dzz reach a plateau value at a volume fraction of 25%. This is due tothe fact that the decrease in displacement at a higher volume fraction is exactly balancedby the increase in collision frequency, resulting in constant diffusion coefficients. Sucha plateau value for Dyy and Dzz is also found in experiments, although at a somewhathigher volume fraction of around φ = 0.35. Only Sierou and Brady [27] found a plateauvalue for Dyy as well as Dzz in their latest model calculations with the ASD technique.

2D AND 3D SUSPENSIONS IN COUETTE FLOW 31
Figure 2.9: The components Dxx, Dyy , Dzz and Dxy of the diffusion tensor for a 3D system,as calculated from the collision model (part a) and Dyy for a 2D system as compared to a 3Dsystem (part b).

32 CHAPTER 2
Most model predictions however do not show a plateau value at all.
The anisotropy Dyy/Dzz between the velocity gradient and vorticity direction is equalto 2 in our model. The value of 2 agrees well with experimentally observed values forthe anisotropy Dyy/Dzz. Although only a limited number of results on Dxx and Dxy
is available in literature, the results of our collision model exhibit large differences withthese results. Particularly the volume fraction dependence is different in our model results.The negative sign of Dxy is however correctly predicted. Since considerable debate stillexists on the magnitudes of Dxx and Dxy, it is hard to assess the accuracy of the modelpredictions; more elucidation is needed.
For a 2D system, the collision model predicts a different volume fraction dependenceof Dyy than for a 3D system (figure 2.9b). For 2D, Dyy starts to increase at an area fractionbetween 0.2 and 0.3. After it has started increasing however, the diffusion component Dyy
not only increases faster with the area/volume fraction, but it also reaches its plateau valueat a critical area fraction, which is two times higher than for a 3D system. Moreover, atarea fractions above the critical value, the diffusion component shows a decrease insteadof staying at a constant level. A relevant factor for these differences is the collision rateper particle. In a 2D system, the collision rate per particle at a certain fraction is twotimes smaller than in a 3D system. On the other hand, the average displacement during acollision is larger because the angle ϕ is equal to 0 in 2D systems, resulting in the maximalvalue of 1 for cos(ϕ). The combination of these two effects leads to a somewhat steeperincrease of Dyy with the area/volume fraction than in 3D systems, although the differenceis not large. The lower collision rate per particle in 2D systems is also relevant for theonset concentration of Dyy and the critical concentration where levelling off occurs. Theonset concentration is directly related to the collision rate, because it is determined bythe point where a two particle collision starts to be disturbed by a third particle. Forthe critical concentration, the average collision time is also important. Since the averagetime needed for a collision does not differ much between 2D and 3D systems, the smallercollision rate causes a shift of the critical concentration from 0.25 to about 0.50 in 2Dsystems. At higher concentrations in 2D systems, the effect of decreasing displacementis larger than the effect of increasing collision rate, leading to a net decrease of Dyy.
Based on this understanding, our expectations for 2D systems are that at relatively lowarea fractions, the shear-induced diffusion component Dyy is smaller than for 3D systems.At area fractions above 0.25, the 2D diffusion component can become up to a factor 3.5higher, due to the difference in area/volume fraction dependence. A normalisation wascarried out by dividing the area or volume fraction by φ∗, the fraction where the diffusivityhas reached half of the maximal value (0.5Dmax), and by dividing the diffusivity by itsmaximal value (Dmax) (Figure 2.10). As a result, the normalised 2D and 3D values ofthe collision model nicely coincide with each other. The same procedure has been carriedout on the 2D and 3D simulation results, but here, because the collision model did notcapture the Dyy − φ relation well, the normalisation parameters were derived from thesimulation results itself. In this way, a good agreement is found between the normaliseddata of our 2D LB simulations and the 3D Stokesian dynamics simulations of Sierouand Brady [27]. This indicates that the 2D-3D scaling relation as determined from thecollision model, is suited for the translation of (future) 2D simulation results to 3D. Inthis way, computationally intensive 3D simulations can be avoided.

2D AND 3D SUSPENSIONS IN COUETTE FLOW 33
Figure 2.10: Comparison of the shear-induced diffusivity as predicted by the collision modeland by computer simulation. The shear-induced diffusivity Dyy and the area or volume frac-tion φ are normalised following scaling rules derived from the results of the collision model.The values for φ∗ and Dmax are determined separately for each curve from the results pre-sented in Figure 2.7 and 2.9. For the 2D results of the present study, the value for Dmax isderived from Dyy at φ∗.
2.5 Conclusions
In this study, we have analysed the flow behaviour of suspensions subjected to Couetteflow, making use of the LB method. The focus was on a comparison of the flow behaviourof 2D and 3D suspensions. Since computations on 3D suspensions can computationallybe very intensive, it is investigated whether and when it is advantageous to carry outcomputations on 2D suspensions and translate these results to 3D suspensions with thehelp of scaling relations.
We have found particle structuring near the walls in both 2D and 3D suspensions. Thethickness of the structuring layer was thinner for 3D suspensions, which is in accordancewith wall effects in 2D and 3D single particle systems. Wall slip was found in bothsystems as well, and was more intensive in 3D systems and at higher concentrations.An important consequence of the differences between 2D and 3D is that when one isinterested in the bulk particle behaviour, in the 2D system, a larger system size should bechosen than in a 3D system.
For computation of the viscosity and shear-induced diffusion, limitations are found in

34 CHAPTER 2
the maximum volume fraction of particles that gives accurate results; these limitations arefound to be related to the grid size of the suspended particles. In 3D systems, for a particleradius of 8 lattice units, the inaccuracy became evident at φ larger than 0.30 (viscosity)or larger than 0.15 (shear-induced diffusion), which is at much lower concentrations thanin 2D systems. This sensitivity of 3D systems to inaccuracy is probably related to thecloser approach distance of two interacting particles in shear flow and may be caused byinaccuracy, introduced by the particle discretisation on the grid.
Because of the very large particle grid sizes, necessary to obtain accurate results for3D systems, only advanced supercomputers are currently suited for LB computations on3D systems, while the computations on 2D systems can be carried out well on a singleprocessor or on small computer clusters. Therefore, adequate scaling relations would behelpful to translate 2D simulation results to 3D systems. For the viscosity, such scalingrelations are already known, and we were able to reproduce those in our LB simulations.For shear-induced diffusion, we have developed an analytical collision model, which isable to predict qualitatively correct shear-induced diffusivities, and which captures thescaling between 2D and 3D well.
This study shows that the feasibility of 3D LB simulations is restricted to smallerparameter domains than 2D simulations. With the use of relatively simple, linear scalingrules, it proved possible to translate 2D simulation results to 3D real systems, whichopens the way to employ the LB method for unexplored aspects of suspension flow inCouette systems, such as particle polydispersity and high Reynolds number flow, withlarge relevance to practical processing of suspensions.
Acknowledgements
Friesland Foods is greatly acknowledged for supporting this research. Prof Dr Mike Catesand Dr Kevin Stratford from Edinburgh University are greatly thanked for fruitful discus-sions. The authors would like to acknowledge the support of the Dutch Ministries ofEconomic Affairs, Education, Culture and Sciences and of Housing, Spatial Planning andthe Environment through a grant of the Dutch Program Economy, Ecology and Technol-ogy and the support of the European Commission through grant number HPRI-CT-1999-00026 (the TRACS Programme at EPCC).
2.6 Lubrication force in a 2D suspension
We apply lubrication theory to calculate the hydrodynamic force between two cylindersin a 2D suspension. For small gaps (i.e. rim to rim distances) 2h the force between twoadjacent cylinders can be calculated, solving the flow field in the gap upto first order inε = h/a. In the calculation two cylinders are considered, approaching each other witha velocity 2U . A Carthesian coordinate system (ex, ez) was used with the origin at thecenter of the gap. The z-coordinate, taken along the line of centers, was scaled on h andthe x-coordinate was scaled on
√ah; the z-component of the velocity was scaled on U , the
x-component on√
a/hU . The pressure was scaled on aηU/h2. Under these conditions

2D AND 3D SUSPENSIONS IN COUETTE FLOW 35
the differential equation for the dimensionless stream function ψ becomes:
∂4ψ
∂z4+ 2ε
∂4ψ
∂x2∂z2+ ε2
∂4ψ
∂x4= 0 (2.6.1)
The rim of both disks is described by z = ±b(x) with
b(x) = 1 + 12x2 + ε1
8x4 + ε2 1
16x6 + ... (2.6.2)
and the boundary conditions on these rims read:
vz = − ∂ψ
∂x= ∓1, (2.6.3)
vx =∂ψ
∂z= 0, (2.6.4)
For convenience ψ = 0 is chosen at z = 0, so ψ is odd in z. This equation can be solvedassuming
ψ = ψ0 + εψ1 + ... (2.6.5)
where ψ0 fulfills the boundary conditions (2.6.3) and (2.6.4) and ∂ψ1/∂x = ∂ψ1/∂z = 0on the rim of the particle. The solution is given by:
ψ0 =1
2x
(3(zb
)−(zb
)3)
(2.6.6)
ψ1 =3
20g(x)
(zb
)(1−
(zb
)2)2
(2.6.7)
where g(x) = 4x(b′)2 − 2bb′ − xbb′′ and b′, b′′ are the first and second derivative ofb = b(x), respectively. The pressure along the line z = 0 can be calculated by integrating:(
∂p
∂x
)z=0
= −3b−3
(x+ ε
(3
5g(x)− 1
2f(x)
))(2.6.8)
where f(x) = 2x(b′)2 − 2bb′ − xbb′′. The zz-component of the total stress tensor (thesuperfix [D] indicates the dimensional form)
T [D]zz = −p[D] + 2η
∂v[D]z
∂z[D]
reads in dimensionless form
Tzz = −p + 2ε∂vz∂z
= −p− 2ε∂2Ψ
∂x∂z
where also Tzz has been scaled on p0 = aηU/h2. The (dimensionless) force per unitlength, F , on the particle is calculated by integrating Tzz along the line z = 0 (withswopping the order of integration of the ∂p/∂x term):
F (ε) = 2
∫ ∞
0
(Tzz)z=0 dx (2.6.9)
= 2
∫ ∞
0
x
(∂p
∂x
)z=0
dx− 4ε
∫ ∞
0
(∂2Ψ
∂x∂z
)z=0
dx
=
∫ ∞
0
3x
b3(x)
(2x+ ε
(6
5g(x)− f(x)
))dx− 4ε
∫ ∞
0
3
2b2(b− xb′)dx

36 CHAPTER 2
This expression can be rewritten as:
F (ε) = F0 + ε (F1 − F2)
where
F0 =
∫ ∞
0
6x2(1 + 1
2x2)3dx =
3
4π√2 = 3.3322
F1 =
∫ ∞
0
3x(1 + 1
2x2)3((
25
10x3 − 3
5x− 6x5
(8 + 4x2)
))dx =
207
80π√2 = 11.496
F2 =
∫ ∞
0
6
(1− 1
2x2)
(1 + 1
2x2)2dx = 0.0
are numerical constants. In our simulations, we have erroneously used a value of F1 =12.829, which lead to about 1% overestimation of the lubrication force. The lubricationforce per unit length in dimensional form, F [D] = p0
√ahF , follows from Equation 2.6.10
as:
F [D] =
(h
a
)−3/2
ηU F (h/a) =
(h
a
)−3/2
ηU
(F0 +
h
aF1
)(2.6.10)
which expression is correct to the first order of ε.
2.7 Analytical model for shear-induced diffusion
2.7.1 The collision frequency of the particle in 3D
Consider a simple shear field in which the velocity of the fluid (in Carthesian coordinates)is given by:
v = γyex (2.7.1)
so the x-direction is the velocity direction, the y-direction along the gradient and the z-direction along the vorticity direction. A collision takes place when two particles toucheach other: rij = p = ai + aj , where ai is the radius of particle (i).
Using spherical coordinates (r, ϑ, ϕ) (see Figure 2.11) and the unit vectors:
er = − cos ϑ ex + sinϑ eseϑ = sinϑ ex + cosϑ eseϕ = − sinϕ ey + cosϕ ez
(2.7.2)
where es is defined by:
es = cosϕ ey + sinϕ ez (2.7.3)
the relative position between two particles is given by:
rrel = p(− cosϑ ex + sinϑ es) (2.7.4)

2D AND 3D SUSPENSIONS IN COUETTE FLOW 37
ey
ex
es
ez
rij
ey
ex
es
ez
rij
Figure 2.11: Geometry for describing a typical collision.
and the relative velocity before collision by:
vrel = γp sinϑ cosϕ ex (2.7.5)
We consider a monodisperse suspension with volume fraction φ of particles with radiusa. The particle flux onto the surface of a tagged particle can be estimated as:
j = nvrel = 2naγ sinϑo cosϕo ex (2.7.6)
where n is the number density of the particles in the suspension. ϑo and ϕo define theorientation of the colliding particles. The collision rate in a certain space angle dNc/dΩis given by:
dNc = −nvrel · (2a)2 dΩ er (2.7.7)
dNc
dΩ= 8na3γ cosϕo sin ϑo cosϑo (2.7.8)
and the total collision rate:
Nc = 2
∫Ω(1)
dNc
dΩdΩ
=12
πφγ
∫ π/2
0
sin2 ϑo cosϑodϑo
∫ π/2
−π/2cosϕodϕo
=8
πγφ (2.7.9)
where Ω(1) is the space angle for which 0 < ϑ < π/2 and −π/2 < φ < π/2. Theprobability that a given collision occurs with orientation (ϑo, ϕo) or (π − ϑo, π + ϕo) isgiven by the function Φ(ϑo, ϕo):
Φ (ϑo, ϕo) =
(dNc/dΩ
)∫Ω(1)
(dNc/dΩ
)dΩ
=3
2cosϕo cosϑo sinϑo (2.7.10)

38 CHAPTER 2
and the mean time, τ , between two collisions of particle 1 with another particle followsfrom Equation 2.7.9:
τ = 1/Nc =π
8γφ(2.7.11)
2.7.2 The collision frequency of a particle in 2D
In 2D the collision rate under a certain angle dNc/dϑ is given by:
dNc = −nvrel · 2adϑ er (2.7.12)
dNc
dϑ= 4na2γ sin ϑo cosϑo (2.7.13)
and the total collision rate:
Nc = 2
∫ π/2
0
dNc
dϑdϑ =
8
πφγ
∫ π/2
0
sin ϑo cosϑodϑo
=4
πγφ (2.7.14)
hence, in 2D
Φ (ϑo) = 2 cosϑo sin ϑo (2.7.15)
and
τ = 1/Nc =π
4γφ(2.7.16)
2.7.3 The displacement of the particle in a collision
To describe the displacement of a particle (i) during a collision with particle (j) we de-scribe the collision with respect to the center of resistance of the two colliding parti-cles. The initial position of particle (i) is given by ϑo, ϕo (in 2D: ϕo = 0): rcm =a(− cosϑoex + sin ϑoes(ϕ)). To obtain a simple collision rule we assume affine motionof the particles as not prohibited by excluded volume effects. When the particles becomeinto contact they role over each other in the xs-plane. Under this assumption the velocityduring the collision, ϑo ≤ ϑ ≤ ϑ1, is:
v = v∞ · (I − erer) (2.7.17)
= aγ cosϕo sin2 ϑ (sinϑ ex + cosϑ es)
while the undisturbed velocity would be given by:
v∞ = aγ cosϕo sin ϑ ex (2.7.18)
The angular speed ϑ is given by: ϑ = γ cosϕo sin2 ϑ so the time a collision takes, is given
by:
∆t =1
γ cosϕo
∫ ϑ1
ϑo
dϑ
sin2 ϑ=
(cotϑ0 − cotϑ1)
γ cosϕo(2.7.19)
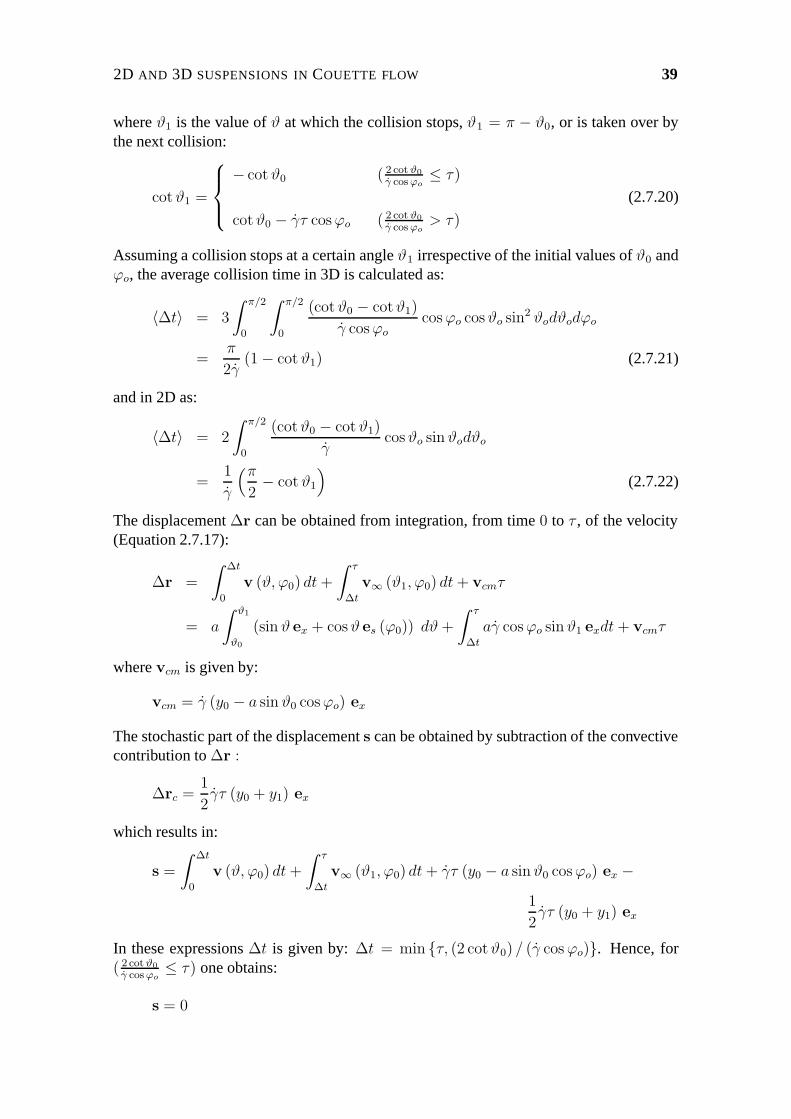
2D AND 3D SUSPENSIONS IN COUETTE FLOW 39
where ϑ1 is the value of ϑ at which the collision stops, ϑ1 = π − ϑ0, or is taken over bythe next collision:
cotϑ1 =
− cotϑ0 ( 2 cot ϑ0
γ cosϕo≤ τ)
cotϑ0 − γτ cosϕo ( 2 cot ϑ0
γ cosϕo> τ)
(2.7.20)
Assuming a collision stops at a certain angle ϑ1 irrespective of the initial values of ϑ0 andϕo, the average collision time in 3D is calculated as:
〈∆t〉 = 3
∫ π/2
0
∫ π/2
0
(cotϑ0 − cotϑ1)
γ cosϕocosϕo cosϑo sin
2 ϑodϑodϕo
=π
2γ(1− cotϑ1) (2.7.21)
and in 2D as:
〈∆t〉 = 2
∫ π/2
0
(cotϑ0 − cotϑ1)
γcosϑo sinϑodϑo
=1
γ
(π2− cotϑ1
)(2.7.22)
The displacement ∆r can be obtained from integration, from time 0 to τ , of the velocity(Equation 2.7.17):
∆r =
∫ ∆t
0
v (ϑ, ϕ0) dt+
∫ τ
∆t
v∞ (ϑ1, ϕ0) dt+ vcmτ
= a
∫ ϑ1
ϑ0
(sin ϑ ex + cosϑ es (ϕ0)) dϑ+
∫ τ
∆t
aγ cosϕo sinϑ1 exdt+ vcmτ
where vcm is given by:
vcm = γ (y0 − a sin ϑ0 cosϕo) ex
The stochastic part of the displacement s can be obtained by subtraction of the convectivecontribution to ∆r :
∆rc =1
2γτ (y0 + y1) ex
which results in:
s =
∫ ∆t
0
v (ϑ, ϕ0) dt+
∫ τ
∆t
v∞ (ϑ1, ϕ0) dt+ γτ (y0 − a sinϑ0 cosϕo) ex −1
2γτ (y0 + y1) ex
In these expressions ∆t is given by: ∆t = min τ, (2 cotϑ0) / (γ cosϕo). Hence, for( 2 cot ϑ0
γ cosϕo≤ τ) one obtains:
s = 0

40 CHAPTER 2
and for ( 2 cot ϑ0
γ cosϕo> τ):
s/a = [sinϑ1 − sinϑ0] es + [cos ϑ0 − cos ϑ1 − (2.7.23)12(sinϑ0 + sinϑ1) (cotϑ0 − cotϑ1) ex
where we have used:
γτ cosϕo = cotϑ0 − cotϑ1
(in 2D the obtained expressions for the displacements are valid if one substitutes ϕo = 0).
2.7.4 The self-diffusion tensor
The self-diffusion tensor D for a particle can be calculated from:
D =〈s s〉2τ
(2.7.24)
The averaging has to be done with the weight function Φ (Equation 2.7.10) in the follow-ing way:
〈s s〉 =
∫ π/2
−π/2
∫ π/2
0
(s s) Φ(ϑo, ϕo) sinϑodϑo dϕo (2.7.25)
= 3
∫ π/2
0
∫ π/2
0
(s s) sin2 ϑo cosϑodϑo cosϕo dϕo (2.7.26)
The diad (s s) is for ∆t = (2 cotϑ0) / (γ cosϕo) < τ given by:
〈s s〉 = a2 〈s s〉
〈s s〉 = 3
∫ π/2
0
∫ ϑm(ϕo)
0
(s s) sin2 ϑo cosϑodϑo cosϕo dϕo
where ϑm(ϕo) = arctan (16φ/ (π cosϕo)). The dyad (s s) is given by:
s = [sinϑ1 − sinϑ0] es + [cosϑ0 − cos ϑ1 − (2.7.27)12(sinϑ0 + sinϑ1) (cotϑ0 − cotϑ1) ex
with
cotϑ1 = cotϑ0 − π cosϕo
8φ
Finally one obtains an expression for the diffusion tensor:
D = γa24φ
π〈s s〉 (2.7.28)
Using Equations 2.7.27 and 2.7.28 all the components of the self-diffusion tensor canbe calculated. In the 2D calculations no ϕ dependence exists and the weight function Φis given by Equation 2.7.15, while in the expressions for the displacements one has toreplace ϕo by 0.

3
Shear-induced self-diffusion andmicrostructure in non-Browniansuspensions at non-zero Reynolds
numbers
J. Kromkamp, D.T.M. van den Ende, D. Kandhai, R.G.M. v.d. Sman, R.M. Boom, J. Fluid Mech. 529(2005) 253-278

42 CHAPTER 3
This paper addresses shear-induced self-diffusion in a monodisperse suspension ofnon-Brownian particles in Couette flow, by two-dimensional computer simulations fol-lowing the Lattice Boltzmann method. This method is suited for the study of (many-particle) particulate suspensions and can not only be applied for Stokes flow, but also forflow with finite Reynolds number.
At relatively low shear particle Reynolds numbers (Reshear,p) (up to 0.023), shear-induced diffusivity exhibited a linear dependence on the shear rate, as expected fromtheoretical considerations. Simulations at Reshear,p between 0.023 and 0.35, however,revealed that in this regime, shear-induced diffusivity did not show this linear dependenceanymore. Instead, the diffusivity was found to increase more than linearly with the shearrate, an effect that was most pronounced at lower area fractions of 0.10 and 0.25.
In the same shear regime, major changes were found in the flow trajectories of twointeracting particles in shear flow (longer and closer approach) and in the viscosity of thesuspension (shear thickening). Moreover, the suspended particles exhibited particle clus-tering. The increase of shear-induced diffusivity is shown to be directly correlated withthis particle clustering. As for shear-induced diffusivity, the effect of increasing shearrates on particle clustering was the most intensive at low area fractions of 0.10 and 0.25,where the radius of the clusters increased from about 4 to about 7 particle radii with anincrease of the Reshear,p from 0.023 to 0.35. The importance of particle clustering toshear-induced diffusion might also indicate the importance of other factors that can in-duce particle clustering, such as, for example, colloidal instability.
3.1 Introduction
In concentrated non-Brownian suspensions, shear-induced diffusion affects the motion ofthe suspended particles and is consequently of major importance for the flow behaviourof these suspensions. A variety of interesting rheological phenomena in concentratedsuspensions is invoked by shear-induced diffusion, such as viscous resuspension (duringsedimentation and cross-flow filtration) and particle segregation in radial and pipe flow(see e.g. [51, 52]). Therefore, this subject has attracted considerable attention from re-searchers, starting with the first direct experimental study of Eckstein, Bailey and Shapiroin 1977 [14]. Later, theoretical as well as numerical work followed (see e.g. [26, 53]).
In contrast to the more familiar diffusion concepts of Brownian diffusion and turbu-lent diffusion, which are, respectively, caused by thermal fluctuations and inertial effects,shear-induced diffusion is caused by hydrodynamic particle-particle interactions. Thediffusivity of the particles is the result of the spatial hindrance that they experience in aconcentrated suspension which is macroscopically forced to flow. Although this processin principle is a deterministic process, it can be described as a diffusion process owing tothe complex nature of the hydrodynamics.
A distinction can be made between shear-induced self-diffusion and shear-inducedgradient diffusion (or migration). The first concept considers the motion of individualparticles in a homogeneous suspension, whereas the latter considers collective particlemigration in the presence of a gradient. This paper addresses the concept of shear-inducedself-diffusion only.

SHEAR-INDUCED SELF-DIFFUSION AT NON-ZERO REYNOLDS NUMBERS 43
To obtain information about shear-induced self-diffusion, the motion of individualparticles in a suspension must be monitored. Experimental work is mostly carried outwith the use of tracer particles in a suspension. An overview of experimental data onshear-induced self-diffusion is given in two articles of Breedveld and co-workers [17, 18].Unfortunately, experimental techniques mostly impose severe limitations on the range ofstrain values during which the particles can be monitored, which complicates the work onshear-induced self-diffusion considerably. Theoretical analyses and numerical computa-tions can therefore be helpful for comparison and for information that cannot be obtainedwith experiments.
A theoretical approach of shear-induced self-diffusion is complicated by the fact thata two-body system in the presence of only hydrodynamic interactions, either does notexhibit diffusive behaviour (for the motion parallel to the velocity gradient and vorticitydirections) or exhibits singular behaviour (for the motion parallel to the fluid velocity).Approaches that have been applied to overcome this problem in the theoretical compu-tation of shear-induced diffusion, are the introduction of an additional pair of particles[20], examination of three particle interactions [22], introduction of surface roughness onthe particles [21] and introduction of residual Brownian motion and a hard-sphere inter-particle force [53]. The latter approach by Brady and Morris can be considered the mostsuccessful up to now. It predicts the correct level of anisotropy between the diffusion inthe velocity gradient (Dyy) and vorticity (Dzz) direction. The calculated diffusivities are,however, a factor of about six higher than values from experimental studies. Moreover,the theory predicts a continuous increase of the diffusion coefficient with volume fraction,while experimental values level off at high volume fractions. We can therefore concludethat, in spite of the aforementioned rigorous attempts, up to now, no theory is availablethat satisfactorily predicts shear-induced diffusive behaviour.
Some numerical studies on shear-induced diffusion have been reported using Stoke-sian Dynamics (SD) simulations [25, 26, 54, 55]. Many-body hydrodynamic interactionsare included in this simulation technique. The SD simulations provided self-diffusion co-efficients that are of the same order of magnitude as experimental results. The computedanisotropy between Dyy and Dzz also compared well with experimental data. Althoughthe SD simulations strongly contributed to the level of understanding of shear-induceddiffusion, the results of the simulations are not uncontroversial. The dependence of thediffusion coefficient on the volume fraction, for example, is not clear. While earlier workshows a continuous increase of the diffusion coefficient with the volume fraction, recentwork suggests the existence of a plateau at high volume fractions [25, 55]. This plateauwas, however, only found for Dyy and not for Dzz. Another controversial aspect is thenumber of particles incorporated in the system. The computational costs for calculationson non-colloidal systems (dominated by hydrodynamics) are very high with SD and inmost published work, systems were used with 27 particles only. Since this system size issmall compared to any realistic system, the results have to be treated with care. The recentintroduction of the Accelerated Stokesian Dynamics (ASD) simulation technique [56],based on a much faster computational algorithm, allows the study of large systems withtypically 1000 suspension particles. Using ASD to study shear-induced self-diffusion,Sierou and Brady [27] indeed showed the relevance of high particle numbers and suf-ficiently high strains for reliable diffusion coefficients. Their results, covering the fulldiffusivity tensor, can probably be considered the most accurate up to now.
Besides the relatively high computational cost, SD, and also ASD, have other limi-

44 CHAPTER 3
tations for the simulation of shear-induced diffusion. The suspending fluid is assumedto be Newtonian and to be flowing under conditions approximating Stokes flow (particleReynolds number Rep −→ 0). Although ASD may have better possibilities, with SD,the application of non-spherical particle shapes and size distributions is complex. More-over, it is difficult to make the method suitable for simulations in bounded regimes withcontainer walls [33]. These aspects may be of importance to gain a better insight intoshear-induced diffusion in practical systems. Therefore, although SD and ASD are ro-bust methods that accurately resolve hydrodynamic interactions, they are not yet able toaddress all relevant aspects of shear-induced diffusion.
In this paper, a study on shear-induced diffusion is presented making use of a LatticeBoltzmann (LB) model for particulate suspensions [33]. This model combines Newtoniandynamics of solid particles with a discretised Boltzmann equation for the fluid phase.The many-body hydrodynamic interactions are fully accounted for (with inclusion of anexplicit lubrication force for hydrodynamic interactions over very short distances). TheLB model may have a number of advantages for the simulation of shear-induced diffusionover the SD model. Since the interactions between the fluid and the suspended solidparticles can be calculated with simple local rules, the computational cost depends linearlyon the amount of suspended particles, which makes many-particle simulations feasible.The LB model is also not restricted to the Stokes flow regime for fluid flow and caneasily be applied for non-spherical particles, for particles with a size distribution andfor systems bounded by container walls [33]. This may make the LB technique moresuitable for the simulation of shear-induced diffusion in more complex systems, wherethe aforementioned aspects play a role.
The aim of this work is to examine shear-induced diffusion outside the Stokes flowregime, at finite Reynolds numbers, and investigate the effect of inertia. The fact that theseconditions of finite Reynolds numbers are frequently applied in (industrial) processes ofsuspensions, such as milk and other foods, paints and river water, makes the relevanceof this work evident. Although it is well-known that the rheological behaviour of con-centrated suspensions can become non-Newtonian in this regime, as far as we know, thescaling of shear-induced diffusion with the shear rate has not been studied yet. In thisstudy, we furthermore compare the shear-induced diffusive behaviour with the effects ofshear on the flow trajectories of one particle and two interacting particles and on the vis-cosity of a multi-particle suspension, so as to be able to detect possible correlations. Thestudy is carried out for two-dimensional (2D) systems in order to limit the computationalcosts. Although this might lead to differences in the scaling of the relations in comparisonwith three-dimensional systems, the trends will be similar as is presented in [78].
In section 3.2, we present an outline of our LB method for particulate suspensions.Subsequently, we show results of the shear-dependent behaviour of one (flow trajectory),two (flow trajectory) and multi-particle (viscosity) systems (section 3.3). In section 3.4,we present our results on shear-induced diffusion. As a relevant parameter, in section 3.5,an analysis is made of the suspension microstructure at different shear rates, whereafterwe draw our conclusions.

SHEAR-INDUCED SELF-DIFFUSION AT NON-ZERO REYNOLDS NUMBERS 45
3.2 Computer simulation method
We have applied the LB method in our simulations. Since this method has already beenoutlined extensively in literature (see e.g. [29, 33]), we will only recapitulate the most im-portant points. The LB method models a compressible fluid (in which the speed of soundis finite) in the limit of low Mach number (Ma=flow velocity/speed of sound), by solvingthe discretised Boltzmann equation for fictitious fluid particles, that are constrained tomove on a lattice. The state of the fluid is characterised by the single-particle distributionfunction fi(x, t) , describing the average number of particles at a particular node of thelattice x, at a time t, with the discrete velocity ci, which brings the fluid particles in onetime step to an adjacent lattice node. In the simulations described in this paper, the fluiddynamics were solved with a D2Q9 LB scheme, which is defined on a 2D square latticewith rest particles and 8 non-zero particle velocities. The velocity directions link latticesites to its nearest and next-nearest neighbours. The velocity vectors on this 2D lattice aredefined as:
ci =
(0, 0) , i = 0(cos i−1
2π, sin i−1
2π), i = 1, 2, 3, 4√
2(cos(i−12π + π
4
), sin
(i−12π + π
4
)), i = 5, 6, 7, 8
(3.1)
The hydrodynamic fields mass density ρ, momentum density j, and the momentum fluxdensity Π are moments of this velocity distribution:
ρ =∑i
fi, j =∑i
fici, Π =∑i
ficici (3.2)
The fictitious fluid particles evolve by collisions and subsequent propagation to neigh-bouring lattice sites. This two-step process is described by the following equations:
f ′i(x, t) = fi(x, t)−
∑j
Ωijfneqj (x, t) (3.3)
fi(x+∆xi, t+∆t) = f ′i(x, t) (3.4)
Here f ′i(x, t) is the post-colllisional distribution function. The non-equilibrium part of the
distribution function is defined as f neqi (x, t) = fi(x, t)− f eqi (x, t). The lattice spacing is
defined as ∆xi = ci∆t . The collision operator Ωij controls the shear stress relaxation atevery lattice site. In our simulations, we applied the collision operator of the Bhatnagar-Gross-Krook (BGK) model [37, 57], which is a simplification of the full LB model. TheBGK collision operator is defined such that the distribution functions are simply relaxedat each time step towards the local equilibrium distribution with the relaxation time τ :
fi(x+∆xi, t+∆t) = fi(x, t)− fi(x, t)− f eqi (x, t)
τ(3.5)
The relaxation time τ controls the relaxation of the viscous stress in the fluid and is linkedto the kinematic viscosity ν via:
ν = c2s
(τ − 1
2
)∆t (3.6)

46 CHAPTER 3
where the speed of sound cs is defined by c2s = c2/3. In our simulations we appliedτ =1.0 (in lattice units), which corresponds to a kinematic viscosity ν of the fluid of 1/6(in lattice units). The equilibrium distribution f eq
i (x, t) is chosen such that the Navier-Stokes equations for a weakly compressible system are obtained [36]. It can be expressedas a series expansion in powers of the flow velocity u:
f eqi = ρwi(1 +1
c2su · ci +
1
2c4suu : cici − 1
2c2su2) (3.7)
where uu is the traceless part of uu, and the double dot product is defined as A : B =∑α,β AαβBβα. The weight factors are given by w0 = 4/9, w1 = w3 = w5 = w7 =1/9
and w2 = w4 = w6 = w8 =1/36.In the LB scheme for particulate suspensions as developed by Ladd [29], the solid
particles are defined by a boundary surface, which can be of any size or shape. The solidparticles are placed on the lattice, where the boundary surface cuts some of the links be-tween lattice nodes. Fluid particles moving along the boundary surface interact with thesurface at boundary nodes that are located at the lattice nodes nearest to the boundarysurface of the solid particles, following an alternative method to Ladd’s, that was devel-oped by Behrend [38]. In this method, called relaxed bounce back at the nodes, the LBcollisions are carried out at every node, including the boundary nodes. The collision rulesat the boundary surface enforce a stick boundary condition on the fluid, which means thatthe fluid velocity is matched to the local solid-body velocity ub. This local solid-bodyvelocity ub (at position xb) is determined by the solid-particle velocity U, its angularvelocity Ω and the position of its center of mass R:
ub = U + Ω× (xb − R) (3.8)
After the collision phase, the boundary nodes are updated in the following way:
fi(x +∆xi, t+∆t) = f ′−i(x, t) +
2ρwi
c2sub · ci (3.9)
fi(x −∆xi, t+∆t) = f ′i(x, t)−
2ρwi
c2sub · ci (3.10)
For moving suspension particles, in this update, momentum is exchanged between theincoming particles from the fluid and the solid side (the combined momentum of thefluid and the solid phase is, however, conserved). From this momentum exchange, theforce and torque exerted on a suspension particle is calculated. Hereinafter, the kinematicproperties of the suspension particles are updated with a simple Euler forward integrationof Newton’s second law.
The choice of the location of the boundary nodes, the discretisation of the particle sur-face onto the lattice and the boundary update rules induce a certain hydrodynamic particlediameter that is larger than the diameter based on the number of occupied lattice nodes[30]. In dilute systems, in the Stokes flow regime and for sufficiently large particles, thedifference between the input particle diameter and the hydrodynamic particle diametercan be considered constant (but dependent on the kinematic viscosity). In that situation,the hydrodynamic instead of the real particle diameter could be used for the calculationof the particle fraction or shear-induced diffusivity. In our simulations, we focus on ratherconcentrated suspensions outside the Stokes flow regime, where we not only expect the

SHEAR-INDUCED SELF-DIFFUSION AT NON-ZERO REYNOLDS NUMBERS 47
deviation to be smaller than for dilute systems in the Stokes flow regime, but also tobe dependent on the actual hydrodynamic conditions. Because determination of the ac-tual hydrodynamic diameter in concentrated suspensions outside the Stokes flow regimewould become very complex, we used the real particle diameter in our simulations, know-ing that this gives a small, albeit probably negligible error. For the relatively large particlediameters of 16 lattice units applied in this study, this would give a deviation on the in-put particle diameter of at most 5%. The particle fraction and shear-induced diffusivityare the most important parameters that depend on the particle diameter. The quadraticdependence of these parameters on the particle diameter would, in its turn, give rise to amaximal deviation of 10% on the particle fraction and the shear-induced diffusivity. Ingeneral, this deviation lies within the standard deviation of our simulation results.
Since a suspended particle is essentially simulated by the introduction of a boundarysurface, separating the interior of the particle from the exterior, the interior of the particlealso consists of fluid. Ladd [30] examined the effects of the interior fluid on the behaviourof the particle. With a sufficiently high effective mass of the particle, the interior fluidonly contributes an inertial force due to the extra mass of the particle. Our computationswere carried out in this regime, with an effective mass density ρs/ρ of 10. By comparingsimulation results at low Rep with an effective mass of 3 and 10, we found that the rela-tively high effective particle mass did not contribute to the observed effects of Rep on theviscosity and shear-induced diffusion in this paper. It can therefore be hypothesized thatfluid inertia plays a larger role than particle inertia in our system; here, we do not take itinto consideration any further.
Since shear-induced diffusion is mainly governed by hydrodynamic particle interac-tions, these interactions must be accurately resolved in the computations. When two sus-pension particles come into close contact with each other, the lubrication force becomesimportant. This force is caused by the attenuation of the fluid film in the gap between thetwo particles and is repulsive upon approach and attractive upon separation of the parti-cles. When the gap width between two particles is of the order of one lattice spacing, thelubrication force is, however, not exactly resolved with the LB method. This is due to thediscretisation of the particles and fluid on a grid and is a problem that is encountered byall numerical methods. To overcome this problem, we applied a lubrication correction asproposed by Ladd and Verberg [33] for a 3D system. It starts with an explicit calculationof the lubrication force when the gap width is smaller than two lattice units (= 0.25a).Since we considered a 2D system, we used the following equation for the lubricationforce per unit length F , which is valid for the lubrication force between two cylinders(see Appendix 3.7):
F = ηU
((h
a
)− 32
(F0 +h
aF1)−
(hc
a
)− 32
(F0 +hc
aF1)
),
h < hc (3.11)
F = 0, h > hc (3.12)
where two particles approach each other with a velocity U , 2h = |R12| − 2a is the gap(distance between the particle surfaces), F0 and F1 are numerical constants. In accordancewith Ladd and Verberg [33], we applied a correction on the lubrication force to accountfor the lubrication force that is already resolved in the computations of the fluid dynamics.This was done by subtracting the lubrication force at a cut-off distance hc from the total

48 CHAPTER 3
lubrication force, as indicated in Equation 3.12. The cut-off distance hc represents the cut-off distance between the particle surfaces for the added lubrication force and was chosenequal to one lattice unit (= 0.125a) in our study. For 3D systems, Nguyen and Ladd[40] showed that this correction leads to more accurate results for particle interactionsat short interparticle distances, even with neutrally buoyant particles very near to contactand without causing instabilities in the particle dynamics. These improvements are alsoexpected for a 2D system.
We have noticed, that in suspensions with particle fractions exceeding 0.40 and at rel-atively high shear rates, particle clustering and overlap can occur, which greatly affectedthe diffusive behaviour of the particles. This behaviour seems to be correlated with thelubrication breakdown of concentrated colloids, that was reported by Ball and Melrose[41]. As suggested by these authors, we applied a Hookean spring force between theparticles for particle fractions exceeding 0.40 to avoid this clustering and overlap. ThisHookean spring force was applied for gaps 2h smaller than a thickness δ and was appliedin the direction of the line of particle centres, according to:
Fh = Fm −(Fm
δ
)2h (3.13)
with a maximal Hookean spring force Fm of 10.0 (in lattice units). The Hookean springforce is active in a layer around the particle with a thickness δ/2 of 0.05 lattice units(= 0.00625a). When using the LB model as described above, we found a good agree-ment between our computer simulation results for the viscosity and model results of theKrieger-Dougherty model (particle fractions between 0.05 to 0.55), which is known to de-scribe experimental data well. Especially at high particle fractions, the viscosity is knownto be highly dependent on particle interactions. The good agreement with the Krieger-Dougherty model therefore indicates that our model captures the particle behaviour well.
3.3 Effects of hydrodynamics and inertia in particle sus-pensions
Our simulations on shear-induced diffusion are carried out in a 2D multi-particle suspen-sion (actually cylinders) in a Couette system with solid moving walls. Before examiningthis rather complex system, we firstly studied the behaviour of a single cylinder and oftwo interacting cylinders in shear flow, in order to investigate some relevant effects ina simpler system. The case of the single cylinder studies wall effects and the effect ofRep and is compared with data from literature concerning 3D systems. The case of twointeracting cylinders is presented to show the effect of Rep on the flow trajectory of twointeracting cylinders in shear flow. For this specific case, neither analytical nor numer-ical (2D) solutions were available so the comparison with literature is only qualitative.Besides these one and two cylinder systems, we determined the effects of Rep on theviscosity of a multi-particle suspension, which enabled us to examine the collective par-ticle behaviour in a Couette system with solid moving walls and relate this behaviour tothe results presented in section 3.4 and 3.5 of this paper. The results of the preliminarysimulations are discussed in this section.
The computer simulations on a single and on two interacting cylinders were carriedout in a Couette system, consisting of a box with solid walls at the upper and lower

SHEAR-INDUCED SELF-DIFFUSION AT NON-ZERO REYNOLDS NUMBERS 49
Figure 3.1: The angular velocity ω as a function of Reshear,p for a single cylinder with radiusa in shear flow. The distance between the solid walls of the Couette system was variedbetween 2.5a and 40a. The results are compared to results of Nirschl and co-workers [42]for a 3D system. The inset shows a scheme of the simulated situation.
side and periodic boundaries at the left- and right-hand side of the box. The walls moveparallel to each other with a constant velocity, but in opposite directions. The width ofthe box between the periodic boundaries was equal to 640 lattice units (=80a). The heightof the box between the two parallel walls was 320 lattice units (=40a) (in most cases)and the wall velocity was between 0.002 and 0.054 lattice units per time step, resultingin a shear rate between 1.25*10−5 and 7.50*10−4 per time-step. Therewith, the shearbased particle Reynolds number Reshear,p (= 4γa2/ν, with ν the kinematic viscosity) wasbetween 0.019 and 1.152. For the case of a single cylinder, the height of the box and thewall velocity were varied, but in such a way that the shear rate and Reshear,p were in therange indicated above.
For a single cylinder placed at the horizontal centerline of the Couette system, theequilibrium angular velocity of the cylinder is determined as a function of the distancebetween the solid walls and as a function of Reshear,p. In this paper, the angular velocityω is normalised for the shear rate. We compare our results to results of Nirschl and others[42], who carried out comparable computations with a finite volume numerical scheme,but for a 3D system. Taylor [43] derived an analytical solution for low Reynolds numberflow over a rotating sphere in simple shear, which predicts an angular velocity ω of a half.The computed angular velocity ω is presented as a function of Reshear,p in Figure 3.1.
For a distance between the walls Y = 10a and Y = 40a and Reshear,p <0.5, theangular velocity ω approached Taylor’s solution to within a few percent. For Reshear,p upto 1.152, no large influence of Reshear,p on the angular velocity ω is seen. The influence

50 CHAPTER 3
was slightly larger for larger distances between the walls. This is in agreement with thefindings of Nirschl and others [42] for a 3D system. The influence of Reshear,p can beattributed to the blockage of fluid near the particle axis. This blockage creates a recircu-lation of fluid, and the streamlines divert into the gap between the wall and the particle.Therewith the resistance to flow in the gap increases, and the flow losses are larger withincreasing Reshear,p, leading to a decrease of the angular velocity ω. When the distancebetween the walls is smaller, the recirculation is inhibited so that the effect of Reshear,p
is less than for larger distances. When the distance between the walls decreased to 5a orsmaller in our simulations, the walls had an increasing effect on the angular velocity ω.Compared to the 3D results of Nirschl and others, this effect is more pronounced in a 2Dsystem. This can be understood because the intensity of the flow field around a cylinderis larger than around a spherical particle.
All together, these results lead us to the conclusion that in the shear regime of ourstudy, Reshear,p does not have a significant effect on the rotation of a single cylinder.When the cylinder closely approaches a solid wall, the angular velocity decreases owingto the interaction with the wall. This effect is larger in a 2D than in a 3D system. Theseresults also give an indication of wall effects in a Couette system where the cylinder isplaced eccentrically in that system. It is known that cylinders tend to migrate to thecenterline of a Couette system [58]. The migration velocity is, amongst others, dependenton the distance from the wall. We can expect that migration becomes important at particledistances from the wall where the angular velocity is significantly affected. Consequently,when wall effects on the total system need to be negligible, the distance between the wallsin a multi-particle system needs to be sufficiently high. Therefore, the distance betweenthe walls was minimally 56a in the simulations on multi-particle systems in the rest ofthis paper.
In another study, we determined the drag coefficient of a single cylinder settling alongthe centerline of a confined channel (results not shown). These results were found to bein good agreement with results of Feng and others [59] and Aidun and Lu [60], indicatingthat the drag of a transposing cylinder is accurately resolved with our LB method.
The interactions between two cylinders subjected to simple shear flow provide an im-portant basis for analysing shear-induced diffusive behaviour of suspensions, because thisbehaviour can be considered the basis for shear-induced diffusion in the low concentra-tion limit. Batchelor and Green [44] have derived analytical solutions for 3D systems ofspheres without inertia. Trajectories can either extend to infinity (open trajectory) or not(closed trajectory). The interaction between equal-sized spheres is symmetric and suchspheres can approach each other to exceedingly small separations. Factors such as surfaceroughness can disturb the symmetry of the process, because this can impose an additionalforce onto the spheres when in close contact. Therefore, closed trajectories will probablyonly occur for very smooth spheres. We have studied the effect of inertia on hydrodynam-ically interacting cylinders by varying Reshear,p in a system with two equal-sized cylindersin an open trajectory.
In our simulations, these two cylinders were placed in the box at heights symmetricalaround the horizontal centerline, at a distance of 19.25a from the moving wall and 0.75afrom the centerline. The initial horizontal distance between the cylinders was 10.0a.Based on the simulations on one cylinder as presented in Figure 3.1, it can be expectedthat the walls did not affect the flow of the cylinders. The trajectories of the interactingcylinders were computed for various shear rates (Figure 3.2).

SHEAR-INDUCED SELF-DIFFUSION AT NON-ZERO REYNOLDS NUMBERS 51
Figure 3.2: Flow trajectories for two interacting cylinders with radius a in shear flow.Reshear,p varied between 0.019 and 0.518. The positions are related to the initial midpoint ofthe two cylinders.
At Reshear,p 0.019 and 0.058, no clear effects of inertia can be seen in the flow tra-jectories. In their tumbling movement around each other, the cylinders reach a minimumseparation of 0.20 ∗ 2a (Figure 3.3). When compared to 3D systems, this minimum sep-aration is large. This can be explained because the flow of fluid out of or into the gapduring respectively approach or separation of two parallel cylinders is more hindered thanfor the case of spheres. The trajectories upon approach and upon separation are prac-tically symmetric, which is in accordance with the relatively large separation distancesin this system. At Reshear,p >0.058, inertial effects become visible in the trajectories.One effect is that the separation distance between the cylinders became smaller, bothduring approach and during separation. The minimum separation between the cylindersdecreased to 0.11∗2a for Reshear,p equal to 0.52 (Figure 3.3). This effect can be explainedbecause inertia causes the cylinders to move to different streamlines, and is probably dueto particle inertia rather than fluid inertia. A second effect is that at larger separation dis-tances, the cylinders slowly moved towards the center axis of the system before they starttumbling over each other. Upon separation, a similar movement away from the centeraxis took place. Inertial effects in the fluid flow around the cylinders are the most proba-ble cause for this effect. Finally, the trajectories upon approach and separation exhibitedan increasing asymmetry with increasing Reshear,p. This effect, although small, can beseen in Figure 3.3. The minimum separation was still too large to be able to explain theobserved asymmetry with the action of the repulsive Hookean spring force Fh or with

52 CHAPTER 3
Figure 3.3: Separation distance as a function of the horizontal position of the upper cylinder,for two interacting cylinders with radius a in shear flow. Reshear,p varied between 0.019 and0.518.
the effect of surface roughness (a different flow trajectory would then also be expected).Inertial effects seem, therefore, to be responsible for this asymmetry.
The inertial effects during the interaction between the cylinders lead to a dispersal ofthe cylinders at Reshear,p=0.52, which proceeded with repeated encounters of the cylin-ders (Figure 3.4). Even when the separation distance between the cylinders has becomelarger than 7 ∗ 2a, the dispersal still proceeds. Because the vertical velocity decreaseswith increasing separation distance and does not exhibit a logarithmic trend in time, itis expected that the cylinders will have reached their equilibrium position at a separationdistance of about 8 ∗ 2a. The distance from the walls was still about 12a, so that it is notlikely that this final separation distance is affected by the presence of the walls.
The viscosity is determined from a multi-cylinder suspension in a Couette system,with Reshear,p varying between 0.003 and 0.33. Our results for the viscosity are presentedas relative values to results from the semi-empirical model of Krieger and Dougherty [46].This model is known to give accurate predictions for the viscosity at low Re, for both 2Dand 3D suspensions. The effective viscosity µs/µf is calculated as follows:
µs/µf =
(1− 〈φs〉
φmax
)−[η]φmax
(3.14)
where 〈φs〉 is the averaged solid volume or area fraction and φmax is the maximum packing

SHEAR-INDUCED SELF-DIFFUSION AT NON-ZERO REYNOLDS NUMBERS 53
Figure 3.4: Vertical position (Y −Ycenter)/a as a function of the strain γt for two interactingcylinders with radius a in shear flow. Reshear,p was equal to 0.518. The initial position ofthe cylinders was symmetrical around the center axis, at a distance of 0.75a from the centeraxis and of 19.25a from the nearest wall. The oscillations in the trajectory are caused by therepeated encounters of the cylinders.
fraction, which has a value of 0.82 for a 2D suspension. The dimensionless factor [η] isthe intrinsic relative viscosity of the suspension and has a value of 2 for a 2D suspension.
In our computations, the system height and width were 518 (= 64.75a) and 259(= 32.38a) lattice units, respectively, and the shear rate varied between 1.93*10−6 and2.16*10−4 per time step. An amount of 66, 166 or 266 cylinders with radius a were ran-domly suspended in the domain, corresponding with area fractions φ of 0.10, 0.25 and0.40, respectively. The viscosity was determined from the average stress at the walls overa strain range of at least 1.5 at a shear rate of 1.93*10−6 per timestep, increasing to astrain range of 86 at a shear rate of 2.16*10−4 per time-step. This increase of strain rangewas necessary to acquire sufficient accuracy at high shear rates, where the time-dependentfluctuations of the stress were higher.
Our viscosity data in the regime with low Reshear,p agree well with the Krieger-Dougherty model since the normalised viscosity is around 1.0 (Figure 3.5). At higherReshear,p, however, starting at Reshear,p=0.012, shear thickening occurred in the suspen-sions with area fractions of 0.25 and 0.40. This shear thickening was most intense at anarea fraction of 0.40, where the effective viscosity increased about 35% for an increaseof Reshear,p to a value of 0.1. At these high values for Reshear,p, the viscosity starts tolevel off. The velocity profile in the Couette system was found to be linear, except forφ =0.40 and Reshear,p >0.2, where slip started to occur near the wall. At φ =0.40 andReshear,p =0.33, this lead to a decrease of the shear rate in the bulk phase of about 15%when compared to a situation with a linear profile. This might also have consequences

54 CHAPTER 3
Figure 3.5: Viscosity of a 2D suspension as a function of Reshear,p for suspensions witha cylinder area fraction φ of 0.10, 0.25 and 0.40. The viscosity is presented as the effectiveviscosity, normalised for model results of the Krieger-Dougherty model (φmax =0.82, [η] =2)at the respective area fractions. The lines are fits to the data points and are drawn as a guideto the eye.
for the accuracy of the viscosity calculations, since the viscosity is determined from thestress near the wall. For the great majority of the calculations, however, slip did not playa role and the viscosity calculations are expected to be accurate. For highly concentratedsuspensions, the increase of viscosity with increasing particle fraction in the Stokes flowregime has been found to coincide with particle clustering [61]. It might be that in ourcase, where we found a viscosity increase with shear rate, particle clustering also plays arole. An analysis on particle clustering in our system is therefore presented in section 3.5.
Although limited results are available, shear thickening behaviour has also been ob-served by other authors, experimentally as well as in computer simulations (see e.g.[47, 62]). Shear thickening is found particularly in suspensions where hydrodynamicforces are dominant (at high Peclet number (= 8µfa
3γkT
where k is the Boltzmann con-stant and T the absolute temperature)). Similar to our results, Shakib-Manesh and others[47] observed shear thickening of 2D suspensions. In their study, for suspensions witha cylinder area fraction up to 0.52, the effect of shear thickening on the viscosity wasonly relevant when Reshear,p was larger than about 0.5, so, in a quantitative sense, theirresults do not fully agree with ours. This may, however, be due to differences in the waythe particle interactions are handled at short distances in the codes used. In contrast toour method, Shakib-Manesh and co-authors did not correct for the lubrication force at

SHEAR-INDUCED SELF-DIFFUSION AT NON-ZERO REYNOLDS NUMBERS 55
short particle distances; this difference might be relevant for clustering behaviour of thesuspension. This comparison shows that shear thickening can be delicately affected byinterparticle forces, which hampers quantitative comparison of data.
3.4 Shear-induced diffusion at non-zero Reynolds num-bers
In this section, we present results of LB simulations on shear-induced diffusion in 2Dsystems. In these 2D systems, we can distinguish components of the shear-induced self-diffusion tensor in the fluid velocity and in the velocity gradient direction, and their diag-onal component. Whereas the displacements in the velocity gradient direction are purelydetermined by the hydrodynamic interactions between the cylinders, the displacementsin the fluid velocity direction also consist of a convective term due to the shear flow ofthe fluid. The analysis of shear-induced self-diffusion in the velocity gradient direction isconsequently more straightforward. Since the component in the velocity gradient direc-tion is, in practice, the most relevant, we only describe our results for this direction.
The relevant time and length scales in the system are the shear rate γ and the cylinderradius a, respectively. On the basis of dimensional arguments, it can be shown that theself-diffusivity scales as γa2 (in the Stokes flow regime). All diffusivities reported aretherefore normalized on γa2 .
The shear-induced self-diffusion coefficients can be determined from the increase ofthe mean-square displacements with time after diffusive motion has been established,according to:
〈y(t)y(t)〉 ≈ 2Dyyt (3.15)
The angle brackets denote an average over all cylinders in the system, while y denotesthe displacement of a single particle in the direction of the velocity gradient. Dyy denotesthe self-diffusivity in the velocity gradient direction. This self-diffusivity is defined as thetime rate of change of a half multiplied by the mean-square displacement:
Dyy ≡ limt→∞
1
2
d
dt〈 y(t)y(t)〉 (3.16)
The motion of a non-Brownian cylinder is, in principle, purely deterministic and the dis-placement of a given cylinder depends only on the external velocity field and its inter-actions with all other cylinders in the system. To obtain the random displacements thatare a characteristic of diffusive motion, the initial cylinder configuration must also bechanged. As a consequence, the sampling time must be relatively long in order to deter-mine the diffusion coefficients. Therefore, shear-induced diffusion can be characterisedas a long-time diffusion process.
As for the aforementioned studies on one or two interacting cylinders in shear flowand on the viscosity in relation to the particle fraction, the system consisted of a Couettesystem with periodic boundaries in the flow direction of the fluid and two moving wallsin the velocity gradient direction. A varying number of cylinders with a radius of 8 latticeunits is randomly distributed in the system at the start of the simulation. The simulationruns were started with position-dependent fluid and cylinder velocities according to linearshear flow.

56 CHAPTER 3
Figure 3.6: Mean-square displacement in the velocity gradient direction as a function oftime, both presented as dimensionless values, for a 2D suspension (N =200, φ =0.25) inshear flow at Reshear,p =0.023.
As an example of the typical time-dependent behaviour of the cylinder displacements,in Figure 3.6, a mean-square displacement curve is shown for a system with a cylindernumber N of 200 and an area fraction φ of 0.25. From the double-logarithmic plot in Fig-ure 3.6, it becomes clear that, at very short times, the mean-square displacement shows aquadratic temporal behaviour, which corresponds to the deterministic strongly correlatedcylinder displacements in this regime. Only after a strain of about γt =8 do the cylinderdisplacements become random, resulting in a linear behaviour of the mean-square dis-placement curves. The diffusion coefficient, which is evaluated from this simulation run,is also given in Figure 3.6. In order to evaluate the effect of the initial particle configu-ration on the diffusion coefficient, we split the displacement curve of one simulation runinto several curves which start at different times of the simulation run (and consequentlyat different particle configurations). In each separate curve, the mean square displacementwas monitored over a strain of 30. The final diffusion coefficient is the mean value of thediffusion coefficients that were determined from the individual mean square displacementcurves.
From a strain γt of about 1 to 8, a transitional regime exists, in which the temporalbehaviour is neither quadratic nor linear. The time-dependent behaviour in our (2D) sim-ulations seems to compare well with the findings of Sierou and Brady [27] from their (3D)ASD simulations. Our results confirm their statement that strains must be sufficiently longin order to obtain an accurate value for the shear-induced diffusion coefficient. Strains thatare too small lead to an overestimation of the shear-induced diffusion coefficients. Thisprobably explains the relatively high diffusion coefficients in some experimental studies,
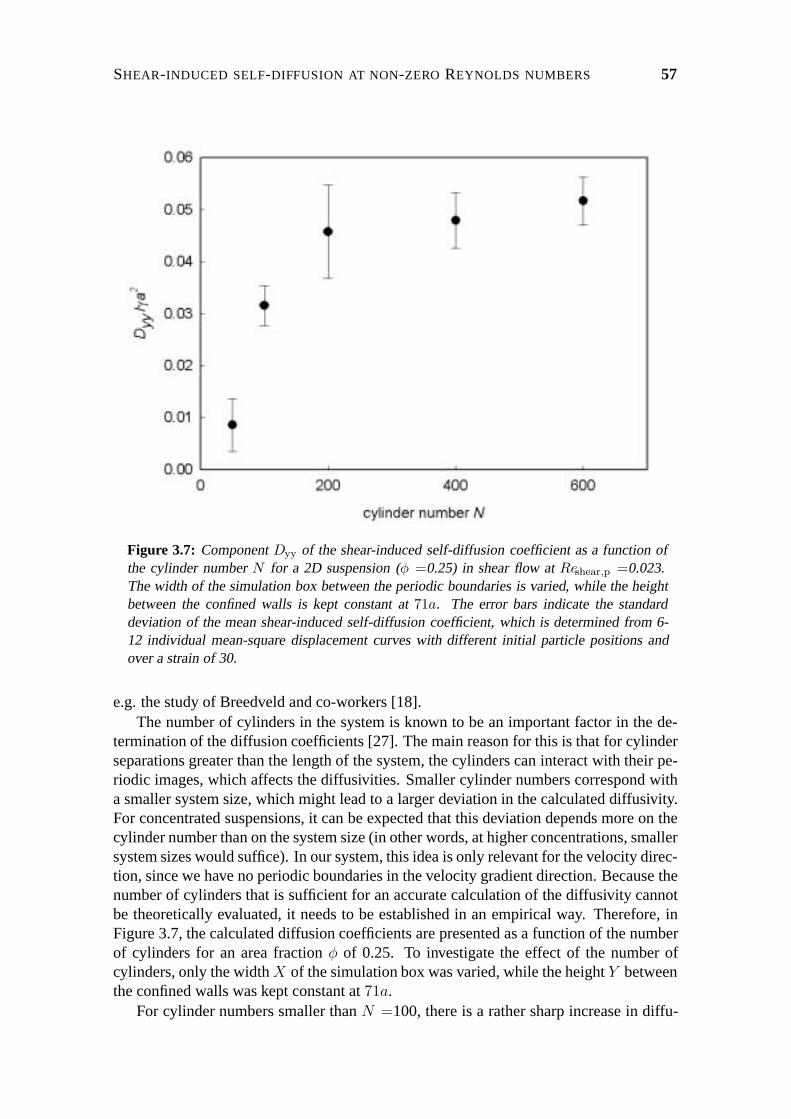
SHEAR-INDUCED SELF-DIFFUSION AT NON-ZERO REYNOLDS NUMBERS 57
Figure 3.7: Component Dyy of the shear-induced self-diffusion coefficient as a function ofthe cylinder number N for a 2D suspension (φ =0.25) in shear flow at Reshear,p =0.023.The width of the simulation box between the periodic boundaries is varied, while the heightbetween the confined walls is kept constant at 71a. The error bars indicate the standarddeviation of the mean shear-induced self-diffusion coefficient, which is determined from 6-12 individual mean-square displacement curves with different initial particle positions andover a strain of 30.
e.g. the study of Breedveld and co-workers [18].The number of cylinders in the system is known to be an important factor in the de-
termination of the diffusion coefficients [27]. The main reason for this is that for cylinderseparations greater than the length of the system, the cylinders can interact with their pe-riodic images, which affects the diffusivities. Smaller cylinder numbers correspond witha smaller system size, which might lead to a larger deviation in the calculated diffusivity.For concentrated suspensions, it can be expected that this deviation depends more on thecylinder number than on the system size (in other words, at higher concentrations, smallersystem sizes would suffice). In our system, this idea is only relevant for the velocity direc-tion, since we have no periodic boundaries in the velocity gradient direction. Because thenumber of cylinders that is sufficient for an accurate calculation of the diffusivity cannotbe theoretically evaluated, it needs to be established in an empirical way. Therefore, inFigure 3.7, the calculated diffusion coefficients are presented as a function of the numberof cylinders for an area fraction φ of 0.25. To investigate the effect of the number ofcylinders, only the width X of the simulation box was varied, while the height Y betweenthe confined walls was kept constant at 71a.
For cylinder numbers smaller than N =100, there is a rather sharp increase in diffu-
58 CHAPTER 3
sivity with the number of cylinders. This is followed by a levelling off of the diffusivitywith higher numbers of cylinders. The decrease of the standard deviation from N =200to N =600 reflects the improved statistical accuracy by the increased cylinder number,since the same number of configurations is used for the calculation of shear-induced dif-fusivity. From the observed relationship, we draw the conclusion that a cylinder numberof more than 100 is required for the determination of diffusivities with sufficient accu-racy. Although not expected a priori, the relation between the diffusivity and the cylindernumber is found to compare well with the one that was found in SD simulations for 3Dsystems [27]. Our results therewith confirm a statement of Sierou and Brady [27], namelythat the results of Foss and Brady [55] are influenced by the fact that they only used aparticle number N of 27 in their SD simulations. For the following simulations presentedin this paper, we applied a cylinder number N of 200, unless otherwise stated. The sizeof the simulation box is chosen such that Y was always twice as large as X , as is thecase in the simulations presented in Figure 3.7 with N =200. The distance between thesolid walls Y was such that the measured shear-induced diffusivity agrees with that of aninfinitely large system (results not shown).
LB simulations are not limited to the Stokes flow regime. This makes it possible todetermine the particle movements in systems with non-zero Reynolds numbers, which canbe considered relevant for many practical systems. During pipeflow and microfiltration forexample, the shear rate can, in general, easily exceed values of 1000 s−1, which is alreadybeyond the Stokes flow regime for suspensions with particles sizes in the micrometerrange. On the basis of the consideration that particle interactions cause shear-induceddiffusion and that the number of particle interactions scales linearly with the shear rate,it can be expected that the dimensionless diffusion coefficient Dyy/γa
2 is independentof γ in the regime where inertial or other shear-related effects do not (yet) play a role.To our knowledge, however, it is not known at which conditions inertial or other shear-related effects come into play and how they affect shear-induced diffusion. We thereforeanalysed the particle movements in the velocity gradient direction in relation to Reshear,p.
For Reshear,p from 0.023 up to 0.346 and cylinder area fractions of 0.10, 0.25 and 0.40,the mean square displacement 〈yy〉 /a2 as a function of the strain γt is presented in Figure3.8. The relation was linear (after a strain γt ≈8), as in accordance with shear-induceddiffusive behaviour. We also observed that the average displacement in the velocity gra-dient direction remained (nearly) zero for particle area fractions of 0.10, 0.25 as well as0.40. The particle distribution across the height between the two walls remained nearlyconstant in time as well, which also indicates that no net particle transport has taken place.At a cylinder area fraction of 0.10 and 0.25, a systematic increase of 〈yy〉 /a2 with γt isobserved when Reshear,p was increased. At a cylinder area fraction of 0.40, this increasewith Reshear,p was also present, although not as evident as for an area fraction of 0.10 and0.25. The diffusivity seems to reach a plateau value at this area fraction of 0.40. As men-tioned in section 3.3, wall slip starts to occur at φ =0.40 and for Reshear,p >0.2. The effectof wall slip on the shear rate seems too small to explain the relatively small increase ofthe diffusivity at φ =0.40, but the behaviour might be related to microstructural features.This is investigated in the next section.
The results indicate that the dimensionless diffusion coefficient Dyy/γa2, as deter-
mined from the slope of the curves in Figure 3.8, was not independent from the shearrate, as is shown in Figure 3.9. For φ =0.10, 0.25 and 0.40, the increase started at aboutReshear,p =0.04, which is comparable to where the shear thickening behaviour started.

SHEAR-INDUCED SELF-DIFFUSION AT NON-ZERO REYNOLDS NUMBERS 59
Figure 3.8: Mean-square displacement in the velocity gradient direction as a function oftime, both presented as dimensionless values, for a 2D suspension (N =200, φ = 0.10 (a),0.25 (b) and 0.40 (c)) in shear flow at Reshear,p =0.023 (solid line), 0.115 (dotted line), 0.161(medium dashed line) and 0.346 (dash-dot-dotted line).

60 CHAPTER 3
Figure 3.9: Component Dyy of the shear-induced self-diffusion coefficient as a function ofReshear,p for a 2D suspension (N =200) in shear flow with a cylinder area fraction φ of 0.10(filled circles), 0.25 (open triangles) and 0.40 (filled squares). The error bars indicate thestandard deviation of the mean shear-induced self-diffusion coefficient, which is determinedfrom 6-12 individual mean-square displacement curves with different initial particle positionsand over a strain of 30. The lines are fits to the data points and are drawn as a guide to theeye.
The effect of the cylinder fraction was, however, opposite to the effect on the viscosity,because we observed the largest relative effects on shear-induced diffusion at the lowercylinder fractions.
In spite of the lower number of particle collisions, the standard deviation of the shear-induced diffusivity was relatively low at a particle area fraction φ =0.10. This indi-cates that, in principle, the averaging took place over sufficiently large strains and withsufficiently high cylinder numbers. The standard deviation, however, increased with in-creasing Reshear,p and when Dyy/γa
2 exceeded a value of about 0.10, the standard devia-tion was relatively large, indicating time-dependent fluctuations in the collective cylindermovements. This might be a combined effect of correlated movement of the cylinders,caused by particle clustering, and high stresses on the cylinders. Improving the accu-racy of the shear-induced diffusion coefficients in this regime would require much largersystems, which was not deemed necessary in this study.
It may be expected that the dependence of the shear-induced diffusivity on Reshear,p isdue to the correlated motion of cylinders, in other words, to the formation of a suspensionmicrostructure. In the next section, this microstructure is analysed in order to have a

SHEAR-INDUCED SELF-DIFFUSION AT NON-ZERO REYNOLDS NUMBERS 61
clearer picture of shear-induced changes in the suspensions.
3.5 Shear-induced changes in microstructure
In order to analyse the microstructure, we determined the 2D pair-distribution function,which represents the concentration distribution of cylinders around a cylinder. This pair-distribution function was assessed by averaging the pair-distribution function of two sep-arate simulation runs. In each simulation run, the distribution function was determinedby averaging the distribution at five different strains, namely at γt =30.0, 37.5, 45.0,52.5 and 60.0. Cylinders at a position closer than a distance 0.2Y (Y=height between thewalls) from the wall were excluded as reference particles from the distribution function,in order to avoid wall effects. The concentration distributions are only shown for ∆X and∆Y smaller than 3.5a, because outside this region no cylinder preference positions couldbe observed. For a cylinder area fraction of 0.10, a clear effect of Reshear,p can be seen(Figure 3.10).
At Reshear,p =0.023, a concentration peak can be observed above and under the cylin-der, at a distance of about 2a − 3a. The concentration distribution was anisotropic as nopeak can be observed left and right of the particle. At higher Reshear,p, the concentrationpeak at a distance of about 2a − 3a becomes more circular (isotropic) as well as morepronounced. A maximum concentration peak with a value of about 1.4 a.u. is found atReshear,p =0.161. These results clearly show that the cylinders tend to stay closer to eachother at higher Reshear,p. For a cylinder area fraction of 0.25, already at Reshear,p =0.023a circular concentration peak was present at a distance of about 2a − 3a (Figure 3.10).Small peaks with a maximum concentration of about 2.8 a.u. were already present as well.With increasing Reshear,p, the concentration peak was more pronounced, which again in-dicates an increased clustering of the particles. The concentration profile at a cylinderarea fraction of 0.40 was already very pronounced at Reshear,p =0.023 with locally maxi-mum concentrations of about 5.0 a.u. (Figure 3.10). In contrast to cylinder area fractionsof 0.10 and 0.25, high Reshear,p, however, did not invoke more clustering. This seemsto be consistent with the effects on shear-induced diffusion, where we also found minorchanges at a cylinder area fraction of 0.40.
In the pair-distribution function, the concentration peaks at short interparticle dis-tances are generally very high, whereas they are less pronounced at longer interparticledistances, especially in the case of isotropic distributions. This makes the pair-distributionfunction less sensitive to concentration variations at longer interparticle distances andtherefore not suited for the analysis of the size and density of the particle clusters. Theseparameters can, however, be determined from the scaling of the integrated pair correlationfunction, according to a version of the so-called sandbox method [63]. In this method, weconsider the number of particles n(r) in a sphere of radius r around any particle of thecluster. Simple linear regression on log(n) versus log(r) yields the parameters n0 and df
from the scaling relation for fractal clusters:
n(r) = n0 ·(ra
)df
(3.17)
where n0 is a dimensionless proportionality constant (generally of order unity, the actualvalue of n0 depends on the definition of r used) and df is the fractal dimensionality. In a

62 CHAPTER 3
Figure 3.10: The 2D pair-distribution function, averaged over a strain γt from 30 to 60, fora 2D suspension (N =200) in shear flow with a cylinder area fraction φ of 0.10 (top), 0.25(middle) and 0.40 (bottom) at Reshear,p =0.023 (left), 0.161 (middle) and 0.346 (right). Darkregions represent high probability and light low.
plot of log(n) versus log(r), we would see a fractal regime for low values of r which endsat the size of the average cluster in the system (we have neglected effects of monomers,which have zero close neighbours and hence suppress n0). At high values of r we havethe homogeneous regime, where the number of neighbouring particles simply scales withthe volume of the surrounding sphere. The prefactor then becomes the volume fraction:
n(r) = φ ·(ra
)3
(3.18)
In our 2D system, the number of neighbouring cylinders scales with the area of the sur-rounding cylinder, which changes the power in this equation from 3 to 2. If the fractalregime extends all the way to the homogeneous regime, there is an intersection point be-tween the two regimes. The radius which corresponds to this intersection point is calledthe correlation length ζ and is an indication of the average size of the aggregates. In many
SHEAR-INDUCED SELF-DIFFUSION AT NON-ZERO REYNOLDS NUMBERS 63
systems, however, there will be a finite cross-over regime between the fractal and ho-mogeneous regime, which can, for example, be due to the existence of clusters of varioussizes and shapes. In this case, the correlation length can be defined by linear extrapolationof the fractal and homogeneous scaling regime to the intersection point.
In our results, from a distance of 5a − 10a, the regime is indeed found to be homo-geneous (Figure 3.11). The regime is clearly non-homogeneous for smaller distances, butthe slope varies with the distance. This indicates that aggregates are present, but that thefractal dimensionality varies with the distance from the center of the aggregate. The aver-aged size of the aggregates can be obtained from the point where the non-homogeneousregime turns into the homogeneous regime; a constant fractal dimensionality is not re-quired. Therefore, the correlation length was assessed by determining the distance r/awhere the fit value, obtained by linear regression of the log(n(r))-log(r/a)-plot at dis-tances r/a larger than 10, deviated more than 5% from the actual value of log(n(r)).These data are also given in figure 11. The correlation length is found to depend on thecylinder area fraction in the system as well as on Reshear,p. The lowest correlation lengthof 2.3a is found for an area fraction of 0.40 and Reshear,p =0.023. For area fractions of0.10 and 0.25, the correlation lengths were 4.0a and 3.9a, respectively (Reshear,p =0.023).With increasing Reshear,p, the correlation length tends to increase, to maximal 7.5a, 6.9aand 5.3a for area fractions of 0.10, 0.25 and 0.40, respectively. The largest clusters areagain found at the lowest area fraction.
Compared to the pair-distribution functions, these results provide additional informa-tion about the size of the clusters. The results agree well with each other; the largesteffects of Reshear,p on the microstructure are found for the lowest area fractions. More-over, the trends in the effects of Reshear,p on the microstructure agree well with the effectson shear-induced diffusion. It seems likely that the microstructure is the coupling factorfor the effect of Reshear,p on shear-induced diffusion. The development of particle clus-tering might, moreover, be related to the longer and closer approach of two interactingparticles at higher shear rates. This direct relationship with microstructure does, however,not exist for the viscosity of the suspension, where not only the microstructure seems tobe important but also the averaged solid volume fraction, resulting in a more pronouncedeffect of Reshear,p at high area fractions [47]. Because of the direct coupling betweenmicrostructure and shear-induced diffusion, it can be expected that other factors that canaffect the microstructure, such as attractive colloidal forces between the particles, willalso affect shear-induced diffusion.
In our results, Reshear,p starts to have a significant effect on the shear-induced diffu-sivity at a value of about 0.1. In practical systems, for a suspension with particles with aradius a of 3 µm, for example, a shear rate of about 2800 s−1 would be required in orderto obtain this significant effect. For larger particles, this value quickly drops to even lowervalues. The shear rate in this example is well within the range of commonly applied shearrates, which indicates the relevance of this study to practical systems.
3.6 Conclusions
In this study, the LB method was applied in order to examine the effects of shear rate onthe flow behaviour and microstructure of non-Brownian suspensions in a Couette system.In the shear regime studied, inertial effects on a single cylinder were negligibly small.

64 CHAPTER 3
Figure 3.11: The number of cylinders n(r) contained in a circle of radius r for a 2D sus-pension in shear flow with a cylinder area fraction of 0.10 (a), 0.25 (b) and 0.40 (c) atReshear,p =0.023-0.346. The values are time-averaged over a strain γt from 30 to 60. Thecorrelation length ζ represents the distance where the cylinder distribution changes from non-homogeneous into homogeneous.
SHEAR-INDUCED SELF-DIFFUSION AT NON-ZERO REYNOLDS NUMBERS 65
In a system with two interacting cylinders, however, some effects of the shear rate werepresent. First, the cylinders approached each other more closely and during a longertime with increasing shear rate, which is in accordance with expectations when inertiacauses them to move to other streamlines. Secondly, at Reshear,p higher than 0.06, theparticle trajectory started to become asymmetric, finally leading to a dispersal of the twoparticles. The viscosity was also dependent on the shear rate in the shear regime studied:the suspension namely exhibited shear thickening behaviour.
In order to know how we could reliably evaluate shear-induced self-diffusion in oursystem, first, the displacements of the particles were monitored as a function of strain. Thesimulations clearly showed that shear-induced self-diffusion is a long-time diffusive be-haviour, which typically only established itself after a strain of about 5-10. Furthermore,it is shown that at least a few hundred suspended particles are needed in the simulationsto resolve shear-induced diffusion coefficients reliably. For systems with fewer than 100particles, the suspended particles interact with their periodic images over the periodicboundaries in the system, leading to an underestimation of the diffusion coefficients.
Following the developed method, the effect of Reshear,p up to 0.35 on shear-inducedself-diffusion was investigated for particle fractions of 0.10, 0.25 and 0.40. In contrastto theory for the Stokes flow regime, which predicts a linear increase of the diffusivitywith shear rate, the mean square particle displacements were found to increase fasterat increasing Reshear,p, leading to a similar increase of the dimensionless shear-induceddiffusion coefficient Dyy/γa
2. This increase was most pronounced at particle fractions of0.10 and 0.25 and started already at Reshear,p equal to 0.05-0.07, which is comparable tothe shear regime where effects on two interacting particles and the viscosity arose.
Analysis of the microstructure of the suspensions revealed that an increase of Reshear,p
leads to an increase of particle clustering, especially at particle fractions of 0.10 and0.25. The effects of Reshear,p on particle clustering relate well to the effects on shear-induced diffusion, indicating that the microstructure of suspensions is a key factor forshear-induced diffusivity. This will be very relevant for suspensions with attractive inter-particle forces.
Acknowledgements
Friesland Foods is greatly acknowledged for supporting this research. Prof Dr Mike Catesand Dr Kevin Stratford from Edinburgh University as well as Dr Joost van Opheusdenfrom Wageningen University are greatly thanked for fruitful discussions. The authorswould like to acknowledge the support of the Dutch Ministries of Economic Affairs, Ed-ucation, Culture and Sciences and of Housing, Spatial Planning and the Environmentthrough a grant of the Dutch Program Economy, Ecology and Technology and the supportof the European Commission through grant number HPRI-CT-1999-00026 (the TRACSProgramme at EPCC).
3.7 Lubrication force in a 2D suspension
We apply lubrication theory to calculate the hydrodynamic force between two cylindersin a 2D suspension. For small gaps (i.e. rim to rim distances) 2h the force between twoadjacent cylinders can be calculated, solving the flow field in the gap upto first order in

66 CHAPTER 3
ε = h/a. In the calculation two cylinders are considered, approaching each other witha velocity 2U . A Cartesian coordinate system (ex, ez) was used with the origin at thecenter of the gap. The z-coordinate, taken along the line of centers, was scaled on h andthe x-coordinate was scaled on
√ah; the z-component of the velocity was scaled on U , the
x-component on√
a/hU . The pressure was scaled on aηU/h2. Under these conditions,the differential equation for the dimensionless streamfunction ψ becomes:
∂4ψ
∂z4+ 2ε
∂4ψ
∂x2∂z2+ ε2
∂4ψ
∂x4= 0 (3.7.1)
The rim of both disks is described by z = ±b(x) with
b(x) = 1 + 12x2 + ε1
8x4 + ε2 1
16x6 + ... (3.7.2)
and the boundary conditions on these rims read:
vz = − ∂ψ
∂x= ∓1, (3.7.3)
vx =∂ψ
∂z= 0, (3.7.4)
For convenience, ψ = 0 is chosen at z = 0, so ψ is odd in z. This equation can be solvedassuming
ψ = ψ0 + εψ1 + ... (3.7.5)
where ψ0 fulfils the boundary conditions (3.7.3) and (3.7.4) and ∂ψ1/∂x = ∂ψ1/∂z = 0on the rim of the particle. The solution is given by:
ψ0 =1
2x
(3(zb
)−(zb
)3)
(3.7.6)
ψ1 =3
20g(x)
(zb
)(1−
(zb
)2)2
(3.7.7)
where g(x) = 4x(b′)2 − 2bb′ − xbb′′ and b′, b′′ are the first and second derivatives ofb = b(x), respectively. The pressure along the line z = 0 can be calculated by integrating:(
∂p
∂x
)z=0
= −3b−3
(x+ ε
(3
5g(x)− 1
2f(x)
))(3.7.8)
where f(x) = 2x(b′)2 − 2bb′ − xbb′′. The zz-component of the total stress tensor (thesuperfix [D] indicates the dimensional form)
T [D]zz = −p[D] + 2η
∂v[D]z
∂z[D]
reads in dimensionless form
Tzz = −p + 2ε∂vz∂z
= −p− 2ε∂2Ψ
∂x∂z

SHEAR-INDUCED SELF-DIFFUSION AT NON-ZERO REYNOLDS NUMBERS 67
where also Tzz has been scaled on p0 = aηU/h2. The (dimensionless) force per unitlength, F , on the particle is calculated by integrating Tzz along the line z = 0 (swoppingthe order of integration of the ∂p/∂x term):
F (ε) = 2
∫ ∞
0
(Tzz)z=0 dx
= 2
∫ ∞
0
x
(∂p
∂x
)z=0
dx− 4ε
∫ ∞
0
(∂2Ψ
∂x∂z
)z=0
dx (3.7.9)
=
∫ ∞
0
3x
b3(x)
(2x+ ε
(6
5g(x)− f(x)
))dx− 4ε
∫ ∞
0
3
2b2(b− xb′)dx
This expression can be rewritten as:
F (ε) = F0 + ε (F1 − F2)
where
F0 =
∫ ∞
0
6x2(1 + 1
2x2)3dx =
3
4π√2 = 3.3322
F1 =
∫ ∞
0
3x(1 + 1
2x2)3((
25
10x3 − 3
5x− 6x5
(8 + 4x2)
))dx =
207
80π√2 = 11.496
F2 =
∫ ∞
0
6
(1− 1
2x2)
(1 + 1
2x2)2dx = 0.0
are numerical constants. In our simulations, we have erroneously used a value of F1 =12.829,which lead to about 1% overestimation of the lubrication force. The lubrication force perunit length in dimensional form, F [D] = p0
√ahF , follows from Equation 3.7.9 as:
F [D] =
(h
a
)−3/2
ηU F (h/a) =
(h
a
)−3/2
ηU
(F0 +
h
aF1
)(3.7.10)
which expression is correct in first order of ε.


4
Shear-induced self-diffusion inbidisperse suspensions
J. Kromkamp, D. Kandhai, R.G.M. v.d. Sman, R.M. Boom, submitted.
70 CHAPTER 4
Shear-induced diffusion is an important transport mechanism in concentrated suspen-sions in shear flow, and is relatively well understood, but only for monodisperse suspen-sions. Presently, not much attention is paid to shear-induced diffusion in polydisperse sus-pensions, in spite of the widespread incidence of these suspensions. This paper adressesshear-induced diffusion in bidisperse suspensions. Our study is carried out by means ofcomputer simulations on two-dimensional suspensions in a Couette system, followingthe Lattice Boltzmann method. Two aspects were found to be of particular importance,namely particle clustering and the dominance of large particles. From the shear thick-ening behaviour of the suspensions at non-zero Reynolds numbers, which is known tobe highly correlated with particle clustering, it became clear that particle clustering in-creased with increasing relative fraction of large particles and with increasing size of thelarge particles. This effect is explained with the fact that larger particles experience moreinertia. This is opposite to what happens in the Newtonian regime, where the viscosity ofbidisperse suspensions is always lower than that of corresponding monodisperse suspen-sions. Because particle clustering also induces an increase of shear-induced diffusivity,the presence of large particles can amplify this increase.
The second aspect is the dominance of large particles over small particles. It is foundthat when the relative area fraction of large particles exceeds 0.3, the shear-induced diffu-sivity is totally determined by these large particles, in other words the small particles be-have as ’slave particles’. In this situation, their shear-induced diffusivity could be stronglyincreased by the presence of the large particles. Below this relative fraction of 0.3, thelarge particles did not have a specific effect on the small particles. The shear-induceddiffusivity of the large particles was much lower than expected for a monodisperse sus-pension. When the relative fraction of large particles exceeded 0.3, the shear-induceddiffusivity of the large particles increased to a level that would be expected for the sus-pension without the small particles. The results presented in this paper are relevant forprediction of rheology and shear-induced mass transport in polydisperse suspensions.
4.1 Introduction
Shear-induced diffusion is a transport phenomenon that occurs in concentrated suspen-sions under shear flow. It is important for various processes, such as sedimentation andfiltration, and for transport of suspensions, such as in pipes and channels. In a previouspaper [39], we addressed the topic of shear-induced self-diffusion in non-Brownian sus-pensions at non-zero Reynolds numbers. These suspensions were monodisperse, as inmost other studies on shear-induced self-diffusion (see e.g. [27, 50]). Because in general,industrially relevant suspensions are not monodisperse, but have a relatively broad par-ticle size distribution, it is important to understand the effects of polydispersity. In thispaper we address shear-induced self-diffusion in suspensions containing particles with abimodal size distribution, hereafter shortly called bidisperse suspensions.
In concentrated suspensions undergoing shear flow, hydrodynamic particle interac-tions are responsible for the shear-induced diffusion process. This leads to particle dis-placements in the fluid velocity direction, as well as in the velocity gradient and in thevorticity direction, but in an anisotropic way. Because the mechanism is different from
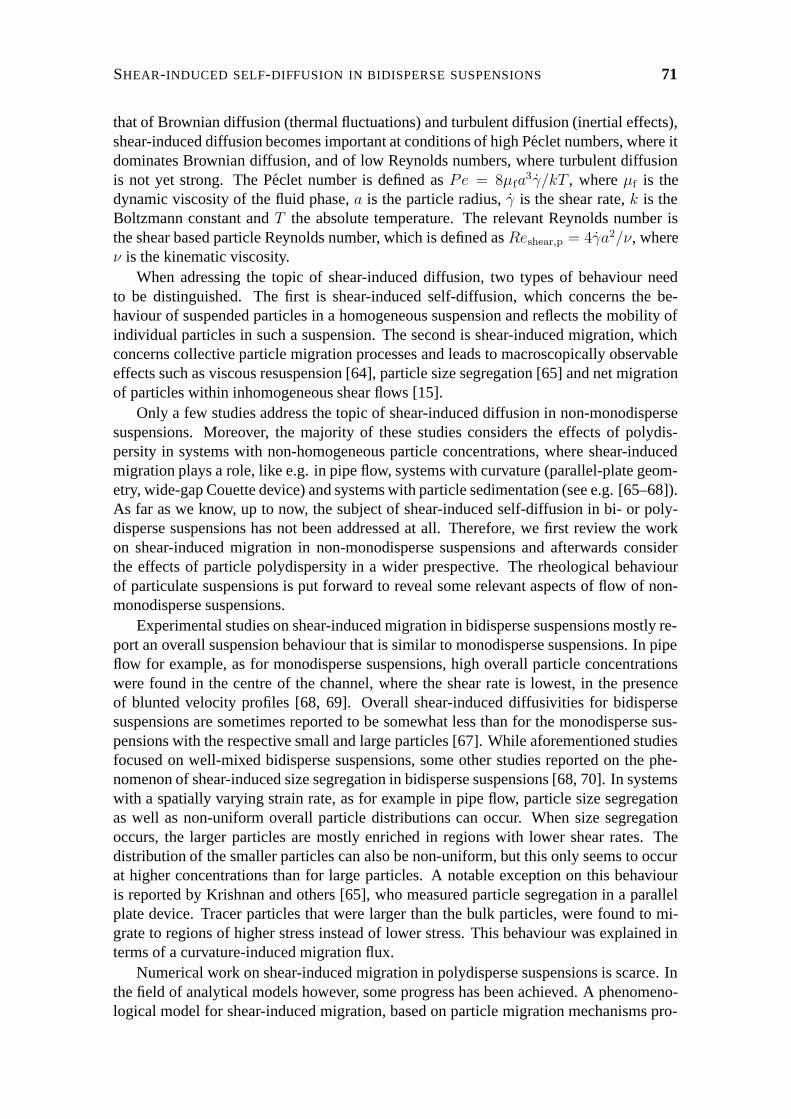
SHEAR-INDUCED SELF-DIFFUSION IN BIDISPERSE SUSPENSIONS 71
that of Brownian diffusion (thermal fluctuations) and turbulent diffusion (inertial effects),shear-induced diffusion becomes important at conditions of high Peclet numbers, where itdominates Brownian diffusion, and of low Reynolds numbers, where turbulent diffusionis not yet strong. The Peclet number is defined as Pe = 8µfa
3γ/kT , where µf is thedynamic viscosity of the fluid phase, a is the particle radius, γ is the shear rate, k is theBoltzmann constant and T the absolute temperature. The relevant Reynolds number isthe shear based particle Reynolds number, which is defined as Reshear,p = 4γa2/ν, whereν is the kinematic viscosity.
When adressing the topic of shear-induced diffusion, two types of behaviour needto be distinguished. The first is shear-induced self-diffusion, which concerns the be-haviour of suspended particles in a homogeneous suspension and reflects the mobility ofindividual particles in such a suspension. The second is shear-induced migration, whichconcerns collective particle migration processes and leads to macroscopically observableeffects such as viscous resuspension [64], particle size segregation [65] and net migrationof particles within inhomogeneous shear flows [15].
Only a few studies address the topic of shear-induced diffusion in non-monodispersesuspensions. Moreover, the majority of these studies considers the effects of polydis-persity in systems with non-homogeneous particle concentrations, where shear-inducedmigration plays a role, like e.g. in pipe flow, systems with curvature (parallel-plate geom-etry, wide-gap Couette device) and systems with particle sedimentation (see e.g. [65–68]).As far as we know, up to now, the subject of shear-induced self-diffusion in bi- or poly-disperse suspensions has not been addressed at all. Therefore, we first review the workon shear-induced migration in non-monodisperse suspensions and afterwards considerthe effects of particle polydispersity in a wider prespective. The rheological behaviourof particulate suspensions is put forward to reveal some relevant aspects of flow of non-monodisperse suspensions.
Experimental studies on shear-induced migration in bidisperse suspensions mostly re-port an overall suspension behaviour that is similar to monodisperse suspensions. In pipeflow for example, as for monodisperse suspensions, high overall particle concentrationswere found in the centre of the channel, where the shear rate is lowest, in the presenceof blunted velocity profiles [68, 69]. Overall shear-induced diffusivities for bidispersesuspensions are sometimes reported to be somewhat less than for the monodisperse sus-pensions with the respective small and large particles [67]. While aforementioned studiesfocused on well-mixed bidisperse suspensions, some other studies reported on the phe-nomenon of shear-induced size segregation in bidisperse suspensions [68, 70]. In systemswith a spatially varying strain rate, as for example in pipe flow, particle size segregationas well as non-uniform overall particle distributions can occur. When size segregationoccurs, the larger particles are mostly enriched in regions with lower shear rates. Thedistribution of the smaller particles can also be non-uniform, but this only seems to occurat higher concentrations than for large particles. A notable exception on this behaviouris reported by Krishnan and others [65], who measured particle segregation in a parallelplate device. Tracer particles that were larger than the bulk particles, were found to mi-grate to regions of higher stress instead of lower stress. This behaviour was explained interms of a curvature-induced migration flux.
Numerical work on shear-induced migration in polydisperse suspensions is scarce. Inthe field of analytical models however, some progress has been achieved. A phenomeno-logical model for shear-induced migration, based on particle migration mechanisms pro-
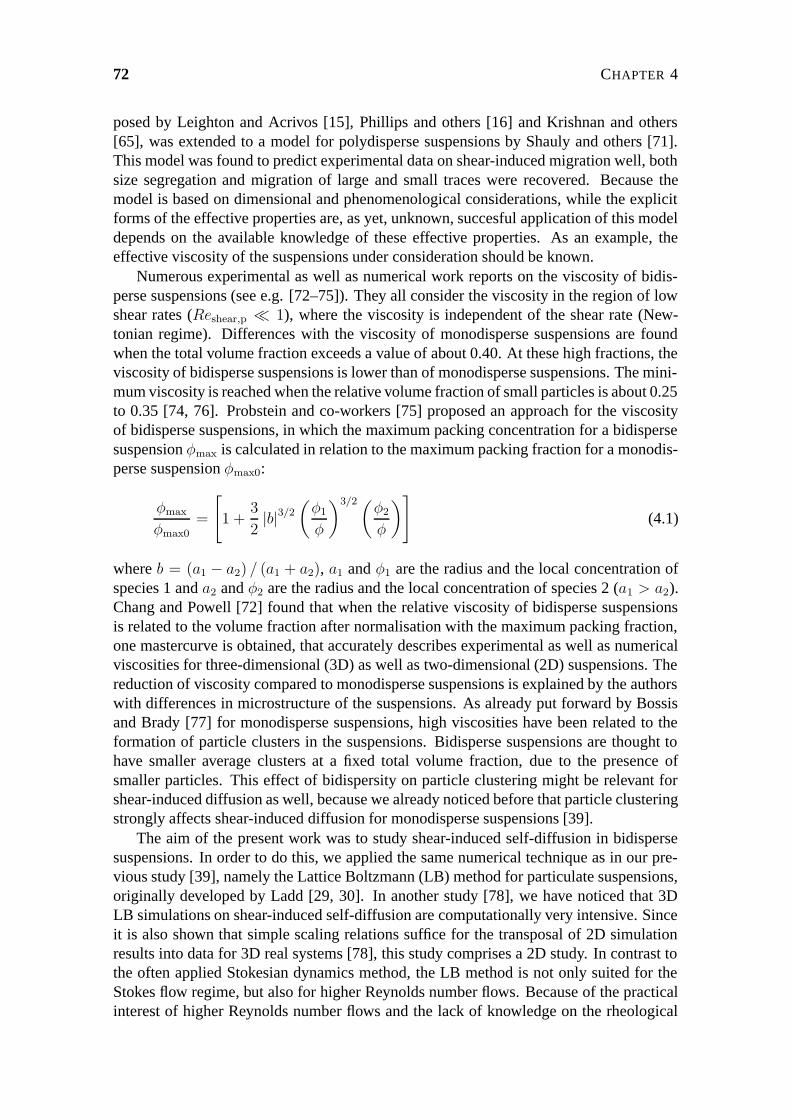
72 CHAPTER 4
posed by Leighton and Acrivos [15], Phillips and others [16] and Krishnan and others[65], was extended to a model for polydisperse suspensions by Shauly and others [71].This model was found to predict experimental data on shear-induced migration well, bothsize segregation and migration of large and small traces were recovered. Because themodel is based on dimensional and phenomenological considerations, while the explicitforms of the effective properties are, as yet, unknown, succesful application of this modeldepends on the available knowledge of these effective properties. As an example, theeffective viscosity of the suspensions under consideration should be known.
Numerous experimental as well as numerical work reports on the viscosity of bidis-perse suspensions (see e.g. [72–75]). They all consider the viscosity in the region of lowshear rates (Reshear,p 1), where the viscosity is independent of the shear rate (New-tonian regime). Differences with the viscosity of monodisperse suspensions are foundwhen the total volume fraction exceeds a value of about 0.40. At these high fractions, theviscosity of bidisperse suspensions is lower than of monodisperse suspensions. The mini-mum viscosity is reached when the relative volume fraction of small particles is about 0.25to 0.35 [74, 76]. Probstein and co-workers [75] proposed an approach for the viscosityof bidisperse suspensions, in which the maximum packing concentration for a bidispersesuspension φmax is calculated in relation to the maximum packing fraction for a monodis-perse suspension φmax0:
φmax
φmax0=
[1 +
3
2|b|3/2
(φ1
φ
)3/2(φ2
φ
)](4.1)
where b = (a1 − a2) / (a1 + a2), a1 and φ1 are the radius and the local concentration ofspecies 1 and a2 and φ2 are the radius and the local concentration of species 2 (a1 > a2).Chang and Powell [72] found that when the relative viscosity of bidisperse suspensionsis related to the volume fraction after normalisation with the maximum packing fraction,one mastercurve is obtained, that accurately describes experimental as well as numericalviscosities for three-dimensional (3D) as well as two-dimensional (2D) suspensions. Thereduction of viscosity compared to monodisperse suspensions is explained by the authorswith differences in microstructure of the suspensions. As already put forward by Bossisand Brady [77] for monodisperse suspensions, high viscosities have been related to theformation of particle clusters in the suspensions. Bidisperse suspensions are thought tohave smaller average clusters at a fixed total volume fraction, due to the presence ofsmaller particles. This effect of bidispersity on particle clustering might be relevant forshear-induced diffusion as well, because we already noticed before that particle clusteringstrongly affects shear-induced diffusion for monodisperse suspensions [39].
The aim of the present work was to study shear-induced self-diffusion in bidispersesuspensions. In order to do this, we applied the same numerical technique as in our pre-vious study [39], namely the Lattice Boltzmann (LB) method for particulate suspensions,originally developed by Ladd [29, 30]. In another study [78], we have noticed that 3DLB simulations on shear-induced self-diffusion are computationally very intensive. Sinceit is also shown that simple scaling relations suffice for the transposal of 2D simulationresults into data for 3D real systems [78], this study comprises a 2D study. In contrast tothe often applied Stokesian dynamics method, the LB method is not only suited for theStokes flow regime, but also for higher Reynolds number flows. Because of the practicalinterest of higher Reynolds number flows and the lack of knowledge on the rheological

SHEAR-INDUCED SELF-DIFFUSION IN BIDISPERSE SUSPENSIONS 73
behaviour of bidisperse suspensions at these higher Reynolds numbers, the first part of ourwork is devoted to these effects. The second part focuses on shear-induced self-diffusionof bidisperse suspensions and the observed behaviour is related to the rheological be-haviour. Finally, we draw conclusions about the effect of Reynolds number and particleinteractions on shear-induced self-diffusion in bidisperse suspensions.
4.2 Computer simulation method
The LB method has already extensively been explained in literature (see e.g. [34]). Here,we will only briefly recapitulate some general information about the LB method so thatthe emphasis is more on specific aspects of our own model.
The LB method models a compressible fluid (in which the speed of sound is finite)in the limit of low Mach number (Ma=flow velocity/speed of sound), by solving the dis-cretised Boltzmann equation for fictitious fluid particles, that are constrained to move ona lattice. The state of the fluid is characterised by the single-particle distribution func-tion fi(x, t), describing the average number of particles at a particular node of the latticex, at a time t, with the discrete velocity ci, which brings the fluid particles in one timestep to an adjacent lattice node. In the simulations described in this paper, the fluid dy-namics were solved with a D2Q9 LB scheme, which is defined on a 2D square latticewith rest particles and 8 non-zero particle velocities. The velocity directions link latticesites to its nearest and next-nearest neighbours. The hydrodynamic field’s mass densityρ, momentum density j, and the momentum flux density Π are moments of this velocitydistribution:
ρ =∑i
fi, j =∑i
fici, Π =∑i
ficici (4.2)
The fictitious fluid particles evolve by collisions and subsequent propagation to neigh-bouring lattice sites. In a collision step, the distribution function is relaxed towards thelocal equilibrium distribution according to:
fi(x+∆xi, t+∆t) = fi(x, t)− fi(x, t)− f eqi (x, t)
τ(4.3)
The relaxation time τ controls the relaxation of the viscous stress in the fluid and is linkedto the kinematic viscosity ν via:
ν = c2s
(τ − 1
2
)∆t (4.4)
where the speed of sound cs is defined by c2s = c2/3. In our simulations we appliedτ = 1.0 (in lattice units), which corresponds to a kinematic viscosity ν of the fluid of 1/6(in lattice units). The equilibrium distribution f eq
i (x, t) is chosen such that the Navier-Stokes equations for a weakly compressible system are obtained [37].
In the LB scheme for particulate suspensions as developed by Ladd [29], the solid par-ticles are defined by a boundary surface, which can be of any size or shape. The spherical(3D) or circular (2D) particles are projected on the lattice, where the boundary surfacecuts some of the links between lattice nodes. Fluid particles moving along the boundarysurface interact with the surface at boundary nodes that are located at the lattice nodes

74 CHAPTER 4
nearest to the boundary surface of the solid particles, following an alternative methodto Ladd’s, that was developed by Behrend [38]. In this method, called relaxed bounceback conditions at the nodes, the LB collisions are carried out at every node, includingthe boundary nodes. The collision rules at the boundary surface enforce a stick boundarycondition on the fluid, which means that the fluid velocity is matched to the local solid-body velocity ub. This local solid-body velocity ub (at position xb) is determined by thesolid-particle velocity U, its angular velocity Ω and the position of its center of mass R:
ub = U + Ω× (xb − R) (4.5)
After the collision phase, the boundary nodes are updated in the following way:
fi(x +∆xi, t+∆t) = f ′−i(x, t) +
2ρwi
c2sub · ci (4.6)
fi(x −∆xi, t+∆t) = f ′i(x, t)−
2ρwi
c2sub · ci (4.7)
For moving suspension particles, in this update, momentum is exchanged between theincoming particles from the fluid and the solid side (the combined momentum of the fluidand the solid phase is however conserved). From this momentum exchange the force andtorque exerted on a suspension particle is calculated. Hereafter the kinematic properties ofthe suspension particles themselves are updated with a simple Euler forward integrationof Newton’s second law.
By the projection of the suspended particles on the lattice, a discrete representation ofthe surface is obtained, which becomes more and more precise as the surface curvaturegets smaller and which is exact for surfaces parallel to lattice planes. Together with thechoice of the location of the boundary nodes and the boundary update rules, the discretisa-tion of the particle surface onto the lattice induces a hydrodynamic particle diameter thatis slightly larger than the diameter based on the number of occupied lattice nodes [29]. Itis therefore often proposed that the particle diameter should be corrected for this hydrody-namic effect. The magnitude of the correction is mostly based on the particle behaviour inthe Stokes flow regime and at low particle concentrations. As also presented in an earlierpaper [39], we have seen that in suspensions in shear flow, particles can approach eachother very close, such that particles would largely overlap when the hydrodynamic par-ticle size would be taken into account. The closest approach distance is moreover foundto be dependent on conditions such as the particle concentration and the shear rate. Sinceassessment of the hydrodynamic particle diameter in these systems is virtually impossi-ble, while the corrections would probably be very small, we did not apply this correctionbut used the input particle diameter in our calculations.
Since a suspended particle is essentially simulated by the introduction of a boundarysurface, separating the interior of the particle from the exterior, the interior of the particlealso consists of fluid. Ladd [30] examined the effects of the interior fluid on the behaviourof the particle. With a sufficiently high effective mass of the particle, the interior fluid onlycontributes an inertial force due to the extra mass of the particle. Our computations werecarried out in this regime, with an effective mass ρs/ρ of 10. The magnitude of the inertialeffects in our computations was limited because Reshear,p was relatively small. Moreover,by comparing simulation results with an effective mass of 3 and 10, we found that therelatively high effective particle mass did not contribute to the observed effects on the

SHEAR-INDUCED SELF-DIFFUSION IN BIDISPERSE SUSPENSIONS 75
viscosity and shear-induced diffusion in this paper. The observed effects of changing Retherefore seem to be caused by fluid inertial effects and not by the inertia of the particles.
Since shear-induced diffusion is mainly governed by hydrodynamic particle interac-tions, these interactions need to be accurately resolved in the computations. When twosuspension particles come into close contact with each other, the lubrication force be-comes important. This force is caused by the attenuation of the fluid film in the gapbetween the two particles and is repulsive upon approach and attractive upon separationof the particles. When the gap width between two particles is in the order of one latticespacing, the lubrication force is however not exactly resolved with the LB method. Thisis due to the discretisation of the particles and fluid on a grid and is a problem that isencountered by all numerical methods. To overcome this problem we applied an explicitcalculation of the lubrication force when the gap width was smaller than two lattice units(= 0.25a). Since we considered a 2D system, we used the following equation for thelubrication force per unit length F , which is valid for the lubrication force between twocylinders [39]:
F =1
2ηU12.R12
((a1 + a2
h
) 32
(F0 +h
a1 + a2F1)−
(a1 + a2
hc
) 32
(F0 +hc
a1 + a2
F1), h < hc
(4.8)
F = 0, h > hc
where U12 = U1 − U2, h = |R12| − (a1 + a2) is the gap (distance between the particlesurfaces), F0 is the numerical constant 3
4π√2 = 3.3322 and F1 is the first order correction
for the lubrication limit h/2a << 1 with a value of 23180
·π ·√2 = 12.829. The unit vectorΓR12 = R12/ |R12|. In accordance with Ladd and Verberg [33], we applied a correctionon the lubrication force to account for the lubrication force that is already resolved in thecomputations of the fluid dynamics. This was done by subtracting the lubrication forceat a cut-off distance hc from the total lubrication force, as indicated in Eq. 4.8. Thecut-off distance hc represents the cut-off distance between the particle surfaces for theadded lubrication force and was chosen equal to two lattice units (= 0.25a) in our study.For 3D systems, Nguyen and Ladd [40] showed that this correction leads to more accurateresults for particle interactions at short interparticle distances, even with neutrally buoyantparticles very near to contact and without causing instabilities in the particle dynamics.
We have noticed, that in suspensions with relatively high particle fractions or at highparticle Reynolds number, particle clustering and overlap can occur, which greatly affectsthe diffusive behaviour of the particles. This behaviour seems to be correlated with thelubrication breakdown of concentrated colloids, that was reported by Ball and Melrose[41]. As suggested by these authors, we applied a Hookean spring force between theparticles to avoid this clustering and overlap. This Hookean spring force was applied forgaps h smaller than a thickness δ and was applied in the direction of the line of particlecentres, according to:
Fh = F0 −(F0
δ
)h (4.9)
with a maximal Hookean spring force F0 of 10.0 (in lattice units). The Hookean springforce is active in a layer around the particle with a thickness δ/2 of 0.05 lattice units
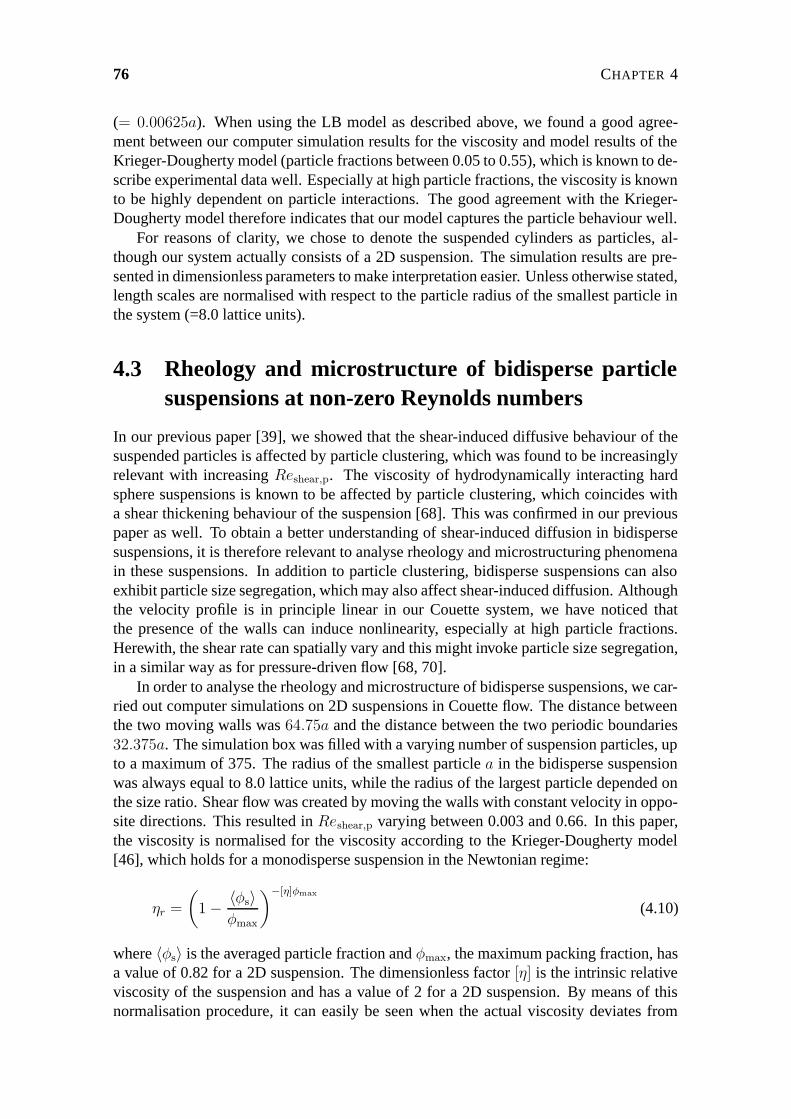
76 CHAPTER 4
(= 0.00625a). When using the LB model as described above, we found a good agree-ment between our computer simulation results for the viscosity and model results of theKrieger-Dougherty model (particle fractions between 0.05 to 0.55), which is known to de-scribe experimental data well. Especially at high particle fractions, the viscosity is knownto be highly dependent on particle interactions. The good agreement with the Krieger-Dougherty model therefore indicates that our model captures the particle behaviour well.
For reasons of clarity, we chose to denote the suspended cylinders as particles, al-though our system actually consists of a 2D suspension. The simulation results are pre-sented in dimensionless parameters to make interpretation easier. Unless otherwise stated,length scales are normalised with respect to the particle radius of the smallest particle inthe system (=8.0 lattice units).
4.3 Rheology and microstructure of bidisperse particlesuspensions at non-zero Reynolds numbers
In our previous paper [39], we showed that the shear-induced diffusive behaviour of thesuspended particles is affected by particle clustering, which was found to be increasinglyrelevant with increasing Reshear,p. The viscosity of hydrodynamically interacting hardsphere suspensions is known to be affected by particle clustering, which coincides witha shear thickening behaviour of the suspension [68]. This was confirmed in our previouspaper as well. To obtain a better understanding of shear-induced diffusion in bidispersesuspensions, it is therefore relevant to analyse rheology and microstructuring phenomenain these suspensions. In addition to particle clustering, bidisperse suspensions can alsoexhibit particle size segregation, which may also affect shear-induced diffusion. Althoughthe velocity profile is in principle linear in our Couette system, we have noticed thatthe presence of the walls can induce nonlinearity, especially at high particle fractions.Herewith, the shear rate can spatially vary and this might invoke particle size segregation,in a similar way as for pressure-driven flow [68, 70].
In order to analyse the rheology and microstructure of bidisperse suspensions, we car-ried out computer simulations on 2D suspensions in Couette flow. The distance betweenthe two moving walls was 64.75a and the distance between the two periodic boundaries32.375a. The simulation box was filled with a varying number of suspension particles, upto a maximum of 375. The radius of the smallest particle a in the bidisperse suspensionwas always equal to 8.0 lattice units, while the radius of the largest particle depended onthe size ratio. Shear flow was created by moving the walls with constant velocity in oppo-site directions. This resulted in Reshear,p varying between 0.003 and 0.66. In this paper,the viscosity is normalised for the viscosity according to the Krieger-Dougherty model[46], which holds for a monodisperse suspension in the Newtonian regime:
ηr =
(1− 〈φs〉
φmax
)−[η]φmax
(4.10)
where 〈φs〉 is the averaged particle fraction and φmax, the maximum packing fraction, hasa value of 0.82 for a 2D suspension. The dimensionless factor [η] is the intrinsic relativeviscosity of the suspension and has a value of 2 for a 2D suspension. By means of thisnormalisation procedure, it can easily be seen when the actual viscosity deviates from

SHEAR-INDUCED SELF-DIFFUSION IN BIDISPERSE SUSPENSIONS 77
Figure 4.1: Simulation results for the viscosity of a 2D bidisperse suspension (φtotal=0.40,alarge/asmall=3) as a function of the relative fraction of large particles φlarge/φtotal at aReshear,p (calculated for the smallest particles) of 0.012. The viscosity is normalised forthe viscosity according to the Krieger-Dougherty model. The error bars indicate the stan-dard deviation. The line without symbols represents model calculations for the viscosity inthe Newtonian regime, according to Eq. 4.1 [75]. The inset presents similar results but foralarge/asmall=2 and 4. The lines connecting the data points are drawn to guide the eye.
the viscosity that is predicted for a monodisperse suspension in the Newtonian regime(η = 1).
The viscosity of a bidisperse suspension was determined as a function of the relativefraction of large particles for a diameter ratio of large to small particles of 2, 3 and 4(Figure 4.1). In contrast to the results of Chang and Powell [72, 73], the viscosity wasnot always lower than that of the respective monodisperse suspensions. This can be ex-plained with the shear thickening behaviour of the suspension. For the large particles inthe suspension, Reshear,p is respectively 4, 9 or 16 times higher than for the small particlesat a certain shear rate, because of the proportionality of Reshear,p to a2. It can thereforebe expected that the large particles exhibit more intense shear thickening and this prob-ably causes the increase of viscosity with increasing fraction of large particles. In spiteof this effect however, at first the viscosity remains relatively stable at low fractions oflarge particles, whereas it increases faster at relative fractions exceeding 0.5 − 0.6. Thisbehaviour might be related to microstructuring phenomena in the bidisperse systems, asalso occurs in the Newtonian flow regime. No clear minimum is observed in the viscosity

78 CHAPTER 4
Figure 4.2: Viscosity dependence of 2D bidisperse suspensions (φtotal=0.40,alarge/asmall=3) on Reshear,p (calculated for the smallest particles) as compared to amonodisperse suspension. The viscosity is normalised for the viscosity according to theKrieger-Dougherty model. The symbols on the Y-axis represent model calculations for theviscosity in the Newtonian regime, according to Eq. 4.1 [75]. The error bars indicate thestandard deviation and lines are drawn as a guide to the eye.
for diameter ratios of 2 and 3, which might be due to the dominance of the shear thick-ening behaviour of the large particles. The total area fraction of particles of 0.40 is stillquite low as well, so that the decrease of viscosity compared to monodisperse suspen-sions (in the Newtonian regime) is small, less than 10%, as becomes clear from the modelcalculcations in Figure 4.1. This is different for the suspension with a diameter ratio of4. Although the effective viscosity does not become smaller than 1.0, a clear minimumis present at a relative fraction of 0.5− 0.6. This seems to be a combined effect of 1) anintense shear thickening due to the large size of the largest particles and 2) intense mi-crostructuring phenomena leading to a pronounced viscosity minimum, as predicted byEq. 4.1 [75]. These results show that the viscosity of bidisperse suspensions can be af-fected by shear thickening, leading to higher viscosities with increasing fractions of largeparticles, which is in contrast to the Newtonian regime where the viscosity of bidispersesuspensions is lower than for monodisperse suspensions. The Reshear,p for the largest par-ticles in the suspension probably determines whether an effect of shear thickening will bepresent.
The shear thickening behaviour of bidisperse suspensions is investigated in more de-tail by examining the effect of Reshear,p on the viscosity (Figure 4.2). The increase of

SHEAR-INDUCED SELF-DIFFUSION IN BIDISPERSE SUSPENSIONS 79
Figure 4.3: Snapshots of the particle configuration (2D bidisperse suspensions, φtotal=0.40,alarge/asmall=3, φlarge/φtotal=0.34) at a Reshear,p (calculated for the smallest particles) of0.023 (left), 0.046 (middle) and 0.16 (right).
viscosity with the Reshear,p was slightly dependent on the relative fraction of large parti-cles. At a relative fraction of large particles of 0.672, the onset of shear thickening was ata lower Reshear,p, which resulted in a higher viscosity. From a Reshear,p of about 0.1 up-ward, the viscosities were of the same order of magnitude again, due to the faster increaseof viscosity of the other two suspensions with less large particles. The effects of shearon bidisperse suspensions do not differ fundamentally from the effects on monodispersesuspensions as presented in [39]. This can also be seen in Figure 4.3, where snapshotsof the particle configurations are shown. At higher Reshear,p, the particle clustering wasmore intense, in a comparable way as has been seen in monodisperse suspensions [39].This figure also demonstrates that there was no important particle segregation of large andsmall particles in the system. In that respect, this figure can be considered illustrative forthe other simulation results, where no particle segregation is found as well.
4.4 Shear-induced self-diffusion in bidisperse suspensions
Shear-induced self-diffusivity reflects the mobility of individual particles in a suspensionunder shear flow and can be determined from the individual diffusive particle displace-ments. Shear-induced diffusion is a so-called long-time diffusive behaviour, which showsstochastic behaviour after a longer time. The reason for this behaviour is that the motionof a given particle is in principle purely deterministic and dependent on the external ve-locity field and its interactions with all other particles in the system. Only when the initialparticle configuration has drastically changed, do the particle displacements become ran-dom, due to the complex nature of the hydrodynamics. This long-time diffusive effect is

80 CHAPTER 4
reflected in the definition of shear-induced self-diffusivity:
Ds ≡ limt→∞
1
2
d
dt〈 x(t)x(t)〉 (4.11)
Ds denotes the shear-induced self-diffusivity tensor. The angle brackets denote an averageover all particles in the system, while x denotes the displacement of a single particle.The long-time diffusive character of shear-induced self-diffusion is also clear from therelation between mean square displacement of particles in a monodisperse suspensionand the strain γt, as presented in our previous paper [39]. This relation exhibited a lineardependence, indicating that the behaviour has become stochastic, only after a strain γt ofabout 8.
As is usual, we normalised all reported shear-induced diffusivities on γa2. The shearrate γ and the particle radius a are relevant time and length scales in the system, so that af-ter normalising, a dimensionless parameter is obtained that is independent from the actualvelocities. In a 2D system, we distinguish components of the shear-induced self-diffusiontensor in the fluid velocity and in the velocity gradient direction and their diagonal com-ponent. The displacements in the velocity gradient direction are purely determined bythe hydrodynamic interactions between the particles, whereas the displacements in thefluid velocity direction are mainly determined by the convective flow. In our system, theconvective particle displacements are hard to assess with sufficient accuracy because ofthe time-dependent velocity fluctuations in the system and the characteristic shear flowpattern, which slightly deviates from perfectly linear. Because the component in the ve-locity gradient direction is most relevant for many practical situations, we have limitedourselves to the analysis of this latter component of the shear-induced diffusion tensor.Our system consists of a Couette system, with periodic boundaries in the flow directionand two moving walls in the velocity gradient direction. The distance between the bound-aries was chosen such, that the obtained diffusion coefficients correspond with diffusionin an infinitely large system [39]. The distance between the two moving walls was twiceas large as between the periodic boundaries. The simulation box contained a numberof 200 or 150 particles, respectively with one size (monodisperse) or two different sizes(bidisperse). The simulation runs were started with a random particle distribution andposition-dependent fluid and particle velocities according to linear shear flow.
The diffusion coefficient was determined from the regression coefficient in the linearpart of the simulation curve of the mean square displacement versus the strain. In orderto evaluate the effect of the initial particle configuration on the diffusion coefficient, wesplit the simulation curve of one simulation run into several curves with a strain span of30, which start at different times and consequently at different initial positions. The finaldiffusion coefficient is the mean value of the diffusion coefficients that are obtained fromthese individual curves, mostly from two different simulation runs.
In Figure 4.4, we present the dependence of the shear-induced diffusivity on Reshear,p
for the smallest particles in a bidisperse suspension with a relative fraction large parti-cles of 0.34. The increase of shear-induced diffusivity with increased Reshear,p is prob-ably caused by a stronger particle clustering, as can be observed visually in Figure 4.3.This effect of particle clustering may be the underlying cause of the effect on viscos-ity as well (see previous section). When comparing the bidisperse suspension with themonodisperse, it becomes evident that the shear-induced diffusivity is not only higherfor a bidisperse suspension than for a monodisperse suspension, but also that the bidis-
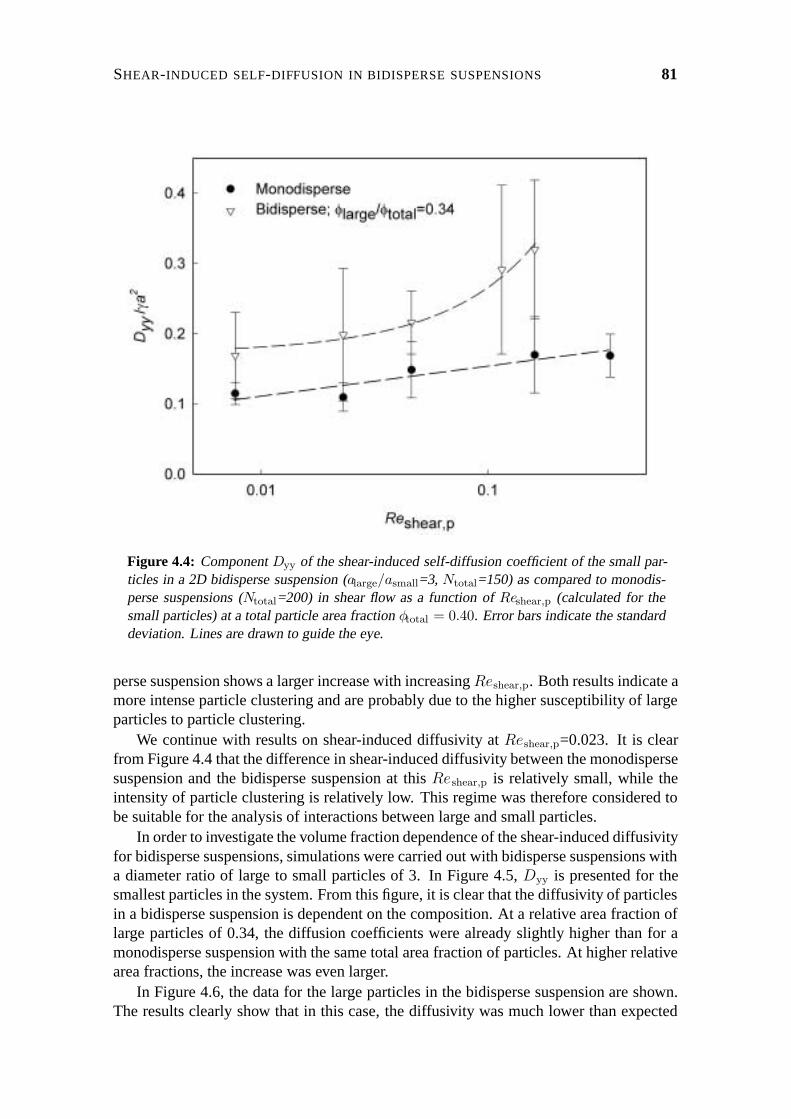
SHEAR-INDUCED SELF-DIFFUSION IN BIDISPERSE SUSPENSIONS 81
Figure 4.4: Component Dyy of the shear-induced self-diffusion coefficient of the small par-ticles in a 2D bidisperse suspension (alarge/asmall=3, Ntotal=150) as compared to monodis-perse suspensions (Ntotal=200) in shear flow as a function of Reshear,p (calculated for thesmall particles) at a total particle area fraction φtotal = 0.40. Error bars indicate the standarddeviation. Lines are drawn to guide the eye.
perse suspension shows a larger increase with increasing Reshear,p. Both results indicate amore intense particle clustering and are probably due to the higher susceptibility of largeparticles to particle clustering.
We continue with results on shear-induced diffusivity at Reshear,p=0.023. It is clearfrom Figure 4.4 that the difference in shear-induced diffusivity between the monodispersesuspension and the bidisperse suspension at this Reshear,p is relatively small, while theintensity of particle clustering is relatively low. This regime was therefore considered tobe suitable for the analysis of interactions between large and small particles.
In order to investigate the volume fraction dependence of the shear-induced diffusivityfor bidisperse suspensions, simulations were carried out with bidisperse suspensions witha diameter ratio of large to small particles of 3. In Figure 4.5, Dyy is presented for thesmallest particles in the system. From this figure, it is clear that the diffusivity of particlesin a bidisperse suspension is dependent on the composition. At a relative area fraction oflarge particles of 0.34, the diffusion coefficients were already slightly higher than for amonodisperse suspension with the same total area fraction of particles. At higher relativearea fractions, the increase was even larger.
In Figure 4.6, the data for the large particles in the bidisperse suspension are shown.The results clearly show that in this case, the diffusivity was much lower than expected

82 CHAPTER 4
Figure 4.5: Component Dyy of the shear-induced self-diffusion coefficient of the small par-ticles in a 2D bidisperse suspension (alarge/asmall=3, Ntotal=150 (bidisperse suspensions)or 200 (monodisperse suspensions)) as a function of the total particle area fraction φtotal inshear flow at a Reshear,p of 0.023 (calculated for the small particles). Error bars indicate thestandard deviation. Lines are drawn to guide the eye.
for a monodisperse suspension. It is evident that the diffusivity of the small as well as thelarge particles is not only the result of the total particle fraction in the system, but alsoof the particle size distibution. The presence of large particles is found to have a positiveeffect on the diffusivity of small particles, whereas small particles have a reverse effecton large particles.
We compared the (non-normalised) diffusivity of the small particles to the expecteddiffusivity of the large particles when these large particles are present in a monodispersesuspension with the same area fraction as that of large particles in the bidisperse sus-pension. Figure 4.7 shows that the diffusivity of the small particles in the bidispersesuspensions is practically the same as the expected diffusivity of the large particles. Thisstrongly suggests that the small particles behave as ’slave particles’ in the suspension,whose mobility is completely determined by the presence of the large particles in the sys-tem. For the large particles, this would mean that their diffusivity is unaffected by thepresence of the small particles and that their diffusivity is the same as for a monodispersesuspension with the large particles solely. From Figure 4.8, it can be seen that this wasindeed the case in the bidisperse suspensions. Also when φlarge > 0.2, the small and thelarge particles are expected to behave as ’slave’ and ’master particles’ respectively, thusfollowing the curves of the monodisperse large particles in 4.7 and 4.8.

SHEAR-INDUCED SELF-DIFFUSION IN BIDISPERSE SUSPENSIONS 83
Figure 4.6: Component Dyy of the shear-induced self-diffusion coefficient of the large par-ticles in a 2D bidisperse suspension (alarge/asmall=3, Ntotal=150 (bidisperse suspensions)or 200 (monodisperse suspensions)) as a function of the total particle area fraction φtotal inshear flow at a Reshear,p of 0.023 (calculated for the small particles). Error bars indicate thestandard deviation.
In Figure 4.5, the shear-induced diffusion coefficients of the small particles in thebidisperse suspensions were all higher than for the monodisperse case. We can howeverexpect that there will only be an increase when the large particles in the bidisperse sus-pensions are present in a sufficient amount and/or with a sufficient diameter ratio. Weinvestigated this for bidisperse suspensions with a total particle area fraction of 0.40, butwith varying diameter ratio and relative area fraction of large particles. The results inFigure 4.9 show that the diffusivity of the small particles is indeed related to the diameterratio. At a fixed relative amount of large particles, the diffusivity increases with the diam-eter ratio. This increase with the diameter ratio was steeper when the relative amount oflarge particles was higher. The increase starts at a certain onset point, indicating that whenthe diameter ratio and the relative amount of large particles are not sufficiently high, thediffusivity of the small particles is not affected compared to the monodisperse case. Thisonset value is mostly determined by the relative fraction of large particles and to a muchlower extent to the diameter ratio. After putting the relative fraction of large particles onthe X-axis (Figure 4.10), for φlarge/φtotal < 0.6 a mastercurve is obtained from which canbe seen that the diffusivity starts to increase at a relative area fraction of large particlesof about 0.3. At relatively high amounts of large particles, e.g. with 26.7 number% oflarge particles (Figure 4.10), the diffusivities seem to level off, so that the diffusivity of

84 CHAPTER 4
Figure 4.7: The non-normalised diffusivity (in lattice dimensions) of the small particles ina bidisperse suspension (alarge/asmall=3, Ntotal=150) in relation to the fraction of large par-ticles φlarge at a Reshear,p of 0.023 (calculated for the small particles), as compared to thenon-normalised diffusivity of large particles in a monodisperse suspension. Error bars indi-cate the standard deviation.
the small particles is smaller than expected. Although we did not explore this regime inmore detail, we think that this might be due to the effect of the relatively limited box sizefor the large particles. Sierou and Brady [27] have shown earlier that a limited box sizecan lead to a decrease of the diffusivity.
It is of importance to interpret the reason why the onset value is at a fraction of largeparticles of 0.3. For a monodisperse suspension, Dyy/γa
2 is dependent on φ. It can bedebated that the onset point is determined by the situation in which the diffusivity ofthe larger particles starts to become larger than the diffusivity of a monodisperse suspen-sion with φtotal = 0.4. In Figure 4.5, it can be seen that the latter diffusivity is equal to0.11, corresponding with a non-normalised diffusivity of 0.00011 (in lattice dimensions,at Reshear,p=0.023). For particle size ratios of 2, 3 and 4, the larger particles obtain thisnon-normalised diffusivity at a fraction φ of respectively 0.21, 0.12 and 0.06. These val-ues are smaller than found for the onset point, which indicates that the contribution of thesmall particles themselves to the diffusivity cannot be neglected at this onset point. There-fore, this phenomenon does not seem to completely explain the value of the onset-point.Another related phenomenon is the area surrounding a large particle that is significantlyinfluenced by the presence of this large particle. At a relative fraction of large particles of0.3, the fraction φlarge was 0.12. From 2D simulations on the rotation of a single particlein the vicinity of a wall and on the interaction between two particles in shear flow [39], it
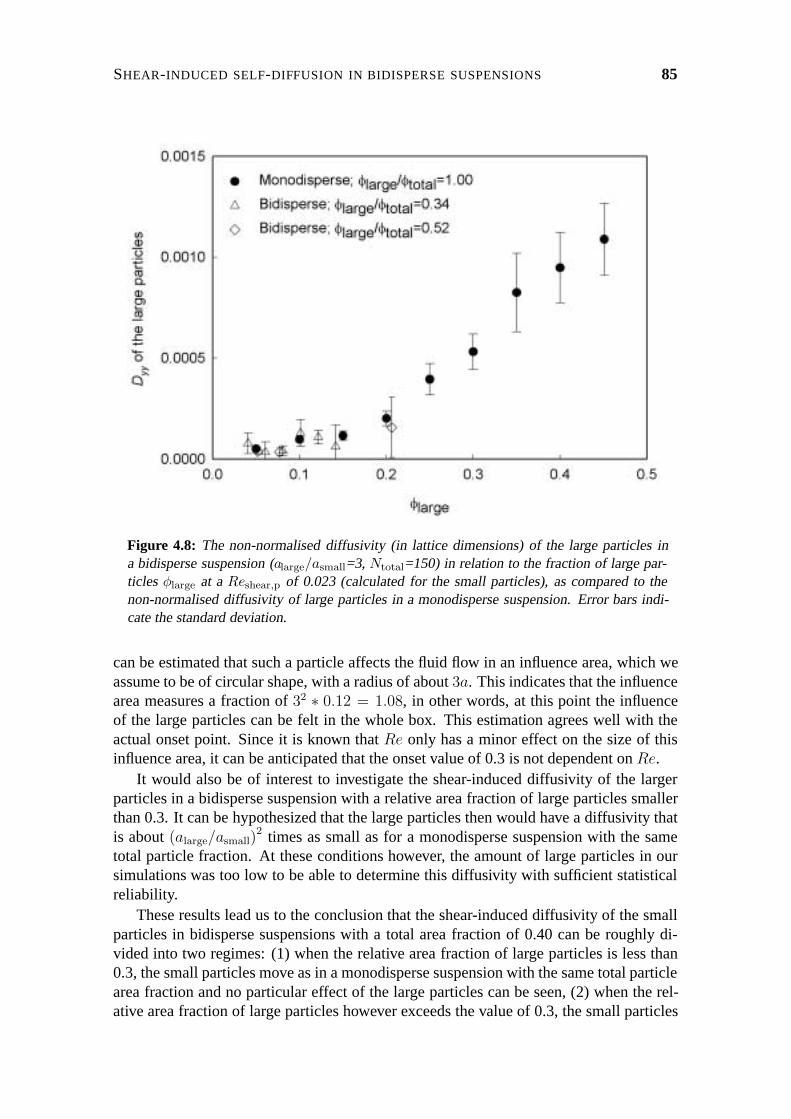
SHEAR-INDUCED SELF-DIFFUSION IN BIDISPERSE SUSPENSIONS 85
Figure 4.8: The non-normalised diffusivity (in lattice dimensions) of the large particles ina bidisperse suspension (alarge/asmall=3, Ntotal=150) in relation to the fraction of large par-ticles φlarge at a Reshear,p of 0.023 (calculated for the small particles), as compared to thenon-normalised diffusivity of large particles in a monodisperse suspension. Error bars indi-cate the standard deviation.
can be estimated that such a particle affects the fluid flow in an influence area, which weassume to be of circular shape, with a radius of about 3a. This indicates that the influencearea measures a fraction of 32 ∗ 0.12 = 1.08, in other words, at this point the influenceof the large particles can be felt in the whole box. This estimation agrees well with theactual onset point. Since it is known that Re only has a minor effect on the size of thisinfluence area, it can be anticipated that the onset value of 0.3 is not dependent on Re.
It would also be of interest to investigate the shear-induced diffusivity of the largerparticles in a bidisperse suspension with a relative area fraction of large particles smallerthan 0.3. It can be hypothesized that the large particles then would have a diffusivity thatis about (alarge/asmall)
2 times as small as for a monodisperse suspension with the sametotal particle fraction. At these conditions however, the amount of large particles in oursimulations was too low to be able to determine this diffusivity with sufficient statisticalreliability.
These results lead us to the conclusion that the shear-induced diffusivity of the smallparticles in bidisperse suspensions with a total area fraction of 0.40 can be roughly di-vided into two regimes: (1) when the relative area fraction of large particles is less than0.3, the small particles move as in a monodisperse suspension with the same total particlearea fraction and no particular effect of the large particles can be seen, (2) when the rel-ative area fraction of large particles however exceeds the value of 0.3, the small particles

86 CHAPTER 4
Figure 4.9: Component Dyy of the shear-induced self-diffusion coefficient of the small par-ticles in a 2D bidisperse suspension (φtotal=0.40,Ntotal=150 (bidisperse suspensions) or 200(monodisperse suspensions)) as a function of the ratio of the particle radii alarge/asmall inshear flow at a Reshear,p of 0.023 (calculated for the small particles) and for different numberfrequencies of large particles. The number frequencies correspond with relative fractions oflarge particles φlarge/φtotal ranging between 0.05-0.40 (1.3 number%), 0.18-0.58 (5.3 num-ber%), 0.32-0.66 (10.7 number%) and 0.59-0.77 (26.7 number%). Error bars indicate thestandard deviation. Lines are drawn to guide the eye.
behave as ’slave particles’ and obtain a higher diffusivity, which is totally governed by thediffusivity of the large particles in the system. Shear-induced diffusivity is affected by theparticle size distribution, which is of importance for the relation between shear-induceddiffusivity in polydisperse suspensions and in monodisperse suspensions.
4.5 Conclusions
It is shown that bidisperse suspensions, in analogy with monodisperse suspensions, ex-hibit shear thickening behaviour. The size and relative fraction of large particles highlydetermine the degree of shear thickening at a certain shear rate. This can be explainedbecause the shear based particle Reynolds number Reshear,p, which is a relevant param-eter for shear thickening, has a quadratic dependence on the particle radius. Moreover,the viscosity of the bidisperse suspensions was not always lower than for monodispersesuspensions, as is the case in the Newtonian regime, but increased with increasing relative

SHEAR-INDUCED SELF-DIFFUSION IN BIDISPERSE SUSPENSIONS 87
Figure 4.10: Component Dyy of the shear-induced self-diffusion coefficient of the small par-ticles in a 2D bidisperse suspension (φtotal=0.40,Ntotal=150 (bidisperse suspensions) or 200(monodisperse suspensions), alarge/asmall=2, 3, 4 or 5) as a function of the fraction of largeparticles φlarge in shear flow at a Reshear,p of 0.023 (calculated for the small particles) andfor different number frequencies of large particles. The number frequencies correspond withrelative fractions of large particles φlarge/φtotal ranging between 0.05-0.40 (1.3 number%),0.18-0.58 (5.3 number%), 0.32-0.66 (10.7 number%) and 0.59-0.77 (26.7 number%). Errorbars indicate the standard deviation. The dashed line indicates the value of Dyy in a monodis-perse suspension.
fraction of large particles. This increase was not gradual, which can be caused by particlestructuring phenomena in the bidisperse suspensions.
Shear thickening behaviour in monodisperse suspensions is known to coincide withparticle clustering and an increase of shear-induced diffusivity. In bidisperse suspensions,we have also found an increase of shear-induced diffusivity with increasing Reshear,p.The rheology as well as the shear-induced diffusivity of bidisperse suspensions is largelydetermined by the larger particles in the suspension. The influence of the larger particle onthe fluid flow field can not only lead to increased particle clustering and shear thickening,but also to an increased diffusivity of the smaller particles.
In bidisperse suspensions, the small and large particles exhibited a different (nor-malised) shear-induced diffusivity Dyy/γa
2. Whereas the diffusivity of the small particlesincreased compared to the monodisperse situation, the diffusivity of the large particlesdeclined. The non-normalised shear-induced diffusivity Dyy was however similar for thesmall and large particles, indicating an equal absolute mobility, which was predominantly

88 CHAPTER 4
determined by the relative fraction of large particles in the system. The predominance ofthe large particles became evident when the relative fraction of large particles exceeded avalue of about 0.3, independent of the size ratio of the particles. In that case, the shear-induced diffusivity of both the small and the large particles are dependent on φlarge solely.Or in other words, the small particles can be seen as ’slave particles’ that are totally ruledby the large ’master particles’. Below the onset value of 0.3, the shear-induced diffusivityDyy/γa
2 of the small particles was similar to that of equal-sized particles in a monodis-perse suspension with the same total particle fraction.
In this study, it is shown how shear-induced diffusivity is affected by the particlesize distribution, leading to a better understanding of the relation between shear-induceddiffusivity in polydisperse suspensions and in monodisperse suspensions.
Acknowledgements
Friesland Foods is greatly acknowledged for supporting this research. The authors wouldlike to acknowledge the support of the Dutch Ministries of Economic Affairs, Education,Culture and Sciences and of Housing, Spatial Planning and the Environment through agrant of the Dutch Program Economy, Ecology and Technology.

5
Shear-induced diffusion model formicrofiltration of polydisperse
suspensions
J. Kromkamp, M. v. Domselaar, K. Schroen, R. v.d. Sman, R. Boom, Desalination 146 (2002) 63-68.

90 CHAPTER 5
A detailed study on concentration polarisation during microfiltration (MF) was carriedout in order to improve control on cake layer formation. Concentration polarisation is re-duced by several back-transport mechanisms, however, for particles in the size range 0.5-30 µm shear-induced diffusion is the predominant one. Shear-induced diffusion is causedby the hydrodynamic interactions between particles in shear flow, which are strongly de-pendent on the particle size. Because of this, the polydispersity of suspensions is expectedto have a large effect on cake layer formation. Although this aspect will be of consider-able practical relevance, it has only received minor attention in literature. In this work,the effect of particle size distribution on MF was investigated by studying the steady-stateflux of bidisperse suspensions with a ratio of particle radii of 3. The flux appeared to becompletely determined by the smaller particles; it remained almost constant between avolume fraction of 0.2 and 1 of small particles. This trend in the steady-state flux wasin good agreement with calculations based on a shear-induced particle migration modelfor polydisperse suspensions. Since polydispersity is a common property of suspensions,the present work may contribute to optimisation of flux and selectivity in MF processes,which depend largely on adequate control of cake layer formation. This can be achievedby implementation of the developed model in process control routines.
5.1 Introduction
Crossflow microfiltration (MF) is a well-known technique for the separation of micropar-ticles, emulsion droplets and micro-organisms from fluids, with many (potential) indus-trial applications in food and bioprocess engineering [79]. In these processes, concen-tration polarisation mostly leads to the formation of a cake layer at the membrane sur-face, which has a large negative effect on flux and selectivity. Therefore, concentrationpolarisation can be considered a key factor in the control of MF processes. Concentra-tion polarisation is governed by two simultaneous processes: (1) convective transport ofparticles towards the membrane along with the permeate flow and (2) back-transport ofparticles from the concentrated layer into the bulk phase. In case of an excess particleflux towards the membrane, a cake layer builds up. When convective transport balancesback-transport, the situation can be considered a steady-state. In this situation only minorvariations in cake layer resistance and flux are expected. Shear-induced diffusion can beconsidered the predominant back-transport mechanism during MF of suspensions withparticles in the range of 0.5-30 µm [10]. This mechanism comprises the diffusive move-ments of particles in a shear field that are caused by hydrodynamic interactions. In thepresence of a concentration or shear rate gradient, shear-induced diffusion leads to a netmigration of particles in the direction of a lower concentration or shear rate, therewitheffectively reducing concentration polarisation. Using the fundamental knowledge aboutshear-induced diffusion, the MF behaviour of monodisperse suspensions can, in generalbe predicted well. However, practically relevant suspensions are seldom monodisperse.Polydispersity, that is known to influence permeate flux and flow resistance of cake layers,seems to be the rule. Incorporation of effects of polydispersity in shear-induced diffusionmodels for MF would therefore be an important step toward a better control of concen-tration polarisation during MF of practically relevant suspensions. In this article, we

POLYDISPERSE SUSPENSIONS: SHEAR-INDUCED DIFFUSION MODEL 91
present our research conducted on the effects of polydispersity on concentration polarisa-tion during MF. We investigated the effect of the particle size distribution of a bidispersesuspension on the steady-state flux and compared our results with predictions obtainedwith a particle migration model for polydisperse suspensions [71].
5.2 Shear-induced migration model for polydisperse sus-pensions
For the quantitative description of shear-induced diffusion, most MF models use the re-search of Eckstein and co-workers [14] and Leighton and Acrivos [15, 80]. The researchof these authors was directed at self-diffusion of monodisperse particles in a suspen-sion under shear. A frequently applied equation for shear-induced diffusion, reportedby Leighton and Acrivos, is
Ds = 0.33γa2φ2(1 + 0.5e8.8φ
)(5.1)
All symbols are explained in the nomenclature list. For the steady-state permeate flux,Davis and Sherwood [81] derived the following equation, using an exact similarity solu-tion with shear-induced diffusion as the dominant mechanism for particle back-transport
〈J〉 = 0.072γ0
(φwa
4
φbL
)1/3
(5.2)
Shear-induced self-diffusion of particles in polydisperse suspensions has to our knowl-edge not been reported. Phillips and co-workers [16] proposed a phenomenological modelfor shear-induced particle migration. The model is based on particle migration potentials.Migration is induced by two mechanisms, a nonuniform frequency of particle interactionsin a shear field and a nonuniform viscosity field. Shauly and co-workers [71] extended thismodel to polydisperse suspensions with various particle sizes. For the system investigatedhere, the total flux of particles of species i can be described with
ji = −kγaaiφφi
[∇ ln (γφi) +
a
ai∇ lnµλ
](5.3)
The term outside the brackets equals the shear-induced diffusion coefficient for the ithparticle. The migration potential in the shear-induced particle migration model consistsof an interaction and a viscosity term. For the viscosity of monodisperse suspensions,Krieger [46] found:
µ =
(1− φ
φm
)−m
(5.4)
where m = 1.82 and the maximum packing density for a monodisperse suspension (φm0)is assumed to be 0.68. This expression was extended by Probstein and co-workers [75] todescribe the effective viscosity of a bidisperse suspension. In the approach of Probsteinand co-workers the maximum packing density is not taken as a constant but is calculatedas a function of the species local concentrations φ1 and φ2, as is shown in Equation 5.5:
φm
φm0=
[1 +
3
2|b|3/2
(φ1
φ
)3/2(φ2
φ
)](5.5)
with b = (a1 − a2)/(a1 + a2).

92 CHAPTER 5
Figure 5.1: Electron microscope photo of a microsieve.
5.3 Materials and methods
Microfiltration (MF) experiments were performed with microsieves, MF membranes thatare fabricated with silicon micromachining technology. This technology allows the con-struction of smooth, thin membranes with very well defined pores. The membrane re-sistance of microsieves is typically 100 to 1000-fold smaller than for conventional mem-branes. The microsieves we used had a membrane surface area of 30.2 mm2 and slit-shaped pores with a length and width of 3 and 0.7 µm respectively. The thickness ofthe membrane was only 1 µm. A SEM-photo is given in Figure 5.1. The feed forMF consisted of suspensions of polystyrene spherical particles (surfactant-free, sulfatepolystyrene, Interfacial Dynamics Corporation, USA) in a neutrally buoyant mixture ofdemineralized water and glycerol (density 1.055 g/ml at 293 K). The experiments werecarried out in a parallel plate device with a channel height of 0.25 mm. The temperatureof the feed was kept constant at 298 K. The pressure was monitored with two pressuresensors in the parallel plate device, one before and one after the microsieve. The pressureat the permeate side of the microsieve was atmospheric. The feed flow rate was moni-tored with a rotameter and the permeate flux was measured with an analytical balance.Since the microsieve was divided into porous and non-porous fields, the permeate fluxwas calculated based on the surface area of the porous fields only.
5.4 Results and discussion
5.4.1 Predicted steady-state fluxes
Using Equation 5.3, we first calculated the diffusion coefficients for the separate particlesin a bidisperse suspension as a function of the suspension composition and related thesevalues to the diffusion coefficients in case of a monodisperse suspension (Figure 5.2).The ratio of the particle radii a2/a1 was 3 (equal to that in the experiments). In thecalculations, the total volume fraction of particles φ in the concentration polarisation layer

POLYDISPERSE SUSPENSIONS: SHEAR-INDUCED DIFFUSION MODEL 93
Figure 5.2: Relative diffusion coefficient for the separate particles in a bidisperse suspensionas a function of suspension composition for a total volume fraction of 0.6 and a2/a1=3, ascalculated on basis of the particle migration model.
was always assumed 0.6. Starting from a monodisperse suspension of particle 1 (φ1/φ=1),the diffusion coefficient first increases with increasing amount of particle 2. This is dueto the increase of the mean particle radius (Equation 5.3: a) in the suspension. From avolume ratio φ1/φ of 0 up to 0.75, the increasing volume fraction of particle 1 (φ1) in thesuspension causes the diffusion coefficient to increase. In contrast to particle 1, particle2 shows a monotonous decrease of the diffusion coefficient with increasing volume ratioof the small particle. This is because the mean particle radius and the concentration ofparticle 2 both decrease. Apparently, the diffusion coefficient of the smaller particle in thebidisperse suspension has a different dependence on suspension composition as comparedto that of the larger particle. But what does this imply for the steady-state flux during MF?To analyse this effect, we calculated the steady-state flux using Equation 5.2, but adjustedfor the relative change of the diffusion coefficients of both particles 1 and 2, as comparedto the monodisperse case. With these model calculations we get two relations for thesteady-state flux as a function of suspension composition (Figure 5.3).
We can expect that the lowest value for the steady-state flux will actually be measuredduring MF, because this represents the situation in which neither for particle 1 nor forparticle 2 an excess particle flux exists. According to Figure 5.3, this would imply that fora volume ratio φ1/φ lower than 0.75, the back-transport flux of particle 1 determines the

94 CHAPTER 5
Figure 5.3: Length-averaged steady-state permeate flux for cross-flow MF, calculated for theseparate particles (a1=0.8 µm; a2=2.4 µm) in a bidisperse suspension based on the particlemigration model. The bold lines indicate the predicted actual steady-state flux. Microfiltra-tion conditions: γ0 =2.0*103 s−1; φw =0.6; φb =1.5*10−5; T =298 K; L =4.1*10−3 m.
steady-state flux, while for a volume ratio φ1/φ higher than 0.75 particle 2 does (exceptfor a volume ratio φ1/φ of exactly 0 or 1). From this, it follows that the flux is comparableto the flux of the monodisperse suspension of the smaller particle for a volume ratio from0.25 up to 0.75. For volume ratios φ1/φ near 0 or 1, the experimentally determined fluxvalues should be considered with care, because measured fluxes may easily be influencedby particle depletion in the concentration polarisation layer or by very slow cake layerformation. Please note, in the calculations we only consider the concentration differencebetween concentration polarisation layer and bulk phase for the migration potential. Weassume that the shear rate and the viscosity do not change the migration potential sig-nificantly from that of the monodisperse case. This seems a reasonable assumption. Wecalculated, using the model of Probstein and co-workers (Equation 5.5), that for the bidis-perse suspension, the volume fraction in the concentration polarisation layer would needto rise from φ=0.60 to 0.66 (in the most extreme case) in order to achieve the same viscos-ity as for the monodisperse suspension. This increase in volume fraction gives an increasein steady-state flux of only 3%.

POLYDISPERSE SUSPENSIONS: SHEAR-INDUCED DIFFUSION MODEL 95
Figure 5.4: Flux and transmembrane pressure during microfiltration of a bidisperse suspen-sion of polystyrene particles (a1 =0.8 µm, φ1/φ =0.8 and a2 =2.4 µm, φ2/φ =0.2). Thetransmembrane pressure was step-wise increased during the run. Microfiltration conditions:γ0 =2.0*103 s−1; φb =1.5*10−5;T =298 K.
5.4.2 Experimental results
Steady-state flux levels were determined for monodisperse suspensions with particle radiiof 0.8 and 2.4 µm and for bidisperse suspensions, consisting of mixtures of these twoparticles. This was done by step-wise increasing the transmembrane pressure during afiltration run and measuring the steady-state flux (an example is shown in Figure 5.4).
Due to the low membrane resistance of microsieves, already at an extremely low trans-membrane pressure a cake layer is formed and a steady-state flux level is achieved. In asteady-state situation, an increase of the transmembrane pressure only resulted in a tem-porary increase of the permeate flux. The subsequent decrease of the flux can be explainedwith extra accumulation of particles on the membrane surface, resulting in a thicker cakelayer. From our calculations on bidisperse suspensions, we expected that the particle withthe largest excess particle flux would determine the steady-state flux level.
As can be seen from Figure 5.5, for all bidisperse mixtures the steady-state flux wascomparable to the flux of the monodisperse suspension with the smaller particles. Thevariation in flux between the mixtures was relatively small. Apparently, in the bidis-perse mixtures, the smaller particle had a larger excess particle flux and determined thesteady-state flux level. This is in agreement with our model predictions. Comparison ofthe measured steady-state flux levels with values that are predicted by the shear-induceddiffusion model reveals that the measured fluxes are about 5 times lower. This mightbe due to an overestimation of the predicted steady-state flux for short filter lengths (L).

96 CHAPTER 5
Figure 5.5: Measured steady-state flux for microfiltration of a bidisperse suspension ofpolystyrene particles (a1 =0.8 µm; a2 =2.4 µm) as a function of suspension composition.Microfiltration conditions: γ0 =2.0*103 s−1; φb =1.5*10−5;T =298 K.
According to Equation 5.2, the flux of monodisperse suspensions increases with the di-ameter of the particles with a power-dependence of 1.33. For the particles investigatedhere (a2/a1 =3), a flux ratio (J2/J1) of 4.3 is expected, while we measured a flux ratio of2.7. This effect is currently investigated further.
5.5 Conclusions
In this study, we found that the steady-state flux for MF of a bidisperse suspension witha ratio of particle radii of 3 has a level that is comparable to that of a monodisperse sus-pension of the smallest particle (in the bidisperse suspension). The trend in the observedbehaviour could be described accurately with a particle migration model for polydispersesuspensions. This model takes the effect of the particle size distribution on the shear-induced migration of individual particles into account.
List of symbols
a particle radius, m
POLYDISPERSE SUSPENSIONS: SHEAR-INDUCED DIFFUSION MODEL 97
a average particle radius, mb dimensionless function in Eq. 5.5Ds shear-induced diffusivity, m2/s〈J〉 lengt-averaged permeate flux, m/sji migratory flux of particle i, m2/sk dimensionless particle migration parameter in Eq. 5.3L filter length, mPtm transmembrane pressure, bar
Greek symbols:φ particle volume fractionφb particle volume fraction in the bulk suspensionφm maximum packing densityφm0 maximum packing density for a monodisperse suspensionφw particle volume fraction at the channel wallγ shear rate, s−1
γ0 nominal shear rate at the membrane surface, s−1
λ dimensionless particle migration coefficient in Eq. 5.3µ viscosity, kg/m.s
Acknowledgements
We would like to thank Aquamarijn Microfiltration BV (Zutphen, the Netherlands) forsupplying the microsieves. Friesland Foods is greatly acknowledged for supporting thisresearch. The authors would like to acknowledge the support of the Dutch Ministries ofEconomic Affairs, Education, Culture and Sciences and of Housing, Spatial Planning andthe Environment through a grant of the Dutch Program Economy, Ecology and Technol-ogy.


6
Effects of particle size segregation oncrossflow microfiltration performance:control mechanism for concentration
polarisation and particle fractionation
J. Kromkamp, F. Faber, K. Schroen, R. Boom, accepted for publication by Journal of Membrane Sci-ence.

100 CHAPTER 6
Although the principal mechanisms of crossflow microfiltration (MF) are well-known,the practical applicability of the resulting microfiltration models is still limited. This canbe largely attributed to the lack of understanding of effects of polydispersity in the par-ticulate suspensions, as relevant to concentration polarisation in MF. This paper describesan investigation of concentration polarisation behaviour of bidisperse suspensions, in theregime where shear-induced diffusion is the dominant back-transport mechanism. In thetransient flux regime, the particle deposition onto the membrane was monitored by meansof Confocal Scanning Laser Microscopy. As in accordance with the linear dependence ofthe shear-induced diffusivity on a2, only the small particles in the bidisperse suspensionswere found to deposit onto the membrane. The back-transport flux that was calculatedfrom the deposition rate and the actual permeate flux, was found to be independent ofthe composition of the suspension, whereas it was equal to the back-transport flux of amonodisperse suspension of the small particles only, with a similar total particle fraction.These results can be explained with the occurrence of particle size segregation in the feedflow, which leads to an enrichment with small particles of the suspension near the mem-brane. The findings are also shown to be relevant to particle fractionation processes byMF. In such fractionation processes, particle size segregation is found to have a strongeffect on the separation characteristics such as particle size and fat content of the perme-ate. A polydisperse suspension could be fractionated using a membrane having a poresize larger than the largest particles present. The fractionation thus results not from sizeexclusion in the membrane, but from segregation effects in the feed channel.
6.1 Introduction
It is already known for a century that the yield of microfiltration (MF) processes can beimproved by means of a crossflow parallel to the membrane [82]. The shear flow that isinduced in this way, reduces the deposition of suspended particles onto the membrane andenables operation at a (quasi-)stationary filtration rate for a long time.
In spite of the succes of MF, the process of particle deposition and its effects on MF areonly marginally understood, because of the great number of parameters that is involved.Just to name a few, particle size distribution, shape and deformability of the suspendedparticles, flow resistance of the deposited layer, and membrane morphology. It is obviousthat for process design and improvement, a better understanding of crossflow MF is ofmajor importance; preferably based on (model) predictions. The two key aspects for thisare: 1) the kinetics of particle deposition and 2) the properties of the deposited layer. Thispaper will focus solely on the kinetics of particle deposition.
The last twenty years, significant progress has been made in the understanding ofcrossflow effects on suspensions with hard spherical particles of one size. The mod-els that are available for such systems, distinguish different mechanisms for the reducedparticle deposition onto the membrane such as Brownian diffusion, shear-induced diffu-sion, inertial lift and surface transport [10]. The relevance of these particle back-transportmechanisms for an actual MF system is determined by mainly the shear rate and the par-ticle radius. When colloidal interactions play a role, normally for particle sizes between10 nm and 1 µm, the potential barrier between particles is also relevant [83].

EFFECTS OF PARTICLE SIZE SEGREGATION ON CROSSFLOW MICROFILTRATION 101
For particle sizes between 0.5 and 30 µm, shear-induced diffusion is the most rele-vant back-transport mechanism [10]. Since particle-particle interactions determine shear-induced diffusion, modelling of the MF process of polydisperse suspensions in the shear-induced diffusive regime requires knowledge of the ensemble behaviour of the suspendedparticles. Kramadhati and co-workers [84] evaluated the shear-induced diffusion modelof Romero and Davis [8] for MF of a polydisperse feed suspension. Their calculationsshowed amongst others that the average particle size in the deposited layer was in generalsmaller than in the bulk phase, due to the lower deposition rate of the larger particles.Although their calculations may be illustrative for the effects of polydispersity, the pre-dictions of Kramadhati and co-workers have not been validated yet. In earlier work [85],we adapted a shear-induced migration model of Shauly and co-workers [71] for MF ofbidisperse suspensions and found that this model gave a good description of the stationaryfiltration rate for relative volume fractions of large particles between 20 and 80%. Thepaper is one of the few that include the effects of particle polydispersity on the kinetics ofparticle deposition, albeit directed at stationary situations.
Experimental work of several authors revealed that the average particle size in thedeposited layer is smaller than in the bulk phase of the suspension [86–88]. Kim andco-workers [89] found a good correlation between experimental results on the cake resis-tance and a newly defined effective particle diameter, which was related to shear-induceddiffusivity. In our earlier work [85], we analysed the stationary filtration rate for a bidis-perse particle suspension, in the regime of shear-induced diffusion. We found that thesmallest particle in the suspension determined the filtration rate. For the particle size ratioof 3 used in this study, the stationary filtration rates for the bidisperse suspensions weresimilar to that of monodisperse suspensions of the smallest particle.
This paper presents an experimental study on the behaviour of bidisperse suspensionsin the shear-induced diffusive back-transport regime of MF. The particle deposition ontothe membrane is monitored in the transient flux regime by means of Confocal Laser Scan-ning Microscopy. In this way, the back-transport of the separate particles in the bidispersesuspension is quantified as a function of the suspension composition (ratio of particleradii, relative volume fraction of large and small particles). The observed behaviour is re-lated to different shear-induced diffusion phenomena described in literature. The practicalrelevance of our findings is demonstrated in a study on fractionation of milk fat globules.In the next paragraph, we give an overview of those shear-induced diffusion phenomenain bi- or polydisperse suspensions that are relevant to MF.
6.2 Shear-induced diffusion in polydisperse suspensions
6.2.1 Particle back-transport as determined by shear-induced mi-gration
Shear-induced migration comprises the phenomenon of collective particle behaviour asa result of shear-induced diffusion. In a suspension that is subjected to a shear flow,hydrodynamic particle-particle interactions can give rise to this diffusive behaviour, whichis the main cause for back-transport of particles between 0.5 and 30 µm [10]. Romero andDavis used a model of Leighton and Acrivos [15] for the description of the shear-induced

102 CHAPTER 6
diffusivity Ds of a monodisperse suspension with hard, spherical particles:
Ds = 0.33γa2φ2(1 + 0.5e8.8φ
)(6.1)
From this equation, it becomes clear that the particle radius strongly affects the shear-induced diffusivity. It can therefore be anticipated that the particle size distribution willbe of considerable influence as well.
Romero and Davis [8] have developed a MF model, describing the particle depositiononto the membrane and the permeate flux, with shear-induced migration as the back-transport mechanism for monodisperse suspensions. According to an exact similaritysolution of this model [81], the stationary permeate flux Jss is given by:
〈Jss〉 = 0.072 · γwall,0 ·(
φc · a4
φb · Lm
)1/3
(6.2)
where γwall,0 is the nominal shear rate at the wall, φc and φb are respectively the particlevolume fraction in the particle layer and in the bulk phase, a is the particle radius, andLm is the total membrane length. The angle brackets denote that the flux is averaged overthe membrane length. This solution is valid for a bulk particle volume fraction φb <0.1,for a situation where the permeate flux is determined by the flow resistance of the particlelayer at the membrane, and for a membrane length that is much longer than the length ofthe particle layer-free zone at the beginning of the membrane.
Shauly and co-workers [71] took the particle size distribution into account in a shear-induced migration model, which was originally developed by Phillips and co-workers[16]. This phenomenological model describes shear-induced diffusive particle fluxes re-sulting from a gradient in particle interactions and a gradient in shear stress [71]:
ji = −kγaaiφφi
[ ln (γφi) +
a
ai lnµλ
](6.3)
where ji is the migratory flux of particle i, k and λ are dimensionless constants, a is theaverage particle radius and µ is the viscosity. The term outside the brackets denotes theshear-induced diffusivity Ds,i for the ith particle.
In previous work [85], we carried out calculations on the stationary flux by introducingthe shear-induced diffusivity of the small particles (in bidisperse suspensions: Equation6.3) in the model for the stationary permeate flux Jss (Equation 6.2). Therewith, theparticle volume fraction remains as a driving force for shear-induced migration.
6.2.2 Shear-induced particle segregation in channel flow
It is known from literature that shear-induced migration can also lead to size segregationof particles in a suspension subjected to channel flow. The center region of the channelis found to be enriched with large particles, whereas the zone near the channel wall wasalmost depleted of large particles [68]. This size segregation could be important for mi-crofiltration systems, because the crossflow is usually much larger than the flow throughthe membrane. In that way, only the composition of the suspension that flows closelyalong the membrane wall may be relevant to concentration polarisation and cake layerformation. Whether this is also the case in this study, is discussed in the results section.

EFFECTS OF PARTICLE SIZE SEGREGATION ON CROSSFLOW MICROFILTRATION 103
Figure 6.1: Schematic drawing of the microfiltration set-up with on-line monitoring of parti-cle deposition onto the membrane by means of CSLM. A detailed description is given in thetext.
6.3 Materials and methods
6.3.1 CSLM experiments
Microfiltration set-up
A crossflow MF system was used, consisting of a parallel plate device with a channelheight of 0.25 mm and a channel width of 26 mm (Figure 6.1). The feed was continuouslyrecirculated over the parallel plate device with a crossflow velocity of 0.04 m/s. Thisyields a shear rate γ at the membrane surface of 1000 s−1. The volume in the recirculationloop was such that no significant concentration took place during an experiment. Thepressure was monitored with two pressure sensors in the parallel plate device, at equaldistance up- and downstream of the membrane. At the permeate side the pressure wasatmospheric. The experiments were performed at ambient temperature.
A polyethersulfon MF membrane (Omega, low-protein binding modified, Filtron,USA) with a Molecular Weight Cut-Off (MWCO) of 100 kDa and a membrane areaof 36 mm2 was used. The feed consisted of a suspension of dyed polystyrene spheri-cal particles (surfactant-free, sulfate polystyrene, density 1.06 g/ml, Interfacial DynamicsCorporation, USA) in demineralised water. The particles were dyed with fluorescent col-oring agents in order to make them visible with the Confocal Scanning Laser Microscope(CSLM). Particles with a diameter of 1.6 and 4.0 or of 1.6 and 9.8 µm were mixed toobtain a bidisperse suspension. With these particle diameters, together with the relativelylow shear rate of 1000 s−1, we are well within the shear-induced diffusive regime [10].The total volume fraction φtotal of particles was always 1.8*10−5. Because it is knownthat the smaller particles mainly deposit onto the membrane and it is expected that thesesmaller particles will be influenced most at relatively high concentrations of large parti-

104 CHAPTER 6
Figure 6.2: Example of the particle deposition onto the membrane during MF of a bidispersesuspension, as monitored with CSLM. The images represent a time sequence, where timeproceeds from left to right, and consist of an overlay of images that were taken separately ofthe different-sized particles (particle diameter 1.6 and 9.8 µm).
cles, bidisperse suspensions with more than 70% v/v large particles were chosen for theexperiments.
Analysis of the particle deposition and the permeate flux
The permeate flux through the membrane was monitored with an analytical balance. Theparticle deposition onto the membrane was monitored with CSLM (Leica TCS SP2, LeicaMicrosystems, Heidelberg, Germany). Hereto, a lens was used with a magnification of20 and a working distance of 3.2 mm. The CSLM images encompassed 0.036 mm2
membrane surface. The excitation wave length of the laser was 488 nm. The different-sized particles had different colors, so they were viewed separately at an emission wavelength of 500-536 nm and 568-621 nm respectively. The CSLM generates x-y images ofthe focal plane. Because the depth z at which the particles deposit was not exactly knownbeforehand, the 2-D images were scanned at different depths. The acquisition time forone x-y image was about 1 s, while the total scan took about 30 s.
Figure 6.2 shows an example of CSLM images, taken during MF of a bidisperse sus-pension at three points in time. The figure shows an overlay of the images that were takenseparately for each particle-size. These separate images were analysed with the imageprocessing software Qwin (Leica Microsystems, Heidelberg, Germany), which first con-verts the image into a binary file. The amount of particles deposited onto the membranewas assessed by counting the pixels with an intensity above a certain treshold value. Foreach experiment, a calibration was carried out first in order to relate the amount of pixelsto the number of particles. The assessment of the amount of particles was only possiblewhen less than one layer of particles was deposited onto the membrane. Therefore, onlydata for a total surface occupation of less than 60-65%, as derived from the counting of thepixels, were taken into account. The amount of particles on the membrane is presented asthe surface load Γ, which corresponds to the volume of particles per surface area of mem-brane (unit: ml/m2). The theoretical maximum surface load Γ corresponds to the surfaceload of one layer of particles with a volume fraction of 1.0 and is dependent on the particlesize: 1.1 ml/m2 (1.6 µm), 2.7 ml/m2 (4.0 µm) and 6.5 ml/m2 (9.8 µm)). Since we are onlyinterested in concentration polarisation-controlled particle deposition, we have correctedthe surface load for the amount of particles that deposited otherwise (physico-chemicaladsorption). This amount of adsorbed particles is determined from calibration curves,

EFFECTS OF PARTICLE SIZE SEGREGATION ON CROSSFLOW MICROFILTRATION 105
Figure 6.3: Cumulative particle size distribution of milk, as analysed by laser diffraction.
which were measured for the respective monodisperse suspensions at φtotal= 1.8*10−5.It is assumed that the adsorption rate is linearly dependent on the concentration of therespective particle in the bulk phase.
6.3.2 Fractionation of milk fat globules
Raw milk (fat content 4.40%) was used in the experiments. The particle size distribution(psd), which is primarily determined by the milk fat globules present in milk, is shown inFigure 6.3.
The MF set-up consisted of the Alfa Laval MFS-1 system, equipped with a 5.0 µmceramic MF membrane (SCT Membralox P19-40, tubular α−Al2O3 membrane, tube di-ameter 4.0 mm, membrane area 0.20 m2). The filtration temperature was 50C and thecrossflow rate was set at 2.2 or 6.6 m3/h, corresponding to a crossflow velocity (CFV)of 2.6 and 7.7 m/s respectively. The wall shear rate γwall,0, which is given by 8v/dt(v=velocity, dt=tube diameter), was equal to 5.1 ∗ 103 and 15.4 ∗ 103 s−1 respectively.At a CFV of 7.7 m/s, not only shear-induced diffusion, but also inertial lift may play arole as back-transport mechanism, especially for the largest milk fat globules [10]. Theexperiments were carried out following the so-called Uniform Transmembrane Pressureconcept [90] by circulating permeate co-current to the retentate. The permeate circulationcapacity was adjusted to the actual crossflow rate in order to create a permeate pressuredrop equal to the retentate pressure drop. The experiments were carried out in continuousmode at a concentration factor CF (=Qfeed/Qretentate) of 2.5. The transmembrane pressure

106 CHAPTER 6
Figure 6.4: The relative flux J/J0 as a function of time for a suspension with 1.6 µm particlesat a TMP of 0.1 and 0.4 bar and for suspensions with 4.0 and 9.7 µm particles at a TMP of0.4 bar.
was adjusted in such a way that the permeate flux was between 0.069 and 0.56 mm/s.Each experiment was started at a low permeate flux of 0.069 mm/s, allowed to settle for0.5 h, and followed by a run of 0.5 h at a similar permeate flux. Then the permeate fluxwas increased stepwise to 0.139, 0.278 and 0.417 or 0.556 mm/s, in three more runs of0.5 h each. At the end of each run, samples were taken of the retentate and permeate,and analysed for fat content (Rose Gottlieb method) and particle size distribution (laserdiffraction, Mastersizer X (Malvern Instruments, Malvern, UK)).
6.4 Results
6.4.1 Kinetics of particle deposition
The CSLM experiments are carried out at a transmembrane pressure (TMP) of 0.4 bar,which goes together with a clean water flux (CWF) of 0.3 mm/s. From Figure 6.4, itbecomes clear that at a TMP of 0.4 bar the flux decrease is strongest for the 1.6 µm particlesuspension. The fluxes for the other particles are fairly constant. This is in agreement withEquation 6.2, which predicts that only monodisperse suspensions with a particle diameterof 1.6 µm will exhibit flux decline and particle deposition. At a TMP of 0.1 bar, the fluxwas also fairly constant for 1.6 µm particles, as was expected from Equation 6.2.
For particle diameters of 4.0 and 9.8 µm, some particle deposition has been monitored

EFFECTS OF PARTICLE SIZE SEGREGATION ON CROSSFLOW MICROFILTRATION 107
with CSLM (Figure 6.5). The surface load Γ was found to increase almost linearly intime. Since the initial flux J0 was lower than the flux predicted by Equation 6.2 for therespective particles, it is unlikely that this particle deposition is caused by an unbalance inthe concentration polarisation-controlled transport of particles towards the membrane. Wetherefore hypothesize that this particle deposition is due to physico-chemical adsorption,which is not related to the phenomena that are currently under investigation. For theparticle size of 1.6 µm, the total particle deposition was much faster at a TMP of 0.4 barthan at 0.1 bar, therewith indicating that it is still well-possible to distinguish between theconcentration polarisation-controlled kinetics in which we are interested and adsorptioneffects. In the following results, we have therefore corrected the surface load for theamount of adsorbed particles, as described in section 6.3. The corrections that we haveapplied this way are in the order of 17% of the original surface load Γ.
The flux and surface load during filtration of bidisperse suspensions (particle sizes 1.6and 4.0 µm) were investigated. The flux decline was very slow and depended on the con-centration of small particles: the fastest flux decline is found for the suspension with thehighest concentration of small particles (Figure 6.6). In the first few minutes of filtration,for concentrations of small particles of 10, 15 and 20%, the flux was relatively low andunstable, due to start-up effects. Therefore, the following analysis of our results is basedon the momentaneous flux. The surface load Γ for the small particles increases to 0.07-0.16 ml/m2 in the first 10 min of the filtration run (Figure 6.6). After the start-up period,the increase was practically linear in time and was faster with increasing concentration ofsmall particles. The surface load for the large particles was found to be negligibly small(results not shown). Apparently, the back-transport velocity of the large particles in thebidisperse suspensions does not decrease drastically compared to a monodisperse suspen-sion. The linear increase of the surface load can be understood as follows: the transport ofparticles towards the membrane only decreased very slowly, as is reflected in the observa-tion that the flux is almost constant, and the back-transport of particles is also expected tobe constant in time since bulk volume fractions and CFV remain constant. Therefore, thedeposition rate of particles, which is the difference between the two transport velocities,is constant as well.
For bidisperse suspensions with particle sizes of 1.6 and 9.8 µm, similar trends werefound as with particle sizes of 1.6 and 4.0 µm (Figure 6.7). The higher the amount of smallparticles, the more small particles are deposited. Moreover, both experiments carried outwith 10% small particles show similar numerical values for the surface load. The surfaceload Γ of the large particles was negligibly small again (results not shown). The fluxdecline was very gradual, albeit that the suspension with 2.5% small particles showedsome start-up problems.
6.4.2 Shear-induced diffusive particle behaviour
In order to analyse the shear-induced diffusive behaviour of the small particles in thebidisperse suspensions, we calculated the back-transport fluxes in our experiments andcompared these to the back-transport fluxes as predicted by Equation 6.2. The back-transport flux in the experiments is calculated in three steps: 1) determine the particledeposition rate as a function of time by progressive regression of Γ over t over a timeinterval of 4 min, moving along the time axis, 2) determine the maximum value for thedeposition rate as to exclude possible start-up effects, 3) determine the back-transport

108 CHAPTER 6
Figure 6.5: The surface load Γ as a function of time for a monodisperse suspension with 1.6µm particles at a TMP of 0.1 and 0.4 bar (top) and for suspensions with 1.6 (TMP 0.1 bar),4.0 (TMP 0.4 bar) and 9.7 (TMP 0.4 bar) µm particles (bottom).

EFFECTS OF PARTICLE SIZE SEGREGATION ON CROSSFLOW MICROFILTRATION 109
Figure 6.6: The surface load Γ (top) and the relative flux J/J0 (bottom) as a function of timefor bidisperse suspensions with 1.6 and 4.0 µm particles (TMP 0.4 bar).

110 CHAPTER 6
Figure 6.7: The surface load Γ (top) and the relative flux J/J0 (bottom) as a function of timefor bidisperse suspensions with 1.6 and 9.8 µm particles (TMP 0.4 bar).
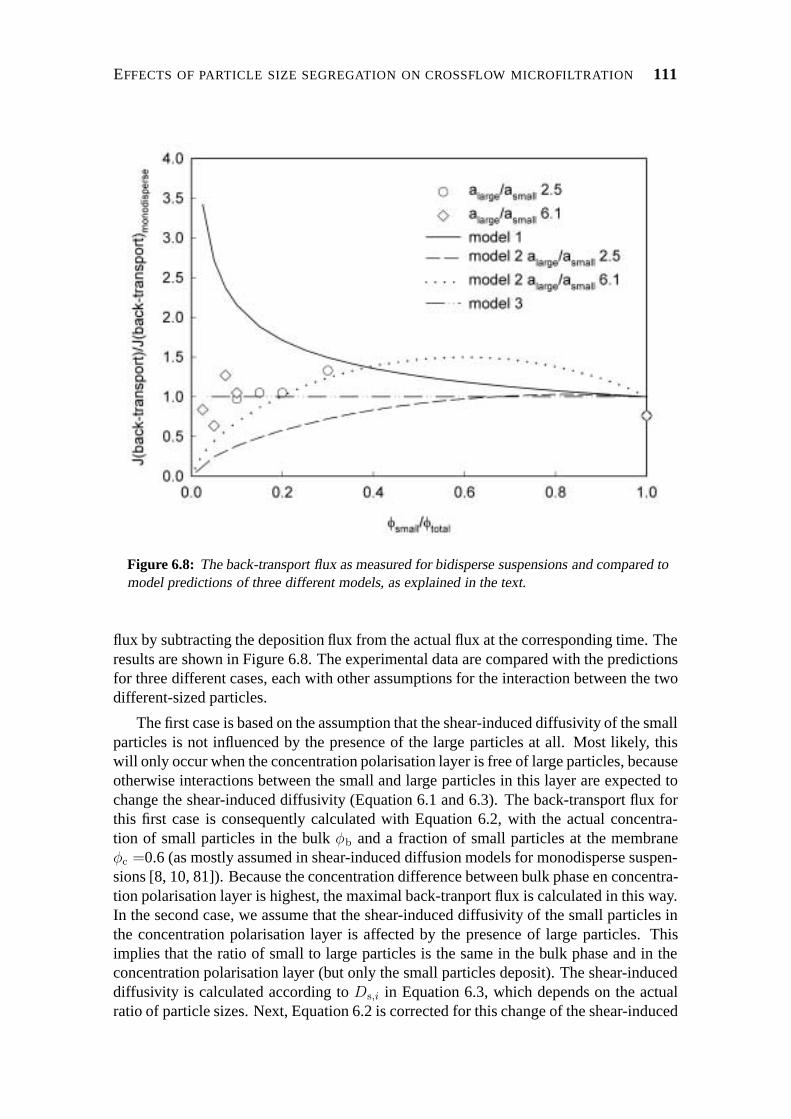
EFFECTS OF PARTICLE SIZE SEGREGATION ON CROSSFLOW MICROFILTRATION 111
Figure 6.8: The back-transport flux as measured for bidisperse suspensions and compared tomodel predictions of three different models, as explained in the text.
flux by subtracting the deposition flux from the actual flux at the corresponding time. Theresults are shown in Figure 6.8. The experimental data are compared with the predictionsfor three different cases, each with other assumptions for the interaction between the twodifferent-sized particles.
The first case is based on the assumption that the shear-induced diffusivity of the smallparticles is not influenced by the presence of the large particles at all. Most likely, thiswill only occur when the concentration polarisation layer is free of large particles, becauseotherwise interactions between the small and large particles in this layer are expected tochange the shear-induced diffusivity (Equation 6.1 and 6.3). The back-transport flux forthis first case is consequently calculated with Equation 6.2, with the actual concentra-tion of small particles in the bulk φb and a fraction of small particles at the membraneφc =0.6 (as mostly assumed in shear-induced diffusion models for monodisperse suspen-sions [8, 10, 81]). Because the concentration difference between bulk phase en concentra-tion polarisation layer is highest, the maximal back-tranport flux is calculated in this way.In the second case, we assume that the shear-induced diffusivity of the small particles inthe concentration polarisation layer is affected by the presence of large particles. Thisimplies that the ratio of small to large particles is the same in the bulk phase and in theconcentration polarisation layer (but only the small particles deposit). The shear-induceddiffusivity is calculated according to Ds,i in Equation 6.3, which depends on the actualratio of particle sizes. Next, Equation 6.2 is corrected for this change of the shear-induced

112 CHAPTER 6
diffusivity by correction of the value of a. Hereafter the back-transport flux is calculated(Equation 6.2). In the third case, we assume that particle size segregation as measuredin bidisperse suspensions by Lyon and Leal [68] occurs in the feed flow. These authorsfound that the region close to the wall was totally depleted of large particles, whereasthe fraction of small particles was equal to that of a monodisperse suspension with thesame total volume fraction of particles. We have therefore taken the total particle fraction(=φlarge + φsmall) as the bulk fraction φb in our calculations (φc =0.6) and subsequentlycalculated the back-transport flux with Equation 6.2.
The three cases described earlier are used to calculate the back-transport flux as afunction of the fraction of small particles. In Figure 6.8, the normalised back-transportflux (relative to back-transport in a monodisperse suspension) is shown. In the first case,the normalised back-transport flux is a function of the concentration of small particlesand will decrease with increasing concentration of small particles (Equation 6.3). Forthe second case, the normalised back-transport flux is a function of the concentration ofboth particles and their size aspect ratio. The curves show an optimal ratio of small tolarge particles for back-transport. The third case shows back-transport behaviour whichis independent of the fraction of small particles. The measured back-transport fluxes areall between 0.64 and 1.33 of the back-transport flux for a monodisperse suspension. Theexperimental data are best described by model 3 that takes particle size segregation intoaccount. The back-transport flux of the small particles in the bidisperse suspension doesnot seem to be affected by the particle composition and is equal to that of a monodispersesuspension with the same total volume fraction of particles. Based on these results, itcan be expected that the steady-state flux 〈Jss〉 of these bidiperse suspensions will alsobe equal to that of monodisperse suspensions, which is in accordance with our previousfindings [85]. Measuring the steady-state flux 〈Jss〉 for the suspensions used in this paperis very difficult, since the flux decline is very slow. Therefore, these measurements werenot carried through till steady-state was reached.
Our CSLM method has given us important clues on the kinetics of particle depositionduring MF and shows that particle size segregation is a factor that can be of importancewhile designing MF processes. Whether this is the case is tested in a milk filtration set-up.
6.4.3 Fractionation of milk fat globules
The fractionation of milk fat globules is carried out partly following a patented process[91], but at much lower flux levels and with a membrane with a relatively large pore size.The measured TMP is shown as a function of J in Figure 6.9. The TMP increases nearlylinear with J , with an identical slope for the different CFV’s. Moreover, the slope wasidentical to the slope for clean water. This indicates that no deposition of fat globuleshas taken place and that J is controlled by the membrane resistance solely. Apparently,the membrane pore size is larger than the fat globule size of the permeating fat globules,such that they can pass the membrane. The absolute values of the TMP are higher at aCFV of 7.7 m/s. As can also be concluded from the measurements of the cleanwaterflux,these higher values are due to the presence of an offset pressure in the system, probablycaused by the placement of the pressure sensors near a pipe constriction, just outside themembrane module.
At a CFV of 2.6 m/s, the relative fat content of the permeate increased from 0.43(J=0.069 mm/s) to 0.79 (J=0.42 mm/s) with increasing J (Figure 6.10). The mean par-

EFFECTS OF PARTICLE SIZE SEGREGATION ON CROSSFLOW MICROFILTRATION 113
Figure 6.9: Transmembrane pressure TMP as a function of the permeate flux J (crossflowvelocity CFV 2.6 and 7.7 m/s) during MF (5.0 µm, 50C, CF 2.5) of milk. The solid linesrepresent fit results of linear regression, whereas the dashed lines show the relation betweenTMP and J for clean water.
ticle size showed a similar trend and increased from 3.0 to 3.6 µm. At a CFV of 7.7 m/s,the relative fat content was always lower and the particle size was always smaller. Theincrease with J was less pronounced as well. The average values were 0.29 (relative fatcontent) and 2.9 µm (median psd).
It is clear that the fat globules are separated on size. As stated above, deposition of fatglobules onto the membrane can be excluded as the cause for this separation. It could bedebated whether the membrane itself could act as a screen, without resulting in particledeposition. It can be seen in Figure 6.10 that at CFV=2.6 m/s and J=0.42 mm/s, the fatglobule size and the fat content of the permeate approaches that of the feed very near. Atdifferent conditions, but with the same membrane however, the fat globule size and the fatcontent of the permeate shifted to totally different values. This effect cannot be explainedwith the screening action of the membrane.
The results in Figure 6.10 indicate that particle size segregation takes place. In contrastto the bidisperse suspensions, for the largest fat globules and CFV=7.7 m/s, the particlesize segregation may not be solely induced by shear-induced diffusion. Because of therelatively large particle size and high wall shear rate, inertial lift can also play a role. Ascan be seen in Figure 6.10, also in this regime, particle size segregation was still evident.In general, particle size segregation increases with increasing shear rate. This will resultin smaller particle sizes in the region near the wall and consequently in smaller particle

114 CHAPTER 6
Figure 6.10: The fat content, relative to the fat content of milk, and the median of the particlesize distribution in MF-permeate as a function of the permeate flux J (crossflow velocity CFV2.6 and 7.7 m/s) during MF (5.0 µm, 50C, CF 2.5) of milk.
sizes in the permeate. In Figure 6.10, the median indeed decreases with increasing CFVindicating that particle size segregation was more severe at a CFV of 7.7 m/s. Moreover,an increase of particle size in the permeate can be expected with increasing J (no retentionby membrane), a trend that is expected to be more pronounced at lower shear rates. Thisis because a larger part of the crossflow, with larger particle sizes, permeates throughthe membrane. Again, this was measured. We can therefore conclude that particle sizesegregation is not only significant for bidisperse suspensions, but also for polydisperseparticle fractionation by MF. In such particle fractionation processes, the composition ofthe permeate can be controlled with the CFV and J, while the only limitation for the poresize of the membrane is that it is larger than the largest particles in the feed suspension.
6.5 Conclusions
In order to investigate the shear-induced diffusive behaviour of particles in bidisperse sus-pensions, as relevant to concentration polarisation in MF processes, we have analysed theflux and particle deposition onto the membrane. The particle deposition was monitored bymeans of on-line CSLM. From the measured deposition rate of the small particles and theflux, it could be concluded that the back-transport flux of the small particles did not de-pend on the composition of the bidisperse suspension and was equal to the back-transportflux of the monodisperse suspension with the same total particle volume fraction. These

EFFECTS OF PARTICLE SIZE SEGREGATION ON CROSSFLOW MICROFILTRATION 115
results can be explained with the occurrence of particle size segregation in the feed flow,leading to an enrichment with small particles of the suspension in the vicinity of themembrane wall. This conclusion is not only relevant to concentration polarisation in MFprocesses, but also to particle fractionation by MF as is shown in a study on the frac-tionation of milk fat globules. Here, particle size segregation leads to a distinct effect onthe separation characteristics of the process such as particle size and fat content of thepermeate, leading to fractionation of a polydisperse suspension with a membrane havinga pore size that is larger than the largest particle present.
List of symbols
a particle radius, mCF concentration factorCFV crossflow velocity, m/sCWF clean waterflux, m/sd diameter, mD diffusivity, m2/sj migratory particle flux, m2/sJ transmembrane flux, m/sk dimensionless particle migration parameter in Eq. 6.3L length, mQ mass flow rate, m3/st time, sTMP transmembrane pressure, barv velocity, m/s
Greek symbols:γ shear rate, s−1
Γ surface load, ml/m2
λ dimensionless particle migration coefficient in Eq. 6.3µ viscosity, kg/m.sφ particle volume fraction
Subscripts:b bulkc cakem membranes shear-inducedss steady-statet tube0 nominal

116 CHAPTER 6
Acknowledgements
Friesland Foods is greatly acknowledged for supporting this research. Anno Koning(Friesland Foods) is thanked for the skilful application of the CSLM-technique. HenkStreppel (Friesland Foods) is gratefully thanked for carrying out the pilot-plant fractiona-tion experiments. The authors would like to acknowledge the support of the Dutch Min-istries of Economic Affairs, Education, Culture and Sciences and of Housing, SpatialPlanning and the Environment through a grant of the Dutch Program Economy, Ecologyand Technology.

7
Differential analysis of particledeposition layers from micellar casein
and milk fat globule suspensions
J. Kromkamp, S. Rijnsent, R. Huttenhuis, K. Schroen, R. Boom, submitted.
118 CHAPTER 7
Particle deposition behaviour on membrane filters is of the utmost importance for theflux and selectivity. For milk filtration not only the particle behaviour as such but alsothe behaviour in time is a factor to take into account. Therefore we applied a differentialanalysis to the flux decline during dead-end filtration of latex, casein micelles and milkfat globules.
Based on our analysis for latex we distinguished two regions, one best described bypore blocking and one by cake filtration. Besides these two regions, no other time depen-dent behaviour was observed, as was expected for latex. However, for casein micelles andmilk fat globules various other time dependent effects were observed and quantified.
Pore blocking of an UF membrane by micellar casein was relatively inefficient, asconcluded from the values of the pore blocking parameter of 0.1-0.2. In contrast, the cakeresistance was relatively high, 35 times higher than expected from the Carman-Kozenytheory. This may be attributed to a decrease of the size of the casein micelles, leading tothe formation of very compact layers. The specific cake resistance of micellar casein waslower for a MF membrane where depth filtration played a role.
Milk fat globules generate layers with a very high cake resistance, both for liquid andfor partly crystallised fat. For liquid fat, spreading of milk fat globules onto the mem-brane and deformation of milk fat globules seem to be the main cause for the high cakeresistance. When a large part of the milk fat was crystallised (T=5C), partial coalescenceof milk fat globules in the cake layer seems to play a role.
Differential cake analysis proved to be a valuable method for the evaluation of con-centrated particle layers, resulting in better knowledge about the specific (time dependent)particle behaviour in these layers. In this way, parameters are identified that are essentialfor the design of microfiltration or ultrafiltration processes.
7.1 Introduction
Microfiltration is a widely applied technique in the food and bioprocess industry for theseparation and fractionation of particles in suspensions, such as present in milk. Milkcontains about 15% v/v colloidal particles, mainly casein micelles (proteins) and (emul-sified) fat globules. The development of the Uniform Transmembrane Pressure (UTP)concept in the 70’s and 80’s of the last century [90] enabled succesful microfiltration ofthis concentrated suspension on an industrial scale. This opened the way for the applica-tion of microfiltration for e.g. the reduction of bacteria and spores [92], fractionation offat globules [91] and the separation of casein micelles and serum proteins in milk [92].
The performance of microfiltration processes is governed by particle deposition ontothe membrane. Therefore, prediction of flux (decline) and separation performance re-quires a good understanding of this particle deposition process. Not only the depositionrate, but also the properties of the deposited layer play an important role.
Studies on the properties of deposition layers of (other) proteins [93–97] and emul-sion droplets [98] are mostly carried out by modelling of dead-end filtration processeswith a constant pressure drop. Two different modelling approaches can be distinguished:1) based on the filtration equations of Hermia [99], and 2) based on the sieve mechanismof Flippov [100]. Both approaches recognise two different mechanisms: pore blocking
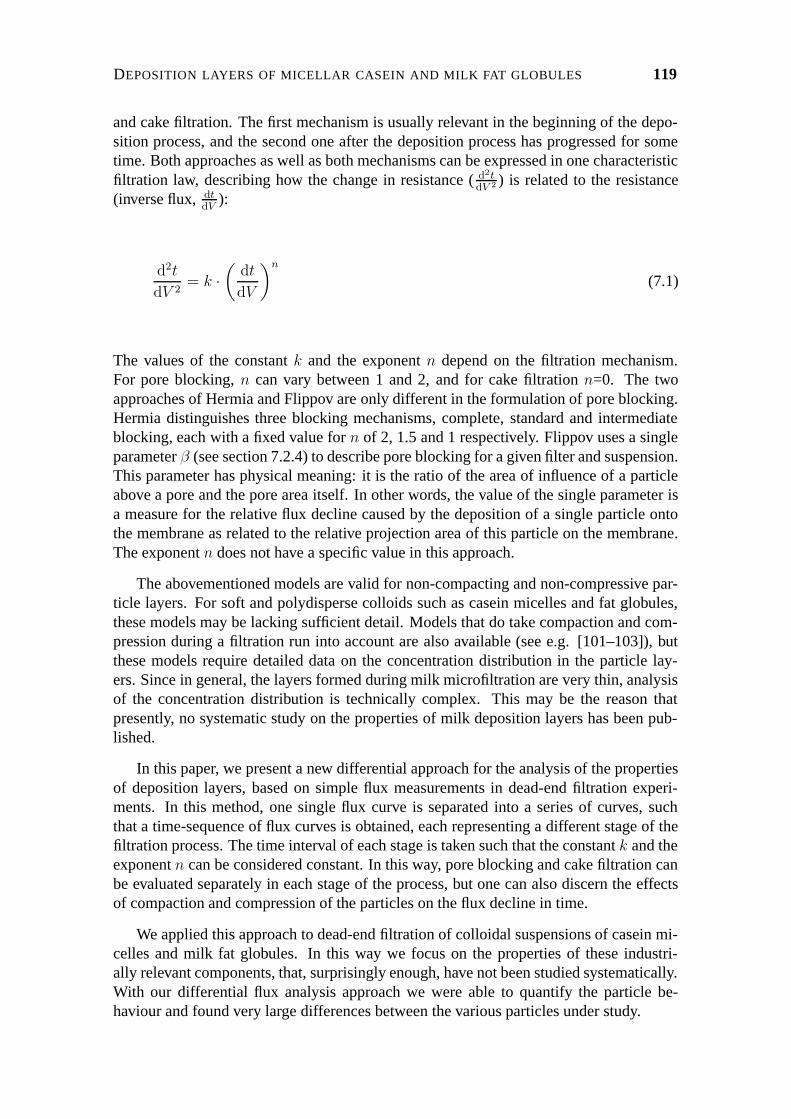
DEPOSITION LAYERS OF MICELLAR CASEIN AND MILK FAT GLOBULES 119
and cake filtration. The first mechanism is usually relevant in the beginning of the depo-sition process, and the second one after the deposition process has progressed for sometime. Both approaches as well as both mechanisms can be expressed in one characteristicfiltration law, describing how the change in resistance ( d2t
dV 2 ) is related to the resistance(inverse flux, dt
dV):
d2t
dV 2= k ·
(dt
dV
)n
(7.1)
The values of the constant k and the exponent n depend on the filtration mechanism.For pore blocking, n can vary between 1 and 2, and for cake filtration n=0. The twoapproaches of Hermia and Flippov are only different in the formulation of pore blocking.Hermia distinguishes three blocking mechanisms, complete, standard and intermediateblocking, each with a fixed value for n of 2, 1.5 and 1 respectively. Flippov uses a singleparameter β (see section 7.2.4) to describe pore blocking for a given filter and suspension.This parameter has physical meaning: it is the ratio of the area of influence of a particleabove a pore and the pore area itself. In other words, the value of the single parameter isa measure for the relative flux decline caused by the deposition of a single particle ontothe membrane as related to the relative projection area of this particle on the membrane.The exponent n does not have a specific value in this approach.
The abovementioned models are valid for non-compacting and non-compressive par-ticle layers. For soft and polydisperse colloids such as casein micelles and fat globules,these models may be lacking sufficient detail. Models that do take compaction and com-pression during a filtration run into account are also available (see e.g. [101–103]), butthese models require detailed data on the concentration distribution in the particle lay-ers. Since in general, the layers formed during milk microfiltration are very thin, analysisof the concentration distribution is technically complex. This may be the reason thatpresently, no systematic study on the properties of milk deposition layers has been pub-lished.
In this paper, we present a new differential approach for the analysis of the propertiesof deposition layers, based on simple flux measurements in dead-end filtration experi-ments. In this method, one single flux curve is separated into a series of curves, suchthat a time-sequence of flux curves is obtained, each representing a different stage of thefiltration process. The time interval of each stage is taken such that the constant k and theexponent n can be considered constant. In this way, pore blocking and cake filtration canbe evaluated separately in each stage of the process, but one can also discern the effectsof compaction and compression of the particles on the flux decline in time.
We applied this approach to dead-end filtration of colloidal suspensions of casein mi-celles and milk fat globules. In this way we focus on the properties of these industri-ally relevant components, that, surprisingly enough, have not been studied systematically.With our differential flux analysis approach we were able to quantify the particle be-haviour and found very large differences between the various particles under study.

120 CHAPTER 7
7.2 Materials and methods
7.2.1 Preparation of colloidal suspensions
Latex particles
Three different suspensions were used; suspensions of latex particles, casein micelles andof milk fat globules. The latex particles (surfactant-free, sulfate polystyrene, density 1.06g/ml, Interfacial Dynamics Corporation, USA) had mean diameters of 0.42 and 0.60 µmand were suspended in a mixture of demineralised water with 23.1 % w/w glycerol, whichhas the same density as the latex particles. The viscosity of the water-glycerol mixture is2 mPa·s (25C).
Casein micelles
The suspension of casein micelles was prepared from pasteurised skimmilk. The skim-milk contained 3.6% w/w protein (Kjeldahl method), consisting of 2.7% w/w casein and0.7% w/w serum protein. The skimmilk was microfiltered (Alfa Laval MFS-1 system,filtration temperature 50C) with a 0.2 µm ceramic MF membrane (SCT MembraloxP19-40, tubular αAl2O3 membrane, tube diameter 4.0 mm, membrane area 0.20 m2) upto a concentration factor (=Qfeed/ Qretentate) of 7 (viscosity measurements) or of 4 andsubsequently diafiltered (100%) and diluted (100%) with protein-free milkserum (dead-end filtration measurements), in order to increase the protein purity of the casein micellefraction. After MF to a concentration factor of 4 and subsequent diafiltration, a micel-lar casein suspension was obtained with 6.1% w/w casein and 1.4% w/w serum protein.Since the voluminosity of casein micelles is about 4 ml/g and of serum proteins about 1.5ml/g (room temperature) [104], the volumetric protein purity was about 92%. By meansof ultrafiltration (filtration temperature 50C) with a membrane with a Molecular WeightCut Off (MWCO) of 5 kDa, a protein-free milkserum was obtained from milk, which wasused to suspend the casein micelle fraction. After preparation of both the casein micellefraction and the milkserum, a preservative was added after which the liquids were kept ata temperature of 2C. The mean diameter of the casein micelles was 104 nm, as accordingto Walstra and others [104]. For viscosity measurements at 50C, the voluminosity wastaken equal to 3 ml/g [104]. The viscosity of the milkserum was assumed to be equal tothat of water.
Milk fat globules
Pasteurised cream, prepared by centrifugation of milk, was used as raw material for the fatglobule suspension. To remove protein from the cream, it was diafiltered with protein-freemilkserum (prepared following the aforementioned method). Diafiltration was carriedout batch-wise, with an intensity of four times 100%, using a microfiltration set-up (AlfaLaval MFS-1 system, filtration temperature 50C) with a 0.8 instead of a 0.2 µm ceramicMF membrane. The ratio of protein to fat (Rose Gottlieb method) decreased from about0.87 in milk (4% w/w fat) to about 0.02 in the cream after diafiltration. The fat globulefraction was suspended in the same medium and kept in the same way as the caseinmicelle fraction. The size distribution of the fat globules was assessed by laser diffraction

DEPOSITION LAYERS OF MICELLAR CASEIN AND MILK FAT GLOBULES 121
Figure 7.1: Cumulative particle size distribution of milk fat globule suspension, as analysedby laser diffraction.
(Mastersizer X, Malvern Instruments, Malvern, UK). The median of the distribution was3.59 µm (batch I, Figure 7.1) and 3.50 µm (batch II).
Milk fat consists of a heterogeneous mixture of lipids with a melting range between-30 and +40C [104]. At low temperatures, the amount and the morphology of the fatcrystals can vary strongly depending on the (temperature) history of the product. Toexclude temperature history effects in the filtration experiments at 5C, the fat globuleswere molten and subsequently recrystallised in the following standardised way. The fatglobule suspension was prepared 16 h before the start of the experiment, heated to 40-45C and cooled down and kept at 5C.
The concentrations of particles in the suspensions are given in this paper as volumetricconcentrations, unless indicated otherwise.
7.2.2 Viscosity of micellar casein suspensions
Viscosity measurements were carried out at 50C with a Physica MCR300 rheometer.For casein micelle concentrations lower than 0.5, the double gap cylinder geometry DG26.7 with gap diameters of 0.42 and 0.47 mm was used; for higher concentrations the gapdiameter was 1.13 mm (type CC 27). The measurements were carried out by starting at ashear rate of 0.01 1/s, increasing the shear rate logaritmically to 1000 1/s and subsequentlydecreasing it again to 0.01 1/s. The casein micelle concentrate was measured after storageat 4C. The viscosity in relation to the casein micelle concentration was determined from

122 CHAPTER 7
the viscosity in the descending series of shear rates.
7.2.3 Dead-end filtration
For dead-end filtration we made use of a device (type Omegacell, Pall Life Sciences) thatwas thermostatted by means of a jacket which was connected to a waterbath. The latex andmicellar casein suspensions were filtered at a temperature of 25C, the milk fat globulesuspensions at 5C and 45C. Compressed air was used to control the transmembranepressure. The weight of the permeate was continuously monitored with an analyticalbalance connected to a computer. The volume of the membrane cell was 150 ml. Themembrane was placed at the bottom of the cell and had a membrane area of 23.2 cm2.The membrane material was polyethersulfon (Omega, Pall Life Sciences). Two differentpore sizes were used, a pore size of 0.3 µm and a MWCO of 10 kDa.
7.2.4 Analysis of cake properties
Filtration properties
We distinguish two different mechanisms for flux decline, pore blocking and cake filtra-tion. For pore blocking, we follow the approach of Flippov and others [100], who derivedthe following filtration equation:
V ∗ =1
βln (1 + βt∗) (7.2)
The dimensionless variables V ∗ and t∗ are defined as follows:
V ∗ = γnV and t∗ = γndV
dt
∣∣∣∣∣t=0
t (7.3)
where n is the number of particles per unit volume, V is the permeate volume, t is thefiltration time and γ represents the area ratio of the pore to the filter area:
γ =πd2
4S(7.4)
where d is the mean pore diameter and S is the filter area. The parameter γ is a singledimensionless constant for all suspension concentrations and operating pressures. In thispore blocking model, β is the only parameter that must be identified from experimentalmeasurement. It represents the ratio of the area of influence of a particle above a poreand the pore area itself and relates the relative flux decline caused by the deposition ofa single particle onto the membrane to the relative projection area of this particle on themembrane. For a membrane with distinct circular pores, such as track-etched membranesand microsieves, β should have a value of slightly larger than unity. For tortuous pathmembranes as used in this study, the value of β can also lie between zero and unitybecause the fluid has the possibility to flow laterally within the membrane structure.
The value of β was evaluated by regression analysis, minimising the residual sumof squares between the (smoothed) measured and model fluxes. Smoothing of the mea-surements was found to be necessary, since the resolution of the weight measurements

DEPOSITION LAYERS OF MICELLAR CASEIN AND MILK FAT GLOBULES 123
introduced too much noise in relation to the relative short time interval that was used inthe fit. The measurements were smoothed by fitting the measured permeate volume ver-sus time with a cubic polynomial. Because the value of β is expected to be dependent onthe amount of particles deposited onto the membrane, we have split the initial flux curveinto various stages and assessed β in every stage. The length of the stage matches with thedeposition of a fixed amount of particles. This fixed amount corresponds to one depositedlayer of average-sized particles with a volume fraction of 0.6. In this way, values for β areobtained for each “separate layer”. For the latex and micellar casein suspensions, β wasanalysed for the first up to the tenth layer, and for the milk fat globule suspensions for the
first, second and third layer. The value for the initial flux dVdt
∣∣∣t=0
was reset at each stage.
For cake filtration a comparable approach is used. The equation for the flux duringdead-end microfiltration with a constant pressure drop is [105]:
J (t) = J0
(1 +
2Rc φs ∆p t
(φc − φs) η0 R2m
)−1/2
(7.5)
where J is the permeate flux, Rc is the specific cake resistance, φs and φc are the particlefraction in the bulk and in the cake respectively, ∆p is the transmembrane pressure, η0 isthe viscosity of the particle-free medium and Rm is the membrane resistance. The initialflux J0 is given by:
J0 =∆p
η0 Rm(7.6)
When the cake resistance is the dominating resistance, the equation for J (t) as well asthe corresponding equation for V (t) reduce to power law functions of t, with slopesof -0.5 and 0.5, respectively, in a log-log plot. Here, the values of Rc and φc need tobe determined from measurements. Since we cannot determine them independently, weconsider them as coupled parameters. A least squares fit on the fluxes (no smoothing) wascarried out to assess Rc and φc. The flux curve was again split into various stages. Forthe latex and micellar casein suspensions, the stages comprise five particle layers from2.5-7.5, 7.5-12.5, 12.5-17.5, etcetera up to 42.5-47.5 particle layers thick. For the fatglobule suspensions, the stages comprise a one-particle thick layer, from layer 1 up to 12.During cake filtration of monodisperse suspensions of rigid spherical particles, the valuesfor Rc and φc are constant and pressure-independent. The specific cake resistance Rc canbe estimated with the Carman-Kozeny equation, which is given by:
Rc =K (1− εc)
2 S2c
ε3c(7.7)
where εc is the void fraction of the cake, and Sc is the solids surface area per unit volumeof solids in the cake. For rigid spherical particles of radius r, the specific surface area isSc = 3/r, the void fraction of a randomly packed cake is εc ≈ 0.4 (so φc≈ 0.6), and theconstant K is reported to have a value of 5.0. For polydisperse suspensions, Thies-Weesieand Philipse [106] developed the following equation:
Rc =C (1− εc)
2
ε3c
1
[1 + 4σ2] 〈r〉2 (7.8)

124 CHAPTER 7
where C is a constant with a value of 45, 〈r〉 is the number-averaged radius, and thestandard deviation σ is equal to:
σ =〈r2〉 − 〈r〉2
〈r〉2 (7.9)
In case of compaction or compression, Rc and φc are not constant during filtration, butincrease with the amount of deposited particles. The increase of Rc and φc reflect boththe properties of the newly deposited layer(s) and the changes in the existing layer(s).
Both for pore blocking and for cake filtration, and for every fit procedure, the 95%confidence interval of the fit parameter was determined. Sometimes, this 95% confidenceinterval was relatively large, for instance due to start-up effects or pressure fluctuations.Therefore, it was decided to exclude values if the confidence interval was larger than ±50% of the fit parameter itself.
Fat content milk fat globule layer
For the analysis of the fat content of the milk fat globule layer, a filtration run was carriedout at a temperature of 5C and a TMP of 2.2 bar. After the total suspension was filteredand only a cake layer of fat globules was left on the membrane, this cake layer is collectedand analysed with NMR. 1H-NMR experiments were carried out on a Bruker DRX500spectrometer operating at 500.13 MHz. Spectra were taken at 21C, using 90 pulses anda relaxation delay of 30 s. Samples were prepared by dissolving 45 mg of the milk fatsample in 1.5 g CDCl3 and separation of the chloroform layer by centrifugation at 14000g for 5 min. The signal of residual CHCl3 was used as an internal reference. The fatcontent was determined by comparing the intensity of the glycerol-CαH2 resonance ofthe milk fat sample with that of a butter sample with a known fat content.
7.3 Results
7.3.1 Latex suspensions
Figure 7.2 shows the collected permeate volume as a function of time for latex suspen-sions with 0.42 µm particles. The order of the relation varied from 0.8 at the start, to 1.0 ashort time later and to 0.7 at the end of filtration. This indicates that the volume increaseis relatively fast at the start, accelerates slightly and then slows down gradually duringfiltration. Because both pore blocking and cake filtration do not necessarily give constantorders, it cannot be assessed where either mechanism prevails. Therefore, we applied ourdifferential cake analysis method to these data in order to determine the respective modelparameters.
For pore blocking as well as cake filtration, different stages of the flux curve are fitted.Figure 7.3 shows the measured values together with the fitted model lines. Fits with thepore blocking model are used for the first ten particle layers. These layers were formedwithin 0.5 h. Due to start-up instabilities, the fit line for the first particle layer could notbe assessed, but for the others (up to particle layer 10) β has a value between 0.016 and0.021 (Figure 7.4), and shows a tendency to increase slightly with increasing number ofparticle layers. The values are much lower than 1.0, indicating that the particles block

DEPOSITION LAYERS OF MICELLAR CASEIN AND MILK FAT GLOBULES 125
Figure 7.2: Permeate volume versus time during MF (TMP 16 mbar) of a latex suspension(0.42 µm, 3*10−6%).
the membrane rather inefficiently. This is probably related to the tortuous membranestructure, which allows lateral flow of the fluid in the membrane structure. The fluxdecline per formed layer is fairly equal.
The cake filtration model is fitted over a trajectory corresponding with 2.5 up to 47.5particle layers. For the cake filtration model, Rc is shown in Figure 7.4, which is calcu-lated for φc =0.6. The values of Rc are slightly scattered. Except for the first 10 particlelayers of the 0.42 µm particle, Rc is found to be independent of the number of particlelayers. The mean values for Rc are 8.2*1015 (0.42 µm particles) and 5.5*1015 (0.60 µmparticles) 1/m2. This is comparable to the values predicted by the Carman-Kozeny model:5.7*1015 (0.42 µm) and 2.8*1015 (0.60 µm). The fact that the measured Rc is slightlyhigher than the predicted values can be attributed to particle polydispersity.
The differential cake analysis method thus enables us to analyse the evolution of thecake properties during a filtration run. The constant value of Rc indicates that no com-pression or compaction occured, which is in accordance with expectations. The slightlylower values of Rc for the first 10 particle layers could indicate that the (pure) cake fil-tration regime had not started yet, but that pore blocking is the prevailing mechanism.This agrees with the constant values found for β, and with the findings of Kosvintsev andothers [107], who found cake filtration for 12 and more particle layers.
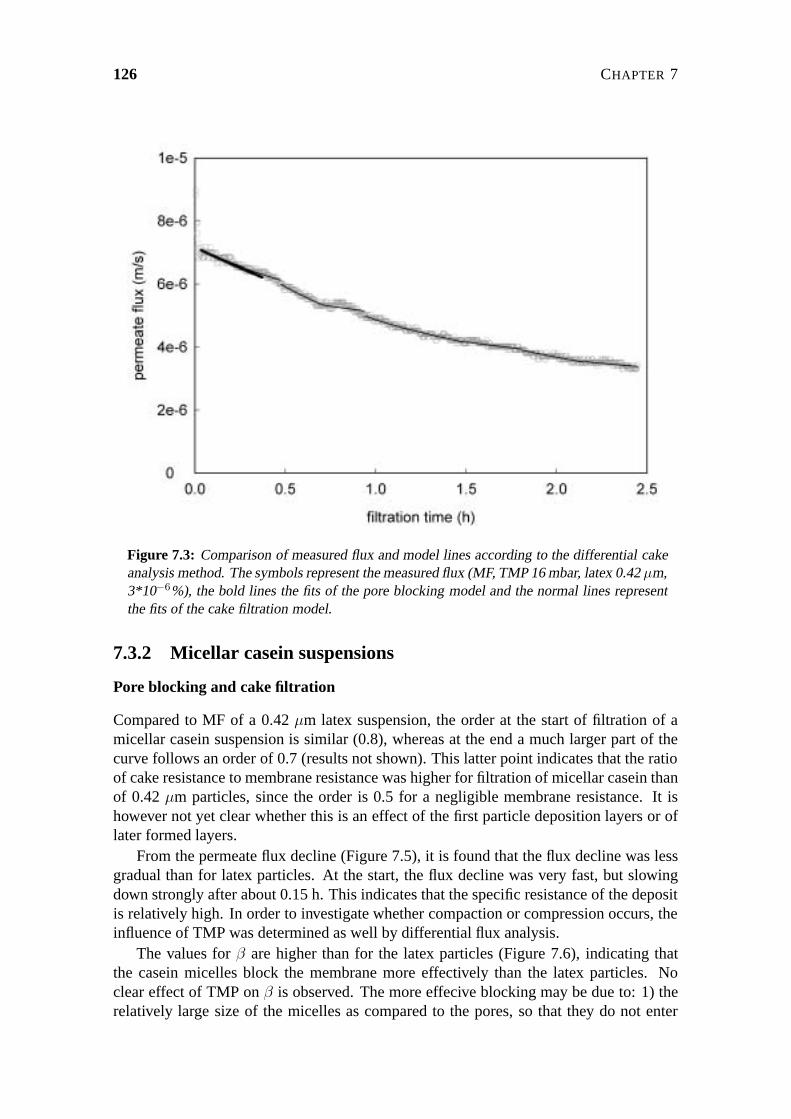
126 CHAPTER 7
Figure 7.3: Comparison of measured flux and model lines according to the differential cakeanalysis method. The symbols represent the measured flux (MF, TMP 16 mbar, latex 0.42 µm,3*10−6%), the bold lines the fits of the pore blocking model and the normal lines representthe fits of the cake filtration model.
7.3.2 Micellar casein suspensions
Pore blocking and cake filtration
Compared to MF of a 0.42 µm latex suspension, the order at the start of filtration of amicellar casein suspension is similar (0.8), whereas at the end a much larger part of thecurve follows an order of 0.7 (results not shown). This latter point indicates that the ratioof cake resistance to membrane resistance was higher for filtration of micellar casein thanof 0.42 µm particles, since the order is 0.5 for a negligible membrane resistance. It ishowever not yet clear whether this is an effect of the first particle deposition layers or oflater formed layers.
From the permeate flux decline (Figure 7.5), it is found that the flux decline was lessgradual than for latex particles. At the start, the flux decline was very fast, but slowingdown strongly after about 0.15 h. This indicates that the specific resistance of the depositis relatively high. In order to investigate whether compaction or compression occurs, theinfluence of TMP was determined as well by differential flux analysis.
The values for β are higher than for the latex particles (Figure 7.6), indicating thatthe casein micelles block the membrane more effectively than the latex particles. Noclear effect of TMP on β is observed. The more effecive blocking may be due to: 1) therelatively large size of the micelles as compared to the pores, so that they do not enter

DEPOSITION LAYERS OF MICELLAR CASEIN AND MILK FAT GLOBULES 127
Figure 7.4: Overview of the fit parameters β and Rc (calculated under the assumption thatφc =0.6) as a function of the amount of latex (0.42 and 0.60 µm) deposited onto the mem-brane during MF at a TMP of 16 mbar.
the membrane and occupy a maximum area on the membrane and 2) the high packingdensity of the micellar casein layers. During the formation of the first seven particlelayers, β seems to increase slightly, while β decreases when 7-10 particle layers haveformed (TMP higher than 0.5 bar). The reason for this change is not totally clear, but itmay indicate a flux-dependent cake morphology.
The mean Rc (12.5-47.5 particle layers) was 3.3*1018 1/m2, which is 400-600 timeshigher than that of the latex particles (Figure 7.6). The Carman-Kozeny equation gives9.4*1016 1/m2, so the measured value is approximately 35 times higher. No clear trendis observed for Rc as a function of number of particle layers or TMP, which indicatesthat compaction or compression does not play a major role. The relatively high value forRc may be caused by particle polydispersity but also by a change of the specific micellevolume. Casein micelles are highly swollen particles which contain around 75% water.The outer layer exists of a “hairy” layer of hydrophilic κ-casein tails, which is relativelyeven more voluminous. Mechanical interparticle forces and hydrodynamic forces maytherefore lead to shrinkage and/or deformation of the micelles when present in a concen-trated suspension, and thus result in very dense layers. The shrinkage and/or deformationmay occur so quickly that no dependency of TMP or the layer thickness is observed inthe experimental parameter regime. Such a behaviour can be evident from the viscosityat higher concentrations.
Therefore, the viscosity of micellar casein suspensions was measured as a functionof the concentration of casein at different shear rates (Figure 7.7). The casein volume

128 CHAPTER 7
Figure 7.5: Permeate flux as a function of time for UF of a micellar casein suspension(0.0024%) at a TMP of 0.5, 1.0, 1.5 and 2.0 bar.
fraction was calculated with a voluminosity of 3 ml/g and ranged between 0 and 0.76.The micellar casein suspensions were shear thinning; at a shear rate of 10 1/s, the relativeviscosity increased to about 17 and 13000 at casein volume fractions of 0.37 and 0.76respectively, but at a shear rate of 1000 1/s, the relative viscosity was about 6 and 560 atsimilar concentrations. In theory, at a concentration of 0.74, the viscosity as described bythe Eilers model has an asymptote, whereas the measured values increase more gradually.These results indicate that micellar casein suspensions can be highly concentrated, butthat they also are very shear-sensitive. This can be due to a stress-dependent voluminos-ity of the casein micelles, possibly in combination with attractive interactions betweenthe micelles. The viscosity measurements thus confirm our hypothesis that the specificmicellar volume may have decreased in a cake layer.
When micellar casein suspensions are filtered over the MF membrane, the flux declinediffers from that of the UF membrane (Figure 7.8). At the start of filtration, the fluxdecline was less steep. This is also clear from the values of β (Figure 7.9), which aresmaller for MF, especially for the first particle layer. Rc was about 10-35 times smallerthan for UF. Since the mean pore size of the MF membrane was about 3 times larger thanthe size of the casein micelles, while the retention of casein micelles was verified to beequal to 1.0, it is most likely that depth filtration was an important filtration mechanismhere. During depth filtration, casein micelles deposit in the internal pore structure of themembrane, which apparently leads to relatively small specific cake resistances, dependingon the filtration velocity. The low TMPs seem to correspond to low Rc’s while the high

DEPOSITION LAYERS OF MICELLAR CASEIN AND MILK FAT GLOBULES 129
Figure 7.6: Overview of the fit parameters β and Rc (calculated under the assumption thatφc =0.6) as a function of the amount of casein deposited onto the membrane during UF at aTMP of 0.5, 1.0, 1.5 and 2.0 bar.
TMPs correspond to high Rc’s. The results thus show that different membrane structurescan lead to large differences in flux decline, even for permeate fluxes of the same order ofmagnitude, and that the membrane used has a big influence on the behaviour of the cakelayer formed.
7.3.3 Milk fat globule suspensions
During UF of milk fat globule suspensions, the order of the increase of permeate volumeversus time was again 0.8 at the start of filtration, comparable to that of latex and themicellar casein suspension (results not shown). After about 0.2 h filtration, the orderdecreased to 0.5, indicating cake filtration with negligibly small membrane resistance.The initial flux decline was very fast for the milk fat globule suspension (Figure 7.10), asis also reflected in the values for Rc (Figure 7.11). In spite of the relatively large meanparticle size of 3.6 µm, Rc has a value of 1-7*1018 1/m2, which is of the same order asfor UF of the micellar casein suspension. The Carman-Kozeny model for polydispersesuspensions (Equation 7.8) predicts a Rc of 1.4*1014 1/m2, so the experimentally foundRc is 9.0-47*103 times larger for the fat globules. On top of that, Rc increased witha factor 7 when the TMP was increased from 0.4 to 2.2 bar. The high values for Rc,together with the pressure dependency, point to compression of the cake layer, which canbe expected since milk fat is liquid at 45C so the droplets can deform easily. Based onthe Laplace pressure, which is given by 2γ/a (γ=interfacial tension), it can be expectedthat fat droplets start to deform at a pressure of 0.01-0.1 bar (γ estimated at 1-10 mN/m).

130 CHAPTER 7
Figure 7.7: The effective viscosity (=ηsuspension/ηwater) of micellar casein suspensions as afunction of the volume fraction of casein micelles, at shear rates of 10, 100 and 1000 1/s(temperature 50C). Each data point represents the average of two or three different measure-ments. The lines connecting the data points are drawn as a guide to the eye. The solid lineindicates the viscosity as predicted by the Eilers model, with φmax =0.74.
Although part of the TMP is present over the membrane itself, a TMP between 0.4 to2.2 bar is expected to be sufficient for deformation of fat droplets. During filtration atconstant TMP, Rc remained constant between 3 and 12 particle layers formed onto themembrane, indicating that the deformation of the milk fat droplets did not vary with cakeheight.
The values for the pore blocking parameter β are substantially higher than for caseinmicelles. For the first particle layer, β has a value of about 1.3, which indicates that thefat globules spread on the membrane surface. The value of β for the second layer is 0.4.For the third layer, the value of β seems to exhibit a pressure dependency. These resultsshow a similar tendency as for Rc, i.e. that milk fat globules form very compact andcompressible particle layers at a temperature of 45C.
The flux curves for UF of milk fat globule suspensions at a temperature of 5C arepresented in Figure 7.12. Due to the 2.6-fold higher viscosity, the permeate fluxes arelower than at 45C. The flux decline is again very fast, and Rc was found to be even higherthan at 45C (Figure 7.13). Due to its dependency on TMP, Rc varied between 4*1018
1/m2 at a TMP of 0.8 bar and 8*1018 1/m2 at a TMP of 2.2 bar. The dependency of Rc
on TMP is however much less than at 45C. Especially at the lowest TMP values, Rc ishigher than at 45C. The fat content of the milk fat globule layer, as analysed with NMR,was 76%. When both the particle polydispersity and the fat content of 76% are taken into

DEPOSITION LAYERS OF MICELLAR CASEIN AND MILK FAT GLOBULES 131
Figure 7.8: Permeate flux as a function of time for MF of a micellar casein suspension(0.0024%) at a TMP of 16, 24, 40 and 60 mbar.
account, according to Equation 7.8, the calculated value of Rc is 1.1*1015 1/m2, which isabout 7 times higher than when the fat content is 0.6. This can however still not explainthe difference with measured values.
The values for β are slightly higher as well and exhibit a similar trend as for 45C.Based on the fact that about 50-60% of the milk fat is crystallised at 5C [108], one wouldexpect that the milk fat globules are less deformable and form less compressible particlelayers. This does not appear to be true. On the other hand, it is known that partly crys-tallised fat globules can easily coalesce when they are brought together. This phenomenonis often referred to as partial coalescence [109], and leads to the formation of a networkof fat crystals, “glued” together by liquid fat. Partial coalescence is known to occur forinstance during the whipping of cream and the churning of butter. Our hypothesis is thatpartial coalescence occurs in the cake layers at 5C, and that this has a negative effect onthe permeate flux.
The differential flux analysis method proved to be a valuable method for the evaluationof time-dependent behaviour of particle deposition layers from micellar casein and milkfat globule suspensions, which are relevant inputparameters for process design.
7.4 Conclusions
In order to analyse the properties of particle depostion layers on membrane filters, a differ-ential method is applied, which gives an estimate of the properties per layer of particles

132 CHAPTER 7
Figure 7.9: Overview of the fit parameters β and Rc (calculated under the assumption thatφc =0.6) as a function of the amount of casein deposited onto the membrane during MF at aTMP of 16, 24, 40 and 60 mbar.
deposited onto the membrane. This enabled the independent assessment of model pa-rameters of the pore blocking and the cake formation mechanism and allowed for thedetection of compaction or compression during the filtration run. Differential analysisof deposition layers of latex particles revealed that these did not exhibit compaction orcompression and that the specific cake resistance agreed fairly well with that predicted bythe Carman-Kozeny equation.
The behaviour of casein micelles and milk fat globules was found to differ stronglyfrom that of ideal hard spheres. This can for example be concluded from the specificcake resistance, which was in general much higher than predicted by the Carman-Kozenyequation. For UF of micellar casein, no compaction or compression is observed in thepressure range studied, but high specific cake resistances are found. This is probably dueto the formation of very compact layers. For a membrane with a much larger pore size(0.3 µm), the specific cake resistance was about 10-35 times lower than for UF, whichcan be ascribed to the formation of particle layers into the membrane rather than on themembrane. Virtually all casein micelles were retained by the membrane.
The behaviour of milk fat globules differed substantially from the micellar casein. Fortemperatures of 45C (at which milk fat is liquid) as well as 5C (at which 50-60% ofmilk fat is crystallised), the value of β for the first particle layer was higher than one,which probably indicates that the fat globules spread on the membrane surface. Thevalues of β for the second and third layer were again higher than for micellar casein. At45C, compression was found, such that the specific resistance increased 5 times upon anincrease of TMP from 0.4 to 2.2 bar. At 5C, compression was less intense, but the specific

DEPOSITION LAYERS OF MICELLAR CASEIN AND MILK FAT GLOBULES 133
Figure 7.10: Permeate flux as a function of time for UF (T 45C) of a milk fat globulesuspension (0.12%) at a TMP of 0.4, 0.8, 1.2 and 2.2 bar.
resistance was similar to that found at the highest pressures for 45C. This, together withthe very high values of β, points to partial coalescence, leading to a network of fat crystals,“glued” together by liquid fat, comparable to what is also seen during the whipping ofcream and the churning of butter.
A general conclusion is that the properties of the cake layer depend not only on theproperties of the feed suspension and the operating conditions, but on the type of mem-brane as well.
Differential cake analysis proved to be a valuable method for the evaluation of con-centrated particle layers and can be used as a method to identify characteristic parametersof these particle layers. The generated knowledge is not only relevant for the design ofmembrane filtration processes but also of other systems where concentrated suspensionsare used.
Acknowledgements
Friesland Foods is greatly acknowledged for supporting this research. Henk Streppel(Friesland Foods, preparation micellar casein and milk fat globule suspensions from milk),Miriam Krijgsman (Friesland Foods, viscosity measurements) and Harry Rollema (NIZO,NMR measurements) are thanked for their valuable contribution to the research. The au-thors would like to acknowledge the support of the Dutch Ministries of Economic Affairs,Education, Culture and Sciences and of Housing, Spatial Planning and the Environment

134 CHAPTER 7
Figure 7.11: Overview of the fit parameters β and Rc (calculated under the assumption thatφc =0.6) as a function of the amount of milk fat deposited onto the membrane during UF(T 45C) at a TMP of 0.4, 0.8, 1.2, 1.6 and 2.2 bar. For the determination of β of the firstparticle layer, J0 is not fitted, but calculated according to a value for Rm of 8.4*1012 1/m.
through a grant of the Dutch Program Economy, Ecology and Technology.

DEPOSITION LAYERS OF MICELLAR CASEIN AND MILK FAT GLOBULES 135
Figure 7.12: Permeate flux as a function of time for UF (T 5C) of a milk fat globule sus-pension (0.12%) at a TMP of 0.8, 1.2, 1.6 and 2.2 bar.

136 CHAPTER 7
Figure 7.13: Overview of the fit parameters β and Rc (calculated under the assumption thatφc =0.6) as a function of the amount of milk fat deposited onto the membrane during UF (T5C) at a TMP of 0.8, 1.2, 1.6 and 2.2 bar.

8
A suspension flow model forhydrodynamics and concentration
polarisation in crossflowmicrofiltration
J. Kromkamp, A. Bastiaanse, J. Swarts, G. Brans, R.G.M. v.d. Sman, R.M. Boom, J. Membr. Sci. 253(2005) 67-79

138 CHAPTER 8
A new computer simulation model is proposed for suspension flow in microfiltrationsystems. In this model, the diffusion of the suspended microparticles is governed by themechanism of shear-induced migration. Using an Euler-Euler approach, hydrodynamicsand convection-diffusion are simultaneously resolved according to the Lattice Boltzmannmethod. The new suspension flow model allows the complete solution of the flow field(including calculation of the actual local shear rate) in systems with complex geometriesand the application of a pressure gradient over the feed flow channel as well as over themembrane. The cake layer dimensions and permeability are explicitly taken into account.For a simple cross-flow system, a comparison is made between the new suspension flowmodel and existing models. The more realistic approach of the suspension flow model isfound to be especially significant for the calculation of the cake layer profile at the be-ginning and the end of the membrane. Also the effect of narrowing of the flow channelby cake formation on the suspension flow pattern (at a constant pressure gradient overthe flow channel) is more realistically predicted. Finally, some examples are presentedof the concentration polarisation and cake layer formation in microfiltration systems withmore complex geometries. The newly developed suspension flow model has generic ap-plicability as a design tool for microfiltration membranes, systems and processes. Ex-tensions of the model to three-dimensional systems (including parallel computations), aswell as adaptations of the diffusion model to anisotropic diffusivity can be relatively eas-ily achieved.
8.1 Introduction
The performance of microfiltration processes is in general mainly determined by con-centration polarisation, which arises from the simultaneous transport of non-permeablespecies towards and back from the membrane surface. Modelling of flow and concentra-tion polarisation in microfiltration systems is already often put forward as an importanttool to help understand and optimise these systems. Although numerous filtration modelsof varying degrees of complexity and simplification have appeared in literature, most ofthem do not apply for microfiltration, due to the different diffusion mechanism in partic-ulate suspensions as compared to molecular solutions.
As has been identified by Belfort and others [10], for particulate suspensions withparticle sizes between 0.5 and 30 µm, shear-induced diffusion can often be consideredthe relevant back-transport mechanism in the concentration polarisation process. Otherback-transport mechanisms are Brownian diffusion and inertial lift, which are respec-tively dominant for particle sizes smaller than 0.5 µm and larger than 30 µm. This paperaddresses modelling of flow and concentration polarisation in the shear-induced diffusiveregime. Shear-induced diffusion, also called hydrodynamic diffusion, is a transport mech-anism that is caused by hydrodynamic particle interactions in a suspension in shear flow.Excluded volume effects can then lead to particle displacements. In contrast to inertiallift, which is only relevant in the regime where the Reynolds number based on the particlesize is not negligible, shear-induced diffusion occurs in the slow laminar flow regime aswell. A general property of shear-induced diffusion is that it increases proportionally withthe shear rate.

SUSPENSION FLOW MODEL FOR CROSSFLOW MICROFILTRATION 139
About two decades ago, shear-induced diffusion was first introduced in relation to mi-crofiltration theory by Zydney and Colton [110]. Their concentration polarisation modelis based upon the classical Leveque solution for mass transfer in which they replaced theStokes-Einstein diffusivity with the shear-induced diffusivity, as determined from exper-imental data of Eckstein and others [14]. In the same year as Zydney and Colton, Davisand Leighton presented a model that describes the transport of a concentrated layer of par-ticles along a porous wall under laminar flow conditions [7]. In this model, shear-induceddiffusion accounts for the lateral migration of particles away from the porous wall. In-stead of the approximate fit to the data of Eckstein and others, Davis and Leighton applieddata of Leighton and Acrivos [64] for shear-induced diffusion, which were about 25 timesgreater and were shown to better describe the viscous resuspension of a settled layer ofrigid particles in shear flow.
Romero and Davis [8] extended the model of Davis and Leighton from a local treat-ment of the particle layer to a global model of crossflow microfiltration. This globalmodel is able to predict the axial dependence of the permeate flux and the thickness ofthe concentrated particle layer under steady or quasi-steady operation. The model alsodescribes under which conditions a stagnant layer of packed particles exists beneath theflowing layer. In a following step, the global model was converted into a transient model,which not only describes the steady-state behaviour but also the time-dependent declineof the permeate flux due to particle layer buildup [9].
In the aforementioned models, particle convection parallel to the membrane walls wasignored. As a consequence, the models are only valid for very small particle volume frac-tions in the bulk of the suspension φb. Davis and Sherwood overcame this limitation intheir similarity solution for crossflow microfiltration under conditions where the stagnantparticle layer provides the controlling resistance to flow [81]. In their solution, the stag-nant particle layer grows like x1/3, where x denotes the dimensionless distance from thefilter entrance. Their solution is however only valid in the situation that the critical lengthneeded for the stagnant layer to form is much smaller than the filter length. Pelekasis de-veloped a model which does not have this limitation [111], although his solution is onlyvalid in situations where the permeate flux can be considered constant over the membranelength. This model is valid over a wide range of bulk particle concentrations. It is shownthat in the limit where the particle volume fraction in the bulk suspension φb → 0, themodel of Davis and Leighton is recovered.
All the abovementioned models have in common that they assume the bulk flow tobe fully developed Poiseuille flow with a time-independent flow rate. This is valid fora straight flow channel, when the permeate velocity is much smaller than the averagedownchannel velocity of the suspension and when the stagnant layer is much thinner thanhalf the channel width. These conditions are often not met in reality. First of all, theflow channel may deviate from perfectly circular or rectangular, e.g. when turbulencepromotors are present. Secondly, when suspensions are filtered with particles that havea relatively low cake resistance, the cake layer height can become sinificant compared tothe channel half width. Poiseuille flow can still be considered present when the cake layerheight does not vary much along the filter length (and the actual flow velocity profile canbe adapted to the actual channel height). The flow pattern can however easily deviatefrom Poiseuille flow when the cake layer height strongly varies along the filter length,like e.g. at the beginning and at the end of the filter. Thirdly, the flow pattern can alsobe time-dependent, such as when oscillating cross-flow or backpulsing is applied. One

140 CHAPTER 8
should moreover realise that, in contrast to Brownian diffusion, shear-induced diffusiondepends linearly on the shear rate. Local deviations of the flow field from Poiseuille flowwill therefore have a large influence on the local morphology of the flowing and stagnantparticle layer.
This indicates that a more generic model with broad applicability to membrane sys-tems requires an accurate, more detailed solution of the fluid flow field. This is possiblewith computational fluid dynamics (CFD). So far, this technique is not often applied tomembrane systems. Recently, Wiley and Fletcher [112] succesfully developed a genericCFD model that incorporates the flow across the membrane wall. In their article, they alsoreviewed earlier attempts in this field, which in general lead to less generic solutions thantheir model. Another recent approach is that of Richardson and Nassehi [113]. Theseauthors developed a finite element model for the solution of concentration profiles in flowdomains with curved porous boundaries. Although both models may be extensible tomodelling of concentration polarisation in microfiltration processes, with shear-induceddiffusion as back-transport mechanism and with cake layer formation, up to now no re-sults on this subject have been published.
The present work is directed at the development of a CFD model for flow and con-centration polarisation in microfiltration systems with shear-induced diffusion as back-transport mechanism. We apply the Lattice Boltzmann (LB) method for this aim, whichis based on kinetic theory, the physical theory describing the dynamics of large systemsof particles. The LB method, being a discrete version of the Boltzmann equation, is inspecial cases identical to the finite volume scheme as used by Wiley and Fletcher [112].Both methods can be applied for laminar as well as turbulent flows. The LB methodmay however have some advantages when compared to other finite difference schemes.Complex geometries can be quickly set-up and easily used in the LB method, while inother methods, the use of complex geometries is a major issue. The LB method is alsovery convenient for systems with moving boundaries and multiphase systems such as fluidflow with suspended particles. In the present work, this may be relevant for the simulationof rapidly growing, flowing and stagnant layers. Finally, LB schemes can be very easilyimplemented on a parallel computer, which facilitates computations of large systems.
Although the LB simulations can be easily carried out in three dimensions, as a firststep, the present work presents results on two-dimensional (2D) systems. In order to val-idate the model, the simulation results are compared with results of approximate modelswhen appropriate. Hereafter, the effects of some variations in the geometry on the flowingand stagnant particle layers and the resulting flux will be shown.
8.2 Computer simulation method
8.2.1 Suspension flow model
The suspension flow model is based on an Euler-Euler description of the system, in whichboth the hydrodynamics and the suspension flow are completely resolved. The hydrody-namics are calculated according to the continuity and Navier-Stokes (NS) equations:
∂ρ
∂t= · ρu
∂ρu
∂t+ u · ρu = − p+ ν 2 ρu+ F (8.1)

SUSPENSION FLOW MODEL FOR CROSSFLOW MICROFILTRATION 141
where − p is the pressure gradient and F is the body force. The LB method solvesthe NS equation for weakly compressible conditions, therewith behaving as a pseudo-compressible scheme [114]. An advantage of this approach is that the Poisson equationdoes not need to be solved for the pressure. For the calculation of the NS equation, thekinematic viscosity ν (= η/ρ, with η representing the dynamic viscosity) of the fluidneeds to be known. In our suspension flow model, we took into account that the viscosityη depends on the local concentration of suspended microparticles. Hereto, a model isused that is also applied by Romero and Davis [8]:
η(φ) = η0
[1 + 1.5
φ(1− φ
0.6
)]2
(8.2)
where φ represents the particle volume fraction and η0 the viscosity of the particle freemedium. In our suspension flow model, the feed for the microfiltration process consists ofa particulate suspension with particles of a size between 0.5 and 30 µm. These suspendedparticles are described as a component that is continuously distributed in the fluid. Theirdistribution over the system is calculated according to the convection-diffusion equation:
∂φ
∂t+ u · φ = D 2 φ (8.3)
The velocity field u is calculated according to the NS equation. In our simulations, thediffusion coefficient D represents the shear-induced diffusion coefficient, following theshear-induced migration model of Leighton and Acrivos [8, 64]:
D = 0.33γa2φ2(1 + 0.5e8.8φ
)(8.4)
where γ is the shear rate and a is the radius of the suspended particles. Both the vis-cosity η and the shear-induced diffusivity D are treated as time and location dependentvariables in our suspension flow model. In order to resolve the NS equation as well as theconvection-diffusion equation the LB method is followed, which is explained in the nexttwo paragraphs.
8.2.2 Lattice Boltzmann method for hydrodynamics and convection-diffusion
For a general introduction to the LB method, we refer to Succi [34]. In this article, we willexplain relevant aspects of our method, without going into much detail. Hydrodynamicsand convection-diffusion were solved with two separate LB schemes. Here, we will firstintroduce the LB method for the case of hydrodynamics.
The LB method discretises kinetic theory by collecting fluid mass in discrete latticegas particles, locating these particles on points of a regular lattice and moving the particlesaccording to a finite, discrete set of velocities, taking them to adjacent lattice points. As aconsequence of this discretisation procedure space, time and particle velocity are discretevariables. Physical quantities are represented by moments of a particle distribution func-tion, in contrast to finite volume schemes, where physical quantities are represented bycontinuous fields. The lattice gas particles behave like real particles: they move and col-lide on the lattice. Collision occurs when particles encounter each other at a lattice point.

142 CHAPTER 8
After collision they move to adjacent lattice points. If this is done within the constraintsof physical conservation laws and with a lattice with sufficient symmetry, real physicalphenomena can be modelled this way.
In analogy with the Boltzmann equation of the classical kinetic theory, the state of theparticles on a lattice point is characterised by the particle distribution function f i(x, t) ,describing the average number of particles at a particular node of the lattice x, at a timet, with the discrete velocity ci, which brings the particles in one time step to an adjacentlattice node. In the simulations described in this paper, the hydrodynamics were solvedwith a D2Q9 LB scheme, which is defined on a 2D square lattice with rest particles and8 non-zero particle velocities. The velocity directions link lattice sites to its nearest andnext-nearest neighbours. The velocity vectors on this 2D lattice are defined as:
ci =
(0, 0) , i = 0(cos i−1
2π, sin i−1
2π), i = 1, 2, 3, 4√
2(cos(i−12π + π
4
), sin
(i−12π + π
4
)), i = 5, 6, 7, 8
(8.5)
The particle distribution function contains information on physical properties of thefluid. The hydrodynamic field’s mass density ρ, momentum density j, and the momentumflux density Π, being identical to the field’s in the NS equation, are moments of thisvelocity distribution:
ρ =∑
i
fi, j =∑
i
fici, Π =∑
i
ficici = ρc2s,fI + ρuu = pI + ρuu (8.6)
The lattice gas particles evolve by collisions and subsequent propagation to neighbouringlattice sites. This two-step process is described by the following equations:
f ′i (x, t) = fi(x, t)− fi(x, t)− f eqi (x, t)
τf+
ciαFα
c2s,f(8.7)
fi(x +∆xi, t+∆t) = f ′i (x, t) (8.8)
Here f ′i (x, t) is the post-colllisional distribution function. The lattice spacing is defined as
∆xi = ci∆t. F is the body force and the speed of sound cs,f is defined by c2s,f = c2/3. Inour simulations, we applied the BGK model [37, 57], which is a simplification of the fullLB model. In this BGK model, the distribution functions are simply relaxed at each timestep towards the local equilibrium distribution f eq
i (x, t) with the relaxation time τf . Thisrelaxation time τf controls the relaxation of the viscous stress in the fluid and is linked tothe kinematic viscosity ν via:
ν = c2s,f
(τf − 1
2
)∆t (8.9)
In our simulations τf , and therewith the kinematic viscosity ν (= η/ρ) of the fluid on eachlattice point was dependent on the local particle concentration, according to Equation(8.2). The equilibrium distribution f eq
i (x, t) is chosen such that the weakly compressibleNS equations (8.1) are obtained [36]. It can be expressed as a series expansion in powersof the flow velocity u:
f eqi = ρwi(1 +1
c2s,fu · ci +
1
2c4s,fuu : cici − 1
2c2s,fu2) (8.10)

SUSPENSION FLOW MODEL FOR CROSSFLOW MICROFILTRATION 143
where uu is the traceless part of uu, and the double dot product is defined as A : B =∑α,β AαβBβα. The weight factors are given by w0 =4/9, w1 = w3 = w5 = w7 =1/9 and
w2 = w4 = w6 = w8 =1/36.The computation scheme for convection-diffusion has a strong analogy with the scheme
for hydrodynamics. The particle distribution function gi(x, t) now contains informationon physical properties of the diffusive component, in our case the suspended particles. Forreasons of clarity, we will refer to fluid particles for the lattice gas particles in the hydro-dynamics scheme and to suspended particles for the lattice gas particles in the convection-diffusion scheme. The relevant continuum field derived from the latter scheme representsthe concentration of suspended particles φ:
φ =∑
i
gi (8.11)
The relaxation parameter in the collision operator of the convection-diffusion scheme isnot related to the kinematic viscosity ν but to the diffusion coefficient D:
D = c2s,g
(τg − 1
2
)∆t (8.12)
Here, the speed of sound cs,g is also defined by c2s,g = c2/3. In our simulations, thisdiffusion coefficient D represents the shear-induced diffusion coefficient, according to theshear-induced migration model of Leighton and Acrivos [64], which is given by Equation(8.4). Since the diffusion coefficient is dependent on the time and location dependentvariables γ and φ, it is recalculated every timestep at every lattice point. The shear rateγ is calculated from the diagonal vectors of the non-equilibrium part of the distributionfunction according to [115]:
−c2s,fω
ργ =
i=8∑i=0
ci,xci,y (fi − f eqi ) (8.13)
Because we considered the diffusion to be isotropic, the absolute value for γ was used forthe calculation of the shear-induced diffusivity D. More recent investigations have shownthat shear-induced diffusion is not an isotropic process, but that the diffusivity dependson the direction relative to the shear field (see e.g. [19, 27]). Moreover, improved modelshave become available for shear-induced migration (see e.g. [16]). Our model can beeasily adapted to implement such modifications of the shear-induced diffusivity models.We do however not expect that taking into account anisotropy will have a large effect,since convection is strongly dominant along the flowlines.
Typical for the LB scheme is that the resulting finite difference equation for the evo-lution of φ is identical to the Lax-Wendroff (LW) finite volume scheme in case of τg=1[116]. Both the LW and the LB scheme automatically correct for numerical diffusion,for the LB scheme as a consequence of the constraints for the equilibrium distribution.If τg = 1, spurious oscillations, which are present in the LW scheme, are damped in theLB scheme. The LB scheme therewith behaves like a third order accurate scheme (forτg = 1) [116].
In order to have stable calculations, stability criteria have to be met. In the hydro-dynamics scheme, the grid Courant number Cr, which is a measure for the relative flow

144 CHAPTER 8
velocity on the grid, should meet the following condition:
Cr =u t
x< 1 (8.14)
Also the compression of the medium should be sufficiently small, such that the Machnumber Ma:
Ma =u
cs,f 1 (8.15)
The abovementioned conditions are met by a proper choice of the model parameters inour system. For the convection-diffusion scheme, the criteria for the diffusivity needsome more attention because of the variation of the diffusivity with the shear rate andthe concentration of suspended particles. The Fourier number Fo∗ is a measure for thediffusion velocity on the grid:
Fo∗ =D t
x2≤ 0.5 (8.16)
We have chosen our model parameters such that even when D is maximal in our system,this condition is met. Also the ratio between convection and diffusion is subjected to astability condition. The timescale of diffusivity needs to be sufficiently fast compared toconvection, which is reflected in the grid Peclet number Pe∗:
Pe∗ =u x
D≤ 25 (8.17)
Because the LB method behaves as a third order accurate scheme, the limiting value canbe higher than the common value of 2. We have estimated the value of 25 ourselves bycarrying out simulations with different maximal values for Pe∗. When Pe∗ >25, spuriousoscillations were sometimes found, leading to anomalous results. Because of its depen-dency on the shear rate and the concentration of suspended particles, the shear-induceddiffusivity D can strongly vary in our system. In order to meet the condition for Pe∗, thevalue of Pe∗ was calculated at every time-step and at every node of the lattice. When thecondition Pe∗ <25 was not met, the diffusivity was locally adjusted such that Pe∗ =25.The consequence is that D cannot become zero (as e.g. in the center of the flow channel,where the shear rate is equal to zero), but has a certain minimum limit, depending onthe actual flow velocity u. When u is relatively high, such as in the center of the flowchannel, the minimum limit for D is also high. In our system, the maximal flow velocityin the channel and therewith the shear rate at the wall was so high, that D did not need tobe adjusted in the largest part of the concentration polarisation layer. Only in the centerarea of the flow channel with relatively high flow velocity and where the concentrationof suspended particles φ was lower than about 0.10, might the diffusivity be set slightlyhigher than according to the shear-induced migration model. The effect of this correctionon the simulation results was however found to be negligibly small.
8.2.3 Initial and boundary conditions
In figure 8.1, the geometry of the microfiltration system is depicted. Its geometry anddimensions are inspired on the newly emerging class of micro-engineered membranes,
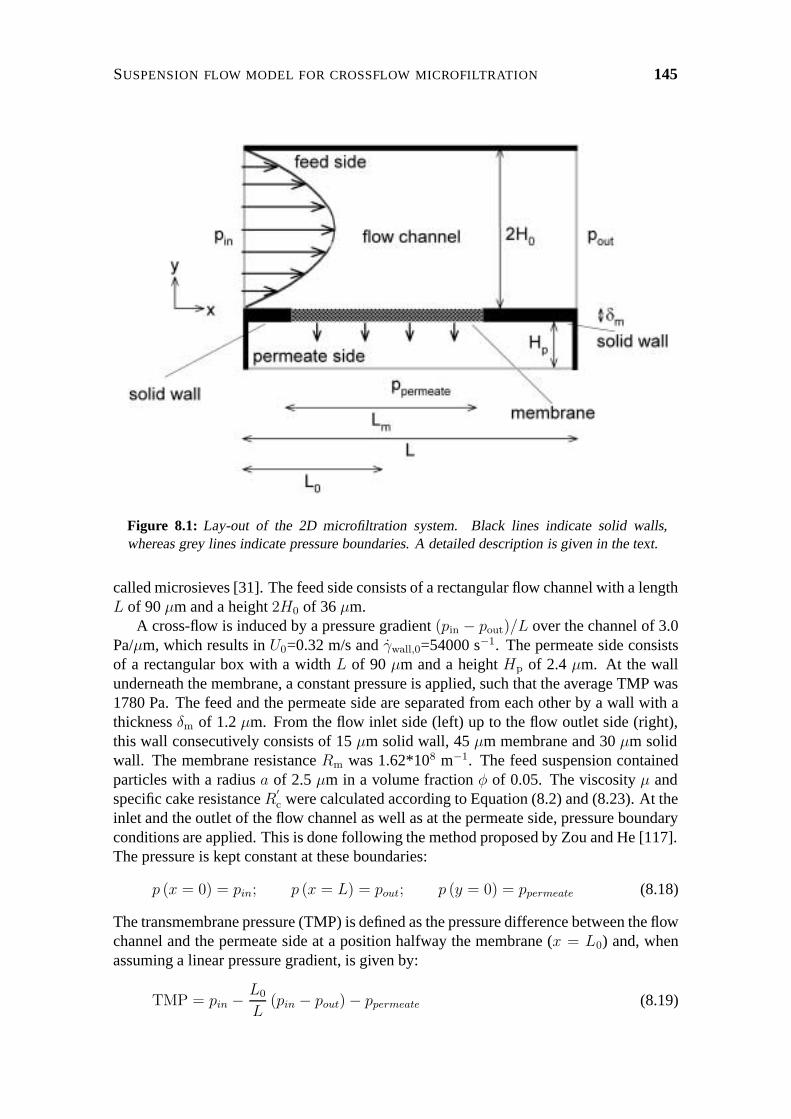
SUSPENSION FLOW MODEL FOR CROSSFLOW MICROFILTRATION 145
Figure 8.1: Lay-out of the 2D microfiltration system. Black lines indicate solid walls,whereas grey lines indicate pressure boundaries. A detailed description is given in the text.
called microsieves [31]. The feed side consists of a rectangular flow channel with a lengthL of 90 µm and a height 2H0 of 36 µm.
A cross-flow is induced by a pressure gradient (pin − pout)/L over the channel of 3.0Pa/µm, which results in U0=0.32 m/s and γwall,0=54000 s−1. The permeate side consistsof a rectangular box with a width L of 90 µm and a height Hp of 2.4 µm. At the wallunderneath the membrane, a constant pressure is applied, such that the average TMP was1780 Pa. The feed and the permeate side are separated from each other by a wall with athickness δm of 1.2 µm. From the flow inlet side (left) up to the flow outlet side (right),this wall consecutively consists of 15 µm solid wall, 45 µm membrane and 30 µm solidwall. The membrane resistance Rm was 1.62*108 m−1. The feed suspension containedparticles with a radius a of 2.5 µm in a volume fraction φ of 0.05. The viscosity µ andspecific cake resistance R
′c were calculated according to Equation (8.2) and (8.23). At the
inlet and the outlet of the flow channel as well as at the permeate side, pressure boundaryconditions are applied. This is done following the method proposed by Zou and He [117].The pressure is kept constant at these boundaries:
p (x = 0) = pin; p (x = L) = pout; p (y = 0) = ppermeate (8.18)
The transmembrane pressure (TMP) is defined as the pressure difference between the flowchannel and the permeate side at a position halfway the membrane (x = L0) and, whenassuming a linear pressure gradient, is given by:
TMP = pin − L0
L(pin − pout)− ppermeate (8.19)

146 CHAPTER 8
For the suspended particles, boundary conditions with a fixed inlet concentration and afree outflow are applied at these boundaries, according to:
φ (x = 0) = φb;∂φ (x = L)
∂x= 0 (8.20)
There is no need for a boundary condition for suspended particles at the permeate side(y=0), since a no-flux condition is applied at the membrane. At the solid walls at the topside of the feed side and at the left and right side of the permeate side no-slip conditionsare applied to the fluid. The suspended particles are subjected to a no-flux condition atthese boundaries.
The geometry is divided into a feed and a permeate side by the presence of a horizon-tally placed membrane. The membrane is placed between two solid walls at the beginningand the end of the flow channel. The suspended particles are fully retained by the mem-brane, by application of no-flux conditions. For the fluid, the membrane is described asa porous medium. The fluid experiences a hydraulic resistance when passing the mem-brane, because part of the fluid is retained. Hereto, a body force F is applied on the fluidwhen passing the membrane, following Darcy’s law:
F = − ρu
Kmembrane(8.21)
The coefficient Kmembrane is dependent on the membrane resistance Rm, the membranethickness δm and the viscosity of the fluid phase, according to:
1
Kmembrane= η
Rm
δm(8.22)
During filtration, a high concentration of suspended particles may be reached at themembrane surface, which may subsequently lead to the formation of a stagnant cakelayer. Suspensions with monodisperse, hard spherical particles form a cake layer whenthe concentration reaches a value of 0.60. This cake layer behaves as a porous medium;suspended particles are fully retained by the cake, while the fluid experiences a flowresistance. In our simulations, this process of cake layer formation is simulated in asimilar way. When the concentration of suspended particles locally exceeds a value of0.60, the respective lattice point is described as a porous medium, in a similar way asthe membrane. No-flux conditions are applied for the suspended particles, while the fluidexperiences a body force as given by Equation (8.21) with the coefficient Kcake. Thiscoefficient is chosen such that the Carman-Kozeny relation is obeyed:
1
Kcake= ηR
′c = η
C (1− εc)2 S2
c
ε3c
(8.23)
The Carman-Kozeny relation describes the specific cake resistance of a monodisperse,non-compressible cake with porosity εc, specific surface Sc = 3/a and constant C. Ran-domly packed cake layers normally have a porosity εc ≈ 0.4, while the constant C ≈ 5.Not only the stagnant cake layer, but also the flowing concentrated layer can be consid-ered a porous medium. In general, the flow resistance of this layer is negligibly small.Therefore, we have neglected this effect, as is usual in MF modelling [10].

SUSPENSION FLOW MODEL FOR CROSSFLOW MICROFILTRATION 147
The initial conditions of the simulations are consistent with a fully developed parabolicvelocity profile for the fluid particles in the flow channel, following Poiseuille type flowby a downchannel pressure gradient:
−dpdx
= 3ηbU0
H20
(8.24)
where ηb is the viscosity in the bulk of the suspension, U0 is the average flow velocity, H0
is the channel half width. The concentration of suspended particles in the flow channelwas initially equal to the bulk concentration. At the permeate side of the membrane, theinitial velocity of the fluid particles as well as the concentration of suspended particleswas equal to zero.
8.3 Results
8.3.1 Simulation of microfiltration with the suspension flow model
In this section of the paper, we will first present results of the suspension flow modelon the effect of transmembrane pressure. In this way, the development of the permeateflux in time is analysed at conditions with and without the presence of a cake layer. Itis also investigated whether a steady-state situation occurs. The suspension flow modelis compared with the existing model of Romero and Davis [8] and Davis and Sherwood[81], in order to validate our model. This comparison is made on basis of the position-dependence of the flux and cake layer thickness in the steady-state regime so as to analysethe differences in cake layer profile along the membrane between the different models.To make comparison with the similarity solution of Davis and Sherwood possible, thesimulations were carried out in the regime where the cake layer is thin compared to thechannel height. Finally, we will step from a simple cross-flow system to systems with amore complex geometry, in order to illustrate the advanced possibilities of the suspensionflow model compared to existing models. As examples of systems with a more complexgeometry, simulation results of the steady-state flux will be presented of a system witha discontinuous membrane, a system with flow barriers and a system with a corrugatedmembrane. The permeate flux J in the simulation results is equal to the fluid velocityu underneath the membrane. The length-averaged flux 〈J〉 is the average permeate fluxover the length of the membrane.
8.3.2 Effect of transmembrane pressure on flux and cake layer for-mation
In figure 8.2, the development of the length-averaged flux 〈J〉 in time is shown for differ-ent transmembrane pressures (TMP). The initial flux increases proportional to the TMP.At a TMP of 1180 Pa, the flux 〈J〉 remains constant in time. Here, the transport ofsuspended particles towards the membrane is too low to cause cake layer formation. At aTMP of 1780 Pa and higher however, the flux 〈J〉 declines in the initial phase, but reachesa steady-state at about 0.01 s. Figure 8.2 also shows the flux at t=0 as calculated from themembrane resistance and TMP (=flux particle-free medium J0). This makes clear that thecake formation process does not start immediately at t=0, but about 1 ms later. This is due

148 CHAPTER 8
Figure 8.2: The length-averaged flux as a function of time for a transmembrane pressure of1180, 1780, 2980 and 4180 Pa. Other system parameters as in figure 8.1. The calculatedvalues for J0 are depicted as circles on the Y-axis.
to the time required to develop the concentration polarisation profile. The steady-stateconcentration distribution near the membrane is presented in figure 8.6.
In accordance with the fluxes in figure 8.2, it can be seen that the cake is thickest atthe highest TMP (4180 Pa), namely 5.7 µm, while no cake is formed at a TMP of 1180Pa. The cake gradually increases in thickness along the membrane, reaches a maximumthickness at about 2/3 of the membrane length and then decreases to a thickness of zero atthe end of the membrane. The cake at the end of the membrane is steep. The concentrationpolarisation layer follows more or less the shape of the cake layer. It has a thickness ofabout 5 µm, which is equal to 1 suspended particle diameter in this case. It can be seen thatthe concentration change is relatively fast at low particle concentrations, which results ina sharp transition from concentration polarisation layer into bulk phase. This effect is dueto the dependence of the shear-induced diffusivity on φ, and is different from Browniandiffusion-dominated concentration polarisation. Behind the membrane, the concentrationpolarisation layer disappears only very gradually. The difference between the length-averaged steady-state flux 〈Jss〉 at 1780 and 4180 Pa (see also figure 8.3) can mainly beexplained with the relative length of the cake-free zone at the beginning of the membrane,but differences in the cake-morphology at the end of the membrane and the narrowing ofthe flow channel by the cake formation may also have some effect.
At lower TMP, the length of the cake-free zone is relatively long so that in a largepart of the membrane the maximum particle concentration at the membrane wall has not

SUSPENSION FLOW MODEL FOR CROSSFLOW MICROFILTRATION 149
Figure 8.3: Length-averaged steady-state flux as a function of transmembrane pressure. Alsoindicated is the calculated line for the nominal flux 〈J0〉. System parameters as in figure 8.2.
reached the value of 0.6, which leads to less back-transport of suspended particles andtherewith to a lower steady-state flux. At higher TMP, the cake-free zone disappearscompletely (which is contrary to the model of Romero and Davis). In this regime, thedifference in cake height can also contribute to the difference in steady-state flux 〈Jss〉.We can take the situation at a TMP of 2980 Pa as an example. Here the maximal thick-ness of the cake is 3.0 µm, which is about 8% of the total channel height. The pressuregradient ∆p over the channel is kept constant, so if we assume that the channel height hasdecreased with 8% over the total channel length, the crossflow velocity U will decreaseaccording to:
∆p = f · L
Dh
· 12ρU2 (8.25)
where f is the friction factor, L the length of the flow channel, Dh the hydraulic diameterand ρ is the fluid density. Since it follows that the velocity only decreases with a factor√0.92 = 0.96, it becomes clear that according to:
γwall =2Umax
H0
(8.26)
the shear rate at the wall γwall will be raised locally with about 4% by the presence ofthe cake layer (compared to the situation without a cake layer). This higher shear ratecan cause a thinner concentration polarisation layer and faster particle back-transport (a

150 CHAPTER 8
higher shear-induced diffusivity), therewith resulting in a higher steady-state flux 〈Jss〉.This behaviour results in a steady-state flux 〈Jss〉 as a function of TMP as presented infigure 8.3. At low TMP, no cake layer is formed so that the flux follows the linear trendfor the particle-free medium. At a TMP of 1780 Pa, a cake layer starts to be formed, sothat the flux 〈Jss〉 levels off and becomes almost constant at a TMP of 3600 Pa.
These results show that the suspension flow model is not only able to simulate theflux and cake layer formation in time, but also the dependence on TMP. This is not onlypossible in the limits of infinitely thin cake layers or infinitely small flux decline, but alsoin transient regimes, as described in the model of Romero and Davis [8, 9].
8.3.3 Position-dependence of flux and cake layer thickness
The suspension flow model incorporates a number of factors that are neglected in themodel of Romero and Davis [8], such as 1) the variation of TMP over the length of themembrane, 2) the fully resolved velocity field following NS and 3) the axial migrationof suspended particles between the bulk phase and the concentration polarisation layer(which e.g. enables the calculation of the dispersion of the concentration polarisationlayer at the end of the membrane). In this paragraph, we will analyse which differencesthis brings about for the cake layer thickness and the flux. In the situation of an infinitelythin cake layer, and for a distance along the membrane x xcr, where xcr is the lengthof the cake-free zone at the beginning of the membrane, Romero and Davis predict thatthe steady-state flux decreases along the membrane with the distance x, as given by:
Jss (x) = J0 ·[3
2· (x− xcr)
xcr
+ 1
]−1/3
(8.27)
where J0 is the nominal transmembrane flux (=flux of particle-free medium). Accordingto the similarity solution of Davis and Sherwood [81], under the conditions of φb <0.1,cake-dominated resistance and L xcr, the length-averaged flux 〈Jss〉 is given by:
〈Jss〉 = 0.072 · γwall,0 ·(
φc · a4
φb · Lm
)1/3
(8.28)
where γwall,0 is the nominal shear rate at the wall, φb the bulk particle volume fraction andLm is the total membrane length. For the particle volume fraction in the cake φc (=1− εc)a value of 0.6 was taken in our calculations.
First, the flux Jss of the suspension flow model is compared with the model of Romeroand Davis (figure 8.4). The latter model does not take the pressure drop over the flowchannel into account, so that the flux Jss is equal to the flux of the particle-free medium(at the average TMP) from the beginning of the membrane until the critical distance xcr.Behind this point, the flux declines as predicted by Equation (8.27). In the computer sim-ulations, conditions are chosen such that the cake layer did not become thicker than 10%of the channel height, so that γwall can be considered constant in time. In the suspen-sion flow model, the critical distance xcr and the flux at the beginning of the membraneare dependent on the total membrane length. This can mainly be ascribed to the vari-ation of TMP over the length of the membrane; since the average TMP is similar, theTMP at the beginning of the membrane is higher with longer membrane lengths. Due tothese differences in TMP, the flux Jss also drops off more quickly for longer membrane

SUSPENSION FLOW MODEL FOR CROSSFLOW MICROFILTRATION 151
Figure 8.4: Steady-state flux as a function of position along the membrane for total mem-brane lengths between 90 and 360 µm. Also indicated is the calculated line for the steady-state flux as predicted by the model of Romero and Davis (Equation (8.27)). Other systemparameters as in figure 8.1.
lengths. At the end of the membrane, the flux exhibits a peak due to the dispersion of theconcentration polarisation layer.
In figure 8.5, it is shown how the length-averaged steady-state flux 〈Jss〉 depends onthe membrane length. For short membrane lengths, the difference between the suspensionflow model and the model of Romero and Davis is relatively large. At a membrane lengthof 90 µm, the flux was almost 30% higher for the suspension flow model. The fluxes arehowever practically the same at longer membrane lengths, indicating that differences incake layer formation between the models mainly occur at the beginning and the end of themembrane. This is in accordance with our expectations, since axial convective transportcan be expected to be most relevant in these regions. With increasing membrane length,there is an increasing difference between the fluxes at different TMP. An increase of TMPcan apparently lead to a more than proportional growth of the cake layer with eventuallya lower flux. This may be due to the decrease of the mass flow rate Q (= 2U ·H0) throughthe flow channel at higher TMP. The decrease of flux with increasing TMP does not agreewith the expected effect of narrowing of the channel as explained in paragraph 8.3.2, sincewe then would expect an increase of γwall and therewith an increase of the flux as well.As explained before, the effect of narrowing of the channel by cake formation will leadto a lower cross-flow velocity but a higher shear rate at the place where the cake layer isat its highest point. At other places along the membrane however, where the cake layeris thinner, the cross-flow velocity U will even be lower, which, in combination with the

152 CHAPTER 8
Figure 8.5: Length-averaged steady-state flux as a function of membrane length. Also in-dicated is the steady-state flux as predicted by the model of Davis and Sherwood (Equation(8.28)). Other system parameters as in figure 8.1.
higher channel height, can now lead to a drop of the shear rate. Thus, at places along themembrane where the cake layer height is less than maximal, the drop of the shear rate canlead to a decrease of the flux Jss. This latter effect seems to prevail in the simulations infigure 8.5.
The results in this paragraph show that for simple cross-flow systems with relativelylong membranes, our suspension flow model predicts cake layer profiles that converge tothe profiles that are predicted by the model of Romero and Davis. Differences between thepredicted cake layer profiles mainly occur at the beginning and the end of the membrane,resulting in a higher 〈Jss〉 for short membrane lengths with the suspension flow model.Since the suspension flow model incorporates extra features as compared to the modelof Romero and Davis, the results of this model can be considered to be more accurate,which is particularly relevant to systems with short membrane lengths and large variationof TMP over the length of the membrane.
8.3.4 Microfiltration in systems with different geometries
The solution of the flow field in the suspension flow model enables the calculation ofconcentration polarisation in more complex flow geometries. In this paragraph we willdemonstrate some possibilities of the model by showing some examples. First, the effectof the presence of separate pore fields will be demonstrated. In such a situation, porefields and solid walls alternate along the length of the membrane channel. This will result

SUSPENSION FLOW MODEL FOR CROSSFLOW MICROFILTRATION 153
in extra membrane beginnings and ends, where the flux is relatively high. The passageof the concentration polarisation layer over a piece of solid wall will namely lead to a(partial) dispersion, so that the flux at the start of the next membrane field will be higherthan without the presence of the solid wall. The division of a homogeneous membraneinto pore fields and fields with solid walls might be used as a means to optimise theflux. The benefit of dispersion of the concentration polarisation layer and the presence ofrepetitive membrane ends should then compensate for the diminished back-transport dueto the reduced wall concentration at the solid walls. The suspension flow model enablesan accurate flux prediction for these types of membranes. The presence of separate porefields can also be an intrinsic property of some membrane types, such as the so-calledmicrosieves [31], membranes prepared by micro-engineering which usually feature thesedistinct pore fields. The mechanical strength of these ultrathin microsieves is dependenton the size and division of the pore fields over the membrane surface. Here, the suspensionflow model can be used to find the optimal lay-out of the pore fields as determined by bothflux and mechanical strength.
In figure 8.7, the steady-state flux Jss is presented for a homogeneous membrane witha total length of 135 µm and for a membrane with the same total length, which is dividedinto three evenly distributed membrane fields with a length of 33 µm and two solid wallswith a length of 18 µm. It can be seen that the flux at the pore fields is clearly higherfor the subdivided membrane. The length-averaged flux 〈Jss〉 (membrane length similarto homogeneous membrane) is however about 5% lower. In this situation, the dimin-ished back-transport is the dominant effect, which is unfavourable for the flux. In caseof microsieves, the mechanical strength will however improve much by this subdivision[118].
The dispersion of the concentration polarisation layer might improve with the pres-ence of flow barriers at the solid walls. Whether or not this will render a positive fluxeffect is dependent on the trade-off between this improved dispersion on the one hand andthe decreased wall shear rate on the other hand. With the suspension flow model, we areable to compute the effect of flow barriers. An example is given in figure 8.8.
Here, triangles with a height of 2.7 µm were placed centrally on the solid walls. It canbe seen in figure 8.8 that the flux is hardly influenced by the presence of these barriers,although their height exceeds the height of the cake layer. This might be related to themicroscale of the flow barriers. Because the Reynolds number is linearly dependent on thesquare height of the flow barrier, it will hardly be affected by the presence of these smallflow barriers. In figure 8.8, it can accordingly be seen that the flow barriers do not induceflow disturbances such as vortices. On the other hand, because of the mechanism of shear-induced diffusion, the wall shear rate has a large effect on the flux. The decrease of thewall shear rate, due to an increased flow resistance of the flow channel, is the dominanteffect in this example, such that the length-averaged steady-state flux 〈Jss〉 was about 3%lower. Although more research is needed, this example might indicate that microscaleflow barriers are not effective for flux improvement.
Another possibility for a higher flux would be the use of corrugated membranes. Thesecorrugations are expected to lead to a better dispersion of the concentration polarisationlayer and increased flow resistance, as for the system with triangles, but would also affectthe shear rate profile at the membrane wall for the total membrane length. More infor-mation on the application of corrugated membranes can e.g. be found in [119]. In ourexample, the membrane corrugations consist of triangles of membrane material, which

154 CHAPTER 8
Figure 8.6: Concentration distribution and flow field near the membrane in the steady-statesituation for a transmembrane pressure of 1180 (a), 1780 (b), 2980 (c) and 4180 (d) Pa. Onlythe part just above the membrane, with a height of 9.0 µm is presented. The colors indicatethe particle volume fraction, ranging from 0.0-0.1 (turquoise) to 0.5-0.6 (pink). The con-centration polarisation layer already develops before the beginning of the membrane. Othersystem parameters as in figure 8.1.
are placed centrally on the membranes. The size was such that the membrane surface areawas increased with 1.8 %. Because the membrane has become much thicker at the posi-tion of the triangles, application of a similar TMP as for the aforementioned computationswould lead to a suboptimal flux. Therefore TMP was increased to 5340 Pa.
Figure 8.9 shows the flux along the membrane in steady-state situation. At the be-ginning and the end of the membrane, the steady-state flux Jss is about 1.5 times higherthan without the membrane corrugations. Because of the reduced cake formation in theseregions, the relatively high TMP results in this high steady-state flux Jss. This result alsoindicates that the membrane corrugations are particularly favourable in a system with
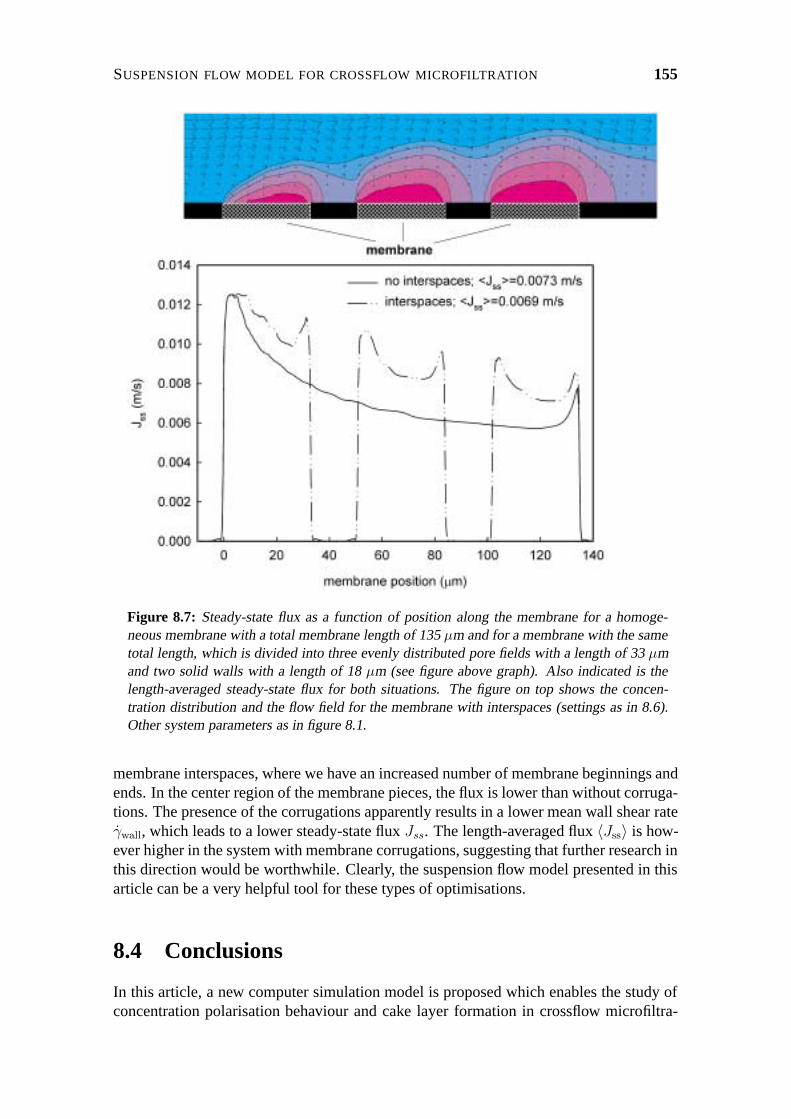
SUSPENSION FLOW MODEL FOR CROSSFLOW MICROFILTRATION 155
Figure 8.7: Steady-state flux as a function of position along the membrane for a homoge-neous membrane with a total membrane length of 135 µm and for a membrane with the sametotal length, which is divided into three evenly distributed pore fields with a length of 33 µmand two solid walls with a length of 18 µm (see figure above graph). Also indicated is thelength-averaged steady-state flux for both situations. The figure on top shows the concen-tration distribution and the flow field for the membrane with interspaces (settings as in 8.6).Other system parameters as in figure 8.1.
membrane interspaces, where we have an increased number of membrane beginnings andends. In the center region of the membrane pieces, the flux is lower than without corruga-tions. The presence of the corrugations apparently results in a lower mean wall shear rateγwall, which leads to a lower steady-state flux Jss. The length-averaged flux 〈Jss〉 is how-ever higher in the system with membrane corrugations, suggesting that further research inthis direction would be worthwhile. Clearly, the suspension flow model presented in thisarticle can be a very helpful tool for these types of optimisations.
8.4 Conclusions
In this article, a new computer simulation model is proposed which enables the study ofconcentration polarisation behaviour and cake layer formation in crossflow microfiltra-

156 CHAPTER 8
tion systems. The new model solves the NS equations for the suspension flow togetherwith the convection-diffusion equation for the suspended particles and follows the Lat-tice Boltzmann method. Diffusion of the suspended particles takes place according to themechanism of shear-induced migration, which describes the migration of particles in asuspension in shear flow. The shear-induced migration velocity increases linearly withthe shear rate and is strongly concentration-dependent.
Upon application for simple crossflow systems, the new suspension flow model yieldsmore realistic results for the flux and cake layer profile than existing models. This isdue to the fact that the suspension flow model totally resolves the suspension flow andthe shear-induced diffusion behaviour of the suspended particles, including a time- andlocation-dependent shear rate, whereas the existing models normally assume a Poiseuilleflow profile and neglect axial transport between the bulk phase and the concentration po-larisation layer. In contrast to existing models, the new suspension flow model moreoveraccounts for pressure loss in the flow channel.
From comparison with results of the model of Romero and Davis [8], it became clearthat the more realistic approach of the suspension flow model is especially significant forthe calculation of the cake layer profile at the beginning and the end of the membrane.Also the effect of narrowing of the flow channel by cake formation on the suspensionflow pattern (at a constant pressure gradient over the flow channel) leads to a substantialimprovement of the predictions. In the situation of long membrane lengths and thin cakelayers, the solution of the suspension flow model converges to that of the model of Romeroand Davis.
The suspension flow model has a wider applicability than the existing models. Besidesthe use for simple crossflow systems, the suspension flow model allows for applicationin microfiltration systems with complex geometries and moving boundaries. In order toexemplify these possibilities, calculations are presented on systems with a discontinuousmembrane, with flow barriers and with corrugated membranes. From these examples,it became clear that this model can be a valuable tool for the design of microfiltrationmembranes, systems and processes.
List of symbols
Symbols Lattice Boltzmann method (in lattice units):a particle radiusci discrete velocity fluid particlescs,f speed of sound fluid particlescs,g speed of sound suspended particlesD diffusion coefficientF body forcefi (x, t) particle distribution function fluid particlesf ′i (x, t) post-colllisional distribution function
gi (x, t) particle distribution function suspended particlesj momentum densityp pressuret timeu flow velocity

SUSPENSION FLOW MODEL FOR CROSSFLOW MICROFILTRATION 157
x a particular node of the latticewi weight factor
Greek symbols:γ shear rateη dynamic viscosityν kinematic viscosityΠ momentum flux densityρ mass densityτf relaxation time fluid particlesτg relaxation time suspended particlesφ suspended particle volume fraction
Symbols system parameters:a radius of the suspended particles, mC constant in Eq. (8.23)D diffusion coefficient, m/sDh hydraulic diameter, mf friction factorH0 half-height of the channel, mHp height permeate side, mJ transmembrane flux, m/s〈J〉 length-averaged flux, m/sJ0 nominal transmembrane flux, m/sJss steady-state flux, m/sK coefficient in Eq. (8.21)L length of the flow channel, mL0 length from flow inlet until halfway membrane, mLm total membrane length, mp pressure, PaQ mass flow rate, m2/sRm membrane resistance, m−1
R′c specific cake resistance, m−2
Sc specific surface, m−1
TMP transmembrane pressure, Pau velocity, m/sU crossflow velocity, m/sU0 average nominal flow velocity, m/sUmax maximal flow velocity, m/sx dimensional distance along the filter, mxcr critical distance, m
Greek symbols:γ shear rate, s−1
γwall shear rate at the wall, s−1
γwall,0 nominal shear rate at the wall, s−1
δc thickness of the cake layer, m

158 CHAPTER 8
Figure 8.8: Steady-state flux as a function of position along the membrane for two differentmembranes: 1) a membrane with a total membrane length of 135 µm, which is divided intothree evenly distributed pore fields with a length of 33 µm and two solid walls with a lengthof 18 µm and 2) the same membrane but with flow barriers placed at the solid walls (seefigure above graph). The flow barriers had a triangular form, with a width of 9.9 µm at thebottom side to 0.3 µm at the top side. The height was 2.7 µm. Three flow barriers wereplaced in total, each with the center at a distance of 9 µm after a piece of membrane. Alsoindicated is the length-averaged steady-state flux for both situations. The figure on top showsthe concentration distribution and the flow field for the membrane with flow barriers (settingsas in 8.6). Other system parameters as in figure 8.1.
δm thickness of the membrane, mεc porosity of the cakeη0 viscosity of the particle free medium, Pa sηb viscosity in the bulk of the suspension, Pa sρ fluid density, kg/m3
φ particle volume fractionφb particle volume fraction in bulk suspension

SUSPENSION FLOW MODEL FOR CROSSFLOW MICROFILTRATION 159
Figure 8.9: Steady-state flux as a function of position along the membrane for two differentmembranes: 1) a membrane with a total membrane length of 135 µm, which is divided intothree evenly distributed pore fields with a length of 33 µm and two solid walls with a lengthof 18 µm and 2) the same membrane but with a corrugated structure (see figure above graph).The corrugations consist of triangular pieces of membrane which are put on top of the porefields. The triangular pieces had a width of 24.3 µm at the bottom side to 0.3 µm at thetop side. The height was 2.7 µm. Three triangular pieces were placed in total, each with thecenter at a distance of 16.5 µm from the beginning of a pore field. Also indicated is the length-averaged steady-state flux for both situations. The figure on top shows the concentrationdistribution and the flow field for the membrane with corrugations (settings as in 8.6, but theheight is 20.2 µm). Other system parameters as in figure 8.1.

160 CHAPTER 8
Acknowledgements
Friesland Foods is greatly acknowledged for supporting this research. The authors wouldlike to acknowledge the support of the Dutch Ministries of Economic Affairs, Education,Culture and Sciences and of Housing, Spatial Planning and the Environment through agrant of the Dutch Program Economy, Ecology and Technology.

9
References

162 CHAPTER 9
[1] C.J. King, Separation processes, McGraw-Hill, New York, 1971, 26-31.
[2] R.W. Rousseau (Ed.), Handbook of separation process technology, John WileySons, 1971.
[3] G. Brans, C.G.P.H. Schroen, R.G.M. van der Sman, R.M. Boom, Membrane frac-tionation of milk: state of the art and challenges, J. Membr. Sci. 243, 2004, 263-272.
[4] M.C. Porter, Ultrafiltration of colloidal suspensions, In: Recent advances in separa-tion techniques, AIChE Symp. Ser. No. 120, 1972, 21-30.
[5] G. Green, G. Belfort, Fouling of ultrafiltration membranes: lateral migration and theparticle trajectory model, Desalination 35, 1980, 129-147.
[6] D.A. Drew, J.A. Schonberg, G. Belfort, Lateral inertial migration of a small spherein fast laminar flow through a membrane duct, Chem. Eng. Sci. 46, 1991, 3219-3224.
[7] R.H. Davis, D.T. Leighton, Shear-induced transport of a particle layer along a porouswall, Chem. Eng.Sci. 42, 1987, 275-281.
[8] C.A. Romero, R.H. Davis, Global model of crossflow microfiltration based on hy-drodynamic particle diffusion, J. Membr. Sci. 39, 1988, 157-185.
[9] C.A. Romero, R.H. Davis, Transient model of crossflow microfiltration, Chem. Eng.Sci. 45, 1990, 13-25.
[10] G. Belfort, R.H. Davis, A.L. Zydney, The behavior of suspensions and macromolec-ular solutions in crossflow microfiltration, J. Membr. Sci. 96, 1994, 1-58.
[11] A.G. Fane, C.J.D. Fell, M.T. Nor, Ultrafiltration in the presence of suspended matter,In: Ind. Chem. Eng. Jubilee Symp. 73, 1982, C1-C12.
[12] R.G. Gutman, The design of membrane separation plant: Part 2 - Fouling of ROmembranes, The Chemical Engineer 322, 1977, 521-523.
[13] H. Ebner, Die kontinuerliche Microfiltration von Essig, Chem. Ing. Tech. 53, 1981,25-31.
[14] E.C. Eckstein, D.G. Bailey, A.H. Shapiro, Self-diffusion of particles in shear flowof a suspension, J. Fluid Mech. 79 (1), 1977, 191-208.
[15] D. Leighton, A. Acrivos, The shear-induced migration of particles in concentratedsuspensions, J. Fluid Mech. 181, 1987, 415-439.
[16] R.J. Phillips, R.C. Armstrong, R.A. Brown, A.L. Graham, J.R. Abbott, A constitu-tive equation for concentrated suspensions that accounts for shear-induced particlemigration, Phys. Fluids A 4, 1992, 30-40.
[17] V. Breedveld, D. van den Ende, A. Tripathi, A.A. Acrivos, The measurement of theshear-induced particle and fluid tracer diffusivities in concentrated suspensions by anovel method, J. Fluid Mech. 375, 1998, 297-318.
[18] V. Breedveld, D. van den Ende, M. Bosscher, R.J.J. Jongschaap, J. Mellema, Mea-suring shear-induced self-diffusion in a counterrotating geometry, Phys. Rev. E 63(021403), 2001, 1-10.
[19] V. Breedveld, D. van den Ende, M. Bosscher, R.J.J. Jongschaap, J. Mellema, Mea-surement of the full shear-induced self-diffusion tensor of noncolloidal suspensions,J. Chem. Phys. 116, 2002, 10529-10535.

REFERENCES 163
[20] A. Acrivos, G.K. Batchelor, E.J. Hinch, D.L. Koch, R. Mauri, Longitudinal shear-induced diffusion of spheres in a dilute suspension, J. Fluid Mech. 240, 1992, 651-657.
[21] F.R. Da Cunha, E.J. Hinch, Shear-induced dispersion in a dilute suspension of roughspheres, J. Fluid Mech. 309, 1996, 211-223.
[22] Y. Wang, R. Mauri, A. Acrivos, The transverse shear-induced liquid and particletracer diffusivities of a dilute suspension of spheres undergoing a simple shear flow,J. Fluid Mech. 327, 1996, 255-272.
[23] Y. Wang, R. Mauri, A. Acrivos, Transverse shear-induced gradient diffusivity of adilute suspension of spheres, J. Fluid Mech. 357, 1998, 279-287.
[24] J.F. Morris, J.F. Brady, Self-diffusion in sheared suspensions, J. Fluid Mech. 312,1996, 223-252.
[25] M. Marchioro, A. Acrivos, Shear-induced particle diffusivities from numerical sim-ulations. J. Fluid Mech. 443, 2001, 101-128.
[26] G. Drazer, J. Koplik, B. Khusid, A. Acrivos, Deterministic and stochastic behaviourof non-Brownian spheres in sheared suspensions, J. Fluid Mech. 460, 2002, 307-335.
[27] A. Sierou, J.F. Brady, Shear-induced self-diffusion in non-colloidal suspensions, J.Fluid Mech. 506, 2004, 285-314.
[28] A.M. Leshansky, J.F. Brady, Dynamic structure factor study of diffusion in stronglysheared suspensions, J. Fluid Mech. 527, 2005, 141-169.
[29] A.J.C. Ladd, Numerical simulations of particulate suspensions via a discretizedBoltzmann equation. Part 1. Theoretical foundation, J. Fluid Mech. 271, 1994, 285-309.
[30] A.J.C. Ladd, Numerical simulations of particulate suspensions via a discretizedBoltzmann equation. Part 2. Numerical results, J. Fluid Mech. 271, 1994, 311-339.
[31] C.J.M. van Rijn, M.C. Elwenspoek, Micro filtration membrane sieve with siliconmicro machining for industrial and biomedical applications, Proc. IEEE 1995, 83-87.
[32] A. Komnik, J. Harting, Transport phenomena and structuring in shear flow of sus-pensions near solid walls, Cond. Mat. 0408029, 2004, 1-13.
[33] A.J.C. Ladd, R. Verberg, Lattice-Boltzmann simulations of particle-fluid suspen-sions, J. Stat. Phys. 104 (5/6), 2001, 1191-1251.
[34] S. Succi, The Lattice Boltzmann equation for fluid dynamics and beyond, OxfordUniversity Press, New York, 2001.
[35] S. Chapman, T.G. Cowling, The mathematical theory of non-uniform gases, Cam-bridge University Press, 1960.
[36] U. Frisch, B. Hasslacher, Y. Pomeau, Lattice-gas automata for the Navier-Stokesequation, Phys. Rev. Lett. 56 (14), 1986, 1505-1508.
[37] Y.H. Qian, D. d’Humieres, P. Lallemand, Lattice BGK models for the Navier-Stokesequation, Europhys. Lett. 17, 1992, 479-484.
164 CHAPTER 9
[38] O. Behrend, Solid-fluid boundaries in particle suspension simulations via the latticeBoltzmann method, Phys. Rev. E 52 (1), 1995, 1164-1175.
[39] J. Kromkamp, D.T.M. van den Ende, D. Kandhai, R.G.M. van der Sman, R.M.Boom, Shear-induced self-diffusion and microstructure in non-Brownian suspen-sions at non-zero Reynolds numbers, J. Fluid Mech. 529, 2005, 253-278.
[40] N.-Q. Nguyen, A.J.C. Ladd, Lubrication corrections for Lattice-Boltzmann simula-tions of particle suspensions, Phys. Rev. E 66 (046708), 2002, 1-12.
[41] R.C. Ball, J.R. Melrose, Lubrication breakdown in hydrodynamic simulations ofconcentrated colloids, Adv. Coll. Int. Sci. 59, 1995, 19-30.
[42] H. Nirschl, H.A. Dwyer, V. Denk, Three-dimensional calculations of the simpleshear flow around a single particle between two moving walls, J. Fluid Mech. 283,1995, 273-285.
[43] G.I. Taylor, The viscosity of a fluid containing small drops of another fluid, Proc. R.Soc. Lond. A 138 (834), 1932, 41-48.
[44] G.K. Batchelor, J.T. Green, The hydrodynamic interaction of two small freely-moving spheres in a linear flow field, J. Fluid Mech. 56 (2), 1972, 375-400.
[45] N.A. Frankel, A. Acrivos, On the viscosity of a concentrated suspension of solidspheres, Chem. Eng. Sci. 22, 1967, 847-853.
[46] I.M. Krieger, Rheology of monodisperse lattices, Adv. Coll. Int. Sci. 3, 1972, 111-136. I.M. Krieger, T.J. Dougherty, A mechanism for non-Newtonian flow in suspen-sions of rigid spheres, Trans. Soc. Rheol. 3, 1959, 137-152.
[47] A. Shakib-Manesh, P. Raiskinmki, A. Koponen, M. Kataja, J. Timonen, Shear stressin a Couette flow of liquid-particle suspensions, J. Stat. Phys. 107 (1/2), 2002, 67-84.
[48] M.W. Heemels, M.H.J. Hagen, C.P. Lowe, Simulating solid colloidal particles usingthe Lattice-Boltzmann method, J. Comp. Phys. 164, 2000, 48-61.
[49] R.S. Farr, J.R. Melrose, R.C. Ball, Kinetic theory of jamming in hard-sphere startupflows, Phys. Rev. E 55 (6), 1997, 7203-7211.
[50] L.V.A. Breedveld, Shear-induced self-diffusion in concentrated suspensions, Ph.D.thesis University of Twente, The Netherlands, 2000.
[51] B.K. Chapman, D.T. Leighton, Dynamic viscous resuspension, Int. J. MultiphaseFlow 17 (4), 1991, 469-483.
[52] M.K. Lyon, L.G. Leal, An experimental study of the motion of concentrated sus-pensions in two-dimensional channel flow. Part 1. Monodisperse systems, J. FluidMech. 363, 1998, 25-56.
[53] J.F. Brady, J.F. Morris, Microstructure of strongly sheared suspensions and its im-pact on rheology and diffusion, J. Fluid Mech. 348, 1997, 103-139.
[54] Y. Yurkovetsky, I. Statistical mechanics of bubbly liquids; II. Behavior of shearedsuspensions of non-Brownian particles, Dissertation Californian Institute of Tech-nology, United States of America, 1998.
[55] D.R. Foss, J.F. Brady, Self-diffusion in sheared suspensions by dynamic simulation,J. Fluid Mech. 401, 1999, 243-274.

REFERENCES 165
[56] A. Sierou, J.F. Brady, Accelerated Stokesian Dynamics simulations, J. Fluid Mech.448, 2001, 115-146.
[57] P. Bhatnagar, E.P. Gross, M.K. Krook, Phys. Rev. 94 , 1954, 511-525.
[58] J. Feng, H.H. Hu, D.D. Joseph, Direct simulation of initial value problems for themotion of solid bodies in a Newtonian fluid. Part 2. Couette and Poiseuille flows, J.Fluid Mech. 277, 1994, 271-301.
[59] J. Feng, H.H. Hu, D.D. Joseph, Direct simulation of initial value problems for themotion of solid bodies in a Newtonian fluid. Part 1. Sedimentation, J. Fluid Mech.261, 1994, 95-134.
[60] C.K. Aidun, Y. Lu, Lattice Boltzmann simulation of solid particles suspended influid. J. Stat. Phys. 81 (1/2), 1995, 49-61.
[61] J.F. Brady, G. Bossis, The rheology of concentrated suspensions of spheres in simpleshear flow by numerical simulation, J. Fluid Mech. 155, 1985, 105-129.
[62] R.L. Hoffman, Explanations for the cause of shear thickening in concentrated col-loidal suspensions, J. Rheol. 42, 1998, 111-123.
[63] M.D. Haw, W.C.K. Poon, P.N. Pusey, Structure factors from cluster-cluster aggrega-tion simulation at high concentration, Physica A 208, 1994, 8-17.
[64] D.T. Leighton, A.A. Acrivos, Viscous resuspension, Chem. Eng. Sci. 41(6), 1986,1377-1384.
[65] G.P. Krishnan, S. Beimfohr, D.T. Leighton, Shear-induced radial segregation inbidisperse suspensions, J. Fluid Mech. 321, 1996, 371-393.
[66] K. Hofler, S. Schwarzer, B. Wachmann, Simulation of hindered settling in bidispersesuspensions of rigid spheres, Comp. Phys. Comm. 121-122, 1999, 268-269.
[67] G.P. Krishnan, D.T. Leighton, Dynamic viscous resuspension of bidisperse suspen-sions - I. Effective diffusivity, Int. J. Multiphase Flow 21(5), 1995, 721-732.
[68] M.K. Lyon, L.G. Leal, An experimental study of the motion of concentrated suspen-sions in two-dimensional channel flow. Part 2. Bidisperse systems, J. Fluid Mech.363, 1998, 57-77.
[69] A.W. Chow, R.D. Hamlin, Size segregation of concentrated, bidisperse and poly-disperse suspensions during tube drawing, IUTAM Symposium on HydrodynamicDiffusion of Suspended Particles, Estes Park, CO, 1995.
[70] D.M. Husband, L.A. Mondy, E. Ganani, A.L. Graham, Direct measurements ofshear-induced particle migration in suspensions of bimodal spheres, Rheol. Acta33, 1994, 185-192.
[71] A. Shauly, A. Wachs, A. Nir, Shear-induced particle migration in a polydisperseconcentrated suspension, J. Rheol. 42, 1998, 1329-1348.
[72] C. Chang, R.L. Powell, Dynamic simulation of bimodal suspensions of hydrody-namically interacting spherical particles, J. Fluid Mech. 253, 1993, 1-25.
[73] C. Chang, R.L. Powell, Effect of particle size distributions on the rheology of con-centrated bimodal suspensions, J. Rheol. 38(1), 1994, 85-98.

166 CHAPTER 9
[74] A.P. Shapiro, R.F. Probstein, Random packings of spheres and fluidity limits ofmonodisperse and bidisperse suspensions, Phys. Rev. Lett. 68, 1992, 1422-1425.
[75] R.F. Probstein, M.Z. Sengun, T.-C. Tseng, Bimodal model of concentrated suspen-sion viscosity for distributed particle sizes, J. Rheol. 38, 1994, 811-829.
[76] J.S. Chong, E.B. Christiansen, A.D. Baer, Rheology of concentrated suspensions, J.Appl. Polym. Sci. 15, 1971, 2007-2021.
[77] G. Bossis, J.F. Brady, The rheology of Brownian suspensions, J. Chem. Phys. 91,1989, 1866-1874.
[78] Kromkamp, J., D. Kandhai, R.G.M. van der Sman, R.M. Boom, Lattice Boltzmannsimulation of 2D and 3D non-Brownian suspensions in Couette flow, Submitted forpublication.
[79] G. Daufin, J.-P. Escudier, H. Carrre, S. Brot, L. Fillaudeau, M. Decloux, Recent andemerging applications of membrane processes in the food and dairy industry, TransIChemE 79, 2001, 89-102.
[80] D.T. Leighton, A.A. Acrivos, Measurement of the shear-induced coefficient of self-diffusion in concentrated dispersions of spheres, J. Fluid Mech. 177, 1987, 109-131.
[81] R.H. Davis, J.D. Sherwood, A similarity solution for steady-state crossflow micro-filtration, Chem. Eng. Science 45, 1990, 3203-3209.
[82] H. Bechhold, Kolloidstudien mit der Filtrationsmethode, Z. Phys. Chem. 60, 1907,257-318.
[83] P. Bacchin, P. Aimar, V. Sanchez, Model for colloidal fouling of membranes, AIChEJournal 41, 1995, 368-376.
[84] N.N. Kramadhati, M. Mondor, C. Moresoli, Evaluation of the shear-induced diffu-sion model for the microfiltration of polydisperse feed suspension, Sep. Pur. Techn.27, 2002, 11-24.
[85] J. Kromkamp, M. Domselaar, K. Schroen, R. van der Sman, R. Boom, Shear-induced diffusion model for microfiltration of polydisperse suspensions, Desalina-tion 146, 2002, 63-68.
[86] S. Chellam, M.R. Wiesner, Evaluation of crossflow filtration models based on shear-induced diffusion and particle adhesion: Complications induced by feed suspensionpolydispersivity, J. Membr. Sci. 138, 1998, 83-97.
[87] H. Li, A.G. Fane, H.G.L. Coster, S. Vigneswaran, Direct observation of particledeposition on the membrane surface during crossflow microfiltration, J. Membr. Sci.149, 1998, 83-97.
[88] A. Ould-Dris, M.Y. Jaffrin, D. Si-Hassen, Y. Neggaz, Effect of cake thickness andparticle polydispersity on prediction of permeate flux in microfiltration of particulatesuspensions by a hydrodynamic diffusion model, J. Membr. Sci. 164, 2000, 211-227.
[89] S. Kim, S.-H. Cho, H. Park, Effects of particle size distribution on the cake formationin crossflow microfiltration, Water Sci. Techn.: Water supply 2, 2002, 305-311.
[90] R.M. Sandblom (Alfa-Laval), Filtering Process, Swedish Pat. 7416257, 1974.

REFERENCES 167
[91] H. Goudedranche, J.L. Maubois, J. Fauquant, Produits, en particulier laitiers, com-prenant des fractions selectionne es de globules gras, obtention et applications,Brevet FR. 2.776.208.-A1, 1998.
[92] J.-L. Maubois, New applications of membrane technology in the dairy industry, Aus.J. Dairy Technol. 46, 1991, 91-95.
[93] C.-C. Ho, A.L. Zydney, Effect of membrane morphology on the initial rate of proteinfouling during microfiltration, J. Membr. Sci. 155, 1999, 261-275.
[94] C.-C. Ho, A.L. Zydney, A combined pore blockage and cake filtration model forprotein fouling during microfiltration, J. Coll. Int. Sci. 232, 2000, 389-399.
[95] M. Hlavacek, F. Bouchet, Constant flowrate blocking laws and an example of theirapplication to dead-end microfiltration of protein solutions, J. Membr. Sci. 82, 1993,285-295.
[96] E.M. Tracey, R.H. Davis, Protein fouling of track-etched polycarbonate microfiltra-tion membranes, J. Coll. Int. Sci. 167, 1994, 104-106.
[97] C. Guell, R.H. Davis, Membrane fouling during microfiltration of protein mixtures,J. Membr. Sci. 119, 1996, 269-284.
[98] T.C. Arnot, R.W. Field, A.B. Koltuniewicz, Cross-flow and dead-end microfiltra-tion of oily-water emulsions. Part II. Mechanisms and modelling of flux decline, J.Membr. Sci. 169, 2000, 1-15.
[99] J. Hermia, Constant pressure blocking filtration laws—application to power law non-Newtonian flows, Trans. Inst. Chem. Eng. 60, 1982, 183-187.
[100] A. Flippov, V.M. Starov, D.R. Lloyd, S. Chakravarti, S. Glaser, Sieve mechanismof microfiltration, J. Membr. Sci. 89, 1994, 199-213.
[101] D.E. Smiles, J.M. Kirby, Aspects of one-dimensional filtration, Sep. Sci. Technol.22, 1987, 1405-1423.
[102] J.R. Philip, D.E. Smiles, Macroscopic analysis of the behaviour of colloidal sus-pensions, Adv. Coll. Int. Sci. 17, 1982, 83-103.
[103] D.E. Smiles, P.A.C. Raats, J.H. Knight, Constant pressure filtration: The effect ofa filter membrane, Chem. Eng. Sci. 37, 1982, 707-714.
[104] P. Walstra, T.J. Geurts, A. Noomen, A. Jellema, M.A.J.S. van Boekel, Dairy Tech-nology: Principles of milk properties and processes, Marcel Dekker, New York,1999.
[105] R. H. Davis, D.C. Grant, Theory for deadend microfiltration, In: Membrane Hand-book, W.S. Ho, K. Sirkar (Ed.), Van Nostrand Reinhold, New York, 1992.
[106] D.M.E. Thies-Weesie, A.P. Philipse, Liquid permeation of bidisperse colloidalhard-sphere packings and the Kozeny-Carman scaling relation, J. Coll. Int. Sci. 162,1994, 470-480.
[107] S. Kosvintsev, R.G. Holdich, I.W. Cumming, V.M. Starov, Modelling of dead-endmicrofiltration with pore blocking and cake formation, J. Membr. Sci. 208, 2002,181-192.

168 CHAPTER 9
[108] R.W. Hartel, K.E. Kaylegian, Advances in milk fat fractionation, In: Crystallizationprocesses in fats and lipid systems, N. Garti, K. Sato (Ed.), Marcel Dekker, NewYork, 2001.
[109] P. Walstra, R. Jenness, Dairy chemistry and physics, Wiley, New York, 1984.
[110] A.L. Zydney, C.K. Colton, A concentration polarization model for the filtrate fluxin cross-flow microfiltration of particulate suspensions, Chem. Eng. Comm. 47,1986, 1-21.
[111] N. Pelekasis, A convection-shear induced resuspension model for crossflow micro-filtration, Chem. Eng. Sci. 53, 1998, 3469-3481.
[112] D.E. Wiley, D.F. Fletcher, Techniques for computational fluid dynamics modellingof flow in membrane channels, J. Membr. Sci. 211, 2003, 127-137.
[113] C.J. Richardson, V. Nassehi, Finite element modelling of concentration profiles inflow domains with curved porous boundaries, Chem. Eng. Sci. 58, 2003, 2491-2503.
[114] X. He, S. Chen, G.D. Doolen, A novel thermal model for the Lattice Boltzmannmethod in incompressible limit, J. Comp. Phys. 146, 1998, 282-300.
[115] S. Hou, J. Sterling, S. Chen, G.D. Doolen, A Lattice Boltzmann subgrid model forhigh Reynolds number flows, Fields Inst. Commun. 6, 1996, 151-166.
[116] R.G.M. van der Sman, M.H. Ernst, Convection-diffusion lattice Boltzmann schemefor irregular lattices, J. Comp. Phys. 160, 2000, 766-782.
[117] Q. Zou, X. He, On pressure and velocity flow boundary conditions for the latticeBoltzmann BGK model, Phys. Fluids 9, 1997, 1591-1598.
[118] S. Kuiper, R. Brink, W. Nijdam, G.J.M. Krijnen, M.C. Elwenspoek, Ceramic mi-crosieves: influence of perforation shape and distribution on flow resistance andmembrane strength, J. Membr. Sci. 196, 2002, 149-157.
[119] K. Scott, A.J. Mahmood, R.J. Jachuck, B. Hu, Intensified membrane filtration withcorrugated membranes, J. Membr. Sci. 173, 2000, 1-16.

Summary
Microfiltration (MF) is a process that is used for the separation or fractionation of par-ticles (0.02-20 µm) in a suspension. A suspension is pressed through a MF membrane;larger particles are retained by the membrane and a size-selective separation is obtained,which can be applied for e.g. water treatment and the manufacture of many products inbiotechnological, food and medical applications.
In general, accumulation and deposition of retained particles in and onto the mem-brane, often referred to as concentration polarisation and cake layer formation respec-tively, severely limit the flux and selectivity of MF processes. This is especially the casefor MF of complex suspensions such as milk, which contains a high volume fraction ofdispersed matter (± 15%) with a broad particle size distribution (1 nm - 20 µm). In thisthesis, factors affecting the flux and selectivity of MF processes for milk separation arestudied on various levels of detail. The initial focus was at a microscopic scale by study-ing suspension flow at conditions relevant to MF (Chapter 2, 3 and 4) and then graduallyshifted to a macroscopic scale, studying the filtration behaviour of complex suspensions(Chapter 5, 6 and 7), for which a computer simulation model was developed to supportthe design of MF processes (Chapter 8).
In Chapter 2, a computer simulation model for suspension flow is presented, basedon the Lattice Boltzmann (LB) method. With this model, the flow behaviour of two-dimensional (2D) and three-dimensional (3D) suspensions in Couette systems are com-pared. Scaling relations were found for the translation of 2D computer simulation resultsto 3D real systems therewith reducing the computational effort considerably.
Chapter 3 discusses the effect of non-zero Reynolds numbers on Couette flow of 2Dsuspensions. Shear-induced diffusion, a diffusion mechanism that reduces concentrationpolarisation and cake layer formation in cross-flow MF systems, is found to increase withthe Reynolds number. A similar effect is found for the suspension viscosity. These effectscorrelated with the occurrence of particle clustering in the suspensions, which can notonly be achieved by increasing the Reynolds number but also by increasing the attractionbetween particles.
Shear-induced diffusion in suspensions with a bimodal particle size distribution isdescribed in Chapter 4, as studied by computer simulations with the LB method. Inmonodisperse suspensions, shear-induced diffusivity scales with the squared particle ra-dius, which stresses the importance of particle size. In bidisperse suspensions, the largerparticles behave as “master particles” when they are present in a sufficient amount: theshear-induced diffusivity is totally determined by these larger particles. The smaller“slave particles” acquire a shear-induced diffusivity similar to the large particles, butlarger than in the respective monodisperse suspension (equal total volume fraction, sameparticle size). Moreover, it is found that the larger particles can enhance the effects ofnon-zero Reynolds number as found in Chapter 3, since these particles experience a larger

170 SUMMARY
shear intensity. The results clearly demonstrate that the particle size distribution affectsthe shear-induced diffusion coefficients of the individual particles in the suspension.
Chapter 5 reports on an experimental study on the steady-state flux in cross-flow MFof latex suspensions with a bimodal size distribution. For monodisperse suspensions, thesteady-state flux is known to relate to a4/3, where a is the particle radius. In bidisperse sus-pensions with various concentration ratios of small to large particles but with a constanttotal volume fraction, it turned out that the steady-state flux is similar to the steady-stateflux of a monodisperse suspension of the small particles. The influence of the presenceof the large particles on the shear-induced diffusivity of the smaller particles could beexplained with a model for shear-induced particle migration of polydisperse suspensions,which is also relevant in practice.
In Chapter 6, the study of the MF behaviour of suspensions with a particle size dis-tribution is extended towards particle deposition onto the membrane, and towards par-ticle fractionation. In the transient flux regime, particle deposition is the net result oftransport of particles towards the membrane by the flux through the membrane and theback-transport of particles from the membrane towards the bulk phase by shear-induceddiffusion. By monitoring the particle deposition onto the membrane during MF by meansof Confocal Scanning Laser Microscopy, it was found that only the small particles in thebidisperse suspension deposit on the membrane. These results can be explained by the oc-currence of particle size segregation in the feed flow, which leads to an enrichment of thesmaller particles near the membrane. The findings are also shown to be relevant to parti-cle fractionation processes by MF as was demonstrated with the fractionation of milk fatglobules in milk. This polydisperse suspension could be fractionated using a membranehaving a pore size larger than the largest particles present. The separation characteris-tics of the process, such as particle size and fat content of the permeate, could be totallycontrolled by the cross-flow velocity and permeate flux. This demonstrates that the frac-tionation is not due to size exclusion by the membrane, but instead due to segregationeffects in the feed channel.
Some particle deposition is often inevitable in MF processes. For the purpose of pro-cess design, it is important to know the relevant properties of these deposition layers. Formany complex suspensions, these cannot be predicted easily. In Chapter 7, the proper-ties of particle deposition layers from micellar casein and milk fat globule suspensionsare studied. By following a differential approach, it was possible to evaluate the particledeposition layers during their formation in a dead-end filtration process. Both micellarcasein and milk fat globules were able to form layers with a very high hydrodynamicresistance. While the permeability of layers of micellar casein was independent of thepressure gradient applied, the layers of (liquid) milk fat globules were dependent on thepressure gradient. When the fat was partly crystallised, the compressibility was smaller,but the hydrodynamic resistance of the deposition layers was still very high, probablybecause of the occurrence of partial coalescence of the fat globules. The parameters iden-tified in this study are considered essential for the rational design of UF and MF processesof milk.
Process models that predict the flux and selectivity as a function of system and processparameters, are important tools in the design of MF processes. Chapter 8 presents a newlydeveloped MF model which predicts concentration polarisation and cake layer formation,and which is, unlike other MF models, suited for MF processes of complex suspensionsand in MF systems with complex membrane or module geometries or process conditions.

SUMMARY 171
The so-called suspension flow model is a computer simulation model, in which the hy-drodynamics and convection-diffusion are resolved simultaneously, using an Euler-Eulerapproach. This model, which is based on the LB method, allows the complete solution ofthe flow field (including calculation of the actual local shear rate) and the application of apressure gradient over the feed flow channel as well as over the membrane. The generalapplicability of the suspension flow model as a design tool for MF membranes, systemsand processes is demonstrated with computations on concentration polarisation and cakelayer formation in MF systems with complex geometries, such as feed flow channels withflow barriers and corrugated membranes. The suspension flow model is a practical toolfor the design of MF processes of complex suspensions such as milk.


Samenvatting
Microfiltratie (MF) is een proces dat wordt gebruikt om deeltjes (0.02-20 µm) in eensuspensie af te scheiden of te fractioneren. De suspensie wordt hierbij door een MFmembraan geperst; grotere deeltjes worden tegengehouden door het membraan, zodat eenscheiding op grootte wordt verkregen. Deze scheiding kan bijvoorbeeld worden ingezetvoor waterbehandeling en voor de vervaardiging van producten voor biotechnologische,voedings- en medische toepassing.
In het algemeen wordt de flux en selectiviteit van MF processen ernstig beperkt doorophoping en afzetting van de tegengehouden deeltjes aan en op het membraan, verschijn-selen die vaak aangeduid worden met respectievelijk concentratiepolarisatie en koeklaag-vorming. Dit treedt in het bijzonder op tijdens MF van suspensies met een complexesamenstelling, zoals melk, dat een hoge volumefractie aan gedispergeerd materiaal bevat(± 15%) met een brede grootteverdeling (1 nm - 20 µm). Dit proefschrift beschrijft eenonderzoek waarin op verschillende detailniveaus factoren zijn bestudeerd die de flux enselectiviteit van MF processen voor de scheiding van melk beinvloeden. Het begin vandit proefschrift focuseert op de microscopische schaal, met een studie van het stromings-gedrag van suspensies onder condities die relevant zijn voor MF (Hoofdstuk 2, 3 en 4),waarna de focus geleidelijk verschuift naar macroscopische schaal, met een studie vanhet filtratiegedrag van suspensies met een complexe samenstelling (Hoofdstuk 5, 6 en 7).Het laatste Hoofdstuk beschrijft een computersimulatiemodel dat is ontwikkeld om hetontwerp van MF processen te ondersteunen (Hoofdstuk 8).
In Hoofdstuk 2 wordt een computersimulatiemodel gepresenteerd, dat is gebaseerdop de Lattice Boltzmann (LB) methode. Aan de hand van dit model is een vergelijkinggemaakt tussen het stromingsgedrag van twee-dimensionale (2D) en drie-dimensionale(3D) suspensies in Couette systemen. Er zijn schalingsrelaties gevonden voor de vertalingvan 2D computersimulatie resultaten naar 3D reele systemen, waarmee de benodigdecomputercapaciteit voor het berekenen van het stromingsgedrag aanzienlijk gereduceerdkan worden.
Hoofdstuk 3 bediscussieert het effect van Reynolds getallen groter dan nul op Couettestroming van 2D suspensies. Shear-induced diffusie, een diffusiemechanisme dat con-centratiepolarisatie en koeklaagvorming in cross-flow MF systemen reduceert, bleek toete nemen met een toenemend Reynolds getal. Een vergelijkbare toename werd gevondenvoor de viscositeit van de suspensie. Deze effecten correleerden met het optreden vanclustering van deeltjes in de suspensie, hetgeen niet alleen optrad met een toename vanhet Reynolds getal maar ook met een toename van de attractie tussen deeltjes.
Shear-induced diffusie in suspensies met een bimodale deeltjesgrootteverdeling, be-studeerd door middel van computersimulaties met de LB methode, is beschreven in Hoofd-stuk 4. In monodisperse suspensies schaalt de shear-induced diffusiviteit met het kwadraatvan de deeltjesstraal. Het belang van de grootteverdeling wordt duidelijk in bidisperse

174 SAMENVATTING
suspensies, waar de grotere deeltjes, wanneer aanwezig in voldoende hoeveelheid, hungedrag volledig opleggen aan de kleinere deeltjes: de shear-induced diffusiviteit is danvolledig bepaald door deze grotere deeltjes. De kleinere deeltjes nemen een shear-induceddiffusiviteit aan die gelijk is aan die van de grotere deeltjes, en daardoor groter dan in eenmonodisperse suspensie van alleen de kleinere deeltjes (met gelijke totale volumefractie).De grotere deeltjes blijken bovendien de effecten van toenemende Reynolds getallen, zo-als gevonden in Hoofdstuk 3, te kunnen versterken, doordat deze deeltjes in een bidispersesuspensie een groter shear Reynolds getal ervaren dan de kleinere deeltjes. De resulta-ten tonen duidelijk aan dat de deeltjesgrootteverdeling van invloed is op de shear-induceddiffusiecoefficienten van de individuele deeltjes in de suspensie.
Hoofdstuk 5 doet verslag van een experimentele studie naar de steady-state flux tijdenscross-flow MF van latex suspensies met een bimodale grootteverdeling. Voor monodis-perse suspensies is het bekend dat de steady-state flux lineair schaalt met a4/3, waar agelijk is aan de deeltjesstraal. Voor bidisperse suspensies met verschillende concentratie-verhoudingen van kleine tot grote deeltjes, maar met een constante totale volumefractie,bleek de steady-state flux gelijk te zijn aan die van een monodisperse suspensie van alleende kleine deeltjes. De invloed van de aanwezigheid van grote deeltjes op de shear-induceddiffusiviteit van kleine deeltjes kon worden verklaard met een model voor polydispersesuspensies, dat shear-induced migratie van individuele deeltjes in een polydisperse sus-pensie beschrijft in aanwezigheid van een concentratie-gradient. Hiermee is een stapgemaakt naar de beschrijving van shear-induced diffusie gedrag zoals relevant voor MFvan polydisperse suspensies.
In Hoofdstuk 6 is de studie naar het MF gedrag van suspensies met een deeltjesgroot-teverdeling uitgebreid naar deeltjesdepositie op het membraan en deeltjesfractionering. Inhet dynamische flux regime is deeltjesdepositie het netto resultaat van enerzijds het trans-port van deeltjes naar het membraan, veroorzaakt door de flux door het membraan, enanderzijds het terugtransport van deeltjes vanaf het membraan naar de bulkfase, veroor-zaakt door shear-induced diffusie. Door de deeltjesdepositie op het membraan tijdens MFte volgen door middel van Confocal Scanning Laser Microscopie is gevonden dat alleende kleinere deeltjes van de bidisperse suspensie zich afzetten op het membraan. Deze re-sultaten kunnen worden verklaard met het optreden van deeltjessegregatie in de crossflow,gedreven door grootteverschillen tussen de deeltjes, die leidt tot een verrijking met klei-nere deeltjes van de suspensie bij het membraan. Met een studie naar de fractionering vanmelkvetbollen in melk is aangetoond dat de bovengenoemde resultaten ook relevant zijnvoor deeltjesfractioneringsprocessen middels MF. De polydisperse melkvetbolsuspensiekon worden gefractioneerd met gebruik van een membraan waarvan de poriegrootte gro-ter was dan de grootste deeltjes in de suspensie. De scheidingseigenschappen van hetproces, waaronder de deeltjesgrootte en het vetgehalte van het permeaat, kon volledig in-gesteld worden met de crossflow snelheid en de permeaatflux. Dit maakt duidelijk dat defractionering niet toegeschreven kan worden aan uitsluiting door het membraan op basisvan afmetingen, maar dat deze toegeschreven kan worden aan segregatie effecten in hetstromingskanaal.
Enige mate van deeltjesdepositie blijkt vaak onvermijdbaar in MF processen. In hetkader van procesontwerp is het belangrijk om de relevante eigenschappen van deze depo-sitielagen te kennen. In Hoofdstuk 7 zijn de eigenschappen van deeltjesdepositielagen vansuspensies van micellair caseine en melkvetbollen bestudeerd. Door een differentiele be-nadering te gebruiken was het mogelijk om de deeltjesdepositielagen te bestuderen tijdens

SAMENVATTING 175
hun vorming in een dead-end filtratieproces. Zowel micellair caseine als melkvetbollenvormden lagen met een zeer grote hydrodynamische weerstand. Terwijl de permeabili-teit van lagen van micellair caseine onafhankelijk was van de toegepaste drukgradient,vertoonden lagen van (vloeibare) melkvetbollen wel een afhankelijkheid van de druk-gradient. Wanneer het vet gedeeltelijk gekristalliseerd was, was de drukafhankelijkheid,en daarmee de compressibiliteit van de lagen, kleiner. De hydrodynamische weerstandvan de depositielagen was dan echter nog steeds zeer hoog, waarschijnlijk vanwege hetoptreden van partiele coalescentie van de vetbollen. De parameters die zijn vastgesteld indeze studie, zijn van belang voor het rationeel ontwerpen van UF en MF processen vanmelk.
Procesmodellen die de flux en selectiviteit voorspellen als functie van systeem en pro-ces parameters vormen belangrijke instrumenten voor het ontwerp van MF processen.Hoofdstuk 8 presenteert een nieuw ontwikkeld MF model, dat concentratiepolarisatie enkoeklaagvorming voorspelt en dat, in tegenstelling tot andere MF modellen, geschikt isvoor MF processen van complexe suspensies en voor MF systemen met complexe mem-braan of module geometrien of procescondities. Dit zogenoemde suspensie flow model iseen computersimulatie model, waarin de hydrodynamica en convectie-diffusie gelijktij-dig worden opgelost, gebruikmakend van een Euler-Euler benadering. Het model is geba-seerd op de LB methode en maakt het volledig oplossen van het stromingsveld mogelijk(inclusief het berekenen van de actuele lokale afschuifsnelheid) in aanwezigheid van eendrukgradient over zowel het crossflow kanaal als het membraan. De algemene toepas-baarheid van het suspensie flow model als een ontwerpinstrument voor MF membranen,systemen en processen is gedemonstreerd met berekeningen van concentratiepolarisatieen koeklaagvorming in MF systemen met complexe geometrien, zoals crossflow kanalenmet flow barrierres en gecorrugeerde membranen. Het suspensie flow model is daarmeeeen praktisch instrument voor het ontwerp van MF processen van complexe suspensieszoals melk.


Nawoord
Het nawoord: de plek om iedereen te bedanken die op enigerlei wijze heeft bijgedragenaan de totstandkoming van dit proefschrift. En dat zijn er veel! Allereerst wil ik mijnwerkgever Friesland Foods van harte bedanken dat zij mij de gelegenheid heeft gebodendit promotie-onderzoek uit te voeren. Voor mij betekende dit onderzoek een prachtigekans mijn kennis te verdiepen en uit te breiden, en daarbij tegelijk een optimale bijdrageaan innovatie binnen Friesland Foods te leveren.
Voor dit promotie-onderzoek ben ik op part-time basis gedetacheerd geweest bij de sectieProceskunde aan de Landbouwuniversiteit in Wageningen, waar ik begeleid werd doorRemko Boom, Karin Schroen (eerst nog even door Albert van der Padt, maar die beslootal snel collega bij Friesland Foods in Deventer te worden) en Ruud van der Sman. Al-lereerst wil ik Remko bedanken voor zijn enthousiaste en inspirerende begeleiding. Onzebesprekingen heb ik altijd als zeer prettig ervaren en ik ging altijd weer met nieuwe ideeenjouw deur uit. Karin, met veel plezier hebben we samen studenten begeleid bij hun af-studeeronderzoek. Bovendien werden mijn artikelen door jouw correcties zienderogensterker. Ruud heeft mij geintroduceerd in de wereld van computersimulaties, mijn groot-ste avontuur in mijn promotie-onderzoek. Dit is mij niet alleen erg goed bevallen, maarik heb er ook heel veel van geleerd. Ook jullie van harte bedankt!
Ook buiten de sectie Proceskunde zijn er een aantal mensen geweest die een belang-rijke rol hebben gespeeld. Allereerst wil ik Drona Kandhai (destijds) van het KramersLaboratorium voor Fysische Technologie van de TU Delft noemen. Drona, jij hebt jouwcomputercode voor Lattice Boltzmann simulaties aan suspensies ter beschikking gestelden mij daarin wegwijs gemaakt. Daarnaast heb jij mij geweldig geholpen door als klank-bord te fungeren voor mijn onderzoek op dit gebied. Dirk van den Ende van Science andTechnology van de UT Twente heeft mij een stuk verder gebracht op het gebied van de fy-sica van suspensies en met een analytisch model voor shear-induced diffusie. During mythesis, I have worked for a period of seven weeks at the University of Edinburgh, underthe terms of the European program for Training and Research on Advanced ComputingSystems. I was impressed by the large knowledge and research infrastructure at the De-partment of Physics and Astronomy and the Edinburgh Parallel Computing Centre, andacknowledging the pleasant supervision by Mike Cates and Kevin Stratford, I have learnta lot more of physics and computer science, and on top of that, thanks to the Burns supper,about Scottish traditional poetry and food (haggis, tatties and neeps with whiskey). Du-ring my stay in Edinburgh, I have shared a student flat with Fatima Lucas. Fatima, yourcompany was always very nice, not only in our flat, but also during our weekend trips inScotland and in our meetings with so many other people! Joost van Opheusden van deleerstoelgroep Wiskundige en Statistische Methoden van Wageningen Universiteit heeft

178 NAWOORD
me goed op weg geholpen met het analyseren van deeltjesaggregatie en microstructurenin suspensies. John Brady, due to your part-time professorship at the UT Twente, I had theunique opportunity to discuss my work with you on several occasions. These discussionshave been very interesting and clarifying for me, so I have really appreciated them.
Ook aan de studenten heb ik veel te danken. Mark, Jeroen, Rob, Annet, Jan, Nienke,Bieuwe, Frits, Sarah en Sylvia, het was een plezier met jullie samen te werken. Jullie heb-ben een belangrijke bijdrage geleverd, welke jullie in meer of mindere mate terug kunnenzien in de hoofdstukken 5 t/m 8. Andere mensen die een rechtstreekse bijdrage aan ditproefschrift hebben geleverd zijn Henk Streppel, Miriam Krijgsman en Anno Koning (al-len van Friesland Foods Corporate Research) en Harry Rollema (NIZO Food Research).En natuurlijk de mensen van de technische werkplaats van het Biotechnion van Wagenin-gen Universiteit, en in het bijzonder Hans, die heel wat ideeen in mooie meetopstellingenheeft omgezet. Mijn dank daarvoor!
Mijn onderzoek was onderdeel van een groot samenwerkingsproject, D-Force genaamd.Het projectteam, met mensen van verschillende expertise en achtergrond, kwam op re-gelmatige basis bij elkaar, wat meestal leidde tot levendige en interessante discussies.Meningsverschillen werden overbrugd of juist niet (computersjoemulaties!). Hoewel desamenwerking zowel ups als downs heeft gekend, vind ik dat er de afgelopen jaren veelis bereikt. Aan de basis van het D-Force project ligt de samenwerking tussen FrieslandFoods en Aquamarijn, met Cees van Rijn als de uitvinder van de microzeven. Cees, on-danks jouw initiele scepsis over de toepasbaarheid van microzeven voor melk, denk ikdat het nut van microzeven ondertussen meer dan bewezen is. Rolf, bedankt dat je alsprojectleider van het D-Force project mijn promotie-onderzoek altijd hebt ondersteund.Miriam en Gerben waren collega-promovendi binnen het D-Force project. Bedankt voorde fijne samenwerking en jullie vriendschap! Bij Friesland Foods voerden we ondertus-sen onderzoek aan microfiltratie van melk uit. En dat was weer heel andere koek danonderzoek aan keurige modelsystemen. Reinier, Bas, Henk, Frank, Albert, Kees, Gerriten Rolf, wat hebben we geploeterd met z’n allen, maar wat mogen we trots zijn op hetresultaat!
Voor mijn promotie-onderzoek is er een Friesland Foods begeleidingscommissie in hetleven geroepen, bestaande uit verschillende “kennisiconen”. Tjeerd, Geert, Albert, Hans,Ger, Evert en Tom, bedankt voor jullie betrokkenheid, opbouwende kritiek en ideeen.Tjeerd, jij bent altijd een belangrijke motor geweest achter het D-Force project en hebtdaarmee ook een onmisbare rol gespeeld in de totstandkoming van dit boekje. Rolf enAlbert, bedankt voor jullie inbreng in de bilaterale besprekingen. Daarnaast was er ookde Technology Circle “Separations” met collega’s van verschillende werkmaatschappijenvan Friesland Foods. Sytze, Gerard, Marc, Krin, Cor, Evert, Bert, Tjeerd en Albert, be-dankt voor jullie belangstelling voor het onderzoek en de goede besprekingen, ondermeerover de praktische toepassing van microfiltratie.
Door mijn part-time detachering bij de sectie Proceskunde kreeg ik opeens veel extra col-lega’s. En dat heeft veel voordelen. Pieter en Olivier, bedankt voor het aan de gang krijgenen houden van het rekencluster, Gerrit, bedankt voor het oplossen van computer- en net-werkproblemen, en Jos, voor de ondersteuning op het lab. Ik heb genoten van de AIO-reis

NAWOORD 179
naar Zuid-Afrika (hoewel wel erg kort voor mij) en vooral Canada, de verschillende feest-jes en borrels, wielrentochten in Belgie en Duitsland en natuurlijk de dagelijkse sfeer engein op de afdeling. Kamergenoten te over voor serieuze en minder serieuze kletspraatjes(in wat soms ook wel het kippenhok werd genoemd): Marieke, Rolf, Marcel, Nick, Hadi,Julita, Judy en Jan (die na zijn afstudeeronderzoek terugkwam als promovendus).
En dan natuurlijk het thuisfront. Allereerst de sportclubjes (wielrennen en korfbal), voorde broodnodige lichamelijke inspanning en geestelijke ontspanning! Familie en vrienden,bedankt voor de gezelligheid tijdens feestjes, etentjes, ski-vakanties, fietskampeerweek-enden en wat al niet meer. Lieve ouders en schoonouders, bedankt voor jullie onvoor-waardelijke liefde en steun. Mam, het was kantjeboord drie jaar geleden, maar ik ben blijdat je er nog bent en dat ik alles wat nu gebeurt met je kan delen!
Lieve George, bij niemand voel ik me zo thuis als bij jou! Je geloof in mij heeft megesterkt bij het uitvoeren van dit onderzoek. Hopelijk hebben we samen nog een mooietijd te gaan.


Curriculum vitae
Janneke Kromkamp werd geboren op 4 november 1965 in de zuid-Friese gemeente Oost-stellingwerf. In 1984 behaalde zij het Gymnasium-β diploma aan de Rijksscholenge-meenschap te Heerenveen. Daarna volgde zij de studie Levensmiddelentechnologie aande Agrarische Hogeschool Friesland in Bolsward. Deze studie werd in 1988 met goedgevolg afgerond.
Van 1 augustus 1988 tot 1 november 1997 was zij werkzaam bij NIZO te Ede, waarzij als onderzoeksmedewerkster achtereenvolgens werkzaam was op de gebieden bio-procestechnologie, membraanfiltratie en eiwittechnologie. Tijdens deze periode volgdezij in 1989 en 1990 de post-HBO cursus Bioprocestechnologie van de Stichting PHTOHogeschool Heerlen, die zij met lof afrondde. Van 1993 tot en met 1996 volgde ze destudie Levensmiddelentechnologie aan de Landbouwuniversiteit in Wageningen. In hetkader van haar afstudeervak (orientatie Zuivelkunde) voerde zij een onderzoek uit naar dedenaturatie van het eiwit β-lactoglobuline onder invloed van hoge isostatische druk. Injanuari 1997 slaagde zij met lof.
Sinds 1 november 1997 is ze werkzaam bij Friesland Foods Corporate Research inDeventer. Als researcher Process Technology voerde zij van 1 oktober 2000 tot 1 okto-ber 2004 het in dit proefschrift beschreven promotie-onderzoek uit. Dit onderzoek is totstand gekomen onder begeleiding van Prof. R.M. Boom, Dr. C.P.G.H. Schroen en Dr.R.G.M. van der Sman van de sectie Proceskunde van Wageningen Universiteit. Tijdenshet promotie-onderzoek was Janneke Kromkamp op part-time basis gedetacheerd in dezesectie.


List of publications
Articles
Timmer, J.M.K., Kromkamp, J., Robbertsen, T., Lactic acid separation from fermenta-tion broths by reverse osmosis and nanofiltration, J. Membr. Sci. 92 (1994) 185-197.
Timmer, J.M.K., Kromkamp, J., Efficiency of lactic acid production by Lactobacillushelveticus in a membrane cell recycle reactor, FEMS Microbiology Reviews 14 (1994)29-38.
Kromkamp, J., Moreira, R.M., Langeveld, L.P.M., Mil, P.J.J.M., Microorganisms in milkand yoghurt: selective inactivation by high hydrostatic pressure, In: Proceedings of theIDF Symposium Heat treatments and alternative methods, Vienna, 1995, 267-271.
Kromkamp, J., Domselaar, M. van, Schroen, K., Sman, R. van der, Boom, R., Shear-induced diffusion model for microfiltration of polydisperse suspensions, Desalination 146(2002) 63-68.
Kromkamp, J., Cross flow microfiltration of polydisperse suspensions: concentration po-larisation and shear-induced diffusion, In: Nano and micro engineered membrane tech-nology, 10, Rijn, C.J.M. van, Elsevier, 2004, ISNB 0-444-51489-9.
Kromkamp, J., Ende, D.T.M. van den, Kandhai, D., Sman, R.G.M. van der, Boom, R.M.,Shear-induced self-diffusion and microstructure in non-Brownian suspensions at non-zeroReynolds numbers, J. Fluid Mech. 529 (2005) 253-278.
Kromkamp, J., Bastiaanse, A., Swarts, J., Brans, G., Sman, R.G.M. van der, Boom, R.M.,A suspension flow model for hydrodynamics and concentration polarisation in crossflowmicrofiltration, J. Membr. Sci. 253 (2005) 67-79.
Kromkamp, J., Faber, F., Schroen, K., Boom, R., Effects of particle size segregation oncrossflow microfiltration performance: control mechanism for concentration polarisationand particle fractionation, accepted for publication by J. Membr. Sci.
Kromkamp, J., Rijnsent, S., Huttenhuis, R., Schroen, K., Boom, R., Differential anal-ysis of particle deposition layers from micellar casein and milk fat globule suspensions,submitted 2005.

184 LIST OF PUBLICATIONS
Kromkamp, J., Ende, D.T.M. van den, Kandhai, D., Sman, R.G.M. van der, Boom, R.M.,Lattice Boltzmann simulation of 2D and 3D non-Brownian suspensions in Couette flow,submitted 2005.
Kromkamp, J., Kandhai, D., Sman, R.G.M. van der, Boom, R.M., Shear-induced self-diffusion in bidisperse suspensions, submitted 2005.
Brans, G., Kromkamp, J., Pek, N., Gielen, J., Heck, J., Schroen, C.P.G.H., Sman, R.G.M.van der, Boom, R.M., Evaluation of microsieve membrane design with particle filtrationexperiments and lattice Boltzmann CFD calculations, submitted 2005.
Patents
Kromkamp, J., Rijn, C.J.M. van, Method for filtering milk, Patent WO 02/09527 (2002).
Kromkamp, J., Padt, A. van der, Vorst, C. van der, Inrichting en werkwijze voor micro-of ultrafiltratie, Patent P67278NL00 (2004).
Kromkamp, J., Padt, A. van der, Schroen, C.G.P.H., Boom, R.M., Shear-induced frac-tionation of suspensions, Patent application 04078536.2 (2004).