Studies of Cosmic Ray Composition and Air Shower Structure with the Pierre Auger Observatory
Upload
independentCategory
view
0download
0
32ND INTERNATIONAL COSMIC RAY CONFERENCE, BEIJING 2011
The Pierre Auger Observatory II: Studies of CosmicRay Composition and Hadronic Interaction models
THE PIERRE AUGER COLLABORATION
Observatorio Pierre Auger, Av. San Martın Norte 304, 5613 Malargue, Argentina
1 The distribution of shower maxima of UHECR air showerspresented by Pedro Facal San Luis 1
2 Measurement of Atmospheric Production Depths of muons with the Pierre Auger Observatorypresented by Diego Garcıa-Gamez 5
3 Measurements of the Longitudinal Development of Air Showers with the Pierre Auger Observatorypresented by Diego Garcia-Pinto 9
4 Estimate of the proton-air cross-section with the Pierre Auger Observatorypresented by Ralf Ulrich 13
5 Interpretation of the signals produced by showers from cosmic rays of 1019 eV observed in the surface
detectors of the Pierre Auger Observatorypresented by Jeff Allen 17
6 A new method for determining the primary energy from the calorimetric energy of showers observed inhybrid mode on a shower-by-shower basispresented by Analisa G. Mariazzi 21

32ND INTERNATIONAL COSMIC RAY CONFERENCE, BEIJING 2011
The Pierre Auger Collaboration
P. ABREU74 , M. AGLIETTA57, E.J. AHN93, I.F.M. ALBUQUERQUE19 , D. ALLARD33, I. ALLEKOTTE1,J. ALLEN96, P. ALLISON98, J. ALVAREZ CASTILLO67 , J. ALVAREZ-MUNIZ84, M. AMBROSIO50 , A. AMINAEI 68 ,L. A NCHORDOQUI109 , S. ANDRINGA74 , T. ANTICIC27 , A. ANZALONE56, C. ARAMO50 , E. ARGANDA81 ,F. ARQUEROS81 , H. ASOREY1 , P. ASSIS74 , J. AUBLIN35 , M. AVE41, M. AVENIER36, G. AVILA 12, T. BACKER45 ,M. BALZER40 , K.B. BARBER13 , A.F. BARBOSA16 , R. BARDENET34 , S.L.C. BARROSO22 , B. BAUGHMAN98 ,J. BAUML 39 , J.J. BEATTY98, B.R. BECKER106 , K.H. BECKER38 , A. BELLETOILE37, J.A. BELLIDO13,S. BENZVI108 , C. BERAT36, X. BERTOU1 , P.L. BIERMANN42 , P. BILLOIR35 , F. BLANCO81 , M. BLANCO82 ,C. BLEVE38, H. BLUMER41, 39, M. BOHACOVA29, 101 , D. BONCIOLI51 , C. BONIFAZI25, 35 , R. BONINO57 ,N. BORODAI72 , J. BRACK91 , P. BROGUEIRA74 , W.C. BROWN92 , R. BRUIJN87 , P. BUCHHOLZ45 , A. BUENO83 ,R.E. BURTON89 , K.S. CABALLERO-MORA99 , L. CARAMETE42, R. CARUSO52 , A. CASTELLINA57, O. CATALANO 56,G. CATALDI 49, L. CAZON74 , R. CESTER53, J. CHAUVIN 36 , S.H. CHENG99 , A. CHIAVASSA57 , J.A. CHINELLATO20,A. CHOU93, 96, J. CHUDOBA29 , R.W. CLAY 13 , M.R. COLUCCIA49 , R. CONCEICAO74 , F. CONTRERAS11 , H. COOK87 ,M.J. COOPER13 , J. COPPENS68, 70, A. CORDIER34 , U. COTTI66 , S. COUTU99 , C.E. COVAULT89 , A. CREUSOT33, 79,A. CRISS99 , J. CRONIN101 , A. CURUTIU42 , S. DAGORET-CAMPAGNE34 , R. DALLIER37, S. DASSO8, 4,K. DAUMILLER 39, B.R. DAWSON13, R.M. DE ALMEIDA 26, M. DE DOMENICO52 , C. DE DONATO67, 48, S.J. DE
JONG68, 70, G. DE LA VEGA10 , W.J.M. DE MELLO JUNIOR20 , J.R.T.DE MELLO NETO25, I. DE M ITRI49 , V. DE
SOUZA18 , K.D. DE VRIES69 , G. DECERPRIT33 , L. DEL PERAL82, O. DELIGNY32, H. DEMBINSKI41 , N. DHITAL 95,C. DI GIULIO47, 51, J.C. DIAZ95 , M.L. D IAZ CASTRO17 , P.N. DIEP110, C. DOBRIGKEIT 20, W. DOCTERS69 ,J.C. D’OLIVO67, P.N. DONG110, 32, A. DOROFEEV91 , J.C.DOS ANJOS16, M.T. DOVA7, D. D’URSO50 , I. DUTAN42,J. EBR29 , R. ENGEL39, M. ERDMANN43 , C.O. ESCOBAR20 , A. ETCHEGOYEN2, P. FACAL SAN LUIS101 , I. FAJARDO
TAPIA67 , H. FALCKE68, 71, G. FARRAR96 , A.C. FAUTH20, N. FAZZINI 93, A.P. FERGUSON89 , A. FERRERO2 ,B. FICK95 , A. FILEVICH2 , A. FILIPCIC78, 79, S. FLIESCHER43 , C.E. FRACCHIOLLA91 , E.D. FRAENKEL69,U. FROHLICH45 , B. FUCHS16 , R. GAIOR35 , R.F. GAMARRA2 , S. GAMBETTA46, B. GARCIA10 , D. GARCIA
GAMEZ83, D. GARCIA-PINTO81 , A. GASCON83 , H. GEMMEKE40, K. GESTERLING106, P.L. GHIA35, 57,U. GIACCARI49 , M. GILLER73, H. GLASS93 , M.S. GOLD106 , G. GOLUP1, F. GOMEZ ALBARRACIN7 , M. GOMEZ
BERISSO1 , P. GONCALVES74, D. GONZALEZ41, J.G. GONZALEZ41, B. GOOKIN91 , D. GORA41, 72, A. GORGI57 ,P. GOUFFON19 , S.R. GOZZINI87, E. GRASHORN98 , S. GREBE68, 70, N. GRIFFITH98 , M. GRIGAT43 , A.F. GRILLO58,Y. GUARDINCERRI4 , F. GUARINO50 , G.P. GUEDES21, A. GUZMAN67, J.D. HAGUE106, P. HANSEN7, D. HARARI1 ,S. HARMSMA69, 70, J.L. HARTON91, A. HAUNGS39 , T. HEBBEKER43 , D. HECK39 , A.E. HERVE13, C. HOJVAT93,N. HOLLON101, V.C. HOLMES13, P. HOMOLA72, J.R. HORANDEL68, A. HORNEFFER68 , M. HRABOVSKY30, 29,T. HUEGE39, A. INSOLIA52, F. IONITA101, A. ITALIANO 52, C. JARNE7 , S. JIRASKOVA68 , M. JOSEBACHUILI2 ,K. K ADIJA27 , K.-H. KAMPERT38, P. KARHAN28 , P. KASPER93 , B. KEGL34, B. KEILHAUER39 , A. KEIVANI 94 ,J.L. KELLEY68, E. KEMP20, R.M. KIECKHAFER95 , H.O. KLAGES39, M. KLEIFGES40, J. KLEINFELLER39,J. KNAPP87, D.-H. KOANG36, K. KOTERA101 , N. KROHM38 , O. KROMER40 , D. KRUPPKE-HANSEN38 ,F. KUEHN93 , D. KUEMPEL38, J.K. KULBARTZ44, N. KUNKA40, G. LA ROSA56 , C. LACHAUD33 , P. LAUTRIDOU37 ,M.S.A.B. LEAO24, D. LEBRUN36 , P. LEBRUN93 , M.A. L EIGUI DE OLIVEIRA 24 , A. LEMIERE32, A. LETESSIER-SELVON35 , I. LHENRY-YVON32, K. L INK41, R. LOPEZ63, A. LOPEZ AGUERA84 , K. LOUEDEC34 , J. LOZANO
BAHILO83 , A. LUCERO2, 57 , M. LUDWIG41 , H. LYBERIS32, M.C. MACCARONE56 , C. MACOLINO35 , S. MALDERA57,D. MANDAT29, P. MANTSCH93 , A.G. MARIAZZI 7 , J. MARIN11, 57, V. MARIN37 , I.C. MARIS35 , H.R. MARQUEZ
FALCON66 , G. MARSELLA54, D. MARTELLO49, L. MARTIN37 , H. MARTINEZ64, O. MARTINEZ BRAVO63 ,

H.J. MATHES39, J. MATTHEWS94, 100, J.A.J. MATTHEWS106, G. MATTHIAE51, D. MAURIZIO53 , P.O. MAZUR93,G. MEDINA-TANCO67 , M. MELISSAS41, D. MELO2, 53 , E. MENICHETTI53, A. MENSHIKOV40, P. MERTSCH85,C. MEURER43 , S. MI CANOVIC27 , M.I. M ICHELETTI9, W. MILLER106, L. M IRAMONTI48 , S. MOLLERACH1,M. M ONASOR101 , D. MONNIER RAGAIGNE34 , F. MONTANET36, B. MORALES67, C. MORELLO57, E. MORENO63,J.C. MORENO7 , C. MORRIS98 , M. MOSTAFA91, C.A. MOURA24, 50, S. MUELLER39, M.A. M ULLER20,G. MULLER43, M. M UNCHMEYER35, R. MUSSA53 , G. NAVARRA57 †, J.L. NAVARRO83 , S. NAVAS83 , P. NECESAL29,L. NELLEN67, A. NELLES68, 70, J. NEUSER38, P.T. NHUNG110, L. NIEMIETZ38, N. NIERSTENHOEFER38,D. NITZ95, D. NOSEK28, L. NOZKA29, M. NYKLICEK 29 , J. OEHLSCHLAGER39, A. OLINTO101, V.M. OLMOS-GILBAJA84 , M. ORTIZ81, N. PACHECO82 , D. PAKK SELMI -DEI20, M. PALATKA 29, J. PALLOTTA 3, N. PALMIERI 41 ,G. PARENTE84 , E. PARIZOT33 , A. PARRA84 , R.D. PARSONS87 , S. PASTOR80 , T. PAUL97 , M. PECH29 , J. PEKALA 72,R. PELAYO84 , I.M. PEPE23, L. PERRONE54 , R. PESCE46, E. PETERMANN105 , S. PETRERA47 , P. PETRINCA51 ,A. PETROLINI46 , Y. PETROV91, J. PETROVIC70 , C. PFENDNER108, N. PHAN106 , R. PIEGAIA4 , T. PIEROG39 ,P. PIERONI4 , M. PIMENTA74, V. PIRRONELLO52 , M. PLATINO2, V.H. PONCE1 , M. PONTZ45, P. PRIVITERA101 ,M. PROUZA29 , E.J. QUEL3, S. QUERCHFELD38 , J. RAUTENBERG38 , O. RAVEL37, D. RAVIGNANI 2 , B. REVENU37,J. RIDKY 29 , S. RIGGI84, 52, M. RISSE45 , P. RISTORI3 , H. RIVERA48 , V. RIZI47 , J. ROBERTS96 , C. ROBLEDO63 ,W. RODRIGUES DE CARVALHO84, 19, G. RODRIGUEZ84 , J. RODRIGUEZ MARTINO11, 52, J. RODRIGUEZ ROJO11 ,I. RODRIGUEZ-CABO84 , M.D. RODRIGUEZ-FRIAS82 , G. ROS82 , J. ROSADO81 , T. ROSSLER30 , M. ROTH39 ,B. ROUILL E-D’ORFEUIL101, E. ROULET1, A.C. ROVERO8 , C. RUHLE40 , F. SALAMIDA 47, 39, H. SALAZAR 63,G. SALINA 51 , F. SANCHEZ2 , M. SANTANDER11 , C.E. SANTO74, E. SANTOS74, E.M. SANTOS25 , F. SARAZIN90 ,B. SARKAR38 , S. SARKAR85 , R. SATO11, N. SCHARF43 , V. SCHERINI48 , H. SCHIELER39, P. SCHIFFER43 ,A. SCHMIDT40 , F. SCHMIDT101 , O. SCHOLTEN69, H. SCHOORLEMMER68, 70 , J. SCHOVANCOVA29 , P. SCHOVANEK29 ,F. SCHRODER39 , S. SCHULTE43, D. SCHUSTER90 , S.J. SCIUTTO7 , M. SCUDERI52 , A. SEGRETO56, M. SETTIMO45,A. SHADKAM 94 , R.C. SHELLARD16, 17, I. SIDELNIK 2 , G. SIGL44, H.H. SILVA LOPEZ67, A. SMIAŁKOWSKI 73 ,R. SMIDA39, 29, G.R. SNOW105 , P. SOMMERS99 , J. SOROKIN13 , H. SPINKA88, 93 , R. SQUARTINI11 , S. STANIC79 ,J. STAPLETON98, J. STASIELAK72, M. STEPHAN43, E. STRAZZERI56, A. STUTZ36, F. SUAREZ2 , T. SUOMIJARVI32 ,A.D. SUPANITSKY8, 67 , T. SUSA27 , M.S. SUTHERLAND94, 98, J. SWAIN97 , Z. SZADKOWSKI73 , M. SZUBA39,A. TAMASHIRO8 , A. TAPIA2, M. TARTARE36 , O. TASCAU38 , C.G. TAVERA RUIZ67 , R. TCACIUC45 ,D. TEGOLO52, 61, N.T. THAO110 , D. THOMAS91, J. TIFFENBERG4 , C. TIMMERMANS70, 68, D.K. TIWARI66 ,W. TKACZYK 73 , C.J. TODEROPEIXOTO18, 24, B. TOME74, A. TONACHINI53 , P. TRAVNICEK29 , D.B. TRIDAPALLI 19 ,G. TRISTRAM33 , E. TROVATO52, M. TUEROS84, 4, R. ULRICH99, 39 , M. UNGER39 , M. URBAN34 , J.F. VALD ES
GALICIA 67 , I. VALI NO84, 39 , L. VALORE50, A.M. VAN DEN BERG69, E. VARELA63 , B. VARGAS CARDENAS67 ,J.R. VAZQUEZ81, R.A. VAZQUEZ84, D. VEBERIC79, 78 , V. VERZI51, J. VICHA29 , M. V IDELA10, L. V ILLASENOR66,H. WAHLBERG7 , P. WAHRLICH13 , O. WAINBERG2 , D. WALZ43, D. WARNER91 , A.A. WATSON87, M. WEBER40 ,K. WEIDENHAUPT43 , A. WEINDL39 , S. WESTERHOFF108 , B.J. WHELAN13, G. WIECZOREK73 , L. WIENCKE90 ,B. WILCZY NSKA72 , H. WILCZY NSKI72 , M. WILL 39, C. WILLIAMS 101 , T. WINCHEN43 , L. WINDERS109 ,M.G. WINNICK13 , M. WOMMER39 , B. WUNDHEILER2 , T. YAMAMOTO101 a, T. YAPICI95 , P. YOUNK45 , G. YUAN94 ,A. Y USHKOV84, 50 , B. ZAMORANO83 , E. ZAS84, D. ZAVRTANIK 79, 78, M. ZAVRTANIK 78, 79, I. ZAW96, A. ZEPEDA64,M. Z IMBRES-SILVA 20, 38 M. Z IOLKOWSKI45
1 Centro Atomico Bariloche and Instituto Balseiro (CNEA- UNCuyo-CONICET), San Carlos de Bariloche, Argentina2 Centro Atomico Constituyentes (Comision Nacional de Energıa Atomica/CONICET/UTN-FRBA), Buenos Aires,Argentina3 Centro de Investigaciones en Laseres y Aplicaciones, CITEFA and CONICET, Argentina4 Departamento de Fısica, FCEyN, Universidad de Buenos Aires y CONICET, Argentina7 IFLP, Universidad Nacional de La Plata and CONICET, La Plata, Argentina8 Instituto de Astronomıa y Fısica del Espacio (CONICET- UBA), Buenos Aires, Argentina9 Instituto de Fısica de Rosario (IFIR) - CONICET/U.N.R. and Facultad de Ciencias Bioquımicas y FarmaceuticasU.N.R., Rosario, Argentina10 National Technological University, Faculty Mendoza (CONICET/CNEA), Mendoza, Argentina11 Observatorio Pierre Auger, Malargue, Argentina12 Observatorio Pierre Auger and Comision Nacional de Energıa Atomica, Malargue, Argentina13 University of Adelaide, Adelaide, S.A., Australia16 Centro Brasileiro de Pesquisas Fisicas, Rio de Janeiro, RJ,Brazil17 Pontifıcia Universidade Catolica, Rio de Janeiro, RJ, Brazil
32ND INTERNATIONAL COSMIC RAY CONFERENCE, BEIJING 2011
18 Universidade de Sao Paulo, Instituto de Fısica, Sao Carlos, SP, Brazil19 Universidade de Sao Paulo, Instituto de Fısica, Sao Paulo, SP, Brazil20 Universidade Estadual de Campinas, IFGW, Campinas, SP, Brazil21 Universidade Estadual de Feira de Santana, Brazil22 Universidade Estadual do Sudoeste da Bahia, Vitoria da Conquista, BA, Brazil23 Universidade Federal da Bahia, Salvador, BA, Brazil24 Universidade Federal do ABC, Santo Andre, SP, Brazil25 Universidade Federal do Rio de Janeiro, Instituto de Fısica, Rio de Janeiro, RJ, Brazil26 Universidade Federal Fluminense, EEIMVR, Volta Redonda, RJ, Brazil27 Rudjer Boskovic Institute, 10000 Zagreb, Croatia28 Charles University, Faculty of Mathematics and Physics, Institute of Particle and Nuclear Physics, Prague, CzechRepublic29 Institute of Physics of the Academy of Sciences of the Czech Republic, Prague, Czech Republic30 Palacky University, RCATM, Olomouc, Czech Republic32 Institut de Physique Nucleaire d’Orsay (IPNO), Universite Paris 11, CNRS-IN2P3, Orsay, France33 Laboratoire AstroParticule et Cosmologie (APC), Universite Paris 7, CNRS-IN2P3, Paris, France34 Laboratoire de l’Accelerateur Lineaire (LAL), Universite Paris 11, CNRS-IN2P3, Orsay, France35 Laboratoire de Physique Nucleaire et de Hautes Energies (LPNHE), Universites Paris 6 et Paris 7, CNRS-IN2P3,Paris, France36 Laboratoire de Physique Subatomique et de Cosmologie (LPSC), Universite Joseph Fourier, INPG, CNRS-IN2P3,Grenoble, France37 SUBATECH,Ecole des Mines de Nantes, CNRS-IN2P3, Universite de Nantes, Nantes, France38 Bergische Universitat Wuppertal, Wuppertal, Germany39 Karlsruhe Institute of Technology - Campus North - Institutfur Kernphysik, Karlsruhe, Germany40 Karlsruhe Institute of Technology - Campus North - Institutfur Prozessdatenverarbeitung und Elektronik, Karlsruhe,Germany41 Karlsruhe Institute of Technology - Campus South - Institutfur Experimentelle Kernphysik (IEKP), Karlsruhe,Germany42 Max-Planck-Institut fur Radioastronomie, Bonn, Germany43 RWTH Aachen University, III. Physikalisches Institut A, Aachen, Germany44 Universitat Hamburg, Hamburg, Germany45 Universitat Siegen, Siegen, Germany46 Dipartimento di Fisica dell’Universita and INFN, Genova, Italy47 Universita dell’Aquila and INFN, L’Aquila, Italy48 Universita di Milano and Sezione INFN, Milan, Italy49 Dipartimento di Fisica dell’Universita del Salento and Sezione INFN, Lecce, Italy50 Universita di Napoli ”Federico II” and Sezione INFN, Napoli, Italy51 Universita di Roma II ”Tor Vergata” and Sezione INFN, Roma, Italy52 Universita di Catania and Sezione INFN, Catania, Italy53 Universita di Torino and Sezione INFN, Torino, Italy54 Dipartimento di Ingegneria dell’Innovazione dell’Universita del Salento and Sezione INFN, Lecce, Italy56 Istituto di Astrofisica Spaziale e Fisica Cosmica di Palermo(INAF), Palermo, Italy57 Istituto di Fisica dello Spazio Interplanetario (INAF), Universita di Torino and Sezione INFN, Torino, Italy58 INFN, Laboratori Nazionali del Gran Sasso, Assergi (L’Aquila), Italy61 Universita di Palermo and Sezione INFN, Catania, Italy63 Benemerita Universidad Autonoma de Puebla, Puebla, Mexico64 Centro de Investigacion y de Estudios Avanzados del IPN (CINVESTAV), Mexico, D.F., Mexico66 Universidad Michoacana de San Nicolas de Hidalgo, Morelia,Michoacan, Mexico67 Universidad Nacional Autonoma de Mexico, Mexico, D.F., Mexico68 IMAPP, Radboud University Nijmegen, Netherlands69 Kernfysisch Versneller Instituut, University of Groningen, Groningen, Netherlands70 Nikhef, Science Park, Amsterdam, Netherlands71 ASTRON, Dwingeloo, Netherlands72 Institute of Nuclear Physics PAN, Krakow, Poland
73 University of Łodz, Łodz, Poland74 LIP and Instituto Superior Tecnico, Lisboa, Portugal78 J. Stefan Institute, Ljubljana, Slovenia79 Laboratory for Astroparticle Physics, University of Nova Gorica, Slovenia80 Instituto de Fısica Corpuscular, CSIC-Universitat de Valencia, Valencia, Spain81 Universidad Complutense de Madrid, Madrid, Spain82 Universidad de Alcala, Alcala de Henares (Madrid), Spain83 Universidad de Granada & C.A.F.P.E., Granada, Spain84 Universidad de Santiago de Compostela, Spain85 Rudolf Peierls Centre for Theoretical Physics, Universityof Oxford, Oxford, United Kingdom87 School of Physics and Astronomy, University of Leeds, United Kingdom88 Argonne National Laboratory, Argonne, IL, USA89 Case Western Reserve University, Cleveland, OH, USA90 Colorado School of Mines, Golden, CO, USA91 Colorado State University, Fort Collins, CO, USA92 Colorado State University, Pueblo, CO, USA93 Fermilab, Batavia, IL, USA94 Louisiana State University, Baton Rouge, LA, USA95 Michigan Technological University, Houghton, MI, USA96 New York University, New York, NY, USA97 Northeastern University, Boston, MA, USA98 Ohio State University, Columbus, OH, USA99 Pennsylvania State University, University Park, PA, USA100 Southern University, Baton Rouge, LA, USA101 University of Chicago, Enrico Fermi Institute, Chicago, IL, USA105 University of Nebraska, Lincoln, NE, USA106 University of New Mexico, Albuquerque, NM, USA108 University of Wisconsin, Madison, WI, USA109 University of Wisconsin, Milwaukee, WI, USA110 Institute for Nuclear Science and Technology (INST), Hanoi, Vietnam† Deceaseda at Konan University, Kobe, Japan
32ND INTERNATIONAL COSMIC RAY CONFERENCE, BEIJING 2011
The distribution of shower maxima of UHECR air showers
PEDRO FACAL SAN LUIS1 FOR THEPIERRE AUGER COLLABORATION2
1Enrico Fermi Institute & Kavli Institute for Cosmological Physics, University of Chicago, Chicago IL 60637, USA2Observatorio Pierre Auger, Av. San Martin Norte 304, 5613 Malargue, Argentina(Full author list: http://www.auger.org/archive/authors_2011_05.html)[email protected]
Abstract: We present the measurement ofXmax, the depth of the maximum of the longitudinal development of ultrahigh energy air showers, with the fluorescence detector of the Pierre Auger Observatory. After giving an update on theaverage and fluctuations ofXmax with 80% more data than previously published, we discuss the distributions ofXmax
for different energies and compare it to the predictions of air shower simulations for different primary particles.
Keywords: UHECR, The Pierre Auger Observatory, mass composition, shower maxima.
1 Introduction
Measuring the cosmic ray composition at the highest en-ergies, along with other measurements such as the flux andthe arrival direction distribution, is a key to separate thedif-ferent scenarios of origin and propagation of cosmic rays.The composition cannot be determined from direct mea-surements but must be inferred from measurements of theshower that the cosmic ray primary produces in the atmo-sphere. The atmospheric depth at which this shower at-tains its maximum size,Xmax, carries information aboutthe mass of the primary particle and the characteristicsof hadronic interactions at very high energy. For a givenshower,Xmax will be determined by the depth of the firstinteraction of the primary in the atmosphere, plus the depththat it takes the cascade to develop. The depth of the first in-teraction is expected to be a decreasing function of the log-arithm of the primary energy, while the depth of the showerdevelopment rises asln(E) [1]. The measured distributionof Xmax results from the folding of the distribution of thedepth of the first interaction, the shower to shower devel-opment fluctuations, and the detector resolution.
The superposition model allows a qualitative treatment ofdifferent nuclear primaries of massA: at a given energyE,it describes the shower as a superposition ofA showers ofenergyE/A. Under this assumption the depth of the max-imum of the cascade will be linear with(ln(E) − ln(A)).Showers of heavier nuclear primaries will develop fasterthat lighter ones. At the same time the fluctuations of thefirst interaction will be reduced (by less than1/
√A due to
correlations between the interactions of the different nucle-ons). Thus not only the mean value ofXmax carries infor-
mation about the mass of the primary cosmic ray, but thewhole distribution is sensitive to the mass composition.
We expect the maximum of the shower to behave as
α(lnE − lnA) + β
as function of the energyE and the massA of the primary.The elongation rateis defined as the change of〈Xmax〉with energyD10 = d 〈Xmax〉 /dlogE. The parametersαandβ enclose the dependency ofXmax on the propertiesof the hadronic interactions. There are different theoreti-cal calculations extrapolating the available data to the en-ergies of the interaction between the primary and the atmo-spheric nucleon [2]. In factXmax can be used to study theproperties of the hadronic interactions at the highest ener-gies [3, 4]. The different hadronic models predict differentvalues forXmax, but its dependence on the mass of the pri-mary is qualitatively compatible with the model describedhere: at a given energy, we expect that for lighter primariesthe distribution ofXmax will be deeper and broader thanthe one for heavier primaries.
We use data from the Fluorescence Detector (FD) of thePierre Auger Observatory [5] to measure the distributionof Xmax for ultra high energy cosmic ray showers. Firstwe present an update of the measurements of〈Xmax〉 andRMS (Xmax) as a function of energy with 80% more statis-tics than previously reported [6]. In addition, we present,for the first time, the measuredXmax distributions.
2 Data Analysis
Data taken by the Pierre Auger Observatory between De-cember 2004 and September 2010 are used here. The Sur-
1
P. FACAL SAN LUIS et al. THE DISTRIBUTION OF SHOWER MAXIMA OFUHECR AIR SHOWERS
]-2 [g/cm2/maxX∆-80 -60 -40 -20 0 20 40 60 80 100
even
ts
0
10
20
30
40
50
60 21.1 g/cm±data: RMS=19
2 (syst.) g/cm+2
-10.1 (stat.) ±MC: RMS=19
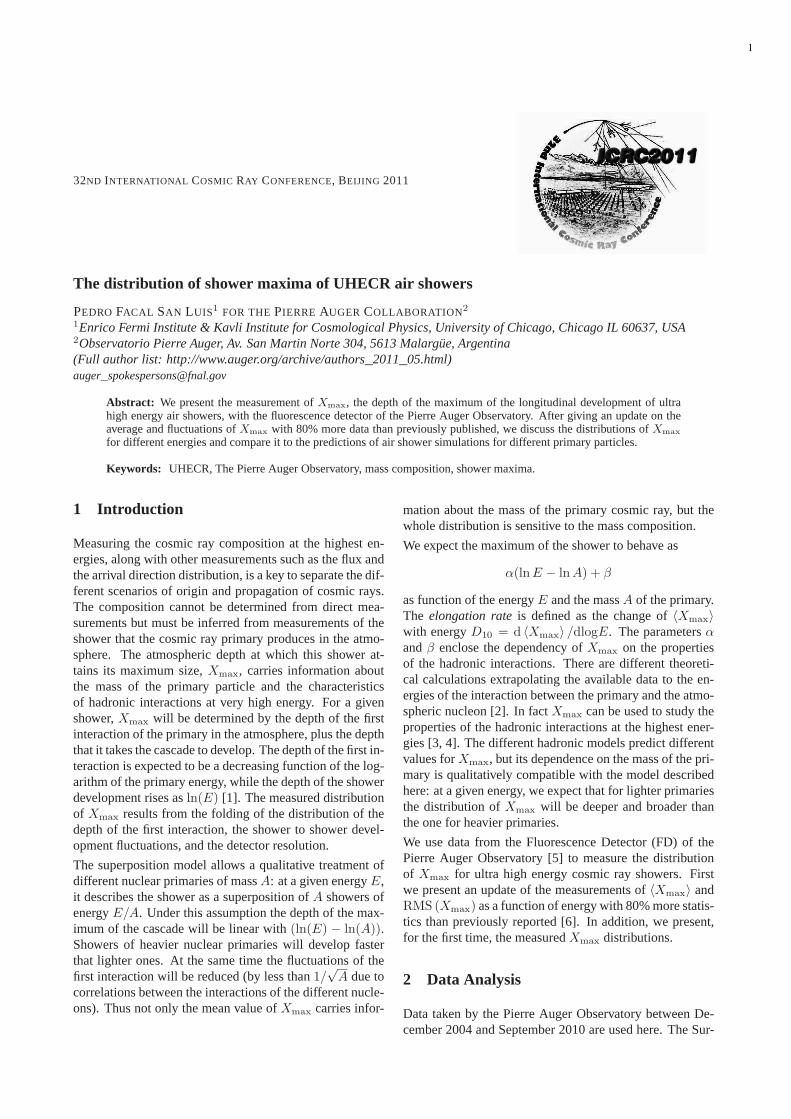
Figure 1: The resolution ofXmax obtained using events recordedsimultaneously from two FD stations, compared to a detailedMonte Carlo simulation.
face Detector (SD) has 1660 water detector stations ar-ranged in a 1.5 km triangular grid and sensitive to theshower particles at the ground. The FD has 27 tele-scopes overlooking the SD, housed in 5 different stations,recording UV light emitted in the de-excitation of nitro-gen molecules in the atmosphere after the passage of thecharged particles of a shower. The shower geometry is re-constructed from the arrival times of the data. The numberof fluorescence photons emitted is proportional to the en-ergy deposited in the atmosphere by the shower. Using theshower geometry and correcting for the attenuation of thelight between the shower and the detector, the longitudinalprofile of the shower can be reconstructed. This profile isfitted to a Gaisser-Hillas function [7] to determineXmax
and the energy of the shower [8].
We follow the analysis already reported in [6]. We consideronly showers reconstructed using FD data and that have atleast a signal in one of the SD stations measured in coinci-dence. The geometry for these events is determined with anangular uncertainty of 0.6◦ [9]. The aerosol content in theatmosphere is monitored constantly during data taking [10]and only events for which a reliable measurement of theaerosol optical depth exists are considered. Also the cloudcontent is monitored nightly across the array and periodswith excessive cloud coverage are rejected. Furthermore,we reject events with aχ2/Ndf greater than 2.5 when theprofile is fitted to a Gaisser-Hillas, as this could indicate thepresence of residual clouds. The total statistical uncertaintyin the reconstruction ofXmax is calculated including theuncertainties due to the geometry reconstruction and to theatmospheric conditions. Events with uncertainties above40 g/cm2 are rejected. We also reject events that have anangle between the shower and the telescope smaller than20◦ to account for the difficulties of reconstructing theirgeometry and for their high fraction of Cherenkov light. Fi-nally, in order to reliably determineXmax we require thatthe maximum has been actually observed within the fieldof view of the FD. 15979 events pass this quality selection.
Another set of cuts is used to ensure that the data sample isunbiased with respect to the cosmic ray composition. Since
E [eV]1810 1910
]2>
[g/c
mm
ax<
X
650
700
750
800
850
14071251
998 781619 457 331 230 188
143186 106
47
EPOSv1.99p
Fe
QGSJET01 p
Fe
SIBYLL2.1p
Fe
QGSJETII
p
Fe
EPOSv1.99p
Fe
QGSJET01 p
Fe
SIBYLL2.1p
Fe
QGSJETII
p
Fe
E [eV]1810 1910
]2)
[g/c
mm
axR
MS
(X
0
10
20
30
40
50
60
70
14071251
998 781 619457
331
230 188
143 186
10647
p
Fe
p
Fe
p
Fe
p
Fe
p
Fe
p
Fe
p
Fe
p
Fe
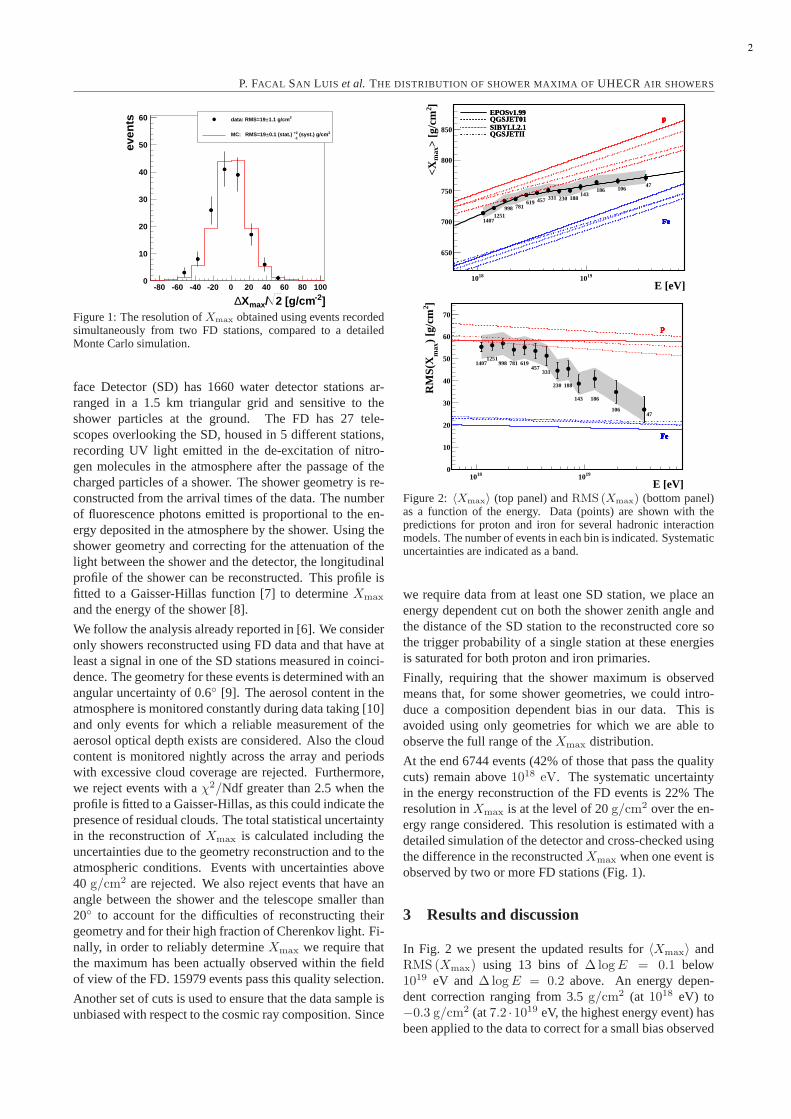
Figure 2: 〈Xmax〉 (top panel) andRMS (Xmax) (bottom panel)as a function of the energy. Data (points) are shown with thepredictions for proton and iron for several hadronic interactionmodels. The number of events in each bin is indicated. Systematicuncertainties are indicated as a band.
we require data from at least one SD station, we place anenergy dependent cut on both the shower zenith angle andthe distance of the SD station to the reconstructed core sothe trigger probability of a single station at these energiesis saturated for both proton and iron primaries.
Finally, requiring that the shower maximum is observedmeans that, for some shower geometries, we could intro-duce a composition dependent bias in our data. This isavoided using only geometries for which we are able toobserve the full range of theXmax distribution.
At the end 6744 events (42% of those that pass the qualitycuts) remain above1018 eV. The systematic uncertaintyin the energy reconstruction of the FD events is 22% Theresolution inXmax is at the level of 20g/cm2 over the en-ergy range considered. This resolution is estimated with adetailed simulation of the detector and cross-checked usingthe difference in the reconstructedXmax when one event isobserved by two or more FD stations (Fig. 1).
3 Results and discussion
In Fig. 2 we present the updated results for〈Xmax〉 andRMS (Xmax) using 13 bins of∆logE = 0.1 below1019 eV and∆logE = 0.2 above. An energy depen-dent correction ranging from 3.5g/cm2 (at 1018 eV) to−0.3 g/cm2 (at7.2 ·1019 eV, the highest energy event) hasbeen applied to the data to correct for a small bias observed
2

32ND INTERNATIONAL COSMIC RAY CONFERENCE, BEIJING 2011
]2 [g/cmmaxX600 800 1000
Eve
nts
0
100
200
30018.1 > log(E) > 18.0
1407 events
]2 [g/cmmaxX600 800 1000
Eve
nts
0
50
100
150
20018.2 > log(E) > 18.1
1251 events
]2 [g/cmmaxX600 800 1000
Eve
nts
0
50
100
150
18.3 > log(E) > 18.2
998 events
]2 [g/cmmaxX600 800 1000
Eve
nts
0
50
100
150 18.4 > log(E) > 18.3
781 events
]2 [g/cmmaxX600 800 1000
Eve
nts
0
50
100
18.5 > log(E) > 18.4
619 events
]2 [g/cmmaxX600 800 1000
Eve
nts
0
50
100 18.6 > log(E) > 18.5
457 events
]2 [g/cmmaxX600 800 1000
Eve
nts
0
20
40
6018.7 > log(E) > 18.6
331 events
]2 [g/cmmaxX600 800 1000
Eve
nts
0
20
40
6018.8 > log(E) > 18.7
230 events
]2 [g/cmmaxX600 800 1000
Eve
nts
0
20
40
18.9 > log(E) > 18.8
188 events
]2 [g/cmmaxX600 800 1000
Eve
nts
0
10
20
30
4019.0 > log(E) > 18.9
143 events
]2 [g/cmmaxX600 800 1000
Eve
nts
0
20
40
19.2 > log(E) > 19.0
186 events
]2 [g/cmmaxX600 800 1000
Eve
nts
0
10
20
30
40 19.4 > log(E) > 19.2
106 events
]2 [g/cmmaxX600 800 1000
Eve
nts
0
5
10
15
20 log(E) > 19.4
47 events
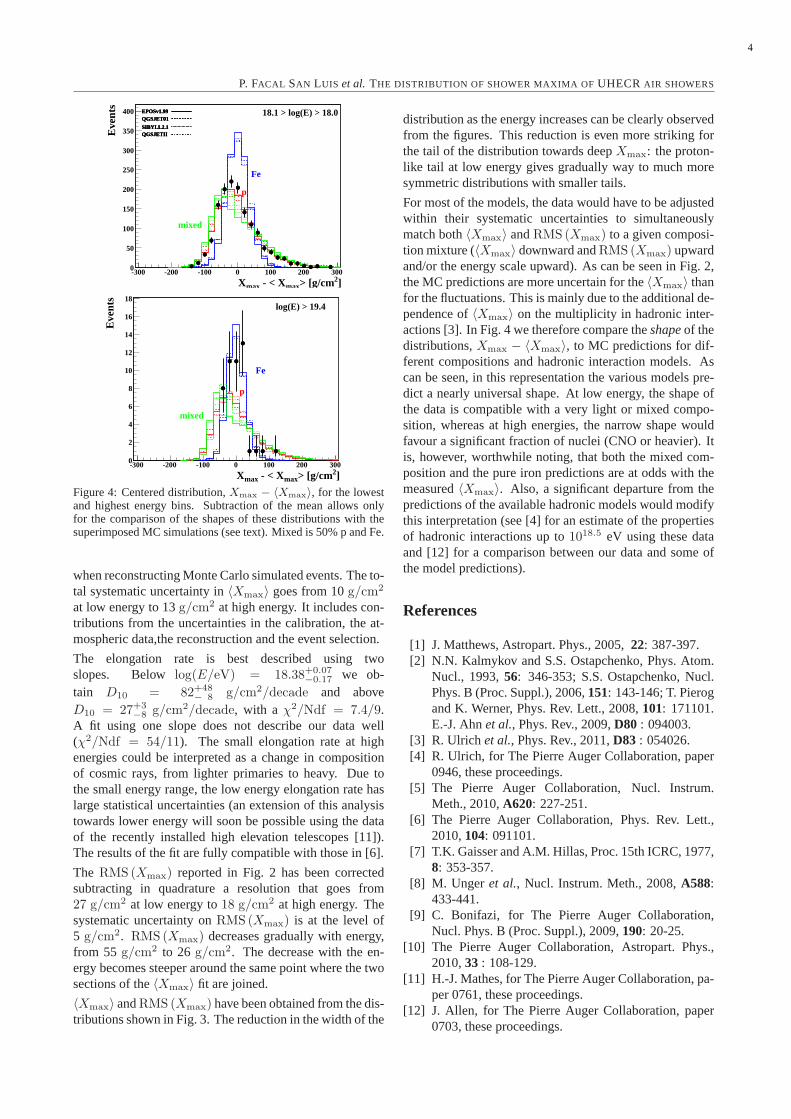
Figure 3: Distribution ofXmax. The values of the energy limits and the number of events selected are indicated for each panel.
3
P. FACAL SAN LUIS et al. THE DISTRIBUTION OF SHOWER MAXIMA OFUHECR AIR SHOWERS
]2> [g/cmmax - < XmaxX-300 -200 -100 0 100 200 300
Eve
nts
0
50
100
150
200
250
300
350
400 EPOSv1.99QGSJET01
SIBYLL2.1QGSJETII
EPOSv1.99QGSJET01
SIBYLL2.1QGSJETII
EPOSv1.99QGSJET01
SIBYLL2.1QGSJETII
p
Fe
mixed
18.1 > log(E) > 18.0
]2> [g/cmmax - < XmaxX-300 -200 -100 0 100 200 300
Eve
nts
0
2
4
6
8
10
12
14
16
18
p
Fe
mixed
log(E) > 19.4
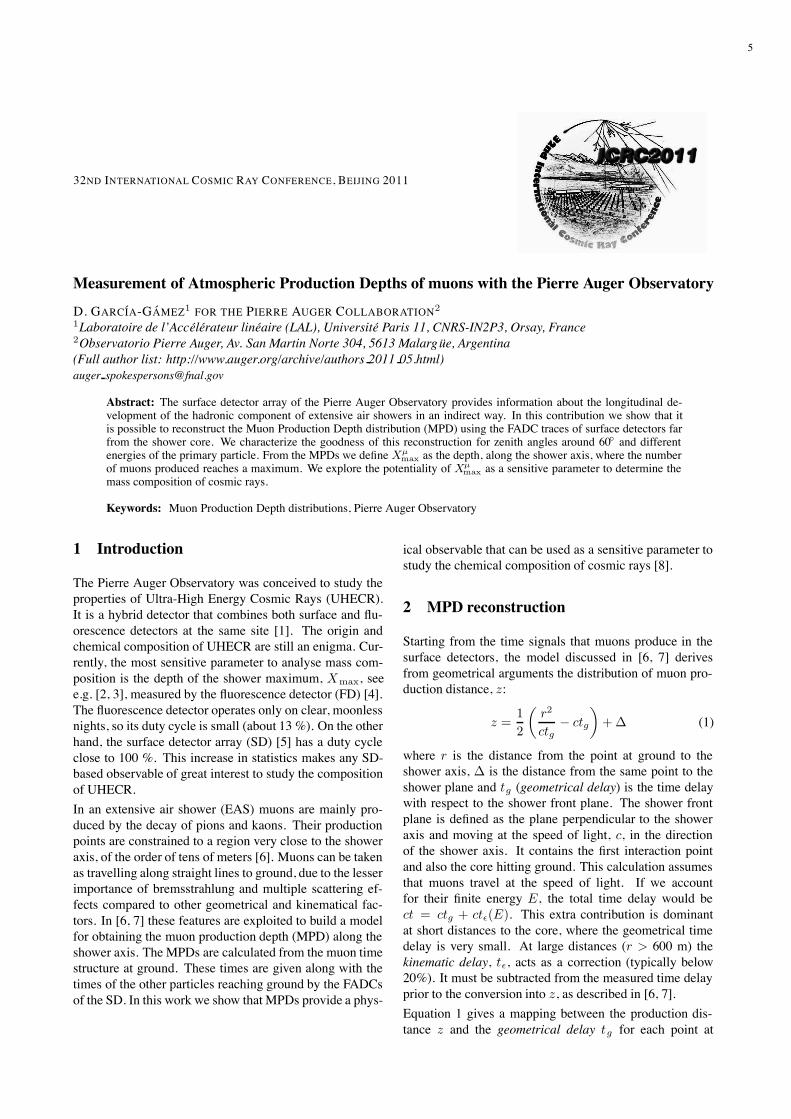
Figure 4: Centered distribution,Xmax − 〈Xmax〉, for the lowestand highest energy bins. Subtraction of the mean allows onlyfor the comparison of the shapes of these distributions with thesuperimposed MC simulations (see text). Mixed is 50% p and Fe.
when reconstructing Monte Carlo simulated events. The to-tal systematic uncertainty in〈Xmax〉 goes from 10g/cm2
at low energy to 13g/cm2 at high energy. It includes con-tributions from the uncertainties in the calibration, the at-mospheric data,the reconstruction and the event selection.
The elongation rate is best described using twoslopes. Below log(E/eV) = 18.38+0.07
−0.17 we ob-tain D10 = 82+48
− 8 g/cm2/decade and aboveD10 = 27+3
−8 g/cm2/decade, with a χ2/Ndf = 7.4/9.A fit using one slope does not describe our data well(χ2/Ndf = 54/11). The small elongation rate at highenergies could be interpreted as a change in compositionof cosmic rays, from lighter primaries to heavy. Due tothe small energy range, the low energy elongation rate haslarge statistical uncertainties (an extension of this analysistowards lower energy will soon be possible using the dataof the recently installed high elevation telescopes [11]).The results of the fit are fully compatible with those in [6].
The RMS (Xmax) reported in Fig. 2 has been correctedsubtracting in quadrature a resolution that goes from27 g/cm2 at low energy to18 g/cm2 at high energy. Thesystematic uncertainty onRMS (Xmax) is at the level of5 g/cm2. RMS (Xmax) decreases gradually with energy,from 55 g/cm2 to 26 g/cm2. The decrease with the en-ergy becomes steeper around the same point where the twosections of the〈Xmax〉 fit are joined.
〈Xmax〉 andRMS (Xmax) have been obtained from the dis-tributions shown in Fig. 3. The reduction in the width of the
distribution as the energy increases can be clearly observedfrom the figures. This reduction is even more striking forthe tail of the distribution towards deepXmax: the proton-like tail at low energy gives gradually way to much moresymmetric distributions with smaller tails.
For most of the models, the data would have to be adjustedwithin their systematic uncertainties to simultaneouslymatch both〈Xmax〉 andRMS (Xmax) to a given composi-tion mixture (〈Xmax〉 downward andRMS (Xmax) upwardand/or the energy scale upward). As can be seen in Fig. 2,the MC predictions are more uncertain for the〈Xmax〉 thanfor the fluctuations. This is mainly due to the additional de-pendence of〈Xmax〉 on the multiplicity in hadronic inter-actions [3]. In Fig. 4 we therefore compare theshapeof thedistributions,Xmax − 〈Xmax〉, to MC predictions for dif-ferent compositions and hadronic interaction models. Ascan be seen, in this representation the various models pre-dict a nearly universal shape. At low energy, the shape ofthe data is compatible with a very light or mixed compo-sition, whereas at high energies, the narrow shape wouldfavour a significant fraction of nuclei (CNO or heavier). Itis, however, worthwhile noting, that both the mixed com-position and the pure iron predictions are at odds with themeasured〈Xmax〉. Also, a significant departure from thepredictions of the available hadronic models would modifythis interpretation (see [4] for an estimate of the propertiesof hadronic interactions up to1018.5 eV using these dataand [12] for a comparison between our data and some ofthe model predictions).
References
[1] J. Matthews, Astropart. Phys., 2005,22: 387-397.[2] N.N. Kalmykov and S.S. Ostapchenko, Phys. Atom.
Nucl., 1993,56: 346-353; S.S. Ostapchenko, Nucl.Phys. B (Proc. Suppl.), 2006,151: 143-146; T. Pierogand K. Werner, Phys. Rev. Lett., 2008,101: 171101.E.-J. Ahnet al., Phys. Rev., 2009,D80 : 094003.
[3] R. Ulrich et al., Phys. Rev., 2011,D83 : 054026.[4] R. Ulrich, for The Pierre Auger Collaboration, paper
0946, these proceedings.[5] The Pierre Auger Collaboration, Nucl. Instrum.
Meth., 2010,A620: 227-251.[6] The Pierre Auger Collaboration, Phys. Rev. Lett.,
2010,104: 091101.[7] T.K. Gaisser and A.M. Hillas, Proc. 15th ICRC, 1977,
8: 353-357.[8] M. Unger et al., Nucl. Instrum. Meth., 2008,A588:
433-441.[9] C. Bonifazi, for The Pierre Auger Collaboration,
Nucl. Phys. B (Proc. Suppl.), 2009,190: 20-25.[10] The Pierre Auger Collaboration, Astropart. Phys.,
2010,33 : 108-129.[11] H.-J. Mathes, for The Pierre Auger Collaboration, pa-
per 0761, these proceedings.[12] J. Allen, for The Pierre Auger Collaboration, paper
0703, these proceedings.
4
32ND INTERNATIONAL COSMIC RAY CONFERENCE, BEIJING 2011
Measurement of Atmospheric Production Depths of muons with the Pierre Auger ObservatoryD. GARCIA-GAMEZ1 FOR THE PIERRE AUGER COLLABORATION2
1Laboratoire de l’Accelerateur lineaire (LAL), Universite Paris 11, CNRS-IN2P3, Orsay, France2Observatorio Pierre Auger, Av. San Martin Norte 304, 5613 Malarg ue, Argentina(Full author list: http://www.auger.org/archive/authors 2011 05.html)auger [email protected]
Abstract: The surface detector array of the Pierre Auger Observatory provides information about the longitudinal de-velopment of the hadronic component of extensive air showers in an indirect way. In this contribution we show that itis possible to reconstruct the Muon Production Depth distribution (MPD) using the FADC traces of surface detectors farfrom the shower core. We characterize the goodness of this reconstruction for zenith angles around 60! and differentenergies of the primary particle. From the MPDs we defineXµ
max as the depth, along the shower axis, where the numberof muons produced reaches a maximum. We explore the potentiality of Xµ
max as a sensitive parameter to determine themass composition of cosmic rays.
Keywords: Muon Production Depth distributions, Pierre Auger Observatory
1 Introduction
The Pierre Auger Observatory was conceived to study theproperties of Ultra-High Energy Cosmic Rays (UHECR).It is a hybrid detector that combines both surface and flu-orescence detectors at the same site [1]. The origin andchemical composition of UHECR are still an enigma. Cur-rently, the most sensitive parameter to analyse mass com-position is the depth of the shower maximum, Xmax, seee.g. [2, 3], measured by the fluorescence detector (FD) [4].The fluorescence detector operates only on clear, moonlessnights, so its duty cycle is small (about 13 %). On the otherhand, the surface detector array (SD) [5] has a duty cycleclose to 100 %. This increase in statistics makes any SD-based observable of great interest to study the compositionof UHECR.In an extensive air shower (EAS) muons are mainly pro-duced by the decay of pions and kaons. Their productionpoints are constrained to a region very close to the showeraxis, of the order of tens of meters [6]. Muons can be takenas travelling along straight lines to ground, due to the lesserimportance of bremsstrahlung and multiple scattering ef-fects compared to other geometrical and kinematical fac-tors. In [6, 7] these features are exploited to build a modelfor obtaining the muon production depth (MPD) along theshower axis. The MPDs are calculated from the muon timestructure at ground. These times are given along with thetimes of the other particles reaching ground by the FADCsof the SD. In this work we show that MPDs provide a phys-
ical observable that can be used as a sensitive parameter tostudy the chemical composition of cosmic rays [8].
2 MPD reconstruction
Starting from the time signals that muons produce in thesurface detectors, the model discussed in [6, 7] derivesfrom geometrical arguments the distribution of muon pro-duction distance, z:
z =12
!r2
ctg! ctg
"+ ! (1)
where r is the distance from the point at ground to theshower axis, ! is the distance from the same point to theshower plane and tg (geometrical delay) is the time delaywith respect to the shower front plane. The shower frontplane is defined as the plane perpendicular to the showeraxis and moving at the speed of light, c, in the directionof the shower axis. It contains the first interaction pointand also the core hitting ground. This calculation assumesthat muons travel at the speed of light. If we accountfor their finite energy E, the total time delay would bect = ctg + ct!(E). This extra contribution is dominantat short distances to the core, where the geometrical timedelay is very small. At large distances (r > 600 m) thekinematic delay, t!, acts as a correction (typically below20%). It must be subtracted from the measured time delayprior to the conversion into z, as described in [6, 7].Equation 1 gives a mapping between the production dis-tance z and the geometrical delay tg for each point at
5

D. GARCIA-GAMEZ et al. MUON PRODUCTION DEPTHS WITH THE PIERRE AUGER OBSERVATORY
]-2[g cmµX0 200 400 600 800 1000 1200
/dX
µdN
5
10
15
20
25
30
35
40610×
full MPD distributionMPD at 400 m from the coreMPD at 1800 m from the core
]-2[g cmµX0 200 400 600 800 1000 1200 1400 1600 1800
/dX
µdN
2
4
6
8
10
12
14
16
18
20
610×
full MPD distributionMPD at 400 m from the coreMPD at 1800 m from the core
Figure 1: Muon production depth distributions (MPDs) extracted from an iron shower of 10 19 eV simulated withAIRES [10] at two different zenith angles: 41! (left) and 60! (right). The MPD dependence with the distance to thecore is shown.
ground. The production distance can be easily related tothe total amount of traversed matterX µ using
Xµ =# "
z!(z#)dz# (2)
where ! is the atmosphere density. This X µ distribution isreferred to as MPD. The shape of the MPD contains rel-evant information about the development of the hadroniccascade and the first interaction point. To extract valu-able physics insight from the MPD we perform a fit. Itwas found that a Gaisser-Hillas function [9] can describethe shape of the MPD well. The fit with this function pro-vides the maximum of the distribution,X µ
max. We interpretXµ
max as the point where the production of muons reachesthe maximum along the cascade development. As shownin the following sections, this new observable can be usedfor composition studies.The MPD is populated with the surviving muons reach-ing ground, so its shape depends on the zenith angle. Fig-ure 1 displays MPDs directly extracted from AIRES sim-ulations [10] at different zenith angles and at different dis-tances from the core, r. For angles of about 40! and lower,the shape of the MPD and the position of its maximumshow a strong r dependence. However, at zenith anglesof around 60! and above, where the showers develop veryhigh in the atmosphere, the differences between the MPDat different distances to the core become small. Thus, forthose showers we can add in the same histogram the X µ
values given by the time signals from the different surfacedetectors. The addition of the signals from the differentsurface detectors contributing to the MPD at small zenithangles would demand the introduction of a correction fac-tor that transforms all those signals to the one expected at areference r (see [6, 7] for a thorough discussion about thiscorrection). At larger zenith angles the distortion due to thedetector time resolution becomes larger. The above reasons
lead us to select the data with measured zenith angles be-tween 55! and 65! for our analysis.
2.1 Detector effects
The precision of the method is limited so far by the detec-tor capabilities. The total uncertainty of the MPD maxi-mum, "Xµ
max, decreases as the square root of the numberof muonsNµ, and decreases quadraticallywith the distanceto the core r. This last uncertainty is linked to each singletime bin entry of the FADC traces. To keep the distortionson the reconstructed MPD small, only detectors far fromthe core can be used. The cut in r diminishes the efficiencyof the reconstruction, as the number of muons contribut-ing to the MPD is reduced. Hence a rcut value must becarefully chosen in order to guarantee good reconstructionefficiencies, avoiding at the same time a bias on the massof the primary.Furthermore, signals collected by the water Cherenkovdetectors are the sum of the electromagnetic (EM) andmuonic components. Both exhibit a different arrival timebehavior. As a consequence, a cut on signal threshold,rejecting all time bins with signal below a certain value,might help diminishing the contribution of the EM contam-ination. The so called EM halo, coming from the decay ofmuons in flight, is harder to suppress. But this componentfollows closer the time distribution of their parent muons,thus it does not hamper our analysis.
2.2 Reconstruction cuts
To study and select the cuts needed for a good MPD re-construction and an accurate X µ
max determination we haveused Monte Carlo simulations. The selection of cuts mustbe a trade off between the resolution of the reconstructedMPD and the number of muons being accepted into such
6

32ND INTERNATIONAL COSMIC RAY CONFERENCE, BEIJING 2011
log(E/eV)19.2 19.3 19.4 19.5 19.6 19.7 19.8 19.9 20
]-2
(gen
)) [g
cm
max
µ(r
ec) -
Xm
axµ
RM
S(X
20
30
40
50
60
70
80
90
100
110
120
130
140
proton
iron
o = 60
Figure 2: Energy evolution of the resolution we obtain, onan event by event basis, when we reconstruct X µ
max forshowers generated with AIRES and QGSJETII [11].
reconstruction. The chosen rcut is energy independent.This implies that any difference in resolution that we findfor different energies will be mainly a consequence of thedifferent amount of muons detected at ground. In our anal-ysis, we consider only those detectors whose distance tothe shower core is larger than 1800 m. To reduce residualEM contamination and potential baseline fluctuations wehave applied a mild cut on the threshold of the FADC sig-nals used to build the MPD. We have discarded FADC binswhere the signal is below 0.3 VEM. Finally, the MPD isreconstructed adding those detectors whose total recordedsignal is above 3 VEM. This requirement is set to avoid,in real data, the contribution of detectors (usually far awayfrom the core) having a signal dominated by accidental par-ticles.This set of cuts has a high muon selection efficiency. Re-gardless of the energy of the primary and its composition,muon fractions above 85% are always obtained. This guar-antees an EM contamination low enough to obtain an accu-rate value ofXµ
max.
2.3 Selection cuts
To optimize the quality of our reconstructed profiles we ap-ply the following cuts:
• Trigger cut: All events must fulfill the T5 triggercondition [5].
• Energy cut: Since the number of muons is energydependent, Nµ " E"/r# , we have observed that inevents with energies below 20 EeV the population ofthe MPD is very small, giving a very poor determi-nation of theXµ
max observable. Therefore we restrictour analysis to events with energy larger than 20 EeV.
]-2[g cmµX0 200 400 600 800 1000 1200 1400
/dX
[a.u
.]µ
dN
0
5
10
15
20
25
30
35
40
45
Figure 3: Real reconstructed MPD, # = (59.05 ± 0.07) !
and E = (94 ± 3) EeV, with its fit to a Gaisser-Hillas func-tion.
• Fit quality: Only events with a good MPD fit($2/ndf < 2.5) to a Gaisser-Hillas function are ac-cepted.
• Shape cut: The reduced $2 of a straight lineand a Gaisser-Hillas fit must satisfy $2
GH /ndf <2$2
line/ndf.
• Curvature: When the fitted radius of curvature ofthe shower front, R, is very large we observe an un-derestimation of the reconstructed X µ
max. So onlyevents with R < 29000 m are included in our analy-sis.
The overall event selection efficiencies are high (> 80%)and the difference between iron and proton is small for thewhole range of considered energies (see Table 1). Our cutsdo not introduce any appreciable composition bias. We fi-nally note that for the set of surviving events, the bias in theXµ
max reconstruction is between ± 10 g cm$2, regardlessof the initial energy or the chemical composition of the pri-mary. The resolution ranges from about 120 g cm$2 at thelower energies to less than 50 g cm$2 at the highest energy(see Figure 2).We note that the predictions of X µ
max from differenthadronic models (such as those shown in Figure 4) wouldnot be affected if a discrepancy between a model anddata [12] is limited to the total number of muons. How-ever, differences in the muon energy and spatial distribu-tion would modify the predictions.
3 Application to real data
Our analysis makes use of the data collected between Jan-uary 2004 andDecember 2010. Our initial sample of events
7
D. GARCIA-GAMEZ et al. MUON PRODUCTION DEPTHS WITH THE PIERRE AUGER OBSERVATORY
(E/eV)10
log19.3 19.4 19.5 19.6 19.7 19.8
]-2
[g c
mm
axµ X
450
500
550
600
650
107 62 32 30 13
QGSJETIISibyllEpos 1.99
proton
iron
Systematic error
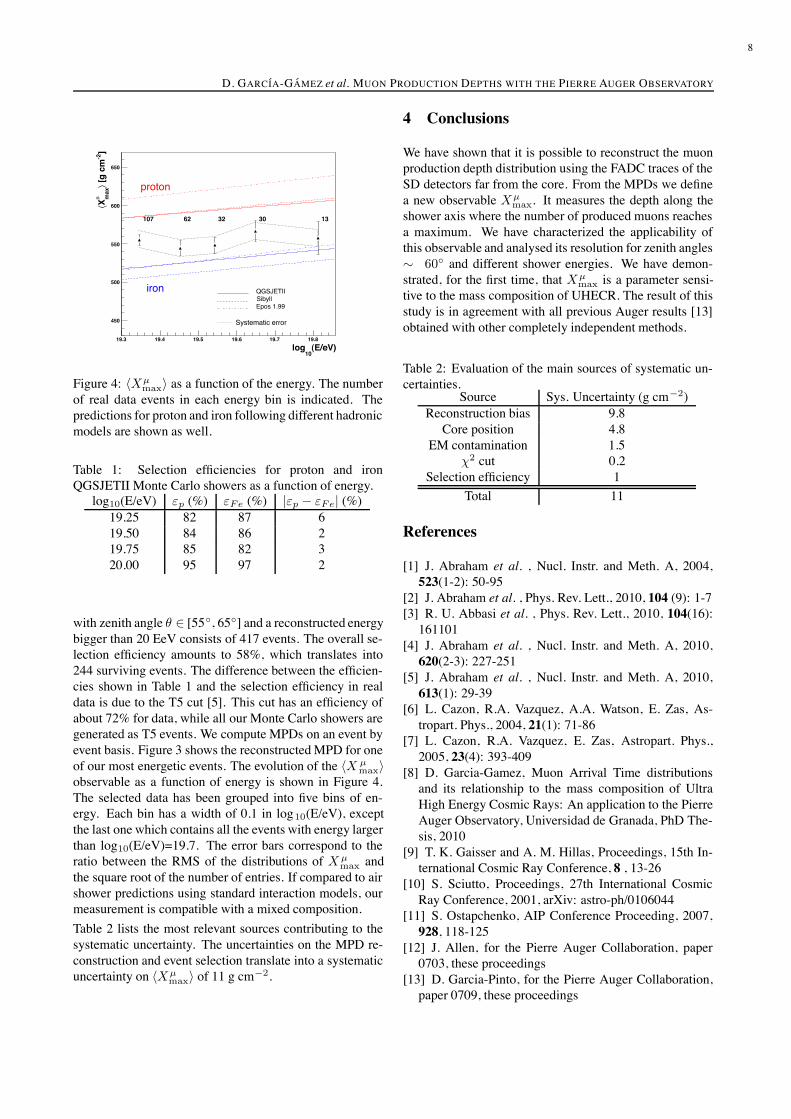
Figure 4: #Xµmax$ as a function of the energy. The number
of real data events in each energy bin is indicated. Thepredictions for proton and iron following different hadronicmodels are shown as well.
Table 1: Selection efficiencies for proton and ironQGSJETII Monte Carlo showers as a function of energy.
log10(E/eV) %p (%) %Fe (%) |%p ! %Fe| (%)19.25 82 87 619.50 84 86 219.75 85 82 320.00 95 97 2
with zenith angle # % [55!, 65!] and a reconstructed energybigger than 20 EeV consists of 417 events. The overall se-lection efficiency amounts to 58%, which translates into244 surviving events. The difference between the efficien-cies shown in Table 1 and the selection efficiency in realdata is due to the T5 cut [5]. This cut has an efficiency ofabout 72% for data, while all our Monte Carlo showers aregenerated as T5 events. We compute MPDs on an event byevent basis. Figure 3 shows the reconstructedMPD for oneof our most energetic events. The evolution of the #X µ
max$observable as a function of energy is shown in Figure 4.The selected data has been grouped into five bins of en-ergy. Each bin has a width of 0.1 in log10(E/eV), exceptthe last one which contains all the events with energy largerthan log10(E/eV)=19.7. The error bars correspond to theratio between the RMS of the distributions of X µ
max andthe square root of the number of entries. If compared to airshower predictions using standard interaction models, ourmeasurement is compatible with a mixed composition.Table 2 lists the most relevant sources contributing to thesystematic uncertainty. The uncertainties on the MPD re-construction and event selection translate into a systematicuncertainty on #Xµ
max$ of 11 g cm$2.
4 Conclusions
We have shown that it is possible to reconstruct the muonproduction depth distribution using the FADC traces of theSD detectors far from the core. From the MPDs we definea new observable Xµ
max. It measures the depth along theshower axis where the number of produced muons reachesa maximum. We have characterized the applicability ofthis observable and analysed its resolution for zenith angles& 60! and different shower energies. We have demon-strated, for the first time, that Xµ
max is a parameter sensi-tive to the mass composition of UHECR. The result of thisstudy is in agreement with all previous Auger results [13]obtained with other completely independent methods.
Table 2: Evaluation of the main sources of systematic un-certainties.
Source Sys. Uncertainty (g cm$2)Reconstruction bias 9.8Core position 4.8
EM contamination 1.5$2 cut 0.2
Selection efficiency 1Total 11
References
[1] J. Abraham et al. , Nucl. Instr. and Meth. A, 2004,523(1-2): 50-95
[2] J. Abraham et al. , Phys. Rev. Lett., 2010, 104 (9): 1-7[3] R. U. Abbasi et al. , Phys. Rev. Lett., 2010, 104(16):161101
[4] J. Abraham et al. , Nucl. Instr. and Meth. A, 2010,620(2-3): 227-251
[5] J. Abraham et al. , Nucl. Instr. and Meth. A, 2010,613(1): 29-39
[6] L. Cazon, R.A. Vazquez, A.A. Watson, E. Zas, As-tropart. Phys., 2004, 21(1): 71-86
[7] L. Cazon, R.A. Vazquez, E. Zas, Astropart. Phys.,2005, 23(4): 393-409
[8] D. Garcia-Gamez, Muon Arrival Time distributionsand its relationship to the mass composition of UltraHigh Energy Cosmic Rays: An application to the PierreAuger Observatory, Universidad de Granada, PhD The-sis, 2010
[9] T. K. Gaisser and A. M. Hillas, Proceedings, 15th In-ternational Cosmic Ray Conference, 8 , 13-26
[10] S. Sciutto, Proceedings, 27th International CosmicRay Conference, 2001, arXiv: astro-ph/0106044
[11] S. Ostapchenko, AIP Conference Proceeding, 2007,928, 118-125
[12] J. Allen, for the Pierre Auger Collaboration, paper0703, these proceedings
[13] D. Garcia-Pinto, for the Pierre Auger Collaboration,paper 0709, these proceedings
8
32ND INTERNATIONAL COSMIC RAY CONFERENCE, BEIJING 2011
Measurements of the Longitudinal Development of Air Showers with the Pierre Auger Obser-vatory
DIEGO GARCIA-PINTO1 FOR THEPIERRE AUGER COLLABORATION2
1Universidad Complutense de Madrid, Madrid, Spain2Observatorio Pierre Auger, Av. San Martin Norte 304, 5613 Malargue, Argentina(Full author list: http://www.auger.org/archive/authors 201105.html)auger [email protected]
Abstract: Due to its hybrid design, the Pierre Auger Observatory provides a variety of independent experimental observ-ables that carry information on the characteristics of the longitudinal development of ultra-high energy air showers.Theseinclude the direct measurement of the profile of the energy deposit of showers in the atmosphere through the detection offluorescence light but also observables derived from the shower signal measured with the surface detector array. In thiscontribution we present a comparison of the results obtained with the fluorescence detector on the depth of shower max-imum with complementary information derived from asymmetry properties of the particle signal in the surface detectorstations and the depth profile of muon production points, also derived from surface detector data. The measurements arecompared to predictions for proton- and iron-induced showers.
Keywords: UHECR, The Pierre Auger Observatory, mass composition, hadronic interactions
1 Introduction
The properties of ultra-high energy cosmic rays (UHE-CRs) can be studied by measuring the extensive air showers(EAS) that they produce in the atmosphere. For example,information on the mass of the primary particles can, inprinciple, be derived from the longitudinal depth profilesof these showers. However, the longitudinal developmentof the showers are strongly affected by the mass compo-sition of cosmic rays and by the features of the hadronicinteractions, both of which vary with energy in a mannerthat is unknown. If one were confident about the behaviourof one of these quantities then the behaviour of the othercould be deduced.
In this article we present the measurement of four indepen-dent observables that are closely related to the longitudinaldepth profile of air showers and hence, sensitive to primarymass composition. Due to the different character of the ob-servables employed, a direct comparison of the measure-ment results is not possible. Instead, the data are comparedto predictions from air shower simulations. Modelling un-certainties are considered by using the three different in-teraction models EPOS, QGSJET II, and SIBYLL [1], butit is understood that the differences between these modelsmight not fully represent the theoretical uncertainties [2].
2 Measurements of the Longitudinal ShowerDevelopment
With the Pierre Auger Observatory [3] information on theshower development can be extracted using both the Sur-face Detector (SD) and the Fluorescence Detector (FD).The SD consists of more than 1660 detector stations cov-ering an area of approximately3000 km2. Each SD unit isa water-Cherenkov detector with electronics that digitisesthe signal at 40 MHz sampling rate. The FD has a total of27 optical telescopes arranged in five sites overseeing theSD.
The observation of showers with the FD allows us to di-rectly measure the most important observable to charac-terise the longitudinal profile of a shower, the depth of theshower maximum,Xmax, i.e. the depth at which air show-ers deposit the maximum energy per unit mass of atmo-sphere traversed [4]. On the other hand, the SD providesobservables which are related to the longitudinal showerprofile as well. These observables are subject to indepen-dent systematic uncertainties (both experimentally and the-oretically). Moreover the higher statistics of showers mea-sured with the SD allows us to reach higher energies thanwith the FD.
9

D. GARCIA-PINTO et al. MEASUREMENTS OFLONGITUDINAL DEVELOPMENT OFA IR SHOWERS
]2slant depth [g/cm400 600 800 1000 1200
)]2dE
/dX
[PeV
/(g/
cm
0
20
40
60
80
100
120
))θln(sec(0.2 0.3 0.4 0.5 0.6 0.7
b/a
0.16
0.18
0.2
0.22
0.24
0.26
0.28
0.3
0.32
0.34
]-2[g cmµX0 200 400 600 800 1000 1200 1400
/dX
[a.u
.]µ
dN
0
5
10
15
20
25
30
35
40
45
Figure 1: Typical longitudinal development of the energy deposit (left panel), of the average asymmetry in the risetime(centre panel) and the muon production depth (right panel).
2.1 Depth of Shower Maximum
The measurement of the longitudinal profile of the energydeposit in the atmosphere with the Pierre Auger Observa-tory is described in [4]. In this analysis hybrid events, i.e.showers observed simultaneously by the FD and at leastby one SD station, have been used. The longitudinal pro-file of the energy deposit is reconstructed by the FD fromthe recorded fluorescence and Cherenkov light signals. Thecollected light is corrected for the attenuation between theshower and the detector using data from atmospheric mon-itoring devices. The longitudinal shower profile is recon-structed as a function of the atmospheric depth andXmax
is obtained by fitting the profile with a Gaisser-Hillas func-tion. A typical longitudinal profile of the energy deposit ofone shower is shown in the left panel of Fig. 1.
TheXmax results presented here are an update of [4]. Hy-brid events recorded between December 2004 and Septem-ber 2010 with reconstructed energy above1018 eV havebeen used for the present analysis. To obtain a good res-olution in the measurement ofXmax, several quality cutsare applied. The cuts and their effects are described fullyin [5]. After all cuts, 6744 events are selected for theXmax analysis. The average values of the shower max-imum, 〈Xmax〉, as a function of energy are displayed inFig. 2, alongside predictions from several models. Uncer-tainties of the atmospheric conditions, calibration, event se-lection and reconstruction give rise to a systematic uncer-tainty of≤ 13g/cm2 [4] which corresponds to. 13% ofthe proton-iron separation predicted by the models. SincetheXmax resolution of the FD is at the level of 20g/cm2
above a few EeV, the intrinsic shower-to-shower fluctua-tions, RMS(Xmax), can be measured as well, see lowerpanel of Fig. 2.
2.2 Asymmetry of Signal Risetime
For each SD event, the water-Cherenkov detectors recordthe signal as a function of time. The first part of the signalis dominated by the muon component which arrives ear-lier and over a period of time shorter than the electromag-
netic particles, since muons travel in almost straight lineswhereas the electromagnetic particles suffer more multi-ple scattering on their way to ground. Due to the absorp-tion of the electromagnetic (EM) component, the numberof these particles at the ground depends, for a given energy,on the distance to the shower maximum and therefore onthe primary mass. In consequence, the time profile of par-ticles reaching ground is sensitive to cascade developmentas the higher is the production height the narrower is thetime pulse.
The time distribution of the SD signal is characterised bymeans of the risetime (the time to go from 10% to 50% ofthe total integrated signal),t1/2, which depends on the dis-tance to the shower maximum, the zenith angleθ and thedistance to the corer. In previous studies [6] the risetimewas related to the shower maximum using a subset of hy-brid events. Using this correlation it is possible to measurethe shower evolution with surface detector data.
The azimuthal asymmetry oft1/2 from water-Cherenkovdetector signals of non-vertical showers carries informationabout the longitudinal development of the showers [7]. Un-fortunately it is not possible to define the asymmetry on anevent-by-event basis, therefore the risetime asymmetry isobtained by grouping events in bins of energy andsec θ. Akey parameter for the analysis is the angleζ, the azimuthangle in the shower plane (the plane perpendicular to theshower axis). Detectors that are struck early in the devel-opment of the shower across the array have values of thisangle in the range−π/2 < ζ < π/2 with ζ = 0◦ corre-sponding to the vertical projection of the incoming direc-tion onto the shower plane. For each (E, sec θ) bin a fit of〈t1/2/r〉 = a+ b cos ζ provides the asymmetry amplitude,b/a. For a given energy, theb/a value changes with thezenith angle, i.e. distance to the shower maximum. Theevolution ofb/a with zenith angle is thus reminiscent ofthe longitudinal development of the shower and has a max-imum which is different for different primaries [8]. Foreach energy bin, the asymmetry amplitude is fitted using aGaussian function ofln(sec θ). This allows the determina-tion of the position of the maximum,Θmax, defined as thevalue ofsec θ for which b/a is maximum. In Fig.1, centre
10
32ND INTERNATIONAL COSMIC RAY CONFERENCE, BEIJING 2011]2
[g/c
m⟩
max
µX⟨
500
550
600
650EPOSv1.99QGSJETII-03
SIBYLL 2.1proton
ironSyst. Unc.
max
Θ
1.5
1.55
1.6
]2 [g
/cm
⟩m
axX⟨
650
700
750
800
850
energy [eV]
1810 1910 2010
]2)
[g/c
mm
axR
MS
(X
20
30
40
50
60
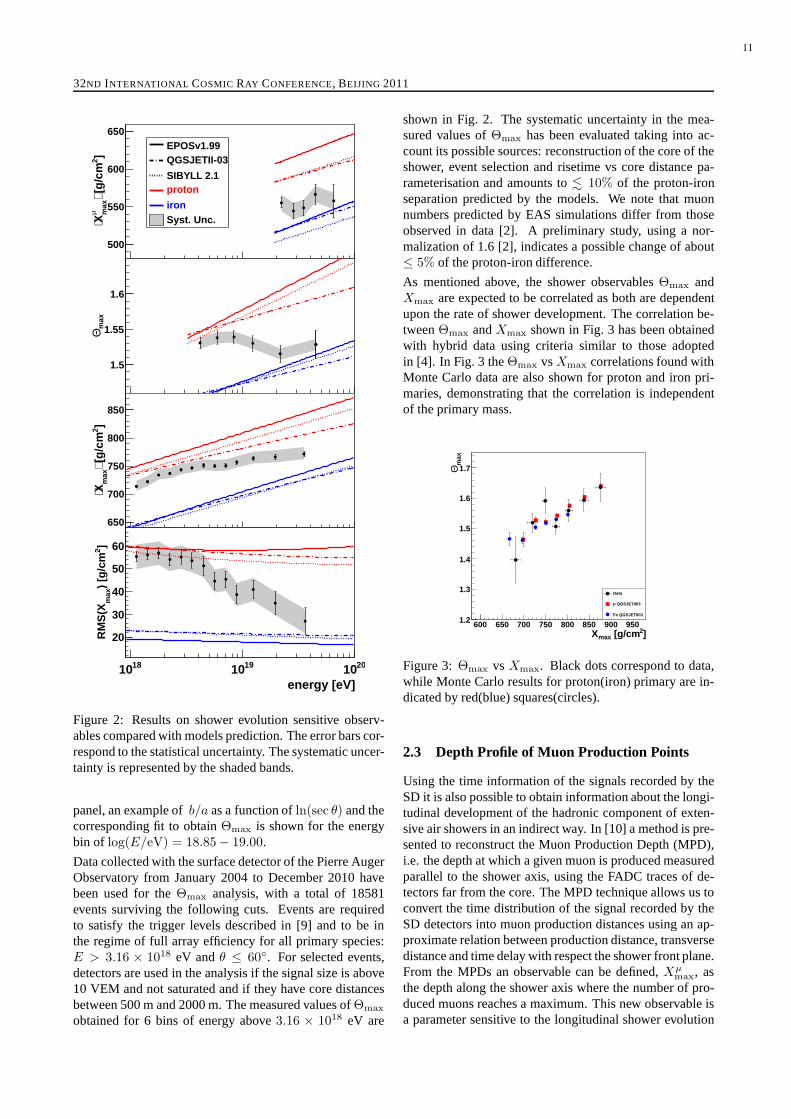
Figure 2: Results on shower evolution sensitive observ-ables compared with models prediction. The error bars cor-respond to the statistical uncertainty. The systematic uncer-tainty is represented by the shaded bands.
panel, an example ofb/a as a function ofln(sec θ) and thecorresponding fit to obtainΘmax is shown for the energybin of log(E/eV) = 18.85− 19.00.
Data collected with the surface detector of the Pierre AugerObservatory from January 2004 to December 2010 havebeen used for theΘmax analysis, with a total of 18581events surviving the following cuts. Events are requiredto satisfy the trigger levels described in [9] and to be inthe regime of full array efficiency for all primary species:E > 3.16 × 10¹⁸ eV andθ ≤ 60◦. For selected events,detectors are used in the analysis if the signal size is above10 VEM and not saturated and if they have core distancesbetween 500 m and 2000 m. The measured values ofΘmax
obtained for 6 bins of energy above3.16 × 1018 eV are
shown in Fig. 2. The systematic uncertainty in the mea-sured values ofΘmax has been evaluated taking into ac-count its possible sources: reconstruction of the core of theshower, event selection and risetime vs core distance pa-rameterisation and amounts to. 10% of the proton-ironseparation predicted by the models. We note that muonnumbers predicted by EAS simulations differ from thoseobserved in data [2]. A preliminary study, using a nor-malization of 1.6 [2], indicates a possible change of about≤ 5% of the proton-iron difference.
As mentioned above, the shower observablesΘmax andXmax are expected to be correlated as both are dependentupon the rate of shower development. The correlation be-tweenΘmax andXmax shown in Fig. 3 has been obtainedwith hybrid data using criteria similar to those adoptedin [4]. In Fig. 3 theΘmax vsXmax correlations found withMonte Carlo data are also shown for proton and iron pri-maries, demonstrating that the correlation is independentof the primary mass.
]2 [g/cmmaxX600 650 700 750 800 850 900 950
max
Θ
1.2
1.3
1.4
1.5
1.6
1.7
Data
p QGSJETII03
Fe QGSJETII03
Figure 3:Θmax vs Xmax. Black dots correspond to data,while Monte Carlo results for proton(iron) primary are in-dicated by red(blue) squares(circles).
2.3 Depth Profile of Muon Production Points
Using the time information of the signals recorded by theSD it is also possible to obtain information about the longi-tudinal development of the hadronic component of exten-sive air showers in an indirect way. In [10] a method is pre-sented to reconstruct the Muon Production Depth (MPD),i.e. the depth at which a given muon is produced measuredparallel to the shower axis, using the FADC traces of de-tectors far from the core. The MPD technique allows us toconvert the time distribution of the signal recorded by theSD detectors into muon production distances using an ap-proximate relation between production distance, transversedistance and time delay with respect the shower front plane.From the MPDs an observable can be defined,Xµ
max, asthe depth along the shower axis where the number of pro-duced muons reaches a maximum. This new observable isa parameter sensitive to the longitudinal shower evolution
11
D. GARCIA-PINTO et al. MEASUREMENTS OFLONGITUDINAL DEVELOPMENT OFA IR SHOWERS
which, as in the case ofΘmax, can be obtained with the in-formation provided by the SD alone (see [11] for detailedexplanation of the analysis). The method is currently re-stricted to inclined showers where muons dominate the sig-nal at ground level (studies to extend the analysis to verticalshowers are ongoing). Once the MPD is obtained for eachevent, the value ofXµ
max is found by fitting a Gaisser-Hillasfunction to the depth profile. An example of the MPD pro-file and the result of the Gaisser-Hillas fit of a particularevent withE ≈ 95 EeV and zenith angleθ ≈ 60◦ is shownin the right panel of Fig. 1.
The results of〈Xµ
max〉 presented here are based on datacollected between January 2004 and December 2010, withzenith angles between55◦ and65◦. The angular windowwas chosen as a trade-off between muon to EM ratio andthe reconstruction uncertainty. The finite time resolutionin the FADC traces produces an uncertainty on the recon-struction that decreases with the core distance and increaseswith the zenith angle. Thus, to keep these distortions low,only detectors far from the core (r> 1800 m) can be used.This distance restriction imposes a severe limitation in theenergy range where the method can by applied. Thereforeonly events with reconstructed energy larger than 20 EeVare used. After applying a set of reconstruction and qualitycuts (see [11] for a complete description of the cuts), a totalof 244 events are selected. The measured values of〈Xµ
max〉are presented in the upper panel of Fig. 2. The systematicuncertainty due to reconstruction bias, core position, re-jection of the EM component and quality cuts amounts to11 g/cm2, corresponding to about 14% of the proton-ironseparation predicted by the models [11]. The predictions ofXµ
max from different hadronic models (such as those shownin Fig. 2) would not be affected if a discrepancy between amodel and data [2] is limited to the total number of muons.However, differences in the muon energy and spatial distri-bution would modify the predictions.
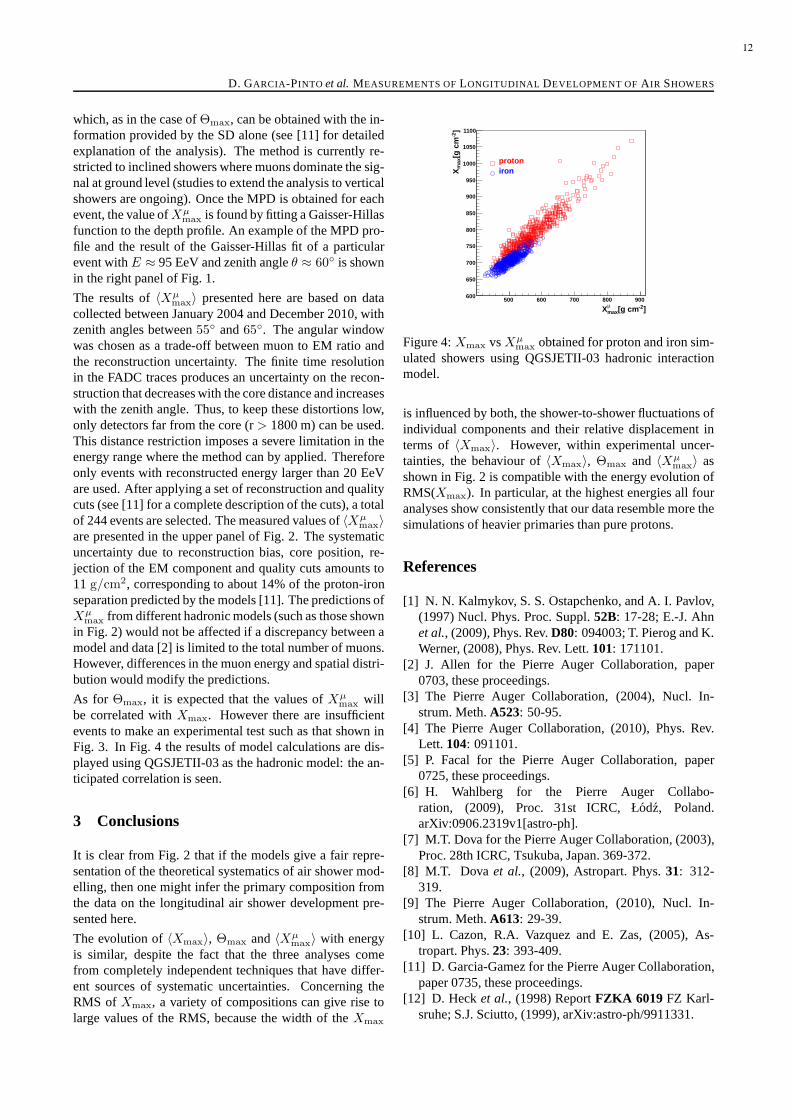
As for Θmax, it is expected that the values ofXµ
max willbe correlated withXmax. However there are insufficientevents to make an experimental test such as that shown inFig. 3. In Fig. 4 the results of model calculations are dis-played using QGSJETII-03 as the hadronic model: the an-ticipated correlation is seen.
3 Conclusions
It is clear from Fig. 2 that if the models give a fair repre-sentation of the theoretical systematics of air shower mod-elling, then one might infer the primary composition fromthe data on the longitudinal air shower development pre-sented here.
The evolution of〈Xmax〉, Θmax and〈Xµ
max〉 with energyis similar, despite the fact that the three analyses comefrom completely independent techniques that have differ-ent sources of systematic uncertainties. Concerning theRMS of Xmax, a variety of compositions can give rise tolarge values of the RMS, because the width of theXmax
]-2[g cmmaxµX
500 600 700 800 900
]-2
[g c
mm
axX
600
650
700
750
800
850
900
950
1000
1050
1100
protoniron
Figure 4:Xmax vsXµ
max obtained for proton and iron sim-ulated showers using QGSJETII-03 hadronic interactionmodel.
is influenced by both, the shower-to-shower fluctuations ofindividual components and their relative displacement interms of 〈Xmax〉. However, within experimental uncer-tainties, the behaviour of〈Xmax〉, Θmax and 〈Xµ
max〉 asshown in Fig. 2 is compatible with the energy evolution ofRMS(Xmax). In particular, at the highest energies all fouranalyses show consistently that our data resemble more thesimulations of heavier primaries than pure protons.
References
[1] N. N. Kalmykov, S. S. Ostapchenko, and A. I. Pavlov,(1997) Nucl. Phys. Proc. Suppl.52B: 17-28; E.-J. Ahnet al., (2009), Phys. Rev.D80: 094003; T. Pierog and K.Werner, (2008), Phys. Rev. Lett.101: 171101.
[2] J. Allen for the Pierre Auger Collaboration, paper0703, these proceedings.
[3] The Pierre Auger Collaboration, (2004), Nucl. In-strum. Meth.A523: 50-95.
[4] The Pierre Auger Collaboration, (2010), Phys. Rev.Lett. 104: 091101.
[5] P. Facal for the Pierre Auger Collaboration, paper0725, these proceedings.
[6] H. Wahlberg for the Pierre Auger Collabo-ration, (2009), Proc. 31st ICRC, Łodz, Poland.arXiv:0906.2319v1[astro-ph].
[7] M.T. Dova for the Pierre Auger Collaboration, (2003),Proc. 28th ICRC, Tsukuba, Japan. 369-372.
[8] M.T. Dova et al., (2009), Astropart. Phys.31: 312-319.
[9] The Pierre Auger Collaboration, (2010), Nucl. In-strum. Meth.A613: 29-39.
[10] L. Cazon, R.A. Vazquez and E. Zas, (2005), As-tropart. Phys.23: 393-409.
[11] D. Garcia-Gamez for the Pierre Auger Collaboration,paper 0735, these proceedings.
[12] D. Hecket al., (1998) ReportFZKA 6019 FZ Karl-sruhe; S.J. Sciutto, (1999), arXiv:astro-ph/9911331.
12

32ND INTERNATIONAL COSMIC RAY CONFERENCE, BEIJING 2011
Estimate of the proton-air cross-section with the Pierre Auger Observatory
RALF ULRICH1 FOR THEPIERRE AUGER COLLABORATION2
1Karlsruhe Institute of Technology, Karlsruhe, Germany2Observatorio Pierre Auger, Av. San Martin Norte 304, 5613 Malargue, Argentina(Full author list: http://www.auger.org/archive/authors 201105.html)auger [email protected]
Abstract: Using the tail of the distribution of the depth of shower maxima observed with the Pierre Auger Observatory,we derive an estimate of the proton-air cross-section for particle production at center-of-mass energies of57TeV. Airshowers observed with the fluorescence detector and at least one station of the surface detector array are analysed inthe energy range from1018 to 1018.5 eV. Systematic uncertainties in the cross-section estimate arising from the limitedknowledge of the primary mass composition, the need to use shower simulations and the selection of showers are studiedin detail.
Keywords: Proton-air, Cross-section, Pierre Auger Observatory
1 Introduction
One of the biggest challenges towards a better understand-ing of the nature of ultra-high energy cosmic rays is to im-prove the modeling of hadronic interaction in air showers.Currently, none of the models is able to consistently de-scribe cosmic ray data, which most importantly prevents aprecise determination of the primary cosmic ray mass com-position.
Studies to exploit the sensitivity of cosmic ray data to thecharacteristics of hadronic interactions at energies beyondstate-of-the-art accelerator technology began over50 yearsago. While first measurements were based on the directobservation of cosmic ray particles [1], the rapidly shiftingfocus towards higher energies required the use of extensiveair shower observations [2,3]. The property of interactionsmost directly linked to the development of extensive airshowers is the cross-section for the production of hadronicparticles (e.g. [4,5]).
We present the first analysis of the proton-air cross-sectionbased on hybrid data from the Pierre Auger Observatory.For this purpose we analyse the shape of the distribution ofthe largest values of the depth of shower maxima,Xmax,the position at which air showers deposit the maximum en-ergy per unit of mass of atmosphere traversed. Thistailof theXmax-distribution is very sensitive to the proton-aircross-section, a technique first exploited in the pioneeringwork of Fly’s Eye [3]. To obtain accurate measurementsof Xmax, the timing data from the fluorescence telescopesis combined with that from the surface detector array for aprecise reconstruction of the geometry of events.
An over-riding concern of the analysis has been the assign-ment of realistic systematic uncertainties to the result. Werecognise and identify the unknown mass composition ofcosmic rays asthemajor source of systematic uncertaintyfor the proton-air cross-section analysis and we evaluateits impact on the final result. The analysis is optimised tominimise the impact of contamination by the presence ofparticles other than protons in the primary beam.
2 Analysis approach
The method used to estimate the proton-air cross-sectionis the comparison of an appropriate air shower observablewith Monte Carlo predictions. A disagreement betweendata and predictions is then attributed to a modified valueof the proton-air cross-section. The present analysis is atwo-step process.
Firstly, we measure an air shower observable with high sen-sitivity to the cross-section. Secondly, we convert this mea-surement into an estimate of the proton-air cross-sectionfor particle production,σp−air, in the energy interval1018
to 1018.5 eV. The selection of this energy range has the fol-lowing advantages and features:
Statistics: A large number of events are recorded.
Composition: The shape of theXmax-distribution is com-patible with there being a substantial fraction of protons inthe cosmic ray beam. The situation is less clear at higherenergies.
Energy: The average center-of-mass energy for a cosmicray proton interacting with a nucleon in the atmosphere
13

R. ULRICH et al. ESTIMATE OF THE PROTON-AIR CROSS-SECTION WITH THEPIERRE AUGER OBSERVATORY
is 57 TeV, significantly above what will be reached at theLHC.
As the primary observable we defineΛf
via the exponen-tial shapedN/dXmax ∝ exp(−Xmax/Λf
) of theXmax-distribution of the fractionf of the most deeply penetratingair showers. Considering only these events enhances thecontribution of protons in the sample as the average depthat which showers maximise is higher in the atmosphere fornon-proton primaries.
The choice of the fractionf is a crucial part of the def-inition of the observableΛ
f
. While a small value offwill enhances the proton fraction, since protons penetratemost deeply of all primary nuclei, it also reduces the num-ber of events for the analysis. By varyingf we investigatehow much the bias due to non-proton induced showers canbe reduced without statistical uncertainties being dominant.Following these studies we have chosenf = 20% so thatfor helium-fractions up to 15 % biases induced by heliumare kept below the level of the statistical resolution. At thesame time this choice suppresses elements heavier than he-lium very efficiently.
3 The Measurement of Λf
We use events collected between December 2004 andSeptember 2010. The atmospheric and event-quality cutsapplied are identical to those used for the analysis of〈Xmax〉 and RMS(Xmax) [6,8]. This results in11628 highquality events between1018 and1018.5 eV.
]2 [g/cmmaxX500 600 700 800 900 1000 1100 1200
/g]
2 [
cmm
axdN
/dX
-110
1
10
2 g/cm+2.4-2.3 = 55.8 fΛ
Figure 1: Unbinned likelihood fit ofΛf
to the tail of theXmax distribution.
TheXmax distribution of the data is affected by the knowngeometrical acceptance of the fluorescence telescopes aswell as by detection limitations related to atmospheric lighttransmission. The impact of the telescope acceptance ontheXmax distribution is well understood and can be stud-ied by using data (see [8]) and with detailed Monte Carlosimulations of the shower detection process. In the follow-ing we use the strategy developed for the measurement of
the〈Xmax〉 and RMS(Xmax) [6,8] to extract a data samplethat has an unbiasedXmax distribution.
In the first step we derive the range of values ofXmax
that corresponds to the deepestf = 20% of the mea-sured showers. We select only event geometries that al-low, for each shower, the complete observation of the slantdepth range from550 to1004 g/cm2, which corresponds to99.8 % of the observedXmax-distribution. These fiducialvolume cuts reduce the data sample to1635 events, pro-viding a good estimate of the unbiasedXmax-distribution.This distribution is then used to find the range of valuesof Xmax that contains the20% deepest showers, which isidentified to extend from 768 to 1004 g/cm2. Due to thelimited statistics involved in this range estimation, there isa±1.5 g/cm2 uncertainty on the definition of the range ofthe tail, which will be included in the estimation of the sys-tematic uncertainties.
In the second step we select those events from the orig-inal data sample of11628 high quality events that allowthe complete observation of values ofXmax from 768 to1004 g/cm2, corresponding to the20%-tail of the unbiaseddistribution. This is a more relaxed fiducial volume cutsince we are not requiring that a shower track can be ob-served at depths higher in the atmosphere than 768 g/cm2,which maximises the event statistics and still guarantees anunbiasedXmax distribution in the range of interest. In totalthere are3082 showers passing the fiducial volume cuts, ofwhich783 events have theirXmax in the selected range andthus directly contribute to the measurement ofΛ
f
. The av-erage energy of these events is1018.24 eV, corresponding toa center-of-mass energy of
√s = 57TeV in proton-proton
collisions.
In Fig. 1 we show the data and the result of an unbinnedmaximum likelihood fit of an exponential function over therange768 to 1004 g/cm2. This yields
Λf
= (55.8± 2.3stat ± 0.6syst) g/cm2. (1)
The systematic uncertainty arises from the precision withwhich the range of depths that are used can be defined.
Values ofΛf
have been calculated for modified event selec-tions and for different ranges of atmospheric depths. It isfound that the changes inΛ
r
lie within the statistical uncer-tainties. The re-analysis of sub-samples selected accordingto zenith-angle, shower-telescope distance and energy pro-duces variations of the value ofΛ
f
consistent with statis-tical fluctuations. We conclude that the systematic uncer-tainties related to the measurement are below5%.
4 Determination of the cross-section
We must resort to Monte Carlo simulations to derive anestimate of the proton-air cross-section from the measure-ment ofΛ
f
. These have been made using the same energydistribution as in the data, and the events from the simula-tions have been analysed with the identical procedures usedfor the data.
14
32ND INTERNATIONAL COSMIC RAY CONFERENCE, BEIJING 2011
[mb]p-airσ400 500 600 700 800
]2 [
g/cm
fMC
Λ
50
60
70
80QGSJet01c
QGSJetII.3
Sibyll 2.1
Epos 1.99
Auger Data
Stat. Error
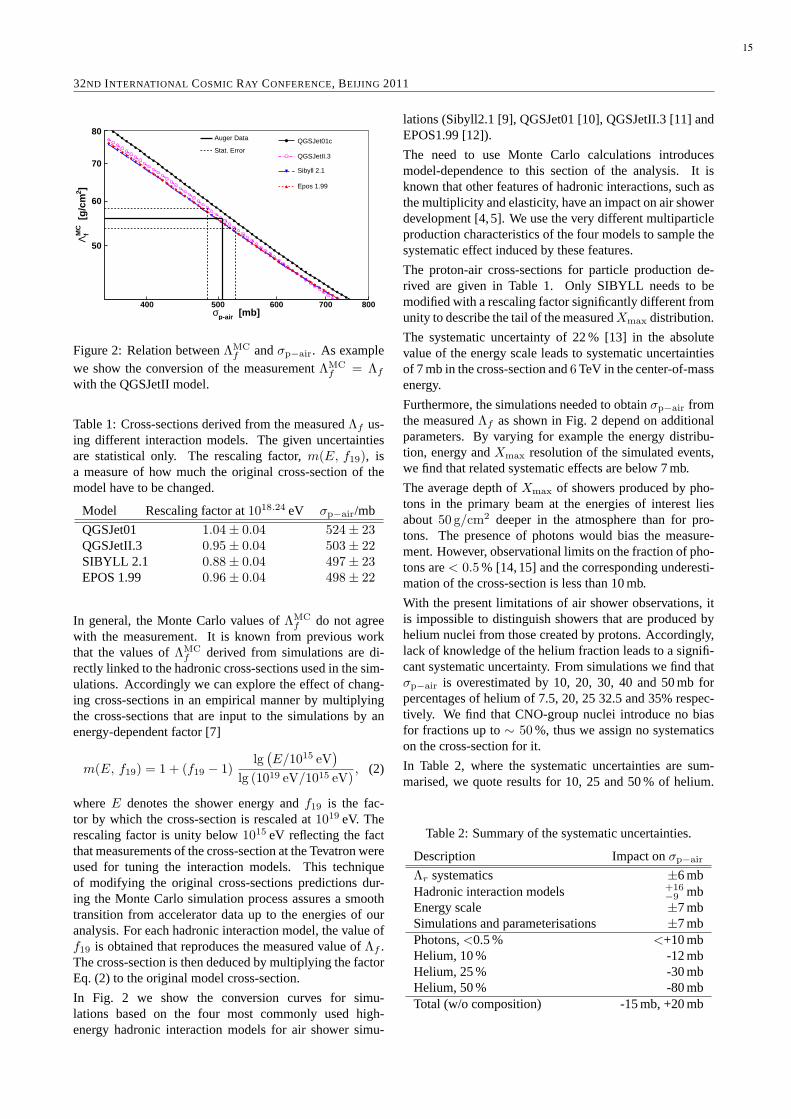
Figure 2: Relation betweenΛMCf
andσp−air. As examplewe show the conversion of the measurementΛMC
f
= Λf
with the QGSJetII model.
Table 1: Cross-sections derived from the measuredΛf
us-ing different interaction models. The given uncertaintiesare statistical only. The rescaling factor,m(E, f19), isa measure of how much the original cross-section of themodel have to be changed.
Model Rescaling factor at1018.24 eV σp−air/mb
QGSJet01 1.04± 0.04 524± 23QGSJetII.3 0.95± 0.04 503± 22SIBYLL 2.1 0.88± 0.04 497± 23EPOS 1.99 0.96± 0.04 498± 22
In general, the Monte Carlo values ofΛMCf
do not agreewith the measurement. It is known from previous workthat the values ofΛMC
f
derived from simulations are di-rectly linked to the hadronic cross-sections used in the sim-ulations. Accordingly we can explore the effect of chang-ing cross-sections in an empirical manner by multiplyingthe cross-sections that are input to the simulations by anenergy-dependent factor [7]
m(E, f19) = 1 + (f19 − 1)lg(
E/1015 eV)
lg (1019 eV/1015 eV), (2)
whereE denotes the shower energy andf19 is the fac-tor by which the cross-section is rescaled at1019 eV. Therescaling factor is unity below1015 eV reflecting the factthat measurements of the cross-section at the Tevatron wereused for tuning the interaction models. This techniqueof modifying the original cross-sections predictions dur-ing the Monte Carlo simulation process assures a smoothtransition from accelerator data up to the energies of ouranalysis. For each hadronic interaction model, the value off19 is obtained that reproduces the measured value ofΛ
f
.The cross-section is then deduced by multiplying the factorEq. (2) to the original model cross-section.
In Fig. 2 we show the conversion curves for simu-lations based on the four most commonly used high-energy hadronic interaction models for air shower simu-
lations (Sibyll2.1 [9], QGSJet01 [10], QGSJetII.3 [11] andEPOS1.99 [12]).
The need to use Monte Carlo calculations introducesmodel-dependence to this section of the analysis. It isknown that other features of hadronic interactions, such asthe multiplicity and elasticity, have an impact on air showerdevelopment [4,5]. We use the very different multiparticleproduction characteristics of the four models to sample thesystematic effect induced by these features.
The proton-air cross-sections for particle production de-rived are given in Table 1. Only SIBYLL needs to bemodified with a rescaling factor significantly different fromunity to describe the tail of the measuredXmax distribution.
The systematic uncertainty of 22 % [13] in the absolutevalue of the energy scale leads to systematic uncertaintiesof 7 mb in the cross-section and6TeV in the center-of-massenergy.
Furthermore, the simulations needed to obtainσp−air fromthe measuredΛ
f
as shown in Fig. 2 depend on additionalparameters. By varying for example the energy distribu-tion, energy andXmax resolution of the simulated events,we find that related systematic effects are below 7 mb.
The average depth ofXmax of showers produced by pho-tons in the primary beam at the energies of interest liesabout 50 g/cm2 deeper in the atmosphere than for pro-tons. The presence of photons would bias the measure-ment. However, observational limits on the fraction of pho-tons are< 0.5% [14,15] and the corresponding underesti-mation of the cross-section is less than 10 mb.
With the present limitations of air shower observations, itis impossible to distinguish showers that are produced byhelium nuclei from those created by protons. Accordingly,lack of knowledge of the helium fraction leads to a signifi-cant systematic uncertainty. From simulations we find thatσp−air is overestimated by 10, 20, 30, 40 and 50 mb forpercentages of helium of 7.5, 20, 25 32.5 and 35% respec-tively. We find that CNO-group nuclei introduce no biasfor fractions up to∼ 50%, thus we assign no systematicson the cross-section for it.
In Table 2, where the systematic uncertainties are sum-marised, we quote results for 10, 25 and 50 % of helium.
Table 2: Summary of the systematic uncertainties.
Description Impact onσp−air
Λr
systematics ±6 mbHadronic interaction models +16
−9 mbEnergy scale ±7 mbSimulations and parameterisations ±7 mbPhotons,<0.5 % <+10 mbHelium, 10 % -12 mbHelium, 25 % -30 mbHelium, 50 % -80 mbTotal (w/o composition) -15 mb, +20 mb
15
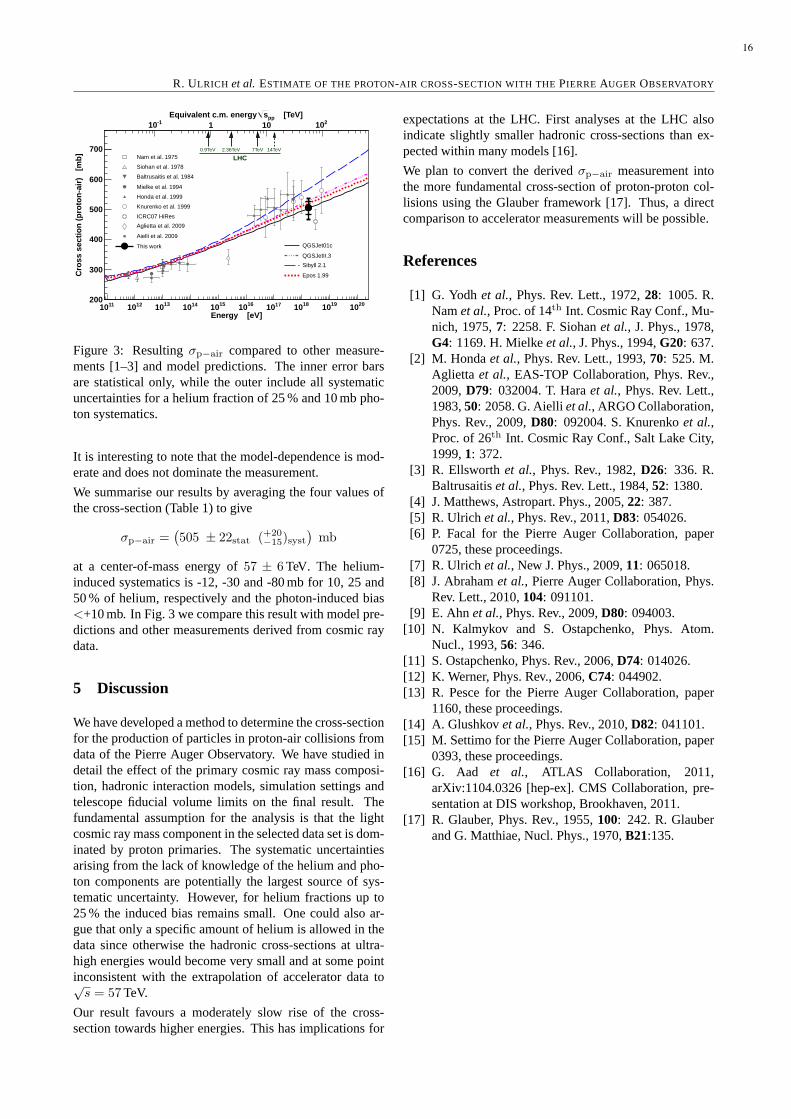
R. ULRICH et al. ESTIMATE OF THE PROTON-AIR CROSS-SECTION WITH THEPIERRE AUGER OBSERVATORY
(Energy/eV)10
log11 12 13 14 15 16 17 18 19 20
Cro
ss s
ectio
n (p
roto
n-ai
r)
[mb]
200
300
400
500
600
700
QGSJet01c
QGSJetII.3
Sibyll 2.1
Epos 1.99
Energy [eV]1110 1210 1310 1410 1510 1610 1710 1810 1910 2010
[TeV]ppsEquivalent c.m. energy -110 1 10 210
Nam et al. 1975
Siohan et al. 1978
Baltrusaitis et al. 1984
Mielke et al. 1994
Honda et al. 1999
Knurenko et al. 1999
ICRC07 HiRes
Aglietta et al. 2009
Aielli et al. 2009
This work
0.9TeV 2.36TeV 7TeV 14TeV
LHC
Figure 3: Resultingσp−air compared to other measure-ments [1–3] and model predictions. The inner error barsare statistical only, while the outer include all systematicuncertainties for a helium fraction of 25 % and 10 mb pho-ton systematics.
It is interesting to note that the model-dependence is mod-erate and does not dominate the measurement.
We summarise our results by averaging the four values ofthe cross-section (Table 1) to give
σp−air =(
505 ± 22stat (+20−15)syst
)
mb
at a center-of-mass energy of57 ± 6TeV. The helium-induced systematics is -12, -30 and -80 mb for 10, 25 and50 % of helium, respectively and the photon-induced bias<+10 mb. In Fig. 3 we compare this result with model pre-dictions and other measurements derived from cosmic raydata.
5 Discussion
We have developed a method to determine the cross-sectionfor the production of particles in proton-air collisions fromdata of the Pierre Auger Observatory. We have studied indetail the effect of the primary cosmic ray mass composi-tion, hadronic interaction models, simulation settings andtelescope fiducial volume limits on the final result. Thefundamental assumption for the analysis is that the lightcosmic ray mass component in the selected data set is dom-inated by proton primaries. The systematic uncertaintiesarising from the lack of knowledge of the helium and pho-ton components are potentially the largest source of sys-tematic uncertainty. However, for helium fractions up to25 % the induced bias remains small. One could also ar-gue that only a specific amount of helium is allowed in thedata since otherwise the hadronic cross-sections at ultra-high energies would become very small and at some pointinconsistent with the extrapolation of accelerator data to√s = 57TeV.
Our result favours a moderately slow rise of the cross-section towards higher energies. This has implications for
expectations at the LHC. First analyses at the LHC alsoindicate slightly smaller hadronic cross-sections than ex-pected within many models [16].
We plan to convert the derivedσp−air measurement intothe more fundamental cross-section of proton-proton col-lisions using the Glauber framework [17]. Thus, a directcomparison to accelerator measurements will be possible.
References
[1] G. Yodh et al., Phys. Rev. Lett., 1972,28: 1005. R.Namet al., Proc. of 14th Int. Cosmic Ray Conf., Mu-nich, 1975,7: 2258. F. Siohanet al., J. Phys., 1978,G4: 1169. H. Mielkeet al., J. Phys., 1994,G20: 637.
[2] M. Hondaet al., Phys. Rev. Lett., 1993,70: 525. M.Aglietta et al., EAS-TOP Collaboration, Phys. Rev.,2009,D79: 032004. T. Haraet al., Phys. Rev. Lett.,1983,50: 2058. G. Aielliet al., ARGO Collaboration,Phys. Rev., 2009,D80: 092004. S. Knurenkoet al.,Proc. of 26th Int. Cosmic Ray Conf., Salt Lake City,1999,1: 372.
[3] R. Ellsworth et al., Phys. Rev., 1982,D26: 336. R.Baltrusaitiset al., Phys. Rev. Lett., 1984,52: 1380.
[4] J. Matthews, Astropart. Phys., 2005,22: 387.[5] R. Ulrich et al., Phys. Rev., 2011,D83: 054026.[6] P. Facal for the Pierre Auger Collaboration, paper
0725, these proceedings.[7] R. Ulrich et al., New J. Phys., 2009,11: 065018.[8] J. Abrahamet al., Pierre Auger Collaboration, Phys.
Rev. Lett., 2010,104: 091101.[9] E. Ahn et al., Phys. Rev., 2009,D80: 094003.
[10] N. Kalmykov and S. Ostapchenko, Phys. Atom.Nucl., 1993,56: 346.
[11] S. Ostapchenko, Phys. Rev., 2006,D74: 014026.[12] K. Werner, Phys. Rev., 2006,C74: 044902.[13] R. Pesce for the Pierre Auger Collaboration, paper
1160, these proceedings.[14] A. Glushkovet al., Phys. Rev., 2010,D82: 041101.[15] M. Settimo for the Pierre Auger Collaboration, paper
0393, these proceedings.[16] G. Aad et al., ATLAS Collaboration, 2011,
arXiv:1104.0326 [hep-ex]. CMS Collaboration, pre-sentation at DIS workshop, Brookhaven, 2011.
[17] R. Glauber, Phys. Rev., 1955,100: 242. R. Glauberand G. Matthiae, Nucl. Phys., 1970,B21:135.
16
32ND INTERNATIONAL COSMIC RAY CONFERENCE, BEIJING 2011
Interpretation of the signals produced by showers from cosmic rays of 1019 eV observed in thesurface detectors of the Pierre Auger Observatory
JEFF ALLEN1 FOR THEPIERRE AUGER COLLABORATION2
1New York University, 4 Washington Place, New York, NY, 10003, USA2Observatorio Pierre Auger, Av. San Martin Norte 304, 5613 Malargue, Argentina(Full author list: http://www.auger.org/archive/authors 201105.html)[email protected]
Abstract: Muons in extensive air showers are messengers of the hadronic-shower core whose simulation is subject to largetheoretical uncertainties due to our limited knowledge of multi-particle production in hadronic interactions. Different meth-ods of deriving the fraction of the signal observed in the surface detectors coming from either the muonic or electromagneticshower components are used to compare the data from the Pierre AugerObservatory with predictions of Monte Carlo sim-ulations. The observations are quantified relative to the predictions obtained with QGSJET II and FLUKA as interactionmodels. The predicted number of muons at 1000 m from the shower axisis lower than that found in data, and the energythat would have to be assigned to the surface detector signal, based on shower simulations, is systematically higher than thatderived from fluorescence observations.
Keywords: muons, hadronic interactions, ultra high energy extensive air showers, muon deficit, simulations
1 Introduction
The Pierre Auger Observatory is a powerful detector forstudying extensive air showers at very high energy. Thecombination of the fluorescence detector (FD) and surfacedetector array (SD) of the Observatory allows the simul-taneous measurement of several observables of showers,providing opportunities to cross-check our current under-standing of the physics of air showers. Many features of airshowers depend directly on the characteristics of hadronicinteractions which are unknown at very high energy and inphase space regions not covered in accelerator experiments.For example, recent work has quantified the sensitivity ofthe number of muons in ultra-high-energy air showers toseveral properties of hadronic interactions, including themultiplicity, the charge ratio (the fraction of secondary pi-ons which are neutral), and the baryon anti-baryon pair pro-duction [1, 2]. Using models of hadronic interactions thatdo not provide a good description of shower data might leadto incorrect conclusions about the mass and the energy as-signment being drawn from measurements.
In this work the data of the Pierre Auger Observatory iscompared to showers simulated using the interaction modelQGSJET II.03 [3], which has become a standard referencemodel for air-shower experiments. Updates are providedto several methods presented previously [4], and a newmethod is introduced. In Sec. 2, the data from the surfaceand fluorescence detectors is compared simultaneously, onan event-by-event basis, to the results of simulations. In
Sec. 3, the time structure of the particle signals in thesurface detectors and a universal property of air showersare used to estimate the number of muons in the data. Fi-nally, in Sec. 4, the ground signals of simulated eventsare matched to those measured by rescaling the number ofmuons arising from hadronic processes and changing theenergy assignment in simulated showers.
2 Study of Individual Hybrid Events
At the Auger Observatory, thousands of showers have beenrecorded for which reconstruction has been possible usingboth the FD and SD. These hybrid events have been used toconstruct a library of simulated air-shower events where thelongitudinal profile (LP) of each simulated event matchesa measured LP. The measured LP constrains the naturalshower-to-shower fluctuations of the distribution of parti-cles at ground. This allows the ground signals of simulatedevents to be compared to the ground signals of measuredevents on an event-by-event basis.
Hybrid events were selected using the criteria adoptedfor the energy calibration of the SD [5] in the energyrange18.8 < log (E) < 19.2 recorded between 1 Jan-uary 2004 and 31 December 2008. 227 events passed allcuts. Air showers were simulated using SENECA [6] withQGSJET II and FLUKA [7] as the high- and low-energyevent generators. For every hybrid event, three proton-and three iron-initiated showers were selected from a set of200 simulated showers for each primary type. The energy
17

J. ALLEN et al. INTERPRETATION OFAUGER OBSERVATORY SURFACE DETECTOR SIGNAL
10
20
30
200 400 600 800 1000 1200
dE/d
X [P
eV/g
/cm
2 ]
Depth [g/cm2]
Energy: (13.8 +_ 0.7) EeV
Zenith: (56.5 +_ 0.2o)
XMax: (752 +_ 9) g/cm2 χ2/dof (p) = 1.19
χ2/dof (Fe) = 1.21
Proton SimIron Sim
Data
100
101
102
500 1000 1500 2000
S [V
EM
]
Radius [m]
Proton SimIron Sim
Data
1.5
2
2.5
1 1.2 1.4 1.6 1.8 2
R
sec(θ)
Figure 1: Top panel:A longitudinal profile measured fora hybrid event and matching simulations of two showerswith proton and iron primaries.Middle panel: A lateraldistribution function determined for the same hybrid eventas in the top panel and that of the two simulated events.Bottom panel:R, defined asS(1000)Data
S(1000)Sim, averaged over the
hybrid events as a function of secθ.
and arrival direction of the showers matches the measuredevent, and the LPs of the selected showers have the lowestχ2 compared to the measured LP. The measured LP andtwo selected LPs of an example event are shown in the toppanel of Fig. 1.
The detector response for the selected showers was simu-lated using the AugerOff line software package [8,9]. Thelateral distribution function of an observed event and thatof two simulated events are shown in the middle panel ofFig. 1. For each of the 227 events, the ground signal at1000 m from the shower axis, S(1000), is smaller for thesimulated events than that measured. The ratio of the mea-sured S(1000) to that predicted in simulations of showers
with proton primaries,S(1000)DataS(1000)Sim
, is 1.5 for vertical showersand grows to around 2 for inclined events; see the bottompanel of Fig. 1. The ground signal of more-inclined events
is muon-dominated. Therefore, the increase of the discrep-ancy with zenith angle suggests that there is a deficit ofmuons in the simulated showers compared to the data. Thediscrepancy exists for simulations of showers with iron pri-maries as well, which means that the ground signal cannotbe explained only through composition.
3 Estimate of the Muonic Signal in Data
3.1 A multivariate muon counterIn this section, the number of muons at 1000 m from theshower axis is reconstructed. This was accomplished byfirst estimating the number of muons in the surface detec-tors using the characteristic signals created by muons in thePMT FADC traces and then reconstructing the muonic lat-eral distribution function (LDF) of SD events.
In the first stage, the number of muons in individual surfacedetectors is estimated. As in thejump method[4], the totalsignal from discrete jumps
J =∑
FADC bin i
(xi+1 − x
i
)︸ ︷︷ ︸
jump
I {xi+1 − x
i
> 0.1} (1)
was extracted from each FADC signal, wherexi
is the sig-nal measured in theith bin in Vertical Equivalent Muon(VEM) units, and the indicator functionI {y} is 1 if itsargumenty is true and0 otherwise. The estimatorJ iscorrelated with the number of muons in the detector, but ithas an RMS of approximately40%. To improve the pre-cision, a multivariate model was used to predict the ratioη = (N
µ
+ 1)/(J + 1). 172 observables that are plausiblycorrelated to muon content, such as the number of jumpsand the rise-time, were extracted from each FADC signal.Principal Component Analysis was then applied to deter-mine19 linear combinations of the observables which bestcapture the variance of the original FADC signals. Usingthese19 linear combinations, an artificial neural network(ANN) [10] was trained to predictη and its uncertainty.The output of the ANN was compiled into a probability ta-blePANN = P (N
µ
= N |FADC signal). The RMS of thisestimator is about25%, and biases are also reduced com-pared to the estimatorJ .
In the second stage of the reconstruction, a LDF
N(r, ν, β, γ) =
exp
(
ν + β logr
1000m+ γ log
( r
1000m
)2)
(2)
is fit to the estimated number of muons in the detectors foreach event, wherer is the distance of the detector from theshower axis andν, β, andγ are fit parameters. The num-ber of muons in each surface detector varies from the LDFaccording to the estimatePANN and Poisson fluctuations.The fit parameters,ν, β, andγ, have means which dependon the primary energy and zenith angle as well as vari-ances arising from shower-to-shower fluctuations. Gaus-sian prior distributions with energy- and zenith-dependentmeans were defined for the three fit parameters. All the
18

32ND INTERNATIONAL COSMIC RAY CONFERENCE, BEIJING 2011
parameters were estimated using an empirical Bayesian ap-proach: three iterations were performed between (i) findingthe maximuma posterioriestimateν
i
, βi
, andγi
for eachshoweri given the fixed priors, and (ii) re-estimating thepriors given the fixed parameter estimatesν
i
, βi
, andγi
.
The value of the muonic LDF at 1000 m,exp(ν), is highlycorrelated withN
µ
(1000), the number of muons in sur-face detectors 1000 m from the shower axis. The RMSof exp(ν) in showers simulated using QGSJET II is12%and5% for proton and iron primaries. To correct severalbiases that depend on the energy and zenith angle of theshowers, a quadratic functionf
(
exp(ν), θ)
was tuned ona library of showers simulated using QGSJET II with sim-ulated detector response. The final estimatorN
µ
(1000) =
f(
exp(ν), θ)
has a systematic uncertainty below50◦ of
6% from uncertainty in the composition and+10%
−0%from
uncertainty in the hadronic models, determined by recon-structing showers simulated using EPOS 1.6. The totalsystematic uncertainty decreases with the zenith angle: atθ = 55◦ it is +9%
−3%.
3.2 Universality of Sµ/Sem behavior on Xv
max
The ratio of the muonic signal to the electromagnetic (EM)signal,S
µ
/Sem, at 1000 m from the shower axis exhibitsan empirical universal property for all showers at a fixedvertical depth of shower maximum,Xv
max [11]. Sµ
/Sem isindependent of the primary particle type, primary energy,and incident zenith angle. The dependence ofS
µ
/Sem onXv
max can be described by a simple parameterization whichleads to the following expression for the muonic signal inshowers with zenith angle between45◦ and65◦
Sfitµ
=S(1000)
1 + cosα(θ)/(
(Xvmax/A)1/b − a
) , (3)
where S(1000) is as defined above,θ is the zenith angle,α = 1.2, andA, a andb are fit parameters [12]. The esti-mation of the muonic signal in data is complicated by thedependence of the fit parametersA, a, andb in Eq. (3) onthe choice of hadronic interaction model. This dependencegives rise to a systematic uncertainty in the measurementof the muonic signal in data which is difficult to quantifydue to the uncertainty in properties of hadronic interac-tions. This problem can be overcome with an additionalphenomenological consideration: for showers with zenithangles above45◦, the fraction of the EM signal comingfrom the decay and interactions of muons rapidly increases.As shown in [13], different models of hadronic interactionsare in agreement on theS
µ
/Sem ratio for showers withzenith angle above45◦, sinceS
µ
/Sem increasingly reflectsthe equilibrium between muons and their EM halo.
The fit in Eq. (3) provides an unbiased estimate of both themuonic and EM signals. The RMS of the muonic signalin showers simulated using CORSIKA [14] is less than 5%and 3% for proton and iron primaries [12]. The systematicuncertainty ofS
µ
from uncertainty in the hadronic modelsis estimated to be 6%, determined by the application of the
1
1.5
2
2.5
1 1.25 1.5 1.75 2
15 30 45 60
Nµre
l
sec(θ)
Zenith Angle [Degrees]
Multiv. MethodUniversality
Univ. IronMulti. Iron
Figure 2: The number of muons estimated at1000min data relative to the predictions of simulations usingQGSJET II with proton primaries. The results obtainedusing the multivariate method are shown as the solid linewith systematic uncertainties as the dashed lines. The re-sults obtained using the universality ofS
µ
/Sem are shownas circles with statistical and systematic uncertainties.Theresults when the methods are applied on a library of iron-initiated showers are shown as the dot and dash-dot lines.
parameterization of Eq. (3) using QGSJET II on showerssimulated using EPOS 1.99. The systematic uncertaintyof S
µ
from event reconstruction is 14% at1019 eV, deter-mined through complete shower simulation and reconstruc-tion using AugerOff line. The systematic uncertainty fromevent reconstruction is dominated by the systematic uncer-tainty of S(1000), with only a few percent coming fromthe uncertainty ofXv
max and the zenith angle.
3.3 Application to data
By applying the multivariate and the universality methodsto data collected between 1 January 2004 and 30 Septem-ber 2010, a significant excess of muons is measured com-pared to the predictions of simulations using QGSJET II;see Fig. 2. The multivariate method was applied to SDevents over the energy range18.6 < log(E) < 19.4 and0◦ − 57◦. The universality method was applied to hybridevents over the energy range18.8 < log(E) < 19.2 and45◦ − 65◦. For both methods, the excess is estimated hererelative to showers simulated with proton primaries.
The multivariate method is used to determine the num-ber of muons,N
µ
(1000). The relative excess is angle-independent, to within 3%, until about40◦, above whichit increases. In particular, atθ = 38◦ the excess is(
1.65+0.26−0.10
)
and atθ = 55◦ the excess is(
1.88+0.17−0.06
)
. Theuniversality ofS
µ
/Sem for fixedXvmax is used to estimate
the total muonic signal. For45◦−53◦, the relative excess is(1.76 ± 0.04(stat.) ± 0.29 (syst.)), while for 53◦ − 65◦
the discrepancy rises to(1.89 ± 0.04 ± 0.28).
4 Discussion
As demonstrated in the analyses, and shown in Figs. 1 and2, simulations of air showers using QGSJET II with pro-
19
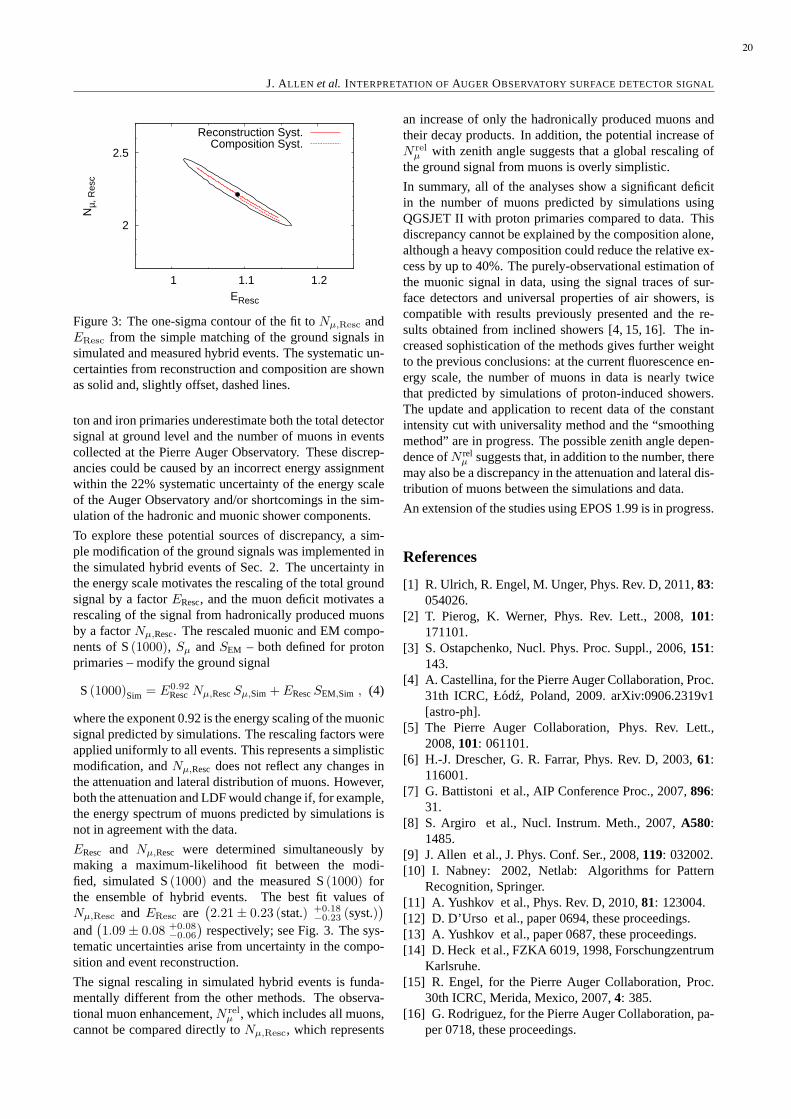
J. ALLEN et al. INTERPRETATION OFAUGER OBSERVATORY SURFACE DETECTOR SIGNAL
2
2.5
1 1.1 1.2
Nµ,
Res
c
EResc
Reconstruction Syst.Composition Syst.
Figure 3: The one-sigma contour of the fit toNµ,Resc and
EResc from the simple matching of the ground signals insimulated and measured hybrid events. The systematic un-certainties from reconstruction and composition are shownas solid and, slightly offset, dashed lines.
ton and iron primaries underestimate both the total detectorsignal at ground level and the number of muons in eventscollected at the Pierre Auger Observatory. These discrep-ancies could be caused by an incorrect energy assignmentwithin the 22% systematic uncertainty of the energy scaleof the Auger Observatory and/or shortcomings in the sim-ulation of the hadronic and muonic shower components.
To explore these potential sources of discrepancy, a sim-ple modification of the ground signals was implemented inthe simulated hybrid events of Sec. 2. The uncertainty inthe energy scale motivates the rescaling of the total groundsignal by a factorEResc, and the muon deficit motivates arescaling of the signal from hadronically produced muonsby a factorN
µ,Resc. The rescaled muonic and EM compo-nents of S(1000), S
µ
andSEM – both defined for protonprimaries – modify the ground signal
S(1000)Sim = E0.92RescNµ,RescSµ,Sim + ERescSEM,Sim , (4)
where the exponent 0.92 is the energy scaling of the muonicsignal predicted by simulations. The rescaling factors wereapplied uniformly to all events. This represents a simplisticmodification, andN
µ,Resc does not reflect any changes inthe attenuation and lateral distribution of muons. However,both the attenuation and LDF would change if, for example,the energy spectrum of muons predicted by simulations isnot in agreement with the data.
EResc and Nµ,Resc were determined simultaneously by
making a maximum-likelihood fit between the modi-fied, simulated S(1000) and the measured S(1000) forthe ensemble of hybrid events. The best fit values ofN
µ,Resc andEResc are(
2.21± 0.23 (stat.) +0.18−0.23 (syst.)
)
and(
1.09± 0.08 +0.08−0.06
)
respectively; see Fig. 3. The sys-tematic uncertainties arise from uncertainty in the compo-sition and event reconstruction.
The signal rescaling in simulated hybrid events is funda-mentally different from the other methods. The observa-tional muon enhancement,N rel
µ
, which includes all muons,cannot be compared directly toN
µ,Resc, which represents
an increase of only the hadronically produced muons andtheir decay products. In addition, the potential increase ofN rel
µ
with zenith angle suggests that a global rescaling ofthe ground signal from muons is overly simplistic.
In summary, all of the analyses show a significant deficitin the number of muons predicted by simulations usingQGSJET II with proton primaries compared to data. Thisdiscrepancy cannot be explained by the composition alone,although a heavy composition could reduce the relative ex-cess by up to 40%. The purely-observational estimation ofthe muonic signal in data, using the signal traces of sur-face detectors and universal properties of air showers, iscompatible with results previously presented and the re-sults obtained from inclined showers [4, 15, 16]. The in-creased sophistication of the methods gives further weightto the previous conclusions: at the current fluorescence en-ergy scale, the number of muons in data is nearly twicethat predicted by simulations of proton-induced showers.The update and application to recent data of the constantintensity cut with universality method and the “smoothingmethod” are in progress. The possible zenith angle depen-dence ofN rel
µ
suggests that, in addition to the number, theremay also be a discrepancy in the attenuation and lateral dis-tribution of muons between the simulations and data.
An extension of the studies using EPOS 1.99 is in progress.
References
[1] R. Ulrich, R. Engel, M. Unger, Phys. Rev. D, 2011,83:054026.
[2] T. Pierog, K. Werner, Phys. Rev. Lett., 2008,101:171101.
[3] S. Ostapchenko, Nucl. Phys. Proc. Suppl., 2006,151:143.
[4] A. Castellina, for the Pierre Auger Collaboration, Proc.31th ICRC, Łodz, Poland, 2009. arXiv:0906.2319v1[astro-ph].
[5] The Pierre Auger Collaboration, Phys. Rev. Lett.,2008,101: 061101.
[6] H.-J. Drescher, G. R. Farrar, Phys. Rev. D, 2003,61:116001.
[7] G. Battistoni et al., AIP Conference Proc., 2007,896:31.
[8] S. Argiro et al., Nucl. Instrum. Meth., 2007,A580:1485.
[9] J. Allen et al., J. Phys. Conf. Ser., 2008,119: 032002.[10] I. Nabney: 2002, Netlab: Algorithms for Pattern
Recognition, Springer.[11] A. Yushkov et al., Phys. Rev. D, 2010,81: 123004.[12] D. D’Urso et al., paper 0694, these proceedings.[13] A. Yushkov et al., paper 0687, these proceedings.[14] D. Heck et al., FZKA 6019, 1998, Forschungzentrum
Karlsruhe.[15] R. Engel, for the Pierre Auger Collaboration, Proc.
30th ICRC, Merida, Mexico, 2007,4: 385.[16] G. Rodriguez, for the Pierre Auger Collaboration, pa-
per 0718, these proceedings.
20

32ND INTERNATIONAL COSMIC RAY CONFERENCE, BEIJING 2011
A new method for determining the primary energy from the calorimetric energy of showersobserved in hybrid mode on a shower-by-shower basis
ANALISA G. MARIAZZI 1 FOR THEPIERRE AUGER COLLABORATION2
1IFLP, Universidad Nacional de La Plata and CONICET, La Plata, Argentina2Observatorio Pierre Auger, Av. San Martin Norte 304, 5613 Malargue, Argentina(Full author list: http://www.auger.org/archive/authors 201105.html)[email protected]
Abstract: The energy deposit integral can be used for determining the calorimetricenergy of air showers observed withfluorescence telescopes. The invisible fraction of the primary energy,averaged over many showers, is typically estimatedfrom Monte Carlo simulations and later added for the reconstruction of the total primary energy. In this contribution wederive a simple parameterization of the invisible energy correction that can be applied to individual events measured withboth the fluorescence and the surface detectors. The obtained parameterization is robust with respect to a change of thehigh energy hadronic interaction model employed in the simulation and has only a very small primary mass dependence,reducing the associated systematic uncertainties of energy reconstruction.
Keywords: Ultra High Energy Extensive Air Showers, Missing Energy, Muons, Hadronic interactions
1 Introduction
When an ultra high energy cosmic ray interacts in the atmo-sphere a cascade of particles is generated. In the cascade,an important fraction of the energy is deposited in the atmo-sphere as ionization of the air molecules and atoms, and theremaining fraction is carried away by neutrinos and highenergy muons that hit the ground.
A fraction of the total deposited energy is re-emitted dur-ing the de-excitation of the ionized molecules as fluores-cence light that can be detected by fluorescence telescopes.The telescopes use the atmosphere as a calorimeter, mak-ing a direct measurement of the longitudinal shower devel-opment. The energy deposit integral can be used to de-termine the calorimetric energy (E
Cal
) of air showers ob-served with fluorescence telescopes.
The fraction of energy carried away by neutrinos and highenergy muons isa priori unknown, and corrections forthis so-called missing energy (E
Missing
) must be properlyapplied to the measuredE
Cal
to find the primary energy(E
Primary
). Generally, the missing energy correction isparameterized as a function ofE
Cal
(EMissing
(ECal
)),which is estimated from Monte Carlo simulations aver-aging over many showers. The missing energy is about10% of the primary energy depending on the high energyhadronic interaction model and on the primary mass, asshown in Figure 1. Since the primary mass cannot be de-termined on an event by event basis, an average mass com-position must be assumed. This introduces a systematic
[eV])Cal
(E10
Log18 18.5 19 19.5 20 20.5
[%
]P
rim
ary
/EM
iss
E
0
2
4
6
8
10
12
14
16
18
20Missing Energy Correction
Iron EPOS 1.99Mixed EPOS 1.99Proton EPOS 1.99Iron QGSJET-IIMixed QGSJET-IIProton QGSJET-IIMixed QGSJET01CMixed Sybill 2.1
Figure 1:EMissing
(ECal
) correction for fluorescence de-tectors.
uncertainty in the determination of the primary energy andpossibly a bias, if the actual mass composition is differentfrom the assumed average.
The model dependence of the missing energy estimation asa function ofE
Cal
is a direct consequence of using a pa-rameter that is not actually related to the missing energy,but to the electromagnetic energy. The lack of knowledge
21

A. M ARIAZZI et al. A NEW METHOD FOR DETERMINING THE PRIMARY ENERGY
Primary))/E
Cal(EMissing
QGSJET01-EMontecarloMissing
(E
-0.1 -0.08 -0.06 -0.04 -0.02 0 0.02 0.04 0.06 0.08 0.1
A.U
. (A
ll h
isto
gra
ms
no
rma
lize
d to
1)
0
0.02
0.04
0.06
0.08
0.1
0.12Hadronic Model & Primary Mass
QGSJET-II Proton
EPOS 1.99 Proton
QGSJET-II Iron
EPOS 1.99 Iron
Figure 2: Difference betweenEQGSJET01
Missing
(ECal
) and themissing energy from showers simulated with EPOS andQGSJETII, in units of the primary energy.
of the correct interaction model at high energies also intro-duces a systematic uncertainty and possibly a bias, that areultimately not known. For example, a mis-reconstructionof the missing energy due to appearance of new physics inthe hadronic interaction models could explain features ofthe cosmic ray energy spectrum like the knee without mak-ing any use of changes in the primary spectrum slope[1].The event by event deviations with respect to a refer-ence average value of the missing energy for QGSJET01mixed mass composition(EQGSJET01
Missing
(ECal
) ) can be seenin Figure 2 . Looking at the spread caused by the mis-reconstruction of the missing energy, it is then desirableto have a missing energy parameterization as a function ofshower observables that are less model dependent, and givea better estimation of the true missing energy on a shower-by-shower basis.
Extensive air showers created by ultra-high energy cosmicray are measured with two complementary techniques atthe Pierre Auger Observatory. The longitudinal showerdevelopment is recorded with the Fluorescence Detector(FD), while the muonic and electromagnetic componentscan be measured at ground by the Surface Detector (SD).The lateral distribution of the shower particles at ground issampled with an array of more than 1600 water-Cherenkovdetectors while the fluorescence light emission along theshower trajectory through the atmosphere is observed witha set of 24 telescopes [2].
In this article, a new approach for the determination of themissing energy in extensive air showers is presented. Thisapproach takes advantage of the hybrid nature of the PierreAuger Observatory, using the signal at 1000 m from theshower core (S(1000)) and the atmospheric slant depth ofthe shower maximum (X
max
) to provide a robust estima-tion of the missing energy, reducing the systematic uncer-tainties that this correction introduces in the determinationof the primary energy.
2 A Toy Model for the Missing Energy
In the Heitler model extended to hadronic cascades byMatthews [3], the primary energy is distributed betweenelectromagnetic particles and muons.
E0 = ξec
Nmax
+ ξπc
Nµ
(1)
One can identify the second term directly as the missingenergy:
EMissing
= ξπc
Nµ
(2)
whereξec
is the critical energy for the electromagnetic parti-cles andξπ
c
is the pion critical energy. Although the numberof muons generated in the shower depends on the high en-ergy hadronic interaction model, the pion critical energyis a well established quantity that depends primarily onthe medium density where the first interactions take place,making this relationship robust to changes in the hadronicinteraction model.
Nyklicek et al. [4] have shown using vertical showers thatthe model dependence is reduced ifE
Missing
is estimatedusing its correlation with the total number of muons atground above 1GeV. In their work there is a linear relationto the number of muons (Eq. 2) and the proportionality fac-tor obtained from Monte Carlo simulations is of the orderof a critical energyξπ
c
≈ 10 GeV which is in agreementwith the predictions made using the extended toy model ofMatthews [3].
An observable related to the muon content of the showerwould be more suitable for the determination of the missingenergy correction. However, the number of muons is notdirectly measured in the Pierre Auger Observatory. One ofthe simplest observables related to the muon content of theshower isS(1000).
Based on universality studies [5, 6], the relationship be-tweenS(1000) and the muon content should be univer-sal when expressed as a function of the stage of develop-ment of the cascade at ground level measured byDX =X
ground
−Xmax
(distance measured in atmospheric depthfrom the ground to the point of maximum development ofthe shower). For a fixedDX, a change in the primary massor the hadronic model that modifies the muon content of theshower (an thus, the missing energy) will changeS(1000)accordingly. This makes the combination of these param-eters more robust for the determination of the missing en-ergy, and less dependent of the details of the hadronic in-teractions or the primary mass composition. Even if theHeitler model is an oversimplification, it provides great in-sight on the phenomenology of shower cascades. The totalnumber of muons follows a power law with the primaryenergy
Nµ
=
(
E0
ξπc
)
β
. (3)
The primary energyE0 is also a power law ofS(1000) fora fixed angle (S38◦ ), or for a fixed stage of shower devel-
22
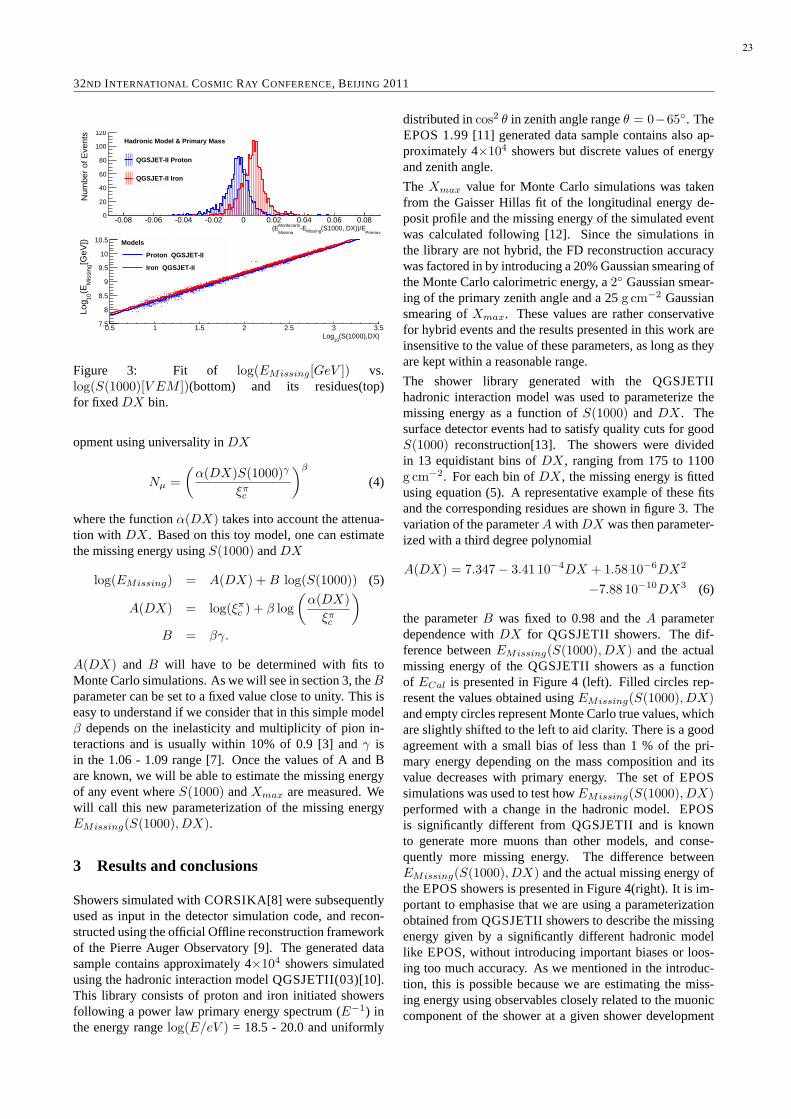
32ND INTERNATIONAL COSMIC RAY CONFERENCE, BEIJING 2011
Primary(S1000, DX))/EMissing-E
Missing
Montecarlo(E-0.1 -0.08-0.06-0.04-0.02 0 0.02 0.04 0.06 0.08 0.1
A.U
. (A
ll hi
stog
ram
s no
rmal
ized
to 1
)
0
50
100
150
200
250 Hadronic Model & Primary Mass
QGSJET-II Proton
QGSJET-II Iron
(S1000, DX))/E-E
-0.1-0.08-0.06-0.04-0.02 0 0.020.040.060.080.1
A.U
. (A
ll hi
stog
ram
s no
rmal
ized
to 1
)
0
20
40
60
80
100
120
Primary(S1000, DX))/EMissing-E
Missing
Montecarlo(E-0.08 -0.06 -0.04 -0.02 0 0.02 0.04 0.06 0.08
Num
ber
of E
vent
s
0
20
40
60
80
100
120Hadronic Model & Primary Mass
QGSJET-II Proton
QGSJET-II Iron
) at groundµ(N10
Log5 5.5 6 6.5 7 7.5 8 8.5 9 9.5 10
[GeV
])M
issi
ng(E
10Lo
g
6.5
7
7.5
8
8.5
9
9.5
10
10.5
11Models
Proton QGSJET-II
Iron QGSJET-II
Models
Proton QGSJET-II
Iron QGSJET-II
) at 1000mµ
ρ(10
Log-2 -1.5 -1 -0.5 0 0.5 1 1.5 2 2.5 3
[GeV
])M
issi
ng(E
10Lo
g
6.5
7
7.5
8
8.5
9
9.5
10
10.5
11Models
Proton QGSJET-II
Iron QGSJET-II
Models
Proton QGSJET-II
Iron QGSJET-II
(S(1000),DX)10
Log0.5 1 1.5 2 2.5 3 3.5
[GeV
])M
issi
ng(E
10Lo
g
7.5
8
8.5
9
9.5
10
10.5
Models
Proton QGSJET-II
Iron QGSJET-II
Models
Proton QGSJET-II
Iron QGSJET-II
Figure 3: Fit of log(EMissing
[GeV ]) vs.log(S(1000)[V EM ])(bottom) and its residues(top)for fixedDX bin.
opment using universality inDX
Nµ
=
(
α(DX)S(1000)γ
ξπc
)
β
(4)
where the functionα(DX) takes into account the attenua-tion with DX. Based on this toy model, one can estimatethe missing energy usingS(1000) andDX
log(EMissing
) = A(DX) +B log(S(1000)) (5)
A(DX) = log(ξπc
) + β log
(
α(DX)
ξπc
)
B = βγ.
A(DX) and B will have to be determined with fits toMonte Carlo simulations. As we will see in section 3, theBparameter can be set to a fixed value close to unity. This iseasy to understand if we consider that in this simple modelβ depends on the inelasticity and multiplicity of pion in-teractions and is usually within 10% of 0.9 [3] andγ isin the 1.06 - 1.09 range [7]. Once the values of A and Bare known, we will be able to estimate the missing energyof any event whereS(1000) andX
max
are measured. Wewill call this new parameterization of the missing energyE
Missing
(S(1000), DX).
3 Results and conclusions
Showers simulated with CORSIKA[8] were subsequentlyused as input in the detector simulation code, and recon-structed using the official Offline reconstruction frameworkof the Pierre Auger Observatory [9]. The generated datasample contains approximately 4×10⁴ showers simulatedusing the hadronic interaction model QGSJETII(03)[10].This library consists of proton and iron initiated showersfollowing a power law primary energy spectrum (E−1) inthe energy rangelog(E/eV ) = 18.5 - 20.0 and uniformly
distributed incos2 θ in zenith angle rangeθ = 0−65◦. TheEPOS 1.99 [11] generated data sample contains also ap-proximately 4×10⁴ showers but discrete values of energyand zenith angle.
The Xmax
value for Monte Carlo simulations was takenfrom the Gaisser Hillas fit of the longitudinal energy de-posit profile and the missing energy of the simulated eventwas calculated following [12]. Since the simulations inthe library are not hybrid, the FD reconstruction accuracywas factored in by introducing a 20% Gaussian smearing ofthe Monte Carlo calorimetric energy, a2◦ Gaussian smear-ing of the primary zenith angle and a 25g cm−2 Gaussiansmearing ofX
max
. These values are rather conservativefor hybrid events and the results presented in this work areinsensitive to the value of these parameters, as long as theyare kept within a reasonable range.
The shower library generated with the QGSJETIIhadronic interaction model was used to parameterize themissing energy as a function ofS(1000) andDX. Thesurface detector events had to satisfy quality cuts for goodS(1000) reconstruction[13]. The showers were dividedin 13 equidistant bins ofDX, ranging from 175 to 1100g cm−2. For each bin ofDX, the missing energy is fittedusing equation (5). A representative example of these fitsand the corresponding residues are shown in figure 3. Thevariation of the parameterA with DX was then parameter-ized with a third degree polynomial
A(DX) = 7.347− 3.41 10−4DX + 1.58 10−6DX2
−7.88 10−10DX3 (6)
the parameterB was fixed to 0.98 and theA parameterdependence withDX for QGSJETII showers. The dif-ference betweenE
Missing
(S(1000), DX) and the actualmissing energy of the QGSJETII showers as a functionof E
Cal
is presented in Figure 4 (left). Filled circles rep-resent the values obtained usingE
Missing
(S(1000), DX)and empty circles represent Monte Carlo true values, whichare slightly shifted to the left to aid clarity. There is a goodagreement with a small bias of less than 1 % of the pri-mary energy depending on the mass composition and itsvalue decreases with primary energy. The set of EPOSsimulations was used to test howE
Missing
(S(1000), DX)performed with a change in the hadronic model. EPOSis significantly different from QGSJETII and is knownto generate more muons than other models, and conse-quently more missing energy. The difference betweenE
Missing
(S(1000), DX) and the actual missing energy ofthe EPOS showers is presented in Figure 4(right). It is im-portant to emphasise that we are using a parameterizationobtained from QGSJETII showers to describe the missingenergy given by a significantly different hadronic modellike EPOS, without introducing important biases or loos-ing too much accuracy. As we mentioned in the introduc-tion, this is possible because we are estimating the miss-ing energy using observables closely related to the muoniccomponent of the shower at a given shower development
23

A. M ARIAZZI et al. A NEW METHOD FOR DETERMINING THE PRIMARY ENERGY
[eV])Cal
(E10
Log18 18.5 19 19.5 20 20.5
[%]
Prim
ary
/EM
issi
ngE
0
2
4
6
8
10
12
14
16
18
20
Missing Energy Correction
Iron QGSJET-II
Mixed QGSJET-II
Proton QGSJET-II
Mixed QGSJET01C
[eV])Cal
(E10
Log18 18.5 19 19.5 20 20.5
[%]
Prim
ary
/EM
issi
ngE
0
2
4
6
8
10
12
14
16
18
20
Missing Energy Correction
Iron EPOS 1.99
Mixed EPOS 1.99
Proton EPOS 1.99
Mixed QGSJET01C
Figure 4: Average missing energyEMissing
(S1000, DX) (filled circles) as a function of the calorimetric energy forQGSJETII (left) and for EPOS (right) using theE
Missing
(S1000, DX) from QGSJETII. Monte Carlo true values(empty circles) are slightly shifted to the left to aid clarity. Lines representE
Missing
(ECal
) parameterizations.
stage, that are in turn tightly related to the origin of themissing energy.
To illustrate this point, in figures 2 and 5 we showthe difference between the missing energy parameteri-zations and the simulation true values for each of theconsidered parameterizations. It can be seen in fig-ure 5 howE
Missing
(S(1000), DX) gives a better esti-mation of the missing energy thanEQGSJET01
Missing
(ECal
),even if the hadronic model or the primary mass ischanged. Using the presented missing energy estimatorE
Missing
(S(1000), DX), the hadronic interaction modelbias is removed while, at the same time, the bias due to themass composition is reduced by a factor of two with respectto the previousEQGSJET01
Missing
(ECal
) parameterization.
EMissing
(S(1000), DX) enables us to estimate the miss-ing energy of almost any event with a good reconstructionof S(1000) andX
max
, without making assumptions on the
Primary(S1000, DX))/EMissing-EMontecarlo
Missing(E
-0.1 -0.08 -0.06 -0.04 -0.02 0 0.02 0.04 0.06 0.08 0.1
A.U
. (A
ll h
isto
gra
ms
no
rma
lize
d t
o 1
)
0
0.01
0.02
0.03
0.04
0.05Hadronic Model & Primary Mass
QGSJET-II Proton
EPOS 1.99 Proton
QGSJET-II Iron
EPOS 1.99 Iron
Figure 5: Difference betweenEMissing
(S(1000), DX)and the missing energy from showers simulated withEPOS and QGSJETII, in units of the primary energy.
primary mass or the hadronic model. Future work willalso include tests with other hadronic interaction modelsto strengthen the hypothesis of hadronic model indepen-dence, and an extension applicable to the reconstruction ofvery inclined showers.
Hybrid events that trigger the surface detector array and thefluorescence telescopes separately are ideally suited to es-timate the missing energy. The application of this methodto determine the missing energy from a set of such hybridevents and a detailed study of the impact of this new miss-ing energy correction on the surface detector calibration arein progress.
References
[1] A. Petrukhin, Nucl. Phys. B (Proc. Suppl.), 2006,151:57.
[2] The Pierre Auger Collaboration, Nucl. Instrum. Meth.A, 2004,523: 50.
[3] J. Matthews, Astropart. Phys., 2005,22: 387.[4] M. Nyclicek et al., Proc. 31st ICRC, Łodz, Poland,
2009.[5] A. Yushkov et al., Phys. Rev. D, 2010,81: 123004.[6] F. Schmidt et al., Astropart. Phys., 2008,29(Issue 6):
355.[7] The Pierre Auger Collaboration, Phys. Rev. Lett.,
2008,101:061101.[8] D. Heck et al., FZKA 6019, Forschungszentrum
Karlsruhe(1998),http://www-ik.fzk.de/corsika.[9] S. Argiro et al, Nucl. Instrum. Meth. A, 2007,580:
1485.[10] S. Ostapchenko, Phys. Rev. D, 2006,74: 014026.[11] K. Werner et al., Nucl. Phys. Proc. Suppl., 2008,175:
81.[12] H. Barbosa et al., Astropart. Phys., 2004,22: 159.[13] The Pierre Auger Collaboration, Nucl. Instrum. Meth.
A, 2010,613: 29.
24

32ND INTERNATIONAL COSMIC RAY CONFERENCE, BEIJING 2011
AcknowledgmentsThe successful installation, commissioning and operationof the Pierre Auger Observatory would not have been possiblewithout the strong commitment and effort from the technicaland administrative staff in Malargue.
We are very grateful to the following agencies and organizations for financial support:
Comision Nacional de Energıa Atomica, Fundacion Antorchas, Gobierno De La Provincia de Mendoza, Municipali-dad de Malargue, NDM Holdings and Valle Las Lenas, in gratitude for their continuing cooperation over land ac-cess, Argentina; the Australian Research Council; Conselho Nacional de Desenvolvimento Cientıfico e Tecnologico(CNPq), Financiadora de Estudos e Projetos (FINEP), Fundac¸ao de Amparo a Pesquisa do Estado de Rio de Janeiro(FAPERJ), Fundacao de Amparo a Pesquisa do Estado de SaoPaulo (FAPESP), Ministerio de Ciencia e Tec-nologia (MCT), Brazil; AVCR AV0Z10100502 and AV0Z10100522, GAAV KJB100100904, MSMT-CR LA08016,LC527, 1M06002, and MSM0021620859, Czech Republic; Centrede Calcul IN2P3/CNRS, Centre National de laRecherche Scientifique (CNRS), Conseil Regional Ile-de-France, Departement Physique Nucleaire et Corpusculaire(PNC-IN2P3/CNRS), Departement Sciences de l’Univers (SDU-INSU/CNRS), France; Bundesministerium fur Bildungund Forschung (BMBF), Deutsche Forschungsgemeinschaft (DFG), Finanzministerium Baden-Wurttemberg, Helmholtz-Gemeinschaft Deutscher Forschungszentren (HGF), Ministerium fur Wissenschaft und Forschung, Nordrhein-Westfalen,Ministerium fur Wissenschaft, Forschung und Kunst, Baden-Wurttemberg, Germany; Istituto Nazionale di Fisica Nu-cleare (INFN), Ministero dell’Istruzione, dell’Universita e della Ricerca (MIUR), Italy; Consejo Nacional de Cienciay Tecnologıa (CONACYT), Mexico; Ministerie van Onderwijs, Cultuur en Wetenschap, Nederlandse Organisatie voorWetenschappelijk Onderzoek (NWO), Stichting voor Fundamenteel Onderzoek der Materie (FOM), Netherlands; Min-istry of Science and Higher Education, Grant Nos. 1 P03 D 014 30, N202 090 31/0623, and PAP/218/2006, Poland;Fundacao para a Ciencia e a Tecnologia, Portugal; Ministry for Higher Education, Science, and Technology, SlovenianResearch Agency, Slovenia; Comunidad de Madrid, Consejer´ıa de Educacion de la Comunidad de Castilla La Mancha,FEDER funds, Ministerio de Ciencia e Innovacion and Consolider-Ingenio 2010 (CPAN), Xunta de Galicia, Spain; Sci-ence and Technology Facilities Council, United Kingdom; Department of Energy, Contract Nos. DE-AC02-07CH11359,DE-FR02-04ER41300, National Science Foundation, Grant No. 0450696, The Grainger Foundation USA; ALFA-EC /HELEN, European Union 6th Framework Program, Grant No. MEIF-CT-2005-025057, European Union 7th FrameworkProgram, Grant No. PIEF-GA-2008-220240, and UNESCO.
Copyright © 2022 FDOKUMEN