
Trigger and aperture of the surface detector array of the Pierre Auger Observatory
29
arXiv:1111.6764v1 [astro-ph.IM] 29 Nov 2011 Trigger and Aperture of the Surface Detector Array of the Pierre Auger Observatory The Pierre Auger Collaboration J. Abraham 8 , P. Abreu 71 , M. Aglietta 54 , C. Aguirre 12 , E.J. Ahn 87 , D. Allard 31 , I. Allekotte 1 , J. Allen 90 , J. Alvarez-Muñiz 78 , M. Ambrosio 48 , L. Anchordoqui 104 , S. Andringa 71 , A. Anzalone 53 , C. Aramo 48 , E. Arganda 75 , S. Argirò 51 , K. Arisaka 95 , F. Arneodo 55 , F. Arqueros 75 , T. Asch 38 , H. Asorey 1 , P. Assis 71 , J. Aublin 33 , M. Ave 96 , G. Avila 10 , T. Bäcker 42 , D. Badagnani 6 , K.B. Barber 11 , A.F. Barbosa 14 , S.L.C. Barroso 20 , B. Baughman 92 , P. Bauleo 85 , J.J. Beatty 92 , T. Beau 31 , B.R. Becker 101 , K.H. Becker 36 , A. Bellétoile 34 , J.A. Bellido 11, 93 , S. BenZvi 103 , C. Berat 34 , P. Bernardini 47 , X. Bertou 1 , P.L. Biermann 39 , P. Billoir 33 , O. Blanch-Bigas 33 , F. Blanco 75 , C. Bleve 47 , H. Blümer 41, 37 , M. Boháčová 96, 27 , D. Boncioli 49 , C. Bonifazi 33 , R. Bonino 54 , N. Borodai 69 , J. Brack 85 , P. Brogueira 71 , W.C. Brown 86 , R. Bruijn 81 , P. Buchholz 42 , A. Bueno 77 , R.E. Burton 83 , N.G. Busca 31 , K.S. Caballero-Mora 41 , L. Caramete 39 , R. Caruso 50 , W. Carvalho 17 , A. Castellina 54 , O. Catalano 53 , L. Cazon 96 , R. Cester 51 , J. Chauvin 34 , A. Chiavassa 54 , J.A. Chinellato 18 , A. Chou 87, 90 , J. Chudoba 27 , J. Chye 89 d , R.W. Clay 11 , E. Colombo 2 , R. Conceição 71 , B. Connolly 102 , F. Contreras 9 , J. Coppens 65, 67 , A. Cordier 32 , U. Cotti 63 , S. Coutu 93 , C.E. Covault 83 , A. Creusot 73 , A. Criss 93 , J. Cronin 96 , A. Curutiu 39 , S. Dagoret-Campagne 32 , R. Dallier 35 , K. Daumiller 37 , B.R. Dawson 11 , R.M. de Almeida 18 , M. De Domenico 50 , C. De Donato 46 , S.J. de Jong 65 , G. De La Vega 8 , W.J.M. de Mello Junior 18 , J.R.T. de Mello Neto 23 , I. De Mitri 47 , V. de Souza 16 , K.D. de Vries 66 , G. Decerprit 31 , L. del Peral 76 , O. Deligny 30 , A. Della Selva 48 , C. Delle Fratte 49 , H. Dembinski 40 , C. Di Giulio 49 , J.C. Diaz 89 , P.N. Diep 105 , C. Dobrigkeit 18 , J.C. D’Olivo 64 , P.N. Dong 105 , A. Dorofeev 85, 88 , J.C. dos Anjos 14 , M.T. Dova 6 , D. D’Urso 48 , I. Dutan 39 , M.A. DuVernois 98 , R. Engel 37 , M. Erdmann 40 , C.O. Escobar 18 , A. Etchegoyen 2 , P. Facal San Luis 96, 78 , H. Falcke 65, 68 , G. Farrar 90 , A.C. Fauth 18 , N. Fazzini 87 , F. Ferrer 83 , A. Ferrero 2 , B. Fick 89 , A. Filevich 2 , A. Filipčič 72, 73 , I. Fleck 42 , S. Fliescher 40 , C.E. Fracchiolla 85 , E.D. Fraenkel 66 , W. Fulgione 54 , ∗ Corresponding author. Email address: [email protected] Preprint submitted to Elsevier November 30, 2011
Transcript of Trigger and aperture of the surface detector array of the Pierre Auger Observatory
arX
iv:1
111.
6764
v1 [
astr
o-ph
.IM
] 2
9 N
ov 2
011
Trigger and Aperture of the Surface Detector Array of
the Pierre Auger Observatory
The Pierre Auger Collaboration
J. Abraham8, P. Abreu71, M. Aglietta54, C. Aguirre12, E.J. Ahn87,D. Allard31, I. Allekotte1, J. Allen90, J. Alvarez-Muñiz78, M. Ambrosio48,
L. Anchordoqui104, S. Andringa71, A. Anzalone53, C. Aramo48,E. Arganda75, S. Argirò51, K. Arisaka95, F. Arneodo55, F. Arqueros75,T. Asch38, H. Asorey1, P. Assis71, J. Aublin33, M. Ave96, G. Avila10,
T. Bäcker42, D. Badagnani6, K.B. Barber11, A.F. Barbosa14,S.L.C. Barroso20, B. Baughman92, P. Bauleo85, J.J. Beatty92, T. Beau31,
B.R. Becker101, K.H. Becker36, A. Bellétoile34, J.A. Bellido11, 93,S. BenZvi103, C. Berat34, P. Bernardini47, X. Bertou1, P.L. Biermann39,P. Billoir33, O. Blanch-Bigas33, F. Blanco75, C. Bleve47, H. Blümer41, 37,
M. Boháčová96, 27, D. Boncioli49, C. Bonifazi33, R. Bonino54, N. Borodai69,J. Brack85, P. Brogueira71, W.C. Brown86, R. Bruijn81, P. Buchholz42,
A. Bueno77, R.E. Burton83, N.G. Busca31, K.S. Caballero-Mora41,L. Caramete39, R. Caruso50, W. Carvalho17, A. Castellina54, O. Catalano53,L. Cazon96, R. Cester51, J. Chauvin34, A. Chiavassa54, J.A. Chinellato18,
A. Chou87, 90, J. Chudoba27, J. Chye89 d, R.W. Clay11, E. Colombo2,R. Conceição71, B. Connolly102, F. Contreras9, J. Coppens65, 67,
A. Cordier32, U. Cotti63, S. Coutu93, C.E. Covault83, A. Creusot73,A. Criss93, J. Cronin96, A. Curutiu39, S. Dagoret-Campagne32, R. Dallier35,
K. Daumiller37, B.R. Dawson11, R.M. de Almeida18, M. De Domenico50,C. De Donato46, S.J. de Jong65, G. De La Vega8, W.J.M. de Mello Junior18,
J.R.T. de Mello Neto23, I. De Mitri47, V. de Souza16, K.D. de Vries66,G. Decerprit31, L. del Peral76, O. Deligny30, A. Della Selva48, C. DelleFratte49, H. Dembinski40, C. Di Giulio49, J.C. Diaz89, P.N. Diep105,
C. Dobrigkeit 18, J.C. D’Olivo64, P.N. Dong105, A. Dorofeev85, 88, J.C. dosAnjos14, M.T. Dova6, D. D’Urso48, I. Dutan39, M.A. DuVernois98,
R. Engel37, M. Erdmann40, C.O. Escobar18, A. Etchegoyen2, P. Facal SanLuis96, 78, H. Falcke65, 68, G. Farrar90, A.C. Fauth18, N. Fazzini87,
F. Ferrer83, A. Ferrero2, B. Fick89, A. Filevich2, A. Filipčič72, 73, I. Fleck42,S. Fliescher40, C.E. Fracchiolla85, E.D. Fraenkel66, W. Fulgione54,
∗Corresponding author. Email address: [email protected]
Preprint submitted to Elsevier November 30, 2011
R.F. Gamarra2, S. Gambetta44, B. García8, D. García Gámez77,D. Garcia-Pinto75, X. Garrido37, 32, G. Gelmini95, H. Gemmeke38,
P.L. Ghia30, 54, U. Giaccari47, M. Giller70, H. Glass87, L.M. Goggin104,M.S. Gold101, G. Golup1, F. Gomez Albarracin6, M. Gómez Berisso1,
P. Gonçalves71, M. Gonçalves do Amaral24, D. Gonzalez41,J.G. Gonzalez77, 88, D. Góra41, 69, A. Gorgi54, P. Gouffon17, S.R. Gozzini81,E. Grashorn92, S. Grebe65, M. Grigat40, A.F. Grillo55, Y. Guardincerri4,
F. Guarino48, G.P. Guedes19, J. Gutiérrez76, J.D. Hague101, V. Halenka28,P. Hansen6, D. Harari1, S. Harmsma66, 67, J.L. Harton85, A. Haungs37,M.D. Healy95, T. Hebbeker40, G. Hebrero76, D. Heck37, C. Hojvat87,
V.C. Holmes11, P. Homola69, J.R. Hörandel65, A. Horneffer65,M. Hrabovský28, 27, T. Huege37, M. Hussain73, M. Iarlori45, A. Insolia50,
F. Ionita96, A. Italiano50, S. Jiraskova65, M. Kaducak87, K.H. Kampert36,T. Karova27, P. Kasper87, B. Kégl32, B. Keilhauer37, E. Kemp18,R.M. Kieckhafer89, H.O. Klages37, M. Kleifges38, J. Kleinfeller37,
R. Knapik85, J. Knapp81, D.-H. Koang34, A. Krieger2, O. Krömer38,D. Kruppke-Hansen36, F. Kuehn87, D. Kuempel36, K. Kulbartz43,
N. Kunka38, A. Kusenko95, G. La Rosa53, C. Lachaud31, B.L. Lago23,P. Lautridou35, M.S.A.B. Leão22, D. Lebrun34, P. Lebrun87, J. Lee95,
M.A. Leigui de Oliveira22, A. Lemiere30, A. Letessier-Selvon33,M. Leuthold40, I. Lhenry-Yvon30, R. López59, A. Lopez Agüera78,
K. Louedec32, J. Lozano Bahilo77, A. Lucero54, H. Lyberis30,M.C. Maccarone53, C. Macolino45, S. Maldera54, D. Mandat27,
P. Mantsch87, A.G. Mariazzi6, I.C. Maris41, H.R. Marquez Falcon63,D. Martello47, O. Martínez Bravo59, H.J. Mathes37, J. Matthews88, 94,
J.A.J. Matthews101, G. Matthiae49∗, D. Maurizio51, P.O. Mazur87,M. McEwen76, R.R. McNeil88, G. Medina-Tanco64, M. Melissas41,
D. Melo51, E. Menichetti51, A. Menshikov38, R. Meyhandan14,M.I. Micheletti2, G. Miele48, W. Miller101, L. Miramonti46, S. Mollerach1,
M. Monasor75, D. Monnier Ragaigne32, F. Montanet34, B. Morales64,C. Morello54, J.C. Moreno6, C. Morris92, M. Mostafá85, C.A. Moura48,S. Mueller37, M.A. Muller18, R. Mussa51, G. Navarra54, J.L. Navarro77,
S. Navas77, P. Necesal27, L. Nellen64, C. Newman-Holmes87, D. Newton81,P.T. Nhung105, N. Nierstenhoefer36, D. Nitz89, D. Nosek26, L. Nožka27,
M. Nyklicek27, J. Oehlschläger37, A. Olinto96, P. Oliva36,V.M. Olmos-Gilbaja78, M. Ortiz75, N. Pacheco76, D. Pakk Selmi-Dei18,
M. Palatka27, J. Pallotta3, G. Parente78, E. Parizot31, S. Parlati55,S. Pastor74, M. Patel81, T. Paul91, V. Pavlidou96 c, K. Payet34, M. Pech27,
2
J. Pekala69, I.M. Pepe21, L. Perrone52, R. Pesce44, E. Petermann100,S. Petrera45, P. Petrinca49, A. Petrolini44, Y. Petrov85, J. Petrovic67,C. Pfendner103, R. Piegaia4, T. Pierog37, M. Pimenta71, T. Pinto74,V. Pirronello50, O. Pisanti48, M. Platino2, J. Pochon1, V.H. Ponce1,M. Pontz42, P. Privitera96, M. Prouza27, E.J. Quel3, J. Rautenberg36,
O. Ravel35, D. Ravignani2, A. Redondo76, B. Revenu35, F.A.S. Rezende14,J. Ridky27, S. Riggi50, M. Risse36, C. Rivière34, V. Rizi45, C. Robledo59,
G. Rodriguez49, J. Rodriguez Martino50, J. Rodriguez Rojo9,I. Rodriguez-Cabo78, M.D. Rodríguez-Frías76, G. Ros75, 76, J. Rosado75,
T. Rossler28, M. Roth37, B. Rouillé-d’Orfeuil31, E. Roulet1, A.C. Rovero7,F. Salamida45, H. Salazar59 b, G. Salina49, F. Sánchez64, M. Santander9,
C.E. Santo71, E.M. Santos23, F. Sarazin84, S. Sarkar79, R. Sato9, N. Scharf40,V. Scherini36, H. Schieler37, P. Schiffer40, A. Schmidt38, F. Schmidt96,T. Schmidt41, O. Scholten66, H. Schoorlemmer65, J. Schovancova27,
P. Schovánek27, F. Schroeder37, S. Schulte40, F. Schüssler37, D. Schuster84,S.J. Sciutto6, M. Scuderi50, A. Segreto53, D. Semikoz31, M. Settimo47,
R.C. Shellard14, 15, I. Sidelnik2, B.B. Siffert23, G. Sigl43, A. Śmiałkowski70,R. Šmída27, B.E. Smith81, G.R. Snow100, P. Sommers93, J. Sorokin11,H. Spinka82, 87, R. Squartini9, E. Strazzeri32, A. Stutz34, F. Suarez2,T. Suomijärvi30, A.D. Supanitsky64, M.S. Sutherland92, J. Swain91,
Z. Szadkowski70, A. Tamashiro7, A. Tamburro41, T. Tarutina6, O. Taşcău36,R. Tcaciuc42, D. Tcherniakhovski38, D. Tegolo58, N.T. Thao105,D. Thomas85, R. Ticona13, J. Tiffenberg4, C. Timmermans67, 65,
W. Tkaczyk70, C.J. Todero Peixoto22, B. Tomé71, A. Tonachini51,I. Torres59, P. Travnicek27, D.B. Tridapalli17, G. Tristram31, E. Trovato50,M. Tueros6, R. Ulrich37, M. Unger37, M. Urban32, J.F. Valdés Galicia64,
I. Valiño37, L. Valore48, A.M. van den Berg66, J.R. Vázquez75,R.A. Vázquez78, D. Veberič73, 72, A. Velarde13, T. Venters96, V. Verzi49,
M. Videla8, L. Villaseñor63, S. Vorobiov73, L. Voyvodic87 ‡, H. Wahlberg6,P. Wahrlich11, O. Wainberg2, D. Warner85, A.A. Watson81, S. Westerhoff103,
B.J. Whelan11, G. Wieczorek70, L. Wiencke84, B. Wilczyńska69,H. Wilczyński69, C. Wileman81, M.G. Winnick11, H. Wu32, B. Wundheiler2,
T. Yamamoto96 a, P. Younk85, G. Yuan88, A. Yushkov48, E. Zas78,D. Zavrtanik73, 72, M. Zavrtanik72, 73, I. Zaw90, A. Zepeda60 b,
M. Ziolkowski42
1 Centro Atómico Bariloche and Instituto Balseiro (CNEA- UNCuyo-CONICET), SanCarlos de Bariloche, Argentina
2 Centro Atómico Constituyentes (Comisión Nacional de Energía
3
Atómica/CONICET/UTN-FRBA), Buenos Aires, Argentina3 Centro de Investigaciones en Láseres y Aplicaciones, CITEFA and CONICET,
Argentina4 Departamento de Física, FCEyN, Universidad de Buenos Aires y CONICET, Argentina
6 IFLP, Universidad Nacional de La Plata and CONICET, La Plata, Argentina7 Instituto de Astronomía y Física del Espacio (CONICET), Buenos Aires, Argentina8 National Technological University, Faculty Mendoza (CONICET/CNEA), Mendoza,
Argentina9 Pierre Auger Southern Observatory, Malargüe, Argentina
10 Pierre Auger Southern Observatory and Comisión Nacional de Energía Atómica,Malargüe, Argentina
11 University of Adelaide, Adelaide, S.A., Australia12 Universidad Catolica de Bolivia, La Paz, Bolivia
13 Universidad Mayor de San Andrés, Bolivia14 Centro Brasileiro de Pesquisas Fisicas, Rio de Janeiro, RJ, Brazil
15 Pontifícia Universidade Católica, Rio de Janeiro, RJ, Brazil16 Universidade de São Paulo, Instituto de Física, São Carlos, SP, Brazil17 Universidade de São Paulo, Instituto de Física, São Paulo, SP, Brazil18 Universidade Estadual de Campinas, IFGW, Campinas, SP, Brazil
19 Universidade Estadual de Feira de Santana, Brazil20 Universidade Estadual do Sudoeste da Bahia, Vitoria da Conquista, BA, Brazil
21 Universidade Federal da Bahia, Salvador, BA, Brazil22 Universidade Federal do ABC, Santo André, SP, Brazil
23 Universidade Federal do Rio de Janeiro, Instituto de Física, Rio de Janeiro, RJ, Brazil24 Universidade Federal Fluminense, Instituto de Fisica, Niterói, RJ, Brazil
26 Charles University, Faculty of Mathematics and Physics, Institute of Particle andNuclear Physics, Prague, Czech Republic
27 Institute of Physics of the Academy of Sciences of the Czech Republic, Prague, CzechRepublic
28 Palacký University, Olomouc, Czech Republic30 Institut de Physique Nucléaire d’Orsay (IPNO), Université Paris 11, CNRS-IN2P3,
Orsay, France31 Laboratoire AstroParticule et Cosmologie (APC), Université Paris 7, CNRS-IN2P3,
Paris, France32 Laboratoire de l’Accélérateur Linéaire (LAL), Université Paris 11, CNRS-IN2P3,
Orsay, France33 Laboratoire de Physique Nucléaire et de Hautes Energies (LPNHE), Universités Paris
6 et Paris 7, Paris Cedex 05, France34 Laboratoire de Physique Subatomique et de Cosmologie (LPSC), Université Joseph
Fourier, INPG, CNRS-IN2P3, Grenoble, France35 SUBATECH, Nantes, France
36 Bergische Universität Wuppertal, Wuppertal, Germany37 Forschungszentrum Karlsruhe, Institut für Kernphysik, Karlsruhe, Germany
38 Forschungszentrum Karlsruhe, Institut für Prozessdatenverarbeitung und Elektronik,Karlsruhe, Germany
4
39 Max-Planck-Institut für Radioastronomie, Bonn, Germany40 RWTH Aachen University, III. Physikalisches Institut A, Aachen, Germany41 Universität Karlsruhe (TH), Institut für Experimentelle Kernphysik (IEKP),
Karlsruhe, Germany42 Universität Siegen, Siegen, Germany
43 Universität Hamburg, Hamburg, Germany44 Dipartimento di Fisica dell’Università and INFN, Genova, Italy
45 Università dell’Aquila and INFN, L’Aquila, Italy46 Università di Milano and Sezione INFN, Milan, Italy
47 Dipartimento di Fisica dell’Università del Salento and Sezione INFN, Lecce, Italy48 Università di Napoli “Federico II” and Sezione INFN, Napoli, Italy
49 Università di Roma II “Tor Vergata” and Sezione INFN, Roma, Italy50 Università di Catania and Sezione INFN, Catania, Italy51 Università di Torino and Sezione INFN, Torino, Italy
52 Dipartimento di Ingegneria dell’Innovazione dell’Università del Salento and SezioneINFN, Lecce, Italy
53 Istituto di Astrofisica Spaziale e Fisica Cosmica di Palermo (INAF), Palermo, Italy54 Istituto di Fisica dello Spazio Interplanetario (INAF), Università di Torino and
Sezione INFN, Torino, Italy55 INFN, Laboratori Nazionali del Gran Sasso, Assergi (L’Aquila), Italy
58 Università di Palermo and Sezione INFN, Catania, Italy59 Benemérita Universidad Autónoma de Puebla, Puebla, Mexico
60 Centro de Investigación y de Estudios Avanzados del IPN (CINVESTAV), México,D.F., Mexico
61 Instituto Nacional de Astrofisica, Optica y Electronica, Tonantzintla, Puebla, Mexico63 Universidad Michoacana de San Nicolas de Hidalgo, Morelia, Michoacan, Mexico
64 Universidad Nacional Autonoma de Mexico, Mexico, D.F., Mexico65 IMAPP, Radboud University, Nijmegen, Netherlands
66 Kernfysisch Versneller Instituut, University of Groningen, Groningen, Netherlands67 NIKHEF, Amsterdam, Netherlands68 ASTRON, Dwingeloo, Netherlands
69 Institute of Nuclear Physics PAN, Krakow, Poland70 University of Łódź, Łódź, Poland
71 LIP and Instituto Superior Técnico, Lisboa, Portugal72 J. Stefan Institute, Ljubljana, Slovenia
73 Laboratory for Astroparticle Physics, University of Nova Gorica, Slovenia74 Instituto de Física Corpuscular, CSIC-Universitat de València, Valencia, Spain
75 Universidad Complutense de Madrid, Madrid, Spain76 Universidad de Alcalá, Alcalá de Henares (Madrid), Spain77 Universidad de Granada & C.A.F.P.E., Granada, Spain
78 Universidad de Santiago de Compostela, Spain79 Rudolf Peierls Centre for Theoretical Physics, University of Oxford, Oxford, United
Kingdom81 School of Physics and Astronomy, University of Leeds, United Kingdom
82 Argonne National Laboratory, Argonne, IL, USA
5
83 Case Western Reserve University, Cleveland, OH, USA84 Colorado School of Mines, Golden, CO, USA
85 Colorado State University, Fort Collins, CO, USA86 Colorado State University, Pueblo, CO, USA
87 Fermilab, Batavia, IL, USA88 Louisiana State University, Baton Rouge, LA, USA
89 Michigan Technological University, Houghton, MI, USA90 New York University, New York, NY, USA91 Northeastern University, Boston, MA, USA92 Ohio State University, Columbus, OH, USA
93 Pennsylvania State University, University Park, PA, USA94 Southern University, Baton Rouge, LA, USA
95 University of California, Los Angeles, CA, USA96 University of Chicago, Enrico Fermi Institute, Chicago, IL, USA
98 University of Hawaii, Honolulu, HI, USA100 University of Nebraska, Lincoln, NE, USA
101 University of New Mexico, Albuquerque, NM, USA102 University of Pennsylvania, Philadelphia, PA, USA
103 University of Wisconsin, Madison, WI, USA104 University of Wisconsin, Milwaukee, WI, USA
105 Institute for Nuclear Science and Technology (INST), Hanoi, Vietnam(‡) Deceased
(a) at Konan University, Kobe, Japan(b) On leave of absence at the Instituto Nacional de Astrofisica, Optica y Electronica
(c) at Caltech, Pasadena, USA(d) at Hawaii Pacific University
Abstract
The surface detector array of the Pierre Auger Observatory consists of1600 water-Cherenkov detectors, for the study of extensive air showers (EAS)generated by ultra-high-energy cosmic rays. We describe the trigger hierar-chy, from the identification of candidate showers at the level of a single detec-tor, amongst a large background (mainly random single cosmic ray muons),up to the selection of real events and the rejection of random coincidences.Such trigger makes the surface detector array fully efficient for the detectionof EAS with energy above 3 × 10¹⁸ eV, for all zenith angles between 0◦ and60◦, independently of the position of the impact point and of the mass ofthe primary particle. In these range of energies and angles, the exposure ofthe surface array can be determined purely on the basis of the geometrical
6

acceptance.
Key words: Ultra high energy cosmic rays, Auger Observatory, Extensiveair showers, Trigger, ExposurePACS: 95.85.Ry, 96.40.Pq
1. Introduction1
The main objective of the Pierre Auger Collaboration is to measure the2
flux, arrival direction distribution and mass composition of cosmic rays from3
≈ 1018 eV up to the highest energies. Due to the very low fluxes at these4
energies, cosmic rays have to be measured through the extensive air showers5
(EAS) they produce in the atmosphere.6
The Pierre Auger Observatory, located near Malargüe, Argentina, at 14007
m asl, detects EAS in two independent and complementary ways. It includes8
a surface detector array (SD), consisting of 1600 water-Cherenkov detectors9
[1] on a triangular grid of 1.5 km spacing covering an area of approximately10
3000 km2, which detects the secondary particles at ground level and thus11
samples their lateral density distribution. The surface detector array is over-12
looked by a fluorescence detector (FD) consisting of 24 telescopes at four13
sites, which measure the fluorescence light emitted along the path of the air-14
showers and thus traces their longitudinal development [2]. Showers detected15
by both detectors are called hybrid events and they are characterised more16
accurately with respect to direction and energy than using either technique17
alone. However, the livetime of the FD is limited to ≈ 13%, as it only op-18
erates on clear, moonless nights [2]. The bulk of data is provided by the SD19
with its nearly 100% livetime. The study of the trigger and the determina-20
tion of the aperture of the SD is thus essential for the physics aims of the21
Pierre Auger Observatory.22
The SD data acquisition (DAQ) trigger must fulfill both physical and23
technical requirements. The main limitation to the rate of recordable events24
comes from the wireless communication system which connects the surface25
detectors to the central campus. The latter must serve continuously 160026
stations spread over 3000 km2, each using an emitter consuming less than27
1 W power to transmit to collectors as far as 40 km away. The maximum28
sustainable rate of events per detector is less than one per hour, to be com-29
pared to the 3 kHz counting rate per station, due to the atmospheric muon30
flux. The trigger thus must reduce the single station rate, without induc-31
7
ing loss of physics events. It must also allow data acquisition down to the32
lowest possible energy. To deal with all these requirements, the design of33
the DAQ SD trigger (described in section 3) has been realised in a hierar-34
chical form, where at each level the single station rate becomes less and less,35
by means of discrimination against background stricter and stricter. At the36
same time, the DAQ trigger is designed to allow the storage of the largest37
possible number of EAS candidates .38
The ultimate discrimination of EAS from chance events due to combina-39
torial coincidences among the surface detectors is performed off-line through40
a selection of physics events, and of detectors participating in each of them.41
The event selection procedure is hierarchical too, it is described in section 4.42
In section 5.1, we show that the trigger and event selection hierarchy43
makes the array fully efficient for the detection of showers above 3×10¹⁸ eV.44
We restrict ourselves to this energy range for the calculation of the exposure45
(described in section 5.2), which is simply proportional to the observation46
time and to the geometrical size of the SD array. Under these conditions the47
calculation of the exposure is very robust and almost devoid of systematic48
uncertainties. Therefore it is straightforward to calculate the cosmic ray flux49
as the ratio of the number of collected events to the effective, as it was done50
in the measurement of the cosmic ray spectrum by the surface detector of51
Auger [3].52
2. The surface detector of the Pierre Auger Observatory53
Each water Cherenkov detector of the surface array has a 10 m2 water54
surface area and 1.2 m water depth, with three 9” photomultiplier tubes55
(PMTs) looking through optical coupling material into the water volume,56
which is contained in a Tyvek R© reflective liner [1, 4]. Each detector operates57
autonomously, with its own electronics and communications systems powered58
by solar energy. Each PMT provides two signals, which are digitised by 4059
MHz 10-bit Flash Analog to Digital Converters (FADCs). One signal is60
directly taken from the anode of the PMT, and the other signal is provided61
by the last dynode, amplified and inverted within the PMT base electronics to62
a total signal nominally 32 times the anode signal. The two signals are used63
to provide sufficient dynamic range to cover with good precision both the64
signals produced in the detectors near the shower core (∼ 1000 particles/µs)65
and those produced far from the shower core (∼ 1 particle/µs). Each FADC66
bin corresponds to 25 ns [4].67
8
The signals from the three PMTs are sent to a central data acquisition system68
(CDAS) once a candidate shower event triggers the surface detector array (see69
section 3.2). The total bandwidth available for data transmission from the70
detectors to the CDAS is 1200 bits per second, which precludes the possibility71
of any remote calibration. For this reason, the calibration of each detector72
is performed locally and automatically. It relies on the measurement of the73
average charge collected by a PMT from the Cherenkov light produced by a74
vertical and central through-going muon, QV EM [5]. The water-Cherenkov75
detector in its normal configuration has no way to select only vertical muons.76
However, the distribution of the light of atmospheric muons produces a peak77
in the charge distribution, QpeakV EM (or VEM in short), as well as a peak in78
that of the pulse height, IpeakV EM , both of them being proportional to those79
produced by a vertical through-going muon. The calibration parameters are80
determined with 2% accuracy every 60 s and returned to the CDAS with81
each event. Due to the limited bandwidth, the first level triggers are also82
performed locally. These triggers (section 3.1) are set in electronic units83
(channels): the reference unit is IpeakV EM .84
With respect to shower reconstruction, the signals recorded by the detec-85
tors - evaluated by integrating the FADC bins of the traces - are converted86
to units of QV EM . These are fitted with a measured Lateral Distribution87
Function (LDF) [11], that describes S(r), the signals as a function of dis-88
tance r from the shower core, to find the signal at 1000 m, S(1000) [6]. The89
variation of S(1000) with zenith angle θ arising from the evolution of the90
shower, is quantified by applying the constant integral intensity cut method91
[7], justified by the approximately isotropic flux of primary cosmic rays. An92
energy estimator for each event, independent of θ, is S38, the S(1000) that93
EAS would have produced had they arrived at the median zenith angle, 38◦.94
The energy corresponding to each S38 is then obtained through a calibration95
with the fluorescence detector based on a subset of high-quality hybrid events96
[3].97
3. The DAQ trigger system of the surface detector array98
The trigger for the surface detector array is hierarchical. Two levels of99
trigger (called T1 and T2) are formed at each detector. T2 triggers are com-100
bined with those from other detectors and examined for spatial and temporal101
correlations, leading to an array trigger (T3). The T3 trigger initiates data102
9
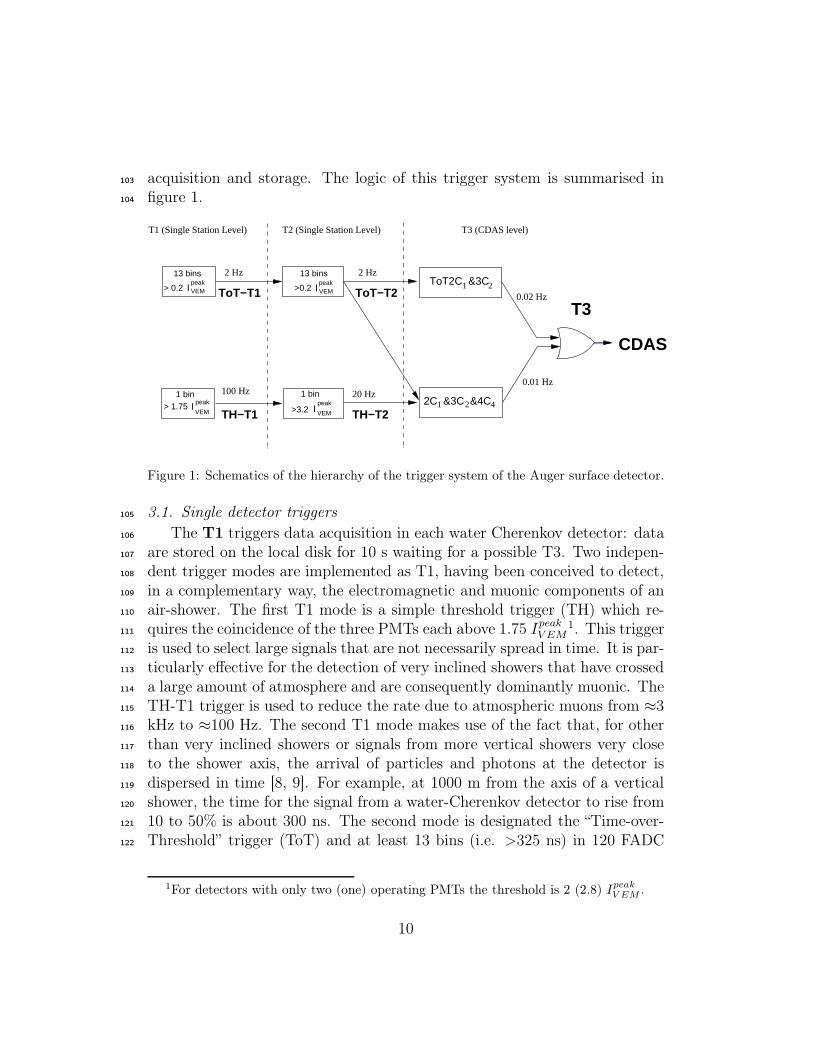
acquisition and storage. The logic of this trigger system is summarised in103
figure 1.104
1 2
1 2 4
> 0.2
2 Hz
T2 (Single Station Level) T1 (Single Station Level) T3 (CDAS level)
100 Hz 20 Hz
ToT−T1 ToT−T2>0.2
2 Hz
TH−T2
0.02 Hz
0.01 Hz
ToT2C &3C
T3
CDAS
2C &3C &4C >3.2TH−T1
1 bin > 1.75 I peak
VEM
1 bin
Ipeak
VEM
IpeakVEM
13 bins
VEMpeak
13 bins
I
Figure 1: Schematics of the hierarchy of the trigger system of the Auger surface detector.
3.1. Single detector triggers105
The T1 triggers data acquisition in each water Cherenkov detector: data106
are stored on the local disk for 10 s waiting for a possible T3. Two indepen-107
dent trigger modes are implemented as T1, having been conceived to detect,108
in a complementary way, the electromagnetic and muonic components of an109
air-shower. The first T1 mode is a simple threshold trigger (TH) which re-110
quires the coincidence of the three PMTs each above 1.75 IpeakV EM1. This trigger111
is used to select large signals that are not necessarily spread in time. It is par-112
ticularly effective for the detection of very inclined showers that have crossed113
a large amount of atmosphere and are consequently dominantly muonic. The114
TH-T1 trigger is used to reduce the rate due to atmospheric muons from ≈3115
kHz to ≈100 Hz. The second T1 mode makes use of the fact that, for other116
than very inclined showers or signals from more vertical showers very close117
to the shower axis, the arrival of particles and photons at the detector is118
dispersed in time [8, 9]. For example, at 1000 m from the axis of a vertical119
shower, the time for the signal from a water-Cherenkov detector to rise from120
10 to 50% is about 300 ns. The second mode is designated the “Time-over-121
Threshold” trigger (ToT) and at least 13 bins (i.e. >325 ns) in 120 FADC122
1For detectors with only two (one) operating PMTs the threshold is 2 (2.8) IpeakV EM .
10
bins of a sliding window of 3µs are required to be above a threshold of 0.2123
IpeakV EM in coincidence in 2 out of 3 PMTs2. This trigger is intended to select124
sequences of small signals spread in time. The ToT trigger is thus optimised125
for the detection of near-by, low energy showers, dominated by the electro-126
magnetic component, or for high-energy showers where the core is distant.127
The time spread arises from a combination of scattering (electromagnetic128
component) and geometrical effects (muons) as discussed in [8, 9] where de-129
tails are given of how the time spread depends on distance and zenith angle.130
Since the average signal duration of a single muon is only about 150 ns, the131
time spread of the ToT (325 ns) is very efficient at eliminating the random132
muon background. The ToT rate at each detector is < 2Hz and is mainly133
due to the occurrence of two muons arriving within 3µs, the duration of the134
sliding window.135
The T2 is applied in the station controller to reduce to about 20Hz the136
rate of events per detector. This reduction is done to cope with the band-137
width of the communication system between the detectors and the central138
campus. The T2 triggers, namely their time stamp and the kind of T2, are139
sent to the CDAS for the formation of the trigger of the array. All ToT-T1140
triggers are promoted to the T2 level, whereas TH-T1 triggers are requested141
to pass a further higher threshold of 3.2 IpeakV EM in coincidence among the three142
PMTs3. The rates of the TH-T2 triggers are rather uniform in the detectors143
over the whole array within a few percent, while those due to the ToT-T2144
are less uniform. This is due to the fact that the ToT is very sensitive to the145
shape of the signal, this in turn depending on the characteristics of the water,146
the reflective liner in the detector and the electronic pulse shaper. However,147
the lack of uniformity of the trigger response over the array does not af-148
fect the event selection or reconstruction above the energy corresponding to149
saturated acceptance.150
3.2. Trigger of the surface array151
The third level trigger, T3, initiates the central data acquisition from the152
array. It is formed at the CDAS, and it is based on the spatial and temporal153
combination of T2. Once a T3 is formed, all FADC signals from detectors154
2For detectors with only two (one) operating PMTs, the algorithm is applied to two(one) PMTs.
3For detectors with only two (one) operating PMTs the threshold is set to 3.8 (4.5)
Ipeak
V EM .
11
passing the T2 are sent to the CDAS, as well as those from detectors passing155
the T1 but not the T2, provided that they are within 30 µs of the T3.156
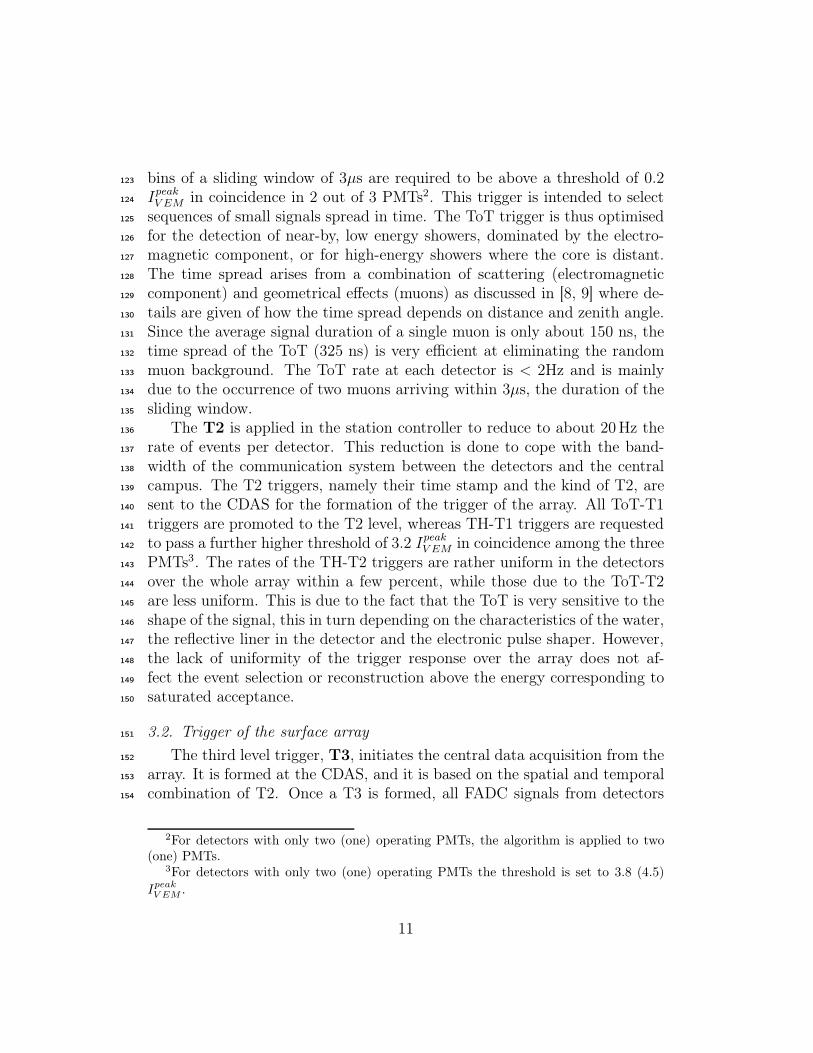
The trigger of the array is realised in two modes. The first T3 mode157
requires the coincidence of at least three detectors that have passed the ToT158
condition and that meet the requirement of a minimum of compactness,159
namely, one of the detectors must have one of its closest neighbours and160
one of its second closest neighbours triggered. It is called "ToT2C1&3C2",161
where Cn indicates the nth set of neighbours (see figure 2). Once the spatial162
coincidence is verified, timing criteria are imposed: each T2 must be within163
(6 + 5Cn)µs of the first one. An example of such T3 configuration is shown164
in figure 2, left. Since the ToT as a local trigger has very low background,165
this trigger selects predominantly physics events. The rate of this T3 with166
the full array in operation is around 1600 events per day, meaning that each167
detector participates in an event about 3 times per day. This trigger is168
extremely pure since 90% of the selected events are real showers and it is169
mostly efficient for showers below 60◦. The 10% remaining are caused by170
chance coincidences due to the permissive timing criteria. The second T3171
mode is more permissive. It requires a four-fold coincidence of any T2 with172
a moderate compactness. Namely, among the four fired detectors, within173
appropriate time windows, at least one must be in the first set of neighbours174
from a selected station (C1), another one must be in the second set (C2)175
and the last one can be as far as in the fourth set (C4). This trigger is176
called "2C1&3C2&4C4". Concerning timing criteria, we apply the same logic177
as for the "ToT2C1&3C2". An example of such T3 configuration, is shown178
in figure 2, right. Such a trigger is efficient for the detection of horizontal179
showers that, being rich in muons, generate in the detectors signals that have180
a narrow time spread, with triggered detectors having wide-spread patterns181
on the ground. With the full array configuration, this trigger selects about182
1200 events per day, out of which about 10% are real showers.183
12
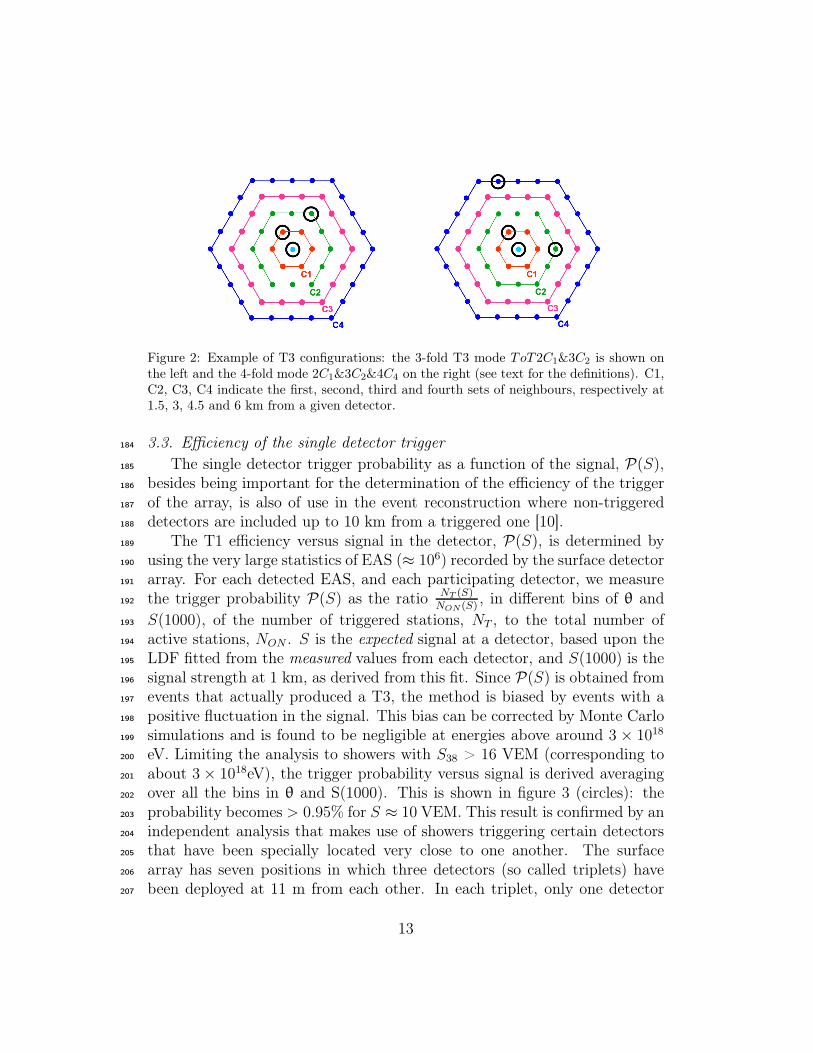
Figure 2: Example of T3 configurations: the 3-fold T3 mode ToT 2C1&3C2 is shown onthe left and the 4-fold mode 2C1&3C2&4C4 on the right (see text for the definitions). C1,C2, C3, C4 indicate the first, second, third and fourth sets of neighbours, respectively at1.5, 3, 4.5 and 6 km from a given detector.
3.3. Efficiency of the single detector trigger184
The single detector trigger probability as a function of the signal, P(S),185
besides being important for the determination of the efficiency of the trigger186
of the array, is also of use in the event reconstruction where non-triggered187
detectors are included up to 10 km from a triggered one [10].188
The T1 efficiency versus signal in the detector, P(S), is determined by189
using the very large statistics of EAS (≈ 106) recorded by the surface detector190
array. For each detected EAS, and each participating detector, we measure191
the trigger probability P(S) as the ratio NT (S)NON(S)
, in different bins of θ and192
S(1000), of the number of triggered stations, NT , to the total number of193
active stations, NON . S is the expected signal at a detector, based upon the194
LDF fitted from the measured values from each detector, and S(1000) is the195
signal strength at 1 km, as derived from this fit. Since P(S) is obtained from196
events that actually produced a T3, the method is biased by events with a197
positive fluctuation in the signal. This bias can be corrected by Monte Carlo198
simulations and is found to be negligible at energies above around 3 × 1018199
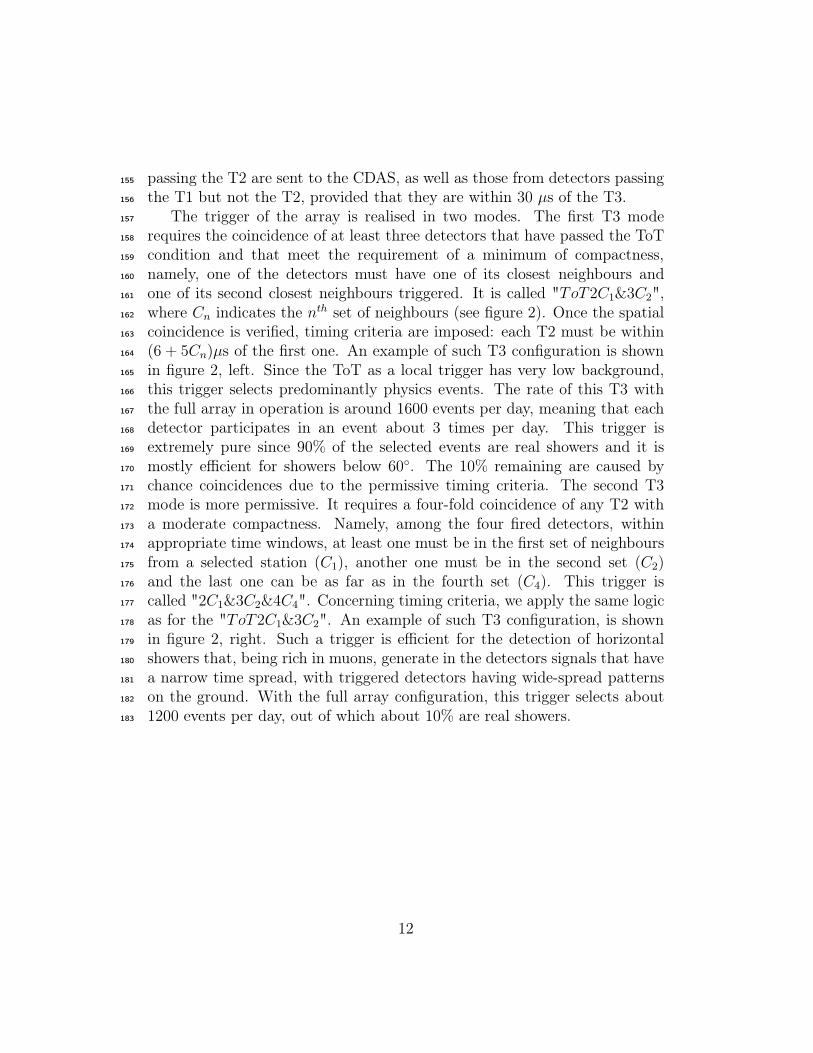
eV. Limiting the analysis to showers with S38 > 16 VEM (corresponding to200
about 3 × 10¹⁸eV), the trigger probability versus signal is derived averaging201
over all the bins in θ and S(1000). This is shown in figure 3 (circles): the202
probability becomes > 0.95% for S ≈ 10 VEM. This result is confirmed by an203
independent analysis that makes use of showers triggering certain detectors204
that have been specially located very close to one another. The surface205
array has seven positions in which three detectors (so called triplets) have206
been deployed at 11 m from each other. In each triplet, only one detector207
13

(master) sends T2 to CDAS, while the other two (slaves) are independently208
read out each time a T3 is generated and if they pass the T1. For each209
slave, the trigger probability versus recorded signal S is derived from the210
ratio between the number of events where both slaves have triggered and211
the number of events where only the other one has triggered. Depending if212
one or two slaves have triggered, S is either the signal of the only triggered213
detector or the average of the two.214
Signal (VEM)0 2 4 6 8 10 12 14 16 18 20S
ingl
e S
tatio
n T
rigge
r P
roba
bilit
y
0
0.2
0.4
0.6
0.8
1
P(S) from Triplets
eV18P(S) from data > 3 x 10
Figure 3: Single detector trigger probability as a function of the signal in the detector,P(S), obtained from triplets data (triangles) and from showers data with E > 3× 10¹⁸ eV(circles).
From the analysis of about 10000 events, and combining the probabilities215
for the two slaves, P(S) is obtained and it is shown in figure 3 (triangles), in216
good agreement with the one obtained by showers data.217
4. Event selection of the surface detector array for showers with218
zenith angle below 60◦219
A selection of physics events and of detectors belonging to each event is220
made after data acquisition. Indeed, a large number of chance coincidence221
events is expected due to the large number of possible combinations among222
the single detectors. We focus here on the selection of events between 0◦ and223
60◦ since more inclined showers have different properties and require specific224
selection criteria described elsewhere [12].225
14
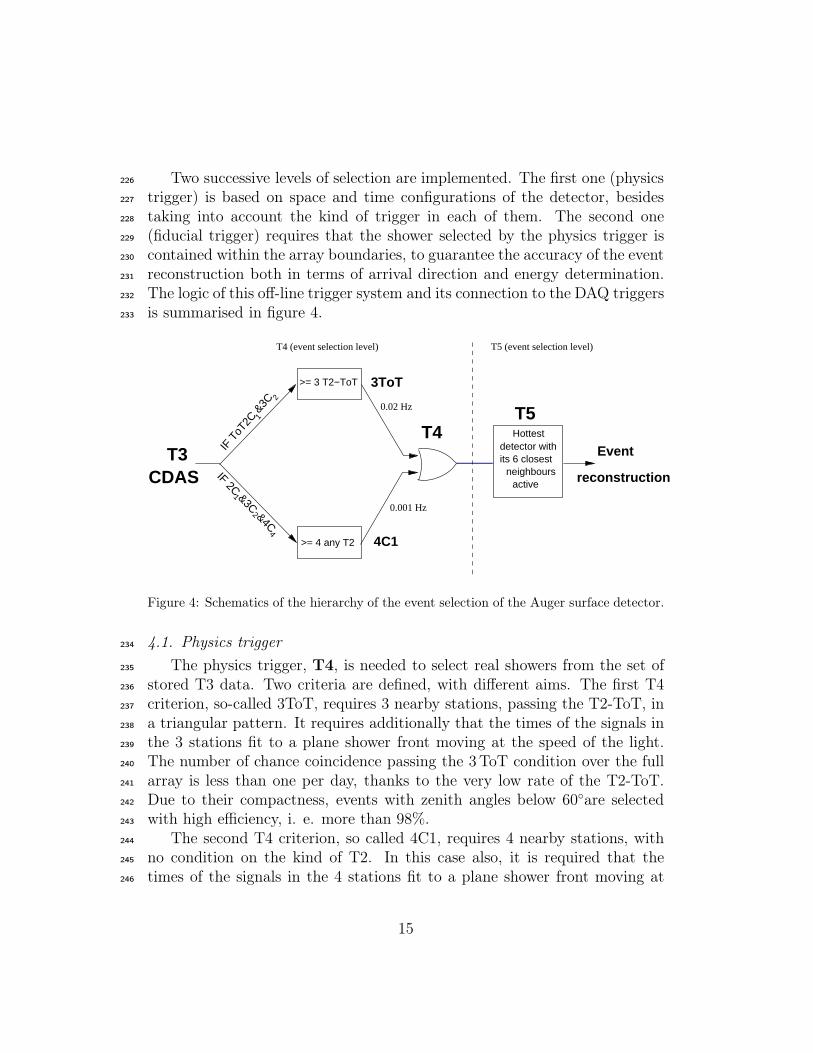
Two successive levels of selection are implemented. The first one (physics226
trigger) is based on space and time configurations of the detector, besides227
taking into account the kind of trigger in each of them. The second one228
(fiducial trigger) requires that the shower selected by the physics trigger is229
contained within the array boundaries, to guarantee the accuracy of the event230
reconstruction both in terms of arrival direction and energy determination.231
The logic of this off-line trigger system and its connection to the DAQ triggers232
is summarised in figure 4.233
Hottestdetector withits 6 closest
neighboursactive
4C1
3ToT
T4
T4 (event selection level) T5 (event selection level)
0.02 Hz
0.001 Hz
T3CDAS
T5
Event
reconstruction
IF T
oT2C
&3C
>= 3 T2−ToT
>= 4 any T2
1
2
1
4
IF 2C &3C&4C
2
Figure 4: Schematics of the hierarchy of the event selection of the Auger surface detector.
4.1. Physics trigger234
The physics trigger, T4, is needed to select real showers from the set of235
stored T3 data. Two criteria are defined, with different aims. The first T4236
criterion, so-called 3ToT, requires 3 nearby stations, passing the T2-ToT, in237
a triangular pattern. It requires additionally that the times of the signals in238
the 3 stations fit to a plane shower front moving at the speed of the light.239
The number of chance coincidence passing the 3ToT condition over the full240
array is less than one per day, thanks to the very low rate of the T2-ToT.241
Due to their compactness, events with zenith angles below 60◦are selected242
with high efficiency, i. e. more than 98%.243
The second T4 criterion, so called 4C1, requires 4 nearby stations, with244
no condition on the kind of T2. In this case also, it is required that the245
times of the signals in the 4 stations fit to a plane shower front moving at246
15
the speed of the light. This 4C1 trigger brings to ≈100% the efficiency for247
showers below 60◦.248
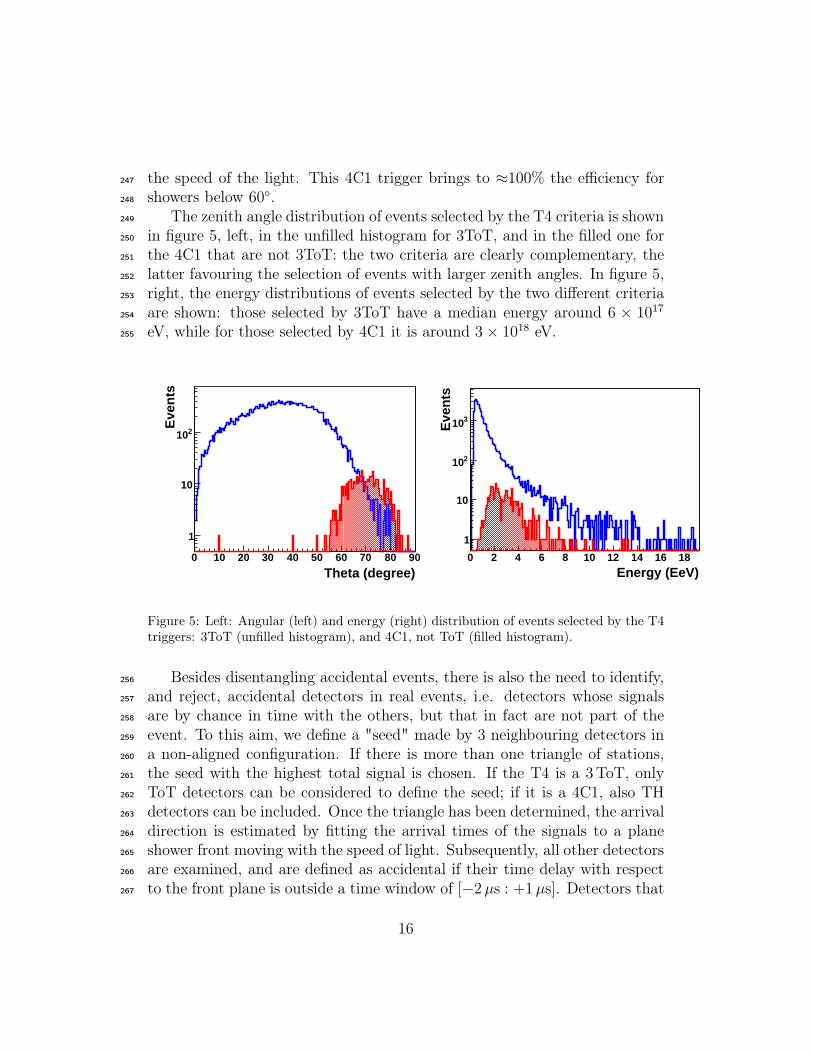
The zenith angle distribution of events selected by the T4 criteria is shown249
in figure 5, left, in the unfilled histogram for 3ToT, and in the filled one for250
the 4C1 that are not 3ToT: the two criteria are clearly complementary, the251
latter favouring the selection of events with larger zenith angles. In figure 5,252
right, the energy distributions of events selected by the two different criteria253
are shown: those selected by 3ToT have a median energy around 6 × 1017254
eV, while for those selected by 4C1 it is around 3× 10¹⁸ eV.255
Theta (degree)0 10 20 30 40 50 60 70 80 90
Eve
nts
1
10
210
Energy (EeV)0 2 4 6 8 10 12 14 16 18
Eve
nts
1
10
210
310
Figure 5: Left: Angular (left) and energy (right) distribution of events selected by the T4triggers: 3ToT (unfilled histogram), and 4C1, not ToT (filled histogram).
Besides disentangling accidental events, there is also the need to identify,256
and reject, accidental detectors in real events, i.e. detectors whose signals257
are by chance in time with the others, but that in fact are not part of the258
event. To this aim, we define a "seed" made by 3 neighbouring detectors in259
a non-aligned configuration. If there is more than one triangle of stations,260
the seed with the highest total signal is chosen. If the T4 is a 3ToT, only261
ToT detectors can be considered to define the seed; if it is a 4C1, also TH262
detectors can be included. Once the triangle has been determined, the arrival263
direction is estimated by fitting the arrival times of the signals to a plane264
shower front moving with the speed of light. Subsequently, all other detectors265
are examined, and are defined as accidental if their time delay with respect266
to the front plane is outside a time window of [−2µs : +1µs]. Detectors that267
16
have no triggered neighbours within 3 km are always removed.268
After the selection chain (both event selection and accidental detectors269
removal), 99.9% of the selected events pass the full reconstruction procedure,270
that is arrival direction, core position and S(1000) are determined.271
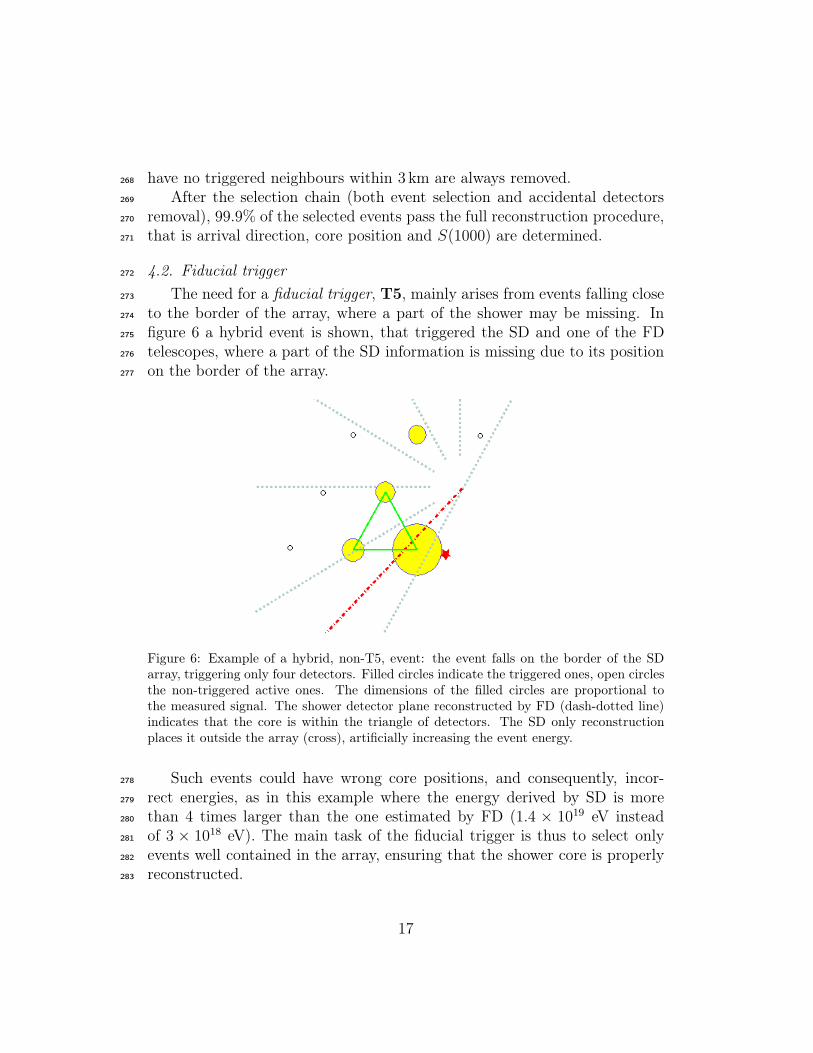
4.2. Fiducial trigger272
The need for a fiducial trigger, T5, mainly arises from events falling close273
to the border of the array, where a part of the shower may be missing. In274
figure 6 a hybrid event is shown, that triggered the SD and one of the FD275
telescopes, where a part of the SD information is missing due to its position276
on the border of the array.277
Figure 6: Example of a hybrid, non-T5, event: the event falls on the border of the SDarray, triggering only four detectors. Filled circles indicate the triggered ones, open circlesthe non-triggered active ones. The dimensions of the filled circles are proportional tothe measured signal. The shower detector plane reconstructed by FD (dash-dotted line)indicates that the core is within the triangle of detectors. The SD only reconstructionplaces it outside the array (cross), artificially increasing the event energy.
Such events could have wrong core positions, and consequently, incor-278
rect energies, as in this example where the energy derived by SD is more279
than 4 times larger than the one estimated by FD (1.4 × 10¹⁹ eV instead280
of 3 × 10¹⁸ eV). The main task of the fiducial trigger is thus to select only281
events well contained in the array, ensuring that the shower core is properly282
reconstructed.283
17
The fiducial trigger should be applied a priori on the events, to be inde-284
pendent of the reconstruction procedure. The T5 adopted requires that the285
detector with the highest signal has all its 6 closest neighbours working at286
the time of the event (i.e., it must be surrounded by a working hexagon).287
This ensures adequate containment of the event inside the array. Even in the288
case of a high energy event that falls inside, but close to the border of the289
array, where part of the data may be missing, information from the seven290
detectors closest to the shower core ensures a proper reconstruction. Apply-291
ing this condition, the maximum statistical uncertainty in the reconstructed292
S(1000) due to event sampling by the array is ≈ 3% [10]. It has to be noted293
that this criterion also discards events that, though contained, fall close to294
a non-working detector: this is an important issue because, due to the large295
number of detectors distributed over 3000 km2, about 1% of the detectors are296
expected to be not functioning at any moment, even with constant detector297
maintenance. For the fully completed array, and taking this into account,298
the application of the T5 condition reduces the effective area by 10% with299
respect to the nominal one.300
Finally, the use of the fiducial trigger allows the effective area of the array301
to saturate to the geometrical one above a certain primary energy. Indeed,302
with no conditions on event containment, the acceptance would increase with303
increasing energy, since showers falling outside the borders of the array might304
still trigger sufficient detectors to be recorded; the higher their energy, the305
farther the distance.306
5. Aperture and exposure of the surface detector array for showers307
with zenith angle below 60 degrees308
The aperture of the surface detector array is given by the effective area309
integrated over solid angle. When the trigger and event selection have full310
efficiency, i.e. when the acceptance does not depend on the nature of the311
primary particle, its energy or arrival direction, the effective area coincides312
with the geometrical one. In subsection 5.1, the energy above which the313
acceptance saturates is derived. In section 5.2, the calculation of the exposure314
above this energy is detailed.315
5.1. Determination of the acceptance saturation energy316
I. From SD data. The acceptance saturation energy, ESAT , is deter-317
mined using two different methods that use events recorded by the surface318
18

detector array. In the first one, starting from detected showers, mock events319
are generated by fluctuating the amplitude of the signals recorded in each320
detector and their arrival time. Such fluctuations are measured [13, 14] by321
using twin detectors located at 11 m from each other. To each simulated322
event, the full trigger and event selection chain are applied. From the ratio323
of the number of triggered events to the simulated, the trigger efficiency is324
obtained as a function of energy, as shown in figure 7 (triangles). As can325
be seen, the trigger probability becomes almost unity (> 97%) at energy326
E ∼ 3×10¹⁸ eV for all angles between 0◦ and 60◦. The fact that the method327
is based on the use of showers that actually triggered the array may bias328
the estimation of the trigger probability at low energy. However, it does not329
bias the result on the trigger probability close to full efficiency, and hence on330
ESAT .331
(E/eV)10
log17 17.5 18 18.5 19 19.5
Arr
ay T
rigge
r ef
ficie
ncy
0
0.2
0.4
0.6
0.8
1
Figure 7: Trigger efficiency as a function of energy, derived from SD data (triangles) andhybrid data (circles).
II. From hybrid data. The hybrid data sample is composed of events332
observed by the FD and that triggered at least one SD detector: consequently,333
it has an intrinsically lower energy threshold than the SD. For each bin in334
energy (of width 0.2 in log10(E)), the number of events that pass the SD335
19
trigger out of the total number of events are counted. To avoid biases from336
primary composition, the same data selection criteria as in [15] are used.337
Additionally, in analogy with the T5, to avoid the effects of the borders338
of the array, it is required that the detector used in the hybrid geometry339
reconstruction is surrounded by 6 active detectors. The trigger efficiency of340
the surface detector array is found to be saturated (> 97% ) for energies341
above 3 × 10¹⁸ eV, as shown in figure 7 (circles), in agreement with what is342
obtained by the analysis of SD data alone.343
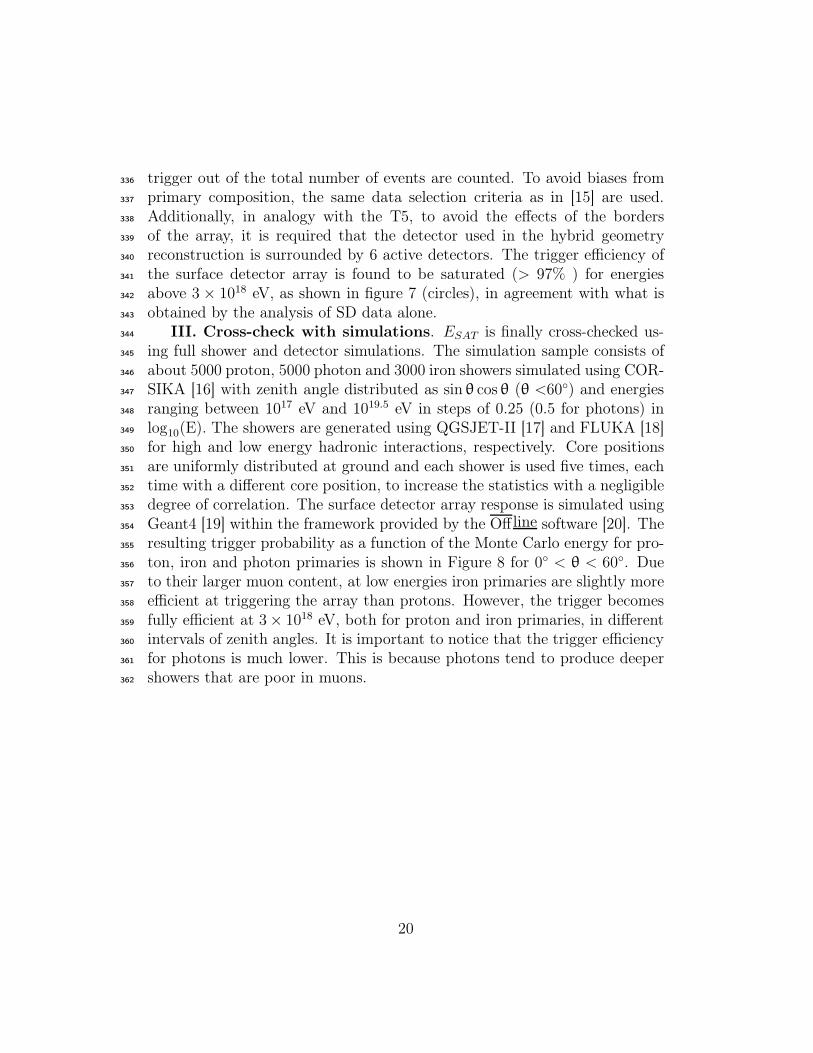
III. Cross-check with simulations. ESAT is finally cross-checked us-344
ing full shower and detector simulations. The simulation sample consists of345
about 5000 proton, 5000 photon and 3000 iron showers simulated using COR-346
SIKA [16] with zenith angle distributed as sin θ cosθ (θ <60◦) and energies347
ranging between 1017 eV and 1019.5 eV in steps of 0.25 (0.5 for photons) in348
log10(E). The showers are generated using QGSJET-II [17] and FLUKA [18]349
for high and low energy hadronic interactions, respectively. Core positions350
are uniformly distributed at ground and each shower is used five times, each351
time with a different core position, to increase the statistics with a negligible352
degree of correlation. The surface detector array response is simulated using353
Geant4 [19] within the framework provided by the Offline software [20]. The354
resulting trigger probability as a function of the Monte Carlo energy for pro-355
ton, iron and photon primaries is shown in Figure 8 for 0◦ < θ < 60◦. Due356
to their larger muon content, at low energies iron primaries are slightly more357
efficient at triggering the array than protons. However, the trigger becomes358
fully efficient at 3× 10¹⁸ eV, both for proton and iron primaries, in different359
intervals of zenith angles. It is important to notice that the trigger efficiency360
for photons is much lower. This is because photons tend to produce deeper361
showers that are poor in muons.362
20
(E/eV)10
log17.5 18 18.5 19 19.5
Trig
ger
effic
ienc
y
0
0.2
0.4
0.6
0.8
1
iron
proton
photon
Figure 8: SD trigger efficiency as a function of Monte Carlo energy E for proton (circles),iron (triangles) and photon primaries (squares) and zenith angle integrated up to 60◦.Lines are drawn only to guide the eyes.
5.2. Calculation of the integrated exposure363
The studies described above have shown that the full efficiency of the364
SD trigger and event selection is reached at 3 × 10¹⁸ eV. Above this energy,365
the calculation of the exposure is based solely on the determination of the366
geometrical aperture and of the observation time.367
With respect to the aperture, the choice of a fiducial trigger based on368
hexagons, as explained in section 4.2, allows us to exploit the regularity of369
the array very simply. The aperture of the array is obtained as a multiple of370
the aperture of an elemental hexagon cell, acell, defined as any active detector371
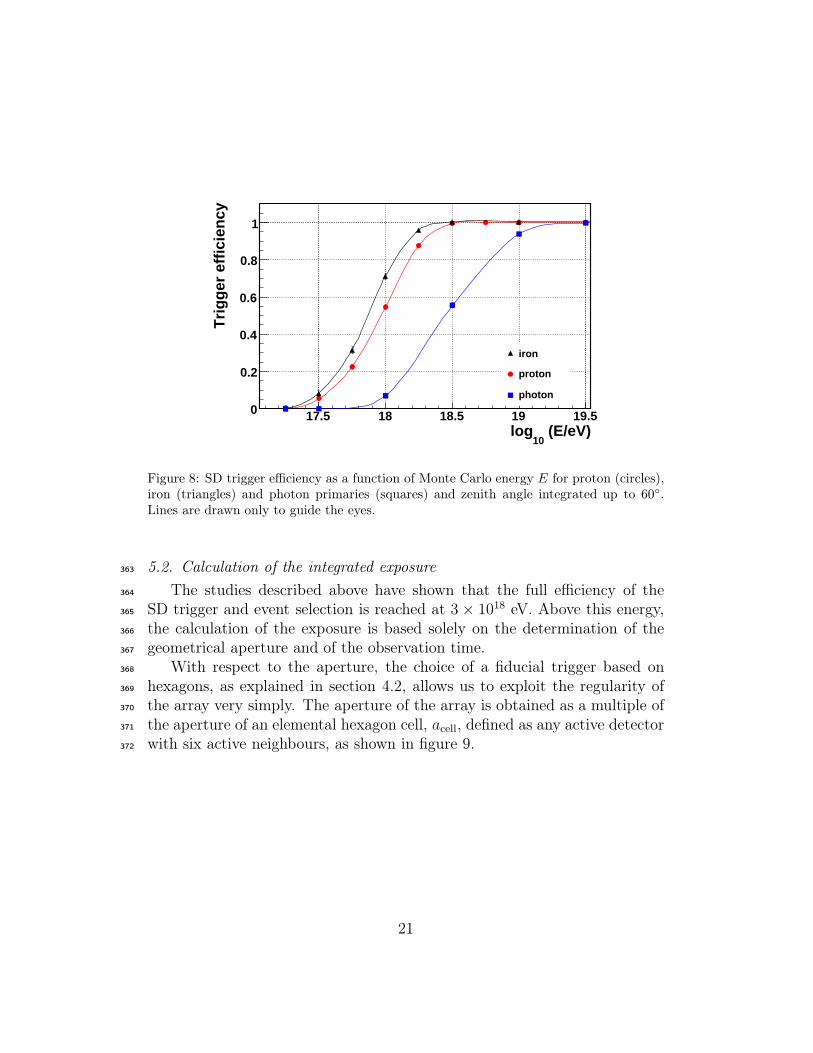
with six active neighbours, as shown in figure 9.372
21
����������
����������
Figure 9: Scheme of an hexagon of detectors: the elemental hexagon cell, acell, is theshaded area around the central detector.
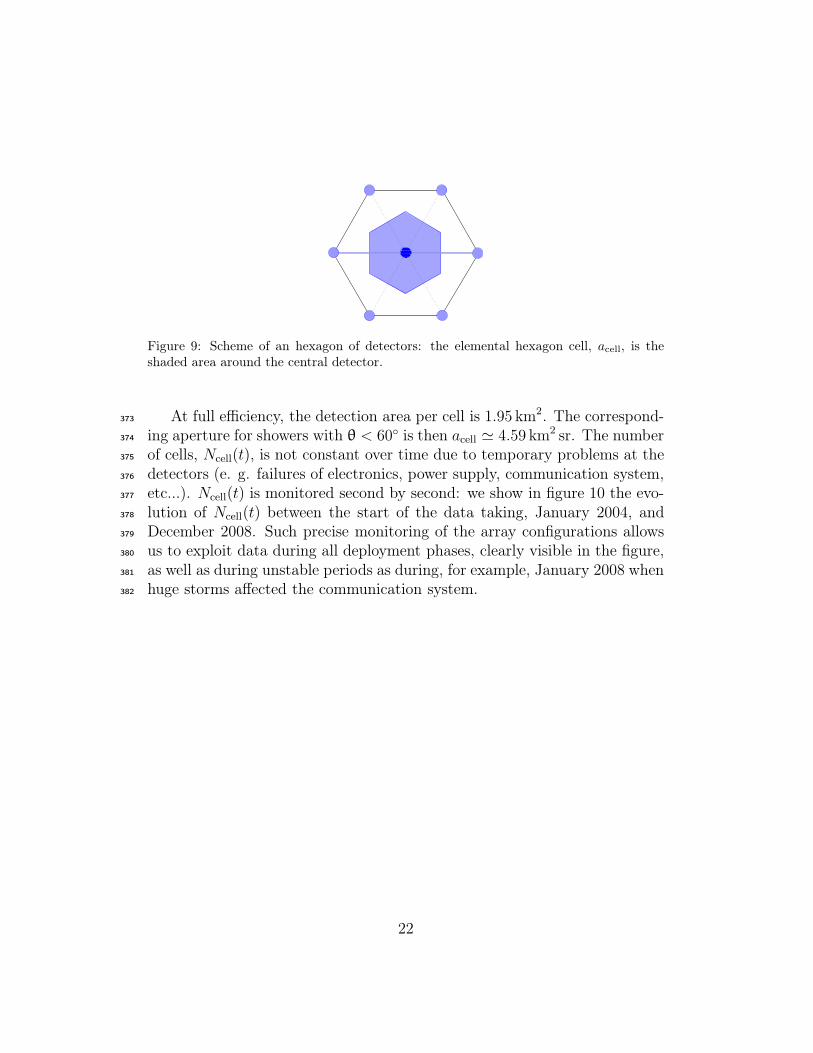
At full efficiency, the detection area per cell is 1.95 km2. The correspond-373
ing aperture for showers with θ < 60◦ is then acell ≃ 4.59 km2 sr. The number374
of cells, Ncell(t), is not constant over time due to temporary problems at the375
detectors (e. g. failures of electronics, power supply, communication system,376
etc...). Ncell(t) is monitored second by second: we show in figure 10 the evo-377
lution of Ncell(t) between the start of the data taking, January 2004, and378
December 2008. Such precise monitoring of the array configurations allows379
us to exploit data during all deployment phases, clearly visible in the figure,380
as well as during unstable periods as during, for example, January 2008 when381
huge storms affected the communication system.382
22
Date31/12/04 31/12/05 31/12/06 01/01/08 31/12/08
Nce
ll
200
400
600
800
1000
1200
Figure 10: Evolution of the number of hexagonal cells (see text) between January 1st,2004 and December 31st, 2008
The second-by-second monitoring provides at the same time the aperture383
of the array per second, acell × Ncell(t), as well as the observation time with384
high precision. To calculate the integrated exposure over a given period of385
time, the aperture of the array, Ncell(t)×acell, is integrated over the number of386
live seconds. This calculation is expected to be very precise, since it is based387
on a purely geometrical aperture and a very good time precision. However388
both the determination of Ncell(t) and of the observation time are affected389
by uncertainties.390
Concerning the determination of Ncell(t), to evaluate the uncertainty in391
the number of active detectors, a check of the consistency of the event rate of392
each detector with its running time, determined from the monitoring system,393
is performed. The uncertainty derived from this study is added to that due394
to errors of communication between the station and the DAQ, which are also395
monitored. Overall, the uncertainty on the determination of Ncell(t) amounts396
to about 1.5%.397
For the determination of the observation time, and related uncertainty,398
the dead time that is unaccounted for in the second by second monitoring399
23
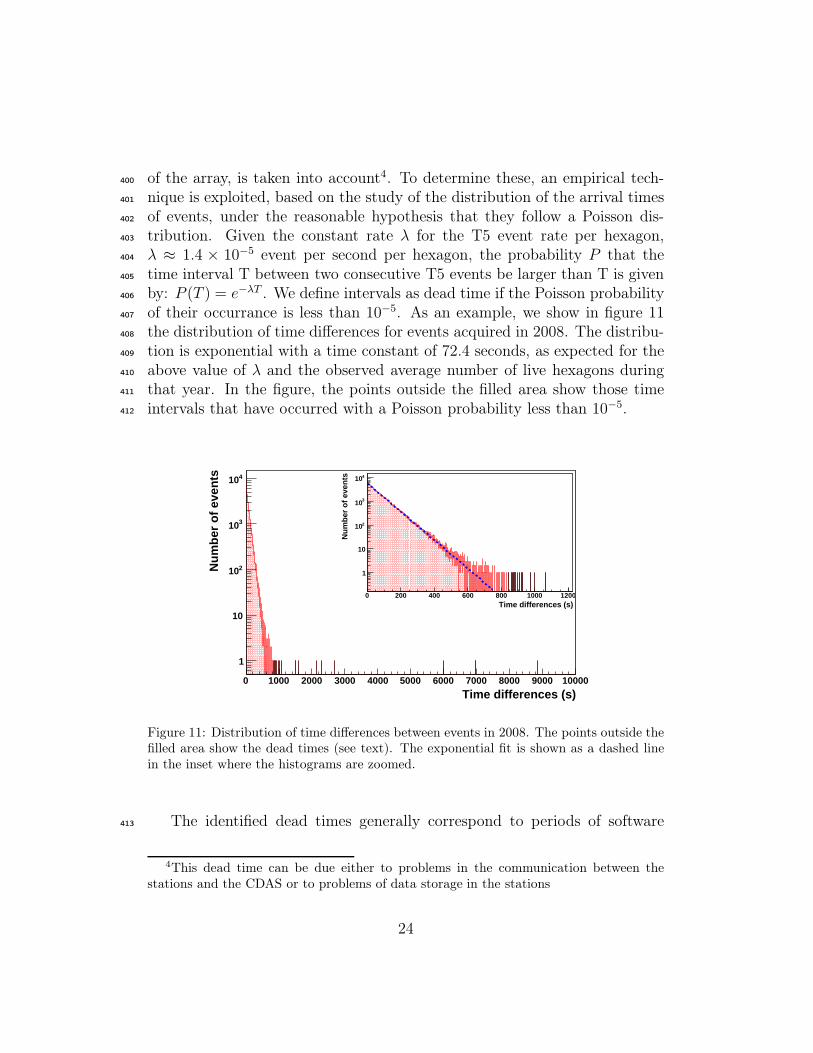
of the array, is taken into account4. To determine these, an empirical tech-400
nique is exploited, based on the study of the distribution of the arrival times401
of events, under the reasonable hypothesis that they follow a Poisson dis-402
tribution. Given the constant rate λ for the T5 event rate per hexagon,403
λ ≈ 1.4 × 10⁻⁵ event per second per hexagon, the probability P that the404
time interval T between two consecutive T5 events be larger than T is given405
by: P (T ) = e−λT . We define intervals as dead time if the Poisson probability406
of their occurrance is less than 10−5. As an example, we show in figure 11407
the distribution of time differences for events acquired in 2008. The distribu-408
tion is exponential with a time constant of 72.4 seconds, as expected for the409
above value of λ and the observed average number of live hexagons during410
that year. In the figure, the points outside the filled area show those time411
intervals that have occurred with a Poisson probability less than 10−5.412
Time differences (s)0 1000 2000 3000 4000 5000 6000 7000 8000 9000 10000
Num
ber
of e
vent
s
1
10
210
310
410
Time differences (s)0 200 400 600 800 1000 1200
Num
ber
of e
vent
s
1
10
210
310
410
Figure 11: Distribution of time differences between events in 2008. The points outside thefilled area show the dead times (see text). The exponential fit is shown as a dashed linein the inset where the histograms are zoomed.
The identified dead times generally correspond to periods of software413
4This dead time can be due either to problems in the communication between thestations and the CDAS or to problems of data storage in the stations
24
modifications at the level either of the single detectors or of the CDAS. These414
were rather frequent during the deployment phase of the surface detector415
array, which lasted until June 2008. The uncertainty in the determination416
of the livetime is estimated to be around 1%. Between January 2004 and417
December 2008, the livetime of the surface detector array data acquisition is418
96%. Hidden dead times reduce the effective livetime to 87%, the reduction419
being mostly due to the two first years of operation. However, due to the420
growth of the surface detector array, their impact on the total integrated421
exposure is a reduction of only 3%.422
6. Conclusions423
The DAQ trigger of the surface detector array of the Pierre Auger Ob-424
servatory is organised in a hierarchical way, starting at the level of the single425
detector (T1, T2) up to the data acquisition (T3). The selection of events426
below 60◦ takes place off-line, and it is also hierarchical (T4, T5). The whole427
chain, from the single detector trigger, up to event selection, is able to re-428
duce the counting rate of the single detector from about 3 kHz, due mainly429
to single, uncorrelated, cosmic muons, down to about 3 × 10⁻⁵ Hz. This430
final rate is due to extensive air showers, more than 99% of which pass the431
reconstruction chain.432
In spite of the large number of detectors and the possible number of433
chance events due to combinatorial coincidences among the detectors, the434
high-purity Time Over Threshold trigger enables the main trigger of the435
array to be kept at the level of a 3-fold coincidence, thus extending the436
range of physics that can be studied. Such a trigger, together with the437
event selection strategy, allows the acquisition and reconstruction of about438
one cosmic ray shower per minute, with median energy around 6× 10¹⁷ eV.439
Moreover, it makes the surface detector array fully efficient for showers due to440
primary cosmic rays above 3×10¹⁸ eV, independent of their mass and arrival441
directions. The trigger provides at the same time a larger overlapping energy442
region with the FD, which is naturally efficient at lower energies, allowing443
the measurement of the cosmic ray spectrum down to 1018 eV [21].444
Above 3× 10¹⁸ eV, the calculation of the exposure is purely geometrical,445
being the integration of the geometrical aperture over the observation time.446
Both of them are known with high precision, so that the overall uncertainty447
on the integrated exposure is less than 3%. The integrated SD exposure as a448
function of time is shown in figure 12, from January 2004 to December 2008:449
25
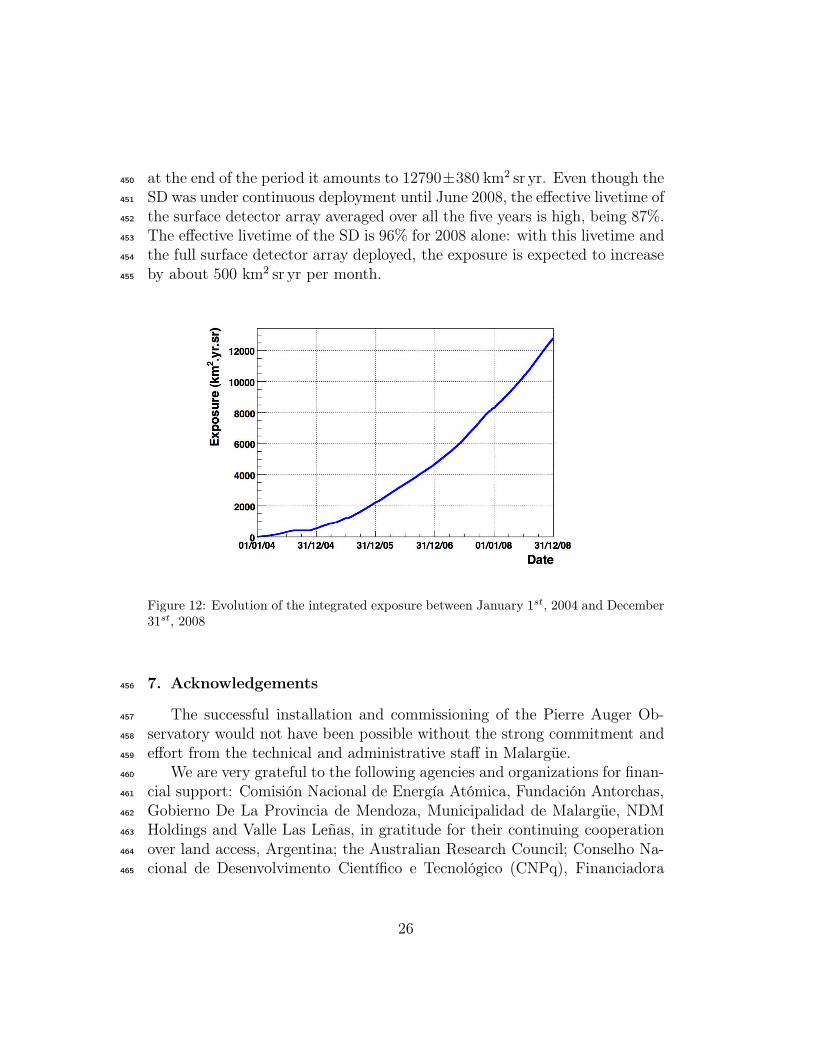
at the end of the period it amounts to 12790±380 km2 sr yr. Even though the450
SD was under continuous deployment until June 2008, the effective livetime of451
the surface detector array averaged over all the five years is high, being 87%.452
The effective livetime of the SD is 96% for 2008 alone: with this livetime and453
the full surface detector array deployed, the exposure is expected to increase454
by about 500 km2 sr yr per month.455
Figure 12: Evolution of the integrated exposure between January 1st, 2004 and December31st, 2008
7. Acknowledgements456
The successful installation and commissioning of the Pierre Auger Ob-457
servatory would not have been possible without the strong commitment and458
effort from the technical and administrative staff in Malargüe.459
We are very grateful to the following agencies and organizations for finan-460
cial support: Comisión Nacional de Energía Atómica, Fundación Antorchas,461
Gobierno De La Provincia de Mendoza, Municipalidad de Malargüe, NDM462
Holdings and Valle Las Leñas, in gratitude for their continuing cooperation463
over land access, Argentina; the Australian Research Council; Conselho Na-464
cional de Desenvolvimento Científico e Tecnológico (CNPq), Financiadora465
26
de Estudos e Projetos (FINEP), Fundação de Amparo à Pesquisa do Es-466
tado de Rio de Janeiro (FAPERJ), Fundação de Amparo à Pesquisa do Es-467
tado de São Paulo (FAPESP), Ministério de Ciência e Tecnologia (MCT),468
Brazil; AVCR AV0Z10100502 and AV0Z10100522, GAAV KJB300100801469
and KJB100100904, MSMT-CR LA08016, LC527, 1M06002, and MSM00216-470
20859, Czech Republic; Centre de Calcul IN2P3/CNRS, Centre National471
de la Recherche Scientifique (CNRS), Conseil Régional Ile-de-France, Dé-472
partement Physique Nucléaire et Corpusculaire (PNC-IN2P3/CNRS), Dé-473
partement Sciences de l’Univers (SDU-INSU/CNRS), France; Bundesmin-474
isterium für Bildung und Forschung (BMBF), Deutsche Forschungsgemein-475
schaft (DFG), Finanzministerium Baden-Württemberg, Helmholtz-Gemein-476
schaft Deutscher Forschungszentren (HGF), Ministerium für Wissenschaft477
und Forschung, Nordrhein-Westfalen, Ministerium für Wissenschaft, For-478
schung und Kunst, Baden-Württemberg, Germany; Istituto Nazionale di479
Fisica Nucleare (INFN), Ministero dell’Istruzione, dell’Università e della Ri-480
cerca (MIUR), Italy; Consejo Nacional de Ciencia y Tecnología (CONA-481
CYT), Mexico; Ministerie van Onderwijs, Cultuur en Wetenschap, Neder-482
landse Organisatie voor Wetenschappelijk Onderzoek (NWO), Stichting voor483
Fundamenteel Onderzoek der Materie (FOM), Netherlands; Ministry of Sci-484
ence and Higher Education, Grant Nos. 1 P03 D 014 30, N202 090 31/0623,485
and PAP/218/2006, Poland; Fundação para a Ciência e a Tecnologia, Por-486
tugal; Ministry for Higher Education, Science, and Technology, Slovenian487
Research Agency, Slovenia; Comunidad de Madrid, Consejería de Educación488
de la Comunidad de Castilla La Mancha, FEDER funds, Ministerio de Cien-489
cia e Innovación, Xunta de Galicia, Spain; Science and Technology Facilities490
Council, United Kingdom; Department of Energy, Contract No. DE-AC02-491
07CH11359, National Science Foundation, Grant No. 0450696, The Grainger492
Foundation USA; ALFA-EC / HELEN, European Union 6th Framework Pro-493
gram, Grant No. MEIF-CT-2005-025057, European Union 7th Framework494
Program, Grant No. PIEF-GA-2008-220240, and UNESCO.495
References496
[1] I. Allekotte et al. (Pierre Auger Collaboration), Nucl. Instr. and Meth.497
A 586 (2008) 409498
[2] Pierre Auger Collaboration, submitted to Nucl. Instr. and Meth.,499
arXiv:0907.4282v1 [astro-ph.IM].500
27
[3] J. Abraham et al. (Pierre Auger Collaboration), Phys. Rev. Lett. 101501
(2008) 061101502
[4] J. Abraham et al (Pierre Auger Collaboration), Nucl. Instr. and Meth.503
A 523 (2004) 50504
[5] X. Bertou et al. (Pierre Auger Collaboration), Nucl. Instr. and Meth. A505
568 (2006) 839506
[6] D. Newton, J. Knapp, A.A. Watson, Astropart. Phys. 26 (2007) 414507
[7] J. Hersil et al., Phys. Rev. Letts. 6 (1961) 22508
[8] J. Linsley and L. Scarsi, Phys. Rev. 128 (1962) 2384509
[9] A.A. Watson and J.G. Wilson, J. Phys. A 7 (1974) 1199510
[10] P.L. Ghia et al. (Pierre Auger Collaboration), Proc. of 29th ICRC,511
eds. B.S.Acharya et al. Tata Inst. of Fundamental Research, Mumbai, 7512
(2006) 167513
[11] P. Bauleo et al. (Pierre Auger Collaboration), Proc. of 29th ICRC,514
eds. B.S.Acharya et al. Tata Inst. of Fundamental Research, Mumbai, 7515
(2006) 291516
[12] P. Facal San Luis et al. (Pierre Auger Collaboration), Proc. of 30th517
ICRC, eds. R.Caballero et al., Universidad Nacional Autonoma de Mex-518
ico, Mexico City, 4 (2008) 339519
[13] M. Ave et al., Nucl. Instr. and Meth. A 578 (2007) 180520
[14] C. Bonifazi et al., Astropart. Phys. 28 (2008) 523521
[15] M. Unger et al. (Pierre Auger Collaboration), Proc. of 30th ICRC, eds.522
R.Caballero et al., Universidad Nacional Autonoma de Mexico, Mexico523
City, 4 (2008) 373524
[16] D. Heck, J. Knapp, J.N. Capdevielle, G. Schatz, and T. Thouw, Report525
FZKA 6019 (1998), Forschungszentrum Karlsruhe526
[17] S. Ostapchenko, Phys.Lett. B 636 (2006) 40, Phys. Rev. D 74 (2006)527
014026528
28

[18] G. Battistoni et al., Nucl. Phys. Proc. Suppl. 175 (2008) 88529
[19] S. Agostinelli, J. Allison et al., Nucl. Instr. and Meth. A 506 (2003) 250,530
IEEE Transactions on Nuclear Science 53 No. 1 (2006) 270531
[20] S. Argirò, S.L.C. Barroso, J. Gonzalez, L. Nellen, T. Paul, T.A. Porter,532
L. Prado Jr., M. Roth, R. Ulrich, D. Veberič, Nucl. Instr. and Meth. A533
580 (2007) 1485.534
[21] F. Schüssler et al. (Pierre Auger Collaboration), submitted to Proc. of535
31st ICRC, Lodz, Poland, 2009536
29