
Exoplanet Transit Observations with Small Aperture Ground ...
Upload
khangminh22Category
view
0download
0
Page 1
Millimeter Wave and Terahertz Synthetic Aperture Radar for
Locating Metallic Scatterers Embedded in Scattering Media
Jonathan T. Richard,1 Henry O. Everitt 2
1IERUS Technologies, Huntsville, AL 35805, USA.
2Charles M. Bowden Research Center, Army Aviation & Missile RD&E Center, Redstone Arsenal, AL
35898, USA.
Abstract: A rail-mounted synthetic aperture radar has been constructed to operate at W-band (75
- 110 GHz) and a THz band (325 - 500 GHz) in order to ascertain its ability to locate isolated
small, visually obscured metallic scatterers embedded in highly scattering dielectric hosts that
are either semi-transparent or opaque. A “top view” 2D algorithm was used to reconstruct scenes
from the acquired data, locating metallic scatterers at W-band with high range and cross-range
resolution of 4.3 and 2 mm, respectively, and with improved range resolution of 0.86 mm at the
THz band. Millimeter-sized metallic scatterers were easily located when embedded in semi-
transparent, highly scattering target hosts of Styrofoam and waxy packing foam but were more
difficult to locate when embedded in relatively opaque, highly scattering Celotex panels.
Although the THz band provided the expected greater spatial resolution, it required the target to
be moved closer to the rail and had a more limited field of view that prevented some targets from
being identified. Techniques for improving the signal to noise ratio are discussed. This work
establishes a path for developing techniques to render a complete 3D reconstruction of a scene.

Page 2
1. Introduction
Synthetic Aperture Radar (SAR) is a well-established, widely fielded technique that uses
either a moving platform or a moving target to reconstruct images with higher spatial resolution
than the diffraction-limited imagery possible with a stationary aperture and target [1][2][3][4][5].
Most deployed SARs operate at conventional microwave frequencies because of the high powers
and sufficient bandwidth available to reconstruct large scenes (>>1 km2) over long distances (>1
km) with good resolution (<10 m). Considerably less explored is the application of compact
SAR for short range, high resolution applications such as non-destructive test of composite
structures, location of scatterers in opaque media, and non-contact surveying of compact,
complex objects such as those fabricated by modern 3D printing techniques. For such high
resolution (< 1 cm) applications, high frequency SAR must be developed and deployed on
platforms that are stable to within a fraction of a wavelength or are extremely well characterized
in real time so that the location of the transceiver can reliably be known and accurate
reconstructions made. Some progress has been made to develop millimeter wave and even
terahertz frequency SAR, including some impressive proof-of-concept demonstrations, but much
work remains for these high frequency radars to become practical [6][7][8][9]. The clear
technological challenges in source power, component fragility and cost, and platform stability
are further exasperated by the increasing atmospheric attenuation with increasing frequency,
suggesting that the application of such radars will exploit its inherently shorter range and higher
resolution.
Here we demonstrate millimeter wave (MMW) and terahertz (THz) frequency SAR
reconstructions using a transceiver mounted on a rail in order to resolve millimeter-sized metallic
scatterers embedded in highly scattering host panels composed of semi-transparent foams or an

Page 3
opaque thermoset plastic. Two different frequency bands were compared to quantify the tradeoff
of increased resolution and decreased penetration. Two separate 2D SAR reconstruction
algorithms were considered with the ultimate goal of achieving a 3D SAR reconstruction of the
scene. Side-looking SAR provided the best 2D reconstructions in this study. Several target
hosts, including extruded polystyrene foam (Styrofoam) and polyisocyanurate insulation boards
(Celotex), were used to characterize the transmissibility of the medium for the frequency bands
of interest. Styrofoam was transparent in both bands while the opacity of Celotex reduced the
signal-to-noise ratio of the embedded metallic scatterers and made object identification more
difficult. Moreover, clutter from both hosts produced false positive returns that had to be
discriminated from the metallic scatterers. Our objective was to establish and assess the
necessary tools in 2D to achieve full 3D rail SAR reconstruction at high frequencies so that small
scatterers may be located in absorptive, scattering hosts. Our work illustrates some of the
opportunities and challenges these 3D reconstructions will face.
2. Experiment
The experimental system shown in Fig. 1(a,b) used an Agilent N5222A vector network
analyzer (VNA) with MMW or THz transceiver front ends, a linear stage on which the
transceiver was scanned, a tripod on which objects were mounted, and a computer to control the
hardware and acquire the data. A Virginia Diodes (VDI) WR10 and WR2.2 transceivers
transmitted and received W-band (75 - 110 GHz) and THz (325 - 500 GHz) signals, and
radiation was coupled through a standard gain horn antenna. The VDI W band transceiver
includes the necessary transmitter, receiver, and couplers within a single box using a single horn

Page 4
antenna, while the VDI THz transceiver consists of a separate VDI transmitter, two VDI
receivers, and two couplers on a common breadboard with a single horn antenna. (The first
coupler connects the transmitter to one receiver to establish a reference signal, and the second
coupler connects to the second receiver to acquire the round trip-delayed signal which is
compared to the reference signal.) Calibration of the VNA removed undesired reflections and
standing waves that were consistently seen by the radar. The VNA was swept in frequency over
the entire W-band or THz-Band with an intermediate frequency (IF) bandwidth of only 100 Hz
to minimize noise.
Cross-range and range data were obtained by a lateral translation of the transceiver and a
linear frequency sweep, respectively. The transceiver was mounted on a linear stage and moved
1 m in 500 discrete steps of length δx = 2 mm. At each location the transceiver emitted a linear
frequency sweep, and the VNA recorded the received complex valued (real and imaginary IQ
data) signal and digitized it into 4096 frequency bins. A Hamming window [19] was
subsequently applied to the Fourier transform of the data to smooth it and lower sidelobes caused
by spectral leakage. Finally, a Matlab algorithm computed an inverse fast Fourier transform
(IFFT) of the data to convert the frequency domain data to the range domain, whose range
resolution is
Δr = !!"
(1)
for frequency bandwidth B in Hz and the speed of light c in m/s. For this experiment, the W-
band range resolution achieved with a bandwidth of B = 35 GHz is Δr = 4.3 mm, while the range
resolution for the THz bandwidth B = 175 GHz was 0.86 mm. This provides an unambiguous
range of 4096Δr = 17.6 m for the W-band radar and 3.5 m for the THz radar. When completed,

Page 5
the collected 2D data fills an array of 500 x 4096 elements from which the scene may be
reconstructed.
Fig. 1. (a) Top down view of the SAR setup. The range domain corresponds to the Z axis and the cross range domain corresponds to the X axis. (b) Side view of the SAR setup. The range domain corresponds to the Z axis and the cross vertical domain corresponds to the Y axis. Stripmap SAR reconstructions using the (c) Carrara X-Z and (d) Gorham Y-Z algorithms, with strengths presented in dB.
Although the ultimate goal is to be able to generate 3D SAR reconstructions, it is valuable
first to consider various 2D SAR acquisition and reconstruction methodologies. The
configurations shown in Fig. 1 provide for 2D scene reconstructions in the X-Z or Y-Z planes,
respectively. For either configuration, rail SAR, also known as stripmap SAR, uses an antenna
that emits a diverging beam, while spotlight SAR adjusts the beam to remain focused on a

Page 6
desired area as the antenna moves in location. The well-known algorithm by Carrara et al. is
routinely used to reconstruct scenes in the X-Z configuration (Fig. 1(c)) and will be described
more below [1]. For the side-looking X-Y configuration at a particular range along the Z axis,
the Gorham and Rigling SAR algorithm may be used to generate 2D reconstructions (Fig. 1(d))
[11]. A 3D SAR reconstruction could be generated by utilizing a combination of Carrara and
Gorham algorithms, for example, or a complete 3D SAR algorithm could be implemented
[12][13][14][15][16][17][18]. In the absence of a 3D algorithm, a series of 2D scans with an
increasingly tilted target or transceiver can remove the location ambiguity of scatterers
distributed in the third dimension (e.g. for the Carrara algorithm, separating scatterers at the
same X-Z location but separated in Y) and partially reconstruct the scene as scatterers project
into one of the other two dimensions (e.g. in the X or Z direction).
3. Results and Discussion
Here we used stripmap SAR and the Carrara algorithm to produce top-down, X-Z 2D
reconstructions of a variety of targets. The insights about the sensitivity and accuracy of the
reconstructions provided by these analyses will be described below. For all of the datasets, the
radar is looking at the target from the left. Initially a single metallic rod in free space was used to
verify that the technique was working, and our procedure is detailed below for that simple target.
Then more complex targets were investigated in order to estimate the spatial resolution and
penetration depth in increasingly challenging configurations in increasingly absorptive and
scattering hosts. These complex targets were composed of a variety of Styrofoam and Celotex
host panels embedded with a variety of aluminum rods, rectangular brackets, staples, and strips
of wire that approximate perfect electrical conductors (PECs).

Page 7
A. Single aluminum rod
Our first measurement was of an isolated cylindrical 1.3 cm diameter aluminum rod to
illustrate the how the rail SAR technique is used to acquire and process a 2D data set and to
ascertain how accurately the location of the rod could be quantified. The rod was placed at z0 =
2.3 meters down range and x0 = 0.17 meters in cross range from the center of the rail, as
illustrated in Fig. 2(a). The VDI transceiver was stepped 500 times with 2 mm increments along
the rail, and at each location the VDI transceiver performed a frequency sweep to collect 4096
points of IQ data spanning 75 - 110 GHz using a 100 Hz IF bandwidth. This produced a two
dimensional data set composed of IQ data as a function of location (x) and frequency (related to
z by an IFFT), plotted in Fig. 2(b).

Page 8
Fig. 2. (a) Top down view of the SAR setup. The rod is 2.3 meters downrange on the Z axis and 0.17 m cross-range on the X-axis. (b) Plot of a W-band 2D SAR data collected from a single rod, plotted in dB as a function of range and cross-range rail distances.
In stripmap SAR the distance of the rod from the transceiver changes as the transceiver
scans, reaching a minimum when the transceiver is at (x0, 0) and increasing as the transceiver
moves away on either side as 𝑟 = 𝑧!! + (𝑥 − 𝑥!)!. The 2D unprocessed data plot in Fig. 2(b)
clearly indicates the presence of this single scatterer through the boomerang shaped return
measured, and the apex of the curve indicates the location of rod at (x0, z0). To account for this
boomerang effect, we adopted the Carrara algorithm to reconstruct the scene in the X-Z plane

Page 9
and measure the location (x0, z0) of the rod, as shown in Fig. 1(c) [1]. A range migration
algorithm (RMA) interprets the range curvature produced by the scanning transceiver and
accurately locates the target, following the procedure in [1]. First, an FFT operation, preceded
and followed by FFT shift operations on the data, is performed along the cross range step
dimension. Next, a 2D phase compensation matched filter 𝑒!!!" is applied to this 2D data array
to transform and correct for this curvature, where 𝐹!" = 𝑟!( 𝑘!! − 𝑘!! − 𝑘!). Here, 𝑟! is the
range to the center of the scene, 𝑘! = !!!
is the frequency wave number, and 𝑘! is the azimuthal
wave number, which is represented as a 500 element linear array between - !!"
and + !!"
with step
size δx = 2 mm. Next, a Stolt interpolation [1] is applied to map the non-planar wavefront to the
discretized 2D array across the step dimension of the data by using a 1D spline interpolation
from 𝐾! values to rounded values of 𝐾!. Any data points outside the bounds of the interpolation
are set to the noise floor so that values outside the region of interpolation will not affect the data
when the FFT is applied. This slightly reduces the SNR of the data but otherwise leaves it
unaffected. Then a Hamming window is applied along the frequency dimension to remove high
frequency artifacts observed in the Fourier transformed data, followed by an IFFT and an FFT
shift along the frequency dimension to convert to the range domain. Then an IFFT, preceded and
followed by FFT shift operations, is applied along the cross range step dimension to produce a
SAR image. After the IFFTs along both dimensions are completed, the range migration is
complete, and the data presented in Fig. 1(c) is converted to decibels. The SAR image’s rod
location was found to match that of physical measurements with a ruler, with the center of the
rod being within the range and cross range resolution of 4.3 and 2 mm, respectively.

Page 10
If r is ever larger than the unambiguous range, well known “wrapping” or “aliasing”
artifacts appear that prevent accurate reconstructions. Since frequency fi correlates with range bin
i, this problem can be avoided in the Carrara algorithm by adding a range delay correction
𝜏! = 𝑒!!!!!!!!/! that effectively shifts the frequency domain data a distance rd closer in z so
that the range becomes 𝑟 = (𝑧! − 𝑟!)! + (𝑥 − 𝑥!)!. Once this is done, the range migration
algorithm perfectly interprets the range curvature produced by the scanning transceiver and
accurately locates the target. To explore the sensitivity of the reconstruction on choices of range
delay correction rd, the imagery presented in Fig. 3 applies rd = 0, 3, and 5 m to the data for each
frequency in the sweep. As can be seen, the Carrara algorithm is relatively insensitive to the
value of rd chosen, as long as it moves the scene of interest away from the range boundaries and
toward the center. In cases where the range is roughly known, such as in the cases detailed
below with scatterers embedded in a single host panel, excellent reconstructions are possible
when rd ≈ z0.
Fig. 3. SAR reconstructions plotted in dB for a single aluminum rod located 2.3 meters downrange on the Z axis and 0.17m cross-range on the X-axis with a range delay of (a) 0 m, (b) 3 m, and (c) 5 m.
Page 11
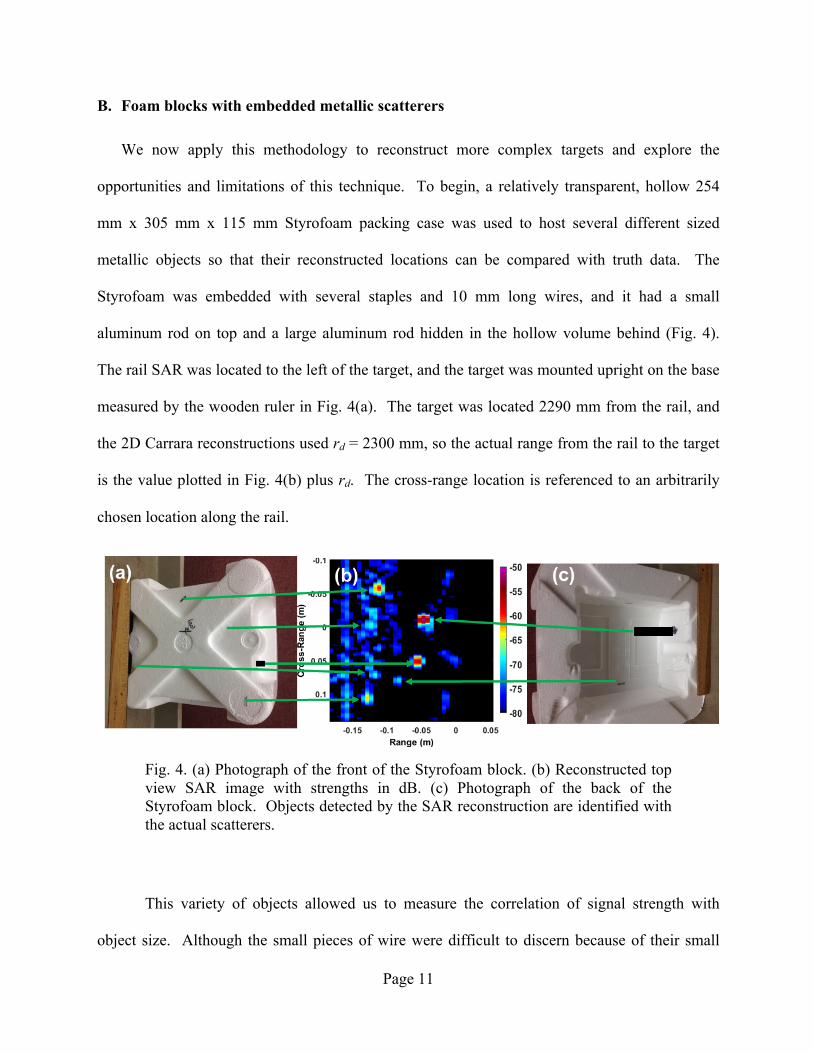
B. Foam blocks with embedded metallic scatterers
We now apply this methodology to reconstruct more complex targets and explore the
opportunities and limitations of this technique. To begin, a relatively transparent, hollow 254
mm x 305 mm x 115 mm Styrofoam packing case was used to host several different sized
metallic objects so that their reconstructed locations can be compared with truth data. The
Styrofoam was embedded with several staples and 10 mm long wires, and it had a small
aluminum rod on top and a large aluminum rod hidden in the hollow volume behind (Fig. 4).
The rail SAR was located to the left of the target, and the target was mounted upright on the base
measured by the wooden ruler in Fig. 4(a). The target was located 2290 mm from the rail, and
the 2D Carrara reconstructions used rd = 2300 mm, so the actual range from the rail to the target
is the value plotted in Fig. 4(b) plus rd. The cross-range location is referenced to an arbitrarily
chosen location along the rail.
Fig. 4. (a) Photograph of the front of the Styrofoam block. (b) Reconstructed top view SAR image with strengths in dB. (c) Photograph of the back of the Styrofoam block. Objects detected by the SAR reconstruction are identified with the actual scatterers.
This variety of objects allowed us to measure the correlation of signal strength with
object size. Although the small pieces of wire were difficult to discern because of their small

Page 12
size and orientation, the staples and rods were easily identified even though they were visibly
obscured (Fig. 4). All the objects were located to within the range and cross range bin size
tolerances of the locations measured with a ruler. The visibly obscured rod was 102 mm tall and
12 mm diameter and had a 40 dB SNR. The smaller, visible rod was 25mm tall and 6 mm
diameter and had a 33 dB SNR. The visible staples had 27-30 dB SNR while the non-visible
staple had an SNR of 20 dB. The small, visible pieces of wire had an SNR of 20 dB as well;
however, the local noise levels were 10 dB higher. Of course all of the objects were found within
the 115 mm depth of the host, but because it was mounted vertically, no information about they
distribution of the scatterers in the Y-dimension was possible. The clutter produced by scatter
from the host medium was comparatively low, and none of it produced a return with and SNR
greater than 15 dB. Of course, the various methods available to reduce noise (decreased cross
range step size, increased acquisition time at each step) or eliminate calibration artifacts would
further improve the ability to detect objects and increase their SNR.
Fig. 5. (a) A photograph of the front face of the waxy packing foam embedded with staples and (b) the SAR reconstruction of the target with strengths in dB.

Page 13
Next, a solid, semi-transparent, highly scattering rectangular piece of waxy packing foam 76
mm x 305 mm x 38 mm hosted six staples inserted in the front face (Fig. 5(a)) and four in the
back face. The center of the target was located 2295 mm from the rail, and the 2D Carrara
reconstructions used rd = 2300 mm. The foam was placed at a 30° angle rotated about the Y axis
through the foam’s center so that the staples were projected along the X-Z plane, removing range
and location ambiguity for staples distributed along the Y direction. All the staples in the front
face of the foam were located (Fig. 5(b)), but because the packing foam was less transparent and
more highly scattering than the Styrofoam host with voids as large as 100 mm3, many of the
staples in the back were harder to discriminate from the clutter produced by the host. The clutter
was 10 dB above the noise level. The staples on the front had a Signal to Clutter Ratio (SCR)
between 10-15 dB, where the clutter level is determined by the scatter from the foam in regions
where no metallic scatterers have been embedded. The staples on the back had an SCR 3 dB
lower but were still discernable from the clutter. There was some false positives that had as
much as 8 dB SCR.
C. Tilted Celotex panels with embedded with metallic scatterers
To consider next the case of an absorbing, highly scattering host, a 305 mm x 305 mm x
13 mm section of Celotex paneling was embedded with several metallic scatterers distributed in
the front and back faces of the panel. These scatterers were metallic fragments with a variety of
shapes and sizes and were completely buried inside the Celotex panel as a blind test. This target
approximates many practical applications for which this technique may prove useful, such as
locating nails and screws in sheetrock or fragments in an arena test, and the objective here was to

Page 14
ascertain the penetration and resolution possible by this rail SAR technique. Although the size
and location of the pre-embedded fragments could not be accurately measured, they could be
approximated by the size and location of the disturbed Celotex surface region that covered them.
These estimates are presented in Table 1, where the X/Z origin is the bottom left of the image
and SAR reconstruction at (range, cross-range) location of (-64 mm, 155 mm). Rather than
mounting the panel vertically in the X-Y plane, the panel was pivoted 47° down from vertical
about the X-axis, (Fig. 6) to remove the Y ambiguity and allow the scatterers to be located by
projection in the X-Z plane while maintaining strong returns from them.
Fig. 6. Side view of the SAR setup. The range domain corresponds to the Z-axis and the transceiver moved along the rail along the X-axis into the page. The Celotex panel (green) is rotated 45° along the X-axis.
Cross Range (mm)
Flat Range (mm)
Tilted Range (mm)
Approx. Cross Section
(mm2)
Front SCR (dB)
Back SCR (dB)
-115 280 141 80 6 10 -125 177 65 310 7 11 -30 225 101 50 4 4 105 250 119 20 5 7 80 227 102 7 6 4 80 200 82 7 4 NA 91 152 47 80 4 6 95 110 16 7 NA 3 105 73 -11 80 NA 10 83 50 -27 7 NA 5

Page 15
Table 1. The 2D centroid locations and approximate sizes of objects buried in a Celotex panel, referenced to the lower left corner at (-64 mm range, 155 mm cross range) with range values uncorrected (flat) and corrected for the tilt of the panel.
The reconstruction of the scene and the identification of selected scatterers is shown in
Fig. 7. The 47° tilt dramatically reduced the specular reflection from the front of the Celotex
panel, but there remained a significant amount of clutter noise produced by scatter from
imperfections and domains in the Celotex panel that was much stronger than in the Styrofoam or
packing foam. The clutter from the panel was at least 6 dB above the noise floor and as much as
10 dB in some locations, so only scatterers with SCR > 4 dB could be confidently identified. The
extra clutter noise made it difficult to identify many weak scatters, but the tilt caused the clutter
noise to decrease in strength near the top of the panel because of the larger range, so weak
scatterers may be more easily discriminated there.

Page 16
Fig. 7. The front (a) and back (b) of the Celotex panel, showing the location of the embedded metallic scatterers. The SAR reconstruction shows a correlation between objects circled in purple for the scans of the front (c) and back (d) of the Celotex panel, with strengths in dB. The two objects on the top were observed from the front and back in the SAR reconstruction.
To ascertain the ability of the rail SAR to detect and reconstruct the location of metallic
scatterers in the relatively opaque, highly scattering Celotex panel, the target was measured on
both sides using the same 47° tilt. The target was located 2300 mm from the rail, and the 2D
Carrara reconstructions used rd = 2300 mm. The SAR data confirmed what could be deduced
from visual inspection of the disturbed Celotex panel surfaces: two large metallic scatterers

Page 17
spanned the depth of the Celotex panel and could be detected from both sides, while several
smaller scatterers were only detectable from one side (Fig. 7). Regardless of orientation, the
Celotex panel was so opaque that the SAR data did not confidently reveal many objects with
significant SNR on the opposite side of the panel, consistent with a panel absorption coefficient
of 1-10 cm-1 at W-band.
As seen in Table 1, the two largest fragments had an SCR of 10-11 dB and could be seen
on both sides of the panel, while most other scatterers could be located on one side or the other
with SCR ≥ 4 dB. In every case, the scatterer was accurately located in range and cross-range to
within the limits of the instrument’s spatial resolution, recognizing that the range offset in Table
1 differs from the range measured with a ruler because of the 47° tilt of the panel, so both values
are presented. Fig. 8(a) shows how the 2D locations of all the back-side scatterers, with the
appropriate tilt corrections, accurately overlay the SAR 2D reconstruction of the back side of the
Celotex panel. To make the scatterers easier to identify, a thresholding algorithm was applied to
null range/cross-range bins of Fig. 7(d) where the SCR is below the 6 dB clutter level. Only a
few small objects (<100 mm2 or <-70 dBsm) on the opposite side of the panel could not be
identified because their SCR was too low, and the range equation may be used to estimate the
smallest size scatterer that can be detected as a function of depth in this attenuating, scattering
host. Methods to increase the SCR (i.e. longer integration, more cross range steps) could be used
to improve sensitivity to buried scatterers and reduce false positive detections produced by
clutter.

Page 18
(a) (b)
Fig. 8. The 2D centroid locations overlaid with SAR reconstruction of the tilted Celotex panel, where the threshold clutter floor values have been raised by 6 dB from Fig. 7(d). Reconstruction with (a) δx = 2 mm and (b) δx = 4 mm.
To ascertain the sensitivity to lateral step size for the transceiver, the target was imaged with
cross range steps every δx = 4 mm instead of 2 mm for the same 1 m scan. Halving the number
of steps would halve the acquisition time from six to three minutes but also decreased the signal
to noise ratio (SNR) of the reconstruction via coherent integration, making it more difficult to
identify smaller objects. The 1-2 dB degraded SCR of the returns was apparent in the data
because the clutter noise from the panel was increased by a factor of two (Fig. 8(b)), thereby
slightly degrading the ability to locate the scatterer. In addition to improving SCR of the strong
scatterers, finer steps and more samples will allow smaller objects to be detected and
distinguished from any background clutter noise, at the cost of longer acquisition times.
D. Comparison of W-band and THz-Band using aluminum rods
Finally, to compare the resolution of W band and THz-band rail SAR, a free space target
composed of two large circular aluminum rods, a smaller circular aluminum rod, and a rotated

Page 19
rectangular aluminum post were observed at both W and THz-bands. A photograph of the target
is shown in Fig. 9(a), and the locations and sizes of the objects are shown in Table 2. As
mentioned above, the range resolution is five times better for the THz experiment, but the
unambiguous range is also five times smaller. The cross-range resolution remains the same, as
both W and THz bands used a δx = 2 mm cross range step size. The power at THz-band was
significantly lower than at W-band, so the target was moved closer to the rail the range center
was reduced to rd = 1.0 m (THz) from rd = 2.3 m (W-band) to improve SNR enough that the
targets could be detected. Examining Fig. 9 thus reveals that the large cylindrical rod is located
2.34 m from the rail in the W-band experiment and 0.786 m from the rail in the THz experiment.
Fig. 9. (a) Photograph of the target composed of three metallic rods and a rotated rectangular rod, as viewed from above. SAR reconstructions of the target (b) at W-band and (c) the THz-band with strengths in dB.
Range (mm)
Cross Range (mm)
Approx. Size (mm)
W band SCR (dB)
THz SCR (dB)
-25 -50 6 D x 152 H 35 37 0 0 12 D x 152 H 40 43 25 -25 12 L x 25 W x 305 H 30 32 50 0 6 D x 102 H 10 10
Table 2. The 2D centroid locations and approximate sizes of the aluminum posts, where D is diameter, L is length, W is width, and H is height. The relative

Page 20
locations of the posts are referenced to the center of the large cylindrical rod, designated as (0,0).
Because there is no host and therefore no clutter associated with this target, the SCR and
SNR are the same for each measurement, and as Table 2 indicates, strong returns were seen from
all targets in both bands. It is a coincidence that the SCR for W and THz bands were within 3 dB
of each other as many factors conspired to produce these strengths, including the different
ranges, source power levels, and number of steps each scatterer was in the field of view.
Significantly, because of the greater distance to the target in the W-band experiment afforded by
the greater source power, the number of cross range steps that an object was within the field of
view of the radar in W band was much greater than in the THz band, thereby increasing its SNR.
Nevertheless, there is an optimal distance for target placement to maximize the competing
requirements of strong illumination of the target and long duration within the field of view.
The two large aluminum rods were observed in both bands, and the spatial resolution is
clearly improved in the THz band. One of the small rods was significantly obscured by the
larger rod for many cross-range locations, so it didn’t generate enough strong returns to achieve
sufficient signal strength to be detected in the THz band, but it was weakly observed at W band.
Most interestingly, the two walls of the rectangular post facing the rail were identified at W
band, but these returns were quite weak. This occurred because only at a specific location on the
rail did the transceiver receive a specular return from each face of the rectangular post. At all
other locations of the transceiver, the signal reflected away from the transceiver, so only very
weak returns from the edge were detected. The decreased range and field of view in the THz
band apparently prevented this specular return from being observed, so the rectangular rod was

Page 21
missed. These observations suggest that spotlight SAR may be a more appropriate technique for
lower power THz sources.
4. Conclusion
A rail SAR instrument has been constructed to operate at W-band (75 - 110 GHz) and a THz
band (325 - 500 GHz), and 2D algorithms have been used to reconstruct a variety of targets
composed of metallic scatterers in various hosts in order to ascertain its ability to locate small,
obscured scatterers. The “top view” Carrara algorithm was able to reconstruct scenes and locate
metallic scatterers at W-band with high range and cross-range resolution of 4.3 and 2 mm,
respectively, while range resolution was improved to 0.86 mm at the THz band. Scatterers were
easily located when embedded in target hosts of Styrofoam and packing foam that were semi-
transparent at W band. Scatterers were more difficult to locate when embedded in relatively
opaque Celotex panels. Only the largest scatterers that were as thick as the paneling were
reliably discerned from both sides, while many smaller scatterers could only be detected from the
side where they were closer to the surface. As expected, the THz band allowed for higher spatial
resolution, but its lower power required the target to be located closer to the rail and caused a
more limited field of view that prevented some targets from being identified. Finer cross range
step sizes, longer integration times, and optimal placement to maximize power on target and
duration within the field of view will improve the SNR of all targets, while more uniform host
materials will improve their SCR. This work lays the foundation for a more complete 3D
reconstruction of scatterers and illustrates the sensitivity of this technique to the attenuating and
scattering properties of the host.

Page 22
References
[1] Richards, Mark A, Scheer, James A., Holm, William A., Principles of Modern Radar: Basic Principles, SciTech Publishing, Raleigh, NC (2010).
[2] Barnes, Christopher F., Synthetic Aperture Radar, Barnes, Atlanta, GA (2015). [3] Chen, K-S, Principles of Synthetic Aperture Radar Imaging: A System Simulation
Approach (Signal and Image Processing of Earth Observations), CRC Press, Boca Raton, FL (2015).
[4] Griffiths, H.D., Baker, C., Adamy, David, Stimson's Introduction to Airborne Radar (Electromagnetics and Radar) 3rd Edition, SciTech Publishing, Raleigh, NC (2014).
[5] Soumekh, M., Synthetic Aperture Radar Signal Processing with MATLAB Algorithms, Wiley-Interscience, New York (1999).
[6] J. P. Guillet et al., “Review of Terahertz Tomography Techniques.” J Infrared Milli Terahz Waves. Vol. 35, pp. 382–411 (2014).
[7] V. Krozer et al., “Terahertz Imaging Systems With Aperture Synthesis Techniques.” IEEE Trans. Microw. Theory. Vol. 58, pp. 2027–2039 (2010).
[8] P. Dzwonkowski, P. Samczynski, K. Kulpa, J. Drozdowicz, “The concept of a flexible system for radar measurements at low terahertz frequencies,” 2015 IEEE Radar Conference, pp. 323–327 (2015).
[9] Winfried Johannes et al., “SAR with MIRANDA - millimeterwave radar using analog and new digital approach,” 2011 European Radar Conference (EuRAD) (2011).
[10] W.G. Carrara, R.S. Goodman, and R.M. Majewski, Spotlight Synthetic Aperture Radar Signal Processing Algorithms, Artech House, Boston, MA, 1995.
[11] L.A. Gorham and B. D. Rigling. "Dual Format Algorithm for Monostatic SAR" Algorithms for Synthetic Aperture Radar Imagery XVII, Edmund G. Zelnio & Frederick D. Garber, editors, Proceedings of SPIE, 2010.
[12] Curtis H. Casteel, Jr. ; LeRoy A. Gorham ; Michael J. Minardi ; Steven M. Scarborough ; Kiranmai D. Naidu ; Uttam K. Majumder; A challenge problem for 2D/3D imaging of targets from a volumetric data set in an urban environment. Proc. SPIE 6568, Algorithms for Synthetic Aperture Radar Imagery XIV, 65680D (May 07, 2007).
[13] LeRoy A. Gorham ; Linda J. Moore; SAR image formation toolbox for MATLAB. Proc. SPIE 7699, Algorithms for Synthetic Aperture Radar Imagery XVII, 769906 (April 18, 2010);
[14] Moses, Randolph L., and Lee C. Potter. "Noncoherent 2D and 3D SAR reconstruction from wide-angle measurements."13th Annual Adaptive Sensor Array Processing Workshop. 2005.
[15] J. Ding, M. Kahl, O. Loffeld and P. H. Bolívar, "THz 3-D Image Formation Using SAR Techniques: Simulation, Processing and Experimental Results," in IEEE Transactions on Terahertz Science and Technology, vol. 3, no. 5, pp. 606-616, Sept. 2013.
[16] McClatchey, K., M. T. Reiten, and R. A. Cheville. "Time resolved synthetic aperture terahertz impulse imaging."Applied physics letters 79.27 (2001): 4485-4487.
[17] Martinez-Lorenzo, Jose Angel, Fernando Quivira, and Carey M. Rappaport. "SAR imaging of suicide bombers wearing concealed explosive threats."Progress In Electromagnetics Research 125 (2012): 255-272.

Page 23
[18] S. A. Lang, M. Demming, T. Jaeschke, K. M. Noujeim, A. Konynenberg and N. Pohl, "3D SAR imaging for dry wall inspection using an 80 GHz FMCW radar with 25 GHz bandwidth,"2015 IEEE MTT-S International Microwave Symposium, Phoenix, AZ, 2015, pp. 1-4.
[19] Harris, Fredric J. "On the Use of Windows for Harmonic Analysis with the Discrete Fourier Transform."Proceedings of the IEEE. Vol. 66, January 1978, pp. 51–83.
Copyright © 2022 FDOKUMEN